59459 - World Bank Open Knowledge Repository
125
Public Disclosure Authorized Public Disclosure Authorized Public Disclosure Authorized Public Disclosure Authorized
-
Upload
khangminh22 -
Category
Documents
-
view
1 -
download
0
Transcript of 59459 - World Bank Open Knowledge Repository
1112077
Pub
lic D
iscl
osur
e A
utho
rized
Pub
lic D
iscl
osur
e A
utho
rized
Pub
lic D
iscl
osur
e A
utho
rized
Pub
lic D
iscl
osur
e A
utho
rized
wb370910
Typewritten Text
59459
Caribbean Regional Electricity
Supply OptionsToward Greater Security, Renewables and Resilience
Franz Gerner
Megan Hansen
59459-LAC
ii
© 2011 The International Bank for Reconstruction and Development / The World Bank
1818 H Street, NW
Washington DC 20433
Telephone: 202-473-1000
Internet: www.worldbank.org
Email: [email protected]
All rights reserved
This volume is a product of the staff of the International Bank for Reconstruction and Development / The
World Bank. The findings, interpretations, and conclusions expressed in this volume do not necessarily
reflect the views of the Executive Directors of The World Bank or the governments they represent.
The World Bank does not guarantee the accuracy of the data included in this work and accepts no
responsibility whatsoever for any consequence of their use. The boundaries, colors, denominations, and
other information shown on any map in this work do not imply any judgment on the part of The World
Bank concerning the legal status of any territory or the endorsement or acceptance of such boundaries.
Rights and Permissions
The material in this publication is copyrighted. Copying and/or transmitting portions or all of this work
without permission may be a violation of applicable law. The International Bank for Reconstruction and
Development / The World Bank encourages dissemination of its work and will normally grant permission
to reproduce portions of the work promptly.
For permissions to photocopy or reprint any part of this work, please send a request with complete
information to the Copyright Clearance Center Inc., 222 Rosewood Drive, Danvers, MA 01923, USA;
telephone: 978-750-8400; fax: 978-750-4470; Internet: www.copyright.com.
All other queries on rights and licenses, including subsidiary rights, should be addressed to the Office of
the Publisher, The World Bank, 1818 H Street, NW, Washington, DC, 20433, USA; fax: 202-522-2422;
email: [email protected].

iii
Contents
Foreword ....................................................................................................................................................... v
Acknowledgements………………………………………………………………………..…………….... vi
Acronyms……………………………………………………………………………………….……….... vii
Map………………………………………………………………………………………..…………….... ix
Overview ....................................................................................................................................................... x Executive Summary ................................................................................................................................... xiii
Chapter 1 Introduction .................................................................................................................................. 1
1.1 Objective of the study ......................................................................................................................... 1
1.2 Methodology ....................................................................................................................................... 2
1.3 This Report.......................................................................................................................................... 3
Chapter 2 The Caribbean Context ................................................................................................................. 4
2.1 The Caribbean ..................................................................................................................................... 4
2.2 Electricity Market Overview ............................................................................................................... 7
2.3 Fuels and Generation Technologies: Usage and Potential in the Region ........................................... 8
2.3.1. Liquid Fuels (Distillate, Heavy Fuel Oil) ................................................................................. 10
2.3.2. Coal ........................................................................................................................................... 11
2.3.3. Petroleum coke .......................................................................................................................... 11
2.3.4. Natural Gas (LNG, Mid-Scale LNG, CNG, Pipeline Gas) ....................................................... 12
2.3.5 Solar Photovoltaic (PV) and Concentrating Solar Power (CSP)................................................ 14
2.3.6 Wind ........................................................................................................................................... 14
2.3.7 Geothermal ................................................................................................................................. 15
2.3.8 Hydro ......................................................................................................................................... 15
2.3.9 Biomass ...................................................................................................................................... 15
2.3.10 Other Technologies .................................................................................................................. 16
2.4 Conclusion ........................................................................................................................................ 16
Chapter 3 Individual Countries’ Energy Options ....................................................................................... 18
3.1 Methodology and Assumptions ........................................................................................................ 18
3.1.1. Fossil Fuel Analysis .................................................................................................................. 19
3.1.2. Renewable Energy Resource Analysis...................................................................................... 21
3.2 Country-specific Results ................................................................................................................... 24
3.2.1 Antigua and Barbuda, Grenada, and St. Vincent and the Grenadines ....................................... 24
3.2.2 Barbados .................................................................................................................................... 25
3.2.3 Dominica and Nevis ................................................................................................................... 25
3.2.4 Dominican Republic (DR) ......................................................................................................... 26
3.2.5 Guadeloupe ................................................................................................................................ 27
3.2.6 Haiti............................................................................................................................................ 28
3.2.7 Jamaica ....................................................................................................................................... 28
3.2.8 Martinique .................................................................................................................................. 29
3.2.9 St. Kitts ...................................................................................................................................... 30
3.2.10 St. Lucia ................................................................................................................................... 30
3.3 Conclusions ....................................................................................................................................... 31
Chapter 4 Regional Energy Options ........................................................................................................... 33
4.1 Natural Gas Pipeline ......................................................................................................................... 33

iv
4.1.1 Technical Feasibility of the Pipeline .......................................................................................... 33
4.1.2 Economics of the Pipeline .......................................................................................................... 34
4.2 Fuel Storage and Transshipment Options ......................................................................................... 38
4.2.1 Current Situation of Regional Storage ....................................................................................... 38
4.2.2 Storage Options for the Future ................................................................................................... 39
4.3 Regional Electricity Market Interconnections .................................................................................. 40
4.3.1 Submarine Cable Technologies and Costs ................................................................................. 40
4.3.2 Evaluation of Interconnections/Markets .................................................................................... 42
4.4 Challenges and Risks ........................................................................................................................ 52
4.4.1 Financial and Economic Issues .................................................................................................. 52
4.4.2 Commercial and Regulatory Issues ............................................................................................ 53
4.4.3 Security of Supply ...................................................................................................................... 54
4.4.4 Environmental Concerns ............................................................................................................ 54
4.5 Conclusions ....................................................................................................................................... 54
Chapter 5 Regional Scenario Analysis........................................................................................................ 57
5.1 Methodology ..................................................................................................................................... 57
5.2 The Scenarios .................................................................................................................................... 58
5.2.1 The Base Case Scenario ............................................................................................................. 58
5.2.2 Fossil Fuel Scenario ................................................................................................................... 59
5.2.3 Interconnection/Renewables Scenario ....................................................................................... 61
5.2.4. Comprehensive Integrated Scenario ......................................................................................... 62
5.3 Cost Comparison of Scenario Results ............................................................................................... 63
5.3.1 Net Present Value....................................................................................................................... 63
5.3.2 Investment Requirements and Production Costs ........................................................................ 65
5.4 Country-specific Results and Options ............................................................................................... 67
5.5 Conclusions ....................................................................................................................................... 72
Chapter 6 Conclusions and Looking Forward ............................................................................................ 74
6.1 Key Conclusions ............................................................................................................................... 74
6.2 Limitations and Challenges ............................................................................................................... 75
6.3 Next Steps ......................................................................................................................................... 76
Annex 1 Forecasted Demand and Supply Tables…………………………………………………………78
Annex 2 Nexant Country Overviews……………………………………………………………...……....80
v
Foreword
The Caribbean region continues to be plagued by high and volatile fuel prices, with limited
economies of scale or diversity in electricity supply. Although several studies have examined
alternative resource options for the region, they often only consider solutions for individual
countries in isolation. When one looks at the Caribbean, however, it is apparent that the short
distances between islands and market sizes present opportunities to benefit from regional
solutions. Indeed, increasing interconnection in the Caribbean could pave the way for greater
energy security, a larger use of renewables, and enhanced climate resilience.
Given the dearth of research comparing regional solutions with individual country ones, the
potential benefits of pursuing an integrated approach for the Caribbean were not clear. Thus, this
report, ―Caribbean Regional Electricity Supply Options: Toward Greater Security, Renewables
and Resilience for the Region,‖ serves to explore at a concept level the alternative of
multicountry-based energy development paths that could be implemented by countries to
diversify their electricity mix, improve reliability and access cleaner resources.
The idea of regional interconnections is not new: gas pipelines are widely used to interconnect
gas supply with gas demand, and electricity market interconnections have become the norm
around the world. However, this option does not appear to have received the attention it merits in
the specific context of the Caribbean. While this study analyzes a small subset of the imaginable
regional energy options for the Caribbean, it shows that regional solutions warrant further study.
This synthesis report builds from the technical report that the World Bank commissioned from
Nexant, entitled ―Caribbean Regional Electricity Generation, Interconnection, and Fuels Supply
Strategy.‖ It analyzes a range of regional options. Although further analysis is required, the hope
is that this synthesis report will help to fuel the conversation about interconnected development
pathways for the Caribbean.
Philippe Benoit
Sector Manager, Energy
Latin America and the Caribbean
World Bank

vi
Acknowledgements
This synthesis report was written by Franz Gerner and Megan Hansen (Junior Professional
Associate, LCSEG). Members of the World Bank study team included Franz Gerner (Senior
Energy Economist and Task Team Leader, ECSS2), Michael Levitsky (Lead Energy Economist,
ENV), Alan Townsend (Senior Energy Specialist, EASIN) and Fowzia Hassan (Operations
Analyst, MNSEG).The report was prepared under the direction of Philippe Benoit (Sector
Manager, LCSEG). Special thanks are due to Susan Bogach (Senior Energy Economist, LCSEG)
for reviewing drafts of the report.
Peer reviewers for the study included Charles Feinstein (Sustainable Development Leader,
EASNS), Mark Lambrides (Chief, Energy and Climate Change Mitigation, Organization of
American States) and Tonci Bakovic (Chief Energy Specialist, IFC).
The synthesis report is based on a technical report, prepared by Nexant. The team was composed
of Peter Hindley (Power Generation Expert and Team Leader), Bruce Degen (Natural Gas
Expert), Graham Lawson (Power Transmission/Submarine Interconnection Expert), Babul Patel
(Renewables Expert) and Miljenko Bradaric (Financial/Economic Expert).
Valuable comments on the Nexant technical report were provided by Trevor Byer (Chairman of
the Board of LUCELEC, St. Lucia), Greg Rich (CEO, Eastern Caribbean Gas Pipeline Company,
ECGPC), Nigel Hosein (Executive Director, Caribbean Electric Utility Services Corporation,
CARILEC) and Joseph Williams (Energy Program Manager, Caribbean Community,
CARICOM).
The report also benefitted from the Energy and Climate Change Partnership (ECPA) pre-
ministerial meetings held in April 2010 and organized by the Organization of American States
(OAS) and the US Department of Energy (DOE). The authors express their appreciation to the
governments and utilities of Antigua and Barbuda, Grenada, St. Vincent and the Grenadines, St.
Kitts and Nevis, St. Lucia, Dominica, Barbados, Guadeloupe, Martinique, Haiti, Jamaica,
Dominican Republic and Trinidad and Tobago for providing their full cooperation to the World
Bank and Nexant teams during the study.
The study was financed by the World Bank and the Public-Private Infrastructure Advisory
Facility (PPIAF). PPIAF is a multidonor technical assistance facility which provides support to
governments in developing countries for improving the quality of infrastructure through private
sector involvement.
vii
Acronyms
AC alternating current
bbl barrel
CC combined cycle
CCGT combined cycle gas turbine
CCT simple cycle combustion turbines
CDEEE Corporación Dominicana de Empresas Eléctricas Estatales
CFB circulating fluidized bed
CNG compressed natural gas
CO2 carbon dioxide
CSP concentrated solar power
DC direct current
DR Dominican Republic
ECGP Eastern Caribbean Gas Pipeline
ECGPC Eastern Caribbean Gas Pipeline Company
EIA Energy Information Agency
ft foot/feet
GDP gross domestic product
GJ gigajoule
GNI gross national income
GT gas turbine
GW gigawatt
GWh gigawatt hour
HFO heavy fuel oil
HZ Hertz
ICGPL Intra Caribbean Gas Pipeline Limited
IEDOM Institut d’Emission D’Outre-mer (French Overseas Statistics Agency)
IFIs International Financial Institutions
IGCC integrated gasification combined cycle
IPP independent power producers
km kilometer
kV kilovolt
kW kilowatt
kWh kilowatt-hour
LCL least cost line
LNG liquefied natural gas
LSD low-speed diesel
m meter
MMscfd million standard cubic feet per day
mph miles per hour
MSD medium--speed diesel
MVA million volt-amperes
MW megawatt
MWh megawatt-hour
NG natural gas
viii
NGC National Gas Company of Trinidad & Tobago
NOx nitrogen oxide
NPV net present value
O&M operation and maintenance
PC pulverized coal
PDVSA Petroleos de Venezuela
PV photovoltaic
SOx sulfur oxide
UK United Kingdom
US United States
USVI United States Virgin Islands
ix
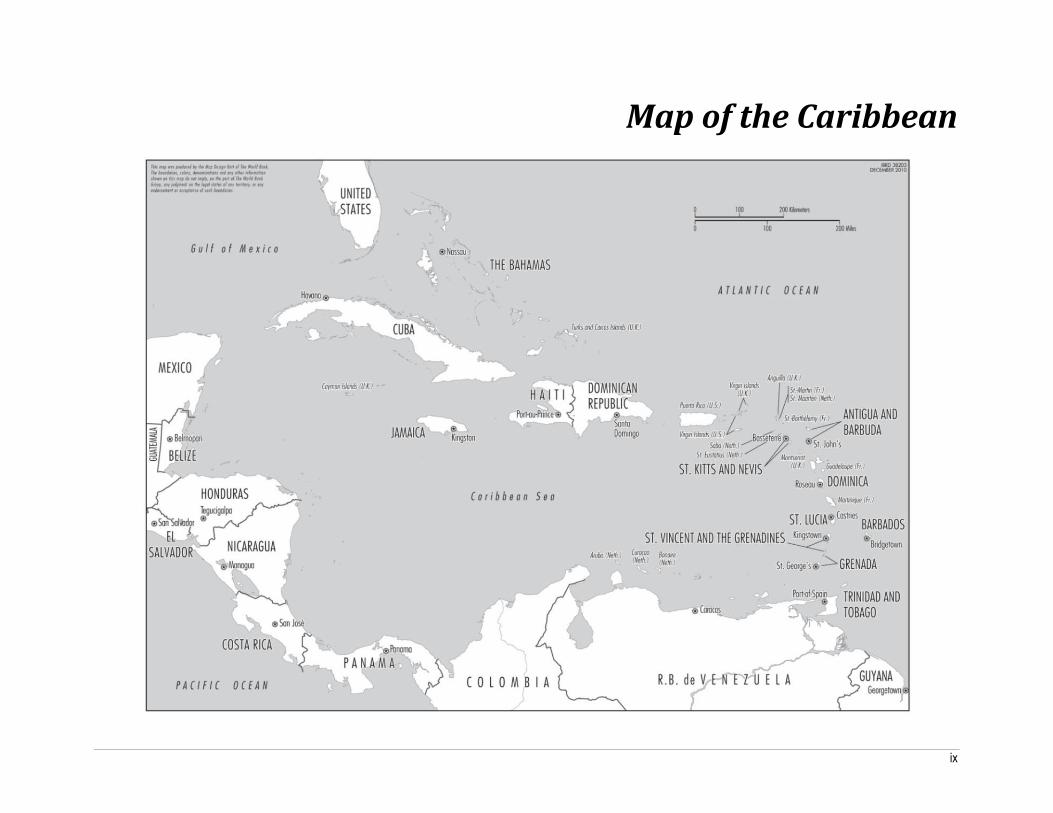
Map of the Caribbean
x
Overview
Toward an Interconnected Caribbean: Paving the Way for Greater Energy Security, More Renewables and
Improved Resilience
he Caribbean region faces some of the world’s highest electricity tariffs. It is plagued by
high and volatile fuel prices, with limited economies of scale or diversity of electricity
supply. Paramount among the region’s challenges is managing the dependence on imported oil
and oil products, mainly diesel and heavy fuel oil (HFO), for electricity generation. In addition,
over the next 20 years electricity demand in the region is expected to double. This will pose
greater fuel supply and financial challenges for countries. There is already significant load
shedding in some countries, while others face deteriorating equipment and high technical and
nontechnical losses.
At the same time, the Caribbean islands are especially vulnerable to climate change, and it is in
the nations’ interests to develop their electricity sectors in a climate-sustainable manner by
setting an example for low-carbon growth and enhancing resilience to climate events. In terms of
resilience, the countries of the Caribbean must better prepare for the impacts of climate change,
such as increased storm intensity and frequency, in their planning for the electricity sector. As
the World Bank’s World Development Report 2010 states, countries must ―act now, act together,
and act differently.‖
The Caribbean region has a unique opportunity to tackle its local electricity challenges while at
the same time being a world leader in transformative energy planning. While the Caribbean
region has traditionally considered single-island solutions for the electricity sector, this report,
the ―Caribbean Regional Electricity Supply Options: Toward Greater Security, Renewables and
Resilience for the Region,‖ explores at a concept level the alternative of multicountry-based
energy solutions that could be implemented bi- or multilaterally. The report analyzes the
prospects for moving toward an interconnected Caribbean in order to increase supply, improve
reliability and provide access to cleaner local energy resources.
A potential tool for achieving this goal is the use of electrical interconnections, notably through
the use of submarine cables to connect different islands. The idea of interconnections is not new:
there are benefits from economies of scale, and numerous regional electricity interconnections
already exist worldwide. However, electrical interconnections have often been overlooked as a
solution for the Caribbean, even though they could provide significant benefits, in part because
the region includes numerous nations on different islands. The study examines a number of
potential interconnections and demonstrates the potential viability of this instrument, from both
an economic and technical perspective, to help the Caribbean improve efficiency and increase
security in the electricity sector.
T

xi
Electricity interconnections can also unlock the potential of various large-scale renewable energy
resources in the Caribbean. Many countries are blessed with abundant renewable energy
potential, such as the geothermal resources on Dominica and Nevis. At the same time, the
demand for electricity in these countries is small, and the local market cannot absorb the full
resource potential. Through interconnections with other islands, such as Puerto Rico,
Guadeloupe or Martinique, there is the possibility of gaining access to the needed markets in
order to transform these investments into viable options. Similarly, some islands have large wind
or solar potential, but intermittency has the potential to disrupt a small grid, and large amounts of
reserves would be needed. Interconnections may allow for the increased penetration of
intermittent renewables by increasing the market size, thus reducing reserve requirements and
improving efficiency.
Interconnections may also enhance a country’s resilience to hurricanes and the vagaries of
climate change, allowing it to receive emergency support in the face of natural disasters or
shortages. For some countries access to emergency reserve power alone may provide significant
justification for further pursuing interconnections. The potential climate-resilience benefits of
interconnections could also open a window to access climate finance funds in order to support
electricity sector development. Given the scale of projects in the Caribbean, even small amounts
of money have the potential to be transformative.
By increasing the role of local renewable resources, thereby diversifying the generation matrix
and providing a means to access emergency reserve power, interconnections would also
strengthen the security of the region’s electricity sector. Diversification and decreased
dependence on imported oil will not only reduce costs, but countries will be less affected by
swings in oil prices. Furthermore, through reliance on local regional resources and support for
energy trade among countries, the use of interconnections has the potential to improve the
stability of intraregional cooperation.
The proposed Eastern Caribbean Gas Pipeline (ECGP) is another regional solution. It would
supply natural gas from Trinidad and Tobago through a pipeline to Barbados, Guadeloupe,
Martinique and St. Lucia. The pipeline gas is potentially a cheap fuel option for these countries
which could cut electricity generation costs by half when compared to diesel-based generation.
Although this project has faced various implementation delays, it may still be worth pursuing in
light of the large expected benefits.
While regional solutions offer the potential to reduce electricity costs and increase renewable
energy penetration, efficiency, security and climate resilience, a number of factors may present
obstacles to implementation. Interconnections, particularly in the context of large-scale
renewables development, require larger amounts of upfront capital than traditional single-island-
based diesel generation. Interconnections could help reduce the unit capital costs of renewable
plants through economies of scale, but private financing, public/private partnerships and support
from international financial institutions (IFIs) and the international donor community will likely
be of key importance. In addition, countries may need improved legal, regulatory and
institutional frameworks for cross-country cooperation and electricity trade. In the Caribbean, as
elsewhere in the world, individual countries may be hesitant to rely on another country for power

xii
or gas, but this hesitancy has been overcome in many parts of the world (including Europe, Asia
and other parts of Latin America) with important benefits to the participating countries.
There are opportunities over the next decade for Caribbean countries to move toward a more
integrated and diverse energy mix, one that would increase the security and efficiency of the
electricity sector, catalyze greater use of renewables, and help the Caribbean improve its
resilience to a changing climate.
To support this vision, the Bank commissioned a technical analysis of regional supply options,
which are summarized in this report. The report provides an overview of the electricity sector of
many of the countries of the Caribbean, and provides some preliminary findings regarding the
potential to interconnect various islands, and the potential to catalyze certain large-scale
renewables investments. These findings are summarized in the following Executive Summary,
with a fuller description provided in the body of this report. The study represents an initial phase
in the process of exploring regional options by providing a concept-level analysis; each project
would need additional in-depth technical, financial, and economic prefeasibility and feasibility
studies before it moves forward. Through this effort, the World Bank hopes to contribute to the
discussion of finding stronger paths for electricity development in the Caribbean and to explore a
shift in paradigm to a more integrated Caribbean.

xiii
Executive Summary
he countries of the Caribbean region face numerous energy challenges. Most urgently,
they must manage their high and growing dependence on the imported oil and oil
products that fuel their domestic economies. Although the total installed capacity of the
Caribbean is around 20 gigawatts (GW), this is fragmented among the small islands, and
currently no interconnections exist between island states. Diseconomies of scale have a major
impact on the cost of power generation. This, in combination with high fuel prices, causes
customers in the Caribbean to face some of the world’s highest electricity tariffs. Regional
solutions, such as electricity market interconnections and gas pipelines, could offer countries
economies of scale in fuel supply as well as in power plant and system operations.
The objective of the study is to conduct a “concept-level” analysis of the potential for
technically and financially sound regional electricity supply options to help match future
supply and demand. These regional energy solutions involve new fuels or fuel transport
methods (pipeline gas, liquefied natural gas), new and renewable energy resources for power
generation (primarily wind and geothermal), and new electrical interconnections through
submarine power cables among islands. Although the study explores selected alternative
electricity development paths for the Caribbean islands, it is not meant to be a comprehensive
analysis of all options or a prefeasibility study. It is hoped that the study of these options will
give rise to ideas that could reduce electricity costs, decrease environmental impacts from energy
production and increase grid reliability.
Overall, this study provides evidence that regional electricity solutions in the Caribbean
merit further research and investigation. Many countries may have significant potential to
gain from developing new resources and exploring interconnections. However, this study uses a
simplified approach; future work is needed to identify the optimal options for each country. It is
recommended that individual countries or sets of countries use these preliminary high-level
findings to conduct more in-depth prefeasibility and feasibility studies of individual, subregional
and regional solutions, and related institutional/regulatory assessments.
Methodology
The World Bank commissioned Nexant to conduct a technical analysis of regional supply
options for the Caribbean. This analysis consisted of four main steps: market analysis, individual
country analysis, regional solution analysis, and a scenario analysis to measure the aggregate
regional impacts and savings from different development paths. The results are presented in its
report entitled ―Caribbean Regional Electricity Generation, Interconnection, and Fuels Supply
Strategy‖ (the ―Nexant Report‖).1
1 The Nexant Report can be downloaded at www.worldbank.org/reference/ under Documents & Reports.
T
xiv
First, current and future electricity markets were analyzed. This analysis consisted of a
country-by-country examination of the current and planned energy infrastructure, a projection of
future demand growth (based on forecasts and historical data), and an overview of the available
technologies to meet this growth.
Second, a comparison of fuel supply and generation technologies was completed to explore
the least-cost options for individual countries in order to later compare these results to
regional options. The results were presented as screening curves for each country. These curves
plot a simplified representation of costs (cents/kilowatt-hour [kWh]) against the relevant capacity
factors. The cost was calculated using capital costs, operating and maintenance costs, fuel costs,
estimated costs for transmission upgrades, the heat rate (or fuel efficiency), and the capacity
factor. The study focuses on the nine Caribbean countries eligible for support from the World
Bank (St. Lucia, St. Vincent and the Grenadines, Grenada, Antigua and Barbuda, St. Kitts and
Nevis, Dominica, Haiti, the Dominican Republic and Jamaica) and a few other countries relevant
to the Caribbean gas pipeline (Martinique, Guadeloupe and Barbados).
The third step focused on analyzing a gas pipeline to serve four countries, three regional
fuel storage options and eleven electricity market interconnections. In addition to those
countries on which this study focused in detail, this step involved a cursory analysis of the
energy markets of various other countries that would be instrumental in regional solutions
(Trinidad and Tobago, Cuba, the United States and Puerto Rico). These results were compared
with single-country solutions in order to assess their economic benefits.
Fourth and finally, a multicountry scenario analysis was conducted to provide a
preliminary assessment of the aggregate economic benefits of four illustrative scenarios.
This analysis built on the previous steps but involved a more detailed system analysis that
simulated yearly expansion and production, based on characteristics of the existing systems,
future conditions, and characteristics of new power plants. Based on the net present value (NPV)
of investment and production costs, an estimated scale of the benefit of diverging from the
business-as-usual path was identified for each country.
This synthesis report builds on the findings of the Nexant Report. The benefits of regional-based
solutions that notably promote the use of renewables provide a potential opportunity for the
Caribbean as a region to increase the security of energy supply, to reap the benefits of larger-
scale renewables and to improve its resilience to climate.
The Caribbean Electricity Sector
Overall, the Caribbean is a diverse region with disparate energy needs, ranging from large
island nations with millions of people, such as the Dominican Republic and Puerto Rico, to
extremely small ones with a few thousand inhabitants, such as Anguilla and St. Kitts and
Nevis. The sizes of the economies range from multibillion dollars to a few million. Given this
disparity in size and wealth, the energy access and demand vary. Most countries have near-
universal access, while others, such as Haiti, struggle to provide coverage. Some have installed
capacities of 5 GW, and others only reach a few megawatts (MW).
xv
However, the main challenge of these countries is similar: supplying a growing energy
demand in a reliable and efficient manner. Most countries depend on diesel and heavy fuel oil
(HFO) which are expensive and lead to extremely high electricity tariffs, although a few also use
natural gas, coal, bagasse and hydro. Since the region’s electricity demand is projected to double
by 2028, large new investments must be made. It is useful to consider what options may be a part
of meeting the challenge of supplying cheaper energy to the Caribbean.
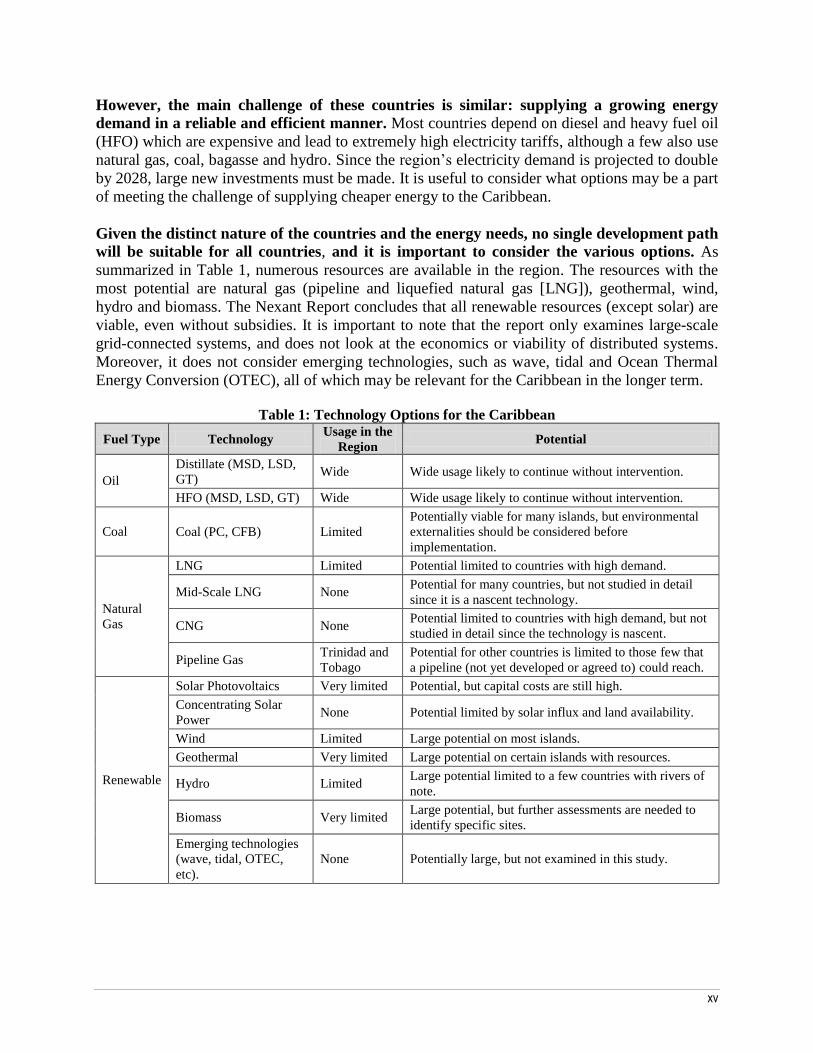
Given the distinct nature of the countries and the energy needs, no single development path
will be suitable for all countries, and it is important to consider the various options. As
summarized in Table 1, numerous resources are available in the region. The resources with the
most potential are natural gas (pipeline and liquefied natural gas [LNG]), geothermal, wind,
hydro and biomass. The Nexant Report concludes that all renewable resources (except solar) are
viable, even without subsidies. It is important to note that the report only examines large-scale
grid-connected systems, and does not look at the economics or viability of distributed systems.
Moreover, it does not consider emerging technologies, such as wave, tidal and Ocean Thermal
Energy Conversion (OTEC), all of which may be relevant for the Caribbean in the longer term.
Table 1: Technology Options for the Caribbean
Fuel Type Technology Usage in the
Region Potential
Oil
Distillate (MSD, LSD,
GT) Wide Wide usage likely to continue without intervention.
HFO (MSD, LSD, GT) Wide Wide usage likely to continue without intervention.
Coal Coal (PC, CFB) Limited
Potentially viable for many islands, but environmental
externalities should be considered before
implementation.
Natural
Gas
LNG Limited Potential limited to countries with high demand.
Mid-Scale LNG None Potential for many countries, but not studied in detail
since it is a nascent technology.
CNG None Potential limited to countries with high demand, but not
studied in detail since the technology is nascent.
Pipeline Gas Trinidad and
Tobago
Potential for other countries is limited to those few that
a pipeline (not yet developed or agreed to) could reach.
Renewable
Solar Photovoltaics Very limited Potential, but capital costs are still high.
Concentrating Solar
Power None Potential limited by solar influx and land availability.
Wind Limited Large potential on most islands.
Geothermal Very limited Large potential on certain islands with resources.
Hydro Limited Large potential limited to a few countries with rivers of
note.
Biomass Very limited Large potential, but further assessments are needed to
identify specific sites.
Emerging technologies
(wave, tidal, OTEC,
etc).
None Potentially large, but not examined in this study.

xvi
Individual Country Solutions
In order to understand the additional benefit of regional options for the Caribbean, it is
important to first recognize what options exist for an individual country’s development. ―Individual country‖ means that each country is considered to be isolated, without connection to
another country by gas pipeline or submarine cable electrical interconnection. Some Caribbean
countries have numerous alternative energy options, while others are limited to only a few.
Which fossil fuel technologies are appropriate on which island are most influenced by the
island’s size, while the competitiveness of renewable technologies is impacted by both the
resources available and the cost of competing fossil fuels (see Table 2).
Table 2: Summary of Individual Countries’ Viable Future Options
2
Country Distillate Coal LNG Wind Geothermal Hydro* Biomass*
Antigua and Barbuda ✔ ✔ ✔ ✔
Grenada ✔ ✔ ✔ ✔ ✔
St. Vincent and the
Grenadines ✔ ✔ ✔ ✔ ✔
St. Kitts ✔ ✔ ✔
St. Lucia ✔ ✔ ✔ ✔
Dominica ✔ ✔ ✔ ✔ ✔
Nevis ✔ ✔ ✔ ✔
Barbados ✔ ✔ ✔ ✔ ✔ ✔
Guadeloupe ✔ ✔ ✔ ✔ ✔ ✔
Martinique ✔ ✔ ✔ ✔ ✔ ✔
Haiti ✔ ✔ ✔ ✔ ✔ ✔
Jamaica ✔ ✔ ✔ ✔ ✔ ✔
Dominican Republic ✔ ✔ ✔ ✔ ✔ ✔
✔ = viable option * The resources are site specific and need to be studied further.
Notably, the smallest islands, including Antigua and Barbuda, Grenada3, St. Vincent and
the Grenadines, St. Kitts, and St. Lucia, have limited fossil fuel options, with the cost of coal
being comparable to distillate, due to the high costs of delivering to and serving a small market.
In addition, coal may require deep sea ports which may not be available on every island. As a
result, renewable options, such as wind, hydro and biomass, are highly competitive where
2 Although mid-scale LNG may be viable options for many countries, it is not included in the Nexant Report due to
the nascent nature of the technology. Mid-scale LNG may be a low-cost option for Barbados, Jamaica, Martinique,
Guadeloupe, Dominican Republic (DR), and possibly Haiti. In addition, compressed natural gas (CNG) may also be
viable for Barbados, Jamaica, Martinique, Guadeloupe, DR, and possibly Haiti, but it has additional risks because it
is a new technology, and was not studied in detail in this analysis. In this analysis the geothermal energy for
Martinique and Guadeloupe was not examined, though potential exists. 3 Grenada has a large estimated geothermal resource, the development of which was not examined in this study. The
government recently announced plans to explore the potential of development, which could impact the country’s
energy options.

xvii
suitable sites can be identified. Since coal is an environmentally more damaging resource relative
to many other sources, and could lead to future financial liabilities in a carbon-constrained world,
countries may choose to pursue renewable options.
Dominica and Nevis have an array of choices similar to those of other small nations, but
their options are augmented by large geothermal potential. In both countries geothermal
energy is the cheapest option at capacity factors at which geothermal power plants would
operate. However, it is important to consider the ratio of the size of the potential resource to the
size of the market. In both countries a plant could supply 100 percent of the islands’ demand
with excess at the time of installation, which would increase the requirements for operational
reserves. The countries may be better able to utilize the full geothermal resource with
interconnections.
In the slightly larger markets of Barbados, Guadeloupe and Martinique, LNG appears to
be the most economical fossil fuel option, and in all countries wind energy could also be viable
and competitive if good sites are identified. Compressed natural gas (CNG) and mid-scale LNG
may also be lower-cost options for these countries, but they were not studied in detail in this
study since they are nascent technologies (see footnote 2).
Finally, in the three largest markets (Haiti, Jamaica and the Dominican Republic),
alternative fossil fuels are competitive. In Haiti, LNG fuels the cheapest power at nearly all
capacity factors. Due to the low cost of fossil fuels in Jamaica and the Dominican Republic,
renewables, such as wind, lose the large
competitive advantage that they have in
smaller countries unless the
environmental costs of fossil fuels are
factored in. However, renewables are
still competitive at good sites.
Regional Solutions
Regional solutions may be an
appealing option for the Caribbean,
because they could help countries
benefit from economies of scale and
indigenous resources on neighboring
islands and offer lower-cost options
than individual development. The
regional solutions examined are the
construction of a gas pipeline, the
enlargement of regional fuel storage and
transshipment facilities, and the
interconnection of electricity markets by
Figure 1: Schematic of the Eastern
Caribbean Gas Pipeline
xviii
means of submarine cables or land transmission lines. From the analysis, it appears that gas
pipelines and submarine cables have the potential to significantly reduce power prices for many
countries.
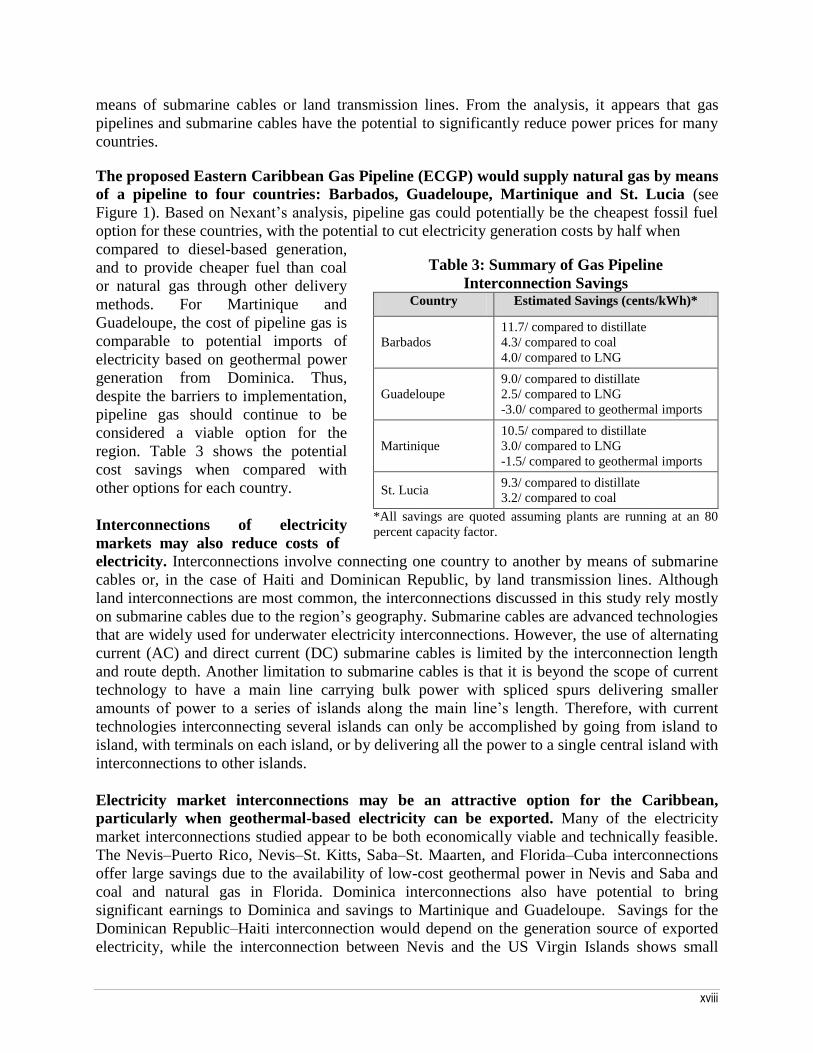
The proposed Eastern Caribbean Gas Pipeline (ECGP) would supply natural gas by means
of a pipeline to four countries: Barbados, Guadeloupe, Martinique and St. Lucia (see
Figure 1). Based on Nexant’s analysis, pipeline gas could potentially be the cheapest fossil fuel
option for these countries, with the potential to cut electricity generation costs by half when
compared to diesel-based generation,
and to provide cheaper fuel than coal
or natural gas through other delivery
methods. For Martinique and
Guadeloupe, the cost of pipeline gas is
comparable to potential imports of
electricity based on geothermal power
generation from Dominica. Thus,
despite the barriers to implementation,
pipeline gas should continue to be
considered a viable option for the
region. Table 3 shows the potential
cost savings when compared with
other options for each country.
Interconnections of electricity
markets may also reduce costs of
Table 3: Summary of Gas Pipeline
Interconnection Savings Country Estimated Savings (cents/kWh)*
Barbados
11.7/ compared to distillate
4.3/ compared to coal
4.0/ compared to LNG
Guadeloupe
9.0/ compared to distillate
2.5/ compared to LNG
-3.0/ compared to geothermal imports
Martinique
10.5/ compared to distillate
3.0/ compared to LNG
-1.5/ compared to geothermal imports
St. Lucia 9.3/ compared to distillate
3.2/ compared to coal
*All savings are quoted assuming plants are running at an 80
percent capacity factor.
electricity. Interconnections involve connecting one country to another by means of submarine
cables or, in the case of Haiti and Dominican Republic, by land transmission lines. Although
land interconnections are most common, the interconnections discussed in this study rely mostly
on submarine cables due to the region’s geography. Submarine cables are advanced technologies
that are widely used for underwater electricity interconnections. However, the use of alternating
current (AC) and direct current (DC) submarine cables is limited by the interconnection length
and route depth. Another limitation to submarine cables is that it is beyond the scope of current
technology to have a main line carrying bulk power with spliced spurs delivering smaller
amounts of power to a series of islands along the main line’s length. Therefore, with current
technologies interconnecting several islands can only be accomplished by going from island to
island, with terminals on each island, or by delivering all the power to a single central island with
interconnections to other islands.
Electricity market interconnections may be an attractive option for the Caribbean,
particularly when geothermal-based electricity can be exported. Many of the electricity
market interconnections studied appear to be both economically viable and technically feasible.
The Nevis–Puerto Rico, Nevis–St. Kitts, Saba–St. Maarten, and Florida–Cuba interconnections
offer large savings due to the availability of low-cost geothermal power in Nevis and Saba and
coal and natural gas in Florida. Dominica interconnections also have potential to bring
significant earnings to Dominica and savings to Martinique and Guadeloupe. Savings for the
Dominican Republic–Haiti interconnection would depend on the generation source of exported
electricity, while the interconnection between Nevis and the US Virgin Islands shows small
xix
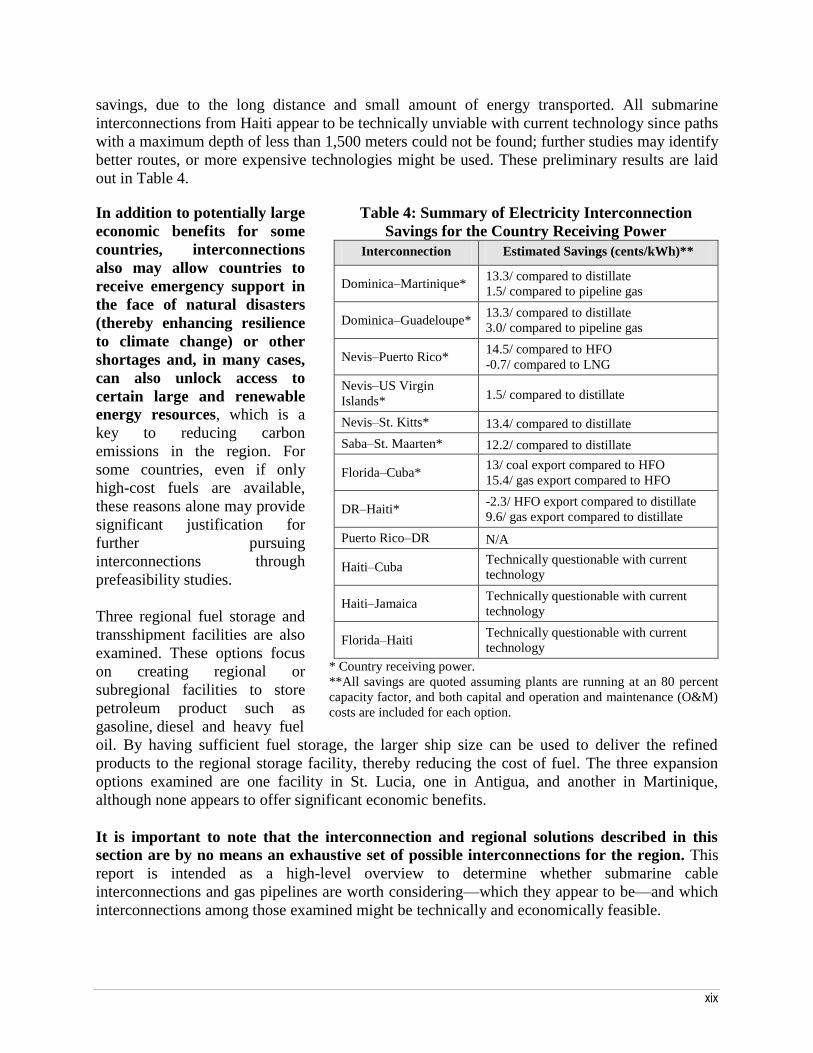
savings, due to the long distance and small amount of energy transported. All submarine
interconnections from Haiti appear to be technically unviable with current technology since paths
with a maximum depth of less than 1,500 meters could not be found; further studies may identify
better routes, or more expensive technologies might be used. These preliminary results are laid
out in Table 4.
In addition to potentially large
economic benefits for some
countries, interconnections
also may allow countries to
receive emergency support in
the face of natural disasters
(thereby enhancing resilience
to climate change) or other
shortages and, in many cases,
can also unlock access to
certain large and renewable
energy resources, which is a
key to reducing carbon
emissions in the region. For
some countries, even if only
high-cost fuels are available,
these reasons alone may provide
significant justification for
further pursuing
interconnections through
prefeasibility studies.
Three regional fuel storage and
transshipment facilities are also
examined. These options focus
on creating regional or
subregional facilities to store
petroleum product such as
gasoline, diesel and heavy fuel
Table 4: Summary of Electricity Interconnection
Savings for the Country Receiving Power
Interconnection Estimated Savings (cents/kWh)**
Dominica–Martinique* 13.3/ compared to distillate
1.5/ compared to pipeline gas
Dominica–Guadeloupe* 13.3/ compared to distillate
3.0/ compared to pipeline gas
Nevis–Puerto Rico* 14.5/ compared to HFO
-0.7/ compared to LNG
Nevis–US Virgin
Islands* 1.5/ compared to distillate
Nevis–St. Kitts* 13.4/ compared to distillate
Saba–St. Maarten* 12.2/ compared to distillate
Florida–Cuba* 13/ coal export compared to HFO
15.4/ gas export compared to HFO
DR–Haiti* -2.3/ HFO export compared to distillate
9.6/ gas export compared to distillate
Puerto Rico–DR N/A
Haiti–Cuba Technically questionable with current
technology
Haiti–Jamaica Technically questionable with current
technology
Florida–Haiti Technically questionable with current
technology
* Country receiving power.
**All savings are quoted assuming plants are running at an 80 percent
capacity factor, and both capital and operation and maintenance (O&M)
costs are included for each option.
oil. By having sufficient fuel storage, the larger ship size can be used to deliver the refined
products to the regional storage facility, thereby reducing the cost of fuel. The three expansion
options examined are one facility in St. Lucia, one in Antigua, and another in Martinique,
although none appears to offer significant economic benefits.
It is important to note that the interconnection and regional solutions described in this
section are by no means an exhaustive set of possible interconnections for the region. This
report is intended as a high-level overview to determine whether submarine cable
interconnections and gas pipelines are worth considering—which they appear to be—and which
interconnections among those examined might be technically and economically feasible.

xx
Illustrative Scenario Analysis of Combined Regional Options
Building from the exploration of possible regional supply options, four scenarios are
analyzed to compare the impact of different fuel and supply development paths at a
regional level. These scenarios are: (i) the Base Case Scenario, assuming continued use of
distillate and HFO; (ii) the Fossil Fuel Scenario, assuming the use of potential alternative fossil
fuels; (iii) the Interconnection/Renewables Scenario, analyzing the potential for renewable
energy development and island integration; and (iv) the Comprehensive Integrated Scenario,
combining options from the Fuel and Interconnection/Renewables Scenarios.
Based on the analysis, it appears that regional benefits from developing a combination of
renewables, alternative fossil fuels and interconnections could be substantial (see Table 5). When the NPV of cost savings compared to the Base Case is estimated, the Comprehensive
Integrated Scenario offers the largest savings at US$4.37 billion through 2028, followed by the
Interconnection/Renewables Scenario at US$2.57 billion, and the Fossil Fuel Scenario at
US$2.56 billion (see Table 5). In addition to accounting for savings within the nine countries
studied, the results factor in fuel savings from displaced fuel from energy exports to Guadeloupe,
Martinique and Puerto Rico and the costs of these interconnections.
The analysis indicates that a number of countries have the potential for large energy
savings from following development paths that include interconnections (gas and
electricity) when compared to the Base Case. These countries are Barbados, Haiti, St. Kitts,
Nevis, Dominica and St. Lucia. The savings in Barbados and St. Lucia result from fuel savings
from the gas pipeline, while savings for Dominica, Nevis and St. Kitts are attributed in part to
low-cost geothermal power generated and used on Dominica and Nevis that substitute for
diesel/HFO generation. However, a large amount of savings in the Comprehensive Integrated
Scenario comes from exports that displace higher-cost fossil fuel generation in Guadeloupe,
Martinique and Puerto Rico. The savings are attributed to Dominica and Nevis in Table 5. Haiti
shows the most significant benefits from diversifying its energy sources independently, with
estimated savings of 24 percent. It is also interesting to note that Dominica is the only country
with higher costs in the Comprehensive Integrated Scenario compared to the
Interconnection/Renewables Scenario. This is because the Comprehensive Integrated Scenario
assumes that the gas pipeline is constructed, and cost savings comparing geothermal to pipeline
gas are smaller than comparing geothermal to distillate. However, geothermal and gas may not
be in direct competition, as there may be a place for both as demand on Martinique and
Guadeloupe continues to grow.4
All other countries without potential for a gas pipeline or submarine interconnection
showed some expected benefit from diversifying fossil fuels by pursuing renewable energy
options on their own, but the savings are predicted to be relatively small. Most notably, the
small islands with limited alternative fuel options have small potential savings. These include
Antigua and Barbuda, Grenada, and St. Vincent and the Grenadines. Moreover, the analysis
4 As mentioned in Guadeloupe’s and Martinique’s power system master plans, for the time being EDF has agreed to
convert existing diesel plants to gas if a gas supply emerges. Geothermal imports from Dominica, on the other hand,
are seen as one of the supply options for the additional near term baseload needs.
xxi
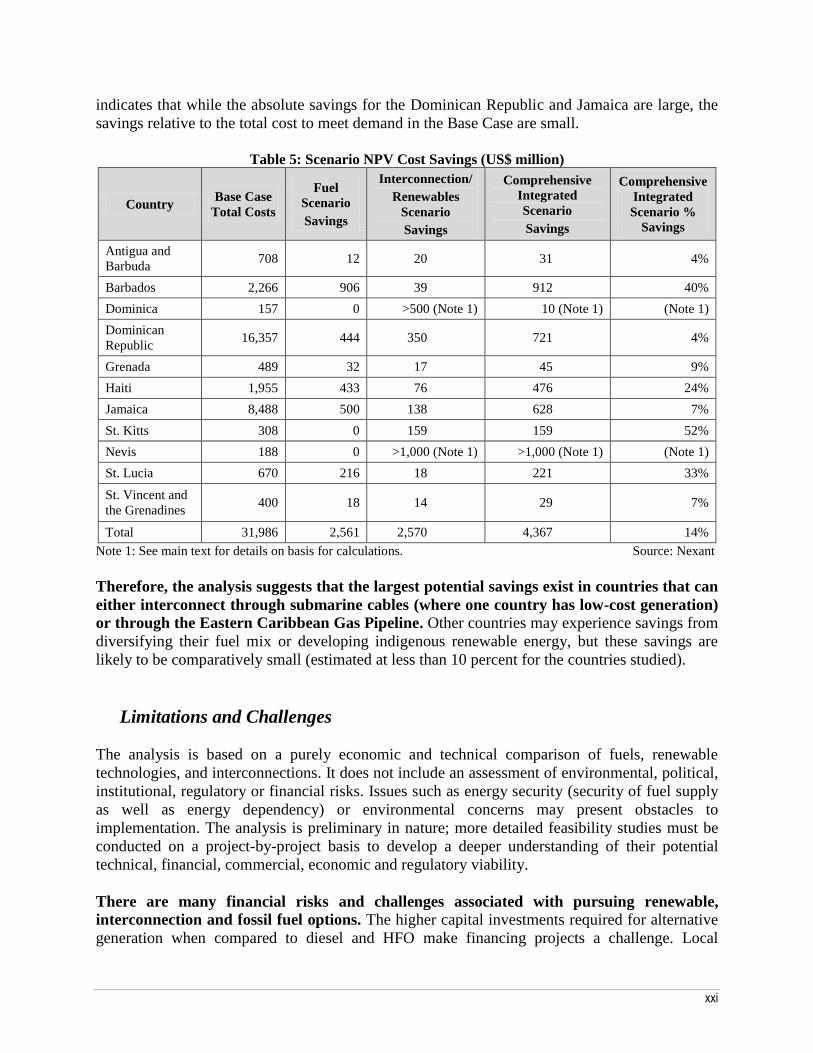
indicates that while the absolute savings for the Dominican Republic and Jamaica are large, the
savings relative to the total cost to meet demand in the Base Case are small.
Table 5: Scenario NPV Cost Savings (US$ million)
Country Base Case
Total Costs
Fuel
Scenario
Savings
Interconnection/
Renewables
Scenario
Savings
Comprehensive
Integrated
Scenario
Savings
Comprehensive
Integrated
Scenario %
Savings
Antigua and
Barbuda 708 12 20 31 4%
Barbados 2,266 906 39 912 40%
Dominica 157 0 >500 (Note 1) 10 (Note 1) (Note 1)
Dominican
Republic 16,357 444 350 721 4%
Grenada 489 32 17 45 9%
Haiti 1,955 433 76 476 24%
Jamaica 8,488 500 138 628 7%
St. Kitts 308 0 159 159 52%
Nevis 188 0 >1,000 (Note 1) >1,000 (Note 1) (Note 1)
St. Lucia 670 216 18 221 33%
St. Vincent and
the Grenadines 400 18 14 29 7%
Total 31,986 2,561 2,570 4,367 14%
Note 1: See main text for details on basis for calculations. Source: Nexant
Therefore, the analysis suggests that the largest potential savings exist in countries that can
either interconnect through submarine cables (where one country has low-cost generation)
or through the Eastern Caribbean Gas Pipeline. Other countries may experience savings from
diversifying their fuel mix or developing indigenous renewable energy, but these savings are
likely to be comparatively small (estimated at less than 10 percent for the countries studied).
Limitations and Challenges
The analysis is based on a purely economic and technical comparison of fuels, renewable
technologies, and interconnections. It does not include an assessment of environmental, political,
institutional, regulatory or financial risks. Issues such as energy security (security of fuel supply
as well as energy dependency) or environmental concerns may present obstacles to
implementation. The analysis is preliminary in nature; more detailed feasibility studies must be
conducted on a project-by-project basis to develop a deeper understanding of their potential
technical, financial, commercial, economic and regulatory viability.
There are many financial risks and challenges associated with pursuing renewable,
interconnection and fossil fuel options. The higher capital investments required for alternative
generation when compared to diesel and HFO make financing projects a challenge. Local
xxii
utilities may have difficulty funding such large investments and some countries may opt for more
expensive operating costs to reduce upfront financing. There are also many unknowns when
future cash flows and risks associated with high fuel cost assumptions are projected. As a result,
utilities may be hesitant to invest in technologies with which they are not familiar, particularly if
the new technologies will require utilities to adapt their business model. Private financing,
public/private partnerships and support from international financial institutions (IFIs) and the
international donor community may often be of key importance.
In addition, countries may need improved legal, regulatory and institutional frameworks
for cross-country cooperation. For regional integration options, regulatory harmonization
among the two or more countries may be necessary for the project’s success. Likewise,
difficulties resulting from separate ownership of various components of interisland power or fuel
supply need to be addressed. For the export of geothermal power by means of a submarine cable,
one private party might own the geothermal power plant in the exporting country while another
owns and operates the submarine cable. Joint ownership can present other types of issues.
Contractual structures and supporting institutions must be created to guarantee supply and
allocate risks and responsibilities to the appropriate parties.
Finally, a secure supply of energy is often viewed as a national security issue, and many
countries may be hesitant to rely on another country for power. Although distillate and HFO
are widely available at present, political unrest or technical failures may compromise one
country’s ability to supply another. As a result, countries involved in regional solutions may
choose to increase reserve margins. This may lead to increased operating reserves, the economic
impact of which was not taken into account in this study.
Nevertheless, the early results from this study reveal interesting interconnection and cross-
country opportunities that are worth pursuing further. Many countries have significant
potential for saving or earning export revenue and may decide that the benefits merit facing these
challenges and risks. Moreover, the interconnections would allow for a greater utilization of
renewable resources in the region.
Conclusions
There are opportunities over the next decade for Caribbean countries to move toward a
more integrated and diverse energy mix, one that could increase the use of renewables.
These opportunities warrant further exploration. Diversity and integration reduce
vulnerabilities from high and volatile fuel prices, load shedding and extreme climate events. The
preliminary analysis indicates that there are three main opportunities for the Caribbean.
Renewable Energy Development: The Caribbean has a large potential for economic
renewable energy resource development, including wind, geothermal and small hydro.
These technologies appear to be highly competitive with the technologies currently in
use. One of the challenges to development will be to identify sites where the resource is
good and development costs are not a barrier. Therefore, to encourage development it
xxiii
may be most cost effective to assist in identifying such sites. Interconnections can
increase countries’ ability to develop large-scale renewable projects.
Submarine Cable Electrical Interconnections: There appear to be a number of highly
economic, technically viable electricity market interconnection options which, as noted
above, could release more large-scale renewable usage. However, a significant amount of
work needs to be done both to understand the viability of interconnections examined in
this study and to evaluate interconnections not considered in this analysis, including
subregional interconnections (such as a Southern Caribbean Ring), continental
connections (such as with Mexico, the US, Colombia or Venezuela), and bilateral
interconnections (such as Montserrat–Antigua and Puerto Rico–Dominican Republic).
Gas Pipelines: The potential for gas pipelines should be considered, given the positive
economic benefits this study shows for the Eastern Caribbean Gas Pipeline (ECGP). The
ECGP may provide the most economical fossil fuel for each island it reaches and benefits
of economies of scale compared to individual development. The gas is about half as
costly as distillate for Barbados, Guadeloupe, Martinique and St. Lucia. Development of
any pipeline will require the agreement of many parties, such as gas suppliers, utilities,
regulators, financial institutions and governments, making the development process more
costly and time consuming. A wide range of support may be required to move these
projects forward.
This is a high-level concept study; detailed feasibility studies need to be carried out on any
proposed interconnection to transform a possibility into a reality. A feasibility study would
include a comprehensive analysis of all key issues related to a proposed interconnection,
including the technical, environmental, commercial, financial and economic aspects. The
analysis would also need to outline the subregional legal, regulatory and institutional frameworks
required to attract investors to carry out the project. Regional organizations and IFIs can provide
valuable contributions both to facilitate the policy dialogue among the countries and to provide
technical assistance and financial support to address political and financial risks for potential
investors.
Opportunities exist for the countries of the Caribbean region to move to a more regionally
based development path that should strengthen their security of supply, support the
greater use of renewables and improve their resilience. These opportunities involve
considering outside-the-box solutions, such as interconnections.


1
Chapter 1
Introduction
he countries of the Caribbean region face numerous energy challenges. Most urgently, they
must manage the high and growing dependence on imported oil and oil products that fuel
their domestic economies. The majority of these countries’ power plants rely primarily or
entirely on imported diesel and heavy fuel oil (HFO), which tend to be costly and
environmentally damaging. In addition, demand is expected to double over the next 20 years and
will pose fuel supply and financial challenges. Problems associated with reliance on high-priced
liquid fuels will increase in proportion to their demand. There is already significant load
shedding in some countries, while others face deteriorating equipment, inadequate tariff levels,
and high technical and nontechnical losses. It will be difficult to close the supply gap using
current energy fuels, technologies and planning strategies.
Moreover, although the region’s total installed capacity is around 20 GW, this is fragmented
among the many islands, and currently no interconnections exist among island states.
Diseconomies of scale have a large impact on the cost of power generation on the small islands
since transport and infrastructure services are likely to cost more in small markets. This, in
combination with high fuel prices, causes customers in the Caribbean to face some of the world’s
highest electricity tariffs. Regional solutions, such as electricity market interconnections and gas
pipelines, could offer countries lower-cost resources and benefits from economies of scale in
power plant and system operations.
1.1 Objective of the study
The objective of the study is to conduct a ―concept-level‖ analysis of the potential for technically
and financially sound regional electricity supply options to help match future supply and
demand. These regional energy solutions involve new fuels or fuel transport methods (pipeline
gas, liquefied natural gas), new and renewable energy resources for power generation (primarily
wind and geothermal), and new electrical interconnections through submarine power cables
between islands. Although the study explores selected alternative electricity development paths
for the Caribbean islands, it is not meant to be a comprehensive analysis of all options or a
prefeasibility study. It is hoped that a study of these options will give rise to ideas that could
reduce electricity costs, decrease environmental impacts from energy production and increase
grid reliability.
T
2
1.2 Methodology
Nexant was commissioned to conduct an analysis that consisted of four main steps: market
analysis, individual country analysis, regional solution analysis, and a scenario analysis to
measure the aggregate regional impacts and savings from different development paths. The
results are presented in its report entitled ―Caribbean Regional Electricity Generation,
Interconnection, and Fuels Supply Strategy‖ (the ―Nexant Report‖).5
First, current and future electricity markets were analyzed. This consisted of a country-by-
country examination of the current and planned energy infrastructure, a projection of future
demand growth (based on forecasts and historical data), and an overview of the available
technologies to meet this growth. After collecting data for the report, the team prepared peak and
energy demand forecasts for each country. Next, cost and performance parameters were
determined for fuels and power generation technologies.
Second, a comparison of fuel supply and generation technologies was completed to explore the
least-cost options for individual countries in order to later compare these results to regional
options. The results were presented as screening curves for each country. These curves plot the
simplified representation of costs (cents/kWh) against the relevant capacity factors. The cost was
calculated using capital costs, operating and maintenance costs, fuel costs, estimated costs for
transmission upgrades, the heat rate (or fuel efficiency), and the capacity factor. The study
focuses on the nine Caribbean countries eligible for support from the World Bank (St. Lucia, St.
Vincent and the Grenadines, Grenada, Antigua and Barbuda, St. Kitts and Nevis, Dominica,
Haiti, the Dominican Republic and Jamaica) and a few other countries relevant to the Caribbean
gas pipeline and interconnections (Martinique, Guadeloupe and Barbados).
The third step focused on analyzing a gas pipeline to serve four countries, three regional fuel
storage options and eleven electricity market interconnections. In addition to those countries on
which this study focused in detail, this step involved a cursory analysis of the energy markets of
various other countries that would be instrumental in regional solutions (Trinidad and Tobago,
Cuba, the United States and Puerto Rico). These results were compared with single-country
solutions by adding the additional options onto the screening curves developed in the second step
in order to assess their comparative economic benefits.
Fourth and finally, a multicountry scenario analysis was conducted to provide a preliminary
assessment of the aggregate economic benefits of four illustrative scenarios. The scenarios are:
(i) the Base Case Scenario, assuming continued use of distillate (diesel) and HFO; (ii) the Fuel
Scenario, assuming potential alternative fossil fuels; (iii) the Interconnection/Renewables
Scenario, analyzing the potential for renewable energy development and island integration; and
(iv) the Comprehensive Integrated Scenario, combining the options of the Fuel and
Interconnection/Renewables Scenarios. This analysis built on the previous steps but involved a
more detailed system analysis that simulated yearly expansion and production, based on
characteristics of the existing systems, future conditions, and characteristics of new power plants.
5 The Nexant Report can be downloaded at www.worldbank.org/reference/ under Documents & Reports.
3
Based on the net present value (NPV) of investment and production costs, the scale of the benefit
of diverging from the business-as-usual path was estimated for each country.
1.3 This Report
In general, the structure of the report follows the methodology. Chapter 2 focuses on the context
of energy in the Caribbean, including the power generation market and potential resource
options. The chapter aims to build an understanding of what the Caribbean looks like
geographically and economically. It then delves into the specifics of the current electricity
markets and the future projected growth. It concludes with an overview of the generation options
and an initial screening to identify which are appropriate for the Caribbean.
Chapter 3 analyzes potential individual power solutions for the nine Caribbean countries eligible
for support from the World Bank and for several other countries relevant to the Caribbean gas
pipeline, using the technology and fuel options outlined in Chapter 2. It begins by explaining the
methodology of screening curves and laying out key assumptions about thermal and renewable
energy. It then presents screening curves for each country.
Chapter 4 describes how regional solutions can further reduce the cost of electricity, and
compares the economics of individual countries’ options to the regional solutions. First, it
examines the gas pipeline, exploring the implications for Martinique, Guadeloupe, Barbados and
St. Lucia. This is followed by an exploration of the potential for regional storage facilities.
Finally, it examines how electricity market interconnections through submarine cables can help
reduce costs of power for importing and exporting countries.
Chapter 5 analyzes the cost savings from various different solutions for the region as a whole,
focusing on several illustrative scenarios to estimate the regional impacts and savings from
different development paths. This section also addresses some of the challenges of pursuing
alternative development paths. Finally, Chapter 6 outlines the main conclusions of the study.
4
Chapter 2
The Caribbean Context
his chapter provides general context related to the Caribbean and its electricity markets,
given the importance of geography, population and resources to understanding the available
development paths. First, it briefly describes the geographic boundaries and key characteristics
of the region, including size, populations and the economy. Second, it discusses the electricity
markets, including current conditions and the future outlook. Finally, the chapter outlines current
fuel and generation technology usage and potential, and defines which technologies would be
appropriate for different countries.
2.1 The Caribbean
The Caribbean region extends from the northern Caribbean Sea to the northeast of South
America. The region is defined by the chain of islands running through the Caribbean Sea. The
region has two main subregions: the Greater Antilles and the Lesser Antilles. The Greater
Antilles is composed mostly of the larger islands, including Haiti and the Dominican Republic
(which share Hispaniola Island), Cuba, Jamaica, Puerto Rico, the Bahamas, and the smaller
Cayman Islands. The Lesser Antilles comprises a ring of smaller islands and nations, including
Anguilla, Antigua and Barbuda, Barbados, Dominica, Grenada, Guadeloupe, Martinique,
Montserrat, St. Kitts and Nevis, St. Lucia, St. Vincent and the Grenadines, Netherlands Antilles,
and Trinidad and Tobago. Other countries traditionally considered part of the Caribbean are
Aruba, Belize, Bermuda, British Virgin Islands, Guyana, Saint Barthélemy, St. Martin,
Suriname, Turks and Caicos Islands, and the US Virgin Islands, many of which are in the
Atlantic or on the mainland of South America.
The countries within the Caribbean region are geographically diverse. While some countries are
over 100,000 km2, others are smaller than 200 km
2. The outer ring of islands is mostly flat land,
while the inner ring is mainly composed of volcanic mountainous islands, many of which have
geothermal activity. The islands themselves are relatively close together, in many cases just a
few kilometers apart, which increases the feasibility of energy interconnections.
The countries of the Caribbean also range in terms of their economic and population sizes. A few
of the larger islands, such as Cuba, the Dominican Republic, Puerto Rico and Jamaica, have
multibillion-dollar economies, while the smaller islands have gross domestic products (GDPs) in
the range of a few million US dollars. Similarly, while some countries have millions of
inhabitants, others have a few thousand. The range in terms of gross national income (GNI) per
T
5
capita is just as varied. Some of the poorest countries, such as Haiti, have a GNI per capita close
to US$600, while in some islands that thrive on tourism or industry, the GNI per capita reaches
more than US$20,000.
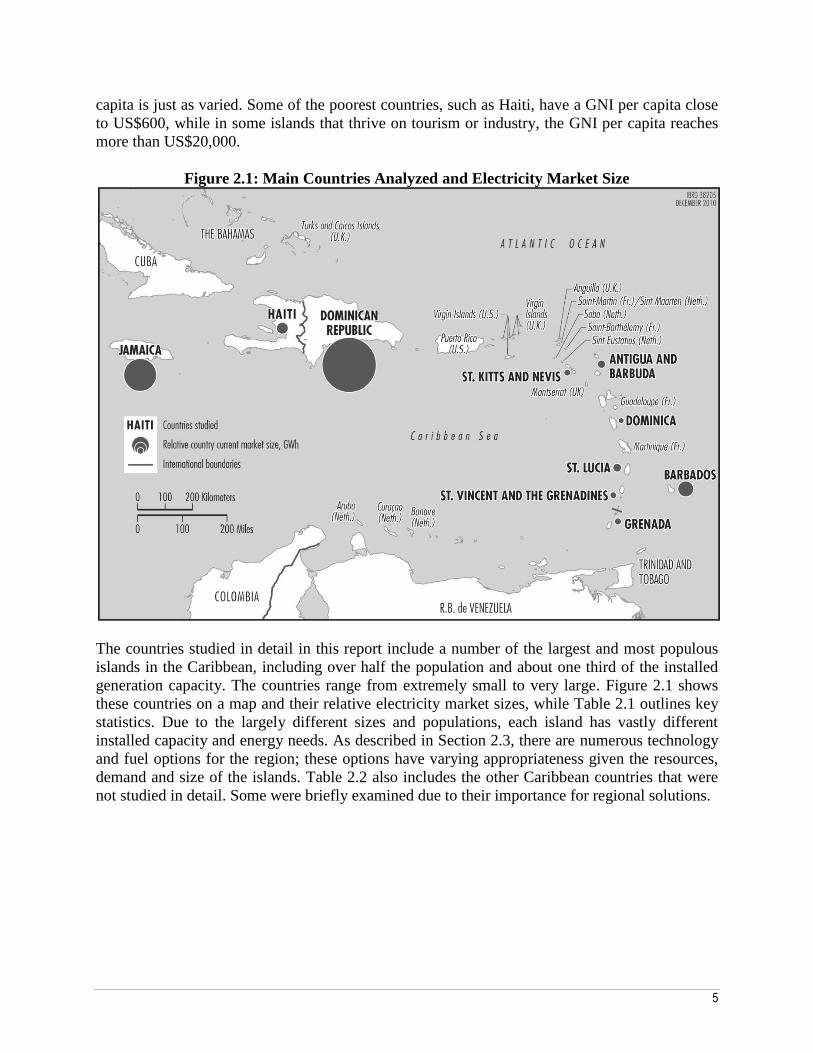
Figure 2.1: Main Countries Analyzed and Electricity Market Size
The countries studied in detail in this report include a number of the largest and most populous
islands in the Caribbean, including over half the population and about one third of the installed
generation capacity. The countries range from extremely small to very large. Figure 2.1 shows
these countries on a map and their relative electricity market sizes, while Table 2.1 outlines key
statistics. Due to the largely different sizes and populations, each island has vastly different
installed capacity and energy needs. As described in Section 2.3, there are numerous technology
and fuel options for the region; these options have varying appropriateness given the resources,
demand and size of the islands. Table 2.2 also includes the other Caribbean countries that were
not studied in detail. Some were briefly examined due to their importance for regional solutions.

6
Table 2.1: Caribbean Countries and Key Statistics
Country Pop.
(Million)
GDP
(US$B)
GNI/Capita
(US$)
Installed
capacity (MW)
Main Caribbean Countries Studied
Antigua and Barbuda 0.09 1.2 13,620 90
Barbados* 0.26 3.4 9,330 238
Dominica 0.07 0.4 4,770 21
Dominican Republic 9.95 45.8 4,390 5,518
Grenada 0.10 0.6 5,710 49
Guadeloupe (overseas department of France)* 0.42 9.7 21,780 411
Haiti 9.88 7.0 660 226
Jamaica 2.69 15.1 4,870 1,161
Martinique (overseas department of France)* 0.41 10.4 25,908 412
St. Kitts and Nevis 0.04 0.5 10,960 48
St. Lucia 0.17 1.0 5,530 72
St. Vincent and the Grenadines 0.12 0.6 5,140 58
Subtotal 24.2 95.7 8,243
Other Caribbean Countries
Anguilla (British overseas territory) 0.014 0.1 19,945 24
Aruba (part of the Netherlands) 0.11 1.9 21,800 150
Bahamas, The 0.34 6.9 17,160 455
Belize 0.33 1.4 3,820 70
Bermuda 0.07 5.9 69,900 175
British Virgin Islands (British overseas territory) 0.03 0.9 38,500 10
Cayman Islands (British overseas territory) 0.05 1.9 43,800 115
Cuba** 11.20 110.8 9,700 5,180
Guyana 0.76 1.2 1,420 310
Montserrat (British overseas territory) 0.01 0.0 3,400 6
Netherlands Antilles, including Curacao, Bonaire,
Sint Eustatius, Saba** and Sint Maarten** (part of the
Netherlands)
0.23 2.8 16,000 210
Puerto Rico (commonwealth of the United States)* 3.97 67.9 10,960 5,864
Saint Barthélemy (overseas territory of France) 0.009 0.23 33,800 21
St. Martin (overseas territory of France) 0.035 0.54 18,850 52
Suriname 0.52 2.9 4,990 390
Trinidad and Tobago** 1.34 23.9 16,540 1,480
Turks and Caicos Islands (British overseas territory) 0.03 0.2 11,500 4
United States Virgin Islands (territory of the United
States)* 0.11 1.6 14,500 323
Subtotal 19.16 231 14,839
Total 43 326 23,082
*Guadeloupe, Martinique and Barbados are not eligible for support from the World Bank. They are studied in more detail than
others due to their importance for the ECGP and for interconnections with countries eligible for support from the World Bank.
**These countries were studied in some detail due to their importance for regional solutions.
Sources: World Development Indicators, CIA Fact Book, EIA, IEDOM, Nexant

7
2.2 Electricity Market Overview
Although the Caribbean countries vary significantly, many characteristics of their power markets
are similar. The current power generation market in the Caribbean consists nearly exclusively of
regulated, vertically integrated utilities that sell electricity to end-use customers. Some
independent power producers (IPPs) and customer-level photovoltaic (PV) installations exist and
sell to the local utility. In some Caribbean countries self-generation is an economic way to meet
industrial demand or to supply power in the event of load shedding. Since most countries are
geographically small, they have small power systems that require high reserve margins to
provide satisfactory reliability. There are no existing interconnections between island nations to
increase market sizes, and therefore no electricity trade among countries.
The main challenge faced by these utilities is high operating costs, driven by high fuel prices and
diseconomies of scale. Remoteness and other geographic characteristics typical of small islands
also increase costs. The expensive operating costs lead to some of the world’s highest electricity
tariffs, at around 25 US cents/kWh, compared to 8 US cents to 15 US cents/kWh in many other
regions. The high prices hurt residential, commercial and industrial consumers.
Although access to electricity in the region is generally high, the quality of service can be low.
Some countries experience significant load shedding, while others are faced with deteriorating
equipment and with high technical and nontechnical losses. Nonpayment for electricity services
makes energy more expensive and hinders cost recovery. Inadequate tariff levels and a lack of
appropriate regulations to promote innovation and efficiency exacerbate the problems.
In the face of these issues, the countries on which this study focuses are projected to experience
enormous growth. Among the countries studied, demand is forecasted to grow at around 3.6
percent through 2028, leading to a near doubling of 2009 values by 2028. Individual country
growth rates range from 2.4 percent to 7.9 percent per year. Haiti is expected to experience some
of the largest growth since it currently has both a large population and low access rates. Total
peak demand is shown in Figure 2.2 (see Annex 1 for a full table of expected demand growth).
Figure 2.2: Peak Demand Load Forecasts 2009–2028 (MW)
0
200
400
600
800
1000
Ne
t P
eak
De
man
d (
MW
)
2028 Forecast
2009
0
1000
2000
3000
4000
5000
6000
7000
8000
Source: Nexant
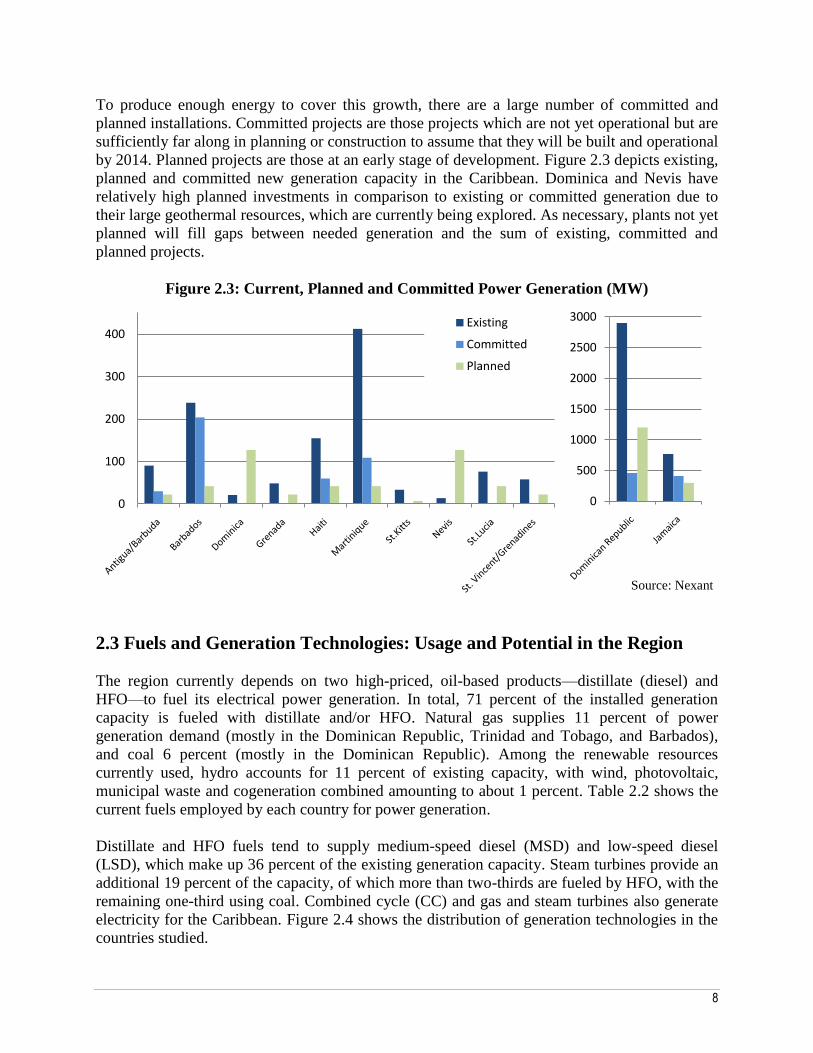
8
To produce enough energy to cover this growth, there are a large number of committed and
planned installations. Committed projects are those projects which are not yet operational but are
sufficiently far along in planning or construction to assume that they will be built and operational
by 2014. Planned projects are those at an early stage of development. Figure 2.3 depicts existing,
planned and committed new generation capacity in the Caribbean. Dominica and Nevis have
relatively high planned investments in comparison to existing or committed generation due to
their large geothermal resources, which are currently being explored. As necessary, plants not yet
planned will fill gaps between needed generation and the sum of existing, committed and
planned projects.
Figure 2.3: Current, Planned and Committed Power Generation (MW)
2.3 Fuels and Generation Technologies: Usage and Potential in the Region
The region currently depends on two high-priced, oil-based products—distillate (diesel) and
HFO—to fuel its electrical power generation. In total, 71 percent of the installed generation
capacity is fueled with distillate and/or HFO. Natural gas supplies 11 percent of power
generation demand (mostly in the Dominican Republic, Trinidad and Tobago, and Barbados),
and coal 6 percent (mostly in the Dominican Republic). Among the renewable resources
currently used, hydro accounts for 11 percent of existing capacity, with wind, photovoltaic,
municipal waste and cogeneration combined amounting to about 1 percent. Table 2.2 shows the
current fuels employed by each country for power generation.
Distillate and HFO fuels tend to supply medium-speed diesel (MSD) and low-speed diesel
(LSD), which make up 36 percent of the existing generation capacity. Steam turbines provide an
additional 19 percent of the capacity, of which more than two-thirds are fueled by HFO, with the
remaining one-third using coal. Combined cycle (CC) and gas and steam turbines also generate
electricity for the Caribbean. Figure 2.4 shows the distribution of generation technologies in the
countries studied.
0
100
200
300
400Existing
Committed
Planned
0
500
1000
1500
2000
2500
3000
Source: Nexant
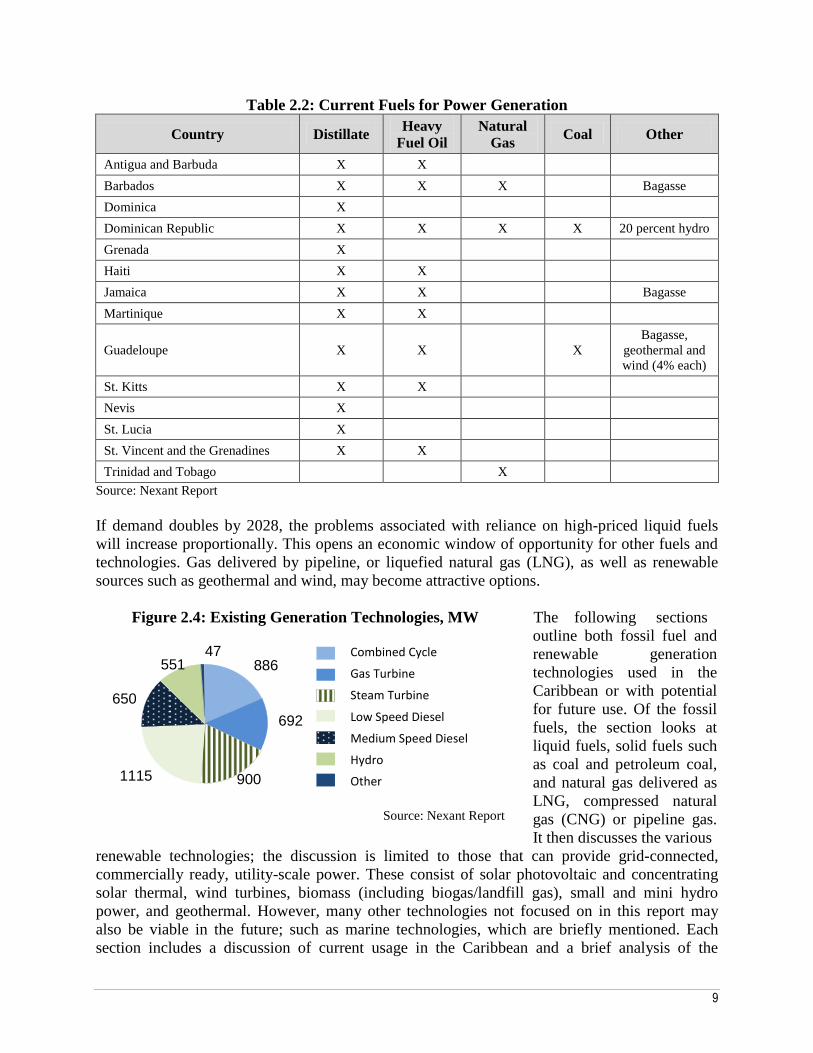
9
Table 2.2: Current Fuels for Power Generation
Country Distillate Heavy
Fuel Oil
Natural
Gas Coal Other
Antigua and Barbuda X X
Barbados X X X Bagasse
Dominica X
Dominican Republic X X X X 20 percent hydro
Grenada X
Haiti X X
Jamaica X X Bagasse
Martinique X X
Guadeloupe X X X
Bagasse,
geothermal and
wind (4% each)
St. Kitts X X
Nevis X
St. Lucia X
St. Vincent and the Grenadines X X
Trinidad and Tobago X
Source: Nexant Report
If demand doubles by 2028, the problems associated with reliance on high-priced liquid fuels
will increase proportionally. This opens an economic window of opportunity for other fuels and
technologies. Gas delivered by pipeline, or liquefied natural gas (LNG), as well as renewable
sources such as geothermal and wind, may become attractive options.
Figure 2.4: Existing Generation Technologies, MW The following sections
outline both fossil fuel and
renewable generation
technologies used in the
Caribbean or with potential
for future use. Of the fossil
fuels, the section looks at
liquid fuels, solid fuels such
as coal and petroleum coal,
and natural gas delivered as
LNG, compressed natural
gas (CNG) or pipeline gas.
It then discusses the various
renewable technologies; the discussion is limited to those that can provide grid-connected,
commercially ready, utility-scale power. These consist of solar photovoltaic and concentrating
solar thermal, wind turbines, biomass (including biogas/landfill gas), small and mini hydro
power, and geothermal. However, many other technologies not focused on in this report may
also be viable in the future; such as marine technologies, which are briefly mentioned. Each
section includes a discussion of current usage in the Caribbean and a brief analysis of the
Comb Cyc
Gas Turb
Stm Turb
MSD
Hydro
886
692
900 1115
650
551 47
LSD
Other
Source: Nexant Report
Combined Cycle
Gas Turbine
Steam Turbine
Low Speed Diesel
Medium Speed Diesel
Hydro
Other

10
viability for the Caribbean region. This high-level resource analysis is used in Chapter 3 when
country-specific options are examined.
2.3.1. Liquid Fuels (Distillate, Heavy Fuel Oil)
As mentioned above, distillate and HFO are widely used in the Caribbean, mainly due to the low
capital costs of technologies using liquid fuels (LSD, MSD, gas turbines) and the ease of
modularity. Since there is limited domestic capacity to produce liquid fuels in the region,
countries import the fuels at international prices, which tend to be high and volatile, thus
increasing operating costs and making diesel-generated electricity some of the most expensive in
the region. As a result, the cost per kWh for diesel-generated power in the Caribbean is estimated
at around 20 US cents/kWh for a plant operating at high-capacity factors.
Most of the existing engines on the smaller islands of the Caribbean are designed to use distillate
instead of HFO, even though distillate is more expensive because it produces relatively fewer air
emissions. Some countries such as Grenada use only diesel, whereas other nations such as
Jamaica are trying to phase out HFO because of environmental concerns. Many areas have
banned HFO use near holiday resorts. However, because of high oil prices, public utilities in the
region have experienced pressure in the past to reduce operational costs by switching from diesel
to HFO.
Trinidad and Tobago is the only country that is a net producer of fuels. For other countries, most
imports come from Venezuela through the PetroCaribe agreements and others from refineries in
Aruba, Curacao, Surinam and St. Croix. The following countries have some fuel supply from
domestic sources:
The Dominican Republic has two small refineries that produce products for the domestic
market and fuel oils for the power generation industry.
Jamaica has a refinery that imports crude oil and produces some liquid fuels for power
generation plus diesel, gasoline and aviation fuels for domestic consumption.
Martinique has a small refinery that produces heavy fuel oil for power generation in
Martinique, French Guiana and Guadeloupe as well as products for domestic
consumption.
Barbados produces a small amount of crude oil and sends it to Trinidad for processing.
Barbados also produces a small amount of natural gas, which is used for domestic
consumption as well as for power generation.
Trinidad is the major producer of natural gas as well as crude oil and petroleum
products. All of its electricity generation is fueled by natural gas.
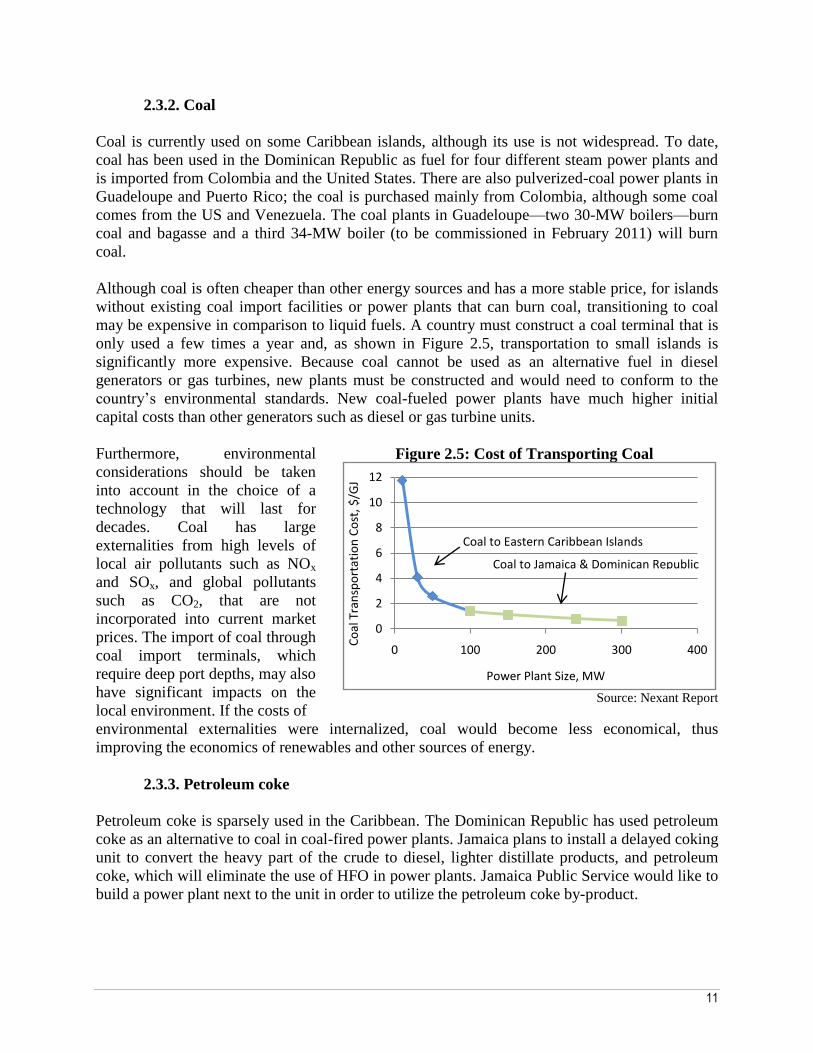
11
2.3.2. Coal
Coal is currently used on some Caribbean islands, although its use is not widespread. To date,
coal has been used in the Dominican Republic as fuel for four different steam power plants and
is imported from Colombia and the United States. There are also pulverized-coal power plants in
Guadeloupe and Puerto Rico; the coal is purchased mainly from Colombia, although some coal
comes from the US and Venezuela. The coal plants in Guadeloupe—two 30-MW boilers—burn
coal and bagasse and a third 34-MW boiler (to be commissioned in February 2011) will burn
coal.
Although coal is often cheaper than other energy sources and has a more stable price, for islands
without existing coal import facilities or power plants that can burn coal, transitioning to coal
may be expensive in comparison to liquid fuels. A country must construct a coal terminal that is
only used a few times a year and, as shown in Figure 2.5, transportation to small islands is
significantly more expensive. Because coal cannot be used as an alternative fuel in diesel
generators or gas turbines, new plants must be constructed and would need to conform to the
country’s environmental standards. New coal-fueled power plants have much higher initial
capital costs than other generators such as diesel or gas turbine units.
Furthermore, environmental
considerations should be taken
into account in the choice of a
technology that will last for
decades. Coal has large
externalities from high levels of
local air pollutants such as NOx
and SOx, and global pollutants
such as CO2, that are not
incorporated into current market
prices. The import of coal through
coal import terminals, which
require deep port depths, may also
have significant impacts on the
local environment. If the costs of
Figure 2.5: Cost of Transporting Coal
Source: Nexant Report
environmental externalities were internalized, coal would become less economical, thus
improving the economics of renewables and other sources of energy.
2.3.3. Petroleum coke
Petroleum coke is sparsely used in the Caribbean. The Dominican Republic has used petroleum
coke as an alternative to coal in coal-fired power plants. Jamaica plans to install a delayed coking
unit to convert the heavy part of the crude to diesel, lighter distillate products, and petroleum
coke, which will eliminate the use of HFO in power plants. Jamaica Public Service would like to
build a power plant next to the unit in order to utilize the petroleum coke by-product.
0
2
4
6
8
10
12
0 100 200 300 400
Co
al T
ran
spo
rtat
ion
Co
st, $
/GJ
Power Plant Size, MW
Coal to Eastern Caribbean Islands
Coal to Jamaica & Dominican Republic
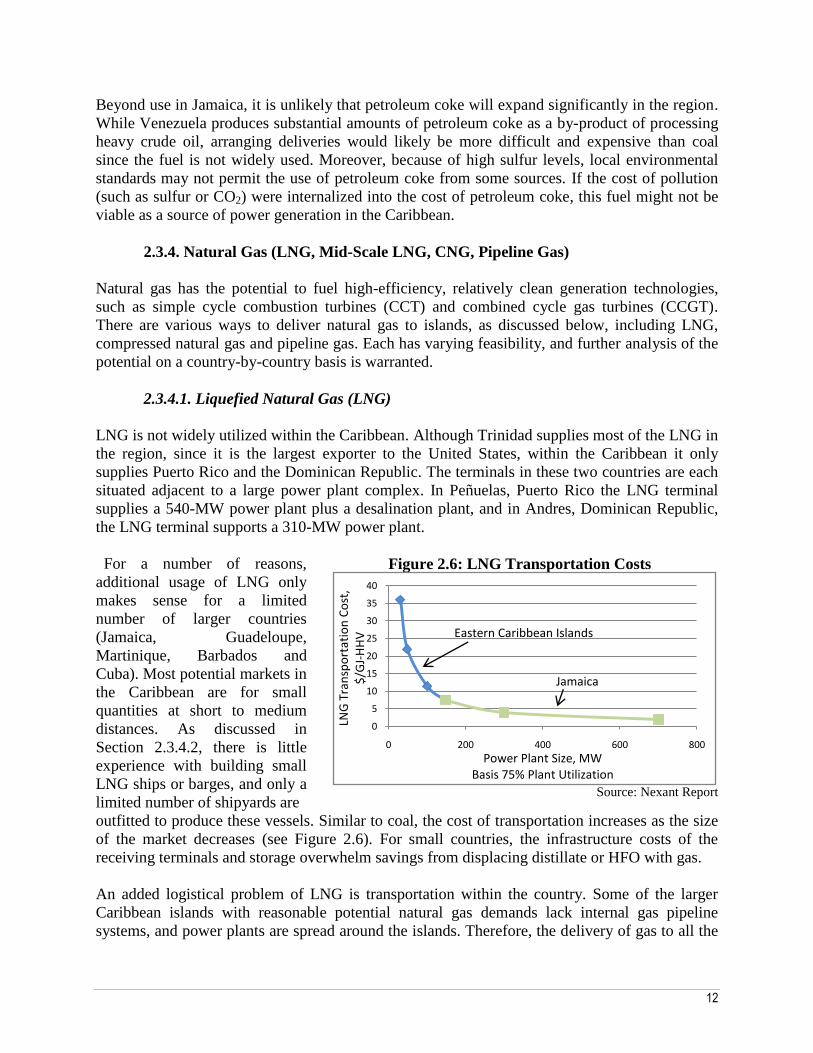
12
Beyond use in Jamaica, it is unlikely that petroleum coke will expand significantly in the region.
While Venezuela produces substantial amounts of petroleum coke as a by-product of processing
heavy crude oil, arranging deliveries would likely be more difficult and expensive than coal
since the fuel is not widely used. Moreover, because of high sulfur levels, local environmental
standards may not permit the use of petroleum coke from some sources. If the cost of pollution
(such as sulfur or CO2) were internalized into the cost of petroleum coke, this fuel might not be
viable as a source of power generation in the Caribbean.
2.3.4. Natural Gas (LNG, Mid-Scale LNG, CNG, Pipeline Gas)
Natural gas has the potential to fuel high-efficiency, relatively clean generation technologies,
such as simple cycle combustion turbines (CCT) and combined cycle gas turbines (CCGT).
There are various ways to deliver natural gas to islands, as discussed below, including LNG,
compressed natural gas and pipeline gas. Each has varying feasibility, and further analysis of the
potential on a country-by-country basis is warranted.
2.3.4.1. Liquefied Natural Gas (LNG)
LNG is not widely utilized within the Caribbean. Although Trinidad supplies most of the LNG in
the region, since it is the largest exporter to the United States, within the Caribbean it only
supplies Puerto Rico and the Dominican Republic. The terminals in these two countries are each
situated adjacent to a large power plant complex. In Peñuelas, Puerto Rico the LNG terminal
supplies a 540-MW power plant plus a desalination plant, and in Andres, Dominican Republic,
the LNG terminal supports a 310-MW power plant.
For a number of reasons,
additional usage of LNG only
makes sense for a limited
number of larger countries
(Jamaica, Guadeloupe,
Martinique, Barbados and
Cuba). Most potential markets in
the Caribbean are for small
quantities at short to medium
distances. As discussed in
Section 2.3.4.2, there is little
experience with building small
LNG ships or barges, and only a
limited number of shipyards are
Figure 2.6: LNG Transportation Costs
Source: Nexant Report
outfitted to produce these vessels. Similar to coal, the cost of transportation increases as the size
of the market decreases (see Figure 2.6). For small countries, the infrastructure costs of the
receiving terminals and storage overwhelm savings from displacing distillate or HFO with gas.
An added logistical problem of LNG is transportation within the country. Some of the larger
Caribbean islands with reasonable potential natural gas demands lack internal gas pipeline
systems, and power plants are spread around the islands. Therefore, the delivery of gas to all the
0
5
10
15
20
25
30
35
40
0 200 400 600 800
LNG
Tra
nsp
ort
atio
n C
ost
, $
/GJ-
HH
V
Power Plant Size, MWBasis 75% Plant Utilization
Eastern Caribbean Islands
Jamaica
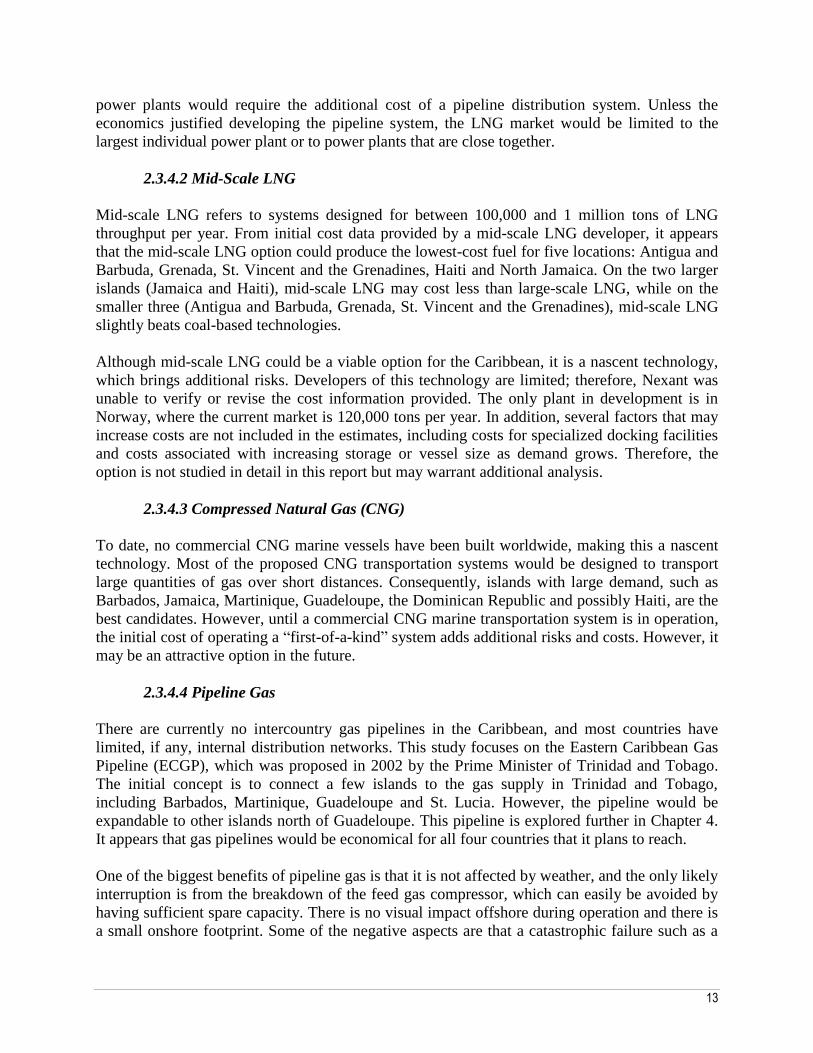
13
power plants would require the additional cost of a pipeline distribution system. Unless the
economics justified developing the pipeline system, the LNG market would be limited to the
largest individual power plant or to power plants that are close together.
2.3.4.2 Mid-Scale LNG
Mid-scale LNG refers to systems designed for between 100,000 and 1 million tons of LNG
throughput per year. From initial cost data provided by a mid-scale LNG developer, it appears
that the mid-scale LNG option could produce the lowest-cost fuel for five locations: Antigua and
Barbuda, Grenada, St. Vincent and the Grenadines, Haiti and North Jamaica. On the two larger
islands (Jamaica and Haiti), mid-scale LNG may cost less than large-scale LNG, while on the
smaller three (Antigua and Barbuda, Grenada, St. Vincent and the Grenadines), mid-scale LNG
slightly beats coal-based technologies.
Although mid-scale LNG could be a viable option for the Caribbean, it is a nascent technology,
which brings additional risks. Developers of this technology are limited; therefore, Nexant was
unable to verify or revise the cost information provided. The only plant in development is in
Norway, where the current market is 120,000 tons per year. In addition, several factors that may
increase costs are not included in the estimates, including costs for specialized docking facilities
and costs associated with increasing storage or vessel size as demand grows. Therefore, the
option is not studied in detail in this report but may warrant additional analysis.
2.3.4.3 Compressed Natural Gas (CNG)
To date, no commercial CNG marine vessels have been built worldwide, making this a nascent
technology. Most of the proposed CNG transportation systems would be designed to transport
large quantities of gas over short distances. Consequently, islands with large demand, such as
Barbados, Jamaica, Martinique, Guadeloupe, the Dominican Republic and possibly Haiti, are the
best candidates. However, until a commercial CNG marine transportation system is in operation,
the initial cost of operating a ―first-of-a-kind‖ system adds additional risks and costs. However, it
may be an attractive option in the future.
2.3.4.4 Pipeline Gas
There are currently no intercountry gas pipelines in the Caribbean, and most countries have
limited, if any, internal distribution networks. This study focuses on the Eastern Caribbean Gas
Pipeline (ECGP), which was proposed in 2002 by the Prime Minister of Trinidad and Tobago.
The initial concept is to connect a few islands to the gas supply in Trinidad and Tobago,
including Barbados, Martinique, Guadeloupe and St. Lucia. However, the pipeline would be
expandable to other islands north of Guadeloupe. This pipeline is explored further in Chapter 4.
It appears that gas pipelines would be economical for all four countries that it plans to reach.
One of the biggest benefits of pipeline gas is that it is not affected by weather, and the only likely
interruption is from the breakdown of the feed gas compressor, which can easily be avoided by
having sufficient spare capacity. There is no visual impact offshore during operation and there is
a small onshore footprint. Some of the negative aspects are that a catastrophic failure such as a

14
line break caused by a submarine seismic event or an unsupported span could temporarily or
permanently shut down the pipeline. In addition, gas pipelines have high capital costs that must
be covered at the beginning of the project when the demand is much smaller than the ultimate
demand. Therefore, unit costs are relatively high in the early years. Subsidies may be needed to
provide incentives for the pipeline until demand increases.
2.3.5 Solar Photovoltaic (PV) and Concentrating Solar Power (CSP)
Although the sun shines everywhere in the Caribbean, frequent cloud cover and the transient
nature of clouds limit the hours of bright sunlight. As a result, the high capital cost of PVs
reduces the economic competitiveness when compared to other technologies available for central
station power generation.6 Still, PV technology is used in the region, mainly stimulated by
subsidies such as high feed-in tariffs for purchases of renewable energy, favorable tax treatment,
and other measures to promote development. Martinique and Guadeloupe have 19 MW and 16
MW, respectively, of installed PV capacity, primarily on warehouse rooftops but also as ground
PV plants, which sell to the utility at a French Government-mandated rate of €400 per MWh.
Given the exponential development of PV projects, the French Government, decided in July
2010 to lower the feed-in tariffs by an average 12 percent.
CSP, on the other hand, is not currently used on a large scale in the Caribbean, since the transient
nature of clouds makes it difficult to design plants because the units cannot use diffuse light.
Furthermore, a CSP plant needs to be at least 20 MW to achieve reasonable economies of scale,
which would require 90–150 acres (36–60 hectares) per plant. It may be difficult to locate a
sufficient number of large parcels to support significant penetration, especially on the smaller
islands.
2.3.6 Wind
Wind turbines are in operation at numerous sites in the Caribbean, and the potential is being
explored on many additional islands. Turbines for grid usage are presently operational in the
Dominican Republic (100 MW at two 50 MW wind farms), Jamaica (20 MW), Guadeloupe (25
MW at 13 wind farms) and Martinique (1 MW). The turbines in Montserrat were put out of
operation by volcanic activity on the island. Demonstration projects have also been built both in
Antigua (a 120-kW vertical axis wind turbine) and Montserrat (an 85-kW horizontal axis
turbine). Other demonstration projects are being considered for Barbados and Curacao.
The potential for wind power in the Caribbean is relatively large since wind patterns are
dominated by the northeast trade winds. The trade winds blow throughout the year, interrupted
only at short intervals during the summer by tropical disturbances and in the winter by eastward-
moving Atlantic depressions. Thus, a number of wind farm projects are being built, giving wind
the potential to be the fastest-growing renewable energy technology in the region over the next
two decades.
6 The Nexant Report does not consider the competitiveness of solar technologies for distributed uses.

15
Although there are promising sites on most Caribbean islands, the economic viability of wind is
highly site dependent, and detailed wind measurements must be conducted at potential sites to
arrive at more accurate projections of the feasibility of specific wind power development.
2.3.7 Geothermal
Current usage of geothermal resources in the Caribbean is limited. The only operational
geothermal plant is the 15 MW Bouillante plant in Guadeloupe, which has produced electricity
since 1986. Geothermal projects are at various stages of exploration and development in St.
Lucia, Dominica and Nevis.
On the other hand, the potential for geothermal energy is huge. It is of the most underutilized
indigenous energy resources in the Caribbean. The islands of Saba and St. Eustatius (Statia) of
the Netherlands Antilles, St. Kitts and Nevis, Montserrat, Dominica, St. Lucia, St. Vincent and
the Grenadines, and the French territories of Guadeloupe and Martinique form part of the active
volcanic arc of the Eastern Caribbean and the Lesser Antilles, creating ideal geothermal
resources. In the cases of Dominica (at Wotten Waven) and St. Lucia (at La Soufrière-Qualibou),
intense surface hydrothermal activity marks the presence of high-enthalpy geothermal systems.
Resources also exist in Grenada. Estimates of geothermal resource availability in these countries
vary from 450 MW to several thousand MW.
2.3.8 Hydro
The Caribbean provides an ideal environment for hydropower, with hilly areas and high year-
round rainfall. As a result, the Caribbean islands already have well-developed hydro resources.
At present, grid-connected hydroelectricity is generated in Dominica (7.6 MW), the Dominican
Republic (472 MW), Haiti (62 MW), Jamaica (43 MW), St. Vincent (6 MW) and Guadeloupe
(9.4 MW). There are also several new hydropower plant developments, especially in the
Dominican Republic.
However, future exploitation may be limited to larger countries with more resources. Although
the introduction of low-volume, continuous-flow systems has made hydropower technologies
readily applicable for small streams, poor agricultural practices and inadequate forest
management have decreased flows in rivers and streams on many islands of the Caribbean.
Given the decreased water flow, with the exception of the larger Caribbean countries that still
have some rivers of note, only Dominica, and to a lesser extent St. Vincent and the Grenadines,
may be able to economically exploit hydropower. However, hydro is highly site specific and
detailed studies must be conducted at potential sites to arrive at more accurate projections of the
economic viability of development.
2.3.9 Biomass
The Caribbean region has various biomass resources, which are utilized in a number of countries.
As mentioned in Section 2.3.2, Guadeloupe uses bagasse (and coal) to fuel two boilers, and the
bagasse contribution accounts for the equivalent of a 15-MW boiler working in baseload.
Martinique has a 4-MW municipal waste plant that primarily uses paper and plastic. Several

16
other biomass projects are being considered in the Bahamas, the Dominican Republic and
Jamaica.
In addition to carbon-based materials, waste-to-energy technologies such as landfill gas may also
be a viable option, although municipal solid waste disposal sites in the Caribbean currently lack
the means to collect generated landfill gas. Large cities with landfill disposal could consider
modification of existing landfill sites to collect and utilize resulting gas. Moreover, waste-to-
energy encompasses a wide number of technologies, some of which are highly evolved while
others are still emerging.
Definitive estimates of biomass power generation potential in the Caribbean are not available
due to the site-specific nature of the resources. However, the potential appears to be large.
Detailed studies are required to demonstrate resource potential and economic viability.
2.3.10 Other Technologies
Numerous other renewable energy technologies exist that are not considered in this report, but
these may be competitive and offer significant potential for the Caribbean islands in the long
term. In particular, given the geography of the Caribbean, marine technologies have the potential
to play a large role in the energy future. For example, wave power can harness the ocean to
generate electric power, tidal power can use the changing currents to produce electricity, and
Ocean Thermal Energy Conversion (OTEC) utilizes temperature variations in shallow and deep
water to run an engine. Biofuels may also present another option. Distributed uses of
technologies are not considered, although these may play a role in meeting the energy needs of
the islands, particularly the needs of the rural poor.
2.4 Conclusion
Overall, the Caribbean is a diverse region with disparate energy needs, ranging from large island
countries with millions of people, such as the Dominican Republic and Puerto Rico, to extremely
small ones, such as Anguilla and St. Kitts and Nevis, with a few thousand inhabitants. The sizes
of the economies range from billions of dollars to a few million. Given this disparity in size and
wealth, energy access and demands vary. Most countries have near-universal access, while
others, such as Haiti, struggle to provide coverage.
However, the main challenge of these countries is similar: supplying a growing energy demand
in a reliable and efficient manner. Most countries rely on diesel and HFO, which are expensive
and lead to extremely high electricity tariffs, although a few also rely on natural gas, coal,
bagasse and hydro. Since electricity demand is projected to double by 2028, large new
investments must be made, and it is useful to consider what alternative options may be a part of
meeting the challenge of supplying cheaper energy to the Caribbean.
Given the distinct nature of the countries and their energy needs, no single development path will
be suitable for all countries, and it is important to consider different options. Most islands
currently use diesel and HFO, although a few also rely on natural gas, and fewer on coal, bagasse
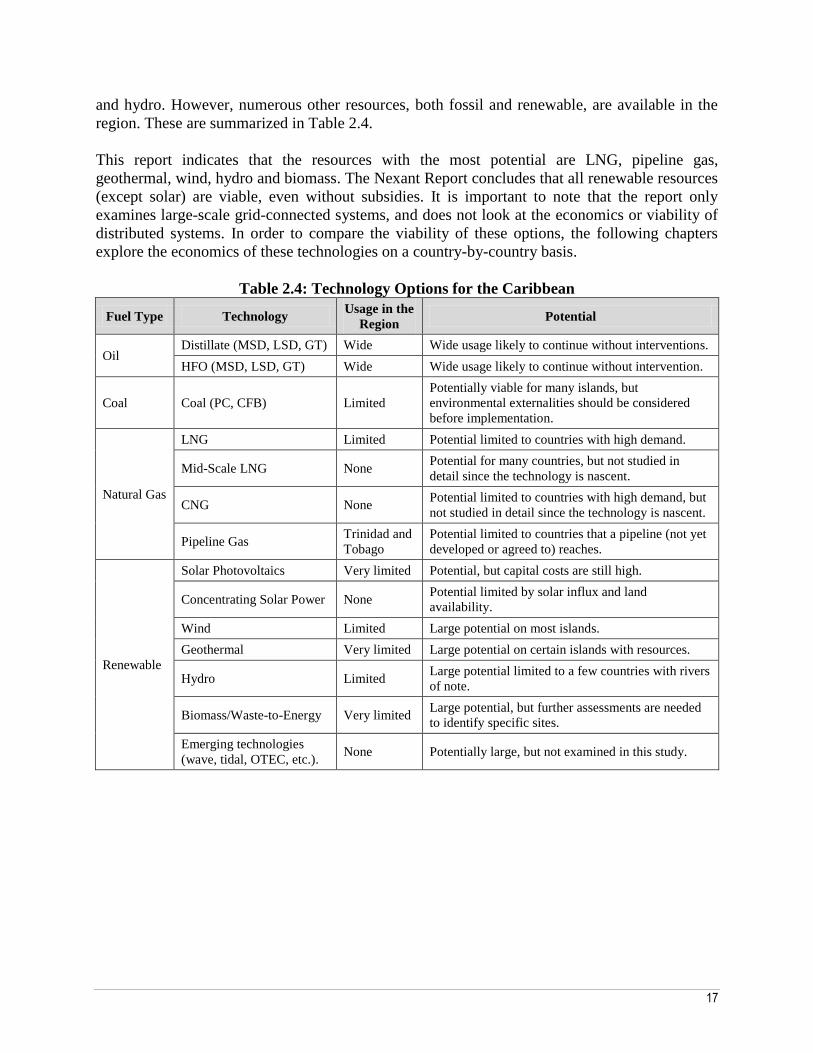
17
and hydro. However, numerous other resources, both fossil and renewable, are available in the
region. These are summarized in Table 2.4.
This report indicates that the resources with the most potential are LNG, pipeline gas,
geothermal, wind, hydro and biomass. The Nexant Report concludes that all renewable resources
(except solar) are viable, even without subsidies. It is important to note that the report only
examines large-scale grid-connected systems, and does not look at the economics or viability of
distributed systems. In order to compare the viability of these options, the following chapters
explore the economics of these technologies on a country-by-country basis.
Table 2.4: Technology Options for the Caribbean
Fuel Type Technology Usage in the
Region Potential
Oil Distillate (MSD, LSD, GT) Wide Wide usage likely to continue without interventions.
HFO (MSD, LSD, GT) Wide Wide usage likely to continue without intervention.
Coal Coal (PC, CFB) Limited
Potentially viable for many islands, but
environmental externalities should be considered
before implementation.
Natural Gas
LNG Limited Potential limited to countries with high demand.
Mid-Scale LNG None Potential for many countries, but not studied in
detail since the technology is nascent.
CNG None Potential limited to countries with high demand, but
not studied in detail since the technology is nascent.
Pipeline Gas Trinidad and
Tobago
Potential limited to countries that a pipeline (not yet
developed or agreed to) reaches.
Renewable
Solar Photovoltaics Very limited Potential, but capital costs are still high.
Concentrating Solar Power None Potential limited by solar influx and land
availability.
Wind Limited Large potential on most islands.
Geothermal Very limited Large potential on certain islands with resources.
Hydro Limited Large potential limited to a few countries with rivers
of note.
Biomass/Waste-to-Energy Very limited Large potential, but further assessments are needed
to identify specific sites.
Emerging technologies
(wave, tidal, OTEC, etc.). None Potentially large, but not examined in this study.

18
Chapter 3
Individual Countries’ Energy Options
lthough the Caribbean as a whole faces similar energy challenges, the appropriateness of
each technology for a single country is highly dependent on that country’s location,
resources and electricity demand. This section provides a country-by-country analysis of the
fossil and renewable technologies outlined in Chapter 2 in order to determine which are most
cost effective for which countries. It first explains the methodology, describing the screening
curve analysis used for comparing technologies and presenting the assumptions used to
determine costs for both renewable and fossil fuel technologies. Next, it provides screening
curves on a country-by-country basis; these curves compare the various options available in
order to determine the least-cost options for each country. The results are later used to
understand how regional options compare with individual country options.
3.1 Methodology and Assumptions
Prior to conducting the specific country-by-country analysis, it is important to understand how
the economics and resource constraints of fossil fuels and renewable energy differ. For example,
fossil fuel technologies tend to have low capital costs, but high fuel costs increase the total costs
incurred to produce electricity. In comparison, renewable energy technologies often have
significantly higher capital costs, but in many cases negligible fuel costs. Given the differing
allocation of when costs are incurred, in order to fairly compare the economics of the
technologies all costs over each project’s lifetime need to be included in the analysis. Moreover,
while fossil fuels are accessible wherever they can be transported and operate at a wide range of
capacity factors, renewable energy technologies tend to be site specific and operate at limited
capacity factors.
Thus, the basis for comparison among technologies is a ―screening curve analysis,‖ which
incorporates into the analysis tradeoffs among capital costs, operating costs and usage levels for
different types of generating units. The screening curve helps identify the optimal mix of
generating technologies for a specific type of load by creating simplified representations of costs
and plotting this against the capacity factor. The cost is calculated using capital costs, operating
and maintenance costs, fuel costs, estimated costs for transmission upgrades, the heat rate (or
fuel efficiency) and the capacity factor. For example, this method recognizes that for applications
requiring small amounts of annual generation, the low capital/lower efficiency characteristics of
combustion turbines are preferable to high capital/higher efficiency characteristics of combined
cycle units.
A

19
There are two ways to represent costs, either as total annual costs ($ per kW-year) or in unit
energy costs (cents per kWh). The following equations define how each cost is calculated:
total annual cost ($/kW-year) =
(annualized fixed cost) + (variable cost * capacity factor * total hours per year)
unit energy costs (cents/kWh) =
total annual costs * (cents per dollar)/(hours in operation per year)
Figure 3.1 presents these equations graphically. The scale for the solid line is US$/kW-year on
the left side. The vertical axis intercept is the technology’s fixed costs, while the slope of the line
represents variable costs.
The dotted line represents
energy unit costs (US
cents/kWh) and its axis is
on the right. The line slopes
downward since capital
costs are spread over more
units as the capacity factor
increases. This report will
present all results in cents
per kWh.
The specifics of how this
method is applied to both
fossil and renewable
technologies are described
in the following sections.
Figure 3.1: Cost Representation for Screening
Analysis Method
Source: Nexant Report
3.1.1. Fossil Fuel Analysis
For each country, the fossil fuel options were added to the screening curve. The Nexant Report
assumes that there is no practical limit on fuel; therefore, resources can be added to the extent
needed and technologies can be used across the range of capacity factors. The technology with
the lowest cost at each capacity factor is considered part of the Least Cost Line (LCL), although
―least cost‖ does not take into account environmental externalities. As an illustrative example,
Figure 3.2 compares generic technologies: coal-fueled steam plants, distillate-fueled gas
turbines, and gas-fueled combined cycle plants. The costs are not for any specific Caribbean
country. In this example the Fossil LCL (the lowest-cost technologies only considering fossil
options) is composed of simple cycle distillate-fueled gas turbines from 0 to 15 percent capacity
factor, gas-fueled combined cycles from 15 percent to 55 percent capacity factor, and
conventional coal-fired steam plants from 55 percent to 90 percent capacity factor.
In order to construct these curves for each country, it is first necessary to determine the country-
specific fuel and technology costs. In this analysis, the capital costs are assumed to be the same
0
10
20
30
40
50
60
70
80
0
500
1,000
1,500
2,000
2,500
0% 10% 20% 30% 40% 50% 60% 70% 80% 90%
Co
st, U
S ce
nts
/kW
h
An
nu
al C
ost
, $/k
W-y
ear
Capacity Factor, %
Example, US$/kW-yr
Example, US cents/kWh
Intercept = Fixed cost
Slope = Variable cost *
capacity factor * 8760

20
Figure 3.2: Illustrative Example of the Least Cost Line
Source: Nexant
for all countries, but for some
fuels the prices vary across
countries.7 For distillate and
HFO, the same price is used on
each island, since no new
infrastructure is needed and
similar delivery methods exist
for each country. On the other
hand, the price of coal varies
by country. This is because for
many of the islands coal would
require significant
infrastructure investments, and
the smaller the island’s
demand, the higher the cost per
unit because the initial capital costs of a delivery system are spread over fewer gigawatt hours
(GWh). Dominica and St. Kitts and Nevis are the only countries where coal is not a practical
option since the demands are so small. As described below, the estimated cost of natural gas also
significantly varies among countries given the large initial infrastructure costs of setting up a
delivery method.
For each country, the lowest-cost gas option is selected as the fuel for the screening analysis. For
the largest countries—the Dominican Republic, Haiti and Jamaica—LNG appears to be the
lowest-cost natural gas fuel. Although not studied in the same detail as the other fuel delivery
options since it is a nascent technology, mid-scale LNG may also provide an economically
attractive option for some countries. CNG is the lowest-cost gas option for several countries, but
is always higher in cost than distillate, and therefore does not appear in the analysis for each
country. For countries where CNG is estimated to be considerably lower in cost than distillate, it
is more costly than other gas delivery options. Pipeline gas is the cheapest gas option for each
country it reaches. However, since a pipeline is a regional solution, the impacts on the associated
countries (Barbados, Martinique, St. Lucia and Guadeloupe) are discussed in Chapter 4.
Table 3.1 summarizes the prices for fossil fuels in different countries.8 The prices assume that
the fuels would be available starting in 2014 and used throughout a 15-year study period
(through 2028). All associated transport and facilities are sized to accommodate the 2028
demand. The forecasted prices do not include any costs associated with CO2 emissions, which
would further increase prices, particularly of coal. It is interesting to note that every country
except Dominica has at least one fuel which is a lower-cost option than distillate (without
including generation technology costs).
7 All prices were related to prices from the Energy Information Agency (EIA) report on fuel supply, prices and
parameters. 8 The general basis for all prices is the March 2009 EIA report on fuel supply, prices and other parameters.
0
20
40
60
80
100
120
140
160
0% 10% 20% 30% 40% 50% 60% 70% 80% 90%
Co
st, U
S ce
nts
/kW
h
Capacity Factor, %
Gas Turbine
Combined Cycle
Conv Coal
Least Cost Line

21
Table 3.1: Fossil Fuel Prices 2014–2028
Country
Fuels Selected in
Addition to Coal and
Distillate
Levelized Fuel Price, US$/GJ
Fuel
Selected Coal Distillate
Antigua and Barbuda None N/A 12.3 20.7
Barbados Pipeline Gas 7.4 7.8 20.7
Dominica Distillate only N/A N/A 20.7
Dominican Republic LNG 9.4 4.2 20.7
Grenada None N/A 12.3 20.7
Guadeloupe Pipeline Gas 10.9 7.8 20.7
Haiti LNG 12.5 7.8 20.7
Jamaica LNG 9.8 4.2 20.7
Martinique Pipeline Gas 9.0 7.8 20.7
St. Kitts and Nevis None N/A 12.3 20.7
St. Lucia Pipeline Gas 10.5 9.1 20.7
St. Vincent and Grenadines None N/A 12.3 20.7
Note: for methodology on pipeline gas prices, see Chapter 4. Source: Nexant Report
In addition to determining appropriate fuels and prices for each country, it is necessary to
determine which generation technologies would best fit the country’s needs based on its demand.
For example, it is assumed that smaller countries would use 10-, 25- and 50-MW circulating
fluidized bed (CFB) steam plants, while countries with larger demand could accommodate a 100-
MW or 300-MW conventional coal steam plant.
3.1.2. Renewable Energy Resource Analysis
Although the concept of the screening curve is similar for renewable technologies, renewable
resources have several unique characteristics that must be taken into account in building the
screening curve. First, unlike fossil fuel resources, which can be reliably supplied to areas where
indigenous resources do not exist, renewable resources are site specific. For example, the wind
blows and the sun shines almost everywhere, but the locations where their intensity is high
enough for economic exploitation for power generation are limited; biomass and municipal waste
have relatively low energy density, with a limited range over which they can be transported
economically; and geothermal and hydro resources exist only in certain locations. Second, many
renewable resources can only generate electricity within a limited range of capacity factors due
to the intermittent energy input. Therefore, other capacity must be added to the system as
reserve, which often increases the costs. Similar to fossil fuel technologies, capital costs for
renewable energy are assumed to be the same in each country.9
To deal with the site-specific nature of renewable resources, all costs assume that the renewable
technology is built on a good site. Total renewable energy development for each country would
be limited by the available resources, which are summarized in Table 3.2.
9 Because biomass is the only renewable resource that requires the purchase of a fuel, its costs were assumed to be
equal to the costs of export coal in the US.
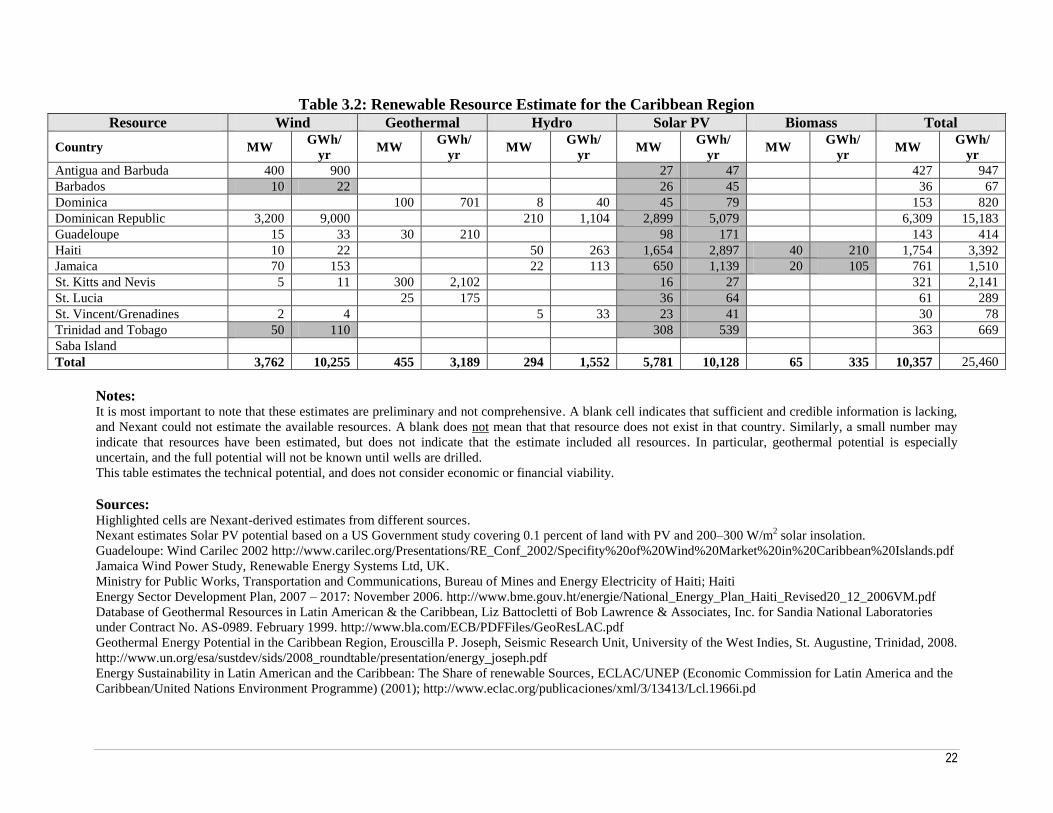
22
Table 3.2: Renewable Resource Estimate for the Caribbean Region
Resource Wind Geothermal Hydro Solar PV Biomass Total
Country MW GWh/
yr MW
GWh/
yr MW
GWh/
yr MW
GWh/
yr MW
GWh/
yr MW
GWh/
yr
Antigua and Barbuda 400 900 27 47 427 947
Barbados 10 22 26 45 36 67
Dominica 100 701 8 40 45 79 153 820
Dominican Republic 3,200 9,000 210 1,104 2,899 5,079 6,309 15,183
Guadeloupe 15 33 30 210 98 171 143 414
Haiti 10 22 50 263 1,654 2,897 40 210 1,754 3,392
Jamaica 70 153 22 113 650 1,139 20 105 761 1,510
St. Kitts and Nevis 5 11 300 2,102 16 27 321 2,141
St. Lucia 25 175 36 64 61 289
St. Vincent/Grenadines 2 4 5 33 23 41 30 78
Trinidad and Tobago 50 110 308 539 363 669
Saba Island
Total 3,762 10,255 455 3,189 294 1,552 5,781 10,128 65 335 10,357 25,460
Notes: It is most important to note that these estimates are preliminary and not comprehensive. A blank cell indicates that sufficient and credible information is lacking,
and Nexant could not estimate the available resources. A blank does not mean that that resource does not exist in that country. Similarly, a small number may
indicate that resources have been estimated, but does not indicate that the estimate included all resources. In particular, geothermal potential is especially
uncertain, and the full potential will not be known until wells are drilled.
This table estimates the technical potential, and does not consider economic or financial viability.
Sources: Highlighted cells are Nexant-derived estimates from different sources.
Nexant estimates Solar PV potential based on a US Government study covering 0.1 percent of land with PV and 200–300 W/m2 solar insolation.
Guadeloupe: Wind Carilec 2002 http://www.carilec.org/Presentations/RE_Conf_2002/Specifity%20of%20Wind%20Market%20in%20Caribbean%20Islands.pdf
Jamaica Wind Power Study, Renewable Energy Systems Ltd, UK.
Ministry for Public Works, Transportation and Communications, Bureau of Mines and Energy Electricity of Haiti; Haiti
Energy Sector Development Plan, 2007 – 2017: November 2006. http://www.bme.gouv.ht/energie/National_Energy_Plan_Haiti_Revised20_12_2006VM.pdf
Database of Geothermal Resources in Latin American & the Caribbean, Liz Battocletti of Bob Lawrence & Associates, Inc. for Sandia National Laboratories
under Contract No. AS-0989. February 1999. http://www.bla.com/ECB/PDFFiles/GeoResLAC.pdf
Geothermal Energy Potential in the Caribbean Region, Erouscilla P. Joseph, Seismic Research Unit, University of the West Indies, St. Augustine, Trinidad, 2008.
http://www.un.org/esa/sustdev/sids/2008_roundtable/presentation/energy_joseph.pdf
Energy Sustainability in Latin American and the Caribbean: The Share of renewable Sources, ECLAC/UNEP (Economic Commission for Latin America and the
Caribbean/United Nations Environment Programme) (2001); http://www.eclac.org/publicaciones/xml/3/13413/Lcl.1966i.pd
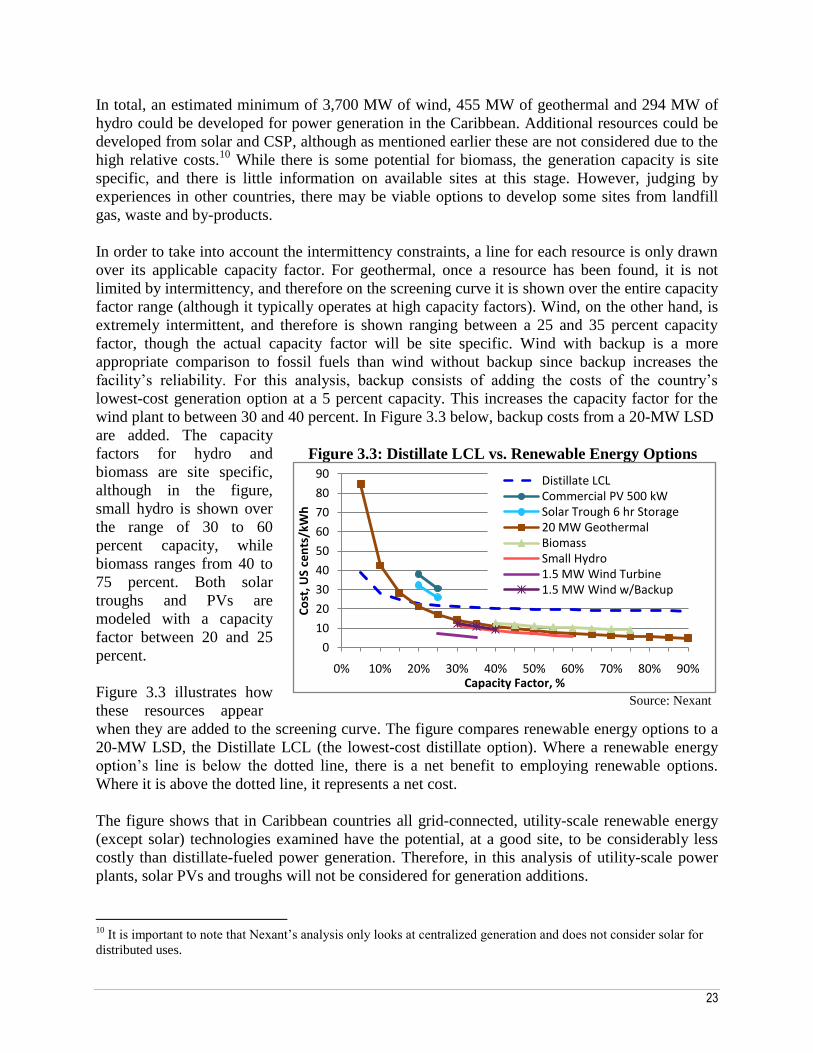
23
In total, an estimated minimum of 3,700 MW of wind, 455 MW of geothermal and 294 MW of
hydro could be developed for power generation in the Caribbean. Additional resources could be
developed from solar and CSP, although as mentioned earlier these are not considered due to the
high relative costs.10
While there is some potential for biomass, the generation capacity is site
specific, and there is little information on available sites at this stage. However, judging by
experiences in other countries, there may be viable options to develop some sites from landfill
gas, waste and by-products.
In order to take into account the intermittency constraints, a line for each resource is only drawn
over its applicable capacity factor. For geothermal, once a resource has been found, it is not
limited by intermittency, and therefore on the screening curve it is shown over the entire capacity
factor range (although it typically operates at high capacity factors). Wind, on the other hand, is
extremely intermittent, and therefore is shown ranging between a 25 and 35 percent capacity
factor, though the actual capacity factor will be site specific. Wind with backup is a more
appropriate comparison to fossil fuels than wind without backup since backup increases the
facility’s reliability. For this analysis, backup consists of adding the costs of the country’s
lowest-cost generation option at a 5 percent capacity. This increases the capacity factor for the
wind plant to between 30 and 40 percent. In Figure 3.3 below, backup costs from a 20-MW LSD
are added. The capacity
factors for hydro and
biomass are site specific,
although in the figure,
small hydro is shown over
the range of 30 to 60
percent capacity, while
biomass ranges from 40 to
75 percent. Both solar
troughs and PVs are
modeled with a capacity
factor between 20 and 25
percent.
Figure 3.3 illustrates how
these resources appear
Figure 3.3: Distillate LCL vs. Renewable Energy Options
Source: Nexant
when they are added to the screening curve. The figure compares renewable energy options to a
20-MW LSD, the Distillate LCL (the lowest-cost distillate option). Where a renewable energy
option’s line is below the dotted line, there is a net benefit to employing renewable options.
Where it is above the dotted line, it represents a net cost.
The figure shows that in Caribbean countries all grid-connected, utility-scale renewable energy
(except solar) technologies examined have the potential, at a good site, to be considerably less
costly than distillate-fueled power generation. Therefore, in this analysis of utility-scale power
plants, solar PVs and troughs will not be considered for generation additions.
10
It is important to note that Nexant’s analysis only looks at centralized generation and does not consider solar for
distributed uses.
0
10
20
30
40
50
60
70
80
90
0% 10% 20% 30% 40% 50% 60% 70% 80% 90%
Co
st, U
S ce
nts
/kW
h
Capacity Factor, %
Distillate LCLCommercial PV 500 kWSolar Trough 6 hr Storage20 MW GeothermalBiomassSmall Hydro1.5 MW Wind Turbine1.5 MW Wind w/Backup
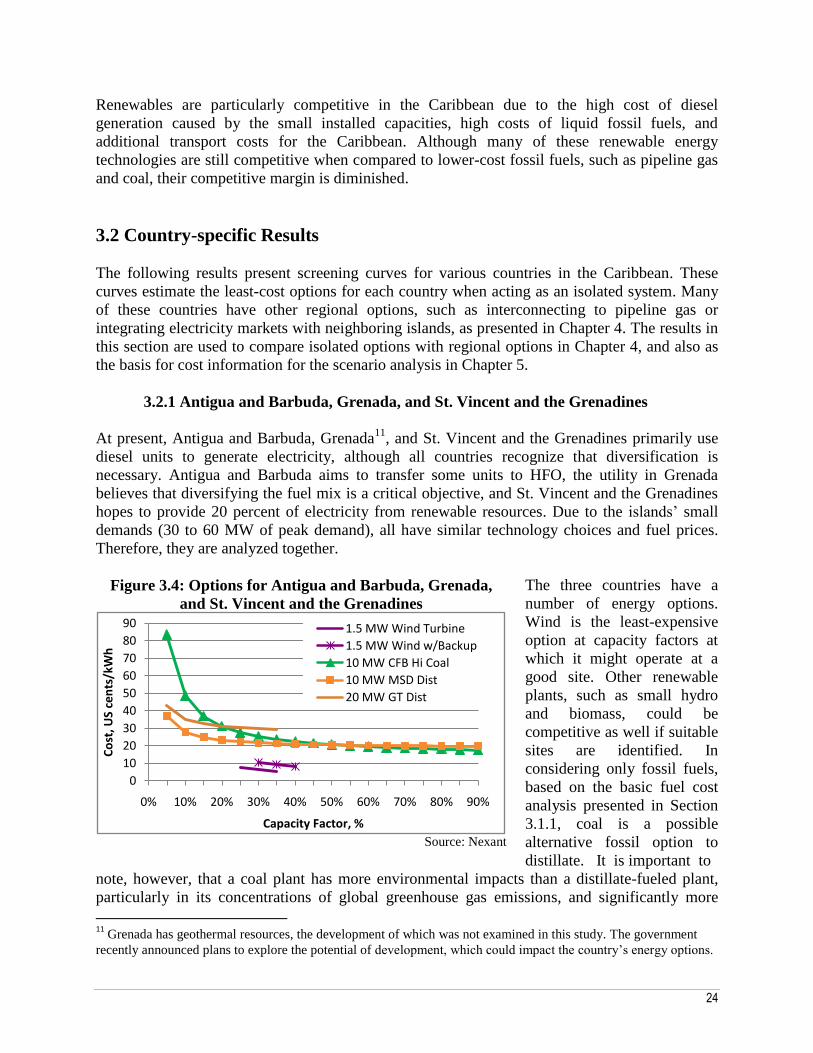
24
Renewables are particularly competitive in the Caribbean due to the high cost of diesel
generation caused by the small installed capacities, high costs of liquid fossil fuels, and
additional transport costs for the Caribbean. Although many of these renewable energy
technologies are still competitive when compared to lower-cost fossil fuels, such as pipeline gas
and coal, their competitive margin is diminished.
3.2 Country-specific Results
The following results present screening curves for various countries in the Caribbean. These
curves estimate the least-cost options for each country when acting as an isolated system. Many
of these countries have other regional options, such as interconnecting to pipeline gas or
integrating electricity markets with neighboring islands, as presented in Chapter 4. The results in
this section are used to compare isolated options with regional options in Chapter 4, and also as
the basis for cost information for the scenario analysis in Chapter 5.
3.2.1 Antigua and Barbuda, Grenada, and St. Vincent and the Grenadines
At present, Antigua and Barbuda, Grenada11
, and St. Vincent and the Grenadines primarily use
diesel units to generate electricity, although all countries recognize that diversification is
necessary. Antigua and Barbuda aims to transfer some units to HFO, the utility in Grenada
believes that diversifying the fuel mix is a critical objective, and St. Vincent and the Grenadines
hopes to provide 20 percent of electricity from renewable resources. Due to the islands’ small
demands (30 to 60 MW of peak demand), all have similar technology choices and fuel prices.
Therefore, they are analyzed together.
Figure 3.4: Options for Antigua and Barbuda, Grenada,
and St. Vincent and the Grenadines
Source: Nexant
The three countries have a
number of energy options.
Wind is the least-expensive
option at capacity factors at
which it might operate at a
good site. Other renewable
plants, such as small hydro
and biomass, could be
competitive as well if suitable
sites are identified. In
considering only fossil fuels,
based on the basic fuel cost
analysis presented in Section
3.1.1, coal is a possible
alternative fossil option to
distillate. It is important to
note, however, that a coal plant has more environmental impacts than a distillate-fueled plant,
particularly in its concentrations of global greenhouse gas emissions, and significantly more
11
Grenada has geothermal resources, the development of which was not examined in this study. The government
recently announced plans to explore the potential of development, which could impact the country’s energy options.
0
10
20
30
40
50
60
70
80
90
0% 10% 20% 30% 40% 50% 60% 70% 80% 90%
Co
st, U
S ce
nts
/kW
h
Capacity Factor, %
1.5 MW Wind Turbine
1.5 MW Wind w/Backup
10 MW CFB Hi Coal
10 MW MSD Dist
20 MW GT Dist
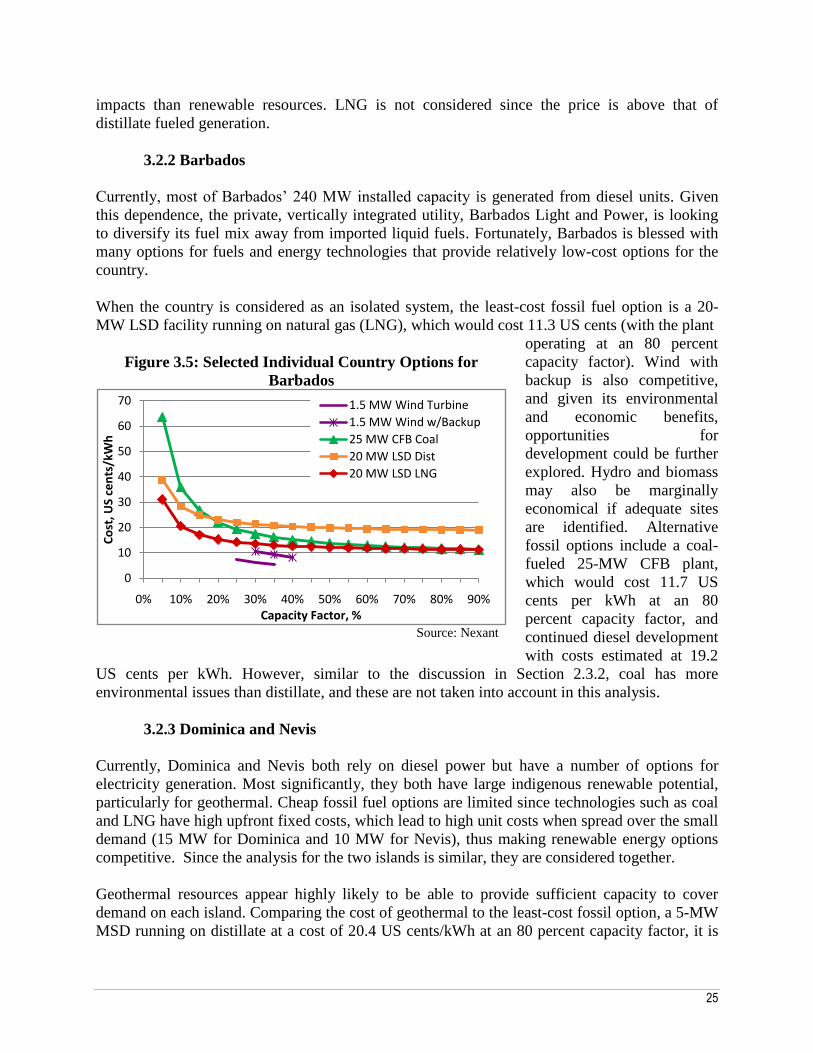
25
impacts than renewable resources. LNG is not considered since the price is above that of
distillate fueled generation.
3.2.2 Barbados
Currently, most of Barbados’ 240 MW installed capacity is generated from diesel units. Given
this dependence, the private, vertically integrated utility, Barbados Light and Power, is looking
to diversify its fuel mix away from imported liquid fuels. Fortunately, Barbados is blessed with
many options for fuels and energy technologies that provide relatively low-cost options for the
country.
When the country is considered as an isolated system, the least-cost fossil fuel option is a 20-
MW LSD facility running on natural gas (LNG), which would cost 11.3 US cents (with the plant
Figure 3.5: Selected Individual Country Options for
Barbados
Source: Nexant
operating at an 80 percent
capacity factor). Wind with
backup is also competitive,
and given its environmental
and economic benefits,
opportunities for
development could be further
explored. Hydro and biomass
may also be marginally
economical if adequate sites
are identified. Alternative
fossil options include a coal-
fueled 25-MW CFB plant,
which would cost 11.7 US
cents per kWh at an 80
percent capacity factor, and
continued diesel development
with costs estimated at 19.2
US cents per kWh. However, similar to the discussion in Section 2.3.2, coal has more
environmental issues than distillate, and these are not taken into account in this analysis.
3.2.3 Dominica and Nevis
Currently, Dominica and Nevis both rely on diesel power but have a number of options for
electricity generation. Most significantly, they both have large indigenous renewable potential,
particularly for geothermal. Cheap fossil fuel options are limited since technologies such as coal
and LNG have high upfront fixed costs, which lead to high unit costs when spread over the small
demand (15 MW for Dominica and 10 MW for Nevis), thus making renewable energy options
competitive. Since the analysis for the two islands is similar, they are considered together.
Geothermal resources appear highly likely to be able to provide sufficient capacity to cover
demand on each island. Comparing the cost of geothermal to the least-cost fossil option, a 5-MW
MSD running on distillate at a cost of 20.4 US cents/kWh at an 80 percent capacity factor, it is
0
10
20
30
40
50
60
70
0% 10% 20% 30% 40% 50% 60% 70% 80% 90%
Co
st, U
S ce
nts
/kW
h
Capacity Factor, %
1.5 MW Wind Turbine
1.5 MW Wind w/Backup
25 MW CFB Coal
20 MW LSD Dist
20 MW LSD LNG

26
clear that there is significant economic benefit from geothermal development. The cost of
geothermal is estimated at 5.5 US cents/kWh at an 80 percent capacity factor. At high capacity
factors (around 80 percent), the net benefit would be approximately 15 US cents/kWh, which
decreases until a break-even point with diesel at an 18 percent capacity factor. Given that
geothermal plants run in a baseload mode, it is likely that the benefit of developing these
resources would be large, provided that a sufficiently large market is available.
For Dominica and Nevis, it is important to consider the size of the geothermal power potential
compared to the islands’ demands. A plant could be designed on both islands to serve 100
percent of the island’s demand at the time of installation. The geothermal plant for the analysis is
estimated at 20 MW on each island, but plants serving only Nevis or Dominica may be closer to
10 MW. The cost per kW of a smaller plant would be expected to be somewhat higher. However,
even if the geothermal costs were twice the estimate above, the energy would cost 11 US
cents/kWh at an 80 percent capacity factor, which would still be far below the cost of power
generated from distillate.
Figure 3.6: Selected Individual Country Options for
Dominica and Nevis
Source: Nexant
Since no power plant is
available for service 100
percent of the time, the
requirements for spinning and
operating reserves may
increase, since the utilities
would need to plan for 100
percent backup of the
geothermal plant from other
resources. Although this could
be initially covered by existing
distillate-fueled generators, it
may eventually be necessary to
build new plants exclusively
for backup. This new
generation would impose an
economic burden that is not
accounted for in this analysis. However, incorporating these costs would most likely not
eliminate the economic advantage.
In addition to geothermal, if good wind sites are identified, wind could supply energy at lower
cost than distillate or coal. Other renewable energy options, not shown in the Figure 3.6, such as
hydropower and biomass, might also contribute to lower-cost energy.
3.2.4 Dominican Republic (DR)
Unlike many countries in the Caribbean, DR today uses a range of fuels, including coal and
natural gas delivered as LNG, although most of its existing generation continues to be fueled by
HFO. Given the country’s large size and growing demand, DR has numerous options to meet
future demand and reduce costs, including the continued use of fossil fuels and the development
of its renewable potential.
0
10
20
30
40
50
60
70
80
90
0% 10% 20% 30% 40% 50% 60% 70% 80% 90%
Co
st, U
S ce
nts
/kW
h
Capacity Factor, %
1.5 MW Wind Turbine
1.5 MW Wind w/Backup
10 MW CFB Hi Coal
5 MW MSD Dist
20 MW Geo

27
DR has the largest demand of
any of the islands addressed
in this study. This reduces the
fuel costs of LNG by
spreading the fixed costs over
more gigajoules, making it a
competitive fuel option. Coal
is also an option, but
environmental considerations
should be taken into account
before moving ahead with
coal development. If
alternative fossil fuels are not
available for generation, a
300-MW HFO-fueled steam
Figure 3.7: Selected Options for Dominican Republic
Source: Nexant
plant would be the likely replacement candidate, with costs more than three times as much as
alternative options at high-capacity factors.
DR has multiple economic renewable options as well. Wind with backup is marginally
economical at the capacity factors corresponding to a good site. Studies have estimated that the
Dominican Republic has approximately 460 km2 with excellent wind generation potential,
totaling 3,200 MW. In addition, the country has an estimated 210 MW of small hydro potential.
3.2.5 Guadeloupe
The bulk of generation in Guadeloupe is currently produced from diesel, although it also has two
coal/bagasse boilers within the country, and one coal boiler to be commissioned. Its relatively
Figure 3.8: Selected Individual Options for Guadeloupe
Source: Nexant
large demand (260 MW)
and installed capacity (411
MW) allows some of the
technologies with larger
capital costs to be
competitive.
Independently, the country
has various supply options,
including LNG, wind,
diesel and coal.
Considering the least-cost
fossil options, Guadeloupe
has the options of building
CFB plants to burn coal or
natural gas (LNG)-fueled
plants. When comparing for baseload power, at an 80 percent capacity factor, in this analysis
coal-fueled power costs 11.7 US cents/kWh while gas-fueled generation is 12.5 US cents/kWh.
Although coal is slightly less expensive than natural gas (LNG)-based generation at high-
0
10
20
30
40
50
60
70
0% 10% 20% 30% 40% 50% 60% 70% 80% 90%C
ost
, US
cen
ts/k
Wh
Capacity Factor, %
300 MW ST HFO50 MW GT LNG 300 MW CC LNGSmall Hydro1.5 MW Wind w/Backup1.5 MW Wind Turbine
0
10
20
30
40
50
60
70
0% 10% 20% 30% 40% 50% 60% 70% 80% 90%
Co
st, U
S ce
nts
/kW
h
Capacity Factor, %
25 MW CFB Coal
20 MW LSD Dist
20 MW LSD LNG
1.5 MW Wind w/Backup
1.5 MW Wind Turbine
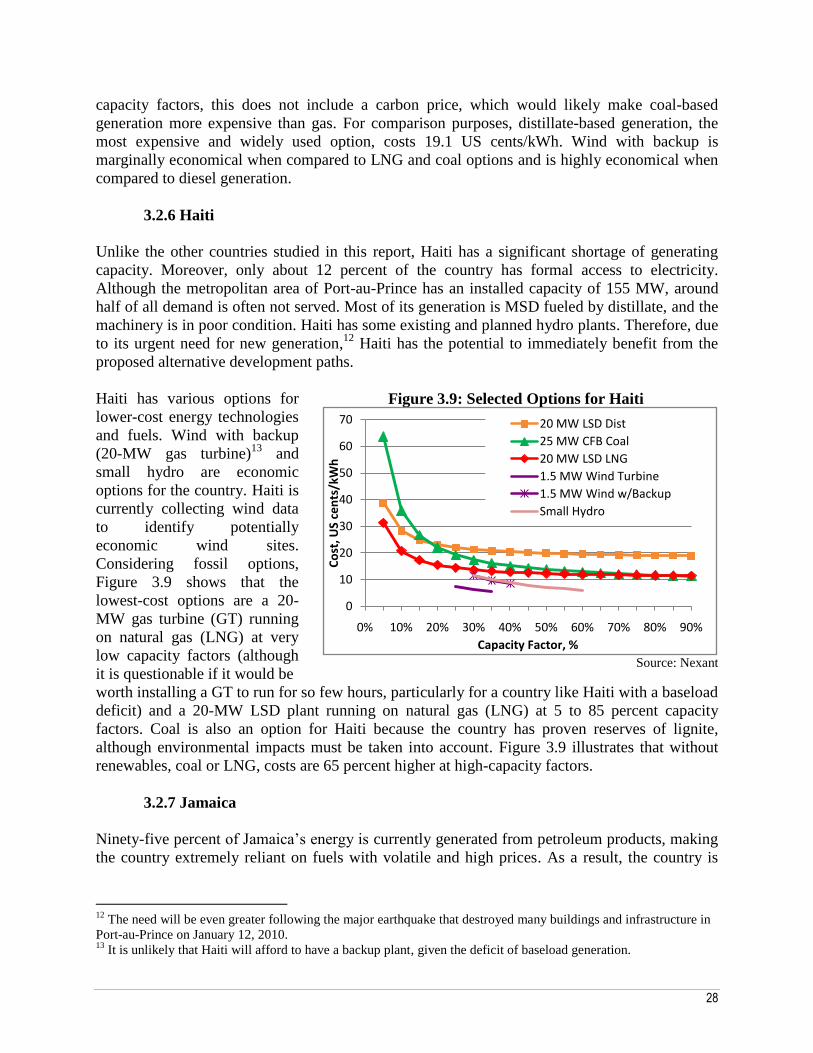
28
capacity factors, this does not include a carbon price, which would likely make coal-based
generation more expensive than gas. For comparison purposes, distillate-based generation, the
most expensive and widely used option, costs 19.1 US cents/kWh. Wind with backup is
marginally economical when compared to LNG and coal options and is highly economical when
compared to diesel generation.
3.2.6 Haiti
Unlike the other countries studied in this report, Haiti has a significant shortage of generating
capacity. Moreover, only about 12 percent of the country has formal access to electricity.
Although the metropolitan area of Port-au-Prince has an installed capacity of 155 MW, around
half of all demand is often not served. Most of its generation is MSD fueled by distillate, and the
machinery is in poor condition. Haiti has some existing and planned hydro plants. Therefore, due
to its urgent need for new generation,12
Haiti has the potential to immediately benefit from the
proposed alternative development paths.
Haiti has various options for
lower-cost energy technologies
and fuels. Wind with backup
(20-MW gas turbine)13
and
small hydro are economic
options for the country. Haiti is
currently collecting wind data
to identify potentially
economic wind sites.
Considering fossil options,
Figure 3.9 shows that the
lowest-cost options are a 20-
MW gas turbine (GT) running
on natural gas (LNG) at very
low capacity factors (although
it is questionable if it would be
Figure 3.9: Selected Options for Haiti
Source: Nexant
worth installing a GT to run for so few hours, particularly for a country like Haiti with a baseload
deficit) and a 20-MW LSD plant running on natural gas (LNG) at 5 to 85 percent capacity
factors. Coal is also an option for Haiti because the country has proven reserves of lignite,
although environmental impacts must be taken into account. Figure 3.9 illustrates that without
renewables, coal or LNG, costs are 65 percent higher at high-capacity factors.
3.2.7 Jamaica
Ninety-five percent of Jamaica’s energy is currently generated from petroleum products, making
the country extremely reliant on fuels with volatile and high prices. As a result, the country is
12
The need will be even greater following the major earthquake that destroyed many buildings and infrastructure in
Port-au-Prince on January 12, 2010. 13
It is unlikely that Haiti will afford to have a backup plant, given the deficit of baseload generation.
0
10
20
30
40
50
60
70
0% 10% 20% 30% 40% 50% 60% 70% 80% 90%
Co
st, U
S ce
nts
/kW
h
Capacity Factor, %
20 MW LSD Dist
25 MW CFB Coal
20 MW LSD LNG
1.5 MW Wind Turbine
1.5 MW Wind w/Backup
Small Hydro

29
focused on diversifying its generation mix, particularly through the use of natural gas. Since
Jamaica is a large country, numerous opportunities exist as alternative electricity sources.
Jamaica’s demand is concentrated in two areas: the southern coast around Hunts Bay and
Montego Bay on the northern coast. The two areas are separated by a mountain range. Thus, the
analysis was divided into two parts: Jamaica’s southern region which makes up 60 percent of
Jamaica’s demand, and the northern area which serves about 30 percent of demand.
The results for southern Jamaica and northern Jamaica are nearly identical.14
The study indicates
that wind with backup (20-MW gas turbine) is a low-cost option at the capacity factors at which
it might operate. Jamaica
may also have opportunities
for hydro and biomass
development, although
further studies should be
conducted to understand the
potential. Least-cost fossil
options for Jamaica are a 50-
MW GT running on natural
gas (LNG) for a capacity
factor from 0 to 10 percent, a
20-MW LSD running on
natural gas (LNG) for
capacity factors of 15 to 45
percent, and a 50-MW coal-
fueled CFB for capacity
Figure 3.10: Selected Options for Jamaica
Source: Nexant
factors from 50 to 90 percent. However, these results do not include environmental costs, and
including a carbon price may make LNG the less-expensive option when compared to coal. As
Figure 3.10 demonstrates, without coal or LNG a 20-MW LSD running on distillate would be the
next least-cost technology, and costs would more than double at high-capacity factors. Although
the results suggest significant economic benefits from developing LNG in both the north and the
south, this study did not compare this option to the possibly viable option of a gas pipeline
connecting the north and south.
3.2.8 Martinique
Martinique’s power sector runs almost exclusively on diesel plants, but has various options
available for lower-cost energy generation. A 20-MW LSD fueled by natural gas (LNG) is the
most economic option for baseload power, with costs of 11.5 US cents/kWh (at an 80 percent
capacity factor), while gas turbines running on natural gas (LNG) would be best for peaking. A
25-MW CFB using coal is also an option, because it is slightly more expensive than LNG
without considering CO2 costs, at 11.7 US cents/kWh (at an 80 percent capacity factor). If CO2
costs are included in the analysis, the competitiveness of LNG over coal may increase. The
14 The only difference between northern and southern Jamaica is the price of natural gas derived from LNG, with
levelized 2014–2028 US$10.90/GJ for north Jamaica compared to US$10.16 for the southern coast.
0
10
20
30
40
50
60
0% 10% 20% 30% 40% 50% 60% 70% 80% 90%
Co
st, U
S ce
nts
/kW
h
Capacity Factor, %
50 MW CFB Coal
50 MW GT LNG
20 MW LSD LNG
1.5 MW Wind Turbine
1.5 MW Wind w/Backup
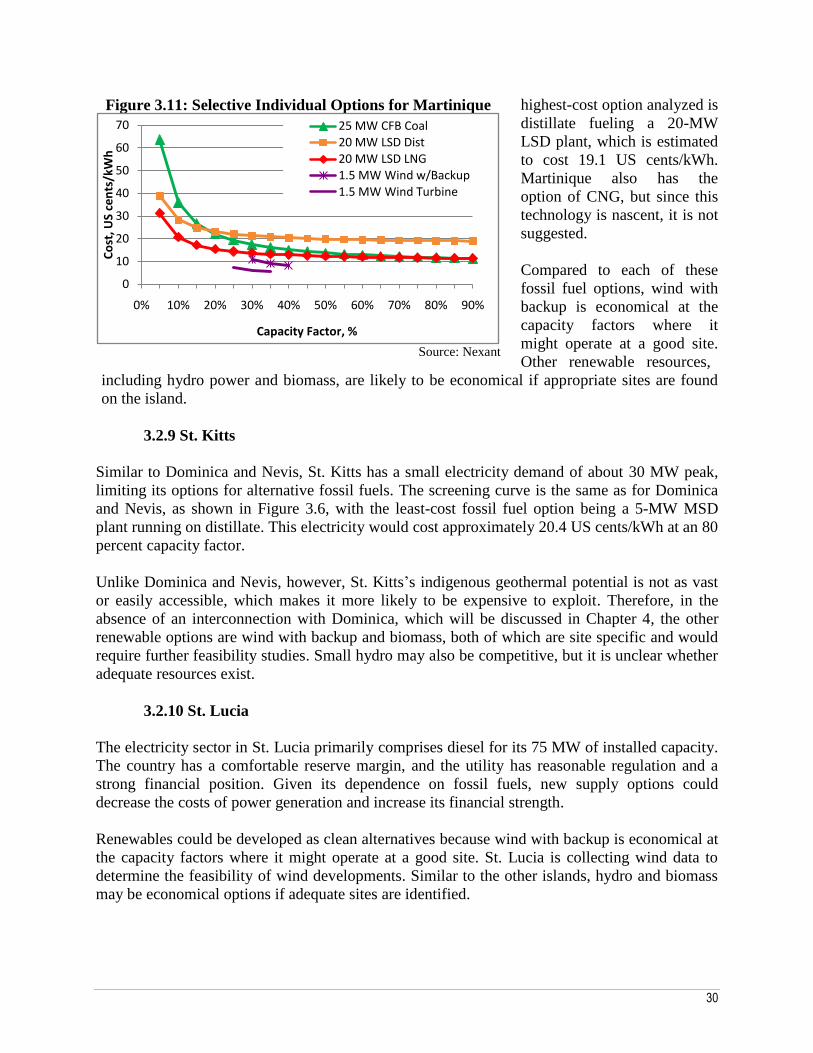
30
Figure 3.11: Selective Individual Options for Martinique
Source: Nexant
highest-cost option analyzed is
distillate fueling a 20-MW
LSD plant, which is estimated
to cost 19.1 US cents/kWh.
Martinique also has the
option of CNG, but since this
technology is nascent, it is not
suggested.
Compared to each of these
fossil fuel options, wind with
backup is economical at the
capacity factors where it
might operate at a good site.
Other renewable resources,
including hydro power and biomass, are likely to be economical if appropriate sites are found
on the island.
3.2.9 St. Kitts
Similar to Dominica and Nevis, St. Kitts has a small electricity demand of about 30 MW peak,
limiting its options for alternative fossil fuels. The screening curve is the same as for Dominica
and Nevis, as shown in Figure 3.6, with the least-cost fossil fuel option being a 5-MW MSD
plant running on distillate. This electricity would cost approximately 20.4 US cents/kWh at an 80
percent capacity factor.
Unlike Dominica and Nevis, however, St. Kitts’s indigenous geothermal potential is not as vast
or easily accessible, which makes it more likely to be expensive to exploit. Therefore, in the
absence of an interconnection with Dominica, which will be discussed in Chapter 4, the other
renewable options are wind with backup and biomass, both of which are site specific and would
require further feasibility studies. Small hydro may also be competitive, but it is unclear whether
adequate resources exist.
3.2.10 St. Lucia
The electricity sector in St. Lucia primarily comprises diesel for its 75 MW of installed capacity.
The country has a comfortable reserve margin, and the utility has reasonable regulation and a
strong financial position. Given its dependence on fossil fuels, new supply options could
decrease the costs of power generation and increase its financial strength.
Renewables could be developed as clean alternatives because wind with backup is economical at
the capacity factors where it might operate at a good site. St. Lucia is collecting wind data to
determine the feasibility of wind developments. Similar to the other islands, hydro and biomass
may be economical options if adequate sites are identified.
0
10
20
30
40
50
60
70
0% 10% 20% 30% 40% 50% 60% 70% 80% 90%
Co
st, U
S ce
nts
/kW
h
Capacity Factor, %
25 MW CFB Coal 20 MW LSD Dist 20 MW LSD LNG 1.5 MW Wind w/Backup1.5 MW Wind Turbine

31
Among the fossil fuel options
analyzed, the only technology
with lower costs than distillate
generation is a 25-MW CFB
fueled by coal. This is because
natural gas (LNG)-fueled
generation is more expensive
than distillate, given the large
upfront costs that would be
spread over a small demand.
However, coal also has more
environmental issues than
distillate and should be
considered in a more detailed
cost comparison.
Figure 3.12: Selected Individual Country Options
for St. Lucia
Source: Nexant
3.3 Conclusions
Overall, individual Caribbean countries have a number of energy options. The most appropriate
fossil fuel technologies on each island are influenced by the island’s size, while the
competitiveness of renewable technologies is impacted by both the resources available and the
cost of competing fossil fuels. Table 3.3 summarizes these results.
Notably, the results indicate that the smallest islands, including Antigua and Barbuda, Grenada15
,
St. Vincent and the Grenadines, St. Kitts, and St. Lucia, all have limited fossil fuel options, with
the cost of coal and distillate being comparable. Natural gas is not an economical option since
there are high costs associated with delivering and developing infrastructure for natural gas in
small markets. Consequently, renewable options, such as wind, hydro and biomass, are highly
competitive where suitable sites can be identified.
Dominica and Nevis have an array of choices similar to those of other small nations, but their
options are augmented by large geothermal potential. In both countries geothermal energy would
be the cheapest generation source at the capacity factors at which it would operate. However, it is
important to consider the ratio of the size of the resource to the size of the market. In both
countries, a plant could supply 100 percent of the island’s demand at the time of installation; this
would increase the requirements for operational reserves. Moreover, the extensive geothermal
resource would be underutilized. Regional opportunities to solve these problems through
interconnection are discussed in Chapter 4.
15
Grenada has a large estimated geothermal resource, the development of which was not examined in this study.
The government recently announced plans to explore the potential of development, which could impact the
country’s energy options.
0
10
20
30
40
50
60
70
0% 10% 20% 30% 40% 50% 60% 70% 80% 90%C
ost
, US
cen
ts/k
Wh
Capacity Factor, %
25 MW CFB Coal
20 MW LSD Dist
1.5 MW Wind w/Backup
1.5 MW Wind Turbine

32
Table 3.3: Summary of Individual Countries’ Viable Future Options16
Country Distillate Coal LNG Wind Geothermal Hydro* Biomass*
Antigua and Barbuda ✔ ✔ ✔ ✔
Grenada ✔ ✔ ✔ ✔ ✔
St. Vincent and the
Grenadines ✔ ✔ ✔ ✔ ✔
St. Kitts ✔ ✔ ✔
St. Lucia ✔ ✔ ✔ ✔
Dominica ✔ ✔ ✔ ✔ ✔
Nevis ✔ ✔ ✔ ✔
Barbados ✔ ✔ ✔ ✔ ✔ ✔
Guadeloupe ✔ ✔ ✔ ✔ ✔ ✔
Martinique ✔ ✔ ✔ ✔ ✔ ✔
Haiti ✔ ✔ ✔ ✔ ✔ ✔
Jamaica ✔ ✔ ✔ ✔ ✔ ✔
Dominican Republic ✔ ✔ ✔ ✔ ✔ ✔
✔ = viable option * The resources are site specific and need to be studied further.
In the slightly larger markets of Barbados, Guadeloupe and Martinique, natural gas (LNG) is the
most economical option, and in all countries wind energy has the potential to be competitive if
good sites are identified. CNG could also be viable in the future, but it was not the least-cost gas
option. Mid-scale LNG may also be an option for these countries, but this resource was not
explored in detail in this study since it is a nascent technology and thus brings additional risks.
Finally, according to the study, alternative fossil fuels are competitive in the three largest
markets (Haiti, Jamaica and the Dominican Republic). Due to the low cost of fossil fuels in
Jamaica and the Dominican Republic, renewables such as wind lose the large competitive
advantage that they have in smaller countries unless the environmental costs are factored in. In
Haiti, natural gas (LNG) fuels the cheapest power at nearly all capacity factors, and wind energy
is a viable option.
16
Although mid-scale LNG may be a viable option for many countries, it is not included in the analysis due to the
nascent nature of the technology. Mid-scale LNG may be the lowest-cost option for Barbados, Jamaica, Martinique,
Guadeloupe, the Dominican Republic and possibly Haiti. In addition, CNG may also be viable for Barbados,
Jamaica, Martinique, Guadeloupe, the Dominican Republic and possibly Haiti, but it has additional risks since it is a
new technology. In this analysis the geothermal energy for Martinique and Guadeloupe was not examined, though
potential exists.
33
Chapter 4
Regional Energy Options
he major objective of this study is to explore, at a concept level, regional options that may
reduce energy costs and increase system reliability. Three types of regional integration are
considered in this chapter: (i) a gas pipeline, (ii) regional fuel storage facilities, and (iii)
electricity market interconnections through submarine cables and overland transmission lines.
These options are compared with individual country solutions in order to understand the
additional benefits they could offer.
It is important to note that the interconnections and regional solutions described in this section
are by no means an exhaustive set of possible interconnections or regional solutions for the
Caribbean. The purpose of this section is to make a preliminary determination of whether
regional solutions are worth considering, and to indicate several among those examined that
appear technically and economically feasible.
4.1 Natural Gas Pipeline
Although there are many imaginable interconnections that use gas pipelines, this report focuses
on the proposed Eastern Caribbean Gas Pipeline (ECGP). The initial concept is to connect a few
islands to the gas supply in Trinidad and Tobago with pipelines that could supply demand
growth for the next two decades. The first section would be a 172-mile, 12-inch pipeline from
Tobago to northwest of Barbados with a small offshore lateral to the island’s main power plant.
The second section would be a 120-mile, 10-inch line from Barbados to Martinique with a side
spur to St. Lucia. The third section would be a 188-mile, 8-inch line from Martinique to
Guadeloupe. The pipeline is designed to send 50 million standard cubic feet per day (MMscfd) to
Barbados and 100 MMscfd combined to Martinique, Guadeloupe and St. Lucia. This pipeline
reaches depths of 5,300 feet between Tobago and Barbados and 5,600 feet near Martinique.
Previously suggested connections to Grenada and St. Vincent were abandoned to avoid tectonic
areas. The interconnections are seen in Figure 4.1.
4.1.1 Technical Feasibility of the Pipeline
The interconnection appears to be technically feasible, although challenges may be encountered.
There are steep slopes off the shores of Martinique that may require a rerouting of the pipeline
and could add additional pipeline length. High Resolution Seabed surveys would be needed in
the area. Moreover, due to hurricane season, each section of the pipeline would have to be
T

34
completed between the end of November and the beginning of June. Pipeline is laid at an
average rate of 2.5 miles per day and the longest pipeline is 180 miles; therefore, the longest
section should take only 75 days. This would leave a buffer period of around 100 days, which
seems reasonable.
4.1.2 Economics of the Pipeline
Various cost estimates have been made on the capital costs of the pipeline. In 2004 Doris
Engineering performed an initial mapping survey and developed a capital cost estimate of
US$550 million for the project. This cost was updated in 2008 to US$800 million. Since then,
many costs have come down and
pipeline advocates believe the
cost would be closer to US$675
million. Independent cost
estimates indicate that these costs
are reasonable, but they are
preliminary and subject to
uncertainty.
The economics of the pipeline
are affected by two cost
components: (i) the gas price and
(ii) the transportation costs. The
gas price would be determined by
the price negotiated with the
Trinidadian gas producers.
Currently, Trinidadian prices
vary based on end use. The
lowest price is for residential
consumers, followed by
commercial and industrial
consumers, and the highest price
is for LNG production, which is
indexed to the world price. The
Nexant Report bases its economic analysis on a gas price equivalent to the LNG input price in
Trinidad, which is the price of LNG in the US upon landing minus losses of 9.1 percent and
gasification costs of US$1.42/GJ.
Similarly, the distribution of transportation costs among the various islands would be determined
by negotiations between the pipeline company (ECGPC) and the individual islands. For this
evaluation, in order to divide the costs among countries, the fixed costs for each of the individual
legs are multiplied by the maximum volume of gas to each island and divided by the total
volume of gas that would use that section of pipeline. This results in 11 percent of the capital
cost being allocated to Barbados, 26 percent to Martinique, 16 percent to St. Lucia and 47
percent to Guadeloupe. With this model, the transportation costs to each country in 2014, 2020
and 2028 are shown in Table 4.1, although for the purpose of this study a levelized cost of fuel
Figure 4.1: Schematic of Eastern Caribbean Gas
Pipeline Proposed Route
35
over the operation period was used for each country. The unit costs are lowest for Barbados,
increasing for Martinique, St. Lucia and Guadeloupe. These price increases correspond to
increases in the pipeline length.
Table 4.1: Pipeline Transportation Costs – All Islands Connected
Transportation Costs, US$/GJ, Based On
Segment Costs and Usages Common
Price to All
Year Barbados Martinique St. Lucia Guadeloupe All Islands
2014 2.28 4.08 6.73 9.15 4.84
2020 2.03 3.59 5.63 5.58 3.88
2028 1.58 3.07 4.47 4.73 3.21
Source: Nexant Report
Since most costs are fixed and do not depend on demand, as demand increases unit costs decline.
Thus, the unit costs in US$/GJ are highest in 2014, which has the lowest demand and spreads the
fixed costs over the smallest number of GJ, with decreasing costs through 2028. In addition,
prices will be lowest if all islands connect due to the higher gas volumes delivered. In reality,
low usage levels in early years may result in prohibitively high costs, and subsidies or cross-
subsidies may be necessary until the market grows sufficiently large. This would add complexity
to the situation because it may be prohibitively difficult for multiple countries to arrange such
policies. If one or more of the islands decides not to interconnect, economies of scale would be
lost and prices would further increase. Moreover, although the economics of the gas pipeline
look promising, further analysis needs to be conducted. In particular, further sensitivity analysis
of capital costs should be performed given the large uncertainty of the actual costs. Further
investigation of expected growth rates of the natural gas market should also be completed to
understand how varying growth rates of the pipeline affect the economic viability. These
challenges will be discussed further in Section 4.4, while some of the political challenges are
examined in Box 4.1.
Box 4.1: History of the Eastern Caribbean Gas Pipeline
The concept of a Caribbean gas pipeline was proposed by the Prime Minister of Trinidad and Tobago
in 2002. An ad hoc development company was created and ownership stakes have changed several
times. The current ownership structure of the Eastern Caribbean Gas Pipeline Company (ECGPC) is
40.5 percent Guardian Holdings, 40.5 percent Trinidad & Tobago Unit Trust Corp., 10 percent
National Gas Company of Trinidad & Tobago (NGC), and 9 percent Intra Caribbean Gas Pipeline
Limited (ICGPL).
In 2003, a prefeasibility study demonstrated the technical and financial viability of the ECGP. A
further in-depth feasibility study was completed in 2004, specifying the pipeline corridors, eliminating
connections to smaller markets and estimating associated investment costs. The current concept
envisages a 12-inch pipeline from the eastern gas fields of Trinidad up to Tobago; this pipeline has yet
to be endorsed by the Government of Trinidad and Tobago. In March 2010 the Government of
Barbados approved a gas pipeline connection to the island.
To achieve economies of scale and scope, the viability of the gas pipeline will rely on the commitment
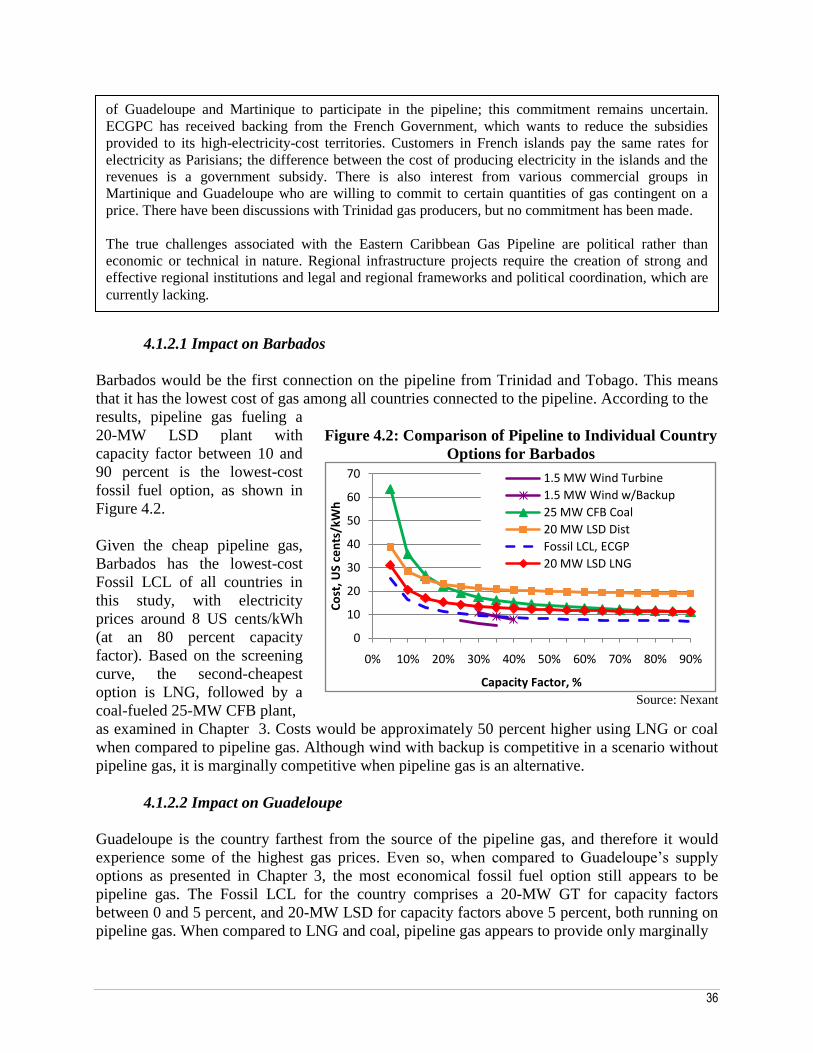
36
4.1.2.1 Impact on Barbados
Barbados would be the first connection on the pipeline from Trinidad and Tobago. This means
that it has the lowest cost of gas among all countries connected to the pipeline. According to the
results, pipeline gas fueling a
20-MW LSD plant with
capacity factor between 10 and
90 percent is the lowest-cost
fossil fuel option, as shown in
Figure 4.2.
Given the cheap pipeline gas,
Barbados has the lowest-cost
Fossil LCL of all countries in
this study, with electricity
prices around 8 US cents/kWh
(at an 80 percent capacity
factor). Based on the screening
curve, the second-cheapest
option is LNG, followed by a
coal-fueled 25-MW CFB plant,
Figure 4.2: Comparison of Pipeline to Individual Country
Options for Barbados
Source: Nexant
as examined in Chapter 3. Costs would be approximately 50 percent higher using LNG or coal
when compared to pipeline gas. Although wind with backup is competitive in a scenario without
pipeline gas, it is marginally competitive when pipeline gas is an alternative.
4.1.2.2 Impact on Guadeloupe
Guadeloupe is the country farthest from the source of the pipeline gas, and therefore it would
experience some of the highest gas prices. Even so, when compared to Guadeloupe’s supply
options as presented in Chapter 3, the most economical fossil fuel option still appears to be
pipeline gas. The Fossil LCL for the country comprises a 20-MW GT for capacity factors
between 0 and 5 percent, and 20-MW LSD for capacity factors above 5 percent, both running on
pipeline gas. When compared to LNG and coal, pipeline gas appears to provide only marginally
0
10
20
30
40
50
60
70
0% 10% 20% 30% 40% 50% 60% 70% 80% 90%
Co
st, U
S ce
nts
/kW
h
Capacity Factor, %
1.5 MW Wind Turbine
1.5 MW Wind w/Backup
25 MW CFB Coal
20 MW LSD Dist
Fossil LCL, ECGP
20 MW LSD LNG
of Guadeloupe and Martinique to participate in the pipeline; this commitment remains uncertain.
ECGPC has received backing from the French Government, which wants to reduce the subsidies
provided to its high-electricity-cost territories. Customers in French islands pay the same rates for
electricity as Parisians; the difference between the cost of producing electricity in the islands and the
revenues is a government subsidy. There is also interest from various commercial groups in
Martinique and Guadeloupe who are willing to commit to certain quantities of gas contingent on a
price. There have been discussions with Trinidad gas producers, but no commitment has been made.
The true challenges associated with the Eastern Caribbean Gas Pipeline are political rather than
economic or technical in nature. Regional infrastructure projects require the creation of strong and
effective regional institutions and legal and regional frameworks and political coordination, which are
currently lacking.

37
less expensive electricity, but it
is close to 50 percent less
expensive than distillate at high
capacity factors.
4.1.2.3 Impact on
Martinique
Martinique would be a central
island in the Eastern Caribbean
Gas Pipeline because it accepts
the pipeline from Barbados and
then sends gas on to
Guadeloupe. According to the
results Martinique would be a
Figure 4.3: Comparison of Pipeline to Individual
Country Options for Guadeloupe
Source: Nexant
central island in the Eastern Caribbean Gas Pipeline because it accepts the pipeline from
Barbados and then sends gas on to Guadeloupe. According to the results, pipeline gas appears to
be the cheapest fossil fuel option for Martinique, and its Fossil LCL is composed of a 20-MW
GT for capacity factors of 0 and 5 percent and a 20-MW LSD plant for capacity factors of 10
percent and above, both fueled by pipeline gas.
Similar to the case of Guadeloupe, pipeline gas is marginally less expensive than the fossil fuel
options available to the country when developed in isolation. The pipeline gas could provide
power at 8.5 US cents/kWh with a plant operating at an 80 percent capacity factor. The costs are
Figure 4.4: Comparison of Pipeline to Individual
Country Options for Martinique
Source: Nexant
slightly below the corresponding
values for Guadeloupe due to
the country’s higher gas cost
(levelized US$8.98/GJ versus
US$10.88 for Guadeloupe).
Comparable values for
electricity based on the coal and
LNG are 11.7 US cents/kWh
and 11.5 US cents/kWh,
respectively. Distillate is nearly
twice as expensive, at 19.1 US
cents/kWh. Although wind with
backup is still competitive
without pipeline gas, when
pipeline gas is added it becomes
marginally economical.
4.1.2.4 Impact on St. Lucia
When pipeline gas is added to St. Lucia’s screening curve, as shown in Chapter 3, pipeline gas
proves to be cheaper than any fossil fuel alternative St. Lucia could develop on its own. The
Fossil LCL comprises a 20-MW GT for capacity factors of 0 and 5 percent and a 20-MW LSD
0
10
20
30
40
50
60
70
0% 10% 20% 30% 40% 50% 60% 70% 80% 90%
Co
st, U
S ce
nts
/kW
hCapacity Factor, %
25 MW CFB Coal20 MW LSD Dist20 MW LSD LNG1.5 MW Wind w/Backup1.5 MW Wind TurbineFossil LCL, ECGP
0
10
20
30
40
50
60
70
0% 10% 20% 30% 40% 50% 60% 70% 80% 90%
Co
st, U
S ce
nts
/kW
h
Capacity Factor, %
25 MW CFB Coal 20 MW LSD Dist 20 MW LSD LNG 1.5 MW Wind w/Backup1.5 MW Wind TurbineFossil LCL, ECGP

38
for capacity factors from 10
through 90 percent, both fueled
by pipeline gas. Pipeline gas-
fueled generation is about three-
fourths the price of coal, and
nearly half the price of diesel at
an 80 percent capacity factor.
Similar to the other countries
connected to pipeline gas,
although wind is significantly less
expensive than the least-cost
fossil options when individual
country solutions are examined,
with the addition of pipeline gas it
becomes marginally economical.
Figure 4.5: Comparison of Pipeline to Individual
Country Options for St. Lucia
Source: Nexant
4.2 Fuel Storage and Transshipment Options
Having large regional/subregional facilities to store petroleum products such as gasoline, diesel
and HFO is another solution that may offer a cheaper, more secure fuel supply to the Caribbean
islands. For many of the islands, the petroleum fuel demand is small; without large storage
facilities, delivery costs are high and countries cannot take advantage of bulk pricing. By having
sufficient fuel storage, larger ships can be used to deliver the refined products to the regional
storage facility, thereby reducing the costs. Moreover, limited fuel storage makes countries
susceptible to shortages in the event of interruptions due to events such as scarcity of petroleum
tankers, major weather events, or worldwide oil supply shortages. Large regional fuel storage
increases the ability to obtain products from nearby when there is a major worldwide shortage of
oil or a short-term spike in oil prices.
4.2.1 Current Situation of Regional Storage
A number of fuel storage facilities exist in the region. The larger islands and some groups of
islands currently have existing refineries that process crude and store petroleum products. Others
store liquid fuels at the power generation facilities. Among the Eastern Caribbean islands, there
are already four centralized storage facilities that serve as transshipment centers for delivery to
nearby islands. The first is located in St. Lucia and serves as a facility to store products for
delivery to other countries in the PetroCaribe agreements.17
The second, in Antigua, is half used
by Antigua and Barbuda with the other half used as storage for PDVSA (Petroleos de Venezuela,
the Venezuelan oil company). Martinique has a refinery that supplies products to Martinique and
the other French islands, and has a fuel storage facility that holds two months’ worth of output
from the refinery. The final regional storage and transshipment facility is in St. Eustatius
(Netherlands Antilles), which is owned by NuStar Energy and is leased to various parties.
17
In these agreements the countries obtain a base price for the refined products based on an index. The countries
then pay for shipping costs. Nearly all of the countries in the Eastern Caribbean have signed the PetroCaribe
agreements.
0
10
20
30
40
50
60
70
0% 10% 20% 30% 40% 50% 60% 70% 80% 90%
Co
st, U
S ce
nts
/kW
hCapacity Factor, %
25 MW CFB Coal
20 MW LSD Dist

39
In the future, the most cost-effective system to maximize the existing storage for small islands
may be to coordinate purchase and product delivery, whereby a large vessel would deliver
sufficient products to fill each island’s storage. Since Jamaica, Haiti and the Dominican Republic
are relatively far from the smaller islands of the Eastern Caribbean, they are not considered in
this solution.
4.2.2 Storage Options for the Future
Three options are explored for expanding regional fuel storage facilities, although none appears
to provide a significant economic advantage. All of the scenarios assume that a large tanker
would deliver products from one of the four large Caribbean refineries (in Aruba, Curacao, St.
Croix and Trinidad) to a regional fuel storage facility where the products would then be shipped
by a smaller tanker or barge to each individual island. All four refineries are approximately 500
nautical miles from the potential regional storage facilities.
The first scenario is to expand Antigua’s facility to serve Nevis, St. Kitts, Barbuda and St.
Maarten. These are all within 87 nautical miles of Antigua. If 200,000 barrels of storage are
added, the shipping costs could be reduced between US$1.3 and US$3.2 million per year.
However, US$8.4 million would be required to develop the storage facilities. After amortizing
the new tankage and adding interest on the cost of the additional inventory, the cost exceeds the
savings of using a larger delivery ship, making this scenario marginally unattractive. A smaller
incremental tankage could be analyzed.
The second scenario is to expand the facility in St. Lucia to serve Dominica, Grenada, and St.
Vincent and the Grenadines. These islands are within 130 nautical miles of St. Lucia. If 200,000
barrels of storage are added, the shipping cost could be reduced between US$1.9 and US$3.9
million per year. As in the first scenario, US$8.4 million is required to develop the fuel storage
facility. In this case, after amortizing the new tankage and adding interest to the cost of the
additional inventory, the cost is slightly less than the savings of using a larger ship, with potential
savings of approximately US$130,000 per year. Given this small value, the savings from
expansion would most likely be insignificant.
The third scenario would expand tankage in Martinique to serve Guadeloupe. However, there
already is sufficient tankage at this facility to handle the large ships that carry upwards of
800,000 barrels. In addition, Guadeloupe has product storage equivalent to two months’ supply
and has a large enough demand to be supplied by large tankers. Thus, no additional fuel storage
is needed.
The preliminary analysis of fuel storage scenarios indicates that there is little potential for
regional storage facilities in the Caribbean. To fully understand the feasibility, however, a more
detailed look at individual fuel storage situations on each island and the cost to transship from
the regional storage facilities to each island would be required.
40
4.3 Regional Electricity Market Interconnections
Interconnections of electricity markets are another regional integration option that may help
reduce electricity costs. Interconnections involve connecting one country to another by land or
submarine transmission lines. Although land interconnections are most common worldwide, the
interconnections discussed in this section rely mostly on submarine cables due to the geography
of the Caribbean. After discussing the viability of submarine technology, this section analyzes
the economics of specific interconnection options, including: the Dominica markets (Dominica–
Martinique, Dominica–Guadeloupe), the Nevis markets (Nevis–Puerto Rico, Nevis–USVI,
Nevis–St. Kitts), Saba–St. Maarten, and the Northern Ring (Florida–Cuba or Florida–Haiti,
Haiti–Dominican Republic, Haiti–Jamaica, Dominican Republic–Puerto Rico, Puerto Rico–
Nevis).
4.3.1 Submarine Cable Technologies and Costs
Submarine cables are advanced technologies that are widely used for underwater electricity
interconnections. Many thousands of kilometers of submarine cables are installed worldwide,
using two technologies: alternating current (AC) and direct current (DC) cables. Although the
cables have been used successfully with low failure rates, it is important to understand the
technical limits of each type in order to assess their appropriate usage.
The usage of AC and DC submarine cables is technically limited by the interconnection length
and maximum route depth. Technical characteristics make AC cable technology more suitable
for short to medium distances; the longest installed AC submarine cable measures 105 km
between the Isle of Man and the UK mainland. DC connections, on the other hand, are
technically feasible up to 1,000 km, although the longest DC connection currently spans 580 km
between Norway and the Netherlands. Depth limitations of submarine cables are also of special
interest in the Caribbean, which is generally deep with numerous trenches. In order to lay a cable
and retrieve it for repair, the strength of the cable material must sufficiently support the weight of
the length of the cable between the ocean floor and the surface. As a general guideline, the
maximum depth for AC cables is about 1,000 meters whereas DC cables can be laid in depths up
to 1,500 meters (with current technologies).
Another limitation to current submarine cable technology is the splicing ability. It is beyond
available technology to have a main line carrying bulk power with spliced spurs delivering
smaller amounts of power to a series of islands along the main line’s length. Therefore,
interconnecting several islands can only be accomplished by going from island to island, with
terminals on each, or by delivering all the power to a single central island. Submarine cables
from the central island would then connect separately to one or more islands in the region.
The costs of interconnections vary significantly based on the route length and depth, and on the
capacity of the cable. Given the complexity of estimating costs, the Nexant Report draws on cost
research that had already been conducted on Caribbean interconnections. In particular, Nexans, a
supplier of submarine cables, had analyzed the technical details and estimated costs of seven
submarine power cable interconnections, as seen in Table 4.2. The results of Nexans’ work were
used to extrapolate the cost of various submarine cable interconnections in the Caribbean by
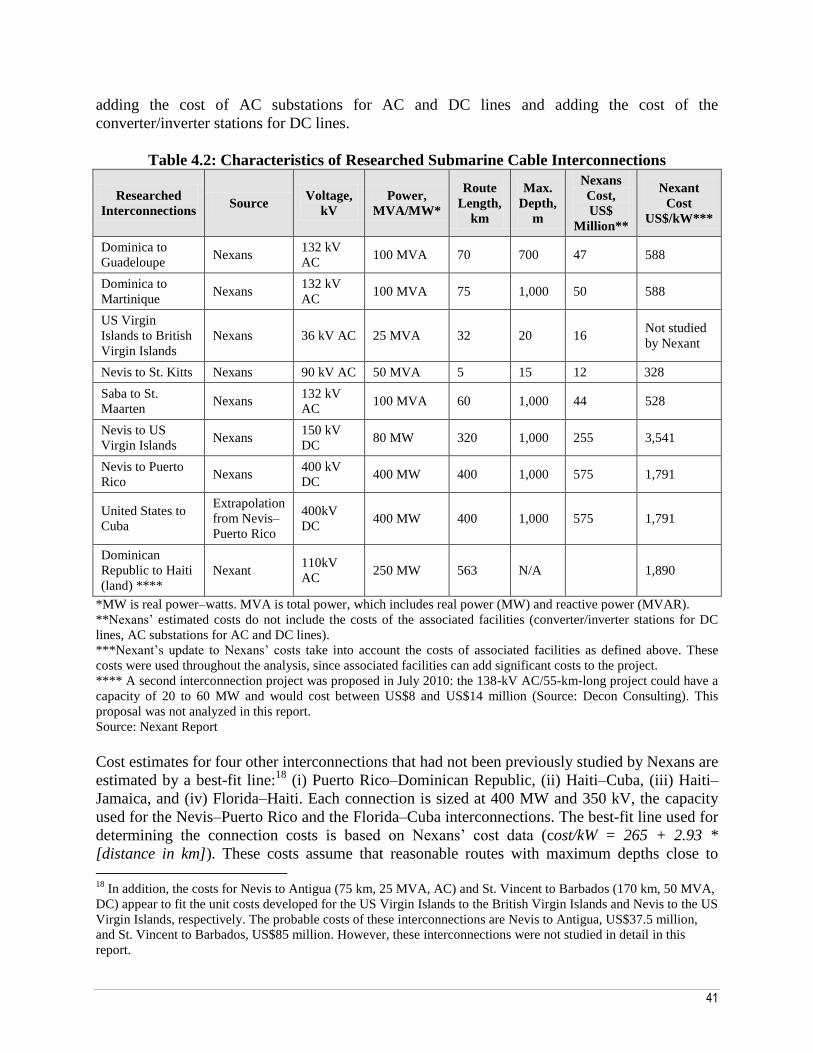
41
adding the cost of AC substations for AC and DC lines and adding the cost of the
converter/inverter stations for DC lines.
Table 4.2: Characteristics of Researched Submarine Cable Interconnections
Researched
Interconnections Source
Voltage,
kV
Power,
MVA/MW*
Route
Length,
km
Max.
Depth,
m
Nexans
Cost,
US$
Million**
Nexant
Cost
US$/kW***
Dominica to
Guadeloupe Nexans
132 kV
AC 100 MVA 70 700 47 588
Dominica to
Martinique Nexans
132 kV
AC 100 MVA 75 1,000 50 588
US Virgin
Islands to British
Virgin Islands
Nexans 36 kV AC 25 MVA 32 20 16 Not studied
by Nexant
Nevis to St. Kitts Nexans 90 kV AC 50 MVA 5 15 12 328
Saba to St.
Maarten Nexans
132 kV
AC 100 MVA 60 1,000 44 528
Nevis to US
Virgin Islands Nexans
150 kV
DC 80 MW 320 1,000 255 3,541
Nevis to Puerto
Rico Nexans
400 kV
DC 400 MW 400 1,000 575 1,791
United States to
Cuba
Extrapolation
from Nevis–
Puerto Rico
400kV
DC 400 MW 400 1,000 575 1,791
Dominican
Republic to Haiti
(land) ****
Nexant 110kV
AC 250 MW 563 N/A 1,890
*MW is real power–watts. MVA is total power, which includes real power (MW) and reactive power (MVAR).
**Nexans’ estimated costs do not include the costs of the associated facilities (converter/inverter stations for DC
lines, AC substations for AC and DC lines).
***Nexant’s update to Nexans’ costs take into account the costs of associated facilities as defined above. These
costs were used throughout the analysis, since associated facilities can add significant costs to the project.
**** A second interconnection project was proposed in July 2010: the 138-kV AC/55-km-long project could have a
capacity of 20 to 60 MW and would cost between US$8 and US$14 million (Source: Decon Consulting). This
proposal was not analyzed in this report.
Source: Nexant Report
Cost estimates for four other interconnections that had not been previously studied by Nexans are
estimated by a best-fit line:18
(i) Puerto Rico–Dominican Republic, (ii) Haiti–Cuba, (iii) Haiti–
Jamaica, and (iv) Florida–Haiti. Each connection is sized at 400 MW and 350 kV, the capacity
used for the Nevis–Puerto Rico and the Florida–Cuba interconnections. The best-fit line used for
determining the connection costs is based on Nexans’ cost data (cost/kW = 265 + 2.93 *
[distance in km]). These costs assume that reasonable routes with maximum depths close to
18
In addition, the costs for Nevis to Antigua (75 km, 25 MVA, AC) and St. Vincent to Barbados (170 km, 50 MVA,
DC) appear to fit the unit costs developed for the US Virgin Islands to the British Virgin Islands and Nevis to the US
Virgin Islands, respectively. The probable costs of these interconnections are Nevis to Antigua, US$37.5 million,
and St. Vincent to Barbados, US$85 million. However, these interconnections were not studied in detail in this
report.

42
1,000 meters can be found, which is not always possible. It is important to note that costs
generated from a best-fit line are a rough estimate of what actual costs might be. The specific
costs would be strongly influenced by the details of the route. The estimated costs are shown in
Table 4.3.
Table 4.3: Northern Ring Interconnection Cost Estimates
Parameter Power,
MW
Route
Length,
Km
Max Depth,
m
Cable System
Cost (US$
Million)
Cost of Cable
System and
Stations,* US$
Million
Cost of
Cable and
Stations,
US$/kW
PR–DR 400 150 400 282 423 705
Haiti–Cuba 400 200 >1,500 340 482 851
Haiti-
Jamaica 400 250 >1,500 399 541 998
Florida–
Haiti 400 1,100 >1,500 1,395 1,537 3488
*Stations include convert, inverter, AC facilities at two DC stations, substations and related facilities.
Source: Nexant Report
4.3.2 Evaluation of Interconnections/Markets
The above data provide estimates of the costs of interconnections, but in order to understand the
overall economic viability of a specific interconnection, an assessment of the electricity markets
of the interconnected islands is required. This takes on both a technical and planning dimension:
first, analyzing the potential usage of submarine power cables to make the physical connection,
and second, assessing the benefits that can be derived from a subregional electricity market.
In addition to the factors included in the Nexant Report’s economic analysis, interconnections
may also allow countries to receive emergency support in the face of natural disasters or
shortages, and in many cases improve access to clean power. Interconnections can also unlock
access to certain large and renewable energy resources in the region, which are keys to reducing
carbon emissions in the region. These economic benefits are not taken into account in this study,
and it would be important to consider them when a more detailed feasibility study is conducted.
4.3.2.1 Subregional Electricity Market I: Dominica Interconnections
Interconnections offer significant potential to reduce domestic energy costs for Dominica and
supply its neighbors with clean electricity. As discussed in Section 3.2.3, due to the small market
size of Dominica’s power sector (21 MW of installed capacity), the country has relatively limited
options for power production when operating in isolation. The Fossil LCL for Dominica shows
costs of 20.4 US cents/kWh for a 5-MW MSD running on distillate (80 percent capacity factor).
At the same time, Dominica’s large estimated geothermal potential (100 MW) could provide
cheaper electricity for the country. However, this potential is relatively large compared to the
country’s demand, and one plant alone could serve the island’s demand at the time of
installation. Since no power plant is available for service 100 percent of the time, the utilities
would need to plan for 100 percent backup of the geothermal plant from other resources, and the

43
requirements for spinning and
operating reserves would
increase. By interconnecting
with Martinique and
Guadeloupe, which both have
current installed capacities of
over 400 MW, Dominica
could increase the reliability
of its own system while
decreasing energy costs and
providing cheap power to
neighboring islands.
Dominica–Martinique: An
interconnection between
Dominica and Martinique
based on geothermal power
exports from Dominica offers
the potential to supply
significantly cheaper energy
to Martinique. At present,
expensive distillate fuels
virtually all of Martinique’s
generation. While the
previous analysis for Martinique presented multiple lower-cost options such as LNG, pipeline
gas and coal, a submarine interconnection could also be beneficial.
This study considers a 100-MW, 70-km AC submarine interconnection, which appears to be both
technically feasible and economically viable. The interconnection cost would be US$588/kW
(including substations). As shown in Figure 4.7, when compared to Martinique’s other options,
the interconnection would be the cheapest power option for the country, assuming that
Dominica’s geothermal plant runs at a capacity factor above 63 percent. Specifically, at an 80
percent capacity factor the geothermal/submarine cable option costs 7.1 US cents/kWh,
compared to the Fossil LCL (technologies using pipeline gas), at a cost of 8.6 US cents/kWh.
Geothermal is also lower in cost than the individual country options: coal and LNG. When
geothermal costs are compared to current distillate-based generation (20.4 US cents/kWh), it is
clear that significant savings could be realized.
Although the analysis assumes that Martinique can accept 93 MW (100 MW minus losses),
because its current installed capacity is 412 MW there would still be benefits even if a cable with
a lower capacity were installed. Instead, if a 50-MW line were installed, the electricity costs
would increase slightly (assuming that the cost would be 67 percent of the capital costs of the
100-MW interconnection), but geothermal would remain the least-cost option for capacity
factors above 75 percent.
Figure 4.6: Schematic of Dominica Interconnections
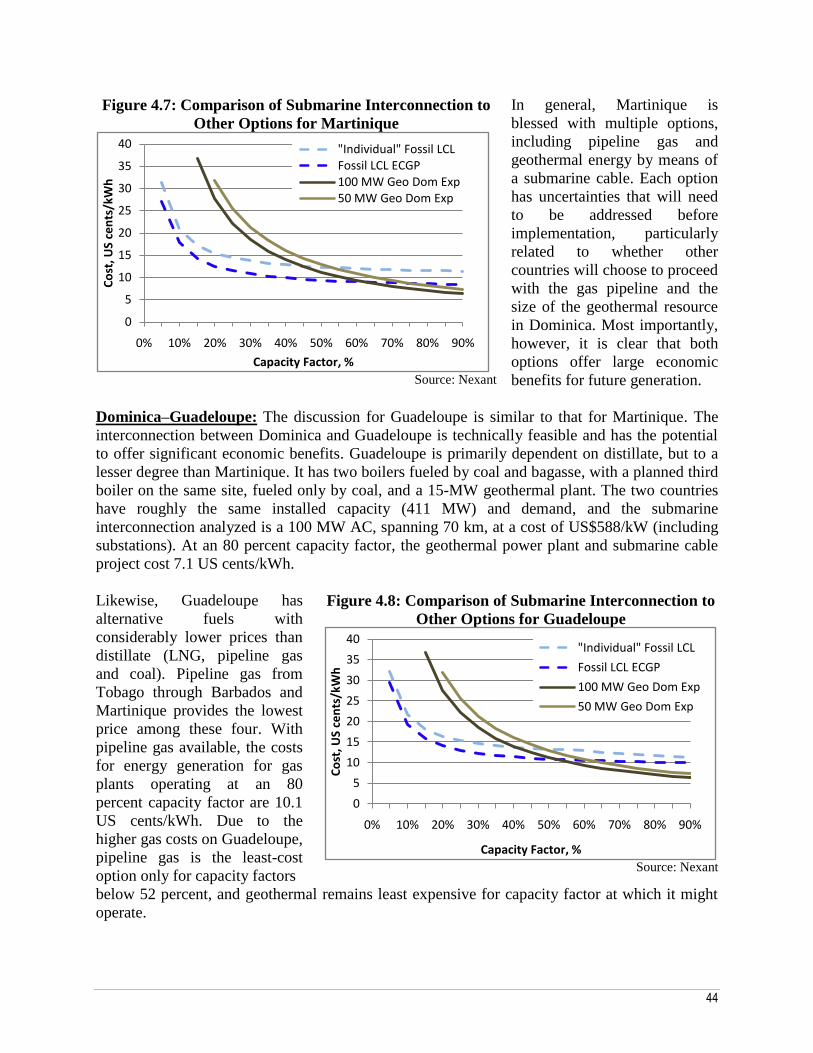
44
Figure 4.7: Comparison of Submarine Interconnection to
Other Options for Martinique
Source: Nexant
In general, Martinique is
blessed with multiple options,
including pipeline gas and
geothermal energy by means of
a submarine cable. Each option
has uncertainties that will need
to be addressed before
implementation, particularly
related to whether other
countries will choose to proceed
with the gas pipeline and the
size of the geothermal resource
in Dominica. Most importantly,
however, it is clear that both
options offer large economic
benefits for future generation.
Dominica–Guadeloupe: The discussion for Guadeloupe is similar to that for Martinique. The
interconnection between Dominica and Guadeloupe is technically feasible and has the potential
to offer significant economic benefits. Guadeloupe is primarily dependent on distillate, but to a
lesser degree than Martinique. It has two boilers fueled by coal and bagasse, with a planned third
boiler on the same site, fueled only by coal, and a 15-MW geothermal plant. The two countries
have roughly the same installed capacity (411 MW) and demand, and the submarine
interconnection analyzed is a 100 MW AC, spanning 70 km, at a cost of US$588/kW (including
substations). At an 80 percent capacity factor, the geothermal power plant and submarine cable
project cost 7.1 US cents/kWh.
Likewise, Guadeloupe has
alternative fuels with
considerably lower prices than
distillate (LNG, pipeline gas
and coal). Pipeline gas from
Tobago through Barbados and
Martinique provides the lowest
price among these four. With
pipeline gas available, the costs
for energy generation for gas
plants operating at an 80
percent capacity factor are 10.1
US cents/kWh. Due to the
higher gas costs on Guadeloupe,
pipeline gas is the least-cost
option only for capacity factors
Figure 4.8: Comparison of Submarine Interconnection to
Other Options for Guadeloupe
Source: Nexant
below 52 percent, and geothermal remains least expensive for capacity factor at which it might
operate.
0
5
10
15
20
25
30
35
40
0% 10% 20% 30% 40% 50% 60% 70% 80% 90%
Co
st, U
S ce
nts
/kW
h
Capacity Factor, %
"Individual" Fossil LCLFossil LCL ECGP100 MW Geo Dom Exp50 MW Geo Dom Exp
0
5
10
15
20
25
30
35
40
0% 10% 20% 30% 40% 50% 60% 70% 80% 90%
Co
st, U
S ce
nts
/kW
h
Capacity Factor, %
"Individual" Fossil LCL
Fossil LCL ECGP
100 MW Geo Dom Exp
50 MW Geo Dom Exp

45
When the geothermal power plant with the submarine cable project is sized as 50 MW rather
than 100 MW (with capital costs estimated at 67 percent of the capital costs of the 100-MW
plant) the geothermal and submarine cable project’s costs are below the Fossil LCL at capacity
factors above 62 percent. The net benefits are reduced but still significant.
4.3.2.2 Subregional Electricity Market II: Nevis Interconnections
Interconnections between Nevis and
Puerto Rico, the US Virgin Islands
and St. Kitts, appear to offer large
potential to provide clean, cheap
power to the interconnected islands
and reduce energy costs for Nevis. As
discussed in Section 3.2.3, and similar
to the case of Dominica, the size of
the geothermal power potential in
Nevis (estimated at around 300 MW)
is large in relation to the island’s
small energy demand (a peak of 10
MW), and the island has relatively
few other low-cost generation options.
A plant could be designed to serve
100 percent of Nevis’s and St. Kitts’s
demand at the time of installation.
Therefore, in order to fully utilize the
geothermal potential, it is important to
look to other interconnections within
the region, such as with Puerto Rico
and the US Virgin Islands.
Nevis–Puerto Rico: The interconnection from Nevis to Puerto Rico is technically feasible and
has the potential to reduce electricity costs for Puerto Rico. The submarine cable would span 400
km with a 400-MW DC capacity, at a cost of US$1,791/kW. Puerto Rico’s installed capacity is
5,864 MW, meaning the amount of imported energy is small relative to the market size. It would
be important to verify whether Nevis has sufficient supply to develop 400 MW of capacity (the
Nexant Report estimates 300 MW of potential). If sufficient resources are not available, a
smaller interconnection would have to be considered.
Since Puerto Rico is not one of the countries studied in detail in Chapter 3, for comparison
purposes this section considers two future development options for Puerto Rico: LNG and HFO.
The economic benefit of the interconnection varies significantly between these two. First, the
geothermal/interconnection option is compared to meeting future electricity demand by building
an additional LNG facility. As shown in Figure 4.10, building the geothermal plant and the
submarine interconnection is more expensive than a 400-MW combined cycle LNG-derived
natural gas plant. Next, comparing the interconnection to expanded HFO-based generation, the
4.9: Schematic of Nevis and Puerto Rico and
US Virgin Islands Interconnections
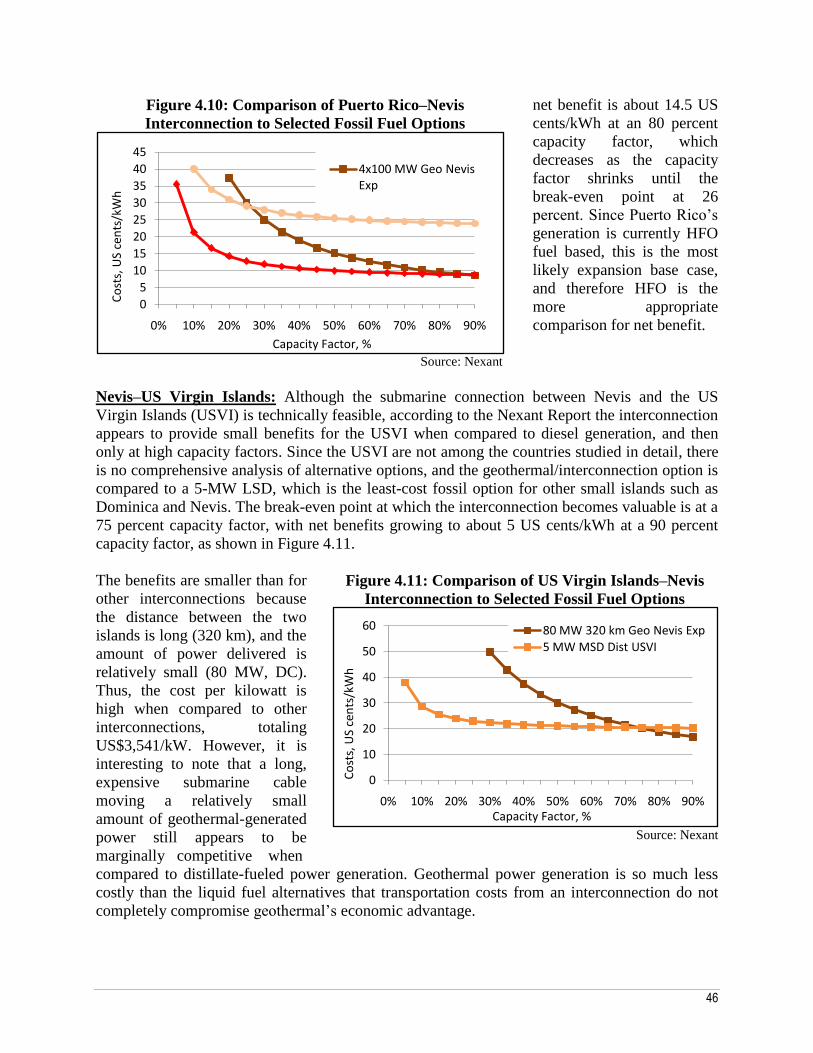
46
Figure 4.10: Comparison of Puerto Rico–Nevis
Interconnection to Selected Fossil Fuel Options
Source: Nexant
net benefit is about 14.5 US
cents/kWh at an 80 percent
capacity factor, which
decreases as the capacity
factor shrinks until the
break-even point at 26
percent. Since Puerto Rico’s
generation is currently HFO
fuel based, this is the most
likely expansion base case,
and therefore HFO is the
more appropriate
comparison for net benefit.
Nevis–US Virgin Islands: Although the submarine connection between Nevis and the US
Virgin Islands (USVI) is technically feasible, according to the Nexant Report the interconnection
appears to provide small benefits for the USVI when compared to diesel generation, and then
only at high capacity factors. Since the USVI are not among the countries studied in detail, there
is no comprehensive analysis of alternative options, and the geothermal/interconnection option is
compared to a 5-MW LSD, which is the least-cost fossil option for other small islands such as
Dominica and Nevis. The break-even point at which the interconnection becomes valuable is at a
75 percent capacity factor, with net benefits growing to about 5 US cents/kWh at a 90 percent
capacity factor, as shown in Figure 4.11.
The benefits are smaller than for
other interconnections because
the distance between the two
islands is long (320 km), and the
amount of power delivered is
relatively small (80 MW, DC).
Thus, the cost per kilowatt is
high when compared to other
interconnections, totaling
US$3,541/kW. However, it is
interesting to note that a long,
expensive submarine cable
moving a relatively small
amount of geothermal-generated
power still appears to be
marginally competitive when
Figure 4.11: Comparison of US Virgin Islands–Nevis
Interconnection to Selected Fossil Fuel Options
Source: Nexant
compared to distillate-fueled power generation. Geothermal power generation is so much less
costly than the liquid fuel alternatives that transportation costs from an interconnection do not
completely compromise geothermal’s economic advantage.
0
5
10
15
20
25
30
35
40
45
0% 10% 20% 30% 40% 50% 60% 70% 80% 90%
Co
sts,
US
cen
ts/k
Wh
Capacity Factor, %
4x100 MW Geo Nevis Exp
0
10
20
30
40
50
60
0% 10% 20% 30% 40% 50% 60% 70% 80% 90%
Co
sts,
US
cen
ts/k
Wh
Capacity Factor, %
80 MW 320 km Geo Nevis Exp
5 MW MSD Dist USVI

47
Other interconnection options to connect Nevis and the USVI could be considered, such as
increasing the size of the interconnection to Puerto Rico and then connecting Puerto Rico and the
USVI.
Nevis–St. Kitts: St. Kitts currently runs primarily on diesel; compared to alternative generation
options, a geothermal interconnection is highly economically viable. The distance between the
two islands is only 5 km, thus
creating an environment for a
technically simple
interconnection. The connection
would be made by means of a 50-
MW submarine cable at a cost of
US$328/kW. The geothermal
capacity of 50 MW would be
enough to serve the 40 MW load
of the St. Kitts utility and some
hotels that are not currently
connected to the grid, with room
for growth.
The high costs of the other
generation options provide large
opportunities for viable
Figure 4.12: Comparison of Nevis–St. Kitts
Interconnection to Individual Options for St. Kitts
Source: Nexant
alternative options such as geothermal resources. St. Kitts has the same Fossil LCL as Dominica
and Nevis, with a 5-MW MSD distillate plant with costs of 20.4 US cents/kWh. In comparison,
the annual cost of geothermal generation and transmission at an 80 percent capacity factor is 7
US cents/kWh, creating a net benefit of about 13 US cents/kWh. The benefits decrease with the
capacity factor until a break-even point is reached at about a 23 percent capacity factor.
Because the geothermal plant and
interconnection could be designed to serve 100
percent of St. Kitts’ demand, the discussion on
backup requirements for the geothermal power
plant in Section 3.2.3 applies to St. Kitts as
well. The increase in reserve requirements
imposes an economic burden not accounted for
in the analysis. However, the incorporation of
these costs would not reverse the economic
advantages of the interconnection.
4.3.2.3 Subregional Electricity Market
III: Saba–St. Maarten
Saba and St. Maarten are both part of the
Netherlands Antilles, and an interconnection
between the two has the potential to be
0
5
10
15
20
25
30
35
40
0% 10% 20% 30% 40% 50% 60% 70% 80% 90%
Co
sts,
US
cen
ts/k
Wh
Capacity Factor, %
Fossil LCL
50 MW 5 km Geo Nevis Exp
Figure 4.13: Schematic of Saba–St.
Maarten Interconnection
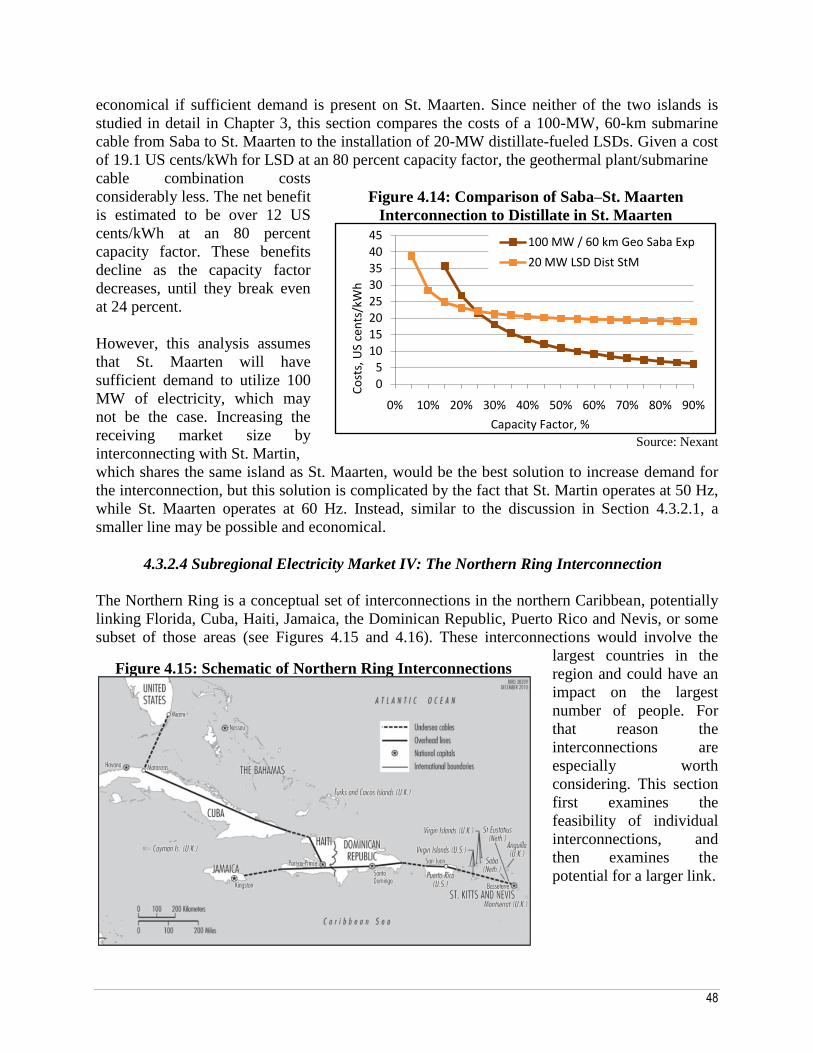
48
economical if sufficient demand is present on St. Maarten. Since neither of the two islands is
studied in detail in Chapter 3, this section compares the costs of a 100-MW, 60-km submarine
cable from Saba to St. Maarten to the installation of 20-MW distillate-fueled LSDs. Given a cost
of 19.1 US cents/kWh for LSD at an 80 percent capacity factor, the geothermal plant/submarine
cable combination costs
considerably less. The net benefit
is estimated to be over 12 US
cents/kWh at an 80 percent
capacity factor. These benefits
decline as the capacity factor
decreases, until they break even
at 24 percent.
However, this analysis assumes
that St. Maarten will have
sufficient demand to utilize 100
MW of electricity, which may
not be the case. Increasing the
receiving market size by
interconnecting with St. Martin,
Figure 4.14: Comparison of Saba–St. Maarten
Interconnection to Distillate in St. Maarten
Source: Nexant
which shares the same island as St. Maarten, would be the best solution to increase demand for
the interconnection, but this solution is complicated by the fact that St. Martin operates at 50 Hz,
while St. Maarten operates at 60 Hz. Instead, similar to the discussion in Section 4.3.2.1, a
smaller line may be possible and economical.
4.3.2.4 Subregional Electricity Market IV: The Northern Ring Interconnection
The Northern Ring is a conceptual set of interconnections in the northern Caribbean, potentially
linking Florida, Cuba, Haiti, Jamaica, the Dominican Republic, Puerto Rico and Nevis, or some
subset of those areas (see Figures 4.15 and 4.16). These interconnections would involve the
largest countries in the
region and could have an
impact on the largest
number of people. For
that reason the
interconnections are
especially worth
considering. This section
first examines the
feasibility of individual
interconnections, and
then examines the
potential for a larger link.
05
1015202530354045
0% 10% 20% 30% 40% 50% 60% 70% 80% 90%
Co
sts,
US
cen
ts/k
Wh
Capacity Factor, %
100 MW / 60 km Geo Saba Exp
20 MW LSD Dist StM
Figure 4.15: Schematic of Northern Ring Interconnections
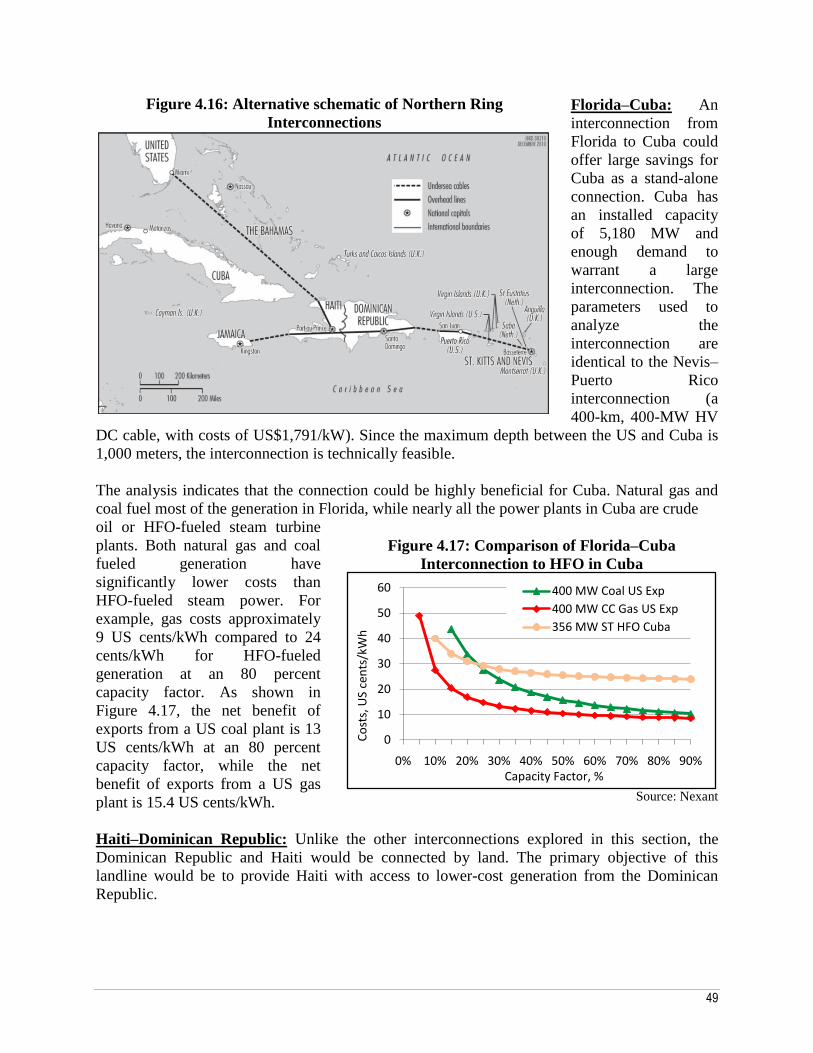
49
Florida–Cuba: An
interconnection from
Florida to Cuba could
offer large savings for
Cuba as a stand-alone
connection. Cuba has
an installed capacity
of 5,180 MW and
enough demand to
warrant a large
interconnection. The
parameters used to
analyze the
interconnection are
identical to the Nevis–
Puerto Rico
interconnection (a
400-km, 400-MW HV
DC cable, with costs of US$1,791/kW). Since the maximum depth between the US and Cuba is
1,000 meters, the interconnection is technically feasible.
The analysis indicates that the connection could be highly beneficial for Cuba. Natural gas and
coal fuel most of the generation in Florida, while nearly all the power plants in Cuba are crude
oil or HFO-fueled steam turbine
plants. Both natural gas and coal
fueled generation have
significantly lower costs than
HFO-fueled steam power. For
example, gas costs approximately
9 US cents/kWh compared to 24
cents/kWh for HFO-fueled
generation at an 80 percent
capacity factor. As shown in
Figure 4.17, the net benefit of
exports from a US coal plant is 13
US cents/kWh at an 80 percent
capacity factor, while the net
benefit of exports from a US gas
plant is 15.4 US cents/kWh.
Figure 4.17: Comparison of Florida–Cuba
Interconnection to HFO in Cuba
Source: Nexant
Haiti–Dominican Republic: Unlike the other interconnections explored in this section, the
Dominican Republic and Haiti would be connected by land. The primary objective of this
landline would be to provide Haiti with access to lower-cost generation from the Dominican
Republic.
0
10
20
30
40
50
60
0% 10% 20% 30% 40% 50% 60% 70% 80% 90%
Co
sts,
US
cen
ts/k
Wh
Capacity Factor, %
400 MW Coal US Exp
400 MW CC Gas US Exp
356 MW ST HFO Cuba
Figure 4.16: Alternative schematic of Northern Ring
Interconnections
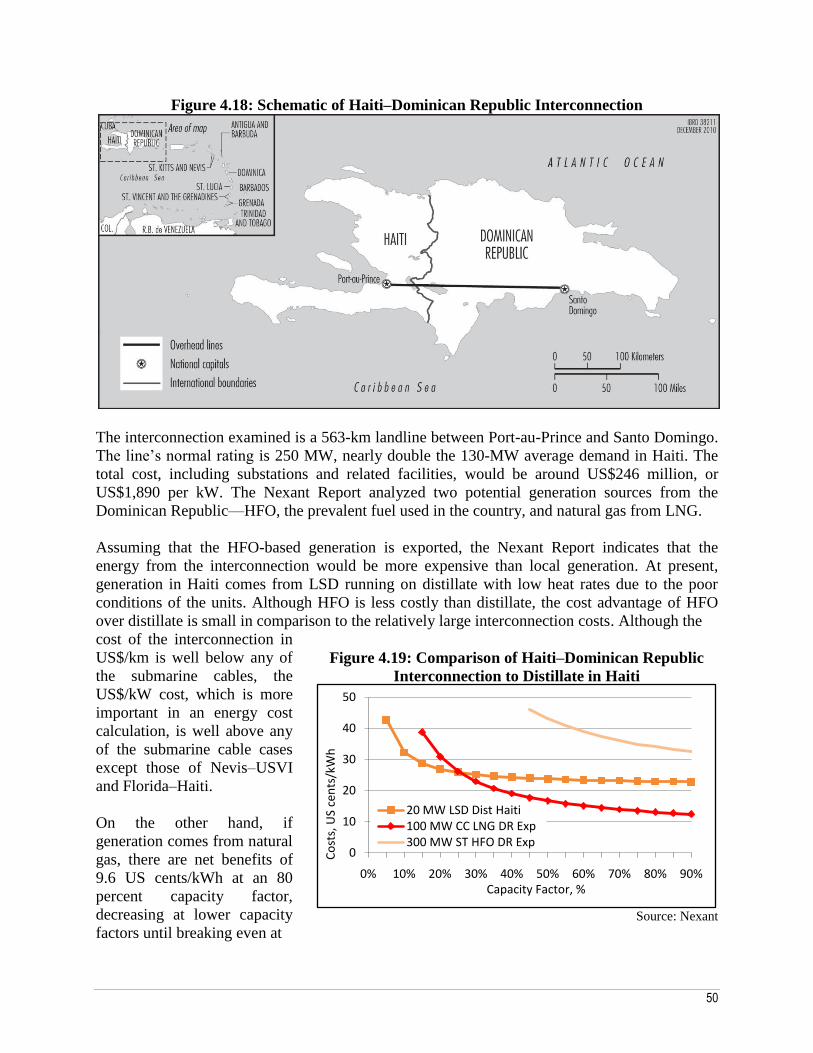
50
Figure 4.18: Schematic of Haiti–Dominican Republic Interconnection
The interconnection examined is a 563-km landline between Port-au-Prince and Santo Domingo.
The line’s normal rating is 250 MW, nearly double the 130-MW average demand in Haiti. The
total cost, including substations and related facilities, would be around US$246 million, or
US$1,890 per kW. The Nexant Report analyzed two potential generation sources from the
Dominican Republic—HFO, the prevalent fuel used in the country, and natural gas from LNG.
Assuming that the HFO-based generation is exported, the Nexant Report indicates that the
energy from the interconnection would be more expensive than local generation. At present,
generation in Haiti comes from LSD running on distillate with low heat rates due to the poor
conditions of the units. Although HFO is less costly than distillate, the cost advantage of HFO
over distillate is small in comparison to the relatively large interconnection costs. Although the
cost of the interconnection in
US$/km is well below any of
the submarine cables, the
US$/kW cost, which is more
important in an energy cost
calculation, is well above any
of the submarine cable cases
except those of Nevis–USVI
and Florida–Haiti.
On the other hand, if
generation comes from natural
gas, there are net benefits of
9.6 US cents/kWh at an 80
percent capacity factor,
decreasing at lower capacity
factors until breaking even at
Figure 4.19: Comparison of Haiti–Dominican Republic
Interconnection to Distillate in Haiti
Source: Nexant
0
10
20
30
40
50
0% 10% 20% 30% 40% 50% 60% 70% 80% 90%
Co
sts,
US
cen
ts/k
Wh
Capacity Factor, %
20 MW LSD Dist Haiti 100 MW CC LNG DR Exp 300 MW ST HFO DR Exp

51
a 27 percent capacity factor, as shown in Figure 4.19. While the Dominican Republic currently
has an LNG terminal with some spare capacity, it would most likely have to build an additional
terminal to expand generation for sufficient export capacity.
Because Haiti has an enormous lack of domestic capacity, electricity from the interconnection
may have additional economic benefits that are not included in this study. For example, the
interconnection could provide baseload power for the Haitian power system and emergency
support in the face of natural disasters or shortages. Alternatively, power could be sold back to
the Dominican Republic in the event of an emergency. These economic benefits are not taken
into account in this study, and it would be important to consider them when a more detailed
feasibility study is conducted.
Dominican Republic–Puerto Rico: The Dominican Republic–Puerto Rico link has
interconnection costs in an economically viable range and appears to be technically feasible. The
route between the islands is short and straightforward, with modest and steady depths. The 400-
MW, 150-km interconnection would cost an estimated US$705/kW. Since both countries have
relatively high-cost electricity, the interconnection was not studied in detail in this report. Most
of the benefits reaped from this interconnection would be decreased required reserves,
emergency support in the face of natural disasters or shortages, or access to cleaner power if one
of the countries develops alternative supply options. Since these benefits were not considered in
the analysis, it would be important to conduct a more detailed feasibility study on this
interconnection.
Nevis–Puerto Rico: See Section 4.3.2.2. As an independent link, the connection between Nevis
and Puerto Rico is technically feasible and economical, assuming that the geothermal energy
exported from Nevis replaces HFO-based generation in Puerto Rico.
Other Haiti interconnections: Interconnections from Haiti to Florida, Cuba and Jamaica appear
to be technically infeasible with current technologies. Due to the extensive undersea canyons and
ridges, a path could not be found with a maximum depth of less than 1,500 meters between Haiti
and these countries, but further verification of the route options is required, and technical
advances may make these interconnections possible.
Interconnected Northern Market: Although some Northern Ring interconnections stand alone
as independent links, others may benefit from a series of interconnections to bring less-expensive
power into the market, either from Florida or Nevis. This would work by having each country
along a series of interconnections take some of the less-expensive power and pass on the rest to
neighboring countries. As a hypothetical and simplistic example, Cuba might receive 1,000 MW
from Florida, keep 400 MW and deliver 600 MW to Haiti. Haiti would keep 200 MW and
deliver 400 MW to the Dominican Republic.
It is unlikely that a full Northern Ring interconnection would materialize from Florida to the
Caribbean due to technical and political barriers. Specifically, for political reasons it is unlikely
that Florida and Cuba will interconnect, and it appears to be technically infeasible with current
technologies to bypass Cuba by connecting directly with Haiti, due to the extreme depths.

52
Furthermore, even if a reasonable path between Florida and Haiti could be found, the costs of the
interconnection appear to be outside the economical range.
When bringing cheap power from Nevis to the Greater Antilles is considered, the prospects are
more promising. An interconnection between Nevis and Puerto Rico appears to be technically
feasible and economically viable under certain conditions. From there, interconnections from
Puerto Rico to the Dominican Republic and the Dominican Republic to Haiti are both technically
feasible and have the potential to be economical with a cheap source of electricity flowing from
Nevis. Since the Haiti–Jamaica and Haiti–Cuba interconnections appear technically infeasible
with current technology, the interconnection would stop in Haiti.
As a result, an interconnection among Nevis, Puerto Rico, the Dominican Republic and Haiti is
possible and has the potential to be economically feasible. An added challenge for this ring is
that land-based transmission systems within the interconnected countries would have to be
strengthened in order to move power across the country to the next converter or invert station.
These expenses are not included in the costs estimates and have the potential to significantly
increase costs.
4.4 Challenges and Risks
The analysis is based on a purely economic and technical comparison of fuels, renewable
technologies and interconnections; it does not include any assessment of political, institutional,
regulatory or financial risks. Issues such as energy security or financial, environmental or
regulatory concerns may present additional obstacles to implementation.
4.4.1 Financial and Economic Issues
Geothermal power plants and submarine cables, or gas pipelines, often have significantly higher
capital costs than those of distillate-based generation. Although the higher capital investments
may lower costs in the long run, obtaining financing for the projects could be a challenge. Local
Box 4.2: Moving from Concept to Reality
This is a high-level concept study, and detailed feasibility studies need to be carried out on all the
proposed interconnections. A feasibility study would include a comprehensive analysis of all key
issues related to a proposed interconnection, including the technical, environmental, commercial,
financial, economic and legal aspects. It would also include an assessment of energy supply and
demand scenarios in the subregional markets that are connected and of energy trading opportunities.
Finally, an analysis would need to be carried out to ensure the presence of efficient and effective
subregional legal, regulatory and institutional frameworks to attract investors to carry out the project.
Regional organizations and international financial institutions (IFIs) can provide valuable
contributions to facilitate the policy and political dialogue among the countries and to provide
technical assistance and financial support to address the political and financial risks facing potential
investors.
53
utilities may have difficulty in funding such large investments and some countries may opt to
maintain more expensive operating costs to reduce upfront financing. For example, while in
some countries renewable-based generation may cost less than diesel in cents/kWh, the capital
costs for renewable technologies are several times those of oil-based generation. This, combined
with the fact that fuel costs can be fully passed on to purchasers, make investment in renewable
energy less attractive to the private sector even for well-known renewable technologies such as
hydropower.
In addition to obtaining financing, many utilities may be hesitant to take the risk to make such
large investments when future fuel costs are unknown. In particular, utilities may be hesitant to
switch from distillate if prices fall or appear to be falling. On the other hand, continuing with
liquid fuels is risky, because prices may return to US$150/barrel (bbl) of oil, and hedging fuel
costs through diversification has its own costs. Utilities must invest based on their own situation
and perceptions.
Thus, private financing, public/private partnerships and support from IFIs and the international
donor community may be of key importance. The private sector is already leading the region in
developing the untapped geothermal potential in many countries and will play a key role in
developing wind and other renewable resources. The same applies for the development of the
Eastern Caribbean Gas Pipeline and potential new LNG facilities. IFIs can help leverage these
investments and mitigate some of the associated risks.
4.4.2 Commercial and Regulatory Issues
To encourage private sector participation and public/private partnerships, and to facilitate
subregional integration, effective legal, regulatory and institutional frameworks will need to be
established. For interconnections in particular, regulation affecting more than one country, such
as regulation associated with power for export, submarine cables, the Eastern Caribbean Gas
Pipeline and imported fuels, will be important. When more than one country is involved in a
project, regulatory harmonization is desirable and may be mandatory for success. The
institutional arrangements of each country will have a profound impact on its ability to
implement regional projects. Where multiple countries are involved, such as in the Eastern
Caribbean Gas Pipeline, an additional level of complexity exists, which would most likely
extend the time needed to reach a successful conclusion.
Similarly, challenges from separate ownership of various components of interisland power or
fuel supply would need to be addressed. For the export of geothermal power by means of a
submarine cable, one private party might own the geothermal power plant in the exporting
country while another owns and operates the submarine cable. For the gas pipeline, a separate
firm will own and operate the pipeline while another organization will supply the gas. Joint
ownership can present other types of issues. In both of these cases, contractual structures must be
created to guarantee supply and allocate risks and responsibilities to the appropriate parties. The
needs of all parties would be best served by long-term contracts that guarantee supply to the
customer and a revenue stream to the suppliers.

54
4.4.3 Security of Supply
A secure supply of energy is often viewed as a national security issue, and utilities may be
concerned about relying on another country for power or fuel vital to power generation.
Although distillate and HFO are widely available at the present time, political unrest or technical
failures, such as a break in the gas pipeline, albeit unlikely, may compromise one country’s
ability to supply another. In addition, if there is an outage in one system, it may impact the other
given the systems’ interdependence. This may impact the reserve margin that countries maintain
to assure adequate supply at all times. A more detailed economic analysis than that included in
this study should incorporate the costs of the increased reserve margin.
Operating reserves may also change, and a more detailed economic analysis of the economic
impact would have to be conducted. In the event that operating reserves are calculated on a
largest contingency basis, and if the largest unit was previously 16 MW but becomes 50 MW, the
costs of this change would have to be considered. However, given that both geothermal power
generation and submarine cables tend to be highly reliable facilities, countries may choose to
decrease their operating reserves.
4.4.4 Environmental Concerns
The main environmental concerns about submarine cable or pipeline technologies relate to
seabed impact. These concerns surround fears that laying the pipeline could stir up harmful toxic
substances contained in seabed sediment, and that submarine cables may increase erosion on the
ocean floor. Moreover, construction of the pipeline or cable may temporarily disturb the flora
and fauna of the area. An Environmental Impact Assessment would indicate the risks related to
construction and operation of the pipeline or cable.
4.5 Conclusions
Regional solutions appear to be interesting options for Caribbean electricity supply because they
could help countries benefit from economies of scale and indigenous resources on neighboring
islands, particularly aiding the
penetration of large-scale renewable
projects. Consequently, many
countries could benefit from
significantly cheaper energy
generation either from a gas pipeline
or an electricity market
interconnection. It does not appear that
a regional fuel storage facility would
offer any significant benefit.
The results indicate that the Eastern
Caribbean Gas Pipeline could provide
the cheapest fossil fuel to the countries
Table 4.4: Summary of Gas Pipeline Savings
Country Estimated Savings (cents/kWh)*
Barbados
11.7/ compared to distillate
4.3/ compared to coal
4.0/ compared to LNG
Guadeloupe
9.0/ compared to distillate
2.5/ compared to LNG
-3.0/ compared to geothermal imports
Martinique
10.5/ compared to distillate
3.0/ compared to LNG
-1.5/ compared to geothermal imports
St. Lucia 9.3/ compared to distillate
3.2/ compared to coal
*All savings assume plants running at 80 percent capacity factor.

55
it reaches: Barbados, Guadeloupe, Martinique and St. Lucia. Pipeline gas could cut electricity
generation costs by half when compared to diesel-based generation, and provide cheaper fuel
than coal or natural gas through other delivery methods. Thus, despite the barriers to
implementation, pipeline gas should continue to be considered a viable option. Table 4.4 shows
the potential cost savings when compared other options for each country.
Electricity market interconnections are also attractive options for the Caribbean because they can
offer cheap alternative energy options, particularly when geothermal-based electricity can be
exported. Many of the interconnections studied are both economically viable and technically
feasible. As shown in Table 4.5, the Nevis–Puerto Rico, Nevis–St. Kitts, Saba–St. Maarten and
Florida–Cuba interconnections also offer large savings due to the availability of low-cost
geothermal power in Nevis and Saba and cheap coal and natural gas in Florida. Both Dominica
interconnections have the potential to bring significant savings to Martinique and Guadeloupe.
Savings for the Dominican Republic–Haiti interconnection would depend on the generation
source of exported electricity, while the interconnection between Nevis–US Virgin Islands
showed some small savings due to the long distance and small amount of energy transported.
In addition to the potentially large economic benefits for some countries, interconnections may
allow countries to receive emergency support in the face of natural disasters or shortages, and in
many cases improve access to clean power. For some countries, these reasons alone may provide
significant justification for further pursuing the idea of interconnections through additional
exploration or studies, because these benefits were not taken into account in this simplified
analysis. Interconnections can also unlock access to certain large and renewable energy resources
in the region, a key to reducing carbon emissions in the region.
Despite the favorable initial economics, a host of financial, regulatory and security risks must be
addressed prior to implementation. This is a high-level concept study, and before moving
forward with any project, further analysis must be conducted to build a more detailed
understanding of the financial, regulatory, economic and technical feasibility of the options.
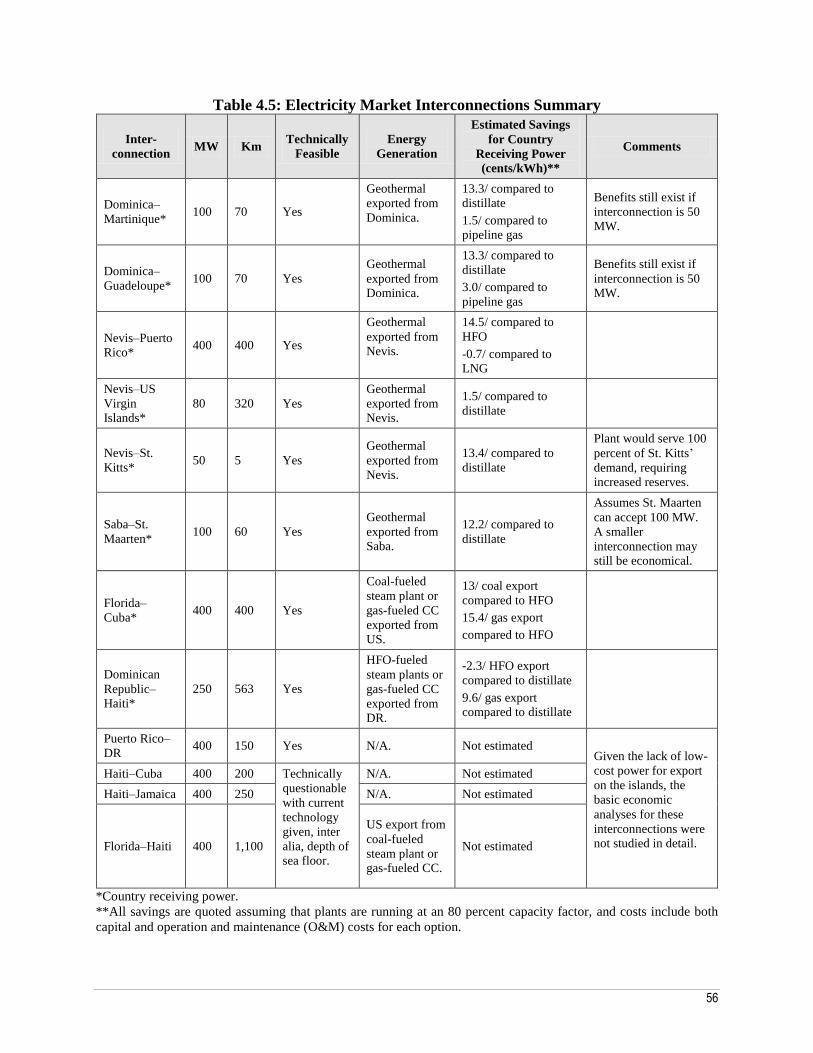
56
Table 4.5: Electricity Market Interconnections Summary
Inter-
connection MW Km
Technically
Feasible
Energy
Generation
Estimated Savings
for Country
Receiving Power
(cents/kWh)**
Comments
Dominica–
Martinique* 100 70 Yes
Geothermal
exported from
Dominica.
13.3/ compared to
distillate
1.5/ compared to
pipeline gas
Benefits still exist if
interconnection is 50
MW.
Dominica–
Guadeloupe* 100 70 Yes
Geothermal
exported from
Dominica.
13.3/ compared to
distillate
3.0/ compared to
pipeline gas
Benefits still exist if
interconnection is 50
MW.
Nevis–Puerto
Rico* 400 400 Yes
Geothermal
exported from
Nevis.
14.5/ compared to
HFO
-0.7/ compared to
LNG
Nevis–US
Virgin
Islands*
80 320 Yes
Geothermal
exported from
Nevis.
1.5/ compared to
distillate
Nevis–St.
Kitts* 50 5 Yes
Geothermal
exported from
Nevis.
13.4/ compared to
distillate
Plant would serve 100
percent of St. Kitts’
demand, requiring
increased reserves.
Saba–St.
Maarten* 100 60 Yes
Geothermal
exported from
Saba.
12.2/ compared to
distillate
Assumes St. Maarten
can accept 100 MW.
A smaller
interconnection may
still be economical.
Florida–
Cuba* 400 400 Yes
Coal-fueled
steam plant or
gas-fueled CC
exported from
US.
13/ coal export
compared to HFO
15.4/ gas export
compared to HFO
Dominican
Republic–
Haiti*
250 563 Yes
HFO-fueled
steam plants or
gas-fueled CC
exported from
DR.
-2.3/ HFO export
compared to distillate
9.6/ gas export
compared to distillate
Puerto Rico–
DR 400 150 Yes N/A. Not estimated
Given the lack of low-
cost power for export
on the islands, the
basic economic
analyses for these
interconnections were
not studied in detail.
Haiti–Cuba 400 200 Technically
questionable
with current
technology
given, inter
alia, depth of
sea floor.
N/A. Not estimated
Haiti–Jamaica 400 250 N/A. Not estimated
Florida–Haiti 400 1,100
US export from
coal-fueled
steam plant or
gas-fueled CC.
Not estimated
*Country receiving power.
**All savings are quoted assuming that plants are running at an 80 percent capacity factor, and costs include both
capital and operation and maintenance (O&M) costs for each option.
57
Chapter 5
Regional Scenario Analysis
he goal of the scenario analysis is to preliminarily assess the aggregate economic benefits of
several supply and interconnection development options across the region. Each of the four
scenarios analyzed offers different development options, and the costs of these options are
evaluated in order to understand the cost and financial impact for each individual country and the
region. It is important to note that the scenarios are illustrative of the options available to the
Caribbean, with the aim of indicating promising directions for future work. While inputs from
Chapters 3 and 4 are used to limit and define the available fuels, resources and costs for each
island, the scenarios do not compare individual versus regional approaches but are instead
defined based on the type of supply options.
This chapter first outlines the methodology used for the analysis and the four illustrative
scenarios: (i) the Base Case Scenario, which is based on existing utilities’ development plans
and/or an assumed business-as-usual planning approach; (ii) the Fuel Scenario, which includes
options for expanding the availability of natural gas and coal to the region; (iii) the
Interconnection/Renewables Scenario, which assumes the combined addition of submarine cable
interconnections and the most attractive new renewable resources; and (iv) the Comprehensive
Integrated Scenario, which combines the expansion of fossil fuel options, the building of
interconnections and the development of renewable generation. The chapter then compares the
results of the model, looking at the NPV and the investment and production costs. Next, on a
country-by-country basis, it describes the potentially beneficial energy options identified for each
country.
5.1 Methodology
The scenario analysis conducts a more detailed system analysis, simulating yearly expansion and
production, based on extensive inputs about the existing system, future conditions, and
characteristics of new power plants. The scenarios take into account the results of the screening
analysis, as the results help define the size and operational role of the various fuel supply and
interconnection options.
The scenario analysis is conducted through a spreadsheet model that simulates the operation of
the generation system from 2009 to 2028, calculating the supply/demand balance for the
planning period to indicate the required capacity additions by year and by country. This is based
on the electricity demand forecast and the expected future production from existing and planned
T
58
resources. The capacity balance uses peak demand and calculates the required reserve margin
based on capacity reliability criteria.19
Resources are assumed to contribute to the reserve margin
with their full net capacity, excluding capacity generators used for power export and wind
generation, both of which do not contribute to the reserve margin at all. Therefore, power exports
and wind development do not affect resource development plans, and the benefits of these
resources are based only on the energy generation savings. After developing the capacity
balance, the model calculates the energy balance from available resources. Energy production for
each unit takes into account the type of unit, unit operating cost, forced and maintenance outage
rates, and limits on energy production typical of renewable energy units.
A discounted cost analysis was conducted for the selected combination of resource additions and
interconnection options. The analysis covers the entire planning period, taking into account
salvage value20
for all investments during the planning period. This total discounted cost forms
the basis for cost comparisons between scenarios. The analysis is based on a 10 percent discount
rate, applied to the costs expressed in constant 2009 US dollars. Although this is a low rate for
private investment in the region, the analysis only considers the economic costs of the various
options, for which 10 percent is considered representative.
5.2 The Scenarios
5.2.1 The Base Case Scenario
The first scenario developed is the reference scenario or Base Case Scenario, which uses
utilities’ existing development plans or, when these are not available, assumes that utilities will
continue their current planning behavior and are thus likely to follow the same development path
of the past. The Base Case Scenario does not assume additional new fossil fuel options,
renewable generation, or interconnections. All units already under construction or committed are
included in the Base Case Scenario. The least-cost generation resources within the Base Case
constraints are then added to each system as they are needed to meet load growth plus the
required reserve margin. The size estimates of future power plants are based on the technology,
fuel options and the size of the system.
For most countries this scenario implies continued development of diesel units using distillate
fuel. In some of the larger power systems, such as those of the Dominican Republic and Jamaica,
the existing coal and LNG fuel usage may be expanded. The results of this scenario are
summarized in Table 5.1 on a country-by-country basis.
19
The reserve margin is dependent on the system’s size. The model used three different levels of reserve margin: 35
percent for systems up to 150 MW, 30 percent for systems up to 600 MW, and 25 percent for larger systems. These
values are comparable to the planning reserve margins used by utilities in the region. 20
The salvage value is calculated based on the in-service year using the straight line depreciation and a 30-year life
for all generation and transmission projects, other than for diesel units, for which a 20-year useful life was assumed.

59
Table 5.1: Base Case Scenario Least-Cost Existing Technologies
Country Committed units assumed in all
scenarios
New Units added by 2028
Natural Gas Diesel Coal
Antigua and
Barbuda
Six 5-MW MSD on distillate
added between 2011 and 2013
Three 10-MW
MSD
Barbados Nine 16-MW LSD, 6 added
between 2011 and2013, 3 added
as needed
Two 20-MW
LSD
Dominica No new capacity needed until
2012
Three 5-MW
MSD
Dominican
Republic
Hydro (356 MW) and Wind (100
MW) between 2010 and 2011
Eight 300-MW CC
using LNG for mid-
range. Two 50-MW
GT on LNG for
peaking
Grenada No new capacity needed before
2013
Seven 10-MW
MSD
Haiti Already short on generation. Need
four 20-MW LSD to meet 2009
demand
Total of 540 MW
of LSD units
Jamaica 11-MW LSD, 120-MW ST, 155-
MW Cogen, 2-MW wind
Eleven 100-
MW
conventional
coal units
St. Kitts and
Nevis
No new capacity needed until
2012
Seven 5-MW
MSD for St.
Kitts, five 5-MW
MSD for Nevis
St. Lucia No new capacity needed until
2011
Four 20-MW
LSD
St. Vincent
and
Grenadines
No new capacity needed until
2017
Seven 10-MW
MSD
5.2.2 Fossil Fuel Scenario
The Fossil Fuel Scenario assumes that future power generation development of the Caribbean
islands could be based on alternate and potentially less expensive fossil fuels and power
generation technologies. This Fossil Fuel Scenario does not assume additional renewable
generation or interconnections, thus assuring that this scenario accounts only for the costs and
benefits associated with selecting different fossil fuel options. Similar to the Base Case Scenario,
all committed units are included, and generation systems are then added as they are needed to
meet the load growth or the reserve margin. The fuels and the technologies selected for each
country are both based on their availability and their ranking in the screening analysis, with the
least-cost generation options installed to their maximum potential.

60
The Fossil Fuel Scenario demonstrates that nearly all countries have lower-cost fossil fuel
options than distillate, including natural gas and coal. Pipeline gas-fueled generation appears to
be the lowest cost fossil fuel option for every country reached by Eastern Caribbean Gas Pipeline
(Barbados, Martinique, St. Lucia and Guadeloupe). LNG is an attractive option for the
Dominican Republic, Haiti and Jamaica. The Nexant Report indicates that coal is competitive
with distillate in Antigua and Barbuda, Grenada, and St. Vincent and the Grenadines. Natural
gas, on the other hand, is relatively expensive due to the small demand and geographic distances.
Dominica and St. Kitts and Nevis have no alternative, economically viable fossil fuel option
when compared to distillate; the relatively small demand and the high fixed costs associated with
other fuel transportation modes make all other fuel options more costly than distillate. However,
it is important to remember that in all these countries, the prices do not take into account
environmental externalities. The inclusion of a carbon price increases the viability of gas and
distillate compared to coal. The results are summarized in Table 5.2 below.
Table 5.2: Summary of Fossil Fuel Scenario Capacity Additions
Country Committed units
assumed in all Scenarios Gas Distillate Coal
Antigua
and
Barbuda
Six 5-MW MSD added
between 2011 and 2013
Three 10-MW
CFB
Barbados Nine 16-MW LSD, 6
added between 2011 and
2013, 3 added as needed
Two 20 MW LSD on
pipeline gas
Dominica No new capacity needed
until 2012
Three 5-MW MSD
(same as Base Case)
Dominican
Republic
Hydro (356 MW) and
Wind (100 MW) between
2010 and 2011
Two 50-MW GT
running on LNG for
peaking
Eight 300-MW
conventional coal
units for baseload
Grenada No new capacity needed
before 2013
Seven 10-MW
CFB
Haiti Already short on
generation. Need four 20-
MW LSD to meet 2009
demand
Total of 540 MW of
LNG gas units, with
LNG terminal starting in
2014
Jamaica 11 MW LSD, 120 MW
ST, 155 MW Cogen, 2
MW wind
Eleven 100 MW CC
running on LNG. 450
MW of existing units
converted to NG
St. Kitts
and Nevis
No new capacity needed
until 2012
Seven 5-MW MSD
on St. Kitts, five 5-
MW MSD on Nevis
(same as Base Case)
St. Lucia No new capacity needed
until 2011
Four 20-MW LSD on
pipeline gas
St. Vincent
and
Grenadines
No new capacity needed
until 2017
Seven 10-MW
CFB
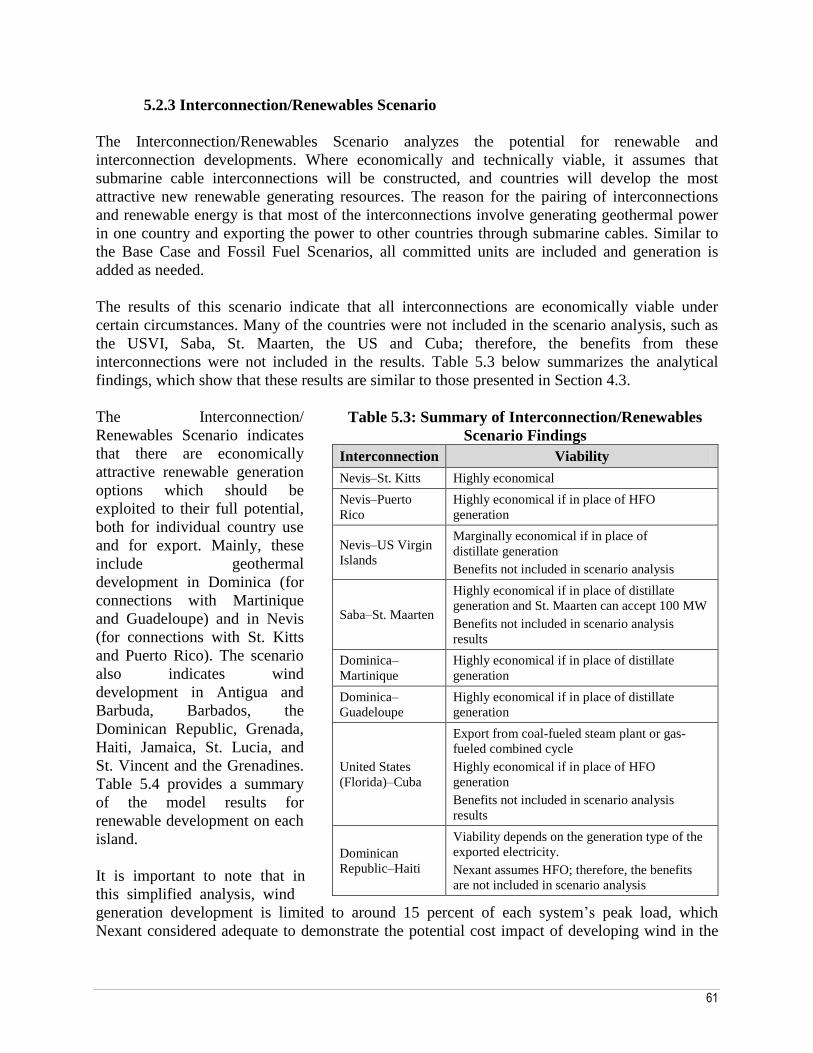
61
5.2.3 Interconnection/Renewables Scenario
The Interconnection/Renewables Scenario analyzes the potential for renewable and
interconnection developments. Where economically and technically viable, it assumes that
submarine cable interconnections will be constructed, and countries will develop the most
attractive new renewable generating resources. The reason for the pairing of interconnections
and renewable energy is that most of the interconnections involve generating geothermal power
in one country and exporting the power to other countries through submarine cables. Similar to
the Base Case and Fossil Fuel Scenarios, all committed units are included and generation is
added as needed.
The results of this scenario indicate that all interconnections are economically viable under
certain circumstances. Many of the countries were not included in the scenario analysis, such as
the USVI, Saba, St. Maarten, the US and Cuba; therefore, the benefits from these
interconnections were not included in the results. Table 5.3 below summarizes the analytical
findings, which show that these results are similar to those presented in Section 4.3.
The Interconnection/
Renewables Scenario indicates
that there are economically
attractive renewable generation
options which should be
exploited to their full potential,
both for individual country use
and for export. Mainly, these
include geothermal
development in Dominica (for
connections with Martinique
and Guadeloupe) and in Nevis
(for connections with St. Kitts
and Puerto Rico). The scenario
also indicates wind
development in Antigua and
Barbuda, Barbados, the
Dominican Republic, Grenada,
Haiti, Jamaica, St. Lucia, and
St. Vincent and the Grenadines.
Table 5.4 provides a summary
of the model results for
renewable development on each
island.
It is important to note that in
this simplified analysis, wind
Table 5.3: Summary of Interconnection/Renewables
Scenario Findings
Interconnection Viability
Nevis–St. Kitts Highly economical
Nevis–Puerto
Rico
Highly economical if in place of HFO
generation
Nevis–US Virgin
Islands
Marginally economical if in place of
distillate generation
Benefits not included in scenario analysis
Saba–St. Maarten
Highly economical if in place of distillate
generation and St. Maarten can accept 100 MW
Benefits not included in scenario analysis
results
Dominica–
Martinique
Highly economical if in place of distillate
generation
Dominica–
Guadeloupe
Highly economical if in place of distillate
generation
United States
(Florida)–Cuba
Export from coal-fueled steam plant or gas-
fueled combined cycle
Highly economical if in place of HFO
generation
Benefits not included in scenario analysis
results
Dominican
Republic–Haiti
Viability depends on the generation type of the
exported electricity.
Nexant assumes HFO; therefore, the benefits
are not included in scenario analysis
generation development is limited to around 15 percent of each system’s peak load, which
Nexant considered adequate to demonstrate the potential cost impact of developing wind in the
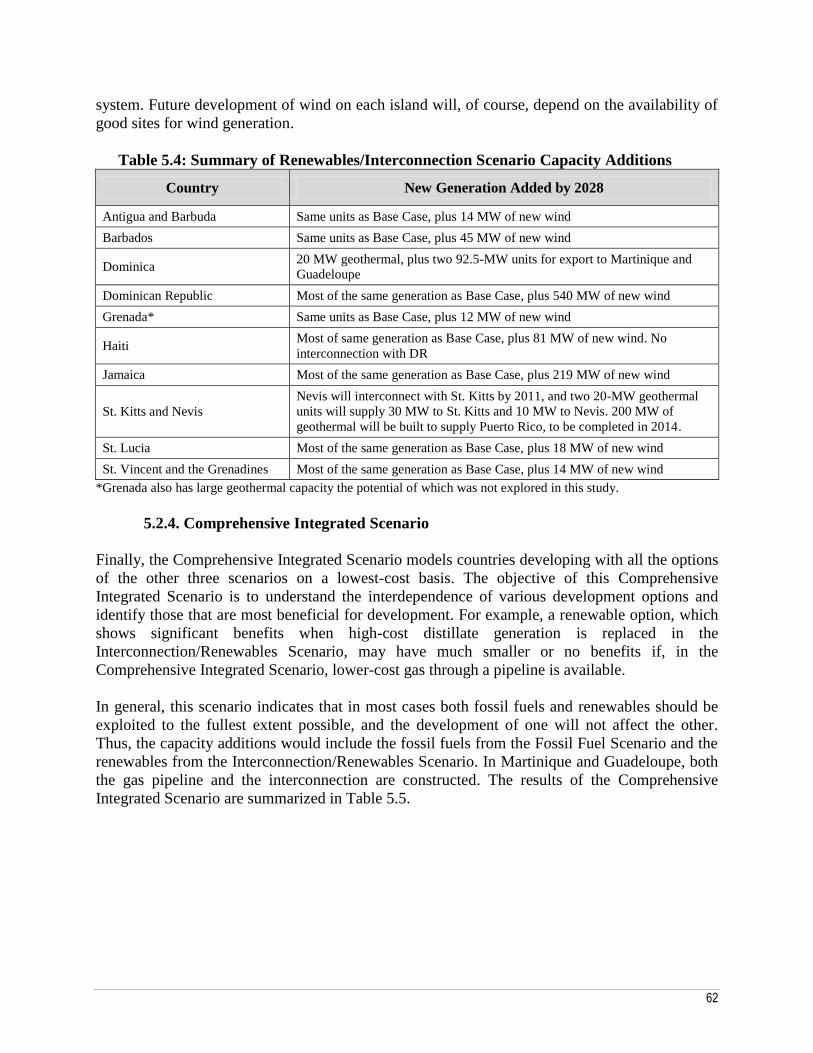
62
system. Future development of wind on each island will, of course, depend on the availability of
good sites for wind generation.
Table 5.4: Summary of Renewables/Interconnection Scenario Capacity Additions
Country New Generation Added by 2028
Antigua and Barbuda Same units as Base Case, plus 14 MW of new wind
Barbados Same units as Base Case, plus 45 MW of new wind
Dominica 20 MW geothermal, plus two 92.5-MW units for export to Martinique and
Guadeloupe
Dominican Republic Most of the same generation as Base Case, plus 540 MW of new wind
Grenada* Same units as Base Case, plus 12 MW of new wind
Haiti Most of same generation as Base Case, plus 81 MW of new wind. No
interconnection with DR
Jamaica Most of the same generation as Base Case, plus 219 MW of new wind
St. Kitts and Nevis
Nevis will interconnect with St. Kitts by 2011, and two 20-MW geothermal
units will supply 30 MW to St. Kitts and 10 MW to Nevis. 200 MW of
geothermal will be built to supply Puerto Rico, to be completed in 2014.
St. Lucia Most of the same generation as Base Case, plus 18 MW of new wind
St. Vincent and the Grenadines Most of the same generation as Base Case, plus 14 MW of new wind
*Grenada also has large geothermal capacity the potential of which was not explored in this study.
5.2.4. Comprehensive Integrated Scenario
Finally, the Comprehensive Integrated Scenario models countries developing with all the options
of the other three scenarios on a lowest-cost basis. The objective of this Comprehensive
Integrated Scenario is to understand the interdependence of various development options and
identify those that are most beneficial for development. For example, a renewable option, which
shows significant benefits when high-cost distillate generation is replaced in the
Interconnection/Renewables Scenario, may have much smaller or no benefits if, in the
Comprehensive Integrated Scenario, lower-cost gas through a pipeline is available.
In general, this scenario indicates that in most cases both fossil fuels and renewables should be
exploited to the fullest extent possible, and the development of one will not affect the other.
Thus, the capacity additions would include the fossil fuels from the Fossil Fuel Scenario and the
renewables from the Interconnection/Renewables Scenario. In Martinique and Guadeloupe, both
the gas pipeline and the interconnection are constructed. The results of the Comprehensive
Integrated Scenario are summarized in Table 5.5.

63
Table 5.5: Summary of Comprehensive Integrated Scenario Capacity Additions
Country
New Generation Added by 2028
Fossil Fuels Renewables
Antigua and Barbuda Three 10-MW CFB 14 MW of new wind
Barbados Two 20-MW LSD on pipeline gas 45 MW of new wind
Dominica
20 MW geothermal, plus two 92.5-MW units
for export to Martinique and Guadeloupe.
Fuel savings in Martinique and Guadeloupe
are reduced compared to the Interconnection/
Renewables Scenario.
Dominican Republic
Two 50-MW GT for peaking, eight
300-MW conventional coal units for
baseload
540 MW of new wind
Grenada Seven 10-MW CFB 12 MW of new wind
Haiti Total of 540 MW of LNG gas units,
with terminal starting in 2014
81 MW of new wind. No interconnection with
DR.
Jamaica
Eleven 100-MW CC running on
LNG. 450 MW of existing units will
be converted to natural gas.
219 MW of new wind
St. Kitts and Nevis
Nevis interconnects with St. Kitts by 2011,
and two 20-MW geothermal units supply 30
MW to St. Kitts and 10 MW to Nevis. 200
MW of geothermal is built to supply Puerto
Rico by 2014.
St. Lucia Four 20-MW LSD on pipeline gas 18 MW of new wind
St. Vincent and the
Grenadines Seven 10-MW CFB 14 MW of new wind
5.3 Cost Comparison of Scenario Results
This section explores the NPV results of the scenario analysis on a countrywide and regional
basis. Overall, it is clear that there are savings from the Comprehensive Integrated Scenario
when compared with the other three scenarios.
5.3.1 Net Present Value
Based on the scenario analysis, it appears that many countries could significantly benefit from
developing a combination of renewables, alternative fossil fuels and interconnections. When the
NPV of cost savings compared to the Base Case is estimated, the Comprehensive Integrated
Scenario offers the largest savings at US$4.37 billion through 2028, followed by the
Interconnection/Renewables Scenario at US$2.57 billion and the Fossil Fuel Scenario at
US$2.56 billion. The NPV includes investment and production costs. In addition to accounting
for savings within the nine Bank countries, the results factor in fuel savings from displaced fuel
from energy exports to Guadeloupe, Martinique and Puerto Rico (see Table 5.6, Note 1). The
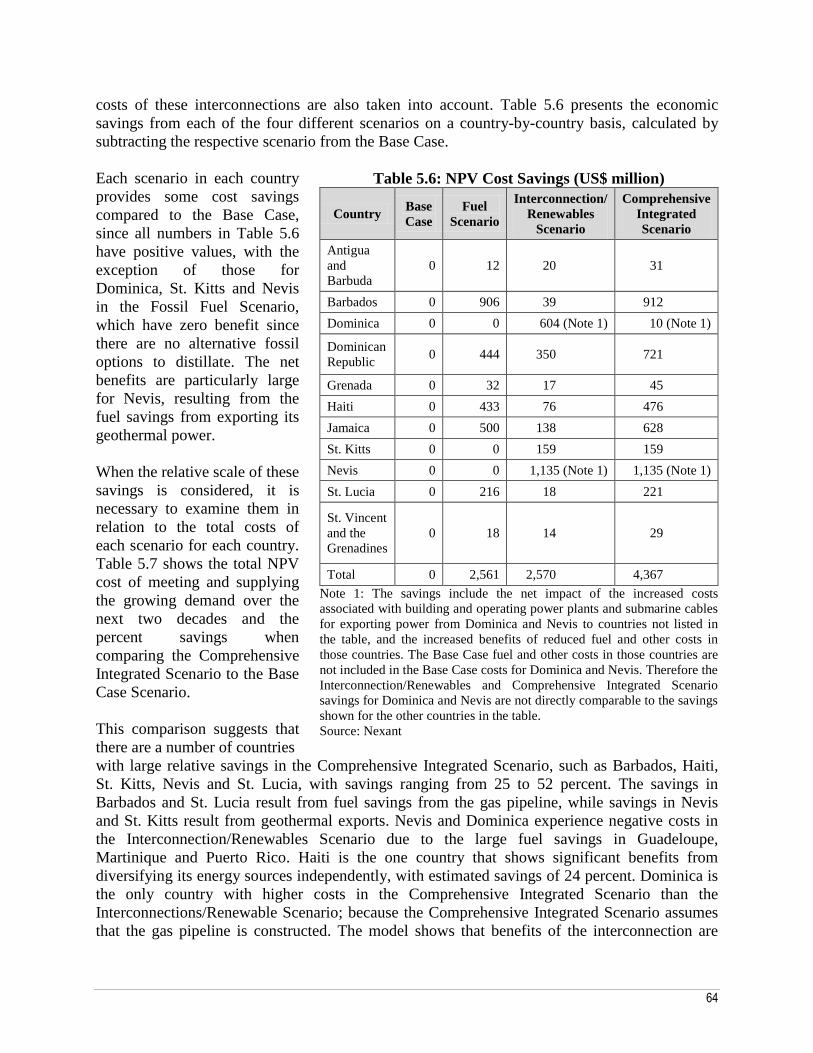
64
costs of these interconnections are also taken into account. Table 5.6 presents the economic
savings from each of the four different scenarios on a country-by-country basis, calculated by
subtracting the respective scenario from the Base Case.
Each scenario in each country
provides some cost savings
compared to the Base Case,
since all numbers in Table 5.6
have positive values, with the
exception of those for
Dominica, St. Kitts and Nevis
in the Fossil Fuel Scenario,
which have zero benefit since
there are no alternative fossil
options to distillate. The net
benefits are particularly large
for Nevis, resulting from the
fuel savings from exporting its
geothermal power.
When the relative scale of these
savings is considered, it is
necessary to examine them in
relation to the total costs of
each scenario for each country.
Table 5.7 shows the total NPV
cost of meeting and supplying
the growing demand over the
next two decades and the
percent savings when
comparing the Comprehensive
Integrated Scenario to the Base
Case Scenario.
This comparison suggests that
there are a number of countries
Table 5.6: NPV Cost Savings (US$ million)
Country Base
Case
Fuel
Scenario
Interconnection/
Renewables
Scenario
Comprehensive
Integrated
Scenario
Antigua
and
Barbuda
0 12 20 31
Barbados 0 906 39 912
Dominica 0 0 604 (Note 1) 10 (Note 1)
Dominican
Republic 0 444 350 721
Grenada 0 32 17 45
Haiti 0 433 76 476
Jamaica 0 500 138 628
St. Kitts 0 0 159 159
Nevis 0 0 1,135 (Note 1) 1,135 (Note 1)
St. Lucia 0 216 18 221
St. Vincent
and the
Grenadines
0 18 14 29
Total 0 2,561 2,570 4,367
Note 1: The savings include the net impact of the increased costs
associated with building and operating power plants and submarine cables
for exporting power from Dominica and Nevis to countries not listed in
the table, and the increased benefits of reduced fuel and other costs in
those countries. The Base Case fuel and other costs in those countries are
not included in the Base Case costs for Dominica and Nevis. Therefore the
Interconnection/Renewables and Comprehensive Integrated Scenario
savings for Dominica and Nevis are not directly comparable to the savings
shown for the other countries in the table.
Source: Nexant
with large relative savings in the Comprehensive Integrated Scenario, such as Barbados, Haiti,
St. Kitts, Nevis and St. Lucia, with savings ranging from 25 to 52 percent. The savings in
Barbados and St. Lucia result from fuel savings from the gas pipeline, while savings in Nevis
and St. Kitts result from geothermal exports. Nevis and Dominica experience negative costs in
the Interconnection/Renewables Scenario due to the large fuel savings in Guadeloupe,
Martinique and Puerto Rico. Haiti is the one country that shows significant benefits from
diversifying its energy sources independently, with estimated savings of 24 percent. Dominica is
the only country with higher costs in the Comprehensive Integrated Scenario than the
Interconnections/Renewable Scenario; because the Comprehensive Integrated Scenario assumes
that the gas pipeline is constructed. The model shows that benefits of the interconnection are
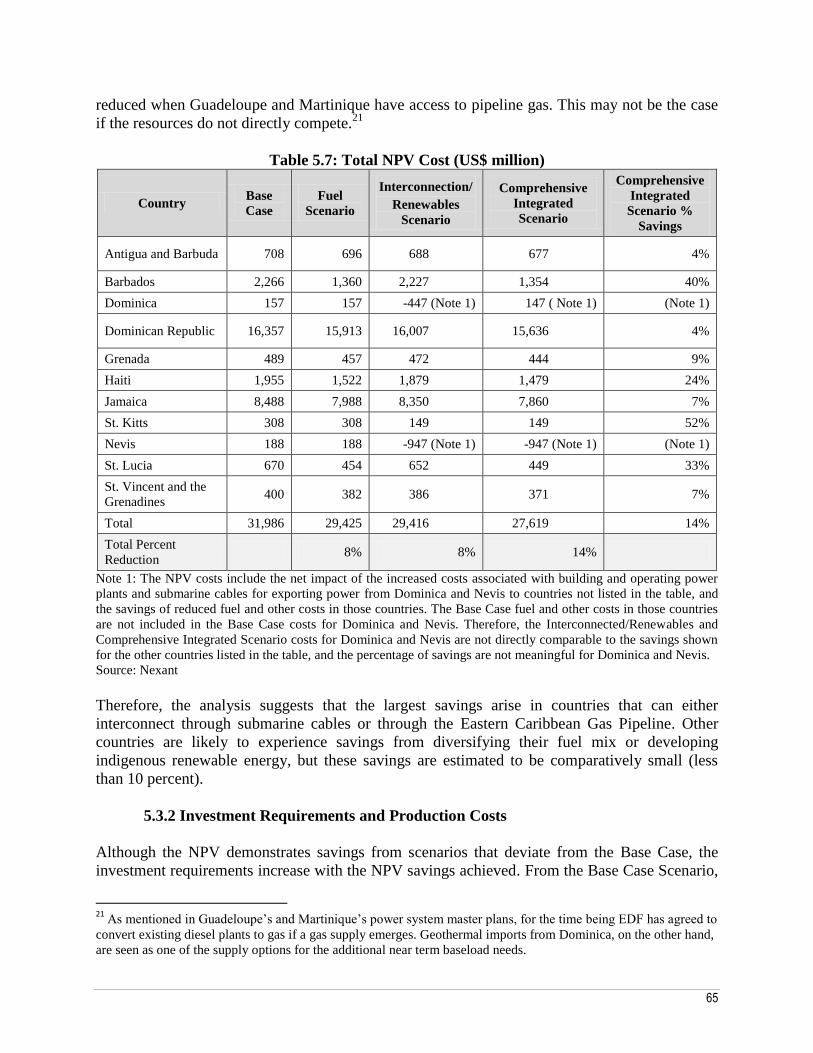
65
reduced when Guadeloupe and Martinique have access to pipeline gas. This may not be the case
if the resources do not directly compete.21
Table 5.7: Total NPV Cost (US$ million)
Country Base
Case
Fuel
Scenario
Interconnection/
Renewables
Scenario
Comprehensive
Integrated
Scenario
Comprehensive
Integrated
Scenario %
Savings
Antigua and Barbuda 708 696 688 677 4%
Barbados 2,266 1,360 2,227 1,354 40%
Dominica 157 157 -447 (Note 1) 147 ( Note 1) (Note 1)
Dominican Republic 16,357 15,913 16,007 15,636 4%
Grenada 489 457 472 444 9%
Haiti 1,955 1,522 1,879 1,479 24%
Jamaica 8,488 7,988 8,350 7,860 7%
St. Kitts 308 308 149 149 52%
Nevis 188 188 -947 (Note 1) -947 (Note 1) (Note 1)
St. Lucia 670 454 652 449 33%
St. Vincent and the
Grenadines 400 382 386 371 7%
Total 31,986 29,425 29,416 27,619 14%
Total Percent
Reduction 8% 8% 14%
Note 1: The NPV costs include the net impact of the increased costs associated with building and operating power
plants and submarine cables for exporting power from Dominica and Nevis to countries not listed in the table, and
the savings of reduced fuel and other costs in those countries. The Base Case fuel and other costs in those countries
are not included in the Base Case costs for Dominica and Nevis. Therefore, the Interconnected/Renewables and
Comprehensive Integrated Scenario costs for Dominica and Nevis are not directly comparable to the savings shown
for the other countries listed in the table, and the percentage of savings are not meaningful for Dominica and Nevis.
Source: Nexant
Therefore, the analysis suggests that the largest savings arise in countries that can either
interconnect through submarine cables or through the Eastern Caribbean Gas Pipeline. Other
countries are likely to experience savings from diversifying their fuel mix or developing
indigenous renewable energy, but these savings are estimated to be comparatively small (less
than 10 percent).
5.3.2 Investment Requirements and Production Costs
Although the NPV demonstrates savings from scenarios that deviate from the Base Case, the
investment requirements increase with the NPV savings achieved. From the Base Case Scenario,
21
As mentioned in Guadeloupe’s and Martinique’s power system master plans, for the time being EDF has agreed to
convert existing diesel plants to gas if a gas supply emerges. Geothermal imports from Dominica, on the other hand,
are seen as one of the supply options for the additional near term baseload needs.

66
investment costs increase by about US$1.7 billion for the Fossil Fuel Scenario, US$3.8 billion
for the Interconnection/Renewables Scenario, and US$5.5 billion for the Comprehensive
Integrated Scenario. The reason for this increase is that the Fossil Fuel, Interconnection/
Renewables and Comprehensive Integrated Scenarios take advantage of technologies that have
lower or no fuel costs, such as wind energy and geothermal development, but larger upfront
costs.
The undiscounted investment requirements for each country to cover electricity demand through
2028 are outlined in Table 5.8 for each scenario. These include the costs of interconnections,
which are attributed to the exporting country.
In order to achieve the
lower NPV costs discussed
in the previous section, the
production costs also must
be considered. As discussed
in Section 3.1, many
technologies with the
highest capital costs have
the lowest production costs.
The production cost savings
range from US$3.7 billion
for the Interconnection/
Renewables Scenario to
US$13.5 billion for the
Comprehensive Integrated
Scenario. These savings
offset many of the initial
investment costs,
demonstrating the possible
benefits of following a
regional and integrated
approach for power
development. It is
important to note that the
calculated production cost
Table 5.8: Investment Requirement by Scenario, US$ million
Country Base
Case
Fuel
Scenario
Interconnection/
Renewables
Scenario
Comprehensive
Integrated
Scenario
Antigua and
Barbuda 27 90 44 107
Barbados 84 84 140 140
Dominica 7 7 818 (Note 1) 818 (Note 1)
Dominican
Republic 2,965 5,525 3,640 6,200
Grenada 32 179 47 194
Haiti 259 259 360 360
Jamaica 2,928 1,663 3,202 1,937
St. Kitts 16 16 2 2
Nevis 11 11 1,913(Note 1) 1,913(Note 1)
St. Lucia 38 38 61 61
St. Vincent
and the
Grenadines
32 179 48 195
Total 6,399 8,051 10,275 11,927
Note 1: Includes the increased costs associated with building power plants and
submarine cables for exporting power to other countries.
Source: Nexant
savings are conservative, because the benefits are only considered through 2028, but the plants
and interconnections may last significantly longer. Depending on when the investment was
made, these investments could continue for more than 15 additional years.
Despite the net benefits from the integrated approach through decreased production costs,
financing the large investment requirements will be a challenge for the Caribbean countries.
Although capital investments will reduce overall costs in the long run because expenditures for
fuel purchases will decline, the public sector may not be able to supply such large upfront sums
because many utilities may not have the necessary financing capabilities, as discussed in Section
4.4.

67
Table 5.9: Production Cost Summary, US$ million, by Scenario
Country Base Case Fuel Scenario
Interconnection/
Renewables
Scenario
Comprehensive
Integrated Scenario
Antigua and Barbuda 1,906 1,809 1,821 1,729
Barbados 6,022 2,951 5,818 2,882
Dominica 410 410 500 (Note 1) 500 (Note 1)
Dominican Republic 39,919 35,983 37,894 34,203
Grenada 1,370 1,118 1,296 1,061
Haiti 5,796 4,105 5,421 3,865
Jamaica 19,078 18,587 18,392 17,915
St. Kitts 816 816 300 300
Nevis 433 433 761 (Note 1) 761 (Note 1)
St. Lucia 1,765 1,028 1,676 988
St. Vincent and the
Grenadines 1,189 1,004 1,123 952
Total 78,704 68,244 75,002 65,156
Note 1: Includes the increased costs associated with variable O&M for power plants and submarine cables for
exporting power to other countries.
Source: Nexant
5.4 Country-specific Results and Options
The analysis demonstrates that the most expensive strategy for countries in the region is to
continue to rely on HFO and diesel to meet future power demand (Base Case Scenario). For
many countries, the benefit of diversifying fossil fuels and interconnecting is substantial.
However, the largest net benefit to the region is realized when there is a diversified approach.
A breakdown of the preliminary findings of the integrated approach for each country follows.
For more detailed country-specific results, see Annex 2.
Antigua and Barbuda: The Nexant report suggests that Antigua and Barbuda could achieve
savings by meeting future demand through a combination of wind and coal developments, but it
is important to note that environmental costs were not considered in the analysis. The country
could pay up to US$31 million more if it were to continue to rely on distillate and HFO to meet
future electricity demand. However, in comparison to the total expected investments required,
these savings are minimal – only 4 percent of the total investments needed.
The addition of coal-fueled CFB technology reduces the NPV costs of supplying electricity, not
including environmental costs, by US$12 million compared to the Base Case Scenario. The cost
advantage compared to distillate-fueled MSD technology ranges from 2 percent at a 55 percent
capacity factor to 10 percent at an 80 percent capacity factor. However, due to the large
investments required for coal and to the environmental impacts, diesel may continue to be the
fuel of choice. When a US$50/ton carbon price is added to the analysis, the cost advantage of
68
coal over distillate disappears. Although conventional LNG is more costly than distillate,
Antigua and Barbuda may consider mid-scale LNG as a viable alternative. A more detailed
analysis is warranted.
The extent to which new fossil fuel capacity will be required will depend on how much wind
capacity can be developed. Development of wind generation reduces NPV costs by US$20
million compared to the Base Case Scenario, assuming that sites with good winds and low
development costs can be identified and acquired. Small hydro and biomass would also be
economical if good sites can be identified. The benefits associated with developing renewables
are relatively unaffected by the choice of fuel for the country’s fossil units. Due to the
environmental impacts associated with coal and other fossil fuels, it would be beneficial to
aggressively promote new wind development and also investigate the potential for other site-
specific competitive renewables.
Barbados: The most significant savings for Barbados come from the introduction of natural gas
into its power generation mix. Replacing distillate and HFO with pipeline gas-fueled generation
to meet future power needs could save the country up to NPV US$906 million through 2028
when compared to the Base Case. Its cost per kWh compared to distillate-fueled generation
ranges from half at a 20 percent capacity factor to 40 percent at an 80 percent capacity factor. In
total, an estimated 40 percent savings could be realized in comparison to the Base Case. If the
ECGP does not materialize, the other fuel options (LNG, coal) could be considered. They would
offer savings compared to distillate, although not as dramatic as the ECGP gas offers.
As shown in the Interconnection/Renewables Scenario, there are also large potential savings
from wind development when compared with traditional fuel options. Development of wind
generation reduces NPV costs in the Interconnection/Renewables Scenario by US$39 million
compared to the Base Case Scenario, assuming that sites with good winds and low development
costs can be identified and acquired. These benefits are reduced to an estimated US$6 million
when pipeline gas is available. This illustrates the high dependence of wind generation savings
on the assumed fuel supply option, and the possibility that wind generation penetration might be
limited to only a few of the best wind sites. Good hydro sites would also be economical, but
biomass would be marginally uneconomical.
Dominica: According to the analysis, Dominica does not have alternative fossil fuel solutions
that are competitive with diesel due to the country’s small demand. However, as shown in the
Interconnection/Renewables Scenario, it could potentially reap large benefits by developing
geothermal for export to Martinique and Guadeloupe and subsequently supplying the domestic
market. This could create large cost savings (to the three countries involved) of over US$600
million through 2028 compared to the Base Case Scenario. This development would help
insulate the country from the high price of distillate and reducing CO2 emissions.
However, as indicated by the decrease in savings in the Comprehensive Integrated Scenario, the
economic benefits of geothermal development in Dominica for exports to Martinique and
Guadeloupe may depend on whether additional units in Martinique and Guadeloupe have access
69
to less expensive natural gas through the pipeline (ECGP) or LNG.22
A more detailed analysis of
the Martinique and Guadeloupe systems would be required to determine if both geothermal and
natural gas pipeline options should be developed simultaneously, and to what extent there is a
first-mover advantage. Moreover, it would be important to confirm that the geothermal resource
in Dominica is large enough to serve Martinique and/or Guadeloupe.
Considering the low cost of geothermal power, wind generation is only marginally economical
compared to geothermal for domestic consumption in Dominica. Small hydro would also be
marginally economical if good sites can be identified, but biomass would be marginally
uneconomical.
Dominican Republic: The Dominican Republic uses a wider range of fuels than any other
country in the Caribbean and has significant renewable resource options. However, because it
already has a largely diversified energy sector, the savings from alternative scenarios are
insignificant, with estimated savings of 6 percent (US$700 million). The benefits come from
continuing to develop a range of fossil fuels while developing good wind and hydro sites.
The Fossil Fuel and Interconnection Scenarios indicate some savings from the development of
alternative generation. Although the Nexant Report shows that developing coal could save
US$444 million compared to the Base Case, this does not take into account the environmental
costs. If a carbon price of US$50/ton is implemented, LNG becomes less costly than coal. The
Interconnection/Renewables Scenario shows savings from the introduction of wind generation.
However, due to the relatively low-cost fuel options, even in the Base Case Scenario, renewable
generation has smaller benefits than in many other countries. Wind generation and small hydro
are marginally economical if good sites can be identified, and biomass is marginally
uneconomical.
The Comprehensive Integrated Scenario shows savings of about 90 percent of the sum of savings
from the Fossil Fuel and Interconnection/Renewables Scenarios, meaning that options in both
scenarios can be developed without significantly reducing the benefits of alternative options.
Grenada: Grenada could benefit from an alternative energy resources, saving up to US$50
million by 2028, or 9 percent, in the Comprehensive Integrated Scenario compared to the Base
Case. Adding coal-fueled CFB technology in the Fossil Fuel Scenario reduces NPV costs, not
including environmental impacts, by US$32 million compared to the Base Case Scenario, with a
cost advantage compared to distillate-fueled MSD technology ranging from 2 percent at a 55
percent capacity factor to 12 percent at a 90 percent capacity factor. As in many other countries,
in Grenada the cost advantage of coal disappears if costs of US$50/ton are added for CO2
emissions. Although conventional LNG is more costly than distillate, mid-scale LNG may be a
more viable fuel option and should be analyzed further. The Interconnection/Renewables
Scenario shows savings from the development of wind generation; NPV costs are reduced by
US$17 million compared to the Base Case Scenario. This assumes that sites with good winds and
low development costs can be identified and acquired. Small hydro and biomass would also be
22
As mentioned in Guadeloupe’s and Martinique’s power system master plans, for the time being EDF has agreed to
convert existing diesel plants to gas if a gas supply emerges. Geothermal imports from Dominica, on the other hand,
are seen as one of the supply options for the additional near term baseload needs.
70
economical if good sites can be identified. The benefits are relatively unaffected by the choice of
fuel for the country’s fossil units.23
Thus, the Comprehensive Integrated Scenario shows combined savings from coal and wind options
that are close to the sum of the other two scenarios. This result means that wind development will
not negatively affect the coal option and vice versa.
Haiti: The poor condition and inadequate amount of generation in Haiti make all near-term
additions highly cost effective until an adequate reserve margin is established. In particular, Haiti
could benefit by introducing LNG and wind, with savings of up to US$476 million through
2028, or 24 percent savings when compared to the Base Case.
The Fuel Scenario savings indicate that it is beneficial to introduce LNG as a fuel, while the
Interconnection/Renewables Scenario shows savings from the introduction of wind generation.
First, in the Fuel Scenario, LNG is the least-cost option and could save US$433 million through
2028 compared to the Base Case. Second, the development of wind generation in the
Interconnection/Renewables Scenario could reduce NPV costs by US$76 million compared to
the Base Case Scenario. This assumes that sites with good winds and low development costs can
be identified and acquired.
The Comprehensive Integrated Scenario shows combined savings of LNG and wind options,
assuming that a new LNG plant starts operation in 2014. In the Comprehensive Integrated
Scenario, wind is less attractive but is still economical because it is used in place of lower-cost
LNG rather than distillate. Small hydro would also be economical and biomass would be
marginally economical if good sites can be identified. The Comprehensive Integrated Scenario
savings results are close to the sum of the other two scenarios, meaning that wind development
will not negatively affect the LNG option and vice versa, and the power system would benefit
the most from development of both options.
The Comprehensive Integrated Scenario does not include an interconnection between the
Dominican Republic and Haiti since Nexant assumes that exports would be based on the more
expensive HFO generation. On an NPV basis, the interconnection would increase system costs in
the Dominican Republic by US$322 million and decrease system costs in Haiti by US$556
million, for total savings of US$235 million. At the same time, the NPV costs of building and
operating transmission lines are US$242 million. However, if the Dominican Republic expands
its natural gas-fueled generation, thus reducing electricity costs, the interconnection could be
economically viable.
Jamaica: The situation in Jamaica is similar to that of the Dominican Republic where alternative
fossil fuels combined with wind generation developments could save money, although not a
significant amount relative to the investments that must be made. In the Fuel Scenario, LNG
displaces HFO in existing plants and the new coal generation assumed to be added in the Base
Case Scenario remains. These changes lead to savings of US$500 million.
23
Grenada has a large estimated geothermal resource, the development of which was not examined in this study.
The government recently announced plans to explore the potential of development, which could impact the
country’s energy options.

71
Development of wind generation in the Interconnection/Renewables Scenario reduces NPV costs
by US$138 million compared to the Base Case Scenario, assuming that sites with good winds
and low development costs can be identified and acquired. Small hydro would also be
economical if good sites can be identified. The benefits are relatively unaffected by the choice of
fuel for the country’s fossil units.
In total, these changes could save about US$630 million compared to continuing the use of HFO
and distillates. However, the Base Case Scenario assumes that the infrastructure to deliver and
generate with coal will be put in place. If this does not occur, the other scenarios’ benefits would
be much larger.
St. Kitts and Nevis: Due to their small systems and geographic locations, St. Kitts and Nevis do
not have any viable alternative fossil fuel options when compared to distillate. Therefore,
geothermal development is important for the two islands, because it would help insulate them
from the high and variable price of distillate and reduce CO2 emissions. St. Kitts and Nevis
would benefit from large savings (US$159 million) from geothermal development on Nevis and
an interconnection to St. Kitts. These saving are much higher than the increased costs associated
with developing the plant and interconnection (around US$100 million). This indicates a win-
win situation for interconnection, and it seems likely that a plan of at least 40 MW will be
developed.
Furthermore, Nevis can achieve large potential benefits through additional geothermal
development and an interconnection with Puerto Rico. The large benefits associated with the
development of 400 MW for export to Puerto Rico are based on using Nevis’s electricity exports
in place of HFO generation in Puerto Rico. In total, NPV savings from geothermal development
and the fuel cost savings from interconnections create potential for huge export revenue. West
Indies Power indicates that exploration data suggest a resource of at least 300 MW, and once the
resource is known, a better estimate of the savings can be calculated.
Given the low cost of geothermal power, other renewables are not as competitive as on other
islands. Wind generation is only marginally economical for domestic consumption. Small hydro
is also marginally economical, though it is not clear that adequate resources exist, and biomass
appears marginally uneconomical.
St. Lucia: According to the analysis, St. Lucia can achieve the largest savings for power
generation by introducing natural gas (from the pipeline) and developing wind power, with a net
benefit of US$221 million, or 33 percent savings of its Base Case costs. The most attractive
option is the Eastern Caribbean Gas Pipeline, gas from which could displace distillate in existing
units and fuel new units. The Fuel Scenario estimates NPV savings of US$216 million compared
to the Base Case Scenario from pipeline gas.
Savings from wind largely depend on the extent to which gas is introduced, because only good
wind sites will be able to compete with natural gas. Development of wind generation reduces the
Interconnection/Renewables Scenario’s NPV costs by US$18 million compared to the Base Case
Scenario. This would require the development of enough good wind sites with low development
costs. However, when ECGP gas is available, as is assumed in the Comprehensive Integrated

72
Scenario, the addition of wind generation saves only US$5 million. Wind is marginally
economical, as is small hydro if sites can be identified, and biomass appears to be marginally
uneconomical. This illustrates the high dependence of wind generation savings on the available
fuel supply. Therefore, wind generation may be limited to only a few of the best wind sites.
St. Vincent and the Grenadines: St. Vincent and the Grenadines may benefit from introducing
a combination of coal and wind generation to replace HFO and distillates in meeting its future
power demand, although the savings are relatively insignificant and the costs do not include
environmental impacts. The analysis indicates that cost savings of up to US$30 million (7
percent of the Base Case) could be achieved over the next two decades.
In the Fuel Scenario, adding coal-fueled CFB technology reduces NPV costs, not including
environmental costs, by US$12 million compared to the Base Case Scenario. The cost advantage
compared to distillate-fueled MSD technology ranges from 2 percent at a 55 percent capacity
factor to 12 percent at a 90 percent capacity factor. However, this cost advantage disappears if a
carbon price of US$50/ton is added, and diesel returns to being a competitive technology. In
addition, a more detailed study on the potential of mid-scale LNG is justified. Although
conventional LNG is more costly than distillate, smaller-scale LNG may be a viable option.
Development of wind generation reduces NPV costs by US$20 million compared to the Base
Case Scenario, assuming good sites. Small hydro and biomass are also economical if good sites
can be identified. The benefits from wind are relatively unaffected by the choice of fuel for the
country’s fossil units. However, the extent to which new coal capacity would be required will
depend on how much wind capacity can be developed.
5.5 Conclusions
Overall, it appears that the region could benefit significantly from developing a combination of
renewables, alternative fossil fuels, and interconnections. The countries that would experience
the most significant benefits are those that would either be connected to the gas pipeline or be
part of a geothermal interconnection. These include Barbados, Dominica, St. Kitts and Nevis,
and St. Lucia, with savings ranging from 30 to 52 percent. Haiti is the one country that shows
significant benefits from diversifying its sources independently, with estimated savings of 24
percent. These results are summarized in Table 5.9.
All other countries without potential for a gas pipeline or submarine interconnection appear to
have some expected benefit from diversifying fossil fuels by pursuing renewable energy options
on their own, but the savings are predicted to be relatively small. Most notably, the small islands
with limited alternative fuel options have small potential savings. These include Antigua and
Barbuda, Grenada, and St. Vincent and the Grenadines. In addition, the analysis indicates that
although the absolute savings for the Dominican Republic and Jamaica are large, the savings
relative to the total cost that are expected to be incurred in the Base Case to meet growing
demand are small.
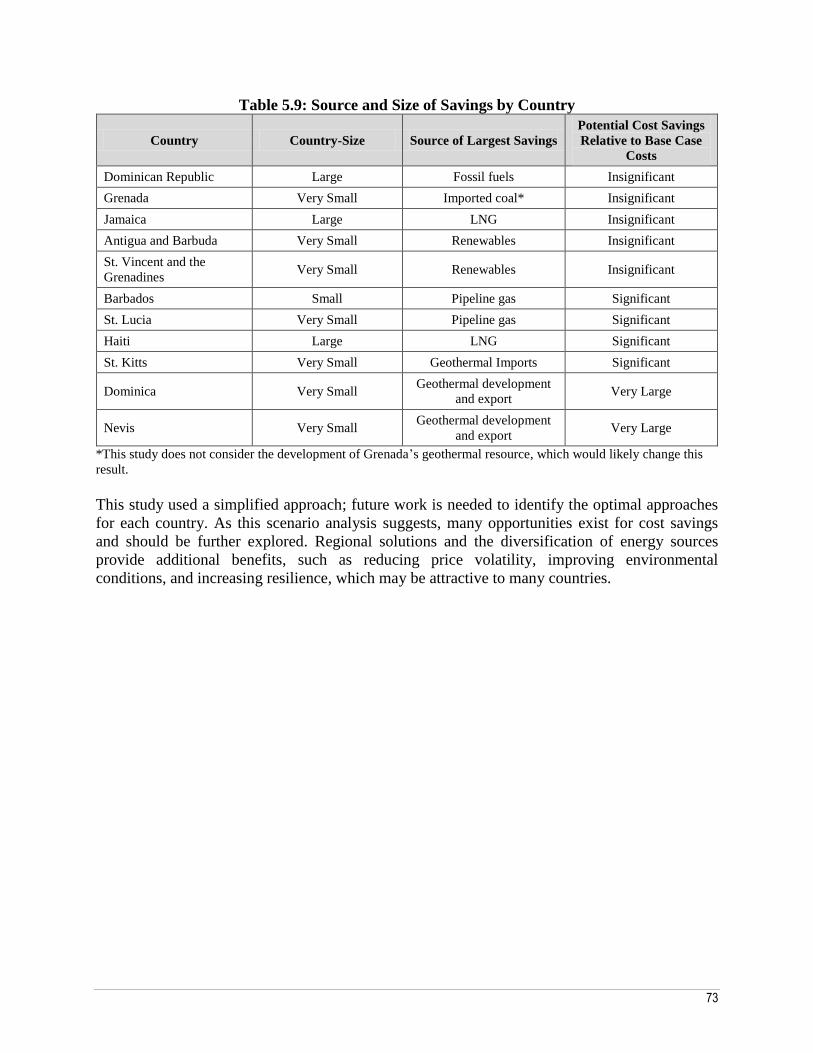
73
Table 5.9: Source and Size of Savings by Country
Country Country-Size Source of Largest Savings
Potential Cost Savings
Relative to Base Case
Costs
Dominican Republic Large Fossil fuels Insignificant
Grenada Very Small Imported coal* Insignificant
Jamaica Large LNG Insignificant
Antigua and Barbuda Very Small Renewables Insignificant
St. Vincent and the
Grenadines Very Small Renewables Insignificant
Barbados Small Pipeline gas Significant
St. Lucia Very Small Pipeline gas Significant
Haiti Large LNG Significant
St. Kitts Very Small Geothermal Imports Significant
Dominica Very Small Geothermal development
and export Very Large
Nevis Very Small Geothermal development
and export Very Large
*This study does not consider the development of Grenada’s geothermal resource, which would likely change this
result.
This study used a simplified approach; future work is needed to identify the optimal approaches
for each country. As this scenario analysis suggests, many opportunities exist for cost savings
and should be further explored. Regional solutions and the diversification of energy sources
provide additional benefits, such as reducing price volatility, improving environmental
conditions, and increasing resilience, which may be attractive to many countries.
74
Chapter 6
Conclusions and Looking Forward
verall, the Caribbean countries face sizeable challenges as they struggle to meet a growing
energy demand and diversify their energy mix. Distillates and HFO are the dominant fuels
for power generation in the region, but they come with a variety of problems such as high prices
and price volatility. As demand increases, the problems associated with relying primarily on
liquid fuels increases as well.
6.1 Key Conclusions
In general, when acting independently, some individual Caribbean countries stand to benefit
from developing indigenous renewable resources and expanding fossil fuel options. The smaller
islands appear to have some benefits from introducing renewable energy, such as wind, hydro
and biomass, but the largest potential among them are the geothermal resources in Dominica and
Nevis. In the slightly larger markets of Barbados, Guadeloupe and Martinique, LNG is the most
economical option, with wind also as a viable option. Finally, in the three largest markets—Haiti,
Jamaica and the Dominican Republic—coal and LNG could potentially reduce costs, although
environmental factors should be considered. While the savings for many of the countries are not
significant, the options are viable and may warrant taking next steps, such as conducting more
in-depth prefeasibility studies to better understand the viability and expected benefits.
The study shows that many countries may be able to enhance the benefits of developing
alternative resources by considering regional solutions, such as interconnecting electricity
markets and constructing a gas pipeline. In most countries, these options appear to provide the
lowest-cost energy, often by significant margins over distillate.
Many of the electricity market interconnections analyzed in depth in the study appear to be
technologically feasible, with the exception of submarine interconnections with Haiti, and most
are economically viable under certain circumstances. The most direct benefit of an
interconnection comes when one country has a source of low-cost power and its neighbor does
not; therefore, lower-cost electricity can be exported, earning revenue for the exporting country
and lowering electricity costs for the importing country. Geothermal is the source of generation
that drives the benefits for many of the interconnections. It is so low cost in comparison to
distillate that even a long connection moving a small amount of power, such as from Nevis to the
US Virgin Islands, shows marginal economic benefits.
O
75
Another regional solution, the proposed Eastern Caribbean Gas Pipeline, also offers the potential
to reduce electricity costs by reducing fuel import costs. Pipeline gas is economical for every
country that it passes through, supplying the cheapest fossil fuel option. However, similar to
individual country solutions, there may be a first-mover advantage between the gas pipeline and
alternative options.
Thus, regional options offer added benefit over individual development. In all countries that
were studied as part of a regional solution, regional integration can further reduce electricity
generation costs. There are also many benefits from interconnection beyond those considered in
the analysis, such as potentially reducing the required reserve, providing emergency support, and
increasing access to cleaner technologies. For some countries, these reasons alone may provide
significant justification for further pursuing the idea of interconnections through additional
exploration or studies.
6.2 Limitations and Challenges
The analysis is based on a purely economic and technical comparison of fuels, renewable
technologies and interconnections. However, as discussed in Section 4.4, there are
environmental, financial, institutional and political difficulties and risks that may inhibit the
achievement of lower-cost options in the region. These are important to consider in discussions
of the feasibility of projects.
A number of financial risks and challenges are associated with pursuing alternative options.
Although the higher capital investments required for alternative generation sources may reduce
expenditure in the long run, obtaining financing for the projects could be a challenge. Local
utilities may have difficulty funding such large investments, and some countries may opt for
slightly more expensive operating costs to reduce upfront financing. There are also many
unknowns when future cash flows are projected, and risks associated with betting on fuel costs
are high. As a result, utilities may be hesitant to invest in alternative technologies. Thus, the
private sector, public-private partnerships and support from international financial institutions
(IFIs) and the international donor community may often be of key importance.
In addition, countries may need improved legal, regulatory and institutional frameworks
domestically and for cross-country cooperation. For regional integration options, regulatory
harmonization among two or more countries may be necessary for the success of the project.
Similarly, issues arising from separate ownership of various components of interisland power or
fuel supply need to be addressed. For the export of geothermal power by means of a submarine
cable, one private party might own the geothermal power plant in the exporting country while
another owns and operates the submarine cable. Joint ownership can present other types of
issues. Contractual structures and supporting institutions must be created to guarantee supply and
allocate risks and responsibilities to the appropriate parties. The needs of all parties would be
best served by long-term contracts that guarantee supply to the customer and a revenue stream to
the suppliers.
76
Finally, a secure supply of energy is often viewed as a national security issue, and many
countries may be hesitant to rely on another country for power. Although distillate and HFO are
widely available at present, political unrest or technical failures may compromise one country’s
ability to supply another. However, this hesitancy has been overcome in many other countries.
Countries may choose to increase reserve margins to improve security, the economic impact of
which was not taken into account in this study.
Nevertheless, these early results reveal interesting interconnection and cross-country
opportunities that are worth pursuing further. Many countries have significant potential for
saving or earning export revenue, and may decide that the benefits merit facing these challenges
and risks. Interconnections may also increase the use of large-scale renewable energy, thereby
reducing carbon emissions from the region.
6.3 Next Steps
There are opportunities for Caribbean countries to move toward a more integrated and diverse
energy mix—one that includes more renewables—over the next decade. Diversity and
integration reduce vulnerabilities from high and volatile fuel prices, load shedding and extreme
climate events. Much more detailed and project-specific work must be done before proceeding
with any major facility, but the priority concepts emerging from this study are as follows:
Renewable Energy Development: The Caribbean has a large potential for renewable, economic
energy resource development, including wind, geothermal and small hydro. Based on this study,
these technologies appear to be highly competitive with the technologies currently in use. A
challenge to development will be to identify sites where the resource is good and development
costs are not a barrier. Therefore, to encourage development it may be most cost effective to
assist in identifying such sites. Interconnections can increase countries’ ability to develop large-
scale renewable projects.
Submarine Cable Electricity Interconnections: There appear to be a number of highly
economical, technically viable electricity market interconnection options. As noted above, this
could promote larger-scale renewable usage. However, a significant amount of work needs to be
done, both to understand the viability of interconnections examined in this study and to evaluate
interconnections not considered in this analysis, including subregional interconnections (such as
a Southern Caribbean Ring), continental connections (such as with Mexico, the US, Colombia or
Venezuela), and bilateral interconnections (such as Montserrat–Antigua and Puerto Rico–
Dominican Republic).
Gas Pipelines: The potential for gas pipelines should also be considered, given the positive
economic benefits that this study suggests. The Eastern Caribbean Gas Pipeline may provide the
most economical fossil fuel for each island it reaches and the benefits of economies of scale
compared to individual development. The gas is about half as costly as distillate for Barbados,
Guadeloupe, Martinique and St. Lucia. Development of any pipeline will require the agreement
of many parties, such as gas suppliers, utilities, regulators, financial institutions and
77
governments, making the development process more costly and time consuming. A wide range
of support may be required to move these projects forward.
This is a high-level concept study; a detailed feasibility study needs to be carried out on any
proposed interconnection to turn a possibility into a reality. A feasibility study would include a
comprehensive analysis of all key issues related to a proposed interconnection, including the
technical, environmental, commercial, financial and economic aspects. The analysis will also
need to outline the subregional legal, regulatory and institutional frameworks needed to attract
investors to carry out the project. Regional organizations and IFIs can provide valuable
contributions both to facilitate the policy dialogue among the countries and to provide technical
assistance and financial support to address political and financial risks for potential investors.
Overall, this study provides evidence that regional electricity solutions merit further research and
investigation in the Caribbean. Many countries have significant potential to gain from
developing new resources and exploring interconnections. Therefore, it is recommended that
individual countries or sets of countries use these preliminary high-level findings to conduct
more in-depth prefeasibility and feasibility studies of individual, subregional and regional
solutions.

78
Annex 1
Forecasted Demand and Supply
Table A1.1: Net Peak Demand Load Forecast (MW)
Year Antigua and
Barbuda Barbados Dominica
Dominican
Republic Grenada Haiti* Jamaica
St.
Kitts Nevis
St.
Lucia
St. Vincent and
the Grenadines Martinique Guadeloupe Total
2009 54 170 15 2353 31 226 680 29 10 56 27 242 250 4143
2010 57 176 15 2447 33 237 707 30 10 58 28 247 256 4301
2011 60 182 16 2544 34 249 736 31 11 61 30 255 263 4472
2012 63 188 16 2640 36 261 767 32 11 63 32 263 269 4641
2013 65 195 17 2727 38 274 799 33 12 65 35 272 276 4808
2014 67 201 17 2803 40 288 832 35 13 68 37 281 284 4966
2015 69 208 18 2896 42 303 867 36 13 70 40 290 291 5143
2016 71 216 18 2992 45 318 904 37 14 73 42 297 298 5325
2017 73 223 19 3091 47 334 943 38 15 76 45 303 305 5512
2018 75 231 19 3194 50 350 983 40 16 79 48 310 313 5708
2019 77 239 20 3300 52 368 1026 41 17 82 52 317 321 5912
2020 80 247 20 3409 55 386 1071 43 18 85 55 324 329 6122
2021 82 256 21 3522 58 405 1116 44 19 88 49 331 337 6328
2022 85 265 21 3638 61 426 1165 46 20 91 63 339 346 6566
2023 87 274 22 3758 64 447 1214 47 21 95 68 346 354 6797
2024 90 284 22 3882 68 469 1267 49 23 98 72 354 363 7041
2025 92 294 23 4010 72 493 1322 51 24 102 77 362 372 7294
2026 95 304 24 4143 75 517 1379 52 25 106 83 370 381 7554
2027 98 314 24 4280 80 543 1439 54 27 110 88 378 391 7826
2028 101 325 25 4421 84 570 1502 56 29 114 94 387 400 8108
Growth
Rate 3.3% 3.5% 2.7% 3.4% 5.4% 5.0% 4.3% 3.5% 5.9% 3.8% 6.9% 2.5% 2.5% 3.6%
* All forecasts were conducted before the January 2010 earthquake. Source: Nexant Report

79
Table A1.2: Net Generation Forecast (GWh)
Year
Antigua
and
Barbuda
Barbados Dominica Dominican
Republic Grenada Haiti* Jamaica St. Kitts Nevis
St.
Lucia
St. Vincent
and the
Grenadines
Martinique Guadeloupe Total
2009 318 1,039 87 12,638 198 660 4,490 161 60 345 156 1,575 1,663 23,390
2010 315 1,073 89 13,142 209 726 4,674 166 67 356 167 1,620 1,720 24,324
2011 312 1,107 91 13,663 220 799 4,865 171 74 367 178 1,672 1,775 25,294
2012 410 1,143 94 14,179 232 878 5,066 175 82 378 191 1,727 1,832 26,387
2013 422 1,180 96 14,646 244 966 5,277 180 86 390 204 1,783 1,888 27,362
2014 434 1,218 99 15,054 257 1,063 5,494 186 90 402 218 1,840 1,947 28,302
2015 447 1,258 101 15,554 270 1,169 5,726 191 94 415 233 1,900 2,003 29,361
2016 461 1,298 104 16,070 285 1,286 5,974 196 99 428 249 1,938 2,060 30,448
2017 475 1,340 106 16,601 300 1,415 6,232 202 103 442 266 1,978 2,117 31,577
2018 489 1,384 109 17,154 316 1,556 6,497 208 107 455 284 2,018 2,174 32,751
2019 503 1,428 112 17,724 333 1,712 6,777 214 111 470 304 2,058 2,233 33,979
2020 519 1,475 114 18,309 350 1,883 7,073 220 115 484 325 2,100 2,284 35,251
2021 534 1,522 117 18,914 369 1,977 7,376 226 119 500 348 2,142 2,337 36,481
2022 550 1,572 120 19,539 389 2,076 7,696 233 124 515 372 2,186 2,390 37,762
2023 567 1,622 123 20,184 409 2,180 8,024 239 129 531 397 2,230 2,445 39,080
2024 583 1,675 126 20,851 431 2,289 8,370 246 134 548 425 2,275 2,501 40,454
2025 600 1,729 129 21,539 454 2,403 8,734 253 139 565 454 2,321 2,559 41,879
2026 618 1,785 133 22,251 478 2,523 9,114 261 145 583 485 2,368 2,618 43,362
2027 636 1,843 136 22,986 504 2,650 9,510 268 150 601 519 2,416 2,679 44,898
2028 654 1902 139 23745 530 2782 9924 276 156 620 555 2465 2,741 46,489
Growth
Rate 3.9% 3.2% 2.5% 3.4% 5.3% 7.9% 4.3% 2.9% 5.2% 3.1% 6.9% 2.4% 2.7% 3.7%
* All forecasts were conducted before the January 2010 earthquake. Source: Nexant Report
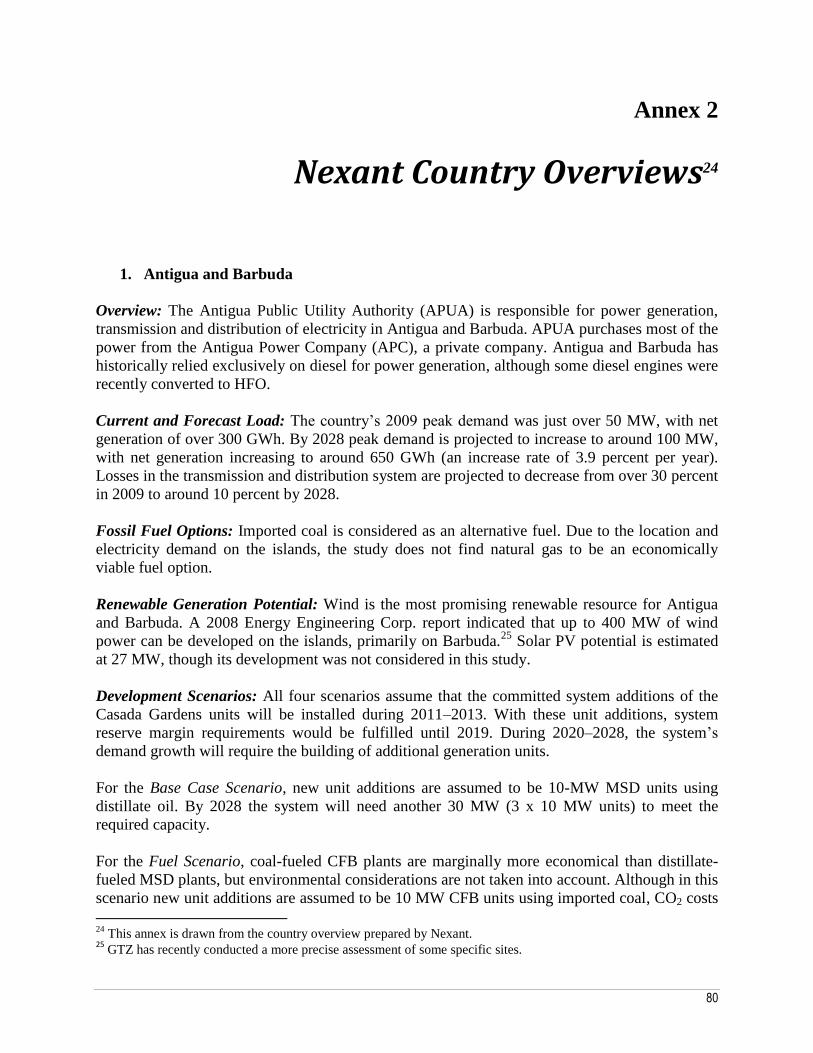
80
Annex 2
Nexant Country Overviews24
1. Antigua and Barbuda
Overview: The Antigua Public Utility Authority (APUA) is responsible for power generation,
transmission and distribution of electricity in Antigua and Barbuda. APUA purchases most of the
power from the Antigua Power Company (APC), a private company. Antigua and Barbuda has
historically relied exclusively on diesel for power generation, although some diesel engines were
recently converted to HFO.
Current and Forecast Load: The country’s 2009 peak demand was just over 50 MW, with net
generation of over 300 GWh. By 2028 peak demand is projected to increase to around 100 MW,
with net generation increasing to around 650 GWh (an increase rate of 3.9 percent per year).
Losses in the transmission and distribution system are projected to decrease from over 30 percent
in 2009 to around 10 percent by 2028.
Fossil Fuel Options: Imported coal is considered as an alternative fuel. Due to the location and
electricity demand on the islands, the study does not find natural gas to be an economically
viable fuel option.
Renewable Generation Potential: Wind is the most promising renewable resource for Antigua
and Barbuda. A 2008 Energy Engineering Corp. report indicated that up to 400 MW of wind
power can be developed on the islands, primarily on Barbuda.25
Solar PV potential is estimated
at 27 MW, though its development was not considered in this study.
Development Scenarios: All four scenarios assume that the committed system additions of the
Casada Gardens units will be installed during 2011–2013. With these unit additions, system
reserve margin requirements would be fulfilled until 2019. During 2020–2028, the system’s
demand growth will require the building of additional generation units.
For the Base Case Scenario, new unit additions are assumed to be 10-MW MSD units using
distillate oil. By 2028 the system will need another 30 MW (3 x 10 MW units) to meet the
required capacity.
For the Fuel Scenario, coal-fueled CFB plants are marginally more economical than distillate-
fueled MSD plants, but environmental considerations are not taken into account. Although in this
scenario new unit additions are assumed to be 10 MW CFB units using imported coal, CO2 costs
24
This annex is drawn from the country overview prepared by Nexant. 25
GTZ has recently conducted a more precise assessment of some specific sites.

81
of US$50/ton would make the distillate-fueled units more economical than the coal-fueled units.
Conventional (large-scale) LNG is more costly than either the distillate or coal option. Although
not studied in the same detail as the other fuel options, mid-scale LNG may provide an
economically attractive option. By 2028 the system will need another 30 MW (3 x 10 MW units)
to meet the required capacity. The Fuel Scenario results show that the introduction of coal
provides NPV savings of US$12 million compared to the Base Case Scenario (not including
environmental costs).
The Interconnection/Renewables Scenario assumes development of new diesel units, as in the
Base Case Scenario, with the addition of 14 MW of new wind units. This assumes that sites with
good winds and low development costs can be identified and acquired. The
Interconnection/Renewables Scenario results show that the introduction of wind generation
provides NPV savings of US$20 million compared to the Base Case Scenario.
The Comprehensive Integrated Scenario assumes that new generation units are 10-MW CFB
units, as in the Fuel Scenario, and the addition of 14 MW of new wind units, as in the
Interconnection/Renewables Scenario. The Comprehensive Integrated Scenario results show that
including both coal as a fuel and wind generation provides combined savings of US$31 million
over the Base Case Scenario, not including environmental costs. The Comprehensive Integrated
Scenario results show savings close to the sum of the savings of other two scenarios.
Discussion of Country Results: Adding coal-fueled CFB technology reduces NPV costs by
US$12 million compared to the Base Case Scenario, not including environmental costs which
would reduce the savings. The cost advantage compared to distillate-fueled MSD technology
ranges from 2 percent at a 55 percent capacity factor to 10 percent at an 80 percent capacity
factor. This cost advantage disappears if costs of US$50/ton are added for CO2 emissions.
Conventional LNG is more costly than distillate, but mid-scale LNG might be a viable fuel
option, thereby justifying a more detailed analysis.
Development of wind generation reduces NPV costs by US$20 million compared to the Base
Case Scenario, assuming that sites with good winds and low development costs can be identified
and acquired. With that assumption, wind is much lower in cost than distillate-fueled generation.
Small hydro and biomass would also be economical if good sites can be identified. The benefits
are relatively unaffected by the choice of fuel for the country’s fossil units.

82
2. Barbados
Overview: Barbados Light and Power (BL&P), a private company, is responsible for power
generation, transmission and distribution of electricity in Barbados. Existing installed generation
of around 240 MW, mostly comprising low- and medium-speed diesel units, substantially
exceeds peak demand and provides a comfortable reserve margin. BL&P is looking to diversify
its fuel mix, which is mostly dependent on imported oil products.
Current and Forecast Load: The country’s 2008 peak demand was 164 MW, with net
generation of over 1,000 GWh. By 2028 peak demand is projected to double to around 325 MW,
with net generation increasing to around 1,900 GWh (an increase rate of 3.5 percent per year).
Fossil Fuel Options: Natural gas, delivered as LNG or through the Eastern Caribbean Gas
Pipeline (ECGP), and imported coal are considered as alternative fuel options. Due to the
location and electricity demand on the island, natural gas delivered through ECGP appears to be
the most economically attractive fuel option.
Renewable Generation Potential: No studies on country-specific overall wind and solar
potential are available. Therefore, Nexant estimates Barbados’ wind potential to be at least 10
MW based on an already approved project. Solar PV potential is estimated at 26 MW of installed
capacity, though its development was not considered in this study.
Development Scenarios: All four scenarios assume that the committed system additions of the
nine 16-MW Trent units will be installed. The first six units will be added during 2011–2013,
and the next three will be added when required to match the load growth. All Trent unit additions
would satisfy reserve margin requirements until 2025. During 2026–2028, the Barbados system
will require new capacity additions.
For the Base Case Scenario, new additions are assumed to be 20-MW low-speed diesel units
using distillate oil. By 2028 the system will need another 40 MW (2 x 20 MW units) to meet the
required capacity.
For the Fuel Scenario, assumed system additions are the same as for the Base Case Scenario.
The difference is that in this scenario most existing and all new units are assumed to use natural
gas as a fuel, supplied through the ECGP. The Fuel Scenario shows that the introduction of
ECGP natural gas could provide NPV savings of US$906 million compared to the Base Case
Scenario.
For the Interconnection/Renewables Scenario, most assumed system additions are the same as
for the Base Case Scenario. The difference in this scenario is the addition of 45 MW of new
wind units. This assumes that sites with good winds and low development costs can be identified
and acquired. There is no electrical interconnection. The Interconnection/Renewables Scenario
shows that the introduction of wind generation could provide NPV savings of US$39 million
compared to the Base Case Scenario.

83
For the Comprehensive Integrated Scenario, the availability of natural gas is assumed, as in the
Fuel Scenario, combined with the addition of 45 MW of new wind units, as in the
Interconnection/Renewables Scenario. The Comprehensive Integrated Scenario results show
NPV savings of US$912 million over the Base Scenario, only slightly more than for the Fuel
Scenario.
Discussion of Country Results: Barbados has three fossil fuel options that offer economic
benefits compared to continued reliance on oil products: natural gas through the ECGP, LNG,
and coal (not including environmental costs). By far the most attractive is the ECGP option,
which provides NPV savings of US$906 million compared to the Base Case Scenario. Its cost
per kWh compared to distillate-fueled generation ranges from less than half at a 20 percent
capacity factor to less than 40 percent at an 80 percent capacity factor.
If the ECGP does not materialize, the other fuel options should be considered. They would offer
significant savings compared to distillate.
Development of wind generation reduces Interconnection/Renewables Scenario NPV costs by
US$39 million compared to the Base Case Scenario, assuming that sites with good winds and
low development costs can be identified and acquired. However, when ECGP gas is available, as
is assumed in the Comprehensive Integrated Scenario, adding wind generation increases savings
by only US$6 million. Wind is only marginally economical, as would be small hydro if good
sites can be identified, but biomass would be marginally uneconomical. This illustrates the high
dependence of wind generation savings on the assumed fuel supply option, and the possibility
that wind generation penetration might be limited to only a few of the best wind sites.
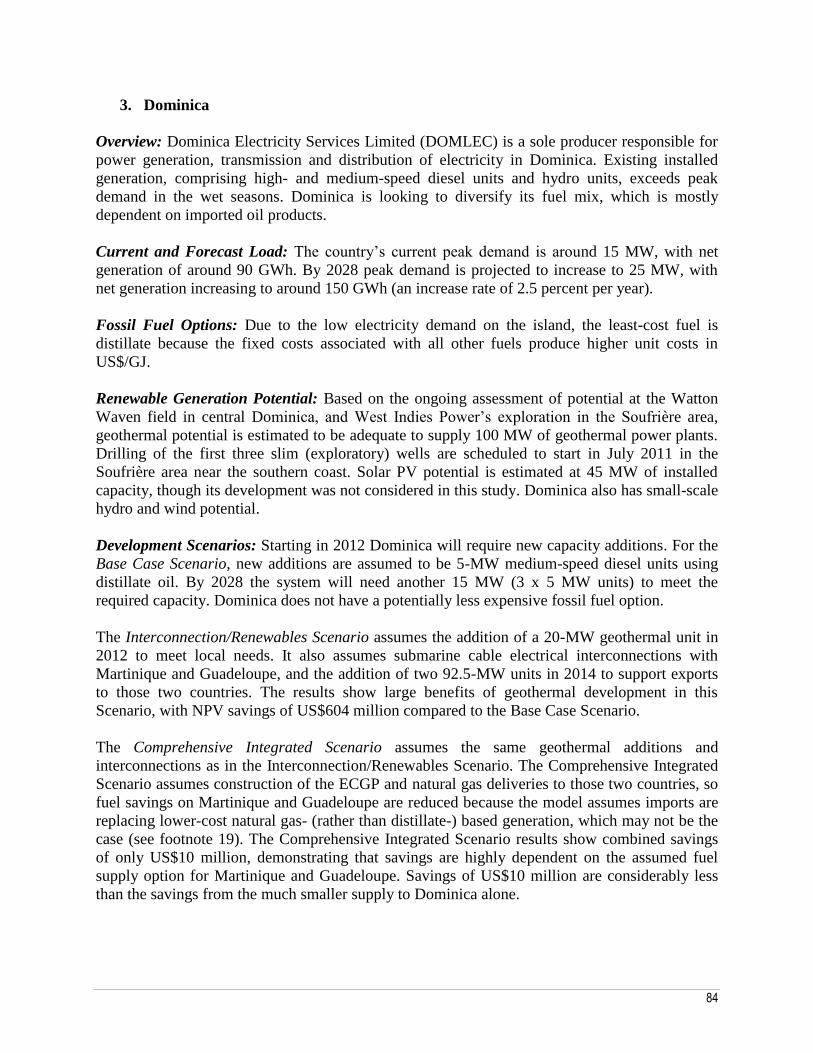
84
3. Dominica
Overview: Dominica Electricity Services Limited (DOMLEC) is a sole producer responsible for
power generation, transmission and distribution of electricity in Dominica. Existing installed
generation, comprising high- and medium-speed diesel units and hydro units, exceeds peak
demand in the wet seasons. Dominica is looking to diversify its fuel mix, which is mostly
dependent on imported oil products.
Current and Forecast Load: The country’s current peak demand is around 15 MW, with net
generation of around 90 GWh. By 2028 peak demand is projected to increase to 25 MW, with
net generation increasing to around 150 GWh (an increase rate of 2.5 percent per year).
Fossil Fuel Options: Due to the low electricity demand on the island, the least-cost fuel is
distillate because the fixed costs associated with all other fuels produce higher unit costs in
US$/GJ.
Renewable Generation Potential: Based on the ongoing assessment of potential at the Watton
Waven field in central Dominica, and West Indies Power’s exploration in the Soufrière area,
geothermal potential is estimated to be adequate to supply 100 MW of geothermal power plants.
Drilling of the first three slim (exploratory) wells are scheduled to start in July 2011 in the
Soufrière area near the southern coast. Solar PV potential is estimated at 45 MW of installed
capacity, though its development was not considered in this study. Dominica also has small-scale
hydro and wind potential.
Development Scenarios: Starting in 2012 Dominica will require new capacity additions. For the
Base Case Scenario, new additions are assumed to be 5-MW medium-speed diesel units using
distillate oil. By 2028 the system will need another 15 MW (3 x 5 MW units) to meet the
required capacity. Dominica does not have a potentially less expensive fossil fuel option.
The Interconnection/Renewables Scenario assumes the addition of a 20-MW geothermal unit in
2012 to meet local needs. It also assumes submarine cable electrical interconnections with
Martinique and Guadeloupe, and the addition of two 92.5-MW units in 2014 to support exports
to those two countries. The results show large benefits of geothermal development in this
Scenario, with NPV savings of US$604 million compared to the Base Case Scenario.
The Comprehensive Integrated Scenario assumes the same geothermal additions and
interconnections as in the Interconnection/Renewables Scenario. The Comprehensive Integrated
Scenario assumes construction of the ECGP and natural gas deliveries to those two countries, so
fuel savings on Martinique and Guadeloupe are reduced because the model assumes imports are
replacing lower-cost natural gas- (rather than distillate-) based generation, which may not be the
case (see footnote 19). The Comprehensive Integrated Scenario results show combined savings
of only US$10 million, demonstrating that savings are highly dependent on the assumed fuel
supply option for Martinique and Guadeloupe. Savings of US$10 million are considerably less
than the savings from the much smaller supply to Dominica alone.

85
Discussion of Country Results: Because its low demand means that no fossil fuel options appear
economical compared to distillate, geothermal development is particularly important for
Dominica. It seems probable that a geothermal resource at least large enough to serve
Dominica’s demand will be confirmed. This would be the most important result from the
country’s point of view, because it would insulate the country from the high price of distillate
and from the uncertainty associated with variations in that price over time. It would also reduce
CO2 emissions.
Considering the low cost of geothermal power, wind generation is only marginally economical
compared to geothermal for domestic consumption on Dominica. Small hydro would also be
marginally economical if good sites can be identified, but biomass would be marginally
uneconomical.
Confirmation of a resource sufficient to serve exports to Martinique and/or Guadeloupe is less
certain. Additionally, Martinique and Guadeloupe have alternative supply options – LNG and
pipeline gas – both of which provide large cost savings over distillate. It is clear that a more
detailed analysis of the Martinique and Guadeloupe systems would be required to determine the
desirability of developing geothermal power in Dominica for export to those countries. That will
depend on the resource, how alternative fuel supplies are used and developed (distillate, ECGP,
LNG), as well as factors such as costs and the number of units that could be converted to natural
gas.
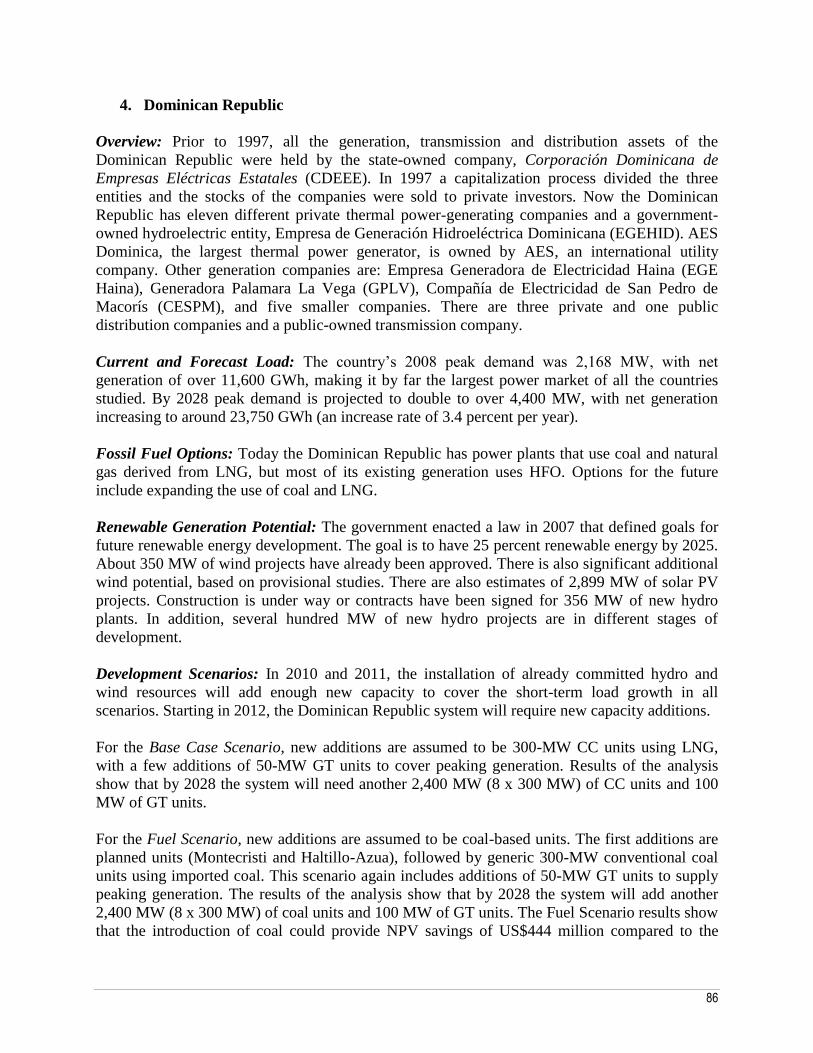
86
4. Dominican Republic
Overview: Prior to 1997, all the generation, transmission and distribution assets of the
Dominican Republic were held by the state-owned company, Corporación Dominicana de
Empresas Eléctricas Estatales (CDEEE). In 1997 a capitalization process divided the three
entities and the stocks of the companies were sold to private investors. Now the Dominican
Republic has eleven different private thermal power-generating companies and a government-
owned hydroelectric entity, Empresa de Generación Hidroeléctrica Dominicana (EGEHID). AES
Dominica, the largest thermal power generator, is owned by AES, an international utility
company. Other generation companies are: Empresa Generadora de Electricidad Haina (EGE
Haina), Generadora Palamara La Vega (GPLV), Compañía de Electricidad de San Pedro de
Macorís (CESPM), and five smaller companies. There are three private and one public
distribution companies and a public-owned transmission company.
Current and Forecast Load: The country’s 2008 peak demand was 2,168 MW, with net
generation of over 11,600 GWh, making it by far the largest power market of all the countries
studied. By 2028 peak demand is projected to double to over 4,400 MW, with net generation
increasing to around 23,750 GWh (an increase rate of 3.4 percent per year).
Fossil Fuel Options: Today the Dominican Republic has power plants that use coal and natural
gas derived from LNG, but most of its existing generation uses HFO. Options for the future
include expanding the use of coal and LNG.
Renewable Generation Potential: The government enacted a law in 2007 that defined goals for
future renewable energy development. The goal is to have 25 percent renewable energy by 2025.
About 350 MW of wind projects have already been approved. There is also significant additional
wind potential, based on provisional studies. There are also estimates of 2,899 MW of solar PV
projects. Construction is under way or contracts have been signed for 356 MW of new hydro
plants. In addition, several hundred MW of new hydro projects are in different stages of
development.
Development Scenarios: In 2010 and 2011, the installation of already committed hydro and
wind resources will add enough new capacity to cover the short-term load growth in all
scenarios. Starting in 2012, the Dominican Republic system will require new capacity additions.
For the Base Case Scenario, new additions are assumed to be 300-MW CC units using LNG,
with a few additions of 50-MW GT units to cover peaking generation. Results of the analysis
show that by 2028 the system will need another 2,400 MW (8 x 300 MW) of CC units and 100
MW of GT units.
For the Fuel Scenario, new additions are assumed to be coal-based units. The first additions are
planned units (Montecristi and Haltillo-Azua), followed by generic 300-MW conventional coal
units using imported coal. This scenario again includes additions of 50-MW GT units to supply
peaking generation. The results of the analysis show that by 2028 the system will add another
2,400 MW (8 x 300 MW) of coal units and 100 MW of GT units. The Fuel Scenario results show
that the introduction of coal could provide NPV savings of US$444 million compared to the
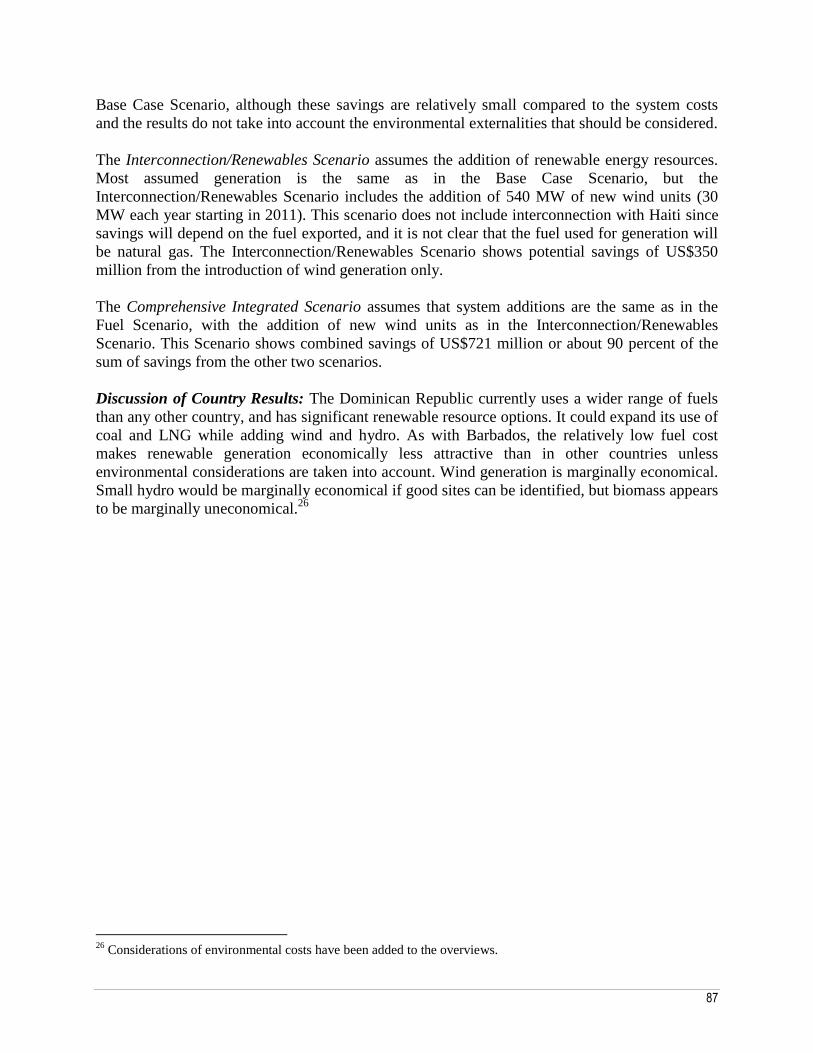
87
Base Case Scenario, although these savings are relatively small compared to the system costs
and the results do not take into account the environmental externalities that should be considered.
The Interconnection/Renewables Scenario assumes the addition of renewable energy resources.
Most assumed generation is the same as in the Base Case Scenario, but the
Interconnection/Renewables Scenario includes the addition of 540 MW of new wind units (30
MW each year starting in 2011). This scenario does not include interconnection with Haiti since
savings will depend on the fuel exported, and it is not clear that the fuel used for generation will
be natural gas. The Interconnection/Renewables Scenario shows potential savings of US$350
million from the introduction of wind generation only.
The Comprehensive Integrated Scenario assumes that system additions are the same as in the
Fuel Scenario, with the addition of new wind units as in the Interconnection/Renewables
Scenario. This Scenario shows combined savings of US$721 million or about 90 percent of the
sum of savings from the other two scenarios.
Discussion of Country Results: The Dominican Republic currently uses a wider range of fuels
than any other country, and has significant renewable resource options. It could expand its use of
coal and LNG while adding wind and hydro. As with Barbados, the relatively low fuel cost
makes renewable generation economically less attractive than in other countries unless
environmental considerations are taken into account. Wind generation is marginally economical.
Small hydro would be marginally economical if good sites can be identified, but biomass appears
to be marginally uneconomical.26
26
Considerations of environmental costs have been added to the overviews.

88
5. Grenada
Overview: Grenada Energy Services Ltd. (GRENLEC) is a private energy provider that owns all
the generation and transmission facilities in Grenada, Carriacou and Petit Martinique.
GRENLEC’s installed generation, mostly LSD units, exceeds 2008 peak demand by about 81
percent, providing a comfortable reserve margin. Most of the generating units were installed
after 2002 and are relatively efficient. The diversification of the fuel/energy mix and the use of
alternative energy sources are two critical strategic objectives.
Current and Forecast Load: The country’s peak demand is around 30 MW, with net generation
of around 190 GWh. By 2028 peak demand is projected to increase significantly to around 84
MW, with net generation increasing to around 530 GWh (an increase rate of 5.3 percent per
year).
Fossil Fuel Options: Imported coal is considered as an alternative fuel. Due to the location and
electricity demand on the island, the study does not find natural gas to be an economically viable
fuel option.
Renewable Generation Potential: Wind is the most promising renewable resource for Grenada.
Initial wind measurements and project installations are under way. Grenada is also encouraging
small photovoltaic installations. Solar PV potential is estimated at 21 MW of installed capacity.
Grenada’s geothermal potential is estimated at 400 MW. The government recently announced
plans for development of the resource, though the impact from future development was not
considered as a part of this study. It is possible that the development of geothermal resources
would significantly change the future energy options of the country.
Development Scenarios: Grenada will require new capacity addition starting in 2013. For the
Base Case Scenario, new additions are assumed to be 10-MW medium-speed diesel units using
distillate oil. By 2028 the system will need another 70 MW (7 x 10 MW units) to cover projected
load growth.
For the Fuel Scenario, new unit additions are assumed to be 10-MW CFB units using imported
coal. Conventional (large-scale) LNG is more costly than either the distillate or coal option.
Although not studied in the same detail as the other fuel options, mid-scale LNG may provide an
economically attractive option. By 2028 the system will need an additional 70 MW (7 x 10 MW
units) to cover projected load growth. The Fuel Scenario results show that the introduction of
coal provides NPV savings of US$32 million compared to the Base Case Scenario, although
these savings do not take into account environmental costs.
For the Interconnection/Renewables Scenario, most assumed new generation units are the same
as in the Base Case. The difference in this scenario is the addition of 12 MW of new wind units.
This assumes that sites with good winds and low development costs can be identified and
acquired. The Interconnection/Renewables Scenario results show that the introduction of wind
generation provides NPV savings of US$17 million compared to the Base Case Scenario.
89
The Comprehensive Integrated Scenario assumes that system additions are the same as in the
Fuel Scenario, with the addition of new wind units as in the Interconnection/Renewables
Scenario. The Comprehensive Integrated Scenario results show that including both coal as a fuel
and wind generation provides combined savings of US$44 million over the Base Case Scenario,
not including the environmental costs of coal. The Comprehensive Integrated Scenario results
show savings close to the sum of the savings of other two scenarios.
Discussion of Country Results: Adding coal-fueled CFB technology reduces NPV costs, not
including environmental costs, by US$12 million compared to the Base Case Scenario, with a
cost advantage compared to distillate-fueled MSD technology ranging from 2 percent at a 55
percent capacity factor to 12 percent at a 90 percent capacity factor. This cost advantage
disappears if costs of US$50/ton are added for CO2 emissions.
Conventional LNG is more costly than distillate, but mid-scale LNG may be a viable fuel option
and merits a more detailed analysis.
Development of wind generation reduces NPV costs by US$20 million compared to the Base
Case Scenario, assuming that sites with good winds and low development costs can be identified
and acquired. Small hydro and biomass would also be economical if good sites can be identified.
The benefits are relatively unaffected by the choice of fuel for the country’s fossil units.
90
6. Haiti27
Overview: Electricité d’Haïti (Electricity of Haiti, EDH) has the monopoly for electricity
generation, transmission and distribution in Haiti. The EDH grid consists of ten isolated areas, of
which the Metropolitan area, which includes Port-au-Prince, is by far the largest, with 80 percent
of total demand. Only about 12 percent of the country’s population is officially electrified (20
percent if unofficial connections are included). Generation, transmission and distribution
facilities are old and need rehabilitation. Operational capacity of generating units is only about
155 MW. At times half of all demand is not served due to load shedding.
Current and Forecast Load: The country’s 2008 unconstrained peak demand was estimated at
215 MW, but due to load shedding net generation was only around 600 GWh. With the
assumption that the economic conditions will improve and generation resources will, over time,
catch up with demand, by 2028 unconstrained peak demand is projected to increase to around
570 MW with net generation increasing to around 2,800 GWh (an increase rate of 5 percent per
year for peak demand and 7.9 percent for energy generation).
Fossil Fuel Options: LNG and imported coal are considered as alternative fuels. The analysis
finds LNG to be the economically preferred fuel option.
Renewable Generation Potential: Wind and hydropower are the most promising renewable
resources for Haiti. A study of wind at three sites was conducted with good results. Haiti has
untapped resources of at least 50 MW in small hydro projects. Solar PV potential is estimated at
1,654 MW of installed capacity, though its development was not considered in this study. The
biomass resource must be assessed cautiously, taking into account deforestation and land use
issues.
Development Scenarios: Haiti’s power system was already short of generation resources in
2009. Nexant calculated that the already committed resources and an additional 80 MW of LSD
units (4 x 20 MW) would need to have been built during 2009 just to meet the existing demand.
For the Base Case Scenario, new unit additions are assumed to be 20-MW LSD units using
distillate oil. Starting in 2010 the system needs another 20 MW (in some years 40 MW) in new
units each year to cover projected load growth. By 2028 the system will need to install a total of
540 MW of new units.
The Fuel Scenario assumes that system additions are the same as for the Base Case Scenario.
The difference is that in this scenario all new units use natural gas as a fuel. Natural gas would be
supplied starting in 2014 from a new LNG terminal. The Fuel Scenario results show that the
introduction of LNG provides NPV savings of US$433 million compared to the Base Scenario.
Although not studied in the same detail as the other fuel options, mid-scale LNG may also
provide an economically attractive option.
The Interconnection/Renewables Scenario assumes that generation is the same as in the Base
Case Scenario, but includes the addition of 81 MW of new wind generation. This assumes that
27
The analysis does not take into account the impact of the January 2010 earthquake.
91
sites with good winds and low development costs can be identified and acquired. There is no
electrical interconnection. The Interconnection/Renewables Scenario results show that the
introduction of wind generation provides NPV savings of US$76 million compared to the Base
Case Scenario.
The Comprehensive Integrated Scenario assumes that system additions are the same as in the
Fuel Scenario, with the addition of new wind units as in the Interconnection/Renewables
Scenario. The Comprehensive Integrated Scenario results show that including both LNG as a
fuel and wind generation provides combined savings of US$476 million over the Base Case
Scenario. The results show that 55 percent of the wind savings in the
Interconnection/Renewables Scenario appear in the Comprehensive Integrated Scenario.
The results of the separate analysis, which studied only interconnection and exports from the
Dominican Republic to Haiti, show, on a NPV basis, that system costs in the Dominican
Republic increase by US$322 million when HFO fuels the exported generation. System costs in
Haiti decrease by US$556 million. The total savings are thus US$235 million. This compares
with the NPV costs of building and operating the transmission line calculated at US$242 million.
The total cost increases outweighed the potential benefits, and therefore a transmission
interconnection is not included in the Interconnection/Renewables Scenario or the
Comprehensive Integrated Scenario. If natural gas-fueled generation provides the exported
generation, the interconnection becomes economically attractive in this analysis. Furthermore,
there are other considerations that should be taken into account when considering an
interconnection, such as the access to emergency energy support or the possibility or reducing
reserve margins.
Discussion of Country Results: The poor condition and inadequate amount of generation in
Haiti make all near-term additions highly cost effective until an adequate reserve margin is
established.
LNG is much less costly than distillate, leading to estimated savings of US$433 million. Coal,
which is more expensive than LNG, is also an option, but it becomes significantly less
economical when costs of US$50/ton are added for CO2 emissions.
Development of wind generation in the Interconnection/Renewables Scenario reduces NPV costs
by US$76 million compared to the Base Case Scenario, assuming that sites with good winds and
low development costs can be identified and acquired. In the Comprehensive Integrated
Scenario, because lower-cost LNG displaces distillate, wind is less attractive but still
economical. Small hydro would also be economical, and biomass would be marginally
economical if good sites can be identified.
The viability of the land-based interconnection with the Dominican Republic depends on the fuel
source for the DR’s generation. Because of its length, the terrain, and the relatively low amount
of power transmitted, the interconnection itself is costly despite being on land, and is most viable
with low-cost generation such as natural gas.

92
7. Jamaica
Overview: Jamaica Public Service (JPS) is the sole distributor of electricity in Jamaica. It is a
vertically integrated company involved with generation, transmission and distribution of
electricity. It also buys power from four independent power producers in Jamaica. The
government has reorganized the energy department under the Ministry of Energy and Mining
(MEM). It sets energy policy and has recently issued a draft of the new energy policy. The main
focus is on developing energy diversity, since 95 percent of power is currently generated by
petroleum products. The ministry has held extensive negotiations with major fuel users, gas
suppliers and foreign partners to help develop a natural gas industry in Jamaica.
Current and Forecast Load: The country’s 2008 peak demand was 622 MW, with net
generation of over 4,100 GWh. By 2028 peak demand is projected to increase to around 1,500
MW, with net generation increasing to around 10,000 GWh (an increase rate of 4.3 percent per
year).
Fossil Fuel Options: Natural gas, delivered as LNG, and imported coal are considered as
alternative fuel options.
Renewable Generation Potential: Wind is the most promising renewable resource for Jamaica.
Detailed engineering is under way to expand Wigdon Wind Farm by 18 MW. Jamaica has
limited potential for small hydro and biomass development. The current resource plan includes
the development of an estimated 20-MW municipal waste project in Kingston. Solar PV
potential is estimated at 650 MW of installed capacity, though its development was not
considered in this study.
Development Scenarios: During the next three years, until 2014, Nexant assumes that the
planned resources, including the Kingston, Hunts Bay, Windalco, Jamalco and Wigton units, will
be built to cover the load growth. If these resources are built, Jamaica will require new capacity
additions starting in 2015.
For the Base Case Scenario, new additions are assumed to be 100-MW conventional coal units
using imported coal. The results of the analysis show that by 2028 the system will need another
1,100 MW (11 x 100 MW units) to cover projected load growth.
For the Fuel Scenario, starting in 2015 new additions are assumed to be 100-MW CC units using
natural gas supplied from two new LNG terminals, one on the southern side of the island and one
on the northern side. Natural gas will become available during 2014 and by that year about 450
MW in existing units are also assumed to be converted to use natural gas. Although not studied
in the same detail as the other fuel options, mid-scale LNG may provide an economically
attractive option. The results of the analysis show that by 2028 the system will need another
1,100 MW (11 x 100 MW units) to cover projected load growth. The Fuel Scenario results show
that the introduction of LNG provides NPV savings of US$500 million compared to the Base
Case Scenario.

93
The Interconnection/Renewables Scenario assumes that system unit additions are the same as for
the Base Case Scenario. The difference is the addition of 219 MW of wind generation by 2028.
This assumes that sites with good winds and low development costs can be identified and
acquired. There is no electrical interconnection. The Interconnection/Renewables Scenario
results show that the introduction of wind generation provides NPV savings of US$138 million
compared to the Base Case Scenario.
The Comprehensive Integrated Scenario assumes that system additions are the same as in the
Fuel Scenario, with the addition of new wind units as in the Interconnection/Renewables
Scenario. The Comprehensive Integrated Scenario results show that including both LNG as a
fuel and wind generation provides combined savings of US$628 million over the Base Case
Scenario. The Comprehensive Integrated Scenario results show savings close to the sum of the
savings of other two scenarios.
Discussion of Country Results: The Base Case Scenario assumes that the infrastructure to
deliver and generate with coal will be put in place. If this does not occur, the other scenarios’
benefits would be much larger.
LNG has the advantage that in the Fuel Scenario it can displace HFO in existing plants as well as
the new coal generation added in the Base Case Scenario. Replacing new coal generation in the
Base Case Scenario with LNG in the Fuel Scenario, and displacing HFO use in existing plants,
leads to savings of US$500 million. Coal becomes even less economical when costs of
US$50/ton are added for CO2 emissions.
Development of wind generation in the Interconnection/Renewables Scenario reduces NPV costs
by US$138 million compared to the Base Case Scenario, assuming that sites with good winds
and low development costs can be identified and acquired. Wind is economical, as would be
small hydro if good sites can be identified. The benefits are relatively unaffected by the choice of
fuel for the country’s fossil units.

94
8. St. Kitts and Nevis
Overview: St. Kitts and Nevis have distinct utility structures. The electricity service in St. Kitts is
provided by a department of the St. Kitts Government. All generation is by low- and medium-
speed diesel units. A plan is under way to convert some of the units to HFO. The Nevis
Electricity Co. Ltd. is a stand-alone government entity that supplies power to Nevis. All of
Nevis’s generation is also by low- and medium-speed diesel units.
Current and Forecast Load: Current peak demand for both islands is less than 40 MW, with net
generation of around 200 GWh. By 2028 peak demand is projected to increase to 85 MW, with
net generation increasing to around 430 GWh (an increase rate of 3.6 percent per year, with rates
of 2.9 percent per year for St. Kitts and 5.2 percent per year for Nevis).
Fossil Fuel Options: Imported coal is considered as an alternative fuel. Due to the location and
electricity demand on the island, the study does not find natural gas to be an economically viable
fuel option.
Renewable Generation Potential: Nevis has significant geothermal resources estimated to
support the development of 300 MW of geothermal power plants. Production drilling for a 10
MW plant is scheduled to begin in January 2011. A 30-MW plant on Nevis to serve demand on
St. Kitts is in late stages of planning. The islands also have the potential to develop small 4- to 5-
MW wind farms. Solar PV potential is estimated at 16 MW of installed capacity, though its
development was not considered in this study.
Development Scenarios: Starting in 2012, St. Kitts will require new capacity additions. For the
Base Case Scenario, new additions are assumed to be 5-MW medium-speed diesel units using
distillate oil. By 2028 the system will need another 35 MW (7 x 5 MW units) to cover projected
load growth.
Starting in 2011, Nevis will require new capacity additions. For the Base Case Scenario, new
additions are assumed to be 5-MW MSD units using distillate oil. By 2028 the system will need
another 25 MW (5 x 5 MW units) to cover projected load growth.
Neither St. Kitts nor Nevis has an alternative, potentially less expensive fossil fuel option to be
used for the Fuel Scenario.
The Interconnection/Renewables Scenario assumes that Nevis will be interconnected with St.
Kitts by 2011 and the two 20-MW geothermal units on Nevis will supply 30 MW for St. Kitts
and 10 MW for Nevis. No new generation units will be built on St. Kitts. This scenario also
assumes that two 200-MW geothermal units will be built on Nevis in 2014 to supply Puerto
Rico. A submarine cable connecting Nevis and Puerto Rico is also assumed to be completed by
2014. The St. Kitts results show NPV savings of US$159 million compared to the Base Case
Scenario, as the result of interconnection and geothermal development on Nevis. These savings
are much higher than the increased costs of US$100 million on Nevis associated with serving the
St. Kitts load. Interconnection of St. Kitts and Nevis and geothermal development of Nevis to
serve both islands is clearly a cost-effective option. Furthermore, large potential benefits of over

95
US$1 billion are the result of additional geothermal development, interconnection and exports of
energy to Puerto Rico.
The Comprehensive Integrated Scenario assumes the same interconnection with Nevis by 2011
and no new generation units built on St. Kitts, as in the Interconnection/Renewables Scenario.
Discussion of Country Results: Because their low demand means that no fossil fuel options
appear economical compared to distillate, geothermal development on Nevis is particularly
important for St. Kitts and Nevis. It seems highly probable that a geothermal resource of at least
40 MW will be developed, based on the exploratory well and signed contracts. This would
insulate the country from the high price of distillate and from the uncertainty associated with
variation in that price over time. It would also reduce CO2 emissions.
Considering the low cost of geothermal power, wind generation is only marginally economical
compared to geothermal for domestic consumption on St. Kitts and Nevis. Small hydro would
also be marginally economical if good sites can be identified, but biomass would be marginally
uneconomical.
Development of a resource sufficient to serve exports to Puerto Rico is less certain, but West
Indies Power indicates that exploration data support at least 300 MW. The very large benefits
associated with the development of 400 MW for export to Puerto Rico are based on the exports
displacing HFO in Puerto Rico, which seem reasonable since HFO is the main fuel used today.
96
9. St. Lucia
Overview: St. Lucia Electricity Services Ltd. (LUCELEC) is responsible for power generation,
transmission and distribution of electricity on St. Lucia. Existing installed generation of around
75 MW, composed of diesel units, exceeds peak demand and provides a comfortable reserve
margin. LUCELEC is looking to diversify its fuel mix, which is mostly dependent on imported
oil products. The utility has adequate tariffs, reasonable regulation and a strong financial
position.
Current and Forecast Load: The country’s 2008 peak demand was 54 MW, with net generation
of over 350 GWh. By 2028, peak demand is projected to increase to around 115 MW, with net
generation increasing to around 650 GWh (an increase rate of 3.2 percent).
Fossil Fuel Options: Natural gas, delivered as LNG or through the ECGP, and imported coal are
considered as alternative fuel options. Due to the location and electricity demand on the island,
natural gas delivered through the ECGP is found to be the most economical fuel option.
Renewable Generation Potential: Wind is the most promising renewable resource for St. Lucia.
LUCELEC is pursuing a wind farm on land it already owns and is starting measurement on
several other promising sites. St. Lucia also has rooftop solar PV installations at many locations.
Solar PV potential is estimated at 36 MW of installed capacity, though its development was not
considered in this study. There was significant geothermal exploration in the 1970s and 1980s,
but the wells did not produce much steam. There appears to be some geothermal potential, but
for a long time the rights to the resource were, and may still be, tied up with a developer.
Development Scenarios: Starting in 2010, St. Lucia will require new capacity additions.
For the Base Case Scenario, new additions are assumed to be 20-MW LSD units using distillate
oil. By 2028 the system will need another 80 MW (4 x 20 MW units) to meet the required
capacity.
The Fuel Scenario assumes that system additions are the same as for the Base Case Scenario.
The difference is that in this scenario most existing and all new units will use natural gas as a
fuel. Natural gas will be supplied through the ECGP. Fuel Scenario results show that the
introduction of ECGP gas provides NPV savings of US$216 million compared to the Base Case
Scenario.
The Interconnection/Renewables Scenario assumes that system additions are the same as for the
Base Case Scenario. The difference is the assumed addition by 2028 of 18 MW of wind
generation. This assumes that sites with good winds and low development costs can be identified
and acquired. There is no electrical interconnection. The Interconnection/Renewables Scenario
results show that the introduction of wind generation provides NPV savings of US$18 million
compared to the Base Case Scenario.
The Comprehensive Integrated Scenario assumes that system additions are the same as in the
Fuel Scenario, with the addition of new wind units as in the Interconnection/Renewables

97
Scenario. Similar to the Barbados results, the Comprehensive Integrated Scenario NPV savings
of US$221 million are only US$5 million higher than the Fuel Scenario, showing that savings
from wind generation are much smaller when the assumed displaced fuel is low-cost gas rather
than high-cost distillate.
Discussion of Country Results: St. Lucia has two fossil fuel options that offer economic
benefits, not taking into account environmental costs, compared to continued reliance on oil
products: natural gas through the ECGP and coal. By far the more attractive is the ECGP option,
which in the Fuel Scenario provides NPV savings of US$216 million compared to the Base Case
Scenario. Its cost per kWh compared to distillate-fueled generation ranges from less than half at
a 20 percent capacity factor to less than 40 percent at an 80 percent capacity factor. ECGP gas
could displace distillate in existing units and could fuel new units.
Development of wind generation reduces Interconnection/Renewables Scenario NPV costs by
US$18 million compared to the Base Case Scenario, assuming that sites with good winds and
low development costs can be identified and acquired. However, when ECGP gas is available, as
is assumed in the Comprehensive Integrated Scenario, adding wind generation increases savings
by only US$5 million. Wind is marginally economical, as would be small hydro if good sites can
be identified, but biomass would be marginally uneconomical. This illustrates the high
dependence of wind generation savings on the assumed fuel supply option, and the possibility
that the penetration of wind generation might be limited to only a few of the best wind sites.

98
10. St. Vincent and the Grenadines
Overview: St. Vincent Electricity Service Ltd. (Vinlec) is a state-owned corporation responsible
for power generation, transmission and distribution of electricity on the islands. Existing
installed generation of around 58 MW, mostly comprising low- and medium-speed diesel and
small hydro units, exceeds peak demand and provides a comfortable reserve margin. The St.
Vincent Government’s goal is to provide 20 percent of electricity from renewable resources.
Canouan Island has generating capacity of 2.5 MW and remaining islands have much smaller
generating capacity.
Current and Forecast Load: The country’s 2008 peak demand was around 25 MW, with net
generation of around 150 GWh. By 2028 peak demand is projected to increase to around 95
MW, with net generation increasing to around 550 GWh (an increase rate of 6.9 percent per
year).
Fossil Fuel Options: Imported coal is considered as an alternative fuel. Due to the location and
electricity demand on the island, the study does not find natural gas to be an economically viable
fuel option.
Renewable Generation Potential: Wind and expansion of small hydro are the most promising
renewable resources. The country announced its first 2-MW wind farm development for
Canouan Island. There appears to be some geothermal potential, but the rights to the resource are
tied up with a developer. Solar PV potential is estimated at 23 MW of installed capacity, though
its development was not considered in this study.
Development Scenarios: St. Vincent and Grenadines will require new capacity additions starting
in 2017.
For the Base Case Scenario, new additions are assumed to be 10-MW medium-speed diesel units
using distillate oil. By 2028 the system will need another 70 MW (7 x 10 MW units) to cover
projected load growth.
For the Fuel Scenario, coal-fueled CFB plants are marginally more economical than distillate-
fueled MSD plants, but this does not take into account environmental costs. Although new unit
additions are assumed to be 10-MW CFB units using imported coal, CO2 costs of US$50/ton
would make the distillate-fueled units more economical than the coal-fueled units. Conventional
(large-scale) LNG appears to be more costly than either the distillate or coal option. Although
not studied in the same detail as the other fuel options, mid-scale LNG may provide an
economically attractive option. By 2028 the system will need another 70 MW (7 x 10 MW units)
to meet the required capacity. The Fuel Scenario results show that the introduction of coal
provides NPV savings of US$18 million compared to the Base Case Scenario, not considering
environmental costs.
The Interconnection/Renewables Scenario assumes that system additions are the same as for the
Base Case Scenario. The difference is the assumed addition of 14 MW of wind generation by
2028. This assumes that sites with good winds and low development costs can be identified and

99
acquired. The Interconnection/Renewables Scenario results show that the introduction of wind
generation provides NPV savings of US$14 million compared to the Base Case Scenario.
The Comprehensive Integrated Scenario assumes that system additions are the same as in the
Fuel Scenario, with the addition of new wind units as in the Interconnection/Renewables
Scenario. The Comprehensive Integrated Scenario results show that including both coal and
wind generation provides combined savings of US$29 million over the Base Case Scenario, not
considering environmental costs. The Comprehensive Integrated Scenario results show savings
close to the sum of the savings of the other two scenarios.
Discussion of Country Results: Adding coal-fueled CFB technology reduces NPV costs by
US$12 million compared to the Base Case Scenario, not including environmental costs, with a
cost advantage compared to distillate-fueled MSD technology ranging from 2 percent at a 55
percent capacity factor to 12 percent at a 90 percent capacity factor. That cost advantage
disappears if costs of US$50/ton are added for CO2 emissions.
Conventional LNG is more costly than distillate, but mid-scale LNG might be a viable fuel
option and deserves a more detailed analysis.
Development of wind generation reduces NPV costs by US$20 million compared to the Base
Case Scenario, assuming that sites with good winds and low development costs can be identified
and acquired. Small hydro and biomass would also be economical if good sites can be identified.
The benefits are relatively unaffected by the choice of fuel for the country’s fossil units.

1112077