JCBM - UCT Open Access Journals
67
` http://journals.uct.ac.za/index.php/jcbm/index JOURNAL OF CONSTRUCTION BUSINESS & MANAGEMENT JCBM ISSN 2521-0165 Volume 3, Number 1, June 2019 JCBM
-
Upload
khangminh22 -
Category
Documents
-
view
0 -
download
0
Transcript of JCBM - UCT Open Access Journals

`
http://journals.uct.ac.za/index.php/jcbm/index
JOURNAL OF
CONSTRUCTION BUSINESS & MANAGEMENT
JCBM ISSN 2521-0165
Volume 3, Number 1, June 2019
JCBM

i
Table of Contents
Volume 3, Number 1, June 2019
Table of Contents i
About JCBM ii
Editorial Board iii
Editorial v
ARTICLES
Firm Attributes and Performance: A Study of Architectural Firms in Nigeria 1
A. A. Oluwatayo, D. Amole and O. A. Alagbe
Organisational Commitment of Construction Skilled Workers in Selected Construction Firms in
Nigeria 8
D.O. Aghimien, O. A. Awodele, and C.S. Maipompo
Respondents’ perception of Risk Factors on Residential Property Development in Abuja,
Nigeria 18
O. T. Ogunbayo
Effect of Management Strategies in Entrenching Organisational Safety Culture in the Electricity
Industry of Zambia 27
E. M. Mwanaumo and M. Mambwe
Influence of the Management Styles and Quality of Management on Project Delivery 38
A. O. Aiyetan
Frameworks for Material Waste Minimization on Nigerian Building Projects 45
O. J. Oladiran, O. E. Ogunsanmi and M. O. Dada

ii
ABOUT JCBM
The Journal of Construction Business and Management (JCBM) is an open access journal published
bi-annually by the University of Cape Town Libraries, South Africa. The Journal is hosted by the
Construction Business and Management Research Group of the University of Cape Town. The journal
aims to explore the experience of construction industry stakeholders and trends in the global system. It
aims to publish peer reviewed and highly quality papers emanating from original theoretical based
research, rigorous review of literature, conceptual papers and development of theories, case studies and
practical notes. The journal also welcomes papers with diverse methodological research approaches
including qualitative, quantitative and mixed methods. Contributions are expected from academia,
public administrators, professionals in the public sector and private practice (such as contracting
organizations and consulting firms) and other related bodies and institutions (such as financial, legal and
NGOs).
The scope of Journal of Construction Business and Management (JCBM) covers, but is not limited
to construction management and project delivery, strategic management, decision making, skills
development, organizational practices and procedures in construction business. The specific areas in
construction management, sustainability in construction and project delivery include project
planning/feasibility studies, procurement, resource management, international construction, ethical
issues, industrial relations, legislative requirements and regulations, construction education, information
and communication technologies, housing policies, and urban design and development. Strategic
management in construction covers risk management, quality management, resilience and disaster
management, cultural and societal management, project life cycle management, and knowledge creation
and management. Among issues in construction organizational practices and procedures covered are
business development strategies, human resources and career development, continuous professional
development, leadership systems, marketing strategies, gender issues and corporate social
responsibility.
Journal of Construction Business and Management (JCBM) is a peer reviewed journal. All research
articles in this journal undergo rigorous peer review, based on initial editor and anonymised refereeing
by at least two anonymous referees.
Journal of Construction Business and Management (JCBM) Partners:
University of Cape Town
Obafemi Awolowo University
The UCT Library takes no responsibility for the content published within journals that are
hosted on OpenUCT: open journals, and does not accept any liability arising out of the use of
or the inability to use the information contained herein. The library, on behalf of itself and the
University, assumes no responsibility, and shall not be liable for any breaches of agreement with
other publishes/hosts.
iii
Editor-in-chief
Professor Abimbola Windapo University of Cape Town, South Africa
Associate Editor
Dr. Sunday Odediran Obafemi Awolowo University, Nigeria
Section Editor
Alireza Moghayedi University of Cape Town, South Africa
Journal Manager
Dr. AbdulRauf Adediran University of Cape Town, South Africa
Editorial Advisory Board
Professor Syed Ahmed
East Carolina University, United States
Professor Alfred Atsango Talukhaba Tshwane University of Technology
South Africa
Professor Chimay Anumba Pennsylvania State University
United States
Professor Godwin Jagboro Obafemi Awolowo University, Nigeria
Professor Keith Cattell University of Cape Town, South Africa
Professor Sam Wamuziri A’Sharqiyah University, Oman
Professor Paul Bowen University of Cape Town, South Africa
Professor Jack Steven Goulding Northumbria University, United Kingdom
Professor Olubola Babalola Obafemi Awolowo University, Nigeria
Professor Gary Holt University of Central Lancashire
United Kingdom
Professor George Ofori National University of Singapore
Singapore
Professor Henry Odeyinka, Obafemi Awolowo University, Nigeria
Professor Fidelis Emuze Central University of Technology
South Africa
Dr Julius Ayodeji Fapohunda Cape Peninsula University of Technology
South Africa
Dr James Rotimi Auckland University of Technology
New Zealand
Professor Kathy Michell University of Cape Town, South Africa
Professor Pantaleo Rwelamila University of South Africa, South Africa
Dr Rodney Milford Construction Industry Development Board
South Africa
Professor Stephen Ogunlana
Heriot-Watt University, United
Kingdom
Professor Alfred Ngowi Central University of Technology
South Africa
Professor John Smallwood Nelson Mandela Metropolitan University
South Africa

iv
Professor Olabode Ogunsanmi University of Lagos, Nigeria
Professor Will Hughes
University of Reading, United
Kingdom
Editorial Reviewer Panel
Dr. Emmanuel Itodo Daniel Southampton Solent University
United Kingdom
Dr Sandeep Shrivastava Malaviya National Institute of Technology
India
Mr. Olalekan Oshodi City University of Hong Kong, Hong Kong
Dr. Ruben Ndihokubwayo Cape Peninsula University of Technology
South Africa
Dr Erastus Mwanaumo University of Zambia, Zambia
Dr Innocent Musonda University of Johannesburg, South Africa
Professor Joe Igwe University of Lagos, Nigeria
Dr Adekunle Adeleke Universiti Utara, Malaysia
Professor Taibat Lawanson University of Lagos, Nigeria
Dr Elyas Jazayeri University of Kentucky, United States
Professor Evelyn Teo Ai Lin National University of Singapore
Singapore
Dr. Oluwaseun Dosumu University of Lagos, Nigeria
Dr. John Oko Ameh University of Lagos, Nigeria
Dr Akeem Bolaji Wahab Obafemi Awolowo University, Nigeria
Dr Ayodeji Aiyetan Durban University of Technology
South Africa
Associate Professor Clinton Aigbavboa University of Johannesburg, South Africa
Dr Grace Kehinde Ojo Obafemi Awolowo University, Nigeria
Dr Joel Ochieng' Wao Tuskegee University, United States
Dr Justus Agumba University of Johannesburg, South Africa
Dr Omokolade Akinsomi University of Witwatersrand, South Africa
Dr Luqman Oyewobi Federal University of Technology Minna
Nigeria
Dr Manya Mooya University of Cape Town, South Africa
Professor Peter Nwilo University of Lagos, Nigeria
Dr Oluwayomi Babatunde University of Witwatersrand, South Africa
Dr Richard Jimoh Federal University of Technology Minna
Nigeria
Dr Tabarak Ballal University of Reading, United Kingdom
Dr Tunde Timothy Oladokun Obafemi Awolowo University, Nigeria

v
Editorial
Welcome to the fifth issue of the Journal of Construction Business and Management. The
experience of construction industry stakeholders and businesses in the dynamic global
economic environment needs investigation towards equipping companies and stakeholders
with strategies for navigating the challenges encountered. The topics covered in this issue are
related to construction business management, organisational commitment, cost planning,
sustainability and practices used in the procurement of construction projects. The issue contains
six articles that were written by thirteen scholars based in Nigeria, South Africa and Zambia.
The articles provide robust narratives relating to recent advances in construction business and
management research. The conclusions reached in the paper are stimulating.
The first paper by Oluwatayo, Amole and Alagbe identified attributes in the profile,
structure and strategies of architectural firms, which are associated with the success of these
firms. They found that factors which were related to the success of these firms. They found that
factors which were related to the success of the Architectural firms include the availability of
information technology and the levels of specialisation of duties. They posit that architectural
firms use IT facilities strategically in enhancing business performance. Paper two by Aghimien,
Awodele and Maipompo noted the shortage of skilled construction workers in the industry and
how ensuring the commitment of the few available workers to their organisation objectives is
essential. Using a survey design of construction company workers to assess their level of
organisation commitment, the study found that the typical type of commitment exhibited by
skilled construction workers is the continuance commitment. Aghimien et al. advance that
construction companies need to continually improve in the aspects of human resource
management to attain better commitment of their workers and at the same time improve their
productivity. The paper by Ogunbayo investigated risk factors in timing development,
minimisation of cost and expected a return as they influence the successful delivery of
residential property development. Ogunbayo established that real estate developers were more
concerned with the influence of economic and technological risks than other sources of risk.
Paper four by Mwanaumo and Mambwe examined management strategies that impact
organisational safety culture in the electricity industry in Zambia. The rationale for their
investigation was based on their assumption that entrenching safety cultural aspects is one of
the functional areas within management systems that underlie various strategies. They
reviewed various literature on management strategies and employed a structured questionnaire
in obtaining the required information. The study by Mwanaumo and Mambwe concluded that
management commitment and their involvement in the safety aspects of the electricity industry
is not just a benevolent obligation, but it compels and motivates workers they protect to achieve
organisational objectives and goals. The article by Aiyetan identifies the influencing factors of
management practices and quality of management during construction that impact on project
delivery time. The study employed a quantitative research approach in obtaining the necessary
information that answers the research objectives. The study found that the management style
and the quality of management used on construction projects are poor and suggested ways
through which this reduced level of performance can be improved. Lastly, the paper by
Oladiran, Ogunsanmi and Dada suggested a novel approach to solving the incidence of building
material waste on sites through developing a framework of the issues and processes that are
involved in its minimisation. Oladiran et al. conducted a survey to validate the proposed
framework for material waste minimisation. They recommended that the proposed framework
that was developed should be adopted by construction stakeholders to prevent and minimise
material waste at all stages of development of building projects.

vi
Finally, I wish to acknowledge all authors who submitted papers for consideration, members
of the JCBM Editorial Board and panel of reviewers for their support, timeous review and
comments that have helped in defining and improving the quality of manuscripts published by
the journal. We welcome feedback and suggestions from readers towards improving the quality
of the journal and in maintaining the integrity of the findings published.
Abimbola Windapo PhD
Editor-in-chief

JCBM (2019) 3(1). 1-7
Firm Attributes and Performance: A Study of Architectural Firms in Nigeria
A. A Oluwatayo 1, D. Amole2 and O. A. Alagbe3
1,.3 Department of Architecture, Covenant University, Ota, Ogun State, Nigeria; 2 Department of Architecture, Obafemi Awolowo University, Ile-Ife, Nigeria
Received 15 June 2018; received in revised form 17 July 2018; accepted 3 August 2018.
https://doi.org/10.15641/jcbm.3.1.2019.592
Abstract
The performance of architectural firms has been a concern to the professional bodies. Studies have however shown that there
are factors within organisations that influence their performance. From the Resource-Based Theory of the Firm, this study
aims to identify attributes in the profiles, structure and strategies of architectural firms, which are associated with the success
of these firms. The performance of firms is conceptualized according to profitability, while the attributes considered are the
ones identified as resources in the Resource-Based Theory of the firm. Data on the attributes and performance of the firms
were obtained from a survey of ninety-two randomly selected architectural firms in Nigeria, using questionnaires and
interviews. The results of the discriminant analysis carried out show that factors, which were related to the successes of the
firms, include the availability of information technology facilities and the level of specialization of duties. The findings
suggest that appropriate sizes, professionally qualified staff; and provision and use of IT facilities were areas that architectural
firms can concentrate on for enhanced performance.
Keywords: Architectural firms, Architectural practice, Firm attributes, Firm Performance, Nigeria, Professional Service
Firms.
1. Introduction
Scholars such as Phua (2006) have noted that the economy
determines the performance of industries and their
structures. However, the unique attributes of a firm
determines its performance relative to the other firms
within the same industry. This suggests that determinants
of firms' successes may be industry specific. In the context
of architectural firms, Larsen (2005) and White (2005)
decried the poor performance and subsequent failures of
many architectural firms in Europe and America
respectively. Only 25 per cent of architectural firms in
America is said to exist beyond the first three years
(Schwennsen, 2004). This poor performance is also
evident in the fact that individual architects are alleged to
be paid lower salaries than their counterparts are in other
professions. Flynn-Heapes (2000) attributed poor
performance of architectural firms to the tendency by
principals of these firms to build the firms around clients
instead of around proven business principles. It is often
believed that business gets in the way of the arts that the
profession seeks to project. This has often led to the lack
1 Corresponding Author.
Email address: [email protected]
of attention to issues of management and profitability.
There are however firms, which have proven that it is
possible to build profitable firms (Cramer, 2006). Very
little study however exists on the attributes that make for
success in these firms. It is therefore of interest to this
study to investigate high-performing firms in comparison
to low-performing ones to elucidate the unique attributes
that distinguish between them.
The unique attributes of firms are said to be important
determinants of their performance (Rumelt, 1991). This
principle is based on the Resource-Based Theory of the
Firm (RBT). The unique attributes of firms consist of their
resources and capabilities. Proponents of this theory
described the resources in the firm as the assets,
knowledge, capabilities and organizational processes,
with which the organisation gain competitive advantage.
Studies, which consider the performances of firms in
relation to their resources, also consider the contexts of
the firms. Such contexts include the strategy, structure,
and environment of the firms. Several studies have
investigated firm-specific resources and capabilities and
how they influence the performances of the firms. Very
University of Cape Town
Journal of Construction Business and Management
http://journals.uct.ac.za/index.php/jcbm

2 A. A. Oluwatayo et al. / Journal of Construction Business and Management (2018) 3(1). 1-7
few of these studies, however, focus on architectural
firms. The purpose of this study is to investigate the
unique attributes, which distinguish high performing
architectural firm from the low-performing ones. This
study is justified in three ways. First, architectural firms,
as firms in the construction industry are increasingly
under pressure to run more effective practices for the
delivery of quality services. A study of this nature may,
therefore, contribute to the debates on the attributes that
make for successful practice in the construction industry.
Second, there is a need to bridge the gap between practice
and scholarship. This is in the light of the fact that
research must precede practice. Third, the study provides
empirical data from the context of architectural firms,
which are mostly managed by principal architects, who
may or may not have formal management training.
2. Firm Resources and Performance
Some studies have drawn attention to the issues of
leadership, core competencies, market orientation, and
corporate culture as factors, which make some companies
more successful than others (Matzler et al., 2010). It is
believed that these are the resources and capabilities of the
companies with which they gain competitive edge. The
concept that captures this is the Resource-Based Theory
(RBT). The RBT (Penrose, 1959) states that firms
compete on the bases of resources or capabilities that are
valuable, rare, and difficult to substitute and imitate.
While the resources of the firms are said to include the
financial capital, physical assets, technology, personnel,
reputation and brand image, the capabilities include
business processes and routines. In this context, a firm is
"a collection of resources bound together in an
administrative framework, the boundaries of which are
determined by the area of administrative coordination and
authoritative communication".
There are important dimensions of the RBT
highlighted in the literature. These, according to Bainey
and Hesterly (1999) include financial resources, physical
resources (such as machines), human resources
(experience, training), and organizational resources
(reputation, teamwork and trust). Also, the contexts such
as the strategy, structure, and environment of the firm are
taken into cognizance of the context in which the
resources are used. While many of these attributes are
within the control of the firms, the environment in which
the firm operates is not within the control of the firms.
Some of these factors that have been investigated in
literature These include the size, the organizational
structure, human resources, and managerial orientations
of top management (Matzler et al., 2010). Other factors in
the literature include the culture of the firms and market
orientations of organizations. Besides, skills and
technologies have also been found to influence the
performance of organizations. The performance of an
organization is often defined in terms of its growth,
advantageous market position/ market share,
competitiveness and profitability. Performance in this
study is defined in terms of the profitability of a company.
A significant resource in architectural firms, which
this study focuses on, is the human resource. This is
because the industry, as a professional service industry, is
labour and knowledge-intensive (Pathirage et al., 2007).
Services rendered often depend on the knowledge and
skill of the workforce. Also, Sirmon et al. (2011) observed
that managers vary in the ways they manage resources and
these differences influence firm performances. The ways
managers manage their firms could depend on the
attributes of the managers. It may therefore be expected,
that the characteristics of the principal may influence the
way the firm is run and subsequently the performances of
the firms. Besides, Matzler et al. (2010) noted that the
orientation of leaders of firms also determines what the
organization invests time and resources on. This goes
further to inspire and motivate employees of the firm to
achieve set objectives. The manager in an architectural
firm is usually the owner, who is referred to as the
principal. This principal may or may not have any
management training, but is nonetheless saddled with the
responsibility of managing the firm. In this respect, the
study by Kim and Arditi (2010) found that the education,
experience, and leadership styles of owners of
construction firms influence the performances of those
firms.
Technology, which has been mainly conceptualized as
Information Technology (IT), has also been found to
influence firm performance (Koellinger, 2008). Scholars
(for example, Benbunan-Fich, 2002) argued that
technology could be used to gain competitive advantage.
In other words, it is also a resource in an organization,
which may determine the performance of the firm in the
end. Also, IT is said to be an enabler of innovation, which
is very important to architectural firms. In fact, Koellinger
(2008) and Tanriverdi (2005) associated IT with
innovation. According to Barret and Sexton (2007),
innovation, which entails solving problems using new
ideas, technologies, and processes, is a means of
achieving sustainable competitiveness in the construction
industry. Matzler et al. (2010) also investigated
innovation orientation of top executives concerning their
willingness to take risks and search for new solutions.
Matzler et al. found that organizations with higher
innovation orientation were more successful.
Apart from innovation orientation, other strategies
influence firm performance (Aragon-Sachez and
Sanchez-Marin, 2005). The strategies of a firm are the
approaches the firm adopts to please customers, achieve
organizational goals, and create competitive edge. These
strategies could influence the technology, personnel
characteristics, and profiles of organizations (Thompson
et al., 2004). Although scholars have found that the
influence of other attributes of an organization on its
performance is moderated by the strategy as posited in the
RBT, the direct influence of strategy and performance is
investigated in this study.
Debates on the influence of strategies of firms on the
performances of the firms abound in literature. Starting
from the studies of Miles and Snow in 1978, scholars
seem to agree that prospectors, defenders, and analyzers
outperform reactors, in that order. The findings of
Matzler et al. (2010) also suggest that organizations that
focus on innovation as their orientation tend to outperform
other organizations. While the prospector strategy seeks
to identify and exploit new opportunities, firms adopting
the defender strategy seek to protect their market and

A. A. Oluwatayo et al./ Journal of Construction Business and Management (2018) 2(2). 1-7 3
establish stability, reliability, and efficiency. Liu,
Ratnatunga and Yao (2014) observed that organizations
that compete using the defender strategy often use the cost
leadership approach. Analyzers on the other hand focus
on cautiously seeking innovativeness, combining the
characteristics of both the prospectors and the defenders.
This is in contrast with the reactor strategy where course
of action depends on existing situations.
Previous research such as the one by Zott and Amit
(2007) have also focused on the role of organizational
design in determining the performance of firms. The
structure of an organization denotes the task and job
reporting relationships in the organization. The
dimensions of the structure identified in literature are
centralization, formalization, and specialization (Miller
and Droge, 1986). While centralization denotes the extent
to which decision-making is concentrated in top
management, formalization is the extent to which rights
and duties of members of the organization are written.
Specialization, on the other hand, is the extent to which
tasks are divided into sub-tasks which individuals are
assigned to. The attributes within the firm are
investigated in this study. These include the IT, personnel,
and culture of the firms. Also, the structure and strategy
of the firms are also investigated.
In addition to these resources, size (Tsai, 2014) and
culture (Matzler et al. 2010) are said to influence firm
performance. The culture was measured in terms of
intensity. The size of the firm has been measured in the
literature by the total number of employees, sales and net
sales. Literature suggests that firms with larger sizes
outperform smaller ones. There is however the need to
investigate these attributes that influence organisational
performance in a professional context, such as
architectural firm. This will contribute to knowledge in
this field and define the limits of generalisation of
findings.
One of the flaws identified in previous studies by
Matzler et al. (2010) is that only successful companies
were investigated. These authors highlighted the
importance of relating seemingly successful companies
with others in order to identify what makes them
successful. Matzler et al. also highlighted the flaws of
relying on only interviews for such studies as the senior
executives tend to attribute the successes of their
companies to themselves. In this study, high performing
firms were compared with the ones that did not perform
so well. Also, measured from the literature that indicate
firm attributes were used to obtain data in self-
administered questionnaires.
3. Research Method
The cross-sectional survey was adopted as a research
strategy for this study. This design collects data at a given
time from a representative sample to allow results to be
generalised to a larger population. The unit of data
collection was the firm, and the sources of data were the
principals of the firms or their representatives.
Respondents for this study were randomly selected from
the list of Architectural firms that were registered to
practice in Nigeria ARCON (2006). Using the formula
proposed by Adedayo (2006), [n =N⁄(1+α^2 N ) where n
= sample size; N = population α = level of significance,
which for this study is 0.05]. A sample size of 157 out of
341 registered firms was arrived at. The firms were then
approached and asked to fill questionnaires, which
consisted of three sections. The first section gathered data
on the profiles of the firms including personnel, while the
second section gathered data on the strategies, structure
and IT characteristics. In the third section, data on the
performances of the firms was gathered. Only 97 of the
questionnaires were returned giving a response rate of 59
per cent. The respondents were the principals of the firms,
and where they were not available, the senior associates
within the firms were asked to fill the questionnaires.
Eight of the principals were also interviewed to gain
deeper insight into the subject of study.
The measures of technological positions include the
availability of IT facilities (computers, intranet and
internet), and application of internet facilities in carrying
out operations within the firms. These were measured on
3-point scales of not available at all/ not used at all to
highly available/ highly used.
Data on the qualifications and gender of architects of the
firms were also obtained. Other human resource data
obtained included those on the gender, age, experience,
qualification of the principals of the firms. Firm size was
measured in terms of the number of staff within the firms.
The respondents also indicated the legal ownership forms
of their firms.
Respondents were asked to indicate on a scale of 1
(strongly disagree) to 5 (strongly agree) their level of
agreement with 11 statements that represent their
strategies. The statements include phrases such as "new
ideas and technology are the determinants of the strategies
of this firm"; "we are very cautious with risky ventures";
we aggressively pursue business opportunities" and
maintaining tradition and consistency is very important to
us". A cluster analysis of the firms was then carried out to
determine the strategies that exist. The first cluster had a
strategy that was similar to the prospector strategy of
Miles and Snow (1978). The firms in this cluster allowed
new ideas and technology to determine their strategy, are
highly innovative, but are cautious in risky ventures. The
firms in the second cluster had a strategy similar to the
defender strategy. These firms scored very high in
maintaining tradition and consistency, although they are
achievement-driven. While firms in the third cluster had
strategies similar to the analyzer strategy, those in the
fourth cluster had a strategy similar to the reactor strategy.
This is because the while the firms in both the third and
fourth clusters scored high in the exercise of caution in a
risky venture and allowing new ideas and technologies to
determine their strategies, firms in the third cluster were,
also, innovative.
The structure of the firms was measured in terms of
the specialization, formalization, and centralization in the
firms. For the level of specialization, the respondents were
asked to indicate the tasks that were carried out
exclusively by one person. The respondents were also
asked to indicate the level to which procedures and rules
were written to deduce the level of formalization within
the firms. The level of centralization was deduced from
the responses of the principals and associates on the ones

4 A. A. Oluwatayo et al. / Journal of Construction Business and Management (2018) 3(1). 1-7
who took certain decisions. The options were arranged in
order of seniority in the firms.
Ali et al. (2013) identified the measures available for
measuring performance in the construction industry.
Objective data were however not available in the
architectural firms. Respondents were also reluctant to
declare their profit and access to audited accounts was not
given. The respondents were, however, willing to indicate
on a scale, their perception of the profitability of the firms.
Wall et al. (2004) and Runyan et al. (2008) concluded that
these subjective measures are as valid as objective
measures when obtained from members of the top
management. We, therefore, operationalized performance
as the perception of the profit of the firm in the last two
years on a 5-point Likert scale, which ranged from "not
good at all" to "very good".
4. Results and discussion
The results in Table I show that more than half of the firms
could be said to have recorded good performances in the
preceding two years. These could be classified as firms
with high performances, while the other firms could be
classified as firms with low performances. The firms in
the study were mostly sole-principal firms, aged less than
15 years and with most of the firms having less than 20
staff. Table I further shows that most of the firms
indicated low level so specialisation, but high levels of
centralisation of decision-making and formalisation of
office activities. The firms were headed by principals who
were mostly aged above 40 years, with more than 15 years
of experience, and having worked in two firms or less.
Table 1: Profiles of the architectural firms
Variables Percentage
Performance of
the firms
Very good 32.6
Good 39.3
Fair 24.7
Not so good 3.4
Age of the
firms
0-5 years 9.9
6-10 years 16.0
11-15 years 27.2
16-20 years 19.7
21-25 years 13.6
26 years and above 13.6
Size of the
firms
1-5 staff 14.9
6-10 staff 33.3
11-20 staff 27.6
21-30 staff 8.0
31-40 staff 6.9
41-50 staff 5.8
51 staff and above 3.5
Level of
specialisation
No specialised task 9.5
1-2 specialised task 41.7
3-4 specialised task 21.4
5-6 specialised task 19.1
7 or more specialised task 8.3
Level of
formalisation
Informal 7.5
Fairly formal 37.5
Very formal 55.0
Level of
centralisation
of decision-
making
Moderate level of
centralisation 31.9
High level of
centralisation 68.1
Level of
availability of
information
technology
facilities
Low 26.0
Moderate 30.1
High 43.8
The degree of
use of internet
facilities
Low use 33.8
Moderate use 36.9
High use 29.2
Legal structure
of ownership
Sole principal 52.3
Partnership 21.6
Unlimited liability
company 8.0
Limited liability company 18.1
Gender of the
principal
Male 89.8
Female 10.2
Age of the
principal
Below 30 years 1.2
31-40 years 22.4
41-50 years 43.5
51-65 years 27.1
Above 65 years 5.9
Highest
qualification of
the principal
HND 3.5
BSc 3.5
MSc 43.5
BArch 42.4
Others 7.1
Years of
experience of
the architect
1-5 years 1.5
6-10 years 12.1
11-15 years 15.2
16-20 years 18.2
21-25 years 21.2
26 years and above 31.8
Management
style of the
principal
A mentor in the firm 9.3
A visionary and
innovative leader 38.4
An efficient manager 11.6
A productivity-oriented
achiever 40.7
Number of
firms the
principal
worked in
before starting
the firm
None 3.5
1 firm 17.6
2 firms 54.1
3 firms 18.8
4 firms 2.4
5 or more firms 3.5
Strategy
Prospector 29.3
Defender 30.4
Analyser 29.3
Reactor 10.9
Discriminant analysis was carried out to investigate
the variables, which differentiate high-performing
architectural firms from low-performing ones. All the
attributes earlier mentioned were entered as independent
variables. The perceptions of profits were entered as
dependent variables. For this analysis, the responses "not
good at all", "not good" and "fair" were recoded as 1,
while the responses "good" and "very good" were recoded

A. A. Oluwatayo et al./ Journal of Construction Business and Management (2018) 2(2). 1-7 5
as 2. Table II shows the variables that best differentiated
the high-performing architectural firms from the low-
performing ones. The Wilk's lambda was significant for
the discriminant function, (λ2 = 60.49, df = 25, p = 0.00).
What this suggests is that the discriminant function does
better than chance at separating the two groups. These
results confirm that the unique attributes of the
architecture firms determine their performances, relative
to other firms in the industry as asserted by Matzler et al.
(2010) and Phua (2006). The discriminant variables
include the size, levels of specialization and
formalization, as well as the levels of availability of IT
facilities and use of internet in carrying out the operations
of the firms. Other factors, which distinguish high-
performing architectural firms from low-performing ones,
are the gender and leadership styles of the principals. The
structure matrix shows that the availability of IT facilities
had the highest standardized coefficient, suggesting that it
is most successful at discriminating between high-
performing and low-performing architectural firms. This
is followed by level of specialization, then size of the
firms.
Table 2: Factors that discriminate between high-performing architectural firms and low-performing ones
Factor Wilks'
Lambda F
Standardized
coefficients Sig.
level of availability of information technology facilities .560 24.371 .176 .000**
level of specialization .758 9.923 .112 .004**
size of firm .769 9.303 .109 .005**
Gender of principal .800 7.750 -.099 .009**
level of use of internet facilities .807 7.428 .097 .010*
level of formalization of office activities .849 5.509 .084 .025*
leadership style of principal .862 4.980 -.080 .033*
ownership form of firm .895 3.655 .068 .065
Number of architects with BSc .933 2.214 .053 .147
Number of architects with OND/HND .938 2.042 .051 .163
highest qualification of the principal architect .943 1.864 .049 .182
Number of architects with other qualifications .965 1.116 .038 .299
age of firm .969 1.005 .036 .324
Number of architects with BArch/MSc .973 .847 .033 .365
level of centralization .981 .602 -.028 .444
Number of female architects .988 .383 .022 .541
Number of registered architects .988 .382 .022 .541
strategy type .991 .291 -.019 .593
number of firms principal had worked previously .993 .230 -.017 .635
age group of the principal .997 .093 .011 .762
years of experience of principal .999 .028 .006 .869
Further interrogation of the data shows that the high-
performing architectural firms were mostly headed by
male principals whose described themselves as either
efficiency manager or productivity-oriented achievers.
The fact the firms with male principals were found to
perform better than those with female principals may be
connected with the gender biases and challenges faced by
female principals, whom one of the respondents to the
interview described as often being "saddled with domestic
issues". Besides, a female interviewee noted that most
female principals might not be achievement oriented,
stating that "men are more ambitious."
The high-performing firms were also smaller, in terms
of the number of employees, confirming that size
influences the performance of firms (Tsai, 2014). This
result is also similar to that of Greenwood et al. (2005)
who found that larger professional service firms were
poor performers. This had to do with the total number of
employees in the firms. However, firms with more
architects with higher architecture qualifications
performed better than those with fewer architects in those
categories. This may suggest that the composition of the
employees in the firms, not just the number may be more
relevant in determining firm performance. Confirming the
results of Koellinger (2008), IT also influenced the firms'
performances. IT facilities were highly available in the
high-performing firms. It would thus appear that, as in
previous studies (Barret and Sexton, 2007), IT was used
as a tool to gain competitive advantage. Also, the level of
specialization in the high-performing firms was high; the
level of formalization was low.
The fact that the strategies of the firms did not directly
differentiate between high- and low- performing
architectural firms may confirm the approach of the RBT
that the influence of other attributes of the firms on
performance is moderated by the strategies of the firms
(Aragon-Sachez and Sanchez-Marin, 2005), although
little direct influence may be observed. In the study by
Kim and Arditi (2010), the qualifications of the
employees as well as the principals were found to
influence the performance of firms in the construction
industry. This study, however, found that none of these
distinguished the high-performing architects from the
ones that did not perform so well. One reason for this may
be that the present study only took samples from one
profession in the construction industry. It may also signify
that other training apart from core architectural skills may
be necessary to run a high-performing firm. This may be
evident in the fact that principals who led by demanding
6 A. A. Oluwatayo et al. / Journal of Construction Business and Management (2018) 3(1). 1-7
efficiency and productivity had firms that performed
better than those who were just innovative or mentors.
The design of the organizations also differentiated the
firms in terms of their performances as found by Zott and
Amit (2007). This was not expected as literature describes
the structure of organizations a moderating variable,
which influences other attributes of the firms, which in
turn influence the performances of the firms. In particular,
higher specialization of tasks was common with high-
performing architectural firms. This may follow from the
fact that when tasks are repeated, persons develop
dexterity in handling those tasks to the benefits of their
organizations. However, the level to which rules and
procedures were written in the high-performing firms was
lower.
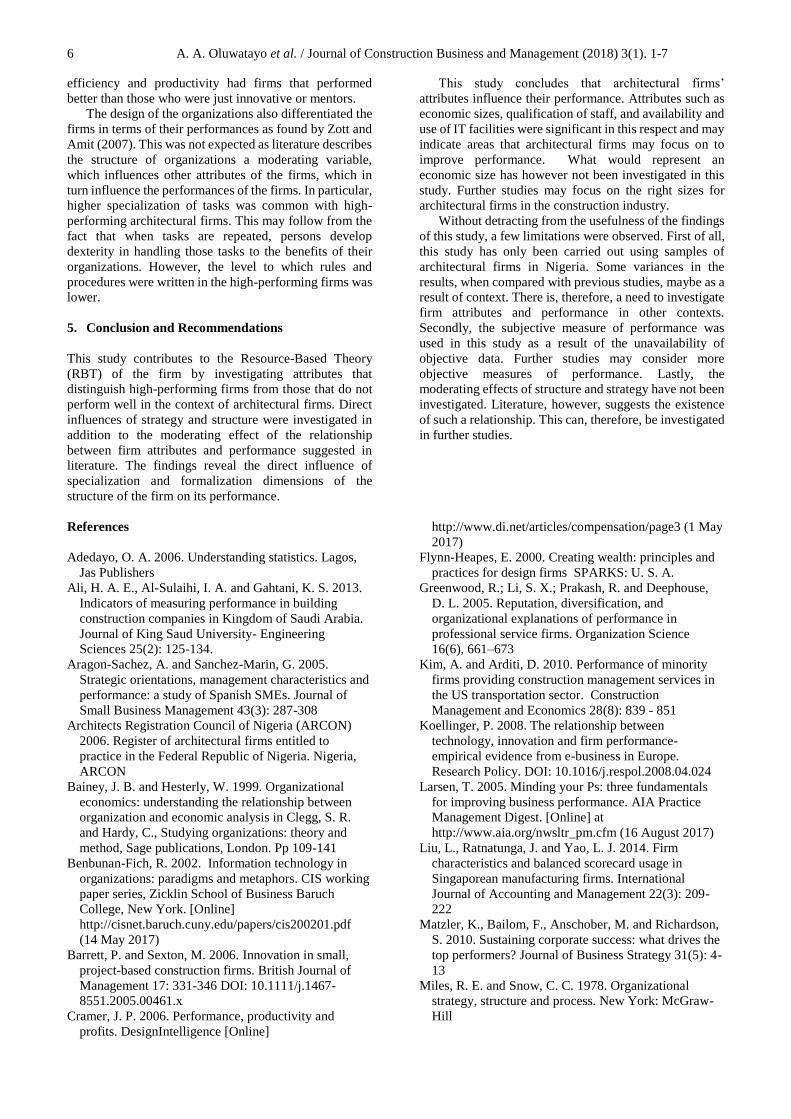
5. Conclusion and Recommendations
This study contributes to the Resource-Based Theory
(RBT) of the firm by investigating attributes that
distinguish high-performing firms from those that do not
perform well in the context of architectural firms. Direct
influences of strategy and structure were investigated in
addition to the moderating effect of the relationship
between firm attributes and performance suggested in
literature. The findings reveal the direct influence of
specialization and formalization dimensions of the
structure of the firm on its performance.
This study concludes that architectural firms’
attributes influence their performance. Attributes such as
economic sizes, qualification of staff, and availability and
use of IT facilities were significant in this respect and may
indicate areas that architectural firms may focus on to
improve performance. What would represent an
economic size has however not been investigated in this
study. Further studies may focus on the right sizes for
architectural firms in the construction industry.
Without detracting from the usefulness of the findings
of this study, a few limitations were observed. First of all,
this study has only been carried out using samples of
architectural firms in Nigeria. Some variances in the
results, when compared with previous studies, maybe as a
result of context. There is, therefore, a need to investigate
firm attributes and performance in other contexts.
Secondly, the subjective measure of performance was
used in this study as a result of the unavailability of
objective data. Further studies may consider more
objective measures of performance. Lastly, the
moderating effects of structure and strategy have not been
investigated. Literature, however, suggests the existence
of such a relationship. This can, therefore, be investigated
in further studies.
References
Adedayo, O. A. 2006. Understanding statistics. Lagos,
Jas Publishers
Ali, H. A. E., Al-Sulaihi, I. A. and Gahtani, K. S. 2013.
Indicators of measuring performance in building
construction companies in Kingdom of Saudi Arabia.
Journal of King Saud University- Engineering
Sciences 25(2): 125-134.
Aragon-Sachez, A. and Sanchez-Marin, G. 2005.
Strategic orientations, management characteristics and
performance: a study of Spanish SMEs. Journal of
Small Business Management 43(3): 287-308
Architects Registration Council of Nigeria (ARCON)
2006. Register of architectural firms entitled to
practice in the Federal Republic of Nigeria. Nigeria,
ARCON
Bainey, J. B. and Hesterly, W. 1999. Organizational
economics: understanding the relationship between
organization and economic analysis in Clegg, S. R.
and Hardy, C., Studying organizations: theory and
method, Sage publications, London. Pp 109-141
Benbunan-Fich, R. 2002. Information technology in
organizations: paradigms and metaphors. CIS working
paper series, Zicklin School of Business Baruch
College, New York. [Online]
http://cisnet.baruch.cuny.edu/papers/cis200201.pdf
(14 May 2017)
Barrett, P. and Sexton, M. 2006. Innovation in small,
project-based construction firms. British Journal of
Management 17: 331-346 DOI: 10.1111/j.1467-
8551.2005.00461.x
Cramer, J. P. 2006. Performance, productivity and
profits. DesignIntelligence [Online]
http://www.di.net/articles/compensation/page3 (1 May
2017)
Flynn-Heapes, E. 2000. Creating wealth: principles and
practices for design firms SPARKS: U. S. A.
Greenwood, R.; Li, S. X.; Prakash, R. and Deephouse,
D. L. 2005. Reputation, diversification, and
organizational explanations of performance in
professional service firms. Organization Science
16(6), 661–673
Kim, A. and Arditi, D. 2010. Performance of minority
firms providing construction management services in
the US transportation sector. Construction
Management and Economics 28(8): 839 - 851
Koellinger, P. 2008. The relationship between
technology, innovation and firm performance-
empirical evidence from e-business in Europe.
Research Policy. DOI: 10.1016/j.respol.2008.04.024
Larsen, T. 2005. Minding your Ps: three fundamentals
for improving business performance. AIA Practice
Management Digest. [Online] at
http://www.aia.org/nwsltr_pm.cfm (16 August 2017)
Liu, L., Ratnatunga, J. and Yao, L. J. 2014. Firm
characteristics and balanced scorecard usage in
Singaporean manufacturing firms. International
Journal of Accounting and Management 22(3): 209-
222
Matzler, K., Bailom, F., Anschober, M. and Richardson,
S. 2010. Sustaining corporate success: what drives the
top performers? Journal of Business Strategy 31(5): 4-
13
Miles, R. E. and Snow, C. C. 1978. Organizational
strategy, structure and process. New York: McGraw-
Hill

A. A. Oluwatayo et al./ Journal of Construction Business and Management (2018) 2(2). 1-7 7
Miller, D. and Droge, C. 1986. Psychological and
traditional determinants of structure Administrative
Science Quarterly 31, 539-560
Pathirage, C. P., Amaratunga, D. G., and Haigh, R. P.
2007. Tacit knowledge and organizational
performance: construction industry perspective.
Journal of Knowledge Management 11(1): 115-126
Penrose, E. 1959. The theory of growth of the firm.
Oxford: Blackwell.
Phua, F. T. T. 2006. Predicting construction firm
performance: an empirical assessment of the
differential impact between industry- and firm-specific
factors. Construction Management and Economics
24(3):309 - 320
Rumelt, R. P. 1991. How much does industry matter?
Strategic management Journal, 12, pp 168-186
Runyan, R., Droge, C. and Swinney, J. 2008.
Entrepreneurial orientation versus small business
orientations: what are their relationships to firm
performance? Journal of Small Business Management
46(4), 567-588
Schwennsen, K., 2004. J /Firm planning and positioning.
Iowa State University, Department of Architecture,
[Online]
http://www.lib.iastate.edu/commons/arch482/04spr/pd
f/JFirmPlan&Position.pdf (13 September 2017)
Sirmon, D. G., Hitt M. A., Ireland R. D. and Gilbert B.
A. 2011. Resource orchestration to create competitive
advantage: breadth, depth and life cycle effects.
Journal of Management 37 (5), 1390-1412 DOI:
10.1177/0149206310385695
Tanriverdi, H. 2005. Information technology relatedness,
knowledge management capability and performance of
multi-business firms. MIS Quarterly 29(2): 311-334
Tsai, M. 2014. Corporate governance, resources, FDI
commitment and firm performance: empirical analyses
of Taiwanese high-tech firms. Chinese Management
Studies 8(3): 313-332 DOI 10.1108/CMS-08-2012-
0118
Thompson, A. A., Gamble J. E., and Strickland A. J.,
2004. Strategy- winning in the marketplace. McGraw-
Hill Irwin, New York
Wall, T. D., Michie, J., Patterson, M., Wood, S. J.,
Sheehan, M., Clegg, C. W. and West, M. 2004. ‘On
the validity of subjective measures of company
performance’, Personnel Psychology, 57 (1), 95-118
White, B. 2005. RIBA Constructive Change: a strategic
industry study into the future of the Architects’
Profession, Full Report, December 2005. [Online]
http://www.architecture.com/fileLibrary/pdf/Construct
ive_Change_Report_-_Full_(Final).pdf (August 17,
2017)
Zott, C. and Amit, R. 2007. Business model design and
the performance of entrepreneurial firms.
Organizational Science 18(2): 181-199.

JCBM (2019) 3(1).8-17
Organisational Commitment of Construction Skilled Workers in Selected Construction
Firms in Nigeria
D.O. Aghimien1, O. A. Awodele2, and C.S. Maipompo3
1Sustainable Human Settlement and Construction Research Centre, Faculty of Engineering and the Built Environment,
University of Johannesburg, South Africa. 2&3Department of Quantity Surveying, Federal University of Technology, Akure, Ondo State, Nigeria.
Received 9 December 2017; received in revised form 1 February 2018, 22 March 2018 and 16 September 2018; accepted 20 September
2018.
https://doi.org/10.15641/jcbm.3.1.2019.481
Abstract
Skilled construction workers are crucial to the successful delivery of construction projects. However, there have been reports
of their shortage within the Nigerian construction industry. Ensuring commitment of the few available ones to their
organisation is important as this is bound to influence the service delivery of these organisations. This paper presents the
result of the assessment of the organisational commitment of skilled construction workers in Abuja, Nigeria. A quantitative
survey design was adopted, and data were gathered from selected skilled construction workers in 31 construction companies
registered with Nigeria's Federation of Construction Industry. Organisational Commitment Scale was adopted in assessing
the commitment of these set of workers, and data were harnessed through the use of a questionnaire. Percentage, mean item
score and Kruskal-Wallis H-Test were used in analysing the data gathered. Cronbach Alpha test was also conducted to test
the reliability of the research instrument. The study revealed that the common type of commitment exhibited by skilled
construction workers is the continuance commitment. Factors such as getting feedback from supervisors, payment received
being equal to work done, and the availability of opportunities to grow, play a major role in the commitment type being
exhibited. The practical implication of this result is that construction companies within the country need to improve in the
aspect of human resource management to attain better commitment and at the same time improve their productivity. It is
believed that the findings of this study will assist construction organisations in adopting the right method that will help
enhance the organisational commitment of their skilled workers.
Keywords: Construction workers, Nigeria, Organisational commitment, Skilled workers, Workers satisfaction.
1. Introduction
In the delivery of construction projects, there is the
need for labour (skilled and unskilled). Construction
firms rely heavily on these set of workers in order to carry
out their activities. According to Olofinji (2016), skilled
construction workers play an important role in the
survival and growth of the construction industry since the
practical completion of projects depend largely on them.
Despite the obvious importance of these set of workers,
the shortage of same has been evident in the construction
industry of most developing countries around the world.
It is believed that the construction industry appears not to
be appealing to youths. Young people tend to pursue
college degrees more, with lesser desire to take up blue-
1 Corresponding Author.
Email address: [email protected]
collar jobs (Tucker et al., 1999). Reason for this, among
other factors, can be the poor organisational investment
and lack of promotion avenues within most construction
companies (Carley et al., 2003). In Nigeria, although the
country as a whole is blessed with a skilled workforce, the
situtation within its construction industry is ironic. While
the Nigerian construction industry (NCI) is believed to be
one of the highest employers of labour, the industry is still
faced with problems of shortage in technically skilled
workers (Bilau et al., 2015).
Commitment which according to Nehmeh (2009), is
as an attachment or loyalty within an organisation, can go
both ways. This can be a worker's commitment to the
organisation or the organisation's commitment to its
workers. While it is assumed that workers need to show
University of Cape Town
Journal of Construction Business and Management
http://journals.uct.ac.za/index.php/jcbm

D.O. Aghimien et al. / Journal of Construction Business and Management (2019) 3(1). 8-17 9
some sense of attachment or loyalty to their organisation,
they also need reassurance that their jobs are secure.
Although this present study focused on worker's
commitment to their organisation, issues surrounding the
organisation's commitment to their workers can be seen in
most human resource management (HRM) studies. The
choice of basing this study on workers commitment to
their organisation is premised on the fact that skilled
workers are important to the successful delivery of
construction projects, and their shortage is evident within
the NCI. Thus, it is important to ascertain the commitment
of the available ones to their organisations. The
commitment of a worker, according to Miller (2003), can
be described as that point where such worker identifies
with the goals of his or her organisation and strives to
maintain affiliation with such organisation. Therefore,
skilled workers commitment in the context of this study is
the state or level of identification of these set of workers
with their respective organisations and their desire to
continue in that organisation.
Bhatti and Qureshi (2007) submitted that the major
issue of most organisations is the implementation
strategies that could help the development of their human
resources. In construction, Ibrahim et al., (2010) noted
that the key problem in the achievement of construction
demands is related to human resources within the
industry. This shows that there is the need to adequately
ascertain the factors that influence the desire of
construction workers to stay or leave a particular
organisation, in order to effectively manage the available
workforce within the organisation and achieve desired
commitment and optimum worker's productivity.
This study identifies with the fact that various research
has been conducted on organisational commitment of
workers in most sectors and even the construction
industry (Abiola-Falemu, 2013; Ashraf et al., 2012;
Gangai and Agrawal, 2015; Girth et al., 2013; Haq et al.,
2014; Luchak, et al., 2008; Norizan, 2012; Oyewobi et al.,
2012; Salim et al., 2007). However, not much has surfaced
regarding the commitment of skilled construction workers
whose impact in successful project delivery is crucial and
which unfortunately is becoming scarce in the NCI. It is
in light of this that this study assessed the commitment of
skilled construction workers in selected construction
firms in Nigeria, through the identification of the type of
commitment exhibited by this set of workers, and the
factors influencing their commitment. This was done
towards providing possible recommendations that will
improve their commitment and by so doing improving the
construction firm's project delivery.
2. Literature Review
2.1 Skilled Construction Workers in the Construction
Industry
The impact of the availability of skilled construction
workers on construction projects, coupled with the
expectation from construction contractors to deliver
projects of desired quality, cost and on schedule, has been
sufficiently reported in literature (Institute of
Management and Administration [IOMA] 2005; Medugu
et al., 2011; Olomolaiye and Ogunlana, 1989; Ugheru,
2006). Studies have also shown that skilled construction
workers contribute greatly to the successful delivery of
the end products of the construction industry (Medugu et
al., 2011). According to Bustani (2000), for the industry
to be effective in the delivery of its services, the quality
and availability of its skilled workforce are important. The
insufficiency of technically qualified personnel in the face
of increased demand has led to a situation where the big
contractors are considering investing in training and
development (T&D) of their workforce. This T&D can be
seen as a way of garnering more workers' commitment to
their organisation (Owoyemi et al., 2011). In an industry
where the shortage of skilled workers has been identified
as a challenge (Bilau et al., 2015), the commitment of the
available ones to their organisation is crucial.
2.2. Organisational Commitment
Often commitment is described as that force of cohesion
between an individual and some course of action relevant
to the attainment of one or more goals (Cohen, 2003).
Organisational commitment can be the commitment from
an organisation to the employee or commitment from the
employee to the organisation. This study, however,
focused on the latter. Miller (2003) opined that
organisational commitment could be seen as “a state in
which an employee identifies with a particular
organisation and its goal and wishes to maintain
membership in the organisation”. Arnold et al. (2005)
further stated that organisational commitment is that
relative strength an individual exhibits when they
indentify with and are involved in, the activities of an
organistion. Thus, when an employee is committed to an
organisation, there is every tendency that such employee
will not want to leave. Hence, there is a sense of
responsibility and attachment to an organisation by a
committed employee. The most popular method of
ascertaining the type of commitment of employees is the
Meyer et al. (1993) organisational commitment scale
(OCS). This approach is the most widely accepted
conceptualisation of organisational commitment and has
been adopted for over 20 years (Cohen, 2003). It sees
commitment from three facets. One is that commitment
can be affective in nature. Also, commitment can be
continuance or normative.
2.2.1 Types of Commitment
Cohen (2003) viewed affective commitment as a positive
affection towards an organisation. This positive affection
is reflected in the employee’s desire to see the
organisation succeed. Affective commitment can also be
seen as the emotional attachment an employee has to
his/her organisation. It is believed that employees that
exhibit this kind of commitment remain in their
organisation out of their own volition not just as a ‘means
to an end’ (Allen and Meyer, 1997). This form of
commitment is based solely on individual’s desire. For
continuance commitment, Meyer et al. (1993) describe
this as an individual’s knowledge of the price they will
have to pay for leaving an organisation. People who
exhibit this commitment type remain in their organisation
not because they want to, but because they need to. They
find it difficult to leave their organisation due to the fear
of the unknown or having few or no other option (Nagar,
2012). Normative commitment according to Antilla

10 D.O. Aghimien et al. / Journal of Construction Business and Management (2019) 3(1). 8-17
(2014) is the feeling of obligation to stay within an
organisation. As a result of this feeling, an employee will
remain with an oragnisation because he/she feels they
obligated to do so. It is believed that the experience of
workers within and outside the organisation plays a vital
role in the exhibition of this type of commitment. This
means that normative commitment of an employee
emanates from both the relationship they have within the
organisation and that which they experience within their
immediate family and society (Allen and Meyer 1990;
Markovits et al., 2013).
2.2.2 Factors Influencing Skilled Workers Commitment
Several factors influence the type of commitment
exhibited by an employee. Haq et al., (2014) opined that
factors such as job conditions, supervisor’s support,
rewards, work-family support, and career growth
opportunities affect the commitment of employees to an
organisation. This implies that if an organisation wants to
have a higher commitment from its workforce, these
outlined factors should be improved and in effect,
employees, in turn, will exhibit such behaviours as
beneficial to the organisation. Bhavna and Swati (2012)
outlined some factors that influence employee's
commitment. These factors are “the quality of working
relationships, workplace leadership, having a say, clear
values, being safe, the built environment, recruitment,
pay, and conditions, getting feedback, autonomy and
uniqueness, a sense of ownership and identity, learning,
passion, having fun, and community connections”. Antilla
(2014) assessed the components of organisational
commitment and concluded that the significant factors
affecting organisational commitment could be company
related factors, community-related factors, and work
characteristics factors. Alsiewi and Agil (2014) examined
job satisfaction influence on affective commitment and
observed that most of the job satisfaction variables which
include; job security, pay, and benefits, feelings of
satisfaction towards teaching staff and principals, growth
and development opportunities and relevance and
meaning of job have a significant relationship with
affective commitment.
Adeyemo and Aremu (1999) analysed the effects of
some multiple predictors on satisfaction and commitment
of workers. The study concluded that the variety in skills
and ambiguity in the role of workers are best
determinantes of satisfaction, while the kind of leadership
within the organisation coupled with the organisation's
age are best determinantes of commitment. Adeyemo
(2000) observed that there exist a positive relationship
between education and organisational commitment. This
was rather in contrast to earlier findings of Ellemer et al.
(1998) which revealed that background variables such as
gender, level of education, or team size have no
significant relationship to any of the three forms of
commitment an employee can exhibit. Similarly, Irving et
al. (1997) found that age has nothing to do with the kind
of commitment an employee will have to his/her
organisation. This submission, however, contradicts
Meyer and Allen (1984) submission that age influences
commitment. On the issue of gender, Mathieu and Zajac
(1990) reported its relationship to organisational
commitment. This was further confirmed by Irving et al.,
(1997)’s findings which revealed that out of a group of
people sampled, men had a higher level of commitment
than the women.
3. Research Methodology
This study assessed the commitment of skilled
construction workers in selected construction firms in
Nigeria, using Abuja as the study area. The choice of this
area is premised on the fact that Abuja is one of the
metropolitan cities in Nigeria and it is also the
administrative centre of the country. The area has lots of
construction projects being executed on a daily basis, and
as such has attracted, many construction organisations
with most of them having their head office or branches
there. A survey approach was adopted, and quantitative
data were gathered from skilled construction workers in
31 construction firms registered with Nigeria's Federation
of Construction Industry which is the largest body of
construction contractors in the country (Aje et al., 2015).
The choice of a quantitative questionnaire survey was
based on the fact that the study hoped to solicit responses
from a different set of skilled workers within these
identified organisations. As a result, a qualitative study
through an interview or other approaches would have
been time-consuming and almost practically impossible to
achieve. Tan (2011) described the questionnaire survey as
a simple survey approach which can cover a wider range
of audience within a short period. Also, Ackroyd and
Hughes (1981) described the questionnaire as a tool which
can achieve quantifiability and objectiveness in research,
hence its adoption in this study.
The questionnaire used was designed in two parts. Part
A dwelt on the background information of respondents,
while Part B dwelt on the objective of the study. The
objective one which was to determine the type of
commitment exhibit by skilled construction workers in
the study area was assessed using Meyer et al. (1993)’s
OCS. Abiola-Falemu (2013) and Jena (2015) adopted a
similar approach in determining the commitment of
workers in Nigeria and India. The OCS employs the use
of specific questions relating to the three major
commitment types and respondents were asked to rate
these questions on a 5-point Likert scale. The second
objective aimed at identifying the factors influencing the
commitment of these set of workers was also assessed on
a 5-point Likert scale based on their level of significance,
with 5 being very high, 4 being high, 3 being average, 2
being low and 1 being very low. While some of the
respondents were able to fill the administered
questionnaire themselves, others could not as a result of
their lack of formal education. In this case, the researcher
personally read the questions, and the respondents gave
their answers which were adequately filled on their
behalf.
A total of 93 questionnaires were distributed (3 each
for the identified 31 construction firm), with 71 retrieved.
This shows a response rate of 76%, and this is far above
the usual response rate of 20-30% for questionnaire
surveys in construction management studies, as suggested
by Akintoye (2000) and Moser and Kalton (1999). The
reliability of the instrument used was tested using
Cronbach's alpha test. The normal range of Cronbach
D.O. Aghimien et al. / Journal of Construction Business and Management (2019) 3(1). 8-17 11
alpha value is between 0.0 and + 1.0, and the higher the
value, the higher the degree of internal consistency. The
alpha values of 0.717 and 0.911 were derived for the type
of commitment, and factors influencing the type of
commitment of skilled workers respectively. This result
shows that the questionnaire use is reliable since the alpha
values are closer to 1.0. Data analysis was done using
frequency and percentage in analysing the background
information of the respondents. Kruskal-Wallis H-test
which is a non-parametric test used in testing the
relationship in the view of three or more groups of
respondents was employed in testing the relationship in
the view of all the various types of skilled workers as
regards their commitment types and the factors
influencing the type of commitment they exhibit. Mean
Item Score was further employed in ranking the various
commitment types and factors based on the respondents'
selection.
4. Findings
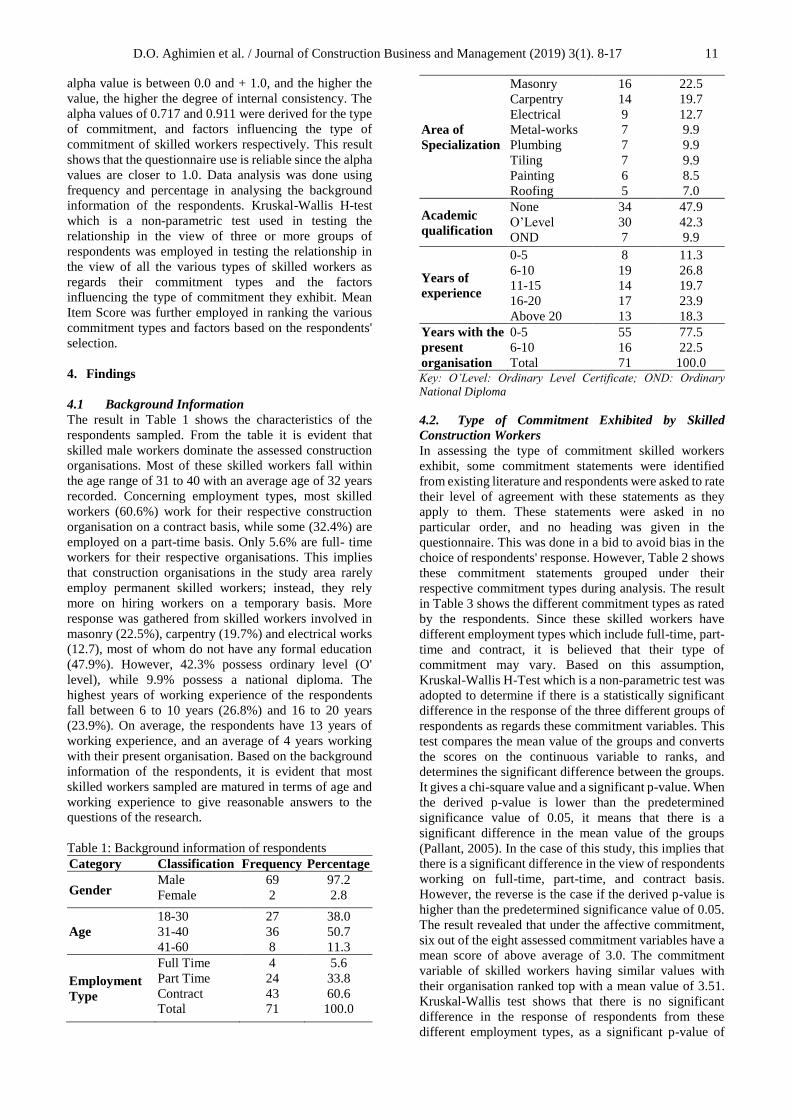
4.1 Background Information
The result in Table 1 shows the characteristics of the
respondents sampled. From the table it is evident that
skilled male workers dominate the assessed construction
organisations. Most of these skilled workers fall within
the age range of 31 to 40 with an average age of 32 years
recorded. Concerning employment types, most skilled
workers (60.6%) work for their respective construction
organisation on a contract basis, while some (32.4%) are
employed on a part-time basis. Only 5.6% are full- time
workers for their respective organisations. This implies
that construction organisations in the study area rarely
employ permanent skilled workers; instead, they rely
more on hiring workers on a temporary basis. More
response was gathered from skilled workers involved in
masonry (22.5%), carpentry (19.7%) and electrical works
(12.7), most of whom do not have any formal education
(47.9%). However, 42.3% possess ordinary level (O'
level), while 9.9% possess a national diploma. The
highest years of working experience of the respondents
fall between 6 to 10 years (26.8%) and 16 to 20 years
(23.9%). On average, the respondents have 13 years of
working experience, and an average of 4 years working
with their present organisation. Based on the background
information of the respondents, it is evident that most
skilled workers sampled are matured in terms of age and
working experience to give reasonable answers to the
questions of the research.
Table 1: Background information of respondents
Category Classification Frequency Percentage
Gender Male
Female
69
2
97.2
2.8
Age
18-30
31-40
41-60
27
36
8
38.0
50.7
11.3
Employment
Type
Full Time
Part Time
Contract
Total
4
24
43
71
5.6
33.8
60.6
100.0
Area of
Specialization
Masonry
Carpentry
Electrical
Metal-works
Plumbing
Tiling
Painting
Roofing
16
14
9
7
7
7
6
5
22.5
19.7
12.7
9.9
9.9
9.9
8.5
7.0
Academic
qualification
None
O’Level
OND
34
30
7
47.9
42.3
9.9
Years of
experience
0-5
6-10
11-15
16-20
Above 20
8
19
14
17
13
11.3
26.8
19.7
23.9
18.3
Years with the
present
organisation
0-5
6-10
Total
55
16
71
77.5
22.5
100.0 Key: O’Level: Ordinary Level Certificate; OND: Ordinary
National Diploma
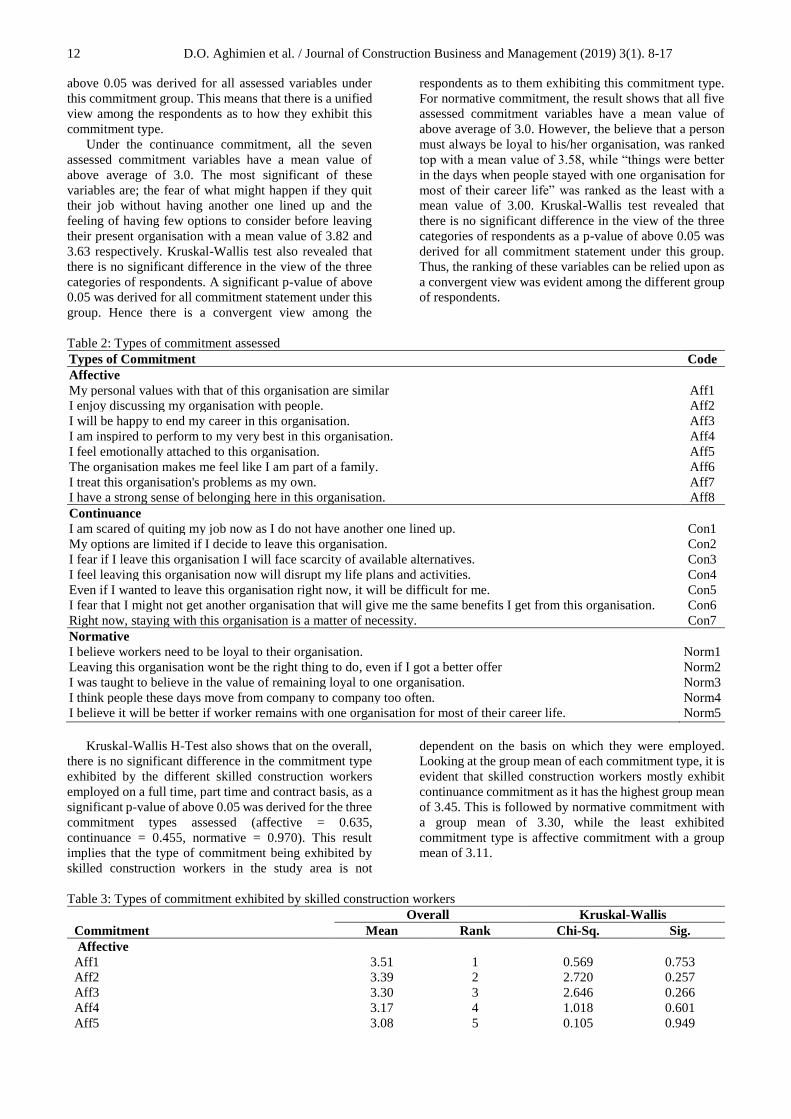
4.2. Type of Commitment Exhibited by Skilled
Construction Workers
In assessing the type of commitment skilled workers
exhibit, some commitment statements were identified
from existing literature and respondents were asked to rate
their level of agreement with these statements as they
apply to them. These statements were asked in no
particular order, and no heading was given in the
questionnaire. This was done in a bid to avoid bias in the
choice of respondents' response. However, Table 2 shows
these commitment statements grouped under their
respective commitment types during analysis. The result
in Table 3 shows the different commitment types as rated
by the respondents. Since these skilled workers have
different employment types which include full-time, part-
time and contract, it is believed that their type of
commitment may vary. Based on this assumption,
Kruskal-Wallis H-Test which is a non-parametric test was
adopted to determine if there is a statistically significant
difference in the response of the three different groups of
respondents as regards these commitment variables. This
test compares the mean value of the groups and converts
the scores on the continuous variable to ranks, and
determines the significant difference between the groups.
It gives a chi-square value and a significant p-value. When
the derived p-value is lower than the predetermined
significance value of 0.05, it means that there is a
significant difference in the mean value of the groups
(Pallant, 2005). In the case of this study, this implies that
there is a significant difference in the view of respondents
working on full-time, part-time, and contract basis.
However, the reverse is the case if the derived p-value is
higher than the predetermined significance value of 0.05.
The result revealed that under the affective commitment,
six out of the eight assessed commitment variables have a
mean score of above average of 3.0. The commitment
variable of skilled workers having similar values with
their organisation ranked top with a mean value of 3.51.
Kruskal-Wallis test shows that there is no significant
difference in the response of respondents from these
different employment types, as a significant p-value of
12 D.O. Aghimien et al. / Journal of Construction Business and Management (2019) 3(1). 8-17
above 0.05 was derived for all assessed variables under
this commitment group. This means that there is a unified
view among the respondents as to how they exhibit this
commitment type.
Under the continuance commitment, all the seven
assessed commitment variables have a mean value of
above average of 3.0. The most significant of these
variables are; the fear of what might happen if they quit
their job without having another one lined up and the
feeling of having few options to consider before leaving
their present organisation with a mean value of 3.82 and
3.63 respectively. Kruskal-Wallis test also revealed that
there is no significant difference in the view of the three
categories of respondents. A significant p-value of above
0.05 was derived for all commitment statement under this
group. Hence there is a convergent view among the
respondents as to them exhibiting this commitment type.
For normative commitment, the result shows that all five
assessed commitment variables have a mean value of
above average of 3.0. However, the believe that a person
must always be loyal to his/her organisation, was ranked
top with a mean value of 3.58, while “things were better
in the days when people stayed with one organisation for
most of their career life” was ranked as the least with a
mean value of 3.00. Kruskal-Wallis test revealed that
there is no significant difference in the view of the three
categories of respondents as a p-value of above 0.05 was
derived for all commitment statement under this group.
Thus, the ranking of these variables can be relied upon as
a convergent view was evident among the different group
of respondents.
Table 2: Types of commitment assessed
Types of Commitment Code
Affective
My personal values with that of this organisation are similar Aff1
I enjoy discussing my organisation with people. Aff2
I will be happy to end my career in this organisation. Aff3
I am inspired to perform to my very best in this organisation. Aff4
I feel emotionally attached to this organisation. Aff5
The organisation makes me feel like I am part of a family. Aff6
I treat this organisation's problems as my own. Aff7
I have a strong sense of belonging here in this organisation. Aff8
Continuance
I am scared of quiting my job now as I do not have another one lined up. Con1
My options are limited if I decide to leave this organisation. Con2
I fear if I leave this organisation I will face scarcity of available alternatives. Con3
I feel leaving this organisation now will disrupt my life plans and activities. Con4
Even if I wanted to leave this organisation right now, it will be difficult for me. Con5
I fear that I might not get another organisation that will give me the same benefits I get from this organisation. Con6
Right now, staying with this organisation is a matter of necessity. Con7
Normative
I believe workers need to be loyal to their organisation. Norm1
Leaving this organisation wont be the right thing to do, even if I got a better offer Norm2
I was taught to believe in the value of remaining loyal to one organisation. Norm3
I think people these days move from company to company too often. Norm4
I believe it will be better if worker remains with one organisation for most of their career life. Norm5
Kruskal-Wallis H-Test also shows that on the overall,
there is no significant difference in the commitment type
exhibited by the different skilled construction workers
employed on a full time, part time and contract basis, as a
significant p-value of above 0.05 was derived for the three
commitment types assessed (affective = 0.635,
continuance = 0.455, normative = 0.970). This result
implies that the type of commitment being exhibited by
skilled construction workers in the study area is not
dependent on the basis on which they were employed.
Looking at the group mean of each commitment type, it is
evident that skilled construction workers mostly exhibit
continuance commitment as it has the highest group mean
of 3.45. This is followed by normative commitment with
a group mean of 3.30, while the least exhibited
commitment type is affective commitment with a group
mean of 3.11.
Table 3: Types of commitment exhibited by skilled construction workers
Overall Kruskal-Wallis
Commitment Mean Rank Chi-Sq. Sig.
Affective
Aff1 3.51 1 0.569 0.753
Aff2 3.39 2 2.720 0.257
Aff3 3.30 3 2.646 0.266
Aff4 3.17 4 1.018 0.601
Aff5 3.08 5 0.105 0.949

D.O. Aghimien et al. / Journal of Construction Business and Management (2019) 3(1). 8-17 13
Aff6 3.01 6 3.180 0.204
Aff7 2.79 7 0.200 0.905
Aff8 2.65 8 5.600 0.061
Group Mean 3.11
0.910 0.635
Continuance
Con1 3.82 1 2.567 0.277
Con2 3.68 2 1.768 0.413
Con3 3.48 3 0.055 0.973
Con4 3.39 4 1.275 0.529
Con5 3.37 5 2.119 0.347
Con6 3.31 6 0.633 0.729
Con7 3.09 7 0.814 0.676
Group Mean 3.45
1.574 0.455
Normative
Norm1 3.58 1 0.223 0.895
Norm2 3.41 2 0.414 0.813
Norm3 3.31 3 1.781 0.410
Norm4 3.20 4 0.793 0.673
Norm5 3.00 5 0.409 0.815
Group Mean 3.30 0.610 0.970
4.3. Factors Influencing the Commitment of Skilled
Construction Workers
Result in Table 4 shows the rating of the identified factors
influencing the commitment of skilled construction
workers and their respective significant p-value derived
from Kruskal-Wallis H-Test. From the table, it is evident
that all the seventeen assessed factors have a mean value
of above average of 3.0. This implies that to a
considerable extent they all tend to influence the
commitment of these set of workers. Chief of these factors
are getting feedback from supervisors, payment received
is equal to work done, and the availability of opportunities
to grow, with a mean value of 3.92, 3.66 and 3.58
respectively. The least rank factor is the social
relationship among workers with a mean value of 3.02.
Kruskal-Wallis H-test also revealed that there is no
statistically significant difference in the view of the
different respondents with regards to the significance of
the identified factors as a p-value of above 0.05 was
derived. This result implies that irrespective of the type of
employment, the factors influencing the commitment of
skilled construction workers within the construction
industry are the same. Thus, construction companies will
do well to understand these factors and improve where
necessary.
Table 4: Factors influencing the commitment of skilled construction workers
Overall Kruskal-Wallis
Factors Mean Rank Chi.-Sq. Sig.
Getting feedback from supervisors 3.92 1 1.578 0.454
Payment received is equal to work done (fair wages) 3.66 2 1.243 0.537
Availability of opportunities to grow 3.58 3 1.400 0.497
Leadership support in job performance 3.48 4 0.295 0.863
Recognition of workers performance/efforts 3.42 5 2.376 0.305
Recognition of important holidays by the organisation 3.41 6 1.852 0.396
Availability of incentives such as bonus and payment of overtime 3.41 6 1.243 0.537
Leadership style that enhances job satisfaction 3.37 8 1.491 0.475
Company policy 3.37 8 1.130 0.568
Working environment 3.34 10 0.898 0.638
Having a sense of responsibility 3.32 11 2.051 0.359
Avenue for training and staff development 3.24 12 0.859 0.651
Having a balance between organisation values and personal values 3.20 13 0.574 0.751
The benefit of healthcare services 3.18 14 2.117 0.347
Good communication structure within the organisation 3.14 15 3.044 0.218
Opportunity to balance working life with family life 3.09 16 1.023 0.600
Social relationship among workers 3.02 17 5.126 0.077
5. Discussions
Findings revealed that the construction organisations in
the study area rarely employ permanent skilled workers;
instead, they rely more on hiring workers on a temporary
basis. This might be associated with the fact that most of
the construction companies in the country are the small
and medium size (Ogbu, 2017) and they cannot finance
projects independently before client's financial
contribution (Odediran et al., 2012). This financial
constraint is bound to affect their ability to keep skilled
workers on a permanent basis, since they may not have

14 D.O. Aghimien et al. / Journal of Construction Business and Management (2019) 3(1). 8-17
many construction projects to handle. However, findings
revealed that the type of organisational commitment
exhibited by skilled construction workers is not dependent
on their type of employment; either on a permanent, part-
time or contract basis. This result follows the line of some
past researches (Ellemer et al., 1998; Irving et al., 1997)
that have discovered that background/demographic
information such as gender, age, team size, level of
education, do not have any significant relationship with
the commitment type being exhibited. The major type of
organisational commitment exhibited by skilled
construction workers in the NCI is the continuance and
normative type of commitment. Meyer et al. (1993) have
stated that continuance commitment is an individual's
awareness of the costs of leaving the organisation.
According to Nagar (2012) workers with a high level of
continuance commitment remain a member of the
organisation because they need to. It has been established
that when workers exhibit continuance commitment, they
do not remain in their organisation because they are
satisfied; rather they do it just because they need to, and
they might have no other option (Gangai and Agrawal
2015; Lumley et al., 2011; Meyer et al., 1993).
This type of commitment being majorly exhibited by
skilled construction workers within the study area is not
the best as the organisation might not get the best from
these set workers. According to Meyer and Allen (1997),
the affective type of commitment motivates employees to
higher levels of performance than continuance or
normative commitment. Unfortunately, this commitment
type is the least exhibited by these set of construction
workers. This result is in contrast with the findings of Jena
(2015) which revealed that workers in ferroalloy
companies in Odisha, India exhibit more affective and
normative commitment than continuance commitment.
This disparity in result further emphasises the need for
improvement in the NCI.
Findings of this study also revealed that the significant
factors influencing the organisational commitment of
skilled construction workers are getting feedback from
supervisor, payment received isequal to work done, and
availability of opportunities to grow. This result is in line
with Bhavna and Swati (2012) submission that factors
such as pay and conditions, and getting feedback, are
crucial in achieving high employees' commitment. Martin
and Root (2008) observed that workers generally value
certain conditions of work, and when these conditions are
met, they will be more satisfied and committed, with less
intention to leave the organisation. One of these
conditions is their payment. Lumley et al. (2011)
submitted that workers pay is a significant determinant in
explaining workers' overall commitment. Mathieu and
Zajac (1990) have indicated that there is a positive
relationship between pay and commitment of workers.
According to Spector (1997), an unfair payment is bound
to lead to demotivation of workers. Findings of this study
also corroborate Haq et al., (2014) submission that factors
such as growth opportunities affect the commitment of
employees to an organisation. Oyewobi et al. (2012)
discovered that Quantity surveyors in Nigeria are more
committed to their jobs when there are adequate
opportunities for advancement. This finding is not
peculiar to this set of construction professionals alone, as
this current study has been able to reveal that
opportunities for growth is also important to skilled
workers and it has a considerable influence on their
commitment to their establishment.
6. Conclusion
This study set out to assess the organisational
commitment of skilled construction workers in the NCI.
Using a survey of selected skilled workers in Abuja, the
study has been able to ascertain the type of commitment
being exhibited by these set of workers, and the factors
influencing their commitment. Based on the findings, the
study concludes that the type of employment of skilled
workers (full time, part-time or contract) has no
significant relationship with their commitment type.
Irrespective of the type of employment arrangement they
have with their respective organisations, their
commitment type is the same. As such, construction
organisations within the country will do well by treating
workers’ commitment issues within their organisations in
like manner.
The common type of commitment exhibited by skilled
construction workers is the continuance commitment. The
most significant factors influencing their commitment are;
getting feedback from supervisors, payment received is
equal to work done, and the availability of opportunities
to grow. This, therefore, implies that construction
companies within the country need to improve in the
aspect of managing their human resources to attain better
commitment and at the same time improve their
productivity. This can be achieved by ensuring that giving
feedback is a priority to site supervisors, as this has a huge
tendency in influencing the commitment of skilled
workers either negatively or positively. Also creating
some job enrichment schemes and ensuring workers get
fair wages is imperative if the commitment level of these
workers is to change from being continuance to affective.
At least the minimum standard obtainable for wages
should be given to workers as this will help boost their
moral to perform and increase their commitment to the
organisation. Finally, the need to create opportunities for
growth for these workers is essential. Occasional
promotion of deserving workers, from ordinary site
workers to site supervisors, can go a long way in
increasing their commitment.
It is believed that the findings of this study will assist
construction organisations within the country in doing
appropriate planning and developing significant methods
that will assist them in enhancing their organisational
commitment of their skilled workers and by so doing
increasing organisational performance and workers
productivity. However, the major limitation of this study
lies in the fact that the study was limited to the
commitment of skilled construction workers in
construction firms in Abuja, Nigeria. The findings can
therefore not be generalised to other parts of the country,
as situations and organisation policies might differ
between regions of the country. Therefore, further studies
can be conducted by appraising the commitment of skilled
construction workers in construction firms in other areas
or regions within the country in order to compare results.
Also, more work can be done by assessing the effect of

D.O. Aghimien et al. / Journal of Construction Business and Management (2019) 3(1). 8-17 15
the commitment type exhibited by skilled construction
workers, on their job performance.
References
Abiola-Falemu, J. O. (2013). Organisational culture,
job satisfaction and commitment of Lagos-based
construction workers, IOSR Journal of Business and
Management, 13(6), 108-120
Ackroyd, S. and Hughes, J.A. (1981), Data Collection
in Context, Longman: London, UK.
Adeyemo, D. A. and Aremu, A.O. (1999). Career
commitment among secondary school teachers in Oyo
state, Nigeria. The Role of biographical mediators.
Nigerian Journal of Applied Psychology, 5 (2), 184-194.
Adeyemo, D.A. (2000). Job involvement, career
commitment, organisational commitment and job
satisfaction of the Nigerian police. A multiple regression
analysis. Journal of Advanced Studies in Educational
Management 5(6), 35-41.
Aje, I.O., Makanjuola, S.A and Olatunji, O.A (2015).
Assessment of Factors Affecting Bid-No-Bid Decision of
Construction Contractors in Nigeria. In: Ogunsemi, D.R.,
Awodele, O.A and Oke, A.E. (Eds). Proceedings of the
2nd Nigerian Institute of Quantity Surveyors Research
Conference. Federal University of Technology, Akure
529-536
Akintoye, A., (2000). Analysis of factors influencing
project cost estimating practice. Construction
Management and Economics, 18 (1), 77-89.
Allen, N. J., and Meyer, J. P. (1997). Affective,
continuance, and normative commitment to the
organisation: An examination of construct validity.
Journal of Vocational Behaviour, 49, 252-276
Allen, N., and Meyer, J. (1990) Organisational
socialization tactics: a longitudinal analysis of links to
newcomers’ commitment and role orientation. The
Academy of Management Journal, 33(4), 847-858.
Alsiewi, A. M. and Agil, S. (2014). Factors that
influence affective commitment to teaching in Libya.
IOSR-Journal of Business and Management, 16(2), 37–
46.
Anttila, E. (2014). Components of organisational
commitment – A case study consisting of managers from
Finnish industrial company master’s thesis, School of
Education, University of Tampere
Arnold, J. Silvester, J. Cooper, C.L., Robertson, I.T.,
and Patterson, F.M (2005). Work psychology:
understanding human behaviors in the workplace, 4th
edition, Prentice Hall/Financial Times.
Ashraf, Z., Jaffri, A. M, Sharif, M. T., and Khan, M. A
(2012), Increasing employee organisational commitment
by correlating goal setting, employee engagement and
optimism at workplace, European Journal of Business and
Management, 4 (2), 71-77
Bhatti, K. K and Qureshi, T. M. (2007). Impact of
Employee participation on Job Satisfaction, Employee
Commitment and Employee Productivity. International
Review of Business Research Papers, 3(2), 54 – 68
Bhavna, A. and Swati, G., (2012) Maximum Success:
Become an Employer of Choice, KKIMRC IJRHR, 1(2),
1-6
Bilau, A. A., Ajagbe, M. A., Kigbu, H. H, and
Sholanke, A. B. (2015). Review of Shortage of Skilled
Craftsmen in Small and Medium Construction Firms in
Nigeria, Journal of Environment and Earth Science 5(15),
98-110
Bustani, S.A. (2000). Availability and Quality of
Construction Craftsmen and Artisans in the Nigerian
Construction Industry. Journal of Construction
Technology and Management, 3(1), 91-103.
Carley, L.A., Goodrum, P.M., Haas, C.T. and
Borcherding, J.D. (2003). Experiences with multiskilling
among non-unit craft workers in US industrial
construction projects. Engineering, Construction and
Architectural Management, 10 (6), 374-381.
Cohen, A. (2003). Multiple commitments in the
workplace: An integrative approach. Mahwah, NJ:
Lawrence Erlbaum
Ellemmer, N., Gilder, D., and Heuvel, H. (1998).
Career oriented versus team-oriented commitment and
behaviour at work. Journal of Applied Psychology 83 (3),
717-730
Gangai, K. N. and Agrawal, R. (2015). Job satisfaction
and organisational commitment: is it important for
employee performance. Int. J. Manag. Bus. Res., 5 (4),
269-278
Ghasemi, A. and Zahediasl, S. (2012). Normality Test
for Statistical Analysis: A guide for non-statisticians.
International Journal of Endocrinol Metab, 10 (2), 486-
489
Girth, H, Sertyesilisik, B, and Horman, B. (2013). An
investigation into job Satisfaction and organisational
commitment of construction personnel, Global Advanced
Research Journal of Social Science, 2 (1), 1-11
Haq, M. A, Jindong, Y., Hussain, N. and Anjum, Z. Z
(2014) Factors affecting organisational commitment
among bank officers in Pakistan, IOSR Journal of
Business and Management, 16 (4), 18-24
Ibrahim, A. R., Roy, M. H., Amed, Z., and Imtiaz, G.,
(2010), An investigation of the status of the Malaysian
construction industry, Benchmarking: An International
Journal, 17(2), 294-308
Institute Of Management and Administration (IOMA)
(2005). Confronting the craft labour shortage.
Contractor's Business Management Report, 1-7.
Irving, P.G., Coleman, D.F., and Cooper, C.L. (1997).
Further assessment of a three-component model of
occupational commitment: Generalizability and
differences across occupations. Journal of Applied
Psychology 82, 444-452.
Jena, R.K (2015). An assessment of demographic
factors affecting organisational commitment among shift
workers in India. Management, 20(1), 59-77
Luchak, A. A., Pohler, D. M. and Gellatly, I. R. (2008).
When do committed employees retire? The effects of
organisational commitment on retirement plans under a
defined-benefit pension plan. Human Resource
Management, 47 (3), 581-599.
Lumley, E. J., Coetzee, M., Tladinyane, R. and Ferreira,
N. (2011). Exploring the job satisfaction and
organisational commitment of employees in the

16 D.O. Aghimien et al. / Journal of Construction Business and Management (2019) 3(1). 8-17
information technology environment. Southern African
Business Review, 15(1), 100-118
Markovits, Y., Boer, D. and van Dick, R. (2013).
Economic crisis and the employee: The effects of
economic crisis on employee job satisfaction,
commitment, and self-regulation. European Management
Journal, 32, 413–422
Martin, A. and Root, G. (2008). Perceptions of
organisational commitment, job satisfaction and turnover
intentions in a post-merger South African tertiary
institution. South African Journal of Industrial
Psychology, 34(1), 23–31.
Mathieu, J., and Zajac, D. (1990). A review and meta-
analysis of the antecedents, correlates and consequences
of organisational commitment. Psychological Bulletin,
108(2), 171-194.
Medugu, N. I., Rafee Majid, M., Bustani, S. A., Bala,
K., Abdullahi, U., and Mbamali, I. (2011). Craft Skills
Availability in the Nigerian Construction Industry:
Perception of Contractors and Consultants. Craft Skills
Availability in the Nigerian Construction Industry:
Perception of Contractors and Consultants. The IUP
Journal of Infrastructure, 9(3), 63-73
Meyer, J. P. and Allen, N. J. (1984). Testing the ‘side-
bet theory’ of organisational commitment: some
methodological considerations. Journal of Applied
Psychology, 69, 372-378
Meyer, J. P. and Allen, N. J. (1997). Commitment in the
workplace: Towards a general model: A review of
literature. Research papers management, 11(3) 299-326
Meyer, J. P., Allen, N. J. and Smith, C. A. (1993).
Commitment to Organisations and Occupations:
Extension and Test of a Three-Component
Conceptualization. Journal of Applied Psychology, 78
(4), 538-551
Miller, K. (2003). Values, attitudes and job satisfaction’
In Robbins, S.P., Odendaal A. and Roodt, G. (Eds),
Organisational Behavior: Global and Southern African
Perspectives. Cape Town: Pearson Education South
Africa.
Moser, C.A. and Kalton, G. (1999). Survey Methods in
Social Investigation, 2nd Edition. Gower Publishing
Company Ltd, Aldershot
Nagar, K. (2012). Organisational Commitment and Job
Satisfaction among Teachers during Times of Burnout.
Vikalpa, 37 (2), 43-60.
Nehmeh, R. (2009). What is Organizational
commitment, why should managers want it in their
workforce and is there any cost-effective way to secure it?
SMC Working Paper, 5, 1-11
Norizan, I. (2012) Organisational commitment and job
satisfaction among staff of higher learning education
institutions in Kelantan, Doctoral Dissertation, University
Utara Malaysia), 1-73
Odediran, S. J, Adeyinka, B. F, Opatunji, O. A. and
Morakinyo, K. O. (2012). Business Structure of
Indigenous Firms in the Nigerian Construction Industry.
International Journal of Business Research and
Management, 3(5), 255-264
Ogbu, C. P (2017). Survival practices of indigenous
construction firms in Nigeria. International Journal of
Construction Management, 18(1), 78-91
Olofinji, L. (2016). Why is there a shortage of Skilled
Construction Workers in Nigeria. An article in the Nigeria
Real Estate Hub. Accessible on:
http://nigeriarealestatehub.com/shortage-skilled-
construction-workers-nigeria.html/
Olomolaiye, P.O and Ogunlana, S.O. (1989). An
Evaluation of Production Outputs of Key Building Trades
in Nigeria, Construction Management and Economics,
7(1), 75-86
Owoyemi, O. A., Oyelere, M., Elegbede, T., and
Gbajumo-Sheriff, M (2011). Enhancing employees'
commitment through training. International Journal of
Business and Management, 6(7), 280-286.
Oyewobi, L.O., Bolaji, S., and Muhammad-Jamil, A.
(2012). Job satisfaction and job commitment; A study of
Quantity Surveyors in Nigeria Public service.
International Journal of Business Management, 7 (5),
179-192
Pallant, J. (2005), SPSS Survival Manual: A Step by
Step Guide to Data Analysis Using SPSS for Windows
(Version 12). 2nd Edition, Allen and Unwin, Crow’s Nest
NSW 2065 Australia
Salim, M., Kamarudin, H. and Abdul-Kadir, M. B
(2007). Factors affecting organisational commitment
among lecturers in higher educational institution in
Malaysia, Retrieved from http://e-
library.unw.ac.id/images/jurnal/4e5e0cd9c876e8652f3e7
ad21908b474.pdf
Spector, P. 2008. Industrial and Organisational
Behaviour (5th edition). New Jersey: John Wiley and
Sons.
Tan, W.C.K. (2011), Practical Research Methods,
Pearson Custom: Singapore.
Tucker, R. L., Haas, C. T., Glover, R. W., Alemany, C.
H., Carley, L. A., Eickmann, J. A., Rodriguz, A. M. and
Shields, D. (1999). Craft Workers' Experiences with and
attitudes Towards Multiskilling. Report No. 3, Center for
Construction Industry Studies, The University of Texas at
Austin, Austin, TX.
Ugheru, D.C. (2006). Training of craftsmen for Nigeria
construction industry. Journal of the Nigerian Association
of Engineering Craftsmen, 5, 9-10.

JCBM (2019)3(1).18-26
Respondents’ perception of Risk Factors on Residential Property Development in
Abuja, Nigeria
O. T. Ogunbayo1
1 Department of Estate Management, Obafemi Awolowo University, Nigeria.
Received 9 May 2018; received in revised form 20 June 2018; accepted 2 August 2018.
https://doi.org/10.15641/jcbm.3.1.2019.588
Abstract
Significant risk factors such as social, technological, economic, environmental and political in the timing development,
minimization of cost and expected return as they influence the successful delivery process of residential property
development were investigated in this study towards enhancing real estate development decisions. This is expedient because
it has been argued that the link between project success criterions determines a successful project delivery. Data were
obtained from members of Real Estate Developers Association (REDAN) in Abuja through the use of a self-administered
questionnaire. The respondents were asked to rate the influence of risk factors on residential property development
parameters, and the data were computed using logistic regression analysis. The study revealed that real estate developers
were more concerned with the influence of economic and technological risk than other sources of risk. Also, the statistical
effects were computed through logistic regression analysis. It was explained by significant value (p<0.05) which depicts the
likelihood of the risk factor which could either be positive or negative, as explained by beta (β). The findings revealed the
effect of economic risk factors in timing development to be (β=1.833, p<0.05). Also, the effect of technological risk factors
to influence development cost were found to be (β=--.187, p<0.05) while the effect of economic risk factors on return was
found to be (β=1.026, p<0.05). The main contribution of the study to the body of knowledge is developing a risk factors
assessment technique for practitioners and academia to assess the residential property development performance as related
to timely completion, cost and returns to enhance the need to develop competence in managing and minimizing the effect of
risk factors on the residential investment appraisal.
Keywords:Development appraisal, Expected return, Profit maximization, Residential property, Risk analysis, Time.
1. Introduction
Risk is a part of everyday life. The distinction between
financially successful and unsuccessful people is the early
awareness of risk in their businesses operations. Tularam
and Attili (2012) opined that decision makers successfully
manage situation subject to uncertainty by awareness of
risks inherent in the project. The real estate industry
comprised an extensive range of organizations and
individuals in the developing and operating property to
meet housing needs in the country (UDIA 2003).
Property development as a whole is risky, and it has been
asserted that every part of a project is fraught with risk
which could result in deviation from the expectation. It is
expected that the higher the complexities of the project,
the higher the risks involved in such projects (Belo and
Agbatekwe, 2002; Newell and Steglick, 2006).
1Corresponding Author
Email address: [email protected]
However, the basic parameter has been identified as
critical factors to achieve project success. For instance,
Bowen et al. (2012), Michell et al. (2007) established the
link between time, profit and total value for money in the
literature. Rwelamila and Hall (1995) argued that poor
handling of the three parameters is detrimental in
achieving project objectives. The study likened cost, time
and quality as three points of the triangle that neglecting
one parameter would have an adverse effect in attaining a
successful project. This explained that in the long run,
timely completion of a project would secure profit and
upon completion guarantee a return on investment.
Moreover, the three basic parameters have been
considered as one that determines the feasibility of a
project objective to guarantee a successful and profitable
development. All these measures are inevitable in
University of Cape Town
Journal of Construction Business and Management
http://journals.uct.ac.za/index.php/jcbm

O. T. Ogunbayo / Journal of Construction Business and Management (2019) 3(1). 18-26 19
property development and are usually affected by the
consequences of risk.
Meanwhile, Khumpaisal (2007); Otegbulu, et al.,
(2011) posited that property development is subject to
risks that are related to social, technological,
environmental, economic and political factors which
could hinder timely completion of project, expected
income, use and general orientation of the proposed
project. During the past, research has concentrated more
on the real estate development process and the risks
evident throughout the property development process
(Ogunbayo et al. 2018, Muka et al. 2015, Khumpaisal,
2007, Newell and Steglick 2006) but research into the
investigation of risk analysis in the real estate
development period, the project cost flow and the total
value which could have an impact on the investment
decision making has received little attention, hence the
need for the study. Also, with the current economic trends
both in developed and emerging countries, rational
investors will only be interested in developing a project
that could be completed within a defined period as well as
being able to predict the likely anticipated returns and
profit on investment. Thus, real estate investors need to
understand the effect of the significant risk factors on the
project criterion to enhance profit over the total value of
the project.
Also, this study will be limited to residential property
development in Abuja. Fisher and Robson (2006),
Windapo and Martin (2010) opined that property
development is a multifaceted process that comprises
features which fluctuate with time and place that could
affect development given that real estate market is
localized. Thus, it has been justified that real estate
developers are keen towards residential property
development due to the commercial activities in the state
which has encouraged migration of people from different
countries across the world and these are a strong
indication that influence residential property development
opportunities in Abuja, hence, the need for the study. The
main aim of this study is assessing the social,
technological, economic, environmental and political risk
factors in residential property development as related to
the timely completion, expected returns via the quality of
the project and the overall cost of an investment in order
to tap into the potential of real estate sector. This is
because it has been revealed that proper handling of these
parameters guarantees a successful investment decision
making.
2. Literature Review
2.1 Project Time, cost and quality
Numerous researchers have conducted studies on the
criteria to measure a successful project delivery that
enhances property decision-making process. Meanwhile,
Lui et al. (2015), suggested that there is need to develop
the concept of operational excellence in construction and
management consulting industries because of the
complexity of the project so as to enable team members to
perform the specified tasks in the right manner, at the right
time as to ensure a desirable outcome. Thus, the criterion
is seen as a determiner to enable successful project
performance (Bowen et al.2012, Michell et al.2007).
2.1.1 Time
The clients, contractors, real estate developers have seen
time as one of the critical factors in arriving at a successful
project development. Completion of projects within the
specified timeframe or schedules is a major problem
confronting real estate development projects; thus it is
worthwhile to carry out a survey investigating how the
risk factors could impact the timely project delivery.
Studies such as Divakar and Subramanian (2009)
examined the concept of time in a construction project.
The study argued that scheduling of project is faced with
uncertainties which could result in project time overrun
ranging from days to week and weeks to months
depending on the project condition. The study identified
critical factors as cash flow of the budget, preparation of
bill of quantities, coordination between agencies parties
that could cause project time overrun if not adequately
monitored. Dissanayaka and Kumaraswamy (1999)
evaluated the factors that could affect time performance
in Hong Kong construction industry. The data were
analyzed with the use of multiple linear regression and
artificial neural network. The finding revealed that non-
procurement related factors such as clients, project
characteristics and client representative characteristics are
the main factors that could influence the timely
completion of a project. While Chan and Kumaraswamy
(1996) asserted that risk is an unavoidable element in
construction projects and identified that contractor-
related" factor category has a high impact on time
performance than a client-related factor. Nevertheless, all
these studies examined the construction time performance
in building projects, but the scope did not cover the
influence of risk on the timely completion of residential
property development.
2.1.2 Cost
Rational investors or clients are concerned with the
overall profitability of a project generally. Charles and
Andrew (1990), Saidu and Shakantu (2017) presented
cost overrun in relation to the timely completion of a
project as a principal factor that could result in high
construction cost of building projects. Chimwaso (2000)
examined the cost performance of a public project in
Botswana and factors that influence construction cost
overruns. The study used a questionnaire survey to elicit
information among professionals in the construction
industry. Thus, the study ranked variations, re-
measurement of provisional works, fluctuations in the
cost of labor and materials, contractual claims, that is,
claims for extension of time with cost as the critical
factors that could influence cost performance of public
projects in the study area. Whilst Kaming, et al., (1997),
Cox, et al., (1999) identified design changes, inadequate
planning, unpredictable weather conditions; and
fluctuations in the cost of building materials, inaccurate
experience of project location and type as main factors
that could influence cost performance of a project. Thus,
these studies examined the factors influencing cost
performance of building projects, but the scope did not
cover the entire basic project criterion for achieving
successful delivery of a project which is the focal point of
the present study.

20 O. T. Ogunbayo / Journal of Construction Business and Management (2019) 3(1). 18-26
2.1.3 Quality
It has been observed that to determine the quality
performance of building projects there is a need to
consider the service received by the owner and the end
user of the developed project as to improve the quality
performance. Vincent and Joel (1995) presented total
quality management as "the integration of strategy and
structure, technical component and culture within an
organization to achieve continuous improvement of the
quality of goods and services. Thus, the project will start
to realize important, quantifiable, and noticeable
improvements if the three elements have been put in
place.
A study conducted by Sanni and Windapo (2008)
investigated the quality control practices on construction
site in Lagos to establish the contractor's alignment with
the implementation of the quality control plan in the study
area. The study analyzed data with the use of descriptive
and inferential statistics, and the results revealed that most
of the contractors do take quality control plan. The study
further details that there is a significant relationship
between having an effective quality control plan and
delivering a high-quality project in the construction
industry. In the same manner, Firuzan et al. (2010)
identified the elements that could influence contractors'
quality performance in the construction industry with the
view to developing an effective construction process and
improving the levels of satisfaction derived by the
customers. The study identified the elements as related to
the construction product, service, and the corporate
quality culture. The study further recommended that a
quality control plan should be implemented to guide the
contractors to enhance the quality of their operations and
high-quality building projects. However, the scope of
these studies did not examine the influence of quality
performance on residential property development that
could improve real estate development decisions in
accruing maximum returns.
Jazayeri and Dadi (2017) investigated the indicators
that could guarantee safety management system in
construction industries in the United States of America.
The study further explained that researches drawn
elements of safety management by analysis of accidents,
the structure of the highly reliable organization among
others as this could enable owners, contractors, and
decision makers to choose and implement methods to
improving the performance of construction safety
management system. In the same manner, Alsulamy et al.
(2012) reviewed the key performance indicators on the
cost, quality and time through the use of construction
process model that spanned through the initiative to
execution stage as to ensure delivery of projects and meet
the needs and expectation of the stakeholders. The study
concluded that performance measurement in the
construction sector and corporate level differs. This is
because the construction cost, time and quality are relied
upon in determining the extent of project success while
the corporate level is evaluated based on the financial and
non-financial measures. The study implied that the
performance measurement indicators should be
considered as marketing tools to achieve a desirable
outcome.
Nevertheless, these studies were a theoretical
investigation of significant metrics in the measurement of
project performance but did not investigate the influence
of risk on the successful delivery of the building projects.
Contrary, an empirical study conducted by Jazayeri et al.
(2018) examined the perception of the subcontractor on
the influential factors to the project's cost, schedule,
quality, and safety outcomes to assess management safety
policies. The study developed a safety rating system that
could enable clients and contractors to evaluate
subcontractor management procedures and policies for
improving safety performance. However, the scope of the
study did not examine the influence of risk on the project
success criterion which is the focus of this study.
However, successful project delivery could be
attained with the integration of the basic parameter to
realize the feasible objective of the project. A study by
Olaku et al., (2015) investigated the perception of
stakeholder on the parameters for successful project
delivery. The study used descriptive statistics such as a
mean and ranking method which revealed time, under
budget and precise specification as the main criterion in
enhancing a successful building project in Niger Delta,
Nigeria. Also, Chandr et al., (2012) posited that project
success could be measured by time, cost, quality,
profitability and customer satisfaction. The study used the
project indicators to predict the function of stakeholders
on project success in East Java. The findings revealed the
role of stakeholders' influence which regarded as
stakeholder impact, stakeholder engagement, and
stakeholder psychological empowerment was correlated
to project success. The studies were conducted in African
countries, but the scope did not cover the respondent's
perception of the analysis of risk factors on the three
criterions for a successful project delivery which is the
focus of this paper.
In summary, the manner in which the clients,
contractors and real estate developers engaged in housing
development projects will exert a significant influence on
the project outcome. However, all these studies did not
examine time, cost and quality in relation to the
influencing risk factors in determining the most optimal
value of the project. Therefore, there is a need to
understand the critical risk factors that could affect the
project success criterion in other to generate well-planned
strategies for improving the performance of future
building projects.
2.2 Risks in Real Estate Development
Risk is unavoidable in property development process. Its
influence can easily be discerned from the inception of the
idea, project feasibility, design and planning, construction
and disposal stage (Khumpaisal and Chen, 2010; Sotoni
et al., 2010). Risk connotes different meaning depending
on the exposure to difficulty or loss. The US-based Project
Management Institute (PMI) (2008) defined risk as “an
uncertain event or condition that, if it occurs will have
either a positive or negative effect on one or more of the
project’s objectives”, which could be project cost, time,
scope and quality.
In addition, risks in real estate development have been
related to the “separation of design from construction,
lack of integration, poor communication, uncertainty,

O. T. Ogunbayo / Journal of Construction Business and Management (2019) 3(1). 18-26 21
changing environment and increasing project complexity
and economic changes such as inflation and deflation, and
regional economic crisis including greater competition”
which could be understood as the risk that could cause
adverse effect on the property development (Gehner, et
al., 2006). Several authors such as (Muka et al. (2015),
Otegbulu et al. (2011), Chen and Khumpaisal (2009),
identified property development risk factors as social,
technological, economic, environmental and political
because of the overall impact on the project management
processes with respect to project delay, project cost,
overrun, the usage and management of the property which
could result in the variation of the total value of the project
whilst Akintoyeand MacLeod (1997) identified different
risk factors with respect to construction project under
extensive group of physical, environmental, design,
logistics, financial, legal, political, construction and
operation risks. All these risk factors depend on their
sources and nature of the project been considered by the
developers or investors within a given environment.
However, for this study, the analysis of social,
technological, economic, environmental and political
(STEEP) risk factors in residential property development
are considered while other sources of risk were neglected
since it has been established in the literature that STEEP
risks are peculiar with the real estate development. These
risk assessment criteria or indicators used in the design of
the questionnaire survey are briefly summarized as
follows.
Table 1: Risks assessment criteria for the real estate development
Risk criteria Risk assessment
Workforce availability This risk measures the level of developer’s satisfaction in relation to the workforce
availability in the project trade area (Danter, 2007)
Community acceptability This is measured by the degree of benefit of the project to the local communities
Cultural compatibility This is measured by the perception of the developers toward the lifestyle harmony in the
local market area
Public hygiene The degree of impacts on local public health and safety due to the development of the
specific project
Language barrier This is measured by the degree of satisfaction of the developers towards the influence of
language in the project area.
Location The risk is measured by the degree of the location concentration on properties values
Site condition This is measured by the degree of difficulties in selection of site or preparation of the site
for a project.
Designers and constructors It is measured by the developers’ satisfaction with the professional experience with regards
to the requirement of the development plan
Multiple functionalities It is measured by the degree of technical difficulties in construction which could affect the
project construction cost (Lam et al. 2006)
Duration It is measured by the total duration of the design and construction which has been specified
in the project development plan
Amendments It is measured by using the possibility of amendments in design and construction for each
specific development plan
Accessibility and evacuation It is measured by the access degree and quick emergency depending on the design of the
project (Moss et al., 2007).
Inclement weather condition It is measured by the perception of the developers on the influence of weather condition
on the project
Adverse environmental impact It is measured by the overall impact of the environment in the project area.
Pollution It is measured by the perception of developers towards the degree of land pollution in
relation to the specific development
Work hour restriction It is measured by the rate of work hour restriction during the developmental stage of a
project.
Accident related loss It is measured by the level of the risk impact on the financial aspect of the development
project.
Demand and supply It is measured by the degree of estimation of demand and supply of similar property.
Cash flow liquidity It is measured by the degree of ability to pay the contractual sum
Lifecycle valuation It is measured over five years for properties in the area
Area accessibility measured by using the degree of regional infrastructures usability associated with a
specific development
Fluctuation in material price It is measured by the degree of impacts of variation in the prices of materials on projects
Interest rate This is assessed by the degree of impact change in interest rate on project investment.
Marketing liquidity It is measured by the sale of property at the same rate in terms of unit price and transaction
time of similar properties in the trade area
Investment returns to measure the expected investment returns are internal rate of return, net present value or
return on investment in real estate development

22 O. T. Ogunbayo / Journal of Construction Business and Management (2019) 3(1). 18-26
Political group or activists This is measured by the degree of protest of the urban communities in relation to real estate
development in the trade area.
Rigid bureaucracy or corruption This is measured by the perception of the developers’ satisfaction towards project
administration of the same kind of real estate development project
Local tax/council approval
This is measured by the total days of construction design approval process by Abuja
Metropolitan Management Council (AMMC) and the rate of the local tax impact on a
specific project.
Source: Chen and Khumpaisal (2009)
3. Methodology
Primary data was used for this study. The data were
elicited through the use of questionnaire administration
and sourced from the member of Real Estate Developers
Association (REDAN) Abuja Chapter, Nigeria. It was
observed that there were 65 active members in Abuja, the
study adopted a total enumeration survey. Out of 65
members, about 90% questionnaire was accurately filled
and returned. There is a consensus among housing experts
on the need for a paradigm shift from government
provision to partnerships between the public and private
sectors because the government lacks enough resources to
address growing housing challenges in many developing
countries (Odebode & Oladokun, 2010) and hence the
choice of REDAN members for this study. The study
selected project time, cost, and profitability as the criteria
for project success. This is principally because of the cost,
time, and profitability metrics are objective.
Consequently, our dependent variable, "Residential
property development success", is binary, with 1
indicating that a project finishes within budget, scheduled
time frame and makes a profit whilst the criteria for our
independent variables are based on an extensive review of
literature in real estate development risks because it has
been explained that risks and uncertainties occurred in all
real estate development projects which could have impact
on overall project development processes as relates to
project delay, project cost overrun and the usage of the
property that causes a considerable loss in project income
(Khumpaisal 2007, Otegbulu et al. 2011).
Therefore, to evaluate the effect of development risk
factors (social. technological, environmental, economic
and political) in project success, respondents were asked
to rate their perception on the relative influence of the
risks in project criteria in other to arrive at risk factors that
could influence a successful residential property
development decision. Also, the respondents were asked
to rate on a Likert scale from 1-No effect to 5-Very high,
and the results were used to compute logistic regression
analysis. The data were analyzed through the use of
statistical package for social sciences (SPSS). The
Logistic regression (LR) explores the predictive ability of
sets or blocks of variables, and it specified the entry of
variables. In logistic regression, instead of predicting the
value of a variable Y from a predictor variable X1 or
several predictor variables (Xs), it predicts the probability
of Y occurring given known values of X1 (or Xs).
The logistic formulas are stated in terms of the
probability that Y = 1, which is referred to as ṗ. The
probability that Y is 0 is 1- ṗ.
𝑃(𝑦) =1
1 + 𝑒−(𝑏0+𝑏𝑖𝑥𝑖+⋯+𝑏𝑛𝑥𝑛)
Where P(Y) is the probability of Y occurring, e is the base
of natural logarithms, and the other coefficients form a
linear combination much the same as in simple
regression.
The efficiency of LR models was established. As 81.8
per cent of the total cases were found to be correctly
predicted for timely completion of the project, 61.8 per
cent were correctly predicted for cost overrun rate of the
project while 65.5 per cent was predicted for the expected
return on the project. Hence the established LR models
can be used to examine the relationship between the risk
factors in residential project success criterion. Thus, this
paper presents the logistic regression analysis on the
residential property development in the study area. It was
used to determine the level of contribution and the level
of significance of the independent variables (social,
economic, technology, political and environmental risk
factors) on the dependent variables to achieve a possible
delivery process.
4. Discussion and Findings
Presented below are the significant findings of the study
discussed under various subheadings.
Table 1: 1. Demographic information
Variables Levels Frequency Percentage
Ownership Private(Individual) 46 83.6
Corporate (Limited Liability) 9 16.4
Years of experience
1-10yrs 31 56.4
11-20yrs 15 27.2
21-30yrs 7 12.7
31yrs above 2 3.6
Job Position of the
respondent
Project manager 23 41.8
Director 1 1.8
managing director 3 5.5
senior manager 1 1.8

O. T. Ogunbayo / Journal of Construction Business and Management (2019) 3(1). 18-26 23
Manager 15 27.3
Architect 2 3.6
Estate surveyors 6 10.9
Advisory Valuer 1 1.8
Quantity Surveyors 3 5.5
Risk Acceptability
Optimistic (risk-loving) 19 34.5
Pessimistic (risk averse) 29 52.7
Midway between optimistic and pessimistic (risk neutral) 7 12.7
Total 55 100.0
Table 1 shows that 46(83.6%) of the real estate
organization is privately owned while 9(16.4%) are
corporately owned. This can be inferred that private real
estate developers participate more in real estate
development in the study area. Also, it is observed that
56.4% of the organizations have 1-10 years of experience
in real estate development, 27.2% fell within the range of
11-20 years of experience; while 12.7% and 3.6% have
21-30 years and above 31years' experience respectively.
This showed that a reasonable number (43.5%) of the
companies had obtained above ten years' experience and
suggested that there has been rapid progress in real estate
sector over the years in the Federal Capital Territory,
Abuja. Further examination of Table 1 also showed the
job position of the respondents in the organization with
23(41.8%) of total respondents being project managers,
director of project 1(1.8%), managing director accounts
for 3(5.5%), senior managers 1(1.8%), manager
15(27.3%), architect 2(3.6%), estate surveyors 6(10.9%),
advisory valuers 1(1.8%) and quantity surveyor accounts
for 3(5.5%). The outcome of the results implied that the
respondents are competent, experienced and qualified
them in exercising sound judgment in providing answers
to the questions. Hence, the responses provided by them
could be relied upon for this study. Besides, it can be
established from Table 1 that 29(52.7%) of the real estate
developers accounted for risk-averse, 19(34.5%)
accounted for risk-loving while 7(12.7%) accounted for
risk neutral (i.e. midway). It can be implied that due to the
fact the property development is fraught with risk, the
respondents still geared by the expected return to be
accrued from building projects.
4.1 Risk factors for timely delivery, cost and return
(value for money) on residential property development
The LR analysis begins with the selection of statistically
significant independent variables to be included in the
analysis. The outputs given in Table 2.1-2.3 showed the
stepwise LR result indicating the estimated coefficients
and related statistics of the developed models for time,
cost and value for money of the residential property
development. Thus, among the five factors, economic
factor is found to be significant as regards the timely
completion and return of the project while technological
factors play the most significant role in explaining the
effect in cost performance of the residential property
development.
Table 3: The effect of risk factors on the timely delivery of residential property development
B S.E. Wald Df Sig. Exp(B)
Social factor .261 .852 .094 1 .759 1.298
Technological factor .250 1.191 .044 1 .834 1.284
Environmental factor -.677 .602 1.265 1 .261 .508
Economic factor 1.833 .758 5.854 1 .016 6.253
Political factor .188 .433 .188 1 .665 1.206
Constant -3.925 2.781 1.992 1 .158 .020
Cox & Snell RSquare= .270, Nagelkerke R Square=.441
Table 2.1 showed the influence of risk factors on
residential property development timely completion and
the significant value is set at .05. From the analysis, it is
found that the variables in the equation explained between
27.0% and 44.1% variability in the dependent variable
(timely completion) as suggested by (Cox & Snell
RSquare= .270, Nagelkerke R Square=.441). It is evident
from the analysis that economic risk factor is statistically
significant to timely delivery of residential property
development. The significant value is at .016, and the
wald level that is the contribution of the factors in timely
completion is 5.854. Furthermore, from the table, the
likely effect of economic risk factors on timely delivery
in residential property development is accounted as 1.833.
This implied that a decrease in the effect of economic risk
factors would lead to the successful, timely delivery of the
development and vice versa. The outcome of the result is
in agreement with the study conducted in Ghana (Chileshe
and Yirenkyi‐Fianko 2012), Malaysia (Alaghbari et al.,
2007), Cambodia (Durdyev et al. (2017) and Nigeria
(Owolabi et al.,2014) that revealed that changes in the
economic risk variables such as fluctuation in the cost of
materials, lack of payment for completed works, changes
in interest rate among others could impact project in terms
of the speed of construction resulting into the delay in the
progression of development through unworkable project
scheduling and late delivery of material.

40 O. T. Ogunbayo / Journal of Construction Business and Management (2019) 3(1). 18-26
Table 4: The effect of risk factors on the cost of residential property development
B S.E. Wald Df Sig. Exp(B)
Social factor -.298 .647 .211 1 .646 .743
Technological factor -1.925 .711 7.319 1 .007 .146
Environmental factor -.187 .388 .232 1 .630 .830
Economic factor .489 .718 .464 1 .496 1.631
Political factor .120 .277 .186 1 .666 1.127
Constant 7.035 2.656 7.018 1 .008 1135.974
Cox & Snell R Square= .273, Nagelkerke R Square=.371
Table 2.2 shows the effect of risk factors in cost that
will lead to profit maximization. In this case, the risk
factors in the equation explained between 27.3% and
37.1% variability in the dependent variable. Also, the
significant column provided information on the variables
that contributed significantly to the predictive ability of
the dependent variables. The technological risk factor is
statistically significant to profit maximization at a p-value
of 0.007. The beta (B) value in the second column
explained the probability or likelihood of the predictor
variables on the dependent variables and also showed the
direction of the relationship. The outcome of the result
indicated that an increase in the effect of the technological
risk factor in residential property development would
affect the likelihood of achieving maximum profit. This
outcome is in agreement with Subramani et al. (2014),
Durdyev et al. (2017), asserted that inclement weather, the
high cost of skilled labor and project managers, change
orders, reworks and additional works could serve as
indicators to cost overruns in the residential building
projects. In contrary to this, Dokata (2017) pointed out
that fluctuation in the price of construction materials, the
size of a project, the rate of human capital expenses and
project cost were the main influencing factors likely to
impact cost performance of a real estate projects. The
difference might be because the scope of the study was
limited to commercial buildings cost performance and the
difference in the business environment.
Table 5: The effect of risk factors on returns(value for money) in residential property development
B S.E. Wald Df Sig. Exp(B)
Social factor -.144 .523 .076 1 .782 .866
Technological factor .264 .871 .092 1 .762 1.302
Environmental factor -.651 .531 1.500 1 .221 .522
Economic factor 1.026 .490 4.391 1 .036 2.790
Political factor -.434 .331 1.722 1 .189 .648
Constant -.691 2.443 .080 1 .777 .501
Cox & Snell RSquare= .187, Nagelkerke R Square=.258
Table 2.3 provides information on the influence of risk
factors on residential property development expected
return at the significant value of 0.05. From the analysis,
it was found that the variables in the equation explained
between 18.7% and 25.8% of the variability in the
dependent variable as suggested by (Cox & Snell
RSquare= .187, Nagelkerke R Square=.258).
Furthermore, it is evident from the analysis that the
economic risk factor is statistically significant to
residential property development expected return. The
significant value is .036 at the level of contribution of
1.026. It was revealed that the probability of the effect of
economic risk factors on residential property development
expected return is 1.833. The outcome of the result is in
consonance with the studies by Fereidouni and
Bazrafshan (2012), Klimczak (2012), Anule and Umeh
(2016) that changes in interest rate, selling price and
volume rate of the same kind of properties in the local
market, marketing strategy as related to housing projects
returns might affect the real estate investors to take
effective and rational investment decisions that constitute
the total value of the projects. This implied that a decrease
in the effect of economic factors would lead to a higher
expected return that would be generated on the developed
residential property.
5. Conclusion
The study investigated the respondent’s perception of
residential property development in Nigeria. From the
outcome of the survey, significant prioritized risk factors
that could influence the time, cost and the expected return
of a residential project were identified. The data were
analyzed using mean and logistic regression analysis of
which are critical in knowing the most influencing risk
factors in residential property investment appraisal. The
findings revealed that technological risk factor such as
accessibility and evacuation, condition of the site,
designers and constructors, inclement weather,
reworks/amendment among others are statistically

O. T. Ogunbayo / Journal of Construction Business and Management (2019) 3(1). 18-26 41
significant in assessing the cost performance whilst
economic risk factor such as fluctuation in cost of
building materials, demand and supply, cash flow
liquidity, location among others are statistically
significant in examining timely completion and value for
money (return) of the residential property development
which could cause variation between the actual and
estimated outcomes. This implied that if consequences of
risk factors are not adequately understood and managed
or monitored it could affect the successful property
development appraisal. Hence, there is a need for the real
estate investors both the local and international to develop
risk factors assessment technique for practitioners and
academia to assess the residential property development
performance as related to timely completion, cost and
returns elements to improve competence to manage and
minimize the effect of risk factors on the residential
investment appraisal.
Also, the study contributed to the empirical
investigations related to the analysis of risk factors
regarding the residential project success which will
strengthen the existing theories. This study provided
information into the phenomenon of how risks could
impact the residential property development performance
and could guide real estate developers to improve real
estate investment decision making given the negative
effects of project's time and cost overrun on investors
profit expectation. However, the limitation to the findings
of the study is that the analysis was conducted on
residential property development and the respondents
involved were only the registered property developers
while others actors in the development industry were left
out of the sample. Therefore, the paper may serve as a
guide on which further detailed analysis could be
examined to establish significant contributors to
improving the time, cost and value for money
performance in the real estate development industry.
References
Akintoye, A. S., and MacLeod, M. J. 1997. Risk
Analysis and Management in Construction.International
journal of project management, 15(1):31-38.
Alaghbari, W., Kadir, A, Salim, A. and Ernawati, 2007.
The Significant factors causing Delay of Building
Construction projects in Malaysia. Engineering,
Construction and Architectural Management,14(2):192-
206,
Alsulamy, S., Wamuziri, S. and Taylor, M. 2012.
Evaluation of key metrics for Measurement of Project
Performance In Smith, S.D (Ed) Proceedings 28th Annual
ARCOM Conference, 3-5 September 2012, Edinburgh,
UK, Association of Researchers in Construction
Management.1101-1110.
Anule, S.A. and Umeh, O.L. 2016. Investment
Performance Indicators of selected Lagos Commercial
Properties. Journal of Property Investment and Finance,
34(1):83-97.
Belo, M. and Agbatekwe, A. 2002. Project
Management in Property Development: The Nigeria
Experience. Published by University Press Plc Three
Crowns Building, Jericho Ibadan.
Bowen, P. A., Cattel, K. S., Hall, K. A., Edwards, P. J.
and Pearl, R. G. 2012. Perceptions of time, cost and
quality management on building projects. Construction
Economics and Building, 2(2):48-56.
Chan, D. W. and Kumaraswamy, M. M. 1996. An
Evaluation of Construction Time Performance in the
Building. Building and Environment, 31(6):569- 578.
Chandr, H. P and Indart, I. 2012. Model of Stakeholder
Influence on Project Success: Finding from Construction
Project in East Java. International Journal of Academic
Research, 4(2): 41-45.
Charles, T.J. and Andrew, M.A. 1990. Predictors of
Cost-overrun Rates. Journal of Construction Engineering
and Management. ASCE 116: 548-52.
Chen, Z. and Khumpaisal, S. 2009. An Analytic
Network Process for Risks Assessment in Commercial
Real Estate Development. Journal of Property Investment
and Finance, 27(3): 238-258.
Chileshe, N. and Yirenkyi‐Fianko, A.B. 2012. An
Evaluation of Risk Factors impacting Construction
Projects in Ghana. Journal of Engineering, Design and
Technology, 10(3):306-329.
Chimwaso, D. K. 2000. An Evaluation of Cost
Performance of Public Projects: Case of Botswana. In
Proceedings of the 2nd International Conference on
Construction in Developing Countries. 81-89.
Cox, I D, Morris, J P, Rogerson, J H and Jared, G E.
1999. A Quantitative study of Post Contract award Design
in Construction. Construction Management and
Economics, 17(4): 427 – 439.
Dissanayaka, S. M., and Kumaraswamy, M. M. 1999.
Evaluation of Factors affecting Time and Cost
Performance in Hong Kong Building Projects.
Engineering Construction and Architectural
Management, 6(3): 287-298.
Divakar, K. and Subramanian, K. 2009. Critical success
factors in the real-time monitoring of construction
projects. Research Journal of Applied Sciences,
Engineering and Technology, 1(2):35-39.
Dokota R.A. 2017. Factors' influencing Building
Construction Projects Costs Management in Commercial
Real Estate in Nairobi County, Kenya. Research Project
Submitted in Fulfillment of Master of Arts in Project
Planning and Management of the University of Nairobi.
Durdyev, S., Omarov, M., and Ismail, S. 2017. Causes
of delay in Residential Construction Projects in
Cambodia. Cogent Engineering, 4(1):1291117.
Durdyev, S., Omarov, M., Ismail, S., and Lim, M. 2017.
Significant contributors to Cost Overruns in Construction
Projects of Cambodia. Cogent Engineering,
4(1):1383638.
Fereidouni, H.G. and Bazrafshan, E. 2012.
Determinants of returns on Housing: The Iranian Case.
International Journal of Housing Markets and Analysis,
5(4):351-360.
FiruzanY. , David A.and Jamshid M. 2002. Assessing
Contractor Quality Performance. Construction
Management and Economics, 20(3): 211-223.
Fisher, P. and Robson, S. 2006. The Perception and
Management of Risk in UK office Property Development.
Journal of Property Research, 23(2):135-161.

42 O. T. Ogunbayo / Journal of Construction Business and Management (2019) 3(1). 18-26
Gehner, E., Halman J. and Dejonge H. 2006. Risk
Management in the Dutch Real Estate Development
Sector: A Survey. In: Amaratunga, D., Haigh, R.,
Vrijhoef, R., Ham-blett M., Van den Broek C., (Eds.):
Proceedings of the 6th International postgraduate research
conference in the built and human environment, Delft,
The Netherlands, 6-7 April. 541-552.
Jazayeri, E. and Dadi, G. B. 2017. Construction safety
management systems and methods of safety performance
measurement: A review. Journal of Safety Engineering,
6(2):15-28.
Jazayeri, E., Liu, H., and Dadi, G. B. Assessing and
Evaluating Subcontractor Management Safety Policies. In
Construction Research Congress 2018. 251-261.
Kaming, P.F., Olomolaiye, P.O., Holt, G.D. and Harris,
F.C. 1997. Factors influencing Construction Time and
Cost-overruns on High Rise Project in Indonesia.
Construction Management and Economics, 15(1):83 - 94
Khumpaisal, S. 2007. Risks in the Construction project
Procurement Process and the Mitigation Methods. Journal
of Architectural / Planning Research and Studies,
5(2):135-145.
Khumpaisal, S. and Chen, Z. 2010. Risks Assessment
in Real Estate Development: An Application of the
Analytic Network Process. Journal of Architectural
Research and Studies, 7(1):103-116.
Klimczak, K. 2010. Determinants of Real Estate
Investment. Economics and Sociology, 3(2): 58-66.
Liu, H., Jazayeri, E., and Dadi, G. B. 2017.
Establishing the Influence of Owner Practices on
Construction Safety in an Operational Excellence Model.
Journal of construction engineering and management,
143(6):1-9.
Michell, K., Bowen, P., Cattell, K., Edward, P. and
Pearl, R. 2007. Stakeholder Perceptions of Contractor
Time, Cost and Quality Management on Building Project.
In Proceeding of the CIB World Building Conference on
Construction for Development, Cape Town, South
Africa.14-18.
Muka, I. W., Tamin, R. Z. and Wibowo, A. 2015.
Property Development Risk: Case Study in Indonesia.
International Refereed Journal of Engineering and
Science, 4(7):21-26.
Newell, G. and Steglick, M. 2006. Assessing the
Importance of Property Development Risk Factors.
Pacific Rim Property Research Journal,12(1):22-37.
Odebode A.A. and Oladokun T.T. 2010. Public Private
Partnership in Housing Delivery in Nigeria. In Fadare,
S.O. and D.A. Adesanya (Eds). Sustainable Environment,
Ile-Ife: Obafemi Awolowo University Press, 132-142.
Ogunbayo, O.T., Odebode, A.A., Oyedele, J.B. And
Ayodele, O.T. 2018.The significance of Real Estate
Development Process Analysis to Residential Property
Investment Appraisal in Abuja, Nigeria. International
Journal of Construction Management, Taylor and
Francis,1(1):1-10
Olaku A.P., Ibrahim S., Abdulazeez, A., Adeniran
O.W. and John, T. A. 2015. Evaluation of Perception of
Stakeholders on Key Performance Indicators for UBE
Building Projects. Journal of Multidisciplinary
Engineering Science and Technology, 2(3):277-285.
Otegbulu, A., Mohammed, M. and Babawale, K. 2011.
Survey on Risk Assessment Techniques Applied in Real
Estate Development Project in Nigeria (A Case Study of
Federal Capital Territory, Abuja).Journal of
Contemporary Issues in Real Estate,1(1):189-202.
Owolabi, J. D., Amusan, L. M., Oloke, C. O., Olusanya,
O., Tunji-Olayeni, P. F., Dele, O., ... and Omuh, I. O.
2014. Causes and Effect of Delay on Project Construction
Delivery Time. International Journal of Education and
Research, 2(4):197-208.
Project Management Institute, 2008. A Guide to the
Project Management Body of Knowledge,4th ed., Project
Management Institute, Atlanta, GA.
Rwelamila, P. D. and Hall, K. A. 1995. Total Systems
Intervention: An Integrated Approach to Time, Cost and
Quality Management. Construction Management and
Economics, 13(3): 235-241.
Saidu, I., and Shakantu, W. (2017). An investigation
into cost overruns for ongoing building projects in Abuja,
Nigeria. Acta Structilia: Journal for the Physical and
Development Sciences, 24(1), 53-72.
Sanni, A. A. and Windapo, A. O. 2008. Evaluation of
Contractor’s Quality Control Practices on Construction
Sites in Nigeria. In: Dainty, A (Ed) Proceedings 24th
Annual ARCOM Conference,1-3 September, Cardiff,
UK, Association of Researchers in Construction
Management.257-265.
Sotoni, A., Qefalia, A. and Barolli, E. 2010. Risks in
Large Scale Projects Management: Case of Industrial
Parks Development in Albania. Conference paper at
Faculty of Economy, Tirana University, Albania.
Economics. University of Pennsylvania (Wharton) and
NBER, Edited version, March 8.106-117.
Subramani, T., Sruthi, P. S., & Kavitha, M. (2014).
Causes of cost overrun in construction. IOSR Journal of
Engineering, 4(6), 1-7.
Tularam G.A. and Attili G.S. 2012. Importance of Risk
Analysis and Management – The Case of Australian Real
Estate Market. International Journal of Technology,16:
357-383.
Urban Development Institute of Australia 2003. The
Development Industry – NSW's Engine Room.
Developers Digest, 3: 12-13.
Vincent, K.O. and Joel, E.R. 1995. Principles of Total
Quality. Kogan Page, London
Windapo, A. and Martin, O. 2010. An investigation into
Nigerian Property Construction Companies’ Perception
of Critical Risk. Insurance Markets and Companies:
Analyses and Actuarial Computations,1(1):78-82.

JCBM (2019) 3(1).27-37
Effect of Management Strategies in Entrenching Organisational Safety Culture in the
Electricity Industry of Zambia
E. M. Mwanaumo1 and M. Mambwe 2
1& 2 Department of Civil and Environmental Engineering, School of Engineering, University of Zambia, Great East Road
Campus, Lusaka, Zambia
Received 7 June 2018; received in revised form 23 October 2018 and 28 December 2018; accepted 10 January 2019.
https://doi.org/10.15641/jcbm.3.1.2019.598
Abstract
Entrenching safety cultural aspects is one of the functional areas within the management system that underlines various
strategies. A number of investigations in the electricity industry revealed that a deficiency of organisational safety culture is
one of the underlying causes of accidents. This study sought to determine management strategies that impact organisational
safety culture in the electricity industry in Zambia. The objectives underpinning the study include establishing management
strategies that affect organisational safety culture, assessing worker's knowledge on safety, health and environmental (SHE)
programs, and ascertain the effect of organisational safety culture on workers attitude towards safety. Various literature was
reviewed on management strategies. The research used the quantitative method in which descriptive and analytical survey
methods using one-way analysis of variance (ANOVA) as inferential statistics. A structured questionnaire to obtain data was
designed, and the multiple linear regression method to analyse data in order to meet the research objectives was applied. The
study selected 230 workers from companies within the electricity industry using simple random sampling while 170
questionnaires were completed, giving a response rate of 73.91%. Findings revealed that workers understand organisational
safety culture and SHE processes; while management strategies such as recruitment, and rewards and compensation, had a
significant influence on organisational safety culture. The study concluded that management commitment and their
involvement in the safety aspects of the electricity industry is not just a benevolent obligation, but it compels and motivates
the workers they protect to achieve organisational objectives and goals. Furthermore, the study recommended the
restructuring of processes during induction and orientation to maintain high levels of safety at workplaces in order to record
few workplace accidents.
Keywords: Electricity Industry, Entrenching, Management Strategies, Organisational Safety Culture
1. Introduction
SHE management has historically been very responsive in
the electricity industry, with measures of improvement
only happening after root causes of major incidents have
been established. Organisational safety culture has the
capacity to create a cohesiveness that cultivates growth
and give distinctiveness by providing standards that allow
a variety of approach in an organisation (Mwanaumo &
Thwala, 2011). According to the United Nations, Safety
at work is not only a sound economic policy but also a
basic human right which can be achieved through culture
(WHO, 2006). This is an important statement that
encourages the need to employ safety policies world over,
as a human right.
1 Corresponding Author.
Email address: [email protected]
Rendering Du Toit (2012), on operational safety culture
in the organisation, he postulated that development of
humanity could enable the magnitude of threats in a
workplace. Further, several studies have been undertaken
that conclude that organisational safety culture in any
industry is an imperative element to SHE management
that ascertains the significance of noticeable engagement
of top management in heightening the adoption of safety
culture by workers (Kwayisi, 2014: 36).
According to Son (2016), organisational safety culture
has increasing prominence and acceptance as one of the
essential elements in the management of risks in large and
complex engineering systems. As a result of the relatively
high magnitude of consequences which are synonymous
with high hazardous industries, a strong emphasis is
University of Cape Town
Journal of Construction Business and Management
http://journals.uct.ac.za/index.php/jcbm

28 E. M. Mwanaumo and M. Mambwe / Journal of Construction Business and Management (2019) 3(1).27-37
placed on development of an excellent safety culture
within an organisation (Olusuyi, 2011). Entrenching
safety cultural aspects is one of the salient functional areas
of the majority of management systems, with strategies
aimed at establishing key frameworks ranked amongst the
top priority of management. The electricity industry is one
such industry that is synonymous with issues of safety
culture due to the dynamic nature of operations
undertaken, coupled with a high level of risk.
Aspects of organisational behaviour that are related to
culture are normally unnoticed and their impact on
organisational safety culture underrated. In entrenching
organisational safety culture in the electricity industry,
management involvement and its commitment to ensuring
safety values are maintained as one of the factors to
organisational safety culture as postulated by Mihai and
Sorin (2010: 305). Implicitly, a relationship exists
between management commitment and safety
performance even though it warrants further research
(Kwayisi, 2014).
In Agbola (2012: 54) organisational safety culture is
considered as a subset of organisational culture and is
focused on commonalities among attitudes to safety.
Organisational safety culture was also paraphrased by
Zou and Sunjino (2015) that it includes shared values at
the group level, formal safety issues attributed to an
organisation, linkages related to management and
supervisory systems that emphasises the contribution of
all organisational partakers, has a positive effect on
workers' behaviour, and involves reward and durability.
According to the Auditor General's Report on the
Management of Occupational Health and Safety in
Zambia presented during the Fifth Session of the Eleventh
National Assembly (2015), the rise in the number of
occupational accidents in high-risk industries such as the
electricity industry could be attributed to lack of strategies
by organisations used to reduce the risk of incidences. The
report further indicated that there was need for top
management to come up with strategies that can be
implemented within such organisations to curb the rise in
accidents and create a culture of safety.
Additionally, according to the Energy Regulation
Board (ERB) Report of Zambia (2014) most electrical
accidents result from unsafe equipment or installation,
unsafe environment, or unsafe work practices.
Investigations into these accidents identified that some of
the causes of injuries and fatalities are related to the safety
perception and include factors such as faulty insulation,
improper grounding, loose connections, defective or
wrong parts, unguarded live parts, and failure to de-
energise electrical parts before inspection or repair,
improperly maintained electrical tools and equipment,
failure to exercise caution when working, exposed
energised lines and equipment, and using inappropriate
personal protective equipment and insulated tools.
Further, ZESCO Limited, a government-owned entity,
experienced a lot of work-related accidents attributed to
SHE in the first quarter of 2016 indicating 38% of the total
incidences in the industry this is according to the report
by the Worker's Compensation Fund Control Board
(WCFCB). These incidences caused electrocutions, road
traffic accidents, fall from a height, electrical
burns/flashes, hit/struck by an object, material/manual
handling and caught-in-between and disease contracted
during employment. Another analysis of data obtained
from WCFCB revealed that the rate of fatalities arising
from workplace accidents rose from 67 to 127 cases in
2011 and 2014 respectively representing an increase of
65% in the period under review (WCFCB, 2016).
Furthermore, during the 2019 National Budget
presentation on 28 September 2018 to the Zambian
Parliament, it was mentioned that the Government had
planned to recruit over 1,000 Safety Inspectors in the
Ministry of Labour and Social Security in order to closely
monitor high risk industries on issues related to SHE and
help organisations formulate strategies, policies and
procedures that can be used to curb accidents and promote
employee welfare. This pronouncement is an indication
that the Zambian Government was ready to work with the
industries in making sure accidents are reduced by helping
promote strategies at a national level that can be adapted
to stimulate organisational safety culture. Similarly, high-
risk industries can develop roadmaps and plans that would
be a basis in formulating strategies to organisational
safety culture.
Given the above, management strategies are required
and important to achieve organisational objectives aligned
with the national strategies on safety. Therefore, the
objectives of the study was to establish management
strategies that have a positive effect on promoting
organisational safety culture; to assess worker's
knowledge of SHE programs; and to establish the effect
of organisational safety culture on workers' attitude
towards safety.
The study findings will contribute to the Zambian
electricity industry safety performance by proposing
strategies to promote organisational safety culture to the
Department of Occupational Health and Safety in the
Ministry of Labour and Social Security, and industry
organisational top management. Furthermore, the
research results shall be of great significant in illustrating
the effects, whether positive or negative, of the strategies
employed specific to the organisation according to the
policies.
2. Overview of Organisational Safety Culture and
Management Strategies
2.1 Organisational safety culture
Organisational safety culture as designated by Dumas
(2011) is a constituent of the general philosophy of an
organisation that affects the attitudes and beliefs of the
workers regarding health and safety routine. Although
there is no treaty on organisational safety culture
definition, various definitions with similar elements have
emerged over the years within the literature such as
Dumas (2011) and Zou and Sunjino (2015). These
elements include attitude, behaviour and perception of
workers in an organisation which make them realise that
safety is a priority. Choudhry et al., (2007) further
described organisational safety culture as: Learned
behaviour and those beliefs in the necessity, practicality
and effectiveness of controls, attitudes and risk perception
which makes people think safely and trust in safety
measures or characteristics and attitudes in an
organisation resulting in safety issues being a priority.

E. M. Mwanaumo and M. Mambwe / Journal of Construction Business and Management (2019) 3(1).27-37 29
Additionally, according to Guldenmund (2007),
organisational safety culture are aspects of the
organisational culture that have a future impact on
attitudes and behaviour and values to increase or decrease
safety risks.
2.2 Organisational safety culture in the electricity
industry
Organisational safety culture lies in the heart of effective
management of all risks related to the electricity industry
such as major accidents and hazards according to Olusuyi
(2011: 3) and is understood to be a major pointer to safety
performance as indicated by Wachter and Yorio (2014:
119). Organisations have programs they can use to
improve organisational safety culture in order to reduce
costs and increase performance (Haukelid, 2008).
Subsequently, some of the accidents in the electricity
industry can be reduced through appropriate safe working
behaviour (Hopkins, 2006). Accumulation of errors,
questionable decisions, and misguided priorities placed
ahead of safety, results in accidents. Nonetheless, causes
of most accidents are ascribed to human error, and as
suggested by most researchers in this knowledge area,
85%- 98% of injuries that occur at workplaces are caused
by unsafe attitudes (Williamsen, 2007: 19). Workers'
unsafe acts are postulated to be the cause of about 88% of
industrial accidents and that organisational failures are the
underlying factors in individual action-oriented errors
(Carrillo, 2010: 50).
Most studies reviewed in the Sub-Saharan regions
have applauded the need for management to create
strategies that would increase the levels of safety
awareness and encourage organisational safety culture.
However, the studies reviewed are not specific to the
electricity industry but inclined to other industries such as
mining, construction and aviation. In the study by Akpan
(2011) on effective health and safety management
policies for improved performance in organisations in
Africa, he mentioned that there was a need for
management to be the driver for effective health and
safety. Some of his findings can be used in the electricity
industry since most of the safety problems in the region
are similar regardless of the sector. Additionally, Asiedu-
Appiah et al. (2013) whose study was specific to the
mining industry indicated the importance of management
involvement in formulating SHE strategies. Other
proponents for using management strategies such as
policies and procedures, training and worker involvement
in uplifting organisational safety culture in organisations
in the construction and health industry include
Mwanaumo and Thwala (2011) in Botswana and Kwayisi
(2014) Ghana.
On the other hand, in some organisations within the
electricity industry in Zambia, management are
disconcerted with issues of safety. This assertion is
supported by Asiedu-Appiah, et al. (2013) who opined
that responsibilities in coordination and planning of
organisational safety cultural aspects in the electricity
industry had no clear-cut and that adherence to SHE laws
and regulations were generally low. Kilian (2012) further
espoused that management requires that it champions
organisational safety culture as they have a significant
role to play through administering, communicating,
facilitating and supporting the process.
A report prepared by the Kafue Gorge Regional
Training Centre (2014: 5) showed that safety programs
were not highly recognized especially in the distribution
divisions of the electricity sector. This report
recommended that there was need for management,
especially in distribution facades to adopt organisational
safety culture as a key function and hence establish safety
programs. This gap could be ascribed to a lack of safety
policy at the time, to provide the direction needed for the
framework and successful implementation of safety-
driven culture.
2.3 The role of management strategies in organisational
safety culture
In the perspective of the organisational safety culture of
an organisation, participation of top and middle
management denotes the extent to which individual
workers get involved with critical safety activities
(Dumas, 2011). According to Mambwe and Mwanaumo
(2017: 567), these safety activities include management
presence, collaboration and interaction of managers at
safety seminars, SHE Circles (Safety Tool Box), Green
Area Meetings, and ability to stay in-touch with risks
relevant to the day to day operations with the workers.
The Occupation and Safety Act No. 36 (2010) requires
an employer to ensure all workers implement safety and
health strategies. This ensures that Safety Managers assist
in the implementation and management of SHE programs,
processes and strategies of an organisation and are
responsible for the maintenance of safety records,
coordinating induction and orientation on SHE for new
and existing workers, accident investigation,
communication and information materials on safety.
Tan and Nasurdin (2011: 157) aver that management
strategies are aligned to specific strategies, attitudes and
policies planned to motivate, attract, develop and retain
workers to ensure the effective operation and survival of
an organisation. In effect, SHE policies are intended to
improve and maintain a safety cultural environment that
prevents and reduces potential risks, and workplace
hazards. Management strategies impact the operation of
the organisation in terms of safety and health management
as postulated by Asiedu-Appiah et al. (2013: 32). As
functional areas of management in ensuring
organisational safety culture, they included training and
development, recruitment and selection, information and
communication and performance management, as
paramount strategies.
However, Akpan (2011: 162) expounded numerous
ways of edifying organisational safety culture which
include management leadership and organisational
commitment, roles and responsibilities, employee
participation in hazard identification and assessment
process, determination of controls, enforcement of
controls and emergency response plans. While the
management commitment is acknowledged as very
contributory, Mihai and Sorin (2010: 303) in their study
specified that managers had limited understanding of both
their legal and corporate responsibilities on safety and
health and on ensuring a hazard-free workplace
environment.

30 E. M. Mwanaumo and M. Mambwe / Journal of Construction Business and Management (2019) 3(1).27-37
The account of the problem can be derived from the
fact that several studies have been conducted on
organisational safety culture in the electricity industry in
Zambia and have overlooked the roles and strategies that
key players such as safety managers and top management
add to the implementation of an organisational safety
culture. Management formulates appropriate policies on
safety and health, and environmental management
systems by making sure there is a conducive atmosphere
for safety at work. Nonetheless, according to the Auditor
General's Report on Occupational Health and Safety
(2015), Zambia has seen an increase in fatalities in the
industry arising from workplace accidents. The increase
was from 67 to 127 cases from 2011 to 2014 representing
an increase of 65%. This led to a public outcry on the need
to improve occupational safety and health conditions and
to introduce strategies that can be used to curb accidents
and help reduce fatalities.
Hence, as can be seen from the empirical studies
undertaken, the lack of literature on management
strategies in entrenching a safety-driven culture
necessitated this study. Therefore, the objective of the
study was to assess the effect of management strategies in
entrenching a safety-driven culture in the electricity
industry of Zambia in order to reduce workplace
accidents. Furthermore, the study determined
management strategies that have an impact on
organisational safety culture, assessed worker's
knowledge on SHE programs and established the effect of
organisational safety culture on workers. The study
adopted six themes as management strategies that can be
used in entrenching organisational safety culture
according to Asiedu-Appiah et al. (2013), Iqbal et al.
(2015) and Byers and Rue (2011: 325).
3. Research Methodology
The study adopted a quantitative research approach and
descriptive survey in which both primary and secondary
sources of data were used in assessing management
strategies. According to Weigmann et al. (2004),
quantitative approaches especially surveys of individual
responses, are more practical in terms of time and cost-
effectiveness. Primary sources of data were collected
using a structured questionnaire as a research instrument,
while secondary sources of data such as articles, statutes,
journals and past researches, were also reviewed in the
study as applauded by Machabe and Indermun (2013) of
South Africa. According to Guldenmund (2010), as cited
by Ganson (2014), organisational safety culture is
normally assessed or measured by conducting
questionnaire surveys among a group of workers in an
organisation. The study utilised a descriptive survey
research. Leedy and Ormrod (2015) postulated that
descriptive surveys could be used as a means to collect
data from the questionnaire. The survey in this study
involved asking workers to complete a designed pre-
tested specific, standardized questionnaire which was
administered to provide the respondent with an
opportunity to give their perceptions on certain health and
safety related dimensions, and as such, this method was
considered for data collection and analysis purposes.
The study respondents comprised of technicians,
engineers, safety managers, supervisors, and maintenance
managers, senior managers and top managers from the
electricity companies in Zambia that were categorized as
government owned and privately-owned organisations.
The sampling techniques adopted in the study were for
purposes of selecting respondents strategically designated
based on the roles they play within the electricity industry.
Hence, simple random sampling techniques and
purposive sampling techniques were applied. According
to Davies (2007) and Saunders et al. (2009) purposive
sampling helps the researcher identify and target
individuals that will be typical candidates of the
population under review. Distributed questionnaires were
230, of which 170 usable responses were received, while
35 (15.22) were either incomplete or spoiled, which gave
a response rate of 73.91% and included usable
questionaires and was onsidered as being close to the
acceptable range of 80% as reported by Branson et al.,
(2017). The remaining 25 (10.87%) questionnaires were
not recovered or responded. Statistical Package for Social
Science (SPSS) and Microsoft Excel software were
applied to analyse the data through the use of descriptive
statistics and linear regression models.
Mojapelo et al. (2016; 106) applied seven dimensions
to explore perceptions of employees in the steel industry
towards occupational health and safety standards in the
manufacturing industry in South Africa, in order to tailor
a structured questionnaire distributed to a purposive
sample of 165 employees. The results revealed that
employees perceived occupational health and safety
standards as satisfactory in all seven-occupational health
and safety dimensions adopted as independent variables
for the multiple linear regression analysis to assess the
data. These were (1) information and training, (2) health
and safety awareness, (3) employee behaviour (4) role of
the supervisor, (5) health and safety reporting
mechanisms, (6) workplace inspection, and (7) workplace
environment. Conversely, Mojapelo et al.’s (2016) study
was focused on employees, while the present study was
more focused on management strategies.
However, to assess the effect of management
strategies in entrenching organisational safety culture, the
current study espoused six themes as safety dimensions
and human resource strategies as applied by Akpan
(2011). These include (1) Recruitment, (2) Training &
Development, (3) Performance Analysis, (4)
Communication, (5) Induction & Orientation, and (6)
Reward & Compensation. These dimensions were applied
as independent variables to create a multiple linear
regression model, while organisational safety culture was
applied as a dependent variable.
Additionally, Davids (2016) undertook a study using
the 5-point Likert scale to respond to 49-item statements
by choosing one answer per statement. The results
indicated that a highly positive correlation was found to
exist between the themes of organisational commitment
and management involvement. The study, therefore,
adopted the use of a 5-point Likert scale. Several studies
have indicated the use of a 5-Point Likert scale in the
study of organisational safety culture. The scale allows
the respondents to express how much they agree or
disagree with a particular statement on the questionnaire,

E. M. Mwanaumo and M. Mambwe / Journal of Construction Business and Management (2019) 3(1).27-37 31
the scale is also easily understood, and responses are
easily quantifiable and subjective to the computation of
some mathematical analysis (Leedy & Ormrod, 2015).
Figure 1: Demographic Distribution of Questionnaire Respondents
According to Mason et al. (1989), descriptive statistics
are used to summarise data, hence considering that the
sample size was 170, the parametric test was carried out
for normality (Motulsky, 2005). Trochim (2004) indicates
that reliability is established when the data is collected
from the correct sources through the appropriate method.
Therefore, it was considered that the government and
private employees working in the electricity industry
provided reliable answers to the questions on the effect of
management strategies on organisational safety culture.
The research also centred on capturing the
relationships that exist between management strategies
and organisational safety culture, in order to conceptualise
the study. The relationship that exists is inversely
proportional, in that when strategies such as the right
recruitment of staff, training and development on SHE,
performance analysis, enhanced communication,
induction and orientation, and rewards and compensation,
are implemented, the rate of incidents, environmental
risks and occupational health diseases are reduced.
Once these measurements are reduced, safety culture in
the organisation is increased affirmatively.
Correspondingly, when worker's knowledge on issues of
SHE is enhanced, organisational safety culture is
increased and inversely affects the rate of safety incidents
positively by reducing the risks. Similar accessions were
also postulated by Agba (2012), Du Toit (2012) and by
Wachter and Yorio (2014). In all instances, organisational
safety culture was dependant on management strategies
and worker's knowledge of safety which are independent
variables.
Further, Guldenmund (2007) and Carrillo (2010)
acknowledged that when organisational safety is
enhanced, workers attitude towards safe work is
enhanced. This study conceptualizes that there is a direct
interaction between organisational safety and the
dependent variable, workers attitude towards safe work as
illustrated in Figure 2.
Figure 2: Conceptual framework - effects of management strategies in entrenching organisational safety culture (Author,
2018)
5
2
15
6
20
10
40
10
39
23
119
51
0 20 40 60 80 100 120 140
Government
Company
Private Company
Demographic Distribution of Questionnaire Respondents
Totals Technicians/artisansSupervisors and Engineers Safety and Maintenance ManagersSenior Managers Top Managers
Factors:
- Recruitment - Training & Development
- Performance Analysis - Communication
- Induction & Orientation - Reward & Compensation
Management Strategies
Organisational Safety Culture
- Reduced accidents rates and safety
incidences
- Reduced occupational health incidences
- Reduced environmental risk
Workers knowledge on SHE
Independent Variables Dependent Variable
Affects
Affects
Organisational Safety Culture Worker's attitude towards safety
(Positively)
Independent Variable Dependent Variable
Impacts

32 E. M. Mwanaumo and M. Mambwe / Journal of Construction Business and Management (2019) 3(1).27-37
4. Findings and Discussion
4.1 Demographic profile of respondents
This section analysed the respondent’s demographic
information by use of percentages based on counts and
charts that were undertaken. The demographic profile of
respondents used was educational attainment of
respondents and the position or grade held at the
workplaces.
4.1.1 Descriptive analysis of respondents’ educational
attainment
To establish the educational attainment levels of the
workers in the electricity industry of Zambia as recorded
across the survey's respondents. According to Table 1, it
was found that the highest educational attainment was that
of a Doctorate which constituted 1% of the entire
electricity organisations respondents that took part in the
study and then from Master's degree, Bachelor degree,
Diploma, and Certificates holders, as the most attained
level of education.
Table 1: Educational attainment of respondents
Sum Percentage
PhD 2 1.18
Masters 46 27.06
Bachelor 55 32.35
Diploma 50 29.41
Certificate and others 17 10
Totals 170 100
Among these qualifications, most of the workers indicated
to have a Bachelor's Degree (32.35%) and a Diploma
(29.41%). With regards to work experience, the results
indicated that most of the workers had experience for over
nine (9) years while those who worked less than three (3)
years, were a smaller group. With more qualified workers
and reasonable experience in the electricity industry, it
can be deduced that the composition of workers are more
experienced and understand the management strategies in
entrenching organisational safety culture in the electricity
industry in Zambia.
4.1.2 Analysis of respondents’ grade/position at the
workplace
For easy reference, respondents were grouped into three
categories, senior management, junior management and
unionised workers. The senior management category
comprised of principal and chief engineers, managers,
senior managers and directors. Junior management staff
included engineers, support staff with degrees, senior
officers, superintendents and supervisors. Most unionized
workers were made up of foremen, technologists, artisans,
linesmen, and daily casual of employees. The senior
management represented 23.2% of the total respondents,
while junior management and unionized workers
represented 56.4% and 20.4% respectively. The study
incorporated the position of the workers during the
questionnaire survey to understand the roles and
responsibilities of each rank and how they would affect
the management strategies that management and
supervisors use to support organisational safety culture.
4.2 Central Tendencies Measurement
Measurement of central tendency using a mean of the
various themes in the questionnaire was analysed.
According to Son (2016), most of safety culture
measurement tools employ 5-point Likert scale. David
(2016) undertook a study using the 5-point Likert scale to
respond to 49-item statements by choosing one answer per
statement. His results indicated that a highly positive
correlation was found to exist between the themes of
organisational commitment and management
involvement. Therefore, based on those mentioned above,
the study adopted the use of a 5-Point Likert scale with
five scales of intervals that ranged from strongly agree
(SA) to strongly disagree (SD). The view of respondents
on organisational safety culture knowledge from
respective workplaces and departments was gathered to
measure the level of exposure on the strategies on SHE
management.
Table2: Statistical interpretation of knowledge on organisational safety culture
Strongly
Agree
(%)
Agree
(%)
Neutral
(%)
Disagree
(%)
Strongly
Disagree
(%)
Mean
(N)
Rank
(N)
I understand safety and health issues as required in
OSH Act 36 of 2010 and Factories Act, Cap. 441 of
the Laws of Zambia
24.9 52.4 12.1 5.7 4.9 2.33 2
Provision of significant updates on knowledge on
SHE. 8.5 35.6 32.1 18.7 5.1 2.71 1
Non-conformance to safety procedures lead to
punishment. 22.6 56.2 11.5 8.2 1.3 2.12 4
Unsafe workplace and environment gives me the right
to refuse to work 33.2 26.2 29.1 8.2 3.3 2.17 3
Management understands the risks associated with
operations. 32.1 48.0 12.4 2.9 4.6 1.90 6
Management and the workforce work together to
tackle safety issues. 23.5 38.6 11.4 14.1 12.4 1.91 5
Scale denotation: Likert Scale: 1 = Strongly agree to 5 = Strongly disagree
Overall mean score = 2.43

E. M. Mwanaumo and M. Mambwe / Journal of Construction Business and Management (2019) 3(1).27-37 33
Management strategies in inculcating organisational
safety culture are very critical when addressing SHE
adherence. The overall mean score for the scale was 2.43
indicating a moderate inclination to the "agree" scale. The
mean scores in this study ranged from 1.90 – 2.71 As
indicated in Table 2 the theme with the highest mean score
of 2.71 ranking is "Provision of significant updates of
knowledge on SHE". This represents a stronger
inclination towards ‘agree' position on the Likert scale.
The higher mean scores demonstrate that management
provides significant updates of knowledge on SHE and
can be deduced that employees have significant
knowledge and understanding on SHE. While the lowest
mean score value of 1.90 was found to be "management
understands risks associated with operations". This can be
deduced that management takes time to understand the
risks that the operations of the electricity industry bring
about and hence lie in the category of strongly agree on
the Likert scale. From the above, it can be deduced that
workers that took part in the survey appreciably
understand and have knowledge on safety and health and
the role that management play in driving an organisational
safety culture in the industry. Furthermore, this finding
was supported by the research undertaken by Nunez and
Villanueva (2011) who affirmed that there is a direct
relationship between management involvement, safety
risks and safety knowledge/awareness to lower the
occurrence of accidents. If workers did not have the
knowledge required, as postulated in the OSH Act 36 of
2010 and Factories Act, Cap 441 of the Laws of Zambia,
working under a congenial environment that is safe would
not be possible.
In assessing the knowledge that workers had
pertaining to organisational safety culture about SHE
operations of the electricity industry, it was found that
70% of the workers had a good understanding of the
ascription made in the OSH Act 36 of 2010 and the
Factories Act, Cap 441 of the Laws of Zambia. They also
corresponded to have been involved in the SHE aspects.
Additionally, it was disclosed that workers are involved
in the provision and updates regarding knowledge on SHE
aspects of the organisations they represent. This was an
attestation of knowledge on safety and health activities at
various workplaces in the electricity industry.
4.3 Respondents views analysed inferentially
Statistical inferential techniques were used to analyse the
data drawn from the questionnaire survey in order to
determine the Analysis of Variance (ANOVA) and model
of Multiple Linear Regression to quantify the effect of
management strategies on organisational safety culture
entrenchment in the electricity industry as perceived by
the workers. According to Leedy and Ormrod (2015),
normally distributed data that can use the one-way or two-
way ANOVA test are parametric. Moreover, the data
fitted the normal distribution by assuming normality.
Justifiably, the use of the one-way ANOVA indicates that
there were no outliers in the data set. The use of ANOVA
based on the literature reviewed in the study was applied
by Davids (2016) who assessed safety culture of
professional pilots within the aviation industry, and his
results indicated assumed normality after testing using a
one-way ANOVA with a size of over 100 respondents.
Similarly, tests were used by Mojapelo et al. (2016)
whose test for normality was affirmative after applying
ANOVA and multiple regression analysis to quantify
safety perception of employees in the steel industry.
Additionally, the use for normality in this study indicated
that the there were no multiple outliers in the data set and
that the sample size of 170 was justifiable to use
parametric tests. Since the dependent variable was only
organisational safety culture, the research adopted the
one-way ANOVA. However, their study used seven
dimensions of safety culture as independent variables
while this study employed five strategies as independent
variables for the multiple regression analysis.
4.3.1 Analysis of variance (ANOVA)
A set of independent variables whose normality was
determined using ANOVA technique showed variability
in the outcome. The results were derived using SPSS as
shown in Table 3.
Table 3: Analysis of variance of the data
Sum of Squares Degree of Freedom Mean Square F-Statistics Sig
Regression 83, 637 6 12.844 17.325 0.00
Residual 128, 434 162 0.702
Total 212, 071 168
The independent variables used in the analysis were
the six management strategies: recruitment; training and
development; performance analysis; communication and
information; induction and orientation; and reward and
compensation, illustrated 83, 637 from the total of 212,
071. The indicative results showed that the dependent
variable, organisational safety culture signified 39.44% of
the whole variability of the data. This implies that the
remaining 60.56% representing the sum square of 128,
434 in the outcome is considered to be unexplained by the
independent variables used in this study. Additionally, the
p-value of 0.00 is affirmative of the six management
strategies and significant influence on the process of
entrenching organisational safety culture in the SHE
management systems. Thus, demonstrating that there are
more independent variables that could have been used and
were not included in the regression analysis hence the
variability proportion in the outcome.
4.3.2 Multiple Linear Regression Analysis
The independent variables used in the study and the
dependent variable were used to create the multiple linear
regression model. The six independent variables were
used in the multiple linear regression formula in a

34 E. M. Mwanaumo and M. Mambwe / Journal of Construction Business and Management (2019) 3(1).27-37
collective manner and organisational safety culture as a
variable that was dependent.
Table 4: Multiple linear regression estimates
Dependent Variable:
Organisational Safety Culture
Unstandardized
Coefficient
Estimate
Standard
Error
Standardized
Coefficient
Estimate
T-Statistic Sig. VIF
Constant 1.927 0.441 - 4.520 0.000 -
Recruitment 0.671 0.128 0.477 5.541 0.000 1.912
Training & Development 0.153 0.129 0.082 1.272 0.243 1.643
Performance Analysis 0.072 0.132 0.038 0.586 0.629 1.574
Communication -0.066 0.097 -0.047 -0.692 0.555 1.407
Induction & Orientation -0.423 0.086 -0.383 -5.426 0.000 1.309
Reward & Compensation 0.056 0.132 0.037 0.493 0.696 2.240
The results of the multiple linear regression from
Table 4 shows that the independent variables with high
significant diverse effects on organisational safety culture
were training and development, and induction and
orientation. Additionally, the practice of recruitment was
affirmative while induction and orientation indicated a
non-affirmative effect on organisational safety culture.
Conversely, this implies that an increase in the right
recruitment of workers to perform the right jobs leads to
a 0.671 increase in organisational safety culture at
workplaces. While a reduction in induction and
orientation strategies by management tends to reduce
organisational safety culture by 0.423. Training and
development, performance analysis, communication and
rewards and compensation indicated varied effects not
statistically significant. This was because the literature on
the use for instance, of rewards and compensation varied.
It could be affirmed that the Zambian electricity industry
does not reward or compensate appropriately for
adherence to SHE procedures.
The standardised coefficient estimates are beta
coefficients resulting from the regression analysis that
have been homogeneous so that the variances of
dependent and independent variables are one (1)
(Wakefield, 2014). The negative beta indicates that there
is a decreased use of the dimension in communication,
and induction and orientation since the outcome variables
decreased by 0.047 and 0.383 respectively.
4.3.3 Goodness-of-fit and collinearity
No two or more independent variables with their
estimated coefficients are expected to have the same
influence on the dependent variable according to the
principle of multicollinearity as postulated by Wakefield
(2014). This implies that independent variables do not
exert the same degree of effect on a given dependent
variable. The Variance inflation Factor (VIF) should be
below 5 for the non-existence of collinearity. Table 4
shows that none of the six strategies had VIF above 5,
implying absence of collinearity between the six
independent variables. This confirms that each of the
independent variables employs distinctive influence on
organisational safety culture.
The multiple linear regression technique is used in
determining the fit for adequacies. The R-value in this
study as indicated in Table 5 provides the correlation
coefficient between the six strategies and organisational
safety culture.
Table 5: Goodness-of-fit Statistical Analysis
R R-Squared Adjusted R-Squared Standard Error (S.E) of Estimate Dublin-Watson
0.637 0.387 0.354 0.885 1.809
The correlation coefficient which is the R-Value of
0.637 was found to be of a reasonably high positive
correlation. The adjusted R-squared which gives the
amount of proportion to which the set of the six
independent variables could explain the variations in
organisational safety culture is a dependent variable.
From this background, the study was indicative of the six
strategies which only elucidate 35.4% of the variations in
organisational safety culture; while 64.6% was non-
indicative. This implies that there were certain variables
not used in the study that were equally important.
Furthermore, a standard error of 0.885 was fairly
considerate for the assessed coefficients. The fit for
adequacies passed the acceptable threshold of 1.500 to
2.500 as it indicated a Dublin-Watson test statistic of
1.809.
The specific objectives underpinning the study were
namely, to determine management strategies that have an
impact on organisational safety culture, to assess worker's
knowledge on SHE programs and to establish the effect
of organisational safety culture on workers. Various
literature was reviewed on management strategies. In
analyzing the data, the adoption of ANOVA and multiple
linear regression analysis to further explore the data
applied six management strategies that include:
recruitment, training and development, performance

E. M. Mwanaumo and M. Mambwe / Journal of Construction Business and Management (2019) 3(1).27-37 35
analysis, communication and information, induction and
orientation and reward and compensation, as independent
variables. While organisational safety culture was used as
a dependent variable, it can be postulated that the
strategies implored in the study have a statistically
significant effect on organisational safety culture. A
similar analysis was used by Yule (2008) and indicated
the need to adopt other independent variables besides the
ones used in the analysis. Hence the six factors used in the
regression could not elucidate much of the total variability
of management strategies in organisational safety culture.
Further to the effects, the results were indicative of
recruitment which was positive and induction and
orientation which was negative, as being factors that had
variability effect on organisational safety culture. This
variability could be attributed to the failure of
management to induct successfully and orient workers on
SHE related issues to promote organisational safety
culture. On the other hand, of the remaining four with a
positive indication of the effect on organisational safety
culture, the study did not adjudge their statistical
connotation.
Based on the literature review and the research results
the study showed that management, in essence, plays an
important and participatory role in inculcating the needed
safety requirements in an electricity organisation whose
ultimate responsibilities is to ensure safety and health
strategies are understood and followed by all workers. As
a management strategy, aligning the policies and
procedures to the current legal statutes and regulatory
requirements such as the OSH Act 36 of 2010 and the
Factories Act, Cap 441 of the Laws of Zambia, gives
credit of understanding safety values, culture and
behaviour from an individual to a country in driving
development in a safe environment. Having disclosed in
the reviewed literature and the research results that
workers are involved in making sure that aspects of SHE
are embraced and updated with knowledge and reviewed
continuously, it substantiates the existence of knowledge
on SHE activities at various workplaces they represent in
the electricity industry.
Having noted in the literature reviewed, according to
Tan and Nasurdin (2011) and Asiedu-Appiah et al.
(2013), that management strategies relate to
organisational policies and attitudes, training and
development, recruitment and selection, information and
communication, performance appraisals and retention,
they ensure continuous improvement of organisational
safety requirements. Besides these strategies, this study
also proposed that the use of information, induction,
reward and compensation can also be used as
management strategies in entrenching organisational
safety culture and safety performance in the electricity
industry. Hence, it can be postulated that the strategies
examined in the study have a statistically significant effect
on organisational safety culture and can be used with other
strategies recommended in the safety and health body of
knowledge by other researchers.
5. Conclusion
The overarching aim of the study was to assess the effect
of management strategies in entrenching a safety-driven
culture in the electricity industry of Zambia to reduce
workplace accidents. The study sought to establish
knowledge of SHE programs to entrench organisational
safety culture in the industry. The study found that
recruitment and induction and orientation were cardinal
factors that indicated statistical significance of
management strategies and had varied effects on
organisational safety culture. Further, the results indicated
that recruitment had positive effect while induction and
orientation factors recorded a negative effect. There was
an understanding of safety and health process as tabulated
in the OSH Act 36 of 2010 and Factories Act Cap 441
since most of the workers established to being provided
with SHE knowledge. Additionally, the study showed that
the workers in the electricity industry get fairly involved
in SHE related problems. The study's objectives were
achieved and were in line with previous research.
The outcome of the study was limited by restriction to
the electricity industry, and however, the results can be
generalised to other sectors as data collected was only
from the players within the electricity industry in Zambia.
Additionally, the sample used in the study is a reflection
of the representation of the major companies that are in
the electricity industry.
It is therefore recommended that similar studies can be
pursued outside the confines of the electricity industry in
order to attain a longitudinal and comparative study. The
study recommends stronger recruitment practices that are
appropriate and would have a positive effect on
organisational safety culture. The study also recommends
restructuring processes during induction and orientation
to maintain high levels of safety at workplaces and record
fewer workplace accidents. For additional research, it is
recommends an exploration and examination of the
effects of several other management practices in SHE
processes be undertaken.
The findings of the study will significantly contribute
to the existing body of knowledge in the area of SHE and
management strategies useful in entrenching
organisational safety culture in the electricity industry.
The recommendations of this study would also be used to
strengthen management strategies and improve operations
within institutions in the safety and health systems. Lastly,
the study would provide the basis for further research in
line with management strategies and organisational safety
culture in the electricity industry.
References
Agbola, R. M. (2012). Impact of occupational health
and safety management on employee safety. Developing
Country Studies, II (9), 156-167.
Akpan, E. I. (2011). Effective safety and health
management policy for improved performance of
organization in Africa. International journal of business
and management, VI (3), 159-168.
Asiedu-Appiah, F., Kontor, E., & Asamoah, D. (2013).
Effect of human resources management practices on
employee retention: Perspective from the mining

36 E. M. Mwanaumo and M. Mambwe / Journal of Construction Business and Management (2019) 3(1).27-37
industry. International Research Journal of Arts and
Social Sciences, II (2 ), 30-40.
Auditor General. (2015). Report by the Auditor General
on the Management of Occupational Safety and Health for
the fifth Session of the Eleventh National Assembly,
National Assembly of Zambia. 1-99. Lusaka: National
Assembly of Zambia.
Bayers, L., & Rue, L. W. (2011). Human Resource
Management (10th ed.). New York: McGraw-Hill
Publisher.
Carrillo, A. (2010). Positive safety culture: How to
create, lead and maintain. Professional Safety, 55 (5), 47-
54.
Choudhry, R. M., Fang, D., & Mohamed, S. (2007).
The Nature of Safety Culture: A Survey of the State of the
Art. Journal of Safety Science, 45, 993-1012.
Davids, G. T. (2016). Assessing Safety Culture of
Professional Pilots within Selected South African Based
Aviation Organisations. The University of Western Cape,
Faculty of Economics and Management Sciences. South
Africa: Western Cape University Library.
Davies, M. B. (2007). Doing a successful research
project: using qualitative or quantitative methods.
Palgrave, UK: MacMillan Publishers.
Du Toit, W. J. (2012). The Relationship Between
Health and Safety and the Human Risk Taking Behaviour
in the South African Electrical Construction Industry.
Nelson Mandela Metropolitan University. Durban, South
Africa: NMMU Library.
Dumas, M. C. (2011). Influence of management’s
leadership on safety culture: The role of the construction
contractors; in Proceedings of the SPE European health,
safety and environment conference in oil and gas
exploration and production. Proceedings of the SPE
European health, safety and environment conference in oil
and gas exploration and production, (pp. 22-24). Vienna:
Austria.
ERB. (2014). The Energy Regulator. The Energy
Regulator Newsletter, 1 (21), 1-20.
Guldenmund, F. W. (2007). The Nature of Safety
Culture: A Review of Theory and Research. Safety
Science, 45, 215-257.
Haukelid, K. (2008). Theories of (safety) culture
revisited—an anthropological approach. Safety Science,
46, 413-426.
Hopkins, A. (2006). Studying organisational Cultures
and their Effects on Safety. Safety Science, 44, 875-889.
Impact of health and Safety Management on Employee
Safety. (2012). Developing Country Studies, II (9), 156-
167.
Iqbal, N., Anwar, S., & Halder, N. (2015). Effect of
Leadership Style on Employee Performance. Arabian
Journal of Business Management Review, 5 (146).
Kafue Gorge Regional Training Centre. (2014).
Effective Management and Safety Study. Lusaka:
KGRTC and ZESCO Limited.
Kilian, J. (2012). What is the Role of the HR in Health
and Safety Compliance? Retrieved March 28, 2018, from
Human Capital Web Site: www.eohumancapital.co.za.
Kwayisi, K. A. (2014). The effect of human resources
management practices on health and safety: A case study
of the Ghana health service. Accra, Ghana: Nkwame
Nkrumah University of Sciences and Technology.
Leedy, P., & Ormrod, J. (2015). Practical Research:
Planning and Design (11th ed.). Essex: Pearson Education
Limited.
Machabe, A. P., & Indermun, V. (2013). Management
Perceptions of the Occupational Health and Safety
System in Steel Manufacturing Firm. Arabian Journal of
Business and Management Review (Nigerian Chapter), 1
(11), 25-36.
Mambwe, M., & Mwanaumo, E. M. (2017). The Impact
of Organisational Safety Culture On Safety Health and
Environment (SHE) in Zambia's Electricity Distribution
Industry. Proceedings in Joint CIB W099 & TG59
International Safety, Health and People in Construction
Conference. Cape Town, South Africa: Joint Construction
in Building.
Mason, R. L., Gunst, R. F., & Hess, J. L. (1989).
Statistical Design and Analysis of Experiments with
Applications to Engineering Science. New York: Wiley.
Mihai, M. P., & Sorin, B. M. (2010). Behavioral Based
Safety Management in Electric Power Industry –
Complementary Safety of Workers. Advances in
Automatic Control, Modelling and Simulation, 303 - 307.
Mojapelo, J., Mafini, C., & Dhurup, M. (2016).
Employee Perceptions of Occupational Health and Safety
Standards in the Steel Industry. International Journal of
Social Sciences and Humanity Studies, 8 (2), 106-121.
Motulsky, I. (2005). Prism 4 Statistics Guide -
Statistical Analyses for Laboratory and Clinical
Researchers. San Diego CA, USA, 2003: GraphPad
Software Inc.
Mwanaumo, E. M., & Thwala, W. D. (2011). A Review
of health and Saftey legislation in Botswana relative to
construction industry stakeholders. In S. Laryea, R.
Leiringer, & W. Hughs, Proceedings of West Africa Built
Environment Research (WABER) Conference, 19-21 July
2011 (pp. 47-57). Accra, Ghana.
National Assembly of Zambia. (2010). Occupational
Health and Safety Act No.36 of 2010. Lusaka: GRZ.
Nunez, I., & Villanueva, M. (2011). Safety capital: The
Management of Organisational Knowledge on
Occupational Health and Safety. Journal of Workplace
Health, 1 (23), 56-71.
Olusuyi, B. O. (2011). Influencing Safety Culture in the
UK Offshore Oil and Gas Industry: The Importance of
Employee Involvement. Department of Management.
Aberdeen: Published Thesis; Aberdeen Business School.
Saunders, M., Lewis, P., & Thornhill, A. (2009).
Research Methods for business students. Harlow: Pearson
Education Limited.
Son, C. (2016). Study of Safety Culture Assessment
Framework for Process Industries and its Application to a
Bayesian Belief Network Analysis. Texas: Submitted to
the Office of Graduate and Professional Studies of Texas
A&M.
Tan, C. L., & Nasurdin, A. M. (2011). Human resource
management practices and organizational innovation:
Assessing the mediating role of knowledge management
effectiveness. Electronic Journal of Knowledge
Management, 9 (2), 155-167.
Trochim, B. (2004). Research Methods Tutorials.
Retrieved September 30, 2018, from
http://www.socialresearchmethods.net/tutorial.htm.

E. M. Mwanaumo and M. Mambwe / Journal of Construction Business and Management (2019) 3(1).27-37 37
Wachter, J. K., & Yorio, P. L. (2014). A system of
Safety Management Practices and Worker Engagement
for Reducing and Preventing Accidents: An Empirical
and Theoretical Investigation. Science Direct, 68, 117-
130.
Wakefield, J. (2014, September 29). Wiley StatsRef:
Statistics Reference Online. Retrieved April 3, 2018, from
General and Introductory Statistics:
http://www.onlinelibrary.wiley.com
WCFCB. (2016). Worker's Compensation Fund
Control Board (WCFCB) Report. Lusaka: WCFCB.
WHO. (2006). World Health Organisation Report. New
York: WHO, United Nations.
Williamsen, M. (2007). The culture of safety: Interview
with safety pioneer Dan Petersen. Professional safety, 52
(7), 17-27.
Yule, S. (2008). Senior Management Influence on
safety performance in the UK and US energy sectors.
Scotland: Doctoral thesis: University of Aberdeen.
Zou, P. X., & Sunjino, R. Y. (2015). Strategic Safety
Management in Construction and Engineering. West
Sussex: John Wiley & Sons Ltd.

JCBM (2019) 3(1). 38-44
Influence of the Management Styles and Quality of Management on Project Delivery
A. O. Aiyetan1
1.Department of Construction Management and Quantity Surveying, Durban University. of Technology, South Africa
Received 9 November 2016; received in revised form 19 April 2017, 6 September 2018; accepted 2 October 2018.
https://doi.org/10.15641/jcbm.3.1.2019.65
Abstract
Construction projects differ in features and complexity to each passing decade. Therefore, control is a fundamental
requirement to avoid overruns of key performance parameters. The study aims to identify influencing factors of management
practices and quality of management during construction on project delivery time to mitigate their impact. The inferential
statistic was used in the analysis of data for the study. The sample population consists of architects; builders; quantity
surveyors; structural engineers, and clients, totalling eighty-eight (88). The metropolitan cities of five provinces constituted
the geographical delimitation of the study. The provinces are Eastern Cape; Free State; Gauteng; KwaZulu-Natal, and
Western Cape, while the metropolitan cities are Bloemfontein; Cape Town; Durban; Johannesburg, and Port Elizabeth. The
probability sampling method was employed in the selection of architects, South African property owner's, and masters
builders. While stratified sampling was used for quantity surveyors. A questionnaire survey was conducted among these
stakeholders in the Building Construction Industry to access influencing factors of management style and quality of
management during construction. Finding relative to management style include that set time limits, specify goals people are
to accomplish and require regular reporting on progress and for quality of management during construction are effectively
coordinating resources, developing an appropriate organizational structure to maintain workflow influences project delivery
time In most cases these tradesmen require supervision construction, which results in delay and attending, may drastically
reduce delay on projects. Based on the finding of the study, ways to mitigate poor management style and quality of
management during construction were suggested.
Keywords: Construction, Delivery time, Management style, Quality.
1. Introduction
Construction involves a lot of tasks, which are
executed by tradesmen. In most cases, these tradesmen
require supervision to deliver the work according to
specification and quality. The extent of management of
these tradesmen concerning the level of control given and
management style will determine the quality of product
and productivity level. Management style dictates the
quality of the product, as happy workers engender
commitment to work, leading to high productivity and
quality. It is in the interest of the contractor to keep
workers happy; else the contrary has an adverse effect on
the delivery of the project, such as delay. Gonzalez et al.
(2016) state that delays can lengthen schedules, increase
project costs, and jeopardise quality and safety. Generally,
workers do not want to be coarse to work. There is a need
to balance supervision with the management style being
1 Corresponding Author.
Email address: [email protected]
adopted to achieve the optimum level of production and
quality. Accidents on sites are common occurrences
(Yilmaz, 2015). Planning against their occurrence is
important. The consequences of accidents are adverse
relative to project delivery, final cost figure, the
company's image and competitive advantage, and the
client's finances are always affected. On the part of the
industry, the public impression is that of a hazardous
industry, which leads to low entrants into the industry at
all levels, with the most effect on skilled labour, resulting
in shortages. The objectives of this paper are to assess the
influence of management styles and qualities on project
delivery time in South Africa.
First, a literature review of relevant concepts is
presented in Section 2. Section 3 presents the research
methodology for the study. This is followed by the
presentation of results and discussion of findings in
Section 4. The paper ends by identifying further research
University of Cape Town
Journal of Construction Business and Management
http://journals.uct.ac.za/index.php/jcbm

A. O. Aiyetan / Journal of Construction Business and Management (2019) 3(1). 38-44 39
areas and drawing conclusions on the findings of the
study.
2. Literature Review
2.1 Project Delivery Time and Project Duration
It is intended for every project to start, finish and use for
its intended purpose and afterwards it is demolished.
Project delivery time is the time it takes from
commencement to the handing over of key or the project
to the client (Darwish, 2017). Project duration is the initial
completion time agreed to while awarding the contract for
the project, stemming from the master schedule of works
submitted by the contractor (Acebes et al., 2015). Project
delivery time is different from project duration in that
project delivery time encompasses the time for
mobilisation of the project team and resources, project
duration, and defect liability period (Atkinson, 1999;
Darwish, 2017). According to Acebes et al. (2015),
project duration is critical to project delivery time because
any increase in the project duration will lead to an increase
in the project delivery time.
2.2 Management Style
Management style deals with the personal attributes
possessed by the manager in managing an organisation
along with the leadership style. Managers operate within
an organisation and manage the functions of an
organisation. These attributes possessed by managers that
enable them to succeed are called competency. Rees and
Porter (2001) define competence as the skills or
knowledge possessed by individuals that allows them to
manage an organisation successfully. Smallwood
(2006:3) states that competencies can be divided into two
categories: threshold or surface, which are required to be
minimally effective and differentiating or core, a
yardstick for superior performers. These are the
competitiveness factor (Orozco et al., 2011).
The threshold or surface competencies are Knowledge
– information regarding content, and Skills – the ability to
perform a task. According to Singh (2004), competences
predict performance. Goals need to be defined before
actions are taken and performance measured. There are
three types of goals, Organisation-wide goals – these
include objectives about future directions for large
segments of the organisation population; Task-oriented
goals – which are specific objectives assigned to an
individual or small group of individuals; and Personal
goals or level of aspirations – these are goals set by the
individuals themselves.
Fryer (2004) points out that lots of leadership studies
have taken account of the leader's competence or ability,
either in the limited sense of technical knowledge or the
broader understanding of competence to lead. For
effective and efficient management of human resources,
both the technical ability and competence to lead must be
employed and could be referred to as management
practice. The technical ability concerns laying down
construction methods and drawing up of the schedule of
works. The competence to lead refers to the motivation
and support given to workers.
Griffith and Watson (2004) identify three leadership
styles. Autocratic leaders give orders which they insist
shall be obeyed; determine policies for the group without
consulting it; provide no detailed information about future
plans but merely tell the group what immediate step it
must take; give personal praise or criticism to each
member on their own initiative and remain aloof from the
group for the greater part of the time; Democratic leaders
give orders only after consulting the group; see to it that
policies are worked out with the acceptance of the group
(this is critical for effective implementation); never ask
people to do things without sketching out the long-term
plans on which they are to work; make it clear that praise
or blame is a matter for the group and participate in the
group as a member, and Laissez-faire leaders do not lead,
but leave the group entirely to itself and do not participate.
2.3 Management Styles of Construction Managers
According to Burke and Barron (2007), management
styles refer to the characteristics, attributes, and skills of
construction managers. Although management and
leadership are unique systems of action, they are also
complimentary. The management styles of construction
managers are reinforced and balanced with leadership
styles to successfully operate in the complex project
environment (Toor and Ofori, 2008). These management
styles are identified and summarised in the following sub-
sections.
Pheng and Chuan (2005) state that the definition of
goals affects project performance positively. The overall
goal of an activity must be set out for each. This will be
the driving force for day-to-day achievement and overall
accomplishment of the goal. Goal-setting can inspire and
motivate subordinates, especially if their performance is
linked to remuneration. It also provides an effective
means of evaluation and control (Du Toit et al., 2007).
Additionally, when staff participate in the decision-
making process of the organisation, it creates a sense of
belonging which leads to individuals paying greater
attention to their jobs. These create an environment
conducive for work, resulting in high productivity.
One of the factors influencing performance in
construction projects is the sequencing of work and the
allocation of crew sizes. Rojas and Aramvareel (2003)
are of the opinion that out-of-sequence scheduling of
work may result in a loss of momentum (rhythm).
Walker and Shen (2002) suggest that contractor-related
factors such as poor site management and supervision are
significant causes of delays in project delivery. Lack of
organisation creates a situation of confusion and chaos, a
situation in which no meaningful progress can be made.
A site that is well laid out, in which offices, storage, and
workspaces are well defined, aids the smooth flow of
work.
For the achievement of targeted production, time
limits should be set for each task to be carried out. A
bricklayer has a certain number of bricks to lay per day,
depending on the type of brick. A fitter has a certain
amount of tonnes/kilograms of steel to bend or cut for a
day's wage, and this applies to all trades. Based on this
analogy, timelines are set for the achievement of each
activity to avoid delay as clear time-lines promote more
efficient and goal-driven work.
Managers or site engineers provide specific guidance
on what must be done and how it must be done. Bassioni

40 A. O. Aiyetan / Journal of Construction Business and Management (2019) 3(1).38-44
et al. (2005) acknowledge that one factor that enhances
performance is the development of the organisation's
mission, vision and values by a leader and communication
of these attributes to the workforce. Pheng and Chuan
(2005) conclude that thirteen factors negatively affect
project performance, among which is, the non-availability
of information. When this is lacking errors may occur,
which may lead to poor workmanship and repetition of
work. When these situations arise, the project suffers
delays.
Edum-Fotwe and McCaffer (2000) identify
management skills such as time management and
leadership as having a positive effect on construction
project delivery. Chan et al. (2004) argue that a project
leader's commitment to time affects the delivery of a
construction project. A work schedule is a tool that is used
to monitor the progress of work. To avoid delays in
project delivery, the performance of the project should be
evaluated regularly on this through work schedule. This
helps in identifying areas of poor performance so that the
reasons for this lag in
Management of an organisation should not only be
concerned about work performance but also staff welfare.
Management should not turn a blind eye to staff
challenges. There should be a means for the personal
challenges of workers to be made known to management.
The labourers and skilled labour are those who perform
construction activities with guidance from management
staff; therefore their health is crucial to the speedy
completion of a project. All the factors discussed above
are those that create job satisfaction and boost
productivity.
2.4 Quality of Management During Construction
Many factors affect quality, which impedes on the
construction speed of a contractor. Aiyetan (2011) gives a
listing while Ponpeng and Liston (2003) conclude that the
factors outlined in the following sub-sections are criteria
that determine contractor’s ability to deliver a project with
regards to acceptable quality standards.
Scheduling of activities using the Gantt chart is an aid
for an operative, smooth flow and monitoring of works
during the construction stage. Arditi and Mohammadi
(2002) state that timeliness is the completion of the
contract as planned, and with high accuracy. That is, the
ability to execute the work regarding the correct
specification and quality are good indicators of a
contractor's expertise.
The key parameters of delivering a project are quality,
time, and cost. Therefore, it is important to analyse the
various construction methods as against the volume and
complexity of work. This is done, in order, to select the
best delivery solution for the project. While bearing in
mind the key performance parameters in doing this.
Belout and Gauvreau (2003) and Proverb and Holt
(2000:2) also share this view
One of the factors that may contribute to project delay
is access to and from the site. A bad road surface to the
site will cause vehicles to break down and result in late
delivery. Materials need to be moved from one point to
another on site. For example, from production point to
place of incorporation on the project. Difficulty in the
movement of materials will lead to late supply and
ultimately result in delayed delivery of the project. This is
further buttressed by Koushki and Kartam (2004)
declaring that late delivery and damaged materials to site
cause project delays. Besides, Pertula et al. (2003:10)
report that a total of 2 945 disability days were
experienced on a project over a period of eighteen months,
which is traceable to accidents resulting from materials
handling on site.
This refers to the chronology of work execution. The
planning of activities as they should flow to avoid
stoppages. The identification of the critical path
contributes immensely to achieving work sequencing and
maintenance of workflow. Fox et al. (2003) state that
construction processes should be assessed before
implementation.
The continual updating of the schedule and planning
afford the opportunity of keeping the project on track. Lee
et al. (2004) cite Lantelme and Formoso (2000) who
declare that measurement-managed companies have
proven better performance compared to their non-
measurement counterparts. Pongpeng and Liston (2002)
identify criteria for contractors’ ability to perform with
regards to a project, that monitoring is one out of five most
important factors.
A project will take a longer time to complete
compared with the initially planned time if activities are
repeated (Hardie, 2001). The causes of these problems are
the poor quality of workmanship and poor quality of
material usage. The ability to quickly resolve and recover
from these problems on a project is a good quality relative
to the project manager. Dainty et al. (2004) specify
qualities for successful project completion that a project
must possess, which include analytical thinking power,
information seeking and initiative. These will enhance
problem-solving on site. Scott-Young and Samson (2007)
postulate that there is a direct and positive relationship
between effective team problem–solving and project
outcomes.
The effective layout of a site is very important and
afford minimum travel time and movement of materials,
plant and labour (Tam et al., 2002). Different authors have
varying views concerning the coordination skills of a
project manager. Chan et al. (2004) note that it affects the
construction of the project. Kazaz and Ulubeyli (2003)
declare that the assignment of resources determines the
overall duration and cost of the project. Therefore, to
overcome this, there must be a good inventory system in
place. Material movement schedule should be developed
to monitor levels of materials at any time, to ensure a
continuous flow of activities. Also, Jha and Iyer (2005)
affirm that coordination among project participants and
resources positively influence project delivery.
Bassioni et al. (2005) are of the view that the
involvement of leaders in ensuring that management
systems are developed for operations is a significant
performance factor for success. For operations to flow
smoothly and ensure its successful delivery, there should
be a good system in place concerning command and
information dissemination. Activities are executed based
on information given and relative to the next operation,
the quantity of materials and work crew supply.
Therefore, an organogram concerning hierarchy in an
organisation is needful and will assist in this regard.

A. O. Aiyetan / Journal of Construction Business and Management (2019) 3(1). 38-44 41
3. Research Methodology
A study titled influence of management style and quality
during construction was conducted at the Nelson Mandela
Metropolitan University, Port Elizabeth in South Africa,
to identify and assess factors influencing the delivery of
project concerning these factors. The study focussed on
project duration. The research methodology consists of
five parts; an in-depth review of related literature; the
research design; findings and discussion; conclusions and
recommendations, and references. The sampling frame
consist architects 1149 (obtained from the South African
Institute of Architects (SAIA)); Master Builders 320
(obtained from the Master Builder’s Association (MBA));
clients 161 (obtained from the South African Property
Owners Association (SAPOA)); structural engineers 43
(obtained from Civil Engineers’ South Africa (CESA -
East Cape)), and quantity surveyors 473 (obtained from
the Association of South African Quantity Surveyors
(ASAQS)). From these, the sample sizes were calculated.
Probability sampling technique was employed for
sample selection. For the Architects, Master Builders, and
the Clients random sampling was used. Systematic
sampling techniques were used for the quantity surveyors,
and the structural engineers and other the entire sample
were surveyed based on the recommendation of Leedy
and Omrod (2014). The research instrument for this study
was a questionnaire survey, which was administered to
respondents through the post (Architects, Master
Builders, Structural engineers, SAPOA and CESA) and e-
mail (Quantity Surveyors).
Based on Griffith and Watson’s categorization of
leadership styles, nine (9) management styles (Set
timelines, Specify goals people are to accomplish,
Require regular reporting on progress, Provide specific
direction, Organise the work situation for workers,
Involve team members through discussion of work,
Provide support and encouragement, Allow the workers
to organize the work, Seek worker's opinion and
concerns) were identified and presented to the
respondents to indicate their influences on project
delivery time. The responses were received through the
same means. The questionnaire response rate according to
professional obtained is architects (9), master builders
(18), quantity surveyors (23), and structural engineers
(23), clients (12) and others (3). A total of eighty-eight
(88) questionnaires are representing 6.1% response rate
achievement recorded on questionnaire administration.
The data obtained were analysed using descriptive and
Inferential statistical techniques. A five-point Likert scale
adjoined with ‘Unsure' and ‘Does not' (DN) options were
employed to analyse summated scores of the respondent's
responses. Given that there are five points on the scale,
and that 5 – 1 = 4, the ranges were determined by dividing
four by five which equates to 0.8. Consequently, the
scales and their definitions are given as follows:
• 4.20 ≤ 5.00 between a near major to major/major
influence;
• > 3.40 ≤ 4.20 between moderate influence to a
near major / near major influence;
• > 2.60 ≤ 3.40 between a near minor to moderate
influence / moderate influence;
• > 1.80 ≤ 2.60 between a minor to near minor
influence / near minor influence, and
• > 1.00 ≤ 1.08 between a minor to near minor
influence.
Cronbach’s coefficient test and validity test were
performed and were found satisfactory. Cronbach’s alpha
of ≥ .97 and factor loading of >.60 for samples sizes 85-
89 were obtained. Based on these data obtained can be
deemed reliable. It was found that majority of the
respondents belong to the private sector (74%), their
average working years is 17, and most are over the age of
thirty (30). Respondents with Bachelor’s degree
predominate (25%), and who have handled not less than
six (6) types of projects.
4. Findings and Discussion
4.1 Influence of Management Styles on Project
Delivery Time
The study sought to find out the influence of management
styles on project delivery time. The data collected in this
regard is presented in Table 1.
Table 1: Mean score of the influence of management
styles on project delivery time
Management styles adopted Mean score
Set timelines 4.13
Specify goals people are to accomplish 4.06
Require regular reporting on progress 3.97
Provide specific direction 3.96
Organise the work situation for workers 3.79
Involve team members through discussion
of work 3.93
Provide support and encouragement 3.85
Allow the workers to organise the work 3.79
Seek worker’s opinion and concerns 3.54
Table 1 presents the respondents’ rating of the influence
of management styles on project delivery time in South
Africa. It is notable that all factors in this category have
mean scores is 3.40<Mean Score<4.20, which indicates
that these factors have between a moderate to near major
/ near major influence on project delivery time. Nine (9)
management styles were presented to the respondents for
rating; out of which four (Set timelines, Specify goals
people are to accomplish, Require regular reporting on
progress, Provide specific direction) were derivatives of
autocratic leadership styles, three (Organise the work
situation for workers, Involve team members through
discussion of work, Provide support and encouragement)
were derived from democratic leadership styles, and two
(Allow the workers to organize the work, Seek worker’s
opinion and concerns) from laissez-faire leadership styles.
Table 1 shows that management styles derived from
autocratic leadership styles were found to have the most
influence on project delivery time (Mean Score is from
3.96 to 4.13). Among the autocratic-based management
styles, the most influential management styles on project
delivery time are setting timelines.
This finding is close in agreement with previous
studies by Rojas and Aramvareel (2003) that out-of-
sequence scheduling of work may result in a loss of

42 A. O. Aiyetan / Journal of Construction Business and Management (2019) 3(1).38-44
momentum (rhythm) per time and subsequently lost in
production. This implies that to achieve meaningful
progress, managers need to define the number of tasks to
be performed within a specified time. Also, the result
shows that the lack of specification of timelines for the
performance of activities may have an adverse effect on
the delivery of projects. Construction activities have been
described as difficult and masculine. Therefore, to meet
production targets, measures such as setting timelines are
set to achieve planned production levels.
The next significant management style among the
autocratic-based management styles is specifying the
goals that people are to accomplish. Construction projects
consist of activities, which need to be specified to workers
and supervisors through information given by
management for monthly, weekly or daily task executions
until project completion. This is partly the reason for the
need to provide a work schedule. When these details are
not adhered to, it may have an adverse effect on the
delivery time of projects. This agrees with the conclusion
of Pheng and Chuan (2005) that the definition of goals
affects project performance positively.
Require regular reporting on progress and Provide
specific direction only have a moderate influence on
project delivery time. A progress report is a project
control system, and when the project delivery time is
being monitored and controlled effectively, the chance of
timely delivery is high. All the three democratic-based
management styles have a moderate influence on project
delivery time (Organise the work situation for workers
(Mean Score=3.79), Involve team members through
discussion of work (Mean Score=3.93), Provide support
and encouragement (Mean Score=3.85)). This shows that
the efforts by construction managers to organise tasks,
involve the workers in the organisation of works, and
encourage workers, contribute positively to the project
delivery time. It is deduced from this result that workers
value the encouragement and involvement in work
planning and organisation.
The least influential management styles are found in
laissez-faire-based management styles category (Allow
the workers to organise the work (Mean Score=3.79),
Seek worker’s opinion and concerns (Mean Score=3.54)).
This shows that although it is important to involve the
workers in work planning, it is detrimental to the project
objectives and expectations to allow the workers to be in
control of the work planning and organisation. Workers
are not very skilful in contributing ideas to improve work
execution. Most of the workers are afraid to speak to their
supervisors. These are the most likely reasons for this
factor having the lowest impact on project delivery time.
4.2 Influence of Management Qualities on Project
Delivery Time
The study also sought to investigate the influence of
management qualities on project delivery time. The data
collected in this regard is presented in Table 2.
Table 2: Mean score of the influence of management
qualities on project delivery time
Management styles adopted Mean score
Effectively coordinating resources 3.92
Developing an appropriate organisational
structure to maintain workflow 3.88
Forecasted planning date - activity duration,
resource quantities required 3. 80
Responding to recover from problems or
taking advantage of opportunities presented 3.77
Monitoring and updating plans to reflect
work status appropriately 3.66
Analysing of work sequencing to achieve
and maintain workflow 3.66
Analysing resource movement to and on-
site 3.50
Analysing construction methods 3.38
Effectively coordinating resources 3.92
Respondents were required to rate the influence of
management qualities during construction on project
delivery (Table 2). Seven out of eight management
qualities have Mean Score > 3.40 ≤ 4.20, which indicates
a moderate to a near major / near major influence on
project delivery time. The most critical management
quality as found in this study is effectively coordinating
resources. The lack of effective control of resources,
namely machines, materials and human resources may
lead to disorder on construction sites. A clash of activities,
which may, in turn, lead to a lack of materials on site and
a shortage of labour on site, may, in turn, result in low
productivity. These all have a cumulative adverse effect
on the delivery time of the project. These findings concur
with the findings of Chan et al. (2004) and Kazaz and
Ulubeyli (2003). Chan et al. (2004) found that the
coordinating skills of the project team leader affect the
construction of a project and Kazaz and Ulubeyli (2003)
are of the view that assignment decisions of resources
such as labour, equipment and materials control the
overall duration and cost of a project.
The next influential management quality is developing
an appropriate organisational structure to maintain
workflow. Construction activities are carried out by
issuing instructions, and by providing guidance and
support. Superiors give instructions to subordinates. The
labourers and supervisors must be aware of whom they
must take instructions from and whom to report. A
situation where these are not well defined may lead to
poor performance on the project. A well-defined
organisational structure will assist in the maintenance of
a steady workflow. This finding is in line with the
conclusion of Bassioni et al. (2005) declaring that the
involvement of leaders in ensuring that management
systems are developed for operations is a significant
performance factor for success
The management quality with the lowest mean score
is analysing the movement of resources to and from the
site. The various resources that are required on site must
be estimated to avoid idleness which engenders waste.
These could be in the form of time losses, which is
indirectly wasting money and may lead to bankruptcy and
abandonment of the project.
The findings of this study agree with most results of
studies that have been conducted in different countries in
the world such as Koushki and Kartam (2004) that show
that late delivery and damaged materials to site cause
project delays. Pheng and Chuan (2005) found that

A. O. Aiyetan / Journal of Construction Business and Management (2019) 3(1). 38-44 43
management style adopted adversely affect workers
productivity when the specification of goals workers are
to achieve are not set. Relative to management quality
during construction, inability to effectively coordinate
resources were found to have an adverse effect on project
delivery time, when adequate measures are not in place to
mitigate their impact on project delivery time (Tam et al.,
2002); develop appropriate organization structure
(Bassiani et al., 2003), and forecasted planning date
(Arditi and Mohammed, 2002).
5. Conclusion and Further Research
The study reached these conclusions that the following
adversely affect project delivery time when attention is
not given to them: setting timelines, specifying goals for
workers, regular reporting on progress, effectively
coordinating resources, developing an appropriate
organisational structure to maintain workflow, and
forecasting planning date. To mitigate the effect of the
findings, it is recommended that weekly planning of
resources and optimum gang size should be developed.
This is relative to alleviating materials shortages and
achievement of the target output of production, selecting
adequate gang sizes to the task, and ensuring correct
activity sequencing. Identification of key performance
factors such as physical and socio-cultural factors that
could impede on construction speed is recommended for
further research.
6. Publication
An earlier version of this paper was presented at the 9th
cidb PG Conference, 1-4 February 2016, Cape Town,
South Africa.
References
Acebes, F., Pajares, J., Galan, J.M., and Lopez-Paredes,
A. (2015). Exploring the relations between project
delivery and activity duration. J.L. Ayuso Munoz et al.
(eds.) Project Management and Engineering. DOI
10.1007/978-3-319-12754-5-2.
Aiyetan, A.O. 2011. Influences on Construction Project
Delivery Time: Influencing Factors of Delays on Project
Delivery. 1st ed VDM Publishing House Ltd., USA.
Andawei, M. M. 2003. Critical Path Method: A tool for
project Delay Control. The Quantity Surveyor, 44 (3), 2-
5.
Atkinson, R. (1999). Project management: cost, time
and quality, two best guesses and a phenomenon, it’s time
to accept other success criteria. International Journal of
Project Management, 17(6): 337-342.
Bassioni, H. A., Price, A. D. F. and Hassan, T. M. 2005.
Building a Conceptual Framework for Measuring
Business Performance in Construction: An Empirical
Evaluation. Construction Management and Economics,
(23), 495-507.
Belout, A. and Gauvreau, C. 2004. Factors influencing
project success: The Impact of Human Resource
Management. International Journal of Project
Management, 22 (1), 1-11.
Burke, R. and Barron, S. (2007). Project management
leadership. UK: Burke publishing.
Chan, A. P. C., Scott, D. and Chan, A.P.L. 2004.
Factors Affecting The Success of a Construction Project.
Journal of Construction Engineering and Management,
ASCE 130 (1), 153-155.
Dai, J., Goodrum, P. M. and Maloney, W. 2007.
Analysis of Craft Workers’ and Foremen’s perceptions of
the Factors Affecting Construction Labour Productivity.
Construction Management and Economics, (25), 1139-
1152.
Dainty, A.R.J., Cheng, M. and Moore, D.R. 2003.
Redefining Performance Measures for Construction
Project Managers: An Empirical Evaluation. Journal of
Construction Management and Economics, (21), 209-218
Darwish, M. (2017). Construction project delivery
methods.https://www.researchgate.net/publication/32016
5827_Construction_Project_Delivery_Methods
Edum – Fotwe, F.T. and McCaffer, R. 2000.
Developing Project Management Competency:
Perspective from the Construction Industry. International
Journal of Project Management, 18 (2), 111-124
Fox, S., Marsh, L. and Cockerham, G. 2003. Assessing
the Capability of Construction Processes to Realize
Building Designs. Construction Management and
Economics, (21), 7-10.
Fryer, B. 2004. The Practice of Construction
Management. 4th Ed, Oxford: Blackwell Publishing.
Griffith, A. and Watson, P. 2004. Construction
Management Principles and Practice, 1st Ed, Palgrave
Macmillan, New York.
Gonzalez, P.; Gonzalez, V.; Molenaar, K. Orozco, F.
(2016) Analysis of Causes of Delay and Time
Performance in Construction Projects. Journal of
Construction, Engineering and Management, 140(1).
Hardie, N. 2001. The Prediction and Control of Project
Duration: A Recursive Model. International Journal of
Project Management (1(0, pp. 401-409.
Jha, K.N. and Iyer, K.C. 2006. Critical Determinants of
Project Coordination. International Journal of Project
Management, l24 (4), 314-322
Koushki, P. A. and Kartam, N. 2004. Impact of
Construction Materials on Project Time and Cost in
Kuwait. Engineering, Construction and Architectural
Management, 11 (2), 126-132.
Lantelme, E. And Formoso, C. T 2000. Improving
Performance Through Measurement: The Application of
Lean Production and Organisational Learning
Principles. Proc. IGLC – 8. International Group for
Lean Construction, Brington.
Lee, H., Yu, J. and Kim, S. 2004. Impact of Labour
factors on Workflow. Journal of Construction
Engineering and Management, 130 (6), 918-923.
Leedy, P. D. And Ormrod, J. E. 2014. Practical
Research: planning and design. 10th Ed. New Jersey:
Pearson Prentice Hall.
Ogunsemi, D. R. and Jagboro, G. O. 2006. Time - Cost
Model for Building Projects in Nigeria. Construction
Management and Economics, (24), 253 – 258.
Orozco, F., Serpell, A., Molenaar, K., and Forcael, E.
2011. “Modeling Competitiveness Factors and Indexes

44 A. O. Aiyetan / Journal of Construction Business and Management (2019) 3(1).38-44
for Construction Companies: Findings of Chile.” Journal
of Construction, Engineering and Management.
Perttula, P., Merjuma, J., Kiurula, M. and Laitinen, H.
2003. Accidents in Materials Handling at Construction
Sites. Construction Management and Economics, (21),
729-736.
Pheng, L. S. and Chuan, Q. T. 2006. Environmental
Factors and Work Performance of Project Managers in
The Construction Industry. International Journal of
Project Management, 24 (1), 24-37.
Ponpeng, J. and Liston, J. 2003. Contractor Ability
Criteria: A Review from the Thai Construction Industry.
Journal of Construction Management and Economics,
(21), 267-282
Proverbs, D.C. and Holt, G.D. 2000. A Theoretical
Model for Optimum Project (Time) Performance Based
on European Best Practice. Construction Management
and Economics, (17), 652-665.
Rees, W. D. and Porter, C. 2001. The Skill of
Management. 5th Ed. Publishers: Thomas learning,
London.
Scott-Young, C and Samson, D. 2009. Team
Management for Fast Projects: An Empirical Study of
Process Industries. International Journal of Operations
and Production Management. 29 (6), 612-635.
Sing, T. F. 2002. Time to Build Options in Construction
Processes. Construction Management and Economics,
(20), 119-130.
Smallwood, J.J. 2006. The Practice of Construction
Management. Acta Structilia, 13 (2), 25-42.
Toor, S. and Ofori, G. (2008). Leadership for future
construction industry: agenda for autocratic leadership.
International journal of project management, 26(6): 620-
630.
Walker, D. H. T. and Shen, Y. J. (2002) Project
Understanding, Planning, Flexibility of Management
Action and Construction Time Performance: Two
Australian Case Studies. Construction Management and
Economics, (20), 31-44.
Yilmaz, F. 2015. Monitoring and Analysis of
Construction Site Accidents by using Accidents Analysis
Management System in Turkey. Journal of Sustainable
Development. 8(2), 57-65.

JCBM (2019) 3(1). 45-61
Frameworks for Material Waste Minimization on Nigerian Building Projects
O. J. Oladiran1, O. E. Ogunsanmi2 and M. O. Dada3
1.2 Department of Building, University of Lagos, Nigeria.
Received 16 May 2018; received in revised form 27 July 2018; 18 January 2019; accepted 20 January 2019.
https://doi.org/10.15641/jcbm.3.1.2019.593
Abstract
A novel approach to solving waste incidence of materials on building projects is to framework the issues and processes that
are involved in its minimization. The objective of the study is to develop and validate frameworks for material waste
minimization in building projects. This study is a survey research in South West Nigeria. Define, Review, Identify, Verify
and Execute (DRIVE) and Construction Process Improvement Methodology (CPIM) techniques were used to develop the
proposed frameworks; while the validation was done by face validity and scoring model approaches. A pilot validation was
done by five academics while the main validation involved 17 potential end users. Data were analysed with frequency and
percentage. The study reveals that the frameworks are clear, informative, appropriate and applicable. It is concluded that the
frameworks can minimize material waste at every stage of building projects. It is therefore recommended that the proposed
FMWM should be adopted by all stakeholders to prevent and minimize material waste at all stages of building projects.
Keywords: CPIM, DRIVE, Frameworks, Minimization, Prevention, Waste.
1. Introduction
A framework is a schematic and interrelated processes,
procedures or illustrations to achieve a goal. Material
waste minimization requires a systematic arrangement of
issues, such as sources and causes of waste, and
minimization strategies to foster its attainment in building
projects. Lu and Yuan (2011) indicate that although
considerable researches have been carried out on waste
management, little effort have been made in embracing all
issues of waste management in form of framework. The
study therefore developed an intuitive framework, not to
minimize material wastage, but to understand the state of
the art of the waste management studies in several
journals. Dajadian and Koch (2014) also opine that
construction waste potents financial and environmental
problems for construction industry, which has drawn
serious attention from all stakeholders globally. This has
made a lot of countries to promulgate regulations geared
toward minimization of waste, such as United Nations
Framework Convention on Climate Change (UNFCCC),
Ontario 3R Regulations (Recycling Council of Ontario
(RCO), 2009), National Solid Waste Management Policy
(NSWP) in Malaysia and so on. In the case of Nigeria,
there are frameworks for several aspects of construction
1 Corresponding Author.
Email address: [email protected]
management, such as the framework for managing risk in
privately financed markets projects (Awodele, 2012); but
there is no framework or regulations for the minimization
of material wastages in building projects. This study
therefore endeavours to fill this gap, by developing and
validating frameworks for the minimization of material
waste on building projects in Nigeria. Building project
stages in this study include client (i.e. clients’ direct
involvement stage), design, purchase/supply, handling
and operation. Thus, the specific objective of the study is
to develop and validate frameworks to minimize material
waste at these five identified stages in the building
projects of medium and large contractors. The problem
that the study seeks to solve to minimize material
wastages on construction projects through the
instrumentality of frameworks. The frameworks are all
encompassing and thus will be veritable tools for
designers, contractors and project managers to procure
projects at minimal waste generation. They will also be
useful to public clients, project managers and waste
managers.
2. Literature Review
2.1 Types and causes of material waste
University of Cape Town
Journal of Construction Business and Management
http://journals.uct.ac.za/index.php/jcbm

46 O. J. Oladiran et al. / Journal of Construction Business and Management (2019) 3(1). 45-61
Skoyles and Skoyles (1987) identify two types of
construction waste, namely: structure and finishing waste.
Material waste generated during the builder’s work stage
are termed structure waste such as concrete pieces,
reinforcement and timber off-cuts, broken blocks and
bricks, filtered nails and so on. Finishing wastes are those
generated at the finishing stage, these include among
others broken tiles and glass, smeared paints, excessive
cement mortar, aluminium profiles, off-cuts of ceiling and
wall finishes, packaging of public and household facilities
such as gas cookers, bathtubs, washtubs, window frames
and so on. Skoyles and Skoyles (1987) further group
building material waste into direct and indirect waste.
Direct waste is the loss of those materials which are
damaged and cannot be repaired and subsequently used,
or which are lost during the building process. Indirect
waste is distinguished from direct waste because it
normally represents only a monetary loss and the
materials are not lost physically. Construction material
waste can also be classified into unavoidable waste (or
natural waste), in which the investment necessary for its
reduction is higher than the economic benefit produced;
and avoidable waste, when the cost of waste is
significantly higher than the cost of preventing it.
Avoidable waste is related to the level of technological
development and hence the rate varies from companies to
companies (Formoso, Isatto & Hirota, 1999).
Akinkurolere and Franklin (2005) revealed the
sources of materials waste in South West Nigeria as
storage system, transport and delivery to site, intra-
site/transit, wrong specification, fixing, negligence,
pilfering and theft, conversion, demolition,
mismanagement of materials, wrong use, residual waste,
over estimation and unskillful labourers. In the same vein,
Wahab and Lawal (2011) identified over consumption of
resources as the most occurred cause of material waste on
other projects in South West Nigeria. This is followed in
descending order by composite and the design of building,
weather and inappropriate storage, mishandling or
careless delivery, vandalism, rework/improve, lack of
recording of materials supplied and used on site, and site
office waste. Other causes identified in Wahab and Lawal
(2011) include usage of wet-trade process instead of
prefabricated elements and non-calculation of waste
index. In another region of Nigeria, Adewuyi and Otali
(2013) revealed 74 causes of waste generation in South-
South Nigeria, out of which rework contrary to drawings
and specifications is topmost and the least are
inappropriate equipment and difficulties in obtaining
work permits. Other causes in the study comprise design
changes and revisions, waste from uneconomical shapes,
severe weather conditions, purchase of materials contrary
to specifications, using untrained labours, lack of on-site
control, use of incorrect materials, overproduction, over
ordering or under ordering, substitution of a material by a
more expensive one, rework, poor workmanship, errors in
contract documents, purchase of material contrary to
specification, inadequate supervision and so on. The
contractors and consultants considered all the 74 causes
important in contributing to waste generation, but their
degree of importance or contribution to waste generation
varies.
2.2 Materials Waste Minimization
Li, Zhang, Ding and Feng (2015) posit that estimation of
materials waste is sequel to its successful minimization
for sustainable environment. In this regard, Dajadian and
Koch (2014) highlight certain waste models to be used for
waste estimation, which include average cost estimation
model (ratio of total cost of waste with the total
production for a period), equivalent method of cost
estimation and activity-based costing model. Dajadian
and Koch (2014) also posit that waste can be minimized
by investment in waste management, on-site waste
management or treatment locations, waste contractors,
designing out waste, using the 3R’s, prefabrication and
Industrialized Building Systems (IBS). Investment in
waste management is through assigning workers
responsible for on-site waste collection, sorting and
handling, purchasing equipment and machines for waste
management, developing and implementing waste
management plans, motivating practitioners to minimize
waste and improving operatives’ skills of waste handling
through vocational training. On-site waste management
location is required for collection and sorting to minimize
waste on sites. Waste contractors are responsible for
removal of waste from sites, after the waste have been
collected in labeled bins according to the waste stream.
Dajadian and Koch (2014) recommended having
subcontractor solely meant for managing waste on a
project. The waste contractor will estimate waste quantity
and component in addition to periodic meeting to discuss
waste. Designing out waste is designers’ attempt to avoid,
eliminate and reduce waste at sources. This is achievable
via steel formworks; use of prefabrication and off-site
prefabrication; standard component; realistic component
size, capacity and specification; minimizing temporary
works; optimizing design lives; specification of recycled
materials in design; designing for recycling and ease of
disassembly; identification of materials/products which
create waste; and communication. This strategy offers the
greatest opportunities for waste minimization.
Poon, Yu, Wong and Cheung (2004) note that design
is the initial stage of the project that material control can
be exerted to reduce large number of off-cuts during
construction (Proverbs and Olomolaiye 1995; Otunola,
2004). Poon et al. (2004) observe that clients’
requirements, cost effectiveness and aesthetics are factors
that hinder designers from designing out waste on
projects. According to Ekanayake and Ofori, (2000,
2004), and Enshassi (1996), improper designs are
responsible for much of material waste on site. Akande
(2000) notes that achieving minimum waste was never a
priority in design in Nigeria. In the realization of this,
Ekanayake and Ofori developed a Building Waste
Assessment Score (BWAS) model for designers to design
buildings of minimum waste generation on site. It serves
as a basis to evaluate design on waste. However, the
model is incomplete because it does not incorporate
foundation, and mechanical and electrical (M and E)
engineering works. Furthermore, Fuchs (2003)
corroborated by CRiBE (2003) offers several ideas to
design-out waste in construction. The 3Rs connote
reduce, reuse and recycle. Tam and Tam (1994) posit that
reuse, recycle and reduce are the only methods to recover
waste generated, but they require coordination among

O. J. Oladiran et al./ Journal of Construction Business and Management (2018) 2(2). 36-41 47
designers and constructors. Ng, Seow and Goh (2015)
opine that weaknesses in the implementation on solid
waste reduction through 3R among contractors in the
construction industry will cause unsustainable
construction waste management. Thus, Construction
waste should be managed through the 3R as it is
sustainable.
Ng et. al. (2015) indicate that the 3R practice is
prevalent among contractors in Penang, but the
percentage of construction waste that is managed through
3R practice is still very low. This is because contractors
only reuse and recycle common materials like steel and
wood, which make up very little of the overall amount of
construction waste. The study recommends concerted
efforts of all parties involved, in form of top-down
approach, to overcome the challenges and practice 3R to
reduce construction waste disposal in landfills. Top-down
approach is a style of autocratic and hierarchical decision-
making, where organizational and leadership changes in
the strategy or plan are established from the top and
passed down to the lower level for implementation.
Government is to also enforce implementation of laws and
policies to mandate contractors to implement 3R, via
monitoring, guidelines, standards, incentives and
penalties. Relevant bodies can also organize talks,
courses, awareness campaigns, and education and training
programs among contractors, in addition to the use of
technology, to disseminate information and knowledge
about 3R and to motivate the contractors to practice 3R.
Reduce is the most effective and efficient because the cost
of waste transportation and disposal are also reduced.
Reusing materials reduces landfill disposal and saves cost.
RCO (2009) opines that some of the wastes generated on
sites have secondary market value, indicating that it is less
costly to reuse them than disposal. Recycling protects the
environment, thus, the Ontario 3Rs Regulations stipulates
that new construction should have a definite program and
efforts for reusing and recycling waste (RCO, 2009).
Edwards (1999) states that the benefits of recycling
include reducing the demand upon new resources; cutting
down on transport and production energy costs; and using
waste which would otherwise be lost to landfill sites.
Manowong and Brockmann (nd) estimate that energy
saving from recycling all construction waste could be 3,
553 kWh per year in Thailand. Although, some
construction waste such as wood, plastic, paper and metal
are used for recycling but a larger part such as concrete,
cement, and bricks are sent to landfills because of lower
cost and greater convenience. Tam and Tam (2006)
reveal that recycling can increase contractors’
competitiveness through lower production costs and a
better public image. The study therefore proposes
measures to improve recycling, comprising higher landfill
charges, centralized recycling centre, governmental
provision land for recycling plants, innovative demolition
methods, locations to drop-off recyclable materials,
flexible demolition periods, mobile recycling plants,
reusable components, higher flexibility in receiving
concrete waste in recycling plant, and balancing the
supply and demand of recycled materials through
legislations or incentive schemes.
Additional strategies to minimize material wastages
that are apparent in previous works include waste
management plan (Oladiran, 2008a; Poon et. al., 2004);
waste handling methods (Motete, Mbachu & Nkado,
2003; Seydel, Wilson & Skitmore, 2002); good material
ordering and storage (Ekanayake & Ofori, 2000); sub-
contractor’s responsibility (Proverbs & Olomolaiye,
1995) among others. This present study employs the
sources and causes of materials waste indicated in this
review, with all these strategies to develop and validate
frameworks to minimize material waste in construction
projects.
3. Research Method
3.1. Questionnaire Survey
An initial questionnaire survey was conducted in the study
area, which was the entire South West Nigeria. The
population of the study is spread across the South West,
which consists of six states- Lagos, Ogun, Oyo, Osun,
Ondo and Ekiti. The population for this study is the site
managers of building projects under execution by medium
and large contracting organizations in South West
Nigeria. The projects used for the study were identified in
the research area based on the specified requirements,
since there is no list of such projects. A total of 167
building projects under execution by medium and large
contracting organizations were identified and selected as
sample in the research area through purposive sampling
technique. A questionnaire was designed to elicit
information from the site managers comprising three
sections, namely, respondents’ and organizations’ general
information (see Table 1); examination of the occurrence,
impact and severity of 55 causes of material waste
(severity was calculated as the product of occurrence and
impact of each causes); and evaluation of the usage and
effect of 40 minimization strategies. The questionnaire
data were analyzed using mean, frequency, rank, and the
result is presented in Table 2.
1: Project’ organizations’ and site managers’ profile
Project Organizations.
Type Percentage
Indigenous 74
Multinational 26
Age
0 – 5 years 8
6 – 10 years 21
11 – 15 years 31
16 – 20 years 13
Above 20 years 27
Staff Strength 8 – 114 90
Above 114 10
Structure
Project 28
Matrix 23
Functional 28
Mixed 21
Site Managers
Profession
Architecture 13
Building 32
Civil
Engineering 37
Quantity
Surveying 18
Academic
Qualification
OND 2
HND 24

48 O. J. Oladiran et al. / Journal of Construction Business and Management (2019) 3(1). 45-61
B.Sc 37
M.Sc 35
PGD 1
PhD 1
Experience
0 – 5 years 18
6 – 10 years 49
11 – 15 years 16
16 – 20 years 13
Above 20 years 4
Professional Body
NIOB 33
NIQS 14
NIA 16
NSE 28
NATE 8
ACEN 1
Grade of
Membership
None 6
Associates 25
Graduates 49
Corporate 16
Fellow 4 Key: OND : Ordinary National Diploma, HND: Higher
National Diploma, PGD: Post Graduate Diploma, NIOB:
Nigerian Institute of Building, NIQS: Nigerian Institute of
Quantity Surveying, NIA: Nigerian Institute of Architects, NSE:
Nigerian Society of Engineers, NATE: Nigerian Association of
Technologists in Engineering and ACEN: Association of
Consulting Engineers in Nigeria
3.2. Development of the Proposed Frameworks for
Material Waste Minimization (FMWM).
Problem solving methodologies are used to investigate
issues by probing into existing structures and identifying
areas of rectification and improvement (Straker, 1995).
Define, Review, Identify, Verify and Execute (DRIVE)
and Construction Process Improvement Methodology
(CPIM) techniques are two of such methodologies that
were used in this study to develop the proposed
framework for material waste minimization (FMWM) of
medium and large building projects. CPIM centers on
improvement of construction process and waste
reduction. The two techniques were used to set up and
propose the FMWM logically and sequentially, in line
with construction stages’ category, based on the finding
of the questionnaire survey presented in Table 2. The
content of the frameworks, that is, causes, sources and
minimization strategies of material waste were coined
from literature and Table 2. The layout was constructed in
line with the sequence of project stages reflected in Table
2. The research also explored a potential implementation
strategy of the proposed frameworks.
Table 2: Severity of the causes of material waste.
SN Causes of Materials Waste Mean of
Frequency
Mean of
Impact Severity(S) R OR
Client Source. 2.93 3.48 10.21 1
1 Undue pressure to deliver 2.99 3.47 10.38 1 4
2 Expectations of too high standard 2.99 3.45 10.32 2 5
3 Delay decisions /changes 2.91 3.51 10.21 3 7
4 Undue interference with project’s execution 2.84 3.49 9.91 4 9
Design Source 2.75 3.38 9.27 2
1 Design changes and revisions 3.34 3.9 13.03 1 1
2 Lack of collaboration 3.24 3.51 11.37 2 2
3 Materials and component complexity 3.05 3.47 10.58 3
4 Lack of or error in information on types and sizes of materials 2.83 3.61 10.22 4 6
5 Over Designing 2.74 3.51 9.62 5 11
6 Specifying materials’ without considering standard sizes. 2.80 3.33 9.32 6 14
7 Lack of Contractors’ influence 2.71 3.41 9.24 7 15
8 Design Coordination 2.76 3.34 9.22 8 16
9 Ineffective Communication 2.75 3.26 8.97 9 18
10 Delay in approval of drawings 2.58 3.20 8.26 10 25
11 Unfamiliarity with alternative Products 2.61 3.13 8.17 11 27
12 Incorrect /Inconclusive standard specification 2.48 3.29 8.16 12 28
13 Uncompleted Design 2.50 3.23 8.08 13 29
14 Poor site documentation 2.43 3.26 7.92 14 32
15 Designers’ Inexperience 2.37 3.20 7.58 15 41
Handling Source. 2.52 3.38 8.51 3
1 Unpacked supply i.e. loosed materials 2.81 3.61 10.14 1 8
2 Throwaway packaging 2.80 3.53 9.88 2 10
3 Poor site storage 2.50 3.49 8.73 3 21
4 Double handling 2.46 3.41 8.39 4 22
5 Too much material inventories 2.48 3.30 8.18 5 26

O. J. Oladiran et al./ Journal of Construction Business and Management (2018) 2(2). 36-41 49
6 Imperfect planning of construction 2.41 3.28 7.90 6 33
7 Wrong equipment for materials’ movement. 2.34 3.30 7.72 7 40
8 Unfriendly attitudes from personnel 2.35 3.11 7.31 8 47
Purchase/Supply Source. 2.48 3.28 8.14 4
1 Delay in materials supply 2.65 3.38 8.96 1 10
2 Damage during transportation 2.60 3.44 8.94 2 20
3 Ordering that do not fulfill design 2.42 3.42 8.28 3 24
4 Lack of possibilities to order small quantities. 2.55 3.12 7.96 4 31
5 Delay in transportation and installation of equipment 2.46 3.19 7.85 5 36
6 Lack of coordination 2.39 3.26 7.79 6 38
7 Wrong ordering by Estimators. 2.32 3.14 7.28 7 48
Operation Source. 2.43 3.14 7.62 5
1 Inclement weather 2.85 3.37 9.60 1 12
2 Workers mistake 2.65 3.40 9.01 2 17
3 Poor Workmanship 2.53 3.28 8.30 3 23
4 Equipment malfunction shortage. 2.47 3.27 8.08 4 29
5 Inappropriate /Misuse of materials 2.47 3.2 7.90 5 33
6 Damage caused by subsequent trades. 2.48 3.18 7.89 6 35
7 Too much over time for labour 2.55 3.06 7.80 7 37
8 Late information 2.48 3.14 7.79 8 38
9 Poor formwork 2.42 3.14 7.60 9 12
10 Improper planning and organization. 2.45 3.09 7.57 10 42
11 Improper sites record 2.38 3.18 7.57 10 42
12 Inexperienced inspectors 2.41 3.13 7.54 12 44
13 Poor material management practices 2.36 3.17 7.48 13 45
14 Lack of subcontractor’s skills 2.40 3.07 7.37 14 46
15 Lack of supervision and skillful tradesmen 2.31 3.14 7.25 15 9
16 Misinterpretation of drawings 2.29 3.16 7.24 16 50
17 Accidents 2.36 3.06 7.22 17 51
18 Wrong construction methodology 2.27 3.16 7.17 18 52
19 Replacement occasioned by wrong materials 2.34 3.03 7.09 19 53
20 Poor site layout and setting out 2.31 2.95 6.81 20 54
21 Unnecessary people move 2.18 2.74 5.97 21 55
OR= overall rank; R = group rank; S = severity, calculated as the product of frequency and impact, also indexed as: “not sever” from
0.00 – 3.99; “low severity” from 4.00 – 8.99; “medium severity” from 9.00 – 25.00; “high severity” from above 25.00.
3.3. Validation and evaluation of proposed FMWM
A combination of face validity approach and scoring
model approach was adopted in this study to validate and
evaluate the proposed FMWM. Having chosen the
approach, certain steps must be followed to ensure that the
framework achieve its purpose (Chew & Sullivan, 2000).
The first step is to identify the potential end users who will
be involved in carrying out the validation and evaluation
exercise. The following were the users identified: I.
Indigenous contractors. II. Multinational contractors. III.
Public organizations. IV. Consulting organizations. V.
Client organizations. The second step is how to go about
the exercise. Five academics modified the framework
before proceeding to the real validation exercise by the
identified users.
4. Results and discussions
4.1. The proposed FMWM for projects of medium
and large contractors
The proposed FMWM pinpoints waste origins and waste
routes with efforts to identify their respective waste
minimization strategies. It is noteworthy that the proposed
FMWM is applicable at every stage of building projects
of medium and large organizations – preconstruction
stage (i.e. client and design) and construction stage
(purchase/supply, handling and operation).
4.2. Structure of the Proposed FMWM
The layout of the proposed FMWM is presented in Figure
1. The structure of the proposed frameworks entails two
aspects:
1. FMWM levels: These comprise the main-level
and subsidiary-level.
The main level outlays an overview of waste origin from
all stages of building project and their waste minimization
process. The subsidiary-levels comprise five components
that are linked to the main-level.

50 O. J. Oladiran et al. / Journal of Construction Business and Management (2019) 3(1). 45-61
2. FMWM axis: Horizontal and vertical axes
representing waste origin from all stages of building
project and waste minimization process respectively. The
waste minimization process consists of three stages for
both the main and subsidiary-levels (i.e. waste causes’
identification; waste analysis and evaluation; and
strategies for minimization).
The layout was constructed in line with the sequence of
building project stages
4.3. Main-Level FMWM
The main-level FMWM shows waste origin from all
stages of building project and waste minimization process
as shown in Figure 2. The horizontal axis of the main-
level FMWM comprises sources of waste from the five
stages of building project, namely: client, design,
purchase/supply, handling and operation. The vertical
axis of the framework denotes the waste minimization
process, which consists of three stages: identification of
severe causes of waste; waste analysis and evaluation; and
strategies for minimization. The main-level FMWM
contents also link the sub-origins for each of the five
sources of waste clusters and their respective strategies for
minimization. The contents presented in the main-level
are further elaborated within five subsidiary-level
components.
4.4. Subsidiary-Level FMWM.
Each of the five low-level FMWM components
presented in Figures 3,4,5,6 and 7 represents one source
of waste from the five stages of building projects,
namely: Figure 3: Client waste origin; Figure 4: Design
waste origin; Figure 5: Purchase/supply waste origin;
Figure 6: Handling waste origin; Figure 7: Operation
waste origin.
The subsidiary components adopt the same structure
of the main-level in terms of horizontal axis and vertical
axis. All the subsidiary components and their contents
emanate from Table 2. For instance, one of the client
waste origin is “undue pressure to deliver” as shown in
Figure 3. Table 2 reveals that undue pressure to deliver
from clients is one of the most severe causes of waste on
building projects (i.e. origin of waste). This occurs (i.e.
the route) as a result of “prioritized targets” and “time
constraints” according to experts’ opinion. Therefore, the
proposed strategies for minimization of “undue pressure”
are “setting of good and reasonable targets” and “adequate
project duration”. This approach was employed to
determine potential minimization strategies for each of
the sub-waste origins listed in the “routes to waste
origins” of all the subsidiary FMWM components.
It is very important to note that, the proposed FMWM
suggests that, in addition to several lean construction
techniques that have been included and explained in it
already, more relevant lean construction techniques
should be investigated and embedded as the need arise in
all the five subsidiary components to minimize material
waste. It is also noteworthy that the proposed FMWM
suggests “waste analysis and evaluation” for
purchase/supply, handling, operation waste origins, and
also “design analysis and assessment for waste” for
designs before the application of all the proposed
minimization strategies. This is in accordance with the
opinion that waste quantity and waste stream should be
known before attempting to minimize it (Al-Moghany,
2007).
4.4.1. Client FMWM
The origin of material waste from client include undue
pressure to deliver, expectation of too high standard, delay
decision or changes and undue interference with projects’
execution. This is presented in Figure 3.
Undue pressure: it occurs due to prioritized targets and
time constraints. Therefore, good targets and adequate
project duration were proposed as strategies to minimize
them.
Expectation of too high standards: it occurs due to
ignorance and unreasonable requirement of clients.
Enlightenment of clients and setting of achievable
objectives by the clients were proposed as strategies to
minimize its occurrence. Delays: it occurs due to financial
constraints; while realistic budget and cash flow was
proposed as the strategy for minimizing its occurrence.
Undue interference: it occurs due to late changes; while
avoidance of late changes and project definition were
proposed as the minimization strategies
4.4.2. Design FMWM
The origins of material waste from design include design
changes, lack of collaboration, delay in approval of
drawings, lack of standardization and others. This is
presented in Figure 4.
Design changes: it occurs due to overdesign, lack of
contractors’ influence at design stages, non-coordination
of designs, incorrect specification, designers’
inexperience and site conditions. As a result, the
framework proposes flexible design, collaborative design,
experienced designers and site visits as strategies for
minimization.
Lack of collaboration: it stems from ineffective
communication, procurement method and nature of
construction industry. The strategies proposed to
minimize its occurrence are appropriate construction
procurement, collaborative design, effective
communication and reengineering.
Delay of approval of drawings: it is caused by
incomplete designs, and poor site information and
documentation. The strategies to handle them are timely
designs and good documentation.
Lack of standardization: it occurs due to specifying
materials without considering standard sizes, materials’
and components’ complexity, incorrect information about
materials, unfamiliarity with alternative products and lack
of code requirements for standard sizes. The
corresponding proposed minimization strategies are
designers’ familiarity with and specification of standard
sizes; inclusion of standard sizes in codes’ requirement;
compliance to codes’ requirements; compatible design;
and set-based design.
Others: design waste also originates from not
incorporating recycling and reusage; and unnecessary
temporary works. The proposed minimization strategies
are concurrent design, designing for future, specifying
recyclable and reusable materials and components; and
elimination of unnecessary temporary works.
.

O. J. Oladiran et al./ Journal of Construction Business and Management (2018) 2(2). 36-41 51
Figure 1: The link between main-level and subsidiary level of materials waste minimization framework for medium and large contracting organizations projects.
Advise the clients
on the implication
of and the need to
eliminate:
1. Too high
standards
2. Undue pressure
3. Delay decisions /
changes
4. undue
interference
Strategies for
minimization
Cause of waste
Waste analysis &
evaluation
1. Flexible design
2. Collaborative
design
3. Design for
standardization
4. Concurrent
design
5. Explore other
relevant techniques
of Lean
Construction
1. Good
packaging &
transportation
2. Just in time
delivery
3. Suppliers’
involvement
4. Embed other
relevant
techniques of
Lean Construction
OPERATION
1. Poor or non-
mechanization
2. on-site wet
trades/ construction
4. Planning
5. Others
1. Central dumping
point
2. Good planning
3. Good layout and
monitoring to prevent
double handling
4. Suppliers managed
inventories
5. Investigate other
appropriate
techniques of Lean
Construction
HANDLING
1. Loose materials
2. Improper
planning
3. Double handling
4. Storage
SUPPLY/
Purchases
1. Damages
2. Delays
3. Uncoordinated
purchase
CLIENT
1. Too high
standards
2. undue pressure
3. Delay decisions /
changes
4. undue
interference
DESIGN
1. Design changes
2. Lack of
collaboration
3. Non-
consideration for
standard sizes
4. Complexities
Sources of Waste
Ma
teri
al
Wa
ste
Min
imiz
ati
on
Pro
cess
1. Waste Scores
2. Buildability &
maintainability
analysis score
1. Mechanization
2. Experienced and
relevant
professionals
3. Multi-skilled
operatives
4. New technology
5. Last Planner
6. Security
7. Incorporate other
relevant techniques
of Lean Construction
Operation Waste
Origin
(See Figure 7)
Handling Waste Origin
(See Figure 6)
Purchase/ Supply
Waste Origin
(See Figure 5)
Design Waste Origin
(See Figure 4)
Client Waste Origin
(See Figure 3)
Mai
n L
evel
S
ub
sid
iary
Lev
el

52 O. J. Oladiran et al. / Journal of Construction Business and Management (2019) 3(1). 45-61
Figure 2: Framework for material waste minimization for medium and large contractors (main-level).
Figure 3: Client waste minimization subsidiary-level framework for medium and large contracting organizations projects.
Client material
waste minimization
strategies
(Figure 3).
STAGE 3
Application of strategies to
minimize material waste
STAGE 1
Identification of waste
causes and categorization
to sources
Total Material Waste STAGE 2
Waste analysis and
quantification
Design material
waste minimization
strategies
(Figure 4).
Purchase/ supply
material waste
minimization strategies
(Figure 5).
Handling material
waste minimization
strategies
(Figure 6).
OPERATION
Identified operation
waste causes
(Figure 7).
HANDLING
Identified handling
waste causes
(Figure 6).
PURCHASE SUPPLY
Identified purchase supply
waste causes
(Figure 5).
CLIENT
Identified client
waste causes
(Figure 3).
DESIGN
Identified design
waste causes
(Figure 4).
Sources of Material Waste M
ate
ria
l W
ast
e M
inim
iza
tio
n P
roce
ss
Waste Scores
Operation material
waste minimization
strategies
(Figure 7).
1. Enlightenment.
2. Achievable objectives
STAGE 2
Application of Client
Material Waste
Minimization Strategies
STAGE 1
Classification of Client
Waste Causes to routes and
origins
1. Good and reasonable
targets.
2. Adequate project
duration
1. Realistic budget and cash
flow.
2. Timely decision
1. Avoidance of late
changes
2. Project definition.
UNDUE
INTERFERENCES
1. Late changes.
DELAYS
1. Financial constraints
TOO HIGH STANDARD
1. Ignorance
2. Unreasonable requirements
UNDUE PRESSURE
1. Prioritized targets.
2. Time constraints
Client Waste Origins
Ma
teri
al
Wa
ste
Min
imiz
ati
on
Pro
cess

O. J. Oladiran et al./ Journal of Construction Business and Management (2018) 2(2). 36-41 53
Figure 4: Design waste minimization subsidiary-level framework for medium and large contracting organizations projects.
1. Flexible design
2. Collaborative
design.
3. Concurrent
design
4. Site Visits
5. Experienced
designers
6 Lean
Construction
techniques
STAGE 3
Application of Design
Material Waste
Minimization Strategies
STAGE 1
Classification of Design
Waste Causes to routes and
origins
1. Waste score
2. Buildability & maintainability analysis score
STAGE 2
Waste analysis
1. Appropriate
construction
procurement
system.
2. Collaborative
design
3. Effective
communication
4. Re engineering
1.Timely
designs
2.Good
documentation
1. Designers’ familiarity
with specification of
standard sizes.
2. Inclusion of standard
sizes in code’s
requirements.
3. Compliance to code’s
requirements
4. Compatible design
5. Set-based design
6. Incorporate Lean
Construction techniques
OTHERS
1. Design not
incorporating
recycling and
restage.
2. Unnecessary
temporary
works.
LACK OF
STANDARDIZATION
1. Specifying materials without
considering standard sizes.
2. Materials’ and components’
complexity.
3. Incorrect information about
materials
4. Unfamiliarity with
alternative products.
5. Lack of code requirements
for standard sizes.
DELAY IN
APPROVAL
OF
DRAWINGS
1. Incomplete
designs.
2. Poor site
information and
documentation.
DESIGN CHANGES
1. Overdesign
2. Lack of contractors’
influence at design
stages.
3. Non-coordination of
designs.
4. Incorrect
Specification.
5. Designers’
inexperience.
6. Site condition.
LACK OF
COLLABORATION
1. Ineffective
communication
2. Procurement
Methods
3. Nature of industry
Design Waste Origins M
ate
ria
l W
ast
e M
inim
iza
tio
n P
roce
ss
1. Concurrent design
2. Designing for future
3. Specifying recyclable
and reusable materials
and components.
4. Elimination of
unnecessary temporary
works
6. Investigate other
relevant techniques of
Lean Construction

54 O. J. Oladiran et al. / Journal of Construction Business and Management (2019) 3(1). 45-61
Figure 5: Purchase/Supply waste minimization subsidiary-level framework for medium and large contracting organizations projects
1. Good transportation
and road network
2. Elimination of
packaging or good
packaging
3. Incorporate other Lean
Construction techniques
STAGE 3
Application of
Purchase/Supply Material
Waste Minimization
Strategies
STAGE 1
Classification of
Purchase/Supply Waste
Causes to routes and
origins
Total waste quantity from Purchase/Supply source STAGE 2
Waste analysis and
quantification
1. Timely ordering
2. Logistic planning13
3. Work structuring13
4. Incorporate other
Lean Construction
techniques
Lean Construction
1. Appropriate
ordering.
2. Incorporate
other relevant
techniques of
Lean
Construction
1. Requisite and experienced supply &
purchase manager.
2. Effective communication
3. Partnering14 and suppliers’ involvement
4. Adequate inspection at delivery with
appropriate documentation
5. Incorporate other relevant techniques of
Lean Construction
BAD MATERIALS/
COMPONENTS
1. In experienced
Supply & purchase manager
2. Poor communication between
site and head office.
3. Late involvement of suppliers
4. Poor inspection
ORDERING
1. ordering that do not fulfil
design.
2. Lack of possibilities to
order small quantities.
3. Wrong ordering by
estimators.
4. Lack of coordination of
purchase/supply
DAMAGES
1. Bad transportation
& road network.
2. Bad packaging
3. Mode of delivery
DELAYS
1. Delay in material
supplies.
2. Delay in
transportation and
installation of
equipment.
3. Late ordering
4. Poor logistics
Purchase/Supply Waste Origins M
ate
ria
l W
ast
e M
inim
iza
tio
n P
roce
ss

O. J. Oladiran et al./ Journal of Construction Business and Management (2018) 2(2). 36-41 55
Figure 6: Handling waste minimization subsidiary-level framework for medium and large contracting organizations projects
1. Good delivery
methods.
2. Programmed
Ordering.
3. Central Dump
4. Embed other relevant
techniques of Lean
Construction
STAGE 3
Application of Handling
Material Waste
Minimization Strategies
STAGE 1
Classification of Handling
Waste Causes to routes and
origins
Total waste quantity from Handling source STAGE 2
Waste analysis and
quantification
1. Mechanization
2. Increasing crew.
3. Training
4. Multi-skilled operatives
5. Good resource allocation
6. Embed other relevant
techniques of Lean
Construction
1. Discharge of materials
at the point of usage.
2. Good site layout
3. Good Distribution
method within site
4. Embed other relevant
techniques of Lean
Construction
1. Appropriate storage
2. Adequate protection for
materials
3. Just in time delivery5
4. Supplier managed store
4. Offsite construction
5. Embed other relevant
techniques of Lean Construction
STORAGE PROBLEM
1. Too much material inventory
2. In appropriate
Storage
3. Congestion
DOUBLE HANDLING
1. Wrong equipment for material
movement.
2. Wrong discharge point of
materials.
3. Site layout problem
4. Wrong distribution within site
UNPACKED
SUPPLY WASTE
1. Throwaway
Packaging.
IMPERFECT
PLANNING
1. Unfriendly attitude
from personnel.
2. Insufficient operatives
3. Poor resource
allocation
Handling Waste Origins M
ate
ria
l W
ast
e M
inim
iza
tio
n P
roce
ss

56 O. J. Oladiran et al. / Journal of Construction Business and Management (2019) 3(1). 45-61
Figure 7: Operation waste minimization subsidiary-level framework for medium and large contracting organizations projects
1. Training
2.Competent
and skilful
personnel.
3.Adequate
supervision
4. Lean
Construction
Techniques
STAGE 3
Application of Design
Material Waste
Minimization Strategies
STAGE 1
Classification of Design
Waste Causes to routes and
origins
Total waste quantity from Operation source STAGE 2
Waste analysis
1. Top management
support.
2 Total Productive
Maintenance.
3. Security.
4. Good program of
work.
5. Good planning.
6. Good equipment.
7. Techniques of Lean
Construction
1. Total quality
management
2.Introduction
of safety
policies
3. Lean
Construction
Techniques
1. Multi-skilled
operatives
2. Last Planner
3. Offsite
construction
4. First Run Studies
5. Visual
management
6. Lean Construction
Techniques
WRONG METHODS
1. Too much overtime for
labour.
2. Poor formwork.
3. Improper planning and
organizations.
4. Improper sites’ records.
5. Poor material
management practices.
6.Unusage of modern
methods
7. Lack of waste
management plan
ERRORS
1. Workers’ mistakes.
2. Poor workmanship.
3. Inappropriate/
misuse of materials
4. Misinterpretation of
drawings.
5. Replacement
occasioned by wrong
materials
6. Conversion.
7. Negligence
DAMAGES
1. Damage
caused by
subsequent
trades.
2.Accidents
INEXPERIENCE
1. Inexperienced
Inspectors.
2. Unskilful
Subcontractors.
3. Unskilful tradesmen.
4. Poor site layout and
setting out.
5. Poor supervision
6. Low quality target
7. Unqualified
personnel
DELAY
1. Equipment
malfunctions/
shortage.
2. Inclement
weather.
3. Late information.
4. Unnecessary
people moves.
5. Lack of top
management support.
6. Theft.
Operation Waste Origins M
ate
ria
l W
ast
e M
inim
iza
tio
n P
roce
ss
1. Benchmarking
2. Value based management
3. Re engineering
4. Modern methods
5. Steel formwork
6. Corrective actions
7. Sub-contractors managing
waste generated by them.
8 Lean Construction
Techniques

O. J. Oladiran et al./ Journal of Construction Business and Management (2018) 2(2). 36-41 57
4.4.3. Purchase/Supply FMWM
The origins of waste from purchase/supply are presented
in Figure 5, which include damages, delays, bad materials
or products and ordering problems.
Damages: it occurs due to bad transportation and road
network, bad packaging and mode of delivery. The
proposed minimization strategies consist of good
transportation and road network; and elimination of
packaging or good packaging. Delays: it occurs due to
delay in material supplies, delay in transportation and
installation of equipment, late ordering and poor logistics.
The proposed minimization strategies are timely ordering,
logistic planning and work structuring.
Bad materials or products: it stems from
inexperienced supply and purchase manager; poor
communication; late involvement of suppliers; and poor
inspection. The proposed strategies for minimization are
requisite and experienced supply/purchase manager,
partnering and adequate inspection.
Ordering problems: they occur from ordering that do
not fulfill design, lack of possibilities to order small
quantities, wrong ordering by estimators and lack of
coordination of purchase/supply. The proposed strategy is
appropriate ordering.
4.4.4. Handling FMWM
Figure 6 presents the handling waste origins, which
include unpacked supplies waste, imperfect planning,
double handling and storage problems. Unpacked
supplies: waste occurs through throwaway packaging.
The proposed strategies for minimization in the
framework are good delivery methods, programmed
ordering and central dump.
Imperfect planning: it stems from unfriendly attitude
from personnel, insufficient crew of workers and poor
resource allocation. The proposed strategies are
mechanization, increment of crews, training of operatives,
multi-skilled operatives and good resource allocation.
Double handling: it occurs from wrong equipment, wrong
discharge point of materials, site layouts’ problems and
wrong distribution of materials within site. The proposed
strategies are discharge of materials at the point of usage,
good site layout and good distribution method within
sites.
Storage problem: it occurs from too much material
inventory, inappropriate storage and congestion. The
proposed strategies are appropriate storage, adequate
protection for materials, just in time delivery, supplier-
managed store and off-site construction.
4.4.5. Operation FMWM
The origins of operation waste presented in Figure 7 are
inexperience, delay, damages, errors and wrong methods.
Inexperience: it stems from inexperienced inspectors,
unskillful subcontractors, unskillful tradesmen, poor site
layout and setting out, poor supervision, low quality target
and unqualified personnel. The proposed strategies for
minimization include training, competent and skillful
personnel, and adequate supervision.
Delay: it occurs from equipment malfunctions/
shortage; inclement weather; late information;
unnecessary people moves; lack of top management
support; and theft. The proposed strategies are top
management support, security, good program of work,
good planning and good equipment.
Damages: it occurs due to subsequent trades and
accidents. The proposed strategies for minimization are
total quality management and introduction of safety
policies. Errors: they result from workers’ mistakes, poor
workmanship, inappropriate/ misuse of materials,
misinterpretation of drawings, replacement occasioned by
wrong materials, conversion and negligence. The
proposed strategies for minimization are multi-skilled
operatives, last planner, off site construction, first run
studies and visual management.
Wrong methods: these are due to too much overtime
for labour; poor formwork; improper planning and
organizations; improper sites’ records; poor material
management practices; non-usage of modern methods;
and lack of waste management plan. The proposed
minimization strategies are benchmarking, value-based
management, re-engineering, modern methods, steel
formwork, corrective actions and sub-contractors
managing waste generated by them.
4.5. Frameworks’ validation.
4.5.1. Aim and objectives of the validation
The aim of the validation is to refine and assess the
content and appropriateness of the proposed FMWM for
medium and large contracting organizations.
The objectives of the validation are: -
1. To assess the clarity of the proposed FMWM.
2. To examine the information flow of the proposed
FMWM.
3. To ascertain the appropriateness of the content and
structure of the five subsidiary-level FMWM.
4. To examine the comprehensiveness of the content
of the proposed FMWM.
5. To identify other waste routes, waste origins and
minimization strategies that may not be contained in
the proposed FMWM.
6. To identify potential implementation strategies for
the proposed FMWM.
7. To find out the overall assessment and
applicability of the proposed FMWM.
The validation was done in two stages, which are pilot
validation and main validation.
4.5.2. Pilot Validation
Eleven academics in the University of Lagos were
contacted to modify the framework out of which five of
them participated. It involved them rigorously criticizing
the proposed FMWM and also evaluate them via an
instrument. The five researchers include a Professor, an
Associate Professor, two Senior Lecturers and a Lecturer
II of the University of Lagos, Nigeria. All of them hold
PhD degree and their academic/research experiences
range between six to over 20 years. Four of them either
“agree” or “strongly agree” with the clarity of the main-
level FMWM in terms of structure, content and process.
Similarly, three of them either “agree” or “strongly agree”
with the information flow of the main-level FMWM in
terms of clarity and relationships. One each “disagree”
and “neither agree/ disagree”. Additionally, four of them
either “agree” or “strongly agree” with the
appropriateness of the five subsidiary- level FMWM in
terms of clarity, familiarity and content. Again, one of

58 O. J. Oladiran et al. / Journal of Construction Business and Management (2019) 3(1). 45-61
them “disagree”. The opinion of the one person who
disagreed was sought on improvement. His comment was
that the arrow showing relationship should be improved
to enhance understanding and interpretation of the
frameworks. All the comments and suggestions of the
academics were employed in the improvement of the
proposed FMWM. One of them also commented that
some of the minimization strategies (especially, lean
construction techniques) should be explained in the
proposed FMWM for the benefit of those who do not
know them. All their suggestions were used to modify the
proposed FMWM. Consequently, the proposed FMWM
were sent to 25 potential end users (five each from the five
categories of end users indicated earlier) with an
evaluation instrument, out of which 17 were returned and
found useful. The suggested measures from the pilot
survey, which were used to improve the proposed FMWM
prior to the main validation, are presented in Table 3.
Table 3: Improvement measures suggested from the pilot study and modification actions taken on the framework.
S/N Proposed Improvement Measures Modification Actions Taken
1.
Minimize the complexity arising from
multiplicity of redundant
elements/components.
Removal of redundant boxes.
2. Additional indicative arrows to convey
messages convincingly.
Introduction of arrows from waste quantification to
strategies for waste minimization.
3.
Sequential arrangement of origins of waste
under some sources of waste in the main-level
framework.
Rearrangement of the design origins of waste in the main-
level framework – design changes, uncollaboration,
inconsideration for standard sizes were rearranged as
inconsideration for standard sizes, uncollaboration, design
changes.
4. Rework some of the content. Uncollaboration was changed to lack of collaboration,
5. Inclusion of lean construction techniques
Additional lean construction techniques were included, with
an instruction to investigate and embed relevant lean
techniques in all the boxes for strategies for waste
minimization.
6.
Explanation of some minimization strategies
that may not be known to the respondents
especially the lean construction techniques
Explanation of about 21 strategies is included as footnotes
on the framework.
4.5.3. Main validation.
4.5.3.1. Demographic information of respondents
Table 4 shows the demographic information of the
respondents that participated in the validation exercise. A
total of 17 construction professionals were involved in the
exercise out of the 25 that were contacted. 23% of them
are project managers, 18% each are builders and
architects while 35% and 6% are civil engineers and
quantity surveyors respectively. Also, 64% have M.Sc
degree, while 18% each has B.Sc degree and HND. 18%
have less than 5 years construction experience, 29% have
from 6 to 10 years and 53% have from 11 to 15 years.
Table 4: Demographic information of respondents
Respondents’ information Frequency Percentage
Designation
Project Managers 4 23
Builders 3 18
Architects 3 18
Civil Engineers 6 35
Quantity Surveyors 1 6
Profession
Architecture 3 18
Quantity Surveying 2 12
Building 4 24
Civil Engineering 8 47
Academic qualification
M.Sc 11 64
B.Sc 3 18
HND 3 18
Construction experience
Less than 5 years 3 53
6 – 10 years 5 29
11 – 15 years 9 53
Category of organization
Indigenous 12 71
Multinational 5 29
Type of organization
Private 11 65
Public 6 35
Nature of organization
Contracting 11 64
Consulting 3 18
Client 3 18
Moreover, 71% of the respondents are from indigenous
construction organization while 29% are from
multinational organization, 65% are from private
organizations while 35% are from public. Also, 64% are
from contracting organizations, 18% each from
consulting and client organizations. The result shows that
the targeted respondents are qualified to validate the
proposed frameworks.
4.5.3.2. Clarity of the main-level FMWM
The respondents were asked to rate their agreement level
(from strongly disagree to strongly agree) about the
statements on clarity provided in the questionnaire. The
result reveals that 94% of them either “agree” or “strongly
agree” with the clarity of the framework in terms of
structure, content, sources and causes of waste within the
material waste minimization process in the main-level.

O. J. Oladiran et al./ Journal of Construction Business and Management (2018) 2(2). 36-41 59
Only 6% “nether agree/disagree” just on familiarity with
the content alone.
4.5.3.3. Information flow of the main-level FMWM
The respondents were asked to rate their agreement level
(from strongly disagree to strongly agree) about the
statements on information flow of the main-level FMWM
provided in the questionnaire. The result reveals that at
least 75% of the respondents either “agree” or strongly
agree” with the information flow of the framework, in
terms of clarity and relationship between the sources and
causes of waste, and material waste minimization process
in the main component.
4.5.3.4. Appropriateness of the Subsidiary-level FMWM
clusters.
The respondents were also asked to indicate the
appropriateness of the five subsidiary-level FMWM (from
strongly disagree to strongly agree) on the statements
provided in the questionnaire. The result sheds light that
at least 75% of the respondents either “agree” or “strongly
agree” with the five subsidiary components in terms of
structures’ clarity, contents’ familiarity, contents’
appropriateness and clarity of material waste
minimization process.
4.5.3.5. Overall assessment and applicability of the
FMWM
The respondents were asked to rate some framework
assessment and applicability statements (FAAS), from
extremely poor (1) to excellent (5), to indicate the overall
assessment and applicability of the entire framework. The
result is shown in Table 5. Interestingly, the result shows
that all the respondents (i.e. 100%) either indicated
“above average” or “excellent” for the assessment and
applicability of the framework. Infact, 65% opined
“excellent” on the comprehensiveness and practical
relevance to material waste minimization, while over 75%
also indicated “excellent” on the applicability in
minimizing materials wastage.
4.6. Implementation Strategies of the FMWM
The following implementation strategies were suggested
by various respondents:
1. Engagement of competent and requisite
professionals for site works.
2. There is the need for usage of skillful workers.
3. Proper monitoring and coordination of material
procurement.
4. Training and education on movement and storage
of materials.
5. There is the need to allow suppliers to manage
storage of materials.
6. Adequate planning for handling and good
materials packaging.
7. Teamwork.
8. Educating workers on correct placement of
materials.
9. Good material packaging and changing
construction methods.
10. Mechanization or increasing crew on sites.
11. Total quality management.
12. Achievable objectives must be clearly stated for
achievable goals.
13. Usage of waste audit.
The Nigerian building industry requires frameworks to
forestall the incidence of material waste on building
projects. Previous works on the issue of waste in Nigeria
have not attempted to evolve a framework that can be used
by construction practitioners to prevent and reduce
material waste. Additionally, Wahab and Lawal (2011)
indicate that there are no policies that mandate contractors
to minimize material waste on projects. The introduction
of policies will not be efficient, if there are no frameworks
that synergize the key issues about waste, especially as it
relates to the Nigerian context. The proposed FMWM in
this study depicts factors that are germane to waste
incidence and processes for their minimization. A major
highlight in the framework for waste minimization apart
from identifying routes of waste and minimization
strategies is the analysis and evaluation of waste. This is
seldom practiced in Nigeria. For instance, designs are not
evaluated for waste in Nigeria. Thus, a lot of waste that
could be prevented at the design stage occurs on site.
Ekanayake and Ofori (2004) developed and
recommended Building Waste Assessment Score
(BWAS) model to evaluate designs for potential to
generate waste, so as to produce designs that have less
potential to generate waste. Contractors are also enjoined
to employ the model to select site management techniques
which help them to face the waste challenge posed by the
design. Designs should also be subjected to ‘buildability
and maintainability analysis’, which will reveal among
other things, the inherent waste tendency in designs.
Moreover, the frameworks suggest that clients need to be
educated on the implication of their undue involvement in
building projects. Additionally, a major advocate in the
frameworks is the application of Lean Construction (LC)
techniques in building projects in Nigeria. Polat and
Ballard (2005) recommend the application of tools and
techniques of LC to prevent waste from occurring by
identifying the root-causes of waste and eliminating them
at all stages of construction. However, Oladiran (2008b)
reveals that LC is alien to the Nigerian building industry;
while the study also indicates the barriers and
implementation strategies for LC in Nigeria, of which is
education and skill development on LC. Thus, there has
been growing interest, research and development on LC
in Nigeria; hence its inclusion in the frameworks.
Furthermore, the validation exercise reinforces the need,
relevance and appropriateness of the frameworks. The
validation exercise highlights various implementation
strategies for them. The practical relevance of the
framework can be seen in the evaluation and comments of
the potential end users. The following comments were
made on the frameworks by some of the respondents:
i. If the frameworks are fully implemented on site,
waste will be minimized on construction sites.
ii. The frameworks are implementable on
construction sites and must be effectively practiced.
iii. They are good frameworks.
iv. The information and the flow is self explanatory.
v. There is thorough research and comprehensive
details about the framework. The report surely is
understandable and obtainable.
vi. They are satisfactory.

60 O. J. Oladiran et al. / Journal of Construction Business and Management (2019) 3(1). 45-61
5. Conclusion and Recommendations
The study opined that frameworks that can be used to
minimize material wastage on projects do not exist in
Nigeria. This gap was filled by the frameworks provided
in the study. The frameworks can be used to minimize
material waste at every stage of building projects. They
suggest that material waste minimization does not start
from the sites, but from the clients to everyone involved
in the execution of building projects. Thus, all
stakeholders need an understanding of the issues, content
and processes of the framework for effective
minimization of material wastage. The study recommends
that the proposed FMWM should be adopted by all
stakeholders to minimize material waste at all stages of
building projects. It should also be adopted to formulate
policies for waste minimization. Practitioners should be
sensitized to the potential gains of the proposed
framework to minimize material wastage.
6. Further Area of Research
The proposed frameworks were validated using face
validity and scoring model approaches as suggested and
used in previous works (Sargent, 2005; Awodele, 2012;
Gamage, 2011). It is important to validate them on real
life projects for improved objective assessment. Future
research will therefore focus on validating the
frameworks on case projects to further ascertain its
applicability and effectiveness.
References
Adewuyi, T.O., & Otali, M. (2013). Evaluation of
causes of construction material waste -- case of Rivers
State, Nigeria. Ethiopian Journal of Environmental
Studies and Management, 6: 746 – 753.
Akande, O.A. (2000). Estimating the percentage
wastage of materials in tendering- case of concretework
and blockwork. (M.Sc project report). University of
Lagos, Yaba, Lagos, Nigeria.
Akinkurolere, O.O. & Franklin, S.O. (2005),
Investigation into Waste Management on Construction
Sites in South Western Nigeria. American Journal of
Applied Sciences 2 (5): 980-984.
Al-Moghany, S.S. (2006). Managing and minimizing
construction waste in Gaza Strip. (M.Sc project report).
Islamic University of Gaza – Palestine.
Awodele, O.A. (2012). Framework for managing risk
in privately financed market projects in Nigeria.
(Doctorate Thesis), Heriot-Watt University.
Centre for Research in the Built Environment (CRiBE)
(2003). Construction waste minimization - Good Practice
Guide.”
Chew, J. & Sullivan, C. (2000). Verification, validation,
and accreditation in the life cycle of models and
simulations. In: Awodele, O.A. (2012). Framework for
managing risk in privately financed market projects in
Nigeria. (Doctorate Thesis), Heriot-Watt University.
Dajadian, A.D. & Koch, D.C. (2014). Waste
management models and their applications on
construction sites. International Journal of Construction
Engineering and Management, 3(3), 91-98.
Edwards, B. (1999). Sustainable architecture: European
directives and building design. 2nd ed., Oxford:
Architectural Press.
Ekanayake, L.L., & Ofori, G. (2000). Construction
material waste source evaluation. Proceedings from 2nd
Southern African conference on sustainable development
in the built environment: strategies for a sustainable built
environment, Pretoria, South Africa, August 23 -25: 1 –
6.
Enshassi, A. (1996). Materials control and waste on
building sites. Building Research Information, 24(1), 31-
34.
Ekanayake, L. L., & Ofori, G. (2004). Building waste
assessment score: design-based tool. Building and
Environment, 39: 851-861.
Fuchs, R. (2003). Avoiding construction waste. New
Zealand: Building Biology and Ecology Institute.
Formoso, C. T., Isatto, E. L., & Hirota, E. H. (1999).
Method for waste control in the building industry.
Proceedings of International Group for Lean Construction
– 7, University of California, Berkeley, CA, USA, July 26
– 28, 325 – 334.
Gamage, I.S.W. (2011). A waste minimization
framework for the procurement of design and build
construction projects. (Doctorate Thesis), Loughborough
University.
Li, Zhang, Ding & Feng (2015). Developing a
quantitative construction waste estimation model
forbuilding construction projects. Resources,
Conservation and Recycling, 106 (2016) 9–20.
Lu, W. & Yuan, H. (2011). A framework for
understanding waste management studies in construction.
Waste Management, 31 (6), 1252-1260.
Manowong, E & Brockmann, C. (nd). Construction
Waste Management in Newly industrialized countries.
Retrieved on 26/07/2108 from:
https://www.irbnet.de/daten/iconda/CIB_DC24555.pdf
Motete, L., Mbachu, J., & Nkado, R. (2003).
Investigations into material wastage on building sites.
Proceedings of CIDB 1st postgraduate conference, Port
Elizabeth, South Africa, October 14, 1 – 10.
Ng, L. S., Seow, T. W. & Goh, K. C. (2015).
Implementation on solid waste reduction through 3R
(NSWM Policy) and elements to close gap between policy
and contractors in construction industry in Penang.
International Journal of Environmental Science and
Development, 6(9), 668 – 675.
Oladiran, O.J. (2008a). Optimization of waste
management plan for waste reduction on construction
projects in Nigeria. Proceedings: International conference
on innovation in Architecture, Engineering and
construction, June 23-25, Antalya, Turkey.
Oladiran, O. J. (2008b). Lean -In- Nigerian
Construction: State, Barriers, Strategies and “Go-To-
Gemba” Approach. Proceedings of the IGLC –16,
Manchester, UK..
O. J. Oladiran et al./ Journal of Construction Business and Management (2018) 2(2). 36-41 61
Otunola, A.T. (2004). The use of waste recycled
materials in the construction industry. (Unpublished M.Sc
project report). University of Lagos, Yaba, Lagos,
Nigeria.
Poon, C. S., Yu, A. T. W., Wong, S. W., & Cheung, E.
(2004). Management of construction waste in public
housing projects in Hong Kong. Construction
Management and Economics, 22(7): 675-689.
Polat, G ., & Ballard, G . (2005). Waste in Turkish
construction: Need for Lean Construction techniques.
Proceedings of International Group for Lean Construction
– 13, Sydney, Australia, July 18 – 20, 1 – 14.
Proverbs, D. , & Olomolaye, P. (1995). Organizational
Productivity – A case study of materials management in
UK construction firms. Proceeding of 1st International
Conference on Construction project management,
Singapore, January.
Recycling Council of Ontario (RCO) (2009). 3Rs for
construction and demolition projects. Ontario: Queen’s
Printer
Sargent R. G. (2005). Verification and validation of
simulation models. In: Awodele, O.A. (2012). Framework
for managing risk in privately financed market projects in
Nigeria. (Doctorate Thesis), Heriot-Watt University.
Seydel, A. Wilson O. D. , & Skitmore, R. M.(2002).
Financial evaluation of waste management methods.
Journal of Construction Research, 3(1): 161-167.
Skoyles, E.R.,& Skoyles, J.R. (1987). Waste prevention
on site. London: Mitchell Publishing.
Straker, D.1 (995). A tool book for quality
improvement and problem solving. London: Prentice
Hall.
Tam, V.W.Y. & Tam, C.M. (2006). Evaluations of
existing waste recycling methods: A Hong Kong study.
Building and Environment, 41(12), 1649-1660.
Tam, V.W.Y. & Tam, C.M. (1994). A Review on the
Viable Technology for Construction Waste Recycling.
Proceedings of the first international conference of CIB
TG 16 , Centre for Construction and Environment,
Ganiesville, Florida
Wahab, A.B., & Lawal, A.F. (2011). An evaluation of
waste control measures in construction industry in
Nigeria. African Journal of Environmental Science &
Technology, 5(3), 246 – 254.