Novel Radio Link Buffer Management Schemes for End-User Multi-class Traffic in High Speed Packet...
29
1 Novel Radio Link Buffer Management Schemes for End-user Multi-class Traffic in High Speed Downlink Packet Access Networks. SULEIMAN YERIMA and KHALID AL-BEGAIN Postprint Full article information: Yerima, S. Y., & Al-Begain, K. (2011). Novel Radio Link Buffer Management Schemes for End-User Multi-class Traffic in High Speed Packet Access Networks. Wireless Personal Communications, 61(2), 349-382. DOI: 10.1007/s11277-010-0027-3
Transcript of Novel Radio Link Buffer Management Schemes for End-User Multi-class Traffic in High Speed Packet...

1
Novel Radio Link Buffer Management Schemes for End-user Multi-class Traffic in High Speed Downlink Packet Access Networks.
SULEIMAN YERIMA and KHALID AL-BEGAIN
Postprint
Full article information:
Yerima, S. Y., & Al-Begain, K. (2011). Novel Radio Link Buffer Management Schemes for End-User Multi-class Traffic in High Speed Packet Access Networks. Wireless Personal Communications, 61(2), 349-382. DOI: 10.1007/s11277-010-0027-3

2
Novel Radio Link Buffer Management Schemes for End-user Multi-class Traffic in High Speed Downlink Packet Access Networks.
SULEIMAN YERIMA and KHALID AL-BEGAIN
Integrated Communications Research Centre, Faculty of Advanced Technology, University of Glamorgan,
CF37 1SQ, Pontypridd, UK
E-mail: [email protected]; [email protected]
Tel: 01443483612
Fax: 01443654087
Abstract: High Speed Downlink Packet Access (HSDPA) is a 3.5 G wireless system introduced to improve downlink
packet data and multimedia services support in 3G Universal Mobile Telecommunication Systems (UMTS). HSDPA
standards support end-user multi-class sessions comprising parallel flows with diverse Quality of Service (QoS)
requirements, such as real-time (RT) voice or video streaming concurrent with non real-time (NRT) data service being
transmitted to the same user, with differentiated queuing at the radio link interface i.e. Node B. Hence, in this paper
we present and evaluate novel HSDPA radio link buffer management schemes for QoS control of multimedia traffic
comprising concurrent RT and NRT flows in the same HSDPA end-user session. The new buffer management
schemes – Enhanced Time Space Priority (E-TSP) and Dynamic Time Space Priority (D-TSP) – are designed to
improve radio link and network resource utilization as well as optimize end-to-end QoS performance of both RT and
NRT flows in the end-user session. Both schemes are based on a Time-Space Priority (TSP) queuing system, which
provides joint delay and loss differentiation between the flows by queuing (partially) loss tolerant RT flow packets for
higher transmission priority but with restricted access to the buffer space, whilst allowing unlimited access to the
buffer space for delay-tolerant NRT flow but with queuing for lower transmission priority. Experiments by means of
extensive system-level HSDPA simulations demonstrates that with the proposed TSP-based radio link buffer
management schemes, significant end-to-end QoS performance gains accrue to end-user traffic with simultaneous RT
and NRT flows, in addition to improved resource utilization in the radio access network.
Keywords: HSDPA, buffer management, QoS, multimedia, queuing theory, performance evaluation
3
1. INTRODUCTION
Universal Mobile Telecommunications Systems (UMTS) is a Third Generation mobile system designed for enhanced person-to-
person communications, access to information and services on public and private networks, and new flexible communication
capabilities [1]. The third generation partnership project (3GPP), standardized High Speed Downlink Packet Access (HSDPA) [2]
as a set of technological enhancements to UMTS, whose combination improves network capacity, spectrum efficiency, and peak
data rates up to 14.4 Mbps for downlink packet data traffic. The availability of higher data rates will enable developers to create
content rich multimedia applications, typically consisting of a number of classes of media or data, with different Quality of
Service (QoS) requirements being concurrently downloaded to a single user [3]. Furthermore, higher data rate packet data support
as well as proliferation of advanced mobile terminals will enable mobile broadband multimedia sessions characterised by multiple
flows being transmitted in parallel to the same end-user; for instance, VoIP communication during an FTP download or a
streaming video session concurrent with data download to the same terminal. Hence, in order to provide optimum end-to-end QoS
guarantees for the multiple flows present in such mobile multimedia sessions, the system must support mechanisms to enable
session/connection level (i.e. intra-user) traffic differentiation, priority handling, and QoS management especially at the radio link
which poses a severe bottleneck to end-to-end communication.
In HSDPA, the base station (i.e. Node B) is responsible for scheduling data transmission to multiple end-user terminals in a cell
on a shared downlink channel. Similarly, physical layer data retransmissions for radio link error recovery in HSDPA, originate
from the base station. Since both functionalities necessitate buffering of data at the radio link interface, 3GPP HSDPA standards
provides mechanisms for allocating separate base station data buffers for each end-user or user equipment (UE) connected to the
downlink shared channel. In order to facilitate priority handling of multiple flows belonging to the same user, the allocated data
buffers can consist of multiple priority queues according to the 3GPP standards. On the other hand, detailed algorithms for
priority handling, traffic control and data transmission scheduling at the radio link interface are left out from the standards as open
implementation-specific issues. Solutions that address these functionalities are extremely vital to QoS provisioning, end-to-end
traffic performance, and efficient radio link utilization, given the buffering of the flows at the radio link interface where
bandwidth constraints are frequently encountered due to the time-varying capacity and error-prone nature of the radio channel. An
effective solution is to incorporate buffer management algorithms for intra-user traffic control and priority handling in the base
station. Mechanisms to incorporate buffer management algorithms to optimize traffic performance in the radio access network
already exist within the current 3GPP HSDPA standards. Hence, in this paper we propose and investigate novel radio link buffer
management schemes for multimedia sessions with concurrent RT and NRT classes of flows being transmitted to the same user.
The proposed buffer management schemes are based on Time-Space priority queuing- a hybrid queuing strategy that allows
preferential treatment to real-time and non-real-time flows according to their QoS requirements. The paper presents a
comparative study of the Time-Space priority queuing system with conventional priority queuing schemes by means of stochastic-
analytic models. Furthermore, extensive end-to-end performance evaluation studies, using detailed system-level HSDPA
simulations to investigate the impact of the proposed Time-Space priority queuing based buffer management algorithms on traffic
end-to-end QoS, system performance and resource utilization, are also presented.
1.1 Related Works
Buffer management is a fundamental technology to provide QoS control mechanisms, by controlling the assignment of buffer
resources among different flows or aggregation of flows according to certain policies [4]. Buffer management schemes can be
categorized into three classes from resource management viewpoint, namely: Complete Buffer Partitioning (CBP), Complete

4
Buffer Sharing (CBS) and Partial Buffer Sharing (PBS) [5]. From a queuing strategy viewpoint, buffer management can be
categorized into time priority and space priority. For finite buffer systems, a queuing strategy is composed of the service
(selection) discipline and the buffer access control (BAC) discipline [6]. The former deals with the rule(s) of selecting the next
packet(s) for transmission, while the latter is concerned with the rule(s) of accepting new arriving packets. If the priority rule is
enforced at the service discipline such that preferential treatment is given to some classes of flows in order to control their end-to-
end delay and jitter, then the mechanism is classified as time priority. On the other hand, enforcing the priority rule at the buffer
access control, such that preferential access to buffer space is given to some classes of flows in order to control their packet loss
rate, yields a space priority scheme. In the literature, time priority schemes are also known as delay differentiated schemes while
space priority schemes are commonly referred to as loss differentiated schemes. Generally speaking, in priority queuing systems,
preferential treatment given to one service/traffic class is always achieved at the expense of the other classes. But, introducing
priority queuing mechanisms provide a flexible approach to provision QoS which results in better network resource utilization
than dimensioning the network to satisfy the most stringent QoS requirements [7].
Most existing priority queuing and buffer management schemes in the literature are either delay or loss differentiated focussing on
either time (service) or space prioritization of the different classes of flows. Several space priority-based schemes have been
proposed, many of which have been applied in ATM networks to provide different levels of packet loss rate control for buffered
flows with different loss priorities. Two main mechanisms for space priorities are Partial Buffer Sharing (PBS) and push-out (PO).
In PBS-based buffer management schemes, packet loss rates of incoming traffic from different (loss) priority classes are
controlled based on a threshold in the buffer. When the buffer level is below a pre-determined threshold, PBS accepts both low
and high priority packets, but when the buffer level exceeds the threshold, low priority packets cannot access the buffer. High
priority packets continue to access the buffer until it is full, at which point arriving high priority packets will also be discarded
despite the presence of low priority packets in the buffer. Classical PBS schemes have a static threshold and have been studied in
[6], [8-15], for example. In order to improve the overall buffer utilization and responsiveness to changing traffic condition,
dynamic threshold PBS schemes have been proposed (see e.g. [4],[16],[17], and [18]). In [19], Awan and Al-Begain, investigate
an enhanced PBS scheme where two classes of flows, one of which is delay sensitive (high priority) and the other, loss sensitive
(low priority), arrive at the finite buffer. In their proposed PBS scheme, the high priority (delay sensitive) packets are only
allowed access to the buffer when the total number of packets is below the pre-determined threshold; otherwise, only the low
priority (loss sensitive) packets can access the buffer until it becomes full. While the enhanced PBS scheme in [19], unlike the
other loss-differentiated only PBS, provides both delay and loss differentiation, it lacks time/transmission or service prioritization.
Despite their packet loss rate control capabilities, the main drawback of employing PBS-based buffer management schemes (or
other space priority schemes) in QoS control of concurrent RT and NRT flows, is that the lack of time/transmission prioritization
is seriously detrimental to RT flow QoS provisioning.
Complete Buffer Partitioning (CBP) [5] is a buffer resource management policy that segments a given buffer space into multiple
queues, according to the differentiated classes of traffic, each of which corresponds to a single class. Traffic belonging to one
class cannot occupy the buffer space assigned to another class, resulting in discarded arriving packets even when the overall
allocated buffer is not yet full. A CBP scheme with first come first serve (FCFS) service discipline is investigated in [20] for two
classes of flows with bursty traffic. In contrast, the Complete Buffer Sharing (CBS) scheme admits packets of any class into a
shared allocated buffer as long as there is available space. Thus, an arriving packet of any class is dropped when the buffer is full.
Unlike CBP, CBS can achieve high buffer utilization because the entire buffer space is always occupied unless there is shortage of
arriving packets. CBS is basically a first-in-first-out (FIFO) queuing discipline with drop-tail packet discarding when an arriving
packet encounters a full buffer; it therefore suffers from lack of service differentiation and fairness control. Pushout (PO) schemes
are generally considered to be space priority schemes that enhance CBS to support multiple classes (i.e. service differentiation).
PO selectively discards the lowest priority packet to allow an incoming higher priority packet to enter the buffer. The main

5
drawback of PO schemes is computational complexity, since the lower priority packet has to be ‘found’ before being overwritten
by the high priority packet. Choudhary and Hahne proposed a selective pushout scheme for ATM switches in [7]. The scheme
allows an arriving cell to overwrite a cell whose priority is less than or equal to itself from the longest output queue in the buffer
when full. Buffer space is completely utilized at high traffic load, with very low overall cell loss rate, as well as very low cell loss
rate for the high priority flow. Although PO-based schemes offer improved buffer utilization and overall loss rate performance,
they (like other space priority/loss differentiated schemes) are not designed to guarantee delay requirements of RT traffic; and,
hence, cannot adequately provide optimum joint QoS control of RT and NRT classes of flows simultaneously being transmitted in
an end-user session.
In the state-of-the-art HSDPA cellular network, due to packet buffering at the base station, downlink packet scheduling
functionality is one of the main mechanisms employed to enable QoS provisioning. The 3GPP HSDPA specifications allow for
separate Node B data buffers for each user connection with priority queuing, thus enabling the design and implementation of
different choices of traffic prioritization schemes (i.e. scheduling, buffer management algorithms) to optimize QoS provisioning.
Consequently, different packet scheduling algorithms have been proposed for UMTS/HSDPA in several papers amongst which
the Proportional Fair [21], [22], [23], Maximum C/I, Round Robin, and variations of these are frequently cited. Majority of these
packet scheduling algorithms are designed for inter-user packet scheduling under assumption of single traffic flow type per user.
A few proposals such as in [3] and [24] for instance, presented inter-user packet scheduling schemes that allow inter-class
prioritization but do not address buffer management for the traffic classes belonging to the same user.
While the proposed scheduling solutions in [3] and [24] provide class differentiation to support users that are running several
applications simultaneously, the buffer or queue management aspect is not taken into account. Whereas, because the packet
scheduling functionality necessitates data buffering at the edge of the radio access network, where the bottleneck to end-to-end
communication exists, buffer/queue management is vital to enhancing network and radio resource utilization as well as improving
traffic performance. Most importantly, employing efficient buffer management schemes in the radio access networks will allow
for QoS control to cater for the diverse performance requirements of multiple flows simultaneously transmitted to the same user
on HSDPA shared channel. Our radio link buffer management approach decouples the inter-class priority handling and control
amongst the user’s flows, from the inter-user packet scheduling functionality by designing buffer management schemes for the
former while re-using existing (inter-user) packet scheduling schemes for the latter. This allows for a flexible scheduler-
independent solution which is advantageous since operators are free to choose whichever (inter-user) scheduling scheme suits
their requirements. In this paper, we focus on the design and performance evaluation of buffer management schemes for diverse
mixed (real-time and non-real-time class) traffic in an end-user session which can be coupled with existing (inter-user) packet
scheduling schemes to provide end-to-end QoS provisioning.
1.2 Paper Contribution
In this paper, two new HSDPA radio-link buffer management schemes for QoS control of multimedia traffic with concurrent RT
and NRT flows transmitted to the same user, are presented and investigated. The first one is the Enhanced Time Space Priority
buffer management scheme (E-TSP), which incorporates Time-Space priority queuing mechanism with a credit-based flow
control algorithm to mitigate buffer overflow. The E-TSP credit-based flow control algorithm is designed to take into account in
its operation, the user terminal’s radio link quality, the base station buffer occupancy, and the arrival rates of the user’s incoming
RT and NRT flows. While E-TSP provides an effective solution for joint intra-user RT and NRT QoS control in the HSDPA
radio-link buffers, in certain multi-class traffic mix where persistent, high bit-rate RT flow arrival is present, the NRT flow may
experience periods of radio link bandwidth starvation. Hence, a second radio link buffer management scheme is proposed to
alleviate potential NRT bandwidth starvation problem. The second scheme is termed the Dynamic Time Space Priority buffer
management (D-TSP). D-TSP incorporates a dynamic time/transmission priority switching between the RT and NRT flows.

6
While E-TSP and D-TSP are proposed as radio link buffer management schemes for end-to-end QoS enhancement of end-user
multi-class traffic in HSDPA, the concepts of the schemes are equally applicable to similar fixed wireless or mobile systems with
a common downlink channel shared by several users.
E-TSP and D-TSP are based on our novel Time-Space Priority (TSP) queuing system which, unlike conventional priority queuing
systems that have either time prioritization (delay differentiated) or space prioritization (loss differentiated), offers both delay and
loss differentiation in a combined time- and space-priority queuing scheme; thus making TSP suitable for joint RT (delay
sensitive) and NRT (loss sensitive) QoS control and optimization. In TSP queuing, RT flow is given time priority by default but
is only allowed access to part of the allocated buffer, while NRT flow enjoys space priority by unrestricted access to end-user
allocated buffer space. In this paper, we have developed analytical models for comparative analyses of TSP with conventional
priority queuing disciplines; and we discuss their relative merits and demerits for concurrent RT and NRT QoS control, through
performance measures such as mean delay and packet loss probability. Furthermore, end-to-end performance evaluation of the
proposed TSP-based buffer management schemes using extensive system-level HSDPA simulations of example multimedia
communication scenarios, are presented to demonstrate the effectiveness and design trade-offs of the proposed solutions.
The rest of the paper is organised as follows. The next section gives a background description of the 3GPP HSDPA system in
order to put our proposed solutions into context. Next, TSP queuing mechanism is described, together with the development of
analytical models for comparative study with conventional queuing disciplines. Details of our new buffer management schemes,
E-TSP and D-TSP, are presented next, followed by description of the HSDPA system simulation set up for their end-to-end
performance evaluation. Next, the numerical results of end-to-end E-TSP and D-TSP simulation studies are presented and
discussed. Finally, we present the conclusions of the findings in this paper and highlight possible areas for future work.
2. HSDPA SYSTEM DESCRIPTION
2.1 General Overview
HSDPA utilizes a shared channel (HS-DSCH) to transmit data to the User Equipments (UE) over the downlink of a HSDPA-
enhanced UMTS cell. Compared to Release 99 UMTS, shorter connection and response times and higher cell throughput can be
achieved with HSDPA. An overview of HSDPA network topology is shown in Figure 1. It consists of three interacting domains;
Core Network (CN), UMTS Terrestrial Radio Access Network (UTRAN) and the UE (User Equipment). The CN is responsible
for switching, transit and routing of user traffic. UTRAN provides the air interface access for the receiver and handles all radio
related functionalities. UTRAN consists of a Radio Network Controller (RNC) and base station or Node B. The Radio Network
Controller (RNC) is the network element responsible for the control of the radio resources of the Node Bs connected to it, and also
serves as the service access point that the UTRAN provides to the CN. The main elements of the CN are adopted from GSM, i.e.
Serving GPRS Support Node (SGSN) and the Gateway GPRS Support Node (GGSN), through which the HSDPA network
connects to external packet switched networks.
The main changes in UMTS (Release 99) to introduce HSDPA (Release 5), have been made to the Node B entity [25]. In Release
99 UMTS, Node B performs air interface processing which includes channel coding and interleaving, rate adaptation, spreading
etc., and some basic Radio Resource Management operations such as inner loop power control. Whereas, in HSDPA, the Node B
has been equipped with a new MAC layer, called the MAC-hs, which has extended its functionality to include Adaptive
Modulation and Coding (AMC), Hybrid-ARQ, and fast Packet Scheduling. In addition, transmission time interval (TTI) is
reduced to 2ms to enable fast tracking of varying channel conditions required with the new functionalities.

7
Uu
Node B
RNC
RNC
SGSN
Node B
UTRAN
Core Network
Gn
Iub
Node B
GGSN
Gi
IP
Networks
Figure 1: HSDPA Network topology overview.
2.1.1 Adaptive Modulation and Coding
HSDPA allows higher order 16 QAM modulation in addition to QPSK. A given combination of modulation scheme and allowed
coding rate comprises a modulation and coding scheme (MSC). The basic principle of Adaptive Modulation and Coding (AMC) is
to change the modulation and coding scheme for data transmission in accordance with the variations in channel conditions of the
UE. The basic unit of data transmission is known as a Transport Block whose size varies with the selected AMC scheme, such
that when receiver has good channel conditions, AMC allows for larger Transport Block. Channel conditions estimated by UE are
fed back to Node B using Channel Quality Indicator (CQI) via the uplink control channel.
2.1.2 Hybrid Automatic Repeat reQuest (HARQ)
The HARQ entity in HSDPA is responsible for retransmission of data that the UE is unable to decode due to radio transmission
errors. HARQ operates in the physical layer of the Node B allowing for fast re-transmission of erroneous packets. Two kinds of
HARQ schemes can be used in HSDPA: Chase Combining and Incremental Redundancy [1]. HARQ operation is handled by
several HARQ processes which operate independently to yield an N-channel stop-and-wait operation, where N is the number of
processes. Only one HARQ process is allowed per TTI for a given UE transmission.
2.1.3 Packet Scheduling
In Release 99 UMTS, the RNC is responsible for packet scheduling over a minimum TTI of 10ms. In HSDPA, the packet
scheduling functionality is performed in the Node B with a shorter TTI of 2ms. The basic function of a HSDPA packet scheduler
is to determine which user will receive transmission in the next TTI. The size of the data block transmitted in the TTI frame is
determined by the AMC scheme selected, which in turn is based on the channel quality reported via the feedback uplink control
channel. In addition to the UE channel quality information, ACK/NACK feedback is also carried on the return uplink channel for
the HARQ operation.
In the 3GPP standards, packet scheduling is specified as a MAC-hs functionality as shown in Figure 2. Additionally, priority
handling functionality is defined, because multiple queues can exist for a single user with separate flows being transmitted to the
UE. However, the standards do not provide implementation details. Our proposed buffer management schemes are designed to
fulfil not only the priority handling in MAC-hs but also to enable QoS control for improved end-to-end traffic performance.

8
MAC-hs
MAC – Control
HS-DSCH
TFRC selection
Priority Queuedistribution
Associated DownlinkSignalling
Associated UplinkSignalling
MAC-d flows
HARQ entity
Priority Queuedistribution
PriorityQueue
PriorityQueue
PriorityQueue
PriorityQueue
Scheduling/Priority handling
Associated Downlink
Signalling
Figure 2 : UTRAN side (Node B) MAC-hs architecture in HSDPA standard [26].
2.2 Data Flow Mechanisms in HSDPA
In this section, the main protocol entities and mechanisms involved in a typical HSDPA data flow are described. Referring to the
user plane protocol architecture shown in Figure 3, data packets from an external network are routed to the required RNC, by the
GGSN via the SGSN after all the connection establishment procedures are completed. In the RNC, the Packet Data Convergence
Protocol (PDCP) carries out header compression if required, to improve efficiency of packet switched data transmission over the
UTRAN and radio interface. The packets are then segmented/concatenated to generate RLC MAC Protocol Data Units (MAC-d
PDUs) for onward transmission to the Node B. Depending on the type of service, RLC MAC-d PDUs can be transferred in either
the Acknowledged Mode (AM) or the Unacknowledged Mode (UM) in HSDPA.
The RLC protocol is active in both the RNC and the UE. For PDUs transferred using AM, an ARQ (Automatic Repeat request)
retransmission protocol is used for error recovery. The AM is the RLC mode used for TCP-based packet switched services such as
web browsing, file downloads, and email for guaranteed data delivery. Segmentation, concatenation, padding and duplicate
detection are provided by adding header fields to the data when generating the RLC PDUs from the higher layer packets. When
error/loss recovery fails in the RLC AM entity, the application relies on TCP retransmission to recover the lost packets.
In the UM mode, no retransmission protocol is used, which means data delivery is not guaranteed. An RLC entity in the UM
mode is defined as unidirectional because no association is needed between the uplink and the downlink. UM is used with
applications transported using UDP transport protocol such as VoIP or Streaming audio/video in which RLC level retransmissions
are not required or useful. The integrity of higher layer data can be observed using the sequence number in the PDU header which
are added to the data to provide segmentation, concatenation, and padding. The complete specification of the HSDPA RLC
protocol is given in [27].

9
Appl.
TCP UDP
IP
PDCP
RLC
MAC-hs
WCDMA L1WCDMA L1
MAC-hs
TN
FP
RLC
PDCP
TN
FP
MAC
Appl.
TCP UDP
IP
GGSN/SGSN
Uu IubUE RNC Appl. HostNode B
C
N
N
o
d
e
s
Figure 3: HSDPA User plane protocol stack.
The transfer of AM or UM RLC PDUs to the Node B occurs over the Iub interface using the HSDSCH Frame Protocol (FP). In
[28], 3GPP specifies a credit-based Iub flow control mechanism for the transfer of data from the RNC to the Node B using the
HS-DSCH FP. Again, the credit-based algorithm employed in practice is an open issue, but the flow control mechanism is aimed
at controlling the amount of user data buffered in the MAC-hs of the Node B ready for scheduling on the HS-DSCH to prevent
buffer overflow. In the Iub flows control, the Node B issues credits to the RNC through the CAPACITY ALLOCATION FP
control frame on receipt of a CAPACITY REQUEST FP control frame from the RNC. The number of credits issued corresponds
to the number of RLC PDUs belonging to a particular flow of a given user to be transferred; thus, the RNC packs the PDUs into
10ms HS-DSCH frames to be transmitted to the Node B. The buffer management schemes proposed in this paper are designed to
exploit these mechanisms in their incorporated credit-based flow control algorithm.
On arrival of the HS-DSCH frames carrying the RLC PDUs to the Node B MAC-hs, the RLC PDUs are retrieved and queued in
the MAC-hs buffer to await transmission. When the packet scheduler assigns a transmission slot to the UE, one or several MAC-d
PDUs from its queue(s) are assembled into a data block. A MAC-hs header containing the queue identity, and transmission
sequence number etc., is added to form a MAC-hs PDU or Transport Block which is then forwarded to the physical layer for
further processing. Recall that the Transport Block Size and hence number of MAC-d PDUs transmitted will depend on the
selected AMC schemes and the number of channelization codes which will be chosen according to the Channel Quality Indicator
which expresses the last known UE channel conditions. The maximum number of channelization codes allowed for HS-DSCH
transmission is 15, but 5 or 10 codes could be used depending on the terminal capability [29]. Although HS-DSCH spreading
factor of 16 allows for up to 16 codes, one code is always reserved for the associated High Speed Shared Control Channel (HS-
SCCH) that carries channel decoding information. A HARQ process is assigned for the transmission of a Transport block to the
UE in the allocated TTI, and the Transmission Sequence Number (TSN) in the frame is used to preserve the integrity and the
order of the data.
The UE has peer HARQ entities which receives the data frame and sends an ACK if decoding was successful or a NACK
otherwise. A reverse feedback channel, the HS-DPCCH is used to carry the HARQ ACK/NACK as well as the Channel Quality
Indicator that controls the AMC process. Correctly received frames are de-assembled into MAC-hs PDUs and reordered in the
MAC-hs reordering queues. The MAC-d PDUs are extracted and sent to the RLC layer for further processing. A peer RLC AM
entity will send a STATUS PDU in the return direction if a POLL bit has been set in the header of the received PDUs. The packets
are reconstructed from the RLC PDUs and passed to the higher layer transport protocol for further processing and onward transfer
to the application layer. All the above described mechanisms are either explicitly or implicitly modelled in our system-level
HSDPA simulator used to evaluate the end-to-end performance of our proposed E-TSP and D-TSP buffer management schemes
described in section 4.
10
3. ANALYSIS OF PRIOIRTY QUEUING SCHEMES
In this section, the Time-Space priority (TSP) queuing system is described. The conventional priority queue management types
commonly encountered in the literature namely, CBS (complete buffer sharing), PBS (partial buffer sharing), and CBP (complete
buffer partitioning) are used as reference for comparative analysis to the TSP queue management. Analytical models are
formulated using continuous-time Markov Chains and the effects of different traffic, system and configuration parameters on the
performance measures like packet loss probability, and mean delay are studied using the model. The study is intended to give
insight into merits and constraints of TSP queuing and to assess its capability for joint RT and NRT QoS control compared to the
conventional alternatives.
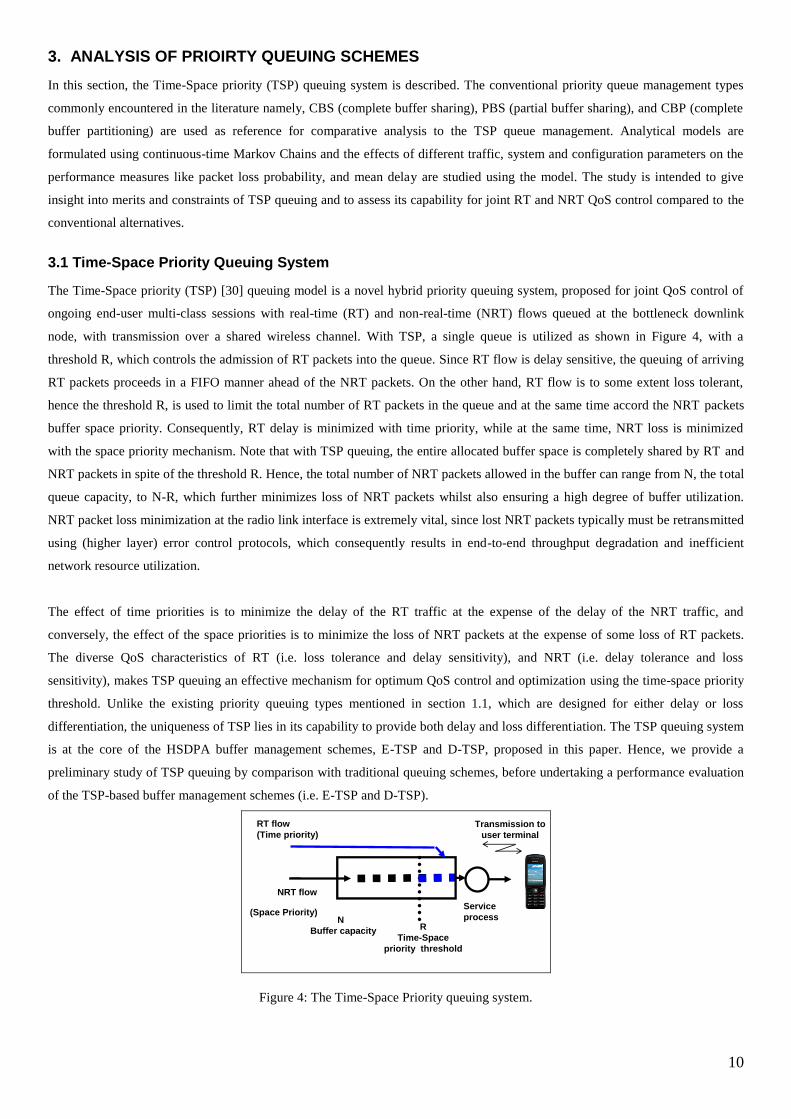
3.1 Time-Space Priority Queuing System
The Time-Space priority (TSP) [30] queuing model is a novel hybrid priority queuing system, proposed for joint QoS control of
ongoing end-user multi-class sessions with real-time (RT) and non-real-time (NRT) flows queued at the bottleneck downlink
node, with transmission over a shared wireless channel. With TSP, a single queue is utilized as shown in Figure 4, with a
threshold R, which controls the admission of RT packets into the queue. Since RT flow is delay sensitive, the queuing of arriving
RT packets proceeds in a FIFO manner ahead of the NRT packets. On the other hand, RT flow is to some extent loss tolerant,
hence the threshold R, is used to limit the total number of RT packets in the queue and at the same time accord the NRT packets
buffer space priority. Consequently, RT delay is minimized with time priority, while at the same time, NRT loss is minimized
with the space priority mechanism. Note that with TSP queuing, the entire allocated buffer space is completely shared by RT and
NRT packets in spite of the threshold R. Hence, the total number of NRT packets allowed in the buffer can range from N, the total
queue capacity, to N-R, which further minimizes loss of NRT packets whilst also ensuring a high degree of buffer utilization.
NRT packet loss minimization at the radio link interface is extremely vital, since lost NRT packets typically must be retransmitted
using (higher layer) error control protocols, which consequently results in end-to-end throughput degradation and inefficient
network resource utilization.
The effect of time priorities is to minimize the delay of the RT traffic at the expense of the delay of the NRT traffic, and
conversely, the effect of the space priorities is to minimize the loss of NRT packets at the expense of some loss of RT packets.
The diverse QoS characteristics of RT (i.e. loss tolerance and delay sensitivity), and NRT (i.e. delay tolerance and loss
sensitivity), makes TSP queuing an effective mechanism for optimum QoS control and optimization using the time-space priority
threshold. Unlike the existing priority queuing types mentioned in section 1.1, which are designed for either delay or loss
differentiation, the uniqueness of TSP lies in its capability to provide both delay and loss differentiation. The TSP queuing system
is at the core of the HSDPA buffer management schemes, E-TSP and D-TSP, proposed in this paper. Hence, we provide a
preliminary study of TSP queuing by comparison with traditional queuing schemes, before undertaking a performance evaluation
of the TSP-based buffer management schemes (i.e. E-TSP and D-TSP).
N
Buffer capacity
Transmission to
user terminal
R
Time-Space
priority threshold
RT flow
(Time priority)
NRT flow
(Space Priority)Service
process
Figure 4: The Time-Space Priority queuing system.

11
3.2 Conventional Priority Queuing Schemes
Recall from section 1.1 that most existing priority queuing schemes can be classed in to CBS, PBS or CBP, from buffer resource
management viewpoint; while in terms of service differentiation strategy priority queuing can be based on time priorities or space
priorities. Thus, in order to assess the capability of TSP to enable joint RT and NRT QoS control in a multi-class connection, we
compare its performance to the following conventional queuing schemes:
1) PBS (Partial Buffer Sharing): Assuming two levels of priority -high and low- corresponding to NRT and RT classes
respectively, PBS operates a selective discard mechanism aimed at minimizing the loss of packets of the high priority flow with
respect to the lower priority flow packets. PBS uses a threshold to reserve a part of the buffer for high priority packets only. If the
queue size is below the threshold, both high and low priority packets are accepted into the queue. Above the threshold, only high
priority (NRT) packets are accepted. Since PBS is the most widely studied space priority scheme, it is taken as a baseline space
priority scheme for comparative study.
2) CBP (Complete Buffer Partitioning): Separate buffer partitions are maintained for the RT and NRT flows, without any
common buffer sharing. Static time prioritization is applied to always transmit RT packets first before the transmission of NRT
packets. CBP is well known for its fairness properties (in buffer space allocation) especially under asymmetric traffic conditions.
The CBP scheme is taken as the baseline time-priority scheme for the comparative analyses.
3) CBS (Complete Buffer Sharing): CBS does not utilize thresholds to partition the waiting area of the buffer. Arriving RT and
NRT packets are accepted into the queue in a first-come-first-serve manner as long as there is available buffer space while drop-
tail discarding is used when the buffer is full. Even though no delay or loss differentiation is employed, CBS queuing discipline
ensures the highest possible buffer utilization when applied to multi-class traffic. Hence, CBS provides a baseline to assess the
buffer utilization capability of TSP for multi-class traffic.
3.3 Formulation of the Analytical Models
Figure 5 shows the arrangement of the assumed system configuration for the Markov models used in the comparative performance
evaluation of the queuing schemes. The system comprises the radio controller (RNC) queues and the base station (BS) queue(s).
The policy for admitting packets from the RNC queues into the BS queue(s) and the order of packet transmission, proceed
according to the descriptions of the priority queuing schemes given in section 3.2 and set the conditions governing the state
transitions in the Markov model.
Buffer
admission
control
Mobile
Terminal
Base station buffer
Radio channel
Priority queuing scheme
(CBP, CBS, PBP, or TSP)
NRT buffer
RT flow
RT buffer
NRT flow
Radio network
controller
TSP
CBS
PBS
CBP
Figure 5: Simplified model for investigating performance of the priority queuing mechanisms for mobile radio access network
downlink end-user multi-class traffic.

12
3.3.1 Basic system assumptions and notations:
Two classes of traffic, RT and NRT exist within a connection or session with arrival to separate RNC queues according to
independent Poisson process with arrival rates λrt and λnrt respectively. The RNC queues are of limited capacity hence
arriving packets that encounter a full queue are discarded (as shown in Figure 5).
We assume that packets are transmitted between the RNC and BS buffers without any transmission loss or delay and
proceed only when BS buffer admission control policy, which differs with applied BS queuing scheme, permits.
Let the radio channel state ch assume either a ‘good’ state or ‘bad’ state corresponding to favourable and unfavourable
channel conditions respectively. Assuming the time spent in each state is exponentially distributed, ch transits from ‘good’
to ‘bad’ (ch = 1 to ch =0) at an average rate of 1/(1- Pg) and from ‘bad’ to ‘good’ (ch = 0 to ch =1 ) on average at the rate
of 1/(1-Pb) = 1/Pg. Where Pg denotes probability that ch is in ‘good’ state and Pb = 1-Pg denotes the probability of ch
remaining in ‘bad’ state. State ch, allows modelling an error-prone radio channel in the Markov chain to capture the effect
of packet loss and retransmission on the air interface due to unfavourable radio channel conditions. Thus, packet
transmission proceeds on the radio link, only when the channel state ch is ‘good’.
Packet transmission times at the radio interface are assumed to be independent and exponentially distributed with mean
1/µ, with the order of packet transmission depending on the applied BS queuing scheme.
Let R represent the total RNC RT queue capacity while N represents the total RNC NRT queue capacity. Denote r as the
number of RT packets in the RNC RT queue, and n as the number of NRT packets in the NRT RNC queue at any given
time.
Let T represent the total BS queue capacity. Also denote t = rb + nb as the total number of packets present in the base
station at any given time, where rb and nb are the number of RT and NRT packets present respectively.
Denote Rb as the TSP threshold in the BS queue i.e. maximum number of allowable RT packets according to TSP policy.
Thus, with TSP queuing, RT packets are moved from RNC RT queue to BS only when rb < Rb, while NRT packets move
from RNC NRT queue to BS whenever t < T.
Denote Rc as the CBP partition threshold which divides the BS queue such that the maximum allowable number of RT
packets in the BS queue is given by Rc for CBP.
Let th denote the PBS threshold in the BS queue, when PBS queuing is applied.
Finally, denote by p = 1 the state when the head-of-the-line BS queue packet waiting for transmission is an RT packet and
p = 0 otherwise; and by q = 1, when the head-of-the-line packet awaiting transmission is an NRT packet and q = 0
otherwise. Empty state of the BS queue is given by p = 0, q = 0.
3.3.2 The Markov models
We define the state of the system by a vector X = J’ where J’ = ( r, n, t, p, q, ch) when TSP or CBP is applied in the BS queue,
and J’ = ( r, n, t, ch) when either PBS or CBS policy is applied in the BS queue. Let the number of possible states in the Markov
chain be given by M. We can thus define K to represent the finite state space of the system given that the states are conveniently
ordered from 0... M−1. Since X comprises several elements defining the system state space with each of the applied queuing
schemes, a multi-dimensional Markov model is formulated to capture the applied scheme’s mechanism in the system with defined
states and transitions from which steady state probabilities and hence performance measures can be computed. If we denote by Q,
the generator matrix of each of the multi-dimensional Markov models, which are homogeneous and irreducible on the finite state
space K, a unique steady state distribution P = {Px }, x = 0 .. M−1, exists.
The solution of the matrix equation P. Q = 0, subject to 1
0
M
x
Px = 1, yields the steady state probabilities Px, x = 0 … M−1, from
which the performance measures of interest are calculated. The elements of the matrix Q are given by the transition rates from a
state X = J’ to a succeeding state X+= J’+ or a preceding state X- = J’-, where J’+ denotes a discrete increment in a vector element

13
by one and J’- denotes a decrement in a vector element by one, given an initial state X0= J’0. The transitions and rates are
governed by conditions which are defined by the chosen BS queuing mechanism under the assumptions described in section 3.3.1.
Since ch has two possible states (0 and 1) and (p,q) have three possibilities of allowed combined states ((0,0), (0,1), (1,0)), the
sizes of the finite state space required to compute the performance measures from the multi-dimensional Markov model are given
by:
( 1) ( 1) ( 1) ( 1) 2 3c cS R N T R R for CBP,
( 1) ( 1) ( 1) 2S R N T for PBS or CBS,
( 1)2 3 ( 1) ( 1) ((( 1)( 1)) ( ))
2
b b
b
R RS R N R T
for TSP.
Thus, Q will be an S * S square matrix while P is a vector of dimension S. Clearly, even for small R and N and T values, the size
of the state space and hence the recursive linear equations required for the solution of the steady state probability matrix equation
can be quite large. Hence, we apply the Markov modelling tool, MOSEL-2 [31-33] to generate the state space and numerically
solve the Markov model using Stochastic Petri Net Package (SPNP) [34] package to obtain the performance measures of interest
defined as follows:
RT packet loss probability:
Lrt = ( )x k
P x
For TSP: {x : , {0,1,..., }, , , {(0,0),(1,0),(0,1)}, {0,1}}b bk r R n N r R p q ch
For CPB: {x : , {0,1,..., }, , , {(0,0),(1,0),(0,1)}, {0,1}}b ck r R n N r R p q ch
For PBS: {x : , {0,1,..., }, , {0,1}}k r R n N t th ch
For CBS {x : , {0,1,..., }, , {0,1}}k r R n N t T ch
which define the set of all the states of the system in which an arriving RT packet to the RNC RT buffer will be discarded for
the various schemes.
NRT packet loss probability:
Lnrt = ( )x k
P x
For TSP: {x : {0,1,..., }, , , , {(0,0),(0,1),(1,0)}, {0,1}}k r R n N t T p q ch
For CBP: {x : {0,1,..., }, , , , {(0,0),(1,0),(0,1)}, {0,1}}ck r R n N t T R p q ch
For PBS and CBS: {x : {0,1..., }, , , {0,1}}k r R n N t T ch
which all define the set of all possible states of the system in which an arriving NRT packet to the RNC NRT buffer will be
discarded.
In all schemes, the mean queue length of the RNC RT buffer is given by:
Nrt = ( )x k
rP x
where {0,1,..., }r R in all possible states k.
In all schemes, the mean queue length of the RNC NRT buffer is given by:
Nnrt = ( )x k
nP x
where {0,1,..., }n N in all possible states k.
From Little’s law, mean delay for RT packets is calculated from [35]:
r(1 )
rtrt
rt t
ND
L
From Little’s law, mean delay for NRT packets is calculated from:
r(1 )
nrtnrt
nrt n t
ND
L

14
3.4 Numerical Results and Discussions
Numerical results are presented in this section to illustrate the effects on the performance metrics, when each of the queuing
schemes are employed in the BS buffer of the system shown in Figure 5, modelled with the continuous-time Markov Chain
models formulated above. The default system parameter values assumed in the Markov models used in the experiments are
summarized in Table 1. A range of input traffic configurations with different NRT to RT flow traffic load ratios are considered.
The total multiplexed traffic load is kept constant, while the RT packet loss probability, NRT packet loss probability, mean RT
delay, and total (RT and NRT) packet loss, are taken as performance indicators for comparative analysis.
Table 1: Values of default parameters used in analytical models for comparative performance evaluation of the priority queuing
schemes.
Parameter Value
Mean total arrival rate (to RNC queues), λ 10
Mean service rate (at radio interface), µ 12
Probability of good channel state, Pg 0.8
RNC RT queue capacity, R 5
RNC NRT queue capacity, N 5
BS total queue capacity, T 10
TSP scheme threshold in BS queue, Rb 4
CPB scheme threshold in BS queue, Rc 4
PBS scheme threshold in the BS queue, th 4
traffic ratio 0.2, 0.4, 0.6, 0.8
Mean NRT arrival rate, λnrt λ * traffic ratio
Mean RT arrival rate, λrt λ - λnrt
Figure 6 shows the mean RT delay for the compared schemes under NRT to total input traffic ratios of 0.2, 0.4, 0.6, and 0.8
respectively. A parameter value of 0.2, for example, means that on average 20% of packet arrivals are from the NRT flow while
the remaining 80% are from the RT flow. Conversely, a parameter value of 0.8 indicates that 80% of packet arrivals are from the
NRT flow while the remaining 20% are from the RT flow. This metric allows us to capture a wide range of multi-class traffic
configurations and is used throughout the experiments.
From Figure 6, it can be seen that TSP and CBP generally achieve the lowest mean RT flow delay due to RT service
prioritization. With CBS applied in the BS, RT packets can traverse the system more easily than with PBS, because of better
fairness in access to BS buffer space that CBS provides for RT flow compared to PBS which utilizes a threshold to limit access to
BS buffer space. For this reason, CBS achieves lower mean RT delay compared to PBS. Note that even though TSP also uses a
limiting threshold, Rb, the precedence queuing and service (time) priority for RT flow, which are features absent in PBS, not only
minimizes RT queuing delay but also allows transfer of RT packets from RNC to BS if there is available space while rb < Rb in the
BS. Whereas, with PBS, even when BS buffer space is available as long as t ≥ th (th = Rb in the experiments), RT packets cannot
go through the system. An increase in the traffic ratio on the x-axis represents increase in NRT traffic component and a
corresponding decrease in RT component; the effect of this is apparent in the PBS curve behaviour. That is, the increase in the
NRT flow component causes further stalling of RT flow in the RNC RT queue, leading to corresponding increase in delay. The
opposite effect can be observed (to a lesser extent) in the TSP or CBP curves; i.e. RT delay lowers with decreasing RT flow
component. From Figure 7, it can be observed that the lowest RT packet loss probabilities are generally obtained with TSP and

15
CBP. PBS gives the highest RT packet loss probabilities. Similar to the case of delay performance in Figure 6, the observed better
TSP RT loss performance is due to service (time) prioritization present in the scheme.
Figure 8 plots the NRT packet loss probabilities for all the schemes. Due to space priority mechanism in PBS for NRT flow, PBS
showed the lowest NRT loss probability, followed by CBS, TSP and CBP respectively. Because of higher buffer utilization
inherent in TSP queuing compared to CBP, it achieved better NRT loss performance than the latter. Figure 9 shows that overall
packet loss is highest with PBS, while overall packet loss is lowest with CBS. TSP gives lower overall packet loss than CBP,
indicative of better BS buffer space utilization in TSP compare to CBP. As stated before, the CBS scheme always achieves a high
degree of buffer utilization, which is the reason for the lowest overall packet loss when used in the BS compared to the others.
Note also that TSP performance comes closest to CBS in Figure 9, illustrating the high buffer utilization capability of TSP as well.
The results provide insight into the comparative behaviours of the schemes over a range of multi-class traffic configurations. The
drawback of PBP and CBS compared to TSP is the tendency to compromise RT class QoS. On the other hand, the drawback of
CBP is the lower buffer utilization and tendency to achieve lower NRT QoS compared to an equivalent TSP queue. This leads to
the conclusion that compared to the typical priority queuing disciplines, TSP is the most effective queuing scheme that can be
used achieve a compromise between QoS of RT and NRT classes of flows that are concurrent in a multi-class session, whilst also
enabling a high degree of buffer utilization and low overall packet loss.
0
0.05
0.1
0.15
0.2
0.25
0.3
0.35
0.4
0.2 0.4 0.6 0.8
Fraction of NRT arrivals in overall traffic
Me
an
RT
de
lay
(s
)
PBS
CBS
CBP
TSP
Figure 6: Mean RT delay vs. fraction of NRT arrivals in concurrent RT and NRT traffic for TSP, CBP, PBS, and CBS queuing.
0
0.01
0.02
0.03
0.04
0.05
0.06
0.2 0.4 0.6 0.8
Fraction of NRT arrivals in overall traffic
RT
lo
ss
pro
ba
bil
ity
PBS
CBS
CBP
TSP
Figure 7: RT packet loss probability vs. fraction of NRT arrivals in concurrent RT and NRT traffic for TSP, CBP, PBS, and CBS
queuing.

16
0.000
0.005
0.010
0.015
0.020
0.025
0.030
0.035
0.2 0.4 0.6 0.8
Fraction of NRT arrivals in overall traffic
NR
T lo
ss
pro
pa
bilit
y
PBS
CBS
CBP
TSP
Figure 8: NRT packet loss probability vs. fraction of NRT arrivals in concurrent RT and NRT traffic for TSP, CBP, PBS, and
CBS queuing.
0
0.01
0.02
0.03
0.04
0.05
0.06
0.2 0.4 0.6 0.8
Fraction of NRT arrivals in overall traffic
To
tal
los
s
PBS
CBS
CBP
TSP
Figure 9: Overall packet loss probability vs. fraction of NRT arrivals in concurrent RT and NRT traffic for TSP, CBP, PBS, and
CBS queuing.
4. PROPOSED HSDPA BUFFER MANAGEMENT SCHEMES
Having evaluated TSP queuing against conventional schemes, we devote the following sections to description and evaluation of
our proposed TSP-based HSDPA buffer management schemes.
4.1 The Enhanced Time-Space Priority (E-TSP) Buffer Management Scheme
TSP, despite being more effective than conventional queuing schemes for joint RT and NRT QoS control of end-user multi-class
traffic, uses drop-tail queuing. Because of drop-tail queuing when the buffer is full, deploying TSP at the radio link of practical
wireless systems like HSDPA, could adversely affect end-to-end QoS where TCP is used to transport one or more of the flows in
the multi-class session. It is therefore desirable to design pro-active radio link buffer management schemes for multi-class traffic
in order to alleviate the side effects of buffer overflow, which can negatively impact end-to-end throughput. HSDPA standard
specifies mechanisms [36] for (credit-based) Node B flow control where credits are sent to the RNC to regulate the flow of traffic

17
to the RNC. Hence, we propose an Enhanced Time-Space priority buffer management (E-TSP) for HSDPA multi-class sessions
with concurrent RT and NRT flow illustrated in Figure 10.
In addition to TSP queuing, E-TSP incorporates a (credit-based) flow control algorithm necessitating the additional thresholds L
and H besides the TSP threshold, R. Thus the overall E-TSP logical queue incorporates three thresholds as shown in Figure 10.
The proposed Iub flow control algorithm uses the HS-DSCH Frame Protocol explained in section 2.2, to issue credits which gives
the number of Protocol Data Units (PDUs) allowed to be transmitted from the RNC. Furthermore, our algorithm is designed to
react to variation of the UE channel conditions, HSDPA channel load, as well as buffer occupancy which not only mitigates buffer
overflow but also achieves more efficient radio link utilization. The basic idea of the E-TSP flow control algorithm is that when
buffer occupancy exceeds the lower flow control threshold L, the NRT arrival rate (controlled by credit-allocation) is reduced. If
the buffer occupancy exceeds the higher flow control threshold H, no credits are issued i.e. instantaneous NRT arrival is reduced
to zero.
RNC
H
UE 1 NRT PDUs
Packet
Scheduling
Iub Flow Control
L
R
N
UE 1 RT PDUs
UE 2 buffer
UE n buffer
UE 1
UE 2
UE n
UE 2 PDUs
UE n PDUs
Node B MAC-hs
Radio link
UE 1 buffer
Figure 10: E-TSP buffer management scheme for multi-class traffic UE in Node B.
The E-TSP algorithm is described with the following assumptions and notations:
Assuming a total buffer allocation of N PDUs for UEn, in the Node B MAC-hs, where n is the nth user in the HSDPA cell.
Let R denote the total number of allowed RT PDUs in the nth user’s MAC-hs buffer.
Let r(t) be the number of nth user’s RT PDUs in the buffer at time t, while we denote the number of nth user’s NRT PDUs
at time t as n(t). Thus from TSP principle 0 < r(t) < R and 0 < n(t) < N at any given time t.
Denote the lower Iub flow control threshold as L, where L > R. Likewise the higher flow control threshold is given by H,
where L < H < N.
Let the nth user’s buffer occupancy at time t be given by q(t) = r(t) + n(t). The average buffer occupancy is estimated using
a moving average filter with ith sample given by:
qi = w . q(i-1) + (1-w) . q(t) (1)
Denote λrt as the Guaranteed Bit Rate (GBR) of the RT flow (obtainable from bearer negotiation parameters [37]).
Let λ’nrt express the estimated average NRT flow data rate at the radio interface determined from:
λ'nrt (i) = α ∙ λ'nrt (i-1) + (1- α) ∙ λnrt (t) (2)
where i is the ith TTI in which the user’s NRT flow was transmitted during a UE scheduling opportunity and λnrt (t) is the
amount of NRT data transmitted during the ith TTI.
Let k denote a parameter for buffer overflow control, while Tf and PDU_size be HS_DSCH FP inter-frame period (10ms)
and the MAC-d PDU size in bits, respectively.

18
Given the above assumptions and notations, E-TSP scheme in HSDPA operates as follows:
Part 1: User n Credit allocation:
Step 1: Compute per frame RT flow credit allocation
Crt = (λrt / PDU_size) ∙ Tf (3)
Step 2: Compute per frame maximum NRT credits
CNRTmax = (λ'nrt /PDU_size) ∙ Tf if qi < L
k ∙ (λ'nrt /PDU_size) ∙ Tf if L ≤ qi ≤ H
0, if qi > H (4)
Step 3: Compute per frame NRT credit allocation
CNRT = min {CNRTmax, RNCNRT} where RNCNRT is the RNC NRT flow buffer occupancy.
Step 4: Compute total per frame credit for nth user
CT = Crt + CNRT
Part 2: TSP queue management:
Step 1: For each arriving HS-DSCH data frame from RNC for user n determine the flow class - RT or NRT.
Step 2: If flow belongs to RT class, for each MAC-d PDU in the payload:
If (r(t) < R) queue PDU at RT queue tail
Else drop MAC-d PDU and update RT loss
Else If flow belongs to the NRT class, for each MAC-d PDU in the payload:
If r(t) + n(t) < N queue PDU at buffer queue tail
Else drop MAC-d PDU and update NRT loss
Part 3: Transmission priority control:
For each UEn transmission opportunity:
IF (r(t) > 0)
{
Time Priority = RT flow
Generate MAC-hs Transport Block from RT PDUs
}
ELSE IF (r(t) = =0 AND n(t) > 0)
{
Time Priority = NRT flow
Generate MAC-hs Transport Block from NRT PDUs
}
Note that NRT grant allocation and hence NRT flow arrival rate is made dependent on channel load and UE channel quality
through equations (2) and (4). Generally, the better the channel quality or the lighter the cell load, the larger λ’nrt estimate hence
the more credits get allocated and vice versa. Since averages are used in the grant calculation, and because of possible time-lag
between issued credit and RNC reaction, the space between H and N absorbs instantaneous burst arrivals that could occur even
whilst CNRTmax = 0.
4.2 The Dynamic Time-Space Priority (D-TSP) Buffer Management Scheme
While E-TSP algorithm (designed to address the potential buffer overflow, reduce excessive radio link buffer queuing delays, and
for better radio link utilization) would adequately provide QoS control for many HSDPA RT and NRT multi-class session
scenarios, due to the static prioritization of RT packets’ transmission, occasions may arise where stalling of the NRT flow occurs

19
at the radio link buffer. During heavier downlink shared channel loads or deteriorating UE channel conditions, potential NRT flow
stalling is even more likely (thus annulling the gain of Iub flow control). A possible alleviating solution is to incorporate dynamic
transmission priority switching between the concurrent RT and NRT flows. Hence, we propose a Dynamic Time-Space priority
buffer management scheme to this effect. The D-TSP scheme is illustrated in Figure 11.
RNC
H
UE 1 NRT PDUs
Packet
Scheduling
Iub Flow Control
L
R
N
UE 1 RT PDUs
UE 2 buffer
UE n buffer
UE 1
UE 2
UE n
UE 2 PDUs
UE n PDUs
Node B MAC-hs
Radio link
UE 1 bufferD-TSP switching
Figure 11: Dynamic Time-Space priority buffer management scheme in HSDPA Node B UE buffer.
D-TSP buffer management incorporates dynamic time priority switching with Iub flow control and TSP buffer admission control
strategy. Basically, for a given transmission opportunity assigned to the UE by the Packet Scheduling discipline, when the head-
of-the-line RT packet queuing delay is below a given delay budget, transmission priority is switched to the NRT flow, otherwise it
remains with the RT flow. Adopting the same notations and assumptions for E-TSP in 4.1, the further assumptions for D-TSP are
as follows:
We assume a given delay budget, DB, for the UE RT flow PDU queuing in the Node B MAC-hs. DB is used to determine
the priority switching control parameter. RT flow PDU inter-arrival time, i can be estimated from the already known GBR
thus:
i = PDU_size (bits)/ λrt (bits/sec) (5)
Define a priority switching control parameter δ given by:
δ = DB/ i (6)
Assuming a discard timer (DT) [37] is used to discard MAC-d PDUs of the RT flow with Node B MAC-hs queuing delay
exceeding a given maximum delay budget DBmax. If Y is the maximum allowable downlink delay then:
DBmax = Y – (external network + CN + RNC+ Iub) delay (7)
With the above assumptions and notations, the D-TSP scheme operates as follows with part 1 and part 2 exactly the same as in
E-TSP with part 3 replaced by the following:
Part 3: Dynamic Transmission priority control:
For each UEn transmission opportunity:
IF (r(t) < δ AND RT HOL delay < DBmax AND n(t) > 0)
{
Time Priority = NRT flow
Generate MAC-hs Transport Block from NRT PDUs
}
ELSE
{
Time Priority = RT flow

20
IF r(t)>0
Generate MAC-hs Transport Block from RT PDUs
}
5. E-TSP and D-TSP END-TO-END PERFORMANCE EVALUATION
In order to evaluate the end-to-end performance of the proposed TSP-based buffer management schemes, a custom system-level
HSPDA simulator was developed using OPNET modeler. Simulation was chosen for the end-to-end performance evaluation
rather than analytical modelling, in order to include as much system detail as possible to capture the dynamics of the scenarios
more realistically. The simulation model is shown in Figure 12.
IP Network
User
Equipments
HSDPA
CELL
Node BRNC Core Network
voice connection
External Network
voice + data
connection
Data connection
70ms20ms2ms
Figure 12. HSDPA Simulation model for E-TSP/D-TSP end-to-end performance evaluation.
The multi-class traffic sources comprise implementation of VoIP ON/OFF source with the same parameters employed by Bang et.
al in [38], and a customizable NRT traffic source with TCP Reno implementation. Detailed modelling of the HSDPA data flow
mechanisms and the entities involved as described in section 2.2 are included in the HSDPA simulator, except for the external
network and core network elements, whose effects (as shown in Figure 12) are abstracted by a single assumed fixed delay of 70ms
to packets arriving at the HSDPA RNC. The duration of the VoIP ON/OFF periods is negative exponentially distributed with
mean duration of 3 seconds. The VoIP packet length is taken as 304 bits or 38 bytes including RTP/UDP/IP and RLC header
overheads. Packets are assumed to arrive from the core network to the radio access network without any loss. For the Radio
Access Network, a single HSDPA cell served by a Node B under the control of an RNC with the concurrent VoIP and FTP
downlink traffic towards an end user (UE) was modelled. Radio propagation was modeled using ITU R path loss model and
lognormal shadowing with std. deviation σ = 8 dB. The path loss model used is taken from [39]:
L = 40 log10 R + 30 log10 f + 39 (8)
where f is the WCDMA carrier frequency i.e. 2GHz, and R is the distance of the mobile from the base station in kilometers. The
lognormal shadowing in logarithmic scale is characterized by a Gaussian distribution N (0, σ) with Gaussian random variable of
mean 0 and σ = 8 [40]. The shadowing value is updated every 2ms. Due to the slow fading process versus distance, adjacent
shadow fading values are correlated [41]. Thus the following correlation model is considered for shadow fading [39]:
C(d) = 2-d/dcor (9)
where C(d) is a normalized autocorrelation function of shadowing when decorrelation length is given by dcor and the moving
distance of the mobile after the last calculation of shadowing is d. Basically, the shadowing effect is represented by [39]:
S = C(d) * S' + 1- [C(d)]2 * N (0, σ) (10)
S is the shadowing value in dB updated with the last calculated value S'. In the simulation dcor is set to 5 meters [41].
Total Node B transmission power is assumed to be 15 W, while the allocated HS-PDSCH power was 7W. The instantaneous
throughput towards the UE is determined by transport block size (TBS) which is governed by the Adaptive modulation and coding

21
(AMC) functionality. We assumed that six AMC schemes are available and selected based on the reported channel quality (the
instantaneous Signal-to-Interference Ratio, SINR) of each UE. Table 2 shows the equivalent number of bits transmitted per HS-
PDSCH code per TTI for each of the AMC scheme. In the simulator, a look up table is used to map instantaneous SINR values to
each of the AMC schemes in order to model the HSDPA CQI operation.
Table 2: Assumed AMC schemes and equivalent instantaneous bit rates per TTI [29]
Modulation and Coding scheme No of bits per code per TTI
QPSK 1/4 240
QPSK 1/2 360
QPSK 1/3 480
QPSK 3/4 720
16QAM 1/4 960
16QAM 3/4 1440
Due to channel quality transmission latency, packets may be received in error as it is possible for the UE SINR at that instance to
be different from the last known SINR in the Node B that was used for AMC scheme selection. Thus HARQ re-transmission is
modeled with soft combining of all received packets, with the effective SINR taken as N∙ SNIRinit where N is the number of
transmissions and SINRinit is the SINR of the first transmission. MAC-d PDU size length after RLC packet
segmentation/assembly is taken as 320 bits for both VoIP and TCP-based FTP flows in the multimedia traffic. In all the
experiments, a test user equipment (UE 1) was assumed to be receiving multi-class traffic of simultaneous RT (VoIP) and NRT
(FTP) during a 120s simulated voice conversation and file download session. VoIP packets were being received while file
download was taking place using FTP over TCP. The overall set up models a single HSDPA cell with inter-user packet scheduling
to m users. A summary of the HSDPA parameters used are given in Table 3.
Table 3: Summary of assumed HSDPA simulation parameters for E-TSP and D-TSP end-to-end performance evaluation.
HSDPA Simulation Parameters
Parameter Value
HS-DSCH TTI 2ms
Path loss Model 148 + 40 log (R) dB
Transmit powers Total Node B power=15W, HSDSCH power= 50%
Shadow fading Log-normal: σ = 8 dB
AMC schemes QPSK ¼, QPSK ½, QPSK ¾, 16QAM ¼, 16 QAM ½
No. of assigned HSDSCH codes 5
CQI delay 3 TTIs (6ms)
HARQ processes 4
HARQ feedback delay 5ms
Test UE position from Node B 0.2 km
Packet Scheduling Fair time
MAC PDU size 320 bits
Iub (RNC-Node B) delay 20ms
External + CN delays 70ms
HS-DSCH frame 10ms
Flow control parameters α = 0.7; w= 0.7; k = 0.5
TCP Parameters: Reno; MSS = 536 bytes; RWIND = 64 (32KB)
5.1 E-TSP End-to-end QoS Performance Evaluation
E-TSP end-to-end performance evaluation using the HSDPA simulator is discussed in this section. In order to determine if
performance gains accrue from the proposed flow control algorithm and its effectiveness in mitigating buffer overflow, E-TSP is

22
compared with (drop-tail) TSP queuing and CBS scheme (with FIFO service) as baseline schemes. Buffer scheme configurations
are: N=150, for CBS; R=10, N = 150, for TSP; R = 10, L =30, H=100, N=150 for E-TSP. Various HSDPA channel loads are
considered and a test UE assumed to be receiving VoIP and FTP downloads simultaneously, is observed for 120s. The
performance metrics recorded include:
End-to-end NRT throughput: the end-to-end file download TCP throughput at the test UE receiver during the concurrent VoIP
and file download multi-class traffic session.
End-to-end VoIP delay: The end-to-end delay of VoIP packets measured in the multi-class traffic test UE receiver during the
concurrent VoIP and file download session.
5.1.1 NRT flow end-to-end performance
Figures 13-15 show results of the end-to-end TCP average throughput measurements with time, for the test UE receiving
concurrent VoIP and FTP flows during the 120s multi-class session under various HSDPA cell loads. The test UE is assumed to
be located 200m away from the base station and moving away at 3km/h speed, while other UEs are placed at random positions in
the cell and assumed to each be receiving a single flow of FTP downloads during their sessions and hence no buffer management
scheme is applied to their MAC-hs queues.
Figure 13 plots the NRT throughput obtained with complete buffer sharing used in the MAC-hs for the multi-class traffic of the
test UE; where arriving NRT or RT PDUs from the RNC for the test UE are queued and transmitted in a FIFO manner in an
allocated buffer of capacity N. With more users scheduled on the HSDPA channel, the throughput observed in the test UE drops
as expected. Since fair time scheduling is used, the throughput of the test UE is expected to drop with more users as the end-to-
end TCP RTT increases due to increased inter-scheduling gaps. Due to lack of flow control mechanism CBS is not immune from
buffer overflow, but is generally expected to give better NRT throughput than TSP (with drop-tail) because of the fairer chance of
access to transmission opportunity to NRT packets inherent in the FCFS service. The unsteadiness in the throughput over time can
be attributed to loss recovery at the RLC layer when MAC-hs buffer overflows, and also possible loss recovery at the TCP layer in
the event of RLC recovery failure (after a maximum of six attempts).
The same experiment is repeated with drop-tail TSP applied to the MAC-hs buffer of the test UE and the results are shown in
Figure 14. Like CBS, TSP is also not immune from buffer overflow, so a similar pattern to Figure 13 is observed. While the
average throughput is steady at almost 240 kbps for the single user scenario, the throughput drops dramatically in the scenarios
with more users on the shared channel. Also, the fact that some unsteadiness in the throughput is observed indicates that inter-
scheduling gaps due to higher channel loading alone is not responsible for the drop, but buffer overflow (and consequent RLC
and TCP loss recoveries) is a contributing factor.
0
20000
40000
60000
80000
100000
120000
140000
160000
180000
200000
220000
240000
260000
0 5 10 15 20 25 30 35 40 45 50 55 60 65 70 75 80 85 90 95 100 105 110 115 120
time (sec)
En
d-t
o-e
nd
TC
P T
hro
ug
hp
ut
(bp
s)
1 user
5 users
10 users
20 users
30 users
Figure 13: End-to-end NRT throughput at multimedia test UE with Complete Buffer Sharing for 1, 5, 10, 20 and 30 users utilizing
the HSDPA shared channel.

23
0
20000
40000
60000
80000
100000
120000
140000
160000
180000
200000
220000
240000
260000
0 5 10 15 20 25 30 35 40 45 50 55 60 65 70 75 80 85 90 95 100 105 110 115 120
time (sec)
En
d-t
o-e
nd
tro
ug
hp
ut
(bp
s)
1 User
5 users
10 users
20 users
30 users
Figure 14: End-to-end NRT throughput at multimedia test UE with (drop-tail) TSP buffer management for 1, 5, 10, 20 and 30
users utilizing the HSDPA shared channel.
0
20000
40000
60000
80000
100000
120000
140000
160000
180000
200000
220000
0 5 10 15 20 25 30 35 40 45 50 55 60 65 70 75 80 85 90 95 100 105 110 115
time (sec)
En
d-t
o-e
nd
TC
P T
hro
ug
hp
ut
(bp
s)
1 user
5 users
10 users
20 users
30 users
Figure 15: End-to-end NRT throughput at multimedia test UE with E-TSP buffer management for 1, 5, 10, 20 and 30 users
utilizing the HSDPA shared channel.
0
20000
40000
60000
80000
100000
120000
140000
160000
180000
200000
220000
240000
260000
1 5 10 20 30
Number of users
Av
era
ge
th
rou
gh
pu
t fo
r te
st
us
er
(b
ps
)
TSP
CBS
E-TSP
Figure 16: Average end-to-end NRT throughput at test UE Vs no. of users (CBS, TSP and E-TSP).

24
In Fig. 15, results of the same experiment with the E-TSP scheme applied to the MAC-hs queue of the multi-flow user is shown.
The test UE TCP throughput is seen to have a steady throughput after the initial rise, indicating comparatively lower RTT
variation. This is because of lack of buffer overflow which prevents consequent RLC or TCP layer loss recovery. Thus, E-TSP
was able to mitigate MAC-hs NRT PDU losses, reducing the occurrence of RLC level and hence TCP retransmissions. Of course
the inevitable drop in throughput with more users can only be attributed to fewer scheduling opportunities and hence larger
transmission gaps, but the flow control algorithm of E-TSP reacts accordingly to prevent buffer overflow.
Figure 16 illustrates the average NRT TCP throughput over the entire session for the three schemes, in a single graph. It shows
that E-TSP yields significant throughput improvement especially with higher cell loads. It is interesting to observe from Figure 16
that E-TSP gave the lowest throughput for the single user scenario. The reason for this is the increased TCP RTT as a result of the
flow control mechanisms and the time priority of the RT PDUs. But as the cell load increases, the effect of the inter-scheduling
gaps and potential losses due to MAC-hs buffer overflow become the dominating factors. Since the E- TSP is equipped with the
flow control mechanism, it is best able to cope with load and channel quality variation so that performance improvement is
noticeable at higher load.
Note that the better NRT throughput performance that CBS achieves compared to drop-tail TSP is at the expense of RT flow QoS
degradation (see Figure 17). That is, with CBS, NRT packets have fairer chance of scheduling opportunity at the expense of VoIP
delay. On the other hand, the trade-off in NRT throughput as a result of TSP schemes always manifests in better VoIP delay
performance (as is evident from Figure 17). One important implication of this set of results is that TSP-based schemes will benefit
from additional mechanisms that can provide more fairness in NRT flow transmission bandwidth allocation at the expense of
further trade-off in RT QoS performance as long as this is kept within maximum allowable constraints.
5.1.2 RT flow end-to-end performance
The most important observation to be made from Figure 17 is that the end-to-end VoIP QoS is not degraded as a result of the E-
TSP flow control scheme. Whereas, we observe from Figure 16 the corresponding end-to-end NRT performance gain with E-TSP.
While TSP and E-TSP show identical VoIP performance in the multi-flow session because both have the time priority mechanism,
they also maintain a fairly low variation in end-to-end delay with increasing load, compared to CBS. Thus, the set of results
obtained demonstrate that E-TSP is an effective buffer management scheme for joint QoS control in multi-class sessions with RT
and NRT flows, which when implemented at the radio link buffer can improve end-to-end traffic QoS of both flows. This idea is
exploited in the D-TSP scheme whose performance is evaluated in section 5.2.
0.00
0.05
0.10
0.15
0.20
0.25
0.30
0.35
Ave
rage
VoI
P e
nd-t
o-en
d de
lay
(s)
1 5 10 20 30
No of HSDPA users in cell
CBS
TSP
E-TSP
Figure 17: Average end-to-end VoIP PDU delay at test UE vs. number of users in cell. Results given for CBS (left) TSP (centre)
and E- TSP.
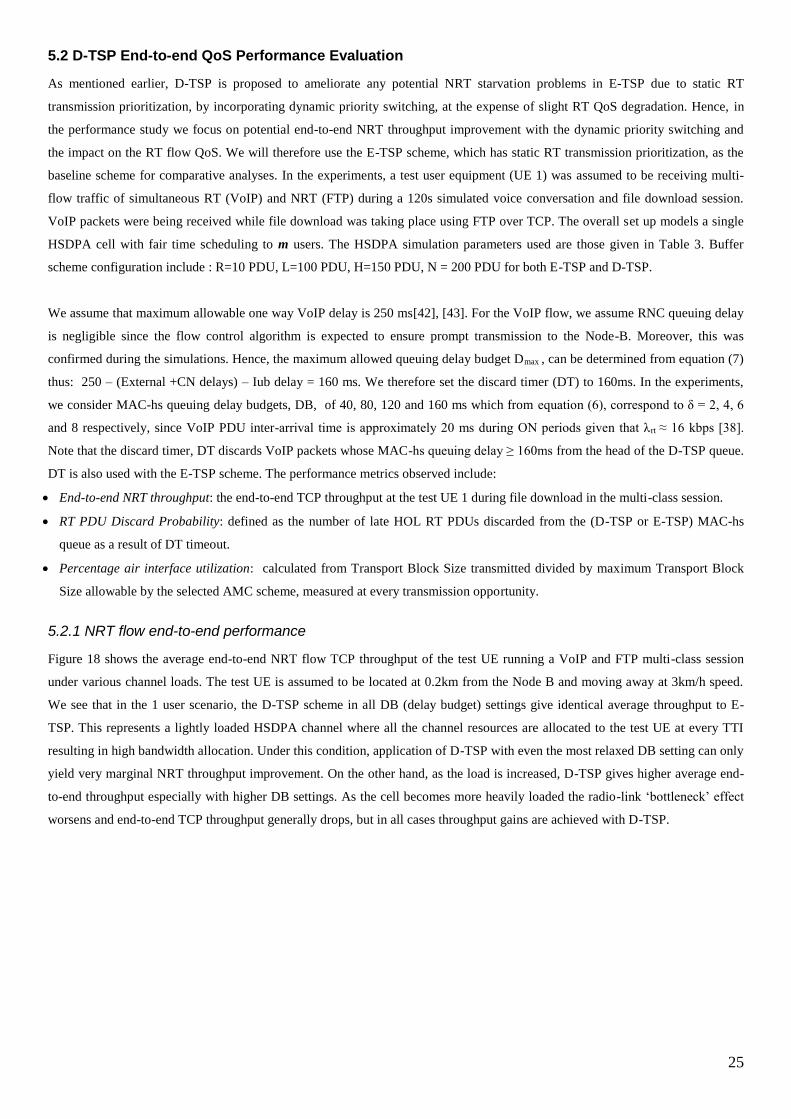
25
5.2 D-TSP End-to-end QoS Performance Evaluation
As mentioned earlier, D-TSP is proposed to ameliorate any potential NRT starvation problems in E-TSP due to static RT
transmission prioritization, by incorporating dynamic priority switching, at the expense of slight RT QoS degradation. Hence, in
the performance study we focus on potential end-to-end NRT throughput improvement with the dynamic priority switching and
the impact on the RT flow QoS. We will therefore use the E-TSP scheme, which has static RT transmission prioritization, as the
baseline scheme for comparative analyses. In the experiments, a test user equipment (UE 1) was assumed to be receiving multi-
flow traffic of simultaneous RT (VoIP) and NRT (FTP) during a 120s simulated voice conversation and file download session.
VoIP packets were being received while file download was taking place using FTP over TCP. The overall set up models a single
HSDPA cell with fair time scheduling to m users. The HSDPA simulation parameters used are those given in Table 3. Buffer
scheme configuration include : R=10 PDU, L=100 PDU, H=150 PDU, N = 200 PDU for both E-TSP and D-TSP.
We assume that maximum allowable one way VoIP delay is 250 ms[42], [43]. For the VoIP flow, we assume RNC queuing delay
is negligible since the flow control algorithm is expected to ensure prompt transmission to the Node-B. Moreover, this was
confirmed during the simulations. Hence, the maximum allowed queuing delay budget Dmax , can be determined from equation (7)
thus: 250 – (External +CN delays) – Iub delay = 160 ms. We therefore set the discard timer (DT) to 160ms. In the experiments,
we consider MAC-hs queuing delay budgets, DB, of 40, 80, 120 and 160 ms which from equation (6), correspond to δ = 2, 4, 6
and 8 respectively, since VoIP PDU inter-arrival time is approximately 20 ms during ON periods given that λrt ≈ 16 kbps [38].
Note that the discard timer, DT discards VoIP packets whose MAC-hs queuing delay ≥ 160ms from the head of the D-TSP queue.
DT is also used with the E-TSP scheme. The performance metrics observed include:
End-to-end NRT throughput: the end-to-end TCP throughput at the test UE 1 during file download in the multi-class session.
RT PDU Discard Probability: defined as the number of late HOL RT PDUs discarded from the (D-TSP or E-TSP) MAC-hs
queue as a result of DT timeout.
Percentage air interface utilization: calculated from Transport Block Size transmitted divided by maximum Transport Block
Size allowable by the selected AMC scheme, measured at every transmission opportunity.
5.2.1 NRT flow end-to-end performance
Figure 18 shows the average end-to-end NRT flow TCP throughput of the test UE running a VoIP and FTP multi-class session
under various channel loads. The test UE is assumed to be located at 0.2km from the Node B and moving away at 3km/h speed.
We see that in the 1 user scenario, the D-TSP scheme in all DB (delay budget) settings give identical average throughput to E-
TSP. This represents a lightly loaded HSDPA channel where all the channel resources are allocated to the test UE at every TTI
resulting in high bandwidth allocation. Under this condition, application of D-TSP with even the most relaxed DB setting can only
yield very marginal NRT throughput improvement. On the other hand, as the load is increased, D-TSP gives higher average end-
to-end throughput especially with higher DB settings. As the cell becomes more heavily loaded the radio-link ‘bottleneck’ effect
worsens and end-to-end TCP throughput generally drops, but in all cases throughput gains are achieved with D-TSP.

26
0
50000
100000
150000
200000
250000
1 user 5 users 10 users 20 users 30 users 50 users
En
d-t
o-e
nd
TC
P t
rho
ug
hp
ut
(bp
s)
Number of users on HSDPA channel
TSP
D-TSP (δ=2)
D-TSP (δ=4)
D-TSP (δ=6)
D-TSP (δ=8)
Figure 18: End-to-end NRT throughput of test UE for E-TSP, DTSP (δ = 2, 4, 6, 8) with 1, 5, 10, 20, 30 and 50 users sharing the
HSDPA channel.
5.2.2 RT flow end-to-end performance
Since a Discard Timer is used to discard Head-of-Line VoIP PDUs with delay exceeding the discard time DT setting of 160ms,
PDUs violating the delay deadline bound will not be received at the test UE 1. Thus, as a measure of the UE 1 VoIP QoS in the
multi-class session, we consider the VoIP PDU discard probabilities for the aforementioned scenarios for both TSP and D-TSP
with the various DB settings. The results are illustrated in Figure 19. Generally, more VoIP PDUs are discarded from the UE 1
MAC-hs queue as more users are scheduled on the HSDPA channel, and also with higher DB settings which correspond to more
relaxed delay budget. Assuming a maximum of discard ratio of 2 % is acceptable for VoIP QoS, Figure 19 shows that VoIP QoS
is satisfied in all cases of D-TSP and E-TSP for the 1-user, 5-user, 10-user scenarios (Recall that the discard timer DT mechanism
is also applied in E-TSP). Whereas, for the 20-user scenario, the maximum setting of δ for D-TSP is 6 corresponding to maximum
delay budget of 120ms. For the 30-user scenario, maximum acceptable δ = 4 corresponding to maximum delay budget of 80ms.
While in the 50-user scenario, maximum acceptable setting for δ is 2 corresponding to maximum delay budget of 40ms.
0
0.02
0.04
0.06
0.08
0.1
0.12
0.14
0.16
0.18
0.2
0.22
0.24
0.26
0.28
1 user 5 users 10 users 20 users 30 users 50 users
RT
PD
U d
isc
ard
ra
tio
Number of users on HSDPA channel
TSP
D-TSP (δ=2)
D-TSP (δ=4)
D-TSP (δ=6)
D-TSP (δ=8)
Figure 19: UE 1 VoIP PDU Discard probability for vs. number of HSDPA users.
5.2.3 HSDPA channel utilization
In addition to the throughput performance gain, D-TSP also improves the air interface utilization on the HSDPA channel
compared to E-TSP. As seen from Figure 20, the higher the number of users being scheduled on the air interface with the better
the air interface utilization. For instance, in the 20-user scenario, total channel utilization is 54 % for both RT and NRT flows in
the multi-flow session of the UE 1 when using TSP. With D-TSP and δ = 6, on the other hand, utilization of almost 62% is

27
achieved. This is due to VoIP PDU bundling in the Transport Block during transmission. The fact that increased utilization of the
radio resources is more noticeable with higher δ for the higher cell loading scenarios reflects the statistical multiplexing properties
of the HSDPA high-speed downlink shared channel (HS-DSCH)
The set of results presented in this section demonstrate that D-TSP can achieve better radio link bandwidth fairness to improve
NRT end-to-end throughput by exploiting RT flow tolerance within allowable QoS constraints. The scheme is capable of
optimizing the QoS performance between the two classes of flows during the UE session. With the improved bandwidth fairness
due to dynamic priority switching, potential NRT bandwidth starvation problem is eliminated.
0.5
0.51
0.52
0.53
0.54
0.55
0.56
0.57
0.58
0.59
0.6
0.61
0.62
0.63
0.64
0.65
0.66
0.67
0.68
1 user 5 users 10 users 20 users 30 users 50 users
Ra
dio
lin
k u
tiliz
ati
on
Number of users on HSDPA channel
TSP
D-TSP (δ =2)
D-TSP (δ=4)
D-TSP (δ=6)
D-TSP (δ=8)
Figure 20: UE 1 HSDPA channel utilization for the various D-TSP settings.
6. Concluding remarks
This paper presented two novel buffer management schemes, E-TSP and D-TSP, for HSDPA radio link QoS control of concurrent
RT and NRT flows transmitted to the same user. The schemes are based on time-space priority queuing (TSP) system which
provides time priority with precedence queuing and restricted admission for RT class, while NRT class is queued with unrestricted
buffer access but lower transmission priority. TSP was compared to conventional queuing schemes like CBS, PBP, and PBS using
Markov models, and the results illustrate the effectiveness of TSP queuing in joint RT and NRT QoS control in the multi-class
traffic in addition to efficient buffer utilization. Furthermore, using extensive system-level HSDPA simulations, we showed that
E-TSP can achieve end-to-end NRT throughput performance gains without compromising RT QoS by preventing buffer overflow.
Finally, also via extensive HSDPA system simulations, we demonstrated the radio link bandwidth allocation fairness and resulting
end-to-end NRT performance improvement achievable with dynamic time priority switching in D-TSP, besides its capability for
optimum RT and NRT QoS control. Although the proposed schemes were proposed for and evaluated in HSDPA multimedia
traffic scenarios, the concepts can be extended to other wireless systems with multi-class queuing at the air interface. In further
work, the impact of the proposed buffer management schemes on system capacity, i.e. impact on performance of QoS-aware call
admission control and handoff algorithms will be investigated.
7. Acknowledgement
The authors are grateful for the support of Higher Education Council for Wales (HFCE) ORSAS scheme in the
duration of this work.
28
References
[1] H. Holma and A. Toskala, WCDMA for UMTS-HSPA Evolution and LTE: John Wiley & Sons Ltd, 2007.
[2] 3GPP, "High Speed Downlink Packet Access; Overall Description," 3GPP TR 25.308 version 5.7.0, December 2004.
[3] A. Golaup, O. Holland, and A. H. Aghvami, "Concept and Optimization of an effective Packet Scheduling Algorithm for Multimedia
Traffic over HSDPA," in IEEE International Symposium on Personal, Indoor and Mobile Radio Communications. Berlin, Germany, 2005.
[4] L. Chuang and L. Yin., "Dynamic partial buffer sharing scheme: Proportional packet loss rate," in Proceedings of ICCT2003, 2003, pp.
259-262.
[5] J. W. Causey and H. S. Kim, "Comparison of buffer allocation schemes in ATM switches: Complete sharing, partial sharing, and
dedicated allocation," in Proceedings of International Conference on Communications, vol. 2, May 1994, pp. 1164-1168.
[6] A. Y. M. Lin and J. Silvester, "Priority Queuing Strategies and Buffer Allocation Protocols for Traffic Control at an ATM Integrated
Broadband Switching System " IEEE Journal on Selected Areas in Communications, vol. SAC-9, No. 9, pp. 1524- 1536, December 199l.
[7] A. K. Choudhury and E. L. Hahne, "Space priority management in a shared memory ATM switch " in Proc. IEEE GLOBECOM 93,
vol. 3, 1993, pp. 1375-1383.
[8] T. Czachovski and F. Peregrine, "A queuing model for optimal control of partial buffer sharing," ATM Computer Operation Research,
vol. 25 (2), pp. 113-126, Feb. 1998.
[9] C. G. Kang and H. H. Tan, "Queuing analysis of explicit priority assignment partial buffers sharing schemes for ATM networks " in
Proc. IEEE/ACM INFOCOM, March 1993, pp. 810-819.
[10] J. J. Bae, T. Suda, and R. Simha, "Analysis of a Finite Buffer Queue with Heterogeneous Markov Modulated Poisson Arrival
Processes: A Study of Traffic Burstiness and Priority Packet Discarding," in Proc. IEEE INFOCOM ’92, August 1992.
[11] K. Bala, I. Cidon, and K. Sohraby, "Congestion Control for High Speed Packet Switched Network," in Proc. IEEE INFOCOM ’90,
June 1990, pp. 520-526.
[12] H. Kroner, G. Herbuterne, P. Boye, and A. Gravey, "Priority Management in ATM Switching Nodes," IEEE Journal on Selected Areas
in Communications, vol. 9, pp. 418-427, April 1991
[13] G. Gallassi, G. Rigolio, and L. Fratta, " Bandwidth Assignment in Prioritized ATM Networks," in Proc.IEEE GLOBECOM ’90,
December 1990 pp. 852-856.
[14] H. Kroner, "Comparative Performance Study of Space Priority Mechanisms for ATM Networks " in Proc. IEEE INFOCOM ’90, June
1990, pp. 1136-1143.
[15] G. Hetbuterne and A. Gravey, "A Space Priority Queueing Mechanism for Multiplexing ATM Channels," Computer Networks and
systems, pp. 37-43, 1990.
[16] D. Mitra and I. Ziedins, "Virtual partitioning by dynamic priorities: Fair and efficient resource-sharing by several services, ," in
Broadband Communications: Network Services, Applications, Future Directions, Lecture Notes in Computer Science: Spinger Verlag, 1996, pp.
173-185.
[17] J.-W. Cho and H. Dong, "Dynamic buffer management scheme based on rate estimation in packet-switched networks," Computer
Networks, vol. 39, No.6, pp. 769-787, August, 2002.
[18] I. Cidon, L. Georgiadis, R. Guerin, and A. Khamisy, "Optimal Buffer Sharing," IEEE J. Select. Areas Commun., vol. 13, pp. 1229-
1240, Sept. 1995.
[19] I. Awan and K. Al-Begain, "An Analytical Study of Quality of Service Provisioning for Multi-service Mobile IP Networks Using
Adaptive Buffer Management," in Proc. of 11th International Conference on Analytical and Stochastic Modelling Techniques and Applications
(ASMTA04). Magdeburg, Germany, June 2004, pp. 166-172.
[20] S. Ahmad, I. Awan, and B. Ahmad, "Performance Modelling of Finite Capacity Queues with Complete Buffer Partitioning Scheme for
Bursty Traffic " in Proc. First Asia International Conference on Modelling and Simulation (AMS’07). Phuket, Thailand, March 2007.
[21] T. E. Kolding, "Link and System Performance Aspects of Proportional Fair Packet Scheduling in WCDMA/HSDPA," in Proc. IEEE
Vehicular Technology Conference, Sept. 2003, pp. 1717-1722.
[22] G. Barriac and J. Holtzman, "Introducing Delay Sensitivity into the Proportional Fair Algorithm for CDMA Downlink Scheduling," in
IEEE Proc. International Symposium on Spread Spectrum Techniques and Applications, September 2002, pp. 652-656.
[23] P. A. Hosein, "QoS Control for WCDMA High Speed Packet Data," in IEEE Proc. Vehicular Technology Conference, 2002.
[24] O. Holland, A. Golaup, and H. Aghvami, "Efficient Packet Scheduling for HSDPA Allowing Inter-class Prioritization," IET
Electronics Letters, vol. 42. No. 18, Aug 2006.
[25] K. I. Pedersen, P. E. Mogensen, and T. E. Kolding, "QoS Considerations for HSDPA and Performance Results for Different Services,"
in Proc. IEEE 64th Vehicular Technology Conference VTC-2006 25-28 Sept. 2006, pp. 1-5.
[26] 3GPP, "Medium Access Control (MAC) protocol specification," 3GPP TS 25.321 version 7.5.0, June 2007.
[27] 3GPP, "Radio Link Control (RLC) protocol specification," TS 25.322 version 5.13.0, December 2005.
[28] 3GPP, "High Speed Downlink Packet Access : Iub/Iur protocol aspects," 3GPP TS 25.877 Version 5.4.0, Release 5, June 2002.
[29] H. Holma and A. Toskala, HSDPA/HSUPA for UMTS: John Wiley & Sons Ltd, 2006.
[30] K. Al-Begain, A. Dudin, and V. Mushko, "Novel Queuing Model for Multimedia over Downlink in 3.5G Wireless Networks," Journal
of Communications Software and Systems, vol. 2, No 2, June 2006.
[31] P. Wüchner, H. D. Meer, J. Barner, and G. Bolch, "A brief Introduction to MOSEL-2," in Proceedings of 13th GI/ITG Conference:
Measuring Modeling and Evaluation of Computer and Communication Systems. Nürnberg, Germany, 2006, pp. 473-476.
[32] K. Al-Begain, J. Barner, G. Bolch, and A. I. Zriekat online, "The performance and Reliability Modelling Language MOSEL and its
Application," International Journal of Simulation: Systems, Science and Technology vol. 3 No. 3-4, pp. 66-80, 2002.
[33] A. I. Zriekat, S. Y. Yerima, and K. Al-Begain, " Performance Evaluation and Resource Management of Hierarchical MACRO-
/MICRO Cellular Networks Using MOSEL-2," Wireless Personal Communications, vol. 44 , Issue 2 pp. 153 - 179 January 2008.

29
[34] G. Ciardo, R. M. Fricks, J. Muppala, and K. S. Trivedi, "SPNP Users Manual Version 4.0," Duke University, Department of Electrical
Engineering, Durham, NC. March 1994.
[35] G. Bolch, S. Greiner, H. D. Meer, and K. S. Trivedi, Queueing Networks and Markov Chains: John Wiley & Sons Ltd., 1998.
[36] 3GPP, "UTRAN Iub Interface User Plane Protocols for Common Transport Channel data streams " 3GPP TS 25.435 Version 5.7.0,
March 2004.
[37] K. I. Pedersen, P. E. Mogensen, and T. E. Kolding, "Overview of QoS Options for HSDPA," in IEEE Communications Magazine, July
2006, pp. 100-105.
[38] W. Bang, K. I. Pedersen, T. E. Kolding, and P. E. Mogensen, "Performance of VoIP on HSDPA," in Proc. IEEE VTC. Stockholm,
June 2005.
[39] ITU, "Guidelines for Evaluation of Radio Transmission Technologies for IMT-2000," Recommendation ITU-R M.1225 1997.
[40] 3GPP, "Physical Layer Aspects of UTRA High Speed Downlink Packet Access (Release 4)," TR 25.848 version 5.13.0, March 2001.
[41] W. S. Jeong, D. G. Jeong, and B. Kim, "Packet Scheduler for Mobile Internet Services Using High Speed Downlink Packet Access,"
IEEE Transactions on Wireless Communications, vol. 3, No.5, September 2004.
[42] ITU, " One-way Transmission Time " ITU Recommendation G.114 2003.
[43] R. Cuny and A. Lakaniemi, "VoIP in 3G Networks: An end-to-end quality of service analysis," in Proc. IEEE Vehicular Technlogy
Conference vol. 2, April 2003, pp. 930-934.