Drum –Buffer-Rope - IS MUNI
25
Drum –Buffer-Rope Based on : R. Holt, Ph.D., PE
-
Upload
khangminh22 -
Category
Documents
-
view
2 -
download
0
Transcript of Drum –Buffer-Rope - IS MUNI

Drum –Buffer-Rope
Based on : R. Holt, Ph.D., PE

Principy
Resource : http://www.allaboutlean.com/drum-buffer-rope/
imaginace

Simplified Drum Buffer Rope (S-DBR)
Principy
Most importantly, it does try to constrain the work-in-progress and aims
to prevent an overloading of the system. As such it can be considered
sort of a pull system like Kanban or CONWIP, and hence Drum-Buffer-
Rope is superior to the traditional push systems.
Push –MRP-II
Pull –JIT- kanban=
WIP=NV WIP=NV
WIP=NV->0

No Consideration for Shifting Bottlenecks
Nevýhoda DBR->nebere do úvahy posuny úzkého místa

System not controlled (Neregulovaný systém)
Based on pictures taken from CH.Hohman show

System not controlled and modification DBR
Based on pictures taken from CH.Hohman show

Rope opened raw material valve
Based on pictures taken from CH.Hohman show

We Measure Operational Efficiency
Work flows from left to right
through processes with
capacity shown.
Process A B C D E
RM FG
Capability (Throughput Rate)
Parts/Day 7 9 5 8 6
Excellent Efficiency--Near 100%
Chronic Complainer
Too Much Overtime
Market
Request
11
RM = raw material
FG = finished goods

Reward Based on Efficiency
Work flows from left to right.
Process A B C D E
Capability(Throughput Rate)
Parts/Day 7 9 5 8 6
Both (D and E) found ways to look busy and appear to have a capacity of 5 parts/day.
RM FG
„horní tok“ „dolní tok“

In reality...
Process A B C D E
Potential
P/D 7 9 5 8 6
Reality 5 5 5 5 5
Processes A and B won’t produce
more than Process C for long.
RM FG
P/D=parts/day

Then Variability Sets In
Processing times are just
AVERAGE Estimates
Process A B C D E
Reality 5 2 5 2 5 2 5 2 5 2
RM FG 7 9 5 8 6

What’s an Average? 50%
Process A B C D E
Reality 5 2 5 2 5 2 5 2 5 2
Probability 0.5 0.5 0.5 0.5 0.5
Half the time there are 5 or more per day at
each process--Half the time less
Two at a time: 0.25 0.25
Over all: 0,5*0,5*0,5*0,5*0,5=0,03125=3% Chance of 5 per day !!!
RM FG 7 9 5 8 6

Previous Solution (not good one !): Inventory
WIP 5 5 5 5 5 Total 25 in WIP
Process A B C D E
Variable 5 2 5 2 5 2 5 2 5 2
Process
Put a day of inventory (WIP) at each process!
RM FG 7 9 5 8 6
WIP= Work in Progress = NV=Nedokončená výroba

System Variability Takes OverChaos
Variable 5 2 5 2 5 2 5 2 5 2
Process
WIP 3 0 10 8 4 Total 25
RM FG
Process A B C D E
Inventory (WIP) quickly shifts position.
Inventory manager tries to smooth it out.
Distribution problems result. Costs go up !!!
7 9 5 8 6

System Variability Takes Over--Chaos
WIP 3 0 10 8 4 Total 25
Variable 5 2 5 2 5 2 5 2 5 2
Process Shifting work-in-process creates large queues at some locations. This makes work wait longer to be processed. (based on Little s law -> THTH CT)CT) THTHCTCT CT=average time from when the job is released into station (machine or line) to when it exits
RM FG
An Average of 5 means sometimes 3 and some times 7
Process A B C D E
7 9 5 8 6

System Variability Takes Over--Chaos
WIP 3 0 10 8 4 Total 25
Variable 5 2 5 2 5 2 5 2 5 2
Process
Shifting work-in-process creates large queues at some
locations. This makes work wait longer to be processed.
Other workstations are starving for work (B) The work they
could do is delayed because they have no input material. They
can’t take advantage of their extra capability. So....... ?
RM FG 7 9 5 8 6
Process A B C D E

System Variability Takes Over--Chaos
WIP 3 5 10 8 4 Total 25
Variable 5 2 5 2 5 2 5 2 5 2
Process
So… Management Helps! Management puts in more work
(Inventory) (rate of input RM) to give everyone something to do (Cost world)!
Result: It takes longer and longer from time of release
until final shipping. More and more delay!!!!!!!!!!!
RM FG
Process A B C D E
->X 30
7 9 5 8 6

TOC Steps to
Continuous Improvement
Step 1. IdentifyIdentify the system’s constraint.
Step 2. ExploitExploit the system’s constraint.
Step 3. SubordinateSubordinate everything else to the above
decision.
Step 4. ElevateElevate the system’s constraint.
Step 5. If a constraint is broken (that is, relieved or
improved), go back to Step 1. But don’t allow
inertiainertia to become a constraint.

Five Steps Applied to Flow Operations
A B C D E
7 9 5 8 6
WIP Total
Step 3. Subordinate Everything Else (Rope) – zpětná vazba
Step 4. Elevate the Constraint ($?->vícenáklady)
Step 5. If the Constraint Moves, Start Over
Five Focusing Steps
RM
Step 1. Identify the Constraint (The Drum) – CRT -strom současné reality
FG
Step 2. Exploit the Constraint (Buffer the Drum) – časová rezerva
12 12

FG
Understanding Buffers
A B C D E
7 9 5 8 6
RM
• The “Buffer” is Time! Zásobník reprezentuje čas
• In general, the buffer is the total time from work release until
the work arrives at the constraint. Jde o čas mezi vstupem
komponent do systému až po dobu příchodu k omezení
• Contents of the buffer alters (see below) – obsah zásobníku se v
čase mění
• If different items spend different time at the constraint, then
number of items in the buffer changes
• but Time in the buffer remains constantTime in the buffer remains constant.
WIP Total 12parts/5parts per day=2.5 Days

We need more than one Buffer
FG
A B C D E
7 9 5 8 6
RM
There is variability in the Constraint.
To protect our delivery to our customer we
need a finished goods buffer. Ochrana zákazníků, aby
vždy dostali včas požadované výrobky
Finished Goods
Buffer
• There is variability in our suppliers.
We need to protect ourselves from unreliable
delivery. Dodávky v čase kolísají, takže se musíme
• před tímto nežádoucím efektem chránit
Raw Material
Buffer
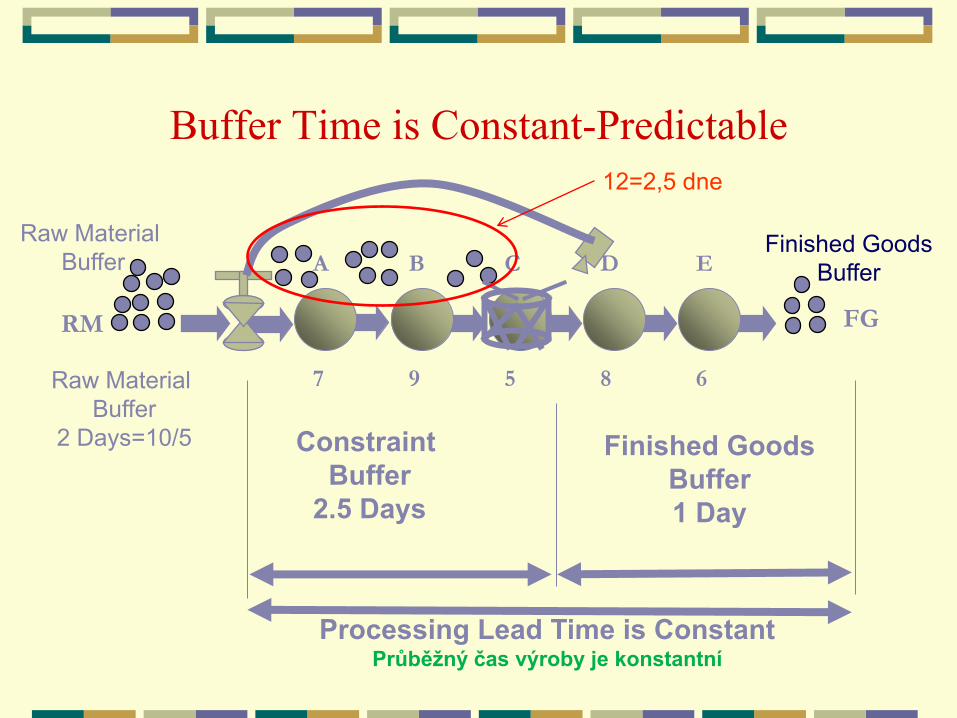
Buffer Time is Constant-Predictable
FG
A B C D E
7 9 5 8 6
RM
Finished Goods
Buffer
Constraint
Buffer
2.5 Days
Raw Material
Buffer
Finished Goods
Buffer
1 Day
Processing Lead Time is Constant Průběžný čas výroby je konstantní
Raw Material
Buffer
2 Days=10/5
12=2,5 dne

FG
Buffer Management
A B C D E
7 9 5 8 6
RM
Constraint Buffer WIP Total 12/5=2.5 Days
Time until Scheduled at Constraint
0 2.5 Days
WO17
WO14
WO15
WO16
WO10
WO11
WO12
WO13
WO18
WO19
WO21
WO20
WO = Work Order

A B C D E
FG
Problem Identification
7 9 5 8 6
RM
Time until Scheduled at Constraint
0 2.5 Days
WO10
WO20 WO12
WO13 WO21
WO15
WO16
WO17
WO18
WO11
Delayed
Parts
WO11
WO14
WO19
WO19 OK (GreenGreen)
Watch WO14 (YellowYellow))
Constraint schedule
is in jeopardy!
(RedRed Zone Hole WO11)

Additional Buffers
Constraint Buffer (as we discussed)
• Protects the Constraint from running out of work
Finished Goods Buffer
• Protects customer delivery from Constraint variation
Raw Material Buffer
• Protects the Release of material from suppliers
Assembly Buffer
• Facilitates speedy flow of products
https://www.youtube.com/watch?v=8yehd2ZsKH0