The deubiquitinase USP9X suppresses pancreatic ductal adenocarcinoma

BioMed CentralBMC Cancer
ss
Open AcceResearch articleNovel markers for differentiation of lobular and ductal invasive breast carcinomas by laser microdissection and microarray analysisGulisa Turashvili1, Jan Bouchal*1, Karl Baumforth2, Wenbin Wei2, Marta Dziechciarkova3, Jiri Ehrmann1, Jiri Klein4, Eduard Fridman5, Jozef Skarda1, Josef Srovnal3, Marian Hajduch3, Paul Murray2 and Zdenek Kolar1Address: 1Laboratory of Molecular Pathology, Institute of Pathology, Palacky University, Olomouc, Czech Republic, 2Cancer Research U.K. Institute of Cancer Studies, University of Birmingham, UK, 3Laboratory of Experimental Medicine, Department of Pediatrics, Palacky University, Olomouc, Czech Republic, 4Department of Surgery, Palacky University, Olomouc, Czech Republic and 5Department of Pathology, Tel Aviv University, Chaim Sheba Medical Center and Sackler School of Medicine, Tel Aviv, Israel
Email: Gulisa Turashvili - [email protected]; Jan Bouchal* - [email protected]; Karl Baumforth - [email protected]; Wenbin Wei - [email protected]; Marta Dziechciarkova - [email protected]; Jiri Ehrmann - [email protected]; Jiri Klein - [email protected]; Eduard Fridman - [email protected]; Jozef Skarda - [email protected]; Josef Srovnal - [email protected]; Marian Hajduch - [email protected]; Paul Murray - [email protected]; Zdenek Kolar - [email protected]
* Corresponding author
AbstractBackground: Invasive ductal and lobular carcinomas (IDC and ILC) are the most common histological types of breastcancer. Clinical follow-up data and metastatic patterns suggest that the development and progression of these tumorsare different. The aim of our study was to identify gene expression profiles of IDC and ILC in relation to normal breastepithelial cells.
Methods: We examined 30 samples (normal ductal and lobular cells from 10 patients, IDC cells from 5 patients, ILCcells from 5 patients) microdissected from cryosections of ten mastectomy specimens from postmenopausal patients.Fifty nanograms of total RNA were amplified and labeled by PCR and in vitro transcription. Samples were analysed uponAffymetrix U133 Plus 2.0 Arrays. The expression of seven differentially expressed genes (CDH1, EMP1, DDR1, DVL1,KRT5, KRT6, KRT17) was verified by immunohistochemistry on tissue microarrays. Expression of ASPN mRNA wasvalidated by in situ hybridization on frozen sections, and CTHRC1, ASPN and COL3A1 were tested by PCR.
Results: Using GCOS pairwise comparison algorithm and rank products we have identified 84 named genes commonto ILC versus normal cell types, 74 named genes common to IDC versus normal cell types, 78 named genes differentiallyexpressed between normal ductal and lobular cells, and 28 named genes between IDC and ILC. Genes distinguishingbetween IDC and ILC are involved in epithelial-mesenchymal transition, TGF-beta and Wnt signaling. These changeswere present in both tumor types but appeared to be more prominent in ILC. Immunohistochemistry for several novelmarkers (EMP1, DVL1, DDR1) distinguished large sets of IDC from ILC.
Conclusion: IDC and ILC can be differentiated both at the gene and protein levels. In this study we report two candidategenes, asporin (ASPN) and collagen triple helix repeat containing 1 (CTHRC1) which might be significant in breastcarcinogenesis. Besides E-cadherin, the proteins validated on tissue microarrays (EMP1, DVL1, DDR1) may representnovel immunohistochemical markers helpful in distinguishing between IDC and ILC. Further studies with larger sets ofpatients are needed to verify the gene expression profiles of various histological types of breast cancer in order todetermine molecular subclassifications, prognosis and the optimum treatment strategies.
Published: 27 March 2007
BMC Cancer 2007, 7:55 doi:10.1186/1471-2407-7-55
Received: 27 November 2006Accepted: 27 March 2007
This article is available from: http://www.biomedcentral.com/1471-2407/7/55
© 2007 Turashvili et al; licensee BioMed Central Ltd. This is an Open Access article distributed under the terms of the Creative Commons Attribution License (http://creativecommons.org/licenses/by/2.0), which permits unrestricted use, distribution, and reproduction in any medium, provided the original work is properly cited.
Page 1 of 20(page number not for citation purposes)

BMC Cancer 2007, 7:55 http://www.biomedcentral.com/1471-2407/7/55
BackgroundInvasive ductal (IDC) and lobular carcinomas (ILC) arethe most common histological types of breast cancer[1,2]. The terminology of ductal and lobular carcinomasis considered to be controversial as on purely anatomicalgrounds there is no justification for this nomenclature.Both carcinomas are derived from the terminal duct lobu-lar unit (TDLU), and the differences in their morphologyare likely to reflect the differences in mechanisms of car-cinogenesis rather than the anatomical origin of thelesions. At presentation the clinical pathological parame-ters such as tumor site, size, grade and stage are similar forboth tumor types [3], however, clinical follow-up dataand the patterns of metastasis suggest that their develop-ment and progression are different [4,5]. Treatment forstage-matched tumors is similar [6], but ILCs are oftenresistant to neoadjuvant therapy [7]. Although patientswith ILCs are older, have low grade tumor and less lym-phatic invasion, they have no survival advantage com-pared with IDCs [8,9].
Expression profiling using microarrays is a powerful tech-nology which enables the simultaneous study of theexpression of thousands of genes and, in conjunction withlaser capture microdissection, the high-throughputgenetic analysis of morphologically distinct cell subpopu-lations within tumor tissue [10,11]. Microarray analysishas a number of applications, including tumor classifica-tion, molecular pathway modeling, functional genomics,and comparison of gene expression profiles betweengroups [12]. The study of gene expression in primarybreast tumor tissues is complicated for two major reasons.First, breast cancer consists of many different cell types,including normal epithelial, stromal, adipose andendothelial cells. Second, tumor cells are morphologicallyand genetically diverse [13]. The recent development oflaser capture microdissection has provided an opportu-nity to generate gene expression signatures from individ-ual cell types [14-20].
Microarrays were used for analysis of breast tumor sub-classes with clinical implication [21,22], for analysis ofgene expression changes in single breast cancer cells fromwithin the same tumor [14], for expression analysis of dif-ferent gene families in breast cancer [23,24], and for anal-ysis of gene expression in different cellular and tumortypes [25-28]. ER status of the tumor was the most impor-tant discriminator of expression subtypes. Unsupervisedhierarchical clustering segregated these tumors into twomain clusters based on their basal (predominantly ERnegative) and luminal (predominantly ER positive) char-acteristics [29]. Ductal breast cancer classes have beenidentified with aggressive phenotype and poor prognosisversus those with good prognosis [30-32]. Another study
reported distinct expression patterns based on BRCA1 andBRCA2 status [33].
To date, few papers have been published on gene expres-sion profiles of normal cell populations in the mammarygland [34]. Several studies suggest differences in expres-sion profiles of IDC and ILC. Inactivating mutations of E-cadherin gene are very frequent in ILC [35]. However, theloss of E-cadherin expression was shown to be an inde-pendent prognostic marker for recurrence, especially innode-negative breast cancer patients, irrespective of thehistological type [36]. Abnormal cytoplasmic and nuclearlocalization of p120, a member of the E-cadherin/cateninadhesion complex, is mediated by E-cadherin loss andoccurs in the early stages of ILC [37]. Non-microdissectedIDC and ILC tissues have also been used to study specificgene expression profiles of lobular and ductal tumors[38,39]. We aimed to identify genes differentiallyexpressed between normal cell types (ductal and lobular),between tumor cells and normal cells as well as betweentumor types (ductal no special type and lobular). Despiteexamining limited number of patients, our study is thefirst full genome analysis of microdissected ductal andlobular tumor and normal cells which allowed us todetect normal mammary epithelium- and cancer-specificgenes.
MethodsLaser capture microdissection and RNA isolationAltogether ten surgical specimens with either invasiveductal carcinoma NST (no special type) (n = 5) or invasivelobular carcinoma (n = 5) were investigated. This researchprotocol was approved by the ethics committee at PalackyUniversity. Tumor and normal tissues from the samemammary gland were identified by an experiencedpathologist, snap-frozen in liquid nitrogen and stored at -80°C for further analysis. For microdissection, frozen tis-sues were embedded in TissueTek medium and cut onstandard cryostat (Leica CM1850, Leica MicrosystemsGmbH, Wetzlar, Germany). Frozen sections (7 μm) wereimmediately fixed in acetone, stained by hematoxylin anddehydrated in alcohol and xylene. All solutions were pre-pared using diethyl pyrocarbonate-treated water. RNasefree instruments and RnaseZap (Sigma, St Louis, MO,USA) were used throughout.
At least 1000 infiltrating ductal or lobular tumor cellstogether with normal lobular and ductal cells were micro-dissected from cryosections using the Veritas™ Laser Cap-ture Microdissection System (Arcturus Bioscience, Inc.,Mountain View, CA, USA) according to standard proto-cols. When microdissecting normal cells, no attempt hasbeen made to exclude basal or myoepithelial cells for tworeasons. First, both ducts and lobules are atrophic in men-opause, and no clearly defined layers of luminal and
Page 2 of 20(page number not for citation purposes)

BMC Cancer 2007, 7:55 http://www.biomedcentral.com/1471-2407/7/55
myoepithelial cells are preserved. Second, it is impossibleto exclude contamination with or entrapment of myoepi-thelial cells during the microdissection procedure. Capswith captured cells were directly placed in 100 μl lysisbuffer (Qiagen, Hilden, Germany). Total cellular RNA wasisolated (RNeasy® Micro Kit, Qiagen) according to manu-facturer's recommendations and subsequently quantifiedon a Nanodrop spectrophotometer (Nanodrop Technolo-gies, Wilmington, DE, USA).
RNA amplification, microarray target synthesis and hybridizationFifty nanograms of total RNA were reverse transcribed andamplified by Microarray Target Amplification Kit (Rochediagnostics, Basel, Switzerland). In brief, total RNA (50ng) was converted into cDNA using a modified oligo (dT)primer (TAS-T7 Oligo (dT)24). A unique Target Amplifica-tion Sequence (TAS) with no homology to any knownsequences in public databases generated the 3' anchor onthe cDNA for subsequent PCR amplification. In order toinclude a 5' anchor sequence on the cDNA, the TAS-(dN)10 primer was used for the initiation of the secondstrand cDNA synthesis. After purification using the Micro-array Target Purification Kit (Roche), PCR was performedusing the TAS primer and Expand PCR Enzyme Mix whichis optimized for long (>1 kb) and unbiased PCR products.In order to ensure that messages were not amplified to sat-uration, the optimal number of PCR cycles was estimatedby preliminary PCR and agarose electrophoresis of PCRproducts from cycles 21, 24, 27, 30 and 33. The optimalnumber of PCR cycles was set either to 27 cycles forpatients 3, 4, 8, 9, and 10 or 29 cycles for patients 1, 2, 5,6, and 7. All three populations from each patient wereamplified by the same number of PCR cycles. If higherPCR cycling was needed for any cell population, newmicrodissection, RNA isolation, cDNA synthesis and PCRamplification were performed until the same PCR cyclingwas possible. After purification with the Microarray TargetPurification Kit (Roche), the PCR products were labeledwith biotin-14-CTP (Invitrogen, CarlsBad, CA, USA) andbiotin-16-UTP (Roche) by in vitro transcription usingMicroarray RNA Target Synthesis Kit T7 (Roche). Thelabeled cRNA was purified using the Microarray TargetPurification Kit (Roche), quantified by spectrophotome-ter and checked by agarose electrophoresis. The entireamplification and labeling process was monitored byGeneChip® Eukaryotic Poly-A RNA Control Kit (Affyme-trix, Santa Clara, CA, USA) with exogenous positive con-trols which were spiked into the total RNA before cDNAsynthesis. In all cases, 25 μg of each biotinylated cRNApreparation was fragmented, assessed by gel electrophore-sis, and placed in hybridization cocktail containing bioti-nylated hybridization controls (GeneChip™ EukaryoticHybridization Control Kit, Affymetrix). Samples were firsthybridized to Test3 Arrays for 16 hours, washed, stained
using antibody-mediated signal amplification andscanned. After passing this quality control stage, the sam-ples were hybridized onto the large Human GenomeU133 Plus 2.0 Arrays (Affymetrix).
Microarray data analysisScanned images of microarray chips were analysed by theGCOS (GeneChip Operating Software) from Affymetrixwith the default settings except that the target signal wasset to 100. Differentially expressed genes between celltypes were identified using the GCOS change algorithmand Rank Products (RP) [40] following RMA (RobustMultiarray Analysis) [41]. GCOS pairwise analysis wasperformed to compare gene expression levels among thenormal lobular, normal ductal and tumor cells withinindividual patients and between lobular and ductal carci-noma cells of different patients. For each comparisonbetween two cell types, the number of increase anddecrease calls of each probe set was calculated using MSExcel and probe sets with the highest number of consist-ent changes among all patients were identified. Probelevel quantile normalization [40] and robust multiarrayanalysis [41] on the raw. CEL files were performed usingthe Affymetrix package of the Bioconductor [42]. The cut-off value of percentage of false-positives for RP analysiswas set to 10%. Gene lists were uploaded to DAVID (Data-base for Annotation, Visualization and Integrated Discov-ery) [43], and functional annotation was performed.Further informations on genes were obtained from publicdatabases, such as Gene Cards [44] and NETAFFX AnalysisCenter [45]. Hierarchical clustering was performed usingdChip software [46]. The data discussed in this publica-tion have been deposited in NCBI Gene ExpressionOmnibus (GEO) [47], and are accessible through GEOSeries accession number GSE5764.
Validation by immunohistochemistrySeven differentially expressed genes were verified byimmunohistochemical staining on tissue microarrays(TMA), which were constructed from 119 breast cancercases and contained 278 cores of 2.0 mm diameter. Theyconsisted of 80 ductal carcinomas, 29 lobular carcinomas,one tubular carcinoma, 3 medullary carcinomas, 2 tubu-lar-lobular carcinomas, 2 mixed ductal-lobular carcino-mas, one mucinous and one papillary carcinoma. Theconstruction of the tissue microarrays was done using atissue arrayer (Beecher Instruments, Inc., Sun Prairie, WI,USA) [48]. The paraffin sections from 22 additional breastcancer samples containing normal mammary gland struc-tures were used for comparison.
TMA sections were stained using standard immunohisto-chemical methods. Monoclonal mouse antibodies againstcytokeratin 17 (dilution 1:100, clone 2D4-1G9, Abnova,Taipei, Taiwan), cytokeratin 5/6 (dilution 1:100, clone
Page 3 of 20(page number not for citation purposes)

BMC Cancer 2007, 7:55 http://www.biomedcentral.com/1471-2407/7/55
D5/16 B4, Dako, Denmark) and E-cadherin (dilution1:50, clone NCH-38, Dako), polyclonal mouse antibodiesagainst EMP1 (epithelial membrane antigen 1; dilution1:100, clone 2D4-1G9, Abnova), DDR1 (discoidindomain receptor 1; dilution 1:100, Abnova) and DVL1(human homolog of the Drosophila dishevelled gene;dilution 1:100, Abnova) were used. Microwave antigenretrieval was performed in citrate buffer (pH 6.0). Forantigen visualization, the EnVision/HRP system andDAB+ (Dako) were used, slides were subsequently coun-terstained with hematoxylin, dehydrated and mounted inCanadian balsam. Immunohistochemical procedure wasoptimized by testing different antigen retrieval methodsand negative controls. We regarded cells as immunoreac-tive when an obvious membranous or submembranous(E-cadherin, DDR1, EMP1) and cytoplasmic (cytokerat-ins, DVL1) staining was seen. Immunoreactivity wasscored as follows: retained (++) when more than 50% ofmembrane/cytoplasm were strongly positive, reduced (+)when 10–50% of the membrane/cytoplasm were positive,and absent (-) when 0–10% of the membrane/cytoplasmwere positive. Frequencies of positive and negative stain-ing in tumor and normal tissues were compared byFisher's exact test (Statistica 6.0, StatSoft, Prague, CzechRepublic).
Validation by in situ hybridizationAsporin mRNA expression was verified by chromogenic insitu hybridization (CISH) on frozen sections. Fluoresceinlabeled oligonucleotide (5'AAG TTG GTG GTA AGC CTTTAG GAA CTG AGG-FAM) was designed to the junction ofexons five and six of the asporin mRNA (Generi Biotech,Hradec Kralove, Czech Republic). Sections were mountedon Superfrost Plus slides and stored at -80°C until furtherstaining. Before CISH, the sections were heated at 50°Cfor 2 min, and then dried at room temperature for 30 min.Tissues were delipidized in chloroform at room tempera-ture for 5 min and dried to evaporate the chloroform.Block of endogenous peroxidase activity was followed byincubation of tissue sections in 10% paraformaldehydefor 7 min, then washed in PBS for 3 min and in 2× SSC (1×SSC contains 150 mM NaCl, 15 mM sodium citrate; pH7.2) twice for 5 min. The sections were covered with 100μl hybridization buffer (60% formamide, 5× SSC) con-taining 150 ng/ml of probe and incubated in moist cham-ber at 37°C for 22 hours. After the hybridization,unbound probe was washed from the sections at 37°C by2× SSC for 5 min, then three times with 60% formamidein 0.2× SSC at 37°C for 5 min, and twice with 2× SSC atroom temperature for 5 min. Then polyclonal rabbit anti-FITC/HRP (dilution 1:40, Dako) was applied at roomtemperature for 45 min, followed by washing in 2× SSCtwice for 10 min. For visualization, DAB+ (Dako) wasused, slides were subsequently counterstained with hema-toxylin, dehydrated and mounted in Canadian balsam.
Validation by PCRProducts after PCR amplification (see RNA amplification,microarray target synthesis and hybridization) were usedfor verification of CTHRC1, ASPN and COL3A1 geneexpression using gene specific PCR. The primers were asfollows: CTHRC1 forward 5'ACA AGT GCC AAC CCAGAT AGC AAC, reverse 5'ATC GCA CTT CTT CTG TGGAAG GAC (20 cycles of 95°C, 59°C and 72°C 1 min each,product length 79 bp, kindly provided by Dr. DanutaRadzioch, McGill University, Montreal, Canada), ASPNforward 5'GTT CAG CTT GGG AAC TTT GGA ATG TAA,reverse 5'ACT GCA ATA GAT GCT TGT TTC TCT CAA CCC(20 cycles of 95°C, 58.5°C and 72°C 1 min each, productlength 243 bp [modified from [49]], and COL3A1 forward5'TTG TCA ACC AGT GCA AGT GAC CGA C, reverse5'TGG TGA GCA CAG TCA TTG CTC TGC A (20 cycles of95°C, 59°C and 72°C 1 min each, product length 276bp) [50]. PCR products were separated on 10% polyacry-lamide gels, stained with ethidium bromide and capturedusing a gel documentation system (DIANA II with cooledCCD camera, Raytest, Germany). Band intensities,expressed as "OD (optical density) × cm", were assessedby Multi-Analyst densitometric software (Bio-Rad, USA).The results were correlated with fluorescence signals fromthe relevant Affymetrix probe sets by Spearman coefficientusing Statistica 6.0 software (StatSoft, Czech Republic).
ResultsUnsupervised clusteringThe clinical and histopathological characteristics includ-ing lymph node status, tumor grade, expression of estro-gen/progesterone receptors (ER/PgR), c-erbB-B2/HER2/neu and accompanying lesions of ten breast cancerpatients are shown in Table 1. We microdissected normaland tumor cells from these cases which resulted in a totalof 30 samples for gene expression profiling (10 normalductal, 10 normal lobular, 5 tumor ductal and 5 tumorlobular). Unsupervised clustering of all samples was per-formed using all probe sets without filtering. No tumortypes were grouped together but two large clusters wereevident: one mainly consisted of tumor cells and the othercluster mainly of normal cells. This clearly suggests differ-ences in global gene expression profiles of tumor and nor-mal cells (Figure 1).
Genes differentially expressed between normal ductal and lobular cellsIn this comparison 367 probe sets were identified by pair-wise comparison, and 501 probe sets by Rank Products(RP). There were 82 probe sets (78 named genes) identi-fied by both methods. In pairwise comparisons, the differ-entially expressed genes were found by selecting thosewith count of changes more than 6 (out of 10, eitherincrease or decrease). Multiple cytokeratins (5, 7, 14, 15,17) were expressed in both cells, but none of them was
Page 4 of 20(page number not for citation purposes)
BMC Cancer 2007, 7:55 http://www.biomedcentral.com/1471-2407/7/55
useful to separate two cell types. Genes encoding proteinsinvolved in proteolysis and metabolism (USP25,TMPRSS3, ACACB), protein biosynthesis and modifica-tion (PDE4DIP, LOXL1), ion transport (CLCN3, GABRP)and protein kinase cascade (MAP4K5) as well as genes reg-ulating transcription (RFXAP, HSZFP36) were upregu-lated in ductal cells. However, genes regulating cellgrowth, activation and motility (TSPAN5), genes encod-ing actin-binding proteins (EHBP1), small leucine-richproteoglycan (DCN), and proteins with GTPase activity(RHOBTB3, ARHGEF9) were overexpressed in lobularcells (Table 2). Hierarchical clustering of normal cell typesbased on the 82 probe sets found by both RP and pairwisecomparison showed that gene expression profiles of nor-mal ductal and lobular cells from the same patients weresimilar, and they could not be well separated from eachother (Figure 2).
Genes differentially expressed between tumor cell types and normal cellsA comparison of ductal carcinoma cells with normal duc-tal cells identified 1055 probe sets by pairwise analysis,604 probe sets by RP and 326 probe sets by both methods.A comparison of ductal carcinoma cells with normal lob-ular cells identified 792 probe sets by pairwise analysis,347 probe sets by RP and 171 probe sets by both methods.A comparison of lobular carcinoma cells with normalductal cells identified 1022 probe sets by pairwise analy-sis, 350 probe sets by RP and 201 probe sets by bothmethods. A comparison of lobular carcinoma cells withnormal lobular cells identified 983 probe sets by pairwiseanalysis, 344 probe sets by RP and 208 probe sets by bothmethods (see Additional file 1). In pairwise comparisons,the differentially expressed genes were identified by select-ing those with count of changes more than 4 (out of 5,either increase or decrease).
Comparison between lobular carcinoma and normal cellsCombined pairwise analysis and RP have identified 106differentially expressed probe sets (84 named genes) com-mon to lobular carcinoma versus normal ductal and lob-ular cells. Of these probe sets, several genes encodingproteins involved in extracellular matrix (ECM)-tumorinteraction and focal adhesion (COL6A3, COL8A1,CTHRC1, THBS2, COMP) were upregulated, whereasITGA2gene with the same function was downregulated intumor cells. ASPN (asporin) was one of the upregulatedgenes with the highest fold change. It encodes a proteinwith porin activity which belongs to a family of leucine-rich repeat (LRR) proteins associated with the cartilagematrix.
Of the differentially expressed genes involved in Wnt sig-naling, SFRP2 (secreted frizzled-related protein 2) andWISP1 (WNT1 inducible signaling pathway protein 1)were upregulated in lobular carcinomas. Several genesencoding proteins involved in actin, calcium and metalion binding were downregulated (MYBPC1, DST, PIP,CA2), and some genes with the same function (BGN,ADAM12) were upregulated in lobular carcinomas.CDH1 (E-cadherin) was downregulated in lobular tumorsaccompanied by downregulation of ITGA2 (integrin,alpha 2) which it is a ligand of. Several other genes weredifferentially expressed between lobular carcinomas andnormal cells. LYZ/LILRB1 was upregulated in lobular can-cer cells. Other downregulated genes were as follows:CGNL1 is a cellular myosin that appears to play a role incytokinesis, cell shape, and specialized functions such assecretion and capping; EHF encodes a protein thatbelongs to an ETS transcription factor subfamily charac-terized by epithelial-specific expression (ESEs). This pro-tein may be involved in epithelial differentiation andcarcinogenesis; CLIC6 encodes a member of the chloride
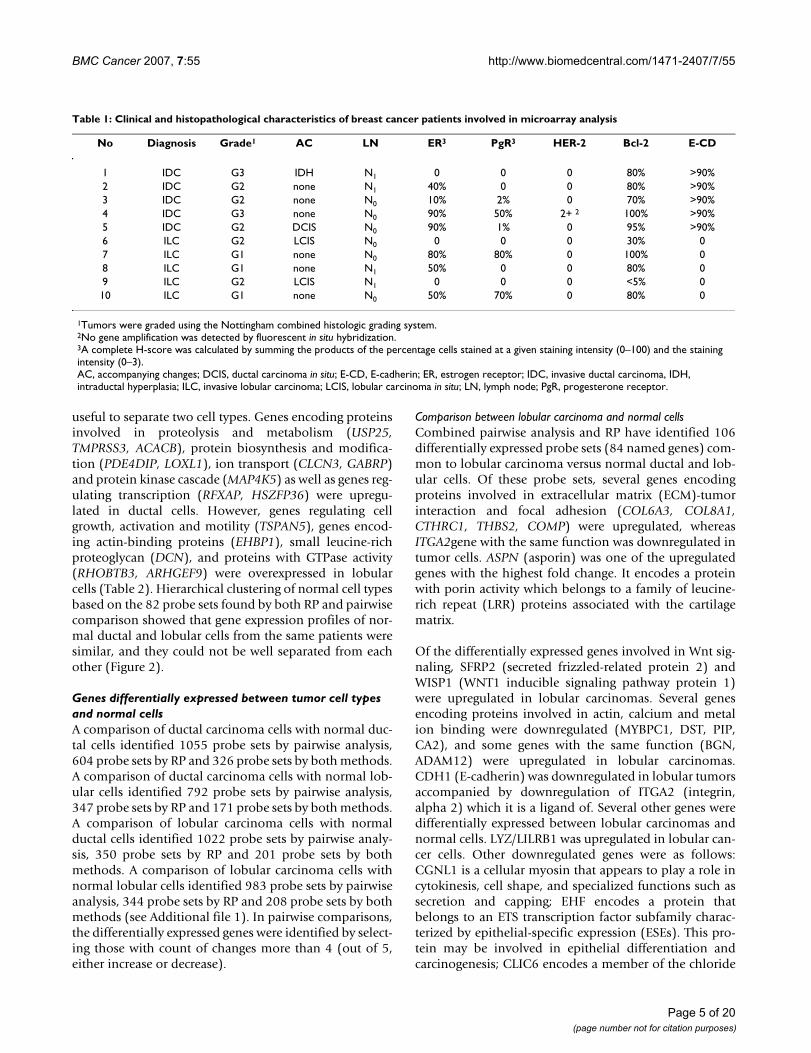
Table 1: Clinical and histopathological characteristics of breast cancer patients involved in microarray analysis
No Diagnosis Grade1 AC LN ER3 PgR3 HER-2 Bcl-2 E-CD
1 IDC G3 IDH N1 0 0 0 80% >90%2 IDC G2 none N1 40% 0 0 80% >90%3 IDC G2 none N0 10% 2% 0 70% >90%4 IDC G3 none N0 90% 50% 2+ 2 100% >90%5 IDC G2 DCIS N0 90% 1% 0 95% >90%6 ILC G2 LCIS N0 0 0 0 30% 07 ILC G1 none N0 80% 80% 0 100% 08 ILC G1 none N1 50% 0 0 80% 09 ILC G2 LCIS N1 0 0 0 <5% 010 ILC G1 none N0 50% 70% 0 80% 0
1Tumors were graded using the Nottingham combined histologic grading system.2No gene amplification was detected by fluorescent in situ hybridization.3A complete H-score was calculated by summing the products of the percentage cells stained at a given staining intensity (0–100) and the staining intensity (0–3).AC, accompanying changes; DCIS, ductal carcinoma in situ; E-CD, E-cadherin; ER, estrogen receptor; IDC, invasive ductal carcinoma, IDH, intraductal hyperplasia; ILC, invasive lobular carcinoma; LCIS, lobular carcinoma in situ; LN, lymph node; PgR, progesterone receptor.
Page 5 of 20(page number not for citation purposes)

BMC Cancer 2007, 7:55 http://www.biomedcentral.com/1471-2407/7/55
intracellular channel family of proteins and is involved inion transport (Table 3).
Comparison between ductal carcinoma and normal cellsCombined pairwise analysis and RP have identified 90differentially expressed probe sets (74 named genes) com-mon to ductal carcinoma versus normal ductal and lobu-lar cells. In particular, transcription regulators (ATF3,PIGR), genes encoding proteins with cytokine and growthfactor activity (PTN, CX3CL1) and genes encoding pro-teins involved in ion transport and metabolism (ATP1A2,MMP7) were downregulated in ductal carcinomas whencompared with normal cells (Table 3).
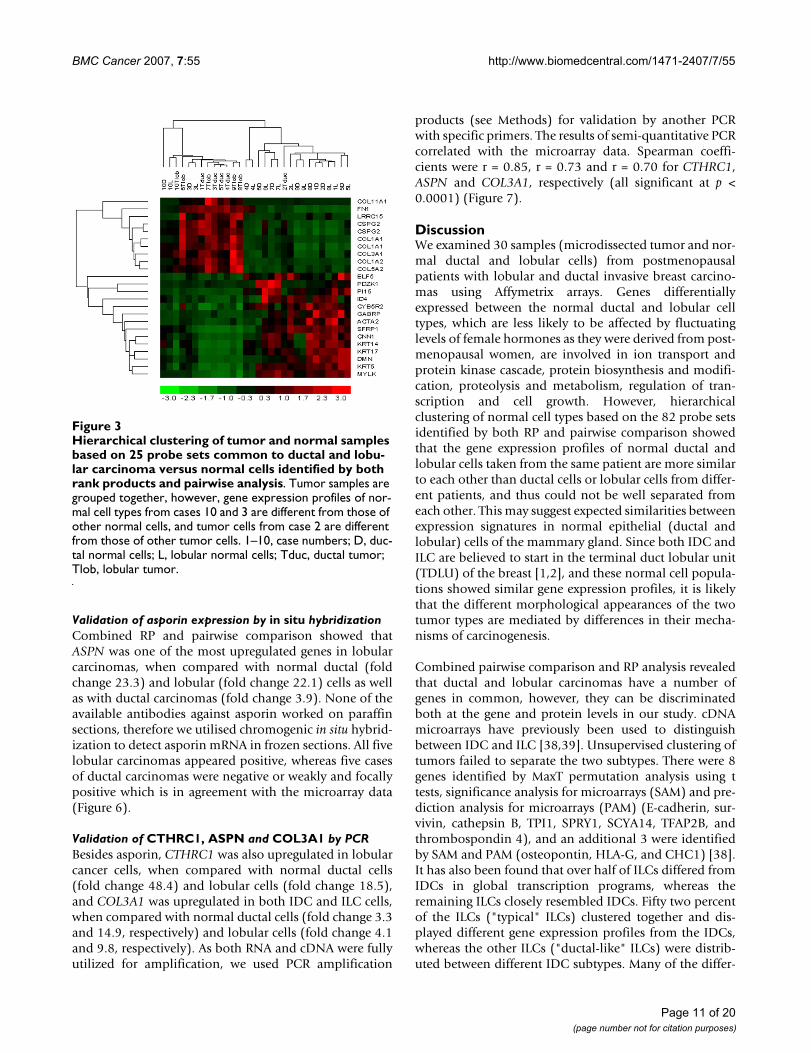
Comparison between both types of tumor cells and normal cellsOf 90 probe sets differentially expressed between ductalcarcinoma and both normal cells, and 106 probe sets dif-ferentially expressed between lobular carcinoma and bothnormal cells, only 25 probe sets were common (Table 3).Hierarchical clustering based on those 25 probe setsshowed that tumor samples were grouped together, how-ever, gene expression profiles of normal cell types fromcases 10 and 3 were different from other normal cells, andtumor cells from case 2 were different from other tumorcells (Figure 3).
Several upregulated genes (collagen type I, III, V, XI,fibronectin 1, versican) were related to tumor- ECM inter-actions and focal adhesion. However, another gene medi-ating focal adhesion, MYLK, was downregulated in tumorcells. This gene encodes a myosin light polypeptide kinasecontaining 1 fibronectin type-III domain. Genes encodingproteins involved in ion and electron transport (CYB5R2,GABRP), and genes encoding proteins with transcriptionfactor and regulator activity (ELF5, ID4) were downregu-lated in both populations of tumor cells. They have alsobeen implicated as regulators of cell proliferation, differ-entiation, and transformation. In addition, genesinvolved in cell differentiation and apoptosis (PDZK1)and genes encoding actin and actin-binding proteins(CNN1, ACTA2) were also downregulated in both types oftumor cells. Wnt signaling molecules were differentiallyexpressed in our samples. Of these, SFRP1 (secreted friz-zled-related protein 1) was downregulated in tumor cells,and genes involved in calcium regulation pathway werenot significantly changed. Structural constituents ofcytoskeleton such as type I (14, 15, 17, 23) and type II (5)keratins were downregulated in tumor cells. Several othergenes were also differentially expressed between tumorand normal cells. PI15 (peptidase inhibitor 15) wasdownregulated, whereas LRRC15 (leucine rich repeat con-taining 15) was upregulated in both tumor cells.
Unsupervised hierarchical clustering of all samples using all probe setsFigure 1Unsupervised hierarchical clustering of all samples using all probe sets. No tumor types are grouped together, however, two large clusters are evident: one (blue) mainly consists of tumor cells and the other (black) mainly consists of normal cells. This suggests differences in global gene expression profiles of tumor and normal cells. 1–10, case numbers; D, ductal normal cells; L, lobular normal cells; Tduc, ductal tumor; Tlob, lobular tumor.
Page 6 of 20(page number not for citation purposes)

BMC Cancer 2007, 7:55 http://www.biomedcentral.com/1471-2407/7/55
Genes differentially expressed between ductal and lobular carcinomasIn this comparison 208 probe sets were identified by pair-wise comparison, 122 probe sets by RP, and 32 probe sets(28 named genes) by both methods (Table 4). In pairwisecomparisons, the differentially expressed genes were iden-tified by selecting those with count of changes more than19 (out of 25 inter-patient comparison, every ductal carci-noma against every lobular carcinoma, either increase ordecrease). These tumors were well separated by hierarchi-cal clustering based on all 325 probe sets identified by RPand/or pairwise analysis (Figure 4). The expression ofgenes encoding proteins involved in cell adhesion waschanged. Although CDH1 (E-cadherin), a classical mem-ber of the cadherin superfamily, was downregulated,THBS4 encoding calcium-binding adhesive glycoprotein,thrombospondin-4, was upregulated in all lobular carci-nomas. DDR1 encoding receptor tyrosine kinase was over-expressed in ductal carcinomas.
The DVL1 gene encoding protein involved in Wnt signal-ing and the leucine-rich repeat protein ASPN (asporin)were upregulated in lobular carcinomas. Ductal carcino-
mas showed upregulated genes which are involved in cellproliferation, signaling and cell cycle regulation, includ-ing RHOU, member of the Rho family of GTPases stimu-lating quiescent cells to reenter the cell cycle; PCSK6encoding a calcium-dependent serine endoprotease;PRKCI encoding calcium-independent and phospholipid-dependent protein kinase C; PPP3CB encoding proteinphosphatase 3; and CKS2 encoding a component of theCDC28 protein kinase. Epithelial membrane protein 1(EMP1) was the only upregulated gene involved in cellgrowth and proliferation in lobular carcinomas. Thesechanges were accompanied by the differential expressionof transcription regulators. Majority of genes with thisfunction were upregulated in ductal carcinomas such asAHCTF1, IRAK1, NRIP1, ADNP. Overexpressed genes inlobular carcinomas were the tumor suppressor FOXP1and another transcription regulator MID1.
The genes encoding proteins involved in ubiquitin-medi-ated proteolysis, such as USP3, RKHD2 and TTC3, andnuclear components, such as DTL, GLCC11, TTC14,FAM54A, HIST1H3B, were upregulated in ductal carcino-mas. Majority of genes encoding proteins with enzyme
Table 2: Genes differentially expressed between normal lobular versus normal ductal cells by both rank products and pairwise analysis
Probe Set1 Gene Symbol Gene Title Rank products Pairwise comparison
Fold-change Incr/Decr
Regulation of transcription229431_at RFXAP↓ Regulatory factor X-associated protein -3.1 1/6229732_at HSZFP36↓ ZFP-36 for a zinc finger protein -3.0 0/6207117_at H-plk↑ Krueppel-related zinc finger protein 2.4 6/1Protein biosynthesis and modification214130_s_at PDE4DIP↓ Phosphodiesterase 4D interacting protein (myomegalin) -3.2 1/6232752_at --- (LOXL1) ↓ CDNA FLJ10302 fis, clone NT2RM2000042 (lysyl oxidase-like 1) -1.4 1/6Proteolysis and metabolism49452_at ACACB↓ Acetyl-Coenzyme A carboxylase beta -18 0/8220419_s_at USP25↓ Ubiquitin specific peptidase 25 -2.9 1/6220177_s_at TMPRSS3↓ Transmembrane protease, serine 3 -2.8 1/6Ion transport201735_s_at CLCN3↓ Chloride channel 3 -2.8 2/6205044_at GABRP↓ Gamma-aminobutyric acid (GABA) A receptor, pi -1.8 1/6Actin binding212650_at EHBP1↑ EH domain binding protein 1 2.6 6/0GTPase activity202975_s_at RHOBTB3↑ Rho-related BTB domain containing 3 2.5 7/1203264_s_at ARHGEF9↑ Cdc42 guanine nucleotide exchange factor (GEF) 9 2.6 6/0Regulation of cell development, activation, growth and motility209890_at TSPAN5↑ Tetraspanin 5 2.6 7/0Small leucine-rich proteoglycan (slrp) family211896_s_at DCN↑ Decorin 2.0 7/1Protein kinase cascade211081_s_at MAP4K5↓ Mitogen-activated protein kinase kinase kinase kinase 5 -2.3 1/7Other206157_at PTX3↓ Pentraxin-related gene, rapidly induced by IL-1 beta -2.8 2/7218431_at C14orf133↓ Chromosome 14 open reading frame 133 -2.7 0/7218514_at FLJ10587↓ Hypothetical protein FLJ10587 -2.6 1/7226760_at LOC203411↑ Hypothetical protein LOC203411 3.0 6/2
↑ – upregulated in normal lobular cells; ↓ – downregulated in normal lobular cells1Affymetrix probe set number; If there was more than one probe set for the particular gene found among top 20 changed genes (according to the fold change), the probe set with the highest fold change is used and number of other probe set is indicated.
Page 7 of 20(page number not for citation purposes)

BMC Cancer 2007, 7:55 http://www.biomedcentral.com/1471-2407/7/55
activity or implicated in metabolism were also upregu-lated in ductal carcinomas (STK4, SLC1A2, B3GALT3,OSBPL10, CRBN, CHML, YWHAB).
Two lobular and three ductal carcinomas were estrogenreceptor-negative, whereas three lobular and two ductalcarcinomas were estrogen receptor-positive. Hierarchicalclustering using all probe sets was performed to determinewhether receptor-positive and receptor-negative tumorscould be separated. The tumors of the same histologicaltype showed similar gene expression profiles without dif-ferences in relation to ER status as well as to other clinicalparameters such as nodal status, stage and the expressionof other immunohistochemical markers (data notshown).
Validation by immunohistochemistry on tissue microarraysSeven differentially expressed genes (KRT5, KRT6 andKRT17 between tumor and normal cells, CDH1, EMP1,DDR1 and DVL1 between lobular and ductal carcinomas)were verified by immunohistochemical detection of pro-teins on TMA slides comprising of cores from 119 cases.The clinical and histopathological characteristics of thesepatients are shown in Table 5. The reduced expression orabsence of cytokeratins 5/6 and 17 (KRT5, KRT6, KRT17)was found in both tumor tissues in comparison to termi-nal duct lobular units in 22 normal mammary tissues (p <0.0001) (Table 6 and Figure 5). In a majority of ducts andlobules including TDLU, these cytokeratins wereexpressed in both basal and luminal cells, verifying thepreviously described variability of the expression of basalcytokeratins and their relationship to the cellular origin[51]. Cytokeratin 5 and 17 have also been found in a sub-set of breast cancer and identified patients with poor clin-ical outcome [31].
E-cadherin (CDH1) has successfully separated ductal andlobular invasive carcinomas. It was absent in 93.3% oflobular tumors compared with only 15% of ductal tumors(p < 0.0001). Epithelial membrane protein 1 (EMP1), dis-coidin domain receptor 1 (DDR1) and human homologof the Drosophila dishevelled gene (DVL1) were found bypairwise comparison analysis to be differentiallyexpressed between lobular and ductal carcinomas. Immu-nohistochemistry confirmed higher expression of DVL1and EMP1 in lobular carcinomas and of DDR1 in ductalcarcinomas (p < 0.0001) (Table 7 and Figure 5). Of thespecial type carcinomas included on TMA slides, a papil-lary and two medullary carcinomas were positive for basalcytokeratins, one out of three medullary carcinomas waspositive for EMP1 and E-cadherin, a ductal-lobular carci-noma was positive for DDR1, all other special type carci-nomas were negative for these markers, and finally nonewere positive for DVL1 (data not shown).
Hierarchical clustering of normal ductal and lobular cells based on 82 probe sets found by both rank products and pairwise analysisFigure 2Hierarchical clustering of normal ductal and lobular cells based on 82 probe sets found by both rank prod-ucts and pairwise analysis. Ductal and lobular cells from the same patients tend to cluster together, and they can not be well separated from each other. This suggests expected similarities of expression signatures in normal epithelial (duc-tal and lobular) cells of mammary gland tree. 1–10, case num-bers; D, ductal normal cells; L, lobular normal cells.
Page 8 of 20(page number not for citation purposes)

BMC Cancer 2007, 7:55 http://www.biomedcentral.com/1471-2407/7/55
Table 3: Genes differentially expressed between tumor versus normal cells by both rank products and pairwise analysis
Probe Set1 Gene Symbol Gene Title Fold-change
Tduc Tlob
Lobular carcinoma vs normal cells(↑ – upregulated in Tlob, ↓ – downregulated in Tlob)
L D L D
Extracellular matrix-receptor interaction and focal adhesion (epithelial-mesenchymal transition)
227314_at ITGA2↓ Integrin, alpha 2 n n -4.7 -6.2
201438_at COL6A3↑ Collagen, type VI, alpha 3 n n 4.5 7.7
203083_at THBS2↑ Thrombospondin 2 n n 6.5 6.5
205713_s_at COMP↑ Cartilage oligomeric matrix protein n n 6.7 8.1
226237_at COL8A1↑ Collagen, type VIII, alpha 1 n n 8.4 5.9
225681_at CTHRC1↑ Collagen triple helix repeat containing 1 n n 18.5 48.4
219087_at ASPN↑ Asporin n n 23.3 22.1
WNT signalling
223121_s_at 223122_s_at SFRP2↑ Secreted frizzled-related protein 2 n n 5.8 3.9 7.4 7.1
229802_at WISP1↑ WNT1 inducible signaling pathway protein 1 n n 9.1 12.4
Actin, calcium and metal ion binding
204455_at DST↓ Dystonin n n -22.2 -18.3
214087_s_at MYBPC1↓ Myosin binding protein C, slow type n n -10.1 -12.2
209301_at CA2↓ Carbonic anhydrase II n n -9.2 -8.7
206509_at PIP↓ Prolactin-induced protein n n -7.0 -6.3
201131_s_at CDH1↓ Cadherin 1, type 1, E-cadherin n n -6.2 -7.2
226777_at ADAM12↑ ADAM metallopeptidase domain 12 n n 5.7 5.3
213905_x_at BGN/SDCCAG33↑ Biglycan/serologically defined colon cancer antigen 33 n n 8.3 7.2
Other
227742_at CLIC6↓ Chloride intracellular channel 6 n n -9.3 -8.2
225817_at CGNL1↓ Cingulin-like 1 n n -5.9 -7.8
219850_s_at EHF↓ Ets homologous factor n n -4.1 -6.3
213975_s_at LYZ/ILRB1↑ Lysozyme n n 10.8 7.3
Ductal carcinoma vs normal cells(↓ – upregulated in Tduc, ↓ – downregulated in Tduc)
Regulation of transcription
202672_s_at ATF3↓ Activating transcription factor 3 -4.5 -7.7 n n
226147_s_at PIGR↓ Polymeric immunoglobulin receptor -4.8 -10 n n
Cytokine and growth factor activity
209466_x_at 211737_x_at PTN↓ Pleiotrophin -5.8 -7.1 -8.3 -12.5 n n
823_at CX3CL1↓ Chemokine (C-X3-C motif) ligand 1 -3.6 -8.3 n n
Ion transport and metabolism
203296_s_at ATP1A2↓ ATPase, Na+/K+ transporting, alpha 2 -8.2 -9.6 n n
204259_at MMP7↓ Matrix metallopeptidase 7 -4.5 -7.2 n n
Page 9 of 20(page number not for citation purposes)

BMC Cancer 2007, 7:55 http://www.biomedcentral.com/1471-2407/7/55
212353_at SULF1↓ Sulfatase 1 4.6 4.0 n n
Other
1553602_at LOC118430↓ Small breast epithelial mucin -7.1 -10.4 n n
223623_at ECRG4↓ Esophageal cancer related gene 4 protein -6.6 -5.6 n n
206548_at FLJ23556↓ Hypothetical protein FLJ23556 -6.3 -11.2 n n
218585_s_at DTL↑ Denticleless homolog (Drosophila) 3.6 4.8 n n
Tumor vs normal cells(↑ – upregulated in tumor, ↓ – downregulated in tumor)
Extracellular matrix-receptor interaction and focal adhesion (epithelial-mesenchymal transition)
224823_at MYLK↓ Myosin, light polypeptide kinase -3.5 -3.4 -5.9 -5.4
204620_s_at 221731_x_at CSPG2↑ Chondroitin sulfate proteoglycan 2 (versican) 3.0 3.5 4.9 5.3 4.5 4.0 5.8 6.1
221729_at COL5A2↑ Collagen, type V, alpha 2 3.5 4.4 9.3 11.3
211161_s_at COL3A1↑ Collagen, type III, alpha 1 4.1 3.3 9.8 14.9
212464_s_at FN1↑ Fibronectin 1 5.2 5.0 8.0 10.5
202311_s_at 202310_s_at COL1A1↑ Collagen, type I, alpha 1 5.6 5.1 6.0 5.1 12.7 10.4 13.0 10.8
37892_at COL11A1↑ Collagen, type XI, alpha 1 6.7 7.8 6.6 5.9
202404_s_at COL1A2↑ Collagen, type I, alpha 2 6.8 10.1 30.5 18.3
Ion and electron transport
205044_at GABRP↓ Gamma-aminobutyric acid (GABA) A receptor, pi -4.2 -8.7 -6.2 -8.6
220230_s_at CYB5R2↓ Cytochrome b5 reductase 2 -3.6 -3.8 -4.3 -4.2
Regulation of transcription
220625_s_at ELF5↓ E74-like factor 5 (ets domain transcription factor) -4.0 -4.8 -5.9 -8.4
209292_at ID4↓ Inhibitor of DNA binding 4 -2.9 -5.1 -10.8 -4.5
Actin and actin-binding proteins
203951_at CNN1↓ Calponin 1, basic, smooth muscle -6.7 -6.6 -6.9 -7.3
243140_at ACTA2↓ Actin, alpha 2, smooth muscle, aorta -4.0 -4.1 -8.7 -4.0
WNT signaling
202037_s_at SFRP1↓ Secreted frizzled-related protein 1 -7.1 -8.8 -8.5 -7.3
Intermediate filament proteins
209351_at KRT14↓ Keratin 14 -22.9 -31.0 -21.9 -24.0
205157_s_at KRT17↓ Keratin 17 -17.7 -21.4 -9.9 -12.6
212730_at DMN↓ Desmuslin -10.0 -10.4 -7.2 -7.5
201820_at KRT5↓ Keratin 5 -8.9 -12.7 -11.3 -12.1
Other
229947_at PI15↓ Peptidase inhibitor 15 -6.5 -7.5 -18.5 -15.0
205380_at PDZK1↓ PDZ domain containing 1 -4.5 -5.8 -4.2 -6.4
213909_at LRRC15↑ Leucine rich repeat containing 15 6.2 5.7 7.3 11.8
Tduc – ductal tumor; Tlob – lobular tumor; D – normal ductal cells; L – normal lobular cells; n – not differentially expressed among top 20 genes.1Affymetrix probe set number; If there was more than one probe set for the particular gene found among top 20 changed genes (according to the fold change), the probe set with the highest fold change is used and number of other probe set is indicated.
Table 3: Genes differentially expressed between tumor versus normal cells by both rank products and pairwise analysis (Continued)
Page 10 of 20(page number not for citation purposes)
BMC Cancer 2007, 7:55 http://www.biomedcentral.com/1471-2407/7/55
Validation of asporin expression by in situ hybridizationCombined RP and pairwise comparison showed thatASPN was one of the most upregulated genes in lobularcarcinomas, when compared with normal ductal (foldchange 23.3) and lobular (fold change 22.1) cells as wellas with ductal carcinomas (fold change 3.9). None of theavailable antibodies against asporin worked on paraffinsections, therefore we utilised chromogenic in situ hybrid-ization to detect asporin mRNA in frozen sections. All fivelobular carcinomas appeared positive, whereas five casesof ductal carcinomas were negative or weakly and focallypositive which is in agreement with the microarray data(Figure 6).
Validation of CTHRC1, ASPN and COL3A1 by PCRBesides asporin, CTHRC1 was also upregulated in lobularcancer cells, when compared with normal ductal cells(fold change 48.4) and lobular cells (fold change 18.5),and COL3A1 was upregulated in both IDC and ILC cells,when compared with normal ductal cells (fold change 3.3and 14.9, respectively) and lobular cells (fold change 4.1and 9.8, respectively). As both RNA and cDNA were fullyutilized for amplification, we used PCR amplification
products (see Methods) for validation by another PCRwith specific primers. The results of semi-quantitative PCRcorrelated with the microarray data. Spearman coeffi-cients were r = 0.85, r = 0.73 and r = 0.70 for CTHRC1,ASPN and COL3A1, respectively (all significant at p <0.0001) (Figure 7).
DiscussionWe examined 30 samples (microdissected tumor and nor-mal ductal and lobular cells) from postmenopausalpatients with lobular and ductal invasive breast carcino-mas using Affymetrix arrays. Genes differentiallyexpressed between the normal ductal and lobular celltypes, which are less likely to be affected by fluctuatinglevels of female hormones as they were derived from post-menopausal women, are involved in ion transport andprotein kinase cascade, protein biosynthesis and modifi-cation, proteolysis and metabolism, regulation of tran-scription and cell growth. However, hierarchicalclustering of normal cell types based on the 82 probe setsidentified by both RP and pairwise comparison showedthat the gene expression profiles of normal ductal andlobular cells taken from the same patient are more similarto each other than ductal cells or lobular cells from differ-ent patients, and thus could not be well separated fromeach other. This may suggest expected similarities betweenexpression signatures in normal epithelial (ductal andlobular) cells of the mammary gland. Since both IDC andILC are believed to start in the terminal duct lobular unit(TDLU) of the breast [1,2], and these normal cell popula-tions showed similar gene expression profiles, it is likelythat the different morphological appearances of the twotumor types are mediated by differences in their mecha-nisms of carcinogenesis.
Combined pairwise comparison and RP analysis revealedthat ductal and lobular carcinomas have a number ofgenes in common, however, they can be discriminatedboth at the gene and protein levels in our study. cDNAmicroarrays have previously been used to distinguishbetween IDC and ILC [38,39]. Unsupervised clustering oftumors failed to separate the two subtypes. There were 8genes identified by MaxT permutation analysis using ttests, significance analysis for microarrays (SAM) and pre-diction analysis for microarrays (PAM) (E-cadherin, sur-vivin, cathepsin B, TPI1, SPRY1, SCYA14, TFAP2B, andthrombospondin 4), and an additional 3 were identifiedby SAM and PAM (osteopontin, HLA-G, and CHC1) [38].It has also been found that over half of ILCs differed fromIDCs in global transcription programs, whereas theremaining ILCs closely resembled IDCs. Fifty two percentof the ILCs ("typical" ILCs) clustered together and dis-played different gene expression profiles from the IDCs,whereas the other ILCs ("ductal-like" ILCs) were distrib-uted between different IDC subtypes. Many of the differ-
Hierarchical clustering of tumor and normal samples based on 25 probe sets common to ductal and lobular carcinoma versus normal cells identified by both rank products and pair-wise analysisFigure 3Hierarchical clustering of tumor and normal samples based on 25 probe sets common to ductal and lobu-lar carcinoma versus normal cells identified by both rank products and pairwise analysis. Tumor samples are grouped together, however, gene expression profiles of nor-mal cell types from cases 10 and 3 are different from those of other normal cells, and tumor cells from case 2 are different from those of other tumor cells. 1–10, case numbers; D, duc-tal normal cells; L, lobular normal cells; Tduc, ductal tumor; Tlob, lobular tumor.
Page 11 of 20(page number not for citation purposes)

BMC Cancer 2007, 7:55 http://www.biomedcentral.com/1471-2407/7/55
Page 12 of 20(page number not for citation purposes)
Table 4: Genes differentially expressed in lobular versus ductal invasive carcinomas by rank products and/or pairwise analysis
Probe Set1 Gene Symbol Gene Title Rank products Pairwise comparison
Fold-change Incr/Decr
Cell adhesion201131_s_at CDH1↓ Cadherin 1, type 1, E-cadherin (epithelial) -6.0 3/19207169_x_a DDR1↓ Discoidin domain receptor family, member 1 n 5/19204776_at THBS4↑ Thrombospondin 4 n 19/2219087_at ASPN↑ Asporin (LRR class 1) 3.9 23/0Wnt signalling223168_at RHOU↓ RAS homolog gene family, member U n 2/20203230_at DVL1↑ Dishevelled, dsh homolog 1 (Drosophila) n 20/0Protein ubiquitination215392_at USP3↓ Ubiquitin specific peptidase 3 -5.0 1/21218247_s_at RKHD2↓ Ring finger and KH domain containing 2 -4.6 0/191569472_s_at TTC3↓ Tetratricopeptide repeat domain 3 -4.5 0/23Regulation of transcription226115_at AHCTF1↓ AT hook containing transcription factor 1 -4.0 0/22201587_s_at IRAK1↓ Interleukin-1 receptor-associated kinase 1 n 2/19202599_s_at NRIP1↓ Nuclear receptor interacting protein 1 n 0/19201773_at ADNP↓ Activity-dependent neuroprotector n 0/20203637_s_at MID1↑ Midline 1 (Opitz/BBB syndrome) 4.0 20/0235444_at FOXP1↑ Forkhead box P1 n 19/4Electron and protein transport204351_at S100P↓ S100 calcium binding protein P -5.3 0/19225177_at RAB11FIP1↓ RAB11 family interacting protein 1 (class I) -3.5 2/21204041_at MAOB↑ Monoamine oxidase B 3.5 20/4212902_at SEC24A↑ SEC24 related gene family, member A 3.5 19/2Cell cycle regulation, cell proliferation and signaling204170_s_at CKS2↓ CDC28 protein kinase regulatory subunit 2 -4.8 2/20207414_s_at PCSK6↓ Proprotein convertase subtilisin/kexin type 6 n 4/19209678_s_at PRKCI↓ Protein kinase C, iota n 0/22209817_at PPP3CB↓ Protein phosphatase 3, catalytic subunit, beta isoform (calcineurin A beta) n 0/24201324_at EMP1↑ Epithelial membrane protein 1 n 21/0Metabolism and enzyme activity205509_at CPB1↓ Carboxypeptidase B1 (tissue) -11.1 0/19223746_at STK4↓ Serine/threonine kinase 4 -4.5 2/20225491_at SLC1A2↓ Solute carrier family 1 (glial high affinity glutamate transporter), member 2 -4.1 0/20211379_x_at B3GALT3↓ UDP-Gal:betaGlcNAc beta 1,3-galactosyltransferase, polypeptide 3 -4.0 0/20219073_s_at OSBPL10↓ Oxysterol binding protein-like 10 -4.0 1/21229366_at CRBN↓ Cereblon -3.6 0/20226350_at CHML↓ Choroideremia-like (Rab escort protein 2) n 0/24217717_s_at YWHAB↓ Tyrosine 3-monooxygenase/tryptophan 5-mono-oxygenase activation protein, beta polypeptide n 1/2049452_at ACACB↑ Acetyl-Coenzyme A carboxylase beta n 19/0220770_s_at LOC63920↑ Transposon-derived Buster3 transposase-like 5.3 24/0Actin and cytoskeletal protein binding211776_s_at EPB41L3↓ Erythrocyte membrane protein band 4.1-like 3 -5.3 0/21201341_at ENC1↓ Ectodermal-neural cortex (with BTB-like domain) n 19/3Nuclear components218585_s_at DTL↓ Denticleless homolog (Drosophila) -4.6 1/19225706_at GLCCI1↓ Glucocorticoid induced transcript 1 -4.5 0/25241863_x_at TTC14↓ Tetratricopeptide repeat domain 14 -4.4 1/20228069_at FAM54A↓ Family with sequence similarity 54, member A -3.8 0/20208576_s_at HIST1H3B↓ Histone 1, H3b -3.3 1/19Other1568838_at --- ↓ Full-length cDNA clone CS0DF033YE17 of Fetal brain of Homo sapiens (human) -5.0 1/20226067_at C20orf114↓ Chromosome 20 open reading frame 114 -4.9 0/191553979_at --- ↓ Homo sapiens, clone IMAGE:3906992, mRNA -4.1 0/19230534_at MGC15634↓ Hypothetical protein MGC15634 -3.6 2/20226671_at --- ↓ CDNA clone IMAGE:4797120 -3.8 2/20219768_at VTCN1↑ V-set domain containing T cell activation inhibitor 1 7.8 21/2214657_s_at TncRNA↑ Trophoblast-derived noncoding RNA 4.5 21/0213004_at ANGPTL2↑ Angiopoietin-like 2 n 19/4
↑ – upregulated in lobular carcinoma; ↓ – downregulated in lobular carcinoma; n – gene not found by rank products at the level of 10% of false positives, Incr/decr – increase or decrease in lobular versus ductal carcinoma by pairwise comparison.1All 32 probe sets identified by combined pairwise comparison and rank products are included, also a number of genes found by pairwise comparison were validated by immunohistochemistry (DVL1, DDR1, EMP1), therefore, functional categories also include named genes identified by pairwise analysis.

BMC Cancer 2007, 7:55 http://www.biomedcentral.com/1471-2407/7/55
entially expressed genes encode for proteins involved incell adhesion/motility, lipid/fatty acid transport andmetabolism, immune/defense response, and electrontransport. Many genes distinguishing between typical andductal-like ILCs are involved in regulation of cell growthand immune response [39]. However, these two previousstudies examined whole tumor tissues without microdis-section, suggesting that expression of a number of genescould be related not only to tumor cells but also to othercomponents of mammary tissue such as stromal, adipose,endothelial etc. Our study is the first full genome analysis
of microdissected ductal and lobular tumor and normalcells reporting both normal mammary epithelium- andcancer-specific genes expression profiles.
Importantly, CDH1 (E-cadherin gene) was downregulatedin our lobular carcinomas, and immunohistochemistryconfirmed this loss at the protein level within tumors. E-cadherin is considered to be the most important cell adhe-sion molecule in the mammary gland. It acts as a tumorsuppressor inhibiting invasion and metastasis. Mutationsof this gene are correlated with gastric, breast, colorectal,thyroid and ovarian cancer. During tumor progression, E-cadherin can be functionally inactivated or silenced bydifferent mechanisms such as post-translational control,somatic mutations, downregulation of gene expressionthrough promoter hypermethylation, histone deacetyla-tion, and transcriptional repression [52,53]. The latterinduces cellular responses leading to the conversion ofepithelial cells into invasive mesenchymal-like cells withincreased motility and invasiveness, and this process iscalled an epithelial-mesenchymal transition (EMT) [52].To date, it is believed that lost, non-polar or cytoplasmicexpression of E-cadherin protein and/or transcriptionalrepression of its mRNA are hallmarks of EMT in cancerprogression [53-55]. It has also been shown that severalproteins such as fibronectin and integrin αvβ6 [54], Ets,TGFβ, FGF-1,-2,-8, α-SMA, collagen type I, III and throm-bospondins increase in abundance during EMT [56], con-versely, amongst proteins that decrease in abundance areE-cadherin and cytokeratins [54]. According to our results,collagen type I and III, fibronectin and Ets domain tran-scription factor are upregulated and cytokeratins aredownregulated in both tumor cell types. The expression ofcollagens and other mesenchyme-associated genes inmicrodissected breast cancer cells was also confirmed byNishidate and co-workers [57]. In addition, pairwise com-parisons revealed that thrombospondin 4 was upregu-lated only in lobular cancer cells, which agrees with theliterature [38]. Thus we propose that the EMT plays a rolein both tumor types but appears to be more important inlobular carcinomas. The EMT phenomenon seems to bepromising because multiple molecules involved in EMT,such as receptor- and SRC-family tyrosine kinases, RASand other small GTPases, can be envisioned as targets foranti-EMT therapy [58].
The tissue microenvironment, including the ECM-cell andcell-cell interactions, plays an important role in both nor-mal mammary gland development and cancer. Neoplastictransformation of cells dramatically alters the synthesis ofproteoglycans and other ECM proteins both in tumor andthe surrounding matrix [59]. This can stimulate thegrowth and spread of tumor cells by decreasing the adhe-sive functions of the ECM [60]. Both tumor types exam-ined show upregulated genes involved in tumor-ECM
Hierarchical clustering of invasive ductal and lobular breast carcinomas based on 325 probe sets identified by rank prod-ucts and/or pairwise analysisFigure 4Hierarchical clustering of invasive ductal and lobular breast carcinomas based on 325 probe sets identified by rank products and/or pairwise analysis. Tumor types are well separated. 1–10, case numbers; Tduc, ductal tumor; Tlob, lobular tumor.
Page 13 of 20(page number not for citation purposes)

BMC Cancer 2007, 7:55 http://www.biomedcentral.com/1471-2407/7/55
interactions, cell adhesion and migration processesincluding metastasis. Expression of majority of the pro-teins encoded by these genes is related to TGFβ or Wnt sig-naling, and both the TGFβ and Wnt pathways may affectECM.
Asporin is a cartilage extracellular protein that has beenreported to be associated with knee and hip osteoarthritis.This leucine-rich repeat protein was shown to interactwith and inhibit TGFβ signaling which is thought to leadto insufficient quantities of aggrecan and type II collagenin osteoarthritis [61,62]. Asporin was more upregulated inour lobular carcinomas when compared with ductaltumors as well as with normal cell types. Overexpressionof asporin mRNA in lobular carcinomas was then con-firmed by chromogenic in situ hybridization and PCR. Insupport of our findings, upregulation of this gene has alsobeen described in microdissected androgen-independentprostate cancer cells using Affymetrix Human GenomeU133A GeneChips [63]. The authors did not discuss itand importantly, asporin has not been related to carcino-genesis to date.
We have found another candidate gene, collagen triplehelix repeat containing 1 (CTHRC1), which was upregu-lated in ILC in comparison with normal cells, and itsexpression was also validated by PCR. Aberrant expressionof CTHRC1 has recently been reported in human solidtumors, including cancers of the gastrointestinal tract,
lung, breast, thyroid, ovarian, cervix, liver, and the pan-creas. It is associated with cancer tissue invasion andmetastasis and potentially plays important functionalroles in cancer progression, perhaps by increasing cancercell migration [64]. TGFβ upregulates CTHRC1, versican,ADAM12, and downregulates SFRP1 and E-cadherin [65-67]. The loss of SFRP1 is known to be associated withbreast cancer progression and poor prognosis in earlystages [68], and a similar expression profile is seen in ourstudy. SFRP1 is downregulated and versican is upregu-lated in both tumor types. Furthermore, pairwise compar-ison identified other overexpressed genes in lobularcarcinoma such as SFRP2 and ADAM12. E-cadherin,which is downregulated in lobular cancer cells, can also berepressed by TGFβ-induced expression of transcriptionfactor complexes [69]. TGFβ signaling inhibitors havebeen shown to prevent EMT, to inhibit mammary tumorviability and to block metastasis in various murine mod-els [70]. According to these results, we propose that dereg-ulated TGFβ signaling is likely to be more important inlobular carcinogenesis.
Wnt signaling molecules are also expressed in our samplesin several comparisons. The Wnt proteins are smallsecreted glycoproteins which are involved in the self-renewal of stem cells and may be responsible for themaintenance of mature tissues [71]. On binding to Friz-zled receptors, Wnts can activate canonical (β-catenin-dependent) and/or non-canonical (β-catenin-independ-
Table 6: Immunohistochemical staining of cytokeratins in tumor and normal tissues
Antibodies Tumors Normal tissues (n = 22) Fisher's p value
Cytokeratin 5/6 Ductal carcinomas (n = 80) 9 (11.2%) 22 (100%) <0.0001Lobular carcinomas (n = 29) 3 (10.3%) <0.0001
Cytokeratin 17 Ductal carcinomas (n = 80) 8 (10%) 22 (100%) <0.0001Lobular carcinomas (n = 29) 2 (6.9%) <0.0001
Table 5: Clinical and histopathological characteristics of TMA cases
Features IDC ILC
G1 6 (7.5%) 15 (51.7%)G2 57 (71.3%) 11 (37.9%)G3 17 (21.2%) 3 (10.3%)ER+ 57 (71.3%) 19 (65.5%)PgR+ 50 (62.5%) 17 (58.6%)
HER-2+ 12 (15%) 1 (3.4%)Bcl-2+ 13 (16.3%) 4 (13.8%)
N0 56 (70%) 21 (72.4%)N1 16 (20%) 6 (20.7%)N2 8 (10%) 2 (6.9%)
Total number of cases 80 29
ER, estrogen receptor; G1-3, grade 1–3; IDC, invasive ductal carcinoma; ILC, invasive lobular carcinoma; N0–1, lymph node status; PgR, progesterone receptor; TMA, tissue microarray.
Page 14 of 20(page number not for citation purposes)

BMC Cancer 2007, 7:55 http://www.biomedcentral.com/1471-2407/7/55
ent Wnt/planar cell polarity pathway and Wnt/Ca2+ path-way) Wnt signaling [72,73]. Downregulation of frizzledrelated proteins has been described in breast cancer [68].Of these, SFRP1 is downregulated in both types of ourtumor cells, and genes involved in calcium regulation
pathway are not significantly changed. The promoter offibronectin 1 contains LEF/TCR-binding sites, making it adirect target of canonical Wnt signaling [59,74]. Fibronec-tin 1 is also upregulated in both tumor types. However,there is a difference in Wnt signaling between ILC and
Representative immunohistochemical staining for the selected proteins: E-cadherin, DDR1, DVL1, cytokeratin 5/6, cytokeratin 17 and EMP1Figure 5Representative immunohistochemical staining for the selected proteins: E-cadherin, DDR1, DVL1, cytokeratin 5/6, cytokeratin 17 and EMP1. 1.1. E-cadherin is negative in lobular carcinoma; 1.2. E-cadherin is positive in ductal carci-noma; 2.1. DDR1 is negative in lobular carcinoma; 2.2. DDR1 is positive in ductal carcinoma; 3.1. DVL1 is positive in lobular carcinoma; 3.2. DVL1 is negative in ductal carcinoma; 4.1. Cytokeratin 5/6 is negative in lobular carcinoma cells, but its expres-sion is retained in normal ductal epithelial cells; 4.2. Cytokeratin 5/6 is negative in ductal carcinoma cells; 4.3. Duct lobular unit in normal mammary gland tissue is positive for cytokeratin 5/6; 5.1. Cytokeratin 17 is negative in lobular carcinoma cells, but its expression is retained in normal ductal epithelial cells; 5.2. Cytokeratin 17 is negative in ductal carcinoma cells, but its expres-sion is retained in normal ductal epithelial cells; 5.3. Duct lobular unit in normal mammary gland tissue is positive for cytokera-tin 17; 6.1. EMP1 is positive in lobular carcinoma; 6.2. EMP1 is negative in ductal carcinoma.
Table 7: Immunohistochemistry differentiates ductal and lobular carcinomas
Antibodies Ductal carcinomas (n = 80) Lobular carcinomas (n = 29) Fisher's p value
E-cadherin 68 (85%) 2 (6.7%) <0.0001DVL1 20 (25%) 28 (96.5%) <0.0001EMP1 13 (16.3%) 27 (93.1%) <0.0001DDR1 77 (96.2%) 4 (13.8%) <0.0001
Page 15 of 20(page number not for citation purposes)

BMC Cancer 2007, 7:55 http://www.biomedcentral.com/1471-2407/7/55
IDC. SULF1 (sulfatase 1) is upregulated and MMP7 isdownregulated only in IDCs. MMP7 is a confirmed Wnttarget [75] and it has been shown to be activated in bothcanonical [76,77] and non-canonical Wnt signaling [78].Binding Wnt ligands to frizzled receptors is regulated bythe 6-O sulfation-desulfation of cell surface heparan sul-fates (HSs) by sulfatase 1. Sulfated HSs bind to Wnt ligandwith high affinity and inhibit Wnt signaling. Sulfatase 1removes 0–6 sulfates from HSs and reduces their bindingto Wnt ligands which in turn allows the formation offunctional Wnt-Frizzled complexes and thus promotesWnt signaling [79,80]. Frizzled-related proteins also haveheparin-binding domains that promote the formation ofWnt-Frizzled complexes [81]. Although SULF1 is upregu-lated, SFRP1 and MMP7 are downregulated in ductal can-cer cells, whereas SFRP2 and other Wnt molecules, such asDVL1 and WISP1, are upregulated in lobular cancer cells.This suggests that Wnt signaling is activated in ILC cellsbut not in IDC cells. Since mRNA level of β-catenin wasnot changed between normal and tumor cells, the expres-sion of Wnt molecules appears to be β-catenin-independ-ent, favoring the non-canonical Wnt signaling in ILC.There is evidence that Wnts acting through the non-canonical pathway can promote tumor progression[82,83] which may also be true in ILC.
In addition to Wnt molecules such as DVL1, pairwisecomparison revealed that EMP1, gene encoding a tumor-associated membrane protein involved in cell-cell interac-tions and proliferation control [84], was upregulated,whereas DDR1, epithelial-specific receptor kinase capableof binding Wnt5 and regulating the adhesion of mam-mary cells [85,86], was downregulated in ILCs. Immuno-histochemistry has also confirmed the same differentialexpression of these three proteins in IDC and ILC on tis-
sue microarrays. Thus all the evidence suggests that thetwo tumor types can be distinguished both at the gene andprotein levels. Specific changes in gene and proteinexpression are likely to reflect the differences in mecha-nisms of carcinogenesis as well as the specific histologicaland clinical characteristics of these tumors derived fromthe same anatomical compartment, TDLU.
ConclusionMicrodissection of normal and tumor cell types from thebreast and full genome expression analysis by Affymetrixarrays allowed us to provide novel data on breast cancer.Invasive lobular and ductal breast carcinomas can be dif-ferentiated both at the gene and protein levels. Despiteanalyzing only thirty samples from ten patients, theresults are in good accordance with previous literature[14,38,39,57,64]. Our data provide evidence for deregu-lated TGFβ and Wnt signaling accompanied by the over-expression of mesenchyme-associated genes like thecollagens, asporin and others which might be occurring inconjunction with an altered EMT. We propose that dereg-ulated TGFβ signaling and EMT phenomenon areinvolved in both tumor types, but they seem to be moreimportant in lobular carcinomas which is in concordancewith the loss of E-cadherin expression and their distinctmorphology from ductal tumors. In this study we reporttwo candidate genes, asporin (ASPN) and collagen triplehelix repeat containing 1 (CTHRC1), which might be sig-nificant in mammary gland carcinogenesis and may alsobe important either in cancer diagnosis or therapy.Besides E-cadherin, the proteins validated on tissuemicroarrays by immunohistochemistry (EMP1, DVL1,DDR1) may represent novel tissue markers helpful in thedifferentiation of ductal and lobular cancers. Further stud-ies with larger sets of patients are needed to verify the gene
Asporin mRNA detection by chromogenic in situ hybridizationFigure 6Asporin mRNA detection by chromogenic in situ hybridization. 1–2. Various magnifications (×100, ×400, ×400) of lobular carcinoma; red arrows, lobular tumor cells are positive; blue arrows, stromal cells are negative; 3. Ductal carcinoma is negative (×200).
Page 16 of 20(page number not for citation purposes)

BMC Cancer 2007, 7:55 http://www.biomedcentral.com/1471-2407/7/55
Page 17 of 20(page number not for citation purposes)
PCR validation of microarray results for CTHRC1 (1), ASPN (2), and COL3A1 (3)Figure 7PCR validation of microarray results for CTHRC1 (1), ASPN (2), and COL3A1 (3). Fluorescence signals from Affyme-trix probe sets (225681_at, 219087_at and 211161_s_at, respectively) and optical density of PCR bands (OD × cm) were transformed to a percentage of the highest value. 1–10, case numbers; Tduc, ductal tumor; Tlob, lobular tumor; D, normal duc-tal cells; L, normal lobular cells.

BMC Cancer 2007, 7:55 http://www.biomedcentral.com/1471-2407/7/55
expression profiles of various histological types of breastcancer in order to determine molecular subclassifications,prognosis, and the optimum treatment strategies.
AbbreviationsADAM12 = ADAM metallopeptidase domain 12; ASPN =Asporin; CK = Cytokeratin; CTHRC1 = Collagen triplehelix repeat containing 1; DAVID = Database for Annota-tion, Visualization and Integrated Discovery; DDR1 = Dis-coidin domain receptor 1; DVL1 = Human homolog ofthe Drosophila dishevelled gene; ECM = Extracellularmatrix; EMP1 = Epithelial membrane antigen 1; EMT =Epithelial-mesenchymal transition; ER = Estrogen recep-tor; GCOS = GeneChip Operating Software; IDC = Inva-sive ductal carcinoma; ILC = Invasive lobular carcinoma;ISH = In situ hybridization; IVT = In vitro transcription;PCR = Polymerase chain reaction; PgR = Progesteronereceptor; RMA = Robust multiarray analysis; RNA = Ribo-nucleic acid; RP = Rank products analysis; SFRP1 =Secreted frizzled-related protein 1; TDLU = Terminal ductlobular unit; TGFβ = Transforming growth factor β ; TMA= Tissue microarray; WISP1 = WNT1 inducible signalingpathway protein 1.
Competing interestsThe author(s) declare that they have no competing inter-ests.
Authors' contributionsGT and JB contributed equally to this work. GT partici-pated in collecting surgical specimens, cutting and evalu-ation of frozen sections, laser microdissection,immunohistochemistry, ISH, analysis of microarrayresults and drafting the manuscript. JB participated in thedesign of the study, collecting surgical specimens, RNAisolation, amplification and labeling, analysis of micro-array results, ISH and PCR validation, drafting the manu-script. KB carried out the hybridization and scanning ofthe arrays and proofreading of the manuscript. WW per-formed data analysis and participated in drafting the man-uscript. MD and MH were involved in lasermicrodissection. JEparticipated in collection and evalua-tion of frozen sections. JK participated in obtaining surgi-cal specimens. EF and JS participated in tissue microarrayconstruction. JS was involved in RNA isolation and PCRvalidation. PM participated in analysis of microarrayresults. ZK conceived of the study, participated in itsdesign and coordination, as well as in collecting surgicalspecimens, evaluation of frozen sections and drafting themanuscript. All authors read and approved the final man-uscript.
Additional material
AcknowledgementsThe work was supported by grants NR 7844-3 and NR 8425-3 from the Czech Ministry of Health and MSM 6198959216 from the Czech Ministry of Education. The authors cordially thank to Jirina Zatloukalova, Jirina Proc-hazkova, Prof. George Burkadze, Dalimil Zurek, Veronika Krejci, Pravomila Abrahamova, Alena Lukasova, Renata Bilkova and Gabriela Korinkova for scientific discussions and kind technical assistance.
References1. Rosen PP: Rosen's breast pathology Lippincots-Raven Publishers; 1997. 2. Weidner N, Cote R, Suster S, Weiss L: Modern Surgical Pathology Else-
vier Science; 2003. 3. Winchester DJ, Chang HR, Graves TA, Menck HR, Bland KI, Win-
chester DP: A comparative analysis of lobular and ductal car-cinoma of the breast: presentation, treatment, andoutcomes. J Am Coll Surg 1998, 186:416-422.
4. Silverstein MJ, Lewinsky BS, Waisman JR, Gierson ED, Colburn WJ,Senofsky GM, Gamagami P: Infiltrating lobular carcinoma. Is itdifferent from infiltrating duct carcinoma? Cancer 1994,73:1673-1677.
5. Toikkanen S, Pylkkanen L, Joensuu H: Invasive lobular carcinomaof the breast has better short- and long-term survival thaninvasive ductal carcinoma. Br J Cancer 1997, 76:1234-40.
6. Molland JG, Donnellan M, Janu NC, Carmalt HL, Kennedy CW, GillettDJ: Infiltrating lobular carcinoma – a comparison of diagno-sis, management and outcome with infiltrating duct carci-noma. Breast 2004, 13:389-396.
7. Newman LA, Buzdar AU, Singletary SE, Kuerer HM, Buchholz T,Ames FC, Ross MI, Hunt KK: A prospective trial of preoperativechemotherapy in resectable breast cancer: predictors ofbreast-conservation therapy feasibility. Ann Surg Oncol 2002,9:228-234.
8. Mersin H, Yildirim E, Gulben K, Berberoglu U: Is invasive lobularcarcinoma different from invasive ductal carcinoma? Eur JSurg Oncol 2003, 29:390-395.
9. Arpino G, Bardou VJ, Clark GM, Elledge RM: Infiltrating lobularcarcinoma of the breast: tumor characteristics and clinicaloutcome. Breast Cancer Res 2004, 6:R149-156.
10. Perou CM, Jeffrey SS, van de Rijn M, Rees CA, Eisen MB, Ross DT,Pergamenschikov A, Williams CF, Zhu SX, Lee JC, Lashkari D, ShalonD, Brown PO, Botstein D: Distinctive gene expression patternsin human mammary epithelial cells and breast cancers. ProcNatl Acad Sci USA 1999, 96:9212-9217.
11. Schena M, Shalon D, Davis RW, Brown PO: Quantitative monitor-ing of gene expression patterns with a complementary DNAmicroarray. Science 1995, 270:467-470.
12. Bertucci F, Viens P, Hingamp P, Nasser V, Houlgatte R, Birnbaum D:Breast cancer revisited using DNA array-based gene expres-sion profiling. Int J Cancer 2003, 103:565-571.
13. Tavassoli FA, Scnitt SJ: Pathology of the breast New York: Elsevier;1992.
14. Zhu G, Reynolds L, Crnogorac-Jurcevic T, Gillett CE, Dublin EA, Mar-shall JF, Barnes D, D'Arrigo C, Van Trappen PO, Lemoine NR, Hart
Additional File 1Supplementary tables. The data provided represent supplementary tables listing all differentially expressed probe sets found by both rank products and pairwise analysis between normal ductal and normal lobular cells, ductal carcinoma and normal ductal cells, ductal carcinoma and normal lobular cells, ductal carcinoma and lobular carcinoma cells, lobular carci-noma and normal ductal cells, and lobular carcinoma and normal lobular cells.Click here for file[http://www.biomedcentral.com/content/supplementary/1471-2407-7-55-S1.doc]
Page 18 of 20(page number not for citation purposes)

BMC Cancer 2007, 7:55 http://www.biomedcentral.com/1471-2407/7/55
IR: Combination of microdissection and microarray analysisto identify gene expression changes between differentiallylocated tumor cells in breast cancer. Oncogene 2003,22:3742-3748.
15. Schuetz CS, Bonin M, Clare SE, Nieselt K, Sotlar K, Walter M, FehmT, Solomayer E, Riess O, Wallwiener D, Kurek R, Neubauer HJ: Pro-gression-specific genes identified by expression profiling ofmatched ductal carcinomas in situ and invasive breasttumors, combining laser capture microdissection and oligo-nucleotide microarray analysis. Cancer Res 2006, 66:5278-5286.
16. Yang F, Foekens JA, Yu J, Sieuwerts AM, Timmermans M, Klijn JG,Atkins D, Wang Y, Jiang Y: Laser microdissection and micro-array analysis of breast tumors reveal ER-alpha relatedgenes and pathways. Oncogene 2006, 25:1413-1419.
17. Aoyagi K, Tatsuta T, Nishigaki M, Akimoto S, Tanabe C, Omoto Y,Hayashi S, Sakamoto H, Sakamoto M, Yoshida T, Terada M, Sasaki H:A faithful method for PCR-mediated global mRNA amplifi-cation and its integration into microarray analysis on laser-captured cells. Biochem Biophys Res Commun 2003, 300:915-920.
18. Luzzi V, Mahadevappa M, Raja R, Warrington JA, Watson MA: Accu-rate and reproducible gene expression profiles from lasercapture microdissection, transcript amplification, and highdensity oligonucleotide microarray analysis. J Mol Diagn 2003,5:9-14.
19. Klur S, Toy K, Williams MP, Certa U: Evaluation of proceduresfor amplification of small-size samples for hybridization onmicroarrays. Genomics 2004, 83:508-517.
20. Ji W, Zhou W, Gregg K, Lindpaintner K, Davis S, Davis S: A methodfor gene expression analysis by oligonucleotide arrays fromminute biological materials. Anal Biochem 2004, 331:329-339.
21. Sorlie T, Tibshirani R, Parker J, Hastie T, Marron JS, Nobel A, Deng S,Johnsen H, Pesich R, Geisler S, Demeter J, Perou CM, Lonning PE,Brown PO, Borresen-Dale AL, Botstein D: Repeated observationof breast tumor subtypes in independent gene expressiondata sets. Proc Natl Acad Sci USA 2003, 100:8418-8423.
22. Bertucci F, Houlgatte R, Granjeaud S, Nasser V, Loriod B, BeaudoingE, Hingamp P, Jacquemier J, Viens P, Birnbaum D, Nguyen C: Prog-nosis of breast cancer and gene expression profiling usingDNA arrays. Ann N Y Acad Sci 2002, 975:217-231.
23. Reinholz MM, Iturria SJ, Ingle JN, Roche PC: Differential geneexpression of TGF-beta family members and osteopontin inbreast tumor tissue: analysis by real-time quantitative PCR.Breast Cancer Res Treat 2002, 74:255-269.
24. Mackay A, Jones C, Dexter T, Silva RL, Bulmer K, Jones A, Simpson P,Harris RA, Jat PS, Neville AM, Reis LF, Lakhani SR, O'Hare MJ: cDNAmicroarray analysis of genes associated with ERBB2 (HER2/neu) overexpression in human mammary luminal epithelialcells. Oncogene 2003, 22:2680-2688.
25. Barsky SH: Myoepithelial mRNA expression profiling reveals acommon tumor-suppressor phenotype. Exp Mol Pathol 2003,74:113-122.
26. Pusztai L, Sotiriou C, Buchholz TA, Meric F, Symmans WF, Esteva FJ,Sahin A, Liu ET, Hortobagi GN: Molecular profiles of invasivemucinous and ductal carcinomas of the breast: a molecularcase study. Cancer Genet Cytogenet 2003, 141:148-153.
27. Dressman MA, Baras A, Malinowski R, Alvis LB, Kwon I, Walz TM,Polymeropoulos MH: Gene expression profiling detects geneamplification and differentiates tumor types in breast can-cer. Cancer Res 2003, 63:2194-2199.
28. Nyante SJ, Devries S, Chen YY, Hwang ES: Array-based compara-tive genomic hybridization of ductal carcinoma in situ andsynchronous invasive lobular cancer. Hum Pathol 2004,35:759-763.
29. Sotiriou C, Neo SY, McShane LM, Korn EL, Long PM, Jazaeri A, Mar-tiat P, Fox SB, Harris AL, Liu ET: Breast cancer classification andprognosis based on gene expression profiles from a popula-tion-based study. Proc Natl Acad Sci USA 2003, 100:10393-10398.
30. Sorlie T, Perou CM, Tibshirani R, Aas T, Geisler S, Johnsen H, HastieT, Eisen MB, van de Rijn M, Jeffrey SS, Thorsen T, Quist H, Matese JC,Brown PO, Botstein D, Eystein Lonning P, Borresen-Dale AL: Geneexpression patterns of breast carcinomas distinguish tumorsubclasses with clinical implications. Proc Natl Acad Sci USA2001, 98:10869-10874.
31. van de Rijn M, Perou CM, Tibshirani R, Haas P, Kallioniemi O,Kononen J, Torhorst J, Sauter G, Zuber M, Kochli OR, Mross F, Die-terich H, Seitz R, Ross D, Botstein D, Brown P: Expression of
cytokeratins 17 and 5 identifies a group of breast carcinomaswith poor clinical outcome. Am J Pathol 2002, 161:1991-1996.
32. van't Veer LJ, Dai H, van de Vijver MJ, He YD, Hart AA, Bernards R,Friend SH: Expression profiling predicts outcome in breastcancer. Breast Cancer Res 2003, 5:57-58.
33. Hedenfalk I, Duggan D, Chen Y, Radmacher M, Bittner M, Simon R,Meltzer P, Gusterson B, Esteller M, Kallioniemi OP, Wilfond B, BorgA, Trent J, Raffeld M, Yakhini Z, Ben-Dor A, Dougherty E, KononenJ, Bubendorf L, Fehrle W, Pittaluga S, Gruvberger S, Loman N, Johan-nsson O, Olsson H, Sauter G: Gene-expression profiles in hered-itary breast cancer. N Engl J Med 2001, 344:539-548.
34. Grigoriadis A, Mackay A, Reis-Filho JS, Steele D, Iseli C, Stevenson BJ,Jongeneel CV, Valgeirsson H, Fenwick K, Iravani M, Leao M, SimpsonAJ, Strausberg RL, Jat PS, Ashworth A, Neville AM, O'hare MJ: Estab-lishment of the epithelial-specific transcriptome of normaland malignant human breast cells based on MPSS and arrayexpression data. Breast Cancer Res 2006, 8:R56.
35. Huiping C, Sigurgeirsdottir JR, Jonasson JG, Eiriksdottir G, Johanns-dottir JT, Egilsson V, Ingvarsson S: Chromosome alterations andE-cadherin gene mutations in human lobular breast cancer.Br J Cancer 1999, 81:1103-1110.
36. Asgeirsson KS, Jonasson JG, Tryggvadottir L, Olafsdottir K, Sigur-geirsdottir JR, Ingvarsson S, Ogmundsdottir HM: Altered expres-sion of E-cadherin in breast cancer. patterns, mechanismsand clinical significance. Eur J Cancer 2000, 36:1098-1106.
37. Sarrio D, Perez-Mies B, Hardisson D, Moreno-Bueno G, Suarez A,Cano A, Martin-Perez J, Gamallo C, Palacios J: Cytoplasmic locali-zation of p120ctn and E-cadherin loss characterize lobularbreast carcinoma from preinvasive to metastatic lesions.Oncogene 2004, 23:3272-3283.
38. Korkola JE, DeVries S, Fridlyand J, Hwang ES, Estep AL, Chen YY,Chew KL, Dairkee SH, Jensen RM, Waldman FM: Differentiation oflobular versus ductal breast carcinomas by expressionmicroarray analysis. Cancer Res 2003, 63:7167-7175.
39. Zhao H, Langerod A, Ji Y, Nowels KW, Nesland JM, Tibshirani R,Bukholm IK, Karesen R, Botstein D, Borresen-Dale AL, Jeffrey SS:Different gene expression patterns in invasive lobular andductal carcinomas of the breast. Mol Biol Cell 2004,15:2523-2536.
40. Breitling R, Armengaud P, Amtmann A, Herzyk P: Rank products: asimple, yet powerful, new method to detect differentiallyregulated genes in replicated microarray experiments. FEBSLett 2004, 573:83-92.
41. Irizarry RA, Bolstad BM, Collin F, Cope LM, Hobbs B, Speed TP:Summaries of Affymetrix GeneChip probe level data. NucleicAcids Res 2003, 31:e15.
42. Affymetrix package of the Bioconductor [http://www.bioconductor.org]
43. DAVID: Database for Annotation, Visualization and Inte-grated Discovery [http://david.abcc.ncifcrf.gov]
44. Gene Cards [http://www.genecards.org]45. NETAFFX Analysis Center [http://www.affymetrix.com/analy
sis]46. dChip software: Gene Expression Microarray and SNP
Microarray Analysis [http://www.dchip.org]47. NCBIs Gene Expression Omnibus [http://
www.ncbi.nlm.nih.gov/geo]48. Simon R, Sauter G: Tissue microarrays for miniaturized high-
throughput molecular profiling of tumors. Exp Hematol 2002,30:1365-1372.
49. Henry SP, Takanosu M, Boyd TC, Mayne PM, Eberspaecher H, ZhouW, de Crombrugghe B, Hook M, Mayne R: Expression pattern andgene characterization of asporin. a newly discovered mem-ber of the leucine-rich repeat protein family. J Biol Chem 2001,276:12212-12221.
50. Nakamura S, Terashima T, Yoshida T, Iseki S, Takano Y, Ishikawa I,Shinomura T: Identification of genes preferentially expressedin periodontal ligament: specific expression of a novelsecreted protein, FDC-SP. Biochem Biophys Res Commun 2005,338:1197-1203.
51. Gusterson BA, Ross DT, Heath VJ, Stein T: Basal cytokeratins andtheir relationship to the cellular origin and functional classi-fication of breast cancer. Breast Cancer Res 2005, 7:143-8.
52. Peinado H, Portillo F, Cano A: Transcriptional regulation of cad-herins during development and carcinogenesis. Int J Dev Biol2004, 48:365-375.
Page 19 of 20(page number not for citation purposes)

BMC Cancer 2007, 7:55 http://www.biomedcentral.com/1471-2407/7/55
53. Grille SJ, Bellacosa A, Upson J, Klein-Szanto AJ, van Roy F, Lee-KwonW, Donowitz M, Tsichlis PN, Larue L: The protein kinase Aktinduces epithelial mesenchymal transition and promotesenhanced motility and invasiveness of squamous cell carci-noma lines. Cancer Res 2003, 63:2172-2178.
54. Thiery JP: Epithelial-mesenchymal transitions in developmentand pathologies. Curr Opin Cell Biol 2003, 15:740-746.
55. Thiery JP: Epithelial-mesenchymal transitions in tumour pro-gression. Nat Rev Cancer 2002, 2:442-454.
56. Kalluri R, Neilson EG: Epithelial-mesenchymal transition andits implications for fibrosis. J Clin Invest 2003, 112:1776-1784.
57. Nishidate T, Katagiri T, Lin ML, Mano Y, Miki Y, Kasumi F, YoshimotoM, Tsunoda T, Hirata K, Nakamura Y: Genome-wide gene-expression profiles of breast-cancer cells purified with lasermicrobeam microdissection: identification of genes associ-ated with progression and metastasis. Int J Oncol 2004,25:797-819.
58. Cheng JQ, Lindsley CW, Cheng GZ, Yang H, Nicosia SV: The Akt/PKB pathway: molecular target for cancer drug discovery.Oncogene 2005, 24:7482-7492.
59. Schambony A, Kunz M, Gradl D: Cross-regulation of Wnt signal-ing and cell adhesion. Differentiation 2004, 72:307-318.
60. Esko JD, Rostand KS, Weinke JL: Tumor formation dependenton proteoglycan biosynthesis. Science 1988, 241:1092-1096.
61. Kizawa H, Kou I, Iida A, Sudo A, Miyamoto Y, Fukuda A, Mabuchi A,Kotani A, Kawakami A, Yamamoto S, Uchida A, Nakamura K, NotoyaK, Nakamura Y, Ikegawa S: An aspartic acid repeat polymor-phism in asporin inhibits chondrogenesis and increases sus-ceptibility to osteoarthritis. Nat Genet 2005, 37:138-144.
62. Loughlin J: Polymorphism in signal transduction is a majorroute through which osteoarthritis susceptibility is acting.Curr Opin Rheumatol 2005, 17:629-633.
63. Best CJ, Gillespie JW, Yi Y, Chandramouli GV, Perlmutter MA, Gath-right Y, Erickson HS, Georgevich L, Tangrea MA, Duray PH, GonzalezS, Velasco A, Linehan WM, Matusik RJ, Price DK, Figg WD, Emmert-Buck MR, Chuaqui RF: Molecular alterations in primary pros-tate cancer after androgen ablation therapy. Clin Cancer Res2005, 11:6823-6834.
64. Tang L, Dai DL, Su M, Martinka M, Li G, Zhou Y: Aberrant expres-sion of collagen triple helix repeat containing 1 in humansolid cancers. Clin Cancer Res 2006, 12:3716-3722.
65. Pyagay P, Heroult M, Wang Q, Lehnert W, Belden J, Liaw L, FrieselRE, Lindner V: Collagen triple helix repeat containing 1, anovel secreted protein in injured and diseased arteries,inhibits collagen expression and promotes cell migration.Circ Res 2005, 96:261-268.
66. Zhao X, Ramsey KE, Stephan DA, Russell P: Gene and proteinexpression changes in human trabecular meshwork cellstreated with transforming growth factor-beta. Invest Ophthal-mol Vis Sci 2004, 45:4023-4034.
67. Durmus T, Leclair RJ, Park KS, Terzic A, Yoon JK, Lindner V: Expres-sion analysis of the novel gene collagen triple helix repeatcontaining-1 (Cthrc1). Gene Expr Patterns 2006, 6:935-940.
68. Klopocki E, Kristiansen G, Wild PJ, Klaman I, Castanos-Velez E, SingerG, Stohr R, Simon R, Sauter G, Leibiger H, Essers L, Weber B, Her-mann K, Rosenthal A, Hartmann A, Dahl E: Loss of SFRP1 is asso-ciated with breast cancer progression and poor prognosis inearly stage tumors. Int J Oncol 2004, 25:641-649.
69. Eger A, Stockinger A, Park J, Langkopf E, Mikula M, Gotzmann J, Miku-lits W, Beug H, Foisner R: beta-Catenin and TGFbeta signallingcooperate to maintain a mesenchymal phenotype afterFosER-induced epithelial to mesenchymal transition. Onco-gene 2004, 23:2672-2680.
70. Huber MA, Azoitei N, Baumann B, Grunert S, Sommer A, Peham-berger H, Kraut N, Beug H, Wirth T: NF-kappaB is essential forepithelial-mesenchymal transition and metastasis in a modelof breast cancer progression. J Clin Invest 2004, 114:569-581.
71. Willert K, Brown JD, Danenberg E, Duncan AW, Weissman IL, ReyaT, Yates JR 3rd, Nusse R: Wnt proteins are lipidmodified andcan act as stem cell growth factors. Nature 2003, 423:448-452.
72. Papkoff J, Rubinfeld B, Schryver B, Polakis P: Wnt-1 regulates freepools of catenins and stabilizes APC-catenin complexes. MolCell Biol 1996, 16:2128-2134.
73. Veeman MT, Axelrod JD, Moon RT: A second canon: functionsand mechanisms of beta-catenin-independent wnt signaling.Dev Cell 2003, 5:367-377.
74. Gradl D, Kuhl M, Wedlich D: The Wnt/Wg signal transducerbeta-catenin controls fibronectin expression. Mol Cell Biol1999, 19:5576-5587.
75. Marchenko GN, Marchenko ND, Leng J, Strongin AY: Promotercharacterization of the novel human matrix metalloprotein-ase-26 gene: regulation by the T-cell factor-4 implies specificexpression of the gene in cancer cells of epithelial origin. Bio-chem J 2002, 363:253-262.
76. Brabletz T, Jung A, Dag S, Hlubek F, Kirchner T: Beta-catenin reg-ulates the expression of the matrix metalloproteinase-7 inhuman colorectal cancer. Am J Pathol 1999, 155:1033-1038.
77. Crawford HC, Fingleton BM, Rudolph-Owen LA, Goss KJ, RubinfeldB, Polakis P, Matrisian LM: The metalloproteinase matrilysin is atarget of beta-catenin transactivation in intestinal tumors.Oncogene 1999, 18:2883-2891.
78. Rivat C, Le Floch N, Sabbah M, Teyrol I, Redeuilh G, Bruyneel E,Mareel M, Matrisian LM, Crawford HC, Gespach C, Attoub S: Syner-gistic cooperation between the AP-1 and LEF-1 transcrip-tion factors in activation of the matrilysin promoter by thesrc oncogene: implications in cellular invasion. FASEB J 2003,17:1721-1723.
79. Schlessinger J, Plotnikov AN, Ibrahimi OA, Eliseenkova AV, Yeh BK,Yayon A, Linhardt RJ, Mohammadi M: Crystal structure of a ter-nary FGF-FGFR-heparin complex reveals a dual role forheparin in FGFR binding and dimerization. Mol Cell 2000,6:743-750.
80. Ai X, Do AT, Lozynska O, Kusche-Gullberg M, Lindahl U, EmersonCP Jr: QSulf1 remodels the 6-O sulfation states of cell surfaceheparan sulfate proteoglycans to promote Wnt signaling. JCell Biol 2003, 162:341-351.
81. Chong JM, Uren A, Rubin JS, Speicher DW: Disulfide bond assign-ments of secreted Frizzled-related protein-1 provideinsights about Frizzled homology and netrin modules. J BiolChem 2002, 277:5134-5144.
82. Weeraratna AT, Jiang YA, Hostetter G, Rosenblatt K, Duray P, Bit-tner M, Trent JM: Wnt5a signaling directly affects cell motilityand invasion of metastatic melanoma. Cancer Cell 2002,1:279-288.
83. Jonsson M, Dejmek J, Bendahl PO, Andersson T: Loss of Wnt-5aprotein is associated with early relapse in invasive ductalbreast carcinomas. Cancer Res 2002, 62:409-416.
84. Chen Y, Medvedev A, Ruzanov P, Marvin KW, Jetten AM: cDNAcloning, genomic structure, and chromosome mapping ofthe human epithelial membrane protein CL-20 gene(EMP1), a member of the PMP22 family. Genomics 1997,41:40-48.
85. Dejmek J, Dib K, Jonsson M, Andersson T: Wnt-5a and G-proteinsignaling are required for collagen-induced DDR1 receptoractivation and normal mammary cell adhesion. Int J Cancer2003, 103:344-351.
86. Jonsson M, Andersson T: Repression of Wnt-5a impairs DDR1phosphorylation and modifies adhesion and migration ofmammary cells. J Cell Sci 2001, 114:2043-2053.
Pre-publication historyThe pre-publication history for this paper can be accessedhere:
http://www.biomedcentral.com/1471-2407/7/55/prepub
Page 20 of 20(page number not for citation purposes)
Copyright © 2022 FDOKUMEN