In vivo optical coherence tomography imaging of the pancreatic and biliary ductal system
Upload
independentCategory
view
4download
0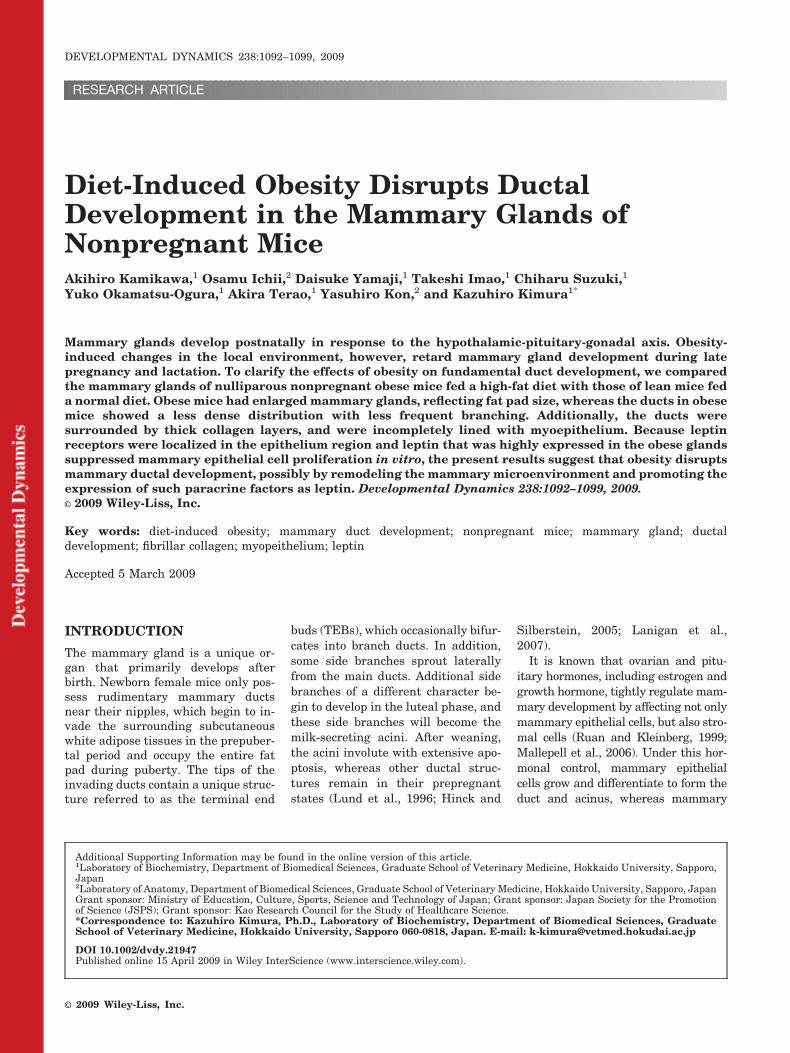
RESEARCH ARTICLE
Diet-Induced Obesity Disrupts DuctalDevelopment in the Mammary Glands ofNonpregnant MiceAkihiro Kamikawa,1 Osamu Ichii,2 Daisuke Yamaji,1 Takeshi Imao,1 Chiharu Suzuki,1
Yuko Okamatsu-Ogura,1 Akira Terao,1 Yasuhiro Kon,2 and Kazuhiro Kimura1*
Mammary glands develop postnatally in response to the hypothalamic-pituitary-gonadal axis. Obesity-induced changes in the local environment, however, retard mammary gland development during latepregnancy and lactation. To clarify the effects of obesity on fundamental duct development, we comparedthe mammary glands of nulliparous nonpregnant obese mice fed a high-fat diet with those of lean mice feda normal diet. Obese mice had enlarged mammary glands, reflecting fat pad size, whereas the ducts in obesemice showed a less dense distribution with less frequent branching. Additionally, the ducts weresurrounded by thick collagen layers, and were incompletely lined with myoepithelium. Because leptinreceptors were localized in the epithelium region and leptin that was highly expressed in the obese glandssuppressed mammary epithelial cell proliferation in vitro, the present results suggest that obesity disruptsmammary ductal development, possibly by remodeling the mammary microenvironment and promoting theexpression of such paracrine factors as leptin. Developmental Dynamics 238:1092–1099, 2009.© 2009 Wiley-Liss, Inc.
Key words: diet-induced obesity; mammary duct development; nonpregnant mice; mammary gland; ductaldevelopment; fibrillar collagen; myopeithelium; leptin
Accepted 5 March 2009
INTRODUCTION
The mammary gland is a unique or-gan that primarily develops afterbirth. Newborn female mice only pos-sess rudimentary mammary ductsnear their nipples, which begin to in-vade the surrounding subcutaneouswhite adipose tissues in the prepuber-tal period and occupy the entire fatpad during puberty. The tips of theinvading ducts contain a unique struc-ture referred to as the terminal end
buds (TEBs), which occasionally bifur-cates into branch ducts. In addition,some side branches sprout laterallyfrom the main ducts. Additional sidebranches of a different character be-gin to develop in the luteal phase, andthese side branches will become themilk-secreting acini. After weaning,the acini involute with extensive apo-ptosis, whereas other ductal struc-tures remain in their prepregnantstates (Lund et al., 1996; Hinck and
Silberstein, 2005; Lanigan et al.,2007).
It is known that ovarian and pitu-itary hormones, including estrogen andgrowth hormone, tightly regulate mam-mary development by affecting not onlymammary epithelial cells, but also stro-mal cells (Ruan and Kleinberg, 1999;Mallepell et al., 2006). Under this hor-monal control, mammary epithelialcells grow and differentiate to form theduct and acinus, whereas mammary
Additional Supporting Information may be found in the online version of this article.1Laboratory of Biochemistry, Department of Biomedical Sciences, Graduate School of Veterinary Medicine, Hokkaido University, Sapporo,Japan2Laboratory of Anatomy, Department of Biomedical Sciences, Graduate School of Veterinary Medicine, Hokkaido University, Sapporo, JapanGrant sponsor: Ministry of Education, Culture, Sports, Science and Technology of Japan; Grant sponsor: Japan Society for the Promotionof Science (JSPS); Grant sponsor: Kao Research Council for the Study of Healthcare Science.*Correspondence to: Kazuhiro Kimura, Ph.D., Laboratory of Biochemistry, Department of Biomedical Sciences, GraduateSchool of Veterinary Medicine, Hokkaido University, Sapporo 060-0818, Japan. E-mail: [email protected]
DOI 10.1002/dvdy.21947Published online 15 April 2009 in Wiley InterScience (www.interscience.wiley.com).
DEVELOPMENTAL DYNAMICS 238:1092–1099, 2009
© 2009 Wiley-Liss, Inc.
stromal cells surrounding the epithelialcells produce a variety of growth factorsand extracellular matrix (ECM) compo-nents to facilitate epithelial growth anddifferentiation (Hovey et al., 1999;Sternlicht et al., 2006).
The mammary stromal cell popula-tion mainly consists of fibroblasts, adi-pocytes, and vascular endothelium. Thenumber and size of the stromal cells,and possibly their functions, depend onthe stage of mammary gland develop-ment (Richert et al., 2000). In addition,the composition and functions of thestromal cell population may be affectedby nutritional status, such as obesity,which suggests that epithelial growthand differentiation are modulated bythese factors. Indeed, diet-induced obe-sity in mice results in impaired lobu-loalveolar development during preg-nancy and reduced lactation (Flint et al.,2005). Similar obesity-induced lactationfailure may also occur in humans andrats, because obese women (body massindex [BMI] � 29.0) have shorter breast-feeding periods than lean women (BMI �26.0) (Kugyelka et al., 2004) and neonatalpups from obese rat dams are afflictedwith a high fatality rate due to insuffi-cient milk intake (Rasmussen et al.,2001). The mechanisms underlying obesi-ty-mediated lactation failure, however,remain to be elucidated.
To date, whether obesity affects pu-bertal ductal development is unknown.Although genetically obese ob/ob anddb/db mice show impaired ductal devel-opment (Hu et al., 2002), both mousestrains are sterile due to a deficiency inleptin signaling that disturbs the hypo-thalamic-pituitary-gonadal axis (Che-hab et al., 1996; Yu et al., 1997). There-fore, a lack of hypothalamic-pituitary-gonadal hormonal regulation in thesegenetically obese mice certainly influ-ences ductal development. To clarify theeffects of obesity on mammary ductaldevelopment, we have examined themammary glands of diet-induced obesemice, and found that obesity reducesthe branching frequency and width ofthe ducts, which is accompanied by en-hanced collagen deposition and an ab-normal myoepithelium.
RESULTS
High-Fat-Diet-Induced Obesity
As shown in Figure 1, mice given theHFD for 16 weeks gained approximately
10 g more weight than the mice fed theND. The obese mice exhibited an increasein the weights of the abdominal and tho-racic mammary glands (subcutaneousadipose tissue), mesenteric adipose tis-sue, and liver, whereas no change wasobserved in the skeletal muscle (Table 1).Concomitantly, the obese mice showedhyperglycemia, hyperinsulinemia, hyper-lipidemia, and hyperleptinemia, whereasplasma adiponectin levels were not af-fected (Table 1).
Diet-Induced Obesity CausedAbnormal Mammary DuctalDevelopment inNonpregnant Mice
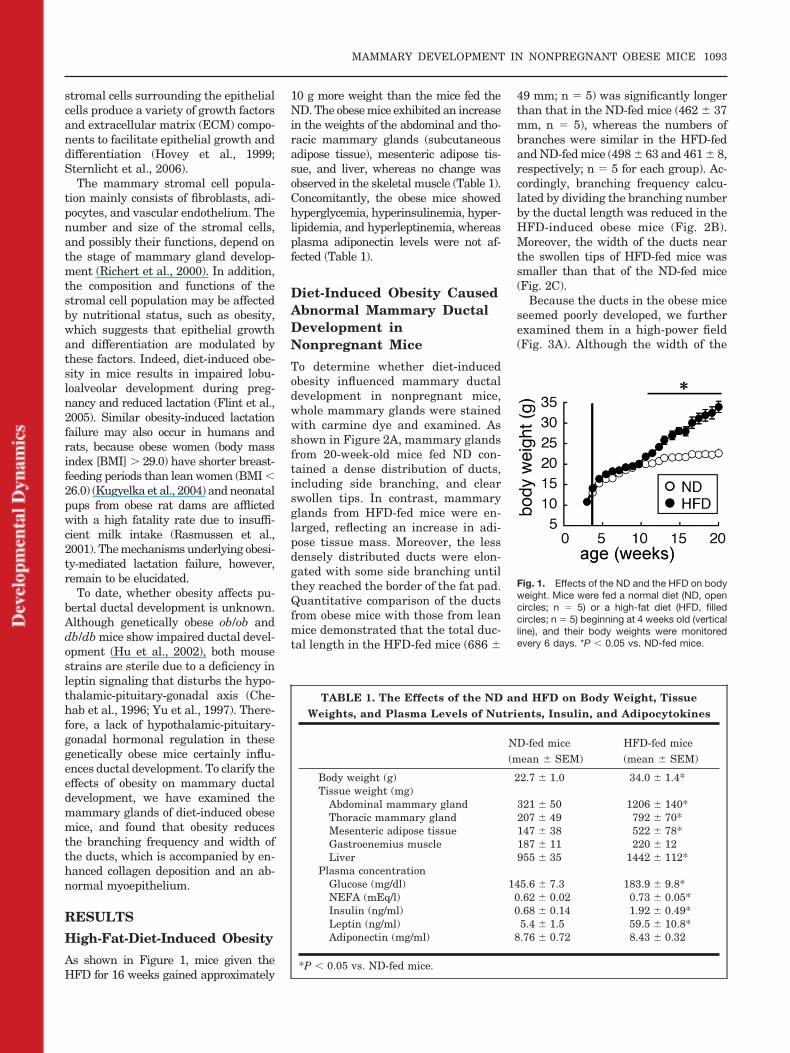
To determine whether diet-inducedobesity influenced mammary ductaldevelopment in nonpregnant mice,whole mammary glands were stainedwith carmine dye and examined. Asshown in Figure 2A, mammary glandsfrom 20-week-old mice fed ND con-tained a dense distribution of ducts,including side branching, and clearswollen tips. In contrast, mammaryglands from HFD-fed mice were en-larged, reflecting an increase in adi-pose tissue mass. Moreover, the lessdensely distributed ducts were elon-gated with some side branching untilthey reached the border of the fat pad.Quantitative comparison of the ductsfrom obese mice with those from leanmice demonstrated that the total duc-tal length in the HFD-fed mice (686 �
49 mm; n � 5) was significantly longerthan that in the ND-fed mice (462 � 37mm, n � 5), whereas the numbers ofbranches were similar in the HFD-fedand ND-fed mice (498 � 63 and 461 � 8,respectively; n � 5 for each group). Ac-cordingly, branching frequency calcu-lated by dividing the branching numberby the ductal length was reduced in theHFD-induced obese mice (Fig. 2B).Moreover, the width of the ducts nearthe swollen tips of HFD-fed mice wassmaller than that of the ND-fed mice(Fig. 2C).
Because the ducts in the obese miceseemed poorly developed, we furtherexamined them in a high-power field(Fig. 3A). Although the width of the
Fig. 1. Effects of the ND and the HFD on bodyweight. Mice were fed a normal diet (ND, opencircles; n � 5) or a high-fat diet (HFD, filledcircles; n � 5) beginning at 4 weeks old (verticalline), and their body weights were monitoredevery 6 days. *P � 0.05 vs. ND-fed mice.
TABLE 1. The Effects of the ND and HFD on Body Weight, TissueWeights, and Plasma Levels of Nutrients, Insulin, and Adipocytokines
ND-fed mice(mean � SEM)
HFD-fed mice(mean � SEM)
Body weight (g) 22.7 � 1.0 34.0 � 1.4*Tissue weight (mg)
Abdominal mammary gland 321 � 50 1206 � 140*Thoracic mammary gland 207 � 49 792 � 70*Mesenteric adipose tissue 147 � 38 522 � 78*Gastroenemius muscle 187 � 11 220 � 12Liver 955 � 35 1442 � 112*
Plasma concentrationGlucose (mg/dl) 145.6 � 7.3 183.9 � 9.8*NEFA (mEq/l) 0.62 � 0.02 0.73 � 0.05*Insulin (ng/ml) 0.68 � 0.14 1.92 � 0.49*Leptin (ng/ml) 5.4 � 1.5 59.5 � 10.8*Adiponectin (mg/ml) 8.76 � 0.72 8.43 � 0.32
*P � 0.05 vs. ND-fed mice.
MAMMARY DEVELOPMENT IN NONPREGNANT OBESE MICE 1093

ductal lumen in the HFD-fed mice wasalmost the same as that in the ND-fedmice (Fig. 3B), the thickness of theductal epithelium layer in the HFD-fed mice was significantly smallerthan that of the ND-fed mice (Fig. 3B).The mammary ducts were composedof two epithelial layers: the luminalepithelium and the basal myoepithe-lium. The latter was clearly labeledwith the antibody specific for �-SMA(Fig. 3C). When we compared theducts from mice fed the ND with thosefrom the mice fed the HFD, almost60% of the ducts in the HFD-fed micewere not lined completely with�-SMA-positive cells, whereas mostducts from the ND-fed mice were com-pletely lined (Fig. 3C and D), suggest-ing that the decrease in the number ofmyoepithelial cells in the obese micewas the basis of the decreased ductalwidth observed in Figure 2C.
Diet-Induced ObesityResulted in AbnormalInterstitial Cells and anAltered ExtracellularEnvironment in theMammary Glands ofNonpregnant Mice
We next examined the effects of diet-induced obesity on the interstitialcells and surrounding extracellularenvironment. As expected, adipocytes,which occupied the majority of the in-terstitial region, were enlarged inHFD-fed mice, compared with those ofmice fed the ND (Fig. 3A). Moreover,the eosinophilic layer surrounding theducts was thicker in the mice fed theHFD than in the mice fed the ND(Figs. 3A and 4C). This eosinophiliclayer was also stained using Masson’strichrome method (Fig. 4A) and anti-type I collagen antibody (Fig. 4B), in-dicating that the layer was composedof fibrous collagen, the deposition ofwhich was augmented in mice fed theHFD.
Carmine dye stained the mammaryductal epithelium intensely, whereas itfaintly marked such stromal cells as fibro-blasts and adipocytes. Unlike the micefed the ND, however, mammary glandsfrom the HFD-fed mice contained a num-ber of cell aggregates in the stromal re-gion that were densely stained with car-mine (Fig. 5A; 72.8 � 29.9 aggregates per
gland). The aggregates, which resembled“crowns,” were composed of macrophagesthat had been recruited into the adipocytetissue as previously reported (Weisberg etal., 2003). This was confirmed by thestaining with antibody against F4/80, amarker of the macrophage (Fig. 5B). Wethen examined the mRNA expression ofthe proinflammatory cytokines IL-6 andTNF�. Although both genes were rarelyexpressed in the mammary glands of ND-fed mice, TNF� mRNA expression, butnot IL-6 mRNA expression, tends to in-crease in all of the mice fed the HFD(Supp. Fig. S1, which is available online).Therefore, a small but significant numberof macrophages recruited into the stro-mal region is possibly indicative of an in-flammatory reaction surrounding tissuein the mammary gland from the HFD-fedmice.
We also examined the mRNA expres-sion of some cytokines that affect mam-mary epithelial growth and functions(Bonnette and Hadsell, 2001; Pollard,2001). Conventional and real-timequantitative PCR analyses showed thatHGF, TGF-�1, and IGF-1 mRNA weredetected in the mammary gland of ND-fed mice, but their expression was notsignificantly changed in the mice fedthe HFD (Supp. Fig. S1). Gene expres-sion analysis, however, revealed thatleptin mRNA expression was signifi-cantly higher in the mammary glandsof obese mice (Fig. 6A), which corre-sponded with a higher plasma leptinconcentration (Table 1). In addition,leptin receptors were localized on thebasal and luminal epithelial cells andperiductal fibroblasts in the mammaryglands of both ND- and HFD-fed mice(Fig. 6B), suggesting that leptin is thestromal-derived factor that affectsmammary epithelial functions directlyand causes the ductal abnormalitiesmentioned above. To test this hypothe-sis, BMEC proliferation was assessed inthe absence or presence of leptin. Asshown in Figure 6C, leptin reduced thecell number on day 4 (59.3 � 8.6% ofcontrol samples; P � 0.05).
DISCUSSION
In the present study, we have demon-strated that diet-induced obesity innonpregnant mice results in a typicalnutritional disorder phenotype, in-cluding enlarged abdominal mam-mary glands (fat pads). Moreover, the
obese mice display abnormal mam-mary ductal development, that is, re-duced branching frequency and mam-mary duct width, a partial deficit inthe myoepithelium, and increased col-lagen deposition surrounding the duc-tal epithelium (Figs. 2–4). Therefore,obesity-induced abnormalities in duc-tal development, especially incom-plete lining of the luminal epitheliumwith myoepithelium, might lead to re-tardation of lobuloalveolar formationafter pregnancy, and lactation failurebecause the myoepithelium plays animportant role in the maintenance ofductal structures for milk ejection(Faraldo et al., 2005).
It has been suggested that stromalfunctions altered by obesity are one ofcausative mechanisms for impairedthe ductal development, because obe-sity markedly alters the expressionprofile of adipocytokines and proin-flammatory cytokines in adipose tis-sues (Ronti et al., 2006). Indeed, themammary glands of obese mice fed theHFD contained larger adipocytes andmore infiltrating macrophages (Figs. 3and 5). However, among the factorstested, obesity only markedly in-creased leptin expression (Fig. 6A). In-terestingly, leptin receptors werepresent on both the basal and luminalepithelial cells (Fig. 6B), and leptindirectly inhibited the growth of BMEC(Fig. 6C) and HGF-induced BMECductal morphogenesis in three-dimen-sional collagen gels (Yamaji et al.,2007). Such leptin-dependent inhibi-tion of cell proliferation is also re-ported in noncancerous mouse mam-mary epithelial cell lines as well asbovine cells (Silva et al., 2002; Barattaet al., 2003; Motta et al., 2007), al-though there is a report showing thatleptin stimulates proliferation of oneof the human breast cancer cell lines(Dieudonne et al., 2002). Thus, leptinincreased in obesity likely plays a sup-pressive role in ductal growth, whichresulted in the reduced ductal widthand incomplete lining of the luminalepithelium with myoepithelium (Figs.2 and 3). Furthermore, it is worth not-ing that ob/ob mice suffer several re-productive and endocrine abnormali-ties, which, with the exception oflactation, can be rescued by leptin ad-ministration (Malik et al., 2001). Thisresult suggests that leptin replace-ment in ob/ob mice may inhibit lacta-
1094 KAMIKAWA ET AL.
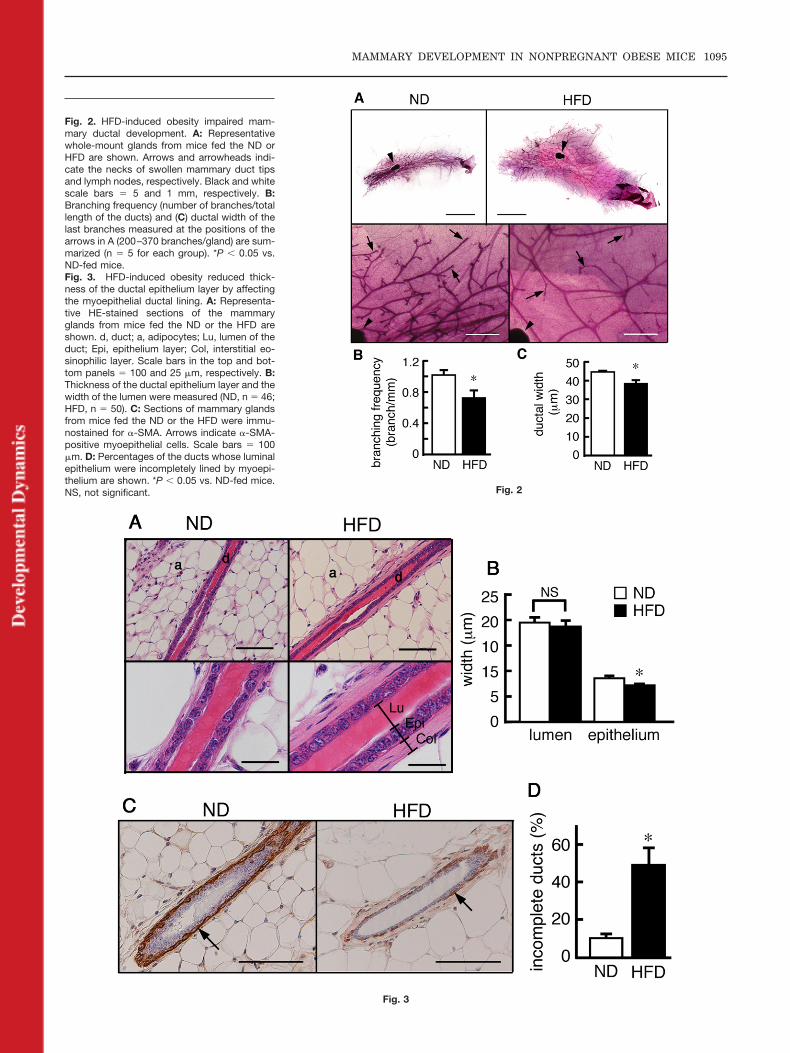
Fig. 2
Fig. 3
Fig. 2. HFD-induced obesity impaired mam-mary ductal development. A: Representativewhole-mount glands from mice fed the ND orHFD are shown. Arrows and arrowheads indi-cate the necks of swollen mammary duct tipsand lymph nodes, respectively. Black and whitescale bars � 5 and 1 mm, respectively. B:Branching frequency (number of branches/totallength of the ducts) and (C) ductal width of thelast branches measured at the positions of thearrows in A (200–370 branches/gland) are sum-marized (n � 5 for each group). *P � 0.05 vs.ND-fed mice.Fig. 3. HFD-induced obesity reduced thick-ness of the ductal epithelium layer by affectingthe myoepithelial ductal lining. A: Representa-tive HE-stained sections of the mammaryglands from mice fed the ND or the HFD areshown. d, duct; a, adipocytes; Lu, lumen of theduct; Epi, epithelium layer; Col, interstitial eo-sinophilic layer. Scale bars in the top and bot-tom panels � 100 and 25 �m, respectively. B:Thickness of the ductal epithelium layer and thewidth of the lumen were measured (ND, n � 46;HFD, n � 50). C: Sections of mammary glandsfrom mice fed the ND or the HFD were immu-nostained for �-SMA. Arrows indicate �-SMA-positive myoepithelial cells. Scale bars � 100�m. D: Percentages of the ducts whose luminalepithelium were incompletely lined by myoepi-thelium are shown. *P � 0.05 vs. ND-fed mice.NS, not significant.
MAMMARY DEVELOPMENT IN NONPREGNANT OBESE MICE 1095

Fig. 4
Fig. 5
Fig. 6
Fig. 4. HFD-induced obesity promoted collagendeposition around the mammary ducts. A: Rep-resentative Masson’s trichrome-stained sec-tions are shown. Blue indicates the presence ofcollagen fibers. Scale bars � 100 �m. B: Sec-tions of mammary glands from mice fed the NDor the HFD were immunostained for collagentype I. Arrows indicate collagen type I–positiveperiductal region. Scale bars � 100 �m. C: Thethickness of the layer surrounding the ductmeasured as an interstitial eosinophilic layer inFigure 3A is shown. *P � 0.05 vs. ND-fed mice.
Fig. 5. HFD-induced obesity promoted macro-phage infiltration into the mammary glands. A:Crown-like structures were only found in thestromal region of whole-mount glands frommice fed the HFD. A representative carmine-stained crown-like structure is shown at twodifferent magnifications. Scale bars in the leftand right panels � 200 and 20 �m, respec-tively. B: Sections of mammary glands frommice fed the HFD were immunostained forF4/80 macrophage-specific antigen. Scalebars � 20 �m.
Fig. 6. Expression of leptin and leptin receptorin the mammary glands, and leptin suppressionof the growth of primary cultured mammaryepithelial cells. A: Total RNA was extractedfrom the abdominal mammary glands of micefed the ND or the HFD. mRNA expression ofleptin was determined quantitatively using realtime-PCRs, and normalized to the expressionlevel of �-actin in each sample. The data forHFD-fed mice are expressed as the expressionlevel relative to that observed in ND-fed mice.*P � 0.05 vs. ND-fed mice. B: Sections ofmammary glands from mice fed the ND or theHFD were immunostained for leptin receptors(Ob-Rs). The arrows in the left and middle pan-els indicate Ob-Rs-positive epithelium,whereas the arrowheads indicate Ob-Rs-posi-tive periductal fibroblasts. Positively stainedcells were not observed in sections without pri-mary antibodies (PBS). Scale bars � 25 �m. C:BMECs were cultured in the absence (opencircles) or presence (filled circles) of 5 nM leptinfor a maximum of 4 days. Cell numbers weredetermined every day (n � 4), and expressed asthe value relative to the number of cells countedafter 1 day of culture without leptin.
1096 KAMIKAWA ET AL.

tion by directly affecting mammaryepithelial cells.
In human hepatic stellate cells, leptinincreases collagen production (Choud-hury et al., 2006) and suppresses ma-trix metalloproteinase (MMP)-1 mRNAexpression, an enzyme involved in thedegradation of type I collagen fibril (Caoet al., 2007). Thus, increased leptin lev-els in obese mice likely act on the leptinreceptor–expressing fibroblasts presentin the periductal region (Fig. 6B), andpromote collagen production and depo-sition as shown in Figure 4. In addi-tion to leptin signaling, macrophagesmay be required for ductal outgrowththrough a promotion of collagen fibril-logenesis around the TEB to facilitatethe formation of the bud during puber-tal ductal development (Ingman et al.,2006). Therefore, excess recruitmentand activation of macrophages possi-bly contribute to the deposition offibrillar collagen around the ducts ob-served in this study.
Obesity-induced abnormal deposi-tion of collagen and/or increased levelsof other ECM components, such asheparan sulfate proteoglycans, maybe a reason for reduction of branchingfrequency (Fig. 2). This is supportedby the fact that deletion of MMP-3, anECM remodeling ectoenzyme ex-pressed in periductal stroma and adi-pocytes, decreases the number of sidebranching ducts in the mammarygland (Wiseman et al., 2003). SuchECM remodeling in the obese mice isalso a likely indirect mechanism tosuppress myoepithelium proliferation,in addition to the direct suppressiveeffect of leptin mentioned above, be-cause the proliferation of humanmammary myoepithelial cells hasbeen shown to depend on heparan sul-fate proteoglycans (Sergeant et al.,2000).
In summary, we have shown thatobesity suppresses mammary duct de-velopment in nulliparous nonpregnantmice, presumably through a remodelingof the mammary microenvironmentand paracrine factors, such as leptin.Although additional studies are re-quired to further elucidate the underly-ing mechanisms, our results have re-vealed some of the important roles ofthe local microenvironment duringmammary ductal development.
EXPERIMENTALPROCEDURES
Animals and TissuePreparations
In this study, experimental proceduresand animal care were carried out in ac-cordance with the Guidelines of AnimalCare and Use from Hokkaido Univer-sity, and were approved by the Univer-sity Committee for the Care and Use ofLaboratory Animals. Female 3-week-old C57BL/6J mice (n � 10) were ob-tained from Nihon SLC (Shizuoka, Ja-pan), housed under specific pathogen-free conditions at 24°C with a 12 h:12 hlight: dark cycle, and given food andwater ad libitum. One week after accli-mation, mice were randomly dividedinto two groups (n � 5), which were fedeither a high-fat diet (HFD: 507.6 kcal/100g [fat kcal 56.7%], Clea, Tokyo, Ja-pan) containing 24.5 wt% unsaturatedand 7.1 wt% saturated fatty acid, 25.5wt% protein, and 2.9 wt% fiber or anormal diet (ND: 343.1 kcal/100g, Clea)containing 4.8 wt% fat, 25.1 wt% pro-tein, and 4.2 wt% fiber. The bodyweights of the mice were measured ev-ery 6 days and the mice were sacrificedusing cervical dislocation 16 weekslater. Blood was collected from the ca-rotid artery into a heparinized tube.Plasma was immediately separated bycentrifugation (12,000g, 3 min, 4°C) andstored at �80°C until it was used in anassay. Bilateral abdominal mammaryglands (the fourth mammary gland)were excised and weighed. The rightgland was spread on a glass slide forwhole-mount staining, whereas half ofthe left gland was preserved at �80°Cin RNAlater (Ambion, Austin, TX) andthe other was in 10% formalin after re-moving the lymph node.
Measurement of PlasmaParameters
Plasma concentrations of glucose,nonesterified fatty acid (NEFA), insu-lin, leptin, and adiponectin were mea-sured with the following commercialkits: glucose-B and NEFA-C tests(Wako Pure Chemical, Osaka, Japan),mouse insulin and leptin ELISA kits(Morinaga Bioscience Institute, Yoko-hama, Japan), and an adiponectin/Acrp30 immunoassay kit (R&D sys-tems, Minneapolis, MN).
Whole-Mount Examination ofMammary Gland
Mammary glands were spread on glassslides, fixed in Carnoy’s fixative (absoluteethanol, chloroform, and glacial aceticacid at a volume ratio of 6:3:1), washedwith 70% ethanol, and rehydrated withdecreasing concentrations of ethanol fol-lowed by distilled water. The gland wasstained overnight at 4°C in carmine alum(0.2% carmine dye in 0.5% aluminum po-tassium sulfate), and dehydrated againwith a series of 70, 80, 90, and 100% eth-anol, and then with xylene. The glandwas photographed with a digital cameraunder a dissecting microscope, and theimage was analyzed using Photoshop(Adobe Systems, San Jose, CA) and NIHImage software. The length of the ductsand the number of branches were deter-mined by tracing all of the ducts in theentire mammary gland. Branching fre-quency was calculated by dividing thenumber of branches by the length of theducts. The duct width was measured atthe “necks” of the swollen tips (see Fig.2A, arrow) with approximately 200–370branches per gland; the mean value wasdefined as the individual ductal width.Additionally, the crown-like struc-tures found exclusively in the stromalregion of the carmine-stained whole-mount glands from mice fed the HFDwere counted.
Histological Analysis
The carmine-stained, whole-mount mam-mary gland was removed from the glassslide and embedded in paraffin. Thegland was cut into 5-�m-thick sectionsto examine the duct along the long axis,and the sections were stained with he-matoxylin and eosin (HE) or Masson’strichrome stain for collagen fibers. Pic-tures were obtained, and all ducts cutlongitudinally in a section (5–13 ductsper a section) were selected. The thick-ness of the ductal epithelium layer andthe layer surrounding the duct, and thewidth of the lumen, were measuredfor 46–50 ducts in each experimentalgroup.
ImmunohistochemicalAnalysis
Localization of the myoepithelium wasdetermined by immunohistochemicalvisualizing �-smooth muscle actin (�-
MAMMARY DEVELOPMENT IN NONPREGNANT OBESE MICE 1097
SMA) using a Histfine SAB-PO kit(Nichirei, Tokyo, Japan). Briefly, thesection was prepared from the carmine-stained, whole-mount mammary gland.Deparaffinized and rehydrated sectionswere sequentially incubated in metha-nol containing 3% H2O2 for 30 min, 10%rabbit normal serum for 1 hr, PBS withor without anti-�-SMA mouse monoclo-nal antibody (1:10,000 dilution in PBS;Sigma-Aldrich, St. Louis, MO) over-night at 4°C, biotin-conjugated rabbitanti-mouse IgG solution (1:30 dilution)for 1 hr, peroxidase-conjugated strepta-vidin solution (1:3 dilution) for 1 hr, andfinally diaminobenzidine as a substratefor 40 sec. The sections were counter-stained with hematoxylin. �-SMA ex-pression in 20 ducts per mouse wereexamined in a blinded manner to deter-mine whether the luminal epithelia ofthe ducts were completely or incom-pletely lined with �-SMA-positive cells.
Infiltration of macrophages wasconfirmed in the formalin-fixed paraf-fin-embedded gland by immunohisto-chemical staining with rat anti-F4/80monoclonal antibody (1:200 dilution,AbD Serotec, Oxford, UK) and a Hist-fine MAX-PO kit (Nichirei).
Expression of leptin receptors (Ob-Rs)and collagen type I were examined in thesection prepared from the carmine-stained, whole-mount mammary gland,by using rabbit anti-Ob-Re polyclonal an-tibody (1:50 dilution, Morinaga Bio-science Institute) and rabbit anti-collagentype I antibody (1:1,000 dilution, Rock-land, Gilbertsville, PA), respectively.
Analysis of mRNA Expression
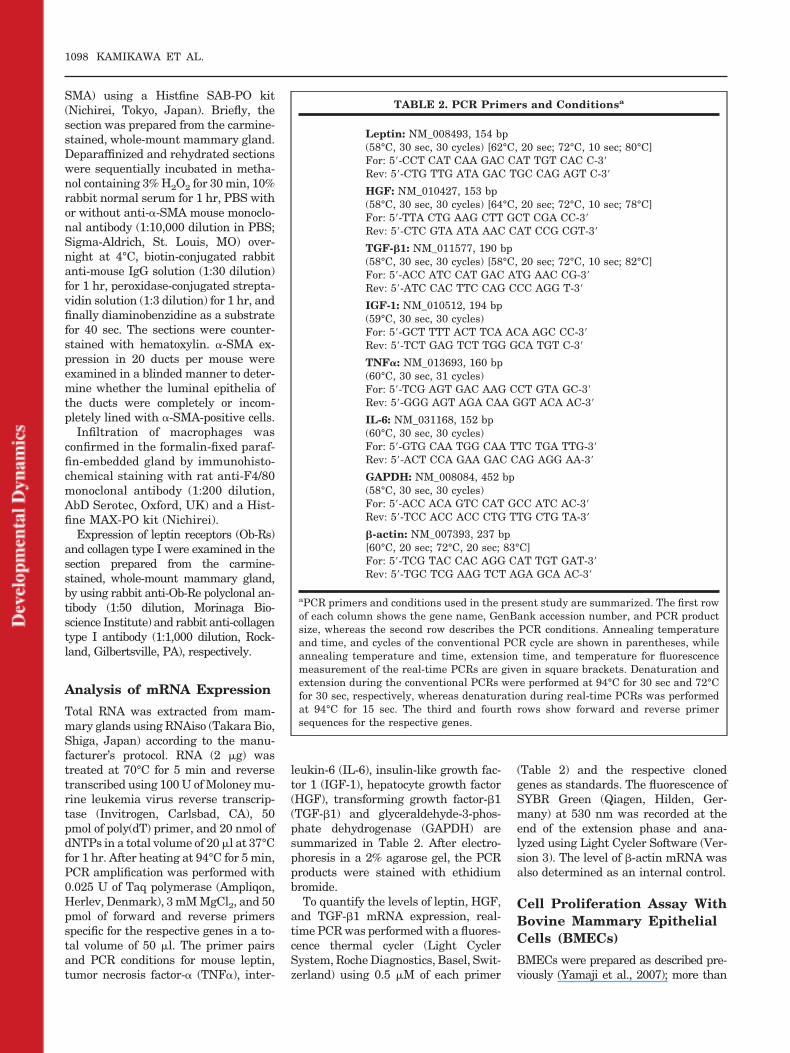
Total RNA was extracted from mam-mary glands using RNAiso (Takara Bio,Shiga, Japan) according to the manu-facturer’s protocol. RNA (2 �g) wastreated at 70°C for 5 min and reversetranscribed using 100 U of Moloney mu-rine leukemia virus reverse transcrip-tase (Invitrogen, Carlsbad, CA), 50pmol of poly(dT) primer, and 20 nmol ofdNTPs in a total volume of 20 �l at 37°Cfor 1 hr. After heating at 94°C for 5 min,PCR amplification was performed with0.025 U of Taq polymerase (Ampliqon,Herlev, Denmark), 3 mM MgCl2, and 50pmol of forward and reverse primersspecific for the respective genes in a to-tal volume of 50 �l. The primer pairsand PCR conditions for mouse leptin,tumor necrosis factor-� (TNF�), inter-
leukin-6 (IL-6), insulin-like growth fac-tor 1 (IGF-1), hepatocyte growth factor(HGF), transforming growth factor-�1(TGF-�1) and glyceraldehyde-3-phos-phate dehydrogenase (GAPDH) aresummarized in Table 2. After electro-phoresis in a 2% agarose gel, the PCRproducts were stained with ethidiumbromide.
To quantify the levels of leptin, HGF,and TGF-�1 mRNA expression, real-time PCR was performed with a fluores-cence thermal cycler (Light CyclerSystem, Roche Diagnostics, Basel, Swit-zerland) using 0.5 �M of each primer
(Table 2) and the respective clonedgenes as standards. The fluorescence ofSYBR Green (Qiagen, Hilden, Ger-many) at 530 nm was recorded at theend of the extension phase and ana-lyzed using Light Cycler Software (Ver-sion 3). The level of �-actin mRNA wasalso determined as an internal control.
Cell Proliferation Assay WithBovine Mammary EpithelialCells (BMECs)
BMECs were prepared as described pre-viously (Yamaji et al., 2007); more than
TABLE 2. PCR Primers and Conditionsa
Leptin: NM_008493, 154 bp(58°C, 30 sec, 30 cycles) [62°C, 20 sec; 72°C, 10 sec; 80°C]For: 5-CCT CAT CAA GAC CAT TGT CAC C-3Rev: 5-CTG TTG ATA GAC TGC CAG AGT C-3
HGF: NM_010427, 153 bp(58°C, 30 sec, 30 cycles) [64°C, 20 sec; 72°C, 10 sec; 78°C]For: 5-TTA CTG AAG CTT GCT CGA CC-3Rev: 5-CTC GTA ATA AAC CAT CCG CGT-3
TGF-�1: NM_011577, 190 bp(58°C, 30 sec, 30 cycles) [58°C, 20 sec; 72°C, 10 sec; 82°C]For: 5-ACC ATC CAT GAC ATG AAC CG-3Rev: 5-ATC CAC TTC CAG CCC AGG T-3
IGF-1: NM_010512, 194 bp(59°C, 30 sec, 30 cycles)For: 5-GCT TTT ACT TCA ACA AGC CC-3Rev: 5-TCT GAG TCT TGG GCA TGT C-3
TNF�: NM_013693, 160 bp(60°C, 30 sec, 31 cycles)For: 5-TCG AGT GAC AAG CCT GTA GC-3Rev: 5-GGG AGT AGA CAA GGT ACA AC-3
IL-6: NM_031168, 152 bp(60°C, 30 sec, 30 cycles)For: 5-GTG CAA TGG CAA TTC TGA TTG-3Rev: 5-ACT CCA GAA GAC CAG AGG AA-3
GAPDH: NM_008084, 452 bp(58°C, 30 sec, 30 cycles)For: 5-ACC ACA GTC CAT GCC ATC AC-3Rev: 5-TCC ACC ACC CTG TTG CTG TA-3
�-actin: NM_007393, 237 bp[60°C, 20 sec; 72°C, 20 sec; 83°C]For: 5-TCG TAC CAC AGG CAT TGT GAT-3Rev: 5-TGC TCG AAG TCT AGA GCA AC-3
aPCR primers and conditions used in the present study are summarized. The first rowof each column shows the gene name, GenBank accession number, and PCR productsize, whereas the second row describes the PCR conditions. Annealing temperatureand time, and cycles of the conventional PCR cycle are shown in parentheses, whileannealing temperature and time, extension time, and temperature for fluorescencemeasurement of the real-time PCRs are given in square brackets. Denaturation andextension during the conventional PCRs were performed at 94°C for 30 sec and 72°Cfor 30 sec, respectively, whereas denaturation during real-time PCRs was performedat 94°C for 15 sec. The third and fourth rows show forward and reverse primersequences for the respective genes.
1098 KAMIKAWA ET AL.
95% of the purified cells were labeledwith anti-cytokeratin antibodies, an epi-thelial marker. To further enrich the ep-ithelial cell population, BMECs were em-bedded in a type I collagen gel (0.6 mg/mlCellmatrix type I-A; Nitta Gelatin, Tokyo,Japan) and cultured in growth medium(Dulbecco’s modified Eagle’s medium[DMEM]/Ham’s F-12 [1:1] [Sigma], sup-plemented with BSA [2 mg/ml; Sigma],penicillin [100 units/ml; Meiji Seika, To-kyo, Japan], streptomycin [100 �g/ml;Meiji Seika], gentamicin [10 �g/ml; In-vitrogen], amphotericin B [250 ng/ml; In-vitrogen], holotransferrin [10 �g/ml; In-vitrogen], insulin [10 �g/ml; Sigma],cortisol [5 �g/ml; Sigma], epidermalgrowth factor [10 ng/ml, Wako], and chol-era toxin [10 ng/ml; Wako]) at 37°C in ahumidified atmosphere containing 5%CO2 in air for one week. To perform thecell proliferation assay, BMECs werefreed from the collagen gel by treatingthem with M199 medium (Sigma) con-taining 1% collagenase and 0.1% soybeantrypsin inhibitor, after which the cellswere dispersed using trypsin-EDTA. Thecells (1 103 cells) were then cultured in96-well plates coated with type I collagen(Cellmatrix type I-C, Nitta Gelatin) and200 �l of the growth medium overnight,and further cultured in a basal medium(DMEM/F-12 with antibiotics, BSA, holo-transferrin, and cholera toxin) either inthe absence or presence of 5 nM (80 ng/ml) leptin (PeproTech, London, UK; n �4, each experiment was performed in trip-licate) for a 4-day period. The number ofcells was assessed every day using a CellTiter-Glo luminescent viability assay kit(Promega, Madison, WI).
Statistic Analysis
Data are expressed as means �S.E.M. (standard error of the mean),and were analyzed using the unpairedtwo-tailed Student’s t-tests. P valuesless than 0.05 were considered to bestatistically significant.
ACKNOWLEDGMENTSThe work was supported in part byJSPS Research Fellowships for YoungScientists to O. I. and Y. O.-O.
REFERENCES
Baratta M, Grolli S, Tamanini C. 2003.Effect of leptin in proliferating and dif-ferentiated HC11 mouse mammary cells.Regul Pept 113:101–107.
Bonnette SG, Hadsell DL. 2001. Targeted dis-ruption of the IGF-I receptor gene decreasescellular proliferation in mammary terminalend buds. Endocrinology 142:4937–4945.
Cao Q, Mak KM, Lieber CS. 2007. Leptinrepresses matrix metalloproteinase-1gene expression in LX2 human hepaticstellate cells. J Hepatol 46:124–133.
Chehab FF, Lim ME, Lu R. 1996. Correc-tion of the sterility defect in homozygousobese female mice by treatment with thehuman recombinant leptin. Nat Genet12:318–320.
Choudhury J, Mirshahi F, Murthy KS,Yager DR, Sanyal AJ. 2006. Physiologicconcentrations of leptin increase colla-gen production by non-immortalized hu-man hepatic stellate cells. Metabolism55:1317–1322.
Dieudonne MN, Machinal-Quelin F, Sera-zin-Leroy V, Leneveu MC, Pecquery R,Giudicelli Y. 2002. Leptin mediates aproliferative response in human MCF7breast cancer cells. Biochem Biophys ResCommun 293:622–628.
Faraldo MM, Teuliere J, Deugnier MA,Taddei-De La Hosseraye I, Thiery JP,Glukhova MA. 2005. Myoepithelial cellsin the control of mammary developmentand tumorigenesis: data from geneticallymodified mice. J Mammary Gland BiolNeoplasia 10:211–219.
Flint DJ, Travers MT, Barber MC, BinartN, Kelly PA. 2005. Diet-induced obesityimpairs mammary development and lac-togenesis in murine mammary gland.Am J Physiol Endocrinol Metab 288:E1179–E1187.
Hinck L, Silberstein GB. 2005. Key stagesin mammary gland development: themammary end bud as a motile organ.Breast Cancer Res 7:245–251.
Hovey RC, McFadden TB, Akers RM. 1999.Regulation of mammary gland growthand morphogenesis by the mammary fatpad: a species comparison. J MammaryGland Biol Neoplasia 4:53–68.
Hu X, Juneja SC, Maihle NJ, Cleary MP.2002. Leptin-a growth factor in normaland malignant breast cells and for nor-mal mammary gland development.J Natl Cancer Inst 94:1704–1711.
Ingman WV, Wyckoff J, Gouon-Evans V, Con-deelis J, Pollard JW. 2006. Macrophagespromote collagen fibrillogenesis around ter-minal end buds of the developing mammarygland. Dev Dyn 235:3222–3229.
Kugyelka JG, Rasmussen KM, FrongilloEA. 2004. Maternal obesity is negativelyassociated with breastfeeding successamong Hispanic but not Black women. JNutr 134:1746–1753.
Lanigan F, O’Connor D, Martin F, GallagherWM. 2007. Molecular links between mam-mary gland development and breast can-cer. Cell Mol Life Sci 64:3159–3184.
Lund LR, Romer J, Thomasset N, SolbergH, Pyke C, Bissell MJ, Dano K, Werb Z.1996. Two distinct phases of apoptosis inmammary gland involution: proteinase-independent and -dependent pathways.Development 122:181–193.
Malik NM, Carter ND, Murray JF, Scar-amuzzi RJ, Wilson CA, Stock MJ. 2001.
Leptin requirement for conception, im-plantation, and gestation in the mouse.Endocrinology 142:5198–5202.
Mallepell S, Krust A, Chambon P, BriskenC. 2006. Paracrine signaling through theepithelial estrogen receptor alpha is re-quired for proliferation and morphogen-esis in the mammary gland. Proc NatlAcad Sci USA 103:2196–2201.
Motta M, Accornero P, Taulli R, Bernabei P,Desrivieres S, Baratta M. 2007. Leptin en-hances STAT-3 phosphorylation in HC11cell line: effect on cell differentiation and cellviability. Mol Cell Endocrinol 263:149–155.
Pollard JW. 2001. Tumour-stromal interac-tions transforming growth factor-� isoformsand hepatocyte growth factor/scatter factorin mammary gland ductal morphogenesis.Breast Cancer Res 3:230–237
Rasmussen KM, Hilson JA, Kjolhede CL.2001. Obesity may impair lactogenesisII. J Nutr 131:3009S–3011S.
Richert MM, Schwertfeger KL, Ryder JW,Anderson SM. 2000. An atlas of mousemammary gland development. J Mam-mary Gland Biol Neoplasia 5:227–241.
Ronti T, Lupattelli G, Mannarino E. 2006.The endocrine function of adipose tissue:an update. Clin Endocrinol 64:355–365.
Ruan W, Kleinberg DL. 1999. Insulin-likegrowth factor I is essential for terminalend bud formation and ductal morpho-genesis during mammary development.Endocrinology 140:5075–5081.
Sergeant N, Lyon M, Rudland PS, FernigDG, Delehedde M. 2000. Stimulation ofDNA synthesis and cell proliferation ofhuman mammary myoepithelial-likecells by hepatocyte growth factor/scatterfactor depends on heparan sulfate pro-teoglycans and sustained phosphoryla-tion of mitogen-activated protein kinasesp42/44. J Biol Chem 275:17094–17099.
Silva LF, VandeHaar MJ, Weber NielsenMS, Smith GW. 2002. Evidence for a lo-cal effect of leptin in bovine mammarygland. J Dairy Sci 85:3277–3286.
Sternlicht MD, Kouros-Mehr H, Lu P,Werb Z. 2006. Hormonal and local con-trol of mammary branching morphogen-esis. Differentiation 74:365–381.
Weisberg SP, McCann D, Desai M, Rosen-baum M, Leibel RL, Ferrante AW, Jr.2003. Obesity is associated with macro-phage accumulation in adipose tissue.J Clin Invest 112:1796–1808.
Wiseman BS, Sternlicht MD, Lund LR, Al-exander CM, Mott J, Bissell MJ, SolowayP, Itohara S, Werb Z. 2003. Site-specificinductive and inhibitory activities ofMMP-2 and MMP-3 orchestrate mam-mary gland branching morphogenesis.J Cell Biol 162:1123–1133.
Yamaji D, Kamikawa A, Soliman MM, Ito T,Ahmed MM, Makondo K, Watanabe A,Saito M, Kimura K. 2007. Leptin inhibitshepatocyte growth factor-induced ductalmorphogenesis of bovine mammary epi-thelial cells. Jpn J Vet Res 54:183–189.
Yu WH, Kimura M, Walczewska A, KaranthS, McCann SM. 1997. Role of leptin in hypo-thalamic-pituitary function. Proc Natl AcadSci USA 94:1023–1028.
MAMMARY DEVELOPMENT IN NONPREGNANT OBESE MICE 1099
Copyright © 2022 FDOKUMEN