Novel Approaches for the Production & Analysis of Biological ...
211
Novel Approaches to the Production & Analysis of Biological Nanomaterials for Serial-Femtosecond X-ray Crystallography Dissertation zur Erlangung des Doktorgrades an der Fakult¨ at Mathematik, Informatik und Naturwissenschaften Fachbereich Physik der Universit¨ at Hamburg vorgelegt von Thomas Seine Hamburg 2018
-
Upload
khangminh22 -
Category
Documents
-
view
0 -
download
0
Transcript of Novel Approaches for the Production & Analysis of Biological ...
Novel Approaches to the Production & Analysis of
Biological Nanomaterials for Serial-Femtosecond X-ray
Crystallography
Dissertationzur Erlangung des Doktorgrades
an der Fakultat Mathematik, Informatik und NaturwissenschaftenFachbereich Physik
der Universitat Hamburg
vorgelegt vonThomas Seine
Hamburg2018

Examination copy
Author e-mail: [email protected]
Gutachter/innen der Dissertation: Prof. Dr. Henry ChapmanProf. Dr. Matthias Wilmanns
Zusammensetzung der Prüfungskommission: Prof. Dr. Daniela PfannkucheProf. Dr. Arwen PearsonProf. Dr. Henry ChapmanProf. Dr. Matthias WilmannsProf. Dr. Lars Redecke
Vorsitzende/r der Prüfungskommission: Prof. Dr. Daniela Pfannkuche
Datum der Disputation -
Vorsitzender Fach-Promotionsausschuss PHYSIK: Prof. Dr. Wolfgang Hansen
Leiter des Fachbereichs PHYSIK: Prof. Dr. Michael Potthoff
Dekan der Fakultät MIN: Prof. Dr. Heinrich Graener

Eidesstattliche Versicherung /Declaration on Oath
Hiermit versichere ich an Eides statt, die vorliegende Dissertationsschrift selbstverfasst und keine anderen als die angegebenen Hilfsmittel und Quellen benutztzu haben.
Die eingereichte schriftliche Fassung entspricht der auf dem elektronischenSpeichermedium.
Die Dissertation wurde in der vorgelegten oder einer ähnlichen Form nichtschon einmal in einem früheren Promotionsverfahren angenommen oder alsungenügend beurteilt.
Hamburg, den 02.05.2018

Discere ne cessa, cura sapientia crescat.-Disticha catonis

Summary
T remendous effort has recently been put into the development of novelmethods and techniques in the realm of serial-femtosecond x-ray crys-
tallography (SFX) and x-ray free-electron lasers (XFEL). This thesis strivesto contribute to current research approaches. This is done by focusing onthe exploration of methods that can accommodate the increasing demand fornano-sized samples in serial data collection.The presented research focuses on the investigation of the peroxisomal system ofthe budding yeast species H. polymorpha and S. cerevisiae in particular. Bothare potential in vivo factories and carriers of crystalline material from heterol-ogously expressed proteins. The outstanding features of the yeast eukaryoticsystems, their size, robustness and versatility indicate optimal conditions forsuch efforts. Using the example of naturally-occuring peroxisomal AOX crystalsin the yeast H. polymorpha, it is shown that meaningful diffraction data canbe obtained at modern XFEL sources via the injection of whole yeast cells intothe x-ray beam. The yeast systems demonstrate robustness under the appliedharsh experimental conditions (injection via a GDVN nozzle). Thus, proofis given that yeast cells are a suitable envelope to protect fragile, nano-sizedprotein crystals. To build up on the idea of creating a productive in vivo’crystal factory’, it is further shown how to characterize in vivo crystals bymeans of synchrotron powder diffraction and a Williamson-Hall analysis.These methods enable to quantify crystal domain sizes and strain and can beused in future attempts to evaluate and optimize crystal quality ahead of FELexperiments.It has also been demonstrated how to obtain superoxide dismutase 1 (SOD1)amyloid-fibers, so as to provide suitable samples for serial data collection fromnon-crystalline material. In relation to results from dynamic light scattering(DLS), electron microscopy (EM) and fluorescence-binding assays (ThT as-say), possible mechanisms are discussed by which protein fibers are formed.Moreover, it has been attempted to utilize the optimized fiber sample for serialfemtosecond fiber diffraction at a XFEL source.In order to investigate the accumulation and possible nucleation/crystallizationof heterologously expressed proteins in the peroxisomal environment, a newapproach has been developed. It relies on the combination of intraperoxisomal,fluorescent probe molecules and the observation of their steady-state fluores-cence anisotropy. A theoretical model is developed to which experimentaldata can be compared in terms of fluorescence anisotropy and energy transfer.Using the example of the protein EGFP it is shown that yeast cells requirefurther genetic engineering to corroborate the hypothesis of an ever-increasingintraperoxisomal protein concentration. Consequently, the occurrence of AOXcrystals seems also not to be induced by extremely high protein concentrations.Proceeding from the established anisotropy method, a gedankenexperimentis conducted to demonstrate the possibility to distinguish protein clustersfrom crystals in case the influence of the FRET orientation factor κ2 is beingconsidered in measurements of fluorescence anisotropy and homoFRET.
Zusammenfassung
I m Überschneidungsbereich der seriellen Kristallographie und der An-wendung ultrakurzer Röntgenpulse an Freie-Elektronen-Lasern gab es
zuletzt wesentliche technische Fortschritte und Neuentwicklungen. Mit der hiervorgelegten Arbeit wird angestrebt, einen Beitrag zu eben diesen Entwicklun-gen zu leisten. Dies ist umgesetzt durch die Erforschung neuer Methodikendie die verlässliche Produktion von benötigten Proben im Nanometerbereichermöglichen.Im Speziellen widmet sich die Arbeit der Erforschung des peroxisomalen Sys-tems der Hefen H. polymorpha und S. cerevisiae. Die damit verbundenenMöglichkeiten, dieses als Produktionsstätte und Schutzsystem für kristallisierte,heterolog-exprimierte Proteine zu nutzen, werden im Detail untersucht. Diebekannten Eigenschaften dieses Systems, speziell seine Größe, Robustheit undVielseitigkeit, unterstreichen die gute Einsetzbarkeit dieses eukaryotischenSystems. Am Beispiel von natürlich vorkommenden AOX Kristallen in denPeroxisomen der Hefe H. polymorpha wird zunächst gezeigt, dass es möglich ist,klare Diffraktionsbilder von eben diesen zu erhalten, sogar wenn die Hefezellenals Ganzes auf den Röntgenstrahl treffen. Dabei wird die außerordentlicheFähigkeit des Systems deutlich, die fragilen Proteinkristalle auch unter denharschen experimentellen Bedingungen solcher Versuche zu erhalten. Auf-bauend auf der Idee einer Hefe-basierten "Kristallfabrik" wird in dieser Arbeitebenfalls gezeigt, wie sich in vivo Nanokristalle bereits durch Synchroton-basierte Pulverdiffraktion charakterisieren lassen. Darüber hinaus wird eineWilliamson-Hall Analyse eingesetzt, um eine Möglichkeit aufzuzeigen, diegewonnenen Daten hinsichtlich der Größe von Kristalldomänen und Verzerrun-gen im Kristallgitter bereits im Vorfeld von FEL Experimenten zu untersuchen.Im Bestreben, auch an nicht-kristallinen Proben Forschung zu betreiben, wird ineinem letzten Abschnitt auf die erfolgreiche Produktion von SOD1 Amyloidfib-rillen eingegangen. Mit Bezug auf Ergebnisse aus verschiedensten Methodiken(DLS, EM, ThT Experiment) wird der Mechanismus diskutiert, durch densich stabile Fibrillen produzieren lassen. Es wurde auch versucht, diese inExperimenten der seriellen Diffraktion an XFEL-Röntgenquelle zu nutzen.Des Weiteren wird eine neue Methodik präsentiert, die es ermöglicht, dieAkkumulation und ggf. Nukleation/Kristallisation von heterolog-exprimiertenProteinen im peroxisomalen System zu untersuchen. Sie basiert auf der Kom-bination von fluoreszenten Probemolekülen in Peroxisomen und der Messungvon Fluoreszenzanisotropie und Resonanzenergietransfer. Dabei wird zunächstein theoretisches Modell entwickelt, um diese Parameter genau zu beschreibenund um sie dann in einem weiteren Schritt mit experimentellen Daten zuvergleichen. Am Beispiel von EGFP ist es so möglich nachzuweisen, dass dieaufgestellte Hypothese von sehr hohen Proteinkonzentrationen unter den exper-imentellen Bedingungen nicht verifiziert kann. Offenbar ist die Kristallisationvon AOX in Peroxisomen nur bedingt abhängig von größeren Mengen desProteins. Ebenso scheint es unerlässlich, weitere genetische Modifikationenam Hefesystem vorzunehmen, um auch Kristallisationsbedingungen für andereProteine zu schaffen. Ausgehend von diesen Untersuchungen wurde auch einkurzes Gedankenexperiment durchgeführt, in dem die Möglichkeit aufgezeigtwird, Proteinansammlungen von Proteinkristallen zu unterscheiden. Hierbeiwird der Einfluss des FRET Orientierungsfaktors κ2 diskutiert.

Acknowledgments
I t seems to me that the scientific method, the constant search for answers,is the most important, fate-changing momentum in human history. We
should never be too scared "to boldly go where no man has gone before"1.Likewise, we should also never forget that science is borne by humans, not justby itself. The past four years have been a long and interesting journey. Notonly did I learn more about science, but I am also especially grateful for manyfriendly encounters, for numerous help- or cheerful words and conversations.Now, it is time for me to move on to meet new challenges. Therefore, I wouldlike to thank those who accompanied me during the past years.
Firstly, I want to thank my two supervisors Prof. Dr. Henry Chapmanand Prof. Dr. Matthias Wilmanns for all the given opportunities. It hasbeen a truly adventurous time and an honor to work in such a flourishingenvironment, to be able to collaborate with scientists from all over the worldand to take part in the groundbreaking research in the field of x-ray diffraction.It has been especially fascinating to carry out scientific experiments at modernfree-electron laser facilities in Japan and the USA. It has been an experience Iwill never forget.
Secondly, it is vital to thank Margret Fischer and Irmtraud Kleine, whoboth took care of countless organizational issues during my time at EMBL andCFEL. In the same breath, I also want to say thank you to my graduate school"The Centre for Ultrafast Imaging" (CUI) for their outstanding organizationalsupport.
I would also like to thank many of my former/current colleagues and col-laborators for their support. Most notably, Prof. Dr. Wolfgang Schliebs, Dr.Alke Meents, Dr. Miriam Barthelmeß and Dr. Leonard Chavas. All of youwere able provide me with new perspectives. This is also true for many newand old friends. Especially Dr. Robin Schubert, Julius Nitsche and PhilippHornburg who share my enthusiasm for science.
Concerning my private life I am also really thankful for the infinite support ofmy family, especially for the constant faith of my mother.At long last, I want to thank the most important person in my life. Miriam,you have been the bastion of calm, you have taken away my fears and troubleswhenever I was struggling. I would not have mastered the past journey withoutyour unconditional love.
1Yes, a Star Trek quote.
Contents
List of Figures iii
List of Tables xii
List of Abbreviations xv
I Motivation 1
II Introduction 2
1 Modern X-ray Crystallography 21.1 A Brief History . . . . . . . . . . . . . . . . . . . . . . . . . . . 21.2 Advanced X-ray Sources . . . . . . . . . . . . . . . . . . . . . . 41.3 Theory of Protein Crystal Diffraction . . . . . . . . . . . . . . . 61.4 Serial Femtosecond X-ray Crystallography (SFX) . . . . . . . . 111.5 Principles of Protein- Nucleation & Crystallization . . . . . . . 13
2 Budding Yeast & The Crystal Factory 162.1 Budding Yeast in Heterologous Gene Expression . . . . . . . . 162.2 The Peroxisomal System of S. cerevisiae & H. polymorpha . . . 172.3 In Vivo Protein Crystallization . . . . . . . . . . . . . . . . . . 19
3 Fluorescence Anisotropy & Energy Transfer 213.1 Principles of Fluorescence Anisotropy . . . . . . . . . . . . . . 213.2 Förster Resonance Energy Transfer (FRET) . . . . . . . . . . . 22
III Materials & Methods 27
4 X-ray Diffraction Experiments 274.1 In Cellulo Powder Diffraction at Synchrotron X-Ray Sources . 274.2 Williamson-Hall Analysis . . . . . . . . . . . . . . . . . . . . . 28
5 Sample Purification & Characterization 305.1 General Laboratory Equipment . . . . . . . . . . . . . . . . . . 305.2 Chromatography for Batch Protein Purification . . . . . . . . . 315.3 Dynamic Light Scattering (DLS) . . . . . . . . . . . . . . . . . 315.4 Electron Microscopy (EM) . . . . . . . . . . . . . . . . . . . . . 31
i
5.5 SDS-Polyacrylamide Gel Electrophoresis . . . . . . . . . . . . . 32
6 Yeast Cultivation & Genetic Engineering 336.1 H. polymorpha & S. cerevisiae Yeast Strains . . . . . . . . . . . 336.2 Nutritional Supplements & Cellular Growth . . . . . . . . . . . 346.3 Molecular Cloning . . . . . . . . . . . . . . . . . . . . . . . . . 386.4 Electroporation of Budding Yeast . . . . . . . . . . . . . . . . . 416.5 Purification of Peroxisomes . . . . . . . . . . . . . . . . . . . . 44
7 Fluorescence-based Assays 487.1 Fluorescence Microscopy . . . . . . . . . . . . . . . . . . . . . . 487.2 Thioflavin T- Protein Fiber Assay . . . . . . . . . . . . . . . . 507.3 Fluorescence Anisotropy & Plate Reader-based Screening . . . 51
IV Results & Discussion 54
8 Engineering the Peroxisomal Crystal Factory 548.1 AOX Purification & Verification of PAOX Induction . . . . . . . 548.2 In vitro Re-Crystallization of Alcohol Oxidase . . . . . . . . . . 598.3 Creation of Genetically-modified H. polymorpha Strains . . . . 608.4 Heterologous Expression & Peroxisomal Targeting of Proteins
in the Yeast S. cerevisiae & H. polymorpha . . . . . . . . . . . 62
9 Probing Target Crystallization in the Peroxisomal Crystal Fac-tory 679.1 Synchrotron-based Powder Diffraction for In Cellulo Nano-
Crystal Analysis . . . . . . . . . . . . . . . . . . . . . . . . . . 679.1.1 Optimal X-Ray Powder Diffraction From Yeast In Vivo
Samples . . . . . . . . . . . . . . . . . . . . . . . . . . . 679.1.2 Estimation of the Minimal Detectable Volume Fraction
of Crystalline Material in a Yeast Powder . . . . . . . . 719.1.3 Williamson-Hall Analysis to Characterize Domain Size
& Strain . . . . . . . . . . . . . . . . . . . . . . . . . . . 729.2 Powder Diffraction Analysis of Various Yeast Samples . . . . . 76
10 Proof of Principle Experiments for Yeast In Vivo Diffractionat XFELs 7810.1 Purification of Mature Peroxisomes from Yeast Cells . . . . . . 7810.2 Size Distribution Analysis of Purified Yeast Peroxisomes via DLS 8110.3 Verification of Sample Crystallinity by Electron Microscopy . . 8510.4 Testing Yeast Cell- Beam Injection via Liquid Jets . . . . . . . 8710.5 SFX Experiments with In Cellulo Alcohol Oxidase (AOX) Nano-
Crystals . . . . . . . . . . . . . . . . . . . . . . . . . . . . . . . 89
11 Revealing Properties of the Peroxisomal Crystal Factory 9211.1 In Cellulo Steady-State Fluorescence Anisotropy as an Analysis
Tool . . . . . . . . . . . . . . . . . . . . . . . . . . . . . . . . . 9211.1.1 Theoretical Framework for Protein Concentration Anal-
ysis by Fluorescence Anisotropy . . . . . . . . . . . . . . 9311.1.2 EGFP as a Responsive Probe in Steady-State Anisotropy10211.1.3 Measurement of In Cellulo Anisotropy Data . . . . . . . 108
ii

11.1.4 Anisotropy-based Analysis of Intraperoxisomal TargetProtein Concentrations in Yeast Batch Cultures . . . . 113
11.2 Localization & Distribution Analysis of SKL-tagged EGFP viaFluorescence Microscopy . . . . . . . . . . . . . . . . . . . . . . 121
11.3 Development & Application of an In Vivo Crystallization Con-dition Screen . . . . . . . . . . . . . . . . . . . . . . . . . . . . 12711.3.1 In situ Quenching of Flavin-like Species Allows for Easy
Fluorescence Readout . . . . . . . . . . . . . . . . . . . 12711.3.2 A Reliable Plate Reader-based Readout of Fluorescence
& Anisotropy . . . . . . . . . . . . . . . . . . . . . . . . 13111.3.3 Introducing System Perturbations for Supportive Crys-
tallization Conditions . . . . . . . . . . . . . . . . . . . 131
12 Implications from Fluorescence Anisotropy for Protein Crys-tallography 13612.1 Short-Range Order Permits Variations of the Orientation Factor
κ2 . . . . . . . . . . . . . . . . . . . . . . . . . . . . . . . . . . 13712.2 FRET Orientation Factor in a P212121- EGFP Crystal . . . . . 13812.3 Prerequisites for the Differentiation of Protein Crystals & Clusters14012.4 Application of Anisotropy-based Crystal Identification . . . . . 141
13 In Vitro Production of Protein-Nanofibers for Diffraction Ex-periments at XFELs 14313.1 Optimization of SOD1-Amyloid Fiber Formation . . . . . . . . 143
13.1.1 Investigation of Fiber Formation via Thioflavin T Assay 14413.1.2 Investigation of SOD1 Fiber Formation via DLS . . . . 14613.1.3 Identification of Particle Species by Electron Microscopy 147
13.2 Serial-Femtosecond Fiber Diffraction Experiments with SOD1Amyloids . . . . . . . . . . . . . . . . . . . . . . . . . . . . . . 149
V Conclusions 151
A Appendix 157
References 165
List of Related Publications 181
iii
List of Figures
1.1 First demonstration of x-ray crystallography (A) Experimentalsetup with x-ray bulb, goniometer and photographic film (B)First diffraction recorded after narrowing beam slit size; Imagetaken from: [5] . . . . . . . . . . . . . . . . . . . . . . . . . . . 2
1.2 Geometrical explanation of x-ray reflection spots via latticeplanes in a stereographic projection (A) Geometrical derivationfor diffraction from a lattice plane (B) Projected spots of apotassium chloride crystal with assigned Laue indices hkl; Imagetaken from: [4] . . . . . . . . . . . . . . . . . . . . . . . . . . . 3
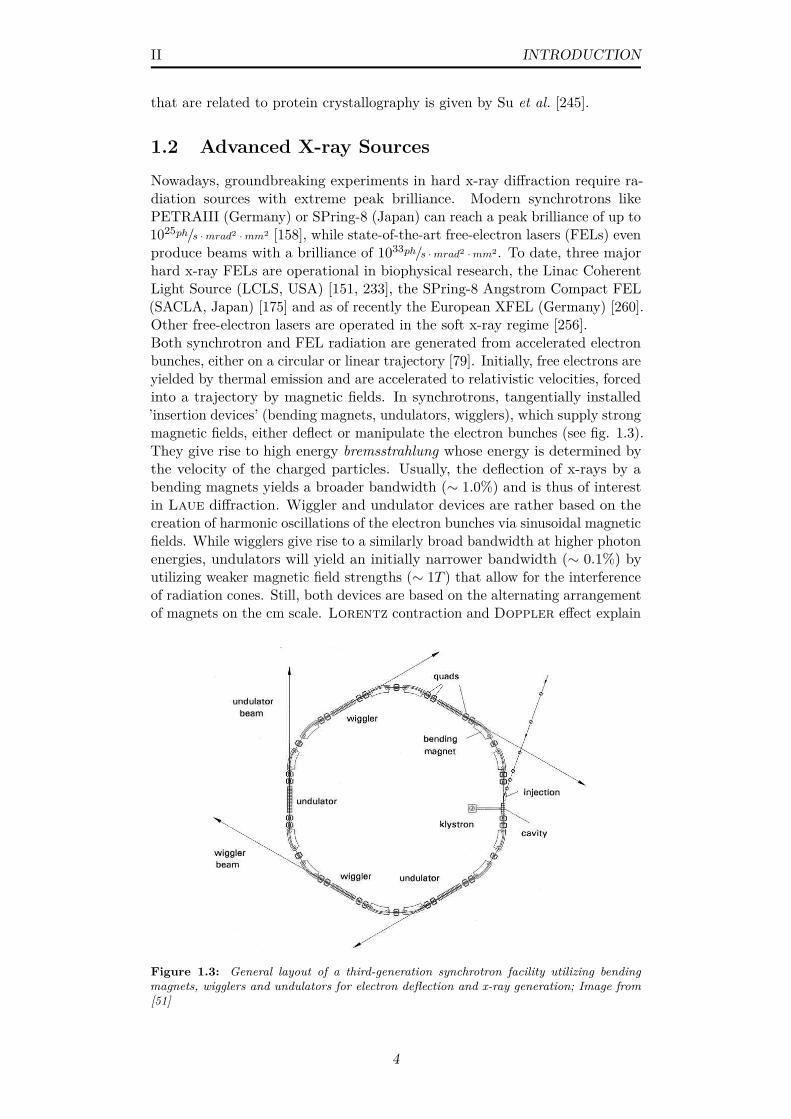
1.3 General layout of a third-generation synchrotron facility utilizingbending magnets, wigglers and undulators for electron deflectionand x-ray generation; Image from [51] . . . . . . . . . . . . . . 4
1.4 Schematic representation of SASE microbunching of electronsand gain in radiative power via increasing coherence . . . . . . 5
1.5 Unit cells of centered bases and their symbols, The numbersspecify by which factor the unit cell is enlarged relative to thecorresponding primitive cell; Image from [190] . . . . . . . . . . 7
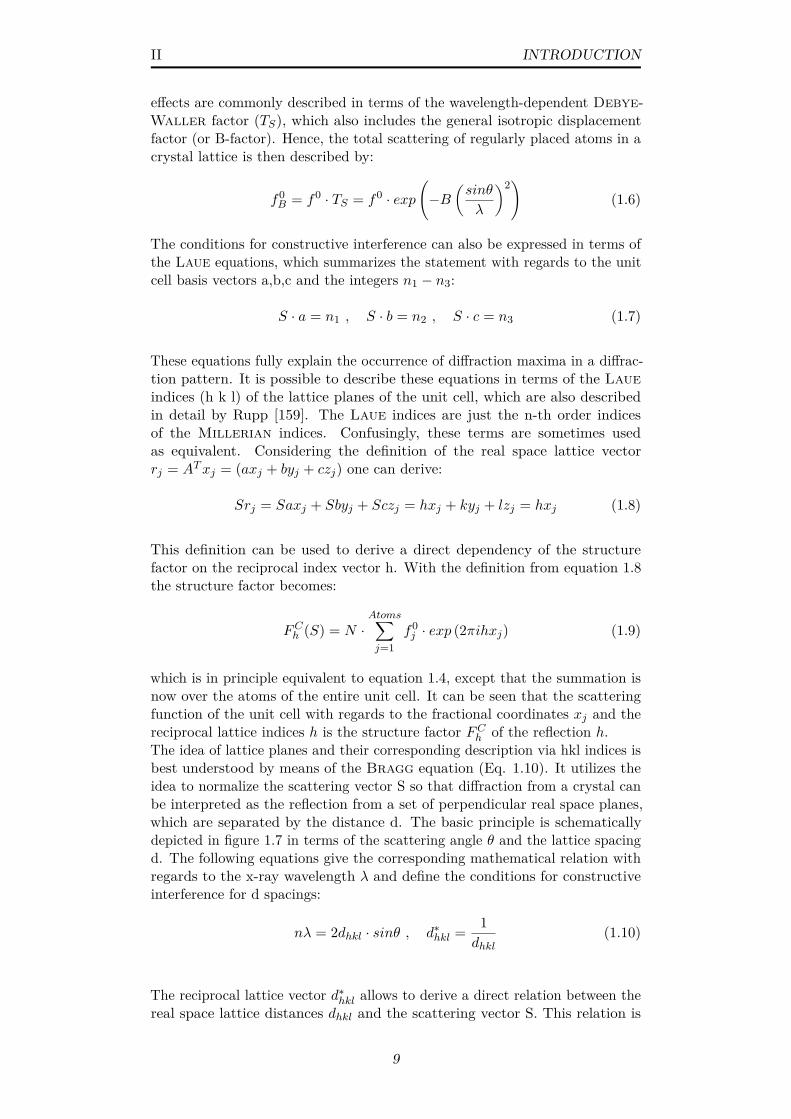
1.6 Schematic depiction of diffraction interpreted as originatingfrom crystal lattice planes (P1, P2) at an angle of incidence θand lattice spacing d, IW: incoming wave, OW: outgoing wave;Usually described in terms of the Bragg equation (Eq. 1.10) . 10
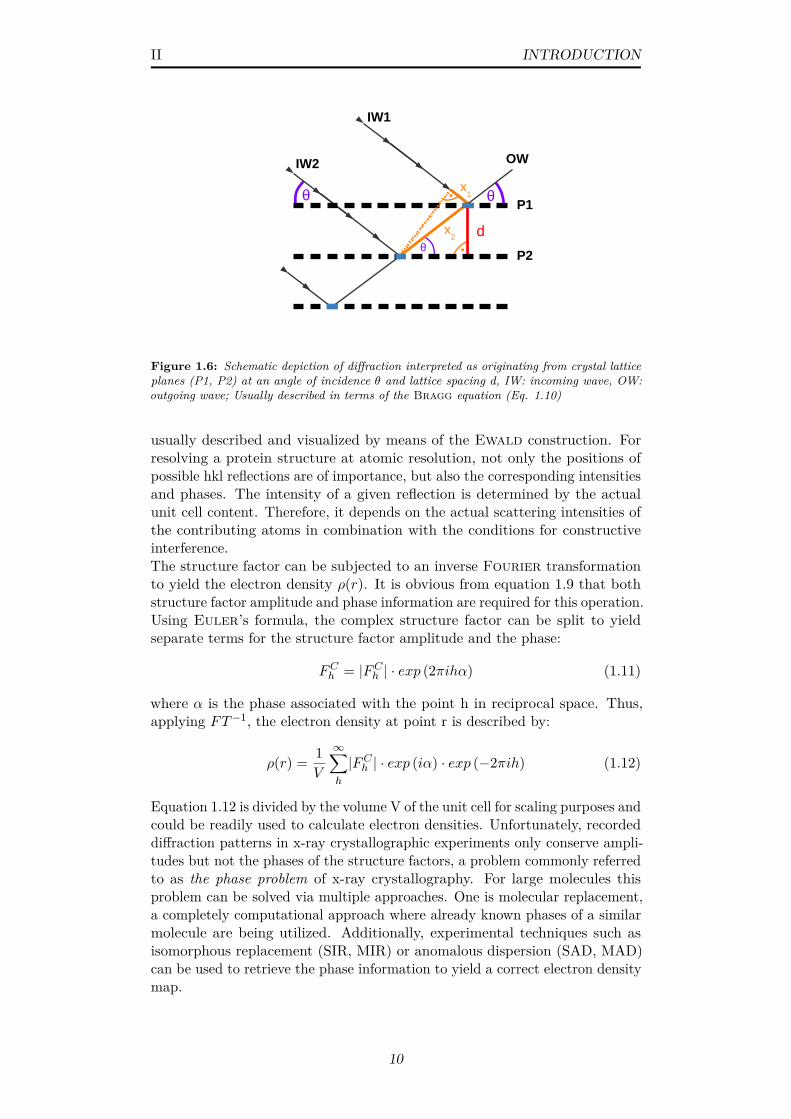
1.7 Schematic representation of typical sample delivery methodsin SFX (A) Injection in a liquid jet via nozzles (B) Sampledelivery in a loop or fixed-target device; Image adapted from [254] 12
1.8 Schematic representation of the protein crystallization phasediagram; Image from [127] . . . . . . . . . . . . . . . . . . . . . 13
2.1 Schematic representation of intracellular peroxisome biogenesis& pexophagy in H. polymorpha wildtype, ∆PEX5 and ∆PEX11strains under methanol growth conditions . . . . . . . . . . . . 18
2.2 Examples of successful in vivo crystallization upon heterologousexpression (A) Firefly luciferase crystals in Sf9 insect cells [244](B) Hex-1 crystals in S. cerevisiae cells [140] (C) CryA3 toxincrystals in B.t. cells [217] . . . . . . . . . . . . . . . . . . . . . 19
iv
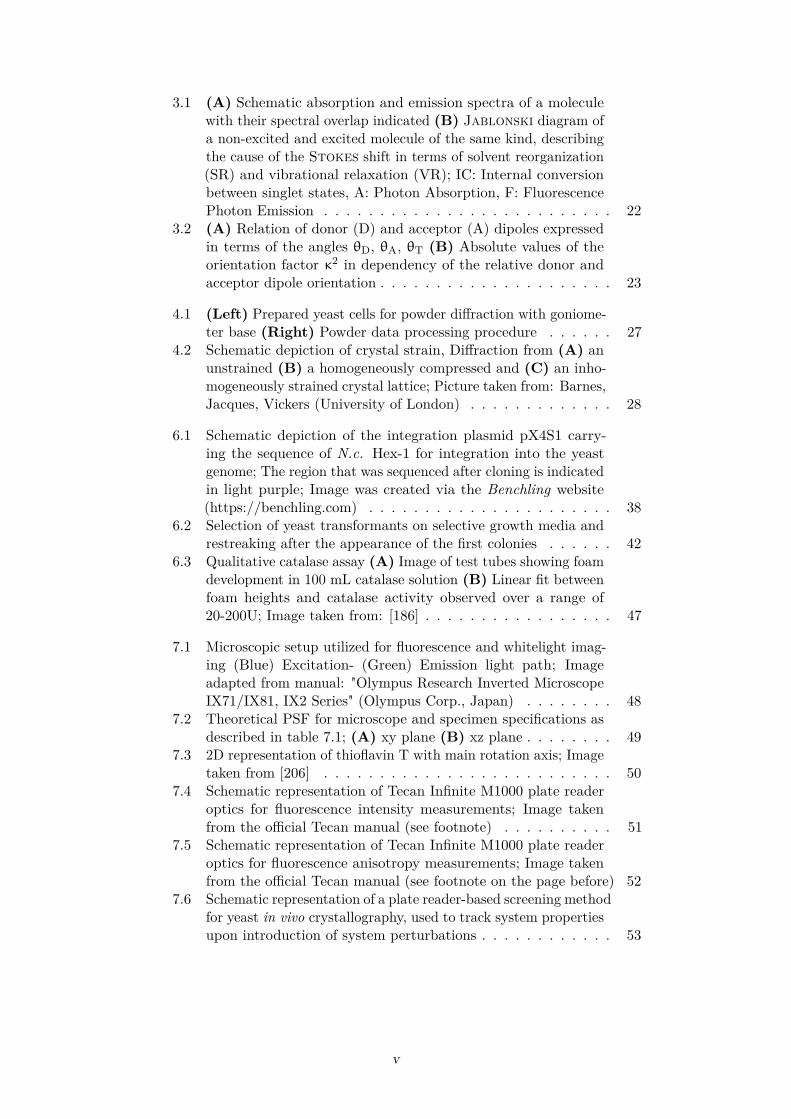
3.1 (A) Schematic absorption and emission spectra of a moleculewith their spectral overlap indicated (B) Jablonski diagram ofa non-excited and excited molecule of the same kind, describingthe cause of the Stokes shift in terms of solvent reorganization(SR) and vibrational relaxation (VR); IC: Internal conversionbetween singlet states, A: Photon Absorption, F: FluorescencePhoton Emission . . . . . . . . . . . . . . . . . . . . . . . . . . 22
3.2 (A) Relation of donor (D) and acceptor (A) dipoles expressedin terms of the angles θD, θA, θT (B) Absolute values of theorientation factor κ2 in dependency of the relative donor andacceptor dipole orientation . . . . . . . . . . . . . . . . . . . . . 23
4.1 (Left) Prepared yeast cells for powder diffraction with goniome-ter base (Right) Powder data processing procedure . . . . . . 27
4.2 Schematic depiction of crystal strain, Diffraction from (A) anunstrained (B) a homogeneously compressed and (C) an inho-mogeneously strained crystal lattice; Picture taken from: Barnes,Jacques, Vickers (University of London) . . . . . . . . . . . . . 28
6.1 Schematic depiction of the integration plasmid pX4S1 carry-ing the sequence of N.c. Hex-1 for integration into the yeastgenome; The region that was sequenced after cloning is indicatedin light purple; Image was created via the Benchling website(https://benchling.com) . . . . . . . . . . . . . . . . . . . . . . 38
6.2 Selection of yeast transformants on selective growth media andrestreaking after the appearance of the first colonies . . . . . . 42
6.3 Qualitative catalase assay (A) Image of test tubes showing foamdevelopment in 100 mL catalase solution (B) Linear fit betweenfoam heights and catalase activity observed over a range of20-200U; Image taken from: [186] . . . . . . . . . . . . . . . . . 47
7.1 Microscopic setup utilized for fluorescence and whitelight imag-ing (Blue) Excitation- (Green) Emission light path; Imageadapted from manual: "Olympus Research Inverted MicroscopeIX71/IX81, IX2 Series" (Olympus Corp., Japan) . . . . . . . . 48
7.2 Theoretical PSF for microscope and specimen specifications asdescribed in table 7.1; (A) xy plane (B) xz plane . . . . . . . . 49
7.3 2D representation of thioflavin T with main rotation axis; Imagetaken from [206] . . . . . . . . . . . . . . . . . . . . . . . . . . 50
7.4 Schematic representation of Tecan Infinite M1000 plate readeroptics for fluorescence intensity measurements; Image takenfrom the official Tecan manual (see footnote) . . . . . . . . . . 51
7.5 Schematic representation of Tecan Infinite M1000 plate readeroptics for fluorescence anisotropy measurements; Image takenfrom the official Tecan manual (see footnote on the page before) 52
7.6 Schematic representation of a plate reader-based screening methodfor yeast in vivo crystallography, used to track system propertiesupon introduction of system perturbations . . . . . . . . . . . . 53
v
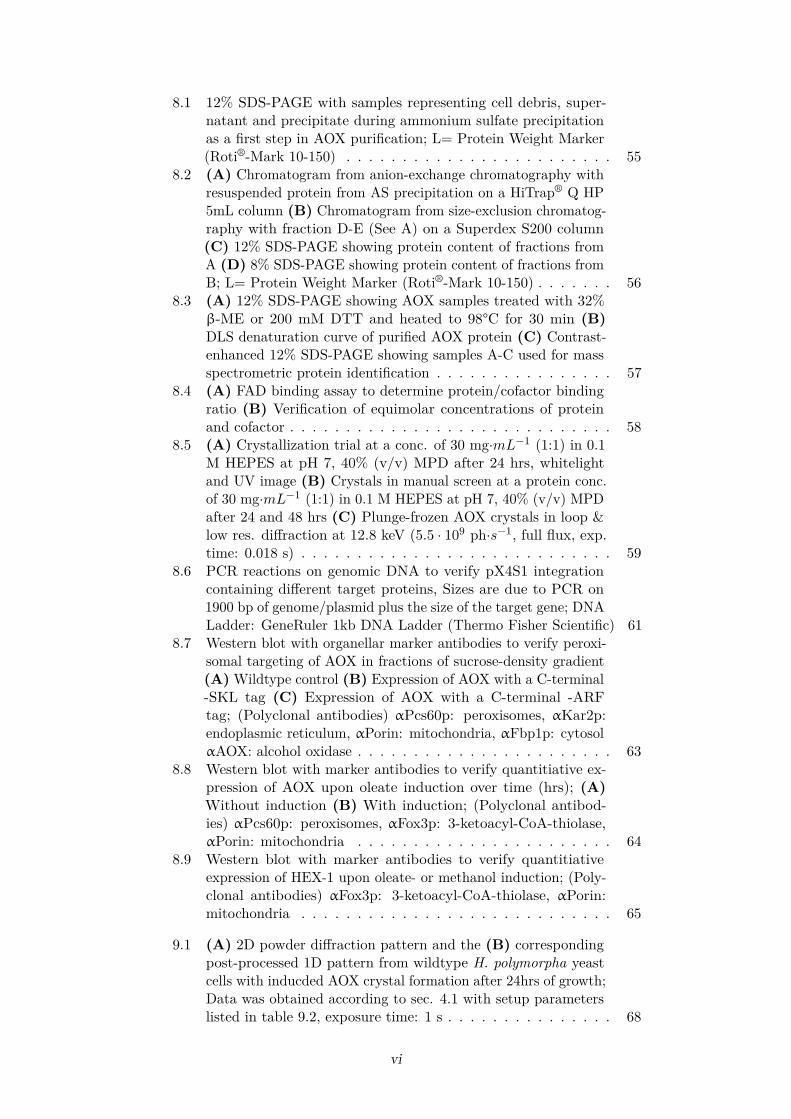
8.1 12% SDS-PAGE with samples representing cell debris, super-natant and precipitate during ammonium sulfate precipitationas a first step in AOX purification; L= Protein Weight Marker(Roti®-Mark 10-150) . . . . . . . . . . . . . . . . . . . . . . . . 55
8.2 (A) Chromatogram from anion-exchange chromatography withresuspended protein from AS precipitation on a HiTrap® Q HP5mL column (B) Chromatogram from size-exclusion chromatog-raphy with fraction D-E (See A) on a Superdex S200 column(C) 12% SDS-PAGE showing protein content of fractions fromA (D) 8% SDS-PAGE showing protein content of fractions fromB; L= Protein Weight Marker (Roti®-Mark 10-150) . . . . . . . 56
8.3 (A) 12% SDS-PAGE showing AOX samples treated with 32%β-ME or 200 mM DTT and heated to 98°C for 30 min (B)DLS denaturation curve of purified AOX protein (C) Contrast-enhanced 12% SDS-PAGE showing samples A-C used for massspectrometric protein identification . . . . . . . . . . . . . . . . 57
8.4 (A) FAD binding assay to determine protein/cofactor bindingratio (B) Verification of equimolar concentrations of proteinand cofactor . . . . . . . . . . . . . . . . . . . . . . . . . . . . . 58
8.5 (A) Crystallization trial at a conc. of 30 mg·mL−1 (1:1) in 0.1M HEPES at pH 7, 40% (v/v) MPD after 24 hrs, whitelightand UV image (B) Crystals in manual screen at a protein conc.of 30 mg·mL−1 (1:1) in 0.1 M HEPES at pH 7, 40% (v/v) MPDafter 24 and 48 hrs (C) Plunge-frozen AOX crystals in loop &low res. diffraction at 12.8 keV (5.5 · 109 ph·s−1, full flux, exp.time: 0.018 s) . . . . . . . . . . . . . . . . . . . . . . . . . . . . 59
8.6 PCR reactions on genomic DNA to verify pX4S1 integrationcontaining different target proteins, Sizes are due to PCR on1900 bp of genome/plasmid plus the size of the target gene; DNALadder: GeneRuler 1kb DNA Ladder (Thermo Fisher Scientific) 61
8.7 Western blot with organellar marker antibodies to verify peroxi-somal targeting of AOX in fractions of sucrose-density gradient(A) Wildtype control (B) Expression of AOX with a C-terminal-SKL tag (C) Expression of AOX with a C-terminal -ARFtag; (Polyclonal antibodies) αPcs60p: peroxisomes, αKar2p:endoplasmic reticulum, αPorin: mitochondria, αFbp1p: cytosolαAOX: alcohol oxidase . . . . . . . . . . . . . . . . . . . . . . . 63
8.8 Western blot with marker antibodies to verify quantitiative ex-pression of AOX upon oleate induction over time (hrs); (A)Without induction (B) With induction; (Polyclonal antibod-ies) αPcs60p: peroxisomes, αFox3p: 3-ketoacyl-CoA-thiolase,αPorin: mitochondria . . . . . . . . . . . . . . . . . . . . . . . 64
8.9 Western blot with marker antibodies to verify quantitiativeexpression of HEX-1 upon oleate- or methanol induction; (Poly-clonal antibodies) αFox3p: 3-ketoacyl-CoA-thiolase, αPorin:mitochondria . . . . . . . . . . . . . . . . . . . . . . . . . . . . 65
9.1 (A) 2D powder diffraction pattern and the (B) correspondingpost-processed 1D pattern from wildtype H. polymorpha yeastcells with inducded AOX crystal formation after 24hrs of growth;Data was obtained according to sec. 4.1 with setup parameterslisted in table 9.2, exposure time: 1 s . . . . . . . . . . . . . . . 68
vi
9.2 First derivative of a 1D powder diffraction pattern for 2Θ anglesbetween (A) 0.3°to 1.2°and (B) 1.2°to 2.5°; Setup parametersare listed in table 9.2, exposure time: 15 s . . . . . . . . . . . . 69
9.3 (A) 1D powder pattern of mixed phases: wildtype cells (crys-talline phase) / control cells (amorphous phase) (B) Integralbreadth decrease of 100% peak (peak 2) upon mixing with amor-phous phase; Setup parameters are listed in table 9.2, exposuretime: 1 s . . . . . . . . . . . . . . . . . . . . . . . . . . . . . . . 71
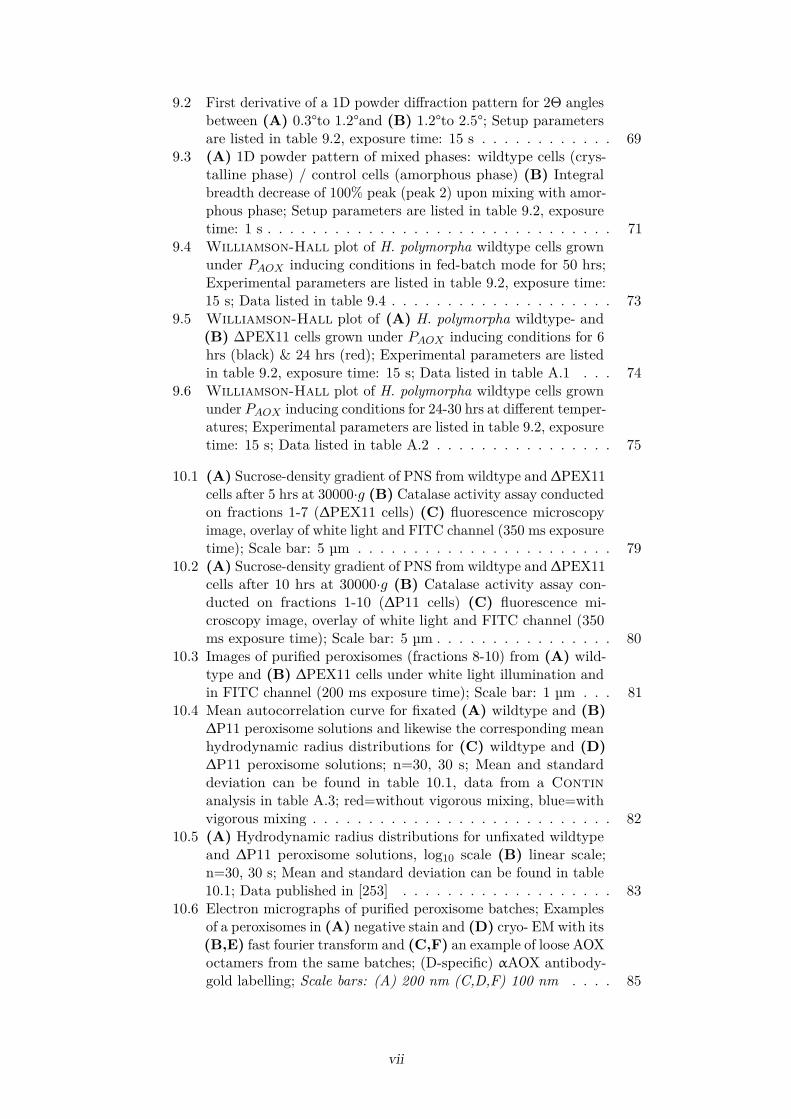
9.4 Williamson-Hall plot of H. polymorpha wildtype cells grownunder PAOX inducing conditions in fed-batch mode for 50 hrs;Experimental parameters are listed in table 9.2, exposure time:15 s; Data listed in table 9.4 . . . . . . . . . . . . . . . . . . . . 73
9.5 Williamson-Hall plot of (A) H. polymorpha wildtype- and(B) ∆PEX11 cells grown under PAOX inducing conditions for 6hrs (black) & 24 hrs (red); Experimental parameters are listedin table 9.2, exposure time: 15 s; Data listed in table A.1 . . . 74
9.6 Williamson-Hall plot of H. polymorpha wildtype cells grownunder PAOX inducing conditions for 24-30 hrs at different temper-atures; Experimental parameters are listed in table 9.2, exposuretime: 15 s; Data listed in table A.2 . . . . . . . . . . . . . . . . 75
10.1 (A) Sucrose-density gradient of PNS from wildtype and ∆PEX11cells after 5 hrs at 30000·g (B) Catalase activity assay conductedon fractions 1-7 (∆PEX11 cells) (C) fluorescence microscopyimage, overlay of white light and FITC channel (350 ms exposuretime); Scale bar: 5 µm . . . . . . . . . . . . . . . . . . . . . . . 79
10.2 (A) Sucrose-density gradient of PNS from wildtype and ∆PEX11cells after 10 hrs at 30000·g (B) Catalase activity assay con-ducted on fractions 1-10 (∆P11 cells) (C) fluorescence mi-croscopy image, overlay of white light and FITC channel (350ms exposure time); Scale bar: 5 µm . . . . . . . . . . . . . . . . 80
10.3 Images of purified peroxisomes (fractions 8-10) from (A) wild-type and (B) ∆PEX11 cells under white light illumination andin FITC channel (200 ms exposure time); Scale bar: 1 µm . . . 81
10.4 Mean autocorrelation curve for fixated (A) wildtype and (B)∆P11 peroxisome solutions and likewise the corresponding meanhydrodynamic radius distributions for (C) wildtype and (D)∆P11 peroxisome solutions; n=30, 30 s; Mean and standarddeviation can be found in table 10.1, data from a Continanalysis in table A.3; red=without vigorous mixing, blue=withvigorous mixing . . . . . . . . . . . . . . . . . . . . . . . . . . . 82
10.5 (A) Hydrodynamic radius distributions for unfixated wildtypeand ∆P11 peroxisome solutions, log10 scale (B) linear scale;n=30, 30 s; Mean and standard deviation can be found in table10.1; Data published in [253] . . . . . . . . . . . . . . . . . . . 83
10.6 Electron micrographs of purified peroxisome batches; Examplesof a peroxisomes in (A) negative stain and (D) cryo- EM with its(B,E) fast fourier transform and (C,F) an example of loose AOXoctamers from the same batches; (D-specific) αAOX antibody-gold labelling; Scale bars: (A) 200 nm (C,D,F) 100 nm . . . . 85
vii
10.7 (A,B) Electron micrographs of cryo-sections of whole H. poly-morpha yeast cells; P=Peroxisomes, M=Mitochondria, V=Vacuole,AOX=alcohol oxidase; Scale bars: (A) 500 nm (B) 200 nm . . 86
10.8 Stable liquid jets for nozzles in (A) run 10 and (B) run 11; Jetbreakup was estimated from diffuse regions . . . . . . . . . . . 88
10.9 (A) Single-crystal diffraction pattern from an AOX crystalscontained within an intact ∆PEX11 yeast cell (B) Compositepowder pattern created by a summation of individual diffractionpatterns from ∆PEX11 sample; Blue and red circles indicatethe resolution; Data published in [253] . . . . . . . . . . . . . . 90
11.1 (A) Schematic depiction of equal fluorescence intensity at differ-ent local in cellulo concentrations (B) Utilization of fluorescenceanisotropy for different purposes . . . . . . . . . . . . . . . . . 93
11.2 Schematic representation of increasing probe molecule concen-trations in an organelle; Concentration is increasing from A toC . . . . . . . . . . . . . . . . . . . . . . . . . . . . . . . . . . . 94
11.3 Krieger-Dougherty plots at different arbitrary η0 values,ranging from 0.2 to 5 cP; δ/δmax equals a total space occupancyof 74% (close packing of equal spheres) as schematically depicted 95
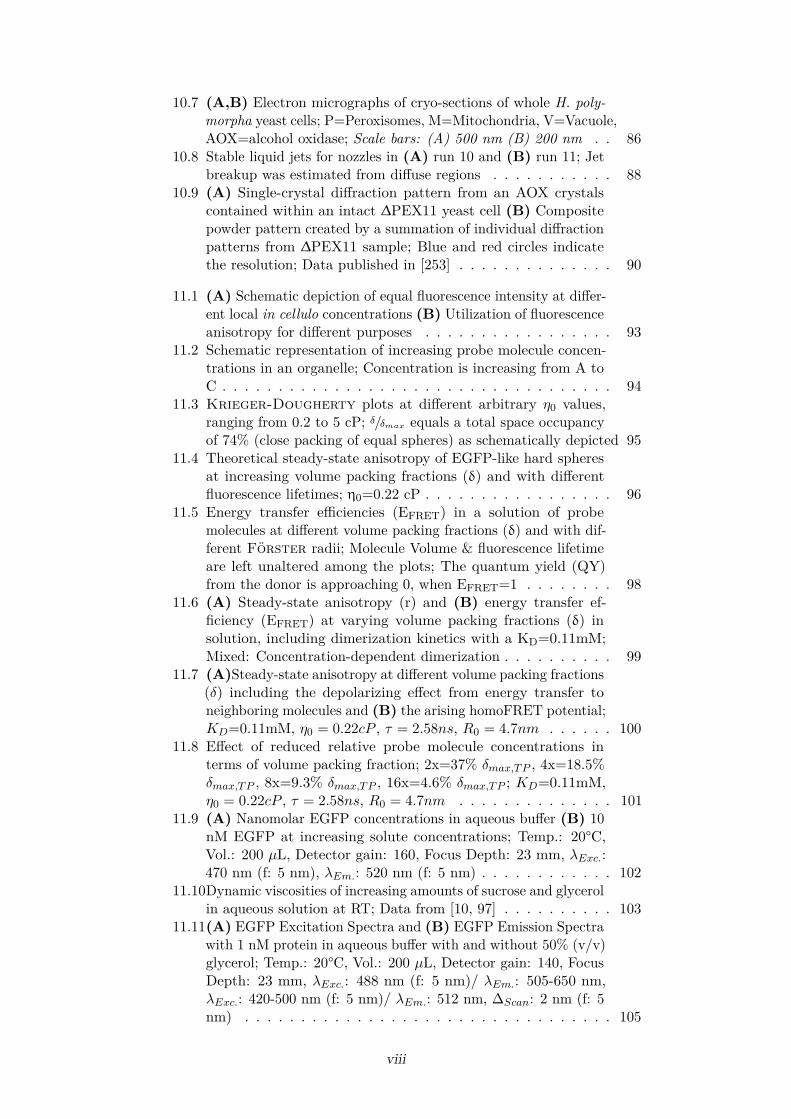
11.4 Theoretical steady-state anisotropy of EGFP-like hard spheresat increasing volume packing fractions (δ) and with differentfluorescence lifetimes; η0=0.22 cP . . . . . . . . . . . . . . . . . 96
11.5 Energy transfer efficiencies (EFRET) in a solution of probemolecules at different volume packing fractions (δ) and with dif-ferent Förster radii; Molecule Volume & fluorescence lifetimeare left unaltered among the plots; The quantum yield (QY)from the donor is approaching 0, when EFRET=1 . . . . . . . . 98
11.6 (A) Steady-state anisotropy (r) and (B) energy transfer ef-ficiency (EFRET) at varying volume packing fractions (δ) insolution, including dimerization kinetics with a KD=0.11mM;Mixed: Concentration-dependent dimerization . . . . . . . . . . 99
11.7 (A)Steady-state anisotropy at different volume packing fractions(δ) including the depolarizing effect from energy transfer toneighboring molecules and (B) the arising homoFRET potential;KD=0.11mM, η0 = 0.22cP , τ = 2.58ns, R0 = 4.7nm . . . . . . 100
11.8 Effect of reduced relative probe molecule concentrations interms of volume packing fraction; 2x=37% δmax,TP , 4x=18.5%δmax,TP , 8x=9.3% δmax,TP , 16x=4.6% δmax,TP ; KD=0.11mM,η0 = 0.22cP , τ = 2.58ns, R0 = 4.7nm . . . . . . . . . . . . . . 101
11.9 (A) Nanomolar EGFP concentrations in aqueous buffer (B) 10nM EGFP at increasing solute concentrations; Temp.: 20°C,Vol.: 200 µL, Detector gain: 160, Focus Depth: 23 mm, λExc.:470 nm (f: 5 nm), λEm.: 520 nm (f: 5 nm) . . . . . . . . . . . . 102
11.10Dynamic viscosities of increasing amounts of sucrose and glycerolin aqueous solution at RT; Data from [10, 97] . . . . . . . . . . 103
11.11(A) EGFP Excitation Spectra and (B) EGFP Emission Spectrawith 1 nM protein in aqueous buffer with and without 50% (v/v)glycerol; Temp.: 20°C, Vol.: 200 µL, Detector gain: 140, FocusDepth: 23 mm, λExc.: 488 nm (f: 5 nm)/ λEm.: 505-650 nm,λExc.: 420-500 nm (f: 5 nm)/ λEm.: 512 nm, ∆Scan: 2 nm (f: 5nm) . . . . . . . . . . . . . . . . . . . . . . . . . . . . . . . . . 105
viii
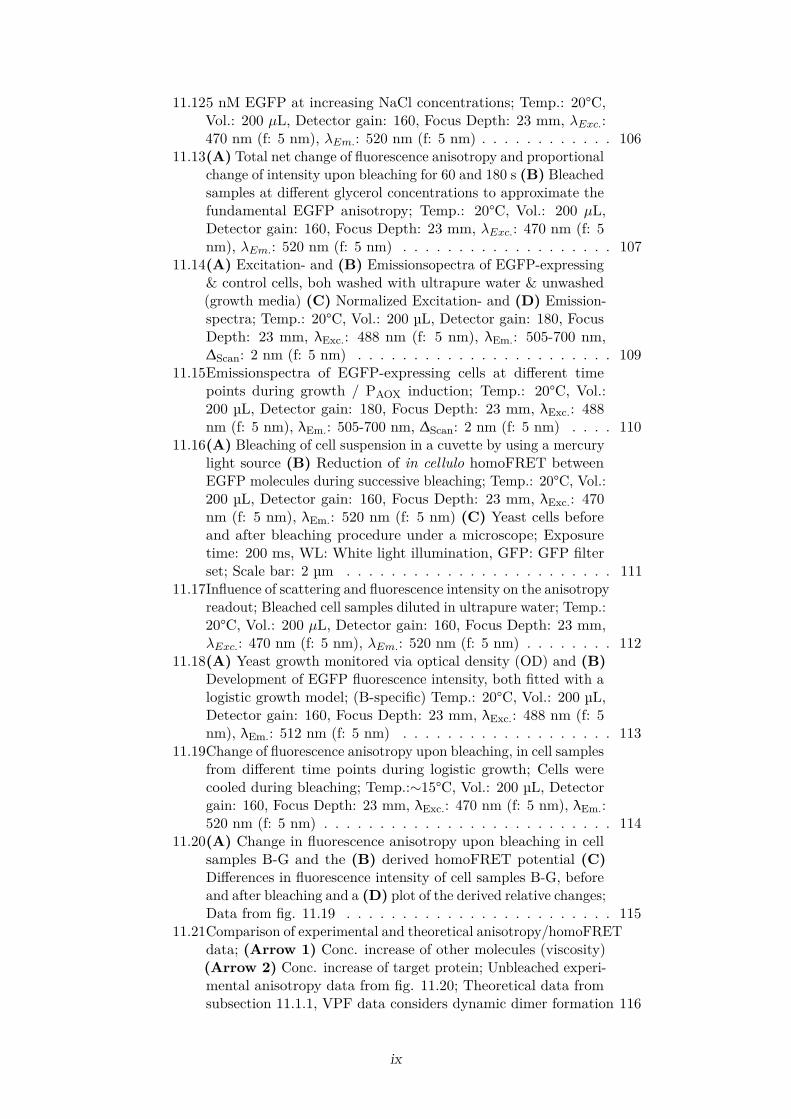
11.125 nM EGFP at increasing NaCl concentrations; Temp.: 20°C,Vol.: 200 µL, Detector gain: 160, Focus Depth: 23 mm, λExc.:470 nm (f: 5 nm), λEm.: 520 nm (f: 5 nm) . . . . . . . . . . . . 106
11.13(A) Total net change of fluorescence anisotropy and proportionalchange of intensity upon bleaching for 60 and 180 s (B) Bleachedsamples at different glycerol concentrations to approximate thefundamental EGFP anisotropy; Temp.: 20°C, Vol.: 200 µL,Detector gain: 160, Focus Depth: 23 mm, λExc.: 470 nm (f: 5nm), λEm.: 520 nm (f: 5 nm) . . . . . . . . . . . . . . . . . . . 107
11.14(A) Excitation- and (B) Emissionsopectra of EGFP-expressing& control cells, boh washed with ultrapure water & unwashed(growth media) (C) Normalized Excitation- and (D) Emission-spectra; Temp.: 20°C, Vol.: 200 µL, Detector gain: 180, FocusDepth: 23 mm, λExc.: 488 nm (f: 5 nm), λEm.: 505-700 nm,∆Scan: 2 nm (f: 5 nm) . . . . . . . . . . . . . . . . . . . . . . . 109
11.15Emissionspectra of EGFP-expressing cells at different timepoints during growth / PAOX induction; Temp.: 20°C, Vol.:200 µL, Detector gain: 180, Focus Depth: 23 mm, λExc.: 488nm (f: 5 nm), λEm.: 505-700 nm, ∆Scan: 2 nm (f: 5 nm) . . . . 110
11.16(A) Bleaching of cell suspension in a cuvette by using a mercurylight source (B) Reduction of in cellulo homoFRET betweenEGFP molecules during successive bleaching; Temp.: 20°C, Vol.:200 µL, Detector gain: 160, Focus Depth: 23 mm, λExc.: 470nm (f: 5 nm), λEm.: 520 nm (f: 5 nm) (C) Yeast cells beforeand after bleaching procedure under a microscope; Exposuretime: 200 ms, WL: White light illumination, GFP: GFP filterset; Scale bar: 2 µm . . . . . . . . . . . . . . . . . . . . . . . . 111
11.17Influence of scattering and fluorescence intensity on the anisotropyreadout; Bleached cell samples diluted in ultrapure water; Temp.:20°C, Vol.: 200 µL, Detector gain: 160, Focus Depth: 23 mm,λExc.: 470 nm (f: 5 nm), λEm.: 520 nm (f: 5 nm) . . . . . . . . 112
11.18(A) Yeast growth monitored via optical density (OD) and (B)Development of EGFP fluorescence intensity, both fitted with alogistic growth model; (B-specific) Temp.: 20°C, Vol.: 200 µL,Detector gain: 160, Focus Depth: 23 mm, λExc.: 488 nm (f: 5nm), λEm.: 512 nm (f: 5 nm) . . . . . . . . . . . . . . . . . . . 113
11.19Change of fluorescence anisotropy upon bleaching, in cell samplesfrom different time points during logistic growth; Cells werecooled during bleaching; Temp.:∼15°C, Vol.: 200 µL, Detectorgain: 160, Focus Depth: 23 mm, λExc.: 470 nm (f: 5 nm), λEm.:520 nm (f: 5 nm) . . . . . . . . . . . . . . . . . . . . . . . . . . 114
11.20(A) Change in fluorescence anisotropy upon bleaching in cellsamples B-G and the (B) derived homoFRET potential (C)Differences in fluorescence intensity of cell samples B-G, beforeand after bleaching and a (D) plot of the derived relative changes;Data from fig. 11.19 . . . . . . . . . . . . . . . . . . . . . . . . 115
11.21Comparison of experimental and theoretical anisotropy/homoFRETdata; (Arrow 1) Conc. increase of other molecules (viscosity)(Arrow 2) Conc. increase of target protein; Unbleached experi-mental anisotropy data from fig. 11.20; Theoretical data fromsubsection 11.1.1, VPF data considers dynamic dimer formation 116
ix
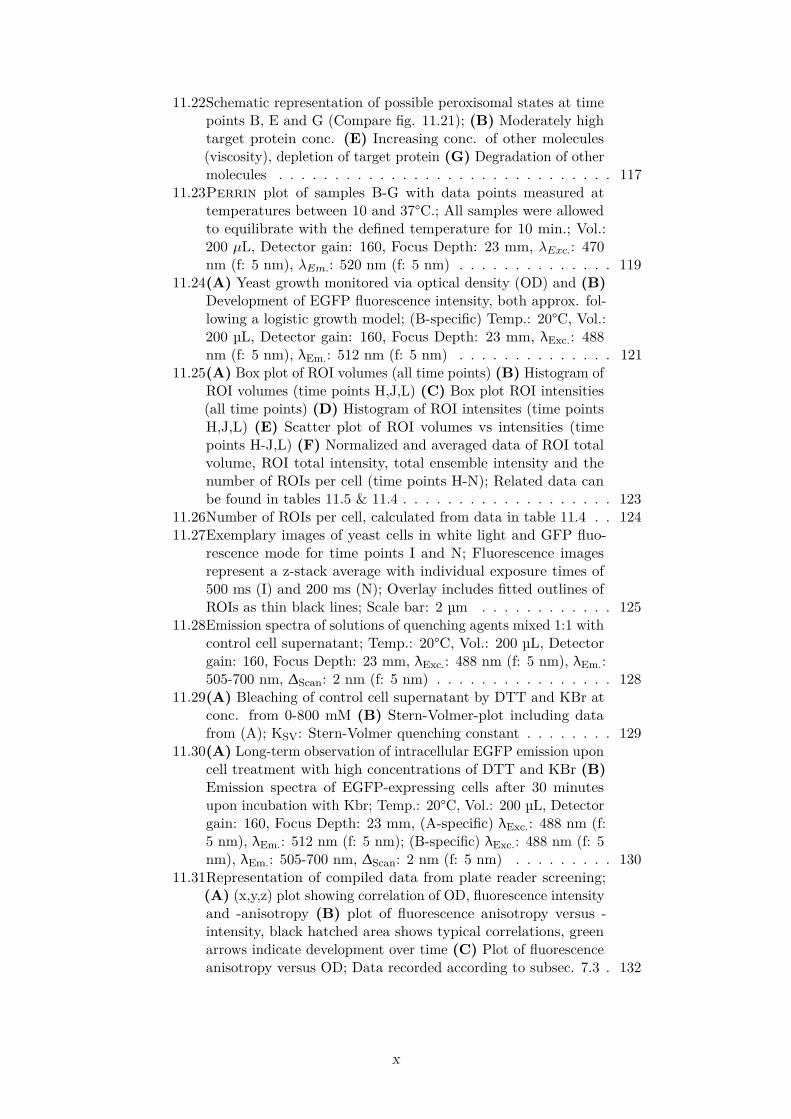
11.22Schematic representation of possible peroxisomal states at timepoints B, E and G (Compare fig. 11.21); (B) Moderately hightarget protein conc. (E) Increasing conc. of other molecules(viscosity), depletion of target protein (G) Degradation of othermolecules . . . . . . . . . . . . . . . . . . . . . . . . . . . . . . 117
11.23Perrin plot of samples B-G with data points measured attemperatures between 10 and 37°C.; All samples were allowedto equilibrate with the defined temperature for 10 min.; Vol.:200 µL, Detector gain: 160, Focus Depth: 23 mm, λExc.: 470nm (f: 5 nm), λEm.: 520 nm (f: 5 nm) . . . . . . . . . . . . . . 119
11.24(A) Yeast growth monitored via optical density (OD) and (B)Development of EGFP fluorescence intensity, both approx. fol-lowing a logistic growth model; (B-specific) Temp.: 20°C, Vol.:200 µL, Detector gain: 160, Focus Depth: 23 mm, λExc.: 488nm (f: 5 nm), λEm.: 512 nm (f: 5 nm) . . . . . . . . . . . . . . 121
11.25(A) Box plot of ROI volumes (all time points) (B) Histogram ofROI volumes (time points H,J,L) (C) Box plot ROI intensities(all time points) (D) Histogram of ROI intensites (time pointsH,J,L) (E) Scatter plot of ROI volumes vs intensities (timepoints H-J,L) (F) Normalized and averaged data of ROI totalvolume, ROI total intensity, total ensemble intensity and thenumber of ROIs per cell (time points H-N); Related data canbe found in tables 11.5 & 11.4 . . . . . . . . . . . . . . . . . . . 123
11.26Number of ROIs per cell, calculated from data in table 11.4 . . 12411.27Exemplary images of yeast cells in white light and GFP fluo-
rescence mode for time points I and N; Fluorescence imagesrepresent a z-stack average with individual exposure times of500 ms (I) and 200 ms (N); Overlay includes fitted outlines ofROIs as thin black lines; Scale bar: 2 µm . . . . . . . . . . . . 125
11.28Emission spectra of solutions of quenching agents mixed 1:1 withcontrol cell supernatant; Temp.: 20°C, Vol.: 200 µL, Detectorgain: 160, Focus Depth: 23 mm, λExc.: 488 nm (f: 5 nm), λEm.:505-700 nm, ∆Scan: 2 nm (f: 5 nm) . . . . . . . . . . . . . . . . 128
11.29(A) Bleaching of control cell supernatant by DTT and KBr atconc. from 0-800 mM (B) Stern-Volmer-plot including datafrom (A); KSV: Stern-Volmer quenching constant . . . . . . . . 129
11.30(A) Long-term observation of intracellular EGFP emission uponcell treatment with high concentrations of DTT and KBr (B)Emission spectra of EGFP-expressing cells after 30 minutesupon incubation with Kbr; Temp.: 20°C, Vol.: 200 µL, Detectorgain: 160, Focus Depth: 23 mm, (A-specific) λExc.: 488 nm (f:5 nm), λEm.: 512 nm (f: 5 nm); (B-specific) λExc.: 488 nm (f: 5nm), λEm.: 505-700 nm, ∆Scan: 2 nm (f: 5 nm) . . . . . . . . . 130
11.31Representation of compiled data from plate reader screening;(A) (x,y,z) plot showing correlation of OD, fluorescence intensityand -anisotropy (B) plot of fluorescence anisotropy versus -intensity, black hatched area shows typical correlations, greenarrows indicate development over time (C) Plot of fluorescenceanisotropy versus OD; Data recorded according to subsec. 7.3 . 132
x
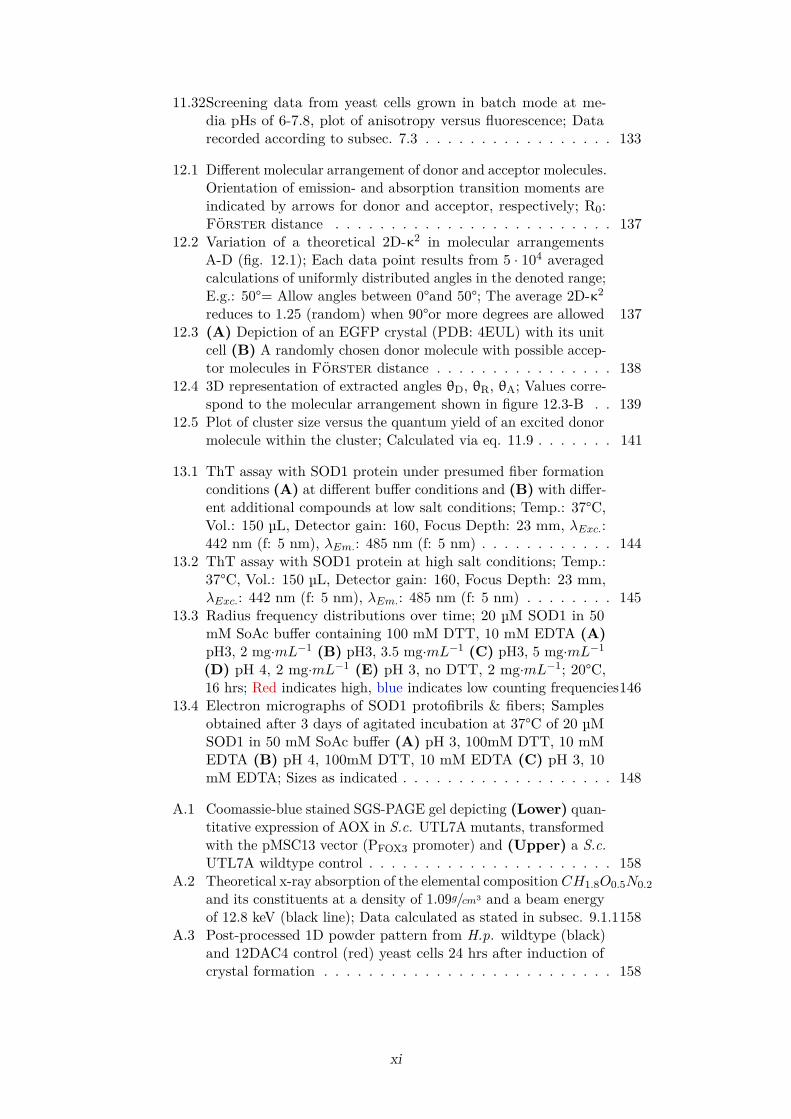
11.32Screening data from yeast cells grown in batch mode at me-dia pHs of 6-7.8, plot of anisotropy versus fluorescence; Datarecorded according to subsec. 7.3 . . . . . . . . . . . . . . . . . 133
12.1 Different molecular arrangement of donor and acceptor molecules.Orientation of emission- and absorption transition moments areindicated by arrows for donor and acceptor, respectively; R0:Förster distance . . . . . . . . . . . . . . . . . . . . . . . . . 137
12.2 Variation of a theoretical 2D-κ2 in molecular arrangementsA-D (fig. 12.1); Each data point results from 5 · 104 averagedcalculations of uniformly distributed angles in the denoted range;E.g.: 50°= Allow angles between 0°and 50°; The average 2D-κ2
reduces to 1.25 (random) when 90°or more degrees are allowed 13712.3 (A) Depiction of an EGFP crystal (PDB: 4EUL) with its unit
cell (B) A randomly chosen donor molecule with possible accep-tor molecules in Förster distance . . . . . . . . . . . . . . . . 138
12.4 3D representation of extracted angles θD, θR, θA; Values corre-spond to the molecular arrangement shown in figure 12.3-B . . 139
12.5 Plot of cluster size versus the quantum yield of an excited donormolecule within the cluster; Calculated via eq. 11.9 . . . . . . . 141
13.1 ThT assay with SOD1 protein under presumed fiber formationconditions (A) at different buffer conditions and (B) with differ-ent additional compounds at low salt conditions; Temp.: 37°C,Vol.: 150 µL, Detector gain: 160, Focus Depth: 23 mm, λExc.:442 nm (f: 5 nm), λEm.: 485 nm (f: 5 nm) . . . . . . . . . . . . 144
13.2 ThT assay with SOD1 protein at high salt conditions; Temp.:37°C, Vol.: 150 µL, Detector gain: 160, Focus Depth: 23 mm,λExc.: 442 nm (f: 5 nm), λEm.: 485 nm (f: 5 nm) . . . . . . . . 145
13.3 Radius frequency distributions over time; 20 µM SOD1 in 50mM SoAc buffer containing 100 mM DTT, 10 mM EDTA (A)pH3, 2 mg·mL−1 (B) pH3, 3.5 mg·mL−1 (C) pH3, 5 mg·mL−1
(D) pH 4, 2 mg·mL−1 (E) pH 3, no DTT, 2 mg·mL−1; 20°C,16 hrs; Red indicates high, blue indicates low counting frequencies146
13.4 Electron micrographs of SOD1 protofibrils & fibers; Samplesobtained after 3 days of agitated incubation at 37°C of 20 µMSOD1 in 50 mM SoAc buffer (A) pH 3, 100mM DTT, 10 mMEDTA (B) pH 4, 100mM DTT, 10 mM EDTA (C) pH 3, 10mM EDTA; Sizes as indicated . . . . . . . . . . . . . . . . . . . 148
A.1 Coomassie-blue stained SGS-PAGE gel depicting (Lower) quan-titative expression of AOX in S.c. UTL7A mutants, transformedwith the pMSC13 vector (PFOX3 promoter) and (Upper) a S.c.UTL7A wildtype control . . . . . . . . . . . . . . . . . . . . . . 158
A.2 Theoretical x-ray absorption of the elemental composition CH1.8O0.5N0.2and its constituents at a density of 1.09g/cm3 and a beam energyof 12.8 keV (black line); Data calculated as stated in subsec. 9.1.1158
A.3 Post-processed 1D powder pattern from H.p. wildtype (black)and 12DAC4 control (red) yeast cells 24 hrs after induction ofcrystal formation . . . . . . . . . . . . . . . . . . . . . . . . . . 158
xi

A.4 Observed versus calculated hkl reflections for a body(I)-centeredcubic lattice of AOX in vivo crystals (Image Inlet) Schematicindication of anisotropic disorder in AOX crystals due to missinghkl reflections . . . . . . . . . . . . . . . . . . . . . . . . . . . . 159
A.5 100% peak intensity/shape and manual fitting at different vol-ume packing fractions of crystalline phase; Data from 1D powderpatterns of in vivo AOX crystals . . . . . . . . . . . . . . . . . 159
A.6 100% peak FWHM at different volume packing fractions ofcrystalline phase, Indication of reliable peak fitting at lowerscattering intensities; Data from 1D powder patterns of in vivoAOX crystals . . . . . . . . . . . . . . . . . . . . . . . . . . . . 160
A.7 Time-resolved WH plot analysis of ∆PEX11 cells containingAOX crystals (Image Inlet) Residual sum of squares (RSS) fordata points and linear fit model for different time points, fitaccuracy is increasing over time . . . . . . . . . . . . . . . . . . 160
A.8 Comparison of (A) peak intensity and (B) FWHM duringprolonged storage of in vivo AOX crystals in yeast cells storedat 4°C (C) Corresponding 1D powder patterns . . . . . . . . . 160
A.9 Control DLS measurements with Duke Standard 600 nm NISTTraceable Polymer Microspheres (Thermo Scientific, USA) inwater and 1.2 M sorbitol with an aqueous viscosity parameter . 162
A.10 (A) Class-sums of particles in negative stain-EM possibly rep-resenting loose AOX octamers (B) Cryo-EM, single images ofparticles possibly representing AOX octamers . . . . . . . . . . 162
A.11 GDVN jet diameter approximation from linear plots in verticaldirection of the liquid flow (A,B) Representation of jets fromtwo different nozzles as stated in sec. 10.4 . . . . . . . . . . . . 162
A.12 Verification of yeast cell integrity after jetting in a typical GDVNsetup as described in sec. 10.4 . . . . . . . . . . . . . . . . . . . 163
A.13 Linear dependency of plate-reader based and undiluted OD mea-surements (y-axis) in comparison to diluted OD measurementson a spectrophotometer (x-axis) . . . . . . . . . . . . . . . . . . 163
A.14 ThT assay, control measurements to investigate the pH influenceon the SOD1 fiber formation process; Experimental conditionsare specified in subsec. 13.1.1 . . . . . . . . . . . . . . . . . . . 163
xii
List of Tables
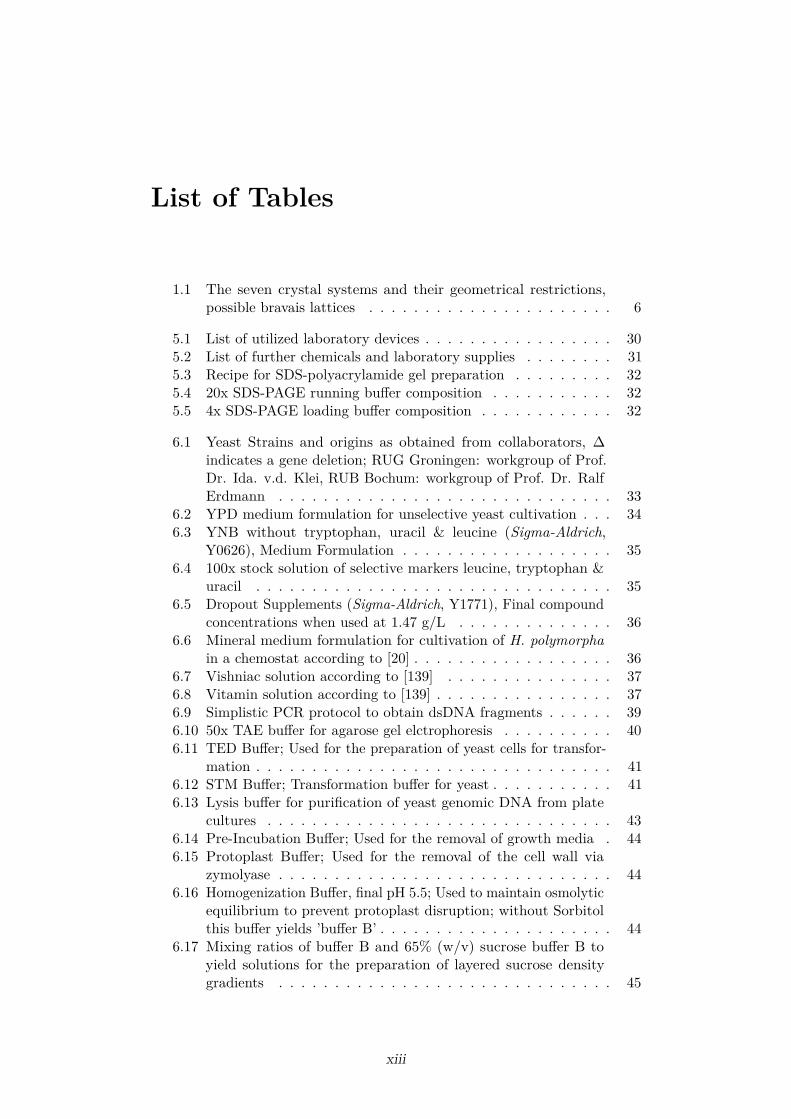
1.1 The seven crystal systems and their geometrical restrictions,possible bravais lattices . . . . . . . . . . . . . . . . . . . . . . 6
5.1 List of utilized laboratory devices . . . . . . . . . . . . . . . . . 305.2 List of further chemicals and laboratory supplies . . . . . . . . 315.3 Recipe for SDS-polyacrylamide gel preparation . . . . . . . . . 325.4 20x SDS-PAGE running buffer composition . . . . . . . . . . . 325.5 4x SDS-PAGE loading buffer composition . . . . . . . . . . . . 32
6.1 Yeast Strains and origins as obtained from collaborators, ∆indicates a gene deletion; RUG Groningen: workgroup of Prof.Dr. Ida. v.d. Klei, RUB Bochum: workgroup of Prof. Dr. RalfErdmann . . . . . . . . . . . . . . . . . . . . . . . . . . . . . . 33
6.2 YPD medium formulation for unselective yeast cultivation . . . 346.3 YNB without tryptophan, uracil & leucine (Sigma-Aldrich,
Y0626), Medium Formulation . . . . . . . . . . . . . . . . . . . 356.4 100x stock solution of selective markers leucine, tryptophan &
uracil . . . . . . . . . . . . . . . . . . . . . . . . . . . . . . . . 356.5 Dropout Supplements (Sigma-Aldrich, Y1771), Final compound
concentrations when used at 1.47 g/L . . . . . . . . . . . . . . 366.6 Mineral medium formulation for cultivation of H. polymorpha
in a chemostat according to [20] . . . . . . . . . . . . . . . . . . 366.7 Vishniac solution according to [139] . . . . . . . . . . . . . . . 376.8 Vitamin solution according to [139] . . . . . . . . . . . . . . . . 376.9 Simplistic PCR protocol to obtain dsDNA fragments . . . . . . 396.10 50x TAE buffer for agarose gel elctrophoresis . . . . . . . . . . 406.11 TED Buffer; Used for the preparation of yeast cells for transfor-
mation . . . . . . . . . . . . . . . . . . . . . . . . . . . . . . . . 416.12 STM Buffer; Transformation buffer for yeast . . . . . . . . . . . 416.13 Lysis buffer for purification of yeast genomic DNA from plate
cultures . . . . . . . . . . . . . . . . . . . . . . . . . . . . . . . 436.14 Pre-Incubation Buffer; Used for the removal of growth media . 446.15 Protoplast Buffer; Used for the removal of the cell wall via
zymolyase . . . . . . . . . . . . . . . . . . . . . . . . . . . . . . 446.16 Homogenization Buffer, final pH 5.5; Used to maintain osmolytic
equilibrium to prevent protoplast disruption; without Sorbitolthis buffer yields ’buffer B’ . . . . . . . . . . . . . . . . . . . . . 44
6.17 Mixing ratios of buffer B and 65% (w/v) sucrose buffer B toyield solutions for the preparation of layered sucrose densitygradients . . . . . . . . . . . . . . . . . . . . . . . . . . . . . . 45
xiii

6.18 Volumes for single sucrose density gradients for organelle pu-rification either with an organellar pellet (OP) or post-nuclearsupernatant (PNS); OP gradients are overlayed by 35% sucrosesolution while PNS gradients are overlayed by HOMO-buffer;For both, not more than 10 mL sample (depending on conc.) . 46
7.1 Microscope and specimen specifications for the calculation of atheoretical PSF . . . . . . . . . . . . . . . . . . . . . . . . . . . 49
7.2 Parameters for constrained iterative image deconvolution withthe DAMAS3 plugin for the Fiji software suite [178] . . . . . . 50
8.1 Data of FAD binding assay to determine protein/cofactor bindingratio; Conducted with a NanoDrop™ 1000 Spectrophotometer 58
8.2 Overview of successful cloning attempts for target proteins;12DAC4: triple-deletion strain (∆AOX, ∆DHAS, ∆CAT); MBP:maltose-binding protein, DAO: D-aspartate oxidase . . . . . . . 61
9.1 Anomalous scattering coefficients & absorption of the atomiccomposition CH1.8O0.5N0.2 at a density of 1.09 g/cm3 for an x-raybeam at 12.8 keV . . . . . . . . . . . . . . . . . . . . . . . . . . 68
9.2 Setup Parameters for Powder Diffraction Experiments at beam-line P14 . . . . . . . . . . . . . . . . . . . . . . . . . . . . . . . 69
9.3 2Θ angles, d-spacing and millerian indices for AOX in cellulocrystal reflections in a 1D powder patter from H. polymorphawildtype cells, indexed as a body(I)-centered cubic lattice . . . 70
9.4 Williamson-Hall plot data; Fitted and corrected FWHM(2Θ) of incorporated hkl reflections; B = FWHM/2 . . . . . . . . 73
9.5 Overview of samples tested in powder diffraction experiments atsynchrotron beamline P14 (PETRAIII, DESY, Germany) to ver-ify in vivo crystallization; Yeast specifications and their respec-tive growth conditions; YPM and MM contained always a com-bination of methanol and glycerol as described; SD: synthetic-defined medium, O: oleic acid, R: Rytka, G: glucose . . . . . . 77
10.1 Mean and standard deviation of radius frequency distributionson the interval [0.1,1] for experiments presented in figures 10.4and 10.5 (fixated and fresh peroxisomes) . . . . . . . . . . . . . 84
10.2 Test setup parameters for stable liquid jets at different cellconcentrations; ICD=Inner capillary diameter, OD=optical density 88
11.1 Descriptive plotting parameters; τand R0 are EGFP-specificvalues, Protein mass density represents an average value . . . . 96
11.2 Experimental Anisotropy and homoFRET data for time pointsB-G at ∼15°C; Anisotropy after bleaching (AB) has been deter-mined by a horizontal fit to the plateau of sufficient bleaching;BB = before bleaching . . . . . . . . . . . . . . . . . . . . . . . 114
11.3 Perrin plot parameters, obtained from fits to the data in figure11.23 . . . . . . . . . . . . . . . . . . . . . . . . . . . . . . . . . 119
11.4 Exposure times for microscopical image recording and intensitycorrection factors for samples H-N . . . . . . . . . . . . . . . . 122
11.5 Overview of radius and related statistical data of labeled perox-isomes; N(C)= Number cells, N(P)= Number of peroxisomes . 122
xiv
11.6 Applied quenching agents, Standard redox potentials (E0) ac-cording to [261] . . . . . . . . . . . . . . . . . . . . . . . . . . . 128
11.7 Test conditions for perturbation screening; If not stated other-wise, all conditions contained 0.5% (v/v) methanol, const. Glyc.indicates a glycerol concentration of 0.2% (v/v); Results areshown in fig. 11.31-A . . . . . . . . . . . . . . . . . . . . . . . . 135
12.1 Extracted angles θD, θR, θA and calculated κ2 values for symme-try mates 1-12; Values correspond to the molecular arrangementshown in figure 12.3-B . . . . . . . . . . . . . . . . . . . . . . . 139
12.2 Theoretical values for homoFRET transfer efficiencies and fluo-rescence anisotropy in an EGFP-like molecule conglomerate fordifferent κ2 factors; Other molecule properties are identical tothose in subsec. 11.1.1 . . . . . . . . . . . . . . . . . . . . . . . 141
A.1 Williamson-Hall plot data, Comparison of H.p. wildtype- (WT)and ∆PEX11-grown AOX crystals; Fitted and corrected FWHM(2Θ) of incorporated hkl reflections; B = FWHM/2 . . . . . . . . 157
A.2 Williamson-Hall plot data, Comparison of H.p. wildtype-grownAOX crystals at different growth temperatures; Fitted andcorrected FWHM (2Θ) of incorporated hkl reflections; B =FWHM/2 . . . . . . . . . . . . . . . . . . . . . . . . . . . . . . . 161
A.3 DLS data analysis, CONTIN analysis results of purified peroxi-somes from H.p. wildtype and ∆PEX11 cells, indicating differentpeak fractions . . . . . . . . . . . . . . . . . . . . . . . . . . . . 161
A.4 DNA Primers in 5’-3’ direction used for SLiCE cloning ofpHIPZ4/pHIPX4 cloning of target protein sequences, spacerpeptides and SKL tag . . . . . . . . . . . . . . . . . . . . . . . 164
xv

List of Abbreviations
A.U. Arbitrary Units
AOX Alcohol Oxidase
CAT (Peroxisomal) Catalase
CNS Classical Nucleation Theory
DESY Deutsches Elektronen-Synchrotron
DHAS Dihydroxyacetone Synthase
DLS Dynamic Light Scattering
DTT Dithiothreitol
EGFP Enhanced Green Fluorescent Protein
EM electron microscopy
Em. Emission Wavelength
eV electron volt
Exc. Excitation Wavelength
FAD Flavin Adenine Dinucleotide
FEL (X-Ray) Free-Electron Laser
FRET Förster Resonance Energy Transfer
GDVN Gas Dynamic Virtual Nozzle
H.p. Hansenula polymorpha
HEPES 4-(2-hydroxyethyl)-1-piperazineethanesulfonic acid
HIP Hansenula Integration Plasmid
KBr Potassium Bromide
kDa kilo Dalton
LCLS Linac Coherent Light Source
mAns Unitless Fluorescence Anisotropy
ME Mercaptoethanol
MW Molecular Weight
xvi

MX Macromolecular Crystallography
NaCl Sodium Chloride
NMR nuclear magnetic resonance spectroscopy
OD Optical Density
PCR Polymerase Chain Reaction
PDB Protein Data Bank
PETRA(III) Positron-Electron Tandem Ring Accelerator
PP Potassium Phosphate
PPMCC Pearson Product-Moment Correlation Coefficient
PTS Peroxisomal Targeting Signal
QY Quantum Yield
ROI Region of Interest
S.c. Saccharomyces cerevisiae
SACLA SPring-8 Angstrom Compact FEL
SDS-PAGE Sodium Dodecylsulfate Polyacrylamide Gel Electrophoresis
SEC Size-Exclusion Chromatography
SED Stokes-Einstein-Debye
SFX Serial Femtosecond X-ray Crystallography
SKL Serine-Lysine-Leucine
SLiCE Seamless Ligation Cloning Extract
SLS Static Light Scattering
ssDNA Single-Stranded Deoxyribonucleic Acid
TCEP tris(2-carboxyethyl)phosphine
TRIS 2-Amino-2-(hydroxymethyl)propane-1,3-diol
UV/vis Ultraviolet & Visible Light Spectrum
VPF Volume Packing Fraction
YP Yeast Peptone
xvii

I | Motivation
I MOTIVATION
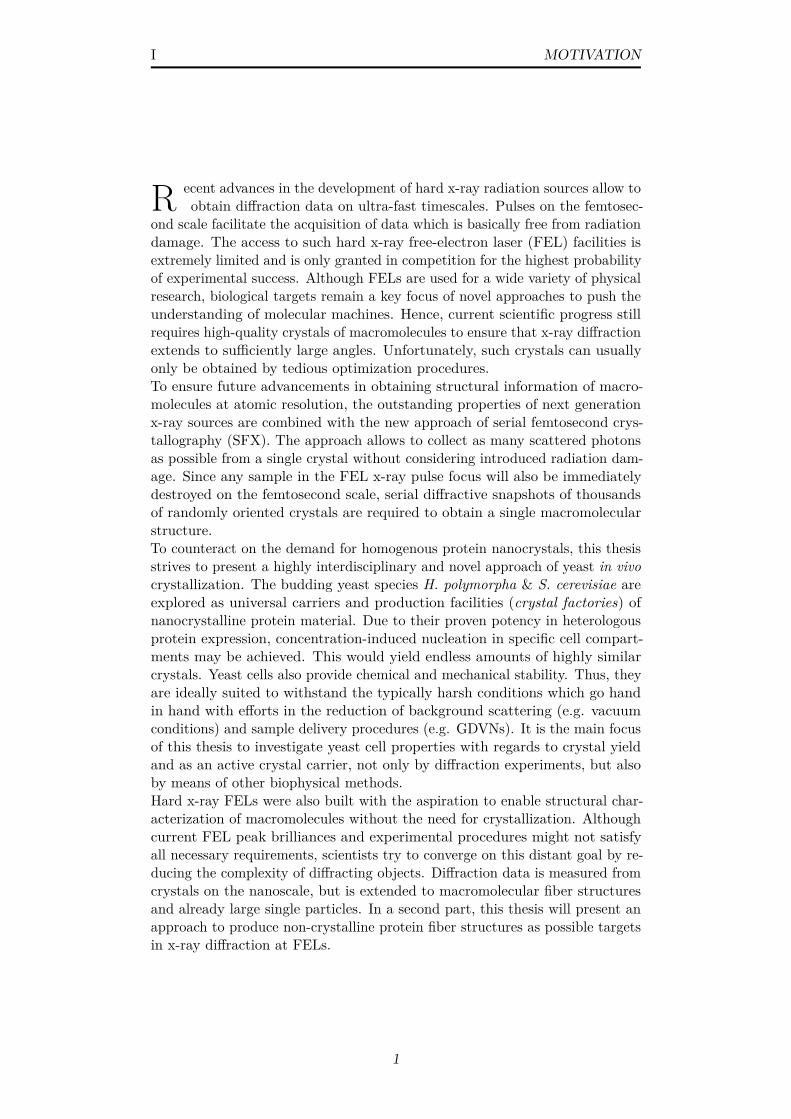
R ecent advances in the development of hard x-ray radiation sources allow toobtain diffraction data on ultra-fast timescales. Pulses on the femtosec-
ond scale facilitate the acquisition of data which is basically free from radiationdamage. The access to such hard x-ray free-electron laser (FEL) facilities isextremely limited and is only granted in competition for the highest probabilityof experimental success. Although FELs are used for a wide variety of physicalresearch, biological targets remain a key focus of novel approaches to push theunderstanding of molecular machines. Hence, current scientific progress stillrequires high-quality crystals of macromolecules to ensure that x-ray diffractionextends to sufficiently large angles. Unfortunately, such crystals can usuallyonly be obtained by tedious optimization procedures.To ensure future advancements in obtaining structural information of macro-molecules at atomic resolution, the outstanding properties of next generationx-ray sources are combined with the new approach of serial femtosecond crys-tallography (SFX). The approach allows to collect as many scattered photonsas possible from a single crystal without considering introduced radiation dam-age. Since any sample in the FEL x-ray pulse focus will also be immediatelydestroyed on the femtosecond scale, serial diffractive snapshots of thousandsof randomly oriented crystals are required to obtain a single macromolecularstructure.To counteract on the demand for homogenous protein nanocrystals, this thesisstrives to present a highly interdisciplinary and novel approach of yeast in vivocrystallization. The budding yeast species H. polymorpha & S. cerevisiae areexplored as universal carriers and production facilities (crystal factories) ofnanocrystalline protein material. Due to their proven potency in heterologousprotein expression, concentration-induced nucleation in specific cell compart-ments may be achieved. This would yield endless amounts of highly similarcrystals. Yeast cells also provide chemical and mechanical stability. Thus, theyare ideally suited to withstand the typically harsh conditions which go handin hand with efforts in the reduction of background scattering (e.g. vacuumconditions) and sample delivery procedures (e.g. GDVNs). It is the main focusof this thesis to investigate yeast cell properties with regards to crystal yieldand as an active crystal carrier, not only by diffraction experiments, but alsoby means of other biophysical methods.Hard x-ray FELs were also built with the aspiration to enable structural char-acterization of macromolecules without the need for crystallization. Althoughcurrent FEL peak brilliances and experimental procedures might not satisfyall necessary requirements, scientists try to converge on this distant goal by re-ducing the complexity of diffracting objects. Diffraction data is measured fromcrystals on the nanoscale, but is extended to macromolecular fiber structuresand already large single particles. In a second part, this thesis will present anapproach to produce non-crystalline protein fiber structures as possible targetsin x-ray diffraction at FELs.
1

II | Introduction

II INTRODUCTION
1 | Modern X-ray Crystallography
1.1 A Brief HistoryIn retrospect, it has been a truly adventurous endeavor for humankind to arriveat the advanced research that is performed nowadays in terms of structuralinvestigation at atomic resolution. Not only did humankind come a long waysince the discovery of X-ray radiation by W. C. Röntgen in 1895 [3] to shinea light on the very basic structure of the most important molecules of life,proteins and nucleic acid. It also managed to constantly realign its focus onthe progress of the development of new methods in x-ray crystallography andcompeting techniques. This led to the amazing 112’000+ protein structuresdeposited in the protein data bank (PDB) by September, 2017 [271], notcounting structures from nuclear magnetic resonance spectroscopy (NMR) orelectron microscopy (EM).
A B
Figure 1.1: First demonstration of x-ray crystallography (A) Experimental setup with x-raybulb, goniometer and photographic film (B) First diffraction recorded after narrowing beamslit size; Image taken from: [5]
At the time Röntgen discovered x-rays, it was still up to debate to define thetrue nature of light and arguments were raised for a particle (corpuscular)or a wave-like nature. Röntgen’s findings about this new type of radiationstimulated further research into the topic. In fact, diffraction-like behaviourfor x-rays was already postulated, but not convincingly proven in 1899 byH. Haga and C. H. Wind in Groningen. Their research is connected to thetheoretical work of A. Sommerfeld who developed a mathematical theory of thediffraction of light, which he extended to the case of x-rays in 1901 [183]. W.Wien and J. Stark contributed to the scientific discussion, as they individuallypublished results on the possible wavelength of x-rays in 1907 [4] by extendingPlancks radiation theory to x-rays. Both estimated the wavelength to be about0.6 – 0.7 Å. Following many attempts to further proof the wave nature ofx-rays, M. von Laue postulated diffraction of x-rays from crystals in 1912.Together with P. Knipping and W. Friedrich, von Laue published the results
2
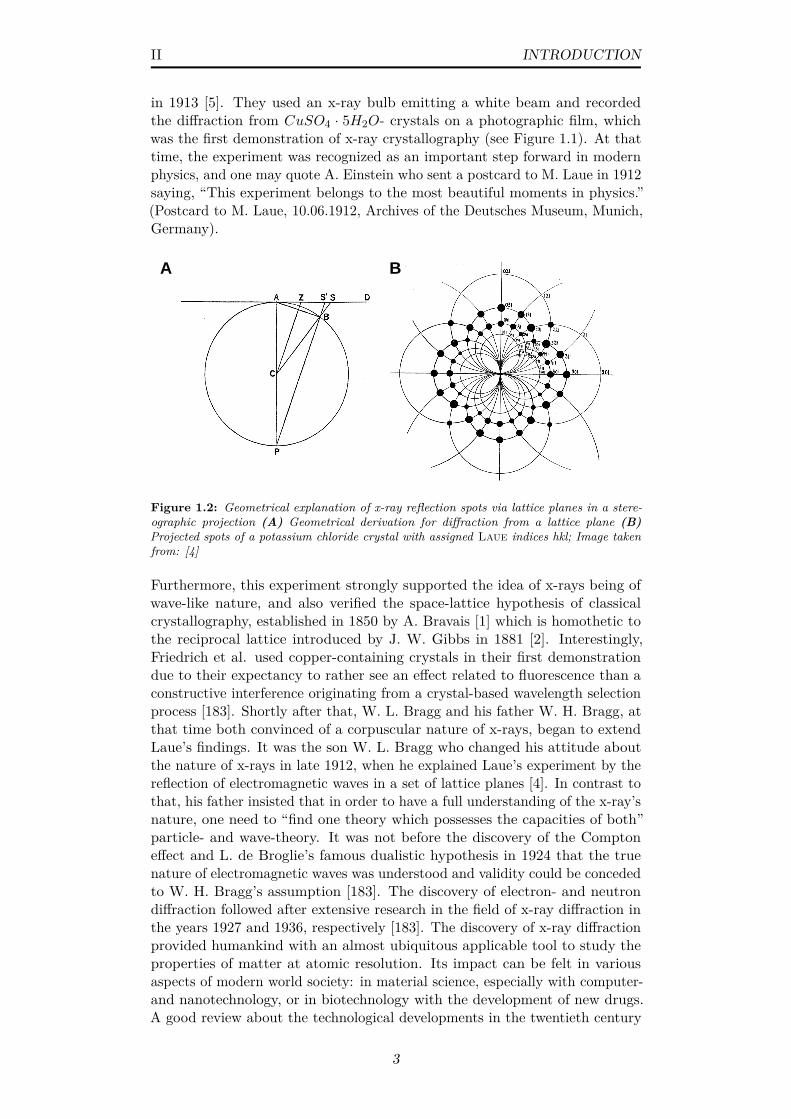
II INTRODUCTION
in 1913 [5]. They used an x-ray bulb emitting a white beam and recordedthe diffraction from CuSO4 · 5H2O- crystals on a photographic film, whichwas the first demonstration of x-ray crystallography (see Figure 1.1). At thattime, the experiment was recognized as an important step forward in modernphysics, and one may quote A. Einstein who sent a postcard to M. Laue in 1912saying, “This experiment belongs to the most beautiful moments in physics.”(Postcard to M. Laue, 10.06.1912, Archives of the Deutsches Museum, Munich,Germany).
A B
Figure 1.2: Geometrical explanation of x-ray reflection spots via lattice planes in a stere-ographic projection (A) Geometrical derivation for diffraction from a lattice plane (B)Projected spots of a potassium chloride crystal with assigned Laue indices hkl; Image takenfrom: [4]
Furthermore, this experiment strongly supported the idea of x-rays being ofwave-like nature, and also verified the space-lattice hypothesis of classicalcrystallography, established in 1850 by A. Bravais [1] which is homothetic tothe reciprocal lattice introduced by J. W. Gibbs in 1881 [2]. Interestingly,Friedrich et al. used copper-containing crystals in their first demonstrationdue to their expectancy to rather see an effect related to fluorescence than aconstructive interference originating from a crystal-based wavelength selectionprocess [183]. Shortly after that, W. L. Bragg and his father W. H. Bragg, atthat time both convinced of a corpuscular nature of x-rays, began to extendLaue’s findings. It was the son W. L. Bragg who changed his attitude aboutthe nature of x-rays in late 1912, when he explained Laue’s experiment by thereflection of electromagnetic waves in a set of lattice planes [4]. In contrast tothat, his father insisted that in order to have a full understanding of the x-ray’snature, one need to “find one theory which possesses the capacities of both”particle- and wave-theory. It was not before the discovery of the Comptoneffect and L. de Broglie’s famous dualistic hypothesis in 1924 that the truenature of electromagnetic waves was understood and validity could be concededto W. H. Bragg’s assumption [183]. The discovery of electron- and neutrondiffraction followed after extensive research in the field of x-ray diffraction inthe years 1927 and 1936, respectively [183]. The discovery of x-ray diffractionprovided humankind with an almost ubiquitous applicable tool to study theproperties of matter at atomic resolution. Its impact can be felt in variousaspects of modern world society: in material science, especially with computer-and nanotechnology, or in biotechnology with the development of new drugs.A good review about the technological developments in the twentieth century
3
II INTRODUCTION
that are related to protein crystallography is given by Su et al. [245].
1.2 Advanced X-ray SourcesNowadays, groundbreaking experiments in hard x-ray diffraction require ra-diation sources with extreme peak brilliance. Modern synchrotrons likePETRAIII (Germany) or SPring-8 (Japan) can reach a peak brilliance of up to1025ph/s ·mrad2 ·mm2 [158], while state-of-the-art free-electron lasers (FELs) evenproduce beams with a brilliance of 1033ph/s ·mrad2 ·mm2. To date, three majorhard x-ray FELs are operational in biophysical research, the Linac CoherentLight Source (LCLS, USA) [151, 233], the SPring-8 Angstrom Compact FEL(SACLA, Japan) [175] and as of recently the European XFEL (Germany) [260].Other free-electron lasers are operated in the soft x-ray regime [256].Both synchrotron and FEL radiation are generated from accelerated electronbunches, either on a circular or linear trajectory [79]. Initially, free electrons areyielded by thermal emission and are accelerated to relativistic velocities, forcedinto a trajectory by magnetic fields. In synchrotrons, tangentially installed’insertion devices’ (bending magnets, undulators, wigglers), which supply strongmagnetic fields, either deflect or manipulate the electron bunches (see fig. 1.3).They give rise to high energy bremsstrahlung whose energy is determined bythe velocity of the charged particles. Usually, the deflection of x-rays by abending magnets yields a broader bandwidth (∼ 1.0%) and is thus of interestin Laue diffraction. Wiggler and undulator devices are rather based on thecreation of harmonic oscillations of the electron bunches via sinusoidal magneticfields. While wigglers give rise to a similarly broad bandwidth at higher photonenergies, undulators will yield an initially narrower bandwidth (∼ 0.1%) byutilizing weaker magnetic field strengths (∼ 1T ) that allow for the interferenceof radiation cones. Still, both devices are based on the alternating arrangementof magnets on the cm scale. Lorentz contraction and Doppler effect explain
Figure 1.3: General layout of a third-generation synchrotron facility utilizing bendingmagnets, wigglers and undulators for electron deflection and x-ray generation; Image from[51]
4
II INTRODUCTION
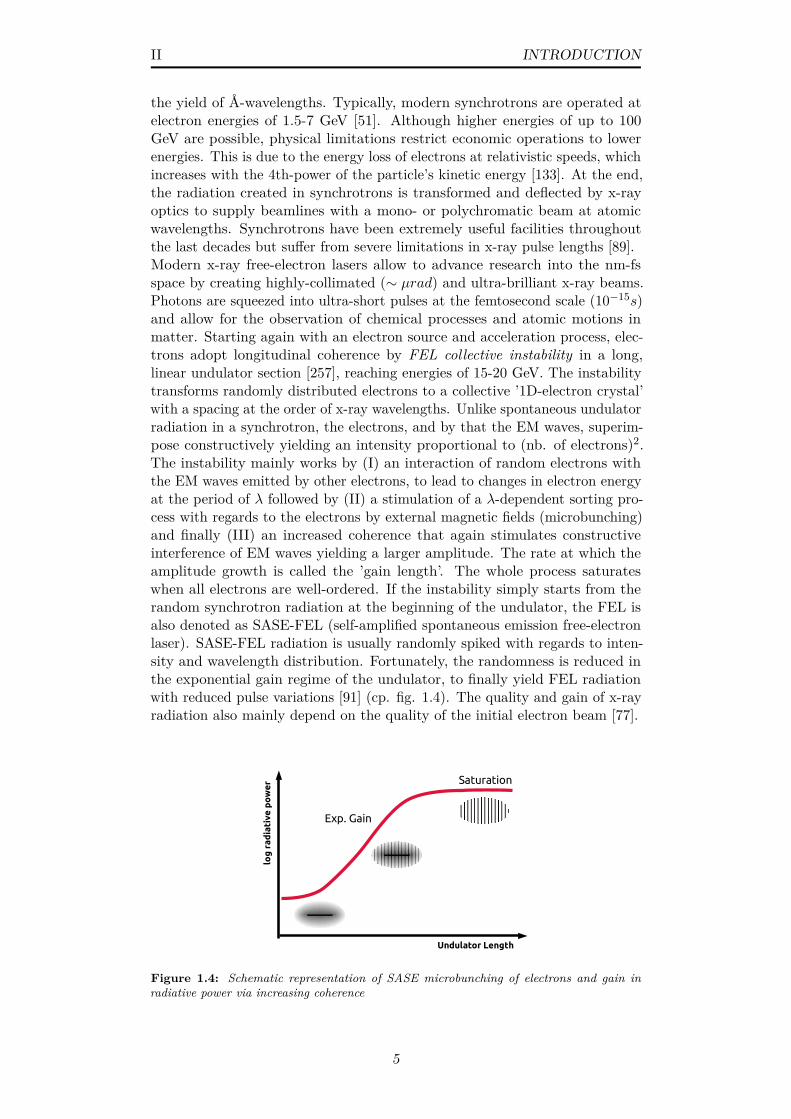
the yield of Å-wavelengths. Typically, modern synchrotrons are operated atelectron energies of 1.5-7 GeV [51]. Although higher energies of up to 100GeV are possible, physical limitations restrict economic operations to lowerenergies. This is due to the energy loss of electrons at relativistic speeds, whichincreases with the 4th-power of the particle’s kinetic energy [133]. At the end,the radiation created in synchrotrons is transformed and deflected by x-rayoptics to supply beamlines with a mono- or polychromatic beam at atomicwavelengths. Synchrotrons have been extremely useful facilities throughoutthe last decades but suffer from severe limitations in x-ray pulse lengths [89].Modern x-ray free-electron lasers allow to advance research into the nm-fsspace by creating highly-collimated (∼ µrad) and ultra-brilliant x-ray beams.Photons are squeezed into ultra-short pulses at the femtosecond scale (10−15s)and allow for the observation of chemical processes and atomic motions inmatter. Starting again with an electron source and acceleration process, elec-trons adopt longitudinal coherence by FEL collective instability in a long,linear undulator section [257], reaching energies of 15-20 GeV. The instabilitytransforms randomly distributed electrons to a collective ’1D-electron crystal’with a spacing at the order of x-ray wavelengths. Unlike spontaneous undulatorradiation in a synchrotron, the electrons, and by that the EM waves, superim-pose constructively yielding an intensity proportional to (nb. of electrons)2.The instability mainly works by (I) an interaction of random electrons withthe EM waves emitted by other electrons, to lead to changes in electron energyat the period of λ followed by (II) a stimulation of a λ-dependent sorting pro-cess with regards to the electrons by external magnetic fields (microbunching)and finally (III) an increased coherence that again stimulates constructiveinterference of EM waves yielding a larger amplitude. The rate at which theamplitude growth is called the ’gain length’. The whole process saturateswhen all electrons are well-ordered. If the instability simply starts from therandom synchrotron radiation at the beginning of the undulator, the FEL isalso denoted as SASE-FEL (self-amplified spontaneous emission free-electronlaser). SASE-FEL radiation is usually randomly spiked with regards to inten-sity and wavelength distribution. Fortunately, the randomness is reduced inthe exponential gain regime of the undulator, to finally yield FEL radiationwith reduced pulse variations [91] (cp. fig. 1.4). The quality and gain of x-rayradiation also mainly depend on the quality of the initial electron beam [77].
Undulator Length
Saturation
log
rad
iati
ve p
ow
er
Exp. Gain
Figure 1.4: Schematic representation of SASE microbunching of electrons and gain inradiative power via increasing coherence
5
II INTRODUCTION
1.3 Theory of Protein Crystal DiffractionCrystals of biological macromolecules are difficult to obtain, as most suchmolecules only tend to congregate at rare conditions. Still, large in vitrogrown protein crystals are the backbone of today’s approaches in structuralinvestigation of biomolecules via x-rays. Therefore, a clear understanding of thebasic definitions with regards to crystalline material is obligatory. Typically,a crystal is defined as a solid material of homogeneous nature which is madeup of repeating units whose order extends repetitively in several dimensions.This ’unit cell’ repeats only through translation, but might contain furthersymmetry elements. The lattice parameters consisting of the basis vectors a, b,c and their interaxial angles α, β, γ describe the general structure of the unitcell, so that all linear combinations of the basis vectors are lattice vectors. Thesmallest volume unit, which contains all of the structural information, is called’asymmetric unit’. It can reproduce the unit cell by the application of certainsymmetry operations.
Crystalline Order
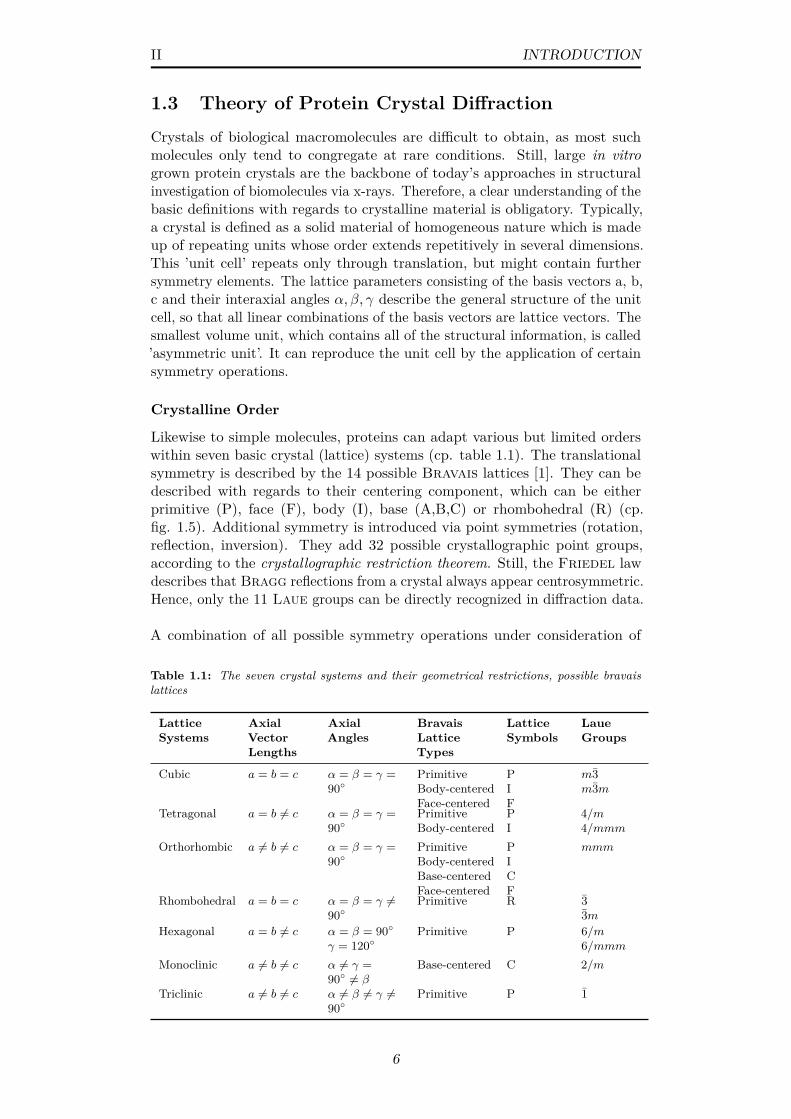
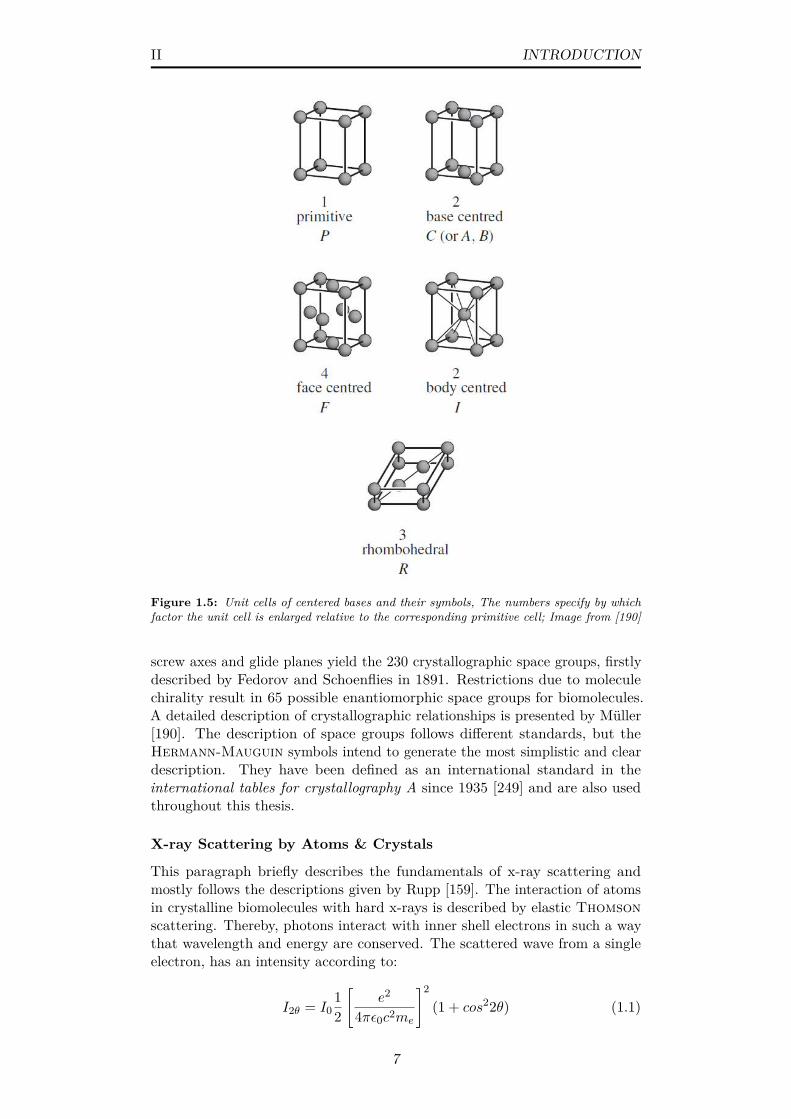
Likewise to simple molecules, proteins can adapt various but limited orderswithin seven basic crystal (lattice) systems (cp. table 1.1). The translationalsymmetry is described by the 14 possible Bravais lattices [1]. They can bedescribed with regards to their centering component, which can be eitherprimitive (P), face (F), body (I), base (A,B,C) or rhombohedral (R) (cp.fig. 1.5). Additional symmetry is introduced via point symmetries (rotation,reflection, inversion). They add 32 possible crystallographic point groups,according to the crystallographic restriction theorem. Still, the Friedel lawdescribes that Bragg reflections from a crystal always appear centrosymmetric.Hence, only the 11 Laue groups can be directly recognized in diffraction data.
A combination of all possible symmetry operations under consideration of
Table 1.1: The seven crystal systems and their geometrical restrictions, possible bravaislattices
LatticeSystems
AxialVectorLengths
AxialAngles
BravaisLatticeTypes
LatticeSymbols
LaueGroups
Cubic a = b = c α = β = γ =90◦
PrimitiveBody-centeredFace-centered
PIF
m3m3m
Tetragonal a = b 6= c α = β = γ =90◦
PrimitiveBody-centered
PI
4/m4/mmm
Orthorhombic a 6= b 6= c α = β = γ =90◦
PrimitiveBody-centeredBase-centeredFace-centered
PICF
mmm
Rhombohedral a = b = c α = β = γ 6=90◦
Primitive R 33m
Hexagonal a = b 6= c α = β = 90◦γ = 120◦
Primitive P 6/m6/mmm
Monoclinic a 6= b 6= c α 6= γ =90◦ 6= β
Base-centered C 2/m
Triclinic a 6= b 6= c α 6= β 6= γ 6=90◦
Primitive P 1
6
II INTRODUCTION
Figure 1.5: Unit cells of centered bases and their symbols, The numbers specify by whichfactor the unit cell is enlarged relative to the corresponding primitive cell; Image from [190]
screw axes and glide planes yield the 230 crystallographic space groups, firstlydescribed by Fedorov and Schoenflies in 1891. Restrictions due to moleculechirality result in 65 possible enantiomorphic space groups for biomolecules.A detailed description of crystallographic relationships is presented by Müller[190]. The description of space groups follows different standards, but theHermann-Mauguin symbols intend to generate the most simplistic and cleardescription. They have been defined as an international standard in theinternational tables for crystallography A since 1935 [249] and are also usedthroughout this thesis.
X-ray Scattering by Atoms & Crystals
This paragraph briefly describes the fundamentals of x-ray scattering andmostly follows the descriptions given by Rupp [159]. The interaction of atomsin crystalline biomolecules with hard x-rays is described by elastic Thomsonscattering. Thereby, photons interact with inner shell electrons in such a waythat wavelength and energy are conserved. The scattered wave from a singleelectron, has an intensity according to:
I2θ = I012
[e2
4πε0c2me
]2
(1 + cos22θ) (1.1)
7
II INTRODUCTION
In this equation I0 is the intensity of the incident wave and I2θ the scatteredintensity at a given angle. e, and me are the charge and mass of an electron, re-spectively. ε0 describes the permitivity of the vacuum, whereas c is the vacuumspeed of light. The last bracket describes the cosine-dependent polarizationfactor. Obviously, scattering is strongest in forward and backward direction.The scattering amplitude from a single atom scales with its atomic numberZ and thus depends on the electron density ρ(r) (r is a position vector). Thegeneral distribution of electrons is assumed to be spherical in first approx-imation. The phases of all scattered waves from one atom are completelycoincident in the forward direction but show an increasing dissonance with alarger scattering angle θ due to the atomic electron distribution. The scatter-ing from a single atom in spherical approximation is described in terms of awavelength-independent atomic scattering (form) factor:
f0(S) =∫ V (Atom)
ρ(r)e2πiS·rdr (1.2)
S (sometimes also denoted as: Q = 2πS) is the momentum transfer or scatter-ing vector and is also a vector in 3D reciprocal space to describe the change ofmomentum between incident and scattered electromagnetic wave. The atomicscattering vector falls rapidly off with increasing scattering angle and appearscentrosymmetric due to the approximation of the electron cloud. It is relatedto the unit vectors of incident (k0) and scattered wave (k1) and the x-raywavelength by:
S = 1λ
(k1 − k0) , S = 2sinθλ
(1.3)
As a conclusive generalization, the total diffraction from a molecule is thendescribed by a summation:
FM (S) =Atoms∑j=1
f0j · exp (2πiSrj) (1.4)
Here, rj is the position vector of an individual atom in the molecule. FM iscalled the molecular diffraction envelope or scattering function and describesscattering due to the superposition of waves from all atoms in the molecule.Since in such a case atoms are usually ordered in an irregular pattern, thescattering function is a continuous, decaying complex function with irregularlystructured modulations. The phase difference between scattered waves can bedescribed with regards to the separation vector r between two objects:
∆φ = 2πiS · r (1.5)
On the contrary, the periodicity of a crystal lattice, in which each atom/moleculehas exact translational (in-phase) equivalents in 3D space, leads to a linearintensity amplification that scales with the number of unit cells: FC = n ·FUC(UC= unit cell). The amplification process is simply due to constructive in-terference (cp. eq. 1.5), thus it strongly depends on the accuracy of atomicpositions in a repeating lattice. The accurate repetition of a lattice is usuallydisturbed by vibrations of atoms and molecules, which depends on their kineticenergy. Additionally, crystal quality can suffer due to general disorder. Both
8
II INTRODUCTION
effects are commonly described in terms of the wavelength-dependent Debye-Waller factor (TS), which also includes the general isotropic displacementfactor (or B-factor). Hence, the total scattering of regularly placed atoms in acrystal lattice is then described by:
f0B = f0 · TS = f0 · exp
(−B
(sinθ
λ
)2)(1.6)
The conditions for constructive interference can also be expressed in terms ofthe Laue equations, which summarizes the statement with regards to the unitcell basis vectors a,b,c and the integers n1 − n3:
S · a = n1 , S · b = n2 , S · c = n3 (1.7)
These equations fully explain the occurrence of diffraction maxima in a diffrac-tion pattern. It is possible to describe these equations in terms of the Laueindices (h k l) of the lattice planes of the unit cell, which are also describedin detail by Rupp [159]. The Laue indices are just the n-th order indicesof the Millerian indices. Confusingly, these terms are sometimes usedas equivalent. Considering the definition of the real space lattice vectorrj = ATxj = (axj + byj + czj) one can derive:
Srj = Saxj + Sbyj + Sczj = hxj + kyj + lzj = hxj (1.8)
This definition can be used to derive a direct dependency of the structurefactor on the reciprocal index vector h. With the definition from equation 1.8the structure factor becomes:
FCh (S) = N ·Atoms∑j=1
f0j · exp (2πihxj) (1.9)
which is in principle equivalent to equation 1.4, except that the summation isnow over the atoms of the entire unit cell. It can be seen that the scatteringfunction of the unit cell with regards to the fractional coordinates xj and thereciprocal lattice indices h is the structure factor FCh of the reflection h.The idea of lattice planes and their corresponding description via hkl indices isbest understood by means of the Bragg equation (Eq. 1.10). It utilizes theidea to normalize the scattering vector S so that diffraction from a crystal canbe interpreted as the reflection from a set of perpendicular real space planes,which are separated by the distance d. The basic principle is schematicallydepicted in figure 1.7 in terms of the scattering angle θ and the lattice spacingd. The following equations give the corresponding mathematical relation withregards to the x-ray wavelength λ and define the conditions for constructiveinterference for d spacings:
nλ = 2dhkl · sinθ , d∗hkl = 1dhkl
(1.10)
The reciprocal lattice vector d∗hkl allows to derive a direct relation between thereal space lattice distances dhkl and the scattering vector S. This relation is
9
II INTRODUCTION
θ
d
P1
P2θ
OWIW2
IW1
θ
x2
x1
Figure 1.6: Schematic depiction of diffraction interpreted as originating from crystal latticeplanes (P1, P2) at an angle of incidence θ and lattice spacing d, IW: incoming wave, OW:outgoing wave; Usually described in terms of the Bragg equation (Eq. 1.10)
usually described and visualized by means of the Ewald construction. Forresolving a protein structure at atomic resolution, not only the positions ofpossible hkl reflections are of importance, but also the corresponding intensitiesand phases. The intensity of a given reflection is determined by the actualunit cell content. Therefore, it depends on the actual scattering intensities ofthe contributing atoms in combination with the conditions for constructiveinterference.The structure factor can be subjected to an inverse Fourier transformationto yield the electron density ρ(r). It is obvious from equation 1.9 that bothstructure factor amplitude and phase information are required for this operation.Using Euler’s formula, the complex structure factor can be split to yieldseparate terms for the structure factor amplitude and the phase:
FCh = |FCh | · exp (2πihα) (1.11)
where α is the phase associated with the point h in reciprocal space. Thus,applying FT−1, the electron density at point r is described by:
ρ(r) = 1V
∞∑h
|FCh | · exp (iα) · exp (−2πih) (1.12)
Equation 1.12 is divided by the volume V of the unit cell for scaling purposes andcould be readily used to calculate electron densities. Unfortunately, recordeddiffraction patterns in x-ray crystallographic experiments only conserve ampli-tudes but not the phases of the structure factors, a problem commonly referredto as the phase problem of x-ray crystallography. For large molecules thisproblem can be solved via multiple approaches. One is molecular replacement,a completely computational approach where already known phases of a similarmolecule are being utilized. Additionally, experimental techniques such asisomorphous replacement (SIR, MIR) or anomalous dispersion (SAD, MAD)can be used to retrieve the phase information to yield a correct electron densitymap.
10

II INTRODUCTION
Further Interactions of X-ray Radiation and Matter
Elastic scattering, as it was described above, is only one possible type ofinteraction between x-ray radiation and matter. Furthermore, x-rays canbe scattered via inelastic Compton scattering, but can also be absorbed(photoelectric effect). The transmission (or attenuation) of an x-ray beam canbe calculated according to the Lambert-Beer law:
T = I
I0= exp(−µR) (1.13)
Here, sfracII0 is the ratio of incident and outgoing intensity, R is the penetra-tion depth and µ is the attenuation (absorption) coefficient defined as:
µ =(ρNA
M
)σ (1.14)
in which σ represents the absorption cross-section of the material, ρ is themass density and M the molar mass of the investigated material. NA is theAvogadro constant. The attenuation of x-rays approximately scales with the4-th power of the atomic number Z.
1.4 Serial Femtosecond X-ray Crystallography (SFX)Over the past decade new developments in the field of ultra-brilliant lightsources (cp. sec. 1.2), fast-readout detectors and sample delivery techniqueshave stimulated new approaches in protein crystallography at synchrotronsand XFELs. Even though classical macromolecular crystallography (MX)with macroscopic crystals is responsible for tremendous progress in biologicalresearch the fundamental limitations in technical feasibility and sample prepa-ration/deterioration largely prevent further groundbreaking research [268].An alternative approach is serial crystallography (SX), which can circumventradiation damage and difficulties in growth of large, well-ordered crystals.Instead of simply rotating a single large crystal, SX is based on acquiringconsecutive diffraction patterns from thousands of single sub-micron sized andrandomly-oriented crystals. The utilization of intense, femtosecond (20-50fs) x-ray pulses at XFELs allows to apply ultra-high doses to single crystalsin comparison to classical MX, whilst still avoiding signal deterioration fromradiation damage (diffraction-before-destruction principle). Unfortunately, onlythree hard x-ray FELs are operational to date, which limits access for a broaderscientific community. Furthermore, multidisciplinary teams are required toprovide experimental chambers, suitable sample delivery methods, the samplesthemselves and a fast pipeline for data evaluation. Due to the high demand forserial data collection, the principle has been recently also transferred to syn-chrotron facilities as serial millisecond crystallography (SMX) or in a broadersense by taking serial diffraction snapshots along a larger crystal [207, 268,269]. Even though millisecond exposures cannot circumvent the acquisitionof diffraction data influenced by molecular damage from liberated electrons,they can outrun secondary radiation damage from molecule relaxation or dif-fusing radicals. Thus, all these approaches share the idea of distributing theradiation dose to allow for a more unbiased data acquisition. More recently,also serial Laue diffraction has been performed at synchrotrons as shown byPerry et al. [215] and Meents et al. [264]. SFX with nano- or micro-crystalsis also advantageous in terms of time-resolved measurements at FELs. Only
11
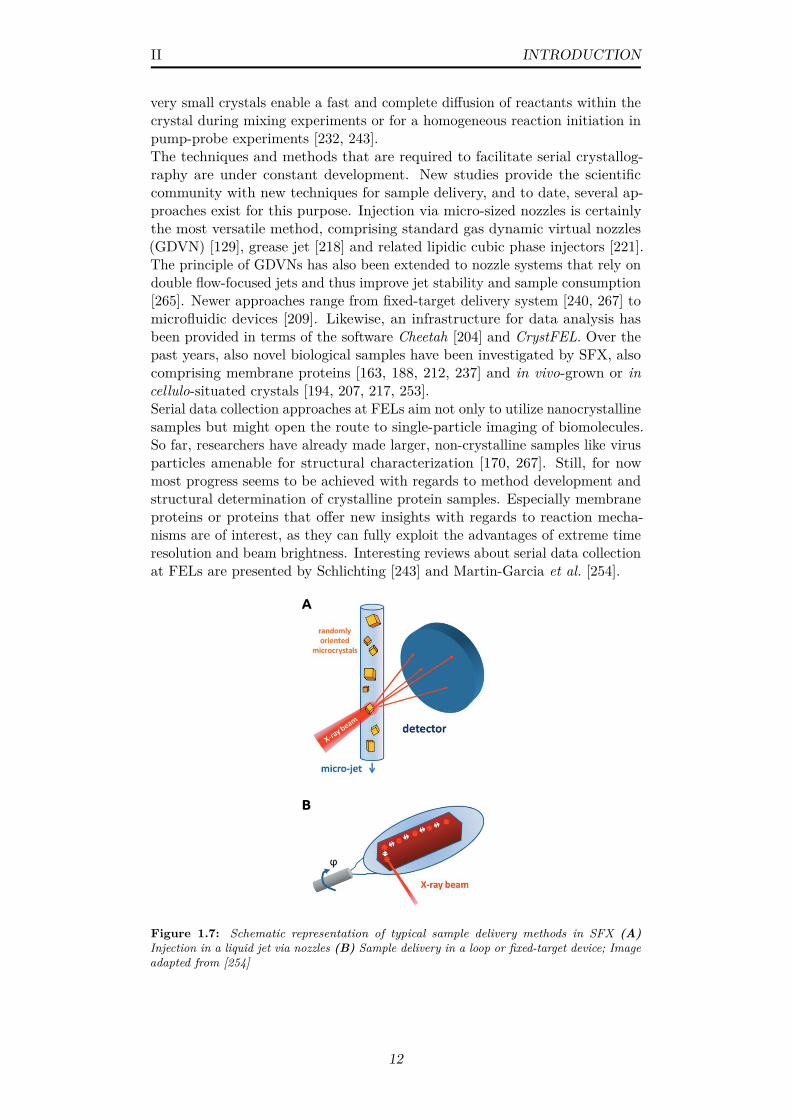
II INTRODUCTION
very small crystals enable a fast and complete diffusion of reactants within thecrystal during mixing experiments or for a homogeneous reaction initiation inpump-probe experiments [232, 243].The techniques and methods that are required to facilitate serial crystallog-raphy are under constant development. New studies provide the scientificcommunity with new techniques for sample delivery, and to date, several ap-proaches exist for this purpose. Injection via micro-sized nozzles is certainlythe most versatile method, comprising standard gas dynamic virtual nozzles(GDVN) [129], grease jet [218] and related lipidic cubic phase injectors [221].The principle of GDVNs has also been extended to nozzle systems that rely ondouble flow-focused jets and thus improve jet stability and sample consumption[265]. Newer approaches range from fixed-target delivery system [240, 267] tomicrofluidic devices [209]. Likewise, an infrastructure for data analysis hasbeen provided in terms of the software Cheetah [204] and CrystFEL. Over thepast years, also novel biological samples have been investigated by SFX, alsocomprising membrane proteins [163, 188, 212, 237] and in vivo-grown or incellulo-situated crystals [194, 207, 217, 253].Serial data collection approaches at FELs aim not only to utilize nanocrystallinesamples but might open the route to single-particle imaging of biomolecules.So far, researchers have already made larger, non-crystalline samples like virusparticles amenable for structural characterization [170, 267]. Still, for nowmost progress seems to be achieved with regards to method development andstructural determination of crystalline protein samples. Especially membraneproteins or proteins that offer new insights with regards to reaction mecha-nisms are of interest, as they can fully exploit the advantages of extreme timeresolution and beam brightness. Interesting reviews about serial data collectionat FELs are presented by Schlichting [243] and Martin-Garcia et al. [254].
A
B
Figure 1.7: Schematic representation of typical sample delivery methods in SFX (A)Injection in a liquid jet via nozzles (B) Sample delivery in a loop or fixed-target device; Imageadapted from [254]
12
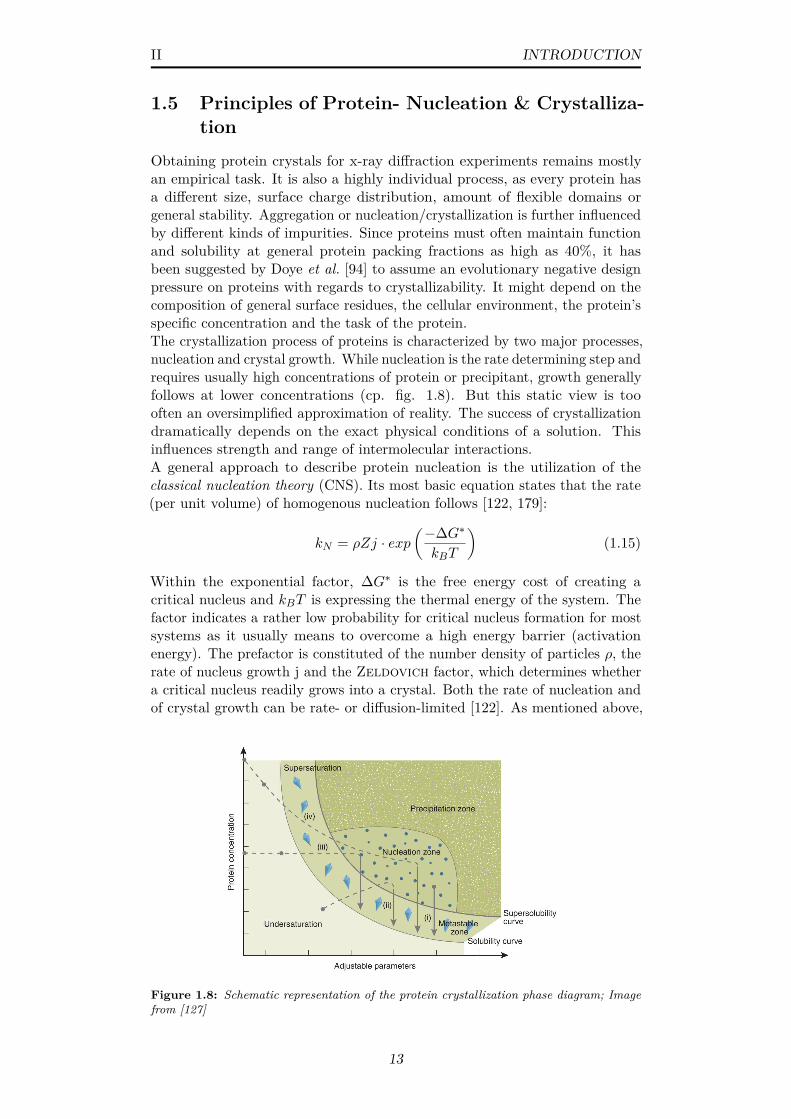
II INTRODUCTION
1.5 Principles of Protein- Nucleation & Crystalliza-tion
Obtaining protein crystals for x-ray diffraction experiments remains mostlyan empirical task. It is also a highly individual process, as every protein hasa different size, surface charge distribution, amount of flexible domains orgeneral stability. Aggregation or nucleation/crystallization is further influencedby different kinds of impurities. Since proteins must often maintain functionand solubility at general protein packing fractions as high as 40%, it hasbeen suggested by Doye et al. [94] to assume an evolutionary negative designpressure on proteins with regards to crystallizability. It might depend on thecomposition of general surface residues, the cellular environment, the protein’sspecific concentration and the task of the protein.The crystallization process of proteins is characterized by two major processes,nucleation and crystal growth. While nucleation is the rate determining step andrequires usually high concentrations of protein or precipitant, growth generallyfollows at lower concentrations (cp. fig. 1.8). But this static view is toooften an oversimplified approximation of reality. The success of crystallizationdramatically depends on the exact physical conditions of a solution. Thisinfluences strength and range of intermolecular interactions.A general approach to describe protein nucleation is the utilization of theclassical nucleation theory (CNS). Its most basic equation states that the rate(per unit volume) of homogenous nucleation follows [122, 179]:
kN = ρZj · exp(−∆G∗
kBT
)(1.15)
Within the exponential factor, ∆G∗ is the free energy cost of creating acritical nucleus and kBT is expressing the thermal energy of the system. Thefactor indicates a rather low probability for critical nucleus formation for mostsystems as it usually means to overcome a high energy barrier (activationenergy). The prefactor is constituted of the number density of particles ρ, therate of nucleus growth j and the Zeldovich factor, which determines whethera critical nucleus readily grows into a crystal. Both the rate of nucleation andof crystal growth can be rate- or diffusion-limited [122]. As mentioned above,
Figure 1.8: Schematic representation of the protein crystallization phase diagram; Imagefrom [127]
13
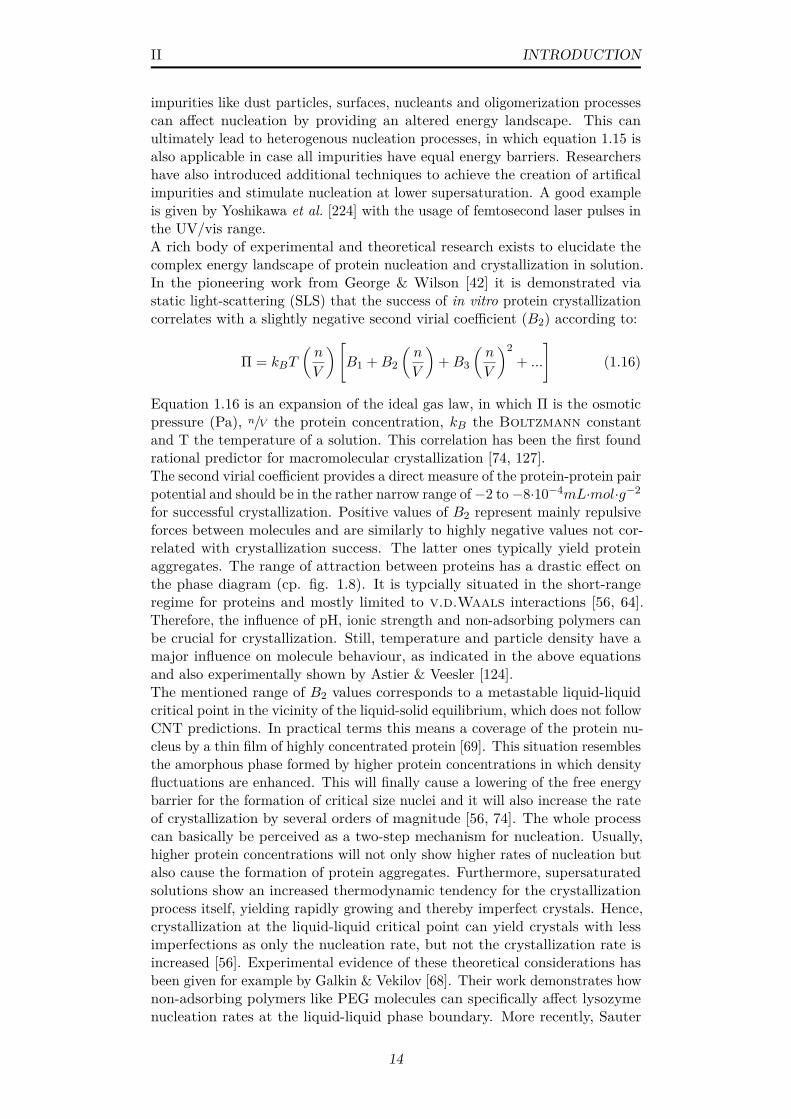
II INTRODUCTION
impurities like dust particles, surfaces, nucleants and oligomerization processescan affect nucleation by providing an altered energy landscape. This canultimately lead to heterogenous nucleation processes, in which equation 1.15 isalso applicable in case all impurities have equal energy barriers. Researchershave also introduced additional techniques to achieve the creation of artificalimpurities and stimulate nucleation at lower supersaturation. A good exampleis given by Yoshikawa et al. [224] with the usage of femtosecond laser pulses inthe UV/vis range.A rich body of experimental and theoretical research exists to elucidate thecomplex energy landscape of protein nucleation and crystallization in solution.In the pioneering work from George & Wilson [42] it is demonstrated viastatic light-scattering (SLS) that the success of in vitro protein crystallizationcorrelates with a slightly negative second virial coefficient (B2) according to:
Π = kBT
(n
V
)[B1 +B2
(n
V
)+B3
(n
V
)2+ ...
](1.16)
Equation 1.16 is an expansion of the ideal gas law, in which Π is the osmoticpressure (Pa), n/V the protein concentration, kB the Boltzmann constantand T the temperature of a solution. This correlation has been the first foundrational predictor for macromolecular crystallization [74, 127].The second virial coefficient provides a direct measure of the protein-protein pairpotential and should be in the rather narrow range of−2 to−8·10−4mL·mol·g−2
for successful crystallization. Positive values of B2 represent mainly repulsiveforces between molecules and are similarly to highly negative values not cor-related with crystallization success. The latter ones typically yield proteinaggregates. The range of attraction between proteins has a drastic effect onthe phase diagram (cp. fig. 1.8). It is typcially situated in the short-rangeregime for proteins and mostly limited to v.d.Waals interactions [56, 64].Therefore, the influence of pH, ionic strength and non-adsorbing polymers canbe crucial for crystallization. Still, temperature and particle density have amajor influence on molecule behaviour, as indicated in the above equationsand also experimentally shown by Astier & Veesler [124].The mentioned range of B2 values corresponds to a metastable liquid-liquidcritical point in the vicinity of the liquid-solid equilibrium, which does not followCNT predictions. In practical terms this means a coverage of the protein nu-cleus by a thin film of highly concentrated protein [69]. This situation resemblesthe amorphous phase formed by higher protein concentrations in which densityfluctuations are enhanced. This will finally cause a lowering of the free energybarrier for the formation of critical size nuclei and it will also increase the rateof crystallization by several orders of magnitude [56, 74]. The whole processcan basically be perceived as a two-step mechanism for nucleation. Usually,higher protein concentrations will not only show higher rates of nucleation butalso cause the formation of protein aggregates. Furthermore, supersaturatedsolutions show an increased thermodynamic tendency for the crystallizationprocess itself, yielding rapidly growing and thereby imperfect crystals. Hence,crystallization at the liquid-liquid critical point can yield crystals with lessimperfections as only the nucleation rate, but not the crystallization rate isincreased [56]. Experimental evidence of these theoretical considerations hasbeen given for example by Galkin & Vekilov [68]. Their work demonstrates hownon-adsorbing polymers like PEG molecules can specifically affect lysozymenucleation rates at the liquid-liquid phase boundary. More recently, Sauter
14
II INTRODUCTION
et al. [242] have demonstrated the observation of two-step nucleation of proteinsvia optical microscopy and SAXS, which corresponds to the presented theoryof nucleation at the liquid-liquid critical point. On the contrary, even thoughcomputer simulations by Wedekind et al. [248] corroborate the assertion ofliquid patches in which the free energy barrier is lowered, their experiments alsosuggest that the two-step model does not apply for all metastable liquid-liquidphase transitions but is complemented by two additional mechanisms: (I)direct crystallization from a low-density phase and (II) crystallization fromunstable liquid droplets at critical densities. It is additionally shown thathigher nucleation rates are rather associated with the whole metastable regionrather than just the metastable critical point itself.In recent years, miniaturization and automation of crystallization experimentshave been applied to facilitate easier high-throughput screening of suitablecrystallization conditions. Intriguingly, nanoliter or even picoliter volumesrepresent a different environment as the same ’mother liquor’ in a µL droplet.Experiments suggest that the number of nucleation events is linearly propor-tional to the droplet volume [80, 116]. Therefore, it takes longer for crystals toappear in smaller volumes. The decreased nucleation rate might be related tothe increased surface tension of a small drop according to [80]:
∆ρ = σ
r(1.17)
ρ is the pressure inside the droplet, whereas σ and r are the surface tensionand radius of the droplet, respectively. Bodenstaff et al. [80] also identifieddifferent crystal shapes in dependency of the droplet volume, indicating a visi-ble influence of surface tension on the crystallization process. These findingsappear somewhat related to the influence of gravity on protein crystallizationsuccess and crystal shape/size as found for crystallization trials in the earthorbit [235]. In general, it is a widely accepted fact that nanoliter volumesrender a different environment despite equal buffer conditions [127].In experimental terms in vitro crystallization is based on many different tech-niques like microbatch crystallization, in which a paraffin oil works as protectionagainst early evaporation, or vapor-diffusion, that is based on drop equilibrationagainst a liquor reservoir (sitting-drop, hanging-drop). Other techniques likedialysis, free interface diffusion (FID) or the application of microfluidic deviceshave also been successfully used in protein crystallization. A decent review ofsuch techniques is for example given by Chayen & Saridakis [127].Biological systems like cells or organelles are much more complex than a simpledrop of mother liquor. Still, they also have to obey general laws of physics, butare simultaneously more difficult to approach. Despite the known mechanismsof active turgor pressure regulation, cells and organelles might encounter furtherout-of-equilibrium fluctuations with regards to hydrostatic and osmotic pres-sure [205]. Considering equation 1.16, this might have a tremendous influenceon in vivo crystallization success. On the other hand, the presence of a mixedsolution of macromolecules and solutes might also act as mixture of naturalnucleants and enhance nucleation. Unfortunately, there are no studies availableto confirm such a claim.
15
II INTRODUCTION
2 | Budding Yeast & The CrystalFactory
2.1 Budding Yeast in Heterologous Gene Expres-sion
Yeast can be defined as unicellular, ascomycetous or basidiomycetous fungiexhibiting vegetative reproduction by budding or fission. Most budding yeastspecies exist in different states, more precisely haploidic or diploidic cells,capable of sexual reproduction and sporulation. In a non-scientific sense theword ’yeast’ usually solely relates to the budding yeast species Saccharomycescerevisiae, which is not only popular in food production and general biotech-nology, but is also one of the most important eukaryotes exploited in scientificresearch. It usually has its growth optimum at about 30°C and shows neithera strong resilience at low nor at high temperatures. Haploidic cells commonlyreach diameters of 2-5 µm [28, 61, 149, 168, 193].Hansenula polymorpha (also designated as Ogataea angusta or Pichia angusta)is a distant relative of S. cerevisiae in the family of Saccharomycetaceae. Itshows distinct differences in comparison to its relative with regards to geno-and phenotype [193]. In fact, it belongs to the rare group of methylotrophicyeast and can be additionally characterized by its pronounced thermotolerancewith possible growth between 20-50°C. Cells usually grow only to diameters of1-3 µm. H. polymorpha and other closely related yeast like Pichia pastoris havebeen heavily exploited in industry, for example for the production of hepatitisB vaccine, insulin, IFNα-2a, or even biofuels [149, 191]. Indeed, yeasts are asuperior eukaryotic system for heterologous gene expression. On the one hand,cultivation and growth are easier and faster, also less-expensive and can befacilitated at large-scale in comparison to mammalian or insect cell lines. Onthe other hand, yeasts still support many more posttranslational modificationswhich are not supported by bacterial expression systems. Additionally, mostyeasts are also capable of fermentation [52, 61, 214]. Not surprisingly, a lot ofscientific studies promote these outstanding properties in heterologous geneexpression, either with regards to S. cerevisiae [25], H. polymorpha [37, 63] orother yeast species [201].Peroxisomal research is usually closely associated with the issue of high expres-sion yields due to the strong promoters that are involved in the expression ofperoxisomal enzymes [222, 239]. Although S. cerevisiae is a more inconspicuousyeast, all of the mentioned species allow for an easily achievable inductionof peroxisome proliferation by specific growth conditions. While oleic acid isinducing peroxisomal fatty acid β-oxidation enzymes in S. cerevisiae, methanolstimulates the expression of peroxisomal enzymes which target on carbonassimilation and energy extraction in H. polymorpha. Both processes foster the
16

II INTRODUCTION
development of a multitude of fully developed peroxisomes per cell and resultin high yields of metabolic enzymes. Promoters that offer strong expressionrates are either PFOX3 in S. cerevisiae, which is inducing the expression of3-ketoacyl-CoA-thiolase (Fox3p) under oleate-inducing conditions, or PAOX inH. polymorpha, responsible for the expression of alcohol oxidase (MOX, AOX)under methanol-inducing conditions. Still, some S. cerevisiae strains are notcapable to solely grow on oleic acid. On the contrary, H. polymorpha canmaintain cellular growth on methanol as the sole carbon- and energy source.Thus, the widespread application of these yeast species and the availability ofa simple trigger for peroxisome biogenesis have also rendered both as suitablemodel organisms specifically in peroxisomal research [60, 196, 208, 222].
2.2 The Peroxisomal System of S. cerevisiae & H.polymorpha
As mentioned in section 2.1, S. cerevisiae and H. polymorpha are utilizedto study peroxisome biogenesis and disease-related deficiencies of peroxiso-mal proteins in eukaryotic cells. Both species utilize a well-conserved andcomparable protein family, mostly denoted as PEX proteins, to accomplishperoxisomal development. Most underlying processes are also partially com-parable to such in mammalian cells. Under non-inducing growth conditionsonly about one small preperoxisome exists per yeast cell. This is a situationwhich changes dramatically upon induction of peroxisome proliferation. Twodistinct mechanisms have been proposed to contribute to the multiplication ofperoxisomes within cells. Firstly, de novo formation from the ER at an earlystage of induction and secondly, direct fission from preexisting organelles asindicated in figure 2.1. A comprehensive discussion of this topic is providedby Veenhuis & van der Klei [220] or Kim & Hettema [229]. Multiplication oforganelles is due to the increased demand for protein synthesis of peroxisomalmatrix proteins, mostly specific metabolic enzymes, which are imported in vastamounts into peroxisomes to process metabolites in a confined environment.Upon prolonged incubation such proteins can substantially contribute to thetotal protein yield from yeast cells. When synthesis capacities are adjustedto counteract on the demand for matrix proteins, it is equally important forcells to provide an efficient import machinery for peroxisomes. For yeast, twodistinct transient pores (PTSI & PTSII) are proposed which facilitate proteinimport. The cytosolic receptors Pex5p and Pex7p recognize specifically eitherPTSI, or PTSII motifs, respectively. These are short C- or N-terminal peptidessufficient for targeting and translocation. For example, the PTSI motif simplyconsists of a SKL tripeptide, or one of its many recognized variants [102]. Theaforementioned transient pores are constituted of several PEX proteins andassemble within the peroxisomal membrane upon cargo recognition [121, 123].Although a complete understanding of these pores is not yet in reach and nocomplete atomic model exists for either of them, it is well established that aminimalistic PTSI or PTSII tag might be sufficient for the peroxisomal importof heterologously-expressed and cytosolically-folded proteins [43, 46, 162].It has been shown that a deletion of the protein Pex11p yields enlarged per-oxisomes at an reduced number of organelles per cell, as it usually facilitatesperoxisomal fission [147]. A deletion of the receptor protein Pex5p is similarlydetrimental for matrix protein import. Both mutants result in specific pheno-types as indicated in figure 2.1. In the case of an absence of Pex5p, peroxisomal
17
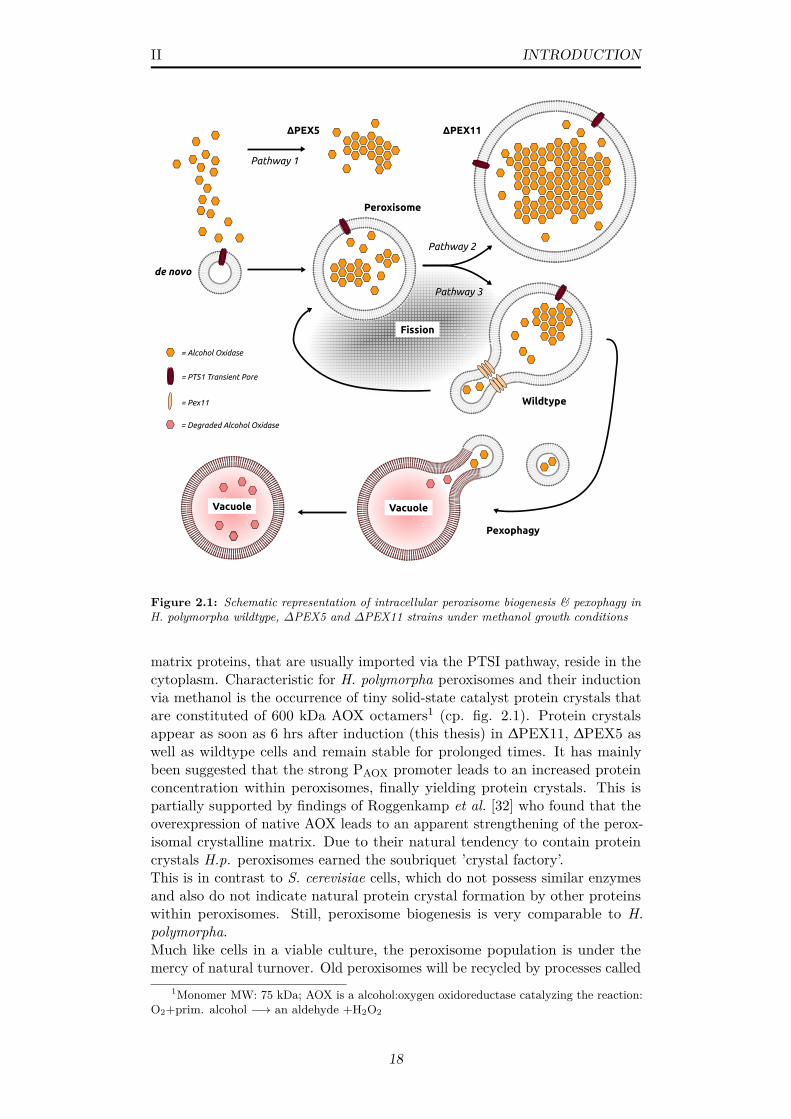
II INTRODUCTION
ΔPEX11ΔPEX5
Fission
de novo
= Alcohol Oxidase
= PTS1 Transient Pore
= Pex11
Pathway 2
Pathway 3
Pathway 1
Wildtype
VacuoleVacuole
Pexophagy
= Degraded Alcohol Oxidase
Peroxisome
Figure 2.1: Schematic representation of intracellular peroxisome biogenesis & pexophagy inH. polymorpha wildtype, ∆PEX5 and ∆PEX11 strains under methanol growth conditions
matrix proteins, that are usually imported via the PTSI pathway, reside in thecytoplasm. Characteristic for H. polymorpha peroxisomes and their inductionvia methanol is the occurrence of tiny solid-state catalyst protein crystals thatare constituted of 600 kDa AOX octamers1 (cp. fig. 2.1). Protein crystalsappear as soon as 6 hrs after induction (this thesis) in ∆PEX11, ∆PEX5 aswell as wildtype cells and remain stable for prolonged times. It has mainlybeen suggested that the strong PAOX promoter leads to an increased proteinconcentration within peroxisomes, finally yielding protein crystals. This ispartially supported by findings of Roggenkamp et al. [32] who found that theoverexpression of native AOX leads to an apparent strengthening of the perox-isomal crystalline matrix. Due to their natural tendency to contain proteincrystals H.p. peroxisomes earned the soubriquet ’crystal factory’.This is in contrast to S. cerevisiae cells, which do not possess similar enzymesand also do not indicate natural protein crystal formation by other proteinswithin peroxisomes. Still, peroxisome biogenesis is very comparable to H.polymorpha.Much like cells in a viable culture, the peroxisome population is under themercy of natural turnover. Old peroxisomes will be recycled by processes called
1Monomer MW: 75 kDa; AOX is a alcohol:oxygen oxidoreductase catalyzing the reaction:O2+prim. alcohol −→ an aldehyde +H2O2
18
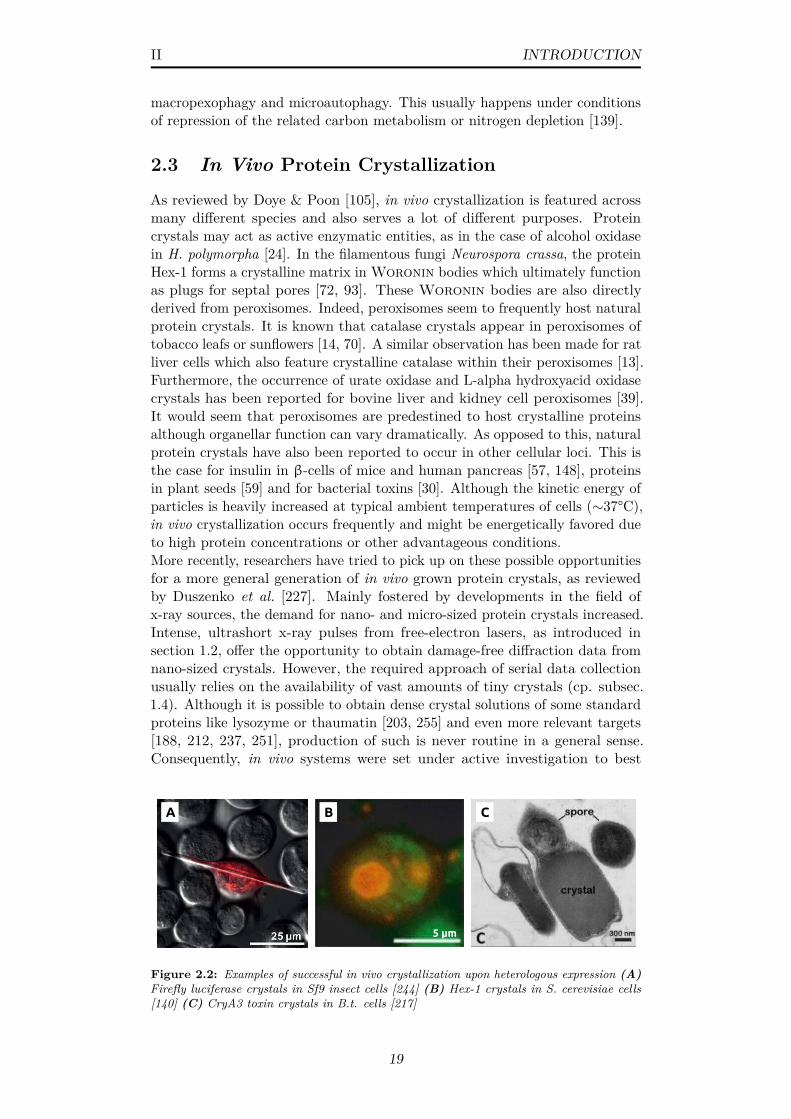
II INTRODUCTION
macropexophagy and microautophagy. This usually happens under conditionsof repression of the related carbon metabolism or nitrogen depletion [139].
2.3 In Vivo Protein Crystallization
As reviewed by Doye & Poon [105], in vivo crystallization is featured acrossmany different species and also serves a lot of different purposes. Proteincrystals may act as active enzymatic entities, as in the case of alcohol oxidasein H. polymorpha [24]. In the filamentous fungi Neurospora crassa, the proteinHex-1 forms a crystalline matrix in Woronin bodies which ultimately functionas plugs for septal pores [72, 93]. These Woronin bodies are also directlyderived from peroxisomes. Indeed, peroxisomes seem to frequently host naturalprotein crystals. It is known that catalase crystals appear in peroxisomes oftobacco leafs or sunflowers [14, 70]. A similar observation has been made for ratliver cells which also feature crystalline catalase within their peroxisomes [13].Furthermore, the occurrence of urate oxidase and L-alpha hydroxyacid oxidasecrystals has been reported for bovine liver and kidney cell peroxisomes [39].It would seem that peroxisomes are predestined to host crystalline proteinsalthough organellar function can vary dramatically. As opposed to this, naturalprotein crystals have also been reported to occur in other cellular loci. This isthe case for insulin in β-cells of mice and human pancreas [57, 148], proteinsin plant seeds [59] and for bacterial toxins [30]. Although the kinetic energy ofparticles is heavily increased at typical ambient temperatures of cells (∼37°C),in vivo crystallization occurs frequently and might be energetically favored dueto high protein concentrations or other advantageous conditions.More recently, researchers have tried to pick up on these possible opportunitiesfor a more general generation of in vivo grown protein crystals, as reviewedby Duszenko et al. [227]. Mainly fostered by developments in the field ofx-ray sources, the demand for nano- and micro-sized protein crystals increased.Intense, ultrashort x-ray pulses from free-electron lasers, as introduced insection 1.2, offer the opportunity to obtain damage-free diffraction data fromnano-sized crystals. However, the required approach of serial data collectionusually relies on the availability of vast amounts of tiny crystals (cp. subsec.1.4). Although it is possible to obtain dense crystal solutions of some standardproteins like lysozyme or thaumatin [203, 255] and even more relevant targets[188, 212, 237, 251], production of such is never routine in a general sense.Consequently, in vivo systems were set under active investigation to best
5 μm
A B C
Figure 2.2: Examples of successful in vivo crystallization upon heterologous expression (A)Firefly luciferase crystals in Sf9 insect cells [244] (B) Hex-1 crystals in S. cerevisiae cells[140] (C) CryA3 toxin crystals in B.t. cells [217]
19
II INTRODUCTION
accommodate this demand, as they may offer easy, large-scale productionand in cellulo maintenance of crystals, but also different degrees of directposttranslational modifications of proteins.Especially the Sf9/Baculovirus system has received a lot of attention recently,as it has demonstrated its advanced maturation in the generation of in vivoprotein crystals. Following its application in general protein overexpressionand more historic observations of calcineurin protein crystals by Fan et al. [49],the system yielded crystals of cathepsin B [194, 207], polyhedrin [202, 228],luciferase and GFP-tagged reovirus µNS [244]. Still, as represented by thelast example, high-quality crystals are not necessarily obtained in every case.Intriguingly, crystallization has been achieved in various cellular compartments.Mammalian cell lines have also been exploited as carriers of protein crystals inseveral cases. For example, the overexpression of human IgG in hamster ovarycells [166] or of the protein KikGR in HEK293 cells [247] lead both to successfulprotein crystallization. Nonetheless, most of these efforts yielded micro-sizedprotein crystals which are still amenable to synchrotron-based data collection.It is even more sweeping that in many cases removal of the crystals from thecellular environment is required, not only to reach proper concentrations, butalso to allow for an injection via liquid jets in SFX experiments. This removalcan of course introduce additional damage to the crystals and thereby reducethe achievable resolution. A partial remedy for this drawback has recentlybeen found in fixed-target delivery systems. On the contrary, Sawaya et al.[217] demonstrated that smaller bacterial cells can be directly injected into anx-ray beam.Yeast cells have not yet been exploited as generalized ’crystal factories’, eventhough they are in a superb starting position (cp. sec. 2.1 & 2.2). Theyare small enough to be directly used as crystal carriers, and protein crystalformation in peroxisomes has been reported after heterologous expression of atarget protein [140].
20
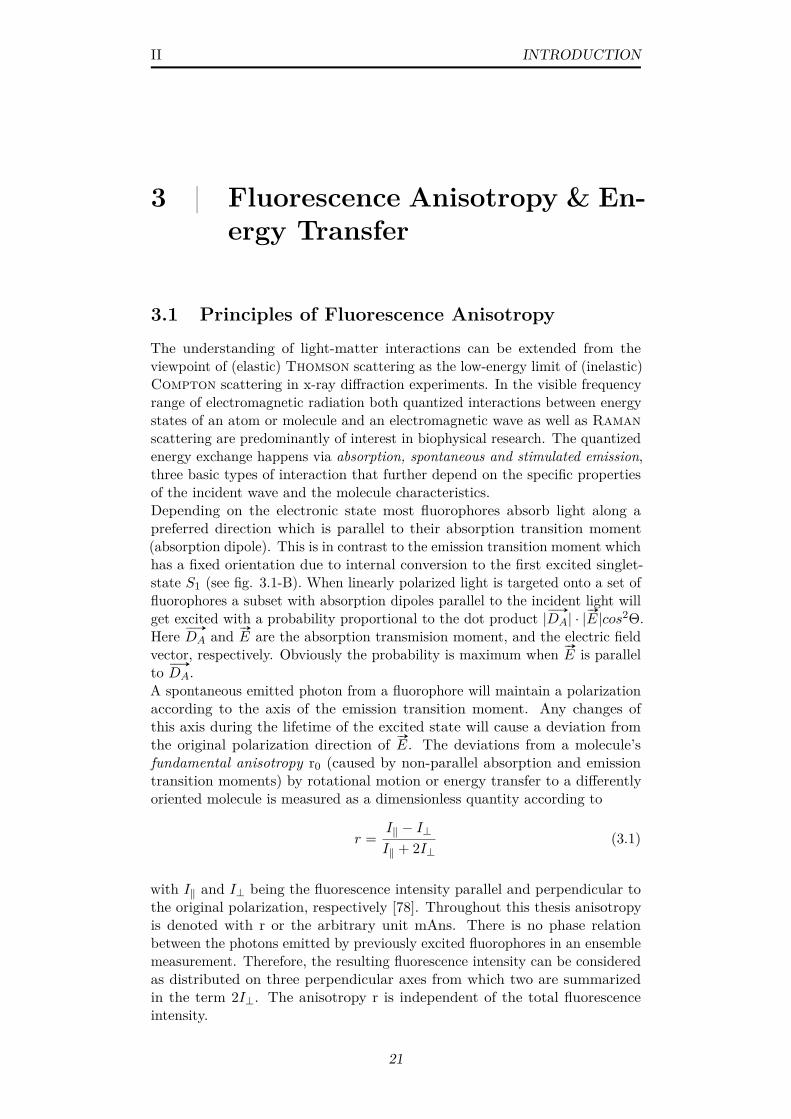
II INTRODUCTION
3 | Fluorescence Anisotropy & En-ergy Transfer
3.1 Principles of Fluorescence AnisotropyThe understanding of light-matter interactions can be extended from theviewpoint of (elastic) Thomson scattering as the low-energy limit of (inelastic)Compton scattering in x-ray diffraction experiments. In the visible frequencyrange of electromagnetic radiation both quantized interactions between energystates of an atom or molecule and an electromagnetic wave as well as Ramanscattering are predominantly of interest in biophysical research. The quantizedenergy exchange happens via absorption, spontaneous and stimulated emission,three basic types of interaction that further depend on the specific propertiesof the incident wave and the molecule characteristics.Depending on the electronic state most fluorophores absorb light along apreferred direction which is parallel to their absorption transition moment(absorption dipole). This is in contrast to the emission transition moment whichhas a fixed orientation due to internal conversion to the first excited singlet-state S1 (see fig. 3.1-B). When linearly polarized light is targeted onto a set offluorophores a subset with absorption dipoles parallel to the incident light willget excited with a probability proportional to the dot product | # »
DA| · |#»
E|cos2Θ.Here # »
DA and #»
E are the absorption transmision moment, and the electric fieldvector, respectively. Obviously the probability is maximum when #»
E is parallelto # »
DA.A spontaneous emitted photon from a fluorophore will maintain a polarizationaccording to the axis of the emission transition moment. Any changes ofthis axis during the lifetime of the excited state will cause a deviation fromthe original polarization direction of #»
E. The deviations from a molecule’sfundamental anisotropy r0 (caused by non-parallel absorption and emissiontransition moments) by rotational motion or energy transfer to a differentlyoriented molecule is measured as a dimensionless quantity according to
r =I‖ − I⊥I‖ + 2I⊥
(3.1)
with I‖ and I⊥ being the fluorescence intensity parallel and perpendicular tothe original polarization, respectively [78]. Throughout this thesis anisotropyis denoted with r or the arbitrary unit mAns. There is no phase relationbetween the photons emitted by previously excited fluorophores in an ensemblemeasurement. Therefore, the resulting fluorescence intensity can be consideredas distributed on three perpendicular axes from which two are summarizedin the term 2I⊥. The anisotropy r is independent of the total fluorescenceintensity.
21
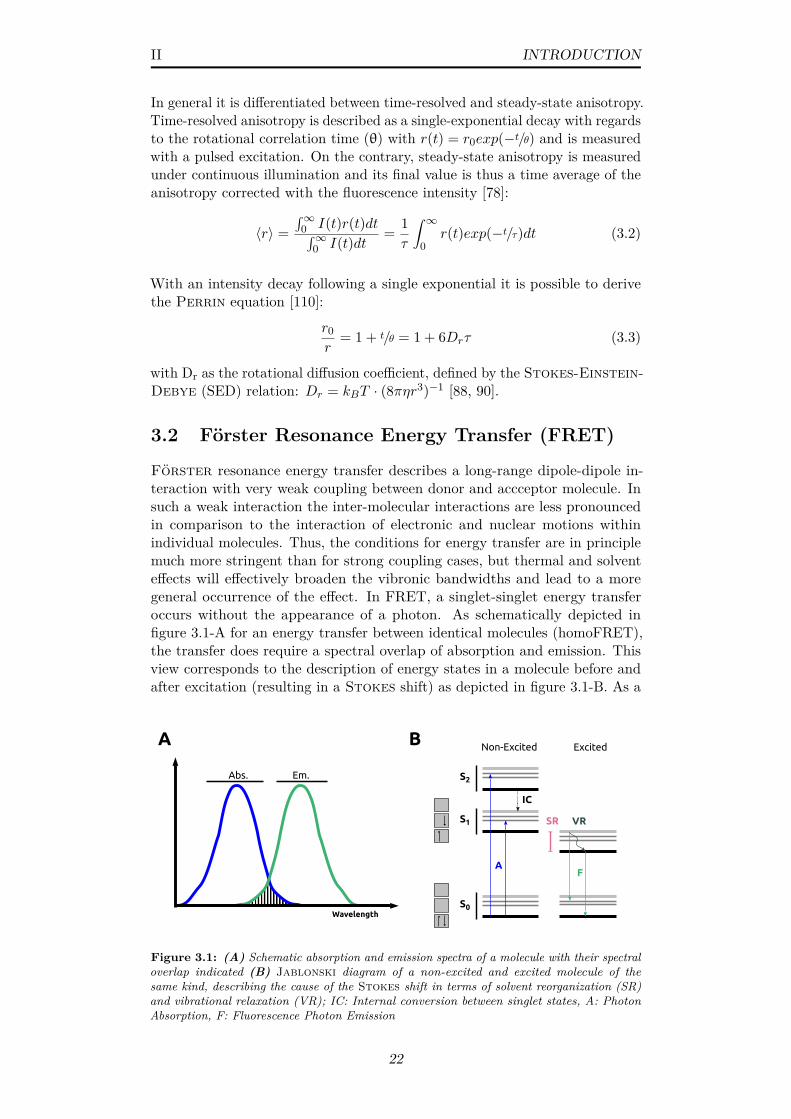
II INTRODUCTION
In general it is differentiated between time-resolved and steady-state anisotropy.Time-resolved anisotropy is described as a single-exponential decay with regardsto the rotational correlation time (θ) with r(t) = r0exp(−t/θ) and is measuredwith a pulsed excitation. On the contrary, steady-state anisotropy is measuredunder continuous illumination and its final value is thus a time average of theanisotropy corrected with the fluorescence intensity [78]:
〈r〉 =∫∞
0 I(t)r(t)dt∫∞0 I(t)dt = 1
τ
∫ ∞0
r(t)exp(−t/τ)dt (3.2)
With an intensity decay following a single exponential it is possible to derivethe Perrin equation [110]:
r0r
= 1 + t/θ = 1 + 6Drτ (3.3)
with Dr as the rotational diffusion coefficient, defined by the Stokes-Einstein-Debye (SED) relation: Dr = kBT · (8πηr3)−1 [88, 90].
3.2 Förster Resonance Energy Transfer (FRET)
Förster resonance energy transfer describes a long-range dipole-dipole in-teraction with very weak coupling between donor and accceptor molecule. Insuch a weak interaction the inter-molecular interactions are less pronouncedin comparison to the interaction of electronic and nuclear motions withinindividual molecules. Thus, the conditions for energy transfer are in principlemuch more stringent than for strong coupling cases, but thermal and solventeffects will effectively broaden the vibronic bandwidths and lead to a moregeneral occurrence of the effect. In FRET, a singlet-singlet energy transferoccurs without the appearance of a photon. As schematically depicted infigure 3.1-A for an energy transfer between identical molecules (homoFRET),the transfer does require a spectral overlap of absorption and emission. Thisview corresponds to the description of energy states in a molecule before andafter excitation (resulting in a Stokes shift) as depicted in figure 3.1-B. As a
Wavelength
Abs. Em.
S1
S0
S2
IC
AF
SR
Non-Excited Excited
VR
A B
Figure 3.1: (A) Schematic absorption and emission spectra of a molecule with their spectraloverlap indicated (B) Jablonski diagram of a non-excited and excited molecule of thesame kind, describing the cause of the Stokes shift in terms of solvent reorganization (SR)and vibrational relaxation (VR); IC: Internal conversion between singlet states, A: PhotonAbsorption, F: Fluorescence Photon Emission
22
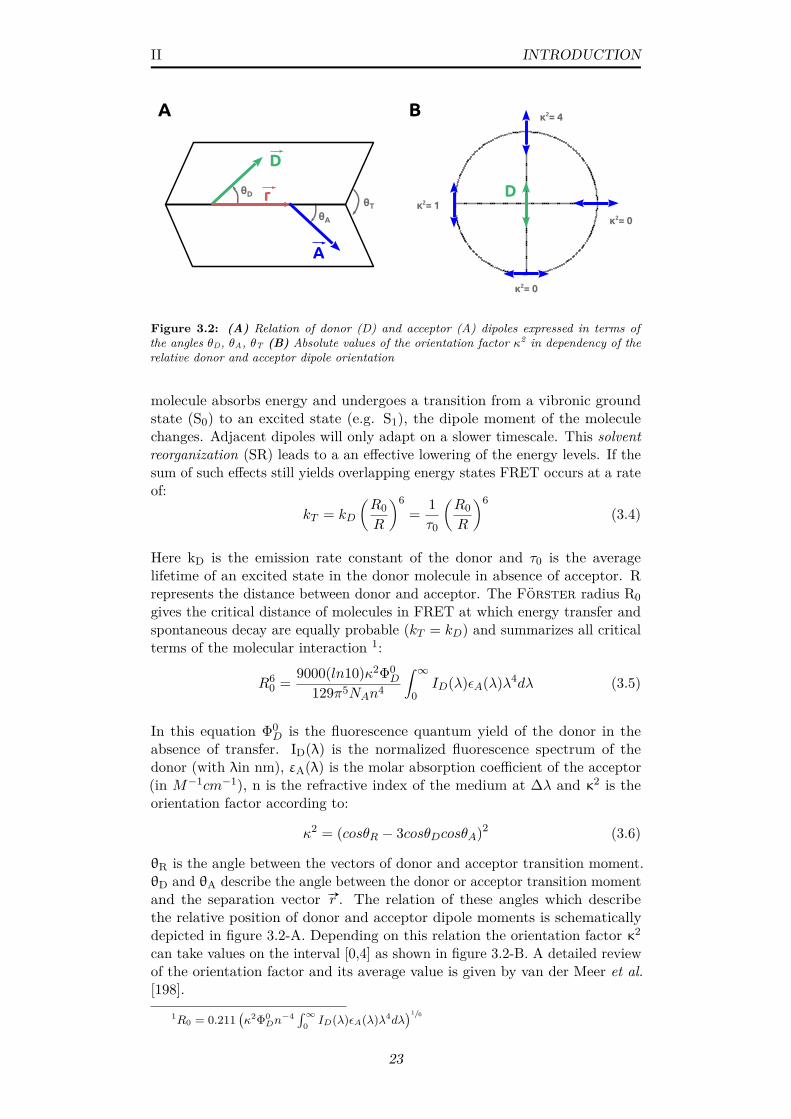
II INTRODUCTION
A B
r
D
A
θD
θA
θT
D
κ2= 0
κ2= 1
κ2= 4
κ2= 0
Figure 3.2: (A) Relation of donor (D) and acceptor (A) dipoles expressed in terms ofthe angles θD, θA, θT (B) Absolute values of the orientation factor κ2 in dependency of therelative donor and acceptor dipole orientation
molecule absorbs energy and undergoes a transition from a vibronic groundstate (S0) to an excited state (e.g. S1), the dipole moment of the moleculechanges. Adjacent dipoles will only adapt on a slower timescale. This solventreorganization (SR) leads to a an effective lowering of the energy levels. If thesum of such effects still yields overlapping energy states FRET occurs at a rateof:
kT = kD
(R0R
)6= 1τ0
(R0R
)6(3.4)
Here kD is the emission rate constant of the donor and τ0 is the averagelifetime of an excited state in the donor molecule in absence of acceptor. Rrepresents the distance between donor and acceptor. The Förster radius R0gives the critical distance of molecules in FRET at which energy transfer andspontaneous decay are equally probable (kT = kD) and summarizes all criticalterms of the molecular interaction 1:
R60 = 9000(ln10)κ2Φ0
D
129π5NAn4
∫ ∞0
ID(λ)εA(λ)λ4dλ (3.5)
In this equation Φ0D is the fluorescence quantum yield of the donor in the
absence of transfer. ID(λ) is the normalized fluorescence spectrum of thedonor (with λin nm), εA(λ) is the molar absorption coefficient of the acceptor(in M−1cm−1), n is the refractive index of the medium at ∆λ and κ2 is theorientation factor according to:
κ2 = (cosθR − 3cosθDcosθA)2 (3.6)
θR is the angle between the vectors of donor and acceptor transition moment.θD and θA describe the angle between the donor or acceptor transition momentand the separation vector #»r . The relation of these angles which describethe relative position of donor and acceptor dipole moments is schematicallydepicted in figure 3.2-A. Depending on this relation the orientation factor κ2
can take values on the interval [0,4] as shown in figure 3.2-B. A detailed reviewof the orientation factor and its average value is given by van der Meer et al.[198].
1R0 = 0.211(κ2Φ0
Dn−4 ∫∞
0 ID(λ)εA(λ)λ4dλ)1/6
23
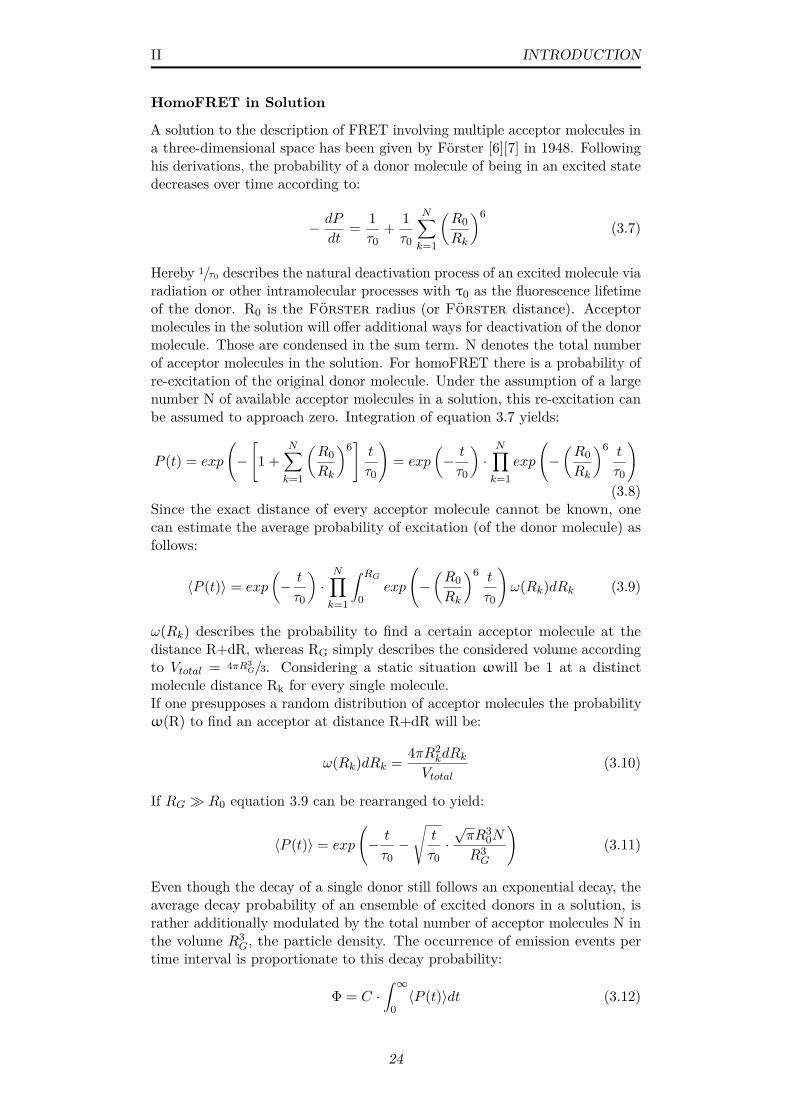
II INTRODUCTION
HomoFRET in Solution
A solution to the description of FRET involving multiple acceptor molecules ina three-dimensional space has been given by Förster [6][7] in 1948. Followinghis derivations, the probability of a donor molecule of being in an excited statedecreases over time according to:
− dP
dt= 1τ0
+ 1τ0
N∑k=1
(R0Rk
)6(3.7)
Hereby 1/τ0 describes the natural deactivation process of an excited molecule viaradiation or other intramolecular processes with τ0 as the fluorescence lifetimeof the donor. R0 is the Förster radius (or Förster distance). Acceptormolecules in the solution will offer additional ways for deactivation of the donormolecule. Those are condensed in the sum term. N denotes the total numberof acceptor molecules in the solution. For homoFRET there is a probability ofre-excitation of the original donor molecule. Under the assumption of a largenumber N of available acceptor molecules in a solution, this re-excitation canbe assumed to approach zero. Integration of equation 3.7 yields:
P (t) = exp
(−[1 +
N∑k=1
(R0Rk
)6] t
τ0
)= exp
(− t
τ0
)·N∏k=1
exp
(−(R0Rk
)6 t
τ0
)(3.8)
Since the exact distance of every acceptor molecule cannot be known, onecan estimate the average probability of excitation (of the donor molecule) asfollows:
〈P (t)〉 = exp
(− t
τ0
)·N∏k=1
∫ RG
0exp
(−(R0Rk
)6 t
τ0
)ω(Rk)dRk (3.9)
ω(Rk) describes the probability to find a certain acceptor molecule at thedistance R+dR, whereas RG simply describes the considered volume accordingto Vtotal = 4πR3
G/3. Considering a static situation ωwill be 1 at a distinctmolecule distance Rk for every single molecule.If one presupposes a random distribution of acceptor molecules the probabilityω(R) to find an acceptor at distance R+dR will be:
ω(Rk)dRk = 4πR2kdRk
Vtotal(3.10)
If RG � R0 equation 3.9 can be rearranged to yield:
〈P (t)〉 = exp
(− t
τ0−√t
τ0·√πR3
0N
R3G
)(3.11)
Even though the decay of a single donor still follows an exponential decay, theaverage decay probability of an ensemble of excited donors in a solution, israther additionally modulated by the total number of acceptor molecules N inthe volume R3
G, the particle density. The occurrence of emission events pertime interval is proportionate to this decay probability:
Φ = C ·∫ ∞
0〈P (t)〉dt (3.12)
24
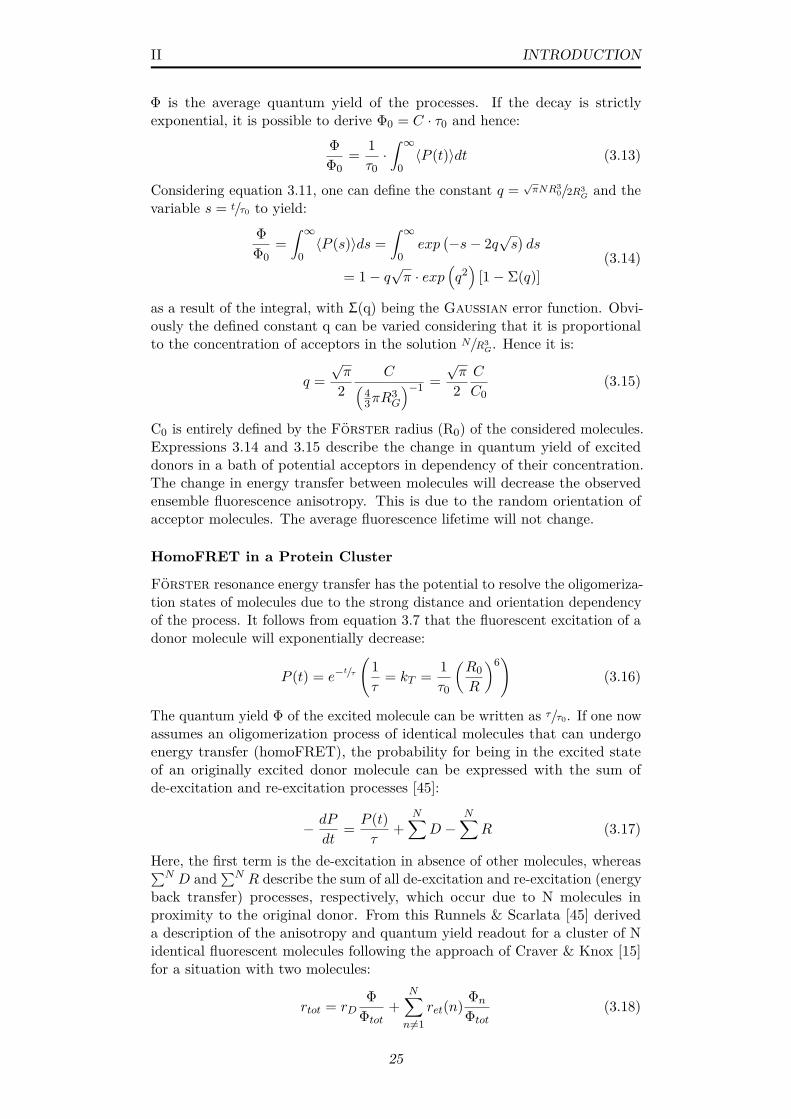
II INTRODUCTION
Φ is the average quantum yield of the processes. If the decay is strictlyexponential, it is possible to derive Φ0 = C · τ0 and hence:
ΦΦ0
= 1τ0·∫ ∞
0〈P (t)〉dt (3.13)
Considering equation 3.11, one can define the constant q = √πNR3
0/2R3G and the
variable s = t/τ0 to yield:
ΦΦ0
=∫ ∞
0〈P (s)〉ds =
∫ ∞0
exp(−s− 2q
√s)ds
= 1− q√π · exp
(q2)
[1− Σ(q)](3.14)
as a result of the integral, with Σ(q) being the Gaussian error function. Obvi-ously the defined constant q can be varied considering that it is proportionalto the concentration of acceptors in the solution N/R3
G. Hence it is:
q =√π
2C(
43πR
3G
)−1 =√π
2C
C0(3.15)
C0 is entirely defined by the Förster radius (R0) of the considered molecules.Expressions 3.14 and 3.15 describe the change in quantum yield of exciteddonors in a bath of potential acceptors in dependency of their concentration.The change in energy transfer between molecules will decrease the observedensemble fluorescence anisotropy. This is due to the random orientation ofacceptor molecules. The average fluorescence lifetime will not change.
HomoFRET in a Protein Cluster
Förster resonance energy transfer has the potential to resolve the oligomeriza-tion states of molecules due to the strong distance and orientation dependencyof the process. It follows from equation 3.7 that the fluorescent excitation of adonor molecule will exponentially decrease:
P (t) = e−t/τ
(1τ
= kT = 1τ0
(R0R
)6)(3.16)
The quantum yield Φ of the excited molecule can be written as τ/τ0. If one nowassumes an oligomerization process of identical molecules that can undergoenergy transfer (homoFRET), the probability for being in the excited stateof an originally excited donor molecule can be expressed with the sum ofde-excitation and re-excitation processes [45]:
− dP
dt= P (t)
τ+
N∑D −
N∑R (3.17)
Here, the first term is the de-excitation in absence of other molecules, whereas∑N D and∑N R describe the sum of all de-excitation and re-excitation (energy
back transfer) processes, respectively, which occur due to N molecules inproximity to the original donor. From this Runnels & Scarlata [45] deriveda description of the anisotropy and quantum yield readout for a cluster of Nidentical fluorescent molecules following the approach of Craver & Knox [15]for a situation with two molecules:
rtot = rDΦ
Φtot+
N∑n6=1
ret(n) Φn
Φtot(3.18)
25

II INTRODUCTION
In this equation rtot and ret are the ensemble and transfer emission anisotropy,respectively. The latter one is simply the anisotropy arising from the n-thmolecule in the cluster. Consequently, Φ is the quantum yield of the originaldonor and Φn the quantum yield of the molecule n in the cluster. Theseconsiderations finally yield the following equation [15, 45]:
rtot = rD(1 + kT · τ)
(1 +N · kT · τ) + ret(N − 1) · (kT · τ)(1 +N · kT · τ) (3.19)
to describe the change in anisotropy in a cluster of identical molecules. Thistheory has been applied e.g. by Bader et al. [113][143] to quantify in cellulooligomerization states in fluorescence anisotropy microscopy. Another study byGanguly et al. [165] similarly describes the utilization of homoFRET to quantifyhigher-order oligomers of serotonin 1A receptors in cells. Older studies havealso tried to utilize simple fluorescence anisotropy measurements to observeearly steps in protein crystallization [31].
26

III | Materials & Methods
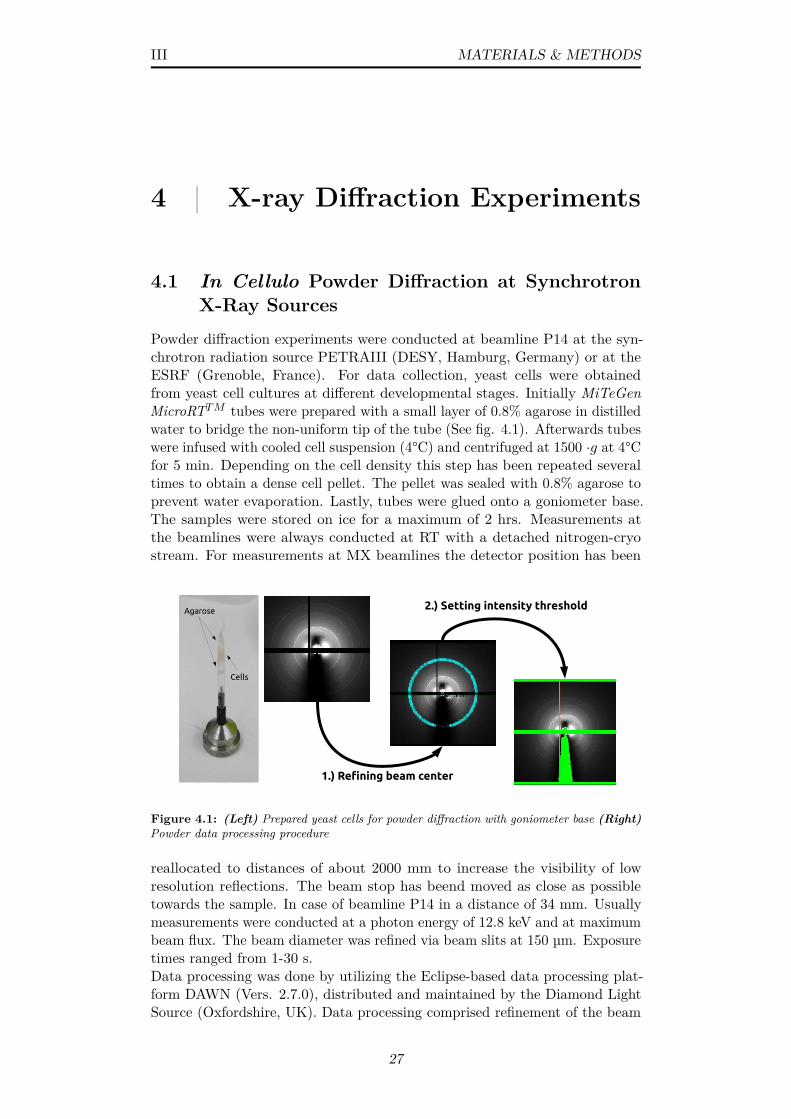
III MATERIALS & METHODS
4 | X-ray Diffraction Experiments
4.1 In Cellulo Powder Diffraction at SynchrotronX-Ray Sources
Powder diffraction experiments were conducted at beamline P14 at the syn-chrotron radiation source PETRAIII (DESY, Hamburg, Germany) or at theESRF (Grenoble, France). For data collection, yeast cells were obtainedfrom yeast cell cultures at different developmental stages. Initially MiTeGenMicroRTTM tubes were prepared with a small layer of 0.8% agarose in distilledwater to bridge the non-uniform tip of the tube (See fig. 4.1). Afterwards tubeswere infused with cooled cell suspension (4°C) and centrifuged at 1500 ·g at 4°Cfor 5 min. Depending on the cell density this step has been repeated severaltimes to obtain a dense cell pellet. The pellet was sealed with 0.8% agarose toprevent water evaporation. Lastly, tubes were glued onto a goniometer base.The samples were stored on ice for a maximum of 2 hrs. Measurements atthe beamlines were always conducted at RT with a detached nitrogen-cryostream. For measurements at MX beamlines the detector position has been
Agarose
Cells
1.) Refning beam center
2.) Setting intensity threshold
Figure 4.1: (Left) Prepared yeast cells for powder diffraction with goniometer base (Right)Powder data processing procedure
reallocated to distances of about 2000 mm to increase the visibility of lowresolution reflections. The beam stop has beend moved as close as possibletowards the sample. In case of beamline P14 in a distance of 34 mm. Usuallymeasurements were conducted at a photon energy of 12.8 keV and at maximumbeam flux. The beam diameter was refined via beam slits at 150 µm. Exposuretimes ranged from 1-30 s.Data processing was done by utilizing the Eclipse-based data processing plat-form DAWN (Vers. 2.7.0), distributed and maintained by the Diamond LightSource (Oxfordshire, UK). Data processing comprised refinement of the beam
27
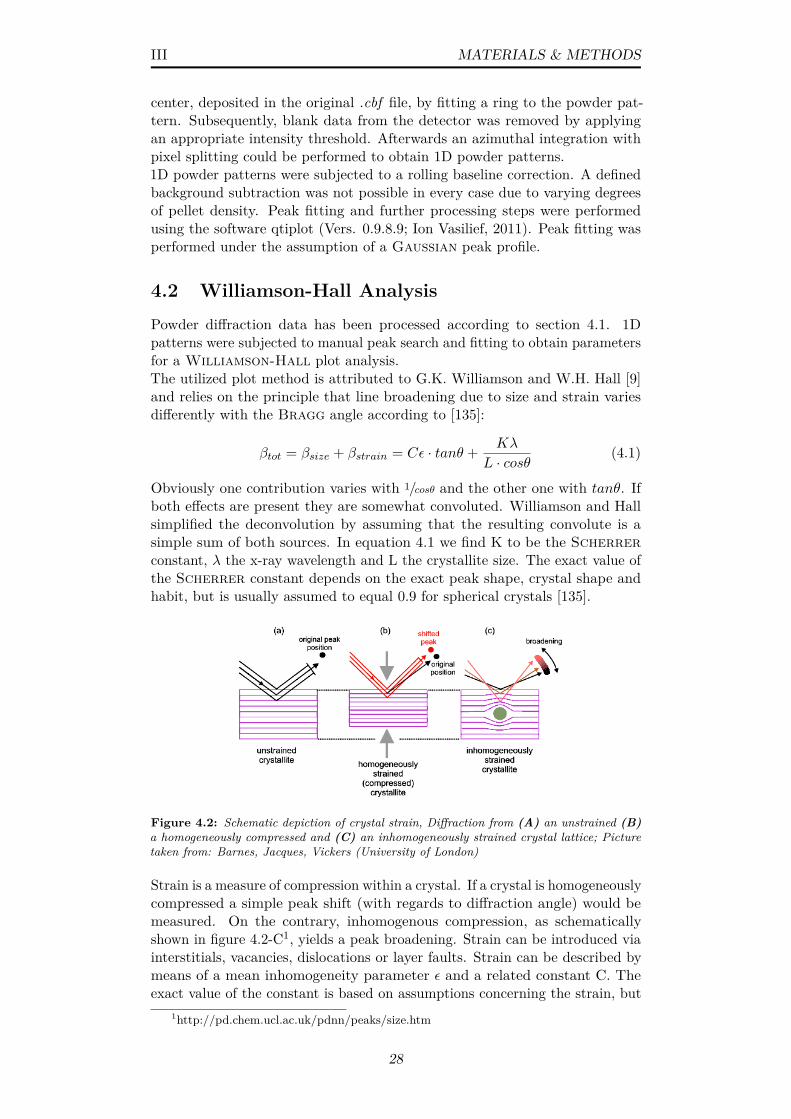
III MATERIALS & METHODS
center, deposited in the original .cbf file, by fitting a ring to the powder pat-tern. Subsequently, blank data from the detector was removed by applyingan appropriate intensity threshold. Afterwards an azimuthal integration withpixel splitting could be performed to obtain 1D powder patterns.1D powder patterns were subjected to a rolling baseline correction. A definedbackground subtraction was not possible in every case due to varying degreesof pellet density. Peak fitting and further processing steps were performedusing the software qtiplot (Vers. 0.9.8.9; Ion Vasilief, 2011). Peak fitting wasperformed under the assumption of a Gaussian peak profile.
4.2 Williamson-Hall AnalysisPowder diffraction data has been processed according to section 4.1. 1Dpatterns were subjected to manual peak search and fitting to obtain parametersfor a Williamson-Hall plot analysis.The utilized plot method is attributed to G.K. Williamson and W.H. Hall [9]and relies on the principle that line broadening due to size and strain variesdifferently with the Bragg angle according to [135]:
βtot = βsize + βstrain = Cε · tanθ + Kλ
L · cosθ(4.1)
Obviously one contribution varies with 1/cosθ and the other one with tanθ. Ifboth effects are present they are somewhat convoluted. Williamson and Hallsimplified the deconvolution by assuming that the resulting convolute is asimple sum of both sources. In equation 4.1 we find K to be the Scherrerconstant, λ the x-ray wavelength and L the crystallite size. The exact value ofthe Scherrer constant depends on the exact peak shape, crystal shape andhabit, but is usually assumed to equal 0.9 for spherical crystals [135].
Figure 4.2: Schematic depiction of crystal strain, Diffraction from (A) an unstrained (B)a homogeneously compressed and (C) an inhomogeneously strained crystal lattice; Picturetaken from: Barnes, Jacques, Vickers (University of London)
Strain is a measure of compression within a crystal. If a crystal is homogeneouslycompressed a simple peak shift (with regards to diffraction angle) would bemeasured. On the contrary, inhomogenous compression, as schematicallyshown in figure 4.2-C1, yields a peak broadening. Strain can be introduced viainterstitials, vacancies, dislocations or layer faults. Strain can be described bymeans of a mean inhomogeneity parameter ε and a related constant C. Theexact value of the constant is based on assumptions concerning the strain, but
1http://pd.chem.ucl.ac.uk/pdnn/peaks/size.htm
28

III MATERIALS & METHODS
is typically assumed to be ∼ 4− 5 [216].Equation 4.1 can be transformed to be equivalent to a standard equation for astraight line:
βtotcosθ = Cε · sinθ + Kλ
L(4.2)
From this it is possible to derive the slope Cε and the y-intercept Kλ/L.
29

III MATERIALS & METHODS
5 | Sample Purification & Charac-terization
5.1 General Laboratory Equipment
Table 5.1: List of utilized laboratory devices
Manufacturer Device Description
eppendorf (Germany) 5810 R centrifugeeppendorf (Germany) miniSpin centrifugeeppendorf (Germany) 5424 centrifugeeppendorf (Germany) MasterCycler (Personal) thermocyclereppendorf (Germany) BioPhotometer OD600eppendorf (Germany) Thermomixer C heating- & stirring deviceHeidolph (Germany) MR 3001 K magnetic stirrerScientific Industries (USA) Vortex-Genie 2 vortex deviceNew Brunswick Scientific(USA)
Innova 44 / 40 batch incubator
Mettler Toledo (USA) PL303 micro scaleBio-Rad (USA) ChemiDoc gel imaging systemBio-Rad (USA) MicroPulser electroporator deviceConsort (Belgium) EV245 electrophoresis power
supplyThermo Fisher Scientific(USA)
Power Ease 500 electrophoresis powersupply
Thermo Fisher Scientific(USA)
Sorvall RC26 Plus, SS-34 centrifuge
Tecan (Austria) Infinite M1000 plate readerAgilent (USA) Varian Cary 50 Scan
UV-VisSpectrophotometer
Avestin (Canada) Emulsiflex high pressure homogenizerOlympus (Japan) IX-71, Power Supply 232 Microscopy EquipmentLEj (Germany) HXP 120 V compact light sourceServa (Germany) Implen OD600 OD600GE Healthcare (USA) Amersham plc Aekta
Purifier, Frac-950chromatography system
Beckman Coulter (USA) Avanti I-20 XP, JLA-8.1 centrifuge
30
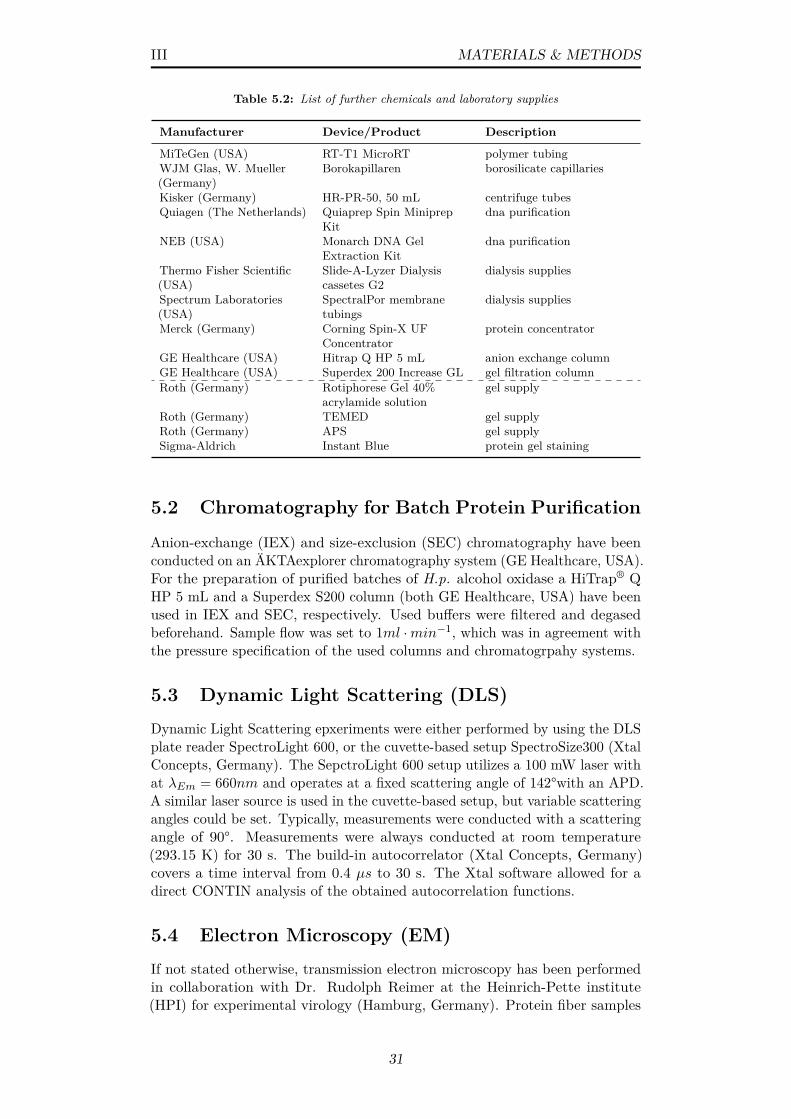
III MATERIALS & METHODS
Table 5.2: List of further chemicals and laboratory supplies
Manufacturer Device/Product Description
MiTeGen (USA) RT-T1 MicroRT polymer tubingWJM Glas, W. Mueller(Germany)
Borokapillaren borosilicate capillaries
Kisker (Germany) HR-PR-50, 50 mL centrifuge tubesQuiagen (The Netherlands) Quiaprep Spin Miniprep
Kitdna purification
NEB (USA) Monarch DNA GelExtraction Kit
dna purification
Thermo Fisher Scientific(USA)
Slide-A-Lyzer Dialysiscassetes G2
dialysis supplies
Spectrum Laboratories(USA)
SpectralPor membranetubings
dialysis supplies
Merck (Germany) Corning Spin-X UFConcentrator
protein concentrator
GE Healthcare (USA) Hitrap Q HP 5 mL anion exchange columnGE Healthcare (USA) Superdex 200 Increase GL gel filtration columnRoth (Germany) Rotiphorese Gel 40%
acrylamide solutiongel supply
Roth (Germany) TEMED gel supplyRoth (Germany) APS gel supplySigma-Aldrich Instant Blue protein gel staining
5.2 Chromatography for Batch Protein Purification
Anion-exchange (IEX) and size-exclusion (SEC) chromatography have beenconducted on an ÄKTAexplorer chromatography system (GE Healthcare, USA).For the preparation of purified batches of H.p. alcohol oxidase a HiTrap® QHP 5 mL and a Superdex S200 column (both GE Healthcare, USA) have beenused in IEX and SEC, respectively. Used buffers were filtered and degasedbeforehand. Sample flow was set to 1ml ·min−1, which was in agreement withthe pressure specification of the used columns and chromatogrpahy systems.
5.3 Dynamic Light Scattering (DLS)Dynamic Light Scattering epxeriments were either performed by using the DLSplate reader SpectroLight 600, or the cuvette-based setup SpectroSize300 (XtalConcepts, Germany). The SepctroLight 600 setup utilizes a 100 mW laser withat λEm = 660nm and operates at a fixed scattering angle of 142°with an APD.A similar laser source is used in the cuvette-based setup, but variable scatteringangles could be set. Typically, measurements were conducted with a scatteringangle of 90°. Measurements were always conducted at room temperature(293.15 K) for 30 s. The build-in autocorrelator (Xtal Concepts, Germany)covers a time interval from 0.4 µs to 30 s. The Xtal software allowed for adirect CONTIN analysis of the obtained autocorrelation functions.
5.4 Electron Microscopy (EM)If not stated otherwise, transmission electron microscopy has been performedin collaboration with Dr. Rudolph Reimer at the Heinrich-Pette institute(HPI) for experimental virology (Hamburg, Germany). Protein fiber samples
31

III MATERIALS & METHODS
were prepared over night at varying temperatures according to section 13.1.Afterwards, samples were transported to the HPI at ambient temperatures. Inorder to visualize all different types of fiber or protein structures the solutionwas mildly vortexed right before processing. At first, 400 · 400µm coppersquare meshes (Electron Microscopy Sciences, USA) were glow-discharged for1 min at 25 mV (EmiTech, KX100). Thereafter, 2 ţL of dense protein solutionwere pipetted onto the grid and incubated for 60 s. The Sample solution wasimmediately removed with Whatman paper and the grid was directly coveredwith 2-3% (w/v) uranyl acetate solution. After an incubation for 30 s thegrid was washed two times with ultrapure water. Imaging was performed ata FEI Tecnai G20 transmission electron microscope operated at 120 kV incombination with a FEI Eagle 4k CCD camera.
5.5 SDS-Polyacrylamide Gel ElectrophoresisSDS gels were prepared according to table 5.3. 5x gel buffer was preparedby dissolving 74.4 g BisTris in 200 mL ultrapure water. Afterwards the pHhas been adjusted to a value o about 6.5-6.8 with HCl. Usually MES runningbuffer has been used for standard SDS-PAGE. It was prepared according to 5.4.Protein samples were first treated with loading buffer (see tab. 5.5) and heatedup to 75°C for several minutes. Afterwards gel electrophoresis was started byapplying voltage of about 150-200 V. After a successful SDS-PAGE run, gelswere washed and afterwards stained with Instant Blue over night.
Table 5.3: Recipe for SDS-polyacrylamide gel preparation
For 2 gels: 10 mL 12% 10% 8% Stacking
5x gel buffer [mL] 2 2 2 0.840% acrylamide [mL] 3 2.5 2 0.5Ultrapure water [mL] 4.9 5.4 5.9 2.720% APS [ţL] 50 50 50 50TEMED 10 10 10 10
Table 5.4: 20x SDS-PAGE running buffer composition
Compound Conc.
MES 97.6 g/500 mLTris base 60.6 g/500 mLSDS 10 gEDTA 3 g
Table 5.5: 4x SDS-PAGE loading buffer composition
Compound Conc.
Tris-HCl 200 mMDTT 400 mMSDS 8% (w/v)Bromphenol blue 0.4% (w/v)Glycerol 40% (v/v)
32
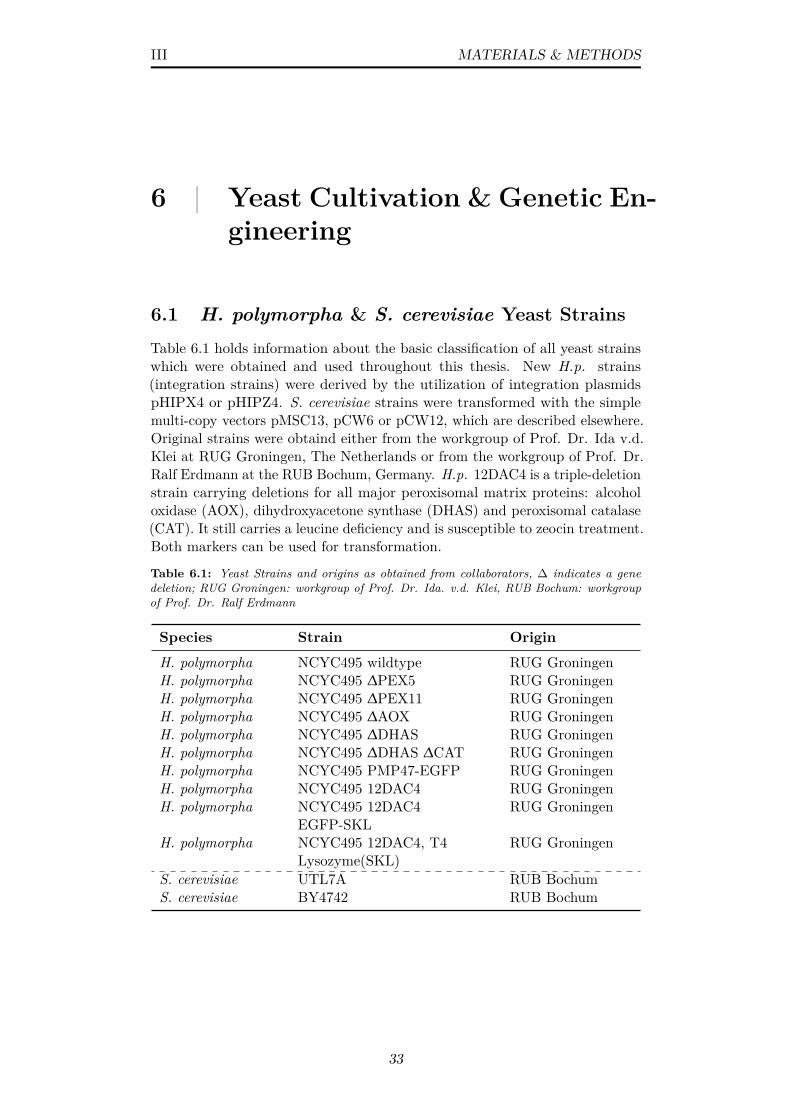
III MATERIALS & METHODS
6 | Yeast Cultivation & Genetic En-gineering
6.1 H. polymorpha & S. cerevisiae Yeast StrainsTable 6.1 holds information about the basic classification of all yeast strainswhich were obtained and used throughout this thesis. New H.p. strains(integration strains) were derived by the utilization of integration plasmidspHIPX4 or pHIPZ4. S. cerevisiae strains were transformed with the simplemulti-copy vectors pMSC13, pCW6 or pCW12, which are described elsewhere.Original strains were obtaind either from the workgroup of Prof. Dr. Ida v.d.Klei at RUG Groningen, The Netherlands or from the workgroup of Prof. Dr.Ralf Erdmann at the RUB Bochum, Germany. H.p. 12DAC4 is a triple-deletionstrain carrying deletions for all major peroxisomal matrix proteins: alcoholoxidase (AOX), dihydroxyacetone synthase (DHAS) and peroxisomal catalase(CAT). It still carries a leucine deficiency and is susceptible to zeocin treatment.Both markers can be used for transformation.
Table 6.1: Yeast Strains and origins as obtained from collaborators, ∆ indicates a genedeletion; RUG Groningen: workgroup of Prof. Dr. Ida. v.d. Klei, RUB Bochum: workgroupof Prof. Dr. Ralf Erdmann
Species Strain Origin
H. polymorpha NCYC495 wildtype RUG GroningenH. polymorpha NCYC495 ∆PEX5 RUG GroningenH. polymorpha NCYC495 ∆PEX11 RUG GroningenH. polymorpha NCYC495 ∆AOX RUG GroningenH. polymorpha NCYC495 ∆DHAS RUG GroningenH. polymorpha NCYC495 ∆DHAS ∆CAT RUG GroningenH. polymorpha NCYC495 PMP47-EGFP RUG GroningenH. polymorpha NCYC495 12DAC4 RUG GroningenH. polymorpha NCYC495 12DAC4
EGFP-SKLRUG Groningen
H. polymorpha NCYC495 12DAC4, T4Lysozyme(SKL)
RUG Groningen
S. cerevisiae UTL7A RUB BochumS. cerevisiae BY4742 RUB Bochum
33

III MATERIALS & METHODS
6.2 Nutritional Supplements & Cellular GrowthIf not stated otherwise all chemicals used for yeast growth were obtained fromSigma-Aldrich, USA.
Yeast Rich Medium (Unselective)
Yeast rich medium is mainly constituted of two compounds. First, yeastextract, to supplement cells with a complex formulation of nutrients andsecondly, peptone, to supply cells with easily consumable nitrogen. Bothcompounds are usually supplied in amounts of 1-2% (w/v). Additionally acarbon source needs to be present to enable growth. This is usually D-Glucose(Dextrose) but may vary depending on the experiment. If dextrose is suppliedas the sole carbon source, the medium is usually called Yeast Extract-Peptone-Dextrose (YPD). The wildtype of the yeast H. polymorpha can instead also besupplied with methanol, or a combination of methanol and glycerol if PAOX isintended to be induced. In such specific cases also other complementary sugarslike D-Xylose or D-Ribose [107] can be used as de-repressing carbon sourceto replace glycerol. Depending on the intended growth pattern the carbonsource concentration may be varied from 0.1-2% (w/v). The formulation of allcompounds is summarized in table 6.2. Kanamycin may be added to preventbacterial contamination. For preparation purposes peptone and yeast extract
Table 6.2: YPD medium formulation for unselective yeast cultivation
Compound RelativeAmount [%]
Conc. [g/L]
D-Glucose 0.5 5Yeast Extract 1 10Peptone 1 10Sorbitol 1M 182.2
can easily be dissolved in water at RT. This solution is autoclaved overnight.A carbon source is prepared separately as described later in this section andadded freshly whenever medium is used. For the maintenance of spheroblastsor fragile cells 1M sorbitol can be added additionally.
Synthetic-Defined (SD) Medium (Selective)
Synthetic defined medium comprises synthetic-complete as well as synthetic-minimal medium. Typically a variant is used that enables for the selection forcertain markers. Most often enzymes necessary for the synthesis of tryptophan,uracil and leucine are knocked out in a cell line. If these cells are transformedwith a plasmid containing the required enzyme sequences, colonies can bescreened for successful transformation/ genomic integration. If the cells arenot complemented with regards to a selection marker, the nutrient need to besupplied in the medium (cp. table 6.4).The basis of SD medium is constituted of YNB whose compounds are listed intable 6.3. Freshly prepared media may be stored at a dark and cold place for 1month. Once opened it should be used within 1-3 days. Kanamycin may beadded to prevent bacterial contamination.
34
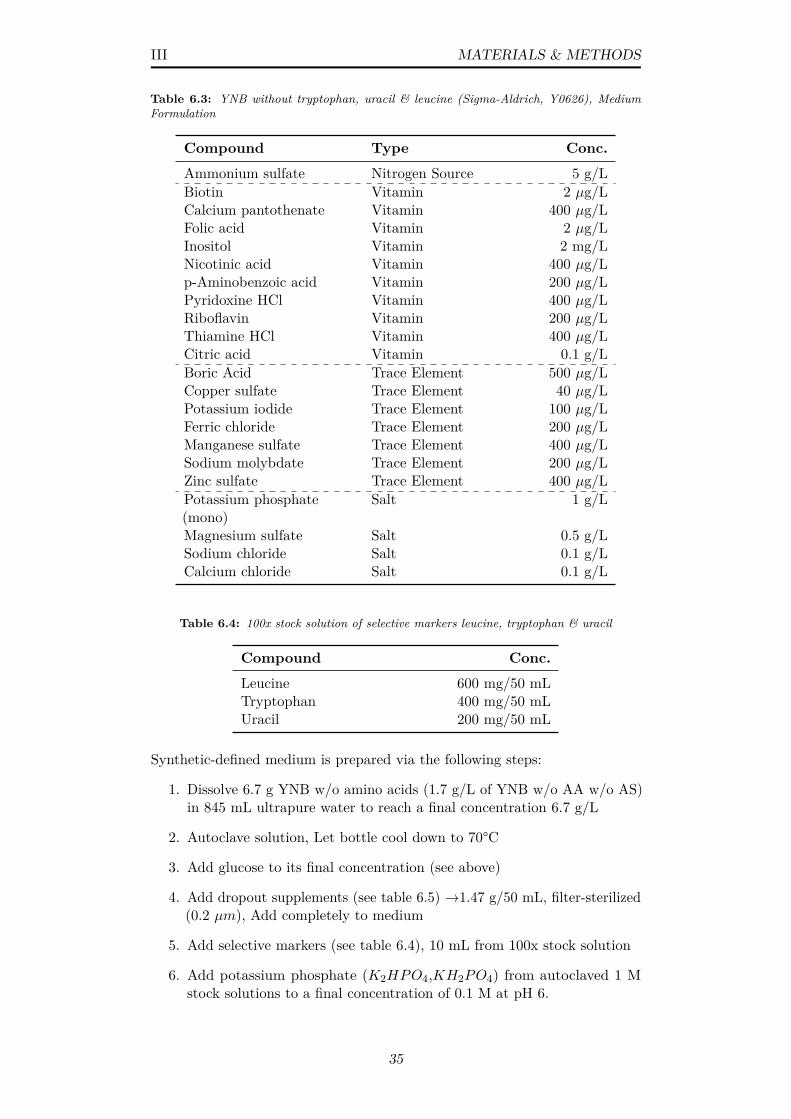
III MATERIALS & METHODS
Table 6.3: YNB without tryptophan, uracil & leucine (Sigma-Aldrich, Y0626), MediumFormulation
Compound Type Conc.
Ammonium sulfate Nitrogen Source 5 g/LBiotin Vitamin 2 µg/LCalcium pantothenate Vitamin 400 µg/LFolic acid Vitamin 2 µg/LInositol Vitamin 2 mg/LNicotinic acid Vitamin 400 µg/Lp-Aminobenzoic acid Vitamin 200 µg/LPyridoxine HCl Vitamin 400 µg/LRiboflavin Vitamin 200 µg/LThiamine HCl Vitamin 400 µg/LCitric acid Vitamin 0.1 g/LBoric Acid Trace Element 500 µg/LCopper sulfate Trace Element 40 µg/LPotassium iodide Trace Element 100 µg/LFerric chloride Trace Element 200 µg/LManganese sulfate Trace Element 400 µg/LSodium molybdate Trace Element 200 µg/LZinc sulfate Trace Element 400 µg/LPotassium phosphate(mono)
Salt 1 g/L
Magnesium sulfate Salt 0.5 g/LSodium chloride Salt 0.1 g/LCalcium chloride Salt 0.1 g/L
Table 6.4: 100x stock solution of selective markers leucine, tryptophan & uracil
Compound Conc.
Leucine 600 mg/50 mLTryptophan 400 mg/50 mLUracil 200 mg/50 mL
Synthetic-defined medium is prepared via the following steps:
1. Dissolve 6.7 g YNB w/o amino acids (1.7 g/L of YNB w/o AA w/o AS)in 845 mL ultrapure water to reach a final concentration 6.7 g/L
2. Autoclave solution, Let bottle cool down to 70°C
3. Add glucose to its final concentration (see above)
4. Add dropout supplements (see table 6.5) →1.47 g/50 mL, filter-sterilized(0.2 µm), Add completely to medium
5. Add selective markers (see table 6.4), 10 mL from 100x stock solution
6. Add potassium phosphate (K2HPO4,KH2PO4) from autoclaved 1 Mstock solutions to a final concentration of 0.1 M at pH 6.
35
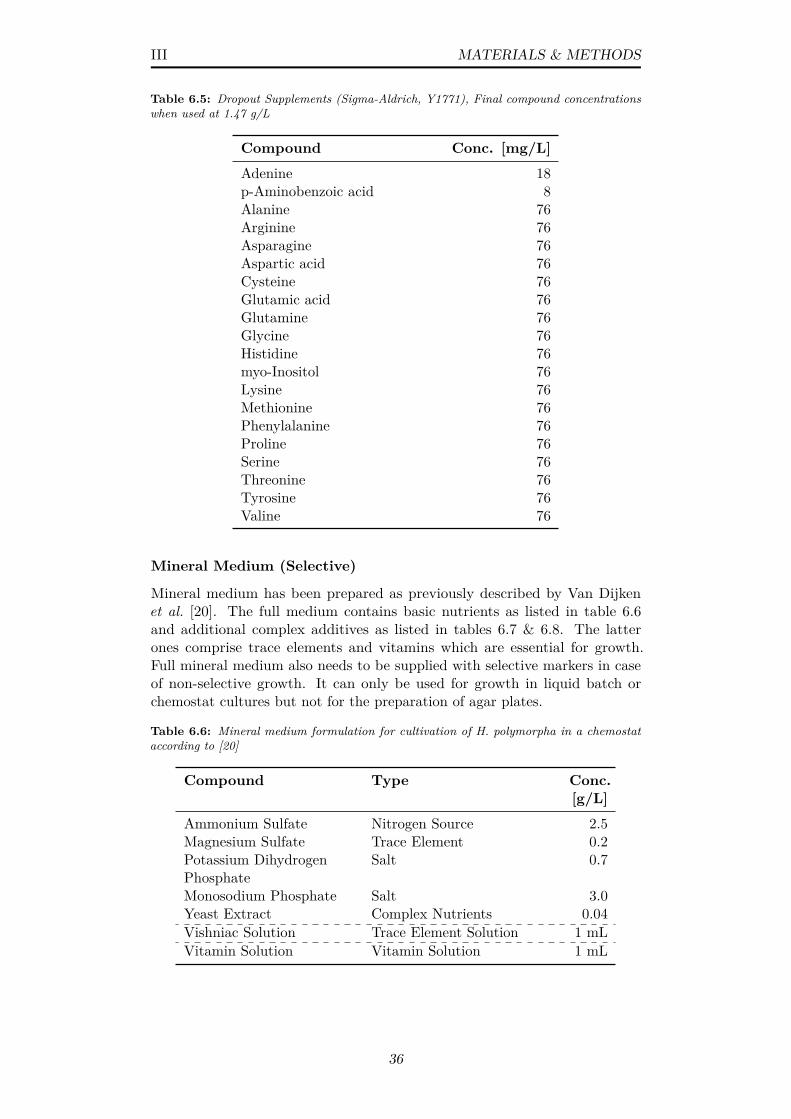
III MATERIALS & METHODS
Table 6.5: Dropout Supplements (Sigma-Aldrich, Y1771), Final compound concentrationswhen used at 1.47 g/L
Compound Conc. [mg/L]
Adenine 18p-Aminobenzoic acid 8Alanine 76Arginine 76Asparagine 76Aspartic acid 76Cysteine 76Glutamic acid 76Glutamine 76Glycine 76Histidine 76myo-Inositol 76Lysine 76Methionine 76Phenylalanine 76Proline 76Serine 76Threonine 76Tyrosine 76Valine 76
Mineral Medium (Selective)
Mineral medium has been prepared as previously described by Van Dijkenet al. [20]. The full medium contains basic nutrients as listed in table 6.6and additional complex additives as listed in tables 6.7 & 6.8. The latterones comprise trace elements and vitamins which are essential for growth.Full mineral medium also needs to be supplied with selective markers in caseof non-selective growth. It can only be used for growth in liquid batch orchemostat cultures but not for the preparation of agar plates.
Table 6.6: Mineral medium formulation for cultivation of H. polymorpha in a chemostataccording to [20]
Compound Type Conc.[g/L]
Ammonium Sulfate Nitrogen Source 2.5Magnesium Sulfate Trace Element 0.2Potassium DihydrogenPhosphate
Salt 0.7
Monosodium Phosphate Salt 3.0Yeast Extract Complex Nutrients 0.04Vishniac Solution Trace Element Solution 1 mLVitamin Solution Vitamin Solution 1 mL
36
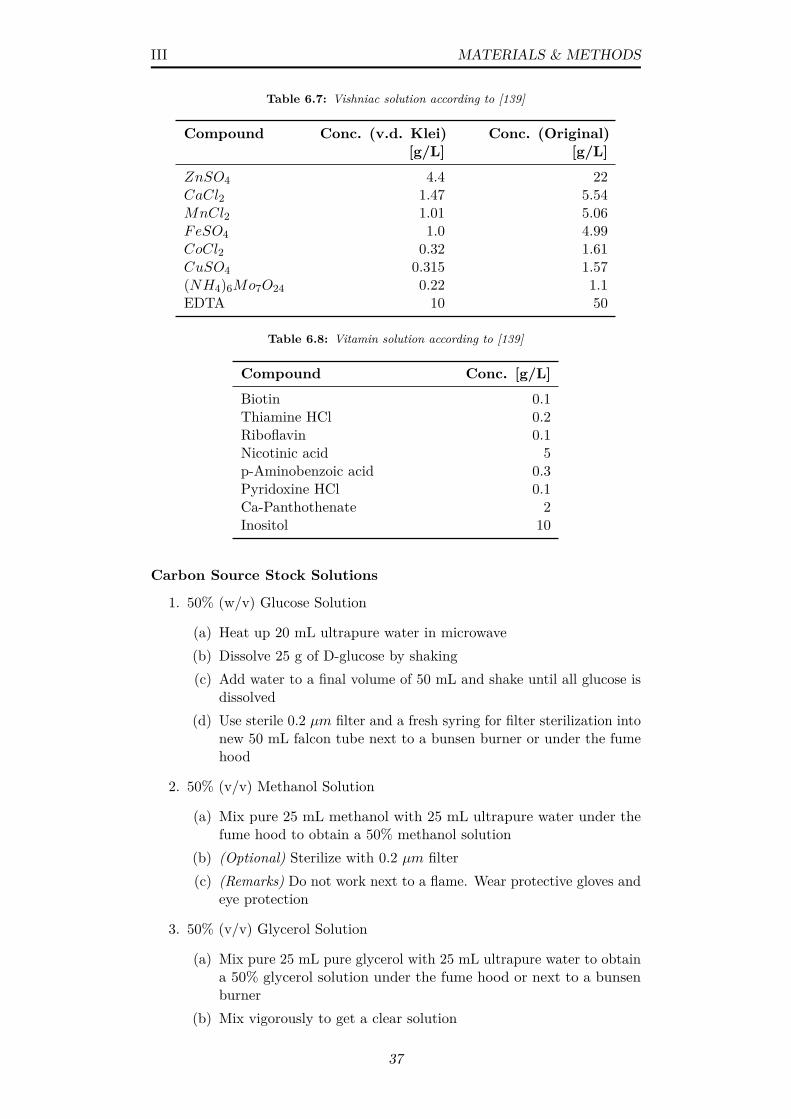
III MATERIALS & METHODS
Table 6.7: Vishniac solution according to [139]
Compound Conc. (v.d. Klei)[g/L]
Conc. (Original)[g/L]
ZnSO4 4.4 22CaCl2 1.47 5.54MnCl2 1.01 5.06FeSO4 1.0 4.99CoCl2 0.32 1.61CuSO4 0.315 1.57(NH4)6Mo7O24 0.22 1.1EDTA 10 50
Table 6.8: Vitamin solution according to [139]
Compound Conc. [g/L]
Biotin 0.1Thiamine HCl 0.2Riboflavin 0.1Nicotinic acid 5p-Aminobenzoic acid 0.3Pyridoxine HCl 0.1Ca-Panthothenate 2Inositol 10
Carbon Source Stock Solutions
1. 50% (w/v) Glucose Solution
(a) Heat up 20 mL ultrapure water in microwave(b) Dissolve 25 g of D-glucose by shaking(c) Add water to a final volume of 50 mL and shake until all glucose is
dissolved(d) Use sterile 0.2 µm filter and a fresh syring for filter sterilization into
new 50 mL falcon tube next to a bunsen burner or under the fumehood
2. 50% (v/v) Methanol Solution
(a) Mix pure 25 mL methanol with 25 mL ultrapure water under thefume hood to obtain a 50% methanol solution
(b) (Optional) Sterilize with 0.2 µm filter(c) (Remarks) Do not work next to a flame. Wear protective gloves and
eye protection
3. 50% (v/v) Glycerol Solution
(a) Mix pure 25 mL pure glycerol with 25 mL ultrapure water to obtaina 50% glycerol solution under the fume hood or next to a bunsenburner
(b) Mix vigorously to get a clear solution
37
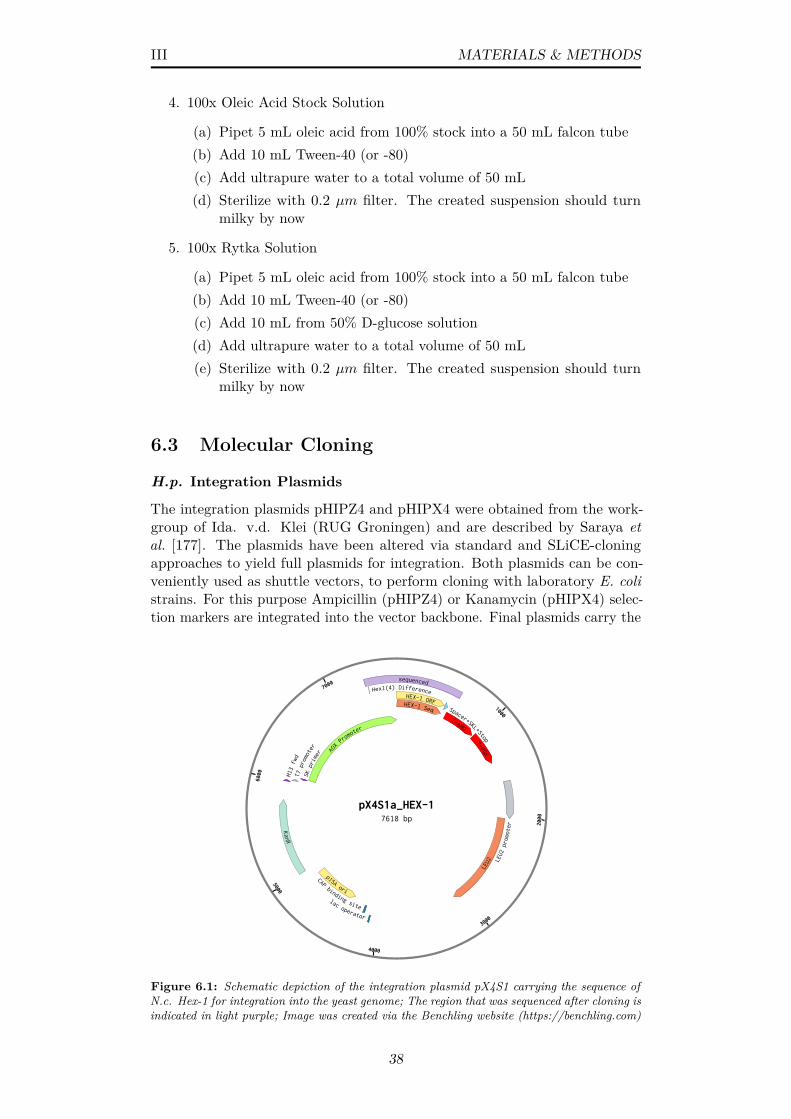
III MATERIALS & METHODS
4. 100x Oleic Acid Stock Solution
(a) Pipet 5 mL oleic acid from 100% stock into a 50 mL falcon tube(b) Add 10 mL Tween-40 (or -80)(c) Add ultrapure water to a total volume of 50 mL(d) Sterilize with 0.2 µm filter. The created suspension should turn
milky by now
5. 100x Rytka Solution
(a) Pipet 5 mL oleic acid from 100% stock into a 50 mL falcon tube(b) Add 10 mL Tween-40 (or -80)(c) Add 10 mL from 50% D-glucose solution(d) Add ultrapure water to a total volume of 50 mL(e) Sterilize with 0.2 µm filter. The created suspension should turn
milky by now
6.3 Molecular Cloning
H.p. Integration Plasmids
The integration plasmids pHIPZ4 and pHIPX4 were obtained from the work-group of Ida. v.d. Klei (RUG Groningen) and are described by Saraya etal. [177]. The plasmids have been altered via standard and SLiCE-cloningapproaches to yield full plasmids for integration. Both plasmids can be con-veniently used as shuttle vectors, to perform cloning with laboratory E. colistrains. For this purpose Ampicillin (pHIPZ4) or Kanamycin (pHIPX4) selec-tion markers are integrated into the vector backbone. Final plasmids carry the
23.4.2018 12:23:22
https://benchling.com/tseine/f/wfV69AUb-in-vivo-crystallization/seq-4xfwIWYr-px4s1a_hex-1/edit 1/1
pX4S1a_HEX-1 (7618 bp)
pX4S1a_HEX-17618 bp
1000
2000
3000
4000
5000
6000
7000
LEU2
KanR
p15Aori
HEX-1 ORFHEX-1 Seq
LEU2 promoter
T-AMO
T-PGK
Spacer+SKL+Stop
CAP binding site
T7 promoter
M13 fwd
lac operator
SK primer
Hex1(4) Difference
AO
X Promote
r
sequenced
Figure 6.1: Schematic depiction of the integration plasmid pX4S1 carrying the sequence ofN.c. Hex-1 for integration into the yeast genome; The region that was sequenced after cloning isindicated in light purple; Image was created via the Benchling website (https://benchling.com)
38
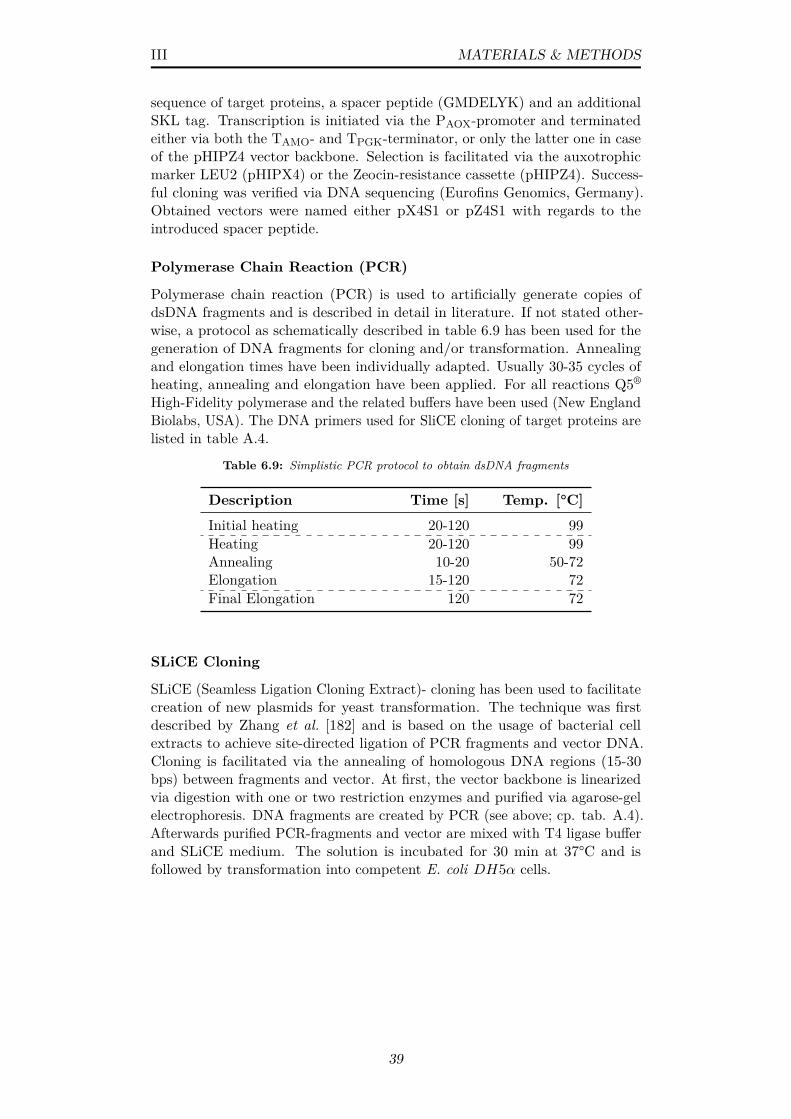
III MATERIALS & METHODS
sequence of target proteins, a spacer peptide (GMDELYK) and an additionalSKL tag. Transcription is initiated via the PAOX-promoter and terminatedeither via both the TAMO- and TPGK-terminator, or only the latter one in caseof the pHIPZ4 vector backbone. Selection is facilitated via the auxotrophicmarker LEU2 (pHIPX4) or the Zeocin-resistance cassette (pHIPZ4). Success-ful cloning was verified via DNA sequencing (Eurofins Genomics, Germany).Obtained vectors were named either pX4S1 or pZ4S1 with regards to theintroduced spacer peptide.
Polymerase Chain Reaction (PCR)
Polymerase chain reaction (PCR) is used to artificially generate copies ofdsDNA fragments and is described in detail in literature. If not stated other-wise, a protocol as schematically described in table 6.9 has been used for thegeneration of DNA fragments for cloning and/or transformation. Annealingand elongation times have been individually adapted. Usually 30-35 cycles ofheating, annealing and elongation have been applied. For all reactions Q5®
High-Fidelity polymerase and the related buffers have been used (New EnglandBiolabs, USA). The DNA primers used for SliCE cloning of target proteins arelisted in table A.4.
Table 6.9: Simplistic PCR protocol to obtain dsDNA fragments
Description Time [s] Temp. [°C]
Initial heating 20-120 99Heating 20-120 99Annealing 10-20 50-72Elongation 15-120 72Final Elongation 120 72
SLiCE Cloning
SLiCE (Seamless Ligation Cloning Extract)- cloning has been used to facilitatecreation of new plasmids for yeast transformation. The technique was firstdescribed by Zhang et al. [182] and is based on the usage of bacterial cellextracts to achieve site-directed ligation of PCR fragments and vector DNA.Cloning is facilitated via the annealing of homologous DNA regions (15-30bps) between fragments and vector. At first, the vector backbone is linearizedvia digestion with one or two restriction enzymes and purified via agarose-gelelectrophoresis. DNA fragments are created by PCR (see above; cp. tab. A.4).Afterwards purified PCR-fragments and vector are mixed with T4 ligase bufferand SLiCE medium. The solution is incubated for 30 min at 37°C and isfollowed by transformation into competent E. coli DH5α cells.
39

III MATERIALS & METHODS
Transformation of E. coli DH5α Cells
1. Thaw competent cells on ice
2. Mix 1-5 µL of ligation reaction with competent cells
3. Leave mixture on ice for 20-30 min
4. Perform heat shock in water bath at 42°C
5. Place cell suspension immediately back on ice for 2 min
6. Add 500 µL of LB media at RT
7. Inc ubate suspension for 1 hr at 37°C
8. Plate out on selective LB agar plates
Agarose Gel-Electrophoresis
Agarose-gel electrophoresis is a technique to separate DNA in a agarose matrixwith regards to size and charge of particles. Typcial gels were casted by using0.8% (w/v) agarose dissolved in 1x TAE buffer (cp. table 6.10) adjusted to pH8.
Table 6.10: 50x TAE buffer for agarose gel elctrophoresis
Compound Conc.
Tris-HCl 2 MAcetic Acid 1 MEDTA 50 mM
40

III MATERIALS & METHODS
6.4 Electroporation of Budding YeastElectroporation of budding yeast is conducted for transformation of circularmulti-copy plasmids in case of S. cerevisiae and of linearized integration-plasmids in case of H. polymorpha.
Buffers for Yeast Electroporation
Table 6.11: TED Buffer; Used for the preparation of yeast cells for transformation
Compound Conc. [mM]
Tris-HCl, pH 8 100EDTA, pH 8 50DTT (fresh!) 25
Table 6.12: STM Buffer; Transformation buffer for yeast
Compound Conc. [mM]
Tris-HCl, pH 8 10Sucrose 270MgCl2 1
Preparation of Competent Cells
1. Grow cells overnight at 30°C/37°C
2. Innoculate 50 mL (pre-heated) YPD or mineral medium with 0.5 mL fromovernight culture and allow further growth at the appropriate temperature
3. Allow growth until an OD600 of 1.2-1.5 is reached
4. Pellet cells 10 min at 6000 rpm (table-top centrifuge) at RT
5. Resuspend cells in 0.2 vol. pre-heated TED buffer
6. Incubate cells 15 min at 30°C/ 37°C, while shaking at 200 rpm
7. Pellet cells 10 min at 6000 rpm (table-top centrifuge) at RT
8. Wash cells twice with 1.0 vol. in ice-cold STM buffer
9. Pellet cells 10 min at 6000 rpm (large table-top centrifuge) at 4°C
10. Resuspend cells in 0.25 mL ice-cold STM buffer
11. Divide the suspension with competent cells into batches 60 µL (Useimmediately or freeze in liquid nitrogen, followed by storage at -80°C)
41
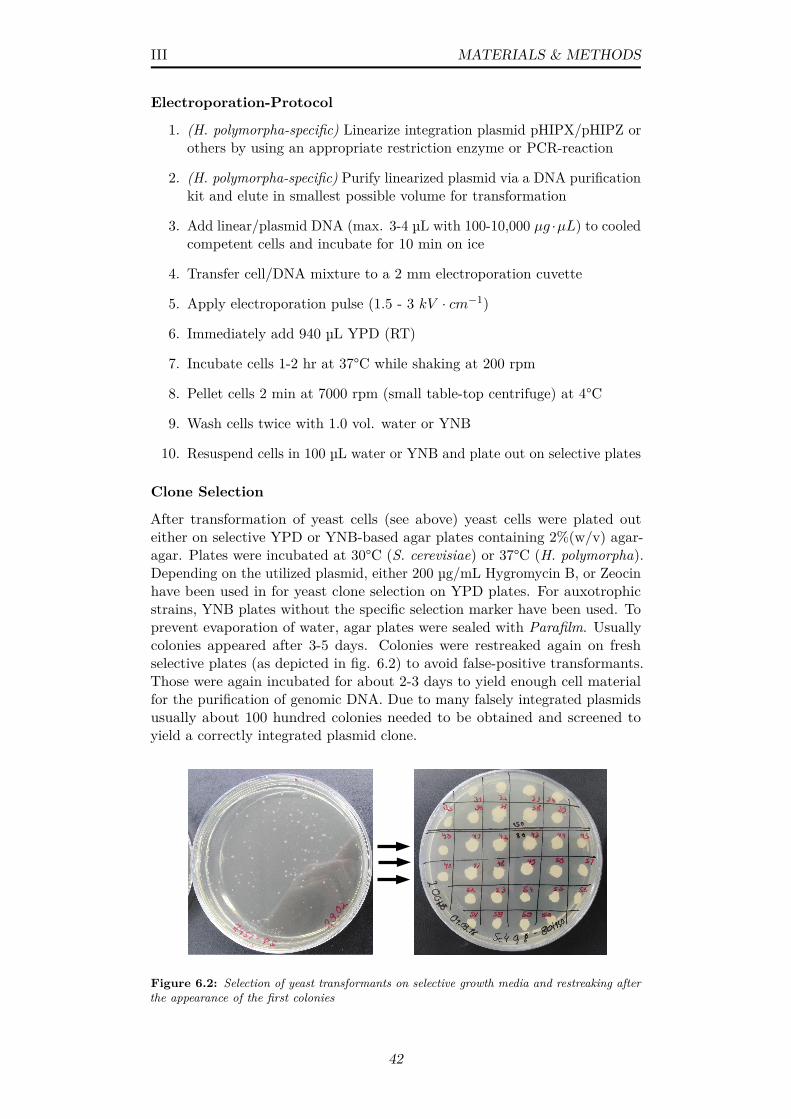
III MATERIALS & METHODS
Electroporation-Protocol
1. (H. polymorpha-specific) Linearize integration plasmid pHIPX/pHIPZ orothers by using an appropriate restriction enzyme or PCR-reaction
2. (H. polymorpha-specific) Purify linearized plasmid via a DNA purificationkit and elute in smallest possible volume for transformation
3. Add linear/plasmid DNA (max. 3-4 µL with 100-10,000 µg ·µL) to cooledcompetent cells and incubate for 10 min on ice
4. Transfer cell/DNA mixture to a 2 mm electroporation cuvette
5. Apply electroporation pulse (1.5 - 3 kV · cm−1)
6. Immediately add 940 µL YPD (RT)
7. Incubate cells 1-2 hr at 37°C while shaking at 200 rpm
8. Pellet cells 2 min at 7000 rpm (small table-top centrifuge) at 4°C
9. Wash cells twice with 1.0 vol. water or YNB
10. Resuspend cells in 100 µL water or YNB and plate out on selective plates
Clone Selection
After transformation of yeast cells (see above) yeast cells were plated outeither on selective YPD or YNB-based agar plates containing 2%(w/v) agar-agar. Plates were incubated at 30°C (S. cerevisiae) or 37°C (H. polymorpha).Depending on the utilized plasmid, either 200 µg/mL Hygromycin B, or Zeocinhave been used in for yeast clone selection on YPD plates. For auxotrophicstrains, YNB plates without the specific selection marker have been used. Toprevent evaporation of water, agar plates were sealed with Parafilm. Usuallycolonies appeared after 3-5 days. Colonies were restreaked again on freshselective plates (as depicted in fig. 6.2) to avoid false-positive transformants.Those were again incubated for about 2-3 days to yield enough cell materialfor the purification of genomic DNA. Due to many falsely integrated plasmidsusually about 100 hundred colonies needed to be obtained and screened toyield a correctly integrated plasmid clone.
Figure 6.2: Selection of yeast transformants on selective growth media and restreaking afterthe appearance of the first colonies
42

III MATERIALS & METHODS
Isolation of genomic DNA
Isolation of genomic DNA was necessary to allow for reliable PCR conditions.A protocol from Harju et al. [95] has been adapted to obtain pure genomicDNA:
1. Pick a yeast colony from a selective plate after two days growth (prefer-entially freshly grown cells)
2. Resuspend cells in 100 µL lysis buffer (see table 6.13)
3. Rapidly freeze cells at -80°C for 2-3 min
4. Rapidly heat cells to 98°C for 1 min
5. Repeat freezing/heating 3 times
6. Vortex vigorously for 30 s
7. Add 200 µL chloroform and vortex for 2 min
8. Centrifuge 5 min at 20000 · g at RT (in table-top centrifuge)
9. Transfer upper aqueous layer into a tube which contains 400 µL ice-cold100% ethanol
10. Allow samplpe precipitation for 5 min on ice
11. Centrifuge again 5 min at 20000 · g at RT
12. Remove supernatant and let pellet dry for several minutes
13. Wash DNA pellet with 0.5 mL 70% (v/v) ethanol
14. Repeat drying step
15. Resuspend pellet in 50-100 µL ultrapure water
16. Use about 1 µL (should be about 150 ng) for a PCR reaction
Table 6.13: Lysis buffer for purification of yeast genomic DNA from plate cultures
Compound Conc.
Triton X-100 2%SDS 1%NaCl 100 mMTris-HCl, pH 8.0 10 mMEDTA, pH 8.0 1 mM
43

III MATERIALS & METHODS
6.5 Purification of PeroxisomesProtocols of this section were partially obtained from the workgroup of Prof.Dr. Ida v.d. Klei (RUG Groningen, The Netherlands).
Buffers for Peroxisome Purification
Table 6.14: Pre-Incubation Buffer; Used for the removal of growth media
Compound Conc. [mM]
Tris-HCl, pH 8 100EDTA 50
Table 6.15: Protoplast Buffer; Used for the removal of the cell wall via zymolyase
Compound Conc. [mM]
Potassium phosphate, pH 7.2 50Sorbitol 1200
For the preparation of protoplast buffer the following volumes from preparedpotassium phosphate stock solutions can be used (for 1 L): 35.85 mL 1 MK2HPO4 & 14.15 mL KH2PO4.
Table 6.16: Homogenization Buffer, final pH 5.5; Used to maintain osmolytic equilibrium toprevent protoplast disruption; without Sorbitol this buffer yields ’buffer B’
Compound Conc. [mM]
MES, pH 5.5 5EDTA 0.1KCl 1Sorbitol 1200
Protocol for the Preparation of Peroxisomes
1. Protoplast-preparation
(a) Determine the weight of the empty centrifuge tubes(b) Harvest cells by centrifugation, 5 min at 3800 ·g at RT (4000 rpm
large table-top centrifuge)(c) Determine wet weight of pellets(d) Resuspend cells at 0.06 g ·mL−1 in pre-incubation buffer and add
140 mM β-mercaptoethanol (or 70 mM fresh DTT)(e) Incubate for 15 min at 37°C(f) Pellet cells 2 min at 4000 rpm at RT(g) Wash cells twice in pre-heated protoplast buffer(h) Resuspend cells in pre-heated protoplast buffer and add Zymolyase
(1mg ·mL−1)
44
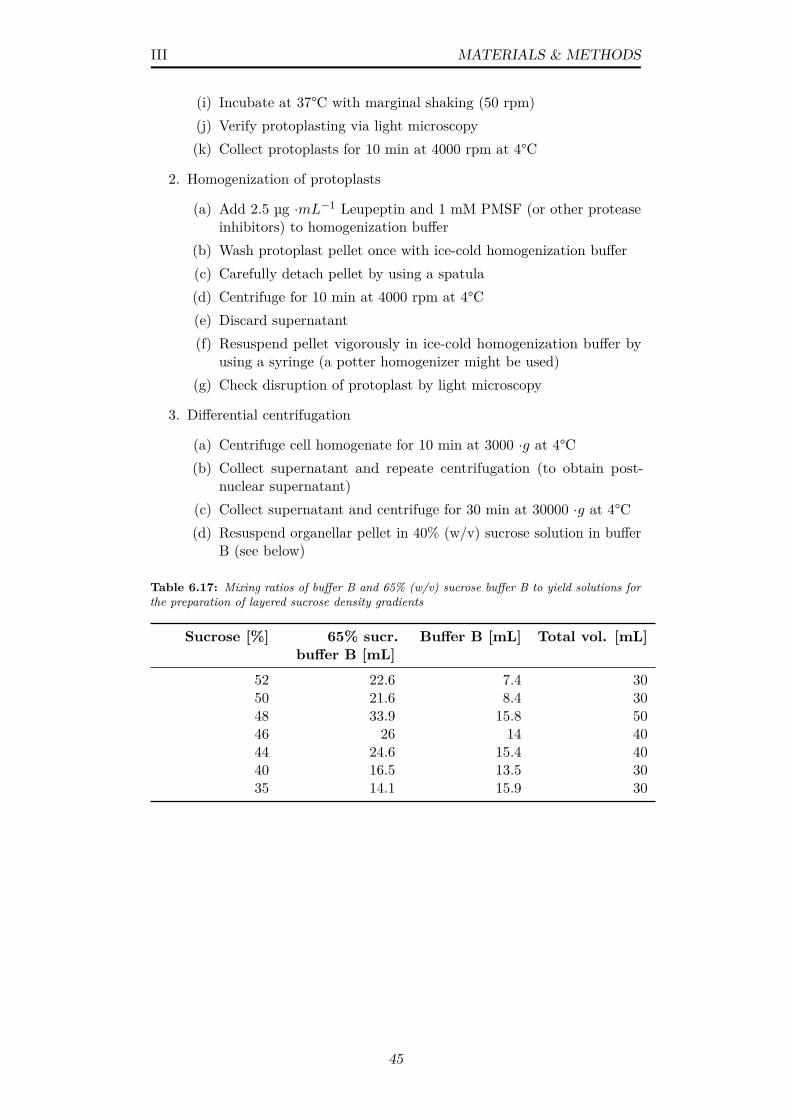
III MATERIALS & METHODS
(i) Incubate at 37°C with marginal shaking (50 rpm)(j) Verify protoplasting via light microscopy(k) Collect protoplasts for 10 min at 4000 rpm at 4°C
2. Homogenization of protoplasts
(a) Add 2.5 µg ·mL−1 Leupeptin and 1 mM PMSF (or other proteaseinhibitors) to homogenization buffer
(b) Wash protoplast pellet once with ice-cold homogenization buffer(c) Carefully detach pellet by using a spatula(d) Centrifuge for 10 min at 4000 rpm at 4°C(e) Discard supernatant(f) Resuspend pellet vigorously in ice-cold homogenization buffer by
using a syringe (a potter homogenizer might be used)(g) Check disruption of protoplast by light microscopy
3. Differential centrifugation
(a) Centrifuge cell homogenate for 10 min at 3000 ·g at 4°C(b) Collect supernatant and repeate centrifugation (to obtain post-
nuclear supernatant)(c) Collect supernatant and centrifuge for 30 min at 30000 ·g at 4°C(d) Resuspend organellar pellet in 40% (w/v) sucrose solution in buffer
B (see below)
Table 6.17: Mixing ratios of buffer B and 65% (w/v) sucrose buffer B to yield solutions forthe preparation of layered sucrose density gradients
Sucrose [%] 65% sucr.buffer B [mL]
Buffer B [mL] Total vol. [mL]
52 22.6 7.4 3050 21.6 8.4 3048 33.9 15.8 5046 26 14 4044 24.6 15.4 4040 16.5 13.5 3035 14.1 15.9 30
45
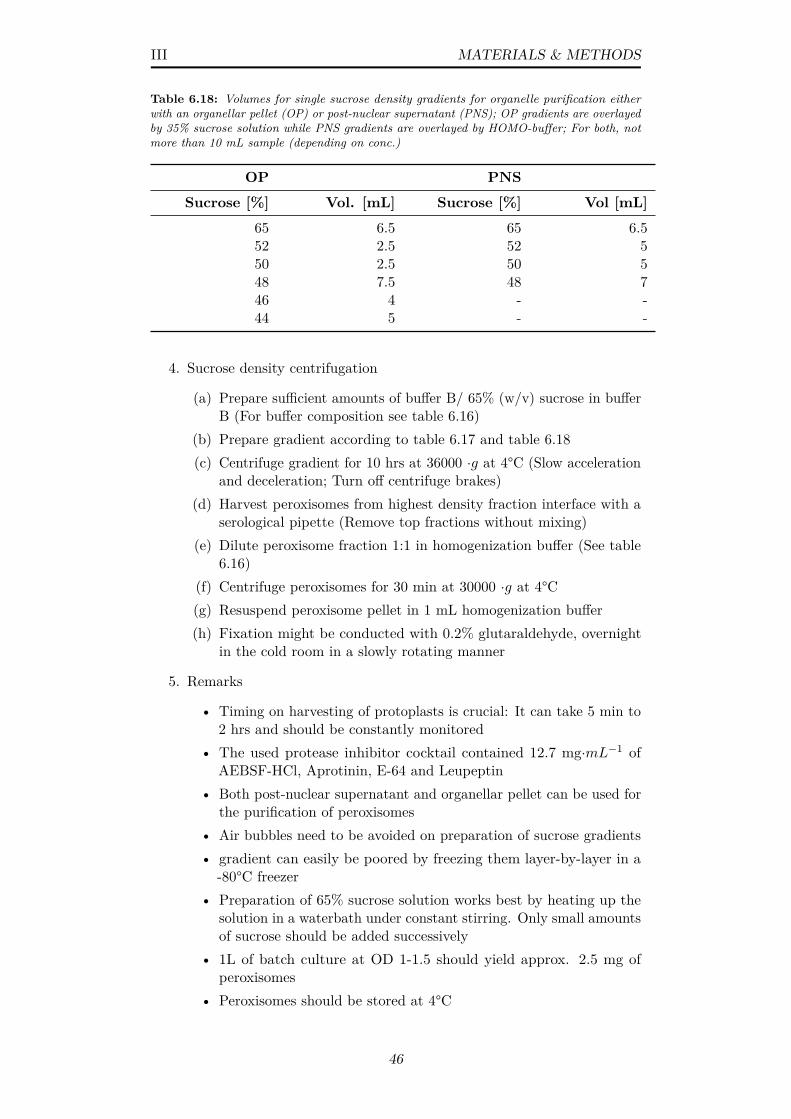
III MATERIALS & METHODS
Table 6.18: Volumes for single sucrose density gradients for organelle purification eitherwith an organellar pellet (OP) or post-nuclear supernatant (PNS); OP gradients are overlayedby 35% sucrose solution while PNS gradients are overlayed by HOMO-buffer; For both, notmore than 10 mL sample (depending on conc.)
OP PNS
Sucrose [%] Vol. [mL] Sucrose [%] Vol [mL]
65 6.5 65 6.552 2.5 52 550 2.5 50 548 7.5 48 746 4 - -44 5 - -
4. Sucrose density centrifugation
(a) Prepare sufficient amounts of buffer B/ 65% (w/v) sucrose in bufferB (For buffer composition see table 6.16)
(b) Prepare gradient according to table 6.17 and table 6.18(c) Centrifuge gradient for 10 hrs at 36000 ·g at 4°C (Slow acceleration
and deceleration; Turn off centrifuge brakes)(d) Harvest peroxisomes from highest density fraction interface with a
serological pipette (Remove top fractions without mixing)(e) Dilute peroxisome fraction 1:1 in homogenization buffer (See table
6.16)(f) Centrifuge peroxisomes for 30 min at 30000 ·g at 4°C(g) Resuspend peroxisome pellet in 1 mL homogenization buffer(h) Fixation might be conducted with 0.2% glutaraldehyde, overnight
in the cold room in a slowly rotating manner
5. Remarks
• Timing on harvesting of protoplasts is crucial: It can take 5 min to2 hrs and should be constantly monitored
• The used protease inhibitor cocktail contained 12.7 mg·mL−1 ofAEBSF-HCl, Aprotinin, E-64 and Leupeptin
• Both post-nuclear supernatant and organellar pellet can be used forthe purification of peroxisomes
• Air bubbles need to be avoided on preparation of sucrose gradients• gradient can easily be poored by freezing them layer-by-layer in a
-80°C freezer• Preparation of 65% sucrose solution works best by heating up the
solution in a waterbath under constant stirring. Only small amountsof sucrose should be added successively
• 1L of batch culture at OD 1-1.5 should yield approx. 2.5 mg ofperoxisomes
• Peroxisomes should be stored at 4°C
46
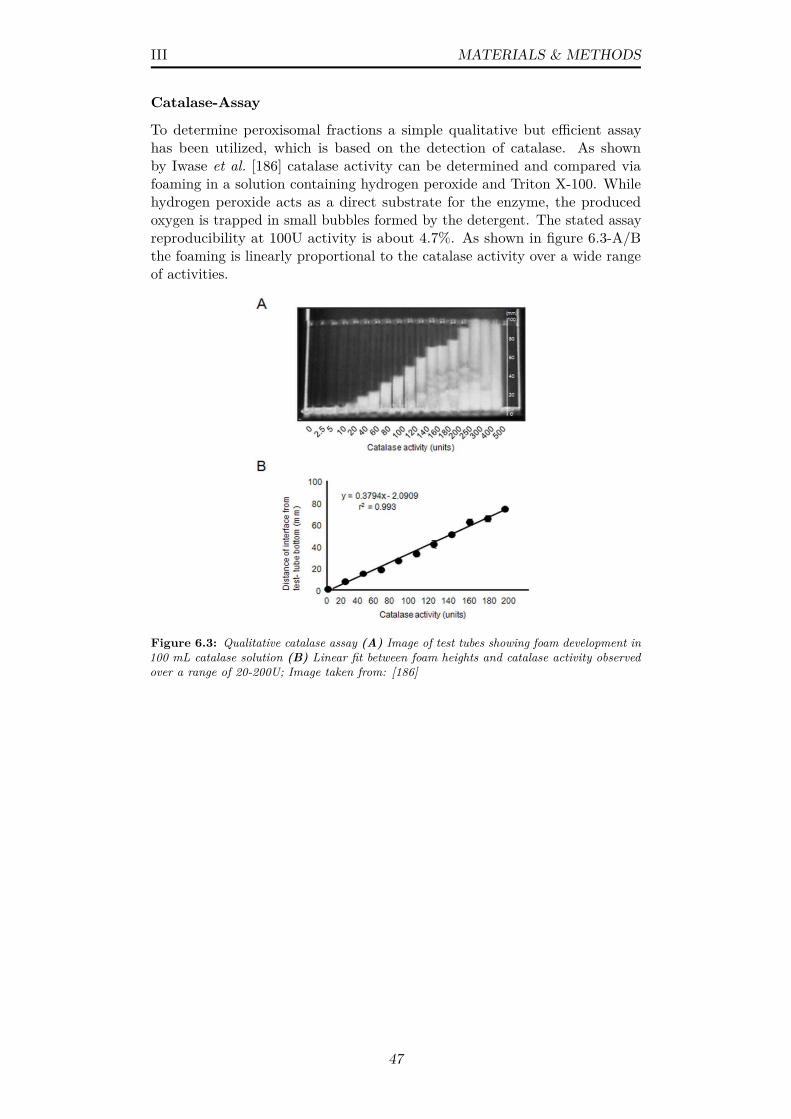
III MATERIALS & METHODS
Catalase-Assay
To determine peroxisomal fractions a simple qualitative but efficient assayhas been utilized, which is based on the detection of catalase. As shownby Iwase et al. [186] catalase activity can be determined and compared viafoaming in a solution containing hydrogen peroxide and Triton X-100. Whilehydrogen peroxide acts as a direct substrate for the enzyme, the producedoxygen is trapped in small bubbles formed by the detergent. The stated assayreproducibility at 100U activity is about 4.7%. As shown in figure 6.3-A/Bthe foaming is linearly proportional to the catalase activity over a wide rangeof activities.
Figure 6.3: Qualitative catalase assay (A) Image of test tubes showing foam development in100 mL catalase solution (B) Linear fit between foam heights and catalase activity observedover a range of 20-200U; Image taken from: [186]
47
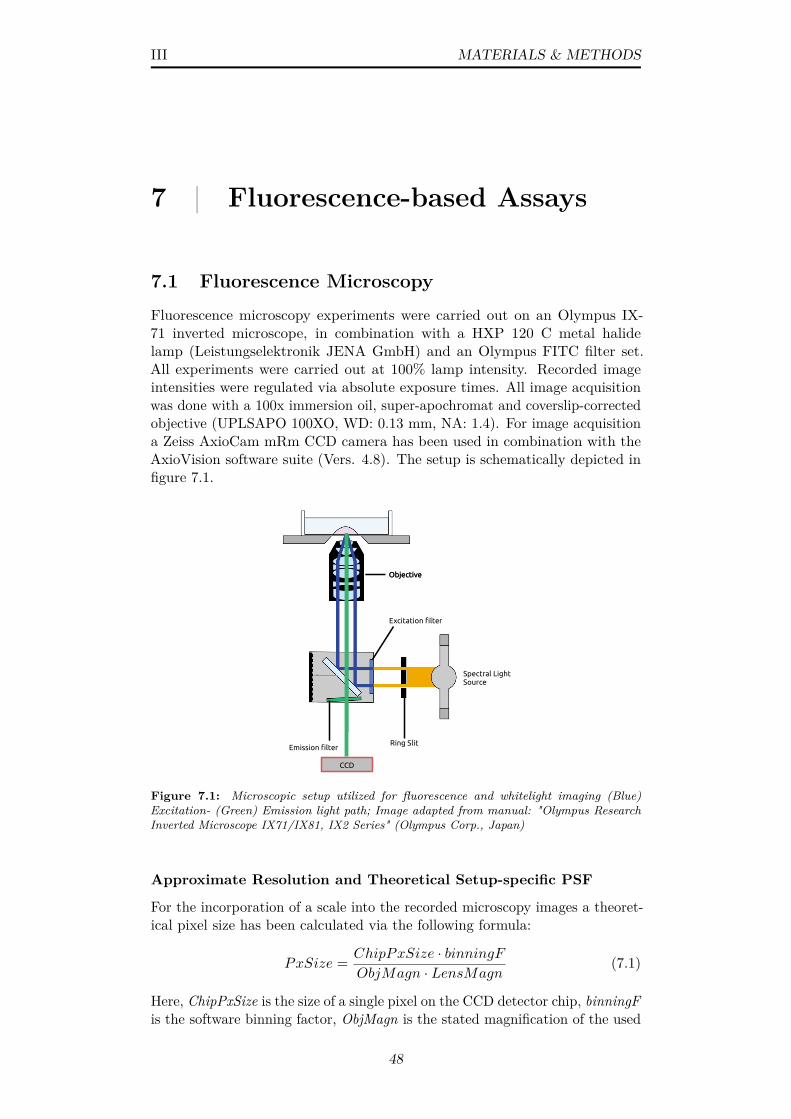
III MATERIALS & METHODS
7 | Fluorescence-based Assays
7.1 Fluorescence MicroscopyFluorescence microscopy experiments were carried out on an Olympus IX-71 inverted microscope, in combination with a HXP 120 C metal halidelamp (Leistungselektronik JENA GmbH) and an Olympus FITC filter set.All experiments were carried out at 100% lamp intensity. Recorded imageintensities were regulated via absolute exposure times. All image acquisitionwas done with a 100x immersion oil, super-apochromat and coverslip-correctedobjective (UPLSAPO 100XO, WD: 0.13 mm, NA: 1.4). For image acquisitiona Zeiss AxioCam mRm CCD camera has been used in combination with theAxioVision software suite (Vers. 4.8). The setup is schematically depicted infigure 7.1.
Objective
Emission fiter
Objective
Ring Siit
Excitation fiter
Spectrai Light Source
CCD
Figure 7.1: Microscopic setup utilized for fluorescence and whitelight imaging (Blue)Excitation- (Green) Emission light path; Image adapted from manual: "Olympus ResearchInverted Microscope IX71/IX81, IX2 Series" (Olympus Corp., Japan)
Approximate Resolution and Theoretical Setup-specific PSF
For the incorporation of a scale into the recorded microscopy images a theoret-ical pixel size has been calculated via the following formula:
PxSize = ChipPxSize · binningFObjMagn · LensMagn
(7.1)
Here, ChipPxSize is the size of a single pixel on the CCD detector chip, binningFis the software binning factor, ObjMagn is the stated magnification of the used
48
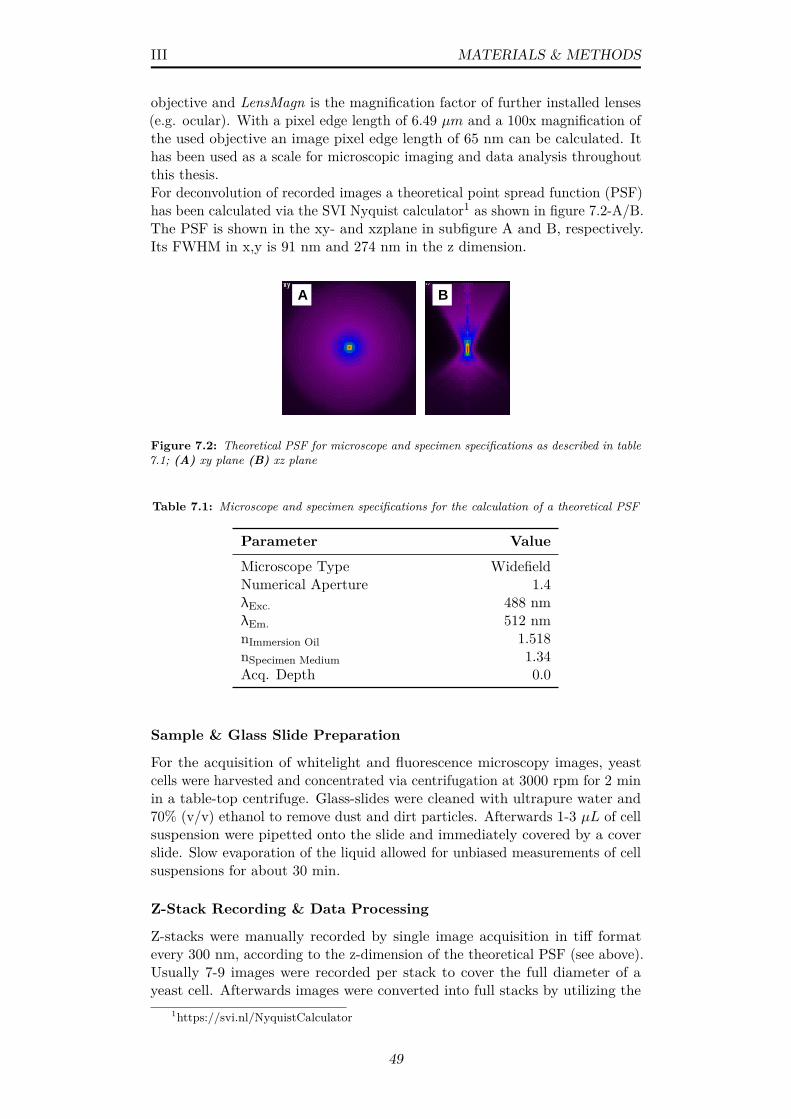
III MATERIALS & METHODS
objective and LensMagn is the magnification factor of further installed lenses(e.g. ocular). With a pixel edge length of 6.49 µm and a 100x magnification ofthe used objective an image pixel edge length of 65 nm can be calculated. Ithas been used as a scale for microscopic imaging and data analysis throughoutthis thesis.For deconvolution of recorded images a theoretical point spread function (PSF)has been calculated via the SVI Nyquist calculator1 as shown in figure 7.2-A/B.The PSF is shown in the xy- and xzplane in subfigure A and B, respectively.Its FWHM in x,y is 91 nm and 274 nm in the z dimension.
A B
Figure 7.2: Theoretical PSF for microscope and specimen specifications as described in table7.1; (A) xy plane (B) xz plane
Table 7.1: Microscope and specimen specifications for the calculation of a theoretical PSF
Parameter Value
Microscope Type WidefieldNumerical Aperture 1.4λExc. 488 nmλEm. 512 nmnImmersion Oil 1.518nSpecimen Medium 1.34Acq. Depth 0.0
Sample & Glass Slide Preparation
For the acquisition of whitelight and fluorescence microscopy images, yeastcells were harvested and concentrated via centrifugation at 3000 rpm for 2 minin a table-top centrifuge. Glass-slides were cleaned with ultrapure water and70% (v/v) ethanol to remove dust and dirt particles. Afterwards 1-3 µL of cellsuspension were pipetted onto the slide and immediately covered by a coverslide. Slow evaporation of the liquid allowed for unbiased measurements of cellsuspensions for about 30 min.
Z-Stack Recording & Data Processing
Z-stacks were manually recorded by single image acquisition in tiff formatevery 300 nm, according to the z-dimension of the theoretical PSF (see above).Usually 7-9 images were recorded per stack to cover the full diameter of ayeast cell. Afterwards images were converted into full stacks by utilizing the
1https://svi.nl/NyquistCalculator
49
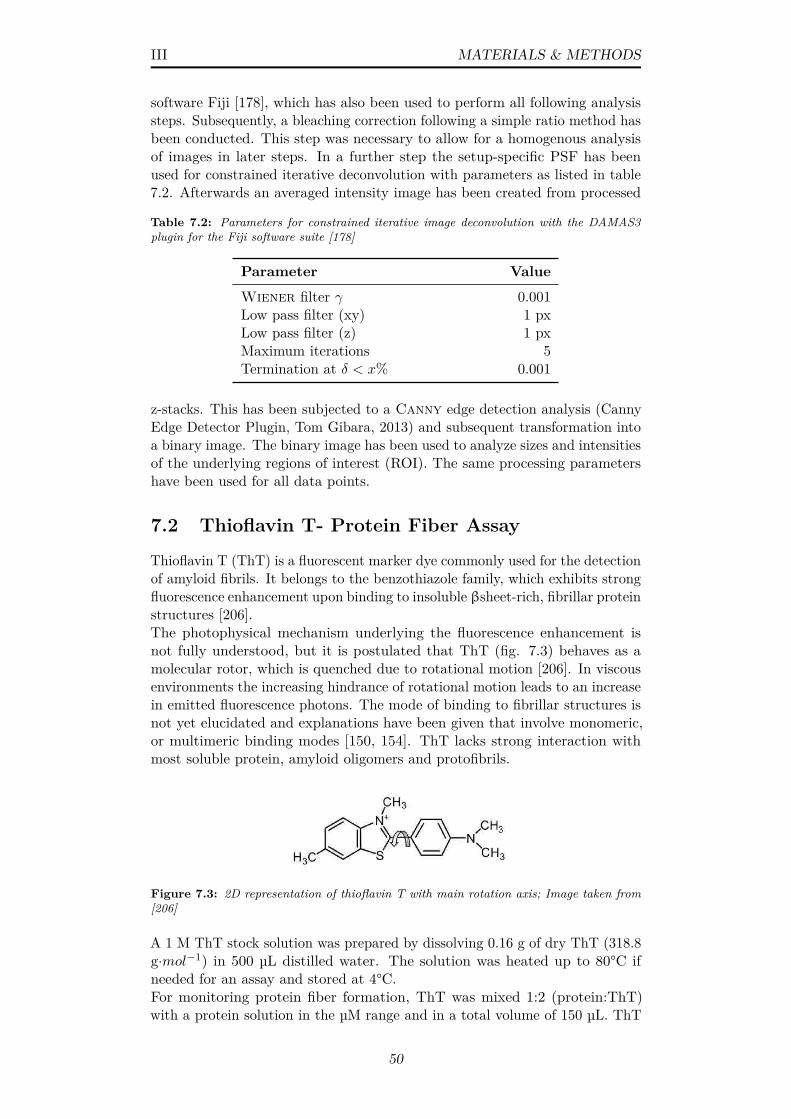
III MATERIALS & METHODS
software Fiji [178], which has also been used to perform all following analysissteps. Subsequently, a bleaching correction following a simple ratio method hasbeen conducted. This step was necessary to allow for a homogenous analysisof images in later steps. In a further step the setup-specific PSF has beenused for constrained iterative deconvolution with parameters as listed in table7.2. Afterwards an averaged intensity image has been created from processed
Table 7.2: Parameters for constrained iterative image deconvolution with the DAMAS3plugin for the Fiji software suite [178]
Parameter Value
Wiener filter γ 0.001Low pass filter (xy) 1 pxLow pass filter (z) 1 pxMaximum iterations 5Termination at δ < x% 0.001
z-stacks. This has been subjected to a Canny edge detection analysis (CannyEdge Detector Plugin, Tom Gibara, 2013) and subsequent transformation intoa binary image. The binary image has been used to analyze sizes and intensitiesof the underlying regions of interest (ROI). The same processing parametershave been used for all data points.
7.2 Thioflavin T- Protein Fiber Assay
Thioflavin T (ThT) is a fluorescent marker dye commonly used for the detectionof amyloid fibrils. It belongs to the benzothiazole family, which exhibits strongfluorescence enhancement upon binding to insoluble βsheet-rich, fibrillar proteinstructures [206].The photophysical mechanism underlying the fluorescence enhancement isnot fully understood, but it is postulated that ThT (fig. 7.3) behaves as amolecular rotor, which is quenched due to rotational motion [206]. In viscousenvironments the increasing hindrance of rotational motion leads to an increasein emitted fluorescence photons. The mode of binding to fibrillar structures isnot yet elucidated and explanations have been given that involve monomeric,or multimeric binding modes [150, 154]. ThT lacks strong interaction withmost soluble protein, amyloid oligomers and protofibrils.
Figure 7.3: 2D representation of thioflavin T with main rotation axis; Image taken from[206]
A 1 M ThT stock solution was prepared by dissolving 0.16 g of dry ThT (318.8g·mol−1) in 500 µL distilled water. The solution was heated up to 80°C ifneeded for an assay and stored at 4°C.For monitoring protein fiber formation, ThT was mixed 1:2 (protein:ThT)with a protein solution in the µM range and in a total volume of 150 µL. ThT
50
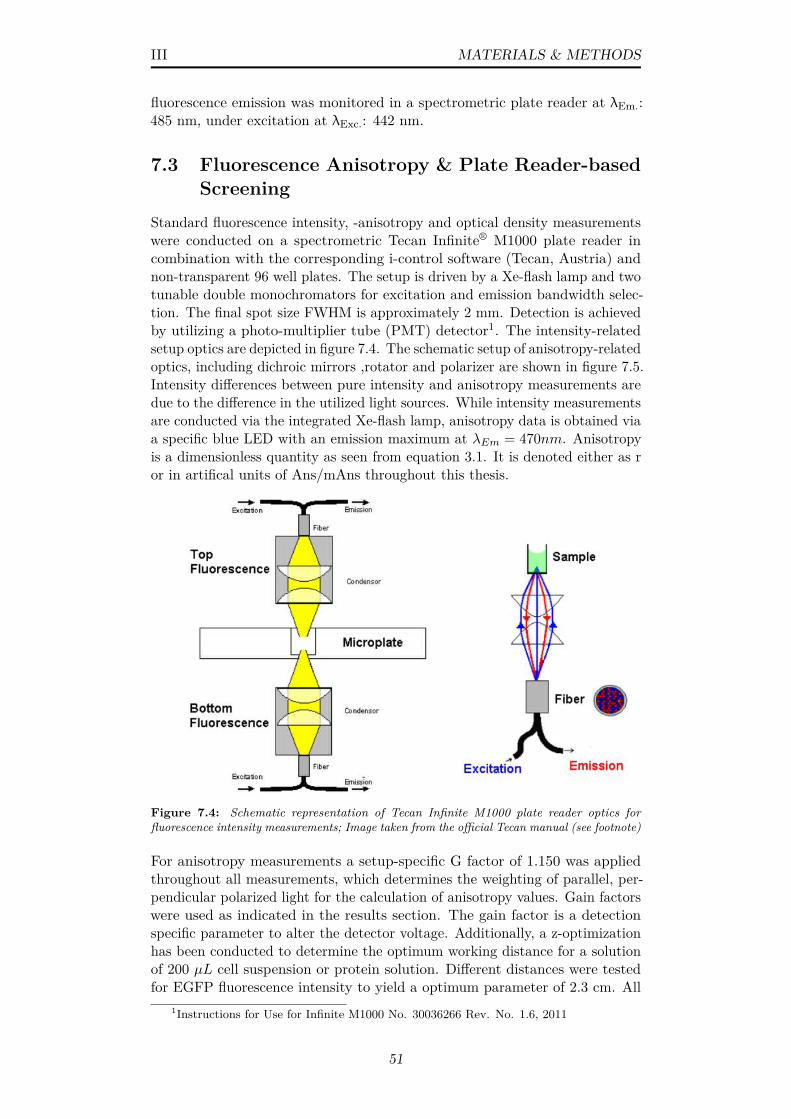
III MATERIALS & METHODS
fluorescence emission was monitored in a spectrometric plate reader at λEm.:485 nm, under excitation at λExc.: 442 nm.
7.3 Fluorescence Anisotropy & Plate Reader-basedScreening
Standard fluorescence intensity, -anisotropy and optical density measurementswere conducted on a spectrometric Tecan Infinite® M1000 plate reader incombination with the corresponding i-control software (Tecan, Austria) andnon-transparent 96 well plates. The setup is driven by a Xe-flash lamp and twotunable double monochromators for excitation and emission bandwidth selec-tion. The final spot size FWHM is approximately 2 mm. Detection is achievedby utilizing a photo-multiplier tube (PMT) detector1. The intensity-relatedsetup optics are depicted in figure 7.4. The schematic setup of anisotropy-relatedoptics, including dichroic mirrors ,rotator and polarizer are shown in figure 7.5.Intensity differences between pure intensity and anisotropy measurements aredue to the difference in the utilized light sources. While intensity measurementsare conducted via the integrated Xe-flash lamp, anisotropy data is obtained viaa specific blue LED with an emission maximum at λEm = 470nm. Anisotropyis a dimensionless quantity as seen from equation 3.1. It is denoted either as ror in artifical units of Ans/mAns throughout this thesis.
Figure 7.4: Schematic representation of Tecan Infinite M1000 plate reader optics forfluorescence intensity measurements; Image taken from the official Tecan manual (see footnote)
For anisotropy measurements a setup-specific G factor of 1.150 was appliedthroughout all measurements, which determines the weighting of parallel, per-pendicular polarized light for the calculation of anisotropy values. Gain factorswere used as indicated in the results section. The gain factor is a detectionspecific parameter to alter the detector voltage. Additionally, a z-optimizationhas been conducted to determine the optimum working distance for a solutionof 200 µL cell suspension or protein solution. Different distances were testedfor EGFP fluorescence intensity to yield a optimum parameter of 2.3 cm. All
1Instructions for Use for Infinite M1000 No. 30036266 Rev. No. 1.6, 2011
51
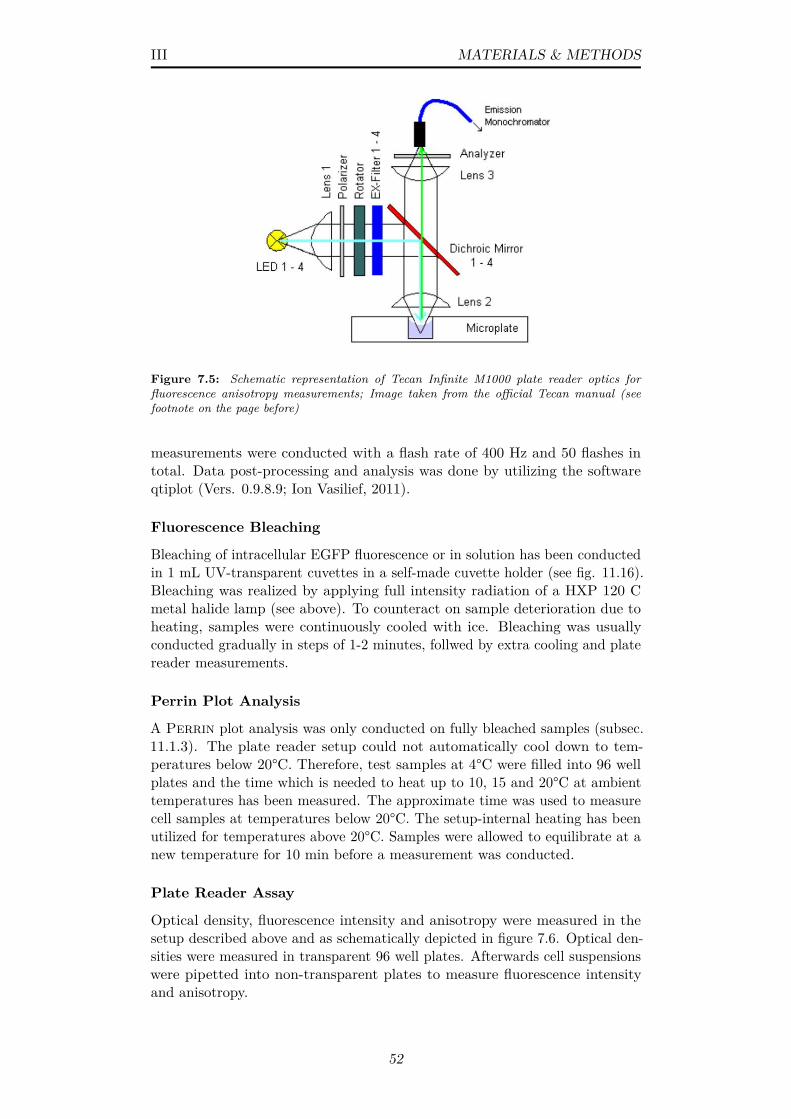
III MATERIALS & METHODS
Figure 7.5: Schematic representation of Tecan Infinite M1000 plate reader optics forfluorescence anisotropy measurements; Image taken from the official Tecan manual (seefootnote on the page before)
measurements were conducted with a flash rate of 400 Hz and 50 flashes intotal. Data post-processing and analysis was done by utilizing the softwareqtiplot (Vers. 0.9.8.9; Ion Vasilief, 2011).
Fluorescence Bleaching
Bleaching of intracellular EGFP fluorescence or in solution has been conductedin 1 mL UV-transparent cuvettes in a self-made cuvette holder (see fig. 11.16).Bleaching was realized by applying full intensity radiation of a HXP 120 Cmetal halide lamp (see above). To counteract on sample deterioration due toheating, samples were continuously cooled with ice. Bleaching was usuallyconducted gradually in steps of 1-2 minutes, follwed by extra cooling and platereader measurements.
Perrin Plot Analysis
A Perrin plot analysis was only conducted on fully bleached samples (subsec.11.1.3). The plate reader setup could not automatically cool down to tem-peratures below 20°C. Therefore, test samples at 4°C were filled into 96 wellplates and the time which is needed to heat up to 10, 15 and 20°C at ambienttemperatures has been measured. The approximate time was used to measurecell samples at temperatures below 20°C. The setup-internal heating has beenutilized for temperatures above 20°C. Samples were allowed to equilibrate at anew temperature for 10 min before a measurement was conducted.
Plate Reader Assay
Optical density, fluorescence intensity and anisotropy were measured in thesetup described above and as schematically depicted in figure 7.6. Optical den-sities were measured in transparent 96 well plates. Afterwards cell suspensionswere pipetted into non-transparent plates to measure fluorescence intensityand anisotropy.
52
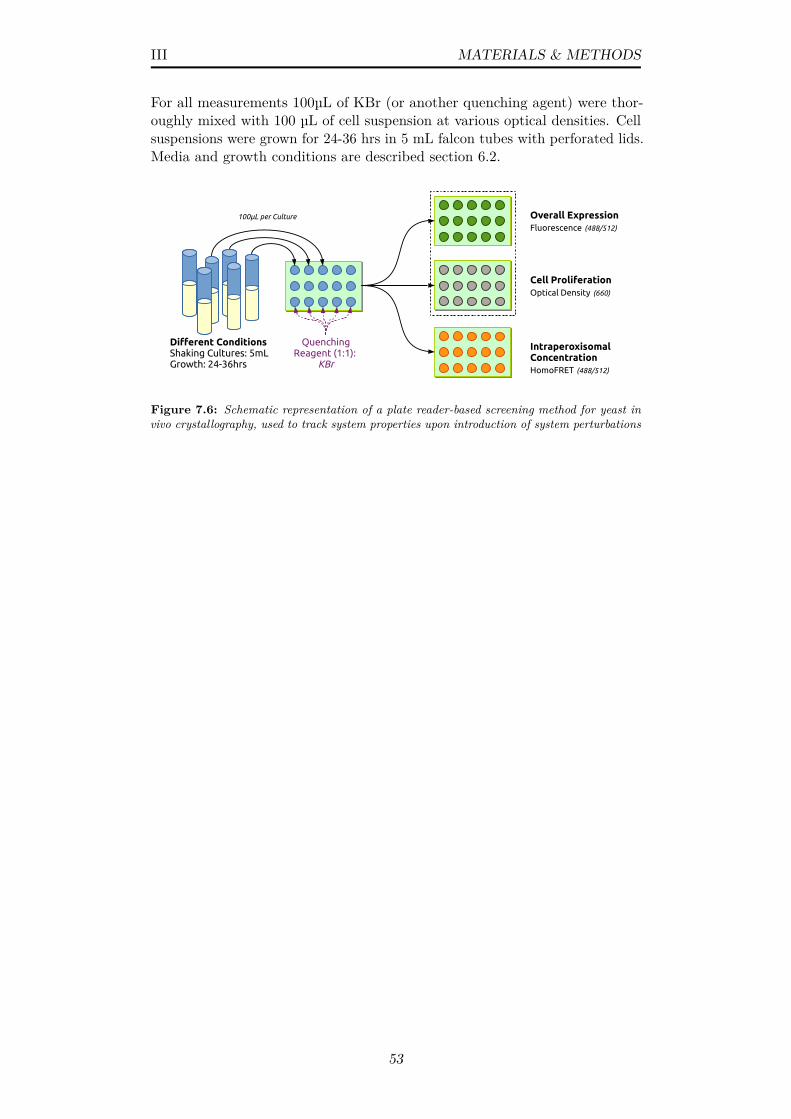
III MATERIALS & METHODS
For all measurements 100µL of KBr (or another quenching agent) were thor-oughly mixed with 100 µL of cell suspension at various optical densities. Cellsuspensions were grown for 24-36 hrs in 5 mL falcon tubes with perforated lids.Media and growth conditions are described section 6.2.
Cell ProliferationOptical Density (660)
Overall ExpressionFluorescence (488/512)
Intraperoxisomal ConcentrationHomoFRET (488/512)
Quenching Reagent (1:1):
KBr
Diferent ConitionsShaking Cultures: 5mLGrowth: 24-36hrs
100μL per Culture
Figure 7.6: Schematic representation of a plate reader-based screening method for yeast invivo crystallography, used to track system properties upon introduction of system perturbations
53

IV | Results & Discussion
IV RESULTS & DISCUSSION
8 | Engineering the PeroxisomalCrystal Factory
Heterologous expression of proteins in different budding yeast species is utilizedin scientific research and industrial applications for different purposes. Here,the yeast H. polymorpha has been chosen as the prime target organism forcloning and expression attempts due to its unique features with regards topromoter strength and peroxisomal induction (sec. 2.1). This chapter startswith a verification of the induction of PAOX under new laboratory conditions(sec. 8.1). Additionally, in vitro crystallization attempts of purified H.p.AOX are presented to complement data from powder diffraction and SFXexperiments (sec. 8.2). Lastly, section 8.4 exemplary describes the successfulheterologous expression and peroxisomal targeting of proteins in the organismsH. polymorpha and in S. cerevisiae.
8.1 AOX Purification & Verification of PAOX Induc-tion
In a first step, it was necessary to verify the induction of 75 kDa alcoholoxidase (AOX)1 expression in H. polymorpha under new laboratory conditions.Without having the advantage of a specific antibody the protein was directlypurified from yeast cells and identified via mass spectrometry. This was anecessary approach due to the extremely weak expression in comparison tobacterial systems.Furthermore, an attempt was made to establish a purification protocol toobtain functional protein for an in vitro crystallization attempt (see sec. 8.2).This was done in a multi-step approach comprising ammonium sulfate (AS)precipitation, anion exchange- and size-exclusion chromatography (SEC). Theprotocol for AOX purification from yeast cells has been adapted from van derKlei et al. [35]. It has to be remarked that cultivation of yeast cells had beendifficult with its usually complex media requirements (see sec. 6.2). To simplifythe cultivation it was tried to grow cells in unselective YP media supplementedwith glucose/methanol as the sole carbon source.
Purification & Identification via Mass Spectrometry
For the purification of AOX protein from yeast cells the following steps wereconducted. In addition, proof is given that pure, monodisperse protein wasobtained which was subjected to crystallization trials.Yeast cells were harvested from 6×200 mL batch cultures, inoculated froma YPD pre-culture and grown for 24 hrs in 0.5% YPM media. All media
1Usually assembles into an octameric structure of ∼ 600 kDa
54

IV RESULTS & DISCUSSION
contained 0.1 M KH2PO4/K2HPO4 at pH 6.0 to prevent early acidification duringgrowth. Cells were spun down in a table-top centrifuge at 5000·g for 10 minat 4°C. The pellet was washed twice in 50 mM potassium phosphate (PP)buffer pH 7.5. All following steps were equally performed at 4°C to preventdegradation. In the next step, cells were subject to 5 cycles of emulsifiertreatment (1 g cells/5 mL, 1.4 · 105kN/m2) to break most of the cell walls.The breakage was monitored via microscopy. To remove cell remains, the lysatewas centrifuged for 30 min at 30000·g. The obtained supernatant was usedfor ammonium sulfate precipitation. To collect the fraction containing AOXat first a 45% (w/v) saturation was reached by adding 66.67 g AS to 250 mLbuffer. The solution was kept on ice in the cold-room for about 30 min andafterwards centrifuged for 20 min at 10000·g. In a further precipitation step17.46 g AS were added to the supernatant to obtain a 55% (w/v) concentrationof AS. The total volume of the lysate was now about 295 mL. The solutionwas again kept on ice for 20 min.
Cell D
ebris
[kDa]
8060
40
Cell D
ebris
SN afte
r Pre
c 1
SN afte
r Pre
c 2
Preci
pita
te 0
.1Pre
cipi
tate
1.0
L
Figure 8.1: 12% SDS-PAGE with samples representing cell debris, supernatant and precipi-tate during ammonium sulfate precipitation as a first step in AOX purification; L= ProteinWeight Marker (Roti®-Mark 10-150)
The precipitated fraction between 45% and 55% was collected as it containsmost of the AOX activity and was resuspended in 1 mL 50 mM PP bufferpH 7.5. The solution was subject to an overnight dialysis step against thesame buffer (2 L) to remove most of the ammonium sulfate. The results werechecked on a SDS gel as depicted in figure 8.1. The gel shows initial cell debris,cell debris after centrifugation, two lanes supernatant after the precipitationsteps and two lanes from the resuspended AOX fraction between 45% and55% AS from left to right. It is apparent that a strong band appears for theresuspended fraction at around 75 kDa which corresponds to the monomerweight of AOX. The band is slightly visible in the cell debris, too, indicatingthat not all cells/organelles were broken during purification. The concentrationof the rightmost lanes were 0.1 and 1.0 mg·mL−1, respectively, both in 20 µLloading volume. The other samples were applied as obtained.Hereafter, the solution was first concentrated and then purified further by usinga HiTrap® Q HP 5mL column. Equilibration was done with 50 mM PP pH 7.5buffer and 0 M AS. This represents the low salt buffer A. A second bufferdenoted as buffer B (or elution buffer) is used for ’salting out’ and containsadditional 0.5M AS. This buffer is used in a linear gradient to change the ionicstrength and elute AOX and other proteins separately from the column. Theresults are shown in figure 8.2-A and -C. As it can be seen in figure 8.2-A, acertain fraction of molecules elutes as nonretained from the column withoutan increased salt concentration (peaks X1 and X2 ). After increasing buffer B
55
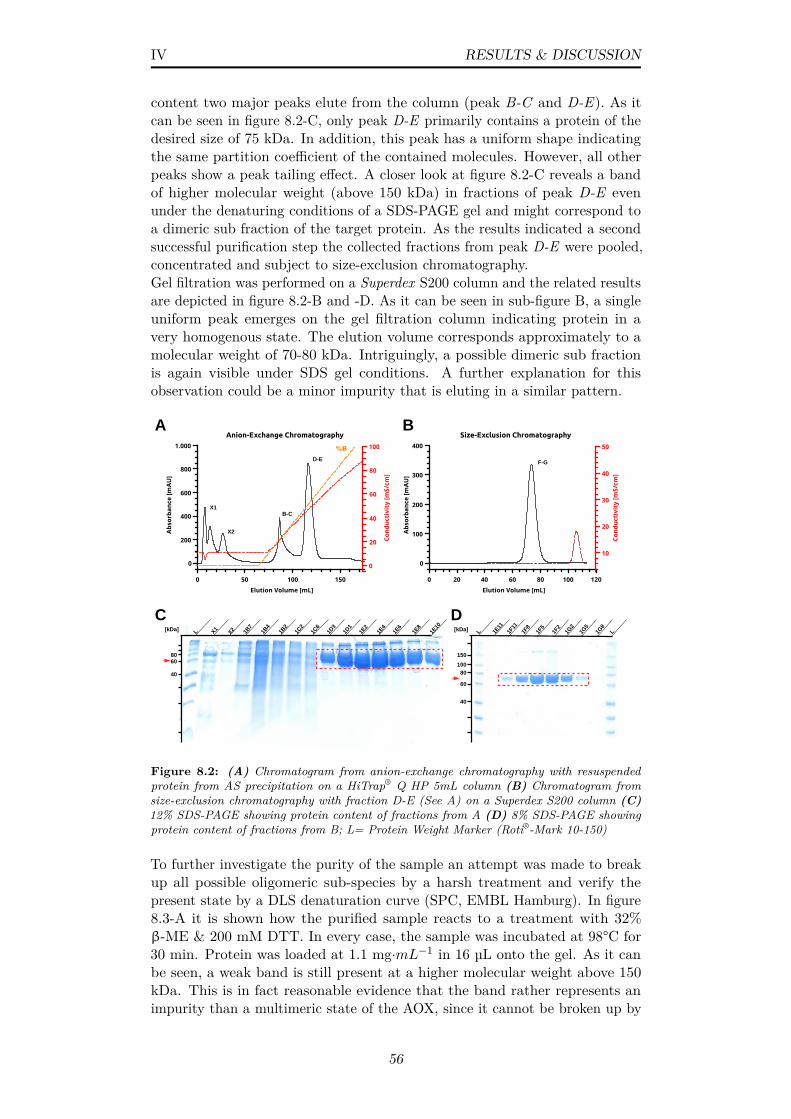
IV RESULTS & DISCUSSION
content two major peaks elute from the column (peak B-C and D-E). As itcan be seen in figure 8.2-C, only peak D-E primarily contains a protein of thedesired size of 75 kDa. In addition, this peak has a uniform shape indicatingthe same partition coefficient of the contained molecules. However, all otherpeaks show a peak tailing effect. A closer look at figure 8.2-C reveals a bandof higher molecular weight (above 150 kDa) in fractions of peak D-E evenunder the denaturing conditions of a SDS-PAGE gel and might correspond toa dimeric sub fraction of the target protein. As the results indicated a secondsuccessful purification step the collected fractions from peak D-E were pooled,concentrated and subject to size-exclusion chromatography.Gel filtration was performed on a Superdex S200 column and the related resultsare depicted in figure 8.2-B and -D. As it can be seen in sub-figure B, a singleuniform peak emerges on the gel filtration column indicating protein in avery homogenous state. The elution volume corresponds approximately to amolecular weight of 70-80 kDa. Intriguingly, a possible dimeric sub fractionis again visible under SDS gel conditions. A further explanation for thisobservation could be a minor impurity that is eluting in a similar pattern.
X2X1L 1B7
1B4
1B2
1C2
1C6
1D3
1D1
1E2
1E4
1E6
1E8
1E10
L L1E11
1F11
1F8
1F5
1F2
1G2
1G5
1G8
8060
40
[kDa] [kDa]
150
100
80
60
40
A B
F-G
C D
D-E
B-C
X2
X1
Size-Exclusion Chromatography
Abs
orba
nce
[mA
U]
0
100
200
300
400
Elution Volume [mL]0 20 40 60 80 100 120
Anion-Exchange Chromatography
Abs
orba
nce
[mA
U]
0
200
400
600
800
1.000
Elution Volume [mL]0 50 100 150
Cond
ucti
vity
[mS/
cm]
0
20
40
60
80
100%B
Cond
ucti
vity
[mS/
cm]
10
20
30
40
50
Figure 8.2: (A) Chromatogram from anion-exchange chromatography with resuspendedprotein from AS precipitation on a HiTrap® Q HP 5mL column (B) Chromatogram fromsize-exclusion chromatography with fraction D-E (See A) on a Superdex S200 column (C)12% SDS-PAGE showing protein content of fractions from A (D) 8% SDS-PAGE showingprotein content of fractions from B; L= Protein Weight Marker (Roti®-Mark 10-150)
To further investigate the purity of the sample an attempt was made to breakup all possible oligomeric sub-species by a harsh treatment and verify thepresent state by a DLS denaturation curve (SPC, EMBL Hamburg). In figure8.3-A it is shown how the purified sample reacts to a treatment with 32%β-ME & 200 mM DTT. In every case, the sample was incubated at 98°C for30 min. Protein was loaded at 1.1 mg·mL−1 in 16 µL onto the gel. As it canbe seen, a weak band is still present at a higher molecular weight above 150kDa. This is in fact reasonable evidence that the band rather represents animpurity than a multimeric state of the AOX, since it cannot be broken up by
56
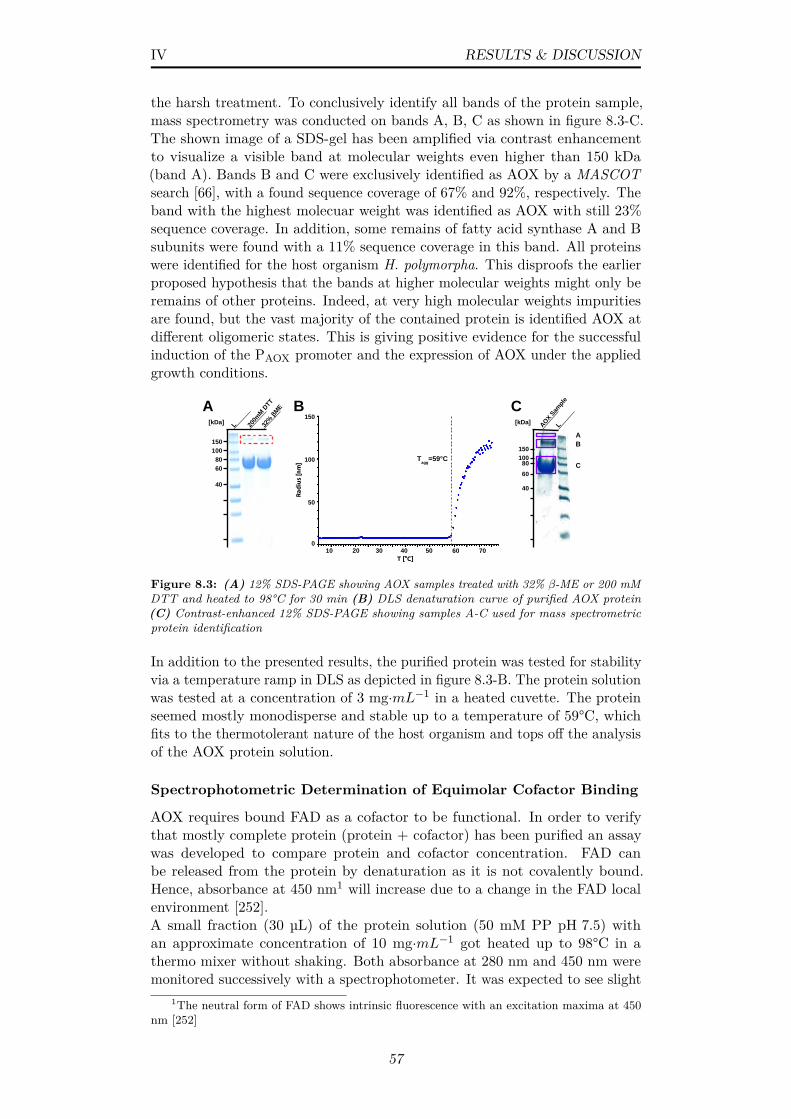
IV RESULTS & DISCUSSION
the harsh treatment. To conclusively identify all bands of the protein sample,mass spectrometry was conducted on bands A, B, C as shown in figure 8.3-C.The shown image of a SDS-gel has been amplified via contrast enhancementto visualize a visible band at molecular weights even higher than 150 kDa(band A). Bands B and C were exclusively identified as AOX by a MASCOTsearch [66], with a found sequence coverage of 67% and 92%, respectively. Theband with the highest molecuar weight was identified as AOX with still 23%sequence coverage. In addition, some remains of fatty acid synthase A and Bsubunits were found with a 11% sequence coverage in this band. All proteinswere identified for the host organism H. polymorpha. This disproofs the earlierproposed hypothesis that the bands at higher molecular weights might only beremains of other proteins. Indeed, at very high molecular weights impuritiesare found, but the vast majority of the contained protein is identified AOX atdifferent oligomeric states. This is giving positive evidence for the successfulinduction of the PAOX promoter and the expression of AOX under the appliedgrowth conditions.
200m
M D
TT
[kDa]
80
60
40
32%
βM
E
L
100
150
150
100
50
02010 30 40 50 60 70
T [°C]
Rad
ius
[nm
]
Tagg
=59°C
A B C
AOX S
ampl
e
100
60
40
L
150
[kDa]
AB
C80
Figure 8.3: (A) 12% SDS-PAGE showing AOX samples treated with 32% β-ME or 200 mMDTT and heated to 98°C for 30 min (B) DLS denaturation curve of purified AOX protein(C) Contrast-enhanced 12% SDS-PAGE showing samples A-C used for mass spectrometricprotein identification
In addition to the presented results, the purified protein was tested for stabilityvia a temperature ramp in DLS as depicted in figure 8.3-B. The protein solutionwas tested at a concentration of 3 mg·mL−1 in a heated cuvette. The proteinseemed mostly monodisperse and stable up to a temperature of 59°C, whichfits to the thermotolerant nature of the host organism and tops off the analysisof the AOX protein solution.
Spectrophotometric Determination of Equimolar Cofactor Binding
AOX requires bound FAD as a cofactor to be functional. In order to verifythat mostly complete protein (protein + cofactor) has been purified an assaywas developed to compare protein and cofactor concentration. FAD canbe released from the protein by denaturation as it is not covalently bound.Hence, absorbance at 450 nm1 will increase due to a change in the FAD localenvironment [252].A small fraction (30 µL) of the protein solution (50 mM PP pH 7.5) withan approximate concentration of 10 mg·mL−1 got heated up to 98°C in athermo mixer without shaking. Both absorbance at 280 nm and 450 nm weremonitored successively with a spectrophotometer. It was expected to see slight
1The neutral form of FAD shows intrinsic fluorescence with an excitation maxima at 450nm [252]
57

IV RESULTS & DISCUSSION
changes in the UV-absorbance of the aromatic amino acids due to denaturation.This process is obviously initiated by changes in the local environment of theresidues. Usually, the absorbance at 280 nm will give more precise results withcalculated extinction coefficients if the protein is denatured. Additionally, anincrease in absorbance at 450 nm was expected due to freed FAD molecules.Table 8.1 shows the obtained values from the assay at the timepoints 0, 10, 20and 30 min. In addition, figure 8.4-A and -B depict these values in a plot fora better comparison. As it can be seen in figure 8.4-B a lot of FAD seems tobe released within the first 10 min of the assay and its concentration slowlyreaches saturation after 30 min. In contrast, the absorbance at 280 nm (Fig.8.4-A) seems to decrease between 20 and 30 min which is why a completedenaturation was assumed. Accurate calculation of the concentration was donewith an extinction coefficients of 93500 M · cm−1 for AOX and 11300 Mcm−1
for FAD [62].
Table 8.1: Data of FAD binding assay to determine protein/cofactor binding ratio; Conductedwith a NanoDrop™ 1000 Spectrophotometer
Time [min] Abs. at 280nm
Abs. at 450nm
0 1.172± 0.013 0.051± 0.00310 1.962± 0.098 0.219± 0.00420 1.985± 0.049 0.241± 0.01030 1.785± 0.102 0.245± 0.018
By using the Lambert-Beer law, a path length of 0.1 cm and approximatemolar masses of 75 kDa (AOX) and 0.785 kDa (FAD), it was possible tocalculate the molar- and mass concentration of both species in the solution.Since no crucial changes occurred after an incubation time of 10 min anaveraged value of the timepoints 10-30 min was used for this calculation. As aresult the concentrations were calculated to be 204±12.9µM (15.32 mg·mL−1)and 208 ±13.8µM (0.16 mg·mL−1) for AOX and FAD, respectively. Theimplementation of a SEC purification step ensured that no free FAD waspresent in the solution before the experiment started. In conclusion, it isapparent that both molecule species are present at equimolar concentrationsand a 1:1 binding can be assumed. Hence, the purified protein seems to befully assembled [48].
Denaturation Assay
Abs
orba
nce
[AU
]
1
1,2
1,4
1,6
1,8
2
2,2
Time [min]0 5 10 15 20 25 30
Alcohol Oxidase
Abso
rban
ce [A
U]
0
0,05
0,1
0,15
0,2
0,25
0,3
Flavin-Adenine-Dinucleotide
A B Comparison of Molar Conc.
Mol
ar C
onc.
[μM
]
160
180
200
220
240
AOX FAD
Figure 8.4: (A) FAD binding assay to determine protein/cofactor binding ratio (B) Verifi-cation of equimolar concentrations of protein and cofactor
58
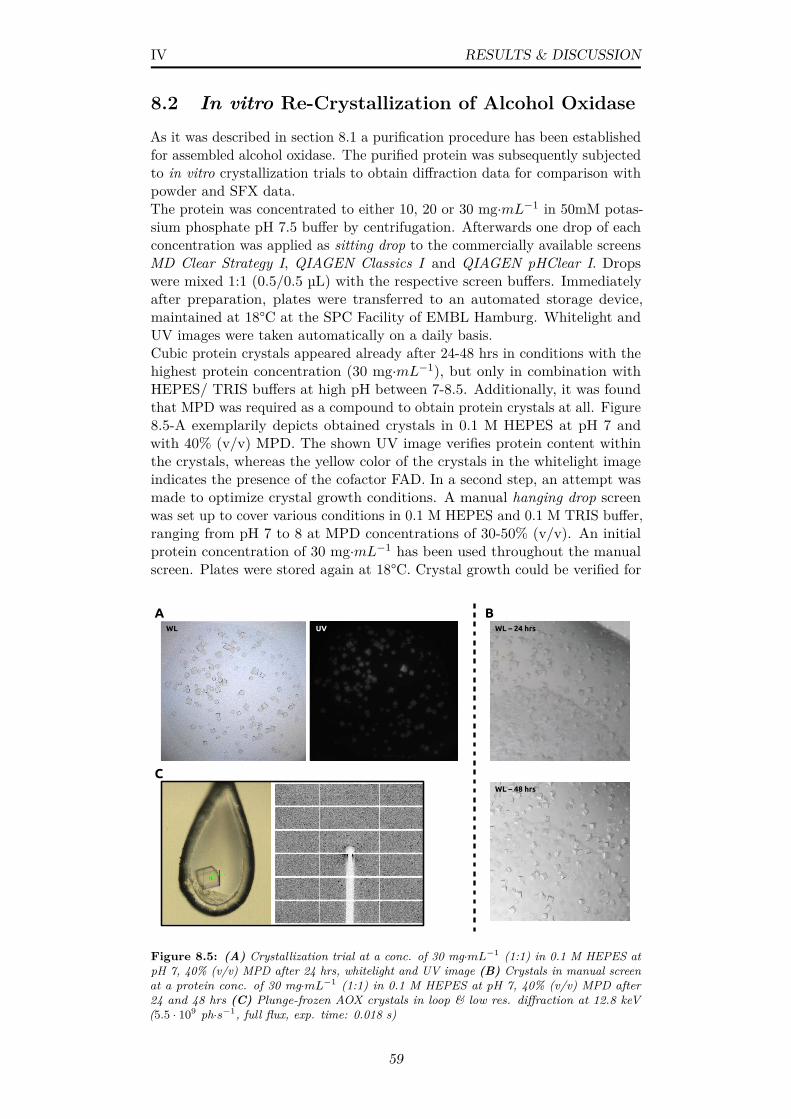
IV RESULTS & DISCUSSION
8.2 In vitro Re-Crystallization of Alcohol OxidaseAs it was described in section 8.1 a purification procedure has been establishedfor assembled alcohol oxidase. The purified protein was subsequently subjectedto in vitro crystallization trials to obtain diffraction data for comparison withpowder and SFX data.The protein was concentrated to either 10, 20 or 30 mg·mL−1 in 50mM potas-sium phosphate pH 7.5 buffer by centrifugation. Afterwards one drop of eachconcentration was applied as sitting drop to the commercially available screensMD Clear Strategy I, QIAGEN Classics I and QIAGEN pHClear I. Dropswere mixed 1:1 (0.5/0.5 µL) with the respective screen buffers. Immediatelyafter preparation, plates were transferred to an automated storage device,maintained at 18°C at the SPC Facility of EMBL Hamburg. Whitelight andUV images were taken automatically on a daily basis.Cubic protein crystals appeared already after 24-48 hrs in conditions with thehighest protein concentration (30 mg·mL−1), but only in combination withHEPES/ TRIS buffers at high pH between 7-8.5. Additionally, it was foundthat MPD was required as a compound to obtain protein crystals at all. Figure8.5-A exemplarily depicts obtained crystals in 0.1 M HEPES at pH 7 andwith 40% (v/v) MPD. The shown UV image verifies protein content withinthe crystals, whereas the yellow color of the crystals in the whitelight imageindicates the presence of the cofactor FAD. In a second step, an attempt wasmade to optimize crystal growth conditions. A manual hanging drop screenwas set up to cover various conditions in 0.1 M HEPES and 0.1 M TRIS buffer,ranging from pH 7 to 8 at MPD concentrations of 30-50% (v/v). An initialprotein concentration of 30 mg·mL−1 has been used throughout the manualscreen. Plates were stored again at 18°C. Crystal growth could be verified for
WL UV
A BWL – 24 hrs
CWL – 48 hrs
Figure 8.5: (A) Crystallization trial at a conc. of 30 mg·mL−1 (1:1) in 0.1 M HEPES atpH 7, 40% (v/v) MPD after 24 hrs, whitelight and UV image (B) Crystals in manual screenat a protein conc. of 30 mg·mL−1 (1:1) in 0.1 M HEPES at pH 7, 40% (v/v) MPD after24 and 48 hrs (C) Plunge-frozen AOX crystals in loop & low res. diffraction at 12.8 keV(5.5 · 109 ph·s−1, full flux, exp. time: 0.018 s)
59
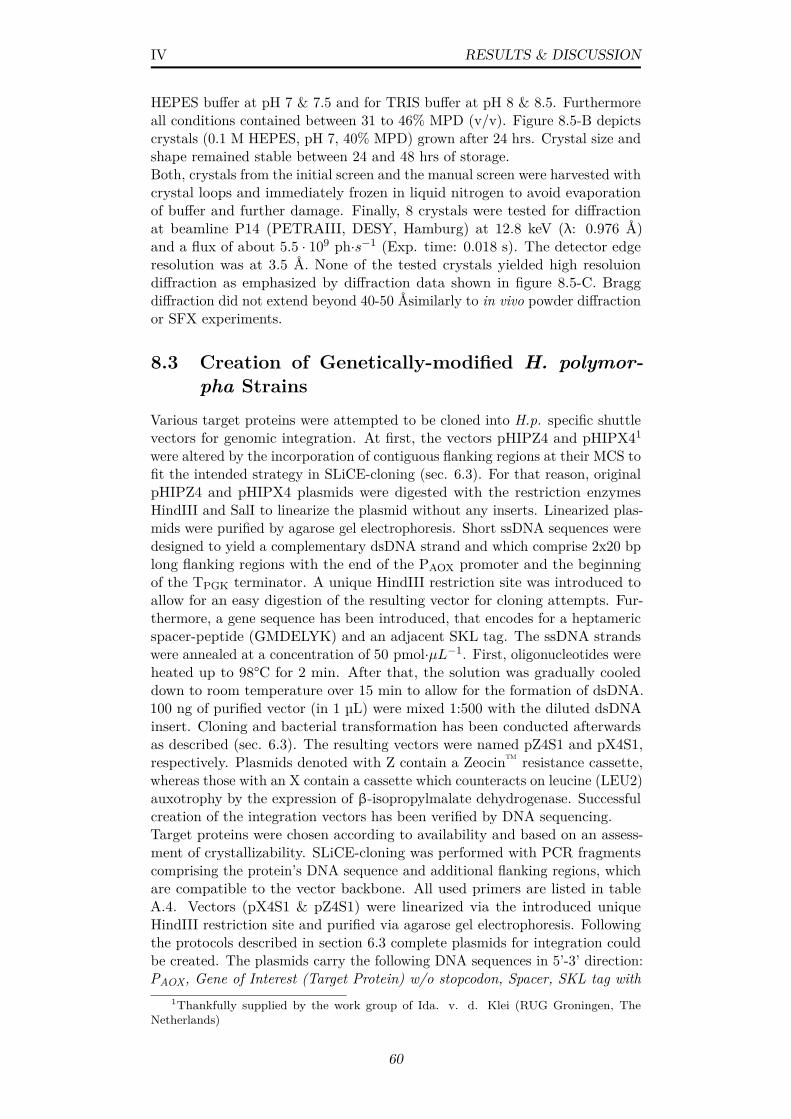
IV RESULTS & DISCUSSION
HEPES buffer at pH 7 & 7.5 and for TRIS buffer at pH 8 & 8.5. Furthermoreall conditions contained between 31 to 46% MPD (v/v). Figure 8.5-B depictscrystals (0.1 M HEPES, pH 7, 40% MPD) grown after 24 hrs. Crystal size andshape remained stable between 24 and 48 hrs of storage.Both, crystals from the initial screen and the manual screen were harvested withcrystal loops and immediately frozen in liquid nitrogen to avoid evaporationof buffer and further damage. Finally, 8 crystals were tested for diffractionat beamline P14 (PETRAIII, DESY, Hamburg) at 12.8 keV (λ: 0.976 Å)and a flux of about 5.5 · 109 ph·s−1 (Exp. time: 0.018 s). The detector edgeresolution was at 3.5 Å. None of the tested crystals yielded high resoluiondiffraction as emphasized by diffraction data shown in figure 8.5-C. Braggdiffraction did not extend beyond 40-50 Åsimilarly to in vivo powder diffractionor SFX experiments.
8.3 Creation of Genetically-modified H. polymor-pha Strains
Various target proteins were attempted to be cloned into H.p. specific shuttlevectors for genomic integration. At first, the vectors pHIPZ4 and pHIPX41
were altered by the incorporation of contiguous flanking regions at their MCS tofit the intended strategy in SLiCE-cloning (sec. 6.3). For that reason, originalpHIPZ4 and pHIPX4 plasmids were digested with the restriction enzymesHindIII and SalI to linearize the plasmid without any inserts. Linearized plas-mids were purified by agarose gel electrophoresis. Short ssDNA sequences weredesigned to yield a complementary dsDNA strand and which comprise 2x20 bplong flanking regions with the end of the PAOX promoter and the beginningof the TPGK terminator. A unique HindIII restriction site was introduced toallow for an easy digestion of the resulting vector for cloning attempts. Fur-thermore, a gene sequence has been introduced, that encodes for a heptamericspacer-peptide (GMDELYK) and an adjacent SKL tag. The ssDNA strandswere annealed at a concentration of 50 pmol·µL−1. First, oligonucleotides wereheated up to 98°C for 2 min. After that, the solution was gradually cooleddown to room temperature over 15 min to allow for the formation of dsDNA.100 ng of purified vector (in 1 µL) were mixed 1:500 with the diluted dsDNAinsert. Cloning and bacterial transformation has been conducted afterwardsas described (sec. 6.3). The resulting vectors were named pZ4S1 and pX4S1,respectively. Plasmids denoted with Z contain a Zeocin™ resistance cassette,whereas those with an X contain a cassette which counteracts on leucine (LEU2)auxotrophy by the expression of β-isopropylmalate dehydrogenase. Successfulcreation of the integration vectors has been verified by DNA sequencing.Target proteins were chosen according to availability and based on an assess-ment of crystallizability. SLiCE-cloning was performed with PCR fragmentscomprising the protein’s DNA sequence and additional flanking regions, whichare compatible to the vector backbone. All used primers are listed in tableA.4. Vectors (pX4S1 & pZ4S1) were linearized via the introduced uniqueHindIII restriction site and purified via agarose gel electrophoresis. Followingthe protocols described in section 6.3 complete plasmids for integration couldbe created. The plasmids carry the following DNA sequences in 5’-3’ direction:PAOX, Gene of Interest (Target Protein) w/o stopcodon, Spacer, SKL tag with
1Thankfully supplied by the work group of Ida. v. d. Klei (RUG Groningen, TheNetherlands)
60
IV RESULTS & DISCUSSION
stopcodon, TPGK. Linearization for integration of plasmids was done eitherat the unique restriction site of PflMI, StuI or SpHI, respectively, which areall located within the sequence of PAOX. Due to the linearization within thepromoter region, homologous recombination at the PAOX genome locus isenabled. Plasmids were purified and subjected to yeast electroporation andplate-based clone selection (sec. 6.3). Usually colonies appeared after 3-5days. Single colonies were re-streaked on selective plates and exploited forthe purification of genomic DNA. PCR reactions on purified genomic DNAwere used to verify stable integration of the plasmids at the location of thePAOX promoter. Stable integration was achieved for target proteins listed in
3,0
[kbp]
PRDX5 -1
PRDX5 -2
Cathe
psin
B
HEX-1
DNA Lad
der
Esat-6
2,5
2,0
1,5
3,5
4,0
Figure 8.6: PCR reactions on genomic DNA to verify pX4S1 integration containing differenttarget proteins, Sizes are due to PCR on 1900 bp of genome/plasmid plus the size of thetarget gene; DNA Ladder: GeneRuler 1kb DNA Ladder (Thermo Fisher Scientific)
Table 8.2: Overview of successful cloning attempts for target proteins; 12DAC4: triple-deletion strain (∆AOX, ∆DHAS, ∆CAT); MBP: maltose-binding protein, DAO: D-aspartateoxidase
TargetProtein
Species ofOrigin
CreatedVectors
Yeast Int.Strain
HEX-1 N. crassa pZ4S1, pX4S1 12DAC4Cathepsin B T. brucei pZ4S1, pX4S1 12DAC4PRDX5 H. polymorpha pZ4S1, pX4S1 12DAC4Esat-6 S. agalactiae pZ4S1, pX4S1 12DAC4MBP E. coli pZ4S1, pX4S1 -Luciferase P. pyralis (Firefly) pZ4S1, pX4S1 -DAO H. polymorpha pZ4S1, pX4S1 -
table 8.2. Exemplary PCR results with primers from table A.4 for successfullyobtained integration clones (all pX4S1-based) are shown in figure 8.6. Thefigure shows two obtained clones for the protein PRDX5 (510 bp) and one foreach of the proteins Cathepsin B (966 bp), HEX-1 (533 bp) and Esat-6 (285 bp).The final fragment length results from reaction design that involved a forwardprimer, starting on a genomic upstream location and a reverse primer startingon the terminator sequence of the vector. This results in a total fragmentlength of 1900 bp plus length of the DNA sequence of a target protein.Two major problems could be identified during the cloning process. Firstly, thePAOX promoter seems to exhibit a strong secondary structure, which decreases
61
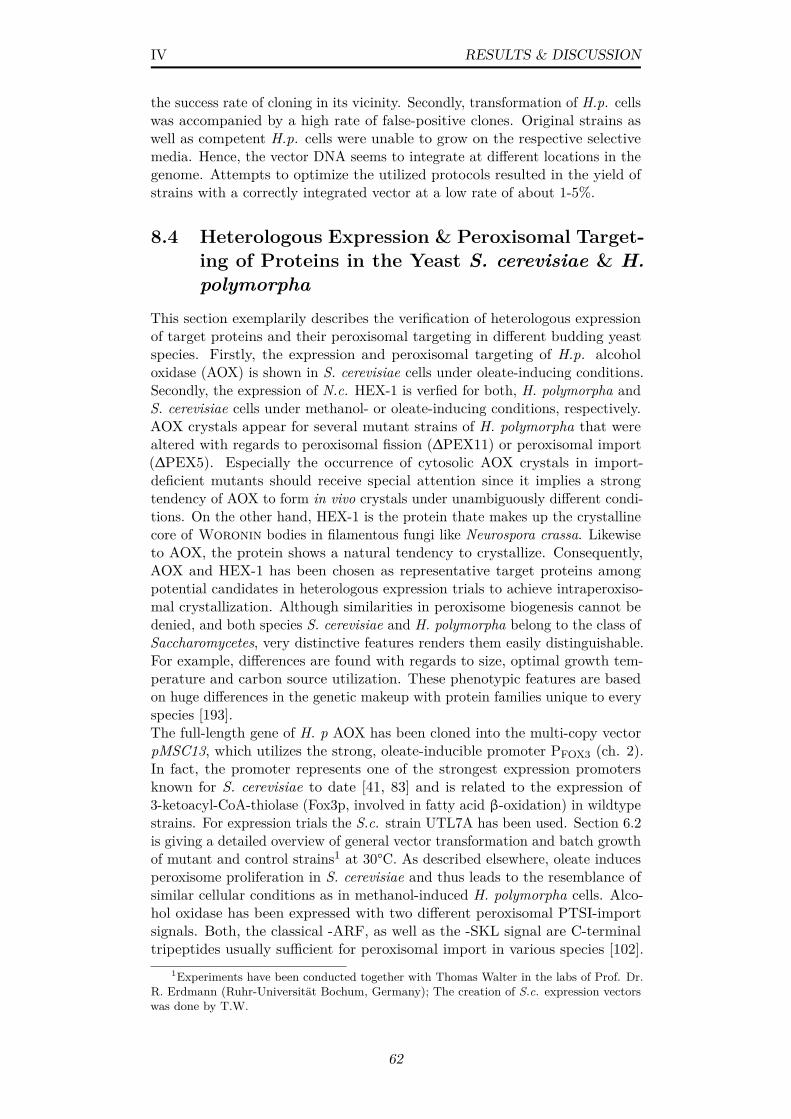
IV RESULTS & DISCUSSION
the success rate of cloning in its vicinity. Secondly, transformation of H.p. cellswas accompanied by a high rate of false-positive clones. Original strains aswell as competent H.p. cells were unable to grow on the respective selectivemedia. Hence, the vector DNA seems to integrate at different locations in thegenome. Attempts to optimize the utilized protocols resulted in the yield ofstrains with a correctly integrated vector at a low rate of about 1-5%.
8.4 Heterologous Expression & Peroxisomal Target-ing of Proteins in the Yeast S. cerevisiae & H.polymorpha
This section exemplarily describes the verification of heterologous expressionof target proteins and their peroxisomal targeting in different budding yeastspecies. Firstly, the expression and peroxisomal targeting of H.p. alcoholoxidase (AOX) is shown in S. cerevisiae cells under oleate-inducing conditions.Secondly, the expression of N.c. HEX-1 is verfied for both, H. polymorpha andS. cerevisiae cells under methanol- or oleate-inducing conditions, respectively.AOX crystals appear for several mutant strains of H. polymorpha that werealtered with regards to peroxisomal fission (∆PEX11) or peroxisomal import(∆PEX5). Especially the occurrence of cytosolic AOX crystals in import-deficient mutants should receive special attention since it implies a strongtendency of AOX to form in vivo crystals under unambiguously different condi-tions. On the other hand, HEX-1 is the protein thate makes up the crystallinecore of Woronin bodies in filamentous fungi like Neurospora crassa. Likewiseto AOX, the protein shows a natural tendency to crystallize. Consequently,AOX and HEX-1 has been chosen as representative target proteins amongpotential candidates in heterologous expression trials to achieve intraperoxiso-mal crystallization. Although similarities in peroxisome biogenesis cannot bedenied, and both species S. cerevisiae and H. polymorpha belong to the class ofSaccharomycetes, very distinctive features renders them easily distinguishable.For example, differences are found with regards to size, optimal growth tem-perature and carbon source utilization. These phenotypic features are basedon huge differences in the genetic makeup with protein families unique to everyspecies [193].The full-length gene of H. p AOX has been cloned into the multi-copy vectorpMSC13, which utilizes the strong, oleate-inducible promoter PFOX3 (ch. 2).In fact, the promoter represents one of the strongest expression promotersknown for S. cerevisiae to date [41, 83] and is related to the expression of3-ketoacyl-CoA-thiolase (Fox3p, involved in fatty acid β-oxidation) in wildtypestrains. For expression trials the S.c. strain UTL7A has been used. Section 6.2is giving a detailed overview of general vector transformation and batch growthof mutant and control strains1 at 30°C. As described elsewhere, oleate inducesperoxisome proliferation in S. cerevisiae and thus leads to the resemblance ofsimilar cellular conditions as in methanol-induced H. polymorpha cells. Alco-hol oxidase has been expressed with two different peroxisomal PTSI-importsignals. Both, the classical -ARF, as well as the -SKL signal are C-terminaltripeptides usually sufficient for peroxisomal import in various species [102].
1Experiments have been conducted together with Thomas Walter in the labs of Prof. Dr.R. Erdmann (Ruhr-Universität Bochum, Germany); The creation of S.c. expression vectorswas done by T.W.
62
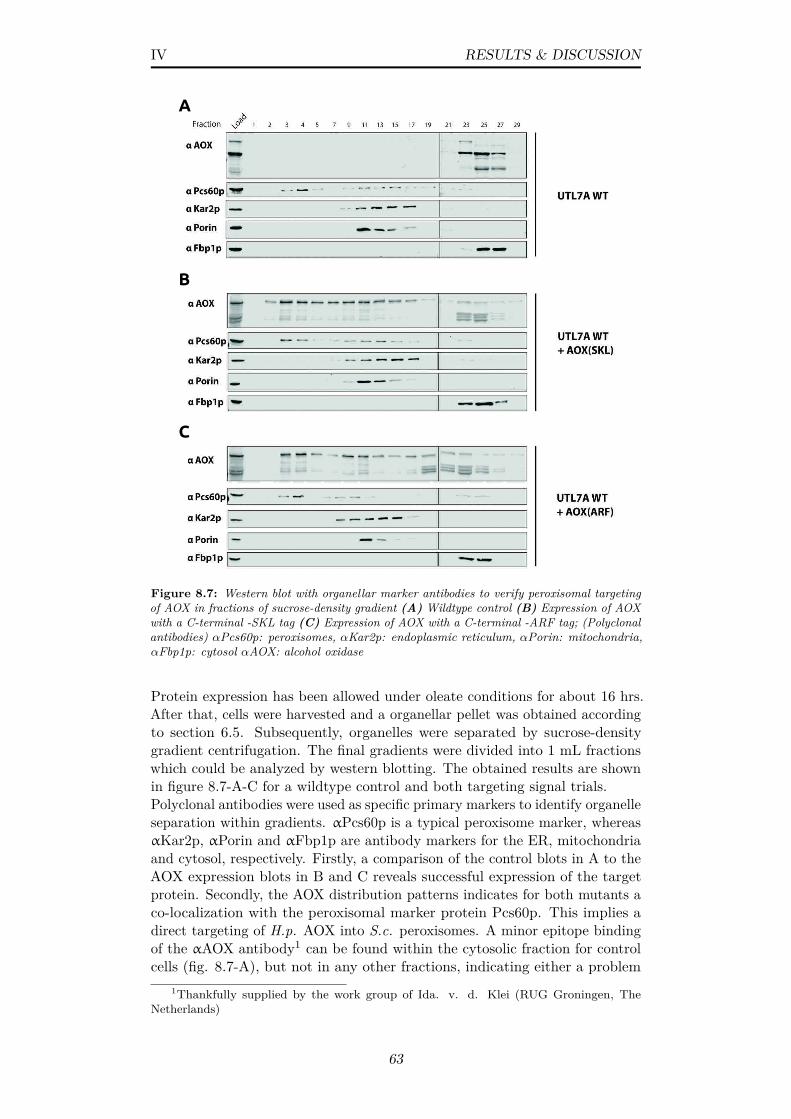
IV RESULTS & DISCUSSION
A
B
C
Figure 8.7: Western blot with organellar marker antibodies to verify peroxisomal targetingof AOX in fractions of sucrose-density gradient (A) Wildtype control (B) Expression of AOXwith a C-terminal -SKL tag (C) Expression of AOX with a C-terminal -ARF tag; (Polyclonalantibodies) αPcs60p: peroxisomes, αKar2p: endoplasmic reticulum, αPorin: mitochondria,αFbp1p: cytosol αAOX: alcohol oxidase
Protein expression has been allowed under oleate conditions for about 16 hrs.After that, cells were harvested and a organellar pellet was obtained accordingto section 6.5. Subsequently, organelles were separated by sucrose-densitygradient centrifugation. The final gradients were divided into 1 mL fractionswhich could be analyzed by western blotting. The obtained results are shownin figure 8.7-A-C for a wildtype control and both targeting signal trials.Polyclonal antibodies were used as specific primary markers to identify organelleseparation within gradients. αPcs60p is a typical peroxisome marker, whereasαKar2p, αPorin and αFbp1p are antibody markers for the ER, mitochondriaand cytosol, respectively. Firstly, a comparison of the control blots in A to theAOX expression blots in B and C reveals successful expression of the targetprotein. Secondly, the AOX distribution patterns indicates for both mutants aco-localization with the peroxisomal marker protein Pcs60p. This implies adirect targeting of H.p. AOX into S.c. peroxisomes. A minor epitope bindingof the αAOX antibody1 can be found within the cytosolic fraction for controlcells (fig. 8.7-A), but not in any other fractions, indicating either a problem
1Thankfully supplied by the work group of Ida. v. d. Klei (RUG Groningen, TheNetherlands)
63
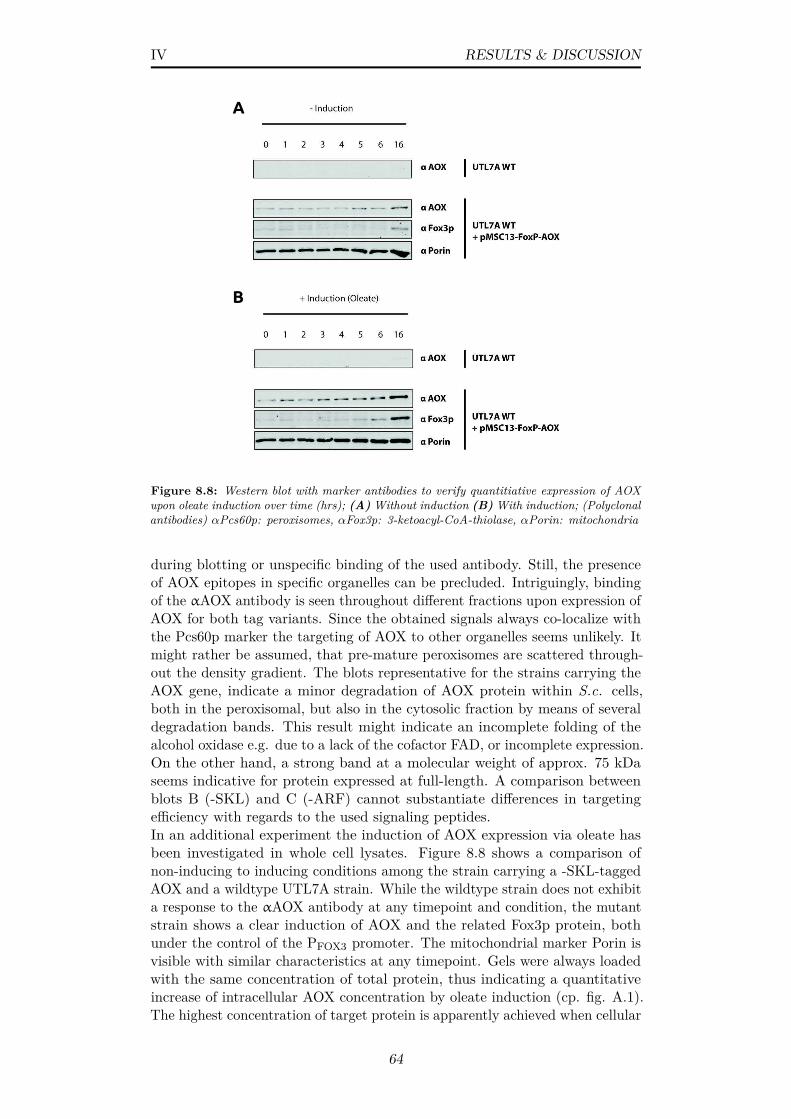
IV RESULTS & DISCUSSION
A
B
Figure 8.8: Western blot with marker antibodies to verify quantitiative expression of AOXupon oleate induction over time (hrs); (A) Without induction (B) With induction; (Polyclonalantibodies) αPcs60p: peroxisomes, αFox3p: 3-ketoacyl-CoA-thiolase, αPorin: mitochondria
during blotting or unspecific binding of the used antibody. Still, the presenceof AOX epitopes in specific organelles can be precluded. Intriguingly, bindingof the αAOX antibody is seen throughout different fractions upon expression ofAOX for both tag variants. Since the obtained signals always co-localize withthe Pcs60p marker the targeting of AOX to other organelles seems unlikely. Itmight rather be assumed, that pre-mature peroxisomes are scattered through-out the density gradient. The blots representative for the strains carrying theAOX gene, indicate a minor degradation of AOX protein within S.c. cells,both in the peroxisomal, but also in the cytosolic fraction by means of severaldegradation bands. This result might indicate an incomplete folding of thealcohol oxidase e.g. due to a lack of the cofactor FAD, or incomplete expression.On the other hand, a strong band at a molecular weight of approx. 75 kDaseems indicative for protein expressed at full-length. A comparison betweenblots B (-SKL) and C (-ARF) cannot substantiate differences in targetingefficiency with regards to the used signaling peptides.In an additional experiment the induction of AOX expression via oleate hasbeen investigated in whole cell lysates. Figure 8.8 shows a comparison ofnon-inducing to inducing conditions among the strain carrying a -SKL-taggedAOX and a wildtype UTL7A strain. While the wildtype strain does not exhibita response to the αAOX antibody at any timepoint and condition, the mutantstrain shows a clear induction of AOX and the related Fox3p protein, bothunder the control of the PFOX3 promoter. The mitochondrial marker Porin isvisible with similar characteristics at any timepoint. Gels were always loadedwith the same concentration of total protein, thus indicating a quantitativeincrease of intracellular AOX concentration by oleate induction (cp. fig. A.1).The highest concentration of target protein is apparently achieved when cellular
64
IV RESULTS & DISCUSSION
growth is allowed until stationary phase (16 hrs). Peroxisomal targeting via thePTSI pathway and the -SKL tripeptide is a widely applied tool in peroxisomalresearch, which has proven to function with proteins at different sizes andoligomeric states [121]. The conducted experiments verify that both targetingsignals (-SKL,-ARF) can be used for successful targeting of heterologouslyexpressed H.p. AOX into peroxisomes in S. cerevisiae batch cultures. Further-more quantitiative expression of the target protein is achieved during growthfor 16 hrs.
The full-length gene of N.c. HEX-1 has been cloned either into the multi-copyvectors pCW6 (PPGK) and pCW12 (PFOX3), or the integration vector pHIPX4(PAOX) for the expression in S. cerevisiae or H. polymorpha, respectively. In allthree cases a C-terminal -SKL tag has been attached to the protein for peroxiso-mal targeting (see sec. 8.3). The strains BY4742 (S.c.) and NCYC495-12DAC4(H.p.) have been used for expression trials. Likewise to the above experimentsthe related methods are presented in section 6.3. Cells at OD 2 were subjectedto TCA precipitation, SDS-PAGE and western blotting with specific polyclonalantibodies. For comparison S. cerevisiae cells were grown either on glucose-,Rytka-, or pure oleate-containing medium, whereas H. polymorpha was grownon a combination of methanol and glycerol as sole carbon sources. As it canbe seen in the upper panel of figure 8.9, a constitutive expression of HEX-1 isfound for the PPGK promoter under glucose-, oleate- or Rytka- conditions inS. cerevisiae. On the contrary, the PFOX3 promoter only allows expression ofHEX-1 under oleate-inducing conditions. After 16 hrs of growth the expressionunder pure oleate conditions is more pronounced as for the Rytka- condition.This is correlated with the earlier expression of Fox3p, simply indicating astronger initial derepression of the PFOX3 promoter. The advantage of theRytka medium is a smooth transition to inducing conditions under oleate,but seems to differ from the direct derepression of the PAOX promoter in H.polymorpha under methanol/glycerol conditions [108]. Usage of the PPGKpromoter might be advantagous in terms of achieving higher peroxisomal target
Figure 8.9: Western blot with marker antibodies to verify quantitiative expression of HEX-1upon oleate- or methanol induction; (Polyclonal antibodies) αFox3p: 3-ketoacyl-CoA-thiolase,αPorin: mitochondria
65

IV RESULTS & DISCUSSION
protein concentrations, as peroxisome proliferation not necessarily needs tobe induced for cell growth and heterologous protein expression. Still, this apurely tendencious assumption, since no studies exist to date that have testedperoxisomal import capacities under conditions that do not favor the expressionof the peroxisomal proteome.The lower panel of 8.9 summarizes the results of heterologous HEX-1 expressionin two host organisms. As discussed above, a strong expression of N.c. HEX-1is found for S. cerevisiae cells under oleate conditions, whereas the wildtypecontrol cells do not show any antibody binding.
66
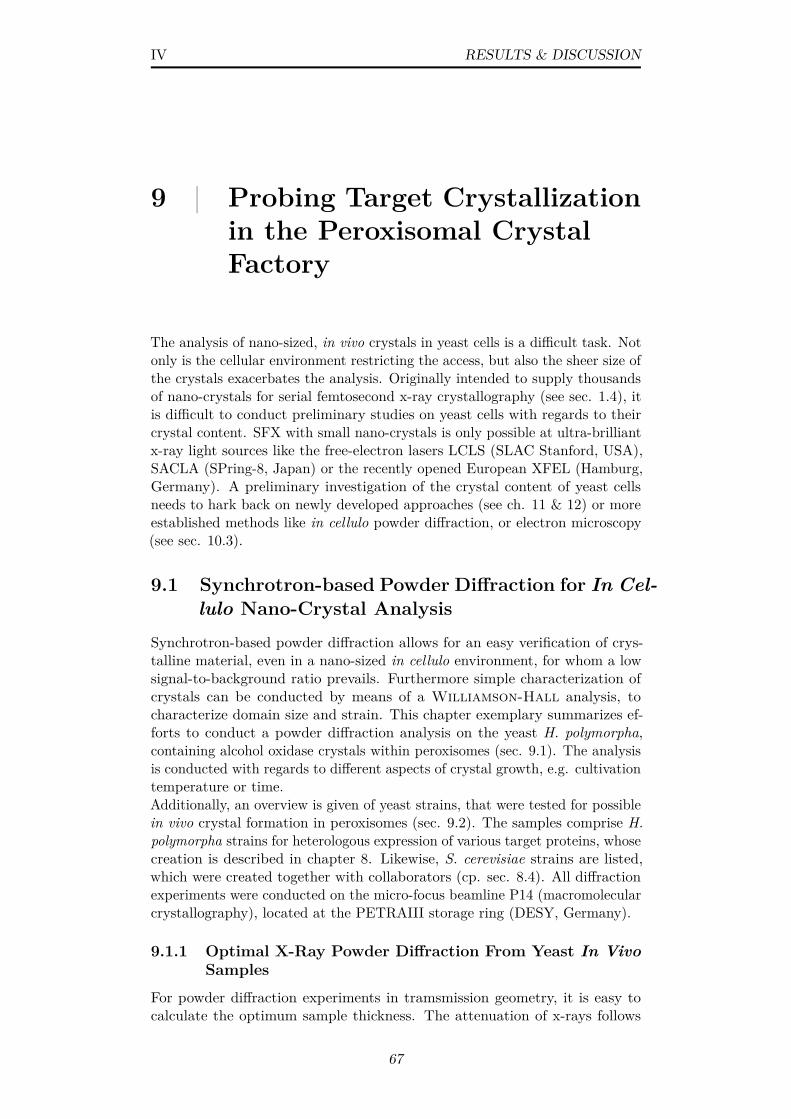
IV RESULTS & DISCUSSION
9 | Probing Target Crystallizationin the Peroxisomal CrystalFactory
The analysis of nano-sized, in vivo crystals in yeast cells is a difficult task. Notonly is the cellular environment restricting the access, but also the sheer size ofthe crystals exacerbates the analysis. Originally intended to supply thousandsof nano-crystals for serial femtosecond x-ray crystallography (see sec. 1.4), itis difficult to conduct preliminary studies on yeast cells with regards to theircrystal content. SFX with small nano-crystals is only possible at ultra-brilliantx-ray light sources like the free-electron lasers LCLS (SLAC Stanford, USA),SACLA (SPring-8, Japan) or the recently opened European XFEL (Hamburg,Germany). A preliminary investigation of the crystal content of yeast cellsneeds to hark back on newly developed approaches (see ch. 11 & 12) or moreestablished methods like in cellulo powder diffraction, or electron microscopy(see sec. 10.3).
9.1 Synchrotron-based Powder Diffraction for In Cel-lulo Nano-Crystal Analysis
Synchrotron-based powder diffraction allows for an easy verification of crys-talline material, even in a nano-sized in cellulo environment, for whom a lowsignal-to-background ratio prevails. Furthermore simple characterization ofcrystals can be conducted by means of a Williamson-Hall analysis, tocharacterize domain size and strain. This chapter exemplary summarizes ef-forts to conduct a powder diffraction analysis on the yeast H. polymorpha,containing alcohol oxidase crystals within peroxisomes (sec. 9.1). The analysisis conducted with regards to different aspects of crystal growth, e.g. cultivationtemperature or time.Additionally, an overview is given of yeast strains, that were tested for possiblein vivo crystal formation in peroxisomes (sec. 9.2). The samples comprise H.polymorpha strains for heterologous expression of various target proteins, whosecreation is described in chapter 8. Likewise, S. cerevisiae strains are listed,which were created together with collaborators (cp. sec. 8.4). All diffractionexperiments were conducted on the micro-focus beamline P14 (macromolecularcrystallography), located at the PETRAIII storage ring (DESY, Germany).
9.1.1 Optimal X-Ray Powder Diffraction From Yeast In VivoSamples
For powder diffraction experiments in tramsmission geometry, it is easy tocalculate the optimum sample thickness. The attenuation of x-rays follows
67
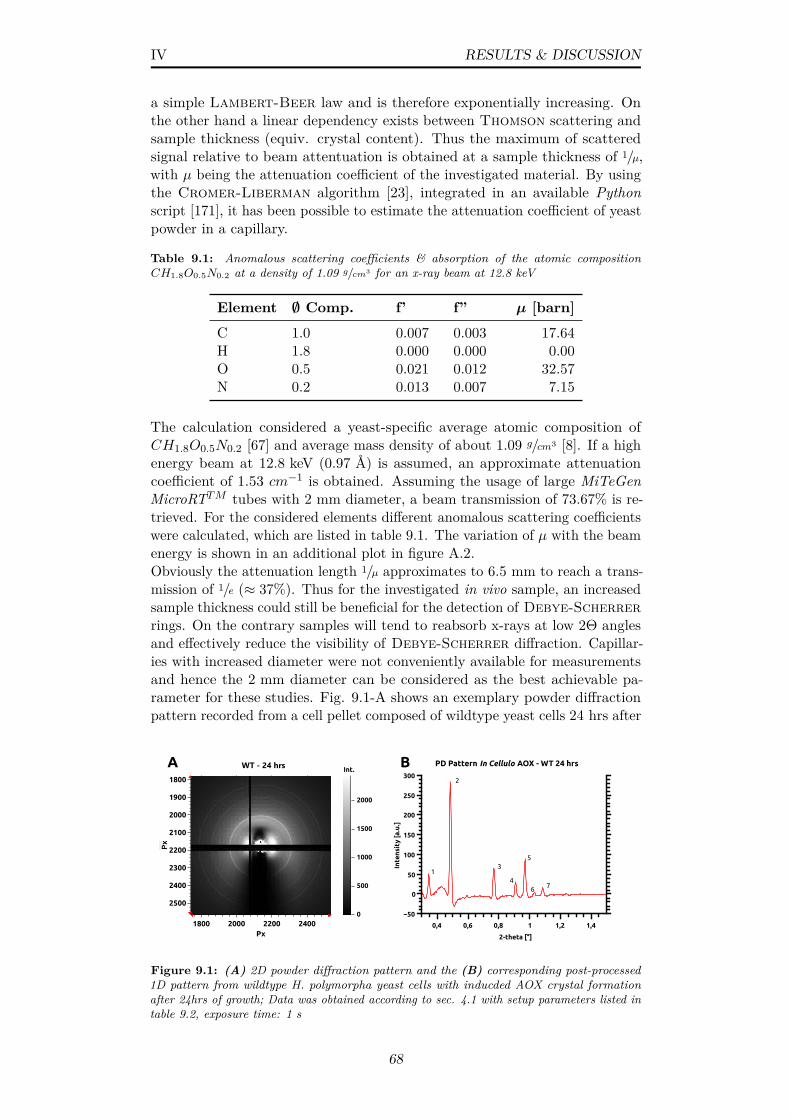
IV RESULTS & DISCUSSION
a simple Lambert-Beer law and is therefore exponentially increasing. Onthe other hand a linear dependency exists between Thomson scattering andsample thickness (equiv. crystal content). Thus the maximum of scatteredsignal relative to beam attentuation is obtained at a sample thickness of 1/µ,with µ being the attenuation coefficient of the investigated material. By usingthe Cromer-Liberman algorithm [23], integrated in an available Pythonscript [171], it has been possible to estimate the attenuation coefficient of yeastpowder in a capillary.
Table 9.1: Anomalous scattering coefficients & absorption of the atomic compositionCH1.8O0.5N0.2 at a density of 1.09 g/cm3 for an x-ray beam at 12.8 keV
Element ∅ Comp. f’ f” µ [barn]
C 1.0 0.007 0.003 17.64H 1.8 0.000 0.000 0.00O 0.5 0.021 0.012 32.57N 0.2 0.013 0.007 7.15
The calculation considered a yeast-specific average atomic composition ofCH1.8O0.5N0.2 [67] and average mass density of about 1.09 g/cm3 [8]. If a highenergy beam at 12.8 keV (0.97 Å) is assumed, an approximate attenuationcoefficient of 1.53 cm−1 is obtained. Assuming the usage of large MiTeGenMicroRTTM tubes with 2 mm diameter, a beam transmission of 73.67% is re-trieved. For the considered elements different anomalous scattering coefficientswere calculated, which are listed in table 9.1. The variation of µ with the beamenergy is shown in an additional plot in figure A.2.Obviously the attenuation length 1/µ approximates to 6.5 mm to reach a trans-mission of 1/e (≈ 37%). Thus for the investigated in vivo sample, an increasedsample thickness could still be beneficial for the detection of Debye-Scherrerrings. On the contrary samples will tend to reabsorb x-rays at low 2Θ anglesand effectively reduce the visibility of Debye-Scherrer diffraction. Capillar-ies with increased diameter were not conveniently available for measurementsand hence the 2 mm diameter can be considered as the best achievable pa-rameter for these studies. Fig. 9.1-A shows an exemplary powder diffractionpattern recorded from a cell pellet composed of wildtype yeast cells 24 hrs after
WT - 24 hrs
2500
2400
2300
2200
2100
2000
1900
1800
1800 2000 2200 2400Px
0
500
1000
1500
2000
WT - 24 hrs
2500
2400
2300
2200
2100
2000
1900
1800
1800 2000 2200 2400Px
0
500
1000
1500
2000
0
500
1000
1500
2000
Int.PD Pattern In Cellulo AOX - WT 24 hrs
Inte
nsi
ty [
a.u
.]
−50
0
50
100
150
200
250
300
2-theta [°]
0,4 0,6 0,8 1 1,2 1,4
2
A B
1
2
3
4
5
6 7
Figure 9.1: (A) 2D powder diffraction pattern and the (B) corresponding post-processed1D pattern from wildtype H. polymorpha yeast cells with inducded AOX crystal formationafter 24hrs of growth; Data was obtained according to sec. 4.1 with setup parameters listed intable 9.2, exposure time: 1 s
68
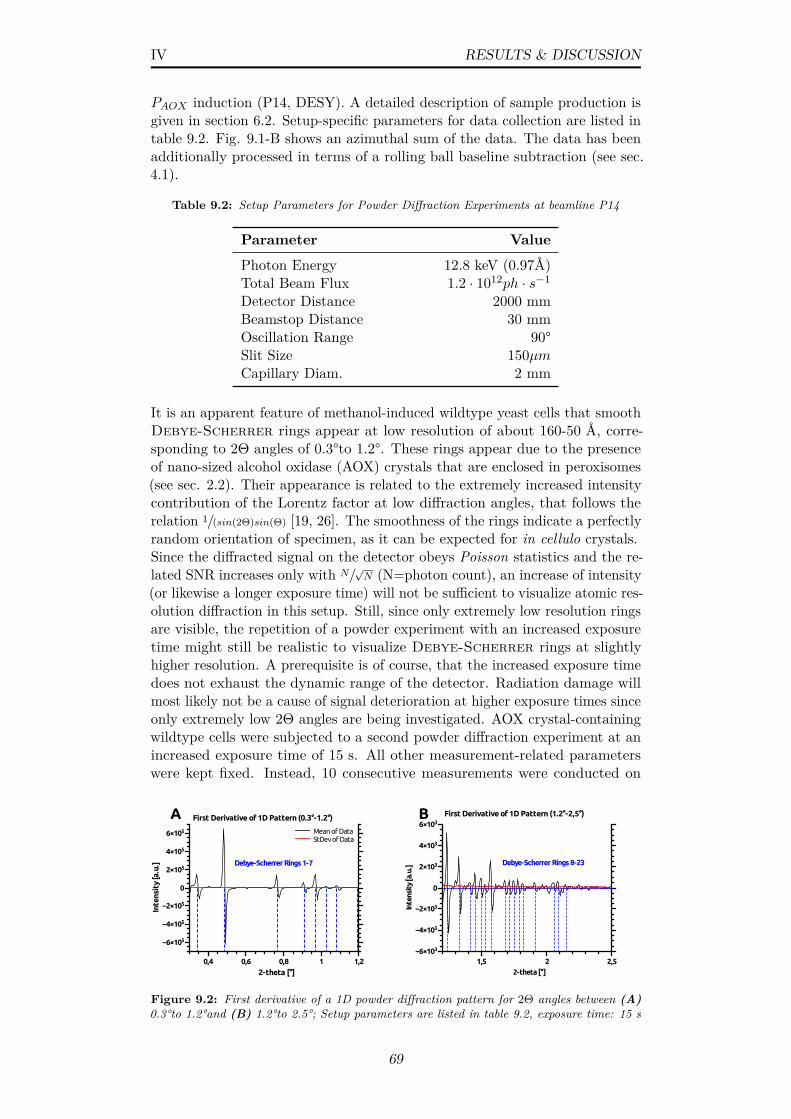
IV RESULTS & DISCUSSION
PAOX induction (P14, DESY). A detailed description of sample production isgiven in section 6.2. Setup-specific parameters for data collection are listed intable 9.2. Fig. 9.1-B shows an azimuthal sum of the data. The data has beenadditionally processed in terms of a rolling ball baseline subtraction (see sec.4.1).
Table 9.2: Setup Parameters for Powder Diffraction Experiments at beamline P14
Parameter Value
Photon Energy 12.8 keV (0.97Å)Total Beam Flux 1.2 · 1012ph · s−1
Detector Distance 2000 mmBeamstop Distance 30 mmOscillation Range 90°Slit Size 150µmCapillary Diam. 2 mm
It is an apparent feature of methanol-induced wildtype yeast cells that smoothDebye-Scherrer rings appear at low resolution of about 160-50 Å, corre-sponding to 2Θ angles of 0.3°to 1.2°. These rings appear due to the presenceof nano-sized alcohol oxidase (AOX) crystals that are enclosed in peroxisomes(see sec. 2.2). Their appearance is related to the extremely increased intensitycontribution of the Lorentz factor at low diffraction angles, that follows therelation 1/(sin(2Θ)sin(Θ) [19, 26]. The smoothness of the rings indicate a perfectlyrandom orientation of specimen, as it can be expected for in cellulo crystals.Since the diffracted signal on the detector obeys Poisson statistics and the re-lated SNR increases only with N/
√N (N=photon count), an increase of intensity
(or likewise a longer exposure time) will not be sufficient to visualize atomic res-olution diffraction in this setup. Still, since only extremely low resolution ringsare visible, the repetition of a powder experiment with an increased exposuretime might still be realistic to visualize Debye-Scherrer rings at slightlyhigher resolution. A prerequisite is of course, that the increased exposure timedoes not exhaust the dynamic range of the detector. Radiation damage willmost likely not be a cause of signal deterioration at higher exposure times sinceonly extremely low 2Θ angles are being investigated. AOX crystal-containingwildtype cells were subjected to a second powder diffraction experiment at anincreased exposure time of 15 s. All other measurement-related parameterswere kept fixed. Instead, 10 consecutive measurements were conducted on
First Derivative of 1D Pattern (0.3°-1.2°)
Inte
nsit
y [a
.u.]
−6×10⁵
−4×10⁵
−2×10⁵
0
2×10⁵
4×10⁵
6×10⁵
2-theta [°]0,4 0,6 0,8 1 1,2
MEANSTDEV
Debye-Scherrer Rings 1-7
A BMean of DataStDev of Data
First Derivative of 1D Pattern (1.2°-2,5°)
Inte
nsit
y [a
.u.]
−6×10³
−4×10³
−2×10³
0
2×10³
4×10³
6×10³
2-theta [°]1,5 2 2,5
MEANSTDEV
Debye-Scherrer Rings 8-23
Figure 9.2: First derivative of a 1D powder diffraction pattern for 2Θ angles between (A)0.3°to 1.2°and (B) 1.2°to 2.5°; Setup parameters are listed in table 9.2, exposure time: 15 s
69
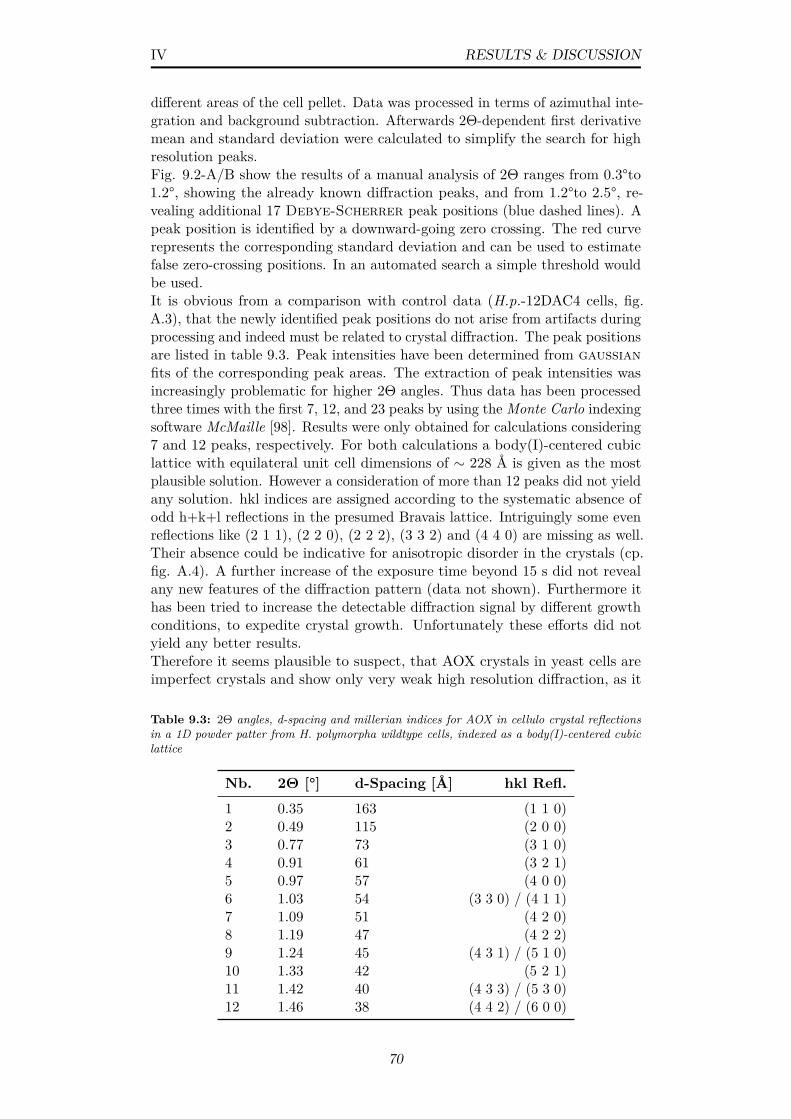
IV RESULTS & DISCUSSION
different areas of the cell pellet. Data was processed in terms of azimuthal inte-gration and background subtraction. Afterwards 2Θ-dependent first derivativemean and standard deviation were calculated to simplify the search for highresolution peaks.Fig. 9.2-A/B show the results of a manual analysis of 2Θ ranges from 0.3°to1.2°, showing the already known diffraction peaks, and from 1.2°to 2.5°, re-vealing additional 17 Debye-Scherrer peak positions (blue dashed lines). Apeak position is identified by a downward-going zero crossing. The red curverepresents the corresponding standard deviation and can be used to estimatefalse zero-crossing positions. In an automated search a simple threshold wouldbe used.It is obvious from a comparison with control data (H.p.-12DAC4 cells, fig.A.3), that the newly identified peak positions do not arise from artifacts duringprocessing and indeed must be related to crystal diffraction. The peak positionsare listed in table 9.3. Peak intensities have been determined from gaussianfits of the corresponding peak areas. The extraction of peak intensities wasincreasingly problematic for higher 2Θ angles. Thus data has been processedthree times with the first 7, 12, and 23 peaks by using the Monte Carlo indexingsoftware McMaille [98]. Results were only obtained for calculations considering7 and 12 peaks, respectively. For both calculations a body(I)-centered cubiclattice with equilateral unit cell dimensions of ∼ 228 Å is given as the mostplausible solution. However a consideration of more than 12 peaks did not yieldany solution. hkl indices are assigned according to the systematic absence ofodd h+k+l reflections in the presumed Bravais lattice. Intriguingly some evenreflections like (2 1 1), (2 2 0), (2 2 2), (3 3 2) and (4 4 0) are missing as well.Their absence could be indicative for anisotropic disorder in the crystals (cp.fig. A.4). A further increase of the exposure time beyond 15 s did not revealany new features of the diffraction pattern (data not shown). Furthermore ithas been tried to increase the detectable diffraction signal by different growthconditions, to expedite crystal growth. Unfortunately these efforts did notyield any better results.Therefore it seems plausible to suspect, that AOX crystals in yeast cells areimperfect crystals and show only very weak high resolution diffraction, as it
Table 9.3: 2Θ angles, d-spacing and millerian indices for AOX in cellulo crystal reflectionsin a 1D powder patter from H. polymorpha wildtype cells, indexed as a body(I)-centered cubiclattice
Nb. 2Θ [°] d-Spacing [Å] hkl Refl.
1 0.35 163 (1 1 0)2 0.49 115 (2 0 0)3 0.77 73 (3 1 0)4 0.91 61 (3 2 1)5 0.97 57 (4 0 0)6 1.03 54 (3 3 0) / (4 1 1)7 1.09 51 (4 2 0)8 1.19 47 (4 2 2)9 1.24 45 (4 3 1) / (5 1 0)10 1.33 42 (5 2 1)11 1.42 40 (4 3 3) / (5 3 0)12 1.46 38 (4 4 2) / (6 0 0)
70
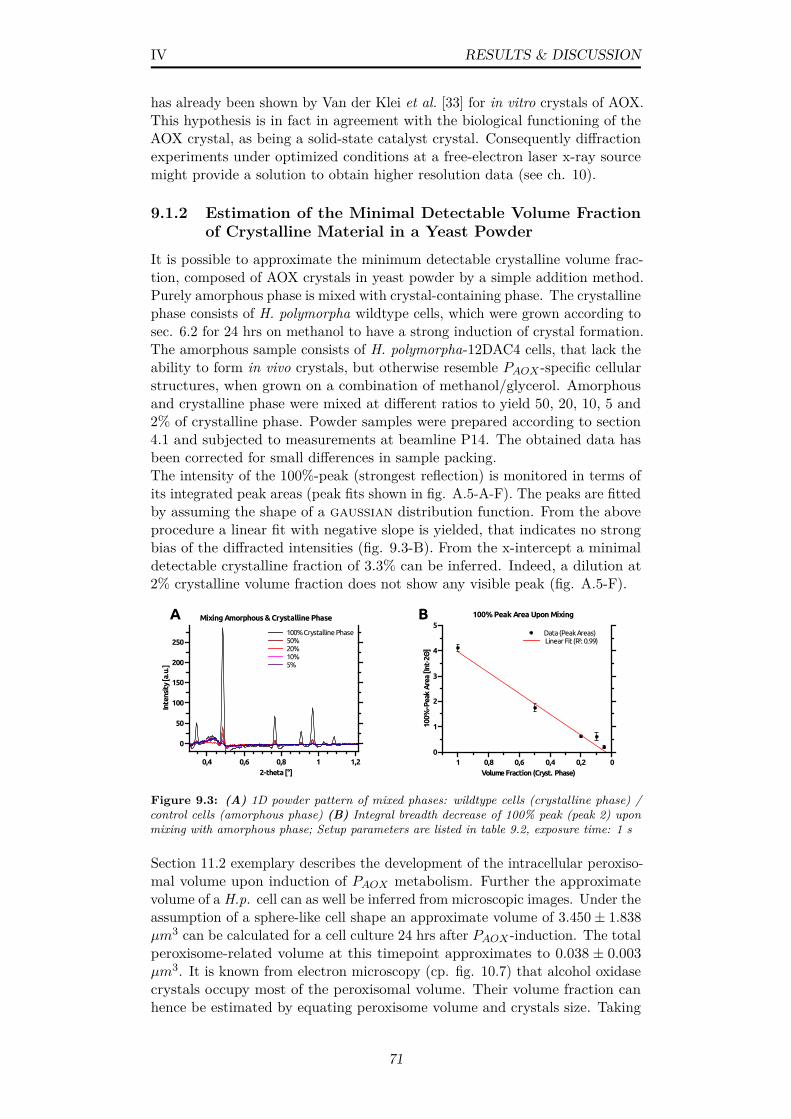
IV RESULTS & DISCUSSION
has already been shown by Van der Klei et al. [33] for in vitro crystals of AOX.This hypothesis is in fact in agreement with the biological functioning of theAOX crystal, as being a solid-state catalyst crystal. Consequently diffractionexperiments under optimized conditions at a free-electron laser x-ray sourcemight provide a solution to obtain higher resolution data (see ch. 10).
9.1.2 Estimation of the Minimal Detectable Volume Fractionof Crystalline Material in a Yeast Powder
It is possible to approximate the minimum detectable crystalline volume frac-tion, composed of AOX crystals in yeast powder by a simple addition method.Purely amorphous phase is mixed with crystal-containing phase. The crystallinephase consists of H. polymorpha wildtype cells, which were grown according tosec. 6.2 for 24 hrs on methanol to have a strong induction of crystal formation.The amorphous sample consists of H. polymorpha-12DAC4 cells, that lack theability to form in vivo crystals, but otherwise resemble PAOX -specific cellularstructures, when grown on a combination of methanol/glycerol. Amorphousand crystalline phase were mixed at different ratios to yield 50, 20, 10, 5 and2% of crystalline phase. Powder samples were prepared according to section4.1 and subjected to measurements at beamline P14. The obtained data hasbeen corrected for small differences in sample packing.The intensity of the 100%-peak (strongest reflection) is monitored in terms ofits integrated peak areas (peak fits shown in fig. A.5-A-F). The peaks are fittedby assuming the shape of a gaussian distribution function. From the aboveprocedure a linear fit with negative slope is yielded, that indicates no strongbias of the diffracted intensities (fig. 9.3-B). From the x-intercept a minimaldetectable crystalline fraction of 3.3% can be inferred. Indeed, a dilution at2% crystalline volume fraction does not show any visible peak (fig. A.5-F).
100% Peak Area Upon Mixing
100%
-Pea
k A
rea
[Int∙
2Θ]
0
1
2
3
4
5
Volume Fraction (Cryst. Phase)1 0,8 0,6 0,4 0,2 0
Data (Peak Areas) Linear Fit (R²: 0.99)
Mixing Amorphous & Crystalline Phase
Inte
nsit
y [a
.u.]
0
50
100
150
200
250
2-theta [°]0,4 0,6 0,8 1 1,2
undiluted25102050
100% Crystalline Phase50%20%10%5%
A B
Figure 9.3: (A) 1D powder pattern of mixed phases: wildtype cells (crystalline phase) /control cells (amorphous phase) (B) Integral breadth decrease of 100% peak (peak 2) uponmixing with amorphous phase; Setup parameters are listed in table 9.2, exposure time: 1 s
Section 11.2 exemplary describes the development of the intracellular peroxiso-mal volume upon induction of PAOX metabolism. Further the approximatevolume of a H.p. cell can as well be inferred from microscopic images. Under theassumption of a sphere-like cell shape an approximate volume of 3.450± 1.838µm3 can be calculated for a cell culture 24 hrs after PAOX -induction. The totalperoxisome-related volume at this timepoint approximates to 0.038 ± 0.003µm3. It is known from electron microscopy (cp. fig. 10.7) that alcohol oxidasecrystals occupy most of the peroxisomal volume. Their volume fraction canhence be estimated by equating peroxisome volume and crystals size. Taking
71
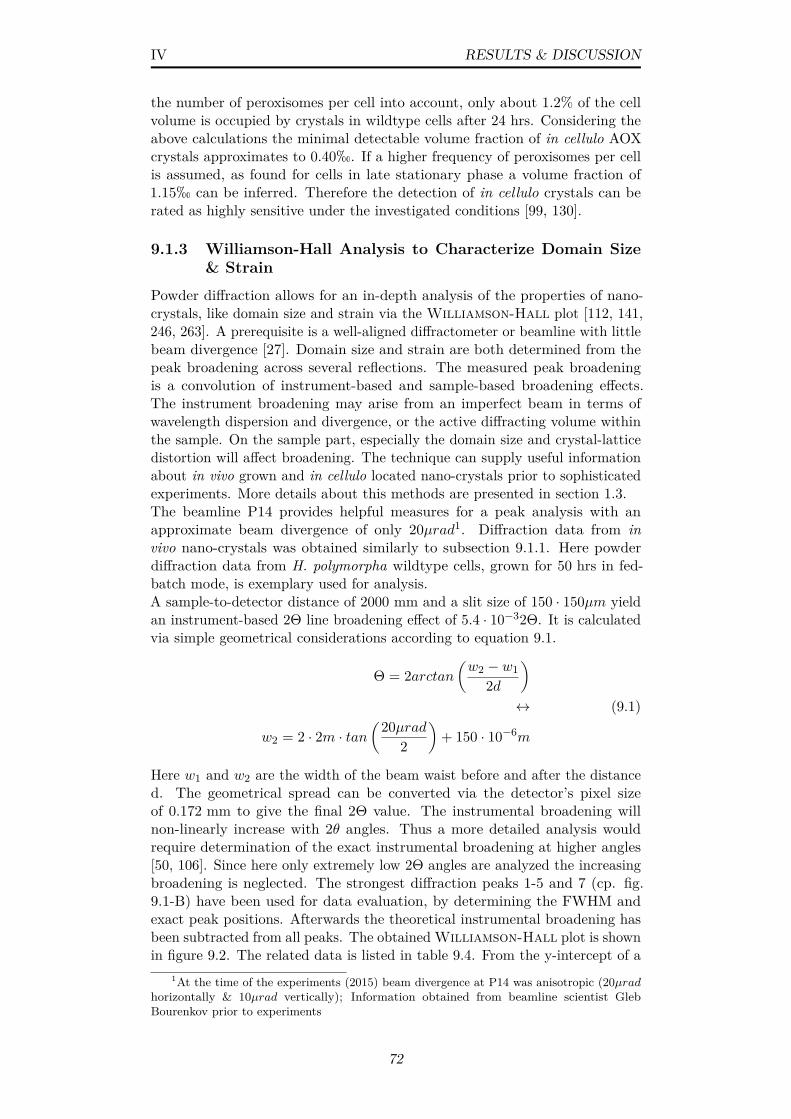
IV RESULTS & DISCUSSION
the number of peroxisomes per cell into account, only about 1.2% of the cellvolume is occupied by crystals in wildtype cells after 24 hrs. Considering theabove calculations the minimal detectable volume fraction of in cellulo AOXcrystals approximates to 0.40h. If a higher frequency of peroxisomes per cellis assumed, as found for cells in late stationary phase a volume fraction of1.15h can be inferred. Therefore the detection of in cellulo crystals can berated as highly sensitive under the investigated conditions [99, 130].
9.1.3 Williamson-Hall Analysis to Characterize Domain Size& Strain
Powder diffraction allows for an in-depth analysis of the properties of nano-crystals, like domain size and strain via the Williamson-Hall plot [112, 141,246, 263]. A prerequisite is a well-aligned diffractometer or beamline with littlebeam divergence [27]. Domain size and strain are both determined from thepeak broadening across several reflections. The measured peak broadeningis a convolution of instrument-based and sample-based broadening effects.The instrument broadening may arise from an imperfect beam in terms ofwavelength dispersion and divergence, or the active diffracting volume withinthe sample. On the sample part, especially the domain size and crystal-latticedistortion will affect broadening. The technique can supply useful informationabout in vivo grown and in cellulo located nano-crystals prior to sophisticatedexperiments. More details about this methods are presented in section 1.3.The beamline P14 provides helpful measures for a peak analysis with anapproximate beam divergence of only 20µrad1. Diffraction data from invivo nano-crystals was obtained similarly to subsection 9.1.1. Here powderdiffraction data from H. polymorpha wildtype cells, grown for 50 hrs in fed-batch mode, is exemplary used for analysis.A sample-to-detector distance of 2000 mm and a slit size of 150 · 150µm yieldan instrument-based 2Θ line broadening effect of 5.4 · 10−32Θ. It is calculatedvia simple geometrical considerations according to equation 9.1.
Θ = 2arctan(w2 − w1
2d
)↔
w2 = 2 · 2m · tan(20µrad
2
)+ 150 · 10−6m
(9.1)
Here w1 and w2 are the width of the beam waist before and after the distanced. The geometrical spread can be converted via the detector’s pixel sizeof 0.172 mm to give the final 2Θ value. The instrumental broadening willnon-linearly increase with 2θ angles. Thus a more detailed analysis wouldrequire determination of the exact instrumental broadening at higher angles[50, 106]. Since here only extremely low 2Θ angles are analyzed the increasingbroadening is neglected. The strongest diffraction peaks 1-5 and 7 (cp. fig.9.1-B) have been used for data evaluation, by determining the FWHM andexact peak positions. Afterwards the theoretical instrumental broadening hasbeen subtracted from all peaks. The obtained Williamson-Hall plot is shownin figure 9.2. The related data is listed in table 9.4. From the y-intercept of a
1At the time of the experiments (2015) beam divergence at P14 was anisotropic (20µradhorizontally & 10µrad vertically); Information obtained from beamline scientist GlebBourenkov prior to experiments
72

IV RESULTS & DISCUSSION
Williamson-Hall Plot - WT Cells 50 hrs FB
B ∙ c
os Θ
1,8×10⁻³
2,0×10⁻³
2,2×10⁻³
2,4×10⁻³
2,6×10⁻³
2,8×10⁻³
3,0×10⁻³
3,2×10⁻³
3,4×10⁻³
sin Θ0 2,0×10⁻³ 4,0×10⁻³ 6,0×10⁻³ 8,0×10⁻³ 1,0×10⁻²
BcosthetaLinearFit1
Corrected Peak DataLinear Fit (R²: 0.75)
Domain Size: 51.1 ± 6.1 nmStrain: 0.126 ± 0.036
Figure 9.4: Williamson-Hall plot of H. polymorpha wildtype cells grown under PAOXinducing conditions in fed-batch mode for 50 hrs; Experimental parameters are listed in table9.2, exposure time: 15 s; Data listed in table 9.4
linear fit to the data points an average diffracting domain diameter of 51±7nmcan be estimated, if the Scherrer constant (K) is assumed to equal 1 (e.g.for spherical crystals). This indeed very low value is indicative for a highlyimperfect crystal with domain irregularities at the order of about 2 unit cells.Due to the systematic absence of odd reflections it remains difficult to estimatea directional preference of disorder. But as mentioned above, the completeabsence of certain even reflections might already indicate strong anisotropicdisorder. The determined domain size is not necessarily correlated with theparticle size estimated from electron microscopy (see sec. 10.3). It is rathera readout to estimate the average distance of crystallographically ordered,and diffracting domains in a paracrystalline material. If defects are being tooextended, it is easier to consider the domain size as the size of a diffractingcrystal, embedded with other such domains in a polycrystalline material [50].The positive slope of the linear fit indicates the presence of microstrain ata magnitude of about 0.128. Intensive microstrain will dominate the peakbroadening and thus can lead to a false approximation of the domain size[50]. Consequently it can be assumed, that the diffracting domain size is infact larger. Both readouts are supporting the hypothesis of disordered AOXcrystals [33] (subsec. 9.1.1).
Table 9.4: Williamson-Hall plot data; Fitted and corrected FWHM (2Θ) of incorporatedhkl reflections; B = FWHM/2
hkl Refl. FWHM[10−3 °]
sinΘ[10−3]
B · cosΘ[10−3]
(1 1 0) 4.617 3.054 2.309(2 0 0) 4.950 4.276 2.475(3 1 0) 5.162 6.719 2.581(3 2 1) 5.724 7.941 2.862(4 0 0) 6.613 8.465 3.306(4 2 0) 5.936 9.512 2.968
Comparison of AOX Crystal Quality in Wildtype & ∆PEX11 Cells
To emphasize the capabilities of such a simple analysis method the crystallinecontent of H. polymorpha wildtype and ∆PEX11 cells were compared 6 and
73
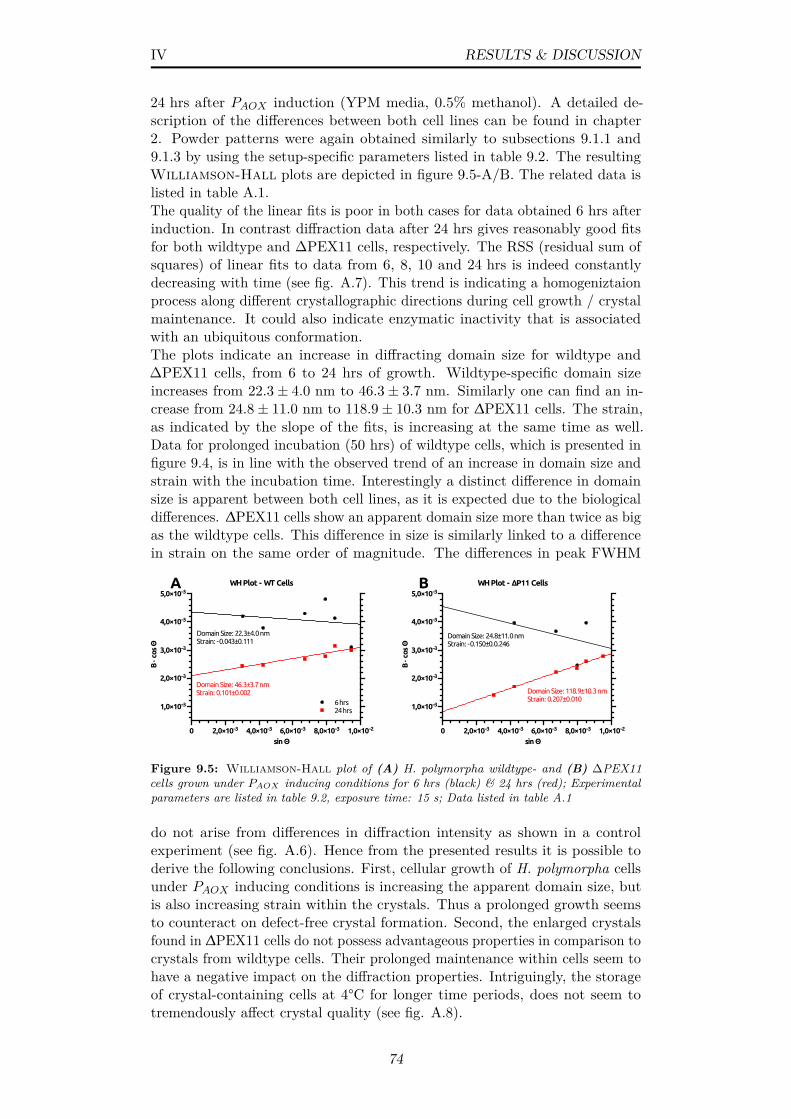
IV RESULTS & DISCUSSION
24 hrs after PAOX induction (YPM media, 0.5% methanol). A detailed de-scription of the differences between both cell lines can be found in chapter2. Powder patterns were again obtained similarly to subsections 9.1.1 and9.1.3 by using the setup-specific parameters listed in table 9.2. The resultingWilliamson-Hall plots are depicted in figure 9.5-A/B. The related data islisted in table A.1.The quality of the linear fits is poor in both cases for data obtained 6 hrs afterinduction. In contrast diffraction data after 24 hrs gives reasonably good fitsfor both wildtype and ∆PEX11 cells, respectively. The RSS (residual sum ofsquares) of linear fits to data from 6, 8, 10 and 24 hrs is indeed constantlydecreasing with time (see fig. A.7). This trend is indicating a homogeniztaionprocess along different crystallographic directions during cell growth / crystalmaintenance. It could also indicate enzymatic inactivity that is associatedwith an ubiquitous conformation.The plots indicate an increase in diffracting domain size for wildtype and∆PEX11 cells, from 6 to 24 hrs of growth. Wildtype-specific domain sizeincreases from 22.3± 4.0 nm to 46.3± 3.7 nm. Similarly one can find an in-crease from 24.8± 11.0 nm to 118.9± 10.3 nm for ∆PEX11 cells. The strain,as indicated by the slope of the fits, is increasing at the same time as well.Data for prolonged incubation (50 hrs) of wildtype cells, which is presented infigure 9.4, is in line with the observed trend of an increase in domain size andstrain with the incubation time. Interestingly a distinct difference in domainsize is apparent between both cell lines, as it is expected due to the biologicaldifferences. ∆PEX11 cells show an apparent domain size more than twice as bigas the wildtype cells. This difference in size is similarly linked to a differencein strain on the same order of magnitude. The differences in peak FWHM
WH Plot - ΔP11 Cells
B ∙ c
os Θ
1,0×10⁻³
2,0×10⁻³
3,0×10⁻³
4,0×10⁻³
5,0×10⁻³
sin Θ0 2,0×10⁻³ 4,0×10⁻³ 6,0×10⁻³ 8,0×10⁻³ 1,0×10⁻²
WH Plot - WT Cells
B ∙ c
os Θ
1,0×10⁻³
2,0×10⁻³
3,0×10⁻³
4,0×10⁻³
5,0×10⁻³
sin Θ0 2,0×10⁻³ 4,0×10⁻³ 6,0×10⁻³ 8,0×10⁻³ 1,0×10⁻²
6 hrs24 hrs
A B
Domain Size: 22.3±4.0 nmStrain: -0.043±0.111
Domain Size: 46.3±3.7 nmStrain: 0.101±0.002
Domain Size: 24.8±11.0 nmStrain: -0.150±0.0.246
Domain Size: 118.9±10.3 nmStrain: 0.207±0.010
Figure 9.5: Williamson-Hall plot of (A) H. polymorpha wildtype- and (B) ∆PEX11cells grown under PAOX inducing conditions for 6 hrs (black) & 24 hrs (red); Experimentalparameters are listed in table 9.2, exposure time: 15 s; Data listed in table A.1
do not arise from differences in diffraction intensity as shown in a controlexperiment (see fig. A.6). Hence from the presented results it is possible toderive the following conclusions. First, cellular growth of H. polymorpha cellsunder PAOX inducing conditions is increasing the apparent domain size, butis also increasing strain within the crystals. Thus a prolonged growth seemsto counteract on defect-free crystal formation. Second, the enlarged crystalsfound in ∆PEX11 cells do not possess advantageous properties in comparison tocrystals from wildtype cells. Their prolonged maintenance within cells seem tohave a negative impact on the diffraction properties. Intriguingly, the storageof crystal-containing cells at 4°C for longer time periods, does not seem totremendously affect crystal quality (see fig. A.8).
74
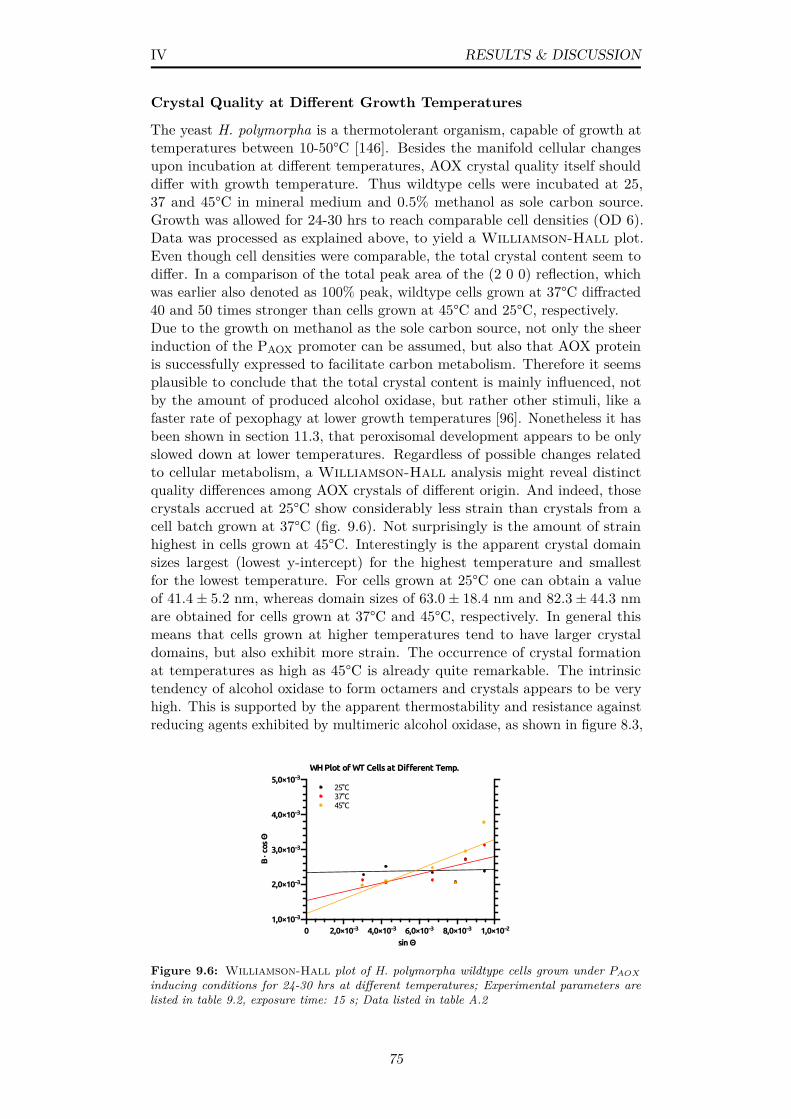
IV RESULTS & DISCUSSION
Crystal Quality at Different Growth Temperatures
The yeast H. polymorpha is a thermotolerant organism, capable of growth attemperatures between 10-50°C [146]. Besides the manifold cellular changesupon incubation at different temperatures, AOX crystal quality itself shoulddiffer with growth temperature. Thus wildtype cells were incubated at 25,37 and 45°C in mineral medium and 0.5% methanol as sole carbon source.Growth was allowed for 24-30 hrs to reach comparable cell densities (OD 6).Data was processed as explained above, to yield a Williamson-Hall plot.Even though cell densities were comparable, the total crystal content seem todiffer. In a comparison of the total peak area of the (2 0 0) reflection, whichwas earlier also denoted as 100% peak, wildtype cells grown at 37°C diffracted40 and 50 times stronger than cells grown at 45°C and 25°C, respectively.Due to the growth on methanol as the sole carbon source, not only the sheerinduction of the PAOX promoter can be assumed, but also that AOX proteinis successfully expressed to facilitate carbon metabolism. Therefore it seemsplausible to conclude that the total crystal content is mainly influenced, notby the amount of produced alcohol oxidase, but rather other stimuli, like afaster rate of pexophagy at lower growth temperatures [96]. Nonetheless it hasbeen shown in section 11.3, that peroxisomal development appears to be onlyslowed down at lower temperatures. Regardless of possible changes relatedto cellular metabolism, a Williamson-Hall analysis might reveal distinctquality differences among AOX crystals of different origin. And indeed, thosecrystals accrued at 25°C show considerably less strain than crystals from acell batch grown at 37°C (fig. 9.6). Not surprisingly is the amount of strainhighest in cells grown at 45°C. Interestingly is the apparent crystal domainsizes largest (lowest y-intercept) for the highest temperature and smallestfor the lowest temperature. For cells grown at 25°C one can obtain a valueof 41.4± 5.2 nm, whereas domain sizes of 63.0± 18.4 nm and 82.3± 44.3 nmare obtained for cells grown at 37°C and 45°C, respectively. In general thismeans that cells grown at higher temperatures tend to have larger crystaldomains, but also exhibit more strain. The occurrence of crystal formationat temperatures as high as 45°C is already quite remarkable. The intrinsictendency of alcohol oxidase to form octamers and crystals appears to be veryhigh. This is supported by the apparent thermostability and resistance againstreducing agents exhibited by multimeric alcohol oxidase, as shown in figure 8.3,
WH Plot of WT Cells at Different Temp.
B ∙ c
os Θ
1,0×10⁻³
2,0×10⁻³
3,0×10⁻³
4,0×10⁻³
5,0×10⁻³
sin Θ0 2,0×10⁻³ 4,0×10⁻³ 6,0×10⁻³ 8,0×10⁻³ 1,0×10⁻²
25°C 37°C 45°C
Figure 9.6: Williamson-Hall plot of H. polymorpha wildtype cells grown under PAOXinducing conditions for 24-30 hrs at different temperatures; Experimental parameters arelisted in table 9.2, exposure time: 15 s; Data listed in table A.2
75
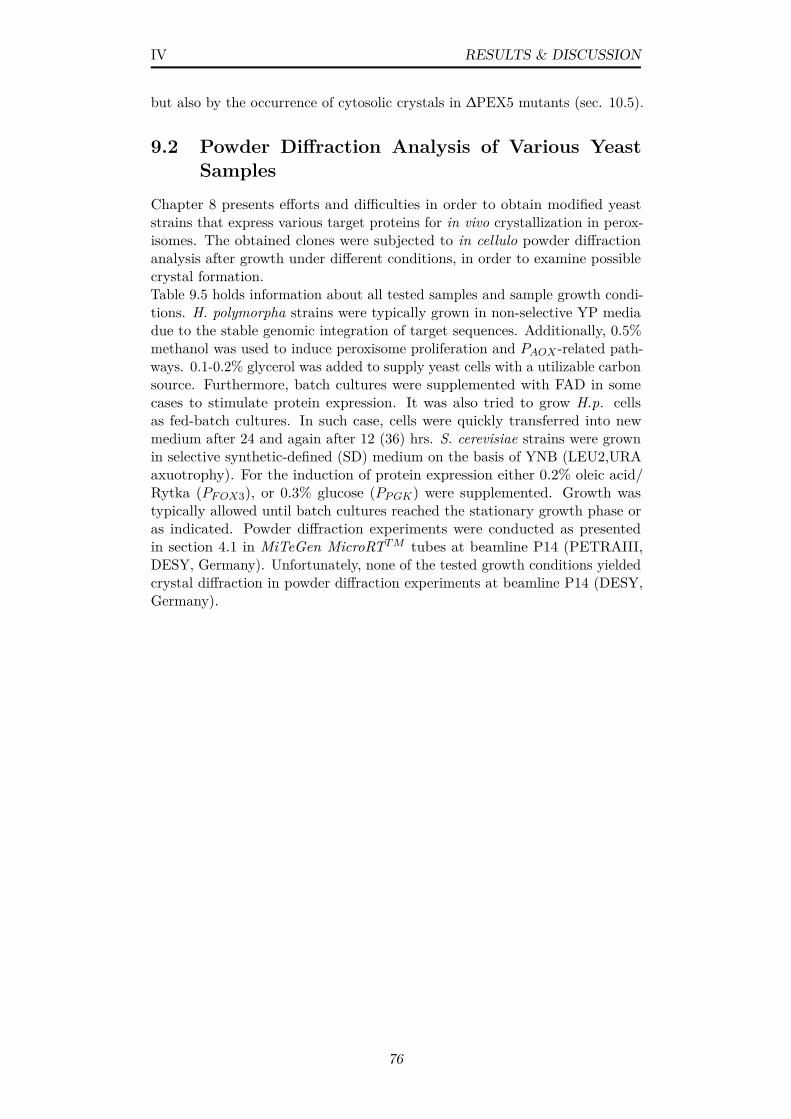
IV RESULTS & DISCUSSION
but also by the occurrence of cytosolic crystals in ∆PEX5 mutants (sec. 10.5).
9.2 Powder Diffraction Analysis of Various YeastSamples
Chapter 8 presents efforts and difficulties in order to obtain modified yeaststrains that express various target proteins for in vivo crystallization in perox-isomes. The obtained clones were subjected to in cellulo powder diffractionanalysis after growth under different conditions, in order to examine possiblecrystal formation.Table 9.5 holds information about all tested samples and sample growth condi-tions. H. polymorpha strains were typically grown in non-selective YP mediadue to the stable genomic integration of target sequences. Additionally, 0.5%methanol was used to induce peroxisome proliferation and PAOX -related path-ways. 0.1-0.2% glycerol was added to supply yeast cells with a utilizable carbonsource. Furthermore, batch cultures were supplemented with FAD in somecases to stimulate protein expression. It was also tried to grow H.p. cellsas fed-batch cultures. In such case, cells were quickly transferred into newmedium after 24 and again after 12 (36) hrs. S. cerevisiae strains were grownin selective synthetic-defined (SD) medium on the basis of YNB (LEU2,URAaxuotrophy). For the induction of protein expression either 0.2% oleic acid/Rytka (PFOX3), or 0.3% glucose (PPGK) were supplemented. Growth wastypically allowed until batch cultures reached the stationary growth phase oras indicated. Powder diffraction experiments were conducted as presentedin section 4.1 in MiTeGen MicroRTTM tubes at beamline P14 (PETRAIII,DESY, Germany). Unfortunately, none of the tested growth conditions yieldedcrystal diffraction in powder diffraction experiments at beamline P14 (DESY,Germany).
76
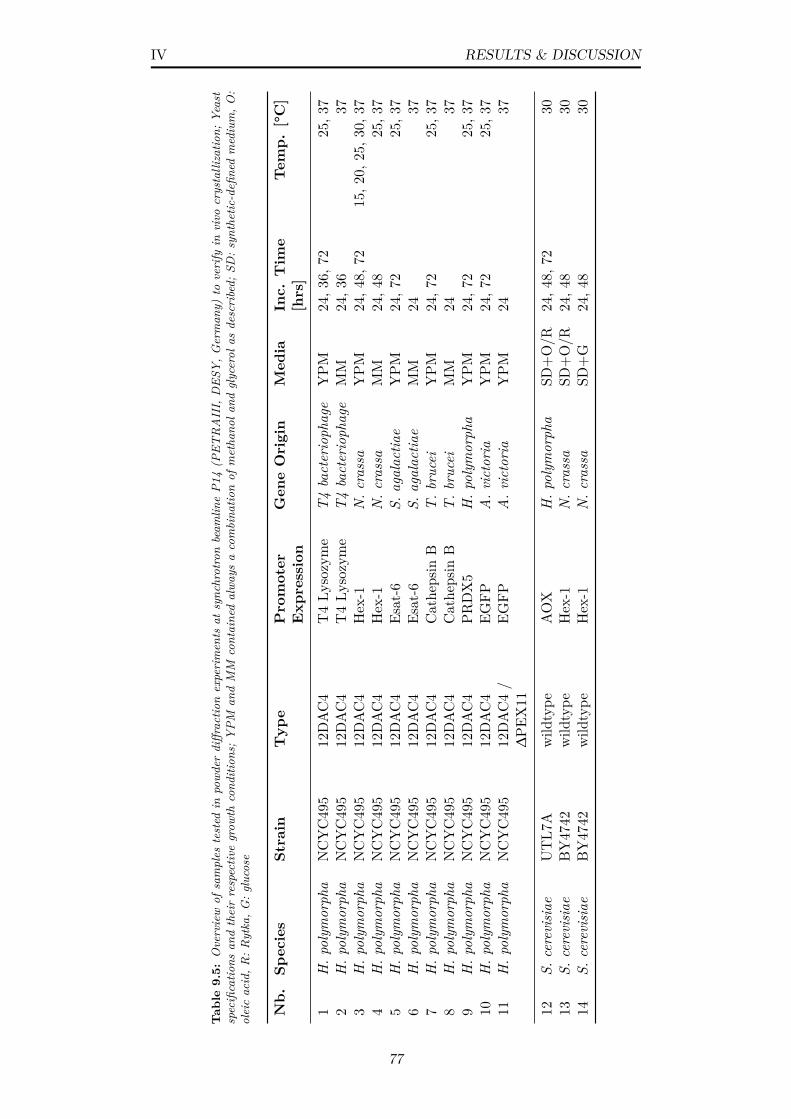
IV RESULTS & DISCUSSION
Tab
le9.
5:Overviewof
samples
tested
inpowd
erdiffractio
nexperiments
atsynchrotronbeam
lineP1
4(P
ETRAIII,
DES
Y,G
erman
y)to
verify
invivo
crystallizatio
n;Ye
ast
specificatio
nsan
dtheirrespectiv
egrow
thcond
ition
s;YPM
andMM
containedalwa
ysacombina
tionof
metha
nola
ndglycerol
asdescribed;
SD:s
ynthetic-defi
nedmedium,O
:oleicacid,R
:Rytka,G
:glucose
Nb.
Species
Strain
Typ
ePromoter
Exp
ression
Gen
eOrigin
Med
iaInc.
Tim
e[hrs]
Tem
p.[°C]
1H.p
olym
orph
aNCYC49
512
DAC4
T4Ly
sozyme
T4bacteriophage
YPM
24,3
6,72
25,3
72
H.p
olym
orph
aNCYC49
512
DAC4
T4Ly
sozyme
T4bacteriophage
MM
24,3
637
3H.p
olym
orph
aNCYC49
512
DAC4
Hex-1
N.c
rassa
YPM
24,4
8,72
15,2
0,25
,30,
374
H.p
olym
orph
aNCYC49
512
DAC4
Hex-1
N.c
rassa
MM
24,4
825
,37
5H.p
olym
orph
aNCYC49
512
DAC4
Esat-6
S.agalactia
eYPM
24,7
225
,37
6H.p
olym
orph
aNCYC49
512
DAC4
Esat-6
S.agalactia
eMM
2437
7H.p
olym
orph
aNCYC49
512
DAC4
Cathe
psin
BT.b
rucei
YPM
24,7
225
,37
8H.p
olym
orph
aNCYC49
512
DAC4
Cathe
psin
BT.b
rucei
MM
2437
9H.p
olym
orph
aNCYC49
512
DAC4
PRDX5
H.p
olym
orph
aYPM
24,7
225
,37
10H.p
olym
orph
aNCYC49
512
DAC4
EGFP
A.v
ictoria
YPM
24,7
225
,37
11H.p
olym
orph
aNCYC49
512
DAC4/
∆PE
X11
EGFP
A.v
ictoria
YPM
2437
12S.
cerevisiae
UTL7
Awild
type
AOX
H.p
olym
orph
aSD
+O/R
24,4
8,72
3013
S.cerevisiae
BY47
42wild
type
Hex-1
N.c
rassa
SD+O/R
24,4
830
14S.
cerevisiae
BY47
42wild
type
Hex-1
N.c
rassa
SD+G
24,4
830
77

IV RESULTS & DISCUSSION
10 | Proof of Principle Experimentsfor Yeast In Vivo Diffractionat XFELs
The preceding chapters delineate a conceptual approach to investigate proper-ties of the yeast peroxisomal system. Ranging from genetic engineering (ch. 8)to synchrotron-based diffraction studies (ch. 9), effort has been put into theinvestigation of the utilizability of H. polymorpha cells as a potential ’crystalfactory’ for SFX studies at XFELs.This chapter comprises the description of successful proof-of-principle SFXexperiments with AOX nano-crystals contained in whole H. polymorpha yeastcells, at the free-electron laser LCLS (SLAC Stanford, USA). First, sections 10.1& 10.2 show the purification of yeast peroxisomes and their characterizationvia DLS to estimate crystal sizes. Additionally section 10.3 presents resultsfrom a sample investigation via transmission electron microscopy, to verifyAOX crystal formation and analyze sample integrity for batches of purifiedperoxisomes. The testing of sample injection into a x-ray beam via a liquidmicrojet is described in sec. 10.4. Finally diffraction studies are described insection 10.5. The presented results demonstrate the general feasibility of ayeast-based, in vivo sample delivery-approach in SFX.
10.1 Purification of Mature Peroxisomes from YeastCells
In this section the preparation of peroxisomal fractions from two mutant yeaststrains is demonstrated. Wildtype-like peroxisomal characteristics are embod-ied by one strain (WT, PMP47-GFP), whereas a PEX11 deficiency leads todifferent phenotype in the other mutant (∆PEX11, PMP47-GFP). Both mu-tants express the fusion protein PMP47-GFP, which is constituted of PMP47as a peroxisome-specific adenosine triphosphate transporter and monomericGFP. The abundance of PMP47 enables visual inspections in a microscope,but was not subjected to quantification of total fluorescence signals.Crystal-containing yeast cells were produced according to a PAOX-inductionprotocol (sec. 6.2). For each cell type a total of 600 mL culture was grown inYPM media. For efficient incubation the cells were split into 3×200 mL andpoured in 2 L flasks. Growth was allowed over night until early stationaryphase up to an optical density of 10.In a second step peroxisomes were purified via a two-step purification ofdifferential- and sucrose density-centrifugation. Cells were harvested at roomtemperature for 5 min at3800·g and subjected to successive treatment. Firstprotoplasting was achieved by zymolyase treatment. After disrupting the
78
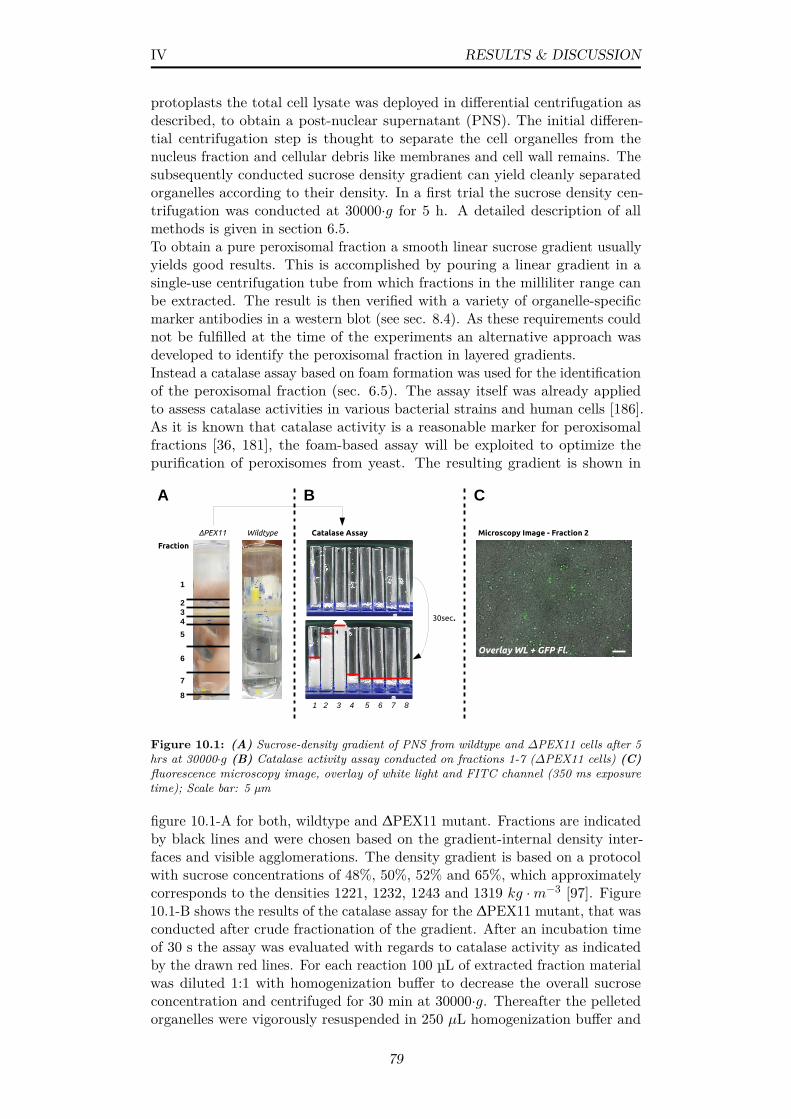
IV RESULTS & DISCUSSION
protoplasts the total cell lysate was deployed in differential centrifugation asdescribed, to obtain a post-nuclear supernatant (PNS). The initial differen-tial centrifugation step is thought to separate the cell organelles from thenucleus fraction and cellular debris like membranes and cell wall remains. Thesubsequently conducted sucrose density gradient can yield cleanly separatedorganelles according to their density. In a first trial the sucrose density cen-trifugation was conducted at 30000·g for 5 h. A detailed description of allmethods is given in section 6.5.To obtain a pure peroxisomal fraction a smooth linear sucrose gradient usuallyyields good results. This is accomplished by pouring a linear gradient in asingle-use centrifugation tube from which fractions in the milliliter range canbe extracted. The result is then verified with a variety of organelle-specificmarker antibodies in a western blot (see sec. 8.4). As these requirements couldnot be fulfilled at the time of the experiments an alternative approach wasdeveloped to identify the peroxisomal fraction in layered gradients.Instead a catalase assay based on foam formation was used for the identificationof the peroxisomal fraction (sec. 6.5). The assay itself was already appliedto assess catalase activities in various bacterial strains and human cells [186].As it is known that catalase activity is a reasonable marker for peroxisomalfractions [36, 181], the foam-based assay will be exploited to optimize thepurification of peroxisomes from yeast. The resulting gradient is shown in
234
5
6
7
8
1
Fraction
ΔPEX11 Wildtype Catalase Assay
30sec.
A B
1 2 3 4 5 6 7 8
C
Microscopy Image - Fraction 2
Overlay WL + GFP Fl.
Figure 10.1: (A) Sucrose-density gradient of PNS from wildtype and ∆PEX11 cells after 5hrs at 30000·g (B) Catalase activity assay conducted on fractions 1-7 (∆PEX11 cells) (C)fluorescence microscopy image, overlay of white light and FITC channel (350 ms exposuretime); Scale bar: 5 µm
figure 10.1-A for both, wildtype and ∆PEX11 mutant. Fractions are indicatedby black lines and were chosen based on the gradient-internal density inter-faces and visible agglomerations. The density gradient is based on a protocolwith sucrose concentrations of 48%, 50%, 52% and 65%, which approximatelycorresponds to the densities 1221, 1232, 1243 and 1319 kg ·m−3 [97]. Figure10.1-B shows the results of the catalase assay for the ∆PEX11 mutant, that wasconducted after crude fractionation of the gradient. After an incubation timeof 30 s the assay was evaluated with regards to catalase activity as indicatedby the drawn red lines. For each reaction 100 µL of extracted fraction materialwas diluted 1:1 with homogenization buffer to decrease the overall sucroseconcentration and centrifuged for 30 min at 30000·g. Thereafter the pelletedorganelles were vigorously resuspended in 250 µL homogenization buffer and
79
IV RESULTS & DISCUSSION
incubated with each 100 µL 30% H2O2 and 10% Triton X-100. The resultingfoaming due to the presence of catalase was investigated. From the obtainedresults no distinct difference between wildtype and ∆PEX11 mutant could befound with regards to separation in the gradient. Mature peroxisomes are
Fraction
ΔPEX11 Wildtype Catalase Assay
30sec.
A B
1 2 3 4 5 6 7 8 9 10
C
Microscopy Image - Fraction 8
3
1
2
4
3
5
6
7
8
9
10
Overlay WL + GFP Fl.
Figure 10.2: (A) Sucrose-density gradient of PNS from wildtype and ∆PEX11 cells after10 hrs at 30000·g (B) Catalase activity assay conducted on fractions 1-10 (∆P11 cells) (C)fluorescence microscopy image, overlay of white light and FITC channel (350 ms exposuretime); Scale bar: 5 µm
thought to have the highest density of all cell organelles in the PNS and hencewere expected to accumulate at the interface between 52% and 65% sucrosesolution, or eventually migrate to the bottom of the centrifugation tube [81,104]. Interestingly, the catalase assay strongly indicated an accumulation ofperoxisomes at lower densities corresponding to a sucrose concentration of0-48% (fractions 2-4). Figure 10.1-C shows organelles from fraction 2 in anoverlay of white light image and FITC channel. It clearly shows a large amountof peroxisomes apparent from the PMP47-GFP fluorescence, but unfortunatelyco-localized with other non-fluorescent organellar structures. Strong foamingfor low density fractions is also partially explained by the presence of catalasefrom the cytosolic fraction and the overall protein concentration.Furthermore the following explanations for the results can be adduced. First,mostly immature peroxisomes could populate the cells and hence end up atlower densities. A certain fraction of immature peroxisomes is always expectedin a viable culture (sec. 2.2), but no visible organelles could be seen in fraction7 or 8 when they were subjected to microscopic investigation. The latterobservation would be conclusive with the second explanation, which is that theperoxisomes did not properly migrate through the gradient. Either becausethey stick to other cellular components or because the time of centrifugationwas too short.Hence the protocol was adapted to this new hypothesis. The time for cen-trifugation for the sucrose density gradient was increased to 10 h and thecell lysate has been treated by more extensive pipetting to achieve a strongerhomogenization of the sub-cellular fractions. An inspection under the micro-scope indicated still intact organelles (data not shown). The results of thenew approach are shown in figure 10.2. As expected and visible in 10.2-A thegradient appears more fractionated. Due to the appearance of a more complexpurification pattern 10 layers were defined for extraction and subjected tothe catalase assay (fig. 10.2-B). In both cases the same amount of protein of
80
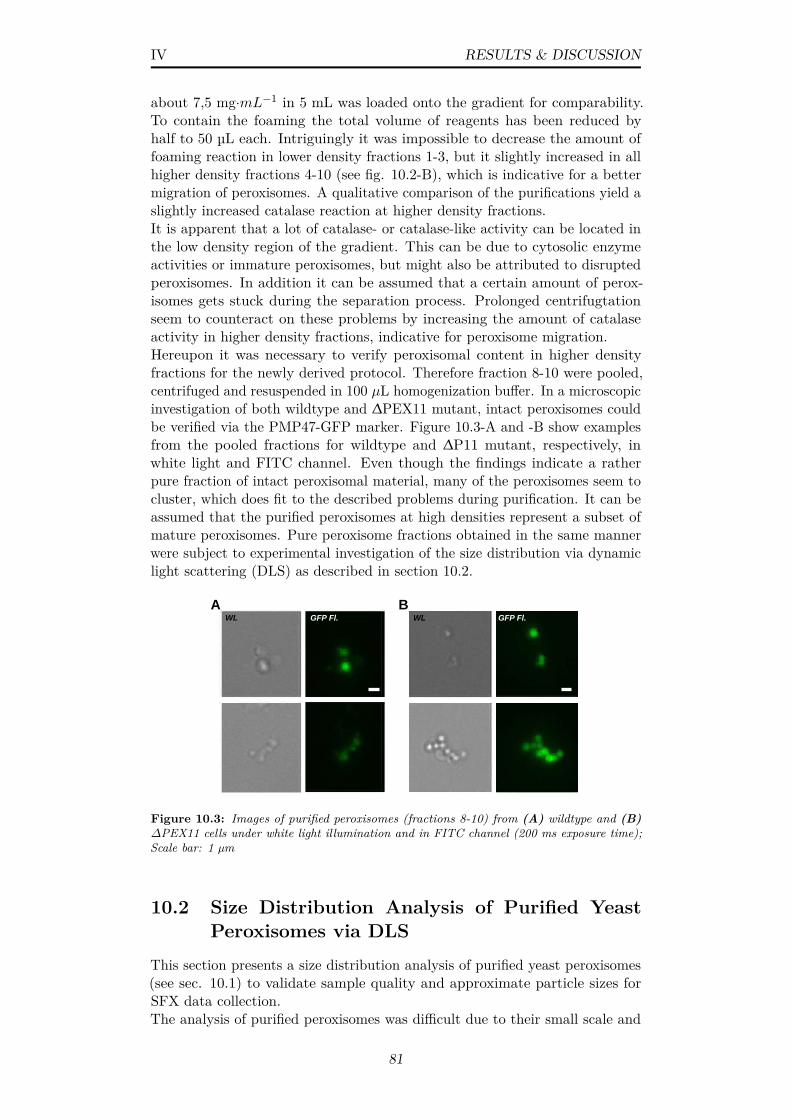
IV RESULTS & DISCUSSION
about 7,5 mg·mL−1 in 5 mL was loaded onto the gradient for comparability.To contain the foaming the total volume of reagents has been reduced byhalf to 50 µL each. Intriguingly it was impossible to decrease the amount offoaming reaction in lower density fractions 1-3, but it slightly increased in allhigher density fractions 4-10 (see fig. 10.2-B), which is indicative for a bettermigration of peroxisomes. A qualitative comparison of the purifications yield aslightly increased catalase reaction at higher density fractions.It is apparent that a lot of catalase- or catalase-like activity can be located inthe low density region of the gradient. This can be due to cytosolic enzymeactivities or immature peroxisomes, but might also be attributed to disruptedperoxisomes. In addition it can be assumed that a certain amount of perox-isomes gets stuck during the separation process. Prolonged centrifugtationseem to counteract on these problems by increasing the amount of catalaseactivity in higher density fractions, indicative for peroxisome migration.Hereupon it was necessary to verify peroxisomal content in higher densityfractions for the newly derived protocol. Therefore fraction 8-10 were pooled,centrifuged and resuspended in 100 µL homogenization buffer. In a microscopicinvestigation of both wildtype and ∆PEX11 mutant, intact peroxisomes couldbe verified via the PMP47-GFP marker. Figure 10.3-A and -B show examplesfrom the pooled fractions for wildtype and ∆P11 mutant, respectively, inwhite light and FITC channel. Even though the findings indicate a ratherpure fraction of intact peroxisomal material, many of the peroxisomes seem tocluster, which does fit to the described problems during purification. It can beassumed that the purified peroxisomes at high densities represent a subset ofmature peroxisomes. Pure peroxisome fractions obtained in the same mannerwere subject to experimental investigation of the size distribution via dynamiclight scattering (DLS) as described in section 10.2.
A BWL GFP Fl. WL GFP Fl.
Figure 10.3: Images of purified peroxisomes (fractions 8-10) from (A) wildtype and (B)∆PEX11 cells under white light illumination and in FITC channel (200 ms exposure time);Scale bar: 1 µm
10.2 Size Distribution Analysis of Purified YeastPeroxisomes via DLS
This section presents a size distribution analysis of purified yeast peroxisomes(see sec. 10.1) to validate sample quality and approximate particle sizes forSFX data collection.The analysis of purified peroxisomes was difficult due to their small scale and
81
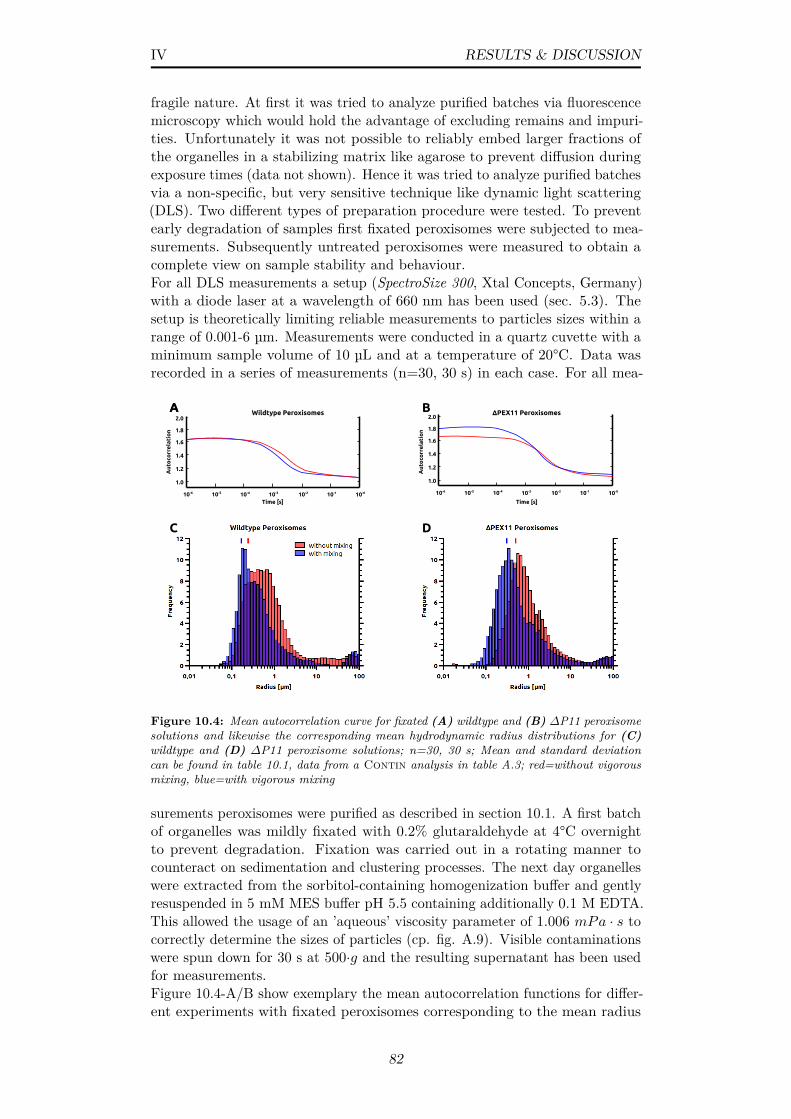
IV RESULTS & DISCUSSION
fragile nature. At first it was tried to analyze purified batches via fluorescencemicroscopy which would hold the advantage of excluding remains and impuri-ties. Unfortunately it was not possible to reliably embed larger fractions ofthe organelles in a stabilizing matrix like agarose to prevent diffusion duringexposure times (data not shown). Hence it was tried to analyze purified batchesvia a non-specific, but very sensitive technique like dynamic light scattering(DLS). Two different types of preparation procedure were tested. To preventearly degradation of samples first fixated peroxisomes were subjected to mea-surements. Subsequently untreated peroxisomes were measured to obtain acomplete view on sample stability and behaviour.For all DLS measurements a setup (SpectroSize 300, Xtal Concepts, Germany)with a diode laser at a wavelength of 660 nm has been used (sec. 5.3). Thesetup is theoretically limiting reliable measurements to particles sizes within arange of 0.001-6 µm. Measurements were conducted in a quartz cuvette with aminimum sample volume of 10 µL and at a temperature of 20°C. Data wasrecorded in a series of measurements (n=30, 30 s) in each case. For all mea-
2.0
1.8
1.6
1.4
1.2
1.0
10-6 10-5 10-4 10-3 10-2 10-1 10-0
Wildtype Peroxisomes
Time [s]
Au
toco
rre
lati
on
2.0
1.8
1.6
1.4
1.2
1.0
10-6 10-5 10-4 10-3 10-2 10-1 10-0
ΔPEX11 PeroxisomesA
uto
corr
ela
tio
n
Time [s]
A BA
DC
Figure 10.4: Mean autocorrelation curve for fixated (A) wildtype and (B) ∆P11 peroxisomesolutions and likewise the corresponding mean hydrodynamic radius distributions for (C)wildtype and (D) ∆P11 peroxisome solutions; n=30, 30 s; Mean and standard deviationcan be found in table 10.1, data from a Contin analysis in table A.3; red=without vigorousmixing, blue=with vigorous mixing
surements peroxisomes were purified as described in section 10.1. A first batchof organelles was mildly fixated with 0.2% glutaraldehyde at 4°C overnightto prevent degradation. Fixation was carried out in a rotating manner tocounteract on sedimentation and clustering processes. The next day organelleswere extracted from the sorbitol-containing homogenization buffer and gentlyresuspended in 5 mM MES buffer pH 5.5 containing additionally 0.1 M EDTA.This allowed the usage of an ’aqueous’ viscosity parameter of 1.006 mPa · s tocorrectly determine the sizes of particles (cp. fig. A.9). Visible contaminationswere spun down for 30 s at 500·g and the resulting supernatant has been usedfor measurements.Figure 10.4-A/B show exemplary the mean autocorrelation functions for differ-ent experiments with fixated peroxisomes corresponding to the mean radius
82
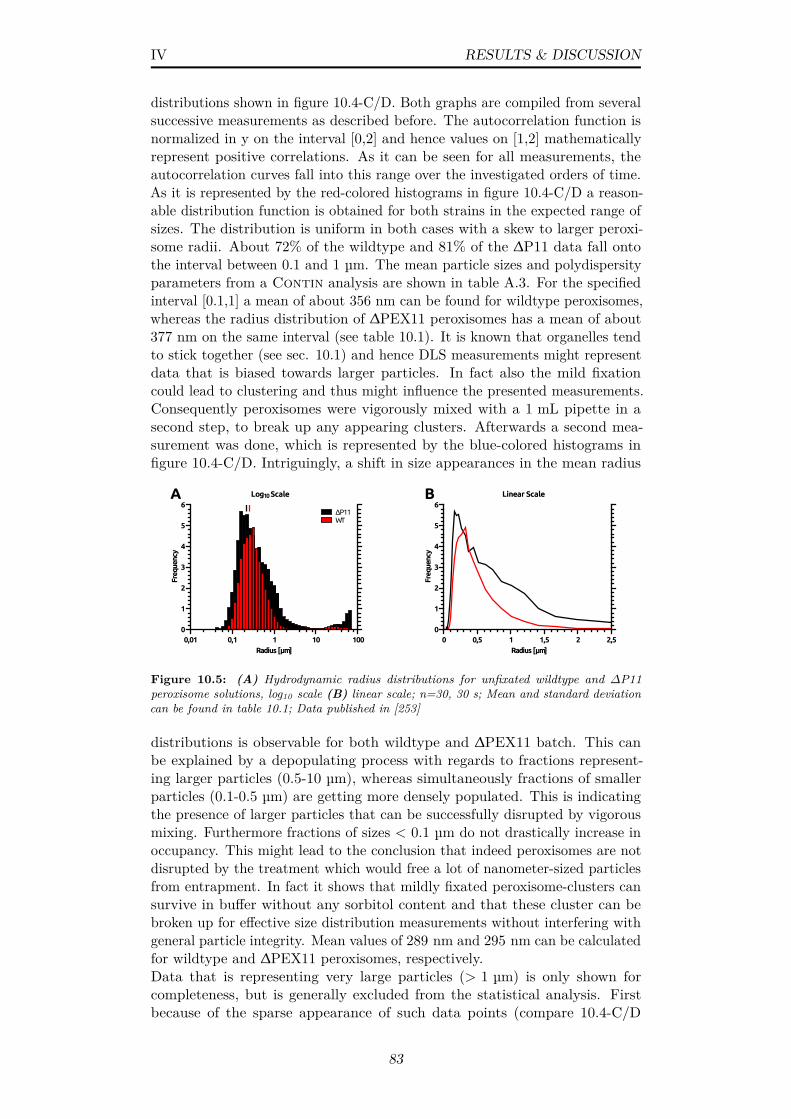
IV RESULTS & DISCUSSION
distributions shown in figure 10.4-C/D. Both graphs are compiled from severalsuccessive measurements as described before. The autocorrelation function isnormalized in y on the interval [0,2] and hence values on [1,2] mathematicallyrepresent positive correlations. As it can be seen for all measurements, theautocorrelation curves fall into this range over the investigated orders of time.As it is represented by the red-colored histograms in figure 10.4-C/D a reason-able distribution function is obtained for both strains in the expected range ofsizes. The distribution is uniform in both cases with a skew to larger peroxi-some radii. About 72% of the wildtype and 81% of the ∆P11 data fall ontothe interval between 0.1 and 1 µm. The mean particle sizes and polydispersityparameters from a Contin analysis are shown in table A.3. For the specifiedinterval [0.1,1] a mean of about 356 nm can be found for wildtype peroxisomes,whereas the radius distribution of ∆PEX11 peroxisomes has a mean of about377 nm on the same interval (see table 10.1). It is known that organelles tendto stick together (see sec. 10.1) and hence DLS measurements might representdata that is biased towards larger particles. In fact also the mild fixationcould lead to clustering and thus might influence the presented measurements.Consequently peroxisomes were vigorously mixed with a 1 mL pipette in asecond step, to break up any appearing clusters. Afterwards a second mea-surement was done, which is represented by the blue-colored histograms infigure 10.4-C/D. Intriguingly, a shift in size appearances in the mean radius
Log10 Scale
Freq
uenc
y
0
1
2
3
4
5
6
Radius [μm]0,01 0,1 1 10 100
ΔP11WT
A B Linear Scale
Freq
uenc
y
0
1
2
3
4
5
6
Radius [μm]0 0,5 1 1,5 2 2,5
Figure 10.5: (A) Hydrodynamic radius distributions for unfixated wildtype and ∆P11peroxisome solutions, log10 scale (B) linear scale; n=30, 30 s; Mean and standard deviationcan be found in table 10.1; Data published in [253]
distributions is observable for both wildtype and ∆PEX11 batch. This canbe explained by a depopulating process with regards to fractions represent-ing larger particles (0.5-10 µm), whereas simultaneously fractions of smallerparticles (0.1-0.5 µm) are getting more densely populated. This is indicatingthe presence of larger particles that can be successfully disrupted by vigorousmixing. Furthermore fractions of sizes < 0.1 µm do not drastically increase inoccupancy. This might lead to the conclusion that indeed peroxisomes are notdisrupted by the treatment which would free a lot of nanometer-sized particlesfrom entrapment. In fact it shows that mildly fixated peroxisome-clusters cansurvive in buffer without any sorbitol content and that these cluster can bebroken up for effective size distribution measurements without interfering withgeneral particle integrity. Mean values of 289 nm and 295 nm can be calculatedfor wildtype and ∆PEX11 peroxisomes, respectively.Data that is representing very large particles (> 1 µm) is only shown forcompleteness, but is generally excluded from the statistical analysis. Firstbecause of the sparse appearance of such data points (compare 10.4-C/D
83
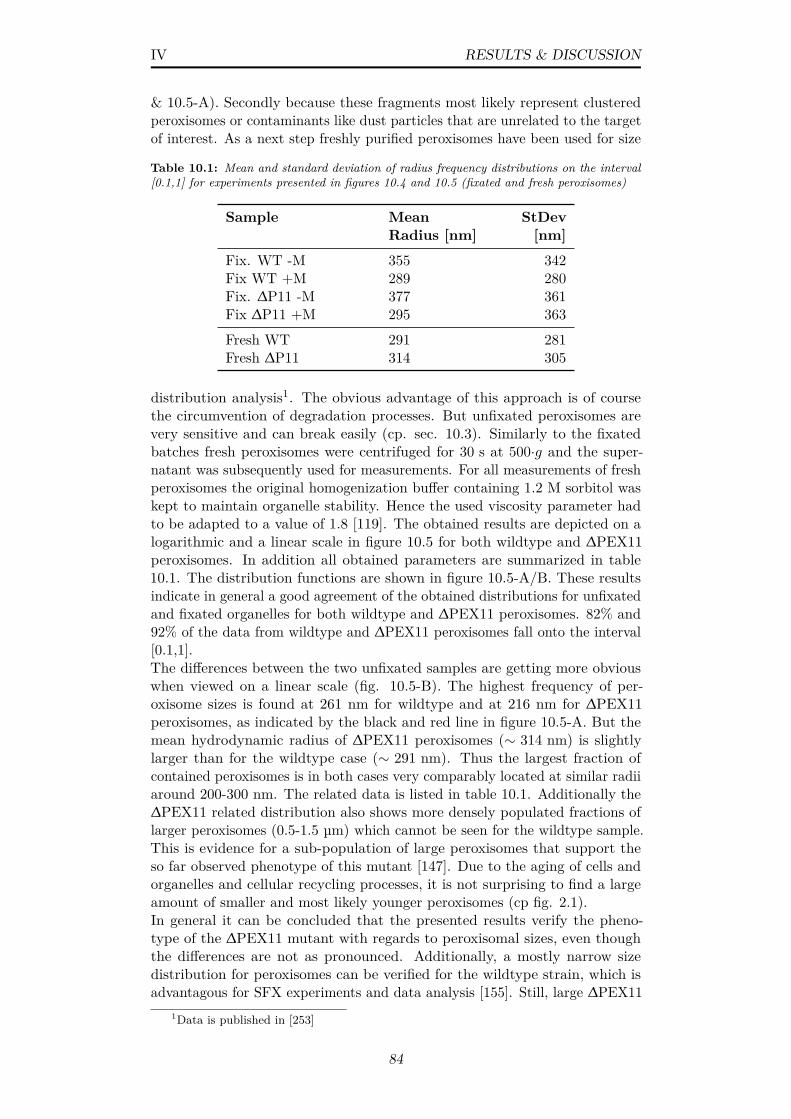
IV RESULTS & DISCUSSION
& 10.5-A). Secondly because these fragments most likely represent clusteredperoxisomes or contaminants like dust particles that are unrelated to the targetof interest. As a next step freshly purified peroxisomes have been used for size
Table 10.1: Mean and standard deviation of radius frequency distributions on the interval[0.1,1] for experiments presented in figures 10.4 and 10.5 (fixated and fresh peroxisomes)
Sample MeanRadius [nm]
StDev[nm]
Fix. WT -M 355 342Fix WT +M 289 280Fix. ∆P11 -M 377 361Fix ∆P11 +M 295 363
Fresh WT 291 281Fresh ∆P11 314 305
distribution analysis1. The obvious advantage of this approach is of coursethe circumvention of degradation processes. But unfixated peroxisomes arevery sensitive and can break easily (cp. sec. 10.3). Similarly to the fixatedbatches fresh peroxisomes were centrifuged for 30 s at 500·g and the super-natant was subsequently used for measurements. For all measurements of freshperoxisomes the original homogenization buffer containing 1.2 M sorbitol waskept to maintain organelle stability. Hence the used viscosity parameter hadto be adapted to a value of 1.8 [119]. The obtained results are depicted on alogarithmic and a linear scale in figure 10.5 for both wildtype and ∆PEX11peroxisomes. In addition all obtained parameters are summarized in table10.1. The distribution functions are shown in figure 10.5-A/B. These resultsindicate in general a good agreement of the obtained distributions for unfixatedand fixated organelles for both wildtype and ∆PEX11 peroxisomes. 82% and92% of the data from wildtype and ∆PEX11 peroxisomes fall onto the interval[0.1,1].The differences between the two unfixated samples are getting more obviouswhen viewed on a linear scale (fig. 10.5-B). The highest frequency of per-oxisome sizes is found at 261 nm for wildtype and at 216 nm for ∆PEX11peroxisomes, as indicated by the black and red line in figure 10.5-A. But themean hydrodynamic radius of ∆PEX11 peroxisomes (∼ 314 nm) is slightlylarger than for the wildtype case (∼ 291 nm). Thus the largest fraction ofcontained peroxisomes is in both cases very comparably located at similar radiiaround 200-300 nm. The related data is listed in table 10.1. Additionally the∆PEX11 related distribution also shows more densely populated fractions oflarger peroxisomes (0.5-1.5 µm) which cannot be seen for the wildtype sample.This is evidence for a sub-population of large peroxisomes that support theso far observed phenotype of this mutant [147]. Due to the aging of cells andorganelles and cellular recycling processes, it is not surprising to find a largeamount of smaller and most likely younger peroxisomes (cp fig. 2.1).In general it can be concluded that the presented results verify the pheno-type of the ∆PEX11 mutant with regards to peroxisomal sizes, even thoughthe differences are not as pronounced. Additionally, a mostly narrow sizedistribution for peroxisomes can be verified for the wildtype strain, which isadvantagous for SFX experiments and data analysis [155]. Still, large ∆PEX11
1Data is published in [253]
84
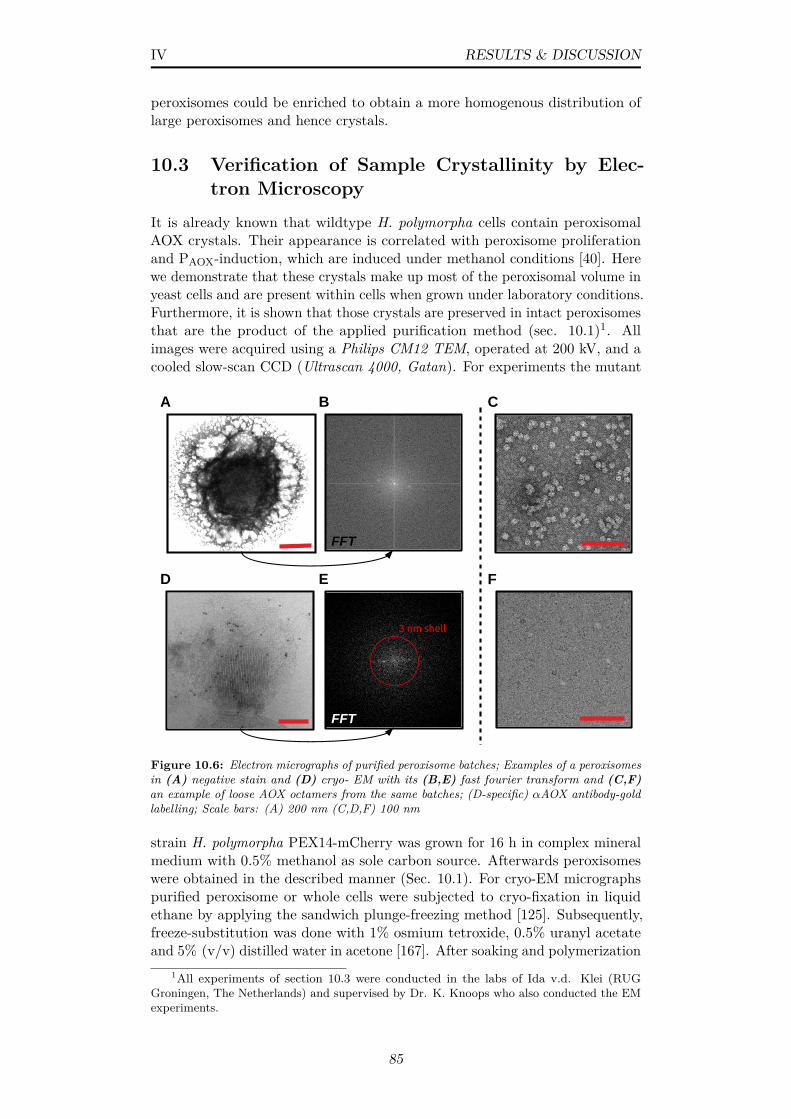
IV RESULTS & DISCUSSION
peroxisomes could be enriched to obtain a more homogenous distribution oflarge peroxisomes and hence crystals.
10.3 Verification of Sample Crystallinity by Elec-tron Microscopy
It is already known that wildtype H. polymorpha cells contain peroxisomalAOX crystals. Their appearance is correlated with peroxisome proliferationand PAOX-induction, which are induced under methanol conditions [40]. Herewe demonstrate that these crystals make up most of the peroxisomal volume inyeast cells and are present within cells when grown under laboratory conditions.Furthermore, it is shown that those crystals are preserved in intact peroxisomesthat are the product of the applied purification method (sec. 10.1)1. Allimages were acquired using a Philips CM12 TEM, operated at 200 kV, and acooled slow-scan CCD (Ultrascan 4000, Gatan). For experiments the mutant
A B
D E
C
F
FFT
FFT
3 nm shell
Figure 10.6: Electron micrographs of purified peroxisome batches; Examples of a peroxisomesin (A) negative stain and (D) cryo- EM with its (B,E) fast fourier transform and (C,F)an example of loose AOX octamers from the same batches; (D-specific) αAOX antibody-goldlabelling; Scale bars: (A) 200 nm (C,D,F) 100 nm
strain H. polymorpha PEX14-mCherry was grown for 16 h in complex mineralmedium with 0.5% methanol as sole carbon source. Afterwards peroxisomeswere obtained in the described manner (Sec. 10.1). For cryo-EM micrographspurified peroxisome or whole cells were subjected to cryo-fixation in liquidethane by applying the sandwich plunge-freezing method [125]. Subsequently,freeze-substitution was done with 1% osmium tetroxide, 0.5% uranyl acetateand 5% (v/v) distilled water in acetone [167]. After soaking and polymerization
1All experiments of section 10.3 were conducted in the labs of Ida v.d. Klei (RUGGroningen, The Netherlands) and supervised by Dr. K. Knoops who also conducted the EMexperiments.
85
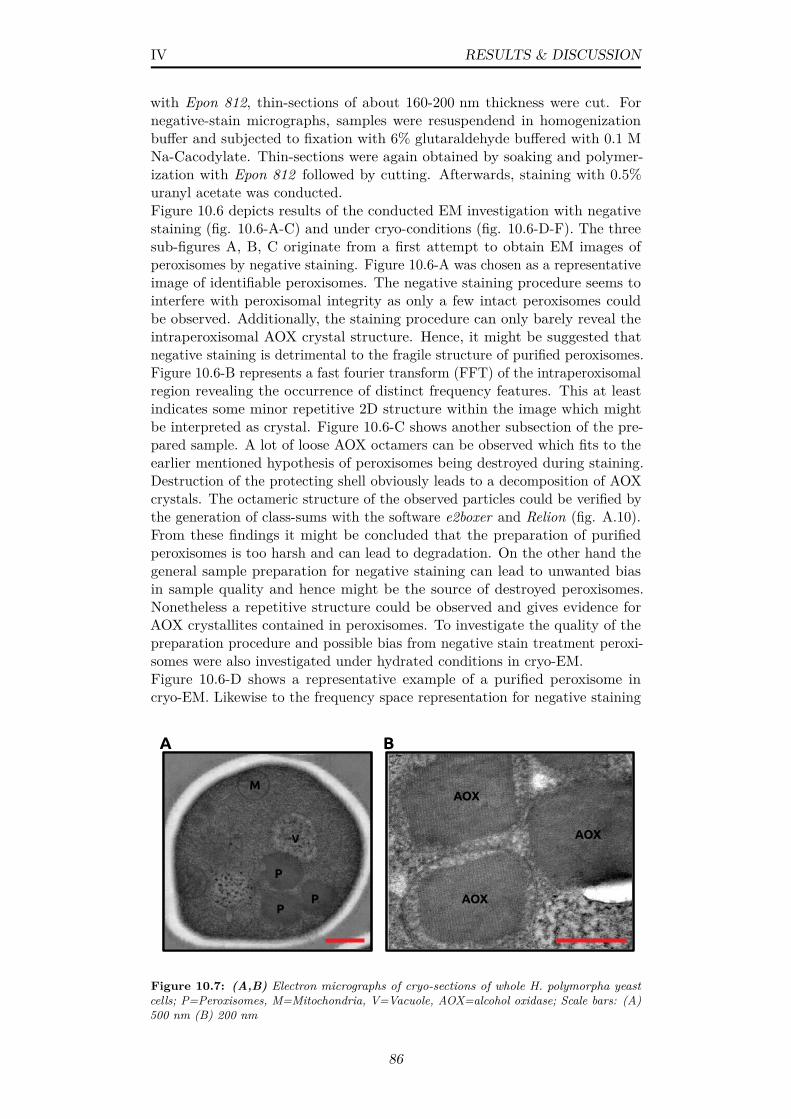
IV RESULTS & DISCUSSION
with Epon 812, thin-sections of about 160-200 nm thickness were cut. Fornegative-stain micrographs, samples were resuspendend in homogenizationbuffer and subjected to fixation with 6% glutaraldehyde buffered with 0.1 MNa-Cacodylate. Thin-sections were again obtained by soaking and polymer-ization with Epon 812 followed by cutting. Afterwards, staining with 0.5%uranyl acetate was conducted.Figure 10.6 depicts results of the conducted EM investigation with negativestaining (fig. 10.6-A-C) and under cryo-conditions (fig. 10.6-D-F). The threesub-figures A, B, C originate from a first attempt to obtain EM images ofperoxisomes by negative staining. Figure 10.6-A was chosen as a representativeimage of identifiable peroxisomes. The negative staining procedure seems tointerfere with peroxisomal integrity as only a few intact peroxisomes couldbe observed. Additionally, the staining procedure can only barely reveal theintraperoxisomal AOX crystal structure. Hence, it might be suggested thatnegative staining is detrimental to the fragile structure of purified peroxisomes.Figure 10.6-B represents a fast fourier transform (FFT) of the intraperoxisomalregion revealing the occurrence of distinct frequency features. This at leastindicates some minor repetitive 2D structure within the image which mightbe interpreted as crystal. Figure 10.6-C shows another subsection of the pre-pared sample. A lot of loose AOX octamers can be observed which fits to theearlier mentioned hypothesis of peroxisomes being destroyed during staining.Destruction of the protecting shell obviously leads to a decomposition of AOXcrystals. The octameric structure of the observed particles could be verified bythe generation of class-sums with the software e2boxer and Relion (fig. A.10).From these findings it might be concluded that the preparation of purifiedperoxisomes is too harsh and can lead to degradation. On the other hand thegeneral sample preparation for negative staining can lead to unwanted biasin sample quality and hence might be the source of destroyed peroxisomes.Nonetheless a repetitive structure could be observed and gives evidence forAOX crystallites contained in peroxisomes. To investigate the quality of thepreparation procedure and possible bias from negative stain treatment peroxi-somes were also investigated under hydrated conditions in cryo-EM.Figure 10.6-D shows a representative example of a purified peroxisome incryo-EM. Likewise to the frequency space representation for negative staining
P
V
M
PP
AOX
AOX
AOX
A B
Figure 10.7: (A,B) Electron micrographs of cryo-sections of whole H. polymorpha yeastcells; P=Peroxisomes, M=Mitochondria, V=Vacuole, AOX=alcohol oxidase; Scale bars: (A)500 nm (B) 200 nm
86
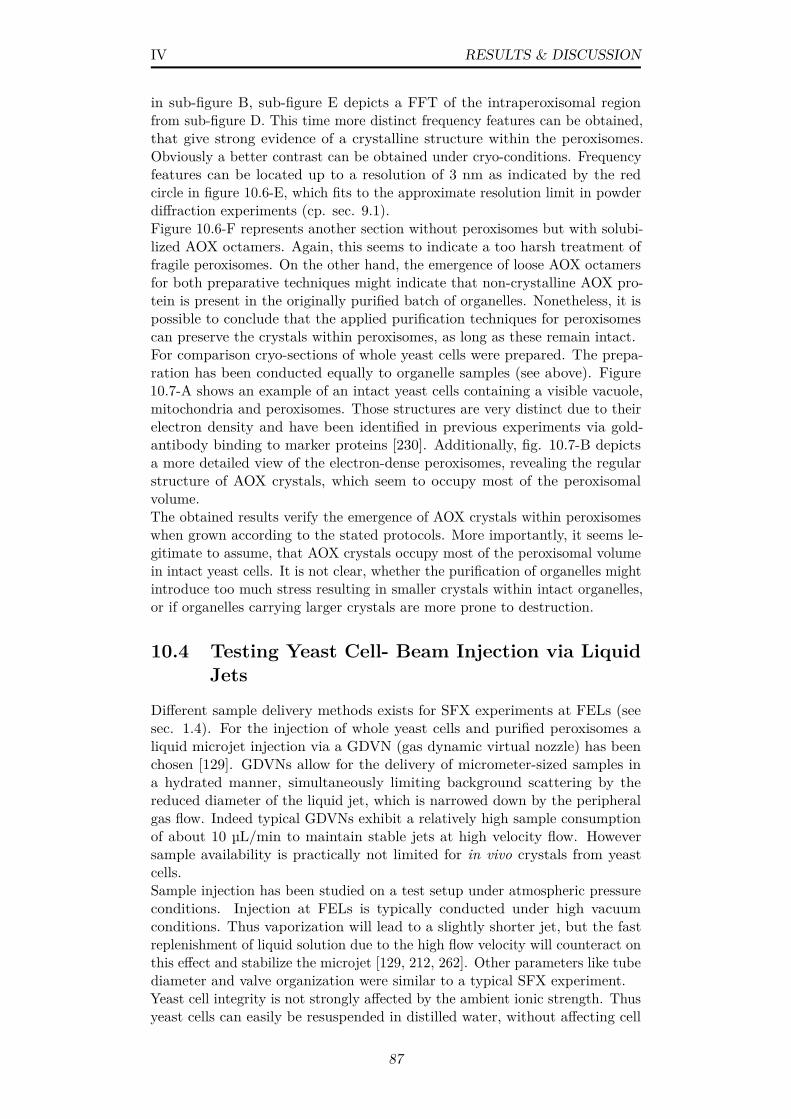
IV RESULTS & DISCUSSION
in sub-figure B, sub-figure E depicts a FFT of the intraperoxisomal regionfrom sub-figure D. This time more distinct frequency features can be obtained,that give strong evidence of a crystalline structure within the peroxisomes.Obviously a better contrast can be obtained under cryo-conditions. Frequencyfeatures can be located up to a resolution of 3 nm as indicated by the redcircle in figure 10.6-E, which fits to the approximate resolution limit in powderdiffraction experiments (cp. sec. 9.1).Figure 10.6-F represents another section without peroxisomes but with solubi-lized AOX octamers. Again, this seems to indicate a too harsh treatment offragile peroxisomes. On the other hand, the emergence of loose AOX octamersfor both preparative techniques might indicate that non-crystalline AOX pro-tein is present in the originally purified batch of organelles. Nonetheless, it ispossible to conclude that the applied purification techniques for peroxisomescan preserve the crystals within peroxisomes, as long as these remain intact.For comparison cryo-sections of whole yeast cells were prepared. The prepa-ration has been conducted equally to organelle samples (see above). Figure10.7-A shows an example of an intact yeast cells containing a visible vacuole,mitochondria and peroxisomes. Those structures are very distinct due to theirelectron density and have been identified in previous experiments via gold-antibody binding to marker proteins [230]. Additionally, fig. 10.7-B depictsa more detailed view of the electron-dense peroxisomes, revealing the regularstructure of AOX crystals, which seem to occupy most of the peroxisomalvolume.The obtained results verify the emergence of AOX crystals within peroxisomeswhen grown according to the stated protocols. More importantly, it seems le-gitimate to assume, that AOX crystals occupy most of the peroxisomal volumein intact yeast cells. It is not clear, whether the purification of organelles mightintroduce too much stress resulting in smaller crystals within intact organelles,or if organelles carrying larger crystals are more prone to destruction.
10.4 Testing Yeast Cell- Beam Injection via LiquidJets
Different sample delivery methods exists for SFX experiments at FELs (seesec. 1.4). For the injection of whole yeast cells and purified peroxisomes aliquid microjet injection via a GDVN (gas dynamic virtual nozzle) has beenchosen [129]. GDVNs allow for the delivery of micrometer-sized samples ina hydrated manner, simultaneously limiting background scattering by thereduced diameter of the liquid jet, which is narrowed down by the peripheralgas flow. Indeed typical GDVNs exhibit a relatively high sample consumptionof about 10 µL/min to maintain stable jets at high velocity flow. Howeversample availability is practically not limited for in vivo crystals from yeastcells.Sample injection has been studied on a test setup under atmospheric pressureconditions. Injection at FELs is typically conducted under high vacuumconditions. Thus vaporization will lead to a slightly shorter jet, but the fastreplenishment of liquid solution due to the high flow velocity will counteract onthis effect and stabilize the microjet [129, 212, 262]. Other parameters like tubediameter and valve organization were similar to a typical SFX experiment.Yeast cell integrity is not strongly affected by the ambient ionic strength. Thusyeast cells can easily be resuspended in distilled water, without affecting cell
87
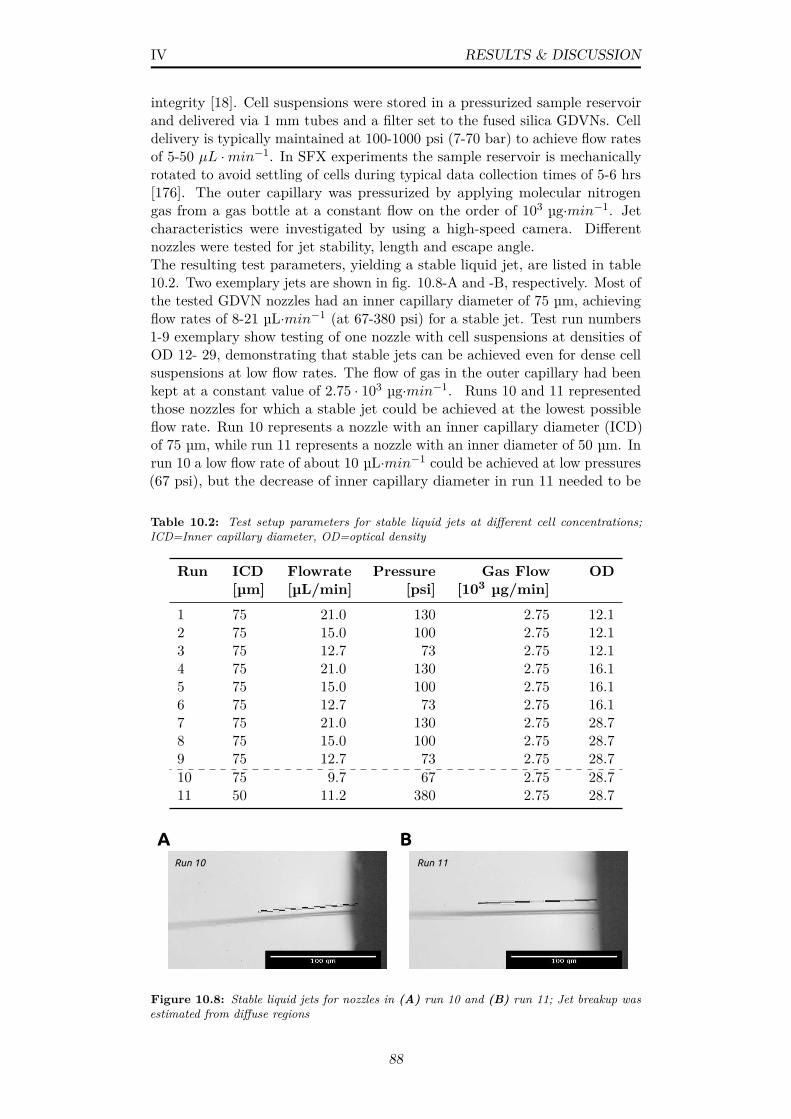
IV RESULTS & DISCUSSION
integrity [18]. Cell suspensions were stored in a pressurized sample reservoirand delivered via 1 mm tubes and a filter set to the fused silica GDVNs. Celldelivery is typically maintained at 100-1000 psi (7-70 bar) to achieve flow ratesof 5-50 µL ·min−1. In SFX experiments the sample reservoir is mechanicallyrotated to avoid settling of cells during typical data collection times of 5-6 hrs[176]. The outer capillary was pressurized by applying molecular nitrogengas from a gas bottle at a constant flow on the order of 103 µg·min−1. Jetcharacteristics were investigated by using a high-speed camera. Differentnozzles were tested for jet stability, length and escape angle.The resulting test parameters, yielding a stable liquid jet, are listed in table10.2. Two exemplary jets are shown in fig. 10.8-A and -B, respectively. Most ofthe tested GDVN nozzles had an inner capillary diameter of 75 µm, achievingflow rates of 8-21 µL·min−1 (at 67-380 psi) for a stable jet. Test run numbers1-9 exemplary show testing of one nozzle with cell suspensions at densities ofOD 12- 29, demonstrating that stable jets can be achieved even for dense cellsuspensions at low flow rates. The flow of gas in the outer capillary had beenkept at a constant value of 2.75 · 103 µg·min−1. Runs 10 and 11 representedthose nozzles for which a stable jet could be achieved at the lowest possibleflow rate. Run 10 represents a nozzle with an inner capillary diameter (ICD)of 75 µm, while run 11 represents a nozzle with an inner diameter of 50 µm. Inrun 10 a low flow rate of about 10 µL·min−1 could be achieved at low pressures(67 psi), but the decrease of inner capillary diameter in run 11 needed to be
Table 10.2: Test setup parameters for stable liquid jets at different cell concentrations;ICD=Inner capillary diameter, OD=optical density
Run ICD[µm]
Flowrate[µL/min]
Pressure[psi]
Gas Flow[103 µg/min]
OD
1 75 21.0 130 2.75 12.12 75 15.0 100 2.75 12.13 75 12.7 73 2.75 12.14 75 21.0 130 2.75 16.15 75 15.0 100 2.75 16.16 75 12.7 73 2.75 16.17 75 21.0 130 2.75 28.78 75 15.0 100 2.75 28.79 75 12.7 73 2.75 28.710 75 9.7 67 2.75 28.711 50 11.2 380 2.75 28.7
A BRun 10 Run 11
Figure 10.8: Stable liquid jets for nozzles in (A) run 10 and (B) run 11; Jet breakup wasestimated from diffuse regions
88
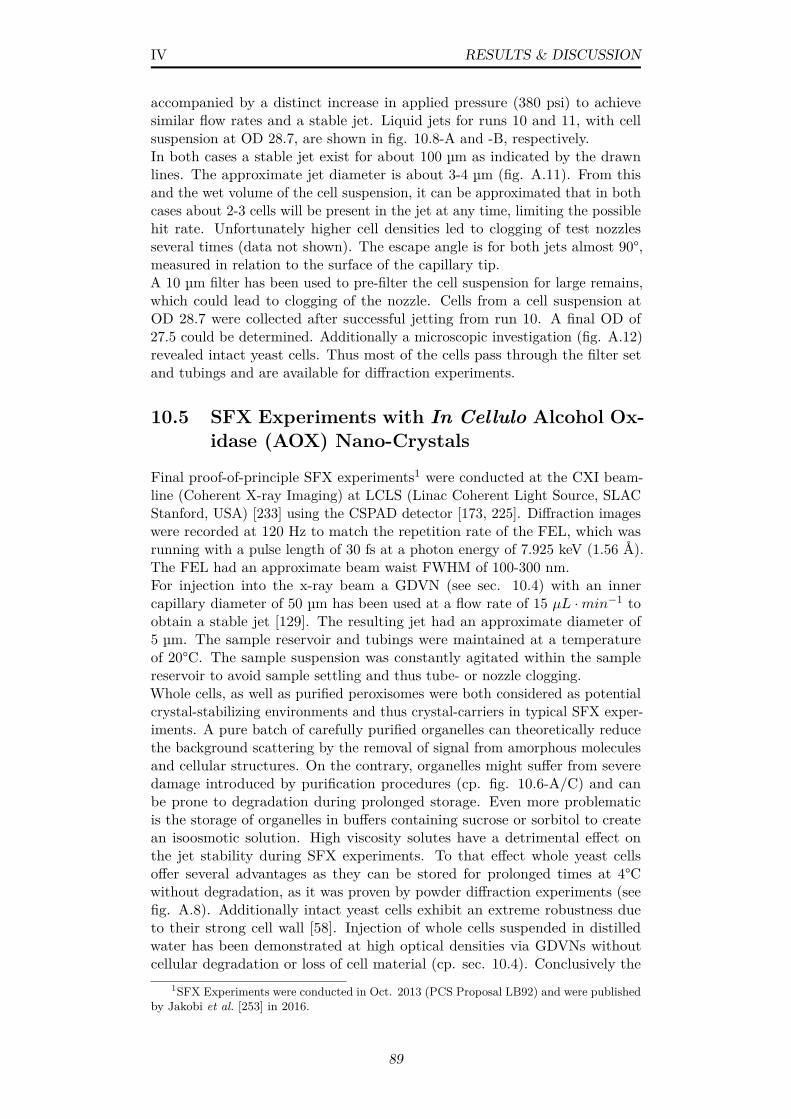
IV RESULTS & DISCUSSION
accompanied by a distinct increase in applied pressure (380 psi) to achievesimilar flow rates and a stable jet. Liquid jets for runs 10 and 11, with cellsuspension at OD 28.7, are shown in fig. 10.8-A and -B, respectively.In both cases a stable jet exist for about 100 µm as indicated by the drawnlines. The approximate jet diameter is about 3-4 µm (fig. A.11). From thisand the wet volume of the cell suspension, it can be approximated that in bothcases about 2-3 cells will be present in the jet at any time, limiting the possiblehit rate. Unfortunately higher cell densities led to clogging of test nozzlesseveral times (data not shown). The escape angle is for both jets almost 90°,measured in relation to the surface of the capillary tip.A 10 µm filter has been used to pre-filter the cell suspension for large remains,which could lead to clogging of the nozzle. Cells from a cell suspension atOD 28.7 were collected after successful jetting from run 10. A final OD of27.5 could be determined. Additionally a microscopic investigation (fig. A.12)revealed intact yeast cells. Thus most of the cells pass through the filter setand tubings and are available for diffraction experiments.
10.5 SFX Experiments with In Cellulo Alcohol Ox-idase (AOX) Nano-Crystals
Final proof-of-principle SFX experiments1 were conducted at the CXI beam-line (Coherent X-ray Imaging) at LCLS (Linac Coherent Light Source, SLACStanford, USA) [233] using the CSPAD detector [173, 225]. Diffraction imageswere recorded at 120 Hz to match the repetition rate of the FEL, which wasrunning with a pulse length of 30 fs at a photon energy of 7.925 keV (1.56 Å).The FEL had an approximate beam waist FWHM of 100-300 nm.For injection into the x-ray beam a GDVN (see sec. 10.4) with an innercapillary diameter of 50 µm has been used at a flow rate of 15 µL ·min−1 toobtain a stable jet [129]. The resulting jet had an approximate diameter of5 µm. The sample reservoir and tubings were maintained at a temperatureof 20°C. The sample suspension was constantly agitated within the samplereservoir to avoid sample settling and thus tube- or nozzle clogging.Whole cells, as well as purified peroxisomes were both considered as potentialcrystal-stabilizing environments and thus crystal-carriers in typical SFX exper-iments. A pure batch of carefully purified organelles can theoretically reducethe background scattering by the removal of signal from amorphous moleculesand cellular structures. On the contrary, organelles might suffer from severedamage introduced by purification procedures (cp. fig. 10.6-A/C) and canbe prone to degradation during prolonged storage. Even more problematicis the storage of organelles in buffers containing sucrose or sorbitol to createan isoosmotic solution. High viscosity solutes have a detrimental effect onthe jet stability during SFX experiments. To that effect whole yeast cellsoffer several advantages as they can be stored for prolonged times at 4°Cwithout degradation, as it was proven by powder diffraction experiments (seefig. A.8). Additionally intact yeast cells exhibit an extreme robustness dueto their strong cell wall [58]. Injection of whole cells suspended in distilledwater has been demonstrated at high optical densities via GDVNs withoutcellular degradation or loss of cell material (cp. sec. 10.4). Conclusively the
1SFX Experiments were conducted in Oct. 2013 (PCS Proposal LB92) and were publishedby Jakobi et al. [253] in 2016.
89
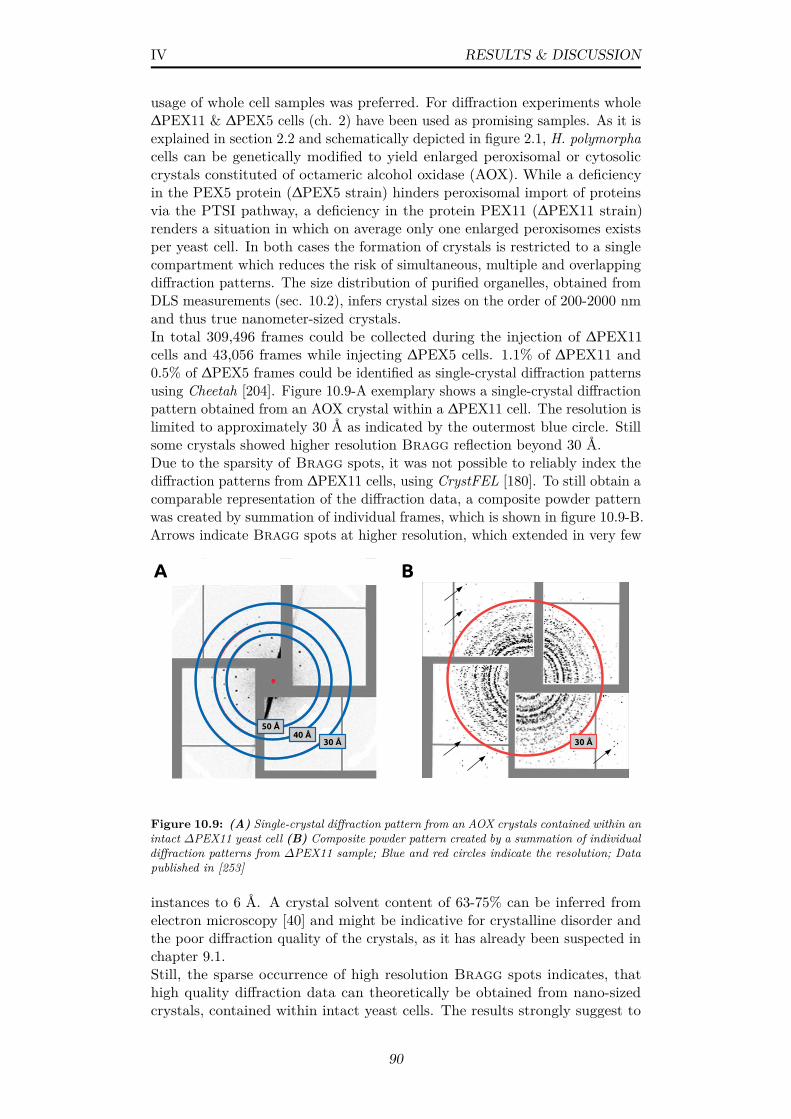
IV RESULTS & DISCUSSION
usage of whole cell samples was preferred. For diffraction experiments whole∆PEX11 & ∆PEX5 cells (ch. 2) have been used as promising samples. As it isexplained in section 2.2 and schematically depicted in figure 2.1, H. polymorphacells can be genetically modified to yield enlarged peroxisomal or cytosoliccrystals constituted of octameric alcohol oxidase (AOX). While a deficiencyin the PEX5 protein (∆PEX5 strain) hinders peroxisomal import of proteinsvia the PTSI pathway, a deficiency in the protein PEX11 (∆PEX11 strain)renders a situation in which on average only one enlarged peroxisomes existsper yeast cell. In both cases the formation of crystals is restricted to a singlecompartment which reduces the risk of simultaneous, multiple and overlappingdiffraction patterns. The size distribution of purified organelles, obtained fromDLS measurements (sec. 10.2), infers crystal sizes on the order of 200-2000 nmand thus true nanometer-sized crystals.In total 309,496 frames could be collected during the injection of ∆PEX11cells and 43,056 frames while injecting ∆PEX5 cells. 1.1% of ∆PEX11 and0.5% of ∆PEX5 frames could be identified as single-crystal diffraction patternsusing Cheetah [204]. Figure 10.9-A exemplary shows a single-crystal diffractionpattern obtained from an AOX crystal within a ∆PEX11 cell. The resolution islimited to approximately 30 Å as indicated by the outermost blue circle. Stillsome crystals showed higher resolution Bragg reflection beyond 30 Å.Due to the sparsity of Bragg spots, it was not possible to reliably index thediffraction patterns from ∆PEX11 cells, using CrystFEL [180]. To still obtain acomparable representation of the diffraction data, a composite powder patternwas created by summation of individual frames, which is shown in figure 10.9-B.Arrows indicate Bragg spots at higher resolution, which extended in very few
50 Å40 Å
30 Å
A B
30 Å
Figure 10.9: (A) Single-crystal diffraction pattern from an AOX crystals contained within anintact ∆PEX11 yeast cell (B) Composite powder pattern created by a summation of individualdiffraction patterns from ∆PEX11 sample; Blue and red circles indicate the resolution; Datapublished in [253]
instances to 6 Å. A crystal solvent content of 63-75% can be inferred fromelectron microscopy [40] and might be indicative for crystalline disorder andthe poor diffraction quality of the crystals, as it has already been suspected inchapter 9.1.Still, the sparse occurrence of high resolution Bragg spots indicates, thathigh quality diffraction data can theoretically be obtained from nano-sizedcrystals, contained within intact yeast cells. The results strongly suggest to
90

IV RESULTS & DISCUSSION
assume a limitation of crystal quality, rather than a limitation of the method.Since in total only 215 frames have been recorded for ∆PEX5 cells that containsingle-crystal diffraction, no further analysis was conducted for this sample.
91
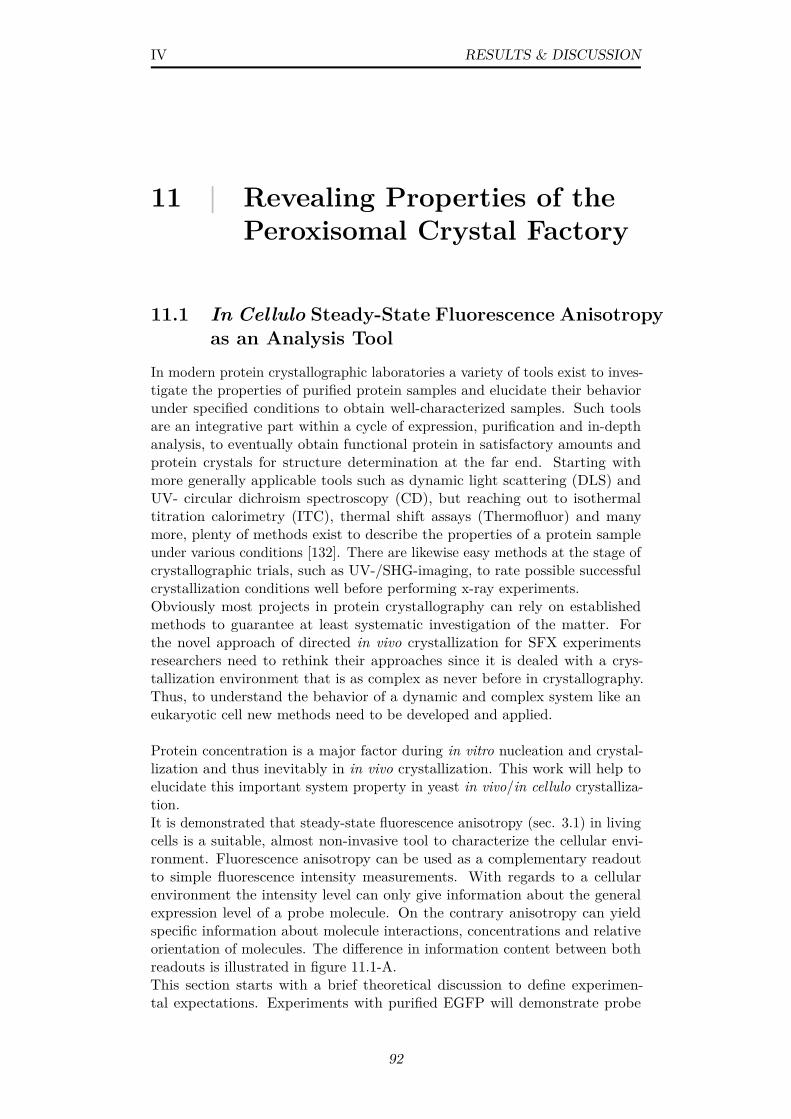
IV RESULTS & DISCUSSION
11 | Revealing Properties of thePeroxisomal Crystal Factory
11.1 In Cellulo Steady-State Fluorescence Anisotropyas an Analysis Tool
In modern protein crystallographic laboratories a variety of tools exist to inves-tigate the properties of purified protein samples and elucidate their behaviorunder specified conditions to obtain well-characterized samples. Such toolsare an integrative part within a cycle of expression, purification and in-depthanalysis, to eventually obtain functional protein in satisfactory amounts andprotein crystals for structure determination at the far end. Starting withmore generally applicable tools such as dynamic light scattering (DLS) andUV- circular dichroism spectroscopy (CD), but reaching out to isothermaltitration calorimetry (ITC), thermal shift assays (Thermofluor) and manymore, plenty of methods exist to describe the properties of a protein sampleunder various conditions [132]. There are likewise easy methods at the stage ofcrystallographic trials, such as UV-/SHG-imaging, to rate possible successfulcrystallization conditions well before performing x-ray experiments.Obviously most projects in protein crystallography can rely on establishedmethods to guarantee at least systematic investigation of the matter. Forthe novel approach of directed in vivo crystallization for SFX experimentsresearchers need to rethink their approaches since it is dealed with a crys-tallization environment that is as complex as never before in crystallography.Thus, to understand the behavior of a dynamic and complex system like aneukaryotic cell new methods need to be developed and applied.
Protein concentration is a major factor during in vitro nucleation and crystal-lization and thus inevitably in in vivo crystallization. This work will help toelucidate this important system property in yeast in vivo/in cellulo crystalliza-tion.It is demonstrated that steady-state fluorescence anisotropy (sec. 3.1) in livingcells is a suitable, almost non-invasive tool to characterize the cellular envi-ronment. Fluorescence anisotropy can be used as a complementary readoutto simple fluorescence intensity measurements. With regards to a cellularenvironment the intensity level can only give information about the generalexpression level of a probe molecule. On the contrary anisotropy can yieldspecific information about molecule interactions, concentrations and relativeorientation of molecules. The difference in information content between bothreadouts is illustrated in figure 11.1-A.This section starts with a brief theoretical discussion to define experimen-tal expectations. Experiments with purified EGFP will demonstrate probe
92
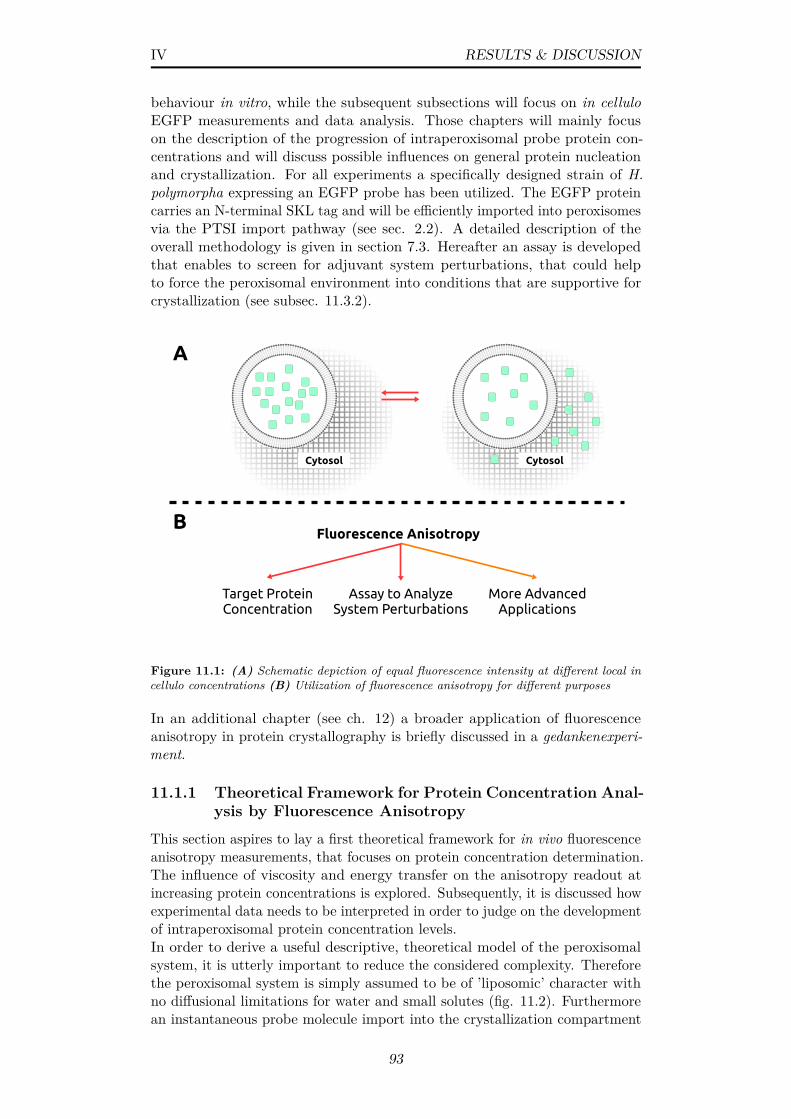
IV RESULTS & DISCUSSION
behaviour in vitro, while the subsequent subsections will focus on in celluloEGFP measurements and data analysis. Those chapters will mainly focuson the description of the progression of intraperoxisomal probe protein con-centrations and will discuss possible influences on general protein nucleationand crystallization. For all experiments a specifically designed strain of H.polymorpha expressing an EGFP probe has been utilized. The EGFP proteincarries an N-terminal SKL tag and will be efficiently imported into peroxisomesvia the PTSI import pathway (see sec. 2.2). A detailed description of theoverall methodology is given in section 7.3. Hereafter an assay is developedthat enables to screen for adjuvant system perturbations, that could helpto force the peroxisomal environment into conditions that are supportive forcrystallization (see subsec. 11.3.2).
Fluorescence Anisotropy
Target Protein Concentration
Assay to Analyze System Perturbations
More Advanced Applications
A
Cytosol Cytosol
B
Figure 11.1: (A) Schematic depiction of equal fluorescence intensity at different local incellulo concentrations (B) Utilization of fluorescence anisotropy for different purposes
In an additional chapter (see ch. 12) a broader application of fluorescenceanisotropy in protein crystallography is briefly discussed in a gedankenexperi-ment.
11.1.1 Theoretical Framework for Protein Concentration Anal-ysis by Fluorescence Anisotropy
This section aspires to lay a first theoretical framework for in vivo fluorescenceanisotropy measurements, that focuses on protein concentration determination.The influence of viscosity and energy transfer on the anisotropy readout atincreasing protein concentrations is explored. Subsequently, it is discussed howexperimental data needs to be interpreted in order to judge on the developmentof intraperoxisomal protein concentration levels.In order to derive a useful descriptive, theoretical model of the peroxisomalsystem, it is utterly important to reduce the considered complexity. Thereforethe peroxisomal system is simply assumed to be of ’liposomic’ character withno diffusional limitations for water and small solutes (fig. 11.2). Furthermorean instantaneous probe molecule import into the crystallization compartment
93
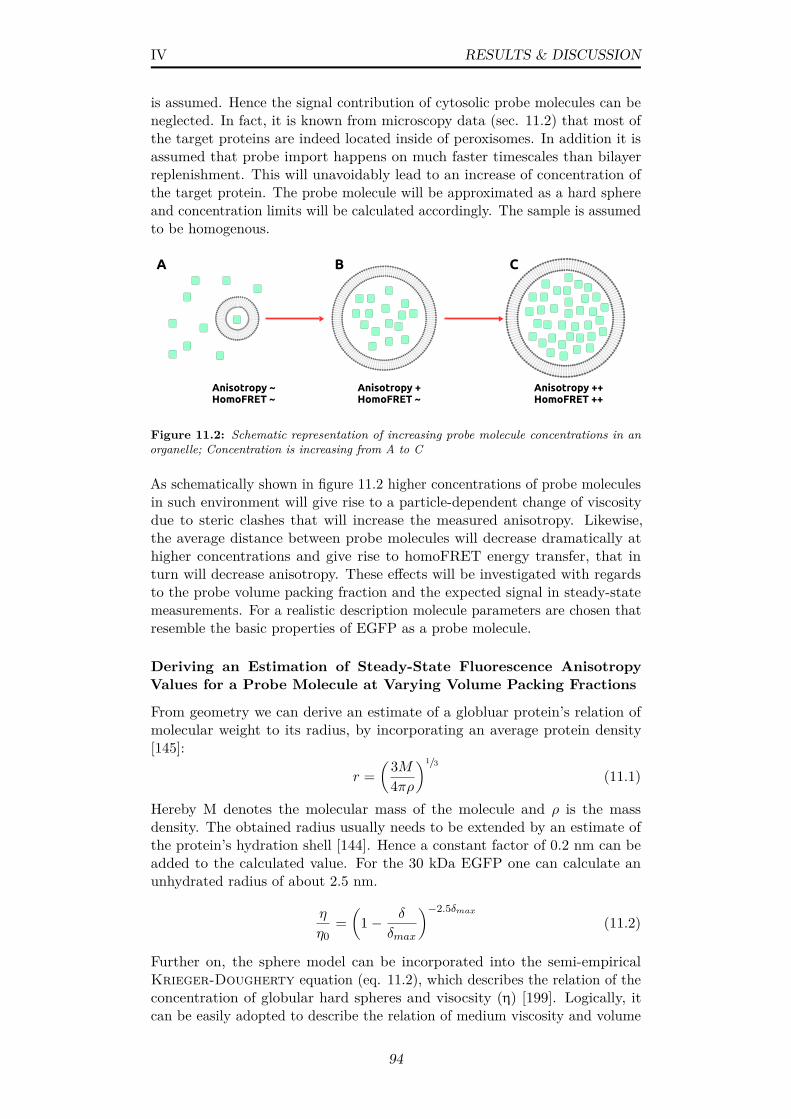
IV RESULTS & DISCUSSION
is assumed. Hence the signal contribution of cytosolic probe molecules can beneglected. In fact, it is known from microscopy data (sec. 11.2) that most ofthe target proteins are indeed located inside of peroxisomes. In addition it isassumed that probe import happens on much faster timescales than bilayerreplenishment. This will unavoidably lead to an increase of concentration ofthe target protein. The probe molecule will be approximated as a hard sphereand concentration limits will be calculated accordingly. The sample is assumedto be homogenous.
Anisotropy ~HomoFRET ~
Anisotropy +HomoFRET ~
Anisotropy ++HomoFRET ++
A B C
Figure 11.2: Schematic representation of increasing probe molecule concentrations in anorganelle; Concentration is increasing from A to C
As schematically shown in figure 11.2 higher concentrations of probe moleculesin such environment will give rise to a particle-dependent change of viscositydue to steric clashes that will increase the measured anisotropy. Likewise,the average distance between probe molecules will decrease dramatically athigher concentrations and give rise to homoFRET energy transfer, that inturn will decrease anisotropy. These effects will be investigated with regardsto the probe volume packing fraction and the expected signal in steady-statemeasurements. For a realistic description molecule parameters are chosen thatresemble the basic properties of EGFP as a probe molecule.
Deriving an Estimation of Steady-State Fluorescence AnisotropyValues for a Probe Molecule at Varying Volume Packing Fractions
From geometry we can derive an estimate of a globluar protein’s relation ofmolecular weight to its radius, by incorporating an average protein density[145]:
r =(3M
4πρ
)1/3
(11.1)
Hereby M denotes the molecular mass of the molecule and ρ is the massdensity. The obtained radius usually needs to be extended by an estimate ofthe protein’s hydration shell [144]. Hence a constant factor of 0.2 nm can beadded to the calculated value. For the 30 kDa EGFP one can calculate anunhydrated radius of about 2.5 nm.
η
η0=(
1− δ
δmax
)−2.5δmax(11.2)
Further on, the sphere model can be incorporated into the semi-empiricalKrieger-Dougherty equation (eq. 11.2), which describes the relation of theconcentration of globular hard spheres and visocsity (η) [199]. Logically, itcan be easily adopted to describe the relation of medium viscosity and volume
94

IV RESULTS & DISCUSSION
fraction (δ) of probe molecules accumulating in peroxisomes. As an upperlimit of volume fraction (δmax) the close packing of equal spheres has beenchosen (cp. fig. 11.3), which corresponds to a maximum of 74% in spaceoccupancy. This is also approximately at the upper limit of protein content incrystals [12]. The lower limit represents free diffusion. Electrostatic interac-tions between the molecules are completely neglected in this approximation.Under the assumption of a maximum volume packing we can obtain for a30 kDa globular protein of average mass density a maximum particle density of1.115·1025particles ·m−3, which corresponds to 555 mg·mL−1, or 18.57 mMof probe molecule.
Krieger-Dougherty Plots
log
Vis
cosi
ty [
cP]
0,1
1
10
100
1.000
10.000
100.000
1e+06
δ/δmax
0 0,2 0,4 0,6 0,8 1
F4F2F7F1F6F5
5 cP3.5 cP2 cP1 cP0.5 cP0.22 cP
Figure 11.3: Krieger-Dougherty plots at different arbitrary η0 values, ranging from 0.2to 5 cP; δ/δmax equals a total space occupancy of 74% (close packing of equal spheres) asschematically depicted
Figure 11.3 is derived from equation 11.2 and shows how viscosity changesupon an increase in concentration. The concentration is expressed as the rela-tive volume packing fraction (δ/δmax). With the relation of volume fraction toviscosity we can use the Stokes-Einstein-Debye equation (eq. 11.3) to buildup a relation to the rotational correlation time (θr) of the probe molecules:
θr = 16Dr
= 8πηr3
kBT(11.3)
kB is the Boltzmann constant, whereas T describes the temperature in Kelvin.From this it is possible to derive theoretical steady-state fluorescence anisotropyvalues by using the obtained correlation times in combination with the Perrinequation (eq. 3.3). By insertion of eq. 11.2 and 11.3 into 3.3 the followingdependency of r can be derived:
r(δ) = r0
1 + τkBT
8πr3η0(1− δ
δmax
)−2.5δmax
−1
(11.4)
Since the Krieger-Dougherty equation already accounts for a 3D distribu-tion of molecules, the presented equation is valid for the theoretical peroxisomemodel. To obtain reasonable theoretical plotting data, it seems necessary toadopt EGFP standard values of different molecule properties from literatureand incorporate them into the calculation. As stated above, EGFP weighsabout 30 kDa and has a fluorescence lifetime (τ) of about 2.58 ns. Assuminga limiting anisotropy of 0.4 (400 mAns) and an initial viscosity of 0.22 cP
95
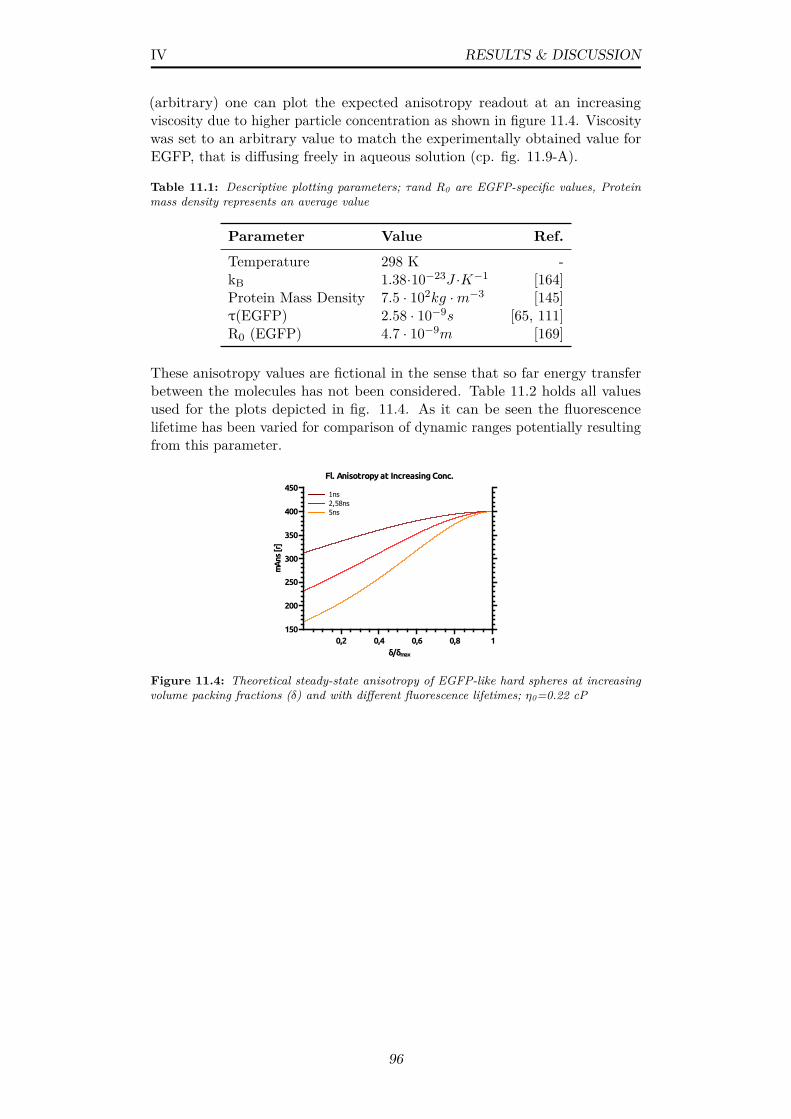
IV RESULTS & DISCUSSION
(arbitrary) one can plot the expected anisotropy readout at an increasingviscosity due to higher particle concentration as shown in figure 11.4. Viscositywas set to an arbitrary value to match the experimentally obtained value forEGFP, that is diffusing freely in aqueous solution (cp. fig. 11.9-A).
Table 11.1: Descriptive plotting parameters; τand R0 are EGFP-specific values, Proteinmass density represents an average value
Parameter Value Ref.
Temperature 298 K -kB 1.38·10−23J ·K−1 [164]Protein Mass Density 7.5 · 102kg ·m−3 [145]τ(EGFP) 2.58 · 10−9s [65, 111]R0 (EGFP) 4.7 · 10−9m [169]
These anisotropy values are fictional in the sense that so far energy transferbetween the molecules has not been considered. Table 11.2 holds all valuesused for the plots depicted in fig. 11.4. As it can be seen the fluorescencelifetime has been varied for comparison of dynamic ranges potentially resultingfrom this parameter.
Fl. Anisotropy at Increasing Conc.
mA
ns [r
]
150
200
250
300
350
400
450
δ/δmax
0,2 0,4 0,6 0,8 1
1ns2,58ns5ns
Figure 11.4: Theoretical steady-state anisotropy of EGFP-like hard spheres at increasingvolume packing fractions (δ) and with different fluorescence lifetimes; η0=0.22 cP
96

IV RESULTS & DISCUSSION
Deriving an Estimation of homoFRET between Probe Molecules atVarying Volume Packing Fractions
In order to connect the predicted anisotropy with the depolarizing effect arisingfrom energy transfer between neighboring probe molecules (homoFRET), itis necessary to extend the generally applied FRET theory to 3D, as shownin section 3.2. Hence the quantum yield(Φ/Φ0) of an arbitrary energy donormolecule in a solution can be described as follows (cp. eq. 3.14):
ΦΦ0
= 1− q√π · exp
(q2)
[1− Σ(q)]
q =√πVFKpack
2VM· δ
δmax
(11.5)
Hereby q originally describes the ratio of acceptor molecule concentration to acritical concentration C0 which is calculated from the Förster radius (seeeq. 3.15). For the presented data an isotropic energy transfer and a randomorientation of probe molecules is assumed. Hence the more acceptors are inproximity to an excited donor, the stronger the emission will be depolarizedand thus reducing the anisotropy readout. Volume packing fraction andconcentration are related by δ = VMN/V . VM is just the volume occupied byone molecule, N is the total number of molecules and V is the consideredtotal volume. Furthermore, we can define Nmax = V ·Kpack/VM and henceδmax = NmaxVM/V = Kpack, which yields:
δ
δmax=
NV VM
Kpack= C
VMKpack
(11.6)
Kpack is a packing parameter that defines the maximum packing fraction of acertain particle within a volume. Nmax is the maximum number of particlesin V, which occupy the total volume Vmax. With the new definition of thevariable q, equation 11.5 can be utilized to determine the overall homoFRETtransfer efficiency at different volume packing fractions, according to [110]:
EFRET = 1− ΦΦ0
(11.7)
Considering all of the stated theoretical assumptions, it is possible to obtain anapproximation of the energy transfer efficiency between probe molecules in asolute at varying volume fractions. In fact, the transfer efficiency from exciteddonor molecules is investigated under the assumption that no back-transfer ofenergy to the original donor is occurring. If the energy transfer rate (kT) ismuch faster than the fluorescence lifetime (τ0), which is likewise faster thanthe rotational correlation time, energy back-transfer would e.g. be a reasonableexplanation for increased anisotropy values.The plotting results are shown in figure 11.5. Three curves are shown torepresent the energy transfer rate between EGFP like molecules with differentFörster radii (R0). If the Förster radius equals the reported value of4.7 nm, transfer efficiency is already equal to 1 at a volume fraction of about0.1. This corresponds to about 2 mM of protein. If the efficiency is reducedto yield a Förster radius that is somewhat equal to the molecule radius, anefficiency of 1 is only reached under maximum packing conditions. These resultsindicate a conclusive approximation of homoFRET in a solution. Thereforethe obtained values can be applied as modifying factors in a holistic view of
97
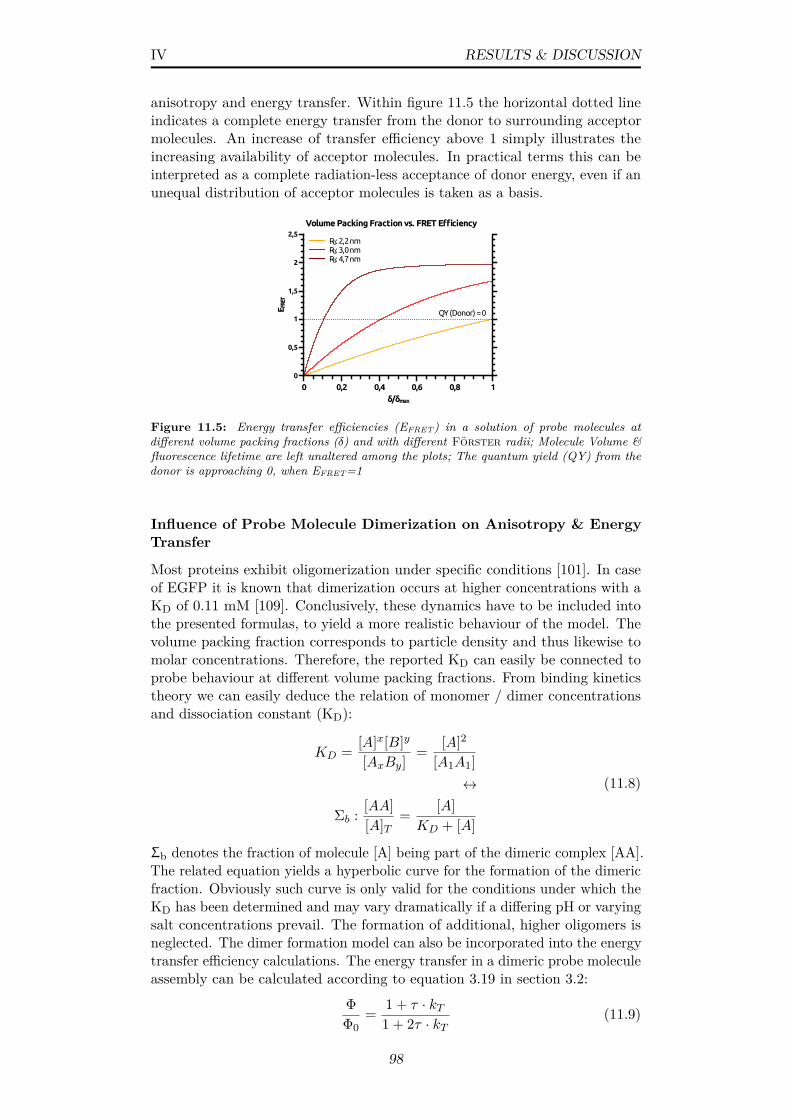
IV RESULTS & DISCUSSION
anisotropy and energy transfer. Within figure 11.5 the horizontal dotted lineindicates a complete energy transfer from the donor to surrounding acceptormolecules. An increase of transfer efficiency above 1 simply illustrates theincreasing availability of acceptor molecules. In practical terms this can beinterpreted as a complete radiation-less acceptance of donor energy, even if anunequal distribution of acceptor molecules is taken as a basis.
Volume Packing Fraction vs. FRET Efficiency
E FRE
T
0
0,5
1
1,5
2
2,5
δ/δmax
0 0,2 0,4 0,6 0,8 1
R0: 2,2 nmR0: 3,0 nmR0: 4,7 nm
QY (Donor) = 0
Figure 11.5: Energy transfer efficiencies (EFRET) in a solution of probe molecules atdifferent volume packing fractions (δ) and with different Förster radii; Molecule Volume &fluorescence lifetime are left unaltered among the plots; The quantum yield (QY) from thedonor is approaching 0, when EFRET=1
Influence of Probe Molecule Dimerization on Anisotropy & EnergyTransfer
Most proteins exhibit oligomerization under specific conditions [101]. In caseof EGFP it is known that dimerization occurs at higher concentrations with aKD of 0.11 mM [109]. Conclusively, these dynamics have to be included intothe presented formulas, to yield a more realistic behaviour of the model. Thevolume packing fraction corresponds to particle density and thus likewise tomolar concentrations. Therefore, the reported KD can easily be connected toprobe behaviour at different volume packing fractions. From binding kineticstheory we can easily deduce the relation of monomer / dimer concentrationsand dissociation constant (KD):
KD = [A]x[B]y
[AxBy]= [A]2
[A1A1]↔
Σb : [AA][A]T
= [A]KD + [A]
(11.8)
Σb denotes the fraction of molecule [A] being part of the dimeric complex [AA].The related equation yields a hyperbolic curve for the formation of the dimericfraction. Obviously such curve is only valid for the conditions under which theKD has been determined and may vary dramatically if a differing pH or varyingsalt concentrations prevail. The formation of additional, higher oligomers isneglected. The dimer formation model can also be incorporated into the energytransfer efficiency calculations. The energy transfer in a dimeric probe moleculeassembly can be calculated according to equation 3.19 in section 3.2:
ΦΦ0
= 1 + τ · kT1 + 2τ · kT
(11.9)
98
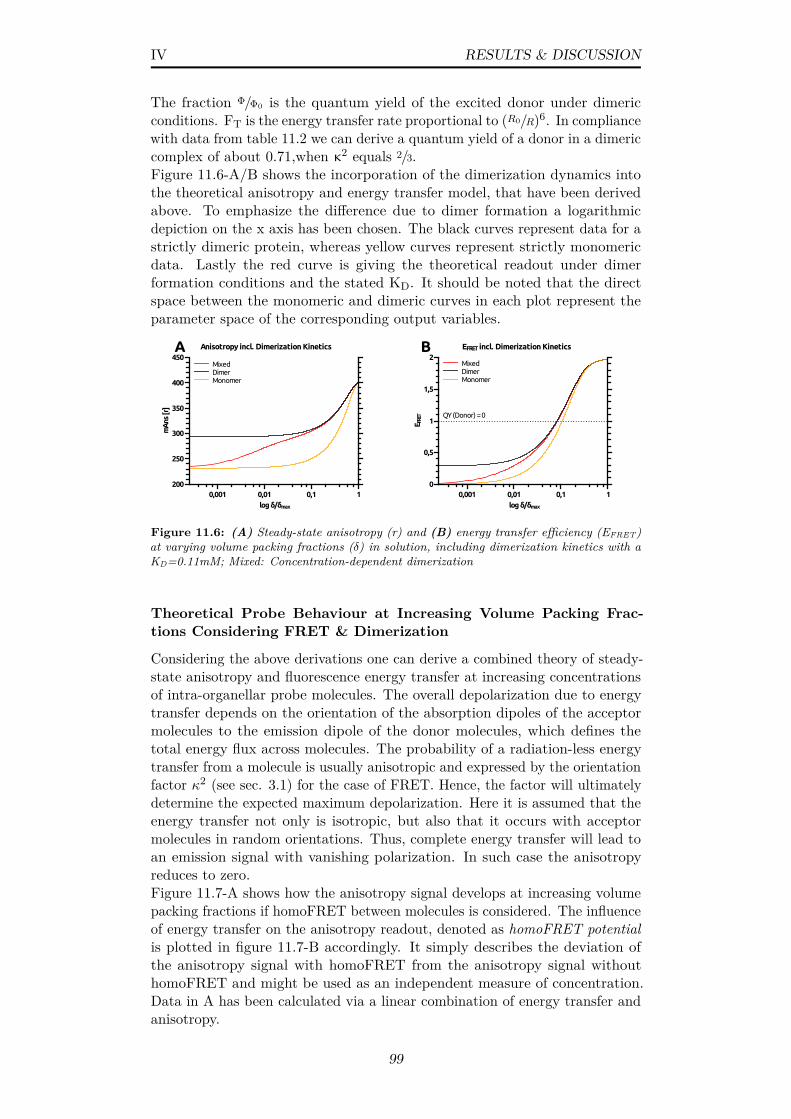
IV RESULTS & DISCUSSION
The fraction Φ/Φ0 is the quantum yield of the excited donor under dimericconditions. FT is the energy transfer rate proportional to (R0/R)6. In compliancewith data from table 11.2 we can derive a quantum yield of a donor in a dimericcomplex of about 0.71,when κ2 equals 2/3.Figure 11.6-A/B shows the incorporation of the dimerization dynamics intothe theoretical anisotropy and energy transfer model, that have been derivedabove. To emphasize the difference due to dimer formation a logarithmicdepiction on the x axis has been chosen. The black curves represent data for astrictly dimeric protein, whereas yellow curves represent strictly monomericdata. Lastly the red curve is giving the theoretical readout under dimerformation conditions and the stated KD. It should be noted that the directspace between the monomeric and dimeric curves in each plot represent theparameter space of the corresponding output variables.
EFRET incl. Dimerization Kinetics
E FRE
T
0
0,5
1
1,5
2
log δ/δmax
0,001 0,01 0,1 1
MixedDimerMonomer
QY (Donor) = 0
Anisotropy incl. Dimerization Kinetics
mA
ns [r
]
200
250
300
350
400
450
log δ/δmax
0,001 0,01 0,1 1
MixedDimerMonomer
A B
Figure 11.6: (A) Steady-state anisotropy (r) and (B) energy transfer efficiency (EFRET)at varying volume packing fractions (δ) in solution, including dimerization kinetics with aKD=0.11mM; Mixed: Concentration-dependent dimerization
Theoretical Probe Behaviour at Increasing Volume Packing Frac-tions Considering FRET & Dimerization
Considering the above derivations one can derive a combined theory of steady-state anisotropy and fluorescence energy transfer at increasing concentrationsof intra-organellar probe molecules. The overall depolarization due to energytransfer depends on the orientation of the absorption dipoles of the acceptormolecules to the emission dipole of the donor molecules, which defines thetotal energy flux across molecules. The probability of a radiation-less energytransfer from a molecule is usually anisotropic and expressed by the orientationfactor κ2 (see sec. 3.1) for the case of FRET. Hence, the factor will ultimatelydetermine the expected maximum depolarization. Here it is assumed that theenergy transfer not only is isotropic, but also that it occurs with acceptormolecules in random orientations. Thus, complete energy transfer will lead toan emission signal with vanishing polarization. In such case the anisotropyreduces to zero.Figure 11.7-A shows how the anisotropy signal develops at increasing volumepacking fractions if homoFRET between molecules is considered. The influenceof energy transfer on the anisotropy readout, denoted as homoFRET potentialis plotted in figure 11.7-B accordingly. It simply describes the deviation ofthe anisotropy signal with homoFRET from the anisotropy signal withouthomoFRET and might be used as an independent measure of concentration.Data in A has been calculated via a linear combination of energy transfer andanisotropy.
99
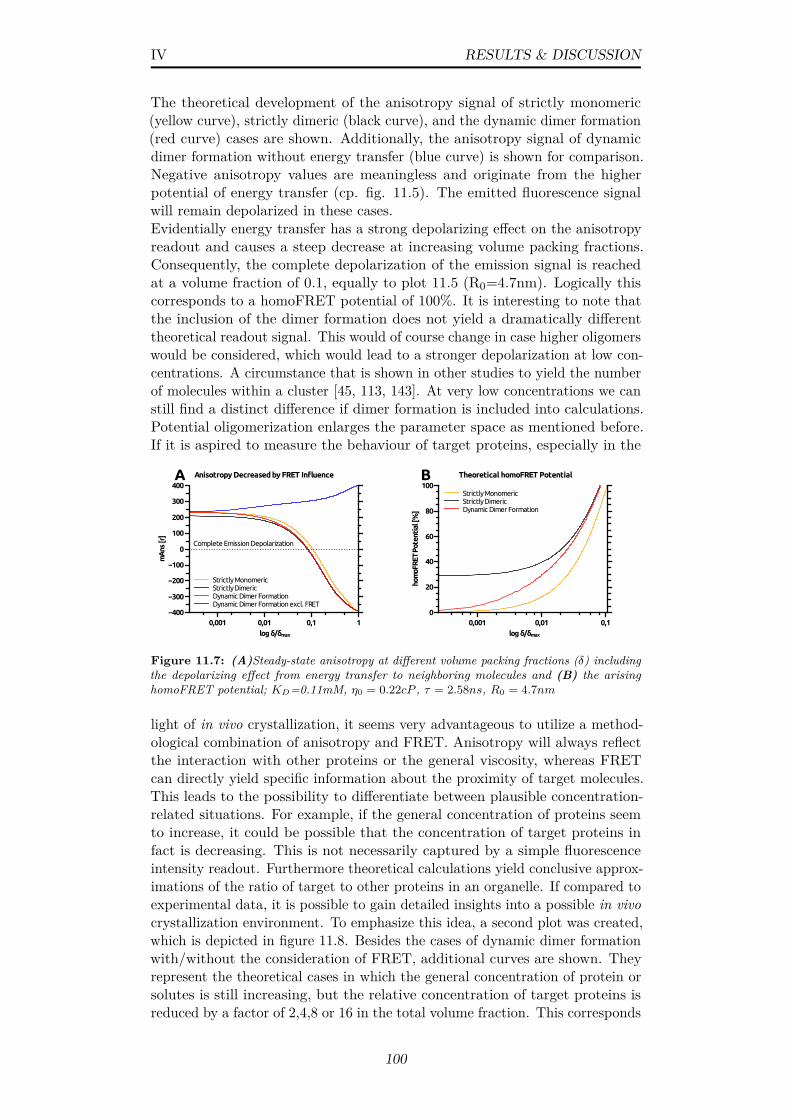
IV RESULTS & DISCUSSION
The theoretical development of the anisotropy signal of strictly monomeric(yellow curve), strictly dimeric (black curve), and the dynamic dimer formation(red curve) cases are shown. Additionally, the anisotropy signal of dynamicdimer formation without energy transfer (blue curve) is shown for comparison.Negative anisotropy values are meaningless and originate from the higherpotential of energy transfer (cp. fig. 11.5). The emitted fluorescence signalwill remain depolarized in these cases.Evidentially energy transfer has a strong depolarizing effect on the anisotropyreadout and causes a steep decrease at increasing volume packing fractions.Consequently, the complete depolarization of the emission signal is reachedat a volume fraction of 0.1, equally to plot 11.5 (R0=4.7nm). Logically thiscorresponds to a homoFRET potential of 100%. It is interesting to note thatthe inclusion of the dimer formation does not yield a dramatically differenttheoretical readout signal. This would of course change in case higher oligomerswould be considered, which would lead to a stronger depolarization at low con-centrations. A circumstance that is shown in other studies to yield the numberof molecules within a cluster [45, 113, 143]. At very low concentrations we canstill find a distinct difference if dimer formation is included into calculations.Potential oligomerization enlarges the parameter space as mentioned before.If it is aspired to measure the behaviour of target proteins, especially in the
Anisotropy Decreased by FRET Influence
mA
ns [r
]
−400
−300
−200
−100
0
100
200
300
400
log δ/δmax
0,001 0,01 0,1 1
Strictly MonomericStrictly DimericDynamic Dimer FormationDynamic Dimer Formation excl. FRET
Complete Emission Depolarization
A B Theoretical homoFRET Potential
hom
oFRE
T Po
tent
ial [
%]
0
20
40
60
80
100
log δ/δmax
0,001 0,01 0,1
strictlydimericstrictlymonomericwithdimer
Strictly MonomericStrictly DimericDynamic Dimer Formation
Figure 11.7: (A)Steady-state anisotropy at different volume packing fractions (δ) includingthe depolarizing effect from energy transfer to neighboring molecules and (B) the arisinghomoFRET potential; KD=0.11mM, η0 = 0.22cP , τ = 2.58ns, R0 = 4.7nm
light of in vivo crystallization, it seems very advantageous to utilize a method-ological combination of anisotropy and FRET. Anisotropy will always reflectthe interaction with other proteins or the general viscosity, whereas FRETcan directly yield specific information about the proximity of target molecules.This leads to the possibility to differentiate between plausible concentration-related situations. For example, if the general concentration of proteins seemto increase, it could be possible that the concentration of target proteins infact is decreasing. This is not necessarily captured by a simple fluorescenceintensity readout. Furthermore theoretical calculations yield conclusive approx-imations of the ratio of target to other proteins in an organelle. If compared toexperimental data, it is possible to gain detailed insights into a possible in vivocrystallization environment. To emphasize this idea, a second plot was created,which is depicted in figure 11.8. Besides the cases of dynamic dimer formationwith/without the consideration of FRET, additional curves are shown. Theyrepresent the theoretical cases in which the general concentration of protein orsolutes is still increasing, but the relative concentration of target proteins isreduced by a factor of 2,4,8 or 16 in the total volume fraction. This corresponds
100
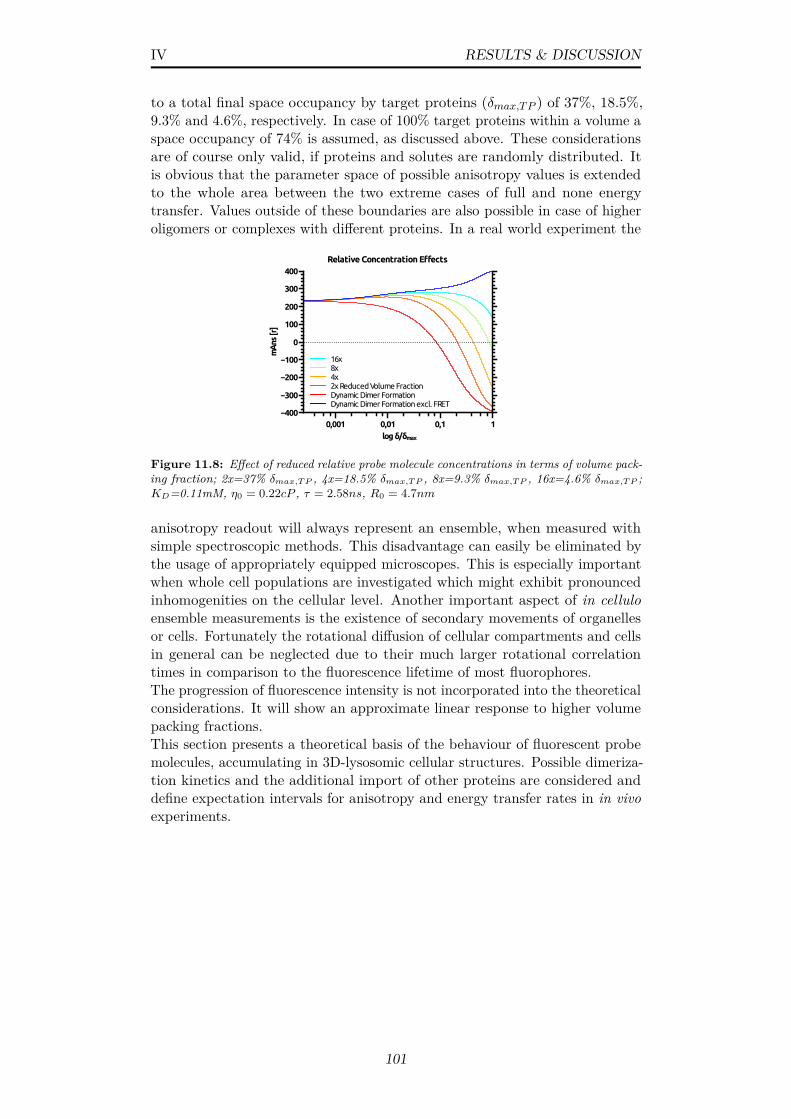
IV RESULTS & DISCUSSION
to a total final space occupancy by target proteins (δmax,TP ) of 37%, 18.5%,9.3% and 4.6%, respectively. In case of 100% target proteins within a volume aspace occupancy of 74% is assumed, as discussed above. These considerationsare of course only valid, if proteins and solutes are randomly distributed. Itis obvious that the parameter space of possible anisotropy values is extendedto the whole area between the two extreme cases of full and none energytransfer. Values outside of these boundaries are also possible in case of higheroligomers or complexes with different proteins. In a real world experiment the
Relative Concentration Effectsm
Ans
[r]
−400
−300
−200
−100
0
100
200
300
400
log δ/δmax
0,001 0,01 0,1 1
16x8x4x2x Reduced Volume FractionDynamic Dimer FormationDynamic Dimer Formation excl. FRET
Figure 11.8: Effect of reduced relative probe molecule concentrations in terms of volume pack-ing fraction; 2x=37% δmax,TP , 4x=18.5% δmax,TP , 8x=9.3% δmax,TP , 16x=4.6% δmax,TP ;KD=0.11mM, η0 = 0.22cP , τ = 2.58ns, R0 = 4.7nm
anisotropy readout will always represent an ensemble, when measured withsimple spectroscopic methods. This disadvantage can easily be eliminated bythe usage of appropriately equipped microscopes. This is especially importantwhen whole cell populations are investigated which might exhibit pronouncedinhomogenities on the cellular level. Another important aspect of in celluloensemble measurements is the existence of secondary movements of organellesor cells. Fortunately the rotational diffusion of cellular compartments and cellsin general can be neglected due to their much larger rotational correlationtimes in comparison to the fluorescence lifetime of most fluorophores.The progression of fluorescence intensity is not incorporated into the theoreticalconsiderations. It will show an approximate linear response to higher volumepacking fractions.This section presents a theoretical basis of the behaviour of fluorescent probemolecules, accumulating in 3D-lysosomic cellular structures. Possible dimeriza-tion kinetics and the additional import of other proteins are considered anddefine expectation intervals for anisotropy and energy transfer rates in in vivoexperiments.
101
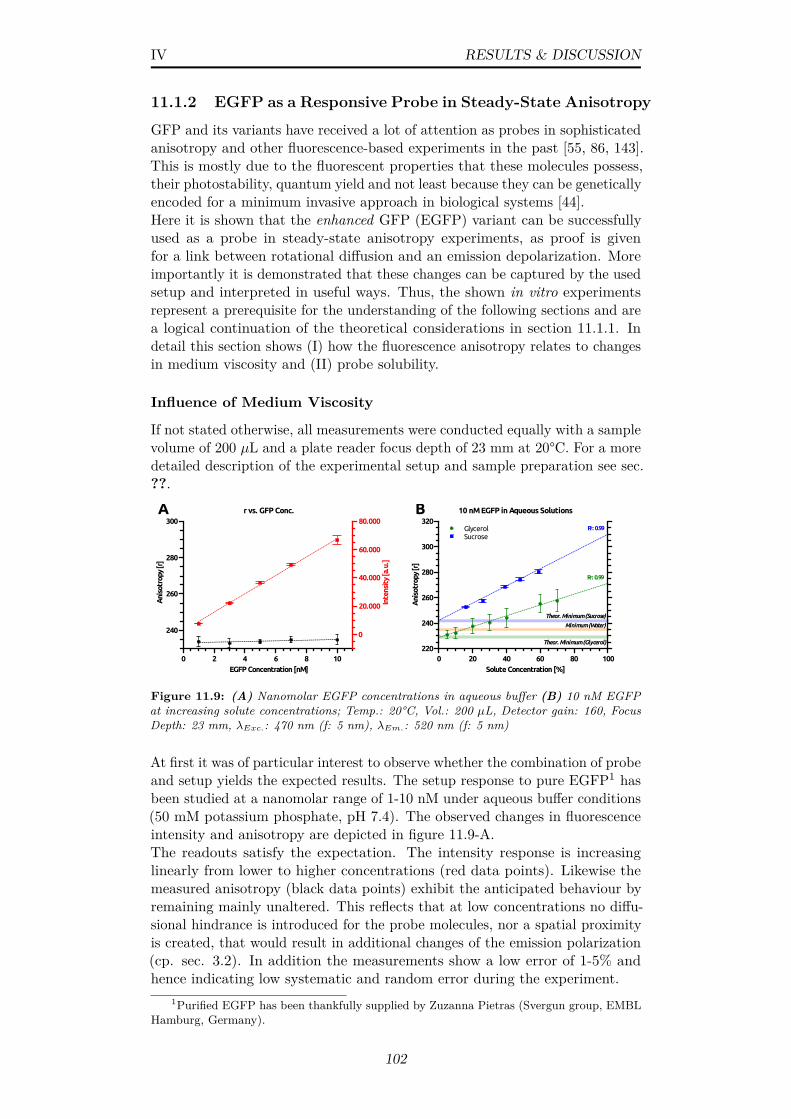
IV RESULTS & DISCUSSION
11.1.2 EGFP as a Responsive Probe in Steady-State Anisotropy
GFP and its variants have received a lot of attention as probes in sophisticatedanisotropy and other fluorescence-based experiments in the past [55, 86, 143].This is mostly due to the fluorescent properties that these molecules possess,their photostability, quantum yield and not least because they can be geneticallyencoded for a minimum invasive approach in biological systems [44].Here it is shown that the enhanced GFP (EGFP) variant can be successfullyused as a probe in steady-state anisotropy experiments, as proof is givenfor a link between rotational diffusion and an emission depolarization. Moreimportantly it is demonstrated that these changes can be captured by the usedsetup and interpreted in useful ways. Thus, the shown in vitro experimentsrepresent a prerequisite for the understanding of the following sections and area logical continuation of the theoretical considerations in section 11.1.1. Indetail this section shows (I) how the fluorescence anisotropy relates to changesin medium viscosity and (II) probe solubility.
Influence of Medium Viscosity
If not stated otherwise, all measurements were conducted equally with a samplevolume of 200 µL and a plate reader focus depth of 23 mm at 20°C. For a moredetailed description of the experimental setup and sample preparation see sec.??.
Ani
sotr
opy
[r]
240
260
280
300
EGFP Concentration [nM]0 2 4 6 8 10
A B r vs. GFP Conc.
Inte
nsit
y [a
.u.]
0
20.000
40.000
60.000
80.00010 nM EGFP in Aqueous Solutions
Ani
sotr
opy
[r]
220
240
260
280
300
320
Solute Concentration [%]0 20 40 60 80 100
Minimum (Water)
Theor. Minimum (Sucrose)
Theor. Minimum (Glycerol)
GlycerolSucrose
R2: 0.99
R2: 0.99
Figure 11.9: (A) Nanomolar EGFP concentrations in aqueous buffer (B) 10 nM EGFPat increasing solute concentrations; Temp.: 20°C, Vol.: 200 µL, Detector gain: 160, FocusDepth: 23 mm, λExc.: 470 nm (f: 5 nm), λEm.: 520 nm (f: 5 nm)
At first it was of particular interest to observe whether the combination of probeand setup yields the expected results. The setup response to pure EGFP1 hasbeen studied at a nanomolar range of 1-10 nM under aqueous buffer conditions(50 mM potassium phosphate, pH 7.4). The observed changes in fluorescenceintensity and anisotropy are depicted in figure 11.9-A.The readouts satisfy the expectation. The intensity response is increasinglinearly from lower to higher concentrations (red data points). Likewise themeasured anisotropy (black data points) exhibit the anticipated behaviour byremaining mainly unaltered. This reflects that at low concentrations no diffu-sional hindrance is introduced for the probe molecules, nor a spatial proximityis created, that would result in additional changes of the emission polarization(cp. sec. 3.2). In addition the measurements show a low error of 1-5% andhence indicating low systematic and random error during the experiment.
1Purified EGFP has been thankfully supplied by Zuzanna Pietras (Svergun group, EMBLHamburg, Germany).
102
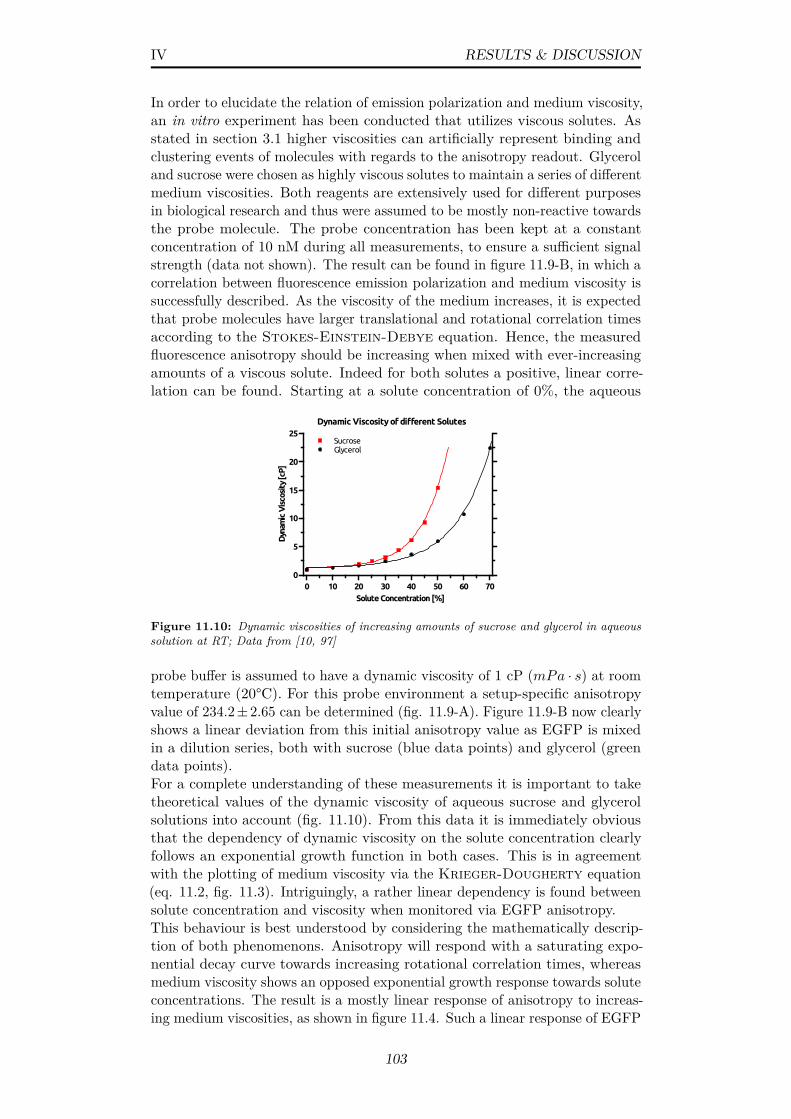
IV RESULTS & DISCUSSION
In order to elucidate the relation of emission polarization and medium viscosity,an in vitro experiment has been conducted that utilizes viscous solutes. Asstated in section 3.1 higher viscosities can artificially represent binding andclustering events of molecules with regards to the anisotropy readout. Glyceroland sucrose were chosen as highly viscous solutes to maintain a series of differentmedium viscosities. Both reagents are extensively used for different purposesin biological research and thus were assumed to be mostly non-reactive towardsthe probe molecule. The probe concentration has been kept at a constantconcentration of 10 nM during all measurements, to ensure a sufficient signalstrength (data not shown). The result can be found in figure 11.9-B, in which acorrelation between fluorescence emission polarization and medium viscosity issuccessfully described. As the viscosity of the medium increases, it is expectedthat probe molecules have larger translational and rotational correlation timesaccording to the Stokes-Einstein-Debye equation. Hence, the measuredfluorescence anisotropy should be increasing when mixed with ever-increasingamounts of a viscous solute. Indeed for both solutes a positive, linear corre-lation can be found. Starting at a solute concentration of 0%, the aqueous
Dynamic Viscosity of different Solutes
Dyn
amic
Vis
cosi
ty [c
P]
0
5
10
15
20
25
Solute Concentration [%]0 10 20 30 40 50 60 70
SucroseGlycerol
Figure 11.10: Dynamic viscosities of increasing amounts of sucrose and glycerol in aqueoussolution at RT; Data from [10, 97]
probe buffer is assumed to have a dynamic viscosity of 1 cP (mPa · s) at roomtemperature (20°C). For this probe environment a setup-specific anisotropyvalue of 234.2±2.65 can be determined (fig. 11.9-A). Figure 11.9-B now clearlyshows a linear deviation from this initial anisotropy value as EGFP is mixedin a dilution series, both with sucrose (blue data points) and glycerol (greendata points).For a complete understanding of these measurements it is important to taketheoretical values of the dynamic viscosity of aqueous sucrose and glycerolsolutions into account (fig. 11.10). From this data it is immediately obviousthat the dependency of dynamic viscosity on the solute concentration clearlyfollows an exponential growth function in both cases. This is in agreementwith the plotting of medium viscosity via the Krieger-Dougherty equation(eq. 11.2, fig. 11.3). Intriguingly, a rather linear dependency is found betweensolute concentration and viscosity when monitored via EGFP anisotropy.This behaviour is best understood by considering the mathematically descrip-tion of both phenomenons. Anisotropy will respond with a saturating expo-nential decay curve towards increasing rotational correlation times, whereasmedium viscosity shows an opposed exponential growth response towards soluteconcentrations. The result is a mostly linear response of anisotropy to increas-ing medium viscosities, as shown in figure 11.4. Such a linear response of EGFP
103
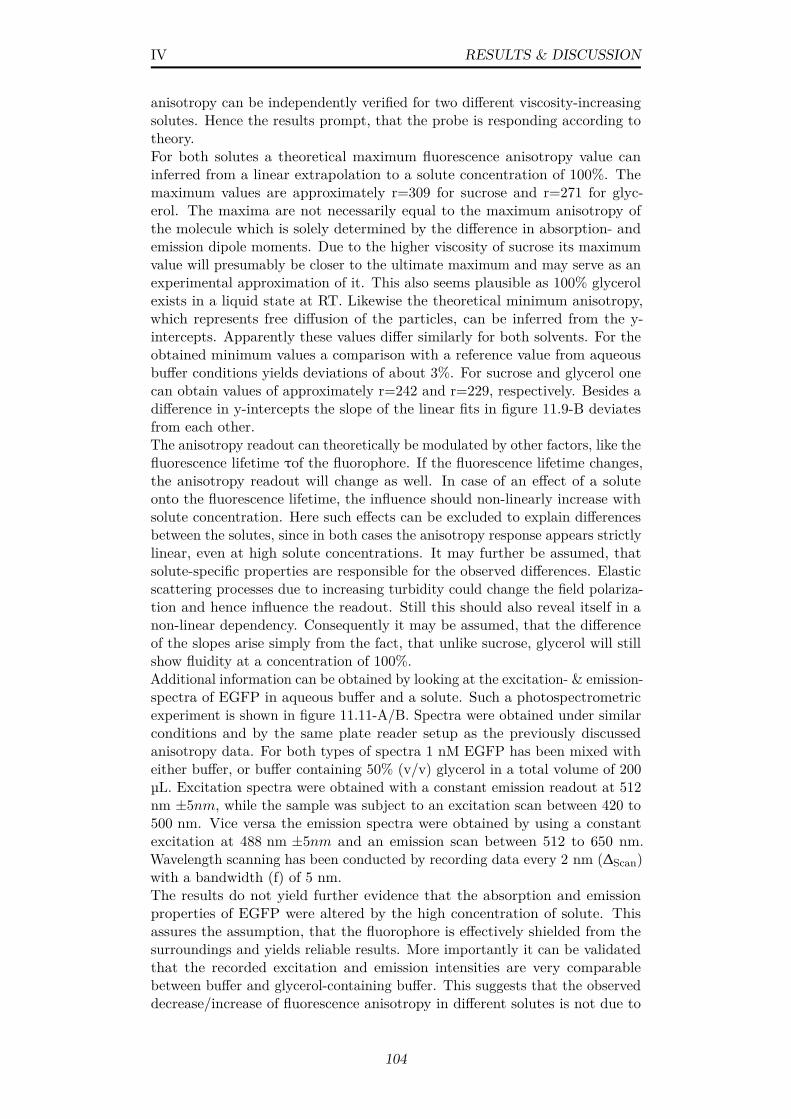
IV RESULTS & DISCUSSION
anisotropy can be independently verified for two different viscosity-increasingsolutes. Hence the results prompt, that the probe is responding according totheory.For both solutes a theoretical maximum fluorescence anisotropy value caninferred from a linear extrapolation to a solute concentration of 100%. Themaximum values are approximately r=309 for sucrose and r=271 for glyc-erol. The maxima are not necessarily equal to the maximum anisotropy ofthe molecule which is solely determined by the difference in absorption- andemission dipole moments. Due to the higher viscosity of sucrose its maximumvalue will presumably be closer to the ultimate maximum and may serve as anexperimental approximation of it. This also seems plausible as 100% glycerolexists in a liquid state at RT. Likewise the theoretical minimum anisotropy,which represents free diffusion of the particles, can be inferred from the y-intercepts. Apparently these values differ similarly for both solvents. For theobtained minimum values a comparison with a reference value from aqueousbuffer conditions yields deviations of about 3%. For sucrose and glycerol onecan obtain values of approximately r=242 and r=229, respectively. Besides adifference in y-intercepts the slope of the linear fits in figure 11.9-B deviatesfrom each other.The anisotropy readout can theoretically be modulated by other factors, like thefluorescence lifetime τof the fluorophore. If the fluorescence lifetime changes,the anisotropy readout will change as well. In case of an effect of a soluteonto the fluorescence lifetime, the influence should non-linearly increase withsolute concentration. Here such effects can be excluded to explain differencesbetween the solutes, since in both cases the anisotropy response appears strictlylinear, even at high solute concentrations. It may further be assumed, thatsolute-specific properties are responsible for the observed differences. Elasticscattering processes due to increasing turbidity could change the field polariza-tion and hence influence the readout. Still this should also reveal itself in anon-linear dependency. Consequently it may be assumed, that the differenceof the slopes arise simply from the fact, that unlike sucrose, glycerol will stillshow fluidity at a concentration of 100%.Additional information can be obtained by looking at the excitation- & emission-spectra of EGFP in aqueous buffer and a solute. Such a photospectrometricexperiment is shown in figure 11.11-A/B. Spectra were obtained under similarconditions and by the same plate reader setup as the previously discussedanisotropy data. For both types of spectra 1 nM EGFP has been mixed witheither buffer, or buffer containing 50% (v/v) glycerol in a total volume of 200µL. Excitation spectra were obtained with a constant emission readout at 512nm ±5nm, while the sample was subject to an excitation scan between 420 to500 nm. Vice versa the emission spectra were obtained by using a constantexcitation at 488 nm ±5nm and an emission scan between 512 to 650 nm.Wavelength scanning has been conducted by recording data every 2 nm (∆Scan)with a bandwidth (f) of 5 nm.The results do not yield further evidence that the absorption and emissionproperties of EGFP were altered by the high concentration of solute. Thisassures the assumption, that the fluorophore is effectively shielded from thesurroundings and yields reliable results. More importantly it can be validatedthat the recorded excitation and emission intensities are very comparablebetween buffer and glycerol-containing buffer. This suggests that the observeddecrease/increase of fluorescence anisotropy in different solutes is not due to
104
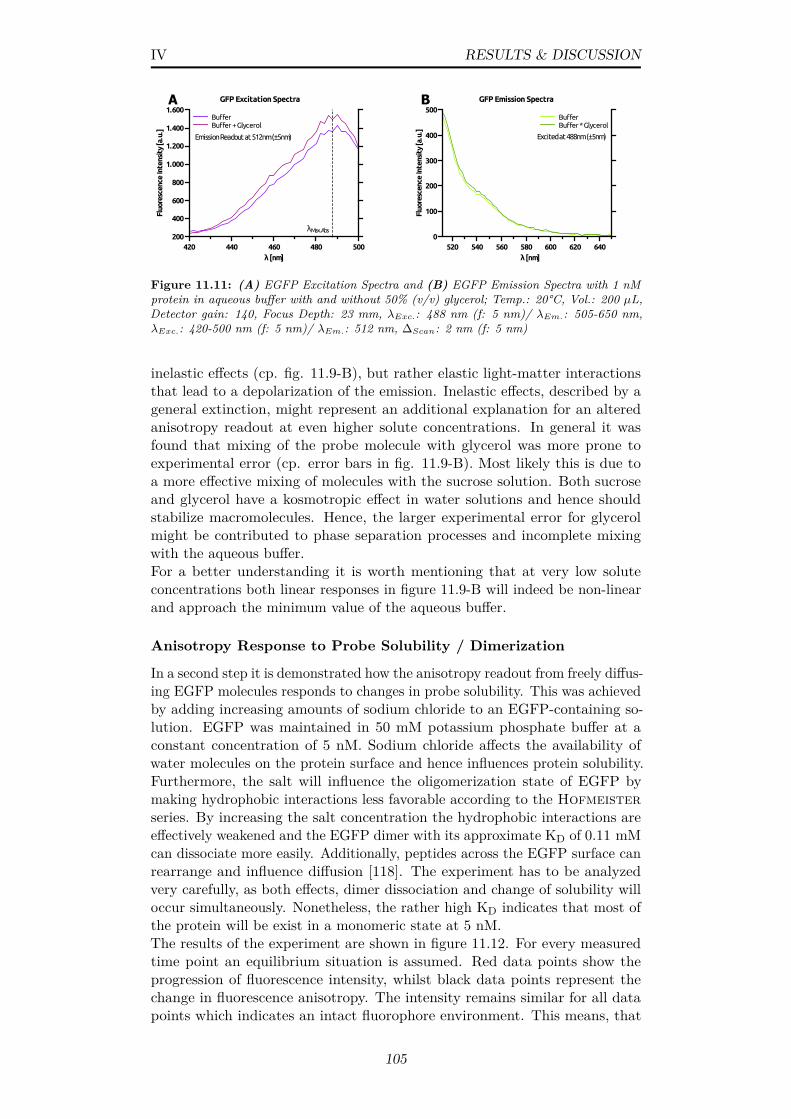
IV RESULTS & DISCUSSION
GFP Excitation Spectra
Fluo
resc
ence
Inte
nsit
y [a
.u.]
200
400
600
800
1.000
1.200
1.400
1.600
λ [nm]420 440 460 480 500
BufferBuffer + Glycerol
A B
λMax.Abs
GFP Emission Spectra
Fluo
resc
ence
Inte
nsit
y [a
.u.]
0
100
200
300
400
500
λ [nm]520 540 560 580 600 620 640
BufferBuffer * Glycerol
Excited at 488nm (±5nm)Emission Readout at 512nm (±5nm)
Figure 11.11: (A) EGFP Excitation Spectra and (B) EGFP Emission Spectra with 1 nMprotein in aqueous buffer with and without 50% (v/v) glycerol; Temp.: 20°C, Vol.: 200 µL,Detector gain: 140, Focus Depth: 23 mm, λExc.: 488 nm (f: 5 nm)/ λEm.: 505-650 nm,λExc.: 420-500 nm (f: 5 nm)/ λEm.: 512 nm, ∆Scan: 2 nm (f: 5 nm)
inelastic effects (cp. fig. 11.9-B), but rather elastic light-matter interactionsthat lead to a depolarization of the emission. Inelastic effects, described by ageneral extinction, might represent an additional explanation for an alteredanisotropy readout at even higher solute concentrations. In general it wasfound that mixing of the probe molecule with glycerol was more prone toexperimental error (cp. error bars in fig. 11.9-B). Most likely this is due toa more effective mixing of molecules with the sucrose solution. Both sucroseand glycerol have a kosmotropic effect in water solutions and hence shouldstabilize macromolecules. Hence, the larger experimental error for glycerolmight be contributed to phase separation processes and incomplete mixingwith the aqueous buffer.For a better understanding it is worth mentioning that at very low soluteconcentrations both linear responses in figure 11.9-B will indeed be non-linearand approach the minimum value of the aqueous buffer.
Anisotropy Response to Probe Solubility / Dimerization
In a second step it is demonstrated how the anisotropy readout from freely diffus-ing EGFP molecules responds to changes in probe solubility. This was achievedby adding increasing amounts of sodium chloride to an EGFP-containing so-lution. EGFP was maintained in 50 mM potassium phosphate buffer at aconstant concentration of 5 nM. Sodium chloride affects the availability ofwater molecules on the protein surface and hence influences protein solubility.Furthermore, the salt will influence the oligomerization state of EGFP bymaking hydrophobic interactions less favorable according to the Hofmeisterseries. By increasing the salt concentration the hydrophobic interactions areeffectively weakened and the EGFP dimer with its approximate KD of 0.11 mMcan dissociate more easily. Additionally, peptides across the EGFP surface canrearrange and influence diffusion [118]. The experiment has to be analyzedvery carefully, as both effects, dimer dissociation and change of solubility willoccur simultaneously. Nonetheless, the rather high KD indicates that most ofthe protein will be exist in a monomeric state at 5 nM.The results of the experiment are shown in figure 11.12. For every measuredtime point an equilibrium situation is assumed. Red data points show theprogression of fluorescence intensity, whilst black data points represent thechange in fluorescence anisotropy. The intensity remains similar for all datapoints which indicates an intact fluorophore environment. This means, that
105
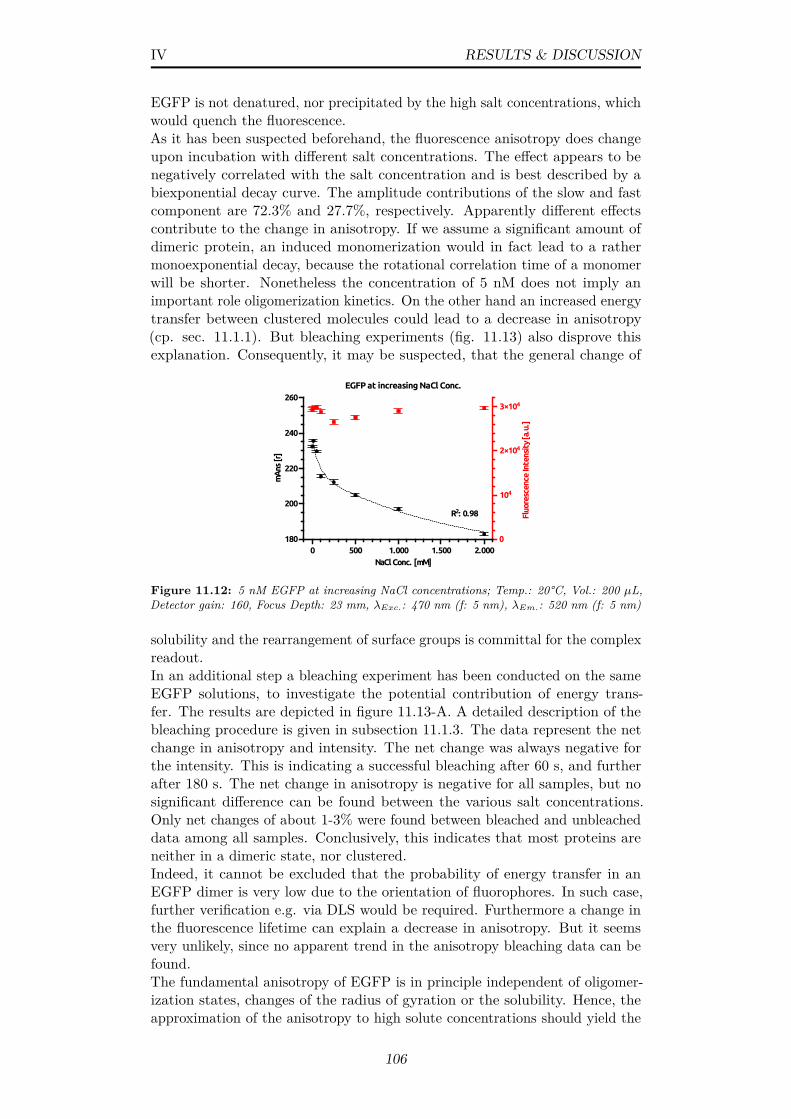
IV RESULTS & DISCUSSION
EGFP is not denatured, nor precipitated by the high salt concentrations, whichwould quench the fluorescence.As it has been suspected beforehand, the fluorescence anisotropy does changeupon incubation with different salt concentrations. The effect appears to benegatively correlated with the salt concentration and is best described by abiexponential decay curve. The amplitude contributions of the slow and fastcomponent are 72.3% and 27.7%, respectively. Apparently different effectscontribute to the change in anisotropy. If we assume a significant amount ofdimeric protein, an induced monomerization would in fact lead to a rathermonoexponential decay, because the rotational correlation time of a monomerwill be shorter. Nonetheless the concentration of 5 nM does not imply animportant role oligomerization kinetics. On the other hand an increased energytransfer between clustered molecules could lead to a decrease in anisotropy(cp. sec. 11.1.1). But bleaching experiments (fig. 11.13) also disprove thisexplanation. Consequently, it may be suspected, that the general change of
Fluo
resc
ence
Inte
nsit
y [a
.u.]
0
104
2×10⁴
3×10⁴
EGFP at increasing NaCl Conc.
mA
ns [r
]
180
200
220
240
260
NaCl Conc. [mM]0 500 1.000 1.500 2.000
R2: 0.98
Figure 11.12: 5 nM EGFP at increasing NaCl concentrations; Temp.: 20°C, Vol.: 200 µL,Detector gain: 160, Focus Depth: 23 mm, λExc.: 470 nm (f: 5 nm), λEm.: 520 nm (f: 5 nm)
solubility and the rearrangement of surface groups is committal for the complexreadout.In an additional step a bleaching experiment has been conducted on the sameEGFP solutions, to investigate the potential contribution of energy trans-fer. The results are depicted in figure 11.13-A. A detailed description of thebleaching procedure is given in subsection 11.1.3. The data represent the netchange in anisotropy and intensity. The net change was always negative forthe intensity. This is indicating a successful bleaching after 60 s, and furtherafter 180 s. The net change in anisotropy is negative for all samples, but nosignificant difference can be found between the various salt concentrations.Only net changes of about 1-3% were found between bleached and unbleacheddata among all samples. Conclusively, this indicates that most proteins areneither in a dimeric state, nor clustered.Indeed, it cannot be excluded that the probability of energy transfer in anEGFP dimer is very low due to the orientation of fluorophores. In such case,further verification e.g. via DLS would be required. Furthermore a change inthe fluorescence lifetime can explain a decrease in anisotropy. But it seemsvery unlikely, since no apparent trend in the anisotropy bleaching data can befound.The fundamental anisotropy of EGFP is in principle independent of oligomer-ization states, changes of the radius of gyration or the solubility. Hence, theapproximation of the anisotropy to high solute concentrations should yield the
106
IV RESULTS & DISCUSSION
same limiting anisotropy. To determine its value, EGFP samples in 2 M NaCland without NaCl, both subjected to bleaching, were additionally mixed withglycerol at different concentrations (see fig. 11.13-B). The obtained data islinearly fitted and extrapolated to indicate the maximum anisotropy at 100%glycerol for both cases. Apparently the data suggest a minor difference in theapparent fundamental anisotropy, with and without 2 M NaCl (blue arrows).This can imply slight changes of the fluorophores’ environment, that in turncould alter the fluorescence lifetime. Due to the larger error in the differentdata points, the interpretation remains difficult. Hence even if high salt con-centrations would influence the fluorophore itself, the effect still appears veryminor and proofs the robustness of the probe molecule. Therefore, changes inanisotropy, which are not accompanied by changes in energy transfer, might besimply ascribed to changes in probe solubility (cp. subsec. 11.1.1). The speedof rotational motion of the probe molecules can be inferred from the slopeof the data. For both experiments a linear fit to the ensemble data indicatesdifferent rotational correlation times.
Fluorescence Anisotropy
Net
Ch.
[%]
−4
−2
02M NaCl vs. No NaCl
mA
ns [r
]
160
180
200
220
240
260
280
300
Glycerol Conc. [%]0 20 40 60 80 100
2M NaClNo NaCl
R2: 0.99
R2: 0.98
Fluorescence Intensity
Net
Cha
nge
[%]
−80
−60
−40
−20
0
NaCl Conc. [mM]0 50 100 250 500 1.000 2.000
A
60 s to 180 s0 s to 60 s
B
60to1800to60
Figure 11.13: (A) Total net change of fluorescence anisotropy and proportional changeof intensity upon bleaching for 60 and 180 s (B) Bleached samples at different glycerolconcentrations to approximate the fundamental EGFP anisotropy; Temp.: 20°C, Vol.: 200µL, Detector gain: 160, Focus Depth: 23 mm, λExc.: 470 nm (f: 5 nm), λEm.: 520 nm (f: 5nm)
As mentioned above, dimerization / monomerization processes have been ex-cluded as an explanation for the probe behaviour. Intriguingly, results fromBader et al. [143] indicate a low homoFRET probability in EGFP dimers.Therefore, it is still possible that such processes are affecting the readout inthis experiment. Of course, without being visible from the rate of energytransfer. In conclusion, it seems plausible to assign the fast and slow decaycomponents of the anisotropy decay (fig. 11.12) to changes in probe solubilityand changes in the radius of gyration as mentioned above.In conclusion, the presented experiments verify the usability of EGFP as aprobe for anisotropy measurements, to detect changes in viscosity or oligomer-ization. The gathered information can be used as a further point of referencefor more complex in vivo studies.
107
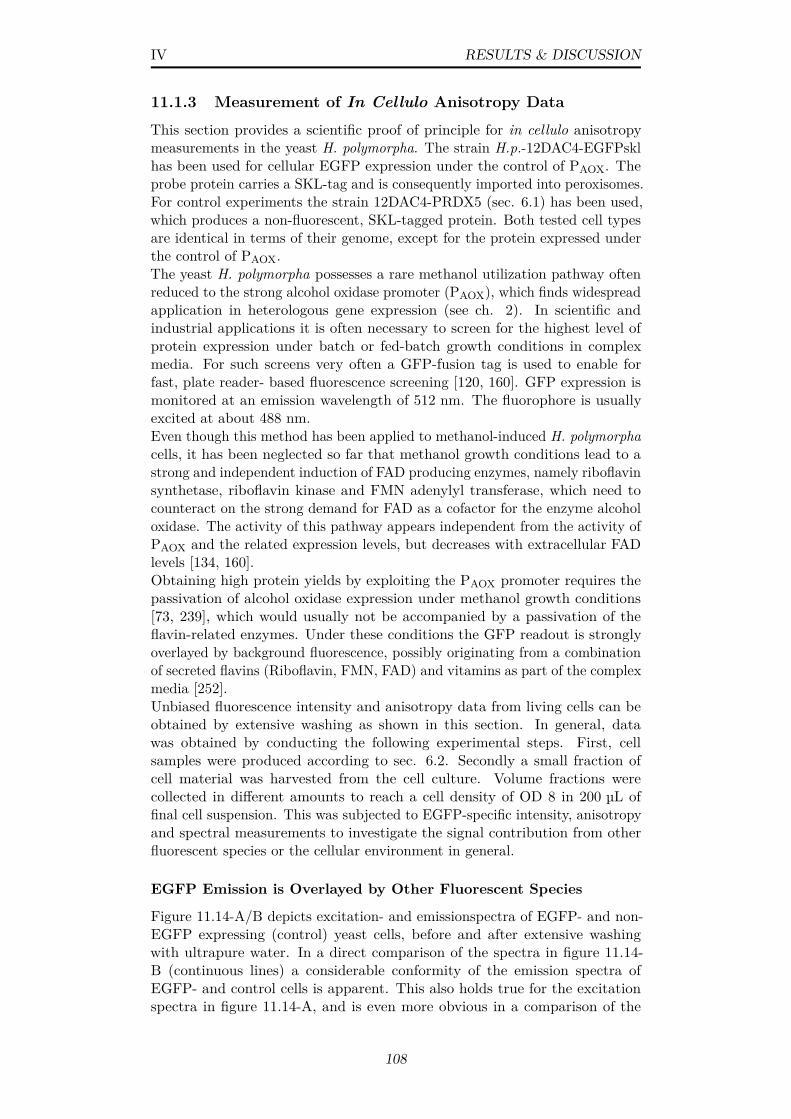
IV RESULTS & DISCUSSION
11.1.3 Measurement of In Cellulo Anisotropy Data
This section provides a scientific proof of principle for in cellulo anisotropymeasurements in the yeast H. polymorpha. The strain H.p.-12DAC4-EGFPsklhas been used for cellular EGFP expression under the control of PAOX. Theprobe protein carries a SKL-tag and is consequently imported into peroxisomes.For control experiments the strain 12DAC4-PRDX5 (sec. 6.1) has been used,which produces a non-fluorescent, SKL-tagged protein. Both tested cell typesare identical in terms of their genome, except for the protein expressed underthe control of PAOX.The yeast H. polymorpha possesses a rare methanol utilization pathway oftenreduced to the strong alcohol oxidase promoter (PAOX), which finds widespreadapplication in heterologous gene expression (see ch. 2). In scientific andindustrial applications it is often necessary to screen for the highest level ofprotein expression under batch or fed-batch growth conditions in complexmedia. For such screens very often a GFP-fusion tag is used to enable forfast, plate reader- based fluorescence screening [120, 160]. GFP expression ismonitored at an emission wavelength of 512 nm. The fluorophore is usuallyexcited at about 488 nm.Even though this method has been applied to methanol-induced H. polymorphacells, it has been neglected so far that methanol growth conditions lead to astrong and independent induction of FAD producing enzymes, namely riboflavinsynthetase, riboflavin kinase and FMN adenylyl transferase, which need tocounteract on the strong demand for FAD as a cofactor for the enzyme alcoholoxidase. The activity of this pathway appears independent from the activity ofPAOX and the related expression levels, but decreases with extracellular FADlevels [134, 160].Obtaining high protein yields by exploiting the PAOX promoter requires thepassivation of alcohol oxidase expression under methanol growth conditions[73, 239], which would usually not be accompanied by a passivation of theflavin-related enzymes. Under these conditions the GFP readout is stronglyoverlayed by background fluorescence, possibly originating from a combinationof secreted flavins (Riboflavin, FMN, FAD) and vitamins as part of the complexmedia [252].Unbiased fluorescence intensity and anisotropy data from living cells can beobtained by extensive washing as shown in this section. In general, datawas obtained by conducting the following experimental steps. First, cellsamples were produced according to sec. 6.2. Secondly a small fraction ofcell material was harvested from the cell culture. Volume fractions werecollected in different amounts to reach a cell density of OD 8 in 200 µL offinal cell suspension. This was subjected to EGFP-specific intensity, anisotropyand spectral measurements to investigate the signal contribution from otherfluorescent species or the cellular environment in general.
EGFP Emission is Overlayed by Other Fluorescent Species
Figure 11.14-A/B depicts excitation- and emissionspectra of EGFP- and non-EGFP expressing (control) yeast cells, before and after extensive washingwith ultrapure water. In a direct comparison of the spectra in figure 11.14-B (continuous lines) a considerable conformity of the emission spectra ofEGFP- and control cells is apparent. This also holds true for the excitationspectra in figure 11.14-A, and is even more obvious in a comparison of the
108

IV RESULTS & DISCUSSION
Emissionspectra (Exc. 488nm)
Fluo
rsce
nce
Inte
nsit
y [a
.u.]
0
5,0×10³
1,0×10⁴
1,5×10⁴
2,0×10⁴
2,5×10⁴
3,0×10⁴
3,5×10⁴
λ [nm]500 550 600 650 700
D
Excitationspectra (Em. 512nm)
Fluo
resc
ence
Inte
nsit
y [a
.u.]
0
2,0×10⁴
4,0×10⁴
6,0×10⁴
8,0×10⁴
1,0×10⁵
1,2×10⁵
1,4×10⁵
1,6×10⁵
λ [nm]400 420 440 460 480
Unwashed Control CellsWashed Control Cells
Unwashed EGFP Cells Washed EGFP Cells
A
C
B
Rescaled Emissionspectra
Resc
aled
Flu
ores
cenc
e In
tens
ity
[a.u
.]
0
0,2
0,4
0,6
0,8
1
1,2
λ [nm]500 550 600 650 700
Rescaled Excitationspectra
Resc
aled
Flu
ores
cenc
e In
tens
ity
[a.u
.]
0,2
0,4
0,6
0,8
1
λ [nm]400 420 440 460 480
Figure 11.14: (A) Excitation- and (B) Emissionsopectra of EGFP-expressing & controlcells, boh washed with ultrapure water & unwashed (growth media) (C) Normalized Excitation-and (D) Emissionspectra; Temp.: 20°C, Vol.: 200 µL, Detector gain: 180, Focus Depth: 23mm, λExc.: 488 nm (f: 5 nm), λEm.: 505-700 nm, ∆Scan: 2 nm (f: 5 nm)
rescaled spectra shown in figures 11.14-C and -D, respectively. In case ofthe EGFP-expressing cells, a slight shift of the curves towards the pertinentEGFP emission maximum is revealing some minor contribution of EGFP to thesignal, but without yielding conclusive information. Upon washing away theoriginal growth media and resuspension of cells in water, a completely alteredsituation is making a case for the importance of the right sample treatment: Incomparison of the spectra in 11.14-A/B (dashed lines) of the washed controlcells, a strong intensity reduction can be found both excitation- and emission-wise. This clearly demonstrates the occurences of media-specific or secretedfluorescent species that interfere with the measurements. In case of the EGFPcells, one can find a strong decrease of signal intensity in those wavelengthdomains, that are naturally not relevant for light-matter interactions of theEGFP fluorophore. Instead clear EGFP-like excitation- and emission spectraemerge, enabling an unbiased readout of expression levels. At an emissionwavelength of 512 nm, a signal reduction of 88% is found for the controlcells, whereas for EGFP-expressing cells the signal is reduced by 32% in thisexperiment. The control cells show a very weak, but still visible backgroundsignal. This level of background seems unavoidable, as it probably originatesfrom molecules populating the cells. But the remaining background should ingeneral not be a problem for quantitative measurements as a distinct differencebetween EGFP- and control cells can be uncovered.In consequence in cellulo measurements, both fluorescence- and anisotropy-wise, require a specific treatment of the cell suspension to yield reliable results.Either extensive preparation via washing of cells, or single-cell analysis (e.g.FACS) in diluted media is required, to exclude foreign fluorescence signals fromthe analysis.
109
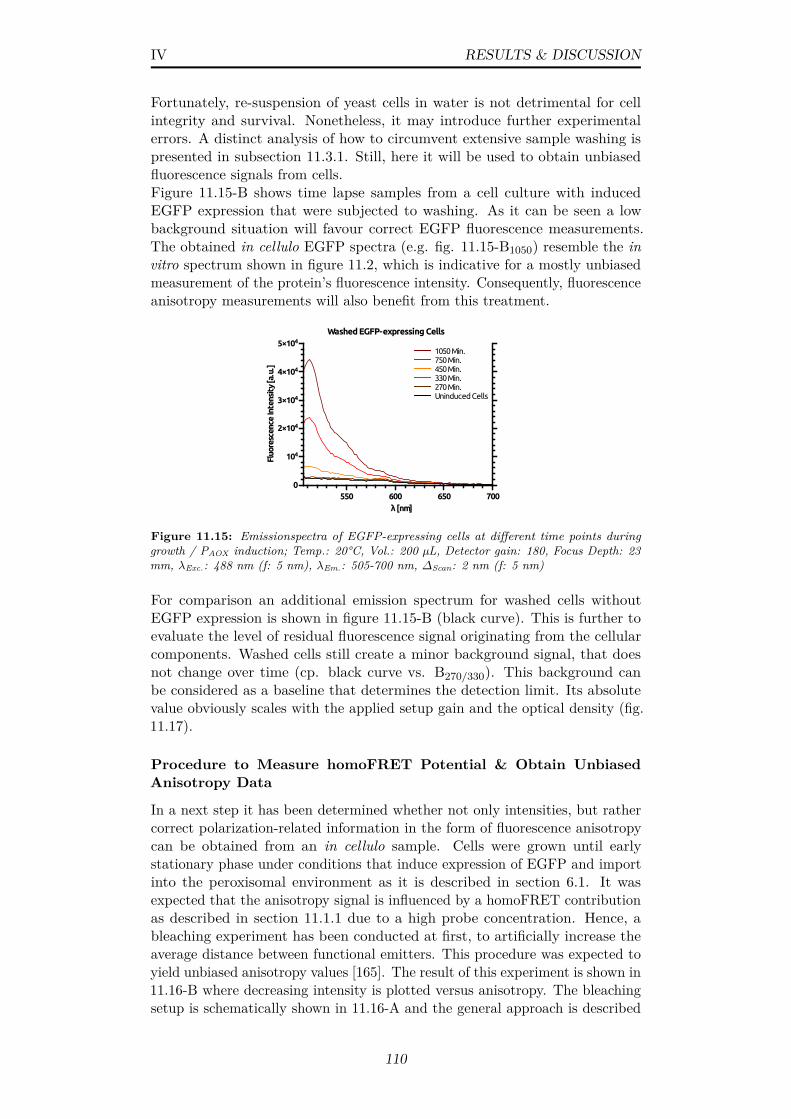
IV RESULTS & DISCUSSION
Fortunately, re-suspension of yeast cells in water is not detrimental for cellintegrity and survival. Nonetheless, it may introduce further experimentalerrors. A distinct analysis of how to circumvent extensive sample washing ispresented in subsection 11.3.1. Still, here it will be used to obtain unbiasedfluorescence signals from cells.Figure 11.15-B shows time lapse samples from a cell culture with inducedEGFP expression that were subjected to washing. As it can be seen a lowbackground situation will favour correct EGFP fluorescence measurements.The obtained in cellulo EGFP spectra (e.g. fig. 11.15-B1050) resemble the invitro spectrum shown in figure 11.2, which is indicative for a mostly unbiasedmeasurement of the protein’s fluorescence intensity. Consequently, fluorescenceanisotropy measurements will also benefit from this treatment.
Washed EGFP-expressing Cells
Fluo
resc
ence
Inte
nsit
y [a
.u.]
0
104
2×10⁴
3×10⁴
4×10⁴
5×10⁴
λ [nm]
550 600 650 700
1050 Min.750 Min.450 Min.330 Min.270 Min.Uninduced Cells
Figure 11.15: Emissionspectra of EGFP-expressing cells at different time points duringgrowth / PAOX induction; Temp.: 20°C, Vol.: 200 µL, Detector gain: 180, Focus Depth: 23mm, λExc.: 488 nm (f: 5 nm), λEm.: 505-700 nm, ∆Scan: 2 nm (f: 5 nm)
For comparison an additional emission spectrum for washed cells withoutEGFP expression is shown in figure 11.15-B (black curve). This is further toevaluate the level of residual fluorescence signal originating from the cellularcomponents. Washed cells still create a minor background signal, that doesnot change over time (cp. black curve vs. B270/330). This background canbe considered as a baseline that determines the detection limit. Its absolutevalue obviously scales with the applied setup gain and the optical density (fig.11.17).
Procedure to Measure homoFRET Potential & Obtain UnbiasedAnisotropy Data
In a next step it has been determined whether not only intensities, but rathercorrect polarization-related information in the form of fluorescence anisotropycan be obtained from an in cellulo sample. Cells were grown until earlystationary phase under conditions that induce expression of EGFP and importinto the peroxisomal environment as it is described in section 6.1. It wasexpected that the anisotropy signal is influenced by a homoFRET contributionas described in section 11.1.1 due to a high probe concentration. Hence, ableaching experiment has been conducted at first, to artificially increase theaverage distance between functional emitters. This procedure was expected toyield unbiased anisotropy values [165]. The result of this experiment is shown in11.16-B where decreasing intensity is plotted versus anisotropy. The bleachingsetup is schematically shown in 11.16-A and the general approach is described
110
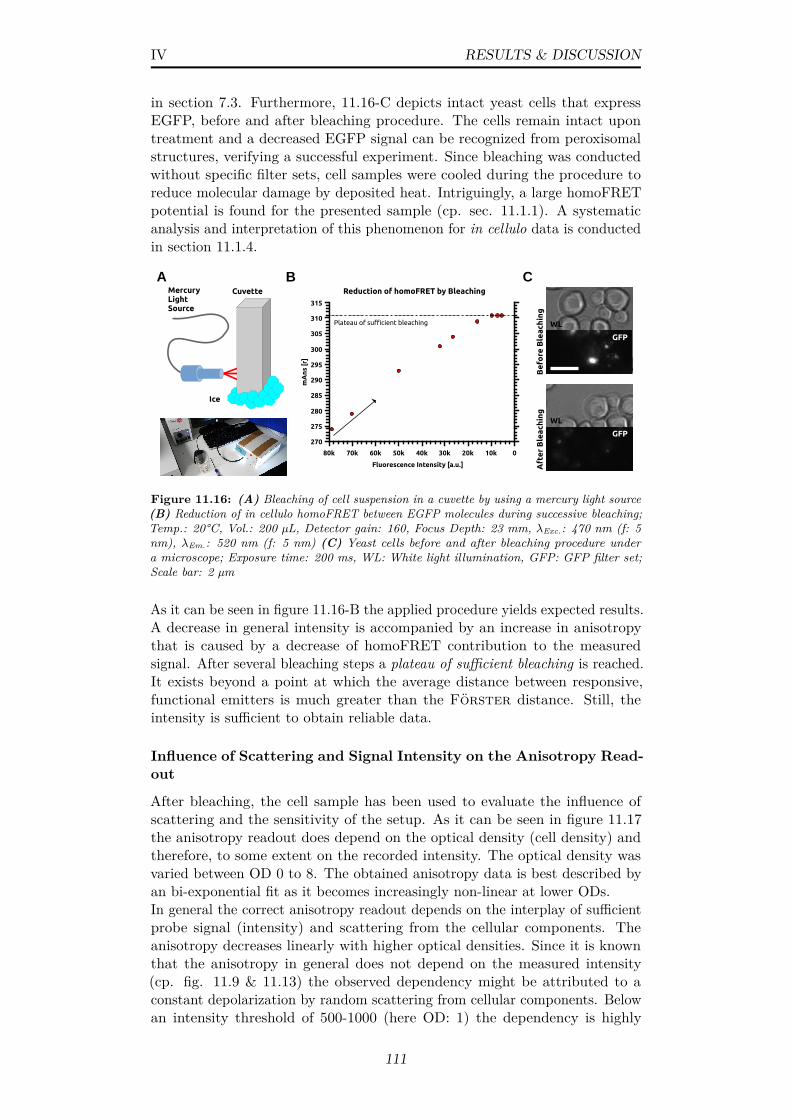
IV RESULTS & DISCUSSION
in section 7.3. Furthermore, 11.16-C depicts intact yeast cells that expressEGFP, before and after bleaching procedure. The cells remain intact upontreatment and a decreased EGFP signal can be recognized from peroxisomalstructures, verifying a successful experiment. Since bleaching was conductedwithout specific filter sets, cell samples were cooled during the procedure toreduce molecular damage by deposited heat. Intriguingly, a large homoFRETpotential is found for the presented sample (cp. sec. 11.1.1). A systematicanalysis and interpretation of this phenomenon for in cellulo data is conductedin section 11.1.4.
A B C
Ice
CuvetteMercury Light Source
Reduction of homoFRET by Bleachingm
An
s [r
]
270
275
280
285
290
295
300
305
310
315
Fluorescence Intensity [a.u.]
80k 70k 60k 50k 40k 30k 20k 10k 0
Plateau of sufficient bleaching
GFP
WL
Aft
er
Ble
ach
ing
Be
fore
Ble
ach
ing
GFP
WL
Figure 11.16: (A) Bleaching of cell suspension in a cuvette by using a mercury light source(B) Reduction of in cellulo homoFRET between EGFP molecules during successive bleaching;Temp.: 20°C, Vol.: 200 µL, Detector gain: 160, Focus Depth: 23 mm, λExc.: 470 nm (f: 5nm), λEm.: 520 nm (f: 5 nm) (C) Yeast cells before and after bleaching procedure undera microscope; Exposure time: 200 ms, WL: White light illumination, GFP: GFP filter set;Scale bar: 2 µm
As it can be seen in figure 11.16-B the applied procedure yields expected results.A decrease in general intensity is accompanied by an increase in anisotropythat is caused by a decrease of homoFRET contribution to the measuredsignal. After several bleaching steps a plateau of sufficient bleaching is reached.It exists beyond a point at which the average distance between responsive,functional emitters is much greater than the Förster distance. Still, theintensity is sufficient to obtain reliable data.
Influence of Scattering and Signal Intensity on the Anisotropy Read-out
After bleaching, the cell sample has been used to evaluate the influence ofscattering and the sensitivity of the setup. As it can be seen in figure 11.17the anisotropy readout does depend on the optical density (cell density) andtherefore, to some extent on the recorded intensity. The optical density wasvaried between OD 0 to 8. The obtained anisotropy data is best described byan bi-exponential fit as it becomes increasingly non-linear at lower ODs.In general the correct anisotropy readout depends on the interplay of sufficientprobe signal (intensity) and scattering from the cellular components. Theanisotropy decreases linearly with higher optical densities. Since it is knownthat the anisotropy in general does not depend on the measured intensity(cp. fig. 11.9 & 11.13) the observed dependency might be attributed to aconstant depolarization by random scattering from cellular components. Belowan intensity threshold of 500-1000 (here OD: 1) the dependency is highly
111
IV RESULTS & DISCUSSION
non-linear. The anisotropy readout seems to be increasingly distorted by thelimitations in signal detection. In fact a polarizing effect can be found thatleads to an increase in anisotropy. This behaviour might be attributed to anincreasing signal contribution of light scattered by the sample holder. Thiswould be in agreement with the increasing error in anisotropy readout at lowerintensities, underlining its random character.
Influence of Scattering on the Anisotropy
Fluo
resc
ence
Inte
nsit
y [a
.u.]
0
1.000
2.000
3.000
4.000
5.000
6.000
Optical Density [OD]−1 0 1 2 3 4 5 6 7 8
mA
ns [r
]
310
320
330
340
350Threshold
Figure 11.17: Influence of scattering and fluorescence intensity on the anisotropy readout;Bleached cell samples diluted in ultrapure water; Temp.: 20°C, Vol.: 200 µL, Detector gain:160, Focus Depth: 23 mm, λExc.: 470 nm (f: 5 nm), λEm.: 520 nm (f: 5 nm)
In conclusion, this points to a detection limit for in cellulo anisotropy data atintensity levels between 500-1000. This limit depends on the readout gain ofthe setup and hence is only valid when measurements are conducted underthe same experimental conditions. It may shift to different values when othergain settings are applied. Still, an unexpected high anisotropy readout at ’incomparison’ low intensity levels might be a good first hint on incorrect data.In contrast the fluorescence intensity decreases linear with the dilution untilan OD of 0.5. Hence, this readout seems to be slightly more robust.From these findings it can be concluded that the measurement of in cellulofluorescence anisotropy data is feasible as long as the related intensity ismaintained above a certain threshold. In case of denser cell suspensions an easylinear correction can account for the depolarizing effects of scattering eventscaused by cellular components. Correct anisotropy data can be obtained byrandomly bleaching a subset of fluorophores in the peroxisomal environment.As a result additional information in the form of a homoFRET potential canbe acquired. It can help to understand the local environment of the probemolecule as discussed in section 11.1.4.
112
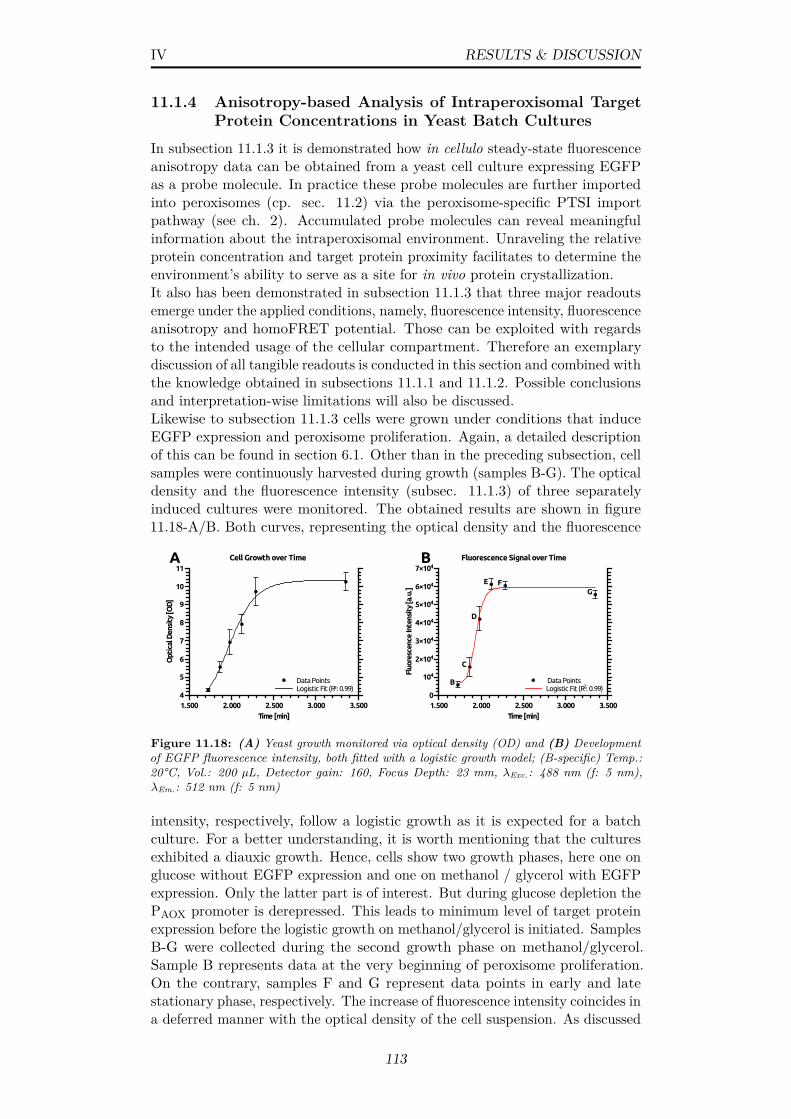
IV RESULTS & DISCUSSION
11.1.4 Anisotropy-based Analysis of Intraperoxisomal TargetProtein Concentrations in Yeast Batch Cultures
In subsection 11.1.3 it is demonstrated how in cellulo steady-state fluorescenceanisotropy data can be obtained from a yeast cell culture expressing EGFPas a probe molecule. In practice these probe molecules are further importedinto peroxisomes (cp. sec. 11.2) via the peroxisome-specific PTSI importpathway (see ch. 2). Accumulated probe molecules can reveal meaningfulinformation about the intraperoxisomal environment. Unraveling the relativeprotein concentration and target protein proximity facilitates to determine theenvironment’s ability to serve as a site for in vivo protein crystallization.It also has been demonstrated in subsection 11.1.3 that three major readoutsemerge under the applied conditions, namely, fluorescence intensity, fluorescenceanisotropy and homoFRET potential. Those can be exploited with regardsto the intended usage of the cellular compartment. Therefore an exemplarydiscussion of all tangible readouts is conducted in this section and combined withthe knowledge obtained in subsections 11.1.1 and 11.1.2. Possible conclusionsand interpretation-wise limitations will also be discussed.Likewise to subsection 11.1.3 cells were grown under conditions that induceEGFP expression and peroxisome proliferation. Again, a detailed descriptionof this can be found in section 6.1. Other than in the preceding subsection, cellsamples were continuously harvested during growth (samples B-G). The opticaldensity and the fluorescence intensity (subsec. 11.1.3) of three separatelyinduced cultures were monitored. The obtained results are shown in figure11.18-A/B. Both curves, representing the optical density and the fluorescence
B
C
D
E FG
Fluorescence Signal over Time
Fluo
resc
ence
Inte
nsit
y [a
.u.]
0
104
2×10⁴
3×10⁴
4×10⁴
5×10⁴
6×10⁴
7×10⁴
Time [min]1.500 2.000 2.500 3.000 3.500
Data PointsLogistic Fit (R2: 0.99)
Cell Growth over Time
Opt
ical
Den
sity
[OD
]
4
5
6
7
8
9
10
11
Time [min]1.500 2.000 2.500 3.000 3.500
A B
Data PointsLogistic Fit (R²: 0.99)
Figure 11.18: (A) Yeast growth monitored via optical density (OD) and (B) Developmentof EGFP fluorescence intensity, both fitted with a logistic growth model; (B-specific) Temp.:20°C, Vol.: 200 µL, Detector gain: 160, Focus Depth: 23 mm, λExc.: 488 nm (f: 5 nm),λEm.: 512 nm (f: 5 nm)
intensity, respectively, follow a logistic growth as it is expected for a batchculture. For a better understanding, it is worth mentioning that the culturesexhibited a diauxic growth. Hence, cells show two growth phases, here one onglucose without EGFP expression and one on methanol / glycerol with EGFPexpression. Only the latter part is of interest. But during glucose depletion thePAOX promoter is derepressed. This leads to minimum level of target proteinexpression before the logistic growth on methanol/glycerol is initiated. SamplesB-G were collected during the second growth phase on methanol/glycerol.Sample B represents data at the very beginning of peroxisome proliferation.On the contrary, samples F and G represent data points in early and latestationary phase, respectively. The increase of fluorescence intensity coincides ina deferred manner with the optical density of the cell suspension. As discussed
113
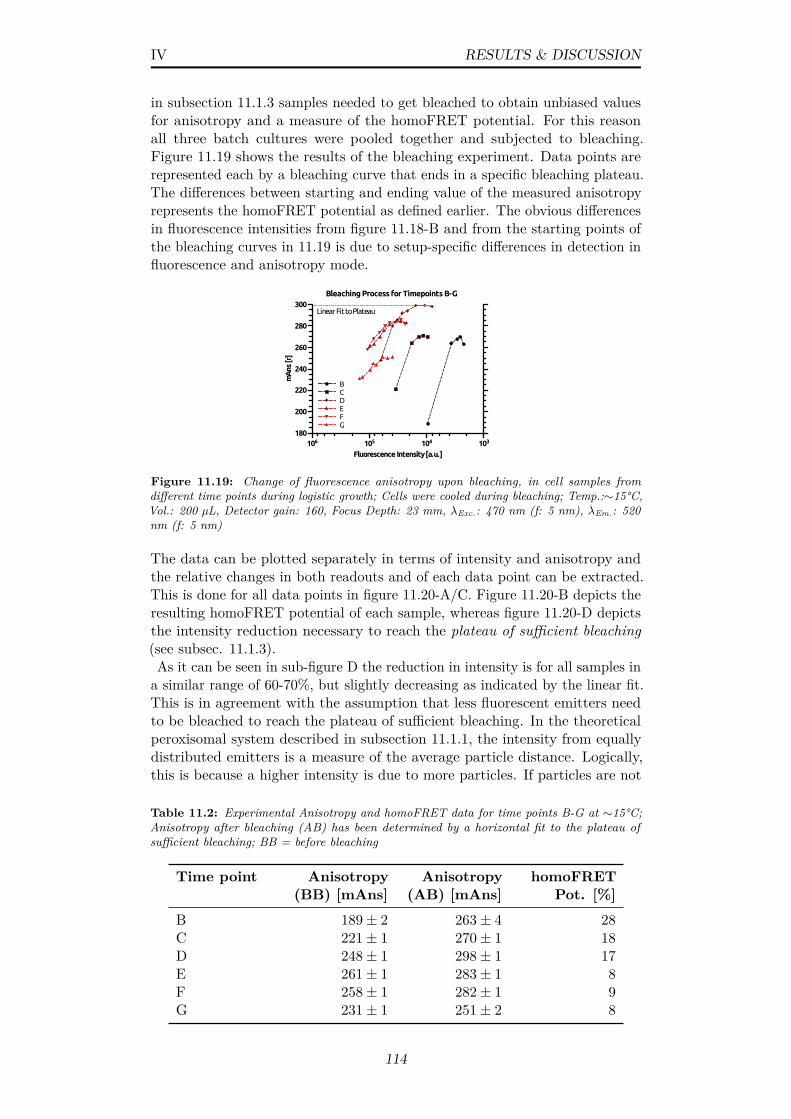
IV RESULTS & DISCUSSION
in subsection 11.1.3 samples needed to get bleached to obtain unbiased valuesfor anisotropy and a measure of the homoFRET potential. For this reasonall three batch cultures were pooled together and subjected to bleaching.Figure 11.19 shows the results of the bleaching experiment. Data points arerepresented each by a bleaching curve that ends in a specific bleaching plateau.The differences between starting and ending value of the measured anisotropyrepresents the homoFRET potential as defined earlier. The obvious differencesin fluorescence intensities from figure 11.18-B and from the starting points ofthe bleaching curves in 11.19 is due to setup-specific differences in detection influorescence and anisotropy mode.
Bleaching Process for Timepoints B-Gm
Ans
[r]
180
200
220
240
260
280
300
Fluorescence Intensity [a.u.]106 105 104 103
BCDEFG
Linear Fit to Plateau
Figure 11.19: Change of fluorescence anisotropy upon bleaching, in cell samples fromdifferent time points during logistic growth; Cells were cooled during bleaching; Temp.:∼15°C,Vol.: 200 µL, Detector gain: 160, Focus Depth: 23 mm, λExc.: 470 nm (f: 5 nm), λEm.: 520nm (f: 5 nm)
The data can be plotted separately in terms of intensity and anisotropy andthe relative changes in both readouts and of each data point can be extracted.This is done for all data points in figure 11.20-A/C. Figure 11.20-B depicts theresulting homoFRET potential of each sample, whereas figure 11.20-D depictsthe intensity reduction necessary to reach the plateau of sufficient bleaching(see subsec. 11.1.3).As it can be seen in sub-figure D the reduction in intensity is for all samples ina similar range of 60-70%, but slightly decreasing as indicated by the linear fit.This is in agreement with the assumption that less fluorescent emitters needto be bleached to reach the plateau of sufficient bleaching. In the theoreticalperoxisomal system described in subsection 11.1.1, the intensity from equallydistributed emitters is a measure of the average particle distance. Logically,this is because a higher intensity is due to more particles. If particles are not
Table 11.2: Experimental Anisotropy and homoFRET data for time points B-G at ∼15°C;Anisotropy after bleaching (AB) has been determined by a horizontal fit to the plateau ofsufficient bleaching; BB = before bleaching
Time point Anisotropy(BB) [mAns]
Anisotropy(AB) [mAns]
homoFRETPot. [%]
B 189± 2 263± 4 28C 221± 1 270± 1 18D 248± 1 298± 1 17E 261± 1 283± 1 8F 258± 1 282± 1 9G 231± 1 251± 2 8
114
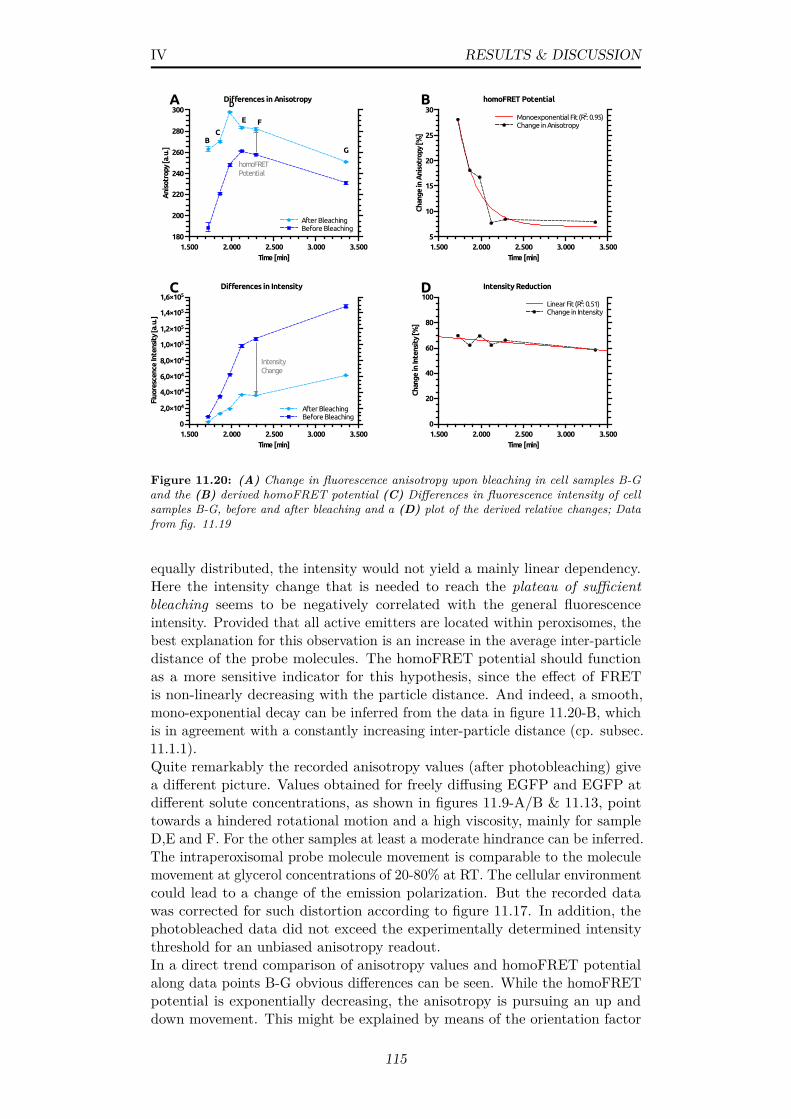
IV RESULTS & DISCUSSION
Differences in Intensity
Fluo
resc
ence
Inte
nsit
y [a
.u.]
0
2,0×10⁴
4,0×10⁴
6,0×10⁴
8,0×10⁴
1,0×10⁵
1,2×10⁵
1,4×10⁵
1,6×10⁵
Time [min]1.500 2.000 2.500 3.000 3.500
After Bleaching Before Bleaching
Intensity Change
Intensity Reduction
Chan
ge in
Inte
nsit
y [%
]0
20
40
60
80
100
Time [min]1.500 2.000 2.500 3.000 3.500
Linear Fit (R2: 0.51)Change in Intensity
homoFRET Potential
Chan
ge in
Ani
sotr
opy
[%]
5
10
15
20
25
30
Time [min]1.500 2.000 2.500 3.000 3.500
Monoexponential Fit (R2: 0.95)Change in Anisotropy
Differences in Anisotropy
Ani
sotr
opy
[a.u
.]
180
200
220
240
260
280
300
Time [min]1.500 2.000 2.500 3.000 3.500
After BleachingBefore Bleaching
homoFRETPotential
A B
C D
BC
D
E F
G
Figure 11.20: (A) Change in fluorescence anisotropy upon bleaching in cell samples B-Gand the (B) derived homoFRET potential (C) Differences in fluorescence intensity of cellsamples B-G, before and after bleaching and a (D) plot of the derived relative changes; Datafrom fig. 11.19
equally distributed, the intensity would not yield a mainly linear dependency.Here the intensity change that is needed to reach the plateau of sufficientbleaching seems to be negatively correlated with the general fluorescenceintensity. Provided that all active emitters are located within peroxisomes, thebest explanation for this observation is an increase in the average inter-particledistance of the probe molecules. The homoFRET potential should functionas a more sensitive indicator for this hypothesis, since the effect of FRETis non-linearly decreasing with the particle distance. And indeed, a smooth,mono-exponential decay can be inferred from the data in figure 11.20-B, whichis in agreement with a constantly increasing inter-particle distance (cp. subsec.11.1.1).Quite remarkably the recorded anisotropy values (after photobleaching) givea different picture. Values obtained for freely diffusing EGFP and EGFP atdifferent solute concentrations, as shown in figures 11.9-A/B & 11.13, pointtowards a hindered rotational motion and a high viscosity, mainly for sampleD,E and F. For the other samples at least a moderate hindrance can be inferred.The intraperoxisomal probe molecule movement is comparable to the moleculemovement at glycerol concentrations of 20-80% at RT. The cellular environmentcould lead to a change of the emission polarization. But the recorded datawas corrected for such distortion according to figure 11.17. In addition, thephotobleached data did not exceed the experimentally determined intensitythreshold for an unbiased anisotropy readout.In a direct trend comparison of anisotropy values and homoFRET potentialalong data points B-G obvious differences can be seen. While the homoFRETpotential is exponentially decreasing, the anisotropy is pursuing an up anddown movement. This might be explained by means of the orientation factor
115
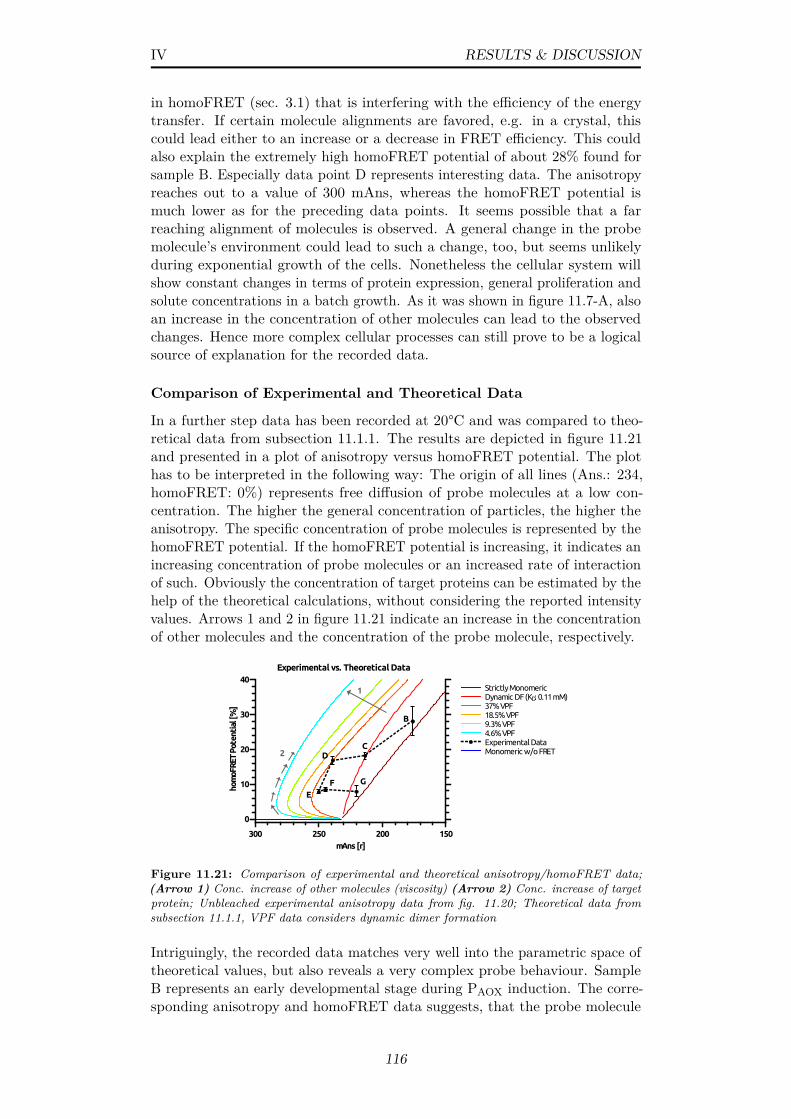
IV RESULTS & DISCUSSION
in homoFRET (sec. 3.1) that is interfering with the efficiency of the energytransfer. If certain molecule alignments are favored, e.g. in a crystal, thiscould lead either to an increase or a decrease in FRET efficiency. This couldalso explain the extremely high homoFRET potential of about 28% found forsample B. Especially data point D represents interesting data. The anisotropyreaches out to a value of 300 mAns, whereas the homoFRET potential ismuch lower as for the preceding data points. It seems possible that a farreaching alignment of molecules is observed. A general change in the probemolecule’s environment could lead to such a change, too, but seems unlikelyduring exponential growth of the cells. Nonetheless the cellular system willshow constant changes in terms of protein expression, general proliferation andsolute concentrations in a batch growth. As it was shown in figure 11.7-A, alsoan increase in the concentration of other molecules can lead to the observedchanges. Hence more complex cellular processes can still prove to be a logicalsource of explanation for the recorded data.
Comparison of Experimental and Theoretical Data
In a further step data has been recorded at 20°C and was compared to theo-retical data from subsection 11.1.1. The results are depicted in figure 11.21and presented in a plot of anisotropy versus homoFRET potential. The plothas to be interpreted in the following way: The origin of all lines (Ans.: 234,homoFRET: 0%) represents free diffusion of probe molecules at a low con-centration. The higher the general concentration of particles, the higher theanisotropy. The specific concentration of probe molecules is represented by thehomoFRET potential. If the homoFRET potential is increasing, it indicates anincreasing concentration of probe molecules or an increased rate of interactionof such. Obviously the concentration of target proteins can be estimated by thehelp of the theoretical calculations, without considering the reported intensityvalues. Arrows 1 and 2 in figure 11.21 indicate an increase in the concentrationof other molecules and the concentration of the probe molecule, respectively.
Experimental vs. Theoretical Data
hom
oFRE
T Po
tent
ial [
%]
0
10
20
30
40
mAns [r]300 250 200 150
B
D
G
C
EF
1
2
Strictly MonomericDynamic DF (KD: 0.11 mM)37% VPF18.5% VPF9.3% VPF4.6% VPFExperimental DataMonomeric w/o FRET
Figure 11.21: Comparison of experimental and theoretical anisotropy/homoFRET data;(Arrow 1) Conc. increase of other molecules (viscosity) (Arrow 2) Conc. increase of targetprotein; Unbleached experimental anisotropy data from fig. 11.20; Theoretical data fromsubsection 11.1.1, VPF data considers dynamic dimer formation
Intriguingly, the recorded data matches very well into the parametric space oftheoretical values, but also reveals a very complex probe behaviour. SampleB represents an early developmental stage during PAOX induction. The corre-sponding anisotropy and homoFRET data suggests, that the probe molecule
116
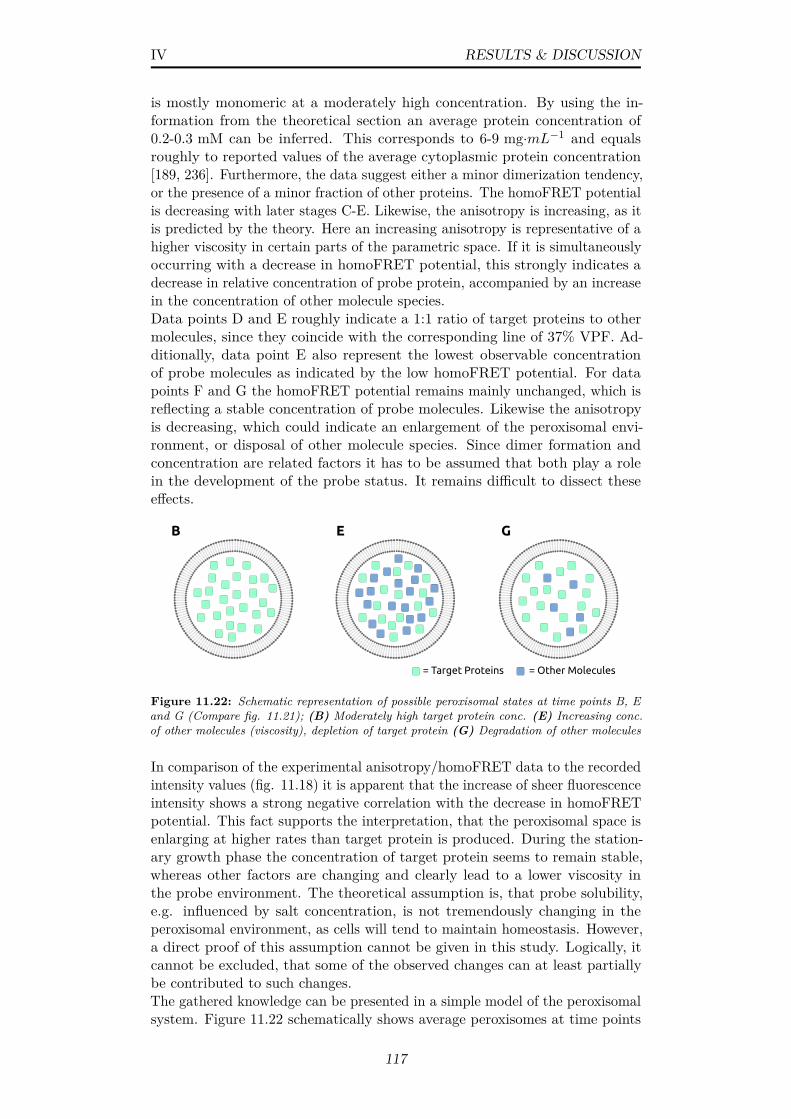
IV RESULTS & DISCUSSION
is mostly monomeric at a moderately high concentration. By using the in-formation from the theoretical section an average protein concentration of0.2-0.3 mM can be inferred. This corresponds to 6-9 mg·mL−1 and equalsroughly to reported values of the average cytoplasmic protein concentration[189, 236]. Furthermore, the data suggest either a minor dimerization tendency,or the presence of a minor fraction of other proteins. The homoFRET potentialis decreasing with later stages C-E. Likewise, the anisotropy is increasing, as itis predicted by the theory. Here an increasing anisotropy is representative of ahigher viscosity in certain parts of the parametric space. If it is simultaneouslyoccurring with a decrease in homoFRET potential, this strongly indicates adecrease in relative concentration of probe protein, accompanied by an increasein the concentration of other molecule species.Data points D and E roughly indicate a 1:1 ratio of target proteins to othermolecules, since they coincide with the corresponding line of 37% VPF. Ad-ditionally, data point E also represent the lowest observable concentrationof probe molecules as indicated by the low homoFRET potential. For datapoints F and G the homoFRET potential remains mainly unchanged, which isreflecting a stable concentration of probe molecules. Likewise the anisotropyis decreasing, which could indicate an enlargement of the peroxisomal envi-ronment, or disposal of other molecule species. Since dimer formation andconcentration are related factors it has to be assumed that both play a rolein the development of the probe status. It remains difficult to dissect theseeffects.
B E G
= Target Proteins = Other Molecules
Figure 11.22: Schematic representation of possible peroxisomal states at time points B, Eand G (Compare fig. 11.21); (B) Moderately high target protein conc. (E) Increasing conc.of other molecules (viscosity), depletion of target protein (G) Degradation of other molecules
In comparison of the experimental anisotropy/homoFRET data to the recordedintensity values (fig. 11.18) it is apparent that the increase of sheer fluorescenceintensity shows a strong negative correlation with the decrease in homoFRETpotential. This fact supports the interpretation, that the peroxisomal space isenlarging at higher rates than target protein is produced. During the station-ary growth phase the concentration of target protein seems to remain stable,whereas other factors are changing and clearly lead to a lower viscosity inthe probe environment. The theoretical assumption is, that probe solubility,e.g. influenced by salt concentration, is not tremendously changing in theperoxisomal environment, as cells will tend to maintain homeostasis. However,a direct proof of this assumption cannot be given in this study. Logically, itcannot be excluded, that some of the observed changes can at least partiallybe contributed to such changes.The gathered knowledge can be presented in a simple model of the peroxisomalsystem. Figure 11.22 schematically shows average peroxisomes at time points
117
IV RESULTS & DISCUSSION
B, E and G, that would be in agreement with the above data. Indeed, thepresented theory could also be too incomplete, due to unconsidered bias ofthe readout. But very good evidence exists, that FRET measurements are areliable tool for sensitive proximity measurements [6, 7, 87]. Furthermore, it isconclusive that such an energy transfer leads to a depolarization and henceinfluences the anisotropy.As mentioned before, the results indicate, that under peroxisome-proliferatingconditions, the volume increase of peroxisomes exceeds the production of targetproteins under the PAOX promoter. This is so far of course only true for thespecified conditions. Still, it will be proven in subsection 11.3 for variousconditions. In fact, depending on the exact conditions, this could imply anunfavorable situation for crystallization. Considering the phase diagram ofcrystallography (see fig. 1.8) a rather fast passage through all possible zonescould be likely. In such case the concentration required for nucleation wouldonly exist for a very short time or simply never. The constant decrease inconcentration would even make it more unlikely that crystals or nuclei couldbe retained. Possible intracellular precipitants like methanol could render thesituation even more complicated and less controllable.
Perrin Plot Analysis
In order to obtain data comparable to experiments conducted with free EGFP,all bleaching samples were subjected to a Perrin plot analysis (see sec. 3.1).Such experiments allow to estimate the molecule’s radius at different timepoints and can help to investigate possible precipitation or clustering. Fur-thermore, the apparent limiting anisotropy can be determined. In a Perrinplot T/η is plotted against 1/r. For Perrin plots usually viscosity is alteredat a constant temperature. Obvious constraints in accessibility of the cellularsystem only allowed for the alteration of temperature at a presumably constantviscosity. Thus, samples were measured at varying temperatures of 10-37°C,to not exceed the natural limits of the system. For an in cellulo Perrin plotanalysis it is required to measure bleached samples to exclude effects fromenergy transfer.Figure 11.23 depicts the results of the experiment. Each data point has beenmeasured at 10, 25 and 37°C. A linear fit of the data indicates rotational speedvia its slope and fundamental anisotropy via the y-intercept. The related datais shown in table 11.3.Controversially, the y-intercepts differ for samples B-G. The fundamentalanisotropy, should remain similar among all samples. A usual interpretation ofsuch data would either incorporate the measurement at different wavelengthsor different temperatures at comparable viscosities. Since samples were treatedand measured equally these explanations seem not to apply. The fundamentalanisotropy ranges here from about 261 to 319 mAns and is in good agreementwith the approximated maximum values of EGFP in sucrose (309 mAns) andglycerol (271 mAns) shown in subsection 11.1.2. A fundamental anisotropysimilar to in vitro experiments verifies that EGFP seems to be the origin of thedetected signals. Smaller fluorescent species would most likely have smallerfluorescence lifetimes and much smaller rotational correlation times. Due tothe unknown composition of the peroxisomal interior, it is plausible to assumethat small differences in pH, salt & solute concentrations can explain smallvariations among the fundamental values.The fitted slopes are a second important readout from the data and are listed
118
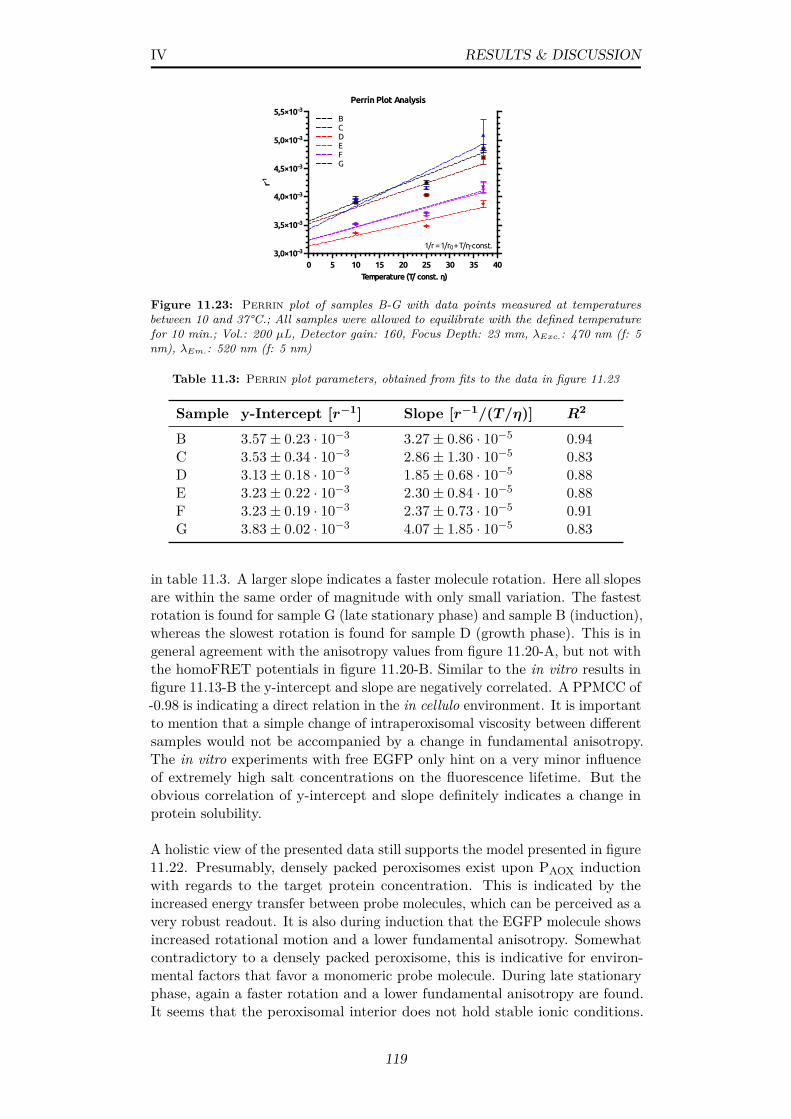
IV RESULTS & DISCUSSION
Perrin Plot Analysis
r-13,0×10⁻³
3,5×10⁻³
4,0×10⁻³
4,5×10⁻³
5,0×10⁻³
5,5×10⁻³
Temperature (T/ const. η)0 5 10 15 20 25 30 35 40
1/r = 1/r0 + T/η∙const.
B C D E F G
Figure 11.23: Perrin plot of samples B-G with data points measured at temperaturesbetween 10 and 37°C.; All samples were allowed to equilibrate with the defined temperaturefor 10 min.; Vol.: 200 µL, Detector gain: 160, Focus Depth: 23 mm, λExc.: 470 nm (f: 5nm), λEm.: 520 nm (f: 5 nm)
Table 11.3: Perrin plot parameters, obtained from fits to the data in figure 11.23
Sample y-Intercept [r−1] Slope [r−1/(T/η)] R2
B 3.57± 0.23 · 10−3 3.27± 0.86 · 10−5 0.94C 3.53± 0.34 · 10−3 2.86± 1.30 · 10−5 0.83D 3.13± 0.18 · 10−3 1.85± 0.68 · 10−5 0.88E 3.23± 0.22 · 10−3 2.30± 0.84 · 10−5 0.88F 3.23± 0.19 · 10−3 2.37± 0.73 · 10−5 0.91G 3.83± 0.02 · 10−3 4.07± 1.85 · 10−5 0.83
in table 11.3. A larger slope indicates a faster molecule rotation. Here all slopesare within the same order of magnitude with only small variation. The fastestrotation is found for sample G (late stationary phase) and sample B (induction),whereas the slowest rotation is found for sample D (growth phase). This is ingeneral agreement with the anisotropy values from figure 11.20-A, but not withthe homoFRET potentials in figure 11.20-B. Similar to the in vitro results infigure 11.13-B the y-intercept and slope are negatively correlated. A PPMCC of-0.98 is indicating a direct relation in the in cellulo environment. It is importantto mention that a simple change of intraperoxisomal viscosity between differentsamples would not be accompanied by a change in fundamental anisotropy.The in vitro experiments with free EGFP only hint on a very minor influenceof extremely high salt concentrations on the fluorescence lifetime. But theobvious correlation of y-intercept and slope definitely indicates a change inprotein solubility.
A holistic view of the presented data still supports the model presented in figure11.22. Presumably, densely packed peroxisomes exist upon PAOX inductionwith regards to the target protein concentration. This is indicated by theincreased energy transfer between probe molecules, which can be perceived as avery robust readout. It is also during induction that the EGFP molecule showsincreased rotational motion and a lower fundamental anisotropy. Somewhatcontradictory to a densely packed peroxisome, this is indicative for environ-mental factors that favor a monomeric probe molecule. During late stationaryphase, again a faster rotation and a lower fundamental anisotropy are found.It seems that the peroxisomal interior does not hold stable ionic conditions.
119
IV RESULTS & DISCUSSION
Furthermore, the ratio of target protein to other peroxisomal proteins (ex-cluding AOX, CAT, DHAS) seems to decrease as implied by the decrease inenergy transfer. No evidence for the clustering or crystallization of a largermolecule fraction can be found, as the rotational diffusion does not changesubstantially. In total this might lead to the conclusion that peroxisomesrender an unfavorable environment for in vivo crystallization under the appliedconditions.Intriguingly, the homoFRET contribution seems to be the predominant readoutof the anisotropy value (without photobleaching). The unbleached anisotropydata from figure 11.20-A shows a strong negative correlation with the associ-ated homoFRET potential values as it can be expected from the depolarizinginfluence of random energy transfers. A PPMCC of -0.85 can be calculatedfor the unbleached data with the homoFRET potential, whereas a value ofonly -0.10 is found for data after photobleaching. Hence it can be conjecturedthat the unbleached anisotropy readout might be used as an indicator of probemolecule proximity under different growth conditions.
120
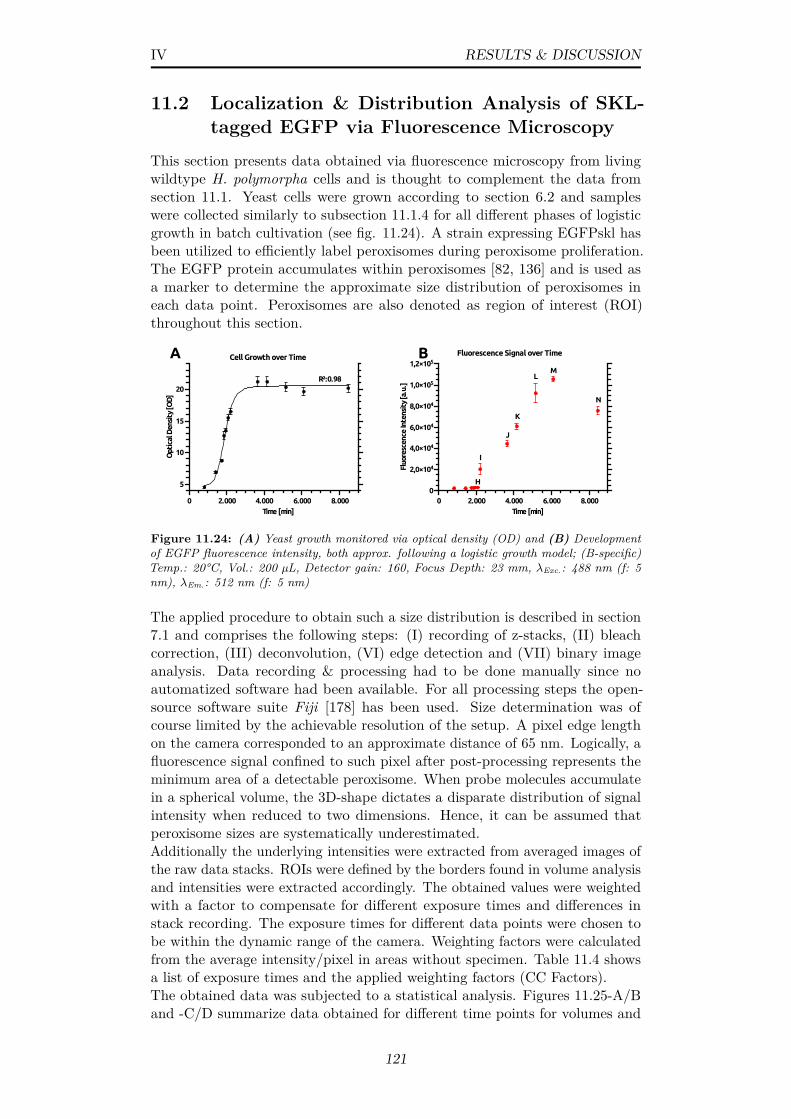
IV RESULTS & DISCUSSION
11.2 Localization & Distribution Analysis of SKL-tagged EGFP via Fluorescence Microscopy
This section presents data obtained via fluorescence microscopy from livingwildtype H. polymorpha cells and is thought to complement the data fromsection 11.1. Yeast cells were grown according to section 6.2 and sampleswere collected similarly to subsection 11.1.4 for all different phases of logisticgrowth in batch cultivation (see fig. 11.24). A strain expressing EGFPskl hasbeen utilized to efficiently label peroxisomes during peroxisome proliferation.The EGFP protein accumulates within peroxisomes [82, 136] and is used asa marker to determine the approximate size distribution of peroxisomes ineach data point. Peroxisomes are also denoted as region of interest (ROI)throughout this section.
Cell Growth over Time
Opt
ical
Den
sity
[OD
]
5
10
15
20
Time [min]0 2.000 4.000 6.000 8.000
R²:0.98
A B Fluorescence Signal over Time
Fluo
resc
ence
Inte
nsit
y [a
.u.]
0
2,0×10⁴
4,0×10⁴
6,0×10⁴
8,0×10⁴
1,0×10⁵
1,2×10⁵
Time [min]0 2.000 4.000 6.000 8.000
N
ML
K
J
I
H
Figure 11.24: (A) Yeast growth monitored via optical density (OD) and (B) Developmentof EGFP fluorescence intensity, both approx. following a logistic growth model; (B-specific)Temp.: 20°C, Vol.: 200 µL, Detector gain: 160, Focus Depth: 23 mm, λExc.: 488 nm (f: 5nm), λEm.: 512 nm (f: 5 nm)
The applied procedure to obtain such a size distribution is described in section7.1 and comprises the following steps: (I) recording of z-stacks, (II) bleachcorrection, (III) deconvolution, (VI) edge detection and (VII) binary imageanalysis. Data recording & processing had to be done manually since noautomatized software had been available. For all processing steps the open-source software suite Fiji [178] has been used. Size determination was ofcourse limited by the achievable resolution of the setup. A pixel edge lengthon the camera corresponded to an approximate distance of 65 nm. Logically, afluorescence signal confined to such pixel after post-processing represents theminimum area of a detectable peroxisome. When probe molecules accumulatein a spherical volume, the 3D-shape dictates a disparate distribution of signalintensity when reduced to two dimensions. Hence, it can be assumed thatperoxisome sizes are systematically underestimated.Additionally the underlying intensities were extracted from averaged images ofthe raw data stacks. ROIs were defined by the borders found in volume analysisand intensities were extracted accordingly. The obtained values were weightedwith a factor to compensate for different exposure times and differences instack recording. The exposure times for different data points were chosen tobe within the dynamic range of the camera. Weighting factors were calculatedfrom the average intensity/pixel in areas without specimen. Table 11.4 showsa list of exposure times and the applied weighting factors (CC Factors).The obtained data was subjected to a statistical analysis. Figures 11.25-A/Band -C/D summarize data obtained for different time points for volumes and
121
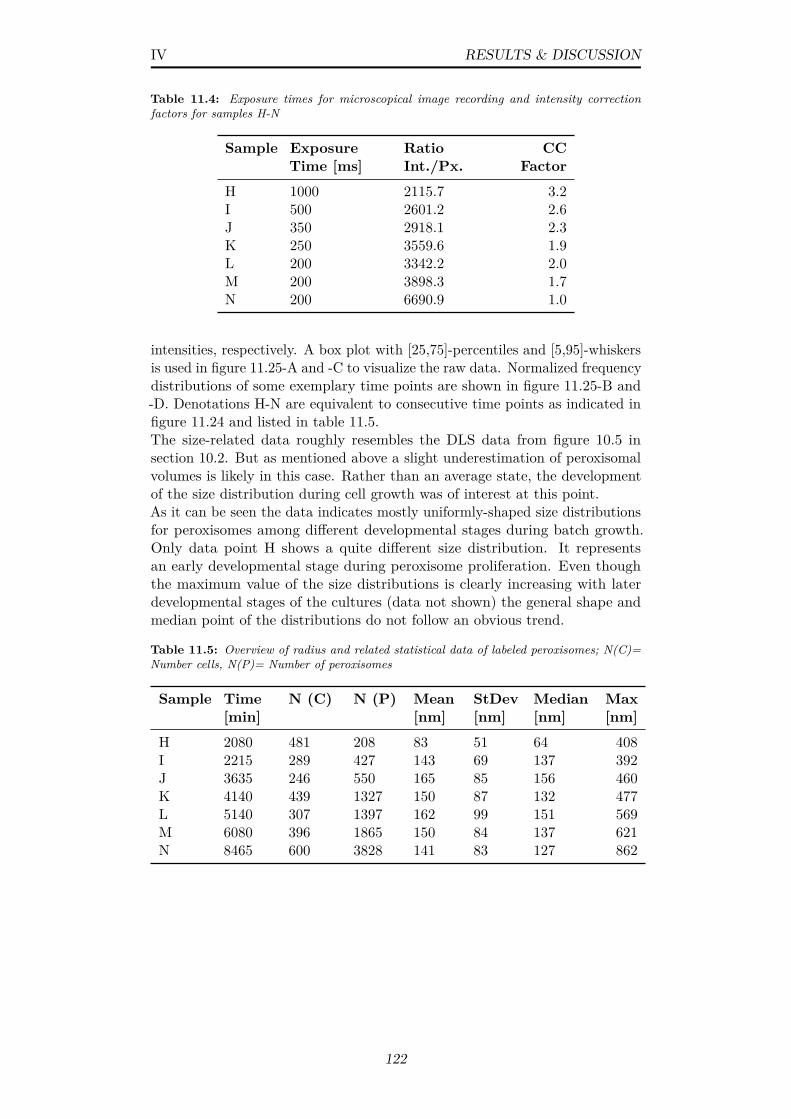
IV RESULTS & DISCUSSION
Table 11.4: Exposure times for microscopical image recording and intensity correctionfactors for samples H-N
Sample ExposureTime [ms]
RatioInt./Px.
CCFactor
H 1000 2115.7 3.2I 500 2601.2 2.6J 350 2918.1 2.3K 250 3559.6 1.9L 200 3342.2 2.0M 200 3898.3 1.7N 200 6690.9 1.0
intensities, respectively. A box plot with [25,75]-percentiles and [5,95]-whiskersis used in figure 11.25-A and -C to visualize the raw data. Normalized frequencydistributions of some exemplary time points are shown in figure 11.25-B and-D. Denotations H-N are equivalent to consecutive time points as indicated infigure 11.24 and listed in table 11.5.The size-related data roughly resembles the DLS data from figure 10.5 insection 10.2. But as mentioned above a slight underestimation of peroxisomalvolumes is likely in this case. Rather than an average state, the developmentof the size distribution during cell growth was of interest at this point.As it can be seen the data indicates mostly uniformly-shaped size distributionsfor peroxisomes among different developmental stages during batch growth.Only data point H shows a quite different size distribution. It representsan early developmental stage during peroxisome proliferation. Even thoughthe maximum value of the size distributions is clearly increasing with laterdevelopmental stages of the cultures (data not shown) the general shape andmedian point of the distributions do not follow an obvious trend.
Table 11.5: Overview of radius and related statistical data of labeled peroxisomes; N(C)=Number cells, N(P)= Number of peroxisomes
Sample Time[min]
N (C) N (P) Mean[nm]
StDev[nm]
Median[nm]
Max[nm]
H 2080 481 208 83 51 64 408I 2215 289 427 143 69 137 392J 3635 246 550 165 85 156 460K 4140 439 1327 150 87 132 477L 5140 307 1397 162 99 151 569M 6080 396 1865 150 84 137 621N 8465 600 3828 141 83 127 862
122

IV RESULTS & DISCUSSION
Box Plot of ROI Volumes
ROI V
olum
e [n
m³]
0
5×10⁷
108
2×10⁸
2×10⁸
SampleH I J K L M N
A B
C D
E F
Histogram of ROI Volumes
Nor
mal
ized
Fre
quen
cy
0
0,1
0,2
0,4
0,8
ROI Volume [nm³]0 5×10⁷ 108 2×10⁸ 2×10⁸ 2×10⁸
HJL
Box Plot of ROI Intensities
ROI F
luor
esce
nce
Inte
nsit
y [a
.u.]
0
5,0×10⁷
1,0×10⁸
1,5×10⁸
SampleH I J K L M N
Histogram of ROI Intensities
Nor
mal
ized
Fre
quen
cy
0
0,1
0,5
1
ROI Intensity [a.u.]0 5,0×10⁷ 1,0×10⁸
HJL
General Data Progression
Resc
aled
Dat
a [a
.u.]
0
0,2
0,4
0,6
0,8
1
1,2
Time [min]2.000 3.000 4.000 5.000 6.000
ROI/CellTotal Fluorescence IntensityROI Fluorescence IntensityROI Volume
Volume-Intensity Scatter-Plot
ROI I
nten
sity
[a.u
.]
0
2,0×10⁷
4,0×10⁷
6,0×10⁷
8,0×10⁷
1,0×10⁸
1,2×10⁸
1,4×10⁸
ROI Volumes [nm³]0 1,0×10⁸ 2,0×10⁸ 3,0×10⁸ 4,0×10⁸
HIJL
Figure 11.25: (A) Box plot of ROI volumes (all time points) (B) Histogram of ROI volumes(time points H,J,L) (C) Box plot ROI intensities (all time points) (D) Histogram of ROIintensites (time points H,J,L) (E) Scatter plot of ROI volumes vs intensities (time pointsH-J,L) (F) Normalized and averaged data of ROI total volume, ROI total intensity, totalensemble intensity and the number of ROIs per cell (time points H-N); Related data can befound in tables 11.5 & 11.4
The size distribution gets most expanded for early to mid stationary phase(J-L) and seems to tighten in late stationary phase (N). A trend best followedby looking at the whiskers of the box plots, but which is barely reproducedby the mean and median of the data (cp. table 11.5). In general, the sizedistribution seems to resemble a Poisson-distribution for most stages.After the induction of peroxisome proliferation the related size distributionis narrow (H) and most ROIs have apparent volumes of about 6 · 106nm3,corresponding to a radius of about 80± 50nm. It is known that peroxisomeswill be generated by de novo formation at this stage [196, 208, 213], whichis also reflected by the low frequency in peroxisomes/cell (cp. fig. 11.26).Therefore, it is plausible to find mostly small organelles. Due to limitationsin detection a broader diversification of this fraction cannot be verified nor
123
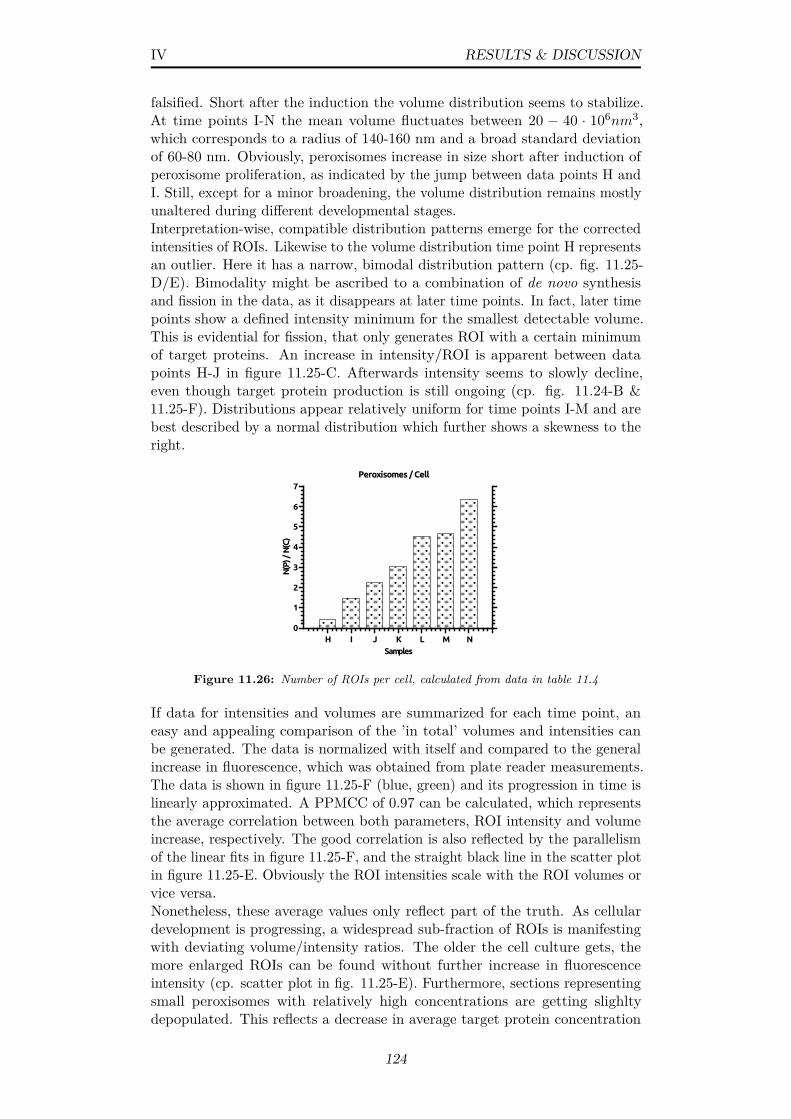
IV RESULTS & DISCUSSION
falsified. Short after the induction the volume distribution seems to stabilize.At time points I-N the mean volume fluctuates between 20 − 40 · 106nm3,which corresponds to a radius of 140-160 nm and a broad standard deviationof 60-80 nm. Obviously, peroxisomes increase in size short after induction ofperoxisome proliferation, as indicated by the jump between data points H andI. Still, except for a minor broadening, the volume distribution remains mostlyunaltered during different developmental stages.Interpretation-wise, compatible distribution patterns emerge for the correctedintensities of ROIs. Likewise to the volume distribution time point H representsan outlier. Here it has a narrow, bimodal distribution pattern (cp. fig. 11.25-D/E). Bimodality might be ascribed to a combination of de novo synthesisand fission in the data, as it disappears at later time points. In fact, later timepoints show a defined intensity minimum for the smallest detectable volume.This is evidential for fission, that only generates ROI with a certain minimumof target proteins. An increase in intensity/ROI is apparent between datapoints H-J in figure 11.25-C. Afterwards intensity seems to slowly decline,even though target protein production is still ongoing (cp. fig. 11.24-B &11.25-F). Distributions appear relatively uniform for time points I-M and arebest described by a normal distribution which further shows a skewness to theright.
Peroxisomes / Cell
N(P
) / N
(C)
0
1
2
3
4
5
6
7
SamplesH I J K L M N
Figure 11.26: Number of ROIs per cell, calculated from data in table 11.4
If data for intensities and volumes are summarized for each time point, aneasy and appealing comparison of the ’in total’ volumes and intensities canbe generated. The data is normalized with itself and compared to the generalincrease in fluorescence, which was obtained from plate reader measurements.The data is shown in figure 11.25-F (blue, green) and its progression in time islinearly approximated. A PPMCC of 0.97 can be calculated, which representsthe average correlation between both parameters, ROI intensity and volumeincrease, respectively. The good correlation is also reflected by the parallelismof the linear fits in figure 11.25-F, and the straight black line in the scatter plotin figure 11.25-E. Obviously the ROI intensities scale with the ROI volumes orvice versa.Nonetheless, these average values only reflect part of the truth. As cellulardevelopment is progressing, a widespread sub-fraction of ROIs is manifestingwith deviating volume/intensity ratios. The older the cell culture gets, themore enlarged ROIs can be found without further increase in fluorescenceintensity (cp. scatter plot in fig. 11.25-E). Furthermore, sections representingsmall peroxisomes with relatively high concentrations are getting slighltydepopulated. This reflects a decrease in average target protein concentration
124
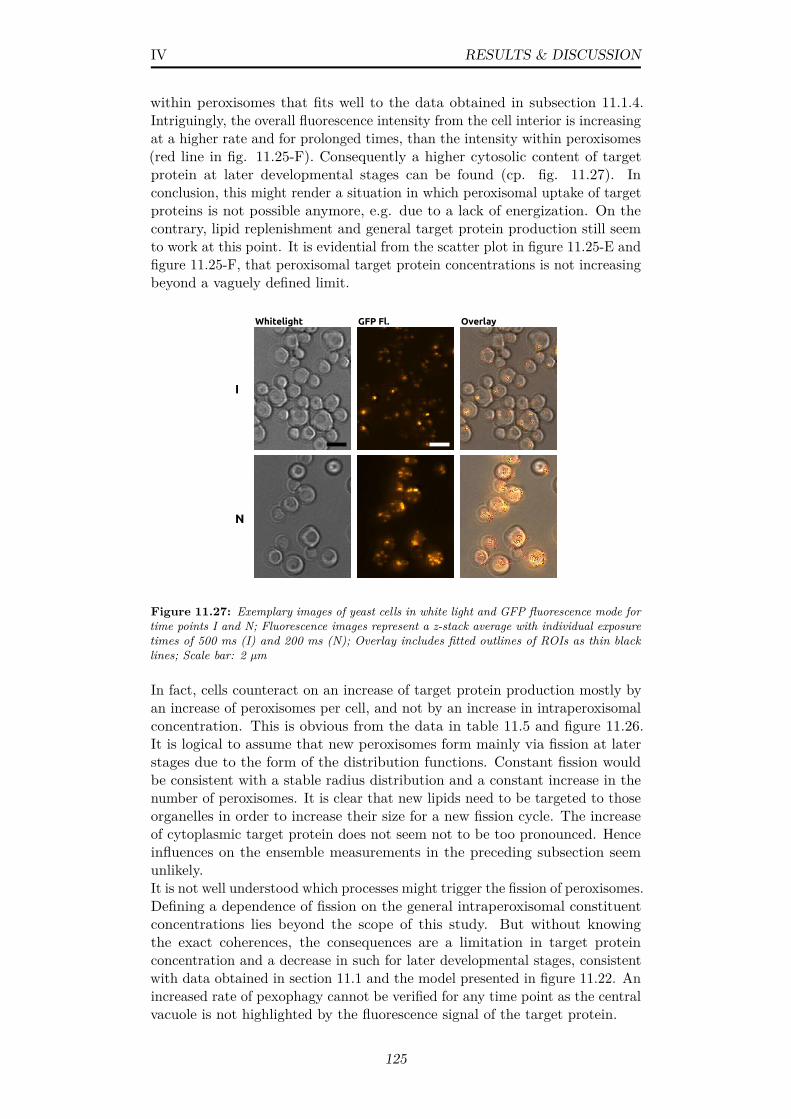
IV RESULTS & DISCUSSION
within peroxisomes that fits well to the data obtained in subsection 11.1.4.Intriguingly, the overall fluorescence intensity from the cell interior is increasingat a higher rate and for prolonged times, than the intensity within peroxisomes(red line in fig. 11.25-F). Consequently a higher cytosolic content of targetprotein at later developmental stages can be found (cp. fig. 11.27). Inconclusion, this might render a situation in which peroxisomal uptake of targetproteins is not possible anymore, e.g. due to a lack of energization. On thecontrary, lipid replenishment and general target protein production still seemto work at this point. It is evidential from the scatter plot in figure 11.25-E andfigure 11.25-F, that peroxisomal target protein concentrations is not increasingbeyond a vaguely defined limit.
I
Whitelight GFP Fl. Overlay
N
Figure 11.27: Exemplary images of yeast cells in white light and GFP fluorescence mode fortime points I and N; Fluorescence images represent a z-stack average with individual exposuretimes of 500 ms (I) and 200 ms (N); Overlay includes fitted outlines of ROIs as thin blacklines; Scale bar: 2 µm
In fact, cells counteract on an increase of target protein production mostly byan increase of peroxisomes per cell, and not by an increase in intraperoxisomalconcentration. This is obvious from the data in table 11.5 and figure 11.26.It is logical to assume that new peroxisomes form mainly via fission at laterstages due to the form of the distribution functions. Constant fission wouldbe consistent with a stable radius distribution and a constant increase in thenumber of peroxisomes. It is clear that new lipids need to be targeted to thoseorganelles in order to increase their size for a new fission cycle. The increaseof cytoplasmic target protein does not seem not to be too pronounced. Henceinfluences on the ensemble measurements in the preceding subsection seemunlikely.It is not well understood which processes might trigger the fission of peroxisomes.Defining a dependence of fission on the general intraperoxisomal constituentconcentrations lies beyond the scope of this study. But without knowingthe exact coherences, the consequences are a limitation in target proteinconcentration and a decrease in such for later developmental stages, consistentwith data obtained in section 11.1 and the model presented in figure 11.22. Anincreased rate of pexophagy cannot be verified for any time point as the centralvacuole is not highlighted by the fluorescence signal of the target protein.
125

IV RESULTS & DISCUSSION
The conclusions from this section are also likely to apply for peroxisomesin ∆PEX11 cells, that constantly increase in size [147]. Due to a lack offission, peroxisome-specific lipids are redirected to the only available organelle.Data in this section suggest that intraperoxisomal target protein content andperoxisomal volumes are correlated, whereas the general production of targetprotein is not well correlated. This indicates a volume-dependent limit, ratherthan a limit due to a lack of energy. Presumably, peroxisomes in ∆PEX11cells will also be bound to such limits for the target protein concentration.Interestingly ∆PEX11 cells can have more than one peroxisome per cell. Insuch case limited uptake into the sole peroxisome might trigger generation ofnew peroxisomes via de novo formation.
126
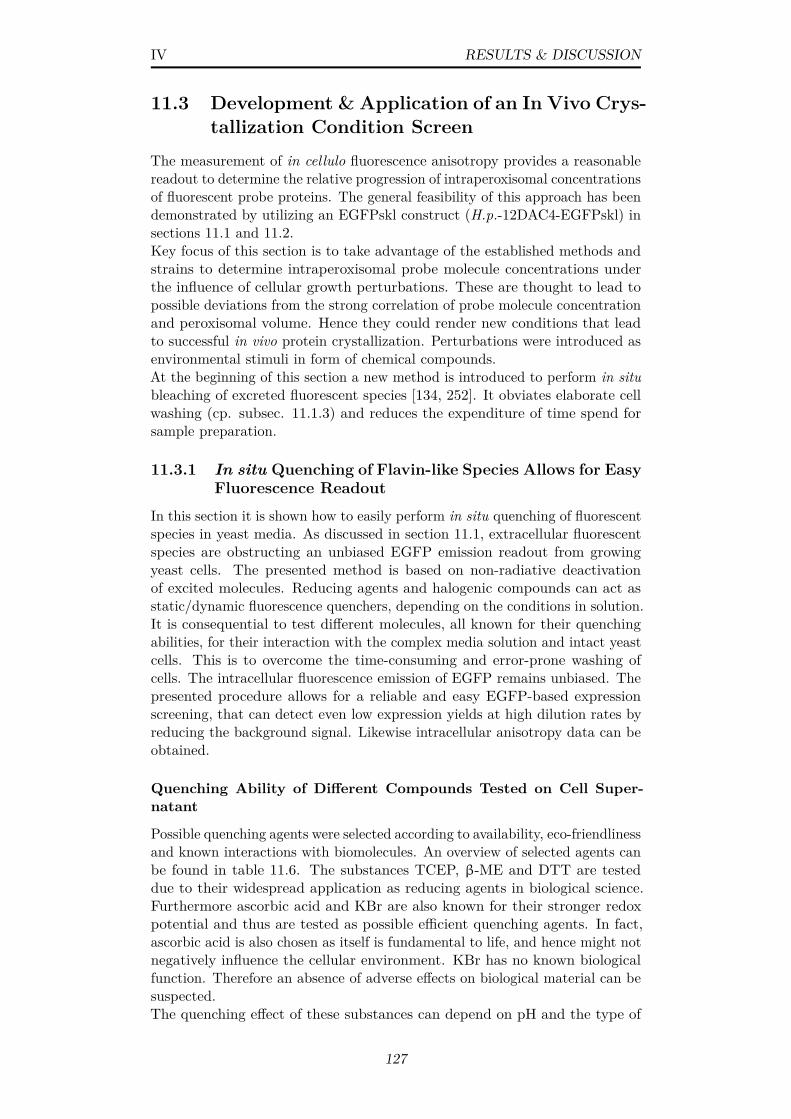
IV RESULTS & DISCUSSION
11.3 Development & Application of an In Vivo Crys-tallization Condition Screen
The measurement of in cellulo fluorescence anisotropy provides a reasonablereadout to determine the relative progression of intraperoxisomal concentrationsof fluorescent probe proteins. The general feasibility of this approach has beendemonstrated by utilizing an EGFPskl construct (H.p.-12DAC4-EGFPskl) insections 11.1 and 11.2.Key focus of this section is to take advantage of the established methods andstrains to determine intraperoxisomal probe molecule concentrations underthe influence of cellular growth perturbations. These are thought to lead topossible deviations from the strong correlation of probe molecule concentrationand peroxisomal volume. Hence they could render new conditions that leadto successful in vivo protein crystallization. Perturbations were introduced asenvironmental stimuli in form of chemical compounds.At the beginning of this section a new method is introduced to perform in situbleaching of excreted fluorescent species [134, 252]. It obviates elaborate cellwashing (cp. subsec. 11.1.3) and reduces the expenditure of time spend forsample preparation.
11.3.1 In situ Quenching of Flavin-like Species Allows for EasyFluorescence Readout
In this section it is shown how to easily perform in situ quenching of fluorescentspecies in yeast media. As discussed in section 11.1, extracellular fluorescentspecies are obstructing an unbiased EGFP emission readout from growingyeast cells. The presented method is based on non-radiative deactivationof excited molecules. Reducing agents and halogenic compounds can act asstatic/dynamic fluorescence quenchers, depending on the conditions in solution.It is consequential to test different molecules, all known for their quenchingabilities, for their interaction with the complex media solution and intact yeastcells. This is to overcome the time-consuming and error-prone washing ofcells. The intracellular fluorescence emission of EGFP remains unbiased. Thepresented procedure allows for a reliable and easy EGFP-based expressionscreening, that can detect even low expression yields at high dilution rates byreducing the background signal. Likewise intracellular anisotropy data can beobtained.
Quenching Ability of Different Compounds Tested on Cell Super-natant
Possible quenching agents were selected according to availability, eco-friendlinessand known interactions with biomolecules. An overview of selected agents canbe found in table 11.6. The substances TCEP, β-ME and DTT are testeddue to their widespread application as reducing agents in biological science.Furthermore ascorbic acid and KBr are also known for their stronger redoxpotential and thus are tested as possible efficient quenching agents. In fact,ascorbic acid is also chosen as itself is fundamental to life, and hence might notnegatively influence the cellular environment. KBr has no known biologicalfunction. Therefore an absence of adverse effects on biological material can besuspected.The quenching effect of these substances can depend on pH and the type of
127
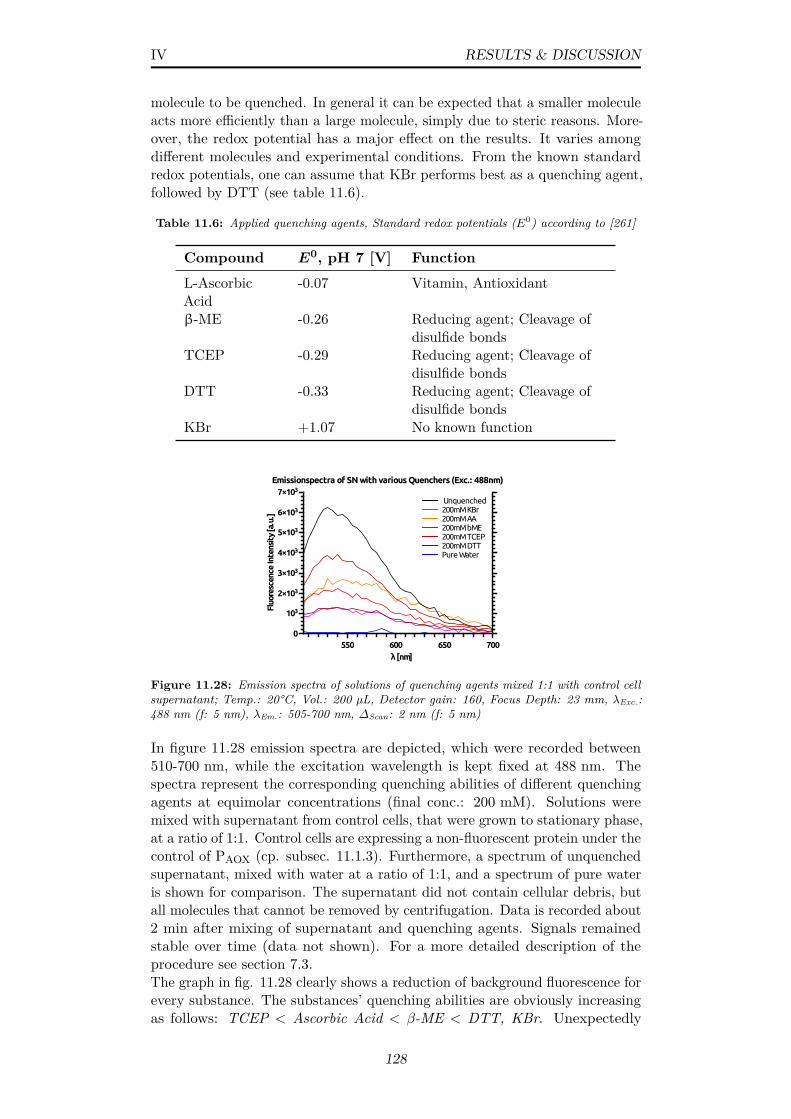
IV RESULTS & DISCUSSION
molecule to be quenched. In general it can be expected that a smaller moleculeacts more efficiently than a large molecule, simply due to steric reasons. More-over, the redox potential has a major effect on the results. It varies amongdifferent molecules and experimental conditions. From the known standardredox potentials, one can assume that KBr performs best as a quenching agent,followed by DTT (see table 11.6).
Table 11.6: Applied quenching agents, Standard redox potentials (E0) according to [261]
Compound E0, pH 7 [V] Function
L-AscorbicAcid
-0.07 Vitamin, Antioxidant
β-ME -0.26 Reducing agent; Cleavage ofdisulfide bonds
TCEP -0.29 Reducing agent; Cleavage ofdisulfide bonds
DTT -0.33 Reducing agent; Cleavage ofdisulfide bonds
KBr +1.07 No known function
Emissionspectra of SN with various Quenchers (Exc.: 488nm)
Fluo
resc
ence
Inte
nsit
y [a
.u.]
0
103
2×10³
3×10³
4×10³
5×10³
6×10³
7×10³
λ [nm]550 600 650 700
Unquenched200mM KBr200mM AA200mM bME200mM TCEP200mM DTTPure Water
Figure 11.28: Emission spectra of solutions of quenching agents mixed 1:1 with control cellsupernatant; Temp.: 20°C, Vol.: 200 µL, Detector gain: 160, Focus Depth: 23 mm, λExc.:488 nm (f: 5 nm), λEm.: 505-700 nm, ∆Scan: 2 nm (f: 5 nm)
In figure 11.28 emission spectra are depicted, which were recorded between510-700 nm, while the excitation wavelength is kept fixed at 488 nm. Thespectra represent the corresponding quenching abilities of different quenchingagents at equimolar concentrations (final conc.: 200 mM). Solutions weremixed with supernatant from control cells, that were grown to stationary phase,at a ratio of 1:1. Control cells are expressing a non-fluorescent protein under thecontrol of PAOX (cp. subsec. 11.1.3). Furthermore, a spectrum of unquenchedsupernatant, mixed with water at a ratio of 1:1, and a spectrum of pure wateris shown for comparison. The supernatant did not contain cellular debris, butall molecules that cannot be removed by centrifugation. Data is recorded about2 min after mixing of supernatant and quenching agents. Signals remainedstable over time (data not shown). For a more detailed description of theprocedure see section 7.3.The graph in fig. 11.28 clearly shows a reduction of background fluorescence forevery substance. The substances’ quenching abilities are obviously increasingas follows: TCEP < Ascorbic Acid < β-ME < DTT, KBr. Unexpectedly
128
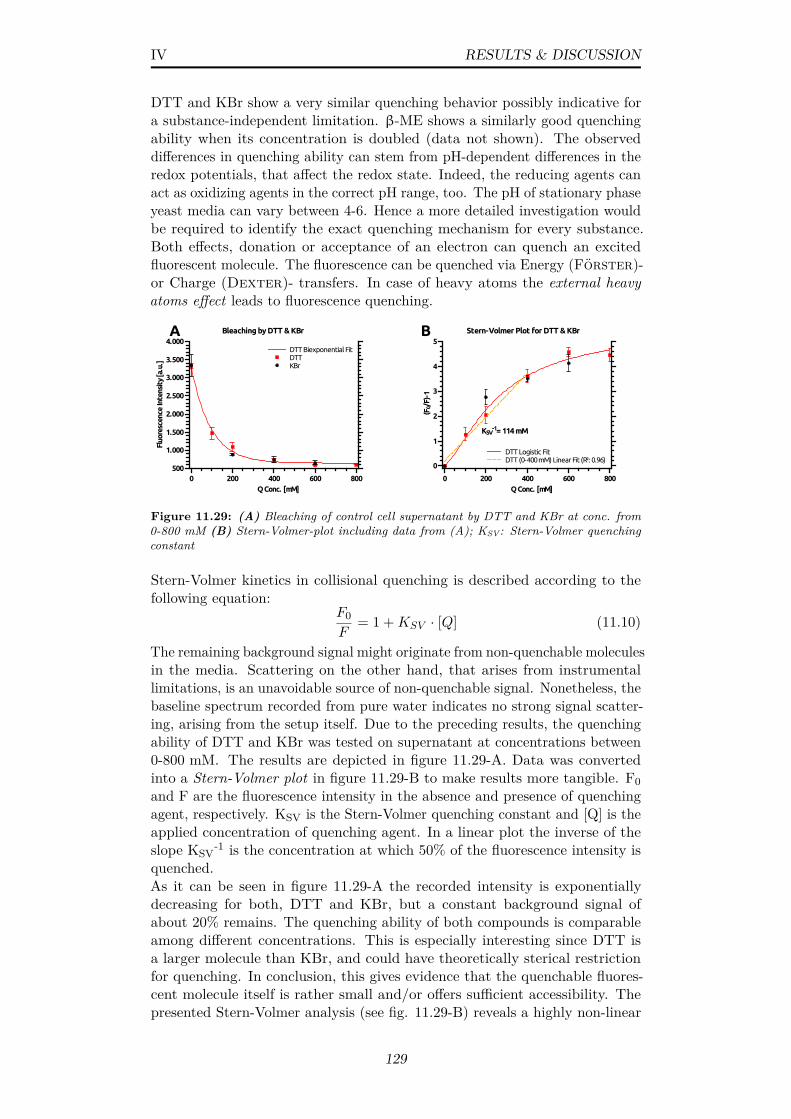
IV RESULTS & DISCUSSION
DTT and KBr show a very similar quenching behavior possibly indicative fora substance-independent limitation. β-ME shows a similarly good quenchingability when its concentration is doubled (data not shown). The observeddifferences in quenching ability can stem from pH-dependent differences in theredox potentials, that affect the redox state. Indeed, the reducing agents canact as oxidizing agents in the correct pH range, too. The pH of stationary phaseyeast media can vary between 4-6. Hence a more detailed investigation wouldbe required to identify the exact quenching mechanism for every substance.Both effects, donation or acceptance of an electron can quench an excitedfluorescent molecule. The fluorescence can be quenched via Energy (Förster)-or Charge (Dexter)- transfers. In case of heavy atoms the external heavyatoms effect leads to fluorescence quenching.
Bleaching by DTT & KBr
Fluo
resc
ence
Inte
nsit
y [a
.u.]
500
1.000
1.500
2.000
2.500
3.000
3.500
4.000
Q Conc. [mM]0 200 400 600 800
A BDTT Biexponential FitDTTKBr
Stern-Volmer Plot for DTT & KBr
(F0/
F)-1
0
1
2
3
4
5
Q Conc. [mM]0 200 400 600 800
DTT Logistic FitDTT (0-400 mM) Linear Fit (R²: 0.96)
KSV-1= 114 mM
Figure 11.29: (A) Bleaching of control cell supernatant by DTT and KBr at conc. from0-800 mM (B) Stern-Volmer-plot including data from (A); KSV: Stern-Volmer quenchingconstant
Stern-Volmer kinetics in collisional quenching is described according to thefollowing equation:
F0F
= 1 +KSV · [Q] (11.10)
The remaining background signal might originate from non-quenchable moleculesin the media. Scattering on the other hand, that arises from instrumentallimitations, is an unavoidable source of non-quenchable signal. Nonetheless, thebaseline spectrum recorded from pure water indicates no strong signal scatter-ing, arising from the setup itself. Due to the preceding results, the quenchingability of DTT and KBr was tested on supernatant at concentrations between0-800 mM. The results are depicted in figure 11.29-A. Data was convertedinto a Stern-Volmer plot in figure 11.29-B to make results more tangible. F0and F are the fluorescence intensity in the absence and presence of quenchingagent, respectively. KSV is the Stern-Volmer quenching constant and [Q] is theapplied concentration of quenching agent. In a linear plot the inverse of theslope KSV
-1 is the concentration at which 50% of the fluorescence intensity isquenched.As it can be seen in figure 11.29-A the recorded intensity is exponentiallydecreasing for both, DTT and KBr, but a constant background signal ofabout 20% remains. The quenching ability of both compounds is comparableamong different concentrations. This is especially interesting since DTT isa larger molecule than KBr, and could have theoretically sterical restrictionfor quenching. In conclusion, this gives evidence that the quenchable fluores-cent molecule itself is rather small and/or offers sufficient accessibility. Thepresented Stern-Volmer analysis (see fig. 11.29-B) reveals a highly non-linear
129
IV RESULTS & DISCUSSION
slope for both compounds. This indicates that multiple fluorescent speciesare contained in the media. Not all seem accessible for the quenching agents.Apparently this equally applies for DTT, as well as KBr. The data can bemostly linear approximated from 0-400 mM. A linear fit reveals an apparentKSV
-1 of about 114± 10 mM, which can be used as a ’quenching estimate’ forthe predominant and quenchable fluorescent species in the solution. Thus toremove most of the quenchable signal a considerably higher concentration ofquenching agent has to be used. Therefore 200-600 mM of DTT and KBr weretested with regards to their long-term influence on EGFP-expressing cells andtheir ability to restore an unbiased EGFP emission spectrum.
Long-term Effects of Quenching Agents on Yeast Cell Suspensions
EGFP-expressing cells from early stationary phase were mixed with 200-600 mM(final concentration) of DTT/KBr. The fluorescence emission signals wereobserved at 512 nm (Exc.: 488 nm) over a prolonged time periode, to estimtatedetrimental effects on cellular fitness and fluorescence signal strength. Theresults of this experiment are depicted in figure 11.30-A.
Emission Spectra from KBr-treated Cells
Fluo
resc
ence
Inte
nsit
y [a
.u.]
0
2,0×10³
4,0×10³
6,0×10³
8,0×10³
1,0×10⁴
1,2×10⁴
Wavelength [nm]550 600 650 700
0 mM KBr200 mM KBr400 mM KBr600 mM KBr
Norm.
Effects on Intracellular EGFP Emission
Resc
aled
Flu
ores
cenc
e In
tens
ity
[a.u
.]
0
0,2
0,4
0,6
0,8
1
1,2
Time [min]0 5 10 15 20 25 30
200 mM DTT400 mM DTT600 mM DTT
200 mM KBr400 mM KBr600 mM KBr
A B
Figure 11.30: (A) Long-term observation of intracellular EGFP emission upon cell treat-ment with high concentrations of DTT and KBr (B) Emission spectra of EGFP-expressingcells after 30 minutes upon incubation with Kbr; Temp.: 20°C, Vol.: 200 µL, Detector gain:160, Focus Depth: 23 mm, (A-specific) λExc.: 488 nm (f: 5 nm), λEm.: 512 nm (f: 5 nm);(B-specific) λExc.: 488 nm (f: 5 nm), λEm.: 505-700 nm, ∆Scan: 2 nm (f: 5 nm)
Intriguingly, DTT seems to increasingly influence the cellular EGFP emissionsignal already after 20 minutes. 30 minutes after mixing, the cellular EGFPemission signal strength decreased by 50-80%. The effect appears to be morepronounced the higher the concentration is. On the contrary, the EGFP emis-sion signal strength remains stable during long-term observation of KBr-treatedcells, regardless of concentration (cp. fig. 11.30-A/B).Figure 11.30-B shows the change of the emission spectra recorded between505-700 nm (Exc.: 488 nm), without and with different amounts of KBr after 30min. As it can be seen, KBr treatment yields a clearly visible EGFP spectrumand removal of background fluorescence. Even though it seems that 200 mMKBr are sufficient to quench most of the accessible background signal, 400 mMKBr will be applied during further experiments. This is, to not be limited inquenching ability due to an insufficient quencher concentration and to allow fora robust assay. Since the EGFP spectrum is very distinct and remains stableover time, it can be assumed that it is possible to conduct mostly unbiased incellulo fluorescence and anisotropy measurements without additional washingof cells.
130
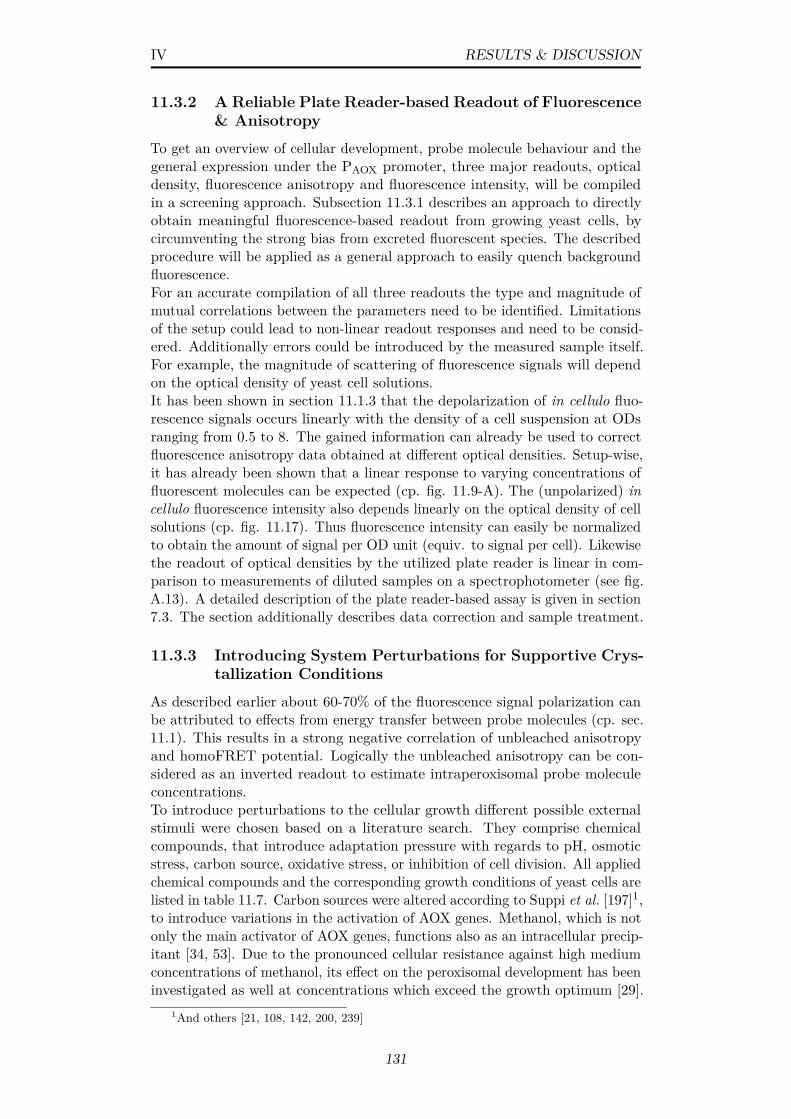
IV RESULTS & DISCUSSION
11.3.2 A Reliable Plate Reader-based Readout of Fluorescence& Anisotropy
To get an overview of cellular development, probe molecule behaviour and thegeneral expression under the PAOX promoter, three major readouts, opticaldensity, fluorescence anisotropy and fluorescence intensity, will be compiledin a screening approach. Subsection 11.3.1 describes an approach to directlyobtain meaningful fluorescence-based readout from growing yeast cells, bycircumventing the strong bias from excreted fluorescent species. The describedprocedure will be applied as a general approach to easily quench backgroundfluorescence.For an accurate compilation of all three readouts the type and magnitude ofmutual correlations between the parameters need to be identified. Limitationsof the setup could lead to non-linear readout responses and need to be consid-ered. Additionally errors could be introduced by the measured sample itself.For example, the magnitude of scattering of fluorescence signals will dependon the optical density of yeast cell solutions.It has been shown in section 11.1.3 that the depolarization of in cellulo fluo-rescence signals occurs linearly with the density of a cell suspension at ODsranging from 0.5 to 8. The gained information can already be used to correctfluorescence anisotropy data obtained at different optical densities. Setup-wise,it has already been shown that a linear response to varying concentrations offluorescent molecules can be expected (cp. fig. 11.9-A). The (unpolarized) incellulo fluorescence intensity also depends linearly on the optical density of cellsolutions (cp. fig. 11.17). Thus fluorescence intensity can easily be normalizedto obtain the amount of signal per OD unit (equiv. to signal per cell). Likewisethe readout of optical densities by the utilized plate reader is linear in com-parison to measurements of diluted samples on a spectrophotometer (see fig.A.13). A detailed description of the plate reader-based assay is given in section7.3. The section additionally describes data correction and sample treatment.
11.3.3 Introducing System Perturbations for Supportive Crys-tallization Conditions
As described earlier about 60-70% of the fluorescence signal polarization canbe attributed to effects from energy transfer between probe molecules (cp. sec.11.1). This results in a strong negative correlation of unbleached anisotropyand homoFRET potential. Logically the unbleached anisotropy can be con-sidered as an inverted readout to estimate intraperoxisomal probe moleculeconcentrations.To introduce perturbations to the cellular growth different possible externalstimuli were chosen based on a literature search. They comprise chemicalcompounds, that introduce adaptation pressure with regards to pH, osmoticstress, carbon source, oxidative stress, or inhibition of cell division. All appliedchemical compounds and the corresponding growth conditions of yeast cells arelisted in table 11.7. Carbon sources were altered according to Suppi et al. [197]1,to introduce variations in the activation of AOX genes. Methanol, which is notonly the main activator of AOX genes, functions also as an intracellular precip-itant [34, 53]. Due to the pronounced cellular resistance against high mediumconcentrations of methanol, its effect on the peroxisomal development has beeninvestigated as well at concentrations which exceed the growth optimum [29].
1And others [21, 108, 142, 200, 239]
131
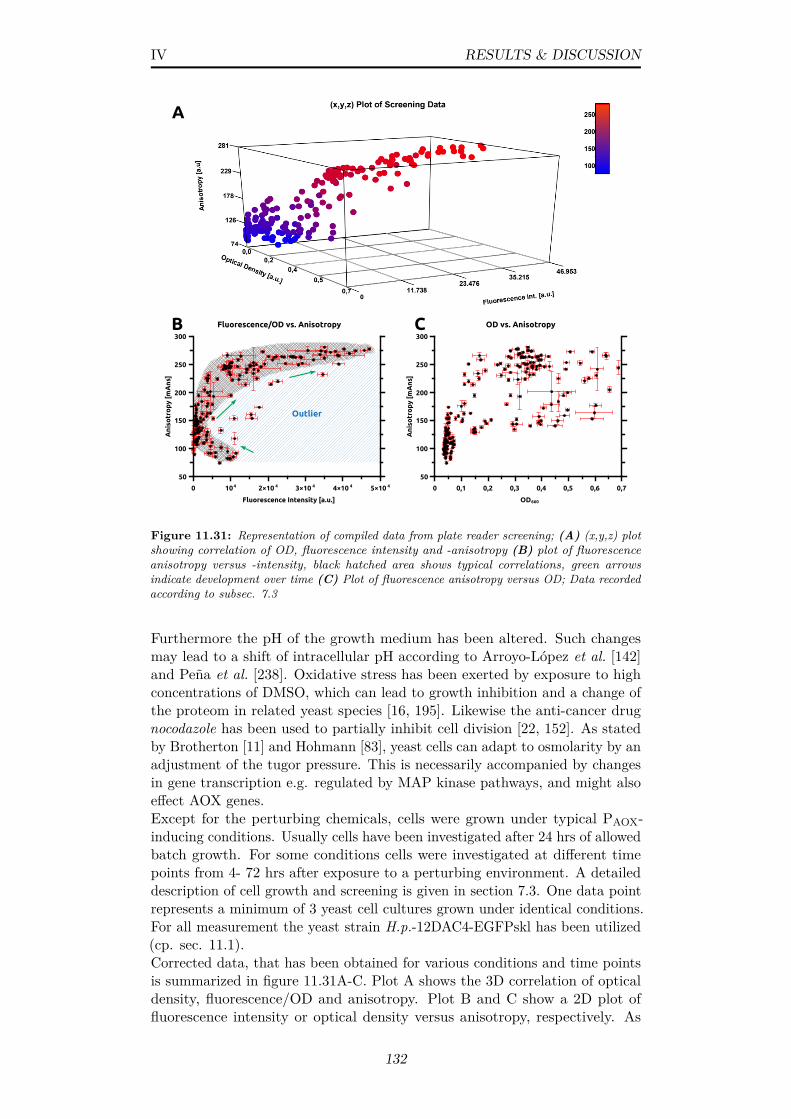
IV RESULTS & DISCUSSION
Fluorescence/OD vs. Anisotropy
An
iso
tro
py
[mA
ns]
50
100
150
200
250
300
Fluorescence Intensity [a.u.]
0 104 2×10 4 3×10 4 4×10 4 5×10 4
OD vs. Anisotropy
An
iso
tro
py
[mA
ns]
50
100
150
200
250
300
OD660
0 0,1 0,2 0,3 0,4 0,5 0,6 0,7
B
A
C
Outlier
Figure 11.31: Representation of compiled data from plate reader screening; (A) (x,y,z) plotshowing correlation of OD, fluorescence intensity and -anisotropy (B) plot of fluorescenceanisotropy versus -intensity, black hatched area shows typical correlations, green arrowsindicate development over time (C) Plot of fluorescence anisotropy versus OD; Data recordedaccording to subsec. 7.3
Furthermore the pH of the growth medium has been altered. Such changesmay lead to a shift of intracellular pH according to Arroyo-López et al. [142]and Peña et al. [238]. Oxidative stress has been exerted by exposure to highconcentrations of DMSO, which can lead to growth inhibition and a change ofthe proteom in related yeast species [16, 195]. Likewise the anti-cancer drugnocodazole has been used to partially inhibit cell division [22, 152]. As statedby Brotherton [11] and Hohmann [83], yeast cells can adapt to osmolarity by anadjustment of the tugor pressure. This is necessarily accompanied by changesin gene transcription e.g. regulated by MAP kinase pathways, and might alsoeffect AOX genes.Except for the perturbing chemicals, cells were grown under typical PAOX-inducing conditions. Usually cells have been investigated after 24 hrs of allowedbatch growth. For some conditions cells were investigated at different timepoints from 4- 72 hrs after exposure to a perturbing environment. A detaileddescription of cell growth and screening is given in section 7.3. One data pointrepresents a minimum of 3 yeast cell cultures grown under identical conditions.For all measurement the yeast strain H.p.-12DAC4-EGFPskl has been utilized(cp. sec. 11.1).Corrected data, that has been obtained for various conditions and time pointsis summarized in figure 11.31A-C. Plot A shows the 3D correlation of opticaldensity, fluorescence/OD and anisotropy. Plot B and C show a 2D plot offluorescence intensity or optical density versus anisotropy, respectively. As
132
IV RESULTS & DISCUSSION
it can be seen, especially fluorescence/OD and anisotropy show an obviousnon-linear correlation, whereas optical density and anisotropy are somewhatuncorrelated.The intraperoxisomal anisotropy almost always follows a predetermined devel-opmental path upon increasing fluorescence intensity per OD unit (fig. 11.31-B,black hatched area). This behaviour is basically reconfirming the intercon-nection of target protein expression (fluorescence intensity) and peroxisomaldevelopment, which has already been described earlier. Unfortunately, thecombined results also indicate a mostly unbiased peroxisomal development,while cellular growth is impeded for many conditions. Nonetheless a few outlierscan be found, that show higher fluorescence intensities while simultaneouslyexhibiting a stronger signal depolarization by homoFRET (fig. 11.31-B, bluehatched area). They represent cell samples that are exclusively grown at pH7-8, stabilized by 50 mM potassium phosphate. Another interesting observationis a small bulge towards higher intensities, visible for extremely low anisotropyvalues. This bulge corresponds to an early expression phase of probe molecules.Following the theory developed in section 11.1, this phase holds the highestconcentration of probe molecules. Areas in figure 11.31-B were drawn manually,based on the typical relation of anisotropy and intensity found for unbiasedconditions (fig. 11.32). Remarkably, cellular growth and PAOX-induction seemnot to be strongly correlated (cp. fig. 11.31-C).For a correct interpretation of the shown figures it is necessary to rememberthat a lower anisotropy value reflects a higher degree of energy transfer andthus of probe proximity/ concentration. Ultimately it is of course a convolutionof energy transfer and viscosity. Data on a horizontal line (at a constantanisotropy value) corresponds either to comparable concentration levels ofprobe molecules or to a certain extent to comparable viscosities. Thus, whilea higher fluorescence intensity would usually be interpreted as higher concen-tration, here it is rather reflective of non-tangible changes in the peroxisomalinterior. For example, if a certain anisotropy value is reached at differentfluorescence intensities this is most likely indicative for differing peroxisomalvolumes that lead to the same relative concentration. Likewise the same inten-sity at differing anisotropy values indicates different concentrations. Hence itis logical to assume a less steeper slope for enlarged peroxisomes in diagramsas in figures 11.31-B or 11.32.Data recorded for yeast cells grown at different medium pHs is shown in aseparate plot in figure 11.32. Different time marks emphasize the progres-
pH Dependency of Anisotropy
Fluo
resc
ence
Ani
sotr
opy
[a.u
.]
100
150
200
250
300
Fluorescence Intensity [a.u.]0 104 2×10⁴ 3×10⁴ 4×10⁴
pH 6.0pH 7.2pH 7.4pH 7.6pH 7.8
16 hrs
32 hrs72 hrs
16 hrs
32 hrs
72 hrs
Figure 11.32: Screening data from yeast cells grown in batch mode at media pHs of 6-7.8,plot of anisotropy versus fluorescence; Data recorded according to subsec. 7.3
133
IV RESULTS & DISCUSSION
sion of data points during cellular growth. From this a clear dependency ofanisotropy/fluorescence on the pH can be identified. The higher the pH themore flat is the increase in anisotropy at higher probe molecule expressionlevels. The steepest increase is found for standard conditions, the growth atpH 6 (black curve) and flattest for cells grown at pH 7.6 (orange line). Cellsincubated in media at pH 7.8 were limited in growth and did not yield distinctdata (gray data points). Data is interpolated either with a 5-order polynomial(pH 6, 7.2, 7.4) or with a linear function (pH 7.6).
This section mainly demonstrates how to simultaneously obtain three ma-jor readouts from growing yeast cell cultures, that were made comparable overa wide dynamic range via data correction. The developed screening approachhas been utilized to probe peroxisomal development and PAOX-induction dur-ing growth under the influence of different stress inducers. The aim has beento identify possible systematic perturbations that could help to crystallizerecombinantly expressed proteins. The acquired data mainly indicates, thatalmost none of the tested conditions lead to a distortion in the balance ofPAOX-induced expression and peroxisomal development. Although for high,but not low pHs a change in peroxisomal development could be detected. Thischange can at best be interpreted as the occurrence of enlarged peroxisomes e.g.by a restriction of fission. Still, further evidence is required to create a moreaccurate description of the observed phenomenon. Even though this findingproves the applicability of the screening approach it has to be questioned,whether such changes can lead to an increased propensity of recombinant pro-teins to crystallize. Unfortunately, no other test condition exhibited stronglydeviating dynamics.
134
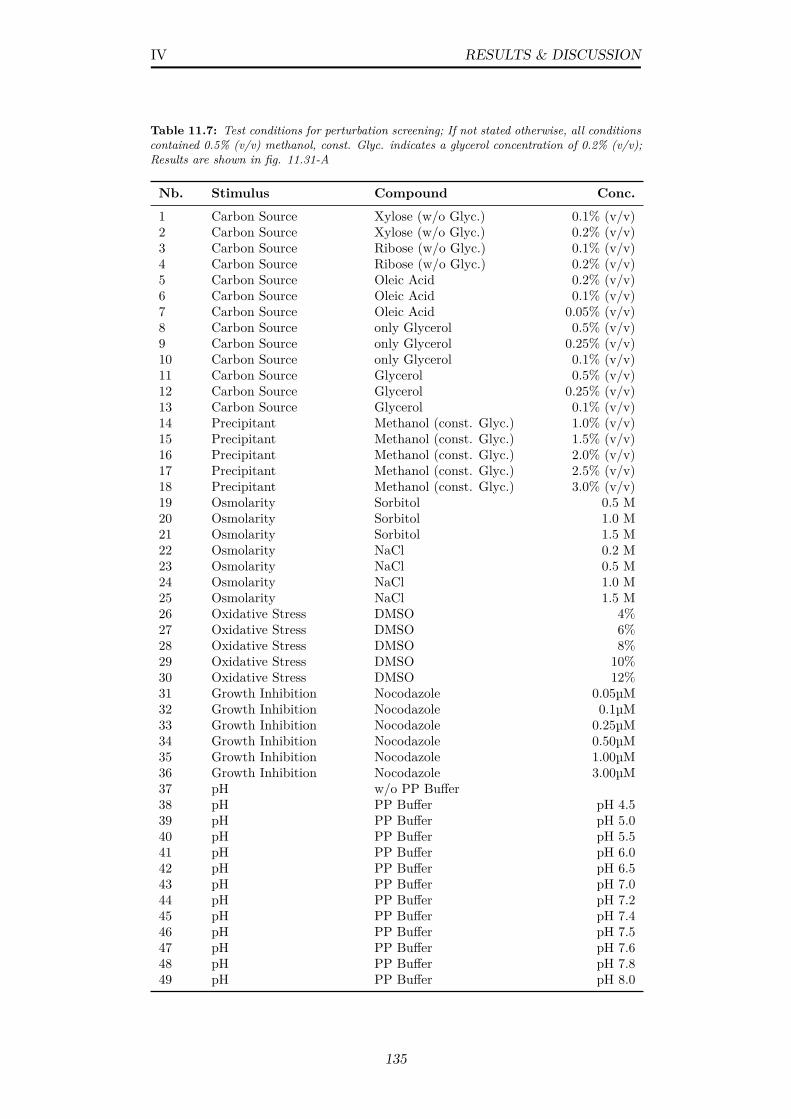
IV RESULTS & DISCUSSION
Table 11.7: Test conditions for perturbation screening; If not stated otherwise, all conditionscontained 0.5% (v/v) methanol, const. Glyc. indicates a glycerol concentration of 0.2% (v/v);Results are shown in fig. 11.31-A
Nb. Stimulus Compound Conc.
1 Carbon Source Xylose (w/o Glyc.) 0.1% (v/v)2 Carbon Source Xylose (w/o Glyc.) 0.2% (v/v)3 Carbon Source Ribose (w/o Glyc.) 0.1% (v/v)4 Carbon Source Ribose (w/o Glyc.) 0.2% (v/v)5 Carbon Source Oleic Acid 0.2% (v/v)6 Carbon Source Oleic Acid 0.1% (v/v)7 Carbon Source Oleic Acid 0.05% (v/v)8 Carbon Source only Glycerol 0.5% (v/v)9 Carbon Source only Glycerol 0.25% (v/v)10 Carbon Source only Glycerol 0.1% (v/v)11 Carbon Source Glycerol 0.5% (v/v)12 Carbon Source Glycerol 0.25% (v/v)13 Carbon Source Glycerol 0.1% (v/v)14 Precipitant Methanol (const. Glyc.) 1.0% (v/v)15 Precipitant Methanol (const. Glyc.) 1.5% (v/v)16 Precipitant Methanol (const. Glyc.) 2.0% (v/v)17 Precipitant Methanol (const. Glyc.) 2.5% (v/v)18 Precipitant Methanol (const. Glyc.) 3.0% (v/v)19 Osmolarity Sorbitol 0.5 M20 Osmolarity Sorbitol 1.0 M21 Osmolarity Sorbitol 1.5 M22 Osmolarity NaCl 0.2 M23 Osmolarity NaCl 0.5 M24 Osmolarity NaCl 1.0 M25 Osmolarity NaCl 1.5 M26 Oxidative Stress DMSO 4%27 Oxidative Stress DMSO 6%28 Oxidative Stress DMSO 8%29 Oxidative Stress DMSO 10%30 Oxidative Stress DMSO 12%31 Growth Inhibition Nocodazole 0.05µM32 Growth Inhibition Nocodazole 0.1µM33 Growth Inhibition Nocodazole 0.25µM34 Growth Inhibition Nocodazole 0.50µM35 Growth Inhibition Nocodazole 1.00µM36 Growth Inhibition Nocodazole 3.00µM37 pH w/o PP Buffer38 pH PP Buffer pH 4.539 pH PP Buffer pH 5.040 pH PP Buffer pH 5.541 pH PP Buffer pH 6.042 pH PP Buffer pH 6.543 pH PP Buffer pH 7.044 pH PP Buffer pH 7.245 pH PP Buffer pH 7.446 pH PP Buffer pH 7.547 pH PP Buffer pH 7.648 pH PP Buffer pH 7.849 pH PP Buffer pH 8.0
135
IV RESULTS & DISCUSSION
12 | Implications from FluorescenceAnisotropy for ProteinCrystallography
In protein crystallography it is assumed that concentration is one of the maindriving forces in protein oligomerization, nucleation and crystallization. It hasbeen proven in section 11.1, that the fluorescence anisotropy of a probe moleculecan help to understand this important parameter in an in vivo crystallizationenvironment. It has been demonstrated that the movement of fluorescentunits and their proximity can yield specific information about their behaviourin terms of particle density and clustering. It is logical to look into furtherpossible applications of this technique in crystallography.The big advantage of fluorescence anisotropy is truly its influenceability bydepolarizing effects. The depolarizing effect of FRET (as it has been appliedthroughout this thesis) is rather caused by the random orientation of acceptormolecules and not by the energy transfer itself. But the probability of energytransfer strongly depends on the orientation of donor and potential acceptormolecules towards each other. More specifically, the orientation of the donoremission transition moment and the acceptor absorption transition moment.In homoFRET the angle between these dipole moments is the same for donorand acceptor. Besides the orientation, other properties like spectral overlap,fluorescence lifetime and quantum efficiency play a role in determining the rateof energy transfer between donor and acceptor.In FRET theory (see sec. 3.1) the magnitude of energy transfer between twodipoles is summarized by the Förster radius. It includes the orientationfactor κ2, whose variations may be used to discern protein clusters and crystals,based on the random versus non-random orientation of molecules.In case of clustering/crystallization of fluorescent molecule, we will find twoopposing effects upon examination via fluorescence anisotropy. First, anincrease of anisotropy due to an increase of the rotational correlation time,second a decrease of anisotropy due to the influence of energy transfers. Thelatter effect will vary with the orientation of acceptor molecules. Hence if bothvalues could be determined from an integrated theory, clusters and crystalshould yield different values.
136
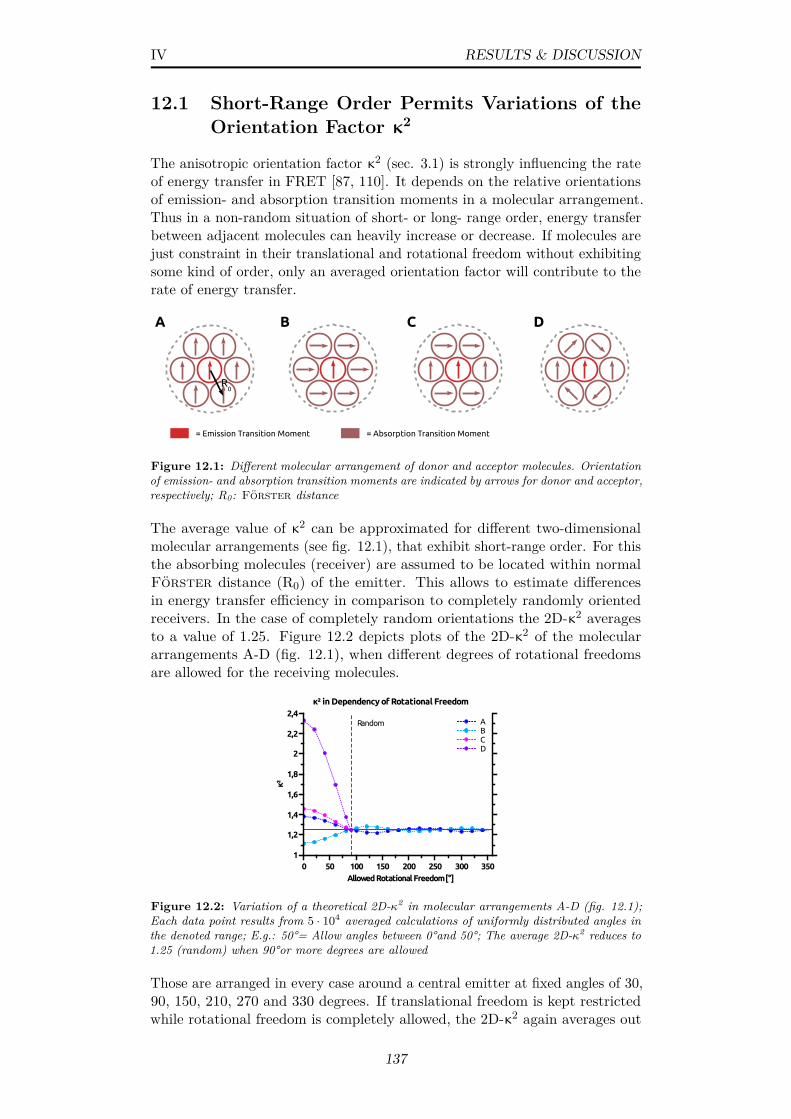
IV RESULTS & DISCUSSION
12.1 Short-Range Order Permits Variations of theOrientation Factor κ2
The anisotropic orientation factor κ2 (sec. 3.1) is strongly influencing the rateof energy transfer in FRET [87, 110]. It depends on the relative orientationsof emission- and absorption transition moments in a molecular arrangement.Thus in a non-random situation of short- or long- range order, energy transferbetween adjacent molecules can heavily increase or decrease. If molecules arejust constraint in their translational and rotational freedom without exhibitingsome kind of order, only an averaged orientation factor will contribute to therate of energy transfer.
R0
= Emission Transition Moment = Absorption Transition Moment
A B C D
Figure 12.1: Different molecular arrangement of donor and acceptor molecules. Orientationof emission- and absorption transition moments are indicated by arrows for donor and acceptor,respectively; R0: Förster distance
The average value of κ2 can be approximated for different two-dimensionalmolecular arrangements (see fig. 12.1), that exhibit short-range order. For thisthe absorbing molecules (receiver) are assumed to be located within normalFörster distance (R0) of the emitter. This allows to estimate differencesin energy transfer efficiency in comparison to completely randomly orientedreceivers. In the case of completely random orientations the 2D-κ2 averagesto a value of 1.25. Figure 12.2 depicts plots of the 2D-κ2 of the moleculararrangements A-D (fig. 12.1), when different degrees of rotational freedomsare allowed for the receiving molecules.
κ² in Dependency of Rotational Freedom
κ²
1
1,2
1,4
1,6
1,8
2
2,2
2,4
Allowed Rotational Freedom [°]0 50 100 150 200 250 300 350
ABCD
Random
Figure 12.2: Variation of a theoretical 2D-κ2 in molecular arrangements A-D (fig. 12.1);Each data point results from 5 · 104 averaged calculations of uniformly distributed angles inthe denoted range; E.g.: 50°= Allow angles between 0°and 50°; The average 2D-κ2 reduces to1.25 (random) when 90°or more degrees are allowed
Those are arranged in every case around a central emitter at fixed angles of 30,90, 150, 210, 270 and 330 degrees. If translational freedom is kept restrictedwhile rotational freedom is completely allowed, the 2D-κ2 again averages out
137
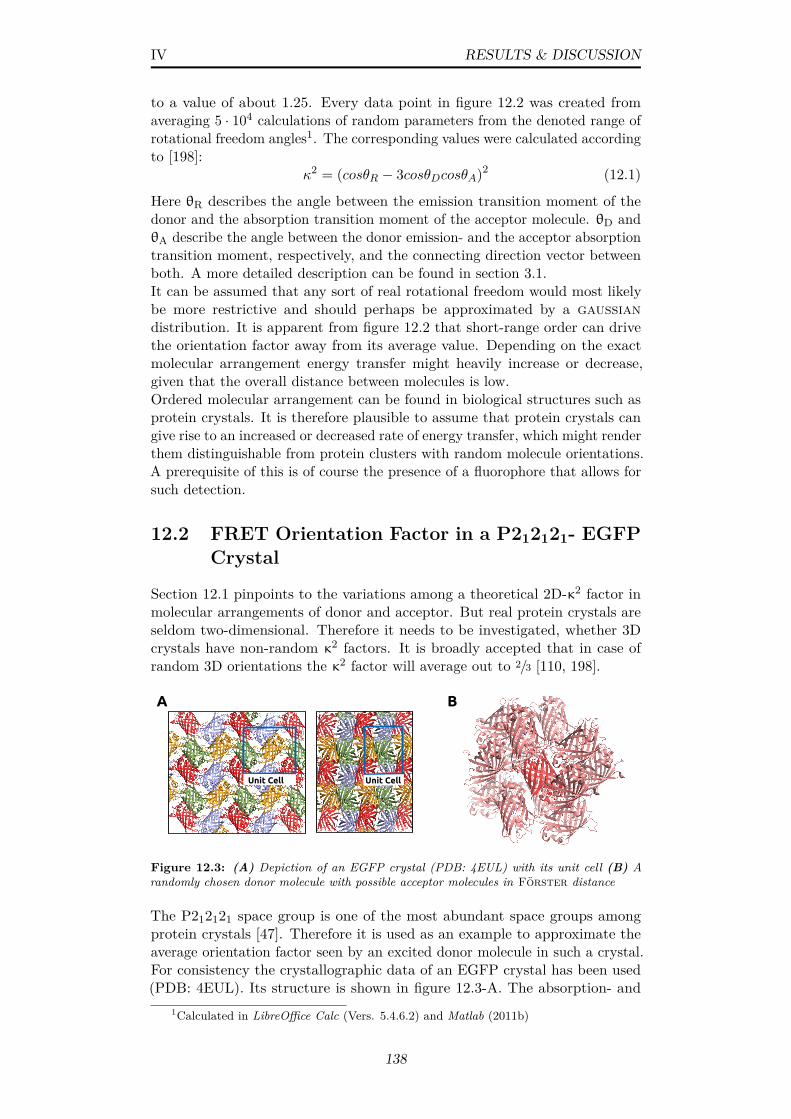
IV RESULTS & DISCUSSION
to a value of about 1.25. Every data point in figure 12.2 was created fromaveraging 5 · 104 calculations of random parameters from the denoted range ofrotational freedom angles1. The corresponding values were calculated accordingto [198]:
κ2 = (cosθR − 3cosθDcosθA)2 (12.1)
Here θR describes the angle between the emission transition moment of thedonor and the absorption transition moment of the acceptor molecule. θD andθA describe the angle between the donor emission- and the acceptor absorptiontransition moment, respectively, and the connecting direction vector betweenboth. A more detailed description can be found in section 3.1.It can be assumed that any sort of real rotational freedom would most likelybe more restrictive and should perhaps be approximated by a gaussiandistribution. It is apparent from figure 12.2 that short-range order can drivethe orientation factor away from its average value. Depending on the exactmolecular arrangement energy transfer might heavily increase or decrease,given that the overall distance between molecules is low.Ordered molecular arrangement can be found in biological structures such asprotein crystals. It is therefore plausible to assume that protein crystals cangive rise to an increased or decreased rate of energy transfer, which might renderthem distinguishable from protein clusters with random molecule orientations.A prerequisite of this is of course the presence of a fluorophore that allows forsuch detection.
12.2 FRET Orientation Factor in a P212121- EGFPCrystal
Section 12.1 pinpoints to the variations among a theoretical 2D-κ2 factor inmolecular arrangements of donor and acceptor. But real protein crystals areseldom two-dimensional. Therefore it needs to be investigated, whether 3Dcrystals have non-random κ2 factors. It is broadly accepted that in case ofrandom 3D orientations the κ2 factor will average out to 2/3 [110, 198].
Unit Cell Unit Cell
A B
Figure 12.3: (A) Depiction of an EGFP crystal (PDB: 4EUL) with its unit cell (B) Arandomly chosen donor molecule with possible acceptor molecules in Förster distance
The P212121 space group is one of the most abundant space groups amongprotein crystals [47]. Therefore it is used as an example to approximate theaverage orientation factor seen by an excited donor molecule in such a crystal.For consistency the crystallographic data of an EGFP crystal has been used(PDB: 4EUL). Its structure is shown in figure 12.3-A. The absorption- and
1Calculated in LibreOffice Calc (Vers. 5.4.6.2) and Matlab (2011b)
138

IV RESULTS & DISCUSSION
Table 12.1: Extracted angles θD, θR, θA and calculated κ2 values for symmetry mates 1-12;Values correspond to the molecular arrangement shown in figure 12.3-B
Sym.-Mate D [°] R [°] A [°] κ2
1 79 90 146 0.2332 35 97 112 0.6473 46 152 113 0.0034 118 90 99 0.0525 68 97 145 0.6476 34 90 101 0.2337 42 152 128 0.2498 81 90 62 0.0529 15 97 111 0.84410 67 152 134 0.00311 69 97 165 0.84412 52 152 138 0.249
Avg. 0.338
Extracted Symmetry Angles
15262
A
165
118R
D
90 15
Figure 12.4: 3D representation of extracted angles θD, θR, θA; Values correspond to themolecular arrangement shown in figure 12.3-B
emission transition moments were approximated as vectors along the longmolecular axis of EGFP, which seems legitimate due to the fixed geometricalrelation of the molecules. The relative orientations were calculated byextracting transformation matrices from PyMol [234] and decomposing thecontained rotation matrices. For the approximation only molecules in therange of the EGFP-Förster distance (R0= 4.7 nm) were considered (see fig.12.3-B). The size of the unit cell (a,b,c) is ∼ 51 · 62 · 70Å. Therefore, equallyoriented molecules were not considered in the calculation. Due to the regularpattern within a crystal, the contribution of molecules outside of the unit cellshould yield non-deviating values with descending influence on the final result.The same applies for a cluster of proteins with true random orientations. Intotal 12 symmetry mates (light red, fig. 12.3-B) of a central donor molecule(red) were included in the calculation. The extracted angles θD, θR, θA andthe corresponding theoretical κ2 value are listed in table 12.1. The angles arealso shown in figure 12.4 to visualize their replication of a 3D relation.Likewise to the 2D case (sec. 12.1), the anisotropic response of the orientationfactor favours some orientations over others. As it can be seen the value of
139
IV RESULTS & DISCUSSION
the orientation factors varies a lot between different symmetry mates. Thehighest value found is 0.844 and the lowest is 0.003. The calculated averageκ2 factor for the investigated P212121 crystal has a value of 0.338, which isconsiderably less than the average value of 2/3 for random orientations. Foranother theoretically excited molecule within the crystal arrangement a valueof 0.306 can be calculated.In conclusion, the average energy transfer rate within an EGFP crystal will beless than in a cluster with random orientations. This seems to be backed up bydata from Inoue et al. [75][84], who found polarized light irradiating from GFPcrystals. But this would indeed require some odd molecule arrangement, thatis required to disallow most of the energy transfer to yield polarized emission.Due to the proximity of molecules in a crystal, the energy transfer efficiencywill be 1 regardless of the difference between a random and a non-randommolecular arrangement. Hence, to successfully measure such differences otherproperties of the homoFRET energy transfer would require fine-tuning.
12.3 Prerequisites for the Differentiation of ProteinCrystals & Clusters
Most importantly the homoFRET energy transfer rate has to be dramaticallyreduced for an investigated conglomerate, in order to make the κ2 differencesvisible. At best the transfer efficiency should not exceed ≈ 1 for a volumepacking fraction (VPF) of 1 (see subsec. 11.1.1). Otherwise it is not possible todetect any differences in an average κ2 arising from the molecule arrangement.As mentioned in subsection 11.1.1, this could be achieved by using fluorophoreswith an increased Stokes shift [192], or by a decreased quantum yield accordingto (cp. eq. 3.5):
R0 = 0.211(κ2n−4QDJ(λ)
)1/6(12.2)
QD is the quantum yield of the donor (in absence of acceptor), J(λ) is theoverlap integral of donor and acceptor spectra and n is the refractive index.The latter one is usually assumed to be 1.4 for proteins in aqueous solutions[110]. It has to be determined to what extend the anisotropy of n in a crystalwould influence the anticipated measurements. Further on, a reduction inenergy transfer rate could also be achieved, if fluorophores are restricted inproximity due to the size of the investigated molecules. In case of the EGFP’sR0 this would require an expansion of the molecule to a radius of about 4.7nm, which in turn equals the R0 (cp. fig. 11.5). Another possibility is thereduction of the labelling rate.For a gedankenexperiment we may assume an EGFP-like fluorescent particlewith a Förster distance that is reduced to R0=2.23 nm. Furthermore size,fluorescence lifetime and quantum yield are assumed to be identical (Comparesubsec. 11.1.1). Under the assumption that κ2 again equals 2/3, the measuredfluorescence anisotropy from excited molecules should reduce to 0, when theparticle density reaches a VPF of 1 (See table 12.2). If the orientation factornow reduces to 0.338, similar to the example presented in figure 12.3-B, theenergy transfer efficiency will drop to 0.77 and yield a steady-state anisotropyof about 90 (assuming a limiting anisotropy of 400 mAns). The difference indepolarization and hence in energy transfer can be detected and should enableto differentiate a molecule cluster from a molecule crystal. Indeed, anotherassumption was made throughout this section, to derive such obvious results:
140
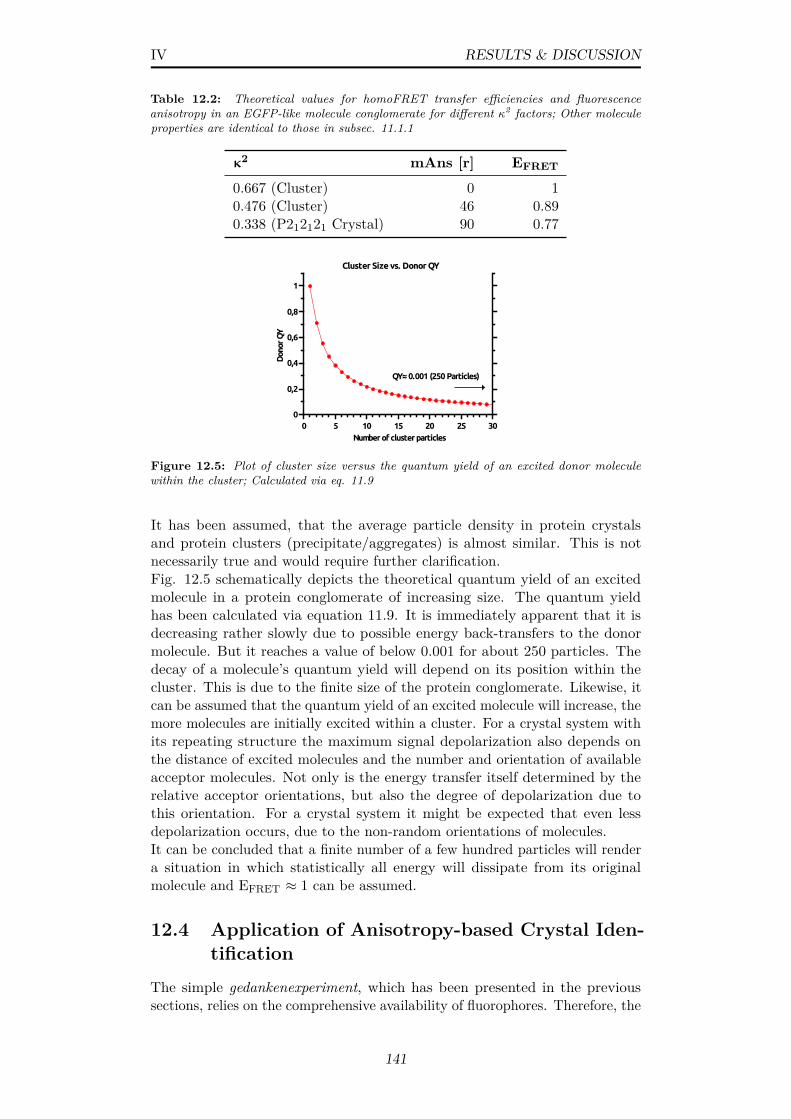
IV RESULTS & DISCUSSION
Table 12.2: Theoretical values for homoFRET transfer efficiencies and fluorescenceanisotropy in an EGFP-like molecule conglomerate for different κ2 factors; Other moleculeproperties are identical to those in subsec. 11.1.1
κ2 mAns [r] EFRET
0.667 (Cluster) 0 10.476 (Cluster) 46 0.890.338 (P212121 Crystal) 90 0.77
Cluster Size vs. Donor QYD
onor
QY
0
0,2
0,4
0,6
0,8
1
Number of cluster particles0 5 10 15 20 25 30
QY≈ 0.001 (250 Particles)
Figure 12.5: Plot of cluster size versus the quantum yield of an excited donor moleculewithin the cluster; Calculated via eq. 11.9
It has been assumed, that the average particle density in protein crystalsand protein clusters (precipitate/aggregates) is almost similar. This is notnecessarily true and would require further clarification.Fig. 12.5 schematically depicts the theoretical quantum yield of an excitedmolecule in a protein conglomerate of increasing size. The quantum yieldhas been calculated via equation 11.9. It is immediately apparent that it isdecreasing rather slowly due to possible energy back-transfers to the donormolecule. But it reaches a value of below 0.001 for about 250 particles. Thedecay of a molecule’s quantum yield will depend on its position within thecluster. This is due to the finite size of the protein conglomerate. Likewise, itcan be assumed that the quantum yield of an excited molecule will increase, themore molecules are initially excited within a cluster. For a crystal system withits repeating structure the maximum signal depolarization also depends onthe distance of excited molecules and the number and orientation of availableacceptor molecules. Not only is the energy transfer itself determined by therelative acceptor orientations, but also the degree of depolarization due tothis orientation. For a crystal system it might be expected that even lessdepolarization occurs, due to the non-random orientations of molecules.It can be concluded that a finite number of a few hundred particles will rendera situation in which statistically all energy will dissipate from its originalmolecule and EFRET ≈ 1 can be assumed.
12.4 Application of Anisotropy-based Crystal Iden-tification
The simple gedankenexperiment, which has been presented in the previoussections, relies on the comprehensive availability of fluorophores. Therefore, the
141
IV RESULTS & DISCUSSION
presented idea is difficult to extend to proteins without an intrinsic fluorescentcenter. But this drawback might be circumvented by several approaches.First, it is of course possible to create a fusion protein from a target- and afluorescent protein [100]. Such a fusion protein can presumably quash any ten-dency of a target protein to crystallize. But it may also serve the opposing sideand be the cause of crystallization. This is indeed suggested by several studies,using GFP- [161], MBP- [259], thioredoxin [128]- or lysozyme-fusion tags [231].A review of fusion tags used in crystallograpy is provided in [92]. Therefore,an utilization of the proposed approach might be extended to non-fluorescenttarget proteins via the usage of a fluorescent fusion protein, that provide afluorescent center. In the light of the anticipated measurements, it is necessaryto provide a rigidly attached fluorescent center. Any introduced rotationalfreedom will reduce the influence of the molecule orientation on the energytransfer efficiency (cp. fig. 12.2).An alternative approach to fluorescent fusion proteins is embodied by a certainclass of biarsenical, organic dyes [117]. They stand out due to their specialproperties: First, they are easily-attachable to a tetracysteine-tag on a proteinand hence are almost non-invasive. Second, they can penetrate biological mem-branes, which renders them also interesting for in vivo crystallography. Lastly,their fluorescence strongly depends on the binding to the tetracysteine-tag.Unbound dye will not be fluorescent. A formidable approach to reduce back-ground signal. The second generation dye CrAsH [103] is a good representativeof this class of dyes. Obviously, a dynamic binding scheme involves the risk ofincomplete binding and requires special attention.
It is worth mentioning that the presented approach would also benefit fromthe usage of more elaborate optical techniques. In conclusion, a fluorescenceanisotropy approach may allow to distinguish between protein clusters in formof precipitate / aggregates and protein crystals under certain conditions. Itwould expand the toolbox of early crystallographic characterization.
142
IV RESULTS & DISCUSSION
13 | In Vitro Production of Protein-Nanofibers for DiffractionExperiments at XFELs
The following chapter comprises an experimental approach in fiber x-raydiffraction1. It is shown how the formation of amyloid protein fibers composedof the human protein superoxide dismutase 1 (SOD1) is optimized in order toobtain a suitable sample for single-fiber structural characterization at a XFEL.SOD1 is a copper and zinc- containing 32 kDa homodimeric enzyme. The16 kDa monomers contain each one Cu and Zn ion. The enzyme is relevantin the removal of reactive oxygen species in human neuronal cells. It isa known actuator of neurodegenerative diseases e.g. familial amyotrophiclateral sclerosis (fALS) and is ultimatively causing motor neuron death dueto misfolding and fiber-like aggregation. More than 110 known mutationswithin the 153 aa-long protein lead to a form of fALS, but the mechanism thatcauses neurodegeneration is not yet fully understood. It has been proposedthat mainly a combination of oxidation and a loss of metal ions lead to theformation of amyloid structures [85, 126, 187, 210].As shown by Sunde et al. [54] , amyloid structures exhibit a diffraction responseto x-ray radiation due to their repetitive structure of amino acids, folded in β-spines. To understand the emergence of neurodegeneration in fALS, XFELsoffer an excellent opportunity to yield structural information at an atomicresolution to understand the mechanism of action in different mutated forms ofSOD1. Here it is described how to induce, analyze and optimize fiber formationunder laboratory conditions for such studies.
13.1 Optimization of SOD1-Amyloid Fiber Forma-tion
The fiber formation is supposedly triggered by depriving Zn and Co ions fromthe protein and induced conformational changes due to oxidation [131]. Forexperiments the chemically modified and ultra stable 2ME-SOD1 has been used,in which a β-ME molecule is covalently linked to Cys111. It can be convertedinto the wildtype form of the protein by incubation with a strong reducingagent [115, 174]. Lyophilized 2ME-SOD1 protein and an initial protocol forfiber formation was supplied by collaborators2. The initial protocol suggestedfiber formation at conditions that comprises a pH range of 3-5, addition ofreducing agents, EDTA, and sodium chloride.
1Project has been initiated by Leonard Chavas (Former researcher at CFEL, Hamburg)under proposal nb. 2015A8003
2Protein was produced by Ube Industries Ltd. and supplied by Noriko Fujiwara, HyogoCollege of Medicine, Nishinomiya, Japan
143
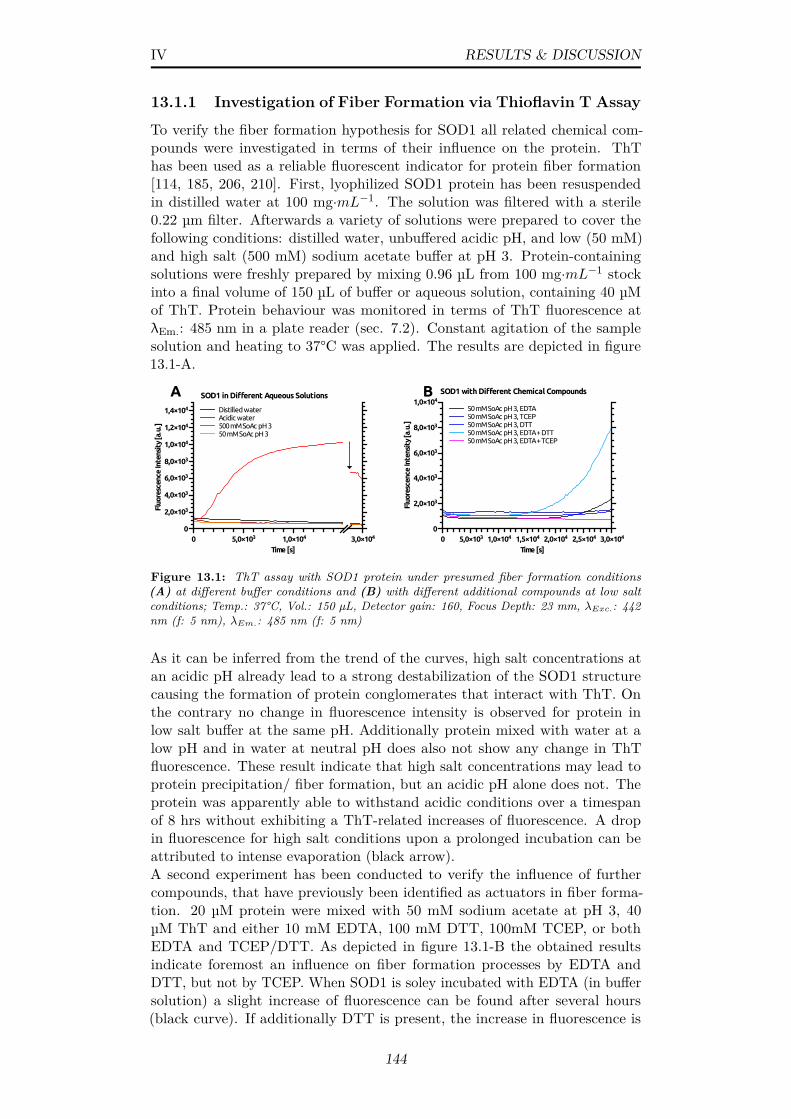
IV RESULTS & DISCUSSION
13.1.1 Investigation of Fiber Formation via Thioflavin T Assay
To verify the fiber formation hypothesis for SOD1 all related chemical com-pounds were investigated in terms of their influence on the protein. ThThas been used as a reliable fluorescent indicator for protein fiber formation[114, 185, 206, 210]. First, lyophilized SOD1 protein has been resuspendedin distilled water at 100 mg·mL−1. The solution was filtered with a sterile0.22 µm filter. Afterwards a variety of solutions were prepared to cover thefollowing conditions: distilled water, unbuffered acidic pH, and low (50 mM)and high salt (500 mM) sodium acetate buffer at pH 3. Protein-containingsolutions were freshly prepared by mixing 0.96 µL from 100 mg·mL−1 stockinto a final volume of 150 µL of buffer or aqueous solution, containing 40 µMof ThT. Protein behaviour was monitored in terms of ThT fluorescence atλEm.: 485 nm in a plate reader (sec. 7.2). Constant agitation of the samplesolution and heating to 37°C was applied. The results are depicted in figure13.1-A.
SOD1 in Different Aqueous Solutions
Fluo
resc
ence
Inte
nsit
y [a
.u.]
0
2,0×10³
4,0×10³
6,0×10³
8,0×10³
1,0×10⁴
1,2×10⁴
1,4×10⁴
Time [s]0 5,0×10³ 1,0×10⁴ 3,0×10⁴
Distilled waterAcidic water500 mM SoAc pH 350 mM SoAc pH 3
A B SOD1 with Different Chemical Compounds
Fluo
resc
ence
Inte
nsit
y [a
.u.]
0
2,0×10³
4,0×10³
6,0×10³
8,0×10³
1,0×10⁴
Time [s]0 5,0×10³ 1,0×10⁴ 1,5×10⁴ 2,0×10⁴ 2,5×10⁴ 3,0×10⁴
50 mM SoAc pH 3, EDTA50 mM SoAc pH 3, TCEP50 mM SoAc pH 3, DTT50 mM SoAc pH 3, EDTA + DTT50 mM SoAc pH 3, EDTA + TCEP
Figure 13.1: ThT assay with SOD1 protein under presumed fiber formation conditions(A) at different buffer conditions and (B) with different additional compounds at low saltconditions; Temp.: 37°C, Vol.: 150 µL, Detector gain: 160, Focus Depth: 23 mm, λExc.: 442nm (f: 5 nm), λEm.: 485 nm (f: 5 nm)
As it can be inferred from the trend of the curves, high salt concentrations atan acidic pH already lead to a strong destabilization of the SOD1 structurecausing the formation of protein conglomerates that interact with ThT. Onthe contrary no change in fluorescence intensity is observed for protein inlow salt buffer at the same pH. Additionally protein mixed with water at alow pH and in water at neutral pH does also not show any change in ThTfluorescence. These result indicate that high salt concentrations may lead toprotein precipitation/ fiber formation, but an acidic pH alone does not. Theprotein was apparently able to withstand acidic conditions over a timespanof 8 hrs without exhibiting a ThT-related increases of fluorescence. A dropin fluorescence for high salt conditions upon a prolonged incubation can beattributed to intense evaporation (black arrow).A second experiment has been conducted to verify the influence of furthercompounds, that have previously been identified as actuators in fiber forma-tion. 20 µM protein were mixed with 50 mM sodium acetate at pH 3, 40µM ThT and either 10 mM EDTA, 100 mM DTT, 100mM TCEP, or bothEDTA and TCEP/DTT. As depicted in figure 13.1-B the obtained resultsindicate foremost an influence on fiber formation processes by EDTA andDTT, but not by TCEP. When SOD1 is soley incubated with EDTA (in buffersolution) a slight increase of fluorescence can be found after several hours(black curve). If additionally DTT is present, the increase in fluorescence is
144
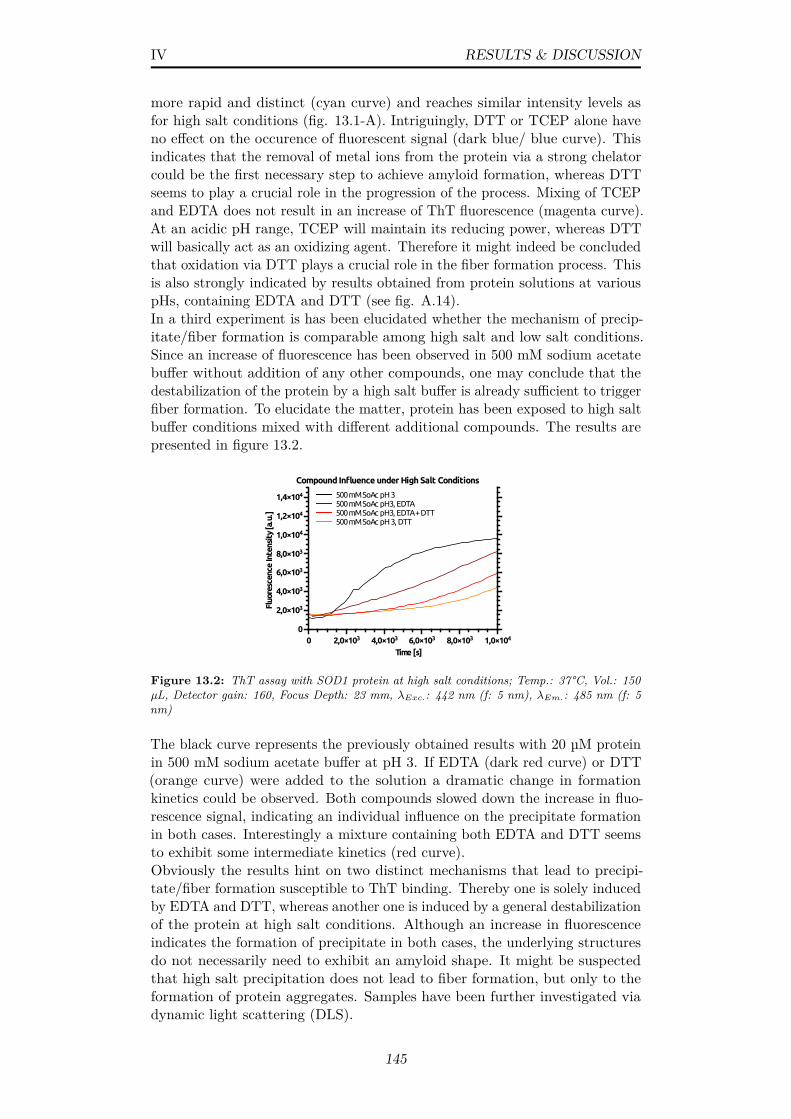
IV RESULTS & DISCUSSION
more rapid and distinct (cyan curve) and reaches similar intensity levels asfor high salt conditions (fig. 13.1-A). Intriguingly, DTT or TCEP alone haveno effect on the occurence of fluorescent signal (dark blue/ blue curve). Thisindicates that the removal of metal ions from the protein via a strong chelatorcould be the first necessary step to achieve amyloid formation, whereas DTTseems to play a crucial role in the progression of the process. Mixing of TCEPand EDTA does not result in an increase of ThT fluorescence (magenta curve).At an acidic pH range, TCEP will maintain its reducing power, whereas DTTwill basically act as an oxidizing agent. Therefore it might indeed be concludedthat oxidation via DTT plays a crucial role in the fiber formation process. Thisis also strongly indicated by results obtained from protein solutions at variouspHs, containing EDTA and DTT (see fig. A.14).In a third experiment is has been elucidated whether the mechanism of precip-itate/fiber formation is comparable among high salt and low salt conditions.Since an increase of fluorescence has been observed in 500 mM sodium acetatebuffer without addition of any other compounds, one may conclude that thedestabilization of the protein by a high salt buffer is already sufficient to triggerfiber formation. To elucidate the matter, protein has been exposed to high saltbuffer conditions mixed with different additional compounds. The results arepresented in figure 13.2.
Compound Influence under High Salt Conditions
Fluo
resc
ence
Inte
nsit
y [a
.u.]
0
2,0×10³
4,0×10³
6,0×10³
8,0×10³
1,0×10⁴
1,2×10⁴
1,4×10⁴
Time [s]0 2,0×10³ 4,0×10³ 6,0×10³ 8,0×10³ 1,0×10⁴
500 mM SoAc pH 3500 mM SoAc pH3, EDTA500 mM SoAc pH3, EDTA + DTT500 mM SoAc pH 3, DTT
Figure 13.2: ThT assay with SOD1 protein at high salt conditions; Temp.: 37°C, Vol.: 150µL, Detector gain: 160, Focus Depth: 23 mm, λExc.: 442 nm (f: 5 nm), λEm.: 485 nm (f: 5nm)
The black curve represents the previously obtained results with 20 µM proteinin 500 mM sodium acetate buffer at pH 3. If EDTA (dark red curve) or DTT(orange curve) were added to the solution a dramatic change in formationkinetics could be observed. Both compounds slowed down the increase in fluo-rescence signal, indicating an individual influence on the precipitate formationin both cases. Interestingly a mixture containing both EDTA and DTT seemsto exhibit some intermediate kinetics (red curve).Obviously the results hint on two distinct mechanisms that lead to precipi-tate/fiber formation susceptible to ThT binding. Thereby one is solely inducedby EDTA and DTT, whereas another one is induced by a general destabilizationof the protein at high salt conditions. Although an increase in fluorescenceindicates the formation of precipitate in both cases, the underlying structuresdo not necessarily need to exhibit an amyloid shape. It might be suspectedthat high salt precipitation does not lead to fiber formation, but only to theformation of protein aggregates. Samples have been further investigated viadynamic light scattering (DLS).
145

IV RESULTS & DISCUSSION
13.1.2 Investigation of SOD1 Fiber Formation via DLS
Measurements were conducted in order to elucidate the particle size distribu-tion under conditions that favour fiber formation (cp. subsec. 13.1.1). DLShas been performed on a SpectroSize 600 (Xtal Concepts, Germany) in 5 µLdroplets covered by immersion oil and maintained at 20°C. Unfortunately,agitation or stirring could not be applied throughout these measurements.Radius frequency distributions were calculated every 5 min for 16 hrs. For sizecalculations an aqueous viscosity parameter of 1.006 mPa · s has been used.The results are depicted in figure 13.3-A-E. Samples contained 2 mg·mL−1
protein in 50 mM sodium acetate, 100 mM DTT and 10 mM EDTA wereprepared at pH 3 (A) and pH 4 (D). Samples depicted in figure 13.3-B/Ccontained 3.5 and 5 mg·mL−1 (both at pH 3), respectively. Sample E containedonly EDTA and no DTT at a pH of 3. Samples A-C exhibit a strong separationinto two fractions at hydrodynamic radii of 2-3 nm and at around 100 nm.The acquired fraction signal intensity representing smaller sizes seems to follow
10001 10 100
60k
30k
0
15k
45k
[nm]
Tim
e [
s]
10001 10 100
[nm]
60k
30k
0
15k
45k
Tim
e [
s]
60k
30k
0
15k
45k
Tim
e [
s]
A
B
C
D
E
Figure 13.3: Radius frequency distributions over time; 20 µM SOD1 in 50 mM SoAc buffercontaining 100 mM DTT, 10 mM EDTA (A) pH3, 2 mg·mL−1 (B) pH3, 3.5 mg·mL−1 (C)pH3, 5 mg·mL−1 (D) pH 4, 2 mg·mL−1 (E) pH 3, no DTT, 2 mg·mL−1; 20°C, 16 hrs; Redindicates high, blue indicates low counting frequencies
146
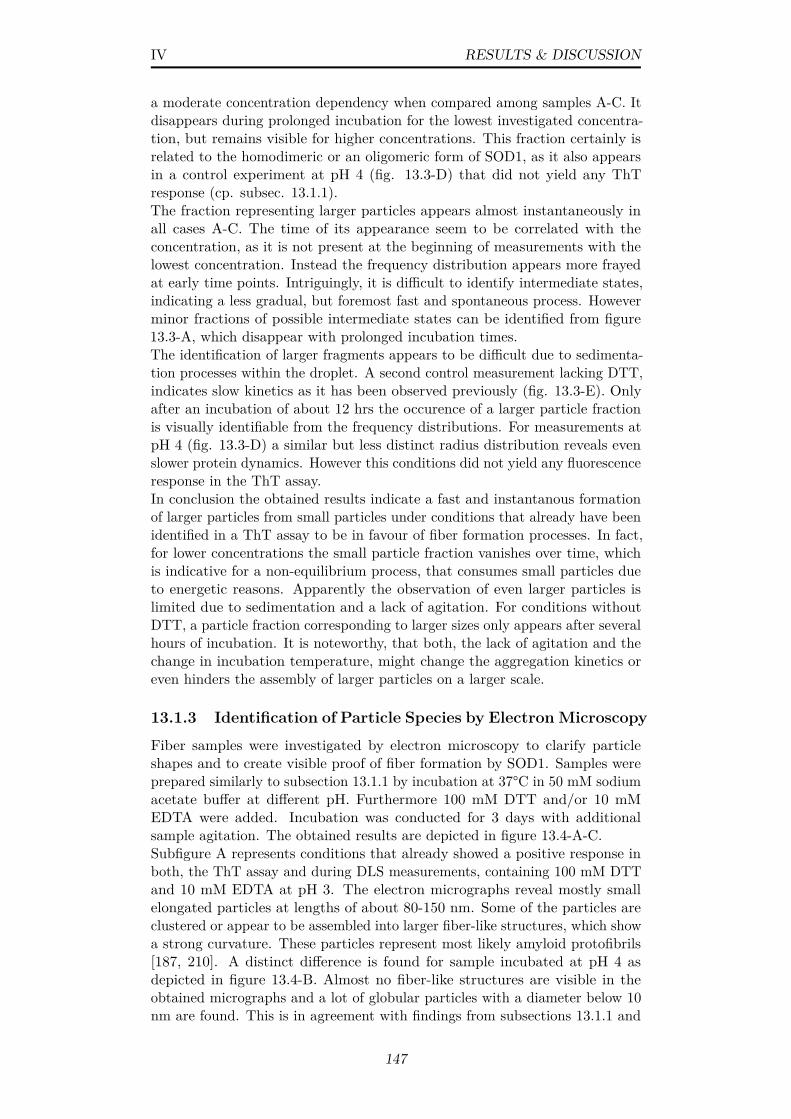
IV RESULTS & DISCUSSION
a moderate concentration dependency when compared among samples A-C. Itdisappears during prolonged incubation for the lowest investigated concentra-tion, but remains visible for higher concentrations. This fraction certainly isrelated to the homodimeric or an oligomeric form of SOD1, as it also appearsin a control experiment at pH 4 (fig. 13.3-D) that did not yield any ThTresponse (cp. subsec. 13.1.1).The fraction representing larger particles appears almost instantaneously inall cases A-C. The time of its appearance seem to be correlated with theconcentration, as it is not present at the beginning of measurements with thelowest concentration. Instead the frequency distribution appears more frayedat early time points. Intriguingly, it is difficult to identify intermediate states,indicating a less gradual, but foremost fast and spontaneous process. Howeverminor fractions of possible intermediate states can be identified from figure13.3-A, which disappear with prolonged incubation times.The identification of larger fragments appears to be difficult due to sedimenta-tion processes within the droplet. A second control measurement lacking DTT,indicates slow kinetics as it has been observed previously (fig. 13.3-E). Onlyafter an incubation of about 12 hrs the occurence of a larger particle fractionis visually identifiable from the frequency distributions. For measurements atpH 4 (fig. 13.3-D) a similar but less distinct radius distribution reveals evenslower protein dynamics. However this conditions did not yield any fluorescenceresponse in the ThT assay.In conclusion the obtained results indicate a fast and instantanous formationof larger particles from small particles under conditions that already have beenidentified in a ThT assay to be in favour of fiber formation processes. In fact,for lower concentrations the small particle fraction vanishes over time, whichis indicative for a non-equilibrium process, that consumes small particles dueto energetic reasons. Apparently the observation of even larger particles islimited due to sedimentation and a lack of agitation. For conditions withoutDTT, a particle fraction corresponding to larger sizes only appears after severalhours of incubation. It is noteworthy, that both, the lack of agitation and thechange in incubation temperature, might change the aggregation kinetics oreven hinders the assembly of larger particles on a larger scale.
13.1.3 Identification of Particle Species by Electron Microscopy
Fiber samples were investigated by electron microscopy to clarify particleshapes and to create visible proof of fiber formation by SOD1. Samples wereprepared similarly to subsection 13.1.1 by incubation at 37°C in 50 mM sodiumacetate buffer at different pH. Furthermore 100 mM DTT and/or 10 mMEDTA were added. Incubation was conducted for 3 days with additionalsample agitation. The obtained results are depicted in figure 13.4-A-C.Subfigure A represents conditions that already showed a positive response inboth, the ThT assay and during DLS measurements, containing 100 mM DTTand 10 mM EDTA at pH 3. The electron micrographs reveal mostly smallelongated particles at lengths of about 80-150 nm. Some of the particles areclustered or appear to be assembled into larger fiber-like structures, which showa strong curvature. These particles represent most likely amyloid protofibrils[187, 210]. A distinct difference is found for sample incubated at pH 4 asdepicted in figure 13.4-B. Almost no fiber-like structures are visible in theobtained micrographs and a lot of globular particles with a diameter below 10nm are found. This is in agreement with findings from subsections 13.1.1 and
147
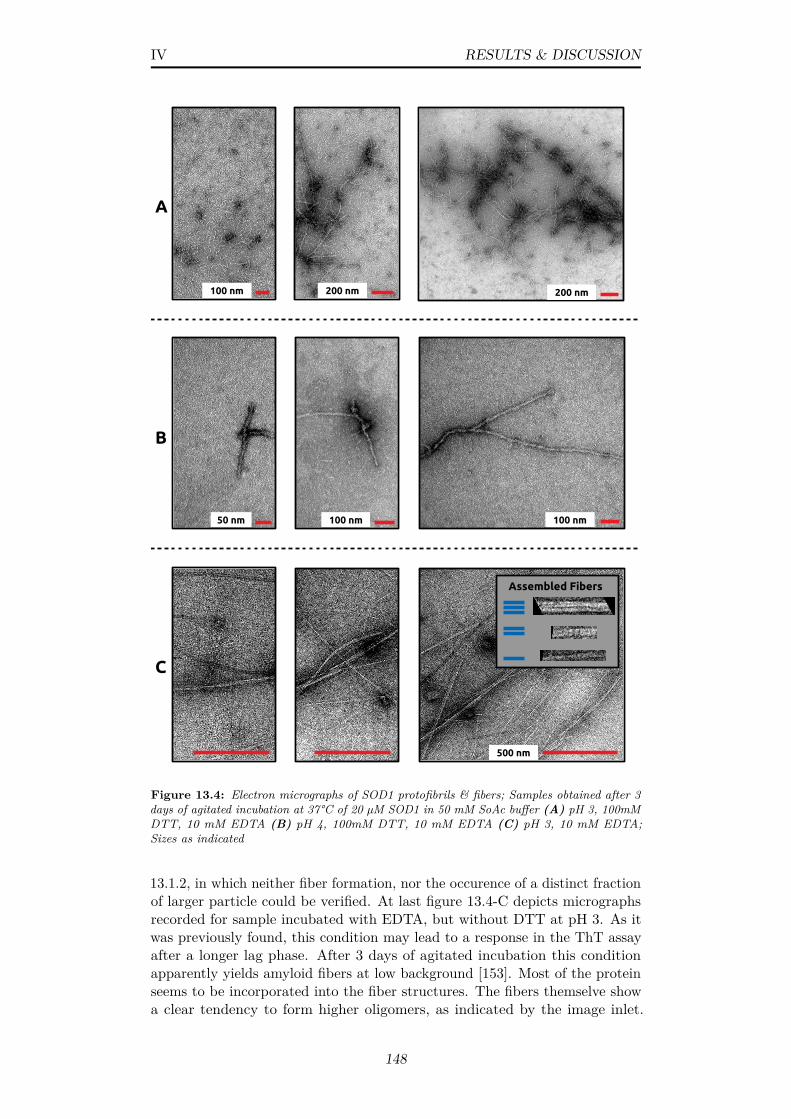
IV RESULTS & DISCUSSION
A
B
100 nm100 nm50 nm
200 nm200 nm100 nm
C
500 nm
Assembled Fibers
Figure 13.4: Electron micrographs of SOD1 protofibrils & fibers; Samples obtained after 3days of agitated incubation at 37°C of 20 µM SOD1 in 50 mM SoAc buffer (A) pH 3, 100mMDTT, 10 mM EDTA (B) pH 4, 100mM DTT, 10 mM EDTA (C) pH 3, 10 mM EDTA;Sizes as indicated
13.1.2, in which neither fiber formation, nor the occurence of a distinct fractionof larger particle could be verified. At last figure 13.4-C depicts micrographsrecorded for sample incubated with EDTA, but without DTT at pH 3. As itwas previously found, this condition may lead to a response in the ThT assayafter a longer lag phase. After 3 days of agitated incubation this conditionapparently yields amyloid fibers at low background [153]. Most of the proteinseems to be incorporated into the fiber structures. The fibers themselve showa clear tendency to form higher oligomers, as indicated by the image inlet.
148
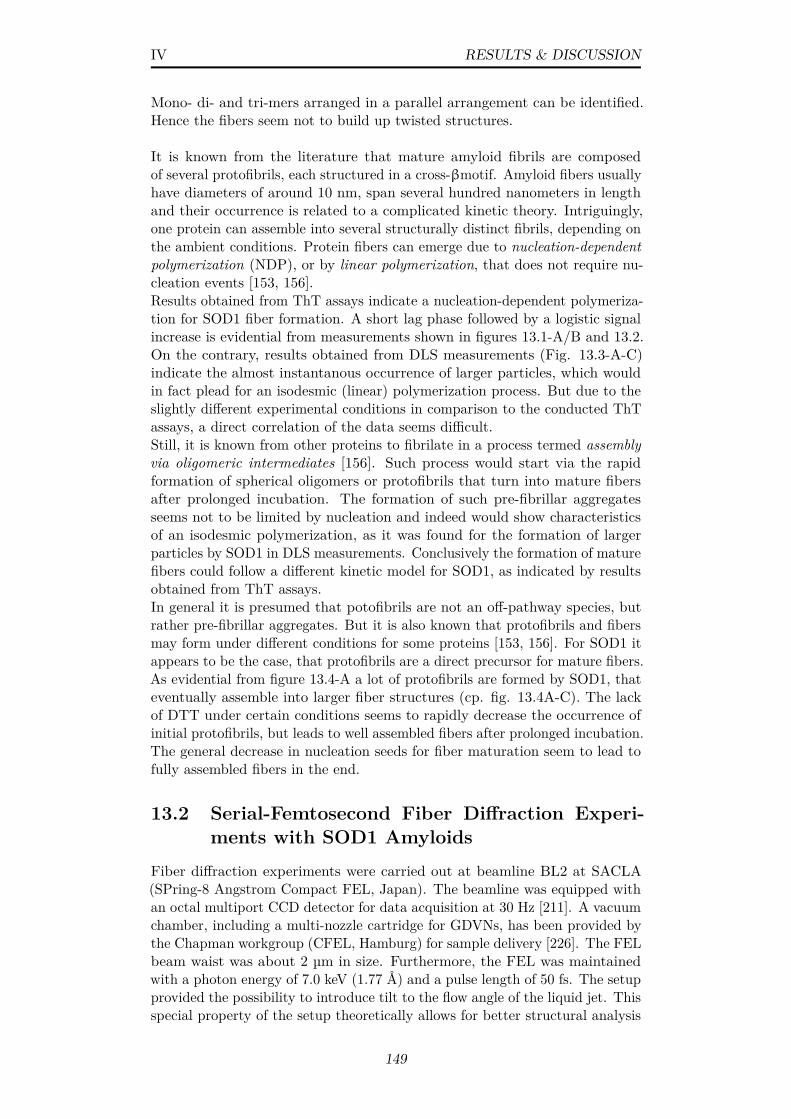
IV RESULTS & DISCUSSION
Mono- di- and tri-mers arranged in a parallel arrangement can be identified.Hence the fibers seem not to build up twisted structures.
It is known from the literature that mature amyloid fibrils are composedof several protofibrils, each structured in a cross-βmotif. Amyloid fibers usuallyhave diameters of around 10 nm, span several hundred nanometers in lengthand their occurrence is related to a complicated kinetic theory. Intriguingly,one protein can assemble into several structurally distinct fibrils, depending onthe ambient conditions. Protein fibers can emerge due to nucleation-dependentpolymerization (NDP), or by linear polymerization, that does not require nu-cleation events [153, 156].Results obtained from ThT assays indicate a nucleation-dependent polymeriza-tion for SOD1 fiber formation. A short lag phase followed by a logistic signalincrease is evidential from measurements shown in figures 13.1-A/B and 13.2.On the contrary, results obtained from DLS measurements (Fig. 13.3-A-C)indicate the almost instantanous occurrence of larger particles, which wouldin fact plead for an isodesmic (linear) polymerization process. But due to theslightly different experimental conditions in comparison to the conducted ThTassays, a direct correlation of the data seems difficult.Still, it is known from other proteins to fibrilate in a process termed assemblyvia oligomeric intermediates [156]. Such process would start via the rapidformation of spherical oligomers or protofibrils that turn into mature fibersafter prolonged incubation. The formation of such pre-fibrillar aggregatesseems not to be limited by nucleation and indeed would show characteristicsof an isodesmic polymerization, as it was found for the formation of largerparticles by SOD1 in DLS measurements. Conclusively the formation of maturefibers could follow a different kinetic model for SOD1, as indicated by resultsobtained from ThT assays.In general it is presumed that potofibrils are not an off-pathway species, butrather pre-fibrillar aggregates. But it is also known that protofibrils and fibersmay form under different conditions for some proteins [153, 156]. For SOD1 itappears to be the case, that protofibrils are a direct precursor for mature fibers.As evidential from figure 13.4-A a lot of protofibrils are formed by SOD1, thateventually assemble into larger fiber structures (cp. fig. 13.4A-C). The lackof DTT under certain conditions seems to rapidly decrease the occurrence ofinitial protofibrils, but leads to well assembled fibers after prolonged incubation.The general decrease in nucleation seeds for fiber maturation seem to lead tofully assembled fibers in the end.
13.2 Serial-Femtosecond Fiber Diffraction Experi-ments with SOD1 Amyloids
Fiber diffraction experiments were carried out at beamline BL2 at SACLA(SPring-8 Angstrom Compact FEL, Japan). The beamline was equipped withan octal multiport CCD detector for data acquisition at 30 Hz [211]. A vacuumchamber, including a multi-nozzle cartridge for GDVNs, has been provided bythe Chapman workgroup (CFEL, Hamburg) for sample delivery [226]. The FELbeam waist was about 2 µm in size. Furthermore, the FEL was maintainedwith a photon energy of 7.0 keV (1.77 Å) and a pulse length of 50 fs. The setupprovided the possibility to introduce tilt to the flow angle of the liquid jet. Thisspecial property of the setup theoretically allows for better structural analysis
149

IV RESULTS & DISCUSSION
for non-randomly oriented samples like protein fibers. The injection of buffersand fiber-containing solutions has been tested similarly to section 10.4 priorto XFEL experiments (data not shown). Stable jets could be maintained atflow rates of 12-15 µL·min−1. Samples were loaded into agitated and Pelletier-cooled sample reservoirs similar to yeast samples (sec. 10.5) to avoid samplesettling. 10 mL of fiber solution at 2 mg ·mL−1 were prepared on site atSPring-8. Fiber formation was verified by incubation with ThT.The beamtime was intended to provide the possibility to optimise sampledelivery of protein fibers to an ultra-intense x-ray beam by GDVNs. Theapplied nozzle technology does help to flow-align fibrillar structures in a low-background situation and hence allows for an easier and faster data acquisition.The utilization of femtosecond, coherent x-rays allows to overcome samplesize limitations and circumvent radiation damage. Therefore, it was intendedto obtain high quality diffraction data from SOD1 nano-fibers to possiblyidentify the molecular basis of amyloid formation by SOD1. Filamentousprotein structures are a direct link between currently investigated protein nano-and micro crystals [163, 172, 212, 221, 253], and single particles [170]. Hence,their investigation can also be considered as a logical step in experiments withcoherent x-rays to provide data at the limits of Bragg diffraction and diffusescattering similar to experiments with imperfect crystals [250].Unfortunately, no fiber diffraction data could be acquired during 3 · 12 hrs dueto alignment problems between the experimental vacuum chamber and thex-ray beam. It was not possible to conduct any follow-up x-ray experiments.
150

V | Conclusions
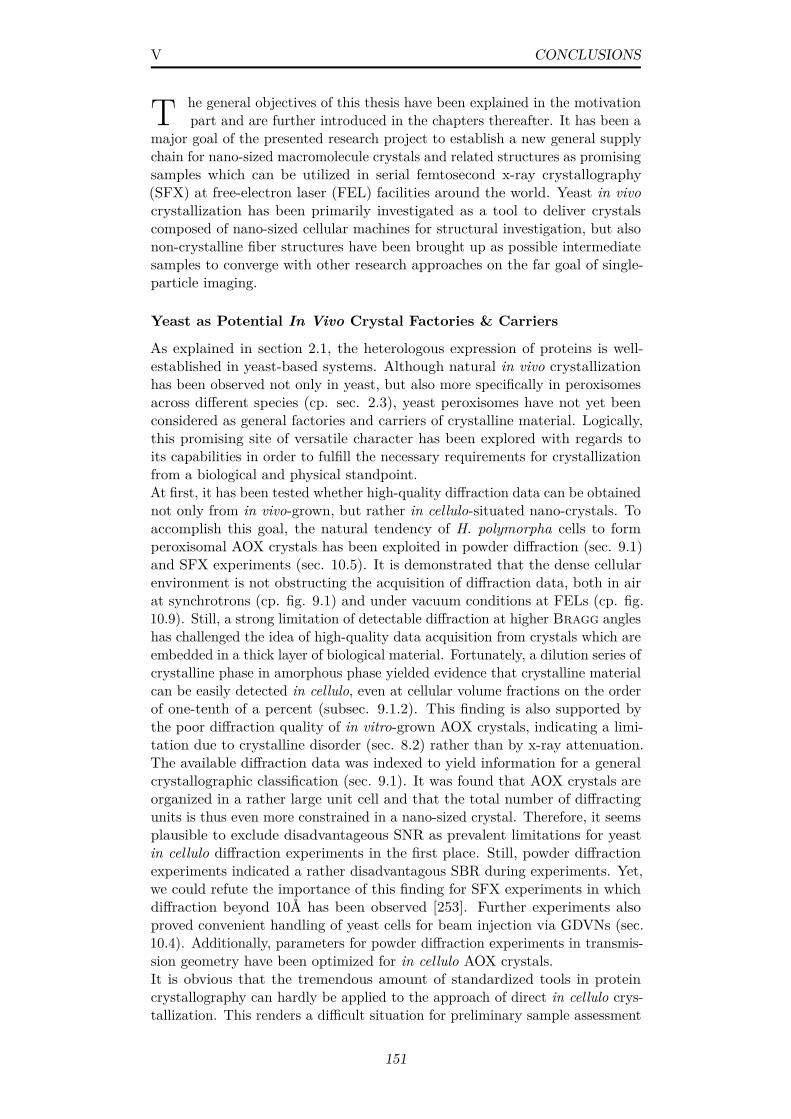
V CONCLUSIONS
T he general objectives of this thesis have been explained in the motivationpart and are further introduced in the chapters thereafter. It has been a
major goal of the presented research project to establish a new general supplychain for nano-sized macromolecule crystals and related structures as promisingsamples which can be utilized in serial femtosecond x-ray crystallography(SFX) at free-electron laser (FEL) facilities around the world. Yeast in vivocrystallization has been primarily investigated as a tool to deliver crystalscomposed of nano-sized cellular machines for structural investigation, but alsonon-crystalline fiber structures have been brought up as possible intermediatesamples to converge with other research approaches on the far goal of single-particle imaging.
Yeast as Potential In Vivo Crystal Factories & Carriers
As explained in section 2.1, the heterologous expression of proteins is well-established in yeast-based systems. Although natural in vivo crystallizationhas been observed not only in yeast, but also more specifically in peroxisomesacross different species (cp. sec. 2.3), yeast peroxisomes have not yet beenconsidered as general factories and carriers of crystalline material. Logically,this promising site of versatile character has been explored with regards toits capabilities in order to fulfill the necessary requirements for crystallizationfrom a biological and physical standpoint.At first, it has been tested whether high-quality diffraction data can be obtainednot only from in vivo-grown, but rather in cellulo-situated nano-crystals. Toaccomplish this goal, the natural tendency of H. polymorpha cells to formperoxisomal AOX crystals has been exploited in powder diffraction (sec. 9.1)and SFX experiments (sec. 10.5). It is demonstrated that the dense cellularenvironment is not obstructing the acquisition of diffraction data, both in airat synchrotrons (cp. fig. 9.1) and under vacuum conditions at FELs (cp. fig.10.9). Still, a strong limitation of detectable diffraction at higher Bragg angleshas challenged the idea of high-quality data acquisition from crystals which areembedded in a thick layer of biological material. Fortunately, a dilution series ofcrystalline phase in amorphous phase yielded evidence that crystalline materialcan be easily detected in cellulo, even at cellular volume fractions on the orderof one-tenth of a percent (subsec. 9.1.2). This finding is also supported bythe poor diffraction quality of in vitro-grown AOX crystals, indicating a limi-tation due to crystalline disorder (sec. 8.2) rather than by x-ray attenuation.The available diffraction data was indexed to yield information for a generalcrystallographic classification (sec. 9.1). It was found that AOX crystals areorganized in a rather large unit cell and that the total number of diffractingunits is thus even more constrained in a nano-sized crystal. Therefore, it seemsplausible to exclude disadvantageous SNR as prevalent limitations for yeastin cellulo diffraction experiments in the first place. Still, powder diffractionexperiments indicated a rather disadvantagous SBR during experiments. Yet,we could refute the importance of this finding for SFX experiments in whichdiffraction beyond 10Å has been observed [253]. Further experiments alsoproved convenient handling of yeast cells for beam injection via GDVNs (sec.10.4). Additionally, parameters for powder diffraction experiments in transmis-sion geometry have been optimized for in cellulo AOX crystals.It is obvious that the tremendous amount of standardized tools in proteincrystallography can hardly be applied to the approach of direct in cellulo crys-tallization. This renders a difficult situation for preliminary sample assessment
151
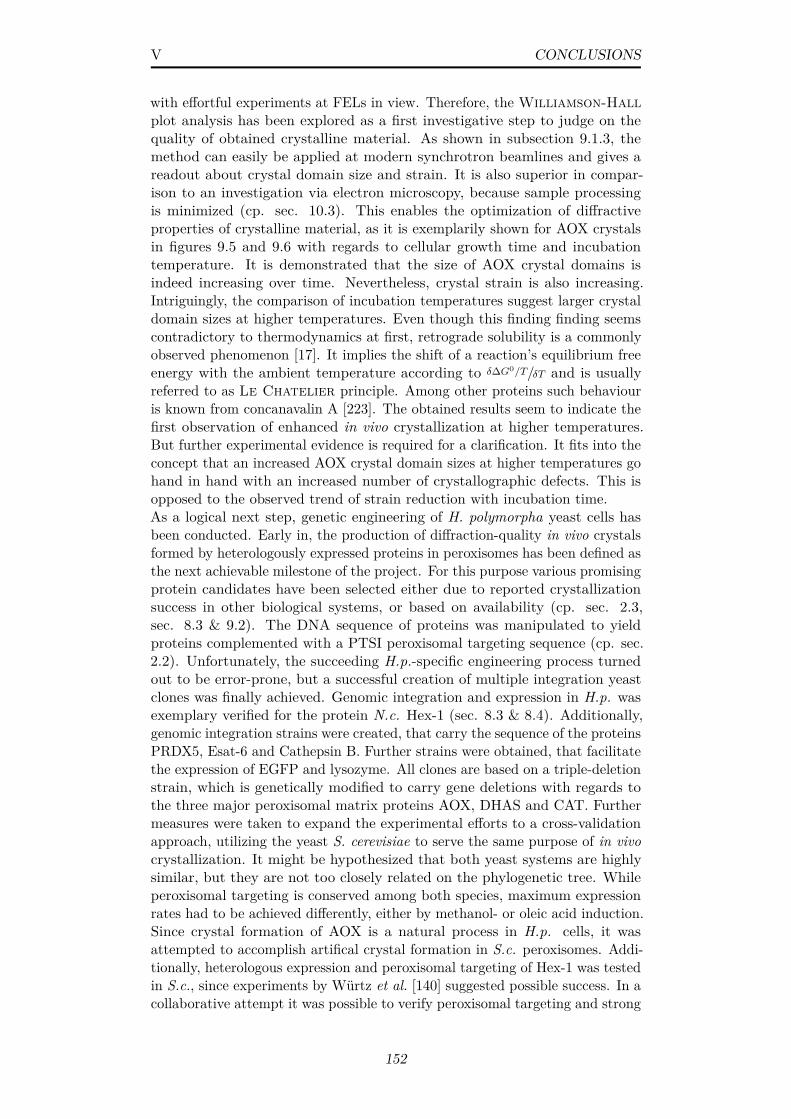
V CONCLUSIONS
with effortful experiments at FELs in view. Therefore, the Williamson-Hallplot analysis has been explored as a first investigative step to judge on thequality of obtained crystalline material. As shown in subsection 9.1.3, themethod can easily be applied at modern synchrotron beamlines and gives areadout about crystal domain size and strain. It is also superior in compar-ison to an investigation via electron microscopy, because sample processingis minimized (cp. sec. 10.3). This enables the optimization of diffractiveproperties of crystalline material, as it is exemplarily shown for AOX crystalsin figures 9.5 and 9.6 with regards to cellular growth time and incubationtemperature. It is demonstrated that the size of AOX crystal domains isindeed increasing over time. Nevertheless, crystal strain is also increasing.Intriguingly, the comparison of incubation temperatures suggest larger crystaldomain sizes at higher temperatures. Even though this finding finding seemscontradictory to thermodynamics at first, retrograde solubility is a commonlyobserved phenomenon [17]. It implies the shift of a reaction’s equilibrium freeenergy with the ambient temperature according to δ∆G0/T/δT and is usuallyreferred to as Le Chatelier principle. Among other proteins such behaviouris known from concanavalin A [223]. The obtained results seem to indicate thefirst observation of enhanced in vivo crystallization at higher temperatures.But further experimental evidence is required for a clarification. It fits into theconcept that an increased AOX crystal domain sizes at higher temperatures gohand in hand with an increased number of crystallographic defects. This isopposed to the observed trend of strain reduction with incubation time.As a logical next step, genetic engineering of H. polymorpha yeast cells hasbeen conducted. Early in, the production of diffraction-quality in vivo crystalsformed by heterologously expressed proteins in peroxisomes has been defined asthe next achievable milestone of the project. For this purpose various promisingprotein candidates have been selected either due to reported crystallizationsuccess in other biological systems, or based on availability (cp. sec. 2.3,sec. 8.3 & 9.2). The DNA sequence of proteins was manipulated to yieldproteins complemented with a PTSI peroxisomal targeting sequence (cp. sec.2.2). Unfortunately, the succeeding H.p.-specific engineering process turnedout to be error-prone, but a successful creation of multiple integration yeastclones was finally achieved. Genomic integration and expression in H.p. wasexemplary verified for the protein N.c. Hex-1 (sec. 8.3 & 8.4). Additionally,genomic integration strains were created, that carry the sequence of the proteinsPRDX5, Esat-6 and Cathepsin B. Further strains were obtained, that facilitatethe expression of EGFP and lysozyme. All clones are based on a triple-deletionstrain, which is genetically modified to carry gene deletions with regards tothe three major peroxisomal matrix proteins AOX, DHAS and CAT. Furthermeasures were taken to expand the experimental efforts to a cross-validationapproach, utilizing the yeast S. cerevisiae to serve the same purpose of in vivocrystallization. It might be hypothesized that both yeast systems are highlysimilar, but they are not too closely related on the phylogenetic tree. Whileperoxisomal targeting is conserved among both species, maximum expressionrates had to be achieved differently, either by methanol- or oleic acid induction.Since crystal formation of AOX is a natural process in H.p. cells, it wasattempted to accomplish artifical crystal formation in S.c. peroxisomes. Addi-tionally, heterologous expression and peroxisomal targeting of Hex-1 was testedin S.c., since experiments by Würtz et al. [140] suggested possible success. In acollaborative attempt it was possible to verify peroxisomal targeting and strong
152
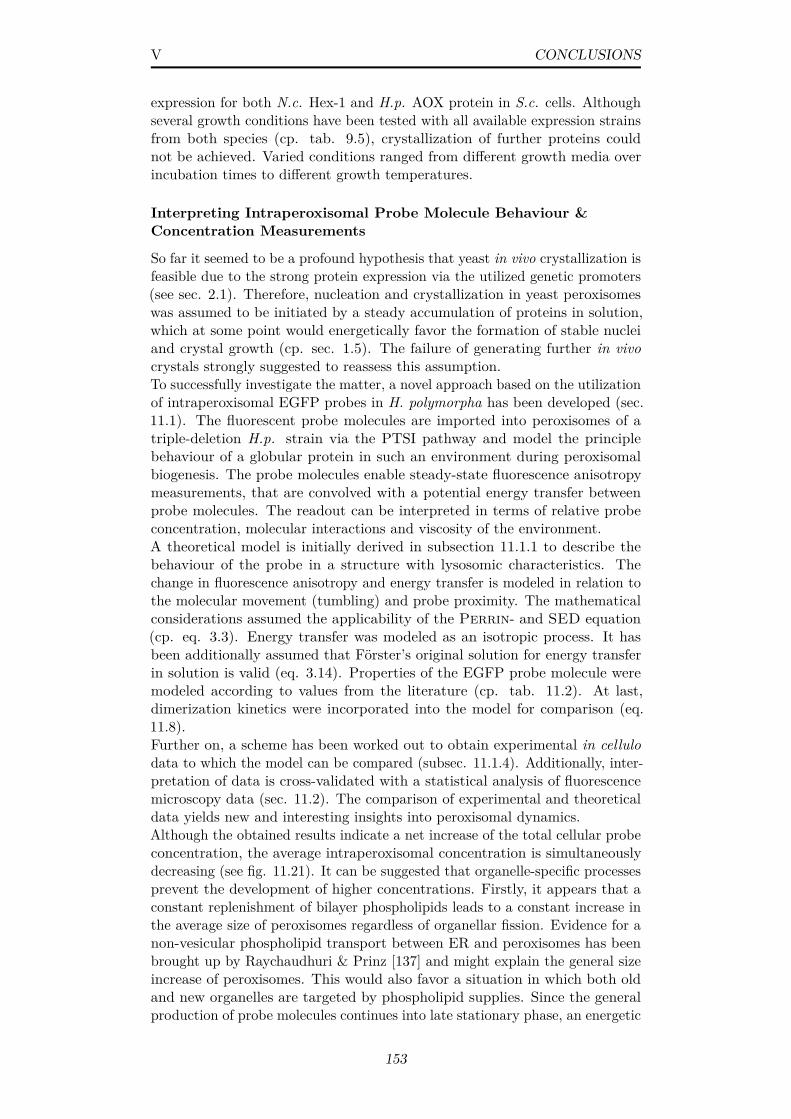
V CONCLUSIONS
expression for both N.c. Hex-1 and H.p. AOX protein in S.c. cells. Althoughseveral growth conditions have been tested with all available expression strainsfrom both species (cp. tab. 9.5), crystallization of further proteins couldnot be achieved. Varied conditions ranged from different growth media overincubation times to different growth temperatures.
Interpreting Intraperoxisomal Probe Molecule Behaviour &Concentration Measurements
So far it seemed to be a profound hypothesis that yeast in vivo crystallization isfeasible due to the strong protein expression via the utilized genetic promoters(see sec. 2.1). Therefore, nucleation and crystallization in yeast peroxisomeswas assumed to be initiated by a steady accumulation of proteins in solution,which at some point would energetically favor the formation of stable nucleiand crystal growth (cp. sec. 1.5). The failure of generating further in vivocrystals strongly suggested to reassess this assumption.To successfully investigate the matter, a novel approach based on the utilizationof intraperoxisomal EGFP probes in H. polymorpha has been developed (sec.11.1). The fluorescent probe molecules are imported into peroxisomes of atriple-deletion H.p. strain via the PTSI pathway and model the principlebehaviour of a globular protein in such an environment during peroxisomalbiogenesis. The probe molecules enable steady-state fluorescence anisotropymeasurements, that are convolved with a potential energy transfer betweenprobe molecules. The readout can be interpreted in terms of relative probeconcentration, molecular interactions and viscosity of the environment.A theoretical model is initially derived in subsection 11.1.1 to describe thebehaviour of the probe in a structure with lysosomic characteristics. Thechange in fluorescence anisotropy and energy transfer is modeled in relation tothe molecular movement (tumbling) and probe proximity. The mathematicalconsiderations assumed the applicability of the Perrin- and SED equation(cp. eq. 3.3). Energy transfer was modeled as an isotropic process. It hasbeen additionally assumed that Förster’s original solution for energy transferin solution is valid (eq. 3.14). Properties of the EGFP probe molecule weremodeled according to values from the literature (cp. tab. 11.2). At last,dimerization kinetics were incorporated into the model for comparison (eq.11.8).Further on, a scheme has been worked out to obtain experimental in cellulodata to which the model can be compared (subsec. 11.1.4). Additionally, inter-pretation of data is cross-validated with a statistical analysis of fluorescencemicroscopy data (sec. 11.2). The comparison of experimental and theoreticaldata yields new and interesting insights into peroxisomal dynamics.Although the obtained results indicate a net increase of the total cellular probeconcentration, the average intraperoxisomal concentration is simultaneouslydecreasing (see fig. 11.21). It can be suggested that organelle-specific processesprevent the development of higher concentrations. Firstly, it appears that aconstant replenishment of bilayer phospholipids leads to a constant increase inthe average size of peroxisomes regardless of organellar fission. Evidence for anon-vesicular phospholipid transport between ER and peroxisomes has beenbrought up by Raychaudhuri & Prinz [137] and might explain the general sizeincrease of peroxisomes. This would also favor a situation in which both oldand new organelles are targeted by phospholipid supplies. Since the generalproduction of probe molecules continues into late stationary phase, an energetic
153
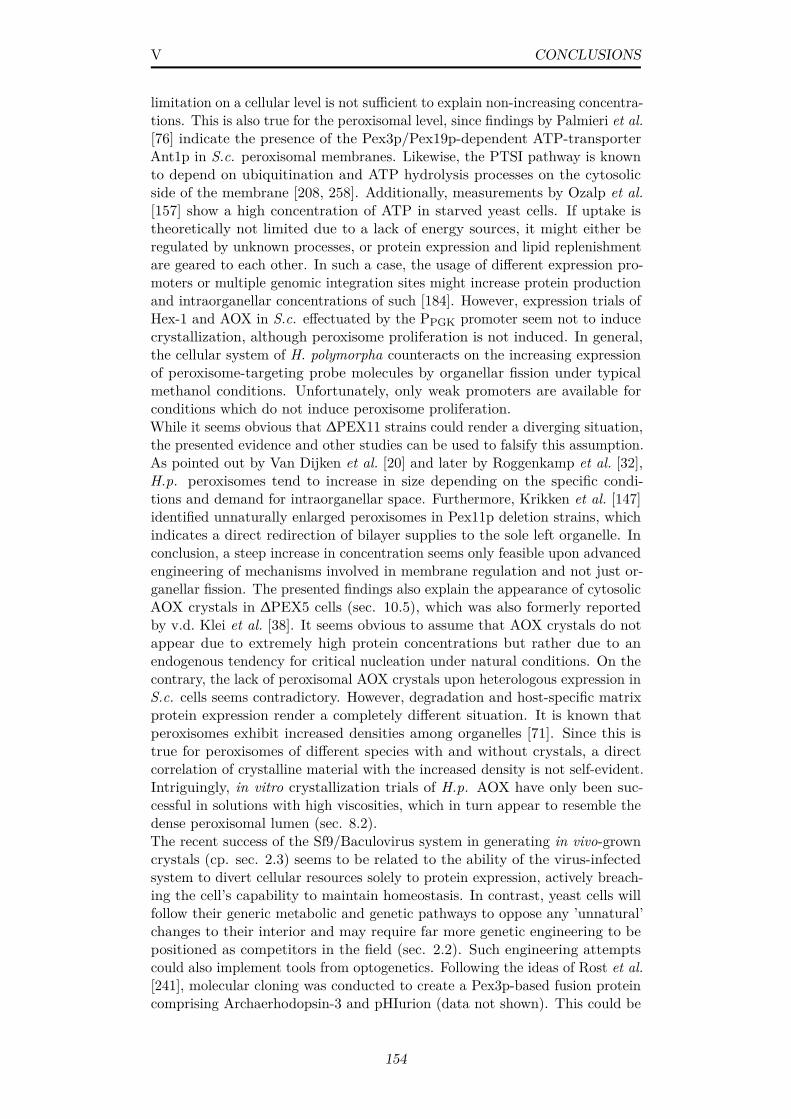
V CONCLUSIONS
limitation on a cellular level is not sufficient to explain non-increasing concentra-tions. This is also true for the peroxisomal level, since findings by Palmieri et al.[76] indicate the presence of the Pex3p/Pex19p-dependent ATP-transporterAnt1p in S.c. peroxisomal membranes. Likewise, the PTSI pathway is knownto depend on ubiquitination and ATP hydrolysis processes on the cytosolicside of the membrane [208, 258]. Additionally, measurements by Ozalp et al.[157] show a high concentration of ATP in starved yeast cells. If uptake istheoretically not limited due to a lack of energy sources, it might either beregulated by unknown processes, or protein expression and lipid replenishmentare geared to each other. In such a case, the usage of different expression pro-moters or multiple genomic integration sites might increase protein productionand intraorganellar concentrations of such [184]. However, expression trials ofHex-1 and AOX in S.c. effectuated by the PPGK promoter seem not to inducecrystallization, although peroxisome proliferation is not induced. In general,the cellular system of H. polymorpha counteracts on the increasing expressionof peroxisome-targeting probe molecules by organellar fission under typicalmethanol conditions. Unfortunately, only weak promoters are available forconditions which do not induce peroxisome proliferation.While it seems obvious that ∆PEX11 strains could render a diverging situation,the presented evidence and other studies can be used to falsify this assumption.As pointed out by Van Dijken et al. [20] and later by Roggenkamp et al. [32],H.p. peroxisomes tend to increase in size depending on the specific condi-tions and demand for intraorganellar space. Furthermore, Krikken et al. [147]identified unnaturally enlarged peroxisomes in Pex11p deletion strains, whichindicates a direct redirection of bilayer supplies to the sole left organelle. Inconclusion, a steep increase in concentration seems only feasible upon advancedengineering of mechanisms involved in membrane regulation and not just or-ganellar fission. The presented findings also explain the appearance of cytosolicAOX crystals in ∆PEX5 cells (sec. 10.5), which was also formerly reportedby v.d. Klei et al. [38]. It seems obvious to assume that AOX crystals do notappear due to extremely high protein concentrations but rather due to anendogenous tendency for critical nucleation under natural conditions. On thecontrary, the lack of peroxisomal AOX crystals upon heterologous expression inS.c. cells seems contradictory. However, degradation and host-specific matrixprotein expression render a completely different situation. It is known thatperoxisomes exhibit increased densities among organelles [71]. Since this istrue for peroxisomes of different species with and without crystals, a directcorrelation of crystalline material with the increased density is not self-evident.Intriguingly, in vitro crystallization trials of H.p. AOX have only been suc-cessful in solutions with high viscosities, which in turn appear to resemble thedense peroxisomal lumen (sec. 8.2).The recent success of the Sf9/Baculovirus system in generating in vivo-growncrystals (cp. sec. 2.3) seems to be related to the ability of the virus-infectedsystem to divert cellular resources solely to protein expression, actively breach-ing the cell’s capability to maintain homeostasis. In contrast, yeast cells willfollow their generic metabolic and genetic pathways to oppose any ’unnatural’changes to their interior and may require far more genetic engineering to bepositioned as competitors in the field (sec. 2.2). Such engineering attemptscould also implement tools from optogenetics. Following the ideas of Rost et al.[241], molecular cloning was conducted to create a Pex3p-based fusion proteincomprising Archaerhodopsin-3 and pHIurion (data not shown). This could be
154
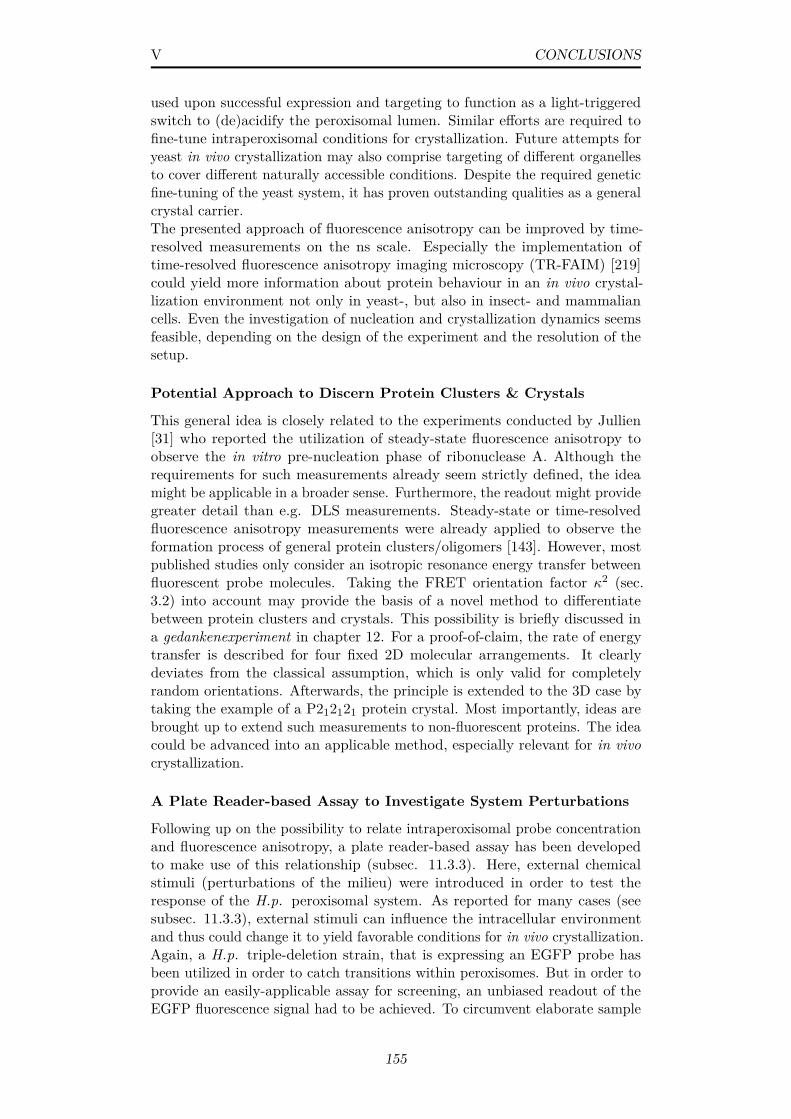
V CONCLUSIONS
used upon successful expression and targeting to function as a light-triggeredswitch to (de)acidify the peroxisomal lumen. Similar efforts are required tofine-tune intraperoxisomal conditions for crystallization. Future attempts foryeast in vivo crystallization may also comprise targeting of different organellesto cover different naturally accessible conditions. Despite the required geneticfine-tuning of the yeast system, it has proven outstanding qualities as a generalcrystal carrier.The presented approach of fluorescence anisotropy can be improved by time-resolved measurements on the ns scale. Especially the implementation oftime-resolved fluorescence anisotropy imaging microscopy (TR-FAIM) [219]could yield more information about protein behaviour in an in vivo crystal-lization environment not only in yeast-, but also in insect- and mammaliancells. Even the investigation of nucleation and crystallization dynamics seemsfeasible, depending on the design of the experiment and the resolution of thesetup.
Potential Approach to Discern Protein Clusters & Crystals
This general idea is closely related to the experiments conducted by Jullien[31] who reported the utilization of steady-state fluorescence anisotropy toobserve the in vitro pre-nucleation phase of ribonuclease A. Although therequirements for such measurements already seem strictly defined, the ideamight be applicable in a broader sense. Furthermore, the readout might providegreater detail than e.g. DLS measurements. Steady-state or time-resolvedfluorescence anisotropy measurements were already applied to observe theformation process of general protein clusters/oligomers [143]. However, mostpublished studies only consider an isotropic resonance energy transfer betweenfluorescent probe molecules. Taking the FRET orientation factor κ2 (sec.3.2) into account may provide the basis of a novel method to differentiatebetween protein clusters and crystals. This possibility is briefly discussed ina gedankenexperiment in chapter 12. For a proof-of-claim, the rate of energytransfer is described for four fixed 2D molecular arrangements. It clearlydeviates from the classical assumption, which is only valid for completelyrandom orientations. Afterwards, the principle is extended to the 3D case bytaking the example of a P212121 protein crystal. Most importantly, ideas arebrought up to extend such measurements to non-fluorescent proteins. The ideacould be advanced into an applicable method, especially relevant for in vivocrystallization.
A Plate Reader-based Assay to Investigate System Perturbations
Following up on the possibility to relate intraperoxisomal probe concentrationand fluorescence anisotropy, a plate reader-based assay has been developedto make use of this relationship (subsec. 11.3.3). Here, external chemicalstimuli (perturbations of the milieu) were introduced in order to test theresponse of the H.p. peroxisomal system. As reported for many cases (seesubsec. 11.3.3), external stimuli can influence the intracellular environmentand thus could change it to yield favorable conditions for in vivo crystallization.Again, a H.p. triple-deletion strain, that is expressing an EGFP probe hasbeen utilized in order to catch transitions within peroxisomes. But in order toprovide an easily-applicable assay for screening, an unbiased readout of theEGFP fluorescence signal had to be achieved. To circumvent elaborate sample
155
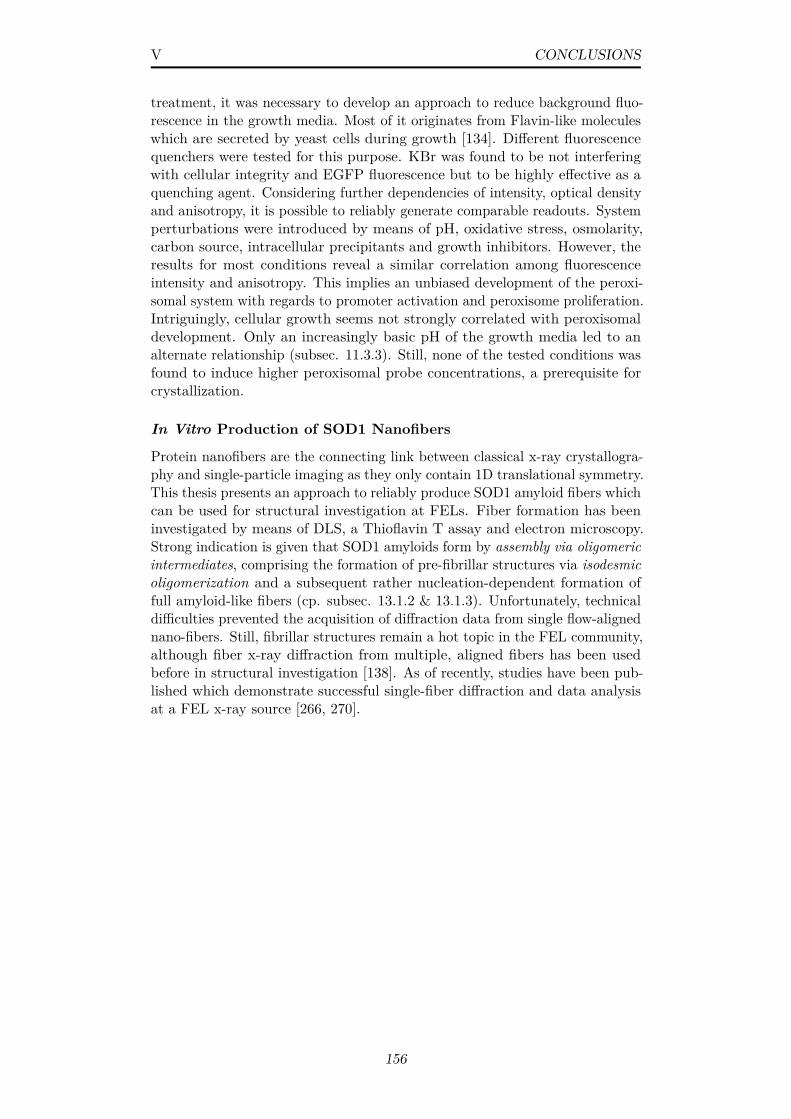
V CONCLUSIONS
treatment, it was necessary to develop an approach to reduce background fluo-rescence in the growth media. Most of it originates from Flavin-like moleculeswhich are secreted by yeast cells during growth [134]. Different fluorescencequenchers were tested for this purpose. KBr was found to be not interferingwith cellular integrity and EGFP fluorescence but to be highly effective as aquenching agent. Considering further dependencies of intensity, optical densityand anisotropy, it is possible to reliably generate comparable readouts. Systemperturbations were introduced by means of pH, oxidative stress, osmolarity,carbon source, intracellular precipitants and growth inhibitors. However, theresults for most conditions reveal a similar correlation among fluorescenceintensity and anisotropy. This implies an unbiased development of the peroxi-somal system with regards to promoter activation and peroxisome proliferation.Intriguingly, cellular growth seems not strongly correlated with peroxisomaldevelopment. Only an increasingly basic pH of the growth media led to analternate relationship (subsec. 11.3.3). Still, none of the tested conditions wasfound to induce higher peroxisomal probe concentrations, a prerequisite forcrystallization.
In Vitro Production of SOD1 Nanofibers
Protein nanofibers are the connecting link between classical x-ray crystallogra-phy and single-particle imaging as they only contain 1D translational symmetry.This thesis presents an approach to reliably produce SOD1 amyloid fibers whichcan be used for structural investigation at FELs. Fiber formation has beeninvestigated by means of DLS, a Thioflavin T assay and electron microscopy.Strong indication is given that SOD1 amyloids form by assembly via oligomericintermediates, comprising the formation of pre-fibrillar structures via isodesmicoligomerization and a subsequent rather nucleation-dependent formation offull amyloid-like fibers (cp. subsec. 13.1.2 & 13.1.3). Unfortunately, technicaldifficulties prevented the acquisition of diffraction data from single flow-alignednano-fibers. Still, fibrillar structures remain a hot topic in the FEL community,although fiber x-ray diffraction from multiple, aligned fibers has been usedbefore in structural investigation [138]. As of recently, studies have been pub-lished which demonstrate successful single-fiber diffraction and data analysisat a FEL x-ray source [266, 270].
156

A | Appendix
Table A.1: Williamson-Hall plot data, Comparison of H.p. wildtype- (WT) and ∆PEX11-grown AOX crystals; Fitted and corrected FWHM (2Θ) of incorporated hkl reflections; B =FWHM/2
Cellline
Time[hrs]
hkl Refl. FWHM[10−3 °]
sinΘ[10−3]
B · cosΘ[10−3]
WT 6 (1 1 0) 8.398 3.026 4.199(2 0 0) 7.586 4.227 3.793(3 1 0) 8.625 6.699 4.312(3 2 1) 9.639 7.930 4.819(4 0 0) 8.271 8.464 4.135(4 2 0) 6.241 9.464 3.120
WT 24 (1 1 0) 4.929 3.008 2.464(2 0 0) 4.950 4.232 2.475(3 1 0) 5.384 6.694 2.692(3 2 1) 5.581 7.922 2.791(4 0 0) 6.337 8.462 3.169(4 2 0) 6.000 9.463 3.000
∆P11 6 (2 0 0) 7.932 4.229 3.966(3 1 0) 7.361 6.704 3.680(3 2 1) 4.936 7.948 2.468(4 0 0) 7.963 8.466 3.981
∆P11 24 (1 1 0) 2.847 3.010 1.423(2 0 0) 3.444 4.236 1.722(3 1 0) 4.466 6.700 2.233(3 2 1) 4.716 7.927 2.358(4 0 0) 5.230 8.470 2.615(4 2 0) 5.587 9.469 2.794
157
L 3 4 5[kDa]
100
70
55
UT
L7A
WT
+ A
OX
-SK
LU
TL7
A W
T
100
70
55
Figure A.1: Coomassie-blue stained SGS-PAGE gel depicting (Lower) quantitative expres-sion of AOX in S.c. UTL7A mutants, transformed with the pMSC13 vector (PFOX3 promoter)and (Upper) a S.c. UTL7A wildtype control
Figure A.2: Theoretical x-ray absorption of the elemental composition CH1.8O0.5N0.2 andits constituents at a density of 1.09g/cm3 and a beam energy of 12.8 keV (black line); Datacalculated as stated in subsec. 9.1.1
1D Powder Diffraction Mean - Comparison with Control Samples
Inte
nsit
y [a
.u.]
−40
−20
0
20
40
2-theta [°]1,2 1,4 1,6 1,8 2 2,2 2,4
4Mean
Wildtype SampleControl Sample
Figure A.3: Post-processed 1D powder pattern from H.p. wildtype (black) and 12DAC4control (red) yeast cells 24 hrs after induction of crystal formation
158
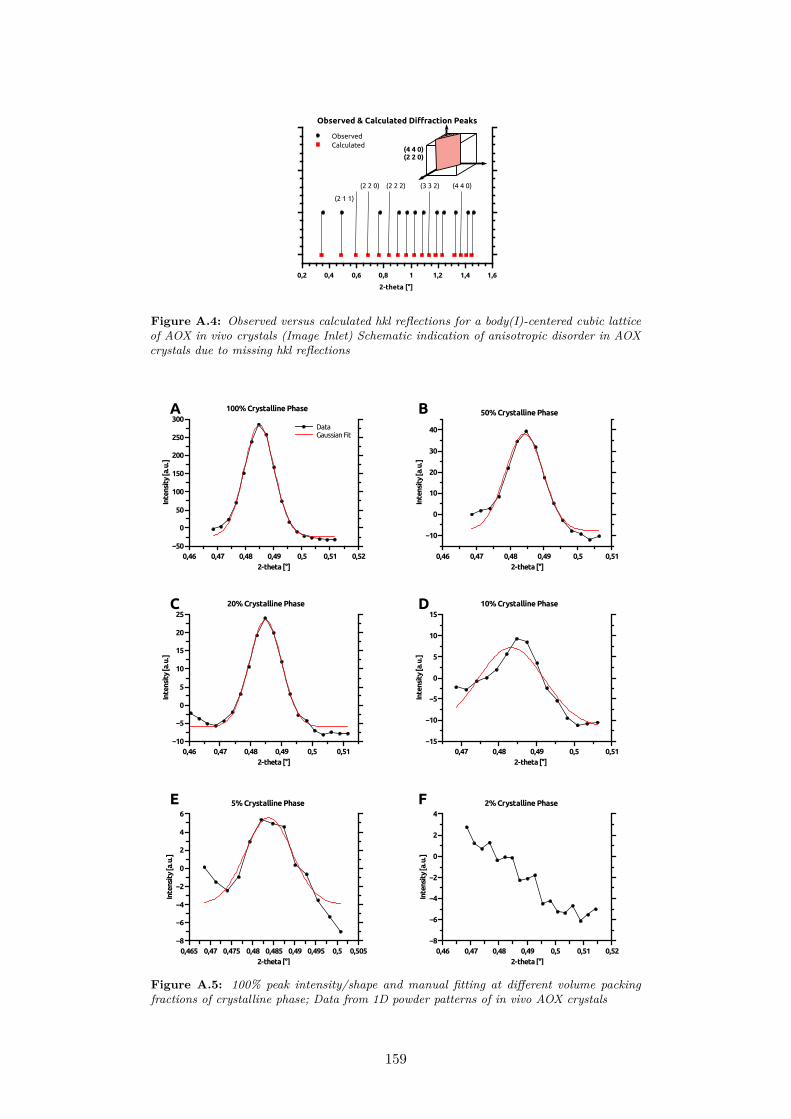
(4 4 0) (2 2 0)
Observed & Calculated Diffraction Peaks
2-theta [°]
0,2 0,4 0,6 0,8 1 1,2 1,4 1,6
ObservedCalculated
(2 1 1)
(2 2 0) (2 2 2) (3 3 2) (4 4 0)
Figure A.4: Observed versus calculated hkl reflections for a body(I)-centered cubic latticeof AOX in vivo crystals (Image Inlet) Schematic indication of anisotropic disorder in AOXcrystals due to missing hkl reflections
50% Crystalline PhaseIn
tens
ity
[a.u
.]
−10
0
10
20
30
40
2-theta [°]0,46 0,47 0,48 0,49 0,5 0,51
10% Crystalline Phase
Inte
nsit
y [a
.u.]
−15
−10
−5
0
5
10
15
2-theta [°]0,47 0,48 0,49 0,5 0,51
100% Crystalline Phase
Inte
nsit
y [a
.u.]
−50
0
50
100
150
200
250
300
2-theta [°]0,46 0,47 0,48 0,49 0,5 0,51 0,52
DataGaussian Fit
A B
C 20% Crystalline Phase
Inte
nsit
y [a
.u.]
−10
−5
0
5
10
15
20
25
2-theta [°]0,46 0,47 0,48 0,49 0,5 0,51
D
E 5% Crystalline Phase
Inte
nsit
y [a
.u.]
−8
−6
−4
−2
0
2
4
6
2-theta [°]0,465 0,47 0,475 0,48 0,485 0,49 0,495 0,5 0,505
F 2% Crystalline Phase
Inte
nsit
y [a
.u.]
−8
−6
−4
−2
0
2
4
2-theta [°]0,46 0,47 0,48 0,49 0,5 0,51 0,52
Figure A.5: 100% peak intensity/shape and manual fitting at different volume packingfractions of crystalline phase; Data from 1D powder patterns of in vivo AOX crystals
159
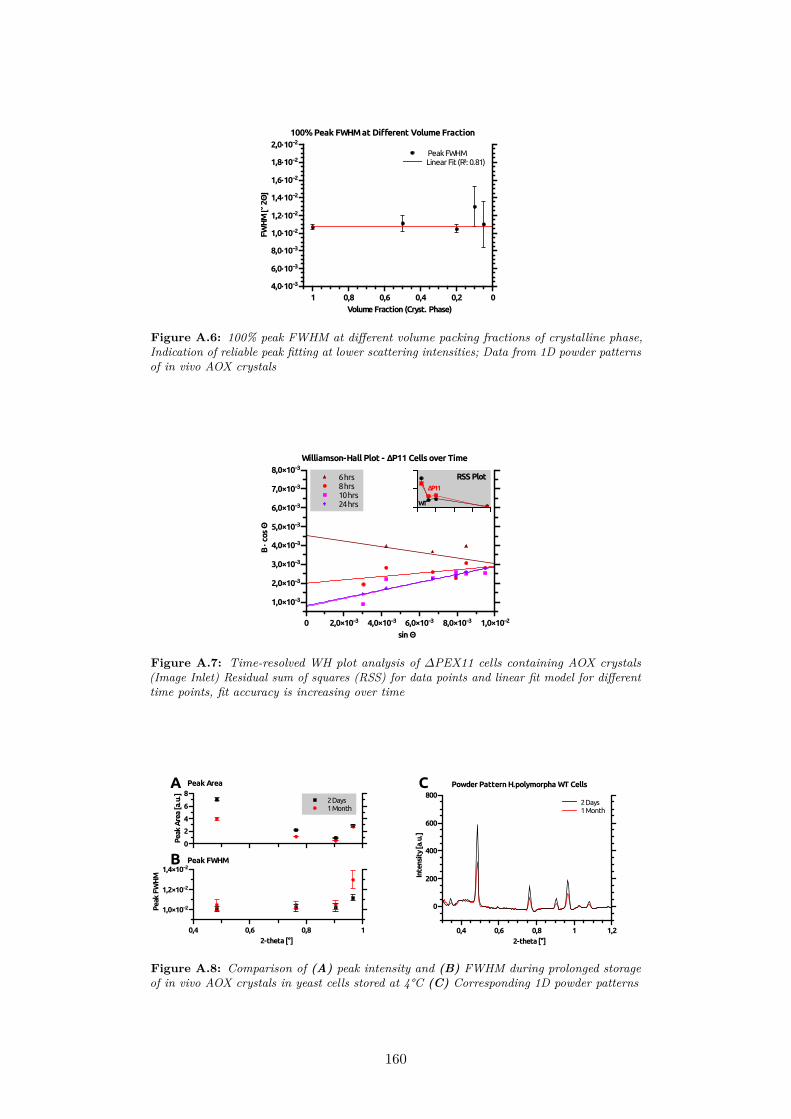
100% Peak FWHM at Different Volume Fraction
FWH
M [°
2Θ
]
4,0·10−3
6,0·10−3
8,0·10−3
1,0·10−2
1,2·10−2
1,4·10−2
1,6·10−2
1,8·10−2
2,0·10−2
Volume Fraction (Cryst. Phase)1 0,8 0,6 0,4 0,2 0
Peak FWHMLinear Fit (R²: 0.81)
Figure A.6: 100% peak FWHM at different volume packing fractions of crystalline phase,Indication of reliable peak fitting at lower scattering intensities; Data from 1D powder patternsof in vivo AOX crystals
WT
ΔP11
Williamson-Hall Plot - ΔP11 Cells over Time
B ∙ c
os Θ
1,0×10⁻³
2,0×10⁻³
3,0×10⁻³
4,0×10⁻³
5,0×10⁻³
6,0×10⁻³
7,0×10⁻³
8,0×10⁻³
sin Θ0 2,0×10⁻³ 4,0×10⁻³ 6,0×10⁻³ 8,0×10⁻³ 1,0×10⁻²
RSS Plot6 hrs8 hrs10 hrs24 hrs
Figure A.7: Time-resolved WH plot analysis of ∆PEX11 cells containing AOX crystals(Image Inlet) Residual sum of squares (RSS) for data points and linear fit model for differenttime points, fit accuracy is increasing over time
Peak
FW
HM
1,0×10⁻²
1,2×10⁻²
1,4×10⁻²
2-theta [°]0,4 0,6 0,8 1
Peak
Are
a [a
.u.]
0
2
4
6
8
2 Days1 Month
A
B
Peak Area
Peak FWHM
C Powder Pattern H.polymorpha WT Cells
Inte
nsit
y [a
.u.]
0
200
400
600
800
2-theta [°]0,4 0,6 0,8 1 1,2
1month2days
2 Days1 Month
Figure A.8: Comparison of (A) peak intensity and (B) FWHM during prolonged storageof in vivo AOX crystals in yeast cells stored at 4°C (C) Corresponding 1D powder patterns
160
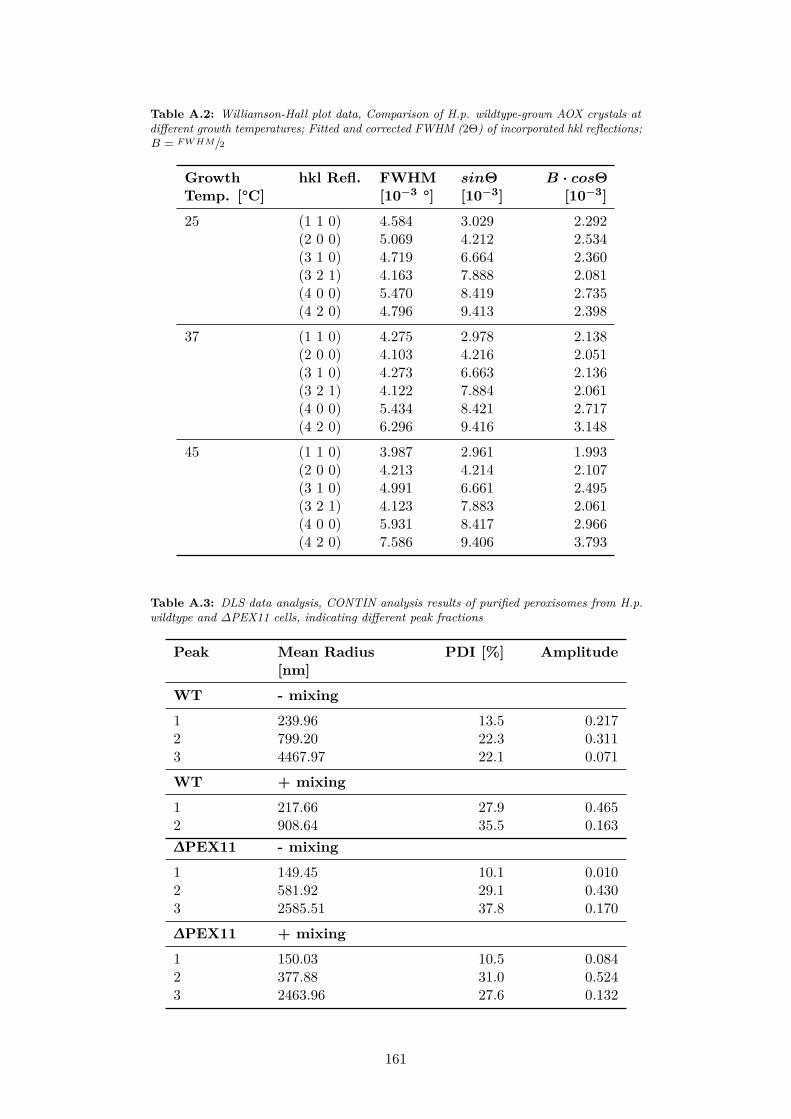
Table A.2: Williamson-Hall plot data, Comparison of H.p. wildtype-grown AOX crystals atdifferent growth temperatures; Fitted and corrected FWHM (2Θ) of incorporated hkl reflections;B = FWHM/2
GrowthTemp. [°C]
hkl Refl. FWHM[10−3 °]
sinΘ[10−3]
B · cosΘ[10−3]
25 (1 1 0) 4.584 3.029 2.292(2 0 0) 5.069 4.212 2.534(3 1 0) 4.719 6.664 2.360(3 2 1) 4.163 7.888 2.081(4 0 0) 5.470 8.419 2.735(4 2 0) 4.796 9.413 2.398
37 (1 1 0) 4.275 2.978 2.138(2 0 0) 4.103 4.216 2.051(3 1 0) 4.273 6.663 2.136(3 2 1) 4.122 7.884 2.061(4 0 0) 5.434 8.421 2.717(4 2 0) 6.296 9.416 3.148
45 (1 1 0) 3.987 2.961 1.993(2 0 0) 4.213 4.214 2.107(3 1 0) 4.991 6.661 2.495(3 2 1) 4.123 7.883 2.061(4 0 0) 5.931 8.417 2.966(4 2 0) 7.586 9.406 3.793
Table A.3: DLS data analysis, CONTIN analysis results of purified peroxisomes from H.p.wildtype and ∆PEX11 cells, indicating different peak fractions
Peak Mean Radius[nm]
PDI [%] Amplitude
WT - mixing
1 239.96 13.5 0.2172 799.20 22.3 0.3113 4467.97 22.1 0.071
WT + mixing
1 217.66 27.9 0.4652 908.64 35.5 0.163∆PEX11 - mixing
1 149.45 10.1 0.0102 581.92 29.1 0.4303 2585.51 37.8 0.170
∆PEX11 + mixing
1 150.03 10.5 0.0842 377.88 31.0 0.5243 2463.96 27.6 0.132
161
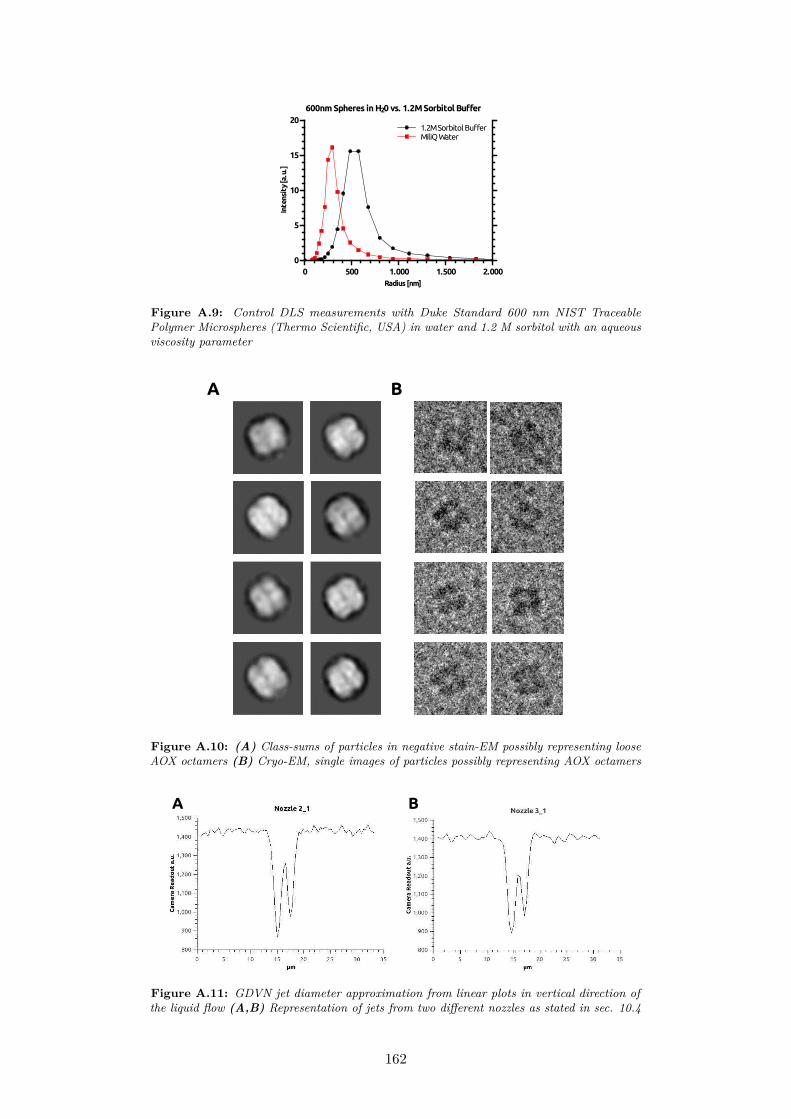
600nm Spheres in H20 vs. 1.2M Sorbitol Buffer
Inte
nsit
y [a
.u.]
0
5
10
15
20
Radius [nm]
0 500 1.000 1.500 2.000
1.2M Sorbitol BufferMiliQ Water
Figure A.9: Control DLS measurements with Duke Standard 600 nm NIST TraceablePolymer Microspheres (Thermo Scientific, USA) in water and 1.2 M sorbitol with an aqueousviscosity parameter
A B
Figure A.10: (A) Class-sums of particles in negative stain-EM possibly representing looseAOX octamers (B) Cryo-EM, single images of particles possibly representing AOX octamers
A B
Figure A.11: GDVN jet diameter approximation from linear plots in vertical direction ofthe liquid flow (A,B) Representation of jets from two different nozzles as stated in sec. 10.4
162

Figure A.12: Verification of yeast cell integrity after jetting in a typical GDVN setup asdescribed in sec. 10.4
Linearity of Plate Reader OD
TECA
N O
D [O
D66
0]
0
0,2
0,4
0,6
0,8
1
Yeast Cell Suspension [OD660]0 2 4 6 8 10
Data PointsLinear Fit (R²: 0.99)
Figure A.13: Linear dependency of plate-reader based and undiluted OD measurements(y-axis) in comparison to diluted OD measurements on a spectrophotometer (x-axis)
ThT Assay at Different pH
Fluo
resc
ence
Inte
nsit
y [a
.u.]
800
1.000
1.200
1.400
1.600
1.800
2.000
Time [s]0 1,0×10⁴ 2,0×10⁴ 3,0×10⁴ 4,0×10⁴ 5,0×10⁴
50 mM SoAc pH 650 mM SoAc pH 550 mM SoAc pH 450 mM PP pH 7.250 mM PP pH 6.650 mM PP pH 7.250 mM Tris-HCl pH 7.2
Figure A.14: ThT assay, control measurements to investigate the pH influence on the SOD1fiber formation process; Experimental conditions are specified in subsec. 13.1.1
163
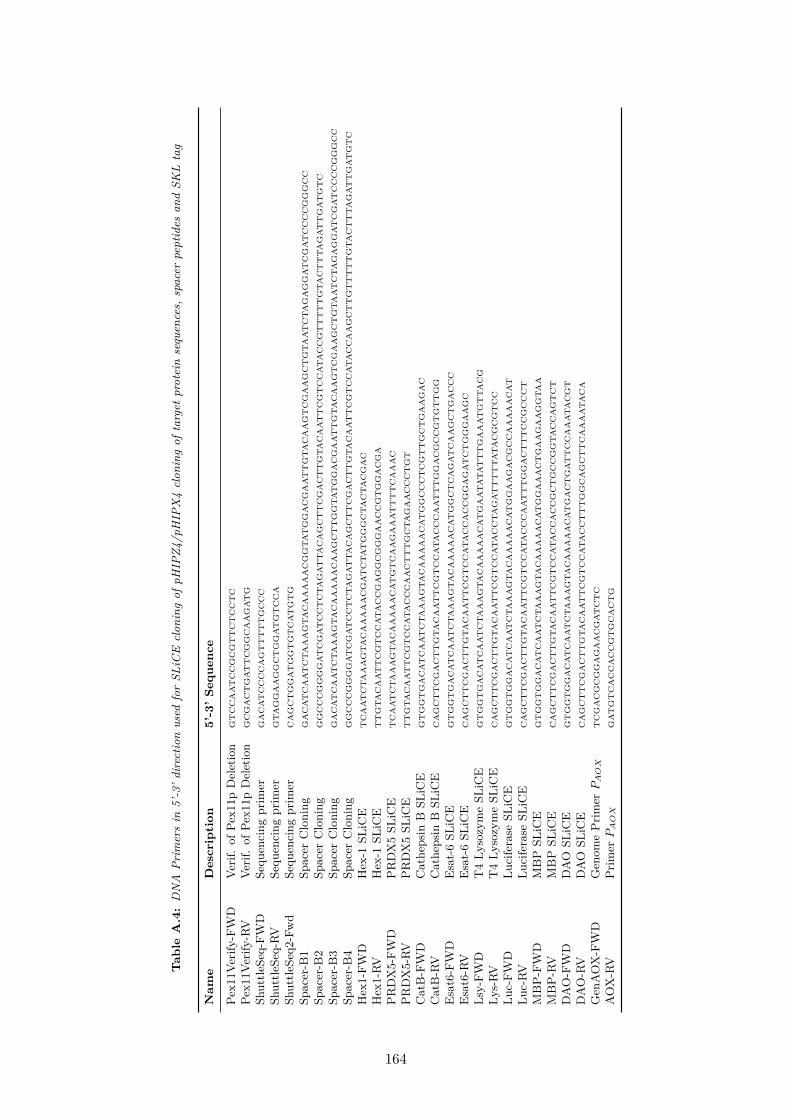
Tab
leA
.4:DNA
Prim
ersin
5’-3’d
irectionused
forSL
iCE
clon
ingof
pHIP
Z4/p
HIP
X4clon
ingof
target
proteinsequen
ces,
spacer
peptides
andSK
Ltag
Nam
eD
escr
ipti
on5’
-3’
Sequ
ence
Pex1
1Verify
-FW
DVe
rif.of
Pex1
1pDeletion
GT
CC
AA
TC
CG
CG
TT
CT
CC
TC
Pex1
1Verify
-RV
Verif.of
Pex1
1pDeletion
GC
GA
CT
GA
TT
CG
GC
AA
GA
TG
Shuttle
Seq-FW
DSe
quen
cing
prim
erG
AC
AT
CC
CC
AG
TT
TT
TG
CC
C
Shuttle
Seq-RV
Sequ
encing
prim
erG
TA
GG
AA
GG
CT
GG
AT
GT
CC
A
Shuttle
Seq2
-Fwd
Sequ
encing
prim
erC
AG
CT
GG
AT
GG
TG
TC
AT
GT
G
Spacer-B
1Sp
acer
Cloning
GA
CA
TC
AA
TC
TA
AA
GT
AC
AA
AA
AC
GG
TA
TG
GA
CG
AA
TT
GT
AC
AA
GT
CG
AA
GC
TG
TA
AT
CT
AG
AG
GA
TC
GA
TC
CC
CG
GG
CC
Spacer-B
2Sp
acer
Cloning
GG
CC
CG
GG
GA
TC
GA
TC
CT
CT
AG
AT
TA
CA
GC
TT
CG
AC
TT
GT
AC
AA
TT
CG
TC
CA
TA
CC
GT
TT
TT
GT
AC
TT
TA
GA
TT
GA
TG
TC
Spacer-B
3Sp
acer
Cloning
GA
CA
TC
AA
TC
TA
AA
GT
AC
AA
AA
AC
AA
GC
TT
GG
TA
TG
GA
CG
AA
TT
GT
AC
AA
GT
CG
AA
GC
TG
TA
AT
CT
AG
AG
GA
TC
GA
TC
CC
CG
GG
CC
Spacer-B
4Sp
acer
Cloning
GG
CC
CG
GG
GA
TC
GA
TC
CT
CT
AG
AT
TA
CA
GC
TT
CG
AC
TT
GT
AC
AA
TT
CG
TC
CA
TA
CC
AA
GC
TT
GT
TT
TT
GT
AC
TT
TA
GA
TT
GA
TG
TC
Hex1-FW
DHex-1
SLiCE
TC
AA
TC
TA
AA
GT
AC
AA
AA
AC
GA
TC
TA
TG
GG
CT
AC
TA
CG
AC
Hex1-RV
Hex-1
SLiCE
TT
GT
AC
AA
TT
CG
TC
CA
TA
CC
GA
GG
CG
GG
AA
CC
GT
GG
AC
GA
PRDX5-FW
DPRDX5SL
iCE
TC
AA
TC
TA
AA
GT
AC
AA
AA
AC
AT
GT
CA
AG
AA
AT
TT
TC
AA
AC
PRDX5-RV
PRDX5SL
iCE
TT
GT
AC
AA
TT
CG
TC
CA
TA
CC
CA
AC
TT
TG
CT
AG
AA
CC
CT
GT
CatB-FW
DCathe
psin
BSL
iCE
GT
GG
TG
AC
AT
CA
AT
CT
AA
AG
TA
CA
AA
AA
CA
TG
GC
CC
TC
GT
TG
CT
GA
AG
AC
CatB-RV
Cathe
psin
BSL
iCE
CA
GC
TT
CG
AC
TT
GT
AC
AA
TT
CG
TC
CA
TA
CC
CA
AT
TT
GG
AC
GC
CG
TG
TT
GG
Esat6-FW
DEsat-6SL
iCE
GT
GG
TG
AC
AT
CA
AT
CT
AA
AG
TA
CA
AA
AA
CA
TG
GC
TC
AG
AT
CA
AG
CT
GA
CC
C
Esat6-RV
Esat-6SL
iCE
CA
GC
TT
CG
AC
TT
GT
AC
AA
TT
CG
TC
CA
TA
CC
AC
CG
GA
GA
TC
TG
GG
AA
GC
Lsy-FW
DT4Ly
sozymeSL
iCE
GT
GG
TG
AC
AT
CA
AT
CT
AA
AG
TA
CA
AA
AA
CA
TG
AA
TA
TA
TT
TG
AA
AT
GT
TA
CG
Lys-RV
T4Ly
sozymeSL
iCE
CA
GC
TT
CG
AC
TT
GT
AC
AA
TT
CG
TC
CA
TA
CC
TA
GA
TT
TT
TA
TA
CG
CG
TC
C
Luc-FW
DLu
ciferase
SLiCE
GT
GG
TG
GA
CA
TC
AA
TC
TA
AA
GT
AC
AA
AA
AC
AT
GG
AA
GA
CG
CC
AA
AA
AC
AT
Luc-RV
Luciferase
SLiCE
CA
GC
TT
CG
AC
TT
GT
AC
AA
TT
CG
TC
CA
TA
CC
CA
AT
TT
GG
AC
TT
TC
CG
CC
CT
MBP-FW
DMBP
SLiCE
GT
GG
TG
GA
CA
TC
AA
TC
TA
AA
GT
AC
AA
AA
AC
AT
GG
AA
AC
TG
AA
GA
AG
GT
AA
MBP-RV
MBP
SLiCE
CA
GC
TT
CG
AC
TT
GT
AC
AA
TT
CG
TC
CA
TA
CC
AC
CG
CT
GC
CG
GT
AC
CA
GT
CT
DAO-FW
DDAO
SLiCE
GT
GG
TG
GA
CA
TC
AA
TC
TA
AA
GT
AC
AA
AA
AC
AT
GA
CT
GA
TT
CC
AA
AT
AC
GT
DAO-RV
DAO
SLiCE
CA
GC
TT
CG
AC
TT
GT
AC
AA
TT
CG
TC
CA
TA
CC
TT
TG
GC
AG
CT
TC
AA
AA
TA
CA
Gen
AOX-FW
DGen
omePrim
erPAOX
TC
GA
CG
CG
GA
GA
AC
GA
TC
TC
AOX-RV
Prim
erPAOX
GA
TG
TC
AC
CA
CC
GT
GC
AC
TG
164
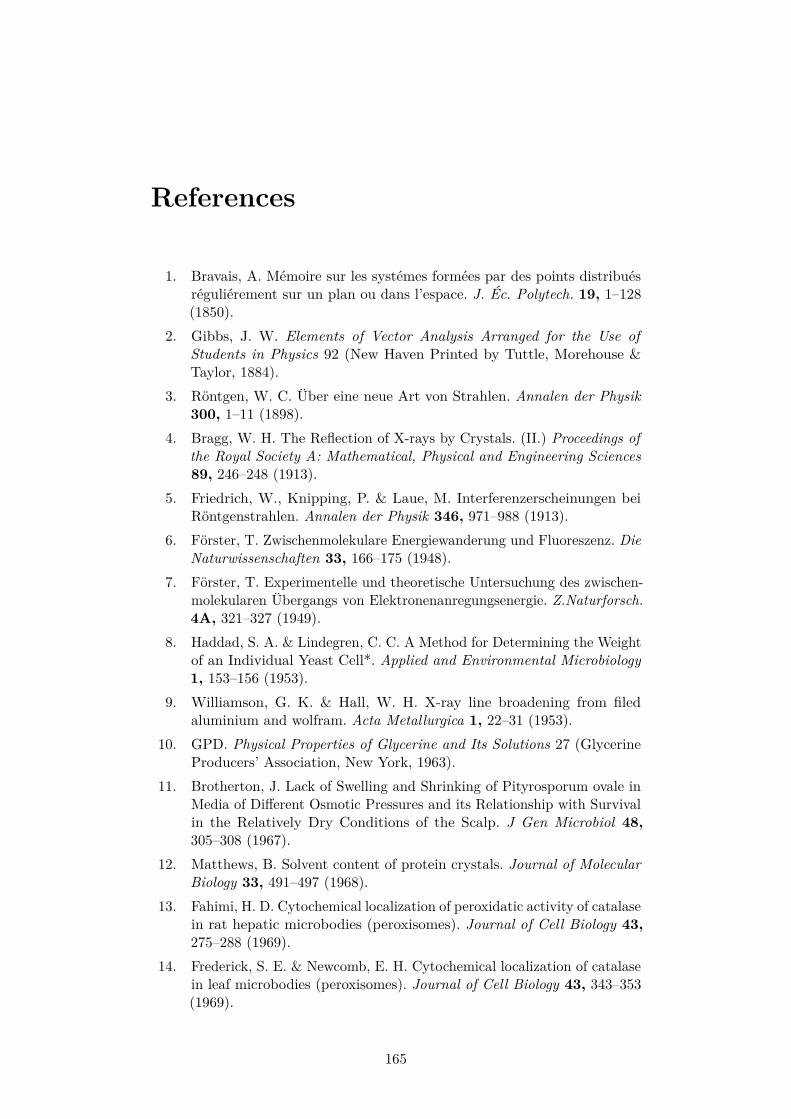
References
1. Bravais, A. Mémoire sur les systémes formées par des points distribuésréguliérement sur un plan ou dans l’espace. J. Éc. Polytech. 19, 1–128(1850).
2. Gibbs, J. W. Elements of Vector Analysis Arranged for the Use ofStudents in Physics 92 (New Haven Printed by Tuttle, Morehouse &Taylor, 1884).
3. Röntgen, W. C. Über eine neue Art von Strahlen. Annalen der Physik300, 1–11 (1898).
4. Bragg, W. H. The Reflection of X-rays by Crystals. (II.) Proceedings ofthe Royal Society A: Mathematical, Physical and Engineering Sciences89, 246–248 (1913).
5. Friedrich, W., Knipping, P. & Laue, M. Interferenzerscheinungen beiRöntgenstrahlen. Annalen der Physik 346, 971–988 (1913).
6. Förster, T. Zwischenmolekulare Energiewanderung und Fluoreszenz. DieNaturwissenschaften 33, 166–175 (1948).
7. Förster, T. Experimentelle und theoretische Untersuchung des zwischen-molekularen Übergangs von Elektronenanregungsenergie. Z.Naturforsch.4A, 321–327 (1949).
8. Haddad, S. A. & Lindegren, C. C. A Method for Determining the Weightof an Individual Yeast Cell*. Applied and Environmental Microbiology1, 153–156 (1953).
9. Williamson, G. K. & Hall, W. H. X-ray line broadening from filedaluminium and wolfram. Acta Metallurgica 1, 22–31 (1953).
10. GPD. Physical Properties of Glycerine and Its Solutions 27 (GlycerineProducers’ Association, New York, 1963).
11. Brotherton, J. Lack of Swelling and Shrinking of Pityrosporum ovale inMedia of Different Osmotic Pressures and its Relationship with Survivalin the Relatively Dry Conditions of the Scalp. J Gen Microbiol 48,305–308 (1967).
12. Matthews, B. Solvent content of protein crystals. Journal of MolecularBiology 33, 491–497 (1968).
13. Fahimi, H. D. Cytochemical localization of peroxidatic activity of catalasein rat hepatic microbodies (peroxisomes). Journal of Cell Biology 43,275–288 (1969).
14. Frederick, S. E. & Newcomb, E. H. Cytochemical localization of catalasein leaf microbodies (peroxisomes). Journal of Cell Biology 43, 343–353(1969).
165
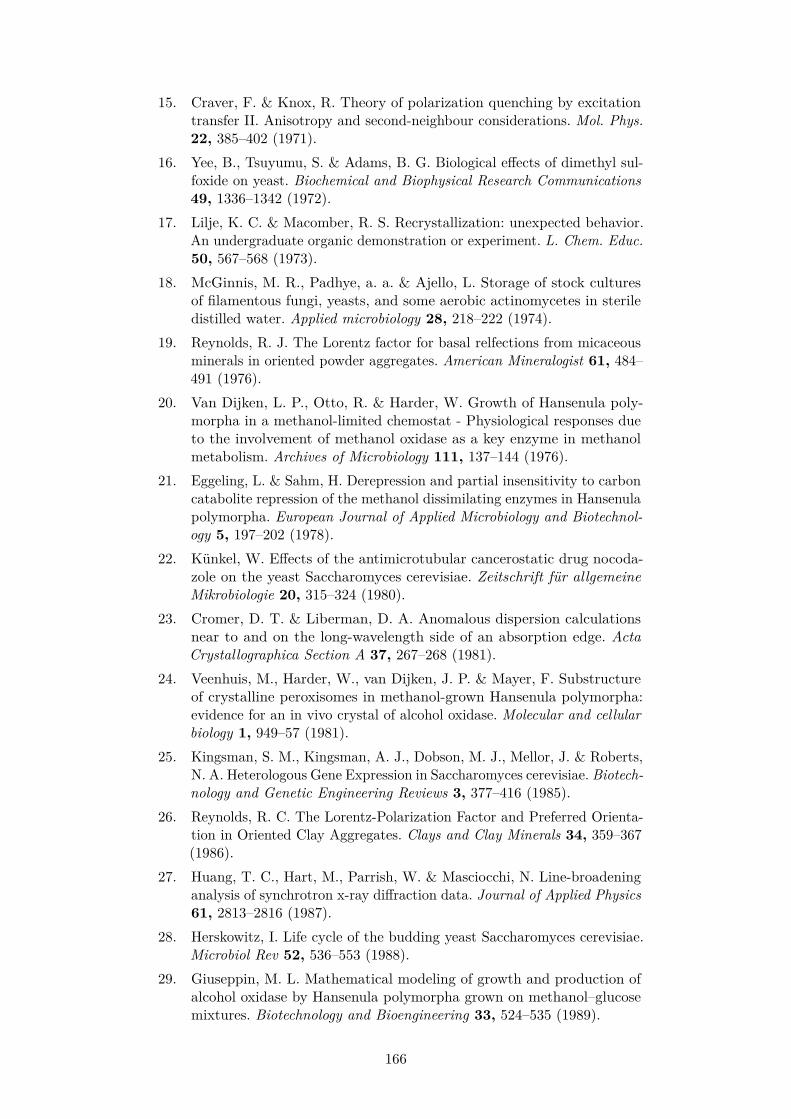
15. Craver, F. & Knox, R. Theory of polarization quenching by excitationtransfer II. Anisotropy and second-neighbour considerations. Mol. Phys.22, 385–402 (1971).
16. Yee, B., Tsuyumu, S. & Adams, B. G. Biological effects of dimethyl sul-foxide on yeast. Biochemical and Biophysical Research Communications49, 1336–1342 (1972).
17. Lilje, K. C. & Macomber, R. S. Recrystallization: unexpected behavior.An undergraduate organic demonstration or experiment. L. Chem. Educ.50, 567–568 (1973).
18. McGinnis, M. R., Padhye, a. a. & Ajello, L. Storage of stock culturesof filamentous fungi, yeasts, and some aerobic actinomycetes in steriledistilled water. Applied microbiology 28, 218–222 (1974).
19. Reynolds, R. J. The Lorentz factor for basal relfections from micaceousminerals in oriented powder aggregates. American Mineralogist 61, 484–491 (1976).
20. Van Dijken, L. P., Otto, R. & Harder, W. Growth of Hansenula poly-morpha in a methanol-limited chemostat - Physiological responses dueto the involvement of methanol oxidase as a key enzyme in methanolmetabolism. Archives of Microbiology 111, 137–144 (1976).
21. Eggeling, L. & Sahm, H. Derepression and partial insensitivity to carboncatabolite repression of the methanol dissimilating enzymes in Hansenulapolymorpha. European Journal of Applied Microbiology and Biotechnol-ogy 5, 197–202 (1978).
22. Künkel, W. Effects of the antimicrotubular cancerostatic drug nocoda-zole on the yeast Saccharomyces cerevisiae. Zeitschrift für allgemeineMikrobiologie 20, 315–324 (1980).
23. Cromer, D. T. & Liberman, D. A. Anomalous dispersion calculationsnear to and on the long-wavelength side of an absorption edge. ActaCrystallographica Section A 37, 267–268 (1981).
24. Veenhuis, M., Harder, W., van Dijken, J. P. & Mayer, F. Substructureof crystalline peroxisomes in methanol-grown Hansenula polymorpha:evidence for an in vivo crystal of alcohol oxidase. Molecular and cellularbiology 1, 949–57 (1981).
25. Kingsman, S. M., Kingsman, A. J., Dobson, M. J., Mellor, J. & Roberts,N. A. Heterologous Gene Expression in Saccharomyces cerevisiae. Biotech-nology and Genetic Engineering Reviews 3, 377–416 (1985).
26. Reynolds, R. C. The Lorentz-Polarization Factor and Preferred Orienta-tion in Oriented Clay Aggregates. Clays and Clay Minerals 34, 359–367(1986).
27. Huang, T. C., Hart, M., Parrish, W. & Masciocchi, N. Line-broadeninganalysis of synchrotron x-ray diffraction data. Journal of Applied Physics61, 2813–2816 (1987).
28. Herskowitz, I. Life cycle of the budding yeast Saccharomyces cerevisiae.Microbiol Rev 52, 536–553 (1988).
29. Giuseppin, M. L. Mathematical modeling of growth and production ofalcohol oxidase by Hansenula polymorpha grown on methanol–glucosemixtures. Biotechnology and Bioengineering 33, 524–535 (1989).
166
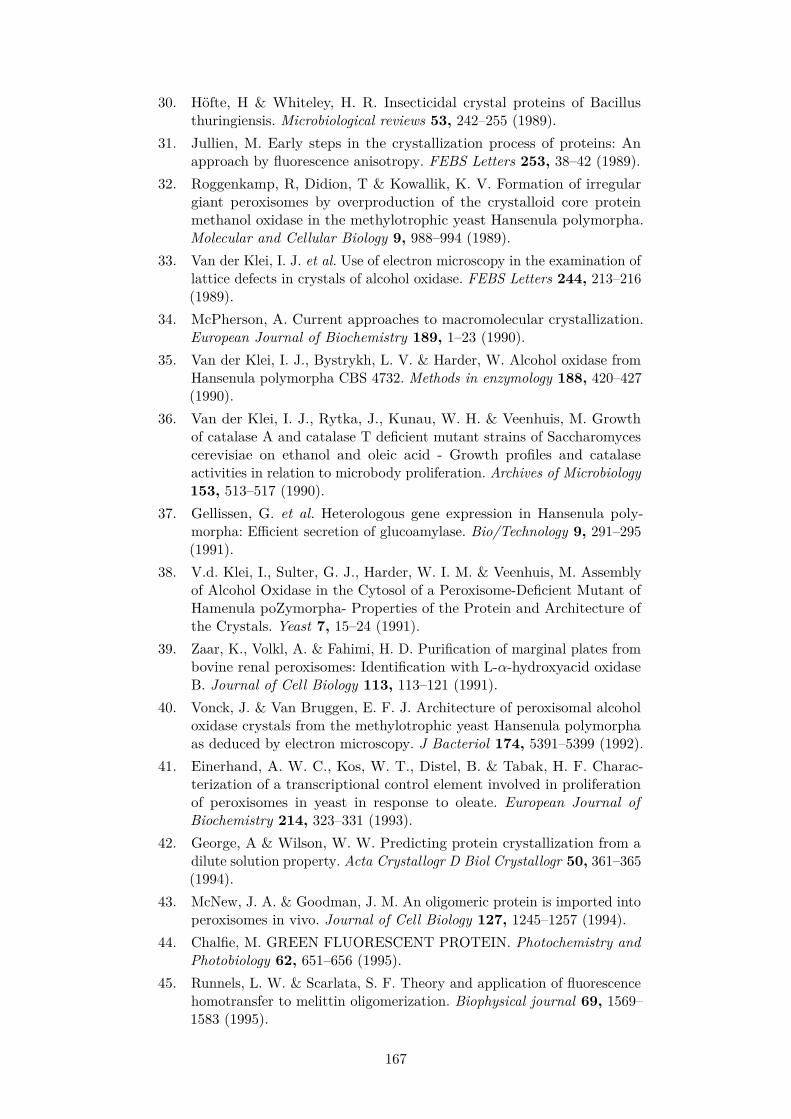
30. Höfte, H & Whiteley, H. R. Insecticidal crystal proteins of Bacillusthuringiensis. Microbiological reviews 53, 242–255 (1989).
31. Jullien, M. Early steps in the crystallization process of proteins: Anapproach by fluorescence anisotropy. FEBS Letters 253, 38–42 (1989).
32. Roggenkamp, R, Didion, T & Kowallik, K. V. Formation of irregulargiant peroxisomes by overproduction of the crystalloid core proteinmethanol oxidase in the methylotrophic yeast Hansenula polymorpha.Molecular and Cellular Biology 9, 988–994 (1989).
33. Van der Klei, I. J. et al. Use of electron microscopy in the examination oflattice defects in crystals of alcohol oxidase. FEBS Letters 244, 213–216(1989).
34. McPherson, A. Current approaches to macromolecular crystallization.European Journal of Biochemistry 189, 1–23 (1990).
35. Van der Klei, I. J., Bystrykh, L. V. & Harder, W. Alcohol oxidase fromHansenula polymorpha CBS 4732. Methods in enzymology 188, 420–427(1990).
36. Van der Klei, I. J., Rytka, J., Kunau, W. H. & Veenhuis, M. Growthof catalase A and catalase T deficient mutant strains of Saccharomycescerevisiae on ethanol and oleic acid - Growth profiles and catalaseactivities in relation to microbody proliferation. Archives of Microbiology153, 513–517 (1990).
37. Gellissen, G. et al. Heterologous gene expression in Hansenula poly-morpha: Efficient secretion of glucoamylase. Bio/Technology 9, 291–295(1991).
38. V.d. Klei, I., Sulter, G. J., Harder, W. I. M. & Veenhuis, M. Assemblyof Alcohol Oxidase in the Cytosol of a Peroxisome-Deficient Mutant ofHamenula poZymorpha- Properties of the Protein and Architecture ofthe Crystals. Yeast 7, 15–24 (1991).
39. Zaar, K., Volkl, A. & Fahimi, H. D. Purification of marginal plates frombovine renal peroxisomes: Identification with L-α-hydroxyacid oxidaseB. Journal of Cell Biology 113, 113–121 (1991).
40. Vonck, J. & Van Bruggen, E. F. J. Architecture of peroxisomal alcoholoxidase crystals from the methylotrophic yeast Hansenula polymorphaas deduced by electron microscopy. J Bacteriol 174, 5391–5399 (1992).
41. Einerhand, A. W. C., Kos, W. T., Distel, B. & Tabak, H. F. Charac-terization of a transcriptional control element involved in proliferationof peroxisomes in yeast in response to oleate. European Journal ofBiochemistry 214, 323–331 (1993).
42. George, A & Wilson, W. W. Predicting protein crystallization from adilute solution property. Acta Crystallogr D Biol Crystallogr 50, 361–365(1994).
43. McNew, J. A. & Goodman, J. M. An oligomeric protein is imported intoperoxisomes in vivo. Journal of Cell Biology 127, 1245–1257 (1994).
44. Chalfie, M. GREEN FLUORESCENT PROTEIN. Photochemistry andPhotobiology 62, 651–656 (1995).
45. Runnels, L. W. & Scarlata, S. F. Theory and application of fluorescencehomotransfer to melittin oligomerization. Biophysical journal 69, 1569–1583 (1995).
167
46. Walton, P. a., Hill, P. E. & Subramani, S. Import of stably folded proteinsinto peroxisomes. Molecular Biology of the Cell 6, 675–683 (1995).
47. Wukovitz, S. W. & Yeates, T. O. Why protein crystals favour some space-groups over others. Nature Structural Biology 2, 1062–1067 (1995).
48. Evers, M. E., Titorenko, V., Harder, W., Van Der Klei, I. & Veenhuis, M.Flavin adenine dinucleotide binding is the crucial step in alcohol oxidaseassembly in the yeast Hansenula polymorpha. Yeast 12, 917–923 (1996).
49. Fan, G. Y. et al. In vivo calcineurin crystals formed using the baculovirusexpression system. Microsc Res Tech 34, 77–86 (1996).
50. Langford, J. I. & Louer, D. Powder diffraction. Rep. Prog. Phys. 59,131–234 (1996).
51. Wille, K. Introduction to insertion devices in CAS - CERN AcceleratorSchool : Synchrotron Radiation and Free Electron Lasers (1996), 61–75.doi:10.5170/CERN-1998-004.61.
52. Gellissen, G. & Hollenberg, C. P. Application of yeasts in gene expressionstudies: A comparison of Saccharomyces cerevisiae, Hansenula polymor-pha and Kluyveromyces lactis - A review in Gene 190 (1997), 87–97.doi:10.1016/S0378-1119(97)00020-6.
53. Kozak, M, Kozian, E, Grzonka, Z & Jaskólski, M. Crystallization andpreliminary crystallographic studies of a new crystal form of papain fromCarica papaya. Acta Biochim Pol 44, 601–605 (1997).
54. Sunde, M et al. Common core structure of amyloid fibrils by synchrotronX-ray diffraction. J Mol Biol 273, 729–739 (1997).
55. Swaminathan, R, Hoang, C. P. & Verkman, A. S. Photobleaching recoveryand anisotropy decay of green fluorescent protein GFP-S65T in solutionand cells: cytoplasmic viscosity probed by green fluorescent proteintranslational and rotational diffusion. Biophys J 72, 1900–7 (1997).
56. Ten Wolde, P. R. & Frenkel, D. Enhancement of protein crystal nucleationby critical density fluctuations. Science 277, 1975–1978 (1997).
57. Dodson, G. & Steiner, D. The role of assembly in insulin’s biosynthesis1998. doi:10.1016/S0959-440X(98)80037-7.
58. Lipke, P. N. & Ovalle, R. Cell wall architecture in yeast: New structureand new challenges 1998.
59. Müntz, K. Deposition of storage proteins. Plant Molecular Biology 38,77–99 (1998).
60. Subramani, S. Components involved in peroxisome import, biogenesis,proliferation, turnover, and movement. Physiol Rev 78, 171–188 (1998).
61. Walker, G. M. Yeast Physiology and Biotechnology 362. doi:978-0-471-96446-9 (Wiley, 1998).
62. Macheroux, P. in Flavoprotein Protocols. Methods in Molecular Biology1–7 (1999). doi:10.1385/1-59259-266-X:1.
63. Mayer, A. F. et al. An expression system matures: A highly efficient andcost-effective process for phytase production by recombinant strains ofHansenula polymorpha. Biotechnology and Bioengineering 63, 373–381(1999).
168
64. Neal, B. L., Asthagiri, D., Velev, O. D., Lenhoff, A. M. & Kaler, E. W.Why is the osmotic second virial coefficient related to protein crystal-lization? Journal of Crystal Growth 196, 377–387 (1999).
65. Pepperkok, R., Squire, A., Geley, S. & Bastiaens, P. I. H. Simultaneousdetection of multiple green fluorescent proteins in live cells by fluorescencelifetime imaging microscopy. Current Biology 9, 269–274 (1999).
66. Perkins, D. N., Pappin, D. J. C., Creasy, D. M. & Cottrell, J. S.Probability-based protein identification by searching sequence databasesusing mass spectrometry data. Electrophoresis 20, 3551–3567 (1999).
67. Von Stockar, U. & Liu, J. S. Does microbial life always feed on negativeentropy? Thermodynamic analysis of microbial growth. Biochim BiophysActa 1412, 191–211 (1999).
68. Galkin, O. & Vekilov, P. G. Control of protein crystal nucleation aroundthe metastable liquid – liquid phase boundary. PNAS 97, 6277–6281(2000).
69. Haas, C. The Interface between a Protein Crystal and an AqueousSolution and Its Effects on Nucleation and Crystal Growth. The Journalof Physical Chemistry B 104, 368–377 (2000).
70. Heinze, M., Reichelt, R., Kleff, S. & Eising, R. High resolution scanningelectron microscopy of protein inclusions (cores) purified from peroxi-somes of sunflower (Helianthus annuus L.) cotyledons. Crystal Researchand Technology 35, 877–886 (2000).
71. Lodish, H. et al. Molecular Cell Biology (4th edition) 1184. doi:10.1016/S1470-8175(01)00023-6 (W.H. Freeman, New York, 2000).
72. Tenney, K. et al. Hex-1, a gene unique to filamentous fungi, encodes themajor protein of the Woronin body and functions as a plug for septalpores. Fungal Genetics and Biology 31, 205–217 (2000).
73. Van Dijk, R., Faber, K. N., Kiel, J. A.K. W., Veenhuis, M. & Van DerKlei, I. The methylotrophic yeast Hansenula polymorpha: A versatilecell factory. Enzyme Microb Technol 26, 793–800 (2000).
74. Curtis, R. A., Blanch, H. W. & Prausnitz, J. M. Calculation of phasediagrams for aqueous protein solutions. Journal of Physical ChemistryB 105, 2445–2452 (2001).
75. Inoue, S., Hole, W. & Goda, M. Gree Fluorescent Protein: EnhancedOptical Signals from Native Crystals. Biol. Bull 201, 231–233 (2001).
76. Palmieri, L. et al. Identification and functional reconstitution of theyeast peroxisomal adenine nucleotide transporter. EMBO Journal 20,5049–5059 (2001).
77. Pellegrini, C. Design considerations for a SASE X-ray FEL in NuclearInstruments and Methods in Physics Research, Section A: Accelerators,Spectrometers, Detectors and Associated Equipment 475 (2001), 1–12.doi:10.1016/S0168-9002(01)01527-3.
78. Valeur, B. Molecular Fluorescence Principles and Applications 84–86.doi:10.1002/3527600248 (2001).
79. Wilson, E. An introduction to Particle Accelerators 268 (Oxford Univer-sity Press, 2001).
169

80. Bodenstaff, E. R., Hoedemaeker, F. J., Kuil, M. E., de Vrind, H. P. M.& Abrahams, J. P. The prospects of protein nanocrystallography. ActaCrystallogr D Biol Crystallogr 58, 1901–1906 (2002).
81. Erdmann, R. & Gould, S. J. Visualization and purification of yeastperoxisomes 2002. doi:10.1016/S0076-6879(02)51858-9.
82. Faber, K. N. et al. Import of assembled PTS1 proteins into peroxisomesof the yeast Hansenula polymorpha: Yes and No! Biochim Biophys Acta.1591, 157–162 (2002).
83. Hohmann, S. Osmotic Stress Signaling and Osmoadaptation in Yeasts.Microbiol Mol Biol Rev 66, 300–372 (2002).
84. Inoue, S., Shimomura, O., Goda, M., Shribak, M. & Tran, P. T. Fluo-rescence polarization of green fluorescence protein. Proceedings of theNational Academy of Sciences 99, 4272–4277 (2002).
85. Rakhit, R. et al. Oxidation-induced misfolding and aggregation of super-oxide dismutase and its implications for amyotrophic lateral sclerosis. JBiol Chem 277, 47551–47556 (2002).
86. Zacharias, D. A., Violin, J. D., Newton, A. C. & Tsien, R. Y. Partitioningof lipid-modified monomeric GFPs into membrane microdomains of livecells. Science 296, 913–916 (2002).
87. Berney, C. & Danuser, G. FRET or no FRET: A quantitative comparison.Biophys J 84, 3992–4010 (2003).
88. Koenderink, G. H. et al. On the validity of Stokes–Einstein–Debye rela-tions for rotational diffusion in colloidal suspensions. Faraday Discussions123, 335–354 (2003).
89. Pellegrini, C. & Stöhr, J. X-ray free-electron lasers - Principles, prop-erties and applications. Nuclear Instruments and Methods in PhysicsResearch, Section A: Accelerators, Spectrometers, Detectors and Associ-ated Equipment 500, 33–40 (2003).
90. Peskir, G. On the diffusion coefficient: The Einstein relation and beyond.Stochastic Models 19, 383–405 (2003).
91. Saldin, E. L., Schneidmiller, E. A. & Yurkov, M. V. Statistical propertiesof radiation from SASE FEL driven by short electron bunches. NuclearInstruments and Methods in Physics Research Section A: Accelerators,Spectrometers, Detectors and Associated Equipment 507, 101–105 (2003).
92. Smyth, D. R., Mrozkiewicz, M. K., McGrath, W. J., Listwan, P. & Kobe,B. Crystal structures of fusion proteins with large-affinity tags. ProteinScience 12, 1313–1322 (2003).
93. Yuan, P. et al. A HEX-1 crystal lattice required for Woronin bodyfunction in Neurospora crassa. Nat Struct Biol 10, 264–70 (2003).
94. Doye, J. P. K., Louis, A. a. & Vendruscolo, M. Inhibition of proteincrystallization by evolutionary negative design. Phys Biol 1, P9–13(2004).
95. Harju, S., Fedosyuk, H. & Peterson, K. R. Rapid isolation of yeastgenomic DNA: Bust n’ Grab. BMC Biotechnology 4, 8 (2004).
96. Komduur, J. a., Bellu, A. R., Knoops, K., van der Klei, I. J. & Veenhuis,M. Cold-inducible selective degradation of peroxisomes in Hansenulapolymorpha. FEMS Yeast Res 5, 281–5 (2004).
170
97. Asadi, M. Beet-Sugar Handbook 866. doi:10.1002/9780471790990 (Wi-ley, 2005).
98. Le Bail, A. Whole powder pattern decomposition methods and applica-tions: A retrospection. Powder Diffraction 20, 316–326 (2005).
99. Nunes, C., Mahendrasingam, A. & Suryanarayanan, R. Quantification ofcrystallinity in substantially amorphous materials by synchrotron X-raypowder diffractometry. Pharmaceutical Research 22, 1942–1953 (2005).
100. Snapp, E. in Current Protocols in Cell Biology (2005). doi:10.1002/0471143030.cb2104s27.
101. Tong, Y., Hughes, D., Placanica, L. & Buck, M. When monomers arepreferred: A strategy for the identification and disruption of weaklyoligomerized proteins. Structure 13, 7–15 (2005).
102. Brocard, C. & Hartig, A. Peroxisome targeting signal 1: is it really asimple tripeptide? Biochim Biophys Acta 1763, 1565–73 (2006).
103. Cao, H., Chen, B., Squier, T. C. & Mayer, M. U. CrAsH: a biarsenicalmulti-use affinity probe with low non-specific fluorescence. ChemicalCommunications, 2601 (2006).
104. Distel, B. & Kragt, A. Purification of yeast peroxisomes. Methods MolBiol 313, 21–6 (2006).
105. Doye, J. P. K. & Poon, W. C. K. Protein crystallization in vivo. CurrentOpinion in Colloid and Interface Science 11, 40–46 (2006).
106. Gozzo, F. et al. The instrumental resolution function of synchrotronradiation powder diffractometers in the presence of focusing optics.Journal of Applied Crystallography 39, 347–357 (2006).
107. Hartner, F. S. & Glieder, A. Regulation of methanol utilisation pathwaygenes in yeasts. Microbial cell factories 5, 39 (2006).
108. Hartner, F. S. et al. Regulation of methanol utilisation pathway genesin yeasts. Microbial Cell Factories 5. doi:10.1186/1475-2859-5-39(2006).
109. Jackson, S. E., Craggs, T. D. & Huang, J. R. Understanding the foldingof GFP using biophysical techniques 2006. doi:10.1586/14789450.3.5.545.
110. Lakowicz, J. R. Principles of Fluorescence Spectroscopy 954. doi:10.1007/978-0-387-46312-4. arXiv: arXiv:1011.1669v3 (2006).
111. Liu, Y., Kim, H. R. & Heikal, A. A. Structural basis of fluorescencefluctuation dynamics of green fluorescent proteins in acidic environments.Journal of Physical Chemistry B 110, 24138–24146 (2006).
112. Rehani, B. R., Joshi, P. B., Lad, K. N. & Pratap, A. Crystallite sizeestimation of elemental and composite silver nano-powders using XRDprinciples. Indian Journal of Pure and Applied Physics 44, 157–161(2006).
113. Bader, A. N., Hofman, E. G., van Bergen En Henegouwen, P. M. P. &Gerritsen, H. C. Imaging of protein cluster sizes by means of confocaltime-gated fluorescence anisotropy microscopy. Opt Express 15, 6934–45(2007).
171
114. Banci, L. et al. Metal-free superoxide dismutase forms soluble oligomersunder physiological conditions: a possible general mechanism for familialALS. PNAS 104, 11263–11267 (2007).
115. Fujiwara, N. et al. Oxidative modification to cysteine sulfonic acid ofCys111 in human copper-zinc superoxide dismutase. J Biol Chem 282,35933–35944 (2007).
116. Georgieva, D. G., Kuil, M. E., Oosterkamp, T. H., Zandbergen, H. W. &Abrahams, J. P. Heterogeneous nucleation of three-dimensional proteinnanocrystals. Acta Crystallogr D Biol Crystallogr 63, 564–70 (2007).
117. Hearps, A. C. et al. The Biarsenical Dye Lumio™ Exhibits a ReducedAbility to Specifically Detect Tetracysteine-Containing Proteins WithinLive Cells. Journal of Fluorescence 17, 593–597 (2007).
118. Ishiii, M, Kunimura, J., Jeng, H., Penna, T. & O, C. Evaluation of thepH- and thermal stability of the recombinant green fluorescent protein(GFP) in the presence of sodium chloride. Appl Biochem Biotechnol 137,555–571 (2007).
119. LIU, Y., SHI, M., CAO, R., ZHANG, Y. & HU, Y. Densities andViscosities of the Quaternary System Mannitol-Sorbitol-D-Glucose-H2Oand Its Ternary Subsystems at 298.15K. Chinese Journal of ChemicalEngineering 15, 703–709 (2007).
120. Newstead, S., Kim, H., von Heijne, G., Iwata, S. & Drew, D. High-throughput fluorescent-based optimization of eukaryotic membrane pro-tein overexpression and purification in Saccharomyces cerevisiae. PNAS104, 13936–13941 (2007).
121. Platta, H. W. & Erdmann, R. The peroxisomal protein import machinery2007. doi:10.1016/j.febslet.2007.04.001.
122. Sear, R. P. Nucleation: Theory and applications to protein solutions andcolloidal suspensions. Journal of Physics Condensed Matter 19, 1–28(2007).
123. Stanley, W. a., Fodor, K., Marti-Renom, M. a., Schliebs, W. & Wilmanns,M. Protein translocation into peroxisomes by ring-shaped import recep-tors. FEBS Letters 581, 4795–802 (2007).
124. Astier, J. P. & Veesler, S. Using temperature to crystallize proteins: Amini-review in Crystal Growth and Design 8 (2008), 4215–4219. doi:10.1021/cg800665b.
125. Baba, M. Electron microscopy in yeast. Methods in enzymology 451,133–49 (2008).
126. Banci, L. et al. SOD1 and amyotrophic lateral sclerosis: Mutations andoligomerization. PLoS ONE 3. doi:10.1371/journal.pone.0001677(2008).
127. Chayen, N. E. & Saridakis, E. Protein crystallization : from purifiedprotein to diffraction-quality crystal. Nat Methods 5, 147–153 (2008).
128. Corsini, L., Hothorn, M., Scheffzek, K., Sattler, M. & Stier, G. Thiore-doxin as a fusion tag for carrier-driven crystallization. Protein Science17, 2070–2079 (2008).
129. DePonte, D. P. et al. Gas dynamic virtual nozzle for generation ofmicroscopic droplet streams. Journal of Physics D: Applied Physics 41.doi:10.1088/0022-3727/41/19/195505. arXiv: 0803.4181 (2008).
172

130. Dinnebier, R. E. & Billinge, S. J. L. Powder diffraction: Theory andpractice 582. doi:10.1039/9781847558237 (2008).
131. Furukawa, Y., Kaneko, K., Yamanaka, K., O’Halloran, T. V. & Nukina,N. Complete loss of post-translational modifications triggers fibrillaraggregation of SOD1 in the familial form of amyotrophic lateral sclerosis.Journal of Biological Chemistry 283, 24167–24176 (2008).
132. Gräslund, S. et al. Protein production and purification. Nature methods5, 135–146 (2008).
133. Hinterberger, F. Physik der Teilchenbeschleuniger und Ionenoptik 417.doi:10.1007/978-3-540-75282-0 (Springer-Verlag Berlin Heidelberg,2008).
134. Marx, H., Mattanovich, D. & Sauer, M. Overexpression of the riboflavinbiosynthetic pathway in Pichia pastoris. Microbial Cell Factories 7, 1–11(2008).
135. Mittemeijer, E. J. & Welzel, U. The "state of the art" of the diffractionanalysis of crystallite size and lattice strain. Zeitschrift fur Kristallogra-phie 223, 552–560 (2008).
136. Nagotu, S., Saraya, R., Otzen, M., Veenhuis, M. & van der Klei, I. J.Peroxisome proliferation in Hansenula polymorpha requires Dnm1pwhich mediates fission but not de novo formation. Biochim Biophys Acta1783, 760–769 (2008).
137. Raychaudhuri, S. & Prinz, W. a. Nonvesicular phospholipid transferbetween peroxisomes and the endoplasmic reticulum. Proceedings ofthe National Academy of Sciences of the United States of America 105,15785–15790 (2008).
138. Tsuruta, H. & Irving, T. C. Experimental approaches for solution X-rayscattering and fiber diffraction 2008. doi:10.1016/j.sbi.2008.08.002.arXiv: NIHMS150003.
139. Van Zutphen, T., van der Klei, I. J. & Kiel, J. a.K. W. Pexophagy inHansenula polymorpha. Methods Enzymol 451, 197–215 (2008).
140. Würtz, C., Schliebs, W., Erdmann, R. & Rottensteiner, H. Dynamin-like protein-dependent formation of Woronin bodies in Saccharomycescerevisiae upon heterologous expression of a single protein. FEBS Journal275, 2932–2941 (2008).
141. Zhao, Y. & Zhang, J. Microstrain and grain-size analysis from diffractionpeak width and graphical derivation of high-pressure thermomechanics.Journal of Applied Crystallography 41, 1095–1108 (2008).
142. Arroyo-López, F. N., Orlić, S., Querol, A. & Barrio, E. Effects of tem-perature, pH and sugar concentration on the growth parameters ofSaccharomyces cerevisiae, S. kudriavzevii and their interspecific hybrid.International Journal of Food Microbiology 131, 120–127 (2009).
143. Bader, A. N., Hofman, E. G., Voortman, J., Van Bergen En Henegouwen,P. M. P. & Gerritsen, H. C. Homo-FRET imaging enables quantificationof protein cluster sizes with subcellular resolution. Biophys J 97, 2613–2622 (2009).
144. Erickson, H. P. Size and shape of protein molecules at the nanometerlevel determined by sedimentation, gel filtration, and electron microscopy2009. doi:10.1007/s12575-009-9008-x. arXiv: arXiv:1011.1669v3.
173
145. Fischer, H., Polikarpov, I. & Craievich, A. F. Average protein density isa molecular-weight-dependent function. Protein Science 13, 2825–2828(2009).
146. Ishchuk, O. P., Voronovsky, A. Y., Abbas, C. A. & Sibirny, A. A. Con-struction of Hansenula polymorpha strains with improved thermotoler-ance. Biotechnology and Bioengineering 104, 911–919 (2009).
147. Krikken, A. M., Veenhuis, M. & van der Klei, I. J. Hansenula polymorphapex11 cells are affected in peroxisome retention. FEBS J 276, 1429–39(2009).
148. Lemaire, K et al. Insulin crystallization depends on zinc transporterZnT8 expression, but is not required for normal glucose homeostasis inmice. Proc Natl Acad Sci U S A 106, 14872–14877 (2009).
149. Satyanarayana, T. & Kunze, G. Yeast Biotechnology: Diversity andapplications 744. doi:10.1007/978- 1- 4020- 8292- 4. arXiv: arXiv:1011.1669v3 (Springer, 2009).
150. Biancalana, M. & Koide, S.Molecular mechanism of Thioflavin-T bindingto amyloid fibrils 2010. doi:10.1016/j.bbapap.2010.04.001. arXiv:NIHMS150003.
151. Emma, P. et al. First lasing and operation of an ångstrom-wavelengthfree-electron laser. Nature Photonics 4, 641–647 (2010).
152. Endo, K., Mizuguchi, M., Harata, A., Itoh, G. & Tanaka, K. Nocodazoleinduces mitotic cell death with apoptotic-like features in Saccharomycescerevisiae. FEBS Letters 584, 2387–2392 (2010).
153. Greenwald, J. & Riek, R. Biology of amyloid: Structure, function, andregulation. Structure 18, 1244–1260 (2010).
154. Groenning, M. Binding mode of Thioflavin T and other molecular probesin the context of amyloid fibrils-current status 2010. doi:10.1007/s12154-009-0027-5.
155. Kirian, R. A. et al. Femtosecond protein nanocrystallography — dataanalysis methods. Opt Express 18, 5713–5723 (2010).
156. Kumar, S. & Udgaonkar, J. B. Mechanisms of amyloid fibril formationby proteins 2010. doi:10.1016/j.jmb.2008.11.033.
157. Ozalp, V. C., Pedersen, T. R., Nielsen, L. J. & Olsen, L. F. Time-resolvedmeasurements of intracellular ATP in the yeast Saccharomyces cerevisiaeusing a new type of nanobiosensor. The Journal of biological chemistry285, 37579–37588 (2010).
158. Robinson, I., Gruebel, G. & Mochrie, S. X-ray beams with high coherence2010. doi:10.1088/1367-2630/12/3/035002.
159. Rupp, B. Biomolecular Crystallography - Principles, Practice, and Ap-plication to Structural Biology 809 (Taylor & Francis Ltd., 2010).
160. Scheidle, M. et al. High-throughput screening of Hansenula polymorphaclones in the batch compared with the controlled-release fed-batch modeon a small scale. FEMS Yeast Research 10, 83–92 (2010).
161. Suzuki, N. et al. Crystallization of small proteins assisted by greenfluorescent protein. Acta Crystallographica Section D: Biological Crys-tallography 66, 1059–1066 (2010).
174
162. Wolf, J., Schliebs, W. & Erdmann, R. Peroxisomes as dynamic organelles:Peroxisomal matrix protein import 2010. doi:10.1111/j.1742-4658.2010.07739.x.
163. Chapman, H. N. et al. Femtosecond X-ray protein nanocrystallography.Nature 470, 73–78 (2011).
164. Feynman, R. P., Leighton, R. B. & Sands, M. The Feynman Lectureson Physics, Vol. I: The New Millennium Edition: Mainly Mechanics,Radiation, and Heat 560. doi:10.1119/1.1972241 (2011).
165. Ganguly, S., Clayton, A. H. & Chattopadhyay, A. Organization of higher-order oligomers of the serotonin1A receptor explored utilizing homo-FRET in live cells. Biophysical Journal 100, 361–368 (2011).
166. Hasegawa, H. et al. In vivo crystallization of human IgG in the endoplas-mic reticulum of engineered chinese hamster ovary (CHO) cells. Journalof Biological Chemistry 286, 19917–19931 (2011).
167. Mcdonald, K. L. & Webb, R. I. Freeze substitution in 3 hours or less.Journal of Microscopy 243, 227–233 (2011).
168. Neiman, A. M. Sporulation in the budding yeast Saccharomyces cere-visiae. Genetics 189, 737–765 (2011).
169. Sahoo, H. Förster resonance energy transfer - A spectroscopic nanoruler:Principle and applications 2011. doi:10.1016/j.jphotochemrev.2011.05.001.
170. Seibert, M. M. et al. Single mimivirus particles intercepted and imagedwith an X-ray laser. Nature 470, 78–82 (2011).
171. Von Dreele, R. B., Suchomel, M. R. & Toby, B. H. CL Algorithm -Python Script 2011.
172. Boutet, S. et al. High-Resolution Protein Structure Determination bySerial Femtosecond Crystallography. Science 337, 362–364 (2012).
173. Hart, P. et al. The Cornell-SLAC pixel array detector at LCLS inIEEE Nuclear Science Symposium Conference Record (2012), 538–541.doi:10.1109/NSSMIC.2012.6551166.
174. Ihara, K. et al. Structural switching of Cu,Zn-superoxide dismutasesat loop VI: insights from the crystal structure of 2-mercaptoethanol-modified enzyme. Bioscience Reports 32, 539–548 (2012).
175. Ishikawa, T. et al. A compact X-ray free-electron laser emitting in thesub-ångström region. Nature Photonics 6, 540–544 (2012).
176. Lomb, L. et al. An anti-settling sample delivery instrument for serialfemtosecond crystallography. Journal of Applied Crystallography 45,674–678 (2012).
177. Saraya, R. et al. Novel genetic tools for Hansenula polymorpha. FEMSYeast Res 12, 271–8 (2012).
178. Schindelin, J. et al. Fiji: An open-source platform for biological-imageanalysis 2012. doi:10.1038/nmeth.2019. arXiv: 1081-8693.
179. Schmit, J. D. & Dill, K. Growth rates of protein crystals. J Am ChemSoc 134, 3934–3937 (2012).
180. White, T. a. et al. CrystFEL: A software suite for snapshot serialcrystallography. Journal of Applied Crystallography 45, 335–341 (2012).
175
181. Williams, C., Bener Aksam, E., Gunkel, K., Veenhuis, M. & van der Klei,I. J. The relevance of the non-canonical PTS1 of peroxisomal catalase.Biochim Biophys Acta 1823, 1133–1141 (2012).
182. Zhang, Y., Werling, U. & Edelmann, W. SLiCE: A novel bacterial cellextract-based DNA cloning method. Nucleic Acids Res 40, 1–10 (2012).
183. Authier, A. Early Days of X-ray Crystallography 464. doi:10.1093/acprof:oso/9780199659845.001.0001 (International Union of Crys-tallography, Oxford University Press, 2013).
184. Aw, R. & Polizzi, K. M. Can too many copies spoil the broth? MicrobCell Fact 12, 128 (2013).
185. Chan, F. T. S., Pinotsi, D., Kaminski Schierle, G. S. & Kaminski, C. F.in Bio-nanoimaging: Protein Misfolding and Aggregation 147–155 (2013).doi:10.1016/B978-0-12-394431-3.00013-4.
186. Iwase, T. et al. A simple assay for measuring catalase activity: a visualapproach. Sci Rep 3, 3081 (2013).
187. Leal, S. S., Cardoso, I., Valentine, J. S. & Gomes, C. M. Calcium ionspromote superoxide dismutase 1 (SOD1) aggregation into non-fibrillaramyloid: A link to toxic effects of calcium overload in amyotrophic lateralsclerosis (ALS)? J Biol Chem 288, 25219–25228 (2013).
188. Liu, W. et al. Serial femtosecond crystallography of G protein-coupledreceptors. Science (New York, N.Y.) 342, 1521–4 (2013).
189. Milo, R. What is the total number of protein molecules per cell volume?A call to rethink some published values. BioEssays 35, 1050–1055 (2013).
190. Müller, U. Symmetry Relationships between Crystal Structures 2013.191. Nielsen, J., Larsson, C., van Maris, A. & Pronk, J. Metabolic engineering
of yeast for production of fuels and chemicals 2013. doi:10.1016/j.copbio.2013.03.023.
192. Piatkevich, K. D. et al. Extended stokes shift in fluorescent proteins:Chromophore-protein interactions in a near-infrared TagRFP675 variant.Scientific Reports 3. doi:10.1038/srep01847 (2013).
193. Ravin, N. et al. Genome sequence and analysis of methylotrophic yeastHansenula polymorpha DL1. BMC Genomics 14. doi:10.1186/1471-2164-14-837 (2013).
194. Redecke, L. et al. Natively inhibited Trypanosoma brucei cathepsin Bstructure determined by using an X-ray laser. Science 339, 227–230(2013).
195. Sadowska-Bartosz, I., Paczka, A., Mołoń, M. & Bartosz, G. Dimethylsulfoxide induces oxidative stress in the yeast Saccharomyces cerevisiae.FEMS yeast research 13, 820–30 (2013).
196. Smith, J. J. & Aitchison, J. D. Peroxisomes take shape. Nat Rev MolCell Biol 14, 803–17 (2013).
197. Suppi, S., Michelson, T., Viigand, K. & Alamäe, T. Repression vs. activa-tion of MOX, FMD, MPP1 and MAL1 promoters by sugars in Hansenulapolymorpha: The outcome depends on cell’s ability to phosphorylatesugar. FEMS Yeast Research 13, 219–232 (2013).
176
198. Van der Meer, B. W., van der Meer, D. M. & Vogel, S. S. in FRET -Förster Resonance Energy Transfer: From Theory to Applications 63–104(2013). doi:10.1002/9783527656028.ch04.
199. Willenbacher, N & Georgieva, K. in Prod Des Eng Formul Gels Pastes 7–49 (Wiley-VCH, 2013). doi:https://doi.org/10.1002/9783527654741.ch1.
200. Adam Kawałek and Ida J. van der Klei. At neutral pH the chronologicallifespan of Hansenula polymorpha increases upon enhancing the carbonsource concentrations. Microbial Cell 1, 163–209 (2014).
201. Ahmad, M., Hirz, M., Pichler, H. & Schwab, H. Protein expression inPichia pastoris: Recent achievements and perspectives for heterologousprotein production 2014. doi:10.1007/s00253-014-5732-5.
202. Axford, D., Ji, X., Stuart, D. I. & Sutton, G. In cellulo structure de-termination of a novel cypovirus polyhedrin. Acta Crystallogr D BiolCrystallogr 70, 1435–1441 (2014).
203. Barends, T. R. M. et al. De novo protein crystal structure determinationfrom X-ray free-electron laser data. Nature 505, 244–7 (2014).
204. Barty, A. et al. Cheetah: Software for high-throughput reduction andanalysis of serial femtosecond X-ray diffraction data. Journal of AppliedCrystallography 47, 1118–1131 (2014).
205. Fischer-Friedrich, E., Hyman, A. A., Jülicher, F., Müller, D. J. & Hele-nius, J. Quantification of surface tension and internal pressure generatedby single mitotic cells. Scientific Reports 4, 4–11 (2014).
206. Freire, S., De Araujo, M. H., Al-Soufi, W. & Novo, M. Photophysicalstudy of Thioflavin T as fluorescence marker of amyloid fibrils. Dyes andPigments 110, 97–105 (2014).
207. Gati, C. et al. Serial crystallography on in vivo grown microcrystalsusing synchrotron radiation. IUCrJ 1, 87–94 (2014).
208. Hettema, E. H., Erdmann, R., van der Klei, I. & Veenhuis, M. Evolvingmodels for peroxisome biogenesis. Curr Opin Cell Biol 29, 25–30 (2014).
209. Heymann, M. et al. Room-temperature serial crystallography using akinetically optimized microfluidic device for protein crystallization andon-chip X-ray diffraction. IUCrJ 1, 349–360 (2014).
210. Ivanova, M. I. et al. Aggregation-triggering segments of SOD1 fibrilformation support a common pathway for familial and sporadic ALS.PNAS 111, 197–201 (2014).
211. Kameshima, T. et al. Development of an X-ray pixel detector with multi-port charge-coupled device for X-ray free-electron laser experiments.Review of Scientific Instruments 85. doi:10.1063/1.4867668 (2014).
212. Kupitz, C. et al. Serial time-resolved crystallography of photosystem IIusing a femtosecond X-ray laser. Nature 513, 261–265 (2014).
213. Mukherji, S. & O’Shea, E. K. Mechanisms of organelle biogenesis governstochastic fluctuations in organelle abundance. eLife 3, e02678 (2014).
214. Nielsen, K. H. Protein expression-yeast. Methods in Enzymology 536,133–147 (2014).
177
215. Perry, S. L. et al. In situ serial Laue diffraction on a microfluidic crys-tallization device. Journal of Applied Crystallography 47, 1975–1982(2014).
216. Prabhu, Y. T. & Rao, K. V. X-Ray Analysis by Williamson-Hall andSize-Strain Plot Methods of ZnO Nanoparticles with Fuel Variation.World Journal of Nano Science and Engineering 4, 21–28 (2014).
217. Sawaya, M. R. et al. Protein crystal structure obtained at 2.9 Å resolutionfrom injecting bacterial cells into an X-ray free-electron laser beam.PNAS 111, 12769–74 (2014).
218. Sugahara, M. et al. Grease matrix as a versatile carrier of proteins forserial crystallography. Nat Methods 12, 61–63 (2014).
219. Suhling, K., Levitt, J. & Chung, P.-H. Time-resolved fluorescence anisotropyimaging. Meth Mol Biol 1076, 503–519 (2014).
220. Veenhuis, M. & van der Klei, I. J. A critical reflection on the principlesof peroxisome formation in yeast 2014. doi:10.3389/fphys.2014.00110.
221. Weierstall, U. et al. Lipidic cubic phase injector facilitates membraneprotein serial femtosecond crystallography. Nature communications 5,3309 (2014).
222. Weinhandl, K., Winkler, M., Glieder, A. & Camattari, A. Carbon sourcedependent promoters in yeasts. Microbial cell factories 13, 1–17 (2014).
223. Wilson, W. W. & Delucas, L. J. Applications of the second virial co-efficient: Protein crystallization and solubility. Acta CrystallographicaSection F:Structural Biology Communications 70, 543–554 (2014).
224. Yoshikawa, H. Y. et al. Laser ablation for protein crystal nucleation andseeding. Chemical Soc Rev 43, 2147–58 (2014).
225. Blaj, G. et al. X-ray detectors at the Linac Coherent Light Source.Journal of Synchrotron Radiation 22, 577–583 (2015).
226. Chavas, L. M., Gumprecht, L. & Chapman, H. N. Possibilities for serialfemtosecond crystallography sample delivery at future light sources.Structural Dynamics 2. doi:10.1063/1.4921220 (2015).
227. Duszenko, M. et al. In vivo protein crystallization in combination withhighly brilliant radiation sources offers novel opportunities for the struc-tural analysis of post-translationally modified eukaryotic proteins. ActaCrystallographica Section:F Structural Biology Communications 71, 929–937 (2015).
228. Ginn, H. M. et al. Structure of CPV17 polyhedrin determined by the im-proved analysis of serial femtosecond crystallographic data. Nat Commun6, 6435 (2015).
229. Kim, P. K. & Hettema, E. H. Multiple pathways for protein transport toperoxisomes 2015. doi:10.1016/j.jmb.2015.02.005.
230. Knoops, K., De Boer, R., Kram, A. & Van Der Klei, I. J. Yeast pex1cells contain peroxisomal ghosts that import matrix proteins upon rein-troduction of Pex1. Journal of Cell Biology 211, 955–962 (2015).
231. Kobe, B., Ve, T. & Williams, S. J. Fusion-protein-assisted protein crys-tallization. Acta Crystallographica Section:F Structural Biology Commu-nications 71, 861–869 (2015).
178

232. Levantino, M., Yorke, B. A., Monteiro, D. C. F., Cammarata, M. &Pearson, A. R. Using synchrotrons and XFELs for time-resolved X-raycrystallography and solution scattering experiments on biomolecules 2015.doi:10.1016/j.sbi.2015.07.017.
233. Liang, M. et al. The Coherent X-ray Imaging instrument at the LinacCoherent Light Source. Journal of Synchrotron Radiation 22, 514–519(2015).
234. LLC., S. The PyMOL Molecular Graphics System, Version 1.8 2015.235. McPherson, A. & DeLucas, L. J. Microgravity protein crystallization.
npj Microgravity 1, 1–15 (2015).236. Milo, R. & Phillips, R. Cell Biology by the Numbers 356 (Taylor &
Francis Ltd, 2015).237. Neutze, R., Brändén, G. & Schertler, G. F. Membrane protein structural
biology using X-ray free electron lasers. Curr Opin Struct Biol 33, 115–125 (2015).
238. Peña, A., Sánchez, N., Álvarez, H., Calahorra, M. & Ramírez, J. Effects ofhigh medium pH on growth, metabolism and transport in Saccharomycescerevisiae. FEMS yeast research 15. doi:10 . 1093 / femsyr / fou005(2015).
239. Peng, B., Williams, T. C., Henry, M., Nielsen, L. K. & Vickers, C. E.Controlling heterologous gene expression in yeast cell factories on dif-ferent carbon substrates and across the diauxic shift: a comparison ofyeast promoter activities. Microbial Cell Factories 14, 91 (2015).
240. Roedig, P et al. A micro-patterned silicon chip as sample holder formacromolecular crystallography experiments with minimal backgroundscattering. Sci Rep 5, 10451 (2015).
241. Rost, B. R. et al. Optogenetic acidification of synaptic vesicles andlysosomes. Nat Neurosci 18. doi:10.1038/nn.4161 (2015).
242. Sauter, A., Roosen-runge, F., Zhang, F. & Lotze, G. On the questionof two-step nucleation in protein crystallization †. Faraday Discussions179, 41–58 (2015).
243. Schlichting, I. Serial femtosecond crystallography: the first five years.IUCrJ 2, 246–255 (2015).
244. Schönherr, R. et al. Real-time investigation of dynamic protein crystal-lization in living cells. Struct Dyn 2, 1–17 (2015).
245. Su, X. D. et al. Protein crystallography from the perspective of technol-ogy developments 2015. doi:10.1080/0889311X.2014.973868. arXiv:15334406.
246. Thandavan, T. M. K., Gani, S. M. A., Wong, C. S. & Nor, R. M.Evaluation of Williamson–Hall Strain and Stress Distribution in ZnONanowires Prepared Using Aliphatic Alcohol. Journal of NondestructiveEvaluation 34, 1–9 (2015).
247. Tsutsui, H. et al. A diffraction-quality protein crystal processed as anautophagic cargo. Molecular Cell 58, 186–193 (2015).
248. Wedekind, J. et al.Optimization of crystal nucleation close to a metastablefluid-fluid phase transition. Scientific Reports 5, 1–7 (2015).
179
249. Aroyo, M. I. International Tables for Crystallography, Volume A, Space-group symmetry doi:10.1107/97809553602060000114 (Wiley, 2016).
250. Ayyer, K. et al. Macromolecular diffractive imaging using imperfectcrystals. Nature 530, 202–206 (2016).
251. Colletier, J.-P. et al. Serial Femtosecond Crystallography and UltrafastAbsorption Spectroscopy of the Photoswitchable Fluorescent ProteinIrisFP. J Phys Chem Lett, 882–887 (2016).
252. Galbán, J., Sanz-Vicente, I., Navarro, J. & De Marcos, S. The intrinsicfluorescence of FAD and its application in analytical chemistry: A review2016. doi:10.1088/2050-6120/4/4/042005.
253. Jakobi, A. J. et al. In cellulo serial crystallography of alcohol oxidasecrystals inside yeast cells. IUCrJ 3, 1–8 (2016).
254. Martin-Garcia, J. M., Conrad, C. E., Coe, J., Roy-Chowdhury, S. &Fromme, P. Serial femtosecond crystallography: A revolution in structuralbiology. Archives of Biochemistry and Biophysics 602, 32–47 (2016).
255. Nass, K. et al. Protein structure determination by single-wavelengthanomalous diffraction phasing of X-ray free-electron laser data. IUCrJ3, 180–191 (2016).
256. Pellegrini, C. X-ray free-electron lasers: From dreams to reality in PhysicaScripta 2016 (2016). doi:10.1088/1402-4896/aa5281.
257. Pellegrini, C., Marinelli, A. & Reiche, S. The physics of x-ray free-electronlasers. Reviews of Modern Physics 88. doi:10.1103/RevModPhys.88.015006 (2016).
258. Sibirny, A. A. Yeast peroxisomes: Structure, functions and biotechnologi-cal opportunities 2016. doi:10.1093/femsyr/fow038.
259. Waugh, D. S. Crystal structures of MBP fusion proteins 2016. doi:10.1002/pro.2863.
260. Decking, W. & Weise, H. Commissioning of the European XFEL ac-celerator in IPAC 2017: The eighth International Particle AcceleratorConference (2017), 1–6. doi:10.18429/JACOW-IPAC2017-MOXAA1.
261. Haynes W. M. CRC Handbook of Chemistry and Physics, 97th Edition2560. doi:10.1136/oem.53.7.504 (CRC Press, 2017).
262. Li, X. et al. Diffraction data of core-shell nanoparticles from an X-rayfree electron laser. Scientific Data 4, 170048 (2017).
263. Mansour, S. F., El-Dek, S. I. & Ahmed, M. K. Physico-mechanicaland morphological features of zirconia substituted hydroxyapatite nanocrystals. Scientific Reports 7. doi:10.1038/srep43202 (2017).
264. Meents, A. et al. Pink-beam serial crystallography. Nature Communica-tions 8. doi:10.1038/s41467-017-01417-3 (2017).
265. Oberthuer, D. et al. Double-flow focused liquid injector for efficientserial femtosecond crystallography. Scientific Reports 7. doi:10.1038/srep44628 (2017).
266. Popp, D. et al. Flow-aligned, single-shot fiber diffraction using a fem-tosecond X-ray free-electron laser. Cytoskeleton 74, 472–481 (2017).
267. Roedig, P. et al. High-speed fixed-target serial virus crystallography. NatMethods 14, 805–810 (2017).
180

268. Standfuss, J. & Spence, J. Serial crystallography at synchrotrons andX-ray lasers. IUCrJ 4, 100–101 (2017).
269. Weinert, T. et al. Serial millisecond crystallography for routine room-temperature structure determination at synchrotrons. Nature Communi-cations 8. doi:10.1038/s41467-017-00630-4 (2017).
270. Wojtas, D. H. et al. Analysis of XFEL serial diffraction data fromindividual crystalline fibrils. IUCrJ 4, 795–811 (2017).
271. Berman, H. M. et al. Protein Data Bank, Table of Released Entriesdoi:doi:10.1093/nar/28.1.235.
181

List of Related Publications
Arjen J. Jakobi, Daniel M. Passon, Kèvin Knoops, Francesco Stellato, Mengn-ing Liang, Thomas A. White, Thomas Seine, Marc Messerschmidt, Henry N.Chapman, Matthias Wilmanns (2016) In cellulo serial crystallography ofalcohol oxidase crystals inside yeast cells, IUCrJ. 2016 3(Pt 2): 88–95.
182