Nanosculpting reversed wavelength sensitivity into a photoswitchable iGluR
Upload
independentCategory
view
1download
0
Journal of Fluorescence, Vol. 5, No. 3, 1995
Wavelength-Selective Fluorescence as a Novel Tool to Study Organization and Dynamics in Complex Biological Systems
Sushmita Mukherjee ~ and Amitabha Chattopadhyay 1,2
Received October 17, 1994; accepted November 2, 1994
The dynamics exhibited by a given component of a large macromolecule such as a folded globular protein or an organized supramolecular assembly like the biological membrane is a function of its precise localization within the larger system. A set of approaches based on the red edge effect in fluorescence spectroscopy, which can be used to monitor directly the environment and dynamics arotmd a fluorophore in a complex biological system, is reviewed in this article. A shift in the wavelength of maximum fluorescence emission toward higher wavelengths, caused by a shift in the excitation wavelength toward the red edge of the absorption band, is termed the red edge excitation shift (REES). This effect is mostly observed with polar fluorophores in motionally restricted media such as very viscous solutions or condensed phases. This phenomenon arises from the slow rates of solvent relaxation around an excited-state fluorophore, which is a function of the motional restriction imposed on the solvent molecules in the immediate vicinity of the fluorophore. Utilizing this approach, it becomes possible to probe the mobility parameters of the environment itself (which is represented by the relaxing solvent molecules) using the fluorophore merely as a reporter group. Further, since the ubiquitous solvent for biological systems is water, the information obtained in such cases will come from the otherwise 'optically silent' water molecules. This makes REES and related techniques extremely useful in biology since hydration plays a crucial modu- latory role in a large number of important cellular events.
KEY WORDS: REES; solvent dipole reorientation; wavelength-dependent fluorescence polarization and life- times; proteins; membranes.
I N T R O D U C T I O N
In order to study the structure-function relationship in any biological macromolecule such as a peptide, pro- tein, or nucleic acid or in an organized supramolecular assembly like the biological membrane or a protein-nu- cleic acid complex, it is necessary to appreciate the dy- namics of the constituent molecules as well as that o f the system as a whole. Although very detailed and pre- cise structural information regarding some of these mac- romolecules can be obtained from crystallographic diffraction data, such information is necessarily static.
Centre for Cellular and Molecular Biology, Hyderabad 500 007, India. 2 To whom correspondence should be addressed.
237
Further, in the case of membrane-embedded proteins and peptides, a detailed crystallographic database is not available due to the inherent difficulty in crystallizing membrane-bound molecules. Spectroscopic techniques, which provide both structural as well as dynamic infor- mation, thus become extremely useful for analyses of such systems. Fluorescence spectroscopy offers one such approach that has found wide-ranging applications in a variety o f systems of biological relevance. The advan- tages of using fluorescence techniques, in addition to the dynamic nature of the information obtained, are its sen- sitivity, suitable time scale, noninvasive nature, and min- imal perturbation/~-5~
The dynamics exhibited by a given component in a complex biological system is thus a function o f its
1053-0509/95/0900-0237507.50/0 �9 I995 Plenum Publishing Corporation
238 Mukherjee and Chattopadhyay
precise localization within the larger system. For in- stance, the membrane is a highly anisotropic medium largely confined to two dimensions, whose hydrophobic interior cannot be mimicked by any isotropic organic solvent. While the center of the bilayer is nearly isotro- pic, the upper portion, only a few angstroms away to- ward the surface of the membrane, is highly ordered. (~ 10) Not only does this result in the anisotropic behavior of the constituent lipid molecules, but more importantly, the environment of a probe molecule becomes very much dependent on its precise location (depth) in the membrane. Similarly, in case of a folded globular pro- tein, the environment experienced by a given amino acid residue or a fluorescence probe, either covalently at- tached or partitioned from the aqueous phase, will be largely dependent on whether it is buried in the hydro- phobic interior of the protein or exposed to the external aqueous milieu.
Such environment-induced motional restriction ex- perienced by a given fluorophore has been previously used to characterize the microenvironment of a given fluorophore. This motional restriction has been variously termed as 'fluidity' or 'microviscosity'5 n ~4) These stud- ies have utilized techniques such as fluorescence depo- larization (which is a function of the rate of rotational diffusion of a fluorophore in the excited state) or exci- mer formation (which is a function of the lateral mobility of the fluorophore). In addition to fluorescence spectros- copy, 'order parameters' calculated from the electron spin resonance hyperfine splittings and deuterium nu- clear magnetic resonance quadrupolar splittings have also been used to represent localized motional charac- teristics.OS.~6~
However, all the above approaches share one major limitation. If the probe under study is freely mobile [e.g., in cases of 1,6-diphenyl-l,3,5-hexatriene (DPH) depo- larization or pyrene excimer formation], it tends to ex- hibit a wide spatial distribution since it is not uniquely localized. Any information about microviscosity ob- tained from such studies is thus at best a representation averaged over the whole range of their spatial distribu- tion. On the other hand, if the probe is localized by covalent attachment to a lipid or peptide, then this at- tachment itself may prove to be a major hindrance to the motional freedom of the probe molecule, thereby overestimating the environment-induced motional re- striction imposed on it. In this review, we discuss a set of approaches based on the red edge effect in fluores- cence spectroscopy which can be used to monitor di- rectly the environment and dynamics around the fluorophore. The red edge effect arises from the slow
rates (when compared to the fluorescence lifetime) of solvent relaxation around an excited-state fluorophore, which is a fimction of the environmentqnduced motional restriction imposed on the solvent molecules in the im- mediate vicinity of the fluorophore. This approach thus allows one to probe the mobility parameters of the en- vironment itself (which is represented by the relaxing solvent molecules) utilizing the fluorophore merely as a reporter group.
THE RED EDGE EFFECT
In general, fluorescence emission is governed by Kasha's rule, which states that fluorescence normally oc- curs from the zero vibrational level of the first excited electronic state of a molecule. (17,18) It is obvious from this rule that fluorescence, in principle, should be independ- ent of wavelength of excitation. In fact, such a lack of dependence on excitation wavelength is often taken as a criterion for purity and homogeneity of a molecule. Thus, for a fluorophore in a bulk nonviscous solvent, the fluorescence decay rates and the wavelength of maxi- mum emission are usually independent of the excitation wavelength.
However, this generalization breaks down in the case of polar fluorophores in motionally restricted media such as very viscous solutions or condensed phases, that is, when the mobility of the surrounding matrix relative to the fluorophore is considerably reduced. This situation arises because of the importance of the solvent shell and its dynamics around the fluorophore during the process of absorption of a photon and its subsequent emission as fluorescence (see below). Under such conditions, when the excitation wavelength is gradually shifted to the red edge of the absorption band, the maximum of fluorescence emission exhibits a concomitant shift to- ward higher wavelengths. Such a shift in the wavelength of maximum emission toward higher wavelengths, caused by a corresponding shift in the excitation wave- length toward the red edge of the absorption band, is termed the red edge excitation shift (eggs) . (19-26) Since REES is observed only under conditions of restricted mobility, it serves as an indicator of fluorophore envi- ronment.
The origin of the red edge effect lies in the change in fluorophore-solvent interactions in the ground and ex- cited states, brought about by a change in the dipole moment of the fluorophore upon excitation, and the rate at which solvent molecules reorient around the excited- state fluorophere. (2L,24-3~ For a polar fluorophore, a di-

Dynamics in Biology by Wavelength-Selective Fluorescence 239
polar interaction with the solvent molecules occurs in the ground state in order to minimize the energy of the given state. Since the dipole moment (magnitude as well as direction) of a molecule changes upon excitation, the solvent dipoles have to reorient around this new excited- state dipole moment of the fluorophore so as to attain an energetically favorable orientation. This readjustment of the dipolar interaction of the solvent molecules with the fluorophore essentially consists of two components: first, the redistribution of electrons in the surrounding solvent molecules because of the altered dipole moment of the excited-state fluorophore, and then the physical reorientation of the solvent molecules around the ex- cited-state fluorophore. The former process is almost in- stantaneous, i.e., electron redistribution in solvent molecules occurs in about the same time scale as the process of excitation of the fluorophore itself (10 -15 s). The reorientation of the solvent dipoles, however, re- quires a net physical displacement. It is thus a much slower process and is dependent on the restriction to their mobility as offered by the surrounding matrix. More precisely, for a polar fluorophore in a bulk non- viscous solvent, this reorientation time % is of the order of 10 -12 s, so that all the solvent molecules completely reorient around the excited-state dipole of the fluorop- hore well within its excited-state lifetime %, which is typically of the order of 10 -9 s. 3 Hence, irrespective of the excitation wavelength used, emission is observed only from the solvent-relaxed state. However, if the same fluorophore is now placed in a viscous medium, this reorientation process is slowed down such that the solvent reorientation time is now of the order of 10 -9 s or longer. Under these conditions, excitation at the red edge of the absorption band selectively excites those fluorophores which interact more strongly with the sol- vent molecules in the excited state. These are the fluo- rophores around which the solvent molecules are oriented in a way similar to that found in the solvent- relaxed state. Thus, the necessary condition for REES is that different fluorophore populations are excited at the maximal and the red edge excitation and, more impor- tantly, that this difference is maintained in the time scale of fluorescence lifetime. As discussed above, this re- quires that the dipolar relaxation time for the solvent shell be comparable to or longer than the fluorescence
3 Use of a single parameter ~s to describe the relaxation of solvent molecules is a first-order approximation since a set of relaxation times would exist in real systems. ~3o However, such an approximation is often made to make the relaxation model simple. Thus, Ts may be considered as a simple effective parameter characterizing the solvent relaxation process.
lifetime. This implies a reduced mobility of the sur- rounding matrix with respect to the fluorophore.
The essential criteria for the observation of the red edge effect can thus be summarized as follows: (1) The fluorophore should normally be polar so as to be able to orient suitably the neighboring solvent molecules in the ground state; (2) the solvent molecules surrounding the fluorophore should be polar; (3) the solvent reorientation time % around the excited-state dipole moment should be comparable to or longer than the fluorescence lifetime %; and (4) there should be a relatively large change in the dipole moment of the fluorophore upon excitation. The observed spectral shifts thus depend both on the properties of the fluorophore itself (i.e., the vectorial dif- ference between the dipole moments in the ground and excited states) and on properties of the environment in- teracting with it (which is a function of %). ft has re- cently been shown for 7-nitrobenz-2-oxa-l,3-diazol-4-yl (NBD)-labeled phospholipids incorporated into model membranes that a dipole moment change of 3.5--3.9 D upon excitation is enough to give rise to significant red edge effects. (32~
THE TWO-STATE MODEL
The two-state model provides a simple conceptual framework within which one can consider the phenom- enon of solvent relaxation. (26,3345) This model assumes that fluorescence emission proceeds from two discontin- uous or discrete states (see Fig. 1): the initial or Franck- Condon (F) state and the final or relaxed (R) state. Excitation at the maximum (center) of the absorption band, kc, initially yields the Franck-Condon excited state around which solvent reorientation has not oc- curred. This initially excited state F can then decay to a completely relaxed state R where soivent reorientation around the excited-state fluorophore is complete, with a characteristic relaxation time -r s. The rate of this relax- ation is determined by both the general and the specific interactions between the fluorophore and the surrounding solvent molecules and the rate at which these interac- tions are modified in response to the newly created ex- cited-state dipole moment. Now, if we denote the direct excitation of the F state as kc and such excitation of the R state as )tR (where XR > Xc), then three possibilities exist (see Fig. 1). I f the rate of solvent reorientation is much faster than the fluorescence lifetime (-r v > > -rs) , the solvent molecules have enough time to reorient be- fore the fluorophore emits. Therefore, irrespective of the excitation wavelength used (X c or X.R), the relaxed emis-
240 Mukherjee and Chattopadhyay
F State
" • R State " ~ ~ '~ f
CONDmON
~'F ) )1 :S
(FREELY MOBILE)
(I NTERMEDIATE MOBILITY )
EXCITATION AT "~C EXCITATION AT "~R
.~Z <[2 ~tu = " _z , ,
%t %2 %~ %z EMISSION WAVELENGTH EMISSION WAVELENGTH
~>- NP"
~m
Oz_ z "X~ 3, 2
EMISSION WAVELENGTH
a w>- "i ,.n 3Etu o z - ,
"X~ %z EMISSION WAVELENGTH
<r <~Z (VERY LOW :~tu ~ m
Iz:I- MOBILITY) z o z ,
'%L 3'2 "~1 ~2 EMISSION WAVELENGTH EMISSION WAVELENGTH
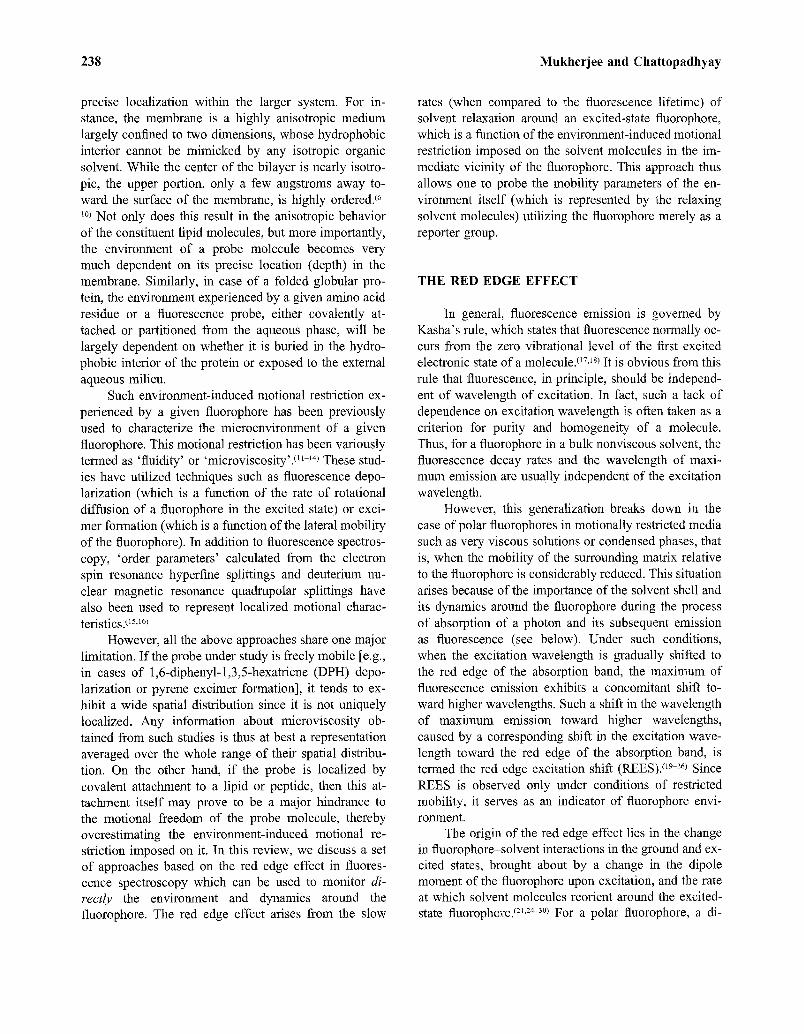
Fig. 1. A schematic representation of the two-state model of solvent relaxation in terms of energy levels (top) and spectra (bottom). F and R states refer to the Franck-Condon (or initial) and relaxed (or final) excited states, respectively. % is the reorientation time of the solvent molecules and -rv is the lifetime of the fluorophore. The large arrows represent the dipole moment vectors of the fluorophore and the small arrows denote those of the solvent molecules surrounding the fluorop- hore. k c and k~ are the respective wavelengths associated with direct excitation of the Franck-Condon and relaxed states. See text for other details.
sion is observed. In other words, under the conditions described above, excitation of either the F state or the R state yields emission spectra centered at k2. This sit- uation is observed for a fluorophore in bulk, nonviscous solvents, or at high temperatures. On the other hand, when the fluorophore is placed in a viscous medium or condensed phase or is frozen to very low temperatures, the relaxation time (which is a function of the rate of the physical reorientation of the solvent molecules) is drastically increased and is now much longer than the fluorescence lifetime (% < < %). Under these condi- tions, the blue-shifted emission o f the F state (emission max imum at k~) is observed with central excitation (kc). However, i f the same system is now excited with lower energy quanta (k~ , it will select a subclass of the total
fluorophore population around which the solvent dipoles are oriented so as to decrease the energy difference be- tween the ground and the excited states. In particular, this photoselected ground state is higher in energy and the photoselected excited state is at a lower energy level (see Fig. 1) because of the alignment of solvent dipoles in the 'solvent-relaxed' orientation. Therefore, red edge excitation under these conditions selects those molecules which have a solvent-relaxed environment and resul- tantly, red-shifted absorption and emission spectra (i.e., the emission spectrum is centered at k2 under these con- ditions). The third possibility is the situation where the rate of solvent reorientation is comparable to the fluo- rescence lifetime (% ~ Ts), i.e., under conditions of in- termediate viscosity or temperature. Here, excitation at kc gives rise to a spectrum centered at a wavelength intermediate between kl and k 2. This can be attributed to the fact that although the F state alone is initially excited, the comparable values of TF and % give rise to emissions from both F and R states. This inhomoge- neous spectrum thus also has a wider spectral distribu- tion. (35-37) Upon red edge excitation, the emission occurs mainly from the R state, giving rise to a more red-shifted emission spectrum, which is also comparatively narrow, as it is composed of emission predominantly from the R state.(25, 27)
T H E C O N T I N U O U S M O D E L
This model was first proposed by Bakhshiev and co-workers (38-4~ to provide a phenomenological descrip- tion of time-dependent effects of solvent-fluorophore interactions on emission spectra in terms of the observed spectral parameters (see Fig. 2). According to this model, the maximum of fluorescence emission [or more rigorously, the center o f gravity of the emission spec- trum, re(t)] is assumed to shift to lower energy in an exponential fashion following excitation, with a char- acteristic relaxation time Ts, i.e.,
Vm( 0 = V~ + (V 0 - - V~)e -'/~s (1)
where v 0 and V~ represent the emission maxima (in cm -t) o f the initially excited (Franck~ondon) and the com- pletely relaxed states, respectively. The spectral shape of the emission is assumed to remain constant during the time course of the emission. Due to the exponential nature of Eq. (1), the emission maxima shift continuously from v = v 0 at t = 0 to V = V~ at t = ~. Therefore at t = T s In 2, the spectral shift is 50% complete.
However, in reality, there exists a statistical distri- bution of solvation states for an ensemble of polar fluo-

Dynamics in Biology by Wavelength-Selective Fluorescence 241
State
~,c kOo
~ 1 " State
xRT R State
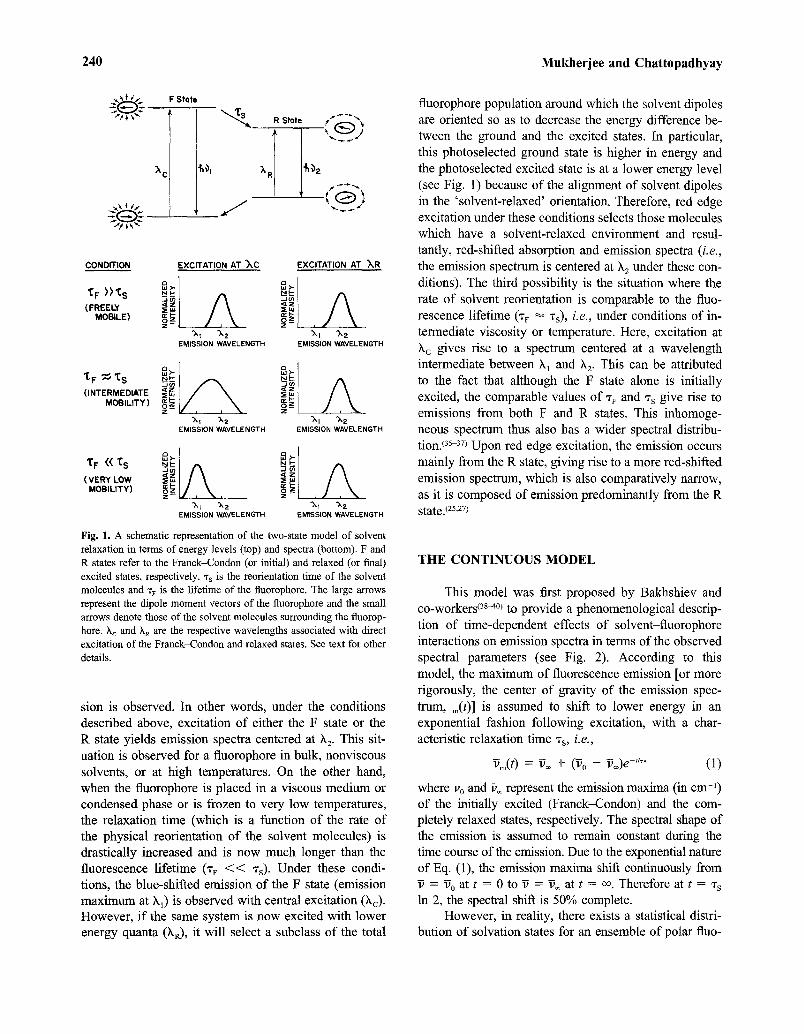
Fig. 2. The continuous model of solvent relaxation. The I state refers to one of the intermediate states between the initial (IF) and the final (R) states, in which the solvent molecules are partially relaxed, vo, v~, and v~ represent the frequencies corresponding to the initially excited (Franck-Condon), intermediate, and completely relaxed states, respec- tively, while he, k~, and ?'R denote the wavelength maxima associated with these states. % is the reorientation time of the solvent. See text for other details.
rophores in solution, based on their dipolar interactions with the solvent molecules in both the ground and ex- cited states. The molecules interacting in solution may differ in their mutual orientation and interaction ener- gies, which results in alteration of the energies of elec- tronic transitions. Both the character of the energy distribution at the moment of excitation and its change with time (relaxation) will determine the spectroscopic behavior of the system. Such a steady-state spectrum will therefore be quite broad due to contributions from the various partially relaxed substates. This has been re- ferred to as the 'dipole-orientational broadening' of the spectrum. (25,2s,3~ Taking all these into account, i.e., the statistical distribution of interaction energies for mole- cules with their environments, and photoselection of ex- cited species according to the energy of the absorbed or emitted quanta, Demchenko later proposed a more re- alistic model.(25,28,3~
ELUCIDATION OF PROTEIN CONFORMATION
The dynamic properties of the protein matrix sur- rounding a given amino acid residue or a fluorophore either covalently attached to or partitioned from the
aqueous phase in case of a globular protein can be ex- amined from the rate at which this matrix responds to (or relaxes around) the newly created excited-state di- pole moment of the fluorophore. In other words, the magnitude of REES could be utilized to estimate the relative rigidity of the region of the protein surrounding the fluorophore. Pioneering work in the application of this effect to proteins was carried out by Demchenko and co-workers. (25,2~31,42-45> In one of their early stud- ies,( TM it was shown that the fluorescence emission spec- tra of 2-(p-toluidinylnaphthalene)-6-sulfonate (TNS) associated with proteins such as [3-1actoglobulin, #3-ca- sein, and bovine and human serum albumins depend on the excitation wavelength used, giving rise to REES of the order of 10 nm in all cases. The fact that this effect was actually a result of the slow rate of solvent dipolar relaxation was confirmed when a similar effect was ob- served in case of the same fluorophore in glucose glass and in glycerol at I~ but not in liquid solutions/TM Such red edge effects have also been observed with other proteins bound to "l~NS (26,42,46) or to 2'-(N,N-di- methyl)amino-6-naphthoyl-4-trans-cyclohexanoic acid ( D A N C A ) , (47) as well as by utilizing the intrinsic tryp- tophan fluorescence of proteins and p e p t i d e s . (43,44,48,49) In- terestingly, a thorough analysis of a variety of single-tryptophan-containing proteins in terms of their ability to exhibit REES yielded the following pattern. (43) It was found that REES was not observed both for pro- teins (such as azurin, a calcium form of whiting parvat- bumin, and ribonucleases T1 and C2) having very short wavelength fluorescence emission maxima (between 307 and 323 nm), and for those (such as myelin basic pro- tein, [3-casein, monomeric form of melittin) with ex- tremely long wavelength emission (between 341 and 350 urn). However, considerable REES effects were ob- served for many proteins (such as tetrameric form of melittin, human serum albumin in F form, albumin com- plexed with sodium dodecyl sulfate) with intermediate maxima of emission (between 325 and 341 nm). It was suggested that in case of proteins emitting at very short wavelengths, the tryptophan residues were in a hydro- phobic environment and the dipole-orientational broad- ening of the spectra was insufficient to create a large enough distribution of differentially solvated substates that could be photoselected in order to give rise to REES. On the other hand, in case of the very long wave- length-emitting proteins, the tryptophans were exposed to an aqueous environment undergoing much faster sol- vent relaxation as compared to the fluorescence lifetimes of the concerned tryptophans. Therefore, only for the proteins that emit in the intermediate-wavelength range is there enough range of dipole-orientational broadening

242 Mukherjee and Chattopadhyay
and, at the same time, is the rate of solvent reorientation slow enough to give rise to this effect.
In addition to the application of REES to study pro- tein conformation in solution, this phenomenon has also been applied to more complex systems, such as the intact eye lens. The eye lens in its normal state is a clear, transparent, and highly refractive cellular body. About 35% by weight of the lens is made up of three closely related proteins called crystallins whose organization and intermolecular interactions have been shown to play a crucial role in maintaining the transparency of the lens. (5~ The magnitude of REES has been effectively utilized as a parameter to study the photophysical and chemical properties of isolated intact eye lenses and to probe the change in the organization of the lens upon photodamage.( 52~ The use of REES has very recently been further extended to relate the properties of the lens with those of its constituent proteins and their homo- and heteroaggregates. (s3~ The properties of intact eye lenses from different species have also been compared to study species-dependent variation of mobility and packing of the crystallins. (53~
ELUCIDATION OF MEMBRANE STRUCTURE: ORGANIZATION AND DYNAMICS
The biological membrane is a highly organized mo- lecular assembly, largely confined to two dimensions, and exhibits considerable degree of anisotropy along the axis perpendicular to the membrane plane36-~~ Not only does this result in the anisotropic behavior of the con- stituent lipid molecules, but more importantly, the en- vironment of a probe molecule becomes very much dependent on its precise localization in the membrane. The biological membrane, with its viscous interior (54,5s~ and distinct motional gradient along its vertical axis, thus provides an ideal system for the utilization of REES to study various membrane phenomena. The use of this technique becomes all the more relevant in view of the fact that no crystallographic database for membrane- bound probes and proteins exists, due to the inherent difficulty in crystallizing such molecules. Although many important functions are associated with cell mem- branes, our understanding of these processes at the mo- lecular level is limited by the lack of high-resolution three-dimensional structures of membrane-bound mole- cules. It is extremely difficult to crystallize membrane- bound molecules for diffraction studies. Only a few years back was the first complete X-ray crystallographic analysis of an integral membrane protein successfully carried out. (56~
Few initial reports in which excitation wavelength dependence of emission maxima of the fluorescence probes TNS or ANS (1-anilinonaphthalene-8-sulfonate) in model lecithin membranes were investigated indicated no appreciable red shift. (26,57~ However, REES was re- ported in case of dioleoyl-sn-glycero-3-phosphocholine (DOPC) vesicles labeled with 6-palmitoyl-2[[[2-(trime- thylammonio)ethyl]amino]methyl]naphthalene chloride (Patman), an amphiphilic phase-sensitive probe. (sS) The above results can be rationalized on the basis of the lo- cation of these probes in the membrane. On one hand, both TNS and ANS are charged at neutral pH and there- fore access the phospholipid headgroup from the exter- nal aqueous phase. This implies that for these probes the immediate environment will be the aqueous phase ad- jacent to the headgroup, where solvent relaxation is ex- tremely fast, and, as such, no red edge effect can be expected. On the other hand, because of the fatty acyl chain in Patman, it partitions well into the membrane and therefore experiences a much more motionally re- stricted environment.
The choice of a suitable probe is thus of utmost importance in designing membrane-active molecules ca- pable of exhibiting REES. It is desirable that the probe be polar and be able to strongly partition into the mem- brane and intercalate with its normal components, i.e., the phospholipids. Further, the fluorescent portion of the molecule should be suitably embedded in the membrane. REES is indeed observed when the above criteria are satisfied. (5~63~ In addition, it is preferable that the mem- brane-embedded molecule has only one fluorescent group and that it has a unique location in the membrane and not a distribution of locations. Such probes can be used to correlate the extent of REES with a specific fluo- rophore environment, which in case of such uniquely localized probes translates to a specific region of the membrane. One such probe that has been employed to study the phenomenon of REES and related effects in membranes is the widely used lipid probe NBD-PE [N- (7-nitrobenz-2-0xa-l,3-diazol-4-yl)-l,2-dipalmitoyl-sn- glycero-3-phosphoethanolamine]? 9,6~ In this probe, the fluorescent NBD label is covalently attached to the head- group of a phosphatidylethanolamine molecule. This study is significant in regard to membrane organization, because the precise orientation and location of the NBD group of this molecule in the membrane are known364- 70~ This group has been found to be localized at the mem- brane interface, which has unique motional and dielec- tric characteristics distinct from both the bulk aqueous phase and the hydrocarbon-like interior of the mem- brane.(6-8.71 7~ In another study, the red edge effect and other related approaches have been utilized to probe the
Dynamics in Biology by Wavelength-Selective Fluorescence 243
environment of the sole tryptophan residue of mem- brane-bound melittin, the principal toxic component in the venom of the European honey bee, Apis mellifera.( 61~ These studies revealed that the tryptophan residue of melittin is localized in a motionally restricted region of the membrane, probably at the membrane interface.
The phenomenon of REES, in conjunction with time-resolved fluorescence spectroscopic parameters such as wavelength-dependent fluorescence lifetimes (see below) and time-resolved emission spectra (TRES), has been further utilized to study the localization and dynamics of the functionally important tryptophan resi- dues in the gramicidin channel. (6a) Gramicidin belongs to a family of prototypical channel formers which are nat- urally fluorescent due to the presence of tryptophan res- idues. These tryptophans are known to play a crucial role in the organization and fimction of the channel. (74-7v~ The results from the above study (62) point out the motional restriction experienced by the tryptophans at the pep- tide-lipid interface of the gramicidin channel. This is consistent with other studies in which such restrictions are thought to be imposed due to hydrogen bonding be- tween the indole rings of the tryptophans and the neigh- boring lipid carbonyls. (74,76) Furthermore, time-resolved fluorescence studies indicate a heterogeneous environ- ment for these tryptophans, which can be grouped into at least two classes experiencing very different micro- environments. These results also indicate the presence of aromatic-aromatic interactions between two of the tryp- tophan residues in the channel conformation. The sig- nificance of such organization in terms of the functioning of the channel is brought out by the fact that substitution, photodamage, or chemical modification of these tryptophans gives rise to channels with altered con- formation and reduced conductivi ty. (74-77~
wavelength in an environment of restricted mobility could be rationalized as follows. When such a fluorop- hore is excited at the mean excitation wavelength, the majority of the fluorophores will emit at the steady-state fluorescence emission maximum (which is also the mon- itoring wavelength for the acquisition of fluorescence intensity decays), and will have a certain mean lifetime associated with them. However, if the same ftuorophore is now excited at the red edge of the absorption band without altering the emission wavelength at which the fluorescence decay is being monitored (which is now no longer the emission maximum), the lifetime will be shortened because of the preselection of only those fluo- rophores which have emitted early, and hence the sol- vent reorientation has not been allowed to shift the emission wavelength to the average (steady-state) max- imum of fluorescence emission for that excitation wave- length.
On the other hand, when a polar fluorophore is placed in an environment of restricted mobility, its mean lifetime is found to increase steadily with increasing emission wavelength when the excitation wavelength is kept constant. (57,58,6~176 Such increasing lifetimes across the emission spectrum may be interpreted in terms of solvent reorientation around the excited-state fluorophore as follows. Observation at shorter wave- lengths of emission selects unrelaxed fluorophores. Their lifetime is shorter because this population is decaying, both at the rate of fluorescence emission at the given excitation wavelength and by decay to longer (unobser- ved) wavelengths. In contrast, observation at the long- wavelength (red) edge of the emission selects the relaxed fluorophores, which have spent enough time in the ex- cited state to allow increasingly larger extents of solvent reorientation.
FLUORESCENCE LIFETIMES: EFFECT OF EXCITATION AND EMISSION WAVELENGTHS
The origin of the red edge effect lies in differential extents of solvent reorientation around the excited-state fluorophore, with each excitation wavelength selectively exciting a different average population of fluorophores. Since fluorescence lifetimes are known to be sensitive to excited-state interactions, differential extents of sol- vent relaxation around a given fluorophore could be ex- pected to give rise to differences in its lifetime. Under conditions where red edge effects are observed, a marked shortening is found in the mean lifetimes of the fluorophores. (23.42,6~ Such a decrease in the mean lifetime of a fluorophore with increasing excitation
FLUORESCENCE POLARIZATION: EFFECT OF EXCITATION AND EMISSION WAVELENGTHS
In addition to the dependence of fluorescence emis- sion maxima and lifetimes on the excitation wavelength, fluorescence polarization is also known to depend on the excitation wavelength in viscous solutions or in other- wise motionally restricted media. (;8,35,6~ Valeur and Weber (79,92~ observed an increase in polarization with increasing excitation wavelength for aromatic fluorop- hores such as naphthylamines. These results were inter- preted as indicating a larger apparent molecular volume, which in turn was explained as the result of an out-of- plane electronic transition, which requires more dis- placement of solvent than an in-plane transition. They
244 Mukherjee and Chattopadhyay
suggested that these out-of-plane transitions are selec- tively excited upon red edge excitation. Weber and Shin- itzky (9~ had previously suggested that such an effect could be interpreted as the failure of self-energy transfer. Lakowicz (93~ proposed an alternate explanation for the same observation. According to this proposition, there is a decreased rotational rate of the fluorophore in the re- laxed state, because of strong dipolar interactions with the surrounding solvent molecules. On red edge excita- tion, a selective excitation of this subclass of fluorop- hores occurs. Because of strong interactions with the polar solvent molecules in the excited state, one may expect these 'solvent-relaxed' fluorophores to rotate more slowly, thereby increasing the polarization.
Fluorescence polarization is also found to be de- pendent on the emission wavelength in case of a mo- tionally restricted fluorophore. Under such conditions, considerable decrease in polarization is observed with increasing emission wavelength. (s7,Ss,6~ This obser- vation can be rationalized as follows. As has been dis- cussed above, the mean lifetime of a fluorophore increases with increasing emission wavelength. Such longer-lived fluorophores, which are also those that emit at higher wavelengths, therefore have more time to rotate in the excited state, giving rise to lower polarization.
CONCLUSION AND FUTURE PERSPECTIVES
Water plays a crucial role in the formation and maintenance of both folded protein and membrane ar- chitecture in a cellular environment. Knowledge of hy- dration at a molecular level is thus of considerable importance in understanding the cellular structure and function. (9649~ As has been pointed out earlier, the red edge effect is based on the change in fluorophore-solvent interactions in the ground and excited states brought about by a change in the dipole moment of the fluorop- bore upon excitation and the rate at which solvent mol- ecules reorient around the excited-state fiuorophore. Since for all biological systems the ubiquitous solvent is water, the information obtained in such cases will come from the otherwise 'optically silent' water molecules. This makes the use of REES and related techniques ex- tremely useful in biology since hydration plays a crucial modulatory role in a large number of important cellular events.(96-99)
A general concern in case of fluorescence studies in motionally restricted systems is that red edge effects could complicate results if such fluorophores are excited at the red edge of the absorption spectra rather than at the absorption maxima. Thus, studies such as energy
transfer could lead to significant errors unless carried out with caution. In fact, it has been recently observed that there is a wavelength-dependent variation in the meas- ured location (depth) of fatty-acyl-attached probes in the membrane. (1~176 In general, a decrease in the apparent depth of the fatty-acyl-attached probes was found both at longer excitation wavelengths and at longer emission wavelengths.
Another potential complication may arise while in- terpreting emission characteristics and fluorescence life- times of the tryptophan residues in proteins and peptides. The excitation maxima of tryptophan and tyrosine resi- dues are very close (280 and 275 nm, respectively). In order to selectively excite tryptophan residues, therefore, proteins are often excited at 295 nm (red edge of the tryptophan absorption band, having minimal interference from the tyrosine excitation), instead of 280 nm, which is the mean excitation wavelength for tryptophan. (1~176 If all the tryptophans of the protein are well exposed to the solvent, it is unlikely that the red edge effect will be operative in fluid solutions. In such a case, excitation at 295 nm will not introduce any artifacts in either the emission maximum or the lifetime of the tryptophan res- idues. However, tryptophans in polar yet restricted en- vironments (e.g., buried or membrane-bound trypto- phans having water or other amino acid side chains or lipid carbonyl dipoles in its immediate vicinity) may well be subject to the red edge effect. Under such con- ditions, excitation of the protein at 295 nm could intro- duce a red shift in its emission maximum, as well as a reduction in its mean lifetime, both of which may be incorrectly interpreted as tryptophan residues being more exposed to the bulk aqueous phase than they really are. Thus, it is important to consider the choice of wave- lengths in such experiments.
While used with the above-mentioned caution in mind, wavelength-dependent fluorescence (both steady- state emission and polarization, as well as time-resolved fluorescence) offers a convenient handle to probe environment-induced motional restriction imposed on the solvent molecules in the immediate vicinity of a fluo- rophore in complex biological systems. However, the lack of a suitable fluorophore often makes it difficult to monitor dynamics in a region of interest. Fortunately, recent advances in molecular biological techniques have made it possible to incorporate (or substitute) endoge- nous labels such as tryptophan in regions of choice in soluble (1~ as well as integral membrane (~~ proteins. A major limitation in working with multitryptophan pro- teins is that the analysis of fluorescence is often com- plicated due to the complexity of fluorescence processes in such systems.OOS.~06) Site-specific incorporation of ex-

Dynamics in Biology by Wavelength-Selective Fluorescence 245
trinsic probes, very recently accomplished by using un- natural amino acid mutagenesis, ('~176 should help avoid this complication. Wavelength-selective fluorescence studies, in conjunction with these powerful molecular biological approaches, could prove to be a novel and extremely powerful tool to probe environments in the vicinity of uniquely localized tryptophans (or other flu- orescent residues, endogenous or introduced in a site- directed manner) in soluble proteins as well as in probes and proteins bound to membranes or supramolecular or- ganizations such as protein-nucleic acid complexes.
REFERENCES
1. G. K. Radda (1975) in E. D. Korn (Ed.), Methods in Membrane Biology: Biophysical Approaches, Vol. 4, Plenum Press, New York, pp. 97-188.
2. J. R. Lakowicz (1980) J. Biochem. Biophys. Meth. 2, 91-119. 3. J. R. Lakowiez (1981) in J. E. Bell (Ed.), Spectroscopy in Bio-
chemistry, Vol. 1, CRC Press, Boca Raton, Florida, pp. 194-245. 4. C. D. Stubbs and B. W. Williams (1992) in J. R. Lakowiez (Ed.),
Topics in Fluorescence Spectroscopy, Vol. 3: Biochemical Ap- plications, Plemtm Press, New York, pp. 231-271.
5. A. Chattopadhyay (1992) in B. P. Gaber and K. R. K. Easwaran (Eds.), Biomembrane Structure & Function: The State of the Art, Adenine Press, Schenectady, New York, pp. 153-163.
6. J. Seelig (1977) Q. Rev. Biophys. 10, 353-418. 7. R. G. Ashcroft, H. G. L. Coster, and J. R. Smith (1981) Biochim.
Biophys. Actu 643, 191-204. 8. C. D. Stubbs, S. R. Meech, A. G. Lee, and D. Phillips (1985)
Biochim. Biophys. Acta 815, 351-360. 9. E. Perochon, A. Lopez, and J. F. Tocanne (1992) Biochemistry
31, 7672-7682. 10. S. H. White and W. C. Wimley (1994) Curt. Opinion Str. Biol.
4, 79-86. 11. M. Shinitzky and Y. Barenholz (1978) Biochim. Biophys. Acta
515, 367-394. 12. H.-J. Gatla and W. Hartrnann (1980) Chem. Phys. Lipids 27,
199-219. 13. D. Chapman and G. Benga (1984) in D. Chapman (Ed.), Biom-
embrane Fluidity--Studies of Model and Natural Biomembranes, Vol. 5, Academic Press, New York, pp. 1-56.
14. M. Shinitzky (1984) in Membrane Fluidity and Cellular Func- tions, Vol. 1, CRC Press, Boca Raton, Florida, pp. 1-51.
15. D. F. Bocian and S. I. Chan (1978) Annu. Rev. Phys. Chem. 29, 307-335.
16. S. Sehreir, C. F. Polnaszek, and I. C. P. Smith (1978) Biochim. Biophys. Acta 515, 375-436.
17. J. B. Birks (1970) Photophysics of Aromatic Molecules, Wiley- Interscience, London.
18. K. K. Rohatgi-Mukherjee (1978) Fundamentals of Photochem- istry, Wiley Eastern, New Delhi.
19. R. F. Chen (1967) Anal. Biochem. 19, 374-387. 20. A. N. Fletcher (1968) J. Phys. Chem. 72, 2742-2749. 21. W. C. Galley and R. M. Purkey (1970) Proc. Natl. Acad. Sci.
USA 67, 1116-1121. 22. A. N. Rubinov and V. I. Tomin (1970) Opt. Spectrosk. 29, 1082-
1089. 23. F. Castelli and L. S. Forster (1973) J. Am. Chem. Soc. 95, 7223-
7226. 24. K.-I. Itoh, and T. Azumi (1975) J. Chem. Phys. 62, 3431-3438. 25. A. P. Demchenko (1982) Biophys. Chem. 15, 101-109.
26. J. R. Lakowicz and S. Keating-Nakamoto (1984) Biochemistry 23, 3013-3021.
27. R. B. Macgregor and G. Weber (1981) Ann. ]~ Y. Acad. Sci. 366, 140-154.
28. A. P. Demchenko (1986) Ultraviolet Spectroscopy of Proteins, Springer-Verlag, Berlin.
29. A. P. Demchenko (1988) Trends Biochem. Sci. 13, 374-377. 30. A. P. Demchenko and A. S. Ladokhin (1988) Eur. Biophys. J.
15, 369-379. 31. A. P. Demchenko (1992) in J. R. Lakowicz (Ed.) Topics in Flu-
orescence Spectroscopy Vol. 3: Biochemical Applications, Ple- num Press, New York, pp. 65-111.
32. S. Mukherjee, A. Chattopadhyay, A. Samanta, and T. Soujanya (1994) a~ Phys. Chem. 98, 2809-2812.
33. J. R. Lakowiez and A. Baker (1982) Biophys. Chem. 15, 353- 360.
34. J. R. Lakowicz and A. Baiter (1982) Photochem. Photobiol. 36, 125-132.
35. J. R. Lakowicz (1983) Principles of Fluorescence Spectroscopy, Plenum Press, New York.
36. G. Weber and F. J. Farris (1979) Biochemistry 18, 3075-3078. 37. J. R. Lakowicz, H. Cherek, G. Laczko, and E. Gratton (1984)
Biochim. Biophys. Actu 777, 183-193. 38. N. G. Bakhshiev, Yu. T. Mazurenko, and I. V. Piterskaya (1966)
Opt. Spectrosk. 21, 307-309. 39. Yu. T. Mazurenko and N. G. Bakhshiev (1970) Opt. Spectrosk.
28, 490-494. 40. N. G. Bakhshiev, Yu. T. Mazurenko, and i. V. Piterskaya (1969)
Izv. Akad. Nauk SSSR Ser. Fiz. 32, 1262-1266. 41. A. P. Demchenko and A. I. Sytnik (1991) J. Phys. Chem. 95,
10518-10524. 42. A. P. Demchenko (1985) FEBS Lett. 182, 99-102. 43. A. P. Demchenko (1988) Eur. Biophys. J. 16, 121-129. 44. A. P. Demchenko and A. S. Ladokhin (1988)Biochim. Biophys.
Actu 955, 352-360. 45. A. P. Demchenko, I. Gryczynski, Z. Gryczynski, W. Wiczk, H.
Malak, and M. Fishrnan (1993) Biophys. Chem. 48, 39-48. 46. J. Albani (1992) Biophys. Chem. 44, 129-137. 47. R. B. Macgregor and G. Weber (1986) Nature 319, 70-73. 48. Z. Wasylewski, H. Koloczek, A. Wasniowska, and K. Slizowska
(1992) Eur. J. Biochem. 206, 235-242. 49. A. S. Ladokhin, L. Wang, A. W. Steggles, and P. W. Holloway
(1991) Biochemistry 30, 10200-10206. 50. M. Luthra, C. S. Sundari, P. Guptasarma, and D. Balasuhraman-
ian (1991) in P. Balaram and S. Ramaseshan (Eds.) Molecular Conformations and Biological Interactions, Indian Academy of Sciences, Bangalore, pp. 281-293.
51. D. Balasubramanian, A. K. Bansal, S. Basti, K. S. Bhatt, J. S. Murthy, and C. M. Rao (1994) Curt. Opthalmol. 41, 153-171.
52. Ch. M. Rao, S. C. Rao, and P. B. Rao (1989) Photochem. Pho- tobiol. 50, 399-402.
53. S. C. Ran and Ch. M. Ran (1994) FEBS Lett. 337, 269-273. 54. R. A. Cone (1972) Nature New Biol. 236, 39-43. 55. M.-M. Poo, and R. A. Cone (1974) Nature 247, 438-441. 56. J. Deisenhofer, O. Epp, K. Miki, R. Huber, and H. Michel (1985)
Nature 318, 618-624. 57. A. P. Demchenko and N. V. Shcherbatska (1985)Biophys. Chem.
22, 131-143. 58. J. R. Lakowicz, D. R. Bevan, B. P. Maliwal, H. Cherek, and A.
Baiter (1983) Biochemistry 22, 5714-5722. 59. A. Chattopadhyay (1991) Biophys. J. 59, 191a. 60. A. Chattopadhyay and S. Mulcherjee (1993) Biochemistry 32,
3804-3811. 61. A. Chattopadhyay and R. Rukrnini (1993) FEBSLett. 335, 341-
344. 62. S. Mukherjee and A. Chattopadhyay (1994) Biochemistry 33,
5089-5097.
246 Mukherjee and Chattopadhyay
63. D. M. Gakamsky, A. P. Demchenko, N. A. Nemkovich, A. N. Rubinov, V. I. Tomin, and N. V. Sheherbatska (1992) Biophys. Chem. 42, 49-61.
64. A. Chattopadhyay and E. London (1987) Biochemistry 26, 39- 45.
65. A. Chattopadhyay and E. London (1988) Biochim. Biophys. Acta 938, 24-34.
66. R. E. Pagano and O. C. Martin (1988) Biochemistry 27, 4439- 4445.
67. A. Chattopadhyay (1990) Chem. Phys. Lipids 53, 1-15. 68. B. Mitra and G. G. Hammes (1990) Biochemistry 29, 9879-9884. 69. D. E. Wol~ A. P. Winiski, A. E. Ting, K. M. Bocian, and R. E.
Pagano (1992) Biochemistry 31, 2865-2873. 70. F. S. Abrams and E. London (1993) Biochemistry 32, 10826
10831. 71. S. J. Slater, C. Ho, F. J. Taddeo, M. B. Kelly, and C. D. Stubbs
(1993) Biochemistry 32, 3714 3721. 72. R. M. Venable, Y. Zhang, B. J. Hardy, and R. W. Pastor (1993)
Science 262, 223-226. 73. K. Gawrisch, J. A. Barry, L. L. Holte, T. Sinnwell, L. D. Ber-
gelson, and J. A. Ferretti (1995) Mol. Memb. Biol. 12, 83-88. 74. M. D. Becker, D. V. Greathouse, R. E. Koeppe, and O. S. An-
dersen (1991) Biochemistry 30, 8830-8839. 75. M. C. Bano, L. Braco, and C. Abad (1992) Biophys. J. 63, 70-
77. 76. V. Fonseca, P. Daumas, L. Ranjalahy-Rasoloarijao, F. 14eitz, R.
Lazaro, Y. Trudelle, and O. S. Andersen (1992) Biochemistry 31, 5340-5350.
77. D. Jones, E. Hayon, and D. Busath (1986) Biochim. Biophys. Acta 861, 62-66.
78. C. Conti and L. S. Forster (1974) Biochem. Biophys. Res. Com- mun. 57, 1287 1292.
79. B. Valeur and G. Weber (1978) J. Chem. Phys. 69, 2393-2400. 80. W. R. Ware, S. K. Lee, G. J. Brant, and P. P. Chow (1971) J.
Chem. Phys. 54, 4729-4737. 81. J. H. Easter, R. P. DeToma, and L. Brand (1976) Biophys. J. 16,
571-583. 82. J. H. Easter, R. P. DeToma, and L. Brand (1978) Biochim. Bio-
phys. Acta 508, 27-38. 83. M. G. Badea, R. P. DeToma, and L. Brand (1978) Biophys. J.
24, 197-212. 84. J. R. Lakowicz and H. Cherek (1980) J. Biol. Chem. 255, 831-
834. 85. E. D. Matayoshi and A. M. Kleinfeld (1981) Biophys. J. 35, 215-
235.
86. J. R. Lakowicz, R. B. Thompson, and H. Cherek (1983) Biochim. Biophys. Acta 734, 295-308.
87. G. Weber (1960) Biochem. J. 75, 335-345. 88. G. Weber (1960) Biochem. J. 75, 345-352. 89. J. Lynn and G. D. Fasman (1968) Biopolymers 6, 159-163. 90. G. Weber and M. Shinitzky (1970) Proc. Natl. Acad Sci. USA
65, 823-830. 91. B. Valeur and G. Weber (1977) Photoehem. Photobiol. 25, 441-
444. 92. B. Valeur and G. Weber (1977) Chem. Phys. Lett. 45, 140-144. 93. J. R. Lakowicz (1984) Biophys. Chem. 19, 13 23. 94. D. L. VanderMeulen, D. G. Nealon, E. Gratton, and E. Jameson
(1990) Biophys. Chem. 36, 177-184. 95. A. Sommer, F. Paltauf, and A. Hermetter (1990) Biochemistry
29, 11134-11140. 96. J. 14. Crowe and L. M. Crowe (1984) Biol. Membr. 5, 57-103. 97. R. P. Rand and V. A. Parsegian (1989) Biochim. Biophys. Acta
988, 351-375. 98. C. Ho and C. D. Stubbs (1992) Biophys. 3~ 63, 897-902. 99. C. Ho, M. B. Kelly, and C. D. Stubbs (1994) Biochim. Biophys.
Acta 1193, 307-315. 100. F. S. Abrams, A. Chattopadhyay, and E. London (1992) Bio-
chemistry 31, 5322-5327. 101. F. W. J. Teale (1960) Biochem. J. 76, 381-388. 102. J. W. Longworth (1971) in R. F. Steiner and I. Weinryb (Eds.),
Excited States of Proteins and Nucleic Acids, Plenum Press, New York, pp. 319-484.
103. V. Gopal, H.-W. Ma, M. K. Kumaran, and D. Chatterji (1994) ~( Mol. Biol. 242, 9-22.
104. M. E. Menezes, P. D. Roepe, and 14. R. Kaback (1990) Proc. NatL Acad. Sci. USA 87, 1638-1642.
105. M. R. Eftink (1991) in C. H. Suelter (Ed.), Methods of Biochem- ical Analysis, Vol. 35. Protein Structure Determination, Wiley, New York, pp. 127-205.
106. A. Chattopadhyay and M. G. McNamee (1991) Biochemistry 30, 7159-7164.
107. V. W. Cornish, D. R. Benson, C. A. Altenbach, K. Hideg, W. L. Hubbell, and P. G. Schultz (1994) Proc. Natl. Aead. Sci. USA 91, 2910-2914.
108. M. W. Nowak, P. C. Kearney, J. R. Sampson, M. E. Saks, C. G. Labarca, S. K. Silverman, W. Zhong, J. Thorson, J. N. Abelson, N. Davidson, P. G. Schultz, D. A. Dougherty, and H. A. Lester (1995) Science 268, 439-442.
Copyright © 2022 FDOKUMEN