Novel Approaches to Design Eco-friendly Materials Based on ...
161
EDITED BY: Aiqin Wang, Wenbo Wang, Hongfei Cheng and Chunhui Zhou PUBLISHED IN: Frontiers in Chemistry NOVEL APPROACHES TO DESIGN ECO-FRIENDLY MATERIALS BASED ON NATURAL NANOMATERIALS
-
Upload
khangminh22 -
Category
Documents
-
view
2 -
download
0
Transcript of Novel Approaches to Design Eco-friendly Materials Based on ...

EDITED BY�: Aiqin Wang, Wenbo Wang, Hongfei Cheng and Chunhui Zhou
PUBLISHED IN�: Frontiers in Chemistry
NOVEL APPROACHES TO DESIGN ECO-FRIENDLY MATERIALS BASED ON NATURAL NANOMATERIALS

1 July 2019 | Novel Approaches to Eco-friendly MaterialsFrontiers in Chemistry
Frontiers Copyright Statement
© Copyright 2007-2019 Frontiers
Media SA. All rights reserved.
All content included on this site,
such as text, graphics, logos, button
icons, images, video/audio clips,
downloads, data compilations and
software, is the property of or is
licensed to Frontiers Media SA
(“Frontiers”) or its licensees and/or
subcontractors. The copyright in the
text of individual articles is the property
of their respective authors, subject to a
license granted to Frontiers.
The compilation of articles constituting
this e-book, wherever published,
as well as the compilation of all other
content on this site, is the exclusive
property of Frontiers. For the
conditions for downloading and
copying of e-books from Frontiers’
website, please see the Terms for
Website Use. If purchasing Frontiers
e-books from other websites
or sources, the conditions of the
website concerned apply.
Images and graphics not forming part
of user-contributed materials may
not be downloaded or copied
without permission.
Individual articles may be downloaded
and reproduced in accordance
with the principles of the CC-BY
licence subject to any copyright or
other notices. They may not be re-sold
as an e-book.
As author or other contributor you
grant a CC-BY licence to others to
reproduce your articles, including any
graphics and third-party materials
supplied by you, in accordance with
the Conditions for Website Use and
subject to any copyright notices which
you include in connection with your
articles and materials.
All copyright, and all rights therein,
are protected by national and
international copyright laws.
The above represents a summary only.
For the full conditions see the
Conditions for Authors and the
Conditions for Website Use.
ISSN 1664-8714
ISBN 978-2-88945-912-4
DOI 10.3389/978-2-88945-912-4
About Frontiers
Frontiers is more than just an open-access publisher of scholarly articles: it is a
pioneering approach to the world of academia, radically improving the way scholarly
research is managed. The grand vision of Frontiers is a world where all people have
an equal opportunity to seek, share and generate knowledge. Frontiers provides
immediate and permanent online open access to all its publications, but this alone
is not enough to realize our grand goals.
Frontiers Journal Series
The Frontiers Journal Series is a multi-tier and interdisciplinary set of open-access,
online journals, promising a paradigm shift from the current review, selection and
dissemination processes in academic publishing. All Frontiers journals are driven
by researchers for researchers; therefore, they constitute a service to the scholarly
community. At the same time, the Frontiers Journal Series operates on a revolutionary
invention, the tiered publishing system, initially addressing specific communities of
scholars, and gradually climbing up to broader public understanding, thus serving
the interests of the lay society, too.
Dedication to Quality
Each Frontiers article is a landmark of the highest quality, thanks to genuinely
collaborative interactions between authors and review editors, who include some
of the world’s best academicians. Research must be certified by peers before entering
a stream of knowledge that may eventually reach the public - and shape society;
therefore, Frontiers only applies the most rigorous and unbiased reviews.
Frontiers revolutionizes research publishing by freely delivering the most outstanding
research, evaluated with no bias from both the academic and social point of view.
By applying the most advanced information technologies, Frontiers is catapulting
scholarly publishing into a new generation.
What are Frontiers Research Topics?
Frontiers Research Topics are very popular trademarks of the Frontiers Journals
Series: they are collections of at least ten articles, all centered on a particular subject.
With their unique mix of varied contributions from Original Research to Review
Articles, Frontiers Research Topics unify the most influential researchers, the latest
key findings and historical advances in a hot research area! Find out more on how
to host your own Frontiers Research Topic or contribute to one as an author by
contacting the Frontiers Editorial Office: [email protected]

2 July 2019 | Novel Approaches to Eco-friendly MaterialsFrontiers in Chemistry
NOVEL APPROACHES TO DESIGN
ECO-FRIENDLY MATERIALS BASED
ON NATURAL NANOMATERIALS
Topic Editors: Aiqin Wang, Lanzhou Institute of Chemical Physics (CAS), ChinaWenbo Wang, Lanzhou Institute of Chemical Physics (CAS), China Hongfei Cheng, Chang’an University, ChinaChunhui Zhou, Zhejiang University of Technology, Qing Yang Institute for Industrial Minerals, China
Naturally available nanomaterials or those synthesized from natural resources become “new favorite” of material world due to their advantages of low cost, safety and environmental friendliness. They are honored as future “green materials” and widely used in fabricating various functional materials. Naturally available materials have been playing an increasingly important role in many fields such as environmental remediation, separation, catalysis, and polymer composites. This book collects latest research results on the new composites for environmental application, focusing on the study of fabricating functional composites using natural clay minerals. Naturally available materials or solid waste or minerals are good precursors for producing adsorbents. Composites based on sub-bituminous coal, lignite, and a blend of coal and Irvingia gabonensis seed shells, the Cl-type Mg-Al hydrotalcite (Cl-LDH), the hydroxyapatite decorated with carbon nanotube and Zirconium (Zr)-containing
Image: designed by Prof. Wenbo Wang and Dr. Xiaowen Wang,
and drawn by Dr. Xiaowen Wang.

3 July 2019 | Novel Approaches to Eco-friendly MaterialsFrontiers in Chemistry
silica residue purification (ZSR-P) were proved to have good adsorption capability to Cd(II) and Pb(II) ions, antibiotic molecules, Cd(II), and fluoride, respectively. The nano-Mg(OH)
2 loaded carbon cloth showed good separation effect for
Eu(III), and the sodium-modified clinoptilolite showed good separation effect for CH
4/N
2 from coal bed gas. Also, natural nanoclay is an effective precursor for the
preparation of inorganic-inorganic or organic-inorganic nano-hybrid materials. Using nano-kaolinite as a carrier, the inorganic-inorganic hybrid cobalt blue pigment with excellent color and stability can be obtained by surface co-precipitation and in-situ calcination crystallization process. The intercalation of 7-amino-4-methylcoumarin (AMC) molecules into the interlayer space of montmorillonite (MMT) can effectively inhibit fluorescence quenching and improve the detection effectiveness of Cr(VI) in water. The interlayer space of kaolinite can accommodate organic molecules to form an organic-inorganic hybrid composite. Natural clay minerals are also effective carriers for catalysts. Er3+:CeO
2/palygorskite nanocomposites prepared
by a facile precipitation method showed excellent desulfurization rate under visible light irradiation. The zero-valent iron-loaded nanoclays composite catalysts can degrade efficiently Rhodamine 6G (Rh 6G) under microwave irradiation. In addition, the polymer composites have been developed using natural palygorskite, montmorillonite nanosheets or silica nanoparticles as inorganic components, which are potential to be used in many fields such as packing, biomedicine, or rubber. With the increasing attention to clay minerals, research methods for the microstructure of clay minerals continue to receive attention. It is no doubt that natural materials have got a booming attention from researchers in mineralogy, materials science, chemistry, energy, biomedicine and other fields due to their advantages. However, there is still a long way to go to substitute traditional synthetic nanomaterials with natural ones, and there are still theoretical and technological limitation in the design and synthesis of new materials from natural materials. Related theoretical research and technological development require continuous exploration by researchers. This book has collected some recent advances in related research, and hopes to play a role in attracting more attention to the construction of functional materials from natural raw materials. It is also believed that through the unremitting efforts of all researchers, the dream of green materials and green preparation processes can be realized.
Citation: Wang, A., Wang, W., Cheng, H., Zhou, C., eds. (2019). Novel Approaches to Design Eco-friendly Materials Based on Natural Nanomaterials. Lausanne: Frontiers Media. doi: 10.3389/978-2-88945-912-4

4 July 2019 | Novel Approaches to Eco-friendly MaterialsFrontiers in Chemistry
SECTION IADSORPTION/SEPARATION MATERIALS BASED ON NATURAL NANOMATERIALS
06 Preparation and Evaluation of Adsorbents From Coal and Irvingia
gabonensis Seed Shell for the Removal of Cd(II) and Pb(II) Ions From
Aqueous Solutions
Mercy A. Ezeokonkwo, Okechukwu F. Ofor and Julius U. Ani
20 The Interactions Between Three Typical PPCPs and LDH
Erwei Li, Libing Liao, Guocheng Lv, Zhaohui Li, Chengxue Yang and Yanan Lu
29 Enhanced Defluoridation Capacity From Aqueous Media via
Hydroxyapatite Decorated With Carbon Nanotube
Qingzi Tang, Tongdan Duan, Peng Li, Ping Zhang and Daishe Wu
38 Adsorption Properties and Mechanism of Cd2+ in Water by Zr-Containing
Silica Residue Purification
Wanting Chen, Han Zhang, Yu Liang, Hao Ding and Sijia Sun
49 Carbon Cloth Supported Nano-Mg(OH)2 for the Enrichment and
Recovery of Rare Earth Element Eu(III) From Aqueous Solution
Yinong Li, Chen Tian, Weizhen Liu, Si Xu, Yunyun Xu, Rongxin Cui and Zhang Lin
58 Separation of CH4 /N2 of Low Concentrations From Coal Bed Gas by
Sodium-Modified Clinoptilolite
Xiaofei Hao, Zhen Li, Hongjie Hu, Xueqin Liu and Yanqiu Huang
67 Synthesis and Microwave Absorbing Properties of Porous One-Dimensional
Nickel Sulfide Nanostructures
Min Lu, Qian Wu, Xiao-Hui Guan, Wei Xu, Hao-Yue Zhang, Xin Di, Guang-Sheng Wang and Shao-Hua Dong
SECTION IIHYBRID MATERIALS BASED ON NATURAL NANOMATERIALS
75 CoAl2O4 /Kaoline Hybrid Pigment Prepared via Solid-Phase Method for
Anticorrosion Application
Anjie Zhang, Bin Mu, Xiaowen Wang and Aiqin Wang
89 Formation and Coloring Mechanism of Typical Aluminosilicate Clay
Minerals for CoAl2O4 Hybrid Pigment Preparation
Anjie Zhang, Bin Mu, Xiaowen Wang, Lixin Wen and Aiqin Wang
100 Fabrication of an AMC/MMT Fluorescence Composite for its Detection of
Cr(VI) in Water
Yanke Wei, Lefu Mei, Rui Li, Meng Liu, Guocheng Lv, Jianle Weng, Libing Liao, Zhaohui Li and Lin Lu
107 Molecular Structure and Decomposition Kinetics of Kaolinite/Alkylamine
Intercalation Compounds
Yi Zhou, Qinghe Liu, Peijie Xu, Hongfei Cheng and Qinfu Liu
Table of Contents

5 July 2019 | Novel Approaches to Eco-friendly MaterialsFrontiers in Chemistry
SECTION IIICATALYSIS MATERIALS BASED ON NATURAL NANOMATERIALS
117 Z-Scheme Photocatalyst Constructed by Natural Attapulgite and
Upconversion Rare Earth Materials for Desulfurization
Fengqin Wu, Xiazhang Li, Haiguang Zhang, Shixiang Zuo and Chao Yao
126 Enhanced Degradation of Rh 6G by Zero Valent Iron Loaded on Two
Typical Clay Minerals With Different Structures Under Microwave
Irradiation
Wenxiu Rao, Guocheng Lv, Danyu Wang and Libing Liao
SECTION IVPOLYMER COMPOSITES
133 Effect of Natural Nanostructured Rods and Platelets on Mechanical and
Water Resistance Properties of Alginate-Based Nanocomposites
Dajian Huang, Zhuo Zhang, Zonghong Ma and Qiling Quan
143 Novel Design of Eco-Friendly Super Elastomer Materials With
Optimized Hard Segments Micro-Structure: Toward Next-Generation
High-Performance Tires
Xuan Qin, Jiadong Wang, Bingyong Han, Bo Wang, Lixin Mao and Liqun Zhang
SECTION VSTRUCTURE CHARACTERISTICS
152 Rietveld Structure Refinement of Cu-Trien Exchanged Nontronites
Xiaoli Wang and Libing Liao

ORIGINAL RESEARCH
published: 26 January 2018
doi: 10.3389/fchem.2017.00132
Frontiers in Chemistry | www.frontiersin.org January 2018 | Volume 5 | Article 132
Edited by:
Hongfei Cheng,
China University of Mining and
Technology, China
Reviewed by:
Zhanjie Xu,
Tianjin University, China
Biswanath Dutta,
University of Connecticut,
United States
*Correspondence:
Julius U. Ani
Specialty section:
This article was submitted to
Green and Environmental Chemistry,
a section of the journal
Frontiers in Chemistry
Received: 25 October 2017
Accepted: 22 December 2017
Published: 26 January 2018
Citation:
Ezeokonkwo MA, Ofor OF and Ani JU
(2018) Preparation and Evaluation of
Adsorbents from Coal and Irvingia
gabonensis Seed Shell for the
Removal of Cd(II) and Pb(II) Ions from
Aqueous Solutions.
Front. Chem. 5:132.
doi: 10.3389/fchem.2017.00132
Preparation and Evaluation ofAdsorbents from Coal and Irvingiagabonensis Seed Shell for theRemoval of Cd(II) and Pb(II) Ions fromAqueous Solutions
Mercy A. Ezeokonkwo, Okechukwu F. Ofor and Julius U. Ani*
Department of Pure and Industrial Chemistry, University of Nigeria, Nsukka, Nigeria
Cd(II) and Pb(II) ions removal using adsorbents prepared from sub-bituminous coal,
lignite, and a blend of coal and Irvingia gabonensis seed shells was investigated. Fourier
transform infrared, scanning electron microscope and X-ray fluorescence analyses
implicated hydroxyl, carbonyl, Al2O3, and SiO2 as being responsible for attaching the
metal ions on the porous adsorbents. The optimum adsorption of carbonized lignite
for the uptake of Cd(II) and Pb(II) ions from aqueous media were 80.93 and 87.85%,
respectively. Batch adsorption was done by effect of adsorbent dosage, pH, contact
time, temperature, particle size, and initial concentration. Equilibrium for the removal
of Pb(II) and Cd(II) was established within 100 and 120min respectively. Blending
the lignite-derived adsorbent with I. gabonensis seed shell improved the performance
significantly. More improvement was observed on modification of the blend using NaOH
and H3PO4. Pb(II) was preferentially adsorbed than Cd(II) in all cases. Adsorption of Cd(II)
and Pb(II) ions followed Langmuir isotherm. The adsorption kinetics was best described
by pseudo-second order model. The potential for using a blend of coal and agricultural
byproduct (I. gabonensis seed shell) was found a viable alternative for removal of toxic
heavy metals from aqueous solutions.
Keywords: lignite, adsorption, Irvingia gabonensis, isotherm, kinetics
INTRODUCTION
The accumulation of toxic heavy metals in industrial wastewater effluents has become a greatchallenge in less developed countries such as Nigeria, as these effluents are indiscriminatelydischarged into water bodies or on land (Weber et al., 1991). Wastewater effluents generated insome chemical process industries contain cadmium, lead, copper, zinc, nickel, and chromium(Argun and Dursun, 2008), which if contained above a given concentration are hazardous andhas the propensity of leading to fatal health challenges. In addition, these elements, unlike mostpollutants are not ecologically degradable rather they undergo a universal ecological cycle in whichsoil and water are the main pathways (Nwokonkwo, 2008). High levels of heavy metals in soilscould result in uptake by local and agronomic plants and leaching to ground and surface waters.
Sewage sludge application causes related problems like rise in injurious level of the heavymetal concentration in edible crops (Nwajei, 2005). Cadmium (II) can enter the food chain

Ezeokonkwo et al. Adsorbents from Coal and Irvingia gabonesis
via plant uptake (Nwajei, 2005). Natural waters are contaminatedby lead through several activities in industries, which includebattery, paint, metal plating, smelting, textiles, and plastics,amongst others (Opeolu et al., 2008). All foods contain varyingamounts of lead and cadmium. Concentrations of lead andselenium in plants may produce subsequent toxic effects (Nwajei,2005).Cadmium and lead are among the most highly toxic metalscommonly found in most industrial wastewater. Lead has beenimplicated as one of the three highly harmful heavy metals,which exhibit latent prolonged negative effect on human health;thereby resulting in a number of diseases such as hepatitis,anaemia, nephritic syndrome, and encephalopathy (Deng et al.,2006). It can also lead to brain and bone damage (Mishra, 2014).Cadmium on the other hand endangers human health as itcan cause so many health disorder including kidney damage,diarrhea, itai—itai disease, mucous membrane destruction, bonedamage, and vomiting. It also influences the formation ofprogesterone and testosterone (Johannes et al., 2006). These andmany other health problems associated with lead and cadmiumprompted the choice of lead and cadmium in this study. There isneed for the concentration of heavy metals in industrial effluentsto be controlled within tolerable levels (Meena et al., 2008) beforebeing discharged into sewage systems, water ways, or on land toavoid ecological pollution.
Several technologies are available in literature for the removalof heavy metals from industrial wastewater (Anand et al., 1985;Kim et al., 1985; Murphy and Erkey, 1997; Monser and Adhoum,2002; Erdem et al., 2004; Golder et al., 2007; Lin et al., 2008; Yuanet al., 2008), which include coagulation/flocculation, adsorption,reverse osmosis, and biological treatment. Of all these techniques,adsorption is the most efficient and versatile for removal ofheavy metal. (Agarwal et al., 2006). Most of the other methodsare non-selective and not very effective in the face of lowmetal concentration in the effluent (Mishra, 2014). Accordingto Kurniawan et al. (2006), adsorption can be defined as “amass transfer process by which a substance is transferred fromthe liquid phase to the surface of a solid, and becomes boundby physical and/or chemical interaction.” Adsorption occurs bytransport of adsorbates from the bulk fluid to the adjoining fluid-adsorbent interface by film diffusion of adsorbates through thelaminar boundary layer surrounding the adsorbent particle. Thisis followed by surface reaction of the adsorbate reactants tothe internal surface of the porous adsorbent to form adsorbedproducts (Nabi et al., 2015). Several works on the adsorption ofheavy metals using activated carbon prepared from various low-cost precursors have been reported (Kumar, 2006). In addition,the potential of coal and coal fly ash as adsorbents has beeninvestigated (Gangoli et al., 1975; Grover and Narayanaswamy,1982; Yadera et al., 1987; Moreno-Castilla et al., 1994; Martyniukand Wieckowska, 1997; Menkiti and Onukwuli, 2011). Variousresearch works have similarly been conducted on the use ofblended adsorbents for wastewater effluent treatment (Pandayet al., 1984; Nordiana and Siti, 2013). Nordiana and Siti(2013) reported that a blend of activated charcoal and peanutshell was more efficient in adsorbing lead ions from aqueoussolution than the individual adsorbents. Wang and Xing (2002)also reported that phosphate-modified goethite improved both
cadmium adsorption and adsorption process. Earlier studieshave shown that adsorption efficiency increases with increasein carbonization temperature as well as the modification of theadsorbent with activating agents such as nitric acid (Kareemand Adisa, 2002), potassium permanganate (Muhammad et al.,2011), hydrochloric acid (Bada and Potgieter-Vermaak, 2008;Muhammad et al., 2011), hydrogen peroxide (Muhammad et al.,2011), and potassium hydroxide (Evbuomwan et al., 2013).
Despite the fact, that much work has been done on adsorptionof heavy metals, there is still need for further exploitation of thisarea (Mishra, 2014). The use of cost effective, readily available,and ecologically friendly materials should be encouraged. Thereis need for low cost adsorbents with improved adsorptioncapacity and having little or no harmful effect to the ecosystemor environment. To this end, the focus of heavy metal adsorptionstudies, as demonstrated in this work, has shifted to the sourcingof adsorbents from natural products that are readily availablesuch as coal, and some environmentally friendly agriculturalbyproducts namely ogbono (Irvingia gabonensis) seed shell,coconut shell, palm kernel shell, walnut shell, and almondshell (Golder et al., 2007). Coal is formed after long time ofdegradation of plant material in the ground. Coal is classified aslignite, sub-bituminous, bituminous, and anthracite depending(in that order) on the age of degradation of the plant matter thatformed the coal, and the carbon content. According to statisticalsurvey, there are proven coal reserves in the following partsof Nigeria: Anambra coal basin, covering 1.5 million hectares;Benue district (Omkpa-Ezimo), 175,000 hectares; Kogi district,225,000 hectares; Enugu district, 270,000 hectares; Inyi deposit,south of Enugu city; the Afikpo deposit, Lafia Obi deposit, theGombe deposit, and the Asaba lignite deposit (Odesola et al.,2013). Coal has many industrial applications which includeelectricity generation, metallurgical extraction of metals, andchemicals production. Little has been reported on the use ofNigerian coal for the preparation of adsorbent (Ani et al., 2012).
This study aims at evaluating the adsorption potential ofdifferent types of coal namely lignite and sub-bituminous coal,and Irvingia gabonensis seed shell (IGSS), for cadmium and leadremoval. The objectives include finding a simpler and moreversatile method for surface modification of coal to improve itsmorphology and surface area for increased adsorption rate.
MATERIALS AND METHODS
Reagents and InstrumentsAnalytical grade of all the chemicals and reagents were used.
The instruments used include Mettler Toledo Seven compactpH meter, atomic absorption spectrometer (Buck Scientific,Model 210 VGP), Fourier transform infrared spectrophotometer(Model IRTracer-100 Shimadzu, Japan), electron scanningmicroscope (PHENOM PROX TESCAN, The Netherlands), andX-Ray fluorescence (Oxford Instruments, England). Others areheat treatment furnace (Kohaszati Gyarepito Vallat Budapest,type KCO−120), air-drying oven (BTOV 1423), Cisa cedaceriaindustrial electromagnetic Shaker (Model BA200N), digital waterbath (Model DK600), Ohaus weighing balance (Model PA213),and a multifunctional oscillator.
Frontiers in Chemistry | www.frontiersin.org January 2018 | Volume 5 | Article 132

Ezeokonkwo et al. Adsorbents from Coal and Irvingia gabonesis
Sampling/Sample PreparationLignite was obtained from Garinmaiganga mine in Gombe State,sub-bituminous coal from Okaba mine in Kogi State; Irvingiagabonensis seed shells were obtained from Obe in Nkanu-westlocal government area of Enugu State, all in Nigeria. The sampleswere thoroughly washed, to remove extraneous materials suchas dirt, sand and other impurities, and subsequently dried, andmilled to fine particle sizes. They were then carbonized separatelyin a muffle furnace (Kohaszati Gyarepito Vallat Budapest, typeKCO-120) at different temperatures.
Preparation of Adsorbate SolutionThe stock solutions of Cd(II) and Pb(II) ions of concentrations1000 mg/L each were obtained by dissolving 2.03 g cadmiumchloride, (CdCl2.2
1/2H2O) and 1.6 g lead nitrate, [Pb(NO3)2],respectively with distilled water in a 1000mL standard flask andmade up to mark. The solutions were then diluted to desiredworking concentrations with distilled water.
Preparation of AdsorbentsThe adsorbents were prepared by carbonization of the rawmaterials. For the first stage of the experiments, lignite, andsub-bituminous coal were carbonized at 800◦C. This was doneby measuring 700 g each of the coals into separate clay pots.The pots were covered, with the edges between the pots andtheir lids sealed with clay to prevent penetration of air. Thesamples were put in a muffle furnace and carbonized at 800◦C for2 h, following the method of Scientific Equipment DevelopmentInstitute (SEDI), Enugu, Nigeria. Lignite, being the sample thathad better adsorption efficiency was used in the determinationof the effect of batch adsorption parameters, and was carbonizedat different temperatures (400–1100◦C) for the determination ofthe effects of carbonization temperature.
Modification Using Irvingia gabonensis
Seed ShellLignite carbonized at 400◦C, which gave the optimum percentyield of 75%, was blended with IGSS biomass in equal proportion.The mixing of the seed shell with lignite was made to findout if blending coal with agricultural byproduct would improveadsorption performance.
Chemical Modification of AdsorbentsThe adsorbents from lignite and its IGSS blend were chemicallymodified with 0.1M of both NaOH and H3PO4 following themethod of Argun and Dursun (2006). Twenty five grams ofadsorbent was measured, washed severally with distilled waterto remove particles sticking to the surface and any particle thatcould be soluble in water. The adsorbent was oven-dried at85◦C for 2 h. The sample was placed in a 500mL conical flaskcontaining 250mL of the modifying reagent. It was then agitatedat 200 rpm in a multifunctional oscillator for 4 h, left overnightand filtered to separate the adsorbent. The adsorbent was washedseverally with distilled water to attain neutral pH. Finally, it wasoven-dried at 85◦C for 2 h and stored for use.
Characterization of AdsorbentX-Ray Fluorescence AnalysisThe X-Ray Fluorescence (XRF) characterization was performedto determine the chemical compositions of the raw materials.
Fourier Transform Infrared AnalysisFourier transform infrared (FTIR) spectroscopic analysis wasperformed to give the vibration frequencies of the adsorbentslattice, which result from stretching of bending modes of thefunctional groups present in the activated carbon. The sampleswere examined in the range 400–4000 cm−1.The analysis wasdone using KBr as background material.
Scanning Electron MicroscopyThe morphology of the prepared adsorbents was studied byuse of scanning electron microscope (SEM). Little amounts ofthe prepared adsorbent samples were first put on a circulardisc-like structure in the scanning electron microscope. Specifictapes were used to attach the samples to the surface of thedisc. The disc was then positioned in the electron chamber,and the electron gun releases a beam of electrons used for thescanning. As the electrons interact with the atoms, images ofthe surface topography is produced, and viewed on a monitor.In order to obtain a more quality image and appropriateclarity, the magnification of the scan was adjusted. The specificmagnifications images were later saved.
Adsorption ExperimentsFour grams of the adsorbents prepared separately from lignite,sub-bituminous coal, and IGSS-coal blend were introducedseparately to 100mL of 300 mg/L metal ion solution in aconical flask and agitated on the multifunctional oscillator setat 200 rpm for 2 h at room temperature. After adsorption wascompleted, the solution was filtered using Whatman No. 1 filterpaper. The residual metal ion concentrations of the solutionwere determined by atomic absorption spectrophotometer.The adsorption capacity and efficiency were calculated usingEquations (1, 2), respectively:
qe =(Ci − Ce)V
m(1)
%Adsorption =Ci − Ct
Cix100 (2)
Where qe is the amount of metal adsorbed at equilibrium (mg/g),m is the mass of adsorbent (g),Ci and Ce are the initial and equilibrium concentrations of
the metal ions (mg/L), while Ct is the concentration at time t(minutes).
Comparative adsorption experiment was carried out usingadsorbents from lignite and sub-bituminous coal. Dosage ofadsorbent from lignite was varied in the range 5–40 g/L todetermine its effect on adsorption of the metal ions. The effectof pH on the adsorption was carried out by adjusting the metalsolution pH from 4 to 10, using 0.1M HCl and 0.1M H3PO4.
The effect of contact time on adsorption was determined byvarying time of the process in the range 20–120min. To study
Frontiers in Chemistry | www.frontiersin.org January 2018 | Volume 5 | Article 132

Ezeokonkwo et al. Adsorbents from Coal and Irvingia gabonesis
the effect of temperature the flask was agitated at a temperaturethat is within the range of 30–65◦C.
Carbonized unmodified lignite was used for adsorption atdifferent particle sizes (250, 355, 500, 710, 850, and 1400μm)to determine effect of particle size. The effect of initial metalion concentration was determined by varying the adsorbateconcentration from 100 to 350 mg/L.
RESULTS AND DISCUSSION
XRF, SEM, and FTIR TechniquesX-Ray Fluorescence CharacterizationThe XRF characterization was performed to obtain the chemicalcompositions of the raw materials (lignite, sub-bituminous coal,and Irvingia gabonensis seed shell). These are as given in Table 1.It could be observed that Al2O3 and SiO2 are the key constituentsof these materials. Fe2O3 is present in considerable amount,while Na2O, MgO, P2O5, K2O, CaO, and TiO2 are present intrace quantities. Hence Al2O3, SiO2, and Fe2O3 might havecontributed in the removal of Cd(II) and Pb(II) ions from thesimulated waste water.
Scanning Electron MicroscopyThe SEM images of the experimental adsorbents are shownin Figure 1. The adsorbents have irregular and porous surfacestructure, which is a characteristic of a potential adsorbent. Theporous structure is an indication that physical adsorption hasserious effect on the removal of the lead and cadmium ions fromaqueous solution (Vafakhah et al., 2014). It is evident that thecarbon particles have wide range of pore sizes. There appearsto be accumulated deposits in the pores of the spent adsorbentsprobably due to adsorption of the metal ions onto the pores onthe surface of the adsorbents.
Analyses of the FTIR SpectraFTIR spectrum of carbonized unmodified lignite (CUL) is shownin Figure 2A. The figure indicates the presence of majorlycarbonyl and hydroxyl groups, which constitute importantadsorption centres. By comparing the FTIR spectrum of CULand spent CUL (Figures 2A,B), changes in peaks were observed.
TABLE 1 | XRF Results of lignite, sub-bituminous coal, and Irvingia gabonensis
seed shell.
Chemical constituent Raw material composition (Wt %)
Lignite SBC IGSS
Na2O 1.979 2.835 2.842
MgO 2.235 1.164 1.726
Al2O3 19.475 19.686 20.374
SiO2 17.408 17.467 11.520
P2O5 1.100 1.105 1.681
K2O 0.266 0.285 3.000
CaO 4.704 0.665 2.356
TiO2 0.773 0.852 0.596
Fe2O3 6.278 5.986 6.503
These changes may be due to interaction between the functionalgroups and metal ions because of adsorption or chemicalreaction. The sharp peaks at 3567, 3676, 3690, 3751, 3649, 3821,3712, 3736, 3858, and 3904 cm−1 were due to O-H stretchingvibrations in alcohols and phenols. Whereas, the peaks at 3587,3619, and 3629 cm−1 are assigned to oximes O-H stretchingvibrations. There is absorption band at 2923 cm−1 present inthe CUL, which can be attributed to the presence of aliphaticCH3. This band was observed in the spent CUL at 2950 cm−1
(Figure 2B). A peak is also observed at 2860 cm−1 in the CUL.The corresponding peak is observed at 2858 cm−1 in the spentCUL. These peaks are assigned to the aliphatic CH2 group. Thepeaks 1734 and 1772 cm−1 are assigned to C=O stretchingvibrations of aldehydes and ketones. The peak at 1697 is assignedto C=O stretching vibrations in α-amino acids whereas thepeak at 1684 is due to the C=O stretching vibrations in α,β-unsaturated acids.
Most of these peaks are not seen in the FTIR spectra of thespent carbonized lignite used to remove cadmium (Figure 2B)and lead (Figure 2C). The reason for this could be the interactionbetween the functional groups and metal ions as a result ofadsorption. This is an indication that binding of metal ions onthe adsorbent took place.
The infrared spectrum of Irvingia gabonensis seed shell ligniteblend (IGSSLB) is shown in Figure 2D. Analyses of FTIRspectra of IGSSLB revealed a sharp and high intensity at 2923cm−1 ascribed to C-H stretching vibration of alkanes in thecompound. The peak range that centres around 2362–1376cm−1 characterize: O-H, N-H, and C-H stretching vibrations.Absorption signal at 722 cm−1 reveal the presence of aromaticC-H out of plane blend, skeletal C-C vibrations. The frequenciesand the proposed assignments of vibrations are based on previousassignments.
Effect of Process Parameters on Batch
AdsorptionEffect of Carbonization TemperatureFigure 3A shows the effect of the carbonization temperatureof unmodified lignite on Cd(II) and Pb(II) adsorption fromaqueous solutions. The adsorption of both Cd(II) and Pb(II) ionsby CUL increased with increase in carbonization temperatureuntil the adsorption reached 100%. This can be as a result ofthe increased adsorption properties of the adsorbents at highertemperatures as more volatile matter is released at the highertemperatures allowing for the creation of more pores untowhich more metal ions are adsorbed. The Cd(II) adsorptionwas more gradual before peaking at 100%. Ozer et al. (1998)has reported a similar trend for the adsorption of cadmium onactivated carbon from sugar beet pulp. Also, Figure 3A showsthat Pb(II) ions adsorption was faster to reach the peak of 100%and remained constant. Thus, it was shown that Pb(II) wasmore preferentially adsorbed than Cd(II). Similar result has beenreported by Kongsuwan et al. (2006).
Effect of Adsorbent Dosage and Contact TimeThe dependence of Cd(II) and Pb(II) adsorption on adsorbentdosage was determined by varying the amount of adsorbents
Frontiers in Chemistry | www.frontiersin.org January 2018 | Volume 5 | Article 132

Ezeokonkwo et al. Adsorbents from Coal and Irvingia gabonesis
FIGURE 1 | SEM images of (A) carbonized unmodified sub-bituminous coal (B) carbonized unmodified lignite (C) spent carbonized unmodified lignite after Cd(II)
adsorption (D) spent carbonized unmodified lignite after Pb(II) adsorption (E) Irvingia gabonensis seed shell lignite blend.
from 5 to 40 g/L, while keeping other parameters constant.Figure 3B shows the adsorption of Cd(II) and Pb(II) efficienciesfor the different dosages used. It can be observed that in general,adsorption efficiencies of the adsorbent increased with increase indosage. The percentage removal of Pb(II) increased from 99.87%at adsorbent dosage of 5 g/L to 100% at adsorbent dosage of20 g/L, and remained constant till 40 g/L adsorbent dosage.For Cd(II), percentage adsorption increased from 74.17% at5 g/L to 99.70% at 40 g/L. The increased adsorption patternfor both metal ions could be attributed to higher number ofavailable adsorption sites as dosage increases. This agrees with
the observations by Kumar et al. (2012) and Gala and Sanak-Rydlewska (2011).
In order to determine the time required for equilibriumadsorption of metal ions, the effect of contact time on theadsorption of Cd(II) and Pb(II) ions from aqueous solutionon the surface of CUL was investigated over a period oftime. In all the cases, increased adsorption of metals withincreasing contact time was observed until equilibrium, afterwhich there was slight decrease in efficiency, as shown inFigure 3C. For Cd(II) ion, equilibrium was reached at 120minat 98.31%. Afterwards the adsorption efficiencies decreased to
Frontiers in Chemistry | www.frontiersin.org January 2018 | Volume 5 | Article 132

Ezeokonkwo et al. Adsorbents from Coal and Irvingia gabonesis
FIGURE 2 | FTIR spectrum of (A) carbonized unmodified lignite (B) spent carbonized unmodified lignite after Cd(II) adsorption (C) spent carbonized unmodified lignite
after Pb(II) adsorption (D) Irvingia gabonensis seed shell lignite blend.
97.63 and 97.33% at 140 and 160min respectively. However,for the Pb(II) ion, adsorption increased from 99.30 to 99.97%at the early stage, remained constant until peaking at 100min
at 100% before dropping to 99.93% at 120min and thenremaining constant. This phenomenon can be due to thefact that, initially, all the active sites on the CUL were
Frontiers in Chemistry | www.frontiersin.org January 2018 | Volume 5 | Article 132

Ezeokonkwo et al. Adsorbents from Coal and Irvingia gabonesis
FIGURE 3 | Effect of carbonization temperature (A), adsorbent dosage (B), contact time (C), adsorption temperature (D), adsorbent particle size (E), pH (F), and
initial metal ion concentration (G) on the adsorption of Cd(II) and Pb(II) on carbonized unmodified lignite adsorbent samples.
vacant and were used for initial adsorption; subsequently,as time increased, the adsorption rate of metal ions becameconstant at equilibrium due to saturation of active sites inagreement with a work reported elsewhere (Meitei and Prasad,2013).
Effect of Adsorption TemperatureFigure 3D shows the effect of solution temperature on theadsorption of Cd(II) and Pb(II) ions on carbonized unmodifiedlignite. As shown in Figure 3D, efficiency of Cd(II) increasedfrom 88.45% at 30◦C to 96.67% at 50◦C. Beyond 50◦C, it
Frontiers in Chemistry | www.frontiersin.org January 2018 | Volume 5 | Article 132

Ezeokonkwo et al. Adsorbents from Coal and Irvingia gabonesis
decreased. The same trend was observed in the adsorption ofPb(II) on CUL. Similar results have been reported elsewhere(García-Rosales andColín-Cruz, 2010; Park et al., 2010; Giri et al.,2012). The increase in adsorption of Cd(II) and Pb(II) ions oncarbonized unmodified lignite with the increase in temperatureshowed that the adsorption process is endothermic, which maybe due to the higher rate of diffusion of the cations onto theadsorbent’s particle surface at moderately higher temperatures.The high surface diffusion is due to the higher randommotion ofthe adsorbates, resulting from the rise in thermal energy. As thetemperatures were increased beyond the optimum values [50◦Cfor Cd(II) and 40◦C for Pb(II)], the adsorbent surface mightdecompose leading to reduced adsorption capacity as explainedby Nabi et al. (2015). Table 2 gives the thermodynamic data(plot not shown) of the adsorption of Cd(II) by carbonizedunmodified lignite. The Gibbs free energy change (�G) increasedwith increase in temperature. The positive values of the enthalpychange (�H) and (�G) indicate that the process is endothermicand thermodynamically non-spontaneous. The value of �H(Table 2) is +1027.78 J/mol indicating chemical adsorption. Thereason that the adsorption process involves a decrease in entropymight be because a molecule in solution has more freedom ofmotion than one that is attached to a surface which impliesdecreased disorderliness on the adsorbent surface.
Effect of Adsorbent Particle SizeThe influence of particle size of CUL on the adsorption of Cd(II)and Pb(II) ions from aqueous solution is shown in Figure 3E.For Cd, adsorption efficiency was highest (96.43%) at 250μm,being the least particle size, while the lowest efficiency (66.43%)was recorded at 1400μm, being the largest particle size. Also forPb, at 250μm adsorption efficiency was 100%, while at 1400μm,it became 72.92%. A close observation of the results shows thatefficiency is inversely related to particle size. As the particle sizedecreased, both surface area and adsorption efficiency of theadsorbent increased. Therefore, a decrease in adsorption withincreasing particle size is due to a decrease in the surface area ofthe adsorbent, consistent with results reported by other authors(Badmus et al., 2007; Ozer et al., 2007; Kannan and Veemaraj,2010; Banerjee et al., 2012; Kelly-Vargas et al., 2012; Barka et al.,2013).
TABLE 2 | Thermodynamic data for adsorption of Cd(II) by carbonized unmodified
lignite.
Temperature (K) �G (J/mol)
303 4,318.36
308 4,372.66
313 4,426.96
318 4,481.26
323 4,535.56
328 4,589.86
333 4,644.16
338 4,698.46
�H (J/mol) –�S (J/mol K)
1027.78 10.86
Effect of Adsorption Solution pHThe pH of the solution has a considerable effect on the removal ofheavy metals from aqueous solutions, because the surface chargeof the adsorbent and the degree of ionization and speciation ofthe adsorbate are controlled by pH (Park et al., 2010). Figure 3Fshows the effect of pH on the adsorption of Cd(II) and Pb(II)ions. The adsorption of Cd(II) was from under 90% while thatof Pb(II) ions was from above 99%. The optimum adsorptionfor Cd(II) was at pH 10 while that of Pb(II) was at pH 6.5.However, percentage adsorption increased as pH increased. Thiscould be attributed to the fact that as the pH of solutionincreases, the adsorptive removal of cationic metals increases,whereas that of anions decreases. At lower pH, the overall surfacecharge of the adsorbent may be positive. The H+ ions competedeffectively with the Cd(II) and Pb(II) ions, causing a decrease inadsorption capacity. When pH values were increased, the CULsurface became increasingly negatively charged, which favouredthe removal of metal ions as a result of electrostatic interaction.This is similar to the observations made by Njoku et al. (2011)and Taha et al. (2011).
The differential removal of the two ions may be attributed tothe difference in their ionic radius. It has been shown that thesmaller the ionic radius or area, the greater is its tendency to behydrolyzed leading to reduced sorption (Horsfall and Spiff, 2005).
Effect of Initial Metal Ion Concentration and
Adsorbent ModificationFigure 3G shows that increase in the initial metal concentrationled to a decrease in removal efficiency. There was 100% removalof Pb(II) ions at concentrations 100–250 mg/L, whereas atconcentrations 300 and 350mg/L adsorption of 99.83 and 99.76%were respectively obtained. However, in the adsorption of Cd(II),there was a proportionate decrease in removal efficiency as theinitial metal concentrations were increased. This observationcould be due to the saturation of adsorption sites on CULsurface. This is in agreement with the results reported byprevious workers (Boota et al., 2009; Kannan andVeemaraj, 2010;Sahmoune et al., 2011; Taha et al., 2011; Kumar et al., 2012).By applying 300 mg/L initial concentration (Ci) of the metalions (Cd and Pb) adsorption, 100% removal was recorded foreach. However, when the concentrations were increased to 400mg/L for ions (Cd and Pb), 80.93 and 87.85% removal wererespectively obtained. Thus, carbonized unmodified lignite is apotentially good adsorbent for the removal of Cd and Pb ionsfrom aqueous solution. Adsorption of Cd(II) and Pb(II) ions onadsorbent from lignite and sub-bituminous coal were comparedat initial metals [Cd(II) and Pb(II)] concentration of 1000 mg/L.The adsorption for Pb(II) was 192mg/L (19.2%) and 294.90mg/L(29.49%) on sub-bituminous coal and lignite respectively. Onthe other hand, amount adsorbed for Cd(II) was 142.85 mg/L(14.29%) and 268.00 (26.80%) on sub-bituminous coal and ligniterespectively. it could be observed that the amount adsorbed forall was not up to 300 mg/L. As a result, 300 mg/L was chosenas the working concentration for subsequent experiments, ligniteon the other handwas used havingmore adsorption capacity thansub-bituminous coal.
Frontiers in Chemistry | www.frontiersin.org January 2018 | Volume 5 | Article 132

Ezeokonkwo et al. Adsorbents from Coal and Irvingia gabonesis
Blends of coal were prepared by mixing lignite carbonized at400◦C with Irvingia gabonensis seed shell, NaOH and H3PO4
in order to achieve improved adsorption efficiency. Table 2
presents how various modifications of the carbonized ligniteaffected the adsorption efficiencies of the adsorbent. Uponmodification of the CUL, the performance was significantlyimproved. For example, in Cd(II) adsorption, the sodiumhydroxide and phosphoric acid modified lignite (SHML andPAML) increased adsorption efficiencies from 48.8 to 64.17%and 63.70% respectively. The Pb(II) adsorption was similarlyenhanced due to the chemical modification (using NaOH andH3PO4) of the adsorbents.
In a work, Argun and Dursun (2006) made similarobservations. There was also a similar trend of increasedadsorption efficiencies with the blended derivatives namelyIrvingia gabonensis seed shell lignite blend (IGSSLB), phosphoricacid modified Irvingia gabonensis seed shell lignite blend(PAMIGSSLB) and sodium hydroxide modified Irvingiagabonensis seed shell lignite blend (SHMIGSSLB) as given inTable 3. However, adsorbents modified with NaOH had betterefficiencies than those modified with H3PO4. Highest efficiencywas obtained with sodium hydroxide modified SHMIGSSLB.
Adsorption Isotherm StudiesSome routinely used adsorption isotherm models were appliedto describe the adsorption mechanism involving carbonizedunmodified lignite. The experimental data at 25◦C werefitted into the following linear adsorption isotherm equationsrepresenting the selected isotherm models:
(Ce
qe
)=
(1
KLqm
)+
(Ce
qm
)(3)
ln qe = lnKf +1�n lnCe (4)
qe = BT lnAT + BT lnCe (5)
where Equations (3–5) represent Langmuir, Freundlich, andTemkin adsorption isotherms. Symbols contained in theadsorption isotherm equations are: the maximum monolayeradsorption capacity (qm), and adsorption constants (KL, Kf , BT ,AT , and 1/n).
The equilibrium isotherm parameters for this study wereobtained from the slopes and intercepts of Equations (3–5)generated from their respective plots (Figure 4) and given inTable 4. The values of the maximum monolayer adsorptioncapacity of the adsorbent (qm) and the Langmuir adsorptionequilibrium constant (KL) can be determined from the intercept
and slope respectively of the linear plot of(Ceqe
)vs. Ce. The
Linearized Langmuir adsorption isotherm was developed withslope, intercept and regression coefficients equal 0.268, 1.660,and 0.984 respectively for Cd(II), and 1.696, −0.018, and 1.000respectively for Pb(II). The Langmuir constants were calculatedfrom intercept and slope [qm = 3.731 (mg/g) (Cd), 0.590 (mg/g)(Pb) and KL = 0.162 L/mg (Cd),−94.162 L/mg (Pb)].
The values of Kf [Freundlich constant related to adsorption(mg/g)] and 1�n (Freundlich constant related to the intensity ofadsorption) can be determined from the intercept and slope,respectively, of linear plot of ln qe vs. lnCe. The linearizedFreundlich adsorption isotherm was developed with slope,intercept and regression coefficients equal to 0.074, 0.884,and 0.613 respectively for Cd(II), and 0.917, 1.509, and 0.300respectively for Pb(II). The Freundlich constants were calculatedfrom intercept and slope [Kf = 7.656 L/g (Cd), 32.285 L/g (Pb),and 1/n = 0.074 (Cd), 0.197 (Pb)]. Freundlich constant 1/n was< 1 in both Cd and Pb adsorption, indicating that the adsorbentsurface is heterogeneous.
The values of BT [constant related to the heat of adsorption(mg/g)] and AT [Temkin isotherm constant (L/g)] can bedetermined from the intercept and slope, respectively, of linearplot of qe vs. lnCe. The linearized Temkin adsorption isothermwas developed with slope, intercept, and regression coefficientsequal 0.225, 2.396, and 0.559 respectively for Cd(II), and 4.855,4.908, and 0.334 respectively for Pb(II). The Temkin constantswere calculated from intercept and slope [BT = 0.225 mg/g(Cd), 4.885 mg/g (Pb), and AT = 4.46 × 10¹⁰ L/g (Cd), 10.255L/g (Pb)].
Because the regression coefficients (R2) for the Langmuir,Freundlich, and Temkin isotherms are (Cd): 0.984, 0.613, and0.559, and (Pb): 0.992, 0.300, and 0.334 respectively, it appearsthat the Langmuir isotherm correlates the adsorption data betterthan the other isotherms. This phenomenon suggests that theadsorption process may be attributed to a monolayer adsorption.The RL (Langmuir isotherm separation factor) values obtainedfor Cd(II) and Pb(II) ions respectively, are 1.7 × 10⁻² and 3.03
TABLE 3 | Effect of adsorbent modification on Cd(II) and Pb(II) Adsorption [Ci of Cd(II) and Pb(II) = 300 mg/L].
Sample Ce (mg/L) qe (mg/g) % Adsorption Surface area (m2/g)
Cd Pb Cd Pb Cd Pb Cd Pb
CUL (400◦C) 153.60 111.0 3.66 4.73 48.80 63.00 805.80 865.80
PAML 108.90 47.0 4.78 6.33 63.79 84.30 857.30 887.30
SHML 107.50 46.2 4.81 6.35 64.17 84.60 888.90 888.90
IG SSLB 106.30 45.5 4.84 6.36 64.57 84.83 889.40 888.10
PAMIGSSLB 82.90 10.3 5.43 7.24 72.37 96.57 893.90 890.50
SHMIGSSLB 80.00 10.0 5.50 7.25 73.33 96.67 895.70 891.90
Frontiers in Chemistry | www.frontiersin.org January 2018 | Volume 5 | Article 132

Ezeokonkwo et al. Adsorbents from Coal and Irvingia gabonesis
FIGURE 4 | Langmuir (A,B); Freundlich (C,D); and Temkin (E,F) isotherms for the adsorption of Cd(II) and Pb(II) respectively, on carbonized unmodified lignite at 25◦C.
× 10−5 suggesting that the adsorption of the metals unto theadsorbent surface was favourable (0 < RL < 1). (Jumina et al.,2007) defined RL as:
RL = 1/(1+ KCo) (6)
where K is the adsorption constant and Co is the initialconcentration of adsorbate (g/L). Further, the lower the value ofRL is indicative of a more favourable adsorption.
Adsorption KineticsAdsorption kinetics study was performed by varying time
of the process for Cd(II) and Pb(II) ions removal usingcarbonized unmodified lignite, in the range 20–120min.In all the cases, increased adsorption of metals withincreasing contact time was observed until equilibrium,after which there was slight decrease in efficiency, as shownin Figure 3C. The adsorption got to equilibrium because at
Frontiers in Chemistry | www.frontiersin.org January 2018 | Volume 5 | Article 132

Ezeokonkwo et al. Adsorbents from Coal and Irvingia gabonesis
TABLE 4 | Adsorption isotherm data for carbonized unmodified lignite at 25◦C.
Isotherm Model Cd(II) Pb(II)
LANGMUIR
qm (mg/g) 3.731 0.590
KL (L/mg) 0.162 −94.162
R2 0.984 0.992
RL 0.017 0.0000303
FREUNDLICH
Kf (L/g) 7.656 32.285
1/n 0.074 0.197
R2 0.613 0.300
TEMKIN
AT (L/g) 4.46 x 10¹⁰ 10.255
BT (mg/g) 0.225 4.855
R2 0.559 0.334
that point the metals could not be removed anymore by theadsorbent.
The kinetic data obtained for the adsorption of Cd(II) andPb(II) ions are fitted by pseudo first-order kinetic model, pseudosecond-order kinetic model, and intra-particle diffusion modelrepresented by Equations (6–8), respectively.
ln(qe − qt) = ln qe − k1t (7)
t
qt=
1
k2q2e+
t
qe(8)
qt = kit0.5 + I (9)
The adsorption kinetic parameters for the present study wereobtained from the slopes and intercepts of Equations (6–8)
FIGURE 5 | Pseudo first order (A,B); Pseudo second order (C,D); and Intra particle diffusion (E,F) for the adsorption of Cd(II) and Pb(II) respectively, on carbonized
unmodified lignite at 25◦C.
Frontiers in Chemistry | www.frontiersin.org January 2018 | Volume 5 | Article 132

Ezeokonkwo et al. Adsorbents from Coal and Irvingia gabonesis
TABLE 5 | Chemical kinetic data of carbonized unmodified lignite at 25◦C.
Model/Parameters Cd(II) Pb(II)
PFO
qecal. (mg/g) 6.5 × 10⁻⁴ 2.94 × 10⁻⁵
k1(/min) 2.303 × 10⁻² −2.3 × 10⁻³
R2 0.090 0.001
qeexp.(mg/g) 7.37 7.50
PSO
qecal. (mg/g) 7.46 7.52
k2 (g/mg min) 6.33 × 10⁻² 4.42
R2 0.999 1
qeexp. (mg/g) 7.37 7.50
IPD
Kd(mg/g min½ ) 0.058 0.003
C 6.642 7.456
R2 0.869 0.374
generated from their respective plots (Figure 5) and given inTable 5. The values of the calculated equilibrium adsorptioncapacity (qe) and the rate constant for pseudo first-order model(k1) can be determined from the intercept and slope respectivelyof the linear plot of ln (qe − qt) vs. t(min). The pseudo first-orderkinetic model was developed with slope, intercept and regressioncoefficients equal 0.010,−3.187, and 0.090 respectively for Cd(II),and −0.001, −4.531, and 0.001 respectively for Pb(II). Thepseudo first- order parameters were calculated from intercept andslope [qe = 6.5× 10⁻⁴ (mg/g) (Cd), 2.94× 10⁻⁴ (mg/g) (Pb) andk1 = 2.303× 10⁻² /min (Cd),−2.300× 10⁻³ /min (Pb)].
The values of the calculated equilibrium adsorption capacity(qe) and the rate constant for pseudo second-order model (k2)can be determined from the intercept and slope respectivelyof the linear plot of t
qtvs. t(min). The pseudo second-order
kinetic model was developed with slope, intercept and regressioncoefficients equal 0.134, 0.284, and 0.999 respectively for Cd(II),and 0.133, 0.004, and 1.000 respectively for Pb(II). The pseudosecond-order parameters were calculated from intercept andslope [qe = 7.46 (mg/g) (Cd), 7.52 (mg/g) (Pb), and k2 = 6.33× 10⁻² g/mg min (Cd), 4.42 g/mg min (Pb)].
The regression coefficient (R2) values of the adsorptionprocess (Table 4) indicated better agreement with the pseudo-second order (PSO) model [0.999 (Cd) and 1.000 (Pb)] thanthe pseudo-first order (PFO) model [0.090 (Cd), 0.001 (Pb)], forthe metal ions removal. In addition, the calculated equilibriumadsorption capacity (qecal.) values for both metals [7.46 (mg/g)(Cd) and 7.52 (mg/g) (Pb)] are quite close to the experimentalequilibrium adsorption capacity (qeexp.) values (7.37 (mg/g)(Cd) and 7.50 (mg/g) (Pb) in the pseudo-second order model,suggesting that adsorption followed the pseudo-second ordermodel. The calculated qe [6.5 × 10⁻⁴ (mg/g) (Cd) and 2.94 ×
10−5 (mg/g) (Pb)] and the experimental qe values are wide apartin the pseudo-first order model. The rate constant (k2) valuesfor PSO are significantly higher than those (k1 values) for PFOwhich further supports that the adsorption favours the pseudosecond-order kinetic model.
The kinetic data was further analyzed with the intra-particlediffusion (IPD) model. A linear plot of qt vs. t1/2 was used
to obtain the constants Kd and C. Intra-particle diffusion isthe sole rate-controlling step if the plot is linear and passesthrough the origin (C=0). The R2 value obtained for the twometal ions indicates the existence of an intra-particle diffusionmechanism, more in Cd(II) ion (0.869) removal than in Pb(II)ion (0.374) adsorption, although it is not the sole rate-controllingstep (C�= 0). Occurrence of the intercept C shows the existence ofa boundary layer effect, indicating a surface phenomenon such asmass transfer or liquid film diffusion in the adsorption process.
CONCLUSIONS
In this work, lignite and sub-bituminous coal with blends andmodifications were explored as precursors for the removal oftoxic pollutants from wastewater effluents. Lignite was found tobe more efficient than sub-bituminous coal in the adsorptionof Cd(II) and Pb(II) from aqueous media. The carbonizedunmodified lignite was found to perform optimally at pH 10,contact time 120min, adsorption temperature 50◦C, adsorbentparticle size of 250μm and dosage of 40 g/L. FTIR showedthat hydroxyl and carbonyl groups may be the major functionalgroups responsible for the binding of the metal ions on theprepared absorbents. X-ray refractive fluorescence showed thatAl2O3 and SiO2 were the major constituents of the preparedadsorbents. Lignite and Irvingia gabonensis seed shell performedbetter when modified with NaOH and H3PO4. For Cd(II)adsorption efficiency, the sodium hydroxide and phosphoric acidmodified lignite (SHML and PAML) improved efficiencies werefrom 48.8% (lignite) to 64.17% and 63.70% respectively. Similarimprovements were observed with Pb(II) ions from 63% (lignite)to 84.30% and 84.60% respectively. The analysis of the adsorptionisotherms for Cd(II) and Pb(II) show the R2 to be 0.984 and0.992 favouring the Langmuir isotherm and thus a monolayeradsorption for both metals. The kinetics of adsorption wasbetter described by pseudo-second order than pseudo-first ordermodel.
AUTHOR CONTRIBUTIONS
ME organized the research problem on the effect of coal ranksand coal biomass blends on the removal of cadmium andlead from aqueous solution and made some scientific inputson interpretation of the results, and participated in writingthe manuscript. OO conducted the experimental work on thepreparation of the adsorbent and batch adsorption tests, andparticipated in writing the manuscript. JA conceived theoreticalinputs on process parameters affecting batch adsorption ofcadmium (II) and lead (II) ions from aqueous solution, andparticipated in writing the manuscript.
ACKNOWLEDGMENTS
The laboratory assistance given by some technical staff of ProjectsDevelopment Institute, Enugu, Nigeria is hereby acknowledged.We thank Mr. I. O. Obi of Energy Centre Research andDevelopment, University of Nigeria, Nsukka, for contributingin the collection of some useful data and proofreading themanuscript.
Frontiers in Chemistry | www.frontiersin.org January 2018 | Volume 5 | Article 132

Ezeokonkwo et al. Adsorbents from Coal and Irvingia gabonesis
REFERENCES
Agarwal, G. S., Bhuptawat, H. K., and Chaudhari, S. (2006). Biosorption of aqueous
chromium (VI) by Tamarindus indica seeds. Bioresour. Technol. 97, 949–956.
doi: 10.1016/j.biortech.2005.04.030
Anand, P., Etzel, J. E., and Friedlaender, F. J. (1985). Heavy-metals removal
by high gradient magnetic separation. IEEE Trans. Magn. 21, 2062–2064.
doi: 10.1109/TMAG.1985.1064013
Ani, J. U., Nnaji, N. J., Okoye, C. O., and Onukwuli, O. D. (2012). Factorial
analyses, equilibrium studies, kinetics and thermodynamics of the removal of
suspended particles from an industrial effluent on coal based activated carbon.
Int. J. Chem. Sci. 10, 1765–1784.
Argun, M. E., and Dursun, S. (2006). Removal of heavy metal using chemically
modified adsorbents. J. Int. Environ. Appl. Sci. 1, 27–40.
Argun, M. E., and Dursun, S. (2008). A new approach to modification of natural
adsorbent for heavy metal adsorption. Bioresour. Technol. 99, 2516–2527.
doi: 10.1016/j.biortech.2007.04.037
Bada, S. O., and Potgieter-Vermaak, S. (2008). Evaluation and treatment of coal fly
ash for adsorption application. Leonardo El J. Pract. Technol. 12, 37–48.
Badmus, M. A., Audu, T. O., and Anyata, B. U. (2007). Removal of lead ion from
industrial wastewaters by activated carbon prepared from periwinkle shells.
Turkish J. Eng. Environ. Sci. 31, 251–263.
Banerjee, K., Ramesh, S. T., Nidheesh, P. V., and Bharathi, K. S. (2012). A novel
agricultural waste adsorbent, water melon shell for the removal of copper from
aqueous solutions. Iran. J. Energy Environ. 3, 143–156.
Barka, N., Abdennour, M., El-Makhfoute, M., and Qourzal, S. (2013). Biosorption
characteristics of cadmium and lead onto eco-friendly dried cactus cladodes. J.
Environ. Chem. Eng. 1, 144–149. doi: 10.1016/j.jece.2013.04.008
Boota, R., Bhatti, H. N., and Hanif, M. A. (2009). Removal of Cu(II) and
Zn(II) using lignocellulosic fiber derived from Citrus reticulata (Kinnow)
waste biomass. Sep Pur Technol. 44, 4000–4022. doi: 10.1080/01496390903
183196
Deng, L., Su, H., Wang, X., and Zhu, X. (2006). Biosorption of copper (II)
and lead (II) from aqueous solutions by non–living green algae Cladophora
fascicularis: equilibrium, kinetics and environmental effects. Adsorption 2,
267–277. doi: 10.1007/s10450-006-0503-y
Erdem, E., Karapinar, N., and Donat, R. (2004). The removal of heavy
metal cations by natural zeolites. J. Colloid Interface Sci. 280, 309–314.
doi: 10.1016/j.jcis.2004.08.028
Evbuomwan, B. O., Abutu, A. S., and Ezeh, C. P. (2013). The effect of carbonisation
temperature on some physiochemical properties of bamboo based activated
carbon by potassium hydroxide (KOH) activated. Greener J. Phys. Sci. 3,
187–191.
Gala, A., and Sanak-Rydlewska, S. A. (2011). Comparison of Pb (II) sorption from
aqueous solutions on walnut shells and plum stones. Pol. J. Environ. Stud. 20,
877–883.
Gangoli, N., Markey, P. C., and Thodos, G. (1975). “Removal of heavy metal ions
from aqueous solution with fly ash,” in Paper Presented at: Second National
Conference on Complete Water Reuse (Chicago, IL).
García-Rosales, G., and Colín-Cruz, A. (2010). Biosorption of lead by
maize (Zea mays) stalk sponge. J. Environ. Manage. 91, 2079–2086.
doi: 10.1016/j.jenvman.2010.06.004
Giri, A. K., Patel, R., and Mandal, S. (2012). Removal of Cr (VI) from aqueous
solution by Eichhorniacrassipes root biomass-derived activated carbon. Chem.
Eng. J. 185–186, 71–81. doi: 10.1016/j.cej.2012.01.025
Golder, A. K., Chanda, A. K., Samanta, A. N., and Ray, S. (2007). Removal
of Cr (VI) from aqueous solution: electro coagulation vs chemical
coagulation. Sep Pur Tech. 42, 2177–2193. doi: 10.1080/014963907014
46464
Grover, M., and Narayanaswamy, M. S. (1982). Removal of hexavalent chromium
by adsorption on fly ash. J. Inst. Eng. 63, 36–39.
Horsfall, M., and Spiff, A. L. (2005). Effect of ion concentration on the biosoprtion
of Pb2+ and Cd2+ by Caladium bicolour (wild cocoyam). Afr. J. Biotechnol. 4,
19–196.
Johannes, F. S., Grosse–Siestrup, C., Esche, V., Brandenburg, P., Reich, A., and
Groneberg, D. A. (2006). The toxicity of cadmium and resulting hazards for
human health. J. Occup. Med. Toxicol. 1, 1–6. doi: 10.1186/1745-6673-1-1
Jumina, R., Eko, S., Brajna, P., Ika, H., and Dwi, S. (2007).
Adsorption Characteristics of Pb(II) and Cr(III) onto C-4-
Methoxyphenylcalix[4]resorcinaene in Batch and Fixed Bed Column Systems.
J. Chinese Chem. Soc. 54, 1167–1178. doi: 10.1002/jccs.200700167
Kannan, N., and Veemaraj, T. (2010). Batch adsorption dynamics and equilibrium
studies for the removal of Cd (II) ions from aqueous solution using jack fruit
seed and commercial activated carbons – a comparative study. Electron. J.
Environ. Agric. Food Chem. 9, 327–336.
Kareem, S. A., and Adisa, A. I. (2002). Effect of carbonisation temperature on
activated carbon adsorption properties in aqueous media. Nigeria J. Appl. Sci.
17, 1302–1308.
Kelly-Vargas, K., Cerro-Lopez, M., Reyna-Tellez, S., Bandala, E. R., and Sanchez-
Salas, J. L. (2012). Biosorption of heavy metals in polluted water using different
waste fruit cortex. Phys. Chem. Earth 37, 26–29. doi: 10.1016/j.pce.2011.03.006
Kim, H., Baek, K., Kim, B. K., Shin, H. J., and Yang, J. W. (1985). Removal
characteristics of metal cations and their mixtures using micellar-enhanced
ultrafiltration. Korean J. Chem. Eng. 25, 232–258.
Kongsuwan, A., Patnukao, P., and Pavasant, P. (2006). “Removal of metal ion from
synthetic waste water by activated carbon from Eucalyptus camaldulensis dehn
bark,” in Conference Paper on Sustainable Energy and Environment (Bangkok),
1–9.
Kumar, P. S., Ramalingam, S., Sathyaselvabala, V., Kirupha, S. D., Murugesan,
A., and Sivanesan, S. (2012). Removal of Cd (II) from aqueous solution
by agricultural waste cashew nut shell. Korean J. Chem. Eng. 29, 756–768.
doi: 10.1007/s11814-011-0259-2
Kumar, U. (2006). Agricultural products and by-products as a low cost adsorbent
for heavy metal removal fromwater and wastewater: a review. Acad. J. 1, 33–37.
Kurniawan, T. A., Chan, G. Y., Lo, W. H., and Babel, S. (2006). Physico-chemical
treatment techniques for wastewater ladenwith heavymetals.Chem. Eng. J. 118,
83–98. doi: 10.1016/j.cej.2006.01.015
Lin, L. C., Li, J. K., and Juang, R. S. (2008). Removal of Cu(II) and Ni(II)
from aqueous solutions using batch and fixed-bed ion exchange processes.
Desalination 225, 249–259. doi: 10.1016/j.desal.2007.03.017
Martyniuk, H., and Wieckowska, J. (1997). The effect of coal rank and
carbonization temperature on SO2 adsorption properties of coal chars. Fuel 76,
563–565. doi: 10.1016/S0016-2361(97)00076-8
Meena, A. K., Kadivelu, K., Mishra, G. K., Rajagopal, C., and Nagar, P.
N. (2008). Adsorptive removal of heavy metals from aqueous solution
by treated sawdust (Acacia arabica). J. Hazard Mater. 150, 604–611.
doi: 10.1016/j.jhazmat.2007.05.030
Meitei, M. D., and Prasad, M. N. (2013). Pb(II) and Cd(II) biosorption on
Spirodelapolyhiza Scheleiden biomass. J. Environ. Chem. Eng. 1, 200–207.
doi: 10.1016/j.jece.2013.04.016
Menkiti, M. C., and Onukwuli, O. D. (2011). Studies on dye removal from aqueous
media using activated coal and clay: an adsorption approach. N. Y. Sci. J. 4,
91–95.
Mishra, S. P. (2014). Adsorption–desorption of heavy metal ions. Curr. Sci. 107,
601–612.
Monser, L., and Adhoum, N. (2002). Modified activated carbon for the removal
of copper, zinc, chromium and Cyanide from wastewater. Sep Pur Tech. 26,
137–146. doi: 10.1016/S1383-5866(01)00155-1
Moreno-Castilla, C., Rivera-Utrilla, J., Lopez-Ramon, M. V., and Carrasco-Marin,
F. (1994). Adsorption of some substituted phenols on activated carbons from a
bituminous coal. Carbon 33, 845–851. doi: 10.1016/0008-6223(94)00182-Y
Muhammad, I., Khalid, S., Imtiaz, A., Muhammad, S., and Muhammad, I.
K. (2011). Physicochemical characteristics and Maleic Acids Adsoorption
Capacity of Lakhra Coal (Pakistau). J. Chem. Soc. Pak. 33, 360–363.
Murphy, J. M., and Erkey, C. (1997). Thermodynamics of extraction of copper (II)
from aqueous solutions by chelation in supercritical carbon dioxide. Environ.
Sci. Technol. 31, 1674–1679. doi: 10.1021/es960519o
Nabi, S. A., Bushra, R., Naushad, M., and Kahn, A. M. (2015). Synthesis,
characterization and analytical applications of a new cation exchange eaterial
poly-o-toluidine stannic molybdate for the separation of toxic metal ions.
Chem. Eng. J. 165, 529–536. doi: 10.1016/j.cej.2010.09.064
Njoku, V. O., Ayuk, A. A., Ejike, E. E., Oguzie, E. E., Duru, C. E., and Bello, O. S.
(2011). Cocoa pod husk as a low cost biosorbent for the removal of Pb(II) and
Cu(II) from aqueous solutions. Aust. J. Basic Appl. Sci. 5, 101–110.
Frontiers in Chemistry | www.frontiersin.org January 2018 | Volume 5 | Article 132
Ezeokonkwo et al. Adsorbents from Coal and Irvingia gabonesis
Nordiana, S. M., and Siti, Z. A. (2013). Adsorption of lead in aqueous solution
by a mixture of activated charcoal and peanut shell. World J. Sci. Tech. Res. 1,
102–109.
Nwajei, G. E. (2005). Trace metals in mushroom from urban and rural areas in
Delta State of Nigeria. J. Chem. Soc. Nig. 30, 1–4.
Nwokonkwo, D. C. (2008). Heavy metal pollution of soils: a case study of
Obio/Akpor area in Niger Delta. J. Chem. Soc. Nig. 33, 17–20.
Odesola, I. F., Eneje, S., and Temilola, O. (2013). Coal development in Nigeria:
prospects and challenges. Int. J. Eng. Appl. Sci. 4, 64–73.
Opeolu, B. O., Bamgbose, O., Arowolo, T. A., and Adetunji, M. T. (2008). Sorption
of lead (II) from aqueous solutions using chemically modified and unmodified
Dioscorea alata (Yam) andManihot esculenta (Cassava) peels. J. Chem. Soc. Nig.
2, 1–10.
Ozer, A., Tanyildizi, M. S., and Tumen, F. (1998). Study of cadmium adsorption
from aqueous solution on activated carbon from sugar beet pulp. Environ.
Technol. 19, 1119–1125. doi: 10.1080/09593331908616770
Ozer, D., Dursun, G., and Ozer, A. (2007). Methylene blue adsorption from
aqueous solution by dehydrated peanut hall. J. Hazard Mater. 144, 171–179.
doi: 10.1016/j.jhazmat.2006.09.092
Panday, K. K., Presad, G., and Singh, V. N. (1984). Removal of Cr(VI) from
aqueous solutions by adsorption on fly ash-woolastonite. J. Chem. Tech.
Biotechnol. 34A, 367–374.
Park, D., Yun, Y., and Park, J. M. (2010). The past, present, and
future trends of biosorption. Biotechnol. Bioprocess. Eng. 15, 86–102.
doi: 10.1007/s12257-009-0199-4
Sahmoune, M. N., Louhab, K., and Boukhiar, A. (2011). Advanced
biosorbents materials for removal of chromium from water and
wastewaters. Environ. Prog. Sustain. 30, 284–293. doi: 10.1002/
ep.10473
Taha, G. M., Arifien, A. E., and El-Nahas, S. (2011). Removal efficiency of potato
peels as a new biosorbent material for uptake of Pb(II), Cd(II) and Zn(II)
from the aqueous solutions. J. Solid Waste Technol. Manage. 37, 128–140.
doi: 10.5276/JSWTM.2011.128
Vafakhah, S., Bahrololoom, M. E., Bazarganlari, R., and Saeedikhani, M. (2014).
Removal of copper ions from electroplating effluent solutions with native corn
cob and corn stalk and chemically modified corn stalk. J. Environ. Chem. Eng.
2, 356–361. doi: 10.1016/j.jece.2014.01.005
Wang, K., and Xing, B. (2002). Adsorption and desorption of Cd
by goethite pretreated with phosphate. Chemosphere 48, 665–670.
doi: 10.1016/S0045-6535(02)00167-4
Weber, W. J., Jr, McGinley, P. M., and Katz, L. E. (1991). Sorption phenomena
in sub-surface systems: concepts, models and effects on contaminant fate and
transport.Water Res. 25, 499–528. doi: 10.1016/0043-1354(91)90125-A
Yadera, K. P., Tyagi, B. S., Panday, K. K., and Singh, V. N. (1987). Fly ash
for the treatment of Cd(II)-rich effluents. Environ. Technol. Lett. 8, 225–234.
doi: 10.1080/09593338709384482
Yuan, X. Z., Meng, Y., Zeng, G. M., Fang, Y., and Shi, J. G. (2008). Evaluation of
tea-derived biosurfactant on removing heavy metal ions from dilute wastewater
by ion flotation. Colloids Surf. A Physicochem. Eng. Aspects 317, 256–261.
doi: 10.1016/j.colsurfa.2007.10.024
Conflict of Interest Statement: The authors declare that the research was
conducted in the absence of any commercial or financial relationships that could
be construed as a potential conflict of interest.
Copyright © 2018 Ezeokonkwo, Ofor and Ani. This is an open-access article
distributed under the terms of the Creative Commons Attribution License (CC
BY). The use, distribution or reproduction in other forums is permitted, provided
the original author(s) and the copyright owner are credited and that the original
publication in this journal is cited, in accordance with accepted academic practice.
No use, distribution or reproduction is permitted which does not comply with these
terms.
Frontiers in Chemistry | www.frontiersin.org January 2018 | Volume 5 | Article 132

ORIGINAL RESEARCH
published: 05 March 2018
doi: 10.3389/fchem.2018.00016
Frontiers in Chemistry | www.frontiersin.org March 2018 | Volume 6 | Article 16
Edited by:
Aiqin Wang,
Lanzhou Institute of Chemical Physics
(CAS), China
Reviewed by:
Wenbo Wang,
Lanzhou Institute of Chemical Physics
(CAS), China
Hui-Fang Cui,
Zhengzhou University, China
Runliang Zhu,
Guangzhou Institute of Geochemistry
(CAS), China
*Correspondence:
Libing Liao
Guocheng Lv
Specialty section:
This article was submitted to
Green and Environmental Chemistry,
a section of the journal
Frontiers in Chemistry
Received: 10 November 2017
Accepted: 19 January 2018
Published: 05 March 2018
Citation:
Li E, Liao L, Lv G, Li Z, Yang C and
Lu Y (2018) The Interactions Between
Three Typical PPCPs and LDH.
Front. Chem. 6:16.
doi: 10.3389/fchem.2018.00016
The Interactions Between ThreeTypical PPCPs and LDH
Erwei Li 1, Libing Liao 1*, Guocheng Lv 1*, Zhaohui Li 2, Chengxue Yang1 and Yanan Lu1
1 Beijing Key Laboratory of Materials Utilization of Nonmetallic Minerals and Solid Wastes, National Laboratory of Mineral
Materials, School of Materials Science and Technology, China University of Geosciences, Beijing, China, 2 Geosciences
Department, University of Wisconsin–Parkside, Kenosha, WI, United States
With a layered structure, layered double hydroxide (LDH) has potential applications in
remediation of anionic contaminants, which has been a hot topic for recent years. In
this study, a Cl type Mg-Al hydrotalcite (Cl-LDH) was prepared by a co-precipitation
method. The adsorption process of three pharmaceuticals and personal care products
(PPCPs) [tetracycline (TC), diclofenac sodium (DF), chloramphenicol (CAP)] by Cl-LDH
was investigated by X-ray diffraction (XRD), Zeta potential, dynamic light scattering
(DLS), BET, Fourier transform infrared (FTIR) spectroscopy, and molecular dynamics
simulation. The results showed that the adsorption equilibrium of TC and DF could
be reached in 120min, and the maximum adsorption capacity of the TC and DF
were 1.85 and 0.95 mmol/g, respectively. The isothermal adsorption model of TC
was fitted with the Freundlich adsorption model, and the isothermal adsorption model
of DF was fitted with the Langmuir adsorption model. The adsorption dynamics of
TC and DF followed the pseudo-second-order model. The adsorption mechanisms of
the three PPCPs into Cl-LDH were different based on the experimental results and
molecular dynamics simulation. The TC adsorption on Cl-LDH was accompanied by the
electrostatic interactions between the negative charge of TC and the positive charge of
Cl-LDH. The uptake of DF was attributed to anion exchange and electrostatic interaction.
Cl-LDH does not adsorb CAP due to no electrostatic interaction. The molecular dynamic
simulation further confirmed different configurations of three selected PPCPs, which were
ultimately responsible for the uptake of PPCPs on Cl-LDH.
Keywords: Cl-LDH, PPCPs, adsorption, electrostatic interaction, anion exchange
INTRODUCTION
For the past decades, a wide range of pharmaceutical and personal care products (PPCPs) havebeen repeatedly observed in natural waters all over the world (Richardson et al., 2005; Nakada et al.,2007; Sui et al., 2015). Owing to their bioaccumulation and biological activity, possible impacts ofPPCPs on the human health and ecological safety have received a lot of concerns (Suárez et al.,2008; Sun et al., 2016). Due to the high demands of PPCPs in curing diseases and sustainingeconomic development in agriculture and livestock farming, the global production of PPCPs wasover 1 × 10⁶ tons in 1993, and the production keep increasing. Among PPCPs, Tetracycline(TC) was reported as the most widely used in animal feed. However, the majority of used TCwas hard to be metabolized by animals or human beings, resulting in a considerable amountsas high as 80–90% of initial value or its metabolites being released to the external environment

Li et al. The Interactions Between Three Typical PPCPs and LDH
(Ahmadi et al., 2017). The environmental concentrations of TCwas about 1.12 μg/L (Jie and Shuhe, 2015). Another widely usednon-steroidal anti-inflammatory drug was Diclofenac sodium(DF), which had potential threats in municipal wastewatersand surface waters (Huang et al., 2017). The environmentalconcentrations of DF could reach 28.4 μg/L (Qi et al., 2015). Asa broad-spectrum antibiotic, chloramphenicol (CAP) was widelyused in both animal and humanmedicine. Nevertheless, CAP hadsevere side-effects on humans, such as bone marrow suppression,aplastic anemia acute leukemia, “gray baby syndrome” etc. (Saiet al., in press). Therefore, environmental pollution caused byabuse of PPCPs is becoming more and more serious. In orderto eliminate the potential risk of the PPCPs, it is necessary to getrid of the PPCPs in natural waters. Accordingly, many methodshave been developed to remove the PPCPs, such as physical (Kimand Tanaka, 2009), chemical (Huber et al., 2005), and biologicaltreatments (Suarez et al., 2010).
Adsorption is an old, simple yet effective method. Eco-friendly adsorbents that adsorption process could removehazardous chemicals efficiently without special facilities andunknown byproducts has been successfully utilized for theremoval of antibiotics from aqueous solutions. Adsorbentsfor antibiotics removal, such as silicate (Sun et al., 2017), clayminerals (Lv et al., 2017), mesoporous materials (Zhang et al.,2015; Li et al., 2017), and layered double hydroxides (LDHs)(Monash and Pugazhenthi, 2014) have been extensivelystudied. LDHs constitute an important class of layeredmaterials, which have potential applications in remediationof anionic contaminants (Prasanna and Vishnu Kamath,2008). The chemical formula can be typically expressed as“[M(II)1−xM(III)x(OH)2]
x+(An−)x/n•mH2O,” in which theM(II) and M(III) are divalent and trivalent cations, representedby Mg2+ and Al3+ or many other transition metal cations(Jobbágy and Regazzoni, 2011; Peng et al., 2015). An− stands foran interlayer anion with a negative charge n, and m representsthe number of interlayer water molecules. The value of x hasa range of 0.17 and 0.33. Many anions or anionic complexes(both organic and inorganic) can be incorporated into thecrystal structure of LDHs. The LDHs can be abbreviated as[MII-MIII-A], where MII can be occupied by Zn2+, Mg2+, Cu2+,Mn2+, and Ca2+ ions; MIII stands for Al3+, Cr3+, Fe3+, andGa3+; An− refers to Cl−, NO−
3 , CO2−3 , and SO2−
4 (Liao et al.,2012). Due to their high anionic exchange capacities, especially,the anions are mainly extracted through ionic exchange withanions in the interlayer of LDHs. On the other hand, adsorptionperformance of the LDHs is affected by the surface properties ofthe LDHs (surface area, micropore surface area, and pore sizedistribution). LDHs have been considered as one of the mostpromising adsorbents for removing antibiotics. Thus, Cl-LDHcould be a useful adsorbent to remove PPCPs.
In this study, we synthesized Cl-LDH by co-precipitatedmethod and applied them as adsorbents for the removalof the three PPCPs (TC, DF, and CAP) from aqueoussolution; to investigate the effect of pH, adsorbents time andPPCPs concentration; to discuss the adsorbent mechanism ofPPCPs on Cl-LDH by theoretical calculations. In addition, themolecular dynamics simulation was also carried out to reveal
the configuration of PPCPs in the interlayer space and theinteractions between PPCPs and the layer structure of Cl-LDH,which helped to understand the adsorption mechanism of Cl-LDH. The purpose of this paper was to explore the possibilityof using Cl-LDH for the removal of TC and DF and developeco-friendly adsorbents.
METHODS AND EXPERIMENT
Preparation of Mg-Al-Cl LDHAll reagents used in this study were of analytical grade andused without further purification. The Cl-LDH was synthesizedthrough a co-precipitated method based on a previous study(Vreysen and Maes, 2008; Yue et al., 2017). Stoichiometric ratioof MgCl2•6H2O (24.396 g, 0.12mol) (Beijing Chemical Works,AR) and AlCl3•9H2O (7.2429 g, 0.03mol) (Beijing ChemicalWorks, AR) were dissolved in 150mL deionized water, markedas solution A. NaOH (12.0 g, 0.3mol) (Beijing Chemical Works,AR) andNaCl (1.7532 g, 0.03mol) (Beijing ChemicalWorks, AR)were dissolved in 150mL boiled deionized water to form solutionB. Solution A and solution B were added dropwise using a buretteat a rate of two drops per second into a three-necked flasksimultaneously, and the mixture was stirred to be homogeneousand the pH-value was kept around 10. The slurry was agedfor 12 h at 70◦C. After being centrifuged, the precipitate wascollected and washed with deionized water for several times, andthen LDHs sample was obtained after drying at 110◦C for 24 h.During the entire process of the experiment, an inert atmosphereof N2 was used to prevent the influence of carbonate ions.
Adsorption Experiments0.015 g Cl-LDH and 25mL PPCPs (pH= 7) solution were mixedin a 50mL centrifuge tube for all batch studies. For the isothermstudy, the initial concentrations of TC (Shanghai Yiji IndustrialCo., AR), DF (Chizhou Kelon Import and Export Co., AR), andCAP (Shenzhen Shijin Valley Technology Co., AR) solutionsvaried from 0.03 to 3.0 mmol/L. The kinetic study of PPCPs (pH= 7) was conducted at initial concentrations of 2.4 mmol/L for allthe three PPCPs. For the pH study, same initial concentrationsof PPCPs solutions with different pH-values (3, 4, 5, 7, 9, 11)were prepared to investigate the effect of pH on the adsorptioncharacteristics of PPCPs. The mixtures were shaken in a waterbath (CHA-S) with a speed of 150 rpm at room temperature for24 h except for the kinetic study in which mixtures were shakenfrom 1 to 1,440min. After that, the mixtures were centrifugedby high speed centrifuge (TG18K-1, DongWang instrument)at 4,500 rpm for 5min. Then, the supernatant solutionswere analyzed using the UV/VIS spectrophotometer (T6 NewCentury) to determine the equilibrium PPCPs concentration.PPCPs removal was identified by the difference between theinitial and final solution concentrations. All batch experimentwas run in duplicates.
Methods of AnalysesThe structures of the samples were analyzed using a RigakuD/Max-IIIa X-ray diffraction analyses diffractometer (XRD) withNi-filtered CuKα radiation at 30 kV and 20mA. Samples were
Frontiers in Chemistry | www.frontiersin.org March 2018 | Volume 6 | Article 16

Li et al. The Interactions Between Three Typical PPCPs and LDH
FIGURE 1 | X-ray diffraction pattern of Cl-LDH.
FIGURE 2 | Effect of pH on adsorption amount.
scanned from 3 to 70◦ (2θ) at 8◦/min with a scanning stepof 0.01◦/step. A 1◦ divergent slit and scatter slit and 0.3mmreceiving slit were used.
Fourier transform infrared (FTIR) spectra were collected ona Nicolet-560 spectrometer (Thermal Nicolet Co., USA) from400 to 4,000 cm−1 with a nominal resolution of 4 cm−1.For each spectrum 16 runs were collected and averaged. Thehydrotalcite samples for FTIR measurement were prepared byadding approximately 1 wt% of the sample powder to dry KBrpowder, and the mixture was pressed into tablet.
The equilibrium PPCPs concentrations were analyzed by aUV/VIS spectrophotometer (T6 New Century). The optimumwavelength of TC, DF, and CAP were 357, 276, and 278 nm,respectively.
Analyzer dynamic light scattering (DLS) and Zeta-potentialof the material were studied on zeta-potential (ELSZ-1000,
FIGURE 3 | Chemical structure of tetracycline (A), diclofenac sodium (C),
chloramphenicol (D), and scheme of TC protonation/deprotonation (B).
Otsuka Electronics Co., Ltd., Japan). The BET specific surfacearea was determined by surface area analyzer (ASAP 2020HD,Micromeritics Instrument Corporation, USA).
RESULTS AND DISCUSSION
Characterization of Cl-LDHFigure 1 showed the XRD pattern of the as-prepared Cl-LDHsample. It was apparently that a series of symmetric (00l) peaks atlower 2θ-values of Cl-LDH could be well-indexed to claymineralscontaining layered structure LDHs. The main strong peak neared2θ = 11.3◦, corresponding to d= 0.7852 nm, and the other sharppeak neared 2θ = 22.7◦, corresponding to d = 0.3920 nm, wereattributed to basal reflections. The sharpness and intensity of thepeaks indicated a highly crystalline structure of Cl-LDH. Thetypical d (003)-value of Cl-LDH was 0.7852 nm, which agreedwell with the values reported by other researchers in the literature(Özgümüs et al., 2013; Peng et al., 2015).
The zeta potential of Cl-LDH was 36.2mV, indicating that Cl-LDH had a good dispersity in water (Liu et al., 2017; Li et al.,2018). The DLS method resembled the size distribution of Cl-LDH in the range of 200–620 nm. The SEM image (Figure S1)of as prepared Cl-LDH reproved the size distribution of LDH aswell. The BET surface of Cl-LDH was 34.85 m2/g, indicating thatCl-LDH had a strong adsorption ability.
Frontiers in Chemistry | www.frontiersin.org March 2018 | Volume 6 | Article 16

Li et al. The Interactions Between Three Typical PPCPs and LDH
FIGURE 4 | Adsorption of DF, TC, and CAP by Cl-LDH at room temperature (A), the Langmuir and Freundlich fitting of the uptake of TC and DF on Cl-LDH (B–E).
TABLE 1 | Langmuir and Freundlich parameters for the TC and DF onto Cl-LDH.
Adsorbent Langmuir equation Freundlich equation
qm
(mmol/g)
KL(L/mmol)
R2 KF(mol1-1/nL1/n
g−1)
n R2
TC 1.85 1.19 0.993 1.05 1.38 0.999
DF 0.95 1.14 0.996 1.53 0.69 0.983
Effect of pHThe pH of the solution should be considered to be an importantfactor affecting the adsorbate process due to its impact on thedegree of ionization of pollutant species and the surface chargeof the adsorbent (Figure 2). When pH < pHPZC, the surface ofCl-LDH (pH < 9.6) was positively charged due to isomorphicsubstitution of Mg2+ ions by Al3+ ions. The zeta potentialvalue of Cl-LDH was 36.2mV which was measured at pHaround 7, suggesting positively charged surfaces. TC was a yellowcrystalline substance with a molecular weight of 480.9 g/mol,and the structure of TC was given in Figure 3A. In aqueoussolutions three different groups of the molecule could undergoprotonation–deprotonation reactions according to varying pH ofsolution. As shown in Figure 3B, three values of the dissociationconstants (pKa1 ≈ 3.4; pKa2 ≈ 7.5; pKa3 ≈ 9.3) had beendetermined experimentally that corresponds to existence of theprotonated (TCH+
3 ), neutral zwitterionic (TCH±2 ), monoanionic
(TCH−), and dianionic (TC−2) forms of TC (Sassman and Lee,2005; Soori et al., 2016). It could be easily seen that the bigger thepH-value was, themore amount of anionic species was.When thepH-value of equilibrium solution was<9, the adsorption amountof TC increased quickly with increasing pH. The maximumadsorption amount of TC was 2.16 mmol/L when pH = 9,which was attributed to the electrostatic interactions between
the negative charge of TC and the positive charge of Cl-LDH.Whereas when pH > pHpzc, namely, pH > 9.6 for Cl-LDH,the surface charge of Cl-LDH became negative and repulsiveto the negatively charged TC species, which caused the resultthat the adsorption amount decreased with the increasing ofpH.
The adsorption capacity at pH-values lower than the pKa(4.2) of DF was smaller than that at pH of 5.0, because DFwas in the form of neutral molecules (–COOH) (Liu et al.,2017; Sun et al., 2017) and the structure of DF was given inFigure 3C. On increasing the pH from 5.0 to 9.0, the adsorptioncapacity reached maximum and kept constant due to DF inthe form of anions (–COO−) at pH > pKa, finally decreasedat pH > 9.0. The zeta potential of the Cl-LDH indicated thatthere was a positive surface charge on Cl-LDH at pH < 9.6, butsurface positive charge decreased at pH > 9.6. This increasesthe electrostatic attraction between the negatively charged DFand Cl-LDH, which results in increased adsorption at pH <
9.6. Correspondingly the electrostatic attraction decreases dueto the decrease of surface positive charge of Cl-LDH from9.6 to 11 resulting in the decreased adsorption. The resultssuggested that the electrostatic interactions between anionicDF and cationic Cl-LDH could be the main driving forces foradsorption.
For CAP that the structure of CAP was given in Figure 3D,no uptake was observed on Cl-LDH. In the water solution, CAPmolecule existed as a cation and was positively, so Cl-LDH hadno electrostatic interaction with CAP.
Cl-LDH Sorption IsothermThe adsorption isotherms of Cl-LDH on different initialconcentrations of TC, DF, and CAP were shown in Figure 4A.With increasing concentrations, the adsorption amount ofTC increased rapidly. When the initial concentration was2.4 mmol/L (the equilibrium concentration of 1.3 mmol/L),
Frontiers in Chemistry | www.frontiersin.org March 2018 | Volume 6 | Article 16

Li et al. The Interactions Between Three Typical PPCPs and LDH
FIGURE 5 | Adsorption amount of DF, TC, and CAP onto Cl-LDH as a function of time (A), and the linear plot of pseudo-second-order model fit of DF and TC
adsorption on Cl-LDH (B).
TABLE 2 | Pseudo-second-order model constants for the TC and DF adsorption
on Cl-LDH.
Adsorbent TC DF
K2
(g·mmol−1
·min−1)
qe
(mmol/g)
R2 K2
(g·mmol−1
·min−1)
qe
(mmol/g)
R2
Cl-LDH 0.03 1.75 0.991 0.13 0.93 0.998
the adsorption amount reached 1.82 mmol/g. And whenthe equilibrium concentration was 1.85 mmol/L (the initialconcentration of 2.4 mmol/L), the maximum adsorption amountof DF reached saturation about 0.95 mmol/g. The adsorptionamount of CAP on Cl-LDH had no obvious change with theincrease of initial concentration, and when the equilibriumconcentration was 2.39 mmol/L (the initial concentration 2.4mmol/L), the maximum adsorption amount was only 0.02mmol/g.
The uptake of TC and DF on Cl-LDH were fitted using bothLangmuir and Freundlich sorption models. The Langmuir modelassumed that the uptake of specific homogeneous surface bymonolayer sorption without interaction between adsorbed ions,which could be written by the following equation (Huang et al.,2016):
1
qe=
1
qmaxklCe+
1
qmax
in which qe (mmol/g) and qmax (mmol/g) were the amount ofadsorbed TC and DF at equilibrium time and the maximumtheoretical adsorption capacity, respectively. Ce (mmol/L)stood for the equilibrium solution concentration, and Kl
(L/mmol) referred to the adsorption equilibrium parameter. The
parameters qmax and Kl could be obtained from the intercept andthe slope of a plot of 1/qe against Ce.
The Freundlich equation was developed empirically, with notheoretical basis. It was useful for describing the sorption of ionsby chemical adsorption and surface precipitation reactions. Thismodel, which was appropriate for heterogeneous systems, couldbe expressed by the following equation:
qe = KFC1�ne
where KF and 1/n were characteristic parameters related tothe sorption capacity and sorption intensity of the system,respectively. The values of KF and 1/n were calculated from alinear plot of lnqe against lnCe.
Figures 4B–E illustrated the Langmuir and Freundlich fittingof the uptake of TC and DF on Cl-LDH, and the adsorptionisotherm parameters for TC andDFwere summarized inTable 1.It was obvious that the Langmuir fitting had a bigger R2-value than Freundlich fitting, indicating the DF adsorption ontothe surface of the Cl-LDH was monolayer, in contrast to TCadsorption onto the surface of the Cl-LDH was multilayer.The fitted TC and DF maximum sorption capacities were1.85 and 0.95 mmol/g, respectively. Gao et al. (2012) reportedthe maximum adsorption capacity that the removal of TCby graphene oxide is 0.65 mmol/g, and Li et al. (2010)reported the maximum adsorption capacity for TC by smectiteis 0.40 mmol/g. Meanwhile, the complete different behaviorbetween TC and DF uptake may reflected totally differentmechanisms of their uptake on Cl-LDH the same experimentalcondition.
Cl-LDH Sorption KineticsThe effect of contact time on the adsorption amount of Cl-LDH at room temperature was investigated, and the adsorptioncapacity of DF, TC, and CAP onto Cl-LDH as a function of
Frontiers in Chemistry | www.frontiersin.org March 2018 | Volume 6 | Article 16

Li et al. The Interactions Between Three Typical PPCPs and LDH
FIGURE 6 | X-ray diffraction pattern of Cl-LDH before and after adsorption of TC, DF, and CAP. (A–C) Patterns of Cl-LDH after TC, DF, and CAP adsorption with
different initial concentrations, respectively. (D–F) XRD patterns of Cl-LDH after TC, DF, and CAP adsorption at different reaction time, respectively.
time was depicted in Figure 5. With the increasing reactiontime, the adsorption amount of TC and DF increased graduallythen reaches saturation, while adsorption amount of CAP wassmall and showed no obvious change. The rate of TC andDF uptake was rapid in the first 60min, where adsorptionamount were 1.24 and 0.74 mmol/g for TC and DF, respectively.After that, the adsorption saturation was reached in 120min,with the maximum adsorption amount of 1.72 and 0.91mmol/g for TC and DF, respectively. At the initial stage, thehigh adsorption rate might be attributed to abundant vacantactive sites on Cl-LDH surfaces available for adsorption. Witha gradual reducing quantity of active sites, the electrostaticrepulsive force played the leading role in the TC and DFloading on Cl-LDH. Thus, the adsorption of TC and DFslowed down, and finally the adsorption equilibrium wasestablished.
In order to understand the mechanism of adsorptionand evaluate the TC and DF adsorption performanceof Cl-LDH adsorbent, the pseudo-first-order kinetic, andpseudo-second-order kinetic models were applied to analyzethe dynamics adsorption experimental data. The kinetic modelswere expressed as follows (Ho and Mckay, 1998; Fu et al., 2015):
The pseudo-first-order kinetic model:
log(qe − qt) = log qe −k1
2.303t
The pseudo-second-order kinetic model:
t
qt=
t
qe+
1
k2q2e
Frontiers in Chemistry | www.frontiersin.org March 2018 | Volume 6 | Article 16

Li et al. The Interactions Between Three Typical PPCPs and LDH
FIGURE 7 | Zeta potential of Cl-LDH after TC, DF, and CAP adsorption.
where k1 (1·min−1) and k2 (g·mol−1·min−1) were the pseudo-first-order equilibrium rate constant and the pseudo-second-order equilibrium rate constant, respectively; q1 and q2(mmol·g−1) were the TC and DF adsorption amount atequilibrium; qt (mmol·g−1) was the amount of the TC and DFadsorbed at time t.
The experimental data could be well fitted with the pseudo-second-order model. The values of qe and k2 could be calculatedfrom the interception and slope of the linear equation of t/qtagainst t (Figure 5). The parameters of pseudo-second-orderkinetic for TC and DF were summarized in Table 2.
The adsorption capacities of TC and DF in the kinetic studywere 1.75 and 0.93 mmol/g, respectively. The result was in goodaccordance with the results obtained from the experiment data(1.72 and 0.91 mmol/g for TC and DF). The effect of the contacttime on the desorption of extent of TC and DF was also discussedin Supplementary Information.
XRD AnalysesThe XRD patterns of Cl-LDH samples before and afteradsorption of TC, DF, and CAP were shown in Figure 6. Spacingvalues of (003) remained approximately the same, indicating thatanion exchange, especially exchanged with interlayer anion didnot account for the high loading efficiency of TC. So the sorptionof TC on Cl-LDH were all on the external surfaces. The d003peak of Cl-LDH shifted toward smaller angle after the adsorptionof DF, of different initial concentrations and different reactiontime, as revealed by Figures 6B,E, suggesting the adsorption ofDF was based on intercalation of Cl-LDH. Besides, no newly-appeared or no shift in peak was observed in CAP experiment,(Figures 6C,F) which meant the adsorption of CAP was mainlyon the external surfaces of Cl-LDH or Cl-LDH tended not toadsorb CAP. The results of molecular simulation (Figure S2) wasin good agreement with the XRD results.
Zeta Potential DeterminationZeta potential was an indicator for the surface charge as well asthe surface hydrophobicity, and the zeta potential of Cl-LDH
before and after adsorption was illustrated by Figure 7. TheCl-LDH had a zeta potential of 36.2mV (pH = 7), indicatingpositively charged surfaces. As the initial concentrations wentup, there was a significant decrease of zeta potential duringthe adsorption of TC onto Cl-LDH, which was caused bythe electrostatic attraction between TC and Cl-LDH. It agreedwell with the results from XRD analysis of TC/Cl-LDH. Theadsorption of TC onto Cl-LDH was a process of chargeneutralization on the external faces. The zeta potential of DF/Cl-LDH showed a smaller decrease compared with TC/LDH.Combined with the result from XRD analysis, the adsorptionof DF might probably be consisted of two parts: electrostaticattraction on the surface and intercalation into Cl-LDH layers.Nevertheless, the zeta potential of CAP/Cl-LDH remained almostthe same after adsorption despite the increase of the initialconcentrations, which reproved that the adsorption of CAP ontoCl-LDH tended to be poor.
FTIR AnalysesThe FTIR spectra of Cl-LDH samples before and after adsorptionof TC, DF, and CAP were shown in Figure 8. In the spectraof Cl-LDH adsorbed TC, the broad peak located in the regionof 3,100–3,400 cm−1 related to O–H stretching vibrations. Thefingerprint peaks of TC range from 1,600 to 750 cm−1 emergeon the FTIR spectra of Cl-LDH after adsorption, which indicatedthat the TC had been effectively adsorbed on Cl-LDH. The bandat 1,581.45 cm−1, which could be attributed (C=C) vibration inaromatic rings. The band at 1,328.21 cm−1 was due to the C–O stretching vibration of phenol group, as shown in Figure 8A.The DF phases primarily appeared in four characteristic bands:the peak at 1,669 cm−1 was due to the C=O stretching vibration,the peak of 1,448 cm−1 referred to the flexural vibration of theCH2, the peak of 1,301 cm
−1 was attributed to the C–N extension,and the peak of 478 cm−1 corresponded to the C–Cl stretchingvibration, as shown in Figure 8B. For CAP-adsorbed Cl-LDH,there showed no obvious characteristic vibration peak of CAP.It suggested CAP could not be adsorbed by Cl-LDH, as shown inFigure 8C.
CONCLUSIONS
An Cl-LDH was synthesized, characterized, and examined forremoval of the three chosen PPCPs (TC, DF, and CAP) fromaqueous solution. According to XRD pattern, the preparedadsorbent had a typical LDH nanostructure. TC sorptionon Cl-LDH followed the Freundlich type isotherm, and DFsorption on Cl-LDH followed the Langmuir type isotherm.The TC and DF sorption by Cl-LDH fitted the pseudo-second-order model well. The novel adsorbent shown a highadsorption capacity of TC and DF (1.82 and 0.95 mmol/g).The adsorption mechanism of PPCPs into Cl-LDH wereproved to be different. The TC adsorption on Cl-LDH wasaccompanied by the electrostatic interactions between thenegative charge of TC and the positive charge of Cl-LDH.The uptake of DF was attributed to negative exchange andelectrostatic interaction. Cl-LDH did not adsorb CAP due tono electrostatic interaction. The molecular dynamic simulationfurther confirmed different configurations of three selected
Frontiers in Chemistry | www.frontiersin.org March 2018 | Volume 6 | Article 16

Li et al. The Interactions Between Three Typical PPCPs and LDH
FIGURE 8 | FTIR spectra of CL-LDH after adsorption of TC (A), DF (B), and CAP (C).
PPCPs were ultimately responsible for the uptake of PPCPs onCl-LDH. The overall results of the present study suggested theefficient use of Cl-LDH for the removal of TC and DF from theaqueous solution.
AUTHOR CONTRIBUTIONS
GL and LL designed the experiments. EL and CY carried outthe experiments and analyzed the data. YL carried out theexperiments. All authors discussed the results, EL, GL, andZL wrote the paper. The manuscript has been reviewed andapproved by all authors.
FUNDING
This present work was supported by the National NaturalScience Foundations of China (Grant No. 51604248), theFundamental Research Funds for the Central Universities (GrantNo. 2652017338 and 2652017380).
SUPPLEMENTARY MATERIAL
The Supplementary Material for this article can be foundonline at: https://www.frontiersin.org/articles/10.3389/fchem.2018.00016/full#supplementary-material
Frontiers in Chemistry | www.frontiersin.org March 2018 | Volume 6 | Article 16

Li et al. The Interactions Between Three Typical PPCPs and LDH
REFERENCES
Ahmadi, M., Ramezani Motlagh, H., Jaafarzadeh, N., Mostoufi, A., Saeedi, R.,
Barzegar, G., et al. (2017). Enhanced photocatalytic degradation of tetracycline
and real pharmaceutical wastewater using MWCNT/TiO2 nano-composite. J.
Environ. Manage. 186, 55–63. doi: 10.1016/j.jenvman.2016.09.088
Fu, J., Chen, Z., Wang, M., Liu, S., Zhang, J., Zhang, J., et al. (2015). Adsorption of
methylene blue by a high-efficiency adsorbent (polydopamine microspheres):
kinetics, isotherm, thermodynamics and mechanism analysis. Chem. Eng. J.
259, 53–61. doi: 10.1016/j.cej.2014.07.101
Gao, Y., Li, Y., Zhang, L., Huang, H., Hu, J., Shah, S. M., et al. (2012). Adsorption
and removal of tetracycline antibiotics from aqueous solution by graphene
oxide. J. Colloid Interface Sci. 368, 540–546. doi: 10.1016/j.jcis.2011.11.015
Ho, Y. S., and Mckay, G. (1998). Kinetic models for the sorption of
dye from aqueous solution by wood. Process Saf. Environ. 76, 183–191.
doi: 10.1205/095758298529326
Huang, Q., Deng, S., Shan, D., Wang, Y., Wang, B., Huang, J., et al.
(2017). Enhanced adsorption of diclofenac sodium on the carbon
nanotubes-polytetrafluorethylene electrode and subsequent degradation
by electro-peroxone treatment. J. Colloid Interface Sci. 488, 142–148.
doi: 10.1016/j.jcis.2016.11.001
Huang, X., Liu, Y., Liu, S., Tan, X., Ding, Y., Zeng, G., et al. (2016).
Effective removal of Cr(vi) using β-cyclodextrin–chitosan modified
biochars with adsorption/reduction bifuctional roles. RSC Adv. 6, 94–104.
doi: 10.1039/C5RA22886G
Huber, M. M., Korhonen, S., Ternes, T. A., and von Gunten, U. (2005). Oxidation
of pharmaceuticals during water treatment with chlorine dioxide. Water Res.
39, 3607–3617. doi: 10.1016/j.watres.2005.05.040
Jie, Z., and Shuhe, W. (2015). The distribution and eco toxicology of tetracycfine
in soil and water environment and its degradation: a review. Acta Ecol. Sin. 35,
2819–2825. doi: 10.5846/stxb201306111662
Jobbágy, M., and Regazzoni, A. E. (2011). Dissolution of nano-size Mg–
Al–Cl hydrotalcite in aqueous media. Appl. Clay Sci. 51, 366–369.
doi: 10.1016/j.clay.2010.11.027
Kim, I., and Tanaka, H. (2009). Photodegradation characteristics of PPCPs in water
with UV treatment. Environ. Int. 35, 793–802. doi: 10.1016/j.envint.2009.01.003
Li, B., Ma, J., Zhou, L., and Qiu, Y. (2017). Magnetic microsphere to remove
tetracycline from water: adsorption, H2 O2 oxidation and regeneration. Chem.
Eng. J. 330, 191–201. doi: 10.1016/j.cej.2017.07.054
Li, L., Qi, G., Wang, B., Yue, D., Wang, Y., and Sato, T. (2018). Fulvic acid
anchored layered double hydroxides: a multifunctional composite adsorbent
for the removal of anionic dye and toxic metal. J. Hazard. Mater. 343, 19–28.
doi: 10.1016/j.jhazmat.2017.09.006
Li, Z., Chang, P. H., Jean, J. S., Jiang, W. T., and Wang, C. J. (2010). Interaction
between tetracycline and smectite in aqueous solution. J. Colloid Interface Sci.
341, 311–319. doi: 10.1016/j.jcis.2009.09.054
Liao, L., Zhao, N., and Xia, Z. (2012). Hydrothermal synthesis of Mg–Al layered
double hydroxides (LDHs) from natural brucite and Al(OH)3.Mater. Res. Bull.
47, 3897–3901. doi: 10.1016/j.materresbull.2012.07.007
Liu, T., Xie, Z., Zhang, Y., Fan, J., and Liu, Q. (2017). Preparation of cationic
polymeric nanoparticles as an effective adsorbent for removing diclofenac
sodium from water. RSC Adv. 7, 38279–38286. doi: 10.1039/C7RA06730E
Lv, G., Li, Z., Elliott, L., Schmidt, M. J., MacWilliams, M. P., and Zhang, B. (2017).
Impact of tetracycline-clay interactions on bacterial growth. J. Hazard. Mater.
doi: 10.1016/j.jhazmat.2017.09.029. [Epub ahead of print].
Monash, P., and Pugazhenthi, G. (2014). Utilization of calcined Ni-Al
layered double hydroxide (LDH) as an adsorbent for removal of methyl
orange dye from aqueous solution. Environ. Prog. Sustain. 33, 154–159.
doi: 10.1002/ep.11771
Nakada, N., Shinohara, H., Murata, A., Kiri, K., Managaki, S., Sato, N., et al.
(2007). Removal of selected pharmaceuticals and personal care products
(PPCPs) and endocrine-disrupting chemicals (EDCs) during sand filtration and
ozonation at a municipal sewage treatment plant. Water Res. 41, 4373–4382.
doi: 10.1016/j.watres.2007.06.038
Özgümüs, S., Gök, M. K., Bal, A., and Güçlü, G. (2013). Study on novel exfoliated
polyampholyte nanocomposite hydrogels based on acrylic monomers andMg–
Al–Cl layered double hydroxide: synthesis and characterization. Chem. Eng. J.
223, 277–286. doi: 10.1016/j.cej.2013.02.098
Peng, C., Yu, J., Zhao, Z., Fu, J., Zhao, M., Wang, W., et al. (2015). Preparation and
properties of a layered double hydroxide deicing additive for asphalt mixture.
Cold Reg. Sci. Technol. 110, 70–76. doi: 10.1016/j.coldregions.2014.11.013
Prasanna, S. V., and Vishnu Kamath, P. (2008). Chromate uptake characteristics
of the pristine layered double hydroxides of Mg with Al. Solid State Sci. 10,
260–266. doi: 10.1016/j.solidstatesciences.2007.09.023
Qi, M., Zhihao, Z., Xiuwen, C., Pu, W., and Huiling, L. (2015).
Research progress in the pollution situation and treatment methods
for diclofenac in water. Shangdong Chenm. Indus. 44, 66–68.
doi: 10.19319/j.cnki.issn.1008-021x.2015.16.026
Richardson, B. J., Lam, P. K., and Martin, M. (2005). Emerging chemicals
of concern: pharmaceuticals and personal care products (PPCPs) in Asia,
with particular reference to Southern China. Mar. Pollut. Bull. 50, 913–920.
doi: 10.1016/j.marpolbul.2005.06.034
Sai, N., Wu, Y., Sun, Z., Yu, G., and Huang, G. (in press). A novel
photonic sensor for the detection of chloramphenicol. Arab. J. Chem.
doi: 10.1016/j.arabjc.2016.06.015
Sassman, S. A., and Lee, L. S. (2005). Sorption of Three Tetracyclines by Several
Soils: assessing the role of pH and cation exchange. Environ. Sci. Technol. 39,
7452–7459. doi: 10.1021/es0480217
Soori, M. M., Ghahramani, E., Kazemian, H., Al-Musawi, T. J., and Zarrabi, M.
(2016). Intercalation of tetracycline in nano sheet layered double hydroxide: an
insight into UV/VIS spectra analysis. J. Taiwan Inst. Chem. Eng. 63, 271–285.
doi: 10.1016/j.jtice.2016.03.015
Suárez, S., Carballa, M., Omil, F., and Lema, J. M. (2008). How are pharmaceutical
and personal care products (PPCPs) removed from urban wastewaters? Rev.
Environ. Sci. Biol. 7, 125–138. doi: 10.1007/s11157-008-9130-2
Suarez, S., Lema, J. M., and Omil, F. (2010). Removal of pharmaceutical and
personal care products (PPCPs) under nitrifying and denitrifying conditions.
Water Res. 44, 3214–3224. doi: 10.1016/j.watres.2010.02.040
Sui, Q., Cao, X., Lu, S., Zhao, W., Qiu, Z., and Yu, G. (2015). Occurrence,
sources and fate of pharmaceuticals and personal care products in the
groundwater: a review. Emerg. Contam. 1, 14–24. doi: 10.1016/j.emcon.2015.
07.001
Sun, K., Shi, Y., Wang, X., Rasmussen, J., Li, Z., and Zhu, J. (2017). Organokaolin
for the uptake of pharmaceuticals diclofenac and chloramphenicol from water.
Chem. Eng. J. 330, 1128–1136. doi: 10.1016/j.cej.2017.08.057
Sun, Q., Li, Y., Li, M., Ashfaq, M., Lv, M., Wang, H., et al. (2016). PPCPs
in Jiulong river estuary (China): spatiotemporal distributions, fate, and
their use as chemical markers of wastewater. Chemosphere 150, 596–604.
doi: 10.1016/j.chemosphere.2016.02.036
Vreysen, S., and Maes, A. (2008). Adsorption mechanism of humic and fulvic
acid onto Mg/Al layered double hydroxides. Appl. Clay Sci. 38, 237–249.
doi: 10.1016/j.clay.2007.02.010
Yue, X., Liu, W., Chen, Z., and Lin, Z. (2017). Simultaneous removal of Cu(II)
and Cr(VI) by Mg-Al-Cl layered double hydroxide and mechanism insight. J.
Environ. Sci. 53, 16–26. doi: 10.1016/j.jes.2016.01.015
Zhang, Z., Liu, H., Wu, L., Lan, H., and Qu, J. (2015). Preparation of amino-Fe(III)
functionalized mesoporous silica for synergistic adsorption of tetracycline and
copper. Chemosphere 138, 625–632. doi: 10.1016/j.chemosphere.2015.07.014
Conflict of Interest Statement: The authors declare that the research was
conducted in the absence of any commercial or financial relationships that could
be construed as a potential conflict of interest.
The reviewer WW, and handling Editor declared their shared affiliation.
Copyright © 2018 Li, Liao, Lv, Li, Yang and Lu. This is an open-access article
distributed under the terms of the Creative Commons Attribution License (CC
BY). The use, distribution or reproduction in other forums is permitted, provided
the original author(s) and the copyright owner are credited and that the original
publication in this journal is cited, in accordance with accepted academic practice.
No use, distribution or reproduction is permitted which does not comply with these
terms.
Frontiers in Chemistry | www.frontiersin.org March 2018 | Volume 6 | Article 16

ORIGINAL RESEARCH
published: 11 April 2018
doi: 10.3389/fchem.2018.00104
Frontiers in Chemistry | www.frontiersin.org April 2018 | Volume 6 | Article 104
Edited by:
Hongfei Cheng,
China University of Mining and
Technology, China
Reviewed by:
Jie Lei,
Fudan University, China
Runliang Zhu,
Guangzhou Institute of Geochemistry
(CAS), China
Nito Angelo Debacher,
Universidade Federal de Santa
Catarina, Brazil
*Correspondence:
Ping Zhang
Daishe Wu
Specialty section:
This article was submitted to
Green and Sustainable Chemistry,
a section of the journal
Frontiers in Chemistry
Received: 13 February 2018
Accepted: 20 March 2018
Published: 11 April 2018
Citation:
Tang Q, Duan T, Li P, Zhang P and
Wu D (2018) Enhanced Defluoridation
Capacity From Aqueous Media via
Hydroxyapatite Decorated With
Carbon Nanotube.
Front. Chem. 6:104.
doi: 10.3389/fchem.2018.00104
Enhanced Defluoridation CapacityFrom Aqueous Media viaHydroxyapatite Decorated WithCarbon Nanotube
Qingzi Tang1, Tongdan Duan1, Peng Li 2, Ping Zhang1,2* and Daishe Wu1*
1 Key Laboratory of Poyang Lake Environment and Resource Utilization, School of Environmental and Chemical Engineering,
Ministry of Education, Nanchang University, Nanchang, China, 2 Australian Institute for Bioengineering and Nanotechnology,
The University of Queensland, Brisbane, QLD, Australia
In this work, the potential of a novel hydroxyapatite decorated with carbon
nanotube composite (CNT-HAP) for fluoride removal was investigated. The synthesized
CNT-HAP composite was systematically characterized by X-ray diffraction(XRD),
Fourier Transform infrared spectroscopy(FTIR), scanning electron microscope (SEM)
and Brunauer–Emmett–Teller(BET). Batch adsorption experiments were conducted to
investigate the defluorination capacity of CNT-HAP. The CNT-HAP composite has
a maximum adsorption capacity of 11.05 mg·g−1 for fluoride, and the isothermal
adsorption data were fitted by the Freundlich model to calculate the thermodynamic
parameters. Thermodynamic analysis implies that the adsorption of fluoride on
CNT-HAP is a spontaneous process. Furthermore, the adsorption of fluoride follows
pseudo-second-order model. The effects of solution pH, co-existing anions and reaction
temperature on defluorination efficiency were examined to optimize the operation
conditions for fluoride adsorption. It is found that the optimized pH-value for fluoride
removal by CNT-HAP composite is 6. In addition, among five common anions studied in
this work, the presence of HCO−3and PO3−
4could considerably affect the fluoride removal
by CNT-HPA in aqueous media. Finally, the underlying mechanism for the fluoride removal
by CNT-HAP is analyzed, and an anion exchange process is proposed.
Keywords: fluoride removal, hydroxyapatite decorated with carbon nanotube (CNT-HAP), ion-exchanged, hydroxyl
anions, removal mechanism
INTRODUCTION
Fluoride is an essential element for both human and animals. However, it may be useful or harmfulto human bodies, depending on its concentration in drinking water and total ingested amount(Chen et al., 2012; Sharma et al., 2017). It is recommended by World Health Organization (WHO)that the most appropriate concentration of fluoride in drinking water is 0.5–1.5 mg·L−1, exceedingwhich people could have dental and / or skeletal fluorosis such as softening of bones, mottlingof teeth and neurological damage (Liu et al., 2015; Zhang L. E. et al., 2017). Unfortunately, theUnfortunately, the concentration of fluoride has been found to be as high as 30 mg·L−1 in thedrinking water of about 25 countries across the world, including India, Mexico and China (Aminiet al., 2008). And the fluoride pollution in drinking water is even worse and worse. (Jagtap et al.,2012; Roy and Dass, 2013). Therefore, it is necessary to remove the excess fluoride from drinkingwater.

Tang et al. CNT-HAP Synthesis and Defluoridation
Currently, there are several methods available fordefluorination, such as chemical precipitation (Xin et al.,2016; Huang et al., 2017), membrane filtration (Zhang J.et al., 2017), electrolysis (Schaefer et al., 2017), ion exchange(Popat et al., 1994; Jamhour, 2005), and adsorption (Rehmanet al., 2015; Lin et al., 2016). Among the above-mentionedmethods, adsorption is a most attractive option owning to itslow cost, high efficiency, and good flexibility (Mohan et al.,2017). Hydroxyapatite [Ca10(PO4)6(OH)2, HAP] is a naturalmineral with abundance in bone and skeletal tissues. It hasbeen demonstrated to be a promising candidate adsorbent forfluoride removal because of its easy synthesis, high recyclability,and good biocompatibility (Beladi et al., 2017; Lei et al., 2017).Jiménez-Reyes. et al. reported that the defluorination capacity ofHAP was 4.7mg of fluoride/g of adsorbent in the pH range of5.0–7.3 (Jiménez-Reyes and Solache-Ríos, 2010). Sundaram et al.prepared the HAP / chitosan nanocomposite for fluoride removalwith a defluorination capacity of 1.56 mg·g−1 (Gao et al., 2009).There are two factors contributing to the removal of fluoride byHAP: ion exchange and electrostatic interaction (He et al., 2015).In this process, fluorapatite [Ca5(PO4)3F] or mixed fluorinatedHAP [Ca5(PO4)3(OH-F)] which are thermodynamically morestable are formed.
However, the practical application of HAP in fluoride removalfrom drinking water is still limited by its low defluorinationcapacity. It has been well established that adsorbents withhigh surface areas and active sites density can be fabricatedby tailoring the morphology and pore size (Chen et al.,2016). Moreover, adsorbents with hierarchically meso- and/or macroporous networks enable the fast diffusion of guestmolecules in the channels, thus facilitating their access to activesites. Among various kinds of materials, carbon nanotubes(CNT) are particularly attractive because they not only have thecharacteristics mentioned above, but also can act as adsorbentsfor fluoride removal. For example, Li et al. (2003) reported use ofaligned CNT to remove fluoride, and an adsorption capacity of4.5mg·g−1 was achieved in the aqueous solution with the fluorideconcentration of 15 mg·L−1.
In a very recently study, Neelgund et al. (Neelgund and Oki,2016) found that CNT could improve the photothermal efficiency(PTE) of HAP, and HAP could also overcome the poor dispersionof CNT. In this work, we proposed the combination of HAPwith CNT for fluoride removal from aqueous media. To thebest of our knowledge, there are few study on such a subject.The major objectives of our work are: (1) to characterize CNT-HAP composite by XRD, FTIR, SEM, and TGA; (2) to comparethe defluorination performance between HAP and CNT-HAPcomposite;(3) to optimize the operation conditions for fluorideremoval; (4) to disclose the underlying mechanism of fluorideremoval.
EXPERIMENTAL SECTION
MaterialsAll the chemicals were purchased fromTianjin DamaoChemicalsCo. Ltd., (China), and used directly without further purification.The water used in this work was in ultrapure grade.
Preparation of CNT-HAP CompositeCNT-HAP composite was synthesized by co-precipitation. ThepH of aqueous solutions of Ca(NO3)2 (0.25 mol·L−1) and(NH4)2HPO4 (0.3·mol L−1) (Ca/P = 1.67) were adjusted to 10.0by NH3·H2O. The CNT (5 wt‰) was functionalized by HNO3,and then added into the aqueous solution of Ca(NO3)2. Thesolution was ultrasonicated until a homogeneous solution wasformed (A). The aqueous solution of (NH4)2HPO4 was drippedslowly into the solution A under vigorous stirring for 1 h at45◦C to generate precipitates. Afterwards, the pH of solutionwas adjusted to 10.0 by NH3·H2O. The mixture was aged for24 h at room temperature to form colloids. The colloids werecentrifuged, washed with ultrapure water for several times, milledwith ethanol, dried at 80◦C, and finally calcined at 200◦C for 2 hto give CNT-HAP composite.
Materials CharacterizationsThe phase composition and crystal structure of CNT-HAPcomposite were characterized by an X-ray powder diffractometer(XRD, D8 ADVANCE X), using Cu Kα (40 kV, 40mA) radiationin the scanning range of 10–80◦. The chemical structure wascharacterized by a Fourier transform infrared spectrometer(FTIR, Nicolet 5700,) in the wavenumber range of 400–4,000cm−1. The elemental composition was examined by an X-rayphotoelectron spectroscopy (XPS, Axis Ultra DLD), using Al Kα
radiation. The morphology was examined by a scanning electronmicroscope (SEM, JSM 6701F) at the accelerating voltage of 5 kV.The specific surface area was calculated by Brunauer-Emmett-Teller (BET) equation from the N2 adsorption-desorptionisotherms determined by a porosity analyser (JW-BK132F). ThepH-values were determined by a pH electrode (pH SJ-4A). Theconcentrations of fluoride in aqueous solutions were determinedby ion chromatography (IC, ICS-1100).
Adsorption ExperimentsThe adsorption experiments were performed by the batchmethod to investigate the effects of different parameters (e.g.,temperature, reaction time, pH and co-existing ions) on fluorideremoval by CNT-HAP. In a typical run, 0.01 g of CNT-HAP wasmixed with 20mL of aqueous solution containing fluoride, andthe mixture was stirred at the rate of 180 rpm and temperature of25◦C for 24 h to achieve the adsorption equilibrium.
RESULTS AND DISCUSSION
X-Ray DiffractionThe XRD patterns of HAP, CNT and CNT-HAP composite arepresented in Figure 1. The diffraction peaks of HAP could beindexed to hexagon-phased HAP with considerable intensitiesat 26, 33, 34, 35, and 40◦ (JCPDS file 09-0432). In comparisonwith the diffraction patterns of HAP, those of CNT-HAP are verysimilar, indicating the successful incorporation of HAP into thematrices of CNT. However, it is worth noting that the diffractionpatterns of CNT could hardly be observed in those of CNT-HAP composite, which should be attributed to the overlap ofthe major diffraction peaks of CNT and HAP at 26◦. On theother hand, if CNT was directly wrapped by as-synthesized
Frontiers in Chemistry | www.frontiersin.org April 2018 | Volume 6 | Article 104

Tang et al. CNT-HAP Synthesis and Defluoridation
HAP, the characteristic peaks of CNT can also not be observedin the diffraction patterns of CNT-HAP composite. This couldalso elucidate successful synthesis of CNT-HAP. In addition, thesharp and symmetric diffraction peaks confirm good crystallinityof synthesized CNT-HAP composite.
Infrared SpectroscopyThe FT-IR spectra of HAP, CNT and CNT-HAP are shown inFigure 2. The broad peaks at 3,150–3,550 cm−1 are assigned tothe O-H vibration (Xu et al., 2013). The bands at 1,030–1,040,600–610, and 550–570 cm−1 are associated with the stretchingvibration of phosphate, confirming the presence of HAP in CNT-HAP composite. Besides those peaks associated with HAP, theC-H stretching vibration appears at 2,800–3,000 cm−1 while theC-H bending vibration is observed at 1,370–1,400 cm−1 (Zhanget al., 2012). The peaks at 1,630–1,640 cm−1 are attributed tothe C= O stretching vibration. All these characteristic peaks canalso be found in the acidified CNT, confirming the pliable phasecomposition of CNT-HAP composite, which is in accordancewith the results concluded from XRD patterns.
Scanning Electron MicroscopyThe SEM images of CNT, HAP and CNT-HAP are presented inFigure 3. HAP displays faint lamellar morphology and compactinternal structure, while CNT-HAP displays legible lamellarmorphology because the introduction of CNT is beneficial forthe nucleation and crystallization of HAP. The vertical growthof HAP along CNT implies that CNT-HAP has higher specificsurface area than HAP. In Figure 3c, the characteristic tubularstructure cannot be observed in CNT-HAP, suggesting that CNTis wrapped by HAP on the surface, which is consistent with theresults concluded from XRD patterns. The SEM images provesthe successful synthesis of CNT-HAP and the assembly of HAPon the surface of CNT.
Adsorption IsothermsThe adsorption isotherms of fluoride on HAP and CNT-HAP at 25, 35, and 45◦C were determined, as shown inFigure 4. The adsorbed amounts of fluoride by HAP and CNT-HAP both increase rapidly at low fluoride concentrations,and the increasing trend gradually fades out at high fluorideconcentrations. With the increase of temperature, the adsorbedamounts of fluoride increase continuously. The maximumadsorption capacity (qm) of fluoride on CNT-HAP at 25◦C is11.05 mg·g−1, being higher than pristine HAP and other HAP-based materials reported in the literature (Table 1; Gao et al.,2009; Sairam Sundaram et al., 2009; Jiménez-Reyes and Solache-Ríos, 2010; Liu et al., 2010; Kanno et al., 2014; Prabhu andMeenakshi, 2014; He et al., 2017; Nigri et al., 2017; Zúñiga-Muroet al., 2017).
To better understand the adsorption behavior of fluoride, theLangmuir and Freundlich models were used to correlate theadsorption data. The Langmuirmodel (Equation 1) applicable formonolayer adsorption process (Li et al., 2012; Reynel-Avila et al.,2016).
qe =qmkLce
1+ kLce(1)
FIGURE 1 | XRD patterns of CNT-HAP (a), HAP (b), and CNT (c).
TABLE 1 | Comparison of fluoride adsorption capacities of pristine HAP and
various HAP-based materials.
Adsorbents Adsorption
capacities
(mg·g−1)
Cinitial
(mg·L−1)
pH References
HAP powder 4.7 20 7.0 Jiménez-Reyes and
Solache-Ríos, 2010
Nano-HAP/Chitin 3.0 10 7.0 Sairam Sundaram
et al., 2009
Al-HAP adsorption
membrane
7.15 10 7.0 He et al., 2017
HAP-coated-limestone 9.3 50 7.0 Kanno et al., 2014
Synthetic nano-HAP 4.8 80 5.0–6.0 Gao et al., 2009
DTAB-HAP powder 3.436 10 7.0 Prabhu and
Meenakshi, 2014
Nano-HAP/Chitosan 1.56 10 7.0 Sairam Sundarama,
2008
Synthetic siderite 1.775 3–20 4.0–9.0 Liu et al., 2010
bone char 4.81 10 7.2–7.7 Nigri et al., 2017
cerium-containing bone
char
13.6 10 7.0 Zúñiga-Muro et al.,
2017
Where qe (mg·g−1) is the adsorbed amount of fluoride atequilibrium; Ce (mg·L−1) (mg·L−1) is the concentration offluoride in supernatant solution at equilibrium; qm (mg·g−1)represents the maximum adsorption capacity; and kL (L·mg−1)represents the adsorption equilibrium constant. The Freundlichmodel (Equation 2) is applicable for the description ofadsorption data on heterogeneous surfaces at low to intermediateconcentrations (Mahmoud et al., 2016).
qe = kFCe1n (2)
Where kF (mg1−n·Ln·g−1) i the adsorption capacity whenthe equilibrium concentration of ion equals to 1; and n isthe dependent degree of adsorption capacity on equilibriumconcentration, with the value of 1∼10. The fitted parameters for
Frontiers in Chemistry | www.frontiersin.org April 2018 | Volume 6 | Article 104

Tang et al. CNT-HAP Synthesis and Defluoridation
two adsorption models as well as the correlation coefficients (R2)are shown in Table 2. According to the values of R2 and fittedcurves shown in Figure 4, it is obvious that the Langmuir modelis better for describing the adsorption behavior of fluoride onHAP, implying that the adsorption energy is constant and theadsorption capacity is limited by the amounts of active sites.In contrast, the Freundlich model is better for describing theadsorption behavior of fluoride on CNT-HAP, implying that theadsorption of fluoride is subjected to multi-layer and physical-chemical adsorption.
Adsorption Thermodynamic AnalysisThe thermodynamic parameters such as Gibbs free energychange (�G◦), adsorption enthalpy (�H◦) and adsorptionentropy (�S◦) could be calculated from the adsorption dataaccording to eqs. 3∼6 (Luo et al., 2015; Wang et al., 2015; Singhand Anil Kumar, 2016).
�G◦ = −RTlnKd (3)
ΔS◦ = −
(∂ΔG◦
∂T
)P
(4)
ΔH◦ = ΔG◦ + TΔS◦ (5)
InK = �S◦/R− �H◦/RT (6)
Where R is the gas constant (8.314 J·mol−1·K−1); T is theabsolute temperature (K); and Kd is the adsorption equilibriumconstant. As shown in Table 3, the negative values of �G◦
indicate that the adsorption process of fluoride is spontaneous.The much lower values of �G◦For fluoride adsorption on CNT-HAP than on HAP at the same temperature suggests the easieradsorption of fluoride on CNT-HAP than on HAP. The positivevalue of �S◦ elucidate that the organization of fluoride ions onthe surface of adsorbents is more random than in the aqueoussolutions. The positive values of �H◦ suggest that the adsorptionof fluoride on HAP and CNT-HAP is endothermic.
Adsorption KineticsThe adsorbed amounts of fluoride were plotted vs. adsorptiontime to examine the adsorption kinetics, as shown in Figure 2.The amounts of fluoride adsorbed byHAP andCNT-HAP rapidlyincrease in the first 2 h. Then the adsorption rate slows down
TABLE 2 | Fitted Langmuir and Freundlich model parameters for fluoride
adsorption on HAP and CNT-HAP composite at different temperatures.
Samples Temperatures
(◦C)
Langmuir model Freundlich model
qm /
(mg·g−1)
KL /
(L·mg−1)
R2 kF n R2
HAP 25 5.01 0.55 0.9772 2.63 6.56 0.8932
HAP 35 6.25 0.50 0.9493 3.07 5.88 0.9136
HAP 45 6.81 1.08 0.9479 4.07 7.77 0.8933
CNT-HAP 25 11.05 0.18 0.9142 3.57 3.96 0.9735
CNT-HAP 35 13.57 0.17 0.9075 4.26 3.88 0.9695
CNT-HAP 45 16.78 0.17 0.8835 5.08 3.74 0.9831
and reaches equilibrium at 240 and 300min, respectively. Theadsorption kinetic data were fitted by pseudo-first-order model(Equation 7), and pseudo-second-order model (Equation 8),respectively (Naowanat et al., 2016; Subbaiah and Kim, 2016; Sunet al., 2017).
qt = qe
(1− e−k1 t
)(7)
qr =q2ek2t
1+ qek2t(8)
Where k1 (min−1); k2 (g·mg−1·h−1) are the pseudo-first-orderand the pseudo-second-order rate constant, respectively; qt(mg·g−1) is the adsorbed amount of fluoride on adsorbents attime t (min); qe (mg·g−1) is the equilibrium adsorption capacity.The nonlinear fitting for qt vs. t is presented in Figure 5. Allthe fitted kinetic kinetic parameters as well as the correlationcoefficients (R2) are listed in Table 4. Obviously, the kinetic dataof fluoride adsorption on HAP and CNT-HAP are well fittedto the pseudo-second-order model, indicating that the fluorideremoval processes are subjected to chemical reaction (Tadjarodiet al., 2016), which determines the overall adsorption rate.
TABLE 3 | The thermodynamic parameters of fluoride adsorption on HAP and
CNT-HAP composite.
Adsorbents T(◦C) �G0
(kJ·mol−1)
�H0
(kJ·mol−1)
�S0
(J·mol−1·K−1)
lnKd
CNT-HAP 25 −16.53 6.67
CNT-HAP 35 −17.78 20.68 124.38 6.94
CNT-HAP 45 −19.03 7.19
HAP 25 −15.54 19.80 118.72 6.27
HAP 35 −16.81 6.56
HAP 45 −17.90 6.77
FIGURE 2 | FT-IR spectra of CNT, HAP, and CNT-HAP.
Frontiers in Chemistry | www.frontiersin.org April 2018 | Volume 6 | Article 104

Tang et al. CNT-HAP Synthesis and Defluoridation
TABLE 4 | Fitted kinetic parameters for fluoride adsorption on HAP and CNT-HAP
composite.
Samples Pseudo first-order Pseudo second-order
k1 / qe / R2 k2 / qe / R2
(min−1) (mg·g−1) (g·mg−1·min−1) (mg·g−1)
HAP 0.22 4.73 0.9204 0.09 4.85 0.9827
CNT-HAP 0.20 5.70 0.3956 0.05 5.97 0.8277
Effects of Solution pH and Co-existing
AnionsThe adsorption of fluoride on HAP and CNT-HAP from aqueous
solutions with different pH values ranging from 3.0 to 10.0 was
investigated (Figure 6A). Obviously, the CNT-HAP composite
exhibits considerably higher adsorption capacities for fluoride
than HAP, thereby displaying great potential application indefluorination from aqueous media. As for the effect of solution
FIGURE 3 | SEM images of CNT (a), HAP (b), and CNT-HAP (c).
FIGURE 4 | Adsorption isotherms of fluoride on HAP (A) and CNT-HAP (B) at three different temperatures (adsorbents dosage: 0.5 g·L−1, pH: 7.0).
Frontiers in Chemistry | www.frontiersin.org April 2018 | Volume 6 | Article 104

Tang et al. CNT-HAP Synthesis and Defluoridation
pH, the fluoride adsorption capacities first increase in the pHrange of 3.0–6.0, but then decrease in the pH range of 6.0–10.0. Therefore, the optimal pH-value for fluoride removal is6.0. Under such a weakly acidic condition, the surface of CNT-HAP and HAP would be protonated, thus increase the densityof active sites on the surface (Jiménez-Reyes and Solache-Ríos,2010; Nie et al., 2012). In contrast, the surface of CNT-HAP andHAP would be saturated with negative charges under alkalinecondition, which restrains the diffusion of fluoride ions on thesurface, thus resulting in lower adsorption capacities. Our resultsare consistent with some other works, which reported the highfluoride removal efficiency in acidicmedia owing to the attractionof fluoride anion to the positively charged adsorbents surface, and
FIGURE 5 | Nonlinear fitting for kinetic data of fluoride adsorption on HAP and
CNT-HAP.
FIGURE 7 | XPS spectra of the HAP (A) and CNT-HAP (B) before and after
fluoride adsorption.
FIGURE 6 | Effects of pH (3.0–11.0) (A) and coexisting anions (B) on the removal of fluoride by HAP and CNT-HAP (adsorbents dosage: 0.5 g·L−1, C0 = 10 mg·L−1,
reaction time = 24 h, temperature = 25◦C).
Frontiers in Chemistry | www.frontiersin.org April 2018 | Volume 6 | Article 104

Tang et al. CNT-HAP Synthesis and Defluoridation
FIGURE 8 | Illustration of the underlying mechanism for fluoride removal by CNT-HAP.
the low fluoride removal efficiency in alkaline media due to therepulsion of fluoride anion from the negatively charge adsorbentssurface.
In addition, the removal of fluoride in the presence of fiveco-existing anions (Cl−, NO−
3 , HCO−3 , SO
2−4 , and PO3−
4 ) wereinvestigated, and results are shown in Figure 6B. As can be seen,the introduction of Cl−, NO−
3 , and SO2−4 have slightly negative
effect on the fluoride removal efficiency, while the introductionof HCO−
3 and PO3−4 has significantly negative impact. This
phenomenon can be explained by the charge/radius (Z/r, Å) ofthese anions. In our case, the order of Z/r values of some commonanions is PO3−
4 (3/2.38) > SO2−4 (2/2.30) > F− (1/1.33) > OH−
(1/1.37) > HCO−3 (1/1.56) > NO3 (1/1.79) > Cl (1/1.81) (Yang
et al., 2014). Clearly, the Z/r value of PO3−4 is the largest among
these anions, suggesting that PO3−4 could easily form bond with
Ca2+ in competition with F−, and reduce the fluoride adsorptioncapacities (Nie et al., 2012). The Z/r value of HCO−
3 (1/1.56)is similar to that of OH− (1/1.37), as a result, it could replacethe OH− in HAP, which subsequently influence the fluorideadsorption capacities. SO2−
4 , though with high Z/r value as well,has only slight effect on the fluoride adsorption capacities becauseof its large ionic radii (2.30 Å). Cl− and NO−
3 also have only slightinfluence on the fluoride adsorption capacities because of theyhave lower ability for binding with the active sites on adsorbentsthan F− (Mohanty et al., 2005).
Brunauer-Emmett-Teller AnalysisThe BET surface area of CNT-HAP composite was determined tobe 70.94 m2·g−1, being much larger than CNT and HAP (32.60and 20.78m2·g−1), which is consistent with the results concludedfrom SEM images. The enhancement of specific surface area inCNT-HAP composite can be explained by the vertical growth ofHAP on the surface of CNT, although they are not assembledcompactly. Consequently, the CNT-HAP composite exhibitsimproved internal density.
Generally, the fluoride removal by HAP is subjected to ionexchange, during which the original hydroxyl anions attachedto HAP are replaced by fluoride anions (Chen et al., 2016).To examine the reaction mechanism for fluoride adsorption onCNT-HAP, the XPS spectra of HAP and CNT-HAP before andafter fluoride adsorption were collected and shown in Figure 7.As shown in Figure 7A, the F 1s signal locating at 680 eV canbe observed in the XPS spectra of HAP after fluoride adsorption,indicating that fluoride is binding to the surface of HAP. In theXPS spectra shown in Figure 7B, the F 1s signal locating at 680 eV
also appears after fluoride adsorption on CNT-HAP, which issimilar to the case of fluoride adsorption on HAP. Therefore, weconfirm that the fluoride removal by CNT-HAP is also subjectedto anion exchange mechanism.
Based on the results obtained, the underlying mechanismfor fluoride removal by CNT-HAP is proposed and depicted inFigure 8. First, the HAP is doped with CNT via co-precipitationmethod to produce CNT-HAP composite. The HAP is mainlyloaded on the surface of CNT, and the CNT-HAP composite isof large surface area. Then the hydroxyl anions in HAP adsorbfluoride via ion exchange. The hydroxyl ion in solution willincreases the pH of the bath solution during the experiments,thus the reaction was suitable to occur in a weakly acidiccondition, which was consistent with the result showed above. Insummary, it is suggested that the significantly enhance fluorideremoval efficiency of CNT-HAP is attributed to the cooperativeeffect of surface hydroxyl anions in HAP and large surface area ofCNT.
CONCLUSION
The hydroxyapatite decorated with carbon nanotube wasprepared and used as an effective adsorbent for fluoride removal.The adsorption of fluoride on CNT-HAP could be well describedby the Freundlich model. The nature of the adsorption processis spontaneous and endothermic. The kinetics of adsorptionfollows pseudo-second-order. The defluorination capacity can besignificantly affected by the solution pHand co-existing anions.Combining the results from XRD, FTIR, SEM, BET, and XPSanalysis, it is demonstrated that the adsorption mechanismfollows an anion exchange process. The efficiency of fluorideremoval by CNT-HAP is greatly enhanced in relative to thepristine HAP, because the introduction of CNT can enlarge thespecific surface area of HAP, thereby affording more surfacehydroxyl anions to be replaced by fluoride.
AUTHOR CONTRIBUTIONS
QT: Performed the experiments and the data analyses and wrotethe manuscript; TD: Helped performed the experiments andanalyze the data; PL: Revised the manuscript; PZ: Coordinatedand supervised the research activities that are being described inthe manuscript, and DW: Contributed to the conception of thisstudy.
Frontiers in Chemistry | www.frontiersin.org April 2018 | Volume 6 | Article 104

Tang et al. CNT-HAP Synthesis and Defluoridation
ACKNOWLEDGMENTS
We would like to thank the support of Analysis and Test Centerof Nanchang University for infrastructure and morphologycharacterizations. We would like to thank Dr. Kuan Huang(Nanchang University) for suggestions contributing to
the final script. This project is financially supported byNational Nature Science Foundation of China No. 21467014,No. 21767018, Postdoctoral Science Foundation of ChinaNo. 2017M612164 and the Natural Science Foundationfor Distinguished Young Scholars of Jiangxi Province No.20171BCB23017.
REFERENCES
Amini, M., Mueller, K., Abbaspour, K. C., Rosenberg, T., Afyuni, M., Møller, K. N.,
et al. (2008). Statistical modeling of global geogenic fluoride contamination in
groundwaters. Environ. Sci. Technol. 42, 3662–3668. doi: 10.1021/es071958y
Beladi, F., Saber-Samandari, S., and Saber-Samandari, S. (2017). Cellular
compatibility of nanocomposite scaffolds based on hydroxyapatite entrapped
in cellulose network for bone repair. Mater. Sci. Eng. C Mater. Biol. Appl. 75,
385–392. doi: 10.1016/j.msec.2017.02.040
Chen, L., He, S., He, B.-Y., Wang, T.-J., Su, C.-L., Zhang, C., et al. (2012).
Synthesis of iron-doped titanium oxide nanoadsorbent and its adsorption
characteristics for fluoride in drinking water. Ind. Eng. Chem. Res. 51,
13150–13156. doi: 10.1021/ie300102v
Chen, L., Zhang, K.-S., He, J.-Y., Xu, W.-H., Huang, X.-J., and Liu,
J.-H. (2016). Enhanced fluoride removal from water by sulfate-doped
hydroxyapatite hierarchical hollow microspheres. Chem. Eng. J. 285, 616–624.
doi: 10.1016/j.cej.2015.10.036
Gao, S., Cui, J., and Wei, Z. (2009). Study on the fluoride adsorption
of various apatite materials. J. Fluorine Chem. 130, 1035–1041.
doi: 10.1016/j.jfluchem.2009.09.004
He, J., Zhang, K., Wu, S., Cai, X., Chen, K., Li, Y., et al. (2015). Performance of
novel hydroxyapatite nanowires in treatment of fluoride contaminated water. J.
Hazard. Mater. 303, 119–130. doi: 10.1016/j.jhazmat.2015.10.028
He, J., Chen, K., Cai, X., Li, Y., Wang, C., Zhang, K., et al. (2017). A
biocompatible and novelly-defined Al-HAP adsorption membrane for highly
effective removal of fluoride from drinking water. J. Colloid Interface Sci. 490,
97–107. doi: 10.1016/j.jcis.2016.11.009
Huang, H., Liu, J., Zhang, P., Zhang, D., and Gao, F. (2017). Investigation on
the simultaneous removal of fluoride, ammonia nitrogen and phosphate from
semiconductor wastewater using chemical precipitation. Chem. Eng. J. 307,
696–706. doi: 10.1016/j.cej.2016.08.134
Jagtap, S., Yenkie, M. K., Labhsetwar, N., and Rayalu, S. (2012). Fluoride in
drinking water and defluoridation of water. Chem. Rev. 112, 2454–2466.
doi: 10.1021/cr2002855
Jamhour, R. M. A. Q. (2005). New inorganic ion-exchangematerial for the selective
removal of fluoride from potable water using ion-selective electrode. A J.
Environ Sci. 1, 1–4. doi: 10.3844/ajessp.2005.1.4
Jiménez-Reyes, M., and Solache-Ríos, M. (2010). Sorption behavior of fluoride
ions from aqueous solutions by hydroxyapatite. J. Hazard. Mater. 180, 297–302.
doi: 10.1016/j.jhazmat.2010.04.030
Kanno, C. M., Sanders, R. L., Flynn, S. M., Lessard, G., and Myneni, S. C.
(2014). Novel apatite-based sorbent for defluoridation: synthesis and sorption
characteristics of nano-micro-crystalline hydroxyapatite-coated-limestone.
Environ. Sci. Technol. 48, 5798–5807. doi: 10.1021/es405135r
Lei, Y., Xu, Z., Ke, Q., Yin, W., Chen, Y., Zhang, C., et al. (2017).
Strontium hydroxyapatite/chitosan nanohybrid scaffolds with enhanced
osteoinductivity for bone tissue engineering. Mat. Sci. Eng. C Mater 72,
134–142. doi: 10.1016/j.msec.2016.11.063
Li, J., Wang, S., Zhang, X., Wei, J., Xu, C., and Luan, Z. (2003). Adsorption of
fluoride fromwater by aligned carbon nanotubes.Mater. Res. Bull. 38, 469–476.
doi: 10.1016/S0025-5408(02)01063-2
Li, J., Zhang, S., Chen, C., Zhao, G., Yang, X., Li, J., et al. (2012). Removal of
Cu(II) and fulvic acid by graphene oxide nanosheets decorated with Fe3O4
nanoparticles. ACS Appl. Mater Interf. 4, 4991–5000. doi: 10.1021/am301358b
Lin, K.-Y. A., Liu, Y.-T., and Chen, S.-Y. (2016). Adsorption of fluoride to UiO-
66-NH2 in water: stability, kinetic, isotherm and thermodynamic studies. J.
Colloid. Interf. Sci. 461, 79–87. doi: 10.1016/j.jcis.2015.08.061
Liu, G., Ye, Q., Chen, W., Zhao, Z., Li, L., and Lin, P. (2015). Study of the
relationship between the lifestyle of residents residing in fluorosis endemic
areas and adult skeletal fluorosis. Environ. Toxicol. Phar. 40, 326–332.
doi: 10.1016/j.etap.2015.06.022
Liu, Q., Guo, H., and Shan, Y. (2010). Adsorption of fluoride on synthetic
siderite from aqueous solution. J. Fluorine Chem. 131, 635–641.
doi: 10.1016/j.jfluchem.2010.02.006
Luo, J., Luo, X., Crittenden, J., Qu, J., Bai, Y., Peng, Y., et al. (2015). Removal
of antimonite (Sb(III)) and antimonate (Sb(V)) from aqueous solution using
carbon nanofibers that are decorated with Zirconium Oxide (ZrO2). Environ.
Sci. Technol. 49, 11115–11124. doi: 10.1021/acs.est.5b02903
Mahmoud, M. E., Nabil, G. M., El-Mallah, N. M., Bassiouny, H. I., Kumar,
S., and Abdel-Fattah, T. M. (2016). Kinetics, isotherm, and thermodynamic
studies of the adsorption of reactive red 195A dye from water by
modified Switchgrass Biochar adsorbent. J. Ind. Eng. Chem. 37, 156–167.
doi: 10.1016/j.jiec.2016.03.020
Mohan, S., Singh, D. K., Kumar, V., and Hasan, S. H. (2017). Effective removal of
Fluoride ions by rGO/ZrO2 nanocomposite from aqueous solution: fixed bed
column adsorption modelling and its adsorption mechanism. J. Fluorine Chem.
194, 40–50. doi: 10.1016/j.jfluchem.2016.12.014
Mohanty, K., Jha, M., Meikap, B. C., and Biswas, M. N. (2005). Removal of
chromium (VI) from dilute aqueous solutions by activated carbon developed
from Terminalia arjuna nuts activated with zinc chloride. Chem. Eng. Sci. 60,
3049–3059. doi: 10.1016/j.ces.2004.12.049
Naowanat, N., Thouchprasitchai, N., and Pongstabodee, S. (2016). Adsorption of
emulsified oil from metalworking fluid on activated bleaching earth-chitosan-
SDS composites: optimization, kinetics, isotherms. J. Environ. Manage. 169,
103–115. doi: 10.1016/j.jenvman.2015.12.024
Neelgund, G. M., and Oki, A. R. (2016). Influence of carbon nanotubes and
graphene nanosheets on photothermal effect of hydroxyapatite. J. Colloid Interf.
Sci. 484, 135–145. doi: 10.1016/j.jcis.2016.07.078
Nie, Y., Hu, C., and Kong, C. (2012). Enhanced fluoride adsorption using Al
(III) modified calcium hydroxyapatite. J. Hazard. Mater. 233–234, 194–199.
doi: 10.1016/j.jhazmat.2012.07.020
Nigri, E. M., Bhatnagar, A., and Rocha, S. D. F. (2017). Thermal regeneration
process of bone char used in the fluoride removal from aqueous solution. J.
Clean Prod. 142, 3558–3570. doi: 10.1016/j.jclepro.2016.10.112
Popat, K. M., Anand, P. S., and Dasare, B. D. (1994). Selective
removal of fluoride ions from water by the aluminium form of the
aminomethylphosphonic acid-type ion exchanger. React. Polym. 23, 23–32.
doi: 10.1016/0923-1137(94)90107-4
Prabhu, S. M., and Meenakshi, S. (2014). Synthesis of surface coated
hydroxyapatite powders for fluoride removal from aqueous solution. Powder
Technol. 268, 306–315. doi: 10.1016/j.powtec.2014.08.041
Rehman, M. A., Yusoff, I., and Alias, Y. (2015). Fluoride adsorption by doped
and un-doped magnetic ferrites CuCexFe2-xO4: preparation, characterization,
optimization and modeling for effectual remediation technologies. J. Hazard.
Mater. 299, 316–324. doi: 10.1016/j.jhazmat.2015.06.030
Reynel-Avila, H. E., Mendoza-Castillo, D. I., and Bonilla-Petriciolet, A. (2016).
Relevance of anionic dye properties on water decolorization performance using
bone char: adsorption kinetics, isotherms and breakthrough curves. J. Mol. Liq.
219, 425–434. doi: 10.1016/j.molliq.2016.03.051
Roy, S., and Dass, G. (2013). Fluoride contamination in drinking water–a review.
Resour. Environ. 3, 53–58. doi: 10.5923/j.re.20130303.02
Sairam Sundaram, C., Viswanathan, N., and Meenakshi, S. (2009). Fluoride
sorption by nano-hydroxyapatite/chitin composite. J. Hazard. Mater. 172,
147–151. doi: 10.1016/j.jhazmat.2009.06.152
Frontiers in Chemistry | www.frontiersin.org April 2018 | Volume 6 | Article 104

Tang et al. CNT-HAP Synthesis and Defluoridation
Sairam Sundaram, C., Viswanathan, N., Meenakshi, S. (2008). Uptake of
fluoride by nano-hydroxyapatite/chitosan, a bioinorganic composite.Bioresour.
Technol. 99, 8226–8230. doi: 10.1016/j.biortech.2008.03.012
Schaefer, C. E., Andaya, C., Burant, A., Condee, C. W., Urtiaga, A., Strathmann,
T. J., et al. (2017). Electrochemical treatment of perfluorooctanoic
acid and perfluorooctane sulfonate: insights into mechanisms and
application to groundwater treatment. Chem. Eng. J. 317, 424–432.
doi: 10.1016/j.cej.2017.02.107
Sharma, M., Mondal, D., Singh, N., Upadhyay, K., Rawat, A., Devkar, R.
V., et al. (2017). Seaweed-derived nontoxic functionalized graphene sheets
as sustainable materials for the efficient removal of fluoride from high
fluoride containing drinking water. ACS Sustainable Chem. Eng. 5, 3488–3498.
doi: 10.1021/acssuschemeng.7b00198
Singh, V. K., and Anil Kumar, E. (2016). Measurement and analysis of adsorption
isotherms of CO2 on activated carbon. Appl. Therm. Engi. 97, 77–86.
doi: 10.1016/j.applthermaleng.2015.10.052
Subbaiah, M. V., and Kim, D. S. (2016). Adsorption of methyl orange
from aqueous solution by aminated pumpkin seed powder: kinetics,
isotherms, and thermodynamic studies. Ecotoxicol. Environ. Saf. 128, 109–117.
doi: 10.1016/j.ecoenv.2016.02.016
Sun, M., Zhang, P., Wu, D., and Frost, R. L. (2017). Novel approach to fabricate
organo-LDH hybrid by the intercalation of sodium hexadecyl sulfate into
tricalcium aluminate.Appl. Clay Sci. 140, 25–30. doi: 10.1016/j.clay.2017.01.026
Tadjarodi, A., Moazen Ferdowsi, S., Zare-Dorabei, R., and Barzin, A. (2016).
Highly efficient ultrasonic-assisted removal of Hg(II) ions on graphene
oxide modified with 2-pyridinecarboxaldehyde thiosemicarbazone:
Adsorption isotherms and kinetics studies. Ultrason. Sonochem. 33, 118–128.
doi: 10.1016/j.ultsonch.2016.04.030
Wang, T., Zhang, P., Wu, D., Sun, M., Deng, Y., and Frost, R. L. (2015). Effective
removal of zinc (II) from aqueous solutions by tricalcium aluminate (C(3)A). J.
Colloid Interface Sci. 443, 65–71. doi: 10.1016/j.jcis.2014.11.046
Xin, S., Guo, X., Hao, H., and Yong, L. (2016). Crystallization kinetics modeling for
fluoride removal from steam ammonia wastewater by chemical precipitation.
Ciesc J. 67, 1357–1367. doi: 10.11949/j.issn.0438-1157.20151079
Xu, W., Wang, J., Wang, L., Sheng, G., Liu, J., Yu, H., et al. (2013). Enhanced
arsenic removal from water by hierarchically porous CeO2-ZrO2 nanospheres:
role of surface- and structure-dependent properties. J. Hazard. Mater. 260,
498–507. doi: 10.1016/j.jhazmat.2013.06.010
Yang, C., Gao, L., Wang, Y., Tian, X., and Komarneni, S. (2014). Fluoride removal
by ordered and disordered mesoporous aluminas. Microporous Mesoporous
Mater. 197, 156–163. doi: 10.1016/j.micromeso.2014.06.010
Zhang, J., Chen, N., Su, P., Li, M., and Feng, C. (2017). Fluoride removal from
aqueous solution by Zirconium-Chitosan/Graphene Oxide Membrane. React.
Funct. Polym. 114, 127–135. doi: 10.1016/j.reactfunctpolym.2017.03.008
Zhang, L. E., Huang, D., Yang, J., Wei, X., Qin, J., Ou, S., et al. (2017).
Probabilistic risk assessment of Chinese residents’ exposure to fluoride in
improved drinking water in endemic fluorosis areas. Environ. Pollut. 222,
118–125. doi: 10.1016/j.envpol.2016.12.074
Zhang, P., Qian, G., Xu, Z. P., Shi, H., Ruan, X., Yang, J., et al. (2012). Effective
adsorption of sodium dodecylsulfate (SDS) by hydrocalumite (CaAl-LDH-Cl)
induced by self-dissolution and re-precipitationmechanism. J. Colloid Interface
Sci. 367, 264–271. doi: 10.1016/j.jcis.2011.10.036
Zúñiga-Muro, N. M., Bonilla-Petriciolet, A., Mendoza-Castillo, D. I.,
Reynel-Ávila, H. E., and Tapia-Picazo, J. C. (2017). Fluoride adsorption
properties of cerium-containing bone char. J. Fluorine Chem. 197, 63–73.
doi: 10.1016/j.jfluchem.2017.03.004
Conflict of Interest Statement: The authors declare that the research was
conducted in the absence of any commercial or financial relationships that could
be construed as a potential conflict of interest.
Copyright © 2018 Tang, Duan, Li, Zhang and Wu. This is an open-access article
distributed under the terms of the Creative Commons Attribution License (CC
BY). The use, distribution or reproduction in other forums is permitted, provided
the original author(s) and the copyright owner are credited and that the original
publication in this journal is cited, in accordance with accepted academic practice.
No use, distribution or reproduction is permitted which does not comply with these
terms.
Frontiers in Chemistry | www.frontiersin.org April 2018 | Volume 6 | Article 104

ORIGINAL RESEARCH
published: 23 November 2018
doi: 10.3389/fchem.2018.00556
Frontiers in Chemistry | www.frontiersin.org November 2018 | Volume 6 | Article 556
Edited by:
Wenbo Wang,
Lanzhou Institute of Chemical Physics
(CAS), China
Reviewed by:
Jianxi Zhu,
Guangzhou Institute of Geochemistry
(CAS), China
Shiyong Sun,
Southwest University of Science and
Technology, China
*Correspondence:
Hao Ding
Specialty section:
This article was submitted to
Green and Sustainable Chemistry,
a section of the journal
Frontiers in Chemistry
Received: 27 July 2018
Accepted: 29 October 2018
Published: 23 November 2018
Citation:
Chen W, Zhang H, Liang Y, Ding H
and Sun S (2018) Adsorption
Properties and Mechanism of Cd2+ in
Water by Zr-containing Silica Residue
Purification. Front. Chem. 6:556.
doi: 10.3389/fchem.2018.00556
Adsorption Properties andMechanism of Cd2+ in Water byZr-containing Silica ResiduePurification
Wanting Chen1, Han Zhang1, Yu Liang2, Hao Ding1* and Sijia Sun1
1 Beijing Key Laboratory of Materials Utilization of Nonmetallic Minerals and Solid Wastes, National Laboratory of Mineral
Materials, School of Materials Science and Technology, China University of Geosciences, Beijing, China, 2 School of Materials
Science and Technology, Shenyang University of Chemical Technology, Shenyang, China
Zirconium (Zr)-containing silica residue purification (ZSR-P) discharged from industrial
production of ZrOCl2 was used as an adsorbent, and CdCl2 solution was used as the
simulated wastewater containing cadmium ions (Cd2+). The properties and mechanisms
of ZSR-P absorbing Cd2+ were studied. The results showed that ZSR-P had a good
effect on the adsorption and removal of Cd2+ in water. The adsorption time, initial
concentration of Cd2+, and pH of the solution had a significant effect on the adsorption
behavior, whilst the pH value had the greatest effect amongst them. Under optimal
conditions, the amount of Cd2+ adsorbed by ZSR-P was 43.1 mg/g. The isothermal
adsorption conformed to the Langmuir adsorption model, and the adsorption kinetics
conformed to the secondary adsorption rate model. In ZSR-P-Cd, Cd2+ was uniformly
distributed on the surface of SiO2 particles and in the pores formed by the accumulation
of particles. Adsorption of Cd2+ by ZSR-P was achieved through the reaction between
Si-OH on the surface of SiO2 and Cd2+ hydroxyl compounds.
Keywords: Zr-containing silica residue purification, adsorption, Cd2+, kinetic model, isothermal models
INTRODUCTION
In recent decades, especially in some developing countries, the world economy has been growingrapidly. The process of industrialization, agricultural economy, and urbanization have beenspeeding up, which results in heavy metal pollution in water due to mining, metal smelting process,electroplating, and pesticide and fertilizer abuse. The excess emissions of sewage have becomemorecritical than ever (Sekhar et al., 2004; Srivastava and Majumder, 2008; Fu and Wang, 2011; Huanget al., 2014). Heavy metal ions are the main water pollutants. They are easy, biologically enrichedand hard to degrade and have high toxicity and stable chemical property, so their damage isextremely serious (Sha et al., 2010). Cadmium ion (Cd2+) is one of the most hazardous ions amongthese heavy metal ions. It has a strong chemical activity in the environment and can easily migrateinto the food chain and endanger human health (Solenkova et al., 2014; Venza et al., 2014). Chronicexposure to Cd could cause great damage to cardiovascular system, nervous system, and livers ofmammals and humans and may lead to renal failure and ultimately death (Romero-Gonzalez et al.,2001). For this reason, international regulatory agencies have issued wastewater standards for thedischarge of various heavy metal ions, including Cd, to limit their entry into surface water andmunicipal sewers. However, due to the high cost of compliance with pollution control legislation,some small businesses cannot afford it. Therefore, some efficient, convenient, and cost effectiveprocesses need to be found for removing heavy metal ions from wastewater.

Chen et al. Adsorption Properties and Mechanism of Cd2+
Currently, there are many available methods to remove heavymetals from the environment (Basci et al., 2004; Dabrowski et al.,2004; Ho and Ofomaja, 2006; Janin et al., 2009; Soylak et al.,2010), including oxidation reduction, chemical precipitation, ionexchange, membrane separation and adsorption, etc. Amongstthese methods, oxidation reduction and chemical precipitationare traditional methods which cause some issues such asthe large amount of chemical reagents, a secondary sourceof pollution to the environment, and poor treatment oflow-concentration wastewater. Although the methods of ionexchange and membrane separation are effective, the processingscale is small and both the investment cost and operation costare high. In contrast, the adsorption method, which is highlyefficient and simple, suitable for renewable use and is applicablefor low-concentration wastewater, requires low investment.Therefore, it is an attractive method with a vital potentialfor further development. At present, in addition to somenonmetallic minerals, the adsorbents used to treat the wastewatercontaining heavy metal ions also include activated carbon, humicacid adsorbents, macromolecule materials, biomaterials, andindustrial solid wastes (Wong et al., 2003; Sprynskyy et al., 2006;Fan et al., 2007; Veli and Alyüz, 2007; Mohammad-Khah andAnsari, 2009). Bhattacharyya and Gupta (2008), Zhu et al. (2009),and Hong-Ping et al. (2001) studied the adsorption behavior ofCd2+ by usingmontmorillonite and kaolinite with the adsorptionmethod and found that the adsorption capacity of differentminerals for Cd2+ was different. However, since the surface areaof the mineral material is not high, the amount of adsorption isreduced; therefore, a large amount of the adsorbent is requiredfor the operation, which may cause a certain proportion ofresources to be wasted. Bayat (2002) used fly ash as an adsorbentto adsorb Zn2+ and Cd2+ in wastewater. Because of its poroushoneycomb structure and large surface area in the internalstructure, it has a good adsorption capacity for various metal ionsin wastewater. The unmodified fly ash needs to be chemicallymodified in order to improve its adsorption performance as thesmall number of functional groups contained on the surfaceinvisibly increases the processing cost of the adsorption process,thus complicating it. The adsorption capacity of the modified flyash can be compared with that of activated carbon, and the costis only one third of the activated carbon.
Recently, more attention has been paid to low-cost adsorbentsthat can be used to replace carbonaceous and mineral materials.Industrial solid waste has become a hot adsorbent materialbecause of its dual advantages in cost and technology. Zirconium(Zr)-containing silica residue is the solid gelatinous wasteduring industrial acid reaction process in the production ofzirconium oxychloride (ZrOCl2) from zirconite as the rawmaterial. It is a loose-type gel. The main solid components ofthe gel are amorphous SiO2 and a small amount of unreactedzirconite, crystalline NaCl, and other impurities. The mainliquid components are water, some dissolved substances suchas hydrochloric acid (HCl), ZrOCl2, Na
+, Cl−, and Fe3+, Zr4+,etc. In addition, the Zr-containing silica residue is purified toobtain Zr-containing silica residue purification (ZSR-P), whichis mainly composed of amorphous SiO2. It is expected to bean excellent adsorbent for the treatment of heavy metal ions in
the water by means of the surface charge properties of SiO2,the characteristics of functional groups, and the pore channelsformed by the accumulation of particles. This work undoubtedlyhas a positive significance for recycling solid waste and reducingthe cost of wastewater treatment. However, very few reports havebeen made on the adsorption behavior and the thermodynamicsof heavy metal ions by ZSR-P.
In this work, the adsorption behavior of Cd2+ from anaqueous solution using ZSR-P was studied by a set of experimentsat various conditions, including temperature, adsorption time,initial concentration of Cd2+, and initial pH value. In orderto identify the possible mechanisms involved in Cd2+ bindingby ZSR-P, some characterization methods such as Fouriertransform infrared spectrometer (FTIR) and X-ray photoelectronspectroscopy (XPS) were performed along with the analysis.
EXPERIMENTS
Raw Materials, Reagents, and InstrumentsZirconium-containing silica residue purification was obtained bypurifying Zr-containing silica residue using a physical method.The Zr-containing silica residue raw material was producedby Henan Baililian Chemical Co. Ltd., Henan, China. Thepurification process involved the following steps. (1) The Zr-containing silica residue and water were added to a dispersingmachine at a solid-liquid ratio of 7% to be crushed and mixedto form a uniform slurry. (2) The mixed slurry was pre-groundby an ultrafine grinder at 1,200 r/min. After 10min, the aluminagrinding balls were added to the mixed slurry at a ball ratioof 15:1. The grinding time was 35min. (3) The mixed slurrycontaining the grinding balls was sieved to obtain the slurry.(4) The mixed slurry was separated by centrifugation, and eachgroup of samples was centrifuged three times in order to obtaina gel of high purity containing amorphous silica. (5) The gelobtained after centrifugation was dried to finally obtain ZSR-P(Zhang et al., 2011). Additionally, ZSR-P had a specific surfacearea of 680.08 m2/g, and the pore diameter was 3.83 nm. Themain chemical components before and after purification areshown in Table 1. The X-ray diffraction (XRD) analysis of ZSR-P is shown in Figure 1. It can be seen that a broad characteristicpeak appears at a diffraction angle (2θ) of 20–25◦, indicating thatZSR-P contains a large amount of amorphous phase components.In addition, there are no characteristic peaks of other impuritiesin the XRD pattern. So, combining with chemical analysis results(SiO2 content of 94.63%), it suggests that the main component ofZSR-P should be amorphous SiO2. Obviously, the properties ofamorphous SiO2 determine the performance of ZSR-P.
The CdCl2 solution was used as the simulated wastewatercontaining Cd2+. A certain amount of solid CdCl2 was weighedand added into distilled water, followed by stirring and dissolvingto prepare the CdCl2 solution with different Cd2+ contents. AnNaOH solution of 0.1 mol/L or HCl of 0.1 mol/L was used for pHadjustment. All chemicals used were of analytical reagent gradeand were obtained from Beijing Chemical Works, China.
The main test equipments used are described as follows.The adsorption reaction of ZSR-P on heavy metal simulatedwastewater under different conditions was carried out by
Frontiers in Chemistry | www.frontiersin.org November 2018 | Volume 6 | Article 556

Chen et al. Adsorption Properties and Mechanism of Cd2+
using a SHZ-82 Thermostatic Bath Oscillator (Beijing GuohuaTechnology Group Ltd., Beijing, China). In addition, pHS-3C(Inesa Analytical Instrument Co., Ltd, Shanghai, China) was usedto adjust the pH of the reaction solution. Prodigy InductivelyCoupled Plasma Atomic Emission Spectrometry (Leeman LabsINC., USA) was used to test the residual heavy metal ion contentafter the adsorption reaction. The potential of the surface beforeand after the adsorption of heavy metals by the adsorbent wastested by using a Zetasizer Nano ZS Potentiometer (MalvernPanalytical, UK). The structural characteristics of mesoporousmaterials were characterized by a specific surface area andporosity analyzer (BET, Quadrasorb Si-MP, Quantachrome,USA). The characterization was mainly at liquid nitrogentemperature (77K), and the relative pressure was P/Po= 0∼0.35.The particle size, surface morphology, and elemental contentdistribution of ZSR-P were determined by using a scanning
TABLE 1 | Comparison XRF of ZSR-P before and after purification.
ZSR ZSR-P
Analyte Result (%) Analyte Result (%)
SiO2 81.8407 SiO2 92.7501
ZrO2 10.0438 ZrO2 4.7031
Cl 4.5786 Cl 1.2328
Na2O 1.2677 Al2O3 0.6939
CaO 0.4332 HfO2 0.2300
HfO2 0.3437 Na2O 0.0951
Fe2O3 0.3437 TiO2 0.0879
TiO2 0.3208 Fe2O3 0.0733
Al2O3 0.2688 Cr2O3 0.0545
SO3 0.2032 K2O 0.0411
MgO 0.1429 ThO2 0.0288
Y2O3 0.0809 NbO 0.0094
Cr2O3 0.0650
ThO2 0.0396
K2O 0.0272
FIGURE 1 | XRD of ZSR-P.
electronic microscope combined with an energy dispersive X-raydetector (SEM-EDX, Hitachi High-Technologies Corporation,Tokyo, Japan). The particle size of the sample material and thecomparative sample was observed using a FEI Tecnai G2F30 Fieldtransmission electron microscope (TEM; acceleration voltage of300 kV). The XRD analyses were conducted on a Rigaku D/max-rA (12 KW) X-ray powder diffractometer (XRD, D/MAX-2000,Rigaku Corporation,Tokyo, Japan) to determine the mineralcomposition operated with Cu Kαradiation at 40 kV and 100mAand with a scanning speed of 0.5◦ (2θ)/min. A Fourier transforminfrared spectroscope (FTIR, Perkin Elmer, Shanghai, China) wasused to evaluate the distribution of functional groups on thesurface between different materials. The XPS (Kratos Axis Ultra,UK) was used to characterize the surface composition and thecombination state of the elements of ZSR-P before and afteradsorption. Binding energies were referenced to the C1s peak at284.8 eV. The oxide content and the elemental composition of thesamples were analyzed by X-ray fluorescence (XRF) spectroscopy(S4-Explorer, Brukeraxs, Germany).
Adsorption ExperimentsThe 100ml Cd2+ solution with a known concentration wasweighed and transferred into a 250mL Erlenmeyer flask,regulating the pH value and adding a certain amount of ZSR-P into the suspension. The suspension was shaken for a certainperiod of time and then centrifuged to obtain a precipitate anda supernatant liquid, which were the ZSR-P products adsorbingCd2+ (ZSR-P-Cd) and the Cd2+ removed from the solution,respectively. The Cd2+ content in the supernatant can bemeasured to evaluate the adsorption effect.
Characterization and Evaluation Method(1) Calculation of adsorption amount
Inductively coupled plasma atomic emissionspectrometry (ICP-AES) was used to determine theCd2+ concentration of the supernatant after adsorption. Theadsorption amount of Cd2+ by ZSR-P was calculated by thefollowing formula:
q =(C0 − C)V
m, (1)
where C0 and C are the initial concentration and residualconcentration of Cd2+ in the solution, respectively, whichare also called the concentrations before and after adsorptionby ZSR-P (mg/L); q is the adsorption capacity of Cd2+
adsorbed by ZSR-P (mg/g); V is the solution volume (L); andm is the quality of ZSR-P added (g).
(2) Surface hydroxyl testAn amount of 2 g of the sample to be tested was weighed
and placed in a 200mL beaker, adding 75mL of NaClsolution, which had a quality score of 0.2; 25mL of absoluteethanol was added to the mixture, and then the mixture wasstirred evenly with a magnetic stirrer. After adjusting the pHof the solution to 4 by using 0.1 mol/L NaOH or 0.1 mol/LHCl, 0.1 mol/L NaOH was added to raise the pH of thesolution to 9 slowly and the pH value was kept unchangedfor 20 s. The volume of NaOH used was recorded, and the
Frontiers in Chemistry | www.frontiersin.org November 2018 | Volume 6 | Article 556

Chen et al. Adsorption Properties and Mechanism of Cd2+
number of hydroxyl groups N per square nanometer of thesample was calculated according to the following formula:
N =CVNA × 10−3
Sm, (2)
where C is the concentration of the NaOH solution (mol/L);V is the volume (L) of the NaOH solution; NA is Avogadro’sconstant; S is the specific surface area of the sample (m2/g);and m is the mass of the sample (g).
RESULTS AND DISCUSSION
Study on Adsorption PropertiesEffect of TemperatureThe Cd2+ solution with a concentration of 100 mg/L (actualmeasured value was 94.97 mg/L by ICP-AES) was adjusted toan initial pH of 8. Later, 3 g/L of ZSR-P was added and heatedto a certain temperature; the thermal insulation oscillation timewas 10min. Figure 2 shows the effect of solution temperatureon the adsorption of Cd2+ by ZSR-P. It can be seen that asthe temperature rose from 25◦C (room temperature) to 45◦C,the amount of Cd2+ adsorbed by ZSR-P remained unchanged.When the temperature rose to 65◦C, the adsorption amountincreased slightly, indicating that temperature had little effecton the adsorption of Cd2+ by ZSR-P. According to the testresults, considering the cost and operation conveniences for thetreatment of the actual wastewater, the adsorption of the Cd2+
solution should be carried out at a temperature of 25◦C, which isthe normal temperature.
Adsorption KineticsThe effect of the adsorption time on the adsorption of Cd2+
by ZSR-P is shown in Figure 3. The concentration of the Cd2+
solution used was 100 mg/L (actual measured value was 106.87mg/L by ICP-AES), initial pH was 8, temperature was 25◦C, and
FIGURE 2 | Effect of solution temperature on adsorption of Cd2+ by ZSR-P.
ZSR-P dosage was 3 g/L. It can be seen from Figure 3 that ZSR-P showed a fast adsorption behavior when the adsorption timewas between 0 and 3min. The adsorption time exceeded 3min,and the adsorption capacity increased slowly and reached anequilibrium value at 7min; the value was 22 mg/g. It showed thatZSR-P had a good effect on Cd2+ adsorption, and the effect ofCd2+ removal from the water was obvious.
According to the adsorption data of Cd2+ by ZSR-P inFigure 3, fitting was performed according to Lagergren quasi-first-order kinetic model and quasi-second-order kinetic model.The equations of the two models are as follows:
Quasi− first− order kinetic model : log(Qe − Qt) = logQe
−K1
2.303• t (3)
Quasi− second− order kinetic model :t
Qt=
1
2K2 • Qe2
+t
Qe(4)
In the formula, Qe is the quality (mg/g) of Cd2+ adsorbedby ZSR-P in solution during adsorption equilibrium; Qt isthe quality (mg/g) of Cd2+ adsorbed by ZSR-P in solution atadsorption time t; and K1 and K2 are empirical factors.
Table 2 shows the parameters of the fitted kinetic equations.Figure 4 compares the fitting curves and the distribution ofthe experimental data points. According to the quasi-first-order kinetic model, the correlation coefficient R2 was only0.035, indicating a low level of fitting degree. According tothe quasi-second-order kinetic model, R2 was as high as 0.999,indicating a high fitting degree. Obviously, the adsorptionof Cd2+ by ZSR-P conformed to the pseudo-second-orderkinetic model, and it also indicated that this adsorption wasthe surface adsorption reaction control process (Ho et al.,2000).
FIGURE 3 | Effect of solution time on adsorption of Cd2+ by ZSR-P.
Frontiers in Chemistry | www.frontiersin.org November 2018 | Volume 6 | Article 556

Chen et al. Adsorption Properties and Mechanism of Cd2+
Equilibrium IsothermsFigure 5 shows the relationship between Cd2+ residualconcentration (equilibrium concentration) in the solution andCd2+ adsorption amount under the conditions of solutiontemperature 25◦C, pH 8, ZSR-P dosage 3g/L, and adsorptiontime 15min (In order to ensure that the adsorption reactionof Cd2+ by ZSR-P was fully balanced, the adsorption time wasincreased to 15min), which is called the adsorption isotherm.It can be seen that with the increase in the concentration ofCd2+, the adsorption amount of Cd2+ by ZSR-P continuedto increase until the concentration of Cd2+ was more than80 mg/L; the stable value of the adsorption amount was 28mg/g. According to the data in Figure 5, the isotherm of Cd2+
adsorbed by ZSR-P can be model-regressed. The Langmuir andFreundlich adsorption isothermal models commonly used are asfollows.
Langmuir equation:
Ce
Qe=
1
KLQm+
Ce
Qm(5)
Freundlich equation:
lnQe = lnKf +1
nlnCe (6)
In the formula, Ce is the equilibrium concentration (mg/L)of Cd2+ adsorbed by ZSR-P in solution, Qe is the adsorptionamount (mg/g), Qm is the saturated adsorption amount (mg/g),and KL, Kf, and n are all empirical coefficients.
The data in Figure 5 were processed and model-fitted toobtain the adsorption isotherm equations described by the
TABLE 2 | ZSR-P adsorption kinetic parameters of Cd2+.
Quasi-first-order kinetic model Quasi-second-order kinetic model
Qe (mg/g) K1 R2 Qe (mg/g) K2 R2
28.89 0.015 0.035 21.88 0.607 0.999
Langmuir and Freundlich models, as shown in Table 3 andFigure 6. It can be seen that the correlation constants R2 ofthe fitted Langmuir and Freundlich adsorption models were0.994 and 0.85, respectively, indicating that the Langmuirmodel can better describe the adsorption isothermal behavioron Cd2+ by ZSR-P. The above results indicated that theadsorption of Cd2+ by ZSR-P was a monolayer adsorption,which indicated that the adsorption site was a single layerarrangement. The adsorption constant KL was 0.058 (the valuewas small), indicating that the adsorption sites have a strongaffinity (Langmuir, 2015).
Effect of pHA 3 g/L solution of ZSR-P was added to the Cd2+ solutionwith different pH values under the conditions of solution Cd2+
concentration of 100 mg/L (actual measured value was 108.39mg/L by ICP-AES) and temperature of 25◦C, and then it wasoscillated for 10min to perform adsorption. Figure 7 shows theeffect of solution pH on adsorption. From Figure 7, it can be seenthat the solution pH had a great influence on the adsorption ofCd2+ by ZSR-P. When pH value was less than 6, the adsorption
FIGURE 5 | Adsorption isotherm equations of Cd2+.
FIGURE 4 | ZSR-P adsorption of Cd2+ kinetic equation fitting results. (A) Quasi-first-order kinetic model; (B) quasi-second-order kinetic model.
Frontiers in Chemistry | www.frontiersin.org November 2018 | Volume 6 | Article 556

Chen et al. Adsorption Properties and Mechanism of Cd2+
amount of Cd2+ was less than 10 mg/g, indicating that whenpH was low, the adsorption of Cd2+ by ZSR-P was poor. Whenthe pH was higher than 7, the adsorption amount increasedgreatly, and the maximum value was reached at pH 9, whichwas 43.1 mg/g. It showed that increasing the pH of the Cd2+
solution can greatly enhance the adsorption of Cd2+ by ZSR-P. The main reason was that Cd2+ was prone to hydrolysisat a higher pH, while ZSR-P has a stronger affinity to Cd2+
hydrolysate than free Cd2+ (Bayat, 2002). Obviously, the pHvalue of the solution was crucial for the adsorption of Cd2+ byZSR-P.
TABLE 3 | Results of the fitting models of Cd2+ adsorption by ZSR-P.
Langmuir model Freundlich model
Qm KL R2 n Kf R2
33.33 0.058 0.994 2.22 3.78 0.85
FIGURE 7 | Effect of pH on the adsorption of Cd2+ by ZSR-P.
ADSORPTION MECHANISM
Analysis of Adsorption PositionFigure 8 shows the SEM images and the surface distribution ofthe elements, such as O, Si, Zr, and Cd, of ZSR-P rawmaterial andadsorbed Cd2+ product (ZSR-P-Cd). Table 4 shows the energyspectrum analysis (EDX) values of each element on the surface.It can be seen that there was no Cd in the ZSR-P raw materialwhile there was a large amount of Cd in ZSR-P-Cd, whichwas consistent with the test results of the adsorption amountof Cd2+. The distribution area of Cd was consistent with theposition of ZSR-P particles in the SEM images, indicating thatCd2+ was uniformly adsorbed on the surface of SiO2 particles inZSR-P.
Figure 9 shows the TEM images of ZSR-P and ZSR-P-Cd.It can be clearly seen from Figure 9A that ZSR-P is mainlycomposed of aggregates formed by combining primary particleswith sizes of about 20 nm. The small particles adhere to eachother, and large aggregates of particles were formed. Due tothe small particle size of the primary particles, ZSR-P hada large specific surface area, which was consistent with thetest results. The large amount of hydroxyl groups presenton the surface may provide a large number of adsorptionand reaction binding sites for Cd2+. Figure 9B shows theTEM images of ZSR-P-Cd. It can be seen that the aggregatedshape of ZSR-P-Cd particles was consistent with that of ZSR-P, indicating that no new substances were produced in theadsorption reaction. It was inferred that Cd2+ was adsorbedon the surface of ZSR-P and binding occurs between theirinterfaces.
Adsorbent PropertiesChanges of Zeta PotentialThe zeta potential is the difference between the shear plane ofthe solid-liquid relative movement and the potential inside thesolution. The magnitude and the positive and negative valuesare determined by the solid surface properties, the Stern layerof the solid-liquid interface, the properties of the medium, andthe concentration and nature of the ions in the solvation layer,which can reflect the difference in surface properties of ZSR-P before and after the adsorption of Cd2+ (Moreno-Castilla
FIGURE 6 | Adsorption isothermal models of Cd2+ adsorption by ZSR-P. (A) Langmuir model fitting results. (B) Freundlich model fitting results.
Frontiers in Chemistry | www.frontiersin.org November 2018 | Volume 6 | Article 556

Chen et al. Adsorption Properties and Mechanism of Cd2+
FIGURE 8 | SEM images of ZSR-P (A) and adsorbed Cd2+ product (B).
TABLE 4 | Elemental analysis of ZSR-P and adsorbed Cd2+ product.
Sample O Si Zr Cd
Atom
fraction
Weight
fraction
Atom
fraction
Weight
fraction
Atom
fraction
Weight
fraction
Atom
fraction
Weight
fraction
ZSR-P 78.42 59.17 17.47 23.14 4.11 17.69 0 0
ZSR-P-Cd 76.90 54.64 18.10 22.58 2.32 9.41 2.68 13.37
FIGURE 9 | TEM images of ZSR-P (A) and adsorbed Cd2+ product (B).
Frontiers in Chemistry | www.frontiersin.org November 2018 | Volume 6 | Article 556

Chen et al. Adsorption Properties and Mechanism of Cd2+
et al., 2000, 2001). Figure 10 shows the surface zeta potentialvalues of ZSR-P raw materials and adsorbed Cd2+ products(ZSR-P-Cd) at different pH conditions. It can be seen that thezeta potential of the surface before and after the adsorptionof Cd2+ by ZSR-P in the water system decreased with theincrease in the pH value. When pH was less than 5.92, the zetapotential of the ZSR-P surface was positive, which indicatedthat the surface charge of ZSR-P was positive, and the counterion of the Stem layer in the solution was negative. As the pHincreased, the H+ ions in the solution gradually decreased, andthe OH− ions in the Stern layer and the diffusion layer of theZSR-P surface gradually increased. The zeta potential of theZSR-P surface was negative, and the absolute value graduallyincreased. When ZSR-P adsorbed Cd2+, the point of zero chargeof ZSR-P-Cd shifted to the right to pH 6.7, indicating that morecations were adsorbed on the surface of the particles. Whenthe pH was less than 6.7, the surface charge value of ZSR-P-Cdwas larger than that of ZSR-P under the same pH condition.When the pH was greater than 6.7, the absolute surface chargevalue of ZSR-P-Cd was smaller than that of ZSR-P at the samepH.
Using the surface hydroxyl test method in formula (2), thesurface hydroxyl groups before and after adsorption of Cd2+
by ZSR-P were 1.39/nm2 and 1.06/nm2, respectively. Therefore,it can be seen from the changes in surface zeta potentialand hydroxyl density that under the same pH condition, thenumber of hydroxyl groups on the surface of the productafter adsorption of Cd2+ were much smaller than that on thesurface of ZSR-P. This indicates that when Cd2+ was addedto the solution, ZSR-P was surrounded by a large numberof cations in the solution, and the large amount of hydroxylgroups on the surface became the main binding site of theadsorption reaction; therefore, Cd2+ ions occupy the surface ofthe ZSR-P particles and the pores formed by the accumulation ofparticles.
FIGURE 10 | Zeta potential of ZSR-P and adsorbed Cd2+ product.
Fourier Transform Infrared (FTIR) SpectroscopyFigure 11 is the infrared spectra of ZSR-P and its adsorbed Cd2+
product (ZSR-P-Cd). In the infrared spectrum of ZSR-P, the peakat 3,438 cm−1 was OH stretching of water; 1,637 cm−1 wasOH deformation of water; the strong absorption band causedby Si-O stretching appeared at 1,090 cm−1 and 791 cm−1; thepeak at 970 cm−1 belonged to Si-OH stretching; and the peak at463 cm−1 was Si-O-Si deformation, reflecting the characteristicsof amorphous SiO2 in ZSR-P. The peaks located at 1,637 cmand 3,438 cm were attributed by the abundant hydroxyl groups,which existing on the large specific surface area, absorb thesurrounding water molecules. The comparison showed thatthe above absorption peaks appeared in the spectrum of ZSR-P adsorbed Cd2+ product except for the absorption peak at 970cm−1, and the peaks at 1,090 cm−1 were slightly moved to 1,096cm−1. It was speculated that the Si-O stretching (Da-Qing et al.,2000) formed on the surface of SiO2 hydrolyzed to form –SiOH(Bogdan et al., 1996) and combined with Cd2+ (d’espinose de laCaillerie et al., 1997). The disappearance of the Si-OH stretchingat 970 cm−1 was presumed to be due to the dehydroxylationreaction on the surface of ZSR-P after the adsorption of Cd2+.
XPS AnalysisX-ray photoelectron spectroscopy analysis of ZSR-P and ZSR-P-Cd was performed, and the results are shown in Figure 12.The results show that the peaks of O, Si, and Zr appeared inthe ZSR-P spectrum, reflecting the characteristics of ZSR-P beinga component of SiO2 and a small quantity of Zr-containingimpurities. However, the peak of Cd3d5/2 appeared in the XPS ofZSR-P-Cd, and its binding energy was 405.72eV, indicating thatCd2+ was adsorbed on the surface of SiO2, which was consistentwith the results of SEM. In addition, the binding energies ofSi2s and Si2p in the XPS of ZSR-P were 153.64 and 102.83 eV,respectively. While their binding energies in the XPS of ZSR-P-Cd were 154.07 and 103.04 eV, respectively. The larger bindingenergy value indicated that the chemical environment of Si hadchanged after the adsorption of Cd2+, which was consistent with
FIGURE 11 | Infrared spectra of ZSR-P and ZSR-P-Cd.
Frontiers in Chemistry | www.frontiersin.org November 2018 | Volume 6 | Article 556

Chen et al. Adsorption Properties and Mechanism of Cd2+
the results of Si-OH on the SiO2 surface and Cd2+ hydratereactions.
Adsorption ModelBased on the above analysis of the properties and mechanismsof ZSR-P adsorbing Cd2+, an interaction model reflecting thisproperty, mechanism, and process was established and shown inFigure 13.
CONCLUSIONS
(1) Zirconium-containing silica residue purification is mainlycomposed of aggregates of amorphous SiO2 nanoparticles.It has an excellent adsorption and removal effect on Cd2+
in water. The pH value of the solution, Cd2+ concentration,and adsorption time have a significant effect on the removaleffect. In addition, ZSR-P, at a dosage of 3 mg/L, was added to
FIGURE 12 | XPS of ZSR-P and ZSR-P-Cd. (A) The XPS full spectrum of ZSR-P and ZSR-P-Cd. (B) The Cd3d spectrum of ZSR-P-Cd. (C) The Si2s and Si2p
spectra of ZSR-P and ZSR-P-Cd.
FIGURE 13 | ZSR-P adsorption model of Cd2+.
Frontiers in Chemistry | www.frontiersin.org November 2018 | Volume 6 | Article 556

Chen et al. Adsorption Properties and Mechanism of Cd2+
an aqueous solution, which had a Cd2+ concentration of 100mg/L and pH 9, and then the mixture was shaken for 10min;subsequently, the adsorption reached an equilibrium. Theadsorption amount of Cd2+ by ZSR-P is 43.1 mg/g.
(2) The isothermal adsorption of Cd2+ by ZSR-P is inaccordance with the Langmuir adsorption model, consistentwith the adsorption characteristics of general microporousmaterials. The adsorption kinetics equation of ZSR-P forCd2+ conforms to the second-order model for adsorptionrate.
(3) The removal of Cd2+ in aqueous solution by ZSR-P is mainlybased on the adsorption between them. In addition, Cd2+ is
uniformly distributed on the surface of SiO2 particles and inthe pores formed by the accumulation of particles in ZSR-P-Cd. Adsorption between SiO2 and Cd2+ is achieved by the
reaction between Si-OH on the surface of SiO2 and Cd2+
hydroxyl compounds.
AUTHOR CONTRIBUTIONS
WC, HZ, HD, and SS conceived and designed the experiments.WC, HZ, and YL performed the experiments. WC and SSanalyzed the data. HZ, YL, and SS contributed reagents. WCwrote the manuscript. YL retouched the document.
ACKNOWLEDGMENTS
The authors are thankful to the School of Materials Science andTechnology, China University of Geoscience (Beijing), China forproviding laboratory facilities.
REFERENCES
Basci, N., Kocadagistan, E., and Kocadagistan, B. (2004). Biosorption of copper
(ii) from aqueous solutions by wheat shell. Desalination 164, 135–140.
doi: 10.1016/S0011-9164(04)00172-9
Bayat, B. (2002). Combined removal of zinc (ii) and cadmium (ii)
from aqueous solutions by adsorption onto high-calcium turkish
fly ash. Water. Air. Soil. Poll. 136, 69–92. doi: 10.1023/A:10152960
32528
Bhattacharyya, K. G., and Gupta, S. S. (2008). Adsorption of a few heavy
metals on natural and modified kaolinite and montmorillonite: a
review. Adv. Colloid. Interfac. 140, 114–131. doi: 10.1016/j.cis.2007.
12.008
Bogdan, A., Kulmala,M., Gorbunov, B., and Kruppa, A. (1996). Nmr study of phase
transitions in pure water and binary H2O/HNO3 films adsorbed on surface
of pyrogenic silica. J. Colloid. Interf. Sci. 177, 79–87. doi: 10.1006/jcis.1996.
0008
Dabrowski, A., Hubicki, Z., Podkoscielny, P., and Robens, E. (2004).
Selective removal of the heavy metal ions from waters and industrial
wastewaters by ion-exchange method. Chemosphere 56, 91–106.
doi: 10.1016/j.chemosphere.2004.03.006
Da-Qing, W. U., Diao, G. Y., Wei, J. F., and Yuan, P. (2000).
Surface function groups and surface reactions of minerals. Geol.
J. China Univ. 6, 225–226. doi: 10.16108/j.issn1006-7493.2000.
02.019
d’espinose de la Caillerie J. B., Aimeur, M. R., Kortobi, Y. E., and Legrand, A.
P. (1997). Water adsorption on pyrogenic silica followed by 1h mas nmr. J.
Colloid. Interf. Sci. 194, 434–439. doi: 10.1006/jcis.1997.5126
Fan, Z., Yu, B., Yue, Z., Wang, T., Xian, W., Liu, Z., et al. (2007). Preparation of
porous chitosan gel beads for copper(ii) ion adsorption. J. Hazard. Mater. 147,
67–73. doi: 10.1016/j.jhazmat.2006.12.045
Fu, F., and Wang, Q. (2011). Removal of heavy metal ions from wastewaters:
a review. J. Environ. Manage. 92, 407–418. doi: 10.1016/j.jenvman.2010.
11.011
Ho, Y. S., Ng, J. C. Y., and Mckay, G. (2000). Kinetics of pollutant
sorption by biosorbents: review. Separ. Purif. Method. 29, 189–232.
doi: 10.1081/SPM-100100009
Ho, Y. S., and Ofomaja, A. E. (2006). Kinetic studies of copper ion
adsorption on palm kernel fibre. J. Hazard. Mater. 137, 1796–1802.
doi: 10.1016/j.jhazmat.2006.05.023
Hong-Ping, H. E., Guo, J. G., Zhu, J. X., and Yang, D. (2001).
An experimental study of adsorption capacity of montmorillonite,
kaolinite and illite for heavy metals. Acta Petrologica Et Mineralogica. 20,
573–578.
Huang, J., Lei, P., Zeng, G., Li, X., Zhao, Y., Liu, L., et al. (2014). Evaluation of
micellar enhanced ultrafiltration for removing methylene blue and cadmium
ion simultaneously with mixed surfactants. Sep. Purif. Technol. 125, 83–89.
doi: 10.1016/j.seppur.2014.01.020
Janin, A., Zaviska, F., Drogui, P., Blais, J. F., and Mercier, G. (2009).
Selective recovery of metals in leachate from chromated copper
arsenate treated wastes using electrochemical technology and chemical
precipitation. Hydrometallurgy 96, 318–326. doi: 10.1016/j.hydromet.2008.
12.002
Langmuir, I. (2015). The adsorption of gases on plane surfaces of glass,
mica and platinum. J. Chem. Phys. 40, 1361–1403. doi: 10.1021/ja0224
2a004
Mohammad-Khah, A., and Ansari, R. (2009). Activated charcoal: preparation,
characterization and applications: a review article. Int. J. Chemtech. Res. 1,
859–864.
Moreno-Castilla, C., Carrasco-Mari, N. F., Parejo-Pérez, C., and Ramón, M. V.
L. (2001). Dehydration of methanol to dimethyl ether catalyzed by oxidized
activated carbons with varying surface acidic character. Carbon. 39, 869–875.
doi: 10.1016/S0008-6223(00)00192-5
Moreno-Castilla, C., López-Ramón, M. V., and Carrasco-Mar,iN., F.
(2000). Changes in surface chemistry of activated carbons by wet
oxidation. Carbon 38, 1995–2001. doi: 10.1016/S0008-6223(00)
00048-8
Romero-Gonzalez, M. E., Williams, C. J., and Gardiner, P. H. (2001). Study of the
mechanisms of cadmium biosorption by dealginated seaweed waste. Environ.
Sci. Technol. 35, 3025–3030. doi: 10.1021/es991133r
Sekhar, K. C., Chary, N. S., Kamala, C. T., Suman Raj D. S., and Sreenivasa
Rao A. (2004). Fractionation studies and bioaccumulation of sediment-bound
heavy metals in Kolleru lake by edible fish. Environ. Int. 29, 1001–1008.
doi: 10.1016/S0160-4120(03)00094-1
Sha, L., Guo, X. Y., Feng, N. C., and Tian, Q. H. (2010). Effective removal of heavy
metals from aqueous solutions by orange peel xanthate. T. Nonferr. Metal. So.
C. 20, 187–191. doi: 10.1016/S1003-6326(10)60037-4
Solenkova, N. V., Newman, J. D., Berger, J. S., Thurston, G., Hochman, J.
S., and Lamas, G. A. (2014). Metal pollutants and cardiovascular disease:
mechanisms and consequences of exposure. Am. Heart. J. 168, 812–822.
doi: 10.1016/j.ahj.2014.07.007
Soylak, M., Unsal, Y. E., Kizil, N., and Aydin, A. (2010). Utilization of membrane
filtration for preconcentration and determination of cu(ii) and pb(ii) in food,
water and geological samples by atomic absorption spectrometry. Food. Chem.
Toxicol. 48, 517–521. doi: 10.1016/j.fct.2009.11.005
Sprynskyy, M., Buszewski, B., Terzyk, A. P., and Namiesnik, J. (2006).
Study of the selection mechanism of heavy metal (Pb2+, Cu2+, Ni2+,
and Cd2+) adsorption on clinoptilolite. J. Colloid. Interf. Sci. 304, 21–28.
doi: 10.1016/j.jcis.2006.07.068
Srivastava, N. K., and Majumder, C. B. (2008). Novel biofiltration methods for the
treatment of heavy metals from industrial wastewater. J. Hazard. Mater. 151,
1–8. doi: 10.1016/j.jhazmat.2007.09.101
Frontiers in Chemistry | www.frontiersin.org November 2018 | Volume 6 | Article 556

Chen et al. Adsorption Properties and Mechanism of Cd2+
Veli, S., and Alyüz, B. (2007). Adsorption of copper and zinc from
aqueous solutions by using natural clay. J. Hazard. Mater. 149, 226–233.
doi: 10.1016/j.jhazmat.2007.04.109
Venza, M., Visalli, M., Biondo, C., Oteri, R., Agliano, F., Morabito,
S., et al. (2014). Epigenetic effects of cadmium in cancer: focus on
melanoma. Curr. Genom. 15, 420–435. doi: 10.2174/1389202915061501061
45932
Wong, K. K., Lee, C. K., Low, K. S., and Haron, M. J. (2003). Removal
of Cu and Pb by tartaric acid modified rice husk from aqueous
solutions. Chemosphere 50, 23–28. doi: 10.1016/S0045-6535(02)
00598-2
Zhang, X. J., Ding, H., and Wang, B. K. (2011). Recycling and characterisation
of amorphous silica from zr-containing silica residue. Adv. Mater. Res.
194–196, 2109–2114. doi: 10.4028/www.scientific.net/AMR.194-196.
2109
Zhu, X. P., Bai, D. K., Xi-Kun, L. I., Zeng, J. P., and Cao, S. Y. (2009).
The adsorption behaviors of montmorillonite and some other clay minerals for
cadmium. Acta Petrologica Et Mineralogica. 28, 643–648.
Conflict of Interest Statement: The authors declare that the research was
conducted in the absence of any commercial or financial relationships that could
be construed as a potential conflict of interest.
Copyright © 2018 Chen, Zhang, Liang, Ding and Sun. This is an open-access article
distributed under the terms of the Creative Commons Attribution License (CC BY).
The use, distribution or reproduction in other forums is permitted, provided the
original author(s) and the copyright owner(s) are credited and that the original
publication in this journal is cited, in accordance with accepted academic practice.
No use, distribution or reproduction is permitted which does not comply with these
terms.
Frontiers in Chemistry | www.frontiersin.org November 2018 | Volume 6 | Article 556

ORIGINAL RESEARCH
published: 18 April 2018
doi: 10.3389/fchem.2018.00118
Frontiers in Chemistry | www.frontiersin.org April 2018 | Volume 6 | Article 118
Edited by:
Hongfei Cheng,
Chang’an University, China
Reviewed by:
Xuan Dou,
Northwestern University, United States
Ping Zhang,
Nanchang University, China
*Correspondence:
Weizhen Liu
Specialty section:
This article was submitted to
Green and Sustainable Chemistry,
a section of the journal
Frontiers in Chemistry
Received: 09 February 2018
Accepted: 30 March 2018
Published: 18 April 2018
Citation:
Li Y, Tian C, Liu W, Xu S, Xu Y, Cui R
and Lin Z (2018) Carbon Cloth
Supported Nano-Mg(OH)2 for the
Enrichment and Recovery of Rare
Earth Element Eu(III) From Aqueous
Solution. Front. Chem. 6:118.
doi: 10.3389/fchem.2018.00118
Carbon Cloth SupportedNano-Mg(OH)2 for the Enrichmentand Recovery of Rare Earth ElementEu(III) From Aqueous Solution
Yinong Li, Chen Tian, Weizhen Liu*, Si Xu, Yunyun Xu, Rongxin Cui and Zhang Lin
The Key Laboratory of Pollution Control and Ecosystem Restoration in Industry Clusters (Ministry of Education), School of
Environment and Energy, South China University of Technology, Guangzhou, China
Nano-Mg(OH)2 is attracting great attention as adsorbent for pre-concentration and
recovery of rare earth elements (REEs) from low-concentration solution, due to
its superior removal efficiency for REEs and environmental friendliness. However,
the nanoparticles also cause some severe problems during application, including
aggregation, blockage in fixed-bed column, as well as the difficulties in separation and
reuse. Herein, in order to avoid the mentioned problems, a carbon cloth (CC) supported
nano-Mg(OH)2 (nano-Mg(OH)2@CC) was synthesized by electrodeposition. The X-ray
diffraction and scanning electron microscopy analysis demonstrated that the interlaced
nano-sheet of Mg(OH)2 grew firmly and uniformly on the surface of carbon cloth fibers.
Batch adsorption experiments of Eu(III) indicated that the nano-Mg(OH)2@CC composite
maintained the excellent adsorption performance of nano-Mg(OH)2 toward Eu(III). After
adsorption, the Eu containing composite was calcined under nitrogen atmosphere. The
content of Eu2O3 in the calcined material was as high as 99.66%. Fixed-bed column
experiments indicated that no blockage for Mg(OH)2@CC composite was observed
during the treatment, while the complete blockage of occurred to nano-Mg(OH)2 at
an effluent volume of 240mL. Moreover, the removal efficiency of Mg(OH)2@CC was
still higher than 90% until 4,200mL of effluent volume. This work provides a promising
method for feasible application of nanoadsorbents in fixed-bed process to recycle
low-concentration REEs from wastewater.
Keywords: Nano-Mg(OH)2, carbon cloth, composite, rare earth, recovery
INTRODUCTION
Recent years, Rare earth elements (REEs) are considered to be irreplaceable critical dopants foradvanced materials in high-tech applications (Alonso et al., 2012), such as luminescent (Zhanget al., 2018), catalysts (Li et al., 2017; Lin et al., 2017), permanent magnets (Mudryk et al., 2017),and sensor material (Willa et al., 2017), due to their special metallurgical, optical, and electronicproperties (Dutta et al., 2016). With the development of the society and industry, the demand forthe REEs is increasing all over the world (Dutta et al., 2016; Tansel, 2017). However, the REEsresource is in a serious shortage due to their low reserves and outputs from the natural minerals.

Li et al. Eu(III) Recovery by Mg(OH)2@CC
Therefore, in order to relieve the environmental burden andease the potential supply crisis, many secondary resourcesfor recycling REEs are developed, including discarded REEs-containing solid waste (Maroufi et al., 2017; Tansel, 2017) andindustrial wastewater (Binnemans et al., 2013; Wilfong et al.,2017), etc. Nevertheless, the REE concentrations in most of thesecondary resources are as low as hundreds of ppm (Binnemanset al., 2013, 2015), which makes their enrichment and separationextremely difficult.
In view of the above issues, adsorption is regarded as aneffective technology for the pre-concentration and recoveryof REEs, owing to its simplicity, easy handling, sludge-freeoperation, and cost effectiveness (Liu et al., 2017; Qi et al.,2017; Wilfong et al., 2017). Compared with other adsorbents,nano-Mg(OH)2, an environmental-friendly material, exhibitsrapid kinetics, and high efficiency (with a maximum adsorptioncapacity of 1,827mg/g) toward a typical REE of Tb(III) atextremely low concentrations (Li et al., 2013). However, it shouldbe pointed out that, like other nanoadsorbents, the small sizeof nano-Mg(OH)2 also caused some issues and difficulties inseparation and reuse, including mass transfer and excessivepressure drops when applied in fixed bed or any other flow-through systems (Zhao et al., 2011). Moreover, the release ofnanoparticles into the environment is also a possible risk toecosystems and human health. These drawbacks strongly hinderthe application of nano-Mg(OH)2 in the wastewater treatment(Zhao et al., 2011; Tesh and Scott, 2014).
An effective approach for overcoming the above bottlenecksis to fabricate nano-Mg(OH)2 onto supporting materialsof larger size (Zhao et al., 2011; Tesh and Scott, 2014;Chen et al., 2016). The resultant nanocomposite is expectedto retain the inherent properties of nano-Mg(OH)2, whilethe supporting material would provide higher mechanicalstrength and improve the dispersity of nano-Mg(OH)2 (Chenet al., 2016). In the previous study, common supportingmaterials include natural polymers (e.g., Chitosan, alginate;Xiao et al., 2015; Zhang L. et al., 2015; Kwon et al.,2016), inorganic materials (He et al., 2011; Chen et al.,2017), synthetic macromolecule materials (Chen et al., 2016;Yu et al., 2016; Zhang et al., 2017), and some carbonmaterials (e.g., graphene, carbon nanotubes, carbon cloth;Dimpe et al., 2017; Kumar et al., 2017; Tian et al., 2017;Xu et al., 2017). Despite plenty of supporting materials canbe alternates for nanomaterials, very few of them were usedto support nano-Mg(OH)2. Jia et al. (2014) reported that thenanofibrous membrane of PA6@Mg(OH)2, which was fabricatedby electrospinning technique combined with hydrothermalstrategy, exhibited preferable removal ability to Cr(VI). Xieet al. (2014) developed a novel modified diatomite adsorbentmodified by dispersed magnesium oxide nanoflake for theremediation of eutrophic lakes by removing excess PO4−
4 .Li et al. (2011) synthesized a Mg(OH)2@reduced grapheneoxide composite using in-situ chemical deposition method. Thecomposite exhibited excellent adsorption effect to methyleneblue. In the above studies, nano-Mg(OH)2 was loaded ontothe surface of carriers by coprecipitation or hydrothermalmethod, which still caused some drawbacks such as complicated
operation, poor controllability, and low synthesis efficiency ofnano-Mg(OH)2.
Compared with the above methods, electrodeposition is arapid, simple, and low-cost method without high-temperaturetreatment to fabricate the nano-composites (Lv et al., 2011;Liu T. et al., 2015). Currently, carbon cloth (CC) hasbeen considered to be an ideal candidate for supportingmaterials by electrodeposition, owing to the following threeadvantages: (1) CC has abundant functional group, which canfasten the nanoparticles on its surface; (2) CC has excellentmechanical property, admirable resistance to the acid/alkaliand environmental friendliness; (3) CC has superior electricalconductivity, which can control the morphology and the loadingamount of nanoparticles during the synthesis. An et al. (2016)fabricated the honeycomb-shaped porous NiCo2O4 on electro-etched CC with strong adhesion by electrodeposition. Thecomposites as a bind-free electrode display fast kinetics andsuperior electrochemical behavior controlled by the surfacereaction. Fan et al. (2016) reported a highly flexible electrodesynthesized by a facile in-situ electrodeposition of MnO2
and polypyrrole on CC. The composite showed superiorelectrochemical performance.
In this work, a nanocomposite was synthesized byelectrodepositing Mg(OH)2 nanoparticles onto carbon cloth.Adsorption performance of the nano-Mg(OH)2@CC compositeto Eu(III), a typical species of REE, was investigated via batchadsorption experiments. The properties of nano-Mg(OH)2@CCnanocomposites before and after adsorption were characterizedby X-ray diffraction (XRD), scanning electron microscope(SEM), energy dispersive spectroscopy (EDS), and inductivelycoupled plasma(ICP). Furthermore, fixed-bed adsorptionexperiments were conducted to assess the enrichment of Eu(III)and the recovery of nano-Mg(OH)2@CC for the treatment ofeffluent containing the Eu(III).
EXPERIMENTAL SECTION
Reagents and MaterialsAll solutions were prepared using deionized water. Europiumchloride hexahydrate (EuCl3·6H2O) was obtained from Aladdin(China). Magnesium sulfate (MgSO4·7H2O), magnesiumnitrate [Mg(NO3)2·6H2O] and sodium hydroxide (NaOH) wereobtained from Sinopharm Chemical Reagent Co. Ltd. (Shanghai,China). All of the chemicals were analytical grade and usedwithout further purification. Carbon cloth was obtained fromPHYCHEMi Co. Ltd. (Taiwan, China).
Preparation of AdsorbentsFlowerlike nano-Mg(OH)2 was prepared at room temperature(25◦C) by precipitation from NaOH andMgSO4·7H2O solutionsaccording to the method described in our previous study (Liu M.et al., 2015). The fabrication of Mg(OH)2@CC nanocompositeis illustrated in Scheme 1. In a typical process, a piece ofcommercial carbon cloth was washed by acetone, methanol,and isopropanol under sonication for 30min to remove anycontaminants on the surface. After drying in the oven, thepiece of carbon cloth was cut into small rectangle piece of
Frontiers in Chemistry | www.frontiersin.org April 2018 | Volume 6 | Article 118

Li et al. Eu(III) Recovery by Mg(OH)2@CC
SCHEME 1 | Schematic diagram showing the process for the engineering growth of the interlaced nano-sheet Mg(OH)2 on the surface of carbon cloth.
2 ∗1 cm and used as the working electrodes. However, only halfof the CC was soaked into the electrolyte to make Mg(OH)2only grow in an area of 1∗1 cm. The electrodeposition ofMg(OH)2 on CC was conducted in a three-electrode systemwith a static potential of −1.5V, soaking in Mg(NO3)2·6H2Oaqueous solution of 1 mol/L. The counter and reference electrodeutilized in the electrodeposition is platinum (Pt) net electrodeand SCE electrode, respectively. After electrodeposition, the CCwas rinsed by DI water and dried in a vacuum oven. Generally,the loading content of Mg(OH)2 on CC can be controlled bythe electrodeposition time. Therefore, different electrodepositiontimes were conducted to optimize the preparation condition.Finally, the Mg(OH)2@CC nanocomposite prepared in optimalcondition was used in the following study.
Batch Adsorption ExperimentsA stock solution of Eu(III) at a concentration of 1,000 mg/L wasprepared using sodium Eu(III) (EuCl3·6H2O; AR). A series of500mL glasses of the solution were added to 200mL of 10, 40, 70,100, 130, 160 mg/L Eu(III) solutions and 14mg Mg(OH)2/CC or14mg flowerlike nano-Mg(OH)2. The adsorbent quality used foranalyzing the adsorption data of the two adsorbents are both interms of the quality of magnesium hydroxide. The samples wereshaken at 200 rpm at room temperature for 24 h to ensure theadsorption reaching equilibrium. The adsorption data were fittedusing Langmuir (Equation 1) and Freundlich model (Equation2). The Langmuir model expressed by the following equation:
Ce
qe=
Ce
qm+
1
kLqm(1)
Where Ce (mg/L) and qe (mg/g) are the solute concentrationand adsorption capacity at equilibrium, respectively, and qm(mg/g) and kL (L/mg) are the maximum monolayer adsorptioncapacity and the binding energy of adsorption, respectively.The Freundlich adsorption model expressed by the followingequation:
qe = kf C1/ne (2)
Where kf and n are the Freundlich constants measuring theadsorption capacity and the adsorption intensity, respectively.
Kinetic experiments were conducted by mixing certainamount of Mg(OH)2@CC or flowerlike nano-Mg(OH)2 intoa 2,000mL flask containing 100 mg/L Eu(III) solutions. Formilli liter solution was sampled at various time intervals todetermine the adsorption kinetics. The kinetic data were fittedby the pseudo-first-order (Equation 3) and pseudo-second-orderequation (Equation 4):
qt = qe (1− e−klt) (3)
qt =q2e K2 t
1+ qe K2 t(4)
Where qe (mg/g) is the adsorption capacity at equilibrium, qt(mg/g) is the adsorption capacity at time t, and k1 (min−1) andk2 (g/mg·min) are the rate constants of pseudo-first-order andpseudo-second-order kinetics, respectively. The rate constants k1and k2 were determined by plotting log(qe-qt) vs. t and t/qt vs. t,respectively.
Continuous Effluent System ExperimentsThree grams nano-Mg(OH)2 was put into the sealedpolytetrafluoroethylene groove with two cores to preventthe loss of nano-Mg(OH)2 (the inner groove size is 200mmin length, 12mm in width, 18mm in height). The initialconcentration of Eu(III) is 100 mg/L. The peristaltic pumpwas used to control the water inlet velocity, while theautomatic collector was used for collecting samples at thesame interval time. The flow rate is calculated by the volumeof per unit time collected by the automatic collector. FigureS1a illustrates the above process in a simplified sequence flowdiagram.
The composite loaded 3 g Mg(OH)2 was put into thesealed polytetrafluoroethylene groove with two slots to fix theMg(OH)2@CC well into the groove (the inner groove size is200mm in length, 12mm in width, 18mm in height). Theinitial concentration of Eu(III) is 100 mg/L. The peristaltic pumpwas used to cycle 200mL solution containing Eu(III) through
Frontiers in Chemistry | www.frontiersin.org April 2018 | Volume 6 | Article 118

Li et al. Eu(III) Recovery by Mg(OH)2@CC
the groove for 10 h with constant flow rate. The solution wasreplaced by 200mL of fresh Eu(III) solution every 10 h, whileeach of the 200mL solution was considered as one cycle to testthe treatment effect of the nanocomposite to Eu(III). Duringprocessing for 25 circulations, the residual solution of every cyclewas collected to measure the Eu(III) concentration. Figure S1b
illustrates the above process in a simplified sequence flowdiagram.
CharacterizationXRD patterns were collected on a Bruker X-ray powderdiffractometer (advance D8) with Cu–Kα radiation. The tube
FIGURE 1 | (a) XRD patterns of carbon cloth and Mg(OH)2@CC. (b) SEM image of the pure carbon cloth (*2000). (c) SEM image of Mg(OH)2@CC (*2000), (d) SEM
image of Mg(OH)2@CC (*5000).
FIGURE 2 | (A) Residual Eu(III) concentration in aqueous solution after adsorbed by Mg(OH)2@CC with different dosages. (B,C) Langmuir and Freundlich isotherms
for Eu(III) adsorption by Mg(OH)2@CC and nano-Mg(OH)2. (D) Adsorption kinetics of Mg(OH)2@CC and nano-Mg(OH)2 toward Eu(III). (E) Pseudo-first-order kinetic
model fitting for Eu(III) adsorption. (F) Pseudo-second-order kinetic model fitting for Eu(III) adsorption.
Frontiers in Chemistry | www.frontiersin.org April 2018 | Volume 6 | Article 118

Li et al. Eu(III) Recovery by Mg(OH)2@CC
voltage was 40 kV and the tube current was 40mA. Diffractionpatterns were collected over 2θ = 10◦−80◦ at 1◦/min. Thestep size of the scan was 0.02◦. The morphology of thesamples was observed using a JSM-7100F SEM with anOxford INCA EDS. Eu(III) content in solution was determinedby inductively coupled plasma optical emission spectrometry(ICP-OES).
RESULTS AND DISCUSSION
Mechanism StudyMechanism of electrodeposition process is shown in Scheme 1
and Equations (5–7):
NO−3 +H20+ 2e− = NO−
2 + 2OH− Eθ = 0.01V (5)
2H2O+ 2e− = 2OH− +H2 Eθ = −0.83V (6)
Mg2+ + 2OH− = Mg (OH)2 (7)
Equations (5, 6) are the main electrode reaction equationsof synthesizing nano-Mg(OH)2 by electrodeposition. Briefly,when the electrochemical workstation is in running state, thecathode will continuously produce the OH− which combineswith Mg2+ in solution, by electrolyzing NO−
3 and H2O. Whenthe concentration product of OH− andMg2+ reach the solubilityproduct of Mg(OH)2, Equation (7) occurs and the Mg(OH)2 willadhere onto the surface of carbon cloth firmly.
Characterization of the AdsorbentsThe XRD patterns of the carbon cloth and Mg(OH)2@CCcomposite are shown in Figure 1a, both of which exhibittwo strong peaks at 2θ = 26.2 and 44.4◦. The two peaksare attributed to (002) and (101) planes of the carbon cloth,respectively (Zhang G. et al., 2015). For the Mg(OH)2@CCcomposite, the characteristic diffraction peaks at 2θ = 18.4,32.9, 38.0, 50.9, 58.7, 62.2, 68.4, and 72.1◦ (except peaksderived from the carbon cloth) are well indexed to (001),(100), (011), (102), (110), (111), (103), and (201) phases ofMg(OH)2, respectively (JCPDS NO.44-1482). Figure S2 showsthe SEM image of Mg(OH)2@CC at different electrodepositiontime. It can be found that with too short electrodepositiontime, magnesium hydroxide on the surface of carbon clothis very sparse. While with too long electrodeposition time,the magnesium hydroxide on the surface of carbon clothwill crack. Only with the appropriate electrodepositiontime (around 10min), one layer of magnesium hydroxide isinterlaced on the surface of the carbon cloth and attachedstrongly. Figures 1b–d show the typical morphologies ofpure carbon cloth (∗2000), Mg(OH)2@CC (∗2000), andMg(OH)2@CC (∗5000), respectively. A low-magnification SEMimage (Figure 1b) reveals that the fibers of the carbon clothpossess ∼10μm in diameter with a smooth surface. After thesynthesis of Mg(OH)2@CC composites via electrodeposition,it is noticed that the interlaced nano-sheets of Mg(OH)2 arefirmly and uniformly grown on the fibers with an averagediameter of 15μm (Figures 1c,d). The above results collectivelydemonstrated the successful integration of the Mg(OH)[email protected] addition, the XRD patterns and SEM image of nano-Mg(OH)2
shown in Figure S3 indicated that the flower-like nano-Mg(OH)2 was successfully synthesized similar to the reportedliterature.
Eu(III) Adsorption Isotherm and KineticsTo confirm that the carbon cloth carrier in Mg(OH)2@CC hasno negative effect on the adsorption performance of nano-Mg(OH)2, the adsorption effect of Mg(OH)2@CC toward Eu(III)was compared with nano-Mg(OH)2. Figure 2A shows that withan initial Eu(III) concentration of 100mg/L (the concentration ofREEs in the actual environment), Mg(OH)2@CC could decreasethe residual Eu(III) concentration in the solution with increasingadsorbent dosage. When the dosage of adsorbent increased to0.07 g/L, the removal efficiency can reach 99%. Once exceed 0.07g/L, the adsorbent will be excessive. Therefore, in the experimentsof adsorption kinetics and adsorption thermodynamics, thedosage of adsorbent was 0.07 g/L.
The adsorption isotherm data of nano-Mg(OH)2 andMg(OH)2@CC to Eu(III) were fitted by the Langmuir andFeriundlich models. The results and related parameters areshown in Figures 2B,C and Table 1. Obviously, no matter usingnano-Mg(OH)2 or Mg(OH)2@CC, the adsorption capacitiesincrease with the concentration of Eu(III), until it reachesequilibrium. Both of Langmuir and Feriundlich models canbe used to describe the adsorption of the two adsorbents (R2
> 0.95), while the R2 value of Langmuir model is higherthan of Feriundlich model. Therefore, Langmuir model ismore suitable to describe the adsorption of two adsorbents toEu(III) and the adsorption type of two materials to Eu(III)is chemical adsorption. The maximum adsorption capacitiesof nano-Mg(OH)2 and Mg(OH)2@CC calculated by Langmuirmodel were 1428.571 and 1436.781 mg/g, respectively (Table 1).Therefore, the loading Mg(OH)2 on the carbon cloth will notaffect the adsorption effect of Mg(OH)2.
The adsorption kinetics data of nano-Mg(OH)2 andMg(OH)2@CC composites to Eu(III) were fitted by thepseudo-first-order kinetic and the pseudo-second-order
TABLE 1 | Parameters of Langmuir and Freundlich isotherm for Eu(III) on Mg(OH)2
and Mg(OH)2@CC.
Eu(III) Langmiur constant Freundlich constant
R2 qm (mg/g) kL R2 KF(mg/g) n
Mg(OH)2 0.9995 1428.571 0.4375 0.9822 854.144 8.8261
Mg(OH)2@CC 0.9976 1436.781 0.2692 0.9631 1091.709 20.6612
TABLE 2 | Kinetic parameters calculated from Pseudo-first order and
Pseudo-second order kinetic models.
Eu(III) Pseudo-first order Pseudo-second order
R2 k1(1/min) qe(mg/g) R2 k2(1/min) qe(mg/g)
Mg(OH)2 0.9938 0.0101 1373.201 0.9127 0.000138 555.56
Mg(OH)2@CC 0.9979 0.0106 1348.705 0.9164 0.000191 555.56
Frontiers in Chemistry | www.frontiersin.org April 2018 | Volume 6 | Article 118

Li et al. Eu(III) Recovery by Mg(OH)2@CC
kinetic model. The results and related parameters are shownin Figures 2D,E and Table 2. Figure 2D. showed that theequilibrium adsorption capacity of the two materials varieswith time. When the dosage of adsorbent was 0.07 g/L andthe initial concentration Eu(III) was 100 mg/L, both of thetwo adsorbents could reach equilibrium in 400min andthe equilibrium adsorption capacities were around 1,400mg/g. Therefore, loading Mg(OH)2 on the carbon clothwill not affect its adsorption rate. The kinetic data of twoadsorbents were fitted using the pseudo-first-order and pseudo-second-order models. The fitting results (Table 2) show thatthe kinetics of the two adsorbents were better describedwith pseudo-first-order model kinetics, which suggestedthat physical and chemical interactions may simultaneouslycontribute and control the uptake of Eu(III) onto the surface ofMg(OH)2.
As a consequence, loading Mg(OH)2 on the surface of carboncloth has no negative effect on its adsorption performance. Themain reason is that the electrodeposited Mg(OH)2 is evenlydistributed on the surface each carbon fiber. Since the carbonfibers are relatively independent, they have no coverage andinterference to the active site of Mg(OH)2, leading to enoughactive sites exposing for Eu(III) adsorption.
Material Characterization After AdsorptionTo explore the adsorption mechanism, Mg(OH)2@CC wasexposed to Eu(III) solution with a high concentration. Themorphology, distribution, and crystal phase of Mg(OH)2@CC-Eu(III) were determined by SEM-EDS and XRD. The SEM
image showed that after adsorption, the original laminarstructure of Mg(OH)2@CC slightly bended, but still retainedthe interlacing laminar structure (Figure 3a). This is due tothe ions interaction between Eu(III) and Mg(II) that changesthe morphology (Li et al., 2013). The distribution map ofcorresponding elements (Eu, O, Mg) was recorded by SEM-EDS(Figures 3b–d). The thick purple areas in Figure 3b showthat the Eu is evenly distributed on the carbon fiber surface,while the sparse blue areas shown in Figure 3d indicate thedecrease of Mg(II) content after adsorption. To confirm theenrichment of Mg(OH)2@CC to Eu(III), the adsorbed powderof Mg(OH)2-Eu was collected from the surface of carboncloth through mechanical methods and calcinated at 800◦Cwithout oxygen. The XRD patterns of the obtained powdershown in Figure 4 can be well indexed as Europium Oxidephase (ICCD card no.00-034-0392). The corresponding ICPdata are shown in Table 3. The content of europium in solidphase is 860,727mg/kg, while the content of magnesiumis only 21.3mg/kg. According to ICP, SEM-EDS, and XRDdata, it can be calculated that 99.66% of the obtained powderafter calcination is europium oxide, while there is almost nomagnesium oxide. Therefore, the Mg(OH)2@CC can extractEu(III) from solution to the surface of the nanocomposite,which can realize the enrichment and recovery ofREEs.
Continuous System (Fixed Bed-Column)To further investigate the practical application of Mg(OH)2@CC,a fixed bed-column experiment was conducted to verify the
FIGURE 3 | (a) SEM image of Mg(OH)2@CC-Eu after reacting with high concentration Eu(III) solution for 24 h. (b) Corresponding EDS elemental mapping images for
Eu, (c) for O, (d) for Mg.
Frontiers in Chemistry | www.frontiersin.org April 2018 | Volume 6 | Article 118

Li et al. Eu(III) Recovery by Mg(OH)2@CC
FIGURE 4 | XRD patterns of Mg(OH)2@CC-Eu after calcination process
without oxygen.
TABLE 3 | ICP data of the reacted powder.
Component Mg Eu Eu2O3
Conversion content 21.3mg/kg 860, 727mg/kg 996, 631mg/kg
removal performance of Eu(III) by Mg(OH)2@CC, taking nano-Mg(OH)2 as comparison. As shown in Figure 5, with the samequality of Mg(OH)2 and the initial Eu(III) concentration of 100mg/L, the adsorption column performance of Mg(OH)2@CCis much better than that of pure nano-Mg(OH)2. It can beexplained that themain adsorptionmechanism ofMg(OH)2@CCto Eu(III) includes two parts: (1) ion exchange of Eu(III)with magnesium hydroxide; (2) the enhanced dispersion ofnano-Mg(OH)2 by the surface function groups of carboncloth. Under the two mechanisms, the treatment capacity ofMg(OH)2@CC is as high as 4,200mL (C/C0 is <0.10), whilethe concentration of effluent Eu(III) decreases to the μg/Llevel after treatment. Meanwhile, the effluent of Mg(OH)2@CCcan be processed at a steady flow rate. The curve of nano-Mg(OH)2 toward Eu(III) uptaken in fixed-bed columns is shownin the bottom left corner of Figure 5A, where there is a shortblack curve. The magnification of the short black curve isshown in Figure 5B. The effluent effect of nano-Mg(OH)2 issuperior (C/C0 approaches 0.00). However, with the increaseof effluent volume, the flow rate also decreases rapidly. Whenthe effluent volume reaches 240mL, the flow rate is closeto zero. A possible explanation is that the agglomeration ofthe nanoparticles reduces the specific surface area of nano-Mg(OH)2, and thus decreases the active sites for Eu(III)adsorption. Moreover, the agglomeration of nano-Mg(OH)2leads to the increase of particle size, which further causesblockage in fix-bed column. This problem will severely limitthe development of nano-Mg(OH)2 in practical application.Therefore, magnesium hydroxide plays an important role in the
FIGURE 5 | (A) Comparison curves of Eu(III) uptake in fixed-bed columns
between nano-Mg(OH)2 and Mg(OH)2@CC (initial concentration of 100 mg/L
Eu(III) effluent) (B) The magnification of the bottom left corner of (A).
absorption of Eu(III) by Mg(OH)2@CC, while the main effect ofcarbon cloth is to strengthen the dispersion of nano-Mg(OH)2.The combination of nano-Mg(OH)2 with carbon cloth wouldfurther improve the efficiency of nano-Mg(OH)2 and preventits loss.
CONCLUSIONS
In summary, a new nanocomposite Mg(OH)2@ CCwas preparedby electrodeposition, and used to adsorb Eu(III) in fixed-bed.The morphology and phase analyses revealed that the interlacedMg(OH)2 nano-sheets are uniformly loaded on the carboncloth fibers. The maximum adsorption capacity (1436.8 mg/g)and removal rate (95% within 300min) of Mg(OH)2/CCtoward Eu(III) is close to those of nano-Mg(OH)2, indicatingthat loading Mg(OH)2 on the surface of carbon cloth has nonegative effect on its adsorption performance. Moreover, up to99.66% of Eu2O3 is found in the adsorbed powder, indicatingMg(OH)2@CC could be an ideal candidate for the enrichmentand recovery of Eu(III) from aqueous solution. In addition,Mg(OH)2@CC exhibited great potential for Eu(III) removalin the fixed-bed compared with nano-Mg(OH)2. Therefore,the excellent performance of Mg(OH)2@CC suggests thatloading nanoparticles on CC via electrodeposition is a promising
Frontiers in Chemistry | www.frontiersin.org April 2018 | Volume 6 | Article 118

Li et al. Eu(III) Recovery by Mg(OH)2@CC
method to improve the application of nano-adsorptionmaterials.
AUTHOR CONTRIBUTIONS
YL: Organized the research problem on carbon clothsupported nano-Mg(OH)2 for the enrichment and recoveryof Rare Earth Element Eu(III) from aqueous solution, andparticipated in writing the manuscript; CT: SynthesizedMg(OH)2@CC and nano-Mg(OH)2; SX: Conducted the batchadsorption experiments and the data fitting; YX: Conducted thecharacterization of the adsorbents before and after adsorption;RC: conducted the fixed bed experiment of two adsorbents;WL and ZL: Analyzed the mechanism of the carbon cloth onenhancing the adsorption ability of Mg(OH)2@CC towardEu(III) in fixed bed and participated in writing the manuscript.
ACKNOWLEDGMENTS
This work was supported by the National Natural Science
Foundation of China (Grant No. 21607045 and 21477129),the Guangdong Innovative and Entrepreneurial Research
Team Program (No. 2016ZT06N569), Guangzhou Science andTechnology Project (No. 201804010189), and the Fundamental
Research Funds for the Central Universities (No. 2015ZM157
and 2017PY009).
SUPPLEMENTARY MATERIAL
The Supplementary Material for this article can be foundonline at: https://www.frontiersin.org/articles/10.3389/fchem.2018.00118/full#supplementary-material
REFERENCES
Alonso, E., Sherman, A. M., Wallington, T. J., Everson, M. P., Field, F. R.,
Roth, R., et al. (2012). Evaluating rare earth element availability: a case with
revolutionary demand from clean technologies. Environ. Sci. Technol. 46,
3406–3414. doi: 10.1021/es203518d
An, Y., Hu, Z., Guo, B., An, N., Zhang, Y., Li, Z., et al. (2016). Electrodeposition
of honeycomb-shaped NiCo2O4 on carbon cloth as binder-free electrode for
asymmetric electrochemical capacitor with high energy density. RSC Adv. 6,
37562–37573. doi: 10.1039/C6RA04788B
Binnemans, K., Jones, P. T., Blanpain, B., Van Gerven, T., and Pontikes,
Y. (2015). Towards zero-waste valorisation of rare-earth-containing
industrial process residues: a critical review. J. Clean. Prod. 99, 17–38.
doi: 10.1016/j.jclepro.2015.02.089
Binnemans, K., Jones, P. T., Blanpain, B., Van Gerven, T., Yang, Y., Walton, A.,
et al. (2013). Recycling of rare earths: a critical review. J. Clean. Prod. 51, 1–22.
doi: 10.1016/j.jclepro.2012.12.037
Chen, D., Zhu, H., Yang, S., Li, N., Xu, Q., Li, H., et al. (2016). Micro-
nanocomposites in environmental management. Adv. Mater. Weinheim. 28,
10443–10458. doi: 10.1002/adma.201601486
Chen, M., Wu, P., Yu, L., Liu, S., Ruan, B., Hu, H., et al. (2017). FeOOH-loaded
MnO2 nano-composite: an efficient emergency material for thallium pollution
incident. J. Environ. Manage. 192, 31–38. doi: 10.1016/j.jenvman.2017.01.038
Dimpe, K. M., Nyaba, L., Magoda, C., Ngila, J. C., and Nomngongo, P.
N. (2017). Synthesis, modification, characterization and application of
AC@Fe2O3 @MnO2 composite for ultrasound assisted dispersive solid phase
microextraction of refractory metals in environmental samples. Chem. Eng. J.
308, 169–176. doi: 10.1016/j.cej.2016.09.079
Dutta, T., Kim, K. H., Uchimiya, M., Kwon, E. E., Jeon, B. H., Deep, A., et al.
(2016). Global demand for rare earth resources and strategies for green mining.
Environ. Res. 150, 182–190. doi: 10.1016/j.envres.2016.05.052
Fan, X., Wang, X., Li, G., Yu, A., and Chen, Z. (2016). High-performance
flexible electrode based on electrodeposition of polypyrrole/MnO2
on carbon cloth for supercapacitors. J. Power Sources 326, 357–364.
doi: 10.1016/j.jpowsour.2016.05.047
He, S., Zhao, Y., Wei, M., Evans, D. G., and Duan, X. (2011). Fabrication of
hierarchical layered double hydroxide framework on aluminum foam as a
structured adsorbent for water treatment. Ind. Eng. Chem. Res. 51, 285–291.
doi: 10.1021/ie2015894
Jia, B.-B., Wang, J.-N., Wu, J., and Li, C.-J. (2014). “Flower-Like” PA6@Mg(OH)2electrospun nanofibers with Cr (VI)-removal capacity. Chem. Eng. J. 254,
98–105. doi: 10.1016/j.cej.2014.05.005
Kumar, V., Kim, K.-H., Park, J.-W., Hong, J., and Kumar, S. (2017). Graphene and
its nanocomposites as a platform for environmental applications. Chem. Eng. J.
315, 210–232. doi: 10.1016/j.cej.2017.01.008
Kwon, O. H., Kim, J. O., Cho, D. W., Kumar, R., Baek, S. H., Kurade, M. B.,
et al. (2016). Adsorption of As(III), As(V) and Cu(II) on zirconium oxide
immobilized alginate beads in aqueous phase. Chemosphere 160, 126–133.
doi: 10.1016/j.chemosphere.2016.06.074
Li, B., Cao, H., and Yin, G. (2011). Mg(OH)2@reduced graphene oxide
composite for removal of dyes from water. J. Mater. Chem. 21, 13765–13768.
doi: 10.1039/c1jm13368c
Li, C. C., Rui, X., Wei, W., Chen, L., and Yu, Y. (2017). Component-
customizable porous rare-earth-based colloidal spheres towards highly
effective catalysts and bioimaging applications. Chemistry 23, 16242–16248.
doi: 10.1002/chem.201702161
Li, C., Zhuang, Z., Huang, F., Wu, Z., Hong, Y., and Lin, Z. (2013). Recycling rare
earth elements from industrial wastewater with flowerlike nano-Mg(OH)(2).
ACS Appl. Mater. Interfaces 5, 9719–9725. doi: 10.1021/am4027967
Lin, F., Liu, Z., Wang, T., and Cui, D. (2017). Highly 2,3-selective polymerization
of phenylallene and its derivatives with rare-earth metal catalysts: from
amorphous to crystalline products. Angew. Chem. Int. Ed. Engl. 56,
14653–14657. doi: 10.1002/anie.201707601
Liu, J., Huang, K., Wu, X.-H., and Liu, H. (2017). Enrichment of low concentration
rare earths from leach solutions of ion-adsorption ores by bubbling organic
liquid membrane extraction using N1923. ACS Sustain. Chem. Eng. 5,
8070–8078. doi: 10.1021/acssuschemeng.7b01682
Liu, M., Wang, Y., Chen, L., Zhang, Y., and Lin, Z. (2015). Mg(OH)2 supported
nanoscale zero valent iron enhancing the removal of Pb(II) from aqueous
solution. ACS Appl. Mater. Interfaces 7, 7961–7969. doi: 10.1021/am509184e
Liu, T., Liang, Y., Liu, Q., Sun, X., He, Y., and Asiri, A. M. (2015).
Electrodeposition of cobalt-sulfide nanosheets film as an efficient
electrocatalyst for oxygen evolution reaction. Electrochem. Commun. 60,
92–96. doi: 10.1016/j.elecom.2015.08.011
Lv, Y., Zhang, Z., Lai, Y., Li, J., and Liu, Y. (2011). Formation mechanism for planes
(011) and (001) oriented Mg(OH)2 films electrodeposited on SnO2 coating
glass. CrystEngComm 13, 3848–3851. doi: 10.1039/c0ce00728e
Maroufi, S., Khayyam Nekouei, R., and Sahajwalla, V. (2017). Thermal isolation of
rare earth oxides from Nd–Fe–B magnets using carbon from waste tyres. ACS
Sustain. Chem. Eng. 5, 6201–6208. doi: 10.1021/acssuschemeng.7b01133
Mudryk, Y., Paudyal, D., Liu, J., and Pecharsky, V. K. (2017). Enhancing magnetic
functionality with scandium: breaking stereotypes in the design of rare earth
materials. Chem. Mater. 29, 3962–3970. doi: 10.1021/acs.chemmater.7b00314
Qi, X. H., Du, K. Z., Feng, M. L., Gao, Y. J., Huang, X. Y., and Kanatzidis, M.
G. (2017). Layered A2Sn3S7 1.25H2O (A = Organic Cation) as efficient ion-
exchanger for rare earth element recovery. J. Am. Chem. Soc. 139, 4314–4317.
doi: 10.1021/jacs.7b00565
Tansel, B. (2017). From electronic consumer products to e-wastes: global
outlook, waste quantities, recycling challenges. Environ. Int. 98, 35–45.
doi: 10.1016/j.envint.2016.10.002
Tesh, S. J., and Scott, T. B. (2014). Nano-composites for water remediation: a
review. Adv. Mater. Weinheim. 26, 6056–6068. doi: 10.1002/adma.201401376
Tian, C., Zhao, J., Zhang, J., Chu, S., Dang, Z., Lin, Z., et al. (2017).
Enhanced removal of roxarsone by Fe3O4@3D graphene nanocomposites:
Frontiers in Chemistry | www.frontiersin.org April 2018 | Volume 6 | Article 118

Li et al. Eu(III) Recovery by Mg(OH)2@CC
synergistic adsorption and mechanism. Environ. Sci. Nano 4, 2134–2143.
doi: 10.1039/C7EN00758B
Wilfong, W. C., Kail, B. W., Bank, T. L., Howard, B. H., and Gray, M.
L. (2017). Recovering rare earth elements from aqueous solution with
porous amine-epoxy networks. ACS Appl. Mater. Interfaces 9, 18283–18294.
doi: 10.1021/acsami.7b03859
Willa, C., Schmid, A., Briand, D., Yuan, J., and Koziej, D. (2017). Lightweight,
room-temperature CO2 gas sensor based on rare-earth metal-free
composites-an impedance study. ACS Appl. Mater. Interfaces 9, 25553–25558.
doi: 10.1021/acsami.7b07379
Xiao, G., Su, H., and Tan, T. (2015). Synthesis of core-shell bioaffinity chitosan-
TiO(2) composite and its environmental applications. J. Hazard. Mater. 283,
888–896. doi: 10.1016/j.jhazmat.2014.10.047
Xie, F., Wu, F., Liu, G., Mu, Y., Feng, C., Wang, H., et al. (2014). Removal
of phosphate from eutrophic lakes through adsorption by in situ formation
of magnesium hydroxide from diatomite. Environ. Sci. Technol. 48, 582–590.
doi: 10.1021/es4037379
Xu, W., Lan, R., Du, D., Humphreys, J., Walker, M., Wu, Z., et al. (2017). Directly
growing hierarchical nickel-copper hydroxide nanowires on carbon fibre cloth
for efficient electrooxidation of ammonia.Appl. Catal. B Environ. 218, 470–479.
doi: 10.1016/j.apcatb.2017.07.005
Yu, M., Li, W., Wang, Z., Zhang, B., Ma, H., Li, L., et al. (2016). Covalent
immobilization of metal-organic frameworks onto the surface of nylon–a new
approach to the functionalization and coloration of textiles. Sci. Rep. 6:22796.
doi: 10.1038/srep22796
Zhang, D., Zhao, Q., Zang, J., Lu, Y.-J., Dong, L., and Shan, C.-X. (2018).
Luminescent hybrid materials based on nanodiamonds. Carbon 127, 170–176.
doi: 10.1016/j.carbon.2017.11.009
Zhang, G., Hou, S., Zhang, H., Zeng, W., Yan, F., Li, C. C., et al. (2015).
High-performance and ultra-stable lithium-ion batteries based on MOF-
derived ZnO@ZnO quantum dots/C core-shell nanorod arrays on a carbon
cloth anode. Adv. Mater. Weinheim. 27, 2400–2405. doi: 10.1002/adma.2014
05222
Zhang, L., Jing, X., Li, R., Liu, Q., Liu, J., Zhang, H., et al. (2015).
Magnesium carbonate basic coating on cotton cloth as a novel adsorbent
for the removal of uranium. RSC Adv. 5, 23144–23151. doi: 10.1039/C4RA
16446F
Zhang, X., Cheng, C., Qian, J., Lu, Z., Pan, S., and Pan, B. (2017). Highly
efficient water decontamination by using sub-10 nm FeOOH confined within
millimeter-sized mesoporous polystyrene beads. Environ. Sci. Technol. 51,
9210–9218. doi: 10.1021/acs.est.7b01608
Zhao, X., Lv, L., Pan, B., Zhang, W., Zhang, S., and Zhang, Q. (2011). Polymer-
supported nanocomposites for environmental application: a review.Chem. Eng.
J. 170, 381–394. doi: 10.1016/j.cej.2011.02.071
Conflict of Interest Statement: The authors declare that the research was
conducted in the absence of any commercial or financial relationships that could
be construed as a potential conflict of interest.
Copyright © 2018 Li, Tian, Liu, Xu, Xu, Cui and Lin. This is an open-access article
distributed under the terms of the Creative Commons Attribution License (CC
BY). The use, distribution or reproduction in other forums is permitted, provided
the original author(s) and the copyright owner are credited and that the original
publication in this journal is cited, in accordance with accepted academic practice.
No use, distribution or reproduction is permitted which does not comply with these
terms.
Frontiers in Chemistry | www.frontiersin.org April 2018 | Volume 6 | Article 118

ORIGINAL RESEARCH
published: 18 December 2018
doi: 10.3389/fchem.2018.00633
Frontiers in Chemistry | www.frontiersin.org December 2018 | Volume 6 | Article 633
Edited by:
Wenbo Wang,
Lanzhou Institute of Chemical Physics
(CAS), China
Reviewed by:
Libing Liao,
China University of Geosciences,
China
Federica Valentini,
Dipartimento di Scienze e Tecnologie
Chimiche, Università di Roma Tor
Vergata, Italy
Xiazhang Li,
Changzhou University, China
*Correspondence:
Zhen Li
Specialty section:
This article was submitted to
Green and Sustainable Chemistry,
a section of the journal
Frontiers in Chemistry
Received: 29 June 2018
Accepted: 06 December 2018
Published: 18 December 2018
Citation:
Hao X, Li Z, Hu H, Liu X and Huang Y
(2018) Separation of CH4/N2 of Low
Concentrations From Coal Bed Gas
by Sodium-Modified Clinoptilolite.
Front. Chem. 6:633.
doi: 10.3389/fchem.2018.00633
Separation of CH4/N2 of LowConcentrations From Coal Bed Gasby Sodium-Modified Clinoptilolite
Xiaofei Hao1,2, Zhen Li 1*, Hongjie Hu2, Xueqin Liu 1 and Yanqiu Huang1
1 Faculty of Materials Science and Chemistry, China University of Geosciences, Wuhan, China, 2 Zhengzhou Fulong Science
and Technology of New Materials Co., Ltd., Zhengzhou Institute of Multipurpose Utilization of Mineral Resources, Chinese
Academy of Geological Sciences, Zhengzhou, China
Clinoptilolite is a widely distributed tectosilicate, mainly composed of Al2O3, SiO2 with
exchangeable cations such as Ca, K, Mg, and Na. In this research, raw clinoptilolite was
ground, gravimetrically concentrated and ion-exchanged using different concentrations
of NaCl solution. Then the modified clinoptilolite powder was formulated into particles
as adsorbents. The adsorbents were applied to CH4 separation in coal bed gas. The
raw and modified clinoptilolites were characterized by X-ray diffraction (XRD), scanning
electron microscope (SEM), transmission electron microscope (TEM), atomic emission
spectrometer (ICP-AES), Fourier transform infrared spectrometer (FTIR), and Brunauer
Emmett Teller (BET) specific surface area. The CH4 absorptivity by raw and modified
clinoptilolites was evaluated using pressure swing adsorption (PSA) to assess the CH4
separation ability. The results indicated that the ion-exchanged clinoptilolite using 0.2
mol/L NaCl solution was found to be promising for the kinetic PSA separation of CH4/N2,
giving a better absorptivity for CH4 separation under different influence factors. Based on
the simulated static experiments, it was indicated that both CH4 and N2 were capable
of diffusing into clinoptilolite while N2 adsorption by clinoptilolite was excellent. The
experiment results also indicated that ion-exchanged clinoptilolite using a 0.2 mol/L
NaCl solution was the optimal adsorbent for separating CH4/N2 at the low pressure
condition. From the simulated dynamic experiments, the ion-exchanged clinoptilolite
using a 0.2 mol/L NaCl solution as a potential sorbent in kinetic PSA processes for
N2/CH4 separation, exhibited the best performance at 648K under 0.2 MPa within
28min, in comparison to the raw clinoptilolite and clinoptilolite under other modification
conditions. In the next phase of research, the modified clinoptilolite will be tested for CH4
separation in real coal bed gas.
Keywords: clinoptilolite, ion-exchange, nitrogen/methane separation, selectivity, low concentrations methane,
pressure swing adsorption
INTRODUCTION
The coalbed gas is found in coal bed with a main composition of methane (CH4), which wasabsorbed on the surface of the coal particles. Part of coal bed gas was dissociated or dissolved inthe hydrocarbon gas in the coal pore and the water of coal bed, which is automatically stored upin the coal bed as the powerful complement to raw gas. CH4 in the coal bed is a high quality gasfuel. Meanwhile, it is also one of detrimental gases influencing mining underground coal and an

Hao et al. Separation of CH4/N2 by Modified Clinoptilolite
important harmful source leading to atmospheric greenhouseeffect. In China, there is up to 13 billion m3 CH4 under theprocess of coal mine a year, which accounts for around one thirdof its emissions globally. On the other hand, the utilization ratioof CH4 in the coal bed gas was only 35%, resulting in a huge CH4
resource loss. We know that the greenhouse effect of CH4 is 21times to the CO2 and power of CH4 for damaging ozone (O3)is 7 times to the CO2. Thus, recycling coal bed gas is of greatsignificance on both energy development and environmentalprotection. With improving consciousness of human on the coalmine safety and environmental protection, the exploitation ofCH4 in the coal bed has been attached great importance to theworld in recent years.
The separation technology of CH4 in the coal bed isnot effective, which is one of the main reasons for low theutilization ratio. In the separation process of low concentrationof coal bed gas, the physicochemical property of N2 and CH4
was similar (Perry et al., 1999; Johnson III, 2015). It ledthe recycle and separation technology to be a key commontechnology challenge. It was also one of the most importanttechnological obstacles on gas development, energy saving andemission reduction (Bomberger et al., 1999; Cavenati et al., 2006;Tagliabue et al., 2009). At present, the common technologieswere cryogenic distillation, pressure swing adsorption (PSA),membrane separation, hydration technology and dissolution-absorption technology. The PSA separation method has becomethe mainstream technology for the purification of coal bed gasat small and medium scales, due to its advantages of low energyconsumption, less investment equipment and high degree ofautomation (Arya et al., 2014; Yin et al., 2015). Its key challengeis the selection of adsorbents. The main adsorbents currentlyused are activated carbon (AC) (Zhou et al., 2002; Gu et al.,2015; Gao et al., 2017), carbon molecular sieve (CMS) (Fatehiet al., 1995; Cavenati et al., 2005; Grande et al., 2005), naturalclinoptilolite (Aguilar-Armenta et al., 2001; Jayaraman et al.,2004, 2005), titanium silicon molecular sieve (Aguilar-Armentaet al., 2001; Jayaraman et al., 2004, 2005; Faghihian et al., 2008).The equilibrium adsorption capacity of CH4 is higher than that ofN2 for AC. Although the separation coefficient is higher and theeffect is better based on results from laboratory studies, it is stillfar away from industrial application. The main reason is that thepreparation process of AC is complex and the cost is relativelyhigh. And it obtains CH4 product in vacuum desorption stage,the subsequent operation needs to be compressed, so the powercost is increased, and the economic effect is not obvious. Theseparation of CH4 and N2 by CMS is based on the kineticeffect. The diffusion rate of N2 in the micropore is higher thanCH4. A large amount of N2 is adsorbed into the pore and CH4
remains outside the pore in a relatively short time. Therefore,the product CH4 is obtained by the adsorption or sequestrationof the PSA process, instead of the vacuum step. With theincrease of adsorption time, the kinetically the effect becomesweaker, and the equilibrium effect will dominate, making CH4
and N2 separation difficult. Although CMS has achieved goodresults in the laboratory, it is mainly aimed at the coal bedgas with high concentration of CH4 (CH4 content >70%).However, there are few reports on the study of coal bed gas
with low concentrations. The natural clinoptilolite as a kind ofPSA adsorbents is of great potential for application with theadvantage of acid resistance, heat resistance, alkali resistance,stable structure, rich resources, and low price. They can showboth equilibrium and kinetic effects. However, the adsorbentprepared from natural clinoptilolite are of different sodiumcontents and its application in low concentration coal bed gas(CH4 < 30%) has not been reported.
Here we present a study of the adsorption isotherms offour adsorbents made from natural clinoptilolite with differentsodium contents at 298K. And the corresponding adsorptionkinetics were measured at the same and different pressure usingthe feed gas containing 20% CH4 and 80% N2 at 298K. Thisstudy will provide technical support for the implementation ofindustrialization.
MATERIALS AND METHODS
MaterialsClinoptilolite and All AgentsThe raw clinoptilolite was collected from the south ofthe Liaoxi metallogenic belt in China. The adsorbents used wereCH4 (99.95%), N2 (99.95%). The purging gas for adsorbentactivation/regeneration was He (99.999%, pre-purified). All gaseswere provided by Praxair. The reagents, including NaCl, usedin this research were of analytically pure and bought fromSinopharm Group Chemical Reagent Co., Ltd.
Clinoptilolite PretreatmentThe raw clinoptilolite was ground by a ball grinder to a granularsize <70μm. Then the milled pulp with clinoptilolite powderswas poured into a Falcon centrifuge to remove some heavyimpurities. The purified clinoptilolite was dried at 105◦C andstored in a desiccator. It was used as a raw material for thepreparation of adsorbents.
Preparation of Modified ClinoptiloliteThe processed clinoptilolite powders were mixed NaCl solutionsat concentrations of 0.1, 0.2, 0.4, and 0.6 mol/L at a solid to liquidratio of 1:20 for 2.5 h in Erlenmeyer flasks separately and coveredwith sealing films and maintained in a 90◦C water bath. Themixture was centrifuged to separate the solids, then washed usingdeionized water until no Cl−. All ion-exchanged clinoptilolitesamples were pressed into a round cake and calcined at 200◦C (todry the samples) for 2 h. And then they were crushed and sieved.Particles of 0.5–1.5mm sizes were used as adsorbents.
Separation Experiment With CH4/N2
The gas mixture of CH4 and N2 was prepared by high-pure standard gas, and the ratio of CH4/N2 was 20/80%. Theexperimental device for adsorption was a single absorbing towerfilled with raw and modified clinoptilolites (Figure 1). At first,the device was pressurized using high-pure standard He untilthe adsorption pressure was up to the setting pressure. Then theintake valve of He was closed and the intake valve of mixture gaswas opened (it was the start time of data recording). In order tokeep the pressure of absorbing tower reaching the experimental
Frontiers in Chemistry | www.frontiersin.org December 2018 | Volume 6 | Article 633

Hao et al. Separation of CH4/N2 by Modified Clinoptilolite
FIGURE 1 | The dynamic test device. 1. He cylinder; 2. Mixture cylinder of CH4/N2; 3, 4. Pressure reducing valve; 5, 6, 7, 8, 9 and 12. Needle-type valve; 10.
Absorbing tower(16mm*320mm); 11. Pressure probe; 13. Mass flow controller; 14. Gas analyzer; 15. Vacuum pump; 16. Windows control center
(Copyright©1994–1997 SIEMENS, AG).
value, it was adjusted by control valves (the flow value of gaswas set to 50 mL/min). The outlet discharge was set using massflow controller before the test. In the process of absorption, thechange of concentration of CH4 was tested and recorded by a gasanalyzer. The test was continued until the concentration of CH4
was the same as the initial concentration of CH4 in the mixture.The activation and regeneration of modified clinoptilolite wasnot begun until inverse vacuum was pumped for 10min.
Pressure/Vacuum Swing Adsorption Experimental
ProgramA vacuum pressure swing adsorption (VPSA) cycle was devisedto be experimented in the pilot-scale unit, which was the purposeof catching CH4 from a dynamical mix of CH4/N2 simulated coalbed gas. The device, single-tower adsorption layer, was shown inFigure 1. Before test, the absorbents were modified clinoptiloliteswhich were activated in the vacuum rotation activation furnacefor 6 h in 648K. When the test began, the pressure of He andpressure of adsorption were both set at the certain pressure,and flow value of tower top was 60 mL/min. It needed tobe emphasized that vacuum pumping treatment using vacuumpumps was initiated before the experiments.
Analytical MethodsThe morphologies of purified clinoptilolite and modifiedclinoptilolite were observed with TEM (Tecnai G2 TF30) andSEM (Hitachi S-4800).
X-ray diffraction (Rigaku MiniFlex600) measurements wereproceeded with copper CuKα1 radiation (λ= 1.5406 Å), utilizinga voltage of 40 kV and a current of 15mA. The divergence slit was0.3mm and data was gathered for 2θ scanned from 3◦ to 80◦ at10◦/min.
TABLE 1 | The chemical composition of clinoptilolites (wt%).
Composition
(wt %)
Modified clinoptilolites
C-0 C-1 C-2 C-3 C-4
SiO2 66.99 68.49 68.48 68.08 68.09
Al2O3 12.01 12.86 12.85 13.02 13.01
K2O 1.63 1.65 1.62 1.61 1.59
Na2O 0.65 1.94 2.45 3.30 3.68
CaO 3.80 3.09 2.73 2.14 1.89
MgO 1.29 1.26 1.20 1.08 1.01
Fe2O3 1.37 1.47 1.48 1.50 1.60
TiO2 0.20 0.19 0.19 0.19 0.19
The chemical components of purified clinoptilolite andmodified clinoptilolite samples were analyzed using aninductively coupled plasma atomic emission spectroscopy(ICP-AES, ICAP7400 THERMO Fisher). To obtain a morerepresentative chemical composition of a sample, the analysiswas done in triplicates per sample, and the element contentswere averaged (Table 1).
Mid-infrared spectra were recorded using a Fourier transforminfrared (FT-IR) spectrometer (Nicolet IS50) with a SmartEnduranceTM single bounce diamond ATR cell. Spectra wereacquired of 4,000–400 cm−1 by the average of 64 scans with aresolution ratio of 4 cm−1. A mirror speed of 0.6 cm/s was used.
The BET surface area was 57.84 ± 0.20 m2/g measured by anASAP 2020 instrument (Micromeritics, USA). N2 (at 298K) andCH4 (at 298K) adsorption were measured to determine the BETsurface area and micropore size distribution.
Frontiers in Chemistry | www.frontiersin.org December 2018 | Volume 6 | Article 633

Hao et al. Separation of CH4/N2 by Modified Clinoptilolite
FIGURE 2 | SEM photographs of clinoptilolites: (a,a*). C-0, (b). C-1, (c). C-2, (d). C-3, (e). C-4.
RESULTS AND DISCUSSION
Characterization of ClinoptilolitesFigure 2 showed SEM photographs of unmodified and
modified clinoptilolites, They didn’t change significantlyamong them. In Figure 2, C-0, unmodified clinoptilolite, was
purified clinoptilolite with no NaCl treatment. The modified
clinoptilolites were depicted by C-1, C-2, C-3, and C-4, whichwere treated by 0.1, 0.2, 0.4, and 0.6 mol/L NaCl solution,
respectively. These crystals are flaggy or schistose, which appearsas parallel conjunctive aggregate. Individual crystals span is
from hundreds of nanometers to several microns. A number
of ordered small particles were also found on the crystals fromFigure 2a∗.
In order to observe the internal microstructure of samples,TEM photographs of modified clinoptilolites were shown in
Figure 3. From Figure 3, inside of C-0 was large lamella stacking.However, inside of C-1, C-2, C-3, and C-4 were stacked withsmall lamella, in which the number of fissures produced by flakeparticles. This is because they are stirred on thin sheets duringion exchange, so more lamellar clinoptilolite is stripped, mainlyconcentrated at 100 × 300 nm, which also makes the exchangeeasier. The 131 faces of clinoptilolite can be seen in C-2 ofphotograph c∗, whose crystal plane spacing is 3.98 Å, which havenot seen in other published papers.
ICP-AES was adopted to analyze the ion change beforeand after modification (table 1). It is obviously that withthe increasing of nacl concentrations, the Na+ componentincreased from 0.65 to 3.68 wt% gradually. Meanwhile, theCa2+ component decreased from 3.8 to 1.89 wt% apparently. Inaddition, other elements showed a random change with increasednacl concentrations (such as Si, Al, K, Mg, Fe, and Ti). The
Frontiers in Chemistry | www.frontiersin.org December 2018 | Volume 6 | Article 633

Hao et al. Separation of CH4/N2 by Modified Clinoptilolite
FIGURE 3 | TEM photographs of clinoptilolites: (a). C-0, (b). C-1, (c,c*). C-2, (d). C-3, (e). C-4.
phenomenon indicated that the ion exchange of Na+ for Ca2+
were carried out in clinoptilolite samples with NaCl solutionsbath.
The XRD patterns were mainly used for confirmation thedifference in all clinoptilolites without and with treatment usingNaCl solution (Figure 4). The major mineral in all sampleswas clinoptilolite with minor amounts of quartz. All the latticeparameters were not observably influenced by the differentcontents of NaCl. We couldn’t see the characteristic peak of NaClin modified clinoptilolites, It showed that the Na+ entered thelattice, and we combined the chemical composition analysis inTable 2. So we know it was replaced with Ca2+. The obviousdifference was the D value of the characteristic peak was smallerthan modified clinoptilolites. It was because the exchange ofdifferent ions leaded to the change of lattice spacing.
The broad band at 620 cm−1 in the clinoptilolites spectra wereattributed to stretching vibrations related to Si-O tetrahedronstructure (Figure 5). The characteristic peak of clinoptilolitewithout ion-exchange was weak. Furthermore, the vibration
absorption peak of Si-O-Si and Al-O-Si appears at 795cm−1. Compared with clinoptilolite without ion-exchange,some evident changes in characteristic absorption peaks werediscovered. The characteristic peak at 985.46 cm−1 derivingfrom Al-O vibrations shifted to 1043.32 cm−1, caused a smallamount of Al-O losing after ion-exchange. A small accountof non-framework Al stuck in the unit cell was shifted byion-exchange. And a small account of Al was shifted fromframework because of Al-O-Si hydrolyzing in the clinoptilolites.Then cavities were formed leading to pore volume increasing.For modified clinoptilolites, the Si-O and/or Al-O out-of-planebend occurred at 485 and 1,622 cm−1. Thus, the intensity of Al-O out-of-plane bend inmodified clinoptilolites was stronger thanthat of clinoptilolite. It was because ion-exchange caused a smallamount of Al-O losing. The broad band at 2,328 cm−1 mainlyresulted from stretching vibrations of OH− groups on modifiedclinoptilolites after ion-exchange. The broad band at 3,743 cm−1
mainly resulted from stretching vibrations of O-H on modifiedclinoptilolites after ion-exchange.
Frontiers in Chemistry | www.frontiersin.org December 2018 | Volume 6 | Article 633

Hao et al. Separation of CH4/N2 by Modified Clinoptilolite
FIGURE 4 | XRD of clinoptilolites.
TABLE 2 | BET of modified clinoptilolites treated by NaCl of different
concentrations with N2 at 77K.
C-1 C-2 C-3 C-4
BET (m2/g) 16.1 16.0 16.0 15.9
External surface
area
(m2/g)
12.0 11.8 12.1 11.8
Micropore surface area
(m2/g)
4.0 4.2 3.9 4.1
Vp (m3/g) 0.068 0.065 0.062 0.073
D (nm) 16.8 16.2 15.5 17.7
FIGURE 5 | FT-IR spectra of modified clinoptilolites.
The N2 adsorption-desorption isotherms at 77K with thefour adsorbents were shown in Figure 6A. According to the
IUPAC classification, all curves were identified as type IV. Thesurface has mesopore and macropore, The curve of p/p0 regionof low relative pressure is convex up, in the higher p/p0 region,the adsorbed material is condensed by capillary, the isothermobtained by desorption does not coincide with the isothermobtained by adsorption, and the desorption isotherm lags overthe adsorption isotherm. So they present a hysteresis loop.It belongs to the class D loop. It is mainly due to the slitholes formed by sloping sheet stacking. In Figure 6B, we knowmost of the pores are between 5 and 80 nanometers, Theyhave different pore structure by loading different contents ofsodium ions. According to Table 2, we know that the internalsurface area of C-2 adsorbents is the largest. With the increaseof the loading of sodium ions, the micropore surface area ofadsorbent increased first and then decreased. So the microporesare adjusted. At the beginning, the calcium ion was replacedby sodium ion, and the pore channel of clinoptilolite becamesmaller. When loading a certain amount, a large number ofsodium ions loaded the surface of clinoptilolite and blocked somechannels.
Simulated ExperimentsTo explore the separation capability of CH4/N2 on the modifiedclinoptilolites, the simulated static experiments were conductedusing BET equipment, and the simulated dynamic experimentswere conducted using the device of adsorption of single tower(Figure 1), in which pure N2 and CH4 gas were chosen asgas-supply.
CH4 adsorption and N2 adsorption of the simulated staticexperiments were shown in Figure 7. It should be noted thatadsorption of the two molecules is competitive and thus thegas-supply in the simulated static experiments is high purity N2
and high purity CH4 at 298K, separately. Before the adsorptionexperiment begun, The absorbents were vacuum activated for 8 hat 370◦. From Figure 7, there was obvious difference betweenquantity adsorbed of CH4 and N2 using clinoptilolites. At thesame relative pressure condition, quantity adsorbed of N2 onclinoptilolites wasmuchmore than that of CH4. From Figure 7A,the quantity adsorbed of N2 using clinoptilolites followed: C-3=C-2> C-4> C-1> C-0. From Figure 7B, the quantity adsorbedof CH4 using clinoptilolites was as follows: C-3> C-4> C-0>C-1> C-2. Considering the contradiction between adsorptioncapability of clinoptilolites for CH4 and N2, it is obvious thatthe C-2 adsorbents static equilibrium separation coefficient is thelarger than other three. It is the most potential adsorbent forseparating CH4/N2.
Dynamic experiments had been done. The CH4 volumeconcentration of product is obtained at 298K on certain pressurewhen the feed gas is a mixture of CH4 (20%) and N2 gas (80%),as shown in Figure 8. Concentrated CH4 could be obtaineddirectly by using these adsorbents of C-1, C-2, C-3, C-4. In thisexperiment, before testing, the adsorbent was vacuum activatedfor 8 h at 648K, and then the package was sealed for use. Whenthe concentration of CH4 of the top of the tower is 20%, it is putback to normal pressure, and a 30min vacuum is activated andregenerated. The experiment was repeated three times, and thedata are recorded in the third experiment. Figure 8A showed the
Frontiers in Chemistry | www.frontiersin.org December 2018 | Volume 6 | Article 633

Hao et al. Separation of CH4/N2 by Modified Clinoptilolite
FIGURE 6 | (A) N2 adsorption-desorption isotherms at 77K; (B) pore size distributions.
FIGURE 7 | (a) N2 adsorption of the simulated static experiments at 298K; (b) CH4 adsorption of the simulated static experiments at 298K.
FIGURE 8 | (A) The different adsorbents breakthrough curve of nitrogen adsorption at 298K on 0.2 Mpa, (B) The C-2 breakthrough curve of nitrogen adsorption at
298K on 0.1, 0.2, 0.3, 0.5 Mpa.
Frontiers in Chemistry | www.frontiersin.org December 2018 | Volume 6 | Article 633

Hao et al. Separation of CH4/N2 by Modified Clinoptilolite
different adsorbents breakthrough curve of nitrogen adsorptionat 298K on 0.2 Mpa. In the dynamic adsorption curve, it showedthat CH4 concentration can be increased.C-1 is from 20 to 65.2%,C-2 is from 20 to 70.0%, C-3 is from 20 to 66.1%, C-4 is from20 to 63.1%. Moreover, they can be continuously regenerated. Sothe adsorbent of C-2 is the best among these adsorbents, whichis consistent with the static adsorption results. Figure 8B showsthe C-2 breakthrough curve of nitrogen adsorption at 298K onthe different pressure. We can control residence time of raw gasin adsorbent by adjusting the pressure of carrier He gas. Theresidence time corresponding to 0.1, 0.2, 0.3, and 0.5 Mpa is 5,7.5, 11, and 14min, respectively. The peak value of CH4 reaches70.0% when the residence time is 7.5min. The results show thatthe N2 adsorption was bigger than CH4 when the mixture ofCH4/N2 were in the absorbing tower. The bigger the pressure,the longer the residence time. CH4 adsorption was bigger thanN2 adsorption when they were adsorbed. The separation factorswould decrease. So, It is very important to choose the suitableresidence time.
From the above, it seemed that the C-2 shows the greatestperformance at 648K under 0.2 MPa within 50min, incomparison to the other modified clinoptilolites, as a underlyingsorbent in kinetic PSA processes for the N2/CH4 separation.The different concentrations of Na+ that were existed inits porous network as well as their distribution were theprimary influence factor that specifies the adsorption andkinetic properties of the clinoptilolites. Thus, the ion-exchange with differences in the concentration of Na+
disturbed the Na+ distribution as well as the electrostaticfield inside the clinoptilolite’s pores affecting the adsorptionproperty.
CONCLUSION
The material structure and CH4/N2 adsorbability of raw andNa+ ion-exchanged clinoptilolites have been examined in detailusing PSA. The effect of adsorbent prepared by clinoptilolite withdifferent sodium ion content on methane nitrogen separation isvery different. The clinoptilolite adsorbents can be adjusted for
their pore channel by controlling the loaded amount of sodiumions.
The C-2 adsorbent prepared using 0.2 mol/L NaCl solutionswas the most promising for the kinetic PSA separation ofCH4/N2, giving the better adsorptivity and influence factorsconcerning the CH4 separation.
From the simulated static experiments, it indicated that N2
and CH4 are both competent in diffusing into the clinoptiloliteswhile N2 adsorptions of clinoptilolites are more excellent. Thepertinent results also indicated that adsorption capability of ion-exchanged clinoptilolite using 0.2 mol/L NaCl solutions wasthe optimal adsorbent for separating CH4/N2 at low pressure,considering the contradiction between adsorption capability ofclinoptilolites for CH4 and and N2.
According to the simulated dynamic experiments, the ion-exchanged clinoptilolite using 0.2 mol/L NaCl solutions exhibitsthe best performance at 648K under 0.2 MPa within 50min,in comparison to raw and other modified clinoptilolites, as aunderlying sorbent in kinetic PSA processes for the N2/CH4
separation.The ion-exchange with differences in the concentration of
Na+ as well as the electrostatic field inside the clinoptilolite’spores affecting the adsorption property. Finally, furthermanipulation for CH4 separation of the clinoptilolite isunderway with coal bed gas as gas-supply.
AUTHOR CONTRIBUTIONS
XH and ZL conceived and designed the project. XH performedthe experiments and wrote the manuscript. HH, XL, and YHanalyzed the data.
FUNDING
The work was financially supported by the Special Fundfor National/International Science and TechnologyCooperation in China (Grant no. 2015DFR60640) andthe Science and Technology Plan of Henan Province (No.182102310031).
REFERENCES
Aguilar-Armenta, G., Hernandez-Ramirez, G., Flores-Loyola, E., Ugarte-
Castaneda, A., Silva-Gonzalez, R., Tabares-Munoz, C., et al. (2001).
Adsorption kinetics of CO2, O2, N2, and CH4 in cation-exchanged
clinoptilolite. J. Phy. Chem. B 105, 1313–1319. doi: 10.1021/jp99
34331
Arya, A., Divekar, S., Rawat, R., Gupta, P., Garg, M. O., Dasgupta, S., et al. (2014).
Upgrading biogas at low pressure by vacuum swing adsorption. Ind. Eng. Chem.
Res. 54, 404–413. doi: 10.1021/ie503243f
Bomberger, D. C., Bomben, J. L., Amirbahman, A., and Asaro, M. (1999).
Nitrogen Removal FromNatural Gas: Phase II. Office of Scientific and Technical
Information Technical Reports.
Cavenati, S., Grande, C. A., and Rodrigues, A. E. (2005). Separation of methane
and nitrogen by adsorption on carbon molecular sieve. Separation Sci. Technol.
40, 2721–2743. doi: 10.1080/01496390500287846
Cavenati, S., Grande, C. A., and Rodrigues, A. E. (2006). Separation of
CH4/CO2/N2 mixtures by layered pressure swing adsorption for upgrade
of natural gas. Chem. Eng. Sci. 61, 3893–3906. doi: 10.1016/j.ces.2006.
01.023
Faghihian, H., Talebi, M., and Pirouzi, M. (2008). Adsorption of nitrogen
from natural gas by clinoptilolite. J. Iran. Chem. Soc. 5, 394–399.
doi: 10.1007/BF03245993
Fatehi, A. I., Loughlin, K. F., and Hassan, M. M. (1995). Separation of methane—
nitrogen mixtures by pressure swing adsorption using a carbon molecular
sieve. Gas Separation Purification 9, 199–204. doi: 10.1016/0950-4214(95)98
227-C
Gao, S., Ge, L., Rufford, T. E., and Zhu, Z. (2017). The
preparation of activated carbon discs from tar pitch and coal
powder for adsorption of CO2, CH4 and N2. Microporous
Mesoporous Mater. 238, 19–26. doi: 10.1016/j.micromeso.2016.
08.004
Grande, C. A., Cavenati, S., Da Silva, F. A., and Rodrigues, A. E.
(2005). Carbon molecular sieves for hydrocarbon separations by
adsorption. Ind. Eng. Chem. Res. 44, 7218–7227. doi: 10.1021/ie05
0376r
Frontiers in Chemistry | www.frontiersin.org December 2018 | Volume 6 | Article 633

Hao et al. Separation of CH4/N2 by Modified Clinoptilolite
Gu, M., Zhang, B., Qi, Z., Liu, Z., Duan, S., Du, X., et al. (2015).
Effects of pore structure of granular activated carbons on CH4
enrichment from CH4/N2 by vacuum pressure swing adsorption.
Separation Purification Technol. 146, 213–218. doi: 10.1016/j.seppur.2015.
03.051
Jayaraman, A., Hernandez-Maldonado, A. J., Yang, R. T., Chinn, D., Munson,
C. L., and Mohr, D. H. (2004). Clinoptilolites for nitrogen/methane
separation. Chem. Eng. Sci. 59, 2407–2417. doi: 10.1016/j.ces.2003.
10.030
Jayaraman, A., Yang, R. T., Chinn, D., and Munson, C. L. (2005). Tailored
clinoptilolites for nitrogen/methane separation. Indus. Eng. Chem. Res. 44,
5184–5192. doi: 10.1021/ie0492855
Johnson III, R. D. (2015). NIST Computational Chemistry Comparison And
Benchmark Database. NIST Standard Reference Database Number 101, Release
15b. 2011. Available online at: cccbdb.nist.gov
Perry, R. H., Chilton, C. H., and Kirkpatrick, S. D. (1999). Chemical Engineers
Handbook. New York, NY: McGraw-Hill.
Tagliabue, M., Farrusseng, D., Valencia, S., Aguado, S., Ravon, U., Rizzo,
C., et al. (2009). Natural gas treating by selective adsorption: material
science and chemical engineering interplay. Chem. Eng. J. 155, 553–566.
doi: 10.1016/j.cej.2009.09.010
Yin, C., Sun, W., Yang, H., and Zhang, D. (2015). Optimization of three-
bed VPSA system for biogas upgrading. Chem. Eng. Sci. 135, 100–108.
doi: 10.1016/j.ces.2015.06.022
Zhou, L., Guo, W. C., and Zhou, Y. P. (2002). A feasibility study of separating
CH4/N2 by adsorption. Chin. J. Chem. Eng. 10, 558–561.
Conflict of Interest Statement: The authors declare that the research was
conducted in the absence of any commercial or financial relationships that could
be construed as a potential conflict of interest.
Copyright © 2018 Hao, Li, Hu, Liu and Huang. This is an open-access article
distributed under the terms of the Creative Commons Attribution License (CC BY).
The use, distribution or reproduction in other forums is permitted, provided the
original author(s) and the copyright owner(s) are credited and that the original
publication in this journal is cited, in accordance with accepted academic practice.
No use, distribution or reproduction is permitted which does not comply with these
terms.
Frontiers in Chemistry | www.frontiersin.org December 2018 | Volume 6 | Article 633

ORIGINAL RESEARCH
published: 11 October 2018
doi: 10.3389/fchem.2018.00405
Frontiers in Chemistry | www.frontiersin.org October 2018 | Volume 6 | Article 405
Edited by:
Wenbo Wang,
Lanzhou Institute of Chemical Physics
(CAS), China
Reviewed by:
Zheng Ren,
University of Connecticut,
United States
Aiwei Tang,
Beijing Jiaotong University, China
*Correspondence:
Guang-Sheng Wang
Shao-Hua Dong
Specialty section:
This article was submitted to
Green and Sustainable Chemistry,
a section of the journal
Frontiers in Chemistry
Received: 30 June 2018
Accepted: 20 August 2018
Published: 11 October 2018
Citation:
Lu M, Wu Q, Guan X-H, Xu W,
Zhang H-Y, Di X, Wang G-S and
Dong S-H (2018) Synthesis and
Microwave Absorbing Properties of
Porous One-Dimensional Nickel
Sulfide Nanostructures.
Front. Chem. 6:405.
doi: 10.3389/fchem.2018.00405
Synthesis and Microwave AbsorbingProperties of PorousOne-Dimensional Nickel SulfideNanostructures
Min Lu1, Qian Wu1, Xiao-Hui Guan1, Wei Xu2, Hao-Yue Zhang2, Xin Di 3,
Guang-Sheng Wang2* and Shao-Hua Dong3*
1 School of Chemical Engineering, Northeast Electric Power University, Jilin, China, 2 School of Chemistry, Beihang University,
Beijing, China, 3 Pipeline Technology Research Center, China University of Petroleum–Beijing, Beijing, China
One-dimensional (1D) porous NixSy nanostructures have been successfully fabricated
by two-step method consisting of solvothermal and subsequent annealing process.
The suitable heat treatment temperature and reaction time play crucial roles in the
final structure, morphology, as well as performance. The uniform and perfect porous
NixSy nanostructures obtained at 310◦C exhibit outstanding microwave absorption
performances. A minimum reflection loss of −35.6 dB is achieved at 8.5 GHz, and the
effective absorption bandwidth almost covers 14.5 GHz with the absorber thickness
range of 2.0–5.0mm. It can be supposed that this porous structure with rough surface
which is favor for increasing the microwave multiple reflection and scattering, contributes
a high-performance electromagnetic absorption.
Keywords: porous, nickel sulfide, one-dimensional, dielectric loss, microwave absorption
INTRODUCTION
Microwave absorber with strong capacity in absorption, low proportion in filler loading, thinthickness in coating, and wide bandwidth in absorption frequency, has aroused burgeoningresearch interest because of their great potential applications both in military and civil fields,including stealth technology, information security, electromagnetic interference shielding, andhealthcare (Zhu et al., 2010; Zhao H. et al., 2014). As is well known that many factors such asmorphology, geometry and structure, have vital impacts on determining the microwave absorption(MA) properties (He et al., 2013). Conventional microwave absorbers with different morphologiesthat have been divided into three classes are as follows: (1) one-dimensional nanostructures suchas ZnO nanowires (Wang et al., 2014), Bi3S2 nanorods (Luo et al., 2014); (2) two-dimensionalmaterials such as MoS2 nanosheets (Ning et al., 2015), α-Fe2O3 flakes (Lv et al., 2015a); and (3)three-dimensional network structures, including Co20Ni80 hierarchical nanospheres (Liu et al.,2015), Ni chains nets (Liu et al., 2016), Fe3O4@carbon ordered arrays (Yuan et al., 2015) and soon. However, the aforementioned materials usually possess high density, thus leading to severelimitations to their practical applications in some specialized fields. In this regard, materials withcharacteristics of low density and special void spaces, such as yolk–shell structural microspheres(Liu et al., 2013; Yu et al., 2014; Qiang et al., 2016), foam composites (Zhang Y. et al., 2015; ZhaoH. B. et al., 2016), as well as porous nanostructures (Yan et al., 2009; Zhou et al., 2010; Zhu et al.,2011), are highly beneficial to obtaining superior microwave absorption performance.

Lu et al. Synthesis and Microwave Absorbing Properties
Considerable attention has been concentrated on the porousstructure of MAmaterials owing to its fascinating characteristics.For example, Liu et al. fabricated porous carbon/Co composites,and the results suggested that the composites with large dielectricloss could achieve a minimum RL of −40 dB at 4.2 GHz with acoating thickness of 5mm (Liu et al., 2008). Lv et al. synthesizedCo/CoO porous 3-D flower nanostructure through annealingprocess at 400◦C and found that the minimal reflection loss wasup to −50 dB when the coating thickness was 3.5mm (Lv et al.,2015b). Similarly, Wang et al. reported the formation of porousflower-like NiO decorated graphene, and the composites with afiller loading of 25 wt% exhibited highly MA performance (−59.6dB) because of their special porous structures and numerous voidspaces (Wang et al., 2017). Benefiting from the porous structure,the above-mentioned materials show superior electromagneticwave absorption performance, which reveals that these porousmaterials are effective as MA materials.
Metal sulfides, as semiconductor materials, have been provento have promising potential as an ideal microwave absorberon account of their typical dielectric loss mechanism (ZhangX. J. et al., 2017). Recent studies have suggested that metalsulfides including MoS2 (Wang et al., 2015), CoS2 (ZhangC. et al., 2017), CdS (Zhang et al., 2014), and CuS (Heet al., 2014), as well as various phase of nickel sulfides (Zhouet al., 2010) can effectively absorb electromagnetic waves andattenuate them in the form of thermal energy. However, themicrowave-absorbing properties of NixSy with special porousstructure have not been reported previously. Based on the abovestudy, we demonstrated the successful design and fabricationof porous one-dimensional NixSy nanomaterial through a facilesolvothermal route together with annealing process. The MAproperties of resultant composites were investigated in detail forthe first time. As expected, the synthesized NixSy nanostructureexhibited excellent microwave absorption property confirmingthat this material can be used as high-performance microwaveabsorber.
MATERIALS AND METHODS
Preparation of Porous NixSyNickel nitrate hexahydrate (Ni(NO3)2·6H2O), elemental sulfur,ethylene glycol (EG), and ethylenediamine (EN) were purchasedfrom Nanjing Chemical Reagent Co. All of the chemicalreagents were analytical-grade purity and used without furtherpurification.
Typically, nickel sulfide was synthesized by the reactionof Ni(NO3)2·6H2O, EN and sulfur powder in EG. At first,Ni(NO3)2·6H2O (0.3489 g) was added to EG (135mL) understrong magnetic stirring to form a light green homogeneoussolution. Then the sulfur powder (0.0288 g) was dissolved inEN (15mL) through ultrasonic treatment. Mix the two solutionstogether and put it into oil bath, maintained at 120◦C for 6 h.After being cooled to room temperature, the resulting solidprecursors were centrifuged, washed with alcohol to removepossible remnant, and finally dried in air at 60◦C for 24 h. Thedried precursors were treated at 310◦C for 2 h with a heating rateof 2◦C/min under N2 atmosphere to get the final NixSy products.
Preparation of Nickel Sulfide/PVDF
NanocompositesThe polyvinylidene fluoride (PVDF) was first dispersed in N-N dimethylformamide (20mL) under magnetic stirring for 1 h.Then, the desired amount of nickel sulfide was added into thesuspension. After ultrasonication for another 1 h, themixture waspoured onto a glass plate and dried at 80◦C for 24 h. The samplesfor testing were also compacted into a cylindrical compact (Φout
= 7.00mm and Φ in = 3.04mm) by hot pressing at 210◦Cunder 5 MPa (pressed for 15min, followed by cooling to roomtemperature under the same pressure).
Instrumental AnalysesThe X-ray diffraction (XRD) pattern of the nickel sulfide productwas carried out on a Rigaku, Dmax2200 diffractometer equippedwith a CuKa radiation source (λ= 1.5416 Å) in the range of 2θ=10–80◦. For the phase analysis. Further microstructural analyseswere performed by using a FEI Quanta 250 field emissiongun environmental scanning electron microscope (JSM-6700Fmicroscope) at 15 kV. In brief, SEM samples were prepared bydiluting the final products with alcohol by ultrasonic treatmentand dropping it on the silicon slice. The relative permittivity(ε′, ε′′) and permeability (μ′, μ′′) values were measured usingtwo-port vector network analyzer (Agilent E5071C) over thefrequency of 2–18 GHz at room temperature, coupled with acoaxial wire setup. Finally, the reflection loss (RL, dB) valuewhich presents the ratio of the total reflected microwave poweragainst the incident microwave power can be calculated by usingthe following formulas (Abbas et al., 2006; Xu et al., 2018).
Zin =
√μr
εrtanh
[j
(2fπd
c
)√
μrεr
](1)
RL(dB) = 20 log
∣∣∣∣Zin − 1
Zin + 1
∣∣∣∣ (2)
where Zin is the normalized input characteristic impedance, f isthe frequency of microwave, d is the thickness of the absorber. Alower RL value stands for a better MA performance.
RESULTS AND DISSCUSSION
An illustration of the synthesis of theNixSy is shown in Figure S1.We first prepared the precursors of NixSy nanorods by a simplesolvothermal method in a controlled way as described later.Then the collected dried precursors were transferred into a tubefurnace and annealed at 310◦C for 2 h under an N2 atmosphere,which eventually led to the generation of the porous NixSy. It iswell recognized that reaction parameters such as temperature,pressure, reaction time, type of solvent, and concentrationof reagents, have a huge effect on the morphology of theproducts. In the present reaction system, Ethylene glycol andEthylenediamine were applied as solvents for the precursorssynthesis of NixSy, and the temperature as well as reaction timewas tightly regulated so that the precursors at a well-defined statewere obtained.
Figure 1 shows the representative SEM images of theprecursors prepared at different temperature of 80, 100, 120, 140,
Frontiers in Chemistry | www.frontiersin.org October 2018 | Volume 6 | Article 405

Lu et al. Synthesis and Microwave Absorbing Properties
FIGURE 1 | SEM images of precursor of NixSy samples under different reaction temperatures: (a) 80, (b) 100, (c) 120, (d) 140, (e) 160, and (f) 180◦C. (scale bar =
1μm).
160, and 180◦C, respectively. When the reaction is performedunder the lower temperature (80 and 100◦C), although one-dimensional structures of products can be formed, theirthicknesses and lengths are varying greatly. On the contrary,when the temperature reaches 180◦C, the 1D nanostructuresare nonuniform, and a certain number of spherical impuritiesemerge. By comparing the morphology of the products underdifferent temperature conditions, the best reaction temperatureis determined. The products are well-defined nanorods withdiameters of about 50 nm and lengths of several micrometers atthe suitable reaction temperature of 120◦C (Figure 1c). On theother hand, the stages of the growth process are monitored at120◦C by varying the reaction time from 2 to 10 h (Figure S2).It is interesting to find that reaction time does not changethe overall morphology of the precursors. However, the yield ofthe products is very low within a short period of 2 h, indicatingthe slow reaction rate in such reaction system. Further increasing
the reaction time produce more products, while the diameter andstructure of the nanorods remain stable.
To obtain porous 1D nanostructures, the precursors wereannealed at different temperatures ranging from 280 to 330◦Cunder the flowing nitrogen gas, and the final products areexhibited in Figure 2. It can be seen that the surfaces areactually becoming porous with annealing temperature, and theas-obtained NixSy retain the rods morphology with appropriateporosity when prepared at 310◦C. Further increasing theannealing temperature will led to 1D structural instabilityand collapse. The energy-dispersive X-ray spectroscopy (EDS)indicates that the obtained product is composed of Ni, S, C,N, and O elements, also demonstrating a very homogeneouselemental distribution (Figure 3). It is worth mentioning thatthe C, N, and O element signals originate from the incompletedecomposition of organic compositions of precursors duringheat treatment. Meanwhile, the XRD results suggest that the
Frontiers in Chemistry | www.frontiersin.org October 2018 | Volume 6 | Article 405

Lu et al. Synthesis and Microwave Absorbing Properties
FIGURE 2 | SEM images of NixSy samples under different annealing temperatures: (a) 280, (b) 300, (c) 310, and (d) 330◦C. (scale bar =1μm).
FIGURE 3 | FESEM image of the NixSy nanorods and corresponding elemental mapping images of Ni, S, C, N, and O.
as-synthesized products are poorly crystallized, containing NiS2phase and Ni7S6 phase (Figure S3).
Figures 4A,B show the frequency dependence of the realpart (ε′) and imaginary part (ε′′) of the complex permittivityfor NixSy/PVDF composites with 10, 20, 30, and 40 wt% filler
loadings in the frequency range of 2–18 GHz. Generally, theε′ is known to stand the storage capability of electromagneticenergy, and ε′′ associated with various of polarization present theenergy dissipation (Zhang X. et al., 2015; Zhao B. et al., 2016).As can be seen in Figure 4, with the increase of NixSy, the ε′
Frontiers in Chemistry | www.frontiersin.org October 2018 | Volume 6 | Article 405

Lu et al. Synthesis and Microwave Absorbing Properties
and ε′′ values show a similar tendency. For nanohybrids with lowconcentration of filler (10 and 20 wt%), the values of ε′ and ε′′
are approximately equal to some certain constant in the wholefrequency range (ε′ = 4, ε′′ = 0.5, and ε′ = 6, ε′′ = 1). With the
NixSy proportion increasing from 20 to 30 wt%, the ε′ increasesfrom 6 to 13 and the ε′′ changes from 1 to 4.5 at 2 GHz. However,when the proportion of fillers is increased to 40 wt%, both theε′ and ε′′ dramatically decrease, which is possibly due to the
FIGURE 4 | Frequency dependence of (A) real part and (B) imaginary part of permittivity, (C) dielectric loss tangent, and (D) reflection loss under a 3mm thickness for
NixSy composites with different filler loadings.
FIGURE 5 | Possible mechanisms of microwave absorption for porous NixSy/PVDF composites.
Frontiers in Chemistry | www.frontiersin.org October 2018 | Volume 6 | Article 405

Lu et al. Synthesis and Microwave Absorbing Properties
fact that the higher concentration of NixSy in this nanohybridmay result in severe agglomeration. Similar phenomena couldbe observed in dielectric loss tangent (tan δe = ε′′/ε′) which isuniversally applied to evaluate the dielectric loss capacity of themicrowave absorber (Yang et al., 2017), shown in Figure 4C. Itcan be seen that the dielectric loss tangent increases with theNixSy proportion first, getting a maximum value of 0.35 with 30wt% NixSy, and then decreases to a value of 0.1.
On the basis of the above analysis, it can be deduced thatthe nanohybrids with 30 wt% NixSy possess the best microwaveabsorption properties which is highly consistent with the testresults, shown in Figure 4D. The minimum RL reaches −34dB at 7.5 GHz with a thickness of 3mm, indicating that99.9% of incident electromagnetic wave is attenuated. Since
NixSy is a typical semiconductive material, various polarization,and related relaxation resulting in a strong dielectric loss arethe dominant mechanism for microwave attenuation (Zhaoet al., 2015). The dielectric loss of NixSy mainly originatefrom the defect dipole polarization, the interfacial polarization,and the electronic relaxation loss. First, the defect dipoles aregenerated by the charge unbalance around the sulfur vacanciesin the NixSy lattice, while the interfacial polarizations comefrom the existence of plentiful interfaces between porous fillersand polymer matrix. Moreover, the porous structures of fillerswith rough surfaces further induce the multiple reflectionand scattering, resulting in more longer propagation pathand greater energy loss (Figure 5). Second, the carbonationof precursors benefits electrical conduction, while the internal
FIGURE 6 | Three-dimensional presentations of the reflection loss for the NixSy composites with different filler loadings: (A) 10, (B) 20, (C) 30, and (D) 40 wt%. (E) RL
curves for 30 wt% NixSy composites with different thickness.
Frontiers in Chemistry | www.frontiersin.org October 2018 | Volume 6 | Article 405

Lu et al. Synthesis and Microwave Absorbing Properties
doping with nitrogen favors electron transport thus furtherimproving electrical conduction. Furthermore, the calcinationalso induces a structural disorder and defects into NixSy thatfrequently lead to an enhanced electrical activity. This calcinationprocess results in significant electronic relaxation polarization,which would enhance the dielectric loss obviously.
Figures 6A–D shows three-dimensional presentations ofcalculated reflection loss for the NixSy/PVDF with different fillerloadings. Clearly, the composite with 30 wt% NixSy has the bestperformance, and the RL values under different thickness areshown in Figure 6E. The minimal reflection loss of −35.6 dBis obtained at 8.5 GHz with a coating thickness of 2.7mm andthe effective bandwidth is about 3 GHz. Furthermore, the RLsexceeding −10 dB in the frequency range of 3.68–18 GHz areobtained for a variation in absorber thicknesses of 2.0–5.0mm,demonstrating that this kind of materials has great potential foruse as a microwave absorber. Meanwhile, there is an interestingphenomenon that with the increasing thickness of absorber theRL peaks shift to the lower-region frequency. This phenomenonis consistent with a so-called quarter-wavelength (λ/4) matchingmodel (Deng and Han, 2007; Wang et al., 2011, 2013) whichplays another significant role in electromagnetic attenuation. Themodel can be expressed as tm = nλ/4 = nc/4fm
√|μr| |εr|(n =
1, 3, 5), where |μr| and |εr| are the moduli of μr and εr ,respectively. Besides, when the thickness of absorber satisfiesabove equation, the curves corresponding to wavelengths of λ/4(crescent shape) can be observed (seen in Figure 6C).
CONCLUSIONS
In summary, we have successfully demonstrated an approach forthe large-scale production of 1D porous NixSy nanostructuresvia solvothermal synthesis together with an annealing process.
Through controlling the reaction temperature and time, productswith uniform morphology are obtained. The results revealthat the interesting porous structure of NixSy might benefitthe access of incident microwave and offer more active sitesfor multiple reflections and scattering, and thereby improvemicrowave absorbing performance. The minimum RL of −35.6dB is achieved with a thickness of 2.7mm at −35.6 dB GHz. Theabsorption bandwidth with RLs below −10 dB is up to 14.5 GHzwhen considering thicknesses of 2.0–5.0mm. Combining thesynergistic effect with intrinsic chemical properties and specialstructures, the NixSy nanorods are promising for utilizationas MA materials in various fields, such as aeroplanes andspacecraft.
AUTHOR CONTRIBUTIONS
ML designed experiments, carried out experiments, analyzedexperimental results, and wrote the manuscript. QW, WX, H-YZ, and XD helped experimental result. X-HG gave guidance onthe revision of the experimental plan and manuscript. G-SW andS-HD funded experimental topics.
ACKNOWLEDGMENTS
This project was supported by the National Nature ScienceFoundation of China (No. 51472012), and the FundamentalResearch Funds for the Central Universities.
SUPPLEMENTARY MATERIAL
The Supplementary Material for this article can be foundonline at: https://www.frontiersin.org/articles/10.3389/fchem.2018.00405/full#supplementary-material
REFERENCES
Abbas, S. M., Chandra, M., Verma, A., Chatterjee, R., and Goel, T. C.
(2006). Complex permittivity and microwave absorption properties of a
composite dielectric absorber. Compos. A Appl. Sci. Manufact. 37, 2148–2154.
doi: 10.1016/j.compositesa.2005.11.006
Deng, L. J., and Han, M. G. (2007). Microwave absorbing performances of
multiwalled carbon nanotube composites with negative permeability. Appl.
Phys. Lett. 91:023119. doi: 10.1063/1.2755875
He, S., Lu, C., Wang, G. S., Wang, J. W., Guo, H. Y., and Guo, L. (2014). Synthesis
and growth mechanism of white-fungus-like nickel sulfide microspheres
and their application in polymer composites with enhanced microwave-
absorption properties. ChemPlusChem 79, 569–576. doi: 10.1002/cplu.201
300435
He, S., Wang, G. S., Lu, C., Liu, J., Wen, B., Liu, H., et al. (2013). Enhanced wave
absorption of nanocomposites based on the synthesized complex symmetrical
CuS nanostructure and poly(vinylidene fluoride). J. Mater. Chem. A 1,
4685–4692. doi: 10.1039/c3ta00072a
Liu, J., Cao, M. S., Luo, Q., Shi, H. L., Wang, W. Z., and Yuan, J. (2016).
Electromagnetic property and tunable microwave absorption of 3D nets
from nickel chains at elevated temperature, ACS Appl. Mater. Interfaces 8,
22615–22622. doi: 10.1021/acsami.6b05480
Liu, J., Xu, J., Che, R., Chen, H., Liu, M., and Liu, Z. (2013). Hierarchical
Fe3O4@TiO2 yolk-shell microspheres with enhanced microwave-absorption
properties. Chem. A Eur. J. 19, 6746–6752. doi: 10.1002/chem.201203557
Liu, Q., Xu, X., Xia, W., Che, R., Chen, C., Cao, Q., et al. (2015). Dependency
of magnetic microwave absorption on surface architecture of Co20Ni80hierarchical structures studied by electron holography.Nanoscale 7, 1736–1743.
doi: 10.1039/c4nr05547k
Liu, Q. L., Zhang, D., and Fan, T. X. (2008). Electromagnetic wave absorption
properties of porous carbon/Co nanocomposites. Appl. Phys. Lett. 93:013110.
doi: 10.1063/1.2957035
Luo, X., Wang, G. S., Guo, H. Y., Zhang, X. J., Cao, W. Q., Wei, Y. Z., et al.
(2014). Enhanced wave-absorption properties of nanocomposites based on the
synthesized Bi2S3 nanorods and polyvinylidene fluoride. ChemPlusChem 79,
1089–1095. doi: 10.1002/cplu.201402050
Lv, H., Liang, X., Cheng, Y., Zhang, H., Tang, D., Zhang, B., et al.
(2015a). Coin-like α-Fe2O3@CoFe2O4 core–shell composites with excellent
electromagnetic absorption performance. ACS Appl. Mater. Interfaces 7,
4744–4750. doi: 10.1021/am508438s
Lv, H., Liang, X., Ji, G., Zhang, H., and Du, Y. (2015b). Porous three-dimensional
flower-like Co/CoO and its excellent electromagnetic absorption properties.
ACS Appl. Mater. Interfaces 7, 9776–9783. doi: 10.1021/acsami.5b01654
Ning, M. Q., Lu, M. M., Li, J. B., Chen, Z., Dou, Y. K., Wang, C. Z., et al.
(2015). Two-dimensional nanosheets of MoS2: a promising material with
high dielectric properties and microwave absorption performance. Nanoscale
7:15734. doi: 10.1039/c5nr04670j
Qiang, R., Du, Y.,Wang, Y.,Wang, N., Tian, C.,Ma, J., et al. (2016). Rational design
of yolk-shell C@C microspheres for the effective enhancement in microwave
absorption. Carbon 98, 599–606. doi: 10.1016/j.carbon.2015.11.054
Frontiers in Chemistry | www.frontiersin.org October 2018 | Volume 6 | Article 405

Lu et al. Synthesis and Microwave Absorbing Properties
Wang, B., Wei, J., Yang, Y., Wang, T., and Li, F. (2011). Investigation
on peak frequency of the microwave absorption for carbonyl
iron/epoxy resin composite. J. Magnet. Magnetic Mater. 323, 1101–1103.
doi: 10.1016/j.jmmm.2010.12.028
Wang, G. S., Wu, Y. Y., Zhang, X. J., Li, Y., Guo, L., and Cao, M. S.
(2014). Controllable synthesis of uniform ZnO nanorods and their enhanced
dielectric and absorption properties. J. Mater. Chem. A 2, 8644–8651.
doi: 10.1039/c4ta00485j
Wang, L., Xing, H., Gao, S., Ji, X., and Shen, Z. (2017). Porous flower-like
NiO@graphene composites with superior microwave absorption properties. J.
Mater. Chem. C 5, 2005–2014. doi: 10.1039/c6tc05179k
Wang, Y., Chen, D., Yin, X., Xu, P., Wu, F., and He, M. (2015). Hybrid
of MoS2 and reduced graphene oxide: a lightweight and broadband
electromagnetic wave absorber. ACS Appl. Mater. Interfaces 7, 26226–26234.
doi: 10.1021/acsami.5b08410
Wang, Y., Wang, L., and Wu, H. (2013). Enhanced microwave absorption
properties of α-Fe2O3-Filled ordered mesoporous carbon nanorods. Materials
6, 1520–1529. doi: 10.3390/ma6041520
Xu, W., Pan, Y. F., Wei, W., and Wang, G. S. (2018). Nanocomposites of
oriented nickel chains with tunable magnetic properties for high-performance
broadband microwave absorption. ACS Appl. Nano Mater. 1, 1116–1123.
doi: 10.1021/acsanm.7b00293
Yan, D., Cheng, S., Zhuo, R. F., Chen, J. T., Feng, J. J., Feng, H. T., et al.
(2009). Nanoparticles and 3D sponge-like porous networks of manganese
oxides and their microwave absorption properties. Nanotechnology 20:105706.
doi: 10.1088/0957-4484/20/10/105706
Yang, R., Wang, B., Xiang, J., Mu, C., Zhang, C., Wen, F., et al. (2017). Fabrication
of NiCo2-anchored graphene nanosheets by liquid-phase exfoliation for
excellent microwave absorbers. ACS Appl. Mater. Interfaces 9, 12673–12679.
doi: 10.1021/acsami.6b16144
Yu, M., Liang, C., Liu, M., Liu, X., Yuan, K., Cao, H., et al. (2014). Yolk–
shell Fe3O4@ZrO2 prepared by a tunable polymer surfactant assisted sol-gel
method for high temperature stable microwave absorption. J. Mater. Chem. C
2, 7275–7283. doi: 10.1039/c4tcQ1285b
Yuan, K., Che, R., Cao, Q., Sun, Z., Yue, Q., and Deng, Y. (2015). Designed
fabrication and characterization of three-dimensionally ordered arrays of core–
shell magnetic mesoporous carbon microspheres. ACS Appl. Mater. Interfaces
7, 5312–5319. doi: 10.1021/am508683p
Zhang, C., Wang, B., Xiang, J., Su, C., Mu, C., Wen, F., et al. (2017).
Microwave absorption properties of CoS2 nanocrystals embedded into
reduced graphene oxide. ACS Appl. Mater. Interfaces 9, 28868–28875.
doi: 10.1021/acsami.7b06982
Zhang, D. D., Zhao, D. L., Zhang, J. M., and Bai, L. Z. (2014). Microwave
absorbing property and complex permittivity and permeability of
graphene-CdS nanocomposite. J. Alloys Compounds 589, 378–383.
doi: 10.1016/j.jallcom.2013.11.195
Zhang, X., Ji, G., Liu, W., Quan, B., Liang, X., Shang, C., et al. (2015). Thermal
conversion of an Fe3O4@metal-organic framework: a new method for an
efficient Fe-Co/nanoporous carbon microwave absorbing material. Nanoscale
7, 12932–12942. doi: 10.1039/c5nr03176a
Zhang, X. J., Wang, S. W., Wang, G. S., Li, Z., Guo, A. P., Zhu, J. Q.,
et al. (2017). Facile synthesis of NiS2@MoS2 core–shell nanospheres for
effective enhancement in microwave absorption. RSC Adv. 7, 22454–22460.
doi: 10.1039/c7ra03260a
Zhang, Y., Huang, Y., Zhang, T., Chang, H., Xiao, P., Chen, H., et al.
(2015). Broadband and tunable high-performance microwave absorption of an
ultralight and highly compressible graphene foam. Adv. Mater. 27, 2049–2053.
doi: 10.1002/adma.201405788
Zhao, B., Guo, X., Zhao, W., Deng, J., Shao, G., Fan, B., et al. (2016). Yolk–
Shell Ni@SnO2 composites with a designable interspace to improve the
electromagnetic wave absorption properties. ACS Appl. Mater. Interfaces 8,
28917–28925. doi: 10.1021/acsami.6b10886
Zhao, B., Shao, G., Fan, B., Zhao, W., Xie, Y., and Zhang, R. (2015).
Facile preparation and enhanced microwave absorption properties
of core–shell composite spheres composited of Ni cores and TiO2
shells. Phys. Chem. Chem. Phys. 17, 8802–8810. doi: 10.1039/c4cp0
5632a
Zhao, H., Li, Z., Zhang, N., Du, Y., Li, S., Shao, L., et al. (2014). γ-irradiation
induced one-step synthesis of electromagnetic functionalized reduced graphene
oxide-Ni nanocomposites. RSC Adv. 4, 30467–30470. doi: 10.1039/c4ra0
5477f
Zhao, H. B., Fu, Z. B., Chen, H. B., Zhong, M. L., and Wang, C. Y. (2016).
Excellent electromagnetic absorption capability of Ni/Carbon based conductive
and magnetic foams synthesized via a green one pot route. ACS Appl. Mater.
Interfaces 8, 1468–1477. doi: 10.1021/acsami.5b10805
Zhou, J. H., He, J. P., Li, G. X., Wang, T., Sun, D., Ding, X. C.,
et al. (2010). Direct incorporation of magnetic constituents within ordered
mesoporous carbon-silica nanocomposites for highly efficient electromagnetic
wave absorbers. J. Phys. Chem. C 114, 7611–7617. doi: 10.1021/jp91
1030n
Zhu, C. L., Zhang, M. L., Qiao, Y. J., Xiao, G., Zhang, F., and Chen, Y.
J. (2010). Fe3O4/TiO2 core/shell nanotubes: synthesis and magnetic and
electromagnetic wave absorption characteristics. J. Phys. Chem. C 114,
16229–16235. doi: 10.1021/jp104445m
Zhu, H. L., Bai, Y. J., Liu, R., Lun, N., Qi, Y. X., Han, F. D., et al. (2011). In
situ synthesis of one-dimensional MWCNT/SiC porous nanocomposites with
excellent microwave absorption properties. J. Phys. Chem. 21, 13581–13587.
doi: 10.1039/c1jm11747e
Conflict of Interest Statement: The authors declare that the research was
conducted in the absence of any commercial or financial relationships that could
be construed as a potential conflict of interest.
Copyright © 2018 Lu, Wu, Guan, Xu, Zhang, Di, Wang and Dong. This is an
open-access article distributed under the terms of the Creative Commons Attribution
License (CC BY). The use, distribution or reproduction in other forums is permitted,
provided the original author(s) and the copyright owner(s) are credited and that the
original publication in this journal is cited, in accordance with accepted academic
practice. No use, distribution or reproduction is permitted which does not comply
with these terms.
Frontiers in Chemistry | www.frontiersin.org October 2018 | Volume 6 | Article 405

ORIGINAL RESEARCH
published: 29 November 2018
doi: 10.3389/fchem.2018.00586
Frontiers in Chemistry | www.frontiersin.org November 2018 | Volume 6 | Article 586
Edited by:
Pu-Xian Gao,
University of Connecticut,
United States
Reviewed by:
Na Tian,
China University of Geosciences,
China
Adimali Piyadasa,
Intel, United States
*Correspondence:
Bin Mu
Aiqin Wang
Specialty section:
This article was submitted to
Green and Sustainable Chemistry,
a section of the journal
Frontiers in Chemistry
Received: 31 July 2018
Accepted: 09 November 2018
Published: 29 November 2018
Citation:
Zhang A, Mu B, Wang X and Wang A
(2018) CoAl2O4/Kaoline Hybrid
Pigment Prepared via Solid-Phase
Method for Anticorrosion Application.
Front. Chem. 6:586.
doi: 10.3389/fchem.2018.00586
CoAl2O4/Kaoline Hybrid PigmentPrepared via Solid-Phase Method forAnticorrosion Application
Anjie Zhang1,2, Bin Mu1*, Xiaowen Wang1,2 and Aiqin Wang1*
1 Key Laboratory of Clay Mineral Applied Research of Gansu Province, Center of Eco-material and Green Chemistry, Lanzhou
Institute of Chemical Physics, Chinese Academy of Sciences, Lanzhou, China, 2 Center of Materials Science and
Optoelectronics Engineering, University of Chinese Academy of Sciences, Beijing, China
In this study, kaoline is incorporated to prepare CoAl2O4/kaoline hybrid pigments via
traditional solid-state reaction, and the introduction of kaoline decreases the preparation
temperature for formation of spinel CoAl2O4, and reduces the production cost of
cobalt blue as well. More importantly, kaoline may participate in the crystallization of
spinel CoAl2O4 during calcining process, and the hybrid pigments prepared using 8.1%
Co3O4 and 81.5% kaoline features bright blue and good chemical resistance. Due
to the synergistic effect between the sheet-like kaoline and the loaded CoAl2O4, the
as-prepared CoAl2O4/kaoline hybrid pigments can be incorporated into epoxy paint
system to obtain the high-performance blue anticorrosion coating, especially for acetic
acid-salt fog corrosion.
Keywords: CoAl2O4, hybrid pigments, kaoline, anticorrosion coating, acetic acid-salt fog
INTRODUCTION
It is well-known that corrosion of the metal materials is one of the common and key problemsto industry applications, especially the high risk fields including aviation, ocean, and chemicalindustry, etc. (De Leon et al., 2012; Daham et al., 2014; Hao et al., 2017). The organic anticorrosioncoating has been recognized as the most effective and economical method for metal protection(Vesely et al., 2010; Golru et al., 2015; Gu et al., 2015; Madhup et al., 2017). The anticorrosionmechanisms of the coatings usually include protection of barrier type, inhibition type protectionand electrochemical protection (Al-Sabagh et al., 2017), and the organic anticorrosion coating isserved as a physical barrier between corrosive electrolyte and steel substrate. However, the maindisadvantage of the organic anticorrosion coating, especially epoxy system, is the creation of holesand defects over the film due to the high crosslink density.
Several approaches have been proposed to enhance the anticorrosion properties of organicanticorrosion coating. By contrast, incorporation of inorganic pigments is efficient and economicalway (Kartsonakis et al., 2012; Montemor et al., 2012; Jeon et al., 2013; Naderi et al., 2014). It isconducive to improving the aesthetics (e.g., gloss, opacity, and color) and themechanical propertiesof the film (El Saeed et al., 2012). However, the relevant application of some commercial availableinorganic pigments is limited due to their disadvantages, such as poor adhesive force and opticaltransparency, weak abrasion and scratch resistance performance (Zhou et al., 2002; Cayton andSawitowski, 2005; El-Wahab et al., 2009). Therefore, many attempts have been carried out toprepare high-performance pigments with good anticorrosion properties by designing lamellar-based nano-materials preventing water, oxygen, or ions from penetrating film (Kalendová et al.,2008; Ahmed et al., 2012; Ammar et al., 2016; Zhang et al., 2016).

Zhang et al. CoAl2O4/Kaoline Hybrid Pigment
Cobalt aluminate (cobalt blue, CoAl2O4) is a spinel typestructure blue eco-friendly pigments with excellent thermaland chemical stability, and it has been widely used in thefields of ceramics, plastics, paint, rubber and glass (Jafariand Hassanzadeh-Tabriz, 2014; Álvarez-Docio et al., 2017; Heet al., 2017; Yoneda et al., 2018). Therefore, cobalt blue maybe expected to develop the high-performance anticorrosioncoating, especially for acetic acid-salt fog corrosion. However,the agglomeration of CoAl2O4 nanoparticles is inevitable duringpreparation process, which goes against the dispersion of cobaltblue in coating substrate. In addition, the high-cost of cobaltblue also limits its wide application in anticorrosion coating(Tirsoaga et al., 2011; Dandapat and De, 2012; Zou and Zheng,2016). In our previous work (Mu et al., 2015; Zhang A. J.et al., 2017), clay minerals were employed to fabricate thehigh-performance CoAl2O4 hybrid pigment with low-cost andprefect color properties. Kaoline (Kaol) is a 1:1 type layeredsilicate mineral with one tetrahedral sheet of silica (SiO4) linkedthrough oxygen atoms to one octahedral sheet of alumina(AlO6) octahedral (Liu et al., 2016; Kloprogge, 2017; Zhang S.L. et al., 2017). Owing to the advantages of excellent mechanicalproperties, thermal stability, high whiteness and unique flake-like morphology (Vesely et al., 2010; Ahmed et al., 2012; Quet al., 2017), it is a promising candidate for preparation ofcobalt blue hybrid pigment to design the color high-performanceanticorrosion coating (Zhang et al., 2018a,b). However, thepreparation process of co-precipitation usually involves in thedischarge of the wastewater and lengthy steps including washing,solid-liquid separation and drying.
In this study, CoAl2O4/Kaol hybrid pigments were preparedby the traditional solid-state reaction after grinding the mixtureof γ-Al2O3, Co3O4, and Kaol. The preparation conditionswere systematically investigated including the grinding time,the calcining temperature and the added amount of Kaol.Furthermore, the formation and coloring mechanisms ofCoAl2O4/Kaol hybrid pigments were also studied and discussed.In order to evaluate the anticorrosion application of the as-prepared hybrid pigment, it was incorporated into the epoxypaint system to obtain the blue anticorrosion coating, and thenplaced in acetic acid-salt spray testing chamber.
MATERIALS AND METHODS
MaterialsKaol was obtained from Longyan kaoline Development Co., Ltd.,(FuJian, China), Kaol were firstly crushed and purified by 4%HCl (wt%), and then the solid were filtered by passing througha 200-mesh sieve to remove quartz sand, and the XRF (X-rayfluorescence) chemical compositions of Kaol were presented inTable S1 (see ESI) before and after being treated by HCl. γ-Al2O3
(purity > 99.9%, particle size= 20∼ 50 nm) and Co3O4 ( purity> 99.9%, D50: 4 ∼ 6μm) were obtained from Shanghai ReagentFactory (Shanghai, China).
Preparation of CoAl2O4/Kaol Hybrid
Pigments8.00 g of Kaol, 0.80 g of Co3O4 and 1.02 g of Al2O3 witha Co to Al mole ratio of 2:1 were mixed and grinded in a
TABLE 1 | Conditions for preparation of the samples.
Factors Temperature/◦C Co3O4/g Al2O3/g Kaol/g Grinding
time (h)
Temperature 900 0.8 1.02 1 2
1,000 0.8 1.02 1 2
1,100 0.8 1.02 1 2
1,200 0.8 1.02 1 2
Added amount
of Kaol
1,100 0.8 1.02 0 2
1,100 0.8 1.02 1 2
1,100 0.8 1.02 2 2
1,100 0.8 1.02 4 2
1,100 0.8 1.02 6 2
1,100 0.8 1.02 8 2
Grinding time 1,100 0.8 1.02 1 0.5
1,100 0.8 1.02 1 1
1,100 0.8 1.02 1 2
1,100 0.8 1.02 1 4
mortar mill (CRINOER, MG100, China) for 2 h in anhydrousethanol medium, and then the mixture was calcined to obtainCoAl2O4/Kaol hybrid pigments. The optimum preparationconditions were systematically investigated including thecalcining temperatures (900, 1,000, 1,100, and 1,200◦C), thegrinding time (0.5, 1, 2, and 4 h) and the added amount of Kaol(0, 1, 2, 4, 6, and 8 g), as summarized in Table 1.
CharacterizationThe Fourier Transform infrared (FTIR) spectra were collectedon a Thermo Nicolet NEXUS TM spectro photometer usingKBr pellets. The morphology was observed using transmissionelectron microscopy (TEM, JEM-1200EX/S, JEOL). XRD testwas conducted on X’pert PRO diffractometer with a scan stepsize of 0.02◦ per second. Raman spectra were tested usinga Labram HR Evolution Raman spectrometer (Horiba). Thechemical compositions were measured on a MiniPal 4 XRFspectrometer (PANalytical Co., Netherland). The anticorrosionperformance was evaluated on a salt spray testing chamber(YWX-750, Nanjing Huanke experimental equipment Co. Ltd,China). The colorimetric values and reflectance spectra weremeasured on a Color-Eye automatic differential colorimeter (X-Rite, Ci 7800).
Stability Evaluation of CoAl2O4/Kaol Hybrid
PigmentsIn order to evaluate the environmental stability of CoAl2O4/Kaolhybrid pigment, it was sprayed onto glass substrate and driedin the open atmosphere after being ultrasonically dispersed intoethanol for 30min. And then the glass plates were placed for15 days in a UV Accelerated Weathering Tester (ZN-P, Xinlang,Shanghai, China) with eight UV-B (280-315 nm) bulbs (40W)at 60◦C under UV-B exposure with a radiation intensity of 320W/m2. The color properties were measured before and afterbeing exposed in a UV accelerated weathering tester to evaluateUV irradiation stability.
Frontiers in Chemistry | www.frontiersin.org November 2018 | Volume 6 | Article 586

Zhang et al. CoAl2O4/Kaoline Hybrid Pigment
The obtained sample plates were also immersed into 3M HCl,3MNaOH, and ethanol at room temperature for 72 h to study thechemical stability of CoAl2O4/Kaol hybrid pigment, respectively.Unlike with above glass substrate, the hybrid pigments weresprayed onto ceramic substrate and then placed in a mufflefurnace to be calcined at 1,000◦C for 2 h to evaluate the thermalstability.
Anticorrosion Evaluation of the Blue Epoxy
CoatingThe anticorrosion coating was prepared by following procedures:Firstly, epoxy resin, 5 wt% CoAl2O4/Kaol hybrid pigment,dispersing agent, flatting agent, auxiliary solvents, talcumpowder, ethyl acetate, and some grading beads added in a 500mLstainless steel under high shear for 30min (2,000 rpm), and thenthe antifoaming agent, wetting agent were added into the abovemill base and stirred under low shear for 60min (500 rpm). If themaximum pigment size was lower than 30μm, the grinding wasconsidered for meet the requirements, and then the viscosity of
the coating was adjusted by ethyl acetate to 20∼30 s. And thenit was sprayed onto steel plate substrate of size 15 cm × 10 cm× 0.1 cm and dried under the standard conditions (temperature:25◦C and humidity: 40%) for 7 days ( the coating thickness: D= 50 ± 2μm). The obtained sample plates were placed in saltspray testing chamber to evaluate the salt fog corrosion resistanceperformance (35◦C, 100% humidity and 5.0 wt% NaCl solution).In addition, the obtained sample plates were also placed in aceticacid-salt spray testing chamber to evaluate the acetic acid-salt fogcorrosion resistance performance (35◦C, 100% humidity and 5.0wt% NaCl solution, pH= 2.8∼ 3.0).
RESULTS AND DISCUSSION
Preparation of CoAl2O4/Kaol Hybrid
PigmentsThe calcining temperature is an important factor to formspinel CoAl2O4 with prefect blue color (Yang et al., 2013),and thus the effect of calcining temperatures on the color
FIGURE 1 | (A) CIE parameters and (B) reflectance spectra of CoAl2O4/Kaol hybrid pigments calcined at different temperatures, (C) FTIR, and (D) XRD patterns of
Kaol, Kaol-1100◦C, and CoAl2O4/Kaol-1100◦C (the insert is the partial enlarged view of XRD patterns).
Frontiers in Chemistry | www.frontiersin.org November 2018 | Volume 6 | Article 586

Zhang et al. CoAl2O4/Kaoline Hybrid Pigment
parameters of hybrid pigment was studied. Figure 1a gives thecolor parameters of CoAl2O4/Kaol hybrid pigments after beingcalcined at 900∼1,200◦C. The b∗ value of hybrid pigmentsfirstly decreases with the increase in the temperatures, and thenit almost has no obvious change as the temperature is above1,100◦C. The values of L∗ and a∗ continuously increase withthe increase in the calcining temperatures. With the increasein the calcining temperature from 900 to 1,100◦C, the color ofthe hybrid pigments transforms from green to blue to brightblue, which is also consistent with the change of their colorparameters. The blue color is derived from Co2+ in tetrahedralsites, while the green color is attributed to Co3+ in octahedralcoordination (Álvarez-Docio et al., 2017). By contrast, the b∗
value of hybrid pigments reaches the minimum value afterbeing calcined at 1,100◦C, suggesting that the optimum calciningtemperature is 1,100◦C. As shown in Figure 1b, the reflectionbands and absorption bands are observed at 440∼500 nm and at550∼650 nm, respectively, except for hybrid pigment preparedat 900◦C. These bands are associated with the blue color ofCoAl2O4 due to
4A2 (F) →4T1 (P) of the Co
2+ d-d transitionin tetrahedral coordination (Tielens et al., 2006; Kurajica et al.,2012; Gomesan et al., 2015; Tahereh et al., 2016). And for the
hybrid pigment prepared at 900◦C, the bands at 380 and 670 nmare indicative of the occurrence of octahedrally coordinatedCo3+, and are ascribed to the 1A1g→
1T2g and 1A1g→1T1g
transitions of low spin Co3+ in octahedral symmetry (Brik et al.,2001; Herrero et al., 2007), the sample exhibits greenish hueannealed at low temperature, which is also in accordance with thedigital photos of the hybrid pigment calcined at 900◦C (Kurajicaet al., 2012). In addition, the intensity of the reflection peaksalso increases with the increase in the preparation temperaturesuntil 1,100◦C, and then it decreases as the calcining temperaturereaches 1,200◦C, which may be due to crystal phase andstructural transformation of Kaol (Juneja et al., 2010; Yeo,2011).
Figure S1a depicts the effect of grinding time on colorparameters of hybrid pigment, the b∗ value of CoAl2O4/Kaolhybrid pigments firstly decreases with the increase in the grindingtime from 0.5 to 1 h, and no obvious change is observed withthe continuous increasing grinding time. In order to ensurethe reaction uniformity, the grinding time is selected to 2 h.Figure S1b exhibits the effect of the added amount of Kaol oncolor parameters. At the same calcining temperature (1,100◦C),the L∗ value of hybrid pigments gradually increases with increase
FIGURE 2 | TEM images of (A) Kaol and (B–D) CoAl2O4/Kaol-1100◦C.
Frontiers in Chemistry | www.frontiersin.org November 2018 | Volume 6 | Article 586

Zhang et al. CoAl2O4/Kaoline Hybrid Pigment
in the added amount of Kaol, while the a∗ and b∗ values of thesample containing Kaol of 35.5 wt% (1 g Kaol) reach maximum.Interestingly, CoAl2O4/Kaol hybrid pigments still exhibits goodcolor properties (L∗ = 29.9, a∗ = 2.01, b∗ = −54.93) asthe added amount of Kaol is up to 81.5 wt% (8 g Kaol).However, the sample is atrovirens prepared without Kaol at1,100◦C, suggesting that the introduction the low-cost Kaolnot only reduces the production cost of CoAl2O4, but alsodecreases the high temperature crystallization temperature forformation of spinel structure. During calcining process, Kaol(2SiO2 · Al2O3 · 2H2O) transforms into metakaolinite (2SiO2 ·
Al2O3) at 400∼600◦C, and then it turns into SiAl2O5 andamorphous SiO2 (>900◦C), even amorphous SiO2 and low-order crystalline α-Al2O3 at above 1,100◦C (Ribeiro et al.,2005; Gilkes and Prakongkep, 2016). Because the mass transferprocess is the rate controlling step during CoAl2O4 preparation(He and Becker, 1997), the uniform distribution Co3O4 andAl2O3 on the surface of Kaol after being grinded is in favorof reducing the mass transfer resistance, thus the incorporationof Kaol decreases the calcining temperature for formation ofspinel CoAl2O4 (Wang et al., 2006; Gabrovska et al., 2014).Based on above results, the optimum conditions for preparinghybrid pigment with the prefect color are 1,100◦C and 81.5 wt%of Kaol.
Characterization of CoAl2O4/Kaol Hybrid
PigmentFigure 1c presents FTIR spectra of Kaol, the calcined Kaol at1,100◦C and CoAl2O4/Kaol hybrid pigment, respectively. FTIRspectrum of Kaol exhibits the characteristic bands of Si-O-Si(at about 471, 522, 699, 1,032, and 1,114 cm−1), Si-O-Al (ataround 525, 750, and 795 cm−1), Al-Al-OH (at around 522 and911 cm−1), -OH (at about 3,684, 3,684, 3,651, and 3,440 cm−1),while the bending vibration of the inter-layer water is observedat 1,636 cm−1 (Rekik et al., 2017; Sreelekshmi et al., 2017).After being calcined, these typical absorption bands disappear
compared with that of the raw Kaol, which is ascribed to thedehydroxylation and the crystal phase transition of Kaol duringcalcining process. In the case of FTIR spectrum of hybridpigment, several new absorption bands appear at 668, 557, and509 cm−1, which can be attributed to the stretching vibrationof Al-O of AlO6 and Co-O of CoO4, respectively (Zayat andLevy, 2000; Zhang A. J. et al., 2017), indicating the formation ofCoAl2O4.
Figure 1d shows the XRD patterns of Kaol, the calcined Kaolat 1,100◦C and CoAl2O4/Kaol hybrid pigment, respectively. Itis clear that the associated minerals are quartz (2θ = 20.8◦ and26.7◦) and mica (2θ = 8.9◦) (Chhikara et al., 2015; Mymrinet al., 2017), and the typical characteristic peaks of kaolinitepresents the well-defined reflections at 2θ = 12◦ and 25◦. WhenKaol was calcined at 1,100◦C, only diffraction peaks of quartzare remained. For hybrid pigment, new diffraction peaks areobserved at 2θ = 31.1◦, 36.8◦, 44.8◦, 49.0◦, 55.5◦, 59.2◦ and 65.2◦,which correspond to (220), (311), (400), (331), (422), (511), and(440) planes of CoAl2O4 according to JCPD card No. 10-458,respectively (Xi et al., 2012; Zhu et al., 2015). In fact, CoO alsoreacts with silica derived from Kaol to form cobaltous silicate,but this reaction is considered to be a minor reaction since mostof CoO react with Al2O3 because CoO has high affinity to Al2O3
(Ahmed et al., 2012).Figure S2 shows Raman spectra of CoAl2O4 pigment without
Kaol and CoAl2O4/Kaol hybrid pigment. CoAl2O4 pigment witha spinel structure usually exhibits five Raman active modes:A1g (764 cm−1), F2g (644, 511, and 203 cm−1) and Eg (413cm−1). Hybrid pigment also clearly presents the five expectedRaman active modes at 760, 641, 510, 410, and 202 cm−1,indicating that hybrid pigments is assigned to the spinel structure(Zha et al., 2016; Liu et al., 2017). Compared with the Ramanspectrum of CoAl2O4, all modes of hybrid pigment shift to lowerfrequencies, and this red shift suggests that primary coordinativeenvironments of tetrahedron and octahedron positions maychange after incorporation of Kaol.
FIGURE 3 | TEM image and the corresponding element mapping of CoAl2O4/Kaol-1100◦C.
Frontiers in Chemistry | www.frontiersin.org November 2018 | Volume 6 | Article 586

Zhang et al. CoAl2O4/Kaoline Hybrid Pigment
The typical structures and the morphology evolution ofthe samples can be observed by TEM. As illustrated inFigure 2a, Kaol presents a typical lamellar structure with asmooth surface. After being calcined at 1,100◦C (Figure S3a),the lamellar morphology remains well, which reveals that Kaolpossesses the good thermal stability. With the introductionof CoAl2O4 nanoparticles, the surface of lamellar morphologybecomes coarse (Figures 2b,c), and CoAl2O4 nanoparticlesare uniformly distributed on the substrate surface with adiameter of 10∼20 nm. Furthermore, no obvious aggregation isobserved, thus it indicates that incorporation of Kaol effectivelyprevents from the aggregation and controls the size of CoAl2O4
nanoparticles. The selected area electron diffraction pattern ofhybrid pigment also indicates the successful formation of spinelCoAl2O4 (Figure S3b) (Naderi et al., 2014; Zou and Zheng,2016). Figure 2d gives an enlarged electron micrograph, andit provides a well-resolved lattice plane with an interplanarspacing of 0.244 nm, corresponding to (311) plane of the cubicFd3m space group, which is identified on the basis of dataof the standard CoAl2O4 database JCPD card No. 10-458(Kim et al., 2012). Meanwhile, the micrograph also displaysthe coexistence of amorphous and crystalline phases, whichis attributed to the amorphous SiO2 derived from Kaol andspinel CoAl2O4, respectively (Cho and Kakihana, 1999). Inaddition, Figure 3 illustrates the elemental mapping of hybrid
pigment, it is clear that hybrid pigment is mainly composedof Co, Al, O, and Si elements. Co element is uniformlydistributed on the surface of lamellar substrates, suggesting thatthe generated CoAl2O4 is uniformly anchored on the surface ofsubstrate.
Based on our previous studies, Kaol is not merely a carrierfor loading of CoAl2O4 nanoparticles, Al2O3 as one of the maincompositions of Kaol might participate in the high-temperaturecrystallization to form clay mineral doped spinel CoAl2O4. Inorder to confirm above inference, the sample was preparedusing Co3O4 and Kaol without Al2O3 by the same procedurewith CoAl2O4/Kaol hybrid pigments. As shown in Figure 4 andTable S2, the color of the as-prepared pigment is blue, and thevalues of L∗ and a∗ decrease with the increase of the additionamount of Co3O4, but b
∗ firstly decrease with the increase ofthe added amount of Co3O4 to 13%, and then it begins toincrease as Co3O4 reaches 16%. At this moment, the obtainedpigment is dark-green color, which is mainly ascribed to the factthat the excess Co3O4 is not fully involved in the reaction andanchors on the pigment surface (Aguilar-Elguézabal et al., 2017).At the low addition amount of Co3O4 (4.8%), CoO derived fromthe thermal reduction of Co3O4 can react with Al2O3 derivedfrom Kaol to form spinel CoAl2O4 at 1,100◦C, which can beconfirmed by their XRD patterns and FTIR spectra (Figure S4).Therefore, it can be safely concluded that Kaol may be served as
FIGURE 4 | Color coordinates of pigment prepared using the different addition of Co3O4 in the presence of 2 g Kaol without Al2O3 (a-0%, b-2.4%, c-4.8%, d-9.1%,
e-13%, f-16.7%).
Frontiers in Chemistry | www.frontiersin.org November 2018 | Volume 6 | Article 586

Zhang et al. CoAl2O4/Kaoline Hybrid Pigment
an aluminum source to take part in the crystallization process ofCoAl2O4.
Possible Formation Mechanism of
CoAl2O4/Kaol Hybrid PigmentAccording to the above results, the as-prepared hybrid pigmentexhibit good color performances at a low Co content comparedwith the commercial CoAl2O4 pigments even 7 wt%. Thepossible formation mechanism of CoAl2O4/Kaol hybridpigments can be described as follows: Co3O4 and Al2O3
can be uniformly distributed on the surface of Kaol duringgrinding. With the increase of the calcining temperature(400∼600◦C), Kaol (2SiO2·Al2O3·2H2O) is turned intometakaolinite (2SiO2·Al2O3). As the calcining temperatureincreases to 900◦C, Co3O4 begins to thermally reduce into CoO,subsequently the increase in the calcining temperature results inthe formation of spinel CoAl2O4 based on the reaction betweenCoO and Al2O3 on Kaol substrate accompanied with the crystalphase transition of Kaol to amorphous SiO2 and low-ordercrystalline α-Al2O3. In this process, the uniform distributionof Co3O4 and Al2O3 may be expected to decrease the masstransfer resistance for formation of spinel CoAl2O4, whichreduces the processing time and calcining temperature, whilethe traditional solid-phase method for preparation of CoAl2O4
spends the long time ranging from several hours to days athigh temperature (>1,200◦C) (Wang et al., 2006). Furthermore,α-Al2O3 from Kaol also simultaneously reacts with CoO duringhigh-temperature crystallization, thus the generated CoAl2O4
and the calcined production of Kaol finally form a solid solution.The possible formation mechanism of CoAl2O4/Kaol hybridpigment can be illustrated in Scheme 1.
Environmental Stability of CoAl2O4/Kaol
Hybrid PigmentsAs shown in Figure S5a, the reflectance spectra of hybridpigments are nearly same before and after being exposed underUV light for 15 days, indicating the excellent stability of hybridpigment to UV light. In addition, the color of the sample plateshas no obvious difference before and after being immersed intoHCl, NaOH and ethanol, suggesting the excellent resistance of
hybrid pigments to the corresponding reagents, which also canbe confirmed from their color parameters (Table 2). Meanwhile,CoAl2O4/Kaol hybrid pigment presents the excellent thermalstability (Figures S5b,c).
In this study, the potential applications of the as-preparedhybrid pigment were also explored in this study. The thermalresistance coating was prepared by following procedures: Firstly,5 wt% CoAl2O4/Kaol hybrid pigment was dispersed into ethylacetate and stirred under high shear for 30min (2,000 rpm), andthe above obtainedmill base were added into commercial thermalresistance coating and stirred under low shear for 60min (500rpm). The viscosity of the coating was adjusted by ethyl acetateto 20∼30 s. And then it was sprayed onto steel plate substrateof size 15 cm × 10 cm × 0.1 cm and dried under the standardconditions (temperature: 25◦C and humidity: 40%) for 7 days (the coating thickness: D = 50 ± 2μm). The obtained sampleplates were shown in Figure S6c, it is clear that the surface ofthe sample plate is smooth after hybrid pigment (5 wt%) is addedinto the commercial thermal resistance coating, indicating hybridpigment disperses well in the painting. Furthermore, the filmcontaining hybrid pigments exhibits the similar color parameters(L∗ = 24.88, a∗ = 13.54, b∗ = −57.80) (Figure S6d) after beingcalcined at 800◦C for 2 h. However, the steel plate coated the
TABLE 2 | Color parameters of the sample plates before and after being
immersed into 3M HCl, 3M NaOH, and ethanol for 72 h, respectively.
Different medium Color parameters
L* a* b*
Before immersion 43.68 −7.88 −59.33
3M HCl 42.86 −7.56 −59.38
3M NaOH 43.55 −7.63 −59.12
Ethanol 43.83 −7.92 −59.34
The Commission Internationale de l’Eclairage (CIE) 1976 L*,a*,b* colorimetric method was
revised based on the Hunter L*a*b (1958). And the parameters of L* is the lightness axis (0
for black and 100 for white). The parameters of a* (negative values for green and positive
values for red) and b*(negative values for blue and positive values for yellow) denote the
hue or color dimensions.
SCHEME 1 | Possible formation mechanism of CoAl2O4/Kaol hybrid pigment.
Frontiers in Chemistry | www.frontiersin.org November 2018 | Volume 6 | Article 586

Zhang et al. CoAl2O4/Kaoline Hybrid Pigment
commercial thermal resistance coating (Figure S6a) is damagedheavily (Figure S6b). It indicates that the film containing hybridpigment has a good thermal stability, and it can effectively protectsteel plate substrate to avoid excessive damage. Meanwhile, thisfilm also exhibited excellent fireproof properties, which can beillustrated by its fire test using a flame gun (800∼1,000◦C)(Figure S6e). It is found that this film has no obvious changeafter being placed on the fire for 30 s (Movie S1 and Figure S6f),revealing that the hybrid pigment may be used as fireproof paint.In addition, the as-prepared hybrid pigment also can be used as acolored painting and artistic pigment (Figures S7a,b).
Anticorrosion Coating Application of
Hybrid PigmentsCorrosion is a natural and gradual destruction process ofmetal materials resulting from chemical and/or electrochemicalreaction with their environment, which leads to enormous lossesto our lives, finances, etc. Therefore, corrosion engineeringis the field to control and stop corrosion using variousmethods, especially surface coating protection technology, inwhich inorganic pigments (e.g., ZnO and TiO2) are commonlyincorporated to improve the anticorrosion properties of coating,and perhaps provide the color for coating (e.g., α-Fe2O3).Therefore, the as-prepared hybrid pigment is incorporated intothe common epoxy anticorrosion coating to investigate itsanticorrosion properties. As shown in Figure 5, the steel platesubstrate suffers from an aggravating corrosion referred fromthe large-scale red rust without the epoxy anticorrosion coating(Figure 5e). After coating of epoxy anticorrosion coating, thecorrosion of steel plate is slightly improved (Figure 5f). In
particular, this anticorrosion effect is obvious after introducingthe commercial CoAl2O4 pigments (Figure 5g). With theincorporation of the as-prepared hybrid pigment, no obviousrust was found on the surface of coating (Figure 5h). It suggeststhat the introduction of hybrid pigment obviously improves thecorrosion resistance of coating. This is mainly ascribed to thesynergistic effect between the lamellar layered structure of Kaoland the excellent weatherability of CoAl2O4, which can preventssmall molecules (H2O and O2) or ions from penetrating into thecoating film. Thus, the relevant mechanisms of anticorrosion canbe illustrated in Scheme 2.
Furthermore, the chemical stability of the anticorrosioncoating film was also evaluated by immersing into 3M HCl, 3MNaOH, and ethanol at room temperature for 72 h, respectively.
SCHEME 2 | The corrosion protection mechanism of the anticorrosion
coating.
FIGURE 5 | Photographs of (a) steel substrate, (b) steel coated the paint without pigment, (c) steel coated the paint containing commercial CoAl2O4, (d) steel
coated the paint containing hybrid pigment. (e–h) Their corresponding images after being exposed to salt spray test for 60 days, respectively.
Frontiers in Chemistry | www.frontiersin.org November 2018 | Volume 6 | Article 586

Zhang et al. CoAl2O4/Kaoline Hybrid Pigment
The film has no obvious difference before and after beingimmersed, exhibiting the excellent resistance to HCl, NaOH,and ethanol (Figure S8). This is also confirmed by their color
TABLE 3 | Color parameters of the film before and after being immersed into 3M
HCl, 3M NaOH and ethanol for 72 h, respectively.
Different medium Color parameters
L* a* b*
Before immersion 25.11 13.97 −58.10
3M HCl 25.12 13.86 −58.05
3M NaOH 24.88 13.75 −57.88
Ethanol 25.13 13.88 −58.31
The Commission Internationale de l’Eclairage (CIE) 1976 L*,a*,b* colorimetric method was
revised based on the Hunter L*a*b (1958). And the parameters of L* is the lightness axis (0
for black and 100 for white). The parameters of a* (negative values for green and positive
values for red) and b*(negative values for blue and positive values for yellow) denote the
hue or color dimensions.
parameters before and after being immersed in the correspondingreagents (Table 3). More importantly, the obtained sample plateswere also immersed into 3.5 wt% saline water to study the saltedwater resistance test for 60 days. As shown in Figure 6, the surfaceof coating film without pigment is smooth and dense beforeimmersing (Figure 6a). After adding of CoAl2O4 without Kaol,the film color seems darker compared with that of containingCoAl2O4/Kaol hybrid pigment (Figures 6b,c). As expected, thefilm without pigment is swelling, blistering, and rusty afterimmersed into saline water for 60 days (Figure 6d). Furthermore,the same phenomenon also is observed from the one containingCoAl2O4 (Figure 6e), but the situation is better than theformer due to the good weatherability of CoAl2O4 to acid,salt, etc. Surprisingly, the film incorporating of CoAl2O4/Kaolhybrid pigment was perfect without any defects (Figure 6f). Itsuggests that the coating film exhibited the excellent salted waterresistance, which may be ascribed to the synergistic effect of thelamellar layered structure of Kaol and the excellent weatherabilityof CoAl2O4.
FIGURE 6 | Photographs of the film (a) without pigment, (b) containing CoAl2O4, and (c) hybrid pigment. (d–f) Their corresponding images after being exposed to
3.5% NaCl for 60 days, respectively.
Frontiers in Chemistry | www.frontiersin.org November 2018 | Volume 6 | Article 586

Zhang et al. CoAl2O4/Kaoline Hybrid Pigment
Furthermore, the obtained sample plate containing hybridpigment presents the better acid resistance than that ofincorporating of ultramarine after contacting with 36.5 wt%HCl, which changes from blue to white due to its instabilityto acid (Figure S9). Therefore, the obtained sample plate wasalso placed in acetic acid-salt spray testing chamber to evaluatethe acetic acid-salt fog corrosion resistance of the anticorrosioncoating. As a control, the coatings containing Kaol, ZnO, Fe2O3
and CoAl2O4 calcined at 1,100◦C are also investigated, andthe components of paints were provided in Table S3. Firstly,the different amounts of the CoAl2O4/Kaol hybrid pigmentwere added into epoxy resin to determine the amounts of thehybrid pigment, and the results are shown in Figure S10. Itis clear that the sample that containing 5 wt% CoAl2O4/Kaolhybrid pigment is bright blue, so the added amounts of thehybrid pigment is 5 wt%. And then the sample containing Kaol,ZnO, Fe2O3, and CoAl2O4 calcined at 1,100◦C are shown inFigure 7, the corrosion of the films containing Fe2O3 (Figure 7f),CoAl2O4 calcined at 1,100◦C (Figure 7g), and ZnO (Figure 7j)are very serious after be exposed in salt spray testing chamber60 days. Interestingly, the corrosion of the sample containing
CoAl2O4/Kaol hybrid pigment (Figure 7h) and Kaol (Figure 7j)were negligible, especially the sample of hybrid pigment. It maybe ascribed to the excellent acid resistance and lamellar layeredstructure of hybrid pigment and Kaol, respectively. In addition,Figure 8 gives the anticorrosion ability of the coatings containingCoAl2O4/Kaol hybrid pigments, ZnO, Fe2O3, CoAl2O4 calcinedat 1,100◦C and the one without pigment. Bode plots indicates thatthe addition of CoAl2O4/Kaol hybrid pigments in epoxy paintshows a significant improvement in the anticorrosion propertiescompared with the pure epoxy paint and others pigment. Italso suggests the synergistic effect between the lamellar layeredstructure of Kaol and the excellent weatherability of CoAl2O4 isin favor of improving the resistance to salts, which also is superiorto the reported works (Table 4).
Anti-corrosion of the anticorrosive film is commonlydetermined from electrochemical measurements such ascorrosion potential (Ecorr) and corrosion current (Icorr), andElectrochemical Impedance Spectroscopy (EIS) measurementswere carried out with the use of an electrochemical workingstation (CHI660E) at open circuit potential. A three-electrode cellincluding the Ag/AgCl (3M KCl) reference electrode, the studied
FIGURE 7 | Photographs of the film containing (a) Fe2O3, (b) CoAl2O4, (c) CoAl2O4/Kaol hybrid pigment, (d) Kaol, and (e) ZnO. (f–j) The corresponding images of
the film after being exposed to acetic acid-salt spray for 60 days, respectively.
Frontiers in Chemistry | www.frontiersin.org November 2018 | Volume 6 | Article 586

Zhang et al. CoAl2O4/Kaoline Hybrid Pigment
FIGURE 8 | Bode plots of the coatings containing CoAl2O4/Kaol hybrid pigment, ZnO, Fe2O3, CoAl2O4, the control without pigment and steel before (A) and after
(B) being immersed in the 3.5 wt% NaCl solution for 60 days.
TABLE 4 | Comparison with the anticorrosion performance of the reported
additives and hybrid pigment in epoxy anticorrosive coating.
Condition Materials (added
amount)
Time/h References
Neutral salt
spray test
H-BN decorated with
Fe3O4 (2%)
720 Zhang et al., 2016
Neutral salt
spray test
Graphite nanoplatelets
(0.5%)
750 Mohammadi et al.,
2014
Neutral salt
spray test
Zn (6%) 500 Bagherzadeh and
Mousavinejad, 2012
Neutral salt
spray test
ZnO/nano-Co:ZnO
(6%)
168 Rostami et al., 2014
Neutral salt
spray test
ZnO (6.5%) 720 Naderi et al., 2014
Neutral salt
spray test
Ceramic
nanocontainers (4%)
750 Kartsonakis et al., 2012
Neutral salt
spray test
Hybrid pigments (5%) 1,440 This work
Acetic
acid-salt
spray test
Hybrid pigments (5%) 1,440 This work
sample as working electrode and the platinum counter electrodewas used to run EIS tests. EIS measurements are studied in thefrequency range from 100 kHz to 0.005Hz with a perturbationof 5mV, and the working electrode area was 1 cm2. Figure 9shows the Tafel plots generated for the anticorrosion coatingcontaining CoAl2O4/hybrid pigment, ZnO, Fe2O3, CoAl2O4
calcined at 1,100◦C, control (without pigment) and blankimmersed in 3.5 wt% NaCl solution about 30min. And the Tafelcurve parameters are given in Table 5. As shown in Figure 9
and Table 5, the corrosion current of the control (withoutpigment) decreases from −1.52 × 10⁻⁷ A to −3.39 × 10⁻⁸ Acompared with the blank, and the corrosion current obviouslydeclines when the pigments were added into the anticorrosioncoating. After incorporation of CoAl2O4/hybrid pigment, the
FIGURE 9 | Tafel plots of blank and anticorrosion coatings containing
CoAl2O4 calcined at 1,100◦C, control without pigment, ZnO, CoAl2O4/hybrid
pigment, and Fe2O3, respectively.
corrosion current decreases from −3.39 × 10⁻⁸ A to −5.75 ×
10−12 A, while the corrosion potential increases from −1.439Vto −0.443V. In fact, the anticorrosion ability of the coating isrelated to the chemical composition and microstructure. Thelower of the corrosion current or the higher corrosion potentialsuggests the better of the anticorrosion ability (Liang et al.,2007; Chang et al., 2012). Therefore, the anticorrosion coatingscontaining CoAl2O4/hybrid pigment, ZnO, Fe2O3 present goodanticorrosion ability, and CoAl2O4/hybrid pigment exhibitssuperior anticorrosion ability compared with than that of ZnOand Fe2O3, which is consistent with that of the Bode plots(Figure 8), implying that the addition of CoAl2O4/Kaol hybridpigments in epoxy paint shows a significant improvement in theelectrochemical corrosion properties compared with the pureepoxy paint and other pigments.
Frontiers in Chemistry | www.frontiersin.org November 2018 | Volume 6 | Article 586

Zhang et al. CoAl2O4/Kaoline Hybrid Pigment
TABLE 5 | Tafel curve parameters of the anticorrosion coatings containing
different pigments and blank sample.
Sample Corrosion potential
(Ecorr)/V
Corrosion current
density
(Icorr)/A·cm−2
Corrosion
current (I)/A
Blank −0.427 −6.82 −1.52 × 10⁻⁷
CoAl2O4 −0.966 −7.96 −1.10 × 10⁻⁸
Fe2O3 −1.171 −10.50 −3.16 × 10⁻¹¹
ZnO −1.538 −9.55 −2.82 × 10⁻¹⁰
Control −1.439 −7.57 −3.39 × 10⁻⁸
Hybrid pigment −0.443 −11.24 −5.75 × 10⁻¹²
CONCLUSION
In conclusion, the low-cost bright blue CoAl2O4/Kaol hybridpigments were successfully prepared by the traditional solid-state reaction. The introduction of Kaol not only reduces theCo consumption and the temperature for formation of spinelCoAl2O4, but also enhances the color properties of cobaltblue pigments with bright blue and high NIR reflectance,especially prepared using 8.1% Co3O4 and 81.5% Kaol. Duringpreparation, Co3O4 and Al2O3 can be uniformly distributed onthe surface of Kaol, which reduces the mass transfer resistanceand prevents from the aggregation CoAl2O4 nanoparticlesduring high-temperature crystallization process. In addition, theAl2O3 originated fromKaol alsomay participate in the formationof spinel CoAl2O4 pigments. Due to the synergistic effectbetween the lamellar layered structure of Kaol and the excellent
weatherability of CoAl2O4, the anticorrosion coating containing
hybrid pigments exhibited the excellent corrosion resistancetoward the salt and acetic acid-salt system. Furthermore, theCoAl2O4/Kaol hybrid pigments prepared by traditional solid-phase method can be applied in thermal resistance coating, wallpainting and artistic pigment.
AUTHOR CONTRIBUTIONS
AZ and XW contribute to the experiment process, samplescharacterization, data analysis, and paper preparation. BM andAW are mainly responsible for the design of experiment, dataanalysis, and paper revision.
ACKNOWLEDGMENTS
This work is supported by the Regional Key Project of theScience and Technology Service of the Chinese Academy ofSciences ([2016] No. 70), the Youth Innovation PromotionAssociation CAS (2017458), the Major Projects of the NationalNatural Science Foundation of Gansu, China (18JR4RA001),and The Funds for Creative Research Groups of Gansu, China(17JR5RA306).
SUPPLEMENTARY MATERIAL
The Supplementary Material for this article can be foundonline at: https://www.frontiersin.org/articles/10.3389/fchem.2018.00586/full#supplementary-material
REFERENCES
Aguilar-Elguézabal, A., Román-Aguirre, M., De la Torre-Sáenz, L., Pizá-
Ruiz, P., and Bocanegra-Bernal, M. (2017). Synthesis of CoAl2O4/Al2O3
nanoparticles for ceramic blue pigments. Ceram. Int. 43, 15254–15257.
doi: 10.1016/j.ceramint.2017.08.062
Ahmed, N. A., Abdel-Fatah, H. T. M., and Youssef, E. A. (2012). Corrosion studies
on tailored Zn·Co aluminate/kaolin core-shell pigments in alkyd based paints.
Prog. Org. Coat. 73, 76–87. doi: 10.1016/j.porgcoat.2011.09.003
Al-Sabagh, A. M., Abdou, M. I., Migahed, M. A., Fadl, A. M., Farag, A. A.,
Mohammedy, M. M., et al. (2017). Influence of ilmenite ore particles as
pigments on the anticorrosion and mechanical performance properties of
polyamine cured epoxy for internal coating of gas transmission pipelines. Egypt.
J. Pet. doi: 10.1016/j.ejpe.2017.07.005. [Epub ahead of print].
Álvarez-Docio, C. M., Reinosa, J. J., Del Campo, A., and Fernández, J. F. (2017). 2D
particles forming a nanostructured shell: a step forward cool NIR reflectivity for
CoAl2O4 pigments.Dyes Pigments 137, 1–11. doi: 10.1016/j.dyepig.2016.09.061
Ammar, S., Ramesh, K., Vengadaesvaran, B., Ramesh, S., and Arof, A. K. (2016).
Amelioration of anticorrosion and hydrophobic properties of epoxy/pdms
composite coatings containing Nano ZnO particles. Prog. Org. Coat. 92, 54–65.
doi: 10.1016/j.porgcoat.2015.12.007
Bagherzadeh, M. R., and Mousavinejad, T. (2012), Preparation and investigation
of anticorrosion properties of the water-based epoxy-clay nanocoating
modified by Na+-MMT and Cloisite 30B. Prog. Org. Coat. 74, 589–595.
doi: 10.1016/j.porgcoat.2012.02.006
Brik, Y., Kacimi, M., Ziyad, M., and Bozon-Verduraz, F. (2001). Titania-
supported cobalt and cobalt–phosphorus catalysts: characterization and
performances in ethane oxidative dehydrogenation. J. Catal. 202, 118–128.
doi: 10.1006/jcat.2001.3262
Cayton, H. R., and Sawitowski, T. (2005). The impact of nano-materials on coating
technologies. NSTI-Nanotech 2, 83–85.
Chang, C. H., Huang, T. C., Peng, C. W., Yeh, T. C., Lu, H. I., Hung, W. I.,
et al. (2012). Novel anticorrosion coatings prepared from polyaniline/graphene
composites. Carbon 50, 5044–5051. doi: 10.1016/j.carbon.2012.06.043
Chhikara, D., Kumar, M. S., and Srivatsa, K. M. K. (2015). On the
synthesis of Zn/ZnO core-shell solid microspheres on quartz substrate
by thermal evaporation technique. Superlattice. Microstruct. 82, 368–377.
doi: 10.1016/j.spmi.2015.02.036
Cho, W. S., and Kakihana, M. (1999). Crystallization of ceramic pigment CoAl2O4
nanocrystals from Co-Al metal organic precursor. J. Alloy. Compd. 287, 87–90.
doi: 10.1016/S0925-8388(99)00059-6
Daham, P. V., Gunawardana, S., Nguyen, T. T. M., Walmsley, J. C., and Venvik, H.
J. (2014). Initiation of metal dusting corrosion in conversion of natural gas to
syngas studied under industrially relevant conditions. Ind. Eng. Chem. Res. 53,
1794–1803. doi: 10.1021/ie4024947
Dandapat, A., and De, G. (2012). Host-mediated synthesis of cobalt aluminate/γ-
alumina nanoflakes: a dispersible composite pigment with high catalytic
activities. ACS Appl. Mater. Inter. 4, 228–234. doi: 10.1021/am201283c
de Leon, A. C., Pernites, R. B., and Advincula, R. C. (2012). Superhydrophobic
colloidally textured polythiophene film as superior anticorrosion coating. ACS
Appl. Mater. Inter. 4 , 3169–3176. doi: 10.1021/am300513e
El Saeed, A. M., El-Fattah, M. A., and Azzam, A. M. (2012). Synthesis of ZnO
nanoparticles and studying its influence on the antimicrobial, anticorrosion
and mechanical behavior of polyurethane composite for surface coating. Dyes
Pigments 121, 282–289. doi: 10.1016/j.dyepig.2015.05.037
El-Wahab, H. A., EL-Fattah, M. A., Abdou, M. I., and El-Hai, F. A. (2009). New
anticorrosive coating compositions incorporated ilmenite ore. Prog. Org. Coat.
66, 242–247. doi: 10.1016/j.porgcoat.2009.07.010
Frontiers in Chemistry | www.frontiersin.org November 2018 | Volume 6 | Article 586

Zhang et al. CoAl2O4/Kaoline Hybrid Pigment
Gabrovska, M. V., Crisan, D., Stanica, N., and Kardjieva, R. (2014). Co-Al layered
double hydroxides as precursors of ceramic pigment CoAl2O4. Part I: phase
composition. Rev. Roum. Chim. 59, 445–450.
Gilkes, R. J., and Prakongkep, N. (2016). How the unique properties of soil
kaolin affect the fertility of tropical soils. Appl. Clay Sci. 131, 100–106.
doi: 10.1016/j.clay.2016.01.007
Golru, S. S., Attar, M.M., and Ramezanadeh, B. (2015). Effects of surface treatment
of aluminium alloy 1050 on the adhesion and anticorrosion properties of the
apoxy coating. Appl. Surf. Sci. 345, 360–368. doi: 10.1016/j.apsusc.2015.03.148
Gomesan, Y. F., Medeirosa, P. N., Bomioa, M. .R. D., Santosb, I. M. G.,
Paskocimasa, C. A., and Nascimentoa, R. M. (2015). Optimizing the synthesis
of cobalt aluminate pigment using fractional factorial design. Ceram. Int. 41,
699–706. doi: 10.1016/j.ceramint.2014.08.125
Gu, L., Liu, S., Zhao, H., and Yu, H. B. (2015). Facile preparation of
water-dispersible graphene sheets stabilized by carboxylated oligoanilines
and their anticorrosion coatings. ACS Appl. Mater. Inter. 7, 17641–17648.
doi: 10.1021/acsami.5b05531
Hao, L., Yan, T. T., Zhang, Y. M., Zhao, X. H., Lei, X. D., Xu, S.
L., et al. (2017). Fabrication and anticorrosion properties of composite
films of silica/layered double hydroxide. Surf. Coat. Tech. 326, 200–206.
doi: 10.1016/j.surfcoat.2017.06.024
He, T., and Becker, K. D. (1997). An optical in-situ study of a reacting spinel crystal.
Solid State Ionics 101, 337–342. doi: 10.1016/S0167-2738(97)84050-7
He, Y., Cao, Y., Liao, H. L., and Wang, J. A. (2017). Preparation of porous cobalt
aluminate and its chromogenic mechanism. Powder Technol. 324, 95–101.
doi: 10.1016/j.powtec.2017.08.056
Herrero, M., Benito, P., Labajos, F. M., and Rives, V. (2007). Stabilization of Co2+
in layered double hydroxides (LDHs) by microwave-assisted ageing. J. Solid
State Chem. 180, 873–884. doi: 10.1016/j.jssc.2006.12.011
Jafari, M., andHassanzadeh-Tabriz, S. A. (2014). Preparation of CoAl2O4 nanoblue
pigment via polyacrylamide gel method. Powder Technol. 266, 236–239.
doi: 10.1016/j.powtec.2014.06.018
Jeon, H., Park, J., and Shon, M. (2013). Corrosion protection by epoxy coating
containing multi-walled carbon nanotubes. J. Ind. Eng. Chem. 19, 849–853.
doi: 10.1016/j.jiec.2012.10.030
Juneja, A., Hegde, A., Lee, F. H., and Yeo, C. H. (2010). Centrifuge modelling
of tunnel face reinforcement using forepoling. Tunn. Undergr. Space Tech. 25,
377–381. doi: 10.1016/j.tust.2010.01.013
Kalendová, A., Sapurina, I., Stejskal, J., and Veselý, D. (2008). Anticorrosion
properties of polyaniline-coated pigments in organic coatings. Corros. Sci. 50
, 3549–3560. doi: 10.1016/j.corsci.2008.08.044
Kartsonakis, I. A., Balaskas, A. C., Koumoulos, E. P., Charitidis, C. A., and Kordas,
G. C. (2012). Incorporation of ceramic nanocontainers into epoxy coatings for
the corrosion protection of hot dip galvanized steel. Corros. Sci. 57, 30–41.
doi: 10.1016/j.corsci.2011.12.037
Kim, J. H., Son, B. R., Yoon, D. H., Hwang, K. T., Noh, H. G., Cho,
W. S., et al. (2012). Characterization of blue CoAl2O4 nano-pigment
synthesized by ultrasonic hydrothermal method. Ceram. Int. 38, 5707–5712.
doi: 10.1016/j.ceramint.2012.04.015
Kloprogge, J. T. (2017). Chapter 6 - Raman spectroscopy of clay minerals. Dev.
Clay Sci. 8, 150–199. doi: 10.1016/B978-0-08-100355-8.00006-0
Kurajica, S., Popovic, J., Tkalcec, E., Grzeta, B., andMandic, V. (2012). The effect of
annealing temperature on the structure and optical properties of sol-gel derived
nanocrystalline cobalt aluminate spinel. Mater. Chem. Phys. 135, 587–593.
doi: 10.1016/j.matchemphys.2012.05.030
Liang, J., Hu, L. T., and Hao, J. C. (2007). Improvement of corrosion properties of
microarc oxidation coating on magnesium alloy by optimizing current density
parameters. Appl. Surf. Sci. 253, 6939–6945. doi: 10.1016/j.apsusc.2007.02.010
Liu, Q. F., Li, X. G., and Cheng, H. F. (2016). Insight into the self-adaptive
deformation of kaolinite layers into nanoscrolls. Appl. Clay Sci. 124–125,
175–182. doi: 10.1016/j.clay.2016.02.015
Liu, Y., Jia, L. T., Hou, B., Sun, D. K., and Li, D. B. (2017). Cobalt aluminate-
modified alumina as a carrier for cobalt in fischer-tropsch synthesis. Appl.
Catal. A: Gen. 530, 30–36. doi: 10.1016/j.apcata.2016.11.014
Madhup, M. K., Shah, N. K., and Parekh, N. R. (2017). Investigation and
improvement of abrasion resistance, water vapor barrier and anticorrosion
properties of mixed clay epoxy nanocomposite coating. Prog. Org. Coat. 102,
186–193. doi: 10.1016/j.porgcoat.2016.10.012
Mohammadi, S., Taromi, F. A., Shariatpanahi, H., Neshati, J., and Hemmati,
M. (2014). Electrochemical and anticorrosion behavior of functionalized
graphite nanoplatelets epoxy coating. J. Ind. Eng. Chem. 20, 4124–4139.
doi: 10.1016/j.jiec.2014.01.011
Montemor, M. F., Snihirov, D. V., Taryb, M. G., Lamaka, S. V., Kartsonakis, I.
A., and Balaskas, A. C. (2012). Evaluation of self-healing ability in protective
coatings modified with combinations of layered double hydroxides and cerium
molibdate nanocontainers filled with corrosion inhibitors. Electrochim Acta 60,
31–40. doi: 10.1016/j.electacta.2011.10.078
Mu, B., Wang, Q., and Wang, A. Q. (2015). Effect of different clay minerals and
calcination temperature on the morphology and color of clay/CoAl2O4 hybrid
pigments. RSC Adv. 5, 102674–102681. doi: 10.1039/C5RA19955G
Mymrin, V., Pedroso, A. M., Ponte, H. A., Ponte, M. J. J., , Alekseeva, K.,
and Evaniki, D., et al. (2017). Thermal engineering method application for
hazardous spent petrochemical catalyst neutralization. Appl. Therm. Eng. 110,
1428–1436. doi: 10.1016/j.applthermaleng.2016.09.077
Naderi, R., Arman, S. Y., and Fouladvand, S. (2014). Investigation on the inhibition
synergism of new generations of phosphate-based anticorrosion pigments.Dyes
Pigments 105, 23–33. doi: 10.1016/j.dyepig.2014.01.015
Qu, M. N., Liu, S. S., He, J. M., Feng, J., Yao, Y. L., Ma, X. R., et al.
(2017). Fabrication of recyclable and durable superhydrophobic materials with
wear/corrosion-resistance properties from kaolin and polyvinylchloride. Appl.
Surf. Sci. 410, 299–307. doi: 10.1016/j.apsusc.2017.03.127
Rekik, S. B., Gassara, S., Bouaziz, J., Deratani, A., and Baklouti, S.
(2017). Development and characterization of porous membranes
based on kaolin/chitosan composite. Appl. Clay Sci. 143, 1–9.
doi: 10.1016/j.clay.2017.03.008
Ribeiro, M. J., Tulyagavov, D. U., Ferreira, J. M., and Labrincha, J. A. (2005). High
temperature mullite dissolution in ceramic bodies derived from al-rich sludge.
J. Eur. Ceram. Soc. 25, 703–710. doi: 10.1016/j.jeurceramsoc.2004.03.028
Rostami, M., Rasouli, S., Ramezanzadeh, B., and Askari, A. (2014). Electrochemical
investigation of the properties of Co doped ZnO nanoparticle as a corrosion
inhibitive pigment for modifying corrosion resistance of the epoxy coating.
Corros. Sci. 88, 387–399. doi: 10.1016/j.corsci.2014.07.056
Sreelekshmi, R. V., Brahmakumar, M., Sudha, J. D., and Menon, A. R.
(2017). Studies on natural rubber containing kaolin modified with
hexamethylenediamine derivative of phosphorylated cashew nut shell
liquid prepolymer. Appl. Clay Sci. 141, 171–179. doi: 10.1016/j.clay.2017.02.034
Tahereh, G., Masoud, S. N., and Shokufeh, V. (2016). Investigation of the
electrochemical hydrogen storage and photocatalytic properties of CoAl2O4
pigment: green synthesis and characterization. Int. J. Hydrogen Ener. 41,
9418–9426. doi: 10.1016/j.ijhydene.2016.03.144
Tielens, F., Calatayud, M., Franco, R., Recio, J. M., Pérez-Ramírez, J., andMinot, C.
(2006). Periodic DFT study of the structural and electronic properties of bulk
CoAl2O4 spinel. J. Phys. Chem. B 110 , 988–995. doi: 10.1021/jp053375l
Tirsoaga, A., Visinescu, D., Jurca, B., Ianculescu, A., and Carp, O. (2011). Eco-
friendly combustion-based synthesis of metal aluminates MAl2O4 (M = Ni,
Co). J. Nanopart. Res. 13, 6397–6408. doi: 10.1007/s11051-011-0392-1
Vesely, D., Kalendov, A., and Kalend, P. (2010). A study of diatomite and calcined
kaoline properties in anticorrosion protective coatings. Prog. Org. Coat. 68,
173–179. doi: 10.1016/j.porgcoat.2010.02.007
Wang, C., Liu, S. M., Liu, L. H., and Bai, X. (2006). Synthesis of cobalt-aluminate
spinels via glycine chelated precursors. Mater. Chem. Phys. 96, 361–370.
doi: 10.1016/j.matchemphys.2005.07.066
Xi, X. L., Nie, Z. R., Ma, L. W., Xu, X. Y., and Zuo, E. Y. (2012). Synthesis
and characterization of ultrafine Co2AlO4 pigment by freeze-drying. Powder
Technol. 226, 114–116. doi: 10.1016/j.powtec.2012.04.029
Yang, Y., Li, L. L., and Li, W. K. (2013). Plasmon absorption of Au-in-
CoAl2O4 linear nanopeapod chains. J. Phys. Chem. C 117, 14142–14148.
doi: 10.1021/jp403150h
Yeo, C. H. (2011). Stability and Collapse Mechanisms of Unreinforced and Forepole-
Reinforced Tunnel Headings, Ph.D. thesis national university of Singapore,
Singapore.
Yoneda, M., Gotoh, K., Nakanishi, M., Fujii, T., and Nomura, T. (2018). Influence
of aluminum source on the color tone of cobalt blue pigment. Powder Technol.
323, 574–580. doi: 10.1016/j.powtec.2016.06.021
Zayat, M., and Levy, D. (2000). Blue CoAl2O4 particles prepared by the sol-gel and
citrate-gel methods. Chem. Mater. 12, 2763–2769. doi: 10.1021/cm001061z
Frontiers in Chemistry | www.frontiersin.org November 2018 | Volume 6 | Article 586

Zhang et al. CoAl2O4/Kaoline Hybrid Pigment
Zha, W. W., Zhou, Z. H., Zhao, D. L., and Feng, S. J. (2016). Positive effects
of Al3+ partially substituted by Co2+ cations on the catalytic performance of
Co1+xAl2−xO4 (x = 0-0.2) for methane combustion. J. Sol-Gel Sci. Techn. 78,
144–150. doi: 10.1007/s10971-015-3910-2
Zhang, A., Mu, B., Wang, X., Wen, L. , and Wang, A. (2018b).
Formation and coloring mechanism of typical aluminosilicate clay
minerals for CoAl2O4 hybrid pigment preparation. Front. Chem. 6:125.
doi: 10.3389/fchem.2018.00125
Zhang, A. J., Mu, B., Hui, A. P., and Wang, A. Q. (2018a). A facile
approach to fabricate bright blue heat-resisting paint with self-cleaning ability
based on CoAl2O4/kaoline hybrid pigment. Appl. Clay Sci. 160, 153–161.
doi: 10.1016/j.clay.2017.12.004
Zhang, A. J., Mu, B., Luo, Z. H., and Wang, A. Q. (2017). Bright
blue halloysite/CoAl2O4 hybrid pigments: preparation, characterization
and application in water-based painting. Dyes Pigments 139, 473–481.
doi: 10.1016/j.dyepig.2016.12.055
Zhang, C. L., He, Y., Li, F., Di, H. H., Zhang, L., and Zhan, Y. Q. (2016). h-
BN decorated with Fe3O4 nanoparticles through mussel-inspired chemistry of
dopamine for reinforcing anticorrosion performance of epoxy coatings. J. Alloy.
Compd. 685, 743–751. doi: 10.1016/j.jallcom.2016.06.220
Zhang, S. L., Liu, Q. F., Yang, Y. J., Wang, D., He, J. K., and Sun, L. Y. (2017).
Preparation, morphology, and structure of kaolinites with various aspect ratios.
Appl. Clay Sci. 147, 117–122. doi: 10.1016/j.clay.2017.07.014
Zhou, S., Wu, L., Sun, J., and Shen, W. (2002). The change of the
properties of acrylic-based polyurethane via addition of nano-
silica. Prog. Org. Coat. 45, 33–42. doi: 10.1016/S0300-9440(02)
00085-1
Zhu, X. H., Li, H., Zhou, H., and Zhong, S. A. (2015). Fabrication and evaluation of
protein imprinted polymer based on magnetic halloysite nanotubes. RSC Adv.
5, 66147–66154. doi: 10.1039/C5RA09740A
Zou, J., and Zheng, W. (2016). TiO2@CoTiO3 complex green
pigments with low cobalt content and tunable color properties.
Ceram. Int. 42, 8198–8205. doi: 10.1016/j.ceramint.2016.
02.029
Conflict of Interest Statement: The authors declare that the research was
conducted in the absence of any commercial or financial relationships that could
be construed as a potential conflict of interest.
Copyright © 2018 Zhang, Mu, Wang and Wang. This is an open-access article
distributed under the terms of the Creative Commons Attribution License (CC BY).
The use, distribution or reproduction in other forums is permitted, provided the
original author(s) and the copyright owner(s) are credited and that the original
publication in this journal is cited, in accordance with accepted academic practice.
No use, distribution or reproduction is permitted which does not comply with these
terms.
Frontiers in Chemistry | www.frontiersin.org November 2018 | Volume 6 | Article 586

ORIGINAL RESEARCH
published: 19 April 2018
doi: 10.3389/fchem.2018.00125
Frontiers in Chemistry | www.frontiersin.org April 2018 | Volume 6 | Article 125
Edited by:
Pu-Xian Gao,
University of Connecticut,
United States
Reviewed by:
Sibo Wang,
University of Connecticut,
United States
Kaixuan Bu,
Rutgers University, The State
University of New Jersey,
United States
Quansheng Liu,
Changchun University of Technology,
China
*Correspondence:
Bin Mu
Aiqin Wang
Specialty section:
This article was submitted to
Green and Sustainable Chemistry,
a section of the journal
Frontiers in Chemistry
Received: 05 February 2018
Accepted: 03 April 2018
Published: 19 April 2018
Citation:
Zhang A, Mu B, Wang X, Wen L and
Wang A (2018) Formation and
Coloring Mechanism of Typical
Aluminosilicate Clay Minerals for
CoAl2O4 Hybrid Pigment Preparation.
Front. Chem. 6:125.
doi: 10.3389/fchem.2018.00125
Formation and Coloring Mechanismof Typical Aluminosilicate ClayMinerals for CoAl2O4 Hybrid PigmentPreparation
Anjie Zhang1,2,3, Bin Mu1*, Xiaowen Wang1,2, Lixin Wen3 and Aiqin Wang1*
1 Key Laboratory of Clay Mineral Applied Research of Gansu Province, Center of Eco-material and Green Chemistry, Lanzhou
Institute of Chemical Physics, Chinese Academy of Sciences, Lanzhou, China, 2 University of Chinese Academy of Sciences,
Beijing, China, 3 Northwest Yongxin Coatings Limited Company, Lanzhou, China
Different kinds of aluminosilicate minerals were employed to fabricate CoAl2O4 hybrid
pigment for studying its formation and coloring mechanism. It revealed that the color of
the obtained hybrid pigments was determined by the content of Al2O3 and lightness of
clay minerals. The higher the Al2O3 content and the lightness of clay minerals, the better
the color parameters of hybrid pigments. During the preparation of hybrid pigments,
CoAl2O4 nanoparticles were confined to be loaded on the surface of the aluminosilicate
minerals, which effectively prevented from the aggregation and the size increase of
CoAl2O4 nanoparticles. What’s more, aluminosilicate mineral might be an ideal natural
aluminum source to compensate the aluminum loss due to the dissolution of Al(OH)3
at alkaline medium during precursor preparation, keeping an optimum molar ratio of
Co2+/Al3+ for formation of spinel CoAl2O4 pigments in the process of high-temperature
crystallization.
Keywords: CoAl2O4, aluminosilicate minerals, hybrid pigments, formation mechanism, coloring mechanism
INTRODUCTION
AB2O4 spinel complex oxides usually are used as ceramic materials, inorganic pigments, magneticmaterials, catalysts and gas-sensitive materials (Ren et al., 2014; Yoneda et al., 2016; Zou and Zheng,2016; Álvarez-Docio et al., 2017; Chafi et al., 2017; Rani, 2017; Tang et al., 2017), the most famousone of them is cobalt aluminate (CoAl2O4). As a high-grade eco-friendly intense blue pigment,it can be applied in the fields of ceramics, plastics, paint, glass, and color TV tubes due to highrefractive index, excellent chemical, and thermal stability (Mahé et al., 2008; Ryu et al., 2008;Tirsoaga et al., 2011; Merino et al., 2015; Soleimani-Gorgania et al., 2015). However, the highcost of CoAl2O4 pigments has severely restrained their wide applications because of the expensivecobalt compounds (De Souza et al., 2009; Gholizadeh and Malekzadeh, 2017; Zhang et al., 2017).In addition, the traditional method for preparation of cobalt blue pigment was involved in thecalcination of CoO and Al2O3 at above 1,300◦C for a long time (Armijo, 1969; Salavati-Niasariet al., 2009; Sale, 2015; He et al., 2017; Zhang et al., 2017), which was obviously time-consuming.Therefore, it is urgent to develop a strategy to prepare the low-cost cobalt blue pigment with prefectcolor property in order to realize its wide applications.
Incorporation of non-toxic and low-cost elementsmay be an efficientmethod to decrease the useof Co element. Torkian et al. synthesized CoxMg1−xAl2O4 nanopigment based on the substitution

Zhang et al. CoAl2O4 Hybrid Pigment
of Co2+ using Mg2+ via combustion method (Torkian et al.,2013). Khattab et al. also synthesized CoxMg1−xAl2O4 bluepigment after replacing of Co2+ with Mg2+ during thecalcination process (Khattab et al., 2017), and Sedghi preparedCoxZn1−xAl2O4 nano-pigments by gel combustion method(Sedghi et al., 2014). It suggests that the doping technology usingthe matched metal ions can enhance the color properties as wellas decrease the cost of cobalt blue. However, the decrease in thecost of cobalt blue is limited by the substitution of Co2+ usingother metal ions. What’s more, the agglomeration and crystalgrain growth of cobalt blue nanoparticles still remain duringcalcining process.
Recently, many inorganic substrates are employed toconstruct the eco-friendly high-grade inorganic hybrid pigment(Mousavand et al., 2006; Zhang et al., 2015; Meng et al., 2016;Mishra et al., 2017; Tian et al., 2017). Due to the abundance innature, low-cost, non-toxic and unique structure features, clayminerals can be served as a promising substrate for loadingof the inorganic nanoparticles (Wang et al., 2011; Todorovaet al., 2014; Mu and Wang, 2015; Ezzatahmadi et al., 2017;Intachai et al., 2017). Therefore, our groups have preparedcobalt blue hybrid pigments after incorporating of attapulgite,halloysite (Hal), montmorillonite (Mt), etc., via co-precipitationmethod followed by a calcination process (Mu et al., 2015;Zhang et al., 2017). It has confirmed that the introduction ofclay minerals dramatically decreases the cost of pigment, aswell as improves the aggregation of cobalt blue nanoparticles.In addition, some components of clay minerals might enterinto tetrahedral or octahedral positions of CoAl2O4 spinelstructure to substitute Co2+ or Al3+, which have an obviouseffect on the color properties of cobalt blue. However, therelevant formation and coloring mechanism of the CoAl2O4/claymineral hybrid pigments was still not clear. Therefore, severalof typical aluminosilicate minerals were selected to constructthe CoAl2O4/aluminosilicate clay mineral hybrid pigments tostudy its relevant formation and coloring mechanism in thisstudy, the involved clay minerals included Hal, Mt, kaoline(Kaol), andalusite (And), dickite (Dic), mullite (M47 and M70,the number is indicator of the Al2O3 content). The effect of thedifferent aluminosilicate clay minerals on the color parametersof hybrid pigment was studied in detail, and the possibleformation and coloring mechanism of the hybrid pigments wasproposed. It is expected to provide guidance for preparationof low-cost and high-grade cobalt blue with the prefect colorproperties.
EXPERIMENTAL
MaterialsHal and And were obtained from Zhengzhou JinyangguangCeramics Co., Ltd. (HeNan, China). Mt, Dic, M47 and M70were obtained fromYixian Kaolin Development Co., Ltd. (HeBei,China), Qingdao Yuzhou chemical Co., Ltd. (ShanDong, China),Huakang Non-Metallic Minerals Processing Plants (HeBei,China), respectively. Kaol was purchased from Longyan KaolinCo., Ltd. (FuJian, China). In order to analyze the compositionsof aluminosilicate minerals using X-ray fluorescence, the
aluminosilicate minerals were firstly crushed and purified by 4%HCl (wt%) to remove carbonates, and then the purified clayminerals were filtered by passing through a 200-mesh sieve.The composition of the involved aluminosilicate minerals issummarized in Table 1. Co(NO3)2·6H2O and Al(NO3)3·9H2Owere purchased from Shanghai Reagent Factory (Shanghai,China). NaOH, HCl, and anhydrous ethanol were obtained byChina National Medicines Co., Ltd.
Preparation of CoAl2O4/Aluminosilicate
Clay Mineral Hybrid PigmentThe CoAl2O4/aluminosilicate clay mineral hybrid pigments werefabricated according to the similar procedure reported in ourprevious study (Zhang et al., 2017). Co(NO3)2·6H2O (0.01mol),Al(NO3)3·9H2O (0.02mol), and 1.090 g of aluminosilicate claymineral (60 wt% of CoAl2O4) were added into water (50mL)and magnetically stirred at 150 rpm for 1 h. And then thepH value of the reaction system was adjusted to 10 using3M NaOH aqueous solution and stirred for 2 h at roomtemperature. The obtained solid products were collected bycentrifugation, and washed more than five times using waterbefore being dried at 60◦C for 10 h. Finally, it was calcinedat 1,100◦C for 2 h with a rate of 10◦C/min from roomtemperature to 1,100◦C, and the as-prepared hybrid pigmentswere abbreviated to Kaol-HP, Hal-HP, Mt-HP, M47-HP, M70-HP,And-HP, and Dic-HP corresponding to different clay minerals,respectively. As a control, cobalt blue pigments without clayminerals also were fabricated by the same procedures, andthe productions were labeled to CoAl2O4-900, CoAl2O4-1000,CoAl2O4-1100, and CoAl2O4-1200 according to the calciningtemperatures, respectively. In additional, different clay mineralswere also calcined at 1,100◦C and defined as Kaol-1100, Hal-1100, Mt-1100, M47-1100, M70-1100 And-1100, and Dic-1100,respectively.
CharacterizationThe morphology was measured using transmission electronmicroscopy (TEM, JEM-1200EX/S, JEOL). The structure andcomposition was analyzed using Fourier Transform infrared(FTIR, Thermo Nicolet NEXUS TM, Madison, USA). The X’pertPRO diffractometer (λ = 1.54060Å) was used to analysis theXRD patterns of the sample with a scan step size of 0.02◦ persecond. Raman spectra were recorded using the microprobe on a
TABLE 1 | Chemical composition of different clay minerals after acid treatment.
Clay Al2O3 Na2O MgO CaO SiO2 K2O Fe2O3 TiO2
minerals (%) (%) (%) (%) (%) (%) (%) (%)
Hal 29.49 0 0.39 0.08 41.15 0.61 1.71 –
Kaol 54.2 0.014 0.45 0.32 23.5 3.3 0.67 1.36
Mt 22 – – – 64.6 5.24 6.03 1.34
Dic 26.2 – – 0.24 54.1 0.49 0.26 –
And 56.5 – – 0.37 38.7 1.18 1.39 1.38
M47 49.1 – – 0.92 42.8 0.96 2.38 3.07
M70 64.6 – – 0.99 25.5 1.17 2.1 1.02
Frontiers in Chemistry | www.frontiersin.org April 2018 | Volume 6 | Article 125

Zhang et al. CoAl2O4 Hybrid Pigment
LabramHR Evolution Raman spectrometer (Horiba). The Color-Eye automatic differential colorimeter (X-Rite, Ci 7800) was usedto study the color properties of the as-prepared pigments bythe Commission Internationale de l’Eclairage (CIE) 1976 L∗, a∗,b∗ colorimetric method. L∗ is the lightness axis (0 for blackand 100 for white). The parameters of a∗ (negative values forgreen and positive values for red) and b∗ (negative values forblue and positive values for yellow) denote the hue or colordimensions.
RESULTS AND DISCUSSION
Characterization of Kaol-HPFigure S1 (see ESI) gives the CIE parameters of Kaol-HP calcinedat different temperatures. It is observed that the L∗ value ofhybrid pigments firstly increases with the increase of the calciningtemperatures, and then it decreases as the temperature is above1,100◦C. The same change trend is also observed from the valueof b∗ of Kaol-HP, but the color of CoAl2O4 pigments withoutKaol is different compared with that of Kaol-HP prepared underthe same conditions. In order to obtain the blue color, thecalcining temperature for preparation of CoAl2O4 pigmentswithout Kaol must be above 1,200◦C (Figure S2, see ESI), butits color properties (L∗ = 37.41, a∗ = −0.52, b∗ = −41.14) arepoor compared with Kaol-HP prepared at 1,100◦C (L∗ = 48.11,a∗ = 2.64, b∗= −63.75). Thus these two samples are selectedto investigate the effect of introduction of clay minerals on thestructure and properties of pigments. However, the L∗ value ofKaol-HP decreases when the temperature increases to 1,200◦C,which might be due to the crystal phase transition and thecollapse of Kaol structure (Juneja et al., 2010; Yeo, 2011; Zhanget al., 2017).
Figure 1A presents the FTIR spectra of the raw Kaol, Kaolcalcined at 1,100◦C, Kaol-HP, and CoAl2O4 calcined at 1,200◦C.As depicted in the FTIR spectrum of the raw Kaol, the band at3,684 and 3,651 cm−1 are assigned to stretching vibrations ofAl-OH (Saikia and Parthasarathy, 2010). The bands at 3,440 and1,636 cm−1 are assigned to the physisorbed water on the surfaceof Kaol and the bending vibration of H-O-H, respectively. The IRpeaks at 911 cm−1 can be ascribed to the Al-Al-OH vibration ofthe clay sheet, while the bands located at 1,114, 1,096, 1,032, and471 cm−1 are related to Si-O-Si of the clay tetrahedron sheets(Jafari and Hassanzadeh-Tabrizi, 2014). After being calcined at1,100◦C, the typical absorption bands of Kaol at 3,651, 3,684, and911 cm−1 disappear due to the dehydroxylation of Kaol duringcalcination. After incorporating of CoAl2O4 nanoparticles, thecharacteristic absorption bands of CoAl2O4 at 668, 557, and 509cm−1 were clearly observed, which correspond to the stretchingvibration of Al-O of AlO6 and Co-O of CoO4 (Chapskaya et al.,2005), respectively. Furthermore, these characteristic adsorptionbands also can be found in the FTIR spectrum of CoAl2O4
pigments.Figure 1B exhibits the XRD patterns of the raw Kaol, Kaol
calcined at 1,100◦C, Kaol-HP, and CoAl2O4 calcined at 1,200◦C.The raw Kaol presents well-defined reflections at 2θ = 12 and25◦, which are typical characteristic peaks of kaolinite (Pandaet al., 2010; Konduri and Fatehi, 2017). The diffraction peak
of mica is observed at 2θ = 8.9◦ while the ones located at2θ = 18.3 and 20.2◦ are attributed to the diffraction peaks of Hal.It indicates that the raw Kaol is associated with Hal, quartz andmica. When Kaol is calcined at 1,100◦C, the typical diffractionpeaks of Kaol, Hal, and mica disappear, and only the diffractionpeaks of quartz remain. As for Kaol-HP, it is obvious that thetypical diffraction peaks of Kaol vanish accompanied with thepresence of some new diffraction peaks, which are assignedto spinel CoAl2O4. According to JCPD card No. 10-458, thediffraction peaks located at 2θ = 31.1, 36.8, 44.8, 49.0, 55.5, 59.2,65.2◦ correspond to (220), (311), (400), (331), (422), (511), and(440) of CoAl2O4, respectively (Abaide et al., 2015). In order tostudy the effect of calcining temperatures and incorporating ofclay minerals on the sizes of CoAl2O4, the crystallite size is alsocalculated using Sherrer relation according to XRD patterns ofall samples (including hybrid pigments prepared using Kaol atdifferent temperatures, see Figure S3) (Equation 1):
D =0.89× λ
B× cos θ(1)
where D is the crystallite size, λ is the wavelength (Cu Ka), θ isthe diffraction angle of the most intense diffraction peak (Zhanget al., 2018), B is the corrected half-width obtained using a quartzas reference. B= Bm–Bs, where Bm refers to the tested results andBs was got by testing a reference substance. As shown in TableS1, it is clear that the crystallite sizes of CoAl2O4 increases withthe increase of the calcining temperatures either hybrid pigmentsor CoAl2O4 pigments without Kaol. However, the crystallitesizes of the as-prepared hybrid pigments are smaller than thatof CoAl2O4 pigments, suggesting that the introduction of clayminerals obviously prevents from the increase in size and theagglomeration of CoAl2O4 particles during calcining process.
Figure 2a provides the TEM image of Kaol, and it can befound that Kaol is a typical lamellar layered structure with asmooth surface, and some tubular morphology is also observed,which can be attributed to the associated tubular Hal. Thelength of Hal is around 0.2–2.0μm while the external and innerdiameters are about 50–80 and 20–50 nm, respectively. Afterbeing calcined at 1,100◦C (Figure 2b), the lamellar morphologyof Kaol remains while the tubular structure is transformed intorodlike one, which is possible related to the phase transformationof Hal. After introducing of CoAl2O4 nanoparticles, thesurface of lamellar morphology becomes coarse due to theloading of CoAl2O4 nanoparticles. The CoAl2O4 nanoparticleswith a diameter of about 10–20 nm are uniformly anchored onthe surface of lamellar (Figure 2c). Furthermore, the selected areaelectron diffraction pattern of Kaol-HP calcined at 1,100◦C alsoconfirmed the formation of CoAl2O4 nanoparticles (Figure S4,see ESI) (Ouahdi et al., 2005; Mindru et al., 2010). In addition,Figure 2d gives an enlarged electron micrograph of Figure 2c,it provides a well-resolved lattice plane with an interplanarspacing of 0.244 nm, corresponding to [311] plane of the cubicFd3m space group, which is identified on the basis of datafrom the standard CoAl2O4 database JCPD card no. 10-458(Kim et al., 2012). The micrograph displays the coexistenceof amorphous and crystalline phases, and the crystalline phase
Frontiers in Chemistry | www.frontiersin.org April 2018 | Volume 6 | Article 125

Zhang et al. CoAl2O4 Hybrid Pigment
FIGURE 1 | (A) FTIR spectra and (B) XRD patterns of the raw Kaol, Kaol-1100, Kaol-HP, and CoAl2O4-1200, respectively.
FIGURE 2 | TEM images of (a) the raw Kaol, (b) Kaol calcined at 1,100◦C, (c)
Kaol-HP, and (d) the enlarged electron micrograph of Kaol-HP.
might be attributed to the spinel CoAl2O4 while the amorphousone is related to silicate derived from Kaol (Cho and Kakihana,1999).
Figure S5 depicts the EDX spectrum of Kaol-HP, and itcan be found that Kaol-HP is mainly composed of Co, Al, O,and Si elements. Element mapping of Kaol-HP is illustrated inFigure 3, it is clear that Co element is uniformly distributed onthe surface of lamellar, suggesting that the generated CoAl2O4
is well anchored on the surface of substrate. Furthermore, otherelements also present the uniform distribution. By contrast, theedge color of Si element is obscure, which can be attributed to
the fact that the edge thickness of the silicate substrate is thin.However, the value of Co/Al decreases from 0.49 to 0.37 to 0.31with the change of the selected area from boundary to centerof Kaol-HP (Table 2), which indicates the loading content ofCoAl2O4 in the edge reign is higher than the center of the silicatesubstrate. Based on the above analysis, it suggests that Kaol-HPhas been successfully prepared.
Effect of Different Aluminosilicate Clay
Minerals and Coloring MechanismIn our previous study (Zhang et al., 2017), it has been confirmedthat the introduction of clay minerals, especially aluminosilicatemineral of Hal, was in favor of decreasing the formationtemperature of spinel-type CoAl2O4, and enhancing the colorproperties of CoAl2O4 pigment. In order to investigate the effectof the different aluminosilicate minerals on the color propertiesof hybrid pigments, several of representative aluminosilicateminerals were selected to prepare CoAl2O4 hybrid pigmentsincluding Hal, And, Kaol, Mt, Dic, M47, and M70.
The XRD patterns of the different aluminosilicate minerals areprovided in Figure 4. Hal is a 1:1 aluminosilicate mineral with theempirical formula Al2Si2O5(OH)4, the typical diffraction peaksof Hal are observed at 2θ = 12.3, 18.3, 20.2, 24.8◦, and thediffraction peaks of quartz are located at 2θ = 20.8, 26.7, and36.6◦ (Figure 4A) (Philip et al., 2017). Figure 4B gives XRDpattern of Mt, its characteristic diffraction peaks are located at2θ = 5.9, 19.7, and 35.1◦, while the diffraction peaks at 2θ = 12.5and 17.5◦ are attributed to illite (Wang et al., 2016; Liang et al.,2017). Dic is a kind of layered silicate mineral, and pertains to 1:1type of Kaol subgroup. As shown in Figure 4C, the characteristicdiffraction peaks between 34 and 39◦ can be observed, whichare assigned to (200), (131), (006), and (133) of Dic, respectively(Zheng et al., 2011). Figures 4D–F depicted the XRD patternsof M47, M70, and And. Mullite is an artificial material, whichis synthesized using natural raw materials during 1,100–1,600◦C,such as And, kyanite, etc. (Xu et al., 2017; Yuan et al., 2017).
Frontiers in Chemistry | www.frontiersin.org April 2018 | Volume 6 | Article 125

Zhang et al. CoAl2O4 Hybrid Pigment
FIGURE 3 | Element mapping of Kaol-HP.
TABLE 2 | The element content of the different selection areas of Kaol-HP.
Element Atomic (%)
No. 1 No. 2 No. 3
O 67 63.61 51.21
Na 0.95 0.90 0.47
Al 17.01 21.06 31.55
Si 9.49 6.17 1.35
K 0.35 0.22 0
Co 5.18 8.01 15.39
Co/Al 0.31 0.37 0.49
Total 100 100 100
Figure 5 shows the digital photos of the raw aluminosilicateclay minerals, the calcined aluminosilicate clay minerals at1,100◦C and CoAl2O4 hybrid pigments derived from differentaluminosilicate clay minerals, respectively. It is obvious thatdifferent clay minerals present different colors. Dic and Kaol arewhite, Hal and Mt are light brown, while M47, M70, and Andare gray. After being calcined at 1,100◦C (Figure 5b), Kaol andDic are white, Mt is yellowish-brown, Hal was light pink, andthe others (M47, M70, and And) are gray. The digital photosthe as-prepared hybrid pigments are exhibited in Figure 5c, itis found that all hybrid pigments present typical blue, but thereare difference among different hybrid pigments. By contrast,the color of Kaol-HP is optimal, which is also consistentwith their color parameters (Table 3). Kaol-HP exhibits themaximum b∗ and C∗ values, followed by M70-HP, M47-HP, Hal-HP, respectively, while Mt-HP and And-HP indicate the worstlightness (L∗). It suggests that the colors of the hybrid pigmentsmight be related to the types and compositions of aluminosilicateclay minerals.
As shown in Table 1, the main compositions of the involvedaluminosilicate clay minerals are Al2O3 and SiO2. Therefore, therelationship between the content of Al2O3 or SiO2 and the color
parameters of hybrid pigments are investigated, and Figure 6
gives the relationship between the CIE parameters of CoAl2O4
hybrid pigments and the content of Al2O3 and SiO2 of differentaluminosilicate clay minerals, while Table S2 summarizes thecontent of Al2O3 and SiO2 of the clay minerals and the CIE ofhybrid pigments. As a whole, the value of a∗ of hybrid pigmentsincreases with the increase in the content of Al2O3, but the b∗
value becomesmore negative. It indicates the blue color of hybridpigments become deeper with the increase in the Al2O3 content.However, the b∗ value is more positive with the increase in thecontent of SiO2, indicating a poor blue color. Therefore, Al2O3
and SiO2 of aluminosilicate clay minerals plays an importantrole in adjusting the color of CoAl2O4 hybrid pigments, butthe ultimate color properties of hybrid pigments results fromthe synergy of various compositions of aluminosilicate clayminerals, besides their colors. In order to prove above proposal,Al2O3 and SiO2 with different added amounts were employedto fabricate hybrid pigments without clay minerals, respectively.As shown in Figure 7, the b∗ value of hybrid pigments preparedusing Al2O3 gradually decreases with the increase in the addedamounts of Al2O3 (more negative). On the contrary, the b∗
value of hybrid pigments derived from SiO2 increases with theincrease in the amount of SiO2 (more positive), which mightbe attributed to the formation of cobalt silicate (Llusar et al.,2001). This variation trend is also agreement with the results ofFigures 6A,B.
In addition, the pH value of the reaction system is crucial tocobalt-aluminum double hydroxides (Co/Al DH) (Zhang et al.,2017), the excess OH− affects the molar ratio of Co/Al in theultimate CoAl2O4 due to the dissolution loss of Al in alkalinemedium, which directly determinate the color properties ofpigments. In order to prove this effect, HCl was added intothe centrifugate after the co-precipitation reaction, it can clearlyobserve the white precipitate upon the addition of HCl (1.0M),and the precipitate is confirmed to be Al(OH)3 using FTIRtechnique (Figure S6, see ESI) (Kamaraj and Vasudevan, 2016).In addition, the higher the pH values of the reaction, the more
Frontiers in Chemistry | www.frontiersin.org April 2018 | Volume 6 | Article 125
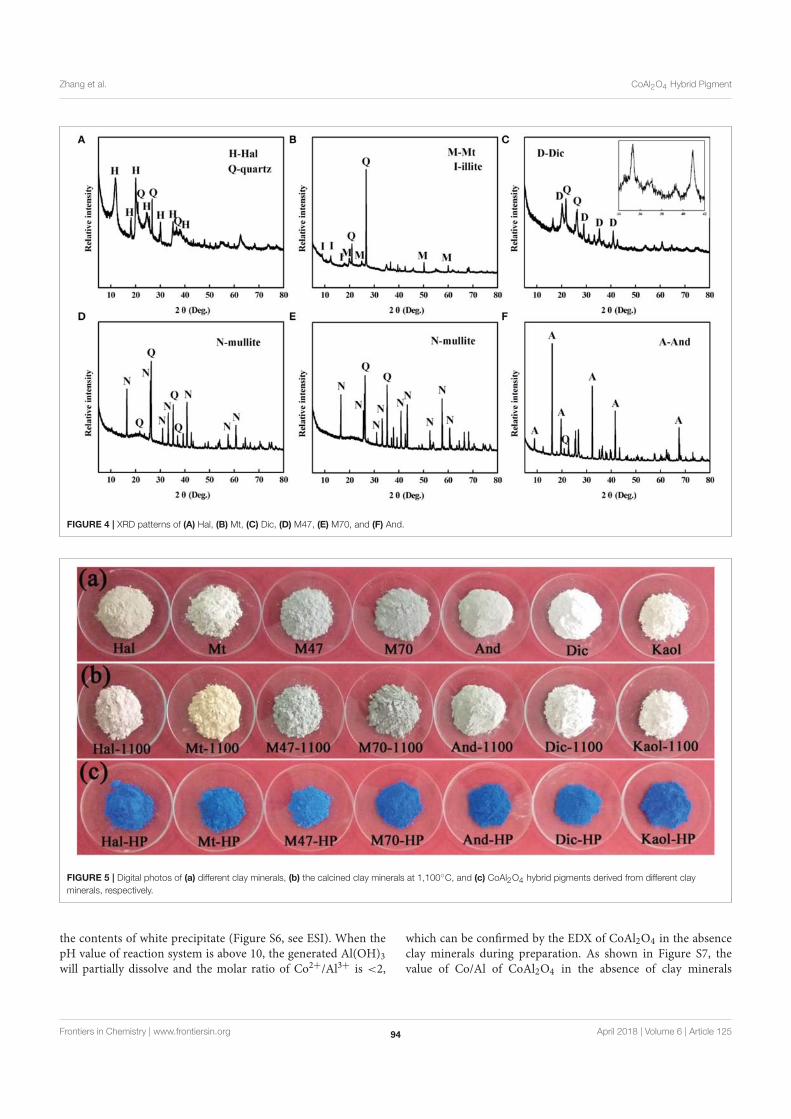
Zhang et al. CoAl2O4 Hybrid Pigment
FIGURE 4 | XRD patterns of (A) Hal, (B) Mt, (C) Dic, (D) M47, (E) M70, and (F) And.
FIGURE 5 | Digital photos of (a) different clay minerals, (b) the calcined clay minerals at 1,100◦C, and (c) CoAl2O4 hybrid pigments derived from different clay
minerals, respectively.
the contents of white precipitate (Figure S6, see ESI). When thepH value of reaction system is above 10, the generated Al(OH)3will partially dissolve and the molar ratio of Co2+/Al3+ is <2,
which can be confirmed by the EDX of CoAl2O4 in the absenceclay minerals during preparation. As shown in Figure S7, thevalue of Co/Al of CoAl2O4 in the absence of clay minerals
Frontiers in Chemistry | www.frontiersin.org April 2018 | Volume 6 | Article 125

Zhang et al. CoAl2O4 Hybrid Pigment
is about 0.62, and thus the Al loss is about 20% due to thedissolution of Al(OH)3 at alkaline medium during preparationof precursor. Therefore, the incorporation of aluminosilicate clay
TABLE 3 | CIE parameters of the different CoAl2O4 hybrid pigment.
Hybrid pigments L* a* b* C*
Hal-HP 54.60 −4.30 −50.10 50.28
Kaol-HP 48.11 2.64 −63.75 63.80
Mt-HP 29.66 −13.97 −43.33 45.53
Dic-HP 49.14 −8.27 −47.63 48.34
And-HP 30.26 −10.41 −54.69 55.67
M47-HP 40.69 −14.65 −52.43 54.44
M70-HP 33.53 −1.63 −58.45 58.47
mineral may be an ideal natural aluminum sources to compensatethe aluminum loss due to the dissolution of Al(OH)3 at alkalinemedium during preparation of precursor, keeping an optimummolar ratio of Co2+/Al3+ for formation of spinel CoAl2O4
pigment. It can be inferred that the Al originated from clayminerals about 20% might be participated in reaction and enterinto the octahedral positions of CoAl2O4 spinel structure to formCoAl2O4-silicate solid solution (Tang et al., 2018). This is alsocan be confirmed by the production derived from Co2+ saltand Kaol in the absence of Al3+ salt, which is prepared usingthe same procedure with Kaol-HP. As shown in Figure S8, theXRD pattern of the product presents the characteristic diffractionpeaks of CoAl2O4 suggesting that Kaol can be served as analuminum source to form CoAl2O4. The evolution process mightbe depicted by the following process (Figure 8) (Zhong et al.,1999; Cava et al., 2006).
FIGURE 6 | The relationship between the CIE parameters of CoAl2O4 hybrid pigments and the content of Al2O3 (A) and SiO2 (B) of different clay minerals,
respectively.
FIGURE 7 | The relationship between the CIE parameters of CoAl2O4 hybrid pigments prepared after incorporating of different added amounts of (A) Al2O3 and
(B) SiO2 without clay minerals, respectively.
Frontiers in Chemistry | www.frontiersin.org April 2018 | Volume 6 | Article 125

Zhang et al. CoAl2O4 Hybrid Pigment
Formation Mechanism of CoAl2O4 Hybrid
PigmentsBased on the above results, the possible formation mechanismof CoAl2O4 hybrid pigments was proposed (Scheme 1). Duringthe co-precipitation reaction, the Co2+ and Al3+ were firstlyadsorbed on the surface of clay minerals due to the electrostaticinteraction and ion exchange between metal ions and clayminerals, and then Co2+ and Al3+ were transformed into thehydroxides and deposited on the surface of clay mineral after
FIGURE 8 | Possible formation process of CoAl2O4 hybrid pigment prepared
using Kaol and Co2+ without Al3+.
introducing of OH−. Due to the difference in the solubilityconstant of Al(OH)3 and Co(OH)2, Al3+ was firstly beganto precipitate at lower pH, and then Co2+ was transformedinto Co(OH)2 at higher pH (Loganathan et al., 1977; Heand Becker, 1997; Matjie et al., 2003; Akdemir et al., 2011).When the pH of reaction system was above 10, Co2+ almostprecipitated completely, but Al(OH)3 partially dissolved toform AlO−
2 . As a result, the molar ratio of Co2+/Al3+ is <2.(Lavrencic Štangar et al., 2003; Carta et al., 2005; Xu et al.,2008; Tielens et al., 2009; Kurajica et al., 2012). Therefore,CoAl DH was decomposed to form amorphous Co3O4 phaseat around 400–500◦C accompanied with the presence of highlyamorphous Al2O3 once heating. With the increase in thecalcining temperature (500–700◦C), the amorphous Co3O4 wastransformed into the spinel-type Co3O4 while Kaol was turnedinto metakaolinite (2SiO2·Al2O3) (Yu et al., 2009; Duan et al.,2011), and Co3O4 was then progressively transformed intoCoAl2O4 phase above 900
◦C, thus the content of spinel CoAl2O4
phase gradually increased with the vanishing of Co3O4 phase asthe calcining temperature was above 1,000◦C (Zayat and Levy,2000; Duan et al., 2011; Álvarez-Docio et al., 2017; Zhang et al.,2018). In addition, metakaolinite was firstly transformed intospinel SiAl2O5 and amorphous SiO2, and then the spinel SiAl2O5
changed into amorphous SiO2 and low-order crystalline α-Al2O3
above 1,000◦C (Chen et al., 2000; Ribeiro et al., 2005; Veselý et al.,2010; Wu et al., 2017). In fact, the thermal reduction of Co3+ to
SCHEME 1 | Schematic for Kaol-HP formation process and the relevant phase transformation process during calcining.
Frontiers in Chemistry | www.frontiersin.org April 2018 | Volume 6 | Article 125

Zhang et al. CoAl2O4 Hybrid Pigment
Co2+ was simultaneous with the diffusion and reorganization ofCo2+ and Al3+ ions derived from the precursor and claymineralsduring this process.
It is well-known that the mass transfer process was thecontrolling rate step during CoAl2O4 preparation (Gabrovskaet al., 2014). Therefore, the aluminosilicate clay minerals inducedthe anchoring of CoAl DH on their surface preventing fromthe free aggregations of CoAl DH, which could effectivelydecrease mass transfer resistance to reduce the time and calciningtemperature for formation of spinel CoAl2O4. In addition, itwas in favor of controlling the size and particle size distributionof CoAl2O4 nanoparticles during calcinaion process. What’smore, Al3+ derived from aluminosilicate clay mineral alsoparticipated in the CoAl2O4 crystallization by the diffusionfrom substrate to compensate the aluminum loss during the co-precipitation reaction (Wang et al., 2006; Álvarez-Docio et al.,2017). Therefore, it may explain why the bright blue CoAl2O4
hybrid pigments could be obtained at 1,100◦C for 2 h, but thetraditional solid phase method for preparation of CoAl2O4 mustbe conducted at high temperature (>1,200◦C) for a long time (Jiet al., 2000; Lorite et al., 2012). Especially, the hybrid pigmentsderived from the 1:1 style aluminosilicate clay minerals presentedhigh CIE parameters. Due to the higher affinity of CoO to Al2O3
than SiO2, and the CoO was easily arrived to the interphase of α-Al2O3 originating from aluminosilicate clay mineral to generateCoAl2O4 (Ahmed et al., 2012). For 2:1 style aluminosilicateclay minerals, the aluminosilicate clay minerals transformed intoamorphous SiO2 and α-Al2O3 at high temperature, and thecontent of SiO2 is much higher than that of α-Al2O3. CoOmight react with partially SiO2 to form the CoSiO3, whichled to poor color properties of hybrid pigment. In order toprove above proposal, XRD patterns of Kaol-HP and Mt-HP arecompared (Figure S9), it is clear that the CoSiO3 (JCPD cardno. 72-1508) occurs in Mt-HP accompanied with SiO2 (JCPDcard no. 86-0680), but they cannot be found in XRD pattern ofKaol-HP.
CONCLUSIONS
In summary, different aluminosilicate clay minerals wereemployed to prepare the CoAl2O4 hybrid pigment with different
color properties. It was found that the more content of Al2O3,the better color properties of hybrid pigment (higher lightnessand blue), suggesting that the rich-aluminum silicate mineralwas appropriate for preparation of bright blue cobalt bluepigment. The aluminosilicate clay mineral was served as acarrier to load CoAl2O4 nanoparticles, preventing from theaggregation and controlling the size of CoAl2O4 nanoparticlesduring calcining process. What’s more, it was an ideal naturalaluminum sources to compensate the aluminum loss due to thedissolution of Al(OH)3 at alkaline medium during preparationof precursor, keeping an optimum molar ratio of Co2+/Al3+ forformation of spinel CoAl2O4 pigments during high-temperaturecrystallization. Therefore, this study may provide a feasiblestrategy not only to develop low-cost and bright blue cobalt bluepigments, but also to control the color properties of cobalt blueby adjusting the types of clay minerals to meet the personalizeddemand in the practice application.
AUTHOR CONTRIBUTIONS
AZ and XW contribute to the experiment process, data analysis,and paper preparation. BM and AW are mainly responsible forthe design of experiment, data analysis and paper revision. LWcontributes to the samples characterization.
ACKNOWLEDGMENTS
The authors are grateful for financial support of RegionalKey Project of the Science and Technology Service (STS) ofthe Chinese Academy of Sciences [(2016) No. 70], the YouthInnovation Promotion Association of CAS (2017458), MajorScience and Technology Projects of Lanzhou (2017-2-3), theFunds for Creative Research Groups of Gansu, China (No.17JR5RA306) and the fifth 333 project of Jiangsu Province ofChina (No. BRA2017259 and BRA2016244).
SUPPLEMENTARY MATERIAL
The Supplementary Material for this article can be foundonline at: https://www.frontiersin.org/articles/10.3389/fchem.2018.00125/full#supplementary-material
REFERENCES
Abaide, E. R., Anchieta, C. G., Foletto, V. S., Reinehr, B., Nunes, L. F., Kuhn, R.
C., et al. (2015). Production of copper and cobalt aluminate spinels and their
application as supports for inulinase immobilization. Mat. Res. 18, 1062–1069.
doi: 10.1590/1516-1439.031415
Ahmed, N. A., Abdel-Fatah, H. T. M., and Youssef, E. A. (2012). Corrosion studies
on tailored Zn·Co aluminate/kaolin core-shell pigments in alkyd based paints.
Prog. Org. Coat. 73, 76–87. doi: 10.1016/j.porgcoat.2011.09.003
Akdemir, S., Ozel, E., and Suvaci, E. (2011). Solubility of blue CoAl2O4 ceramic
pigments in water and diethylene glycol media. Ceram. Int. 37, 863–870.
doi: 10.1016/j.ceramint.2010.10.031
Álvarez-Docio, C. M., Reinosa, J. J., Del Campo, A., and Fernández, J. F. (2017). 2D
particles forming a nanostructured shell: a step forward cool NIR reflectivity for
CoAl2O4 pigments.Dyes Pigments 137, 1–11. doi: 10.1016/j.dyepig.2016.09.061
Armijo, J. S. (1969). The kinetics and mechanism of solid-state spinel
formation-review and critique. Oxid. Met. 1, 171–198. doi: 10.1007/BF006
03514
Carta, G., Casarin, M., Habra, N., and Zanella, P. (2005). MOCVD
deposition of CoAl2O4 films. Electrochim. Acta 50, 4592–4599.
doi: 10.1016/j.electacta.2004.10.094
Cava, S., Tebcherani, S. M., Pianaro, S. A., Paskocimas, C. A., Longo, E.,
and Varela, J. A. (2006). Structural and spectroscopic analysis of γ-Al2O3
to α-Al2O3-CoAl2O4 phase transition. Mater. chem. phys. 97, 102–108.
doi: 10.1016/j.matchemphys.2005.07.057
Chafi, M. S., Ghasemi, B., and Arabi, A. M. (2017). Solution combustion synthesis
(SCS) of chrome alumina as a high temperature pink pigment. Int. J. Appl.
Ceram. Tec. 15, 203–209. doi: 10.1111/ijac.12770.
Chapskaya, A. Y., Radishevskaya, N. I., Kasatskii, N. G., Lepakova, O. K.,
Naiborodenko, Y. S., and Vereshchagin, V. V. (2005). The effect of composition
Frontiers in Chemistry | www.frontiersin.org April 2018 | Volume 6 | Article 125

Zhang et al. CoAl2O4 Hybrid Pigment
and synthesis conditions on the structure of cobalt-bearing pigments of the
spinel type. Glass Ceram. 62, 388–390. doi: 10.1007/s10717-006-0016-x
Chen, C. Y., Lan, C. S., and Tuan, W. H. (2000). Microstructural evolution
of mullite during the sintering of kaolin powder compacts. Ceram. Int. 26,
715–720. doi: 10.1016/S0272-8842(00)00009-2
Cho, W. S., and Kakihana, M. (1999). Crystallization of ceramic pigment CoAl2O4
nanocrystals from Co-Al metal organic precursor. J. Alloys Compd. 287, 87–90.
doi: 10.1016/S0925-8388(99)00059-6
De Souza, L. K. C., Zamian, J. R., Da Rocha Filho, G. N., Soledadeb, L. E. B.,
Dos Santos, I. M. G., Souza, A. G., et al. (2009). Blue pigments based on
CoxZn1−xAl2O4 spinels synthesized by the polymeric precursor method. Dyes
Pigments 81, 187–192. doi: 10.1016/j.dyepig.2008.09.017
Duan, X., Pan, M., Yu, F., and Yuan, D. R. (2011). Synthesis, structure and optical
properties of CoAl2O4 spinel nanocrystals. J. Alloy. Compd. 509, 1079–1083.
doi: 10.1016/j.jallcom.2010.09.199
Ezzatahmadi, N., Ayoko, G. A., Millar, G. J., Speight, R., Yan, C., Li, J. H., et al.
(2017). Clay-supported nanoscale zero-valent iron composite materials for the
remediation of contaminated aqueous solutions: a review. Chem. Eng. J. 312,
336–350. doi: 10.1016/j.cej.2016.11.154
Gabrovska, M. V., Crisan, D., Stanica, N., and Kardjieva, R. (2014). Co-Al layerea
double hydroxides as precursors of ceramic pigment CoAl2O4. Part I: phase
composition. Rev. Roum. Chim. 59, 445–450.
Gholizadeh, A., and Malekzadeh, A. (2017). Structural and redox features
of La0.7Bi0.3Mn1−xCoxO3 nanoperovskites for ethane combustion and
CO oxidation. Int. J. Appl. Ceram. Tec. 14, 404–412. doi: 10.1111/ijac.
12650
He, T., and Becker, K. D. (1997). An optical in-situ study of a reacting spinel crystal.
Solid State Ionics 101, 337–342. doi: 10.1016/S0167-2738(97)84050-7
He, Y., Cao, Y., Liao, H. L., and Wang, J. A. (2017). Preparation of porous cobalt
aluminate and its chromogenic mechanism. Powder Technol. 324, 95–101.
doi: 10.1016/j.powtec.2017.08.056
Intachai, S., Suppaso, C., Klinsrisuk, S., Khaorapapong, N., and Ogawa, M.
(2017). The possible doping of Al3+ and F− modification onto CdS in
montmorillonite. Colloid Surf. A Physicochem. Eng. Asp. 522, 133–139.
doi: 10.1016/j.colsurfa.2017.02.044
Jafari, M., and Hassanzadeh-Tabrizi, S. A. (2014). Preparation of CoAl2O4
nanoblue pigment via polyacrylamide gel method. Powder Technol. 266,
236–239. doi: 10.1016/j.powtec.2014.06.018
Ji, L., Lin, J., and Zeng, H. C. (2000). Metal-support interactions in Co/Al2O3
catalysts: a comparative study on reactivity of support. J. Phys. Chem. B 104,
1783–1790. doi: 10.1021/jp993400l
Juneja, A., Hegde, A., Lee, F. H., and Yeo, C. H. (2010). Centrifuge modelling
of tunnel face reinforcement using forepoling. Tunn. Undergr. Space Tech. 25,
377–381. doi: 10.1016/j.tust.2010.01.013
Kamaraj, A., and Vasudevan, S. (2016). Facile one-pot electrosynthesis of
Al(OH)3-kinetics and equilibrium modeling for adsorption of 2,4,5-
trichlorophenoxyacetic acid from aqueous solution. New J. Chem. 40,
2249–2258. doi: 10.1039/C5NJ02407B
Khattab, R. M., Sadek, H. E. H., and Gaber, A. A. (2017). Synthesis of
CoxMg1−xAl2O4 nanospinel pigments by microwave combustion method.
Ceram. Int. 43, 234–243. doi: 10.1016/j.ceramint.2016.09.144
Kim, J. H., Son, B. R., Yoon, D. H., Hwang, K. T., Noh, H. G., Cho,
W. S., et al. (2012). Characterization of blue CoAl2O4 nano-pigment
synthesized by ultrasonic hydrothermal method. Ceram. Int. 38, 5707–5712.
doi: 10.1016/j.ceramint.2012.04.015
Konduri, M. K. R., and Fatehi, P. (2017). Dispersion of kaolin
particles with carboxymethylated xylan. Appl. Clay Sci. 137, 183–191.
doi: 10.1016/j.clay.2016.12.027
Kurajica, S., Popovic, J., Tkalcec, E., GrŽeta, B., and Mandic, V. (2012). The
effect of annealing temperature on the structure and optical properties of sol–
gel derived nanocrystalline cobalt aluminate spinel. Mater. Chem. Phys. 135,
587–593. doi: 10.1016/j.matchemphys.2012.05.030
Lavrencic Štangar, U., Orel, B., and Krajnc, M. (2003). Preparation and
spectroscopic characterization of blue CoAl2O4 coatings. J. Sol Gel sci. Technol.
26, 771–775. doi: 10.1023/A:1020770810027
Liang, H., Wang, Z. Q., Liao, L. M., Chen, L., Li, Z., and Feng, J. (2017).
High performance photocatalysts: montmorillonite supported-nano TiO2
composites. Optik 136, 44–51. doi: 10.1016/j.ijleo.2017.02.018
Llusar, M., Forés, A., Badenes, J. A., Calbo, J., Tena, M. A., and Monrós, G. (2001).
Colour analysis of some cobalt-based blue pigments. J. Eur. Ceram. Soc. 21,
1121–1130. doi: 10.1016/S0955-2219(00)00295-8
Loganathan, P., Burau, R. G., and Fuerstenau, D. W. (1977). Influence of pH on
the sorption of Co2+, Zn2+ and Ca2+ by a hydrous manganese oxide. Soil Sci.
Soc. Am. J. 41, 57–62. doi: 10.2136/sssaj1977.03615995004100010020x
Lorite, I., Campo, A., Romero, J. J., and Fernández, J. F. (2012). Isolated
nanoparticle Raman spectroscopy. J. Raman Spectrosc. 43, 889–894.
doi: 10.1002/jrs.3112
Mahé, M., Heintz, J., RÖdel, J., and Reynders, P. (2008). Cracking of
titania nanocrystalline coatings. J. Eur. Ceram. Soc. 28, 2003–2010.
doi: 10.1016/j.jeurceramsoc.2008.02.002
Matjie, R. H., Mdleleni, M. M., and Scurrell, M. S. (2003). Extraction of cobalt
(II) from an ammonium nitrate-containing leach liquor by an ammonium
salt of di (2-ethylhexyl) phosphoric acid. Miner. Eng. 16, 1013–1017.
doi: 10.1016/S0892-6875(03)00265-6
Meng, K., Gao, S., Wu, L., Wang, G., Liu, X., Chen, G., et al. (2016). Two-
dimensional organic-inorganic hybrid perovskite photonic films.Nano Lett. 16,
4166–4173. doi: 10.1021/acs.nanolett.6b01046
Merino, M. C. G., Estrella, A. L., Rodriguez, M. E., and Vázquez, P. (2015).
Combustion syntheses of CoAl2O4 powders using different fuels. Prog. Mater.
Sci. 8, 519–525. doi: 10.1016/j.mspro.2015.04.104
Mindru, I., Marinescu, G., Gingasu, D., Patron, L., Ghica, C., and Giurginca, M.
(2010). Blue CoAl2O4 spinel via complexationmethod.Mater. Chem. Phys. 122,
491–497. doi: 10.1016/j.matchemphys.2010.03.032
Mishra, A., Mehta, A., Sharma, M., and Basu, S. (2017). Enhanced heterogeneous
photodegradation of VOC and dye using microwave synthesized TiO2/Clay
nanocomposites: a comparison study of different type of clays. J. Alloy. Compd.
694, 574–580. doi: 10.1016/j.jallcom.2016.10.036
Mousavand, T., Takami, S., Umetsu, M., Ohara, S., and Adschiri, T.
(2006). Supercritical hydrothermal synthesis of organic-inorganic hybrid
nanoparticles. J. Mater. Sci. 41, 1445–1448. doi: 10.1007/s10853-006-7458-y
Mu, B., and Wang, A. Q. (2015). One-pot fabrication of multifunctional
superparamagnetic attapulgite/Fe3O4/polyaniline nanocomposites served
as adsorbent and catalyst support. J. Mater. Chem. A 3, 281–289.
doi: 10.1039/C4TA05367B
Mu, B., Wang, Q., and Wang, A. Q. (2015). Effect of different clay minerals and
calcination temperature on the morphology and color of clay/CoAl2O4 hybrid
pigments. RSC Adv. 5, 102674–102681. doi: 10.1039/C5RA19955G
Ouahdi, N., Guillemet, S., Demai, J. J., Durand, B., Er Rakho, L., Moussa, R.,
et al. (2005). Investigation of the reactivity of AlCl3 and CoCl2 toward molten
alkali-metal nitrates in order to synthesize CoAl2O4. Mater. Lett. 59, 334–340.
doi: 10.1016/j.matlet.2004.10.013
Panda, A. K., Mishra, B. G., Mishra, D. K., and Singha, R. K. (2010).
Effect of sulphuric acid treatment on the physico-chemical characteristics
of kaolin clay. Colloid Surf. A Physicochem. Eng. Asp. 363, 98–104.
doi: 10.1016/j.colsurfa.2010.04.022
Philip, A., Lihavainen, J., Keinänen, M., and Pakkanen, T. T. (2017). Gold
nanoparticle decorated halloysite nanotubes-selective catalysts for benzyl
alcohol oxidation. Appl. Clay Sci. 143, 80–88. doi: 10.1016/j.clay.2017.03.015
Rani, G. (2017). Annealing effect on the structural, optical and
thermoluminescent properties of ZnAl2O4:Cr3+. Powder Technol. 312,
354–359. doi: 10.1016/j.powtec.2017.02.040
Ren, Z., Botu, V., Wang, S., Meng, Y., Song, W., Guo, Y., et al. (2014).
Monolithically integrated spinel MxCo3−xO4 (M=Co, Ni, Zn) nanoarray
catalysts: scalable synthesis and cation manipulation for tunable low-
temperature CH4 and CO oxidation. Angew. Chem. Int. Edit. 53, 7223–7227.
doi: 10.1002/anie.201403461
Ribeiro, M. J., Tulyagavov, D. U., Ferreira, J. M., and Labrincha, J. A. (2005).
High temperature mullite dissolution in ceramic bodies derived from Al-
rich sludge. J. Eur. Ceram. Soc. 25, 703–710. doi: 10.1016/j.jeurceramsoc.2004.
03.028
Ryu, Y. C., Kim, T. G., Seo, G., Park, J. H., Suh, C. S., Park, S., et al. (2008). Effect
of substrate on the phase transformation of TiO2 in pearlescent pigment. J. Ind.
Eng. Chem. 14, 213–218. doi: 10.1016/j.jiec.2007.11.004
Saikia, B. J., and Parthasarathy, G. (2010). Fourier transform infrared spectroscopic
characterization of kaolinite from Assam and Meghalaya, Northeastern India.
J. Mod. Phys. 1, 206–210. doi: 10.4236/jmp.2010.14031
Frontiers in Chemistry | www.frontiersin.org April 2018 | Volume 6 | Article 125

Zhang et al. CoAl2O4 Hybrid Pigment
Salavati-Niasari, M., Khansari, A., and Davar, F. (2009). Synthesis and
characterization of Co3O4 nanoparticles by thermal treatment process. J. Clust.
Sci. 362, 4937–4942. doi: 10.1016/j.ica.2009.07.023
Sale, S. (2015). Relationship between gel rheology and specific surface area of nano-
sized CoAl2O4 powder manufactured by autoignition technique. Mater. Lett.
139, 498–500. doi: 10.1016/j.matlet.2014.10.118
Sedghi, A., Alimohammadi, M., and Zadeh, M. C. (2014). Structure and properties
of CoxZn1−xAl2O4 nano-pigments fabricated by gel combustion method.
Ceram. Silikáty 58, 145−150.
Soleimani-Gorgania, A., Ghaharib, M., and Peymannia, M. (2015). In-situ
production of nano-CoAl2O4 on a ceramic surface by ink-jet printing. J. Eur.
Ceram. Soc. 35, 779–786. doi: 10.1016/j.jeurceramsoc.2014.08.047
Tang, W. X., Ren, Z., Lu, X. X., Wang, S. B., Guo, Y. B., Hoang, S., et al.
(2017). Scalable integration of highly uniform MnxCo3−xO4 nano-sheet array
onto ceramic monolithic substrates for low temperature propane oxidation.
ChemCatChem 9, 4112–4119. doi: 10.1002/cctc.201700795
Tang, Y., Wu, C., Song, Y., Zheng, Y., and Zhao, K. (2018). Effects of colouration
mechanism and stability of CoAl2O4 ceramic pigments sintered on substrates.
Ceram. Int. 44, 1019–1025. doi: 10.1016/j.ceramint.2017.10.038
Tian, G. Y., Wang, W. B., Wang, D. D., Wang, Q., and Wang, A. Q. (2017). Novel
environment friendly inorganic red pigments based on attapulgite. Powder
Technol. 315, 60–67. doi: 10.1016/j.powtec.2017.03.044
Tielens, F., Calatayud, M., Franco, R., Recio, J. M., Pérez-Ramírez, J., and
Minot, C. (2009). Theoretical investigation of the inversion parameter in
Co3−sAlsO4 (s = 0-3) spinel structures. Solid State Ionics 180, 1011–1016.
doi: 10.1016/j.ssi.2009.03.023
Tirsoaga, A., Visinescu, D., Jurca, B., Ianculescu, A., and Carp, O. (2011). Eco-
friendly combustion-based synthesis of metal aluminates MAl2O4 (M = Ni,
Co). J. Nanopart. Res. 13, 6397–6408. doi: 10.1007/s11051-011-0392-1
Todorova, N., Giannakopoulou, T., Karapati, S., Petridis, D., Vaimakis, T., and
Trapalis, C. (2014). Composite TiO2/clays materials for photocatalytic NOx
oxidation. Appl. Surf. Sci. 319, 113–120. doi: 10.1016/j.apsusc.2014.07.020
Torkian, L., Daghighi, M., and Boorboor, Z. (2013). Simple and efficient rout for
synthesis of spinel nanopigments. J. Chem. 2013, 1–6. doi: 10.1155/2013/694531
Veselý, D., Kalendova, A., and Kalenda, P. A. (2010). Study of diatomite and
calcined kaoline properties in anticorrosion protective coatings. Prog. Org.
Coat. 68, 173–179. doi: 10.1016/j.porgcoat.2010.02.007
Wang, C., Liu, S. M., Liu, L. H., and Bai, X. (2006). Synthesis of cobalt-aluminate
spinels via glycine chelated precursors. Mater. Chem. Phys. 96, 361–370.
doi: 10.1016/j.matchemphys.2005.07.066
Wang, G. F., Wang, S., Sun, W., Sun, Z. M., and Zheng, S. L. (2016). Synthesis of
a novel illite@carbon nanocomposite adsorbent for removal of Cr (VI) from
wastewater. J. Environ. Sci. 57, 62−71. doi: 10.1016/j.jes.2016.10.017
Wang, R. J., Jiang, G. H., Ding, Y. W., Wang, Y., Sun, X. K., Wang, X. H., et al.
(2011). Photocatalytic activity of heterostructures based on TiO2 and halloysite
nanotubes. Appl. Mater. Inter. 3, 4154–4158. doi: 10.1021/am201020q
Wu, J. F., Hu, C., Xu, X. H., and Zhang, Y. F. (2017). Preparation and
performance study of Mullite/Al2O3 composite ceramics for solar thermal
transmission pipeline. Int. J. Appl. Ceram. Tec. 13, 1017–1023. doi: 10.1111/ijac.
12584
Xu, X. H., Li, J. W., Wu, J. F., Tang, Z. H., Chen, L. L., Li, Y.,
et al. (2017). Preparation and thermal shock resistance of corundum-
mullite composite ceramics from andalusite. Ceram. Int. 43, 1762–1767.
doi: 10.1016/j.ceramint.2016.10.116
Xu, X. H., Qin, X. F., Jiang, F. X., Li, X. L., Chen, Y., and Gehring, G. A.
(2008). The dopant concentration and annealing temperature dependence of
ferromagnetism in Co-doped ZnO thin films. Appl. Surf. Sci. 254, 4956–4960.
doi: 10.1016/j.apsusc.2008.01.164
Yeo, C. H. (2011). Stability and Collapse Mechanisms of Unreinforced and Forepole-
Reinforced Tunnel Headings. Ph.D. thesis, National University of Singapore,
Singapore.
Yoneda, M., Gotoh, K., Nakanishi, M., Fujii, T., and Nomura, T. (2016). Influence
of aluminum source on the color tone of cobalt blue pigment. Powder Technol.
323, 574–580. doi: 10.1016/j.powtec 2016. 06. 021
Yu, F., Yang, J., Ma, J., Du, J., and Zhou, Y. Q. (2009). Preparation of nanosized
CoAl2O4 powders by sol-gel and sol-gel-hydrothermal methods. J. Alloy.
Compd. 468, 443–446. doi: 10.1016/j.jallcom.2008.01.018
Yuan, L., Ma, B. Y., Zhu, Q., Zhang, X. D., Zhang, H., and Yu, J. K.
(2017). Preparation and properties of mullite-bonded porous fibrous mullite
ceramics by an epoxy resin gel-casting process. Ceram. Int. 43, 5478–5483.
doi: 10.1016/j.ceramint.2017.01.062
Zayat, M., and Levy, D., (2000). Blue CoAl2O4 particles prepared by the sol-gel and
citrate-gel methods. Chem. Mater. 12, 2763–2769. doi: 10.1021/cm001061z
Zhang, A. J., Mu, B., Li, H. M., An, X. C., and Wang, A. Q. (2018). Cobalt blue
hybrid pigment doped with magnesium derived from sepiolite. Appl. Clay Sci.
157, 111–120. doi: 10.1016/j.clay.2018.02.032
Zhang, A. J., Mu, B., and Wang, A. Q. (2017). Bright blue halloysite/CoAl2O4
hybrid pigments: preparation, characterization and application in water-based
painting. Dyes Pigments 139, 473–481. doi: 10.1016/j.dyepig.2016.12.055
Zhang, Y., Wang, W. B., Mu, B., Wang, Q., and Wang, A. Q.
(2015). Effect of grinding time on fabricating a stable methylene
blue/palygorskite hybrid nanocomposite. Powder Technol. 280, 173–179.
doi: 10.1016/j.powtec.2015.04.046
Zheng, Q. M., Liu, Q. F., Shen, Q., Wu, Z. G., and Zhang, Y. M.
(2011). The mineralogical characteristics and genesis of the dickite
in Taiyuan formation in Southeastern Shanxi. Proc. Eng. 26, 898–901.
doi: 10.1016/j.proeng.2011.11.2253
Zhong, Z. Y., Mastai, Y., Koltypin, Y., Zhao, Y. M., and Gedanken, A. (1999).
Sonochemical coating of nanosized nickel on alumina submicrospheres and
the interaction between the nickel and nickel oxide with the substrate. Chem.
Mater. 11, 2350–2359. doi: 10.1021/cm981005m
Zou, J., and Zheng, W. (2016). TiO2@CoTiO3 complex green pigments with
low cobalt content and tunable color properties. Ceram. Int. 42, 8198–8205.
doi: 10.1016/j.ceramint.2016.02.029
Conflict of Interest Statement: The authors declare that the research was
conducted in the absence of any commercial or financial relationships that could
be construed as a potential conflict of interest.
The reviewer SW and handling Editor declared their shared affiliation.
Copyright © 2018 Zhang, Mu, Wang, Wen and Wang. This is an open-access
article distributed under the terms of the Creative Commons Attribution License (CC
BY). The use, distribution or reproduction in other forums is permitted, provided
the original author(s) and the copyright owner are credited and that the original
publication in this journal is cited, in accordance with accepted academic practice.
No use, distribution or reproduction is permitted which does not comply with these
terms.
Frontiers in Chemistry | www.frontiersin.org April 2018 | Volume 6 | Article 125

ORIGINAL RESEARCH
published: 21 August 2018
doi: 10.3389/fchem.2018.00367
Frontiers in Chemistry | www.frontiersin.org August 2018 | Volume 6 | Article 367
Edited by:
Wenbo Wang,
Lanzhou Institute of Chemical Physics
(CAS), China
Reviewed by:
Liang Bian,
Southwest University of Science and
Technology, China
Runliang Zhu,
Guangzhou Institute of Geochemistry
(CAS), China
*Correspondence:
Lefu Mei
Guocheng Lv
Libing Liao
Specialty section:
This article was submitted to
Green and Sustainable Chemistry,
a section of the journal
Frontiers in Chemistry
Received: 07 June 2018
Accepted: 30 July 2018
Published: 21 August 2018
Citation:
Wei Y, Mei L, Li R, Liu M, Lv G,
Weng J, Liao L, Li Z and Lu L (2018)
Fabrication of an AMC/MMT
Fluorescence Composite for its
Detection of Cr(VI) in Water.
Front. Chem. 6:367.
doi: 10.3389/fchem.2018.00367
Fabrication of an AMC/MMTFluorescence Composite for itsDetection of Cr(VI) in Water
Yanke Wei 1, Lefu Mei 1*, Rui Li 2, Meng Liu 1, Guocheng Lv 1*, Jianle Weng1, Libing Liao 1*,
Zhaohui Li 1,3 and Lin Lu2
1 Beijing Key Laboratory of Materials Utilization of Nonmetallic Minerals and Solid Wastes, National Laboratory of Mineral
Materials, School of Materials Science and Technology, China University of Geosciences, Beijing, China, 2 State Grid
Corporation of China, Beijing, China, 3 Geosciences Department, University of Wisconsin—Parkside, Kenosha, WI,
United States
Hexavalent chromium species, Cr(VI), which can activate teratogenic processes,
disturb DNA synthesis and induce mutagenic changes resulting in malignant tumors.
The detection and quantification of Cr(VI) is very necessary. One of the rapid and
simple methods for contaminant analysis is fluorescence detection using organic
dye molecules. Its application is limited owing to concentration quenching due to
aggregation of fluorescent molecules. In this study, we successfully intercalated
7-amino-4-methylcoumarin (AMC) into the interlayer space of montmorillonite (MMT),
significantly inhibited fluorescence quenching. Due to enhanced fluorescence property,
the composite was fabricated into a film with chitosan to detect Cr(VI) in water. Cr(VI) can
be detected in aqueous solution by instruments excellent, ranging from 0.005 to 100mM
with a detection limit of 5μM.
Keywords: AMC/MMT composite, fluorescence, quenching, detection, hexavalent chromium
INTRODUCTION
Due to the high toxicity of heavy metals and bioaccumulation in human body through the foodchain, will bring human health and environmental great issue. Cr is one of the most seriouscontaminants among various heavy metals (Soewu et al., 2014; Wu et al., 2015a; Širic et al.,2017). While Cr(III) is an essential micronutrient, Cr(VI) is toxic (Weibel et al., 2016). Cr(VI)is mainly produced by electroplating, leather tanning, and textile dyeing (Dehghani et al., 2016;Omorogie et al., 2016). Cr(VI) is the most virulent form (Miretzky and Cirelli, 2010) of Cr, whichis a highly toxic agent and act as carcinogens, mutagens, and teratogens in biological systems(Hlihor et al., 2017; Mullick et al., 2017). The carcinogenic and toxicity of Cr(VI) is based onits oxidation states like the most transition metals (Yusof and Malek, 2009; Kumar et al., 2017).An effective, simple and low-cost method for detecting Cr(VI) is needed (Babu and Gupta, 2008;Wang G. et al., 2017). The classic methods for detecting Cr(VI) include electrochemical method,atomic absorption method and liquid chromatography (Anthemidis et al., 2002; De Ruiter et al.,2008). These methods are credible. However, the processes are complicated. Due to its sensitivity,fluorescence spectroscopy has become one of the most increasingly used techniques (Wang et al.,2015; Li andWei, 2017). The sensors made of organic or inorganic materials show great promise indetection, lighting, and other application (Rao et al., 2014).

Wei et al. Fluorescence Composite for Cr(VI) Detection
Montmorillonite is a typical phyllosilicate of the smectitegroup of clay minerals (Ismadji et al., 2016; Xu et al., 2016).It is consists of two layers of silicon tetrahedron (T) andthe middle layer of aluminum octahedron (O) (Bekri-Abbesand Srasra, 2016; Scholtzová et al., 2016; Wang W. et al.,2017). Because of the isomorphous replacement of Al3+ byMg2+ and Fe2+ in the octahedral sites and Si4+ by Al3+ inthe tetrahedral sites, TOT layers are negative electric charge,balanced by the cations such as Ca2+ and Na+ intercalateinto the layers (Dominijanni and Manassero, 2012; Wu et al.,2016; Zhou et al., 2016). Luminescent materials of small organicmolecules are easily modified and chemically purified to havewider emission spectrum coverage (Wu et al., 2015b; Tian et al.,2017). However, when they are applied in solid devices, stabilizeand enhance their luminous intensity is crucial. Althoughseveral methods of assembling materials have been developed(Zhang et al., 2005), they often suffer from phase separation,agminated organic small molecules (Wei et al., 2016; De Sa et al.,2017). Clay minerals were rarely used as base materials for theorganic-inorganic composite preparation for luminescence andfluorescence applications.
This research focused on the fabrication of a fluorescencematerial for Cr(VI) detection. To prevent quenching, thephotoactive organic dye AMCwas interposed into the interliningof MMT for maximal dye separation and minimum agminated(Yu et al., 2013, 2014). The AMC/MMT was fabricated ina film with chitosan. Quenching of fluorescence was usedvarious solutions to evaluated. The response of AMC/MMTcomposites in Cr(VI) was excellent, ranging from 0.005 to100mM.
MATERIALS AND METHODS
MaterialsThe montmorillonite was bought from Ningcheng, InnerMongolia, China. Its CEC (Cation Exchange Capacity) was 9.8mmolc/10 g which used Na+ as the staple commutable cationan
FIGURE 1 | Molecular structure of AMC studied. The all strains, C, gray; N,
blue; O, red; H, white.
exchange. The specific external surface area was 78 m2/g.AMC was purchased from Aladdin. The molecular structure(Nowakowska et al., 2001) of AMC is presented in Figure 1. Thepotassium dichromate Cr(VI), chitosan, and other reagents werepurchased from various manufactures that were all of analyticalgrade. Deionized water was used as a solvent.
Preparation of AMC/MMTThe effect of initial AMC concentrations on a performance offlorescence were tested, 50mL the original concentrations ofAMC in water for 20, 50, 100, 200, 500, and 800 mg/L wereblended with 0.25 g of MMT in every 100mL centrifugal tubeafter shaking at 200 rotations per minute at indoor temperaturefor 8 h, respectively. The admixtures were centrifuged at 7,500rotations per minute for 2min. Afterwards, removing thesupernatant, then at 60◦C were dried the residues and pulverizedthe residues to powder as raw materials. This type of product wasused for the AMC/MMT.
Preparation of the Chitosan Film (AMF) for
Cr(VI) Detection in WaterThe chitosan film was prepared as follows: 0.25 g chitosan, 8mL0.1M NaOH solution, 0.1 g AMC/MMT powder and two dropsof 1 g/mL Polyvinyl Alcohol (PVA) solution were appended. The
FIGURE 2 | X-ray diffraction patterns of MMT was inserted with AMC in the
interlayer, which was affected by initial AMC concentrations (mg/L).
Frontiers in Chemistry | www.frontiersin.org August 2018 | Volume 6 | Article 367

Wei et al. Fluorescence Composite for Cr(VI) Detection
admixture was whipped for 30min and then poured into a moldand air dried.
The followed solutions at a concentration of 0.1M wereoriginally screened for quenching of fluorescence in AMF:Al3+, Ca2+, Ba2+, Cr(VI), CTAB, K+, Na+, Ni3+, Pb2+, Fe3+,Imidazole, C2H5OH. Afterwards, they were dropped onto theAMF. Then, the fluorescence degrees were measured using afluorescence spectrophotometer (Hitachi, F4600).
In order to estimate the Cr(VI) range of response, differentconcentrations of Cr(VI) solution were dropped onto the AMF.The Cr(VI) of original concentrations were the ranged of 5μMto 100mM.
Pictures of the AMF after in contact with Cr(VI) solutionswere already obvious demonstration quenching of fluorescenceeffect by Cr(VI) and then measure the florescence intensions ofAMF by fluorescence spectrophotometer (Hitachi, F4600).
FIGURE 3 | FTIR spectra of AMC, and MMT with different amounts of AMC
adsorption.
FIGURE 4 | Fluorescence spectra of AMC/MMT was Influenced by initial
concentrations of AMC.
Instrumental AnalysesPowder X-Ray Diffraction (XRD) was performed by a RigakuD/max-IIIa diffractometer (Tokyo, Japan) with a Ni-filtered CuKa radiation at 40 kV and 40mA. Prototypes were scanned therange of 3◦ to 70◦ at 8◦ perminute with a pace of 0.01◦ to researchthe particular changes in d001 separation distance of MMT asa function of original AMC concentrations. The changing ofpeak position proved the intercalation of AMC into the MMTwas succeeded. The gallery heights were deduced from the (001)reflection of the composites using the Bragg’s equation.
Fourier Transform Infrared Spectroscopy (FTIR) spectra wereacquired on a Perkin Elmer Spectrum 100 Spectrometer. Thespectra were obtained from 4,000 to 500 cm−1 by adding 256scans in the resolution ratio of 4 cm−1.
Photoluminescence emission (PL) spectrum was obtained ona fluorescence spectrophotometer (Hitachi, F4600) at the scopeof 400–600 nm with a photomultiplier tube handled at 800 volt.A 150 watt xenon lamp was served as the pumping source, atan excitation wavelength of 340 nm (Zamojc et al., 2015). Theemission and excitation slits size were 5 nm and scan speed wassetting at 240 nm per min.
Molecular mimicry was performed at the standard module“Forcite” ofMaterials Studio 6.0 software to research the structureof AMC in the interval of MMT. The unit lattice parameters weresetted at a= 1.55 nm, b= 1.79 nm, c= 1.25 nm, α= γ= 90◦, andβ = 99◦. A suite of 2 × 2 × 1 supercells were constructed of theinterlayer spacing setting at 1.63 nm. Every circulation consistedof 106 steps, repeating three cycles.
RESULTS AND DISSCUSSION
The MMT Was Intercalated With AMCThe idea that interlayer cation was Na+ with a monolayerhydration was confirmed because the d001 value of pure MMTwas 12.6 Å. The d001 spacing progressively increased from 12.6 to16.3 Å with the initial AMC concentration increased (Figure 2),
FIGURE 5 | Fluorescence intensity of the AMF in response to a variety of
aqueous solutions at a concentration of 0.1M.
Frontiers in Chemistry | www.frontiersin.org August 2018 | Volume 6 | Article 367

Wei et al. Fluorescence Composite for Cr(VI) Detection
FIGURE 6 | Fluorescence spectra of the AMF in the presence of multifarious concentrations of Cr(VI) (a). Pictures of the AMF with disparate concentrations of Cr(VI)
exposed UV lamp (b).
suggesting AMC molecules insert the portion between theinterlayer space of MMT.
FTIR Spectra of AMC/MMTFTIR spectra of MMT adsorbed with different amounts ofAMC displayed both bands of raw MMT and AMC (Figure 3).The bands between 1,400 and 1,650 cm−1 were allocated toC-C stretching vibrations in aromatic and hetero aromaticcompounds (Talbi et al., 1998; Krishnakumar and Xavier,2005). Therefore, the bands observed at 1,727, 1,695, 1,625,1,566, 1,525, 1,475, 1,446, 1,417, 1,398, 1,390 cm−1 in FTIRspectra were allocated to C-C stretching vibrations of AMC(Arivazhagana et al., 2010). The characteristic peaks of AMCappeared in FTIR spectra of AMC/MMT, as shown in thedotted line (Figure 3), indicating that AMC had been loadedonto MMT.
Luminescence Properties of AMC/MMTAMC powder was hardly used as a luminescent materialjust because the lack of strong luminescence (Wang et al.,2012), causing by concentration quenching (Wu et al., 2015b).The luminous intensity increased significantly after theintercalation of AMC into the interlayer of MMT, whichreason was AMC was uniformly dispersed on MMT, inhibitingits aggregation. The highest spectral intensity was found byAMC/MMT at 100 mg/L, which was an initial concentration(Figure 4).
The Fluorescent Detection of Cr(VI) in
Aqueous Phase by AMFThe AMFwas screened for response to various solutes (Figure 5).The fluorescence response to Cr(VI) was very significant whenthe test solute with an initial concentration of 0.1M, while otherswere not obvious, indicating the high selectivity of AMF forCr(VI).
The mechanism of photoluminescence (PL) quenching ofAFM was further investigated when the aqueous solutioncontains Cr(VI). Most importantly, an apparent decrease
in fluorescence intensity was observed while the Cr(VI)concentration was increasing over the whole concentrationranges from 0.005 to 100mM (Figure 6a). A full PL quenchingprocess can be observed visually at a Cr(VI) concentrationof 1mM. The images of AMF with addition of Cr(VI)that exposed ultraviolet light showed a consistent tendency(Figure 6b).
Mechanism AnalysisMolecular mimicry was performed at the standard module“Forcite” ofMaterials Studio 6.0 software to research the structureof AMC between the interval of MMT. The interlayer spacingof MMT was directly influenced by the interlayer arrangementof AMC and the amount of AMC intercalation,this, on theother hand, would play an significant role in understandingthe system structure and interaction forces (Krauss et al.,2011; Wang et al., 2011; Tournassat et al., 2016). Theinterlayer condition of AMC interpolation MMT with differentquantities was qualitatively simulated, and the initial stateswere represented by a, c, and e; and b, d, and f representthe states after simulation (a stands for low concentration;c stands for medium concentration; and e stands for higherconcentration; Figure 7). The concentration quenching could beeffectively avoid by AMC intercalation MMT and it could alsosignificantly improve luminous intensity, lifespan, and stabilitynotably owing to the stronger interaction forces between AMCmolecules and MMT sheet (Yan et al., 2010a,b; Liu et al.,2014).
CONCLUSIONS
In this research, an organic dye (AMC) was resoundinglyintercalated into the interlayer space of MMT, resultingin observably inhibition in quenching of fluorescence. Thecomposite was fabricated into a film with chitosan to detectCr(VI) in water with its enhanced fluorescent property.Cr(VI) can be detected in aqueous solution by instruments
Frontiers in Chemistry | www.frontiersin.org August 2018 | Volume 6 | Article 367

Wei et al. Fluorescence Composite for Cr(VI) Detection
FIGURE 7 | Dynamic simulation of molecular interposition AMC into MMT at a different angle on account of the electric density and AMC loading distinction. The initial
states were represented by a, c, and e; and b, d, and f represent the states after simulation: a stands for low concentration, c stands for medium concentration and
e stands for higher concentration. The all strains, Mg, green; Al, pink; Si, yellow; C, gray; N, blue; O, red; H, white.
ranging from 0.005 to 100mM with a detection limit of5μM.
AUTHOR CONTRIBUTIONS
YW and LM conceived the project. LM, GL, and LibL designedand performed the experiments. RL, ML, JW, and LinL analyzedthe data. YW, ZL, and LM wrote the manuscript.
FUNDING
This research was supported by National Natural ScienceFoundation of China (grant number: 51604248), the NationalKey R&D Program of China (grant number: 2017YFB0310704),and Fundamental Research Funds for the CentralUniversities (grant numbers: 2652017335, 2652017338 and2652017366).
Frontiers in Chemistry | www.frontiersin.org August 2018 | Volume 6 | Article 367

Wei et al. Fluorescence Composite for Cr(VI) Detection
REFERENCES
Anthemidis, A. N., Zachariadis, G. A., Kougoulis, J. S., and Stratis, J.
A. (2002). Flame atomic absorption spectrometric determination of
chromium (VI) by on-line preconcentration system using a PTFE
packed column. Talanta 57, 15–22. doi: 10.1016/S0039-9140(01)006
76-2
Arivazhagana, M., Sambathkumarb, K., and Jeyavijayanc, S. (2010).
Density functional theory study of FTIR and FT-Raman spectra of
7-acetoxy-4-methyl coumarin. Indian J. Pure Appl. Phys. 48, 716–722.
doi: 10.13140/RG.2.1.4538.7361
Babu, B. V., and Gupta, S. (2008). Adsorption of Cr (VI) using activated neem
leaves: kinetic studies. Adsorption 14, 85–92. doi: 10.1007/s10450-007-9057-x
Bekri-Abbes, I., and Srasra, E. (2016). Effect of mechanochemical treatment on
structure and electrical properties of montmorillonite. J. Alloys Compd. 671,
34–42. doi: 10.1016/j.jallcom.2016.02.048
De Ruiter, G., Gupta, T., and Van Der Boom, M. E. (2008). Selective
optical recognition and quantification of parts per million levels of
Cr6+ in aqueous and organic media by immobilized polypyridyl
complexes on glass. J. Am. Chem. Soc. 130, 2744–2745. doi: 10.1021/ja71
10527
De Sa, A., Moura, I., Abreu, A. S., Oliveira, M., Ferreira, M. F., and Machado,
A. V. (2017). High fluorescent water soluble CdTe quantum dots—a
promising system for light harvesting applications. J.Nanopart. Res. 19:180.
doi: 10.1007/s11051-017-3872-0
Dehghani, M. H., Sanaei, D., Ali, I., and Bhatnagar, A. (2016). Removal of
chromium (VI) from aqueous solution using treated waste newspaper as a
low-cost adsorbent: kinetic modeling and isotherm studies. J. Mol. Liq. 215,
671–679. doi: 10.1016/j.molliq.2015.12.057
Dominijanni, A., and Manassero, M. (2012). Modelling the swelling and osmotic
properties of clay soils. Part II: the physical approach. Int. J. Eng. Sci. 51, 51–73.
doi: 10.1016/j.ijengsci.2011.11.001
Hlihor, R. M., Figueiredo, H., Tavares, T., and Gavrilescu, M. (2017). Biosorption
potential of dead and living Arthrobacter viscosus biomass in the removal of
Cr (VI): batch and column studies. Process Safe. Environ. Prot. 108, 44–56.
doi: 10.1016/j.psep.2016.06.016
Ismadji, S., Tong, D. S., Soetaredjo, F. E., Ayucitra, A., Yu, W. H., and Zhou, C. H.
(2016). Bentonite hydrochar composite for removal of ammonium from Koi
fish tank. Appl. Clay Sci. 119, 146–154. doi: 10.1016/j.clay.2015.08.022
Krauss, T. N., Barrena, E., Lohmüller, T., Spatz, J. P., and Dosch, H. (2011).
Growth mechanisms of phthalocyanine nanowires induced by Au nanoparticle
templates. Phys. Chem. Chem. Phys. 13, 5940–5944. doi: 10.1039/C0CP0
2191A
Krishnakumar, V., and Xavier, R. J. (2005). Density functional theory calculations
and vibrational spectra of 3, 5-dibromopyridine and 3, 5-dichloro-2, 4, 6-
trifluoropyridine. Spectrochim. Acta Part AMol. Biomol. Spectrosc. 61, 253–260.
doi: 10.1016/j.saa.2004.03.038
Kumar, R., Kim, S. J., Kim, K. H., Lee, S. H., Park, H. S., and Jeon, B. H.
(2017). Removal of hazardous hexavalent chromium from aqueous phase using
zirconium oxide-immobilized alginate beads. Appl. Geochem. 88, 113–121.
doi: 10.1016/j.apgeochem.2017.04.002
Li, C., and Wei, C. (2017). DNA-templated silver nanocluster as a label-free
fluorescent probe for the highly sensitive and selective detection of mercury
ions. Sens. Actuat. B Chem. 242, 563–568. doi: 10.1016/j.snb.2016.11.091
Liu, M., Wang, T., Ma, H., Fu, Y., Hu, K., and Guan, C. (2014). Assembly
of luminescent ordered multilayer thin-films based on oppositely-charged
MMT and magnetic NiFe-LDHs nanosheets with ultra-long lifetimes. Sci. Rep.
4:7147. doi: 10.1038/srep07147
Miretzky, P., and Cirelli, A. F. (2010). Cr (VI) and Cr (III) removal from aqueous
solution by raw and modified lignocellulosic materials: a review. J. Hazard.
Mater. 180, 1–19. doi: 10.1016/j.jhazmat.2010.04.060
Mullick, A., Moulik, S., and Bhattacharjee, S. (2017). Removal of hexavalent
chromium from aqueous solutions by low-cost rice husk-based activated
carbon: kinetic and thermodynamic studies. Indian Chem. Eng. 60, 58–71.
doi: 10.1080/00194506.2017.1288173
Nowakowska, M., Smoluch, M., and Sendor, D. (2001). The effect of
cyclodextrins on the photochemical stability of 7-amino-4-methylcoumarin
in aqueous solution. J. Incl. Phenom. Macrocycl. Chem. 40, 213–219.
doi: 10.1023/A:1011820513256
Omorogie, M. O., Babalola, J. O., Unuabonah, E. I., Song, W., and Gong, J. R.
(2016). Efficient chromium abstraction from aqueous solution using a low-
cost biosorbent: nauclea diderrichii seed biomass waste. J. Saudi Chem. Soc. 20,
49–57. doi: 10.1016/j.jscs.2012.09.017
Rao, K. V., Jain, A., and George, S. J. (2014). Organic–inorganic light-
harvesting scaffolds for luminescent hybrids. J. Mater. Chem. C 2, 3055–3064.
doi: 10.1039/C3TC31729C
Scholtzová, E., Madejová, J., and Tunega, D. (2016). Structural and spectroscopic
characterization of montmorillonite intercalated with n-butylammonium
cations (n= 1–4)–Modeling and experimental study. Clays Clay Miner. 64,
401–412. doi: 10.1346/CCMN.2016.0640404
Širic, I., Kasap, A., Bedekovi,c, D., and Falandysz, J. (2017). Lead, cadmium and
mercury contents and bioaccumulation potential of wild edible saprophytic
and ectomycorrhizal mushrooms, Croatia. J. Environ.l Sci. Health Part B 52,
156–165. doi: 10.1080/03601234.2017.1261538
Soewu, D. A., Agbolade, O. M., Oladunjoye, R. Y., and Ayodele, I. A. (2014).
Bioaccumulation of heavy metals in cane rat (Thryonomys swinderianus)
in Ogun State, Nigeria. J. Toxicol. Environ. Health Sci. 6, 154–160.
doi: 10.5897/JTEHS2014.0310
Talbi, H., Humbert, B., and Billaud, D. (1998). FTIR and Raman spectroscopic
investigations on the redox behaviour of poly (5-cyanoindole) in acidic
aqueous solutions. Spectrochim. Acta A Mol. Biomol. Spectr. 54, 1879–1893.
doi: 10.1016/S1386-1425(98)00146-2
Tian, G., Wang, W., Wang, D., Wang, Q., and Wang, A. (2017).
Novel environment friendly inorganic red pigments based on
attapulgite. Powder Technol. 315, 60–67. doi: 10.1016/j.powtec.2017.
03.044
Tournassat, C., Bourg, I. C., Holmboe, M., Sposito, G., and Steefel, C. I.
(2016). Molecular dynamics simulations of anion exclusion in clay interlayer
nanopores. Clays Clay Miner. 64, 374–388. doi: 10.1346/CCMN.2016.06
40403
Wang, F. X., Liu, Y. D., and Pan, G. B. (2011). Vapor growth and photoconductivity
of single-crystal nickel-phthalocyanine nanorods. Mater. Lett. 65, 933–936.
doi: 10.1016/j.matlet.2010.12.012
Wang, G., Wang, S., Sun, W., Sun, Z., and Zheng, S. (2017). Synthesis
of a novel illite@ carbon nanocomposite adsorbent for removal of Cr
(VI) from wastewater. J. Environ. Sci. 57, 62–71. doi: 10.1016/j.jes.2016.
10.017
Wang, J., Hu, Y., Deng, R., Xu, W., Liu, S., Liang, R., et al. (2012). Construction
of multifunctional photonic crystal microcapsules with tunable shell structures
by combining microfluidic and controlled photopolymerization. Lab. Chip 12,
2795–2798. doi: 10.1039/C2LC40419B
Wang, M., He, L., Xu, W., Wang, X., and Yin, Y. (2015). Magnetic
assembly and field- tuning of ellipsoidal-nanoparticle-based colloidal photonic
crystals. Angew. Chem. Int. Edn. 54, 7077–7081. doi: 10.1002/anie.2015
01782
Wang, W., Tian, G., Zong, L., Zhou, Y., Kang, Y., Wang, Q., et al.
(2017). From illite/smectite clay to mesoporous silicate adsorbent for
efficient removal of chlortetracycline from water. J. Environ. Sci. 51, 31–43.
doi: 10.1016/j.jes.2016.09.008
Wei, X., Hao, T., Xu, Y., Lu, K., Li, H., Yan, Y., et al. (2016). Facile polymerizable
surfactant inspired synthesis of fluorescent molecularly imprinted composite
sensor via aqueous CdTe quantum dots for highly selective detection of λ-
cyhalothrin. Sens. Actuat. B Chem. 224, 315–324. doi: 10.1016/j.snb.2015.
10.048
Weibel, G., Waber, H. N., Eggenberger, U., and Mäder, U. K. (2016). Influence
of sample matrix on the alkaline extraction of Cr (VI) in soils and
industrial materials. Environ. Earth Sci. 75:548. doi: 10.1007/s12665-015-
5236-3
Wu, L., Liao, L., Lv, G., and Qin, F. (2015a). Stability and pH-independence
of nano-zero-valent iron intercalated montmorillonite and its application on
Cr (VI) removal. J. Contam. Hydrol. 179, 1–9. doi: 10.1016/j.jconhyd.2015.
05.001
Wu, L., Lv, G., Liu, M., Li, Z., Liao, L., and Pan, C. (2015b). Adjusting
the layer charges of host phyllosilicates to prevent luminescence
Frontiers in Chemistry | www.frontiersin.org August 2018 | Volume 6 | Article 367

Wei et al. Fluorescence Composite for Cr(VI) Detection
quenching of fluorescence dyes. J. Phys. Chem. C. 119, 22625–22631.
doi: 10.1021/acs.jpcc.5b07243
Wu, L. M., Tong, D. S., Li, C. S., Ji, S. F., Lin, C. X., Yang, H.
M., et al. (2016). Insight into formation of montmorillonite-hydrochar
nanocomposite under hydrothermal conditions. Appl. Clay Sci. 119, 116–125.
doi: 10.1016/j.clay.2015.06.015
Xu, W., Mu, B., and Wang, A. (2016). From adsorbents to electrode materials:
facile hydrothermal synthesis of montmorillonite/polyaniline/metal
oxide (hydroxide) composites. New J. Chem. 40, 2687–2695.
doi: 10.1039/C5NJ03734D
Yan, D., Lu, J., Chen, L., Qin, S., Ma, J., Wei, M., et al. (2010a). A strategy
to the ordered assembly of functional small cations with layered double
hydroxides for luminescent ultra-thin films. Chem. Commun. 46, 5912–5914.
doi: 10.1039/C0CC00522C
Yan, D., Lu, J., Ma, J., Wei, M., Wang, X., Evans, D. G., et al. (2010b). Anionic
poly (p-phenylenevinylene)/layered double hydroxide ordered ultrathin films
withmultiple quantumwell structure: a combined experimental and theoretical
study. Langmuir 26, 7007–7014. doi: 10.1021/la904228b
Yu, W. H., Li, N., Tong, D. S., Zhou, C. H., Lin, C. X. C., and
Xu, C. Y. (2013). Adsorption of proteins and nucleic acids on clay
minerals and their interactions: a review. Appl. Clay Sci. 80–81, 443–452.
doi: 10.1016/j.clay.2013.06.003
Yu, W. H., Ren, Q. Q., Tong, D. S., Zhou, C. H., and Wang, H. (2014).
Clean production of CTAB-montmorillonite: formation mechanism
and swelling behavior in xylene. Appl. Clay Sci. 97–98, 222–234.
doi: 10.1016/j.clay.2014.06.007
Yusof, A. M., and Malek, N. A. (2009). Removal of Cr (VI) and As (V) from
aqueous solutions by HDTMA-modified zeolite Y. J. Hazard. Mater. 162,
1019–1024. doi: 10.1016/j.jhazmat.2008.05.134
Zamojc, K., Wiczk, W., Zaborowski, B., Jacewicz, D., and Chmurzynski, L. (2015).
Fluorescence quenching of 7-amino-4-methylcoumarin by different TEMPO
derivatives. Spectrochim. Acta Part A Mol. Biomol. Spectrosc. 136, 1875–1880.
doi: 10.1016/j.saa.2014.10.102
Zhang, H., Wang, C., Li, M., Ji, X., Zhang, J., and Yang, B. (2005). Fluorescent
nanocrystal– polymer composites from aqueous nanocrystals: methods
without ligand exchange. Chem. Mater. 17, 4783–4788. doi: 10.1021/cm05
0260l
Zhou, C. H., Zhao, L. Z., Wang, A. Q., Chen, T. H., and He, H. P. (2016). Current
fundamental and applied research into clay minerals in China. Appl. Clay Sci.
119, 3–7. doi: 10.1016/j.clay.2015.07.043
Conflict of Interest Statement: The authors declare that the research was
conducted in the absence of any commercial or financial relationships that could
be construed as a potential conflict of interest.
Copyright © 2018Wei, Mei, Li, Liu, Lv,Weng, Liao, Li and Lu. This is an open-access
article distributed under the terms of the Creative Commons Attribution License (CC
BY). The use, distribution or reproduction in other forums is permitted, provided
the original author(s) and the copyright owner(s) are credited and that the original
publication in this journal is cited, in accordance with accepted academic practice.
No use, distribution or reproduction is permitted which does not comply with these
terms.
Frontiers in Chemistry | www.frontiersin.org August 2018 | Volume 6 | Article 367

ORIGINAL RESEARCH
published: 27 July 2018
doi: 10.3389/fchem.2018.00310
Frontiers in Chemistry | www.frontiersin.org July 2018 | Volume 6 | Article 310
Edited by:
Steve Suib,
University of Connecticut,
United States
Reviewed by:
Haibo Liu,
Hefei University, China
Runliang Zhu,
Guangzhou Institute of Geochemistry
(CAS), China
Junping Zhang,
Lanzhou Institute of Chemical Physics
(CAS), China
Xuan Dou,
Northwestern University, United States
Ping Zhang,
Nanchang University, China
*Correspondence:
Hongfei Cheng
Specialty section:
This article was submitted to
Green and Sustainable Chemistry,
a section of the journal
Frontiers in Chemistry
Received: 22 May 2018
Accepted: 09 July 2018
Published: 27 July 2018
Citation:
Zhou Y, Liu Q, Xu P, Cheng H and
Liu Q (2018) Molecular Structure and
Decomposition Kinetics of
Kaolinite/Alkylamine Intercalation
Compounds. Front. Chem. 6:310.
doi: 10.3389/fchem.2018.00310
Molecular Structure andDecomposition Kinetics ofKaolinite/Alkylamine IntercalationCompounds
Yi Zhou1,2, Qinghe Liu 1, Peijie Xu1, Hongfei Cheng1,3* and Qinfu Liu 1
1 School of Geoscience and Surveying Engineering, China University of Mining & Technology, Beijing, China, 2 Department of
Chemical and Biomolecular Engineering and Polymer Program, Institute of Materials Science, University of Connecticut,
Storrs, CT, United States, 3 School of Environmental Science and Engineering, Chang’an University, Xi’an, China
Although the development of clay/polymer nanocomposites and their applications have
attracted much attention in recent years, a thorough understanding of the structure
and the decomposition mechanism of clay/polymer nanocomposites is still lacking.
In this research, the intercalation of kaolinite (Kaol) with different alkylamines were
investigated by X-ray diffracion (XRD), Fourier-transform infrared spectroscopy (FTIR),
and thermogravimetry and differential scanning calorimetry (TG-DSC). The results
showed that the intercalation of Kaol/methanol compound with hexylamine (HA),
dodecylamine (DA), and octadecylamine (OA) led to the expansion of the interlayer
distance and resulted in the dominant basal diffraction at 2.86, 4.08, and 5.66 nm.
The alky chains of HA, DA, and OA are tilted toward the Kaol surface in bilayer
with an inclination angle of ∼40◦. The most probable mechanism function, activation
energy E, and pre-exponential factor A were obtained by mutual authentication using
KAS and Ozawa methods, itrative and Satava integral method. The average activation
energy E of the three intercalation compounds are 104.44, 130.80, and 154.59 kJ
mol−1, respectively. It shows a positive correlation with the alkyl chain length. The pre-
exponential factor Awas estimated to be 1.09× 10¹⁵, 1.15× 10⁸, and 4.17× 10²¹ s−1,
respectively. The optimized mechanism function for the decomposition of alkylamine is
G(α) = [(1-α) −1/3 − 1]2.
Keywords: kaolinite, alkylamine, intercalation, structural model, decomposition
INTRODUCTION
Design and fabrication of clay/polymer nanocomposites have attracted high interest from boththe scientific and engineering communities (Cheng et al., 2017). A wide variety of clay/polymernanocomposites have been developed and are being used in widespread application (Gogoi andRaidongia, 2017). Pre-intercalating clays followed by the incorporation of polymers into clayminerals layer is a widely adopted approach for the preparation of clay/polymer nanocomposites (Liet al., 2009; Zare et al., 2017).While being intercalated within inorganic clay layers, organic polymerchains naturally reduce their structural mobility and some of them assume a highly organizedconformation within the layered structure.

Zhou et al. Molecular Structure and Decomposition Kinetics
In nature, kaolinite (Kaol) is a type of clay mineral with a1:1 dioctahedral aluminum silicate layered structure (Brindleyand Robinson, 1945). The layers in Kaol are held together byhydrogen bonds, dipole-dipole interactions, and van der Waalsforces (Brindley et al., 1967). However, only a limited number ofhighly polar organic species including urea (Makó et al., 2009),dimethyl sulfoxide (Costanzo and Giesse, 1986), formamide(Frost et al., 2000a), hydrazine (Cruz and Franco, 2000),and potassium acetate (Frost et al., 2000b) were successfullyintercalated into the gallery of Kaol. The intercalation of smallmolecules into Kaol layers causes an increase in the basal spacing,and can be used as a preliminary expansion step for subsequentinsertion of large-sized, non-reactive species by the displacementof the pre-intercalated small molecules (Cheng et al., 2015).For example, based on the previous reports, a Kaol/methanolintercalation compound can be an effective intermediate forfurther intercalation reaction with ethylene glycol (Hirsemannet al., 2011), hexylamine (Matusik et al., 2012), n-alkylamines(Gardolinski and Lagaly, 2005), and quaternary ammonium salts(Cheng et al., 2016). In addition, the majority of guest moleculesare difficult to be inserted into the interlayer space, one of thereason is the strong hydrogen bonds, another is that there is noexchangeable ions in the Kaol structure.
Although clay/polymer nanocomposites have been welldeveloped in recent years, to synthesize new clay/organicnanocomposites for potential application still presents a bigchallenge (Kotal and Bhowmick, 2015). In order to settle thisproblem, it is really an urgent matter to figure out the nano-scaleprocess of kaolinite intercalation and make a thorough inquiryto the mechanism of decomposition with modern technologyand analytical tools. Thermal analysis and kinetic calculation ofclay/polymer intercalation compounds can help characterize thedecomposition processes and provide scientific basis for controlover intercalation reactions (Zhang et al., 2015). The kineticparameters of the decomposition reaction kinetics process, suchas the activation energy, pre-exponential, reaction orders, andrate constant were assessed with the data from clay/polymerthermograms. In this study, the intercalation of Kaol with variousalkylamines was investigated. Additionally, the intercalationprocess and the decomposition mechanism was systematicallyinvestigated.
EXPERIMENTAL
MaterialsKaolin used in this study was exploited from Zhangjiakou,China. The main mineral composition is a well ordered kaolinite(95% in mass). It was ground to pass a 325-mesh sieve (particlesthat measure <44μm) before intercalation. Alkylaminehexylamine (HA, 99%), dodecylamine (DA, Chemically Pure),and octadecylamine (OA, Chemically Pure) were purchasedfrom Nanjing Shuguang Chemical Company, China. Dimethylsulfoxide (DMSO, Analytical Reagent), methanol (MeOH,Analytical Reagent), and toluene (99%) were received fromXilong Chemical Company, China, and used as received withoutfurther purification. The chemical formula and structuralformula of HA, DA, and OA are shown in Table 1.
Synthesis of Intercalation CompoundsFirst, Kaol/DMSO intercalation compound was prepared bydispersing 20.0 g Kaol into a mixture of 36.0 g DMSO and 4.0 gwater. The mixture was stirred in a water-bath for 2 h at 95◦C,and then the suspension was separated by centrifugation withethanol. Second, the Kaol/DMSO intercalation compound wasused as a precursor for further reaction with MeOH. MeOHwas added to the pre-intercalated Kaol and the reaction mixturewas stirred for 10 days, with MeOH being replaced each daywith a same amount of fresh MeOH. The precipitate in themixture was separated by centrifugation and dried in an oven at60◦C for 12 h to obtain Kaol/MeOH intercalation compounds.Finally, 2 g Kaol/MeOH intercalation compound was mixedwith 30.0mL HA, DA, or OA methanol solutions (1 mol/L) bystirring at ambient temperature, respectively. The dispersionswere centrifuged after reaction for 24 h. The sediments werewashed three times with toluene to remove the excessive HA, DA,or OA. The samples were dried at room temperature for 12 hand ground into powders with an agate mortar (Komori et al.,1999). The resulting compounds are labeled as Kaolpi/HA (pi aspre-intercalated), Kaolpi/DA, and Kaolpi/OA.
CharacterizationThe XRD patterns were recorded on a Rigaku D/max 2500PCX-ray diffractometer with Cu Kα (λ = 1.54178 Å) radiationoperating at 40 kV and 150mA. The randomly orientedspecimens samples were scanned in the 2θ range between 1and 20◦ at a speed of 2◦ min−1. A Thermo Fisher Nicolet6700 spectrophotometer were used to recorded the FTIR spectrawithin the range of 4,000∼400 cm−1. The TG-DSC analyseswere performed with a Mettler-Toledo TG-DSC I/1600 HTsimultaneous thermal analyzer under nitrogen atmosphere.Twenty milligrams of sample was placed in an alumina crucibleand heated from 30 to 1,100◦C with a series of heating rates at 4,6, 8, 10◦C min−1.
RESULTS AND DISCUSSION
XRD CharacterizationThe XRD patterns of the pristine Kaol and its intercalationcompounds are shown in Figure 1. The pattern of thepristine Kaol displays a well-ordered layered structure witha basal spacing [d(001)] of 0.71 nm. This value matches wellwith the standard ICDD reference pattern 14-0164 [kaolinite,Al2Si2O5(OH)4]. Upon being treated with DMSO, a new basalreflection peak appeared at 1.14 nm, indicating that DMSO wassuccessfully inserted into Kaol interlayers. After the Kaol/DMSOintercalation compound was treated with MeOH, the 1.14 nm(001) reflection characteristic of Kaol/DMSO intercalationcompound was shifted to 0.86 nm. It was reported by Matusiket al. (2012) that Kaol/DMSO/MeOH compound was dried at110◦C, the reflection with d = 1.12 nm disappeared and a broadreflection with maximum at 0.95 nm was observed. Based on thechemical formula Al2Si2O5(OH)3.20(OCH3)0.80 of Kaol/DMSOintercalation compound which has been calculated accordingto the basis of CHNS analysis, it showed that about 1/3 of theinner surface OH groups were replaced by methoxy groups, and
Frontiers in Chemistry | www.frontiersin.org July 2018 | Volume 6 | Article 310

Zhou et al. Molecular Structure and Decomposition Kinetics
TABLE 1 | Chemical and structural formula of HA, DA, and OA.
Chemicals Chemical formula Structural formula
Hexylamine (HA) C6H15N
Dodecylamine (DA) C12H27N
Octadecylamine (OA) C18H39N
FIGURE 1 | XRD patterns of Kaol, Kaol/DMSO, Kaol/MeOH, Kaolpi/HA,
Kaolpi/DA, and Kaolpi/OA.
this observation also suggests the formation of a Kaol/MeOHintercalation compound (Tunney and Detellier, 1996; Chenget al., 2015). The XRD patterns also show that the Kaol/MeOHcompounds intercalated with HA, DA, and OA expands thestructure along the c-axis, leading to a large interlayer distanceof 2.86, 4.08, and 5.66 nm, respectively. The lengths of HA, DA,andOAmolecular chains are 1.56, 2.51, and 3.65 nm, respectively(McNulty et al., 2011, 2014). Overall, the interlayer distance ofthe Kaol/alkylamine intercalation compounds increased with thealkyl chain length of the alkylamines, but the alkylaminemoleculeis not a single layer or bilayer structure which is perpendicular tothe Kaol surface.
FTIR SpectraFTIR spectroscopy has been widely used in the characterizationof intercalation compounds (Ledoux andWhite, 1964; Frost et al.,2000c; Cheng et al., 2012). The FTIR spectra of the original Kaol,Kaolpi/HA, Kaolpi/DA, and Kaolpi/OA intercalation compoundsare shown in Figure 2. The characteristic bands at 432, 470,and 541 cm−1 (Figure 2B) belong to the deformation mode ofSi-O, Si-O-Si, and Al-O-Si. The other bands at 1,009, 1,031,
and 1,114 cm−1 (Figure 2C) are assigned to the stretchingvibrations of Si-O-Si in the layer of Kaol. Comparing Kaoland its intercalation compounds spectra, the position of thebands have no apparent variation, which indicates that thisstretching vibrations bands are not affected by the intercalatedmolecules.
The bands at 912 and 938 cm−1 (Figure 2C) belong to theOH deformation of inner hydroxyl groups and inner-surfacehydroxyl groups. There are four obvious hydroxyl stretchingbands at 3,694, 3,669, 3,652, and 3,620 cm−1 (Figure 2D) in thespectrum of the original Kaol, the bands at 3,694, 3,669, and3,652 cm−1 are caused by the inner-surface hydroxyl groupswhile the one at 3,620 cm−1 results from the inner hydroxylgroups (Farmer, 1964; Ledoux andWhite, 1964; Giese and Datta,1973). After the intercalation of alkylamine molecules, somebands were weakened due to the change of the interactionswith neighboring atoms. The shift to 3,697 cm−1 and thedecrease of the intensity of the band at 3,694 cm−1 indicatesthat numerous hydroxyl groups in Kaol participated and formedhydrogen bonds with the amine groups in the alkylaminemolecules (Caglar, 2012; Caglar et al., 2013; Zhang et al.,2015).
The presence of interlayer alkylamine molecules was detectedon the FTIR spectrum by the new peaks, which are shownin Figures 2A,E. For the intercalation compounds, someobvious characteristic peaks such as the band at 1,388 and1,468 cm−1 belong to the C-H bending mode of -CH3 and-CH2, respectively. A new vibration band at 3,334 cm−1
was observed which is due to the stretching mode of theN-H stretching vibration (Griffiths and De Haseth, 2007;Zhang et al., 2018). The new vibration band at 2,956 cm−1
was observed and usually assigned to the C-H asymmetricstretching band of the terminal methyl groups (Cheng et al.,2016). The two vibration bands at 2,919 and 2,851 cm−1 areusually assigned to the symmetric and asymmetric stretchingvibrations of the -(CH2)n- (Venkataraman and Vasudevan,2001). The intensity of the bands increases gradually whichmeans more alkylamine carbon atoms has been inserted intoKaol interlayers. Furthermore, the volatility of alkylamines willdecrease with the increase of carbon chain, so the stability ofthe corresponding Kaol intercalation compounds will graduallyincrease with larger alkylamine molecular mass (Wang et al.,2010).
Frontiers in Chemistry | www.frontiersin.org July 2018 | Volume 6 | Article 310

Zhou et al. Molecular Structure and Decomposition Kinetics
FIGURE 2 | Infrared spectra of Kaol, Kaolpi/HA, Kaolpi/DA, Kaolpi/OA.
FIGURE 3 | The most possible structural model for the kaolinite/alkylamine intercalation compounds.
Structural Model of Kaol/Alkylamine
Intercalation CompoundsThe arrangement of intercalated molecules is the foundation forexperimental analysis of the Kaol/alkylamine intercalation
compound structure. According to Lagaly (1981), themontmorillonite-quaternary ammonium salt intercalationcompounds structural models can be divided into threecategories: (a) monolayers: short chain alkylamine ions; (b)
Frontiers in Chemistry | www.frontiersin.org July 2018 | Volume 6 | Article 310

Zhou et al. Molecular Structure and Decomposition Kinetics
FIGURE 4 | TG-DSC curves for Kaol, Kaolpi/HA, Kaolpi/DA, Kaolpi/OA.
bilayers: long-chain quaternary ammonium ions; (c) three-layers: kinked alkyl chains in highly charged clay minerals.Beneke and Lagaly (1982) further proposed different structureof the intercalated alkylamine molecules based on the XRD,which are summarized as follows: (a) the alky chains in theinterlayer space are tilted to the (001) crystal plane; (b) thealky chains are arranged in bilayers. Brindley and Moll (1965)described that the intercalated molecules are tilted to thesilicate sheets in a single layer, whereas the angle is about65◦ to (001) crystal plane. If the interacting molecules areuniformly attached to all silicate surfaces by the active hydroxylgroups, an “end to end” organization in pairs with somelongitudinal displacement is suggested. The incline angle isin accord with the possible close packing manner betweenthe silicate oxygen surfaces and the terminal hydroxyl groupsand the degree of close packing of chain molecules amongthemselves.
The alkyl molecules are hard to intercalate directly the originalKaol layers since it lacks exchangeable ions in interlayer spaceof Kaol. Valid precursors are essential when the alkylaminemolecules insert into the interlayer of Kaol. It was reportedthat the alkyl trimethyl ammonium chloride chain forms atilted bilayer in the interlayer of Kaol and the angle of tiltis ∼36◦ after calculation (Kuroda et al., 2011). Yuan et al.(2013) pointed out that the structural arrangement of thequaternary ammonium salt molecules in the interlayer of Kaoltilted bilayer and the angle of tilt is ∼38.4◦. Gardolinski andLagaly (2005) proposed that the alkyl chains in the interlayersare fully stretched and oriented perpendicular to the Kaol surfaceby bilayer. Therefore, from analyzing the length of HA, DA,and OA molecules chain, the conclusion can be drawn that
the basal spacing after intercalation is not sufficient to allowthe alky chain entering by vertical and bilayer manner. It canbe seen by further analyzing the XRD results that the alkylchains of HA, DA, and OA are tilted to the Kaol surfacein bilayer and the incline angle of the alky chains are about39.9, 39.9, 41.1◦, respectively. In addition, due to the hydroxylbond between inner-surface hydroxyl in Kaol and amine groupsin alkylamine molecules, the most possible structural modelfor the Kaol/alkylamine intercalation compounds is shown inFigure 3.
Thermal AnalysisThe TG-DSC analysis results of Kaol and its intercalationcompounds are shown in Figure 4. The main mass loss of Kaolis the one between 400 and 600◦C with the maximum lossrate at 525◦C attributed to the loss of water because of thedehydroxylation of the crystal lattice, resulting in the formationof meta-kaolinite (Toussaint et al., 1963; Criado et al., 1984;Sperinck et al., 2011). This loss corresponds to about 12.7% of thetotal mass which is extremely close to the theoretical reference(13.9%). By comparing the TG-DSC curves of the original Kaol,two main mass loss steps are observed in that of Kaolpi/HA,Kaolpi/DA, and Kaolpi/OA intercalation compounds. The firstone occurred between 150 and 350◦C, which is due to thedecomposition of the intercalated alkylamine molecules (Yuanet al., 2013). The second one occurred at about 500◦C is due tothe dehydroxylation of the de-intercalated Kaol. For Kaolpi/OA,some OA were intercalated into the silicate interlayer space toform a stable intercalation, which can be proved by XRD pattern.Some molecules are entangled within each other due to the longchain or a clamp in the nanoscrolls that cannot be fully removed
Frontiers in Chemistry | www.frontiersin.org July 2018 | Volume 6 | Article 310

Zhou et al. Molecular Structure and Decomposition Kinetics
TABLE 2 | E of Kaol/alkylamine intercalation compounds with different α
calculated by KAS, Ozawa, and iteration methods.
α E/(KJ·mol−1)
KAS Ozawa ln[β/h(x)T2]-1/T ln[β/H(x)]-1/T
Kaolpi/HA 0.1 74.92 77.76 75.17 75.18
0.2 77.35 80.19 77.61 77.62
0.3 85.44 88.00 85.69 85.69
0.4 100.23 102.16 100.45 100.45
0.5 113.52 114.89 113.72 113.72
0.6 116.15 117.49 116.35 116.35
0.7 122.54 123.66 122.74 122.74
0.8 126.32 127.38 126.52 126.52
0.9 121.48 122.91 121.69 121.70
Kaolpi/DA 0.1 109.36 109.81 109.51 109.51
0.2 116.52 116.77 116.67 116.67
0.3 104.95 105.96 105.12 105.13
0.4 111.42 112.29 111.59 111.59
0.5 120.44 121.05 120.61 120.61
0.6 136.10 136.12 136.26 136.26
0.7 178.68 176.79 178.81 178.80
0.8 151.39 151.24 151.56 151.56
0.9 146.88 147.24 147.07 147.06
Kaolpi/OA 0.1 105.52 108.44 105.81 105.81
0.2 113.12 115.78 113.40 113.40
0.3 134.68 136.43 134.92 134.92
0.4 179.42 179.37 179.62 179.63
0.5 178.76 178.98 178.98 178.99
0.6 182.19 182.38 182.42 182.42
0.7 183.42 183.66 183.64 183.64
0.8 155.85 157.54 156.11 156.11
0.9 156.15 157.92 156.43 156.43
(Li et al., 2015; Liu et al., 2016). At 220◦C, the distinct massloss is due to the decomposition of the coated or unbonded OA,while the mass loss at 330◦C is attributed to the decomposition ofintercalated OA. The exothermic peak at 996◦C is result from therecrystallization of Kaol.
By comparing the TG-DSC curves of the original Kaoland Kaol/alkylamine intercalation compounds (Kaolpi/HA,Kaolpi/DA, Kaolpi/OA), one can observe: (a) it has different massloss steps, as well as a significant difference in the mass lossesbetween Kaolpi/OA and the other two intercalation compounds(Kaolpi/HA, Kaolpi/DA). The mass loss for the decompositionof Kaolpi/HA and Kaolpi/DA were about 20%, but the amountof the two mass losses for Kaolpi/OA is about 50%. This couldbe owing to a larger amount of OA was intercalated into thesilicate interlayer space than that HA and DA (Wang et al.,2017). (b) Dehydroxylation temperature of the intercalationcompounds was lower than that of the original Kaol by about20◦C. This is because the intercalation molecules expanded theinterlayer spacing, weakened the hydrogen bonds between Kaol
layers, bringing about a more facile dehydroxylation from Kaolsurface. Therefore, the crystallinity of Kaol sharply decreasedafter intercalation, which can be confirmed by XRD and IR(below 800 cm−1). This result is consistent with the conclusionof some other reports that the temperature of dehydroxylationwas determined by the crystallinity of Kaol (Yeskis et al., 1985;Gabor et al., 1995; Sahnoune et al., 2012).
Decomposition Reaction KineticsThe degradation kinetics of the Kaol/alkylamine intercalationcompound were investigated by thermogravimetry techniques.The kinetic parameters (activation energy E and the pre-exponential factor A) of degradation process were calculated onthe basic of KAS and Ozawa methods (Kissinger, 1957; Škváraand Šesták, 1975). The thermal degradation mechanism of theKaol/alkylamine intercalation compoundwas studied with Satavaintegral method (Xie et al., 2001; Gao et al., 2005; Zhang et al.,2015).
According to the reaction theory, the non-isothermaldecomposition kinetic formula is usually expressed as follows:
dα
dt= k · f (α) (1)
where α is the extent of conversion rate of B(s) at time t, f (α) is thereaction mechanism function, and k is the reaction rate constant.k obeys the following equation:
k = Aexp(−E
RT) (2)
where A, E, R, T are pre-exponential factor (s−1), apparentactivation energy (J mol−1), universal gas constant (8.314 Jmol−1
K−1), and the temperature of the mass loss (K). CombiningEquations (1) and (2) gives the following equation:
dα
dt= A exp
(−
E
RT
)f (α) (3)
If the temperature of the sample is controlled at a constantheating rate (β=dT/dt), the reaction rate can be defined asfollows:
dα
dt=
A
βexp
(−
E
RT
)f (α) (4)
After separating the variable, rearranging with integral ordifferential functions of Equation (4), KAS Equation (5), andOzawa Equation (6) can be computed as follows:
lnβ
T2= ln
AR
G (α)E−
E
RT(5)
lnβ = ln0.00484AE
G (α)R−
1.0516E
RT(6)
Where G(α) represents the integral function of conversion.Because of integral approximation, iterative methods were used
Frontiers in Chemistry | www.frontiersin.org July 2018 | Volume 6 | Article 310

Zhou et al. Molecular Structure and Decomposition Kinetics
TABLE 3 | Selected kinetic mechanism functions judged by Satava integral method.
Functions number Integral functions Goodness of fit (%) E (kJ/mol) LgA (s−1)
Kaolpi/HA 6
[1− (1− α)
13
]293.95 107.15 11.17
9
[(1− α)
− 13 − 1
]296.50 135.84 15.04
10 [− ln (1− α)]14 95.92 15.02 1.90
20 [− ln(1− α)]4 95.92 240.40 28.32
28 1− (1− α)14 94.54 55.09 5.56
Kaolpi/DA 6
[1− (1− α)
13
]292.18 61.61 5.75
9
[(1− α)
− 13 − 1
]296.81 77.43 8.06
10 [− ln (1− α)]14 95.03 8.60 1.34
20 [− ln(1− α)]4 95.03 137.62 15.80
28 1− (1− α)14 95.03 31.64 2.89
Kaolpi/OA 6
[1− (1− α)
13
]294.51 179.10 14.96
9
[(1− α)
− 13 − 1
]296.41 208.90 21.61
10 [− ln (1− α)]14 95.35 26.07 2.31
20 [− ln(1− α)]4 95.35 367.05 38.56
28 1− (1− α)14 94.89 92.90 7.48
FIGURE 5 | Linear fitting curves of No. 9 function judged by Satava integral method.
TABLE 4 | Kinetic mechanism functions of Kaol/alkylamine intercalation compounds.
Samples E/kJ mol−1 A/s−1 Kinetic mechanism function
Kaolpi/HA 104.44 1.09 × 10¹⁵ dαdt
= 1.64× 1014 × (1− α)43
[(1− α)
− 13 − 1
]−1
× exp(− 1.26×10⁴
T)
Kaolpi/DA 130.80 1.15 × 10⁸ dαdt
= 1.73× 107 × (1− α)43
[(1− α)
− 13 − 1
]−1
× exp(− 1.57×10⁴
T)
Kaolpi/OA 154.59 4.17 × 10²¹ dαdt
= 6.26× 1020 × (1− α)43
[(1− α)
− 13 − 1
]−1
× exp(− 1.86×10⁴
T)
to calculate E in order to avoid certain deviation. The functionsof iterative methods are as follows:
lnβ
h(x)T2= ln
AR
G (α)E−
E
RT(7)
lnβ
H(x)= ln
0.00484AE
G (α)R−
1.0516E
RT(8)
Set x = E/RT, the definition of h(x) and H(x) are:
h(x) =x4 + 18x3 + 88x2 + 96x
x4 + 20x3 + 120x2 + 240x+ 120(9)
H(x) =exp (−x) h(x)/x2
0.00484exp(−1.0516x)(10)
The iteration are as the following three steps:
Frontiers in Chemistry | www.frontiersin.org July 2018 | Volume 6 | Article 310

Zhou et al. Molecular Structure and Decomposition Kinetics
(a) Set h(x)= 1 orH(x)= 1, calculate E0 by least squares methodaccording to the slope of the linear relationship lnβ/T2 andlnβ to 1/T.
(b) E0 and T at different α and β were substituted into x= E/RTand then x was substituted into h(x) and H(x), the valueswere substituted into (7) and (8), calculate E1 by least squaresmethod according to the slope of the linear relationshipln[β/h(x)T2] and ln[β/H(x)] to 1/T.
(c) Replace E0 with E1, repeat step (b) until Ei-Ei−1 < 0. 1 kJmol−1. Ei is the exact value of the activation energy of thedecomposition reaction.
The E-values of Kaol/alkylamine intercalation compounds werecalculated by KAS, Ozawa, and iterative methods (Table 2). Thecalculated results obtained by KAS method were closer to theresults from iterative methods, however, the results from Ozawaiterative method showed larger deviation to others. Therefore,the average E from iterative methods can be regarded as theactivation energy of the decomposition reaction since they arean improvement over KAS and Ozawa methods. The averageE of Kaolpi/HA, Kaolpi/DA, and Kaolpi/OA are 104.44, 130.80,and 154.59 kJ mol−1. It can be seen that the average E amongof Kaol/alkylamine compounds are positive correlation with thealkyl chain length. One of the reason is that the volatility weakensas the alkyl chain grows. Another reason is that the Kaolpi/OApossesses the best well-ordered intercalation structure which isthe most difficult to de-intercalate. And these results can beconfirmed by XRD patterns.
The functions and A of decomposition reaction mechanismwas calculated by Satava methods, which was described as follow:
lgG (α) = lgAE
βR− 2.315−
0.4567E
RT(11)
Substitute α into every mechanism function G(α) to obtainthe value of lg[G(α)], linear fitting lg[G(α)], and 1/T whichcorresponding to the heating rate, the function which has thelargest fit can be determined as the most probable mechanismfunction. And the values of E and A can be obtained through theslope and intercept of a linear fitting curve.
As shown in Table 3, five mechanism functions with goodnessof fit above 90% are chosen based on Satava integral formula.By comparing there five functions, No. 9 mechanism functionG(α) = [(1-α) −1/3−1]2 with goodness of fit about 97% canbe regarded as the most probable mechanism function, andthe linear fitting curves of No. 9 function has been shown inFigure 5. E and A are also in the normal range of decomposition
kinetics. The decomposition mechanism functions for the three
Kaol/alkylamine intercalation compounds are given in Table 4.
CONCLUSIONS
The possible structure models and decomposition kineticsfor Kaol/alkylamine intercalation compounds have beenstudied using XRD, FT-IR, and TG-DSC. The intercalationof Kaol/MeOH compound with HA, DA, and OA expandsthe interlayer spacing of Kaol along the c-axis, resulting inthe dominant reflection appearing at 2.86, 4.08, and 5.66 nm,respectively. Moreover, the basal spacing after intercalation isnot sufficient to allow the alky chain entering by vertical singleand bilayer manner. It was concluded that the alky chains ofHA, DA, and OA are tilted to the Kaol surface in bilayer and theinclination angle of the alky chains are∼40◦.
Based on the KAS, Ozawa, and iterative methods, theresults of activation energy E of Kaol/alkylamine intercalationcompounds were calculated. The average activation energy Eof Kaolpi/HA, Kaolpi/DA, and Kaolpi/OA are 104.44, 130.80,and 154.59 kJ mol−1. The average activation energy E amongKaol/alkylamine compounds have a positive correlation withthe alkyl chain length. The optimized mechanism functionof Kaol/alkylamine decomposition process was determined asa 3D diffusion with the integral function G(α) = [(1-α)−1/3 − 1]2. This research is advantageous to better understandthe decomposition mechanism of clay/organic nanocompositesin addition to provide an inspiration to synthesize new clay-basedmaterials.
AUTHOR CONTRIBUTIONS
HC and QfL designed the experiment and revised the paper. YZ,QhL, and PX did the experiments and wrote the paper. YZ andQhL contributed equally to this work.
ACKNOWLEDGMENTS
Dr. Luyi Sun (Department of Chemical and BiomolecularEngineering and Polymer Program, Institute of MaterialsScience, University of Connecticut) is acknowledged for revisingthe paper. The authors gratefully acknowledge the financialsupport provided by the National Natural Science Foundationof China (41602171), the Beijing Natural Science Foundation(8164062) and the Yue Qi Young Scholar Project, ChinaUniversity of Mining & Technology, Beijing.
REFERENCES
Beneke, K., and Lagaly, G. (1982). The brittle mica-like KNiAsO4 and its organic
derivatives. Clay Miner. 17, 175–183. doi: 10.1180/claymin.1982.017.2.02
Brindley, G., and Moll, W. (1965). Complexes of natural and synthetic ca-
montmorillonites with fatty acids (CLAY-ORGANIC STUDIES-9). Am.
Mineral. 50, 1355.
Brindley, G. W., and Robinson, K. (1945). Structure of Kaolinite. Nature 156,
661–662. doi: 10.1038/156661b0
Brindley, G. W., Sharp, J., Patterson, J., and Narahari, B. (1967). Kinetics and
mechanism of dehydroxylation processes. I. Temperature and vapor pressure
dependence of dehydroxylation of kaolinite. Am. Mineral. 52, 201.
Caglar, B. (2012). Structural characterization of kaolinite-
nicotinamide intercalation composite. J. Mol. Struct. 1020, 48–55.
doi: 10.1016/j.molstruc.2012.03.061
Caglar, B., Tabak, A., Afsin, B., and Eren, E. (2013). Covalent grafting
of pyridine-2-methanol into kaolinite layers. J. Mol. Struct. 1032, 12–22.
doi: 10.1016/j.molstruc.2012.08.004
Frontiers in Chemistry | www.frontiersin.org July 2018 | Volume 6 | Article 310

Zhou et al. Molecular Structure and Decomposition Kinetics
Cheng, H., Hou, X., Liu, Q., Li, X., and Frost, R. L. (2015). New insights into the
molecular structure of kaolinite–methanol intercalation complexes. Appl. Clay
Sci. 109–110, 55–63. doi: 10.1016/j.clay.2015.03.010
Cheng, H., Liu, Q., Cui, X., Zhang, Q., Zhang, Z., and Frost, R. L.
(2012). Mechanism of dehydroxylation temperature decrease and high
temperature phase transition of coal-bearing strata kaolinite intercalated by
potassium acetate. J. Colloid Interface Sci. 376, 47–56. doi: 10.1016/j.jcis.2012.
02.065
Cheng, H., Xu, P., Wang, D., and Frost, R. L. (2016). Thermal
decomposition behavior and de-intercalation kinetics of kaolinite/quaternary
ammonium salt complexes. J. Therm. Anal. Calorim. 126, 421–433.
doi: 10.1007/s10973-016-5572-x
Cheng, H., Zhou, Y., Feng, Y., Geng, W., Liu, Q., Guo, W., et al. (2017).
electrokinetic energy conversion in self-assembled 2d nanofluidic
channels with janus nanobuilding blocks. Adv.Mater. 29:1700177.
doi: 10.1002/adma.201700177
Costanzo, P., and Giesse, R. (1986). Ordered halloysite; dimethylsulfoxide
intercalate. Clays Clay Miner. 34, 105–107. doi: 10.1346/CCMN.1986.0340115
Criado, J., Ortega, A., Real, C., and Torres De Torres, E. (1984). Re-examination
of the kinetics of the thermal dehydroxylation of kaolinite. Clay Miner. Clay
Miner. 19, 653–661. doi: 10.1180/claymin.1984.019.4.11
Cruz, M. D. R., and Franco, F. (2000). Thermal behavior of the kaolinite-
hydrazine intercalation complex. Clays Clay Miner. 48, 63–67.
doi: 10.1346/CCMN.2000.0480108
Farmer, V. C. (1964). Infrared absorption of hydroxyl groups in kaolinite. Science
145, 1189–1190. doi: 10.1126/science.145.3637.1189
Frost, R. L., Kristof, J., Horvath, E., and Kloprogge, J. T. (2000a). Effect
of water on the formamide-intercalation of kaolinite. Spectrochim. Acta
Part A Mol. Biomol. Spectrosc. 56, 1711–1729. doi: 10.1016/S1386-1425(00)0
0224-9
Frost, R. L., Kristof, J., Horvath, E., and Kloprogge, J. T. (2000b). Rehydration
and phase changes of potassium acetate-intercalated halloysite at
298K. J. Colloid Interface Sci. 226, 318–327. doi: 10.1006/jcis.200
0.6807
Frost, R. L., Kristof, J., Horvath, E., and Kloprogge, J. T. (2000c). Vibrational
spectroscopy of formamide-intercalated kaolinites. Spectrochim. Acta Part
A Mol. Biomol. Spectrosc. 56, 1191–1204. doi: 10.1016/S1386-1425(99)00
221-8
Gabor,M., Toth,M., Kristof, J., and Komaromi-Hiller, G. (1995). Thermal behavior
and decomposition of intercalated kaolinite. Clays Clay Miner. 43, 223–228.
doi: 10.1346/CCMN.1995.0430209
Gao, P., Xiao, H., Wang, H., and Jin, Z. (2005). A study on the
oxidation kinetics and mechanism of three-dimensional (3D) carbon
fiber braid coated by gradient SiC. Mater. Chem. Phys. 93, 164–169.
doi: 10.1016/j.matchemphys.2005.03.003
Gardolinski, J. E. F. C., and Lagaly, G. (2005). Grafted organic derivatives of
kaolinite: II. Intercalation of primary n-alkylamines and delamination. Clay
Miner. 40, 547–556. doi: 10.1180/0009855054040191
Giese, R., and Datta, P. (1973). Hydroxyl orientation in kaolinite, dickite, and
nacrite. Am. Mineral. 58, 471–479.
Gogoi, R. K., and Raidongia, K. (2017). Strategic shuffling of clay
layers to imbue them with responsiveness. Adv. Mater. 29:1701164.
doi: 10.1002/adma.201701164
Griffiths, P. R., and De Haseth, J. A. (2007). Fourier Transform Infrared
Spectrometry. New York, NY: John Wiley & Sons.
Hirsemann, D., Köster, T. K. J., Wack, J., Van Wüllen, L., Breu, J., and
Senker, J. (2011). Covalent grafting to μ-hydroxy-capped surfaces? A
kaolinite case study. Chem. Mater. 23, 3152–3158. doi: 10.1021/cm20
0235x
Kissinger, H. E. (1957). Reaction kinetics in differential thermal analysis. Anal.
Chem. 29, 1702–1706. doi: 10.1021/ac60131a045
Komori, Y., Sugahara, Y., and Kuroda, K. (1999). Intercalation of alkylamines and
water into kaolinite with methanol kaolinite as an intermediate. Appl. Clay Sci.
15, 241–252. doi: 10.1016/S0169-1317(99)00014-9
Kotal, M., and Bhowmick, A. K. (2015). Polymer nanocomposites from modified
clays: recent advances and challenges. Prog. Polym. Sci. 51, 127–187.
doi: 10.1016/j.progpolymsci.2015.10.001
Kuroda, Y., Ito, K., Itabashi, K., and Kuroda, K. (2011). One-Step exfoliation of
kaolinites and their transformation into nanoscrolls. Langmuir 27, 2028–2035.
doi: 10.1021/la1047134
Lagaly, G. (1981). Characterization of clays by organic compounds. ClayMiner. 16,
1–21. doi: 10.1180/claymin.1981.016.1.01
Ledoux, R. L., and White, J. L. (1964). Infrared study of the OH groups
in expanded kaolinite. Science 143, 244–246. doi: 10.1126/science.143.360
3.244
Li, X., Liu, Q., Cheng, H., Zhang, S., and Frost, R. L. (2015). Mechanism
of kaolinite sheets curling via the intercalation and delamination
process. J. Colloid Interface Sci. 444, 74–80. doi: 10.1016/j.jcis.2014.1
2.039
Li, Y., Sun, D., Pan, X., and Zhang, B. (2009). Kaolinite intercalation
precursors. Clays Clay Miner. 57, 779–786. doi: 10.1346/CCMN.2009.05
70610
Liu, Q., Li, X., and Cheng, H. (2016). Insight into the self-adaptive deformation
of kaolinite layers into nanoscrolls. Appl. Clay Sci. 124–125, 175–182.
doi: 10.1016/j.clay.2016.02.015
Makó, Kristóf, J., Horváth, E., and Vágvölgyi, V. (2009). Kaolinite–urea
complexes obtained by mechanochemical and aqueous suspension
techniques—A comparative study. J. Colloid Interface Sci. 330, 367–373.
doi: 10.1016/j.jcis.2008.10.054
Matusik, J., Gaweł, A., and Bahranowski, K. (2012). Grafting of methanol
in dickite and intercalation of hexylamine. Appl. Clay Sci. 56, 63–67.
doi: 10.1016/j.clay.2011.11.023
McNulty, D., Buckley, D. N., and O’dwyer, C. (2011). Synthesis
and characterization of layered vanadium oxide nanotubes for
rechargeable lithium batteries. ECS Trans. 35, 237–245. doi: 10.1149/1.3
654222
McNulty, D., Buckley, D., and O’dwyer, C. (2014). Polycrystalline vanadium
oxide nanorods: growth, structure and improved electrochemical response
as a Li-ion battery cathode material. J. Electrochem. Soc. 161, A1321–A1329.
doi: 10.1149/2.0601409jes
Sahnoune, F., Saheb, N., Khamel, B., and Takkouk, Z. (2012). Thermal analysis
of dehydroxylation of Algerian kaolinite. J. Therm. Anal. Calorim. 107,
1067–1072. doi: 10.1007/s10973-011-1622-6
Škvára, F., and Šesták, J. (1975). Computer calculation of the mechanism and
associated kinetic data using a non-isothermal integral method. J. Therm. Anal.
Calorim. 8, 477–489. doi: 10.1007/BF01910127
Sperinck, S., Raiteri, P., Marks, N., and Wright, K. (2011). Dehydroxylation
of kaolinite to metakaolin-a molecular dynamics study. J. Mater. Chem. 21,
2118–2125. doi: 10.1039/C0JM01748E
Toussaint, F., Fripiat, J. J., and Gastuche, M. C. (1963). Dehydroxylation
of kaolinite. I. Kinetics. J. Phys. Chem. 67, 26–30. doi: 10.1021/j10079
5a007
Tunney, J. J., and Detellier, C. (1996). Chemically modified kaolinite. Grafting of
methoxy groups on the interlamellar aluminol surface of kaolinite. J. Mater.
Chem. 6, 1679–1685. doi: 10.1039/jm9960601679
Venkataraman, N. V., and Vasudevan, S. (2001). Conformation of methylene
chains in an intercalated surfactant bilayer. J. Phys. Chem. B 105, 1805–1812.
doi: 10.1021/jp002505h
Wang, D., Liu, Q., Hou, D., Cheng, H., and Frost, R. L. (2017). The formation
mechanism of organoammonium-kaolinite by solid-solid reaction. Appl. Clay
Sci. 146, 195–200. doi: 10.1016/j.clay.2017.05.022
Wang, L., Lal, V., Khalizov, A. F., and Zhang, R. (2010). Heterogeneous
chemistry of alkylamines with sulfuric acid: implications for atmospheric
formation of alkylaminium sulfates. Environ. Sci. Technol. 44, 2461–2465.
doi: 10.1021/es9036868
Xie, W., Gao, Z., Pan, W.-P., Hunter, D., Singh, A., and Vaia, R. (2001). Thermal
degradation chemistry of alkyl quaternary ammoniummontmorillonite. Chem.
Mater. 13, 2979–2990. doi: 10.1021/cm010305s
Yeskis, D., Van Groos, A. K., and Guggenheim, S. (1985). Dehydroxylation of
kaolinite. Am. Mineral. 70, 1–2.
Yuan, P., Tan, D., Annabi-Bergaya, F., Yan, W., Liu, D., and Liu, Z. (2013).
From platy kaolinite to aluminosilicate nanoroll via one-step delamination
of kaolinite: effect of the temperature of intercalation. Appl. Clay Sci. 83–84,
68–76. doi: 10.1016/j.clay.2013.08.027
Frontiers in Chemistry | www.frontiersin.org July 2018 | Volume 6 | Article 310

Zhou et al. Molecular Structure and Decomposition Kinetics
Zare, Y., Fasihi, M., and Rhee, K. Y. (2017). Efficiency of stress transfer between
polymer matrix and nanoplatelets in clay/polymer nanocomposites. Appl. Clay
Sci. 143, 265–272. doi: 10.1016/j.clay.2017.03.043
Zhang, A., Mu, B., Wang, X., Wen, L., and Wang, A. (2018). Formation
and coloring mechanism of typical aluminosilicate clay minerals
for CoAl2O4 hybrid pigment preparation. Front. Chem. 6:125.
doi: 10.3389/fchem.2018.00125
Zhang, S., Ou, X., Qiang, Y., Niu, J., and Komarneni, S. (2015). Thermal
decomposition behavior and decomposition mechanism of acetamide
intercalated into kaolinite by thermoanalytical techniques. Appl. Clay Sci. 114,
309–314. doi: 10.1016/j.clay.2015.06.002
Conflict of Interest Statement: The authors declare that the research was
conducted in the absence of any commercial or financial relationships that could
be construed as a potential conflict of interest.
Copyright © 2018 Zhou, Liu, Xu, Cheng and Liu. This is an open-access article
distributed under the terms of the Creative Commons Attribution License (CC BY).
The use, distribution or reproduction in other forums is permitted, provided the
original author(s) and the copyright owner(s) are credited and that the original
publication in this journal is cited, in accordance with accepted academic practice.
No use, distribution or reproduction is permitted which does not comply with these
terms.
Frontiers in Chemistry | www.frontiersin.org July 2018 | Volume 6 | Article 310

ORIGINAL RESEARCH
published: 05 October 2018
doi: 10.3389/fchem.2018.00477
Frontiers in Chemistry | www.frontiersin.org October 2018 | Volume 6 | Article 477
Edited by:
Wenbo Wang,
Lanzhou Institute of Chemical Physics
(CAS), China
Reviewed by:
Jinxing Ma,
University of New South Wales,
Australia
Fenghua Liu,
Ningbo Institute of Industrial
Technology (CAS), China
*Correspondence:
Xiazhang Li
Chao Yao
Specialty section:
This article was submitted to
Green and Sustainable Chemistry,
a section of the journal
Frontiers in Chemistry
Received: 25 June 2018
Accepted: 20 September 2018
Published: 05 October 2018
Citation:
Wu F, Li X, Zhang H, Zuo S and Yao C
(2018) Z-Scheme Photocatalyst
Constructed by Natural Attapulgite
and Upconversion Rare Earth
Materials for Desulfurization.
Front. Chem. 6:477.
doi: 10.3389/fchem.2018.00477
Z-Scheme PhotocatalystConstructed by Natural Attapulgiteand Upconversion Rare EarthMaterials for Desulfurization
Fengqin Wu, Xiazhang Li*, Haiguang Zhang, Shixiang Zuo and Chao Yao*
Advanced Catalysis and Green Manufacturing Collaborative Innovation Center, Changzhou University, Changzhou, China
The Er3+:CeO2/ATP (attapulgite) nanocomposites were prepared by a facile precipitation
method. The samples were characterized by various measurements. XRD and TEM
showed that Er3+:CeO2 nanoparticles were well-crystallized and loaded on the surface
of ATP. The visible light was converted into ultraviolet light by Er3+:CeO2 as evidenced
by upconversion photoluminance (PL) analysis. The mass ratio of Er3+:CeO2 to ATP on
the desulfurization efficiency was investigated. Results showed that the desulfurization
rate reached 87% under 4 h visible light irradiation when the mass ratio was 4:10.
The mechanism was put forward as follows. Er3+:CeO2 and ATP formed Z-scheme
heterostructure intermediated by oxygen vacancy, leading to the enhanced separation
of photogenerated charges and preservation of high oxidation-reduction potential, both
of which favored for the generation of radicals to oxidize sulfur species.
Keywords: attapulgite, upconversion, rare earth, Z scheme, photocatalyst
INTRODUCTION
Massive use of fuel has given rise to serious environmental problem including acid rain andatmospheric haze, since the combustion of sulfur compounds in fuels leads to the emission ofpernicious SOx. Therefore, it is imperative to develop new desulfurization technology to satisfy fuelpurification (Liu et al., 2017; Zhang et al., 2018). The conventional hydrodesulfurization (HDS)has been extensively used in removing sulfur compound in fuel, which requires high temperature,pressure and expensive hydrogen (Wang et al., 2016; Zeng et al., 2017). Owing to the drawbacks ofHDS for removing sulfur compound, many alternative strategies have been developed, includingextractive desulfurization (Raj et al., 2017), oxidative desulfurization (Khodadadi Dizaji et al.,2018), biodesulfurization (Agarwal et al., 2016) and adsorption desulfurization (Yang et al., 2018).Among these strategies, oxidative desulfurization is considered as one of the promising strategy fordeep desulfurization due to its cheap and efficient features. Particularly, photocatalytic oxidativedesulfurization is deemed as a potential candidate. In our previous work, we have preparedattapulgite-CeO2/MoS2, CeO2/attapulgite/g-C3N4 and BiP1−xVxO4/attapulgite nanocompositesand found that the photocatalytic oxidative desulfurization rate reached as high as more than90% under the irradiation of visible light (Li et al., 2016, 2017, 2018). As a natural clay material,attapulgite (ATP) has large specific surface area, superior adsorption performance and uniquepore structure, which is widely used in catalyst support (Zhang et al., 2016b). Interestingly, theincorporation of Fe2O3 endows ATP with semiconductor property to some extent. Zhang et al.(Zhang et al., 2013, 2016a) sensitized ATP by taking advantage of eosine Y and CdS to generate

Wu et al. Attapulgite and Upconversion Rare Earth
hydrogen from water. Li et al. (Ma et al., 2018) preparedCQDs/ATP nanocomposites with visible light response.However, ATP can only be stimulated by ultraviolet light whichis accounted for 5% in solar light due to its wide band gap (Balajiet al., 2017).
The upconversion luminescencematerials have attracted greatattentions since they can absorb and upconvert long wave lightwith low-energy to short wave light with high-energy (Feng et al.,2013). In the general composition of upconversion luminescencematerial, the rare earth element has a rich 4f energy levelenabling the electrons jump easily from high to low energylevel. Among the rare earth family, Er3+ has abundant energylevels and higher upconversion luminescence efficiency, makingit as a excellent candidate for the conversion from visible toUV light (Pickering et al., 2017). The Er3+ can be easily dopedinto the crystal lattice of CeO2 along with the production ofoxygen vacancy since the ion radius of Ce4+ is very close toEr3+ (Wu et al., 2014). Meanwhile, CeO2 has high chemicalstability and low phonon energy, making it suitable as matrixmaterials in upconversion. Han et al prepared upconversion Er,Yb-CeO2 hollow spheres for improving the efficiency of dye-sensitized solar cells (Han et al., 2017). However, rare report hasbeen put on the heterostructure constructed by rare earth dopedupconversion luminescence materials (Bhethanabotla et al.,2016). Moreover, the decline of oxidation-reduction ability intraditional type heterostructure is non-negligible. It is worthnoting that Z-type heterostructure causes the annihilation ofphoto-generated charges with lower reduction and oxidationpotential, therefore leading to the preservation of high redoxpotential for the heterostructure (Šutka et al., 2018). Intriguingly,the self-generated oxygen vacancy has been proposed as mediatorin the indirect Z-scheme with the absence of noble metals, suchas Au, Ag, etc. For instance, Ding et al. (Ding et al., 2016)prepared BiO1−xBr/Bi2O2CO3 in which the oxygen vacancy ofBiO1−xBr acted as the medium of transmission for electrons andthe recombination center of photogenerated electrons and holes.
In this work, the Er doped CeO2 upconversion luminescenceoxide was immobilized on ATP. The doping fraction of Er3+
was adjusted to achieve the strongest emission of ultravioletlight to stimulate ATP. Meanwhile, CeO2:Er and ATP formedZ-type heterostructure intermediated by oxygen vacancy, whicheffectively preserved redox potential so as to improve thephotocatalytic desulfurization activity of Er3+:CeO2/ATP.
EXPERIMENTAL SECTION
MaterialsATP powders were obtained from Xuyi, China. Ce(NO3)3·6H2O,Er(NO3)3·5H2O, hexamine (C2H12N4, HMT), octane (C8H18),dibenzothiophene (C12H8S) and acetonitrile (C2H3N) werepurchased from Sionpharm Chemical Reagent Co., Ltd. Allreagents were analytical grade without further purification.
Synthesis of Er3+:CeO2/ATPEr3+:CeO2/ATP composites were synthesized via a one-step precipitation method. Typically, adequate amount ofCe(NO3)3·6H2O, Er(NO3)3·5H2O and 1 g ATP were dissolved in
100mL deionized water and mixed together, followed by addingexcess HMT (molar ratio of HMT to Ce(NO3)3 was 5:1). Themolar fraction of Er (Er/Ce+Er) was adjusted from 0.5 to 2.5%,and the mass ratio of Er3+:CeO2 to ATP was adjusted from 1:10to 5:10. Then the mixture was heated in a water bath at 80◦C for2 h. After cooled down to room temperature, the precipitate waswashed with deionized water for three times. Subsequently, theobtained solid was dried in vacuum at 80◦C for 10 h, and finallycalcined at 300◦C for 2 h.
Materials CharacterizationThe powder X-ray diffraction (XRD) was performed with aD/max 2500PC diffractometer equipped with a Cu-Kα radiation(λ = 1.5406 Å) at a scanning speed of 6◦ min−1 from 5 to 80◦.The morphology was investigated with a JEM-2100 transmissionelection microscope (TEM) operating at 200 kV. Raman spectrawere collected with a Renishaw (UK) spectrometer with anAr ion laser of 514 nm excitation. The ultraviolet visible (UV–Vis) spectra were acquired using a UV-2500 Shimadzu UV–Visspectrophotometer. The photoluminescence (PL) spectra werecollected with the PerkinElmer LS45 at room temperature. TheX-ray photoelectron spectroscopy (XPS) was performed with aPHI 5300 equipped with Kα in the condition of 284.6 eV for C 1s.
Photocatalytic Oxidative DesulfurizationThe photocatalytic desulfurization performance ofEr3+:CeO2/ATP was carried out by degradating the modelgasoline using a photocatalytic reaction apparatus (GHX-2)which was equipped with a 300W xenon lamp. 0.4 g DBT wasdissolved into 500mL octane to acquire the model gasoline withsulfur compounds of 200 ppm. Then the model gasoline andcatalysts were added into the photocatalytic reactor and kept30min with magnetic stirring to ensure adsorption equilibrium.Subsequently, simulated solar light using UV-cut off wasirradiated during the reaction with the irradiation intensityof 30 W/cm2. The samples were collected twice an hour tosatisfy the extraction process. The rest of sulfur content wasmeasured by a sulfur determination device (THA2000S), andthe desulfurization rate D was calculated based on the followingformula:
D = (1−C
C0) × 100%
where C0 is the initial sulfur content of the model gasoline and Cis the final sulfur content.
RESULTS AND DISCUSSIONS
XRD AnalysisFigure 1 shows the XRD patterns of ATP, CeO2/ATP andEr3+:CeO2/ATP. In Figure 1A the characteristic peaks at 8.21,19.75, and 26.54◦Correspond to the (110), (040), and (400) planeof pure ATP (Zhao et al., 2016). The characteristics at 28.55,33.07, 47.48, and 56.34◦Correspond to the (111), (200), (220),and (311) plane of CeO2 (JCPDS 43-1002). However, there is nocharacteristic peak of Er in Er3+:CeO2/ATP composites, which
Frontiers in Chemistry | www.frontiersin.org October 2018 | Volume 6 | Article 477

Wu et al. Attapulgite and Upconversion Rare Earth
FIGURE 1 | XRD patterns of ATP, CeO2/ATP and Er3+:CeO2/ATP with various molar fractions of Er doping (A), the enlarged diffraction peak from 26 to 31◦ (B), and
different mass ratio of Er3+:CeO2 to ATP (C).
FIGURE 2 | Raman patterns of CeO2/ATP and Er3+:CeO2/ATP.
may be due to the small doping amount of Er. In Figure 1B,the characteristic peak at 28.55◦ shows slight shift to higherBragg angle, implying that the Er3+ dopant results in the lattice
FIGURE 3 | Upconversion PL patterns of different Er doping fraction.
contraction due to the fact that Er3+ (0.88 Å) replaced theCe4+ (0.92 Å), subsequently leading to the lattice distortion andformation of oxygen vacancies (Li et al., 2012). Figure 1C shows
Frontiers in Chemistry | www.frontiersin.org October 2018 | Volume 6 | Article 477

Wu et al. Attapulgite and Upconversion Rare Earth
FIGURE 4 | TEM images of ATP (a), Er3+:CeO2/ATP (b), and EDS of Er3+:CeO2/ATP (c).
FIGURE 5 | UV–Vis patterns of ATP, CeO2, and 1%Er3+:CeO2 (A), the plots of transformed Kubelka-Munk function vs. light energy of CeO2, and 1%Er3+:CeO2 (B),
the plots of transformed Kubelka-Munk function vs. light energy of ATP (C), and the UV–Vis patterns of ATP, CeO2, and 1%Er3+:CeO2 (4:10) (D).
Frontiers in Chemistry | www.frontiersin.org October 2018 | Volume 6 | Article 477

Wu et al. Attapulgite and Upconversion Rare Earth
the XRD patterns of different mass ratio of Er3+:CeO2 to ATP.With the increase of mass ratio, the characteristic peak intensityof ATP is gradually weakened whereas the intensity of CeO2 is
FIGURE 6 | PL patterns of ATP, CeO2, CeO2/ATP, and 1%Er3+:CeO2/ATP
(4:10).
strengthened without any change of peak position, suggesting theimmobilization of Er3+:CeO2 on ATP.
Raman AnalysisFigure 2 shows the Raman patterns of CeO2/ATP andEr3+:CeO2/ATP. The peaks appearing in 454–459 cm−1
represent the F2g vibration mode for cubic CeO2 (Kumar andKumar, 2017). Meanwhile, the peak intensity of F2g is graduallydecreased and the peak position is shifted to high wavenumberwith the increase of Er, implying that Er is doped into CeO2
lattice. The peaks located at 537 cm−1 can be attributed to theformation of oxygen vacancies (Mamontov et al., 2016), due tothe fact that Er3+ replaces Ce4+ resulting in the transformationfrom Ce4+ to Ce3+, subsequently oxygen vacancies are producedwhich is consistent with the results of XRD.
Optical AnalysisFigure 3 demonstrates the upconversion PL spectra ofEr3+:CeO2 with different Er molar fraction. The upconversionluminescence was tested by the visible light of 488 nm asexcitation light, while ultraviolet light was emitted near 281 nm,corresponding to the energy transfer from the 2D5/2 excitedstate to the 4I15/2 ground state. The upconversion luminescenceintensity of Er3+:CeO2 is gradually increased below 1%, which
FIGURE 7 | XPS patterns of ATP, and 1%Er3+:CeO2/ATP (4:10), (A) Survey scan, (B) Ce 3d, and (C) Si 2p.
Frontiers in Chemistry | www.frontiersin.org October 2018 | Volume 6 | Article 477

Wu et al. Attapulgite and Upconversion Rare Earth
FIGURE 8 | Photocatalytic oxidation desulfurization efficiency with various
catalysts.
FIGURE 9 | Photocatalytic desulfurization efficiency with different mass ratio of
1%Er3+:CeO2, and ATP.
reach strongest when the doping fraction is 1%. Afterwards,the upconversion luminescence intensity is obviously decreasedwhen doping fraction is more than 1% due to the fact that theexcessive doping of Er3+ shortens the distance and enhancesthe interaction among Er3+ ions, leading to the concentrationquenching of the upconversion luminescence (Ramasamy et al.,2013). Therefore, the upconversion luminescence intensity isgradually decreased, and the doping fraction is optimized tobe 1%.
TEM AnalysisFigure 4 shows the TEM results of ATP and Er3+:CeO2/ATP.Figure 4a shows the pure ATP with a rod like structure havingaverage diameter of 20–30 nm. Figure 4b shows the HRTEMimage of 1% Er3+:CeO2/ATP (4:10), and apparent nanoparticlesare loaded on the surface of ATP. The inset lattice distance ofCeO2 is 0.19 nm corresponding to the (220) plane of CeO2.Energy-dispersive spectroscopy (EDS) in Figure 4c displays Ce,
Er, Si, Fe, Mg, and Al elements, in which Si, Fe, Mg and Al arederived from ATP.
UV–Vis AnalysisFigure 5A shows the UV–Vis image of CeO2, ATP, and Er dopingfraction for 1%. CeO2 has a certain response to visible light,while the absorption edge of CeO2 appears slightly red shiftafter doping of Er, which due to the fact that Er doping maychange the band gap of the CeO2. Figure 5B shows the plots oftransformed Kubelka-Munk function vs. light energy of CeO2
and 1% Er3+:CeO2. The band gap of CeO2 and 1% Er3+:CeO2
is estimated to be 2.53 and 2.51 eV, respectively. As shown inFigure 5C, the band gap of ATP is estimated to be 3.75 eV,indicating ATP has ultraviolet response ability. It is reported thata semiconductor absorbs energy which is equal or larger than itsband gap to produce photogenerated e− and h+ (Zhuo et al.,2012). According to the results in Figure 3, the upconversionwavelength of 1% Er3+:CeO2 locates at 281 nm correspondingto the band gap of 4.41 eV larger than the band gap of ATPwith 3.75 eV. Therefore, ATP can be excited by the upconversionemission of 1% Er3+:CeO2. Figure 5D shows the UV–Vis patternof ATP, CeO2/ATP and 1%Er3+:CeO2/ATP. Compared withATP, the absorption edge of CeO2/ATP and 1% Er3+:CeO2/ATPshows obviously red shift, which may favor for the photocatalyticperformance.
PL AnalysisIn order to investigate the recombination effect ofphotogenerated electrons and holes, PL analysis is performedunder excitation of 300 nm. Figure 6 shows the PL patternsof ATP, CeO2, CeO2/ATP and 1% Er3+:CeO2/ATP (4:10).The emission peak of ATP is displayed, indicating that thephotogenerated electrons and holes were recombined dueto the fact that few Fe2O3 is stimulated to produce thephotogenerated electrons and holes. Compared with pure ATPand CeO2, the intensity of the emission peak of CeO2/ATP and1%Er3+:CeO2/ATP (4:10) is significantly increased. In general,the intensity of the emission peak of PL is inversely proportionalto the separation efficiency of the photogenerated charges.Obviously, the phenomenon described in the Figure 6 violatesthe traditional law, which may be due to the unique Z-typeheterostructure formed by Er3+:CeO2 and ATP.
XPS AnalysisFigure 7 shows the XPS patterns of ATP and 1%Er3+:CeO2/ATP(4:10). Figure 7A is the survey scan indicating the existence ofMg, Fe, Si, Al, Ce, Er, and C elements where Mg, Fe, Si, and Al areoriginated from ATP, Ce and Er are originated from Er3+:CeO2.As shown in Figure 7B, the characteristic peaks of 883.2, 898.6,and 907.9 eV are ascribed to Ce3+ while the characteristic peaksof 889.5, 901.3, and 917.1 eV are ascribed to Ce4+, which is closeto our previous result with respect to Ce 3d in CeO2/ATP, (Liet al., 2017) indicating that the surface of CeO2 contains oxygenvacancy. (Peng et al., 2017) The characteristic peak position ofSi 2p in 1% Er3+:CeO2/ATP (4:10) is lower than that of ATPshown in Figure 7C, due to the fact that the Si-O-Si bond may
Frontiers in Chemistry | www.frontiersin.org October 2018 | Volume 6 | Article 477

Wu et al. Attapulgite and Upconversion Rare Earth
FIGURE 10 | Mott-schottky patterns of ATP (A), 1%Er3+:CeO2 (B), 1%Er3+:CeO2/ATP (4:10) (C), and VB-XPS pattern of ATP (D).
FIGURE 11 | Photocatalytic desulfurization mechanism of Er3+:CeO2/ATP.
Frontiers in Chemistry | www.frontiersin.org October 2018 | Volume 6 | Article 477

Wu et al. Attapulgite and Upconversion Rare Earth
be replaced by Si-O-Ce bond since the electronegativity of Ce isless than that of Si.
Photocatalytic Oxidation DesulfurizationThe photocatalytic oxidation desulfurization is performed usingvarious catalysts. As shown in Figure 8, the desulfurizationrate is 10.8, 29.3, and 34.3% corresponding to ATP, CeO2
and 1%Er3+:CeO2 samples. Meanwhile, the photocatalyticoxidation desulfurization rate of 1%Er3+:CeO2/ATP (4:10)reaches 87%. The 1%Er3+:CeO2 and ATP may have synergywhich accelerates the migration of photogenerated electronsand holes. Furthermore, a unique Z-type structure may formperseving the high redox potential, thus leads to the improveddesulfurization performance.
Figure 9 shows the photocatalytic desulfurizationperformance with different mass ratios of 1%Er3+:CeO2
and ATP. The desulfurization rate is enhanced gradually withthe increase of the mass ratio. When the mass ratio is 4:10,the photocatalytic desulfurization rate of 1%Er3+:CeO2/ATPreached 87% within 4 h, which may be due to the fact thatwith the content of 1%Er3+:CeO2 increased, the concentrationof oxygen vacancy is increased favoring for the transmissionof charges. When the mass ratio is more than 4:10, thephotocatalytic desulfurization rate is decreased, since the excessEr3+:CeO2 nanoparticles may lead to aggregation restrainingthe exposure of surface active sites and destroying the balance ofrecombination of charges.
Photocatalytic Desulfurization MechanismThe position of conduction band (CB), valence band (VB)and Fermi energy levels (Ef) of 1%Er3+:CeO2 and ATP werecalculated, respectively. Figures 10A,B show the Mott-schottkypatterns of ATP and 1%Er3+:CeO2, where the flat band tential(identical Ef) of ATP and 1%Er3+:CeO2 is determined to be0.1 and −0.84 eV, respectively. Figure 10C shows the Mott-schottky pattern of 1%Er3+:CeO2/ATP (4:10) after contact, andthe equilibrium Ef level is shifted to −0.44 eV located betweenthat of Er3+:CeO2 and ATP. Figure 10D shows the VB-XPSpattern of ATP, in which the VB value of ATP is determined tobe 3.25 eV. In addition, the empirical formula of VB and CB is asfollows (Obregón et al., 2016):
EVB = X− Ee +1
2Eg
ECB = EVB − Eg
where EVB and ECB represent the VB and CB edge potential,respectively, X represents the electronegativity, Ee (about 4.5 eV)is the energy of free electrons on the hydrogen, and Eg is theband gap of the semiconductor. According to the above formula,the VB value for 1%Er3+:CeO2 is calculated to be −0.42 eV.Since the Eg of ATP and 1%Er3+:CeO2 is 3.75 and 2.51 eV byUV–Vis analysis in Figure 5, the corresponding CB for ATP and1%Er3+:CeO2 is−0.5 and−2.93 eV, respectively.
According to the above analysis, the photocatalyticdesulfurization mechanism of 1%Er3+:CeO2/ATP (4:10) isproposed as shown in Figure 11. After contact, free electrons
may flow from 1%Er3+:CeO2 to ATP due to the disparity of Efuntil they reach equilibrium, which forms an internal electricfield, leading to the consumption and accumulation of freeelectrons (Huang et al., 2017). Simultaneously, the energy bandedge of Er3+:CeO2 is bended upward whereas the energy bandedge of ATP is bended downward. Under visible light irradiation,the 1%Er3+:CeO2 is stimulated to produce photogenerated e−
and h+ while Er3+ converts visible light to ultraviolet light.Subsequently, ATP is stimulated by the upconverted ultravioletlight to produce photogenerated e− and h+. Then the downwardband bending of ATP allows e− flow to the oxygen vacancy inCeO2 while the upward band bending of 1%Er3+:CeO2 allowsh+ flow to the oxygen vacancy which acted as the recombinationcenter for the e− and h+ (Ding et al., 2016). Finally, thephotogenerated e− in the CB of 1%Er3+:CeO2 is preserved andreacts with O2 to produce ·O−
2 . Then, ·O−2 and h+ in the VB
of ATP synergistically oxidize DBT to DBTO2 (Li et al., 2018).According to the above statement, the reaction equations are putforward as follows:
1%Er3+ :CeO2/ATP + hv → e− + h+ (1)
e− + O2 → ·O−2 (2)
·O2− + DBT → DBTO2 (3)
h+ + DBT → DBTO2 (4)
CONCLUSION
In this work, Er3+:CeO2/ATP nanocomposites have beensuccessfully prepared via a one-step precipitation method.Doping of Er not only alters the band gap of CeO2, but alsoconverts visible light to ultraviolet light and reach the strongestwhen the doping fraction of Er is 1%. Er3+:CeO2 and ATP formZ-type heterostructure intermediated by oxygen vacancy, whichpromotes the transfer of photogenerated electrons and holes andpreserves the charges with higher oxidation-reduction ability.The photocatalytic desulfurization rate reaches the highest 87%when the mass radio of Er3+:CeO2 and ATP is 4:10. Thisnovel photocatalyst integrated by natural clay and rare earthupconversion may pave a new way for design of eco-friendlymaterials and beyond.
AUTHOR CONTRIBUTIONS
FW drafted the manuscript, XL made analysis and revision,HZ synthesized the samples and conducted desulfurizationexperiment, SZ characterized the samples, CY provided the ideaand proposed the mechanism.
FUNDING
This work was supported by the National Science Foundationof China (51674043, 51702026), Jiangsu Key Laboratory ofAdvanced Catalytic Materials and Technology (BM2012110) andPriority Academic Program Development of Jiangsu HigherEducation Institutions (PAPD).
Frontiers in Chemistry | www.frontiersin.org October 2018 | Volume 6 | Article 477

Wu et al. Attapulgite and Upconversion Rare Earth
REFERENCES
Agarwal, M., Dikshit, P. K., Bhasarkar, J. B., Borah, A. J., and Moholkar, V. S.
(2016). Physical insight into ultrasound-assisted biodesulfurization using free
and immobilized cells of Rhodococcus rhodochrous MTCC 3552. Chem. Eng. J.
295, 254–267. doi: 10.1016/j.cej.2016.03.042
Balaji, R., Kumar, S., Reddy, K. L., Sharma, V., Bhattacharyya, K., and Krishnan,
V. (2017). Near-infrared driven photocatalytic performance of lanthanide-
doped NaYF4@CdS core-shell nanostructures with enhanced upconversion
properties. J. Alloys Compd. 724, 481–491. doi: 10.1016/j.jallcom.2017.
07.050
Bhethanabotla, V. C., Russell, D. R., and Kuhn, J. N. (2016). Assessment of
mechanisms for enhanced performance of Yb/Er/titania photocatalysts for
organic degradation: part 2. Role of rare earth elements in the titania
phase. Appl. Catal. B Environ. 202, 156–164. doi: 10.1016/j.apcatb.2016.
09.008
Ding, J., Dai, Z., Qin, F., Zhao, H., Zhao, S., and Chen, R. (2016). Z-scheme
BiO1−xBr/Bi2O2CO3 photocatalyst with rich oxygen vacancy as electron
mediator for highly efficient degradation of antibiotics. Appl. Catal. B Environ.
205, 281–291. doi: 10.1016/j.apcatb.2016.12.018
Feng, W., Han, C., and Li, F. (2013). Upconversion-nanophosphor-
based functional nanocomposites. Adv. Mater. 25, 5287–5303.
doi: 10.1002/adma.201301946
Han, G., Wang, M., Li, D., Bai, J., and Diao, G. (2017). Novel upconversion
Er, Yb-CeO2 hollow spheres as scattering layer materials for efficient
dye-sensitized solar cells. Solar Energy Mater. Solar Cells 160, 54–59.
doi: 10.1016/j.solmat.2016.10.021
Huang, Z.-F., Song, J., Wang X., Pan, L., Li, K., Zhang, X., et al. (2017). Switching
charge transfer of C3N4/W18O49 from type-II to Z-scheme by interfacial band
bending for highly efficient photocatalytic hydrogen evolution.Nano Energy 40,
308–316. doi: 10.1016/j.nanoen.2017.08.032
Khodadadi Dizaji, A., Mortaheb, H. R., and Mokhtarani, B. (2018). Complete
oxidative desulfurization using graphene oxide-based phosphomolybdic acid
catalyst: process optimization by two phase mass balance approach. Chem. Eng.
J. 335, 362–372. doi: 10.1016/j.cej.2017.10.129
Kumar, S., and Kumar, A. (2017). Enhanced photocatalytic activity of rGO-
CeO2 nanocomposites driven by sunlight. Mater. Sci. Eng. B 223, 98–108.
doi: 10.1016/j.mseb.2017.06.006
Li, X., Li, F., Lu, X., Zuo, S., Li, Z., Yao, C., et al. (2018). Microwave
hydrothermal synthesis of BiP1−xVxO4/attapulgite nanocomposite with
efficient photocatalytic performance for deep desulfurization. Powder Technol.
327, 467–475. doi: 10.1016/j.powtec.2018.01.005
Li, X., Ni, C., Yao, C., and Chen, Z. (2012). Development of
attapulgite/Ce1−xZrxO2 nanocomposite as catalyst for the degradation
of methylene blue. Appl. Catal. B Environ. 117–118, 118–124.
doi: 10.1016/j.apcatb.2012.01.008
Li, X., Zhang, Z., Yao, C., Lu, X., Zhao, X., and Ni, C. (2016). Attapulgite-CeO
2 /MoS 2 ternary nanocomposite for photocatalytic oxidative desulfurization.
Appl. Surf. Sci. 364, 589–596. doi: 10.1016/j.apsusc.2015.12.196
Li, X., Zhu,W., Lu, X., Zuo, S., Yao, C., andNi, C. (2017). Integrated nanostructures
of CeO2/attapulgite/g-C3N4 as efficient catalyst for photocatalytic
desulfurization: mechanism, kinetics and influencing factors. Chem. Eng.
J. 326, 87–98. doi: 10.1016/j.cej.2017.05.131
Liu, R., Zhang, J., Xu, Z., Zhao, D., and Sun, S. (2017). Visible light photocatalytic
oxidative desulfurization using Ti-MCM-41-loaded iron phthalocyanine
combined with ionic liquid extraction. J. Mater. Sci. 53, 4927–4938.
doi: 10.1007/s10853-017-1954-0
Ma, S., Li, X., Lu, X., Zuo, S., Li, Z., and Yao, C. (2018). Carbon
quantum dots/attapulgite nanocomposites with enhanced photocatalytic
performance for desulfurization. J. Mater. Sci. Mater. Electron. 29, 2709–2715.
doi: 10.1007/s10854-017-8197-3
Mamontov, G. V., Grabchenko, M. V., Sobolev, V. I., Zaikovskii, V. I., and
Vodyankina, O. V. (2016). Ethanol dehydrogenation over Ag-CeO2/SiO2
catalyst: role of Ag-CeO2 interface. Appl. Catal. A Gen. 528, 161–167.
doi: 10.1016/j.apcata.2016.10.005
Obregón, S., Zhang, Y., and Colón, G. (2016). Cascade charge separation
mechanism by ternary heterostructured BiPO4/TiO2/g-C3N4 photocatalyst.
Appl. Catal. B Environ. 184, 96–103. doi: 10.1016/j.apcatb.2015.11.027
Peng, R., Li, S., Sun, X., Ren, Q., Chen, L., Fu, M., et al. (2017). Size effect of Pt
nanoparticles on the catalytic oxidation of toluene over Pt/CeO2 catalysts.Appl.
Catal. B Environ. 220, 462–470. doi: 10.1016/j.apcatb.2017.07.048
Pickering, J. W., Bhethanabotla, V. R., and Kuhn, J. N. (2017). Assessment of
mechanisms for enhanced performance of TiO2/YAG:Yb+3,Er+3 composite
photocatalysts for organic degradation. Appl. Catal. B Environ. 202, 147–155.
doi: 10.1016/j.apcatb.2016.09.007
Raj, J. J., Magaret, S., Pranesh, M., Lethesh, K. C., Devi, W. C., and Mutalib,
M. I. A. (2017). Extractive desulfurization of model fuel oil using ester
functionalized imidazolium ionic liquids. Sep. Purif. Technol. 196, 115–123.
doi: 10.1016/j.seppur.2017.08.050
Ramasamy, P., Chandra, P., Rhee, S. W., and Kim, J. (2013). Enhanced
upconversion luminescence in NaGdF4:Yb,Er nanocrystals by Fe3+
doping and their application in bioimaging. Nanoscale 5, 8711–8717.
doi: 10.1039/c3nr01608k
Šutka, A., Vanags, M., Joost, U., Šmits, K., RuŽa, J., Locs, J., et al.
(2018). Aqueous synthesis of Z-scheme photocatalyst powders and thin-
film photoanodes from earth abundant elements. J. Environ. Chem. Eng.6,
2606–2615. doi: 10.1016/j.jece.2018.04.003
Wang, L., Wang, W. Y., Mominou, N., Liu, L. X., and Li, S. Z. (2016). Ultra-
deep desulfurization of gasoline through aqueous phase in-situ hydrogenation
and photocatalytic oxidation. Appl. Catal. B Environ. 193, 180–188.
doi: 10.1016/j.apcatb.2016.04.032
Wu, H., Yang, Z., Liao, J., Lai, S., Qiu, J., Song, Z., et al. (2014).
Upconversion luminescence properties of three-dimensional ordered
macroporous CeO2:Er3+,Yb3+. J. Alloys Compd. 586, 485–487.
doi: 10.1016/j.jallcom.2013.10.124
Yang, Y., Lv, G., Li, J., Guo,W., and Zhang, Y. (2018). Synthesis of ceria nanorods as
adsorbent for the adsorption desulfurization of gasoline fuel. J. Alloys Compd.
747, 189–196. doi: 10.1016/j.jallcom.2018.03.026
Zeng, X., Xiao, X., Li, Y., Chen, J., and Wang, H. (2017). Deep desulfurization of
liquid fuels with molecular oxygen through graphene photocatalytic oxidation.
Appl. Catal. B Environ. 209, 98–109. doi: 10.1016/j.apcatb.2017.02.077
Zhang, G., Ren, J., Liu, B., Tian, M., Zhou, H., and Zhao, J. (2018). In situ
hydrothermal preparation and photocatalytic desulfurization performance
of metallophthalocyanine sensitized SnO2. Inorg. Chim. Acta 471, 782–787.
doi: 10.1016/j.ica.2017.12.025
Zhang, G., Wang, H., Guo, S., Wang, J., and Liu, J. (2016b). Synthesis
of Cu/TiO2/organo-attapulgite fiber nanocomposite and its photocatalytic
activity for degradation of acetone in air. Appl. Surf. Sci. 362, 257–264.
doi: 10.1016/j.apsusc.2015.11.218
Zhang, J., Chen, A., Wang, L., Li, X. A., and Huang, W. (2016a). Striving toward
visible light photocatalytic water splitting based on natural silicate clay mineral:
the interface modification of attapulgite at the atomic-molecular level. ACS
Sust. Chem. Eng. 4, 4601–4607. doi: 10.1021/acssuschemeng.6b00716
Zhang, J., He, R., and Liu, X. (2013). Efficient visible light driven
photocatalytic hydrogen production from water using attapulgite
clay sensitized by CdS nanoparticles. Nanotechnology 24:505401.
doi: 10.1088/0957-4484/24/50/505401
Zhao, H., Qiu, F., Yan, J., Wang, J., Li, X., and Yang, D. (2016). Preparation
of economical and environmentally friendly graphene/palygorskite/TiO2
composites and its application for the removal of methylene blue. Appl. Clay
Sci. 121–122, 137–145. doi: 10.1016/j.clay.2015.12.009
Zhuo, S., Shao, M., and Lee, S. T. (2012). Upconversion and downconversion
fluorescent graphene quantum dots: ultrasonic preparation and photocatalysis.
ACS Nano 6, 1059–1064. doi: 10.1021/nn2040395
Conflict of Interest Statement: The authors declare that the research was
conducted in the absence of any commercial or financial relationships that could
be construed as a potential conflict of interest.
Copyright © 2018 Wu, Li, Zhang, Zuo and Yao. This is an open-access article
distributed under the terms of the Creative Commons Attribution License (CC BY).
The use, distribution or reproduction in other forums is permitted, provided the
original author(s) and the copyright owner(s) are credited and that the original
publication in this journal is cited, in accordance with accepted academic practice.
No use, distribution or reproduction is permitted which does not comply with these
terms.
Frontiers in Chemistry | www.frontiersin.org October 2018 | Volume 6 | Article 477

ORIGINAL RESEARCH
published: 09 October 2018
doi: 10.3389/fchem.2018.00463
Frontiers in Chemistry | www.frontiersin.org October 2018 | Volume 6 | Article 463
Edited by:
Wenbo Wang,
Lanzhou Institute of Chemical Physics
(CAS), China
Reviewed by:
Xiazhang Li,
Changzhou University, China
Cláudia Gomes Silva,
Universidade do Porto, Portugal
Priyabrat Mohapatra,
C. V. Raman College of Engineering,
India
*Correspondence:
Guocheng Lv
Libing Liao
Specialty section:
This article was submitted to
Green and Sustainable Chemistry,
a section of the journal
Frontiers in Chemistry
Received: 30 July 2018
Accepted: 14 September 2018
Published: 09 October 2018
Citation:
Rao W, Lv G, Wang D and Liao L
(2018) Enhanced Degradation of Rh
6G by Zero Valent Iron Loaded on
Two Typical Clay Minerals With
Different Structures Under Microwave
Irradiation. Front. Chem. 6:463.
doi: 10.3389/fchem.2018.00463
Enhanced Degradation of Rh 6G byZero Valent Iron Loaded on TwoTypical Clay Minerals With DifferentStructures Under MicrowaveIrradiation
Wenxiu Rao, Guocheng Lv*, Danyu Wang and Libing Liao*
Beijing Key Laboratory of Materials Utilization of Nonmetallic Minerals and Solid Wastes, National Laboratory of Mineral
Materials, School of Materials Science and Technology, China University of Geosciences, Beijing, China
Nanoscale zero valent iron has been a widespread concern in various fields due to its
large specific surface area and high reactivity. However, nanoscale zero valent iron (nZVI)
is very likely to aggregate and be oxidized, which limit its wide application in industry.
Most clay minerals have a large adsorption capacity of cations due to their negative
charges and high specific surface areas. In the present work, nZVI was loaded onto
two typical clay minerals: kaolinite and sepiolite, to inhibit its oxidation and aggregation.
The composites were applied to degrade Rhodamine 6G (Rh 6G) under microwave
irradiation. The effects of pH value and microwave power on degradation were studied.
The results showed that the removal amount of Rh 6G by nZVI/kaolinite was 110 mg/g
in 15min, while it reached 300 mg/g by nZVI/sepiolite. The difference between these two
composites was mostly determined by the structures of these two clay minerals.
Keywords: nanoscale zero valent iron, kaolinite, sepiolite, microwave, Fenton-like reaction
INTRODUCTION
About 80% of the textile wastewater comes from the textile printing and dyeing industry everyyear, which is an industrial sector with large water consumption and high discharge of wastewater(Liu et al., 2017). Printing and dyeing wastewaters have the characteristics of large water volume,high chroma and high pollutant concentration (Zhao et al., 2010). Textile processing wastewatercontains a variety of contaminants. Direct discharge of the wastewater without treatment into riversand lakes would cause serious pollution to environment and bring a serious threat to the survivalof mankind (Kehinde and Aziz, 2016). However, the treatment of wastewater is extremely difficult,which made it necessary to develop new materials to process the wastewater (Liu et al., 2015).
Clay minerals are mainly composed of silicon, aluminum andmagnesium. They are inexpensiveand abundant in nature all over the world, and play an important role in environmental protectionand the development of new mineral materials (Kelm et al., 2003). Clay minerals have complexpore structures and high specific surface areas (Steudel et al., 2009). We want to load nZVI on clayminearls’ surface to make more sufficient contact with the solution. Kaolinite is a typical 1:1 layeredstructure, its lattice structure is very orderly, so there is basically no isomorphous substitution inits structure, resulting in poor swelling performance in water (Ezzatahmadi et al., 2017), sepiolitealso can’t spontaneously swell in water, therefore nZVI can only be supported on their surface.

Rao et al. nZVI/Clay Degraded Rh 6G
Graphical Abstract | nZVI/Clay’s synthesis process, surface topography and degradation performance of Rh 6G.
Kaolinite can be used to adsorb many organic pollutants,due to its special layered structure, such as congo red dye(Vimonses et al., 2009), heavy metals (Matłok et al., 2015) anddipalmitoyl lecithin (Jr et al., 1975). Sepiolite is a common 2:1chain layered type of clay mineral, composed of two layers ofsilicone tetrahedron and an intermediate layer of magnesiumoctahedron (Kaviratna, 1994). It can also adsorb numerousorganic pollutants, such as reactive blue 221 (Alkan et al., 2007),3-aminopropyltriethoxysilane (Demirbas et al., 2007) and β-carotene (Sabah et al., 2007).
Fenton reaction of degradation of organic dyes attractedconsiderable attention in recent years (Cheng et al., 2008), usingthe catalytic power of Fe2+ to generate highly reactive hydroxylradicals (HO•) to degrade organic dyes (Masomboon et al., 2010).However, Fenton reaction requires high concentrations of ironions (Yoon et al., 2001) and an acidic reaction environment (Liuet al., 2013), greatly increasing the cost of degradation of organicdyes. Fenton-like reaction can degrade organic dyes using nZVI(Xu and Wang, 2013), which can solve the problems causedby Fenton reaction mentioned above. nZVI can degrade manyorganic pollutants due to its special properties, such as 2,4-dichlorophenol (Li et al., 2018), trichloroethylene (TCE) (Kimet al., 2010), methylene blue (Yang et al., 2015). However, dueto the aggregation and oxidation of nZVI (Dong et al., 2017),the loading of nZVI onto clay minerals is expected to inhibit theaggregation and oxidation of nZVI.
It has been proven that microwave could accelerate the rate ofcatalytic reactions (Mochizuki et al., 2015; Bianchi et al., 2017).The aqueous solutions in the reaction systems can self-heat byabsorbing microwaves (Zhang and Liao, 2017), and the reactionrate can be greatly improved.
In the present work, nZVI was loaded onto kaolinite andsepiolite, respectively, and used to degrade Rh 6G undermicrowave irradiation. It was found that the removal amount of
Rh 6G by nZVI/sepiolite was greater than that of nZVI/kaolinite.The loading amount of nZVI on sepiolite was almost threetimes as that on kaolinite, which was mainly determined by thestructures of the clay minerals (Graphical Abstract).
EXPERIMENTAL
MaterialsIron (III) chloride hexahydrate (FeCl3·6H2O) and sodiumborohydride (NaBH4) were purchased from Beijing ChemicalWorkstation. Rh 6G was from Aladdin. All the chemicals wereof analytical grade. The sepiolite was obtained from SigmaAldrich, its BET area and average pore size are 319.4 m2/g and6.885 nm, respectively. The kaolinite was bought from ChinaKaolin Co, Ltd, its BET area and average pore size are 22m2/g and30.095 nm, respectively. All the chemicals andminerals were usedwithout further purification. All of the solutions were formulatedwith distilled water.
Synthesis of nZVI/Kaolinite and
nZVI/Sepiolite100mL distilled water, 5 g kaolinite (or sepiolite) and 10 gFeCl3·6H2O were added in a three-necked flask and stirred for12 h to load Fe3+ on clay minerals. Then 8 g NaBH4 was added,and stirred for another 30min under the protection of nitrogen atroom temperature. The suspension was centrifuged and washedwith ethanol for three times. The solid part was then freeze-dried.
Rh 6G Removal Experiment2,000mg Rh 6G was dissolved in 500mL distilled water andultrasonic for 15min to prepare 4,000 mg/L Rh 6G solution. Inbatch experiments, 0.1 g as prepared sample was added in 10mLRh 6G solution, then, the mixture was placed in a microwaveoven to degrade Rh 6G for a certain time under different
Frontiers in Chemistry | www.frontiersin.org October 2018 | Volume 6 | Article 463

Rao et al. nZVI/Clay Degraded Rh 6G
microwave power. After the degradation, the mixture wascentrifuged and the supernatant was filtered through 0.22μmsyringe filters before being taken to a UV-Vis spectrophotometerfor the analysis of equilibrium concentrations. In the cycle test,the used nZVI/clay was reduced by NaBH4 before the next trial.All experiments were run in duplicates.
CharacterizationsThe crystal diffraction data was determined by the X-raydiffractometer (Rigaku D/Max-IIIa X-ray diffractionmeter) witha CuKα-radiation at 30 kV and 20mA operating conditions.Angle ranged from 3 to 70◦ and the speed was 8◦ min−1 witha scanning step length of 0.01◦. Scanning electron microscopy(SEM) was used to record the surface morphology of the samples,carried out on a scanning electron microscope (JSM-IT300) withconditions at 30 kV and 10−4 Pa. The equilibrium concentrationof Rh 6G was determined by a UV-Vis spectrophotometer(UV2400/PC), the value of the absorption coefficient at 525 nm.The surface compositions of samples were tested by an X-rayphotoelectron spectrometer (K-Alpha), which can analyze thevalence of elements in samples, especially valence state of ironelement. The microwave network analyzer N5244A (Agilent)was used to analyze microwave absorption properties of flexibleabsorbing film. The frequency range was from 2 to 10 GHz.Automated gas sorption analyzer (Autosorb-iQ-2MP) was usedto analyze the specific surface area of the samples. Zeta potentialwas recorded by nanoparticle size potential analyzer (ZetasizerNano ZS90). The coaxial wire method was adopted for theanalysis.
RESULTS AND DISCUSSION
The composites were synthesized by liquid phase reducingmethod. The structures of nZVI, kaolinite, speioilte and the
composites were showed in Figure 1. The reflections at 2θ =
12.38◦ (Figure 1A), 7.58◦ (Figure 1B) corresponded to the (001)basal plane of kaolinite (JCPDS No. 89-6538) and the (001)basal plane of sepiolite (JCPDS No. 29-863), respectively. Thediffraction peak at 44.7◦ is attributed to the (110) basal plane
FIGURE 2 | SEM image of kaolinite (a), nZVI/kaolinite (b).
FIGURE 3 | SEM image of sepiolite (a), nZVI/sepiolite (b).
FIGURE 1 | X-ray diffraction patterns. Kaolinite, nZVI, and nZVI/kaolinite (A); Sepiolite, nZVI, and nZVI/sepiolite (B).
Frontiers in Chemistry | www.frontiersin.org October 2018 | Volume 6 | Article 463

Rao et al. nZVI/Clay Degraded Rh 6G
of Fe0 (JCPDS No. 06-0696). No obvious characteristic peaks ofiron oxides was founded in the nZVI/kaolinite or nZVI/sepiolite,indicating that nZVI was not oxidized or only a very small partwas oxidized during the synthesis process. Besides, the patternsof the composites stayed almost the same before and after theloading, suggesting that the structures of clay minerals not yetdestroyed, and nZVI is loaded on the surface of mineral materialrather than intercalated in this study.
The SEM results in Figures 2, 3 revealed the morphology ofthe minerals before and after the loading of nZVI. The lamellar
FIGURE 4 | Color changes of nZVI, nZVI/clay in water after a certain time: 0 h
(a), 12 h (b), 36 h (c), and 72 h (d).
structure of kaolinite was observed clearly. nZVI particles wereevenly distributed on the layers of kaolinite, within a size range of25–35 nm, indicating that the loading of nZVI on kaolinite couldsuppress the aggregation of nZVI effectively.
While loading onto sepiolite, most of the nZVI particles wereattached to the fibers within a size range of 20–45 nm.
Figure 4 showed the color changes of nZVI and nZVI/claycomposites after dispersed in water for different amounts of time.
The color of materials changed to black after the addition ofnZVI and nZVI/clay. As time went by, the color of both materialsbecome lighter gradually due to the oxidation of nZVI. However,nZVI/clay showed a better resistance to oxidation than nZVIas the color of nZVI suspension changed from black to yellowcompletely after 72 h while the color of nZVI/clay suspension juststarted to turn yellow after the same time. It indicated that onlya small portion of nZVI was oxidized after loading, which meansthat loading nZVI onto clay could effectively inhibit its oxidation.
The surface compositions of nZVI/kaolinite andnZVI/sepiolite and the valence state of Fe on its surface wereanalyzed by XPS technique. The survey spectrum of this samplewas shown in Figure 5A, proving that the composites containsiron elements. The fine spectrum of Fe 2p of nZVI/kaoliniteand nZVI/sepiolite contains four different peaks, as shown inFigure 5B. The peaks at binding energies of 705 and 720 eV couldbe assigned to the 2p3/2 and 2p1/2 peaks of Fe0 in nZVI/sepioliteand nZVI/kaolinite. The other two peaks at binding energies of713.5 and 726.5 eV could be attributed to the 2p3/2 and 2p1/2
FIGURE 5 | XPS survey spectrum of nZVI/kaolinite and nZVI/sepiolite (A). XPS fine spectrum of Fe 2p (B). Frequency dependence of nZVI/kaolinite and nZVI/sepiolite
of the dielectric loss (C) and magnetic loss (D).
Frontiers in Chemistry | www.frontiersin.org October 2018 | Volume 6 | Article 463

Rao et al. nZVI/Clay Degraded Rh 6G
peaks of Fe (III) in nZVI/sepiolite while 716 and 726 eV innZVI/kaolinite, indicating that a small part of Fe0 on the surfaceof the composite was oxidized to Fe (III).
The ability of a substance to absorb microwaves is mainlydetermined by its dielectric loss factor. A substance witha large dielectric loss factor usually has a strong ability toabsorb microwaves. On the contrary, a material with a smalldielectric loss factor has a weak ability to absorb microwaves.The dielectric loss (tan δe = ε′′/ε′) of nZVI/kaolinite andnZVI/sepiolite was analyzed by a microwave network analyzer(Figure 5C). The dielectric loss of nZVI/sepiolite was higherthan that of nZVI/kaolinite from 2 to 10 GHz. In addition,good microwave absorption performance also relate to magneticloss. The greater the magnetic loss, the better the microwaveabsorption performance. The magnetic loss (tan δμ = μ′′/μ′)of nZVI/sepiolite was higher than that of nZVI/kaolinite from2 to 10 GHz (Figure 5D). Therefore, nZVI/sepiolite had highermicrowave absorption properties than those of nZVI/kaolinite.
Table 1 presented the chemical compositions of differentmaterials. Kaolinite and sepiolite showed a slight difference iniron content. However, there was a significant difference in ironcontent between nZVI/kaolinite and nZVI/sepiolite, indicatingdifferent loadings of iron.
DEGRADATION OF RH 6G USING
NZVI/KAOLINITE AND NZVI/SEPIOLITE
nZVI can effectively degrade organic dyes through the followingFenton-like reactions. Fe0 was gradually oxidized to Fe3+ andgenerated hydroxyl radicals (HO•) and superoxide radicals(O·−
2 ), which were themain active ingredients for the degradationof Rh 6G.
O2 + Fe0 + 2H+ → Fe2+ +H2O2 (1)
Fe2+ +H2O2 → Fe3+ +HO · + OH− (2)
Fe2+ + O2 → O·−2 + Fe3+ (3)
The degradation ability of Rh 6G was reflected by the removalamount of Rh 6G under microwave irradiation by nZVI/kaoliniteand nZVI/sepiolite. The effect of pH on the degradation rateof Rh 6G was shown in Figure 6A. Both nZVI/kaolinite andnZVI/sepiolite showed higher degradation ability under acidicconditions, indicating that acidic conditions are more suitable.It was because that, under alkaline conditions, the generationof HO• and O·−
2 would be inhibited and Fe0 would reactwith OH− to form iron hydroxide. Meanwhile, H2O2 would
TABLE 1 | Chemical composition of kaolinite, nZVI/kaolinite, sepiolite, and
nZVI/sepiolite.
Si Al Fe K Ti Na Ca Mg
Kaolinite 21.65 18.93 0.347 0.637 0.323
nZVI/Kaolinite 18.60 16.87 9.02 0.518 0.268
Sepiolite 31.70 3.65 0.676 3.87 6.56 0.669 0.175
nZVI/Sepiolite 27.58 3.03 11.18 0.06 1.00 0.76 2.43
decompose rapidly when pH > 7. The effect of microwavepower on the degradation of Rh 6G by nZVI/kaolinite andnZVI/sepiolite was also investigated (Figure 6B). The removalamount of Rh 6G by nZVI/kaolinite and nZVI/sepiolite increaseswith the increase of microwave power, since the generationrate of HO• and O·−
2 are proportional to the microwavepower.
Figure 6C showed the degradation abilities of kaolinite,sepiolite, nZVI/kaolinite, nZVI/sepiolite and nZVI (sameamount with nZVI/kaolinite or nZVI/sepiolite). The removalamounts of Rh 6G by nZVI/sepiolite, nZVI/kaolinite, sepioliteand kaolinite in 15min were 300, 110, 52, and 22 mg/g,respectively. The removal amount of Rh 6G by nZVI/sepiolitewas better than that of sepiolite and kaolinite adsorption andnZVI/kaolinite degradation. It was possibly caused by the ironcontent of the materials. We prepared the same amount of nZVIas nZVI/sepiolite and nZVI/kaolinite, whose removal amount ofRh 6G are 243 and 84 mg/g, respectively, indicating that loadingnZVI on clay can increase the removal amount of Rh 6G. Thehigher the negative charge of the layer, the more favorable toadsorb cations. The zeta potentials of sepiolite and kaolinite are−17.4mV and −11.2mV, respectively. Therefore, more Fe3+
could be adsorbed onto sepiolite and be reduced to Fe0, whichcould generate more free radicals to degrade Rh 6G. In addition,the specific surface area of nZVI/sepiolite is higher than thatof nZVI/kaolinite, which could provide more reactive sitesfor the reaction. What’s more, compared with nZVI/kaolinite,the microwave absorption properties of nZVI/sepiolite werealso stronger. Without microwave irradiation, the removalamounts of Rh 6G by nZVI/sepiolite and nZVI/kaolinite were288 and 81 mg/g (Figure 6D), respectively. Although theremoval amount of Rh 6G was not significantly improved in thepresence of microwave, the equilibrium time decreased from 2 h(Figure 6D) to 15min (Figure 6C) with the irradiation of themicrowave, indicating the presence of microwave could greatlyaccelerate the reaction. Therefore, microwave is necessary in theprocess.
NaBH4 was used to reduce the Fe3+ loaded on the usedmaterial to Fe0 for the recycle of the composites to investigate therecycling performance of the materials (Figure 6E). There wasno significant change in the removal of Rh 6G after three cycles,suggesting that the composites could be reused for several times.We performed an inductively coupled plasma spectroscopy testto check iron leaching to the solution after each reaction, no ironleaching was found, indicating iron has good load stability onclay.
In order to prove the main active ingredient that degradesRh 6G are HO• and O·−
2 , the same molar concentrationsof indolepropionic acid (IPA), p-benzoquinone (PBQ),triethanolamine (TEOA) and silver nitrate (AgNO3) wereadded to solutions during the reaction (Figure 6F). It is well-known that IPA is a typical hydroxyl radical inhibitor and PBQis a typical superoxide radical inhibitor. The removal amountof Rh 6G dramatically dropped with the addition of these twoinhibitors, which indicated that HO• and O·−
2 were the mainactive ingredients for the degradation of Rh 6G by nZVI/claycomposites.
Frontiers in Chemistry | www.frontiersin.org October 2018 | Volume 6 | Article 463

Rao et al. nZVI/Clay Degraded Rh 6G
FIGURE 6 | Removal amount Rh 6G with different solution pH (A), microwave power (B), in the presence of different materials under microwave irradiation (C),
nZVI/sepiolite, and nZVI/kaolinite without microwave irradiation (D). Cycle stability test for nZVI/kaolinite and nZVI/sepiolite (E). Degradation percentages of Rh 6G with
different additives using nZVI/kaolinite, and nZVI/sepiolite under microwave irradiation (F).
CONCLUSION
In summary, the aggregation and oxidation of nZVI can beeffectively inhibited by loading nZVI on clay minerals. Whenthe composites were used to degrade Rh 6G under microwaveirradiation, nZVI/sepiolite exhibited better removal performancethan nZVI/kaolinite, due to the difference in iron loadingamount, which was caused by the difference in specific surfacearea and zeta potential. In addition, composites could be reusedfor several times after regeneration.With the addition of differenttypes of scavengers, it was demonstrated that HO• and O·−
2 werethe main active ingredients in the degradation of Rh 6G. It will bea very promising method for future use of nZVI by loading nZVIon clay minerals.
AUTHOR CONTRIBUTIONS
WR and GL conceived the project. GL and LL designed andperformed the experiments. DW analyzed the data. WR and GLwrote the manuscript.
ACKNOWLEDGMENTS
This research was supported by the National Key R&DProgram of China (2017YFB0310704, 2017YFE0107000),National Natural Science Foundation of China (51604248)
and Fundamental Research Funds for the Central Universities(2652017338).
Frontiers in Chemistry | www.frontiersin.org October 2018 | Volume 6 | Article 463

Rao et al. nZVI/Clay Degraded Rh 6G
REFERENCES
Alkan, M., Demirbas, Ö., and Dogan, M. (2007). Adsorption kinetics and
thermodynamics of an anionic dye onto sepiolite. Microporous Mesoporous
Mater. 101, 388–396. doi: 10.1016/j.micromeso.2006.12.007
Bianchi, C., Bonato, P., Dughiero, F., and Canu, P. (2017). Enhanced power density
uniformity for microwave catalytic reactions adopting solid-state generators:
comparison with magnetron technology. Chem. Eng. Process. Process Int. 120,
286–300. doi: 10.1016/j.cep.2017.07.006
Cheng, M. M., Song, W. J., Ma, W. H., Chen, C. C., Zhao, J. C., Lin, J., et al.
(2008). Catalytic activity of iron species in layered clays for photodegradation
of organic dyes under visible irradiation. Appl. Catal. B Environ. 77, 355–363.
doi: 10.1016/j.apcatb.2007.08.006
Demirbas, O., Alkan, M., Dogan, M., Turhan, Y., Namli, H., and Turan, P.
(2007). Electrokinetic and adsorption properties of sepiolite modified
by 3-aminopropyltriethoxysilane. J. Hazard Mater. 149, 650–656.
doi: 10.1016/j.jhazmat.2007.04.036
Dong, H. R., Zhang, C., Hou, K. J., Cheng, Y. J., Deng, J. M., Jiang, Z.,
et al. (2017). Removal of trichloroethylene by biochar supported nanoscale
zero-valent iron in aqueous solution. Sep. Purif. Technol. 188, 188–196.
doi: 10.1016/j.seppur.2017.07.033
Ezzatahmadi, N., Ayoko, G. A., Millar, G. J., Speight, R., Yan, C., Li, J. H., et al.
(2017). Clay-supported nanoscale zero-valent iron composite materials for the
remediation of contaminated aqueous solutions: a review. Chem. Eng. J. 312,
336–350. doi: 10.1016/j.cej.2016.11.154
Jr, W. E. W., Headley, L. C., and Weber, K. C. (1975). Dipalmitoyl lecithin
surfactant adsorption by kaolin dust in vitro. J. Colloid Interf. Sci. 51, 535–537.
doi: 10.1016/0021-9797(75)90152-6
Kaviratna, H. (1994). Acid Hydrolysis of Octahedral Mg2+ sites in 2:1 layered
silicates: an assessment of edge attack and gallery access mechanisms. Clays
Clay Miner. 42, 717–723. doi: 10.1346/CCMN.1994.0420607
Kehinde, F. O., and Aziz, H. A. (2016). Classical optimization of process variables
in the treatment of real textile wastewater using clinoptilolite. J. Environ. Chem.
Eng. 4, 1242–1247. doi: 10.1016/j.jece.2015.08.019
Kelm, U., Sanhueza, V., andGuzman, C. (2003). Filtration and retention ofmineral
processing slurries with pumice and common clay: low-cost materials for
environmental applications in the small-scale mining industry. Appl. Clay Sci.
24, 35–42. doi: 10.1016/j.clay.2003.07.004
Kim, H., Hong, H. J., Jung, J., Kim, S. H., and Yang, J. W. (2010).
Degradation of trichloroethylene (TCE) by nanoscale zero-valent iron
(nZVI) immobilized in alginate bead. J. Hazard Mater. 176, 1038–1043.
doi: 10.1016/j.jhazmat.2009.11.145
Li, G., Xu, Q. Y., Jin, X. Y., Li, R. C., Dharmarajan, R., and Chen, Z. L. (2018).
Enhanced adsorption and Fenton oxidation of 2,4-dichlorophenol in aqueous
solution using organobentonite supported nZVI. Sep. Purif. Technol. 197,
401–406. doi: 10.1016/j.seppur.2018.01.032
Liu, H. B., Gao, S. S., and Zhu, M. L., Chen, P., and Pan, D. (2015). Use of
manganese/silicon tailing waste for coking wastewater treatment: evaluation of
phenol and phenylamine removal efficiencies. Water Air Soil Pollut. 226, 1–9.
doi: 10.1007/s11270-015-2303-z
Liu, M., Shadbegian, R., and Zhang, B. (2017). Does environmental
regulation affect labor demand in China? Evidence from the textile
printing and dyeing industry. J. Environ. Econ. Manage. 86, 277–294.
doi: 10.1016/j.jeem.2017.05.008
Liu, S. T., Huang, J., Ye, Y., Zhang, A. B., Pan, L., and Chen, X. G.
(2013). Microwave enhanced fenton process for the removal of
methylene blue from aqueous solution. Chem. Eng. J. 215–216, 586–590.
doi: 10.1016/j.cej.2012.11.003
Masomboon, N., Ratanatamskul, C., and Lu, M. C. (2010). Mineralization of
2,6-dimethylaniline by photoelectro-fenton process. Appl. Catal. A Gen. 384,
128–135. doi: 10.1016/j.apcata.2010.06.012
Matłok, M., Petrus, R., and Warchoł, J. K. (2015). Equilibrium study of
heavy metals adsorption on Kaolin. Ind. Eng. Chem. Res. 54, 6975–6984.
doi: 10.1021/acs.iecr.5b00880
Mochizuki, D., Sasaki, R., Maitani, M. M., Okamoto, M., Suzuki, E., and Wada,. Y.
(2015). Catalytic reactions enhanced under microwave-induced local thermal
non-equilibrium in a core–shell, carbon-filled zeolite@zeolite. J. Catal. 323, 1–9.
doi: 10.1016/j.jcat.2014.12.003
Sabah, E., Cinar, M., and Celik, M. S. (2007). Decolorization of vegetable oils:
adsorption mechanism of β-carotene on acid-activated sepiolite. Food Chem.
100, 1661–1668. doi: 10.1016/j.foodchem.2005.12.052
Steudel, A., Batenburg, L. F., Fischer, H. R., Weidler, P. G., and Emmerich, K.
(2009). Alteration of non-swelling clay minerals and magadiite by acid
activation. Appl. Clay Sci. 44, 95–104. doi: 10.1016/j.clay.2009.02.001
Vimonses, V., Lei, S. M., Jin, B., Chow, C. W. K., and Saint, C. (2009). Adsorption
of congo red by three Australian kaolins. Appl. Clay Sci. 43, 465–472.
doi: 10.1016/j.clay.2008.11.008
Xu, L., and Wang, J. (2013). Degradation of 4-chloro-3,5-dimethylphenol by a
heterogeneous fenton-like reaction using nanoscale zero-valent iron catalysts.
Environ. Eng. Sci. 30, 294–301. doi: 10.1089/ees.2012.0025
Yang, B., Tian, Z., Zhang, L., Guo, Y. P., and Yan, S. Q. (2015). Enhanced
heterogeneous fenton degradation of methylene blue by nanoscale zero
valent iron (nZVI) assembled on magnetic Fe3O4/reduced graphene
oxide. J. Water Process Eng. 5, 101–111. doi: 10.1016/j.jwpe.2015.
01.006
Yoon, J., Lee, Y., and Kim, S. (2001). Investigation of the reaction pathway
of OH radicals produced by fenton oxidation in the conditions of
wastewater treatment. Water Sci. Technol. 44, 15–21. doi: 10.2166/wst.2001.
0242
Zhang, Z., and Liao, X. (2017). Microwave design and analysis of a micromachined
self-heating power sensor based on matching thermocouples. J. Micromech.
Microeng. 27:085002. doi: 10.1088/1361-6439/aa780a
Zhao, K., Zhao, G., Li, P., Gao, J., Lv, B., and Li, D. (2010). A novel method
for photodegradation of high-chroma dye wastewater via electrochemical
pre-oxidation. Chemosphere 80, 410–415. doi: 10.1016/j.chemosphere.2010.
04.019
Conflict of Interest Statement: The authors declare that the research was
conducted in the absence of any commercial or financial relationships that could
be construed as a potential conflict of interest.
Copyright © 2018 Rao, Lv, Wang and Liao. This is an open-access article distributed
under the terms of the Creative Commons Attribution License (CC BY). The
use, distribution or reproduction in other forums is permitted, provided the
original author(s) and the copyright owner(s) are credited and that the original
publication in this journal is cited, in accordance with accepted academic practice.
No use, distribution or reproduction is permitted which does not comply with these
terms.
Frontiers in Chemistry | www.frontiersin.org October 2018 | Volume 6 | Article 463

ORIGINAL RESEARCH
published: 19 December 2018
doi: 10.3389/fchem.2018.00635
Frontiers in Chemistry | www.frontiersin.org December 2018 | Volume 6 | Article 635
Edited by:
Wenbo Wang,
Lanzhou Institute of Chemical Physics
(CAS), China
Reviewed by:
Yushan Liu,
Zhengzhou University, China
Yuqi Li,
Guilin University of Technology, China
*Correspondence:
Dajian Huang
Specialty section:
This article was submitted to
Green and Sustainable Chemistry,
a section of the journal
Frontiers in Chemistry
Received: 29 June 2018
Accepted: 07 December 2018
Published: 19 December 2018
Citation:
Huang D, Zhang Z, Ma Z and Quan Q
(2018) Effect of Natural
Nanostructured Rods and Platelets on
Mechanical and Water Resistance
Properties of Alginate-Based
Nanocomposites.
Front. Chem. 6:635.
doi: 10.3389/fchem.2018.00635
Effect of Natural NanostructuredRods and Platelets on Mechanicaland Water Resistance Properties ofAlginate-Based Nanocomposites
Dajian Huang*, Zhuo Zhang, Zonghong Ma and Qiling Quan
School of Materials Science and Engineering, Lanzhou Jiaotong University, Lanzhou, China
A series of biopolymer-based nanocomposite films were prepared by incorporating
natural one-dimensional (1D) palygorskite (PAL) nanorods, and two-dimensional (2D)
montmorillonite (MMT) nanoplatelets into sodium alginate (SA) film by a simple solution
casting method. The effect of different dimensions of nanoclays on the mechanical, water
resistance, and light transmission properties of the SA/PAL or MMT nanocomposite films
were studied. The field-emission scanning electron microscopy (FE-SEM) result showed
that PAL can disperse better than MMT in the SA matrix in the case of the same addition
amount. The incorporation of both PAL and MMT into the SA film can enhance the
tensile strength (TS) and water resistance capability of the film. At a high content of
nanoclays, the SA/PAL nanocomposite film shows relatively higher TS, and better water
resistance than the SA/MMT nanocomposite film. The SA/MMT nanocomposite films
have better light transmission than SA/PAL nanocomposite film at the same loading
amount of nanoclays. These results demonstrated that 1D PAL nanorods are more
suitable candidate of inorganic filler to improve the mechanical and water resistance
properties of biopolymers/nanoclays nanocomposites.
Keywords: palygorskite, montmorillonite, bionanocomposite films, sodium alginate, mechanical strength, water
resistance
INTRODUCTION
Over the past decades, the commodity plastics (i.e., polyethylene, polypropylene, and polyethyleneterephthalate) as commonly used food packaging materials have plaid very important roles inhuman daily production. However, these plastic packaging materials are totally non-biodegradable,so their widespread use caused serious environmental pollution problems (Souza et al., 2017;Costa et al., 2018; Salama et al., 2018). Therefore, the development of biodegradable films usingnatural, non-toxic, and environment benign polymers such as polysaccharides, proteins, and lipidshas drawn much more attention in both of academic and industrial areas (Mushi and Berglund,2014; Wang and Jing, 2017; Youssef and El-Sayed, 2018). Among numerous biodegradable naturalpolymers, sodium alginate (SA) was especially concerned owing to its excellent biocompatibility,film-forming ability, and active functional groups (Shankar et al., 2016; Fabra et al., 2018). SA isan anionic natural biomacromolecule, which is composed of poly-b-1, 4-D-mannuronic acid (Munits), and a 1, 4-L-glucuronic acid (G units) in different proportions by 1–4 linkages. It is extractedfrom marine algae or produced by bacteria, and so it has the advantages including abundance,

Huang et al. Sodium Alginate/Clay Nanocomposites
renewability, non-toxicity, water-solubility, biodegradability, andbiocompatibility (Wang andWang, 2010). However, the inherenthydrophilicity and brittleness of neat SA films limited theirapplications in film materials (Rhim, 2004; Zhang et al., 2017).
In order to overcome the drawbacks of neat SA films, avariety of nanoscale particles such as montmorillonite (MMT)(Tunç and Duman, 2010; Zlopasa et al., 2015), grapheneoxide (Liu et al., 2017), and cellulose nanocrystals (Sirvioet al., 2014) have been incorporated into the SA matrix tofabricate a nanocomposite. Abdollahi et al. (2013) developedan alginate/MMT nanocomposite by a solvent casting method,and found that the mechanical properties of the alginate/MMTcomposites were enhanced significantly after the addition ofMMT. However, MMT forms an agglomeration in the polymermatrix when its addition amount exceeds a certain value, whichleads to the decrease of the mechanical properties of the film.It has been shown that MMT is a 2:1-type layered clay mineralwith a sandwiched structure composed of two 2D platelets andinterlayer cations (i.e., Na+, Ca2+, Mg2+). The strong hydrogen-binding and electrostatic interaction, and van der Waals forcesbetween two platelets make MMT difficult to be exfoliated andtend to be present in a form of agglomeration (Zhang et al., 2014;Block et al., 2015; Liu et al., 2016). In comparison, natural 1Drod-like nanoclays are easy to be dispersed as nanoscale size, andshowed great potential to be used to develop polymer/nanoclayscomposites (Nikolic et al., 2017; Ajmal et al., 2018; Shankaret al., 2018; Zhang P. et al., 2018). It has been demonstratedthat the dispersion of nanoclays in polymer matrix, and thecomprehensive performance of the resultant polymer compositesexhibited interesting dependence on the shape of fillers. Usually,rod-like nanoclays have a relatively smaller contact surface andweaker interaction amount rods, so that they could probablybe dispersed in the polymer matrix well with less aggregation(Bilotti et al., 2009). Palygorskite (PAL) is a naturally available1D nanorod-like silicate clay mineral (Deng et al., 2012; Zhanget al., 2018b). It consists of two double chains of the pyroxene-type (SiO3)
2− like amphibole (Si4O11)6− running parallel to
the fiber axis (Gard and Follett, 1968; Zhu et al., 2016; Zhanget al., 2018a). PAL is a potential filler to fabricate polymercomposite due to its unique advantages, such as high aspectratio, large specific surface area, good thermal stability, and highmodulus (Huang et al., 2012; Ruiz-Hitzky et al., 2013; Dinget al., 2019). It has been confirmed that the incorporation ofsilylated PAL into the polyurethanematrix improved significantlythe thermal stability and mechanical properties of polyurethane(Peng et al., 2011). In addition, 1D fibrous nanoclay hasrelatively higher density of silanol groups on its surface than2D layered silicates, making it able to form more hydrogenbonds with hydrophilic biopolymers (Alcantara et al., 2014). Sofar, the studies on the comparison of 1D and 2D nanoclaysin fabricating SA/nanoclays nanocomposites still received lessattention.
In this paper, we have prepared a series of SA/nanoclaysnanocomposite film using 1D PAL and 2D MMT as theinorganic ingredients, and studied the effect of differentdimensions of nanoclays on the structure, organic/inorganicinterface interaction and the mechanical, water resistance, light
transmission properties of the films. The potential of 1D PALnanorods and 2DMMT for fabricating SA-based nanocompositefilm was also assessed by a systematic comparative study.
EXPERIMENT SECTION
MaterialsSA [characteristic viscosity of 1% aqueous solution at 20 ◦C≥0.02 Pa•s, mannuronic (M) acid/guluronic (G) acid ratio= 65/35, molecular weight ≈120,000 g/mol] was purchasedfrom Sinopharm Chemical Reagent Co., Ltd. (Shanghai, China).Glycerol was obtained from Guangdong Guanghua ChemicalFactory Co., Ltd. (Guangdong, China). MMT was purchasedfrom Zhejiang Fenghong New Material Co., Ltd. (Zhengjiang,China). PAL was purchased fromChangzhouDingbang Clay Co.,Ltd (Jiangsu, China).
Preparation of SA/PAL and SA/MMT
Nanocomposite FilmsThe SA, SA/PAL, and SA/MMT films were prepared by a solutioncasting method. The aqueous solution containing 2 wt.% of SAwere prepared by dissolving SA powder into distilled water under
FIGURE 1 | XRD patterns of (A) PAL, SA film, and SA/PAL nanocomposite
films; and of (B) MMT and SA/MMT nanocomposite films.
Frontiers in Chemistry | www.frontiersin.org December 2018 | Volume 6 | Article 635

Huang et al. Sodium Alginate/Clay Nanocomposites
mechanical stirring for 24 h. Then, glycerol (40 w/w% of themass of SA) as a plasticizer was added into the SA solution,and the mixture was stirred continuously at 600 rpm to obtaina homogeneous solution. PAL or MMT dispersions (2 wt.%)were prepared by dispersing given amounts of clays in distilledwater under mechanical agitation at 600 rpm for 1 h at roomtemperature. Afterward, the obtainedmixture was dispersed withthe aid of ultrasound equipment operating at 40 kHz for 10min.The obtained dispersion of PAL or MMT was added to the SAsolutions (the amount of clays is 2, 4, 6, 8, and 10 wt.% of themass of SA) to form a precursor solution for film-forming. Then,the resultant mixture solutions were poured into the PS dishes(9 cm diameter) and evaporated at atmosphere for 72 h. Afterdrying, the films were peeled off from the plate surface and thenkept in a conditioning cabinet with the relative humidity (RH)of 53% for further treatments. The neat SA film was preparedaccording to a similar procedure without the addition of PAL orMMT.
FIGURE 2 | ATR-FTIR spectra of (A) neat SA film, (B) SA/PAL2, (C) SA/PAL6,
(D) SA/PAL10, (E) SA/MMT2, (F) SA/MMT6, and (G) SA/MMT10.
Test of Mechanical PropertiesThe tensile performance of the film with length of 80mm andwidth of 10mm was studied using an AG-IS material testingmachine (Shimadzu Co., Ltd., Japan). A 200N load cell was used,and the strain rate was 10 mm/min. Samples were studied in eachtest and all tests occurred at room temperature. The averages oftensile strength and elongation at break of five specimens of eachfilm were taken and presented.
Test of Moisture UptakeThe moisture uptake (MU) was measured by cutting the filmsamples into small pieces (2 × 2 cm). The samples were driedat 70◦C for 24 h. After the samples were weighed (W0), theywere conditioned for 72 h at 76% RH (saturated NaCl solution)to ensure equilibrium of the moisture before reweighing (W1).
MU of the samples was calculated as follows:
MU = [W1 −W0]/W0×100% (1)
An average value of five replicates for each sample was taken.
CharacterizationsThe crystalline structure of samples was characterized with anX-ray diffractometer (Philips, X’pert PRO, The Netherland),with the Cu Ka radiation at 40 kV and 30mA. The diffractionpatterns were collected in reflection mode by scanning the2θ range from 5◦ to 30◦, with a scan speed of 6◦/min. AFTIR Spectrophotometer (Thermo Nicolet, NEXUS 670, USA)was employed to record the Infrared spectra of films with theattenuated total reflectance (ATR) model in the range of 4,000–500 cm−1. The surface morphology of samples was observed witha JEOL JSM-6701F microscope after the samples were coatedwith gold. The films for test were immersed in liquid nitrogenand cryo-fractured manually. TEM images of samples were takenwith a TECNAIG2-F30 Transmission electron microscope (FEI,USA). Light transmission of films was measured with a UV–vis spectrophotometer [N4, INESA (Group) Co., Ltd, China] atselected wavelengths between 200 and 600 nm.
FIGURE 3 | SEM and TEM micrographs of PAL and SEM micrograph of MMT.
Frontiers in Chemistry | www.frontiersin.org December 2018 | Volume 6 | Article 635

Huang et al. Sodium Alginate/Clay Nanocomposites
FIGURE 4 | SEM micrographs of the cross-sections of SA/PAL nanocomposite films: neat SA films (A,B), SA/PAL (4 wt.%) (C,D), SA/PAL (6 wt.%) (E,F), and SA/PAL
(10 wt.%) (G,H).
Frontiers in Chemistry | www.frontiersin.org December 2018 | Volume 6 | Article 635

Huang et al. Sodium Alginate/Clay Nanocomposites
RESULTS AND DISCUSSION
XRD AnalysisAs shown in Figure 1, no sharp diffraction peaks were observed
in the XRD patterns of SA/glycerol films (Figure 1A), indicating
that neat SA film shows no crystalline state and the polymerchains are arranged randomly. The neat PAL showed the
diffraction peak at 2θ = 8.4◦, ascribed to the characteristic
reflection of (110) crystallographic plane (Figure 1A) (Xu et al.,2017). The diffraction peak of (110) plane of PAL (2θ = 8.4) wasobserved in the XRD pattern of SA/PAL nanocomposite films.
The position of (110) diffraction peak has not been changed, but
the peak intensity increased with increasing the loading amountof PAL in the SA/PAL film. This result indicated that SA polymer
chains cannot enter the tunnel to cause the change of the crystalstructure of PAL, which is in good agreement with previous
reports (Peng et al., 2011; Huang et al., 2012). Different fromsmectite, PAL has a layer-chain structure in which the structureunit composed of continuous tetrahedrons and discontinuousoctahedrons are very stabile and cannot be intercalated orexfoliated, so the crystal structure, and morphology of PAL canremain well after forming nanocomposite.
The XRD patterns of MMT and the SA/MMT nanocompositefilms with different loading amount of MMT are presented inFigure 1B. An intense diffraction peak at 2θ = 7.06◦ (basalspacing is 1.25 nm), ascribed to the characteristic reflection of(001) crystalline plane of MMT, was observed in the XRD patternof MMT. The characteristic reflection of MMT has not beenobserved in the XRD pattern of SA/MMT when the contentof MMT is 2 wt.%, indicating MMT was exfoliated after itscomposite with SA polymer chains at a relatively lower MMTloading amounts. When the loading amount of MMT increased
FIGURE 5 | SEM images of the surface of SA/MMT nanocomposite films: SA/MMT (2 wt.%) (A,B), SA/MMT (6 wt.%) (C,D), and SA/MMT (10 wt.%) (E,F).
Frontiers in Chemistry | www.frontiersin.org December 2018 | Volume 6 | Article 635

Huang et al. Sodium Alginate/Clay Nanocomposites
FIGURE 6 | (A) MU of the SA/PAL and SA/MMT nanocomposite films with different loadings of nanoclays and (B) Schematic illustration of the presence of PAL or
MMT in the SA matrix.
to 6 and 10 wt.%, the diffraction peak of MMT shifted from7.06◦ to 5.28◦ and 5.02◦, respectively. These results indicated thatsome SA polymer chains were intercalated into the interlayerspace of MMT (Majdzadeh-Ardakani and Nazari, 2010), formingan intercalated-exfoliated nanocomposite structure at relativelyhigher contents of MMT (Nagarajan et al., 2015).
FTIR AnalysisThe incorporation of PAL or MMT into SA matrix was evaluatedby ATR-FTIR analysis of films, because the vibrations andshifts of the FTIR absorption bands may reflect the interactionsbetween SA and nanoclays. The ATR-FTIR spectra of the SA andSA/PAL or SA/MMTnanocomposite films are shown in Figure 2.As shown in Figure 2A, the absorption bands of neat SA filmat 3,256, 1,600 and 1,410, 1,020 cm−1 can be attributed to theO-H stretching vibration, the COO symmetric, and asymmetricstretching vibration of carboxylate groups, and the C-O-Cstretching vibration (Tezcan et al., 2012). After introducing PALor MMT into the SA matrix, the absorption band at 3,256cm−1 shifted to low wavenumber region (Figures 2B–G), whichconfirmed there are strong interaction between SA and PAL orMMT, and the incorporation of PAL or MMT partially break thethe hydrogen bonding between SA and glycerol, and formed newhydrogen bonding between SA chains and PAL or MMT (Huanget al., 2004; Liu M. et al., 2012). A similar tendency has also beenobserved in the CS/PVA/PAL composite film (Huang et al., 2012).
Micrographs of PAL, MMT, and
Corresponding CompositesFigure 3 showed the SEM and TEMmicrographs of PAL and theFESEM image of MMT used in this study. It can be seen fromthe SEM and TEM images of PAL that the PAL shows good rod-like shape with a diameter of 30–70 nm, and a length of about0.3–1.5μm. The rods are slightly aggregated together to form aloose bundle. TheMMT exhibits a platelet-like shape, but most of
the lamellae of MMT stacked together without presence of singleMMT layers.
The dispersion of the PAL or MMT in the SA matrixwas also studied by SEM observation. The SEM images(magnifications ×5,000 and ×20,000) of the cross-section ofSA/PAL nanocomposites with the PAL loading of 0, 2, 6, and 10wt.% are shown in Figure 4, respectively. The fracture surfaceof neat SA film showed a glossy and ordered morphology,indicating the neat SA film has homogeneous microstructure,and the SA and glycerol are compatible very well. All the SA/PALnanocomposites showed much rougher fractured surfaces incomparison with SA film. The bright dots observed in theSEM image of the nanocomposites indicated that the PAL rodsembedded within the SA matrix very well. The number of thebright dots reflecting a well-dispersion of inorganic componentsincreased with increasing the loading amount of PAL. ThePAL has a well-dispersion in the SA matrix without obviousagglomeration, indicating a good compatibility between SAmatrix and PAL. The well-dispersion of PAL in the SA matrixcan be ascribed to the following reasons. First, the 1D nanorod-like feature of PAL and the relatively weaker interaction amongrods allowed them easy to be dispersed in polymer matrix underthe action of shear forces. Secondly, PAL can interact with SAvia hydrogen bonding interactions, which is also helpful to stripeffectively the crystal bundles as individually dispersed nanorods.In addition, the good compatibility between PAL and SA matrixalso indicated a strong matrix-filler interfacial adhesion, whichfacilitates to enhance the mechanical properties of the resultingSA/PAL composite films.
Figure 5 showed the SEMmicrographs of the cross-section ofSA/MMT nanocomposite films with the MMT loading amountsof 2, 6, and 10 wt.% at different magnifications (×5,000 and×20,000). Compared with the neat SA film, the cross-sectionof SA/MMT nanocomposite films is more rough and unevenin varying degrees. The roughness degree of cross-section ofSA/MMT films increased with increasing the loading amount of
Frontiers in Chemistry | www.frontiersin.org December 2018 | Volume 6 | Article 635

Huang et al. Sodium Alginate/Clay Nanocomposites
MMT, owing to the platelet-shaped structure of MMT. It canbe seen that the MMT platelets were directionally stacked anddensely packed with SA matrix, forming a laminated structure(Figure 5D). When the loading amount of MMT increased to10%, the cross-section of SA/MMT nanocomposite film becomeslooser owing to the agglomeration of MMT in the SA matrix,which may have a negative impact on the performance of thecomposites. From Figures 4, 5 it can be seen that PAL hasrelatively better dispersion than MMT in the SA matrix at highloading amounts (6 and 10 wt.%). This behavior may be becausethat the interactions among PAL rods are relatively weaker thanthe interaction between the nanoplatelets of MMT (Lu et al.,2005; Liu M. X. et al., 2012).
Moisture Uptake (MU)MU capability of the SA/PAL and SA/MMT was measured tostudy the effect of the nanoclays on the water-resistant propertiesof the SA films. As shown in Figure 6A, The MU of neat SA filmwas higher than that of SA/PAL and SA/MMT nanocomposites,indicating that the introduction of PAL or MMT can inhibitthe penetration of water molecules into the film, and decreasethe MU of the nanocomposite films (Almasi et al., 2010). Thisreduction of MU is because that PAL and MMT are able toform hydrogen bonding networks with SA matrix, increase thesurface roughness of film, and block the diffusion pathway ofwater molecules, which decreased the water sensitivity of thenanocomposites (Wu et al., 2009; Almasi et al., 2010; Bidsorkhiet al., 2014). In addition, the hydrophilicity of PAL or MMT isweaker than that of neat SA matrix, so the incorporation of PALor MMT is favorable to reduce the MU.
In comparison, the PAL has a relatively better effect thanMMT on reducing the MU of SA film. The total MU of SA filmreduced about 12.9% after the incorporation of 10 wt.% PAL,which was higher than that of SA/MMT10 (MU only reduced8.1%). This can be attributed to the fact that PAL has a betterdispersion than MMT in the SA matrix at high loadings ofnanoclays (see Figure 6B). The good dispersion of PAL nanorodin SA matrix enable it to form more stable and dense hydrogenbond networks with the hydroxyl groups of SA than MMT(little agglomeration in SA matrix) at the same loading amounts.In addition, SA/MMT nanocomposites had a relatively loosersurface structure than SA/PAL nanocomposites at the sampleloading amount of 10 wt.%, which enable them to absorb easilymore water molecules.
Mechanical Performance of SA/PAL and
SA/MMT NanocompositesThe effect of PAL and MMT addition on mechanical propertiesof SA film was studied by a tensile testing experiment. As shownin Figure 7A, the addition of PAL or MMT has great influenceon the tensile strength of nanocomposites. The tensile strength(TS) of SA/PAL nanocomposites increased by 84.56% (from13.67 to 25.23 MPa) with an increase of PAL loading amountfrom 0 to 10 wt.%. This obvious improvement of TS of SA/PALcan be ascribed to the homogenous dispersion of PAL in SAmatrix and the strong hydrogen bonding interaction between thesilanol groups of PAL and the –OH or –COOH groups of SA.
FIGURE 7 | TS (A) and EB (B) of SA/PAL and SA/MMT nanocomposites with
different contents of nanoclays.
In addition, the high aspect ratio of PAL was also favorable tothe stress transfer when the film was subject to be stretched. Thesimilar results were observed in other PAL nanorod-reinforcedpolymers (Chen et al., 2012; Liu et al., 2014).
The TS of SA/MMT increased initially, reached the optimalvalue at the MMT content of 6 wt.%, and then decreased with theincrease of addition amounts of MMT. The TS of nanocompositefilms increased by 82.96% in contrast to the SA films. The TSof nanocomposites decreased when the MMT loading amount islarger than 6 wt.%. This tendency is ascribed to the aggregation ofMMT in the SA matrix, as confirmed by SEM and XRD analysisresults. The similar behavior was also observed by previousresearch result that the tensile strength of gelatin/MMT filmsdecreased after adding 5% of MMT due to a loss in the qualityof MMT dispersion in the gelatin matrix (Flaker et al., 2015).
Figure 7B showed the elongation at breakage (EB) of SAfilm, SA/PAL, and SA/MMT nanocomposite films. The EB ofnanocomposites showed a decreasing trend with the increase ofthe loading amounts of PAL or MMT. This reduction of EB of
Frontiers in Chemistry | www.frontiersin.org December 2018 | Volume 6 | Article 635

Huang et al. Sodium Alginate/Clay Nanocomposites
FIGURE 8 | Light transmission properties of SA film, SA/PAL, and SA/MMT nanocomposite films with different contents of nanoclays.
SA/PAL and SA/MMT nanocomposite films can be attributed tothe fact that the inclusion of rigid clay restricted the motion ofSA molecular chains in the matrix. Peng et al. (2011) confirmedthat the EB of the waterborne polyurethane/PAL nanocompositedecreased with the increase of PAL loading amount. Slavutskyet al. (2014) also proved the EB of brea gum/MMT compositesdecreased with increasing the MMT content.
Light Transmission and TransparencyThe light transmission of neat SA film, SA/PAL, and SA/MMTnanocomposite films as a function of wavelength is shown inFigure 8. The transmittance of SA film is about 87% at 600 nm(visible region), but it decreased slightly with the increase ofPAL or MMT contents. This decrease was possibly related to thepresence of PAL or MMT nanoparticles, because light would beabsorbed partly by clay nanoparticles, leading to the decrease ofenergy of transmitted light. This result is similar to the previousfindings that the light transmittance of pure polyimide film at800 nm sharply decreased by incorporating 7 wt.% of PAL (Anet al., 2008). Slavutsky et al. (2014) also found that the lighttransmission of brea gum/MMT composite films decreased afterincorporation of MMT.
In addition, the light transmittance of SA/PALnanocomposites is slightly lower than that of SA/MMTnanocomposites at the same addition amount. The lighttransmittance of the nanocomposites with addition of 10 wt.%PAL and 10 wt.% MMT at 600 nm was about 67 and 75%,respectively. This result may be due to the diameter of PALnanorods (50–100 nm) is higher than the thickness of MMTnanoplatelets (about 1 nm) (Ge et al., 2015). Thus, the PALobstructed the transmission of light more significantly thanMMT.
CONCLUSIONS
The effects of 1D PAL nanorods and 2D MMT nanoplateletson the mechanical, water resistance, and light transmissionproperties of the SA/PAL and SA/MMT nanocomposites werestudied by a comparative study. It was revealed that PAL canenhance the mechanical and water resistance properties ofSA/PAL nanocomposites better than MMT, because the 1D PALhas better dispersion than 2D MMT in the SA matrix at thesame loading amounts. As a result of it, the TS of SA filmincreased sharply by 84.56% (from 13.67 to 25.23 MPa) afterincorporation of 10 wt.% PAL, which is better than the TSof SA/MMT nanocomposite. In addition, the effect of PAL onthe reduction of MU was more significant than that of MMT.Therefore, the 1D PAL nanorods are more suitable candidate ofnanofillers to fabricate biopolymer-based nanocomposite filmsthan MMT, and this study would lay a foundation to the designand preparation of new types of environment-friendly packingfilm materials.
AUTHOR CONTRIBUTIONS
DH and ZZ conceived and designed the experiments; ZMperformed the experiments; DH, ZM, and ZZ analyzed the data;QQ contributed reagents, materials, and analysis tools; DH wrotethe paper.
ACKNOWLEDGMENTS
The authors would like to thank the funding of the Scienceand Technology Support Project of National Natural ScienceFoundation of the Gansu Province (No. 1506RJZA068).
REFERENCES
Abdollahi, M., Alboofetileh, M., Rezaei, M., and Behrooz, R. (2013). Comparing
physico-mechanical and thermal properties of alginate nanocomposite films
reinforced with organic and/or inorganic nanofillers. Food Hydrocoll. 32,
416–424. doi: 10.1016/j.foodhyd.2013.02.006
Ajmal, A. W., Masood, F., and Yasin, T. (2018). Influence
of sepiolite on thermal, mechanical and biodegradation
Frontiers in Chemistry | www.frontiersin.org December 2018 | Volume 6 | Article 635

Huang et al. Sodium Alginate/Clay Nanocomposites
properties of poly-3-hydroxybutyrate-co-3-hydroxyvalerate nano
composites. Appl. Clay Sci. 156, 11–19. doi: 10.1016/j.clay.2018.0
1.010
Alcantara, A. C. S., Darder, M., Aranda, P., and Ruiz-Hitzky, E. (2014).
Polysaccharide-fibrous clay bionanocomposites. Appl. Clay Sci. 96, 2–8.
doi: 10.1016/j.clay.2014.02.018
Almasi, H., Ghanbarzadeh, B., and Entezami, A. A. (2010). Physicochemical
properties of starch-CMC-nanoclay biodegradable films. Int. J. Biol. Macromol.
46, 1–5. doi: 10.1016/j.ijbiomac.2009.10.001
An, L., Pan, Y., Shen, X., Lu, H., and Yang, Y. (2008). Rod-like
attapulgite/polyimide nanocomposites with simultaneously improved
strength, toughness, thermal stability and related mechanisms. J. Mater.
Chem. 18, 4928–4941. doi: 10.1039/b805849k
Bidsorkhi, H. C., Soheilmoghaddam, M., Pour, R. H., Adelnia, H., and Mohamad,
Z. (2014). Mechanical, thermal, and flammability properties of ethylene-
vinyl acetate (EVA)/sepiolite nanocomposites. Polym. Test. 37, 117–122.
doi: 10.1016/j.polymertesting.2014.05.007
Bilotti, E., Zhang, R., Deng, H., Quero, F., Fischer, H. R., and Peijs,
T. (2009). Sepiolite needle-like clay for PA6 nanocomposites: an
alternative to layered silicates? Compos. Sci. Technol. 69, 2587–2595.
doi: 10.1016/j.compscitech.2009.07.016
Block, K. A., Trusiak, A., Katz, A., Alimova, A., Wei, H., Gottlieb, P., et al. (2015).
Exfoliation and intercalation of montmorillonite by small peptides. Appl. Clay
Sci. 107, 173–181. doi: 10.1016/j.clay.2015.01.021
Chen, L., Liu, K., Jin, T. X., Chen, F., and Fu, Q. (2012). Rod like
attapulgite/poly(ethylene terephthalate) nanocomposites with chemical
bonding between the polymer chain and the filler. eXPESS Polym. Lett. 6,
629–638. doi: 10.3144/expresspolymlett.2012.67
Costa, M. J., Marques, A. M., Pastrana, L. M., Teixeira, J. A., Sillankorva, S. M., and
Cerqueira, M. A. (2018). Physicochemical properties of alginate-based films:
effect of ionic crosslinking and mannuronic and guluronic acid ratio. Food
Hydrocoll. 81, 442–448. doi: 10.1016/j.foodhyd.2018.03.014
Deng, Y., Wang, L., Hu, X., Liu, B., Wei, Z., Yang, S., et al. (2012).
Highly efficient removal of tannic acid from aqueous solution by chitosan-
coated attapulgite. Chem. Eng. J. 181–182, 300–306. doi: 10.1016/j.cej.2011.
11.082
Ding, J. J., Huang, D. J., Wang, W. B., Wang, Q., and Wang, A. Q. (2019). Effect
of removing coloring metal ions from the natural brick-red palygorskite on
properties of alginate/palygorskite nanocomposite film. Int. J. Biol. Macromol.
122, 684–694. doi: 10.1016/j.ijbiomac.2018.10.218
Fabra, M. J., Falcó, I., Randazzo, W., Sánchez, G., and López-Rubio,
A. (2018). Antiviral and antioxidant properties of active alginate
edible films containing phenolic extracts. Food Hydrocoll. 81, 96–103.
doi: 10.1016/j.foodhyd.2018.02.026
Flaker, C. H. C., Lourenco, R. V., Bittante A. M. Q. B., and Sobral, P. J. A.
(2015). Gelatin-based nanocomposite films: a study on montmorillonite
dispersion methods and concentration. J. Food Eng. 167, 65–70.
doi: 10.1016/j.jfoodeng.2014.11.009
Gard, J. A., and Follett, E. A. C. (1968). A structural scheme for palygorskite. Clay
Miner. 7, 367–370. doi: 10.1180/claymin.1968.007.3.10
Ge, L., Li, X., Zhang, R., Yang, T., Ye, X., Li, D., et al. (2015). Development
and characterization of dialdehyde xanthan gum crosslinked gelatin based
edible films incorporated with amino-functionalized montmorillonite. Food
Hydrocoll. 51, 129–135. doi: 10.1016/j.foodhyd.2015.04.029
Huang, D. J., Wang, W. B., Xu, J. X., and Wang, A. Q. (2012). Mechanical and
water resistance properties of chitosan/poly(vinyl alcohol) films reinforced with
attapulgite dispersed by high-pressure homogenization. Chem. Eng. J. 210,
166–172. doi: 10.1016/j.cej.2012.08.096
Huang, M. F., Yu, J. G., and Ma, X. F. (2004). Studies on the properties
of Montmorillonite-reinforced thermoplastic starch composites. Polymer 45,
7017–7023. doi: 10.1016/j.polymer.2004.07.068
Liu, M., Pu, M., and Ma, H. (2012). Preparation, structure and thermal properties
of polylactide/sepiolite nanocomposites with and without organic modifiers.
Compos. Sci. Technol. 72, 1508–1514. doi: 10.1016/j.compscitech.2012.
05.017
Liu, M. X., Li, W. D., Rong, J. H., and Zhou, C. R. (2012). Novel polymer
nanocomposite hydrogel with natural clay nanotubes. Colloid Polym. Sci. 290,
895–905. doi: 10.1007/s00396-012-2588-z
Liu, P., Du, P. C., Zhu, L. X., Wu, Z. H., Wang, H. M., Chen, M., et al. (2014).
Attapulgite/polylactide nanocomposites: effect of polymer brush length. Mater.
Lett. 117, 214–216. doi: 10.1016/j.matlet.2013.12.015
Liu, S., Cai, P., Li, X., Chen, L., Li, L., and Li, B. (2016). Effect of film
multi-scale structure on the water vapor permeability in hydroxypropyl
starch (HPS)/Na-MMT nanocomposites. Carbohyd. Polym. 154, 186–193.
doi: 10.1016/j.carbpol.2016.08.006
Liu, S., Li, Y., and Li, L. (2017). Enhanced stability and mechanical
strength of sodium alginate composite films. Carbohyd. Polym. 160, 62–70.
doi: 10.1016/j.carbpol.2016.12.048
Lu, H. B., Shen, H. B., Song, Z. L., Shing, K. S., Tao, W., and Nutt, S. (2005). Rod-
like silicate-epoxy nanocomposites.Macromol. Rapid Commun. 26, 1445–1450.
doi: 10.1002/marc.200500360
Majdzadeh-Ardakani, K., and Nazari, B. (2010). Improving the mechanical
properties of thermoplastic starch/poly(vinyl alcohol)/clay nanocomposites.
Compos. Sci. Technol. 70, 1557–1563. doi: 10.1016/j.compscitech.2010.05.022
Mushi, N. E., and Berglund, L. A. (2014). Nanostructured biocomposite films of
high toughness based on native chitin nanofibers and chitosan. Front. Chem.
2:99. doi: 10.3389/fchem.2014.00099
Nagarajan, M., Benjakul, S., Prodpran, T., and Songtipya, P. (2015). Effects of pHs
on properties of bio-nanocomposite based on tilapia skin gelatin and Cloisite
Na+. Int. J. Biol. Macromol. 75, 388–397. doi: 10.1016/j.ijbiomac.2015.01.034
Nikolic, M. S., Petrovic, R., Veljovic, D., Cosovic, V., Stankovic, N., and
Djonlagic, J. (2017). Effect of sepiolite organomodification on the
performance of PCL/sepiolite nanocomposites. Eur. Polym. J. 97, 198–209.
doi: 10.1016/j.eurpolymj.2017.10.010
Peng, L., Zhou, L., Li, Y., Pan, F., and Zhang, S. (2011). Synthesis and properties
of waterborne polyurethane/attapulgite nanocomposites. Compos. Sci. Technol.
71, 1280–1285. doi: 10.1016/j.compscitech.2011.04.012
Rhim, J. (2004). Physical and mechanical properties of water resistant
sodium alginate films. LWT Food Sci. Technol. 37, 323–330.
doi: 10.1016/j.lwt.2003.09.008
Ruiz-Hitzky, E., Darder, M., Fernandes, F. M., Wicklein, B., Alcântara, A. C., and
Aranda, P. (2013). Fibrous clays based bionanocomposites. Prog. Polym. Sci. 38,
1392–1414. doi: 10.1016/j.progpolymsci.2013.05.004
Salama, H. E., Abdel Aziz, M. S., and Sabaa, M. W. (2018). Novel
biodegradable and antibacterial edible films based on alginate and
chitosan biguanidine hydrochloride. Int. J. Biol. Macromol. 116, 443–450.
doi: 10.1016/j.ijbiomac.2018.04.183
Shankar, S., Kasapis, S., and Rhim, J. (2018). Alginate-based nanocomposite
films reinforced with halloysite nanotubes functionalized by alkali treatment
and zinc oxide nanoparticles. Int. J. Biol. Macromol. 118, 1824–1832.
doi: 10.1016/j.ijbiomac.2018.07.026
Shankar, S., Wang, L., and Rhim, J. (2016). Preparations and characterization of
alginate/silver composite films: effect of types of silver particles. Carbohyd.
Polym. 146, 208–216. doi: 10.1016/j.carbpol.2016.03.026
Sirvio, J. A., Kolehmainen, A., Liimatainen, H., Niinimaki, J., and Hormi, O. E.
(2014). Biocomposite cellulose-alginate films: promising packaging materials.
Food Chem. 151, 343–351. doi: 10.1016/j.foodchem.2013.11.037
Slavutsky, A. M., Bertuzzi, M. A., Armada, M., Garcia, M. G.,
and Ochoa, N. A. (2014). Preparation and characterization of
montmorillonite/brea gum nanocomposites films. Food Hydrocoll. 35,
270–278. doi: 10.1016/j.foodhyd.2013.06.008
Souza, V. G. L., Fernando, A. L., Pires, J. R. A., Rodrigues, P. F., Lopes,
A. A. S., and Fernandes, F. M. B. (2017). Physical properties of chitosan
films incorporated with natural antioxidants. Int. Crop Prod. 107, 565–572.
doi: 10.1016/j.indcrop.2017.04.056
Tezcan, F., Gunister, E., Ozen, G., and Erim, F. B. (2012). Biocomposite films based
on alginate and organically modified clay. Int. J. Biol. Macromol. 50, 1165–1168.
doi: 10.1016/j.ijbiomac.2012.01.006
Tunç, S., and Duman, O. (2010). Preparation and characterization of
biodegradable methyl cellulose/montmorillonite nanocomposite films.
Appl. Clay Sci. 48, 414–424. doi: 10.1016/j.clay.2010.01.016
Wang, S., and Jing, Y. (2017). Effects of formation and penetration properties of
biodegradable montmorillonite/chitosan nanocomposite film on the barrier of
package paper. Appl. Clay Sci. 138, 74–80. doi: 10.1016/j.clay.2016.12.037
Wang, W. B., and Wang, A. Q. (2010). Synthesis and swelling properties of pH-
sensitive semi-IPN superabsorbent hydrogels based on sodium alginate-g-poly
Frontiers in Chemistry | www.frontiersin.org December 2018 | Volume 6 | Article 635

Huang et al. Sodium Alginate/Clay Nanocomposites
(sodium acrylate) and polyvinylpyrrolidone. Carbohyd. Polym. 80, 1028–1036.
doi: 10.1016/j.carbpol.2010.01.020
Wu, H., Liu, C., Chen, J., Chang, P. R., Chen, Y., and Anderson, D. P. (2009).
Structure and properties of starch/alpha-zirconium phosphate nanocomposite
films. Carbohyd. Polym. 77, 358–364. doi: 10.1016/j.carbpol.2009.01.002
Xu, J. X., Wang, W. B., and Wang, A. Q. (2017). Stable formamide/palygorskite
nanostructure hybrid material fortified by high-pressure
homogenization. Powder Technol. 318, 1–7. doi: 10.1016/j.powtec.2017.
05.032
Youssef, A. M., and El-Sayed, S. M. (2018). Bionanocomposites materials for food
packaging applications: concepts and future outlook. Carbohyd. Polym. 193,
19–27. doi: 10.1016/j.carbpol.2018.03.088
Zhang, N., Xu, J., Gao, X., Fu, X., and Zheng, D. (2017). Factors affecting
water resistance of alginate/gellan blend films on paper cups for hot
drinks. Carbohyd. Polym. 156, 435–442. doi: 10.1016/j.carbpol.2016.
08.101
Zhang, P., Tian, N., Zhang, J., and Wang, A. (2018). Effects of
modification of palygorskite on superamphiphobicity and microstructure
of palygorskite@fluorinated polysiloxane superamphiphobic
coatings. Appl. Clay Sci. 160, 144–152. doi: 10.1016/j.clay.2018.
01.015
Zhang, Y., Zhu, W., Lu, Y., Gao, Z., and Gu, J. (2014). Nano-scale
blocking mechanism of MMT and its effects on the properties of
polyisocyanate-modified soybean protein adhesive. Ind. Crop. Prod. 57, 35–42.
doi: 10.1016/j.indcrop.2014.03.027
Zhang, Z. F., Wang, W. B., Mu, B., and Wang, A. Q. (2018a). Thiourea-induced
change of structure and color of brick-red palygorskite. Clay Clay Miner. 66,
403–414. doi: 10.1346/CCMN.2018.064099
Zhang, Z. F., Wang, W. B., Tian, G. Y., Wang, Q., and Wang, A. Q. (2018b).
Solvothermal evolution of red palygorskite in dimethyl sulfoxide/water. Appl.
Clay Sci. 159, 16–24. doi: 10.1016/j.clay.2017.06.014
Zhu, L., Guo, J., and Liu, P. (2016). Effects of length and organic modification
of attapulgite nanorods on attapulgite/polystyrene nanocomposite
via in-situ radical bulk polymerization. Appl. Clay Sci. 119, 87–95.
doi: 10.1016/j.clay.2015.06.029
Zlopasa, J., Norder, B., Koenders, E. A. B., and Picken, S. J. (2015). Origin of highly
ordered sodium alginate/montmorillonite bionanocomposites. Macromolecules
48, 1204–1209. doi: 10.1021/ma502147m
Conflict of Interest Statement: The authors declare that the research was
conducted in the absence of any commercial or financial relationships that could
be construed as a potential conflict of interest.
Copyright © 2018 Huang, Zhang, Ma and Quan. This is an open-access article
distributed under the terms of the Creative Commons Attribution License (CC BY).
The use, distribution or reproduction in other forums is permitted, provided the
original author(s) and the copyright owner(s) are credited and that the original
publication in this journal is cited, in accordance with accepted academic practice.
No use, distribution or reproduction is permitted which does not comply with these
terms.
Frontiers in Chemistry | www.frontiersin.org December 2018 | Volume 6 | Article 635

ORIGINAL RESEARCH
published: 20 July 2018
doi: 10.3389/fchem.2018.00240
Frontiers in Chemistry | www.frontiersin.org July 2018 | Volume 6 | Article 240
Edited by:
Wenbo Wang,
Lanzhou Institute of Chemical Physics
(CAS), China
Reviewed by:
Guocheng Lv,
China University of Geosciences,
China
Aiwei Tang,
Beijing Jiaotong University, China
Guang-Sheng Wang,
Beihang University, China
*Correspondence:
Liqun Zhang
Specialty section:
This article was submitted to
Green and Sustainable Chemistry,
a section of the journal
Frontiers in Chemistry
Received: 24 May 2018
Accepted: 04 June 2018
Published: 20 July 2018
Citation:
Qin X, Wang J, Han B, Wang B, Mao L
and Zhang L (2018) Novel Design of
Eco-Friendly Super Elastomer
Materials With Optimized Hard
Segments Micro-Structure: Toward
Next-Generation High-Performance
Tires. Front. Chem. 6:240.
doi: 10.3389/fchem.2018.00240
Novel Design of Eco-Friendly SuperElastomer Materials With OptimizedHard Segments Micro-Structure:Toward Next-GenerationHigh-Performance Tires
Xuan Qin 1, Jiadong Wang1, Bingyong Han2, Bo Wang1, Lixin Mao1 and Liqun Zhang1,3,4*
1 State Key Laboratory of Organic-Inorganic Composites, Beijing University of Chemical Technology, Beijing, China, 2 State
Key Lab Chemical Resource Engineering, Beijing University of Chemical Technology, Beijing, China, 3 Engineering Research
Center of Elastomer Materials on Energy Conservation and Resources, Beijing University of Chemical Technology, Beijing,
China, 4 Beijing Advanced Innovation Center for Soft Matter Science and Engineering, Beijing University of Chemical
Technology, Beijing, China
Recently, sustainable development has become a significant concern globally, and the
energy crisis is one of the top priorities. From the perspective of the industrial application
of polymeric materials, rubber tires are critically important in our daily lives. However,
the energy consumption of tires can reach 6% of the world’s total energy consumption
per annum. Meanwhile, it is calculated that around 5% of carbon dioxide comes from
the emission of tire rolling due to energy consumption. To overcome these severe
energy and environmental challenges, designing and developing a high-performance
fuel-saving tire is of paramount significance. Herein, a next-generation, eco-friendly super
elastomer material based on macromolecular assembly technology has been fabricated.
Hydroxyl-terminated solution-polymerized styrene-butadiene rubber (HTSSBR) with high
vinyl contents prepared by anionic polymerization is used as flexible soft segments to
obtain excellent wet skid resistance. Furthermore, highly symmetrical 1,5-naphthalene
diisocyanate (NDI), different proportions of chain extender, and the cross-linking agent
with moderate molecular length are selected as rigid hard segments to achieve
simultaneous high heat resistance. Through this approach, a homogeneous network
supported by uniformly distributed hard segment nanoparticles is formed because soft
segments with equal length are chemically end-linked by the hard segments. This
super elastomer material exhibits excellent wear resistance and low rolling resistance.
More importantly, the wear resistance, rolling resistance, and wet-skid resistance are
reduced by 85.4, 42.3, and 20.8%, respectively, compared to the elastomeric material
conventionally used for tire. By taking advantage of this excellent comprehensive service
performance, the long-standing challenge of the “magic triangle” plaguing the rubber
tire industry for almost 100 years is resolved. It is anticipated that this newly designed
and fabricated elastomeric material tailored for tires will become the next generation
product, which could exhibit high potential for significantly cutting the fuel consumption
and reducing the emission of carbon dioxide.
Keywords: super elastomer, eco-friendly material, green tire, magic triangle, chain extender, cross-linking agent

Qin et al. Tire Materials With Optimized Micro-Structure
INTRODUCTION
Wheels are one of the greatest inventions in the history ofhuman civilization and have led to significant improvements inwork efficiency and liberation of productive force. The entireworld mounts on wheels and advances at full speed. Tires arethe only vital functional components of vehicles with directcontact with the ground, and play the crucial roles of supportingvehicle load, transferring power, braking, shock absorption,and maintaining and changing driving direction. Since rubbertires were invented, they have undergone several technicaland theoretical advances; meanwhile, the rapid developmentof the automotive industry and highways requires tires to beone of the polymer products with maximum yield and at thehighest technological level. Nevertheless, social developmentand environmental problems such as the increasing energyconsumption, increase in safety accidents, and a vast quantityof tire waste due to the short service life give rise to a higherrequirement for the development of the tire industry.
In 1980, the concept of sustainable development was explicitlyproposed by “The World Conservation Strategy” (U-Nations,1980), which has attracted extensive worldwide concern andattention in recent years. “Fossil fuel depletion” and “pollutantemissions and global warming” are the two issues that shouldbe considered by the “sustainable energy development system”(Hammond, 2004). Owing to the rapid development of the globaleconomy, the large use of fossil energy results in the increase ofgreenhouse gas emissions, sea level rise, extreme weather change,a sharp decline of biological species, and a serious threat to theenvironment for human survival. Therefore, the improvement inthe utilization efficiency of fossil energy has become the problemthat is faced and needs to be solved by the whole world. Datafrom the European Union indicates that transportation energyconsumption accounts for more than 20% of the world’s totalenergy consumption in the past 5 years and the fuel consumptionof tires is 20–30% of that of the automobiles. Eighteen percentof the global carbon dioxide emissions are related to trafficand 24% of the carbon dioxide emissions of road vehicles arerelated to tires. To comply with the development trend of fuel-efficiency and safe tires with high performance, the EuropeanUnion released the world-noted legislation of “Tire LabellingRegulation” in 2009 (EU, 2009). This leads to the classificationof the rolling resistance and wet-skid resistance of tires. It isestimated that decreasing rolling resistance of tires by 20% leadsto a 5% reduction in fuel consumption and using B-level greentires can save 20 billion liters of gasoline and reduce 50 milliontons of carbon dioxide emissions every year.
At present, the rubber composites used for manufacturing
pneumatic tires are prepared via vulcanization by mixingmore than 10 kinds of raw materials. Therefore, the energy
consumption of rubber processing is very high. Large amounts of
carbon disulfide, non-methane hydrocarbons, and other organicwaste are produced during the production process, and theaddition of strong carcinogens (e.g., aromatic hydrocarbon oil)is required. Moreover, the constant discharge of heavy metalsand dusts due to surface abrasion of rubber tires causes anadverse impact on the environment. Eighty percent of PM10
of the cities in the UK comes from traffic, and more than10,000 death cases can be attributed to cardiopulmonary diseasecaused by PM10 (Karl, 2012). Furthermore, waste rubber tirescannot be recycled effectively. About 40 million tires arediscarded in the UK annually (Mavroulidou et al., 2006), andthe accumulation of waste tires provides a breeding place formosquitoes and increases the risk of infectious disease outbreaks(Jang et al., 1998). Regarding the structure of tires, pneumatictires still control the tire market. However, they suffer from theshortcomings of poor impact and puncture resistance. There is arisk of leakage or even blow-out during use, which may even leadto major accidents with loss and death. The data shows that therewere 921 traffic accidents caused by tire fault in the UK in 2015,including 17 deaths and 147 serious injuries (UNECE, 2012).
The energy consumption and carbon dioxide emissions ofthe tire are related to the rolling resistance, whereas safetyis correlated with the wet-skid resistance and solid particlepollution is affected by their wear resistance (Heinz and Grosch,2007). These three properties are called the “magic triangle.”Traditional rubber composites are approaching a bottleneck toovercome the problem of the “magic triangle,” which restricts thedevelopment of high-performance tires.
As we reported elsewhere (Qin et al., 2018), polyurethaneelastomer materials, with nano-particles chemically end-linked,have remarkably low dynamic hysteresis loss. The polyurethane
features the presence of the urethane group
(N
H
C
O
O
)on
the macromolecular chain with a more or less frequency(Cooper and Tobolsky, 1967), which is a versatile copolymerconsisting of alternating flexible soft segments and rigid hardsegments (Liff et al., 2007; Jiang et al., 2015). Compared totraditional rubber composite materials, polyurethane has betterwear resistance, relatively high tear strength and elongation,wide hardness range, low rolling resistance, large carryingcapacity, and excellent oil and chemical resistance (Fu et al.,2016). The manufacturing process of polyurethane is simple,which leads to less consumption of environmental pollutantsand the emission of waste water and gas. Besides, modifiedpolyurethane can be made biodegradable, and hence, therecovery would be easier than that of rubber. Moreover, airlesstires made from polyurethane have better safety performanceand their service life is four times than that of ordinaryrubber tires. The application of polyurethane in retread tirescan not only reduce energy consumption but also achievethe goal of recycling development (Chiou and Schoen, 2002),which has a tremendous strategic significance of popularization.However, the undesirable wet traction, which has bearing onthe glass transition temperature of the material, and poor heatresistance (Yoshida et al., 2017), which goes hand in handwith the structure of the material itself, of the preexistingpolyurethane materials, bring up the inconvenience in drivingsecurity and preclude the possibility for its practical usage inthe situation of high-speed and heavy-loading tires as well.Once these disadvantages are overcome, polyurethane elastomeris not only the ideal material to manufacture “green tires,”but also the best choice for realizing “green manufacturing” oftires.
Frontiers in Chemistry | www.frontiersin.org July 2018 | Volume 6 | Article 240

Qin et al. Tire Materials With Optimized Micro-Structure
To address this challenge, we put forward a new thought (Qinet al., 2018): we replace polyester polyols and polyether polyolsof the soft segments of existing polyurethane materials withhydroxyl-terminated solution-polymerized styrene-butadienerubber (HTSSBR) of designed and optimized molecule structure.HTSSBR exhibits a glass transition temperature that can beeasily adjusted in a wide temperature range, and HTSSBRwith relatively high levels of 1,2-butadiene and low levels ofstyrene possessed glass transition temperature of–25∼–15◦Cmeasured by DSC. The polyurethane elastomer material withthis structural designed HTSSBR acting as soft segments revealsa higher tan δ at 0◦C than those of traditional materials, whichmeans a better wet-skid resistance. Hard segments chemicallylink the end of equal length HTSSBR molecular chains toform a network of uniform and tunable distribution of nano-reinforcing units in the polymer matrix, which minimizes thenano-scale frictions, and the tan δ at 60◦C is unusually lowwhich means a lower rolling resistance. Meanwhile, in orderto ensure the stability at very high temperature, high heat-resistant 1,5-naphthalene diisocyanate (NDI) is programmedto synthesize the innovative polyurethane elastomer material,because the low thermal conductivity of polymer may cause heataccumulation. The birth of eco-friendly next generation superelastomer material with a concurrent excellent performanceof wet-skid resistance, wear resistance, rolling resistance,and dynamic mechanical properties, is indeed something tocelebrate.
The properties of the super elastomer material are intensivelyinfluenced by the micro-structures. The chain extender andcross-linking agent are essential parts of the elastomer, whichwill determine the perfect degree of their network. Therefore,we regulated the hard segment micro-structure, principallyabout the ratio of chain extender and cross-linking agent ofthe elastomers. The effects of micro-structure change on itsmacroscopic properties were systematically studied by FT-IR,1H-NMR, XRD, TEM, DSC, TGA, TMA, DMA, and othercharacterization methods. The sketch of the molecular structureof this super elastomer was shown in Figure 1.
EXPERIMENTAL
Reagents and MaterialsButadiene (polymerization grade) was produced by BeijingYanshan Petrochemical Co., China; styrene was purchased fromBeijing Chemical reagents, China; THF (AR), cyclohexane (AR),and ethanol (AR) were supplied by Beijing Chemical Works,China; butyl lithium (CP) and lithium (AR) were provided byBaling Petrochemical Corp, China. NDI (AR) was supported byTCI; BDO and TMP (AR) were produced by Adamas.
Preparation of HTSSBRThrough anionic polymerization, the hydroxyl-terminatedsolution-polymerized styrene butadiene rubber (HTSSBR)was synthesized using self-made dilithium anionic initiator.Considering that the anionic polymerization is highly sensitiveto impurities, it is necessary to purify all the instruments andreagents. To guarantee that the polymerization was suitable,
FIGURE 1 | The diagram of molecular structure of our prepared elastomer
material.
the entire reaction system was cleaned with reactive-polymerand high-purity nitrogen several times. The dilithium anionicinitiator was synthesized as follows. A 1:1 (volume ratio)mixture of isoprene and cyclohexane was introduced bydripping slowly into a tetrahydrofuran solution of lithiumflack protected by argon gas; the reaction was carried out atthe temperature of 0◦C for 6 h. After settling for 24 h, thebrownish red transparent initiator solution was obtainedby filtering. Next, butadiene, styrene, cyclohexane, andtetrahydrofuran were successively added into a 2 L reactorwhich had been thoroughly washed and purified by butyllithium, followed by adding self-made dilithium anionicinitiator. The polymerization progress lasted for 8 h at thetemperature of 50◦C. Then, the polymer was end-capped withethylene oxide under stirring. After 24 h, the reaction wasterminated by ethanol.
Preparation of HTSSBR-PUThe synthesis of HTSSBR-PU was achieved by a two-stepmethod. In the first step, the prepolymer was prepared by reactingNDI and HTSSBR at 80◦C under the nitrogen atmosphere. In thesecond step, extender 1,4-butanediol (BDO), cross-linking agenttrimethylolpropane (TMP) and the prepolymer were mixed upunder high-speed stirring at 65◦C for 6–8min. At last, the samplewas cast into a specific metal mold and then cured at 105◦C for24 h.
Materials CharacterizationThe molecular weight of HTSSBR was characterized by GPC(Waters 1525). The molecular structure was measured using 1HNMR (Bruker AV600) and FT-IR (Nicolet 8700). The micro-structure of the elastomer was measured by TEM (HitachiJEM-3010). X-ray diffraction (XRD) with Cu-Kα radiation (λ= 0.154 nm) was performed on a Bruker D8 ADVANCE. The
Frontiers in Chemistry | www.frontiersin.org July 2018 | Volume 6 | Article 240

Qin et al. Tire Materials With Optimized Micro-Structure
FIGURE 2 | (A) FT-IR spectra and (B) XRD spectra of HTSSBR-PU with different ratios of chain extender to cross-linking agent.
FIGURE 3 | (A) DSC curves and (B) TGA curves of HTSSBR-PU with different ratios of chain extender to cross-linking agent.
FIGURE 4 | (A) TMA curves and (B) DMA curves of HTSSBR-PU with different ratios of chain extender to cross-linking agent.
thermal properties were tested by TGA (Mettler-Toeledo), DSC(Mettler-Toeledo STARe), TMA (TA Q800), and DMA (TAQ800). The mechanical performances of the elastomer wereconducted by the universal testing machine (LRX Plus/LLOYDLRX/MTS CMT4104), Akron abrasion tester (MINGZHU MZ-4061) and a friction coefficient tester (LEIYUN BM-III). Thedetailed information of material characterizations is offered inthe Supplementary Materials.
RESULTS AND DISCUSSION
HTSSBRwas successfully synthesized via anionic polymerization.By analyzing 1H NMR and FT-IR spectroscopy, the contentof 1,2-butadiene, 1,4-butadiene and styrene were 61.56%, 14.69and 23.75%, respectively. The glass transition temperature is−22.47◦C as expected. The molecular weight is ∼3,000 and witha narrow distribution.
Frontiers in Chemistry | www.frontiersin.org July 2018 | Volume 6 | Article 240

Qin et al. Tire Materials With Optimized Micro-Structure
TABLE 1 | The comparison between SSBR composites and our prepared super
elastomer material on mechanical properties.
SSBR compositesa) HTSSBR-PU
Tensile strength /MPa 16.1 22.3 (+38.5%)
Elongation at break/% 365 481 (+31.8%)
Tensile stress at 300%/MPa 12.9 15.1 (+17.1%)
Tear strength /kN·m−1 40.6 45.8 (+12.8%)
Compression heat build-up/◦C 20.9 16.2 (−22.5%)
Akron abrasion loss /mm3 74.0 10.8 (−85.4%)
60◦C tan δ(strain 7%, frequency 10 Hz) 0.130 0.075 (−42.3%)
Pendulum-type friction coefficient 24 29 (+20.8%)
a) Formulas of contrast sample SSBR composites are shown as follows: SSBR 96.3, BR
30.0, Silica 70.0, Bis [3-(triethoxysilyl)propyl] tetrasulfide (TESPT) 6.3, Stearic acid (SA) 2.0,
ZnO 3.5, N-tert-Butyl-2-benzothiazolesulfenamide (TBBS) 2.0, diphenyl guanidine(DPG)
2.0, N-1,3-dimethylbutyl-N′-phenyl-p-phenylenediamine (Antioxidant 4020) 1.0, S 1.7.
To demonstrate our thought, we emphasized polyurethane
materials using HTSSBR as soft segments with different ratio of
cross-linking agent and chain extender. The chemical contentof the elastomer is a critical factor for the performance ofthe material. FT-IR spectroscopy (Figure 2A) was used tosupport that the synthesis progress was successful. The sample isdesignated as A:B, where A and B denote the mass percentages ofchain extender and cross-linking agent, respectively. Taking thesample 50:50 as an example, the broad absorption at 3,290 cm1
corresponds to the N-H bonding. The absorptions from 1,740 to1,700 cm−1 correspond to the stretching vibration of C=O. Theabsorption at 2,280–2,255 cm−1, the witness of –NCO, indicatesthe complete reaction of NDI. There is redshift of the absorptionpeaks of N-H and C=O, attributed to the hydrogen bondedamino group and the carbonyl group. By using peak-fittingsoftware and imitating procedure by the Levenberg-Marquardtalgorithm, hydrogen bonding degree calculated by peak areasis summarized. Degrees of ordered and disordered hydrogenbonding, and the total degree of hydrogen bonding decreasewith the increasing content of the cross-linking agent (Andand Painter, 2007). In this system of polyurethane, the softsegment made up of styrene and butadiene does not includestrong electronegativity elements, making the hydrogen bondingonly form between the hard segments (Harthcock, 1989; Król,2007). The decrease of microtacticity of hard segments, whichis lowered by the trifunctional trimethylolpropane, is the mainreason for the reduction of hydrogen bonding. Compared withthe difunctional 1,4-butanediol, the structure formed by TMPis more rigid and irregular, making the hydrogen bondingharder to form. The degree of ordered and disordered hydrogenbonding both decreases from 52.39 to 45.41% and from 22.64to 18.30% respectively, resulting in the total degree of hydrogenbonding decreasing from 74.03 to 63.71%. The crystallizationproperty of hard segments in the material, which is alsoassociated with the molecular structure, is also influenced by thereduction of hydrogen bonding degree. X-ray diffraction (XRD)was performed to explore the crystallization of the elastomer(Figure 2B). There are dispersing diffraction peaks and a sharpdiffraction peak (2θ≈20◦). The dispersing diffraction peak isformed due to the long-range disorder of the elastomer, and
FIGURE 5 | The schematic diagram of the rolling resistance test machine
(RSS II model).
the sharp diffraction peak is formed by the short-range orderedcrystal area. The shape of the dispersing diffraction peaks isalmost identical, whereas the strength of sharp hard segmentdiffraction peak decreases and the degree of crystallizationdecreases from 7.27 to 1.22% with the ratio of chain extenderto cross-linking agent reduces. As the main content of hardsegment, NDI is a kind of isocyanate with good symmetry, whichbenefits from the regular structure of molecular chains and allowsthe hard phase to have crystallization. Crystallization formed byhard segment units is short range order, and the whole elastomerremains long range disorder. As a tri-functionality cross-linkagent, TMP is not as symmetrical as BDO. This influencesthe formation of short-range order and partly long-range orderstructure, so the degree of crystallization will decrease with theaccretion of TMP (Seefried and Critchfield, 2010).
Due to the difference in polarity between the soft andthe hard segments, the micro-phase separation and chemicallyend-linked nanoparticles are generated uniformly through theself-assembly progress. The thermal and mechanical propertiesare mainly supported by the hard segment nanoparticles;therefore, it is of vital importance to study the effect of
Frontiers in Chemistry | www.frontiersin.org July 2018 | Volume 6 | Article 240

Qin et al. Tire Materials With Optimized Micro-Structure
the structure of hard segment. The thermal properties wereacquired through thermogravimetric analysis and differentialscanning calorimetry. Glass transition temperature (Figure 3A)of HTSSBR is−22.45◦C, and glass transition temperatureincreases as the ratio of chain extender to cross-linking agentreduces. As described in the theoretical formula of glass glasstransition temperature:
Tgx = Tg + Kxρ
where Tgx is the glass transition temperature of the cross-linked polymer, Tg is the glass transition temperature of theorigin polymer, Kx is the characteristic constant, and ρ is thecross-linking density. As the cross-linking density increases,the glass transition temperature of the cross-linked polymerwill rise correspondingly. Adding more crossing-linking agentinto the system increases the chemical cross-linking density,and the mobility of molecular chains is restricted by thethree-dimensional network restricts, which will raise the glasstransition temperature. The thermal decomposition progress(Figure 3B) of PU is composed of two-stages, including hardsegment and soft segment dissociation (Petrovic et al., 2010),successively. The amount of final residual carbon is almostequal. The weight loss rate of two stages is the same as theweight ratio of the hard and soft segment, which indicates thecomplete reaction as well. The initial thermal decompositiontemperature is about 300◦C. The changing ratios of chainextender to cross-linking agent have little effect on the two-stageweight loss. The decomposition is mainly caused by chemicalbond rupture, while the network structures formed by TMP andBDO have a slight influence on chemical bonds, so the thermaldestruction temperature increases slightly. Thermomechanicalanalysis (TMA) was applied to further investigate the thermalproperties of the elastomer. The softening temperature is definedas the critical temperature when the elastomer having a reductionin thickness which leads to a sudden decline in modulus (Leeand Ko, 1993). The softening temperature and expansivity weremeasured (Figure 4A). The disentanglement of hard segment isrelieved by cross-linking structure at high temperature, whichraises the softening temperature. At the same time, with thecontent of cross-link agent increasing, the deformation is morerestricted by the network structure with temperature increases.By comparing with our previous work, the increase of the hardsegment content has more effect on softening temperature thanthat of the ratio of the cross-linking agents to the chain extender.The explanation is as follows: these two factors both contributeto the cross-linking points of the structure. The difference is thathard segment, as physical cross-linking points, mainly forms thewell-defined micro-phase separation due to hydrogen bondingand polarity of hard and soft segment, however cross-linkingagents havemainly impacted the hard segment phase and have nodirect correlation with micro-phase separation. Additionally, thehardness of the elastomer is slightly influenced by the changingthe ratio of the chain extender to the cross-linking agent, whichvaries from 70 to 73. In a micro structure, the hardness ofthe partial area is increased by the network structure formedby tri-functional cross-linking agent. As analyzed earlier, the
FIGURE 6 | The hysteresis loss and terminal temperature of SSBR
composites and our prepared super elastomer material.
macro properties are mildly affected by the cross-link in hardsegment phase, so there is a slight increase in hardness. Dynamicmechanical analyzer (Figure 4B) was used to test the mechanicalproperties of the elastomer (Dong and Cooper, 1971). The areaof loss peaks is reduced as the ratio of chain extender to cross-linking agent decreases. The tan δ 0◦C, which is also known asthe wet-skid resistance, is influenced by change of cross-linkingdensity. The increase in cross-linking density limits the mobilityof molecular chain between cross-link points, which will reducethe loss of energy, resulting in the decrease of peak area. Thetemperature of the loss peak moves to high temperature, asevidenced in DSC.
The above performances of HTSSBR with different ratios ofchain extender and cross-linking agents completely match therequirement of a tire material (Prisacariu, 2011). Comparisonbetween the sample with relatively better performances andSSBR composites are made to highlight the excellent mechanicalproperties. The general mechanical properties comparison aregiven in Table 1. The tensile strength is 22.3 MPa, comparedwith SSBR composites (16.1 MPa), an increase of 38.5%. Theelongation at break is 481%, while the elongation of SSBRcomposites is 365%. Moreover, the wear resistance of HTSSBRis much better, with Akron abrasion loss at 10.8 mm−3, whilethe Akron abrasion loss of SSBR composites is 74 mm−3,which is much larger than Akron abrasion loss of HTSSBR.Tires with better wear resistance means less weight loss atwork and longer service life, which can not only save thecost but also protect the environment. The exceptional wearresistance of the elastomer makes it an environmental-friendlymaterial. In comparison with HTSSBR and SSBR composites,our PU elastomer shows apparent improvement in mechanicalproperties. However, before this elastomer comes to practicalapplication, there are still several properties to be discussed.Hysteresis loss, which is also called dynamic energy loss, is one ofthe most important properties of dynamic elastomers products.As usual, the hysteresis loss dissipates in the form of heat, soit is known as rolling resistance. The dynamic energy loss oftires (Futamura, 1991), turning into heat accumulation, will raise
Frontiers in Chemistry | www.frontiersin.org July 2018 | Volume 6 | Article 240

Qin et al. Tire Materials With Optimized Micro-Structure
FIGURE 7 | TEM images of SSBR composites and HTSSBR-PU.
the working temperature of the tires, which could affect themechanical properties of the tire and have a potential safetyhazard. At the same time, rolling resistance determines thefuel assumption of tires. Therefore, it is of great importance todevelop tires with low dynamic energy loss. In order to reflectthe property of theHTSSBR-PU, a comparison betweenHTSSBR-PU and conventionally SBBR composites used for tire used wasinvested to discuss the mechanical performance of the HTSSBR-PU. Based on the theory of the viscoelasticity of elastomer, amachine (RSS-II model, Figure 5) was designed to measure therolling resistance. The dynamic energy loss can be measuredby the viscoelasticity response of the elastomer in the rotatingprogress of thematerial sampler on the roller. The dynamic strainand stress (Willett, 1973) given as ε (t) = εa sin ( ωt − δ) andσ (t) = σa sin ωt, respectively. The energy loss under a specificcontrolled energy cycle is give as follows
H =
∫ 2π/ω
0σ (t)
dε (t)
dtdt = πεaσasinδ ≈ πεaσatanδ
where ω is the frequency, εa is the amplitude of strain, σa isthe amplitude of stress, δ is the phase difference between stressand strain, and tanδ is the loss factor. After the test cycling(Figure 6), the hysteresis loss of HTSSBR-PU is measured to be0.85 J/r, which is significantly lower than the hysteresis loss of theSSBR composites (4.89 J/r). Due to the heat accumulation causedby the dynamic energy loss, the temperature rise of HTSSBR-PU is 30.2◦C, but the temperature rise of SSBR compositesincredibly reached 88.3◦C. To simulate the reality viscoelasticresponse relation with alternating stress of the materials underthe working conditions, DMA with the strain ε at 7% andthe frequency at 10Hz was performed. The 60◦C tan δ ofthe SSBR composites (0.130) is larger than the 60◦C tan δ ofHTSSBR-PU, which could further prove that the latter have
FIGURE 8 | The “Magic triangle” performance comparisons between SSBR
composites and our prepared super elastomer material.
lower rolling resistance. In addition, the pendulum-type frictioncoefficient reflects that the HTSSBR-PU lost less energy duringthe friction process, illustrating the low rolling resistance ofHTSSBR-PU. As Figure 7 shows, the microstructure of SSBRcomposites is uneven due to the severe conglomerating ofsilica nanoparticles, while homogeneous phase separation inHTSSBR-PU is generated by the self-assembly progress of softand hard segments. At the molecular level, the viscoelasticity
Frontiers in Chemistry | www.frontiersin.org July 2018 | Volume 6 | Article 240

Qin et al. Tire Materials With Optimized Micro-Structure
of the SSBR composites is mainly based on the polymerblend of SSBR/BR, the size, and distribution of nano-particles.The vulcanization and the nano-particles provide the essentialchemical cross-linking points, but there will be the problem ofcombination between the particles and the polymer and unevendistribution of polymer and filler. The system of HTSSBR-PUis totally different in these aspects; the synergy of the networkis supported by the soft segment with uniformly dispersedmolecular weight and the even distribution of physical cross-linkpoints provided by the micro-phase separation (Chen and Hsu,1990; Cho et al., 2013), which leads to noticeable diminutionof hysteresis loss and decrease of heat accumulation. The well-performed rolling resistance can also obviously reduce fuelconsumption, which effectively reduces the carbon emission.Additionally, the molding process of HTSSBR-PU, which doeswithout mixing and vulcanization, is much more straightforwardand more efficient than the preparation technology of SSBRcomposites. To highlight our super elastomer material moreintuitively, “Magic triangle” performance comparisons with SSBRcomposites are expressed in Figure 8. The markedly enlarged“Magic triangle” area elucidated that our super elastomerhas the highest comprehensive performance. It is now well-established that our super elastomer is a kind of advancedmaterial with fantastic performance and inestimable applicationprospects.
CONCLUSIONS
In conclusion, we designed and synthesized a super elastomermaterial by combing the HTSSBR and NDI, and the propertiesinfluenced by the ratio of chain extender and cross-link agentare discussed in particular detail. The excellent mechanicalproperties of the elastomer are provided by the micro-phaseseparation structure and hard segment nanoparticles, andthe structure of hard segments are influenced by the chain
extender and cross-link agent. As the content of cross-linkagent increases, the short-range order structures are affectedand the degree of crystallization decreases. The tri-functionalTMP raises the cross-link density of the hard segment, whichincreases the softening temperature and reduces the expansivity.The network structure in the hard segment has a lightimpact on the micro-phase separation and heat resistance ofthe material. Compared with commercial SSBR composites,the super elastomer material has advantages in most aspects,especially the excellent rolling resistance and wear resistance,
which help to decrease the carbon dioxide emission. Ourprepared elastomer material perfectly matches the requirement
of “green tire,” and it provides a new idea for further
development excellent energy-saving and eco-friendly advancedelastomers.
AUTHOR CONTRIBUTIONS
XQ, JW, and BW contribute to the experiment process, samples
characterization, data analysis, and paper preparation. BH, LM,
and LZ are mainly responsible for the design of experiment, dataanalysis and paper revision.
ACKNOWLEDGMENTS
This research is financially supported by the National 973 Basic
Research Program of China 2015CB654700 (2015CB654704) andthe Major Program (51790500).
SUPPLEMENTARY MATERIAL
The Supplementary Material for this article can be foundonline at: https://www.frontiersin.org/articles/10.3389/fchem.2018.00240/full#supplementary-material
REFERENCES
And, J. M., and Painter, P. (2007). A Comparison of hydrogen bonding and order
in a polyurethane and poly(urethane–urea) and their blends with poly(ethylene
glycol).Macromolecules 40, 1546–1554. doi: 10.1021/ma0626362
Chen, S. A., and Hsu, J. S. (1990). Polyurethane anionomers. II. Phase inversion
and its effect on physical properties. Polymer 28, 1515–1532.
Chiou, B. S., and Schoen, P. E. (2002). Effects of crosslinking on thermal and
mechanical properties of polyurethanes. J. Appl. Polymer Sci. 83, 212–223.
doi: 10.1002/app.10056
Cho, J. R., Lee, H. W., Jeong, W. B., Jeong, K. M., and Kim, K. W. (2013).
Finite element estimation of hysteretic loss and rolling resistance of 3-D
patterned tire. Int. J. Mech. Mater. Design 9, 355–366. doi: 10.1007/s10999-013-
9225-y
Cooper, S. L., and Tobolsky, A. V. (1967). Anomalous depression of
rubbery modulus through crosslinking. J. Appl. Polymer Sci. 11, 1361–1369.
doi: 10.1002/app.1967.070110801
Dong, S. H., and Cooper, S. L. (1971). Dynamic mechanical properties
of polyurethane block polymers. Polymer Eng. Sci. 11, 369–376.
doi: 10.1002/pen.760110504
EU. (2009). Official Journal of the European Union L342, 46–58
Fu, G., Yuan, L., Liang, G., and Gu, A. (2016). Heat-resistant polyurethane film
with great electrostatic dissipation capacity and very high thermally reversible
self-healing efficiency based on multi-furan and liquid multi-maleimide
polymers. J. Mater. Chem. A 4, 4232–4241. doi: 10.1039/C6TA00953K
Futamura, S. (1991). Deformation index—concept for hysteretic energy-
loss process. Rubber Chem. Tech. 64, 57–64. doi: 10.5254/1.35
38540
Hammond, G. P. (2004). Engineering sustainability: thermodynamics,
energy systems and the environment. Int. J. Energy Res. 28, 613–639.
doi: 10.1002/er.988
Harthcock, M. A. (1989). Probing the complex hydrogen bonding
structure of urethane block copolymers and various acid containing
copolymers using infra-red spectroscopy. Polymer 30, 1234–1242.
doi: 10.1016/0032-3861(89)90041-4
Heinz, M., and Grosch, K. A. (2007). A laboratory method to comprehensively
evaluate abrasion, traction and rolling resistance of tire tread compounds.
Rubber Chem. Technol. 80, 580–607. doi: 10.5254/1.3548182
Jang, J. W., Yoo, T. S., Oh, J. H., and Iwasaki, I. (1998). Discarded tire recycling
practices in the United States, Japan and Korea. Resour. Conserv. Recyc. 22,
1–14. doi: 10.1016/S0921-3449(97)00041-4
Jiang, L., Wu, J., Nedolisa, C., Saiani, A., and Assender, H. E. (2015). Phase
separation and crystallization in high hard block content polyurethane thin
films.Macromolecules 48, 5358–5366. doi: 10.1021/acs.macromol.5b01083
Karl, S. (2012). How Dangerous is Rubber Dust? Available online at: http://www.
abc.net.au/science/articles/2012/07/31/3554997.htm.
Frontiers in Chemistry | www.frontiersin.org July 2018 | Volume 6 | Article 240

Qin et al. Tire Materials With Optimized Micro-Structure
Król, P. (2007). Synthesis methods, chemical structures and phase structures
of linear polyurethanes. Properties and applications of linear polyurethanes
in polyurethane elastomers, copolymers and ionomers. Prog. Mater. Sci. 52,
915–1015. doi: 10.1016/j.pmatsci.2006.11.001
Lee, H. K., and Ko, S. W. (1993). Structure and thermal properties of
polyether polyurethaneurea elastomers. J. Appl. Polymer Sci. 50, 1269–1280.
doi: 10.1002/app.1993.070500718
Liff, S. M., Kumar, N., and McKinley, G. H. (2007). High-performance elastomeric
nanocomposites via solvent-exchange processing. Nat. Mater. 6, 76–83.
doi: 10.1038/nmat1798
Mavroulidou, M., Hughes, S. J., and Hellawell, E. E. (2006). A comparison of two
interaction matrix coding techniques used in a gis-based tool for air quality
assessment. Global Nest 49, 923–947. doi: 10.30955/gnj.000417
Petrovic, Z. S., Zavargo, Z., Flyn, J. H., and Macknight, W. J. (2010). Thermal
degradation of segmented polyurethanes. J. Appl. Polymer Sci. 51, 1087–1095.
doi: 10.1002/app.1994.070510615
Prisacariu, C. (2011). Polyurethane elastomers: from morphology
to mechanical aspects. 18, 2808–2814. doi: 10.1007/978-3-7091-
514-6
Qin, X., Han, B., Lu, J., Wang, Z., Sun, Z., Wang, D., et al. (2018). Rational
design of advanced elastomer nanocomposites towards extremely energy-
saving tires based on macromolecular assembly strategy. Nano Energy 48,
180–188. doi: 10.1016/j.nanoen.2018.03.038
Seefried, Jr, C. G., Koleske, J. V., and Critchfield, F. E. (2010). Thermoplastic
urethane elastomers. III. Effects of variations in isocyanate structure. J. Appl.
Polymer Sci. 19, 3185–3191. doi: 10.1002/app.1975.070191204
U-Nations (1980). Environmental Policy and Law 6: 102.
UNECE (2012). UNECE Regulation 64.02. Available online at: http://www.
roadsafetyobservatory.com/KeyFacts/vehicles/tyres.
Willett, P. R. (1973). Hysteretic losses in rolling tires. Rubber Chem. Technol. 46,
425–441. doi: 10.5254/1.3542912
Yoshida, S., Ejima, H., and Yoshie, N. (2017). Tough elastomers with superior self-
recoverability induced by bioinspired multiphase design. Adv. Funct. Mater.
27:1701670. doi: 10.1002/adfm.201701670
Conflict of Interest Statement: The authors declare that the research was
conducted in the absence of any commercial or financial relationships that could
be construed as a potential conflict of interest.
Copyright © 2018 Qin, Wang, Han, Wang, Mao and Zhang. This is an open-access
article distributed under the terms of the Creative Commons Attribution License (CC
BY). The use, distribution or reproduction in other forums is permitted, provided
the original author(s) and the copyright owner(s) are credited and that the original
publication in this journal is cited, in accordance with accepted academic practice.
No use, distribution or reproduction is permitted which does not comply with these
terms.
Frontiers in Chemistry | www.frontiersin.org July 2018 | Volume 6 | Article 240

ORIGINAL RESEARCH
published: 20 November 2018
doi: 10.3389/fchem.2018.00558
Frontiers in Chemistry | www.frontiersin.org November 2018 | Volume 6 | Article 558
Edited by:
Wenbo Wang,
Lanzhou Institute of Chemical Physics
(CAS), China
Reviewed by:
Luyi Sun,
University of Connecticut,
United States
Jianxi Zhu,
Guangzhou Institute of Geochemistry
(CAS), China
Yunfei Xi,
Queensland University of Technology,
Australia
*Correspondence:
Libing Liao
Specialty section:
This article was submitted to
Green and Sustainable Chemistry,
a section of the journal
Frontiers in Chemistry
Received: 27 July 2018
Accepted: 29 October 2018
Published: 20 November 2018
Citation:
Wang X and Liao L (2018) Rietveld
Structure Refinement of Cu-Trien
Exchanged Nontronites.
Front. Chem. 6:558.
doi: 10.3389/fchem.2018.00558
Rietveld Structure Refinement ofCu-Trien Exchanged Nontronites
Xiaoli Wang1 and Libing Liao 2*
1 Institute of Mineralogy, TU Bergakademie Freiberg, Freiberg, Germany, 2 Key Laboratory of Materials Utilization of
Nonmetallic Minerals and Solid Wastes, National Laboratory of Mineral Materials, School of Materials Science and
Technology, China University of Geosciences, Beijing, China
The Rietveld analysis of X-ray powder diffraction patterns is used widely for obtaining the
structural information of clay minerals. However, the complex hydration behavior and the
variability of interlayer contents are often considered difficult to be described correctly
by a simple structure model. In the present work, the use of Cu-triethylenetetramine
(Cu-trien)-exchanged nontronites has been proposed to simplify the interlayer structure.
This method provides a potential to obtain the structural information of nontronites, for
example, the layer charge density, occupancies of cis-octahedral sites, and the iron
content by the Rietveld analysis from the X-ray powder diffraction patterns. The approach
was demonstrated on three Cu-trien-exchanged nontronite samples. The Rietveld
refinements were carried out first on the purified samples and the results showed a good
peak fitting between measured and calculated patterns. The refined iron content and the
occupancies of cis-octahedral sites are in general agreement with the reference data,
which have been obtained from chemical and thermal analyses. The refinement of layer
charge density showed lower values compared with the reference. It may be due to
the assumption of temperature factor of Cu-trien in the interlayer. A raw sample with
natural impurities was chosen to test the applicability of this method. The refinement
pattern of the raw sample led to good agreement with the observed data. The results
of the iron content and the occupancies of cis-octahedral sites showed the same
tendency as purified samples. This study showed that this approach allows for obtaining
some structural details of nontronites directly from X-ray powder diffraction patterns of
Cu-trien-exchanged samples.
Keywords: nontronites, Rietveld refinement, Cu-triethylenetetramine, crystal structure, X-ray powder diffraction
INTRODUCTION
Nontronite is the iron-rich dioctahedral smectite. The dominant cation in the tetrahedral sheet isSi4+, which can be substituted by Al3+ commonly (Manceau et al., 2000a). The octahedral sheetcontains predominantly Fe3+, partially Al3+, and a minor amount of Mg2+. Only two-thirds of theoctahedral positions are occupied by cations in dioctahedral smectites. In general, octahedral sheetshows two different configurations, that is, cis- and trans-octahedron that relate to the dispositionof hydroxyl groups. In the cis-octahedron, the OH groups are on the same side, whereas in thetrans-octahedron, the OH groups are on the opposite side. Tsipursky and Drits (1984) foundthat natural dioctahedral smectites may cover a wide range of cis-vacant (cv) and trans-vacant(tv) proportions. Based on the oblique-texture electron diffraction and X-ray diffraction analyses,

Wang and Liao Rietveld Refinement of Nontronites
Besson et al. (1983) and Tsipursky and Drits (1984) demonstratedthat for Fe-rich dioctahedral smectites, cis-octahedral positionswere occupied and trans-octahedral sites were vacant. In general,nontronites show turbostratic stacking disorder (Biscoe andWarren, 1942) due to the weak bonds between the 2:1 layers(Moore and Reynolds, 1997). This kind of disorder can bedescribed when the layers rotate or translate randomly to eachother along the c∗ direction (Moore and Reynolds, 1997).This kind of structural defect leads to non-Bragg diffractioneffects and restricts the applicability of the conventionalRietveld method (Bish, 1993) to smectite. Several attempts ofthe Rietveld refinement have been done on turbostraticallydisordered structure (Taylor and Matulis, 1994; Viani et al.,2002; Gournis et al., 2008). However, these authors assumedmore or less the ordered structure models, but not a realturbostratically disordered structure. The BGMN software candescribe turbostratic disorder features of the diffraction patternssuccessfully by using the structure model containing a single-layer approach (Ufer et al., 2004). This method allowed anacceptable quantification of the smectite content in bentonites(Ufer et al., 2008). Later, it was applied for the Rietveldrefinement of illite-smectite mixed-layer minerals (Ufer et al.,2012). However, this approach cannot handle the complexhydration behavior in the interlayer (Sato et al., 1992, 1996;Ferrage et al., 2005b).
Sposito et al. (1999) concluded the hydration shells ofthe cations like Na+ and K+ and the results indicated atendency of inhomogeneous distribution in the interlayer ofmontmorillonite. Ferrage et al. (2005a,b) showed the hydrationbehavior of the smectites and the configuration of the interlayerto be complex and varying. It seems that the correct descriptionof the interlayer configuration is another difficulty for theRietveld analysis of nontronites, except for the turbostraticallydisordered structure. Therefore, a defined and stable occupancyof the interlayer space, which is independent of humidity, may
FIGURE 1 | The XRD patterns of the sample NWa with different cation exchange states.
provide a potential for the modeling of such modified interlayerstructures. In general, the intercalation of ethylene glycol (EG)in smectites is used for the characterization of smectites andvermiculites (MacEwan and Wilson, 1984). However, EG isnot sufficiently stable for long-time measurements. The Cu-triethylenetetramine (Cu-trien) is a kind of stable complex andused routinely in the determination of the cation exchangecapacity (CEC) (Meier and Kahr, 1999). The high selectivityof the index cation [Cu(trien)]2+makes the exchange with theinterlayer content fast and complete (Bergaya et al., 2006).Kaufhold et al. (2011) investigated the swelling capacity ofCu-trien-exchanged smectites and concluded that the Cu-trien-exchanged smectites showed constant d001 spacing andwithout significant water uptake. It may offer a chance toobtain information on the layer charge density by refining theoccupancy of the Cu-trien complex in the interlayer spacing.
The current work applied X-ray diffraction analysis to theCu-trien-exchanged nontronites by using the Rietveld method.The main objectives of this study are given as follows: (I) toinvestigate if some structural details of nontronites such as thelayer charge density, iron content, and the occupancies of thetrans- and cis- octahedral sites can be obtained directly fromthe X-ray diffraction patterns of purified samples and (II) to testthe applicability of this method to raw nontronite samples withnatural impurities.
MATERIALS AND METHODS
Sample PreparationTwo of the studied samples are from Uley Mine, South Australia(NAu-1 and NAu-2, Source Clays Repository) (Keeling et al.,2000). The other one is Washington nontronite (NWa). Keelinget al. (2000) found that both NAu-1 and NAu-2 showed highpurity. This was also proved by primary X-ray diffractionanalysis of samples. Thus, no further chemical treatment was
Frontiers in Chemistry | www.frontiersin.org November 2018 | Volume 6 | Article 558

Wang and Liao Rietveld Refinement of Nontronites
performed for samples, NAu-1 and NAu-2, to remove impuritieslike carbonite, iron oxides, or organic matter. In contrast,sample NWa contained amounts of quartz and trace amountsof goethite (Figure 1 and Table 5). Due to the large size,quartz can be easily removed from samples by the particle sizeseparation process. The common method for the dissolutionof iron oxides is described by Mehra and Jackson (1960).However, Manceau et al. (2000a,b) found that more than 99%octahedral Fe3+ was reduced to Fe2+ after the removal of ironoxides by using this method. Also, the layer charge may alsochange during the reduction processes (Carrado et al., 2006).Therefore, this procedure was not applied on this sample toavoid the destruction of the structure. To get the enrichmentof nontronites, the particle-size separation of the <0.2μmfraction from sodium-saturated samples was necessary. Theexcess salts were removed by dialysis and the <0.2μm fractionwas obtained by centrifugation. Then, the purified samples(<0.2μm) were exchanged with Cu-trien complex: 0.8 g purifiedsamples (<0.2μm) were suspended in 100ml 0.1M Cu-triensolution. After shaking for 24 h, the suspension was centrifugedand washed with deionized water. Then, 100ml of fresh Cu-trien solution was added into the centrifuge tube and shaken for3 h again to ensure the exchange reaction was completed. Afterwashing, the dispersion was dialyzed to remove excess salts andthen dried at room temperature.
The chemical composition of Cu-trien-exchanged nontronitesamples (Table 1) was calculated from the analysis ofXRF (Table 2) using the method described by Köster (1977)(Table 1). The XRF measurement was performed on a MagiXPRO XRF-spectrometer (stimulation power: 3.2 KW) in theInstitute of Geosciences, the Johannes Gutenberg University,Mainz. Sample NAu-2 showed higher iron content and loweraluminum content compared with sample NAu-1 (Table 1).The result is in good agreement with the study of Keeling et al.(2000). The other sample, NWa, showed significantly lower ironcontent and higher aluminum than NAu-1 and NAu-2 (Table 1).The layer charge density was determined by the alkyl ammonium
method (AAM) (Lagaly andWeiss, 1976; Olis et al., 1990; Lagaly,1991, 1994). The occupancies of cis- and trans-octahedral siteswere calculated by fitting the derivative thermogravimetry (dTG)curves, which provided the information of the dehydroxylationtemperature (Drits et al., 1995, 1998). The results showed thatalmost all cis-octahedral sites were occupied (Table 1) and theoctahedral sheets were dominated by trans-vacant structure. Theoccupancy of iron cations in the octahedral sites was obtainedby dividing the octahedral iron content by the octahedraloccupancy (Table 1). The structural information obtained fromthe chemical and thermal analyses was used as independentreferences to evaluate the Rietveld refinements.
X-ray Powder Diffraction AnalysisThe X-ray powder diffraction patterns of nontronites werecollected by using a URD 6 (Seifert, CoKα radiation)diffractometer with a secondary beam graphite monochromator,a 0.2-mm detector slit, and an automatic divergence slit (15-mmirradiated length). The measurements were performed from5◦ to 80◦ 2θ, with a step width of 0.03◦ 2θ and 3–5 s/step. Thepatterns were analyzed by the Analyze RayfleX v.2.352 software.The dried samples (<0.2μm) were ground in an agate mortar byhand and filled into the sample holder by using a side-loadingtechnique. To reduce the influence of the preferred orientationon X-ray powder diffraction patterns, a specific method forsample preparation was applied. The powders passed through asieve with 100-μm mesh to destroy the aggregates, which hadformed during the previous drying process and formed a roughsurface.
Rietveld RefinementsThe program BGMN (Bergmann et al., 1998) was applied for theRietveld refinement. The single-layer approach (Ufer et al., 2004)was used to describe the turbostratically disordered structureof nontronites. A standard cell was elongated 10 times inthe stacking direction and filled only by one single 2:1 layer(Ufer et al., 2004). The atomic coordinates of the 2:1 layers of
TABLE 1 | Structural formulae and properties of nontronite samples (<0.2μm fraction).
Samples Chemical composition
/FU
Layer charge density
[eq/FU]
Iron content per
cation position
Occupancy of
cis-octahedral sites
Nau-1 Cu2+0.18
(Al0.21Fe
3+1.83
) [(Si3.51Al0.49
)O10
(OH
)2
]0.37* 0.897 1
Nau-2 Cu2+0.12
(Al0.04Fe
3+1.94
) [(Si3.81Al0.19
)O10
(OH
)2
]0.25** 0.980 1
NWa Cu2+0.17
(Al0.43Fe
3+1.46
Mg0.21
) [(Si3.58Al0.42
)O10
(OH
)2
]0.34* 0.695 0.955
*Layer charge density according to Lagaly (1994).
**Mean layer charge density according to Olis et al. (1990).
TABLE 2 | XRF analysis of the Cu-trien-exchanged nontronites (< 0.2μm).
Oxides/% SiO2 Al2O3 Fe2O3(t) MnO MgO CaO Na2O TiO2 P2O5 CuO LOI
NAu1 52.04 8.78 36.08 0.01 0.00 0.03 0.00 0.03 0.00 4.56 17.46
NAu2 56.44 2.91 38.14 0.00 0.01 0.05 0.00 0.05 0.00 3.58 15.86
NWa 56.33 10.46 27.86 0.02 2.00 0.03 0.00 0.72 0.03 3.60 19.4
Frontiers in Chemistry | www.frontiersin.org November 2018 | Volume 6 | Article 558

Wang and Liao Rietveld Refinement of Nontronites
nontronites were taken from theManceau et al. (2000a) study andrecalculated for an orthogonal unit cell (Table 3). The positionsof the atoms were kept constant during the refinement. The startvalue for the lattice constant b was set at 0.906 nm and refinedwith the limits ranging from 0.90 to 0.93 nm, and the latticeconstant a was connected to b setting as a = b /
√3 due
to the assumption of the hexagonal layer symmetry (Manceauet al., 2000a). The start value of lattice constant c of Cu-trien-exchanged nontronites was set at 1.31 nm and refined with thelimitation between 1.29 and 1.36 nm (Kaufhold et al., 2011). Theatomic structure of the Cu-trien complex was derived from theKeramidas and Rentzeperis (1992) study. The Cu-trien moleculewas placed in the middle of the interlayer and rotated parallelto the TOT layer. During the refinement, the atomic positionswere kept fixed. The lattice constants were set as a = 0.7362 nm,b = 1.4708 nm, and c = 1.5551 nm (Keramidas and Rentzeperis,1992). According to the study of Szczerba and Ufer (2018), thetemperature factor of Cu-trien cation in the interlayer was set at0.3 nm2, which should be significantly higher than the atoms inother positions.
The occupancy of the Cu-trien complex in the interlayer P(Cutrien) and the iron occupation in the octahedral position P(Fe) were refined. The layer charge density was presented by theparameter P (Cutrien). Despite the nontronites being known toprefer the trans-vacant octahedral configuration, both cis- andtrans-vacant sites are considered. The cis-site occupation P (cis-sites) was tried to be refined for checking this precondition.The scaling factor and the peak-broadening parameters wererefined. The correction function for the preferred orientation wasintroduced and refined during the refinement. The zero-pointshift correction and the sample displacement error were refinedas nonstructural parameters.
RESULTS AND DISCUSSION
Rietveld Refinement on Purified
Cu-Trien-Exchanged SamplesThe X-ray diffraction patterns of sample NWa with differenttreatments are shown in Figure 1. The patterns of the raw andpurified Na-saturated sample displayed asymmetric and broad001 reflection (Figure 1), which indicated complex hydrationstates and inhomogeneous layer charge distribution in theinterlayer (Ferrage et al., 2005b, 2007). Thus, such a peakprofile is difficult to be simulated by a simple structure model.After exchanging the interlayer contents with the Cu-trien, theintensity of the 001 reflection was enhanced and well-defined(Figure 1). This method makes the description of the interlayerstructure much easier and provides a probability to obtain thelayer charge density by refining the occupancy of the Cu-triencomplex in the interlayer.
The refinement of the sample NAu-1 showed a goodagreement between the measured and calculated patterns andgave reasonable results for the iron content and the cis-octahedral sites occupancies (Table 4). The value of Rwp was6.79% (Figure 2). The refined value of P (Fe) = 0.86(8) agreedwith the chemical data within the estimated confidence interval
TABLE 3 | Atomic coordinates of the orthogonalized unit cell for nontronite
recalculated from Manceau et al. (2000a).
x y z
T1 0.63 0.329 0.78
T2 0 0.329 0.22
M1 0.316 0.333 0.5
M2 0.316 0 0.5
O1 0.63 0.688 0.613
O2 0.64 0.5 0.822
O3 0.375 0.736 0.845
O4 0.003 0.313 0.387
O5 0.97 0.5 0.179
O6 0.26 0.74 0.156
O7 0.683 0 0.611
O8 0.944 0 0.389
Na1 0.646 0 0.892
Na2 0 0 0.108
T1 0.63 0.671 0.78
T2 0 0.671 0.22
M1 0.316 0.667 0.5
O1 0.63 0.312 0.613
O3 0.375 0.264 0.845
O4 0.003 0.687 0.387
O6 0.26 0.26 0.156
T1 0.13 0.829 0.78
T2 0.5 0.829 0.22
M1 0.816 0.833 0.5
M2 0.816 0.5 0.5
O1 0.13 0.188 0.613
O2 0.14 0 0.822
O3 0.875 0.236 0.845
O4 0.503 0.813 0.387
O5 0.47 0 0.179
O6 0.76 0.24 0.156
O7 0.183 0.5 0.611
O8 0.444 0.5 0.389
Na1 0.146 0.5 0.892
Na2 0.5 0.5 0.108
T1 0.13 0.171 0.78
T2 0.5 0.171 0.22
M1 0.816 0.167 0.5
O1 0.13 0.812 0.613
O3 0.875 0.764 0.845
O4 0.503 0.187 0.387
O6 0.76 0.76 0.156
Space group = C1/m1, a = 0.523 nm; b = 0.906 nm; c = 0.967 nm.
“M” indicates the cations Al3+, Mg2+, and Fe3+ in the octahedral sites.
“T” indicates the cations Si4+ and Al3+ in the tetrahedral sites.
(Table 4). The cis-octahedral site occupancy P (cis-sites) =
0.97(2) was close to the expected value of 1. On the contrary,the occupancy of Cu-trien in the interlayer P (Cutrien)= 0.312(5)was underestimated compared with the value 0.37 obtained bythe AAMmethod (Table 4).
The refinement of NAu-2 resulted in satisfactory results. TheRwp value was 6.09%. The iron content P (Fe)= 0.91(7) was near
Frontiers in Chemistry | www.frontiersin.org November 2018 | Volume 6 | Article 558

Wang and Liao Rietveld Refinement of Nontronites
TABLE 4 | The refinement results of the purified nontronite samples (<0.2μm).
Nau-1 Nau-2 Nwa
Start
value
Refinement
limits
Reference
values
Refinement result
Rwp = 6.79%
Rexp = 2.63%
Reference
values
Refinement result
Rwp = 6.09%
Rexp = 2.63%
Reference
values
Refinement result
Rwp = 9.95%
Rexp = 2.68%
Contents/wt.%
Nontronite/[3σ] 100 100 99.4(2)
Quartz/[3σ] 0.1(2)
Goethite/[3σ] 0.5(6)
Lattice parameter
b(nm)/[3σ] 0.906 0.90-0.93 0.914(1) 0.9101(2) 0.9072(2)
Structure parameters
P(Fe)/[3σ] 0.4 0-1 0.897 0.86(8) 0.980 0.91(7) 0.695 0.65(9)
P(cis-sites)/[3σ] 0.5 0-1 1 0.97(2) 1 1 0.995 1
Layer charge density
P(Cutrien)/[3σ]
0.2 0-0.4 0.37 0.312(5) 0.25 0.238(4) 0.34 0.310(6)
Preferred orientation/(correction
factor in <00l>, deviation from
random orientation)
0 1.37(2) 1.23(2) 1.81(3)
Reference values: P (Fe) from chemical analysis, P(cis-sites) from thermal analysis, P(Cu-trien) from layer charge density determined by the AAM method.
TABLE 5 | Comparison of the refinement results for purified and raw Washington nontronite.
Start
value
Refinement limits
Reference values Purified
sample
(<0.2μm)
Raw
sample
(<0.4mm)
Rwp = 9.95% Rwp = 8.72%
Rexp = 2.68% Rexp = 3.51%
Contents [mass %]
Smectite/[3σ] 99.4(2) 79.3(4)
Quartz/[3σ] 0.1(2) 17.0(3)
Goethite/[3σ] 0.5(6) 3.7(3)
Structure parameters
P(Fe)/[3σ] 0.4 0-1 0.695 0.65(9) 0.63(9)
P(cis-sites)/[3σ] 0.5 0-1 0.995 1 1
Layer charge density P(Cutrien)/[3σ] 0.2 0-0.4 0.34 0.310(6) 0.355(4)
Preferred orientation /(correction factor in
<00l>, deviation from random orientation)
0 1.81(3) 1.23(4)
Reference values: P(Fe) from chemical analysis, P(cis-sites) from thermal analysis, P(Cu-trien) from layer charge density determined by the AAM method.
the value 0.980 as calculated from the structural formula. Therefined values of P (Cutrien)= 0.238(4) and P (cis-sites)= 1 werein good agreement with the reference data (Table 4).
The refinement of the sample NWa got the Rwp value of9.95% (Figure 2). Mismatches of two main profiles were presentat the 21–26◦2θ 02; 11 band and 30–33◦ 2θ 003 reflection.The high-measured intensities may be related to the high-preferred orientation (Table 4), which could not be compensatedcompletely by the correction model. Alternatively, it may beconsidered that this sample has comparably low iron and highaluminum content in the octahedral sites. The coordinatesderived from the Manceau et al. (2000a) study may not fit
perfectly for such Al-rich varieties. The refined iron contentP(Fe) = 0.65(9) was in agreement with the value of 0.695 (inthe estimated confidence interval). The refined parameter P (cis-sites)= 1 was as expected from the results of the thermal analysis.The refined P (Cutrien) = 0.310(6) was lower compared with thevalue of 0.34 as determined by the AAMmethod (Table 4).
The obtained results showed that the refined cis-siteoccupancies and the iron content for purified samples werefound to be comparatively consistent with the references.A tendency for underestimation of the layer charge densitywas observed. It may relate to the assumed values of thetemperature factor. Despite the temperature factor of Cu-trien
Frontiers in Chemistry | www.frontiersin.org November 2018 | Volume 6 | Article 558

Wang and Liao Rietveld Refinement of Nontronites
FIGURE 2 | Rietveld refinements of purified nontronite samples.
in the interlayer already having been enhanced according toSzczerba and Ufer (2018), there is still room for improvementif the temperature factor could be estimated independently,which, however, is hard to substantiate. The misfit of 001reflection may be caused by the sample roughness, which canmake deviation of peak profiles and intensities at a very lowangle.
Rietveld Refinement of Raw SampleThe feasibility of the structural model was tested in a rawnontronite sample with natural impurities. As the Washingtonbulk nontronite (sample NWa) was the only one containingsignificant impurities, it was chosen as a representative examplein this study. This raw sample was exchanged with the Cu-triencomplex directly without purification and particle size-separationprocess.
The calculated pattern was fitted satisfactorily with theobserved data (Figure 3). The intensity of 02; 11 band wasenhanced and matched much better than the purified sample.This might be related to the low preferred orientation (Table 5).Generally, the bulk sample had bigger particle size and less
aggregation than the purified sample, which may lead to lowerpreferred orientation (Table 5).
The measured pattern was covered with a large number ofquartz reflections and small broadened peaks of goethite. Thecontents of the quartz and goethite were estimated as 17.0(3) and3.7(3)% (Table 5). The Rwp value of raw NWa sample decreasedto 8.72%, while the refinement result of the purified samplewas 9.95% (Table 5). The refined value of cis-octahedral siteoccupancy P(cis-sites)= 1 was in good agreement with the valueof 0.995, which came from the thermal analysis (Table 1). Therefined iron content P (Fe) = 0.63(9) was lower than the valueof 0.695 calculated from the structural formula. However, itdisplayed the same tendency for the purified sample (Table 5).The refinement result of P (Cu-trien) = 0.355 (4) was slightlyhigher than the reference; by contrast, the refined value for thepurified sample was lower than the reference (Table 5).
The refinement result of raw nontronite samples showed thatthe refined cis-octahedral site occupancies and iron content ledto the same trends as the purified sample. However, the refinedvalue of the layer charge density resulted in a reverse tendency tothat of the purified sample (Table 5). This may further confirmthe previous discussion: the selected coordinates may not work
Frontiers in Chemistry | www.frontiersin.org November 2018 | Volume 6 | Article 558

Wang and Liao Rietveld Refinement of Nontronites
FIGURE 3 | Refinement on raw Washington nontronite.
satisfactorily for this specific sample with lower iron-contentand higher aluminum-content nontronites (Tables 4, 5). Theatomic coordinates applied to all samples were chosen identically(derived by Manceau et al., 2000a); however, such a choice mightbe a kind of simplification or compromise.
SUMMARY AND CONCLUSIONS
The Rietveld refinements of purified Cu-trien-exchangednontronites led to comparatively reasonable results. The refinedvalues of the iron content and the cis-octahedral sites were highlyconsistent with the references obtained from the chemical andthermal analyses. However, the refined layer charge densityshowed a tendency for underestimation. It may be attributedto the uncertainty of the temperature factor of Cu-trien inthe interlayer. The test of the structural model on the rawWashington nontronite showed good agreement betweencalculated and measured patterns. The refinement resultsshowed similar tendency for the iron content and occupancies ofcis-octahedral sites, but an uncertain difference of layer chargedensities between the raw and purified samples. It may be aconsequence of the simplification of the atomic coordinates.However, the models should be applied to more nontronitesamples with different iron contents in further research so asprovide evidence for this presumption.
The results of this work show that the current structure modelworks better for nontronites with high iron content than thosewith low iron content. The structure information such as the layercharge density, iron content, and occupancies of cis-octahedralsites can be obtained directly from X-ray diffraction patterns by
the Rietveld method. This study may offer a potential for refiningmore structural parameters of nontronites by using this novelapproach. The temperature factor of the interlayer species shouldbe considered seriously since the occupancy of the atoms in theinterlayer is related to this parameter. On the other hand, furtherdevelopments should also focus on the optimization of the atomicpositions, which may cover nontronite variabilities.
AUTHOR CONTRIBUTIONS
XW performed the experiments, derived the models, interpretedthe data and wrote manuscript. LL supervised developmentof this work, helped in data interpretation and manuscriptevaluation, and acted as corresponding author.
ACKNOWLEDGMENTS
This research was supported by the National Key R&D Programof China (2017YFB0310704). The authors are very gratefulto Dr. Reinhard Kleeberg (TU Bergakademie Freiberg) forhis helpful suggestions and corrections for the manuscript.We would like to thank Dr. Kristian Ufer (Bundesanstalt fürGeowissenschaften und Rohstoffe, BGR) for his assistance inthe structural model creation. We are delighted to thank Dr.Katja Emmerich and Dr. Annett Steudel (Karlsruhe Institute ofTechnology, KIT) for their support in the laboratory for themeasurement of layer charge density and the assistance in thethermal analysis. We would like to thank Prof. Dr. GerhardHeide (TU Bergakademie Freiberg) for all the support during thiswork.
Frontiers in Chemistry | www.frontiersin.org November 2018 | Volume 6 | Article 558

Wang and Liao Rietveld Refinement of Nontronites
REFERENCES
Bergaya, F., Lagaly, G., and Vayer, M. (2006). “Cation and anion exchange,” in
Handbook of Clay Science, Vol. 1. eds F. Bergaya, B. K. G. Theng, and G. Lagaly
(Clay Science), 988–995. doi: 10.1016/S1572-4352(05)01036-6
Bergmann, J., Friedel, P., and Kleeberg, R. (1998). BGMN – a new fundamental
parameters based Rietveld program for laboratory X-ray sources; it’s use in
quantitative analysis and structure investigations. CPD Newslett. Commiss.
Powder Diffract. Int Union Crystallogr. 20, 5–8.
Besson, G., Bookin, A. S., Dainyak, L. G., Rautureau, M., Tsipursky, S. I., Tchoubar,
C., et al. (1983). Use of diffraction and Mössbauer methods for the structural
and crystallochemicalcharacterisation of nontronites. J. Appl. Crystallogr. 16,
374–383. doi: 10.1107/S0021889883010651
Biscoe, J., and Warren, B. E. (1942). An X-ray study of carbon black. J. Appl. Phys.
13, 364–371. doi: 10.1063/1.1714879
Bish, D. L. (1993). “Studies of clays and clay minerals using X-ray powder
diffraction and the Rietveld method,” in CMS Workshop, Lectures 5, Computer
Applications to X-ray Powder Diffraction Analysis of Clay Minerals, eds J. R.
Walker and R. C. Reynolds Jr. (Boulder, CO: The Clay Minerals Society),
79–112.
Carrado, K. A., Decarreau, A., Petit, S., Bergaya, F., and Lagaly, G. (2006). Synthetic
clay minerals and purification of natural clays. Dev. Clay Sci. 1, 115–139.
doi: 10.1016/S1572-4352(05)01004-4
Drits, V. A., Besson, G., and Muller, F. (1995). An improved model for structural
transformations of heat-treated aluminous dioctahedral 2:1 layer silicates.Clays
Clay Miner. 43, 718–731. doi: 10.1346/CCMN.1995.0430608
Drits, V. A., Lindgreen, H., Salyn, A. L., Ylagan, R., and McCarty, D. K. (1998).
Semiquantitative determination of trans-vacantand cis-vacant 2:1 layers in
illites and illitesmectites by thermal analysis and X-ray diffraction.Am.Mineral.
83, 1188–1198. doi: 10.2138/am-1998-11-1207
Ferrage, E., Lanson, B., Malikova, N., Planon, A., Sakharov, B. A., and andDrits,
V. A. (2005a). New insights on the distribution of interlayer water in bi-
hydrated smectite from X-ray diffraction profile modeling of 00 l reflections.
Chem. Mater. 17, 3499–3512. doi: 10.2138/am.2005.1776
Ferrage, E., Lanson, B., Sakharov, B. A., and Drits, V. A. (2005b). Investigation
of smectite hydration properties by modeling experimental X-ray diffraction
pattern. Part I. Montmorillonite hydration properties. Am. Mineral. 90,
1358–1374. doi: 10.1021/cm047995v
Ferrage, E., Lanson, B., Sakharov, B. A., Geoffroy, N., Jacquot, E., and Drits, V. A.
(2007). Investigation of dioctahedral smectite hydration properties bymodeling
of X-ray diffraction profiles: influence of layer charge and charge location. Am.
Mineral. 92, 1731–1743. doi: 10.2138/am.2007.2273
Gournis, D., Lappas, A., Karakassides, M. A., Többens, D., and
Moukarika, A. (2008). A neutron diffraction study of alkali cation
migration in montmorillonites. Phys. Chem. Miner. 35, 49–58.
doi: 10.1007/s00269-007-0197-z
Kaufhold, S., Dohrmann, R., Ufer, K., Kleeberg, R., and Stanjek, H. (2011).
Termination of swelling capacity of smectites by Cu-trien exchange. Clay
Miner. 46, 411–420. doi: 10.1180/claymin.2011.046.3.411
Keeling, J. L., Raven, M. D., and Gates, W. P. (2000). Geology and characterization
of two hydrothermal nontronites from weathered metamorphic rocks at
Uley graphite mine, South Australia. Clays Clay Miner. 48, 537–548.
doi: 10.1346/CCMN.2000.0480506
Keramidas, K. G., and Rentzeperis, P. I. (1992). The crystal structure of
triethylenetetramine copper(II) fluorophosphate, Cu(trien)(PF6)2. Zeitschrift
für Kristallographie 201, 171–176.
Köster, H. M. (1977). Die Berechnung kristallchemischer Strukturformeln
von 2:1 Schichtsilikaten unter Berücksichtigung der gemessenen
Zwischenschichtladungen und Kationenumtauschkapazitäten, sowie der
Darstellung der Ladungsverteilung in der Strukturmittels Dreieckskoordinaten.
Clay Miner. 12, 45–54. doi: 10.1180/claymin.1977.012.1.03
Lagaly, G. (1991). Erkennung und Identifizierung von Tonmineralen mit
organischen Stoffen. eds H. Tributh and G. Lagaly (Gießen: DTTG), 86–130.
Lagaly, G. (1994). “Layer charge determination by alkylammonium ions,” in CMS
Workshop, Lectures 6, Layer Charge Characteristics of 2:1 Silicate Clay Minerals,
ed A. R. Mermut (Aurora, CO: The Clay Minerals Society), 1–46.
Lagaly, G., and Weiss, A. (1976). “The layer charge of smectitic layer silicates,” in
Proceedings of the International Clay Conference (Mexico), 157–172.
MacEwan, D. M. C., and Wilson, M. J. (1984). “Interlayer and intercalation
complexes of clay minerals,” in Crystal Structures of Clay Minerals and Their
x-ray Identification, eds G. W. Brindley, and G. Brown (London: Mineralogical
Society), 197–248.
Manceau, A., Lanson, B., Drits, V. A., Chateigner, D., Gates, W. P., Wu, J., et al.
(2000a). Oxidationreduction mechanism of iron in dioctahedral smectites. I.
Crystal chemistry of oxidized reference nontronites. Am. Mineral. 85, 133–152.
doi: 10.2138/am-2000-0114
Manceau, A., Lanson, B., Drits, V. A., Chateigner, D., Gates, W. P., Wu, J., et al.
(2000b). Oxidationreduction mechanism of iron in dioctahedral smectites. II.
Crystal chemistry of reduced Garfield nontronite. Am. Mineral. 85, 153–172.
doi: 10.2138/am-2000-0115
Mehra, O. P., and Jackson, M. L. (1960). “Iron oxide removal from soils and
clays by a dithionite-citrate-system buffered with sodium bicarbonate,” in 7th
National Conference on Clays and ClayMinerals, ed A. Swineford (Washington,
DC: Pergamon Press), 317–327.
Meier, L. P., and Kahr, G. (1999). Determination of the cation exchange
capacity (CEC) of clay minerals using the complexes of copper (II) ion
with triethylenetetramine and tetraethylenepentamine. Clays Clay Miner. 47,
386–388. doi: 10.1346/CCMN.1999.0470315
Moore, D. M., and Reynolds, R. C. Jr. (1997). X-ray Diffraction and the
Identification and Analysis of Clay Minerals. New York, NY: Oxford University
Press, 335–339.
Olis, A. C., Malla, P. B., and Douglas, L. A. (1990). The rapid estimation of the layer
charges of 2:1 expanding clays from a single alkylammonium ion expansion.
Clay Miner. 25, 39–50. doi: 10.1180/claymin.1990.025.1.05
Sato, T., Murakami, T., and Watanabe, T. (1996). Change in layer charge
of smectites and smectitelayers in illite/smectite during diagenetic
alteration. Clays Clay Miner. 44, 460–469. doi: 10.1346/CCMN.1996.
0440403
Sato, T., Watanabe, T., and Otsuka, R. (1992). Effects of layer charge, charge
location, and energy change on expansion properties of dioctahedral smectites.
Clays Clay Miner. 40, 103–113. doi: 10.1346/CCMN.1992.0400111
Sposito, G., Skipper, N. T., Sutton, R., Park, S., Soper, A. K., and Greathous, J. A.
(1999). Surface geochemistry of the clay minerals. Proc. Natl. Acad. Sci. USA.
96, 3358–3364. doi: 10.1073/pnas.96.7.3358
Szczerba, M., and Ufer, K. (2018). New model of ethylene glycol intercalate
in smectites for XRD modelling. Appl. Clay Sci. 153, 113–123.
doi: 10.1016/j.clay.2017.12.010
Taylor, J. C., and Matulis, C. E. (1994). A new method for Rietveld clay
analysis: part 1. Use of a universally measured standard profile for
Rietveld quantification of montmorillonites. Powder Diffract. 9, 119–123.
doi: 10.1017/S0885715600014093
Tsipursky, S. I., and Drits, V. A. (1984). The distribution of octahedral
cations in the 2:1 layers of dioctahedral smectites studied by oblique-texture
electron diffraction. Clay Miner. 19, 177–193. doi: 10.1180/claymin.1984.
019.2.05
Ufer, K., Kleeberg, R., Bergmann, J., and Dohrmann, R. (2012). Rietveld refinement
of disordered illite-smectite mixed-layer structures by a recursive algorithm
– II: powder-pattern refinement and quantitative phase analysis. Clays Clay
Miner. 60, 535–552. doi: 10.1346/CCMN.2012.0600508
Ufer, K., Roth, G., Kleeberg, R., Stanjek, H., Dohrmann, R., and Bergmann, J.
(2004). Description of X-ray powder pattern of turbostratically disordered layer
structures with a Rietveld compatible approach. Z. Kristallogr. 219, 519–527.
doi: 10.1524/zkri.219.9.519.44039
Ufer, K., Stanjek, H., Roth, G., Kleeberg, R., Dohrmann, R., and Kaufhold, S. (2008).
Quantitative phase analysis of bentonites by the Rietveld method. Clays Clay
Miner. 56, 272–282. doi: 10.1346/CCMN.2008.0560210
Viani, A., Gualtieri, A. F., and Artioli, G. (2002). The nature of disorder in
montmorillonite by simulation of X-ray powder patterns. Am. Mineral. 87,
966–975. doi: 10.2138/am-2002-0720
Conflict of Interest Statement: The authors declare that the research was
conducted in the absence of any commercial or financial relationships that could
be construed as a potential conflict of interest.
Copyright © 2018 Wang and Liao. This is an open-access article distributed
under the terms of the Creative Commons Attribution License (CC BY). The use,
distribution or reproduction in other forums is permitted, provided the original
author(s) and the copyright owner(s) are credited and that the original publication
in this journal is cited, in accordance with accepted academic practice. No use,
distribution or reproduction is permitted which does not comply with these terms.
Frontiers in Chemistry | www.frontiersin.org November 2018 | Volume 6 | Article 558

Advantages of publishing in Frontiers
OPEN ACCESS
Articles are free to read for greatest visibility
and readership
EXTENSIVE PROMOTION
Marketing and promotion
of impactful research
DIGITAL PUBLISHING
Articles designed for optimal readership
across devices
LOOP RESEARCH NETWORK
Our network increases your
article’s readership
Frontiers
Avenue du Tribunal-Fédéral 34 1005 Lausanne | Switzerland
Visit us: www.frontiersin.orgContact us: [email protected] | +41 21 510 17 00
FAST PUBLICATION
Around 90 days from submission
to decision
90
IMPACT METRICS
Advanced article metrics track visibility across
digital media
FOLLOW US
@frontiersin
TRANSPARENT PEER-REVIEW
Editors and reviewers acknowledged by name
on published articles
HIGH QUALITY PEER-REVIEW
Rigorous, collaborative, and constructive
peer-review
REPRODUCIBILITY OF
RESEARCH
Support open data and methods to enhance research reproducibility


![ChemInform Abstract: Eco-Friendly Synthesis of 1,4Benzodiazepine2,5-diones in the Ionic Liquid [bmim]Br](https://static.fdokumen.com/doc/165x107/6319c85065e4a6af370ff8b8/cheminform-abstract-eco-friendly-synthesis-of-14benzodiazepine25-diones-in-the.jpg)