
Metagenomic Insight of a Full Scale Eco-Friendly Treatment ...
19
microorganisms Article Metagenomic Insight of a Full Scale Eco-Friendly Treatment System of Textile Dye Wastewater Using Bioaugmentation of the Composite Culture CES-1 Aalfin Emmanuel Santhanarajan 1,† , Woo-Jun Sul 2,† , Keun-Je Yoo 1 , Hoon-Je Seong 2 , Hong-Gi Kim 3 and Sung-Cheol Koh 1, * Citation: Santhanarajan, A.E.; Sul, W.-J.; Yoo, K.-J.; Seong, H.-J.; Kim, H.-G.; Koh, S.-C. Metagenomic Insight of a Full Scale Eco-Friendly Treatment System of Textile Dye Wastewater Using Bioaugmentation of the Composite Culture CES-1. Microorganisms 2021, 9, 1503. https:// doi.org/10.3390/microorganisms9071503 Academic Editor: Anna H. Kaksonen Received: 8 June 2021 Accepted: 12 July 2021 Published: 14 July 2021 Publisher’s Note: MDPI stays neutral with regard to jurisdictional claims in published maps and institutional affil- iations. Copyright: © 2021 by the authors. Licensee MDPI, Basel, Switzerland. This article is an open access article distributed under the terms and conditions of the Creative Commons Attribution (CC BY) license (https:// creativecommons.org/licenses/by/ 4.0/). 1 Division of Civil, Environmental Engineering and Logistics System, Korea Maritime and Ocean University, Busan 49112, Korea; eaalfi@gmail.com (A.E.S.); [email protected] (K.-J.Y.) 2 Department of Systems Biotechnology, Chung-Ang University, Anseong 06974, Korea; [email protected] (W.-J.S.); [email protected] (H.-J.S.) 3 Bayo Inc., Jinju 52665, Korea; [email protected] * Correspondence: [email protected]; Tel.: +82-10-9900-7294 † Equally contributed as a first author. Abstract: Effects of bioaugmentation of the composite microbial culture CES-1 on a full scale textile dye wastewater treatment process were investigated in terms of water quality, sludge reduction, dynamics of microbial community structures and their functional genes responsible for degradation of azo dye, and other chemicals. The removal efficiencies for Chemical Oxygen Demand (COD), Total Nitrogen (T-N), Total Phosphorus (T-P), Suspended Solids (SS), and color intensity (96.4%, 78.4, 83.1, 84.4, and 92.0, respectively) 300–531 days after the augmentation were generally improved after bioaugmentation. The denitrification linked to T-N removal appeared to contribute to the concomitant COD removal that triggered a reduction of sludge (up to 22%) in the same period of augmentation. Azo dye and aromatic compound degradation and other downstream pathways were highly metabolically interrelated. Augmentation of CES-1 increased microbial diversity in the later stages of augmentation when a strong microbial community selection of Acinetobacter parvus, Acinetobacter johnsonii, Marinobacter manganoxydans, Verminephrobacter sp., and Arcobacter sp. occurred. Herein, there might be a possibility that the CES-1 augmentation could facilitate the indigenous microbial community successions so that the selected communities made the augmentation successful. The metagenomic analysis turned out to be a reasonable and powerful tool to provide with new insights and useful biomarkers for the complex environmental conditions, such as the full scale dye wastewater treatment system undergoing bioaugmentation. Keywords: textile dye wastewater; bioaugmentation; sludge reduction; microbial diversity; metage- nomic analysis 1. Introduction Azo dyes are one of the oldest synthetic chemicals and are still widely used in textile printing and the food industries. The annual production worldwide is approximately 700,000 tons, about 10%–15% of which are released into the environment during manufac- turing and usage [1]. The textile industry is considered one of the largest water consumers in the world. It is rapidly expanding, and dyes are also continuously being upgraded and replaced by superior compounds that have enhanced fastness, stability, brightness, and resistance to natural degradation. Color is the first contaminant to be recognized in the wastewater and has to be removed before discharging into water bodies or on land [2]. The presence of very small amounts of dyes in water (less than 1 ppm for some dyes) is highly visible and affects the aesthetic merit, water transparency, and gas solubility in lakes, rivers, and other water bodies [3]. It is noteworthy that some dyes are highly toxic and mutagenic, Microorganisms 2021, 9, 1503. https://doi.org/10.3390/microorganisms9071503 https://www.mdpi.com/journal/microorganisms
-
Upload
khangminh22 -
Category
Documents
-
view
0 -
download
0
Transcript of Metagenomic Insight of a Full Scale Eco-Friendly Treatment ...

microorganisms
Article
Metagenomic Insight of a Full Scale Eco-Friendly TreatmentSystem of Textile Dye Wastewater Using Bioaugmentation ofthe Composite Culture CES-1
Aalfin Emmanuel Santhanarajan 1,†, Woo-Jun Sul 2,† , Keun-Je Yoo 1 , Hoon-Je Seong 2 , Hong-Gi Kim 3
and Sung-Cheol Koh 1,*
�����������������
Citation: Santhanarajan, A.E.; Sul,
W.-J.; Yoo, K.-J.; Seong, H.-J.; Kim,
H.-G.; Koh, S.-C. Metagenomic
Insight of a Full Scale Eco-Friendly
Treatment System of Textile Dye
Wastewater Using Bioaugmentation
of the Composite Culture CES-1.
Microorganisms 2021, 9, 1503. https://
doi.org/10.3390/microorganisms9071503
Academic Editor: Anna H. Kaksonen
Received: 8 June 2021
Accepted: 12 July 2021
Published: 14 July 2021
Publisher’s Note: MDPI stays neutral
with regard to jurisdictional claims in
published maps and institutional affil-
iations.
Copyright: © 2021 by the authors.
Licensee MDPI, Basel, Switzerland.
This article is an open access article
distributed under the terms and
conditions of the Creative Commons
Attribution (CC BY) license (https://
creativecommons.org/licenses/by/
4.0/).
1 Division of Civil, Environmental Engineering and Logistics System, Korea Maritime and Ocean University,Busan 49112, Korea; [email protected] (A.E.S.); [email protected] (K.-J.Y.)
2 Department of Systems Biotechnology, Chung-Ang University, Anseong 06974, Korea;[email protected] (W.-J.S.); [email protected] (H.-J.S.)
3 Bayo Inc., Jinju 52665, Korea; [email protected]* Correspondence: [email protected]; Tel.: +82-10-9900-7294† Equally contributed as a first author.
Abstract: Effects of bioaugmentation of the composite microbial culture CES-1 on a full scale textiledye wastewater treatment process were investigated in terms of water quality, sludge reduction,dynamics of microbial community structures and their functional genes responsible for degradationof azo dye, and other chemicals. The removal efficiencies for Chemical Oxygen Demand (COD),Total Nitrogen (T-N), Total Phosphorus (T-P), Suspended Solids (SS), and color intensity (96.4%, 78.4,83.1, 84.4, and 92.0, respectively) 300–531 days after the augmentation were generally improvedafter bioaugmentation. The denitrification linked to T-N removal appeared to contribute to theconcomitant COD removal that triggered a reduction of sludge (up to 22%) in the same period ofaugmentation. Azo dye and aromatic compound degradation and other downstream pathwayswere highly metabolically interrelated. Augmentation of CES-1 increased microbial diversity in thelater stages of augmentation when a strong microbial community selection of Acinetobacter parvus,Acinetobacter johnsonii, Marinobacter manganoxydans, Verminephrobacter sp., and Arcobacter sp. occurred.Herein, there might be a possibility that the CES-1 augmentation could facilitate the indigenousmicrobial community successions so that the selected communities made the augmentation successful.The metagenomic analysis turned out to be a reasonable and powerful tool to provide with newinsights and useful biomarkers for the complex environmental conditions, such as the full scale dyewastewater treatment system undergoing bioaugmentation.
Keywords: textile dye wastewater; bioaugmentation; sludge reduction; microbial diversity; metage-nomic analysis
1. Introduction
Azo dyes are one of the oldest synthetic chemicals and are still widely used in textileprinting and the food industries. The annual production worldwide is approximately700,000 tons, about 10%–15% of which are released into the environment during manufac-turing and usage [1]. The textile industry is considered one of the largest water consumersin the world. It is rapidly expanding, and dyes are also continuously being upgraded andreplaced by superior compounds that have enhanced fastness, stability, brightness, andresistance to natural degradation. Color is the first contaminant to be recognized in thewastewater and has to be removed before discharging into water bodies or on land [2]. Thepresence of very small amounts of dyes in water (less than 1 ppm for some dyes) is highlyvisible and affects the aesthetic merit, water transparency, and gas solubility in lakes, rivers,and other water bodies [3]. It is noteworthy that some dyes are highly toxic and mutagenic,
Microorganisms 2021, 9, 1503. https://doi.org/10.3390/microorganisms9071503 https://www.mdpi.com/journal/microorganisms

Microorganisms 2021, 9, 1503 2 of 19
and decrease light penetration and photosynthetic activity, causing oxygen deficiency andlimiting downstream beneficial uses such as recreation, drinking water, and irrigation [4].
It has been shown that azo and nitro-compounds are reduced in sediments [5] and inthe intestinal environment [6], resulting in the regeneration of the parent toxic amines [3].Azo dyes and some of their N-substituted aromatic biodegradation products are toxicand/or carcinogenic and, hence, the dyes need to be treated as important environmentalpollutants [7]. Bacterial azo dye biodegradation typically occurs in two steps. The firststep involves a reductive cleavage of the dyes’ azo linkages, resulting in the generationof generally colorless but potentially toxic aromatic amines. The second one involves thedegradation of the aromatic amines. Azo dye reduction usually happens under anaer-obic conditions, while bacterial biodegradation of aromatic amines is mostly an aerobicprocess [8]. Bacteria can even degrade intermediate products of decolorization such asaromatic amines with the help of enzymes like hydroxylase and oxygenase [9], thus aidingin reducing lethal effects of azo dyes by the formation of non-toxic metabolites. Theseindicate the importance of a proper combination of anaerobic and aerobic bacterial com-munities in the azo dye treatment system. Moreover, it would be necessary to developmicrobial consortia that harbor genes for the efficient degradation of mixtures of azo dyesand aromatic amines. The consortia will be quite useful for the bioaugmentation of theazo dye wastewater treatment system. The decolorization and COD removal of the azodye wastewater in an anaerobic reactor packed with a pair of Fe-graphite plate electrodeswere significantly higher than in a single anaerobic reactor and a single electrode reactorbecause of microbial richness and diversity stimulated by the electrochemical reaction onthe electrodes [10]. Bioaugmentation of the microbial consortium SFC 500-1 showed agreat potential for the treatment of tannery effluents under laboratory and field microcosmsystems [11]. A mutualistic-symbiotic relationship between bioaugmented bacteria andsoil indigenous microbes facilitated an enhanced detoxification of mixed dyes, leading to asustainable approach for restoration of contaminated lands [12]. The bioaugmentation ofhydrolysis acidification (HA) by a halophilic bacterial consortium facilitated an increase ofbacterial diversity and dominant invasion of Marinobacterium which played a key role in azodye decolorization [13]. An imperfect color removal with standard activated sludge systemis related to changes in concentration and composition of dyes, and their toxicity, as wellas sludge adaptation to such unstable conditions. Therefore, there is still a growing needin finding an effective and low-cost method for the removal of dyes from wastewater [4].Industrial-scale studies for bioaugmentation have been applied to the target pollutants,including ammonia and polycyclic aromatic hydrocarbons (PAHs) [14].
Metagenomic analysis by using high-throughput sequencing methods may help toovercome the limitations of conventional methods of studying microbial community dy-namics in the dye wastewater treatment process. The high-throughput sequencing analysisapproach will provide a great opportunity and new insights to reveal the compositionof microbial communities, diversity of functional genes, and enzymes responsible forthe treatment of various wastewaters including tannery and textile wastewaters. Thereshould be more studies for a better understanding of the degradation pathways wherebioaugmentation is implemented. It will be also necessary to undertake bioaugmentationefficacy studies at full scale with test and control streams and evaluation of the economicviability of the technique [14]. Researchers have concentrated on designing numeroustechnologies [15] for the treatment of textile wastewater and also studied the changes inmicrobial community and diversity in the treatment systems. [16]. However, there havebeen no studies on high-throughput detection of microbial community profiles of environ-mental samples such as dye wastewater which have been severely affected by long-termexposure to improper discharge. Guo et al. (2013) and Krishnamoorthy et al. (2021) [17,18]used a metagenomic approach to unravel the community diversity and functional pro-files within activated sludge from a full-scale SNPR WWTP and found that various keyenzymes involved in metabolisms degrading various chemicals could be annotated indifferent treatments. However, it was hard to distinguish the effects of each divergent

Microorganisms 2021, 9, 1503 3 of 19
variable on microbial community in a full-scale dye wastewater treatment plant sincea lot of uncontrollable or even undetectable influential factors were involved in such apollutant-removing process [19]. Thus, it is necessary to evaluate adverse effects on theenzyme functions, variation on the microbial community structures and activities of theactivated sludge under controllable processing conditions.
In this study, a full-scale dye wastewater treatment process was monitored and evalu-ated in terms of physicochemical parameters, sludge reduction, functional genes encodingenzymes responsible for degradation of various chemicals, as well as azo dyes and micro-bial community structures before and after bioaugmentation of the composite microbialculture CES-1 over more than 500 days. The intrinsic relationships among metabolic func-tional genes, the microbial community structures, and samples of different treatment stagesand times were comprehensibly analyzed based on the metagenomic analysis technology.The obtained data appeared to successfully reveal a mechanistic basis of beneficial effectsof CES-1 bioaugmentation on optimal treatment of the recalcitrant dye wastewater leadingto sludge reduction (at least 22%) as well as meeting all requirements for the wastewatertreatment standards at a full-scale system with good economic merit.
2. Materials and Methods2.1. Description of Textile Dye Wastewater Treatment System and Its Operations
The treatment system was a two-stage activated sludge process modified with theaddition of a sludge digestion tank which was located at a dye wastewater treatment plantin Daegu City, South Korea. As shown in Figure 1, the process was essentially composedof multiple steps including the influent tank (I), the buffering tank (B), primary aerationtank (PA), primary sedimentation tank (PS), secondary aeration tank (SA), secondarysedimentation tank (SS), tertiary sedimentation tank (TS), and sludge digestion tank (SD).The wastewater treatment plant routinely treated 15,000 (m3 per day) of wastewater at25–35 ◦C. One thousand (m3/day) of sludge was generated from primary, secondary,and tertiary sedimentation tanks and transported to the sludge thickening tank. Fourhundred (m3/day) of the sludge was then transported into SD (900 m3) after filtrationthrough a sieve screen (1 mm) and digested through bioaugmentation of the active cultureof CES-1 (15 tons per day), and the remaining sludge (600 m3/day) was subjected todehydration, generating dehydrated sludge (50–60 tons/D; 60% moisture). The digestionwas performed at 35–42 ◦C and under 0.5–3.5 mg/L of DO for 54 h, and then the digestedsludge was recycled into B. The composite culture CES-1 was initially enriched from thenatural soils and was originally deposited by Bayo, Inc. (Jinju, Republic of Korea) as aproprietary culture (KCTC 12579BP) at the Biological Resource Center, Korea ResearchInstitute of Bioscience and Biotechnology (Daejeon, Republic of Korea). The mediumfor CES-1 (powder form) includes the following ingredients: rice bran (35%, w/w), ricehusk (35), oak sawdust (27), and minerals including illite, perlite, and vermicu-lite (3).The powder form culture was prepared by growing CES-1 inoculum (1%, w/w) in themedium (moisture, 55%) at 40 ◦C for 5–7 days. The liquid culture of CES-1 was preparedby inoculating 7 kg of CES-1 (powder form) into 1.0 m3 of water and growing it at 40 ◦C for3 days under an aeration (50 L/min). The culture reached 108–109 (cells/mL) and was thendiluted 30 times before being augmented into the sludge digestion tank (SD) at 0.1% (v/v)of the total influent treated daily (15,000 m3 × 0.1% = 15,000 L). Major genera of the liquidculture based on the pyrosequencing analysis were Clostridium (58.0%), Lactococcus (13.5),Gluconacetobacter (11.0), Acidomonas (4.9), Klebsiella (2.9), Enterobacter (1.9), Lactobacillus (1.2),Chitinophaga (1.1), Dyella (1.0), Acidocella (0.5), Citrobacter (0.5), Lacibacter (0.4), Burkholderia(0.4), and others (2.7). The hydraulic retention time for the whole wastewater treatmentsystem was 46.2 h. Traditionally the sludge generated from the primary, secondary, andtertiary sedimentation tanks was transported to the sludge thickening tank and then thethickened sludge was dehydrated to reach 60% of moisture content (50–60 tons producedper day).

Microorganisms 2021, 9, 1503 4 of 19
Microorganisms 2021, 9, x FOR PEER REVIEW 4 of 19
46.2 h. Traditionally the sludge generated from the primary, secondary, and tertiary sed-imentation tanks was transported to the sludge thickening tank and then the thickened sludge was dehydrated to reach 60% of moisture content (50–60 tons produced per day).
Figure 1. The full-scale treatment system of textile dye wastewater and its operational conditions. Sampling and monitoring sites: I, influent; B, buffering tank; PA, primary aeration tank; SA, second-ary aeration tank; SD, sludge digestion tank. HRT hydraulic retention time. D, days.
2.2. Monitoring the Water Quality of Dye Wastewater Treatment System The samples were taken from the treatment plant and labeled with the sample name,
month, date, and the year of the sample taken. The water quality of the dye wastewater treatment processes was monitored in terms of COD, T-N, T-P, NH4+, NO2−, NO3−, and suspended solid (SS). These parameters were measured following the Standard Methods for the Examination of Water and Wastewater [20] and using the wastewater analysis kits and HS-3300 water analyzer (Humas Inc., Daejeon, South Korea), and spectrophotometer (Model Optizen Pop, Mecasys Inc., Daejeon, South Korea) as previously described (Kim et al., 2014). pH was measured using a Neomet pH meter (Istek, Inc., Seoul, South Korea) and dissolved oxygen (DO) using a DO meter (Model Pro2030; YSI Inc., Yellow Springs, OH, USA). The color intensity was measured using platinum-cobalt (Pt-Co) analysis [20].
2.3. DNA Isolation from Samples and Sequencing of Metagenomes DNA was isolated from CES-1 and 19 samples from the different treatment steps (I,
B, PA, SA, and SD) during the five different periods (3 March 2017–29 June 2017; 10 March 2018–13 July 2018; and 26 October 2018). The names of the samples were described as treatment step_month and date_year. They were taken 67 days before augmentation (B_0303_17, PA_0303_17 and SA_0303_17), 50 days after augmentation (I_0629_17, B_0629_17, PA_0629_17, SA_0629_17, SD_0629_17), 300 days after augmentation (I_0310_18, B_0310_18, PA_0310_18, SA_0310_18, SD_0310_18), 425 days after augmenta-tion (I_0713_17), and 531 days after augmentation (I_1026_18, B_1026_18, PA_1026_18, SA_1026_18, SD_1026_18). 0.25 g of biomass was collected by filtering each sample. To avoid the fragmentation of strands due to instability in the pH, the samples were washed with 0.1 M of EDTA. DNA extraction procedures have been shown previously [21], and detailed processes for library preparation, sequencing, and bioinformatics analysis of the metagenomes have been previously described [22]. Briefly, DNA extraction was per-formed on 1–2 milliliters of each sample, which was accomplished using the PowerSoil DNA Isolation Kit (Mo Bio Laboratories, Inc.). The samples were processed using TruSeq DNA LT Sample Prep Kit (Illumina, San Diego, CA, USA) and Paired-end sequencing (2 × 150 bp) was performed on an Illumina MiSeq system (Macrogen Inc., Seoul, South Ko-rea) following the manufacturer’s protocol.
2.4. Contig Assembly and Binning of Metagenomes
Figure 1. The full-scale treatment system of textile dye wastewater and its operational conditions. Sampling and monitoringsites: I, influent; B, buffering tank; PA, primary aeration tank; SA, secondary aeration tank; SD, sludge digestion tank. HRThydraulic retention time. D, days.
2.2. Monitoring the Water Quality of Dye Wastewater Treatment System
The samples were taken from the treatment plant and labeled with the sample name,month, date, and the year of the sample taken. The water quality of the dye wastewatertreatment processes was monitored in terms of COD, T-N, T-P, NH4
+, NO2−, NO3
−, andsuspended solid (SS). These parameters were measured following the Standard Methodsfor the Examination of Water and Wastewater [20] and using the wastewater analysis kitsand HS-3300 water analyzer (Humas Inc., Daejeon, South Korea), and spectrophotometer(Model Optizen Pop, Mecasys Inc., Daejeon, South Korea) as previously described (Kimet al., 2014). pH was measured using a Neomet pH meter (Istek, Inc., Seoul, South Korea)and dissolved oxygen (DO) using a DO meter (Model Pro2030; YSI Inc., Yellow Springs,OH, USA). The color intensity was measured using platinum-cobalt (Pt-Co) analysis [20].
2.3. DNA Isolation from Samples and Sequencing of Metagenomes
DNA was isolated from CES-1 and 19 samples from the different treatment steps(I, B, PA, SA, and SD) during the five different periods (3 March 2017–29 June 2017;10 March 2018–13 July 2018; and 26 October 2018). The names of the samples weredescribed as treatment step_month and date_year. They were taken 67 days beforeaugmentation (B_0303_17, PA_0303_17 and SA_0303_17), 50 days after augmentation(I_0629_17, B_0629_17, PA_0629_17, SA_0629_17, SD_0629_17), 300 days after augmenta-tion (I_0310_18, B_0310_18, PA_0310_18, SA_0310_18, SD_0310_18), 425 days after augmen-tation (I_0713_17), and 531 days after augmentation (I_1026_18, B_1026_18, PA_1026_18,SA_1026_18, SD_1026_18). 0.25 g of biomass was collected by filtering each sample. Toavoid the fragmentation of strands due to instability in the pH, the samples were washedwith 0.1 M of EDTA. DNA extraction procedures have been shown previously [21], anddetailed processes for library preparation, sequencing, and bioinformatics analysis of themetagenomes have been previously described [22]. Briefly, DNA extraction was performedon 1–2 milliliters of each sample, which was accomplished using the PowerSoil DNAIsolation Kit (Mo Bio Laboratories, Inc., San Diego, CA, USA). The samples were processedusing TruSeq DNA LT Sample Prep Kit (Illumina, San Diego, CA, USA) and Paired-endsequencing (2 × 150 bp) was performed on an Illumina MiSeq system (Macrogen Inc.,Seoul, South Korea) following the manufacturer’s protocol.
2.4. Contig Assembly and Binning of Metagenomes
The raw reads were trimmed using Trimmomatic (version 0.36) with a default optionto filter low quality reads. The total reads and the GC% were shown in Table S1. Qualitytrimmed reads were used for taxonomic classification using Kraken2 with a standard

Microorganisms 2021, 9, 1503 5 of 19
database, and the selected genes and the encoded enzymes were listed in Table S2. Thisdatabase consisted of the bacterial, archaeal, and viral genome sequences from RefSeq,along with the human genome and UniVec. Kraken2 results may mislead the resultsbecause the bacterial genome sequence of species (genus) level is nearly identical. Therefore,we re-estimated the relative abundance of each taxonomic level, using Bracken for moreaccurate taxonomy composition analysis.
2.5. Visualization of Metabolic Pathways and Microbial Communities
The statistical analysis of physical and chemical parameters for the wastewater wasaccomplished through one-way ANOVA using SPSS (IBM SPSS Statistics 25) with thesignificance p < 0.05. The visualization of bubble plots and analysis Spearman’s rankcorrelation analysis was conducted with R software using ggplot2 and pheatmap [23] andcorrplot package [24]. The Procrustes correlation was analyzed from the VEGAN packageand plot in ggplot in R and the p-value was obtained by recalculating and normalizingthe abundance value. The simulated correlations between the pathways were confirmedif p < 0.05 [25]. The network analysis was done using Gephi with the whole abundanceas a node based on a p-value (<0.05) and the modularity value as a cluster and edges.The co-occurrence correlation between the pathway gene and the microbial communitypresence was statistically checked and calculated [26].
3. Results and Discussion3.1. Wastewater Treatment Monitoring during Bioaugmentation
The efficiency of the dye wastewater treatment 67 days before the bioaugmentationof CES-1 was shown in Table 1, which was used as a control for the treatments after thebioaugmentation. The removal efficiencies (%) for COD, T-N, T-P, SS, and color intensitywere 94.9, 48.0, 91.6, 63.9, and 66.3, respectively. By the way, the removal efficiencies (%) forCOD, T-N, T-P, SS, and color intensity 50 days after the bioaugmentation were 97.8, 62.6,95.8, 63.4, and 77.9, showing the increase of COD, T-N, T-P, and color intensity removalefficiencies (%) by 2.9, 14.5, 4.2, and 11.6, respectively. This indicates that the bioaugmen-tation of CES-1 may be effective in facilitating dye wastewater treatment. Moreover, theremoval efficiencies (%) for COD, T-N, T-P, SS, and color intensity 300 days (531 days)after the bioaugmentation were 95.5 (97.3), 80.9 (75.9), 96.2 (70), 44.1 (81.3), and 90 (94),respectively. Overall, the removal efficiencies for COD, T-N, T-P, SS, and color intensityafter the augmentation were higher than the control (before augmentation).
The COD removal may be one of the main parameters used to prove sludge reductionand to understand its mechanism. Taking in the 531 days of augmentation, the removalrate of COD was 97.3% while the removal rate of COD before augmentation was 94.9%. Agood sludge reduction (22%) was also observed at the time (Table 2). There was an increasein the removal rate (2.5 to 20%) throughout the bioaugmentation of CES-1 compared withthe previous studies [26–28]. This process appeared to increase the total nitrogen removalefficiencies (62.6–80.9%) of the system compared with the control (48.0%). Removal ofT-N appeared to be more active in the 0310_18 (80.9%) than before the bioaugmentation,and this kind of trend was maintained until 531 days after the bioaugmentation removalefficiencies of T-N (75.9–80.9%). The overall removal efficiencies of COD, T-N, NH4
+,and T-P increased after the augmentation compared with before augmentation (Table1). T-N removal is an important indication of the denitrification whose process requireselectron donors derived from organic materials of which concentration can be estimated byCOD. The removal rates of COD were also higher in the bioaugmented effluent samples.Therefore, the denitrification linked to T-N removal seemed to contribute to the concomitantCOD removal that triggered the reduction of sludge which was the source of organicmaterials in the treatment system as shown previously [20,29].

Microorganisms 2021, 9, 1503 6 of 19
Table 1. Characteristics of the dye wastewater of the different treatment stages before and after the bioaugmentation of the composite microbial consortium CES-1.
3 March 2017(67 Days Before Augmentation)
29 June 2017(50 Days After Augmentation)
10 March 2018(300 Days After Augmentation)
26 October 2018(531 Days After Augmentation)
Influent[I]
Effluent[E]
RemovalRate(%)
Influent[I]
BufferingTank[B]
Effluent[E]
SludgeDigestion
[SD]
RemovalRate(%)
Influent[I]
BufferingTank[B]
Effluent[E]
SludgeDigestion
[SD]
RemovalRate(%)
Influent[I]
BufferingTank[B]
Effluent[E]
SludgeDigestion
[SD]
RemovalRate(%)
COD(mg/L) 584 ± 8.5 c 20.6 ± 0.4 a 94.9 674 ± 51.6 d 466 ± 24.7 c 14.5 ± 0.3 a 141.5 ± 57 b 97.8 472 ± 3.5 d 440 ± 13 c 21.1 ± 0.4 a 2228 ± 3.5 e 95.5 237 ± 79 b 2112 ± 65 d 7.3 ± 0.9 a 1678 ± 76 c 97.3
T-N(mg/L) 36.2 ± 1.3 b 18.8 ± 0.8 a 48 23 ± 0 c 33.4 ± 0.8 d 8.6 ± 0.4 b 22.5 ± 0.1 c 62.6 51.2 ± 0.1 c 48.8 ± 2.7 c 9.7 ± 1.4 a 30.5 ± 1.3 b 80.9 89.4 ± 0.74 e 81.4 ± 0.96 d 21.5 ± 3.1 a 62.3 ± 0.5 c 75.9
T-P(mg/L) 5.1 ± 0.5 b 0.43 ± 0.01 a 91.5 2.4 ± 0.1 b 1.9 ± 0 b 0.1 ± 0 c 6.0 ± 1.2 a 95.8 3.3 ± 0.1 c 4.5 ± 0.4 d 0.1 ± 0.04 a 1.9 ± 0.09 b 96.2 7 ± 0.1 d 3.9 ± 1.2 d 2.1 ± 0.41 bc 2.9 ± 0.56 c 70
NH3(mg/L) 14.8 ± 0.5 b 8.9 ± 0.4 a 43.6 10.5 ± 0.1 c 9.6 ± 0.1 b 6.1 ± 0.2 a 9.5 ± 0.1 b 41.9 7.2 ± 0.9 c 9.5 ± 0.5 c 4.1 ± 0 a 10.8 ± 0.5 c 48.89 16 ± 0.2 e 13.9 ± 0.1 c 6 ± 0.7 a 17.9 ± 0.4 f 62.5
NO2−
(mg/L)1.7 c 0.3 a 82.3 1.43 d 1.01 b 1.4 c,d 0.9 b 2 1.92 c 0.95 b 0.17 a 0.9 b 91.1 2.5 ± 0.6 c 1.6 ± 0.23 b 0.4 ± 0.1 a 2.8 ± 0.1 c 84
NO3−
(mg/L)7.7 ± 0.2 c 0.8 ± 0.07 a 89.6 7.1 ± 0.5 d 5.4 ± 0 c 2.8 ± 0.4 b 14.6 ± 0.2 e 60.5 3.5 ± 0.14 b 4.6 ± 0.6 c 1.8 ± 0.4 a 1.5 ± 0.03 d 47.7 11.7 ± 0.4 c 7.74 ± 0.2 b 2.1 ± 0.2 a 3.59 ± 0.5 a 82
PO43− (mg/L)
3.4 ± 0 c 0.2 ± 0.01 a 94.1 3.54 ± 0.2 d 4.3 ± 0.05 e 0.16 ± 0 a 3.41 ± 0.05 c 95.4 3.9 ± 0.3 c 0.8 ± 0.1 a 0.2 ± 0.01 a 4.3 ± 0.6 c 94.3 5 ± 0.3 e 1.5 ± 2.8 b 0.9 ± 0.04 a 0.0 ± 0.2 d 82
SS(mg/L) - - - 123 - 45 - 63.4 776 - 97 - 87.5 478 - - 89 81.3
Pt-Co(PCU) - - - 347.9 ± 0.2 - - 76.7 ± 1.1 77.9 305.1 ± 1.3 - - 30.4 ± 1.5 90 361.1 ± 0.4 - - 21.4 ± 0 94
Based on buffering replacing influent and secondary sedimentation replacing effluent. “a,b,c,d,e,f” alphabetic markings in ascending order are based on the Duncan test.

Microorganisms 2021, 9, 1503 7 of 19
Table 2. Effect of CES-1 bioaugmentation on the sludge reduction in the full-scale dye wastewater treatment plant.
SamplingPeriod
Influent(M3)
Influent EffluentSludge Total
InfluentSludge Sludge
Reduction ***
(ton) Per ton ofInfluent %
COD COD COD COD(g/m3) (g/m3) (ton)
2017. 3 * 411,588 664 34 1690 273 6.18 −2018. 10 ** 385,158 560 33 1007 217 5.00 22
* Monthly average before bioaugmentation; ** Monthly average after bioaugmentation; *** Sludge reduction per ton of influent COD.
Compliance with effluent nitrogen standards affects a wide variety of dyes. Nitrifica-tion is well known for its process instability due to the requirement for the close linkingof the bacterial species responsible for different parts of the removal process [30]. Bioaug-mentation has been shown to offer the potential to stabilize nitrification and to deal withtransient treatment problems.
As with nitrogen, bioaugmentation has been demonstrated to have some success inthe treatment [31] and an improved long-term stability of treatment systems for treatingaromatic compounds under such bioaugmentation conditions was observed.
3.2. Comparative Analysis of Potential Different Metabolic Pathways Involved in ChemicalDegradation Processes in the Treatment System
Besides understanding of the wastewater treatment processes in terms of dynamics ofthe chemical parameters, it will be highly worthwhile to try to understand the treatmentprocess at a molecular biological level based on metagenome analysis of genes (enzymes)and microbial communities responsible for degradation of chemicals and its resultingsludge reduction. Four groups of the metabolic pathways were compared with each other,and the data showed that they appeared to be highly correlated with each other, indicatingthey are metabolically interrelated [28]. Most of the samples taken after bioaugmentation(I_0713_18, I_1026_18, B_1026_18, PA_1026_18, SA_1026_18, SD_1026_18) were highlyclustered, while the sample before the bioaugmentation (B_0303_17). The augmentation ofCES-1 appeared to allow some microbial communities to be selected strongly over othersso that these metabolic pathways could be highly functional in the positive correlations.
Procrustes analysis demonstrated a significant association between the ordinations oftwo metabolic pathways. In the association of azo dye and aromatic compound degrada-tion, amino acid metabolism and nitrogen and phosphorus cycle with TCA cycle, B_1026_18,and SA_1026_18 got shifted towards the TCA cycle. Most of the samples from 300 daysof bioaugmentation and CES-1 were correlated with azo dye and aromatic compounddegradation, amino acid metabolism, and nitrogen and phosphorus cycle. The rest of theclustered samples were stretched towards the azo dye and aromatic compound degrada-tion and amino acid metabolism. The results indicated that the samples 300 and 531 daysafter the bioaugmentation showed high interrelationships and continuities among path-ways and stretch towards the TCA cycle (Figure 2a–f). Comparison of the Procrustes plotwith chemical analysis revealed that the positive correlations of amino acid metabolismwith nitrogen cycle and TCA cycle support the higher COD removal rate in 50 days, and531 days of augmented samples. It was assumed that the degradation of amino acid andnitrogen cycle might facilitate the enhancement of COD removal [21,32]. The presenceof the TCA cycle in B_1026_18, SA_1026_18, and B_0629_17 indicates the carbon sourceutilization by microbial communities, which completes the cycle of sludge reduction [29].

Microorganisms 2021, 9, 1503 8 of 19
Microorganisms 2021, 9, x FOR PEER REVIEW 8 of 19
over others so that these metabolic pathways could be highly functional in the positive correlations.
Procrustes analysis demonstrated a significant association between the ordinations of two metabolic pathways. In the association of azo dye and aromatic compound degra-dation, amino acid metabolism and nitrogen and phosphorus cycle with TCA cycle, B_1026_18, and SA_1026_18 got shifted towards the TCA cycle. Most of the samples from 300 days of bioaugmentation and CES-1 were correlated with azo dye and aromatic com-pound degradation, amino acid metabolism, and nitrogen and phosphorus cycle. The rest of the clustered samples were stretched towards the azo dye and aromatic compound degradation and amino acid metabolism. The results indicated that the samples 300 and 531 days after the bioaugmentation showed high interrelationships and continuities among pathways and stretch towards the TCA cycle (Figure 2a-f). Comparison of the Pro-crustes plot with chemical analysis revealed that the positive correlations of amino acid metabolism with nitrogen cycle and TCA cycle support the higher COD removal rate in 50 days, and 531 days of augmented samples. It was assumed that the degradation of amino acid and nitrogen cycle might facilitate the enhancement of COD removal [21,32]. The presence of the TCA cycle in B_1026_18, SA_1026_18, and B_0629_17 indicates the carbon source utilization by microbial communities, which completes the cycle of sludge reduction [29].
Figure 2. Procrustes analysis of the major potential degradation pathways in textile wastewater treatment system before and after bioaugmentation of CES-1 over the monitoring period (531 days). Blue arrow indicates the significant positive correlation between the two pathways (p < 0.05).
3.3. Dynamic Changes of Functional Genes for Major Metabolic Pathways in Textile Dye Wastewater Treatment Process Undergoing Bioaugmentation of CES-1 over Time
To understand mechanisms of the degradation of azo dye and other accompanying chemicals, and sludge reduction at a molecular biological level, the metagenomic analysis was done by sequencing the whole microbial community DNA extracted from the twenty
Figure 2. Procrustes analysis of the major potential degradation pathways in textile wastewater treatment system beforeand after bioaugmentation of CES-1 over the monitoring period (531 days). Blue arrow indicates the significant positivecorrelation between the two pathways (p < 0.05).
3.3. Dynamic Changes of Functional Genes for Major Metabolic Pathways in Textile DyeWastewater Treatment Process Undergoing Bioaugmentation of CES-1 over Time
To understand mechanisms of the degradation of azo dye and other accompanyingchemicals, and sludge reduction at a molecular biological level, the metagenomic analysiswas done by sequencing the whole microbial community DNA extracted from the twentydifferent treatment stages. Major functional genes were selected according to their relevantpathways, and their dynamic changes were analyzed using their abundances in all thesamples over time.
The gene abundance profiles of major metabolic pathways in the treated sampleswere shown in Figure 3. Starting with aromatic compound degradation, the presence ofgenes involved in catechol cleavage was higher in most of the samples including CES-1. The catechol cleavage pathway was comparatively higher than the other pathwaysinvolved in aromatic compound degradation. According to Aghapour et al. [28], thecatechol cleavage leads to the formation of succinyl-CoA, acetyl-CoA, and pyruvate. Thisrequires the presence of genes involved in their pathways for amino acid metabolism.Abundances of the dominant amino acid degradation genes were higher in CES-1 and thesamples that went through an early augmentation such as B_0629_17, SA_0629_17, andSD_0629_17. Abundances of the TCA cycle and fatty acid degradation genes were alsohigher in most of the samples. This may indicate the necessity of these pathways to providethe carbon sources for the growth of the microbial communities. In nitrogen metabolism,the nitrate reduction and the denitrification follow the same trends in 50 days and 531 daysof bioaugmented samples. Supporting the higher presence of denitrification genes after thebioaugmentation, the nitrate reduction leads to a high rate of denitrification [22]. Analyzingthe data for chemical parameters, the samples (531 days after augmentation) with a higherfrequency of genes for degradation of amino acid, denitrification, and TCA cycle couldhave contributed to the sludge reduction (Table 2).

Microorganisms 2021, 9, 1503 9 of 19
Microorganisms 2021, 9, x FOR PEER REVIEW 9 of 19
different treatment stages. Major functional genes were selected according to their rele-vant pathways, and their dynamic changes were analyzed using their abundances in all the samples over time.
The gene abundance profiles of major metabolic pathways in the treated samples were shown in Figure 3. Starting with aromatic compound degradation, the presence of genes involved in catechol cleavage was higher in most of the samples including CES-1. The cat-echol cleavage pathway was comparatively higher than the other pathways involved in aromatic compound degradation. According to Aghapour et al. [28], the catechol cleavage leads to the formation of succinyl-CoA, acetyl-CoA, and pyruvate. This requires the pres-ence of genes involved in their pathways for amino acid metabolism. Abundances of the dominant amino acid degradation genes were higher in CES-1 and the samples that went through an early augmentation such as B_0629_17, SA_0629_17, and SD_0629_17. Abun-dances of the TCA cycle and fatty acid degradation genes were also higher in most of the samples. This may indicate the necessity of these pathways to provide the carbon sources for the growth of the microbial communities. In nitrogen metabolism, the nitrate reduction and the denitrification follow the same trends in 50 days and 531 days of bioaugmented samples. Supporting the higher presence of denitrification genes after the bioaugmentation, the nitrate reduction leads to a high rate of denitrification [22]. Analyzing the data for chemical parameters, the samples (531 days after augmentation) with a higher frequency of genes for degradation of amino acid, denitrification, and TCA cycle could have contrib-uted to the sludge reduction (Table 2).
Figure 3. Heatmap analysis of the major potential degradation pathways and their modules in tex-tile wastewater treatment system before and after bioaugmentation of CES-1 over the monitoring period (531 days).
Unexpectedly, azo dye reductase gene (acpD) showed a lower frequency in most of the samples although its removal efficiencies increased as the augmentation progressed (from 78 to 94%) (Figure 4a; Table 1). Aromatic compound degradative genes ligA and ligB (encoding protocatechuate 4,5-dioxygenase alpha chain and beta chain, respectively)
Figure 3. Heatmap analysis of the major potential degradation pathways and their modules in textilewastewater treatment system before and after bioaugmentation of CES-1 over the monitoring period(531 days).
Unexpectedly, azo dye reductase gene (acpD) showed a lower frequency in most ofthe samples although its removal efficiencies increased as the augmentation progressed(from 78 to 94%) (Figure 4a; Table 1). Aromatic compound degradative genes ligA andligB (encoding protocatechuate 4,5-dioxygenase alpha chain and beta chain, respectively)were dominantly carried in the augmented culture CES-1 and all the 2017 samples exceptB_0303_17 and I_06_29_17, which were taken before bioaugmentation and in the early stageof bioaugmentation. These genes almost disappeared in all the samples taken 300 days afterthe augmentation (10 March 2018). However, ligB gene reappeared in all samples 531 daysafter the augmentation (26 October 2018) except the influent, indicating the stabilizedmaintenance of this gene in the steady-state of the treatment system. The cleavage of azobonds (-N=N-) and the replacement of hydroxyl group of ortho-carboxyl group with F-(fluorobenzene) lead to the breaking of benzene ring and the compound degraded into toxic-less metabolites such as, 2-methyl-propionic acid [33,34]. The ligA and ligB genes mightsupport the asymmetric cleavage of the C–N bond, removing N in the aromatic ring, andyielding several intermediate products, such as 9-octadecenamide, (Z)- and phenylethylalcohol, and p-xylene, and the breakage of benzene ring opening and the transformation oflong-chain compounds into low-molecular-weight and less-toxic stable products, such asbutanoic acid, 3-methyl-, and 4-methyl-2-oxovaleric acid. A recent study has demonstratedthe successful decomposition of azo dyes into aromatic amines due to sufficient electrondonor source [32]. Most of the functional genes involved in TCA cycle (fbaA, tpiA, pgk,gpmA, ENO, pyk, gltA, sucD, sdhA, sdhB, and mdh) and fatty acid degradation pathwayswere observed in most of the samples before and after the augmentation (Figure 4b).Moreover, the fatty acid degradative genes encoding acyl-CoA dehydrogenase and enoyl-CoA hydratase were essentially more dominant over the whole experimental period. Thisindicates that most of the genes for TCA cycle and fatty acid degradation appeared to bewidely distributed in the treatment system regardless of bioaugmentation of CES-1. Azo

Microorganisms 2021, 9, 1503 10 of 19
dye degradation requires electrons generated from the fatty acid degrading genes and TCAcycle [35]. In terms of amino acid metabolism, the dominant genes were ligK, serA, asd,and trpB, which were found in most of the samples over the observation period (Figure 4c).The amino acid metabolic genes could be non-specifically functioning regardless of thebioaugmentation. As to nitrogen and phosphorus metabolism, the genes responsible fordenitrification including narG, narZ, and nxrA were relatively dominant in most samplesexcept influent samples and some from buffering (B_0303_17 and B_0310_18) (Figure 4d).In previous studies, metagenome for a full-scale bioreactor in Aalborg, Denmark (DK),that performed nitrogen removal in addition to phosphate removal was reported [36].These observations are corresponding with the lower concentration of nitrate and nitrate in0310_18 and 1026_18. However, the nitrite reductase gene (nrfA) involved in the treatmentshowed 2–4 times lower abundance than the nitrate reductase and denitrification genes(nirS, nosZ, narG, narZ, and nxrA) in the later bioaugmentation, indicating that the treatmentsystem was operated under the conditions favoring denitrification. Total nitrogen (T-N)and COD simultaneously decreased as the augmentation continued over the period, whosephenomena were typically observed in denitrification process. This indicates the CODwas the main electron donor source for the removal of total nitrogen [37]. Therefore, thesedenitrification genes appeared to be functioning in the system under an influence of theCES-1 augmentation. The denitrification also seemed to contribute to the sludge reductionof the system by 22% about 17 months after the augmentation.
Microorganisms 2021, 9, x FOR PEER REVIEW 11 of 19
Figure 4. Abundance dynamics of genes encoding for enzymes involved in the major potential degradation pathways in textile wastewater treatment system before and after bioaugmentation of CES-1 over the monitoring period (531 days).
3.4. Dynamic Changes of Microbial Community Structures in Textile Dye Wastewater Treatment Process under Bioaugmentation of CES-1 at Different Treatment Stages over Time
The families such as Aeromonadaceae were dominant 67 days before and 50 days after bioaugmentation while Bulkholderiaceae, Commamonadaceae, Dermatophilaceae, and Bulkholderiales_noname were dominant 300 and 531 days after the augmentation shown in Figure S1. Since Aeromonadaceae were highly dominant in samples before bio-augmentation as well as in CES-1, the family also became dominant in samples 50 days after bioaugmentation. Burkholderiaceae was dominant in 300 and 531 days after the aug-mentation. In addition, Sphingobium, Sulfitobacter, Mesorhizobium, Acetobacter, Thiomonas, Alicycliphilus, and Burkholderia were generally dominant before and in the early stage of augmentation (Figure S2), but they all became much less dominant in the later stages of augmentation. Several genera including Burkholderia and Sphingobium utilized the azo and aromatic compounds like benzene, pyrene, and flourene as a sole carbon and energy source [33]. Acetobacter and Glucanocetobacter were dominant in BM-S-1 that seemed to play an important role in amino acid degradation pathways [30]. Our data were in agree-ment with the findings of previous studies in the dominance of Proteobacteria in dye wastewater samples [34,38]. Proteobacteria are generally known to have an important role in the degradation of organic pollutants such as nitrogenous, phosphorus and aromatic compounds. Denitrification can be mediated by bacteria, archaea, and eukaryotes, but most of the denitrifiers belong to the phylum [39].
Figure 4. Abundance dynamics of genes encoding for enzymes involved in the major potential degradation pathways intextile wastewater treatment system before and after bioaugmentation of CES-1 over the monitoring period (531 days).

Microorganisms 2021, 9, 1503 11 of 19
3.4. Dynamic Changes of Microbial Community Structures in Textile Dye Wastewater TreatmentProcess under Bioaugmentation of CES-1 at Different Treatment Stages over Time
The families such as Aeromonadaceae were dominant 67 days before and 50 daysafter bioaugmentation while Bulkholderiaceae, Commamonadaceae, Dermatophilaceae,and Bulkholderiales_noname were dominant 300 and 531 days after the augmentationshown in Figure S1. Since Aeromonadaceae were highly dominant in samples beforebioaugmentation as well as in CES-1, the family also became dominant in samples 50 daysafter bioaugmentation. Burkholderiaceae was dominant in 300 and 531 days after theaugmentation. In addition, Sphingobium, Sulfitobacter, Mesorhizobium, Acetobacter, Thiomonas,Alicycliphilus, and Burkholderia were generally dominant before and in the early stage ofaugmentation (Figure S2), but they all became much less dominant in the later stagesof augmentation. Several genera including Burkholderia and Sphingobium utilized theazo and aromatic compounds like benzene, pyrene, and flourene as a sole carbon andenergy source [33]. Acetobacter and Glucanocetobacter were dominant in BM-S-1 that seemedto play an important role in amino acid degradation pathways [30]. Our data were inagreement with the findings of previous studies in the dominance of Proteobacteria in dyewastewater samples [34,38]. Proteobacteria are generally known to have an important rolein the degradation of organic pollutants such as nitrogenous, phosphorus and aromaticcompounds. Denitrification can be mediated by bacteria, archaea, and eukaryotes, butmost of the denitrifiers belong to the phylum [39].
At the species level, Thiomonas_unclassified, Alicycliphilus_unclassified, and Burkholde-ria_unclassified were mostly dominant 67 days before augmentation and 50 days afteraugmentation, but they were significantly diminished in the later stages of augmentation(Figure 5). Although these species seemed to be transient, they may play certain roles indegradation of pollutants in a “low key” mode. It has been reported that Marinobacter sp.have an ability to degrade the O-H and N-H stretching corresponding to aromatic hydroxyland amino groups in azo dye color index Direct Blue-1 [40]. The microbial communitydata indicate that augmentation of CES-1 carrying Gluconacetobacter_unclassified and Ace-tobacter_unclassified as dominant species allowed a good selection of a greater numberof species, leading to a higher diversity index (Shannon indices: 2.11–3.25) in the laterstages of augmentation compared with before augmentation and at the early stage ofaugmentation (Shannon indices: 1.24–2.61). A large number of unclassified sequenceswere found in dye wastewater [41], suggesting that a wide variety of novel species mayinhabit in the dye wastewater treatment system [42]. It is suggested that many degradingmicrobes appeared to be enriched in B, PA, SA, and SD in the later stages of augmentationbecause of long term bioaugmentation of CES-1 into SD. A. johnsonii and A. parvus carriedgenes for azoreductase and proved to be efficient in degrading textile effluents [43,44].Furthermore, Pseudomonas species carries genes for at least three different azoenzymesazoR1, azoR2, and azoR3 [45]. Sphingomonas has genes for several azoreductases and hasperformed both successful dye degradation and mineralization of metabolites [46]. Therewere many less microbial communities present before bioaugmentation due to the presenceof high concentrated azo compounds in the wastewater [18]. This might have resulted inthe decrease of microbial populations and subsequently reducing enzyme activities [47]. Inthis study, however, there was a drastic increase in the abundance of microbial communities(by 75%) in B, SA, and SD after 300 days of bioaugmentation.

Microorganisms 2021, 9, 1503 12 of 19
Microorganisms 2021, 9, x FOR PEER REVIEW 12 of 19
At the species level, Thiomonas_unclassified, Alicycliphilus_unclassified, and Burkhold-eria_unclassified were mostly dominant 67 days before augmentation and 50 days after augmentation, but they were significantly diminished in the later stages of augmentation (Figure 5). Although these species seemed to be transient, they may play certain roles in degradation of pollutants in a “low key” mode. It has been reported that Marinobacter sp. have an ability to degrade the O-H and N-H stretching corresponding to aromatic hy-droxyl and amino groups in azo dye color index Direct Blue-1 [40]. The microbial com-munity data indicate that augmentation of CES-1 carrying Gluconacetobacter_unclassified and Acetobacter_unclassified as dominant species allowed a good selection of a greater number of species, leading to a higher diversity index (Shannon indices: 2.11–3.25) in the later stages of augmentation compared with before augmentation and at the early stage of augmentation (Shannon indices: 1.24–2.61). A large number of unclassified sequences were found in dye wastewater [41], suggesting that a wide variety of novel species may inhabit in the dye wastewater treatment system [42]. It is suggested that many degrading microbes appeared to be enriched in B, PA, SA, and SD in the later stages of augmentation because of long term bioaugmentation of CES-1 into SD. A. johnsonii and A. parvus carried genes for azoreductase and proved to be efficient in degrading textile effluents [43,44]. Furthermore, Pseudomonas species carries genes for at least three different azoenzymes azoR1, azoR2, and azoR3 [45]. Sphingomonas has genes for several azoreductases and has performed both successful dye degradation and mineralization of metabolites [46]. There were many less microbial communities present before bioaugmentation due to the pres-ence of high concentrated azo compounds in the wastewater [18]. This might have re-sulted in the decrease of microbial populations and subsequently reducing enzyme activ-ities [47]. In this study, however, there was a drastic increase in the abundance of micro-bial communities (by 75%) in B, SA, and SD after 300 days of bioaugmentation.
Figure 5. Abundance dynamics of microbial communities (species level) in textile wastewater treat-ment system before and after bioaugmentation of CES-1 over the monitoring period (531 days).
On the other hand, a PCA indicated a transition in the composition of the microbiota at the species level in the different treatment systems. The composition of the bacterial community in the family level including Acetobacteraceae, Sphingobacteraceae, and Fla-vobacteriaceae was affiliated with B_1026_18 and B_0310_18 (Figure 6a). At the species level, B_1026_18 and B_0310_18 were diverged from negative correlation and joined with the rest of the samples from 1026_18 and 0310_18 in the positive correlation including
Figure 5. Abundance dynamics of microbial communities (species level) in textile wastewater treatment system before andafter bioaugmentation of CES-1 over the monitoring period (531 days).
On the other hand, a PCA indicated a transition in the composition of the microbiotaat the species level in the different treatment systems. The composition of the bacte-rial community in the family level including Acetobacteraceae, Sphingobacteraceae, andFlavobacteriaceae was affiliated with B_1026_18 and B_0310_18 (Figure 6a). At the specieslevel, B_1026_18 and B_0310_18 were diverged from negative correlation and joined withthe rest of the samples from 1026_18 and 0310_18 in the positive correlation includingAcinetobacter_johnsonii, Wolinella_succingenes, and Klebsiella_pneumoniae. The species fromAcetobacteraceae, Sphingobacteraceae, and Flavobacteriaceae have stayed in negativecorrelation (Figure 6c). Considering the range distribution values in both F1 and F2 di-mension, the family and species level had significance. There is no universal rule for theestimation of the number of PCs [48]. It was assumed that there was a common corre-lation between the CES-1 and the 50 days of bioaugmented samples indicating a stronginfluence of CES-1 in 0629_17 samples. The positive correlation of 1026_18 and 0310_18showed its significance among the treatments. Additionally, Figure 6c showed a higherpresence of Acinetobacter parvus and Acinetobacter johnsonii with 1026_18 samples. Previousstudies mentioned the extraction of azoreductase, NADH-DCIP reductase, laccase, andlignin peroxidase in Acinetobacter sp. [49]. The higher abundance of Acinetobacter sp. in theB_0310_18 and SA_1026_18 shows its contribution to degrade azo dye through severalenzymatic mechanisms for the nonspecific reductive cleavage of azo linkage [36]. Anincrease of potential species present in the bioaugmented samples indicates its enzymeactivity associated with their contribution to dye degradation.

Microorganisms 2021, 9, 1503 13 of 19
Microorganisms 2021, 9, x FOR PEER REVIEW 13 of 19
Acinetobacter_johnsonii, Wolinella_succingenes, and Klebsiella_pneumoniae. The species from Acetobacteraceae, Sphingobacteraceae, and Flavobacteriaceae have stayed in negative correlation (Figure 6c). Considering the range distribution values in both F1 and F2 di-mension, the family and species level had significance. There is no universal rule for the estimation of the number of PCs [48]. It was assumed that there was a common correlation between the CES-1 and the 50 days of bioaugmented samples indicating a strong influence of CES-1 in 0629_17 samples. The positive correlation of 1026_18 and 0310_18 showed its significance among the treatments. Additionally, Figure 6c showed a higher presence of Acinetobacter parvus and Acinetobacter johnsonii with 1026_18 samples. Previous studies mentioned the extraction of azoreductase, NADH-DCIP reductase, laccase, and lignin pe-roxidase in Acinetobacter sp. [49]. The higher abundance of Acinetobacter sp. in the B_0310_18 and SA_1026_18 shows its contribution to degrade azo dye through several enzymatic mechanisms for the nonspecific reductive cleavage of azo linkage [36]. An in-crease of potential species present in the bioaugmented samples indicates its enzyme ac-tivity associated with their contribution to dye degradation.
Figure 6. Principal component analysis (PCA) of microbial community with linear combinations of the variables sorted to different quantitative variables. The arrow lines represent the correlation coefficient between the principal component scores and parameter. Treatment stages indicated in the blue dot, denitrification genes and degradation enzymes indicated in orange dot. PCA of the relative abundance at family level (a); PCA of the relative abundance at genus level (b); PCA of the relative abundance at species level (c).
3.5. Analysis of Relationships between the Microbial Community Structures and Major Degradation Pathways Involved in the Textile Dye Treatment Process under Bioaugmentation
The Procrustes plot showed a positive correlation only between the microbial family communities and the azo dye/aromatic compound degradation pathway (Figure 7). The correlation between the pathway with genus and species does not show the significance (Figures S3 and S4) As shown in Figure 2, B_0310_18 and SA_0310_18 have higher abun-dance and positive correlations between azo dye/aromatic compound degradation and all the other degradation pathways (amino acid metabolism, TCA cycle and lipid degrada-tion, and nitrogen/phosphorus cycles). The relative abundance of Burkholderiaceae in-creased in the later stages of bioaugmentation may prove that the microbial communities
Figure 6. Principal component analysis (PCA) of microbial community with linear combinations of the variables sortedto different quantitative variables. The arrow lines represent the correlation coefficient between the principal componentscores and parameter. Treatment stages indicated in the blue dot, denitrification genes and degradation enzymes indicatedin orange dot. PCA of the relative abundance at family level (a); PCA of the relative abundance at genus level (b); PCA ofthe relative abundance at species level (c).
3.5. Analysis of Relationships between the Microbial Community Structures and MajorDegradation Pathways Involved in the Textile Dye Treatment Process under Bioaugmentation
The Procrustes plot showed a positive correlation only between the microbial familycommunities and the azo dye/aromatic compound degradation pathway (Figure 7). Thecorrelation between the pathway with genus and species does not show the significance(Figures S3 and S4) As shown in Figure 2, B_0310_18 and SA_0310_18 have higher abun-dance and positive correlations between azo dye/aromatic compound degradation and allthe other degradation pathways (amino acid metabolism, TCA cycle and lipid degradation,and nitrogen/phosphorus cycles). The relative abundance of Burkholderiaceae increasedin the later stages of bioaugmentation may prove that the microbial communities from thefamily can utilize the aromatic compound as a sole carbon and energy source [33,34].
3.6. Time-Course Network Analysis among Microbial Communities, Metabolic Pathways Involvedin the Degradation of Azo Dye and Other Compounds
Based on previous studies [21,29,34], it was hypothesized that the bioaugmentationof potential microorganisms in dye wastewater reduced the sludge and increased thefrequency of genes degradative for toxic organic and inorganic compounds. In general,primary aeration and secondary aeration of all the time frames were formed in a commoncluster with fadE, gltA, ENO, ligA, ligB, and most of genes for the nitrogen and phosphoruscycle metabolic pathways. Gluconacetobacter_unclassified and PGAM, gpmA gene had astrong presence in all the samples of before bioaugmentation (Figure 8a). The formation ofclusters from the sample before bioaugmentation indicates that the specific genes (FBA,PGK, pyk, nifH, and glpQ) and species (Gluconacetobacter_unclassified) used to play a majorrole throughout the treatment process. This weak connection among the treatment stages

Microorganisms 2021, 9, 1503 14 of 19
proves the fluctuations of microbial presence and the gene occurrence in the treatment timeperiod.
Microorganisms 2021, 9, x FOR PEER REVIEW 14 of 19
from the family can utilize the aromatic compound as a sole carbon and energy source [33,34].
Figure 7. Procrustes analysis of the major potential degradation pathways and different microbial families in textile wastewater treatment system before and after bioaugmentation of CES-1 over the monitoring period (531 days). Blue arrow indicates the significant positive correlation between the microbial family and aromatic compound degradation (p < 0.05).
3.6. Time-Course Network Analysis among Microbial Communities, Metabolic Pathways Involved in the Degradation of Azo Dye and Other Compounds
Based on previous studies [21,29,34], it was hypothesized that the bioaugmentation of potential microorganisms in dye wastewater reduced the sludge and increased the fre-quency of genes degradative for toxic organic and inorganic compounds. In general, pri-mary aeration and secondary aeration of all the time frames were formed in a common cluster with fadE, gltA, ENO, ligA, ligB, and most of genes for the nitrogen and phosphorus cycle metabolic pathways. Gluconacetobacter_unclassified and PGAM, gpmA gene had a strong presence in all the samples of before bioaugmentation (Figure 8a). The formation of clusters from the sample before bioaugmentation indicates that the specific genes (FBA, PGK, pyk, nifH, and glpQ) and species (Gluconacetobacter_unclassified) used to play a major role throughout the treatment process. This weak connection among the treatment stages proves the fluctuations of microbial presence and the gene occurrence in the treatment time period.
The sample network 50 days after bioaugmentation had 99 nodes and 434 edges with the modularity value of 0.29. ligA and trpB had a strong connection with I_0629_17 and formed a cluster with PA_0629_17, SA_0629_17, SD_0629_17. Most of the dominant genes including K10907, ligK, dhaa associated with Acinetobacter_parvus, Acetobacter_unclassified, Gluconacetobacter_diazotrophicus, and Marinobacter_manganoxydans was clustered with PA_0629_17, SA_0629_17, SD_0629_17. The lignin peroxidase and azo reductase enzyme
Figure 7. Procrustes analysis of the major potential degradation pathways and different microbialfamilies in textile wastewater treatment system before and after bioaugmentation of CES-1 over themonitoring period (531 days). Blue arrow indicates the significant positive correlation between themicrobial family and aromatic compound degradation (p < 0.05).
The sample network 50 days after bioaugmentation had 99 nodes and 434 edgeswith the modularity value of 0.29. ligA and trpB had a strong connection with I_0629_17and formed a cluster with PA_0629_17, SA_0629_17, SD_0629_17. Most of the domi-nant genes including K10907, ligK, dhaa associated with Acinetobacter_parvus, Acetobac-ter_unclassified, Gluconacetobacter_diazotrophicus, and Marinobacter_manganoxydans was clus-tered with PA_0629_17, SA_0629_17, SD_0629_17. The lignin peroxidase and azo reductaseenzyme present in Acinetobacter sp. involves in a dye degradation [49]. The pht (phthalate4,5-dioxygenase) and K10907 (aminotransferase) genes connected with Acinetobacter sp.and Marinobacter sp. in the cluster with B_0629_17 showed the connection between theazo and aromatic compound degradation and amino acid metabolic pathway in a specificmicrobial community in the buffering treatment [13].
In the samples 300 days after the augmentation, CES-1 got closely connected (strongedge between the samples) with SA_0310_18. This proved the impact of CES-1 on othersamples, including SA. Both CES-1 and SA were a dominant host for azo dye and aromaticcompound degradation genes including ligA, ligB, catA, PHO, acpD, etc. I_0310_18 andB_0310_18 were grouped and had a major connection with PA_0310_18 and SA_0310_18,where it clustered with SD_0310_18 with the total of 102 nodes and 431 edges with themodularity value of 0.32. Most of the communities came under these two groups. Compar-ing with the samples 50 days after bioaugmentation, there was little change in the clusters.Gluconacetobacter_unclassified was a common host for most of the genes and highly sharedits edges with all the samples (Figure 8c). Most of the genes stayed in the same cluster until

Microorganisms 2021, 9, 1503 15 of 19
300 days of bioaugmentation. CES-1 forms a separate cluster in all the time frames butshares most of its genes and communities with B, PA, SA, and SD. SD had a strong connec-tion in the 50 days of bioaugmented samples, and the gene clusters from SD became moreabundant in B and SA in later stages. Actinobacter_parvus remained in the CES-1 clusterbut changed its edge from B to PA, SA, and SD. ALDO, nrfA, appA were the unchangeableclusters of CES-1. Paracoccus_unclassified, Suffitobacter_unclassified, Burkholderia_unclassifiedcommonly carried the high abundant genes like pgk, pfkA, ALDO, glpQ from TCA cycle,nirS, nrfA, and PHO from the nitrogen cycle. Actinobacter_johnsonii became a host for catEfrom the aromatic compound degradation pathway in CES-1.
Microorganisms 2021, 9, x FOR PEER REVIEW 15 of 19
present in Acinetobacter sp. involves in a dye degradation [49]. The pht (phthalate 4,5-diox-ygenase) and K10907 (aminotransferase) genes connected with Acinetobacter sp. and Marinobacter sp. in the cluster with B_0629_17 showed the connection between the azo and aromatic compound degradation and amino acid metabolic pathway in a specific micro-bial community in the buffering treatment [13].
Figure 8. The comprehensive network analyses of the microbial species and their genes involved in the major potential degradation pathways, depending on the samples of the four different time courses in textile wastewater treatment sys-tem. (a) 67 days before bioaugmentation of CES-1; (b, c and d) 50, 300, and 531 days after bioaugmentation, respectively.
In the samples 300 days after the augmentation, CES-1 got closely connected (strong edge between the samples) with SA_0310_18. This proved the impact of CES-1 on other samples, including SA. Both CES-1 and SA were a dominant host for azo dye and aromatic compound degradation genes including ligA, ligB, catA, PHO, acpD, etc. I_0310_18 and B_0310_18 were grouped and had a major connection with PA_0310_18 and SA_0310_18, where it clustered with SD_0310_18 with the total of 102 nodes and 431 edges with the modularity value of 0.32. Most of the communities came under these two groups. Com-paring with the samples 50 days after bioaugmentation, there was little change in the clus-ters. Gluconacetobacter_unclassified was a common host for most of the genes and highly shared its edges with all the samples (Figure 8c). Most of the genes stayed in the same cluster until 300 days of bioaugmentation. CES-1 forms a separate cluster in all the time frames but shares most of its genes and communities with B, PA, SA, and SD. SD had a strong connection in the 50 days of bioaugmented samples, and the gene clusters from SD became more abundant in B and SA in later stages. Actinobacter_parvus remained in the CES-1 cluster but changed its edge from B to PA, SA, and SD. ALDO, nrfA, appA were the unchangeable clusters of CES-1. Paracoccus_unclassified, Suffitobacter_unclassified, Burkhold-eria_unclassified commonly carried the high abundant genes like pgk, pfkA, ALDO, glpQ from TCA cycle, nirS, nrfA, and PHO from the nitrogen cycle. Actinobacter_johnsonii be-came a host for catE from the aromatic compound degradation pathway in CES-1.
Figure 8. The comprehensive network analyses of the microbial species and their genes involvedin the major potential degradation pathways, depending on the samples of the four different timecourses in textile wastewater treatment system. (a) 67 days before bioaugmentation of CES-1; (b–d) 50,300, and 531 days after bioaugmentation, respectively.
The final network formed with 102 nodes, 463 edges, and modularity value of 0.361.fadE, ENO, and Glucanobacter_unclassified were clustered with PA_1026_18 and commonlypresent in all the bioaugmented samples after 531 days (Figure 8d). After 531 days ofbioaugmentation, the SD_1026_18 was separated from PA_1026_18 and SA_1026_18 andformed a tight connection with nitrogen, phosphorus, and TCA cycle genes in associationwith Massilia_timonae, Gluconacetobacter_unclassified, and Kosakonia_radicincitans. The overallseparation and higher connection with CES-1 proved the dominance of CES-1 in thesamples. The microbial community pattern may also depend on the fact that most bacteriawith azoreductase (acpD) and catechol cleavage (catA and catB) use electron shuttles todegrade the azo bond and oxygen inhibits this process by being a more potent electronacceptor [50]. Moreover, since the concentration of COD and T-N decreased substantiallywith the higher abundance and correlation of Wolinella_succinogenes, Klebsiella_pneumoniae,and Acinetobacter_johnsonii in the 300 and 531 days of bioaugmented samples, the microbialcommunities could have utilized COD (derived from organic materials) and T-N as carbonand nitrogen sources [51]. As previously mentioned, Acinetobacter may play a majorrole in dye degradation [41]. The network analysis can prove the potential occurrence

Microorganisms 2021, 9, 1503 16 of 19
of degrading metabolic genes in the specific species present in CES-1 and the CES-1bioaugmented samples. The azo dye degradative gene (acpD) from CES-1 was present in allthe treatment timelines. The gene was highly dominant in the buffering sample (B_1026_18)carrying Glucanacetobacter_unclassified after 531 days of bioaugmentation. Compared withthe three samples before bioaugmentation, buffering samples (B_0629_17, B_0310_18, andB_1026_18) established a major cluster and were highly related to most of the pathwaygenes and the microbial communities. Buffering carries the biomass of carbon and nitrogensources, and other inorganic nutrients recycled from the sludge digestion tank (Figure 1).This implies that the degradative pathway genes from the microbial communities highlyoccurred in B after bioaugmentation. CES-1 was continuously augmented into SD so thatthe microbial communities and the genes from the culture could play a role in digestion ofthe sludge of SD. The digested sludge was then recycled into B together with the CES-1communities and their genes which were subsequently flowed into PA and SA, indicating astrong influence of CES-1 on the whole treatment system. The sludge reduction caused bybioaugmentation was observed over the experimental period (Table 2). The metagenomicnetwork analysis helps us to understand molecular-based functions of degradative pathwaygenes in specific microbes in the treatment process. Recently, network analysis has beenwidely used to explore potential microbes and their degradative pathway genes differentenvironments [25]. The higher consistent results mentioned above indicated that thenetwork analysis might be a reasonable and powerful tool to provide new insights anduseful biomarker in the complex environmental examples.
4. Conclusions
In this study, effects of bioaugmentation of the composite microbial culture CES-1 ona full scale dye wastewater treatment process were investigated in terms of water quality,sludge reduction, dynamics of microbial community structures, and their functional genesresponsible for degradation of various chemicals. The removal efficiencies for COD, T-N,T-P, SS, and color intensity after the augmentation were higher than before augmentation.The denitrification linked to T-N removal seemed to contribute to the concomitant CODremoval that triggered reduction of sludge. Azo dye and aromatic compound degradationand other downstream pathways were highly metabolically interrelated. Augmentation ofCES-1 allowed an increase of higher diversity index in the later stages of augmentation.Acinetobacter sp., Glucanacetobacter sp., Arcobacter sp., and Marinobacter manganoxydans mighthave utilized COD and T-N as carbon and nitrogen sources, leading to denitrification. Thenetwork analysis turned out to be a reasonable and powerful tool to provide new insightsand useful biomarkers for the complex environmental conditions, such as dye wastewatertreatment system undergoing a bioaugmentation. Moreover, functional analyses of themicrobial communities using metatranscriptomics and real time PCR techniques will benecessary to better understand the mechanisms of this bioaugmentation technology. Thisnovel technology may also contribute to full-scale treatments of sewage wastewater, pulpwastewater, livestock wastewater, food wastewater, and industrial malodors.
Supplementary Materials: The following are available online at https://www.mdpi.com/article/10.3390/microorganisms9071503/s1, Figure S1. Changes in the abundance of the microbial communitiesover time at the family level after bioaugmentation of the complex microbial consortium CES-1.Figure S2. Changes in the abundance of the microbial communities over time at the genus levelafter bioaugmentation of the complex microbial consortium CES-1. Figure S3. The Procrustes plotanalysis of microbial community (Genus level) with different degradation pathways. The positivedimension is a nonnegative number, representing the credibility of the cluster results. Blue arrowindicates the significant positive correlation parameters (p < 0.05). Figure S4. The Procrustes plotanalysis of microbial community (species level) with different degradation pathways. The positivedimension is a nonnegative number, representing the credibility of the cluster results. Blue arrowindicates the significant positive correlation parameters (p < 0.05). Table S1. Collection coordinatesand metagenomic samples from the textile dye wastewater plant. Table S2. Genes and enzymesresponsible for the degradation of zo dyes and other chemicals in the textile dye wastewater.

Microorganisms 2021, 9, 1503 17 of 19
Author Contributions: Conceptualization, S.-C.K.; methodology, A.E.S.; Validation, S.-C.K., K.-J.Y.and H.-J.S.; formal analysis, W.-J.S. and A.E.S.; investigation, S.-C.K. and A.E.S.; writing—originaldraft preparation, A.E.S. and W.-J.S.; writing—review and editing, S.-C.K.; visualization, K.-J.Y. andH.-J.S.; supervision, S.-C.K.; project administration, H.-G.K.; funding acquisition, S.-C.K. and H.-G.K.All authors have read and agreed to the published version of the manuscript.
Funding: This work was partially supported by a National Research Foundation of Korea (NRF)Grant funded by the Korean Government (MSIP) (No. 2020R1I1A3A0403821212).
Institutional Review Board Statement: Not applicable.
Informed Consent Statement: Not applicable.
Data Availability Statement: Not applicable.
Conflicts of Interest: The authors declare that they have no known competing financial interests orpersonal relationships that could have appeared to influence the work reported in this paper.
References1. Šajn, N. Environmental Impact of the Textile and Clothing Industry; European Parliament: Brussels, Belgium, 2019; Volume PE 633.143.2. Sharma, S.; Bhattacharya, A. Drinking water contamination and treatment techniques. Appl. Water Sci. 2017, 7, 1043–1067.
[CrossRef]3. Banat, I.; Nigam, P.; Singh, D.; Marchant, R. Microbial decolorization of textile-dyecontaining effluents: A review. Bioresour.
Technol. 1996, 58. [CrossRef]4. Przystas, W.; Zabłocka-Godlewska, E.; Grabinska-Sota, E. Biological removal of azo and triphenylmethane dyes and toxicity of
process by-products. Water Air Soil Pollut. 2011, 223. [CrossRef] [PubMed]5. Weber, E.J.; Wolfe, N.L. Kinetic studies of the reduction of aromatic AZO compounds in anaerobic sediment/water systems.
Environ. Toxicol. Chem. 1987, 6. [CrossRef]6. Chung, K.T.; Fulk, G.E.; Egan, M. Reduction of azo dyes by intestinal anaerobes. Appl. Environ. Microbiol. 1978, 35. [CrossRef]7. Sarkar, S.; Banerjee, A.; Halder, U.; Biswas, R.; Bandopadhyay, R. Degradation of synthetic azo dyes of textile industry: A
sustainable approach using microbial enzymes. Water Conserv. Sci. Eng. 2017, 2, 121–131. [CrossRef]8. Alabdraba, W.; Bayati, M. Biodegradation of azo dyes: A review. Int. J. Environ. Eng. Nat. Resour. 2014, 1, 179–189.9. Pandey, A.; Singh, P.; Iyengar, L. Bacterial decolorization and degradation of azo dyes. Int. Biodeterior. Biodegrad. 2007, 59, 73–84.
[CrossRef]10. Yang, C.; Zhang, W.; Liu, R.; Li, Q.; Li, B.; Wang, S.; Song, C.; Qiao, C.; Mulchandani, A. Phylogenetic diversity and metabolic
potential of activated sludge microbial communities in full-scale wastewater treatment plants. Environ. Sci. Technol. 2011, 45,7408–7415. [CrossRef]
11. Fernandez, R.P.; Carmona-Balea, A.; Cuevas, C.A.; Barrera, J.A.; Kinnison, D.E.; Lamarque, J.; Blaszczak-Boxe, C.; Kim, K.; Choi,W.; Hay, T.; et al. Modeling the sources and chemistry of polar tropospheric halogens (Cl, Br, and I) using the CAM-chem globalchemistry-climate model. J. Adv. Model. Earth Syst. 2019, 11, 2259–2289. [CrossRef]
12. Patil, V.P.; Sandt, J.D.; Kolle, M.; Dunkel, J. Topological mechanics of knots and tangles. Science 2020, 367, 71–75. [CrossRef][PubMed]
13. Tian, Z.; Zhao, H.; Peter, K.T.; Gonzalez, M.; Wetzel, J.; Wu, C.; Hu, X.; Prat, J.; Mudrock, E.; Hettinger, R.; et al. A ubiquitous tirerubber–derived chemical induces acute mortality in coho salmon. Science 2021, 371, 185–189. [CrossRef]
14. Raper, E.; Stephenson, T.; Anderson, D.; Fisher, R.; Soares, A. Industrial wastewater treatment through bioaugmentation. Process.Saf. Environ. Prot. 2018, 118. [CrossRef]
15. Punzi, M.; Anbalagan, A.; Börner, R.A.; Svensson, B.-M.; Jonstrup, M.; Mattiasson, B. Degradation of a textile azo dye usingbiological treatment followed by photo-Fenton oxidation: Evaluation of toxicity and microbial community structure. Chem. Eng.J. 2015, 270, 290–299. [CrossRef]
16. Cui, D.; Li, G.; Zhao, D.; Gu, X.; Wang, C.; Zhao, M. Microbial community structures in mixed bacterial consortia for azo dyetreatment under aerobic and anaerobic conditions. J. Hazard. Mater. 2012, 221–222, 185–192. [CrossRef]
17. Guo, Y.; Zhou, X.; Li, Y.; Li, K.; Wang, C.; Liu, J.; Yan, D.; Liu, Y.; Yang, D.; Xing, J. Heterotrophic nitrification and aerobicdenitrification by a novel Halomonas campisalis. Biotechnol. Lett. 2013, 35. [CrossRef]
18. Krishnamoorthy, R.; Jose, P.A.; Ranjith, M.; Anandham, R.; Suganya, K.; Prabhakaran, J.; Thiyageshwari, S.; Johnson, J.; Gopal, N.;Kumutha, K. Decolourisation and degradation of azo dyes by mixed fungal culture consisted of Dichotomomyces cejpii MRCH1-2 and Phoma tropica MRCH 1-3. J. Environ. Chem. Eng. 2018, 6, 588–595. [CrossRef]
19. Ju, F.; Guo, F.; Ye, L.; Xia, Y.; Zhang, T. Metagenomic analysis on seasonal microbial variations of activated sludge from a full-scalewastewater treatment plant over 4 years. Environ. Microbiol. Rep. 2014, 6, 80–89. [CrossRef]
20. American Public Health Association. APHA Method 9221: Standard Methods for the Examination of Water and Wastewater; APHA:Washington, DC, USA, 2005; Volume 552.
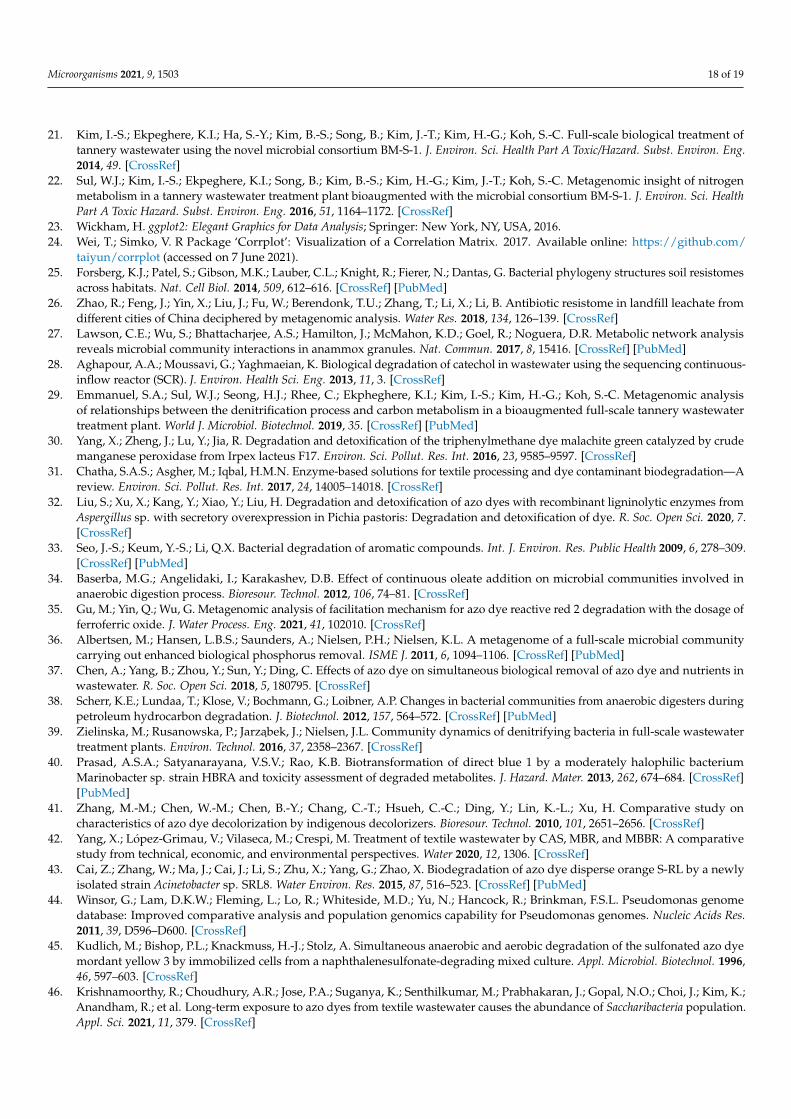
Microorganisms 2021, 9, 1503 18 of 19
21. Kim, I.-S.; Ekpeghere, K.I.; Ha, S.-Y.; Kim, B.-S.; Song, B.; Kim, J.-T.; Kim, H.-G.; Koh, S.-C. Full-scale biological treatment oftannery wastewater using the novel microbial consortium BM-S-1. J. Environ. Sci. Health Part A Toxic/Hazard. Subst. Environ. Eng.2014, 49. [CrossRef]
22. Sul, W.J.; Kim, I.-S.; Ekpeghere, K.I.; Song, B.; Kim, B.-S.; Kim, H.-G.; Kim, J.-T.; Koh, S.-C. Metagenomic insight of nitrogenmetabolism in a tannery wastewater treatment plant bioaugmented with the microbial consortium BM-S-1. J. Environ. Sci. HealthPart A Toxic Hazard. Subst. Environ. Eng. 2016, 51, 1164–1172. [CrossRef]
23. Wickham, H. ggplot2: Elegant Graphics for Data Analysis; Springer: New York, NY, USA, 2016.24. Wei, T.; Simko, V. R Package ‘Corrplot’: Visualization of a Correlation Matrix. 2017. Available online: https://github.com/
taiyun/corrplot (accessed on 7 June 2021).25. Forsberg, K.J.; Patel, S.; Gibson, M.K.; Lauber, C.L.; Knight, R.; Fierer, N.; Dantas, G. Bacterial phylogeny structures soil resistomes
across habitats. Nat. Cell Biol. 2014, 509, 612–616. [CrossRef] [PubMed]26. Zhao, R.; Feng, J.; Yin, X.; Liu, J.; Fu, W.; Berendonk, T.U.; Zhang, T.; Li, X.; Li, B. Antibiotic resistome in landfill leachate from
different cities of China deciphered by metagenomic analysis. Water Res. 2018, 134, 126–139. [CrossRef]27. Lawson, C.E.; Wu, S.; Bhattacharjee, A.S.; Hamilton, J.; McMahon, K.D.; Goel, R.; Noguera, D.R. Metabolic network analysis
reveals microbial community interactions in anammox granules. Nat. Commun. 2017, 8, 15416. [CrossRef] [PubMed]28. Aghapour, A.A.; Moussavi, G.; Yaghmaeian, K. Biological degradation of catechol in wastewater using the sequencing continuous-
inflow reactor (SCR). J. Environ. Health Sci. Eng. 2013, 11, 3. [CrossRef]29. Emmanuel, S.A.; Sul, W.J.; Seong, H.J.; Rhee, C.; Ekpheghere, K.I.; Kim, I.-S.; Kim, H.-G.; Koh, S.-C. Metagenomic analysis
of relationships between the denitrification process and carbon metabolism in a bioaugmented full-scale tannery wastewatertreatment plant. World J. Microbiol. Biotechnol. 2019, 35. [CrossRef] [PubMed]
30. Yang, X.; Zheng, J.; Lu, Y.; Jia, R. Degradation and detoxification of the triphenylmethane dye malachite green catalyzed by crudemanganese peroxidase from Irpex lacteus F17. Environ. Sci. Pollut. Res. Int. 2016, 23, 9585–9597. [CrossRef]
31. Chatha, S.A.S.; Asgher, M.; Iqbal, H.M.N. Enzyme-based solutions for textile processing and dye contaminant biodegradation—Areview. Environ. Sci. Pollut. Res. Int. 2017, 24, 14005–14018. [CrossRef]
32. Liu, S.; Xu, X.; Kang, Y.; Xiao, Y.; Liu, H. Degradation and detoxification of azo dyes with recombinant ligninolytic enzymes fromAspergillus sp. with secretory overexpression in Pichia pastoris: Degradation and detoxification of dye. R. Soc. Open Sci. 2020, 7.[CrossRef]
33. Seo, J.-S.; Keum, Y.-S.; Li, Q.X. Bacterial degradation of aromatic compounds. Int. J. Environ. Res. Public Health 2009, 6, 278–309.[CrossRef] [PubMed]
34. Baserba, M.G.; Angelidaki, I.; Karakashev, D.B. Effect of continuous oleate addition on microbial communities involved inanaerobic digestion process. Bioresour. Technol. 2012, 106, 74–81. [CrossRef]
35. Gu, M.; Yin, Q.; Wu, G. Metagenomic analysis of facilitation mechanism for azo dye reactive red 2 degradation with the dosage offerroferric oxide. J. Water Process. Eng. 2021, 41, 102010. [CrossRef]
36. Albertsen, M.; Hansen, L.B.S.; Saunders, A.; Nielsen, P.H.; Nielsen, K.L. A metagenome of a full-scale microbial communitycarrying out enhanced biological phosphorus removal. ISME J. 2011, 6, 1094–1106. [CrossRef] [PubMed]
37. Chen, A.; Yang, B.; Zhou, Y.; Sun, Y.; Ding, C. Effects of azo dye on simultaneous biological removal of azo dye and nutrients inwastewater. R. Soc. Open Sci. 2018, 5, 180795. [CrossRef]
38. Scherr, K.E.; Lundaa, T.; Klose, V.; Bochmann, G.; Loibner, A.P. Changes in bacterial communities from anaerobic digesters duringpetroleum hydrocarbon degradation. J. Biotechnol. 2012, 157, 564–572. [CrossRef] [PubMed]
39. Zielinska, M.; Rusanowska, P.; Jarzabek, J.; Nielsen, J.L. Community dynamics of denitrifying bacteria in full-scale wastewatertreatment plants. Environ. Technol. 2016, 37, 2358–2367. [CrossRef]
40. Prasad, A.S.A.; Satyanarayana, V.S.V.; Rao, K.B. Biotransformation of direct blue 1 by a moderately halophilic bacteriumMarinobacter sp. strain HBRA and toxicity assessment of degraded metabolites. J. Hazard. Mater. 2013, 262, 674–684. [CrossRef][PubMed]
41. Zhang, M.-M.; Chen, W.-M.; Chen, B.-Y.; Chang, C.-T.; Hsueh, C.-C.; Ding, Y.; Lin, K.-L.; Xu, H. Comparative study oncharacteristics of azo dye decolorization by indigenous decolorizers. Bioresour. Technol. 2010, 101, 2651–2656. [CrossRef]
42. Yang, X.; López-Grimau, V.; Vilaseca, M.; Crespi, M. Treatment of textile wastewater by CAS, MBR, and MBBR: A comparativestudy from technical, economic, and environmental perspectives. Water 2020, 12, 1306. [CrossRef]
43. Cai, Z.; Zhang, W.; Ma, J.; Cai, J.; Li, S.; Zhu, X.; Yang, G.; Zhao, X. Biodegradation of azo dye disperse orange S-RL by a newlyisolated strain Acinetobacter sp. SRL8. Water Environ. Res. 2015, 87, 516–523. [CrossRef] [PubMed]
44. Winsor, G.; Lam, D.K.W.; Fleming, L.; Lo, R.; Whiteside, M.D.; Yu, N.; Hancock, R.; Brinkman, F.S.L. Pseudomonas genomedatabase: Improved comparative analysis and population genomics capability for Pseudomonas genomes. Nucleic Acids Res.2011, 39, D596–D600. [CrossRef]
45. Kudlich, M.; Bishop, P.L.; Knackmuss, H.-J.; Stolz, A. Simultaneous anaerobic and aerobic degradation of the sulfonated azo dyemordant yellow 3 by immobilized cells from a naphthalenesulfonate-degrading mixed culture. Appl. Microbiol. Biotechnol. 1996,46, 597–603. [CrossRef]
46. Krishnamoorthy, R.; Choudhury, A.R.; Jose, P.A.; Suganya, K.; Senthilkumar, M.; Prabhakaran, J.; Gopal, N.O.; Choi, J.; Kim, K.;Anandham, R.; et al. Long-term exposure to azo dyes from textile wastewater causes the abundance of Saccharibacteria population.Appl. Sci. 2021, 11, 379. [CrossRef]

Microorganisms 2021, 9, 1503 19 of 19
47. Praus, P. Principal component weighted index for wastewater quality monitoring. Water 2019, 11, 2376. [CrossRef]48. Unnikrishnan, S.; Khan, M.H.; Ramalingam, K. Dye-tolerant marine Acinetobacter baumannii-mediated biodegradation of
reactive red. Water Sci. Eng. 2018, 11, 265–275. [CrossRef]49. Kim, I.-S.; Ekpeghere, K.; Ha, S.-Y.; Kim, S.-H.; Kim, B.-S.; Song, B.; Chun, J.; Chang, J.-S.; Kim, H.-G.; Koh, S.-C. An eco-friendly
treatment of tannery wastewater using bioaugmentation with a novel microbial consortium. J. Environ. Sci. Health Part A ToxicHazard. Subst. Environ. Eng. 2013, 48. [CrossRef]
50. Ajibade, F.O.; Wang, H.-C.; Guadie, A.; Ajibade, T.F.; Fang, Y.-K.; Sharif, H.M.A.; Liu, W.-Z.; Wang, A.-J. Total nitrogen removalin biochar amended non-aerated vertical flow constructed wetlands for secondary wastewater effluent with low C/N ratio:Microbial community structure and dissolved organic carbon release conditions. Bioresour. Technol. 2021, 322, 124430. [CrossRef]
51. Guo, J.; Li, J.; Chen, H.; Bond, P.; Yuan, Z. Metagenomic analysis reveals wastewater treatment plants as hotspots of antibioticresistance genes and mobile genetic elements. Water Res. 2017, 123, 468–478. [CrossRef]


![ChemInform Abstract: Eco-Friendly Synthesis of 1,4Benzodiazepine2,5-diones in the Ionic Liquid [bmim]Br](https://static.fdokumen.com/doc/165x107/6319c85065e4a6af370ff8b8/cheminform-abstract-eco-friendly-synthesis-of-14benzodiazepine25-diones-in-the.jpg)


