NOTE TO USERS - Université de Sherbrooke
453
NOTE TO USERS This reproduction is the best copy available. ® UMI
-
Upload
khangminh22 -
Category
Documents
-
view
0 -
download
0
Transcript of NOTE TO USERS - Université de Sherbrooke

NOTE TO USERS
This reproduction is the best copy available.
®
UMI


UNIVERSITÉ DE SHERBROOKE
L'impact de la culture nationale sur la signification du succès des systèmes d'information
par
Hafid Agourram
Thèse présentée à la Faculté d'administration
en vue de l'obtention du grade de
Docteur en administration (DBA)
Février 2004
© Hafid Agourram, 2004
_2]L - 5°1't

l+I Library and Archives Canada
Bibliothèque et Archives Canada
Published Heritage Branch
Direction du Patrimoine de l'édition
395 Wellington Street Ottawa ON K1A ON4 Canada
395, rue Wellington Ottawa ON K1A ON4 Canada
The author has granted a nonexclusive license allowing the Library and Archives Canada to reproduce, loan, distribute or sell copies of this thesis in microform, paper or electronic formats.
The author retains ownership of the copyright in this thesis. Neither the thesis nor substantial extracts from it may be printed or otherwise reproduced without the author's permission.
ln compliance with the Canadian Privacy Act some supporting forms may have been removed from this thesis.
While these forms may be included in the document page count, their removal does not represent any loss of content from the thesis.
Canada
Your file Votre référence ISBN: 0-612-94920-6 Our file Notre référence ISBN: 0-612-94920-6
L'auteur a accordé une licence non exclusive permettant à la Bibliothèque et Archives Canada de reproduire, prêter, distribuer ou vendre des copies de cette thèse sous la forme de microfiche/film, de reproduction sur papier ou sur format électronique.
L'auteur conserve la propriété du droit d'auteur qui protège cette thèse. Ni la thèse ni des extraits substantiels de celle-ci ne doivent être imprimés ou aturement reproduits sans son autorisation.
Conformément à la loi canadienne sur la protection de la vie privée, quelques formulaires secondaires ont été enlevés de cette thèse.
Bien que ces formulaires aient inclus dans la pagination, il n'y aura aucun contenu manquant.
UNIVERSITÉ DE SHERBROOKE
F acuité d'administration
L'impact de la culture nationale sur la signification du succès des systèmes d'information
Hafid Agourram
a été évalué par un jury composé des personnes suivantes:
Président du jury Mario Roy
Directeur de recherche Johnlngham
Autre membre du jury Louis Raymond
Examinateur externe Réal Jacob
Autre membre du jury Mario Saucier

PREFACE
This research brings new knowledge to the academic as well as the practice
communities. More specifically, it concems the area of information systems
performance and measurement in a multi-cultural environment. As indicated in the
research title, the meaning of information systems success in different national
cultures will be explored and defined.
Many objectives for this research have been set. The first aim is to develop a
multicultural model that describes how people from different national cultures
perceive the complex concept of information systems success or performance. The
second objective is related to the first one and develops knowledge particular to the
practice community. Once the model is developed, it would become the main tool for
multinational organizations deciding to implement standard systems in different
national cultures. The model would help these organizations succeed in the
implementation of the standard system and moreover, help them to measure its
success using the categories and concepts of the model. The third objective adds to
the knowledge base of the existing models of information systems (IS) success by
taking into account the cultural environment of the system.
The case to be studied is a multibillion and a multinational organization that
decided to implement an Enterprise Resource Planning (ERP) system in all of its
subsidiaries. The multinational organization employs more than 80, 000 employees
worldwide throughout the five continents. A tremendous volume of confidential
documents that deal with the project was collected during a stay at the office
headquarters of the organization. Three interviews were conducted with senior
managers to agree upon the issues to be addressed and resolved. It was decided that in
order to develop a model of IS success in different cultures, it was necessary to travel
to the selected sites to get the pertinent data. The management welcomed the project
during our first interview and acknowledged that they do indeed need this component

4
to complete their general plan for the systems implementation in addition to the long
term control of its performance.
In order to conduct the research, site selection was based on the findings of
previous research. Hofstede's (1994) organizational model was implemented to
choose the sites. A country was chosen from each part of this model; Pyramid:
France, Machine: Germany, Market: Canada, and Family: China.
After setting up the research objectives, there was no choice but to follow an
interpretative paradigm, using a qualitative research approach based on a case study
strategy. A traditional positivist research paradigm was not employed as the present
concem is not to test current propositions but rather to contribute to the development
ofnew theory.
The pioneers of qualitative research encourage researchers to employ multiple
data collection tools and techniques and that was the directive ofthis research. Firstly,
the relevant literature was targeted to find a data collection technique that would help
reduce researcher bias and avoid any intervention of the researcher in the data
collection process. Repertory grid, a technique that responds to our requirement, was
used. This interviewing technique helps the researcher establish the personal
construct system of the interviewee. The constructs are based on actual experiences of
the participant. Repertory grid technique was not the main data collection technique
we used in this research. An open interview technique was also added to the
Repertory grid in order to obtain the participant abstract constructs about the success
of an information system.
Data analysis was therefore conducted on two sets of data. Open interview
data which included the Repertory grid data was analyzed using a grounded theory
data analysis technique, and the Repertory grid data alone was analyzed using a

5
simple content analysis technique. This work was repeated on the four volumes of
data: French data, German data, Canadian data, and Chinese data.
The resulting information produced many results. First, IS success models in
three different national cultures (France, Germany, and Canada) were developed.
The Chinese data were analyzed, but a complete model was not developed due to an
insufficient amount of data from the Chinese participants. The emerging models
provide not only the categories of IS success in these cultures, but also the concepts
that operationalize these categories, which will ease the task of future researchers
wanting to test our model. Secondly, the order of importance of each category of IS
success in each culture is calculated. Thirdly, the cross-cultural ordering of
importance of common categories is displayed. Fourthly, the so-called Emie and Etic
categories are provided. The Etic categories are universal and the Emie categories are
relevant to their corresponding culture. Finally, the clash between IS success as
defined by people in each national culture and the built-in success assumptions of the
ERP system is discussed.
It was confirmed, to a certain extent, that the relationship between the
divergence of cultures and our findings is positive and also explained and confirmed
by existing literature on culture. It was also found that people in the selected sites
perceive IS success differently at certain levels of IS success, particularly, the
individual and organizational levels. This suggests that management at the level of
headquarters must take into account the findings of this research in the
implementation of the ERP system and must implement a change management plan
to fit, to some extent, the systems of meaning mentioned in the preceding paragraph if
a high degree of overall and global success is desired.

RÉSUMÉ
Le résumé présente les idées maîtresses de la thèse. Le document reprend avec plus de détails les idées du sommaire et est structuré comme suit. Nous présentons en premier lieu les objectifs de la thèse, suivi par la problématique de recherche et la problématique managériale. Ensuite, nous élaborons sur la méthodologie de recherche utilisée et les outils de collecte des données. Enfin, nous présentons les résultats et la conclusion.
Notre recherche s'inscrit dans le cadre des recherches multiculturelles en systèmes d'information. L'objet de la recherche est le concept du succès des systèmes d'information (SI) ou la variable dépendante des recherches en systèmes d'information. Notre objectif est de découvrir et de définir le concept du succès des systèmes d'information dans des cultures nationales différentes.
Les théories des organisations, en particulier les organisations internationales, de la psychologie et d'anthropologie ont développé l'idée que la culture nationale influence les composantes sociales des organisations. Hofstede (1980) a conduit une des plus grandes études multiculturelles. Cent seize mille questionnaires qui proviennent des répondants de cinquante cinq pays ont été collectés et analysés. Hofstede a développé quatre dimensions de la culture nationale qui distinguent les pays et par conséquent les organisations dans ces pays: "Power distance", "Uncertainty Avoidance", "lndividualism and Collectivism", et "Masculinity and Feminity". Deux dimensions à savoir: "Power distance" et "Uncertainty Avoidance" déterminent quatre modèles organisationnels: Famille, Pyramide, Marché, et Machine. Hofstede argumente que le management des organisations dans chacun de ces modèles est différent de l'autre. Rosenzweig (1994), en confirmant les conclusions de Hofstede, argumente que l'internationalisation des modèles nord américains fait face à plusieurs obstacles au niveau des trois phases de la recherche scientifique à savoir le choix des libellés des variables, l'opérationnalisation de ces variables et les relations entre les variables. Selon Rosenzweig, ces obstacles sont dus à l'effet de la culture nationale.
Schein (1990), Trompenaars (1994) et d'autres chercheurs affirment que ce sont les systèmes sociotechniques et sociaux qui sont les plus affectés par la culture nationale. En partant de cette théorie et en considérant le fait que les systèmes d'information sont par définition des systèmes sociotechniques, nous avons supposé que la culture nationale devrait avoir des impacts sur la définition et la perception du succès des systèmes d'information.
En se basant sur l'hypothèse que la culture nationale devrait avoir un impact sur la définition du succès des systèmes d'information, une multinationale qui décide d'implanter un système standard dans plusieurs cultures nationales, fait face à deux

7
problèmes complexes: le problème de réussir l'implantation du système dans ces cultures et celui de réaliser et de récolter le succès à long terme de ces systèmes. Le succès à long terme du système est influencé par la signification du succès telle que perçue par les futurs utilisateurs et les suppositions internes du succès du système.
La revue de littérature sur le succès des systèmes d'information propose que ce dernier peut être défini et mesuré selon trois niveaux: le niveau système, le niveau de l'individu qui utilise le système et le niveau de l'organisation dans son ensemble. En prenant le modèle de Trompennars et Hampden-Turners (1998) qui conceptualise les trois niveaux du concept de la culture (les objets, les valeurs, les normes, et les postulats), et en prenant les trois niveaux de définition du concept du succès des systèmes d'information, nous avons développé un modèle théorique afin de nous guider dans notre processus de collecte et d'analyse des données.
Dans ce modèle (page 68), nous avançons que pour une organisation multinationale qui décide de standardiser un système dans des cultures nationales différentes, la définition du succès des systèmes d'information telle qu'exprimée par des individus de chaque culture nationale et les "built-in success assumptions" du système à standardiser, peuvent être non alignés. Cet affrontement entre ces deux systèmes de signification et de définition aurait des impacts très sérieux sur, à la fois, l'implantation du système et son succès à long terme.
Nous avons développé des modèles de succès des systèmes d'information dans des cultures différentes afin d'aider la multinationale à réussir ces deux défis majeurs.
Cette recherche s'inscrit dans le cadre des recherches de type interprétatif. Le paradigme interprétatif est souvent nécessaire lorsque l'objet de la recherche est le développement ou l'émergence d'une ou plusieurs théories ou éventuellement l'analyse d'un processus. Le choix du paradigme interprétatif est très évident dans notre recherche car nous visions à découvrir les modèles de succès des SI dans des cultures différentes.
Comme nous visions à faire émerger une théorie, nous avons utilisé la théorie enracinée comme méthode de recherche. La théorie enracinée vise à faire émerger une théorie en se basant sur les données des participants qui sont ancrées dans leur contexte réel.
Nous avons utilisé deux outils de collecte de données: les entrevues ouvertes et les entrevues "Repertory grids" de Kelly (1955). Nous avons utilisé ces deux techniques essentiellement pour multiplier les outils de collecte des données comme le suggèrent la plupart des chercheurs. La multiplication des outils de collecte des données donne du poids et de la crédibilité aux résultas obtenus.
Les entrevues "Repertory grid" sont généralement utilisées dans les études multiculturelles dans lesquelles le chercheur essaie de minimiser au maximum son

8
biais. Elles servent à découvrir les idées et les pensées de chaque participant. Ces idées se basent essentiellement sur l'expérience de chaque participant vis-à-vis de l'objet à l'étude.
Voici brièvement comment nous avons utilisé cette technique. Nous demandons à chaque participant à se rappeler d'un nombre de systèmes d'information organisationnels qu'il a utilisé durant sa vie professionnelle: deux systèmes qu'il juge excellents, deux qui ne sont pas bons et deux qui sont moyens en terme de leur succès. Nous demandons ensuite au participant de choisir trois systèmes parmi les six qu'il a sélectionnés et nous lui posons la question suivante. "Comment deux de ces trois systèmes sont-ils pareils et en même temps différents du troisième en terme de leur succès"? Cette question est répétée pour chaque niveau d'analyse de succès des SI à savoir le niveau système, le niveau individu et le niveau organisation. Le participant répond en disant par exemple que l'information dans A et B était claire et compréhensible et celle dans C était confuse et non compréhensible. Cette réponse prend le nom de "Construit". Une fois que le chercheur termine ce processus, il regroupe ces construits dans une matrice "Grid" et demande au participant d'affecter un chiffre (1 à 5) pour chaque construit. La matrice est ensuite analysée en utilisant des logiciels tel WebGridll que nous avons utilisé dans cette recherche. Nous n'avons pas pu utiliser cette technique avec l'ensemble des participants. Ceci est dû essentiellement à la difficulté rencontrée par les participants de se rappeler de plusieurs systèmes.
Les entrevues ouvertes ont quant à elles été utilisées avec l'ensemble des participants. Nous avons également introduit les données de la "Repertory grid" avec celles des entrevues ouvertes pour avoir des cartes complètes de ce qu'est le succès des systèmes d'information. Les questions d'entrevues ouvertes sont les suivantes:
1. Est-ce que le succès des systèmes d'information est perçu au niveau du système? Si oui, comment ?
2. Est-ce que le succès des systèmes d'information est perçu au niveau de l'individu qui utilise le système ? Si oui, comment?
3. Est-ce que le succès des systèmes d'information est perçu au niveau de l'organisation? Si oui, comment?
4. Y a-t-il autres niveaux où le succès des systèmes d'information pourrait être perçu?
Nous nous sommes basés sur le modèle de Hofstede (1994) pour sélectionner nos sites. Nous avons pris un pays qui appartient à chacun de ses modèles organisationnels: la France, l'Allemagne, le Canada et la Chine. Nous nous sommes déplacés vers ces pays pour faire la collecte de nos données excepté la Chine vu que nous avons rencontré en Allemagne des participants chinois qui travaillent pour la même multinationale.

9
Trente neuf entrevues ont été réalisées dans cette étude. Neuf entrevues ouvertes et quatre "Repertory grid" au Canada, huit entrevues ouvertes et cinq "Repertory grid" en Allemagne, huit entrevues ouvertes et quatre "Repertory grid" en France et une entrevues sous forme d'un "Focus group" avec les répondants chinois. Les participants sont des gestionnaires de haut niveau qui proviennent de plusieurs fonctions d'entreprise: marketing, ressources humaines, gestion de projet, technologies de l'information, et production.
Nos données ont été analysées en utilisant la technique d'analyse de la théorie enracinée de Corbin et Strauss (1990). Cette technique se base sur l'idée de découvrir des concepts et de les regrouper sous forme de catégories pour faire émerger une théorie. Ce processus de conceptualisation et de théorisation a été fait manuellement et validé par des logiciels. En effet nous avons créé une base de données «Access» de Microsoft pour chaque volume de données et nous avons créé des requêtes pour compléter nos synthèses (annexes X, Y, Z, U, V, W, AA, AB et AC).
Nous avons développé trois modèles de succès des systèmes d'information. Nous n'avons pas développé le modèle chinois en raison de la faible quantité de données que nous avons récoltées des participants chinois. Cependant, nous avons pu produire quelques conclusions.
Nous avons une chaîne d'évidence très solide. En effet, chaque modèle décrit les catégories du succès et les concepts qui déterminent chaque catégorie. En plus, les annexes A, B, C, D, E, F, G, H et I montrent également les données qui déterminent les concepts. Nous avons ensuite calculé le poids de chaque catégorie dans chaque culture et le poids relatif des catégories communes dans toutes les cultures. Finalement, nous avons déterminé les catégories "Emie" et les catégories "Etic". Les dernières sont celles qui sont utilisées universellement et les premières sont celles qui sont spécifiques à chaque culture. Les résultats de notre recherche ont été validés par un panel de deux professeurs en systèmes d'information à l'université de Sherbrooke. Au niveau du système, trois catégories ont été découvertes dans toutes les cultures: qualité d'interaction de ! 'utilisateur avec le système, qualité du système, et qualité des données. Cette dernière catégorie a été ensuite représentée par: qualité intrinsèque des données, qualité d'accessibilité, qualité contextuelle des données, et qualité de représentation des données.
Au niveau de l'utilisateur du système, le succès des SI diffère d'une culture à l'autre. Par exemple, la catégorie indépendance de l'utilisateur face à ses supérieurs et dépendance de l'utilisateur face au groupe, a été découverte en Allemagne, la catégorie pouvoir de l'utilisateur sur le système en France et la catégorie impact sur les connaissances et les habilitées des utilisateurs au Canada. Le succès des SI diffère également au niveau de 1' organisation dans les cultures nationales étudiées. Par exemple, la catégorie impact sur la structure organisationnelle a été découverte en Allemagne, la catégorie alignement entre les

10
modèles de travail des utilisateurs et du système en France et la catégorie développement des connaissances au Canada.
Notre recherche a produit beaucoup de résultats. Au niveau de la pratique, les modèles que nous avons développés seront utilisés par la maison mère de la multinationale pour réussir l'implantation du système standard en utilisant les catégories et les concepts du succès au niveau du système et pour mesurer le succès à long terme après une période d'utilisation du système en se basant sur les catégories au niveau de l'individu, de l'organisation et du système. Notre multinationale devrait également aligner les deux systèmes de définition du succès en mettant en place un plan d'action de gestion de changement. Les multinationales qui décident de standardiser un système d'information dans des cultures nationales différentes, devraient prendre comme référence nos résultats, déterminer les "built-in assumptions" du système à standardiser, et conduire le projet d'alignement de ces systèmes de signification.
Au niveau académique, nous ajoutons la variable contextuelle, dans notre cas la culture, aux différents modèles existant notamment celui de Delone et MacLean (1992).
Notre recherche a confirmé le fait qu'effectivement la culture nationale affecte le succès des systèmes d'information. Au niveau du système, les catégories sont les mêmes dans toutes les cultures. Cependant, même si les libellés des catégories sont similaires, la vraie définition et la vraie signification se trouvent dans les concepts qui déterminent chaque catégorie. Au niveau de l'utilisateur et de l'organisation, nous avons trouvé que les catégories ne sont pas toutes similaires et c'est à ces niveaux que l'impact est plus évident vu que la culture est toujours liée aux personnes.

TABLE OF CONTENTS
PREFACE ............................................................................................................. 3
RÉSUMÉ .............................................................................................................. 6
CHAPTER ONE - INTRODUCTION.................................................................. 21
CHAPTER TWO - THE MANAGE RIAL PROBLEM.............. .... .. .. .. .. .. .. .. 26
1. MULTINATIONAL ORGANIZATIONS................................................................ 28
2. ls STANDARDIZATION.................................................................................... 31
3. ls BUILT-IN ASSUMPTIONS ................................................................................. 32
CHAPTER THREE -THE THEORETICAL CONTEXT............................ 34
1. Is succEss....... ........................................ ......... .................................. 34
2. ls SUCCESS MODELS........................................................................... .... 36
2.1 IS Success in multinational context........ . . . . . . . . . . . . . . . . . . . . . . . . . . . . . . . . . . . . . 40
3. CULTURE ............................................................................................. 43
3.1 National culture .................................................................................................... 48
3.2 Organizational culture............................................................................... 52
3.3 Professional culture............................................................... 57
4. NATIONAL CULTURE AND INFORMATION SYSTEMS ........................................ 59
5. NATIONAL CULTURE AND IS SUCCESS ........................................................ 64
6. RESEARCH FRAMEWORK............................................................................ .... 68
7. RESEARCH QUESTIONS AND SUS-QUESTIONS ............................................. 69
7 .1 Etic and Emie concepts. . . . . . . . . . . . . . . . . . . . . . . . . . . . . . . . . . . . . . . . . . . . . . . . . . . . . . . . . . . . . 71
CHAPTER FOUR- METHODOLOGY...... .... .... .. ...... . .. ......... ............ .... ... 73
1. RESEARCH PARADIGM AND STRATEGY ............................................................ 73
2. METHODOLOGY............. ... ... ... . . .... .. . . . . . .. . . . . ..... . . . . . . . .. . .. . . .. .... . . .. .... ... ....... 76
2.1 The Case and units of analysis.................................................. 79
2.1.1 The case ............................................................................. 79
2.1.2 Units of analysis .................................................................... 88
2.1.3 Participant profiles....... . . . . . . . . . . . . . . . . . . . . . . . . . . . . . . . . . . . . . . . . . . . . . . . . . . . . . . . . . 90

12
2.2 Data collection . . . . . . . . . . . . . . . . . . . . . . . . . . . . . . . . . . . . . . . . . . . . . . . . . . . . . . . . . . . . . . . . . . .. 93
2.2.1 Repertory grid technique......................................................... 95
2.2.2 Open interview technique........................................................ 100
2.3 Validity.. ...... .. . .. . .. . .. . .. . .. . .. ... . ... ... .. . .. . .. . .. . .. . .. .... .. . .. . .. .... .. . ... 107
2.4 Deontology.. .. . . . . .. ... . .. . .. . .. ... . .. .... .. . .. . .. . .. . .. . .. . .. . .. . .. . .. . .. ... . .. . .. 108
CHAPTER FIVE- RESULTS ..................................................................... 110
1 OPEN AND REPERTORY GRID INTERVIEW ANALYSIS AND RESULTS OF............. 113 CANADIAN, GERMAN, AND FRENCH PARTICIPANTS
1.1 Open and Repertory grid interview analysis and results at the system .... 114 level in Canada, Germany, and France
1.1.1 Comparative displays at the system level ...................................... 116
1.1.1.1 Determining the relative category weight in each culture and the......... 119 cross-cultural weight of common categories
1.1.2 Detailed description of data analysis and results at the systems............ 123 level in each culture
1.1.3 Conclusion ......................................................................... 130
1.2 Open and Repertory grid interview analysis and results at the . . . . . . . . . . . . 131 individual level in Canada Germany, and France
1.2.1 Comparative displays at the individual level.................................. 134
1.2.1.1 Determining the relative category weight in each culture and the......... 135 cross-cultural weight of common categories.
1.2.2 Detailed description of data analysis and results at the individual . . . . . ... 138 level in each culture
1.2.2.1 Canada.............................................................................. 139
1.2.2.2 Germany ............................................................................ 143
1.2.2.3 France ............................................................................... 147
1.2.3 Conclusion.......................................................................... 150
1.3 Open and repertory grid interview analysis and results at the . . . . . . . . . . . .. 151 organizational level in Canada, Germany, and France
1.3.1 Comparative displays at the organizational level.......................... .. 155
1.3.1.1 Determining the relative categoryweight in each culture and the ......... 156 cross-cultural weight of common categories.

13
1.3.2 Detailed description of data analysis and results at the..................... 159 organizational in each culture
1.3.2.1 Canada .............................................................................. 159
1.3.2.2 Germany ............................................................................ 162
1.3.2.3 France ............................................................................... 165
1.3.3 Conclusion ......................................................................... 166
2. CHINESE FOCUS GROUP INTERVIEW RESULTS........... . . . . . . . . . . . . . . . . . . . . . . . . . . 167
3. SUMMARY................................................................................................... 171
CHAPTER SIX - DISCUSSION . . . . . . . . . . . . . . . .. . . . . . . . . . . . . . . . . . . . . . . . . . . . . . . . . . . . . . 179
1. INTRODUCTION............................................................................................ 179
2. DISCUSSION ON RESEARCH OBJECTIVES ........................................... 179
2.1 The meaning of1S success at system, the individual, and the............. 180 organizational levels
2.1.1 Systems level................ . . . . . . . . . . . . . . . . . . . . . . . . . . . . . . . . . . . . . . . . . . . . . . . . . . . . . . 181
2.1.2 lndividual level................................................................... 183
2.1.3 Organizational level.. . . . . . . . . . . . . . . . . . . . . . . . . . . . . . . . . . . . . . . . . . . . . . . . . . . . . . . . . . . . 185
2.2 Discussion on the weight of the emerging categories.. .. . .. . ... . .. . . .. . . ... 186
2.3 Discussion on the Chinese findings......................................... ... 187
2.4 Linking results with existing literature....................................... .. 188
3. THE FIT PROCESS.......................................................................................... 190
4. COMP ARING THE FINDINGS WITH CULTURAL VARIABLES................................. 191
4.1 Canada....... . . . . . . . . . . . . . . . . . . . . . . . . . . . . . . . . . . . . . . . . . . . . . . . . . . . . . . . . . . . . . . . . . . . . . . . 192
4.2 German y........ . . . . . . . . . . . . . . . . . . . . . . . . . . . . . . . . . . . . . . . . . . . . . . . . . . . . . . . . . . . . . . . . . . . 193
4.3 France ............................................................................... 194
5 IMPLICATIONS AND FUTURE RESEARCH.... .. .. . . .. . .. . . .. . . . . . . . . .. .. .. . . . . . . . . . . .. .. .. .. .. . .. .. 196
5.1 Implications........................................................................ 196
5 .1.1 Implications for the academic community.. . . . . . . . . . . . . . . . . . . . . . . . . . . . . . . . . . . . 196
5 .1.2 Implications for the practice community...................... . . . . . . . . . . . . . . . . . 197
5 .2 Future research.... . . . . . . . . . . . . . . . . . . . . . . . . . . . . . . . . . . . . . . . . . . . . . . . . . . . . . . . . . . . . . . .. 200
6. LIMITATIONS............................................................................................... 202
14
6.1 Credibility .......................................................................... 202
6.2 Transferability ..................................................................... 203
6.3 Dependability ...................................................................... 204
CHAPTER SEVEN - CONCLUSION .............................................. 205
REFERENCES ............................................................................ 207
Appendix A Canada: list of raw data, concepts and category at the ...... 218 systems level
Appendix B Canada: list of raw data, concepts and category at the ....... 226 individual level
Appendix C Canada: list of raw data, concepts and category at the ....... 232 organizational level
Appendix D Germany: list of raw data, concepts and category at the ..... 237 systems level
Appendix E Germany: list of raw data, concepts and category at the ..... 244 individual level
Appendix F German y: list of raw data, concepts and category at the .... 249 organizational level
Appendix G France: list of raw data, concepts and category at the ........ 256 systems level
Appendix H France: list of raw data, concepts and category at the ........ 262 individual level
Appendix I France: list of raw data, concepts and category at the ........ 268 organizational level
Appendix J Repertory grid data at the system level in Canada ............. 273
Appendix K Repertory grid data at the individual level in Canada ...... 275
Appendix L Repertory grid data at the organizational level in Canada 277
Appendix M Repertory grid data at the "Other" level in Canada ....... 279
Appendix N Repertory grid data at the system level in Germany ........ 281
Appendix 0 Repertory grid data at the individual level in German y .... 283
Appendix p Repertory grid data at the organizational level in ............ 285 Germany
Appendix Q Repertory grid data at the "Other" level in Germany ... 287

Appendix
Appendix
Appendix
Appendix
Appendix
Appendix
Appendix
Appendix
Appendix
R
s T
u V
w X
y
z
15
Repertory grid data at the system level in France........... 289
Repertory grid data at the individual level in France....... 291
Repertory grid data at the organizational lev el in France.. 293
Canada: database reports at the systems lev el................ 295
Canada: database reports at the individual level............ 301
Canada: database reports at the organizational level....... 306
German y: database reports at the systems level . . . . . . . . . . . . .. 311
German y: database reports at the individu al level.......... 318
Germany: database reports at the organizational level . . .. 321
Appendix AA France: database reports at the systems level.............. ... 325
Appendix AB France: data base reports at the individual level............ .. 331
Appendix AC France: database reports at the organizational level......... 336
Appendix AD Web Grid displays ................................................... 341
Appendix AE Validation document distributed to IS specialists.. ...... .. .. 381
Appendix AF Canada: multideterminants concepts at the system level. ... 417
Appendix AG Germany: multideterminants concepts at the system level 422
Appendix AH France: multideterminants concepts at the system level. .... 427
Appendix AI Canada: multideterminants concepts at the individual . . .. 431 level
Appendix AJ German y: multideterminants concepts at the . . . . . . . . . . . . . . . . 433
Appendix AK France: multideterminants concepts at the individual.. .... 435 level
Appendix AL Canada: multideterminants concepts at the. . . . . . . . . . . . . . . . . . . 438 organizational level
Appendix AM Germany: multideterminants concepts at the................. 440 organizational level
Appendix AN France: multideterminants concepts at the organizational 442 level
Appendix AO Background of the Repertory grid Technique............... 444

LIST OF TABLES
Table 1 Inside a culture. . . . . . . . . . . . . . .. . . . .. . . . . . .. .. .. .. .. .. . . ... .. . . .. . .. .. .. . .. ... .. .. .. .. .. .. .. . . . 45
Table 2 Popular models of national culture. . . . . . . . . . . . . . . . . . . . . . . . . . . . . . . . . . . . . .. 49
Table 3 Organizational subcultures and current culture.......................... 58
Table 4 Sample of studies dealing with national culture and information ...... 61 systems
Table 5 Selective studies on culture and IS success....................... .. . . . . .. 64
Table 6 Revenues from 1992 to 2001.. .. . .. . .. . .. . .. . .. . .. . .. ... . .. . .. . . . ... . .. . ... 85
Table 7 Business locations of each division........................................ 85
Table 8 Cultural dimension scores for four countries (0 = low, 100 = high)... 89
Table 9 Cultural differences between Francophone and Anglophone in........ 90 Canada
Table 10 Participants' profiles..................................... . . . . . . . . . . . . . . . .. .. . . 92
Table 11 Number of open and Repertory grid interviews per country........... 106
Table 12 The amount ofraw data per IS success level in each culture........... 113
Table 13 Amount ofraw data per category at the system level.. .. . .. . .. ... . ..... 115
Table 14 Comparative displays at the systems level. ................................ 118
Table 15 Weight of the categories at the systems level in Canada ................ 120
Table 16 Weight of the categories at the systems level in Germany.. .. ... . .. . ... 121
Table 17 Weight of the categories at the systems level in France................. 121
Table 18 Cross-cultural weight at the systems level............................. ... 123
Table 19 Sample; category, concept, raw data, and source ofraw data......... 123
Table 20 Categories and concepts at the systems lev el in Canada................ 125
Table 21 Categories and concepts at the systems level in Germany.. .. . .. . .. . ... 126
Table 22 Categories and concepts at the systems level in France................ 127
Table 23 Example ofmulti-determinant concepts at the system level.. .......... 128
Table 24 Amount of raw data per category at the individual level in . . . . . . . . . . . . 131 Canada, Germany, and France

17
Table 25 Comparative display at the individual level.. .. . . . . . . . . . . . . . . . . . . . . . . . . . . 135
Table 26 Weight of the categories at the individual level in Canada............. 136
Table 27 Weight of the categories at the individual level in Germany.... .... .. 136
Table 28 Weight of the categories at the individual level in France............. 137
Table 29 Cross-cultural weight at the individual level................. .. . .. . .. ..... 138
Table 30 Categories and concepts at the individual level in Canada............. 140
Table 31 Categories and concepts at the individual level in German y........... 143
Table 32 Categories and concepts at the individual level in France.............. 147
Table 33 Amount ofraw data per category at the organizational .. .. .. . .. .. . ... . 152 level in Canada, Germany, and France
Table 34 Comparative display at the organizational level........... .. . . . . . . . . . . .. 155
Table 35 Weight of the categories at the organizational level in Canada........ 157
Table 36 Weight of the categories at the organizational level in Germany ...... 157
Table 37 Weight of the categories at the organizational level in France ......... 158
Table 38 Cross-cultural weight at the organizational level.. ....................... 159
Table 39 Categories and concepts at the organizational level in Canada....... 160
Table 40 Categories and concepts at the organizational level in Germany...... 162
Table 41 Categories and concepts at the organizational level in France........ 166
Table 42 Focus group interview with Chinese participants. Amount of raw ..... 168 data per level of IS success
Table 43 Focus group interviews with Chinese participants. Amount of raw... 168 data at the systems level
Table 44 Focus group interviews with Chinese participants. Amount of raw... 168 data at the individual level
Table 45 Focus group interviews with Chinese participants. Amount of raw ... 169 data at the organizational level
Table 46 Focus group interviews with Chinese participants. Other raw data... 169
Table 47 Local categories at the individual level.. .................................. 172
Table 48 Local categories at the organizational level............................... 173

LIST OF FIGURES
Figure 1 Dimensions influencing key IS issues.................................... 26
Figure 2 Original levels ofIS success................................ .. . . . . . . . . . . .. 37
Figure 3 Process view ofIS consequences.. .. . .. . .. . .. . . . . .. . . . . .. . .. . .. ....... ... 38
Figure 4 Updated model ofIS success.. .. . .. . .. . .. . .. . ... .. . . . . .. . .. . .. . .. ... . .. ... 39
Figure 5 Trompenaars and Hampden-Turner cultural model. . . . . . . . . .. ... . .. .. . .. .. 46
Figure 6 Four implicit models of organizations.................................. 55
Figure 7 Four corporate images..................................................... 57
Figure 8 Framework for global IS research.................................... ... 60
Figure 9 Integrated framework of cultural and IS success layers............... 68
Figure 10 Conceptual framework of data quality.. .. . .. . .. . . . . .. . .. . .. . .. . .. . .. . . 104
Figure 11 Process of data analysis and results . . . . . . . . . . . . . . . . . . . . . . . . . . . . . . . . . . . . . 112
Figure 12 IS success categories at the system level in Canada, Germany, and 130 France
Figure 13 Canada, the determinants of the impact on individual task.. .. . .. . ... 142 category
Figure 14 Germany, the determinants of the impact on the user's career.. .... 146 category
Figure 15 IS success categories at the individual level in Canada, Germany, 150 and France
Figure 16 The relationship between teamwork, impact on organizational . . . .. . . 164 structure and management style and knowledge-based organizational culture
Figure 17 IS success categories at the organizational level in Canada . . . . . . . . . . 167 Germany, and France
Figure 18 Canadian IS success model..... .. . .. . .. . .. . .. . .. . .. . .. . .. . .. . .. .... ........ 174
Figure 19 German IS success model.. .. . .. . .. . .. . .. . . . . .. . .. . .. . .. . .. . .. . ... .. . .. . .. 175
Figure 20 French IS success model................................................... 176

ERP
IS
SIM
MNC
CIO
CEO
IT
MIS
GSS
EIS
ES
MISSSL
MISSIL
MISSOL
MBA
LIST OF ABBREVIATIONS AND ACRONYMS
Enterprise resource planning
Information system
Society of information management
Multinational Corporation
Chief Information officer
Chief Executive officer
Information technology
Management information system
Group support system
Executive information system
Enterprise systems
Meaning of information system success at the systems level
Meaning of information systems success at the individual level
Meaning of information systems success at the organizational level
Master in business administration

ACKNOWLEDGEMENTS
First of all, I would like to thank my research director, Dr John Ingham. His
wisdom to patiently guide me has made this work possible. In him, I found not only a
source of knowledge and encouragement, but also a friend. Special thanks to Dr
Mario Roy, Dr Louis Raymond and Professor Réal Jacob for their encouragement,
advise, support and feedback on my previous work.
I also wish to thank Pierre Ouellette, Mario Saucier, Lyne Gervais and the
other senior managers at the host organization for their warm hospitality and their
help. Thanks are also due to all research participants from France, Canada, Germany
and China. This work would not be possible without their precious data and
information.
Finally, I want to express my gratitude to my parents for their encouragement,
to my children, Hasna and Ghita and to my wife Mahjouba for their unconditional
support. Without them at my side, nothing would have been possible.
This work has been supported by the host organization and the research
departments ofboth the University of Sherbrooke and Bishops University.
Ta my wife Mahjouba and my parents Khadija and Hassan.
CHAPTERONE
INTRODUCTION
The academic discipline of information systems (IS) or computer-based
information systems is a new discipline compared with more traditional fields such as
psychology or sociology. A doctoral candidate student writing on information
systems is usually required to define the reference discipline (s) prior to the research
project proposa!. This requirement cornes from the emerging aspect of IS as a
discipline, which not only relies on many reference disciplines in terms of research
methodologies and paradigms, but also incorporates them in its own body of
knowledge. Presently, IS is a distinguished discipline which is characterized by a
cumulative tradition and a growing research body of knowledge. The object of study
in IS research is the information system itself which has been defined in a variety of
ways.
An information system 1s a system. Rosenzweig (1994) proposes three
categories of systems: technical, social, and socio-technical systems. Technical
systems are tangible and are therefore easy to objectify. Social systems, on the other
hand, are more concemed with the characteristics of people and are much less
tangible. Finally, socio-technical systems are those which combine both social and
technical systems (Rosenzweig, 1994). Information systems are examples of socio
technical systems. Any organization is another example of a socio-technical system.
Leavitt (1958), for example, proposed a socio-technical organizational model in
which culture, tasks, people, structure and technology are all interrelated. The
technical part of an IS is usually referred to as information technology (hardware,
software, and telecommunication tools). The social aspect of the system is concemed
with the people who develop, implement, use, and judge the system.

22
The emerging aspect of IS and its direct relationship to other reference
disciplines did not allow early IS researchers and practitioners to view IS as a socio
technical system. In the early stages of IS research, researchers concentrated their
efforts on the technical aspects of the system (e.g. IS development, operation ... etc.)
Later, the focus shifted to the social aspect of the system. Here, researchers were
more concemed with questions such as the characteristics of the users, developers,
and implementers, the impact IS had on the organization and on the individual using
it as well as with the use of the system to support organizational strategies.
In a recent list of mainstream IS research, (Markus, Axline, Petrie, and Tanis,
2000) argue that one of the most enduring research topics in the field of information
systems is that of information systems success. The importance of and the urge to
cohesively define the dependent variable (IS success) was first defined by Keen
(1980) when he presented a list of five issues that IS researchers need to resolve.
DeLone and McLean (1992) argued that if information systems research is to make a
contribution to the world of practice, a well-defined outcome measure is essential.
Today, managers are still frustrated because the problem of IS success
definition and measurement has no definite or clear answer (Myers, Kappelman, and
Prybutok, 1998). These authors claim that researchers explain this problem in the
following way: 1) the role of the IS fonction in business performance can be difficult
to differentiate from the roles of other organizational fonctions, 2) some companies
use weak surrogate measures of IS effectiveness that hide the true value of the IS
fonction, and 3) some researchers believe that the lack of evidence of a significant
retum on the high investment in technology could be interpreted as reflecting serious
measurement deficiencies.
This problem of IS definition and measurement has largely been documented
in North America. North America is specified because most IS research has been
dominated by this continent's researchers. The IS success problem becomes even

23
more complicated for large organizations or multinational organizations which
conduct business activities across different parts of the globe: that is, in different
contexts or cultures.
Data only becomes information when it is interpreted by a person, and this interpretation of necessity takes place against the backdrop of the individual's culture. In decision making, information is a prerequisite and the decision making process is deeply affected by culture. Thus the meaning of information and effectiveness of an information system can vary substantially in different cultures (Jordan, 1996. p. 2).
This complexity grows in intensity m cases where a multinational
organization seeks to standardize the IS in its subsidiaries. This complexity is largely
justified by the impact culture has on human behaviour, attitudes, and beliefs which
in tum influence managerial practices and the variety of systems used in that
particular culture.
A multinational organization that decides to standardize IS in all its
subsidiaries faces two major challenges. First, the system needs to be implemented
successfully; that is, the system needs to successfully enter the operational phase of
its cycle. Secondly, the multinational organization needs, in due time, to measure the
success of the system. In other words, it needs to evaluate the outcome from
implementing the new system. Both challenges are bound within a particular context;
the subsidiary context or culture.
North American researchers have developed some tentatively integrative IS
success models (DeLone and McLean, 1992; Seddon, 1997; Robey and Boudreau,
2000). However these models were developed by North American researchers whose
ideas and propositions reflect, in a way, the values of North American society.
Moreover, these models are generally tested with North American subjects. In other
words, these researchers operate within the meaning system or constructs systems of
people who belong to the North American culture. However, cross-cultural research

24
has largely suggested that it is not recommended to take these made-in-the-USA
models and theories and apply them to different contexts or cultures (Hofstede, 1980;
Laurent, 1983; Maurice, 1979; Tayeb, 1994; Trompenaars, 1993). Moreover, in
reviewing the literature, no research was found on how people in different cultures
define and operationalize IS success. The intent of this research is to focus on this
issue and fill in the research gap by developing culturally sensitive models of IS
success.
Multinational organizations are perfect targets for conducting cross-cultural
research. The headquarters of a multinational organization, which seeks to
standardize IS, should understand what a successful information system means for its
employees in a specific subsidiary located in a specific culture, and therefore direct
the way these regions operationalize it so that the new system can be adapted to their
beliefs and their values, or more radically, these different cultures could challenge
over time their own values and beliefs and adapt them to the way the corporate office
defines IS success. Until the headquarters of a multinational company confront this
issue, IS implementation and IS success are left with models which may not apply.
This research develops IS success models in four national cultures: France,
Germany, Canada, and China. Our review of the literature indicates that IS
researchers are very aware of the importance and the necessity to expand existing
North American IS success models to include the culture in which they are used.
The research findings will contribute to both the academic and the practice
communities, especially the multinational organizations operating in culturally
specific communities.
The structure of the remaining chapters is as follows. Chapter two discusses
the managerial problem at issue. Chapter three discusses the theoretical components
of the research problem. These components are ones which support the problem's

25
complexity, and therefore target the solution to the managerial problem. Chapter four
considers the research paradigm, design and methodology. Chapter five addresses
data analysis and results. Chapter six discusses the research findings and
implications. Finally, chapter seven concludes the research.

CHAPTERTWO
THE MANAGERIAL PROBLEM
In an effort to provide empirical evidence about key issues in information
systems, the Society of Information Management (SIM) has funded many research
projects on IS key issues, mostly centred on a series ofDelphi-based studies, and rank
the most important IS issues MIS practitioners are concemed with (Brancheau and
Wetherbe, 1987; Dickson, Leitheiser, Wetherbee and Nechis, 1984; Watson and
Brancheau, 1991). ln an attempt to analyze the universal aspect of IS key issues,
Watson and Brancheau (1991) conducted a study on key issues to incorporate the
international perspective. The study shows that, intemationally, there are substantial
differences in key issues in information systems. The authors claim that the possible
reasons for these differences are cultural, economical, developmental, political / legal
environment and the status of technology in the target country and, furthermore, that
national culture can explain these differences in key issues rating. Figure 1 is the
general model, which summarizes the findings.
Figure 1
Dimensions influencing key IS issues
National culture
Economie structure
Political / legal environment
Technology status
Key Issues In IS
Watson, R.T, Brancheau, J.C. (1991). Key Issues in Information Systems Management: An International Perspective, Information and Management, 20 (3), 213-224

27
In both cases, locally and intemationally, IS effectiveness is consistently
reported as among the top 20 most important issues by the members of the Society
for Information Management (Myers et al., 1998). As such, the quest for the benefits
derived from an investment in IS is one of the most researched topics in the IS
discipline (Markus and Tanis, 2000). IS success research focus is linked to the role IT
and IS play in organizations. These roles range from supporting business activities,
helping an organization gain competitive advantages, support its strategies and reach
different markets. This IT and IS potential is extremely important for multinational
organizations. These large organizations are distinguished from other types of
organizations by the fact that they are simultaneously a single entity as well as a
group of individually operating subsets located in different national cultures.
Culture may influence the transfer, development, implementation, and success
of an information system. Even if an IS is developed in a specific culture and then
transferred and implemented in another, its success cannot be defined or measured
using an instrument from its original context (Rosenzweig, 1994, p.32). Culture is a
shared system of meaning (Trompennars and Hampden-Turner, 1998). Therefore, if
the headquarters office and the host organization (subsidiary) are of different cultures,
both could have different shared systems of meaning conceming the worlds around
them. Particularly, the meaning of IS success from the perspective of the office
headquarters would be different in its understanding from the subsidiary perspective
(Garrity and Sanders, 1998).
A multinational organization that decides to implement a standard IS in all of
its subsidiaries faces another very challenging obstacle. If it is not known how people
in a particular culture different from that of the head office, perceive, define, and
operationalize IS success, the following problems could arise:
1. Office headquarters would not be able to measure the success of the existing
IS before implementing the new standard system;

28
2. If it does so, the IS success measured by the office headquarters using its own
instrument has no value as the items defining the instrument would have
different meanings for the people in the subsidiary;
3. The new system (any new standardized system), if implemented successfully,
could only be referred to by the notion of success as defined by the office
headquarters and would thus be different from a notion of IS success as
defined by the people in the subsidiary;
4. Headquarters would not be able to adapt the new system so that success from
the subsidiary perspective is achieved;
5. Headquarters cannot immediately adapt the subsidiary employees' attitudes
and beliefs so that they would fit the headquarters-expected IS success.
Another problem arises with IS standardization. It is the concept of what we
call the built-in assumptions of the information system. The literature states that
every organizational information system is characterized by its built-in assumptions
that reflect the designers' values which in tum are influenced by the national culture
of these designers. The standard information system will then be characterized by
some unique built-in success assumptions. As the perception of IS success by groups
of people from different national cultures differ, a misalignment between the unique
built-in success assumption of the systems and IS success as it is defined by culturally
different groups is likely to occur. The next sections provide more theoretical
discussion about 1. multinational organizations, 2. the concept of IS standardization,
and 3. the concept oflS built-in assumptions.
1. MULTINATIONAL ORGANIZA TI ONS
«From a historical perspective, multinational organizations first appeared
about two hundred years ago» (Ein-Dor, Segev, and Orgad, 1992, p. 34). As the name
indicates, these companies are ones which have multiple nationalities, i.e. they have
many branches in many countries.

29
Multinational organizations (MNCs) are types of organizations which face
pressures on two fronts: market globalization and cultural forces. As multinational
enterprises extend their operations world-wide, there will be an increasing demand
for a comprehensive understanding of the cultural values of foreign cultures.
The terms international company, multinational company, and global
company are used interchangeably in the literature. They are usually employed to
portray companies with some foreign components in their operations (Burn and
Cheung, 1994). Additionally, the authors provide a clear distinction between these
terms and provide the following definitions:
1. An international company can be defined as a company that engages in
business with customers who are in other domestic regions;
2. A multinational company is one that has operations in more than one
domestic area; that is, at least one foreign subsidiary exists within the
company;
3. A global company is one which has a philosophical view of the world as a
single market.
In general, the use of any of the above terms depends on the extent of the
relationship between headquarters and its subsidiaries in terms of a decentralization
or centralization of the decision-making process. However, the optimal intersection
point between market responsiveness of the subsidiary, the consistency of the
subsidiaries with headquarters' general policies and philosophies, and the consistency
among all the subsidiaries (Burn and Cheung, 1994; Fior, 1996) is the ultimate goal
of any type of multinational organization. «Subsidiaries frequently demand more
local autonomy for the modification of products or operations in order to fit with the
different requirements of local markets. On the other hand, the headquarters requires
more central control to reduce the variations in the subsidiaries and alignment with

30
headquarters' policies» (Burn and Cheung, 1994). Trompennars and Hampden
Turner (1998) use globalization to stress the need for this balance.
As market globalizes, the need for standardisation in organizational design, systems and procedures increase. Y et managers are also under pressure to adapt their organizations to the local characteristics of the market, the legislation, the fiscal regime, the socio-political systems and the cultural systems. This balance between consistency and adaptation is essential for corporate success (p.3).
Gordon (1992) further claims that the best-performing international organization is
the one which has the best-integrated diversity.
We can also use a cultural perspective to provide an acceptable distinction
between MNC types. W e can classify these types in terms of the extent to which the
company takes into account the culture of its units. In this perspective, the global
organization would be placed at the extreme of a cultural continuum, the multi
domestic organization at the other extreme, and the MNC in search of the perfect
balance between autonomy of subsidiaries and central control of its headquarters
would be within this continuum. The cultural perspective can also be used to orient
the strategy of an MNC. It could additionally be used by an MNC as a means by
which to control its subsidiaries, among other coordination and control mechanisms
such as accounting-based mechanisms, human resources management, and delegation
of decision making. Each mechanism is designed to regulate the activities of a foreign
subsidiary in order to meet organizational objectives. In information systems, IS
standardization is believed to help reach these organizational objectives. The
standardization of IS aims to enhance the consistency component of an MNC in
achieving a balance. From the IS community perspective, «standards are generally
perceived to be beneficial» (Gordon, 1992, p.275).

31
2. IS STANDARDIZATION
IS standards are defined as <<A set of rules or policies goveming the
characteristics of software and/or hardware that an organization may purchase or
develop» (Gordon, 1992, p. 275). IS standardization has both its benefits and costs
(Gordon, 1992). The most common cost cornes from cultural barriers. According to
the author, the related benefits and costs of IS standardization are as follows.
The benefits are:
1. Minimized duplication of software development;
2. Increased connectivity of systems and the ability to exchange data;
3. Greater economies of scale in purchasing;
4. Reduction of the overhead required for support.
The costs are:
1. Increased cost due to a reduction of flexibility;
2. Stifling of innovation and creativity;
3. Further complications for subsidiaries whose local requirements interfere
with the adoption of standards.
The benefits of IS standardization in an MNC's subsidiary depends on the
output of a complex equation which includes exogenous variables such as the
economical and socio-political environments of the subsidiaries and the cultural gap
between the home country and the host country. The endogen variables include the
company's structure, strategy, and the built-in assumptions of the information system
being standardized. IS built-in assumptions are not well documented in the literature
and are believed to be a critical barrier to IS transfer and implementation across
cultures (Davenport, 1998).

32
3. IS BUILT-IN ASSUMPTIONS
«Information systems have built-in values biases reflecting the value
priorities of the culture in which they are developed» (Krumar and Bjoin-Anderson,
1990, p. 535). This means that a cultural misfit is likely to occur if an information
system or information technology developed in one culture is implemented in an
organization based in another culture: «Although information technology in business
organizations around the world may be similar, the meaning conveyed through the
technology may be dependent on managerial values and national cultures» (Leidner,
Carlsson and Corrales, 1999, p. 1).
The outcomes and use of IS thus depend on the degree of the fit between its
built-in assumptions which are based on the designers' values (Krumar and Bjoin
Anderson, 1990; Watson et al., 1997) and the assumptions and values of the adopting
organization. Both implementation and success of a standard information system in
different national cultures are targeted by analyzing the misfit.
It can now be understood that the issue takes a larger dimension in complexity
when an IS is implemented in different national cultures. The basis of the problem
arises from differences in meaning, in this case, two meanings: the shared system of
meaning of people living in a particular national culture (e.g. their culture) and the
built-in meaning of the system; that is, its built-in assumptions conceming the reason
behind its development and the expected impact on its users. When the system's
built-in assumptions do not fit the assumptions and meaning expected by its future
users, then its built-in success assumptions are likely to differ from the meaning of its
success from the perspective of these users. Two types of IS built-in success
assumptions then emerge: IS built-in implementation success assumptions, and IS
built-in success assumptions. This classification is deduced from categories found in
Markus, Axline, Petrie and Tanis (2000). The authors argue that IS success in general
can be divided as early success (implementation success) and later success ( ongoing

33
success) of the system, and furthermore that the two constructs are not closely related.
That is, even if successfully implemented, the ongoing success is not guaranteed.
Moreover, even if an adopting organization judges that both early and later successes
are achieved in a particular culture, this is less likely to occur in the case of IS
transfer to a different culture. As stated by Leidner et al., (1999), «Even if
successfully implemented, such systems may not yield the same benefits as they do in
the culture from which the systems originally emerge» (p. 2). One probable cause for
this is the misfit between IS built-in success assumptions and the meaning of IS
success given by the adopting organization. So, a multinational organization, which
usually aims to standardize information systems in all of its subsidiaries, faces the
dual challenge ofboth early and later success:
Multinational corporations face a number of potential obstacles in their effort to implement computer-based information systems in subsidiary companies. Culture may impede implementation effort because of differences in the way information systems are interpreted and given meaning. Specifically, the meaning of information systems to MNC headquarters and systems development group may differ from the meaning it has for the managers and users in the subsidiary (Robey and Rodriguez-Diaz, 1989, p. 229).
Assuming that many corporate factors may lead to IS standardization
implementation success (early success), the meaning of the success of an IS in a
particular subsidiary of an MNC which is located in a national culture is likely to be
different from the meaning of its built-in success assumptions except in the culture in
which the system was developed. This is mainly due to the existence of many shared
as well as differing systems of meanings.

CHAPTER THREE
THE THEORETICAL CONTEXT
1. IS SUCCESS
The information system success can be considered as the gained performance
from IS investment. A large volume of research has been conducted on the relevant
independent variables of what causes the failure or the success of information
systems (Bailey and Pearson, 1983; Benbasat, Dexter and Maulis, 1981; Ives, Olson
and Baroudi, 1983; Lucas 1976; Swanson, 1974; Beynon- Davies, 1995; Christiaanse,
Been and Diepen, 1986; Noble and Newman, 1993; Sauer, 1993). Sorne of these
variables are: organization and IS unit size and structure, IS maturity, experience and
resources, IS strategic planning and alignment, project management, IT
characteristics, user involvement and training and management support and
intervention to mentionjust a few. At the same time, a large but confusing volume of
work has been carried out on the definition and measurement of the dependent
variable - IS success (Seddon, Staples, Patnayakuni, and Bowetell, 1999). This
confusion in the research findings is justified by many factors. One of them is the
mixture of the technical and social aspects of an IS as noted by Kanellis et. al (1998):
Failure is the embodiment of a perceived situation (Lyytinen and Hirshheim, 1987). This highlights a fluidity and interpenetration between technological and social views, developed by the authors in another work, which leads us to argue: firstly, that plurality is unavoidable; and secondly, that success is a perspective that emerges from the social and technical interplay within organizations (p. 135).
Alter (2000) also argues that information technology and work practices are now so
intertwined that it is difficult to identify their respective contribution to success.

35
Other researchers link the difficulty of defining IS success to the
methodological aspects involved in measuring IS success: «Specifying a dependent
variable is difficult because of the many theoretical and methodological issues
involved in measuring IS success» (Garrity and Sanders; 1998, p. 14). Seddon,
Staples, Patnayakuni, and Bowetell (1999) present an extensive literature review on
IS success conceptualizations and measurements. They conclude that IS success is
still a fuzzy concept contingent upon different stakeholders and different types ofIT.
This difficulty of IS success definition, and therefore measurement, was at the
origin of the productivity paradox. Practitioners and managers invest a significant
amount of money on IS and IT, and when it cornes to the evaluation of outcomes
from the investment, they are faced with poor measurement instruments and
consequently they base their judgement on intuition and personal perceptions. This
has of course reduced the willingness of the CIO and CEO to put more money into IS
and IT. Low outcomes from huge investments on IS may not be a true or accurate
finding because those outcomes are not based on strong and credible measurement
issues. However, as was indicated earlier, ambiguity leads to low trust and therefore
low investment. Ballantine et al. (1996) wrote:
The many well publicised information systems failures and the paradox of high investment and low productivity retums has brought issues of success causes and success measurement to the fore. Predicated upon success not being a random variable, a number of models which attempt to delineate success and success causes have been proposed (p. 46).
Myers et al. (1998) added:
Information systems managers are under increasing pressure to justify the value and contribution of IS expenditures to the productivity, quality and competitiveness of the organization. IS assessment is not well established and recent studies show that more research is needed (p.94).

36
So, the notion of IS success is not well defined and recent studies show that more
research is needed (Clark, 1992; Delone and McLean, 1992; Dickson, Well and
Wilkes, 1998; Saunders and Jones, 1992).
2. IS SUCCESS MODELS
The DeLone and McLean (1992) model of IS success is probably the most
cited model in the IS community. After an extensive literature review on IS success
research work, the authors found that there was no clear agreement on what
constitutes IS success. They claimed that researchers view the IS success concept in
so many different ways and from so many perspectives that it was either impossible
or very difficult to compare the findings. The authors finally proposed considering IS
success as a process causally linking six variables: system quality, information
quality, usage, user satisfaction, individual impact, and organizational impact. Three
levels of IS success can therefore be deduced from this model (Figure 2): the system
itself (information quality and system quality), the individual level (use, satisfaction
and individual impact), and the organizational level ( organizational impact). The
Delone and McLean model was recently successfully tested in an empirical study
(Rai, Lang and Welker, 2002). But the Delone and McLean model is essentially a
variance model (Seddon, 1997), and variance at the system level deterministically
produces variance at the individual level which, in tum, produces variance at the
organizational level.

37
Figure 2
Original levels of IS success
Organizational level: Business performance and change. Customer service, time to market, inventory turnover, capacity utilization,
etc. (Barua and Mukhopadhyay, 2000)
Individual level: Individual performance (productivity, better decision), satisfaction, use
System level: system quality (ease of use, accessibility, design ... ); information quality (accuracy, timeliness, usefulness ... ) (Seddon, 1997)
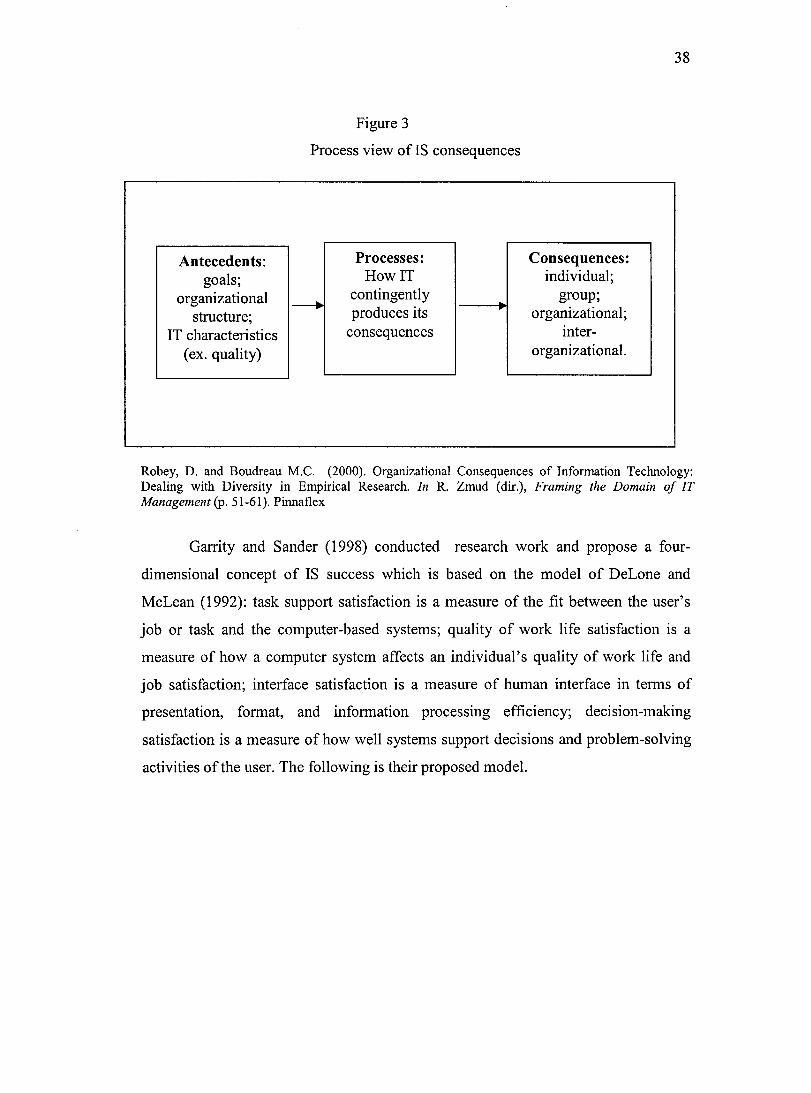
Rabey and Boudreault (2000) propose to also study IS consequences at
different levels but from a process perspective. Two additional levels of impact (the
group level and the inter-organizational level) are added to the original model to
account for more recent developments in information technology (groupware,
intranets, EDI, Internet), in management practices (team working) and in industrial
organization (networks).
Recognizing that the consequences of the same IT may differ in comparable
settings and that the consequences of IT differ within organizations, they also propose
that IT success should be approached taking into account the contingent and uncertain
processes by which IT produces its consequences (success or failure). This process
view of IT impacts is schematized in figure 3.
Antecedents: goals;
organizational structure;
IT characteristics ( ex. quality)
Figure 3
Process view of IS consequences
Processes: HowIT
----+ contingently produces its
consequences
Consequences: individual;
group; organizational;
interorganizational.
38
Robey, D. and Boudreau M.C. (2000). Organizational Consequences of Information Technology: Dealing with Diversity in Empirical Research. In R. Zmud (dir.), Framing the Domain of 1T Management (p. 51-61 ). Pinnaflex
Garrity and Sander (1998) conducted research work and propose a four
dimensional concept of IS success which is based on the model of DeLone and
McLean (1992): task support satisfaction is a measure of the fit between the user's
job or task and the computer-based systems; quality of work life satisfaction is a
measure of how a computer system affects an individual's quality of work life and
job satisfaction; interface satisfaction is a measure of human interface in terms of
presentation, format, and information processing efficiency; decision-making
satisfaction is a measure of how well systems support decisions and problem-solving
activities of the user. The following is their proposed model.

Figure 4
Updated model of IS success
System Use
'
User
,1,
Satisfaction
Task Support
Satisfaction
Decision Making Satisfaction
Quality of Work life Satisfaction
Interface Satisfaction
Individual __. impact
39
Organizational -+ impact
Garrity, E.J. and Sanders, G.L. (1998). Introduction to Information Systems Success Measurement. In E.J. Garrity and G.L, Sanders (dir), Information Systems Success Measurement (p. 1-12). Idea Group Publishing
40
An IS success definition problem was also perceived in the practice
community. Markus and Tanis (2000), for example, discussed the results of a survey
of ERP implementation projects by KPMG Management Consulting. Markus'
analysis showed some worrying results. Eighty-nine per cent of responding
companies claimed that their projects were successful, but only a quarter had actually
obtained and quantified all the planned benefits. Thus, the author concludes that
«This quotation illustrates a fondamental gap in both practical and academic thinking
about information systems lack of consensus and clarity about the meaning of success
where information systems are concemed» (p.185).
2.1 IS Success in multinational context
The problem of IS definition and measurement becomes even more difficult if
we add the international dimension. As Ishman (1998) notes:
Few MIS instruments have been tested outside the homogeneous domestic environment in which they were developed. Yet the variables such instruments attempt to measure are often operationalised in heterogeneous global environments. Information systems are very costly, especially those implemented globally. Accordingly, the development of a global research instrument that measures these variables that influence successful outcomes is important (p. 60).
Garrity and Sanders (1998) add:
The field of information systems could certainly benefit from generally agreed upon dependent measure of IS success. Standardised dependent measures would allow for study replications and cross-study comparison. However, a number of substantial issues need to be addressed regarding the measurement of IS success before we settle on standardised measures. One of these central questions is: how does the researcher's and the user's basic philosophy and viewpoint of information systems shade and filter their concept and perceptions of successful information systems (p.4)?

41
Moreover, add the above authors:
We do not all see things the same way. Just as people describing an accident often give different and contradictory stories or sequence of events based on their physical viewpoint relative to the incident, people likewise describe complex phenomena, like the success or failure of an information system, in different ways because of their differing viewpoints or philosophies which govern their perceptions (Garrity and Sanders, 1998, p. 4).
In considering the perspective from an international context, where cultural
terms such as values and assumptions are used and which may also be at the heart of
the differing perceptions and interpretations, Shing-Kao (1997) argues that «Research
has shown that people notice, interpret and retain information based on their values,
assumptions and expectations. Different assumptions and values lead to different
ways oflooking at the same thing» (p. 13).
This international differing perception of the meaning of a phenomenon is an
important topic in International Management or Cross-cultural Management
disciplines. Do theories and concepts born in North America apply or have the same
meaning elsewhere? Hofstede (1993), for example, after a large survey on work
related values in sixty countries, concluded that management theories and findings
are not automatically transferable from one context to another.
There is something in all countries called management, but its meaning differs to a larger or smaller extent from one country to the other, and it takes considerable historical and cultural insights into local conditions to understand its processes, philosophies, and problems. If the world may already mean so many different things, how can we expect one country's theories of management to apply abroad (Hofstede, 1993, p.16)?
Shing-Kao (1997), Kedia and Bhagat (1988), and Robichaux and Cooper (1998) add
that the majority oftheories of management have a Western and, therefore, generally,
an American perspective which is based on the embedded values that influence the
ways in which Americans perceive and think about the world, as well as the way in

42
which they will behave. However, the majority of North American researchers do not
explicitly state the context for which their proposed theory is built. They assume that
their findings are culture-free (Kedia and Bhagat, 1988), which should not be taken
for granted (Hofstede, 1993).
In research terms and from the systems perspective, Rosenzweig (1994)
argues that a central concern in scientific research is external validity. That is, the
extent to which a theorized or observed relationship among variables can be
generalized to other settings. The author does not mean extemal validity within a
specific context or culture; rather, he questions the applicability of these relationships
to other contexts and other cultures, the international dimension. The author based his
argument on the basic definition of science which is a systematic method of inquiry
that consists of several stages, including: 1. the definition and the operationalization
of variables; 2. the emerged relationship among variables; and 3. the measurement of
variables to test hypotheses. He further argues that the international generalization of
management science research encounters obstacles at each of these stages of the
scientific process.
Problems occur at the definition stage of the research process if the variables
have different meaning in different cultures. The variables may be translated correctly
but fail to translate the meaning. At the operationalization level of variables, even if a
variable can be translated with conceptual equivalence, it must also be
operationalized in a way which will lead to a valid interpretation of the data. At the
level of theorized relationship among variables, the author argues that this
relationship between variables often differs from one country to another. In part,
these differences can be traced to cultural value orientations which vary across
countries.

43
To conclude, Rosenzweig (1994) claims that the main question should not be,
«Are scientific management theories that interest us valid elsewhere? But how can we
best understand management, as it exists around the world? » (p.37). This is exactly
the main goal of this research project where we seek to understand the meaning ofIS
success in different national cultures. It implies that the complex concept of IS
success would have a variety of meanings across other contexts different from the
made-in-the-USA meaning. This difference in meaning of any phenomenon m
general, and IS success in particular, may find its origin in the concept of culture.
3. CULTURE
Culture is a term that was originally developed in the field of anthropology
and has recently become a prevalent research area in organizational studies.
Unfortunately, a consistent definition of this ambiguous concept is extremely difficult
to isolate. Lammers and Hickson (1979) summarize the problems, which pertain to
references of culture in cross-national study of organizations:
1. Culture has rarely been well defined and even anthropologists, who have
given more attention to the concept than other scholars, do not agree on the
meaning of the term;
2. the boundaries of a cultural unit are difficult to define, particularly in light of
the uncertainty as to the meaning of the core concept itself;
3. the identification of variables as being cultural is problematic in most studies
because there has been no explanation of the origin of the variables in the
development of the society concemed;
4. formidable problems exist in the measurement of cultural attributes; they are
partly due to the lack of clarity in conceptual definition and partly of a purely
operational nature.

44
Krants (1975) has even suggested that in light of these problems, it would be
better not to use the term 'culture' in cross-organizational studies. Nevertheless,
researchers need to deal with a concept of 'culture' in cross-cultural studies because it
is the only way to help understand how and why organizations are similar or different
(Lammers and Hickson, 1979).
The complexity of the concept of culture derives then from the multiplicity of
the perspectives that investigate it. One thing that all researchers agree upon it the fact
that culture is related to people. However, researchers differ as to how it should be
conceived and how it is created.
The most popular perspectives in studying culture are the functionalist and the
structuralism perspectives. Two major and opposing schools of thought were
developed by Radcliffe-Brown (1965) and Lévi-Strauss (1958). Both of them
investigate the basis of human societies from the structuralism and functionalist
perspective. But their definitions of these two concepts are what make them different.
Radclifee-Brown ( 1965) relates his methodologies and paradigms in studying
societies to the biological and natural worlds. He considers structure an observable
reality, whereas Lévi-Strauss (1958) considers that structure should not be related to
the empirical world and that it should be considered as a mode! that researchers
would use to study societies. Put differently, Radcliffe-Brown (1965) sees structure
as a real arrangement of real elements, whereas Lévi-Strauss (1958) sees that the
epistemological truth of the concept can only be found in the models that scholars
develop to experiment in reality.
Form this perspective, Radcliffe-Brown (1965) considers that the social
structure is an organized system of elements that make a whole. These elements are
persons. Each person is a human being who holds a position in the society. The
author simulates the social structure with the human body structure by which he
demonstrates his theory of the concepts of process, structure and fonction. Radcliffe-

45
Brown (1965) considers that in order to understand the social system, we need to use
the concept of fonction which he defines as the relationship between the social
structure and the process of social life» (p. 79).
In 1952, the anthropologists Kroeber and Kluckholn claimed that there were
more than 150 definitions of the concept of culture and proposed to define it in the
following way: «Culture consists of patterns, explicit and implicit, of and for
behaviour acquired and transmitted by symbols constituting the distinctive
achievement of human groups including their embodiment of artefacts» (p. 181 ).
Baligh (1994) also argues that there are many ways to describe and define culture and
that one may conceive of culture in terms of its parts and its components, and the two
are related. According to Baligh (1994), the parts are: family, language and
communication, religion, govemment and politics, education, transformation and
technology, society, and economic structures and activities (business). Organizations,
adds the author, are a part of a number of these, notably the last one, «A culture may
be defined in terms of these parts» (p. 16). The components of culture are: truth,
beliefs, values, logic, rules, and actions. The interaction of a part ( e.g. business and
economics) and a component (e.g. rules) may, for example, affect how an
organization defines its customer orientation (e.g. the customer cornes first). The
following table 1 shows some examples where the cultural parts and components
interact.
Table 1
Inside a culture
Parts and components Example
Family and rules Eamings of each shared by all Society and rules Never arrive on time Govemment and politics and beliefs Democracy works best Govemment and politics and values Groups over individuals Business and economics and values Profits Business and economics and rules Customer cornes first Religion and truth Absolute truth from God
Baligh, H.H. (1994). Components of Culture: Nature, Interconnect10ns, and Relevance to the Decisions on the Organization Structure. Management Science, 40(1), 14-27

46
Culture concerns a group of people who share a common understanding and
meaning of things around them. It is a shared system of meaning (Trompenaars and
Hampden-Turner, 1998) or, the collective programming of the human mind that
distinguishes members of one group from another (Hofstede, 1993). Trompenaars and
Hampden-Turner (1998) propose the following framework to understand culture.
Figure 5
Trompenaars and Hampden-Turner (1998) cultural model
A serva e a e ac s exp 1c1 Ob bl rt f: t ( l' 't) ·~ Values and norms
1
Basic assumptions (implicit)
Trompenaars, F.T. an Hamp en-Turner, C.H. 1998). Ri ing T. e Waves o Cu ture Understanding Diversity in Global Business. McGraw-Hill
1
This model indicates that the products of culture (observable artefacts) we see
everywhere are symbols of the norms and values of the people living in that place,
which in turn are based on fondamental basic assumptions about human existence and
life.
Culture cornes in layers, like an onion. To understand it, you have to unpeel it layer by layer. On the outer layer are the products of culture, like the soaring skyscrapers of Manhattan, pillars of private power which congested public streets between them. These are expressions of deeper values and norms in a society that are not directly visible. The layers of values and norms are deeper within the onion and are more difficult to identify. A problem that is regularly solved disappears from consciousness and becomes basic assumption, an underlying premise (Trompenaars and Hampden-Turner, 1998, p. 5).
The following sections discuss the most popular types of culture: national,
organizational and professional cultures (Trompenaars and Hampden-Turner, 1998).

47
Before detailing the discussions on these types, a brief summary of their relationships
and definitions are presented.
In relating culture to the study of organizations, Morgan (1997) brings a new
perspective to the relationship between culture and organization. He claims that the
organization itself can be considered as a cultural phenomenon. The author supports
his argument by differentiating between organization societies that belong to the
industrial culture and the domestic societies. In each type of these societies,
organizations share common goals and practices. The author argues that for example,
organizations in Paris, Moscow, and in other major cities of the industrial countries,
all belong to the same industrial culture.
On the other hand, the author claims that «although all modem societies share
much in common, it would be a mistake to dismiss cross-cultural differences in
culture as being of little significance» (p.22). Organizations are influenced by their
context. This is the national culture or the context culture.
Although national culture has an impact on its organizations, this influence is
not uniform. «Just as individuals in a culture can have different personalities while
sharing much in common, so too with groups and organizations» (p. 129). This is
what we refer to as the corporate or the organizational culture.
Subcultures also exist. An example of this other type of culture 1s the
professional culture.
In many organizations, there may be different and competing value systems that create a mosaic of organizational realities rather than a uniform corporate culture. Besides gender, race, language, and ethnicity; religious, socioeconomic, friendship, and professional groups can have a decisive impact on the cultural mosaic (p. 137).

48
The following section discusses different models of national culture and presents
detailed discussion on organizational and professional cultures.
3.1 National culture
The words National or Societal are used interchangeably to designate a
country or a large community. National culture is a concept that helps to determine
similarities and differences between the cultures of the countries. Although it is a
mistake to limit the characteristics of a particular national culture to a particular
country, the findings of cross-cultural research are usually based on this assumption.
The literature provides some models which try to capture the concept of
national culture. Morden (1999) developed a conceptual comparative paper in which
he describes the different cultural models as based on either a single or multiple
dimensions. The following table 2 summarizes some of the most popular models.
Hall (1976) uses a single dimension; high context versus low context to
differentiate between national cultures. The context dimension draws upon the degree
of communication between individuals in a particular national culture. Individuals
from high context cultures use informa! information and informai communication
mediums to satisfy their information needs. Individuals from low context cultures use
objective data and explicit information that may be stored in computer databases and
in written reports to seek knowledge. Hall (1976) claims that the Chinese culture is
considered as a high context culture while North American (U.S.A, Canada) are
considered as being low context cultures.

49
Table 2
Popular models of national culture
Model Source Cultural dimensions Single Hall, 1960 High context - Low context dimension Lewis, 1992 Monochronic -Polychronic Multiple Hofstede, 1991 Power distance, Uncertainty avoidance, dimensions Individualism- Collectivism, Masculinity-
femininity Hampden-Turner Universalism - particularism and Trompenaars Analyzing - integrating 1994 Individualism-communitarianism
Boundary management or inner-directed -outer-directed Time as sequence - time as synchronization Achieved status - ascribed status Equality - hierarchy
Trompenaars and Universalism versus particularism Hampden-Turner lndividualism versus communitarianism 1998 N eutral versus emotional
Specific versus diffuse Achievement versus ascription Attitude to time Attitude to environement
Morden, T. (1999). Models of National Culture - A Management Review. Cross Cultural Management. 6 (1), 19-44
Lewis also (1992) uses a single dimension to differentiate between national
cultures: the Monochronic and Poychronic dimension. The difference between these
two extreme poles is in the degree to which individuals take time as important. Time
is extremely important in Monochronic cultures. Planning and respect of
appointments are common practices in these cultures. Lewis (1992) characterizes
Germany as being a Monochronic culture. Polychronic cultures on the other hand do
not give much importance to time. Lewis (1992) characterizes Arab and Latin
American cultures as Polychronic.

50
Trompenaars and Hampden-Turner (1998) provide another definition of
culture and claim that: «Culture is the way in which a group of people salves
problems and reconciles dilemmas» (p. 6). These problems, add the authors, can be
classified in three headings: those which deal with our relationships with other
people, those which are related to our attitude toward time, and those that are related
to our attitude toward the environment. The solutions people choose to solve these
problems is what constitute a culture. The authors classify these solutions into seven
dimensions:
1. Universalism versus particularism, or rules versus relationships;
2. Individualism versus communitarianism, or the group versus the individual;
3. Neutra! versus emotional, or the range of feelings expressed;
4. Specific versus diffuse, or the range of involvement;
5. Achievement versus ascription, or how status is accorded;
6. Attitude to time;
7. Attitude to environement.
Hofstede (1980) proposes that national culture and values, as they affect the
work environment and its management, could be categorized on the basis of four
variables, namely: power distance, uncertainty avoidance, individualism
collectivism, and masculinity-femininity.
With uncertainty avoidance, the concern is the extent to which people in a
society avoid uncertainty and ambiguous situations. They would control uncertainty
by establishing and following rules and procedures. Persona! ideas would not be
welcomed. The common imperative would be to follow the rules.
With individualism versus collectivism, the focus is on the relationship
between individuals on one hand and relationships between individuals and their
organizations on the other hand. In individualistic societies, ties between individuals

51
are loose. In collectivist societies, ties between individuals are tight and people
believe in the force of assembled relationships. That is, the group is more important
than the individual.
Regarding the dimension of power distance, the issue is the extent to which
individuals accept the unequal distribution of power as a norm. Hofstede (1980) has
shown that different cultures possess different distributions of power in their
organizational and social hierarchies and that the power distance norm can be used as
a criterion for characterizing this aspect of culture.
The fourth dimension, masculinity versus femininity, is concemed with the
extent to which people put emphasis on status and achievement. Hofstede (1980)
noted that in a masculine culture, the public hero 1s a successful achiever, an
aggressive entrepreneur, which is succinctly put as «big is beautiful» (p.85). In
contrast, feminine societies emphasize quality of life, taking care of others, and a
preference of valuing relationships over achievement. The accent is on «small is
beautiful» (p.85).
The values of people in a particular culture are the most widely used concept
or variable in cross-cultural studies (Glenn and Glenn, 1981; Hofstede, 1980;
Triandis, 1982). The reason for the popularity of values as cross-cultural research
variables is the deeper layer of culture, basic assumptions are preconscious (taken for
granted) and are powerful because they are less debatable than espoused values
(Lachman, Nedd, and Hinings, 1994). The latter define values as «the basis for the
choice by a social group, of a particular end and particular means by which these ends
are to be accomplished» (p. 41). Hofstede (1985) also provides a brief definition of
values and defines these as «broad preferences for one state of affairs over others»
(p.347). Trompenaars and Hampden-Turner (1998) suggest differentiating between
norms and values in claiming that values direct our feelings of good and evil, and

52
that nonns are the basis by which a group of people judge something as right or
wrong.
Before concluding our discussion on national culture, we need to stress that
subcultures exist within national cultures. Moreover, when the size of these
subcultures is large, they can be considered as national cultures on their own. This is
what we usually call a culture within a culture. A subculture concems any group of
people that possesses special characteristics within a large group in the society.
Canadians of French origin in Quebec, for example have specific characteristics than
other Canadians. Hénault (1971) developed a table that indicates differences between
these two groups. Peppas (2002) conducted a comparative study to detennine if
African-Americans and Euro-Americans have significantly different attitudes with
regard to management values. The results show that indeed in a national culture
(American) that is known to be characterized by specific strong values that are
supposed to be shared by people, groups of people may have different values.
3.2 Organizational culture
Organizational or corporate culture is inferred as being a culture that is unique
to a particular organization. However, and as it is the case for the concept of national
culture, organizational culture is also problematic to define. «The problem of defining
organizational culture derives from the fact that the concept of organization is itself
ambiguous» (Schein, 1990). The difficulty of defining organizational culture has also
been expressed by Bali, Cockerham, and Bloor (1999):
Researchers and authors have analogized organizations to an iceberg which shows only 10-15 percent of its total mass above the surface water and is thus a suitable analogy to show the visible and non-visible facets to an organization's culture. This analogy demonstrates the importance of deeper research in an organization in order to gain access to the submerged 85-90 percent of the organization's value and belief system (p.2).

53
Researchers use different perspectives and usually choose few components of the
organizational culture to investigate organizations.
Riley ( 1983) uses the theory of structuration to study organizational culture by
investigating organizational politics in two professional firms. The results suggest
that organizational culture should not be viewed as a unique set of values to which all
organizational members belong to, but as a system of integrated subcultures.
Barley (1983) claims that although there are many differences in defining
the concept of organizational culture, all authors, adds Barley (1983), employ key
terms that belong to the same family. He then defines organizational culture as
«embodied in and transmitted by stories, myths, and symbols» (p. 393).
Speaking of organizational symbols, Pettigrew (1979) studied organizational
culture form the symbolism perspective and defines symbols as «abjects, acts,
relationships that stand ambiguously for a multiplicity of meanings, involve
emotions, and impel men to action» (p. 574). The author argues that entrepreneurs
should be seen not just as creators of tangible aspects of an organization, but also as
creators of symbols, ideology, language, and beliefs. It is then, adds the author,
possible to study the transformation process of organizations from no beliefs to
beliefs, from no rules to new rules and from no culture to new culture. The author
also claims that culture should be regarded as the source of family of concepts:
symbols, language, ideology, beliefs, rituals, and myths.
Romm, Pliskin, Weber, and Lee (1991) claim that, after an extensive literature
review, they found no agreement as to what the most important dimensions of
corporate culture are. However, the authors add that the following measures of
cultural differences are generally agreed upon and have been used with a high level of
reliability and validity. These measures are: innovation and action orientation, risk-

54
taking, integration, lateral interdependence, top management contact, autonomy in
decision making, performance orientation, and reward orientation.
Galpin (1997) defines organizational culture as operationally possessing ten
components. These are: rules and policies, goals, ceremonies and events,
management behaviour, reward and recognition, communication, physical
environment and organizational structure.
Schein (1990) argues that organizational culture may or may not exist,
depending upon the experience of the organization in general:
We must first specify that a given set of people has had enough stability and common history to have allowed culture to form. This means that some organizations will have no overreaching culture because they have no common history, or have frequent turnovers of its members. Other organizations can be presumed to have strong cultures because of a long shared history or because they have shared important experience (Schein, 1990, p.111).
The same author links the concept of culture to the dual pressures upon
human beings: to face external adaptation and interna! integration, and he therefore
proposes defining culture as:
1. a pattern of basic assumptions, 2. invented, discovered, or developed by a given group, 3. as it learns to cope with its problems of external adaptation and interna! integration, 4. has worked well enough to be considered valid and therefore, 5. is to be taught to new members as 6. the correct way to perceive, think, and feel in relation to those problems (p.111 ).
Hofstede (1993), and Trompenaars and Hampden-Turner (1998) link their research
on national culture to develop many types of organizational cultures.
Of the five dimensions that Hofstede (1993) developed, power distance and
uncertainty avoidance are considered the most important in studying organizations in

55
different national cultures. The combination of these dimensions yields a four
quadrant framework, which represents profiles of organizations that are characterized
by specific type of organizational culture. The framework is illustrated in the
following figure.
CANADA
MARKET
Power distance small
MACHINE
GERMANY
Figure 6
Four implicit models of organizations
Uncertainty A voidance weak
Uncertainty A voidance strong
HONGKONG
FAMILY
Power distance large
PYRAMID
FRANCE
Hofstede, G. (1994). Management Scientists Are Human. Management Science, 44(1), 4-13
The model illustrates four organizational models: Machine, Market, Pyramid
and Family. Each part of the organizational model includes all national cultures that
share a common degree of national culture dimensions. National cultures with high
uncertainty avoidance and low power distance belong to the Machine model. National
cultures with high uncertainty avoidance and high power distance belong to the

56
Pyramid model, National cultures with low uncertainty avoidance and low power
distance belong to the Market model, and finally, national cultures with low
uncertainty avoidance and high power distance belong to the Family model.
Trompenaars and Hampden-Turner (1998) use two dimensions: equality
hierarchy and orientation to the person, orientation to the task to determine four types
of organizational cultures. These types are:
1. The Family;
2. The Eiffel Tower;
3. The Guided Missile and
4. The Incubator.
The following figure 7 illustrates four quadrants that determine these
organizational cultures. In each quadrant, the author uses a label to refer to the
corresponding national culture.
The Family culture or the person oriented culture is both personal and
hierarchical. Japanese and Chinese organizations are of this kind. The Eiffel Tower
culture or the role oriented culture is characterized by hierarchy and task orientation.
Organizations in France and Australia are of this type. The Guided Missile cultures
differ from the Eiffel Tower and the Family cultures in that the former are oriented to
tasks and are egalitarian. Teamwork and project type of structures are common
practices in the Guided Missile organizations. Organizations in the U.S.A and
Norway are of this type. The Incubator culture is based on the «existential ideas that
organizations are secondary to the fulfillment of individuals» (Trompenaars and
Hampden-Turner, 1998, p. 179). Organizations in Denmark, Sweeden, and Canada
are of this type. Organizations also include subcultures. Professional cultures are the
most popular subcultures in organizations.

57
Figure 7 Four corporate images
Egalitarian
Fulfilment-oriented culture Process-oriented culture
INCUBATOR GUIDED MISSILE
Person Task
FAMILY EIFFEL TOWER
Person-oriented culture Role-oriented culture
Hierar .::hical Trompenaars, F.T. and Hampden-Turner, C.H. (1998). Riding The Waves of Culture - Understanding
Diversity in Global Business. McGraw-Hill
3.2 Professional culture
In organizational studies, the label of professional culture is used to refer to
designate characteristics of groups of people who perform particular activities and
share common values. Marketing professionals, information systems professionals
and finance professionals are a few examples. SainSaulieu (1995) argues that any
organization is a fondamental place in which many different cultural groups interact.
He emphasized the necessity for any organization to count on its social and
professional communities to organize its development. Belfry and Schmidt (1988)
add that:
A serious problem stems from a lack of awareness of real sub-cultural differences. Failure to address subculture differences has led to frustration and lack of success in many cases, as employees are not getting what they had hoped for and employers can not understand why employees are not succeeding. (p. 47).
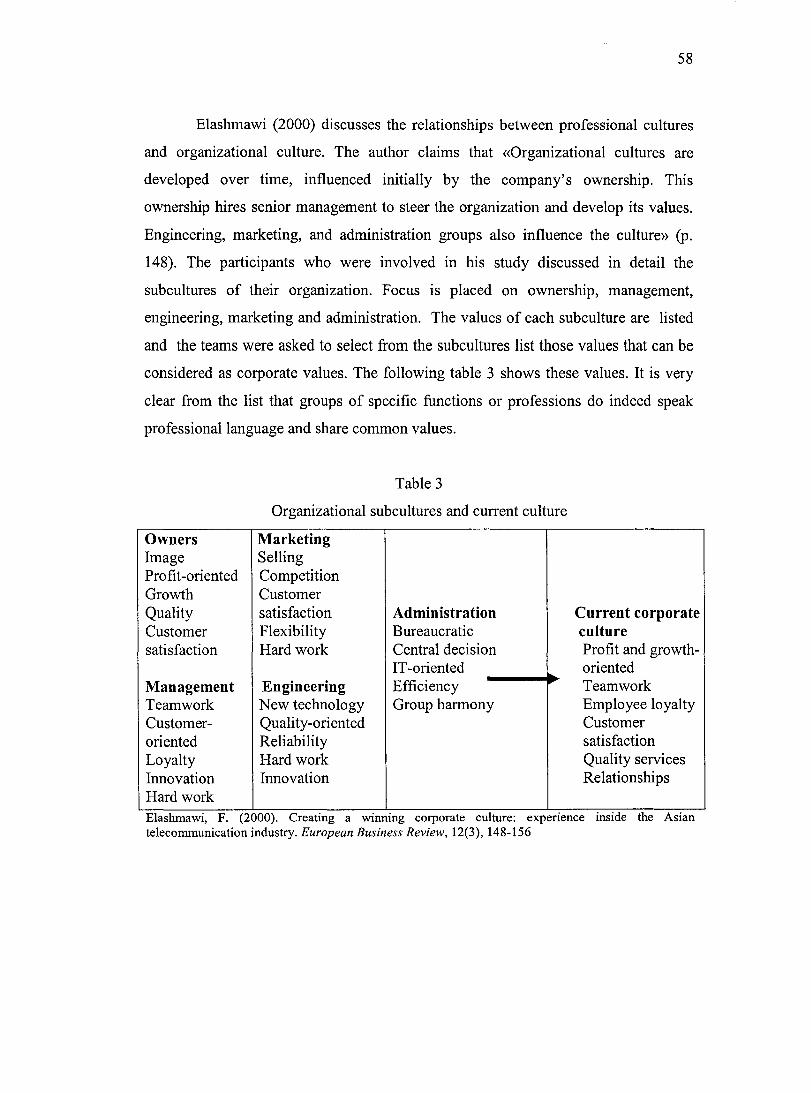
58
Elashmawi (2000) discusses the relationships between professional cultures
and organizational culture. The author claims that «Organizational cultures are
developed over time, influenced initially by the company's ownership. This
ownership hires senior management to steer the organization and develop its values.
Engineering, marketing, and administration groups also influence the culture» (p.
148). The participants who were involved in his study discussed in detail the
subcultures of their organization. Focus is placed on ownership, management,
engineering, marketing and administration. The values of each subculture are listed
and the teams were asked to select from the subcultures list those values that can be
considered as corporate values. The following table 3 shows these values. It is very
clear from the list that groups of specific fonctions or professions do indeed speak
professional language and share common values.
Table 3
Organizational subcultures and current culture
Owners Marketing Image Selling Profit-oriented Competition Growth Customer Quality satisfaction Administration Current corporate Customer Flexibility Bureaucratie culture satisfaction Hard work Central decision Profit and growth-
IT-oriented oriented Management Engineering Efficiency Teamwork Teamwork New technology Group harmony Employee loyalty Customer- Quality-oriented Customer oriented Reliability satisfaction Loyalty Hard work Quality services Innovation Innovation Relationships Hard work Elashmawi, F. (2000). Creatmg a wmmng corporate culture: expenence ms1de the Astan telecommunication industry. European Business Review, 12(3), 148-156
59
To conclude, culture is a borrowed concept from the discipline of
anthropology and is becoming an important issue in international management and
management in general, and in information systems in particular (Ein Dor et al.,
1992). This research argues that national culture would have an impact on the
meaning of IS success. To translate this proposition into practice, multinational
organizations wishing to standardize IS across many different national cultures are
faced with a complex problem and thus a major challenge because it is likely that
there will be a misfit between how people in a particular national culture actually
perceive and define IS success in general, regardless of any particular information
system and inherent meaning of success (built-in) of the system to be standardized.
4. NATIONAL CULTURE AND INFORMATION SYSTEMS
Ein-Dor et al., (1992) have published an article entitled: «The Effect of
National Culture on IS: Implications for International Information Systems». The
authors conducted a meta-analysis of research articles which were concerned with the
impact of national culture on IS. The initial findings of the analysis provide a list of
cultural factors which are then divided into organizational and national factors. Each
factor is further classified as constant or changeable. The second result of the analysis
is the following general global information systems research model which was
adapted from Ein-Dor and Segev (1981) IS research framework and puts national
culture variables at the outer layers of organizational environments.

Figure 8
Framework for Global IS Research
National culture, economic factors, demographic factors
Environmental, extra-organizational, organizational
Structural operating characteristics
Behavioural
Sociopsychological
Factors
Executives, users and implementer
Procedural
Plans and Strategies Projects Operations
60
Ein-Dor, P ; Segev, E. (1981). Comments on Research in computer-based management information systems: An alternative mode!. Working paper, Tel-Aviv University, Faculty of Management
The following table 4 summarizes other research studies investigating national
culture and information systems.
The research studies in this table are impact-types of studies. The researchers
select two or more distinct national cultures and examine whether or not the work
related values of people who live in the selected national cultures have any impact on
information systems research domains such as adoption of IT infrastructure (Png,
Tan, and Wee, 2001), IT implementation (Linn and Francis, 1997, Martinsons and
Westwood, 1997, Thanasankit and Corbit, 1999, Steinwachs, 1999, Thsnasankit,
2002), IT perception (Mejias, Shepherd, Vogel, and Lazaneo, 1997, Tai and Phelps,
2000).

61
Table 4
Sample of studies dealing with national culture and information systems
Authors Objectives Findings
Chow, Deng, and Examine empirically the Chinese versus US national HO, 2000 interaction effects of openness ofknowledge sharing
national culture and was related to their different contextual factors on degrees of collectivism. employees' tendency to share knowledge with co-workers.
Linn and Francis, Examine the influence Support of Hofstede (1980); 1997 national culture has on the characterization specifically of the
design of information uncertainty-avoidance dimension. systems in US and Germany
Mejias, Shepherd, Investigate the effects of Within both US and Mexican Vogel, and national culture upon cultures, results indicate no Lazaneo, 1997 group and perceptions of significant differences in
participation equity and consensus levels between GSS satisfaction within group and manual treatments. However, support system both US and Mexican groups environment and non-GSS generated significantly greater environment relative changes in consensus
levels using GSS technology versus manual technology.
Martinsons and Examination of MIS in Chinese managers make limited W estwood, 1997 Chinese culture direct use of computer-based
information systems. Management technology developed in one context cannot be readily transferred to another.
Png, Tan, and Demonstrate the International service providers Wee,2001 relationship between may take national culture into
national culture and consideration when marketing corporate adoption of IT new infrastructure to businesses, infrastructure and corporate managers may
take national culture into consideration when introducing new 1T infrastructure into their businesses.
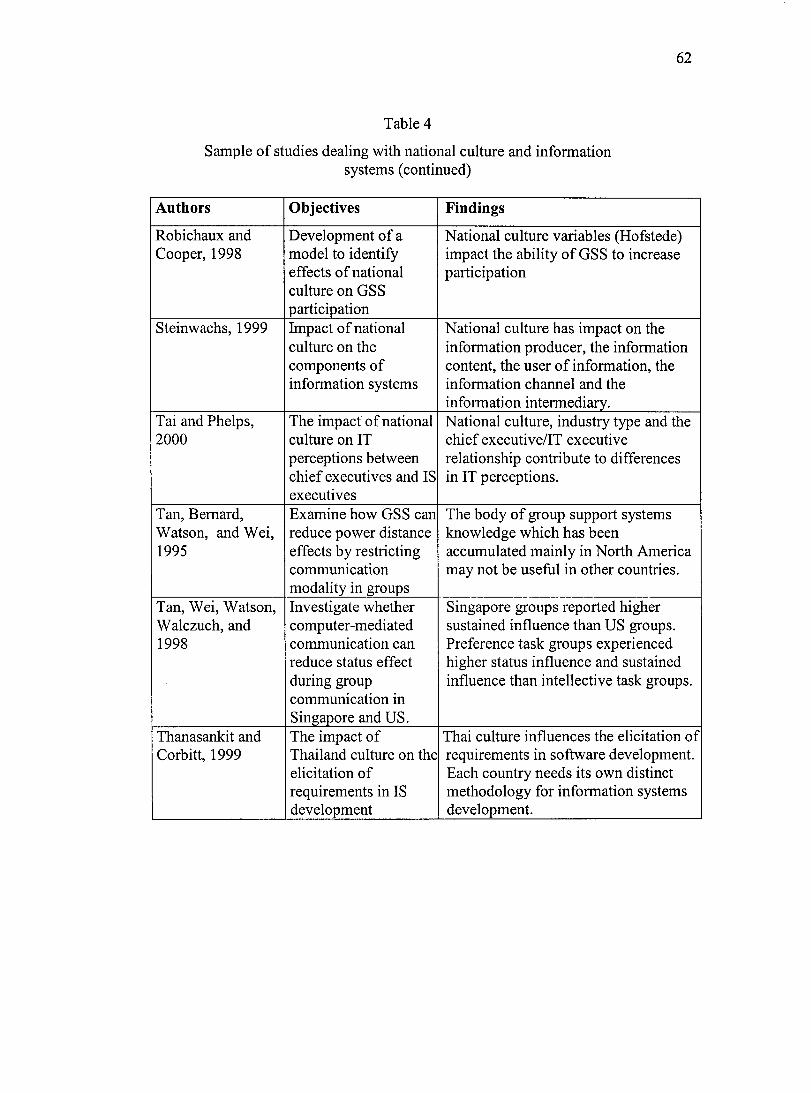
62
Table 4
Sample of studies dealing with national culture and information systems ( continued)
Authors Objectives Findings
Robichaux and Development of a National culture variables (Hofstede) Cooper, 1998 model to identify impact the ability of GSS to increase
effects of national participation culture on GSS participation
Steinwachs, 1999 Impact of national National culture has impact on the culture on the information producer, the information components of content, the user of information, the information systems information channel and the
information intermediary. Tai and Phelps, The impact' of national National culture, industry type and the 2000 culture on IT chief executive/IT executive
perceptions between relationship contribute to differences chief executives and IS in IT perceptions. executives
Tan, Bernard, Examine how GSS can The body of group support systems Watson, and Wei, reduce power distance knowledge which has been 1995 effects by restricting accumulated mainly in North America
communication may not be useful in other countries. modality in groups
Tan, Wei, Watson, Investigate whether Singapore groups reported higher Walczuch, and computer-mediated sustained influence than US groups. 1998 communication can Preference task groups experienced
reduce status eff ect higher status influence and sustained during group influence than intellective task groups. communication in Singapore and US.
Thanasankit and The impact of Thai culture influences the elicitation of Corbitt, 1999 Thailand culture on the requirements in software development.
elicitation of Each country needs its own distinct requirements in IS methodology for information systems development development.
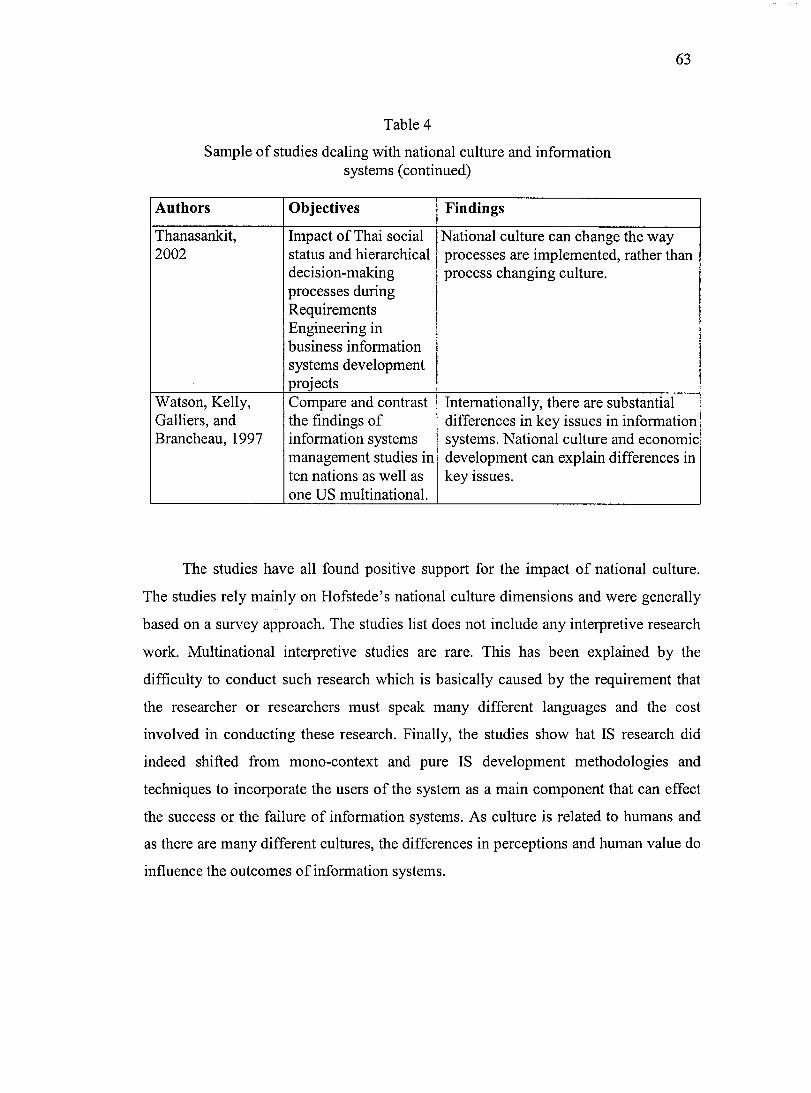
63
Table 4
Sample of studies dealing with national culture and information systems ( continued)
Authors Objectives Findings
Thanasankit, Impact of Thai social National culture can change the way 2002 status and hierarchical processes are implemented, rather than
decision-making process changing culture. processes during Requirements Engineering in business information systems development projects
Watson, Kelly, Compare and contrast Internationally, there are substantial Galliers, and the findings of differences in key issues in information Brancheau, 1997 information systems systems. National culture and economic
management studies in development can explain differences in ten nations as well as key issues. one US multinational.
The studies have all found positive support for the impact of national culture.
The studies rely mainly on Hofstede's national culture dimensions and were generally
based on a survey approach. The studies list does not include any interpretive research
work. Multinational interpretive studies are rare. This has been explained by the
difficulty to conduct such research which is basically caused by the requirement that
the researcher or researchers must speak many different languages and the cost
involved in conducting these research. Finally, the studies show hat IS research did
indeed shifted from mono-context and pure IS development methodologies and
techniques to incorporate the users of the system as a main component that can effect
the success or the failure of information systems. As culture is related to humans and
as there are many different cultures, the differences in perceptions and human value do
influence the outcomes of information systems.

64
S. NATIONAL CULTURE AND IS SUCCESS
Information systems success was also targeted by cross cultural researchers in
IS discipline. The following table 5 provides a selection of these studies. The table
shows cross cultural studies that deal with IS success.
Table 5
Selective studies on culture and IS success
Authors Cultures Findings Cultural variables Hasan and West Africa, Culture clashes whenever -Power distance Dista, 1997 Middle East, foreign technology is -Uncertainty
Australia introduced. Each country avoidance must have a sensitive IT -Individualism-policy that will choose collectivism the best technology for -Time orientation their culture. -Context
-Monochrony and polychrony
Leidner et Sweden, Swedish managers -Power distance al., 1999 Mexico perceived increased -lndividualism and
information availability the collectivism longer the y had used EIS. -Masculinity and Mexican managers Femininity perceived increased information availability the more frequently they had used the EIS. Swedish managers did not perceive increased information availability with frequent EIS use and Mexican managers did not perceive increased information availability with length of time of EIS use.

65
Table 5
Selective studies on culture and IS success ( continued)
Authors Cultures Findines Cultural variables Martinons, and China, U.S The use of MIS in the -Power distance Westwood, Chinese management -Individualism 1997 business culture has been -Masculinity
and will continue to be -Uncertainty shaped by factors such as avoidance patemalism, personalism -Confucian and high context dynamism communication.
Robey and Panama, Chile In Panama, a standard Culture in general Rodriguez- accounting systems was Diaz, 1989 accepted. In Chile the same
system was not accepted. Straub et U.S, Japan, Technology acceptance -Power distance al., 1997 Switzerland model may not predict -Uncertainty
technology use across all avoidance cultures -Masculini ty
Straub, Japan, U.S U.S companies exploit the -Uncertainty 1994 advantage of IT such as E- avoidance
mail. J apanese firms do not, but they utilize more fax
Simon, Asia, Europe, Perception and satisfaction of -Power distance 2001 Latin America, web sites differences exist -Individualism
North America between the cultural clusters and collectivism and gender groups with these -Masculinity and cultures femininity
Tan et al., U.S, Singapore Status influence was present -Power distance 1998 in both Singapore groups and -individualism and
US groups. In situations collectivism where status effects are harmful, Computer Mediated Communications appear to be useful for reducing such harmful eff ects in both national cultures. Status influence was more sustainable and more strongly perceived in Singapore than in the U.S.

66
Table 5 provides some results of research on national culture and IS success.
The majority of the authors conduct cross-cultural research between two or more
culturally different countries and investigate whether or not existing theories or
findings on IS success would hold in these cultures. Other researchers test whether IS
success variables would prove valid in these cultures. However, and according to our
literature review, no research has found IS success categories in different national
cultures. In selecting national cultures, most of the authors rel y mainly on Hofstede's
(1980) work related to national culture variables. Myers and Tan (2002) claimed that
«although there are many different definitions of national culture, most IS research
has tended to rely almost solely on Hofstede's definition» (p.27). They add that «This
is perhaps not surprising given that Hofstede's typology of culture has been one of
the most popular in many different fields» (ibid.). The sample of the studies in table 5
provides support for the fact that national culture does indeed have an impact on IS
success. However, no research was found which actually develops how this success
is perceived in its surrounding culture.
6. RESEARCH FRAMEWORK
The following figure 9 shows our research framework which will guide the
research questions, data collection and analysis procedures. The framework is made
of four main components: national culture levels, IS success levels, the built-in
success assumptions of the standard system, and the fit between IS success meaning
and definition and the built-in success assumptions of the standard system.
The upper left set of circles in the framework shows the layers of the culture of
any subsidiary of a multinational organization as proposed by Trompennars and
Hampden-Turner (1998) (figure 5, p 47). These layers are: basic assumptions, norms
and values, and artefacts. The arrow crossing the three layers from basic assumptions
to artefacts shows the relationship among them as proposed by Trompennars and

67
Hampden-Turner (1998) and described earlier in this document. That is, the basic
assumptions of any culture influence the norms and values of people who live in it.
These norms and values also influence the products or artefacts we see in that culture.
The second set of circles in the upper right side of the model shows the levels
we deduced from DeLone and McLean's (1992) model. These are: systems level,
individual level, and organizational level. As our research is concemed with meaning,
we proposed that the meaning of IS success occurs in these levels. That is, each level
designates the meaning that people would give to IS success: the meaning at the
systems level, at the individual level, and at the organizational level. The arrow
crossing the three levels shows the relationships among IS success levels as proposed
by DeLone and McLean (1992).
The bolded arrow that links the upper left set of circles (culture) with the upper
right set of circles (levels of the meaning of IS success) indicates our assumption that
national culture would have impact on the meaning of IS success at at least three
levels: systems level, individual level, and organizational level.
The discontinued arrow that links the upper right set of circles (levels of the
meaning of IS success) with the fit circle (fit between two systems of meaning) does
not refer to any impact of influence. It only designates an input to the fit process. The
fit circle suggests that a misfit will likely occur between the meanings of IS success
as defined by people that belong to a particular national culture and the inherent
meaning of success of the system to be standardized (built-in assumptions) as
indicated by the built-in assumptions box on the left bottom side of the framework.
As we mentioned before, the built-in assumptions of the standard system reflect the
values of its designers. SAP for example would reflect the values of its designers who
are Germans. An example of its built-in assumptions is information transparency and
information sharing. If people from a particular culture do not consider these as
attributes of IS success, the misfit would occur.

Figure 9
Integrated framework of cultural and IS success layers
Trompenaars and Hampden-Tumers' Cultural mode! applied to local subsidiary
Levels of the meaning of IS success
Built-in assumptions of the standardized system
MISSSL: meaning ofIS success at the system level MISSIL: meaning of IS success at the individual level MISSOL: meaning ofIS success at the organizational level
Fit between two systems ofmeaning
68
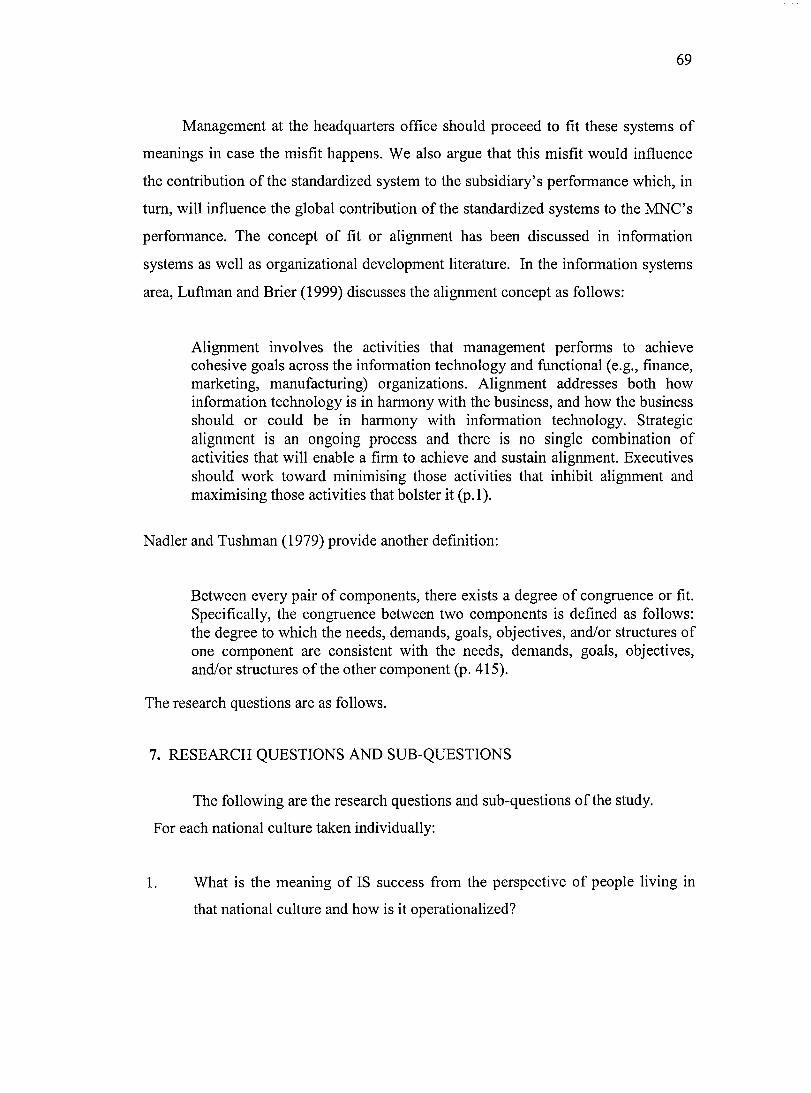
69
Management at the headquarters office should proceed to fit these systems of
meanings in case the misfit happens. We also argue that this misfit would influence
the contribution of the standardized system to the subsidiary' s performance which, in
tum, will influence the global contribution of the standardized systems to the MNC's
performance. The concept of fit or alignment has been discussed in information
systems as well as organizational development literature. In the information systems
area, Luftman and Brier (1999) discusses the alignment concept as follows:
Alignment involves the activities that management performs to achieve cohesive goals across the information technology and functional ( e.g., finance, marketing, manufacturing) organizations. Alignment addresses both how information technology is in harmony with the business, and how the business should or could be in harmony with information technology. Strategic alignment is an ongoing process and there is no single combination of activities that will enable a firm to achieve and sustain alignment. Executives should work toward minimising those activities that inhibit alignment and maximising those activities that bolster it (p.1 ).
Nadler and Tushman (1979) provide another definition:
Between every pair of components, there exists a degree of congruence or fit. Specifically, the congruence between two components is defined as follows: the degree to which the needs, demands, goals, objectives, and/or structures of one component are consistent with the needs, demands, goals, objectives, and/or structures of the other component (p. 415).
The research questions are as follows.
7. RESEARCH QUESTIONS AND SUB-QUESTIONS
The following are the research questions and sub-questions of the study.
For each national culture taken individually:
1. What is the meaning of IS success from the perspective of people living in
that national culture and how is it operationalized?

70
2. How are the constructs of IS success weighted at each level (systems,
individual, and organizational levels) in that national culture (i.e. which are
more important than others)?
For all cultures:
3. What is the cross-cultural weight of common constructs oflS success?
4. What are the common characteristics of IS success in all cultures and what are
the specific ones?
The first research question is deduced from our research model in figure 9.
Figure 9 shows that the national culture (represented by its layers: artefacts, norms
and values, and basic assumptions) of a subsidiary of the multinational organization
would have an impact (represented by the arrow) on the meaning of IS success at the
systems level, the individual level, and the organizational level (MISSSL, MISSIL,
and MISSOL). The first question searches for this meaning. The answer of the
second, the third, and the fourth research questions are deduced from the answer of
the first research question. The following are the research sub-questions that are
asked to answer the first research question:
1. Do people in an MNC subsidiary in a given national culture perceive IS
success at the systems level? If so, how?
2. Do people in an MNC subsidiary in a given national culture perceive IS
success at the individual level? If so, how?
3. Do people in an MNC subsidiary in a given national culture perceive IS
success at the organizational level? If so, how?

71
The above research question four refers to two concepts that are widely used
in cross-cultural research. These are the Etic and Emie concepts that we referred to
respectively as common and specific. The following paragraphs clarify these concepts
and explain how they are used in our research.
7.1 Etic and Emie concepts
The concepts of Emie and Etic do not merely designate research
methodologies. These are research philosophies and as such are much closer to the
concept of paradigm. Morris et al., (1999) expressed the distinction between the two
approaches as:
The Emie or inside perspective follows in the tradition of psychological studies of folk beliefs and in cultural anthropologist' striving to understand culture from the native's point of view. The Etic or outside perspective follows in the tradition of behaviourist psychology and anthropological approaches that link cultural practices to extemal, antecedent factors, such as economic or ecological conditions, that may not be salient to cultural insiders. The <livide between these two approaches persists in contemporary scholarship on culture: in anthropology, between cultural psychologists and comparativists, and in psychology, between cultural psychologists and crosscultural psychologists. In the literature on international differences in organizations, the <livide is manifest in the contrast between classic studies based on fieldwork in a single culture, as opposed to surveys across many (Hofstede, 1980). Likewise in the large body of literature on organizational culture, there is a <livide between researchers employing ethnographie methods and those who favour comparative survey research (p. 2).
The Etic philosophy is related to the positivist paradigm and the Emie
philosophy is related to the interpretative paradigm. When a researcher conducts a
study using universally recognized constructs or variables to test a theoretical model,
the Etic philosophy is employed. The researcher is looking for objective responses
and is not concemed about the context or the culture in which the study takes place.
There is a presupposed neutrality of the experimental setting. On the other hand,
when the purpose of the research is to develop theory, the researcher is then following
an Emie philosophy.

72
The increased relevance of considering both the Emie and Etic approaches in
cross-cultural IS research makes the undertaken research more effective and
productive as stated by Gordon (2000): «The most effective research approach will
be one which incorporates both Emie and Etic elements. That is, cross-cultural
researchers may replicate Emie studies in other cultures from which it may be
possible to evolve an Etic model of universal constructs» (p.3). This is what we
pursued in our research in which we conduct four Emie studies.
The perfect question asked by most researchers who follow an Emie
philosophy after analyzing data is: which categories are universal, meaning those that
may be used by Etic researchers and which are specific to the culture where data
collection took place. This research followed the same approach as Gordon Hunter
and Beck (2000) in which they conduct two Emie studies and we did four. The
common categories that emerge in many Emie studies may be called Etic categories
that can be used by Etic researchers and those that emerge only in their specific
culture are called Emie categories.
For the purposes of clarity and reading convenience and in order to simplify the
concepts, we will use the labels global to refer to the Etic categories of IS success and
local to refer to the specific categories of IS success. The models of IS success that
we will develop in this research for our national cultures will include both global and
local categories of IS success.
CHAPTER FOUR
METHODOLOGY
1. RESEARCH PARADIGM AND STRATEGY
Every research is based on some underlying assumptions about what
constitutes valid research and which research methods are appropriate (Myers, 1997).
A paradigm is an abstract orientation, which dictates the epistemological
assumptions of the researcher. lt is a general conception of reality (Ritzer, 1975). It is
the basic belief system or worldview that guides the investigator not only in choices
of methods but also in ontological and epistemological ways (Guba and Lincoln,
1994).
There are many classifications of paradigms, but the most widely used ones
are positivism, interpretive and critical (Orlikowski and Baroudi, 1991), or just
positivism and interpretive (Tashakkori and Teddie, 1999). Hirschheim (1986)
studied the impact of office automation information systems and found that there are
different types of impacts. The author explained that the differences of impact
originate from differences in the ontological and epistemological assumptions of the
researcher or the observer. The author claimed that two paradigms in information
systems research exist: the functionalism and the interpretivism. The functionalist
paradigm considers that knowledge can be acquired by using scientific methods of
inquiries in which the researcher or the observer seeks an objective position. The
interpretivist paradigm considers that knowledge is conditional. In the same line of
research, Hirschheim and Klein (1989) studied the paradigms in information systems
development. They were concemed about the systems designers and claimed that the

74
epistemological and ontological assumptions of the systems designers influence the
systems outcomes and structure. The authors suggested that there are two types of
epistemological assumption IS designers can adhere to: subjective or objective
assumptions. Each dictates how k:nowledge can be acquired. Other researchers use the
words qualitative and quantitative to designate the philosophical assumptions
(Creswell, 1994). However, Guba and Lincoln (1994) suggest that qualitative and
quantitative terms are best cited to describe research methodologies and not
paradigms. In fact, a qualitative research may be conducted under the three
paradigms: positivist, interpretive and critical. According to Klein and Myers (1999),
positivist researchers assume that reality is objectively given and can be described by
measurable propositions that are independent from the observer (researcher) and his
instrument. Interpretive researchers start out with the assumption that access to reality
(given or socially constructed) is possible only through social constructions such as
language and shared meaning (Myers, 1997). Interpretive studies generally attempt to
understand phenomena through the meaning that people assign to them. Interpretive
researchers assume that reality, as we can know it, is constructed through the
meanings and understandings generated from our social world. There can be no
understanding without interpretation (Angen, 2000). Gadamer (1994) daims that we
live as if the world exists apart from us. But we only know it and understand it
through our attempts to meaningfully interpret it, and those attempts at interpretation
are in tum influenced by our temporal and cultural location. Understanding, adds the
author, therefore cannot be separated from context. Interpretive research is predicated
on the desire for a deeper understanding ofhow humans experience the world through
language, local and historical situations, and actions of the people involved (Moss,
1994). The truth of an interpretation must continually be negotiated through
continuous conversation and dialogue (Kvale, 1996).
The researcher plays a major role in interpretive studies. He or she is the
source of interpretation and understanding. The role of the researcher is inherent to all
phases of the enquiry process (Creswell, 1998).

75
An inductive process is followed in this study. That is, from data that is
grounded in its own context, we aim to induce IS success models. The use of the
inductive logic satisfies the first condition of the scientific research cycle in which
both inductive and deductive logic strategies are necessary. Research may start at
any point in the cycle. However, in most cases, when the aim of the research is
exploratory, that is, there is no solid theory upon which the research would generate
propositions, inductive logic is used to develop a theory. This theory is then taken by
other researchers, usually positivist researchers employing deductive logic, to
continue the cycle and verify it. If the findings confirm the theory, then the theory
may hold valid until other research finds contradictory results or confirms its validity
and thereby increases its robustness.
Since this research aims to explore and to find the meaning of IS success in
different national cultures, a qualitative approach is used. The term qualitative is used
here to designate the use of qualitative data such as interviews and documents to
understand social phenomenon (Myers, 1997). The emerging theory will be
developed from words and their associated meanings as described by the researcher
participants.
A case study is used in this research as a strategy (means) instead of a
methodology. Cases studies are sometimes used in the literature as a research strategy
(Robson, 1998; Yin, 1984) and sometimes as a research methodology (Creswell,
1994). Robson (1998) proposes three research strategies: case studies, surveys, and
experimentation. Case studies are usually used when the purpose of the study is
exploratory; surveys are used when the purpose is explanatory or descriptive, and
experimentation when it is explanatory. On the other hand, interpretive as well as
positivist-oriented researchers can use case study as a research strategy. Examples of
positivist-oriented ones are Yin (1984), and Benbasat, Goldstein, and Mead (1987).
Examples of interpretive oriented include Myers (1994).

76
2. METHODOLOGY
There are many research methodologies associated with the interpretive
paradigm. The most cited classifications include ethnography, grounded theory, case
study and phenomenological study (Creswell, 1994).
A phenomenological mqmry strives to unveil the essence of a social
experience. It concentrates on the common aspects (structure) of individual
experiences, in order to identify themes and social meanings related to the
phenomenon of interest (Moreno, 1999). The aim of phenomenology is to unveil the
essences of phenomena, i.e. their nature as they reveal themselves, free from the
influence of prejudgements, biases, and preconceived ideas about things.
As indicated in the prev10us section, the term case study has multiple
meanings. It can refer to a research strategy, a research methodology or a unit of
analysis. When the term is used to designate a research methodology, it refers to an
empirical inquiry in which:
The researcher explores a single entity or phenomenon (the case) bounded by time and activity (a program, event, process, institution, or social group) and collects detailed information by using a variety of data collection procedures during a sustained period oftime (Creswell, 1994, p. 12).
Ethnography research originates from the discipline of anthropology where
cultural and social phenomenons are studied. In an ethnography study, «the
researcher studies an intact cultural group in a natural setting during a prolonged
period of time by collecting, primarily, observational data» (Creswell, 1994, p. 11).
Ethnographers immerse themselves in the lives of the people they study (Lewis,
1985).

77
Grounded theory is a research method that seeks to develop theory that is
grounded in the data systematically gathered and analyzed (Myers, 1997). It is a
method in which the researcher attempts to derive a theory by using multiple stages
of data collection and refinement and interrelationships of categories of information
(Strauss and Corbin, 1999). This is exactly the aim of the present study. Our models
are to be grounded from the participants' data as they are collected and analyzed in
the participants' context. Accordingly, a grounded theory is used as a research
methodology within a case study strategy.
To summarize the design of our study, an interpretative paradigm is in place
while employing case study strategy approach and grounded theory methodology.
This is mainly due to the nature of our research problem and the inductive approach
we employ in the study. The following paragraphs discuss the main components of
grounded theory methodology.
The three basic elements of grounded theory are: concepts, categories and
propositions. Concepts are the lowest level of abstraction of raw data as stressed by
Corbin and Strauss (1990):
Theories can't be built with actual incidents or activities as observed or reported; that is, from raw data. The incidents, events, happenings are taken as, or analyzed as, potential indicators of phenomena, which are thereby given conceptual labels. If a participant says to the researcher, "Each day I spread my activities over the moming, resting between shaving and bathing," then the researcher might label this phenomenon as "pacing." As the researcher encounters other incidents, and when after comparison to the first, they appear to resemble the same phenomena, then these, too, can be labelled as "pacing." Only by comparing incidents and naming like phenomena with the same term can the theorist accumulate the basic units for theory (p.7).
Categories are higher theoretical abstraction than concepts. The difference
between concepts and categories is the level of theoretical abstraction. However,

78
these levels of abstraction may have various degrees depending on the nature of the
data. Categories are explained by the same authors in the following citation:
Categories are higher in level and more abstract than the concepts they represent. They are generated through the same analytic process of making comparisons to highlight similarities and differences that is used to produce lower level concepts. Categories are the "comerstones" of developing theory. They pro vide the me ans by which the theory can be integrated. W e can show how the grouping of concepts forms categories by continuing with the example presented above. In addition to the concept of "pacing," the analyst might generate the concepts of "self-medicating," "resting," and "watching one's diet." While coding, the analyst may note that, although these concepts are different in form, they seem to represent activities directed toward a similar process: keeping an illness under control. They could be grouped under a more abstract heading, the category: "Self-Strategies for Controlling Illness" (p.7).
Propositions indicate the possible relationships between the categories, what
determines a category and what the category leads to.
A two-stage process is conducted in this study. Stage one concems the analysis
of data by the researcher. In stage two, we asked two information systems professors
at the University of Sherbrooke to verify our findings. Appendix AE shows the
original document distributed to each of them. They were asked to verify that each
concept belongs to its category and that the name of the category accurately
represents its meaning. This verification process helps enhance the credibility of our
findings. The comments and suggestions of the professors were taken into
consideration and incorporated in the findings.
We took serious precautions in conducting this verification task. The professors
were not asked to group the concepts into categories. The researcher did the grouping
and the abstraction task, which was based on interview comment and probe questions
that clarify what the participant really wants to say. The call for experts to verify our
findings was motivated by the fact that the researcher shares to a certain extent
common vocabulary in IS discipline with the experts and the latter would have better

79
ways to name the categories without loosing their meaning. Few suggestions were
provided by the experts. The changes were incorporated in the results.
2.1 The case and units of analysis
As mentioned in the title of this research, the findings of our study will have
implications for multinational organizations that decide to standardize organizational
information systems in diverse cultures.
2.1.1 The case
Before we proceed with the description of our research case, we would like to
present the research background so that the reader will appreciate the work that has
been done before the selection of our case.
The initial choice of the topic was influenced by three factors. First, we had
the chance to participate in a one year training program that took place in Granada,
Spain in 1995. This program was sponsored by the European Union and the Arab
League. They had decided to train about twenty managers from twenty countries and
have them develop a multicultural MBA pro gram. Since then, I have been attracted to
multicultural studies and research. The second variable that influenced my choice was
the increasing demand put upon IS researchers to conduct more research on IS
performance and success.
It took us about three months to find a suitable case. The initial components of
the research problem were information system success and national culture. We
started looking for a host organization that might be interested in this focus. We knew
from the start that the organization must be a multinational organization with
subsidiaries in many national cultures. We succeeded to meet with senior
management of three multinational organizations, namely, AirLiquide, Johnson &
Johnson and the third one that sponsored our project. Johnson & Johnson was
implementing a standard system but only in Canada. Senior management at

80
Airliquide was thinking about standardizing a system world-wide but not in the near
future. The third multinational had started the implementation of a system in many
national cultures. Details about this system will be provided in the case description
section. We spent about three months at the headquarters' office of the organization
in order to validate the managerial problem.
The initial costing of the project was estimated at more than 2.4 billion dollars
over an implementation period of approximately ten years. This project is the largest
the organization has ever undertaken in its history and the management is seriously
aware of the challenges it is facing.
Similarly, this research project was faced by many challenges. The joint
doctorate degree in business administration between the University of Sherbrooke
and the University of Quebec in Trois-Rivieres requires the candidate to spend a few
months in an organization to research and validate a managerial problem. As an
overall evaluation we took risks which paid off and at the same time were lucky. We
were lucky insofar as the vice president of human resources was immediately on our
side and agreed that the organization does indeed need to develop IS success models
in different cultures. However, it must be said that we did not blindly approach
potential sponsoring multinationals without being fully prepared. The decision to
stay in order to familiarize ourselves with the organization so that we can validate the
project was taken on the same day in which we met with the vice president. After
many meetings with the director, we agreed to conduct a large project on IS success
in many countries. The following paragraph describes the organization background at
the time we met with the vice president.
About two years before we met with management at the headquarters' of the
organization, top management decided to implement a large scale project in which
information system standardization constitutes only a subproject. The organization
has decided to adopt a common strategy across its groups and business units. The

81
objectives and expected benefits were: reduce software acquisition costs, reduce
implementation costs, reduce operation costs, produce benefits in the business
sectors, and minimize implementation and ongoing risks. Since the time the decision
was made, no unit or division is allowed to purchase or select a software package that
is not fully compatible with the future standard information system. Information
systems' components acquisition and implementation across ail units of the
multinational organization becomes centralized. The mains objective of this strategy
is to receive real time information about the business activities.
The risk involved is our decision to pursue research in this multinational
organization is that there are not many multinational organizations that plan to
implement the same project. This means that if the organization for some reason
decides to cancel the project or postpone it, we would need to find another
organization or even change research tapies.
A further logistically demanding side of the project is money and time. We
had to travel to Europe to get our data and this began in December 2001. While the
organization participated in financing the project, we had to caver a large part of the
expenses ourselves. The following paragraphs describe in detail our research case.
The focus case of this research is a multinational organization that has
subsidiaries in many different countries; that is, in many cultures. Sorne of its most
important objectives are: the control and coordination between the subsidiaries on the
one hand (intra-unit communication and coordination), and between headquarters and
the subsidiaries on the other hand (inter-unit communication). IS is particularly
important in supporting these objectives, as is the case for many multinational
organizations. Our case has shifted to IS standardization to achieve them. It decided
to implement an Enterprise Resource Planning system (ERP) in ail the subsidiaries.
A standard system is chosen and a multibillion-dollar contract is signed. The
following paragraphs provide discussion about Enterprise Resource Planning

82
Systems. After this discussion, a detailed description of the case of the research is
presented.
A complete definition of Enterprise Resource Planning Systems was provided
by Markus and Tanis (2000):
Enterprise systems are clearly a phenomenon in the IT marketplace. Their potential significance for computer-using organizations cannot be overstated. They represent a nearly complete rearchitecting of an organization's portfolio of transactions-processing applications systems to achieve integration of business processes, systems and information along with corresponding changes in the supporting computing platform: hardware, software, database, and telecommunication (p. 175).
ERPs are commercial software packages that enable the integration of transaction
oriented data and business processes through an organization. Markus and Tanis
(2000) summarize some characteristics of these systems:
1. Integration;
2. Packages. ERPs are commercial packages. That is, they are purchased or
leased from software vendors rather than being developed in- house from
scratch;
3. Best practices. Because they are designed to fit the needs of many
organizations. ERPs are built to support generic business processes that may
differ quite substantially from the way that a particular organization does
business;
4. Evolving. ERPs are rapidly changing.
These systems are very expensive in acquisition and implementation. The
implementation cost may be up to three times the acquisition cost. This high
implementation cost is mainly due to the need to adapt the adopting organization's
business processes to the logic ofbuilt-in generic processes of the system; that is, the
built-in assumptions of the system. As Davenport (1998) states:

83
The design of these systems reflects a series of assumptions about the way companies operate in general. In many cases, the systems will enable a company to operate more efficiently that it did before. In some other cases, the system's assumptions will run counter to a company's best interest. (p. 5).
The logic of IS implementation has changed with ERPs. When an
organization decides to implement an information system, it first has to specify the
systems specifications in terms of its future functionalities and then looks in the
market to purchase one that best suits its needs. The same approach is followed if the
organization has its own staff to implement the system in-house. With the ERP
systems, this logic no longer holds. Managers do not set up their organizational
structure and choose their management practices which best suit their beliefs and
values and then choose an IS to support the organization. Now the ERP dictates how
business should run and imposes a standard and centralized organizational
architecture. "Unlike computer systems in the past, enterprise systems are off-the
shelf solutions. They impose their own logic on a company's strategy, culture, and
organizations, often forcing companies to change the way they do business"
(Davenport, p. 121).
This imposition leads to the emergence of many ERP implementation
problems. The most obvious one is the technical misfit problem. Soh, Kien, and Tay
Yap (2000) argue that there are three types of target misfits: data misfits, functional
misfits and output misfits. Each misfit concems the differences between the adopting
organization and the built-in logic of the ERP system. The authors claim that the
organization must modify its data models, operational activities and its output to fit
the systems logic.
The following discussions about the multinational organization in which we
conduct our research project are mainly based on in-house documents of the
multinational organization and from the discussions we had with various managers at
the corporate office.
84
The organization operates in five domains: aerospace, recreational products,
transportation, finance, and international. Each segment offers different products and
services, requires different technology and marketing strategies and is headed by a
president and the chief operation officer. The mission of the organization is to be the
leader in all the markets in which it operates.
About 92% of the total revenues which reached thirteen billion Canadian
dollars in 2000 originated from foreign markets, and 44% of the organization's
workforce is located in Europe and 52% in North America. A short description of the
mission of each division follows:
The aerospace division is a manufacturer of business and regional aircraft and
a pro vider of related services. It off ers comprehensive families of regional jet aircraft
and a wide range of business jets. The division's revenues were 10.6 billion in 2000-
2001, compared with 8.1 billion in 1999-2000.
The transportation unit is a world leader in the manufacturing of passenger
rail cars, off ers a full range of urban and suburban vehicles as well as complete rail
transit systems. In 2000-2001, the revenues were 3.0 billion compared with 3.4
billion dollars in 1999-2000. This 12% decline in revenues is mainly attributable to
the decrease in value of the Euro compared to the Canadian dollar and to a lower
level of activity in this unit.
The recreational products division designs, builds, and distributes
snowmobiles, watercraft, sport boats, and utility vehicles. The revenues for the year
2000-2001 were 1.7 billion dollars compared with 1.5 billion for the year 1999-2000.
The finance division offers secured financing, leasing, and asset management
solutions to manufacturers, retailers and other commercial businesses, primarily in
North American markets. The revenues for 2000-2001 were 1.0 billion, an increase of

85
40% compared to the previous year. The following table 6 shows a historical view of
the revenues of the organizations from 1992 to 2001.
Year 1992 1993 1994 1995 1996 1997 1998 1999 2000 2001
Table 6
Revenues from 1992 to 2001
Revenues in billions of Canadian dollars 3
4.4 4.7 5.9 7.1 8
8.5 11 13 16
The following table 7 shows the main business locations of each division.
Table 7
Business locations of each division
Division locations Aerospace Canada, United States of America,
Northem Ireland. Transportation Canada, United States of America,
Mexico, Germany, France, Austria, Belgium, Czech Republic, United Kingdom, Switzerland, China.
Recreational products Canada, United States of America, Austria, Finland.
Finance United States of America, Canada, Finland, France,.
International China, Canada.
Senior management at the organization's headquarters believes that the
increasingly diverse nature of the organization's markets, from both the geographic
and product perspectives, affords the organization a further measure of protection. If

86
conditions in one particular region turn unfavorable, only a portion of the activities
would be affected.
As of the year 2001, there were about 80, 000 employees in the organization.
The organization is structured in terms of divisions. Each division contrais the
activities of a specific sector, as indicated earlier. All the divisions are autonomous.
This autonomy is a vital requirement that allows each division to meet its planned
objectives which must be coherent according to the corporate general policies and
guidelines. Power and decision-making are decentralized at each division. This
allows each division to act in a rapid and coordinated way. The organization
encourages interdivisional collaboration, involvement and engagement of its
personnel. The organization puts a great deal of emphasis on its management
philosophy. It believes that even though it does not in any way aim to have all the
subsidiaries look alike, they must share a common management philosophy. The
organization strongly believes that each subsidiary needs to adapt its products to the
market which it serves (local market responsiveness) and to adhere to the
management philosophy of the corporate office (consistency with headquarters'
policies). It is thus a multinational organization which believes that the ideal objective
is to reach an optimum balance between market responsiveness and consistency with
headquarters. The following is a list of the organization's core beliefs:
1. Drive for profitable growth;
2. Foster an entrepreneurial spirit in all our businesses;
3. Constantly innovate in products, operating processes, and systems of management;
4. Set up autonomous business units within a tight strategic governance system;
5. Combine speed with discipline when pursuing acquisitions;
6. Main tain balanced diversification of businesses;
7. Become a lead player in the sectors in which we participate;

87
8. Control key technologies and value-added functions: product design and development, final assembly, marketing and servicing;
9. Share, manage and control business risks and
10. Leam from each other, from our mistakes, and from others.
The corporate management philosophy is one of the mechanisms that support
the consistency component of the balance. The organization also uses sophisticated
accounting reports as another mechanism of support to control and coordinate its
subsidiaries. Every month, each subsidiary sends two reports to the office
headquarters. The first report indicates the monthly accounts and the financial results
with regard to provisions. The second report indicates the expected orders and
financial results for the next three months. As business developed rapidly, the head
office decided that control and coordination mechanisms need to be enhanced. They
believe that the standardization of IS in all of the subsidiaries will help achieve this
goal.
The organization is respectful of the culture of the countries and communities
m which it operates and, within the bounds of sound management principles,
contributes to the enhancement of their economic and social well-being.
The aim of our research is to construct the meaning of IS success in diff erent
national cultures (subsidiaries). This allows the project implementers of the
standardized ERP package to take in consideration our findings in their
implementation efforts and so allows the change-management team at headquarters to
take the findings as a major input to the fit project. We recall that the fit project
consists of aligning the subsidiary meaning of IS success and the built-in success
assumptions of an ERP system to achieve local and global performance.
In order to conduct our research, we chose one division of the MNC. This
allows us to minimize to some extent the impacts of both the industrial environment
88
and the organizational culture. We also use Hofstede's (1994) organizational model
that differentiates between fifty national cultures to select our units of analysis.
2.1. 2 Units of analysis
Hofstede's (1994) organizational model is used to select the national cultures
of the study and the definitions of his national culture dimensions are used to explain
the emerging theory. The choice of this model is based on the popularity and the
robustness of the modelas well as its use by researchers in IS and other disciplines.
Other studies have lent support to the stability of these dimensions. Scholars in social psychology and management have successfully used these dimensions to account for empirical observations. Hofstede's model has been shown to be useful with explanatory power in several disciplines (Tan et al., 1998, p. 121 ).
Robichaux and Cooper (1998) also support the popularity of the model and argue that
the most significant reasons that made it so popular are that it:
1. Resulted from research exploring thousands of respondents m over sixty
countries;
2. Has been validated by further theoretical and empirical evidence;
3. Consists of dimensions that are based on value orientations considered
important and shared across cultures;
4. Has been used successfully by researchers in a variety of disciplines. (p. 290)
In addition, Hofstede's framework has been increasingly employed in information
system research (Straub, 1994; Watson et. al., 1997). However, the main weakness of
Hofstede's dimensions is that they do not distinguish between national cultures in all
their aspects (components and parts), but only in terms of the work-related values.
The units of analysis are respondents from the French, German, Canadian and
Chinese subsidiaries. Our research is a single embedded case study design by using
one MNC (organization) and four sites. Each site is located in each ofHofstede's four

89
quadrants. The following table shows Hofstede's scores of each country according to
each dimension.
Table 8
Cultural dimension scores for four countries (0 = low, 100 = high)
Orientation Power Uncertainty Individualism Masculinity Distance Avoidance
France 68 86 71 43 Germany 35 65 67 66 Canada and 40 46 91 62 U.S.A Hong Kong 68 29 25 57
Hofstede, G. (1994). Management Scientists Are Human. Management Science, 44(1), 4-13
The last row in table 8 above shows that the scores are provided for Hong
Kong. In this research, we are assuming that China as a whole is characterized by
these scores and not only Hong Kong.
The French site is located in a small city in the north of France. The German
site is located in Berlin. It is the main site in Europe. The Canadian site is located in
the province of Quebec. The Chinese participants are all engineers who were invited
to the German site for two months of training. It is worth mentioning here that the
Canadian research participants were located in Quebec. There were both
Anglophones and Francophone. Although Francophone are known to have a
distinctive set of values that differentiate them from the remaining Canadian people
as indicated in the following table 9, no difference between the two groups was made
in this research mainly because Hofstede did not isolate Quebec from Canada and
therefore the computed scores ofhis national culture dimensions apply to Canada as a
whole.

90
Table 9
Cultural diff erences between Francophone and Anglophone in Canada
Cultural English people French people Characteristics
Origin Anglo-Saxon Latin Religion protestant catholic Mother language English French Political tendency conservative liberal Family style influence of the father of the mother
Hénault. G. (1971) Les conséquences du biculturalisme sur la consommation. Commerce septembre
2.1.3 Participant profiles
The actual selection of the research participants was not performed by the
researchers. Our sponsor, a vice president at the office headquarters of the
multinational organization, was charged with taking up ail the necessary steps for the
selection of our interviewees. Again the overriding requirement folfilled in this
selection is that the research participants must have numerous years of experience in
working with multiple organizational systems. We even insisted that they would be
top management people in business fonctions as well as in the information system
fonction. The result of the selection is that the profile of almost all research
participants fit our requirements very well (table 10). This is evident in the volume as
well as in the quality of the data received. There are two types of sampling that look
alike: convenience sampling and purposive sampling. Both share the common
denominator of satisfying the researcher needs in terms of the sources of information.
However, Robson (1993) suggests that convenience sampling is usually used in
survey studies and purposive sampling is usually used in case studies. He further
daims that the goal of selection in purposive sampling is to enable the researcher to
select potential respondents who would provide information to answer the research
questions. Although the selection of the research participants was not done directly

91
by us, we have set conditions that they should satisfy, and that is why our sampling
was purposive in this research.
The Management at the organization's headquarters insisted in not revealing
the name of the multinational organization as well as the name of the ERP system. As
per headquarters and our own request, the participants were notified and assured that
the interviews will be kept anonymous. It was clearly indicated that no one would
read the actual interview of any participant. Management, with our agreement,
promised all participants that a copy of this research would be sent to all of them. In
consideration of these conditions, we provide the reader with the following table 10
showing a limited amount of information conceming the profile of the research
participants.

Country Canada
Number 9
Estimated 38-42
age range
Positions 1. director, project management (business)
2. director, accounting, finance and budget
3. director, information technology
4. director, project management (business)
5. vice president, finance 6. director, change management 7. project coordinator (business) 8. director, marketing 9. director, Strategy and
planning
Table 10
Participants' profiles
Germany
8
36-42
1. consultant, finance 2. project director (business) 3. proj ect director (business) 4. director, information
technology 5. director, human resource 6. director, strategy, processes
and systems 7. manager, change management 8. director, human resources
92
France China
8 5
42-46 30- 32
1. director human Engineers resource
2. manager, accounting 3. proj ect director
(business) 4. information
systems analyst 5. information
systems analyst 6. manager, production 7. manager, finance 8. manager, sales

93
We asked our sponsor to allow us to interview as many participants as
possible. We had hoped to meet with more people, but our sponsor said that the list of
participants we received contains those who fulfill the high knowledge requirements
and can accurately respond to our research questions. Methodologically speaking, this
does not pose any problem and this is so for two reasons. First, as Taylor and Bogdan
(1984) asserted, «In theoretical sampling the actual number of cases studied is
relatively unimportant. What is important is the potential of each case to aid the
researcher in developing theoretical insight into the area of social life being studied»
(p.83). Secondly, and as we will show later in the detailed analysis sections, the
emerging categories have a relatively large number of multi-determinant concepts and
very few single or isolated concepts. This probably suggests that the categories which
emerged would stay unchanged even if we conduct further interviews with other
participants. lt is important to mention that the research participants corne from a
variety of professions. This would help us to minimize to some extend the impact of
professional culture on the findings.
2.2 Data collection
Creswell (1994) claims that evidence for case studies cornes from six sources;
documents, archiva! records, interviews, direct observations, participant observation,
and physical artifacts. The use of any of these data collection tools depends on criteria
such as the nature of the problem in question, the time and the budget allocated to the
project, the experience of the researcher in using the tools, and the willingness of the
host cases (organizations) to provide access to information via these tools. In general,
the literature suggests that the researcher uses multiple sources of evidence, centralizes
and structures the research data for future proof of evidence, and explicit the proof
approach of the results.
Data collection took place in a real context, that is, in the research
participants' working place. Data collection took ten days in France, ten in Germany,

94
and in Canada it took about two months. Data collection in Canada was lengthy
because the participants were not always available. Two main data collection sources
were employed: interviews and documentation. The documentation was collected at
the headquarters office. In general, these tools enable an acceptable degree of interna!
validity. The following paragraphs explain how we approached each unit of analysis
to collect our data.
In France, I introduced myself to the assistant of the Human Resources
Director, who was not informed about my background with the organization. I then
gave her the list of people that I wished to interview and asked her if I could
interview two people per day. The initial interview plan was modified, but the
interviews started on the first day. The interviews were conducted during normal
business hours.
In Germany, it took me about two hours to modify the interview schedule and
to finalize it, as some participants were not able to meet with me according to the
initial appointment plan. The interviews started in the aftemoon of the first day. I
stayed there for ten days in order to conduct all the interviews. Sorne interviews were
held late at night and others early in the moming.
In Canada, it took us about two months to complete the interviews. The main
reason is that interview participants were not able to meet with me during the same
time frame.
The Chinese participants stayed in the same hotel as I did. I was referred to
the team leader after asking one of these participants for an interview. The team
leader strongly suggested that we conduct a focus group because, he said, they would
most likely all give the same information. There was no choice but to accept his
proposai and the discussion took place in a large hotel room. The implication of this
behavior will be examined in the discussion section. The average length of the
interviews with all the groups was about 2 hours per interview.

95
There are three types of interviews: open-ended interviews (non-structured),
focused interviews (semi-structured), and questionnaires (highly structured). It was
first decided to base the research on Kelly's (1955) Repertory grid interviewing
technique, but later, open interviews were also used on site. Consequently, data
collection took place twice using two different yet complementary interview
techniques: Repertory grid and open interviewing techniques. The reasons for two
collections are: first, the Repertory grid technique is known as a technique which
helps the researcher acquire the personal constructs data for each participant in a
particular domain. That is, the research participant's information on the phenomenon
in question is rooted in his personal experience and his own model of reality. The
technique does not allow the participant to provide his abstract data or perceptual data
and that is why we used open interviews to obtain this different kind of information.
Secondly, research methodology scholars always encourage the researcher to use
multiple data collection tools to help him or her add more credibility to the research
flndings. Finally, the requirements of using Repertory grid technique were not easy to
satisfy. We conducted Repertory grid interviews with only some participants from
France (4), Germany (4), and Canada (5) and a focus group interview was conducted
with the Chinese participants. The following paragraphs provide information about
how Repertory grid and open interview were used in our research.
2.2.1 Repertory grid technique
Repertory grid interviews can be considered as semi-structured types of
interviews. The background as well as a detailed discussion on the Repertory grid
components is provided in appendix AO. If the reader is not familiar with Repertory
grid technique, we encourage him or her to read appendix AO so that he can
appreciate its use in our case.
96
The following paragraphs describe the components of the technique, namely:
the participant, the elements, the elicitation questions, and the analysis procedure. The
way we actually conducted the analysis is also described
The research participants are key informants who have many years of
experience in using organizational information systems. The participants also hold an
appropriate rank in the MNC subsidiary as no meaningful answers would be
generated from simple employees.
The elements are the most crucial steps in the Repertory grid technique. If the
element selection does not fit the purpose of the grid and the purpose of the research
project, then the resulting data would be useless. The elements are a variety of
organizational information systems the participant has used.
Conceming the elicitation question, we presented the research purpose and a
summary of the technique to each participant. They were then given blank cards and
asked to think of six organizational information systems or organizational
applications that they have used in the last six to eight years; two which could be
considered very successful, two not successful and two which were average in their
success. All the participants reported that they have worked with many applications
but could not classify them according to our requirements. We then altered our
approach and asked them to think of two systems that were very successful and two
that were not successful. This process took at least ten minutes. W e asked the
participants to write down a reference name for each application they mentioned on a
separate card in order to help keep track in the following series of questions. We then
asked the participant to number the cards 1, 2, 3 and 4 and so we prepared the
following set:

1
1
2
1
2
2
3
3
3
4
4
4
97
These are all the possible combinations of three cards out of a set of four. The
triading question is then omitted since the participant has been provided with all the
combinations. The participant was then asked the following elicitation question.
Take any combination of cards from the above list and tell me:
1. How two of these applications are alike yet diff erent from the third in terms of
success at the system lev el?
2. How two of these applications are like yet different from the third m
terms of success at the individual level?
3. How two of these cards are alike yet different from the third in terms of
success at the organizational level?
In answering, the participant provides us with bipolar raw data ( construct) which is
transcribed on the form. The process is repeated for the remaining combinations. The
result is a set of raw data from each participant. We ask the participant to rate all the
elements ( organizational IS) of each raw data using a five point scale. 1 corresponds
to the fact that the system is not characterised at all by the IS success attribute and 5
corresponds to the fact that the system is fully characterized by the IS success
attribute. The outcome is the Repertory grid matrix which contains the elements, the
raw data and the rating of all the elements of the raw data.
The analysis was based on a simple Repertory grid content data analysis. The
end of the data collection process provided a set of completed Repertory grid
questionnaires. Each grid has four elements, a number of bipolar constructs and the
ranking of each element according to each construct. Web Grid II software package

98
helped to speed up the analysis process. This package processes all the elements of
each Repertory grid questionnaire, and prints some displays. The following paragraph
provides more information about this software and its corresponding displays.
Web Grid II is an implementation for the World Wide Web of George Kelly's
repertory grid technique for building conceptual models based on his personal raw
data psychology theory. It provides a variety of methods for modelling and
visualizing the relationships between raw data. The most important advantages of this
software system is that team members in a research project can work on the project
without being physically close to each other by using the W eh capabilities. The
second advantage is that it is free. All the files are stored in the Web Grid server,
hosted at the University of Calgary. The links to the files can be stored in the
researcher's computer for reference and easy access. Web Grid II allows the user to
enter the purpose of the grid, the set of elements and the raw data generated by the
participant. Of course, it would have saved time and money to use the web system
without travelling to Europe. In doing so, we would have asked all the research
participants in France, German y, Canada, and China to use the W eh system to
produce the constructs of IS success. However, though it may be technically
possible, it is not practically feasible due to the intricate training of the research
participants on the technique as well as the difficulties in the production of the raw
data. Secondly, we would have missed the opportunity to acquire raw data by using
the open interview technique. Thirdly, probe questions could not have been posed.
The software provides three types of displays. Repertory map, Repertory
cluster, and Repertory display. Repertory map groups and maps data that share
common characteristics. The Repertory cluster provides an automated version of a
visual focusing technique. It shows the clustering of raw data and the associated
correlation between the raw data. Repertory display simply displays the raw data, the
elements and the ratings. Appendix AD provides all these outputs for each research
participant who was involved in the Repertory grid technique. The appendix lists the

99
Repertory clustering, followed by the Repertory display and then the Repertory map
of respectively each German participant, Canadian participant, and French
participant.
The raw data, the elements and the correlation were entered into the system
and then printed. The following section describes how we actually conducted our
content analysis procedure.
We were not interested in the information systems the participants chose in
order to produce the raw data. We are; rather, interested and concemed with IS
success characteristics that are provided in the raw data itself. Therefore, ail analysis
should focus on this raw data and not the elements. If, for example, the purpose of the
research was to compare and to distinguish the success factors of an ERP system with
other organizational systems, then the focus would be on both the elements and the
raw data.
We followed the Moynihan (1996) technique, which was employed in the
analysis of the Repertory grid data. Moynihan conducted a research study in order to
generate an inventory of persona! constructs (raw data) for information systems
project risk researchers. The author used content analysis to identify categories
emerging from the participants' own raw data. The scope of the study was not
concemed with the rating and relationships of the constructs. This research followed
the same initial process of research. However, the scope was widened in order to
examine the relationships of the constructs which were produced. This was achieved
using Web Grid II software package.
The following are the steps we undertook to group our data:
1. Each Repertory display is printed. Each display contains data that belongs to
each participant and not to ail participants. This was the main limitation of the
100
software, as we hoped to enter the data of all Canadians, for example, and
analyse the possible relationships;
2. Each piece of data is written on a separate card;
3. The cards that contain data of all the participants at each level and in each
country are put together;
4. A frequency count of the cards that hold the same concept is performed;
5. Appendices J through T provide the Repertory grid raw data at each level and
appendix AD provides the Web systems displays.
Now that the technique is described, it is worth mentioning a maJor
disadvantage in using it. The major weakness of the technique is that it does not
enable flexibility in case the requirements are not met in the first place. The technique
may be perfect for studies that do not require memorization. Studies that require the
research participant to remember a variety of elements are not obvious to conduct.
This was our case, in which the participants were asked to remember many
organizational systems they used for the last five or six years. The research participant
could not all remember these systems.
2.2.2 Open interview technique
Our research is based on the assumption that national culture would have an
impact on the meaning of information systems success. As was explained and
indicated in the previous sections, the main research question is how people of
different national cultures define and perceive information systems success.
Research literature indicates that IS success can be measured at three different
levels: systems level, individual level and organizational level, as shown in the
research framework which guides the research process. The interview questions are
then focused on these levels, but we do not deny the participant the opportunity to
talk about other levels if they exist. In fact, we always ask the participant to feel free

101
ifhe or she wants to provide other information in addition to what was asked for. The
interview questions are:
1. What are the characteristics of a successful information system at the systems
level?
2. Do you think that information system success can be perceived at the
individual level? If so, how?
3. Do you think that information system success can be perceived at the
organizational level? If so, how?
4. Do you think that there may be other levels in which information systems
success can be perceived?
The notes of the interviews were taken on paper and most of them were
recorded. Seven participants refused to be recorded even though they were assured
that the information would be kept private and no one would have access to it. The
number of people who refused the recording is even among the cultures. Apart from
those rare occasions, recording the interview proved to be a beneficial technique.
After each interview, the notes and tapes were reviewed so as to insure that no
relevant information was missed. Each interview was transcribed on the computer
using a word processing package. It was then printed with a computer version of our
notes and the resulting raw data was put on a card. The term raw data refers to a
surrogate statement that was provided by the participant. "Providing up-to-date
data", "Enhancing decision making", and "Modifying business processes", are all
examples of raw data. The interview notes of each participant are ordered by level.
The raw data of the first level is written, then those of the second level and so on.
When all the data of participant 1, for example were written on the cards, we then
separated each set (set = level) by a blank card. The following are the sets of cards
produced from each participant:
Set 1: all data that deal with IS success at the systems level;
Set 2: all data that deal with IS success at the individual level;
Set 3: all data that deal with IS success at the organizational level;
Set 4: all other data not included in any level.
102
Each card has a code. The coding mechanism is structured as follows: three
characters to represent the country, a two digit number to represent the participant
number and one character to represent the level (S: systems, I: individual, 0:
organizational) of IS success. In set number 4, the last character is a blank. For
example, CAN06S, represents raw data of IS success at the system level of Canadian
participant number 6. GER080, represents raw data of IS success at the
organizational level of German participant number 8. FR04 represents raw data that
was provided by French participant 4. This raw data is included in the Others set, set
4 and so has no IS success character. All cards are coded using this coding formula.
The same process applies for all the notes arising from the participants from the other
countries.
The interview sessions provided a considerable amount of data. This can be
justified by many factors. First, the profiles of the participants fit or even exceed the
required profile we specified to our sponsor. These are knowledgeable people who
are very capable of providing a significant amount of data on the subject. Secondly,
the amount of data increased through the use of multiple data collection tools:
Repertory grid and open interviews techniques.
Repertory grid data were included in open interview data. This inclusion is
justified under the following two considerations: first, when the Repertory grid
elicitation session is terminated and open interview started; we noticed in the first
fifteen minutes that the participant provides some repetitive data that was produced
in the Repertory grid session. Then he started providing us with interesting attributes
of successful information systems. Secondly, we are looking for the global picture of

103
IS success of each participant; that is, data based on concrete expenence and
perceptual data, and so each of these techniques are invaluable in determining this
global map. Third the low amount of data that we collected using Repertory grid
technique does not enable us to perform detailed analysis and develop theory only
from these data.
In each country, the data was analyzed in three levels: systems level,
individual level and organizational level. A common approach was maintained in
order to analyse the data across all the cultures except at system level where a
predetermined classification of Data quality category is used before analysing data.
The following paragraphs provide information about this classification.
At the systems level, the analysis concentrated on the three main components
of any information system: the hardware, the user interface, and the data. A large
volume of raw data was collected at the systems level in all the countries, especially
raw data which helped determine the data quality category. All the concepts that
determine the data quality category would have been gathered according to each
country under the category of Data quality, however, due to the high volume of data
in this category it is preferable to create a separate organization in order to make
interpretation as clear as possible. To do so, the Wang and Strong (1996) hierarchy
framework of data quality was utilized. The authors found that data quality is
classified into four dimensions: intrinsic data quality, contextual data quality,
representational data quality and accessibility data quality. The following is the Wang
and Strong (1996) framework showing each data quality category as well as its
corresponding concepts.

1
Intrinsic data quality
1
Reliability Accuracy Objectivity Reputation
Figure 10
Conceptual framework of data quality
1
Contextual data quality
1
V alue-added Relevancy Timeliness Completeness Appropriate amount of data
Data Quality
1
1
Representational data quality
1
Interpretabili ty Ease of understanding Representational consistency Concise representation
1
Accessibility
1
Accessibility Access security
Wang, R.Y and Strong, D.M. (1996). Beyond Accuracy: What Data Quality Means to Data Consumers. Journal of Management Information Systems. 12(4), 5-34
104

105
The following list describes each data quality category type:
1. INTRINSIC DATA QUALITY denotes that data have quality in their own right;
2. CONTEXTUAL DATA QUALITY highlights the requirement that data must be considered within the context of the task at hand;
3. REPRESENTATIONAL DATA QUALITY includes aspects related to the format of the data and meaning of data, and
4. ACCESSIBILITY refers to aspects related to data access security and data accessibility.
Although the framework above was used to organize the theory, the meaning
of data quality may differ from one culture to another. In other words, there would be
for example, French intrinsic data quality, German intrinsic data quality, Canadian
intrinsic data quality and Chinese intrinsic data quality.
A total of thirty nine interviews with participants from four national cultures
have been conducted. Twenty five in depth open interviews, one focus group
interview, and thirteen Repertory grid interviews as indicated in the following table
11. Data is provided by four groups from four national cultures: China, Canada,
France and Germany. Two sets of data were provided by each group except the
Chinese group. The French, Canadian, and the German groups provided in depth
open interviews data and Repertory grid Data. The Chinese group provided only data
from a focus group interview. All the participants provided open interview data, but
only a few Canadians, French, and Germans provided Repertory grid data. The
following table 11 shows the number of open and Repertory grid interviews per
country.

106
Table 11
Number of open and Repertory grid interviews per country
Country Number of open interviews Number of Repertory grid interviews per country
Canada 9 5 Germany 8 4 France 8 4 China 1 (focus group interview with 0
5 participants) Total 26 13
Before we end this chapter and move to the results chapter, we would like to
stress the role of the researcher throughout the data gathering and processing steps of
the study. In an interpretive study such as this, grouping, and interpreting the data is
where the researcher brings out the value of the research. The interpretation and the
grouping of data is not done just by looking at the raw data. The interview notes as
well as the laddering technique and the probing techniques depend on the sensitivity
of the researcher in that they are the means by which the participants express
themselves and provide the data - the basis of the theory. Moreover, it is the
management at the office headquarters who decided to choose the type of ERP and
who set the strategic objectives and the expected business values of the system. It is
also the management at headquarters who selected the implementation team of the
system. The implementation team will implement the system in all the countries of
the study. The subsidiaries will not implement the systems by themselves.
Consequently, the labels of each category must be understood by the implementers
who share the same cultural meaning and connotation with the researcher; both being
Canadian. From the methodological and the theoretical perspective, Gordon, Hunter
and Beck (2000) conducted a study on what constitutes excellent systems analysts in
two national cultures, Singapore and Canada. They stressed the fact that it is the
107
researcher who must do the grouping of the raw data which leads to a comparative
type of studies.
Subsequent data analysis, while conducted by the researchers, was based on the contents of the comments made by the research participants from within the culture. This kind of approach is more consistent with an Emie paradigm of cross-cultural research. The cross-cultural comparison is therefore between what are essentially two Emie studies conducted in two different cultures (Gordon Hunter and Beck, 2000, p. 99).
Here is the risk we wanted to avoid. Rosensweig (1994) mentioned, for example, that
labels that mean the same things may be completely different in writing. U.K people
use the word "Turnover" to refer to "Profit" and North American people use the word
turnover to refer to the rate of change. This is exactly why data grouping should not
be done by the participants themselves in a comparative cross-cultural study.
2.3 Validity
Robson (1993) daims that the terms: interna! validity, external validity, and
reliability are generally associated with the conventional positivist paradigm which
considers the natural and social worlds as context-free. These terms, adds the author,
are inappropriate for the naturalistic or qualitative methodologies. The author uses
other terms to assess the excellence of qualitative research projects. These are:
1. Credibility (interna! validity);
2. Transferability ( external validity or generalizability);
3. Dependability (reliability).
These are the actions we carried out to ensure a high degree of quality in this study:

108
1. Case studies are generally characterized as having a good degree of
credibility. However, this credibility concerns only the case that was studied.
Multiple data collections were used. Moreover, feedback from the
participants was very helpful and always encouraged. The laddering
technique in Repertory grid technique and the probe questions in open
interview technique helped get feedback from each participant in order to
minimize ambiguity and make sure that what we have is what the participant
perceives. This enhances the credibility of our findings;
2. We have set a strong chain of evidence for future researchers who wish to
conduct the same type of inquiries in different cases. This enhances the
dependability of our study;
3. The aim of qualitative case studies is not statistical generalization of results,
but analytical generalization. The findings in our case study are strongly
valid for our multinational organization and not for all multinational
organizations. However, we strongly believe that our results can be
transferred to other cases.
2.4 Deontology
This research is not about describing an event or a process. It is about
generating the meaning ofIS success from numerous research participants in different
national cultures. Our research is, then, a content-research and nota process-research.
These are the precautions we paid attention to while carrying out our project:
1. At the beginning of each interview, we presented to the participant the
purpose of the research project as well as the purpose of the interview. We
also assured him or her total confidentiality. In fact, we explicitly told the
participant that he does not have to provide us with his name;

109
2. We also explained that the goal of the project is to have a high degree of the
ERP systems implementation success as well as the business-derived benefit
of the system;
3. We also asked the participant if he does not mind our use of an audio
recording system and ensured him that no one else would listen to his
answers.

CHAPTER FIVE
RESULTS
The framework in the following figure 11 refers to the structure of the
presentation of the results and the analysis of our data. As we explained in the
methodology chapter, open interview data and Repertory grid data are treated
simultaneously. The first stage of the process in figure 11 consists of describing and
analyzing this set of data. In this stage the collected data at each IS success level in
each culture is analyzed: system level, individual level, and organizational level. The
emerging IS success categories along with their corresponding concepts are presented
and discussed. In stage two, the Chinese data is described. In the last stage, we group
the emerging categories of IS success at each level by culture and present them in a
graphical display. The initiation step in the framework refers to the researcher's
familiarity with data, while the detailed analysis of data refers to the data reduction,
grouping and refinement.
The presentation of the interview data description and analysis will follow the
following strategy. Instead of presenting the results and analysis at the systems level,
the individual level, and organizational level for each culture, we present our findings
by level of IS success in all cultures. That is, we present and describe data that
concems IS success at the system level in all cultures, followed by data analysis of IS
success at the individual level in all cultures, and finally data analysis of IS success at
the organizational level in all cultures. The main benefit of this strategy is to allow the
reader to appreciate similarities and differences in IS success perceptions on a specific
level. Moreover, for each phase of data analysis, we prefer to first present the
comparative displays that show the aggregated results, followed by the detailed
analysis that shows how we inductively came up with these results. In the detailed
analysis section, we describe and discuss the meaning of IS success in each level.

111
The statistics in the tables which contain the grouping and abstraction of data
m the detailed analysis section of each IS success level, derive from relational
databases. Six Microsoft Access databases were created with three databases per
country: France, Canada, and Germany. Each database in each country processes the
data at each level: system, individual, and organizational levels. The benefits of the
databases are threefold. First, the statistical numbers are free from computation errors.
Secondly, the output of the databases serves as a control tool that helps the researcher
confirm the numbers in the manual and the computer manipulation process of data.
Thirdly, it allows for various queries to be performed on the data. This grouping was
carried out as follows on each level in each country:
1. List of concepts per participant;
2. Number of participants who provided at least one concept per category;
3. List of concepts, specific raw data related to each concept, and the amount of
raw data per concept;
4. Number of concepts per category;
5. Categories, concepts and raw data per participant.
Appendices U, X and AA present the output of these queries at the systems
level respectively in Canada, Germany, and France. Appendices V, Y, and BB contain
the output of the queries at the individual level, and appendices W, Z, and AC contain
the output at the organizational level. Only the number of participants who provided at
least one concept per category, and the categories, concepts and raw data per
participant are provided. The remaining reports may be provided upon request from
the reader.

112
Figure 11
Process of data analysis and results
Open and Repertory grid interview results and analysis of IS success at the systems level in Canada, Germany, and France: initiation and detailed analysis
•Ir
Stage 1 Open and Repertory grid interview results and analysis of IS success at the individual level in Canada, Germany, and France: initiation and detailed analysis
•Ir
Open and Repertory grid interview results and analysis oJ IS success at the organizational level in Canada, Germany, and France: initiation and detailed analysis
, ..
Stage 2 Chinese focus group interview results
' Summary of the emerging models oflS success in each
Stage 3 culture

1. OPEN AND REPERTORY GRID INTERVIEW ANALYSIS AND RESULTS OF CANADIAN, GERMAN, AND FRENCH PARTICIPANTS
113
Table 12 below shows the amount of raw data of IS success at each level and
for each country. The "Other" cell includes all the data that was not used in the
analysis because this data could not be considered as attributes of IS success. Raw data
elements are statements that the research participant provides to the researcher in
response to the research questions. A raw data element is also a statement that
provides details or different ways of describing the same phenomenon. The following
are examples of raw data:
1. Reports are easy to read;
2. The presentation is intuitive;
3. Rapid access to data;
4. Impact on relationships with suppliers and
5. Impact on the work method.
Table 12
The amount of raw data per IS success level in each culture
Set Level Canada Germany France China Total 1 Systems level 116 102 100 13 331 2 Individual level 62 40 59 3 164 3 Organizational level 49 63 29 4 145 4 Other 129 104 68 16 317
Total 356 309 256 36 957
AU raw data are provided in the first column of all the tables in Appendix A
though I. These appendices present the raw data that concems IS success at the
systems level, the individual level, and the organizational levels, respectively in
Canada, Germany, and France.

114
A total of 957 raw data were obtained during the interviews, as indicated in
table 12. Of these 957, 640 raw data were used in our analysis. This table shows that
the highest amount of raw data was collected at the systems level (331), followed by
the individual level (164), and by the organizational level (145). By looking at each
column, we can notice that in each culture, we collected more raw data at the systems
level. Also, while the participants in Canada and in France provided more raw data at
the individual level than the organizational level, German participants provided more
data at the organizational level than the individual level.
1.1 Open and Repertory grid interview analysis and results at the systems level in Canada, Germany, and France
Before we display the results at the systems level and discuss in detail the way
our categories were constructed, we would like to recall the main activities that are
involved in the initaiation and the detailed steps which we mentioned in figure 11.
In the initiation step of the systems level for example, the raw data of Set 1 is
examined (first row in table 12). This set contains raw data of each group of
participants (Canadian, German, French, and Chinese) that deals with IS success at the
systems level. The cards which contain raw data are displayed and read 4 or 5 times in
order to become familiar with the data. This initaiation step will help to keep a strong
link with the data abstraction step during detailed analysis and help support our
findings.
The detailed analysis steps include data reduction and theoretical abstraction.
In other words, cleaning up the raw data, refining it, and letting it speak for what it
represents. In this process, other levels of abstraction of analysis emerge. In this step,
the frequency of the same raw data or raw data that holds the same meaning is
calculated. The initaiation and detailed analysis steps are executed at every level of IS
success.

115
The following are the emerging categories at the system level. The labels of
these categories are used in all cultures:
1. Data quality: is expressed in terms of intrinsic data quality, contextual data
quality, representational data quality, and accessibility. We would like to recall
that these categories were borrowed from Wang and Strong's (1996) work as
expressed in figure 1 O;
2. User-system interaction quality: emphasizes the quality of the interaction
between the user and the system;
3. Data processing system quality: emphasizes the hardware, the networks, and
the processing attributes of a successful information system.
The following table 13 provides the amount of raw data per category of IS success at
the systems level in each country. We recall that data were provided by 9 participants
from Canada, 8 from Germany, and 8 from France.
Table 13
Amount of raw data per category of IS success at the systems level
Category ARD* ARD* ARD* in Canada in Germany in France
Intrinsic data quality 13 13 14 Contextual data quality 26 14 13 Representational data 23 10 10 quality Accessibili ty 30 21 25 User-System interaction 9 20 19 quality Data processing 15 24 19 systems quality Total 116 102 100
(*) ARD: Amount ofraw data
Table 13 shows that the participants from Germany and France provided
relatively the same amount of raw data at the systems level, respectively 102, and 100.

116
The Canadian participants provided 116 raw data. Moreover, we can notice that the
average number of raw data per interview is almost the same in all cultures: 12.9 in
Canada, 12.7 in Germany, and 12.5 in France.
The counts in table 13 allow us to corne up with the following tendencies in
terms of the amount of raw data in each IS success category at the systems level.
While the "Accessibility" category was generated by the highest amount of data in
Canada and in France, it is the "Data processing systems quality" category that was
generated by the highest amount of data in Germany. Also, while in Canada, the "User
system interaction" category was referenced by the lowest amount of raw data, it is the
"Representational data quality" category that was referenced by the lowest amount of
data in Germany and France.
1.1.1 Comparative displays at the systems level
The following comparative table 14 shows similarities and differences
conceming the concepts of each category at the systems level and in all cultures.
In this table, we compare IS success perception at the systems level in all
cultures. The names of the categories are the same in all cultures. Category names are
not compared; rather, the concepts that make up each category are compared.
Whenever a concept is found in a culture, a + sign is placed in the corresponding cell.
If the concept does not emerge in a particular culture, a - sign is assigned. For
example, the "Integrated data" concept that belongs to the "Intrinsic data quality"
category emerges in Canada and Germany. A plus (+) sign is placed in the
corresponding cells. As the same concept was not found in France, we put a minus (-)
sign in the corresponding cell. Only multi-determinant concepts are used, analyzed,
and compared, as any comparison of single determinant concepts would not permit
data reduction and theoretical abstraction. A multi-determinant concept is one that
represents at least two pieces of raw data from the whole set of raw data in each

117
culture (Set 1 in table 12). A single determinant concept is one that can be determined
by a single raw data.
To compare our findings at the systems level, we must ensure that the
comparison is logically correct. For example, if we conduct lab experimentation
between two groups of children who have common characteristics in a controlled
environment, then the conclusions about differences and similarities are generally
acceptable. In cross-cultural studies, such comparison is not obvious. In our study, the
search was for cultural meanings on which the comparison is based. Two categories
may have the same labels, but their meanings may be different. For example, the
"Intrinsic data quality" in France and "Intrinsic data quality" in Germany are two
categories with the same labels. However, the actual meanings of these two categories
which are based on the concepts and raw data from France and the concepts and raw
data from Germany may be different. Further detailed discussion on this meaning
matter will be provided in the analysis and the discussion sections.
The following paragraphs discuss the presence and the absence of the concepts
that determine the categories at the systems level in all cultures. The differences and
the similarities in the meaning of the concepts are discussed in the detailed analysis
section.
The "Intrinsic data quality" category is referenced by the concepts of
"Accuracy" in all the cultures. It is also determined by the concept of"Integrated data"
in Canada and Germany but not in France. Also, while German participants perceive
"Data integrity" as a determinant of the "Intrinsic data quality" category, only the
French participants use "Precision" and "Data validation" as attributes of this
category.

118
Table 14 Comparative displays at the systems level
Concept Canada Germany France Intrinsic data qualitv cate1?:orv
Accuracy + + + Integrated data + + -Data integrity - + -Precision - - + Validated data - - +
Contextual data quality cate2ory Relevance + + + Timeliness + - -Completeness + - -F orecasting + - -Data currency - + -Aooropriate amount of data - + +
Representational data quality cate2orv Ease of understanding + + + Interpretability + + -Screen clarity + - + Consistency + - -
Accessibilitv qualitv cate1?:orv Access control + + + Rapid access + + -Data A vailability + - -Accessibility - + -Information sharing + - -
User-System Interaction qualitv cate2ory Interface quality + + + Ease of navigation - + -Easy to leam - + -Easy to use - + +
Data Processinl! Svstems qualitv cate1?:orv Response time + + + Systems flexibility + + + Hardware reliability + + -Hardware standardization + - -
The "Contextual data quality" category is determined by the concept of
"Relevance" in all the cultures. While this category is determined by the concepts of
"Timeliness", "Completeness", and "Forecasting" only in Canada, "Data currency"
determines it only in Germany. Finally, the concept "Appropriate amount of data"

119
determines the "Contextual data quality" category both in Germany and France but not
in Canada.
The "Representational data quality" category is determined by "Ease of
understanding" in all the cultures. The "Interpretability" concept emerges as a
determinant in Canada and Germany but not in France. While the concept "Screen
clarity" emerges as a determinant in both Canada and France but not in Germany, the
concept of "Consistency" references the "Representational data quality" category only
in Canada.
The "Accessibility" category is referenced by the concept of "Access control'' in
all the cultures. "Access control" is the only concept that determines the
"Accessibility" category in France. "Rapid access" emerges as a determinant of the
same category in Canada and Germany. While "Data availability" and "Information
sharing" concepts emerge only in Canada, the "accessibility" concept emerges only in
Germany.
The "User-System interaction quality" category is determined by the concept
of "Interface quality" in all the cultures. "Ease of navigation" and "Easy to leam"
emerge only in Germany and "Ease to use" emerges in both Germany and France.
Finally, the "Data processing systems quality" category is determined by the
concept of "Response time" and "Systems flexibility" in all the cultures. "Hardware
reliability" emerges in both Canada and Germany and "Hardware standardization"
emerges only in Canada.
1.1.1.1 Determining the relative category weight in each culture and the cross
cultural weight of common categories. The following tables 15, 16, and 17 present the
calculated weight of the categories at the systems level in respectively Canada,
Germany and France. The weight is ranked as follows. 1 represents the more
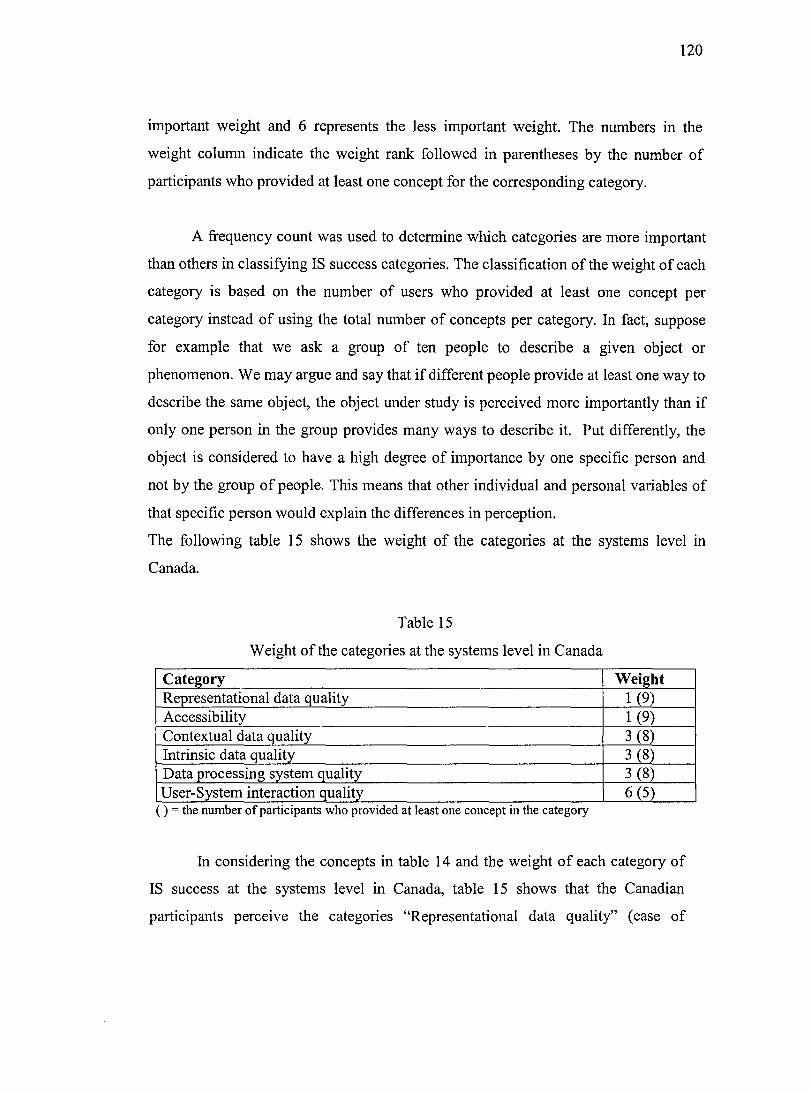
120
important weight and 6 represents the less important weight. The numbers in the
weight column indicate the weight rank followed in parentheses by the number of
participants who provided at least one concept for the corresponding category.
A frequency count was used to determine which categories are more important
than others in classifying IS success categories. The classification of the weight of each
category is based on the number of users who provided at least one concept per
category instead of using the total number of concepts per category. In fact, suppose
for example that we ask a group of ten people to describe a given object or
phenomenon. We may argue and say that if different people provide at least one way to
describe the same object, the object under study is perceived more importantly than if
only one person in the group provides many ways to describe it. Put differently, the
object is considered to have a high degree of importance by one specific person and
not by the group of people. This means that other individual and persona! variables of
that specific person would explain the differences in perception.
The following table 15 shows the weight of the categories at the systems level in
Canada.
Table 15
W eight of the categories at the systems level in Canada
Cate~ory Weight Representational data quality 1 (9) Accessibility 1 (9) Contextual data quality 3 (8) Intrinsic data quality 3 (8) Data processing system quality 3 (8) User-System interaction quality 6 (5)
( ) = the number of participants who provided at least one concept m the category
In considering the concepts in table 14 and the weight of each category of
IS success at the systems level in Canada, table 15 shows that the Canadian
participants perceive the categories "Representational data quality" ( ease of

121
understanding, interpretability, screen clarity, and consistency), and "Accessibility"
( access control, rapid access, data availability, and information sharing) as the most
important indicators of a successful information system at the systems level. The
category "User-System interaction quality" is perceived as the less important
category.
The following table 16 shows the weight of the categories at the systems level in
Germany.
Table 16
W eight of the categories at the systems level in German y
Cateeory Weieht Accessibility 1 (8) Data processing system quality 2 (7) Contextual data quality 2 (7) Representational data quality 4 (6) User-System interaction quality 4 (6) Intrinsic data quality 6 (4)
( ) = the number of participants who provided at least one concept in the category
Table 16 shows that German participants perce1ve the "Accessibility"
category (access control, rapid access, accessibility) as being the most important
category and the "Intrinsic data quality" (integrated data, accuracy, data integrity)
as the less important category.
The following table 17 shows the weight of the categories at the systems level in
France.
Table 17
Weight of the categories at the systems lev el in France
Cateeory Wei2ht Accessibility 1 (8) User-System interaction quality 1 (8) Data processing system quality 1 (8) Contextual data quality 4 (7) Intrinsic data quality 5 (6) Representational data quality 6 (5)
( ) = the number of participants who provided at least one concept m the category

122
Table 17 shows that three categories are perceived to be the most important
indicators of a successful information system in France. These are: "Accessibility"
(access control), "User-System interaction quality" (interface quality, ease to use),
and "Data processing systems quality" (response time, systems flexibility). The
"Representational data quality" category ( ease of understanding, screen clarity) is
perceived to be the less important.
Now that the weight of each category is displayed in each culture, the
following table 18 represents these weights in different layout that would allow the
reader to notice weight variation across all cultures.
Table 18
Cross-cultural weight at the systems level
Cateeory/ country Canada Germany France Accessibili ty 1 1 1 Data processing system quality 3 2 1 Contextual data quality 3 2 4 Representational data quality 1 4 6 User-System interaction quality 6 4 1 Intrinsic data quality 3 6 5
Table 18 indicates that the relative weight of the categories ofIS success at the
systems level varies from culture to culture except the "Accessibility" category which
is considered as being the most important indicator of successful information systems
in all the cultures. This table also shows that the lowest rank categories in Canada,
Germany, and France are respectively: "User systems interaction quality", "Intrinsic
data quality", and "Representational data quality". We can also notice that while the
"Representational data quality": category is ranked 1 in Canada and 6 in France, the
category "User system interaction quality" that ranks 1 in France, ranks 6 in Canada.
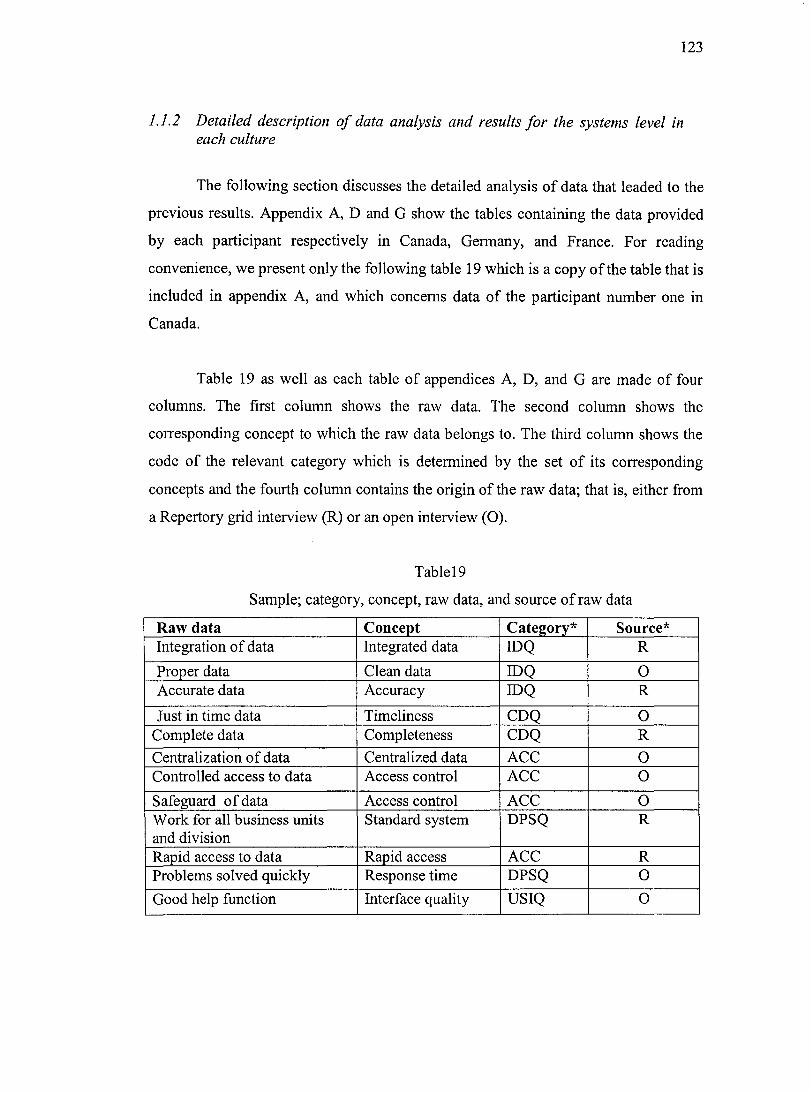
123
1.1.2 Detailed description of data analysis and results for the systems level in each culture
The following section discusses the detailed analysis of data that leaded to the
previous results. Appendix A, D and G show the tables containing the data provided
by each participant respectively in Canada, Germany, and France. For reading
convenience, we present only the following table 19 which is a copy of the table that is
included in appendix A, and which concems data of the participant number one in
Canada.
Table 19 as well as each table of appendices A, D, and G are made of four
columns. The first column shows the raw data. The second column shows the
corresponding concept to which the raw data belongs to. The third column shows the
code of the relevant category which is determined by the set of its corresponding
concepts and the fourth column contains the origin of the raw data; that is, either from
a Repertory grid interview (R) or an open interview (0).
Table19
Sample; category, concept, raw data, and source ofraw data
Raw data Concept Cate2ory* Source* Integration of data Integrated data IDQ R
Proper data Clean data IDQ 0 Accurate data Accuracy IDQ R
Just in time data Timeliness CDQ 0 Complete data Completeness CDQ R
Centralization of data Centralized data ACC 0 Controlled access to data Access control ACC 0
Safeguard of data Access control ACC 0 Work for all business units Standard system DPSQ R and division Rapid access to data Rapid access ACC R Problems solved quickly Response time DPSQ 0
Good help fonction Interface quality USIQ 0

124
Table19
Sample; category, concept, raw data, and source ofraw data (continued)
Raw data Concept Cate2:ory* Source* Quick results Response time DPSQ 0
Self explanatory information Interpretability RDQ 0 on screen or reports Easy to understand Ease of RDQ R information on screen understanding Easy information format for Easy information RDQ 0 management format Information easy to follow Information easy to RDQ R
follow Reports easy to read Reports easy to RDQ 0
read Intuitive presentation Intuitive RDQ R
presentation Meaningful information in Interpretability RDQ 0 other countries Relevant information on Relevance CDQ 0 reports Present complete information Completeness CDQ 0 Get what I want and possibly Relevance CDQ 0 go deeper for more details (*) IDQ: Intrinsic data quality; CDQ: Contextual data quality; RDQ: Representational data quality; ACC: Accessibility data quality; USIQ: User interaction systems quality; DPSQ: Data processing systems quality; R: Repertory grid; 0: Open Interview
After displaying these tables (Appendix A, D, and G), the analysis shifts to a
higher level of abstraction. Each category is then grouped with its corresponding
concepts. The following tables 20, 21, and 22 that correspond respectively to Canada,
Germany, and France are based on data from Appendix A, D and G.
The first column indicates the name of the emerging category. The second
column indicates the corresponding concepts that determine the category. Each multi
determinant concept in column two is indicated by a number showing the amount of
raw data that determines it. For example, "Accuracy (9)" in table 20 in the third row
and the second column specifies that nine separate pieces of raw data determine the
"Accuracy" concept. Appendices AF, AG, and AH show the multi-determinant

125
concepts and the corresponding raw data at the systems level in Canada, Germany, and
France. The third column indicates the number of participants who provided at least
one concept. The fourth column indicates the total number of concepts in the second
column. Tables 20, 21, and 22 are sorted by descending order of the number of
participants who provided at least one concept.
The following table 20 shows the categories and the concepts of IS success at the
systems level in Canada.
Table 20
Categories and concepts at the systems level in Canada
Category Corresponding concepts Representational Ease of understanding (5), easy data quality information format, information easy to
follow, reports easy to read, intuitive presentation, interpretability (7), clarity (3), consistency (4)
Accessibility Access control (13), data Availability (5) information sharing ( 4), rapid access (7) centralized data
Intrinsic data Integrated data (2), clean data, accuracy quality (9), data viability
Contextual data Timeliness (4), completeness (2) quality relevance (13), information that allows
benchmarking, forecasting (3) value added , information that allows users to do analysis, data currency
Data processing Standard system (2), response time (6) systems quality hardware compatibility, hardware
flexibility (3), hardware reliability (3)
User-System Interface quality (8), ease of interaction interaction quality
* NPPOC: Number of participants who provided at least one concept
* TNC: Total number of concepts
NPPOC*
9
9
8
8
8
5
TNC*
8
5
4
8
5
2
126
The following table 21 shows the categories and the concepts of IS success at the
systems level in Germany.
Table 21
Categories and concepts at the systems level in Germany
Category Correspondin2 concepts Accessibility Rapid access (6), access control (11)
accessibility (3), acceptable access, data security
Data processing Hardware standardization, hardware systems quality reliability (7), hardware efficiency,
systems flexibility (10), hardware compatibility, response time (3)
Contextual data Relevance (8), background information, quality forecasting, appropriate amount of data (2),
data currency (3)
Representational Consistency of data meaning in different data quality countries, interpretability ( 4 ), ease of
understanding ( 4), easy presentation of complex data in reports
User-System Interface quality (8), ease of navigation (5) interaction comfortable to use, easy to leam (3), easy quality to use (2)
Intrinsic data Accuracy (6), integrated data (2), data quality integrity (2), harmonized data everywhere
* NPPOC: Number of participants who provided at least one concept * TNC: Total number of concepts
NPPOC*
8
7
7
6
6
4
TNC*
5
6
5
4
5
4
The following table 22 shows the categories and the concepts of IS success at the
systems level in France.
Table 22
Categories and concepts at the systems level in France
Category Correspondine concepts Accessibility Information sharing, access control (23)
User-System Easy to use (4), interface quality (12), fit interaction between user and system logic, smart quality responses
Data processing Systems flexibility (7), hardware systems quality reliability, response time (11)
Contextual data Relevance (5), data aggregation, level of quality detail, customized data, appropriate
amount of data (2), timeliness, feedback information, data currency
Intrinsic data Precision (2), accuracy (9), validated data quality (2), verifiable data
Representational Concise data, ease ofunderstanding (3), data quality clarity ( 4 ), interpretability, report
customization
* NPPOC: Number of participants who provided at least one concept
* TNC: Total number of concepts
NPPOC* 8
8
8
7
6
5
127
TNC* 2
4
3
8
4
5
In table 20 for example, we see that there are 8 people (89% of total
participants) who provide at least one concept to determine the "Intrinsic data quality"
category. The total number of concepts that determine this category is 4 and the
number of determinants (raw data) that determine the category is 13 (2+ 1 +9+1 in
column 2, row 3 of table 20).
For the purposes of clarity and reading convenience, the following table 23
was copied from Appendix AF. It shows how the tables that contain the multi
determinant concepts are structured.

128
Table 23
Example of multideterminant concepts at the systems level in Canada
Multi-determinant conceot Raw data Accuracy Accurate data
Accurate data Accurate data Accurate data Accurate data Accurate data Common data Unique data Excellent data
Integration of data Integrated data Integration of data
Standard data Consistency Same information in global environment
Standard data Data consistency in reports
Timeliness Just in time data Just in time data Just intime data Get data quickly before it is too late
Complete data Completeness Present complete information
Relevance Relevant information on reports Get what I want and possibly go deeper for more details Necessary information User X does not have to know what user Y is doing. Provide data to who needs it Information responds to different objectives of different users Necessary information for the users New information Meets user' s need Gather all necessary information Useful information User X does not have to know what user Y is doing. Provide data to who needs it Necessary information Meets user's need

129
Table 23 shows for example that the accuracy concept is determined by 9
determinants by counting the raw data in the second column.
Before we conclude this section, we would like to bring an interesting remark
that concems the "Accessibility" category. Although this category ranks 1 in all the
cultures (table 18), its meaning differs in France on one hand and in Canada and
Germany on the other hand. In France it is the very controlled access to data that
makes an information system perceived as successful, while in Canada, accessibility
means moderate to high access to data. This difference in meaning can be seen in the
raw data that determines the strongest concept which determines the "Accessibility"
category and that is the "Access control" concept. Tables 20, 21, and 22 show the
numbers of raw data that determines the "Access control" concept which are: 13, 11,
and 23 respectively in Canada, Germany, and France. A portion of the actual raw data
of the "Access control" concept that holds its meaning and which is copied from
appendix AH, AF, and AG which contain the multi-determinants concepts, is as
follows: in France (keep confidentiality, hierarchy of information access, hierarchy of
using the system, controlled access to data, information forward to right people only,
enables confidentiality). In Canada (flexibility in control, trade off in control, system
that is closed and open selectively, access control at certain level), and in Germany
( different levels of access, strategic data controlled).
The difference in the meaning of the concepts that determine the categories of
IS success at the systems level was found only in the "Accessibility" category.
However, even if the concepts are equivalent in terms of the meaning they hold to
refer to the same category, their numbers as well as their presence and absence in each
category differ frorn culture to culture as shown in table 14.
To conclude this section, we can say that IS success at the systems level is
determined by three main categories in all cultures: "Data quality", "User-System
interaction quality", and "Data processing quality". The "Data quality" category is

130
expressed in terms of "Intrinsic data quality", "Representational data quality",
"Accessibility data quality", and "Contextual data quality". However, the actual
meaning of each of these categories is embedded in its corresponding concepts and
raw data.
1.1. 3 Conclusion
We end this section by displaying the IS success categories at the systems level in
all cultures in the following figure 12. We recall that the labels of the categories are
the same. However, differences exist in the meaning of the concepts that determine the
category, as is the case for the "Access control" concept that determine the
"Accessibility" category. Also, even if the meaning held by the concepts is common,
the number of concepts that determines each category as well as the absence and the
presence of the concepts differ in many cases from culture to culture, as indicated in
table 14.
Figure 12
IS success categories at the systems level in Canada, Germany, and France
IS success categories in all cultures
·~
• Intrinsic data quality
• Contextual data quality
• Representational data quality
• Accessibili ty
• User-System interaction quality
• Data processing systems quality
131
1.2 Open and Repertory grid interview analysis and results at the individual level in Canada, Germany, and France
The same strategy of data presentation and analysis of IS success at the
systems level is pursued at the individual level. After presenting the total number of
raw data of each emerging category, comparative displays are provided and supported
with comments and analysis. The detailed analysis that shows the process we followed
to construct IS success categories is then described. However, there are many
categories at the individual level that differ from culture to culture, as opposed to those
that emerged at the systems level. Moreover, only few concepts are multi-determinants
at the individual level. For these reasons, the focus will be on the categories rather
than on concepts.
The following table 24 provides the amount of raw data per category at the
individual level in Canada, Germany, and France. The first column contains the name
of the emerging category. The other column that corresponds to each culture indicates
the total number of raw data that determine each category. A star symbol indicates that
the category did not emerge in the corresponding culture.
Table 24 Amount of raw data per category at the individual level in Canada, Germany, and
France Category ARD* ARD* ARD*
Canada Germany France Impact on individual task 16 5 4 Impact on decision making 13 3 3 Impact on the user's career 11 7 8 Impact on individual skills and knowledge 10 * 9 Impact on the user as a person 10 5 * User satisfaction 2 12 10 User independence from management and * 8 * user dependence on the group User independence from IS professionals * * 6 User power over the system * * 12 Use * * 7 Total 62 40 59
132
In Canada, there are 62 raw data that served in the analysis of IS success at the
individual level. The "Impact on individual task" category was generated by the
highest amount of raw data. The "User satisfaction" category was generated by the
lowest amount ofraw data and the "Impact on individual skills and knowledge" as well
as the "Impact on the user as a person" categories were generated by the same amount
of raw data. The following discussion provides information about the meaning of the
emerging categories at the individual level in Canada. The discussion is supported by
the concepts that determine each category. These concepts are provided in the detail
section.
The "Impact on individual task" category refers to the extent to which
information can influence and modify the tasks that are executed by the user. In
Canada, the participants stress the point that a successful information system should
help change the activities that are executed by the user. The system should provide
relevant information to help the user perform his or her job. The system should handle
the routine activities and let the user perform more intelligent tasks.
The "Impact on individual skills and knowledge" category refers to the extent
to which the information system can influence and enhance the skills and knowledge
of its users. This category is linked to the "Impact on individual task" category in the
sense that if the system takes care of the routine activities, the users would perform
more intelligent activities and therefore would enhance his or her knowledge and
skills.
The "Impact on decision making" category refers to the extent to which an
information system supports its users in their decision-making process. The system
would then be the basis of more specific applications that support the decision making
process, such as: decision support systems, group support systems, executive
information systems, and expert systems.

133
The "Impact on the user's career" category refers to the ability of the system to
influence the position and the long term career of its users. This mainly concems
promotions and new responsibilities in the organization.
The "Impact on the user as a persan" category refers to the extent to which the
information can influence the user as a persan. For example, some users say that a
successful information system would allow them to do their job on time and save some
time for their family.
The "User satisfaction" category refers to the overall satisfaction of the user.
In Germany, 40 raw data served in the analysis of IS success at the individual
level. As opposed to Canada, the "User satisfaction" category was generated by the
highest amount of raw data in Germany. The "Impact on decision making" category is
determined by the lowest amount of raw data. The "Impact on the user as a persan"
and the "Impact on individual task" categories are determined by the same amount of
raw data.
We notice the emergence of a new category at the individual level: "User
independence from management and user dependence on the group". This category
refers to the extent to which an informational system would make its user more
autonomous in performing his or her job independent from the supervisor or the
manager. At the same time, the system would glue its users together.
In France, 59 raw data served in the analysis of IS success at the individual
level. The "User's power over the system" was generated by the highest amount of
raw data. The "Impact on decision making" category is determined by the lowest
amount of raw data. Compared with Canada and Germany, new categories of IS
success at the individual level emerge in France. The following paragraphs describe
their meaning.

134
The "User independence from IS professionals" category refers to the extent to
which the user of a successful information systems can use the system without relying
much on IS professionals.
The "User's power over the system" category refers to the extent to which the
user must dominate the system and not vice versa. That is, the logic and the rules of
work are provided by the user and not the system.
The "Use" category refers to the degree of using the system. The more the
system is used, the more successful it is. However, DeLone and McLean (1992)
argues that the "Use" category can be misleading because there are two situations in
which an IS can be used. The first one is where the user can perform his or her job
without using the system, but he is using it to get information. In this case, a high
degree of systems usage is a good indicator of IS success. The second scenario is
where the user must use the system to perform his or her job. The system is
mandatory. In this case using the "Use" category would lead to a biased conclusion
about IS success. "Use" in our case refers to the first scenario.
1.2.1 Comparative displays at the individual level
To compare the findings at the individual level, categories are examined
instead of concepts. Again, a + sign indicates that the category has emerged in the
corresponding culture and a - sign indicates that it did not.
The following table 25 compares the emerged categories of IS success at the
individual level.

135
Table 25
Comparative display at the individual level
Cate2:ory Canada Germanv France Impact on individual task + + + Impact on the user's career + + + Impact on decision making + + + User satisfaction + + + User independence from management - + -And user dependence on the group User independence from IS professionals - - + User power over the system - - + Use - - + Impact on individual skills and knowledge + - + Impact on the user as a person + + -
Table 25 shows that four common categories of IS success emerge at the
individual level. These are: "Impact on individual task", "Impact on the user's career",
Impact on decision making", and "User satisfaction". These are the global categories
that are presented in the summary section of the present chapter. This section also
presents the local categories that are specific to their corresponding cultures. The table
also shows that three categories emerge only in France: "User independence from IS
professionals", "User power over the system", and "Use". The "User independence
from management and user dependence on the group" category emerges only in
Germany. While the "Impact on individual skills and knowledge" emerges in Canada
and in France but not in Germany, the "Impact on the user as a person" category
emerges in Canada and in Germany but not in France.
1.2.1.1 Determining the relative category weight in each culture and the cross-cultural
weight of common categories. The following tables 26, 27, and 28 show the category
weight in Canada, Germany, and France respectively.

136
Table 26
Weight of the categories at the individual level in Canada
Cateeories Weieht Impact on decision making 1 (7) Impact on individual skills and knowledge 2 (6) Impact on the user as person 2 (6) Impact on the user's career 4 (5) Impact on individual task 5 (3) User satisfaction 6 (2)
( ) number of participants who provided at least one concept
Table 26 displays the weight of the categories at the individual level in Canada.
This table shows that the rank of the category "Impact on decision making" is the
highest and that the rank of the category "User satisfaction" is the lowest. The
categories: "Impact on individual skills and knowledge" and "Impact on the user as a
person" have the same rank of 2.
The following table 27 shows the category weight in Germany.
Table 27
W eight of the categories at the individual level in Germany
Cateeory Weight User satisfaction 1 (6) Impact on the user's career 2 (5) User independence from management and User dependence on 3 (4) the group Impact on the user as a person 3 (4) Impact on decision making 5 (3) Impact on individual task 6 (2) ( ) number of participants who provided at least one concept
Table 27 shows that the rank of the category "User satisfaction" is the highest
and that the rank of the category "Impact on individual task" is the lowest.
The following table 28 shows the category weight in France.

137
Table 28
Weight of the categories at the individual level in France
Cate2:ory Wei2:ht Impact on user's career 1 (7) User independence from IS professionals 2 (6) Impact on individual skills and knowledge 2 (6) Use 2 (6) The user's power over the system 5 (5) User satisfaction 5 (5) Impact on individual task 7 (4) Impact on decision making 8 (3)
.. ( ) number of part1c1pants who prov1ded at least one concept
Table 28 shows that the rank of the category "Impact on user's career" is the
highest and that the rank of the category "Impact on decision making" is the lowest.
The "User independence from IS professionals", "Impact on individual skills and
knowledge", and "Use" categories have the same rank of 2. The "User's power over
the system" and the "User satisfaction" categories have the same rank of 5.
The following table 29 shows a new layout which would enable the reader to
appreciate the cross-cultural variations of the weight of the categories at the individual
level in Canada, Germany, and France. A star symbol in a cell indicates that the
category did not emerge in the corresponding culture.
The table shows that there are no common highest ranked categories in all the
cultures, as was the case at the systems level. In fact, the categories that rank 1 in
respectively Canada, Germany, and France are: "Impact on decision making, "User
satisfaction", and "Impact on user's career". The table also shows that the categories
that the lowest rank categories in Canada, Germany, and France are: "User satisfaction,
"Impact on individual task" and "Impact on decision making".

138
Table 29
Cross-cultural weight at the individual level
Category Canada Germanv France Impact on individual task 5 6 7 Impact on decision making 1 5 8 User satisfaction 6 1 5 Impact on user's career 4 2 1 Impact on individual skills and
2 * 2 knowledge Impact on the user as a person 2 3 * The user' s power over the system * * 5 User independence from IS
* * 2 professionals Use * * 2 User independence from management
* 3 * and User dependence on the group
The following section shows the data reduction and grouping that led to the above
results.
1.2.2 Detailed description of data analysis and results at the individual level in each culture
Appendices V, Y, and AB show the output of the database queries at the
individual level respectively in Canada, Germany and France. Appendices B, E, and H
show the tables that contain the raw data at the individual level of respectively each
Canadian, German and French participant, as well as the corresponding concept and
category.
It is extremely important to recall that our concem is with different systems of
meaning (cultures). As indicated in the literature review chapter of this research,
culture has to do with people. Therefore it is believed that the main impact of national
culture will be at the individual level and the organizational level in considering the
fact that organizations fonction by people. The grouping results per culture are
displayed, followed by a detailed discussion of the emerging categories.

139
1.2.2.1 Canada. The following section describes the detailed data analysis at the
individual level in Canada. Table 30 shows IS success categories, their corresponding
concepts, the number of users who provided at least one concept, and the total number
of concepts.
Appendix AI shows the multi-determinant concepts and the corresponding raw
data at the individual level in Canada. The following paragraphs provide discussion
about the emerging categories. The discussion is also supported by the contents of
table 30 that contain the concepts which determine each category.
All Canadian participants believe that a successful information system has
impacts on the decision making process.
A successful information system enhances the user's skills and knowledge and
helps him or her develop new skills. The newly developed skills are mainly defined by
the analytic competencies of the user. It also enables others to extract the user's tacit
knowledge because of these newly developed analytic skills. The manager or
supervisor can analyse the user's skills and knowledge easily because they become
explicit in his day-to-day activities.
A successful information system has an impact on the user as a person: "User
motivation", "Smiling faces", and "Balancing time for work and family". However,
for some, stress and a decrease in the user's morale are frequently cited by the
participants as a result of the instability caused by a successful IS. So, a positive
impact is apparent if the users are capable of accepting change, and are willing to
switch from routine tasks to analytic tasks. If the users who used to perform routine
tasks are not willing or able to develop their analytic reasoning skills, then stress
increases along with a decrease in user's morale. One participant stressed the fact that
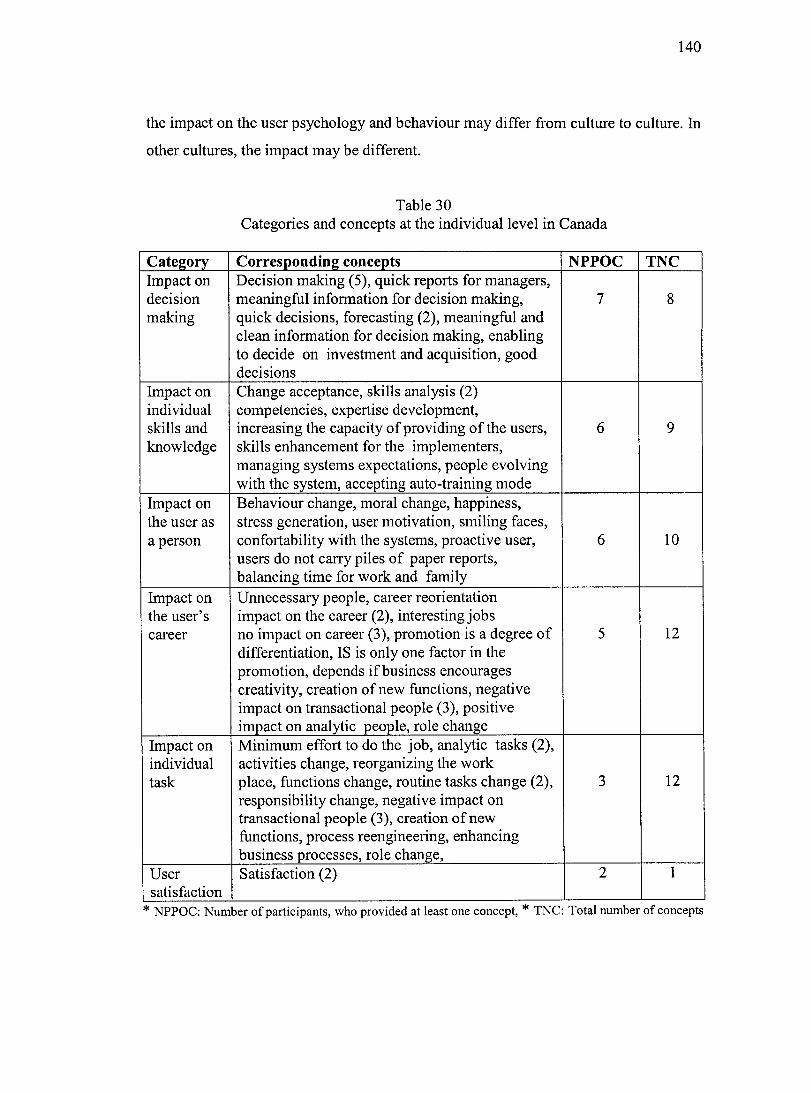
140
the impact on the user psychology and behaviour may differ from culture to culture. In
other cultures, the impact may be different.
Table 30 Categories and concepts at the individual level in Canada
Cateeorv Correspondine concepts NPPOC TNC Impact on Decision making (5), quick reports for managers, decision meaningfol information for decision making, 7 8 making quick decisions, forecasting (2), meaningfol and
clean information for decision making, enabling to decide on investment and acquisition, good decisions
Impact on Change acceptance, skills analysis (2) individual competencies, expertise development, skills and increasing the capacity of providing of the users, 6 9 knowledge skills enhancement for the implementers,
managing systems expectations, people evolving with the system, accepting auto-training mode
Impact on Behaviour change, moral change, happiness, the user as stress generation, user motivation, smiling faces, a person confortability with the systems, proactive user, 6 10
users do not carry piles of paper reports, balancing time for work and family
Impact on Unnecessary people, career reorientation the user's impact on the career (2), interesting jobs career no impact on career (3), promotion is a degree of 5 12
differentiation, IS is only one factor in the promotion, depends if business encourages creativity, creation of new fonctions, negative impact on transactional people (3), positive impact on analytic people, role change
Impact on Minimum effort to do the job, analytic tasks (2), individual activities change, reorganizing the work task place, fonctions change, routine tasks change (2), 3 12
responsibility change, negative impact on transactional people (3), creation of new fonctions, process reengineering, enhancing business processes, role change,
User Satisfaction (2) 2 1 satisfaction
* NPPOC: Number of participants, who provided at least one concept, * TNC: Total number of concepts

141
The most important impact on the user' s career is career change. Most
Canadian participants do not believe that a successful information system has an
impact on the user's career in terms of promotion to higher ran1c They believe that
promotion is conditioned by variables other than IS. However, most participants
mention that users who do not have well developed analytic skills become
unnecessary in the business and those who do have these skills are happy, but
promotion is not associated with happiness. Examples of quotes that support this
argument are: "Human dynamism has an impact and not IS", "IS is only one factor",
"Promotion is a degree of differentiation".
The discussion that concems the category "Impact on individual task" hides
an important meaning that we would like to discuss in the following paragraphs.
We notice that in Canada, the weight of the category "Impact on individual
task" is not high (table 30). There were only 3 people out of 9, which corresponds to
33% of the total number of participants, who perceive it as a good indicator of a
successful information system. However, the amount of data that determines this
category is equal to 16, which corresponds to the highest amount of raw data as
indicated in the above table 30 (by counting the concepts in the first row, second
column and including the numbers in parentheses in the total). In considering these
factors, we have made a few comments about this category. The following discussion
originates from the list of concepts that determine the category (table 30) and the
participants' comments that we recorded during the interviews.
The analysis of the concepts that determine the impact on individual task
category reveals that this category is determined by two sub-categories, namely:
"Activities change", and "Roles and Responsibility change". The following figure 13
illustrates this relationship.

Figure 13
Canada, the determinants of the "Impact on individual task" category
Activities change
Impact on individual task
142
Sorne participants believe that a successful information system has both a
positive and a negative impact on the individual task. The impact is positive from the
business perspective but, it may be negative from the individual perspective. From the
business perspective, a successful information system is one that supports business
process reengineering and redefinition. Thus the process becomes clear, fluid and
efficient and it requires fewer people to handle it than previously since most of the
activities are automated. Transactional activities are reduced to a minimum and non
value activities are eliminated. This leads to financial economy for the business. From
the individual perspective, this leads to a reduction of jobs as tasks and activities
previously executed by the employees are reduced or automated. The "Roles and
responsibilities change" sub-category is also analysed from both perspectives. From
the business perspective, the newly created activities in the business process require
analytic reasoning from the employees. Transactional activities are reduced to
minimum. Workers who are not experienced in analytic reasoning and analysis or who
are not willing to accept the change in their jobs may be in a precarious situation. As
business needs more competent people in analytic reasoning, the roles are created

143
accordingly. From the individual perspective, the change from transactional to analytic
roles may not be appealing to all employees.
1.2.2.2 Germany. The following section provides the detailed data analysis at the
individual level in Germany. The following table 31 shows IS success categories,
their corresponding concepts, the number of users who provided at least one concept,
and the total number of concepts.
Table 31
Categories and concepts at the individual level in Germany
Cate2ory Correspondin2 concepts *NPPOC *TNC User No satisfaction, user friendliness (2), liking satisfaction the system, subjective satisfaction (5), 6 6
satisfaction (high), users happy with the system
Impact on the Changing to other companies, no career user's career impact (2), career development (2), changing 5 4
jobs User Team work approach, connecting people, independence independence from the boss, information 4 8 from sharing, the group helps change the user's management skills, reducing face to face communication And user with the boss, in-group training, generating dependence trust between people and management on the group Impact on the User motivation in IS development, user as a generating stress, frustration (high), 3 5 person reinforcing the state of the mind, having fun
at the job Impact on Different forecasting, enhancing decision decision making, automating decision making 2 3 making Impact on Minimum effort to do the job (2), performing 2 4 individual the task fast, performing the task better, task making life easy in performing the task.
* NPPOC: Number of participants who provided at least one concept* TNC: Total number of concepts

144
Appendix AJ shows the multi-determinant concepts and the corresponding raw
data at the individual level in Germany. The following paragraphs provide discussion
about the emerging categories. The discussion is also based on table 31, which
contains the concepts that determine each category.
A striking phenomenon was found in the German data at the individual level.
Users believe that a successful IS helps the user become more independent from
managers and dependent on the group for input and help. The system reduces the face
to-face communication. Conversely, the user dependence on the group reflected by the
concept of information sharing has been frequently cited in the interviews. German
participants believe that IS is the perfect tool to obtain the user's tacit knowledge.
However, this knowledge needs to be shared. Connecting people and sharing
information is an important aspect: "no more hierarchy in management", "training in
the group", and "connecting people".
In German culture, a successful IS has an impact on the user as a person. It
reduces frustration and enhances the state of the mind. As information sharing is
encouraged and applied, secrecy is reduced and trust is enhanced. This encourages
people to participate in the development and the implementation of future information
systems.
German participants also believe that a successful information system has
impact on the decision making process, the user' satisfaction and on the individual
task.
The discussion that concems the category "Impact on the user's career" hides
an important meaning that we would like to discuss in the following paragraphs. This
category hides a meaning that is revealed only by German participants and is not
obvious in the other cultures.

145
The impact of a successful IS on the user's career can be seen from two
perspectives and each perspective provides two opposing poles. These poles are the
positive impact and negative impact, and the perspectives are those of the user and the
business.
From the user's perspective, the positive impact of a successful IS is career
advancement. The user leams from the system, expands his tacit knowledge and
acquires the tacit knowledge of others. Skills are enhanced and this leads to a positive
impact on the individual which in tum leads to a positive impact on the business. The
negative impact is a reduction of people in the business. The user may feel the danger
of loosing his or her job.
From the business perspective, the positive impact is a consequence of the
positive impact on the user and the negative impact can be seen in the employees'
turnover as they develop their knowledge and expertise and leave the organization to
work for other organizations.
To conclude, we may say that the positive impact from the user's perspective
may lead to a negative impact from the business perspective and the negative impact
from the user's perspective may lead to a positive impact from the business
perspective.
The following graph in figure 14 illustrates and summarizes our discussion.
It shows that the impact on the user's career can be seen from two perspectives: the
business perspective and the user's perspective and that each perspective can
further be classified into negative and positive impact.
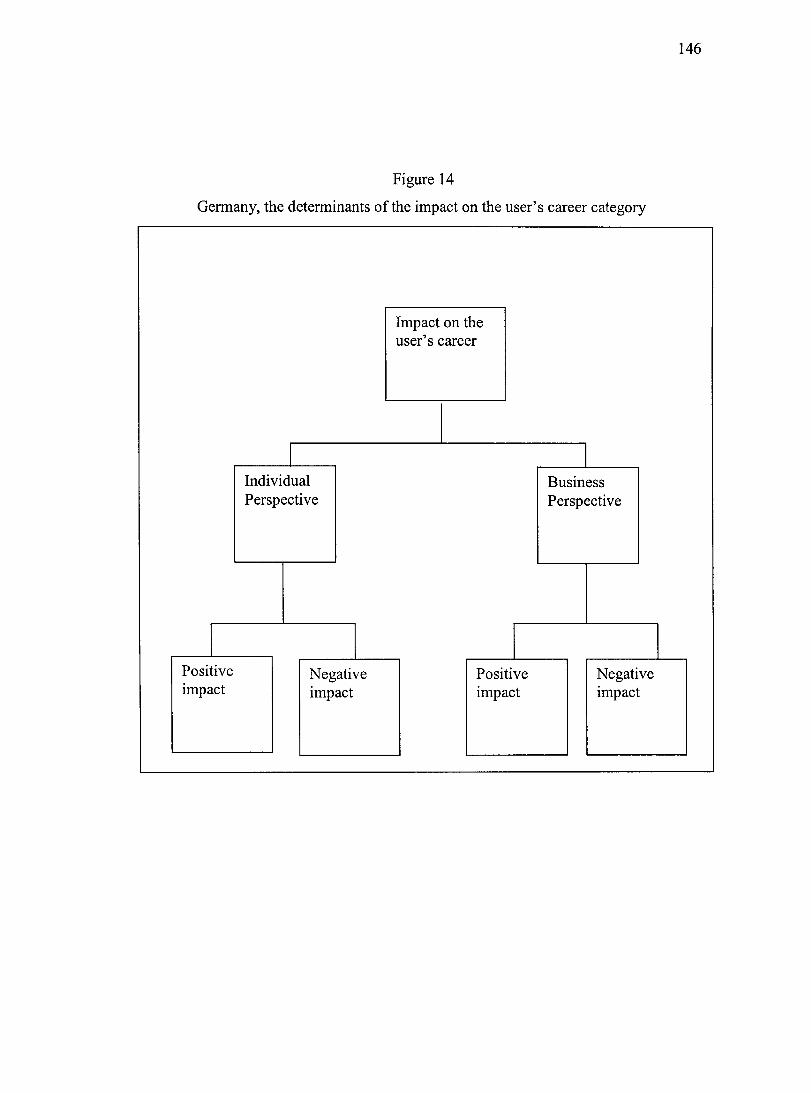
Figure 14
Germany, the determinants of the impact on the user's career category
1
Positive impact
1
Individual Perspective
1
Negative impact
Impact on the user' s career
1
Positive impact
Business Perspective
Negative impact
146
1

147
1.2.2.3 France. The following section provides the detailed data analysis at the
individual level in France. The following table 32 shows IS success categories, their
corresponding concepts, the number of users who provided at least one concept, and
the total number of concepts.
Table 32
Categories and concepts at the individual level in France
Cateeory Correspondine concepts Impact on the user's Enhancing persona! expertise, no impact career on the career (3), impacting the user's
career if users use the system and managers witnessed that (2), impact on the career if us ers mas ter the system, job evolution
User independence Using the system independently form IS from IS professionals professionals (2), no needs for
programmers (4)
Use Using the system (5), use of the system by subordinates, users with high intention to use the system
Impact on individual Pushing users for perfection, enhancing skills and knowledge the user skills and knowledge, better
system queering, creating one's own reports (2), open the user's conscientiousness, creativity, becoming more technical (2)
User satisfaction Users liking the system (4), meets users' needs (3), disappointing non-satisfied users, satisfaction (2)
* NPPOC: Number of participants who provided at least one concept
* TNC: Total number of concepts
NPPOC
7
6
6
6
5
TNC
5
2
3
7
4

Table 32
Categories and concepts at the individual level in France ( continued)
Cate2ory Correspondin2 concepts User power Feeling the superiority of the user on the system (2), over the importance of the user on the system in achieving IS system success, denying the role of IS in making the user
more competent, importance of the user as a measurement tool ofIS success, importance of the functional user in verifying IS success, not blocking users from doing their job, freedom in organizing and managing time, not letting the systems change the users context, user's refusai of standard systems, enabling the users to solve the problems by themselves instead of relying on vendor of standard system, user's refusal ofIS outsourcing
Impact on Facilitating the task, performing the job better, individual aligning task and mission, rethinking the tasks and tasks responsibility Impact on Better decision making (2), gaining time in decision decision making making
* NPPOC: Number of participants who provided at least one concept * TNC: Total number of concepts
NPPOC
5
4
3
148
TNC
11
4
2
Appendix AK shows the multi-determinant concepts and the corresponding
raw data at the individual level in France. The following paragraphs provide
discussion on the emerging categories.
The following paragraphs discuss some categories of IS success at the
individual level in France.
The common category of the impact of the system on decision making that we
found in Canada and in Germany is not strong among French participants. Only few
raw data indicate the positive impact of the system on decision making. This is related
to the non impact of the system on the user's career. ln fact, the French believe that
even if the system can support the decision-making process, it would not have an
impact on the user' career. This is not the case in Canada, where, for example,

149
decision-support systems are developed to support the users in their decision-making
process, which leads to recognition and incentives and therefore the prospect of
advancement in the users' career.
We also came upon the "Impact on user's skills and knowledge" category. The
French participants consider that a successful IS is one that gives them the freedom to
perform the types of queries they like. A system that gives them freedom and liberty.
A system that opens their eyes and help them try things and leam. This is a logical
category in that the participant will try to find alternatives in response to the close
mindedness of the managers. They no longer count on management and therefore they
need to explore other means by which they can gain freedom and independence. This
is also related to the category of "User independence from IS professional" in the
sense that IS professionals exercise power on users, and dictate to users very specific
procedures to follow to use the system.
The discussion that concems the category "Impact on the user's career" also
hides an important meaning that we would like to discuss. The majority of the French
participants believe that a successful IS should not have an impact on the user's career.
In France, managers are the ones who make decisions conceming the career of the
employees. The following raw data belonging to the "Other" set demonstrate the level
of perceived power of managers on employee career orientation:
1. "A true system is a tool";
2. "Managers are the only ones who decide";
3. "Managers are always closed";
4. "We have a very bureaucratie administration in France";
5. "People believe that if it cornes from the managers, then it is not good" and
6. "Managers do not care about employees".

150
1.2.3 Conclusion
We conclude this section by displaying IS success categories at the individual
level in Canada, Germany, and France in the following figure 15. Attention is called
for in some categories such as "Impact on the user's career" which in Germany and
France holds a different meaning than in Canada.
Figure 15
IS success categories at the individual level in Canada, Germany, and France
1
Canada
1
- Impact on decision making
- Impact on individual skills and knowledge
- Impact on the user as a person
- Impact on the user' s career
- Impact on individual task
- User satisfaction
IS Success at the individual level
Germany
- User satisfaction - Impact on the user' s
career - User independence
from management and user dependence on the group
- Impact on the user as a person
- Impact on decision making
- Impact on individual task
1
France
1
- Impact on the user's career
- User independence from IS professionals
- Use - Impact on individual
skills and knowledge - User satisfaction - User power over the
system - Impact on individual
task - Impact on decision
making

151
1.3 Open and Repertory grid interview analysis and results at the organizational level in Canada, Germany, and France
The same strategy of data presentation and analysis of IS success at the
individual level is employed at the organizational level. After presenting the categories
and the amount of raw data that determine each category, comparative displays are
provided, followed by the detailed analysis that shows the chain of evidence of the
emerging categories.
The following table 33 provides the amount of raw data per category at the
organizational level in Canada, Germany, and France. Again, the first column contains
the name of the emerging category. The second column indicates the total amount of
raw data that determine each category. The categories are classified in descending
order by the amount of raw data.
In Canada, 49 pieces of raw data served in the analysis of IS success at the
organizational level. While the "Business process redesign" category was referenced
by the highest amount of data, the "Knowledge development" and the "Ease of user
performance evaluation" categories were referenced by the lowest amount of data. The
"Impact on the business networks" and the "Innovation" categories were referenced by
the same amount of raw data.
The following paragraphs provide information about the meanmg of the
emerging categories at the organizational level in Canada. The discussion is also
supported by the concepts that determine each category. These concepts are provided
in detail in the detailed section.
The category "Financial impact" refers to the extent to which a successful
information system enables the financial growth of the organization.

152
Table 33
Amount of raw data per category at the organizational level in Canada, German y, and France
Category ARD* ARD* ARD* Canada Germanv France
Business process redesign 15 18 8 Financial impact 12 6 3 Impact on the business networks 6 * * Innovation 6 * * Gain of competitive advantage 4 * * Ease of user performance 3 * * evaluation Knowledge development 3 * * Help desk support quality * 7 * Team work * 6 * Impact on organizational structure * 18 * and management style Knowledge-based organizational * 7 * culture Fit between systems and human * * 10 models of work User integration and * * 8 communication in the group Total 49 63 29 (*) Amount of raw data
The category "Impact on the business networks" refers to the extent to which a
successful information system can enable the organization to maintain a sustainable
relationship with its partners such as suppliers, investors and clients.
The category "Business process redesign" refers to the extent to which a
successful information system can reengineer business processes. The reengineering is
possible only by introducing information technology in the different phases of business
pro cesses.

153
The category "Gain of competitive advantages" refers to the extent to which a
successful information system enables the organization to be competitive and gain
advantages over its competitors.
The category "Ease of user performance evaluation" refers to the extent to which
a successful information system enables management or supervisors to easily evaluate
the performance of employees. The idea is that as the system would handle routine
transaction and save time for its users to do more analytical and intelligent reasoning,
it would be easy for management to evaluate the performance of their employees by
looking at the number of problems solved and the number and the quality of the
decisions made ...
The category "Innovation" refers to the extent to which a successful information
system helps the organization be increasingly innovative.
The category "knowledge development" refers to the extent to which a
successful information system helps the development of knowledge in the
organization. Emphases are on the use of tacit knowledge, knowledge sharing and
collaboration.
In Germany, 63 pieces of raw data served in the analysis of IS success at the
organizational level. The table also shows that while the categories "Impact on
organizational structure and management style" and "Business process redesign"
were determined by the highest amount of raw data, the categories "Financial impact"
and "Team work" were generated by the lowest amount of raw data. We also notice
that the categories "Knowledge-based organizational culture" and "Help desk support
quality" were referenced by the same amount of raw data.

154
New categories emerged in Germany. The following paragraphs provide
information on their meanings. The discussion is also supported by the concepts that
determine each category and which are provided in the detailed section.
The category "Impact on organizational structure and management style"
refers to the extent to which a successful information system can change the
organizational structure and management style in the organization.
The category "Knowledge-based organizational culture" refers to the extent to
which a successful information system can help develop a new organizational culture;
a culture which is based on knowledge and knowledge sharing.
The category "Team work" refers to the extent to which a successful information
system can support team work.
The category "Help desk support quality" refers to the quality of the
organization of the help desk as well as the quality of the personnel who work at the
help desk.
Finally, table 33 shows that 29 pieces of raw data served in the analysis of IS
success at the organizational level in France. The table shows that the "Fit between
systems and human models of work" was determined by the highest amount of data
and that the "Financial impact" category was generated by the lowest amount of data.
We can also notice that "Business process redesign" and "User integration and
communication in the group" were referenced by the same amount of raw data.
The following paragraphs provide information on the meanings of the new
categories. The discussion is also supported by the concepts that determine each
category and which are provided in the detailed section.

155
The category "Fit between systems and human models of work" refers to the
extent to which the systems model and logic follows or fits the user's logic and model.
The category "User integration and communication in the group" refers to the
extent to which a successful information system helps the integration of its users and
allows fluid communication in the group.
1.3.1 Comparative displays at the organizational level
The following table 34 displays and compares the emerging categories at the
organizational levels in all cultures. Again, a + sign indicates that the category was
constructed in the corresponding culture and a - sign indicates that it did not.
Table 34
Comparative display of IS success at the organizational level
Cate2ory Canada Germany France Financial impact + + + Business process redesign + + + Fit between systems and human model of work - - + Help desk support quality - + -Team work - + -Impact on organizational structure and - + -management style Knowledge- based organizational culture - + -Innovation + - -Ease of user's performance evaluation + - -Gain of competitive advantage + - -Impact on the business networks + - -Knowledge development + - -User integration and communication in the - - + group
Table 34 shows that only two categories are common in all the cultures. These
are: "Financial impact" and "Business process redesign". This table also shows that 5

156
categories were constructed only in Canada. These are: "Innovation", "Ease of user's
performance evaluation", "Gain of competitive advantage", and "Impact on the business
networks". The categories that emerged only in Germany are: "Help desk support
quality", "Team work", "Impact on organizational structure and management style", and
"Knowledge- based organizational culture". The ones that emerged only in France are:
"Fit between systems and human model of work" and "User integration and
communication in the group".
Before providing the detailed analysis of our data at the organizational level and
know that we can see all the categories of IS success at the organizational level in all
cultures, we would like to make a short comment about the categories of IS success at
the organizational level in Canada.
We would like to recall that the headquarters' office of our multinational
organization is located in Canada. The categories of IS success at the organizational
level in Canada reveal a concem that can be linked to the headquarters' office only. In
fact, it makes sense to say that management has decided to invest billions of dollars on
implementing the ERP system worldwide to: gain competitive advantages, make more
money, redesign and enhance business processes, enhance business network, innovate,
and enable knowledge development. These are also exactly the categories that define
how Canadian participants define and perceive IS success. W e may therefore say that
there might be a possibility of influencing IS success definition and meaning in Canada
due to the location of the headquarters office which is Canada also.
1.3.1.1 Determining the relative category weight in each culture and the cross-cultural
weight of common categories. Tables 35, 36, and 37 provide the category weight in
Canada, Germany, and France respectively.

157
Table 35
Weight of the categories at the organizational level in Canada
Categories Weight Business process redesign 1(7) Financial impact 2 (6) Impact on the business networks 3 (4) Gain of competitive advantage 4 (3) Innovation 4 (3) Knowledge development 6 (2) Ease of user performance evaluation 6 (2) ( ) number of participants who provided at least one concept
Table 35 shows that, while "Business process redesign" category ranks 1, the
categories "Knowledge development", and "Ease of user performance evaluation"
have the lowest rank. This table also shows that two categories have the same rank.
These are: "Gain of competitive advantage" and "Innovation".
The following table 36 shows the weight of the categories at the organizational level in
Germany.
Table 36
Weight of the categories at the organizational level in Germany
Category Weight Business process redesign 1 (7) Financial impact 2 (5) Impact on organizational structure and management style 3 (3) Knowledge-based organizational culture 3 (3) Team work 3 (3) Help desk support quality 3 (3)
( ) number of participants who provided at least one concept
Table 36 shows that the "Business process redesign" category ranks 1 as m
Canada. It also shows that four categories have the same rank. These are: "Impact on
organizational structure and management style", "Knowledge-based organizational
culture", "Team work" and "Help desk support quality".

158
The following table 3 7 shows the weight of the categories at the organizational level in
France.
Table 37
Weight of the categories at the organizational level in France
Category Weight User integration and communication in the group 1 (6) Business process redesign 2 (5) Fit between systems and human model ofwork 3 (4) Financial impact 4 (2)
( ) number of participants who provided at least one concept
Table 37 shows that the "User integration and communication in the group"
category ranks 1 and that the category "Financial impact" has the lowest rank.
The following table 38 shows a new layout that would enable the reader to
appreciate variations in cross-cultural weight of the categories. A star symbol
indicates that the category was not constructed in the corresponding culture.
Table 38 shows that not only is the category "Business process redesign"
common in ail cultures, it is also the one that ranks 1 in Canada and Germany and 2
in France. The category "Financial impact" follows the same logic with an exception
in France. This table also shows that there are more local categories than common
ones.

159
Table 38
Cross-cultural weight at the organizational level
Cate2ory/ country Canada Germany France Business process redesign 1 1 2 Financial impact 2 2 4 User integration and communication in
* * 1 the group Fit between systems and human model
* * 3 ofwork Impact on organizational structure and
* 3 * management style Knowledge-based organizational
* 3 * culture Team work * 3 * Help desk support quality * 3 * Impact on the business networks 3 * * Gain of competitive advantage 4 * * Innovation 4 * * Knowledge development 6 * * Ease of user performance evaluation 6 * *
The following section shows the reduction and the grouping data that led to
the above results.
1.3.2 Detailed description of data analysis and results at the organizational level in each culture
Appendices W, Z, and AC show the output of the database queries at the
organizational level respectively in Canada, Germany and France. Appendices C, F,
and I show the tables that contain the raw data at the organizational level of
respectively each Canadian, German and French participants as well as the
corresponding concept and category.
1.3.2.1 Canada. The following section provides the detailed data analysis at the
organizational level in Canada. The following table 39 shows IS success categories,

160
their corresponding concepts, the number of users who provided at least one concept,
and the total number of concepts.
Table 39 Categories and concepts at the organizational level in Canada
Catee:ory Correspondine concepts NPPOC TNC Business Enabling to identify problems in business process processes (2), process efficiency (2), work redesign method change, fonctions restructuring, 7 12
transaction consolidation , revising processes, business process productivity (2), better process visibility for management, improving processes (2), business process redefinition, process reengineering, enhancing business process
Financial Informing about key performance variables, impact managing finance, quick profit recognition,
identifying areas to improve to save money, 6 9 forecasting, financial improvement, financial impact (4), enabling to evaluate the eamed value of the business, downsizing
Impact on the Happy clients, negotiating with suppliers, business managing contract with suppliers, influencing networks relationships with suppliers, controlling contract 4 6
processing, enhancing relationships with investors
Gain of Information leadership, opportunities, 3 4 competitive competitive advantage gain, concentrating on advantages opportunities
Innovation Encouraging innovation (3), flexible innovation, 3 4 questioning the way the business in run, innovation
Knowledge Users develop analytic reasoning, tacit 2 3 development knowledge development, gratifying tacit,
knowledge providers Ease of user Evaluating users, performance (2), controlling 2 2 performance peoples' jobs evaluation
* NPPOC: Number of participants, who provided at least one concept,* TNC: Total number of concepts

161
Appendix AL shows the multi-determinant concepts and the corresponding
raw data at the organizational level in Canada. The following paragraphs provide
discussion about the emerging categories. The discussion is supported by the contents
of the above table 39.
IS success at the organizational level in Canada can be categorized into two
main areas: intemal and extemal. The intemal area is further divided into: ease of user
performance evaluation, innovation, and impact on finance, business process redesign
and knowledge development categories. The extemal area is divided into: gain of
competitive advantage and impact on the business networks categories.
A successful information system requires business processes to be clearly
defined and well structured. When these processes are accurately defined, employees
perform more and more analytic reasoning rather than transactional routines. The
processes become visible and the human resources management is capable to evaluate
the performance of each employee who works on the process, as well as the
performance of his or her manager, quickly and effectively. Because analytic
reasoning dominates much of the employee's time, they have opportunities to think
about business opportunities which lead to greater innovation.
Because business processes are well structured and do not reqmre many
employees to handle them, the operational costs are reduced and thus the financial
impact of the system is realized: it helps to manage cash flow and fix payments in
advance, it helps top management recognize profit sooner, and it helps to evaluate the
eamed value of the business.
The organization gains competitive advantages because the system provides
day to day data and information about the market. It also helps forecast and manage
the cash flow. The relationships between the business and its suppliers are enhanced
because information conceming contract bidding and negotiation as well as project
follow-up is readily available. Customer satisfaction increases as orders are processed

162
quickly and effectively. Investors retain a favourable image of the business because of
the positive relationships between the suppliers and the customers created by the
information systems.
1.3.2.2 Germany. The following section provides the detailed data analysis at the
organizational level in Germany. The following table 40 shows IS success categories,
their corresponding concepts, the number of users who provided at least one concept,
and the total number of concepts.
Table 40
Categories and concepts at the organizational level in Germany
Cate~ory Correspondin~ concepts Business Enduring business processes, changing process processes (2), reengineering the organization, redesign supporting the business process (3), visibility
of the whole process, efficient processes (3), reducing process complexity, business process productivity (2), enabling flexibility in integrating business processes, integration of information, standardization of processes, reducing work flow cycle
Financial Reducing travel effort, generating financial impact value for the business, reducing work flow
cycle, reducing overhead cost, managing time, reducing cost, downsizing
Help desk Clear help desk structure and process, auto-support quality training help desk personnel, centralizing the
help desk fonction, solving problems by the help desk staff, direct communication with help desk, help desk provides good assistance, help desk sharing
Team work Supporting team work (2), working in an open climate, accessing information by everyone (2), enabling access to more information from colleagues at work
* NPPOC: Number of participants who provided at least one concept
* TNC: Total number of concepts
*NPPOC
7
5
3
3
*TNC
13
7
7
4

163
Table 40
Categories and concepts at the organizational level in German y ( continued)
Category Corresponding concepts Knowledge- Tacit knowledge development, knowledge-based sharing based organizational culture (3), organizational knowledge sharing, changing the culture organizational culture, bringing new ways of
thinking Impact on Developing new structures (8), organizational communication change, using intranet, structure and changing the organizational structure, title management less environment, end user computing (2), style freeing up people for other tasks (2),
decentralizing decision-making process, developing rigor in management
* NPPOC: Number of participants who provided at least one concept
* TNC: Total number of concepts
NPPOC TNC
3 5
3 9
Appendix AM shows the multi-determinant concepts and the corresponding raw
data at the organizational level in Germany. The following paragraphs provide
discussion about the emerging categories.
The participants believe that successful information systems must have a
financial impact on the organization. This can be seen in the cost reduction due to
personnel reduction in business processes as well as the output of the business
processes themselves becoming more fluid.
Sorne German participants strongly believe that a successful information
system does change the culture of the organization. The desired culture is one that is
based on knowledge sharing. They place heavy emphasis on the fact that tacit
knowledge must become explicit. This leads to a teamwork structure which is
explained below. German organizational structures are commonly referred to as
machines. The participants believe that these structures need to change.

164
In parallel with the previous point, the structure of the new culture of
knowledge-sharing must also be changed. Unhierarchical, and flat and matrix
structures should be implemented in order to provide an environment conducive to
sharing knowledge. Divisions and titles have no or little meaning anymore. A new
style of management along with the new organizational culture and structure leads to
more responsibility for managers and employees. End user computing becomes
standardized. End user computing is defined as the use of computing tools by users
who are not IS professionals. Required information is available in the system and an
end user is completely dependent on the system to access it.
A relationship was developed between "Teamwork", "Organizational structure
change" and "Knowledge-based organizational culture" categories. Knowledge
sharing requires teamwork, flat and flexible structures. We can thus deduce the
following theoretical relationship in figure 16.
Figure 16
Germany, the relationship between "Teamwork", "Impact on organizational structure and management style", and "Knowledge-based organizational
culture" categories
Teamwork
flexible structure
organizational culture

165
The above figure suggests that a knowledge based culture is determined by
teamwork and flat and flexible structures. Examples of quotes that support this
category are: "IS is a tool for teamwork" and "Work in an open group climate".
Another interesting category emerging from the analysis of the German data is
"Help desk support quality". Germans believe that IS success can be perceived or
measured by the quality of the help desk service. If the latter corresponds to what they
determine as high quality help desk support, the systems can be perceived as
successful: "Help desk must solve at least 80% of help calls", "One single number to
the help desk office", and "Clear help desk structure and process" are some raw data
that determine this category. This is what DeLone and McLean (2003) refer to as
service quality in their new model of IS success. However, in our case, the category
emerged at the organizational level and we decide not to bring any influence from
existing literature.
1.3.2.3 France. The following section provides the detailed data analysis at the
organizational level in France. Table 41 shows IS success categories, their
corresponding concepts, the number of users who provided at least one concept, and
the total number of concepts.
Appendix AN shows multi-determinant concepts and their corresponding raw
data at the organizational level in France. The following paragraphs provide
discussion about the emerging categories.
French perceptions of IS success at the organizational level are qui te different
from Canadian and German perceptions. Only few cards were collected from the
French participants at the organizational level of IS success. This suggests that that
they do not highly perceive IS success at the organizational level as they do at the
systems and the individual levels. The user integration and communication in the
group is implied by the unwillingness of the user to rely on managers and IS
professionals. French users would rather approach colleagues that hold the same status

166
in terms of hierarchy. The fit between the systems and the human logic of work is
highly emphasized by the French: "Should not extemalize our rules of work", "Be a
logical system", "We are the owners of our ideas", and "Must have our hands on the
system".
Table 41
Categories and concepts at the organizational level in France
Cate2ory Correspondin2 concepts *NPPOC *TNC User integration Communicating between members of the unit, and common competencies among the group, 6 6 communication helping users to be more attached, bringing in the group open climate at work, knowledge sharing,
enhancing social climate
Business process Servicing the customers better, gaining redesign efficiency (3), supporting business processes, 5 6
enabling managers to have a larger visibility in the business, detailing the tasks in the business processes, influencing the inter service relationships
Fit between Aligning the business and the systems systems and strategies, aligning the work methods with the 4 8 human model of system, being a logical system that fits work work logic (2), the system presents a philosophy of
work method, imposing users' ideas on the system (2), not extemalizing our rules or work, not blocking users from doing their job, controlling the system and the system follows
Financial impact Helping to make money (2) 2 1
* NPPOC: Number of participants, who provided at least one concept,* TNC: Total number of concepts.
1.3.3 Conclusion
We end this section by grouping IS success categories at the organizational
level in Canada, Germany, and France in the following figure.

167
Figure 17
IS success categories at the organizational level in Canada, Germany, and
France
1
Canada
1
- Business process redesign
- Financial impact - Impact on business
networks - Gain of competitive
advantages - Innovation - Knowledge sharing - Ease of user
performance evaluation
IS Success at the organizational
level
Germany
1
- Business process redesign
- Financial impact - Help desk support
quality -Team work - Knowledge-based
organizational culture
- Impact on organizational structure and management style
2. CHINESE FOCUS GROUP INTERVIEW RESULTS
1
France
1
- User integration and communication in the group
- Business process redesign
- Fit between systems and human models ofwork
- Financial impact
The Chinese data analysis technique is different and simpler than the French,
Canadian and German data analysis. We simply proceed by a content analysis at each
level and discuss the theoretical emerging meaning. We do not have sufficient data to
deserve multi-level theoretical abstraction. However, the homogeneity of the
responses implied by the use of focus group techniques, allowed us to draw several

168
conclusions about the meaning of IS success in the Chinese group. The following
table shows the amount ofraw data per level ofIS success.
Table 42
Focus group interviews with Chinese participants. Amount of raw data in each level of IS success
Level ARD* System 13 Individual 3 Organization 4 Others 16 Total 36 (*) Amount of raw data
The following table shows the raw data at the systems level as well as their frequency
of mention.
Table 43
Focus group interviews with Chinese participants. Amount of raw data at the systems level
Raw data Frequency Good security 6 Simple screens 3 Only managers can access financial data 2 Exact information 1
High response time 1 Total 13
The following table shows the raw data at the individual level as well as their
frequency of mention.
Raw data
Table 44
Focus group interviews with Chinese participants Amount ofraw data at the individual level
Humans are the only ones who can decide No impact on decision making No impact at all on the users Total
Frequencv 1 1 1 3

The following table shows the raw data at the organizational level as well as their
frequency of mention.
Table 45
Focus group interviews with Chinese participants. Amount of raw data at the organizational level
Raw data Frequency Stable information 1 No impact on the business 1 Many other factors determine the impact on the business 1 W e like face to face business 1 Total 4
169
The following table shows the raw data which were not assigned to any of the above
levels.
Table 46
Focus group interviews with Chinese participants. Amount of the "Other" raw data
Raw data Frequency IS cannot replace people 2 Good IS is just a secretary 2 I do not rely on IS for making decision 2 I like to use my native language 1 IS cannot decide 1 I do not like computers to do my job 1 A computer helps me perform my job 1 I don't like universal systems 1 Easy to use systems 1 W e have diff erent meaning for things 1 An IS gives me only information 1 I like expert information 1 IS gives me information and not solutions 1 Total 16
The collectivist and high power distance dimensions in Chinese society are
probably major factors that have led the Chinese participants to accept a focus group
interview instead of one on one interview. In fact, in collectivist or family-oriented

170
cultures, people are more likely to stress interpersonal and group harmony. Persona!
ideas are not considered as important. The group decision or the group ideas are
important. The leader in family oriented cultures also influences some kind of power
on the group members. He is the father and therefore he can represent the group and
must be respected. It is this power that we felt when a person told us that he would
answer all the questions because he knows that the remaining members would provide
the same answers.
In considering the system level of IS success, it was noticeable that the
Chinese participants put considerable emphasis on security. Access to data must be
controlled and not open to anyone. Only the "father" can access data. Information
must be exact and the presentation logic of data must be simple. Screens do not need
to be filled with superfluous information. The language of the presentation must be in
Chinese script and not in any another language.
According to their view, a successful information system has no impact at all
on its users. Decision making is handled by an expert and IS is considered as serving
the role of a secretary and not even as an assistant.
A successful information system has no impact on the organization. The raw
data in the "Other" set which remained unassigned to any of the listed IS success
levels reveals significant support for the above statements. Again, they stress the fact
that an IS is just a tool.
Kaye, Hilton, and Taylor (1997) compare the Chinese culture with Hofstede's (1980)
dimensions as follows:
The individualism-collectivism dimension characterizes Chinese culture as collectivist, where there is a tight social framework in which people seek fulfillment and happiness in the harmony of the group. The power distance dimension characterizes the Chinese culture as high power distance. Thus
171
obedience, conformity, autocratie decision making and close superv1s1on characterize superior-subordinate relationships. On the uncertainty avoidance dimension, Chinese culture can be characterized as medium to low uncertainty avoidance. Thus Chinese people are usually comfortable with ambiguity and not likely to be emotional and intolerant of change (p. 479).
Since communication is crucial in information systems, the use of Hall (1976)
dimension of low-high context provides a strong support to our finding. Chinese
culture is a high context culture in which tacit and personal information is more
important than straight explicit information. This shows why Chinese do not give
much importance to data and information that is stored in information systems and
explains why the enhancement of the decision-making process was not revealed as a
major factor of successful information systems.
To conclude, it may be questioned whether the concept of IS success has any
determinable meaning or value in Chinese culture. If a system is not considered
important, then how can its success or failure be characterized?
3. SUMMARY
The following tables summarize our results and group them into global and
local categories at the individual and the organizational levels in three cultures:
Canada, Germany, and France. China is not included as there was not a sufficient
amount of data from the Chinese group, and the systems level is not included since
there was a unique classification of categories in all the cultures. If a category is
cnstructed in all the cultures, it may be considered as global. If the category emerges
in only one or two cultures, it is considered as local or culturally specific.
The following are the global categories at the individual level:

1. Impact on individual task;
2. Impact on decision making;
3. Impact on the user's career and
4. User satisfaction.
The following table 47 shows the local categories at the individual
level in Canada, Germany, and France.
Table 47
Local categories at the individual level
Canada Germany France -Impact on individual -Userindependence -User
skills and knowledge from management independence from -Impact on the user as a and user dependence professionals
172
IS
person on the group -Impact on individual skills -Impact on the user as a and knowledge
person -The user's power over the system
-Use
As can be noticed from the list of global categories of IS success at the
individual level, these categories are classic ones that IS researchers are familiar with.
They are common categories that were constructed in all our cultures. The categories:
"Impact on individual task", "Impact on decision making", "Impact on the user's
career", and "User satisfaction" may be called universal or global. However, even
though the category name may be standard and common among all cultures, the actual
meaning that is held by the category may be different. For example, the category
"Impact on the user's career" may be very familiar to the reader. In most cases, the
researcher assumes that a successful IS has a positive impact on the user' s career. But
in France, for example, participants perceive exactly the opposite. They perceive that a
successful IS may have a negative impact on the user's career. The local categories are
specific to their corresponding cultures. They have meaning only to people who
perceive them. More discussion on local categories will be provided in the discussion

173
chapter. We can also notice that there are more global categories that determine IS
success at the individual level in Canada than local ones, more in Germany than local
ones and equal numbers of global and local categories in France.
The following are the global categories at the organizational level:
1. Business process redesign;
2. Financial impact.
The following table 48 shows the local categories at the organizational level m
Canada, Germany, and France.
Table 48
Local categories at the organizational level
Canada Germany France
-Impact on the business -Impact on -Fit of systems and networks organizational human model of
-Gain of competitive structure and work. advantage management style -User integration and
-Ease of user performance -Know ledge-based communication in the evaluation organizational culture group
-Knowledge development -Teamwork -Innovation -Help desk support
quality
In comparing and analyzing the list of global categories and the above table 48
which contains the local categories of IS success at the organizational level in Canada,
Germany, and France, we can easily notice that our findings at the organizational level
are quite opposite from the individual level. In fact, only two categories are global as
opposed to four at the individual level. Moreover, there are more local categories than
global ones in Canada and Germany and an equal number of local and global
categories in France. This analysis shows the extent of the complexity of the fit process
that we proposed in our research model in figure 9. In fact, the more local categories
people perceive in a specific culture and less global categories, the harder it would be
to merge or to fit the meaning of IS success in each culture with the built-in success

174
assumptions of the ERP system. Put differently, suppose for example that there are no
or very few local categories of IS success at the organizational level in Canada,
Germany, and France. The fit management team would have to put less time, money
and effort to design a unique set of fit activities and implement them in all cultures to
fit the built-in success assumption of the ERP system and the meaning of IS success at
the organizational level which is defined equally in all cultures.
To conclude this chapter, we group our findings in single pictures to help the
reader see the emerging categories in each culture and at each level. Figure 18
concems IS success in Canada. This figure copies the categories of IS success at the
systems level from table 13, the categories of IS success at the individual level from
table 24, and the categories of IS success at the organizational level from table 33 and
lists them as follows.
1
IS Success at the systems level
1
- Representational data quality
- Accessibility data quality
- Contextual data quality
- lntrinsic data quality
- Data processing system quality
- User-System interface quality
Figure 18
Canadian IS success model
IS Success in Canada
1
1
IS Success at the individual level
1
- Impact on decision making
- Impact on individual skills and knowledge
- Impact on the user as a persan
- Impact on the user's career
- Impact on individual task
- User satisfaction
1
IS Success at the organizational level
1
- Business process redesign
- Financial impact - Impact on business
networks - Gain of competitive
advantages - Innovation - Knowledge sharing - Base of user
performance evaluation

175
The following figure 19 concems IS success in Germany. This figure takes the
categories of IS success at the systems level from table 13, the categories of IS
success at the individual level from table 25, and IS success at the organizational level
from table 36 and list them as follows.
IS Success at the systems level
- Accessibility - Data processing
system quality - Contextual data
quality - Representational
data quality - User-System
interface quality - Intrinsic data
quality
Figure 19
German IS success model
IS Success in Germany
1
IS Success at the individual level
- User satisfaction - Impact on the user' s
career - User independence
from management and user dependence on the group
- Impact on the user as a person
- Impact on decision making
- Impact on individual task
1
IS Success at the organizational level
1
- Business process redesign
- Financial impact - Help desk support
quality -Teamwork - Knowledge-based
organizational culture
- Impact on organizational structure and management style

176
The following figure 20 concems IS success in France. This figure takes the
categories ofIS success at the systems level from table 13, the categories ofIS success
at the individual level from table 24, and IS success categories at the organizational
level from table 33 and lists them as follows.
IS Success at the systems level
- Accessibility - User-System
interface quality - Data processing
system quality - Contextual data
quality - Intrinsic data
quality - Representational
data quality
Figure 20
French IS success model
IS Success in France
1
1
IS Success at the individual level
1
- Impact on the user's career
- User independence from IS professionals
- Use - Impact on individual
skills and knowledge - User satisfaction - User power over the
system - Impact on individual
task - Impact on decision
making
1
IS Success at the organizational level
1
- User integration and communication in the group
- Business process redesign
- Fit between systems and human models ofwork
- Financial impact

177
Figures 18, 19, and 20 display the categories of IS success in Canada, Germany,
and France. The figures include both global and local categories of IS success.
Although we reserved a complete chapter to discuss the results of our study, we feel
that now that these results are summarized and displayed in the above figures, we
would like to take advantage of this opportunity and bring a short discussion. The
discussion will be based on two perspectives: a descriptive and an analytical
perspective. The analytical perspective will be further discussed at two levels: our case
organization level and the cross-cultural comparative management level.
From the descriptive perspective, the models clearly show that research
participants in Canada, Germany and France do perceive IS success at the systems, the
individual and the organizational levels. The categories of IS success at the system
level are commonly named. But the actual meaning of the categories which is
embodied in the concepts of each category differs for some categories. Common
categories of IS success were also developed at the individual and the organizational
levels. But there are also culture-specific categories of IS success at these levels as
well.
From the analytical perspective, and in considering only our case organization,
the models can be considered as a major input to the implementation team of the ERP
system and to the fit process. In fact, the implementation team would take each
category at the systems level as well as its corresponding concepts and design the
system accordingly. The change management team, who is responsible for the fit
activities, would take each category at the individual level and the organizational level
along with their corresponding concepts and conduct the fit process. On the other
hand, another major use of the models is in the measurement of IS success. After a
few years of using the ERP system, management at the headquarters' office would
develop IS success measurement tools by using IS success categories as well as their
corresponding concepts in each level and in each country.

178
From the analytical perspective and in considering IS success literature, our
models add value and contribute to existing IS success knowledge. The models
support the necessity to consider the cultural variable in defining and in assessing IS
success. On the other hand, and in considering cross-cultural comparative
management, our findings support and contribute to existing knowledge in this area in
which scholars investigate and compare organizational and managerial issues across
many cultures.
Generally speaking, the literature of cross-cultural comparative management
provides knowledge about differences in a variety of organizational and managerial
issues in different cultures. However, multinational organizations which are a major
player and a major target for this knowledge can choose to either act on these
differences in case the strategic orientation of the multinational organization is to
pursue standardization as is the case for our organization, or do business and survive
with these differences. For example, Coca cola has been a greater adherent to
standardization whereas Nestle has always believed in market adaptation (Deshpande
and Webster, 1989). Our proposai to fit the built-in success assumptions of the ERP
system with the meaning of IS success as defined by people in each of our cultures,
follows and supports the strategic orientation of our organization in which we
conducted our study.
To conclude, it is worthwhile to indicate that although Hofstede (1980) gathered
many countries in four different clusters in his corporate organizational model, we are
not claiming that our results are applicable to all countries that belong to the same
cluster as each of our studied cultures.

1. INTRODUCTION
CHAPTERSIX
DISCUSSION
This chapter discusses the findings of our research. Section two examines the
research objectives in regard to their degree of achievement. In doing so, we will map
our findings with the research grand tour question and sub-questions. In section three,
we discuss the fit concept as proposed in the research model. In section four, the
research findings are compared with cultural dimensions which we used to select our
cultures and which explain the difference between them. Section five discusses the
implications of the research findings to the academic and practice communities. Our
propositions for future research are also provided in this section. Finally, in section
six, we discuss the limitations of the research.
2. DISCUSSION ON RESEARCH OBJECTIVES
The following are the research questions and sub-questions of the study.
For each national culture taken individually:
1. What is the meaning of IS success from the perspective of people living in that
national culture and how is it operationalized?
2. How are the categories of IS success weighted at each level (systems,
individual, and organizational levels) in that national culture (i.e. which are
more important than others )?

180
For all cultures:
3. What is the cross-cultural weight of common categories ofIS success?
4. What are the common categories of IS success in all cultures and what are the
specific ones?
The following are the research sub-questions that we asked to answer the first
research question:
1. Do people in an MNC subsidiary in a given national culture perceive IS success
at the systems level? If so, how?
2. Do people in an MNC subsidiary in a given national culture perceive IS
success at the individual level? If so, how?
3. Do people in an MNC subsidiary in a given national culture perceive IS success
at the organizational level? If so, how?
First, we would like to recall that the first research question is deduced from our
research framework. The framework shows that the national culture of a subsidiary of
any multinational organization would have an impact on the meaning of IS success at
the systems level, the individual level, and the organizational level. The first research
question searches for this meaning. The answer to the second, third, and fourth
questions are deduced from the answer of the first question.
2.1 The meaning of IS success at the system, the individual, and the organizational Ievels
This research investigated the meaning of IS success in four national cultures:
France, Germany, Canada, and China. IS success models were developed in all
cultures except in the Chinese culture because of insufficient amount of data. The
findings in the Chinese group will be discussed separately. Few conclusions about IS

181
success in the Chinese culture were derived from our data analysis even if we could
not develop full IS success models.
The target meaning is sought at different levels of IS success; the systems level,
the individual level, and the organizational level. The research participants did not
corne up with any other levels in which IS success could be perceived. The results
show that indeed IS success is not perceived equally at all levels in the selected
cultures and that national culture could be the main factor that explains this finding.
This section also includes discussion on common and specific categories of IS success
which are referred to as global and local categories in the previous chapters.
2.1.1 Systems level
The results of our research reveal that people from different national cultures
do perceive IS success at the systems level.
At the systems level, the meaning and definition of IS success was categorized
into three main categories: "Data quality", "User-system interaction quality", and
"Data processing data quality". Put differently, the emerging models indicate that
people from different cultures use the same characteristics to refer to the quality of the
systems data, the systems interaction with the user, and the systems' data processing.
"Data quality" category was further categorized into: "Intrinsic data quality",
"Contextual data quality", "Representational data quality", and "Accessibility", which
we borrowed form Wang and Strong (1996) to organize our raw data. IS success
categories in Canada, Germany, and France are:
1. "Intrinsic data quality";
2. "Contextual data quality";
3. "Representational data quality";
4. "Accessibility;

182
5. "User-system interaction quality" and
6. "Data processing data quality".
Our finding at the systems level partly supports the theory of Rosenzweig's
(1994) who argues that technical systems as opposed to social and socio-technical
systems are not affected by the cultural values of people who use them. However,
even though the labels of the categories of IS success at the systems level are common
in all cultures, the actual meaning or connotation which is held by the categories is
only embedded in their corresponding concepts and raw data. In other words, the
categories "Intrinsic data quality", "Contextual data quality", "Representational data
quality", "Accessibility, "User-system interaction quality" and "Data processing data
quality", emerged in all the cultures. But the actual indicators (concepts) of these
categories are the ones which indicate what they actually mean.
We found a major difference in meaning of the "Accessibility" category.
Although this category ranks 1 in all the cultures, its meaning differs in France on one
hand and in Canada and Germany on the other hand. In France it is the very controlled
access to data that makes an information system perceived as successful, while in
Canada, accessibility means moderate to high access to data. This difference in
meaning can be seen in the raw data that determines the strongest concept which
determines the "Accessibility" category and that is the "Access control" concept. A set
of the actual raw data of the "Access control" concept that holds its meaning is as
follows: in France (keep confidentiality, hierarchy of information access, hierarchy of
using the system, controlled access to data, information forward to right people only,
enables confidentiality). In Canada (flexibility in control, trade off in control, system
that is closed and open selectively, access control at certain level), and in Germany
( different levels of access, strategic data controlled).
183
We also need to stress the fact that even if the other concepts are equivalent in
terms of the meaning they hold to refer to the same category, their numbers as well as
their presence and absence in each category differs from culture to culture.
Our findings at the systems level will help the implementation team of the ERP
system to succeed the implementation phase of the project. By implementation, we
mean the technical aspect of the system implementation and not the social aspect. If
the above categories and concepts are implemented in the ERP system, the systems
acceptance is very likely to occur because it would be based on how the systems future
users perceive the conditions of an acceptable and good system. The implementation
team should take each of the categories: "Intrinsic data quality", "Contextual data
quality", "Representational data quality", "Accessibility", "User-system interaction
quality", and "Data processing systems quality", along with its corresponding
concepts and implement the system accordingly in each culture.
2.1.2 Individual level
The results of our research reveal that people form different national cultures
do perceive IS success at the individual level.
At the individual level, the results showed that IS success is not perceived
equally in the selected cultures. The perception of what makes an information system
successful at the individual level is not homogenous across all cultures. This is not
surprising. The social sicle of the system which includes the user and the impact on the
user is indeed affected by cultural values (Rosensweig, 1994). Four categories are
common across all the cultures (Canada, France, and Germany).
These are:
1. "Impact on individual task";
2. "Impact on decision making";

184
3. "Impact on the user's career", and
4. "User satisfaction".
These are the global categories that emerged in our studies. The results also
show that there are local categories. Two in Canada: "Impact on individual skills and
knowledge" and "Impact on the user as a person", two in Germany: "User
independence from management and user dependence on the group" and "Impact on
the user as a person", and four in France: "User independence from IS professionals",
"Impact on individual skills and knowledge", "User power over the system", and
"Use". These are the specific categories that emerge in each culture. This means that
in order to design an effective IS success measurement questionnaire; the researcher
must design three different questionnaires. Each questionnaire should include the four
global categories as well as local categories. A standard questionnaire that contains
only the global categories would not be complete and therefore the measured degree of
success at the individual level may not be methodologically correct.
Our findings also suggest that in order to measure IS success at the individual
level in Canada, Germany, and France; the researcher can use the variables whose
relative weight ranges from average to high (acceptable degree of importance). In
Canada these would be: "Impact on individual skills and knowledge", "Impact on
decision making", "Impact on the user's career", and "Impact on the user as a person"
(weight 1, 2, and 4). In Germany, the categories are: "User satisfaction", "Impact on
user's career", "Impact on the user as a person", and "User independence from
management and user dependence on the group" (weight 1, 2, and 3). In France, they
are: "Impact on user's career", "Impact on individual skills and knowledge", "User
satisfaction", "User independence from IS professionals", and "User satisfaction"
(weight 1, 2, and 5).
The results also reveal that even tough there are common or global categories
that can be used to measure IS success at the individual level, their importance is not

185
standard and homogenous. Change is required so that the users augment the degree of
their perception on these categories. The weight of the category "Impact on decision
making" is low in Germany and France and high in Canada. This suggests that
Canadian users would organize their work and implement procedures in a way that
would require the use of the systems information in their decision making process.
French and German users may not. This also suggests that if the ERP built-in success
assumptions support decision making, the outcome would be higher in Canada and
lower in France and Germany.
2.1.3 Organizational level
The results of our research reveal that people from different national cultures
do perceive IS success at the organizational level.
The results showed that IS success at the organizational level is not
homogenous across all the cultures. Only two categories are common across all the
cultures. These are:
1. "Business process redesign" and
2. "Financial impact".
Five categories are local in Canada: "Innovation", "Ease of user's performance
evaluation", "Gain of competitive advantage", "Impact on the business networks, and
"Knowledge development". Four categories are local in Germany: "Help desk support
quality", "Teamwork", "Impact on organizational structure and management style",
and "Knowledge- based organizational culture". Two categories are local in France:
"Fit between systems and human model of work" and "User integration and
communication in the group". This means that the perception of IS success at the
organizational level is even more heterogeneous than the perception of IS success at
the individual level. This comment can be explained by the fact that cultural values are

186
stronger at the organizational level (basic assumptions) than the individual level
(Schein, 1990). A possible explanation of the emergence of two specific global
categories is the fact that any organization would invest money on information systems
and expect retum on investment (Financial impact category). Also, by definition,
knowing that information systems must support one or more business processes,
organizations in general take the opportunity to implement a system by redesigning its
corresponding business processes (Business process redesign category).
W e would like to recall that the headquarters' office of our multinational
organization is located in Canada. The categories of IS success at the organizational
level in Canada reveal a concem that may be linked to the headquarters' office only.
The objectives as well as the strategic goals that support and justify the investment on
the standard ERP system may somehow influence perception given by the Canadian
participants to the meaning of IS success at the organizational level.
2.2 Discussion on the weight of the emerging categories
The results reveal that the weight of the emerging categories in each culture
and the relative cross cultural weight of common categories at each IS success level
are not always equal in our cultures.
The weight of the categories at the system level across all cultures is different
except the "Accessibility" category which ranks 1 in all cultures. The weight of
common categories across all cultures is different at the individual and the
organizational levels.
The weight of the categories at the systems level would help the
implementation team choose the most important categories that must be implemented.
For example, the "Accessibility" category must be implemented in all cultures because
it ranks one in all of them. The weight of the categories at the individual level as well
187
as the organizational level would help the person who would measure IS success (long
term success) use the strong categories that must be included in the questionnaires.
The importance of the weight information was emphasized by DeLone and McLean
(1992) when they proposed their IS success model and argued that the researcher does
not need to use all six dimensions to measure IS success. Instead, add the authors, the
researcher can decide on the level of measurement and then choose the corresponding
dimensions or categories. However, the authors did not specify the criteria that the
researcher would use to choose the categories from each level. Our research provides
this information to ease the task of IS success measurement in our selected cultures.
The following paragraphs discuss the fit process. Put differently, the researcher can
base his or her choice of IS success categories on the weight associated to each
category in each culture.
2.3 Discussion on the Chinese findings
W e would like to recall that a focus group interview with five Chinese
participants was conducted. We could not apply Repertory grid or open interviews
with the Chinese participants. A full IS success model was not developed because of
an insufficient amount of data. As mentioned in the results section of the Chinese
focus group interview, the participants declined conducting one-to-one interviews with
us. They selected a spokesperson and said that he would tell us exactly what the others
would say. He speaks for others. He is the leader of the group. This "father-figure"
type of relationship is typical in Chinese culture. The focus group interview allowed
us to obtain a certain amount of data that enabled us to discuss the results in the
Chinese group and draw a few conclusions about IS success in the Chinese culture.
W e support our conclusions by the strengths of focus group interviews in which all
participants usually agree or disagree about the assertions and answers to the research
questions.

188
Chinese culture scores 68 on the "Power distance" dimension and 29 on the
"Uncertainty avoidance" dimension. The "Power distance" is considered high and the
"Uncertainty avoidance" is low in this culture. The results reveal that Chinese people
do not attribute a high degree of importance to information systems. The informalism
dominates communication and decision making (Kaye, Hilton, and Taylor, 1997). The
collectivist aspect of Chinese society (Hofstede, 1994) is a major factor that explains
this position. China is a family-based of culture as argued by Hofstede (1994) and
Trompenaars and Hampden-Turner (1994). The father or leader decides. However, the
collectivist aspect of Chinese culture forces the leader to discuss the decision before it
is taken. The reliance on IS is not a considered be important. Face-to-face and
interpersonal relationships are important in Chinese culture, while persona! ideas are
not considered as important. The group decision or the group ideas are important
because China is a high context culture (Hall, 1976). The leader in family-oriented
cultures also influences some kind of power on the group members and this can be
noticed in the behavior of the group prior to conducting the focus group interview.
Chinese participants put considerable emphasis on security. The unequal
distribution of power can justifies this emphasis. Only the father can access important
data. The Chinese also prefer the systems displays in their language. IS success is
probably not perceived at the individual level. We could not find any concept that
demonstrates otherwise. In addition, IS success is probably not perceived at the
organizational level either. The role oflS is analogous to "The role of a secretary".
2.4 Linking the results with existing literature
Before ending this section, we would like to compare our findings with existing
literature. The literature comparison is linked directly and indirectly to our research
subject. Our research supports Rosensweig's (1994) theory conceming the
intemationalization of management science. The author argued that the
intemationalization of management science research that concems socio-technical and

189
social systems is impossible mainly because the variables, the measurement of the
variables, and the relationship between the variables are all affected by the values of
people who use them. From this perspective, we found that IS success, a concept that
concems socio-technical systems, is indeed affected by national culture. In the same
line of theory, our research supports Brancheau and Watson's (1991) IS key issues
model. After a large Delphi study, the authors concluded that four international
dimensions influence important IS issues and these are: national culture, economic
structure, political and legal environment, and technological status. IS effectiveness
has always been in the list of most important issues in IS research. Many popular
authors such as Hofstede (1980), Laurent (1983), Maurice (1979), Tayeb (1994),
Trompenaars (1993), suggested that the made-in-the-USA models and theories should
not be applied in different cultures without local adaptation. In the field of information
systems, Shing-Kao (1997), Kedia and Bhagat (1988), and Robichaux and Coopers
(1998) add that the majority of management theories have a western perspective that is
based on the embedded values of Americans. Our research supports these arguments
and assertions by demonstrating that IS success is not perceived equally in different
cultures. The findings of our research also support Jordan (1996) who claimed that the
meaning of information and effectiveness of information systems could vary
substantially in different cultures. We also support Krumar and Bjoin-Anderson (1990)
who argued that information systems have built-in values that reflect the value priority
of the cultures in which they are developed. The rejection of the ERP system in one
specific national culture in which our organization has a subsidiary lends support to
Rabey and Rodriguez-Diaz (1989). The authors claimed that MNC face difficulties in
implementing IS in different subsidiaries because culture may impede implementation
effort due to differences in the way IS are interpreted and given meaning. We also
answer Rosensweig's (1994) major request in which he invited researchers not to
question whether or not existing theories are valid elsewhere but to inquire into how
people in different places perceive and define the research abject in question.
190
3. THE FIT PROCESS
Our research model illustrates two major assumptions. The first one is that the
values held by people in a specific national culture would impact the meaning they
give to IS success. The results of our research do indeed confirm this assumption. The
second assumption concems our proposed action. We proposed that the fit between
the meaning of IS success as defined by people in a particular national culture with the
built-in success assumption of the ERP system would be the best way to help the local
subsidiary achieve a high degree of IS success. This would also help the multinational
organization achieve an overall high degree of success from the implementation of the
ERP system whose initial cost is about 2.5 billion dollars and which is expected to
reach 5.5 billion dollars. The key strategic idea about the design of our model is that
we need to determine how people from each national culture perceive IS success
without mentioning the ERP system. The logic behind this choice is that the
perception of people about IS success is and must be independent from the type of IS
they would use. Otherwise, if we asked people about the success of the ERP system,
they would automatically use their knowledge about the system and answer our
questions. In this case, they would probably provide us with their actual perception of
the built-in success assumption of the ERP. As the ERP built-in success assumptions
are unique and do not change from site to site, and as IS success differs from site to
site, the fit between the two systems of meaning seems to be the best logical solution.
The implementation team must implement the system according to our results at the
systems level. We propose that the change management team help the users of the
system gradually unfreeze from their perception of IS success at the individual level
and the organizational level to fit the built-in success assumptions of the system,
because by definition, the ERPs impose their logic and built-in success assumptions
on the target organization and not vice-versa (Davenport, 1992). The comparative
weight categories of IS success at the individual level and the organizational level
suggest that the question to be asked by the fit management team is "How much work
and where should we concentrate to fit the built-in success assumption of the ERP

191
system with the above emerging IS success categories? They also suggest that the task
of handling the fit activities by the fit management team would be more complex at
the organizational level than at the individual level because at the organizational level
there are many local categories, less global categories, and a fixed number of built-in
success assumptions of the ERP system. Local categories must also be included in the
fit process. The global categories at the organizational level also suggest that people
from different national cultures are fully aware of the requirement and the main
purpose of any information system; which is supporting a business process and at the
same time taking advantage of the IS implementation to redesign and modify the
business processes for which the system is implemented.
4. COMP ARING THE FINDINGS WITH CULTURAL VARIABLES
We found that national culture would affect IS success meaning. W e now need
to go back to cultural theory and see how cultural dimensions could explain the
models of our emerging categories of IS success. The following paragraphs compare
our findings against the definitions of Hofstede's (1993) cultural dimensions, namely,
"Power distance" and "Uncertainty avoidance". Hofstede (1993) developed four
dimensions that differentiate between cultures. However as the author himself stressed
out, "Power distance" and "Uncertainty avoidance", "affect the structuring and
functioning of organizations." (p. 351) and they are the most widely used dimensions
in comparative studies. The discussion of the results brings strong explanations to the
emerging local categories. The discussion includes only our findings at the individual
and the organizational levels as IS success meaning differs at these levels form culture
to culture. Moreover, only local categories are discussed since they are specific to their
corresponding culture. For reading convenience, we display again the scores of the
dimensions of "Power distance" and "Uncertainty A voidance" of our cultures.
Canada, Germany, and France score respectively 40, 35, and 68 on "Power distance"
dimension and 46, 65, and 86 on "Uncertainty avoidance" dimension.

192
4.1 Canada
The following are the local IS success categories at the individual and the
organizational levels in Canada:
1. Impact on individual skills and knowledge;
2. Impact on the user as a person;
3. Impact on the business networks;
4. Gain of competitive advantage;
5. Base of user performance evaluation;
6. Knowledge development and
7. Innovation.
Canada scores low on both the "Power distance" and "Uncertainty avoidance"
dimensions: 40 and 46. In his organizational model, Hofstede (1994) calls
organizations that belong to this part of the model "Market organizations". This means
that the organization would always search the market before any strategy is
implemented. The market demand is what justifies the products and services sold. This
is also found in our Canadian IS success model. We found that Canadians believe that
a good IS must enable them to gain competitive advantages and enhance relationships
with customers, suppliers and investors. Innovation has also emerged in the Canadian
model. This means that the users encourage innovation in order to gain a competitive
advantage. The "Individualistic" characteristic of the Canadian culture supports and
justifies the "Impact on individual skills and knowledge" and "Impact on user as a
person" categories. People in "lndividualistic" culture search for recognition and
promotion and look after themselves instead of putting much emphasis on the group
which characterizes the "Collectivist" cultures. The "Base of user performance
evaluation" is another category that is supported by the "Individualism" dimension. In
fact, as achievement, promotion and persona! recognition are important; managers
need to search for easy ways to help them decide on these characteristics.

193
The low score on "Uncertainty avoidance" ( 46) means that Canadians do not
feel threatened by ambiguous situations. They like to innovate and produce new
products. They prefer a creative approach. This is evident by the categories of "Impact
on skills and knowledge" which lead to "Innovation". We believe that Canadians do
have full understanding of the built-in success assumptions of the ERP system and that
they were prepared to successfully implement it.
4.2 Germany
The following are the emerging local categories of IS success at the individual
and the organizational levels in Germany:
1. User independence from management and User dependence on the group;
2. Impact on the user as a person;
3. Impact on organizational structure and management style;
4. Knowledge-based organizational culture;
5. Teamwork and
6. Help desk support quality.
Germany scores 35 on "Power distance" dimension and this is a low score.
Germans do not believe in the unequal distribution of power in the workplace. A low
score on power distance means that people like to work together. Teamwork is thus
encouraged and implemented in this culture. Power between employees is low. A
person's position depends on his or her knowledge. "User's independence from
management and user dependence on the group" means that users do not rely on
management because the decision making process is not in the hands of the managers
alone. The group decides. The fact that a successful IS supports decision making is
found to be strong in the German culture. This means that Germans would rely on the
system to help them decide. The information provided by the system is crucial and the

194
system is not considered as a tool. Users' dependence on the group is a continuation of
the logic of teamwork. The Germans believe strongly that a successful IS should
enable the organizational culture to change and the desired culture is based on
knowledge sharing.
Germany scores 65 on the "Uncertainty avoidance" dimension and this is
considered a high score. This means that Germans do not like ambiguous situations.
Everything must be prepared and rules and procedures must be implemented before
tasks are undertaken. This is what Hofstede (1994) calls the "Machine" type of
organizational model. The organizational structure must be clear and rigid to avoid
ambiguous situations. The results reveal that Germans believe that a successful IS
must enable organizational structure change. We believe that the users were thinking
about the type of structure which would hold the new organizational culture.
All indicators of IS success at the systems level, the individual level, the
organizational level, and the built-in success assumptions of the system suggested that
the implementation of the system in Germany will be straightforward. After analyzing
the built-in assumptions of the ERP system, we strongly claim that the success of the
system will be achieved mainly because its built-in assumptions fit the Germans
meaning of a successful IS.
4.3 France
The following are the local IS success categories at the individual and the
organizational levels:
1. User independence from IS professionals;
2. Impact on individual skills and knowledge;
3. User's power over the system;
4. Use;

195
5. Fit of systems and human model ofwork and
6. User integration and communication in the group.
The score of the "Power distance" in France is 68. This is considered a high
score on this dimension. This means that the French tend to accept unequal
distribution of power in their organizations. This indicates that the decisions made by
managers are likely to be considered legitimate and should not be disputed. Power is
then believed to be an important value in French society. The "User independence
from IS professionals" and "User power over the system" justify and support the high
score of"Power distance" dimension. This means that a successful IS should maintain
the values held by the users of the system. Users want to maintain power over the
system. They want to make decisions themselves and not by relying on the system.
They want to have more power on IS professionals. As power is legitimated, the users
of the system want the system to provide them with more power. They believe that a
successful IS should enable individual skills knowledge development. This means that
knowledge justifies the power they may have and they want to leam as much as they
canin order to become more knowledgeable and therefore more powerful. The "User
integration and communication in the group" means that the users want to enhance
their technical knowledge about the system and leam fro each other which may
explain the "User independence from IS professionals". IS success is also
characterized by the "Fit between human and systems models of work". This again
means that the systems should not impose a work model or a business philosophy.
People are more powerful than the system and the latter should at least follow the
users' model ofwork. IS is a tool and should remain so.
France scores very high on the uncertainty avoidance dimension, 86 out of
100. This means that the French do not like unstructured situations and ambiguity.
They would prefer to lower the risk and reduce surprises. Therefore they would
implement strategies and procedures in organizations that all employees would follow.
196
In companng these characteristics in French society and the built-in
assumptions of the future ERP system, we can easily conclude that the ERP
implementation will be difficult to unlikely to achieve complete success in France.
The built-in assumptions of the ERP system reflect the values of its designers who are
not French. In fact, the system is designed by people who belong to a culture distinct
from French culture. Moreover, the success of the system as expected by headquarters
will not be achieved because the headquarters' office is in Canada and Canadian IS
success perception differs from French perception about IS success. The system
requires integration of all the units and the standardization of business processes. It
also requires information to be accessed by all users. Information possession is no
longer considered a justification of power. Users must then look for other places to get
power. However, in French society, information possession is power and this is where
misfit can exist. Also the system imposes its logic; that is, its way of modeling
business processes and data. At the same time, we found that for a system to be
characterized as successful in France, it should allow the users to extemalize their
rules and a way to model the business. And this is another case of misfit. Our findings
fit well with the cultural findings in France.
5. IMPLICATIONS AND FUTURE RESEARCH
5.1 Implications
In this section, we discuss the implications of our project to the academic
community, our studied multinational organization, and the practice community.
5.1.1 Implications to the academic community
Our research has many implications for the academic community. First, the
research provides lists of categories of IS success in different cultures. This extends
the model of Delone and McLean (1992) who actually stated in their article that the

197
extemal environment and the context were not included in the model. The second
main benefit is the contribution to the continuous emergence of qualitative research
importance in the IS discipline. The search for grounded data in its corresponding
context is extremely important for research advancement. The research also brings an
opportunity for further scholars who might conduct quantitative research in order to
test and validate our findings. There is also a great opportunity for those who are
interested in multicultural research in IS and more specifically in IS success to
replicate the research in other cultures that were not included in our research. The
research also demonstrates the benefit of combining Repertory grid and open
interview techniques in cross-cultural research. The benefits are twofold. First, the
difficulty of using Repertory grid technique, which is usually found at the stage of
choosing the "elements" can be overcome by the use of the open interview technique.
Second, data collection becomes richer as the researcher gets the map of both types of
perceptions: the experience-based perception of the user with respect to a particular
phenomenon and his theoretical perception. Finally, and as Gordon (2000) argued, the
development and use of the Etic and Emie categories in cross cultural research is what
makes an outstanding research. Our research brings a value in this aspect.
5.1. 2 Implications to the practice community
Conceming the implications of our research to our case and to the practice
community, the following discussion shows how our research contributes in solving a
major managerial problem and how other organizations may benefit from the research
findings. First, we would like to briefly recall the initial context and socio-economic
environment of the organization so that the reader can appreciate the implications of
our research findings. The philosophy of the organization is to encourage
entrepreneurial style of management and decentralize decision making. All divisions
had full autonomy in selecting their work tools including information systems.
Managerial positions in the organizational structures were redundant. In fact, each
division has its own president and vice president of classical business fonctions such

198
as marketing, human resources, finance... The main corporate goal is to help each
division possess all it needs so that it can produce profit for the investors. In the last
ten years, the organization grew very fast. By growing, we mean the expansion of its
physical structure and the growth of its workforce. Up to 1990, the majority of the
manufacturing units were concentrated in North America and today, the organization
is physically present in more than twenty countries. The strategy the organization
perused to expand itself is based on acquisition. It bought businesses that normally
compete with it in specific industry. However, the main problem of acquisition is the
complexity to work with sometimes divergent organizational cultures and
philosophies. This problem was apparent and obvious in our case because our
organization had a very strong philosophy that was developed in the last decades and
which is different from the philosophies of the organizations it acquired.
To support its acquisition strategy and its growth, the organization realized that
rapid coordination and strong control mechanism must be implemented. In doing so, it
decided to implement a large and complex project that aims to standardize business
processes and information systems in every unit of every division. This was exactly
contradictory with the organizational philosophy which was based on decentralization
and autonomy and which was not included in the agenda of this large project. The
standardization of an ERP information system was only one sub-project within this
large scale project. The following paragraphs discuss the benefits of our research to
the organization in light of its initial context.
We would like to recall that the philosophy of the DBA is based on conducting
research work to salve complex organizational problems. We have set a critical
objective in this research. We wanted to provide the solution and the tools to our
multinational organization before it begins the implementation of the ERP system.
However, we could not completely follow the timing schedule of the systems
implementation. The project was set to be completed in a ten year period and we
started data collection two years after it started. The management decided to

199
implement the Finance module of the ERP system. The technical implementation of
this module is finished and the system is actually technically operational in two
cultures. However, the system is accepted in one culture and not accepted in the other.
We conducted a three hours interview with the vice president ERP Finance to
determine the reason for the systems rejection in the other culture. The reason was
simple and very clear. The vice president replied: "If I had had your research results
on time, I would have saved millions and millions of dollars. However, the systems
must be implemented in many countries and we will take the results of the research
and implement them in the future sites and introduce them in the problematic site". A
half day meeting is programmed with senior management at the headquarters office to
present the research results. We are also planning to travel to our research sites and
present the results of our research. W e hope that our findings will help the
organization 1) succeed in the technical implementation phase of the system using the
findings at the systems level, 2) succeed the fit between the two systems of meanings,
and 3) help measure, after extensive use of the systems, the success or the business
value of the system using the categories at the individual and the organizational levels.
The above second expected benefit our organization can gain is extremely
important. In fact, we found that IS success at the organizational level is characterized
by a high number of local categories and less global ones in all cultures. This can
complicate the fit process that we proposed in our research model in figure 9. In fact,
the more local categories people perceive in a specific culture and less global
categories, the harder it would be to merge or to fit the meaning of IS success in each
culture with the built-in success assumptions of the ERP system.
This research also suggests that the standardization of any other socio-technical
system or management philosophy will be faced by the cultural barrier. The results of
our research can help succeed the implementation of such system or be considered as a
starting point for future research and work. For example, if the organization decided to
implement a standard human resource management philosophy, the philosophy can be

200
accepted by specific cultures and not by others. The fit concept can help solve the
problem again. The change management team who is presently conducting the fit
project will use our results at the individual and the organizational levels to succeeding
the change. In fact, the categories "Impact on organizational structure and
management style", "knowledge-based organizational culture", and "Teamwork" have
emerged at the organizational level in Germany. The participants in Germany believe
that a successful information system in general is one that encourages and supports
teamwork and knowledge-based organizational culture. This means that the change
management team will need to first check the built-in success assumptions of the ERP
system to see it they fit the users' perceptions. If not, they need to implement different
activities that lead to the harmonization process in which the IS will be in harmony
with the business and the business will be in harmony with the IS (Luftman and Brier,
1999). However, the amount of change in the users' values and expectations will be
much higher than the amount of change in the ERP built-in assumptions because the
ERP generally impose their logic on the target organization that must change its
business processes and its logic to fit the systems built-in logic.
The supplier of the ERP system would also benefit from the results of our
research. In fact, our research shows how people from different countries perceive the
success of an information system. The ERP manufacturing organization might use our
findings to actually implement them in their packages to ease the ERP implementation
in our cultures. We then would have ERP France, ERP Germany, and ERP Canada.
5.2 Future research
The results of this study will help the management in our case organization
measure IS success (long term success) at the systems level, the individual level and
the organizational level in each culture by continually developing a questionnaire that
includes our emerging categories as well as their corresponding concepts. During the
measurement task, if scales of 1 to 5 are used, the user participant would be asked to

201
circle the number that best characterize his or her perception, 1 being "not at all" and 5
being "very well". The categories as well as the concepts are the ones which we
provided in the detail analysis section. We suggest that, even though the name and the
number of the categories of IS success at the systems level are the same in Canada,
Germany, and France, the person (s) who is responsible for measuring IS success,
needs to design a questionnaire for each of these cultures due to variation in meaning
of the categories.
On the other hand, our research can be considered as a starting point of a
research program in the field of information systems. According to our literature
review, our research is the first of its kind that searches for IS success m a
multinational organization. There are many interesting questions which can be studied
by other scholars. First, we invite other researchers to validate the findings of this
research by administering a survey in the same national cultures and second, to
conduct other research in other national cultures. The first research request would
satisfy the second cycle of any scientific research. We satisfied the first cycle. That is,
IS success models were developed using an inductive type of approach. The second
cycle would add credibility to our findings and would enhance them. The second
research request is extremely important because we do not know how people in other
national cultures perceive IS success. As a matter of fact, we are planning to conduct
similar types of work in other national cultures in which subsidiaries of our
multinational organization exist.
We are also planning to study the impact of the organizational industry on the
meaning of IS success. That is, we plan to select two divisions that belong to the same
multinational organization which operate in totally different types of industries and
design a research project that seeks IS success from this perspective. We will to a
certain extent control the national as well as the organizational culture which would
lead us to accept the research conclusions from the industry perspective. Finally, we

202
encourage research that will ensure the transferability of our results. We strongly
believe that our case experience and results would help researchers to study and
succeed the implementation of many other managerial and organizational tools and
practices in a multinational context.
6. LIMITATIONS
Chapter four ended with a short discussion on our awareness and preparation to
possible quality threats that may influence our study. These are: intemal validity,
extemal validity, and reliability. We recall that these terms are very suitable to
quantitative research. Robson (1993) suggested replacing these terminologies
respectively with: credibility, transferability, and dependability.
6.1 Credibility
In dealing with credibility, the goal is to show that the topic of the research is
accurately described. Robson (1993) suggested that in order to enhance the credibility
of qualitative case study research, the investigator should: 1) invest sufficient time and
get involved in the case context to become familiar with its parameters, 2) persist in
observation for sufficient time, and 3) perform triangulation in which the investigator
uses evidence from different sources, of different methods of collecting data.
Our study has many limitations and we were not able to fully satisfy these
credibility concems. First, although we were able to spend about three months at the
headquarters' office of our case organization, very short time was dedicated at the
research sites. This was mainly due to money constraints as two sites were in two
different countries. Second, observation technique at the site selection was short and
insufficient. Third, triangulation was also limited. The Repertory grid technique was
highly encouraged to use in cross-cultural research in IS and in other disciplines.

203
However, we were not totally aware of its main weakness (the memorization process)
until we were actually conducting the interviews. Moreover, the technique was not
used with all the participants.
There are other credibility limitations in this study. The site selection is based
on findings of previous research on national culture dimensions that were developed
from work-related values of culture and not from all its parts and its components.
Second, since this research is about meaning and perception, researchers' and
participants' biases are not completely eliminated even if we used data collection
techniques, which theoretically allow reducing them. Third, our conclusions about the
Chinese findings are based on a small amount ofraw data. Fourth, although we studied
units of a specific division of the organization mainly to reduce the effect of the
industry factors and the professional culture factors on our research, these effects are
not totally eliminated. Sixth, sub-cultures exist everywhere. The values of Canadian
participants from French origin are quite different from the values of the other
Canadian participants. This difference was not taken into account in our study.
Seventh, even if the selection of our research participants was purposive, it was done
by our sponsor at the main office of the organization and not by us. Eight, the quality
of English language of the Chinese as well as some German participants was not high
and this might have introduced misunderstanding in what the participants really want
to say. Finally, the weights of the categories were determined by using only the
frequency of the number of participants who provided at least one concept and were
calculated from data that was provided by the participants during the interview
sess10ns.
6.2 Transferability
Qualitative and quantitative case studies scholars agree that case studies do not
aim statistical generalisation of the findings but analytical generalisation which we
refer to as transferability (Robson, 1993 Yin, 1984). To ensure high transferability of

204
the study's findings, the researcher should ensure that they can be transferred to other
settings. The goal is not to replicate the case study elsewhere. The goal is to ensure
that other researchers can conduct other cases to support a specific theory. Although
we described our framework to help other researchers decide on whether or not other
case studies can be done to support a specific theory, the framework is still in its initial
stage and does indeed need further enhancement.
6.3 Dependability
Dependability is analogous to reliability. The goal of dependability is to
minimise errors and bias. The goal is to ensure that if another researcher decides to
conduct the same case study and follows the same procedures of data collection and
analysis as we did, he or she should arrive at the same results. Although we took very
serious preparations and precautions to enhance the dependability of our study, errors
and gaps still exist. Apart from providing a complete chain of evidence in this study,
subjectivity and persona! perceptions can not be fully documented and this is a
limitation in our study.
CHAPTER SEVEN
CONCLUSION
A multinational organization has decided to standardize information systems in
all its subsidiaries around the world. It has been argued that culture influences the
outcomes and use of numerous managerial practices. The implementation of a
standard socio-technical system such as ERP in different national cultures presents a
great challenge for the multinational organization. The most important goal of such an
investment is to quickly achieve a high retum on investment. This means that the
multinational organizations' employees in all subsidiaries need to understand the
expected outcomes of such an investment. The implementation team needs to be aware
of the impact of culture on the implementation success of the ERP as well as on the
ERP ongoing success. Furthermore, the proposa! is not to force the system to fit
subsidiaries' culture nor to change their culture to fit the systems built-in assumptions.
Rather, we propose that the fit between the meaning of IS success as defined by the
managers in a particular culture and the ERP built-in success assumptions is the best
way to help achieve a contribution to local subsidiaries and, therefore, a contribution
to the overall performance of the multinational organization. The fit project is a set of
business activities that would put both systems of meaning in harmony with one
another. The literature indicates that there is no single way to achieve the fit and that
the main players in the fit project are change management professionals (Luftman and
Brier, 1999).
We found that people from different national cultures do not define and
perceive IS success equally particularly at the individual and the organizational levels.
These are the levels that involve the social side of IS. This research supports Garrity

206
and Sanders' (1998) idea about the construing of social concepts and gives more
credibility and support to Hofstede's (1993) organizational model. The findings of
this research are imperative for the multinational organization in which the research
took place and are also important for any multinational organization deciding to
standardize IS or any management philosophy. The overall outcome as expected from
the headquarters would not be achieved if the findings of this research are not
implemented. This is so because the cultural perceptions of individual employees will
always alter the effectiveness of IS. This is the case for the employees of the
multinational organization.
Our research is the first of its kind to produce IS success models in diff erent
national cultures. We found that the different perceptions and definitions of IS success
are more concemed with the individual and the organizational levels. Although the
names of IS success categories are the same at the system's level across the cultures
we studied, the meaning of the categories is defined by their corresponding concepts.
We also answered one major concem of cross cultural researchers in that we
identified the local and global categories of IS success. This result will add more
knowledge to existing IS success models and constructs by incorporating the local
categories in the list of existing common categories in cross cultural research which
will make the IS success construct more robust with a higher degree of construct
validity.
We also provided the weight of importance of the categories in each national
culture as well as the cross-cultural weight of common categories. This result will help
the implementation team prioritize their change management actions in the fit process
as proposed in our framework.
REFERENCES
Alter, S. (2000). The Siamese Twin Problem: A Central Issue Ignored by Dimensions oflnformation Effectiveness. Communication of AIS. 2(20), 1-55.
Angen, M. J. (2000). Evaluating interpretive inquiry: Reviewing the validity debate and opening the dialogue. Qualitative Health Research, 10(3), 378-395.
Bailey, J.E. et Pearson, S.W. (1983). Development of a Tool for Measuring and Analysing Computer User Satisfaction. Management Science, 29(5), 530- 545.
Bali, R., Cockerham, G. et Bloor, C. (1999). MISCO: A Conceptual Model for MIS Implementation in SMEs. Information Research, 4(4), 1-21.
Baligh, H.H. (1994). Components of Culture: Nature, Interconnections, and Relevance to the Decisions on the Organization Structure. Management Science, 40(1), 14-27.
Ballantine, J.A., Levy, M.S. et Powell, P. (1996). Against Taylor-Made Solutions: Information Systems Strategy in a Learning Organization. Proceeding of the SIGCPR/SIGMIS Conference, Denver.
Banister, P., Burman, E., Taylor, M. et Tindall, C. (1994). Qualitative Methods in Psychology; A Research Guide. Open University Press, Buckingham
Barua, A. et Mukhopadhyay, T. Information Technology and Business Perfom1ance: Past, Present, and Future. In R. Zmud (dir.), Framing the Domain of IT Management (p. 65-84), Pinnaflex.
Barley, S. (1983). Semiotics and the Study of Occupational and Organizational Cultures, Administrative Science Quarter/y, 28 (3), 393-413
Belfry, M. et Schmidt, L. (1988). Managing the Diverse Work Force. Employment Relations Today, 15(4), 335-339
Benbasat, I., Goldstein, D.K. et Mead, M. (1987). The Case Research Strategy in Studies of Information Systems. MIS Quarter/y, septembre, 369-383.
Benbasat, I., Dexter, A.S. et Masulis, P.S. (1981 ). An Experimental Study of the Human/Computer Interface. Communications of the ACM, 24(11), 752-762.
Beynon-Davies, P. (1995). Information Systems Failure: The Case of the London Ambulance Services' Computer Aided Despatch Project. European Journal of Information Systems, 4(3), 171-184.

208
Brancheau, J.C. et Wetherbee, J.C. (1987). Key Issues m Information Systems Management. MIS Quarter/y, 11(1), 23-45.
Burn, J.M. et Cheung, H.K. (1994). Distributing Global Information Systems Resources in Multinational Companies-A Contingency Madel. Proceedings, IRMA Conference.
Caldwell, N. et Coshall, J. (2002). Measuring brand association for museums using Repertory grid analysis. Management decisions, 40(4), 383-392.
Chirstiaanse, E., Been, J. et Diepen, T.V. (1986). Factors Determining the Failure of Global Systems in the Air Cargo Community. Proceedings of the 29th Annual Hawaii International Conference on Systems Science, Wailea, Hawaii.
Chow, C.W., Deng, F. J. et Ho, J. L. (2000), The openness of knowledge sharing within organizations: A comparative study in the United States and the People's Republic of China, Journal of Management Accounting Research, 12, 65-95.
Clark, T.D. (1992). Corporate Systems Management: An Overview and Research Perspective. Communications of the ACM, 35(2), 60-75.
Corbin, J. et Strauss, A. (1990). Grounded theory research: Procedures, canons, and evaluative criteria. Qualitative Sociology. 13, 3-21.
Creswell, J.W. (1994). Research Design: Qualitative and Quantitative Approaches. Sage Publications.
Creswell, J. (1998). Qualitative inquiry and research design: Choosing among five traditions. Thousand Oaks, CA: Sage.
Crowston, K. et Treacy, M.E. (1986). Assessing the Impact of Information Technology on Enterprise Level Performance. Proceedings of The Seventh International Conference on Information Systems (ICIS), San Diego, CA.
Davenport, T.H. (1998). Putting the Enterprise into the Enterprise System. Harvard Business Review, 76(4), 121-131.
DeLone, W.H et McLean, E.R. (1992). Information Systems Success: The Quest for The Dependent Variable. Information Systems Research, 3(1), 60-95.
DeLone, W.H et McLean, E.R (2003). The Delone and McLean model of Information systems success: A ten-year update. Journal of Information Systems Management, 19( 4), 9-26.

209
Desphpande, R et Webster, E.F. (1989). Organizational Culture and Marketing: Defining the Research. Journal of Marketing, 53(1 ), 3-16.
Dickson, G.W., Leitheiser, R.L., Wetherbee, J.C. et Nechis, M. (1984). Key issues in information systems for the 1980's. MIS Quarter/y, 8(3), 135-148.
Dickson, G.W., Wells, C.E. et Wilkes, R.B. (1998). Toward a derived set ofmeasures for assessing IS organizations. In A, Bjorn-Anderson et G.B. Davis (dir.), Information Systems Assessment: Issues and Challenges (p. 129-147). NorthHooland, NY. Elsevier Science.
Ein-Dor, P. et Segev, E. (1981). Comments on Research in computer-based management information systems: An alternative mode/. Working paper, TelAviv University, Faculty of Management.
Ein-Dor, P., Segev, E. et Orgad, M. (1992). The Effect of National Culture on IS: Implications for International Information Systems. Journal of Global Information Management, 1(1), 33-44.
Elashrnawi, F. (2000). Creating a winning corporate culture: Experience inside the Asian telecommunication industry. European Business Review, 12(3), 148-156
Flor, P.R. (1996). Integration and Differentiation in the Parent-Affiliate Information Systems Configuration of Multinational Corporations: An Institutional and Resource Dependence Perspective. Proceedings of the IRMA International Conference.
Gadamer, H. G. (1994). Truth and method (second edition), New York: Seabury
Galpin, T. (1997). Connecting culture to organizational change. In J.W. Cortada et J.A woods (dir.), The quality yearbook (p. 285-292). London, McGraw-Hill.
Garrity, E.J. et Sanders, G.L. (1998). Introduction to Information Systems Success Measurement. In E.J. Garrity et G.L, Sanders (dir), Information Systems Success Measurement (p. 1-12). Idea Group Publishing.
Glenn, E.S. et Glenn, C.G. (1981 ). Man and Mankind: Conflict and Communication between Cultures. Ablex, Northwood, NJ.
Gordon, S.R. (1992). Standardization of Information Systems and Technology at Multinational Companies. Proceedings of the IRMA Conference.
Gordon Hunter, M. et Beck, J.E. (2000). Using Repertory grid to Conduct Crosscultural Information Systems Research. Information Systems Research, 11(1), 93-101.

210
Gordon Hunter, M. (2001). Cross Cultural Research Issues. Journal of Global Information Technology, 9(4), 3-5.
Guba, E.G. et Lincoln, Y.S. (1994). Competing Paradigms in Qualitative Research. In N.K, Denzin et Y.S. Lincoln (dir), Handbook of Qualitative Research. Sage Publication.
Guba, E. G. et Lincoln, Y. S. (1985). Naturalistic Inquiry. Newbury Park: Sage Publication.
Hall, E.T. (1960). The Silent Language of Overseas Business. Harvard Business Review, mai-juin.
Hall, E.T. (1976). Beyond culture, Anchor press New York NY.
Hampden-Turner, C.H. et Trompenaars, F.T. (1994). The Seven Cultures of Capitalism. Piatkus, London.
Hénault, G. (1971). Les conséquences du biculturalisme sur la consommation. Commerce. Septembre.
Hirschheim, R. et Klein, H. K. (1989). Four paradigms in information systems development. Communications of the ACM, 32(10), 1199-1216.
Hirschheim, R. (1986). The effect of A Priori Views on the Social Implications of Computing: The Case of Office Automation. Computing Surveys, 18(2), 165-195.
Hofstede, G. (1993). Cultures and organizations: software of the mind. London, McGraw-Hill.
Hofstede, G. (1985). The Interaction between National and Organizational Value Systems. Journal of Management Studies, 22(4), 347-357.
Hofstede, G. (1994). Management Scientists Are Human. Management Science, 44(1), 4-13.
Hofstede, G. (1980). Motivation, Leadership and Organization: Do American theories apply abroad? Organizational Dynamics, 75(1), 42-63.
Ishman, M. (1998). Measuring Information Success at the individual level in crosscultural Environments. In E.J. Garrity et G.L, Sanders (dir), Information Systems Success Measurement. Idea Group Publishing.

211
Ives, B., Olson, M.H. et Baroudi, J.J. (1983). The Measurement of User Information Satisfaction. Communications of the ACM, 26(10), 785-793.
Jordan, E. (1996). National Culture and Organizational Culture: Their use in information. Entered on 2002, from http://www.is.cityu.edu.hk/Research/ WorkingPapers /paper/9408.pdf
Kanellis, P., Lycett, M. et Paul, R.J. (1998). An Interpretive Approach to the Measurement of Information Systems Success: From Concept to Practical Application. In E.J. Garrity et G.L. Sanders (dir.), Information Systems Success Measurement (p. 133-151 ), Idea Group Publishing.
Kaye, M., Hilton, B. et Taylor, W.G.K. (1997). Expatriate culture shock in China: a study in the Beijing hotel industry. Journal of Managerial Psychology, 12(8), 496-510.
Kedia, B.L. et Bhagat, R.S. (1988). Cultural Constraints on Transfer of Technology Across Nations: Implications for Research in International and Comparative Management. Academy of Management Review, 13(4), 559-571.
Keen, G.W. (1980). References Disciplines and a Cumulative Tradition. Proceedings of the First International Conference on Information Systems.
Kelly, G.A. (1955). The Psychology of Persona! Construct., New York, Norton.
Klein, H.K. et Myers, M.D. (1999). A Set of Princip les for Conducting and Evaluating Interpretative Field Studies in Information Systems. MIS Quarter/y, 23(1), 67-94.
Kolland, A. (1990). National cultures and Technology transfer: the influence of the Mexican life style on technology adoption. International Journal of Intercultural relations, 14(1), 319-336.
Krants, A.I. (1975). Sorne Recent Advances in Cross-national Management Research. Academy of Management journal, 18, 538-549.
Kroeber, A. et Kluckholn, C. (1952). Culture: a critical review of concepts and ddefinitions. Cambridge, MA.
Krumar, K. et Bjrn-Andersen, L.A. (1990). Cross-Cultural Comparison ofIS Designer Values. Communications of the ACM, 33(5), 528-538.
Kvale, S. (1996). Interviews: An introduction to qualitative research interviewing. Thousand Oaks, CA: Sage
212
Lachman, R., Nedd, A. et Hinings, B. (1994). Analyzing Cross-national Management and Organizations: A Theoretical Framework. Management Science, 40(1), 40-55.
Lammers, C.J. et Hickson, D. J. (1979). Organizations alike and unlike:Toward a comparative sociology of organizations. London: Routledge and Kegan Paul.
Laurent, A. (1983). The cultural diversity of western conceptions of Management. International Studies of Management and Organizations, 23(2), 75-96.
Leavitt, H.J. et Whislet, T.L. (1958). Management in the 1980s. Harvard Business Review, mai-juin.
Leidner, D.E., Carlsson, S. et Corrales, M. (1999). Mexican and Swedish Managers' Perceptions of the Impact of BIS on Organizational Intelligence, Decision making and Structure. Decision sciences, 30(3), 633-658.
Lévi-Strauss, C. (1958). Anthropologie structurale. Paris, Plon.
Lewis, R.D. (1992). Fin/and: Cultural Lane Wolf - Consequences in International Business. Richard Lewis Communications, Helsinki.
Lewis, LM. (1995). Social Anthropology in Perspective. Cambridge University Press, Cambridge.
Lincoln, Y. et Guba, E. (1994). Naturalistic inquiry. Beverly Hills, CA, Sage Publication.
Linn, W. et Francis, H. (1997). National culture differences in theory and practice: Evaluating Hofstede's national culture framework, Information Technology and People, 10 (2), 132-146.
Lucas, H.C.J. (1976). Performance and the Use oflnformation Systems. Management Science, 21(8), 908-919.
Luftman, J. et Brier, T. (1999). Achieving and Sustaining Business-IT Alignment. California Management Review, 42(1), 109-122.
Lyytinen, K. et Hirshheim, R. (1987). Information Systems Failures: A Survey and Classification of the Empirical literature. Oxford Surveys in Information technology, 4, 257-309.

213
Markus, M.L et Tanis, C. (2000). The Enterprise System Experience - From Adoption to Success. In R. Zmud (dir.), Framing the Domain of IT Management (p. 173-207). Pinnaflex.
Markus, M.L., Axline, S., Petrie, D. et Tanis, C. (2000). Leaming from Adopters' Experience with ERP: Problems Encountered and Success Achieved. Journal of Information Technology. 15, 245-265.
Marsden, A. et Litter, D. (2000). Repertory grid Technique - An Interpretative Research Framework. European Journal of Marketing, 34(7), 816-834.
Marshall, C. et Rossman, G.B. (1995). Designing Qualitative Research. Sage Publications.
Martinsons, M. et Westwood, R. (1997). Management Information Systems in Chinese Business Culture: An Explanatory Theory. Information and Management, 32, 215- 228.
Maurice, M. (1979). For a study of the societal effect: the universality and specificity in organizational research. In C.J. Lammers et D.J. Hickson (dir.), Organizations Alike and Unlike. Routledge and Kegan Paul, London.
Mejias, R. J., Shepherd, M. M., Vogel, D. R., et Lazaneo, L. (1997). Consensus and perceived satisfaction levels: A cross-cultural comparison of GSS and non-GSS outcomes within and between the United States and Mexico, Journal of Management Information Systems, 13(3), 137-161.
Miles, M.B. et Huberman, A.M. (1984). Data Analysis. A Sourcebook of New Methods. Sage Publications.
Moynihan, T. (1996). An inventory of personal constructs for information systems project risk researchers. Journal of Information Technology. 11, 359-371.
Morden, T. (1999). Models of National Culture - A Management Review. CrossCultural Management. 6(1), 19-44
Morris, M.W., Leung, K., Ames, D. et Lickel, B. (1999). Views from inside and outside: Integrating emic and etic insights about culture and justice judgement. Academy of Management, 24(4), 1-18.
Moreno, V. (1999). On the social implications of organizational reengineering. A phenomenological study of individual experiences of BPR processes. Information Technology and People, 12(4), 359-388.

214
Morgan, G. (1997). Images of Organizations. Sage Publications
Moss, P.A. Can there be validity without reliability? Educational Researcher 23 (2), 5-12.
Myers, M.D. (1994). A disaster for everyone to see: An Interpretative Analysis of a Failed IS Project. Accounting, Management and Information Technologies, 4(4), 125-136.
Myers, M.D. (1997). Qualitative Research in Information Systems. Entered on May 20th 1997 from http://www.qual.auckland.ac.nz/
Myers, B.L., Kappelman, L.A. et Prybutok, V.R. (1998). A Comprehensive Mode/for Assessing the Quality and Productivity of the Information Systems Function: Toward a Theory for Information Systems Assessment. ldea Group Publishing.
Myers, M.D. et Tan, F.B. (2002). Beyond Models of National Culture in Information Systems Research. Journal of Global Information Management, 10(1), 24-32.
Nadler, D.A. et Tushman, M. (1979). A Congruence Model for Diagnosing Organizational Behaviour. In D.A. Kolb, LM. Rubin et J.M. Mclntyre (dir.),Organizational Psychology (p. 442-458). Englewood Cliffs, Prentice-Hall.
Niederman, F., Brancheau, J.C. et Wetherbe, J.C. (1991). Information Systems Management Issues for the 1990s. MIS Quarter/y, 15(4), 474-500.
Noble, F. et Newman, M. (1993). Integrated Systems, Autonomous Departments: Organizational Invalidity and Systems Change in a University. Journal of Management Studies, 30(2), 196-219.
Orlikowski, W.J. et Baroudi, J.J. (1991). Studying Information Technology in Organizations: Research Approaches and Assumptions. Information Systems Research, 2(1 ), 1- 28.
Peppas, S.C. (2002). Subcultural Approaches to Management: A Comparative Study of African - and Euro-American Values. Cross Cultural Management, 9(2),
45-64.
Pettigrew, A.M. (1979), On Studying Organizational Cultures, Administrative Science Quarter/y, 24 ( 4), 570-581
Pitt, A. Watson, R. et Kavan, K. (1994). Measuring Service Quality in Information Systems. Workingpaper. Department of Management. University ofGeorgia.

215
Png, I. P. L., Tan, B. C. Y., et Wee, K. L. (2001), Dimensions of national culture and corporate adoption of IT infrastructure, IEEE Transactions on Engineering Management, 48 (1 ), 36-46.
Radcliffe-Brown, A.R. (1965). Structure and Function in Primitive Society: essays and addresses. New York, Free Press.
Rai A., Lang S.S. et Welker R.B. (2002). Assessing the Validity of IS Success Models: An Empirical Test and Theoretical Analysis. Information Systems Research, 13(1), 50-69.
Ritzer, (1975). Recherche Sociale. PUB.
Riley, P. (1983). A Structurationist Account of Political Culture, Administrative Science Quarter/y, 28 (3), 414-437
Robey, D. et Rodriguez-Diaz, A. (1989). The Organizational and Cultural Context of System Implementation: Case Experience from Latin America. Information and Management, 17, 229-239.
Robey, D. et Boudreau M.C. (2000). Organizational Consequences of Information Technology: Dealing with Diversity in Empirical Research. In R. Zmud (dir.), Framing the Domain of IT Management (p. 51-61 ). Pinnaflex.
Robichaux, B.P. et Cooper, R.B. (1998). GSS Participation: A Cultural Examination. Information and Management, 33, 287-300.
Robson, C. (1993). Real World Research; A Resource for Social Scientific and Practitioner-Researchers. Blackwell, Oxford UK and Cambridge USA.
Romm, T., Pliskin, N., Weber, Y. et Lee, A. (1991). SOS, Identifying Organizational Culture Clash in MIS Implementation. Information and Management, 21, 99-109.
Rosenzweig, P.M. (1994). When Can Management Science Research Be Generalized Intemationally? Management Science, 40 (1), 28-39.
SainSaulieu, R. (1995), Sociologie de l'entreprise Organisation culturelle et développement, Edition Presse Science Po et Dalloz.
Sauer, C. (1993). Why Information Systems Fait: A case study approach. Henley On Thames: Alfred Waller.
Saunders, C.S. et Jones, J.W. (1992). Measuring the Performance of the Information Systems Function. Journal of Management Information Systems, 8(4), 63-82.

216
Schein, E.H. (1990). Organizational Culture. American Psychologist, 45 (2), 109-119.
Seddon, P.B. (1997). A Respecification and Extension of the Delone and McLean Model ofIS Success. Information Systems Research, 8(3), 240-253.
Seddon, P.B., Staples, S., Patnayakuni, R. et Bowetell, M. (1999). Dimensions of Information Success. Communication of the ACM 2(20), 1-40.
Shing-Kao, L. (1997). A study of National Culture versus Corporate Culture in International Management. Dissertation abstract international, Nova Southeastem University.
Steinwachs, K. (1999), Information and culture - the impact of national culture on information processes, Journal of Information Science, 25 (3), 193-204.
Stewart, V. et Stewart, S. (1981). Business Applications of Repertory grid. McGrawHill Book Company.
Straub, D.W. (1994). The Effect of Culture on IT Diffusion: E-mail and Fax in Japan and the U.S.A. Information Systems Research, 5, 23-47.
Strauss, A. et Corbin, J. (1990). Basics of qualitative research: Grounded theory procedures and techniques. Newbury Park, CA, Sage.
Swanson, E. B. (1974). Management Information Systems: Appreciation and Involvement. Management Science, 21(2). 178-188.
Tai, L. A. et Phelps, R. CEO and CIO perceptions of information systems strategy: Evidence from Hong Kong. European Journal of Information Systems, 9 (3), 163-172.
Tan, B., Wei, K., Watson, R. et Walczuch, R. (1998). Reducing status effects with computer-mediated Communication: Evidence from two national cultures. Journal of Management Information Systems, 15( 1 ), 119-141.
Tan, B.C.Y., Watson, R.T. et Wei, K.K. (1995), National culture and group support systems: Filtering communication to dampen power differentials, European Journal of Information Systems, 4(2), 82-93.
Tashakkori, A. et Teddie, C. (1999). Introduction to Mixed Method and Mixed Madel Studies in the Social and Behavioural Science. Mixed Methodology, Sage Publication.

217
Taylor, J.S. et Bogdan, R. (1984). Introduction to qualitative research method. John Wiley and Son publications.
Tayeb, M. (1994). Organizations and national culture: methodology considered. Organizations Studies, 15(3), 429-446.
Thanasankitt, T. et Corbitt, B. (1999). Cultural context and its impact on requirement elicitation in Thailand. Revisited version of toward an understanding of the impact of Thai culture on requirement elicitation. Proceedings of the CITA conference on computer and information technology in Asia.
Thanasankit, T. (2002), Requirements engineering - exploring the influence of power and Thai values, European Journal of Information Systems, 11 (2), 128-141.
Triandis, H.C. (1982). Dimensions of Cultural Variation as Parameters of Organizational Theories. International Studies of Management and Organizations, 12, 139-169.
Trompenaars, F.T. et Hampden-Turner, C.H. (1998). Riding The Waves of Culture -Understanding Diversity in Global Business. McGraw-Hill.
Trompenaars, F. (1993). Riding the waves of culture: Understanding Cultural Diversity in Business. Economies Books, London.
Wang, R.Y. et Strong, D.M. (1996). Beyond Accuracy: What Data Quality Means to Data Consumers. Journal of Management Information Systems. 12(4), 5-34.
Watson, R.T., Ho, T.H. et Raman, K.S. (1997). Culture: A fourth dimension of group Support systems. Communication of the ACM, 37, 44-55.
Watson, R.T. et Brancheau, J.C. (1991). Key Issues in Information System Management: An International Perspective. Information and Management, 20(3), 211-224.
Yin, R.K (1984). Case Study Research, Design and Methods. Sage Publication.

218
APPENDIXA
CANADA: LIST OF RA W DATA, CONCEPTS AND CATEGORY AT THE SYSTEMS LEVEL

219
Canada 01
Raw data Concept Cateiwrv Source Integration of data Integrated data IDQ R
Proper data Clean data IDQ 0 Accurate data Accuracy IDQ R
Just intime data Timeliness CDQ 0 Complete data Completeness CDQ R
Centralization of data Centralized data ACC 0 Controlled access to data Access control ACC 0
Safeguard of data Access control ACC 0 Work for all business units Standard system DPSQ R and division Rapid access to data Rapid access ACC R Problems solved quickly Response time DPSQ 0
Good help fonction Interface quality USIQ 0 Quick results Response time DPSQ 0 Self explanatory information Interpretability RDQ 0 on screen or reports Easy to understand Base of RDQ R information on screen understanding Easy information format for Easy information RDQ 0 management format Information Easy to follow Information Easy to RDQ R
follow Reports easy to read Reports easy to RDQ 0
read Intuitive presentation Intuitive RDQ R
presentation Meaningful information in Interpretability RDQ 0 other countries Relevant information on Relevance CDQ 0 reports Present complete information Completeness CDQ 0 Get what I want and possibly Relevance CDQ 0 go deeper for more details * IDQ: Intrinsic data quality; CDQ: Contextual data quality; RDQ: Representational data quality; ACC: Accessibility data quality; USIQ: User interaction systems quality; DPSQ: Data processing systems quality

220
Canada 02
Raw data Concept Cate2ory* Source Data availability Data A vailability ACC R
Standard data Consistency RDQ R Accurate data Accuracy IDQ 0
Systems always on Reliability DPSQ 0
Always alive Reliability DPSQ 0
Rapid access to data Rapid access ACC 0
Quick response time Response time DPSQ 0 Graphical user interfaces Interface quality USIQ R Create good impression Interface quality USIQ R
Information in the language Interpretability RDQ 0 of the user Internet easily Ease of interaction USIQ R
Necessary information Relevance CDQ 0 * IDQ: Intrinsic data quality; CDQ: Contextual data quality; RDQ: Representational data quality; ACC: Accessibility data quality; USIQ: User interaction systems quality; DPSQ: Data processing systems quality

221
Canada 03
Raw data Concept Category Source Viable data Data viability IDQ 0 Standard data Consistency IDQ R Flexibility in control Access control ACC 0 Trade off in control Access control ACC 0 User X does not have to Relevance CDQ 0 know what user Y is doing. Provide data to who needs it Systems exportability Hardware DPSQ 0
compatibility Flexibility to grow Hardware DPSQ 0
flexibility Quick response time Response time DPSQ 0 Rapid access to data Rapid access ACC R
Filtered information Access control ACC 0 Shared information Information sharing ACC 0 Convivial presentation Interface quality USIQ R Information easy to Base of RDQ R understand understanding Necessary information Relevance CDQ R Not much information on Clarity RDQ 0 screen
* IDQ: Intrinsic data quality; CDQ: Contextual data quality; RDQ: Representational data quality; ACC: Accessibility data quality; USIQ: User interaction systems quality; DPSQ: Data processing systems quality
Canada 04
Raw data Concept Category Source
Identical data in reports Data consistency in RDQ R reports
Commondata Accuracy IDQ R Unique data Accuracy IDQ 0 Control access to financial Access control ACC 0 data Secured sensible data Access control ACC 0
A system that closed and Access control ACC R open selectively
* IDQ: Intrms1c data quahty; CDQ: Contextual data qualtty; RDQ: Representational data qualtty; ACC: Accessibility data quality; USIQ: User interaction systems quality; DPSQ: Data processing systems quality

222
Canada 05
Raw data Concept Cate2ory Source Data availability Data availability ACC 0 Accurate data Accuracy IDQ 0 Controlled access to data Access control ACC 0 Expand easily Hardware DPSQ 0
flexibility Rapid access to data Rapid access ACC 0 Information responds to Relevance CDQ 0 different objectives of different users Necessary information for the Relevance CDQ 0 users New information Relevance CDQ 0
Interpretable information Ease of RDQ 0 understanding
Not much information on Clarity RDQ 0 screen Understandable information Ease of RDQ 0
understanding * IDQ: Intnns1c data quahty; CDQ: Contextual data quahty; RDQ: Representat1onal data quahty; ACC: Accessibility data quality; USIQ: User interaction systems quality; DPSQ: Data processing systems quality
Canada 06 Raw data Concept Category Source Data availability Data availability ACC 0
Accurate data Accuracy IDQ 0
Meets user's need Relevance CDQ 0
Quick response time Response time DPSQ 0 Runs well Reliability DPSQ 0
Rapid access to data Rapid access ACC 0 Exact meaning of information Interpretability RDQ 0
Information that allows Information that CDQ 0 benchmarking allows
benchmarking * IDQ: Intrinsic data quality; CDQ: Contextual data quality; RDQ: Representational data quality; ACC: Accessibility data quality; USIQ: User interaction systems quality; DPSQ: Data processing systems quality

223
Canada 07 Raw data Concept Category Source Accurate data Accuracy IDQ 0 Excellent data Accuracy IDQ 0 Integration of data Integrated data IDQ 0 Hierarchy to data access but Access control ACC 0 common interpretation of data at all levels Controlled access to data Access control ACC 0 Standard platform that links Standard system DPSQ 0 all the units Long term vision of the Forecasting CDQ 0 system Same information in global Consistency/comm IDQ 0 environment on data Loop logic interface Interface quality USIQ 0 Gather all necessary Relevance CDQ 0 information diffuse effectively Information sharing ACC 0 Information responds to Relevance CDQ 0 different objectives of different users Information diffused rapidly Information sharing ACC 0 Get data quickly before it is Timeliness CDQ 0 too late Exact meaning of information Interpretability RDQ 0 Meaningful information in Interpretability RDQ 0 other countries User friendly interfaces Interface quality USIQ 0
* IDQ: Intnns1c data quahty; CDQ: Contextual data quahty; RDQ: Representat1onal data quahty; ACC: Accessibility data quality; USIQ: User interaction systems quality; DPSQ: Data processing systems quality
224
Canada 08
Raw data Concept Cate2ory Source Just in time data Timeliness CDQ 0 Excellent data Accuracy IDQ 0 Transparent data Ease of RDQ 0
understanding Flexibility in Information sharing ACC 0 information sharing control at certain Access control ACC 0 level Rapid access to data Rapid access ACC 0 Quick response time Response time DPSQ 0 Have information Forecasting CDQ 0 for the present and the future
* IDQ: Intnnstc data quahty; CDQ: Contextual data quahty; RDQ: Representattonal data quahty; ACC: Accessibility data quality; USIQ: User interaction systems quality; DPSQ: Data processing systems quality

225
Canada 09
Raw data Concept Category Source Data availability Data availability ACC 0 Just intime data Timeliness CDQ R U seful information Relevance CDQ 0 User X does not have to Relevance CDQ 0 know what user Y is doing. Provide data to who needs it. Controlled access to data Access control ACC 0 Access to data al the time Data availability ACC 0 Global adaptability Hardware flexibility DPSQ 0 Rapid access to data Rapid access ACC 0 Real time information Currency CDQ 0 Information that shows F orecasting CDQ 0 tendency Not much information on Clarity RDQ 0 screen Information that allows to Value added CDQ 0 search for meaning User friendly interfaces Interface quality USIQ 0 Present quantitative and Interface quality USIQ 0 qualitative information Information that allows users Information that CDQ 0 to do analysis allows users to do
analysis Information is easy to Easy interpretation RDQ 0 interpret of information * IDQ: Intrinsic data quality; CDQ: Contextual data quality; RDQ: Representational data quality; ACC: Accessibility data quality; USIQ: User interaction systems quality; DPSQ: Data processing systems quality

226
APPENDIXB
CANADA: LIST OF RA W DATA, CONCEPTS AND CATEGORY AT THE INDIVIDUAL LEVEL

227
Canada 1
Raw data Concept Category Source Get what I want without a lot Minimum effort to Impact on 0 of efforts do the job individual task Ability to accept change and Change acceptance Impact on 0 manage it individual skills
and knowledge Enables to analyze people Skills analysis Impact on R skills individual skills
and knowledge Helps to take good decisions Decision making Decision making R Instants reports for managers quick reports for Decisions 0
managers making Should be able to get Meaningfol Decision making 0 meaningfol information information for
decision making Satisfaction high satisfaction User satisfaction R Intuitive systems change the Behaviour change Impact on the 0 behaviour user as a person Impact on people moral Moral change Impact on the user R
as a person Make life easier Happiness Impact on the R
user as a person
Canada2
Raw data Concept Category Source A balance between work and Balancing time for Impact on the 0 family work and family user as a person Users needs high level of competencies Impact on 0 competencies individual skills
and knowledge New skills imply new New skills imply New skills imply 0 fonctions new fonctions new fonctions
Take decision quickly Quick decisions Decision making 0 Y es on decision making Decision making Decision making 0 Satisfaction high satisfaction User satisfaction R
228
Canada3
Raw data Concept Category Source Switch from transactional to Analytic tasks Impact on 0 analytic individual task Activities change and Activities change Impact on 0 executed by new people individual task Reorganize the department Reorganizing the Impact on 0
work place individual task Decentralize or centralize Functions change Impact on 0 fonctions individual task
Change business processes Change business Change business 0 processes processes
No more routine tasks Routine Tasks Impact on 0 change individual task
People become unnecessary in Unnecessary people Impact on the R the business career Reorient career Career reorientation Impact on the R
career Definitely, there is an impact Impact on the Impact on the 0 on career career career More interesting jobs Interesting jobs Impact on the R
career Creation of new fonctions Creation of new Impact on the 0
fonctions individual task No place for those who Routine Tasks Impact on 0 perform routine tasks change individual task Helps to take good decisions Decision making Decision making R Generates stress Stress generation Impact on the 0
user as a person Decision on investment and Enabling to decide Decision making 0 acquisitions on investment and
acquisition Reduction of non value Process Impact on 0 activities reengineering individual task

229
Canada4
Raw data Concept Cateeorv Source Develop expertise Expertise Impact on 0
development individual skills and knowledge
No impact on career No impact on Impact on the 0 career career
Y es on decision making Decision making Decision making 0 Enables users to predict the forecasting Decision making 0 future
Canadas
Raw data Concept Cateeory Source Promotion is a degree of Promotion is a Impact on the 0 differentiation degree of career
differentiation No impact No impact on career Impact on the 0
career IS is only one factor in the IS is only one factor Impact on the 0 promotion in the promotion career Motivated users User motivation Impact on the 0
user as a person
Canada 6
Raw data Concept Cateeory Source Impact on capacity of Increasing the Impact on 0 providing of the users capacity of individual skills
providing of the and knowledge users
Human dynamic have an No impact on Impact on the 0 impact and not IS career career Depends if business Depends if business Impact on the 0 encourages creativity encourages career
creativity Inverted effect. Too much Meaningful and Decision making 0 info leads to doubt on clean information decisions for decision making
Y es on decision making Decision making Decision making 0

230
Canada 8
Raw data Concept Category Source Enhancing the skills of the Skills enhancement Impact on 0 implementers for the individual skills
implementers and knowledge Smiling faces Smiling faces Impact on the 0
user as a person Users comfortable with the Confortability with Impact on the 0 systems the systems user as a person
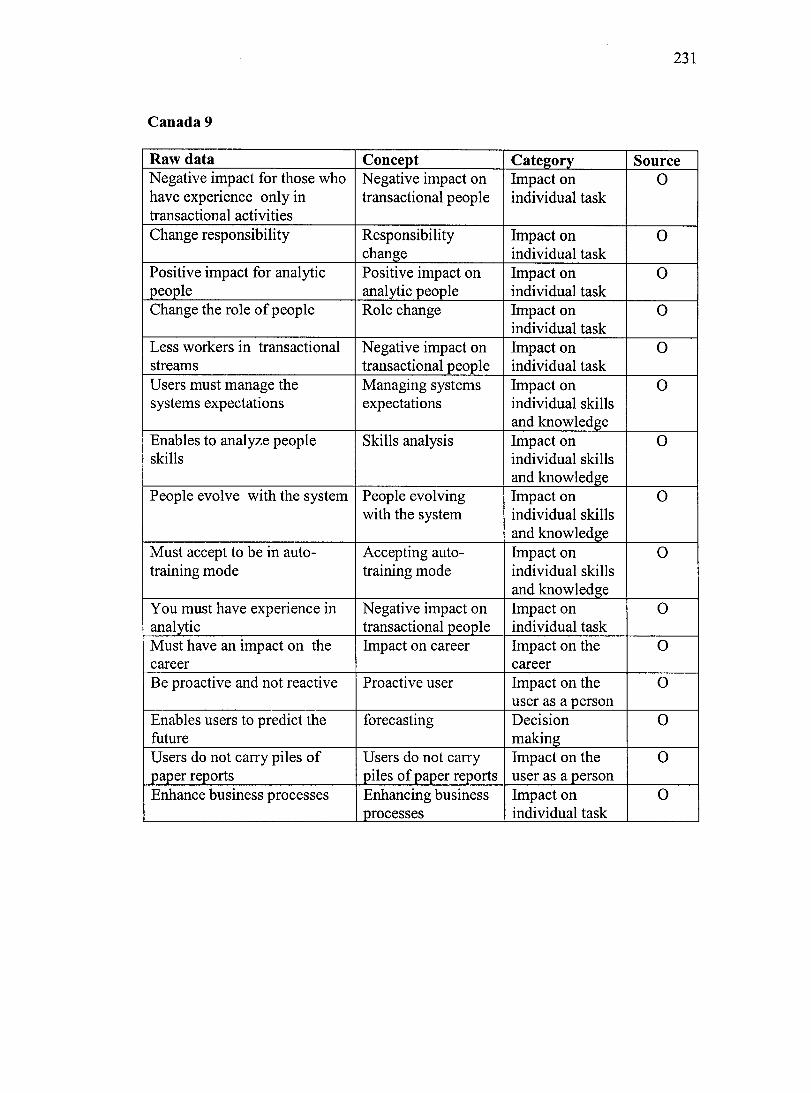
231
Canada 9
Raw data Concept Category Source Negative impact for those who Negative impact on Impact on 0 have experience only in transactional people individual task transactional activities Change responsibility Responsibility Impact on 0
change individual task Positive impact for analytic Positive impact on Impact on 0 people analytic people individual task Change the role of people Role change Impact on 0
individual task Less workers in transactional Negative impact on Impact on 0 streams transactional people individual task U sers must manage the Managing systems Impact on 0 systems expectations expectations individual skills
and knowledge Enables to analyze people Skills analysis Impact on 0 skills individual skills
and knowledge People evolve with the system People evolving Impact on 0
with the system individual skills and knowledge
Must accept to be in auto- Accepting auto- Impact on 0 training mode training mode individual skills
and knowledge Y ou must have experience in Negative impact on Impact on 0 analytic transactional people individual task Must have an impact on the Impact on career Impact on the 0 career career Be proactive and not reactive Proactive user Impact on the 0
user as a person Enables users to predict the forecasting Decision 0 future making Users do not carry piles of Users do not carry Impact on the 0 paper reports piles of paper reports user as a person Enhance business processes Enhancing business Impact on 0
processes individual task

232
APPENDIXC
CANADA: LIST OF RAW DATA, CONCEPTS AND CATEGORY AT THE ORGANIZATIONAL LEVEL

233
Canada 01
Raw data Concept Category Source Provides information on key Informing about key Financial impact 0 performance variables performance
variables Helps to manage cash flow Managing finance Financial impact 0 and fix payment in advance Process efficiency Process efficiency Business process 0
redesign Less people at work Downsizing Financial impact 0
Recognize profit soon Quick Profit Financial impact 0 recognition
The client is happy Happy clients Business 0 networks
Helps to negotiate with Negotiating with Business 0 suppliers suppliers networks Planning and bidding for Managing contract Business R contracts with suppliers networks Allows to know why things do Enabling to identify Business process 0 not go right problems in business redesign
processes Shows area to improve and Identifying areas to Financial impact 0 where to eut costs improve to save
money Users develop analytic Users develop Knowledge 0 reasonmg analytic reasoning development Helps to forecast forecasting Financial impact R Get users tacit knowledge Tacit knowledge Knowledge 0
development development

234
Canada2
Raw data Concept Cateeory Source Impact on the financial side Financial Financial impact 0 of the business improvement Organizational performance Organizational Organizational 0
performance performance Processes efficient Process efficiency Business process 0
redesign Financial impact Financial impact Financial impact 0
Allows to put much effort on Enabling to identify Business process 0 problematic parts problems in business redesign
processes Impact on the work method Work method change Business process 0
redesign Centralize the routine Functions Business process 0 fonctions restructuring redesign Consolidate every transaction Transaction Business process 0
consolidation redesign Enables to put much time on Concentrating on Gain of 0 other business opportunities opportunities competitive
advantage Helps to redefine clearly the Business process Business process 0 process redefinition redesign
Canada3
Raw data Concept Category Source Financial impact Financial impact Financial 0
impact Impact on relationships with Influencing Business 0 su pp li ers relationships with networks
suppliers Reduction of non value Process reengineering Business R activities process
redesign

235
Canada4
Raw data Concept Category Source Enables to evaluate eamed Enabling to evaluate Financial impact 0 value of the business the eamed value of
the business Helps to control processing Controlling contract Business networks 0 of contracts processing Revised processes Revising processes Business process 0
redesign Competitive advantage gain Competitive Gain of 0
advantage gain competitive advantage
Gratify people who provide Gratifying tacit Knowledge 0 tacit knowledge knowledge providers development
Canada 5
Raw data Concept Category Source Good decision Good decision Decision R
making Innovation Innovation Innovation 0 Encourages innovation Encouraging Innovation R
innovation
Canada 6
Raw data Concept Category Source Financial impact Financial impact Financial 0
impact Innovation because you Questioning the way Innovation 0 question the way you are the business in run doing work Flexible innovation Flexible innovation Innovation 0
Encourages innovation Encouraging Innovation 0 innovation
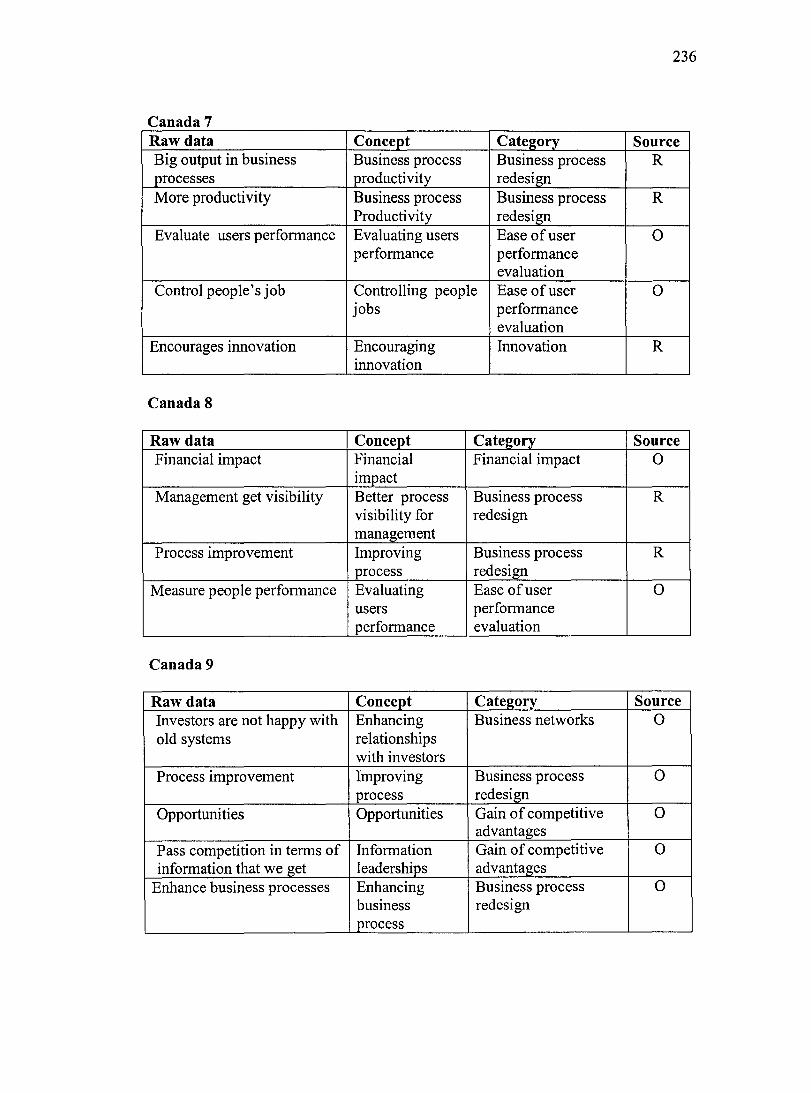
236
Canada 7 Raw data Concept Category Source Big output in business Business process Business process R processes productivity redesign More productivity Business process Business process R
Productivity redesign Evaluate users performance Evaluating users Ease of user 0
performance performance evaluation
Control people's job Controlling people Ease of user 0 jobs performance
evaluation Encourages innovation Encouraging Innovation R
innovation
Canada 8
Raw data Concept Cate2ory Source Financial impact Financial Financial impact 0
impact Management get visibility Better process Business process R
visibility for redesign management
Processimprovement Improving Business process R process redesign
Measure people performance Evaluating Ease of user 0 users performance performance evaluation
Canada 9
Raw data Concept Cate2ory Source Investors are not happy with Enhancing Business networks 0 old systems relationships
with investors Processimprovement Improving Business process 0
process redesign Opportunities Opportunities Gain of competitive 0
advantages Pass competition in terms of Information Gain of competitive 0 information that we get leaderships advantages
Enhance business processes Enhancing Business process 0 business redesign process

237
APPENDIXD
GERMANY: LIST OF RA W DATA, CONCEPTS AND CATEGORY AT THE SYSTEMS LEVEL

238
Germany 01
Raw data Concept Cate2ory Source Relevant data Relevance CDQ R
Relevant data Relevance CDQ 0 Data increase Amount of data CDQ 0
A void multiple meanings of Consistency of data RDQ 0 words in different countries meaning in diff erent
countries Multicultural systems for Systems flexibility DPSQ 0 global businesses Acceptable response time Response time DPSQ 0 Fast access to information Rapid access ACC R
IS has all the alternatives to Interface quality USIQ 0 find the Information Intelligent help fonction Interface quality USIQ R Voice processing interfaces Interface quality USIQ 0 Good navigation screens Ease of navigation USIQ R Customized to users Ease of navigation USIQ R preferences Menu structures Ease of navigation USIQ 0
Different levels of access Access control ACC 0 (specially for simple users) Comfortable to use Comfortable to use USIQ R
English as a common Interpretability RDQ 0 language between people
* IDQ: Intrinsic data quality; CDQ: Contextual data quality; RDQ: Representational data quality; ACC: Accessibility data quality; USIQ: User interaction systems quality; DPSQ: Data processing systems quality
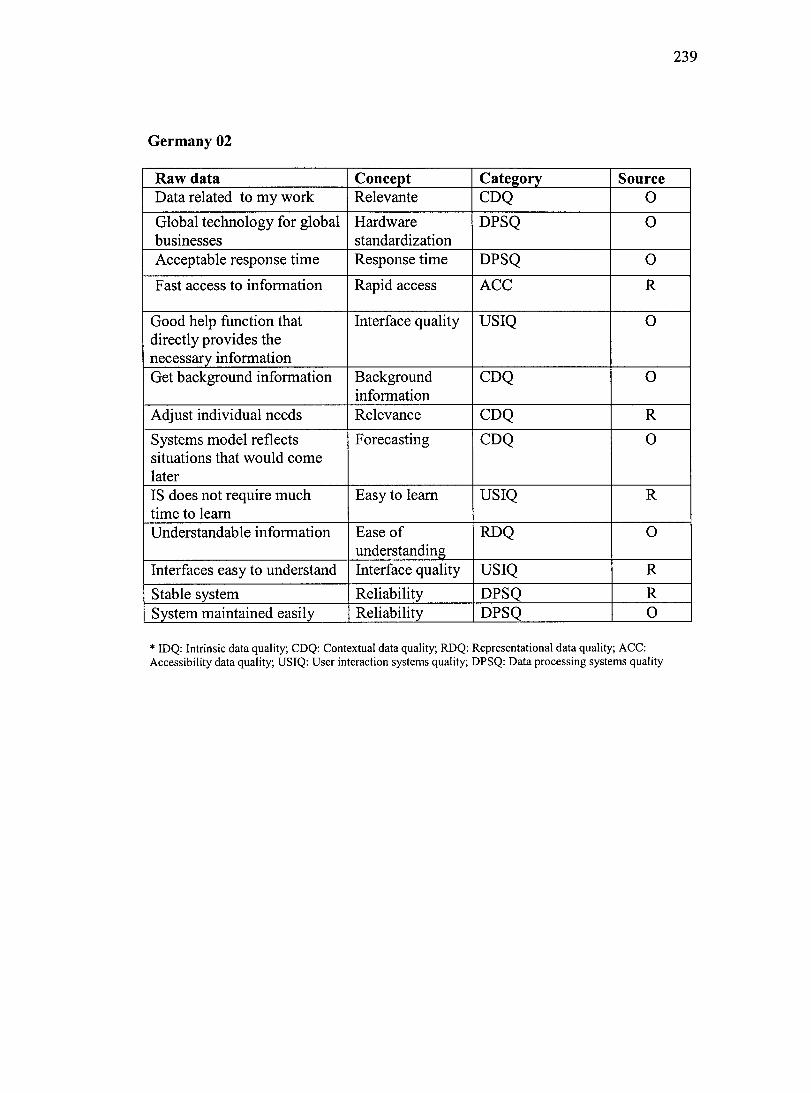
239
Germany02
Raw data Concept Cateiwrv Source Data related to my work Re levante CDQ 0
Global technology for global Hardware DPSQ 0 businesses standardization Acceptable response time Response time DPSQ 0
Fast access to information Rapid access ACC R
Good help fonction that Interface quality USIQ 0 directly provides the necessary information Get background information Background CDQ 0
information Adjust individual needs Relevance CDQ R
Systems model reflects Forecasting CDQ 0 situations that would corne later IS does not require much Easyto leam USIQ R time to leam Understandable information Ease of RDQ 0
understanding Interfaces easy to understand Interface quality USIQ R
Stable system Reliability DPSQ R System maintained easily Reliability DPSQ 0
* IDQ: Intrinsic data quality; COQ: Contextual data quality; RDQ: Representational data quality; ACC: Accessibility data quality; USJQ: User interaction systems quality; DPSQ: Data processing systems quality

240
Germany 03
Raw data Concept Category Source Quality of data provided is High data High data quality 0 high quality Secured personnel data Access control ACC 0 Secured access Access control ACC 0
24 hours service Accessibility ACC 0 Strategic data controlled Access control ACC 0 Secured access Access control ACC 0 Efficient hardware Hardware DPSQ 0
efficiency Information to do my work Relevance CDQ 0 System provides many Systems DPSQ 0 possibilities flexibility Easy to use Easy to use USIQ R IS does not require much Easyto leam USIQ R time to leam
* IDQ: lntrinsic data quality; CDQ: Contextual data quality; RDQ: Representational data quality; ACC: Accessibility data quality; USIQ: User interaction systems quality; DPSQ: Data processing systems quality

241
Germany 04
Raw data Concept Cate2:orv Source Updated data Data currency CDQ 0
Data keyed in a single Accuracy IDQ R location Data stored once Accuracy IDQ 0
Integrated data Integrated data IDQ R Once data is entered and Data integrity IDQ 0 modified, it is secured Secured access Access control ACC 0 Acceptable response time Response time DPSQ R
Adapt application to specific Systems DPSQ 0 situations flexibility Self explanatory Interpretability RDQ 0 Good help fonction that Interface quality USIQ R directly provides the necessary information Meaningful error messages Interpretability RDQ 0
Good navigation screens Ease of USIQ 0 navigation
Easy to use Easy to use USIQ R Transparent (user knows Ease of USIQ 0 where he is in the system) navigation IS does not require much Ease of leaming USIQ R time to leam Flexible standards (hardware Systems DPSQ 0 and software) flexibility Easy adaptation of the Hardware DPSQ R system compatibility Efficient systems reliability DPSQ 0 maintenance Systems customization effort Systems DPSQ R not too high flexibility Data is harmonized Harmonized data IDQ 0 whenever it is supplied
* IDQ: Intrinsic data quality; CDQ: Contextual data quality; RDQ: Representational data quality; ACC: Accessibility data quality; USIQ: User interaction systems quality; DPSQ: Data processing systems quality

242
Germany05
Raw data Concept Cate2orv Source Current data Currency IDQ R
Relevant data Relevante CDQ 0 Clear data and no errors Accuracy IDQ R
Updated data Accuracy IDQ 0 Access to data provided to Accessibility ACC R everyone Protected persona! data Access control ACC 0 Language of the home lnterpretability RDQ 0 culture Access to Intranet Accessibility ACC 0 Updated hardware Reliability DPSQ 0 Updated hardware and Reliability DPSQ R software Fast access to information Rapid access ACC R
Software and hardware Reliability DPSQ 0 updated because of competition
G 06 ermany Raw data Concept Cate2ory Source Specific answer to my query Relevance CDQ 0
Secured data Access control ACC 0 Systems customization to Systems DPSQ 0 each culture flexibility Fast access to information Rapid access ACC 0
Fast access to information Rapid access ACC 0
Opportunities to choose data Relevance CDQ 0 you need Manages interfaces to other Systems DPSQ 0 systems flexibility Graphies Interface quality USIQ 0 Helps understand what you Ease of RDQ 0 see understanding Flexible systems Systems DPSQ 0
flexibility Flexible standards (hardware Systems DPSQ 0 and software) flexibility * IDQ: Intrinsic data quality; CDQ: Contextual data quality; RDQ: Representational data quahty; ACC: Accessibility data quality; USIQ: User interaction systems quality; DPSQ: Data processing systems quality

243
Germany 07
Raw data Concept Category Source Current data Data currency IDQ 0
Correct data Accuracy IDQ 0 Transparent data Ease of RDQ 0
understanding Secured personnel data Access control ACC 0
Fast access to information Rapid access ACC 0 Get information from a broad Appropriate CDQ 0 pool of data Amount of data Good oriented information Ease of RDQ 0
understanding Easy presentation of complex Easy presentation RDQ 0 data in reports of complex data
in reports The system should provides Relevance CDQ 0 exactly what you need Key fields filled in right way Accuracy IDQ 0
Germany 08
Raw data Concept Category Source Same information to all Data integrity IDQ 0 users Integrated data Integrated data IDQ 0
Necessary maintenance of hardware DPSQ 0 the systems Reliability
Secured access Access control ACC 0 Good security Access control ACC 0 Good help fonction that Interface quality USIQ 0 directly provides the necessary information Easy structure of IS Easy navigation USIQ 0 Flexible standards (hardware Systems DPSQ 0 and software) flexibility Same characteristics in all Hardware DPSQ 0 sites standardization Procedures to store data and Data security ACC 0 backup * IDQ: Intrinsic data quahty; CDQ: Contextual data quahty; RDQ: Representattonal data quahty; ACC: Accessibility data quality; USIQ: User interaction systems quality; DPSQ: Data processing systems quality

244
APPENDIXE
GERMANY: LIST OF RA W DATA, CONCEPTS AND CATEGORY AT THE INDIVIDUAL LEVEL

245
Germany 1
Raw data Concept Category Source Go elsewhere Changing to Impact on the 0
other companies user' s career Satisfaction not a good No satisfaction User satisfaction 0 indicator for IS success
Germany2
Raw data Concept Category Source User friendly User friendliness User satisfaction 0
Users like the systems Liking the User satisfaction 0 system
Satisfaction related to user Subjective User satisfaction 0 perception satisfaction User friendly User friendliness User satisfaction 0
Germany 3
Raw data Concept Category Source Forecast differently Different Decision making 0
forecasting No impact on the career No career Impact on the 0
impact user' s career Reduces effort to do the job Minimum effort Impact on 0
to do the job individual task Having fun in the job Having fun in the Impact on the user 0
job as a person Frustration frustration Impact on the user 0
as a person Reduces face to face Reducing face to User 0 communication with the boss face independence
communication from management with the boss And user
dependence on the group

246
Germany4
Raw data Concept Category Source Performs the task fast Performing the the impact on the 0
task fast individual task Performs tasks better Performing the the impact on the 0
task better individual task Reduces effort to do the job Minimum effort the impact on the 0
to do the job individual task Makes life easy in Making life easy the impact on the 0 performing the task in performing the individual task
task
Germany 5
Raw data Concept Category Source Career development Career Impact on the R
development user' s career Users are satisfied Satisfaction User satisfaction R Reinforce the state of the Reinforcing the Impact on the user 0 mind state of the mind as a person Stress generator Generating stress Impact on the user 0
as a person More people involved in User motivation Impact on the user 0 future IS development in IS as a person
development

247
Germany 6
Raw data Concept Cate~ory Source People transfer Changing the job Impact on the 0
user's career Career development Career Impact on the R
development user's career Reduces people in offices Downsizing Impact on the 0
user' s career Happyusers Users happy with User satisfaction R
the system Long term vision to change The group helps User 0 skills of users change users independence
skills from management And user dependence on the group
Training in the group In-group training User 0 independence from management And user dependence on the group
Information sharing Information User R sharing independence
from management And user dependence on the group
Generate trust between t Generating trust User 0 people and management between people independence
and management from management And user dependence on the group

248
Germany 7
Raw data Concept Category Source No impact on the career No career impact Impact on the 0
user' s career Reasons of satisfaction can Subjective User satisfaction 0 be diff erent among users satisfaction Satisfaction is related to Subjective User satisfaction 0 improvement made by the satisfaction IS No reliance on the boss Independence User 0
from the boss independence from management And user dependence on the group
Germany 8
Raw data Concept Category Source Enhances decision Enhancing Decision making 0 making decision making Decision can be Automating Decision making R automated decision making User friendly User friendliness User satisfaction 0
Satisfaction is related Subjective User satisfaction 0 toimprovementmade satisfaction bythe IS
Satisfaction related to Subjective User satisfaction 0 user perception satisfaction Connecting to many Connecting people User independence 0 people from management
And user dependence on the group
No more hierarchy in Team work User independence R management approach from management
And user dependence on the group

249
APPENDIXF
GERMANY: LIST OF RA W DATA, CONCEPTS AND CATEGORY AT THE ORGANIZATIONAL LEVEL

250
Germany 1
Raw data Concept Category Source Clear help desk structure Clear help desk Help desk support 0 and process structure and quality
process Auto-training help desk Auto-training Help desk support 0 personnel help desk quality
personnel Help desk in a single Centralizing the Help desk support 0 location and serves all sites help desk quality
fonction Help desk must solve 80% Solving problems Help desk support 0 of help calls by the help desk quality
staff Direct communication with Direct Help desk support 0 help desk communication quality
with help desk Processes must stay the Enduring Business process 0 same for at least 4 to 5 years business redesign
processes Changes the process Changing Business process 0
processes redesign Reengineering of the Reengineering Business process 0 organization and IS the organization redesign customized for business process and not for us
Germany 2
Raw data Concept Category Source Fully support the business Supporting the Business process 0 process business process redesign Visibility of the whole Visibility of the Business process 0 process whole process redesign

251
Germany 3
Raw data Concept Category Source Reduces travel effort Reducing travel Financial impact 0
effort Efficient processes Efficient Business process 0
processes redesign Reduces process complexity Reducing Business process 0
process redesign complexity
Do business fast Business process Business process 0 productivity redesign
Germany4
Raw data Concept Cateeory Source Help desk Provides good Help desk Help desk 0 assistance Provides good support quality
assistance Generating financial value Generating Financial impact 0 for the business financial value
for the business Efficient processes Efficient Business process 0
processes redesign Great impact on the process Business process Business process 0 cycle productivity redesign Brings new way of thinking Bringing new Knowledge based 0
ways of thinking organizational culture

252
Germany 5
Raw data Concept Category Source IS changes Changing the Knowledge based R organizational culture organizational organizational culture
culture The new culture is Knowledge Knowledge based 0 based on knowledge sharing based organizational culture sharing organizational
culture Force people to share Knowledge Knowledge based 0 their knowledge sharing organizational culture Enables access to Enabling access Team work 0 more information to more encouragement form colleagues at information form work colleagues at
work Rigor in management Developing rigor Impact on R
in management organizational structure and management style
Decentralization of Decentralizing Impact on 0 decision making decision making organizational structure
process and management style Fully support the Supporting Business process R business process business redesign
processes

253
Germany 6
Raw data Concept Cate2ory Source Help desk sharing Help desk sharing Help desk 0
support quality lmplement the culture of Knowledge Knowledge 0 knowledge sharing sharing based based
organizational organizational culture culture
The new culture is based Knowledge Knowledge 0 on knowledge sharing sharing based based
organizational organizational culture culture
Feedback if you get tacit Tacit knowledge Knowledge 0 knowledge development based
organizational culture
Access to information by Accessing Team work 0 all people information by encouragement
everyone Reduce time for work flow Reducing work Financial impact 0
flow cycle Overhead cost can be Reducing Financial impact 0 reduced overhead cost Access to information by all Accessing Team work 0 people information by encouragement
everyone W ork in open climate Working in an Team work 0
open climate encouragement Fully support the business Supporting Business process 0 process business processes redesign Enables Flexibility in Enabling Business process 0 integrating business flexibility in redesign processes integration
business processes Integration of information Integration of Business process R
information redesign Standard processes Standardization of Business process R
processes redesign

254
Germany 7
Raw data Concept Cate~ory Source Time is critical Managing time Financial impact 0
Free up people for Freeing up Impact on organizational 0 other tasks people for other structure and management
tasks style Managers use the Implementation Impact on organizational 0 systems themselves of end user structure and management
computing style practice
Online managers End user Impact on organizational 0 can access data computing structure and management
style Improve decision Improving Decision making 0 making decision making Great impact on the Reducing work Business process redesign 0 process cycle flow cycle Efficient processes Efficient Business process redesign 0
processes Changes the Changing the Business process redesign 0 process process

255
Germany 8
Raw data Concept Cate2ory Source Reduce cost Reducing cost Financial impact 0
Supports team Supporting Team work encouragement 0 work team work Isis a tool for Supporting Team work encouragement R team work team work Project and Developing new Impact on organizational 0 matrix structure structures structure and management style
Free from Developing new Impact on organizational 0 location ofusers structure structure and management style Y ou do not need Developing new Impact on organizational R a boss or structures structure and management style subordinate Free up people Freeing up Impact on organizational 0 for other tasks people for other structure and management style
tasks No more titles Title less Impact on organizational 0
environment structure and management style No more Developing new Impact on organizational 0 department or structures structure and management style division No rigid Developing new Impact on organizational 0 structure structures structure and management style Changes the Changing the Impact on organizational R organizational organizational structure and management style structure structure Use oflntranet Using intranet Impact on organizational 0
structure and management style Changes in Communication Impact on organizational 0 communication change structure and management style in the business Reduces Developing new Impact on organizational 0 organizational structures structure and management style hierarchy Secretaries Developing new Impact on organizational 0 become structures structure and management style assistants Reengineering of Developing new Impact on organizational 0 the organization structures structure and management style
256
APPENDIXG
FRANCE: LIST OF RAW DATA, CONCEPTS AND CATEGORY AT THE SYSTEMS LEVEL

257
France 01
Raw data Concept Catetwrv Source Precise data Precision IDQ R No errors Accuracy IDQ 0 Organized information Concise data RDQ 0 Useful information Relevance CDQ 0
Transparent information Ease of RDQ 0 understanding
Easy to use Easy to use USIQ 0 Same philosophy as our Fit between user and USIQ 0 model of thinking system logic Comprehensive messages Clarity RDQ R Not much information on Clarity RDQ R screen Good presentation and Clarity RDQ 0 format Minimum time to Ease of RDQ 0 understand report understanding Convivial Interface quality USIQ R Enables information Information sharing ACC 0 exchange between employees and managers Open applications Systems flexibility DPSQ R * IDQ: Intrinsic data quality; CDQ: Contextual data quality; RDQ: Representational data quality; ACC: Accessibility data quality; USIQ: User interaction systems quality; DPSQ: Data processing systems quality

258
France 02
Raw data Concept Cate!!ory Source Synthesized information Data aggregation CDQ R Fluid Information flow Response time DPSQ R Keep confidentiality Access control ACC 0 Hierarchy information Access. control ACC 0 access
Hierarchy of using the Access control ACC R system Controlled access to data Access control ACC 0 Smart responses Interface quality USIQ R Convivial Interface quality USIQ 0 Rapid responses Response time DPSQ R Provides many levels of Level of detail CDQ 0 information details Simple to use Interface quality USIQ R * IDQ: Intrinsic data quahty; COQ: Contextual data quality; RDQ: Representational data quality; ACC: Accessibility data quality; USIQ: User interaction systems quality; DPSQ: Data processing systems quality
France 03
Raw data Concept Cate2ory Source Validated data V alidated data IDQ 0 Correspond to user's need Relevance CDQ 0 Controlled access even Access control ACC 0 inside the same division or unit Keep confidentiality Access control ACC 0
Easy to parameter Systems flexibility DPSQ 0 Active screens Interface quality USIQ R Convivial Interface quality USIQ R Rapid responses Response time DPSQ 0 Customized applications Systems flexibility DPSQ R Individual reports Customized data CDQ R Enables to analyze the Verifiable data IDQ R quality of information Enables to verify the Validated data IDQ 0 validity of information Open applications Systems flexibility DPSQ R * IDQ: Intrins1c data quahty; COQ: Contextual data quahty; RDQ: Representat10nal data quahty; ACC: Accessibility data quality; USIQ: User interaction systems quality; DPSQ: Data processing systems quality
259
France 04
Raw data Concept Category Source Comprehensive Clarity RDQ R information More data quality at end Appropriate amount CDQ 0 in terms of data amount of data Information forwarded to Access control ACC 0 right people only High quality at start in Appropriate amount CDQ 0 terms of amount of data of data
Correspond to user' s need Relevance CDQ 0 Only the manager who can Access control ACC 0 decide if information is to be distributed Strategic data accessed only Access control ACC 0 by management Hierarchy information Access control ACC R access Convivial Interface quality USIQ R Rapid responses Response time DPSQ R * IDQ: Intrinsic data quality; CDQ: Contextual data quality; RDQ: Representational data quality; ACC: Accessibility data quality; USIQ: User interaction systems quality; DPSQ: Data processing systems quality

260
France 05
Raw data Concept Category Source Correspond to user' s need relevance CDQ 0 in every culture Data entry quality Accuracy IDQ 0 No errors Accuracy IDQ 0 Clear data Accuracy IDQ 0
Understandable information Ease of RDQ 0 understanding
Correspond to user's need Relevance CDQ 0 Access depends on the role Access control ACC 0 of the user Controlled access to data Access control ACC 0 Secured system Access control ACC 0 Small number of data entry Interface quality USIQ 0 Rapid data entry Interface quality USIQ 0 Rapid responses Response time DPSQ 0 Enables to add changeable Systems flexibility DPSQ 0 parameters * IDQ: Intrins1c data quahty; CDQ: Contextual data quahty; RDQ: Representational data quahty; ACC: Accessibility data quality; USIQ: User interaction systems quality; DPSQ: Data processing systems quality
France 06
Raw data Concept Cate2ory Source On time data Timeliness CDQ 0 Get output that corresponds Reliability DPSQ 0 to input Precise data Precision IDQ 0 Correct information Accuracy IDQ 0
Data entry quality Accuracy IDQ 0 Secured system Access control ACC 0 Secured system Access control ACC 0 Controlled access to data Access control ACC 0 User friendly Interface quality USIQ 0 Simple to use Interface quality USIQ 0 Multilanguage system Systems flexibility DPSQ 0 Easy to use Easy to use USIQ 0 Rapid responses Response time DPSQ 0 Import and export fonctions Response time DPSQ 0 are easy and rapid Enables confidentiality Access control ACC 0 * IDQ: Intnns1c data quahty; CDQ: Contextual data quahty; RDQ: Representat10nal data quahty; ACC: Accessibility data quality; USIQ: User interaction systems quality; DPSQ: Data processing systems quality

261
France 07
Raw data Concept Category Source Updated data Current data CDQ 0 Comprehensive by Interpretability RDQ 0 management Convivial Interface quality USIQ 0 Feedback information Feedback CDQ 0
information Exact data Accuracy IDQ 0 Controlled access to data Access control ACC 0 Hierarchy information Access control ACC 0 access Access depends on Access control ACC 0 responsibility Controlled access to data Access control ACC 0 Easy to use Easy to use USIQ 0 Rapid responses Response time DPSQ 0 Enables to add changeable Systems flexibility DPSQ 0 parameters * IDQ: Intnns1c data quahty; CDQ: Contextual data quahty; RDQ: Representatlonal data quahty; ACC: Accessibility data quality; USIQ: User interaction systems quality; DPSQ: Data processing systems quality
France 08
Raw data Concept Category Source The hardware must be Response time DPSQ 0 sophisticated The hardware must be rapid Speed of access DPSQ 0 Response time very high Response time DPSQ 0 Data is correct Accuracy IDQ 0 Secured system Access control ACC 0 Be able to modify the reports Report customization RDQ 0 according to the user needs Easy to use Easy to use USIQ 0 Convivial Interface quality USIQ 0 Accurate data Accuracy IDQ 0 Control access to data Access control ACC 0 Only those who have the right to Access control ACC 0 get data can access it Easy to use by managers Easy to use USIQ 0 * IDQ: Intnns1c data quahty; CDQ: Contextual data quahty; RDQ: Representatlonal data quahty; ACC: Accessibility data quality; USIQ: User interaction systems quality; DPSQ: Data processing systems quality

262
APPENDIXH
FRANCE: LIST OF RA W DATA, CONCEPTS AND CATEGORY AT THE INDIVIDUAL LEVEL
263
France 1
Raw data Concept Category Source U sers should use the Using the system User independence R systems independently from independently form from IS IS professional IS professionals professionals U sers like the system Users liking the User satisfaction 0
systems Give people what they Meets users needs User satisfaction 0 need If not satisfied, users would Disappointing non User satisfaction 0 develop their own satisfied users applications
Put expertise on CV Enhancing persona! Impact on the user's 0 expertise career
Use the system Using the system Use 0 Facilitate the task Facilitating the task Impact on individual R
tasks

264
France 2
Raw data Concept Category Source Feels that the system is here Feeling the superiority User power over R just to help of the user on the the system
system The system should not have Feeling the superiority User power over 0 power on user of the user on the the system
system IS Success depends on the Importance of the user User power over 0 users and not on the system on the system in the system
achieving IS success It is not the system that Denying the role of IS User power over 0 render a person to be in making the user be the system competent more competent
Users should use the systems Using the system User R independently from IS independently form IS independence professional professionals from IS
professionals Give people what they need Meets users needs User satisfaction 0 Happyusers U sers liking the User satisfaction R
system No impact on the career No impact on the Impact on the 0
career user' s career Pushes users to go for Pushing users for Impact on 0 perfection perfection individual skills
and knowledge Open the eyes of users Enhancing the user Impact on 0
skills and knowledge individual skills and knowledge
Use the system Using the system Use 0 Helps to perform my job Performing the job Impact on 0 better better individual tasks
France 3
Raw data Concept Category Source Helps to better structure Better system Impact on 0 questions and answers queenng individual skills
and knowledge Subordinates need to use the Use of the system by Use 0 system subordinates Alignment between task and Aligning task and Impact on 0 m1ss10n m1ss10n individual tasks

265
France 4
Raw data Concept Category Source Users are best tools that Importance of the user User power over 0 measure the system as a measurement tool the system
ofIS success lt is not IS professional that Importance of the the user power 0 verify the IS success functional user in over the system
verifying IS success Give people what they need Meet users needs User satisfaction 0
Satisfied because of rapid Satisfaction User satisfaction 0 data entry and modification Impact on career if mangers lmpacting the user Impact on the 0 see users using the system career if users use the user' s career
system and managers witnessed that
Probably not because Impacting the user Impact on the 0 managers don 't see behind career if us ers use the user' s career users system and managers
witnessed that U sers create their reports Creating one's own Impact on 0
reports individual skills and knowledge
Use the system Using the system Use 0 users of the systems are Users with high Use 0 motivated intention to use the
system Helps to gain time Gaining time in Decision making 0
decision making
France 5 Raw data Concept Category Source Does not block users Not blocking users User power over the 0 from doing their job from doing their job system W e do not really need No needs for User independence from 0 programmers programmers IS professionals Happyusers Users liking the User satisfaction 0
system Satisfied users Satisfaction User satisfaction 0 Y es if the users master Impact on the Impact on the user's 0 the system career if us ers career
master the system Better decision making Better decision Decision making 0
making

266
France 6
Raw data Concept Cateeory Source freedom in organizing and Freedom in User power over 0 managing time organizing and the system
managing time No more reliance on No needs for User 0 programmers programmers independence
from IS professionals
Users like the system U sers liking the User satisfaction R system
Evolve in my job Job evolution Impact on the R user' s career
Liberty to create what I want Creating one's Impact on 0 own reports individual skills
and knowledge Open my conscientiousness Open the user' s Impact on 0
conscientiousnes individual skills s and knowledge
Need to search and use the U sing the system Use 0 system W e need to keep what we Not letting the User power over 0 have in our context systems change the system
the users context

267
France 7
Raw data Concept Category Source Standard systems are not Refusing standard User power over 0 good systems the system Should let the user solve the Enabling the users to User power over 0 problems by himself instead solve the problems by the system ofrelying on the vendor of themselves instead of the systems relying on vendor of
standard system No outsourcing the IS Users refusal oflS User power over 0 fonction outsourcing the system We do not really need No needs for User R programmers programmers independence
from IS professionals
No impact on the career No impact on the Impact on the 0 career user's career
Help users do things they Creativity Impact on 0 have never done bef ore individual skills
and knowledge Helps users to become more Becoming more Impact on R technical technical individual skills
and knowledge Users use the system because U sing the system Use 0 of the large amount of information Rethink our tasks and Rethinking the tasks Impact on 0 responsibilities and responsibility individual tasks
France 8
Raw data Concept Category Source Helps users to become more Becoming more Impact on 0 technical technical individual skills
and knowledge No impact on the career No impact on the Impact on the 0
career user's career No more reliance on No needs for User 0 programmers programmers independence
from IS professionals
Better decision making Better decision Decision making 0 making

268
APPENDIXI
FRANCE: LIST OF RA W DATA, CONCEPTS AND CATEGORY AT THE ORGANIZATIONAL LEVEL

269
France 1
Raw data Concept Category Source Better customer service Servicing the Business process 0
customers better redesign Gain of efficiency Gaining efficiency Business process 0
redesign The system strategy and the Aligning the business Fit between 0 business strategy are aligned and the systems systems and
strategies human model of work
Our methods ofwork are Aligning the work Fit between 0 aligned with the system methods with the systems and
system human model of work
France 2
Raw data Concept Category Source Support business processes Supporting business Business process 0
processes redesign Helps to make money Helping to make Business process R
money redesign Helps managers to have a Enabling managers to Business process 0 broad view of what is going have al larger redesign on visibility in the
business Be a logical system Being a logical system Fit between R That fits work logic that fits work logic systems and
human model of work
Needs to present a the system presents a Fit between 0 philosophy of doing work philosophy ofwork systems and
method human model of work
If we work fine, the systems Being a logical system Fit between 0 follows that fits our logic systems and
human model of work

270
France 3
Raw data Concept Catee;ory Source Enhance social Enhancing social User integration and 0 climate climate communication in the group
France 4
Raw data Concept Category Source
Transfer the knowledge of Knowledge User integration and 0 using the systems to sharing communication in the group members of the unit
France 5
Raw data Concept Category Source
Detailed business processes Detailing the tasks in Business process 0 the business processes redesign
Impact on inter service Influencing the inter Business process R relationships service relationships redesign Impact on relationships Close relationships User integration 0 between people in the same between people in the and unit group communication

271
France 6
Raw data Concept Cate2ory Source Gain of efficiency Gaining Business process redesign 0
efficiency W e write down what we Imposing Fit between systems and 0 have in our heads users ideas on human model ofwork
the system W e are the owners of our Imposing our Fit between systems and 0 ideas ideas on the human model of work
system Should not extemalize our No Fit between systems and 0 rules of work extemalizing human model of work
our rules or work
Brings open climate at work Bringing User integration and 0 open climate communication in the at work group
Communication cornes from Information User integration and 0 people sharing communication in the
group
France 7
Raw data Concept Cate2ory Source Does not block the user of Not blocking Fit between systems and 0 doing his job users from human model of work
doing their job Have our hands on the Controlling the Fit between systems and R system and the systems system and the human model of work follows system follows Helps users to be more Helping users to User integration and R attached be more communication in the
attached group Same competency between Common User integration and R users competencies communication in the
among the group group
272
France 8
Raw data Concept Category Source no impact in Finance No impact on Financial impact 0
finance Gain of efficiency Gaining Business process redesign 0
efficiency Better communication Communicati User integration and 0 between members of the ng between communication in the unit members of group
the unit

273
APPENDIXJ
CANADA: REPERTORY GRID DATA AT SYSTEMS LEVEL

274
Concept Frequency Complete no missing data/ incomplete data 1 Information is accurate / information is not accurate 1 Information is relevant / information is not relevant 1 Information was standard / information was not standard 3 Data was integrated / data was not integrated at all 2 The system is available / the systems is often off 1 System was closed and open selectively / system was 1 closed Works for all the units / did not work for all the units 1 Reports are produced instantly / it takes too long to 1 produce reports Rapid access to information / slow access to information 1 Customised reports / standard reports 1 Users get the results easily / users get the results with 1 difficulties Provides necessary information / provides a lot of 1 unnecessary information Almost intuitive for users / not intuitive for users 1 Easy to follow / hard to follow 1 Easy to understand / not easy to understand 2 Information is meaningful / no meaning attached to 1 information Interact easily / does not interact easily 1 Great GUI / no GUI 1 Flexible and convivial / not flexible and not convivial 1

275
APPENDIXK
CANADA: REPERTORY GRID DATA AT THE INDIVIDUAL LEVEL
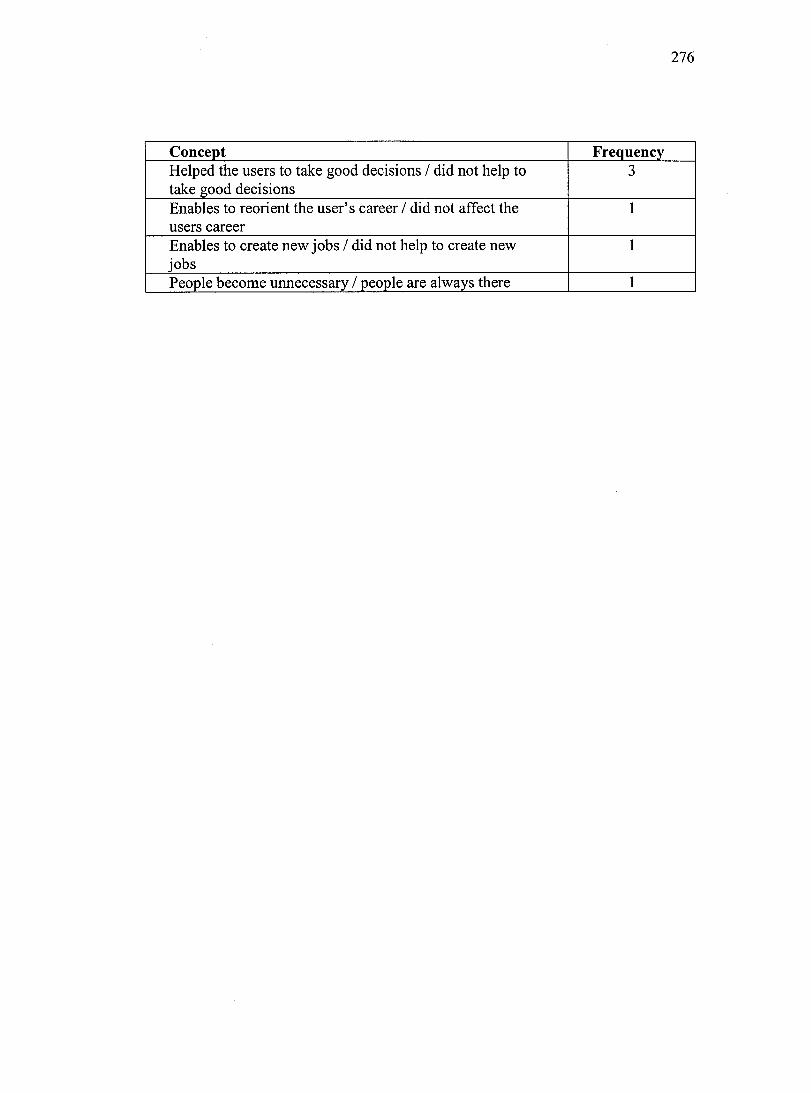
276
Concept Freauency Helped the users to take good decisions / did not help to 3 take good decisions Enables to reorient the user's career / did not affect the 1 users career Enables to create new jobs/ did not help to create new 1 jobs People become unnecessary / people are always there 1

APPENDIXL
CANADA: REPERTORY GRID DATA AT THE ORGANIZATIONAL LEVEL
277
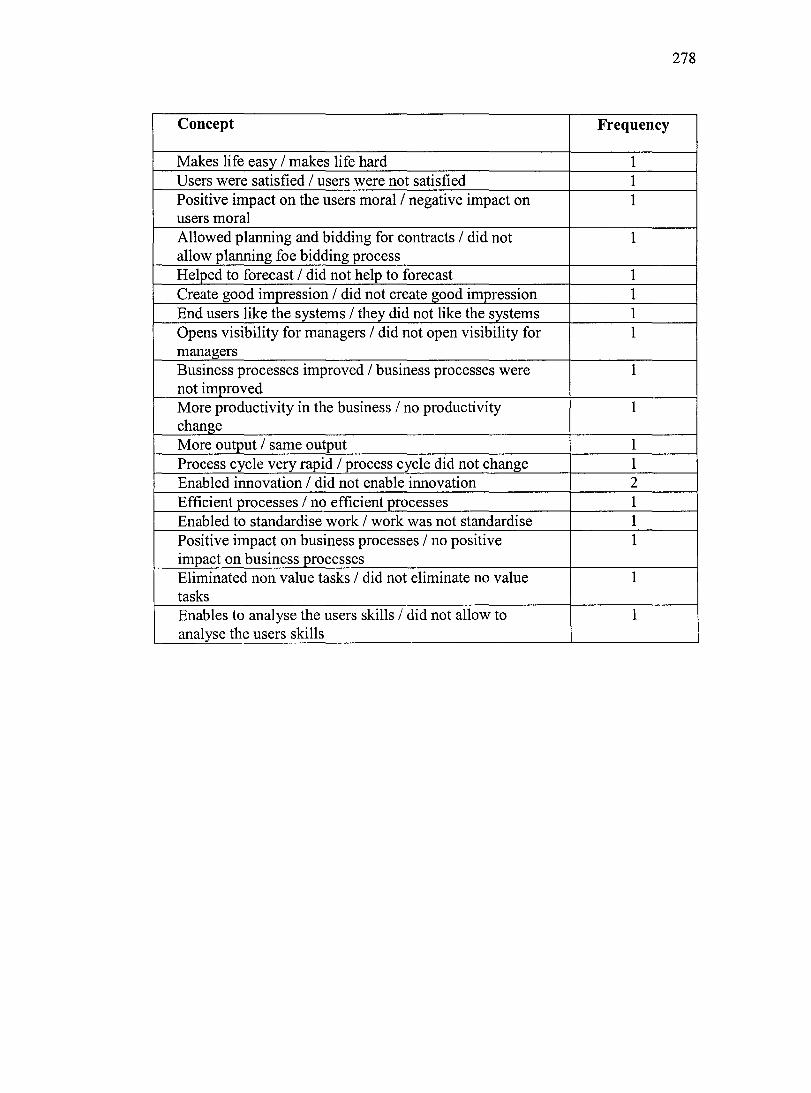
278
Concept Frequency
Makes life easy / makes life hard 1 Users were satisfied / users were not satisfied 1 Positive impact on the users moral / negative impact on 1 users moral Allowed planning and bidding for contracts / did not 1 allow planning foe bidding process Helped to forecast / did not help to forecast 1 Create good impression / did not create good impression 1 End users like the systems / they did not like the systems 1 Opens visibility for managers / did not open visibility for 1 managers Business processes improved / business processes were 1 not improved More productivity in the business / no productivity 1 change More output / same output 1 Process cycle very rapid / process cycle did not change 1 Enabled innovation / did not enable innovation 2 Efficient processes / no efficient processes 1 Enabled to standardise work / work was not standardise 1 Positive impact on business processes / no positive 1 impact on business processes Eliminated non value tasks / did not eliminate no value 1 tasks Enables to analyse the users skills / did not allow to 1 analyse the users skills

279
APPENDIXM
CANADA: REPERTORY GRID DATA AT THE OTHER LEVEL

280
Concept Frequency Systems efficiency high / systems efficiency not high 2 There were a number of people who participate in the 1 project / no users participation The system was not imposed / was imposed 1 Regular discipline was changed smoothly / no change 1 High amount of change with change management / no 1 change management Culture was taken into account / culture was not taken 1 into account Users were well trained / training was poor 4 High degree of utility / low degree of utility 1 Low number ofhelp desk call / high number ofhelp 1 desk calls High impact on the users / low impact on the users 1 Fully support the business processes / did not fully 1 support business processes Business performance was enhanced / we could not 1 notice this Enables everyone to understand the business vocabulary 1 / diff erent vocabulary Enables to work on different information/ the same 1 information

281
APPENDIXN
GERMANY: REPERTORY GRID DATA AT THE SYSTEMS LEVEL

282
Concept Frequency Relevant information / non relevant information 1 Clear and no error / complex and full of logical errors 1 Current information / outdated information 1 Data was integrated / data was not integrated 2 Standard data / non standard data 1 Information is only entered once /multiple information entry 1 Security assurance was high / security assurance was not 1 high Quick response time / response time slow 4 Customised reports / standard reports 1 V ery good help fonction / help fonction no good 2 Does not require standard users / requires standard users 1 Enables individual applications / does not enable individual 2 applications Few interactions for operation / many interactions for 1 operation Good help structure / poor help structure 1 Clear structure of the system/ complex structure of the 1 systems Good navigation screen / poor screen navigation 1 Good level of access / poor level of access 1 Customised menus / standard menus 1 Easy to leam / difficult to leam 2 easy interfaces / complex interfaces 1 Easy to use / difficult to use 2 Standard processes / non standard processes 1 An environment with testing and quality assurance / no such 1 environment Adaptation was not complex / adaptation was complex 1 Customisation effort was low / customisation effort was high 1 The system was stable/ the system was not stable 1

283
APPENDIXO
GERMANY: REPERTORY GRID DATA AT THE INDIVIDUAL LEVEL

284
Concept Frequency User friendly / not user friendly 1 Helps to automate decisions / did not help to automate 2 decisions Users did not rely on the boss for information/ users did 1 rely on the boss for management Information sharing was possible / information sharing 1 was not high Enabled career development / did not enable career 2 development Users were satisfied / users were not satisfied 3 Decreases number of people in offices / did not decrease 1 number of people in offices

285
APPENDIXP
GERMANY: REPERTORY GRID DATA AT THE ORGANIZATIONAL LEVEL

286
Frequency Concept
Collaboration between people / no collaboration 1 The system was considered as a tool for team work / not a 1 tool for team work Enables information sharing / did not enable information 2 sharing Enables decentralisation ofworking place/ did not enable 1 decentralisation ofworking place Helped to reduce travel effort / did not help reduce travel 1 effort Forced people to share information/ dif not force people 3 to share information Large access to information / reduced access to 1 information More time was allocated to analytic reasoning / no 1 analytic reasoning Changed the organizational culture to knowledge 1 management culture/ did not enable culture change Rigour in time management / no rigour in time 1 management Reinforce open climate / did not reinforce open climate 1

287
APPENDIXQ
GERMANY: REPERTORY GRID DATA AT THE OTHER LEVEL

288
Frequency Concept Users were involved in the implementation process / users we1 1 Helped to support the work / did not help to support the 1 work Efficiency at work was high / efficiency at work was low 3 Positive feedback from the users on the efficiency of the 1 systems / no feedback High system use / low system use 1 Enables to instantly evaluate employees performance/ 1 did not help the evaluation

289
APPENDIXR
FRANCE: REPERTORY GRID DATA AT THE SYSTEMS LEVEL

290
Concept Frequency Information is good and recognised / Information is not 1 good and not recognised Information is short and good / too much information 2 Clear and easy to read information / information is hard 1 to read Convivial information/ not convivial 4 Meaningful information / not meaningful information 1 Allowed a hierarchical vision / does not allow a 1 hierarchical vision Reliable system / unreliable system 1 Information was addressed to proper users / information 1 was addressed to everyone Only those concemed have access to information / other 1 users get information even if they are not concemed with The application was open/ the application was closed 1 Efficient information flow / inefficient information flow 1 We were able to analyse information quality / we were 1 not able to analyse information quality We always get answers to our questions / we do get 1 answers to our questions Allowed access to a lot of information / doe not allow to 1 get answer to all data Information is acquired quickly / information acquisition 2 is slow Information on time and available / information is not on 1 time Information was synthesised / information was not 1 synthesised Active screens / passive screens 1

291
APPENDIXS
FRANCE: REPERTORY GRID DATA AT THE INDIVIDUAL LEVEL

292
Concept Frequency
Did not stop users from reasoning / did not allow users to 1 reason Was open and was considered it asjust a tool / was closed 1 We never had a limit / we were always limited 1 Allowed users to be more technical / did not allow users to 1 be more technical Knowledge and skills competencies were equal among 1 users / knowledge was not equal among users Evolve users knowledge and skills / did not help users to 1 enhance their knowledge W e were independent from the programmers / we were 3 dependent on programmers We did have to have a technical person in our office to fix 1 our problems / we always have to have an IS professional in our office Allowed us to intemalise our management / did not allow us 1 to intemalise our management People feel the systems was implemented to help them / 1 people feel the systems was implemented to control them W e had our hands on the systems / we did not have our 1 hands on the systems We implemented it ourselves / we did not implement the 1 systems ourselves We were able to create our own reports / we were not able 1 to create our own reports We were able to create our applications by ourselves / we 1 were not able to create our applications by ourselves Users were comfortable by using the systems/ users not 1 comfortable with the systems People liked the system very much / people did not like 1 these systems People were satisfied and happy with the systems / people 2 were not happy with these systems Have allowed an open climate / did not allow an open 1 climate Users were grouped and attached to each other / users were 1 not attached to each other

293
APPENDIXT
FRANCE: REPERTORY GRID DATA AT THE ORGANIZATIONAL LEVEL

294
Concept Frequency
Good documentation of the application philosophy / bad 1 documentation of the application philosophy Allowed us to implement our rules of work / did not allow us 1 to implement our rules of work The system presents a logic of work / the system did not allow 1 us to present a logic ofwork

295
APPENDIXU
CANADA: DATABASE REPORTS AT THE SYSTEMS LEVEL

Category, concept_ and raw data per user in Canada
user Category Concept Rawdata
jcanadaOI jACC Access control Safeguard of data
Controlled access to data
Centralized data Centralization of data
Rapid access Rapid access to data
ICDQ Completeness Complete data
Present complete information
Relevance Relevant information on reports
Get what I want and possibly go deeper for more details
Timeliness Just in time data
IDPSQ Response time Problems solved quickly
Quick results
Standard system Work for ail business units and division
jlDQ Accuracy Accurate data
Clean data Proper data
Integrated data lntegration of data
IRDQ Ease ofunderstanding Easy to understand information on screen
Easy information format Easy information format for management
Information Easy to follow Information Easy to follow
lnterpretabili ty Meaningful information in other countries
Self explanatory information on screen or reports
Intuitive presentation Intuitive presentation
Reports easy to read Reports easy to read
\USIQ !Interface quality Good help function
jcanada 02 \ACC Data Availability Data availability
Rapid access Rapid access to data
\cDQ Relevance Necessary information
jDPSQ Reliability Systems always on
Always alive
Response lime Quick response lime
11DQ Accuracy Accurate data
IRDQ Consistency Standard data
lnterpretability Information in the language of the user
jus1Q Ease of interaction lnteract easily
Interface quality Create good impression
Graphical user interfaces
jcanada03 jACC Access control Filtered information
Flexibility in control
Trade off in control
Information sharing Shared information
Rapid access Rapid access to data
Thursday. February 20, 2003 Page 1 of3

user Category Concept Rawdata
!CanadaOJ COQ Relevance Necessary infonnation
User X does not have to know what user Y is doing. Pr
DPSQ Hardware compatibility Systems exportability
Hardware llexibility Aexibility to grow
Response time Quick response time
IOQ Data viability Viable data
RDQ Clarity Not much infonnation on screen
Consistency Standard data
Ease ofunderstanding Information easy to understand
USIQ Interface quality Convivial presentation
jCanada04 ACC Access control Control access to financial data
Secured sensible data
A system that closed and open seleciively
IOQ Accuracy Commondata
Unique data
RDQ Consistency Jdentical data in reports
!Canada05 ACC Access control Controlled access to data
Data availability Data availability
Rapid access Rapid access to data
COQ Relevance Information responds to different objectives of different
Necessary infonnation for the users
New information
DPSQ Hardware flexibility Expand easily
IOQ JAccuracy Accurate data
RDQ Clarity Not much information on screen
Ease of understanding lnterpretable information
Understandable information
jcanada06 ACC Data availability Data availability
Rapid access Rapid access to data
COQ Information that allows ben Information to benchmark
Relevance Meets user's need
DPSQ Reliability Runs well
Response time Quick response time
IOQ Accuracy Accurate data
RDQ interpretability Exact meaning of infonnation
jcanada07 ACC Access control Hierarchy to data access but conunon interpretation of
Controlled access to data
Information sharing lnfonnation diffused rapidly
diffuse effectively
COQ Forecasting Long term vision of the system
Relevance Information responds to different objectives of different
Gather ail necessary information
Timeliness Get data quickly before it is too late
DPSQ standard system Standard platform that links ail the units
Thursday, February 20, 2003 Page2of3

user Category Concept Rawdata
jcanada07 IOQ Accuracy Excellent data
Accurate data
Integrated data Integration of data
RDQ Consistency Same information in global environment
Interpretability Exact meaning of information
Meaningful information in other countries
USIQ Interface quality I..oop logic interface
User friendly interfaces
!Canada OS ACC Access control control at certain leveI
Information sharing Flexibility in information sharing
Rapid access Rapid access to data
COQ Forecasting Have information for the present and the future
Timeliness Just in lime data
DPSQ Response lime Quick response lime
IOQ Accuracy Excellent data
RDQ Ease of understanding Transparent data
jcanada09 ACC Access control Controlled access to data
Data availability Data availability
Access to data al the time
Rapid access Rapid access to data
COQ Data currency Real lime information
Forecasting Information that shows tendency
Information that allows user Information that allows users to do analysis
Relevance User X does not have to know what user Y is doing. Pr
Useful information
Timeliness Just in lime data
Valueadded Information that allows to search for rneaning
DPSQ Hardware flexibility Global adaptability
RDQ Clarity Not rnuch information on screen
lnterpretability Information is easy to interpret
USIQ Interface quality User friendly interfaces
Present quantitative and qualitative information
Thursday, February 20, 2003 Page3 of3

Number of users who provided at least one concept per category in Canada
Category user
IACC K;anada 01
K:anada02
Canada03
Canada04
Canada05
Canada06
Canada07
Canada08
Canada09
Summary for 'Category' = ACC (9 detail records)
Sum
ICDQ Canada 01
Canada 02
Canada03
Canada05
Canada06
Canada 07
Canada08
Canada09
Summary for 'Category' = CDQ (8 detail records)
Sum
IDPSQ Canada 01
Canada02
Canada 03
Canada05
Canada06
Canada07
Canada08
K:anada 09
Summary for 'Category' = DPSQ (8 detail records)
Sum
IIDQ Canada01
Canada02
Canada03
Canada04
Canada05
Canada06
Canada07
Canada08
Thursday, February 20, 2003
Count Of mention of user 4
2
5
3
3
2
4
3
4
30
5
1
2
31
2
4
2
7
26
3
3
3
1
2
1
1
1
15
3
1
1
2
1
1
3
1
Page I of2

Category user
Summary for 'Category' = IDQ (8 detail records)
Sum
IRDQ CanadaOI
Canada02
Canada03
Canada04
Canada05
Canada 06
Canada07
Canada OS
Canada09
Summary for 'Category' = RDQ (9 detail records)
Sum
1us1Q CanadaOI
Canada02
Canada03
Canada07
Canada09
Summary for 'Category' = USIQ (5 detail records)
Sum
Grand Total
Thursday, February 20, 2003
Count Of mention of user
13
23
9
116
7
2
3
1
3
1
3
1
2
l
3
1
2
2
Page2of2

301
APPENDIXV
CANADA: DATABASE REPORTS AT THE INDIVIDUAL LEVEL

Number of users who provided at least one concept per category in Canada
Category User Count of mention of users
jDecision making CanadaOI
Canada02
Canada03
Canada04
Canada OS
Canada06
Canada09
Sumrnary for 'Category' = Decision making (7 detail records)
Som
!Impact on individual skills CanadaOI
Canada02
Canada04
Canada06
Canada08
Canada09
Sumrnary for 'Category' = Impact on individual skills and knowledge (6 detail records)
Sum
!Impact on the career Canada03
Canada04
Canada OS
Canada06
Canada09
Summary for 'Category' = Impact on the career (5 detail records)
Som
!Impact on the individual tas CanadaOI
Canada03
Canada09
Summary for 'Category' = Impact on the individual task (3 detail records)
Som
!Impact on the user as a pers CanadaOI
Canada02
Canada03
Canada OS
Canada OS
Canada09
Summary for 'Category' = Impact on the user as a person (6 detail records)
Som
juser satisfaction ICanadaOI
Canada02
Thursday, February 20, 2003
3
2
2
2
1
2
1
13
2
1
1
1
1
4
10
4
1
3
2
1
li
1
8
7
16
3
1
1
1
2
2
10
:1
Page I of2

Category User
Summary for 'Category' = User satisfaction (2 detail records)
Sum
Grand Total
Thursday, February 20, 2003
Count of mention of users
2
62
Page2of2

Category, concept, and raw data per user in Canada
User Category Concept Rawdata
jcanadaOI Decision making Decision making Helps to take good decisions
Meaningful information for Should be able to get meaningful information
quick reports for managers Instants reports for managers
Impact on individual skills Change acceptance Ability to accept change and manage it
Skills analysis Enables to analyze people skills
Impact on the individual tas Minimum effort to do the jo Get what I want without a lot of efforts
Impact on the user as a pers Behaviour change Intuitive systems change the behaviour
Happiness Make life casier
Moral change Impact on people moral
User satisfaction satisfaction Satisfaction high
jcanada02 Decision making Occision making Yes on decision making
Quick decisions Take decision quickly
Impact on individual skills competencies Users needs high Jevel of competencies
Impact on the user as a pers Balancing lime for work an A balance between work and family
User satisfaction satisfaction Satisfaction high
!Canada03 Decision rnaking Decision making Helps to take good decisions
Enabling to decide on inve Decision on investment and acquisitions
Impact on the career Career reorientation Reorient career
Impact on the career Definitely, there is an impact on career
lnteresting jobs More interestingjobs
Unnecessary people People become unnecessary in the business
Impact on the individual tas Activities change Activities change and executed by new people
Analytic tasks Switch from transactional to analytic
Creation of new fonctions Creation of new fonctions
Functions change Decentralize or centralize fonctions
Process reen gineeri ng Reduction of non value activities
Reorganizing the work plac Reorganize the department
Routine Tasks change No more routine tasks
No place for those who perform routine tasks
Impact on the user as a pers Stress generation Generates stress
Jcanada04 Decision making Decision making Y es on decision making
forecasting Enables users to predict the future
Impact on individual skills Expertise development Develop expertise
Impact on the career No impact on career No impact on career
!Canada OS Decision rnaking Good decision Good decision
Impact on the career IS is only one factor in the IS is only one factor in the promotion
No impact on career No impact
Promotion is a degree of dif Promotion is a degree of difîerentiation
Impact on the user ·as a pers User motivation Motivated users
1Canada06 Decision making Decision making Y es on decision rnaking
Thursday, February 20, 2003 Page 1 of2

User Category Concept Rawdata
1Canada06 Decision making Meaningful and clean infor Inverted effect Too much info leads to doubt on decisio
Impact on individual skills lncreasing the capacity of p Impact on capacity of providing of the users
Impact on the career Depends if business encour Depends if business encourages crcativity
No impact on career Human dynamic have an impact and not IS
!Canada OS Impact on individual skilis Skills enhancement for the i Enhancing the skills of the implementers
Impact on the user as a pers Confortability with the syst Users comfortable with the systems
Smiling faces Smiling faces
1canada09 Decision making forecasting Enables users to predict the future
Impact on individual skills Accepting auto-training mo Must accept to be in auto-training mode
Managing systems expectat Users must manage the systems expectations
People evolving with the sy People evolve with the system
Skills analysis Enables to analyze people skills
Impact on the career Impact on the career Must have an impact on the career
Impact on the individual tas Enhancing business process Enhance business processes
Negative impact on transact You must have experience in analytic
l.ess workers in transactional streams
Negative impact for those who have experience only in
Positive impact on analytic Positive impact for analytic people
Responsibility change Change responsibility
Rolechange Change the role of people
Impact on the user as a pers Proactive user Be proactive and not reactive
Users do not carry piles of p People do not walk around with plies of reports
Thursday, February 20, 2003 Page2of2

306
APPENDIXW
CANADA: DATABASE REPORTS AT THE ORGANIZATIONAL LEVEL

Category, concepts and raw data per user in Canada
.User Category Concept Raw data
ICanadaOl Business process redesign Enabling to identify proble Allows to know why things do not go right
Process efficiency Process efficiency
Financial impact Downsizing Less people at work
forecasting Helps to forecast
ldentifying areas to improve Shows area to improve and where to eut costs
Informing about key perf or Provides information on key performance variables
Managing finance Helps to manage cash flow and fix payment in advancc
Quick Profit recognition Recognize profit soon
Impact on business network Happy clients The client is happy
Managing contract with sup Planning and bidding for contracts
Negotiating with supplicrs Helps to negotiate with suppliers
Knowledge development Tacit knowledge developrne Get users tacit knowledge
Users develop analytic reas Users perform analytic reasoning
jcanada02 Business process redesign Business process redefinitio Helps to redefine clearly the process
Enabling to identify proble Allows to put much effort on problematic parts
Functions restructuring Centralize the routine functions
Process efficiency Processes efficient
Transaction consolidation Consolidate every transaction
Work rnethod change Impact on the work rnethod
Financial impact Financial impact Financial impact
Financial improvernent Impact on the financial side of the business
Gain of competitive advant Concentrating on opportuni Enables to put much time on other business opportuniti
jcanada03 Business process redesign Process reengineering Reduction of non value activitics
Financial impact Financial impact Financial impact
Impact on business network lnfluencing relationships wi Impact on relationships with suppliers
jCanada04 Business process redesign Revising processes Revised processes
Financial impact Enabling to evaluate the ear Enables to evaluate eamed value of the business
Gain of competitive advant Competitive advantage gain Competitive advantage gain
Impact on business network Controlling contract proces Helps to control processing of contracts
Knowledge development Gratifying tacit knowledge Gratify people who providc tacit knowledge
jCanadaOS Innovation Encouraging innovation Encourages innovation
Innovation Innovation
jcanada06 Financial impact Financial impact Financial impact
Innovation Encouraging innovation Encourages innovation
Aexiblc innovation flexible innovation
Questioning the way the bu Innovation becausc you question the way you arc doing
jCanada07 Business process redesign Business process productivi Big output in business processes
More productivity
Ease of user performance e Controlling people jobs Control people's job
Evaluating users performan Evaluate users performance
Thursday, February 20, 2003 Pagel of2

User Category Concept Rawdata
jcanada07 Innovation Encouraging innovation Encourages innovation
jCanada08 Business process redesign Better process visibility for Management get visibility
Improving process Process improvement
Ease of user perfonnance e Evaluating users perfonnan Measure people performance
Financial impact Financial impact Financial impact
1Canada09 Business process redesign Improving process Pn;,cess improvement
Gain of competitive advant lnfom,ation leaderships Pass competition in tenns of information that we get
Opportunities Opportunities
Impact on business network Enhancing relationships wit lnvestors are not happy with old systems
Thursday, February 20, 2003 Page 2 of2

Number of users who provided at least one concept per category in Canada
Category User
JBusiness process redesign CanadaOI
Canada02
Canada03
Canada04
Canada07
Canada OS
Canada09
Summaiy for 'Category' = Business process redesign (J detail records}
Sum
CountOfUser
2
6
1
1
2
2
1
15
IEase of user performance e ranada 01 ~,
Canada OS ~-----------------'--------'
Summaiy for 'Category' = Ease of user performance evaluation (2 detail records}
Sum·
IFinancial impact CanadaOI
Canada02
Canada03
Canada04
Canada06
Canada OS
Summaiy for 'Category' = Financial impact (6 detail records}
Sum
jGain of competitive advant Canada02
Canada04
Canada09
Summaiy for 'Category' = Gain of competitive advantage (3 detail records)
Sum
!Impact on business network CanadaOI
Canada03
Canada04
Canada09
Summaiy for 'Category' = Impact on business networks (4 detaiI records}
Sum
!Innovation r~.oo Canada06
Canada07
Summaiy for 'Category' = Innovation (3 detail records}
Sum
JKnowledge development 'CanadaOI
anada04
Thursday, February 20, 2003
3
6
2
l
1
1
1
12
1
1
2
4
3
1
I
1
6
:1 6
Page 1 of2

Category User
Surnmary for 'Category' = Knowledge development (2 detail records) Sum
Grand Total
Thursday, Febrwuy 20, 2003
CountOfUser
3
49
Page 2 of2

311
APPENDIXX
GERMANY: DATABASE REPORTS AT THE SYSTEMS LEVEL

Category, concept and raw data per user in Germany User Category Concept RawData
IGennanyOI IACC Access control Different lcvels ofaccess (specially for simple users)
Rapid access Fast access to information
jcDQ Amount of data Data increase
Relevance Relevant data
Relevant data
IDPSQ Response time Acceptable response time
Systems flexibility Multicultural systems for global businesses
jRDQ Consistency of data meanin Avoid multiple meanings ofwords in different counttie
lnterpretability English as a common language between people
jUSIQ Comfortable to use Comfortable to use
Ease of navigation Customized to users preferences
Good navigation screens
Menu structures
Interface quality Voice processing interfaces
Intelligent help fonction
IS has ail the alternatives to find the Information
1Gennany02 IACC Rapid access Fast access to information
!CDQ Background information Get background information
Forecasting Systems mode! reflects situations that would corne later
Relevance Adjust individual needs
Relevante Data related to my work
IDPSQ Hardware standardization Global technology for global businesses
Reliability Stable system
System maintained easily
Response time Acceptable response time
IRDQ Ease of understanding Understandable information
1us1Q Easyto leam IS does not require much time to leam
Interface quality Good help fonction that directly provides the necessary
Interfaces easy to understand
1Gennany03 lACC Access control Strategic data controlled
Secured access
Secured access
Secured personnel data
Accessibility 24 hours service
!COQ Relcvance Information to do my work
jDPSQ Hardware efliciency Efficient hardware
Systems flexibility System provides many possibilities
1usIQ Easyto leam IS does not require much time to leam
Easyto use Easy to use
1Gennany04 IACC Access control Secured access
Thursday, February 20, 2003 Page I of3

User Category Concept RawData
1Germany04 COQ Data currency Updated data
DPSQ Hardware compatibility Easy adaptation of the system
reliability Efficient systems maintenance
Response lime Acceptable response tirne
Systems flexibility Systems custornization effort not too high
flexible standards (hardware and software)
Adapt application to specific situations
IDQ Accuracy Data stored once
Data keyed in a single location
Data integrity Once data is entered and rnodified, it is secured
Hannonizing data everywhe Data is hannonized whenever it is supplied
Integrated data Integrated data
RDQ lnterpretability Meaningful error messages
Self explanatory
USIQ Ease ofleaming JS does not require much time to leam
Ease of navigation Good navigation screens
Transparent (user knows where he is in the system)
Easy to use Easy to use
Interface quality Good help fonction that directly provides the necessary
jGerrnany 05 ACC Access control Protected persona! data
Accessibility Access to Intranet
Access to data provided to everyone
Rapid access Fast access to information
COQ Relevante Relevant data
DPSQ Reliability Software and hardware updated because of cornpetition
Updated hardware
Updated hardware and software
IDQ Accuracy Updated data
Clear data and no errors
Data currency Current data
RDQ lnterpretability Language of the home culture
1Germany06 ACC Access control Secured data
Rapid access Fast access to information
Fast access to information
COQ Relevance Specific answer to rny query
Opportunities to choose data you need
DPSQ Systems flexibility Manages interfaces to other systems
Systems customization to each culture
flexible standards (hardware and software)
flexible systems
RDQ Ease ofunderstanding Helps understand what you see
USIQ Interface quality Graphies
10errnany 01 ACC Access control Secured personnel data
Rapid access Fast access to information
Thursday, February 20, 2003 Page2 of3

User Category Concept RawData -jGerrnany 07 jCDQ Appropriate Amount of dat Get infonnation from a broad pool of data
Relevance The system should provides exactly what you need
jIDQ Accuracy Key fields filled in right way
Correct data
Data currency Current data
IRDQ Ease of understanding Transparent data
Good oriented information
Easy presentation of compl Easy to get complex data in a report
IGerrnany 08 jACC Access control Secured access
Good security
Data security Procedures to store data and backup
jDPSQ Hardware reliability Necessary maintenance of the systems
Hardware standardization Same characteristics in ail sites
Systems flexibility Flexible standards (hardware and software)
IIDQ Data integrity Same information to ail users
Integrated data Integrated data
jUSIQ Easy navigation Easy structure ofIS
Interface quality Good help fonction that directly provides the necessary
Thursday, February 20, 2003 Page3 of3
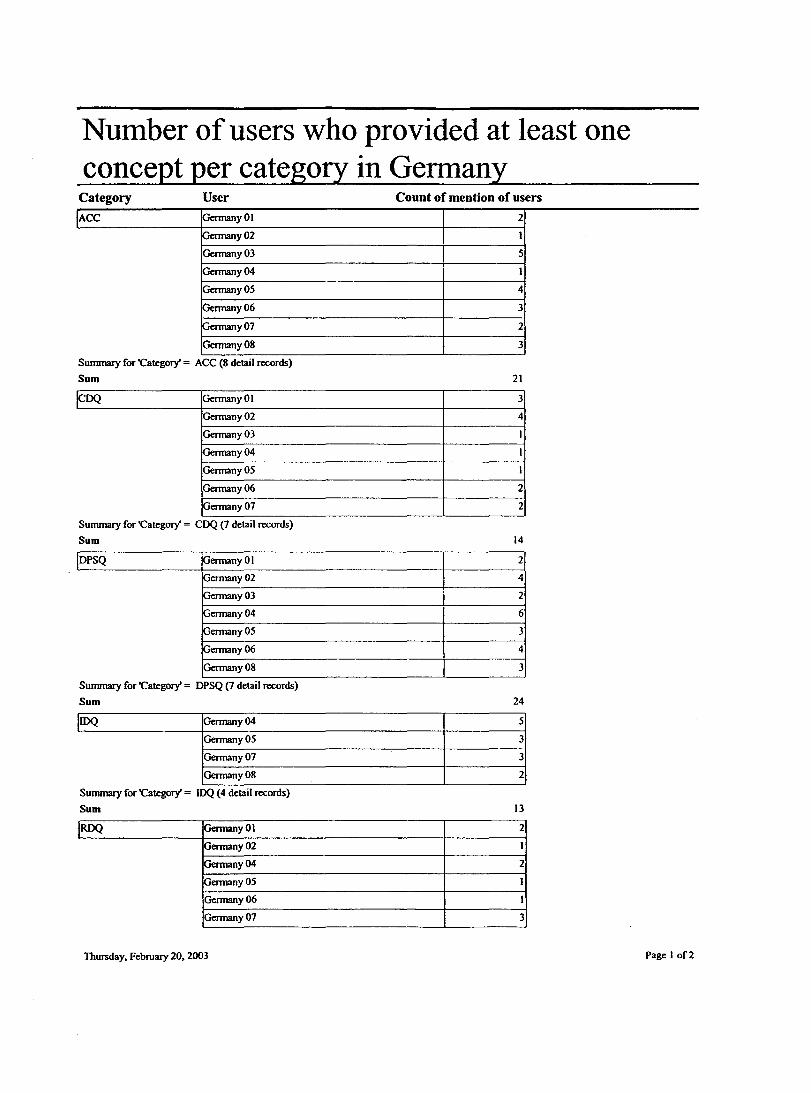
Number ofusers who provided at least one concept per category in Germany
Category User
IACC GermanyOI
Germany02
Gennany03
Germany04
Germany05
Germany06
Gennany07
Germany08
Summary for 'Category' = ACC (8 detail records)
Sum
ICDQ GermanyOI
Germany02
Germany03
Gennany04
Germany05
Gennany06
~ny07
Summary for 'Category' = CDQ (7 detail records)
Sum
jDPSQ GermanyOI
Germany02
Germany03
Germany04
Gennany05
Gennany06
Gennany08
Summary for 'Category' = DPSQ (7 detail records)
Sum
11DQ Germany04
Gennany05
Germany07
Germany08
Summary for 'Category' = IDQ (4 detail records)
Sum
jRDQ GermanyOI
Germany02
Gennany04
Germany05
Germany06
Gennany07
Thursday, Februarr 20, 2003
Count of mention of users
2
1
5
1
4
3
2
3
21
3
4
1
1
1
2
2
14
2
4
2
6
3
4
3
24
5
3
3
2
13
2
1
2
1
1
3
Page I of2

Category User
Summary for 'Category' = RDQ (6 detail records)
Sum
1us1Q GermanyOl
Germany02
Germany03
Germany04
Germany06
Germany08
Summary for 'Category' = USIQ (6 detail records)
Sum
GnodTotal
Thursday, February 20, 2003
Count of mention of users
10
7
3
2
5
1
2
20
102
Page2 of2

Category Concept
jUSIQ Ease of navigation
Easy navigation
Easytoleam
Easytouse
Interface quality
Summary for 'Category' = USIQ (7 detail records)
Sum
Grand Total
Thursday, February 20, 2003
Count Of raw data
5
1
2
.2
8
20
102
Page2 of2

318
APPENDIXY
GERMANY: DATABASE REPORTS AT THE INDIVIDUAL LEVEL

Number of users who provided at least one concept per category in Germany
Category
j0ecïsion making
User Count of mention of users
'Gennany03 y08
Summary for 'Category' = Decision making (2 detail records)
Som
1
3
!Impact on the useras a pers~'= ___ :_~_: _____________ ~----~~'
Summary for 'Category' = Impact on the user as a person (2 detail records)
Som
!Impact on the user's career GermanyOl
Gennany03
Germany05
Gennany06
Germany07
Summary for 'Category' = Impact on the user's career (5 detail records)
Som
5
1
1
1
3
1
7
Jthe impact on the individua 1~~-erma--n_:_: _____________ ~-----~:1 Summary for 'Category' = the impact on the individual task (2 detail records)
Som 5
juser independence from ma Germany03 1
Germany06 4
Germany07 1
Germany08 2
Summary for 'Category' = User independence from management And user dependence on the group (4 detail records)
Som 8
juser satisfaction GermanyOI
Germany02
Germany05
Gennany06
Gennany07
Gennany08
Summary for 'Category' = User satisfaction (6 detail records)
Som
Grand Total
Thursday, February 20, 2003
1
4
1
1
2
3
12
40
Page I of 1

Category, concept and raw data per user in Germany
User Category Concept Rawdata
IGennanyOI Impact on the user's career Changing to other compani Go elsewhere
User satisfaction No satisfaction Satisfaction not a good indicator for IS success
1Gennany02 Liking the system Users like the systems
Subjective satisfaction Satisfaction related to user perception
User friendliness User friendly
User friendly
1Gennany03 Decision making Different forecasting Forecast differently
Impact on the user as a pers frustration Frustration
Having fun in the job Having fun in the job
Impact on the user's career No career impact !No impact on the career
the impact on the individua Minimum effort to do the jo Reduces effort to do the job
User independence from ma Reducing face to face com Reduces face to face communication with the boss
1Germany04 the impact on the individua Making life easy in perform Makes life easy in perf orming the task
Minimum effort to do the jo Reduces effort to do the job
Performing the task fast Perforrns the task fast
Performing the task better Perforrns tasks better
1Gennany05 Impact on the user as a pers Generating stress Stress generator
Reinforcing the state of the Rein"force the state of the mind
User motivation in IS devel More people involved in future IS development
Impact on the user's career Career development Career development
User satisfaction Satisfaction Users are satisfied
!Germany06 Impact on the user's career Career development Career development
Changing the job People transfer
Downsizing Reduces people in offices
User independence from ma Generating trust between pe Generate trust between t people and management
Information sharing Information sharing
In-group training Training in the group
The group helps change the Long term vision to change skills of users
User satisfaction Users happy with the syste Happyusers
1Gennany07 lnipact on the user's career No impact on the career No impact on the career
User independence from ma Independence from the boss No reliance on the boss
User satisfaction Subjective satisfaction Satisfaction is related to improvernent made by the IS
Reasons of satisfaction can be different among users
1Gennany08 Decision making Autornating decision makin Decision can be autornated
Enhancing decision making Enhances decision making
User independence from ma Connecting people Connecting to rnany people
Tearn work approach No more hierarchy in management
User satisfaction Subjective satisfaction Satisfaction is related to improvernent made by the IS
Satisfaction related to user perception
User friendliness User friendly
Thursday, February 20, 2003 Page I ofl

321
APPENDIXZ
GERMANY: DATABASE REPORTS AT THE ORGANIZATIONAL LEVEL

Number ofusers who provided at least one concept per category in Germany
Category User
jBusiness process redesign GennanyOI
Gennany02
Gennany03
Gennany04
Gennany05
Gennany06
Germany07
Summary for 'Category' = Business process redesign (7 detail records)
Sum
!Occision making JGermany 07
Summary for 'Category' = Decision making (1 detail record)
Sum
JFinancial impact Gennany03
Germany04
Germany06
Germany07
Gennany08
Summary for 'Category' = Financial impact (5 detail records)
Sum
IHelp desk support quality GermanyOI
Germany04
Germany06
Summary for 'Category' = Help desk support quality (3 detail records)
Sum
jlmpact on organizational str Germany05
Gennany07
Germany08
CountOfUser
3
2
3
2
I
4
3
18
I
I
2
I
1
6
5
1
1
7
2
3
13
Summary for 'Category' = Impact on organizational structure and management style (3 detail records)
Sum 18
1-"',,..,, .......... l:E:====~=r=5=====================================:1 Summary for 'Category' = Knowledge based organizational culture (3 detail records)
Sum
!Tcamwork
y08
Summary for 'Category' = Tcam work (3 detail records)
Sum
Grand Total
Thursday, February 20, 2003
7
:1 6
63
Page 1 of 1

Category, concept, and raw data per user in Germany
User Category Concept Raw data
IGermanyOl Business process redesign Changing processes Changes the process
Enduring business processe Processes must stay the same for at least 4 to 5 years
Reengineering the organizat Reengineering of the organization and lS customized f
Help desk support quality Auto-training help desk per Auto-training help desk personnel
Centralizing the help desk f Help desk in a single location and serves ail sites
Clear help desk structure an Clear help desk structure and process
Direct communication with Direct communication with help desk
Solving problems by the hel Help desk must solve 80"/o ofhelp calls
jGermany02 Business process redesign Supporting business proces Fully support the business process
Visibility of the whole proc Visibility of the whole process
1Gennany03 1 Business process productivi Do business fast
Efficient processes Efficient processes
Reducing process complexi Reduces process complexity
Financial impact Reducing travel effort Reduces travel effort
jGennany04 Business process redesign Business process productivi Great impact on the process cycle
Efficient processes Efficient processes
Financial impact Generating financial value f Generating financial value for the business
Help desk support quality Help desk Provides good as Help desk Provides good assistance
Knowledge based organizat Bringing new ways of think Brings new way ofthinking
jGermanyOS Business process redesign Supporting business proces Fully support the business process
Impact on organizational str Decentralizing decision ma Decentralization of decision making
Developing rigor in manage Rigor in management
Knowledge based organizat Changing the organizationa IS changes organizational culture
Knowledge sharing Force people to share their knowledge
Knowledge sharing based o The new culture is based on knowledge sharing
Teamwork Enabling access to more inf Enables access to more information form colleagues at
10ennan>'.06 Business process redesign Enabling flexibility_in integ Enables Flexibility in integrating business processes
Integration of information lntegration of information
Standardization of processe Standard processes
Supporting business proces Fully support the business process
Financial impact Reducing work flow cycle Reduce time for work flow
Reducing overhead cost Overhçad cost can be reduced
Help desk support quality Help desk sharing Help desk sharing
Knowledge based organizat Knowledge sharing based o The new culture is based on knowledge sharing
lmplement the culture ofknowledge sharing
Tacit knowledge developme Feedback ifyou get tacit knowledge
Teamwork Accessing information bye Access to information by ail people
Access to information by ail people
Working in an open climate Work in open clirnate
1Germany07 Business process redesign Changing the process Changes the process
Thursday, February 20, 2003 Page I of2

User Category Concept Rawdata
1Gennany07 Business process redesign Efficient processes Efficient processes
Reducing work flow cycle Great impact on the process cycle
Occision making lmproving decision making lmprove decision making
Financial impact Managing time Time is critical
Impact on organizational str Freeing up people for other Free up people for other tasks
lmplementation of end user Online managers can access data
Managers use the systems thernselves
jGennany08 Financial impact Reducing cost Reducecost
Impact on organizational str Changing the organizationa Changes the organizational structure
Communication change Changes in communication in the business
Developing new structures No more departrnent or division
Secretaries become assistants
Reduces organizational hierarchy
No rigid structure
You do not need a boss or subordinate
Free from location of users
Project and matrix structure
Reengineering of the organization
Freeing up people for other Free up people for other tasks
Title Jess environment No more titles
Using intranet Use of Intranet
Teamwork Supporting team work Supports team work
1s is a tool for team work
Thursday, February 20, 2003 Page2 of2

325
APPENDIXAA
FRANCE: DATABASE REPORTS AT THE SYSTEMS LEVEL

Number of users who provided at least one concept per category in France Category User
jACC FranceOI
France02
France03
France04
France OS
France06
France07
France08
Summary for 'Category' = ACC (8 detail records)
Sum
jcDQ FranceOI
France 02
France03
France 04
France OS
France 06
France07
Summary for 'Category' = COQ (7 detail records)
Sum
IDPSQ France 01
France02
France03
France04
France OS
France06
France 07
France 08
Summary for 'Category' = DPSQ (8 detail records)
Sum
j1DQ France 01
France 03
France OS
France06
France07
France08
Sununary for 'Category' = IDQ (6 detail records)
Sum 1~·, rance04
rance OS
Thursday, February 20, 2003
Count of mention of users
1
4
2
4
3
4
4
3
25
1
2
2
3
2
1
2
13
1
2
4
1
2
4
2
3
19
2
3
3
3
1
2
14
:1
Page I of2

Category User Count of mention of users
IRDQ !France 07 : 1 France08 ~----------------~----~
Summary for 'Category' = RDQ (5 detail records)
Sum
1us1Q FranceOI
France02
France03
France04
France OS
France06
France07
France OS
Summary for 'Category' = USIQ (8 detail records)
Sum
Grand Total
Thursday, February 20, 2003
10
3
3
2
1
2
3
2
3
19
100
Page2of2

Category, Concept and raw data per user in France
User Category Concept Rawdata IFranceOl 1 ACC Information sharing Enables infonnation exchange between employees and managers
CDQ Relevance Useful infonnation
DPSQ Systems flexibility Open applications
IDQ Accuracy Noenors
Precision Precise data
IRDQ 1 Clarity Comprehensive messages
Not much infonnation on screen
Good presentation and fonnat
Concise data Organized infonnation
Ease of understandin Transparent infonnation
Minimum time to understand repon
lus1Q 1
Easyto use Easy to use
Fit between user and Same philosophy as our model ofthinking
Interface quality Convivial
lfrance02 1 jACC 1
Access control Keep confidentiality
Hierarchy information access
Hierarchy of using the system
Controlled access to data
ICDQ 1 Data aggregation Synthesized information
Level of detail Provides many Ievels of infonnation details
IDPSQ l Response time Rapid responses
Fluid Information flow
1us1Q 1 !Interface quality
1 Convivial
Sman responses
Simple to use
1France03 1 IACC 1
IAccess control 1
Controlled access even inside the same division or unit
Keep confidentiality
lcDQ 1 Custornized data lndividual repons
Relevance Correspond to user's need
IDPSQ 1 Response time Rapid responses
Systems flexibility Easy to parameter
Open applications
Customized applications
IIDQ 11vatidated data 1 Validated data
Enables to verify the validity of infonnation
Verifiable data Enables to analyze the quality of infonnation
!us1Q 1 Interface quality Convivial
Active screens
!France04 1 ~cc 1 IAccess control 1 Information forwarded to right people only
Hierarchy infonnation access
Thursday, February 20, 2003 Page I of3

User Category Concept Rawdata 1France04 1 ACC jAccess control Strategic data accessed only by management
Only the manager who can decide if infonnation is to be distnl>uted
ICDQ 1 IAppropriatc amount
1 High quality at start in tcrms of amount of data
More data quality at end in tcnns of data amount
Rclevance Correspond to user's need
DPSQ Responsc lime Rapid rcsponscs
RDQ Clarity Comprehcnsive infonnation
USIQ Interface quality Convivial
1France05 1 ACC Access control Secured system
Controlled access to data
Access depends on the role of the user
lcDQ 1 irctevance 1 Correspond to uscr's need
Correspond to user's need in every culture
IDPSQ 1 Responsc time Rapid rcsponses
Systems flexibility Enablcs to add changeable parameters
IIDQ 1 Accuracy Data cntry quality
Clear data
No errors
1= 1
Ease ofunderstandin Understandable infonnation
Interface quality Small number of data cntry
Rapid data cntry
1France06 1 IACC 1 IAccess control 1
Controlled access to data
Enables confidentiality
Secured system
Securcd system
1~: 1
Timeliness On time data
Reliability Get output that corresponds to input
Response lime Rapid responses
Import and export fonctions are easy and rapid
Systems flexibility Multilanguage system
j1DQ 1 Accuracy Correct information
Data cntry quality
Precision Precise data
jus1Q 1
Easyto use Easyto use
Interface quality User friendly
Simple to use
1France07 1 jACC 1
IAccess control 1 Controlled access to data
Controlled access to data
Hierarchy information acccss
Acccss depends on rcsponsibility
lcDQ 1 Data currcncy Updated data
Feedbackinformatio Feedback information
IDPSQ 1 Response time Rapid rcsponses
Systems flexibility Enablcs to add changeable parameters
Thursday, February 20, 2003 Page2 of3
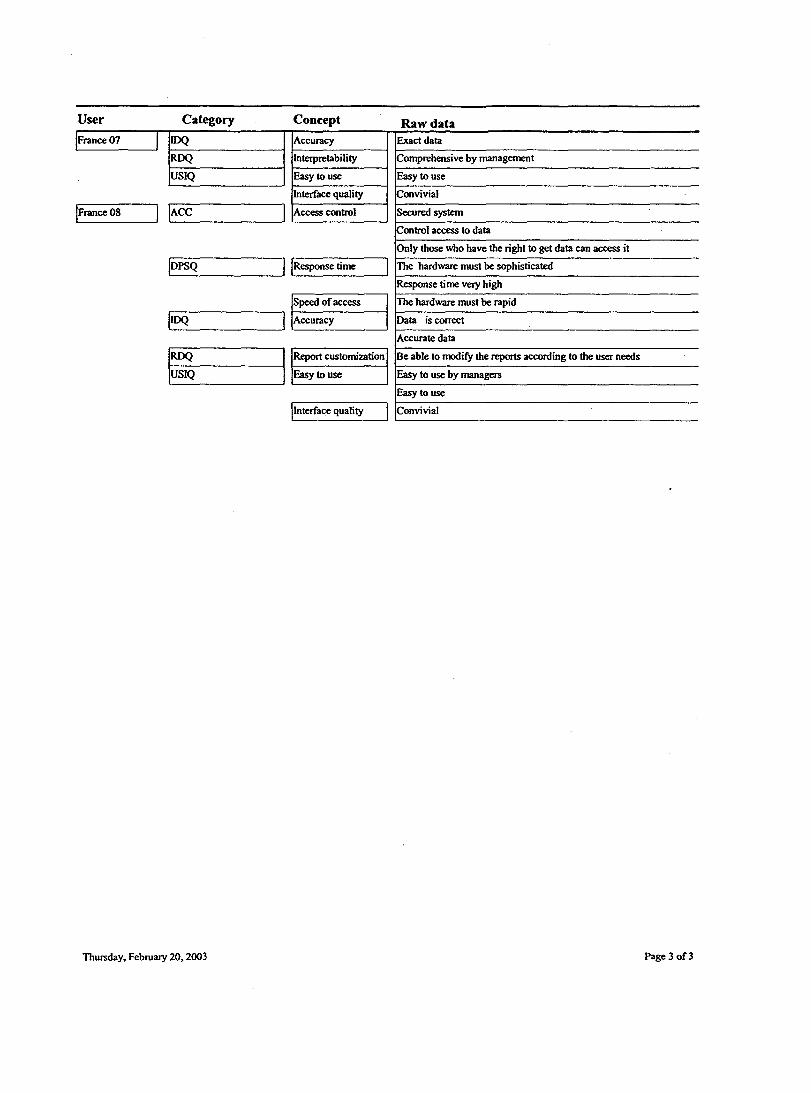
User Category Concept Rawdata jFrance07 1 IDQ Accuracy Exact data
RDQ lnterpretability Comprehensive by management
USIQ Easyto use Easyto use
Interface quality Convivial
!France OS 1 IACC 1 Access control Secured system
Control access to data
Only those who have the right to get data can access it
IDPSQ I IResponse time 1 The hardware must be sophisticated
Response time very high
Speed of access The hardware must be rapid
llDQ 1 Accuracy Data is correct
Accurate data
1~ 1
Report customization Be able to modify the reports according to the user needs
Easytouse Easy to use by managers
Easy to use
lmterfac::e qua)ity 1 Convivial
Thursday, February 20, 2003 Page3of3

331
APPENDIXAB
FRANCE: DATABASE REPORTS AT THE INDIVIDUAL LEVEL

Number ofusers who provided at least one concept per category in France
Category User Count of mention of users
1Decision making r=~ rn=o, rance OB
Summary for 'Category' = Occision making (3 detail records)
Sum
!Impact on individual skills France02
France03
France04
France06
France07
France OB
Summary for 'Category' = Impact on individual skills and knowledge (6 detail records)
Sum
!Impact on individual tasks FranceOl
France02
France 03
France07
Summary for 'Category' = Impact on individual tasks (4 detail records)
Sum
!Impact on the user's career FranceOI
France02
France04
France05
France06
France07
France OB
Summary for 'Category' = Impact on the user's career (7 detail records)
Sum
jThe user power over the sys France02
France04
France05
France06
France07
Summary for 'Category' = The user power over the system (5 detail records)
Sum
!Use FranceOl
France02
France03
France04
France06
Thursday, February 20, 2003
:1
3
2
I
I
2
2
1
9
1
1
1
I
4
I
I
2
1
I
I
1
8
4
2
I
2
3
12
I
1
1
2
1
Page I of2

Category User Count of mention of users
juse !France 07
Sumrnary for 'Category' = Use (6 detail records)
Sum
!User independence from 1S France 01
France02
France05
France06
France07
France OS
Sumrnary for 'Category' = User independence from 1S professionals (6 detail records)
Sum
juser satisfaction France 01
France02
France04
France05
France06
Sumrnary for 'Category' = User satisfaction (5 detail records)
Sum
Grand Total
Thursday, February 20, 2003
7
l
l
1
l
1
1
6
3
2
2
2
1
10
59
Page2of2

Catagory, concepts and raw data per user in France
User Category Concept Rawdata
IFranceOl Impact on individual tasks Facilitating the task Facilitate the task
Impact on the user's career Enhancing persona! experti Put expertise on CV
Use Using the system Use the system
User independence from lS Using the system independe Users should use the systems independently from IS pro
User satisfaction Disappointing non satisfied Ifnot satisfied, user.; would develop their own applicati
Meet users needs Give people what they need
Users liking the system Users like the system
jFrance02 Impact on individual skills Enhancing the user skills an Open the eyes ofusers
Pushing user.; for perfection Pushes users to go for perfection
Impact on individual tasks Performing the job better Helps to perform my job better
Impact on the user's career No impact on the career No impact on the career
The user power over the sys Denying the role of IS in m Il is not the system that render a person to be competen
Feeling the superiority of th Feels that the system is here just to help
The system should not have power on user 1
Importance of the user on th IS Success depends on the users and not on the system
Use Using the system Use the system
User independence from IS Using the system independe Users should use the systems independently from IS pro
User satisfaction Meet users needs Give people what they need
Users liking the system Happyusers
1France03 Impact on individual skills Better system queering Helps to bener structure questions and answers
Impact on individual tasks Aligning task and mission Alignment between task and mission
Use Use of the system by subor Subordinates need to use the system
1France04 Decision making Gaining time in decision m Helps to gain time
Impact on individual skills Creating one's own reports Users create their reports
Impact on the user's career lmpacting the user career if Impact on career if mangers sec users using the system
Probably not because managers don't see behind users
The user power over the sys Importance of the functiona It is not IS professional that verify the IS success
Importance of the user as a Users are best tools that measure the system
Use User.; with high intention to users of the systems are motivated
Using the system Use the system
User satisfaction Meet users needs Give people what they need
Satisfaction Satisfied because of rapid data entry and modification
1France05 Decision making Bener decision making Better decision making . Impact on the user's career Impact on the career if user Y es if the users master the system
The user power over the sys Not blocking users from doi Does not block users from doing their job
User independence from IS No needs for programmers We do not really need programrners
User satisfaction Satisfaction Satisfied users
Users liking the system Happyusers
1France06 Impact on individual skills Creating one's own reports Liberty to create what I want
Open the user's conscienti Open my conscientiousness
Thursday, February 20, 2003 Page 1 of2

User Category Concept Rawdata jFrance06 Impact on the user's career Job evolution Evolve in my job
jThe user power over the sys Freedom in organizing and freedom in organizing and managing time
Not letting the systems cha We need to keep what wc have in our context
Use Using the system Need to search and use the system
User independence from IS INo needs for programmers No more reliance on progranuners
User satisfaction Users liking the system Users Jike the system
jFrance07 Impact on individual skills Becoming more technical Helps users to become more technical
Creativity Help users do things they have never donc before
Impact on individual tasks Rethinking the tasks and re Rethink our tasks and responsibilities
Impact on the user's career . INo impact on the career No impact on the career
The user power over the sys Enabling the users to solve t Should let the user solve the problems by himself inste
Refusing standard systems Standard systems are not good
User refusai ofIS outsourci No outsourcing the IS function
Use Using the system Users use the system because of the large amount of inf
User independence from IS No needs for programmers We do not really need programmers
jFrance08 Decision making Better decision making Better decision making
Impact on individual skills Becoming more technical Helps users to become more technical
Impact on the user's career No impact on the career No impact on the career
User independence from IS No needs for programmers No more reliance on programmers
Thursday, February 20, 2003 Page2 of2

336
APPENDIXAC
FRANCE: DATABASE REPORTS AT THE ORGANIZATIONAL LEVEL

Catgory, concept and raw data per user in France
User Category Concept Rawdata
FranceOI Business process redesign Gaining efficiency Gain of efficiency
Servicing the customers bet Better custorner service
Fit between systems and hu Aligning the business and t The system strategy and the business strategy arc aligne
Aligning the work methods Our methods of work are aligned with the system
France02 Business process redesign Enabling managers to have Helps managers to have a broad view ofwhat is going o
Supporting business proces Support business processes
Financial impact Helping to rnake money Helps to rnake money
Fit between systems and hu Being a logical system that If we work fine, the systems follows
Being a logical system that Be a logical system that fits work logic
the system presents a philos Needs to present a philosophy of doing work
France03 User integration and comm Enhancing social clirnate Enhance social climate
France04 Knowledge sharing Transfer the knowledge of using the systems to member
France OS Business process redesign Detailing the tasks in the bu Detailed business processes
Influencing the inter service Impact on inter service relationships
User integration and comm Close relationships between Impact on relationships between people in the sarne uni
France06 Business process redesign Gaining efficiency Gain of efficiency
Fit between systems and hu Imposing our ideas on the s We write down what we have in our heads
We are the owners of our ideas
No extemalizing our rules o Should not extemalize our rules of work
User integration and comm Bringing open climate at w Brings open climate at work
Information sharing Communication cornes from people
France 07 Fit between systems and hu Controlling the system and Have our hands on the system and the systems follows
Not blocking users from doi Does not block the user of doing his job
User integration and comm Common competencies am Same competency between users
Helping users to be more att Helps users to be more attached
France08 Business process redesign Gaining efficiency Gain of efficiency
Financial impact Helping make money Helps rnake money
No impact on finance no impact in Finance
User integration and comm Communicating between m Better communication between rnembers of the unit
Thursday, February 20, 2003 Page I of 1

Number of users who provided at least one concept per category in France
Category User Count of mention of user
!Business process redesign France 01
France02
France OS
France06
France OS
Su~ry for 'Category' = Business process redesign (5 detail records)
Sum
2
2
2
1
1
8
jFinancial impact rrance 02 ~,
France OS L-------------------'--------'
Summary for 'Category' = Financial impact (2 detail records)
Sum
!Fit between systems and bu FranceOI
France02
France06
France 07
Summary for 'Category' = Fit between systems and human mode! ofwork (4 detail records)
Sum
!User integration and comm France 03
France04
France05
France06
France 07
France 08
Summary for 'Category' = User integration and conununication in the group (6 detail records)
Sum
Grand Total
Thursday, February 20, 2003
3
2
3
3
2
10
1
1
1
2
2
1
8
29
Page 1 of 1

List of concepts per user in France
User Concept
!FranceOI IAligning the business and the systems strategies
Aligning the work rnethods with the system
Gaining efficiency
Servicing the customers better
Sununary for 'User'= France 01 (4 detail records)
Sum
1France02 Being a logical system that fits our logic
Being a logical system that fits work logic
Enabling managers to have al larger visibility in the bus
Helping to make money
Supporting business processes
the system presents a philosophy ofwork rnethod
Surrnnary for 'User'= France 02 (6 detail records)
Sum
!France 03 IEnhancing social climate
Summary for 'User'= France 03 (1 detail record)
Sum
jFrance 04 !Knowledge sharing
Surrunary for 'User' = France 04 ( 1 detail record)
Sum
jFrance05 Close relationships between people in the group
Detailing the tasks in the business processes
lnfluencing the inter service relationships
Surrunary for 'User'= France 05 (3 detail records)
Sum
!France06 Bringing open climate at work
Gaining efficiency
lmposing our ideas on the system
!Information sharing
No extemalizing our rules or work
Surrnnary for 'User' = France 06 (5 detail records)
Sum
1France07 Common competencies among the group
Controlling the system and the system follows
Helping users to be more attached
Not blocking users from doing their job
Surrnnary for 'User'= France 07 ( 4 detail records)
Sum
France OS Communicating between rnembers of the unit
Gaining efficiency
Thursday, February 20, 2003
CountOfRaw data
I
1
I
1
4
1
1
1
1
1
1
6
I
1
1
3
1
1
2
I
1
6
1
I
1
I
4
Page I of2

User Concept
France OS
o impact on finance
Surnmaiy for 'User'= France 08 (4 detail records)
Som
Grand Total
Thursday, February 20, 2003
CountOffl.aw data
4
29
Page2of2

APPENDIXAD
WEB GRID DISPLAYS
341

WebGrid-11 FOCUS Clustering
FOCUS GERMAN'!' CONTACT 1, Domain: INFORMATION SYSTEMS Context: 15 SUCCESS PERCEPTION, 4 ORGANISATIONAL SYSTEMS, 18 SUCCESS ITEMS
MiJb1r ~tr•1is•tion af ,_.-,lrir19 p'lacr
YK!f goot/ hPp l1lfflfl
good hrp siruciurr
good ,wyi9,Jtion scrttn
v•s oonsidKrd • iool for 'lr<lm vork
Milblrs inform.tionr~
ca1WJor•tion brtvrrn p«JP1r
don'trrqufrr stMKl,dus,rs
qux:k rrsponsr timr
cusiomiud mrnus
YK!f rrl•r.Mlt iRfonn.Jtion
USKS V«-r ÎnYOO'rd in iflr fnp1mrnt•fion
r1Wb1rs indiYidw1 ~~tions
USK fre'ind>,/
clr.r structure of ihr SIJSfrm
good 1rrr1 of è/CŒSS
hrp io .uil:;t,wtr drcisions
users did not rrly on ihr boss for inform.ttion
2
2
2
2
2
1
2 1
2 2
2 2
2 2
2
2
2
2 .... :~; .....
2 :~: 2 2
100 90 BO
didnot~~.1iutionofYOrltin9p'IM:. '---'--'
poorhPpmffll#···································· vou ~t'lrl»tyourH11',/ t1on·tv.Jnt ..•...•••..•.
YK!f poor IW~tion :scrttt> • • •• • •• • •• • • •• •• ·• • • •
don·t !Rlf]pOrt irMn vork·· ....•.•••••..••••...•...
did nat M!Jblr infar-tion rxch.mgr ..••.••.. • ••.
usrn v«-r isoùtrd·. ·· ··· ··· •··· ............. · · ··
rrqufrrs stMKl.-d usa-s · · · • · · · · · · ·• · · · · •••• · • · · · ·
s1ov rrsponsr fimt!- •• ·············:···············
stMWJard-···································· it,omud, infornNtion vioh isnotrrMY.inl······
inpas«I viihout uurs in'Yo1Yff11ffli- • • • •• • • · • • · · dors nat~ indiYidw1 ~~fions .••••••••.•
not US«' frwndJv· • • • • • • • · • • • • • • • • • • • • • • • • • • • • • • • • •
poor siruciurr of ihr SIJS~ • • • • • • • • • · • • • • • • • • • • conr,~iPd lf'Yrl of dCCrSS• • • • • • • • • • • • • • • • • • • • • • •
dors nat p«-mit iD ~tr drcisions- •.•• · · • • · · ihr boss vas •'lvJVS ihr inform.t6onproridl!r-·
100 90 BO 70 60 50 1 1 1 1 1 1
..... :::=:=:~:::::::::::::::::::::::::::::::::::::> L. .. =::::::::::::::: :::: ~::::::::::::::::::::::::::::::::::>
Click on title, ORGANISATIONAL SYSTEMS or SUCCESS ITEMS to edit them
Continue
- http:/1136.159. 7 .57 /W ebGrid/Main.k 1/1/2003

WebGrid-11 Display
Oisplay GERMANY CONTACT 1, Ooowin: INfœMATION SYSTEMS Context: IS SUCCESS PERCEPTION, 4 ORGANISATIONM. SYSTEMS, 18 SUCCESS ITEMS
quick rnpons, tim,
c•ar struciur, of ihr svstrm good Nri9ation SDrPffl
good k-Yr1 of «:o,ss
cusir;,m~rd l'flfflt/S
Yi'rV good Mp -good MP siructur,
don'tr~, st~USKS
user frrindlv
rnJbkos indiri*M1 "f,Plic.ltfoM
IIS«'S VK, inYolYH in ihr lr1plm,nfilfion
Mp io -*"-fr drcisians
Y«"fl r,'ûy,mf infarnNtion
coll.tx,,-•tion bC'tvttn p«Jpko
VilS COf1S1dt!rH il iool far iNfn 1l"«i(
nwbkos infarm11&n rxchang,
nwbko tN!CMO"illis•&n of vcrlœs, p~
users did not rrlg on ihr boss far infarllliltion
2 2
1 2
2 1
1 3
2 2
2 1
2 1
2 1
1 2
1 2
1 2
2 3
2 2
1 1
2 1
1 1
2 1
2 2
5 5
5 4
4 4
5 4
5 5.
4 3
4 3
5 5
4 4
4 4
4 5
4 4
4 5
5 5
4 5
5 5
4 3
4 4
s1ov rrspa,R timP
poor sirut:tur, or t1w svstrm YK,t poor NYiç,nion RTNn
C0'1fJlïc.,twJ k>Y,1 of .accns
st•nd.rdlnfflla
poarMpmNIU
vou ~t'W»t,tourN11s/ don'fvilllt
rffiUir,s st.mdilnl usrrs
nof USN frilMdlf/
~s not rnJbko indiri*M1 "f.Plïc.,nons
ÏITpOSH viihout USKS inYolYwnN>i
~s notp«-mit io-*"-fr drcisians
ioo much infarm.tion vid1 is not rrÜYillli
usr,s ver, iso1ilt.d
don't s,,wort iNm ,,_-k
did notffWbko infarm.tian r~
did not ~ "-ntdlisiltion of ,,_.kin9 plMJr
ihrboss VilSillvilljS ill# infarJJ»tionproYÏd«'
SUCŒSSFll.. 2
SUCCESSFUL 1
NON SUCCESSFUL 2
NON SUCCESSFlA. 1
Click on title, ORGANISA TIONAL SYSTEMS or SUCCESS ITEMS to edit them
http:/1136.159. 7 .57 /W ebGrid/Main.k
Continue
1/1/2003

WebGrid-11 PrinCom Map
PrinCom, Domain: INFORMATION SYSTEMS, Us.r:GERMANY CONTACT 1 Context: IS SUCCESS PERCEPTION, 4 ORGANISATIONAL SYSTEMS, 18 SUCCESS ITEMS
ihr boss '11'.JS .t1V"',IS ihr inf«-n»tion prqridff' did not ~ d«:fflir.rliution of vaitilg
gou ~t lrl»t gou ru'llv don·t v. poorlv,p,
itJO much inform.rfion vkh ir not rrl.rY.rni Yff11 poor 11.JYig.mon scr, SKS did not rr1ij an ihr boss for infor,mtion
don·t SfRJ(Jrt tNm vonc 16 indirilw1 "l'P1ic.Jtions r~rs stMIIÜt'd usKs rr frrint/1,J X SUCCESSRA. 1
did not~ inf0t71Ntion r,a;#wngr good 1ew1 of ~s usrn Vft""r iso'IIŒd rrs vKr inYD1Yl'd in ihr Îl1JNl1X'llf.ition
NON SUCCESSFUL 2 st.rndard c1e, siruc*rr of ihr Sf/slrm
NON St.lCCESSFUL 1 ~~v r#..,.... • .,1~~~6,,-6,,---=~~~=--_.-,!!ilir,~yat infornNtion
poor sirur:turr of th# Sf}Sirm
inp,sl'd viihout 1/Sff'S ÏnYDMmt'M cor,r,1ic.rtrd •-1 of~
not USll'r frientJ'lfJ does not rnab'lr indiridw1 "1'1'1ic.Jtions
dors not permit ir, d<liom.tiP dr(;isions
t:01W1or.rtion brtvren p«tpW ~ inform.ttion~
don·tr~r st.nûrd US«-S
· rrspons# timr smmizl'd l1IMl$CSUCCESSFl1. 2
v.rs considrrm .r mol for iNm vcrk good n.iYÏ9*tion scr~n
Yff'Y 9(JOd Mp 111Mt1
MP siructurr NNl,'/r deœnir.r1is.rtion of varlcing ~
Click on title, ORGANISATIONAL SYSTEMS or SUCCESS ITEMS to edit them
bttp://136.159.7.57/WebGrid/Main.k
Continue
1/1/2003
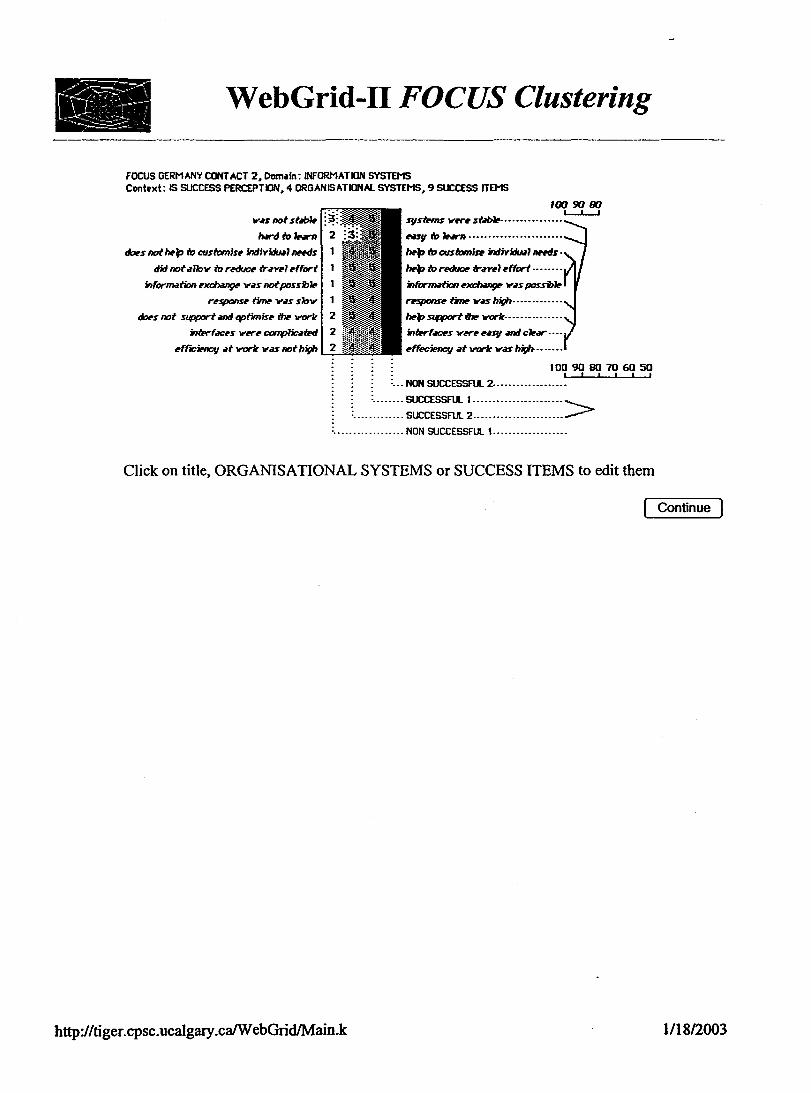
WebGrid-11 FOCUS Clustering
FOCUS GERMANY CONTACT 2, Domain: INFORMATION SYSTEMS Context: 15 SUCCESS PERCEPTION, 4 ORGANISATIONM. SYSTEMS, 9 SUCCESS ITEMS
v.n oot stèlblr ):
lwrdr'o1r.rn 2
~s not ht>p irJ wsromise indiYidwl nHds 1
did not .rlbv ir, rMCJOr ir <1Yrl effort 1
information r~ v,1s notpossiilr 1
rrsponse tit1lt' v.rs s 1ov 1
dors not Slff>Ort .rnd optimise thr va-Ir 2
inif'rfilcrs vrrr cor,pliNiPd
rfrlCPIICfJ .rt va-Ir VdS IIOf hir}h
100 SO BO svstrms vrrr stèlblr- .•..•.••.......
NSJ/ ir, ·-························
ht>p irJ cusromise indiYidwl nttds.
ht>p l'o rMCJOr tr ,1Yrl effort · - · · · - -·
infor-iion r~ v.ispasm•
rrsponsr tit1lt' v.rs hir}h- • • -- · ---· ---ht>p Stff)Drt thr -*· ............. . int.rfdOrs vrrrr,1:sv ,1ndck.r-·-·
t>ffrt:1MCfj ,1f var* VdS big#>•••••••
L-L....J
100 90 80 70 60 50 1 1 1 1 1 1
•. NON SIJCCESSFUL 2- •••••.•••• -••• -•••
. . . . • . . SUCCESSfll. t ....................•.. > ..•..•.••.•. SUCCESSRJL. 2 •••••••••...••••.••••••
: ••...•..•...•••... NON SIJCCESSFUL 1 .••••••••••••••.•••
Click on title, ORGANISATIONAL SYSTEMS or SUCCESS ITEMS to edit them
http://tiger.cpsc.ucalgary.ca/WebGrid/Main.k
Continue
1/18/2003

WebGrid-11 PrinCom Map -------------
PrinCom, Dormin: INFORMATION SYSTEMS, User: GERMAl'f'f CONTACT 2 Context: IS SUCCESS PERCEPTION, 4 ORGANISATIONAI. SYSTEMS, 9 SUCCESS ITEMS
ff«1MC1J ,1t 'll'W'k vn high ._ VNP NS1J ,1,ld CH"
p support tM vat"k Psponsr timlf V,U high SUCCESSFUL 2
NON SUCCESSFU.. 1 ~
information P)(ffl,11,gr V,JS po.ssiil,
,.:.:..:=......._..,...-l.!;::::~~~-.,.,.,..,..,..,.,.....,.,~ hrp io rHUt» tr,1yrlrffort
did Mt ,111ov io reduot! tr ,1yp1 rffort inf0r1n,1tion rxch.lngP v,1.s not po.s.siilr
rr.spon.sr iilnr vn .sbv dors not StlfJPOf"f ,JntJ q,onmisr tM _.k
iniPrf.aor.s vwr corr,,1~ rfî'ICimcfJ ,1t vor-k _vn nothigh
hf'p ir, CUSiomÏ.se ÏndÎYÏdu.11 f>Nd.S
sgsiPms verr s~ XSUCŒSSFU. 1
Click on title, ORGANISATIONAL SYSTEMS or SUCCESS ITEMS to edit them
http://tiger.cpsc.ucalgary.ca/WebGrid/Main.k
Continue
1/18/2003
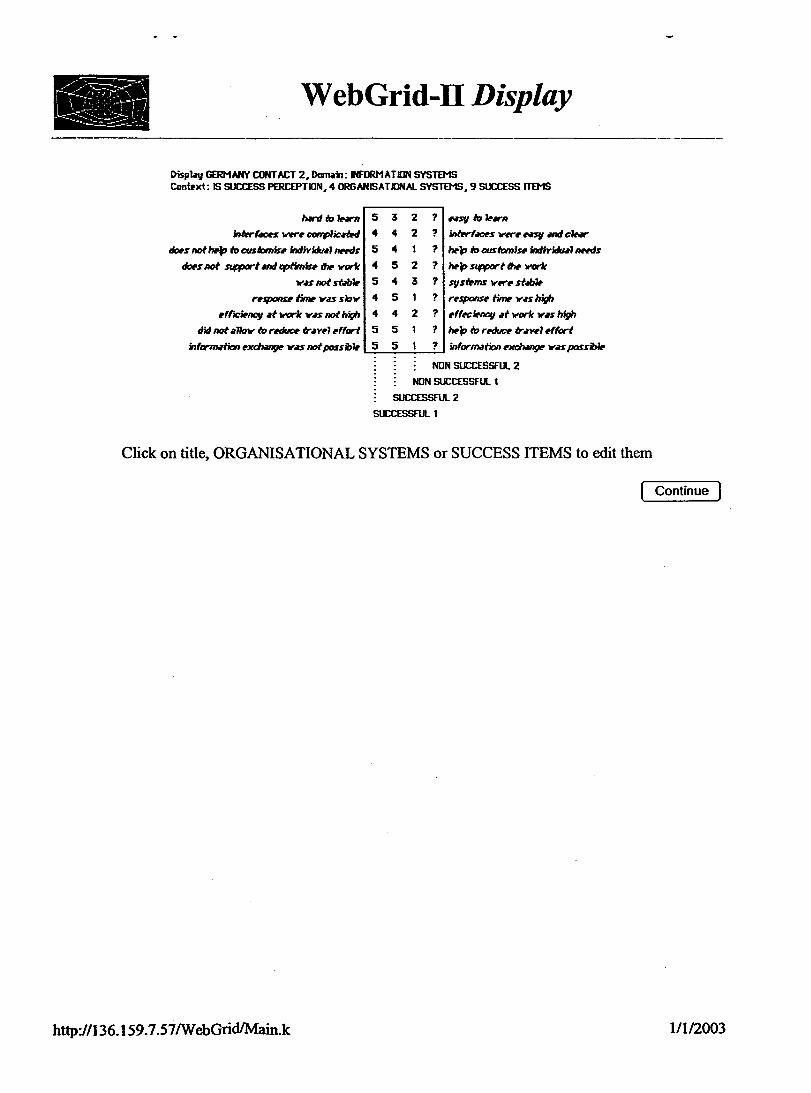
WebGrid-11 Display
Display GERMANY CONTACT 2, Domain: INFORMATION SYSTEMS Context: 15 SUCŒSS PERCEPTION, 4 ORGANISATIONAL SYSTEMS, 9 SUCCESS ITEMS
INrd io INr'n
int.rl.lœ.s Vff"t' ca,rr,1ic«H
dor.s not hrt, io cusicmi.sr indiridu.i1 nHd.s
dor.s not SUff'Ol'"f Mid q,timisr tlltl!' 'll'W"k
v.u not st.bJir
rr$(X)IISr tit1ltl!' vu .slov
,mc~OOl,I .it --k v.n not fflf!,
ni not .i11ov tr, rtl!'ductl!' tr •Yr1 rffarl
inform.,tion .. ~ v.u notpœ.siilr
5
4
5
4
5
4
4
5
5
3 2
4 2
4 1
5 2
4 3
5 1
4 2
5 1
5 1
?
?
?
?
?
?
?
?
?
HSfl tr,J,i,,n
inlrrf.œ.s Vtl!'t'"tl!' HSJI M#I c1Hr
hrt, io cusicmiS# indiridu•1 nrrds
M-p SUff'Ol'"f ihr lr'arlc
SV .strms Vtl!'t'"tl!' st.Jb1r
rrsponsP on. vMhigh
rffrcirnatJ •f 'll'W"k v..s high
M-p œ rtl!'ductl!' ir•Yr1 rffort
inform.tion r~ '11'.n pœ.sib1r
NON SUCCESSfll. 2
NON SUCCESSFUI... 1
SUCCESSfUI.. 2
SUCCESSFUL 1
Click on title, ORGANISATIONAL SYSTEMS or SUCCESS ITEMS to edit them
bttp://136.159.7.57/WebGrid/Main.k
Continue
1/1/2003

WebGrid-Il FOCUS Clustering
FOCUS GERHANY CONTACT 3 , Domain: INFORMATION SYSTEMS Context: IS SUCCESS PERCEPTION, 4 ORGANISATllNAL SYSTEMS, 13 SUCCESS ITEMS
IISKS w,,rr utisr-.d 2
farep p,q,'lt! ir, shrr infDr'INiion
rfr'lci«K
NSV to 1Nrn ihr syst.ms in short timr 1
orp,J11iu6on.a1 cu1turr dNngr (KH) 1
iRform.tion sharing v.u possib'lt! 2
rriRforor tJP1!f1 c'limat 2
W"Çr iltt:/OrSS ir, iRfor-fion 2
c,rr,r tWY#'lapmfflt v.u ihrrr 2
9f'Nf orp111S»6on.a1 rfficÏMOf/ 2
NSJI tousr 2
morr timr v.u o111oc.lœd io ill1il\ftic rr.rsonin9 2
ri9or in timr RJM»grmrni 2
1
2
2
2
2
2
)! .... =~= 2
2
2
2
100 90 BO
USKS VKr nof s.16.Jrw• • • •• • • •• • • •• • • • • • • •• ·•· • •
did not forer p«11ilt! ta slwrr inform.,tiot> • • · • • • • not rfr-,cï,nt .•...•.•••.•••••••.•• ••..••••••••••.••••
hM-d to 1Nrn ihr svsirm iR munimun tifM,. •••.•.
cu1ilrr v.u not dwngrd (KM).··················· IIO iRform.,fion SharÏn9• • • • • • • • • • • • • • • • • • • • • • • • • • • •
did notœp ir, rr'inforor ~ c1im.Jt ....•.• • •.• ·
limiil'd ~s tr, 'informatiot> • • • • · • • · • • · · • · • • • · · ·
did notœpt:Krt!r ,wyr~········· .. ...... . poar ot"SJMIÏS•tiM1 rfr'ICirllq/ • • • • • • · • • • · • • • • • · • • • • COf1f'llC,IIPd ir, USP. • • • • • • • • • • • • • • • • • • • • • • • • • • • • • • • •
70!8' of ihr timr v.u •~œd tr, roo~ t.uks-
1Pss ri9or in timr~···················
L-.1.......J
100 90 80 70 60 50 1 1 1 1 1 1
..... :: :::: ::::::::::::::::::::::::::::::::::::::> L. .. =::::::::::::::::=~::::::::::::::::::::::::::::::::>
Click on title, ORGANISATIONAL SYSTEMS or SUCCESS ITEMS to edit them
Continue
http:/1136.159. 7 .57 /W ebGrid/Main.k 1/1/2003

WebGrid-11 Display
Display GERHANY CONTACT 3, Domain: I\IFORMATION SYSTEMS Context: IS SUCŒSS PERCEPTION, 4 ORGANISATIONM. SYSTEMS, 13 SUCCESS ITEMS
rlficiMt
information sh.ring v•s poss'tbllP
rrinforcr tfWt1 c1inwt
forer p«ipllP ir, shir, informnion
W"9'!' M:IC!nS ir, inf--tian
Cdrf!ff' d,yr'lopmfflt 'll"&S tJwr,
uurs vw, utisfi«I
'.tSJI ir, us, HSV iD llNr'n IN svsœms in short timr
morr timr vas &11ac.rml ir, aM'lt,ltir: rusoning
or9MJis•tiona1 wltut? ~ (KM)
grnt ~nrl1tiona1 rff'ICIMctJ
rigor in timr ~
1 2
2 2
2 2
1 1
2 3
2 3
2 1
2 2
1 2
2 2
1 2
2 2
2 2
4 4
5 5
5 5
4 4
5 4
4 4
4 3
4 4
5 4
4 4
5 5
4 4
4 4
not,fr'ICifflt
no information sh.ring
did not h!op ir, rrinforcr apoM clim&t
did not forer~ ir, shirr infon,wtion
1imu.d «crss ir, infon,wtian
did noth!-p c.t'f!t!r drvrkp,wnt
uurs Yw, not utilfi«J
car,,1icated ir, -
h,d ir, ...-n IN svstrm in munimun timr
10Slr of ~ timr Y.JS ,111ac.rml to rootinr t•sks wllur, v,is notdNng«I (KM)
poor orpmÏSilm.al ,,r'/CfMctJ llPss ri9or" in timr ~nt
SUCCESSFlL 2
SUCŒSSFUL 1
N{l'ol SUCCESSflll. 2
NON SUCCESSFlL 1
Click on title, ORGANISATIONAL SYSTEMS or SUCCESS ITEMS to edit them
http:/1136.159. 7 .57 /W ebGrid/Main.k
Continue
1/1/2003

WebGrid-11 PrinCom Map
PrinCom, Domain: N"ORHATION SYSTEMS, User: GERMANY CONTACT 3 Contl'xt: IS SUCCESS PERCEPTION, 4 ORGANISATIONALSYSTEMS, 13 SUCCESS ITEMS
USKS VKP nof s•&rJed Iffs ri9«' in nmr ~t
poar ~is•tina1 Pfr'ICÏfflt:y 70S11 of~ tinw v•s •l'loc•œd to rootiM ~
COfTf'l'ic:4-Œd to usr did not forPr~ to shrr infonMtion
.rttr drrrlq,rnff>t v.u 'ilwrr 'flP «lOPSS to infot'1D#tion
did not hPp to rrinforw opoM c:1imn to ~.rn ~ sgsmns in short timr no inftJf'1Mtion shring
NON SUCCESSFUL 2
NON SUCCESSfll. 1 )c k ...................... . œllurr v•s not~(KH)
hard iD l!o.rn th# sgstwn in munimun timr notrfr'ICiMt
1imi-Œd -SS to infotrnNtion did not hP~ c:,-,- drrr'lcpmfflt
fi • X SUCCESSFUL 1
or~is•tiolNl wllurr chz1J9r (KM]
infornwtion shJring vas possl,lr
us,,XSUCCESSFU.. 2
rinf- apm climn forer p«Jtilr to SNl'P infornwtion
r tirRP vas •'11oc»œd to-'lj,,6c rN:soning r•t~~1 rfflt:ifflav
Ï9«' in timr~t 1/SN'S VKP s•tisrJed
Click on title, ORGANISA TIONAL SYSTEMS or SUCCESS ITEMS to edit them
Continue
bttp://136.159.7.57/WebGrid/Main.k 1/1/2003
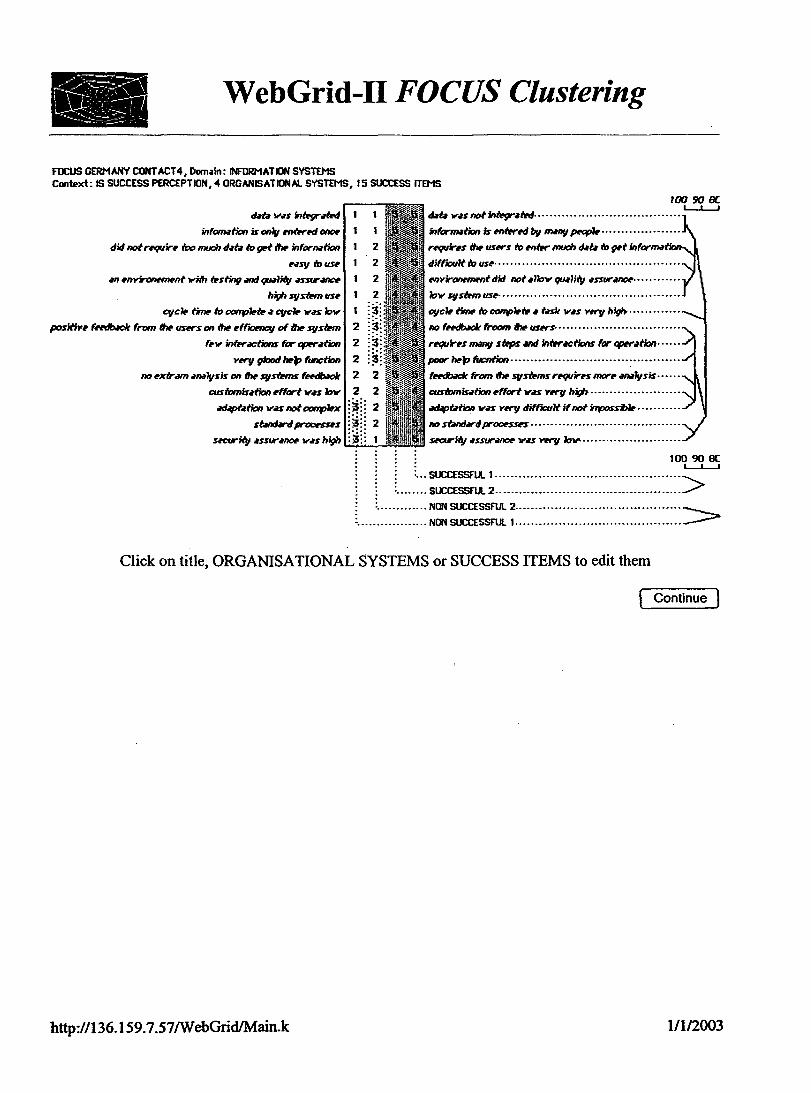
WebGrid-11 FOCUS Clustering
FOCUS GERMANY CONTACT4, Domain: INFORMATION SYSTEMS Context: IS SUCCESS PERCEPTION, 4 ORGANISATIDNAL SYSTEMS, 15 SUCCESS ITEMS
thh v.u iMPgr•iPd
infDmiltion is on\, ffliw-M -did not requirr ioo muoh d•ra iD ~t ihr infor,»tion
r•sv tousr
an rnYÏrtJnNll(>nt vnh 1Psfin9 Mid qwliift •ssvrMIC#
h%,h sgsiwn usr
qJC• timr ir, cor,p1rtr d CVC• Vff bv
positiYr fHdb«:k from ~ ust!rs on ihr rff°'IOMCfl of ihr sgsiwn
frv imPrcJCtions for ~•tion
l'ff'fl 9iood hPp function
2
2
2
2
1 ~= ... 2 a= :.: 2 ~= ... 2 :5:
no rxfrilfTl dn.l,Vsis on iM sgsiwns fNdl»clt
cusiomiution ,ffort v.u bv 2 2
M»pfdtion VM nofcorrp'JrX ~)( 2
st.Jnthrd proorssrs j:: 2
s«:urit/J •ssur- v•s high f \ 1
2 2
100 !10 8C. • L-.1...-1
t»ra VM not 1"iPgr•iPd· • • • • • • • • • • · • • • • • • • • • • • • • • • •• • • • • • • • •
inforn»tion is rnt.r«l bv -nv ~'Ir •.•••••••.••••••••••
rff111irrs 1hr uurs to rnt.r much t»f• to t}rt infar- ·
difficult to usr· · · · · · · · · .•. · · • · · · .................•...........
rn'l'irotwml!nt did not •lbv qwlit/J •ssur•nor· •• ·• • · • • • · ·
lov sgsiwn UH- • • • • • • • • • • • • • • • • • • · • · • • • • • • • • • • • • • • • • • • • • • • • •
q,,c'lr nmr to conp'lrtr. tnk v.u 'Yff'fl higlt .•.......•...
no fHdb.lck froom iM USt!rS· • •• • •••••• • • • • • • • • • ••••••••••••
rfflllhs -nv sœps Mid int.r«tions far ~•tian······ ,,_. hPp fucntion ....•.••.•.•..•........•...... : •..••..••...
fNdl»clt from ihr sr,siwns rrquirn marr -,7vsis ..... .
cusfomiution rfforf VolS l'ff'fl hÏ!}I> • • • • • • • • • • • • • • • • • • • • • • •
«ùpRtion v.u Yff'fl diff1QU1t if not inp,sslnP • • • • · · · · · · ·
no shnturd procrssrs • · • · • • · · • • · · • · • · • • • · · · • • • • · • • • • • • · • • · · Sl'Ctriifl •ssurM>Or v•s 'Yff'fl lov- .... · ................... .
100 90 8C L-.1...-1
..... :::~~=~~:::::::::::::::::::::::::::::::::::::::::::::::> t .... =::::::::::::::: ==~::::::::::::::::::::::::::::::::::::::::::::>
Click on title, ORGANISATIONAL SYSTEMS or SUCCESS ITEMS to edit them
Continue
http:/1136.159. 7 .57 /W ebGrid/Main.k 1/1/2003

WebGrid-11 PrinCom Map
PrinCom. D01Nin: INFORMATION SYSTEMS. User: GERMANV CONT ACT4 Context: IS SUCCESS PERCEPTION. 4 ORGANISATIONAL SYSTEMS. 1 S SUCCESS ITEMS
posim,r fttdb«:k from iM users on itw rff'ICMC1I of iM sgsiPm frllf' lniff'«tions for opK•tion
Yf't'Y giood Mp funcfian dll ffl'Y1l"Onffl1Mt 'lriih iPStin9 Mid qwlllv dSSfrdllCr
SUCCESSFUL I X high sgstPm ug
cycw timr ir, ccnp1ttP • cycw va bv NSV iousr
did not r~r trx> much data ir, grt ihr infDn1,Jtion customis•fian rfforl v.n .....
infMMtion is on>.f ffliff'rd onor
tht•Ya~•ted no rxtrMn •rwlgsis on ttw svst.ms fHdback
SUCCESSfll. 2 X
s«UrKV dSSUl'M1Ctt 'll'dShigh SÛlltN/'d procrssrs
MJ~taoon Y.?S not cor,plrx
taoon ..... a Y«Y mmou1t if not i,,J,osmw sûndn procrs:ws
· assurM1Ctt v•s Yff'JI bv ~ from itw sgsirms rrquirrs morr .n.ilgsi:
.., 11'.U- not int.r;ratrd information is rntww lJv IINIIIJ p,q,w
X NON SUCCESSFll. 1
rrqurn ihr users to MtW' muoh üta to 9rt i,; diffioult io US#
c:s,cw mir il, ~if,. t~ 'll',IS Yffll high YÎt'ont!fMnt did not albllf' qwlllv .u-sur
poor hPp fucntion
rE'Qt./Ïrrs millllJ siPps Mid intw«:tions for ~afian no fHdbildt frocm it>r IJSNS
Click on title, ORGANISATIONAL SYSTEMS or SUCCESS ITEMS to edit them
Continue
bttp://136.159.7.57/WebGrid/Main.k 1/1/2003

WebGrid-11 Display
Display GERMANY CONT ACT4, Domain: WORMATION SYSTEMS Cont.xt: IS SUCCESS PERCEPTION, 4 ORGANISATIONAL SYSTEMS, 15 SUCCESS ITEMS
5 4 1
3 4 2
4 4 2
s 4 2
s s 1
s s 1
4 3 1
s 3 2
3 s 1
2
1
1
2
1
1
2
1
2
r.ug touu
«Mpf•tion V.U nof~K
w.siomisMion rffort W'fi lov
.,, r,,Y1t"'Ollff11IM v1l'b tnting Mid qwliilJ ,l.Sml'i/llCr
infartNtion is ools, rnœr«J onœ
tkt. vu intrgr•ml
frv inœr.ictions for aprr•tion
C!fC• nmr tr, conp'lriP • CjfC'Jtt V,lS bV
s~ ,1s.surM1Dr v.u high
difrlCfilt to uu ad~•tion v•s YKrJ difr,cu1t if nof inp,.srix,r
cusirJmiution rfforl v•.s Y«'J high
MYÏrOMmfflf did nof •11o1"" qwlffJ/ ,IS,Sllf'MPOr
inforrt»tion is rnœr«I bg mill",/ p«fil,
tkt• v.u not iniP9r•ml requirrs mMII/ sœps Mid inŒrM:&ns for aprr•tion
cyc~ ~ io conp•IP • f.mt v,1.s Yff'g high
S«:Ut'Ïilj .USl/t'i/llCr ll"U Y«'J lov
no f~ froom ihr uur.s
requirrs ihr usK.s tr, rntw much tkt• to grt infarn»iion
IIO .sfMKUnJ procn.srs
fttdb.Jck from ihl! sgmms rrquirrs morr .m.r\fsis
poor ht>p fucntian
bll".S"J!SirmUU
4
s 3
4
2
1
2
1
positirr frrdt»dt mrm ihr usKs oo ihr rfrlCMCIJ of ihr .svstrm
did not r«/Uirr iDo nu:h ,ht. io grt ihr infornation
3
4
4
s
4 1
4 1
3 1
4 2
2
1
1
2
.stMld.rd proœs.srs
no rKir.Jm -Jstsis oo ihr .svsiPm.s fl!'«ll»olt
Yff1I 9iood hrp function
high.svsirm-
NON SUCCESSFUL 2
NON SUCCESSFUL 1
SUCCESSFUL 2
SUCCESSFll. 1
Click on title, ORGANISATIONAL SYSTEMS or SUCCESS ITEMS to edit them
http:/1136.159. 7 .57 /W ebGrid/Main.k
Continue
1/1/2003

WebGrid-11 Display
Display GERMAN'!' CONTACTS, l>ofmin: NFORMATION SYSTEMS Context: IS SUCCES$ PERCEPTION, 4 ORGANISATIONAI.. SYSTEMS, 19 SUCCES$ ITEMS
s 5 3
5 5 3
4 3 1
4 3 1
s 5 1
4 5 2
2
2
1
2
1
1
'l.riPst tw:hnolo9in
r411itl-ss c...- .md no «TOl'S
d«rNSn nmbrr of ,-:p1, in orr~s stM1tMrd d.rt.l .rnd inform.rtion
etrrlMf inform.rnon
o1d hdrdv'P .md safh,,.-, trchnologi,s
slav <IOO#!SS
proli1'ms .iris, •11 IN titM
intr,n,s number of p«Jp1' in officn
tkt• .md infor-tion u not sfM1tMrd
information not curr,nt Mid not •1v~s è(JtÛiPd
miulignmfflfb,h,,,t,n ifw sysfffn .md iJ1tl' procns
did not .rlbv f1rxibiliiJI in d«:irion nwking
nofus,r fr•ind>/ us«'S did not#Jrr, good ir•inin9
did not M.rb1r CKttr 11,y,"lq,rnfflt
inrorm.rtion vn not :shar«J
f'l'OP~ ver,not™IPJ viih ifwsvsiPm
inform.rtion vn not infpgr.riPd
p«,p1' h.rd lim1iPd «cns l'o inform.rtion
businnsn v,r, not Ïl1JlroYrd (d«:irion nwkin9) did not ,n.b'I, l'o knov vho is doing vh.rt in r,.rl k~
did not IM.rliko io instmtfrl rr.r'1wiP r11p01o,,J~ perform.rnœ
4
4
5
4
2
2
2
2
ful>,/ .r~b,tttt,n il'IP syst.m .md ihtr proc,ns
.r11ov f1Nd1iliiv in tk>cirion nwking 4 5 2
5 5 2
4 3 2
5 5 2
4 5 2
s s 1
4 4 2
s s 1
s 5 2
3
2
1
1
1
1
1
1
2
us,rfr,nlls,
US#rS h.rd good ir•inin9 M.rb'l«I C.rt'ffr ·~"lq,rnfflt . inform.rnon m.rrin9 Ntv.ffl USKS
p«Jp1' v,r• INff'V viih ihtr sysiPm
inform.rnon v.rs iniPgr.riPd
p«Jp1' h.rd .rcc,ss ir, •11 inform.rnon
bunnrssrs v,r, i,,p-oY«l
ffWb1's ir, knav vho is doin9 vh.rt in rNI tim,
s 5 2 2 ffl«il«J il, mt.rnflt,/ rr,dtt.riP rnpi/ovtts p,rform.rno,
NON SUCCESSFIJL 2
NON SUCCESSFUI. 1
SUCCESSFUL 2
SUCCESSFlA. 1
Click on title, ORGANISATIONAL SYSTEMS or SUCCESS ITEMS to edit them
Continue
http:/1136.159.7.57/WebGrid/Main.k 1/1/2003

WebGrid-11 FOCUS Clustering
FOCUS GERHAN'l'CONTACT 5, Dœmin: INFORMATION SYSTEMS Context: IS SUCCESS PERCEPTION, 4 ORGANISATIONAL SYSTEMS, 1B SUCCESS ITEMS
d«:rus,s RtHTib«- of p«1p1r in amers ) ~f) 2
c'lr, Mid no rrrors : f: 2
-1,1«/c,ft'(',wyr1opnwnt \~!~ 2
p«,p'lr h,d .rcœss l'o •11 infor-tion 2 2
•llbv #1rxibi1iiy/ in d«:lsion nwking 2 2
fu'flg ,;,lignmrnt lwh,,tt,n ihr s,smn .md ihr procns 2
currrnt inform.Jtion 1 2
prop1r vrrr ~ vnh ihr svsmn 1 2
information shring lwt,,,-, usrrs 1
inform.tion va imPgr,;,œd
stMld.rd t»fil Mid inform.Jtion
businrssrs vrrr fr,p-i,v«J
r,1pid «JCnS
wtrst ŒChno'lof}irs
~s ir, knov vho fs doing ~tin rN1 titTw
USl!rShMJ90od ir•ining
-1,1«1 ta instmt1tj rvawiP rny,o'loflHs pt!rlarmmor
USff" frrind1t,/ .___2;_
100 '90 80
inorHSPS lltJl1lbK of p«1p1r in offk:#s• • • • • • • • • • • • • • • • • • • • • • • • • • • • '--'--1
pn,b'IPtns.r~•11 ihr tit,w ••••••••.••••.••••.•••.•.••••••.•.•••••
did not,,,.,. c.-_. drYr'lopm,nt· • • •• •• · ·,,,.,,, •••• · • •••• , .. ,.
~ hMJ limllPd «x:ffS lb inform1tion • · .... • .. • .... · .. • .. · · · ·
did not.,11ov #1rxibmiy/ in d«:ision l1IJlring • • ...... •• , • • • • • • , · • • •
miu1Ïfl,lmMf#wt,,,MII ihr svsmn Mid ihrprr,c#U••"•••••••••
inform.l&n notcurrMt Mid nof •'h,~s #pt»trd·· .. ··········· · ~ VKrnof~ viih ifir SVstrn, ..•.................•••..
inrorm.ttion 'll',IS not st--«J •••....•.......••. ' .•.•.....••....••..
informltion Vff not inœgr•trtJ. • • • • • · · · • • • · • · · • · · · · · • • • · · · · · · • · • ·
t»f.6 Mid inform1tion is not sRlld,d ..... · · · .... · · · · .. · · · ·. ·. · · · ·
businnsn Vl'r'r not ir,proY«l (dft:ision mJlcing)· ••• •• • • · •• •• • •
s1oV-S•••••••••·•••••••••••••••••••••••••••••••···············
o1d hrrdv,r Mid sofft,,.rr iPchno'lof}irs· · • · • · • • • · · • • · • · · • • • · · · •.
did not,,,.,. to knov vho is doing ll'h.lt in rnl k~- · • · • · • •.
rnrrs did not 11.,vr 90od ir•il1in9 · · · · • ·• ·• · · • · · · • · • · · · · · · · · · • • · · ·. did not ~1r to inst.Mflv rv•'lwiP r11p0'1of1Hs prriorm,mar,
not usrr frrind1'j • • • · • • · · • · • · • • • • • • • · • • · • • • • • • • • · • • • · • • • • • • · • • • · • • •
100 90 80 70 1 1 1 1
L. .. =:::::::: :::::::::::::::::::::::::::::::::::::::::::::::::> !. .... =::::::::::::::=:=:~::::::::::::::::::::::::::::::::-:::::::::::::::::::::>
Click on title, ORGANISATIONAL SYSTEMS or SUCCESS ITEMS to edit them
Continue
http:/1136.159. 7.57 /W ebGrid/Main.k 1/1/2003

WebGrid-11 PrinCom Map
PrinCom, Domain: INFORMATION SYSTEMS, User: GERHANY CONTACT 5 Context: IS SUCCESS PERCEPTION, 4 ORGANISATIONAI. SYSTEMS, 18 SUCCESS ITEMS
did not Mab11!' c.rHr d#Yr'kJ,nwlt misa1i9nmMt"'twnn ihr svstem and tlw proons ~ had 'limiiPd -SS to inform.mon okJ l»rdlt'ilrl' and softlt'ilrr t.dino'lagin
peq,11!' .,,,,,, not™PP'J vith thr svstem infor-tion not CfJITent and not aht-~s ~ml
NON SUCCESSFUI.. 2 X
dat. and information is not sÙIKÛrd inforl114'tiM vas not intP9t·-.1iPd NON SUCCESSFUI.. 1 X no usw fi e •
burilf'ssn vl!re not in'p'oY«J (d«:ision mùltinr,) users did not fwye good trainïnr,
did not rnabl# to knov ll'ho is doinr, vh.Jt in rr,11 k · did not M.Jb11!' to instant'ltj eYa1uaiP r11p01ot.Jees perfor
prob'lems arise an ihr lime did not 111ov f11!'xibffitv in d«:ision m.akinr,
inorNsrs numbt!r of peq,11!' in offices
NSff number of peopl# in ofr>C'<"S
frrind>,/ nov flrxl,ffitv in d«:isiM nwldn9
mb1Pd to instMJt1tj rYa'lwiP -,,o1ogtts pc NblPs to knov 'lrllo is doinr, 'll'lwt in rral ti
ÎMSSl'S 'fl'ff'l' in,,rOYH
mation vas iniP9raml t.Jndilrd tkra and information rrrars X SUCCESSFll. 1
good trainïnr,
XSUCCESSFLL 2 inforl114'tion smt'1n9 beflt'ttn USNS
rnt inf~tiM peq,11!' v«-e hifPP'J viib thr sv siPm
~acons 11!' hMJ -SS to 111 inf0f'11Ntion
fu1'1tj align,,w1t betlt'ttn ihr sv sR>m and thr prc enabW carttr deYe'kJ,nwlt
Click on title, ORGANISATIONAL SYSTEMS or SUCCESS ITEMS to edit them
Continue
http://tiger.cpsc.ucalgary.ca/W ebGrid/Main.k 1/18/2003
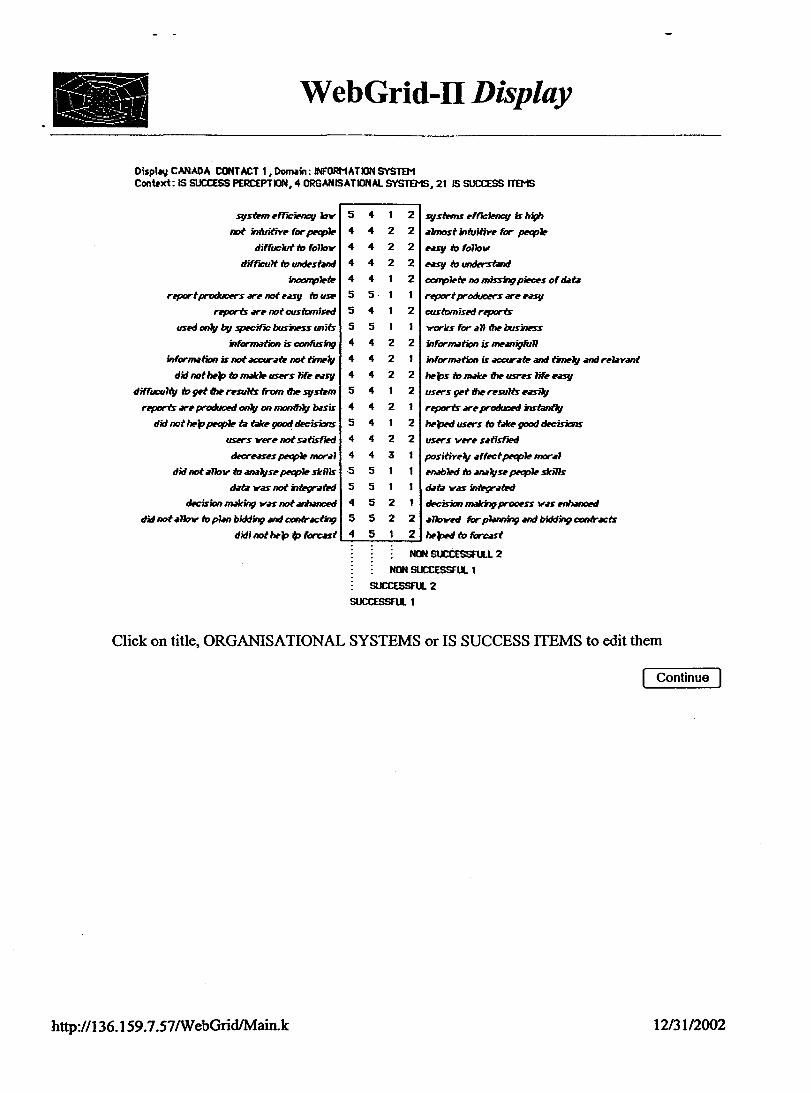
WebGrid-11 Display
Display CANADA CONTACT 1, Domain: INFORMATION SYSTEM Context: 15 SUCCESS PERCEPTION, 4 ORGANISATION& SYSTEMS, 21 15 SUCCESS ITEMS
svstrm ,fr'ICÎtMt:IJ bv
not imtntiYr for prq,•
diffuc'lut tr, fo1bv
dïfr1CU1t tr, ~stand
~kR'
nport produc«'s ,, not rMg io usr
r,porls ,, not cusiom#Rd
used m7st bv sp«:Ïf°'IC businPss uniis
infornwtion is confusing
infor-tion is not ilCCUra"IP not tinw1v ditl natMp io m.ik'J. USNS lifr NSfJ
diffuœ1tg tr, gPt thr rrsu1is from thr svstrm r,porls ,, produc«l GY17sl m monif11v blm
ditl notMp prq,'lr ta tilkr 9«Jd. d«:isiais
USNS ver, not satisfw
d«:rrasn pt!q1'I, mara1
did not •11ov io cJ1»7slsr ,-p'lr sld11s
1kt. vas not inlP9f'•iPd
œcisiM making vas not .mhanœd
did not a11ov io plm bidding .md contracting
didi notMp ip f~t
5
4
4
4
4
5
5
5
4
4
4
5
4
s 4
4
s s 4
5
4
4 1
4 2
4 2
4 2
4 1
5 1
4 1
5 1
4 2
4 2
4 2
4 1
4 2
4 1
4 2
4 3
5 1
s 1
5 2
5 2
s 1
2
2
2
2
2
1
2
1
2
1
2
2
1
2
2
1
1
1
1
2
2
svstwns rff"1cJMcv is high
.a1most intuitiYr for p«JJ'lr
r•sv tr, fo1bv
nsy tr, untkrstand
conr,'lrtr no missing pieors of ddfl
rrport product!rs arr 'ilS1!
customis«J rrpora
'll'ITks for a11 thr bus:irwss
infornwtion is mr.migfu11
information is ilCCUraR' .md timrlv .and rr'l.aY.mt
Mps tr, milkr thr usrrs 1ifr 'ilS1!
us,rs g,t thr rrsu1is NSilrJ rrporis ,, produc«l inst.mt1tj
M~ USKS tr, tilkr 9«Jd. d«:isiais
USKS Vfl"P saiisrwd
positiYr7sl aff«:t p«p'lt! moral
rnab'lrd io -rs,s, p«p'lr slâ11s
fkf,1 VdS intPgramJ
dft:ision makingproc,ss v.n-~
a11ovftl for p'l.mr,ing Mid lnclclin9 ccniraca
M~ioforNst
NON SUCCESSfll.L 2
NON SUCCESSFUI.. 1
SUCCESSFlL 2
SUCCESSFlL 1
Click on title, ORGANISATIONAL SYSTEMS or IS SUCCESS ITEMS to edit them
Continue
bttp://136.159.7.57/WebGrid/Main.k 12/31/2002

WebGrid-11 FOCUS Clustering
FDCUS CANADA CONTACT 1, Doimin: INFORMATION SYSTEM Context: IS SUCCESS PERCEPTION, 4 ORGANISATIONAl. SYSTEMS, 21 IS SUCŒSS ITEMS
.11b!R'd for p'I.Jming Mid bidding ccnlrM:ts
t»fl VIS inm}r•iwJ
vris for .111 ihr bu.sinr.s.s
rt!pOrtproduol!rs ,r NSV
rl»b'l«I to .Jm1'f.sr ~ .s1cm.s
MpH U.S«-"S to f.itr good dft:isians
ousmmis«l rrports
svstrms rfr-,cirnc:v is high
usK.s ~t ihr rrsu1ts Hsllv co11rilrtr no missing pircr.s of dit•
11,,'ps to mM<r ihr usrr.s 1wr nsv
ruv to untkrst.Jnd
.1'/mo.st iniuitiYr for ~
NSIJ ir> folbv
infor!Ntion 1.s mnni9fu11
USKS Vl!rr utisrJ«l
infor-tion is t1CCUr.1iP .1nd ~1y ,1nd rr1.Jy,1nt
rrports rr produœd instmf1v
positiw'lt,t .1ffrct peop'lr mor,11
œocision mMt1l19 prOOt!SS VU rnhano«J
hl't,rd to fore.nt
1 1
1 1
2
1 2
1 2
2
2 2
2 2
2 2
2 2
2 2
2 2
2 2
2 2
2 2
2 2
2
2
,oo 50 80 L-1-..1
did not .Jlbll' ir>,,,.,, biddin9 i1nd conir.cnng ..
tl#f,1 Vol:S nof inœgr,1twJ. • • • • • • • • • • • • • • • • • • • • • • • •
USH 01Jv bf/ 51)«:ific ~SS units • · · · • · · · · • · r,portproduoKs.-rnotr.sv tousr·········
did not .11bl1' io .11»Jv.S# peop• sJa1ls ••••..•...
did not hrp ~ t.J t.tP good d«:isbls• ••.•.
r,ports ,r notcusiomis«l- • • · • • · · · • • · • · · · · · • · • Sfl:smtl rfr1eÏNICtJ 0'11' ••••••••••••••••••••••••••
dwfucultv to ~t ihr rrsu1ts from ihr Sljsil!m
inoanp'lrfr······································· didnothl'p tom.Jlt'lrusKs 1ifrNSJI···········
difficu1t to und,sf.Jnd. •••••••••••••.••••••.•••••.
not ir>iuitiYr for~-························
d;ffuc'/ut to folbv • • · • · • • • • • • • • · • • · · · · • · · · · • · • · · ·
inform.,tion is oonfusin9 · • • · • • • · • · · · · · · · · · • · · · · · USKS VKP nof utisrJ«l. • •• • • • • • • · ·• ·• · · • · •• • · •
infarn»tion is not ilCCUr.JiP not ~>,,- · · · · · · · · r~ .rr producrd 011',/ on monih>J buis-··
d«:rr1srs p«:p'lr mor11· • · ·• • •••••• • · ., · •• · •• • ·.
dft:1.sion millting '11'.J.S not ~ · · · · · • · • · · · • ·
didlnothrp ~ farusl··························
100 90 BO 70 60 50 1 1 1 1 1 1
: ... SUCCESSfll. t ................................... > ••..•.. SUCCESSFlA.L 2- •.•....•....••••.•....•..•••••.•.
L. .. :::::::::::::::==~::::::::::::::::::::::::::::::> Click on title, ORGANISATIONAL SYSTEMS or IS SUCCESS ITEMS to edit them
Continue
http:/1136.159.7.57/WebGrid/Main.k 1/1/2003

WebGrid-11 PrinCom Map
PrinCom, Dormin: NORHATION SYSTEM, User:CANADA CONTACT 1 Context: IS SUCCESS PERCEPTION, 4 ORGANISATIONAL SYSTEMS, 21 IS SUCCESS ITEMS
pontiY,'lfl lff«:t p«1plr mor•l usw-s verr .utisrw
IIPps m mBi> ihP usrrs lifr HSfl inform.,tion is IIINIIÏfl(U
ra,, it> und«-stMKI NSV it,
rrparls arr protluciNI insQnflv inforn»tion is -...tr Mid timr>., Mid rl!'Ml"
drcision 1'Wkin9proorss vu rnhiNlo«J •1'1oVl!d for pwinin9 Mid biddin9 contr~ts id not~p ~ ta tdlcr 9f'Od œcisions
ut• vn intf,gr•iwl iffœu1iJI ir, grt ihr rrsv1ts from ihP svst.m ff>abW it, -Jvsr p«p~ slrills iP X NON SUCCESSFLl. 1
'll'Gr"k.s for •11 ihr burilrss ,ports arr notœ:siomisrd SUCCESSFUL 2 X •'lmost infu1ti -, for JwllWt'i~- svst.m rmcir,q ibv
reporlproducers .rr NSV ...,_:-;-,-,!:::±:::::~~~~~;;::~:;:4 fd~idi:.:.:·~not ~p O> forust
SUCCESSFUL 1 X sysiPms rfr"lt:i#tq is hi9fl
C11Siomisrd reports users grt ~ rrsults r.rn1t,t
hPped users tr, talcr 9f'Od œcisions COIJP*Œ' no misSNJ9 pirces of d<1t<1
report prc,tluo«-s arr not r•SJI ir, usr UYd mls, bv specir"IC businrss uniis ditl not <11'1ov tr, .m,Ts,sr peqilr sJtms
·twrfor~ XNON SUCCESSFULL 2
d<if<i V<iS not iniPgr<itwl did not .r1ibv io p1MI biddin9 Mid conir.icoog drcision malcin9 vn not •nlwnord
._fion is not-,,1tp not timl!''lfl rrparls .rr produci!d on'/f,/ on monih1',/ buis
iffut;'lut to fo11ov
infortNtion is oonfusing
id nothPp l'o RNk~ users 11fr env ers Vft'"r not .utisrw
drcrr<1srs p«ip~ mor•l
Click on title, ORGANISATIONAL SYSTEMS or IS SUCCESS ITEMS to edit them
Continue
http:/1136.159. 7 .57/W ebGrid/Main.k 1/1/2003

WebGrid-11 FOCUS Clustering
FOC:US CANADA CONTACT 2, Domain: INFCRMATION SYSTEM Context: IS SUCCES$ PERCEPTION, 4 ORGANISATNJNM. SYSTEMS, 17 15 SUCCESS ITEMS
infortn1tion V.JS nof :shnd.Jrd
USKS Vff'"I' not vr11 trailw
did not crr.tfr (lOOd .-nskvl
rrguw discplin, ,nforc«I
Mn0Untof~hi9hand no~~nt
p,rtltj i,,posrd
gr.phic.t1 USK intwf- vn ~
cu1turr vas not tàM ini&, acœunt
no inpacton usrrs ( prOCl'Ssn ~)
Md usrrs did not 'lih ilw sy:siPm
did not ~ YisibRU!f for tnilflafl«-S
no businrss prOCi!ss inp'oymi,ni
~s not iiniPractNsi1J/
ihl' sysfwns is nota1vilfls aYaiW>11'
1ov tk-grH of ut'1ii!/
frv ~11' p,riicj»iP in ihr systems tWYl''/cpmmi
high numbN of Mp dl'sc ca11
,oo 90
information vas standard··························· ...... L-J
USl!rS vrrl' vr11 ira~··································· crrat.d(lOOd inp-PssXVIS········'·························
rrguw discj>1in, V<lS cm~ :smouih1s/ • • • • • • · • • • • • • • • • • amountof ohanf;,hi9h viih~~········· vas not 'it,posl'd- • · • • • • • · · · •••.•••••••••••••••••..••..•.•••.
grratGUI···················································· t:111iurl' V<l:S fi/k,n ini&, ilOCOl/nt • • • • • • • • • • • • • • • • • • • • • • • • • • • •
high 'it,pact on us«-s (procnus m,ng«I)· · · · · · · · · · · ·· · · ·
Md USl!rS likr if1I' systrms • • · • · •• • • • • · · • • • • • • • · • • • • • • ••• • •
~. Yisbl1ii!/ of~$•••••••••••••••••••••••••••
buswss procrs:s inf}roY«TINlt• • • • • · • • • • • • • • • • • • • · • • · • · • • · iniPr«:ts NS1'1f,- ••...• .•.••.•.•••••••••••••..•.•.••••..•.••.
ihl' sysirms ilrl' <l1VilflS <lY.til.bl!- • •· •• •• • • •• • •• • • • •• •• •••
high tk-grH of UÔ1Ïi!/· • • • · · • • · • · • · • • • • • • • • • • • • • • • • • • • • • • • • • •
ihN"I' V«-1' a numbN of peo11' vho particj»iP in th, SD
1ov IIUl1lbff- of Mp dtosk c<11J • • · •• • • • • · • • · · • • • • • • • · • · · · · · • •
100 90 BO 70 60 50 1 a , 1 1 r
•• NON SUCCESSFULL 2 ..•.••.••.••••••••••••••••••••••••.•••••
..... :::::::==~::::::::::::::::::::::::::::::::::::::::::::::> : ...•..•••..••••••. NON SUCCESSFUL 1 •.••..••.••••.•••••••••••••.•••••..•.•••••
Click on title, ORGANISATIONAL SYSTEMS or IS SUCCESS ITEMS to edit them
Continue
http:1/136.159.7.57/WebGrid/Main.k 1/1/2003

WebGrid-11 PrinCom Map
PrinCom, Domm: INFORMATION SYSTEM , User: CANADA CONTACT 2 Context: IS SUCCESS PERCEPTION, 4 ORGANISATIONAL SYSTEMS, 17 IS SOCCESS ITEMS
cultur, v•s not t.lt,n inœ -.it did notoruiP good inp-,ssion
gr~it:41 us,r iniPrf«. va .bscMt M110Untof~hfghMIII no~~
p,flv inJ,osH NON SUCCESSFUL 1 3c
information v,rs not sûnthrd
USNS Vl!r#' nat v"11 ir•W'd no if1pacton usr,s( pr_ss,s ~s)
Md USN"S did nat li/œ it1' systr,n did nof Df""' yisi,Riiy for ~s
ihr svstwns is not •lv~s •Y•il.Jb dors not iinffl"".«:t NSi1g
bv M9"«' of rmniy no buswss ,,,_ss fnJ,rDYffiW1t
NON SUCCESSFULL 2 f,v ~ ~jMiP in it1' sysiPms HY#'
high nurnb«- of htop œ:sc c.111
v oombK of hrp Hsk u11 • Vl!r#' ,1 numb,r of ,-,1, lf'ho pwticjMiP in -tl1" SD
,,,_SS ÏRp'OYffnMt
igh M9t'H of ubniy inter .«:ts ,ui1g it1' systwns M'#' <11'111'1:JS <1Y.nwblf>
'f' YisbiniJI of ~s nd USNS 1Ïk#' it1' sysifflts
Nt«I good ïnp-,ssions .,,, discpm, V<IS ~ smoutb'ltj
fgh itrJ»r;ton us,rs ~ssn dwng«J) X SUCCESSFll. 2
f of cm~ hjgh viih cha~ ~lllffli grutGUI
cu1tur, v4s t~•n inœ 4CCCURi
Click on title, ORGANISATIONAL SYSTEMS or IS SUCCESS ITEMS to edit them
Continue
bttp://136.159.7.57/WebGrid/Main.k 1/1/2003

WebGrid-11 Display
DispJ.y CANADA CONTACT 2, Domain: INFORMATION SYSTEM Context: IS SUCCESS PERCEPTION, 4 ORGANISATllNAI.. SYSTEMS, 17 IS SUCCESS ITEMS
fl!V p•qi/# parlicpt. i) fM sgsfrms twYr'/qJmmi
p,tfv~ rl!gt/W .disr:j>line Mfarœd
.amountof chMlfl# high *1111 no~~
ou'lturr v•s nat t.crn inio J1CCDURt
fM Sf/SiPfns fs not ffll'.JVS •Y•iW1W
don not iinœrM:t Hriv uurs vtrr not v,11 ir•in«I
gr.phb1uur inm'f- V.SllMDffli
did not t:rNt. good inf)l'rssion
infarmltion v.is not sûntl,d
1ov d«;t'ff' of utmtv Md uurs did not 'liltr iM sgst.m
high numbff' of hfop d,sc N11
no Sny»cton usrrs C procrssrs ~s)
did not "PP" l'irimiiJI for ,,,.,.,.,-s
no businPss procrss Îl1y1r0Yff11ffli
4
s 4
s s 4
4
4
s 4
5
4
4
4
s 4
4
4 3
4 1
4 1
4 1
4 2
4 2
4 2
s 1
4 1
4 1
s 1
4 2
5 2
4 3
s 2
5 2
4 2
?
?
?
?
?
?
?
?
?
?
?
?
?
?
?
?
?
ih«'r VKr. ooml,er of p,ow vho p,tic;»iP in iM SD
vu not inp,ud
rer;uw discj,1ine v.u- chM,g«I smouth1tj
-»fof clwng, high lrith ~119' ~
œ1iurr v.s t.,, into MXX1U11t
ifw sgsœms .rr •1v.JVS •Y•i1Jbw
int.r M:Πrui1g
uurs vrrr v,n ir•inPd
gt'NIGUI
crr•iH good lnp?ss~
hlot7Mtion v•s stand.rd
high degrtt of uffliiJI Md USNS 1ilcr iM sgsiPms
bv numb«- of hf>p desk c•U
high inpacton USKS (procrssrs clwng,d)
,,,,.n«J tp YÎSb~ of mMliJ9NS
business process inf)l'a-i
NON SUCCESSFUll 2
NON SUCCESSFUI.. 1
SUCCESSFUI.. 2
SUCŒSSFUL 1
Click on title, ORGANISATIONAL SYSTEMS or IS SUCCESS ITEMS to edit them
Continue
http:/1136.159. 7 .57 /W ebGrid/Main.k 1/1/2003
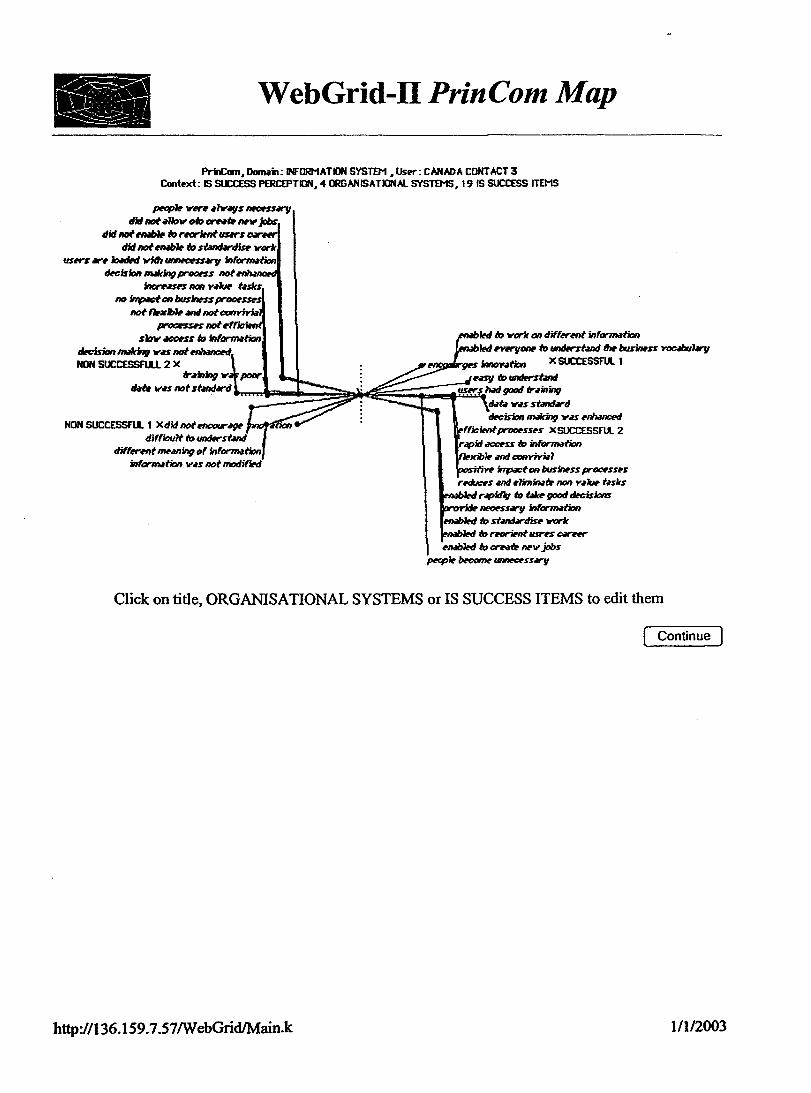
WebGrid-11 PrinCom Map
PrfnCom, Domain: INFORMATION SYSTEM, User: CANADA CONTACT 3 Cont•xt: IS SUCCESS PERCEPTION, 4 ORGANISATIONAL SYSTEMS, 19 IS SUCCESS ITEMS
~ VK# #'lv~S 11«.'ffUl'J/ ni not •llov oio crHiP MV jobs,
did nof ~ to r«Jrifflt USKS c.r,
ni not~ to st.Jntl.rdisr vorlc
W to vorlc on diff,rfflt infarfTNtian processn notrfr,c·
sbv M:Ons io infat'11Ntian d«:isionmâing v.n not~ W #Yff'VOM to untlKst.nd th# bu.nnrss YOC.Jbu'IM"fl
NON SUC:CESSFlll 2 X r•inin91":
Hf• vas not stmd.lnl
NON SUCCESSFll. 1 XdidnotMCOUr~ mM!oo,, difr"IW1t to und«-st.nd
X SUCCESSFUL 1 'gr$ innoY•tian
••svto~ ~, hatJ 9fJOd tr.linin9
HU ,as stdnt»rd œcision RNkÏn9 VM ~
fr,cïrntproœssn XSUCCESSFUL 2 r.i,pid ilOCnS to inforfTNtion t.xibl# M,d co,pyjyi.,l
"t1rr i,rp;lcton ~ss proœssrs r~s #nt/ r'limin.JiP non ,..~ t~ks
W r.pïdlv to tât> good d«:isions · neonury inforfTNtion
en.JbW to sfMJtl,disr ,,_-1c iD r«Jriffltusrn Nrttr
rtNbW iD crNiP MV jobs p«pl# ~ unn«;rSSM"g
Click on title, ORGANISATIONAL SYSTEMS or IS SUCCESS ITEMS to edit them
Continue
bttp://136.159. 7 .57 /W ebGrid/Main.k 1/1/2003

WebGrid-11 Display
Oisplay CANADA CONTACT 3, Domain: N'ORMATICIN SYSTEM Context: IS SUCCESS PERCEPTION, 4 ORGANISATIONAI.. SYSTEMS, 19 1S SUCCESS ITEMS
proongs not rfficifflt
s:Ov «:ens iD information
œciri:w man19 ,,,._s notMhmct!d
usrrs ,r 'lrMdrd viih unneorss,y information
tlifr'IOU1t iD undrrstn
did not Milblr iD st.-1.-dis# vrirlc
r.rining v.rs poor
diffrrrnt mr.rning of inf«m.1tion
1t0f f1exiblr Mid notœnriri,1
no ifTpdct on businns proœssn
inorNRs non nbr t.rsks
inform.rtion v.rs not modirlll'd
dilt.r v.rs not st.rnd.rrd
did not rnab• iD r«rifflt usrrs c.irrw
did not .r11ov oiD crr.riP nrv jobs
~Jr VK,P <lW"!JS MCnSdnJ
d«:isionnwlcing v.rs notMhmct!d
did 110f ffJCOUr"91' WIDY.ttion
5
4
4
4
5
4
5
5
4
5
5
5
5
4
4
4
5
4
?
5 2
5 1
s 2
5 2
5 1
s 2
4 2
4 1
4 1
5 2
5 2
4 1
5 1
4 2
4 2
4 2
s 1
3 1
? ?
2
2
2
2
2
2
1
2
1
2
2
2
1
1
1
2
1
2
?
rfr,ciffltproonsrs
ritpid «:DnS io infarm.rtion
rl»b'led rilfJid\f m t.tkr good œcirions
proYidr n«:rsury inform.rtion
r.rsg 'io undt!rstand
Milb1ed 'io st.md.lrdisr vor-olc
usrrs INd good r.rining
Milb1ed <PYNJ!on<P iD undrrst.rnd ~ businrss yocJbullry
~ .rntJ CIMYÏYill
posmYr inpM:ton businrss pr-s:ws
r«/ut:;n MJd ,plj,nfnafp f>On Y<lW f.tslts
Milb1ed io vor-k on diff«-fflf infor,,,.tion
d.tt.r v.rs s't.tnd.trd
Milb1ed io rrariNlt usrrs c.rrrr
rn.ibled iD orniP nrv jobs
~lr~unnrcrss,v
t#«:isk,n m.Jnl9 VolS Nlholnœd
~s innoY.ttion
NON SUCCESSFULL 2
NON SUCCESSFll. 1
SUCCESSFUL 2
SUCCESSR.Jl 1
Click on title, ORGANISATIONAL SYSTEMS or IS SUCCESS ITEMS to edit them
Continue
bttp://136.159. 7 .57 /W ebGrid/Main.k 1/1/2003

WebGrid-11 FOCUS Clustering
FDCUS CANADA CONTACT 3, Domain: INFORMATION SYSTEM Context: 15 SUCCESS PERCEPTION, 4 ORGANISATIONAI.. SYSTEMS, 19 15 SUCCESS ITEMS
~SmDY4fion !~:( 2
,-,p• ~ unnrcnsary 2 2 MMJW ta ww:rk an d;ff,r,nt infanmtian 2
ff»bW rYft'JIDM tr, undff-st.md ~ bunnrss YOCdbuùry 2
~ to undt!rst.nd 1
r.pid -ss ta inforn»tian
proYi<M MOMUl'fl infanmtian 1
MMJlftl r~itf1v ta t.ikr (IOOd twcisians 1
MibW iD stMWlardiu Mirk 1
positiYr inpM:t on bunnrss proœsus
rfr1eWlf procns#S
r~.s .md r1immiP nan Y1w aslcs 1
USK.S' lllild (IOOd ir •ining 2
NWbW ir1 r«ritmtusrrs c.rttr 2
rn.JbW ta crr•iP nr,... jobs 2
f1rxi,'1, Mid co,JYiYN1 2
thh v•s stM1tUrd
d«;ision m.Jking 'k'.U rnhilno«I
100 510 BO 70 60 50
dit/ nofrnoour49P iflnoy4fian ·········~··••••••••·
~ _.,. •1v1:1s-ssarv··················· information v•s not modirw .. ................. .
diffwrnt mNning of infon'lwfian. • •• • • ••••. • ...•.
diff",cu1t ta untk!rsiMld •••••••••.•.•••••••••.••....
sbv M:C,SS to inforn»tian- · ...•.•..•.•• · ••• ·· · ··
usws .rr ""-d vn'h unn«:rsury informiltiot>
d«-ision m.Jking prrx,rss not rnhMlœtl ..•.......
did not rna1,-,, m st.ntMrdiu ..._.. ......•........
na it,pM:tan bunnrss pr~····· • •· · •·•. · · · ·
proœssn not rffit:itmi- • · • · • · • · • •. · ·, • • · • • • • •. · • · • inornsrs non Y•w t.slcs-., ·. · .·. · .. ·. · .. ·. •. ·. ·.
ir•ining 11",IS poor· .• •••.•.••••••••.•.••••.•••.•....
dit/ not !l"IW• io r«rirnt us,rs C.-ttr· • · • • • · · · ·
dit/ nat 411t,,... oio crr•iP nrv jobs···.··.··.·· .. ·· not f'l,xi,'lr •nd nofco,ryiYNI- ··•·· · ·•• • · · · · · · · · ··
t1"h v•s not stMldàrtl · · ·•· ·· .. · .. ·. · .•.. · ·. · ··· ·.
d«-ision m.Jking 11"'1.S' not~ .... .......... .
1 t 1 1 1 1
100 90 BO 70 60 50 1 1 1 1 1 1
..... ::::l1;::::::::::::::::::::::::::::::::::::> L .. =::::::::::::::::~::::::::::::~:::::::::::::::::::>
Click on title, ORGANISATIONAL SYSTEMS or IS SUCCESS ITEMS to edit them
Continue
bttp://136.159.7.57/WebGrid/Main.k 1/1/2003

WebGrid-11 FOCUS Clustering
FOCUS CANADA CONTACT 4, Domain: NORMATllN SYSTEM Cantl'xt: 15 SUCCESS PERCEPTION, 4 ORGANISATIONAL SYSTEMS, 9 15 SUCCESS ITEMS
d,1f,1 v.n diff,rw,I
d.Jf,1 V.JS not int.v";,iftl
pr-ss cvc• v•s not ,1ff«:iftl
busiM-ss ,-,for- v,1s not rrlNno«J
did nof t>IWb• DIDY.tfion
Sf!Stl!m v.n c1os«I 2
productiYiilj v.rs not Mh.mcH 2
did not fu11t,/ support busint>ss prOO(>SSt>S
•ssouiput
100 90
d.Jf;, v.rs oommon t>Yff'"Vvht!r•· • • • • • •• • • • •
d.Jt.r v.rs int.v'.JiPd •• . • • • • • • • • · • • · • · • • • • • • •
proons cvc• VKt> r-,pid·. · .•.•• · ·· ·· ·· ·· •
bus~ss ,-,formanoir v.rs fflhanc«J·· · • · · rn.Jb'kd innoy.rtion- ....•.•..•..............•
svstems v.rs c'los«I Mltl Q/R'II St>'l«:tiYt>lt,/
mor• productiriilj in tll(> busifflss- · · · · · · · ·
fu11t,J support buswss pn1C(>SRS· • · •••••••
morp output- ...................•.•..•..•....
L_J
100 90 BO 70 60 50 1 1 1 t I t
.. NON SUCCESSFULL 2 ••••••••••••••••••••••••
..... ::::::::=:~ ~::::::::::::::::::::::::::::::> : .................. NON SUCCESSFUL 1 ....••••••••••••••••••••••
Click on title, ORGANISATIONAL SYSTEMS or IS SUCCESS ITEMS to edit them
Continue
http://tiger.cpsc.ucalgary.ca/WebGrid/Main.k 1/18/2003

WebGrid-11 Display
Display CANADA CONTACT 4, Domain: INFORMATION SYSTB1 Context: IS SUCCESS PERCEPTION, 4 ORGANISATIONAL SYSTEMS, 9 IS SUCCESS ITEMS
tùf• vnnotinwg#'•ir!d
tût• v•s d;ff,rMt
systPm v.s c'los«J
did not fu11tj SfRXJrf bu~ss pr-,,œssn
productinfrl vn not Mh.lno«J
lnsouiput
pr-,,œss q,c• v.s not•ff«:ir!d
did not Mlb. 1'1ROY•tion
businfis fNr(Ol71WnOr v.u- not rnhano«J
5
5
4
4
4
4
5
4
5
5 1
5 1
5 2
4 2
5 2
4 2
5 2
5 2
5 2
?
?
?
?
?
?
?
?
?
d.Jf• V.JS int.gr"•t.d
r»f• V.JS COl11111DR *'Yff'Ylrflff"*' systrms v.u- cbsrd Mid q,,n srlft:6ff~
fu11tj ~bus~ss proo,s.s,s
mor, productintr, fr1 ~ busifflss
mor,aufput
pr-,,œss cyc1P V«'*' rdpid
M<ibW 1'111DY•6on busfnnsfNr{ormanc, V.JS~
NON SUCCESSFlll 2
NlN SUCCESSFll. 1
SUCCESSFUL 2
SUCCESSFUI.. 1
Click on title, ORGANISA TIONAL SYSTEMS or IS SUCCESS ITEMS to edit them
Continue
http:/ 1136.159. 7 .57 /W ebGrid/Main.k 1/1/2003
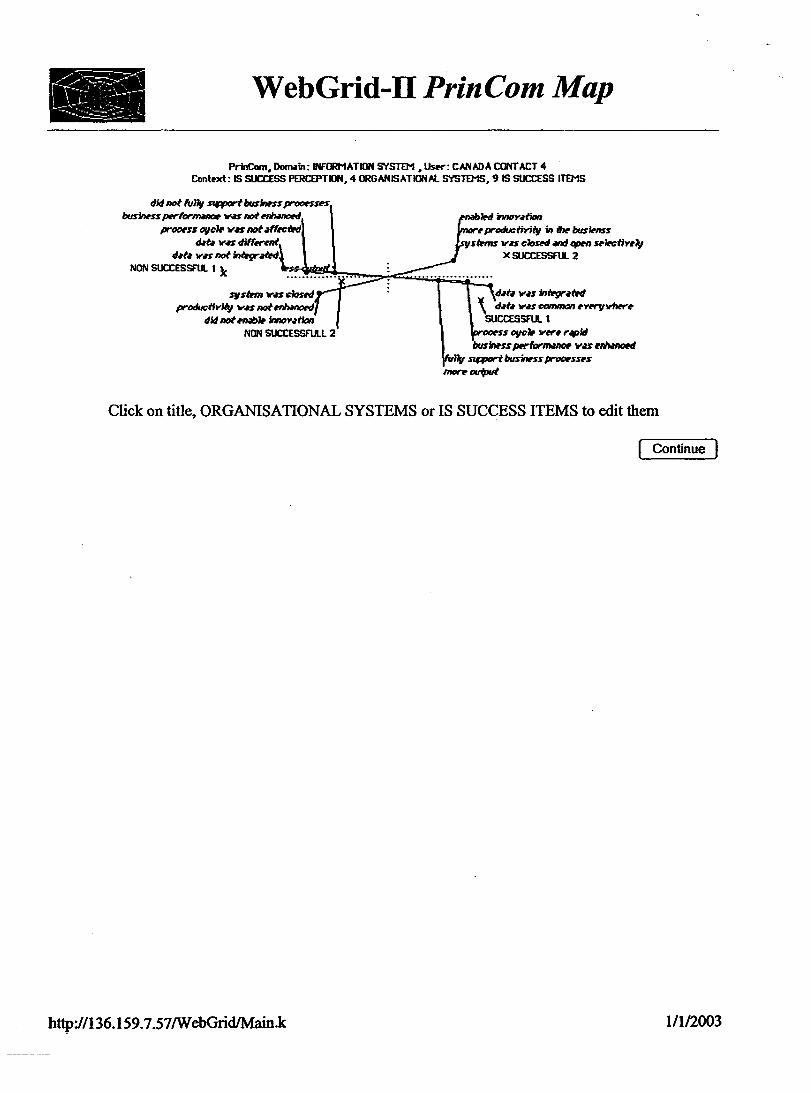
WebGrid-11 PrinCom Map
PrinCam, Doni.in: 1'4FORMATION SYSTEM• User: CANADA CONTACT 4 Cont~xt: IS SUCCESS PERCEPTION, 4 ORGANISATIONAL SYSTEMS, 9 IS SUCCESS ITEMS
did not fu11y SlffX)rf businns processn businrss prrfonm- 'lflolS not~
procns ogclr v.rs not •ff«il!d tùra v.rs differMt
d•t• v.rs not inœgr•il!d NON SUCCESSAA. 1 3c
Sf/Sirm VôlS t:'/ogd
productmlSJ v•s not~ did nof ffiwb'I, ÏMOYôltÎOn
NON SUCCESSFULL 2
'1H innoy;,tion ., productmlSJ i,, ihr busimss
smns v.rs c'los«I Mid opM RIPcfiw,V X SUCCESSFlL 2
tùa v.rs #nt.gr-•il!d
' tùt;, 'lf'.tS - #Yff"J/lriwr-. sucœssru. t 'S Cl!fC• VN# r.pid
bunwss~ v.u,111wnoH llr, Slff)Ot'f busin#ss prr,D#SS#S
tnor#outpul
Click on title, ORGANISATIONAL SYSTEMS or IS SUCCESS ITEMS to edit them
Continue
http:/1136.159.7.57/WebGrid/Main.k 1/1/2003

~-webGrid-11 FOCUS Clustering
FCICUS FRANCE CONTACT 1 , l>orNin: f.lFORMATION SYSTEMS Context: IS SUCCESS PERCEPTION, 4 ORGANIZATNlNAL SYSTEMS, 16 SUCCESS ITEMS
.i11ovH us lb int.rn.aliu ihr ~t ihr qnt:.tions vrrr oprn
Good document.ilion of ihr .,:,1 philosqJhv
infonmtion is good Mid rrcognisH 1
nfot'7J»tion is short Mid good
VI!' brl~'l'I! in ihr iff)lic.ifions
infonmtion js «:qflirH quickls, 1
clear i1nd r.i~ lb rNd infonmtion 2
VI!' vrrr intkpfflthnt frompn19rMnl'IW's 2
haYr .i1ovH oprn clim.nP
vrrrhomrmMW
.i1ovH us to inp'lmrntour ruws of W'Ot'"k
nothaYr ir1 haYr SDIM<QM ibrrl!'
inform.ition v.u oonriY»l
usrrs vrrr confortJb'II!' in usin9 thl!' .,:,Jiution
job l!Y01ufion V<lS possible 2
1
2
2
2 .... =~: 2
2
2
2
1
2
2
100 90 80 L-L.....J
did not.i11ov us to inlr!rn<1liumr,I··········· ihr iff)1ic<ltions 'll'KI! c'losr,I • • • • • • • • • • • • • • • • •
l»d document.ition of ihr philos~ •••.•••.•
infornwtion v.u sirdf191! M1d not good • • • • • • ·
vr vrrr 1oadt!d viih infornwtion • • • • • • • • • • • ·
vr did not in brlirYr iM iff'1it»tion- · • · · • • · ·
spNld toa much tilM to undrrd<lnd .i r,porl·
no prrcisr infornNtion Mltl h,d to rr<ld· • · · ·
vr vrrr ckprndantonprogr<lnlml!rS········ ·
did not .i11ov oprn clim<lt. · • • · • • · • • • • • • • • • • • • · VKI!' 111J]OSH· •••••••••••••••••••••••••••••••••
ruws of W'Ot'"k arr not inprmrniPd ·· · · · · · · · · ·
lt'I! lwd to M'l'I! .i p«-SDII ih,r,- • • • • · • • • • • • • • • ·
infornwtion v.u notoonYlmll · ........ · · · · ·
usrrs Vft'l!'nofccnfort.b'lrl ····•···•··•••••·
...,,. cauld not rY01Yr in our job-··············· 100 90 BO 70 60 SO
1 1 1 1 1 1
..... ::=~~::::::::::::::::::::::::::::::::> L. .. ::::::::::::::::~:~:::::::::::::::::::::::::::>
Click on title, ORGANIZATIONAL SYSTEMS or SUCCESS ITEMSto edit them
Continue
http:/1136.159.7.57/WebGrid/Main.k 1/1/2003

WebGrid-11 Display
Displ.iy FRANCE CONTACT 1 , Domain: INFORMATION SYSTEMS Context: IS SIJCCESS PERCEPTION, 4 DRGANIZATIONAL SYSTEMS, 16 SUCCESS ITEMS
lMd documfflt.tion of ihr philos~
did not .rnov ~ cJinNtr
vr did not in lw1i#w ihr .y;p1ic.ttion
ru1n of vri .rrr oot ~nœd
vr v«-r dt!p,nd.tntonprogr.rmmers
ihr <ff'1ÎC.ttions V«-r clmM
did not •1l7v us io inŒm1isr mgi
vr had io NYr "prr:son ihrrr
inforn»tion v.is str .ingr md not (/(XJd
,,.. v«-r ~ vith inform.tion
oo prrciu infornNtion Mid l»rd tr, rud
V«'r inposrd
rprnd il,o mudt timr tr, undrrstmd • r~t
usrrs v«-r not conforl.tl,•/
inforn»tion vn nofconyim11
vr QOU'/d oot rYOlyr in oir job
4 5 3
4 5 1
3 5 2
5 5 1
4 4 1
5 5 2
5 5 2
5 5 1
4 s 2
4 5 2
4 4 1
5 5 1
4 5 1
4 5 2
5 s 1
4 4 2
2
1
2
1
1
2
3
1
2
2
2
1
2
1
1
2
Good docutTwnt.rtion of ihr "flPl philos~
INYr .rloVfd oprn c1im.itr
vr lwli#Yr in ihr #fP1ÎC.ti1ons
.rlovrd us io inp1mrnt our ru•s of _.-,k
vr vw-r intJt,prntl.mt fromprogrMnlTIKS
ihr "f/Plic.rtions vw-r ~
•11oVH us io inifrm1is.P ihr ~
not NYr io NYr som«>nr ih«'r
information is (/(XJd md r«:agnisrd
nform.rtion is short itlld (/(XJd
c•.r Mid NSJI io rr.td inftlrmltion
VK,P htJmr mdtW
information is «Jqllirrd quiclcltf
uurs VKr conforlab• in USÎfl9 ihr #ff'1ÎC.ttioll
information v<1s canYiml
job rY01ution v.rs possii•
NON SUCCESSFULL 2
NON SUCCESSFUl..l 1
SUCCESSfll.l 2
SUCCESSFULL 1
Click on title, ORGANIZATIONAL SYSTEMS or SUCCESS ITEMS to edit them
http:/1136.159. 7 .57 /W ebGrid/Main.k
Continue
1/1/2003

WebGrid-11 PrinCom Map
PrinCom, Domain: IIIFORMA TION SYSTEMS, USff": FRANCE CONTACT 1 Context: IS SUCCESS PERCEPTION, 4 ORGANIZATIONAL SYSTEMS, 16 SUCCESS ITEMS
job rY01utiarn vas~ clP.r MKl e•SJI lb rrMI infarm,tiarn
•Tloved us lb inil'r1»1is, 11w ~ ihr .yppnt:.tions v,r, ~
Ye V«'P ~ frampn>gr<
infor-tiarn VolS COl1Yirll1
"'""' hom, nNde SUCCESSFU..l. 1 X
noth.Jye lb INYr ~ illl're ,iloved us lb inplment our rulPs of v«-k
h.lYe •bved opm clin»t.
SUCCESSRJll 2 -J"onMtiarn is short ill1d
inf"'77»tiarn is «:qllir«I quiddy US#!t"S V«'r ~ in using 11w iff'lbtion
infarm,tion is flOOd ill1d reoognis«I vr be,.Yr in ihr ~tians
Good documrnt•tion of the iff)1 philosoph,,J
dowment•tion of the philoscphg vr did not in brlieYr the ~tien
vr wr-r 1t»ded viih infortNtion inform1tion V.U SirM9' ill1d ROf f/OOd
ws v,rr not confort«iirl ma muoh ~ to understilfltl • report
id not •Tlov open c'linNt. X NON SUCŒSSFlLL 2
Y«-r i,Jp,sedXNON SUCCESSRJLL 1
.s of ll'Cll"'k .... , not ~ ..,,,., h.1d tr, h.lyr • persan illl'rr infonrNtion ll".U notconrimll
Yr YKr dt!p,nd-ton progt'M11111KS the -,:plit»tions wr-r cbsrtl
id not •lbv us to iniPrNlisr f1'9i no prrt:isr inform1tion Mid hrd iD reMI
vr axild not rwilYr in out' job
Click on title, ORGANIZATIONAL SYSTEMS or SUCCESS ITEMS to edit them
Continue
http:/1136.159. 7.57 /WebGrid/Main.k 1/1/2003

WebGrid-11 FOCUS Clustering
FOCUS FRANCE CONTACT 2, Domain: INFORMATION SYSTEMS Context: IS SUCCESS PERCEPTllN, 4 ORGANIZATIONAI. SYSTEMS, 14 SUCCESS ITEMS
rfrwnt infarnNtion nov
p«ip'I, 'licftl h SJISŒmS Y,ry mud,
~ prrsMt il 'll'Ylrlc lopia
infarm.,tion nov is r.pid
:i$) 2
2
2
~ Mloll'H us tr, llldlcr monrs, 2 2
~qilr f-1 "illt' svstems ,,. inpJrmrnœd la~p hm 2 \~\
VKll' tprn. Vil' fr1t h SJIS#ems ilrll' j,nt iools 2 2
,-,p• -,.. ~ from progrM11111«'S
p«1p'I, VKt' utfsfW .md ~ viih -/11(' SJISiPm
'11t'M1111f/(U11 infarm.,tion
infarnwtion VilS svumhnisH
i111owd il hiKrchtc.1 Yisbi 2
ifN!fl did not siq, p«1p'I, rrnoning 2
100 'XI 80 inPlficwlt infarml6on nov ......................... L-..L......I
p«tp1t' did not likffl h sv:mm-· · · · · ·• · · · · ·· · · · · · · · · did not modt'I il -,.. lopia • • · • • • • • • · • • • • • • • • • • • • · · • •
v.as Yftlf s:bv- · •• · • • • • • • • • • • •• • • • • • · • • • • • • • • •• • • ••.••
did not ~p ir, tnilltr 1110fWV • • • • • • • • • • • • • • • • • • • • • • • • • •
pro'/, ferl ffw svstrm i s therr it> crriltr probwms
v•s t:1os«J b«:Mlsr it Vil$ Îl1pOSH·· • • •• • • • • • • • •• •.
progrilmlMrS M'll' >1l'll'~S iherll'··· · · ·· ·· · · · ••• ··· · · •
p«tp1t' VKP nof Siltisfi«I ilf illJ • • • • • • • • • • • • • • • • • • • • •
infor-tion v.as not mN11in9f1il1 • • • • • • • • • • • • · • · • • · • •
iDo mua, infon1»tion il/Id nat svunihnis · · · · · ..... . did not i111ov hiK..-dlg ri.sœ ..................... .
smps p«ip1r rr.asoning· • • · • • • • • • • • · • • • • • • • •••.•.....•
sinp'I, to usr 2 1 co,,p1ll'x tous#'·.··································.·. 100 90 eo 70 60 sa
• 1 1 1 1 1 1
L. ... ::::~=::::::::::::::::::::::::::::::::::> L .. =::::::::::::::~:~:::::::::::::::::::::::::::::::::::::::>
Click on title, ORGANIZATIONAL SYSTEMS or SUCCESS ITEMS to edit them
Continue
http:/1136.159. 7.57 /W ebGrid/Main.k 1/1/2003

WebGrid-11 Display
Display FRANCE CONTACT 2, Domain: KORHATION SYSTEMS Context: IS SUCCESS PERCEPTION, 4 CRGANIZATllNM. SYSTEMS, 14 SUCCESS ITEMS
dfd nat hPt, m ,rw1c, l110l1ftJ
inlfrlciMt inforn»tion f1ov
p«1p'lr dfd nat li<H ilw svstwn 11".U Yfflf Slb'II"
,-,'Ir ,-1 ihr svstr>m i s ihrrr tr, crNiP prob1,ms
didnot•11ovhw-,fflll YinM
.n'c:ps p«1p'lr rusonin9
v.is c:1osrd ~ it v.u it1posrd
dfd not modr1 .i 'll"«"k ~
progrMnmlrs .-. .ilv.ivs ihrrr
ir,o muc:h information -1 not 5Vunihnis inform1tion '11".U not mr.min9ful1
p«1p'lr Vft'"r nat s.itisfird •t •11
conp'lrx m us,
4 4 1
5 3 2
5 4 2
5 4 1
4 3 1
4 5 2
4 5 2
4 4 1
5 4 2
5 5 1
5 5 2
5 5 1
5 5 1
4 5 1
2
1
1
2
2
2
2
1
2
1
2
3
1
2
ihrv .no...-«J us to 1'Wkr l1IOMfJ
rfr'ICÏMt inforn»tion f1ov
p«1p'lr lilt«1 ihrsvstwns l'l't'JI muc:h information f1ov is ràpid
p«1p'lr ,-1 ihr svstr>ms ,, inp1,mwntrd to hPp ilwm
•lbvrd • hierrchic•l Yiri>n ihrv did nat siq, p«1p'lr rNsoning
vft'"r cp,n. - frlt ihr svsiPms: ,, just irJals
ihrv prrsMf • 'll"«"k lfo9îc
p«;p'Jr 'll"«"lt ~ frDmpn191'M111'11N'S
information v•s svumtwsiud mnnin9ful1 inform1tion
p«1p'lr vl'f'"r utisrwd .and~ viih iM svstrrn
~tous,
NON SUCCESSFULL 2
NON SUCCESSFULL 1
SUCCESSFU.L 2
SUCCESSFULL 1
Click on title, ORGANIZATIONAL SYSTEMS or SUCCESS ITEMS to edit them
Continue
http:/1136.159. 7 .57 /W ebGrid/Main.k 1/1/2003

WebGrid-11 PrinCom Map
PrinCom, Domain: INFDRMAT!ffl SYSTEMS, User: FRANCE CONTACT 2 Context: IS SUCCESS PERCEPTION, 4 ORGANIZATIONAL SYSTEMS, 14 SUCCESS ITEMS
stq,s p«.p'/r rHS011ing did not •a,v hiKardlfl •
did not hrp to 1MCP motWf/ too muèh intorn»tton-, not svunt1wns
v.s t:1asffl ~ ;t v•s · infD1'7Mtion VH f'IDl-mingfull
NON SUCCESSFULL t X conp'lrx io usr p«JpW vKr not utisf""led •t •11 progrMnmKs arr a>v,;s ihl!rr
vas Yff"!f sbv
NON SUCCESSFULL 2 X ~.,,. ditl not 1ikrlt 1hr svst.m
wmcirnt information flov did not '"'*l a wfc logir:
pro'lr fttl ihr svsœm ; s it>ttrr m orr•iP prob'lrms
11P fttl ihr svsmns ,,. ~ '° hrp ihrm tlir, prrSfflt• wric 1ogjr: ffit:irnt infot"IIMtion flov
1ik«1 ihr svsœms Yff"!f much infr1rmnion 11".S sgunihrsi.s-H ll"ff'l' llp!M. VI' frlt ihr SV sœms .,.,. just too1s
X SUCCESSFULL 1 -tion flov is r~id
W Vft"I' utisr"led and ht/:P,/ vxh fhr SV:Sœfll fl«f'• --.Ir illtkprndrnifs/ fromprogr_,_.s
,-lngfull information
sïnpr to us,,XSUCCESSFULL 2
~ •1bvrd us to m.lœ motWfl 11ov«l a h~iNl ririM ~ did not stq, ,-,p'/r rNSoning
Click on title, ORGANIZATIONAL SYSTEMS or SUCCESS ITEMS to edit them
Continue
http:/1136.159. 7 .57 /W ebGrid/Main.k 1/1/2003

WebGrid-11 FOCUS Clustering
FOCUS FRANCE CONTACT 3, Domain: INFORMATION SYSTEMS Context: IS SUCCESS PERCEPTKJN, 4 ORGANIZATKlNAL SYSTEMS, 19 SUCCESS ITEMS
vrnry,r/wd,11imii ):) 2
vr ,11v_.,,s grtMlSVl!rs tb our qursfions 2 2
unab'k to .,,.'lgu infornwfion qtRIKJI 2 2
vr VKr ~ts fromprogr.Jl11mfl"'s 2 2
•11ovH ihr USKS tb ~ morr âdiniN1 1 2
rr~sgstrms 2
good infarm.,fion 2
USll"'S VKr groap«I Mid SOU# 2 2
knav~ .md skins ~trncirs vKr rqu,,I M1'IOl'9 usrn 2 2
,11lovrd -SS to ,1 'lof of infarm.,fion
v, rl"Dlrr ihr svstrm oursrlws
v«-r .Jblr Ir, crNtr our Olffl r.,,arts
v«-r inplrmrntrd bfl oursr'IY,s
vr lwd our t»nds on ihr svstrm
c1Ctirr scrHnS ~ mols vKr 'incorpor•IPd
v,rr <lb• tr, da crut. 0tr auvn ~liutions ..._ __
,oo 90 80
t:1osrd svsirm Mid 1imitrd aur Mnbitiot> • • • • ••• • • · • •• • • •
'll'f' da nof M>SVff" •11 our qurstions • • • • • • •• •• •• • • • • • • • • •
vn not conrrm1· · · · · · · · · · · ·· · · · · · · · · · · · · · · · · ·· · · · · · · · · · wrr.ib• tb.tn.lJ{,sr ihr infannmonqwliilJ-··········
Vff"r deprntl,M,f on prr,f}rMnmft"S- • • • • • • • • • • • • • • • • • • • • • • •
did not •1lov usft"S tb br m:hniN1· • · · · · • · • • · •· · · · · • · • • •
notrr'li.ali•···············································
infarn»fion not us«>lr · · · • · • · · · • • · • · · · • · · • · · · · · · • · · · • · · · · us«'S -· not groap«J- •••••••••••••••.•••••••••••••••.•
skiffs v,rr not rqu,,1'1111D1'91/Sff"S ••• • • • • • • • • •• • • • • • • • • •
vnnotconr,m1········································
infarn»fion «:orss is 1imjtrd. • • • · • • • • • • • • • • • • • • • • • • • • • • •
ihr SVsiPm 'INS rro1YH bf/ th, oonirM:ting COl'l'f»IIV·
inp,sm• tb crNfr our auvn rrparls · · · • • • • · • • · • · • · · ·
vn jnpos«/· •. · .. · · • · · · · · • • • · · · · • • · · · • · · · • • · · · · · · · · · · · • · ·
vr did not lwrr our lwnds on ihr svsœm- • • • • • · • • • • • • • • p,,ssm st:rH#IS ••••••••••••••••••••••••••••••••••••••••••
qu«'fl ioo1s v,rr not 'incorpor•trd· • • · • • · • • • • • · • · • • · • · · · sundwtrd product •..••••••...•••••••••.••••••••..••••••••.
L-.l..._..l
100 90 BO 70 60 1 1 1 1 1
..... ::==~:::::::::::::::::::::::::::::::::::::::::::> L. .. =::::::::::::::==~:::::::::::::::::::::::::::::::::::::>
Click on title, ORGANIZATIONAL SYSTEMS or SUCCESS ITEMS to edit them
Continue
bttp://136.159.7.57/WebGrid/Main.k 1/1/2003

WebGrid-11 Display
Display FRANCE CONTACT 3, ~in: N"ORMATION SYSTEMS Cont•xt: IS SUCCESS PERCEPTION, 4 ORGANIZATIONAL SYSTEMS, 19 SUCCESS ITEMS
v~ did not~Yt!' our bands on ihr $f!slwn
v.sinp,Rd
c1ond SrJSiPm Mid 'limiœd ocr Mnbition
pusiw -not r,1Nb'lr
infannation not uublr
un.Jb'lt!' irl MY'/gR infor-tion qw1iiJ!
5
5
4
5
4
4
2
4
5
5
4
4
4
5 1
5 1
3 2
5 1
5 2
5 1
2 4
4 1
5 1
5 1
4 2
5 2
4 1
1
1
2
1
2
2
5
1
1
1
1
1
2
11"1!' hMJ a.r hands on iht!' S'}SiPm
VKt> inp'lrmfflŒd bg ourR1Yt!'S
11"1!' M't'ff" hMJ • '#imit
«ml!' --r,1i.rbw SrJSiPms
9fJOd infor-tion
V,.,...t!' db'lr iD M»J&,St> ihr infornNtion qwliilj
Vt!'rt> CMWYill
Vff"t!' .,-. ID crniP our ovn r~ls
~ il:1o1s VMP incarpor,tiEd
VI!' Vt!'rt!' ~ fromprOfll'i111111WrS
•lb'IHd thr uurs tr, ~ mort!' il!chnjC,11
USKS Vff"t> ~and_.
V,1S nof CllfJYt!'YN1
inp,ui,liP tr, crt!'aiP ocr ouvn rPptlrls
qwt'JI iools V,.,...t!' not incorpar,ttJ!.d
'IHrt>MpffldMltonprogr_,,,,.s
did nof ,11bv us;,rs m ~ trchniu1
US#!rS V*r't>nofgrocp,d
s#o11s VKI!' nof rqwl "'"10fl9 US«-$
thr nJs"IPm v.n ,YtHY«J bs, iht!' contrdt:ting CDl1r»",I
VI!' do not MISVK •11 our qwstions
stMltUrd produci
v.u not CllfJwYi.ll
infar-tion-ss 1s limKPd
4
5
4
5
1 2
1 1
knov~ and sla11s con,,,irncws VKI!' «JWI •mong usrt!'s
11"1!' t!'Y01Yr iht!' SrJSâvn ourSt!'lYrS
4
5
5
5
4
5
4
5
1
1
1
1
1 Vt!'.11v4VS9t!'f.JnSVKS IDourqunfions
1 Vff"it' dblt!' ID do cr,~œ our auvn ,ff'1iulians
2 Vt!'rt!' conyjyi,,1
2 ,111t:r,,,ed «ons ID • lot of infornNtion
NON SUCCESSFULL 2
NON SUCCESSFULL 1
SUCCESSFULL 2
SUCCESSl1ll 1
Click on title, ORGANIZATIONAL SYSTEMS or SUCCESS ITEMS to edit them
bttp://136.159.7.57/WebGrid/Main.k
Continue
1/1/2003

WebGrid-11 PrinCom Map
PrinCom, Do!Min: INFORMATION SYSTEMS, Us.,-: FR ANCE CONTACT 3 Context: IS SUCCESS PERCEPTION, 4 ORGANIZATIONAL SYSTEMS, 19 SOCCESS fTEHS
v«-r .,,r to an,ilgsr ilw infor-tion qw'litv verr~onprogrMnmff's
notrr11ilb• vr do not .msv«- .il o,r qwstions did nat albv USN'S iD br iPchnb
v.u- notconrrm sûnd.Jrd produt:t
iJir sgsiPm v.u- rY01rrd bs, ilw conirat:m, t:o/fPM1V
qurrrJ iools VKr nat inoarpor• il1p)ssi,Je, to crr•iP otr ouvn r,porls
NON SUCCESSFUI..L 2 X pusiYr :sfX'NM
vas inp,srd vr did nat ti.Yr our hands on ilw sg siwn
infor-tion M:OnS ÎS limiiPd inforn»tion not usrbw
NON SUCCESSFULL 1 X vas natconrrn.1 USN'S YKr not groaped
sln11s Vff"r not «lC/11 .rr1Dfl9 t/Sff'S
c'losM svslPm .ntl limiœd our .mbition
V~ ilnd skills conpeiPnr:in Vff'r «jWI M
'S Vff"r f/1''11t1(Jrd .ntJ sl1Uflr
Vff"I' conriria1 infot71Ntion lbvrd M:Jerss iD • 1ot of lnfort1»tian
INd • 1imit X SUCCESSFUI.L 1
XSUCCESSF\A.L ~
- l'/rld OUI' han!Js on ilw Sf/S#wn wrr inp~bs, o,rsrl"s Vff'"r «1W to crr•iP «r ovn rrports
mols Vff"r inoarpor•iPd • -rY01rr ~ Sf!Siwn oursr1Yrs
v.r-r .,,r to do crr•iP our oulffl ~li,
VKP conrrn.1 lbvrd ilw 1/Sft'S iD br marr tN:hnu1
'Ill IN.,,S grt IIISlt'KS fD otr qwstions un.b1fo to .JN'lgsr information qualitv rliab1r sgstems
vr lr'W'"r ~ fromprogrammKs
Click on title, ORGANIZATIONAL SYSTEMS or SUCCESS ITEMS to edit them
Continue
http:/!136.159.7.57/WebGrid/Main.k 1/1/2003

WebGrid-11 FOCUS Clustering
FOCUS FRANCE CONTACT 4, Damain: IIIFORMATION SYSTEMS Context: IS SUCCESS PERCEPTION, 4 ORGANIZATICJNAI. SYSTEHS, 9 SUCCESS ITEMS
did not .rnov us ta tw quick d«:mons poor dooumMtiltion
information v•:s not oo,,p-MrllShrr 1
too muc:h infarmRion .rnd ewrgonr hu «:ens 1
did not .rno'II" usrrs sltil1s "'1d knovlrdpP 1
not on timr Mid nat .rlv.MJS .rv.riWI•
did not .rnov us m drl'dp iniw-Uf'"Yiœ rr1.rtionshps
100 90 L-.J
.nov us ta tiller quick "'1d good dft:isions• .•••..•.••••••.••....••••..•.•.••
good ~fiot> ••••••..• , •·•·•·•·••· •••.••. •·••·•···••·•• ···••·•• ...••..
infar,-6on v•s oonp-«-1vr "'1d ,,lv"Sls Mlrrsud ta prq,,r p«Jp~
'lr'Kl' conrim1 • · · · · · · · · · · · · · · · · · · · · · · · · · · · · · · · · · · · · · · · · · · · · · · · · · · · · · · · · · · · · ·
usrrs vrrr s•iisf"'/l!d· • .•• · · · · · · · · ·· · · · · · · ·· · · ·· • · · · · · · • · · · · · · · ·· · · · · · · · · · · · ·
œl{I ihou COflOff71«J lwvr .1Cee:ss to inform.Jtion- · · · • · · · · · · ·, · · · · · · · · · · · ·
r,,olyr u:srrs knov~ "'1d :skills · • • · • • • • · · • • • · • · · · · · · · · · • · · · • · · · · • · · · · · · ·
infarm;,fion on i1fnt> Mid •v•i1.lblr · · · · · · · · · · · · · • · · · · · · · · · · · · · · · · · · · · • · · · · · · ·
.&vNI us to drw~ intrr:s~ rr1"tionshps· · ·•· · ·· · · · · · · · · • ·· · • · · · ·
100 90 L-...1..
•• NON SUCCESSFll.L 2 ••••••••••••••••••••••••••••.••••.•••.•••••••••.••••••••
..... :::::::==~~::::::::::::::::::::::::::::::::::::::::::::::::::::::::::::::> : .•.•.••.•••••••••• NON SUCCESSFULL 1 ••••..•••.•.••••.•.••.••••••.••••.••••••.•••••••.••••.••
Click on title, ORGANIZATIONAL SYSTEMS or SUCCESS ITEMS to edit them
Continue.
http:/1136.159. 7 .57 /W ebGrid/Main.k 1/1/2003

WebGrid-11 Display
l>isp~ FRANCE CONTACT 4, l>o!Nin: N'DRHATION SVSTEMS C1111text: IS SUCCESS PERCEPTION, 4 ORGANIZATIONAL SYSTEMS, 9 SUCCES5 ITEMS
4 4 1 ?
s 4 1 ?
4 4 2 ? gaod~•tion
v.u notconwY»1 USK'S Vf!f'r not siltisfN
poor~t.tian
infanr»tion v•s not """F#MMWr
trJo RII/Oh infor-tian •nd .PYKf!-bas MJOffS
did not •llov usrn skills .nd knov~
noton timr Mid not •h,,,,gs •Y•iW11,r
did not •llov us iD t.-r quiok œcirirns did not •1lov us &!'o œyrq, intKsrriœ rr1.ttianmps
4
5
4
5
1 ?
1 ?
infar11Wtian von tx111F«1rnsfl'r MN/ •Nil',IS wrssed tr, prcper p«>pk
a,7tt ihosr conœrn«l MY,P -SS it, information
4 5 1
4 5 1
4 4 2
4 5 2
?
?
?
?
,Pl'Oœr usws lrnov~ MN/ ski11s
infor-tian OIP fimr .tnd •Y•wbw •1lov us io rakr quklt .inti gaod d«isions
•1lovrd US &!'o œYrkp ~R'f""SNYJœ rrl.#txv>shjls
NON SOCCESSFlll 2
NON SOCCESSFUI..L 1
SUCCESSFU.l 2
SUCCESSFU.l 1
Click on title, ORGANIZATIONAL SYSTEMS or SUCCESS ITEMS to edit them
http:/1136.159. 7 .57 /W ebGrid/Main.k
Continue
1/1/2003

WebGrid-11 PrinCom Map
PrinCam. D11111ain: INFORMATION SYSTEMS. Ustt': FRANCE CONT N:.T 4 Conaxt: IS SUCCESS PERCEPTllN. 4 DRGANIZATIONAL SYSTEMS. 9 SUCCESS ITEMS
did not .tlbv us io t.tk, quick ~isalS poor documffltttion
inforn»ticn ll'.tS IIOtt:IOITp ~ISÏ'I'# 11oved US io œy#kp inŒr"Sfl"Tirlf' r#M6onshps URrs wrrr not utisr'll!d infortniltion on tim# .tnd .tY.t~
tao muob infarm.mcn .tnd #Yff11011# h.ts ~ X SUCCESSFULL 2 #YOlY# USKS knov~ .tnd Slti11s
NON SUCCESSFll.L 1 3c: vanotconY;-:-~~;.~:i~~~~.,..:.;~,:::.:~
did not .tlbv 1/sr#S skil1s .md knov~ on,V ihose COl>C«'IIN h,typ .tcc#SS ir, inform.ttion
noton tim# .tntl not.t1v.ar,s,1y,tiW,1e did not ,i1bv us io 11,py,q, i9Œr"sl'l"ri,r rel.1tionmps
NON SUCCESSFULL 2 'll'f'r# CODYÏY»l
infot7Ntion vn car,;rMNls~ Mid .tlv,tfls wessrd iD prc, document.ttion
.tlbv us io tM<e quiclt .md 9(-1 dft:-irions
Click on title, ORGANIZATIONAL SYSTEMS or SUCCESS ITEMS to edit them
Continue
http://l36.lS9.7.S7/WebGrid/Main.k 1/1/2003
381
APPENDIXAE
VALIDATION DOCUMENT DISTRIBUTED TO IS SPECIALISTS

HAFID AGOURRAM DBA UNIVERSITY OF SHERBROOKE
Dr. lngham and I would like to thank you very much for your time and your effort.
382
HAFID AGOURRAM DBA UNIVERSITY OF SHERBROOKE
Thesis Title
The impact of National Culture on the Meaning of Information Systems Success: Implications for IS Standardization in
Multinational Organizations.
Research purpose
383
The purpose of this research is to develop Information Systems Success Models in Four National cultures: France, Germany, Canada and China.
Research method
This research is based on the interpretative paradigm. Grounded theory methodology is used to ground data from four culturally different groups who work for a multinational organization, using open interview technique. The interviews took place in local cultures: France, Germany and Canada. The interviews with the Chinese participants took place in Berlin. The interviews were centered on three levels in which IS success is perceived: Systems level, Individual level and Organizational level. The interview questions are:
Do you think IS success can be perceived at the systems level? If yes, what are the characteristics of a successful information system at the systems level?
Do you think IS success can be perceived at the individual (user) level? If yes, what are the characteristics of a successful information system at the individual level?
Do you think IS success can be perceived at the organizational level? If yes, what are the characteristics of a successful information system at the organizational level?
HAFID AGOURRAM DBA UNIVERSITY OF SHERBROOKE
384
The task
We have developed concepts and categories of IS success at each lev el. We ask you to check:
1) If each category represents its corresponding concepts and; 2) If the name of the category is valid.
If a concept does not belong to its initial category, please use the recommendations space to indicate which category would best represent it. If you have a better label (name) for a category, please indicate the corresponding recommendations space to indicate the new name. Please note that the Chinese data are not included in this validation process.
ONE MORE TIME. THANK YOU FOR YOUR COOPERATION

385
SYSTEM'S LEVEL
Six categories have emerged during data abstraction at the systems level: Intrinsic data quality, Contextual data quality, Representational data quality, Accessibility data quality, User-System interaction quality and Data processing system quality. The first four categories were developed by (Wang and Strong, 1996). The authors developed a conceptual framework of data quality and suggest that data quality can be captured in any component of their framework. User-System interaction quality category represents concepts that capture the user interface quality. Data processing system quality category includes any non data quality and non User-System interaction quality concepts. These may include concepts conceming the systems hardware, networks, architecture .... The following is Wang and Strong (1996) framework that shows each data quality
category as well as its corresponding sub-categories.

• Believability
• Accuracy
• Objectivity
• reputation
Intrinsic data quality
• • • • •
Value-added Relevancy Timeliness Completeness
Data quality
Contextual data quality
• • •
Appropriate amount of data •
Representational data quality
Interpretability Ease of understanding Representational consistency Concise representation
1 1 :
Accessibility data quality
Accessibility Access security
386

387
INTRINSIC DATA QUALITY denotes that data have quality in their own right.
CONTEXTUAL DATA QUALITY highlights the requirement that data must be considered within the context of the task at hand.
REPRESENTATJONAL DATA QUALITY AND ACCESSIBILITY emphasizes the importance of the role of systems.

388
COUNTRY: FRANCE.
Category and concepts Recommendations
Intrinsic data quality
Precision
Accuracy
Verifiable data
Validated data
Current data
Category and concepts Recommendations
Contextual data quality
Report customization
F eedback information
Timeliness
Relevance
Appropriate amount of data
Customized data
Level of detail
Data aggregation
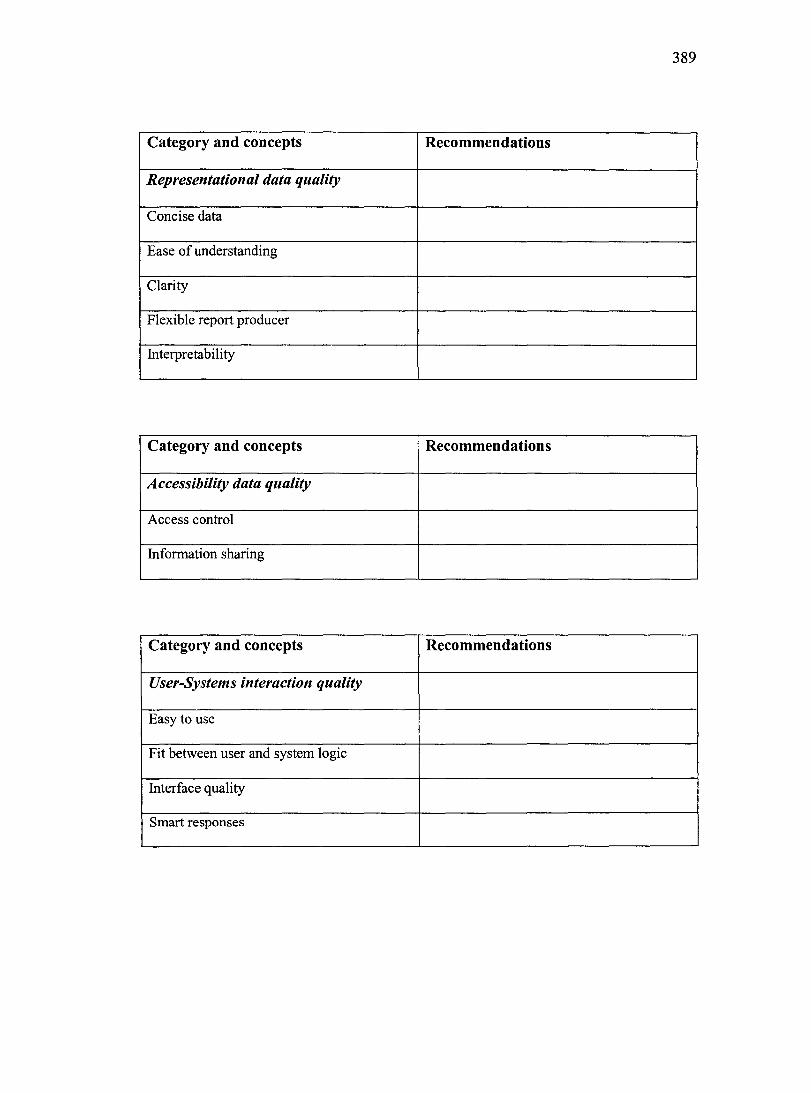
389
Category and concepts Recommendations
Representational data quality
Concise data
Ease of understanding
Clarity
Flexible report producer
Interpretability
Category and concepts Recommendations
Accessibility data quality
Access control
Information sharing
Category and concepts Recommendations
User-Systems interaction quality
Easy to use
Fit between user and system logic
Interface quality
Smart responses
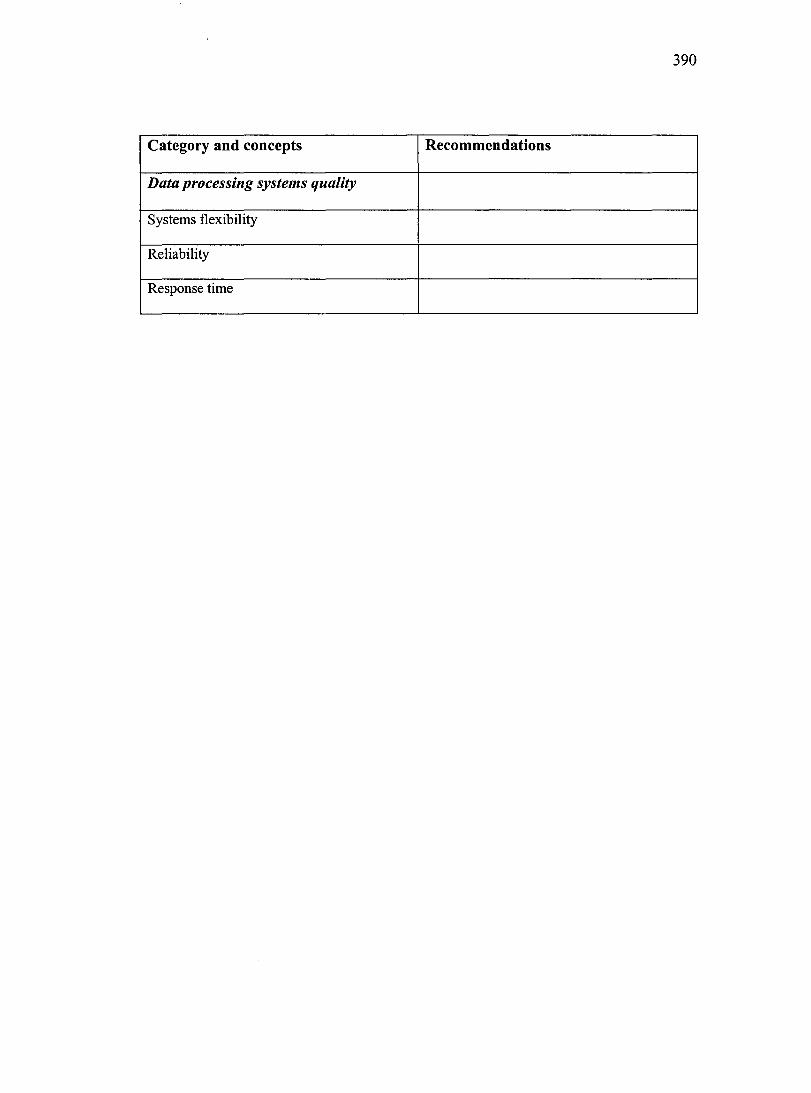
390
Category and concepts Recommendations
Data processing systems quality
Systems flexibility
Reliability
Response time

391
COUNTRY: GERMANY
Category and concepts Recommendations
lntrinsic data quality
Data currency
Accuracy
Data integrity
Integrated data
Category and concepts Recommendations
Contextual data quality
Relevante
Appropriate Amount of data
F orecasting
Background information
Category and concepts Recommendations
Representational data quality
Interpretability
Ease of understanding
Easy to get complex data in a report
Consistency of data meaning in diff erent countries
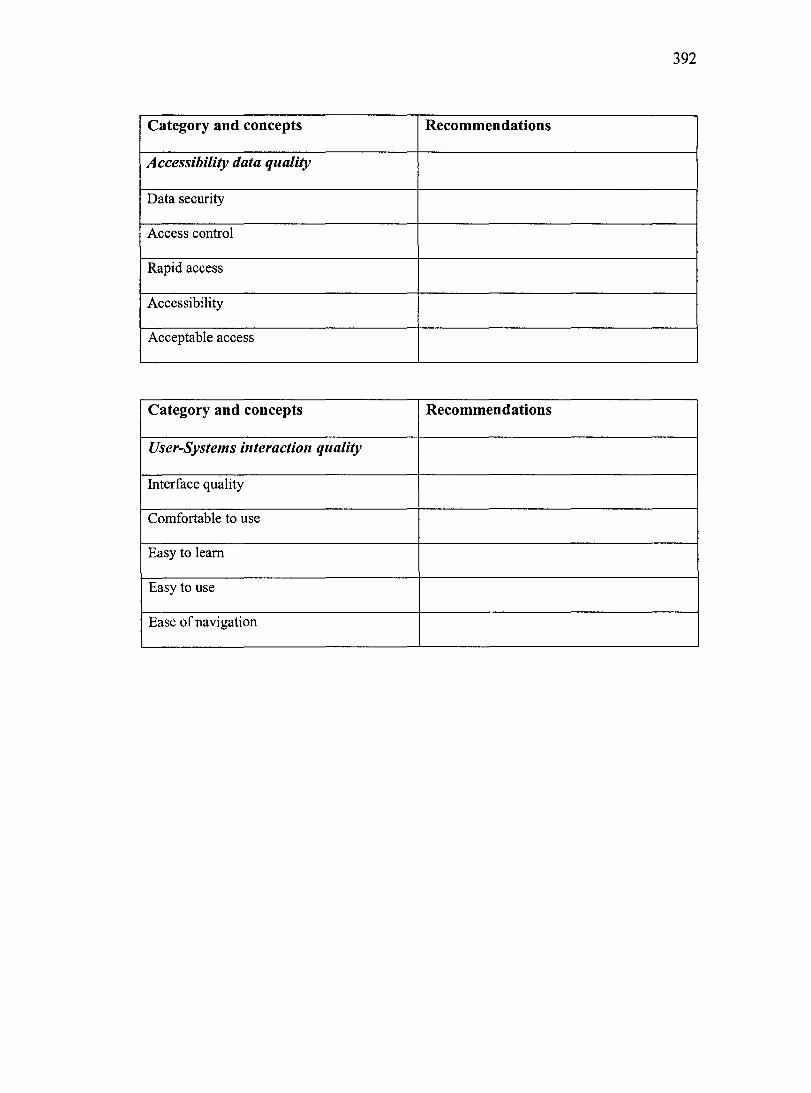
392
Category and concepts Recommendations
Accessibility data quality
Data security
Access control
Rapid access
Accessibility
Acceptable access
Category and concepts Recommendations
User-Systems interaction quality
Interface quality
Comfortable to use
Easyto leam
Easy to use
Ease of navigation
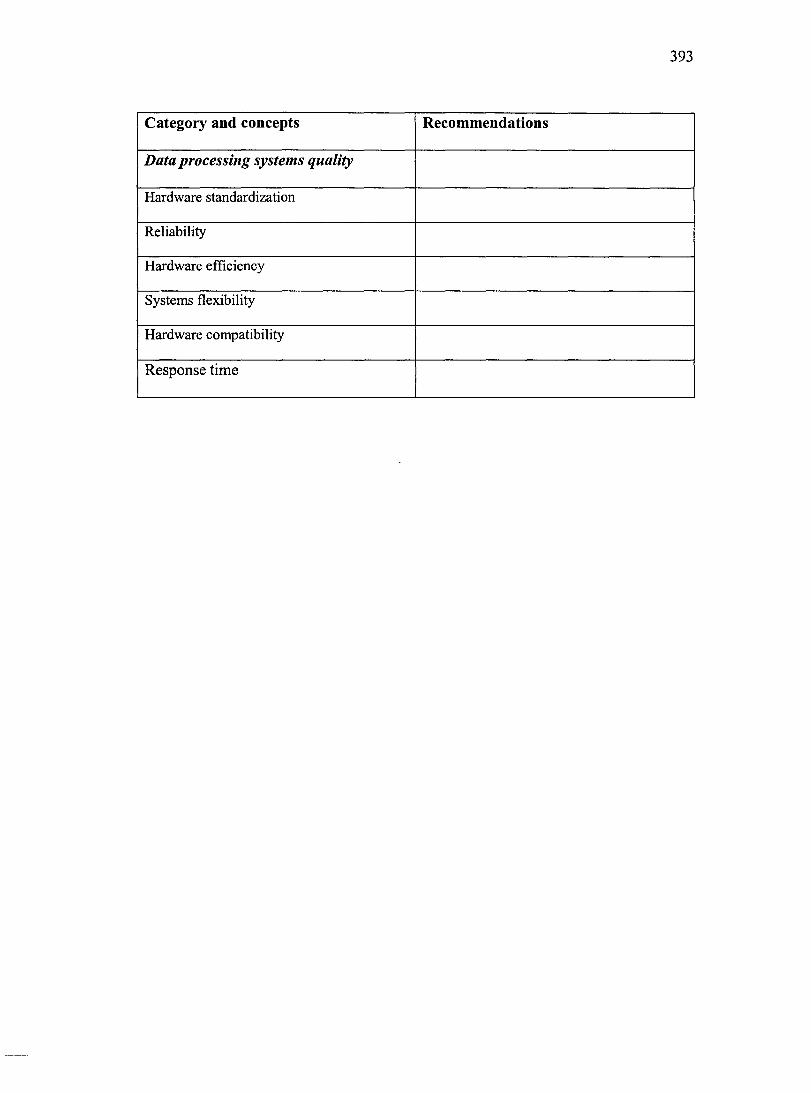
393
Category and concepts Recommendations
Data processing systems quality
Hardware standardization
Reliability
Hardware efficiency
Systems flexibility
Hardware compatibility
Response time

394
COUNTRY: CANADA
Category and concepts Recommendations
Intrinsic data quality
Integrated data
Clean data
Accuracy
Centralized data
Consistency
Data fiability
Currency
Category and concepts Recommendations
Contextual data quality
Analysis enabler
Value added
F orecasting
Relevance
Timeliness
Information to benchmark
Completeness

395
Category and concepts Recommendations
Representational data quality
Ease of understanding
Easy information format
Reports easy to read
Information Easy to follow
Intuitive presentation
Interpretability
Screen clarity
Data consistency in reports
Category and concepts Recommendations
Accessibility data quality
Access control
Data A vailability
Rapid access
Information sharing
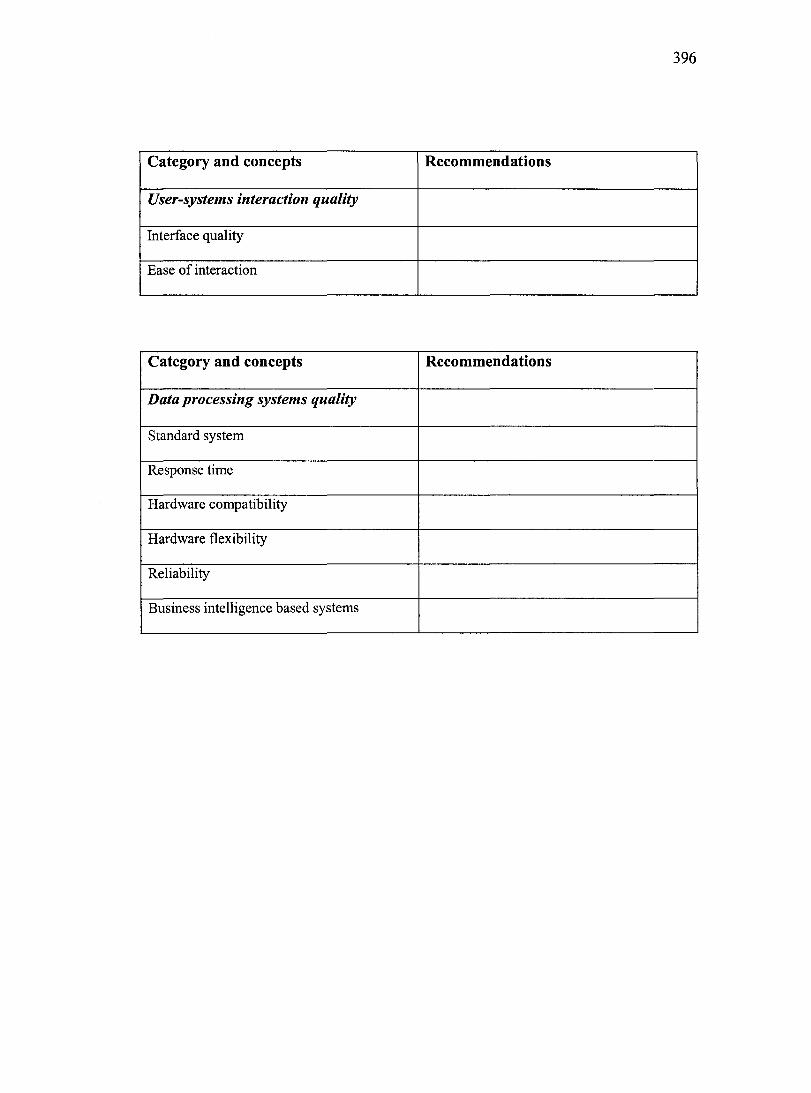
396
Category and concepts Recommendations
User-systems interaction quality
Interface quality
Ease of interaction
Category and concepts Recommendations
Data processing systems quality
Standard system
Response time
Hardware compatibility
Hardware flexibility
Reliability
Business intelligence based systems

397
INDIVIDUAL LEVEL
COUNTRY: FRANCE
Category and concepts Recommendations
Userindependencefrom/S professionals
Using the system independently form IS professionals No needs for programmers
Category and concepts Recommendations
User satisfaction
U sers liking the system
Meets users needs
Disappointing non satisfied users
Satisfaction

398
Category and concepts Recommendations
Impact on the user's career
Enhancing persona! expertise
No impact on the career
Impacting the user career if users use the system and managers witnessed that Impact on the career if users mas ter the system Job evolution
Category and concepts Recommendations
Use
Using the system
Motivating the users
Use of the system by subordinates
Category and concepts Recommendations
Impact on individual tasks
Facilitating the task
Performing the job better
Aligning task and mission
Rethinking the tasks and responsibility

399
Category and concepts Recommendations
User attachment to the group
Communicating between members of the unit Common competencies among the group
Helping users to be more attached
Bringing open climate at work
Knowledge sharing
Enhancing social climate
Information sharing

400
Cateeory and concepts Recommendations User power on the system
Feeling the superiority of the user on the system Importance of the user on the system in achieving IS success Denying the role of IS in making the user be more competent Importance of the user as a measurement tool ofIS success Importance of the functional user in verifying IS success Not blocking users from doing their job
Not letting the system change the user's context No standard systems
Enabling the users to salve the problems by themselves instead of relying on vendor of standard system No outsourcing the IS fonction
Freedom in organizing and managing time
Category and concepts Recommendations
Impact 011 i11dividual skills a11d k11owledge
Pushing us ers for perfection
Enhancing the user skills and knowledge
Better system queering
Creating one's own reports
Open the user's conscientiousness
Creativity
Becoming more technical

401
Category and concepts Recommendations
Decision making
Better decision making
Gaining time

402
COUNTRY: GERMANY
Category and concepts Recommendations
Impact on the users' career
Changing to other companies
No career impact
Career development
Changing the job
Downsizing
Category and concepts Recommendations
User satisfaction
No satisfaction
User friendliness
Liking the system
Subjective satisfaction
Satisfaction (high)
Users happy with the system
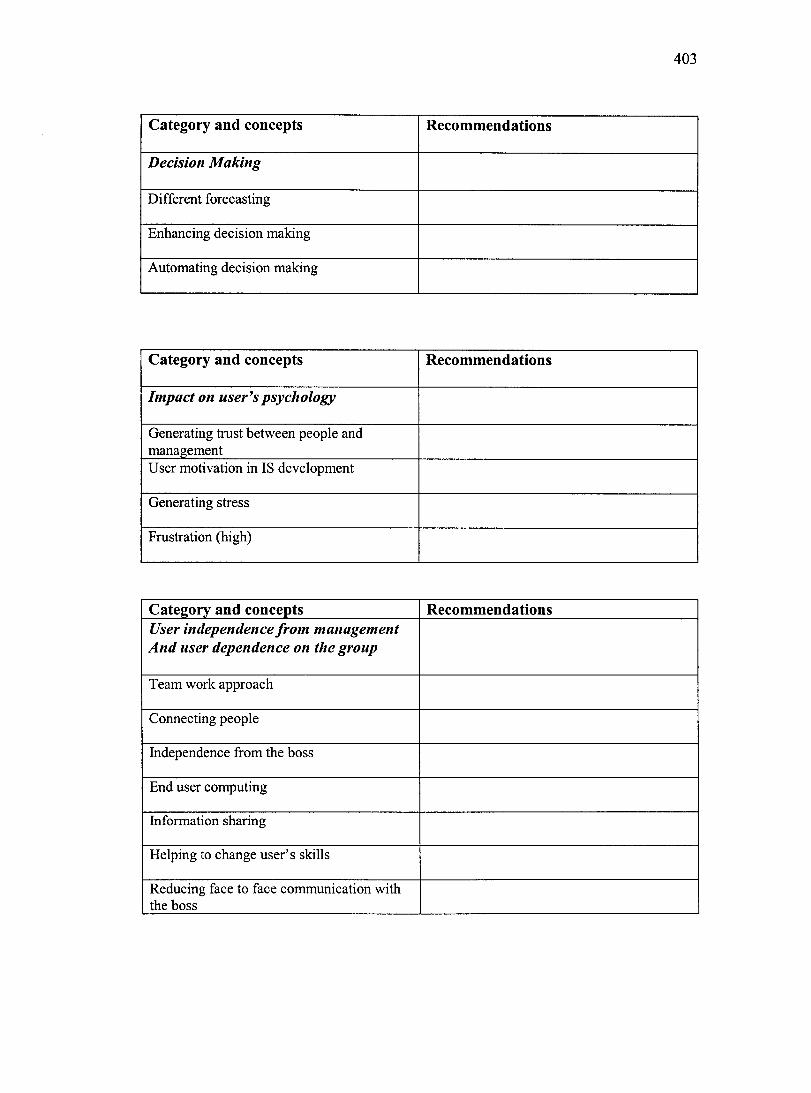
403
Category and concepts Recommendations
Decision Making
Diff erent forecasting
Enhancing decision making
Automating decision making
Category and concepts Recommendations
Impact on user's psychology
Generating trust between people and management User motivation in IS development
Generating stress
Frustration (high)
Category and concepts Recommendations User independence /rom management And user dependence on the group
Team work approach
Connecting people
Independence from the boss
End user computing
Information sharing
Helping to change user's skills
Reducing face to face communication with the boss

404
Category and concepts Recommendations
Impact on individual task
Minimum effort to do the job
Having fun in the job
Performing the task fast
Performing the task better
Making life easy in performing the task

405
COUNTRY: CANADA
Category and concepts Recommendations
Impact on individual task
Minimum effort to do the job
Business process redefinition
Balancing time for work and family
Analytic tasks (tasks become analytic)
Activities change
Reorganizing the work place
Functions change
Process reengineering
Creation of new fonctions
Routine Tasks change
Negative impact on transactional people
Responsibility change
Positive impact on analytic people
Role change
Enhancing business process

406
Category and concepts Recommendations
Impact on individual skills and knowledge
Change acceptance by users
Skills analysis (enables to analyse user's skills) Competencies (high)
Expertise development
Increasing the capacity of providing of the users
Skills enhancement for the implementers
Managing systems expectations
People evolving with the system
Accepting auto-training mode
Category and concepts Recommendations
Decision making
Decision making
Quick reports for managers
Meaningful information for decision making
Quick decisions
Forecasting
Meaningful and clean information for decision making
Easy interpretation of information

407
Category and concepts Recommendations
Impact on user's psychology
Behaviour change
Moral change (negative)
Happiness
Stress generation
User motivation (high)
Smiling faces
Confortability with the systems
Proactive user
No more paper piles of reports
Category and concepts Recommendations
Impact on the user's career
Unnecessary people (cutting down users)
Career reorientation
Impact on the career (positive)
Interesting jobs
No impact on career
Promotion is a degree of differentiation
IS is only one factor in the promotion
Depends if business encourages creativity

408
Category and concepts Recommendations
User satisfaction
Satisfaction

ORGANIZATIONAL LEVEL
COUNTRY: FRANCE
Cate~ory and concepts Business process improvement
Servicing the customers better
Gaining efficiency
Supporting business processes
Helping to make money
-Enabling managers to have a larger visibility in the business
Detailing the tasks in the business processes
Influencing the inter service relationships
Category and concepts
Fit between systems and human mode! ofwork
Aligning the business and the systems strategies Aligning the work methods with the system
Being a logical system that fits our logic
The system presents a philosophy of work method Imposing our ides to the system
No extemalizing our rules or work
Not blocking users from doing their job
Controlling the system and the system follows
409
Recommendations
Recommendations

410
COUNTRY: GERMANY
Category and concepts Recommendations
Help desk support quality
Clear help desk structure and process
Auto-training help desk personnel
Centralizing the help desk fonction
Solving problems by the help desk staff
Direct communication with help desk
Help desk Provides good assistance
Help desk sharing

411
Category and concepts Recommendations
Business process improvement
Enduring business processes
Changing processes
Supporting the business process
Reengineering the organization
Visibility of the whole process
Reducing process complexity
Helping the company to grow
Business process productivity
Efficient processes
Harmonizing data everywhere
Enabling flexibility in
Integrating business processes
Integration of information
Standardization of processes
Reducing work flow cycle

412
Category and concepts Recommendations
Team work encouragement
Supporting team work
Working in an open climate
Accessing information by everyone
Enabling access to more information form colleagues at work
Category and concepts Recommendations
Financial impact
Reducing travel effort
Generating financial value for the business
Reducing work flow cycle
Reducing overhead cost
Managing time
Reducing cost

413
Category and concepts Recommendations
Knowledge based organizational culture change
Tacit knowledge development
Knowledge sharing based organizational culture
Knowledge sharing
Changing the organizational culture
Bringing new ways of thinking
Category and concepts Recommendations
Organizational structure change
Developing new structures
Communication change
U sing intranet
Changing the organizational structure
Title Jess environment
End user computing
Freeing up people for other tasks
Decentralizing decision making process
Developing rigor in management
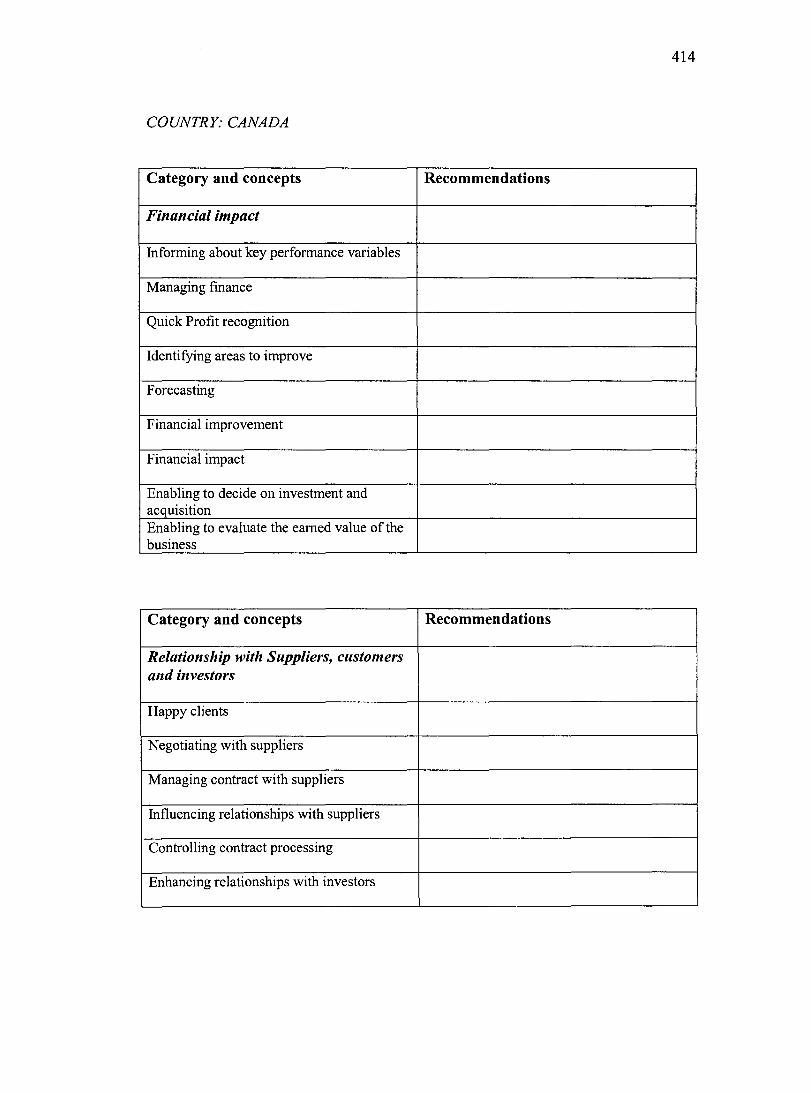
414
COUNTRY: CANADA
Category and concepts Recommendations
Financial impact
lnforming about key performance variables
Managing finance
Quick Profit recognition
Identifying areas to improve
F orecasting
Financial improvement
Financial impact
Enabling to decide on investment and acquisition Enabling to evaluate the eamed value of the business
Category and concepts Recommendations
Relationsltip witlt Suppliers, customers and investors
Happy clients
Negotiating with suppliers
Managing contract with suppliers
Influencing relationships with suppliers
Controlling contract processing
Enhancing relationships with investors

415
Category and concepts Recommendations
Business process improvement
Enabling to identify problems in business processes Process efficiency
Work method change
Functions restructuring
Transaction consolidation
Revising processes
Business process productivity
Better process visibility for management
lmproving process
Category and concepts Recommendations
Gain of competitive advantages
Information leaderships
Opportunities
Competitive advantage gain
Concentrating on opportunities

416
Category and concepts Recommendations
Knowledge management
Analytic reasoning
Tacit knowledge development
Gratifying tacit knowledge providers
Category and concepts Recommendations
Innovation
Encouraging innovation
Questioning the way the business in run
Flexible innovation
Innovation
Category and concepts Recommendations
Ease of user performance evaluation
Evaluating user's performance
Controlling people jobs

APPENDIXAF
CANADA: MULTI-DETERMINANTS CONCEPTS AT THE SYSTEMS LEVEL
417

418
Multi-determinant concept Raw data Accuracy Accurate data
Accurate data Accurate data Accurate data Accurate data Accurate data Commondata Unique data Excellent data
Integration of data Integrated data Integration of data
Standard data Consistency Same information in global environment
Standard data Data consistency in reports
Timeliness Just in time data Just in time data Just in time data Get data quickly before it is too late
Complete data Completeness Present complete information
Relevance Relevant information on reports Get what I want and possibly go deeper for more details Necessary information User X does not have to know what user Y is doing. Provide data to who needs it Information responds to different objectives of different users Necessary information for the users New information Meets user's need Gather all necessary information Useful information User X does not have to know what user Y is doing. Provide data to who needs it Necessary information Meets user's need

419
Multi-determinant concept Raw data F orecasting Long term vision of the system
Have information for the present and the future Information that shows tendency
Ease of understanding Easy to understand information on screen Information easy to understand Interpretable information Understandable information Transparent data
Interpretability Self explanatory information on screen or reports Information in the language of the user Exact meaning of information Meaningful information in other countries Exact meaning of information Meaningful information in other countries Easy interpretation of information
Clarity
Not much information on screen Not much information on screen Not much information on screen

420
Multi-determinant concept Raw data Access control Controlled access to data
Safeguard of data Flexibility in control Trade off in control Filtered information Control access to financial data Secured sensible data A system that closed and open selectively
Controlled access to data Hierarchy to data access but common interpretation
of data at all levels Controlled access to data control at certain level
Data A vailability Data availability Data availability Data availability Data availability Access to data all the time
Response time
Quick response time Quick response time Quick response time Quick response time Quick response time Quick result
Rapid access
Rapid access to data Rapid access to data Rapid access to data Rapid access to data Rapid access to data Rapid access to data
Information sharing Rapid access to data
Shared information diffuse effectively Information diffused rapidly
Standard system Flexibility in information sharing
Standard platform that links all the units W ork for all business units and division

421
Multi-determinant concept Raw data Interface quality Good help fonction
Graphical user interfaces Create good impression Convivial presentation Loop logic interface User friendly interfaces User friendly interfaces Present quantitative and qualitative information
Hardware reliability Systems always on Always alive Runs well
Hardware flexibility Flexibility to grow Expand easily Global adaptability

422
APPENDIXAG
GERMANY: MULTI-DETERMINANTS CONCEPTS AT THE SYSTEMS LEVEL
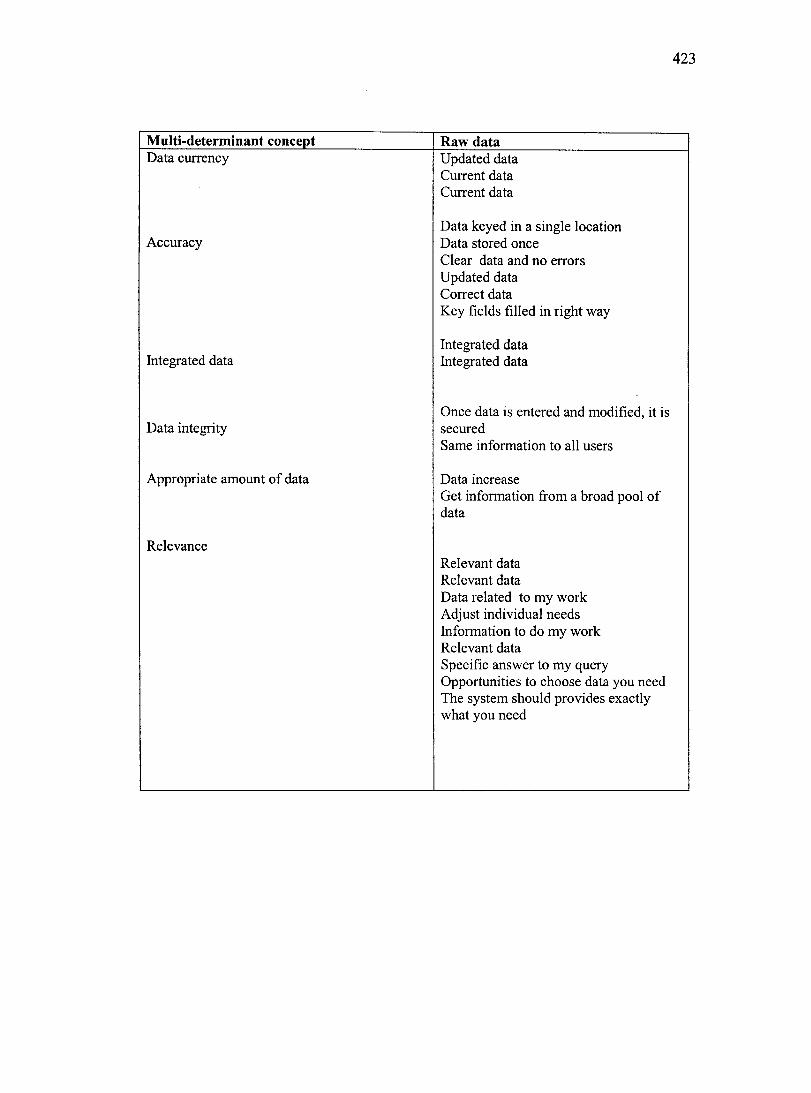
423
Multi-determinant concept Raw data Data currency Updated data
Current data Current data
Data keyed in a single location Accuracy Data stored once
Clear data and no errors Updated data Correct data Key fields filled in right way
Integrated data Integrated data Integrated data
Once data is entered and modified, it is Data integrity secured
Same information to all users
Appropriate amount of data Data increase Get information from a broad pool of data
Relevance Relevant data Relevant data Data related to my work Adjust individual needs Information to do my work Relevant data Specific answer to my query Opportunities to choose data you need The system should provides exactly what you need
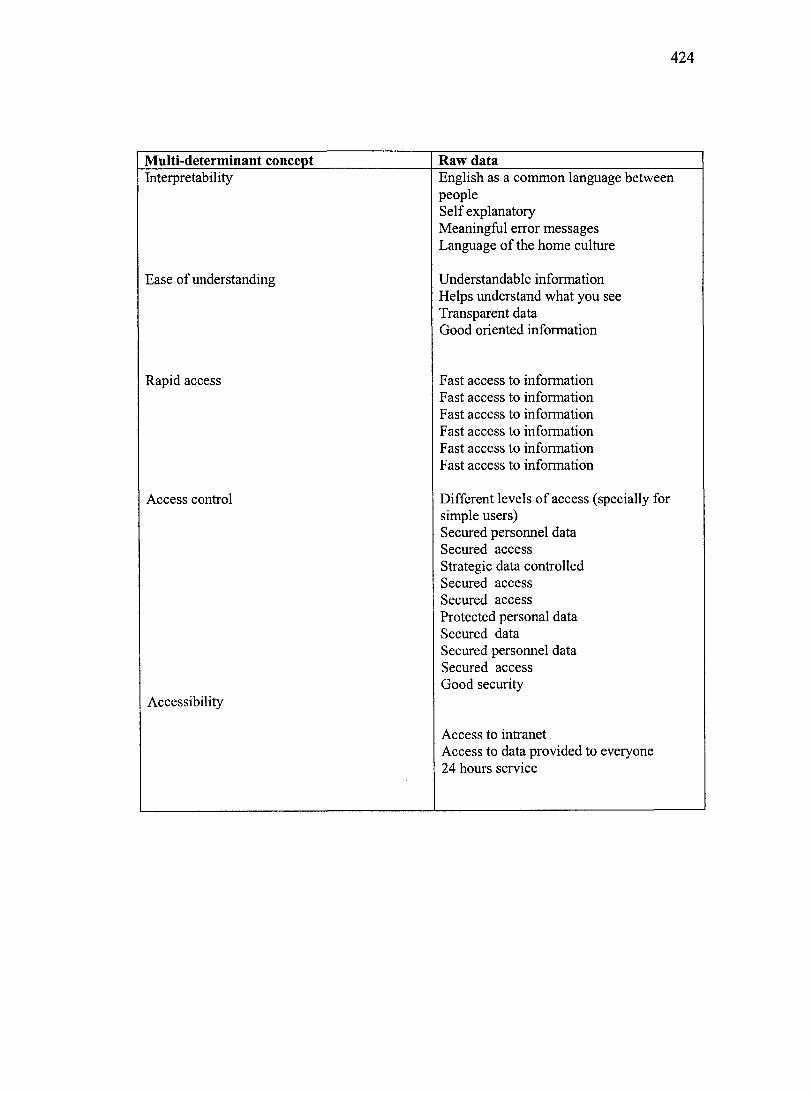
424
Multi-determinant concept Raw data Interpretability English as a common language between
people Self explanatory Meaningful error messages Language of the home culture
Ease of understanding Understandable information Helps understand what you see Transparent data Good oriented information
Rapid access Fast access to information Fast access to information Fast access to information Fast access to information Fast access to information Fast access to information
Access control Different levels of access (specially for simple users) Secured personnel data Secured access Strategic data controlled Secured access Secured access Protected persona} data Secured data Secured personnel data Secured access Good security
Accessibility
Access to intranet Access to data provided to everyone 24 hours service

425
Multi-determinant concept Raw data Interface quality IS has all the alternatives to find the
information Intelligent help fonction Voice processing interfaces Good help fonction that directly provides the necessary information Interfaces easy to understand Good help fonction that directly provides the necessary information Graphies Good help fonction that directly provides the necessary information
Ease of navigation Customized to users pref erences Menu structures Good navigation screens Transparent (user knows where he is in the system) Easy structure of IS
Easy to leam IS does not require much time to leam IS does not require much time to leam IS does not require much time to leam
Easy to use Easy to use Easy to use
Reliability Stable system System maintained easily Efficient systems maintenance Updated hardware Updated hardware and software Software and hardware updated because of competition Necessary maintenance of the systems
Systems flexibility System provides many possibilities Adapt application to specific situations Flexible standards (hardware and software) Systems customization effort not tao high Systems customization to each culture Manages interfaces to other systems Flexible systems Flexible standards (hardware and software)

Response time
426
Flexible standards (hardware and software) Multicultural systems for global businesses
Acceptable response time Acceptable response time Acceptable response time

APPENDIXAH
FRANCE: MULTI-DETERMINANTS CONCEPTS AT THE SYSTEMS LEVEL
427

428
Multi-determinant concept Raw data Precision Precise data
Precise data
Accuracy No errors Data entry quality No errors Clear data Correct information Data entry quality Exact data Accurate data
Validated data Validated data Enables to verify the validity of information
Relevance U seful information Correspond to user's need Correspond to user's need Correspond to user's need in every culture Correspond to user's need
Appropriate amount of data More data quality at end in terms of data amount High quality at start in terms of amount of
Ease of understanding data
Transparent information Clarity Minimum time to understand report
Understandable information
Comprehensive messages Not much information on screen Good presentation and format Comprehensive information

429
Multi-determinant concept Raw data Access control Keep confidentiality
Hierarchy information access Hierarchy of using the system Controlled access to data Controlled access even inside the same division or unit Keep confidentiality Information forwarded to right people only Only the manager who can decide if information is to be distributed Strategic data accessed only by management Hierarchy information access Access depends on the role of the user Controlled access to data Secured system Secured system Secured system Controlled access to data Enables confidentiality Controlled access to data Hierarchy information access Access depends on responsibility Controlled access to data Control access to data Only those who have the right to get data can access it

430
Multi-determinant concept Raw data Easy of use Easy to use
Easy to use Easy to use Easy to use Easy to use by managers
Interface quality Convivial Convivial Simple to use Active screens Convivial Convivial Small amount of data entry Rapid data entry User friendly Simple to use Convivial Convivial
Systems flexibility Easy to parameter Customized applications Open applications Open applications Enables to add changeable parameters Multilanguage system Enables to add changeable parameters
Response time Import and export fonctions are easy and rapid The hardware must be sophisticated Fluid Information flow Response time very high Rapid responses Rapid responses Rapid responses Rapid responses Rapid responses Rapid responses Speed of access

431
APPENDIXAI
CANADA: MULTI-DETERMINANTS CONCEPTS AT THE INDIVIDUAL LEVEL

432
Multi-determinant concept Raw data Negative impact on transactional people Negative impact for those who have
experience only in transactional activities Less workers in transactional streams Y ou must have experience in analytic
Decision making Helps to take good decisions Y es on decision making Helps to take good decisions Yes on decision making Y es on decision making
forecasting Enables users to predict the future Enables users to predict the future
Satisfaction high Satisfaction Satisfaction high
No impact on career No impact on career Human dynamic have an impact and not IS
No impact on career
Impact on career Must have an impact on the career Definitely, there is an impact on career
Skills analysis Enables to analyze people skills Enables to analyze people skills
Routine task change No place for those who perform rootine tasks No more rootine tasks

433
APPENDIXAJ
GERMANY: MULTI-DETERMINANTS CONCEPTS AT THE INDIVIDUAL LEVEL

434
Multi-determinant concept Raw data No career impact No impact on the career
No impact on the career
Career development Career development Career development
User friendliness User friendly User friendly
Subjective satisfaction Satisfaction related to user perception Reasons of satisfaction can be different among users Satisfaction is related to improvement made by the IS Satisfaction is related to improvement made by the IS Satisfaction related to user perception
Reduces effort to do the job Minimum effort to do the job Reduces effort to do the job

435
APPENDIXAK
FRANCE: MULTI-DETERMINANTS CONCEPTS AT THE INDIVIDUAL LEVEL
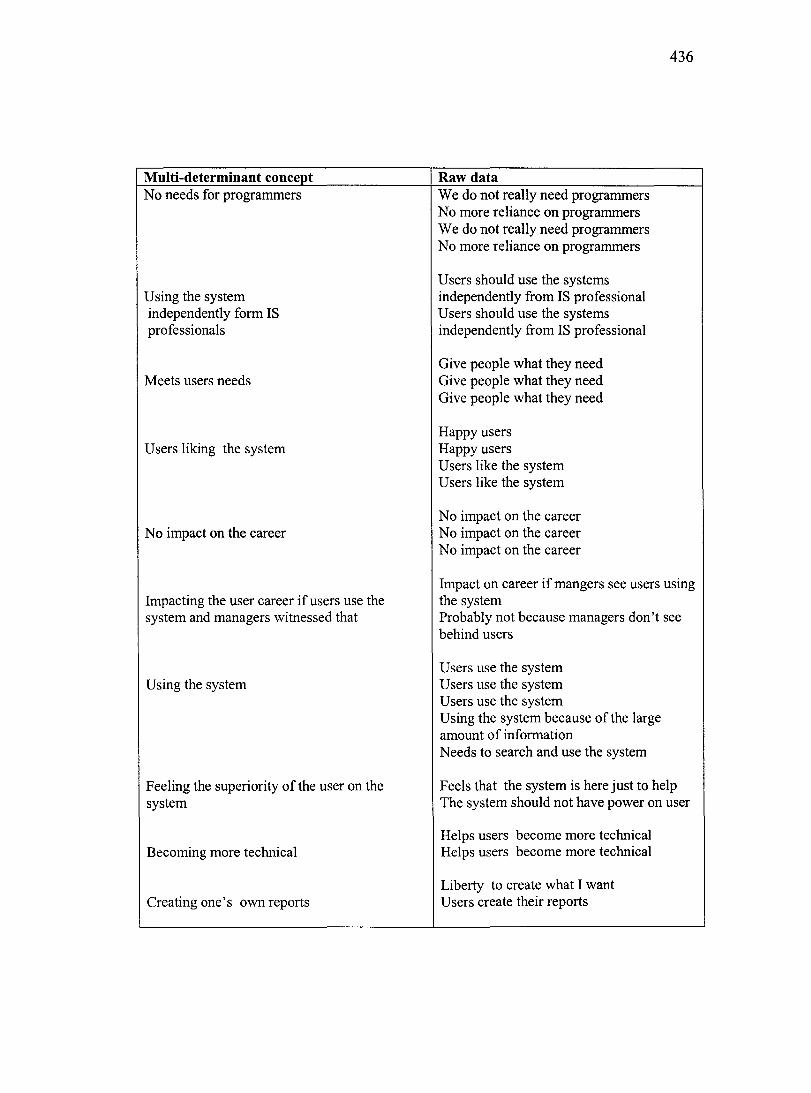
436
Multi-determinant concept Raw data No needs for programmers We do not really need programmers
No more reliance on programmers We do not really need programmers No more reliance on programmers
Users should use the systems Using the system independently from IS professional independently form IS U sers should use the systems professionals independently from IS professional
Give people what they need Meets users needs Give people what they need
Give people what they need
Happy users Users liking the system Happy users
U sers like the system U sers like the system
No impact on the career No impact on the career No impact on the career
No impact on the career
Impact on career if mangers see users using lmpacting the user career if users use the the system system and managers witnessed that Probably not because managers don 't see
behind users
Users use the system U sing the system U sers use the system
U sers use the system U sing the system because of the large amount of information Needs to search and use the system
Feeling the superiority of the user on the Feels that the system is here just to help system The system should not have power on user
Helps users become more technical Becoming more technical Helps users become more technical
Liberty to create what I want Creating one' s own reports U sers create their reports

Better decision making
Satisfaction
Better decision making Better decision making Satisfaction Satisfaction
437

APPENDIXAL
CANADA: MULTI-DETERMINANTS CONCEPTS AT THE ORGANIZATIONAL LEVEL
438

439
Multi-determinant concept Raw data Evaluating users performance Evaluate users performance
Measure people performance
Encouraging innovation Encourages innovation Encourages innovation Encourages innovation
Enabling to identify problems in business Allows to know why things do not go processes right
Allows to put much effort on problematic parts
Business process productivity Big output in business processes More productivity
Improving processes Processimprovement Processimproven1ent
Financial impact Financial impact Financial in1pact Financial impact Financial impact
Process efficiency Process efficiency Process efficiency

APPENDIXAM
GERMANY: MULTI-DETERMINANTS CONCEPTS AT THE ORGANIZATIONAL LEVEL
440

441
Multi-determinant concept Raw data Developing new structures Reengineering of the organization
Secretaries become assistants Reduces organizational hierarchy No rigid structure No more department or division Y ou do not need a boss or subordinate Project and matrix structure Free from location ofusers
Managers use the systems themselves End user computing Online managers can access data
Free up people for other tasks Freeing up people for other Free up people for other tasks tasks
Changes the process Changing the processes Changes the process
Pully support the business process Supporting business processes Pully support the business process
Pully support the business process
Efficient processes Efficient processes Efficient processes Efficient processes
Do business fast Business process productivity Great impact on the process cycle
Accessing information by everyone Access to information by all people Access to information by all people
Supporting team work Supports team work Is is a tool for team work
Knowledge sharing based The new culture is based on knowledge organizational culture sharing
Implement the culture ofknowledge sharing The new culture is based on knowledge sharing

APPENDIXAN
FRANCE: MULTI-DETERMINANTS CONCEPTS AT THE ORGANIZATIONAL LEVEL
442

Multi-determinant concept Gaining efficiency
Helping to make money
Being a logical system that fits our logic
Imposing our ideas on the system
Raw data Gain of efficiency Gain of efficiency Gain of efficiency
Helps make money Helps make money
If we work fine, the systems follows Be a logical system That fits our logic
443
We write down what we have in our heads We are the owners of our ideas

444
APPENDIXAO
BACKGROUND OF THE REPERTORY GRID TECHNIQUE
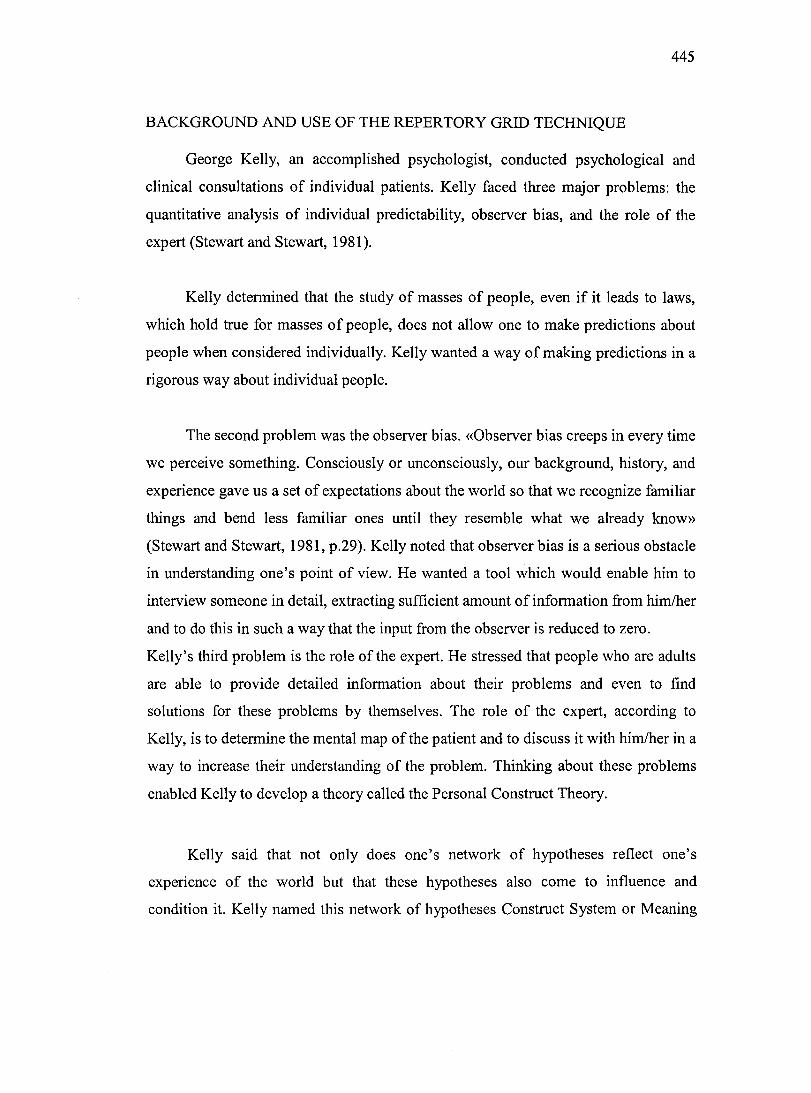
445
BACKGROUND AND USE OF THE REPERTORY GRID TECHNIQUE
George Kelly, an accomplished psychologist, conducted psychological and
clinical consultations of individual patients. Kelly faced three major problems: the
quantitative analysis of individual predictability, observer bias, and the role of the
expert (Stewart and Stewart, 1981 ).
Kelly determined that the study of masses of people, even if it leads to laws,
which hold true for masses of people, does not allow one to make predictions about
people when considered individually. Kelly wanted a way of making predictions in a
rigorous way about individual people.
The second problem was the observer bias. «Observer bias creeps in every time
we perceive something. Consciously or unconsciously, our background, history, and
experience gave us a set of expectations about the world so that we recognize familiar
things and bend less familiar ones until they resemble what we already know»
(Stewart and Stewart, 1981, p.29). Kelly noted that observer bias is a serious obstacle
in understanding one's point of view. He wanted a tool which would enable him to
interview someone in detail, extracting sufficient amount of information from him/her
and to do this in such a way that the input from the observer is reduced to zero.
Kelly's third problem is the role of the expert. He stressed that people who are adults
are able to provide detailed information about their problems and even to find
solutions for these problems by themselves. The role of the expert, according to
Kelly, is to determine the mental map of the patient and to discuss it with him/her in a
way to increase their understanding of the problem. Thinking about these problems
enabled Kelly to develop a theory called the Personal Construct Theory.
Kelly said that not only does one's network of hypotheses reflect one's
experience of the world but that these hypotheses also corne to influence and
condition it. Kelly named this network of hypotheses Construct System or Meaning

446
System where the goal is to have a patient provide him with their own construct
systems. «If you can understand someone's construct system, you can not only
understand his history, but you can make some predictions about how he is likely to
behave in a given situation because you know something about what that situation is
likely to mean to him» (Stewart and Stewart, 1981, p. 29).
Repertory grid is an effective measuring device based on the operationalization
of George Kelly's (1955) psychology of persona! construct (Caldwell and Coshall,
2002).
Basic concepts associated with the Repertory grid interviewing technique
Elements
Elements are lists ofwords, which define the kind of interview, by selecting the
subject matter. They must be discrete (people, objects, events and activities). They
must be homogenous, that is, not a mixture of classes of elements (people with
objects) and also should not be subsets of other elements. The researcher can supply
them to the participants, or can get them from open responses from the participants.
The selection of elements should be linked to the purpose of the Repertory grid and
of course to the purpose of the research project
For example, suppose that a company produces product X and would like to
assess the acceptance of the product in the market. In using the Repertory grid the
researcher would select five to six products of the same kind but from different
companies and would include the target product and ask specific questions to
differentiate it among them. If, for example the target product is an IBM personal
computer, then the list would for example include comparable personal computers
from Dell, Compact, Toshiba, Sony and Mac as elements of the grid.

447
Construct
This is the bipolar distinction which represents the dimensions the interviewee
uses when thinking about the elements.
Construct elicitation
This is the process of developing constructs from elements by asking the
interviewee to put two elements together and then separate them from the third. This
is a triadic-comparison procedure that asks for both a similarity and a difference
determining the poles of a construct.
Repertory grid is essentially made up of three interviewing methods: triading,
laddering, and pyramiding all of which are designed to elicit an individual's method
or construct of psychological abstraction.
Triading involves randomly selecting three elements and asking participants to
describe in a short phrase or sentence how two of them are both alike and different
from the third. In order to elicit the more abstract values associated with these
constructs, the 'laddering' method can be used by asking the participants which of the
poles of the construct is preferred and why it is important to them. This process is
used to obtain more detailed information about elicited constructs. There are two
types of questions in laddering: how and why questions. How questions are used to
go down the ladder. Given a construct x-----y, one can descend the ladder by asking
'Can you tell me some more about how x and y are different?' or 'Can you give me
some more examples of how x is not the same as y?' It is essential to descend the
ladder when a construct is multifaceted, global, and cannot be useful unless it is
subdivided into its component constructs.
Why questions ascend the ladder and take at least two forms: asking for a preference
between x and y in some parameters, and then asking for the reason for the

448
preference, or when the construct x---y has been generated, to ask why is that an
important distinction to make about (naming the class of elements).On the other hand,
the concrete benefits associated with each construct can be elicited using the
'pyramiding' method, which involves asking the participant what defines the
preferred construct pole (Marsden and Littler, 2000).
Element comparison
This stage ofusing the Repertory grid Technique (RGT) involves each participant
completing a Repertory grid questionnaire so that the structural relationship between
the bipolar constructs and the set of elements can be further examined (Banister,
Burman, Taylor, and Tindall, 1994). Referring back to the hypothetical computer
example, the Repertory grid questionnaire would be determined as follows:
1. The participant 1s g1ven 6 cards . Each card contains the name of a
computer
2. The researcher asks the participant to randomly pick three cards.
3. The researcher asks the participant the following triadic question: 'Would
you tell me how two ofthese cards are alike yet different from the third?'.
The participant is at this moment looking for a similarity between two
elements and a difference between this similarity and the third element.
The answer is a bipolar construct. For example, the participant with the
relevant cards might provide the following construct:
4. Dell and Compact are cheap ---------------------- IBM is expensive.
5. The researcher notes the names of the selected elements as well as the
generated construct on a separate sheet.
6. The three elements are put back in the set of the cards.
7. The researcher would ask the participant to randomly select another set of
three cards and would ask the same triadic question.
8. The process of construct elicitation continues until all possible
combinations are passed or the participant runs out of constructs.
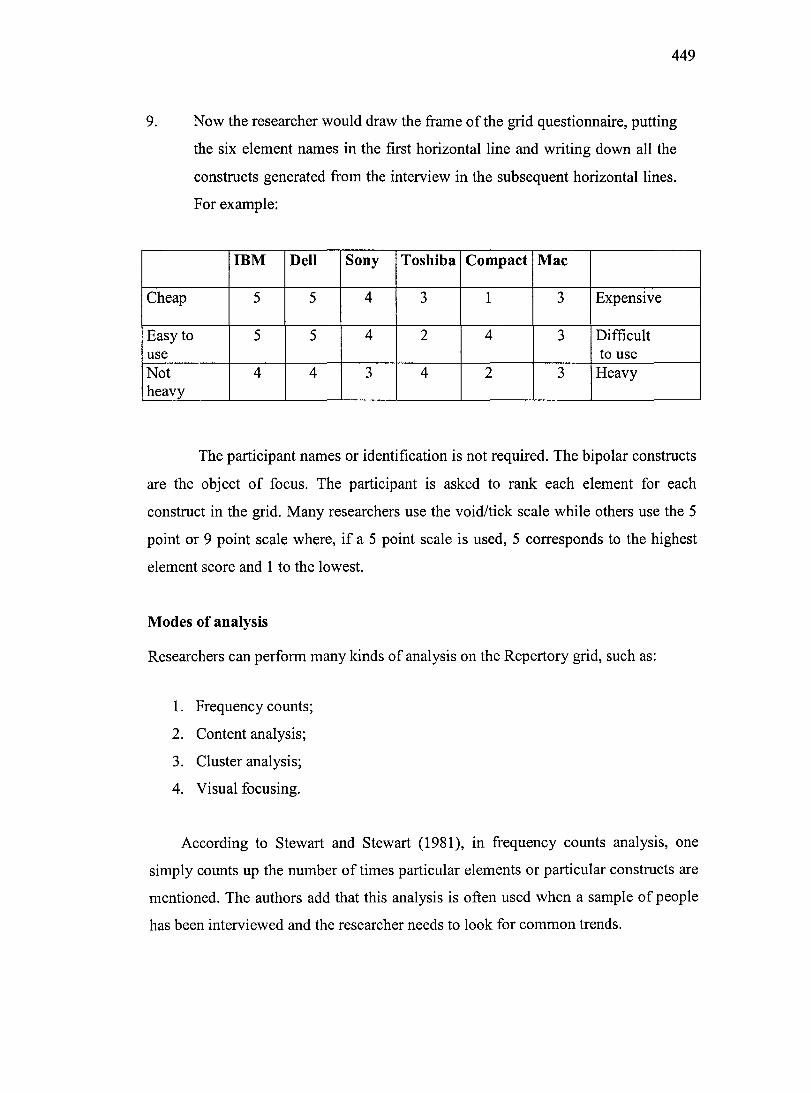
449
9. Now the researcher would draw the frame of the grid questionnaire, putting
the six element names in the first horizontal line and writing down all the
constructs generated from the interview in the subsequent horizontal lines.
For example:
IBM Dell Sony Toshiba Compact Mac
Cheap 5 5 4 3 1 3 Expensive
Easy to 5 5 4 2 4 3 Difficult use to use Not 4 4 3 4 2 3 Heavy heavy
The participant names or identification is not required. The bipolar constructs
are the object of focus. The participant is asked to rank each element for each
construct in the grid. Many researchers use the void/tick scale while others use the 5
point or 9 point scale where, if a 5 point scale is used, 5 corresponds to the highest
element score and 1 to the lowest.
Modes of analysis
Researchers can perform many kinds of analysis on the Repertory grid, such as:
1. Frequency counts;
2. Content analysis;
3. Cluster analysis;
4. Visual focusing.
According to Stewart and Stewart (1981), in frequency counts analysis, one
simply counts up the number of times particular elements or particular constructs are
mentioned. The authors add that this analysis is often used when a sample of people
has been interviewed and the researcher needs to look for common trends.
450
In content analysis, the researcher has to define a list of categories into which the
elements or the constructs fall and then assign the elements or constructs to
categories.
In visual focusing analysis, single grids are analyzed by the eyes. The purpose
1s that the researcher would group together all constructs and elements that are
visually similar.
Cluster analysis is an extension of visual focusing where the analysis is done
by a computer and concems large single grids.