NO2 climatology in the northern subtropical region: diurnal, seasonal and interannual variability
14
Atmos. Chem. Phys., 8, 1635–1648, 2008 www.atmos-chem-phys.net/8/1635/2008/ © Author(s) 2008. This work is distributed under the Creative Commons Attribution 3.0 License. Atmospheric Chemistry and Physics NO 2 climatology in the northern subtropical region: diurnal, seasonal and interannual variability M. Gil 1 , M. Yela 1 , L. N. Gunn 2 , A. Richter 3 , I. Alonso 1 , M. P. Chipperfield 2 , E. Cuevas 4 , J. Iglesias 1 , M. Navarro 1 , O. Puentedura 1 , and S. Rodr´ ıguez 1 1 Area de Investigaci´ on e Instrumentaci ´ on Atmosf´ erica, INTA, Torrej´ on de Ardoz, Spain 2 Institute for Atmospheric Science, School of Earth and Environment, University of Leeds, Leeds, UK 3 Institute of Environmental Physics, University of Bremen, Bremen, Germany 4 Centro de Investigaci´ on Atmosf´ erica de Iza ˜ na, INM, Sta. Cruz de Tenerife, Spain Received: 2 October 2007 – Published in Atmos. Chem. Phys. Discuss.: 19 October 2007 Revised: 13 February 2008 – Accepted: 18 February 2008 – Published: 18 March 2008 Abstract. Daily NO 2 vertical column density (VCD) has been routinely measured by zenith sky spectroscopy at the subtropical station of Iza ˜ na (28 ◦ N, 16 ◦ W) since 1993 in the framework of the Network for the Detection of Atmospheric Composition Change (NDACC). Based on 14 years of data the first low latitude NO 2 VCD climatology has been estab- lished and the main characteristics from short timescales of one day to interannual variability are presented. Instrumen- tal descriptions and different sources of errors are described in detail. The observed diurnal cycle follows that expected by gas-phase NO x chemistry, as can be shown by the good agreement with a vertically integrated chemical box model, and is modulated by solar radiation. The seasonal evolution departs from the phase of the hours of daylight, indicating the signature of upper stratospheric temperature changes. From the data record (1993–2006) no significant long-term trends in NO 2 VCD can be inferred. Comparison of the ground- based data sets with nadir-viewing satellite spectrometers shows excellent agreement for SCIAMACHY with differ- ences between both datasets of 1.1%. GOME displays unre- alistic features with the largest discrepancies during summer. The ground-based data are compared with long-term output of the SLIMCAT 3-D chemical transport model (CTM). The basic model, forced by ECMWF (ERA-40) analyses, cap- tures the observed NO 2 annual cycle but significantly un- derestimates the spring/summer maximum (by 12% at sun- set and up to 25% at sunrise). In a model run which uses assimilation of satellite CH 4 profiles to constrain the model long-lived tracers the agreement is significantly improved. This improvement in modelled column NO 2 is due to better Correspondence to: M. Gil ([email protected]) modelled NO y profiles and points to transport errors in the ECMWF ERA-40 reanalyses. 1 Introduction NO 2 plays an important role in the chemistry of ozone from the mid stratosphere to the mesosphere through catalytic re- actions: NO + O 3 → NO 2 + O 2 (1) NO 2 + O → NO + O 2 (2) Net: O 3 + O → 2O 2 (3) The NO x contribution to the overall O 3 equilibrium de- pends on latitude, altitude and season. The primary source of stratospheric active nitrogen is N 2 O (e.g. see Minschwaner et al., 1993). In the middle and upper stratosphere N 2 O is converted to NO by reaction with excited oxygen atoms O( 1 D) produced mainly by UV photolysis of O 3 . Measure- ments have shown a steady increase in atmospheric N 2 O over the last two decades of 2.2–2.6% per decade (WMO, 2007). While the chemistry of the NO y family has been well estab- lished over recent decades, long-term NO 2 observations dis- play positive trends exceeding that of N 2 O. Liley et al. (2000) analysed the longest available visible spectroscopy dataset (Lauder, New Zealand) and found an increase of 5±1% for the period 1980–1999, some 2% larger than the estimated trend in N 2 O. The same rate of increase (+5.2±3.2% per decade) was obtained by Rinsland et al. (2003) for Kitt Peak (32 ◦ N) using FTIR spectrometer data. Struthers et al. (2004) extended the Liley et al. (2000) work by comparing Lauder Published by Copernicus Publications on behalf of the European Geosciences Union.
Transcript of NO2 climatology in the northern subtropical region: diurnal, seasonal and interannual variability
Atmos. Chem. Phys., 8, 1635–1648, 2008www.atmos-chem-phys.net/8/1635/2008/© Author(s) 2008. This work is distributed underthe Creative Commons Attribution 3.0 License.
AtmosphericChemistry
and Physics
NO2 climatology in the northern subtropical region: diurnal,seasonal and interannual variability
M. Gil 1, M. Yela1, L. N. Gunn2, A. Richter3, I. Alonso1, M. P. Chipperfield2, E. Cuevas4, J. Iglesias1, M. Navarro1,O. Puentedura1, and S. Rodrıguez1
1Area de Investigacion e Instrumentacion Atmosferica, INTA, Torrejon de Ardoz, Spain2Institute for Atmospheric Science, School of Earth and Environment, University of Leeds, Leeds, UK3Institute of Environmental Physics, University of Bremen, Bremen, Germany4Centro de Investigacion Atmosferica de Izana, INM, Sta. Cruz de Tenerife, Spain
Received: 2 October 2007 – Published in Atmos. Chem. Phys. Discuss.: 19 October 2007Revised: 13 February 2008 – Accepted: 18 February 2008 – Published: 18 March 2008
Abstract. Daily NO2 vertical column density (VCD) hasbeen routinely measured by zenith sky spectroscopy at thesubtropical station of Izana (28◦ N, 16◦ W) since 1993 in theframework of the Network for the Detection of AtmosphericComposition Change (NDACC). Based on 14 years of datathe first low latitude NO2 VCD climatology has been estab-lished and the main characteristics from short timescales ofone day to interannual variability are presented. Instrumen-tal descriptions and different sources of errors are describedin detail. The observed diurnal cycle follows that expectedby gas-phase NOx chemistry, as can be shown by the goodagreement with a vertically integrated chemical box model,and is modulated by solar radiation. The seasonal evolutiondeparts from the phase of the hours of daylight, indicating thesignature of upper stratospheric temperature changes. Fromthe data record (1993–2006) no significant long-term trendsin NO2 VCD can be inferred. Comparison of the ground-based data sets with nadir-viewing satellite spectrometersshows excellent agreement for SCIAMACHY with differ-ences between both datasets of 1.1%. GOME displays unre-alistic features with the largest discrepancies during summer.The ground-based data are compared with long-term outputof the SLIMCAT 3-D chemical transport model (CTM). Thebasic model, forced by ECMWF (ERA-40) analyses, cap-tures the observed NO2 annual cycle but significantly un-derestimates the spring/summer maximum (by 12% at sun-set and up to 25% at sunrise). In a model run which usesassimilation of satellite CH4 profiles to constrain the modellong-lived tracers the agreement is significantly improved.This improvement in modelled column NO2 is due to better
Correspondence to:M. Gil([email protected])
modelled NOy profiles and points to transport errors in theECMWF ERA-40 reanalyses.
1 Introduction
NO2 plays an important role in the chemistry of ozone fromthe mid stratosphere to the mesosphere through catalytic re-actions:
NO + O3 → NO2 + O2 (1)
NO2 + O → NO + O2 (2)
Net: O3 + O → 2O2 (3)
The NOx contribution to the overall O3 equilibrium de-pends on latitude, altitude and season. The primary source ofstratospheric active nitrogen is N2O (e.g. see Minschwaneret al., 1993). In the middle and upper stratosphere N2Ois converted to NO by reaction with excited oxygen atomsO(1D) produced mainly by UV photolysis of O3. Measure-ments have shown a steady increase in atmospheric N2O overthe last two decades of 2.2–2.6% per decade (WMO, 2007).While the chemistry of the NOy family has been well estab-lished over recent decades, long-term NO2 observations dis-play positive trends exceeding that of N2O. Liley et al. (2000)analysed the longest available visible spectroscopy dataset(Lauder, New Zealand) and found an increase of 5±1% forthe period 1980–1999, some 2% larger than the estimatedtrend in N2O. The same rate of increase (+5.2±3.2% perdecade) was obtained by Rinsland et al. (2003) for Kitt Peak(32◦ N) using FTIR spectrometer data. Struthers et al. (2004)extended the Liley et al. (2000) work by comparing Lauder
Published by Copernicus Publications on behalf of the European Geosciences Union.

1636 M. Gil et al.: NO2 climatology in the subtropics
and Arrival Heights (Antarctica, 78◦ S) data with a three-dimensional coupled chemistry-climate model (CCM). Theyagain found a greater rate of increase of NO2 compared withN2O both in the measurements and the model.
Differential optical absorption spectrometry (DOAS) inthe visible range has been used extensively for ground-based measurements of NO2 vertical column density (VCD)since the pioneering work of Brewer (1973) and Noxon(1975), and further improvements by Solomon et al. (1987)and others. Since the late 1980s/1990s zenith spectrom-eters have been deployed at remote locations around theglobe for studies of stratospheric NO2. Most of them areintegrated into the Network for Detection of AtmosphericComposition Change (NDACC), formerly NDSC, follow ameasurement protocol and participate in regular intercom-parisons for quality assurance (http://www.ndsc.ncep.noaa.gov/). These data have helped establish a better under-standing of nitrogen oxides stratospheric behaviour in theextra-tropical region. In 1993 Izana (28◦ N) initiated itsroutine measurement programme for NO2, later extendedto O3 and BrO. In the early 1990s four stations werealso set up in the framework of the Systeme d’Analysepar Observation Zenithale (SAOZ) network in the SouthernHemisphere (http://www.aero.jussieu.fr/themes/CA/ReseauSAOZ.html). Recently, two more were added to the BRE-DOM network (http://www.iup.physik.uni-bremen.de/doas/groundbaseddata.htm). However, long records in the trop-ical latitude belt are still scarce and no comprehensive long-term low latitude NO2 measurements have been reported todate.
In the last decade, the technique has been successfully ex-tended to satellites instruments such as GOME (ESA, 1995),SCIAMACHY (Bovensman et al., 1999) and OMI (Dover etal., 2005) and will continue in the years to come with theGOME-2, a set of units on board of the operational METOPseries. While polar orbiting satellites offer the advantage ofglobal coverage, no study of stratospheric diurnal variationis possible since they scan low latitude regions once per dayat best. Additionally, orbiting instruments require validationfrom the ground to establish the optimum settings and detectpotential degradation with time. Ground-based quality con-trolled instrumentation provides independent measurements,stable in time, which are extremely useful for validating or-biting instruments. The UV-Vis spectrometer network hascontributed to the NO2 validation of satellite instrumentssuch as GOME (e.g. Lambert et al., 1998; Richter et al.,2000) on board the ERS-2, and extensively to SCIAMACHY(e.g. Lambert et al., 2004; Richter et al., 2004; Piters et al.,2006; Lambert et al., 2007) and MIPAS (e.g. Hendrick et al.,2004; Wetzel et al., 2007) on the ENVISAT platform.
Here we report the behaviour of the NO2 column overthe high altitude subtropical station of Izana (28◦ N, 16◦ W,Tenerife, Canary Islands, 2370 m a.s.l.) on different timescales, from diurnal to interannual, based on 14 years ofdata. Ground-based observational data are compared to mod-
els and satellite measurements for the same location, consti-tuting a limited low-latitude NO2 climatology for the period1993–2006.
2 Passive DOAS at zenith
The technique used is based on measurement of atmosphericabsorption of solar radiation in selected wavelength bandswhere NO2 has a structured cross-section. For stratosphericobservations the instrument is pointed at the zenith sky. Un-der these conditions, the equivalent photon path (EPP), orradiation slant path, for a given wavelength is defined as thesingle path that corresponds to the sum of all paths contribut-ing to the observed zenith radiation weighted by the inten-sity of each one. At twilight, the scattering point of the EPPoccurs in the stratosphere. The slant path from the top ofthe atmosphere to the scattering point is enhanced as the sunmoves to larger solar zenith angles (sza), while below thescattering point radiation comes from the vertical. As a con-sequence, the stratospheric contribution of the NO2 absorp-tion is amplified compared to the tropospheric one (Solomonet al., 1987).
The logarithm of this equivalent twilight spectrum, ide-ally ratioed to an extraterrestrial spectrum, yields the opti-cal depth of the absorbers, providing that the Lambert-Beerequation applies which is the case in an optically thin atmo-sphere. In practice, the extraterrestrial spectrum is substi-tuted by a spectrum measured at high sun (so called refer-ence spectrum). The measured NO2 column is, in fact, thedifference in NO2 between twilight and high sun EPP andit is called the Differential Slant Column Density (DSCD).The high sun spectrum contains an unknown amount of NO2which has to be estimated and added afterwards to obtain theNO2 Slant Column Density (SCD).
The DOAS at zenith technique requires that all absorbersare known in advance and that their absorption cross-sectionsare known in the spectral range selected. DSCDs are derivedby least squares fitting (i.e. Vandaele et al., 2005) using:(
d
dNi
) ∣∣∣∣ln [I (aλ + b)
Iref(λ)
]+
∑{σi (λ) ∗ DSCDi} + P(λ)
∣∣∣∣2= ε (minimum) (4)
WhereI (λ) is the twilight spectrum. Parametersa andb
account for spectral squeeze and shift due to small changesin the spectrograph and are obtained by iterative approxima-tions until the minimum residual is reached.Iref(λ) is the ref-erence spectrum at high sun after alignment using the Fraun-hofer lines present in the solar spectrum.σi are the differen-tial absorption cross-sections andP(λ) is a polynomial func-tion accounting for scattering. To convert the spectral obser-vations to vertical column density (VCD) a further two-stepprocess is required. First, the amount of the NO2 densitycontained in the reference spectrum must be computed and
Atmos. Chem. Phys., 8, 1635–1648, 2008 www.atmos-chem-phys.net/8/1635/2008/

M. Gil et al.: NO2 climatology in the subtropics 1637
added to the DSCD, and then the vertical column conversionis performed by dividing by the Air Mass Factor (AMF) co-efficients.
2.1 Reference content and AMF calculations
The amount of gas contained in the reference spectrum in dy-namically controlled species can be obtained as the interceptof a linear fit by the classical Langley plot method:
Ref=VCD∗ AMF (sza)−SCD(sza) (5)
where VCD is the vertical column density of the gas underconsideration and SCD (sza) is the amount retrieved from theobservations. AMF (sza) is mainly a function of solar zenithangle (sza) but also dependent, to some extent, on the shapeof the vertical profile of the gas under consideration. Ref isthe amount contained in the zenith reference spectrum at highsun. It can be retrieved as the intercept of the linear fit underthe assumption of no concentration changes during the periodof the measurements. Other species of short photochemicallifetime, e.g. NO2, undergo significant changes throughoutthe day, and the constant column assumption is not valid.Consequently the representation of AMF versus slant columndeparts from a straight line.
For these short-lived species the so-called modified AMFmust be used instead (Lee et al., 1994). These AMFs are ob-tained by including a coefficient C (sza)=VCD0/VCD (sza),where VCD (sza) comes from a photochemical box modelfor the appropriate season. VCD0 is the vertical column atthe sza where the reference spectrum is recorded. The cor-rection assumes that the actual NO2 diurnal variation is pro-portional to the NO2 predicted by the model. The referencecontent can then be estimated by:
Ref=VCD∗ AMF (sza) ∗ C(sza)−SCD(sza) (6)
The reference spectrum can be used for many years if thespectrograph does not change its specifications, and the Lan-gley plot is computed only once per reference.
3 The station
The Global Atmospheric Watch (GAW) Izana station, man-aged by the Instituto Nacional de Meteorologıa (INM,Spain), is located at 28◦18′ N, 16◦29′ W on Tenerife (Ca-nary Islands), 300 km from the African west coast at an al-titude of 2370 m a.s.l. The Canary Islands are below the de-scending branch of the Hadley Cell which favours a large-scale high stability catabatic flow regime, resulting in alarge number of clear-sky days. The appearance of deeplows and cut-off lows, which could favour stratosphere-troposphere exchange, is limited to winter time. The sta-tion is above a quasi-permanent trade wind inversion wellestablished between 800 and 1500 m a.s.l., only absent dur-ing some episodes in winter. As a consequence, the station
is under free-troposphere conditions most of the time, pre-cluding pollution from the Sta. Cruz and Puerto de la Cruzcoastal towns from reaching the station, except on occasionsassociated with the passing of low pressure systems. In-situannual mean NO2 during twilight are of 115 and 473 pptv fora.m. and p.m. respectively (Y. Gonzalez, personal communi-cation). The summer-autumn stratospheric circulation is es-sentially zonal. Air-masses originate at 20–25◦ N with littlelatitudinal variation (Schneider et al., 2005). During winterthere is a large variation in the origin of the air masses arriv-ing at the station due to planetary wave activity. Occasionallypolar stratospheric air-masses reach the station (Yela, 1999).
3.1 Instrumentation
Two instruments contribute to the data record. In May 1993a scanning spectrometer (EVA) was installed on the ter-race of the observatory for twilight measurements between88◦–92◦ in the 430–450 nm spectral range. It is based ona Jobin-Yvon H20 monochromator with a ruled grating of1200 grooves/mm and a photomultiplier tube HammamatsuR212-UH blue enhanced as the detector. Spectral resolutionis 1 nm FWHM and the sampling path is 0.1 nm. A full spec-trum is taken in 1.7 s and 30 spectra per measurement areaccumulated to improve the signal-to-noise ratio. The instru-ment is located outdoors in a thermostatised housing. Lightreaches the spectrograph by a 45◦ angle mirror. The instru-ment takes one measurement per 0.5◦ of sza between 88◦ and92◦.
In December 1998 an advanced visible spectrograph(RASAS) was installed. The instrument is based on anEGG&1453A 1024 photodiode array (PDA) detector con-trolled by an EGG 1461 on a Jarrel-Ash Monospec 18 spec-trograph. Scattered light at zenith is collected by a baf-fled cylinder through a quartz fibre bundle with the innerend rectangle-shaped acting as 100µm entrance slit. A flat-ruled diffraction grating of 600 grooves/mm provides a spec-tral range of 340–600 nm for NO2 and O3 observations withan average FWHM resolution of 1.3 nm. The spectrographand detector are housed in a thermostatised hermetic con-tainer keeping the spectrograph at a constant temperatureof 15±0.2◦C, thus maintaining the alignment of the spec-tra with time. The detector is operated at−35◦C by meansof a 2-step peltier and external assistance of a circulatingchiller at−10◦ C. A continuous supply of dry nitrogen froma generator prevents ice formation on the detector window.In-house control software keeps the assembly in operation.Measurements are carried out in continuous mode from 94◦
sza at dawn to 94◦ at sunset skipping the central hours ofthe day whenever the sza is smaller than 45◦ to avoid spec-tra perturbations due to reflections in the entrance baffle anddirect sun. Typical daytime integration time in clear sky is2.5 s, increasing to 25 s at 90◦ sza. The instrument is pro-grammed to integrate spectra during the time required for thesun to move 0.2◦, therefore about 500 spectra are collected
www.atmos-chem-phys.net/8/1635/2008/ Atmos. Chem. Phys., 8, 1635–1648, 2008
1638 M. Gil et al.: NO2 climatology in the subtropics
Table 1. Summary of main specifications of spectrometers used in this work.
Spectrometers technical specifications
EVA RASAS ARTIST
Type of spectrometer Scanning Spectrograph SpectrographMonochromator Jobin-Yvon H20 Jarrel Ash Monospec 18 Jobin Yvon TRIAX 180Difraction grating Ruled, 1200 grooves/mm Ruled, 600 grooves/mm Holographic, 900 grooves/nmSlit width 250µm 100µm 100µmDetector type Photomultiplier Photodiode array (PDA) Photodiode array (PDA)Detector model HAMAMATSU R212-UH EGG&1453A 1024-PDA
at−35◦CPrinceton Instruments PDA 1024at−40◦C
Controller Home made EGG 1461 Princeton Instruments STS 121FWHM 1.25 nm 1.3 nm 0.6 nmSpectral range 430–450 nm 340–600 nm 325–460 nmFitting window for NO2 430–450 nm 425–540 nm 425–450 nmDetector full depth STN 4000 4100 >10 000Oversampling factor Sampling path 0.1 nm 5 pixel/nm 7.7 pixel/nmLight collection 45◦ angle mirror Quartz fibre bundle Quartz fibre bundleFOV (half angle) 8.5◦ 6.5◦ 3.2◦
Measurement period Since 1993 Since 1998 Since 2001Location Outdoor Indoor IndoorThermostatic control Yes Yes (15±0.2◦C) Yes (14±0.2◦C)External chiller No Yes (T =−10◦C) Yes (T =0◦C)Measurement SZA range 88◦ to 92◦ every half degree a.m. 94◦to 45◦ p.m. 45◦ to 94◦ a.m. 94◦ to 45◦ p.m. 45◦ to 94◦
SZA range for mean twilight 89◦ to 91◦ 89◦ to 91◦ 89◦ to 91◦
Typical integration time 1.7 s /spectrum 2.5–25 s at SZA 90◦ 3–50 s at SZA 90◦
Accumulation 30 spectra/measurement During time required by the sunto move 0.2◦ SZA at SZA 90◦
During time required by sun tomove 0.2◦ SZA at SZA 90◦
Typical shift ±2e−2 nm ±5e−3 nm ±2.5e−3 nmTypical stretch ±4e−3 nm/range ±7.5e−2 nm/range ±1.5e−3 nm/range
everyday. Midnight spectra are recorded everyday for darkcurrent checking. Spectral resolution is measured periodi-cally by monitoring a low-pressure Hg lamp and wheneveran increase in the errors is observed.
Short-term studies and diurnal evolution are carried outwith a third instrument. The ARTIST spectrometer is op-timized for BrO measurements covering the 325–460 nmrange at 0.6 nm resolution FWHM. The detector is a Prince-ton PDA1024 operating at−40◦C controlled by a ST121unit. Light collection is essentially identical to RASAS ex-cept for a narrower Field Of View (FOV). Lower detectornoise and high instrumental stability result in a signal-to-noise 2 times better than the RASAS instrument. The en-trance FOV’s (half angle) are 8.5◦, 6.5◦, and 3.2◦ for EVA,RASAS, and ARTIST, respectively. Instrumental details aresummarised in Table 1.
The UV-Vis spectrometer RASAS has been operating on aroutine basis since late 1998 and ARTIST since 2001. Bothare NDACC (formerly NDSC) -qualified instruments. INTAhas participated in the OHP 1996 (Roscoe et al., 1999) andAndoya 2003 (Vandaele et al., 2005) NDACC intercompari-son exercises.
3.2 Data and settings
Fourteen years of data have been used in the analysis. Dueto a refurbishment of the Izana observatory from 1998 to2003 the spectrometers were installed in a container sepa-rated from the main building. From time to time they suf-fered failures due to power supply interruptions and high dustproduced by the surrounding working machines that reachedthe spectrograph through the nitrogen generator. In October2003 the spectrometers were moved again to the upper floorof the main building tower significantly improving the labo-ratory temperature control and power, resulting in almost nogaps in the data since that date.
NO2 from the scanning EVA spectrometer is retrieved inthe 433–448.5 nm range. The operational RASAS analysismakes use of a larger spectral interval (435–540 nm) for si-multaneous retrieval of NO2 and O3 columns. NO2 from theARTIST is evaluated in the 425–450 nm range. The NO2 ab-sorption cross-sections in the visible are highly structured,Gaussian in shape, with a large number of optically activetransitions with irregular fine structure superimposed, dueto the strong coupling between the ground and first excited
Atmos. Chem. Phys., 8, 1635–1648, 2008 www.atmos-chem-phys.net/8/1635/2008/
M. Gil et al.: NO2 climatology in the subtropics 1639
electronic states (Orphal, 2002). Doppler broadening, dueto thermal motion of the molecules, and pressure broadeningare irrelevant for the retrieval at the spectral resolution usedin our instruments.
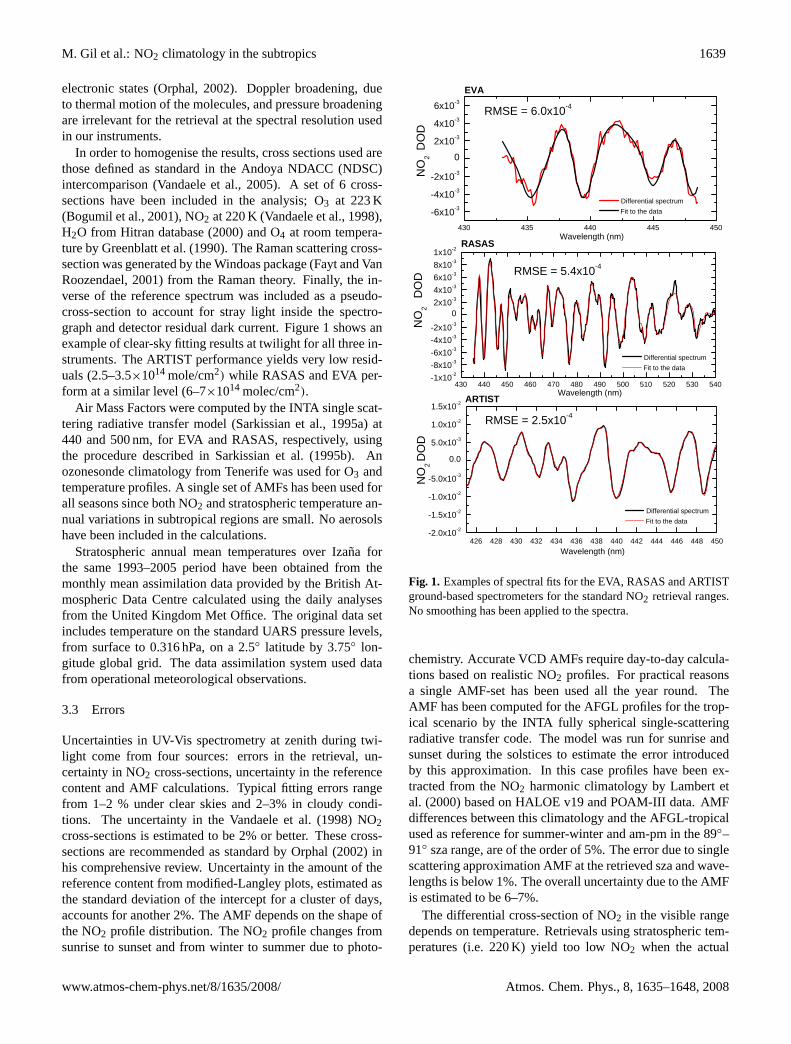
In order to homogenise the results, cross sections used arethose defined as standard in the Andoya NDACC (NDSC)intercomparison (Vandaele et al., 2005). A set of 6 cross-sections have been included in the analysis; O3 at 223 K(Bogumil et al., 2001), NO2 at 220 K (Vandaele et al., 1998),H2O from Hitran database (2000) and O4 at room tempera-ture by Greenblatt et al. (1990). The Raman scattering cross-section was generated by the Windoas package (Fayt and VanRoozendael, 2001) from the Raman theory. Finally, the in-verse of the reference spectrum was included as a pseudo-cross-section to account for stray light inside the spectro-graph and detector residual dark current. Figure 1 shows anexample of clear-sky fitting results at twilight for all three in-struments. The ARTIST performance yields very low resid-uals (2.5–3.5×10¹⁴ mole/cm2) while RASAS and EVA per-form at a similar level (6–7×10¹⁴ molec/cm2).
Air Mass Factors were computed by the INTA single scat-tering radiative transfer model (Sarkissian et al., 1995a) at440 and 500 nm, for EVA and RASAS, respectively, usingthe procedure described in Sarkissian et al. (1995b). Anozonesonde climatology from Tenerife was used for O3 andtemperature profiles. A single set of AMFs has been used forall seasons since both NO2 and stratospheric temperature an-nual variations in subtropical regions are small. No aerosolshave been included in the calculations.
Stratospheric annual mean temperatures over Izana forthe same 1993–2005 period have been obtained from themonthly mean assimilation data provided by the British At-mospheric Data Centre calculated using the daily analysesfrom the United Kingdom Met Office. The original data setincludes temperature on the standard UARS pressure levels,from surface to 0.316 hPa, on a 2.5◦ latitude by 3.75◦ lon-gitude global grid. The data assimilation system used datafrom operational meteorological observations.
3.3 Errors
Uncertainties in UV-Vis spectrometry at zenith during twi-light come from four sources: errors in the retrieval, un-certainty in NO2 cross-sections, uncertainty in the referencecontent and AMF calculations. Typical fitting errors rangefrom 1–2 % under clear skies and 2–3% in cloudy condi-tions. The uncertainty in the Vandaele et al. (1998) NO2cross-sections is estimated to be 2% or better. These cross-sections are recommended as standard by Orphal (2002) inhis comprehensive review. Uncertainty in the amount of thereference content from modified-Langley plots, estimated asthe standard deviation of the intercept for a cluster of days,accounts for another 2%. The AMF depends on the shape ofthe NO2 profile distribution. The NO2 profile changes fromsunrise to sunset and from winter to summer due to photo-
430 440 450 460 470 480 490 500 510 520 530 540-1x10⁻²-8x10⁻³-6x10⁻³-4x10⁻³-2x10⁻³
02x10-34x10-36x10-38x10-31x10-2
426 428 430 432 434 436 438 440 442 444 446 448 450-2.0x10⁻²
-1.5x10⁻²
-1.0x10⁻²
-5.0x10⁻³
0.0
5.0x10⁻³
1.0x10⁻²
1.5x10⁻²
430 435 440 445 450
-6x10⁻³
-4x10⁻³
-2x10⁻³
0
2x10⁻³
4x10⁻³
6x10⁻³
RMSE = 5.4x10⁻⁴
RASAS
Wavelength (nm)
NO
2 D
OD
Differential spectrum Fit to the data
RMSE = 2.5x10⁻⁴
ARTIST
Wavelength (nm)
NO
2 D
OD
Differential spectrum Fit to the data
EVA
Wavelength (nm)
NO
2 D
OD
Differential spectrum Fit to the data
RMSE = 6.0x10⁻⁴
Fig. 1. Examples of spectral fits for the EVA, RASAS and ARTISTground-based spectrometers for the standard NO2 retrieval ranges.No smoothing has been applied to the spectra.
chemistry. Accurate VCD AMFs require day-to-day calcula-tions based on realistic NO2 profiles. For practical reasonsa single AMF-set has been used all the year round. TheAMF has been computed for the AFGL profiles for the trop-ical scenario by the INTA fully spherical single-scatteringradiative transfer code. The model was run for sunrise andsunset during the solstices to estimate the error introducedby this approximation. In this case profiles have been ex-tracted from the NO2 harmonic climatology by Lambert etal. (2000) based on HALOE v19 and POAM-III data. AMFdifferences between this climatology and the AFGL-tropicalused as reference for summer-winter and am-pm in the 89◦–91◦ sza range, are of the order of 5%. The error due to singlescattering approximation AMF at the retrieved sza and wave-lengths is below 1%. The overall uncertainty due to the AMFis estimated to be 6–7%.
The differential cross-section of NO2 in the visible rangedepends on temperature. Retrievals using stratospheric tem-peratures (i.e. 220 K) yield too low NO2 when the actual
www.atmos-chem-phys.net/8/1635/2008/ Atmos. Chem. Phys., 8, 1635–1648, 2008

1640 M. Gil et al.: NO2 climatology in the subtropics
190 200 210 220 230 240 250 260 270 280 290 300-10%
-5%
0%
5%
10%
15%
20%
25%
10
0*(X
S(T
)/XS
(200
K)-
1)
Temperature (K)
y=a+bx+cx2
a= -1.42786b= 0.01716c = -2.78571x10⁻⁵
r2= 1
Fig. 2. Magnitude (in percent) of the errors in the RASAS spectralrange if temperatures are different from 220 K, based on Vandaeleet al. (1998) cross sections.
temperature is higher. Figure 2 shows the magnitude of theerror as a function of the effective temperature of the atmo-sphere for the 435–540 nm spectral range based on the Van-daele et al. (1998) cross-sections. The NO2 effective temper-ature at a given sza can be defined as the mean temperature ofthe atmosphere weighted by the NO2 concentration at eachlayer contributing to the total observed rays in the same wayas the O3 effective temperature (Bernhard et al., 2005):
Teff (sza) =
∫ top0 NO2(z) · WF(sza, z) · T (z)dz∫ top
0 NO2(z) · WF(sza, z)dz(7)
where WF(sza,z) are the normalized weighting functions foreach altitude. Since the altitude of the maximum scattering isstrongly dependent on the sza during twilight a large changein the NO2 effective temperature is observed at high sza(Fig. 3). If a unique NO2 cross-section is used during the dayan underestimation of 10 to 13% occurs at noon due to thiseffect. Except for the investigation of the diurnal variation,only spectra at around 90◦ sza have been used in this work.Under these conditions, the NO2 effective temperature essen-tially matches the cross-section temperature (220 K). About±1–2% error can be produced due to changes in the NO2 ef-fective temperature at twilight during the year, which is notcorrected in the presented data.
The FOV of the instrument also has an impact on the re-trieved columns. The observed spectrum results from the in-tegration of rays of different directions within the FOV, whilethe column is referred to an ideal pure zenith line. We candefine an effective path,R, dependent on the semi FOV (α)
as:
R =secα − 1
ln(secα)(8)
For the FOV’s used in our instrumentsR is less than 1%larger than the pure vertical or, in other words, we expect an
50 55 60 65 70 75 80 85 90 95210
215
220
225
230
235
240
245
250
255
260
265
Effe
ctiv
e te
mpe
ratu
re (K
)
Solar Zenith Angle (deg)
AFGL-Tropical
Summer
Winter
Tenerife
Fig. 3. Effective temperatures above Izana for the solstices from aradiosonde climatology and the AFGL tropical model.
underestimation of the column of less than 1% due to thiseffect. The overall uncertainty in the data considering allmentioned effects is estimated to be 12–14%
3.4 Homogenization of the dataset
In order to minimise the impact of the switch from scanninginstrument (EVA) to PDA-based spectrograph (RASAS) onthe data record, both instruments have been kept in paralleloperation at Izana for an extended time period. In Fig. 4athe VCDs from EVA and RASAS are shown for the twi-light mean between 89◦ and 91◦ for the overlapping years2000 and 2001. Cross-correlation shows no deviation fromunity in the slope (Fig. 4b), the standard deviation being1.6×1014 molec/cm2. When distinguishing between a.m.and p.m. data the slope changes slightly to 0.96 and 1.03,respectively. As a consequence of the excellent overlap be-tween instruments, a complete 1993–2006 NO2 record wascreated without the use of any kind of correction factors.
4 SLIMCAT 3-D model
SLIMCAT is an off-line 3-D chemical transport model(CTM) described in detail by Chipperfield (1999) and Chip-perfield (2006). The model has been used in many studiesof stratospheric chemistry and has been shown to performwell (e.g. Feng et al., 2006). The model contains a gas-phasestratospheric chemistry scheme along with a treatment of het-erogeneous chemistry on liquid aerosols and liquid/solid po-lar stratospheric clouds (PSCs). Horizontal winds and tem-peratures are specified using meteorological analyses (e.g.from European Centre for Medium-Range Weather Forecasts(ECMWF)) while vertical transport in the stratosphere is di-agnosed from calculated heating rates.
Atmos. Chem. Phys., 8, 1635–1648, 2008 www.atmos-chem-phys.net/8/1635/2008/

M. Gil et al.: NO2 climatology in the subtropics 1641
0
1x10¹⁵
2x10¹⁵
3x10¹⁵
4x10¹⁵
5x10¹⁵
6x10¹⁵
1x10¹⁵ 2x10¹⁵ 3x10¹⁵ 4x10¹⁵ 5x10151.0x1015
1.5x10¹⁵
2.0x10¹⁵
2.5x10¹⁵
3.0x10¹⁵
3.5x10¹⁵
4.0x10¹⁵
4.5x10¹⁵
5.0x10¹⁵
5.5x10¹⁵
RA
SA
S-P
DA
(mol
ec/c
m2 )
EVA-Scanning (molec/cm2)
r = 0.98slope =0.997Sd = 1.64x10¹⁴ molec/cm2
J F M A M J J A S O N DJ F M A M J J A S O N D
2001
NO
2 VC
D (m
ol/c
m2 )
EVA RASAS
2000
am
pm
Fig. 4. EVA and RASAS NO2 VCD for the years 2000–2001(a)and cross-correlation(b).
In this study the model was run at a resolution of7.5◦
×7.5◦ with 24 hybridσ−θ levels from the surface to ap-proximately 60 km. Two runs were performed; the first (runA) was a simulation with free-running chemistry. The modelwas integrated from 1977 until 2006 using ECMWF analyses(ERA-40 up to 2001, then operational). Chemical boundaryconditions were applied by specifying surface mixing ratiosof source gases based on past observations (WMO, 2003). Inthis run the distribution of chemical species is therefore de-termined by the modelled chemistry and transport. A secondmodel run (run B) was performed which included chemicaldata assimilation. Run B started in 1991 (initialised from runA) but with assimilation of HALOE O3, CH4, H2O and HCl.The method of chemical data assimilation used in this modelis described in Chipperfield et al. (2002) and uses the sequen-tial technique of Khattatov et al. (2000) along with preserva-tion of model-predicted tracer-tracer correlations. In effect,the assimilation of the long-lived tracer CH4 constrains all ofthe modelled long-lived tracers and serves to correct errors inthe modelled transport (as provided by the forcing analyses).
Model output was saved every 2 days (at 00:00 UT) in-terpolated to the location of Tenerife. A stacked chemical
- Page 12, column 2, line: 53. Page numbers from reference should be: 6-8 - Page 13, column 1, line: 37 Last access reference should be 2008 - Page 13, column 2, line 33 - Page 14, column 2, first reference should be: “…..Atmos. Chem. Phys., 7, 3261-3284, 2007” - Page 14, column 2, line 24, last reference should be: “… Proc. Quadrennial Ozone Symposium, 1055, 1-8 June 2004, Kos, Greece, 2004.” - Figure 5 should be changed by:
355.2 355.3 355.4 355.5 355.6 355.7 355.80.0
5.0x10¹⁴
1.0x10¹⁵
1.5x10¹⁵
2.0x10¹⁵
2.5x10¹⁵
3.0x10¹⁵
3.5x10¹⁵
4.0x10¹⁵
4.5x10¹⁵
5.0x10¹⁵
5.5x10¹⁵
6.0x10¹⁵
Off-axis gaps
Izaña data NO2 VCD day 355/2004
Observations
90ºpm
90ºam
ref (sza=70 pm) = 6x10¹⁵ molec/cm2
Box Model SLIMCAT(+ offset 3x10¹⁴ molec/cm2)
NO
2 VC
D (m
olec
/cm
2 )
Day
Fig. 5. NO2 VCD during a day (red squares) versus output from theSLIMCAT photochemical box model.
box model was then run to obtain model output at the correcttime of day for comparison with the observations (sunriseand sunset at 90◦ sza).
5 Results
5.1 Diurnal variations
Although optimized for twilight observations, DOAS visiblespectroscopy can be used to study the diurnal evolution ofthe NO2 in unpolluted environments. Measurements at lowSZA are challenging since they are highly sensitive to instru-mental noise, accuracy in air mass factors and atmosphericconditions. Additionally, the impact of the uncertainty in thereference content to the VCD, which is small at twilight, in-creases at low SZA since measured SCD approach zero to-wards noon. A wrong estimation of the absorber content inthe reference results in a strong diurnal variation with eithertoo large an increase (excess) or too low (defect of referencecontent).
For these reasons we have selected days with extremelylow aerosol content resulting in very large signal to noise ra-tio. In Fig. 5 an example is shown for winter solstice. Thediurnal variation has been constrained by considering that,once the day conditions are established, NO2 VCD increaseslinearly during the day, between 80◦ morning and evening,essentially due to photodissociation of N2O5 (Solomon et al.,1986). A value of 6×10¹⁵ molec cm−2 in the reference con-tent (sza=70◦ p.m.) is obtained in this way. Measurementsstart at sza of 93.3◦ a.m. and end at 93.6◦ p.m. when the skyillumination is too low. Data gaps between 65◦ and 70◦ ina.m. and p.m. are due to the instrument scheduling configu-ration for off-axis measurements. The diurnal cycle has beensimulated for the same day and latitude by vertically inte-grating in 1-min steps the output profile of a photochemicalbox model derived from the SLIMCAT 3D CTM (Denis etal., 2005). A fixed offset of 3×10¹⁴ molec cm−2 is added
www.atmos-chem-phys.net/8/1635/2008/ Atmos. Chem. Phys., 8, 1635–1648, 2008

1642 M. Gil et al.: NO2 climatology in the subtropics
2x10¹⁵
3x10¹⁵
4x10¹⁵
5x10¹⁵
Izaña
NO
2 VC
D (m
olec
/cm
2 )
Observations1994-2005 mean
8
10
12
14
16
Month
Hours of light ( 30 km)
pm
J F M A M J J A S O N D10
12
14
16
18
20
22
am
Fig. 6. Climatological seasonal waves for a.m. and p.m. data (bluelines). Gray error bars represent one standard deviation. The redcurves show hours of available sunlight at 30 km on two differentscales to show departures from pure photochemical equilibrium.Black lines are the result of the fit of primary and secondary waves(see text).
to the model data to fit the observations. Other tested daysprovide similar results although these kind of observationsare restricted to winter period when days of extremely lowaerosol optical depths (AOD<0.03 at 500 nm) occur. Thegood agreement in the diurnal behaviour provides observa-tional evidence of the accuracy of the model NOy chemistryat low latitudes.
5.2 Seasonal variability
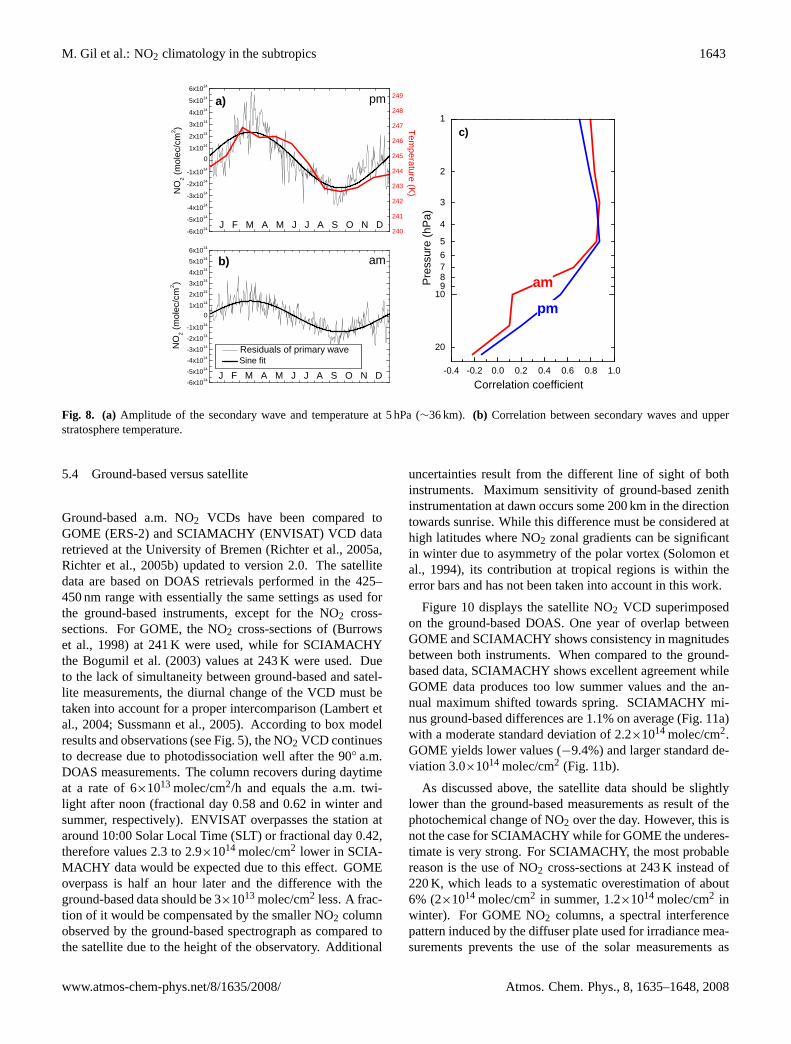
The climatological seasonal wave has been obtained bytaking the mean for each day of all the years consid-ered (Fig. 6). Mean annual values are of 2.51×10¹⁵ and3.79×1015 molec cm−2 for a.m. and p.m., respectively. Al-though strongly modulated by photochemistry through thenumber of sunlit hours in the stratosphere, a spring-autumnasymmetry occurs. The maximum departure from pure pho-tochemical control takes place at 13–13.5 h of light (March–October) (Fig. 7). The asymmetry can be described by a sec-ondary wave which is phase-shifted by 3 months with re-spect to the primary one, having an amplitude of 2.8×10¹⁴
and 4.5×10¹⁴ molec cm−2 for the a.m. and p.m. data, respec-tively. A relative contribution to the VCD of about 6% duringthe equinoxes (Fig. 8a) results in a shifting of the NO2 VCDmaximum/minimum toward spring/autumn. The secondarywave has been found to be highly correlated to the tempera-ture in the upper stratosphere. The sign of the correlation isopposite to that expected from an artefact resulting from tem-perature changes not treated in the retrieval. Figure 8b dis-plays the correlation between the NO2 secondary wave con-tribution to the VCD and the mean temperature from UKMOfor the same time period (1993–2006), showing how the ob-served modulation is dominated by the layer above 5 hPa
1.5x10¹⁵ 2.0x10¹⁵ 2.5x10¹⁵ 3.0x10¹⁵ 3.5x10¹⁵ 4.0x10¹⁵ 4.5x10¹⁵ 5.0x10¹⁵
11
12
13
14
15
Spring
Autumn
Spring
pm
Num
ber o
f hou
rs o
f lig
ht (3
0 km
)
NO2 VCD
am
Autum
n
Fig. 7. The NO2 VCD versus hours of available sunlight at 30 kmshowing a spring-autumn asymmetry.
(∼36 km) where the correlation coefficient is over 0.85. Thechange in NO2 due to temperature can be estimated for day-time by computing the ratio
NO
NO2≈
JNO2 + k1[O]
k2[O3](9)
where k1 and k2 are the reaction constants ofNO2+O→NO+O2 and NO+O3→NO2+O2, respectively.The ratio NO/NO2 decreases as temperature increasesresulting in an almost linear NO2 increase of 1.5%/K inthe stratosphere forJ , [O] and [O3] typical of a tropicalatmosphere. This corresponds to 6% for the 4 K amplitudeof the temperature wave in the upper stratosphere, in goodagreement with observations.
5.3 Interannual variability
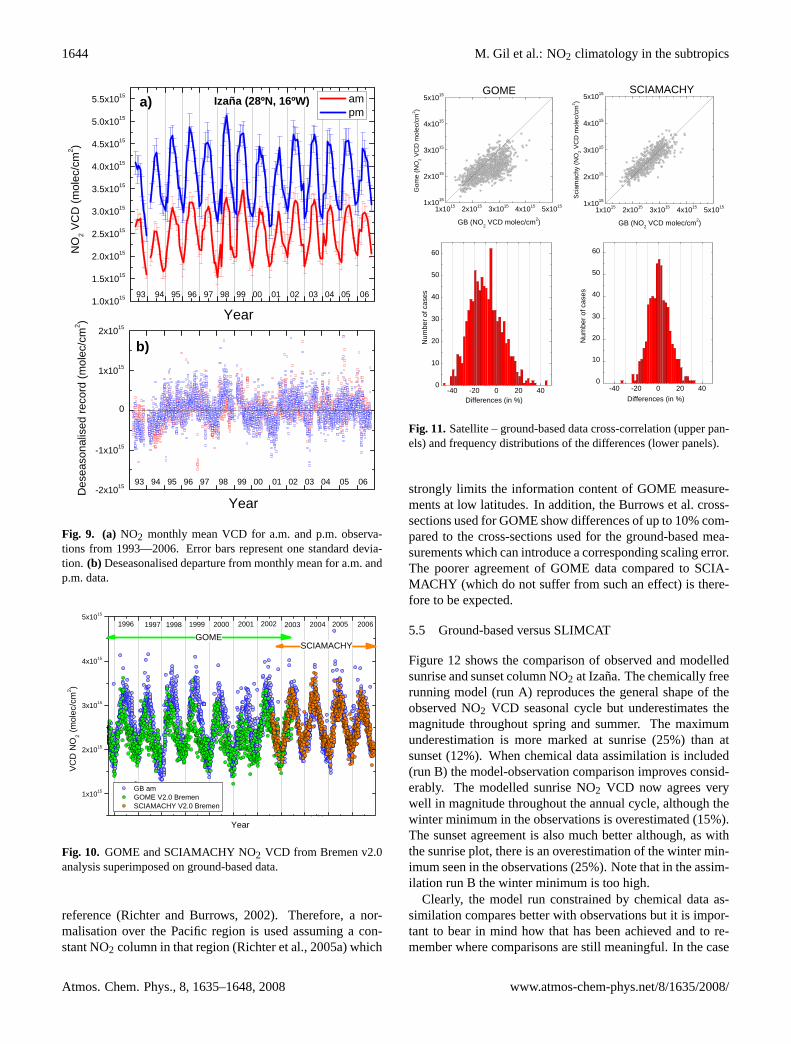
The monthly mean column NO2 data record since 1993 isshown in Fig. 9a. The column displays an increase in the firstyears due to the recovery from stratosphere partial denoxifi-cation after the Mt. Pinatubo eruption in 1991, observed asa general feature in ground-based datasets (Johnston et al.,1992; Koike et al., 1993; Van Roozendael et al., 1997; Lileyet al., 2000). However, other interannual variability can alsobe seen from the observational record. From 2002 onwardsa decrease in the amplitude of the annual wave is observed.Departures from the seasonal mean (Fig. 9b) can be due to anumber of effects such as changes in the meridional compo-nent of dominant winds in the mid stratosphere due to drift-ing in quasi-stationary waves or the QBO, changes in tem-perature, etc. An interpretation of these features requires adetailed knowledge of the dynamics and chemistry of the re-gion and is out of the scope of this work. Trends are notobvious from the figure and in any case are not statisticallysignificant.
Atmos. Chem. Phys., 8, 1635–1648, 2008 www.atmos-chem-phys.net/8/1635/2008/
M. Gil et al.: NO2 climatology in the subtropics 1643
-6x10¹⁴
-5x10¹⁴
-4x10¹⁴
-3x10¹⁴
-2x10¹⁴
-1x10¹⁴
0
1x10¹⁴
2x10¹⁴
3x10¹⁴
4x10¹⁴
5x10¹⁴
6x10¹⁴
-6x10¹⁴
-5x10¹⁴
-4x10¹⁴
-3x10¹⁴
-2x10¹⁴
-1x10¹⁴
0
1x10¹⁴
2x10¹⁴
3x10¹⁴
4x10¹⁴
5x10¹⁴
6x10¹⁴
b)
NO
2 (m
olec
/cm
2 )
Residuals of primary wave Sine fit
am
J F M A M J J A S O N D
NO
2 (m
olec
/cm
2 )
J F M A M J J A S O N D
pma)1
2
3
4
5
6789
10
20
-0.4 -0.2 0.0 0.2 0.4 0.6 0.8 1.0
pm
Correlation coefficient
Pre
ssur
e (h
Pa)
am
c)
240
241
242
243
244
245
246
247
248
249
Tem
perature (K)
Fig. 8. (a) Amplitude of the secondary wave and temperature at 5 hPa (∼36 km). (b) Correlation between secondary waves and upperstratosphere temperature.
5.4 Ground-based versus satellite
Ground-based a.m. NO2 VCDs have been compared toGOME (ERS-2) and SCIAMACHY (ENVISAT) VCD dataretrieved at the University of Bremen (Richter et al., 2005a,Richter et al., 2005b) updated to version 2.0. The satellitedata are based on DOAS retrievals performed in the 425–450 nm range with essentially the same settings as used forthe ground-based instruments, except for the NO2 cross-sections. For GOME, the NO2 cross-sections of (Burrowset al., 1998) at 241 K were used, while for SCIAMACHYthe Bogumil et al. (2003) values at 243 K were used. Dueto the lack of simultaneity between ground-based and satel-lite measurements, the diurnal change of the VCD must betaken into account for a proper intercomparison (Lambert etal., 2004; Sussmann et al., 2005). According to box modelresults and observations (see Fig. 5), the NO2 VCD continuesto decrease due to photodissociation well after the 90◦ a.m.DOAS measurements. The column recovers during daytimeat a rate of 6×10¹³ molec/cm2/h and equals the a.m. twi-light after noon (fractional day 0.58 and 0.62 in winter andsummer, respectively). ENVISAT overpasses the station ataround 10:00 Solar Local Time (SLT) or fractional day 0.42,therefore values 2.3 to 2.9×10¹⁴ molec/cm2 lower in SCIA-MACHY data would be expected due to this effect. GOMEoverpass is half an hour later and the difference with theground-based data should be 3×10¹³ molec/cm2 less. A frac-tion of it would be compensated by the smaller NO2 columnobserved by the ground-based spectrograph as compared tothe satellite due to the height of the observatory. Additional
uncertainties result from the different line of sight of bothinstruments. Maximum sensitivity of ground-based zenithinstrumentation at dawn occurs some 200 km in the directiontowards sunrise. While this difference must be considered athigh latitudes where NO2 zonal gradients can be significantin winter due to asymmetry of the polar vortex (Solomon etal., 1994), its contribution at tropical regions is within theerror bars and has not been taken into account in this work.
Figure 10 displays the satellite NO2 VCD superimposedon the ground-based DOAS. One year of overlap betweenGOME and SCIAMACHY shows consistency in magnitudesbetween both instruments. When compared to the ground-based data, SCIAMACHY shows excellent agreement whileGOME data produces too low summer values and the an-nual maximum shifted towards spring. SCIAMACHY mi-nus ground-based differences are 1.1% on average (Fig. 11a)with a moderate standard deviation of 2.2×10¹⁴ molec/cm2.GOME yields lower values (−9.4%) and larger standard de-viation 3.0×10¹⁴ molec/cm2 (Fig. 11b).
As discussed above, the satellite data should be slightlylower than the ground-based measurements as result of thephotochemical change of NO2 over the day. However, this isnot the case for SCIAMACHY while for GOME the underes-timate is very strong. For SCIAMACHY, the most probablereason is the use of NO2 cross-sections at 243 K instead of220 K, which leads to a systematic overestimation of about6% (2×10¹⁴ molec/cm2 in summer, 1.2×10¹⁴ molec/cm2 inwinter). For GOME NO2 columns, a spectral interferencepattern induced by the diffuser plate used for irradiance mea-surements prevents the use of the solar measurements as
www.atmos-chem-phys.net/8/1635/2008/ Atmos. Chem. Phys., 8, 1635–1648, 2008
1644 M. Gil et al.: NO2 climatology in the subtropics
1.0x10¹⁵
1.5x10¹⁵
2.0x10¹⁵
2.5x10¹⁵
3.0x10¹⁵
3.5x10¹⁵
4.0x10¹⁵
4.5x10¹⁵
5.0x10¹⁵
5.5x10¹⁵
-2x10¹⁵
-1x10¹⁵
0
1x10¹⁵
2x10¹⁵
93 94 95 96 97 98 99 00 01 02 03 04 05 06
Year
N
O2 V
CD
(mol
ec/c
m2 )
am pm
93 94 95 96 97 98 99 00 01 02 03 04 05 06
Izaña (28ºN, 16ºW)a)
b)
Des
easo
nalis
ed re
cord
(mol
ec/c
m2 )
Year
Fig. 9. (a) NO2 monthly mean VCD for a.m. and p.m. observa-tions from 1993—2006. Error bars represent one standard devia-tion. (b) Deseasonalised departure from monthly mean for a.m. andp.m. data.
1x10¹⁵
2x10¹⁵
3x10¹⁵
4x10¹⁵
5x10¹⁵
GB am GOME V2.0 Bremen SCIAMACHY V2.0 Bremen
Year
20062005200420032002200120001999199819971996
VC
D N
O2 (m
olec
/cm
2 )
GOMESCIAMACHY
Fig. 10. GOME and SCIAMACHY NO2 VCD from Bremen v2.0analysis superimposed on ground-based data.
reference (Richter and Burrows, 2002). Therefore, a nor-malisation over the Pacific region is used assuming a con-stant NO2 column in that region (Richter et al., 2005a) which
-40 -20 0 20 400
10
20
30
40
50
60
-40 -20 0 20 400
10
20
30
40
50
60
1x10¹⁵ 2x10¹⁵ 3x10¹⁵ 4x10¹⁵ 5x10151x1015
2x10¹⁵
3x10¹⁵
4x10¹⁵
5x10¹⁵
Gom
e (N
O2 V
CD
mol
ec/c
m2 )
GB (NO2 VCD molec/cm2)
GOME SCIAMACHY
Differences (in %)
Num
ber o
f cas
es
1x10¹⁵ 2x10¹⁵ 3x10¹⁵ 4x10¹⁵ 5x10151x1015
2x10¹⁵
3x10¹⁵
4x10¹⁵
5x10¹⁵
Sci
amac
hy (N
O2 V
CD
mol
ec/c
m2 )
GB (NO2 VCD molec/cm2)
Differences (in %)
Num
ber o
f cas
es
Fig. 11. Satellite – ground-based data cross-correlation (upper pan-els) and frequency distributions of the differences (lower panels).
strongly limits the information content of GOME measure-ments at low latitudes. In addition, the Burrows et al. cross-sections used for GOME show differences of up to 10% com-pared to the cross-sections used for the ground-based mea-surements which can introduce a corresponding scaling error.The poorer agreement of GOME data compared to SCIA-MACHY (which do not suffer from such an effect) is there-fore to be expected.
5.5 Ground-based versus SLIMCAT
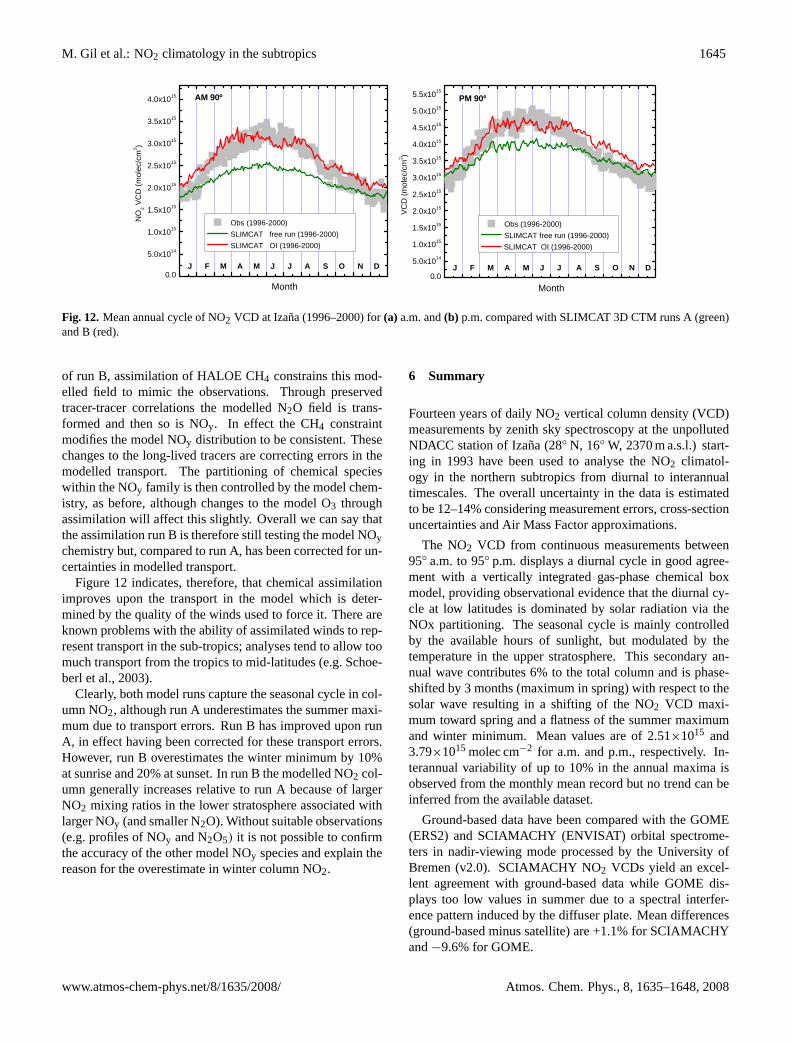
Figure 12 shows the comparison of observed and modelledsunrise and sunset column NO2 at Izana. The chemically freerunning model (run A) reproduces the general shape of theobserved NO2 VCD seasonal cycle but underestimates themagnitude throughout spring and summer. The maximumunderestimation is more marked at sunrise (25%) than atsunset (12%). When chemical data assimilation is included(run B) the model-observation comparison improves consid-erably. The modelled sunrise NO2 VCD now agrees verywell in magnitude throughout the annual cycle, although thewinter minimum in the observations is overestimated (15%).The sunset agreement is also much better although, as withthe sunrise plot, there is an overestimation of the winter min-imum seen in the observations (25%). Note that in the assim-ilation run B the winter minimum is too high.
Clearly, the model run constrained by chemical data as-similation compares better with observations but it is impor-tant to bear in mind how that has been achieved and to re-member where comparisons are still meaningful. In the case
Atmos. Chem. Phys., 8, 1635–1648, 2008 www.atmos-chem-phys.net/8/1635/2008/
M. Gil et al.: NO2 climatology in the subtropics 1645
0.0
5.0x10¹⁴
1.0x10¹⁵
1.5x10¹⁵
2.0x10¹⁵
2.5x10¹⁵
3.0x10¹⁵
3.5x10¹⁵
4.0x10¹⁵
0.0
5.0x10¹⁴
1.0x10¹⁵
1.5x10¹⁵
2.0x10¹⁵
2.5x10¹⁵
3.0x10¹⁵
3.5x10¹⁵
4.0x10¹⁵
4.5x10¹⁵
5.0x10¹⁵
5.5x10¹⁵
Month
NO
2 VC
D (m
olec
/cm
2 )
Obs (1996-2000) SLIMCAT free run (1996-2000) SLIMCAT OI (1996-2000)
J F M A M J J A S O N D
AM 90º
Month
VC
D (m
olec
/cm
2 )
Obs (1996-2000) SLIMCAT free run (1996-2000) SLIMCAT OI (1996-2000)
J F M A M J J A S O N D
PM 90º
Fig. 12. Mean annual cycle of NO2 VCD at Izana (1996–2000) for(a) a.m. and(b) p.m. compared with SLIMCAT 3D CTM runs A (green)and B (red).
of run B, assimilation of HALOE CH4 constrains this mod-elled field to mimic the observations. Through preservedtracer-tracer correlations the modelled N2O field is trans-formed and then so is NOy. In effect the CH4 constraintmodifies the model NOy distribution to be consistent. Thesechanges to the long-lived tracers are correcting errors in themodelled transport. The partitioning of chemical specieswithin the NOy family is then controlled by the model chem-istry, as before, although changes to the model O3 throughassimilation will affect this slightly. Overall we can say thatthe assimilation run B is therefore still testing the model NOychemistry but, compared to run A, has been corrected for un-certainties in modelled transport.
Figure 12 indicates, therefore, that chemical assimilationimproves upon the transport in the model which is deter-mined by the quality of the winds used to force it. There areknown problems with the ability of assimilated winds to rep-resent transport in the sub-tropics; analyses tend to allow toomuch transport from the tropics to mid-latitudes (e.g. Schoe-berl et al., 2003).
Clearly, both model runs capture the seasonal cycle in col-umn NO2, although run A underestimates the summer maxi-mum due to transport errors. Run B has improved upon runA, in effect having been corrected for these transport errors.However, run B overestimates the winter minimum by 10%at sunrise and 20% at sunset. In run B the modelled NO2 col-umn generally increases relative to run A because of largerNO2 mixing ratios in the lower stratosphere associated withlarger NOy (and smaller N2O). Without suitable observations(e.g. profiles of NOy and N2O5) it is not possible to confirmthe accuracy of the other model NOy species and explain thereason for the overestimate in winter column NO2.
6 Summary
Fourteen years of daily NO2 vertical column density (VCD)measurements by zenith sky spectroscopy at the unpollutedNDACC station of Izana (28◦ N, 16◦ W, 2370 m a.s.l.) start-ing in 1993 have been used to analyse the NO2 climatol-ogy in the northern subtropics from diurnal to interannualtimescales. The overall uncertainty in the data is estimatedto be 12–14% considering measurement errors, cross-sectionuncertainties and Air Mass Factor approximations.
The NO2 VCD from continuous measurements between95◦ a.m. to 95◦ p.m. displays a diurnal cycle in good agree-ment with a vertically integrated gas-phase chemical boxmodel, providing observational evidence that the diurnal cy-cle at low latitudes is dominated by solar radiation via theNOx partitioning. The seasonal cycle is mainly controlledby the available hours of sunlight, but modulated by thetemperature in the upper stratosphere. This secondary an-nual wave contributes 6% to the total column and is phase-shifted by 3 months (maximum in spring) with respect to thesolar wave resulting in a shifting of the NO2 VCD maxi-mum toward spring and a flatness of the summer maximumand winter minimum. Mean values are of 2.51×10¹⁵ and3.79×1015 molec cm−2 for a.m. and p.m., respectively. In-terannual variability of up to 10% in the annual maxima isobserved from the monthly mean record but no trend can beinferred from the available dataset.
Ground-based data have been compared with the GOME(ERS2) and SCIAMACHY (ENVISAT) orbital spectrome-ters in nadir-viewing mode processed by the University ofBremen (v2.0). SCIAMACHY NO2 VCDs yield an excel-lent agreement with ground-based data while GOME dis-plays too low values in summer due to a spectral interfer-ence pattern induced by the diffuser plate. Mean differences(ground-based minus satellite) are +1.1% for SCIAMACHYand−9.6% for GOME.
www.atmos-chem-phys.net/8/1635/2008/ Atmos. Chem. Phys., 8, 1635–1648, 2008

1646 M. Gil et al.: NO2 climatology in the subtropics
Additionally, a comparison between data and modellinghas been carried out using long-term output of the SLIM-CAT 3-D CTM. The basic, chemically free running modelrun A, forced by ECMWF (ERA-40) analyses, captures theobserved NO2 annual cycle but significantly underestimatesthe spring/summer maximum. A second model run B, whichassimilated HALOE profiles of CH4 to constrain the modellong-lived tracers, showed much better agreement. This im-provement in modelled column NO2 is likely due to bettermodelled NOy profiles and confirms previously establishedtransport errors in the ECMWF ERA-40 reanalyses. The im-pact of this on CTM studies of long-term trends in NO2 andO3 needs further investigation.
Acknowledgements.The authors want to acknowledge the Izanaoperational team and C. Lopez for the instrument maintenance.C. Fayt and M. Van Roozendael (BIRA/IASB) kindly providedthe WINDOAS package for cross-sections convolution to thefield instruments. J. C. Lambert (BIRA/IASB) provided the NO2climatology based on satellite used in the SLIMCAT box modeladapted by L. Denis and H. Roscoe (BAS). Upper temperature datawere collected from the British Atmospheric Data Centre. Routinemeasurements have been possible thanks to the funding providedby the projects QUILT (EU EVK2-CT2000-0059) SCOUT-O3 (EU505390-GOCE-CT-2004), TROMPETA (MCyT CGL2004-03669)and is on-going through GEOMON (EU FP6-2005-Global-4-036677).
Edited by: V. F. McNeill
References
Bernhard, G., Evans, R. D., Labow, G. J., and Oltmans, S.J.: Bias in Dobson total ozone measurements at high lati-tudes due to approximations in calculations of ozone absorp-tion coefficients and air mass, J. Geophys. Res., 110, D10305,doi:10.1029/2004JD005559, 2005.
Bovensmann, H., Burrows, J. P., Buchwitz, M., Frerick, J., Noel,S., Rozanov, V. V., Chance, K. V., and Goede, A. H. P.: SCIA-MACHY – Mission objectives and measurement modes, J. At-mos. Sci., 56(2), 127–150, 1999.
Bogumil, K., Orphal, J., Flaud, J.-M., and Burrows, J.-P.: Vibra-tional progressions in the visible and near ultraviolet absorptionspectrum of ozone, Chem. Phys. Lett., 349, 241–248, 2001.
Bogumil, K., Orphal, J., Homann, T., Voigt, S., Spietz, P., Fleis-chmann, O. C., Vogel, A., Hartmann, M., Bovensmann, H., Fr-erick, J., and Burrows, J. P.: Measurements of molecular ab-sorption spectra with the SCIAMACHY pre-flight model: Instru-ment characterization and reference data for atmospheric remote-sensing in the 230–2380 nm region, J. Photoch. Photobio. A, 157,167–184, 2003.
Brewer, A. W., McElroy C. T., and Kerr, J. B.: Nitrogen dioxideconcentration in the atmosphere, Nature, 246, 129–133, 1973.
Burrows, J. P., Dehn, A., Deters, B., Himmelmann, S., Richter,A., Voigt, S., and Orphal, J.: Atmospheric remote-sensing refer-ence data from GOME: Part 1. Temperature-dependent absorp-tion cross-sections of NO2 in the 231–794 nm range, J. Quant.Spectrosc. Ra., 60, 1025–1031, 1998.
Chipperfield, M. P.: Multiannual simulations with a three-dimensional chemical transport model, J. Geophys. Res., 104,1781–1805, 1999.
Chipperfield, M. P., Khattatov, B. V., and Lary, D. J.: Se-quential assimilation of stratospheric chemical observationsin a three-dimensional model, J. Geophys. Res. 107, 4585,doi:10.1029/2002JD002110, 2002.
Chipperfield, M. P.: New Version of the TOMCAT/SLIMCAT Off-Line Chemical Transport Model: Intercomparison of Strato-spheric Tracer Experiments, Q. J. Roy Meteor. Soc., 132, 1179–1203, doi:10.1256/qj.05.51, 2006.
Denis, L., Roscoe, H. K., Chipperfield, M. P., Van Roozendael, M.,and Goutail, F.: A new software suite for NO2 vertical profileretrieval from ground-based zenith-sky spectrometers, J. Quant.Spectrosc. Ra., 92, 3, 321–333, 2005.
Dobber, M. R., Dirksen, R., Voors, R., Mount, G. H., and Levelt,P.: Ground-based zenith sky abundances and in situ gas crosssections for ozone and nitrogen dioxide with the Earth ObservingSystem Aura Ozone Monitoring Instrument, Appl. Optics, 44,2846–2856, 2005.
ESA (European Space Agency): GOME Global Ozone MeasuringExperiment Users Manual, ESA SP-1182, ESA/ESTEC, Noord-wijk, 1995.
Fayt, C. and Van Roozendael, M.: WinDOAS 2.1. User Manual,IASB-BIRA, 2001.
Feng, W., Chipperfield, M. P., Dorf, M., Pfeilsticker, K., and Ri-caud, P.: Mid-latitude Ozone Changes: Studies with a 3-D CTMForced by ERA-40 Analyses, Atmos. Chem. Phys., 7, 2357–2369, 2007,http://www.atmos-chem-phys.net/7/2357/2007/.
Greenblatt, G. D., Orlando, J. J., Burkholder, J. B., and Ravis-hankara, A. R.: Absorption Measurements of Oxygen Between330 and 1140 nm, J. Geophys. Res., 95, 18 577–18 581, 1990.
Hendrick, F., Van Roozendael, M., Lambert, J.-C., and de Maziere,M.: Validation of MIPAS NO2 profiles and columns usingground-based zenith-sky UV-visible observations, Geophys. Res.Abstr., 6, 10-2-2004, EGU 2004.
Johnston, P. V., McKenzie, R. L., Keys, J. G., and Matthews, W.A.: Observations of depleted stratospheric NO2 following thePinatubo volcanic eruption, Geophys. Res. Lett., 19, 211–213,1992.
Khattatov, B. V., Lamarque, J. F., Lvjak, L. V., Menard, R., Lev-elt, P., Tie, X. X., Brasseur, G. P., and Gille, J. C.: Assim-ilation of satellite observations of long-lived chemical speciesin global chemistry transport models, J. Geophys. Res., 105,29 135–29 144, 2000.
Koike, M., Kondo, Y., Matthews, W. A., Johnston, P. V., and Ya-mazaki, K.: Decrease of stratospheric NO2 at 44◦ N caused byPinatubo Volcanic aerosols, Geophys. Res. Lett., 20, 1975–1978,1993.
Lambert, J.-C., Van Roozendael, M., Simon, P. C., De Maziere,M., Pommereau, J.-P., Goutail, F., and Sarkissian, A.: Pole-to-pole validation of GOME level-2 products with ground-basednetworks, Earth Observation Quarterly, 58, 6–8, 1998.
Lambert, J.-C., Granville, J., Van Roozendael, M., Muller, J.-F.,Goutail, F., Pommereau, J.-P., Sarkissian, A., Johnston, P. V.,and Russell III, J. M.: Global Behavior of Atmospheric NO2as Derived from the Integrated Use of Satellite, Ground-basedNetwork and Balloon Observations, Atmospheric Ozone, XIX
Atmos. Chem. Phys., 8, 1635–1648, 2008 www.atmos-chem-phys.net/8/1635/2008/
M. Gil et al.: NO2 climatology in the subtropics 1647
Quadrennial Ozone Symposium, Sapporo, Hokkaido, Japan, 3–8July 2000.
Lambert, J.-C., Blumenstock, T., Boersma, F., Bracher, A., DeMaziere, M., Demoulin, P., De Smedt, I., Eskes, H., Gil, M.,Goutail, Granville, J., F., Hendrick, F., Ionov, D. V., Johnston,P. V., Kostadinov, I., Kreher, K., Kyro, E., Martin, R., Meier,A., Navarro-Comas, M., Petritoli, A., Pommereau, J.-P., Richter,A., Roscoe, H. K., Sioris, C., Sussmann, R., Van Roozendael,M., Wagner, T., Wood, S., and Yela, M.: Geophysical vali-dation of SCIAMACHY NO2 vertical columns: overview ofearly 2004 results, Proc. of the Second Workshop on the At-mospheric Chemistry Validation of ENVISAT (ACVE-2), ESAESRIN, Frascati, Italy, 3–7 May 2004, ESA SP-562, 2004.
Lambert, J.-C., Granville, J., Hendrick, F., Andersen, S. B.,Dorokhov, V., Gerard, P., Gil, M., Goutail, F., Gruzdev, A. N.,Held, G., Ionov, D. V., Johnston, P. V., Kostadinov, I., Kreher,K., Kyro, E., Lerot, C., Leveau, J., Navarro-Comas, M., Petritoli,A., Pommereau, J.-P., Richter, A., Roscoe, H. K., Semenov, V.K., Stebel, K., Van Roozendael, M., Vaughan, G., Wagner, T.,Wittrock, F., and Yela, M.: Transfer of GOME Data Processor(GDP) version 4.0 to SCIAMACHY Off-line (OL) processor ver-sion 3.0: Pole-to-pole delta-validation of NO2 column data withthe NDACC/UV-Visible network, Proc. of the Third Workshopon the Atmospheric Chemistry Validation of Envisat (ACVE-3),ESA SP-642, 2007.
Lee, A. M., Roscoe, H. K., Oldham, D. J., Squires, J. A. C.,Sarkissian A., and Pommereau, J.-.P.: Improvements to the ac-curacy of measurements of NO2 by zenith-sky visible spectrom-eters, J. Quant. Spectrosc. Ra., 52, 5, 649–657, 1994.
Liley, J. B., Johnston, P. V., McKenzie, R. L., Thomas, A. J., andBoyd, I. S.: Stratospheric NO2 variations from a long time se-ries at Lauder, New Zealand, J. Geophys. Res., 105(D9), 11 633–11 640, doi:10.1029/1999JD901157, 2000.
Minschwaner, K., Salawitch, R., and McElroy, M.: Absorption ofsolar radiation by O2: Implications for O3 and lifetimes of N2O,CFCl3 and CF2Cl2, J. Geophys. Res., 98, 10 543–10 561, 1993.
NDACC: http://www.ndsc.ncep.noaa.gov/, last access: March2008, 2007.
Noxon, J. F.: Nitrogen Dioxide in the stratosphere and tropospheremeasured by ground-based absorption spectroscopy, Science,189, 547–549, 1975.
Orphal, J. A.: Critical Review of the Absorption Cross-Sections ofO3 and NO2 in the 240–790 nm Region, Part 2. Nitrogen Diox-ide, ESA Technical Note MO-TN-ESA-GO-0302, 2002.
Piters, A. J. M., Bramstedt, K., Lambert, J.-C., and Kirchhoff,B.: Overview of SCIAMACHY validation: 2002–2004, Atmos.Chem. Phys., 6, 127–148, 2006,http://www.atmos-chem-phys.net/6/127/2006/.
Richter, A. and Burrows, J. P.: Retrieval of Tropospheric NO2 fromGOME Measurements, Adv. Space Res., 29(11), 1673–1683,2002.
Richter, A., Wittrock, F., Weber, M., Beirle, S., Kuhl, S., Platt, U.,Wagner, T., Wilms-Grabe, W., and Burrows, J. P.: GOME obser-vations of stratospheric trace gas distributions during the splittingvortex event in the Antarctic winter 2002 Part I: Measurements,J. Atmos. Sci., 62(3), 778–785, 2005a.
Richter, A., Burrows, J. P., Nuß, H., Granier, C., and Niemeier, U.:Increase in tropospheric nitrogen dioxide over China observedfrom space, Nature, 437, 129–132, doi:10.1038/nature04092,
2005b.Richter, A., Kreher, K., Johnston, P. V., Wittrock, F., and Burrows,
J. P.: Validation of GOME O3, NO2, BrO, and OClO Measure-ments in Southern High Latitudes, Procc. of the Fifth EuropeanWorkshop on Stratospheric Ozone, European Commission, AirPollution research report 73, 719–722, 2000.
Richter, A., Burrows, J. P., Fietkau, S., Medeke, T., Notholt, J.,Oetjen, H., Sierk, B., Warneke, T., Wittrock, F., Dix, B., Friess,U., Wagner, T., Blumenstock, T., Griesfeller, A., Sussmann,R., Rockmann, A., and Schultz, A.: A Scientific NO2 productfrom Sciamachy: First Results and validation. Proc. of the Sec-ond Workshop on the Atmospheric Chemistry Validation of EN-VISAT (ACVE-2), ESA ESRIN, Frascati, Italy, 3–7 May 2004,ESA SP-562, 2004.
Rinsland, C. P., Weisenstein, D. K., Ko, M. K. W., Scott, C. J.,Chiou, L. S., Mahieu, E., Zander, R., and Demoulin, P.: Post-Mount Pinatubo eruption ground-based infrared stratosphericcolumn measurements of HNO3, NO, and NO2 and their com-parison with model calculations, J. Geophys. Res., 108(D15),4437, doi:10.1029/2002JD002965, 2003.
Roscoe, H. K., Johnston, P. V., Van Roozendael, M., Richter, A.,Sarkissian, A., Roscoe, J., Preston, K. E., Lambert, J. C., Her-mans, C., Decuyper, W., Dzienus, S., Winterrath, T., Burrows,J., Goutail, F., Pommereau, J. P., D’Almeida, E., Hottier, J.,Coureul, C., Didier, R., Pundt, I., Bartlett, L. M., McElroy, C.T., Kerr, J. E., Elokhov, A., Giovanelli, G., Ravegnani, F., Pre-muda, M., Kostadinov, I., Erle, F., Wagner, T., Pfeilsticker, K.,Kenntner, M., Marquard, L. C., Gil, M., Puentedura, O., Yela,M., Arlander, D. W., Kastad Hoiskar, B. A., Tellefsen, C. W.,Karlsen Tornqvist, K., Heese, B., Jones, R. L., Aliwell, S. R.,and Freshwater, R. A.: Slant column measurements of O3 andNO2 during the NDSC intercomparison of zenith-sky UV-visiblespectrometers in june 1996, J. Atmos. Chem., 32, 281–314, 1999.
SAOZ: http://www.aero.jussieu.fr/themes/CA/ReseauSAOZ.html,2007.
Sarkissian, A., Fish, D., Van Roozendael, M., Gil, M., Chen, H. B.,Wang, P., Pommereau, J. P., and Lenoble, J.: Ozone and NO2air-mass factors for zenith-sky spectrometers: Intercomparisonof calculations with different radiative transfer models, Geophys.Res. Lett., 22, 1113–1116, 1995a.
Sarkissian, A., Roscoe, H. K., and Fish, D.: Ozone measurementsby zenith-sky spectrometers: an evaluation of errors in air-massfactors calculated by radiative transfer models, J. Quant. Spec-trosc. Ra., 54, 471–480, 1995b.
Schneider, M., Blumenstock, T., Chipperfield, M. P., Hase, F.,Kouker, W., Reddmann, T., Ruhnke, R., Cuevas, E., and Fischer,H.: Subtropical trace gas profiles determined by ground-basedFTIR spectroscopy at Izana (28◦ N, 16◦ W): Five-year record,error analysis, and comparison with 3-D CTMs, Atmos. Chem.,Phys., 5, 153–167, 2005.
Solomon, S., Russell III, J. M., and Gordley, L. L.: Observations ofthe diurnal variation of Nitrogen dioxide in the stratosphere, J.Geophys. Res., 91(D5), 5455–5464, 1986.
Solomon, S., Schmeltekopft, A. L., and Sanders, R. W.: On the in-terpretation of zenith sky absorption measurements, J. Geophys.Res., 92(D7), 8311–8319, 1987.
Solomon, S., Sanders, R. W., Jakoubek, R. O., Arpag, K. H.,Stephens, S. L., Keys, J. G., and Garcia, R. R.: Visible and near-ultraviolet spectroscopy at McMurdo Station, Antarctica. 10. Re-
www.atmos-chem-phys.net/8/1635/2008/ Atmos. Chem. Phys., 8, 1635–1648, 2008

1648 M. Gil et al.: NO2 climatology in the subtropics
ductions of statospheric NO2 due to Pinatubo aerosols, J. Geo-phys. Res., 99(D2), 3509–3516, 1994.
Struthers, H., Kreher, K., Austin, J., Schonfield, R., Bodecker, G.,Johnston, P., Shiona, H., and Thomas, A.: Past and future suimu-lations of NO2 from a coupled chemistry-climate model in com-parison with observations, Atmos. Chem. Phys., 4, 2227–2239,2004,http://www.atmos-chem-phys.net/4/2227/2004/.
Sussmann, R., Stremme, W., Burrows, J. P., Richter, A., Seiler,W., and Rettinger, M.: Stratospheric and tropospheric NO2 vari-ability on the diurnal and annual scale: a combined retrievalfrom ENVISAT/SCIAMACHY and solar FTIR at the PermanentGround-Truthing Facility Zugspitze/Garmisch, Atmos. Chem.Phys., 5, 2657–2677, 2005,http://www.atmos-chem-phys.net/5/2657/2005/.
Van Roozendael, M., De Maziere, M., Hermans, C., Simon, P.C., Pommereau, J.-P., Goutail, F., Tie, X.X., Brasseur, G., andGranier, C.: Ground-Based observations of stratospheric NO2 athigh and mid-latitudes in Europe after the Mount Pinatubo erup-tion, J. Geophys Res., 102(D15), 19 171–19 176, 1997.
Vandaele, A. C., Hermans, C., Simon, P .C., Carleer, M., Colins,R., Fally, S., Merienne, M. F., Jenouvrier, A., and Coquart, B.:Measurements of the NO2 absorption cross-sections from 42000cm−1 to 10000 cm−1 (238–1000 nm) at 220 K and 294 K, J.Quant. Spectrosc. Radiat. Transfer, 59, 171–184, 1998.
Vandaele, A. C., Fayt, C., Hendrick, F., Hermans, C., Humbled,F., Van Roozendael, M., Gil, M., Navarro, M., Puentedura, O.,Yela, M., Braathen, G., Stebel, K., Tørnkvist, K., Johnston, P.,Kreher, K., Goutail, F., Mieville, A., Pommereau, J.-P., Khaikine,S., Richter, A., Oetjen, H., Wittrock, F., Bugarski, S., Friess, U.,Pfeilsticker, K., Sinreich, R., Wagner, T., Corlett, G., and Leigh,R.: An intercomparison campaign of ground-based UV-Visiblemeasurements of NO2, BrO, and OClO slant columns. I. NO2, J.Geophys. Res., 110(D8), D08305, doi:10.1029/2004JD005423,2005.
Wetzel, G., Bracher, A., Funke, B., Goutail, F., Hendrick, F., Lam-bert, J.-C., Mikuteit, S., Piccolo, C., Pirre, M., Bazureau, A., Be-lotti, C., Blumenstock, T., De Maziere, M., Fischer, H., Huret,N., Ionov, D., Lopez-Puertas, M., Maucher, G., Oelhaf, H.,Pommereau, J.-P., Ruhnke, R., Sinnhuber, M., Stiller, G., VanRoozendael, M., and Zhang, G.: Validation of MIPAS-ENVISATNO2 operational data, Atmos. Chem. Phys., 7, 3261–3284, 2007,http://www.atmos-chem-phys.net/7/3261/2007/.
WMO (World Meteorological Organization): Scientific Assessmentof Ozone Depletion, 2002, Global Ozone Research and Monitor-ing Project, Report No. 47, 2003.
WMO (World Meteorological Organization): Scientific Assessmentof Ozone Depletion: 2006, Global Ozone Research and Monitor-ing Project, Report No. 50, 2007.
Yela, M., Gil, M., Navarro, M., Rodriguez, S., Cuevas E., andRomero, C.: Meridional transport in the subtropics during winteras seen by NO2 column record, Air Pollution Report 66, EUR18032EN, edited by: Harris, N. R. P., Kilbane-Dawe, I., andAmanatidis, G. T., 88–91, 1998.
Yela., M., Gil, M., Rodrıguez, S., Araujo, J., Ochoa, H., Dıaz, S.,and Deferrari, G.: Unusual behavior of stratospheric NO2 dur-ing splitting vortex event in the Antarctic winter 2002: Compar-ison with a 10-years NO2 climatology at three Antarctic and subAntarctic sites, Proc. Quadrennial Ozone Symposium, 1055, 1–8June 2004, Kos, Greece, 2004.
Atmos. Chem. Phys., 8, 1635–1648, 2008 www.atmos-chem-phys.net/8/1635/2008/


![Small anisotropy, weak thermal fluctuations, and high field superconductivity in Co-doped iron pnictide Ba(Fe[sub 1−x]Co[sub x])[sub 2]As[sub 2]](https://static.fdokumen.com/doc/165x107/633cc1de7000aa173d0630af/small-anisotropy-weak-thermal-fluctuations-and-high-field-superconductivity-in.jpg)


![Structural and thermoelectric properties of Bi[sub 2]Sr[sub 2]Co[sub 2]O[sub y] thin films on LaAlO[sub 3] (100) and fused silica substrates](https://static.fdokumen.com/doc/165x107/634467196cfb3d406409325f/structural-and-thermoelectric-properties-of-bisub-2srsub-2cosub-2osub-y.jpg)