North Saqqara Risk Map Project
14
Transcript of North Saqqara Risk Map Project

1
THE RISK MAP FOR NORTH SAQQARA SITE: A BRIEF REVIEW
The Risk Map for North Saqqara Site it’s a project started in the year 2000. This experimental
program it is one of the first attempts to afford the problems in the management of the
archaeological sites under a complex point of view: archaeological, environmental, socio-
economical, conservation and monitoring questions1. The project has been organized and developed
by the Supreme Council of Antiquities (S.C.A.) of Egypt and the Direzione Generale per la
Cooperazione allo Sviluppo ( D.G.C.S.) of the Italian Foreign Office, together with the Egyptian
Environmental Affair Agency, in the ambit of the National Environmental Action Plan (NEAP) of
Egypt. The scientific direction of the project belongs to the Department of Historical Sciences of the
Ancient World of the University of Pisa.
The aims of the project are:
1. The Creation of a computer model as analysis support for the minimization of
the environmental decay of the Egyptian archaeological sites.
2. Aids to S.C.A. for the development in the management of the archaeological sites.
3. Creation of a development and support integrated system for the Egyptian public
administration interested in the prevention of the environmental risks and the socio-
economic development of the cultural resources of the Country.
4. To organize a specialized working group in the elaboration of integrated models for the
management of the historical sites.
THE SITE
The site selected is North Saqqara which, owing to its wideness, number of visitors, state of
preservation and environmental problems, is suitable to project and test the model of intervention2.
Saqqara is the most important necropolis in Memphis, the ancient capital city, and remained a
cemetery during four millennia: from the beginning of the Egyptian History up to the Christian era.
1 I want to underline that I’m writing in name of all the persons which have been involved in the project. It happens that I’m the author of this article because it has been possible for me to partecipate to the AIVA 2002, which has been a very important experience. All my best thanks goes to all the members of the project staff who gave an indispensable cobtribution to this article . 2 The chair of Egyptology of the University of Pisa has long investigated this area: records and studies of the pit tombs of Ciennehebu and Padineit and the monumental complex of Bakenrenef hypogeum, where the programme of development cooperation called “Workshop in Saqqara” took place.

2
It spreads for an area even more than 12 sq. Km and retains over 600 monuments till now
investigated.
However Cairo proximity and the consequent urban and industrial attack have caused, and still
cause, an irreparable environmental degradation, which until now has forced into closing the 90%
of the monuments. At the same time the flow of mass-tourism, without an organization well
integrated with the conservation thematics, oftten produces an anthropic negative impact on the site.
THE STAFF
To develop and apply a new tool for the management of the necropolis and its environment, a staff
of experts, in different science sectors, Italian and Egyptian, has been working together in full
coordination. This is the list of all the experts.
Project Staff Co-manager: Shawki Nakhla Co-manager: Fabrizio Ago Scientific Direction: Edda Bresciani Cooperation Attache': Guido Benevento Assistant Co-manager: Tiziana Lucidi Technical Director: Antonio Giammarusti Saqqara Site Director: Adel Hussien Architect: Paola Galli Cad: Abdel Hamied Kotob Cad: Mahmoud Helmy Cad: Rosa Maria Iglesias Morsilli Egyptologist: Emad Khater Egyptologist: Mahmud Afifi Egyptologist: Roberto Buongarzone Environmental Monitoring: Atef Abdel Kawy Environmental Monitoring: Franco Pizzi Environment: Wagdi Youhanna Environment: Gennaro Papa Gis: Ali Yehia Gis and Gps: Renzo Carlucci Gis and Database: Emanuele Brienza Gis: Livia Peiser Photographer: Kirols Barsum Photographer: Carlos de la Fuente Preservation: El Hussien Ahmel El Said

3
Preservation: Carlo La Torre Preservation: Marina Paris Socio - Economical Elvira Morella 3D Reconstructions: Giovanni Marchionne 3D Reconstructions: Maria Laura Fanni Administration: Gianluca Mattioli Administration: Massimo Testardi Secretary: Hebat Allah Ismail
THE FIRST PHASE
To analyze the pressures that Saqqara is bearing as a consequence of the urban and industrial assault
and determinate the critical elements many factors have been studied like: damages related to the
accessibility to the area, decay due to fruition of interior spaces, decay due to the absence of
protection and/or maintenance interventions, sources of atmospheric pollution and trouble of the
geological balance.
In this phase it was clear that many resources were available to apply the research but they were of
different nature. Archaeological publications about the necropolis, publications about the
environment of the site, data already recorded by Egyptian monitoring stations present in the
surroundings, old photographic documentation, an huge architectural and archeological graphic
documentation, cartographic documentation.
Complex instruments were necessary to acquire all these notices. A collecting and updating system
information has been established by a special recording network that use:
1. fixed monitoring
2. instruments
3. file card
4. measuring tools
5. information pick up by database or from specialized researches.
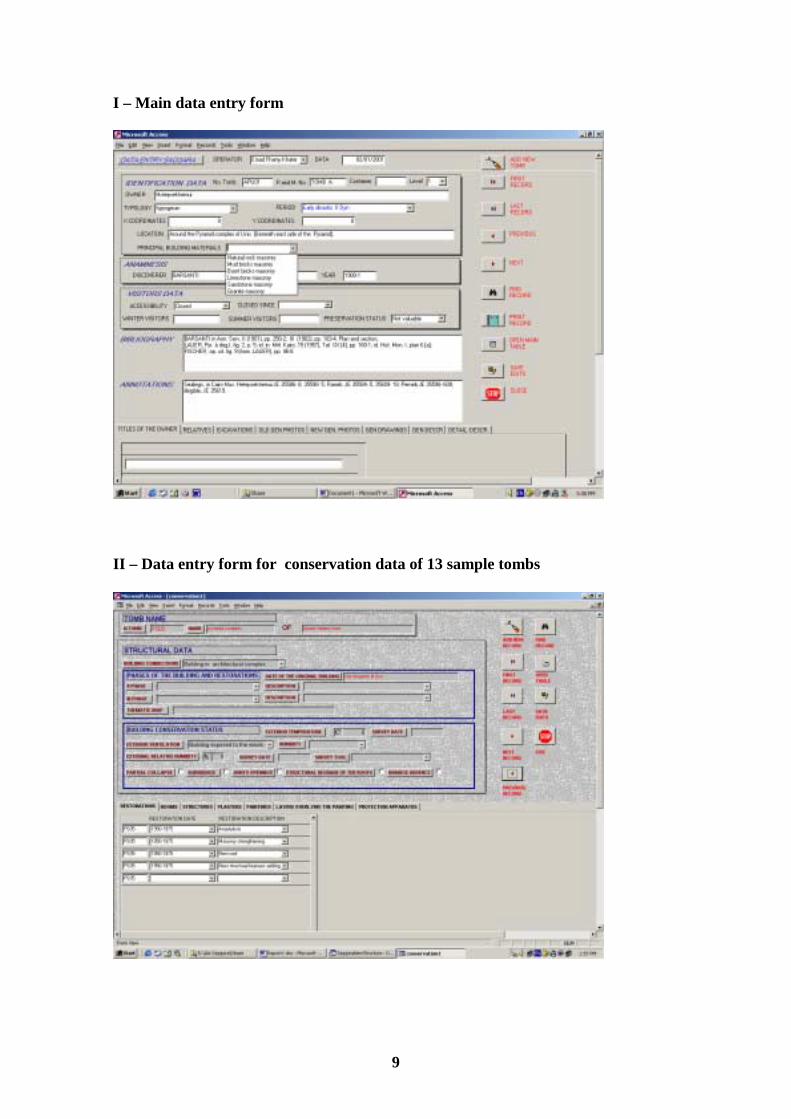
One of the first step of the project has been the planning and developing of a database, realized in
Microsoft Access, for the entry end editing of all the data: environmental, archaeological, about
tourism and about conservation (cfr tavv. I-II-III).
Another step has been the creation of a new map of north Saqqara site.
The base map for this cartography are two very important documents released in the previous years:
1. Saqqara Base Map 1:5000. Survey of Egypt Topographical Series ‘ BLOC U.T.M. 36-46.660/1
Based on: ”Stéréopreparation appuyée sur le canevas géodésique du SURVEY OF EGYPT”

4
1:5000, CONSORTIUM S.F.S./I.G.N. – FRANCE in 1978, according to aerial photos 1:15.000,
April 1977.
2. Saqqara Aerial Photographs provided by the National Authority for Remote Sensing and Space
Sciences of Egypt. These Aerial photographs have been straightened and mosaicized in order to
make a raster photographic image of the area.
The photogrammetric map has been digitalized, in CAD, according to the georeferenced aerial
photomosaic. The published archaeological cartographies, collected by Egyptologists, were
digitized and introduced in the cartographic system. In this way it was possible to link the data base
to the cartography. All this map have been georeferenced to identify the tombs position on the
general map. Several site survey by GPS have been carried out with the purpose to find the
topographic benchmarks according to the aereophotogrammetric maps and the most accurate
archaeological maps (cfr. tav. IV). The equipments used during these surveys were:
1. Mobile device CompaQ Ipaq 3600 (Windows CE)
2. GPS Garmin III
3. Esri Arcpad 5.0.1
4. Digital camera Nikon Coolpix 800. This new planimetry of north Saqqara shows all the tombs excavated from the XIXth Century untill
today (cfr. tav. V).
THE SECOND PHASE
Most of the activities of the second phase have regarded the conservation aspects of the project.
The survey of the preservation status and then the effective vulnerability of the necropolis tombs,
has been developed in three different levels:
At first level the survey is extended to all published monuments, and only cataloguing instruments
are adopted.
In the second level the survey includes 13 sample tombs, chosen on the basis of epoch, typology
and suffered damages.
One section of the database has been developed to record the typology and the conservation status
of all the walls of every room of each tomb(cfr. tav. II).

5
This is the list of the 13 tombs:
NOTOMB Owner period-dinasty Typology Location
PS05A Djoser (Netjery-khet)
Old Kingdom III Dyn.
pyramid complex north Saqqara
WSP09 Ptahhotep II and Akhethotep
Old Kingdom V Dyn mastaba West of the Step
Pyramid
PS05 Djoser (Netjerj-khet)
Old Kingdom III Dyn
pyramid complex north Saqqara
PS01 Teti Old Kingdom VI Dyn
pyramid complex
north-East of the Step Pyramid
NSP45 Unknown Early dinastic Dyn I mastaba north of the Step
Pyramid
ATP18 Mereruka - Meri Old Kingdom VI Dyn mastaba north of Teti
Pyramid
ATP17 Kagemni - Memi (also Gemni)
Old Kingdom VI Dyn mastaba north of Teti
Pyramid
APU55 Padienisi (Pedenisi)
Late period XXVI Dyn shaft tomb South of the
pyramid of Unas
APU53 Tjaiennahebu (Ciennehebu)
Late period XXVI Dyn shaft tomb
Around the pyramid-complex of Unis
APU43 Nefer and Kahay
Old Kingdom V Dyn hypogeum
Around the pyramid-complex of Unis
WSP06 Ptahhotep [I] Old Kingdom V Dyn mastaba west of the Step
Pyramid
PS08 Unas Old Kingdom V Dyn
pyramid complex
Sout-west of Djoser complex
NSP109 Ty Old Kingdom V Dyn mastaba north of the Step
Pyramid * Monitored Tombs
To draw thematic maps about the preservation status of these decorated walls have been use
photogrammetric techniques to generate photomosaics of the walls. From several rectified images
of the structures, all referred at the same scale, it is got an unique image. Using the software Archis
2D, by Sysscam, the images are overlapped, adjusted in tone, colour and brightness in order to
render them homogenous and to give the harmony of one only whole image. Subsequently the high-
resolution photos obtained by photo mosaic are ready for the final use: prepare a thematic map for
the state of conservation of the wall paintings(cfr. tav. VII).
.

6
The third level of analysis consists in the installation of monitoring equipments and it’s concerning
three tombs, which are highlighted in blue in the table shown above.
The type of monitoring preview is fully automatic and consists of checking both the general
external environmental conditions and those characteristics internal. The systems applied on the
three tombs are unrelated among them. Each system consists of the following technical equipments:
1. Sensor unit.
2. Data acquisition system and downloading manual unit.
3. Solar panel power group.
The three systems share a remote PC software for processing and filing data, as well as for
numerical and graphical representation of them(cfr. tav. VI).
During these specific investigations another study-sector of the project has been started off: the
socio-economic analysis, having the task of analyzing the contexts of north Saqqara.
The purpose of this analysis is to study the general economy of the area and its social reality, with a
specific attention to tourism activities and their importance in terms of local development.
The data collected are about demographic aspects, the economy of the area, the tourism presence in
the area, the updated situation about access to the site.
The elaboration of the collected information, integrated in the GIS system, will regard comparative
analysis with the conservation data and hypothesis about tourism flow regulation inside the
archaeological site.
THE THIRD PHASE
The third phase has focused its activities in the construction of the GIS system, and in planning and
developing the automatic procedures of vulnerability and risk evaluation.
The computer system which allows the visualization of data with relations between the database and
the cartographies is ArcView G.I.S by ESRI.
A user interface written on Avenue (the programmimg language working on the ArcView platform)
allows the user to display the data about the tombs. It is possible to select all the tombs, wich have
been georeferenced, to display the relative data, by an SQL connection with the MS Access
database, in dialog-windows planned in Avenue. Several menus have been planned also to display
all the collected graphic documents (cfr. tav. VIII).
For the 13 sample tombs it is possible to act deeper inquiries. The scripts allows the user to get
inside the map of the tomb to explore all its rooms and make inquiries about the wall and their

7
decoration. It is possible also to display the photo and the photomosaics of each wall. It is possible
also to display a virtual 3D reconstruction, developed in the basis of the photomosaics, to display
the internal rooms of the tombs, at their present state (cfr. tav. IX).
Some other function have been written to the user to explore the GIS system on it’s general view.
A research menu allows the user to group and find the tombs using different research-keys like the
typology, period, owner ecc.
It is, therefore, possible to produce thematic cartographies with varied contents such as the
structures subdivision according to their age, typology, state of conservation or level of relative
moisture (cfr. tav. X).
During this phase, the previously drawn up numerical cartographies, which include a division by
categories of the phenomena taken into consideration (for example: monuments, routes, services,
level curves, wind exposition, geology, anthropic impact, ecc.) constitutes a reference grid for all
the main analysis.
Every single monument is taken on as a base element, whose loss or damage risks need to be
assessed or whose possible enhancement needs to be evaluated. .
Hazard depends on the chances that particular dynamics develop in the area where the monument is
located, causing the monument partial or total damage. Such dynamics are mainly physical-
environmental and atrophic phenomena. The process adopted to draw up requires assigning to each
sector of territory risk maps an indicator of its potential danger. This process is first repeated for
each of the potentially dangerous situation. By normalization (standardization) of the data and
assignment of reciprocal importance an overall definition of hazard is drawn up for each
homogeneous sector. By analogy with the Italian experience, the word “risk” means the possibility
that a certain monumental structure is exposed to the occurring or the prolongation of a decay
process. In particular, the relation to which we have referred to, linking the words “risk”,
“vulnerability”, “danger” and “value” corresponds to the one adopted also by UNESCO(RISK =
VALUE x VULNERABILITY x HAZZARD).
Through the “overlay mapping” process it is possible to point out the link between environmental
risks in Saqqara site and the real risks for the monuments in the area.
Using the menu “Risk” in the GIS system it is possible to activate the procedures of spatial analysis
from the overlapping of the different thematic maps, with the different values of everyone of their
features which can define particular zone of danger. In the same way the vulnerability zones are
generated by the vulnerability indexes of each tomb, calculated automatically by the typology, the
architectural and decoration features, and the present status. The interaction between vulnerabilty
maps and danger maps generates risk maps by zone.

8
CONCLUSIONS
As you have seen all the different documents of different type elaborated by the project staff flow
together in the GIS system.
All the written data are imported using a sequel procedure with the tables of the access database.
The data haven’t been transformed in dbf tables, the physical format of the ArcView gis tables,
because the editing and the appending of the records has been performed until now. In this way all
changes made on the access database were automatically and dynamically imported on the gis
system. However all the tables are joined and linked to select, filter and show the data in the same
way of the database forms.
Following a similar procedure all the digitized maps are imported in the system with a dwg format,
the normal autocad files extension. These maps haven’t been transformed in shapefiles, the format
of the arcview maps, for the same reason of the data. A big work of continuous control and editing
was needed and all the changes had to appear, at the same time, on the gis system.
To maintain these dynamical shape of the documents in the GIS we had to elaborate an ad hoc
procedure to link the Autocad maps with the tombs of the database.
This procedure is based on the possibility to record the names of particular graphic elements in the
“blocks” of CAD drawings. During this procedure we have been able to display the results of the
work in progress, to verify and to check them.
At the end of this brief report I’ would like to spend some words about the use of information
systems like GIS in archaeology. Many experiences about GIS have been carried out in all part of
the world. At a certain moment it seemed that the gis systems represented the resolution of all
problems concerning the archeological activity, and the treatment for every activity troubles.
Personally I would point out that the archaeology and informatics sectors use totally different
approaches and also different languages.
The computer performs on undoubted data and objects while the archaeologists reconstruct puzzles
from uncertain excavated ruins. That’s the reason for which the archaeological language is more
pondered and seems less precise than the computer language. The confrontation with these new
technologies can be a challenge for the archaeological science that has to be integrated in the world
of the hi- tech. This means that the archaeologist has to adopt a challenging attitude, and the
capacity to work in multi-disciplinary teams.
Emanuele Brienza
9
I – Main data entry form
II – Data entry form for conservation data of 13 sample tombs

10
III – Data entry form for environmental data
IV – GPS Survey

11
V – New map of north Saqqara
VI – Monitoring tools

12
VII – Creating photomosaics of the walls of the tombs
VIII – GIS first level inquiries

13
IX – GIS second level inquiries
X– Creating thematic maps