North East of England Commercial and Industrial Waste ...
94
North East of England Commercial and Industrial Waste Survey 2010 For NESRB i North East of England Commercial and Industrial Waste Survey 2010 For the North East Sustainable Resources Board March 2011 Report Produced for: Report written by: Peter Scholes, Esther Areikin Q.C. Checked by: The North East Sustainable Resources Board, c/o Centre for Process Innovation Ltd, The Wilton Centre, Wilton, Redcar TS10 4RF Julie Tiffany, James Horne Contact: Additional information: Chris Hayward, Environmental Technologies Manager Final Report Executive Summary Background In 2010, Defra commissioned a survey of commercial and industrial waste arisings at national (England) level. This survey collected data from 4,074 businesses, plus data from pollution, prevention and control returns (PPC) and other sources, and was designed to produce estimates of arisings at a national level, and subsequently at regional level. This survey included the collection of data from 276 businesses in the North East region. By applying sector averages from other regions in England, this survey could provide estimates for waste arisings in the North East region, however the volume of local surveys was insufficient to provide detail at an acceptable level of confidence, or to provide data at a sub-regional or Waste Planning Authority level. Therefore, a further survey was commissioned by The North East Sustainable Resources Board (NESRB) to fill this data gap, and provide arisings estimates for the North East region to acceptable confidence limits, at both regional and sub-regional level. For this reason Urban Mines, in partnership with Gardiner & Theobald, delivered a compatible survey of a further 1,036 businesses in the North East in a statistically valid manner, between October and December 2010, from a total relevant business population of 26,620. Businesses in 12 sector groupings were surveyed, excluding agriculture, mining, quarrying and construction, covering employee numbers from 5 to 250+. Of these around 1/3 rd was delivered by telephone (for small businesses with simple waste profiles) and 2/3 rd by structured face to face survey interview. All of the data collected was thoroughly quality checked using a variety of methods. The survey focussed on waste arisings for financial year 2009-10.
-
Upload
khangminh22 -
Category
Documents
-
view
1 -
download
0
Transcript of North East of England Commercial and Industrial Waste ...
North East of England Commercial and Industrial Waste Survey 2010 For NESRB
i
North East of England Commercial and Industrial Waste Survey 2010 For the North East Sustainable Resources Board March 2011
Report Produced for: Report written by:
Peter Scholes, Esther Areikin
Q.C. Checked by:
The North East Sustainable Resources Board, c/o Centre for Process Innovation Ltd, The Wilton Centre, Wilton, Redcar TS10 4RF
Julie Tiffany, James Horne
Contact: Additional information: Chris Hayward, Environmental Technologies Manager
Final Report
Executive Summary Background In 2010, Defra commissioned a survey of commercial and industrial waste arisings at national (England) level. This survey collected data from 4,074 businesses, plus data from pollution, prevention and control returns (PPC) and other sources, and was designed to produce estimates of arisings at a national level, and subsequently at regional level. This survey included the collection of data from 276 businesses in the North East region. By applying sector averages from other regions in England, this survey could provide estimates for waste arisings in the North East region, however the volume of local surveys was insufficient to provide detail at an acceptable level of confidence, or to provide data at a sub-regional or Waste Planning Authority level. Therefore, a further survey was commissioned by The North East Sustainable Resources Board (NESRB) to fill this data gap, and provide arisings estimates for the North East region to acceptable confidence limits, at both regional and sub-regional level. For this reason Urban Mines, in partnership with Gardiner & Theobald, delivered a compatible survey of a further 1,036 businesses in the North East in a statistically valid manner, between October and December 2010, from a total relevant business population of 26,620. Businesses in 12 sector groupings were surveyed, excluding agriculture, mining, quarrying and construction, covering employee numbers from 5 to 250+. Of these around 1/3rd was delivered by telephone (for small businesses with simple waste profiles) and 2/3rd by structured face to face survey interview. All of the data collected was thoroughly quality checked using a variety of methods. The survey focussed on waste arisings for financial year 2009-10.
EXECUTIVE SUMMARY
North East of England Commercial and Industrial Waste Survey 2010 For NESRB
ii
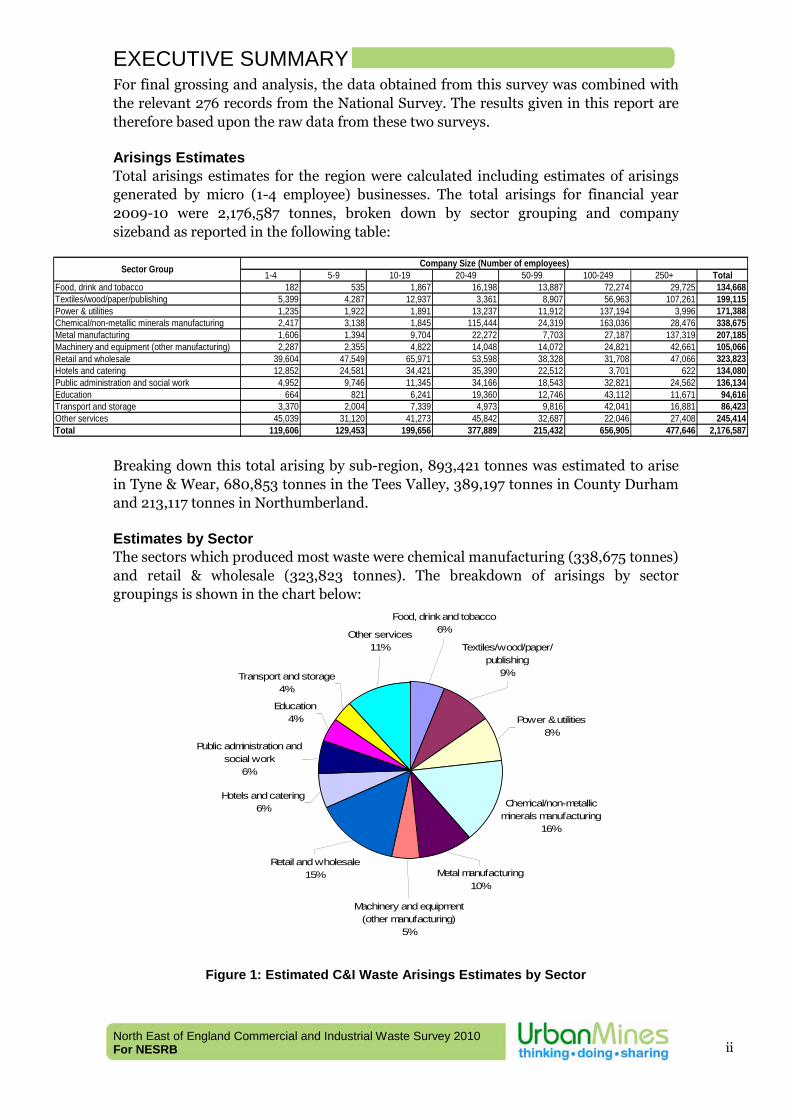
For final grossing and analysis, the data obtained from this survey was combined with the relevant 276 records from the National Survey. The results given in this report are therefore based upon the raw data from these two surveys. Arisings Estimates Total arisings estimates for the region were calculated including estimates of arisings generated by micro (1-4 employee) businesses. The total arisings for financial year 2009-10 were 2,176,587 tonnes, broken down by sector grouping and company sizeband as reported in the following table:
1-4 5-9 10-19 20-49 50-99 100-249 250+ TotalFood, drink and tobacco 182 535 1,867 16,198 13,887 72,274 29,725 134,668Textiles/wood/paper/publishing 5,399 4,287 12,937 3,361 8,907 56,963 107,261 199,115Power & utilities 1,235 1,922 1,891 13,237 11,912 137,194 3,996 171,388Chemical/non-metallic minerals manufacturing 2,417 3,138 1,845 115,444 24,319 163,036 28,476 338,675Metal manufacturing 1,606 1,394 9,704 22,272 7,703 27,187 137,319 207,185Machinery and equipment (other manufacturing) 2,287 2,355 4,822 14,048 14,072 24,821 42,661 105,066Retail and wholesale 39,604 47,549 65,971 53,598 38,328 31,708 47,066 323,823Hotels and catering 12,852 24,581 34,421 35,390 22,512 3,701 622 134,080Public administration and social work 4,952 9,746 11,345 34,166 18,543 32,821 24,562 136,134Education 664 821 6,241 19,360 12,746 43,112 11,671 94,616Transport and storage 3,370 2,004 7,339 4,973 9,816 42,041 16,881 86,423Other services 45,039 31,120 41,273 45,842 32,687 22,046 27,408 245,414Total 119,606 129,453 199,656 377,889 215,432 656,905 477,646 2,176,587
Sector Group Company Size (Number of employees)
Breaking down this total arising by sub-region, 893,421 tonnes was estimated to arise in Tyne & Wear, 680,853 tonnes in the Tees Valley, 389,197 tonnes in County Durham and 213,117 tonnes in Northumberland.
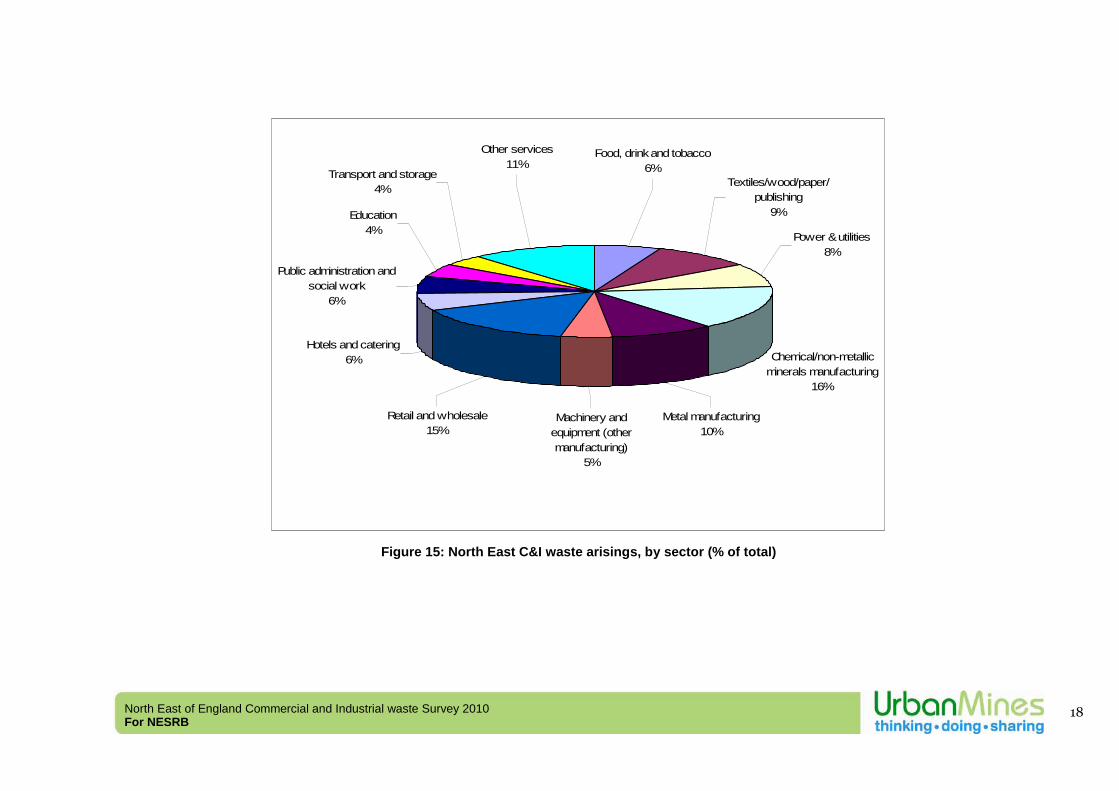
Estimates by Sector The sectors which produced most waste were chemical manufacturing (338,675 tonnes) and retail & wholesale (323,823 tonnes). The breakdown of arisings by sector groupings is shown in the chart below:
Food, drink and tobacco6%
Textiles/wood/paper/publishing
9%
Chemical/non-metallic minerals manufacturing
16%
Machinery and equipment (other manufacturing)
5%
Metal manufacturing10%
Power & utilities8%
Retail and wholesale15%
Hotels and catering6%
Other services11%
Transport and storage4%
Education4%
Public administration and social work
6%
Figure 1: Estimated C&I Waste Arisings Estimates by Sector
EXECUTIVE SUMMARY
North East of England Commercial and Industrial Waste Survey 2010 For NESRB
iii
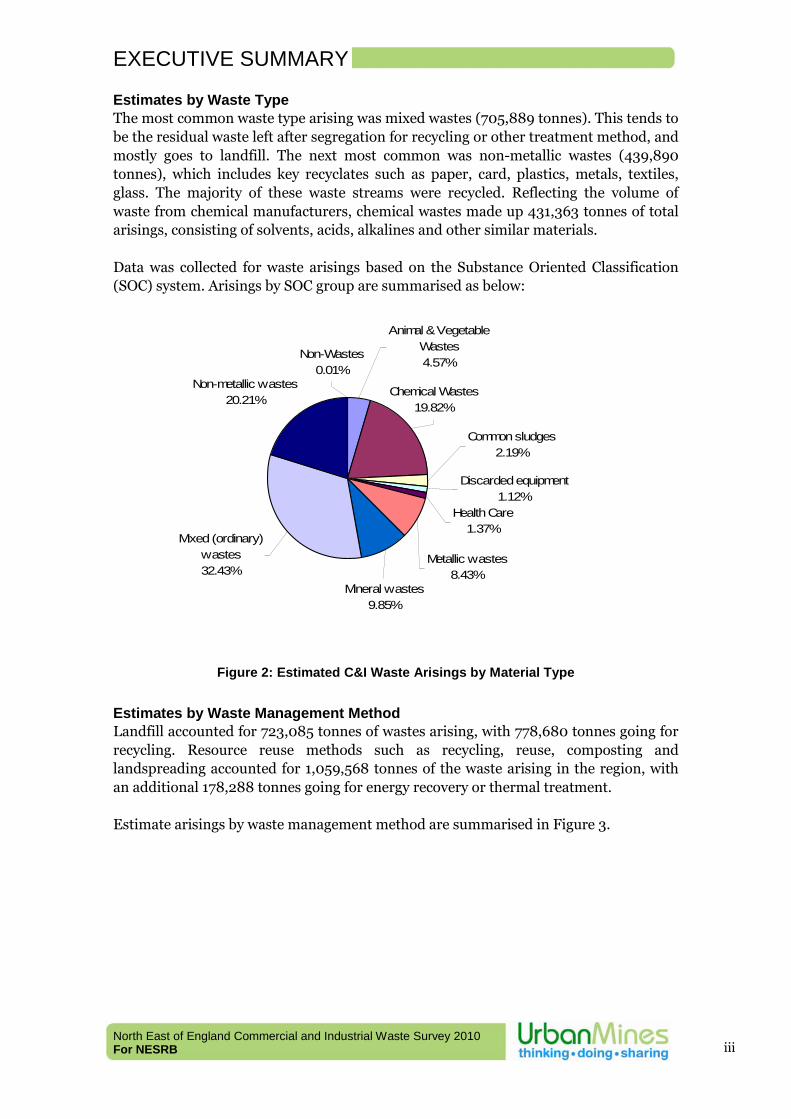
Estimates by Waste Type The most common waste type arising was mixed wastes (705,889 tonnes). This tends to be the residual waste left after segregation for recycling or other treatment method, and mostly goes to landfill. The next most common was non-metallic wastes (439,890 tonnes), which includes key recyclates such as paper, card, plastics, metals, textiles, glass. The majority of these waste streams were recycled. Reflecting the volume of waste from chemical manufacturers, chemical wastes made up 431,363 tonnes of total arisings, consisting of solvents, acids, alkalines and other similar materials. Data was collected for waste arisings based on the Substance Oriented Classification (SOC) system. Arisings by SOC group are summarised as below:
Non-metallic wastes20.21%
Health Care1.37%
Metallic wastes8.43%
Mineral wastes9.85%
Discarded equipment1.12%
Common sludges2.19%
Chemical Wastes19.82%
Animal & Vegetable Wastes4.57%
Non-Wastes0.01%
Mixed (ordinary) wastes32.43%
Figure 2: Estimated C&I Waste Arisings by Material Type
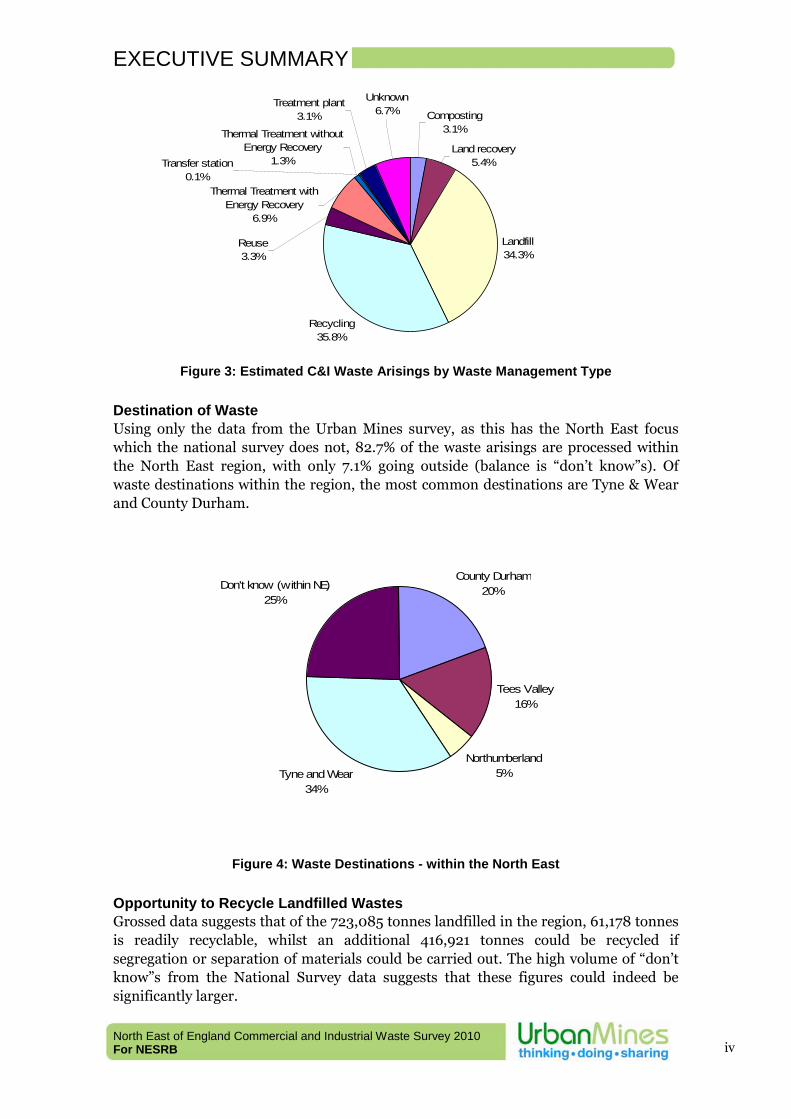
Estimates by Waste Management Method Landfill accounted for 723,085 tonnes of wastes arising, with 778,680 tonnes going for recycling. Resource reuse methods such as recycling, reuse, composting and landspreading accounted for 1,059,568 tonnes of the waste arising in the region, with an additional 178,288 tonnes going for energy recovery or thermal treatment. Estimate arisings by waste management method are summarised in Figure 3.
EXECUTIVE SUMMARY
North East of England Commercial and Industrial Waste Survey 2010 For NESRB
iv
Composting3.1%
Land recovery5.4%
Landfill34.3%
Recycling35.8%
Treatment plant3.1%
Transfer station0.1%
Reuse3.3%
Thermal Treatment with Energy Recovery
6.9%
Thermal Treatment without Energy Recovery
1.3%
Unknown6.7%
Figure 3: Estimated C&I Waste Arisings by Waste Management Type
Destination of Waste Using only the data from the Urban Mines survey, as this has the North East focus which the national survey does not, 82.7% of the waste arisings are processed within the North East region, with only 7.1% going outside (balance is “don’t know”s). Of waste destinations within the region, the most common destinations are Tyne & Wear and County Durham.
County Durham20%
Tees Valley16%
Northumberland5%Tyne and Wear
34%
Don't know (within NE)25%
Figure 4: Waste Destinations - within the North East
Opportunity to Recycle Landfilled Wastes Grossed data suggests that of the 723,085 tonnes landfilled in the region, 61,178 tonnes is readily recyclable, whilst an additional 416,921 tonnes could be recycled if segregation or separation of materials could be carried out. The high volume of “don’t know”s from the National Survey data suggests that these figures could indeed be significantly larger.

EXECUTIVE SUMMARY
North East of England Commercial and Industrial Waste Survey 2010 For NESRB
v
Don't Know32%
Possibly recyclable58%
Not Recyclable2%
Recyclable8%
Figure 5: Recycling Potential of Landfilled Waste
Opportunity to Energy Recover Landfilled Wastes Similarly, all wastes were assessed for their potential to be energy recovered. Separating out those wastes currently landfilled, the results suggested that 324,185 tonnes of landfilled waste could be directly energy recovered, and 124,678 tonnes potentially energy recovered, if pre-treatment facilities were available. Again, the high level of “don’t know”s from the National Survey data suggests that these figures could be even higher.
Don't Know32%
Not recoverable6%
Possibly recoverable17%
Recoverable45%
Figure 6: Recovery Potential of Landfilled Waste
EXECUTIVE SUMMARY
North East of England Commercial and Industrial Waste Survey 2010 For NESRB
vi
The results contained in this report, plus the raw data supplied on CD-ROM, should prove invaluable to waste planners and policy developers in the region in scoping the use of the region’s waste resources in the future.
Peter Scholes
Managing Director
QUALITY ASSURANCE
North East of England Commercial and Industrial Waste Survey 2010 For NESRB
vii
Report Title: North East of England Commercial and Industrial Waste Survey 2010
Authors: Peter Scholes, Esther Areikin
Date: March 2011 (draft) 7th April 2011 (final)
File Reference: T:\Consultancy\NE C&I Survey 2010\FINAL REPORT\FINAL REPORT\NE Survey 2010 Final Report.doc
Prepared For: The North East Sustainable Resources Board
Contact(s): Chris Hayward, Environmental Technologies Manager
Reference: Report Status: Final Report
Copyright: Urban Mines © 2011
Quality Approvals
Name Signature
Project Director Peter Scholes
Quality Reviewer Esther Areiken
Final Proof Read Julie Tiffany
Quality Review Date 07th April, 2011
Urban Mines is Accredited under the Customer First Quality Assurance Standard (20010/12)
The content of this Report is for informational purposes only. Urban Mines assumes no liability for inaccurate or incomplete information, nor for any actions taken in reliance thereon. The information given should not be taken to imply any recommendation or endorsement by Urban Mines.
Urban Mines Ltd
The Cobbett Centre for Environmental Enterprise Village Street, Norwood Green, Halifax, HX3 8QG
Tel: 01274 699400 Fax: 01274 699410
Email: [email protected] Web: www.urbanmines.org.uk
CONTENTS
North East of England Commercial and Industrial Waste Survey 2010 For NESRB
viii
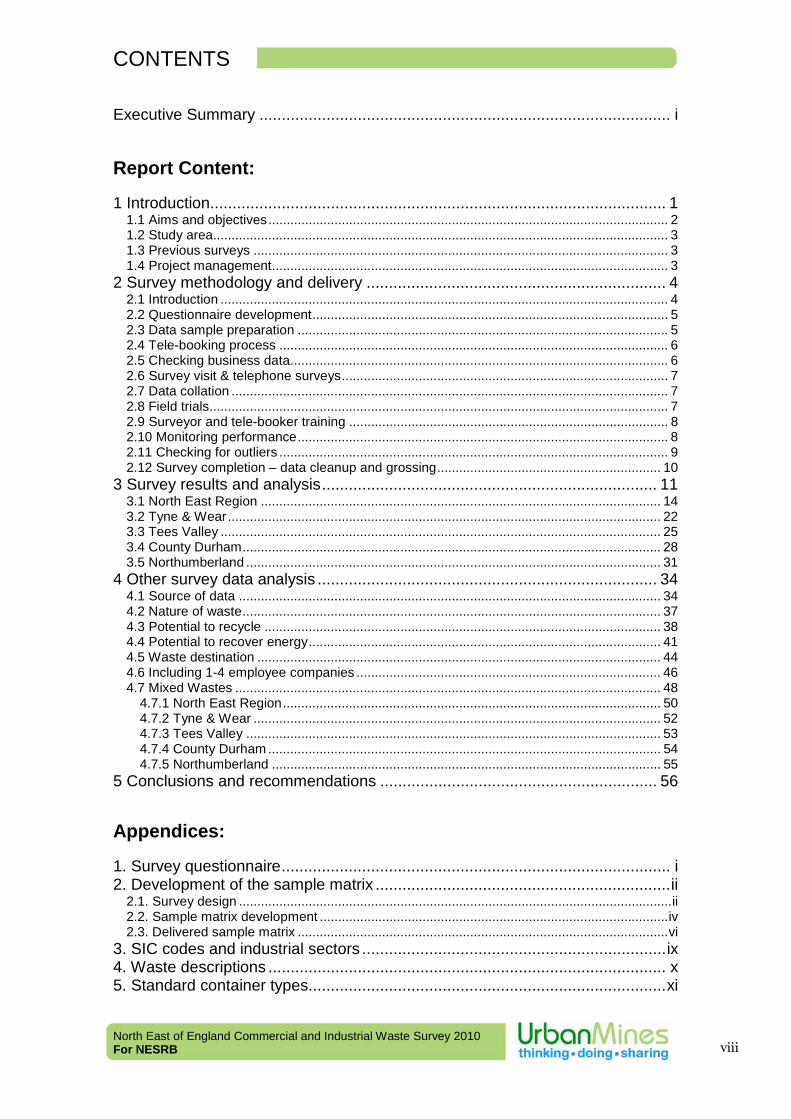
Executive Summary ............................................................................................ i
Report Content: 1 Introduction...................................................................................................... 1
1.1 Aims and objectives............................................................................................................. 2 1.2 Study area............................................................................................................................ 3 1.3 Previous surveys ................................................................................................................. 3 1.4 Project management............................................................................................................ 3
2 Survey methodology and delivery ................................................................... 4 2.1 Introduction .......................................................................................................................... 4 2.2 Questionnaire development................................................................................................. 5 2.3 Data sample preparation ..................................................................................................... 5 2.4 Tele-booking process .......................................................................................................... 6 2.5 Checking business data....................................................................................................... 6 2.6 Survey visit & telephone surveys......................................................................................... 7 2.7 Data collation ....................................................................................................................... 7 2.8 Field trials............................................................................................................................. 7 2.9 Surveyor and tele-booker training ....................................................................................... 8 2.10 Monitoring performance..................................................................................................... 8 2.11 Checking for outliers .......................................................................................................... 9 2.12 Survey completion – data cleanup and grossing............................................................. 10
3 Survey results and analysis........................................................................... 11 3.1 North East Region ............................................................................................................. 14 3.2 Tyne & Wear...................................................................................................................... 22 3.3 Tees Valley ........................................................................................................................ 25 3.4 County Durham.................................................................................................................. 28 3.5 Northumberland ................................................................................................................. 31
4 Other survey data analysis ............................................................................ 34 4.1 Source of data ................................................................................................................... 34 4.2 Nature of waste.................................................................................................................. 37 4.3 Potential to recycle ............................................................................................................ 38 4.4 Potential to recover energy................................................................................................ 41 4.5 Waste destination .............................................................................................................. 44 4.6 Including 1-4 employee companies ................................................................................... 46 4.7 Mixed Wastes .................................................................................................................... 48
4.7.1 North East Region....................................................................................................... 50 4.7.2 Tyne & Wear ............................................................................................................... 52 4.7.3 Tees Valley ................................................................................................................. 53 4.7.4 County Durham ........................................................................................................... 54 4.7.5 Northumberland .......................................................................................................... 55
5 Conclusions and recommendations .............................................................. 56
Appendices: 1. Survey questionnaire....................................................................................... i 2. Development of the sample matrix ..................................................................ii
2.1. Survey design ......................................................................................................................ii 2.2. Sample matrix development ...............................................................................................iv 2.3. Delivered sample matrix .....................................................................................................vi
3. SIC codes and industrial sectors ....................................................................ix 4. Waste descriptions ......................................................................................... x 5. Standard container types................................................................................xi
CONTENTS
North East of England Commercial and Industrial Waste Survey 2010 For NESRB
ix
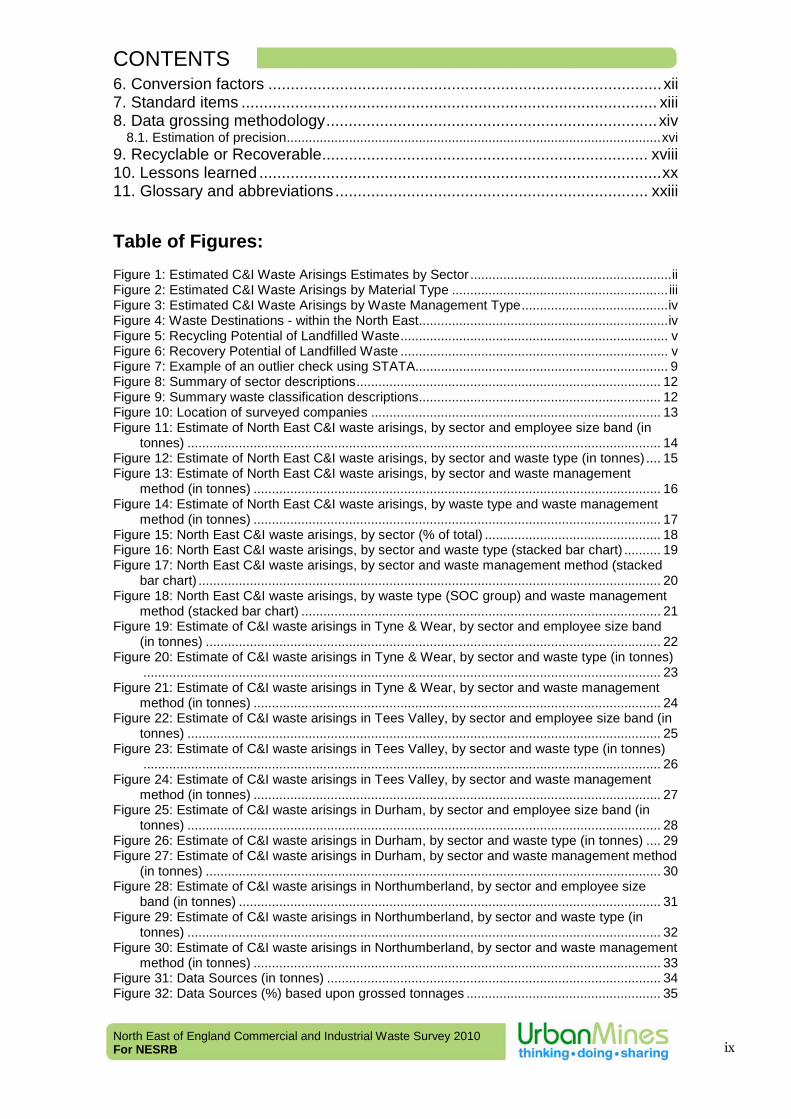
6. Conversion factors ........................................................................................xii 7. Standard items ............................................................................................. xiii 8. Data grossing methodology..........................................................................xiv
8.1. Estimation of precision......................................................................................................xvi 9. Recyclable or Recoverable......................................................................... xviii 10. Lessons learned ..........................................................................................xx 11. Glossary and abbreviations ...................................................................... xxiii
Table of Figures: Figure 1: Estimated C&I Waste Arisings Estimates by Sector .......................................................ii Figure 2: Estimated C&I Waste Arisings by Material Type ........................................................... iii Figure 3: Estimated C&I Waste Arisings by Waste Management Type........................................iv Figure 4: Waste Destinations - within the North East....................................................................iv Figure 5: Recycling Potential of Landfilled Waste......................................................................... v Figure 6: Recovery Potential of Landfilled Waste ......................................................................... v Figure 7: Example of an outlier check using STATA..................................................................... 9 Figure 8: Summary of sector descriptions................................................................................... 12 Figure 9: Summary waste classification descriptions.................................................................. 12 Figure 10: Location of surveyed companies ............................................................................... 13 Figure 11: Estimate of North East C&I waste arisings, by sector and employee size band (in
tonnes) ................................................................................................................................. 14 Figure 12: Estimate of North East C&I waste arisings, by sector and waste type (in tonnes) .... 15 Figure 13: Estimate of North East C&I waste arisings, by sector and waste management
method (in tonnes) ............................................................................................................... 16 Figure 14: Estimate of North East C&I waste arisings, by waste type and waste management
method (in tonnes) ............................................................................................................... 17 Figure 15: North East C&I waste arisings, by sector (% of total) ................................................ 18 Figure 16: North East C&I waste arisings, by sector and waste type (stacked bar chart) .......... 19 Figure 17: North East C&I waste arisings, by sector and waste management method (stacked
bar chart) .............................................................................................................................. 20 Figure 18: North East C&I waste arisings, by waste type (SOC group) and waste management
method (stacked bar chart) .................................................................................................. 21 Figure 19: Estimate of C&I waste arisings in Tyne & Wear, by sector and employee size band
(in tonnes) ............................................................................................................................ 22 Figure 20: Estimate of C&I waste arisings in Tyne & Wear, by sector and waste type (in tonnes)
............................................................................................................................................. 23 Figure 21: Estimate of C&I waste arisings in Tyne & Wear, by sector and waste management
method (in tonnes) ............................................................................................................... 24 Figure 22: Estimate of C&I waste arisings in Tees Valley, by sector and employee size band (in
tonnes) ................................................................................................................................. 25 Figure 23: Estimate of C&I waste arisings in Tees Valley, by sector and waste type (in tonnes)
............................................................................................................................................. 26 Figure 24: Estimate of C&I waste arisings in Tees Valley, by sector and waste management
method (in tonnes) ............................................................................................................... 27 Figure 25: Estimate of C&I waste arisings in Durham, by sector and employee size band (in
tonnes) ................................................................................................................................. 28 Figure 26: Estimate of C&I waste arisings in Durham, by sector and waste type (in tonnes) .... 29 Figure 27: Estimate of C&I waste arisings in Durham, by sector and waste management method
(in tonnes) ............................................................................................................................ 30 Figure 28: Estimate of C&I waste arisings in Northumberland, by sector and employee size
band (in tonnes) ................................................................................................................... 31 Figure 29: Estimate of C&I waste arisings in Northumberland, by sector and waste type (in
tonnes) ................................................................................................................................. 32 Figure 30: Estimate of C&I waste arisings in Northumberland, by sector and waste management
method (in tonnes) ............................................................................................................... 33 Figure 31: Data Sources (in tonnes) ........................................................................................... 34 Figure 32: Data Sources (%) based upon grossed tonnages ..................................................... 35
CONTENTS
North East of England Commercial and Industrial Waste Survey 2010 For NESRB
x
Figure 33: Source of survey data (in tonnes) .............................................................................. 36 Figure 34: Nature of waste (in tonnes) ........................................................................................ 37 Figure 35: Nature of waste (as %)............................................................................................... 37 Figure 36: Potential to recycle, all wastes (in tonnes), based on Urban Mines survey data....... 38 Figure 37: Potential to recycle, all wastes (as %), based on Urban Mines survey data ............. 38 Figure 38: Potential to recycle, all wastes (in tonnes)................................................................. 39 Figure 39: Potential to recycle, all wastes (as %) ....................................................................... 39 Figure 40: Recycling potential of landfilled wastes (in tonnes), based on overall data............... 40 Figure 41: Potential for energy recovery, all wastes (in tonnes), based on Urban Mines data .. 41 Figure 42: Potential for energy recovery, all wastes (as %), based on Urban Mines data ......... 42 Figure 43: Potential for energy recovery, all wastes (in tonnes) ................................................. 42 Figure 44: Potential for energy recovery, all wastes (as %)........................................................ 42 Figure 45: Recovery potential of landfilled wastes (in tonnes), based on Urban Mines data ..... 43 Figure 46: Recovery potential of landfilled wastes (as %), based on Urban Mines data............ 43 Figure 47: Recovery potential of landfilled wastes (in tonnes), based on the overall data ......... 43 Figure 48: Recovery potential of landfilled wastes (as %), based on the overall data................ 44 Figure 49: Waste destination overview (as %), based on Urban Mines survey data.................. 44 Figure 50: Waste destination outside region (in tonnes), based on Urban Mines survey data .. 45 Figure 51: Waste destination inside region (in tonnes), based on Urban Mines survey data..... 45 Figure 52: Waste destination inside region (as %), based on Urban Mines survey data ........... 45 Figure 53: Waste destination overview (in tonnes) ..................................................................... 46 Figure 54: Waste destination overview (as %)............................................................................ 46 Figure 55: Estimated North East C&I waste arisings for size band 1-4 by sector (in tonnes) .... 48 Figure 56: Composition of Mixed Wastes - grossed tonnages ................................................... 49 Figure 57: Estimate of North East C&I waste arisings, by sector and waste type (in tonnes), with
redistributed mixed wastes................................................................................................... 50 Figure 58: North East C&I waste arisings, by sector and waste type (stacked bar chart), with
redistributed mixed wastes................................................................................................... 51 Figure 59: Estimate of C&I waste arisings in Tyne & Wear, by sector and waste type (in tonnes),
with redistributed mixed wastes ........................................................................................... 52 Figure 60: Estimate of C&I waste arisings in Tees Valley, by sector and waste type (in tonnes),
with redistributed mixed wastes ........................................................................................... 53 Figure 61: Estimate of C&I waste arisings in Durham, by sector and waste type (in tonnes), with
redistributed mixed wastes................................................................................................... 54 Figure 62: Estimate of C&I waste arisings in Northumberland, by sector and waste type (in
tonnes), with redistributed mixed wastes ............................................................................. 55 Figure 63: Summary of sector description .................................................................................... iii Figure 64: Business size bands ....................................................................................................iv Figure 65: North East business population (ONS) ........................................................................iv Figure 66: Target sample matrix ...................................................................................................vi Figure 67: Percentage of business sites to be surveyed in each brick .........................................vi Figure 68: Delivered sample matrix as a percentage of the target matrix ...................................vii Figure 69: Data used for grossing ............................................................................................... viii Figure 70: Measure of precision at different confidence levels for the Urban Mines data ..........xvi Figure 71: Measure of precision at different confidence levels for the combined data (i.e. 1,312
companies).......................................................................................................................... xvii Figure 72: Calorific values of different materials .........................................................................xix
North East of England Commercial and Industrial Waste Survey 2010 For NESRB
1
REPORT
1 Introduction The North East Sustainable Resources Board (NESRB) commissioned this survey to obtain data on commercial and industrial (C&I) waste arisings and management in 2009-10 from businesses in North East England (the region is referred to as North East in the rest of the report). The study was funded in partnership with RENEW, One North East, Association of North East Councils (ANEC), Government Office North East (GO-NE), the Environment Agency and Tees Valley Unlimited. The NESRB, in partnership with the above mentioned organisations in the North East region, has a pressing requirement to enhance the evidence base on C&I waste arisings and management in order to:
• inform policy making on reducing the amount of waste produced by businesses, increasing the proportion reused or recycled and reducing the residual waste going to landfill
• inform PPS10 sub-regional planning requirements in relation to waste
management and land-use planning issues • establish realistic and meaningful baselines for use in performance monitoring
and assessing the impact of the North East Resource Management Plan on C&I waste arisings and management
• aid regional business opportunity analysis and development by providing
geographic information on potential for further recovery of materials, helping to de-risk future waste infrastructure investment
• gain better understanding of waste movements both within, into and out of the
region
• enhance and complement existing North East waste data projects i.e. GIS Waste Mapping Tool (Renew) and Environment Agency’s Waste Flows Modelling project
• enable comparisons over time
This arisings data is not available currently via the routine regulatory returns from permitted waste facilities.

North East of England Commercial and Industrial Waste Survey 2010 For NESRB
2
1.1 Aims and objectives The main aim of this study was to determine how much C&I waste was produced in the North East in the financial year 2009-10, broken down by broad business sectors and material types into sub-regions and/or Waste Planning Authorities (i.e. Northumberland, Tyne-Wear, Durham and Tees Valley), and to identify current management methods for each waste stream. The objectives of the study were therefore:
• Development of a robust statistical structure and sampling methodology to provide a sample matrix upon which the survey delivery was based. The sample on which the survey was based was taken from the summary data on the population of C&I “local units” in the North East from the Office for National Statistics (ONS).
• Development of dependable and robust processes and software to provide the basic tools for use during the survey and data collection.
• Effective recruitment of companies to take part in the survey in a way that ensured cancellations were minimised.
• Effective and efficient delivery of the surveys on site and by telephone for smaller companies by experienced and well trained personnel.
• Timely review of data outliers and ongoing data cleaning throughout the survey period to enable immediate follow up if required.
• A thorough final review of the data collected against previous surveys and other available data sources (e.g. deposits data).
• Gross up the survey data taking into account quality assurance issues and filling gaps where there were gaps in the survey data.
• Analyse the grossed up data to enable interpretation of results and produce a final report for the survey.
Based on the survey data and other data obtained from other sources to fill any gaps within the survey data, the following are the outputs of the study:
• the total tonnage of waste produced by C&I businesses, tabulated and split by sector grouping (i.e. the 12 business sectors described in Appendix 3), company size (i.e. 7 company size bands as shown in Appendix 2), waste material type (as shown in Appendix 4) and management method.
• the potential for further recycling/recovery of different waste types currently
heading to landfill, by waste type and generating sector.
• final destinations of waste streams, in terms of movements to facilities within and outside regional boundaries.
North East of England Commercial and Industrial Waste Survey 2010 For NESRB
3
1.2 Study area The ‘study area’ was the North East region, with waste data from businesses provided at a sub-regional level for:
• Northumberland i.e. Northumberland County Council area • Tyne & Wear i.e. Gateshead, Newcastle, North Tyneside, South Tyneside,
Sunderland Council Areas • Durham i.e. Durham County Council area • Tees Valley i.e. Darlington, Hartlepool, Middlesbrough, Redcar & Cleveland and
Stockton-on-Tees Council areas. The business sectors included in the survey are comparable with the English National C&I survey delivered in 2010. As in previous surveys, the sectors not included are agriculture, mining & quarrying and construction.
1.3 Previous surveys This survey was undertaken to supplement data gathered for the North East region for the recent National C&I survey undertaken by Jacobs Engineering UK Ltd on behalf of Defra1. Prior to the recent national survey, two national C&I surveys have been undertaken, by the Environment Agency, reporting on financial years 1998/99 and 2002/03. Whilst these surveys achieved a precision of +/- 5% at a 90% confidence level for total commercial and industrial waste, users were advised to treat the information provided as the best estimate from a range and should not, for example, read too much into small differences between sectors or detailed comparisons with results from the previous (1998-9) survey. The 2002/3 survey showed a 13% reduction in the total C&I waste for the 4 year period (a fall of 23% in industrial wastes and a slight increase in commercial wastes of 3%) at the national level. However, the survey had insufficient detail and the categorisation used did not readily translate into the type and scale of new waste management facilities which may be needed. Prior to 1998, patchy, incompatible waste planning authority level surveys were undertaken before the decision was made to proceed with a national survey. There has not been a survey of arisings from businesses in the region since this date.
1.4 Project management Throughout the development and delivery stages, the project was managed and mentored on behalf of the funders via a Steering Group consisting of the following representatives:
• Chris Hayward, RENEW (Project Manager) • Andrew Smith, Government Office North East • Ray Waters and Phil Jones, One North East
1 Jacobs Engineering UK Ltd, National Commercial and Industrial Waste Survey 2009, December 2010
North East of England Commercial and Industrial Waste Survey 2010 For NESRB
4
• Joanne Cooper, Environment Agency • Andrew Craig, Tees Valley Unlimited
plus representatives of the deliverers, Urban Mines Ltd and Gardiner and Theobald LLP. This group met regularly to review progress and approve key project aspects such as methodology, and received weekly email progress reports.
2 Survey methodology and delivery
2.1 Introduction The survey was delivered by a consortium of consultancies with the following roles:
Gardiner & Theobald Project director, survey team manager, delivery of face to face and telephone surveys via 5 strong survey team and client liaison
Urban Mines Ltd
Operations director - project delivery management, methodology development, statistics, training, survey management & data collection software, data cleanup and grossing
Ainsworth & Parkinson Booking of appointments for face to face and telephone surveys
The survey methodology was based upon a standard stratified random sampling approach. Companies were selected throughout the North East region, based upon a developed survey sample matrix of company sector against employee size band, to give a representative sample from which regional estimates could be determined. This sample matrix was developed from company population data provided by the Office for National Statistics (ONS). Companies (as “local units”) were identified at random and recruited by telephone to fill this sample matrix. Data was collected via a laptop based structured survey questionnaire, delivered during a face to face interview with a company representative, followed by a tour of the company’s site to identify any wastes missed by the interviewee. Small companies (i.e. employee size bands 5-9 and a few of the 10-19), with simple waste profiles and particularly office based businesses, were surveyed by telephone (i.e. approximately 1/3rd of total sample size). The collated data was transferred to a central server by email within 2 days of collection, where quality checks were carried out and any identified outliers or errors checked and addressed with the surveyors. Once the survey was complete, the data was thoroughly quality checked before grossing to provide regional and sub-regional estimates. This section of the report describes these key steps in delivery of this survey in more detail, supported by additional detail provided in a number of appendices.
North East of England Commercial and Industrial Waste Survey 2010 For NESRB
5
2.2 Questionnaire development The survey questionnaire was developed ensuring:
• Its design met the data collection requirements of the survey • Its structure was comparable with that of the previous surveys and the 2010
English National Survey to allow for comparisons, trend identification and evaluation, and also combination of other data to improve confidence levels
• It could be effectively and efficiently delivered via both face to face interviews and telephone surveying
The structure agreed with the Steering Group is presented in Appendix 1. It allows data collection for individual waste streams, by waste type, waste nature (hazardous or non-hazardous), annual quantity, waste management method used for that particular waste stream (fate), and where that method was carried out (destination). The questionnaire also allowed the recording of the source of the recorded waste quantity data (i.e. from written records or estimated/calculated) and whether the given waste stream could be recycled or energy recovered, against a defined set of criteria. The questionnaire used Substance Orientated Classification (SOC) groups and sub-groups for describing individual waste stream types, as shown in Appendix 4. The structure was translated into relevant screens in the data collection software EVSurvey. The software included routines to calculate tonnages where direct written records were not available. These calculations used in-built data such as standard container types (detailed in Appendix 5) to estimate volumes, conversion factors to translate volumes into weights (as Appendix 6) and standard waste item weights (as in Appendix 7) for individual items. Note that the data structure used for the survey retains all this calculation data, so that should conversion factors need revision, new weight data can be calculated from the originally collected raw data. For the purpose of this survey the waste recorded is for all waste produced on site that is outgoing or disposed of (but not recycled or reused) on site. This includes hazardous waste and Environment Agency classified non-wastes i.e. blast furnace slag or virgin timber. It does not include liquid wastes disposed of down a pipe but does include liquid waste tankered off-site.
2.3 Data sample preparation The recruitment of businesses for this survey was based upon the sample matrix developed using “local unit” business data from the Office for National Statistics (ONS). The aim of delivering the survey was to produce waste arisings data from a range of business types (sectors) and sizes (employee numbers) in a statistically valid manner (i.e. matching as close as possible the distribution described in the sample matrix) from which grossed up regional and sub-regional totals could be produced. The development of this sample matrix is explained in detail in Appendix 2.
North East of England Commercial and Industrial Waste Survey 2010 For NESRB
6
The businesses to survey were selected and recruited at random based upon the sample matrix. To do this, business contact data was secured from LBM Direct Marketing Services, based upon a random selection of businesses in proportion to their relevance in the sample matrix, to drive the telephone recruitment process. Data security Steps were taken to ensure the integrity and confidentiality of the business and personal details provided by LBM. Both the tele-bookers and surveyors accessed the business contact data they needed via an internet link into a restricted area of one of the Urban Mines servers. Neither group had access to the data provided by LBM and a single copy of the dataset was retained on the server with access only by the Urban Mines data manager. Each business in the dataset was issued a unique code which allowed identification of waste stream records and their positioning in the sample matrix for grossing up. Only Urban Mines held a copy of the unique code to business name table for data checking, and this, along with the original dataset, was deleted on completion of the project. Urban Mines is registered under the Data Protection Act to handle personal data.
2.4 Tele-booking process Tele-operators from Ainsworth and Parkinson were trained on the developed conversational call script for this survey. All staff were made familiar with Urban Mines’ proprietary call management system, EVCall, which they used remotely, working from their own offices, connected to the Urban Mines servers. The surveyors were based mainly around Newcastle. Urban Mines’ proprietary software “EVCall” presented the tele-operators with businesses selected at random, cycling through the sample matrix “bricks” to ensure a reasonable spread of bricks within each sub-region. Bricks were closed off once the brick target, plus an overbooking margin to take care of cancellations, had been achieved. Each company called was asked whether they had already taken part in the English National Survey, and if so rejected at that stage to guard against double counting. Once a business had agreed to participate in the survey, the tele-operator made an appointment. EVCall offered the operator a selection of dates and time slots, presenting the nearest surveyor at the top of each list. Clustering visits geographically allowed us to maximise the number of visits and telephone calls per day for each individual surveyor. Each business being surveyed was sent a confirmation email and an information pack on the day the booking was made. The surveyors retrieved their booked appointments diary by logging onto the Urban Mines server.
2.5 Checking business data To ensure that the information provided by LBM was correct operators checked the Standard Industrial Classification (SIC) (business type) code and number of employees, and business address details as each booking was made. This data was also checked directly with the company representative during the survey interview. This additional
North East of England Commercial and Industrial Waste Survey 2010 For NESRB
7
checking was carried out as this data is critical to placing the company concerned in the sample matrix, and therefore to the error checking and data grossing process.
2.6 Survey visit & telephone surveys The chosen surveyor visited in person each business with whom they had an appointment booked and also undertook telephone surveys for companies that were to be surveyed by telephone. The surveys consisted of an initial discussion to reiterate the reason for the survey and also to “break the ice”. Following this, the survey was completed using Urban Mines’ proprietary survey software “EVSurvey” on the surveyor’s laptop. Surveyors tried to collect as much data as possible from written records, such as waste collection or disposal invoices, transfer or consignment notes and internal electronic records. If necessary, the surveyor would prompt the business contact by suggesting the types of records which might be available. An innovation, included in the data collection software for this survey, was the ability to check collected data against averages and ranges expected for companies of a similar size and sector, using data from previous surveys. This check was carried out at the end of the survey process so as to not influence the data collected. This gave the opportunity to spot significant outliers or data errors during the survey interview, and to re-test collected data with the company representative. This, coupled with built-in routines to trap data entry errors, produced significantly less outliers and data errors in this survey compared to previous surveys. For surveys undertaken on site, after completion of the interview stage, the surveyor asked to be taken on a brief tour of the business’ facilities, to check the data already collected and to identify any waste streams which the business representative may have overlooked. In a significant number of cases, additional waste streams were identified this way.
2.7 Data collation After a series of visit and telephone surveys, the surveyors used the export function in EVSurvey software to export completed datasets and email these to Urban Mines. Surveyors were asked to do this within 2 days of data collection so that any errors could be checked promptly. On arrival the data was checked and appended to the main survey database. To ensure data security, the only business specific identification data exported and associated with the individual waste stream data was the unique code. This proved to be an effective and reliable process.
2.8 Field trials The survey bookings and survey visits were “road tested” before the full survey was started. This consisted of selecting a sub-set of businesses at random, and then testing: • the call flow script and EVCall software use • confirmation paperwork • survey methodology plus software
North East of England Commercial and Industrial Waste Survey 2010 For NESRB
8
• data entry and collation A total of 8 businesses were booked and visited for these trials, by surveyors from Urban Mines and Gardiner & Theobald. These trials also identified minor problems and were used as part of the training process for the surveyors.
2.9 Surveyor and tele-booker training Day sessions were held with tele-bookers from Ainsworth & Parkinson and three day sessions with the survey team from Gardiner & Theobald (plus those providing cover during periods of absence) to introduce the survey and give specific software and survey methodology training. Particularly for the surveyors, training included explanation of the process of recording data, for handling and selecting waste types and weight conversions, and for interpreting responses. Guidance was also given for answering the “recyclable” and “recoverable” and other questions on the survey questionnaire, and real examples in the form of case studies were reviewed. Survey packs were also provided to surveyors, including a detailed user guide, which re-emphasised all the areas covered during training, and provided a reference during survey visits. During the same session, all required software was installed on the surveyors’ laptops. A review session one week into the survey was carried out with the surveyors, which tackled problems and issues encountered during the first week of the survey.
2.10 Monitoring performance Throughout the survey, the project and data managers at Urban Mines monitored call statistics, brick completion and business cancellation rates via remote access to a set of Excel pivot tables linked live to EVCall. During the initial booking phase, and whenever the booking strategy was changed, Ainsworth and Parkinson and Urban Mines staff monitored the tele-bookers’ performance and that of the call script, by monitoring calls directly on site. As the surveyors picked up details of future bookings from their diaries in EVCall, they also registered the outcome for previous visits. When data from visits was received this too was registered by EVCall. As well as handling booking and business data, the EVCall call software package also produced a number of performance indicators allowing project managers at Urban Mines to monitor:
• success rate per individual tele-booker i.e. surveys booked per hour • cancellation rates (i.e. % cancelled surveys compared to the number booked) • survey visit calls per day per surveyor, and “no show” rate • distance travelled by the surveyor per day • delivered visits and data, and % completing of each brick in the sample
matrix
North East of England Commercial and Industrial Waste Survey 2010 For NESRB
9
At certain periods throughout the survey, both tele-bookers and surveyors were directly monitored to check performance and correct any problems. For the tele-bookers, adherence to script was checked by listening into calls, and changes made if appropriate. Concurrently, Urban Mines also carried out a telephone “mini-survey” of a sub-set of businesses that had been visited and surveyed by telephone by the surveyors, as a further check of performance to ascertain what the business representative thought of the experience from booking to the survey delivery. A number of businesses were called at random for each surveyor. This was not intended to be a statistically valid survey of responses, it was just another check that the surveys were progressing satisfactorily and that the businesses involved were happy with how they were treated. No significant problems were highlighted by these calls, and 100% of those called responded “Yes” to “If contacted, would you be happy to take part in another similar survey in the future?”.
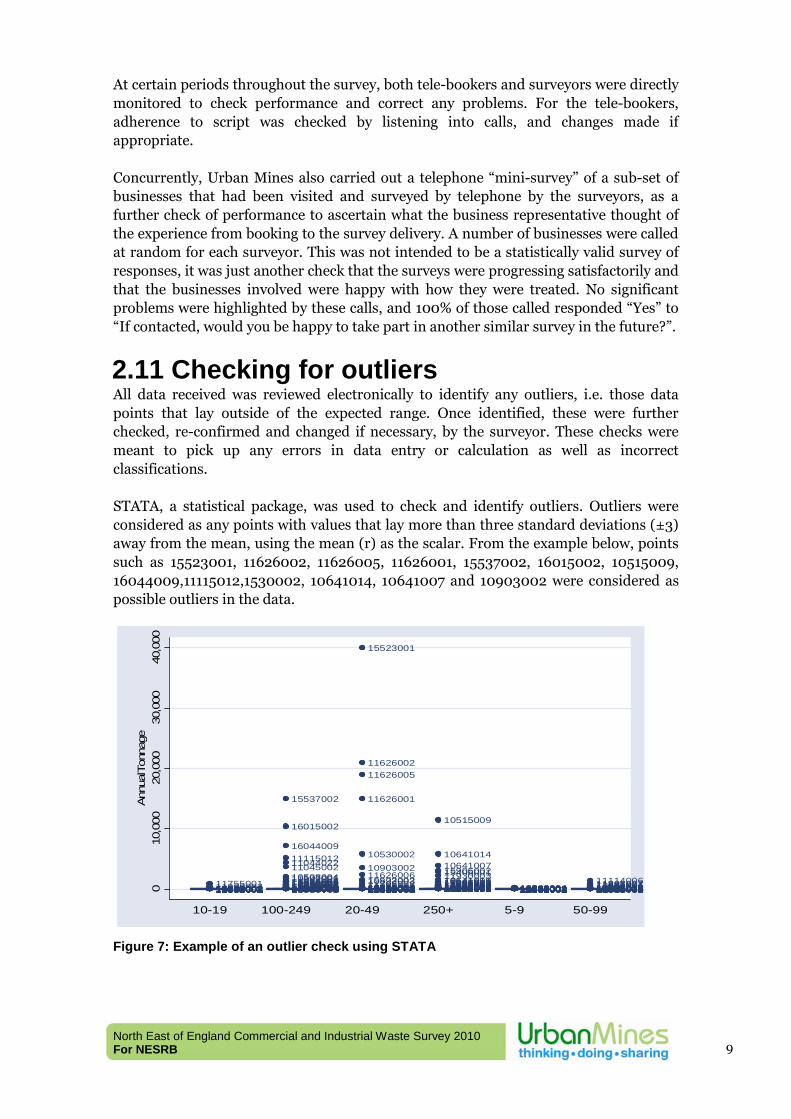
2.11 Checking for outliers All data received was reviewed electronically to identify any outliers, i.e. those data points that lay outside of the expected range. Once identified, these were further checked, re-confirmed and changed if necessary, by the surveyor. These checks were meant to pick up any errors in data entry or calculation as well as incorrect classifications. STATA, a statistical package, was used to check and identify outliers. Outliers were considered as any points with values that lay more than three standard deviations (±3) away from the mean, using the mean (r) as the scalar. From the example below, points such as 15523001, 11626002, 11626005, 11626001, 15537002, 16015002, 10515009, 16044009,11115012,1530002, 10641014, 10641007 and 10903002 were considered as possible outliers in the data.
12615002152760011085000212689002124890021158000111631003114930021046300111542003115720071247200112509001114760011244400113086001125780031103100112592003125480011230800110551002123080021046200310807002145030011257800215790001143030021389500112357001150740011100800111135001105760011157200310618003106840011261900112689001104550011078600110997003107170021389700312511001115750011078600211536002114860021148600110868004115600021061800114303001152700051150900111653002124890031149000411008003117550011199800110593001119040021604400114330008136710021270800111115003160150031122700111188002106290011428900115962016110440121598400610910009109100101433000615980001137330041270900114329003142850051370700210503001112250041050500115578008109110051370300113733002155380011427700110629003111150091091300110505002137030021050300713726012142800021179500114280001106350051433000713726004155730081186700411208002155370041423000114278001110450011554000414307001109150031050800315531001105070031557800315526005112110041433000215953003143290011596200610910007105080061104400215625001159800021553700315537005159620111596201214311001111880071430400110503003112080011184300114264001159620041187700916000001136710131121000615537001155370061059300515595001159770021050700211898002137410011186700111867002143280021063500110909001109000011434400111188001105080011111501613671006127080031171700111924002111150051557800215595005111170031559500311904001110440011111200410625005136710121179500711044005160150011050800814330001159530011091000111218002143300031367100116000005118430051187700311042001105070011050800411045002110440221111501216044009
16015002
15537002
1323500315181002136130021421300110691003117610021085100210903003118050011187600115153004151530011369400113692001124920011347000111845002117120011334100112640001126280021602900111855001160290131347600113282002118550021079400112629003119060051085100112550001126290021188000111809001125980031062100110619002116650021085800216029012152550041089200610569001116340051351000112519002124990011602901410489001140810031251900110903001160290061166200111202001145650011602901513991001117120021264000211748003116650011184500111473003118050031363200112684001106170031515300315127001125190081175700316029005118360021323500116029011160360081089200212628001108030011180500213918001117610011086600116029007117050041090300410621002160290041552300311836001116260071089200111626003160290031386700111705003117050021089200315523002116260061090300210530002
11626001
1162600511626002
15523001
119120051125000611048001112500011375800111231001119230011123600311239007106410061375100111231002142650011371400116034003112390011602700914326002110520011123900211243009112430071433400311927003159950071599200214279001143320011434600115655001142950011565400115575001112360011123600214332005110480031123900615906001106410011565500311930001137680031601100311250002159950011540600214340001159060031433600110641013112430051190800111243010112430031430000116011002119270041192700111927002159950041123900315995003119270061064101210641008106410111193000315406001159060021064100710641014
10515009
144920021229800211335001148090031095200310741001143780051105700314552002148090011198500215563003146870011172800111342001110570021288000114809002113480011226200111973001110820011210600211505001144640011255700112085001115310021197300213746001124160011215900115647002110990011145200112244001107470021459300112162001121000011226800112835001116880011076200211404002118640021080900115647001109220011230200113083001110570041054000210741002105400031556300411268001 155920031111400310891001154700011361800112670002117930011393500111847002136670011364700111797001118290091060200611038002117750021087800111030001118380011183200111829004118790011118400113709001142060011178500311803003106380011267000311732012142430011358900115481001108950101119000111815003126610021514900611896001126690011188600216016005108780051089100412667001116170011177500311114001154520051178000112704001116170031357900411725009110260021172501012698001159910011087800310886002111590011557600112661001118370011360000111793002136910031177200112702004136860011559200211145003118880021180400115452004109080021267000115982001118880011190100311781003108780041266900412702002126870011355800213558001117930061181500211888003118950041266100310879001106380021119000311038001118470031178500210895001118200011060200111841004117850011180300711114006
010
,000
20,0
0030
,000
40,0
00Ann
ualT
onna
ge
10-19 100-249 20-49 250+ 5-9 50-99
Figure 7: Example of an outlier check using STATA
North East of England Commercial and Industrial Waste Survey 2010 For NESRB
10
2.12 Survey completion – data cleanup and grossing
On completion of the survey, the final survey data was collated and final outlier checks run so that residual data could be checked with the surveyors. Over 5,000 separate waste stream lines of data were collected. The aggregated dataset was then grossed for the first time using the methodology described in Appendix 8. Grossing the data by individual waste stream line allowed the secondary checking of data via sensitivity analysis i.e. all waste streams were identified which had a significant impact once grossed on the estimated waste totals (regionally or by waste type, waste management method, sector, etc). All highlighted data was checked by Urban Mines directly with the company from which the data was originally collected. All data with more than a 0.5% impact on the final grossed estimates was checked in this way. This is how we aimed to maximise the confidence in the final data and correct any inconsistencies. In parallel, the company sector and size data was comprehensively checked, in particular where the LBM data did not agree with that recorded, or was changed by the telephone operator and/or the surveyor. After extensive checking, final amendments were made and the resultant dataset used for grossing to give regional and sub-regional waste arisings estimates, again using the methodology described in Appendix 8. Two additional data sources were used to augment the grossed survey data:
1. Supermarkets – we have found from previous experience that it is common that managers of large retail stores, including supermarkets, do not know the amount of waste their stores produce as all waste and recyclate is taken away by the same trucks that deliver new produce. Therefore, to fill data gaps with particularly large retail stores, data obtained directly from 4 major supermarket chains was used.
2. Survey data from the England C&I survey undertaken by Jacobs on behalf of
Defra. Waste data from 276 companies surveyed for the North East region was incorporated into our survey data and grossed to give the total waste estimate for the region.
How this data was incorporated into the final dataset is explained in detail in Appendix 8.
North East of England Commercial and Industrial Waste Survey 2010 For NESRB
11
3 Survey results and analysis The following tables present the grossed up data estimates for commercial and industrial waste arisings in the North East region for the financial year 2009/2010. What was surveyed
• 1,036 industrial and commercial business sites • Businesses across the size range (in terms of number of employees) from those
with 5 employees to >250 employees • All wastes produced on site i.e. outgoing wastes and waste disposed of (but not
recycled or re-used) on site, for financial year 2009-10 • Hazardous and non-hazardous wastes • “Non-Wastes” such as blast furnace slag and virgin timber • The waste management method used to dispose of, recycle or recover the waste,
and where that process was carried out • The potential for the waste to be recycled or energy recovered
What was NOT surveyed
• Businesses involved in agriculture, mining & quarrying and construction • Businesses involved in waste management and recycling (to avoid potential
double counting) • Waste recycled or re-used on the same site it was produced • Waste sent to waste water or effluent treatment on-site or off-site via a pipe • Micro-companies (i.e. 1-4 employees)
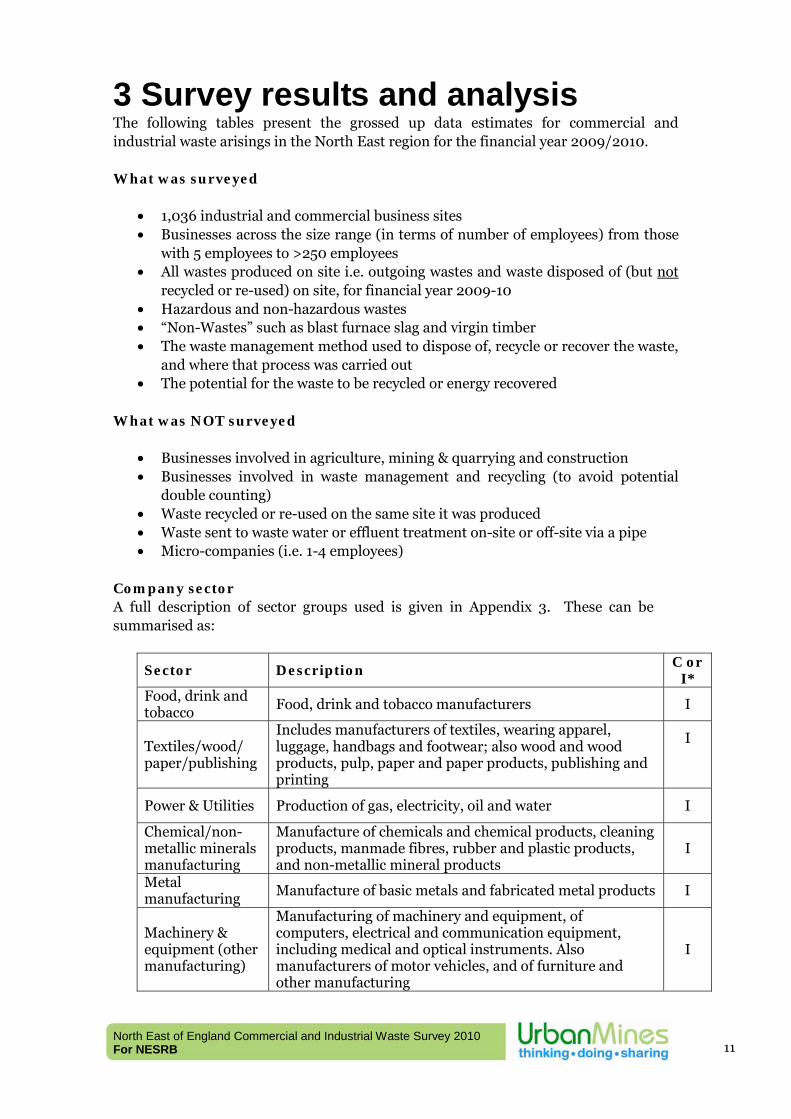
Company sector A full description of sector groups used is given in Appendix 3. These can be summarised as:
Sector Description C or
I* Food, drink and tobacco
Food, drink and tobacco manufacturers I
Textiles/wood/ paper/publishing
Includes manufacturers of textiles, wearing apparel, luggage, handbags and footwear; also wood and wood products, pulp, paper and paper products, publishing and printing
I
Power & Utilities Production of gas, electricity, oil and water I
Chemical/non-metallic minerals manufacturing
Manufacture of chemicals and chemical products, cleaning products, manmade fibres, rubber and plastic products, and non-metallic mineral products
I
Metal manufacturing
Manufacture of basic metals and fabricated metal products I
Machinery & equipment (other manufacturing)
Manufacturing of machinery and equipment, of computers, electrical and communication equipment, including medical and optical instruments. Also manufacturers of motor vehicles, and of furniture and other manufacturing
I
North East of England Commercial and Industrial Waste Survey 2010 For NESRB
12
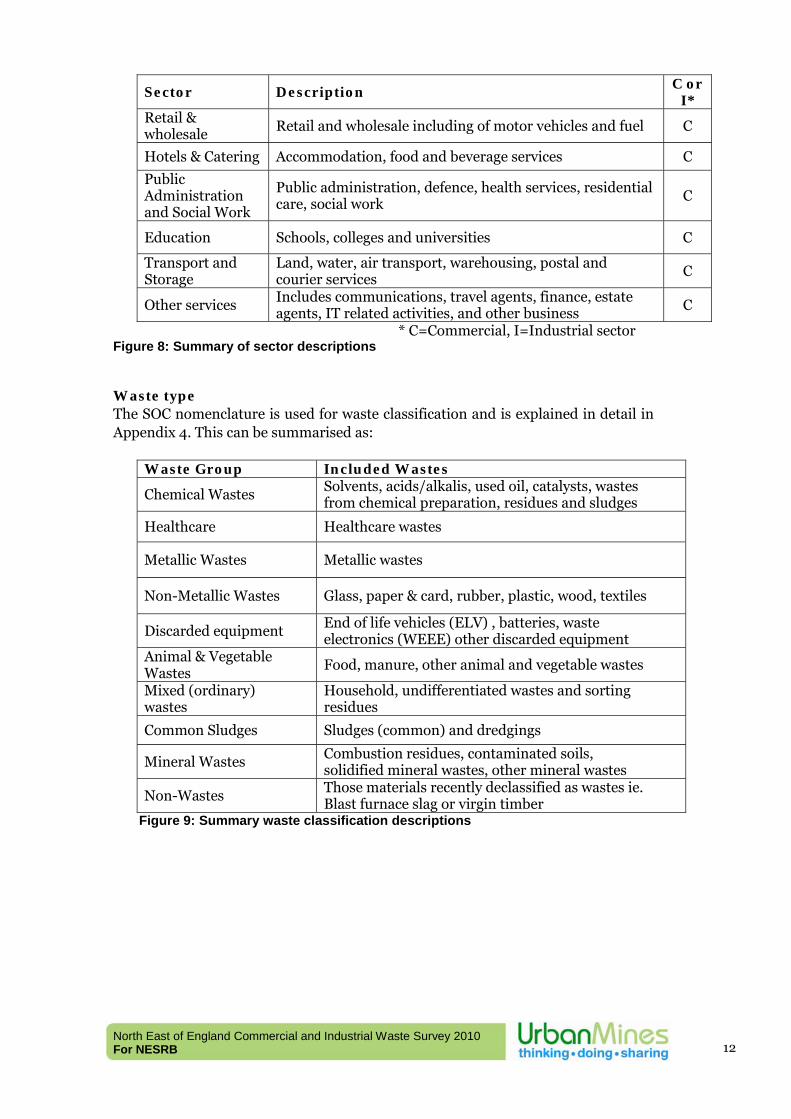
Sector Description C or
I* Retail & wholesale
Retail and wholesale including of motor vehicles and fuel C
Hotels & Catering Accommodation, food and beverage services C
Public Administration and Social Work
Public administration, defence, health services, residential care, social work
C
Education Schools, colleges and universities C
Transport and Storage
Land, water, air transport, warehousing, postal and courier services
C
Other services Includes communications, travel agents, finance, estate agents, IT related activities, and other business
C
* C=Commercial, I=Industrial sector Figure 8: Summary of sector descriptions Waste type The SOC nomenclature is used for waste classification and is explained in detail in Appendix 4. This can be summarised as:
Waste Group Included Wastes
Chemical Wastes Solvents, acids/alkalis, used oil, catalysts, wastes from chemical preparation, residues and sludges
Healthcare Healthcare wastes
Metallic Wastes Metallic wastes
Non-Metallic Wastes Glass, paper & card, rubber, plastic, wood, textiles
Discarded equipment End of life vehicles (ELV) , batteries, waste electronics (WEEE) other discarded equipment
Animal & Vegetable Wastes
Food, manure, other animal and vegetable wastes
Mixed (ordinary) wastes
Household, undifferentiated wastes and sorting residues
Common Sludges Sludges (common) and dredgings
Mineral Wastes Combustion residues, contaminated soils, solidified mineral wastes, other mineral wastes
Non-Wastes Those materials recently declassified as wastes ie. Blast furnace slag or virgin timber
Figure 9: Summary waste classification descriptions
North East of England Commercial and Industrial Waste Survey 2010 For NESRB
13
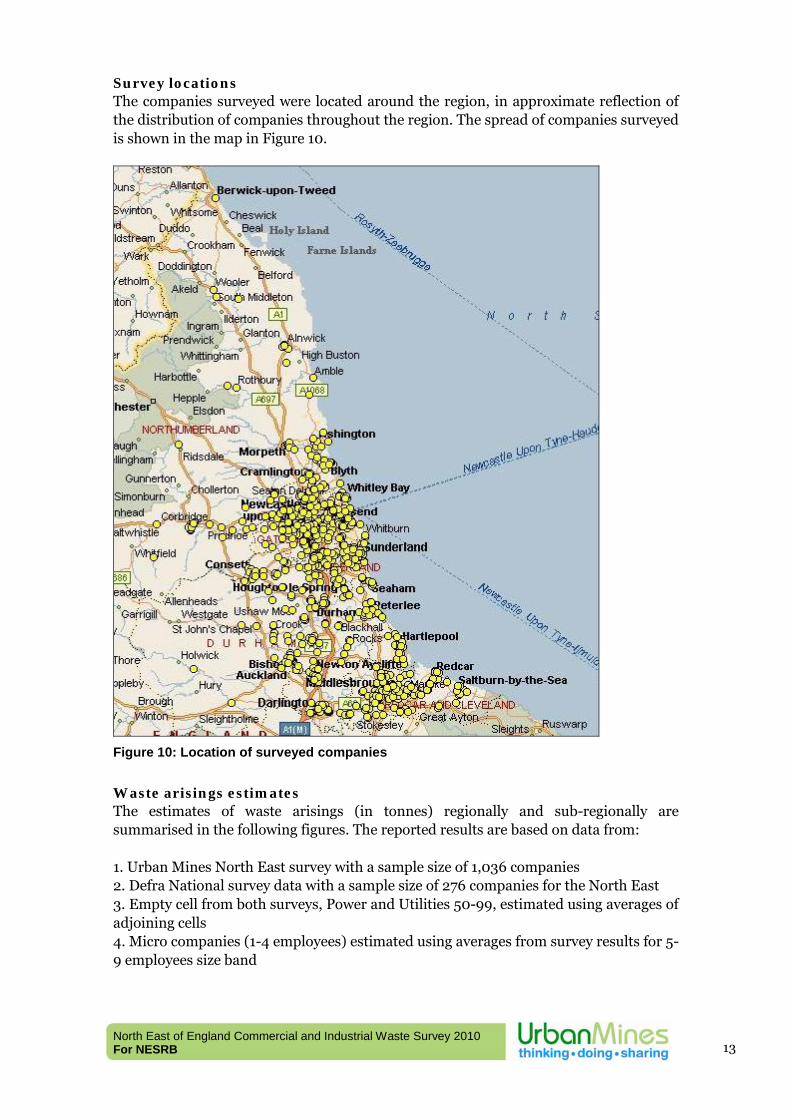
Survey locations The companies surveyed were located around the region, in approximate reflection of the distribution of companies throughout the region. The spread of companies surveyed is shown in the map in Figure 10.
Figure 10: Location of surveyed companies
Waste arisings estimates The estimates of waste arisings (in tonnes) regionally and sub-regionally are summarised in the following figures. The reported results are based on data from: 1. Urban Mines North East survey with a sample size of 1,036 companies 2. Defra National survey data with a sample size of 276 companies for the North East 3. Empty cell from both surveys, Power and Utilities 50-99, estimated using averages of adjoining cells 4. Micro companies (1-4 employees) estimated using averages from survey results for 5-9 employees size band
North East of England Commercial and Industrial waste Survey 2010 For NESRB
14
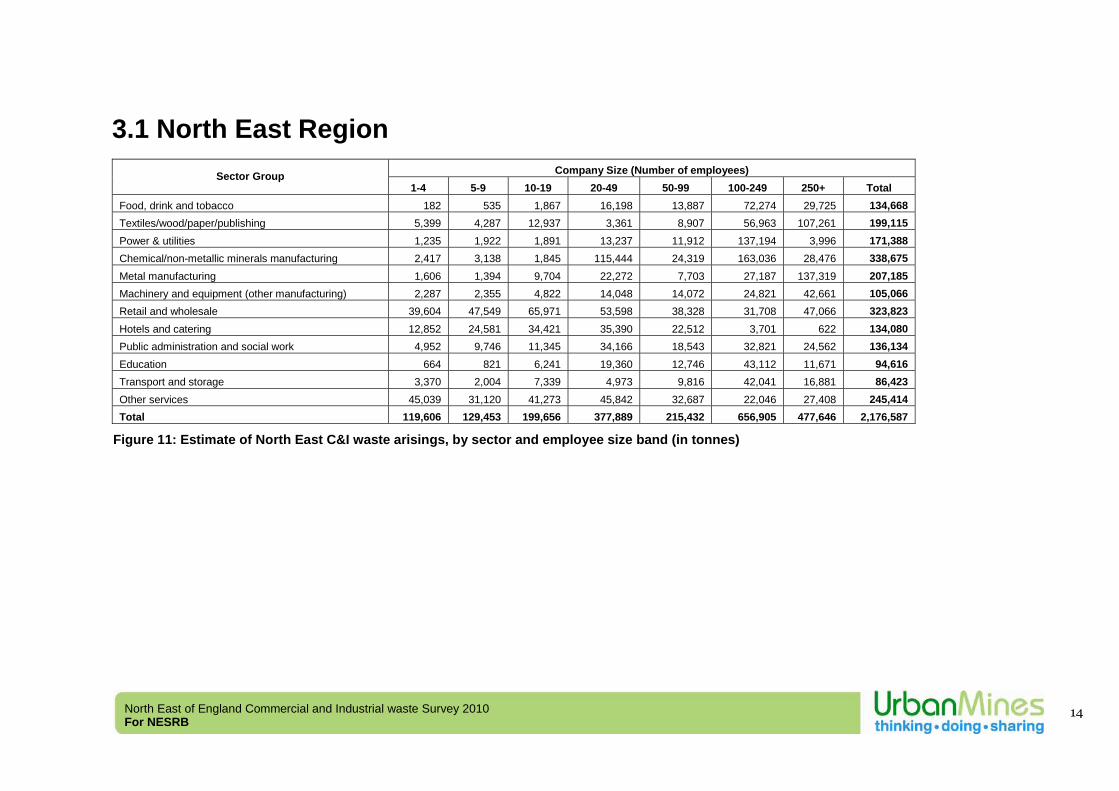
3.1 North East Region
Company Size (Number of employees) Sector Group 1-4 5-9 10-19 20-49 50-99 100-249 250+ Total
Food, drink and tobacco 182 535 1,867 16,198 13,887 72,274 29,725 134,668 Textiles/wood/paper/publishing 5,399 4,287 12,937 3,361 8,907 56,963 107,261 199,115 Power & utilities 1,235 1,922 1,891 13,237 11,912 137,194 3,996 171,388 Chemical/non-metallic minerals manufacturing 2,417 3,138 1,845 115,444 24,319 163,036 28,476 338,675 Metal manufacturing 1,606 1,394 9,704 22,272 7,703 27,187 137,319 207,185 Machinery and equipment (other manufacturing) 2,287 2,355 4,822 14,048 14,072 24,821 42,661 105,066 Retail and wholesale 39,604 47,549 65,971 53,598 38,328 31,708 47,066 323,823 Hotels and catering 12,852 24,581 34,421 35,390 22,512 3,701 622 134,080 Public administration and social work 4,952 9,746 11,345 34,166 18,543 32,821 24,562 136,134 Education 664 821 6,241 19,360 12,746 43,112 11,671 94,616 Transport and storage 3,370 2,004 7,339 4,973 9,816 42,041 16,881 86,423 Other services 45,039 31,120 41,273 45,842 32,687 22,046 27,408 245,414 Total 119,606 129,453 199,656 377,889 215,432 656,905 477,646 2,176,587
Figure 11: Estimate of North East C&I waste arisings, by sector and employee size band (in tonnes)
North East of England Commercial and Industrial waste Survey 2010 For NESRB
15
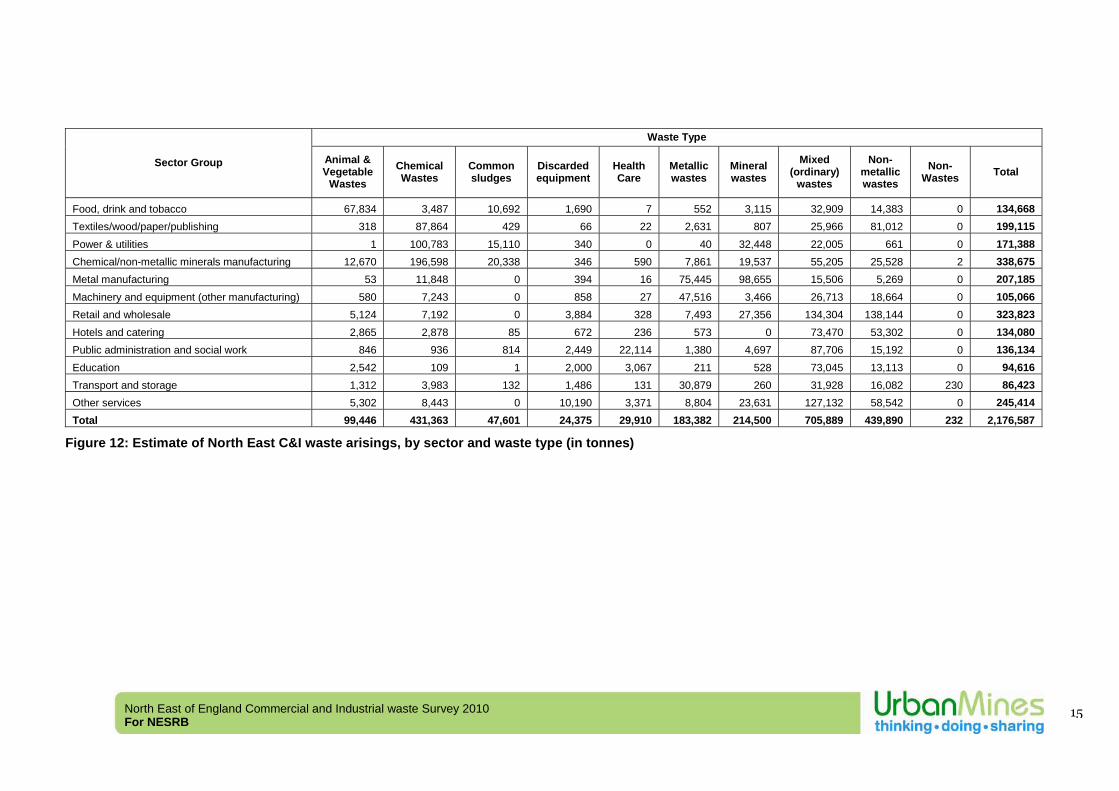
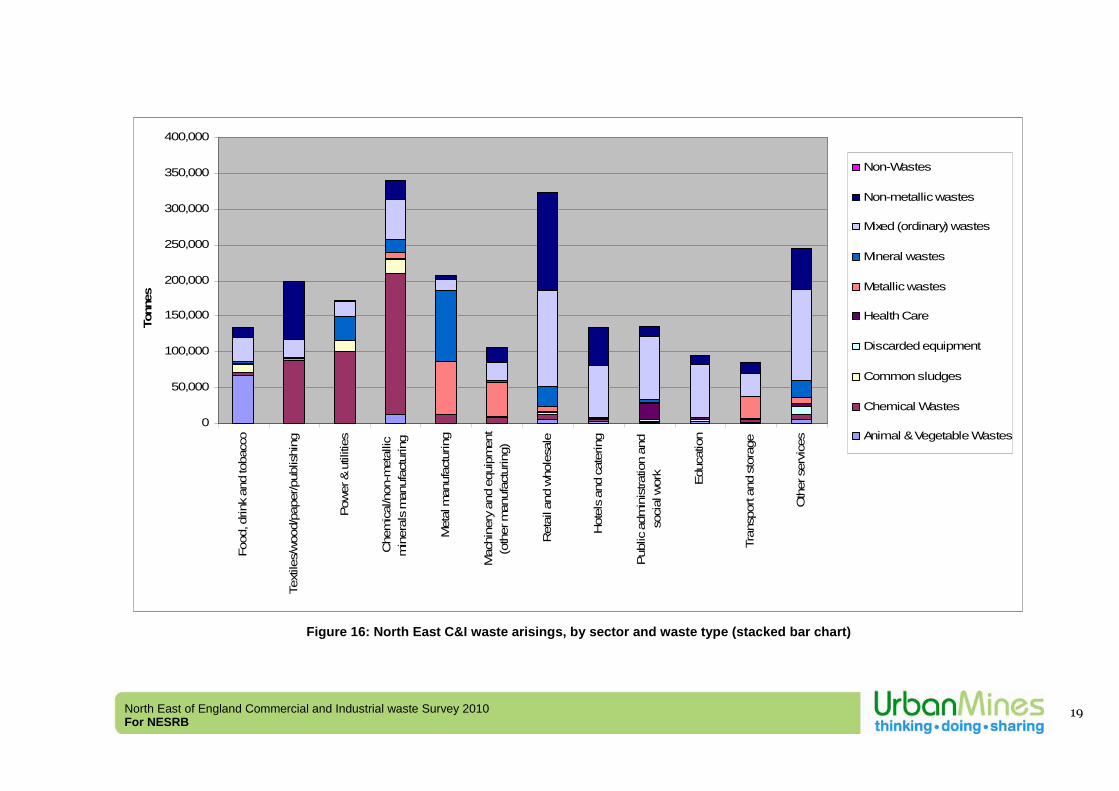
Waste Type
Sector Group Animal & Vegetable
Wastes Chemical Wastes
Common sludges
Discarded equipment
Health Care
Metallic wastes
Mineral wastes
Mixed (ordinary)
wastes
Non-metallic wastes
Non-Wastes Total
Food, drink and tobacco 67,834 3,487 10,692 1,690 7 552 3,115 32,909 14,383 0 134,668 Textiles/wood/paper/publishing 318 87,864 429 66 22 2,631 807 25,966 81,012 0 199,115 Power & utilities 1 100,783 15,110 340 0 40 32,448 22,005 661 0 171,388 Chemical/non-metallic minerals manufacturing 12,670 196,598 20,338 346 590 7,861 19,537 55,205 25,528 2 338,675 Metal manufacturing 53 11,848 0 394 16 75,445 98,655 15,506 5,269 0 207,185 Machinery and equipment (other manufacturing) 580 7,243 0 858 27 47,516 3,466 26,713 18,664 0 105,066 Retail and wholesale 5,124 7,192 0 3,884 328 7,493 27,356 134,304 138,144 0 323,823 Hotels and catering 2,865 2,878 85 672 236 573 0 73,470 53,302 0 134,080 Public administration and social work 846 936 814 2,449 22,114 1,380 4,697 87,706 15,192 0 136,134 Education 2,542 109 1 2,000 3,067 211 528 73,045 13,113 0 94,616 Transport and storage 1,312 3,983 132 1,486 131 30,879 260 31,928 16,082 230 86,423 Other services 5,302 8,443 0 10,190 3,371 8,804 23,631 127,132 58,542 0 245,414 Total 99,446 431,363 47,601 24,375 29,910 183,382 214,500 705,889 439,890 232 2,176,587
Figure 12: Estimate of North East C&I waste arisings, by sector and waste type (in tonnes)
North East of England Commercial and Industrial waste Survey 2010 For NESRB
16
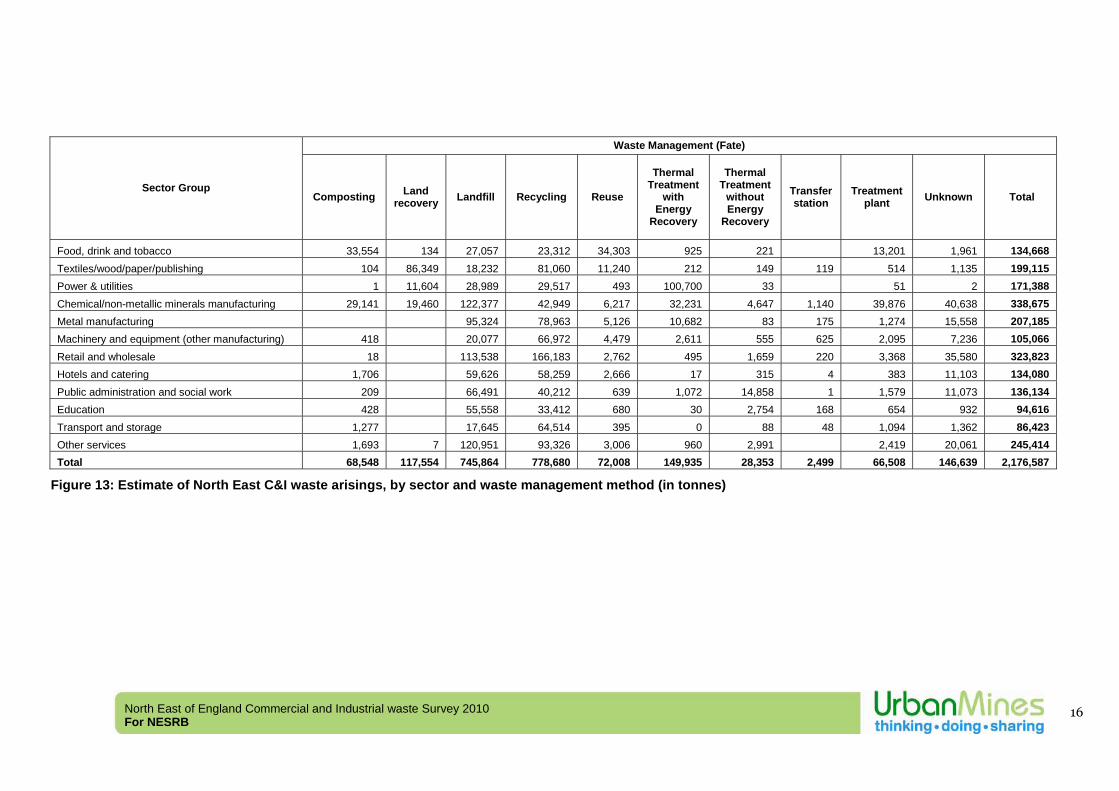
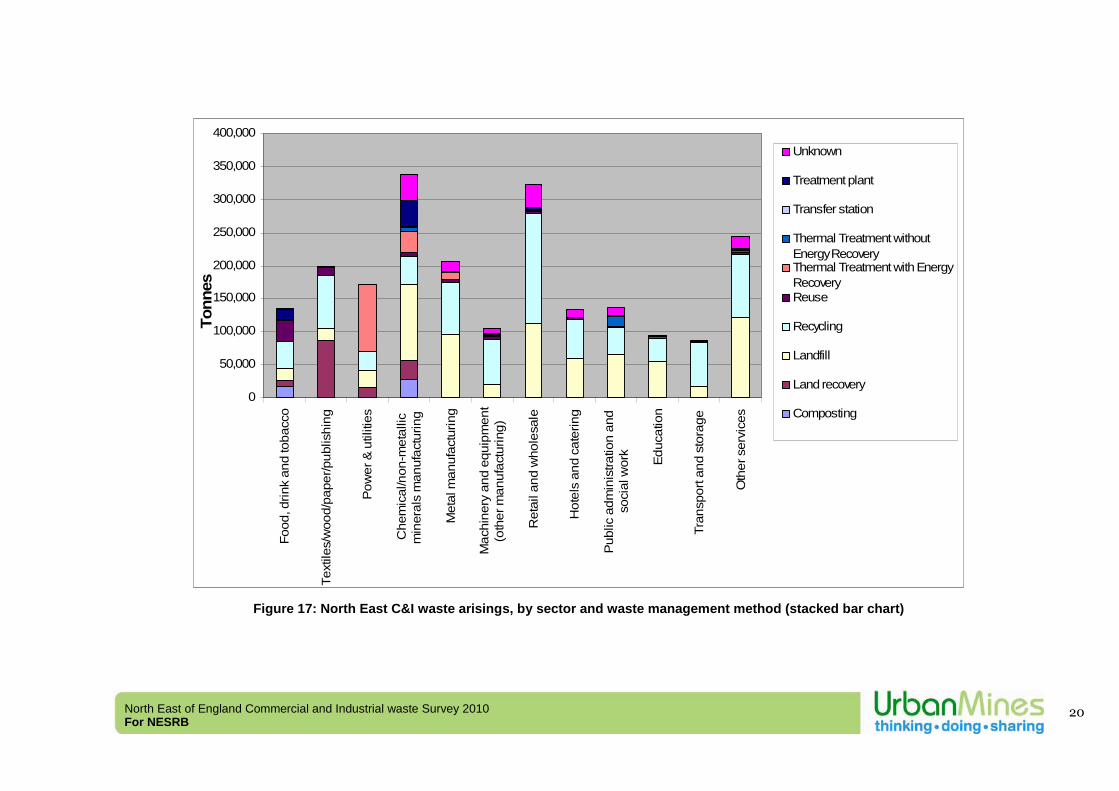
Waste Management (Fate)
Sector Group Composting Land
recovery Landfill Recycling Reuse
Thermal Treatment
with Energy
Recovery
Thermal Treatment
without Energy
Recovery
Transfer station
Treatment plant Unknown Total
Food, drink and tobacco 33,554 134 27,057 23,312 34,303 925 221 13,201 1,961 134,668 Textiles/wood/paper/publishing 104 86,349 18,232 81,060 11,240 212 149 119 514 1,135 199,115 Power & utilities 1 11,604 28,989 29,517 493 100,700 33 51 2 171,388 Chemical/non-metallic minerals manufacturing 29,141 19,460 122,377 42,949 6,217 32,231 4,647 1,140 39,876 40,638 338,675 Metal manufacturing 95,324 78,963 5,126 10,682 83 175 1,274 15,558 207,185 Machinery and equipment (other manufacturing) 418 20,077 66,972 4,479 2,611 555 625 2,095 7,236 105,066 Retail and wholesale 18 113,538 166,183 2,762 495 1,659 220 3,368 35,580 323,823 Hotels and catering 1,706 59,626 58,259 2,666 17 315 4 383 11,103 134,080 Public administration and social work 209 66,491 40,212 639 1,072 14,858 1 1,579 11,073 136,134 Education 428 55,558 33,412 680 30 2,754 168 654 932 94,616 Transport and storage 1,277 17,645 64,514 395 0 88 48 1,094 1,362 86,423 Other services 1,693 7 120,951 93,326 3,006 960 2,991 2,419 20,061 245,414 Total 68,548 117,554 745,864 778,680 72,008 149,935 28,353 2,499 66,508 146,639 2,176,587
Figure 13: Estimate of North East C&I waste arisings, by sector and waste management method (in tonnes)

North East of England Commercial and Industrial waste Survey 2010 For NESRB
17
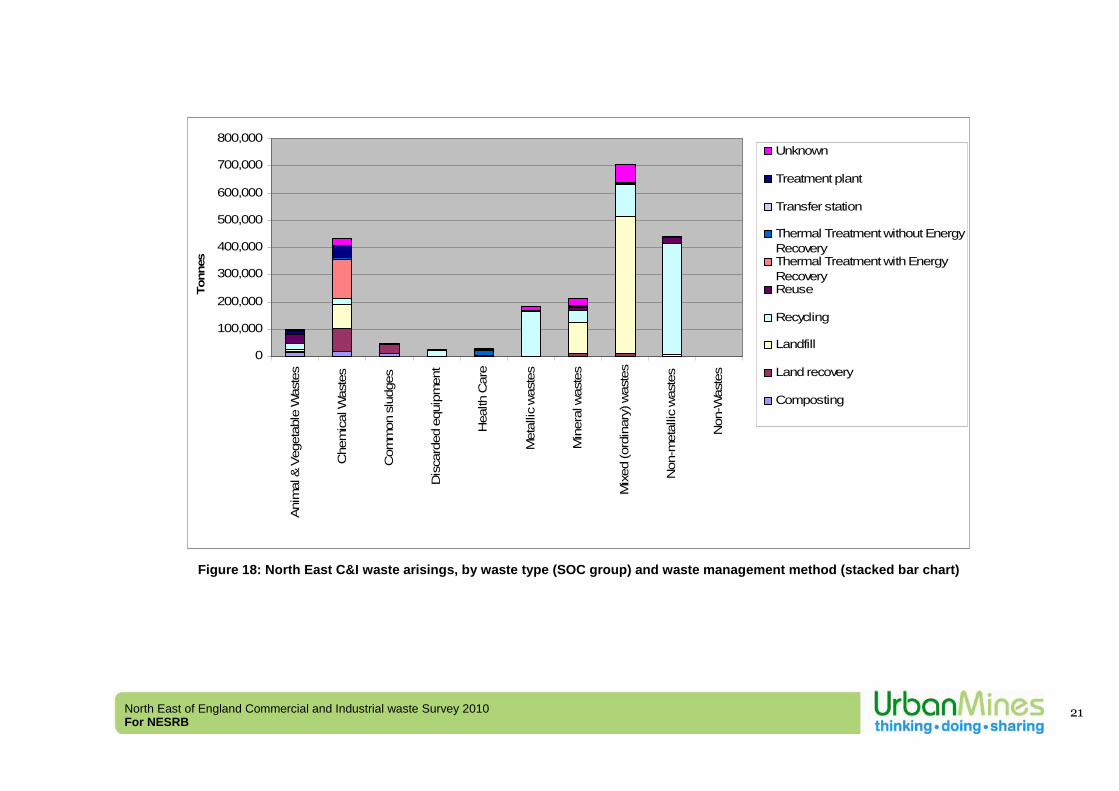
Waste Management (Fate)
Waste Type Composting Land
recovery Landfill Recycling Reuse
Thermal Treatment
with Energy
Recovery
Thermal Treatment
without Energy
Recovery
Transfer station
Treatment plant Unknown Total
Animal & Vegetable Wastes 16,416 134 9,201 21,691 32,990 505 609 0 14,276 3,623 99,446 Chemical Wastes 18,035 86,467 86,174 21,206 2,674 140,546 6,862 471 44,518 24,409 431,363 Common sludges 11,311 30,946 4,956 0 0 80 0 0 175 132 47,601 Discarded equipment 0 0 1,477 18,934 1,493 0 58 1 1,020 1,392 24,375 Health Care 0 0 2,242 354 0 1,074 19,817 0 1,726 4,696 29,910 Metallic wastes 0 0 17 164,583 4,471 0 14 0 250 14,047 183,382 Mineral wastes 0 11,681 112,264 44,323 10,146 5,480 100 0 2,748 27,757 214,500 Mixed (ordinary) wastes 270 11,098 501,121 120,093 0 1,137 702 1,311 1,168 68,989 705,889 Non-metallic wastes 824 7 5,632 408,957 20,234 1,113 189 716 625 1,592 439,890 Non-Wastes 0 0 0 230 0 0 0 0 0 2 232 Total 46,856 140,332 723,085 800,372 72,008 149,935 28,353 2,499 66,508 146,639 2,176,587
Figure 14: Estimate of North East C&I waste arisings, by waste type and waste management method (in tonnes)
North East of England Commercial and Industrial waste Survey 2010 For NESRB
18
Food, drink and tobacco6%
Textiles/wood/paper/publishing
9%
Chemical/non-metallic minerals manufacturing
16%
Machinery and equipment (other manufacturing)
5%
Metal manufacturing10%
Power & utilities8%
Retail and wholesale15%
Hotels and catering6%
Other services11%
Transport and storage4%
Education4%
Public administration and social work
6%
Figure 15: North East C&I waste arisings, by sector (% of total)
North East of England Commercial and Industrial waste Survey 2010 For NESRB
19
0
50,000
100,000
150,000
200,000
250,000
300,000
350,000
400,000
Food
, drin
k an
d to
bacc
o
Text
iles/
woo
d/pa
per/p
ublis
hing
Pow
er &
util
ities
Che
mic
al/n
on-m
etal
licm
iner
als
man
ufac
turin
g
Met
al m
anuf
actu
ring
Mac
hine
ry a
nd e
quip
men
t(o
ther
man
ufac
turin
g)
Ret
ail a
nd w
hole
sale
Hot
els
and
cate
ring
Publ
ic a
dmin
istra
tion
and
soci
al w
ork
Edu
catio
n
Tran
spor
t and
sto
rage
Oth
er s
ervi
ces
Tonn
es
Non-Wastes
Non-metallic wastes
Mixed (ordinary) wastes
Mineral wastes
Metallic wastes
Health Care
Discarded equipment
Common sludges
Chemical Wastes
Animal & Vegetable Wastes
Figure 16: North East C&I waste arisings, by sector and waste type (stacked bar chart)
North East of England Commercial and Industrial waste Survey 2010 For NESRB
20
0
50,000
100,000
150,000
200,000
250,000
300,000
350,000
400,000
Food
, drin
k an
d to
bacc
o
Text
iles/
woo
d/pa
per/p
ublis
hing
Pow
er &
util
ities
Che
mic
al/n
on-m
etal
licm
iner
als
man
ufac
turin
g
Met
al m
anuf
actu
ring
Mac
hine
ry a
nd e
quip
men
t(o
ther
man
ufac
turin
g)
Ret
ail a
nd w
hole
sale
Hot
els
and
cate
ring
Pub
lic a
dmin
istra
tion
and
soci
al w
ork
Educ
atio
n
Tran
spor
t and
sto
rage
Oth
er s
ervi
ces
Tonn
es
Unknown
Treatment plant
Transfer station
Thermal Treatment withoutEnergy RecoveryThermal Treatment with EnergyRecoveryReuse
Recycling
Landfill
Land recovery
Composting
Figure 17: North East C&I waste arisings, by sector and waste management method (stacked bar chart)
North East of England Commercial and Industrial waste Survey 2010 For NESRB
21
0
100,000
200,000
300,000
400,000
500,000
600,000
700,000
800,000
Ani
mal
& V
eget
able
Was
tes
Che
mic
al W
aste
s
Com
mon
slu
dges
Dis
card
ed e
quip
men
t
Hea
lth C
are
Met
allic
was
tes
Min
eral
was
tes
Mix
ed (o
rdin
ary)
was
tes
Non
-met
allic
was
tes
Non
-Was
tes
Tonn
es
Unknown
Treatment plant
Transfer station
Thermal Treatment without EnergyRecoveryThermal Treatment with EnergyRecoveryReuse
Recycling
Landfill
Land recovery
Composting
Figure 18: North East C&I waste arisings, by waste type (SOC group) and waste management method (stacked bar chart)
North East of England Commercial and Industrial waste Survey 2010 For NESRB
22
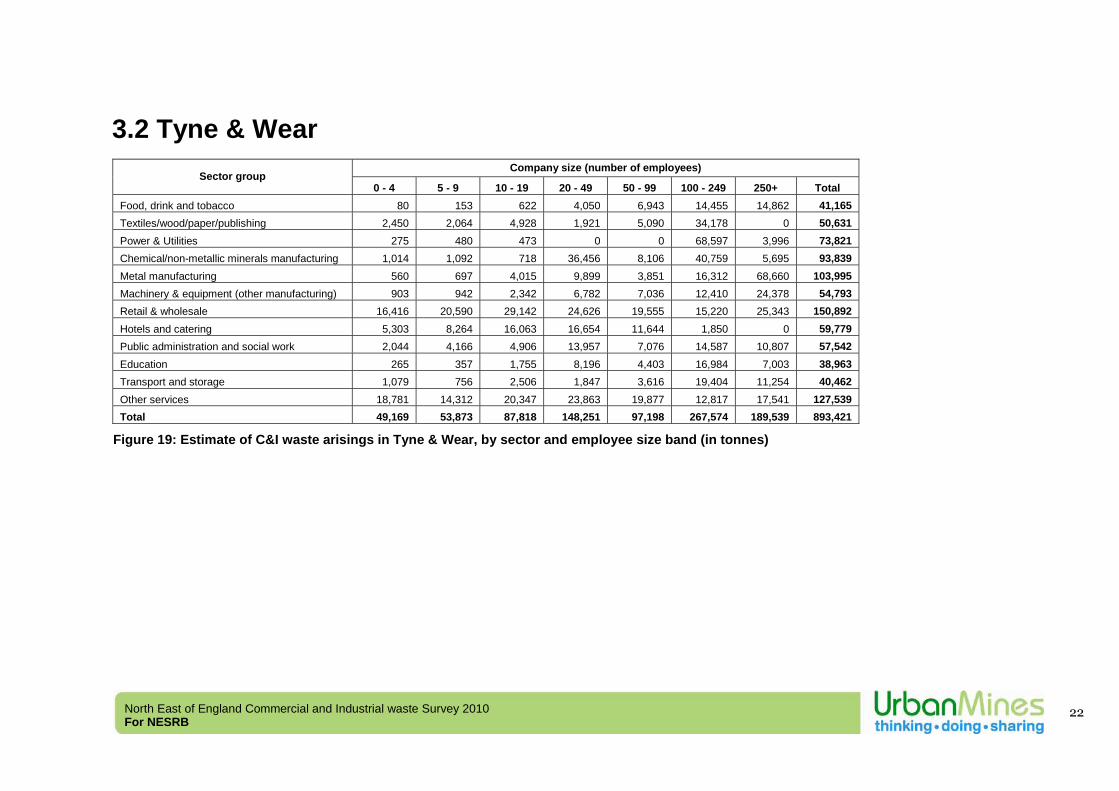
3.2 Tyne & Wear
Company size (number of employees) Sector group
0 - 4 5 - 9 10 - 19 20 - 49 50 - 99 100 - 249 250+ Total Food, drink and tobacco 80 153 622 4,050 6,943 14,455 14,862 41,165 Textiles/wood/paper/publishing 2,450 2,064 4,928 1,921 5,090 34,178 0 50,631 Power & Utilities 275 480 473 0 0 68,597 3,996 73,821 Chemical/non-metallic minerals manufacturing 1,014 1,092 718 36,456 8,106 40,759 5,695 93,839 Metal manufacturing 560 697 4,015 9,899 3,851 16,312 68,660 103,995 Machinery & equipment (other manufacturing) 903 942 2,342 6,782 7,036 12,410 24,378 54,793 Retail & wholesale 16,416 20,590 29,142 24,626 19,555 15,220 25,343 150,892 Hotels and catering 5,303 8,264 16,063 16,654 11,644 1,850 0 59,779 Public administration and social work 2,044 4,166 4,906 13,957 7,076 14,587 10,807 57,542 Education 265 357 1,755 8,196 4,403 16,984 7,003 38,963 Transport and storage 1,079 756 2,506 1,847 3,616 19,404 11,254 40,462 Other services 18,781 14,312 20,347 23,863 19,877 12,817 17,541 127,539 Total 49,169 53,873 87,818 148,251 97,198 267,574 189,539 893,421
Figure 19: Estimate of C&I waste arisings in Tyne & Wear, by sector and employee size band (in tonnes)
North East of England Commercial and Industrial waste Survey 2010 For NESRB
23
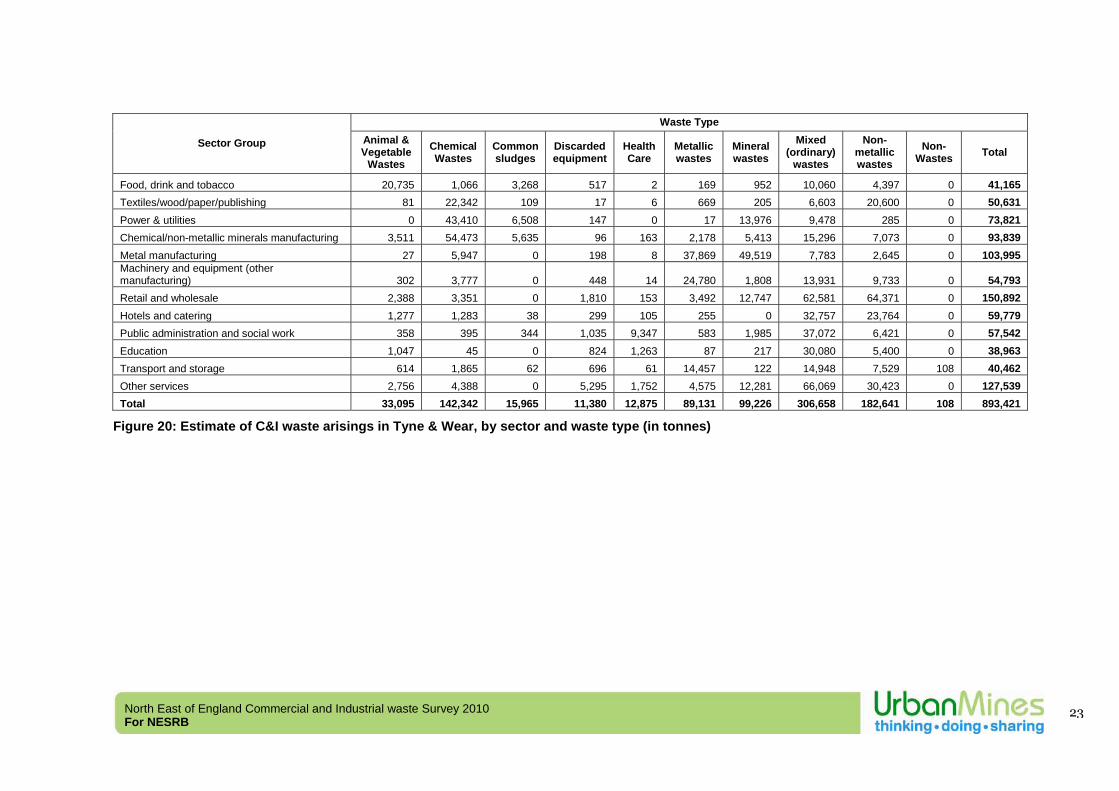
Waste Type
Sector Group Animal & Vegetable
Wastes Chemical Wastes
Common sludges
Discarded equipment
Health Care
Metallic wastes
Mineral wastes
Mixed (ordinary)
wastes
Non-metallic wastes
Non-Wastes Total
Food, drink and tobacco 20,735 1,066 3,268 517 2 169 952 10,060 4,397 0 41,165 Textiles/wood/paper/publishing 81 22,342 109 17 6 669 205 6,603 20,600 0 50,631 Power & utilities 0 43,410 6,508 147 0 17 13,976 9,478 285 0 73,821 Chemical/non-metallic minerals manufacturing 3,511 54,473 5,635 96 163 2,178 5,413 15,296 7,073 0 93,839 Metal manufacturing 27 5,947 0 198 8 37,869 49,519 7,783 2,645 0 103,995 Machinery and equipment (other manufacturing) 302 3,777 0 448 14 24,780 1,808 13,931 9,733 0 54,793 Retail and wholesale 2,388 3,351 0 1,810 153 3,492 12,747 62,581 64,371 0 150,892 Hotels and catering 1,277 1,283 38 299 105 255 0 32,757 23,764 0 59,779 Public administration and social work 358 395 344 1,035 9,347 583 1,985 37,072 6,421 0 57,542 Education 1,047 45 0 824 1,263 87 217 30,080 5,400 0 38,963 Transport and storage 614 1,865 62 696 61 14,457 122 14,948 7,529 108 40,462 Other services 2,756 4,388 0 5,295 1,752 4,575 12,281 66,069 30,423 0 127,539 Total 33,095 142,342 15,965 11,380 12,875 89,131 99,226 306,658 182,641 108 893,421
Figure 20: Estimate of C&I waste arisings in Tyne & Wear, by sector and waste type (in tonnes)
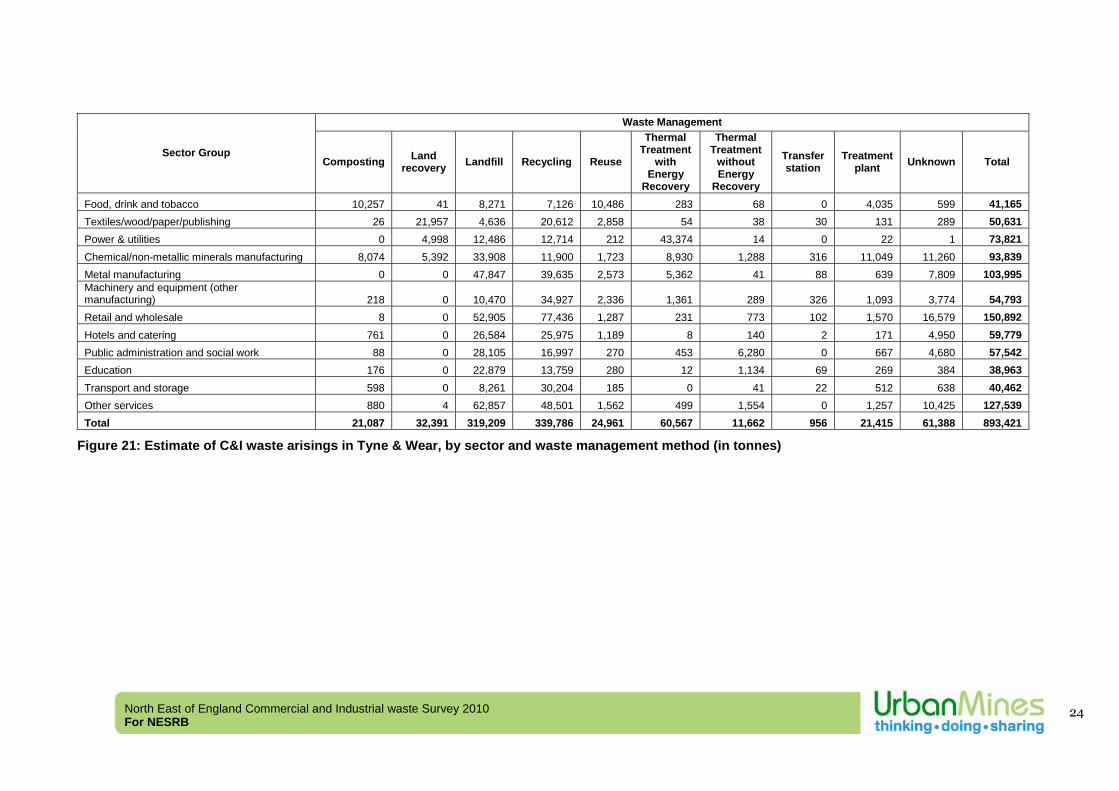
North East of England Commercial and Industrial waste Survey 2010 For NESRB
24
Waste Management
Sector Group Composting Land
recovery Landfill Recycling Reuse
Thermal Treatment
with Energy
Recovery
Thermal Treatment
without Energy
Recovery
Transfer station
Treatment plant Unknown Total
Food, drink and tobacco 10,257 41 8,271 7,126 10,486 283 68 0 4,035 599 41,165 Textiles/wood/paper/publishing 26 21,957 4,636 20,612 2,858 54 38 30 131 289 50,631 Power & utilities 0 4,998 12,486 12,714 212 43,374 14 0 22 1 73,821 Chemical/non-metallic minerals manufacturing 8,074 5,392 33,908 11,900 1,723 8,930 1,288 316 11,049 11,260 93,839 Metal manufacturing 0 0 47,847 39,635 2,573 5,362 41 88 639 7,809 103,995 Machinery and equipment (other manufacturing) 218 0 10,470 34,927 2,336 1,361 289 326 1,093 3,774 54,793 Retail and wholesale 8 0 52,905 77,436 1,287 231 773 102 1,570 16,579 150,892 Hotels and catering 761 0 26,584 25,975 1,189 8 140 2 171 4,950 59,779 Public administration and social work 88 0 28,105 16,997 270 453 6,280 0 667 4,680 57,542 Education 176 0 22,879 13,759 280 12 1,134 69 269 384 38,963 Transport and storage 598 0 8,261 30,204 185 0 41 22 512 638 40,462 Other services 880 4 62,857 48,501 1,562 499 1,554 0 1,257 10,425 127,539 Total 21,087 32,391 319,209 339,786 24,961 60,567 11,662 956 21,415 61,388 893,421
Figure 21: Estimate of C&I waste arisings in Tyne & Wear, by sector and waste management method (in tonnes)
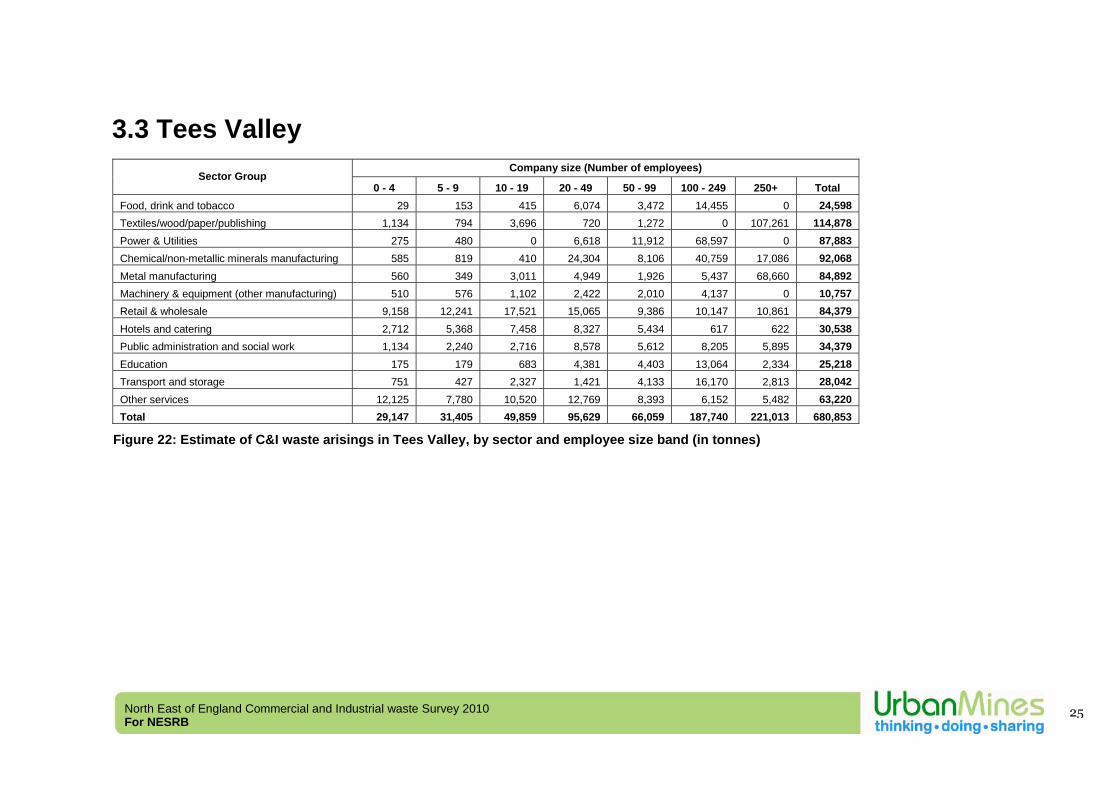
North East of England Commercial and Industrial waste Survey 2010 For NESRB
25
3.3 Tees Valley
Company size (Number of employees) Sector Group
0 - 4 5 - 9 10 - 19 20 - 49 50 - 99 100 - 249 250+ Total Food, drink and tobacco 29 153 415 6,074 3,472 14,455 0 24,598 Textiles/wood/paper/publishing 1,134 794 3,696 720 1,272 0 107,261 114,878 Power & Utilities 275 480 0 6,618 11,912 68,597 0 87,883 Chemical/non-metallic minerals manufacturing 585 819 410 24,304 8,106 40,759 17,086 92,068 Metal manufacturing 560 349 3,011 4,949 1,926 5,437 68,660 84,892 Machinery & equipment (other manufacturing) 510 576 1,102 2,422 2,010 4,137 0 10,757 Retail & wholesale 9,158 12,241 17,521 15,065 9,386 10,147 10,861 84,379 Hotels and catering 2,712 5,368 7,458 8,327 5,434 617 622 30,538 Public administration and social work 1,134 2,240 2,716 8,578 5,612 8,205 5,895 34,379 Education 175 179 683 4,381 4,403 13,064 2,334 25,218 Transport and storage 751 427 2,327 1,421 4,133 16,170 2,813 28,042 Other services 12,125 7,780 10,520 12,769 8,393 6,152 5,482 63,220 Total 29,147 31,405 49,859 95,629 66,059 187,740 221,013 680,853
Figure 22: Estimate of C&I waste arisings in Tees Valley, by sector and employee size band (in tonnes)
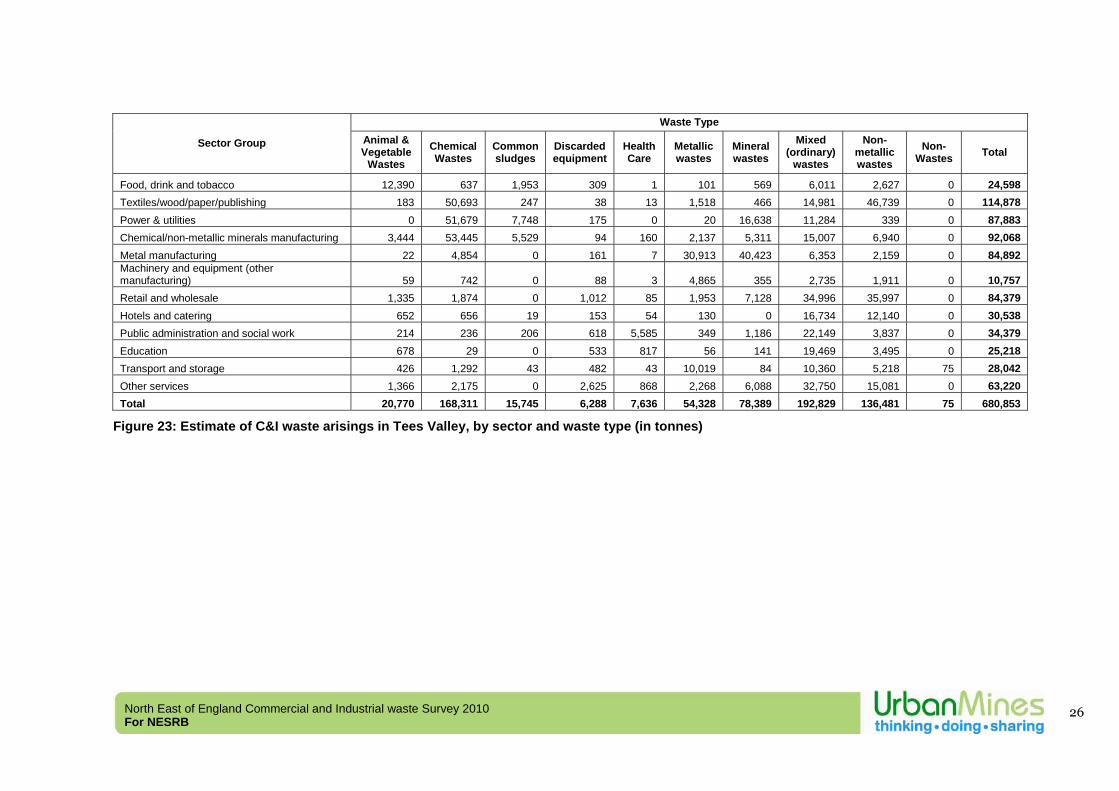
North East of England Commercial and Industrial waste Survey 2010 For NESRB
26
Waste Type
Sector Group Animal & Vegetable
Wastes Chemical Wastes
Common sludges
Discarded equipment
Health Care
Metallic wastes
Mineral wastes
Mixed (ordinary)
wastes
Non-metallic wastes
Non-Wastes Total
Food, drink and tobacco 12,390 637 1,953 309 1 101 569 6,011 2,627 0 24,598 Textiles/wood/paper/publishing 183 50,693 247 38 13 1,518 466 14,981 46,739 0 114,878 Power & utilities 0 51,679 7,748 175 0 20 16,638 11,284 339 0 87,883 Chemical/non-metallic minerals manufacturing 3,444 53,445 5,529 94 160 2,137 5,311 15,007 6,940 0 92,068 Metal manufacturing 22 4,854 0 161 7 30,913 40,423 6,353 2,159 0 84,892 Machinery and equipment (other manufacturing) 59 742 0 88 3 4,865 355 2,735 1,911 0 10,757 Retail and wholesale 1,335 1,874 0 1,012 85 1,953 7,128 34,996 35,997 0 84,379 Hotels and catering 652 656 19 153 54 130 0 16,734 12,140 0 30,538 Public administration and social work 214 236 206 618 5,585 349 1,186 22,149 3,837 0 34,379 Education 678 29 0 533 817 56 141 19,469 3,495 0 25,218 Transport and storage 426 1,292 43 482 43 10,019 84 10,360 5,218 75 28,042 Other services 1,366 2,175 0 2,625 868 2,268 6,088 32,750 15,081 0 63,220 Total 20,770 168,311 15,745 6,288 7,636 54,328 78,389 192,829 136,481 75 680,853
Figure 23: Estimate of C&I waste arisings in Tees Valley, by sector and waste type (in tonnes)
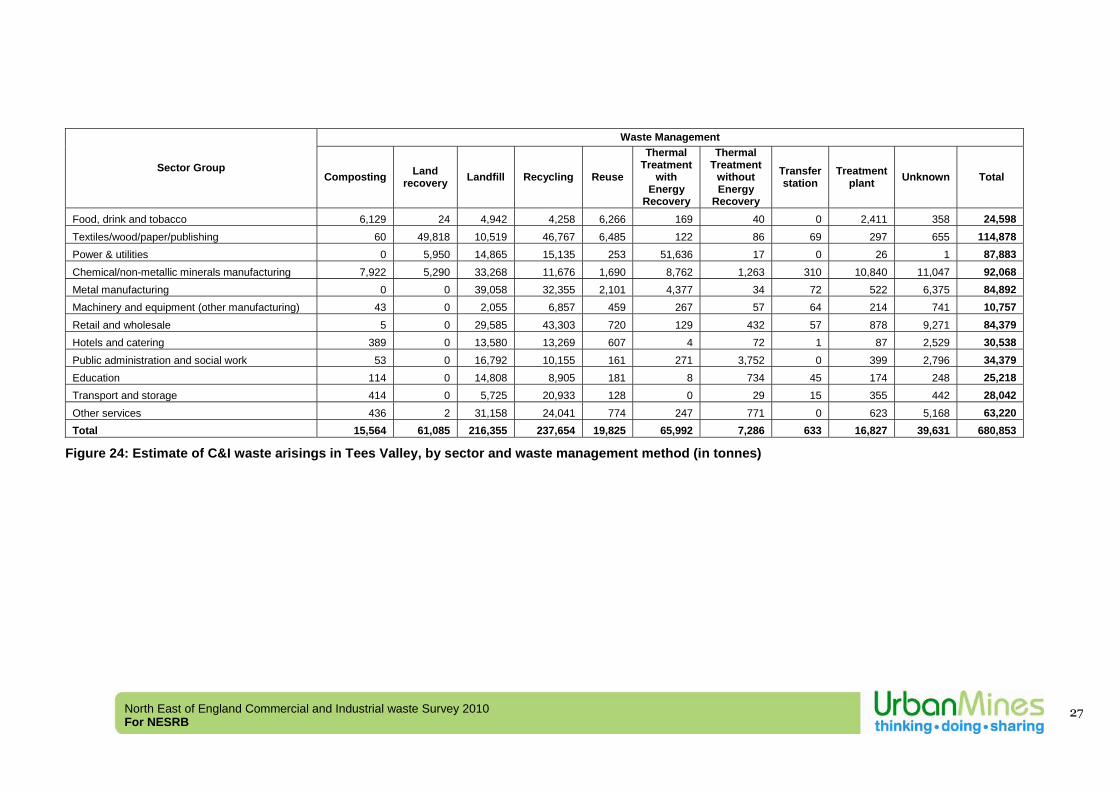
North East of England Commercial and Industrial waste Survey 2010 For NESRB
27
Waste Management
Sector Group Composting Land
recovery Landfill Recycling Reuse
Thermal Treatment
with Energy
Recovery
Thermal Treatment
without Energy
Recovery
Transfer station
Treatment plant Unknown Total
Food, drink and tobacco 6,129 24 4,942 4,258 6,266 169 40 0 2,411 358 24,598 Textiles/wood/paper/publishing 60 49,818 10,519 46,767 6,485 122 86 69 297 655 114,878 Power & utilities 0 5,950 14,865 15,135 253 51,636 17 0 26 1 87,883 Chemical/non-metallic minerals manufacturing 7,922 5,290 33,268 11,676 1,690 8,762 1,263 310 10,840 11,047 92,068 Metal manufacturing 0 0 39,058 32,355 2,101 4,377 34 72 522 6,375 84,892 Machinery and equipment (other manufacturing) 43 0 2,055 6,857 459 267 57 64 214 741 10,757 Retail and wholesale 5 0 29,585 43,303 720 129 432 57 878 9,271 84,379 Hotels and catering 389 0 13,580 13,269 607 4 72 1 87 2,529 30,538 Public administration and social work 53 0 16,792 10,155 161 271 3,752 0 399 2,796 34,379 Education 114 0 14,808 8,905 181 8 734 45 174 248 25,218 Transport and storage 414 0 5,725 20,933 128 0 29 15 355 442 28,042 Other services 436 2 31,158 24,041 774 247 771 0 623 5,168 63,220 Total 15,564 61,085 216,355 237,654 19,825 65,992 7,286 633 16,827 39,631 680,853
Figure 24: Estimate of C&I waste arisings in Tees Valley, by sector and waste management method (in tonnes)
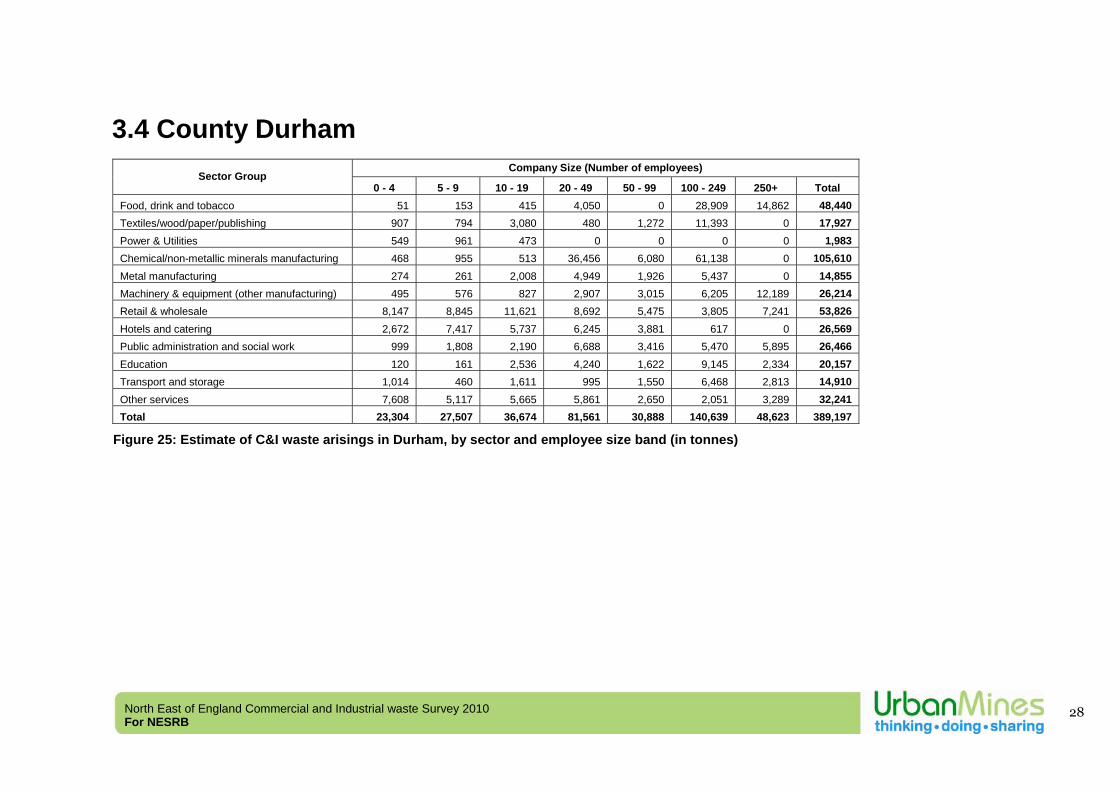
North East of England Commercial and Industrial waste Survey 2010 For NESRB
28
3.4 County Durham
Company Size (Number of employees) Sector Group
0 - 4 5 - 9 10 - 19 20 - 49 50 - 99 100 - 249 250+ Total Food, drink and tobacco 51 153 415 4,050 0 28,909 14,862 48,440 Textiles/wood/paper/publishing 907 794 3,080 480 1,272 11,393 0 17,927 Power & Utilities 549 961 473 0 0 0 0 1,983 Chemical/non-metallic minerals manufacturing 468 955 513 36,456 6,080 61,138 0 105,610 Metal manufacturing 274 261 2,008 4,949 1,926 5,437 0 14,855 Machinery & equipment (other manufacturing) 495 576 827 2,907 3,015 6,205 12,189 26,214 Retail & wholesale 8,147 8,845 11,621 8,692 5,475 3,805 7,241 53,826 Hotels and catering 2,672 7,417 5,737 6,245 3,881 617 0 26,569 Public administration and social work 999 1,808 2,190 6,688 3,416 5,470 5,895 26,466 Education 120 161 2,536 4,240 1,622 9,145 2,334 20,157 Transport and storage 1,014 460 1,611 995 1,550 6,468 2,813 14,910 Other services 7,608 5,117 5,665 5,861 2,650 2,051 3,289 32,241 Total 23,304 27,507 36,674 81,561 30,888 140,639 48,623 389,197
Figure 25: Estimate of C&I waste arisings in Durham, by sector and employee size band (in tonnes)
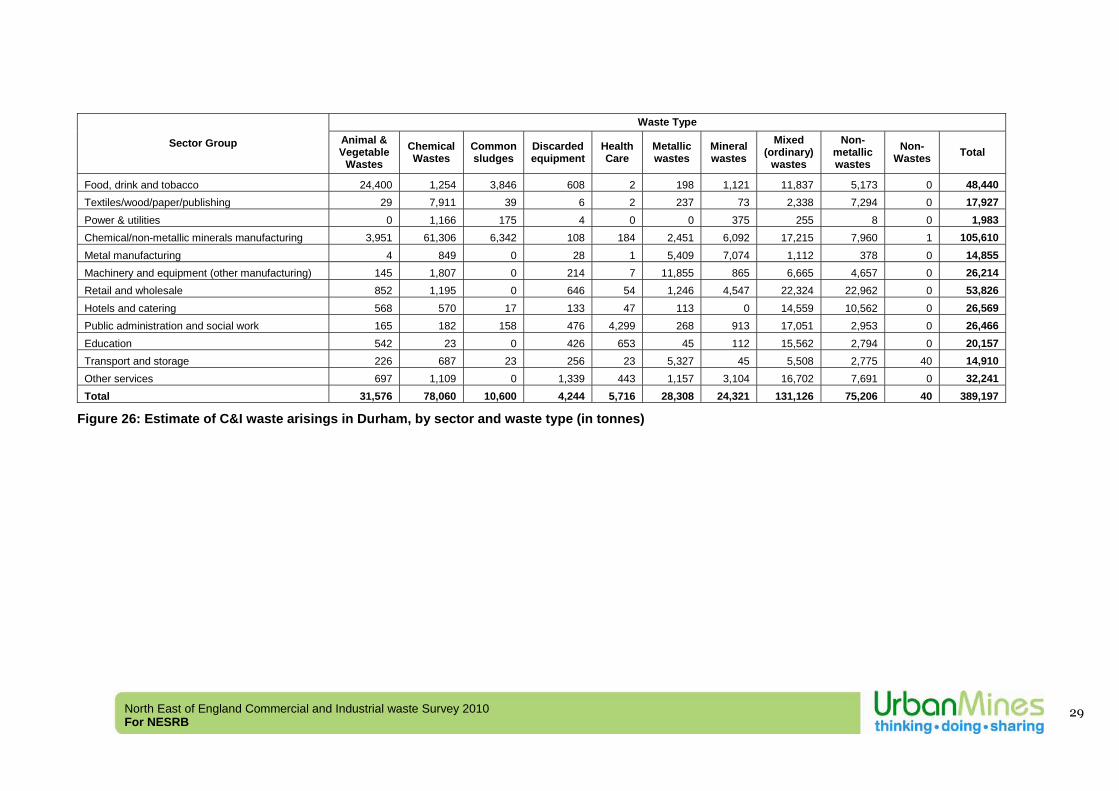
North East of England Commercial and Industrial waste Survey 2010 For NESRB
29
Waste Type
Sector Group Animal & Vegetable
Wastes Chemical Wastes
Common sludges
Discarded equipment
Health Care
Metallic wastes
Mineral wastes
Mixed (ordinary)
wastes
Non-metallic wastes
Non-Wastes Total
Food, drink and tobacco 24,400 1,254 3,846 608 2 198 1,121 11,837 5,173 0 48,440 Textiles/wood/paper/publishing 29 7,911 39 6 2 237 73 2,338 7,294 0 17,927 Power & utilities 0 1,166 175 4 0 0 375 255 8 0 1,983 Chemical/non-metallic minerals manufacturing 3,951 61,306 6,342 108 184 2,451 6,092 17,215 7,960 1 105,610 Metal manufacturing 4 849 0 28 1 5,409 7,074 1,112 378 0 14,855 Machinery and equipment (other manufacturing) 145 1,807 0 214 7 11,855 865 6,665 4,657 0 26,214 Retail and wholesale 852 1,195 0 646 54 1,246 4,547 22,324 22,962 0 53,826 Hotels and catering 568 570 17 133 47 113 0 14,559 10,562 0 26,569 Public administration and social work 165 182 158 476 4,299 268 913 17,051 2,953 0 26,466 Education 542 23 0 426 653 45 112 15,562 2,794 0 20,157 Transport and storage 226 687 23 256 23 5,327 45 5,508 2,775 40 14,910 Other services 697 1,109 0 1,339 443 1,157 3,104 16,702 7,691 0 32,241 Total 31,576 78,060 10,600 4,244 5,716 28,308 24,321 131,126 75,206 40 389,197
Figure 26: Estimate of C&I waste arisings in Durham, by sector and waste type (in tonnes)
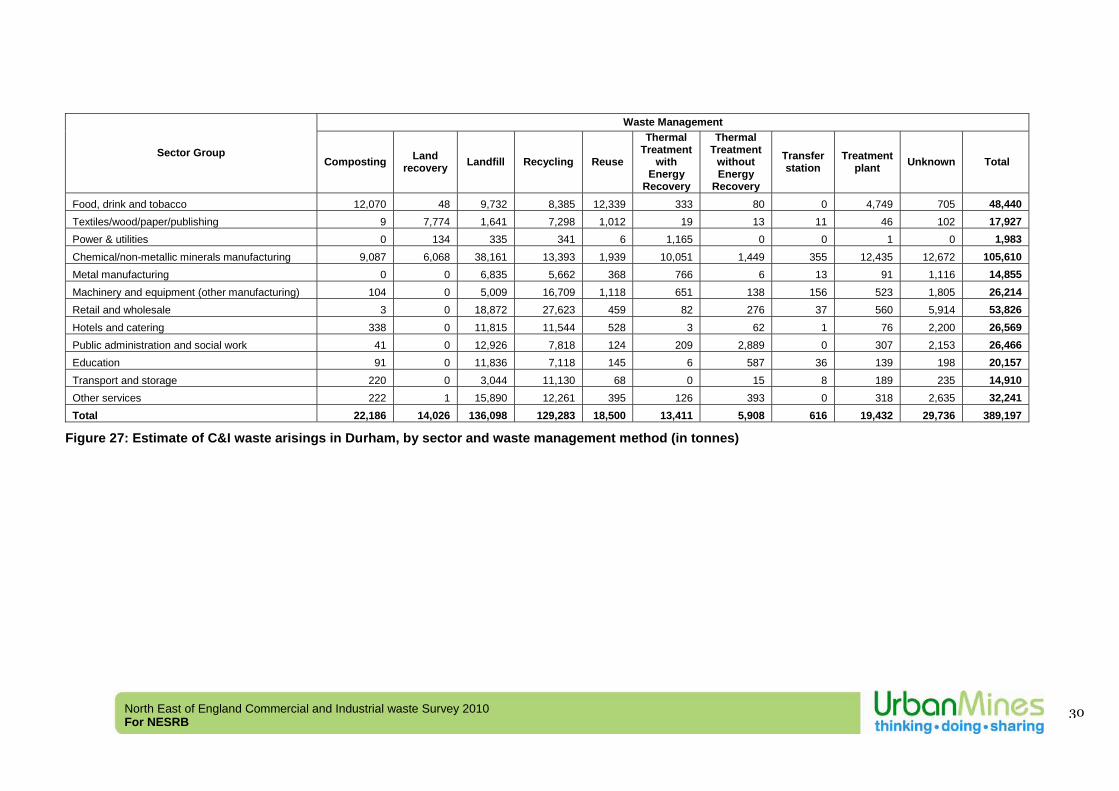
North East of England Commercial and Industrial waste Survey 2010 For NESRB
30
Waste Management
Sector Group Composting Land
recovery Landfill Recycling Reuse
Thermal Treatment
with Energy
Recovery
Thermal Treatment
without Energy
Recovery
Transfer station
Treatment plant Unknown Total
Food, drink and tobacco 12,070 48 9,732 8,385 12,339 333 80 0 4,749 705 48,440 Textiles/wood/paper/publishing 9 7,774 1,641 7,298 1,012 19 13 11 46 102 17,927 Power & utilities 0 134 335 341 6 1,165 0 0 1 0 1,983 Chemical/non-metallic minerals manufacturing 9,087 6,068 38,161 13,393 1,939 10,051 1,449 355 12,435 12,672 105,610 Metal manufacturing 0 0 6,835 5,662 368 766 6 13 91 1,116 14,855 Machinery and equipment (other manufacturing) 104 0 5,009 16,709 1,118 651 138 156 523 1,805 26,214 Retail and wholesale 3 0 18,872 27,623 459 82 276 37 560 5,914 53,826 Hotels and catering 338 0 11,815 11,544 528 3 62 1 76 2,200 26,569 Public administration and social work 41 0 12,926 7,818 124 209 2,889 0 307 2,153 26,466 Education 91 0 11,836 7,118 145 6 587 36 139 198 20,157 Transport and storage 220 0 3,044 11,130 68 0 15 8 189 235 14,910 Other services 222 1 15,890 12,261 395 126 393 0 318 2,635 32,241 Total 22,186 14,026 136,098 129,283 18,500 13,411 5,908 616 19,432 29,736 389,197
Figure 27: Estimate of C&I waste arisings in Durham, by sector and waste management method (in tonnes)
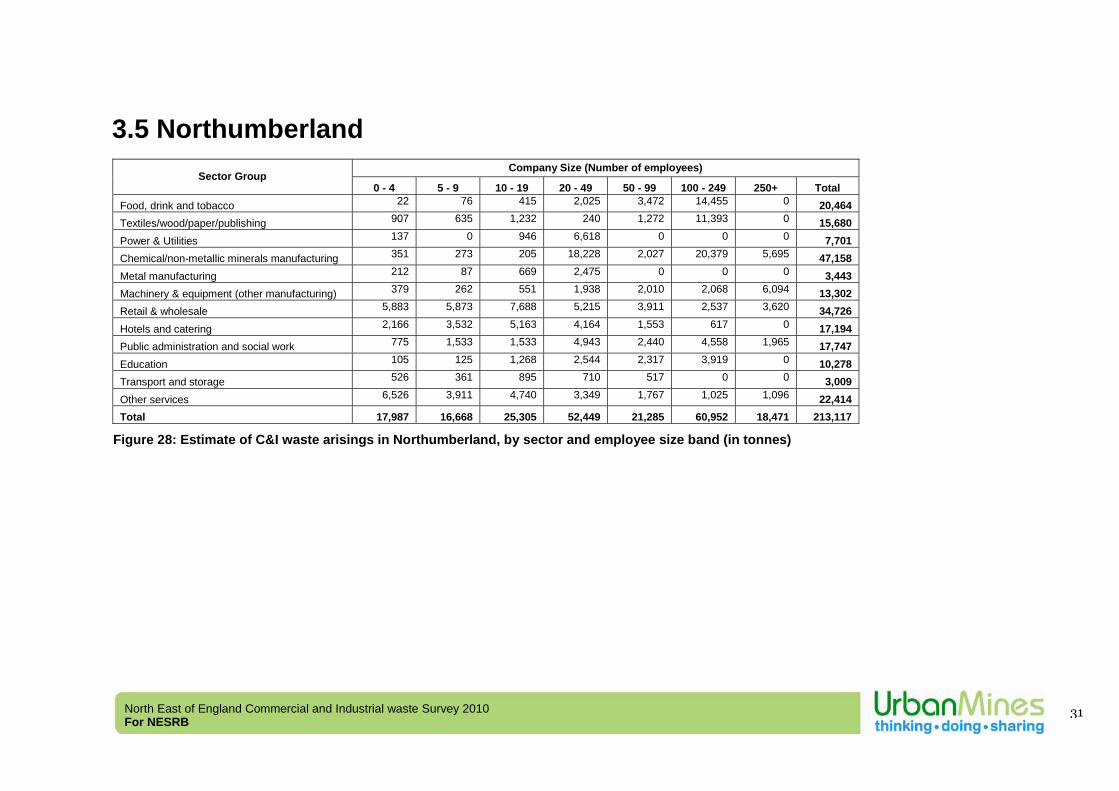
North East of England Commercial and Industrial waste Survey 2010 For NESRB
31
3.5 Northumberland
Company Size (Number of employees) Sector Group
0 - 4 5 - 9 10 - 19 20 - 49 50 - 99 100 - 249 250+ Total Food, drink and tobacco 22 76 415 2,025 3,472 14,455 0 20,464 Textiles/wood/paper/publishing 907 635 1,232 240 1,272 11,393 0 15,680 Power & Utilities 137 0 946 6,618 0 0 0 7,701 Chemical/non-metallic minerals manufacturing 351 273 205 18,228 2,027 20,379 5,695 47,158 Metal manufacturing 212 87 669 2,475 0 0 0 3,443 Machinery & equipment (other manufacturing) 379 262 551 1,938 2,010 2,068 6,094 13,302 Retail & wholesale 5,883 5,873 7,688 5,215 3,911 2,537 3,620 34,726 Hotels and catering 2,166 3,532 5,163 4,164 1,553 617 0 17,194 Public administration and social work 775 1,533 1,533 4,943 2,440 4,558 1,965 17,747 Education 105 125 1,268 2,544 2,317 3,919 0 10,278 Transport and storage 526 361 895 710 517 0 0 3,009 Other services 6,526 3,911 4,740 3,349 1,767 1,025 1,096 22,414 Total 17,987 16,668 25,305 52,449 21,285 60,952 18,471 213,117
Figure 28: Estimate of C&I waste arisings in Northumberland, by sector and employee size band (in tonnes)
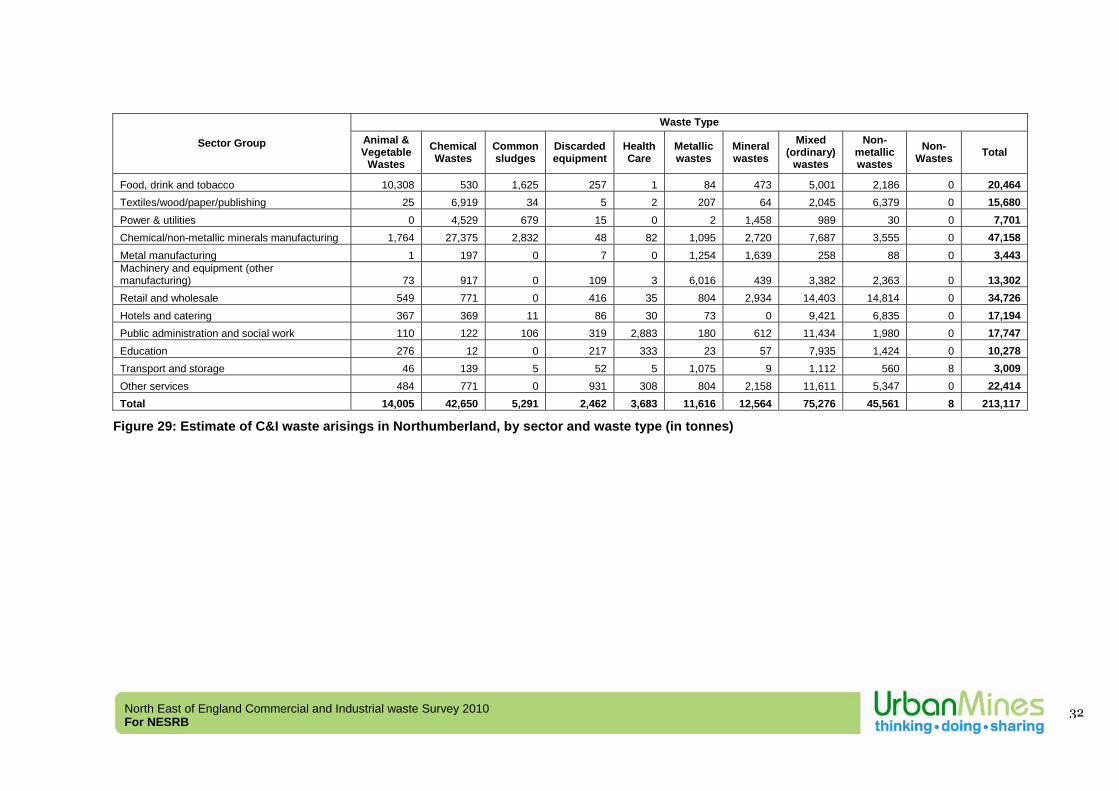
North East of England Commercial and Industrial waste Survey 2010 For NESRB
32
Waste Type
Sector Group Animal & Vegetable
Wastes Chemical Wastes
Common sludges
Discarded equipment
Health Care
Metallic wastes
Mineral wastes
Mixed (ordinary)
wastes
Non-metallic wastes
Non-Wastes Total
Food, drink and tobacco 10,308 530 1,625 257 1 84 473 5,001 2,186 0 20,464 Textiles/wood/paper/publishing 25 6,919 34 5 2 207 64 2,045 6,379 0 15,680 Power & utilities 0 4,529 679 15 0 2 1,458 989 30 0 7,701 Chemical/non-metallic minerals manufacturing 1,764 27,375 2,832 48 82 1,095 2,720 7,687 3,555 0 47,158 Metal manufacturing 1 197 0 7 0 1,254 1,639 258 88 0 3,443 Machinery and equipment (other manufacturing) 73 917 0 109 3 6,016 439 3,382 2,363 0 13,302 Retail and wholesale 549 771 0 416 35 804 2,934 14,403 14,814 0 34,726 Hotels and catering 367 369 11 86 30 73 0 9,421 6,835 0 17,194 Public administration and social work 110 122 106 319 2,883 180 612 11,434 1,980 0 17,747 Education 276 12 0 217 333 23 57 7,935 1,424 0 10,278 Transport and storage 46 139 5 52 5 1,075 9 1,112 560 8 3,009 Other services 484 771 0 931 308 804 2,158 11,611 5,347 0 22,414 Total 14,005 42,650 5,291 2,462 3,683 11,616 12,564 75,276 45,561 8 213,117
Figure 29: Estimate of C&I waste arisings in Northumberland, by sector and waste type (in tonnes)
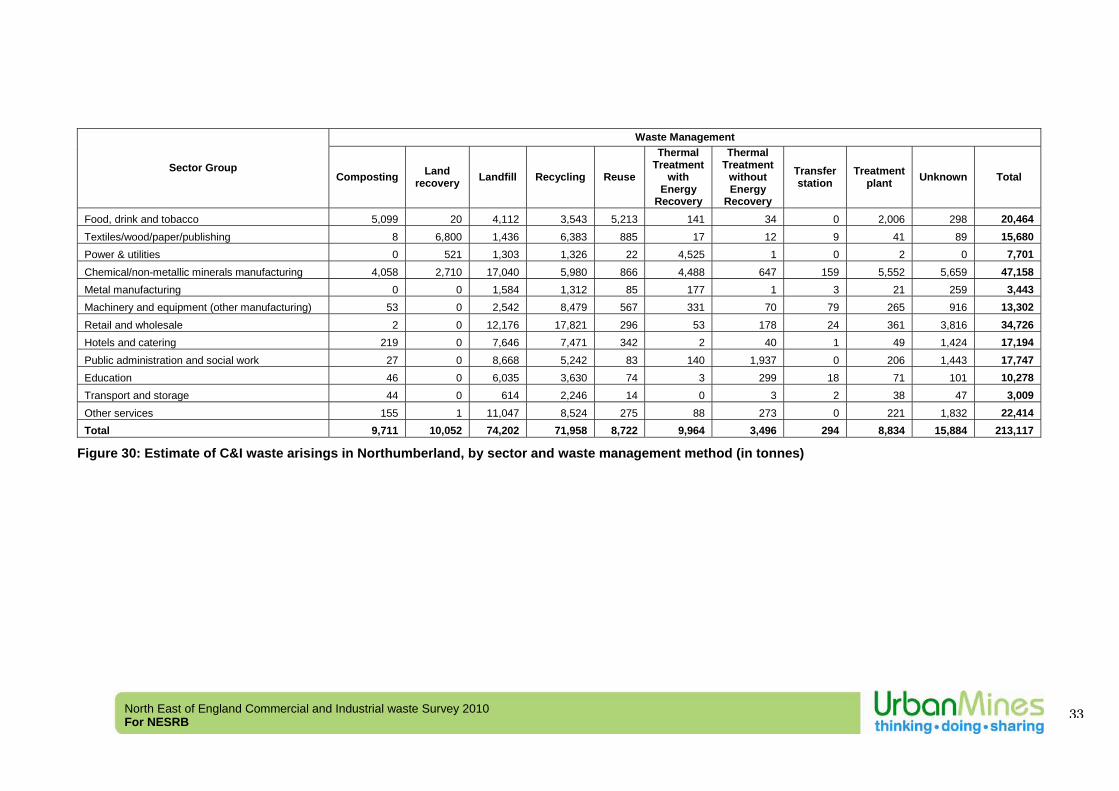
North East of England Commercial and Industrial waste Survey 2010 For NESRB
33
Waste Management
Sector Group Composting Land
recovery Landfill Recycling Reuse
Thermal Treatment
with Energy
Recovery
Thermal Treatment
without Energy
Recovery
Transfer station
Treatment plant Unknown Total
Food, drink and tobacco 5,099 20 4,112 3,543 5,213 141 34 0 2,006 298 20,464 Textiles/wood/paper/publishing 8 6,800 1,436 6,383 885 17 12 9 41 89 15,680 Power & utilities 0 521 1,303 1,326 22 4,525 1 0 2 0 7,701 Chemical/non-metallic minerals manufacturing 4,058 2,710 17,040 5,980 866 4,488 647 159 5,552 5,659 47,158 Metal manufacturing 0 0 1,584 1,312 85 177 1 3 21 259 3,443 Machinery and equipment (other manufacturing) 53 0 2,542 8,479 567 331 70 79 265 916 13,302 Retail and wholesale 2 0 12,176 17,821 296 53 178 24 361 3,816 34,726 Hotels and catering 219 0 7,646 7,471 342 2 40 1 49 1,424 17,194 Public administration and social work 27 0 8,668 5,242 83 140 1,937 0 206 1,443 17,747 Education 46 0 6,035 3,630 74 3 299 18 71 101 10,278 Transport and storage 44 0 614 2,246 14 0 3 2 38 47 3,009 Other services 155 1 11,047 8,524 275 88 273 0 221 1,832 22,414 Total 9,711 10,052 74,202 71,958 8,722 9,964 3,496 294 8,834 15,884 213,117
Figure 30: Estimate of C&I waste arisings in Northumberland, by sector and waste management method (in tonnes)

North East of England Commercial and Industrial waste Survey 2010 For NESRB
34
4 Other survey data analysis
4.1 Source of data For the grossed tonnages presented in this report, as reported elsewhere, tonnages came from a combination of sources of data, including:
• Results from 1,000 face to face and telephone surveys (357 by telephone, 643 by survey visit) plus data from 36 large retail supermarkets (provided by the operating companies)
• Data collated for the North East region during the Defra National survey, which was used to supplement and fill gaps in our survey data. This data was based upon a number of sources, including PPC data from the Environment Agency and other sources as well as direct survey data. This dataset therefore tended to cover the larger companies and larger waste producers in the region. This was used to fill gaps in the Urban Mines survey data
• Estimates for micro companies (i.e. 1-4 company size band) that were not surveyed
• Estimates for bricks in which data was not available in both surveys (i.e. power and utilities 50-99).
Figure 31 below presents results from both surveys, including waste estimates for micro companies and estimates made for bricks that were lacking survey data. Details of how Defra data was incorporated and waste estimates for the micro companies and missing bricks are presented in detail in Appendix 8.
Data Source Samples Survey Data (tonnes)
Grossed Data (tonnes)
Urban Mines Survey 1036 191,432 1,104,692National Survey (Defra) 276 646,182 940,377Estimated 1-4s - 1,169 119,606Estimated Power & Utilities 50-99 - 8,339 11,912Total 1,312 847,122 2,176,587
Figure 31: Data Sources (in tonnes)

North East of England Commercial and Industrial waste Survey 2010 For NESRB
35
UM51%
JACOBS (Defra National Survey)
43%
Estimated 1-4s5%
Estimated Power & Utilities 50-99
1%
Figure 32: Data Sources (%) based upon grossed tonnages
During the survey, for each waste stream recorded, the source of the tonnage data entered was also recorded. The surveyors were told to ask for written evidence of tonnage where possible, for instance from waste management invoices, weighbridge receipts, transfer notes, consignment notes. When such data was not available, a calculator built into the survey software calculated tonnages using standard container sizes (summarised in Appendix 5), conversion factors (a measure of specific gravity or density, summarised in Appendix 6) and standard items (summarised in Appendix 7). When the calculator was used, estimates based on company information (i.e. the company provides details of number of containers and frequency of collection) were recorded as ‘Company Estimate’. If the surveyor made some or all the assumptions themselves then data was recorded as ‘Surveyor Estimate’. The conversion factors used are consistent with those used in the previous surveys undertaken by Urban Mines, and in turn with those used for the recent national survey. All of the individual waste stream data has recorded, if applicable, the conversion factors and container sizes used for the tonnage calculations, so should conversion factors be revised in the future, the resultant tonnages can be recalculated. From the Urban Mines survey data, the following data sources were used to calculate the grossed up tonnages:
Data Sources Survey Data
Grossed Data
Company estimate 57,063 622,712 Surveyor's estimate 303 5,700 Written records 134,066 936,800 Total 191,432 1,565,212
Figure 27: Urban Mines sources of survey data (in tonnes)
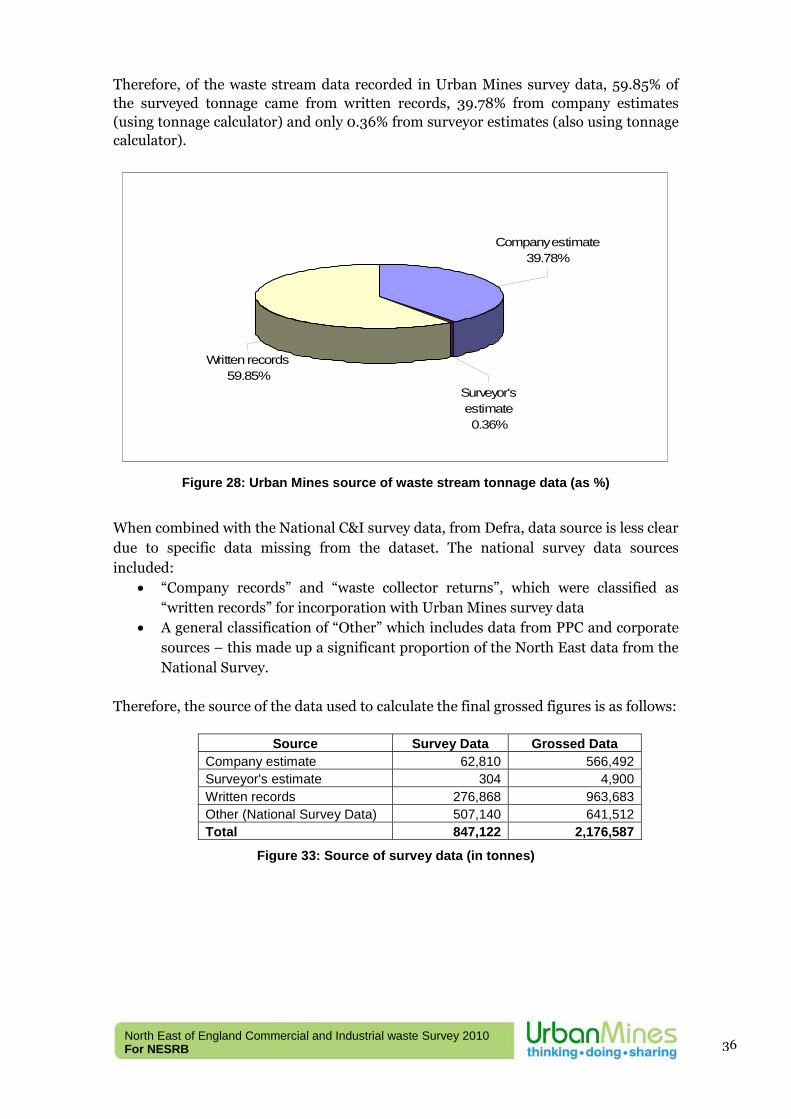
North East of England Commercial and Industrial waste Survey 2010 For NESRB
36
Therefore, of the waste stream data recorded in Urban Mines survey data, 59.85% of the surveyed tonnage came from written records, 39.78% from company estimates (using tonnage calculator) and only 0.36% from surveyor estimates (also using tonnage calculator).
Written records59.85%
Surveyor's estimate0.36%
Company estimate39.78%
Figure 28: Urban Mines source of waste stream tonnage data (as %)
When combined with the National C&I survey data, from Defra, data source is less clear due to specific data missing from the dataset. The national survey data sources included:
• “Company records” and “waste collector returns”, which were classified as “written records” for incorporation with Urban Mines survey data
• A general classification of “Other” which includes data from PPC and corporate sources – this made up a significant proportion of the North East data from the National Survey.
Therefore, the source of the data used to calculate the final grossed figures is as follows:
Source Survey Data Grossed Data Company estimate 62,810 566,492 Surveyor's estimate 304 4,900 Written records 276,868 963,683 Other (National Survey Data) 507,140 641,512 Total 847,122 2,176,587
Figure 33: Source of survey data (in tonnes)
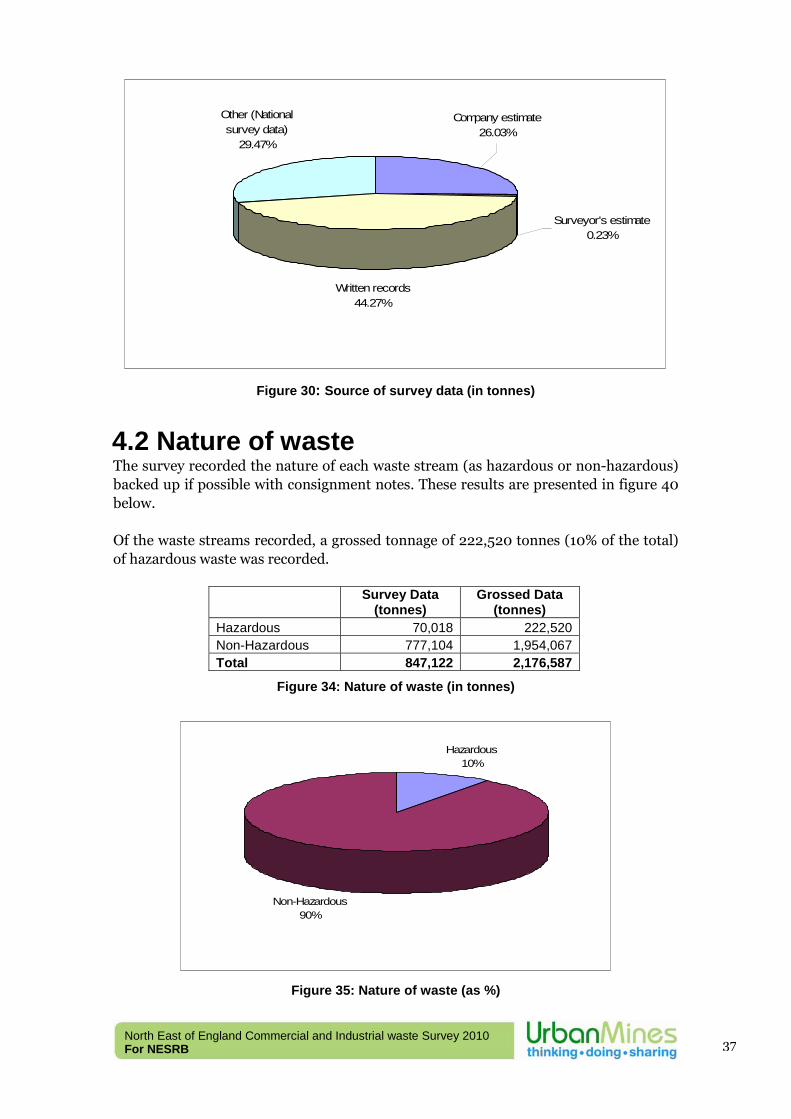
North East of England Commercial and Industrial waste Survey 2010 For NESRB
37
Surveyor's estimate0.23%
Company estimate26.03%
Other (National survey data)
29.47%
Written records44.27%
Figure 30: Source of survey data (in tonnes)
4.2 Nature of waste The survey recorded the nature of each waste stream (as hazardous or non-hazardous) backed up if possible with consignment notes. These results are presented in figure 40 below. Of the waste streams recorded, a grossed tonnage of 222,520 tonnes (10% of the total) of hazardous waste was recorded.
Survey Data
(tonnes) Grossed Data
(tonnes) Hazardous 70,018 222,520 Non-Hazardous 777,104 1,954,067 Total 847,122 2,176,587
Figure 34: Nature of waste (in tonnes)
Hazardous10%
Non-Hazardous90%
Figure 35: Nature of waste (as %)
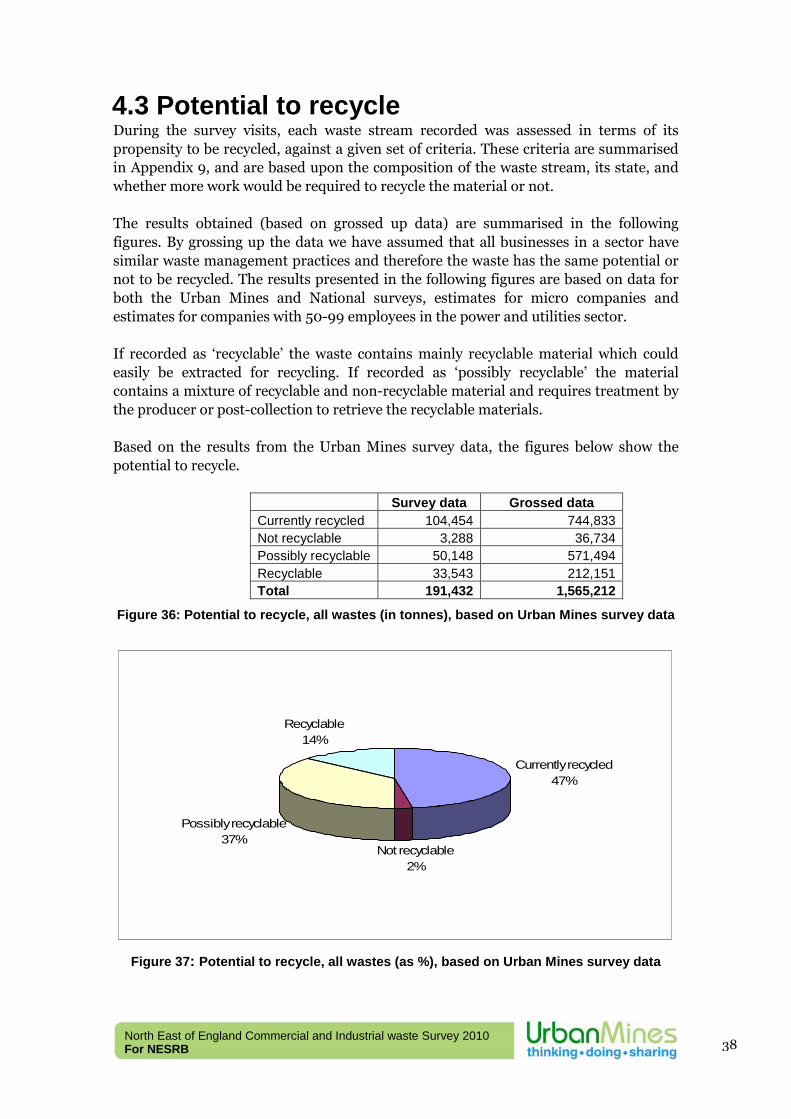
North East of England Commercial and Industrial waste Survey 2010 For NESRB
38
4.3 Potential to recycle During the survey visits, each waste stream recorded was assessed in terms of its propensity to be recycled, against a given set of criteria. These criteria are summarised in Appendix 9, and are based upon the composition of the waste stream, its state, and whether more work would be required to recycle the material or not. The results obtained (based on grossed up data) are summarised in the following figures. By grossing up the data we have assumed that all businesses in a sector have similar waste management practices and therefore the waste has the same potential or not to be recycled. The results presented in the following figures are based on data for both the Urban Mines and National surveys, estimates for micro companies and estimates for companies with 50-99 employees in the power and utilities sector. If recorded as ‘recyclable’ the waste contains mainly recyclable material which could easily be extracted for recycling. If recorded as ‘possibly recyclable’ the material contains a mixture of recyclable and non-recyclable material and requires treatment by the producer or post-collection to retrieve the recyclable materials. Based on the results from the Urban Mines survey data, the figures below show the potential to recycle.
Survey data Grossed data Currently recycled 104,454 744,833 Not recyclable 3,288 36,734 Possibly recyclable 50,148 571,494 Recyclable 33,543 212,151 Total 191,432 1,565,212
Figure 36: Potential to recycle, all wastes (in tonnes), based on Urban Mines survey data
Currently recycled47%
Not recyclable2%
Possibly recyclable37%
Recyclable14%
Figure 37: Potential to recycle, all wastes (as %), based on Urban Mines survey data
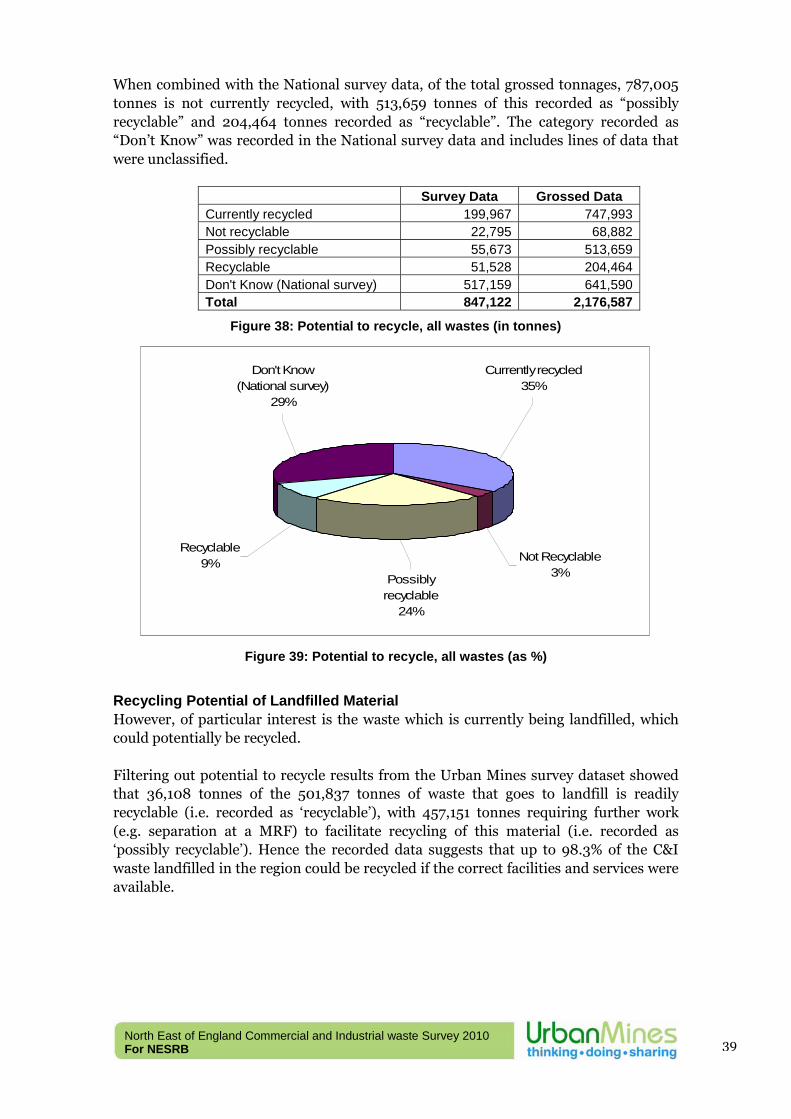
North East of England Commercial and Industrial waste Survey 2010 For NESRB
39
When combined with the National survey data, of the total grossed tonnages, 787,005 tonnes is not currently recycled, with 513,659 tonnes of this recorded as “possibly recyclable” and 204,464 tonnes recorded as “recyclable”. The category recorded as “Don’t Know” was recorded in the National survey data and includes lines of data that were unclassified.
Survey Data Grossed Data Currently recycled 199,967 747,993 Not recyclable 22,795 68,882 Possibly recyclable 55,673 513,659 Recyclable 51,528 204,464 Don't Know (National survey) 517,159 641,590 Total 847,122 2,176,587
Figure 38: Potential to recycle, all wastes (in tonnes)
Currently recycled35%
Possibly recyclable
24%
Recyclable9% Not Recyclable
3%
Don't Know (National survey)
29%
Figure 39: Potential to recycle, all wastes (as %)
Recycling Potential of Landfilled Material However, of particular interest is the waste which is currently being landfilled, which could potentially be recycled. Filtering out potential to recycle results from the Urban Mines survey dataset showed that 36,108 tonnes of the 501,837 tonnes of waste that goes to landfill is readily recyclable (i.e. recorded as ‘recyclable’), with 457,151 tonnes requiring further work (e.g. separation at a MRF) to facilitate recycling of this material (i.e. recorded as ‘possibly recyclable’). Hence the recorded data suggests that up to 98.3% of the C&I waste landfilled in the region could be recycled if the correct facilities and services were available.
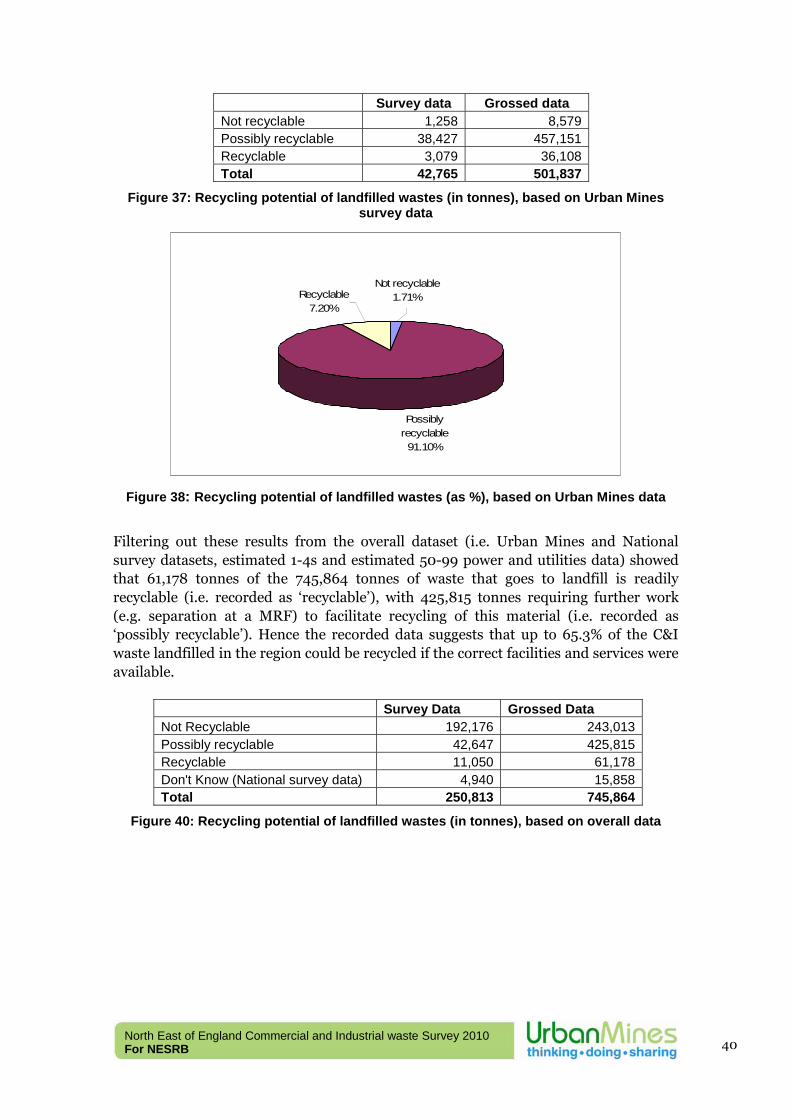
North East of England Commercial and Industrial waste Survey 2010 For NESRB
40
Survey data Grossed data Not recyclable 1,258 8,579 Possibly recyclable 38,427 457,151 Recyclable 3,079 36,108 Total 42,765 501,837
Figure 37: Recycling potential of landfilled wastes (in tonnes), based on Urban Mines survey data
Possibly recyclable91.10%
Not recyclable1.71%Recyclable
7.20%
Figure 38: Recycling potential of landfilled wastes (as %), based on Urban Mines data
Filtering out these results from the overall dataset (i.e. Urban Mines and National survey datasets, estimated 1-4s and estimated 50-99 power and utilities data) showed that 61,178 tonnes of the 745,864 tonnes of waste that goes to landfill is readily recyclable (i.e. recorded as ‘recyclable’), with 425,815 tonnes requiring further work (e.g. separation at a MRF) to facilitate recycling of this material (i.e. recorded as ‘possibly recyclable’). Hence the recorded data suggests that up to 65.3% of the C&I waste landfilled in the region could be recycled if the correct facilities and services were available.
Survey Data Grossed Data Not Recyclable 192,176 243,013 Possibly recyclable 42,647 425,815 Recyclable 11,050 61,178 Don't Know (National survey data) 4,940 15,858 Total 250,813 745,864
Figure 40: Recycling potential of landfilled wastes (in tonnes), based on overall data
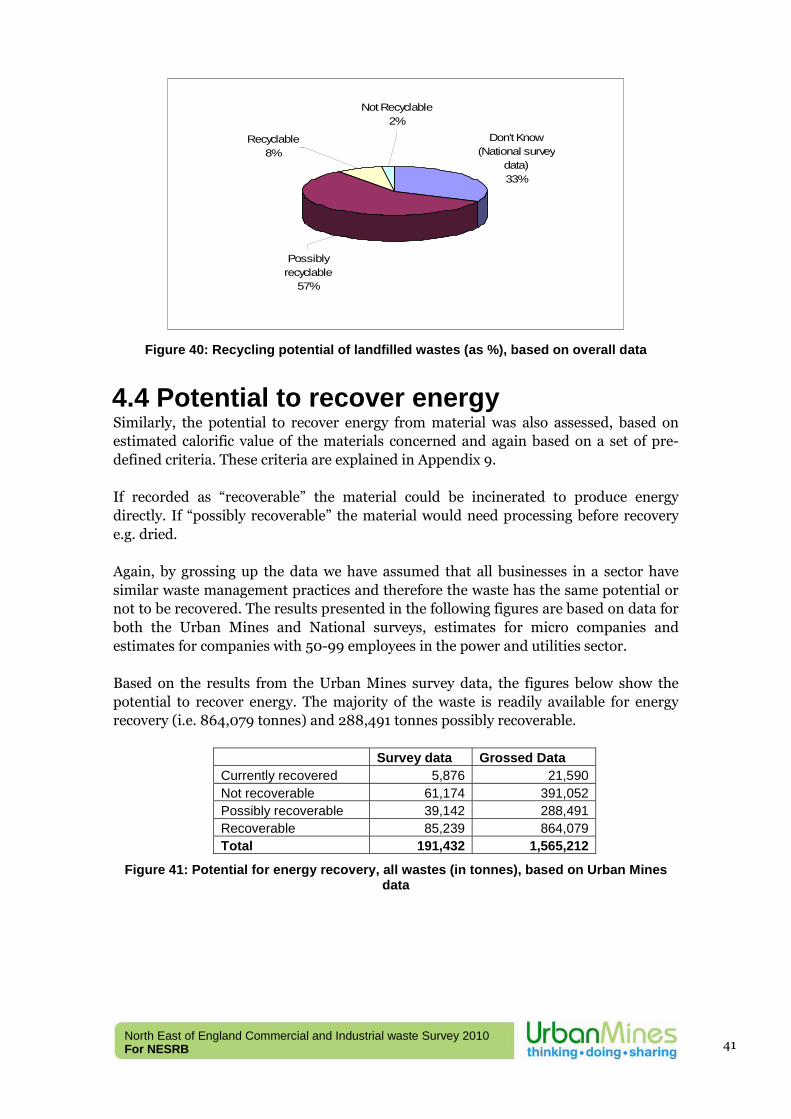
North East of England Commercial and Industrial waste Survey 2010 For NESRB
41
Not Recyclable2%
Possibly recyclable
57%
Don't Know (National survey
data)33%
Recyclable8%
Figure 40: Recycling potential of landfilled wastes (as %), based on overall data
4.4 Potential to recover energy Similarly, the potential to recover energy from material was also assessed, based on estimated calorific value of the materials concerned and again based on a set of pre-defined criteria. These criteria are explained in Appendix 9. If recorded as “recoverable” the material could be incinerated to produce energy directly. If “possibly recoverable” the material would need processing before recovery e.g. dried. Again, by grossing up the data we have assumed that all businesses in a sector have similar waste management practices and therefore the waste has the same potential or not to be recovered. The results presented in the following figures are based on data for both the Urban Mines and National surveys, estimates for micro companies and estimates for companies with 50-99 employees in the power and utilities sector. Based on the results from the Urban Mines survey data, the figures below show the potential to recover energy. The majority of the waste is readily available for energy recovery (i.e. 864,079 tonnes) and 288,491 tonnes possibly recoverable.
Survey data Grossed Data Currently recovered 5,876 21,590 Not recoverable 61,174 391,052 Possibly recoverable 39,142 288,491 Recoverable 85,239 864,079 Total 191,432 1,565,212
Figure 41: Potential for energy recovery, all wastes (in tonnes), based on Urban Mines data
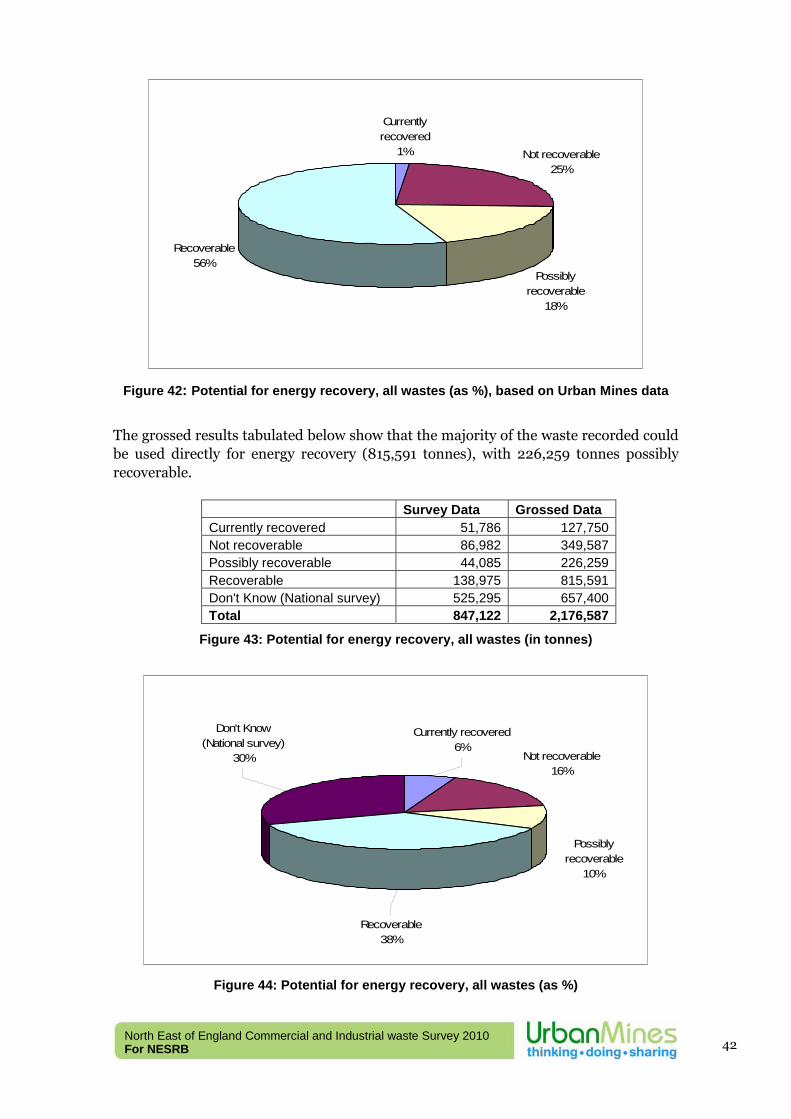
North East of England Commercial and Industrial waste Survey 2010 For NESRB
42
Currently recovered
1% Not recoverable25%
Possibly recoverable
18%
Recoverable56%
Figure 42: Potential for energy recovery, all wastes (as %), based on Urban Mines data
The grossed results tabulated below show that the majority of the waste recorded could be used directly for energy recovery (815,591 tonnes), with 226,259 tonnes possibly recoverable.
Survey Data Grossed Data Currently recovered 51,786 127,750 Not recoverable 86,982 349,587 Possibly recoverable 44,085 226,259 Recoverable 138,975 815,591 Don't Know (National survey) 525,295 657,400 Total 847,122 2,176,587
Figure 43: Potential for energy recovery, all wastes (in tonnes)
Not recoverable16%
Don't Know (National survey)
30%
Recoverable38%
Currently recovered6%
Possibly recoverable
10%
Figure 44: Potential for energy recovery, all wastes (as %)
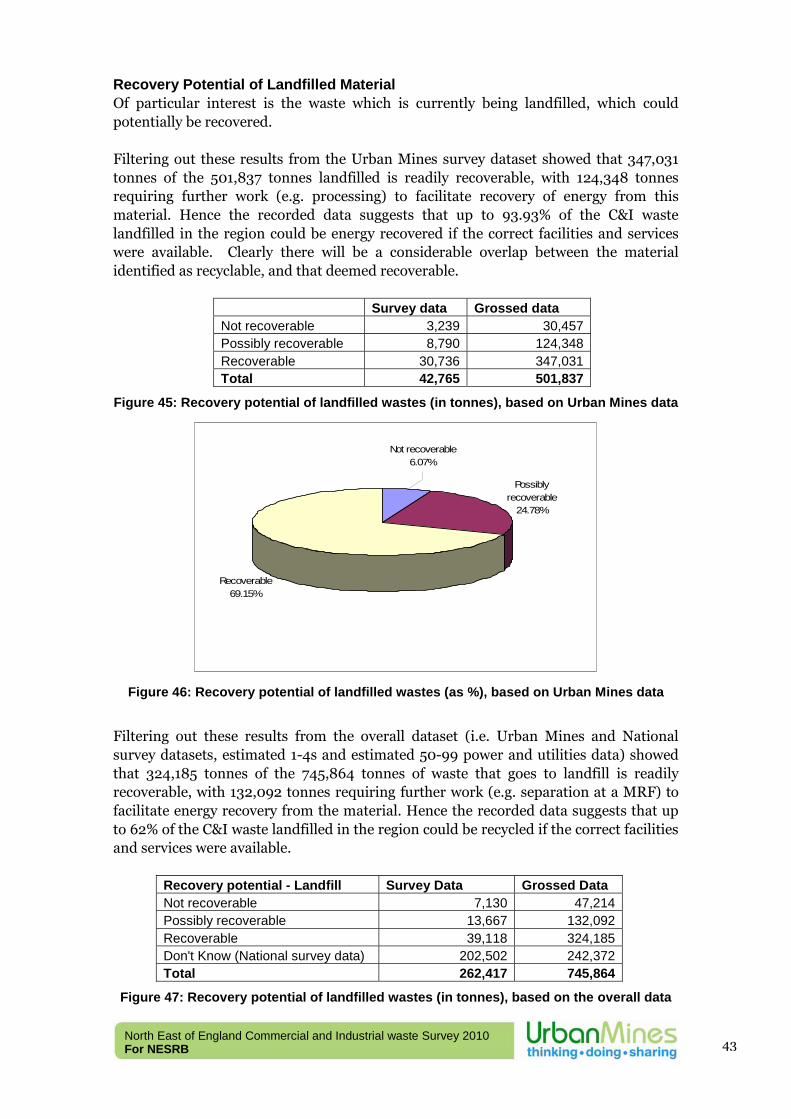
North East of England Commercial and Industrial waste Survey 2010 For NESRB
43
Recovery Potential of Landfilled Material Of particular interest is the waste which is currently being landfilled, which could potentially be recovered. Filtering out these results from the Urban Mines survey dataset showed that 347,031 tonnes of the 501,837 tonnes landfilled is readily recoverable, with 124,348 tonnes requiring further work (e.g. processing) to facilitate recovery of energy from this material. Hence the recorded data suggests that up to 93.93% of the C&I waste landfilled in the region could be energy recovered if the correct facilities and services were available. Clearly there will be a considerable overlap between the material identified as recyclable, and that deemed recoverable.
Survey data Grossed data Not recoverable 3,239 30,457 Possibly recoverable 8,790 124,348 Recoverable 30,736 347,031 Total 42,765 501,837
Figure 45: Recovery potential of landfilled wastes (in tonnes), based on Urban Mines data
Possibly recoverable
24.78%
Recoverable69.15%
Not recoverable6.07%
Figure 46: Recovery potential of landfilled wastes (as %), based on Urban Mines data
Filtering out these results from the overall dataset (i.e. Urban Mines and National survey datasets, estimated 1-4s and estimated 50-99 power and utilities data) showed that 324,185 tonnes of the 745,864 tonnes of waste that goes to landfill is readily recoverable, with 132,092 tonnes requiring further work (e.g. separation at a MRF) to facilitate energy recovery from the material. Hence the recorded data suggests that up to 62% of the C&I waste landfilled in the region could be recycled if the correct facilities and services were available.
Recovery potential - Landfill Survey Data Grossed Data Not recoverable 7,130 47,214 Possibly recoverable 13,667 132,092 Recoverable 39,118 324,185 Don't Know (National survey data) 202,502 242,372 Total 262,417 745,864
Figure 47: Recovery potential of landfilled wastes (in tonnes), based on the overall data
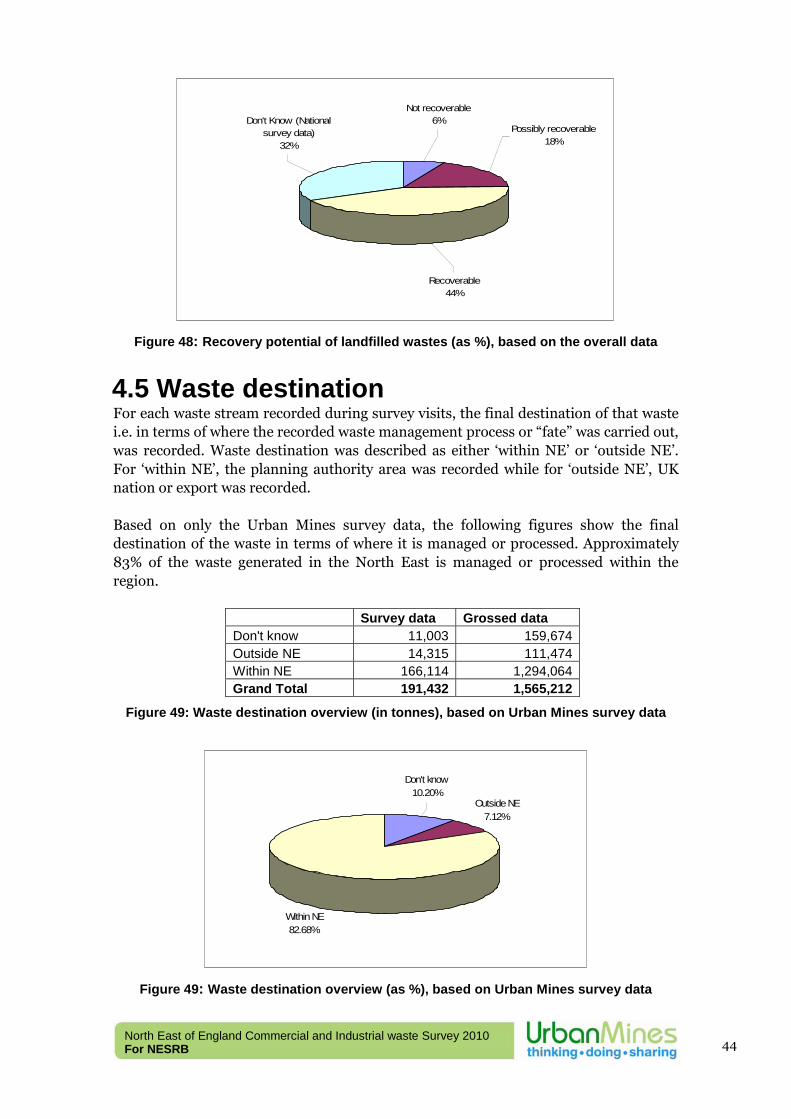
North East of England Commercial and Industrial waste Survey 2010 For NESRB
44
Recoverable44%
Possibly recoverable18%
Don't Know (National survey data)
32%
Not recoverable6%
Figure 48: Recovery potential of landfilled wastes (as %), based on the overall data
4.5 Waste destination For each waste stream recorded during survey visits, the final destination of that waste i.e. in terms of where the recorded waste management process or “fate” was carried out, was recorded. Waste destination was described as either ‘within NE’ or ‘outside NE’. For ‘within NE’, the planning authority area was recorded while for ‘outside NE’, UK nation or export was recorded. Based on only the Urban Mines survey data, the following figures show the final destination of the waste in terms of where it is managed or processed. Approximately 83% of the waste generated in the North East is managed or processed within the region.
Survey data Grossed data Don't know 11,003 159,674 Outside NE 14,315 111,474 Within NE 166,114 1,294,064 Grand Total 191,432 1,565,212
Figure 49: Waste destination overview (in tonnes), based on Urban Mines survey data
Outside NE7.12%
Within NE82.68%
Don't know10.20%
Figure 49: Waste destination overview (as %), based on Urban Mines survey data
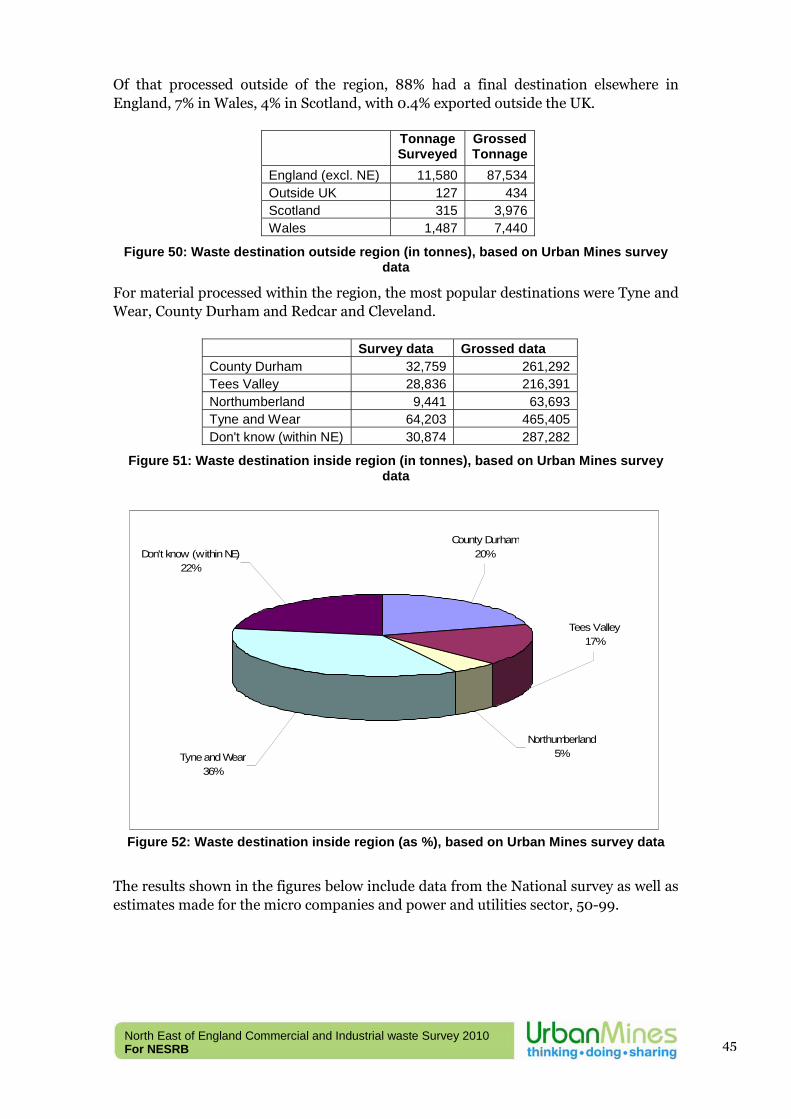
North East of England Commercial and Industrial waste Survey 2010 For NESRB
45
Of that processed outside of the region, 88% had a final destination elsewhere in England, 7% in Wales, 4% in Scotland, with 0.4% exported outside the UK.
Tonnage Surveyed
Grossed Tonnage
England (excl. NE) 11,580 87,534Outside UK 127 434Scotland 315 3,976Wales 1,487 7,440
Figure 50: Waste destination outside region (in tonnes), based on Urban Mines survey data
For material processed within the region, the most popular destinations were Tyne and Wear, County Durham and Redcar and Cleveland.
Survey data Grossed data County Durham 32,759 261,292 Tees Valley 28,836 216,391 Northumberland 9,441 63,693 Tyne and Wear 64,203 465,405 Don't know (within NE) 30,874 287,282
Figure 51: Waste destination inside region (in tonnes), based on Urban Mines survey data
Figure 52: Waste destination inside region (as %), based on Urban Mines survey data
The results shown in the figures below include data from the National survey as well as estimates made for the micro companies and power and utilities sector, 50-99.
Northumberland5%
Tees Valley17%
Tyne and Wear36%
Don't know (within NE)22%
County Durham20%
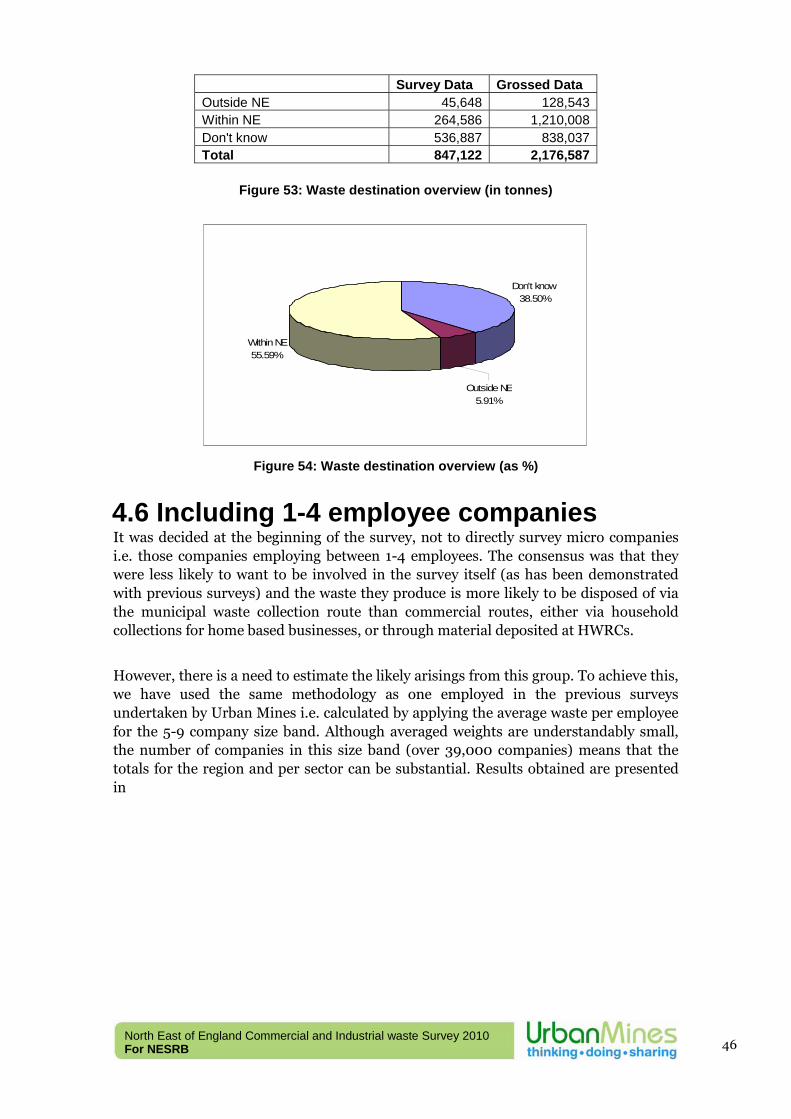
North East of England Commercial and Industrial waste Survey 2010 For NESRB
46
Figure 53: Waste destination overview (in tonnes)
Don't know38.50%
Within NE55.59%
Outside NE5.91%
Figure 54: Waste destination overview (as %)
4.6 Including 1-4 employee companies It was decided at the beginning of the survey, not to directly survey micro companies i.e. those companies employing between 1-4 employees. The consensus was that they were less likely to want to be involved in the survey itself (as has been demonstrated with previous surveys) and the waste they produce is more likely to be disposed of via the municipal waste collection route than commercial routes, either via household collections for home based businesses, or through material deposited at HWRCs.
However, there is a need to estimate the likely arisings from this group. To achieve this, we have used the same methodology as one employed in the previous surveys undertaken by Urban Mines i.e. calculated by applying the average waste per employee for the 5-9 company size band. Although averaged weights are understandably small, the number of companies in this size band (over 39,000 companies) means that the totals for the region and per sector can be substantial. Results obtained are presented in
Survey Data Grossed Data Outside NE 45,648 128,543 Within NE 264,586 1,210,008 Don't know 536,887 838,037 Total 847,122 2,176,587
North East of England Commercial and Industrial waste Survey 2010 For NESRB
47
Figure 55.
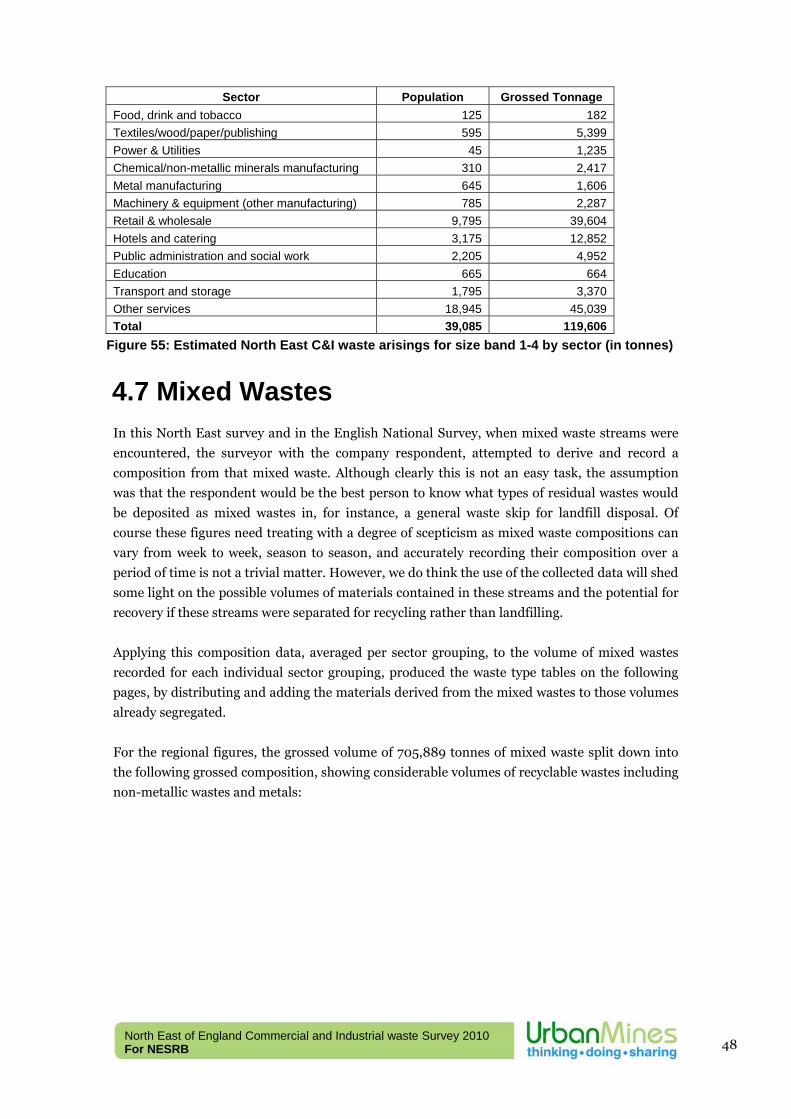
North East of England Commercial and Industrial waste Survey 2010 For NESRB
48
Figure 55: Estimated North East C&I waste arisings for size band 1-4 by sector (in tonnes)
4.7 Mixed Wastes
In this North East survey and in the English National Survey, when mixed waste streams were
encountered, the surveyor with the company respondent, attempted to derive and record a
composition from that mixed waste. Although clearly this is not an easy task, the assumption
was that the respondent would be the best person to know what types of residual wastes would
be deposited as mixed wastes in, for instance, a general waste skip for landfill disposal. Of
course these figures need treating with a degree of scepticism as mixed waste compositions can
vary from week to week, season to season, and accurately recording their composition over a
period of time is not a trivial matter. However, we do think the use of the collected data will shed
some light on the possible volumes of materials contained in these streams and the potential for
recovery if these streams were separated for recycling rather than landfilling.
Applying this composition data, averaged per sector grouping, to the volume of mixed wastes
recorded for each individual sector grouping, produced the waste type tables on the following
pages, by distributing and adding the materials derived from the mixed wastes to those volumes
already segregated.
For the regional figures, the grossed volume of 705,889 tonnes of mixed waste split down into
the following grossed composition, showing considerable volumes of recyclable wastes including
non-metallic wastes and metals:
Sector Population Grossed Tonnage Food, drink and tobacco 125 182 Textiles/wood/paper/publishing 595 5,399 Power & Utilities 45 1,235 Chemical/non-metallic minerals manufacturing 310 2,417 Metal manufacturing 645 1,606 Machinery & equipment (other manufacturing) 785 2,287 Retail & wholesale 9,795 39,604 Hotels and catering 3,175 12,852 Public administration and social work 2,205 4,952 Education 665 664 Transport and storage 1,795 3,370 Other services 18,945 45,039 Total 39,085 119,606
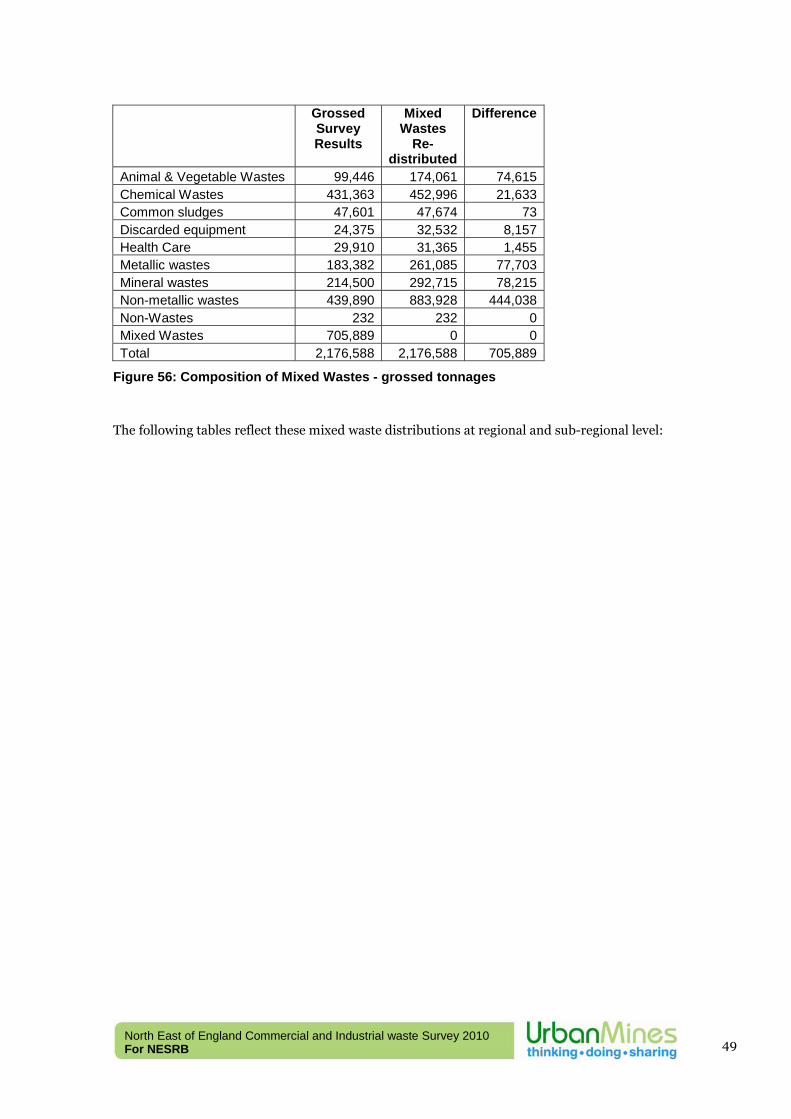
North East of England Commercial and Industrial waste Survey 2010 For NESRB
49
Grossed Survey Results
Mixed Wastes
Re-distributed
Difference
Animal & Vegetable Wastes 99,446 174,061 74,615Chemical Wastes 431,363 452,996 21,633Common sludges 47,601 47,674 73Discarded equipment 24,375 32,532 8,157Health Care 29,910 31,365 1,455Metallic wastes 183,382 261,085 77,703Mineral wastes 214,500 292,715 78,215Non-metallic wastes 439,890 883,928 444,038Non-Wastes 232 232 0Mixed Wastes 705,889 0 0Total 2,176,588 2,176,588 705,889
Figure 56: Composition of Mixed Wastes - grossed tonnages
The following tables reflect these mixed waste distributions at regional and sub-regional level:
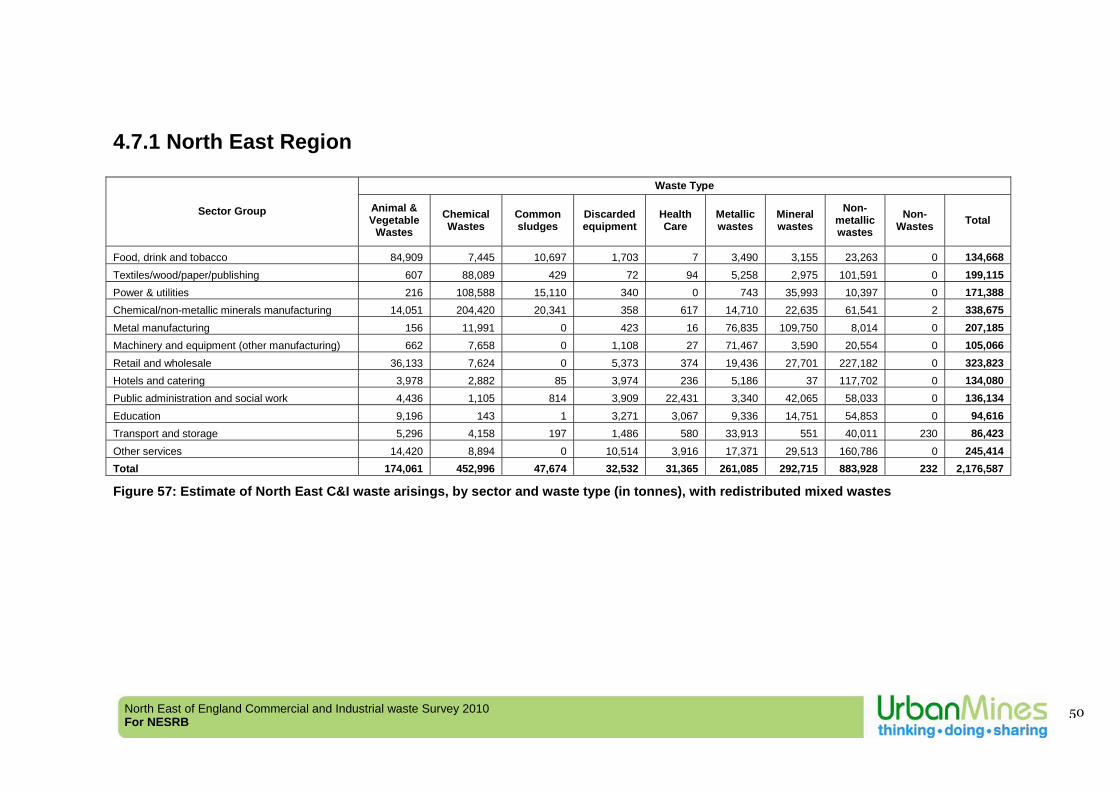
North East of England Commercial and Industrial waste Survey 2010 For NESRB
50
4.7.1 North East Region
Waste Type
Sector Group Animal & Vegetable
Wastes Chemical Wastes
Common sludges
Discarded equipment
Health Care
Metallic wastes
Mineral wastes
Non-metallic wastes
Non-Wastes Total
Food, drink and tobacco 84,909 7,445 10,697 1,703 7 3,490 3,155 23,263 0 134,668 Textiles/wood/paper/publishing 607 88,089 429 72 94 5,258 2,975 101,591 0 199,115 Power & utilities 216 108,588 15,110 340 0 743 35,993 10,397 0 171,388 Chemical/non-metallic minerals manufacturing 14,051 204,420 20,341 358 617 14,710 22,635 61,541 2 338,675 Metal manufacturing 156 11,991 0 423 16 76,835 109,750 8,014 0 207,185 Machinery and equipment (other manufacturing) 662 7,658 0 1,108 27 71,467 3,590 20,554 0 105,066 Retail and wholesale 36,133 7,624 0 5,373 374 19,436 27,701 227,182 0 323,823 Hotels and catering 3,978 2,882 85 3,974 236 5,186 37 117,702 0 134,080 Public administration and social work 4,436 1,105 814 3,909 22,431 3,340 42,065 58,033 0 136,134 Education 9,196 143 1 3,271 3,067 9,336 14,751 54,853 0 94,616 Transport and storage 5,296 4,158 197 1,486 580 33,913 551 40,011 230 86,423 Other services 14,420 8,894 0 10,514 3,916 17,371 29,513 160,786 0 245,414 Total 174,061 452,996 47,674 32,532 31,365 261,085 292,715 883,928 232 2,176,587
Figure 57: Estimate of North East C&I waste arisings, by sector and waste type (in tonnes), with redistributed mixed wastes
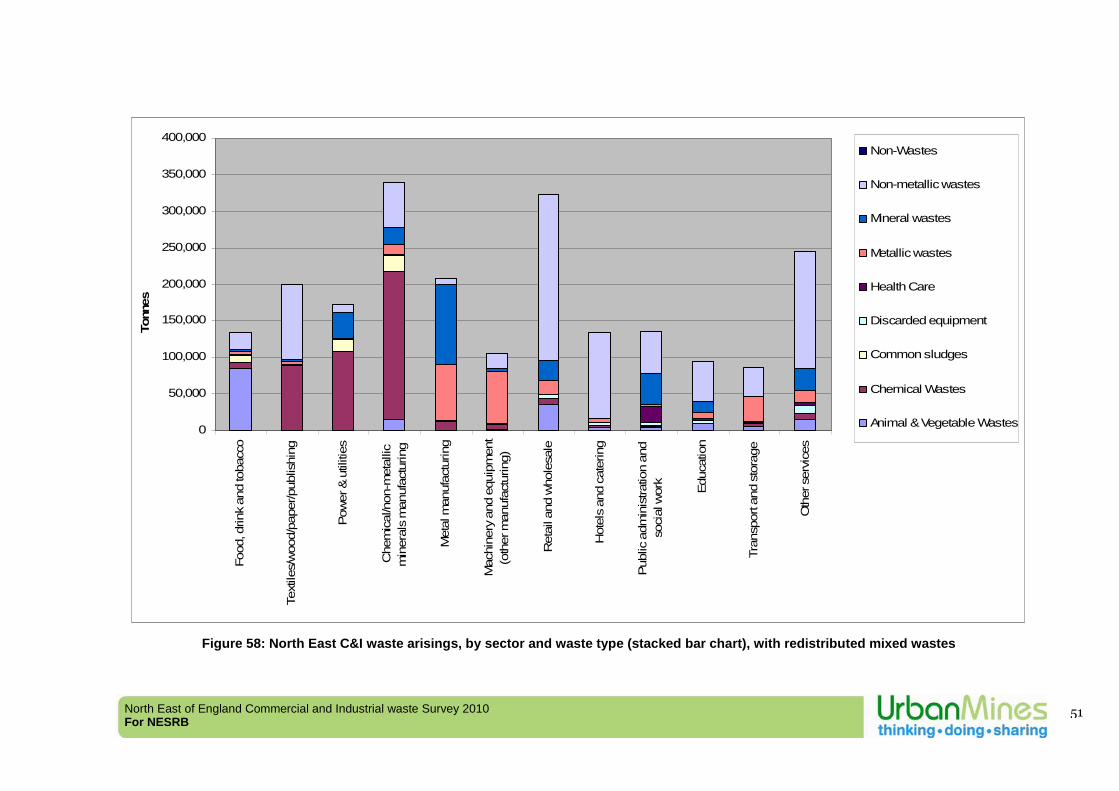
North East of England Commercial and Industrial waste Survey 2010 For NESRB
51
0
50,000
100,000
150,000
200,000
250,000
300,000
350,000
400,000
Food
, drin
k an
d to
bacc
o
Text
iles/
woo
d/pa
per/p
ublis
hing
Pow
er &
util
ities
Che
mic
al/n
on-m
etal
licm
iner
als
man
ufac
turin
g
Met
al m
anuf
actu
ring
Mac
hine
ry a
nd e
quip
men
t(o
ther
man
ufac
turin
g)
Ret
ail a
nd w
hole
sale
Hot
els
and
cate
ring
Publ
ic a
dmin
istra
tion
and
soci
al w
ork
Educ
atio
n
Tran
spor
t and
sto
rage
Oth
er s
ervi
ces
Tonn
es
Non-Wastes
Non-metallic wastes
Mineral wastes
Metallic wastes
Health Care
Discarded equipment
Common sludges
Chemical Wastes
Animal & Vegetable Wastes
Figure 58: North East C&I waste arisings, by sector and waste type (stacked bar chart), with redistributed mixed wastes

North East of England Commercial and Industrial waste Survey 2010 For NESRB
52
4.7.2 Tyne & Wear
Waste Type
Sector Group Animal & Vegetable
Wastes Chemical Wastes
Common sludges
Discarded equipment
Health Care
Metallic wastes
Mineral wastes
Non-metallic wastes
Non-Wastes Total
Food, drink and tobacco 25,955 2,276 3,270 521 2 1,067 964 7,111 0 41,165 Textiles/wood/paper/publishing 154 22,399 109 18 24 1,337 757 25,832 0 50,631 Power & utilities 93 46,772 6,508 147 0 320 15,503 4,478 0 73,821 Chemical/non-metallic minerals manufacturing 3,893 56,640 5,636 99 171 4,076 6,272 17,052 0 93,839 Metal manufacturing 78 6,019 0 212 8 38,567 55,088 4,023 0 103,995 Machinery and equipment (other manufacturing) 345 3,993 0 578 14 37,271 1,872 10,719 0 54,793 Retail and wholesale 16,837 3,553 0 2,504 174 9,056 12,908 105,860 0 150,892 Hotels and catering 1,774 1,285 38 1,772 105 2,312 17 52,477 0 59,779 Public administration and social work 1,875 467 344 1,652 9,481 1,412 17,780 24,530 0 57,542 Education 3,787 59 0 1,347 1,263 3,844 6,074 22,588 0 38,963 Transport and storage 2,480 1,947 92 696 271 15,878 258 18,733 108 40,462 Other services 7,494 4,622 0 5,464 2,035 9,028 15,338 83,558 0 127,539 Total 64,765 150,031 15,998 15,009 13,549 124,168 132,830 376,962 108 893,421
Figure 59: Estimate of C&I waste arisings in Tyne & Wear, by sector and waste type (in tonnes), with redistributed mixed wastes
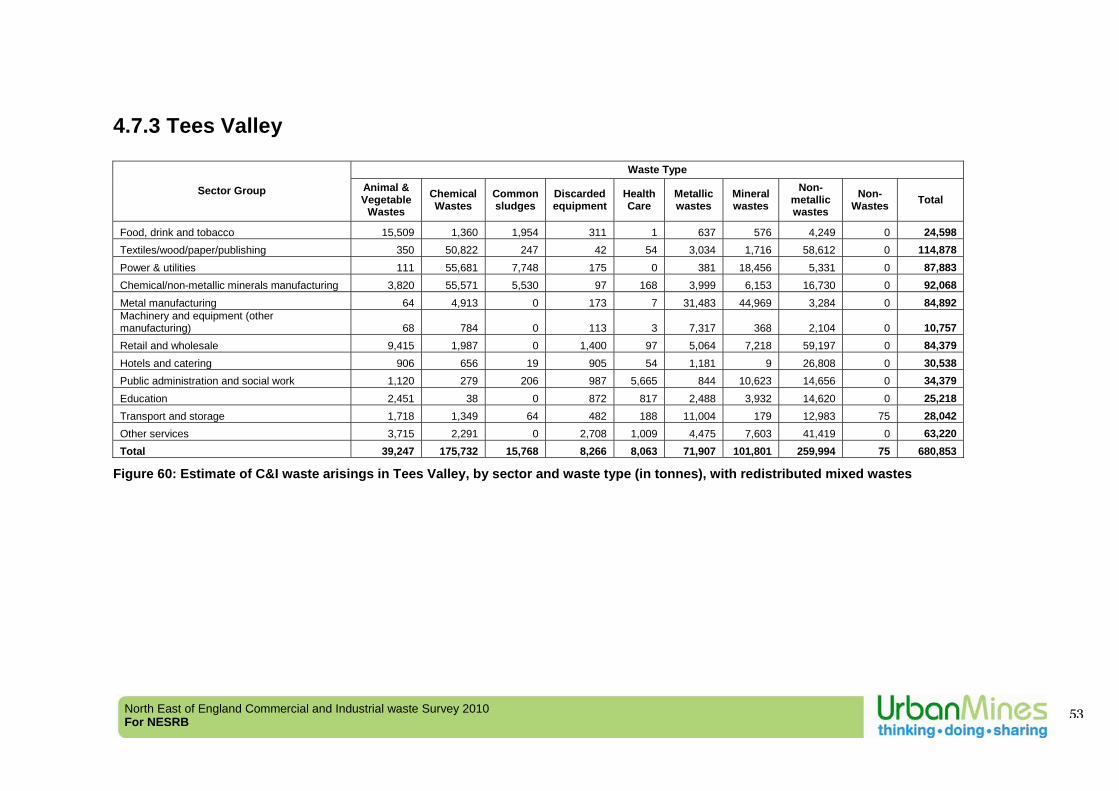
North East of England Commercial and Industrial waste Survey 2010 For NESRB
53
4.7.3 Tees Valley
Waste Type
Sector Group Animal & Vegetable
Wastes Chemical Wastes
Common sludges
Discarded equipment
Health Care
Metallic wastes
Mineral wastes
Non-metallic wastes
Non-Wastes Total
Food, drink and tobacco 15,509 1,360 1,954 311 1 637 576 4,249 0 24,598 Textiles/wood/paper/publishing 350 50,822 247 42 54 3,034 1,716 58,612 0 114,878 Power & utilities 111 55,681 7,748 175 0 381 18,456 5,331 0 87,883 Chemical/non-metallic minerals manufacturing 3,820 55,571 5,530 97 168 3,999 6,153 16,730 0 92,068 Metal manufacturing 64 4,913 0 173 7 31,483 44,969 3,284 0 84,892 Machinery and equipment (other manufacturing) 68 784 0 113 3 7,317 368 2,104 0 10,757 Retail and wholesale 9,415 1,987 0 1,400 97 5,064 7,218 59,197 0 84,379 Hotels and catering 906 656 19 905 54 1,181 9 26,808 0 30,538 Public administration and social work 1,120 279 206 987 5,665 844 10,623 14,656 0 34,379 Education 2,451 38 0 872 817 2,488 3,932 14,620 0 25,218 Transport and storage 1,718 1,349 64 482 188 11,004 179 12,983 75 28,042 Other services 3,715 2,291 0 2,708 1,009 4,475 7,603 41,419 0 63,220 Total 39,247 175,732 15,768 8,266 8,063 71,907 101,801 259,994 75 680,853
Figure 60: Estimate of C&I waste arisings in Tees Valley, by sector and waste type (in tonnes), with redistributed mixed wastes
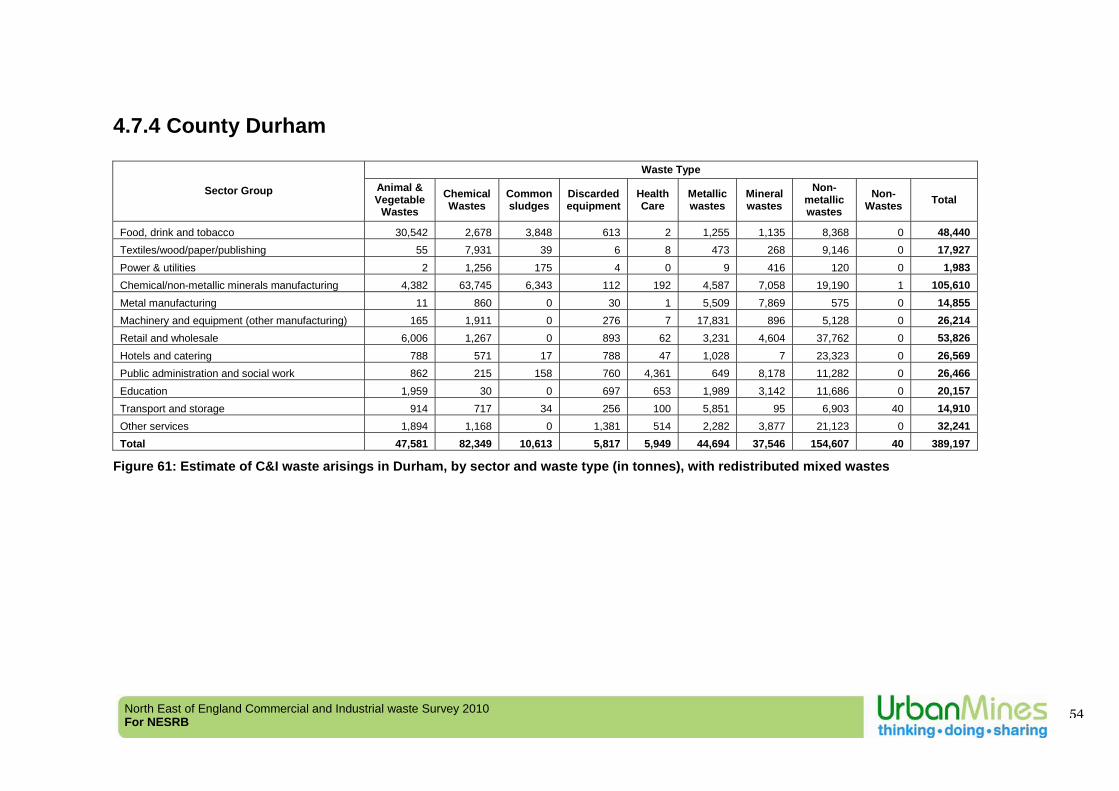
North East of England Commercial and Industrial waste Survey 2010 For NESRB
54
4.7.4 County Durham
Waste Type
Sector Group Animal & Vegetable
Wastes Chemical Wastes
Common sludges
Discarded equipment
Health Care
Metallic wastes
Mineral wastes
Non-metallic wastes
Non-Wastes Total
Food, drink and tobacco 30,542 2,678 3,848 613 2 1,255 1,135 8,368 0 48,440 Textiles/wood/paper/publishing 55 7,931 39 6 8 473 268 9,146 0 17,927 Power & utilities 2 1,256 175 4 0 9 416 120 0 1,983 Chemical/non-metallic minerals manufacturing 4,382 63,745 6,343 112 192 4,587 7,058 19,190 1 105,610 Metal manufacturing 11 860 0 30 1 5,509 7,869 575 0 14,855 Machinery and equipment (other manufacturing) 165 1,911 0 276 7 17,831 896 5,128 0 26,214 Retail and wholesale 6,006 1,267 0 893 62 3,231 4,604 37,762 0 53,826 Hotels and catering 788 571 17 788 47 1,028 7 23,323 0 26,569 Public administration and social work 862 215 158 760 4,361 649 8,178 11,282 0 26,466 Education 1,959 30 0 697 653 1,989 3,142 11,686 0 20,157 Transport and storage 914 717 34 256 100 5,851 95 6,903 40 14,910 Other services 1,894 1,168 0 1,381 514 2,282 3,877 21,123 0 32,241 Total 47,581 82,349 10,613 5,817 5,949 44,694 37,546 154,607 40 389,197
Figure 61: Estimate of C&I waste arisings in Durham, by sector and waste type (in tonnes), with redistributed mixed wastes
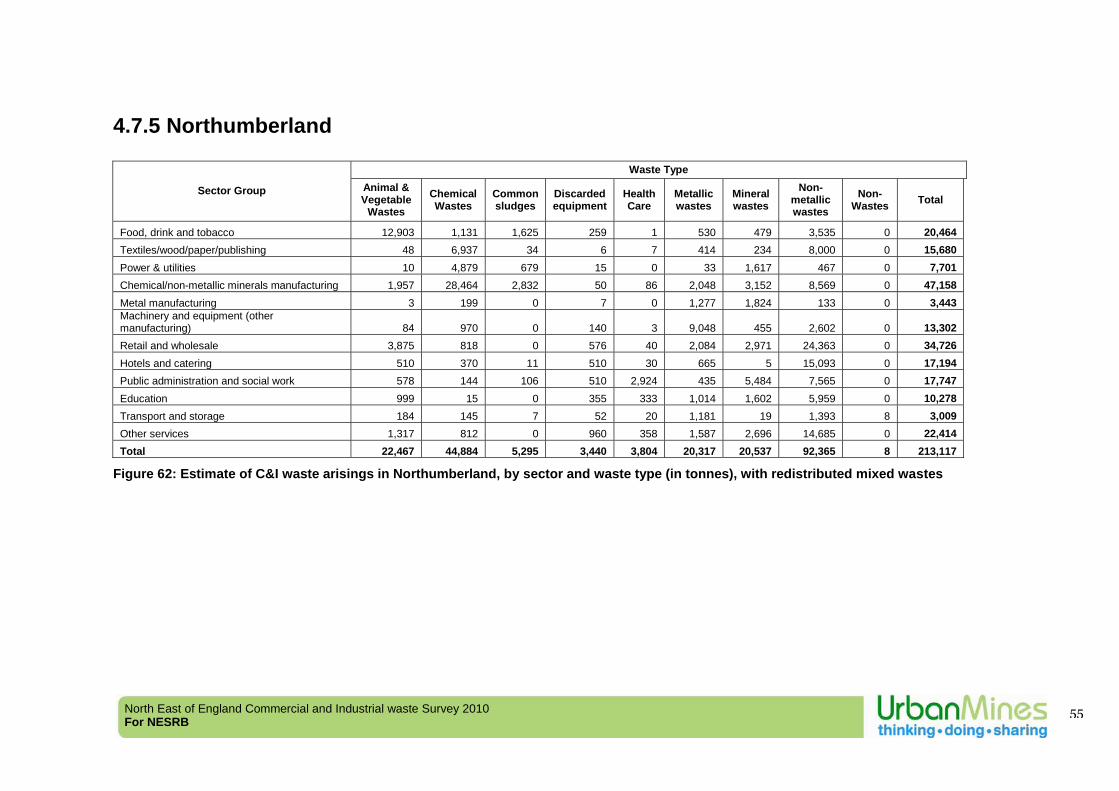
North East of England Commercial and Industrial waste Survey 2010 For NESRB
55
4.7.5 Northumberland
Waste Type
Sector Group Animal & Vegetable
Wastes Chemical Wastes
Common sludges
Discarded equipment
Health Care
Metallic wastes
Mineral wastes
Non-metallic wastes
Non-Wastes Total
Food, drink and tobacco 12,903 1,131 1,625 259 1 530 479 3,535 0 20,464 Textiles/wood/paper/publishing 48 6,937 34 6 7 414 234 8,000 0 15,680 Power & utilities 10 4,879 679 15 0 33 1,617 467 0 7,701 Chemical/non-metallic minerals manufacturing 1,957 28,464 2,832 50 86 2,048 3,152 8,569 0 47,158 Metal manufacturing 3 199 0 7 0 1,277 1,824 133 0 3,443 Machinery and equipment (other manufacturing) 84 970 0 140 3 9,048 455 2,602 0 13,302 Retail and wholesale 3,875 818 0 576 40 2,084 2,971 24,363 0 34,726 Hotels and catering 510 370 11 510 30 665 5 15,093 0 17,194 Public administration and social work 578 144 106 510 2,924 435 5,484 7,565 0 17,747 Education 999 15 0 355 333 1,014 1,602 5,959 0 10,278 Transport and storage 184 145 7 52 20 1,181 19 1,393 8 3,009 Other services 1,317 812 0 960 358 1,587 2,696 14,685 0 22,414 Total 22,467 44,884 5,295 3,440 3,804 20,317 20,537 92,365 8 213,117
Figure 62: Estimate of C&I waste arisings in Northumberland, by sector and waste type (in tonnes), with redistributed mixed wastes

North East of England Commercial and Industrial waste Survey 2010 For NESRB
56
5 Conclusions and recommendations
Survey results The survey has shown regional waste arisings for 2009-10 to be 2.18 million tonnes (including estimate for 1-4 employees). This compares to a regional estimate of 2.35 million tonnes from the recently delivered National C&I Survey2. These conclusions are based upon the grossing of data from 1,036 company locations (local units) distributed around the North East region plus 276 companies surveyed as part of the National Survey. This report contains some basic analysis of the results obtained. The raw and grossed data is presented in separate electronic files, which can be used for further analysis or collation. The survey delivered in 2010 recorded waste arisings data from the 2009-10 financial year, based upon a sample frame and grossing methodology which used ONS population data from March 2009, and therefore is likely to have fully represented the impact on waste arisings of the current economic turndown. Methodology This survey has again demonstrated that the basic methodology for delivery of this type of survey is robust, and can be delivered effectively and efficiently. This survey was delivered to time and budget. A number of issues were identified in the delivery of the survey this time, which are reported in “Lessons Learned” in Appendix 10. This includes comments on the use of companies data from commercial sources, as disclosive data from ONS was not available for this survey, and on the problems inherent in combining survey data from two independent sources. Data confidence We have taken steps to ensure that the data collected through the survey visits is robust, and that extensive data screening is carried out to ensure that errors are trapped, checked and corrected. We are therefore confident in the quality of our survey data collected. Data confidence levels have been calculated and are presented in this report. However, we do need to be aware that there are a number of potential sources of error which we can only partially address in the delivery of this survey. These include, for instance, the assumptions required in use of conversion factors, and the company respondents knowledge of their actual waste production (eg. are waste bins actually 100% full when emptied?). Unfortunately, although combining our survey data with that from the National Survey was required to fill data gaps (for instance, the National Survey had surveyed a number
2 “Commercial and Industrial Waste Survey 2009” Jacobs for Defra, December 2010
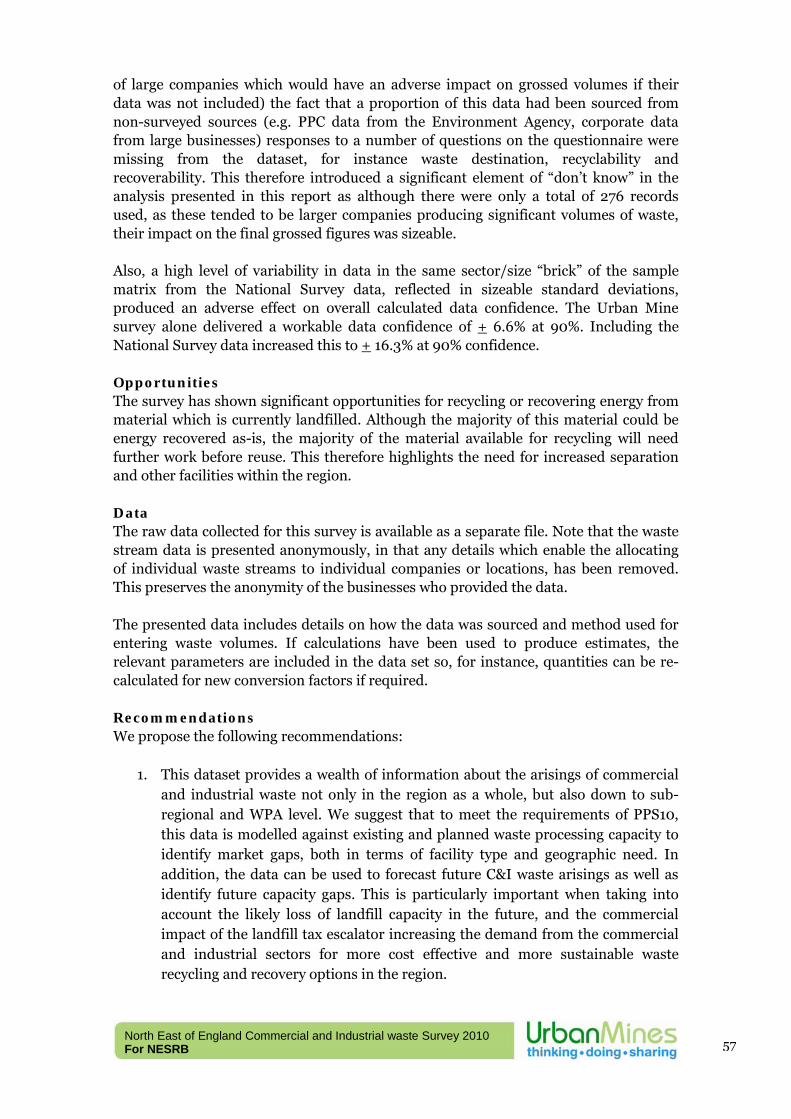
North East of England Commercial and Industrial waste Survey 2010 For NESRB
57
of large companies which would have an adverse impact on grossed volumes if their data was not included) the fact that a proportion of this data had been sourced from non-surveyed sources (e.g. PPC data from the Environment Agency, corporate data from large businesses) responses to a number of questions on the questionnaire were missing from the dataset, for instance waste destination, recyclability and recoverability. This therefore introduced a significant element of “don’t know” in the analysis presented in this report as although there were only a total of 276 records used, as these tended to be larger companies producing significant volumes of waste, their impact on the final grossed figures was sizeable. Also, a high level of variability in data in the same sector/size “brick” of the sample matrix from the National Survey data, reflected in sizeable standard deviations, produced an adverse effect on overall calculated data confidence. The Urban Mine survey alone delivered a workable data confidence of + 6.6% at 90%. Including the National Survey data increased this to + 16.3% at 90% confidence. Opportunities The survey has shown significant opportunities for recycling or recovering energy from material which is currently landfilled. Although the majority of this material could be energy recovered as-is, the majority of the material available for recycling will need further work before reuse. This therefore highlights the need for increased separation and other facilities within the region. Data The raw data collected for this survey is available as a separate file. Note that the waste stream data is presented anonymously, in that any details which enable the allocating of individual waste streams to individual companies or locations, has been removed. This preserves the anonymity of the businesses who provided the data. The presented data includes details on how the data was sourced and method used for entering waste volumes. If calculations have been used to produce estimates, the relevant parameters are included in the data set so, for instance, quantities can be re-calculated for new conversion factors if required. Recommendations We propose the following recommendations:
1. This dataset provides a wealth of information about the arisings of commercial and industrial waste not only in the region as a whole, but also down to sub-regional and WPA level. We suggest that to meet the requirements of PPS10, this data is modelled against existing and planned waste processing capacity to identify market gaps, both in terms of facility type and geographic need. In addition, the data can be used to forecast future C&I waste arisings as well as identify future capacity gaps. This is particularly important when taking into account the likely loss of landfill capacity in the future, and the commercial impact of the landfill tax escalator increasing the demand from the commercial and industrial sectors for more cost effective and more sustainable waste recycling and recovery options in the region.
North East of England Commercial and Industrial waste Survey 2010 For NESRB
58
2. This is the first detailed survey of commercial and industrial waste in the region, for what is an important and significant waste stream. We propose that unless this data can be sourced in the future from reporting associated with Duty of Care, as proposed and being developed by the Environment Agency, that this survey is repeated to identify trends and monitor progress.
3. Assumptions have been made in calculating the waste arisings from micro (1-4
employee businesses). The behaviour of this part of the commercial and industrial sector with regards to waste disposal is not understood. Although the waste production per business is likely to be small, the large number of businesses of this size adds up to a significant waste stream. We suggest therefore that at some stage this sub-sector is addressed through a separate piece of work
4. We suggest that recyclability, recoverability and mixed waste data is studied in
more detail to help target recycling initiatives and business support in the region, and produce realistic targets for improvement.
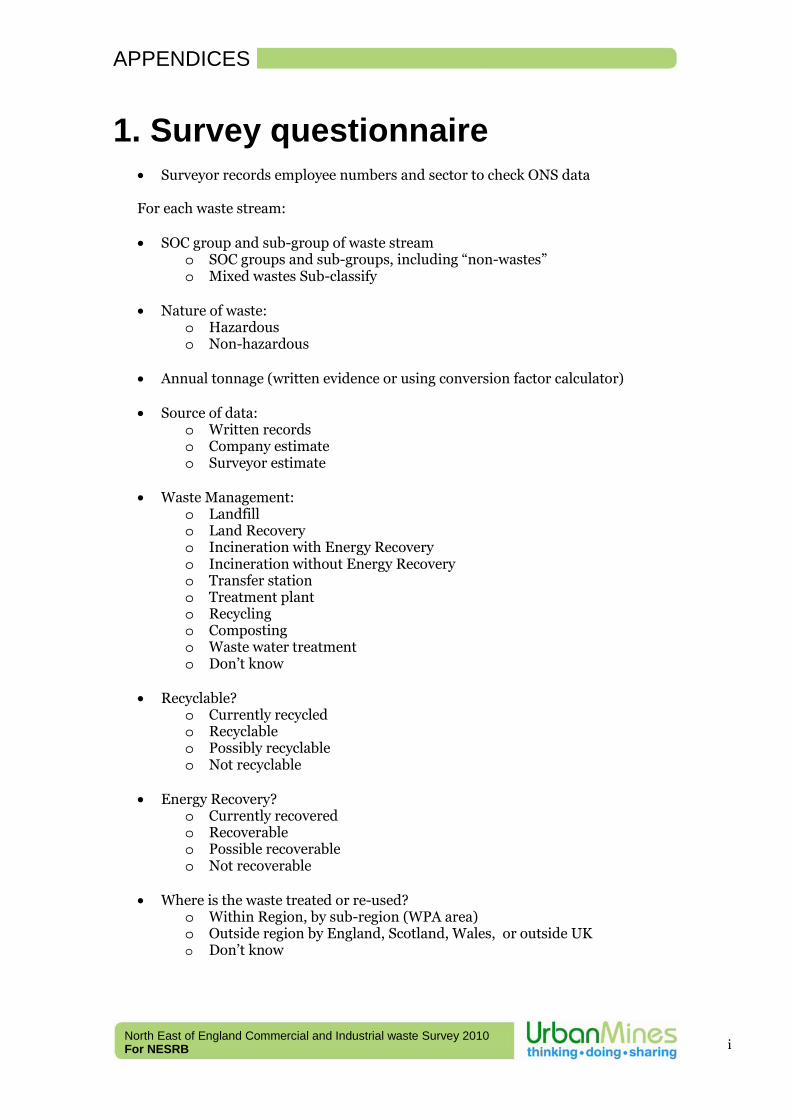
APPENDICES
North East of England Commercial and Industrial waste Survey 2010 For NESRB
i
1. Survey questionnaire
• Surveyor records employee numbers and sector to check ONS data For each waste stream: • SOC group and sub-group of waste stream
o SOC groups and sub-groups, including “non-wastes” o Mixed wastes Sub-classify
• Nature of waste: o Hazardous o Non-hazardous
• Annual tonnage (written evidence or using conversion factor calculator) • Source of data:
o Written records o Company estimate o Surveyor estimate
• Waste Management:
o Landfill o Land Recovery o Incineration with Energy Recovery o Incineration without Energy Recovery o Transfer station o Treatment plant o Recycling o Composting o Waste water treatment o Don’t know
• Recyclable? o Currently recycled o Recyclable o Possibly recyclable o Not recyclable
• Energy Recovery?
o Currently recovered o Recoverable o Possible recoverable o Not recoverable
• Where is the waste treated or re-used? o Within Region, by sub-region (WPA area) o Outside region by England, Scotland, Wales, or outside UK o Don’t know
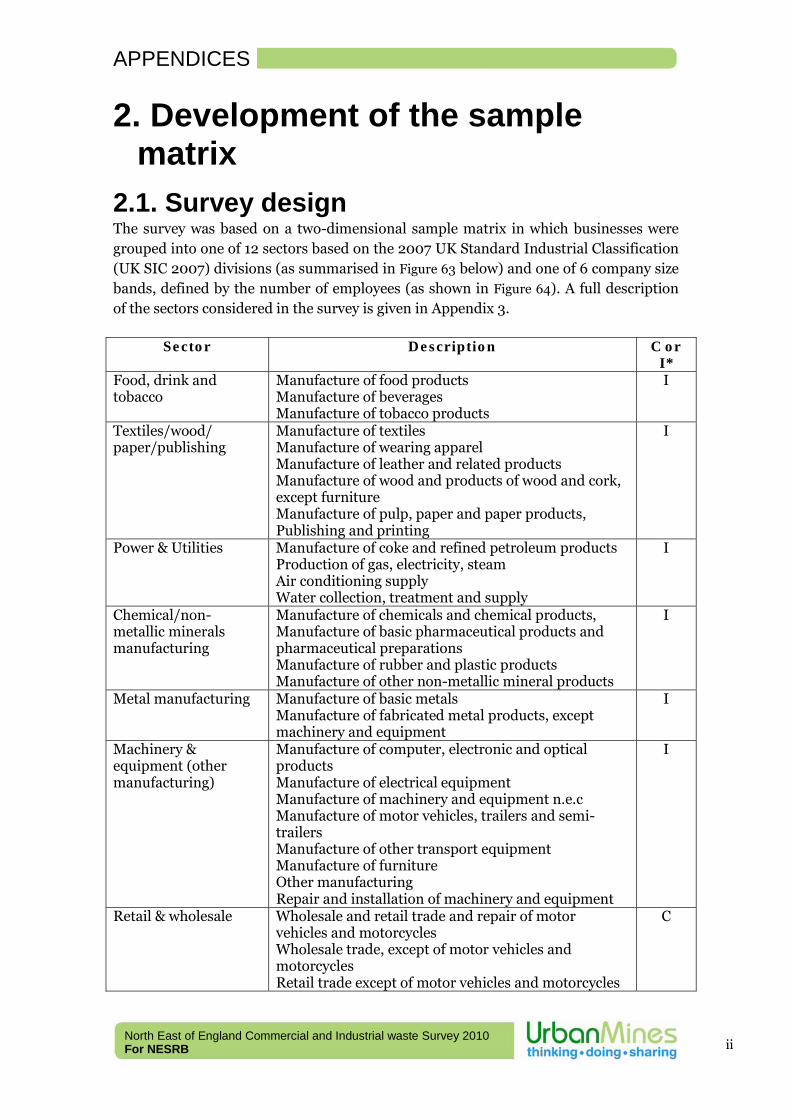
APPENDICES
North East of England Commercial and Industrial waste Survey 2010 For NESRB
ii
2. Development of the sample matrix
2.1. Survey design The survey was based on a two-dimensional sample matrix in which businesses were grouped into one of 12 sectors based on the 2007 UK Standard Industrial Classification (UK SIC 2007) divisions (as summarised in Figure 63 below) and one of 6 company size bands, defined by the number of employees (as shown in Figure 64). A full description of the sectors considered in the survey is given in Appendix 3.
Sector Description C or I*
Food, drink and tobacco
Manufacture of food products Manufacture of beverages Manufacture of tobacco products
I
Textiles/wood/ paper/publishing
Manufacture of textiles Manufacture of wearing apparel Manufacture of leather and related products Manufacture of wood and products of wood and cork, except furniture Manufacture of pulp, paper and paper products, Publishing and printing
I
Power & Utilities Manufacture of coke and refined petroleum products Production of gas, electricity, steam Air conditioning supply Water collection, treatment and supply
I
Chemical/non-metallic minerals manufacturing
Manufacture of chemicals and chemical products, Manufacture of basic pharmaceutical products and pharmaceutical preparations Manufacture of rubber and plastic products Manufacture of other non-metallic mineral products
I
Metal manufacturing Manufacture of basic metals Manufacture of fabricated metal products, except machinery and equipment
I
Machinery & equipment (other manufacturing)
Manufacture of computer, electronic and optical products Manufacture of electrical equipment Manufacture of machinery and equipment n.e.c Manufacture of motor vehicles, trailers and semi-trailers Manufacture of other transport equipment Manufacture of furniture Other manufacturing Repair and installation of machinery and equipment
I
Retail & wholesale Wholesale and retail trade and repair of motor vehicles and motorcycles Wholesale trade, except of motor vehicles and motorcycles Retail trade except of motor vehicles and motorcycles
C
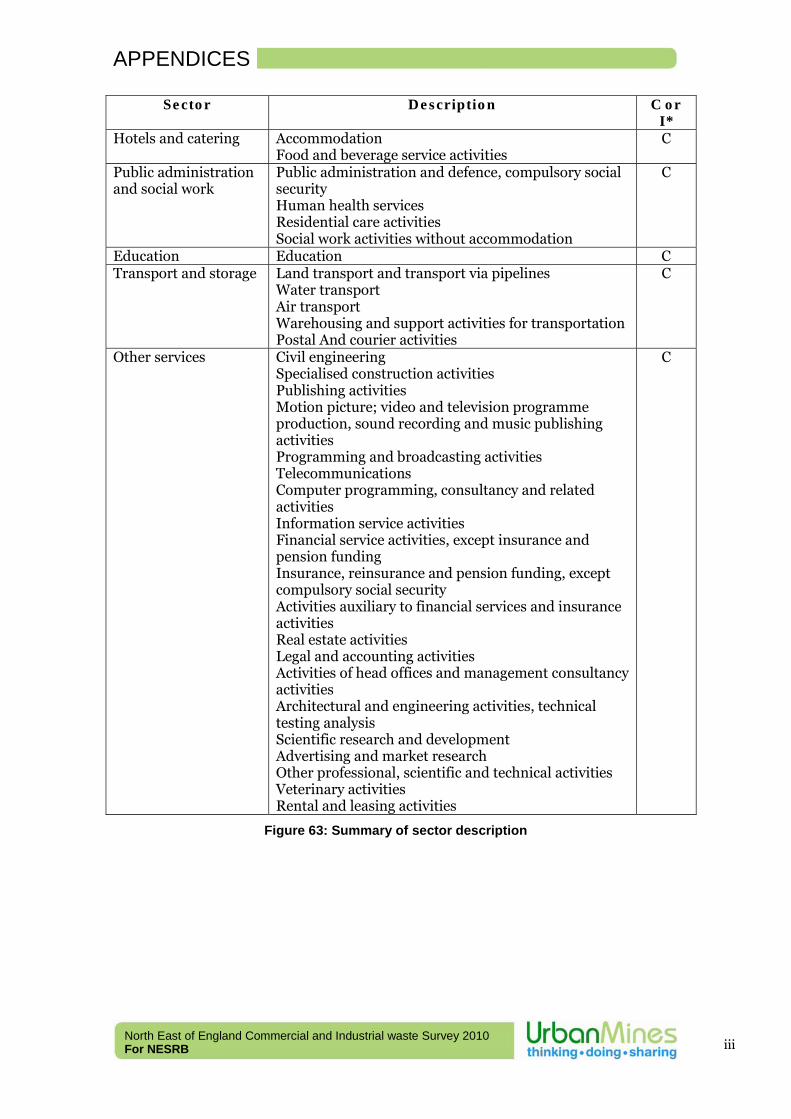
APPENDICES
North East of England Commercial and Industrial waste Survey 2010 For NESRB
iii
Sector Description C or I*
Hotels and catering Accommodation Food and beverage service activities
C
Public administration and social work
Public administration and defence, compulsory social security Human health services Residential care activities Social work activities without accommodation
C
Education Education C Transport and storage Land transport and transport via pipelines
Water transport Air transport Warehousing and support activities for transportation Postal And courier activities
C
Other services Civil engineering Specialised construction activities Publishing activities Motion picture; video and television programme production, sound recording and music publishing activities Programming and broadcasting activities Telecommunications Computer programming, consultancy and related activities Information service activities Financial service activities, except insurance and pension funding Insurance, reinsurance and pension funding, except compulsory social security Activities auxiliary to financial services and insurance activities Real estate activities Legal and accounting activities Activities of head offices and management consultancy activities Architectural and engineering activities, technical testing analysis Scientific research and development Advertising and market research Other professional, scientific and technical activities Veterinary activities Rental and leasing activities
C
Figure 63: Summary of sector description
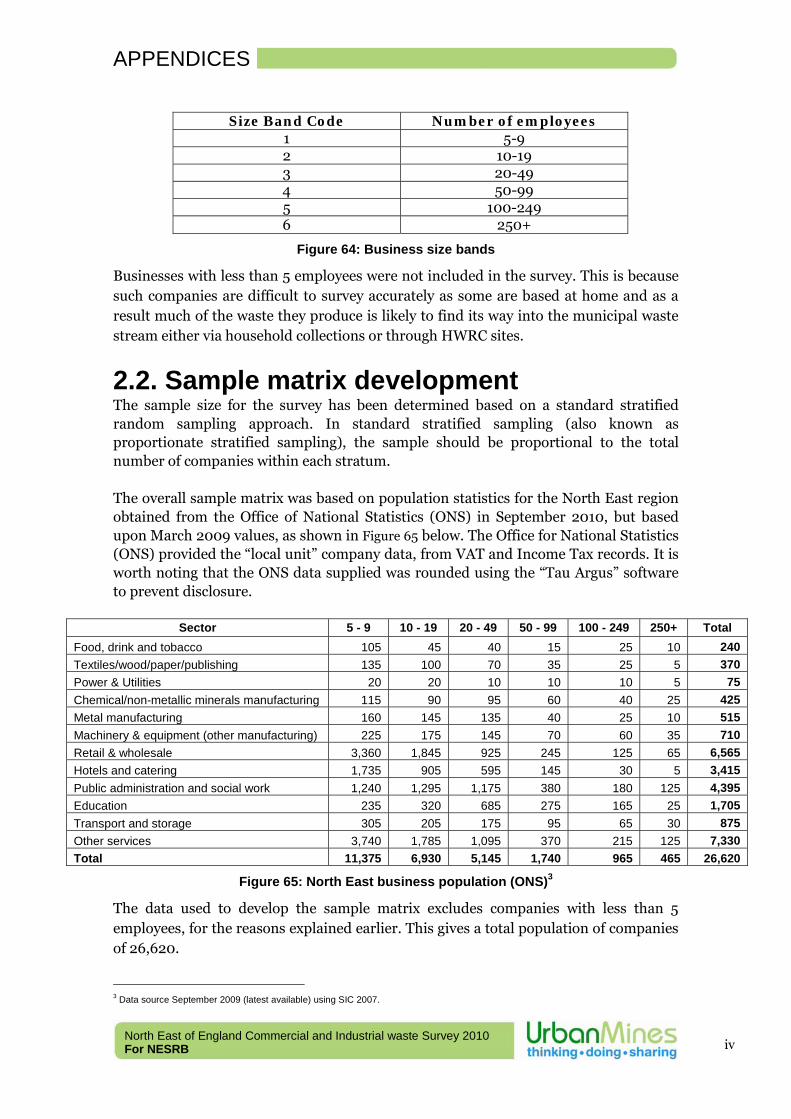
APPENDICES
North East of England Commercial and Industrial waste Survey 2010 For NESRB
iv
Size Band Code Number of employees
1 5-9 2 10-19 3 20-49 4 50-99 5 100-249 6 250+
Figure 64: Business size bands
Businesses with less than 5 employees were not included in the survey. This is because such companies are difficult to survey accurately as some are based at home and as a result much of the waste they produce is likely to find its way into the municipal waste stream either via household collections or through HWRC sites.
2.2. Sample matrix development The sample size for the survey has been determined based on a standard stratified random sampling approach. In standard stratified sampling (also known as proportionate stratified sampling), the sample should be proportional to the total number of companies within each stratum. The overall sample matrix was based on population statistics for the North East region obtained from the Office of National Statistics (ONS) in September 2010, but based upon March 2009 values, as shown in Figure 65 below. The Office for National Statistics (ONS) provided the “local unit” company data, from VAT and Income Tax records. It is worth noting that the ONS data supplied was rounded using the “Tau Argus” software to prevent disclosure.
Sector 5 - 9 10 - 19 20 - 49 50 - 99 100 - 249 250+ Total Food, drink and tobacco 105 45 40 15 25 10 240 Textiles/wood/paper/publishing 135 100 70 35 25 5 370 Power & Utilities 20 20 10 10 10 5 75 Chemical/non-metallic minerals manufacturing 115 90 95 60 40 25 425 Metal manufacturing 160 145 135 40 25 10 515 Machinery & equipment (other manufacturing) 225 175 145 70 60 35 710 Retail & wholesale 3,360 1,845 925 245 125 65 6,565 Hotels and catering 1,735 905 595 145 30 5 3,415 Public administration and social work 1,240 1,295 1,175 380 180 125 4,395 Education 235 320 685 275 165 25 1,705 Transport and storage 305 205 175 95 65 30 875 Other services 3,740 1,785 1,095 370 215 125 7,330 Total 11,375 6,930 5,145 1,740 965 465 26,620
Figure 65: North East business population (ONS)3
The data used to develop the sample matrix excludes companies with less than 5 employees, for the reasons explained earlier. This gives a total population of companies of 26,620. 3 Data source September 2009 (latest available) using SIC 2007.
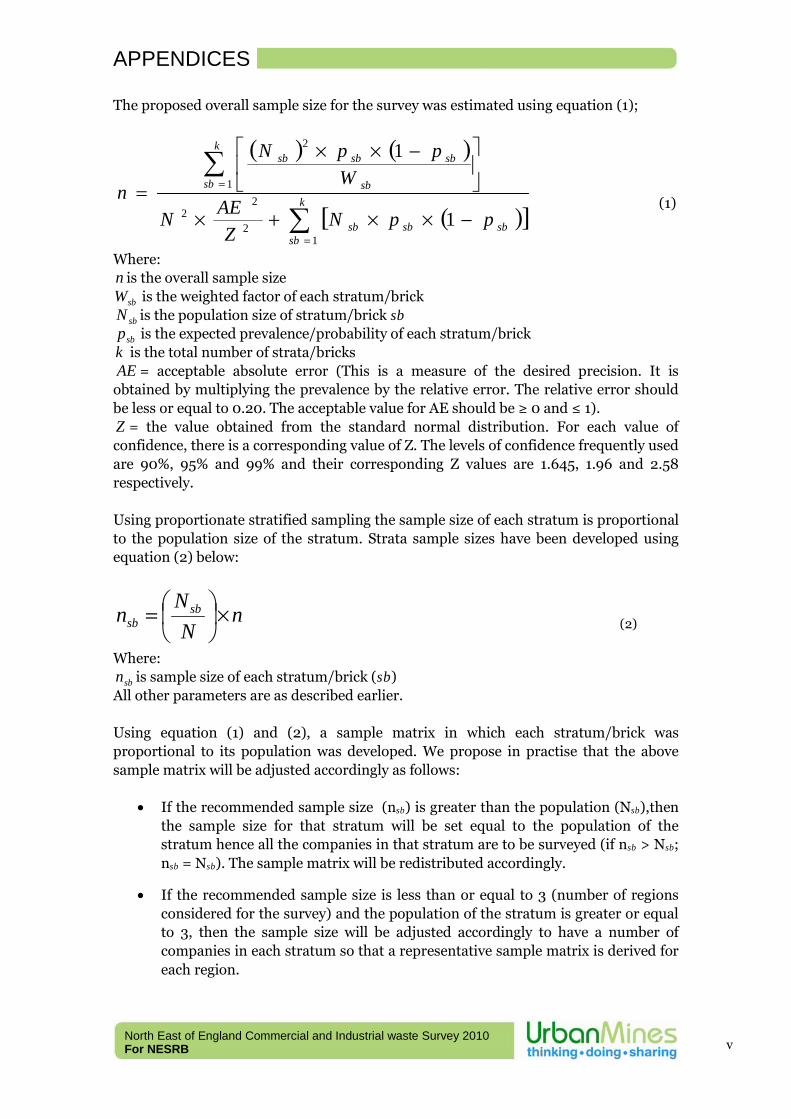
APPENDICES
North East of England Commercial and Industrial waste Survey 2010 For NESRB
v
The proposed overall sample size for the survey was estimated using equation (1);
( ) ( )
( )[ ]∑
∑
=
=
−××+×
⎥⎦
⎤⎢⎣
⎡ −××
= k
sbsbsbsb
k
sb sb
sbsbsb
ppNZ
AEN
WppN
n
12
22
1
2
1
1
(1)
Where: n is the overall sample size
sbW is the weighted factor of each stratum/brick
sbN is the population size of stratum/brick sb
sbp is the expected prevalence/probability of each stratum/brick k is the total number of strata/bricks AE = acceptable absolute error (This is a measure of the desired precision. It is
obtained by multiplying the prevalence by the relative error. The relative error should be less or equal to 0.20. The acceptable value for AE should be ≥ 0 and ≤ 1). Z = the value obtained from the standard normal distribution. For each value of confidence, there is a corresponding value of Z. The levels of confidence frequently used are 90%, 95% and 99% and their corresponding Z values are 1.645, 1.96 and 2.58 respectively. Using proportionate stratified sampling the sample size of each stratum is proportional to the population size of the stratum. Strata sample sizes have been developed using equation (2) below:
nN
Nn sbsb ×⎟
⎠⎞
⎜⎝⎛= (2)
Where:
sbn is sample size of each stratum/brick (sb) All other parameters are as described earlier. Using equation (1) and (2), a sample matrix in which each stratum/brick was proportional to its population was developed. We propose in practise that the above sample matrix will be adjusted accordingly as follows:
• If the recommended sample size (nsb) is greater than the population (Nsb),then the sample size for that stratum will be set equal to the population of the stratum hence all the companies in that stratum are to be surveyed (if nsb > Nsb; nsb = Nsb). The sample matrix will be redistributed accordingly.
• If the recommended sample size is less than or equal to 3 (number of regions considered for the survey) and the population of the stratum is greater or equal to 3, then the sample size will be adjusted accordingly to have a number of companies in each stratum so that a representative sample matrix is derived for each region.
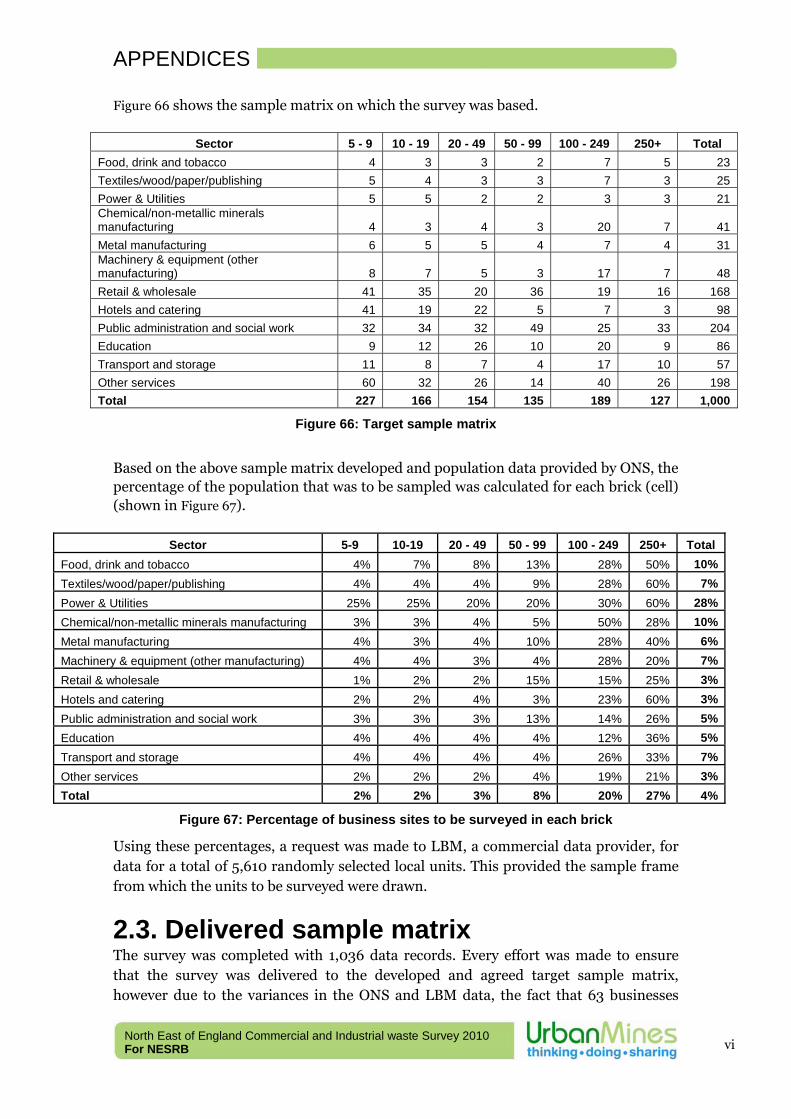
APPENDICES
North East of England Commercial and Industrial waste Survey 2010 For NESRB
vi
Figure 66 shows the sample matrix on which the survey was based.
Sector 5 - 9 10 - 19 20 - 49 50 - 99 100 - 249 250+ Total Food, drink and tobacco 4 3 3 2 7 5 23 Textiles/wood/paper/publishing 5 4 3 3 7 3 25 Power & Utilities 5 5 2 2 3 3 21 Chemical/non-metallic minerals manufacturing 4 3 4 3 20 7 41 Metal manufacturing 6 5 5 4 7 4 31 Machinery & equipment (other manufacturing) 8 7 5 3 17 7 48 Retail & wholesale 41 35 20 36 19 16 168 Hotels and catering 41 19 22 5 7 3 98 Public administration and social work 32 34 32 49 25 33 204 Education 9 12 26 10 20 9 86 Transport and storage 11 8 7 4 17 10 57 Other services 60 32 26 14 40 26 198 Total 227 166 154 135 189 127 1,000
Figure 66: Target sample matrix
Based on the above sample matrix developed and population data provided by ONS, the percentage of the population that was to be sampled was calculated for each brick (cell) (shown in Figure 67).
Sector 5-9 10-19 20 - 49 50 - 99 100 - 249 250+ Total Food, drink and tobacco 4% 7% 8% 13% 28% 50% 10%Textiles/wood/paper/publishing 4% 4% 4% 9% 28% 60% 7%Power & Utilities 25% 25% 20% 20% 30% 60% 28%Chemical/non-metallic minerals manufacturing 3% 3% 4% 5% 50% 28% 10%Metal manufacturing 4% 3% 4% 10% 28% 40% 6%Machinery & equipment (other manufacturing) 4% 4% 3% 4% 28% 20% 7%Retail & wholesale 1% 2% 2% 15% 15% 25% 3%Hotels and catering 2% 2% 4% 3% 23% 60% 3%Public administration and social work 3% 3% 3% 13% 14% 26% 5%Education 4% 4% 4% 4% 12% 36% 5%Transport and storage 4% 4% 4% 4% 26% 33% 7%Other services 2% 2% 2% 4% 19% 21% 3%Total 2% 2% 3% 8% 20% 27% 4%
Figure 67: Percentage of business sites to be surveyed in each brick
Using these percentages, a request was made to LBM, a commercial data provider, for data for a total of 5,610 randomly selected local units. This provided the sample frame from which the units to be surveyed were drawn.
2.3. Delivered sample matrix The survey was completed with 1,036 data records. Every effort was made to ensure that the survey was delivered to the developed and agreed target sample matrix, however due to the variances in the ONS and LBM data, the fact that 63 businesses
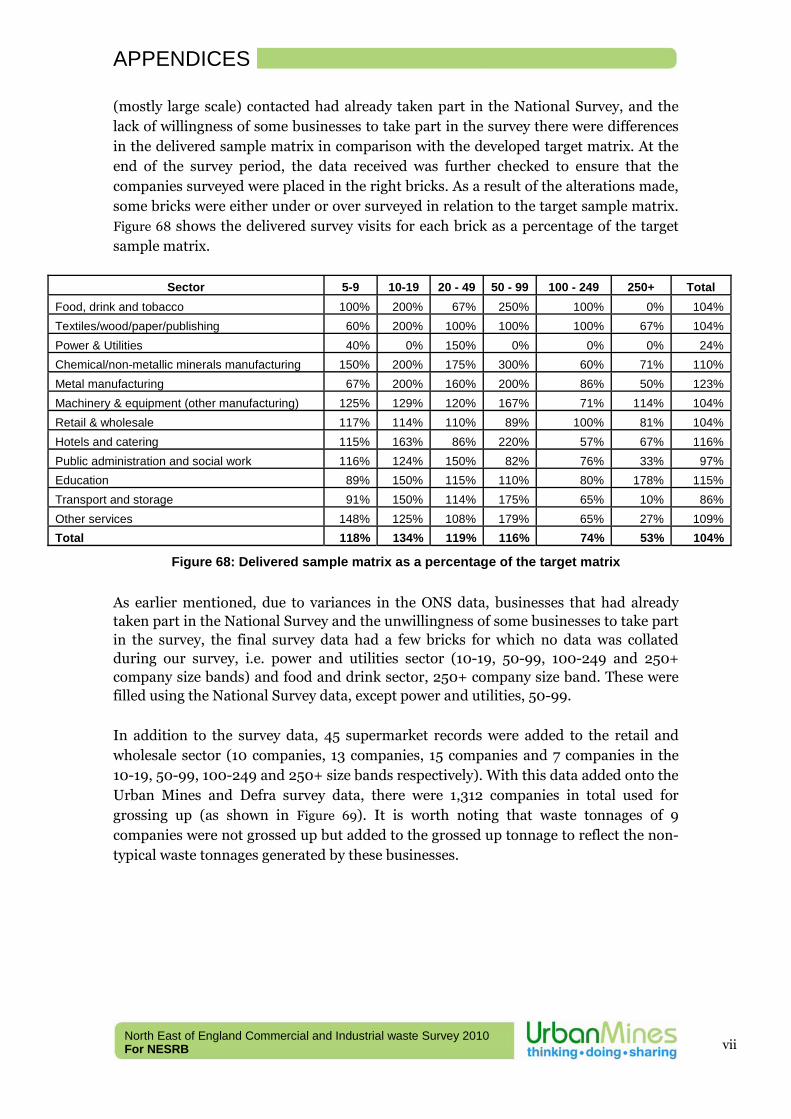
APPENDICES
North East of England Commercial and Industrial waste Survey 2010 For NESRB
vii
(mostly large scale) contacted had already taken part in the National Survey, and the lack of willingness of some businesses to take part in the survey there were differences in the delivered sample matrix in comparison with the developed target matrix. At the end of the survey period, the data received was further checked to ensure that the companies surveyed were placed in the right bricks. As a result of the alterations made, some bricks were either under or over surveyed in relation to the target sample matrix. Figure 68 shows the delivered survey visits for each brick as a percentage of the target sample matrix.
Sector 5-9 10-19 20 - 49 50 - 99 100 - 249 250+ Total Food, drink and tobacco 100% 200% 67% 250% 100% 0% 104% Textiles/wood/paper/publishing 60% 200% 100% 100% 100% 67% 104% Power & Utilities 40% 0% 150% 0% 0% 0% 24% Chemical/non-metallic minerals manufacturing 150% 200% 175% 300% 60% 71% 110% Metal manufacturing 67% 200% 160% 200% 86% 50% 123% Machinery & equipment (other manufacturing) 125% 129% 120% 167% 71% 114% 104% Retail & wholesale 117% 114% 110% 89% 100% 81% 104% Hotels and catering 115% 163% 86% 220% 57% 67% 116% Public administration and social work 116% 124% 150% 82% 76% 33% 97% Education 89% 150% 115% 110% 80% 178% 115% Transport and storage 91% 150% 114% 175% 65% 10% 86% Other services 148% 125% 108% 179% 65% 27% 109% Total 118% 134% 119% 116% 74% 53% 104%
Figure 68: Delivered sample matrix as a percentage of the target matrix
As earlier mentioned, due to variances in the ONS data, businesses that had already taken part in the National Survey and the unwillingness of some businesses to take part in the survey, the final survey data had a few bricks for which no data was collated during our survey, i.e. power and utilities sector (10-19, 50-99, 100-249 and 250+ company size bands) and food and drink sector, 250+ company size band. These were filled using the National Survey data, except power and utilities, 50-99. In addition to the survey data, 45 supermarket records were added to the retail and wholesale sector (10 companies, 13 companies, 15 companies and 7 companies in the 10-19, 50-99, 100-249 and 250+ size bands respectively). With this data added onto the Urban Mines and Defra survey data, there were 1,312 companies in total used for grossing up (as shown in Figure 69). It is worth noting that waste tonnages of 9 companies were not grossed up but added to the grossed up tonnage to reflect the non-typical waste tonnages generated by these businesses.
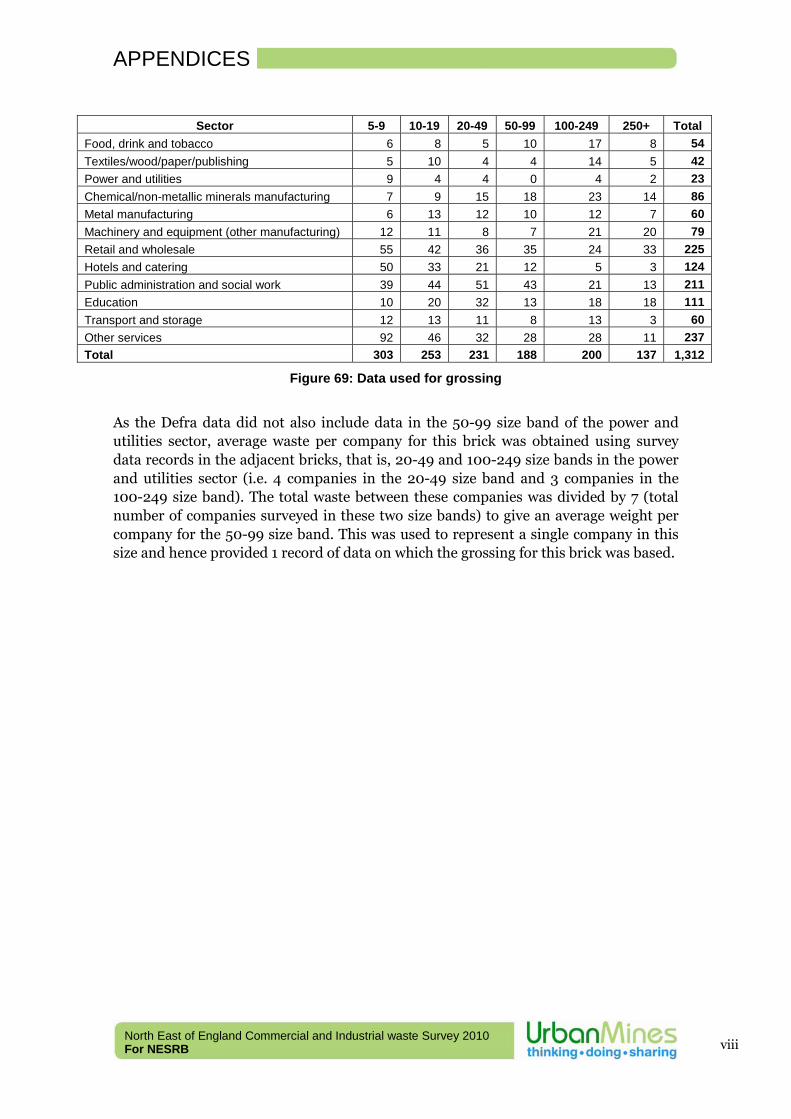
APPENDICES
North East of England Commercial and Industrial waste Survey 2010 For NESRB
viii
Sector 5-9 10-19 20-49 50-99 100-249 250+ Total
Food, drink and tobacco 6 8 5 10 17 8 54 Textiles/wood/paper/publishing 5 10 4 4 14 5 42 Power and utilities 9 4 4 0 4 2 23 Chemical/non-metallic minerals manufacturing 7 9 15 18 23 14 86 Metal manufacturing 6 13 12 10 12 7 60 Machinery and equipment (other manufacturing) 12 11 8 7 21 20 79 Retail and wholesale 55 42 36 35 24 33 225 Hotels and catering 50 33 21 12 5 3 124 Public administration and social work 39 44 51 43 21 13 211 Education 10 20 32 13 18 18 111 Transport and storage 12 13 11 8 13 3 60 Other services 92 46 32 28 28 11 237 Total 303 253 231 188 200 137 1,312
Figure 69: Data used for grossing
As the Defra data did not also include data in the 50-99 size band of the power and utilities sector, average waste per company for this brick was obtained using survey data records in the adjacent bricks, that is, 20-49 and 100-249 size bands in the power and utilities sector (i.e. 4 companies in the 20-49 size band and 3 companies in the 100-249 size band). The total waste between these companies was divided by 7 (total number of companies surveyed in these two size bands) to give an average weight per company for the 50-99 size band. This was used to represent a single company in this size and hence provided 1 record of data on which the grossing for this brick was based.
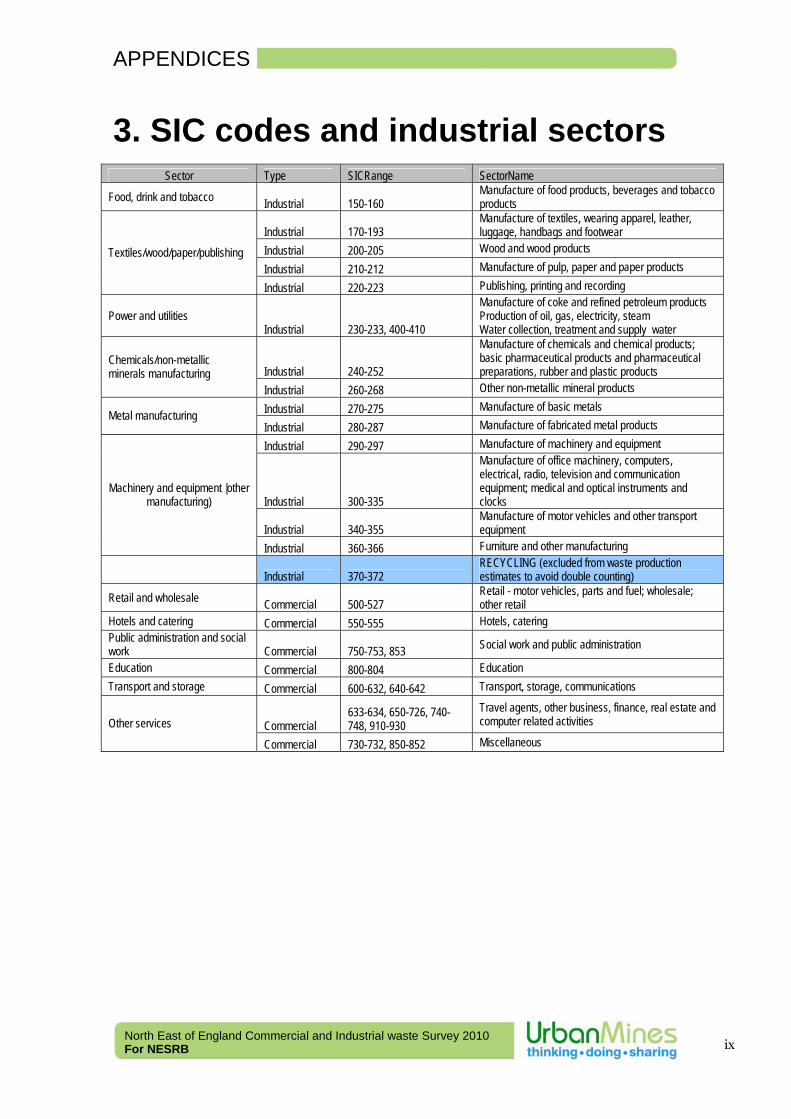
APPENDICES
North East of England Commercial and Industrial waste Survey 2010 For NESRB
ix
3. SIC codes and industrial sectors
Sector Type SICRange SectorName
Food, drink and tobacco Industrial 150-160 Manufacture of food products, beverages and tobacco products
Industrial 170-193 Manufacture of textiles, wearing apparel, leather, luggage, handbags and footwear
Industrial 200-205 Wood and wood products
Industrial 210-212 Manufacture of pulp, paper and paper products Textiles/wood/paper/publishing
Industrial 220-223 Publishing, printing and recording
Power and utilities Industrial 230-233, 400-410
Manufacture of coke and refined petroleum products Production of oil, gas, electricity, steam Water collection, treatment and supply water
Industrial 240-252
Manufacture of chemicals and chemical products; basic pharmaceutical products and pharmaceutical preparations, rubber and plastic products
Chemicals/non-metallic minerals manufacturing
Industrial 260-268 Other non-metallic mineral products
Industrial 270-275 Manufacture of basic metals Metal manufacturing
Industrial 280-287 Manufacture of fabricated metal products
Industrial 290-297 Manufacture of machinery and equipment
Industrial 300-335
Manufacture of office machinery, computers, electrical, radio, television and communication equipment; medical and optical instruments and clocks
Industrial 340-355 Manufacture of motor vehicles and other transport equipment
Machinery and equipment |other manufacturing)
Industrial 360-366 Furniture and other manufacturing
Industrial 370-372 RECYCLING (excluded from waste production estimates to avoid double counting)
Retail and wholesale Commercial 500-527 Retail - motor vehicles, parts and fuel; wholesale; other retail
Hotels and catering Commercial 550-555 Hotels, catering Public administration and social work Commercial 750-753, 853 Social work and public administration
Education Commercial 800-804 Education Transport and storage Commercial 600-632, 640-642 Transport, storage, communications
Commercial 633-634, 650-726, 740-748, 910-930
Travel agents, other business, finance, real estate and computer related activities Other services
Commercial 730-732, 850-852 Miscellaneous
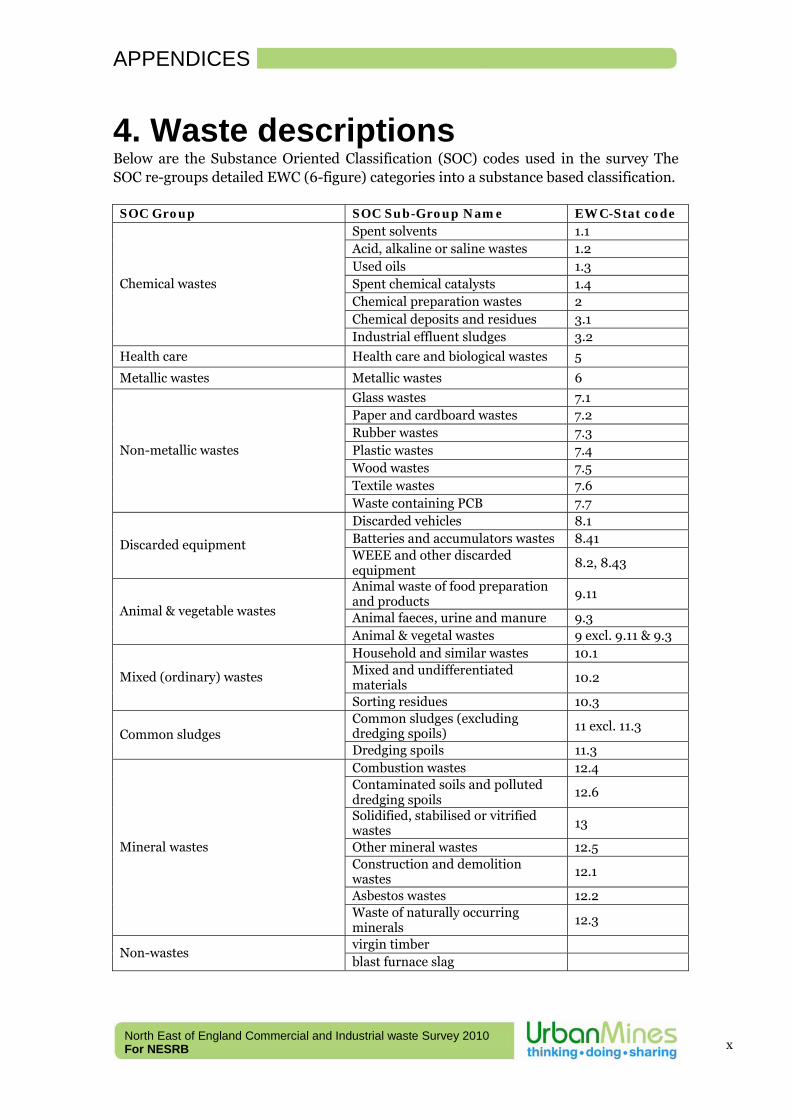
APPENDICES
North East of England Commercial and Industrial waste Survey 2010 For NESRB
x
4. Waste descriptions Below are the Substance Oriented Classification (SOC) codes used in the survey The SOC re-groups detailed EWC (6-figure) categories into a substance based classification.
SOC Group SOC Sub-Group Name EWC-Stat code
Spent solvents 1.1 Acid, alkaline or saline wastes 1.2 Used oils 1.3 Spent chemical catalysts 1.4 Chemical preparation wastes 2 Chemical deposits and residues 3.1
Chemical wastes
Industrial effluent sludges 3.2
Health care Health care and biological wastes 5
Metallic wastes Metallic wastes 6
Glass wastes 7.1 Paper and cardboard wastes 7.2 Rubber wastes 7.3 Plastic wastes 7.4 Wood wastes 7.5 Textile wastes 7.6
Non-metallic wastes
Waste containing PCB 7.7 Discarded vehicles 8.1 Batteries and accumulators wastes 8.41 Discarded equipment WEEE and other discarded equipment
8.2, 8.43
Animal waste of food preparation and products
9.11
Animal faeces, urine and manure 9.3 Animal & vegetable wastes
Animal & vegetal wastes 9 excl. 9.11 & 9.3 Household and similar wastes 10.1 Mixed and undifferentiated materials
10.2 Mixed (ordinary) wastes
Sorting residues 10.3 Common sludges (excluding dredging spoils)
11 excl. 11.3 Common sludges
Dredging spoils 11.3 Combustion wastes 12.4 Contaminated soils and polluted dredging spoils
12.6
Solidified, stabilised or vitrified wastes
13
Other mineral wastes 12.5 Construction and demolition wastes
12.1
Asbestos wastes 12.2
Mineral wastes
Waste of naturally occurring minerals
12.3
virgin timber Non-wastes
blast furnace slag
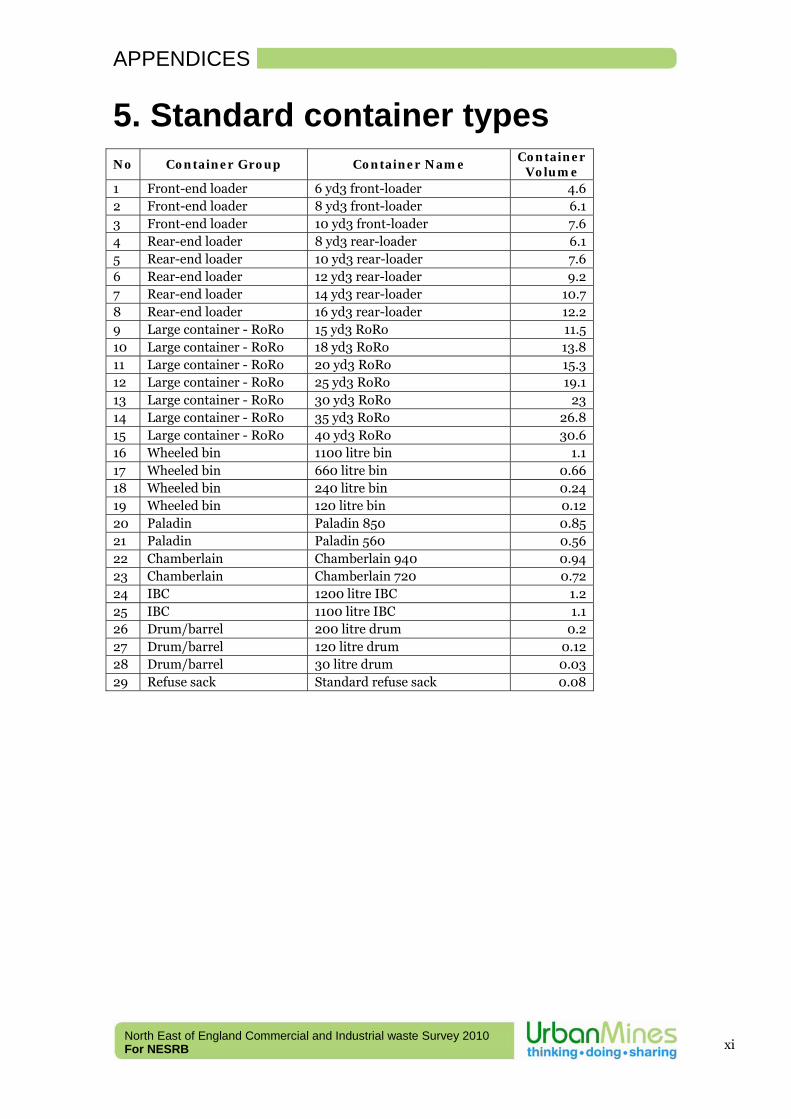
APPENDICES
North East of England Commercial and Industrial waste Survey 2010 For NESRB
xi
5. Standard container types
No Container Group Container Name Container
Volume 1 Front-end loader 6 yd3 front-loader 4.6 2 Front-end loader 8 yd3 front-loader 6.1 3 Front-end loader 10 yd3 front-loader 7.6 4 Rear-end loader 8 yd3 rear-loader 6.1 5 Rear-end loader 10 yd3 rear-loader 7.6 6 Rear-end loader 12 yd3 rear-loader 9.2 7 Rear-end loader 14 yd3 rear-loader 10.7 8 Rear-end loader 16 yd3 rear-loader 12.2 9 Large container - RoRo 15 yd3 RoRo 11.5 10 Large container - RoRo 18 yd3 RoRo 13.8 11 Large container - RoRo 20 yd3 RoRo 15.3 12 Large container - RoRo 25 yd3 RoRo 19.1 13 Large container - RoRo 30 yd3 RoRo 23 14 Large container - RoRo 35 yd3 RoRo 26.8 15 Large container - RoRo 40 yd3 RoRo 30.6 16 Wheeled bin 1100 litre bin 1.1 17 Wheeled bin 660 litre bin 0.66 18 Wheeled bin 240 litre bin 0.24 19 Wheeled bin 120 litre bin 0.12 20 Paladin Paladin 850 0.85 21 Paladin Paladin 560 0.56 22 Chamberlain Chamberlain 940 0.94 23 Chamberlain Chamberlain 720 0.72 24 IBC 1200 litre IBC 1.2 25 IBC 1100 litre IBC 1.1 26 Drum/barrel 200 litre drum 0.2 27 Drum/barrel 120 litre drum 0.12 28 Drum/barrel 30 litre drum 0.03 29 Refuse sack Standard refuse sack 0.08
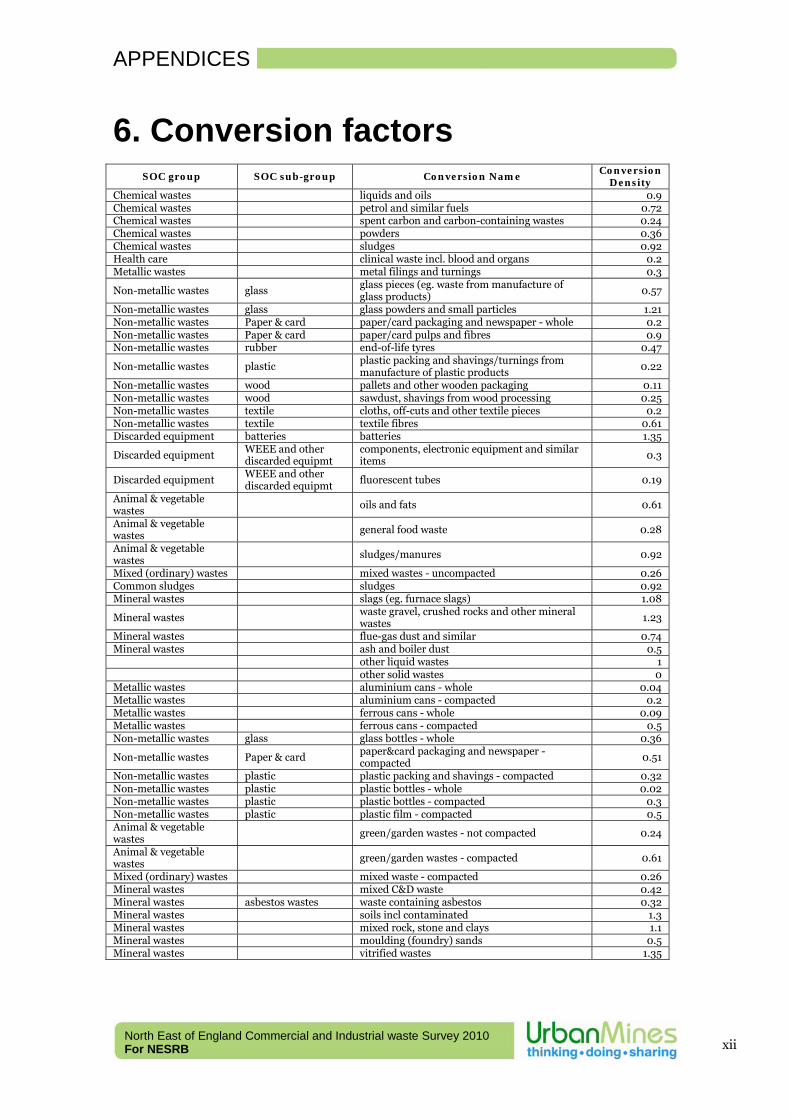
APPENDICES
North East of England Commercial and Industrial waste Survey 2010 For NESRB
xii
6. Conversion factors
SOC group SOC sub-group Conversion Name Conversion
Density Chemical wastes liquids and oils 0.9 Chemical wastes petrol and similar fuels 0.72 Chemical wastes spent carbon and carbon-containing wastes 0.24 Chemical wastes powders 0.36 Chemical wastes sludges 0.92 Health care clinical waste incl. blood and organs 0.2 Metallic wastes metal filings and turnings 0.3
Non-metallic wastes glass glass pieces (eg. waste from manufacture of glass products)
0.57
Non-metallic wastes glass glass powders and small particles 1.21 Non-metallic wastes Paper & card paper/card packaging and newspaper - whole 0.2 Non-metallic wastes Paper & card paper/card pulps and fibres 0.9 Non-metallic wastes rubber end-of-life tyres 0.47
Non-metallic wastes plastic plastic packing and shavings/turnings from manufacture of plastic products
0.22
Non-metallic wastes wood pallets and other wooden packaging 0.11 Non-metallic wastes wood sawdust, shavings from wood processing 0.25 Non-metallic wastes textile cloths, off-cuts and other textile pieces 0.2 Non-metallic wastes textile textile fibres 0.61 Discarded equipment batteries batteries 1.35
Discarded equipment WEEE and other discarded equipmt
components, electronic equipment and similar items 0.3
Discarded equipment WEEE and other discarded equipmt
fluorescent tubes 0.19
Animal & vegetable wastes
oils and fats 0.61
Animal & vegetable wastes general food waste 0.28
Animal & vegetable wastes
sludges/manures 0.92
Mixed (ordinary) wastes mixed wastes - uncompacted 0.26 Common sludges sludges 0.92 Mineral wastes slags (eg. furnace slags) 1.08
Mineral wastes waste gravel, crushed rocks and other mineral wastes 1.23
Mineral wastes flue-gas dust and similar 0.74 Mineral wastes ash and boiler dust 0.5 other liquid wastes 1 other solid wastes 0 Metallic wastes aluminium cans - whole 0.04 Metallic wastes aluminium cans - compacted 0.2 Metallic wastes ferrous cans - whole 0.09 Metallic wastes ferrous cans - compacted 0.5 Non-metallic wastes glass glass bottles - whole 0.36
Non-metallic wastes Paper & card paper&card packaging and newspaper - compacted 0.51
Non-metallic wastes plastic plastic packing and shavings - compacted 0.32 Non-metallic wastes plastic plastic bottles - whole 0.02 Non-metallic wastes plastic plastic bottles - compacted 0.3 Non-metallic wastes plastic plastic film - compacted 0.5 Animal & vegetable wastes
green/garden wastes - not compacted 0.24
Animal & vegetable wastes green/garden wastes - compacted 0.61
Mixed (ordinary) wastes mixed waste - compacted 0.26 Mineral wastes mixed C&D waste 0.42 Mineral wastes asbestos wastes waste containing asbestos 0.32 Mineral wastes soils incl contaminated 1.3 Mineral wastes mixed rock, stone and clays 1.1 Mineral wastes moulding (foundry) sands 0.5 Mineral wastes vitrified wastes 1.35
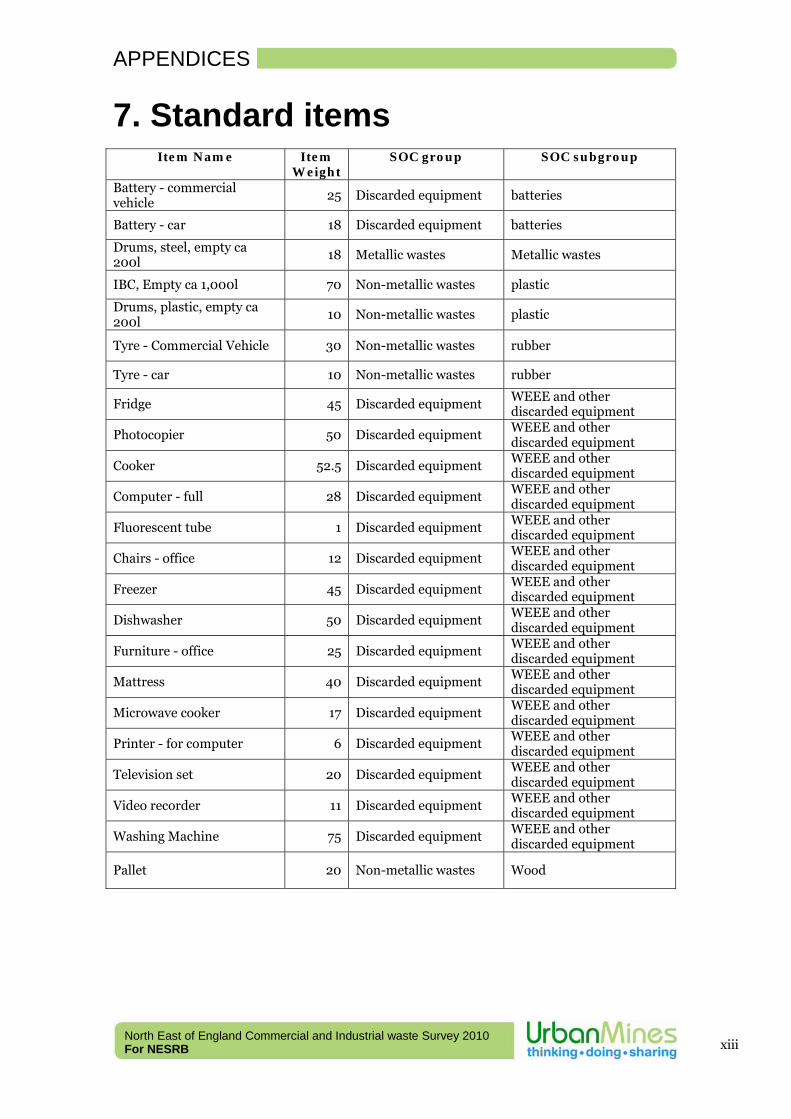
APPENDICES
North East of England Commercial and Industrial waste Survey 2010 For NESRB
xiii
7. Standard items
Item Name Item Weight
SOC group SOC subgroup
Battery - commercial vehicle
25 Discarded equipment batteries
Battery - car 18 Discarded equipment batteries
Drums, steel, empty ca 200l
18 Metallic wastes Metallic wastes
IBC, Empty ca 1,000l 70 Non-metallic wastes plastic
Drums, plastic, empty ca 200l
10 Non-metallic wastes plastic
Tyre - Commercial Vehicle 30 Non-metallic wastes rubber
Tyre - car 10 Non-metallic wastes rubber
Fridge 45 Discarded equipment WEEE and other discarded equipment
Photocopier 50 Discarded equipment WEEE and other discarded equipment
Cooker 52.5 Discarded equipment WEEE and other discarded equipment
Computer - full 28 Discarded equipment WEEE and other discarded equipment
Fluorescent tube 1 Discarded equipment WEEE and other discarded equipment
Chairs - office 12 Discarded equipment WEEE and other discarded equipment
Freezer 45 Discarded equipment WEEE and other discarded equipment
Dishwasher 50 Discarded equipment WEEE and other discarded equipment
Furniture - office 25 Discarded equipment WEEE and other discarded equipment
Mattress 40 Discarded equipment WEEE and other discarded equipment
Microwave cooker 17 Discarded equipment WEEE and other discarded equipment
Printer - for computer 6 Discarded equipment WEEE and other discarded equipment
Television set 20 Discarded equipment WEEE and other discarded equipment
Video recorder 11 Discarded equipment WEEE and other discarded equipment
Washing Machine 75 Discarded equipment WEEE and other discarded equipment
Pallet 20 Non-metallic wastes Wood
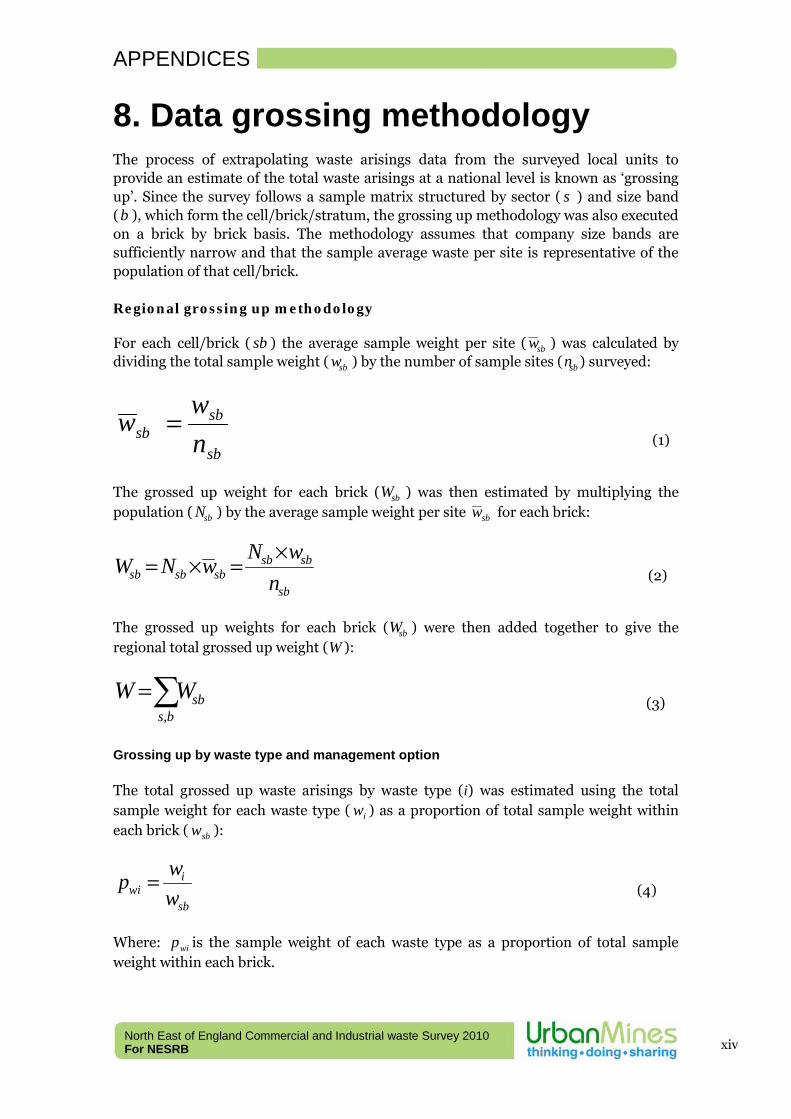
APPENDICES
North East of England Commercial and Industrial waste Survey 2010 For NESRB
xiv
8. Data grossing methodology The process of extrapolating waste arisings data from the surveyed local units to provide an estimate of the total waste arisings at a national level is known as ‘grossing up’. Since the survey follows a sample matrix structured by sector ( s ) and size band (b ), which form the cell/brick/stratum, the grossing up methodology was also executed on a brick by brick basis. The methodology assumes that company size bands are sufficiently narrow and that the sample average waste per site is representative of the population of that cell/brick. Regional grossing up methodology
For each cell/brick ( sb ) the average sample weight per site ( wsb ) was calculated by dividing the total sample weight ( wsb ) by the number of sample sites ( nsb ) surveyed:
sb
sbsb n
w w = (1)
The grossed up weight for each brick ( Wsb ) was then estimated by multiplying the population ( Nsb ) by the average sample weight per site wsb for each brick:
sb
sbsbsbsbsb n
wNwNW
×=×= (2)
The grossed up weights for each brick ( Wsb ) were then added together to give the regional total grossed up weight (W ):
∑=s,b
sbWW (3)
Grossing up by waste type and management option
The total grossed up waste arisings by waste type (i) was estimated using the total sample weight for each waste type ( iw ) as a proportion of total sample weight within each brick ( sbw ):
sb
iwi w
wp = (4)
Where: wip is the sample weight of each waste type as a proportion of total sample weight within each brick.
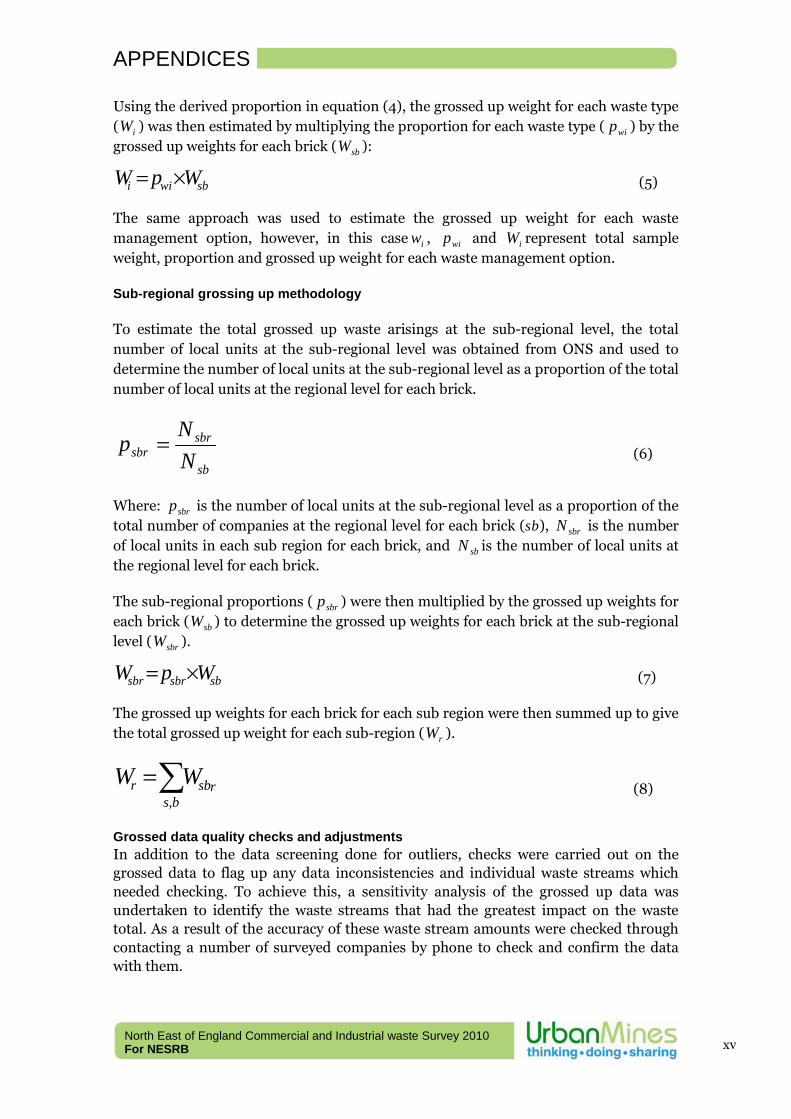
APPENDICES
North East of England Commercial and Industrial waste Survey 2010 For NESRB
xv
Using the derived proportion in equation (4), the grossed up weight for each waste type ( iW ) was then estimated by multiplying the proportion for each waste type ( wip ) by the grossed up weights for each brick ( sbW ):
sbwii WpW ×= (5)
The same approach was used to estimate the grossed up weight for each waste management option, however, in this case iw , wip and iW represent total sample weight, proportion and grossed up weight for each waste management option. Sub-regional grossing up methodology
To estimate the total grossed up waste arisings at the sub-regional level, the total number of local units at the sub-regional level was obtained from ONS and used to determine the number of local units at the sub-regional level as a proportion of the total number of local units at the regional level for each brick.
sb
sbrsbr N
Np = (6)
Where: sbrp is the number of local units at the sub-regional level as a proportion of the total number of companies at the regional level for each brick (sb), sbrN is the number of local units in each sub region for each brick, and sbN is the number of local units at the regional level for each brick.
The sub-regional proportions ( sbrp ) were then multiplied by the grossed up weights for each brick ( sbW ) to determine the grossed up weights for each brick at the sub-regional level ( sbrW ).
sbsbrsbr WpW ×= (7)
The grossed up weights for each brick for each sub region were then summed up to give the total grossed up weight for each sub-region ( rW ).
∑=s,b
rsbr WW (8)
Grossed data quality checks and adjustments In addition to the data screening done for outliers, checks were carried out on the grossed data to flag up any data inconsistencies and individual waste streams which needed checking. To achieve this, a sensitivity analysis of the grossed up data was undertaken to identify the waste streams that had the greatest impact on the waste total. As a result of the accuracy of these waste stream amounts were checked through contacting a number of surveyed companies by phone to check and confirm the data with them.
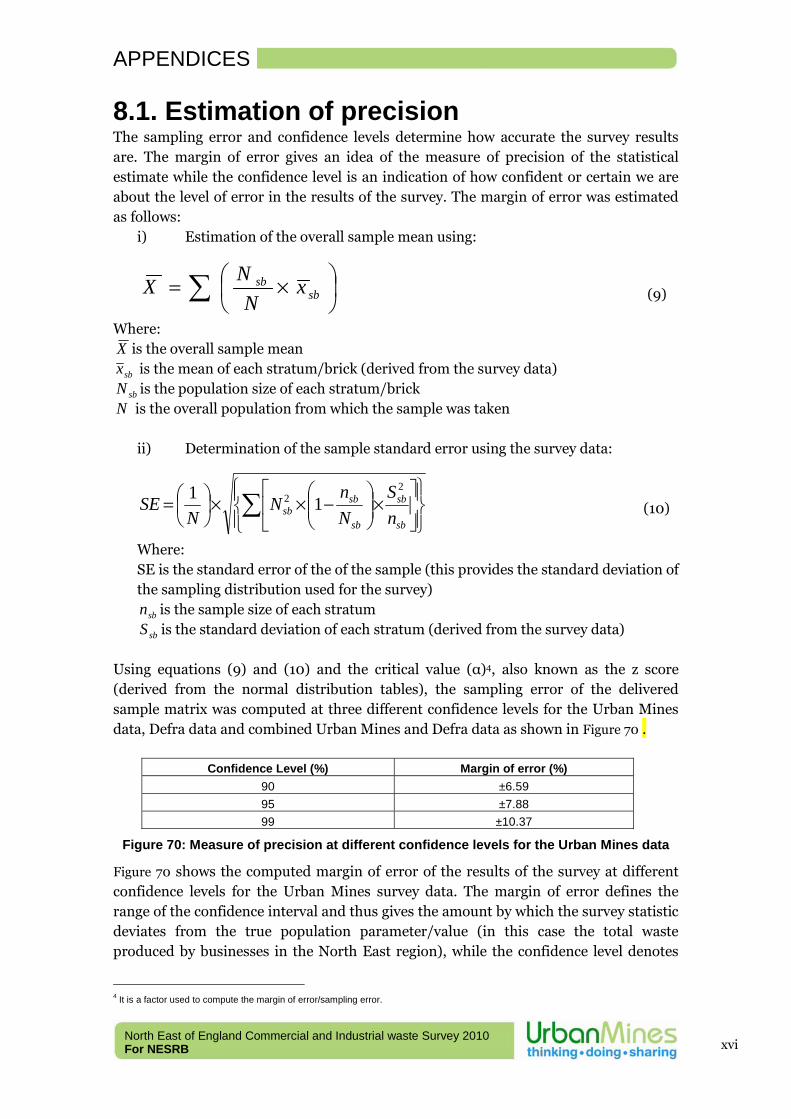
APPENDICES
North East of England Commercial and Industrial waste Survey 2010 For NESRB
xvi
8.1. Estimation of precision The sampling error and confidence levels determine how accurate the survey results are. The margin of error gives an idea of the measure of precision of the statistical estimate while the confidence level is an indication of how confident or certain we are about the level of error in the results of the survey. The margin of error was estimated as follows:
i) Estimation of the overall sample mean using:
∑ ⎟⎠⎞
⎜⎝⎛ ×= sb
sb xN
NX (9)
Where: X is the overall sample mean
sbx is the mean of each stratum/brick (derived from the survey data)
sbN is the population size of each stratum/brick N is the overall population from which the sample was taken
ii) Determination of the sample standard error using the survey data:
⎪⎭
⎪⎬⎫
⎪⎩
⎪⎨⎧
⎥⎦
⎤⎢⎣
⎡×⎟⎟⎠
⎞⎜⎜⎝
⎛−××⎟
⎠⎞
⎜⎝⎛= ∑
sb
sb
sb
sbsb n
SNn
NN
SE2
2 11 (10)
Where: SE is the standard error of the of the sample (this provides the standard deviation of the sampling distribution used for the survey)
sbn is the sample size of each stratum
sbS is the standard deviation of each stratum (derived from the survey data) Using equations (9) and (10) and the critical value (α)4, also known as the z score (derived from the normal distribution tables), the sampling error of the delivered sample matrix was computed at three different confidence levels for the Urban Mines data, Defra data and combined Urban Mines and Defra data as shown in Figure 70 .
Confidence Level (%) Margin of error (%) 90 ±6.59 95 ±7.88 99 ±10.37
Figure 70: Measure of precision at different confidence levels for the Urban Mines data
Figure 70 shows the computed margin of error of the results of the survey at different confidence levels for the Urban Mines survey data. The margin of error defines the range of the confidence interval and thus gives the amount by which the survey statistic deviates from the true population parameter/value (in this case the total waste produced by businesses in the North East region), while the confidence level denotes
4 It is a factor used to compute the margin of error/sampling error.
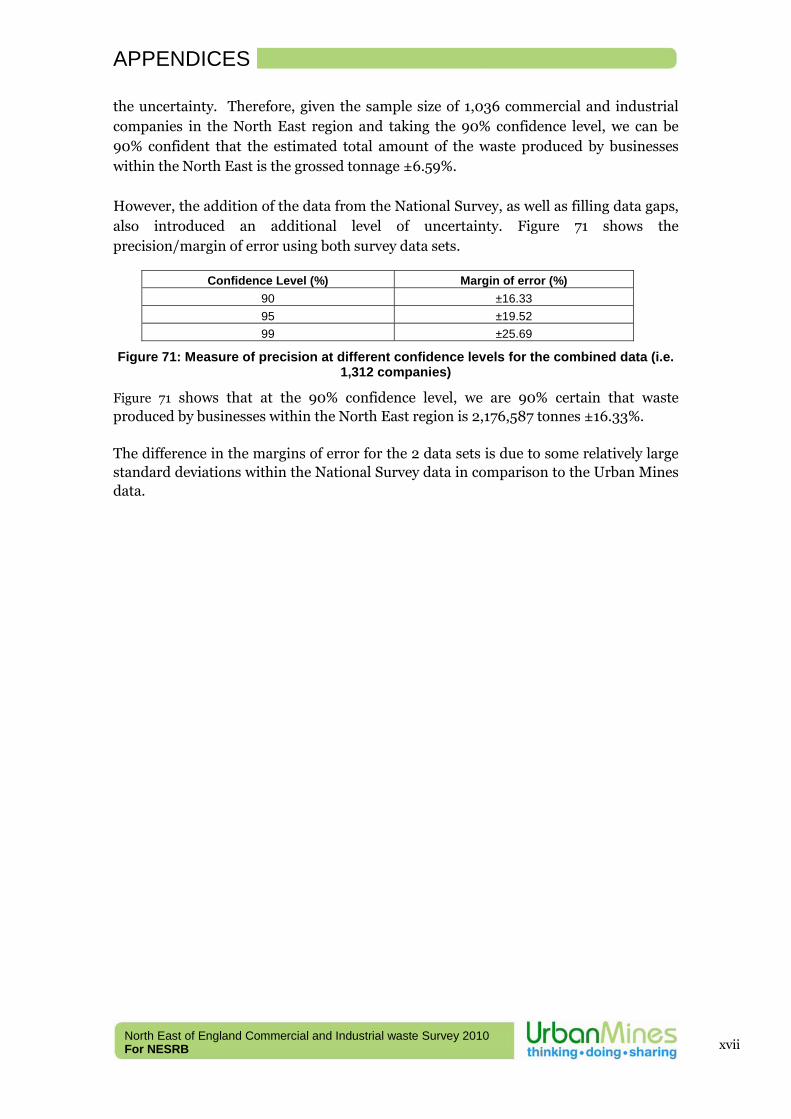
APPENDICES
North East of England Commercial and Industrial waste Survey 2010 For NESRB
xvii
the uncertainty. Therefore, given the sample size of 1,036 commercial and industrial companies in the North East region and taking the 90% confidence level, we can be 90% confident that the estimated total amount of the waste produced by businesses within the North East is the grossed tonnage ±6.59%. However, the addition of the data from the National Survey, as well as filling data gaps, also introduced an additional level of uncertainty. Figure 71 shows the precision/margin of error using both survey data sets.
Confidence Level (%) Margin of error (%) 90 ±16.33 95 ±19.52 99 ±25.69
Figure 71: Measure of precision at different confidence levels for the combined data (i.e. 1,312 companies)
Figure 71 shows that at the 90% confidence level, we are 90% certain that waste produced by businesses within the North East region is 2,176,587 tonnes ±16.33%. The difference in the margins of error for the 2 data sets is due to some relatively large standard deviations within the National Survey data in comparison to the Urban Mines data.
APPENDICES
North East of England Commercial and Industrial waste Survey 2010 For NESRB
xviii
9. Recyclable or Recoverable
The waste survey included an assessment of whether an individual waste stream had the
potential to be recycled or to be energy recovered, if the appropriate facilities were available. The
following gives some background as to how this assessment was made: Recyclable Materials deemed Recyclable included: Paper
Glass
Metals
Plastics:
o HDPE
o PET
o LDPE
o Including mixed plastics
Timber (not including MDF)
Some oils
Tyres
Batteries
Computers
Toner/ink cartridges
Clothing
Fluorescent tubes
Drums, barrels, IBCs
Garden and kitchen waste
WEEE
For mixed recyclable wastes, these were recorded as “Possibly Recyclable” reflecting the fact that
recyclable materials could possibly be separated or segregated at an earlier stage of processing,
or post collection in the right type of facility.
Energy recoverable
Most materials have a calorific value and, if used in the right sort of facility, can be used to
generate heat and/or electricity. Assessment of whether waste was considered recoverable or
not was based upon the calorific value of its major component or constituents.
The calorific value of a material defines the amount of heat released during the combustion of
the material. It is measured in units of energy per amount of material. The typical calorific value
for coal is 28,000 kJ/kg whilst the typical value for crude oil is 45,700 kJ/kg.
The table below (Figure 72) gives calorific values for different materials that may be found in the
waste stream (and for different general waste streams).
Eminently recoverable materials of course include:
• Paper/Card
• Plastics
• Textiles
• Wood/MDF
• Tyres
For such materials, values can be as high as 32,000 KJ/Kg, compared to 28,000 for coal and
46,000 for oil.
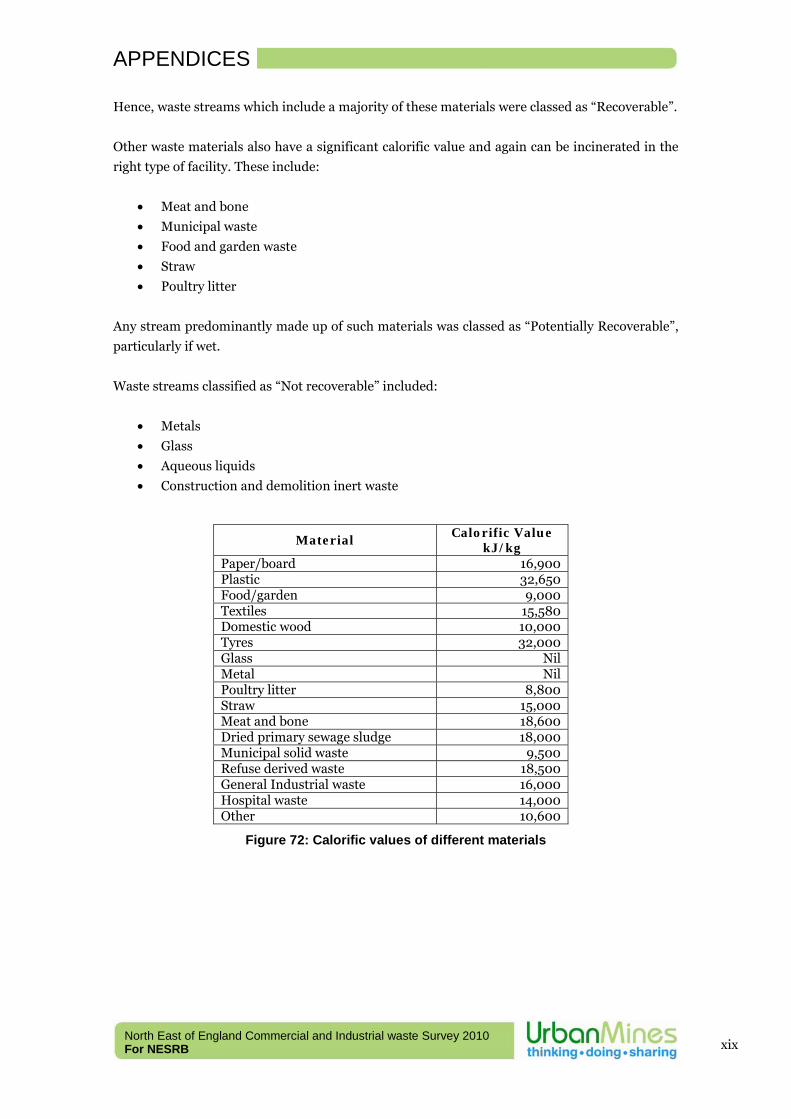
APPENDICES
North East of England Commercial and Industrial waste Survey 2010 For NESRB
xix
Hence, waste streams which include a majority of these materials were classed as “Recoverable”.
Other waste materials also have a significant calorific value and again can be incinerated in the
right type of facility. These include:
• Meat and bone
• Municipal waste
• Food and garden waste
• Straw
• Poultry litter
Any stream predominantly made up of such materials was classed as “Potentially Recoverable”,
particularly if wet.
Waste streams classified as “Not recoverable” included:
• Metals
• Glass
• Aqueous liquids
• Construction and demolition inert waste
Material Calorific Value
kJ/kg Paper/board 16,900 Plastic 32,650 Food/garden 9,000 Textiles 15,580 Domestic wood 10,000 Tyres 32,000 Glass Nil Metal Nil Poultry litter 8,800 Straw 15,000 Meat and bone 18,600 Dried primary sewage sludge 18,000 Municipal solid waste 9,500 Refuse derived waste 18,500 General Industrial waste 16,000 Hospital waste 14,000 Other 10,600
Figure 72: Calorific values of different materials
APPENDICES
North East of England Commercial and Industrial waste Survey 2010 For NESRB
xx
10. Lessons learned Use of Commercial Contact Datasets
The design of the sample matrix for a survey of this type relies upon the use of business population data from the Inter-Departmental Business Register (IDBR), which is a list of UK businesses maintained by the Office for National Statistics (ONS). The two main sources of input are the Value Added Tax (VAT) system from Customs & Excise and Pay As You Earn (PAYE) from Inland Revenue. So as to protect what could be deemed as commercially confidential or personal data, this dataset is deemed disclosive. Disclosive IDBR data is not available to private organisations, as IDBR data is collected under the Statistics of Trade Act 1947; Section 9 of the Act does however allow ONS to supply Government Departments with information relating to individual undertakings for statistical purposes, when in receipt of a Ministerial Direction. As such, submission of a request for disclosive data and subsequent correspondence should be conducted by the Government dept commissioning the survey work, such as the Environment Agency which has such a Ministerial Direction, as has been the case in previous surveys. However, in this case the work was commissioned by a regional body. RDAs are classed as non departmental public bodies, for which there is currently no legal gateway to receive disclosive data. Therefore for this survey, we had to use non-disclosive population data for development of the sample frame and for grossing up final figures (data rounded using the “Tau Argus” software package to avoid disclosure) and could not have access to ONS held company contact details. We therefore reviewed a number of commercially available datasets. As these are mostly marketed to drive marketing campaigns, the data was not always in the form which could be related directly to the developed sample frame. However, we finally selected data from LBM Marketing, which through operation of a bespoke query to their database, was able to provide a randomised selection of business contact details within the region, with appropriate sector group and employee number fields. The use of this data, along with the normal checking to ensure key data field were correct, proceeded well, especially as all records provided accurate telephone numbers in contrast to the ONS dataset. The use of such commercial contact data may therefore be an option for future surveys.
APPENDICES
North East of England Commercial and Industrial waste Survey 2010 For NESRB
xxi
Appending Data from other Surveys As this Urban Mines survey was run concurrently with the end of the larger scale National Survey, steps had to be taken to ensure the same businesses were not surveyed twice, to maximise value from the two surveys and to avoid double counting when the output from the two surveys was combined. Also, it was unlikely that a specific business would volunteer to be surveyed twice in a matter of weeks. As the National Survey data was appended with non-survey data such as PPC and corporate records, and businesses to survey in the North East were selected randomly on the basis of a sample matrix developed at a national level, the 276 sets of survey data from the North East favoured larger businesses whose waste arisings tonnages had regional significance. Although the Urban Mines survey mopped up many of the remaining larger businesses, the two datasets had to be combined at grossing to ensure a representative sample of North East businesses was used to estimate total regional and sub-regional arisings. Because the National dataset contained mostly larger companies, its impact on grossing on the final figures was larger than you might expect in combining 276 samples with the 1,036 samples collected in the Urban Mines survey. However, this is where the different aims of the two surveys produced challenges in combining the data. The Urban Mines survey was North East focussed and specific, collected data such as destination reflected this, whereas the National Survey data did not retain a regional level of detail. Also, because a proportion of the 276 records were from non-survey sources such as PPC returns, a considerable volume of records did not contain responses to key questions such as recyclability and recoverability, introducing a significant volume of unhelpful “don’t know”s into the grossed figures. However, the most significant difference was seen in the variability of data for given sector groupings and business sizebands. The Urban Mines data was thoroughly error checked during collection of the data, on receipt of the data at the central database, and thirdly at data grossing stage. This 3 step approach means we have considerable faith in the accuracy of our figures. For the National Survey, the North East samples represent only 276 out of the ca. 6,000 samples used for grossing to national level estimates, therefore any inconsistencies or inaccuracies in the North East records would be more difficult to spot, and would be less relevant to the survey if their impact on the final national grossed estimates was small. Therefore, we saw a considerably higher variability in the National Survey records, reflected in increased standard deviation for selected sector group - employee sizeband combinations, which has a considerable impact on final grossed figures and on data precision and confidence. Nevertheless, the combined datasets do produce a much more detailed picture of waste arisings in the North East across the range of sectors and business sizes, and the volume of data allows the production of viable estimates at sub-regional level too.
APPENDICES
North East of England Commercial and Industrial waste Survey 2010 For NESRB
xxii
Therefore despite its challenges, the combination of the two datasets has provided a detailed insight into the waste arisings in the region, and the ca. 8,000 line dataset of raw data produced will become invaluable in setting planning and resource policy in the region in the future.
APPENDICES
North East of England Commercial and Industrial waste Survey 2010 For NESRB
xxiii
11. Glossary and abbreviations Statistical Terminology Brick (cell) A cell in the sample matrix, referring to a particular combination
of size band and Standard Industrial Classification (SIC).
Confidence Quoted in conjunction with a measure of precision, confidence is a measure of how confident one is in the reliability of an estimated quantity. For example, if total waste arisings were estimated with a precision of +/-4.7% at 90% confidence, then we can be 90% confident that the true (unknown) total waste arisings are within +/-4.7% of the estimated value.
Grossing (data) In the context of this survey, data grossing means extrapolating the survey data to estimate the total waste produced by a national or regional population.
GUW Grossed up weight
Mean This is a measure of the central tendency or location of the population or sample data. It is the sum of the data values divided by the number of observations. If the data set is from a sample, then it is a sample mean and if it is from a population, it is a population mean.
Outlier This is an observation in a set of data that is far removed in value from the others in the same data set. It is an unusually large or small value compared to others.
Population A complete set of all units (i.e. people, places, objects or many other things) being studied and from which data is collected, described and conclusions drawn. In this report, the population is the collection of all businesses in Wales included in the scope of the survey.
Sample Matrix/Sample Frame
A table that indicates how many businesses are to be sampled from the population. The sample matrix is divided into a number of bricks.
Size Band A classification of business size based upon the actual number of employees employed by the business on site.
Standard Deviation Standard deviation measures the spread of the data about the mean value. It is used to summarise how much variability there is in a sample or population.
APPENDICES
North East of England Commercial and Industrial waste Survey 2010 For NESRB
xxiv
Waste Management Terminology Anaerobic digestion A method of composting that does not require oxygen. This
composting method produces methane. Also known as anaerobic composting.
Animal By-Products Regulations (ABPR)
Legislation governing the processing of wastes derived from animal sources to prevent cross contamination.
Commercial waste Waste arising from premises that are used wholly or mainly for trade, business, sport, recreation or entertainment, excluding household and industrial waste (as defined in Environmental Protection Act 1990, section 75).
Composting The controlled biological decomposition and stabilisation of biodegradable materials (such as organic garden and kitchen wastes) under predominantly aerobic conditions to produce humus (organic)-rich, sanitised and stabilised product that can be beneficial to soil.
Construction and demolition waste
Arising from the construction, repair, maintenance and demolition of buildings and structures. It mostly includes brick, concrete, hardcore, subsoil and topsoil, but it can also include quantities of timber, metal and plastics.
Disposal Any of the operations provided for in annex II A of the Waste Framework Directive.
Energy from waste (EfW)
The recovery of energy value from waste by burning the waste directly, or by burning a fuel produced from the waste.
Energy recovery The process of extracting useful energy from waste, typically from the heat produced by incineration or via methane gas from landfills.
European Waste Catalogue (EWC)
A substance and activity-oriented classification of waste in 20 Chapters.
European Waste Catalogue for Statistics (EWC STAT)
A (mainly) substance-oriented statistical classification (SOC) of waste used for reporting waste statistics to the European Union. Do we need this?
Exempt waste Waste handled by activities that are exempt from waste management licensing.
Gasification Thermal treatment that involves heating waste in the presence of oxygen to recover energy in the form of gas.
Hazardous waste Waste that is reactive, toxic, corrosive, or otherwise dangerous to living things and/or the environment.
Household waste Waste from domestic properties including waste from caravans, residential homes and similar.
APPENDICES
North East of England Commercial and Industrial waste Survey 2010 For NESRB
xxv
Industrial waste Waste from a factory (within the meaning of the Factories Act 1961) or from any premises used for, or in connection with • provision of public transport • public supply of gas, water, electricity or sewerage services • provision to the public of postal or communication services
Landfilling The final disposal of solid waste by placing it in a controlled fashion in a place intended to be permanent.
NACE European Union classification system for economic activities.
Non-wastes The Environment Agency and WRAP (Waste & Resources Action Programme) have reviewed and amended the legal classification of a number of materials including blast furnace slag and virgin timber, from waste to by-product, with clarification from the EU, and through consultation with industry, as part of the “Waste Protocols Project”. A quality protocol gives guidance on how to recover waste, remove it from the regulatory regime and unnecessary regulations. In the context of this report, such wastes are described as “non wastes”. See http://www.environment-agency.gov.uk/business/topics/waste/32154.aspx for more details.
Pollution Prevention and Control (PPC)
A system set up in the UK to implement the Integrated Pollution Prevention and Control Directive (96/61/EC) to prevent and control pollution from certain types of business. The PPC regime replaced the Integrated Pollution Control regime. Permitted sites are now under Environmental Permitting Regulations from 6th April 2008.
Pyrolysis Chemical decomposition of a substance by heat in the absence of oxygen, resulting in various hydrocarbon gases and carbon-like residue.
Recovery Generating value from wastes from a wide variety of activities such as recycling, composting and energy recovery.
Recyclables Materials that are capable of being recycled.
Recycling Recycling involves processing waste materials to produce new materials. Recycling materials like cans, glass, paper and textiles recovers the valuable resources in waste to make new products. The recycled materials can be made into the same product (closed-loop recycling) or a different product (open loop recycling).
Reuse The use of a product more than once in its original form, for the same or a new purpose.
Thermal treatment A broad generic term covering processes that involve the use of heat to treat waste. Incineration is the most common thermal treatment process. Pyrolysis and gasification are other high temperature processes but there are also low temperature processes used, for example, in technologies producing refuse-derived fuel.
Transfer station A site to which waste is delivered for sorting and compacting prior to transfer to another place for recycling, treatment, or disposal.
Wastes In the context of this report, wastes which are controlled under the EU Waste Framework Directive ie. not including “non wastes”
APPENDICES
North East of England Commercial and Industrial waste Survey 2010 For NESRB
xxvi
UK Standard Industrial Classification (SIC) codes
UK classification system for economic activities.
Waste Any substance or object in the categories set out in Annex 1 of the Waste Framework Directive (91/156/EEC), which the holder discards or intends or is required to discard.
Waste arisings The amount of waste generated in a given locality over a given period of time.
Waste minimisation The reduction of waste at source, by understanding and changing processes to reduce and prevent waste. Waste minimisation can also include the substitution of less environmentally harmful materials in the production process. Also called process or resource efficiency.
Waste Statistics Regulations
European Union regulations that require Member States to report data on waste generation and treatment to the European Commission every two years.
WEEE Waste Electrical and Electronic Equipment