Non-stationary thermal time accumulation reduces the predictability of climate change effects on...
7
Non-stationary thermal time accumulation reduces the predictability of climate change effects on agriculture Tianyi Zhang a,c, *, Jiang Zhu b , Xiaoguang Yang d a International Center for Climate and Environment Sciences, Institute of Atmospheric Physics, Chinese Academy of Sciences, Beijing 100029, China b LAPC, Institute of Atmospheric Physics, Chinese Academy of Sciences, Beijing, 100029, China c Graduate University of Chinese Academy of Sciences, Beijing 100049, China d China Agricultural University, Beijing 100094, China 1. Introduction Climate change induced by anthropogenic warming has a significant influence on agricultural production. The Inter- governmental Panel on Climate Change (IPCC, 2007) suggests that a reduction in crop yields would occur with minimal warming in the tropics, while in temperate latitudes yields would be projected to rise slightly from a small rise in temperature (1–3 8C depending on the crop), and then decrease in some regions with continued future warming. Substantial efforts have been made to predicate the future crop yield trends due to climate constraints by using a coupled climate-crop model (Dhungana et al., 2006; Guerena et al., 2001; Matthews et al., 1997; Yao et al., 2007). An example of such a modeling approach has been presented by Yao et al. (2007) who predicted the lowland rice yield response with climate change in China by coupling the CERES-Rice model with a regional climate model. In Yao’s study, a collection of 3– 5 years of experimental rice data for each agro-ecological zone in China was used first. This served as a base to determine the crop genetic coefficients that would be considered constant in the following steps. Then the crop model calculated grain yields under potential water and nitrogen supplies based on the climate scenarios provided by the climate model. Finally, the potential impacts of climate change were assessed by comparing the simulated yields with those under a baseline agricultural and forest meteorology 148 (2008) 1412–1418 article info Article history: Received 28 August 2007 Received in revised form 15 April 2008 Accepted 15 April 2008 Keywords: Phenology Lowland rice Thermal time accumulation Observed trend Model deficiency Climate change abstract Current modeling studies on the impacts of climate change on agriculture widely assume that thermal time accumulation of crops during the growing season remains constant under various climate conditions. However, in this study, a 20-year single rice variety, experi- mental dataset indicates that the thermal time accumulation for the entire growing season is not constant. As a result, a crop model based on constant thermal time accumulation significantly underestimates the observed phenological trend exhibited over the two dec- ades of research—despite comparably accurate simulations of short periods. This deviation can result in misleading yield simulations, whereas the model simulations, using observed phenology data, show a similar yield trend as the observation. This study casts serious doubt on the assumptions of constant thermal time accumulation made in previous modeling studies, and, moreover, it highlights the critical requirements needed to improve phenology simulations on a larger scale so that predictions of the eventual yield trends due to climate change can more accurately reflect the results of yield trends in reality. # 2008 Elsevier B.V. All rights reserved. * Corresponding author at: International Center for Climate and Environment Sciences, Institute of Atmospheric Physics, Chinese Academy of Sciences, P.O. Box 9804, Beijing 100029, China. Tel.: +86 10 82995336. E-mail addresses: [email protected], [email protected] (T. Zhang). available at www.sciencedirect.com journal homepage: www.elsevier.com/locate/agrformet 0168-1923/$ – see front matter # 2008 Elsevier B.V. All rights reserved. doi:10.1016/j.agrformet.2008.04.007
Transcript of Non-stationary thermal time accumulation reduces the predictability of climate change effects on...

Non-stationary thermal time accumulation reduces thepredictability of climate change effects on agriculture
Tianyi Zhang a,c,*, Jiang Zhu b, Xiaoguang Yang d
a International Center for Climate and Environment Sciences, Institute of Atmospheric Physics,
Chinese Academy of Sciences, Beijing 100029, Chinab LAPC, Institute of Atmospheric Physics, Chinese Academy of Sciences, Beijing, 100029, ChinacGraduate University of Chinese Academy of Sciences, Beijing 100049, ChinadChina Agricultural University, Beijing 100094, China
a g r i c u l t u r a l a n d f o r e s t m e t e o r o l o g y 1 4 8 ( 2 0 0 8 ) 1 4 1 2 – 1 4 1 8
a r t i c l e i n f o
Article history:
Received 28 August 2007
Received in revised form
15 April 2008
Accepted 15 April 2008
Keywords:
Phenology
Lowland rice
Thermal time accumulation
Observed trend
Model deficiency
Climate change
a b s t r a c t
Current modeling studies on the impacts of climate change on agriculture widely assume
that thermal time accumulation of crops during the growing season remains constant under
various climate conditions. However, in this study, a 20-year single rice variety, experi-
mental dataset indicates that the thermal time accumulation for the entire growing season
is not constant. As a result, a crop model based on constant thermal time accumulation
significantly underestimates the observed phenological trend exhibited over the two dec-
ades of research—despite comparably accurate simulations of short periods. This deviation
can result in misleading yield simulations, whereas the model simulations, using observed
phenology data, show a similar yield trend as the observation. This study casts serious doubt
on the assumptions of constant thermal time accumulation made in previous modeling
studies, and, moreover, it highlights the critical requirements needed to improve phenology
simulations on a larger scale so that predictions of the eventual yield trends due to climate
change can more accurately reflect the results of yield trends in reality.
# 2008 Elsevier B.V. All rights reserved.
avai lable at www.sc iencedi rec t .com
journal homepage: www.e lsev ier .com/ locate /agr formet
1. Introduction
Climate change induced by anthropogenic warming has a
significant influence on agricultural production. The Inter-
governmental Panel on Climate Change (IPCC, 2007) suggests
that a reduction in crop yields would occur with minimal
warming in the tropics, while in temperate latitudes yields
would be projected to rise slightly from a small rise in
temperature (1–3 8C depending on the crop), and then decrease
in some regions with continued future warming.
Substantial efforts have been made to predicate the future
crop yield trends due to climate constraints by using a coupled
climate-crop model (Dhungana et al., 2006; Guerena et al.,
* Corresponding author at: International Center for Climate and EnAcademy of Sciences, P.O. Box 9804, Beijing 100029, China. Tel.: +86 1
E-mail addresses: [email protected], [email protected]
0168-1923/$ – see front matter # 2008 Elsevier B.V. All rights reservedoi:10.1016/j.agrformet.2008.04.007
2001; Matthews et al., 1997; Yao et al., 2007). An example of
such a modeling approach has been presented by Yao et al.
(2007) who predicted the lowland rice yield response with
climate change in China by coupling the CERES-Rice model
with a regional climate model. In Yao’s study, a collection of 3–
5 years of experimental rice data for each agro-ecological zone
in China was used first. This served as a base to determine the
crop genetic coefficients that would be considered constant in
the following steps. Then the crop model calculated grain
yields under potential water and nitrogen supplies based on
the climate scenarios provided by the climate model. Finally,
the potential impacts of climate change were assessed by
comparing the simulated yields with those under a baseline
vironment Sciences, Institute of Atmospheric Physics, Chinese0 82995336.
(T. Zhang).
d.
a g r i c u l t u r a l a n d f o r e s t m e t e o r o l o g y 1 4 8 ( 2 0 0 8 ) 1 4 1 2 – 1 4 1 8 1413
climate scenario. The model suggested that a negative climatic
impact on lowland rice yield would occur in China. A similar
modeling approach was also adopted by other climate change
studies (Krishnan et al., 2007; Xiong et al., 2007).
Under potential water and nitrogen supplies, modeling
studies such as these suggest two main effects that could play
key roles in crop development under future climate scenarios.
The first, a positive effect, is the direct fertilization effects of
rising CO2 concentrations that would increase yields (Parry
et al., 2004). The second, a negative effect, is primarily due to
the temperature’s influence on crop phenology (earlier
flowering and a shortened growing season), resulting in
substantial yield reductions (Kwak and Lee, 2006; Sadras
and Monzon, 2006; Xiong et al., 2007).
Phenology simulation is based on thermal time accumula-
tion in various crop models such as APSIM (Meinke et al., 1997),
CERES (Ritchie et al., 1998), and ORYZA2000 (Bouman et al.,
2001). In most previous simulation studies, these crop models
were driven by an implicit assumption that thermal time
accumulation for crops would remain constant under various
climate conditions. Using this assumption, an advanced
phenological events modeling projection would be obtained
because of the more rapid accumulation of thermal time
under higher temperature climate scenarios. Thus, this
assumption should be recognized as a crucial component
when determining phenological responses to climate change.
Therefore, in this study, an observed 20-year single lowland
rice variety dataset is provided as an extreme test of this
assumption. The comparison between the observed and
modeled phenology and yields over the 20 years is conducted,
using the ORYZA2000 lowland rice simulation model (Bouman
et al., 2001). The ORYZA series of crop models have been
widely applied to predict the effects of climate change on
lowland rice production, and, therefore, served as a useful tool
in this study as well (e.g. Krishnan et al., 2007; Kwak and Lee,
2006; Matthews et al., 1997).
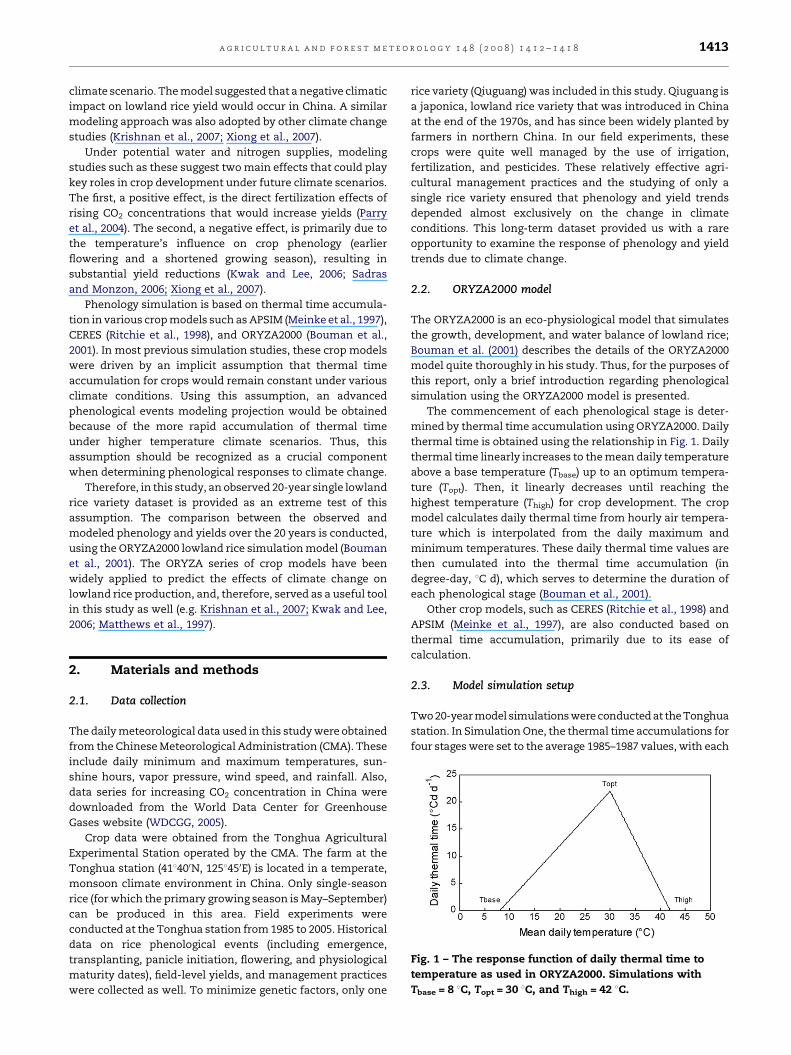
Fig. 1 – The response function of daily thermal time to
temperature as used in ORYZA2000. Simulations with
Tbase = 8 8C, Topt = 30 8C, and Thigh = 42 8C.
2. Materials and methods
2.1. Data collection
The daily meteorological data used in this study were obtained
from the Chinese Meteorological Administration (CMA). These
include daily minimum and maximum temperatures, sun-
shine hours, vapor pressure, wind speed, and rainfall. Also,
data series for increasing CO2 concentration in China were
downloaded from the World Data Center for Greenhouse
Gases website (WDCGG, 2005).
Crop data were obtained from the Tonghua Agricultural
Experimental Station operated by the CMA. The farm at the
Tonghua station (418400N, 1258450E) is located in a temperate,
monsoon climate environment in China. Only single-season
rice (for which the primary growing season is May–September)
can be produced in this area. Field experiments were
conducted at the Tonghua station from 1985 to 2005. Historical
data on rice phenological events (including emergence,
transplanting, panicle initiation, flowering, and physiological
maturity dates), field-level yields, and management practices
were collected as well. To minimize genetic factors, only one
rice variety (Qiuguang) was included in this study. Qiuguang is
a japonica, lowland rice variety that was introduced in China
at the end of the 1970s, and has since been widely planted by
farmers in northern China. In our field experiments, these
crops were quite well managed by the use of irrigation,
fertilization, and pesticides. These relatively effective agri-
cultural management practices and the studying of only a
single rice variety ensured that phenology and yield trends
depended almost exclusively on the change in climate
conditions. This long-term dataset provided us with a rare
opportunity to examine the response of phenology and yield
trends due to climate change.
2.2. ORYZA2000 model
The ORYZA2000 is an eco-physiological model that simulates
the growth, development, and water balance of lowland rice;
Bouman et al. (2001) describes the details of the ORYZA2000
model quite thoroughly in his study. Thus, for the purposes of
this report, only a brief introduction regarding phenological
simulation using the ORYZA2000 model is presented.
The commencement of each phenological stage is deter-
mined by thermal time accumulation using ORYZA2000. Daily
thermal time is obtained using the relationship in Fig. 1. Daily
thermal time linearly increases to the mean daily temperature
above a base temperature (Tbase) up to an optimum tempera-
ture (Topt). Then, it linearly decreases until reaching the
highest temperature (Thigh) for crop development. The crop
model calculates daily thermal time from hourly air tempera-
ture which is interpolated from the daily maximum and
minimum temperatures. These daily thermal time values are
then cumulated into the thermal time accumulation (in
degree-day, 8C d), which serves to determine the duration of
each phenological stage (Bouman et al., 2001).
Other crop models, such as CERES (Ritchie et al., 1998) and
APSIM (Meinke et al., 1997), are also conducted based on
thermal time accumulation, primarily due to its ease of
calculation.
2.3. Model simulation setup
Two 20-year model simulations were conducted at the Tonghua
station. In Simulation One, the thermal time accumulations for
four stages were set to the average 1985–1987 values, with each

a g r i c u l t u r a l a n d f o r e s t m e t e o r o l o g y 1 4 8 ( 2 0 0 8 ) 1 4 1 2 – 1 4 1 81414
simulation being representative of the phenological crop
genetic coefficients for the Qiuguang rice variety. In Simulation
Two, the calculated experiment-specific thermal time accu-
mulation for each year was made to match the simulated
phenological dates of the observations. The rest of the crop
genetic coefficients were the same for each simulation.
Following the climate-impact modeling studies (e.g. Matthews
et al., 1995; Timsina and Humphreys, 2006; Zhu and Min, 1995),
we used the default values of three cardinal temperatures for
crop development (Tbase, Topt, and Thigh as shown in Fig. 1),
which are typically 8, 30, and 42 8C, respectively, according to
Gao et al. (1992), Summerfield et al. (1992) and Yin (1996). In each
simulation, the model was run under real management
practices, taking into account potential water and nitrogen
supplies, which include emergence dates, transplanting dates,
local tillage density, and observed ambient CO2 concentration
for each year.
Fig. 2 – Time trend of average daily (a) maximum
temperature, (b) minimum temperature and (c) sunshine
hours over the main growing season (May–September) at
the Tonghua station from 1985 to 2005. In (c), the dashed
line is regression line for data during 1985–2004; the solid
line is for that during 1985–2005; regression equations,
coefficients of determination (R2) and P-values are shown
in the accompanying table.
Fig. 3 – Time trend of emergency dates (*), transplanting
dates (~), flowering dates (&) and maturity dates (^) from
1985 to 2005 at the Tonghua station.
3. Results
3.1. Observed trends in meteorological conditions andphenological events
Fig. 2 details the observed trends of averaged May–September
(the primary growing season) maximum temperature, mini-
mum temperature, and sunshine hours between 1985 and
2005 at the Tonghua station. It is evident that there are
statistically significant increases in both the maximum
(P < 0.01) and minimum temperatures (P < 0.05) as the
growth rates for increases of 0.88 and 0.56 8C per decade in
maximum and minimum temperatures occurred, respec-
tively (Fig. 2a and b). The sunshine hours significantly rose
between 1985 and 2004 at a rate of 0.72 h day�1 per decade
(P < 0.01), followed by the lowest value recorded in 2005
(Fig. 2c). The general pattern of change in averaged May–
September sunshine hours during the 20 years period,
however, is positive. Fig. 3 gives the time trends of
emergence, transplanting, flowering, and maturity dates
over the two decades of observation. Rice phenological
trends do not present as much change as those in
meteorological conditions.
3.2. Comparison between observed and simulatedphenology and yields
3.2.1. Phenology simulationThe differences between simulated and observed growing
season lengths and flowering dates under Simulation One are
shown in Fig. 4a and b. By considering the thermal time
accumulation observed during 1985–1987 constant, the
ORYZA2000 model consistently underestimates the length
of growing seasons during the 1996–2005 study period.
However, simulated growing season lengths are similar to
the values observed from 1985 to 1996 (Fig. 4a). The average
difference between 1985 and 1996 is only about 6 days, but it
increases to 16 days during the 1996–2005 period. For flowering
dates simulation, a similar pattern can also be observed
(Fig. 4b). Under Simulation One, modeled growing season
lengths shrink with time.
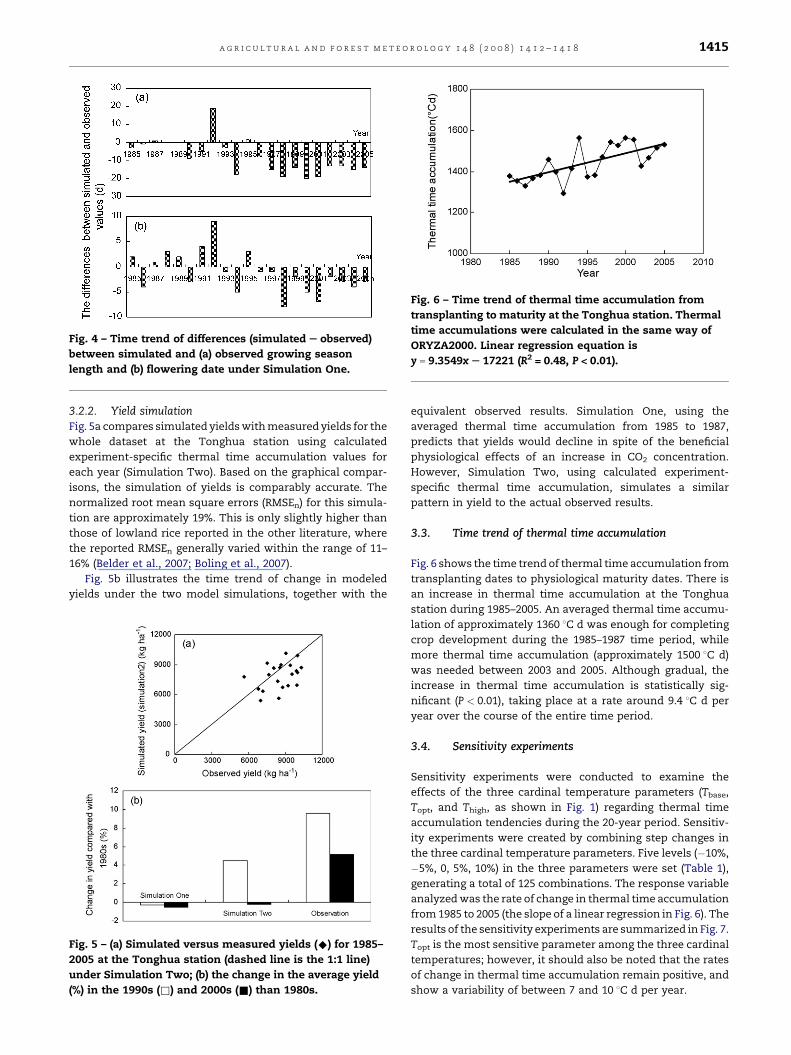
Fig. 4 – Time trend of differences (simulated S observed)
between simulated and (a) observed growing season
length and (b) flowering date under Simulation One.
Fig. 6 – Time trend of thermal time accumulation from
transplanting to maturity at the Tonghua station. Thermal
time accumulations were calculated in the same way of
ORYZA2000. Linear regression equation is
y = 9.3549x S 17221 (R2 = 0.48, P < 0.01).
a g r i c u l t u r a l a n d f o r e s t m e t e o r o l o g y 1 4 8 ( 2 0 0 8 ) 1 4 1 2 – 1 4 1 8 1415
3.2.2. Yield simulationFig. 5a compares simulated yields with measured yields for the
whole dataset at the Tonghua station using calculated
experiment-specific thermal time accumulation values for
each year (Simulation Two). Based on the graphical compar-
isons, the simulation of yields is comparably accurate. The
normalized root mean square errors (RMSEn) for this simula-
tion are approximately 19%. This is only slightly higher than
those of lowland rice reported in the other literature, where
the reported RMSEn generally varied within the range of 11–
16% (Belder et al., 2007; Boling et al., 2007).
Fig. 5b illustrates the time trend of change in modeled
yields under the two model simulations, together with the
Fig. 5 – (a) Simulated versus measured yields (^) for 1985–
2005 at the Tonghua station (dashed line is the 1:1 line)
under Simulation Two; (b) the change in the average yield
(%) in the 1990s (&) and 2000s (&) than 1980s.
equivalent observed results. Simulation One, using the
averaged thermal time accumulation from 1985 to 1987,
predicts that yields would decline in spite of the beneficial
physiological effects of an increase in CO2 concentration.
However, Simulation Two, using calculated experiment-
specific thermal time accumulation, simulates a similar
pattern in yield to the actual observed results.
3.3. Time trend of thermal time accumulation
Fig. 6 shows the time trend of thermal time accumulation from
transplanting dates to physiological maturity dates. There is
an increase in thermal time accumulation at the Tonghua
station during 1985–2005. An averaged thermal time accumu-
lation of approximately 1360 8C d was enough for completing
crop development during the 1985–1987 time period, while
more thermal time accumulation (approximately 1500 8C d)
was needed between 2003 and 2005. Although gradual, the
increase in thermal time accumulation is statistically sig-
nificant (P < 0.01), taking place at a rate around 9.4 8C d per
year over the course of the entire time period.
3.4. Sensitivity experiments
Sensitivity experiments were conducted to examine the
effects of the three cardinal temperature parameters (Tbase,
Topt, and Thigh, as shown in Fig. 1) regarding thermal time
accumulation tendencies during the 20-year period. Sensitiv-
ity experiments were created by combining step changes in
the three cardinal temperature parameters. Five levels (�10%,
�5%, 0, 5%, 10%) in the three parameters were set (Table 1),
generating a total of 125 combinations. The response variable
analyzed was the rate of change in thermal time accumulation
from 1985 to 2005 (the slope of a linear regression in Fig. 6). The
results of the sensitivity experiments are summarized in Fig. 7.
Topt is the most sensitive parameter among the three cardinal
temperatures; however, it should also be noted that the rates
of change in thermal time accumulation remain positive, and
show a variability of between 7 and 10 8C d per year.

Table 1 – Changes in the base temperature, optimum temperature and highest temperature for rice development insensitivity experiments
Parameter Description �10% �5% 0 5% 10%
Tbase Base temperature (8C) 7.2 7.6 8.0 8.4 8.8
Topt Optimum temperature (8C) 27.0 28.5 30.0 31.5 33.0
Thigh Highest temperature (8C) 37.8 39.9 42.0 44.1 46.2
a g r i c u l t u r a l a n d f o r e s t m e t e o r o l o g y 1 4 8 ( 2 0 0 8 ) 1 4 1 2 – 1 4 1 81416
4. Discussion
As shown in Simulation One (Fig. 4a and b), the modeled
growing season lengths and flowering dates match very well
with the observed values over the course of a short study
Fig. 7 – Sensitivity of the rate of thermal time accumulation
(the slope of a linear regression in Fig. 6) from 1985 to 2005
at the Tonghua station to changes in (a) base temperature
(Tbase), (b) optimum temperature (Topt) and (c) highest
temperature (Thigh) for rice development.
period, exhibiting a difference of only about 6 days. The results
are comparable in terms of accuracy with previous studies,
which have generally reported a difference of approximately
5–8 days for flowering dates, using four phenology-prediction
models for lowland rice (Yin et al., 1997); a difference with an
average of 5.5 days for flowering dates, when using the CERES-
Rice model (Yao et al., 2007); and a difference of 4–5 days for
maturity dates, when using the CERES-Rice model (Saseen-
dran et al., 1998; Timsina et al., 1998). This suggests that the
ORYZA2000 model is able to produce no less accurate
phenological simulations than other crop models when the
study period is short.
However, for the longer study periods, the modeled
growing season lengths and flowering dates under Simulation
One were constantly underestimated by an average value of 16
days in the period of 1996–2005. The majority of modeling
studies have concluded that growing season lengths shrink
due to the more rapid accumulation of thermal time under
higher temperatures (Kwak and Lee, 2006; Xiong et al., 2007;
Yao et al., 2007). Similarly, Simulation One, using the constant
thermal time accumulation, also modeled a decline in growing
season length with time. This was, however, not consistent
with the observed pattern. Thus, this indicates that even
though a crop model simulation based on the constant
thermal time accumulation is able to reproduce relatively
accurate phenological dates during a short study period, large
deviations in phenology simulations still occur over the course
of a long-term climate series.
Contrary to the notion assumed in previous studies,
thermal time accumulation is not constant, and in fact rose
with time at the Tonghua station (Fig. 6). Our sensitivity
experiments also support this point (Fig. 7). We found that
even if the three cardinal temperatures varied within the
range of �10%, the time trend of thermal time accumulation
would still have been positive over the 20-year period. Yin et al.
(1996) measured the optimum temperature of 24 indica and
japonica rice varieties in various Asian countries, including
the Philippines, China, Japan and Korea. Their observations
showed that the optimum temperature for the development of
these rice varieties varies over the range of 28–30 8C, a detail
which is not excluded in our sensitivity experiments. There-
fore, these results indicate that assuming thermal time
accumulation to be a constant is not reasonable, as this is
the primary reason for the underestimation of phenology in
long-term simulations at the Tonghua station.
As for yield simulations, consistent with the conclusions of
previous modeling studies, Simulation One, which was based
on constant thermal time accumulation, predicted a decline in
rice yields due to shorter modeled growing seasons (Fig. 5b).
However, Simulation Two, using the observed phenological
dates, suggested a similar pattern in rice yields for the
observed values from 1985 to 2005. This part of the analysis

a g r i c u l t u r a l a n d f o r e s t m e t e o r o l o g y 1 4 8 ( 2 0 0 8 ) 1 4 1 2 – 1 4 1 8 1417
suggests that the underestimation of phenology simulations
at the Tonghua station causes the misleading yields modeling.
Improvements in yield simulations may be expected if future
models can simulate a more accurate phenological trend due
to climate change.
5. Conclusions
The assumption of constant thermal time accumulation is
very important in the modeling studies relevant to climate
change impacts on agriculture. Our long-term observed data
clearly demonstrates that assuming a constant thermal time
accumulation is not always suitable for studies of climate
change impacts on agriculture. Using thermal time accumula-
tion to accurately model climate change is a field that still
needs future study.
However, we caution against extrapolating the increasing
trends in thermal time accumulation observed at the Tonghua
station to other places. Whether the similar increases in
thermal time accumulation can be seen in other regions
remains to be determined due to the lack of long-term single
rice variety data at other places. More research must still be
completed to create accurate thermal time accumulation
simulations that are suitable for the use in climate and yield
production studies.
Acknowledgements
We appreciate Dr. B.A.M. Bouman and two anonymous
reviewers for their valuable comments, and also wish to
thank the CMA for providing crop and meteorological data.
Finally, we also thank Mr. James R. Wright and Dr. John H.C.
Gash who helped improve the clarity of this manuscript.
r e f e r e n c e s
Belder, P., Bouman, B.A.M., Spiertzm, J.H.J., Lu, G., 2007.Comparing options for water savings in lowland rice using amodeling approach. Agric. Syst. 92, 91–114.
Boling, A., Bouman, B.A.M., Tuong, T.P., Murty, M.V.R., Jatmiko,S.Y., 2007. Modeling the effect of groundwater depth onyield-increasing interventions in rainfed lowland rice inCentral Java, Indonesia. Agric. Syst. 92, 115–139.
Bouman, B.A.M., Kropff, M.J., Tuong, T.P., Wopereis, M.C.S., TenBerge, H.F.M., Van Laar, H.H., 2001. ORYZA2000: ModelingLowland Rice. International Rice Research Institute/Wageningen University and Research Centre, Los Banos,Philippines/Wageningen, Netherlands.
Dhungana, P., Eskridge, K.M., Weiss, A., Baenziger, P.S., 2006.Designing crop technology for a future climate: an exampleusing response surface methodology and the CERES-Wheatmodel. Agric. Syst. 87, 63–79.
Gao, L., Jin, Z., Huang, Y., Zhang, L., 1992. Rice clock model: acomputer model to simulate rice development. Agric. For.Meteorol. 60, 1–16.
Guerena, A., Ruiz-Ramos, M., Diaz-Ambrona, C.H., Conde, J.R.,Minguez, M.I., 2001. Assessment of climate change andagriculture in Spain using climate models. Agron. J. 93,237–249.
IPCC, 2007. Climate Change 2007: Impacts, Adaptation andVulnerability Summary for Policymakers Contribution ofWorking Group II to the Fourth Assessment Report of theIntergovernmental Panel on Climate Change. Brussels. April.
Krishnan, P., Swain, D.K., Chandra Bhaskar, B., Nayak, S.K.,Dash, R.N., 2007. Impact of elevated CO2 and temperatureon rice yield and methods of adaptation as elevated by cropsimulation studies. Agric. Ecosyst. Environ. 122, 233–242.
Kwak, K.-S., Lee, C.-K., 2006. How will the increase airtemperature by global warming influence on the yieldcapacity and quality of rice in Korea. In: Proceedings of theJapanese Society of Crop Science Symposium (Spring) on‘‘Current Research Topics on Crop Eco-physiology in Asiawith Emphasis on the Impact of Global Warming on RiceEco-physiology’’.
Matthews, R.B., Horie, T., Kropff, M.J., Bachelet, D., Centeno,H.G., Shin, J.C., Mohandass, S., Singh, S., Zhu, D., Lee, M.,1995. A regional evaluation of the effect of future climatechange on rice production in Asia. In: Matthews, R.B.,Kropff, M.J., Bachelet, D., van Laar, H.H. (Eds.), Modeling theImpact of Climate Change on Rice Production in Asia. CABInternational, Wallingford (UK), pp. 95–139.
Matthews, R.B., Kropff, M.J., Horie, T., Bachelet, D., 1997.Simulating the impact of climate change on rice productionin Asia and evaluating options for adaptation. Agric. Syst.54, 399–425.
Meinke, H., Rabbinge, R., Hammer, G.L., van Keulen, H.,Jamieson, P.D., 1997. Improving wheat simulationcapabilities in Australia from a cropping systemsperspective. II. Testing simulation capabilities of wheatgrowth. Eur. J. Agron. 8, 83–99.
Parry, M.L., Rosenzweig, C., Iglesias, A., Livermore, M., Fischer,G., 2004. Effects of climate change on global food productionunder SRES emissions and socio-economic scenarios.Global Environ. Change 14, 53–67.
Ritchie, J.T., Singh, U., Godwin, D.C., Bowen, W.T., 1998. Cerealgrowth, development and yield. In: Tsuji, G.Y., Hoogenboom,G., Thornton, P.K. (Eds.), Understanding Options forAgricultural Production. Kluwer Academic Publishers, TheNetherlands, pp. 79–98.
Sadras, V.O., Monzon, J.P., 2006. Modeled wheat phenologycaptures rising temperature trends: shortened time toflowering and maturity in Australia and Argentina. FieldCrops Res. 99, 136–146.
Saseendran, S.A., Singh, K.K., Rathore, L.S., Rao, G.S.L.H.V.P.,Mendiratta, N., Lakshmi Narayan, K., Singh, S.V., 1998.Evaluation of the CERES-Rice v.3.0 model for the climateconditions of the state of Kerala, India. Meterol. Appl. 5,385–392.
Summerfield, R.J., Collinson, S.T., Ellis, R.H., Roberts, E.H.,Penning de Vries, F.W.T., 1992. Photothermal response offlowering in rice (Oryza sativa). Ann. Bot. 69, 101–112.
Timsina, J., Humphreys, E., 2006. Performance of CERES-Riceand CERES-Wheat models in rice-wheat systems: a review.Agric. Syst. 90, 5–31.
Timsina, J., Singh, U., Badaruddin, M., Meisner, C., 1998.Cultivar, nitrogen, and moisture effects on a RW sequence:experimentation and simulation. Agron. J. 90, 119–130.
WDCGG, 2005. World Data Center for Greenhouse Gases.WDCGG. On-line electronic database. http://gaw.kishou.go.jp/wdcgg.html. Cited in February 1, 2007.
Xiong, W., Lin, E., Ju, H., Xu, Y., 2007. Climate change and criticalthresholds in China’s food security. Climatic Change 81,205–221.
Yao, F., Xu, Y., Lin, E., Yokozawa, M., Zhang, J., 2007. Assessingthe impacts of climate change on rice yields in the main riceareas of China. Climatic Change 80, 3–4.
Yin, X., 1996. Quantifying the effects of temperature andphotoperiod on phenological development to flowering of

a g r i c u l t u r a l a n d f o r e s t m e t e o r o l o g y 1 4 8 ( 2 0 0 8 ) 1 4 1 2 – 1 4 1 81418
rice. Ph.D. Thesis. Wageningen Agricultural University,Wageningen (Netherlands), p. 173.
Yin, X., Kropff, M.J., Goudriaan, J., 1996. Differential effects ofday and night temperature on development to flowering inrice. Ann. Bot. 77, 203–213.
Yin, X., Kropff, M.J., Horie, T., Nakagawa, H., Goudriaan, J.,1997. A model for photothermal responses of
flowering in rice II. Model evaluation. Field Crops Res. 51,201–211.
Zhu, D., Min, S., 1995. Rice production in China under currentand future climates. In: Matthews, R.B., Kropff, M.J.,Bachelet, D., van Laar, H.H. (Eds.), Modeling the Impact ofClimate Change on Rice Production in Asia. CABInternational, Wallingford (UK), pp. 217–235.