Non-Conformance of Existing Pressure Relief Systems With ...
12
5th Annual Symposium, Mary Kay O'Connor Process Safety Center "Beyond Regulatory Compliance: Making Safety Second Nature" Reed Arena, Texas A&M University, College Station, Texas October 29-30, 2002 Non-Conformance of Existing Pressure Relief Systems With Recommended Practices" A Statistical Analysis Patrick C. Berwanger, P.E., Robert A. Kreder, and Wai-Shan Lee Berwanger, Inc. Oil, Gas & Petrochemical Consulting 4615 SouthWest Freeway, Suite 900 Houston, TX 77027, USA Phone: (800) 658-8809 Email: [email protected] Abstract This article presents a statistical analysis showing that the pressure relief systems on nearly half of the equipment in the oil, gas, and chemical industries lack adequate overpressure protection as defined by recognized and generally accepted good engineering practices. This analysis was based on data collected from a large number of government mandated (per OSHA 1910.119) pressure relief system design audits performed by an independent contractor. The vast majority of these deviations from good practice were not identified during conventional process hazard analyses (PHAs) performed on these same facilities. Most of the units had also been designed by reputable design firms. The authors conclude that, as a practical matter, conventional PHA methods are ineffective tools for evaluating pressure relief systems. They also conclude that the pressure relief system design process could be improved. Specifically, the authors recommend that, in order to reduce this deficiency rate in the future, the industry adopt an equipment-based approach to pressure relief system design and maintenance.
-
Upload
khangminh22 -
Category
Documents
-
view
0 -
download
0
Transcript of Non-Conformance of Existing Pressure Relief Systems With ...

5th Annual Symposium, Mary Kay O'Connor Process Safety Center "Beyond Regulatory Compliance: Making Safety Second Nature"
Reed Arena, Texas A&M University, College Station, Texas October 29-30, 2002
Non-Conformance of Existing Pressure Relief Systems With Recommended Practices" A Statistical Analysis
Patrick C. Berwanger, P.E., Robert A. Kreder, and Wai-Shan Lee
Berwanger, Inc. Oil, Gas & Petrochemical Consulting 4615 SouthWest Freeway, Suite 900
Houston, TX 77027, USA Phone: (800) 658-8809
Email: [email protected]
Abstract
This article presents a statistical analysis showing that the pressure relief systems on nearly half of the equipment in the oil, gas, and chemical industries lack adequate overpressure protection as defined by recognized and generally accepted good engineering practices. This analysis was based on data collected from a large number of government mandated (per OSHA 1910.119) pressure relief system design audits performed by an independent contractor. The vast majority of these deviations from good practice were not identified during conventional process hazard analyses (PHAs) performed on these same facilities. Most of the units had also been designed by reputable design firms.
The authors conclude that, as a practical matter, conventional PHA methods are ineffective tools for evaluating pressure relief systems. They also conclude that the pressure relief system design process could be improved. Specifically, the authors recommend that, in order to reduce this deficiency rate in the future, the industry adopt an equipment-based approach to pressure relief system design and maintenance.

Introduction
The OSHA process safety management (PSM) regulation (29CFR1910.119) has lead many oil, gas, and petrochemical operating companies to the conclusion that they should take a close look at the adequacy of their pressure relief systems. This conclusion generally results from the PSM regulation's requirement that process hazard analysis (PHA) teams and other employees have up to date pressure relief system design and design basis information available to them.
Since quite a few pressure relief systems have been evaluated in some level of detail, it is informative to look at the data that has been collected to better inform our future decision making. Given that roughly 30% of process industry losses can be at least partially attributed to deficient pressure relief systems ~, this matter is of importance.
Specifically, this article summarizes the results of pressure relief system audits performed at more than 400 operating units by an independent contractor. Based on the analysis of this information, we can draw the following conclusions:
Conclusion No. 1" Approximately 35% of equipment has at least one pressure relief system deficiency
More than a third of the equipment in the oil, gas, and chemical industries had some pressure relief system deficiency as compared to widely accepted engineering practices (see below). The types of deficiencies are roughly split between absent and/or undersized pressure relief devices and improperly installed pressure relief devices.
EQUIPMENT OVERPRESSURE PROTECTION STATUS
No Relief Device 12% Undersized
Device 9%
~ / o • ~ ~. Improper Installation
15%
Conclusion No. 2: Current PHA methodologies do not capture most deficiencies
Of the more than 400 operating units in the sample pool, essentially all had already undergone process hazard analyses (PHAs). It is the opinion of the authors that most deficiencies are not identified in PHAs because of time constraints and a general lack of pressure relief system expertise on PHA teams.
Conclusion No. 3: Contractor design methods can be improved by adopting an equipment- based approach
Surprisingly, most of the more than 400 operating units in which deficiencies were found had been designed by reputable design contractors. The authors believe the primary reason so many deficiencies are overlooked in the design process is that a vigorously enforced equipment-based approach to pressure relief system design is not used.

Conclusion No. 4: Current information management techniques have not worked
In an effort to comply with the PSM regulation, many operators have recreated their pressure relief system design and design basis information essentially from scratch. This is because, over the years, most operating companies have relied on pressure relief device datasheets as their primary repository for their pressure relief system design basis information - a purpose for which they were never intended.
Statistical Analysis
Data Source
The data presented below was collected during pressure relief system design audits conducted at facilities in the oil and gas production, refining, petrochemicals, and chemicals sectors. Berwanger's equipment- based pressure relief design methodology was used in a consistent manner for each of the 421 processing units, 42,191 pieces of equipment, and 26,693 pressure relief devices that are included in this statistical analysis. Each equipment item was categorized as a vessel, heat exchanger, air cooler, compressor, pump, filter, or other. Due to the fact that centrifugal pumps normally do not require overpressure protection, these items were excluded from the analysis. The chart below shows the percentage of each equipment category relative to the total.
Equipment Types
Other 17% \
Compressol ,.3%. Air ~ooter= 4% Filters
e~p,, 3%
Heat Exchangers
37%
Vessels ~- 31%
All deviations from recognized and generally accepted good engineering practices (RAGAGEP) were cataloged and categorized in a database. Approximately 15,300 such deficiencies were identified during the review of the 421 processing units. Most deficiencies fell into one of the three following categories:
100 Series 200 Series
300 Series
No relief device present on equipment with one or more potential overpressure scenarios Undersized relief device present on equipment with one or more potential overpressure scenarios Improperly installed relief device

Within each series, categories were defined to further describe the types of deficiencies that were encountered. For each category, the following information is presented:
• Relevant criteria from industry practices • Methodology used to identify the deficiency during design audit • Methodology used to perform statistical analysis • Potential solutions to the deficiency (Series 100 and 300 only, as Series 200 solutions are similar to
Series 100)
A summary table and/or chart are also presented for each series.
Note: The deficiencies presented in this paper primarily pertain to fluid hydraulic issues. Other types of deficiencies were encountered during the pressure relief system audits that did not fall into any of the three series above and are not included in the statistical analyses presented below. These deficiencies included concerns about items such as excessive flare radiation levels, inadequate knockout drums, poorly designed quench systems, discharge of toxic fluids to atmosphere, discharge of combustible liquids to atmosphere, and a general lack of process safety information upon which to base a safe pressure relief system design. Thus, it is the author's belief that the deficiency rates reported herein may understate the actual overall industry deficiency rate.
Series 100- No relief device present on equipment with one or more potential overpressure scenarios
Category 101: No relief device - potential for overpressure due to blocked outlet
• API RP 5212 Section 3.5 states, "To protect a vessel or system from overpressure when all outlets on the vessel or system are blocked, the capacity of the relief device must be at least as great as the capacity of all sources of overpressure."
• In order to identify blocked outlet scenarios, a comparison of the maximum pressure of all inlet sources to the MAWP of the equipment under consideration was performed. In addition, the potential for heat input from the process to result in vaporization at the MAWP was considered.
• As all equipment types were evaluated for the blocked outlet scenario, the total number of deficiencies is reported as a percentage of the total number of equipment.
• Common solutions to this concern include installing a relief device, re-rating the equipment, or removing the mechanism that results in blockage (lock valves open, etc.).
Category 102: No relief device - potential for overpressure due to control valve failure
• API RP 521 Section 3.10.3 states, "The scenario to consider is that one control valve will be in the fully open position regardless of the control valve failure position. Opening of this control valve may be caused by instrument failure or mis-operation."
• To identify inlet control valve scenarios, the maximum expected pressure upstream of each inlet control valve was compared to the MAWP of the equipment under consideration.
• As pumps and compressors are typically not subject to inlet control valve failure scenarios, the total number of deficiencies was reported as a percentage of the vessels, filters, exchangers, air coolers, and others.
• Typical solutions include installing a relief device or re-rating the downstream equipment.
Category 103: No relief device - potential for overpressure due to external fire
API RP 521 Section 3.15 contains extensive guidance relative to relief requirements for external fire. To paraphrase, a pressure relief device adequate for the external fire scenario should be installed for all vessels, heat exchangers, and filters with a liquid inventory that are located within a potential fire zone. The guidelines are less clear on the treatment of vapor-filled equipment that may be subject to thermal

failure prior to overpressure. In these cases, other preventive measures such as depressuring systems may be more appropriate.
• To identify external fire scenarios, all equipment with a liquid inventory located in an area of the facility potentially subject to an external fire was selected. External fire protection was not required for vapor-filled vessels, as other methods of protection are typically more effective.
• From an analysis standpoint, pumps and compressors were not subjected to external fire scenarios. Thus, the total number of deficiencies was reported as a percentage of the vessels, filters, exchangers, air coolers, and others.
• Typical solutions include installing a relief device or providing an open path to an existing relief device.
Category 104: No relief device - potential for overpressure due to heat exchanger tube failure
• ASME VIII Division 13, Paragraph UG-133 (d) states "Heat exchangers and similar vessels shall be protected with a relieving device of sufficient capacity to avoid overpressure in the case of an internal failure." API RP 521 Section 3.18 states, "Complete tube rupture, in which a large quantity of high pressure fluid will flow to the lower pressure exchanger side, is a remote but possible contingency." In addition, API has long used the "two-thirds rule" to identify tube rupture scenarios. This rule states that tube rupture protection is not required when the ratio of the low pressure to high pressure side design pressure is greater than two-thirds.
• Tube rupture scenarios were identified only for shell and tube exchangers that did not meet the two- thirds rule.
• The deficiencies were reported as a percentage of the total number of heat exchangers. The majority of heat exchangers met the two-thirds rule and, therefore, did not require pressure relief for tube rupture.
• Typical solutions include performing rigorous calculations of the relief capacity available via outflow from the low pressure side, re-rating the low pressure side to meet the two-thirds rule, or installing a relief device.
Category 105: No relief device - potential for overpressure due to thermal expansion
• API RP 521 Section 3.14 states the most common causes of thermal expansion are, "(a) Piping or vessels are blocked-in while they are filled with cold liquid and are subsequently heated by heat tracing, coils, ambient heat gain or fire; (b) An exchanger is blocked-in on the cold side with flow in the hot side; or (c) Piping or vessels are blocked-in while they are filled with liquid at near-ambient temperatures and are heated by direct solar radiation."
• Thermal expansion scenarios were identified for all equipment in which the potential existed to isolate and heat a liquid-full system. In addition to heat exchangers, this included liquid-full vessels and filters that could potentially be isolated liquid-full.
• The thermal expansion deficiency results are presented as a percentage of all equipment with the exception of compressors.
• Typical solutions to thermal expansion deficiencies include locking open of outlet block valves on the cold side of exchangers, reliance on shutdown procedures to prevent the scenario, draining and venting out of service equipment, or installing a relief device.
Category 106: No relief device - potential for overpressure due to multiple scenarios
The number of deficiencies in which a piece of equipment had more than one potential overpressure scenario and no relief device is reported as a percentage of the total number of equipment.
Category 107: No relief device - potential for overpressure due to other scenario
The previous categories cover the most common overpressure scenarios; however, all of the sixteen overpressure scenarios in API RP 521 Section 3.1 Table 1 were checked during the evaluation.

Occurrences of these less common scenarios in which pressure relief was not present were entered into this category. Due to the wide variety of scenarios in this category, the number of deficiencies was compared to the total number of equipment.
The following table summarizes the statistical results as described above for each Series 100 Category.
Series 100: Equipment with one or more overpressure E q u i p m e n t E q u i p m e n t Deficiency scenarios and no pressure relief device with in Sample Frequency
, , D e f i c i e n c y P o o l (%) Total 5,269 42,191 12.5
Category 101" No Protection- Blocked Outlet Category 102" No Protection- Inlet Control Valve Failure Category 103" No Protection- External Fire Category 104" No Protection- Heat Exchanger Tube Rupture Category 105" No Protection- Thermal Expansion Category 106" No Protection- Multiple Overpressure Scenarios Category 10"/• No Protection- Other
842 42,191 2.0 41
1,738 361
839 1,232
261
39,599 39,599 14,016
40,903 42,191
42,191
0.1 4,4 2.6
2.1 2.9
0.5
The chart below details the contribution of each category to the overall number of Series 100 deficiencies.
Population of Different Categories of Concerns in Group 100 Equipment-Based
Category 101: Blocked Category 107: Other / - Outlet
4.1% / 16.0%
Category 106: Multiple ,3ategory 102: Inlet Scenarios ontrol Valve Failure
23.4% 0.8%
Category 105: Thermal Expansion
15.9% ,' Category 104: Tube
Rupture 6.9%
Category 103: External Fire
33.0%
Series 200: Undersized relief device present on equipment with one or more potential overpressure scenarios
Category 201" Undersized relief device - potential for overpressure due to blocked outlet
Series 100 Category 101 presented published guidance in relation to the blocked outlet scenario. Due to the variety of blocked outlet situations, different methods were used to determine the required relief rates for different types of equipment. The quantity of material to be relieved was generally

determined at the relieving conditions (i.e., the MAWP plus the code-allowable overpressure) based on the capacity of upstream pressure sources or duty of process heaters. As all equipment types were evaluated for the blocked outlet scenario, the total number of deficiencies is reported as a percentage of the total number of equipment.
Category 202: Undersized relief device - potential for overpressure due to inlet control valve failure
• Series 100 Category 102 presented published guidance in relation to the inlet control valve failure scenario.
• Inlet control valve failure required relief rates were based on manufacturer's valve flow calculations assuming a full open valve. The pressure differential across the control valve was the difference between the maximum expected upstream pressure and the downstream relieving pressure (MAWP plus code-allowable accumulation). In some cases, the flow through the control valve was limited by the capacity of upstream equipment, such as a pump, or by the piping system in which the control valve was installed. The failure of level control valves that regulate the flow of liquid from a higher to lower pressure system can result in a loss of liquid inventory in the upstream vessel and subsequent vapor flow to the low pressure system. This is commonly referred to as gas blow-by. The relief requirement for this case was typically estimated as the maximum vapor flowrate through the control valve. Consideration was also given to the potential for the downstream vessel to fill above the normal level, which could result in the vapor flow from the control valve entering the liquid space in the downstream vessel and require two-phase relief.
• From an analysis standpoint, pumps and compressors were not subjected to inlet control valve scenarios. Thus, the total number of deficiencies was reported as a percentage of the vessels, filters, exchangers, air coolers, and others.
Category 203: Undersized r e l i e f d e v i c e - potential for overpressure due to tube rupture
• Series 100 Category 104 discussed the use of the two-thirds rule to determine if tube rupture protection is required for a heat exchanger.
• The tube rupture calculation algorithms were based on API RP 521 guidance that states that it is conservative to treat a tube rupture as two sharp-edged orifices having the same cross-sectional area as a tube. The maximum expected pressure upstream of the high pressure side of the heat exchanger and the relieving pressure at the low pressure side were used to determine the pressure drop across the orifice.
• The deficiencies were reported as a percentage of the total number of heat exchangers.
Category 204: Undersized relief device - potential for overpressure due to loss of overhead condensing or reflux failure
• In the event the cooling medium in the condenser is lost, additional vapor may be present at the top of the column. This additional vapor may require pressure relief. In a typical distillation system, a cooling failure will also result in a loss of reflux within a short period of time (typically about 15 minutes). API RP 521 states the required relief rates before and after loss of reflux should be considered. The Berwanger method encompassed both of these calculations, as it was not intuitive which case would require the larger required relief rate.
• The procedure to calculate the required relief rate was slightly different depending on whether the column had a partial or total condenser. Typically, the distillation column was simulated at relieving conditions to determine the required relief rate based on a steady-state approach and the maximum expected duty of the reboiler. However, due to the large number of distillation arrangements, consideration was always given to the specifics of the system prior to applying the above methodology.
• Often this scenario would also apply to the reflux accumulator associated with the distillation column; therefore, the deficiencies were reported as a percentage of the total number of vessels.

Category 205: Undersized relief device - potential for overpressure due to external fire
• Series 100 Category 103 discussed the need for overpressure protection for all the equipment items (except pumps and compressors) with a liquid inventory that are located within a potential fire zone.
• The external fire relief requirements were determined using equations presented in Appendix D of API RP 520, which depend on the adequacy of the firefighting and drainage system. Calculation of the wetted area was based on the high liquid level in the vessel up to 25 feet above grade. An environmental factor of 1.0 was generally used unless the insulation on the vessel (if present) was verified to be fireproof.
• From an analysis standpoint, pumps and compressors were not subjected to external fire scenarios. Thus, the total number of deficiencies was reported as a percentage of the vessels, filters, exchangers, air coolers, and others.
Category 206: Undersized relief device - potential to overpressure due to multiple scenarios
The number of deficiencies in which a piece of equipment had an undersized relief device for more than one potential overpressure scenario is reported as a percentage of the total number of equipment.
Category 207: Undersized relief device - potential to overpressure due to other scenario
• The previous categories cover the required relief rate calculations for the most common overpressure scenarios; however, all of the sixteen overpressure scenarios in API RP 521 Section 3.1 Table 1 were checked during the evaluation. Occurrences of these less common scenarios in which pressure relief was not present were entered into this category.
• Due to the wide variety of scenarios in this category, the number of deficiencies was compared to the total number of equipment.
The following table summarizes the statistical results as described above for each Series 200 Category.
Series 200: Equipment with one or more overpressure Equipment Equipment Deficiency scenarios for which the pressure relief device is undersized with in Sample Frequency
Deficiency Pool (%) Total 3,657 42,191 8.7
Category 201" Undersized- Blocked Outlet Category 202: No Protection- Inlet Control Valve Failure Category 203: No Protection- Heat Exchanger Tube ' Rupture Category 204: No Protection- Loss of Condensing or Reflux Failure Category 205: No Protection- Extemal Fire (Vessel with Liquid Inventory ) Category 206: No Protection- Multiple Overpressure Scenarios Category 207: No Protection - Other
596 367 466
38
1,432
446
42,191 39,599
, ,
14,016
15,211
39,599
42,191
1.4 0.9 3.3
0.2
3.6
1.1
312 42,191 0.7
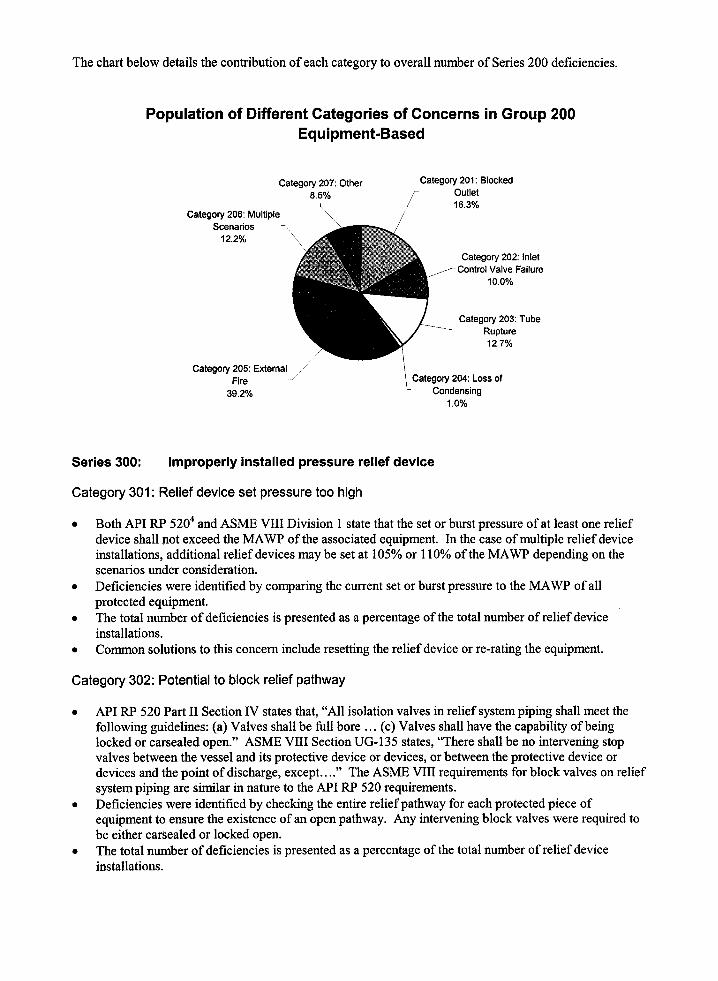
The chart below details the contribution of each category to overall number of Series 200 deficiencies.
Population of Different Categories of Concerns in Group 200 Equipment-Based
Category 207: Other 8.5%
\ Category 206: Multiple \
Scenarios -~ 12.2% \ \
Category 201' Blocked Outlet 16.3%
Category 202: Inlet ;ontrol Valve Failure
10.0%
/ , / / Category 205: External /,
Fire -~ 39.2%
Category 203: Tube Rupture 12.7%
Category 204: Loss of Condensing
1.0%
Series 300: Improperly installed pressure relief device
Category 301" Relief device set pressure too high
• Both API RP 5204 and ASME VIII Division 1 state that the set or burst pressure of at least one relief device shall not exceed the MAWP of the associated equipment. In the case of multiple relief device installations, additional relief devices may be set at 105% or 110% of the MAWP depending on the scenarios under consideration.
• Deficiencies were identified by comparing the current set or burst pressure to the MAWP of all protected equipment.
• The total number of deficiencies is presented as a percentage of the total number of relief device installations.
• Common solutions to this concern include resetting the relief device or re-rating the equipment.
Category 302: Potential to block relief pathway
• API RP 520 Part II Section IV states that, "All isolation valves in relief system piping shall meet the following guidelines: (a) Valves shall be full bore ... (c) Valves shall have the capability of being locked or carsealed open." ASME VIII Section UG-135 states, "There shall be no intervening stop valves between the vessel and its protective device or devices, or between the protective device or devices and the point of discharge, except .... " The ASME VIII requirements for block valves on relief system piping are similar in nature to the API RP 520 requirements.
• Deficiencies were identified by checking the entire relief pathway for each protected piece of equipment to ensure the existence of an open pathway. Any intervening block valves were required to be either carsealed or locked open.
• The total number of deficiencies is presented as a percentage of the total number of relief device installations.

The most common solution to this deficiency is to lock or carseal open all intervening block valves. It should be noted that a carseal or locked valve program should be in place to ensure the integrity of the locks or carseals.
Category 303: Relief valve inlet pressure drop too high
• API RP 520 Part II Section 2.2.2 states, "The total non-recoverable pressure loss between the protected equipment and the pressure relief valve should not exceed 3% of the set pressure of the valve .... " The non-mandatory portion of ASME VIII Division I also includes the 3% limitation. Inlet pressure drops higher than 3% of the set pressure may result in valve instability and chatter. Due to the lack of conclusive experimental evidence, industry has generally accepted the "3% rule" as the standard.
• Inlet pressure drops were evaluated based on the frictional losses only between the adjacent equipment and the relief device. Per API RP 520 Part II Section 2.2.2, inlet pressure drops were calculated based on the actual rated capacity of the relief valve.
• Inlet pressure drops were only quantified for a portion of the data set (about 88%); therefore, the number of inlet pressure drop concerns is presented as a percentage of only the relief devices for which pressure drops were calculated.
• Typical solutions to meet the 3% rule include piping modifications, installing a pilot-operated relief device with remote sensing, or performing more rigorous analysis to further define risk of chattering.
Note : The API is commissioning a study to evaluate the dynamics of relief valve behavior for various inlet and outlet pressure drop scenarios. One should be cautioned that various experts in this area hold very strong yet contradictory opinions on this topic.
Category 304: Relief valve outlet pressure drop too high
• API RP 521 Section 5.4.1.3 states, "Where conventional safety valves are used, the relief manifold system should be sized to limit the built-up back pressure to approximately 10% of the set pressure .... " Higher outlet pressure drops may result in reduced valve capacity and instability. API RP 521 also states the outlet pressure drop for individual relief valves should be based on the actual rated valve capacity consistent with the inlet piping pressure drop.
• Outlet pressure drops were evaluated based on the frictional and kinetic losses from the outlet of the relief device to the discharge point, typically atmosphere or the entrance to a main relief header.
• Note that outlet pressure drops were only quantified for a portion of the data set (about 88%); therefore the number of outlet pressure drop concerns is presented as a percentage of only the relief devices for which pressure drops were calculated.
• Typical solutions to meet the 10% rule include installation of a bellows kit, piping modifications, or performing more rigorous analysis to further def'me risk of chattering.
Category 305: Other installation deficiencies
• API RP 520 Part II and ASME VIII Division 1 contain numerous other installation requirements. This category represents all other installation deficiencies that were identified for both relief valves and rupture disks.
• The total number of deficiencies is presented as a percentage of the total number of relief device installations.

The following table summarizes the statistical results as described above for each Series 300 Category.
Series 300: Incorrectly installed relief devices Relief Relief Devices Deficiency Devices with in Sample Pool Frequency
Deficiency (%) Total 6,355 26,693 23.8
:.:.:~.:.:.:.:.:.~:.:.:.:.:~ .................................. ~ .............................. ~:.:.;.:.:.:.~:: ................. :::~.~:~.:.:~:.:~::~::::~.~.:::.:::~.~::::::.::~.:.;:~.:~::.~:~.::~.~..~-.:::.:~.~ :: ::::: ~: .~ ~ :: ~::.~ :~ ~.~ :: :: .~::.:: :: ::: :: :~ ::.:.: :: :: ::.: ::.~ :: ::.: :: :~ :: :: :: ~:: :~: ::: :: ~:~ ~:: :~ ~..~ ~.~.~. :. ~:: ~: .~,~ ~::.: ~: :: :: ::: .~:: :: ~: ~.:::.: ~: . : .~:: ::: :<~ ~.:-~.:::: :::::~. , : :.. ~: :: :: :: :: :: ::-: ~:-.: ::.: :: :: :: .~: ~.: ~::.: ..:: :..:: ~ .~:~ :~::~: :~: ,.:: :: ~:.:.: :::: :~:.: ~ ~:: :: :::: .-: .~:: :: ~: :~:: ~:~ ~ I::: :~:: :: :: :: ~: : ~:: .~::: ~:: ~: ~:: ~: : :: :: :: :-~. ~...:::.: :: :~ ..:: ~:: :::.:-: :: ~::: ~:: :: ::: ~:: :: ::: ~: : .-::: :: :: :: :: :: s-: ::: :: :: ::: ::: :: ::: :: :: ::.-::: :: ::: ~:::-:: :: ~ : :: ~.::: :: :: :::: :: ..::: :: ~:~ ~:: :: :: ::: ~:: :: :: :: :: :: :: :: :: ~ ...................................... :::::::::::::::::::::::::::::::::::::::::::::::::::::: ......
................................................ i ' " " 1 . . . . . . . . . . . T ' ' " ' T ' r . . . . . . . . . . . . r ' " ' r ' ~ ' l ~ " l ~ : - ' r ' r r . . . . . . t . . . . . . . . . . . i ~ ' - ¢ ~ - Y l " , , ' l ' ' " ' ÷ . . . . r i i T i ~ l ~ , ? . . . . r
Category 301" Relief Device Set Pressure Too High 533 26,693 2.0 Category 302: Potential to Block Relief Pathway 578 26,693 2.2 Category 303: Inlet Pressure Drop Too High 2,257 23,451 9.6 Category 304: Outlet Pressure Drop Too High 2,765 23,451 11.8 Category 305: Other Installation Deficiencies 222 26,693 0.8
The chart below details the contribution of each category to overall number of Series 300 deficiencies.
Population of Different Categories of Concerns in Group 300 Relief Devices
Category 305: Other Installation Deficiencies -~
Category 304: Outlet PD Too High
43.5%
Category 301: Set ~Pressure Too High
3.5% 1 / 8.4%
"\\
Category 302: Blocked Relief Pathway
9.1%
Category 303: Inlet PD Too High
35.5%

Conclusions
It is clear from the foregoing that pressure relief system design and information management practices can and should be improved. Fortunately, design and information management methods are available 5 that can address this situation.
Bibliography
AIChE. Emergency Relief System (ERS) Design Using DIERS Technology. American Institute of Chemical Engineers, New York, NY, 1995.
API. Guide for Pressure-Relieving and Depressuring Systems. API Recommended Practice 521 Fourth Edition, The American Petroleum Institute, Washington, D.C., March 1997.
ASME. ASME Boiler and Pressure Vessel Code. Section VIII, Divisions 1 and 2, The American Society of Mechanical Engineers, New York, NY, 1992.
API. Sizing, Selection, and Installation of Pressure-Relieving Devices in Refineries. API Recommended Practice 520 Sixth Edition, The American Petroleum Institute, Washington, D.C., March 1993.
Berwanger, P. and R. Kreder. "Making Safety Data 'Safe'." Chemical Engineering, McGraw Hill Inc., New York, NY, April 1995.