
NO x adsorption over a wide temperature range on Na-ZSM-5 films
11
Journal of Catalysis 234 (2005) 219–229 www.elsevier.com/locate/jcat NO x adsorption over a wide temperature range on Na-ZSM-5 films Indra Perdana a,∗,1 , Derek Creaser a , Olov Öhrman b , Jonas Hedlund b a Department of Chemical Engineering and Environmental Science, Chalmers University of Technology, SE-412 96, Gothenburg, Sweden b Div. of Chemical Technology, Luleå University of Technology, SE-971 87, Luleå, Sweden Received 16 March 2005; revised 30 May 2005; accepted 9 June 2005 Available online 21 July 2005 Abstract NO x adsorption over a wide temperature range (30–350 ◦ C) on monolith supported Na-ZSM-5 films were studied with a gas flow reactor. The nature of the adsorbed species was further investigated by in situ infrared spectroscopy. Depending on the adsorption temperature, three different ranges of thermally stable species were observed on Na-ZSM-5 films. In addition to the role of cationic sites and residual hydroxyl groups in zeolite frameworks, it was found that the formation of nitric acid plays an important role in NO 2 adsorption. Nitrate species were formed during adsorption by two mechanisms. The nitrates formed via nitric acid and involving NO formation had lower thermal stability than those formed through an NO 2 disproportionation reaction. 2005 Elsevier Inc. All rights reserved. Keywords: NO x adsorption; Monolith; ZMS-5 films; Adsorption mechanisms 1. Introduction Zeolites are alumina silicates with a well-defined crys- talline structure with cavities and pores of molecular dimen- sions. Positively charged cations are often required in the structure to balance the charge. These cations are exchange- able and influence the catalytic and transport properties of the zeolite. These characteristics make zeolites promising materials for catalysis and separation applications. Among the different types of zeolites, the MFI type in particular (i.e., ZSM-5 and silicalite-1) is widely used and studied. For separation applications, zeolite crystals may be inter- grown to form a film on a porous support material, resulting in a zeolite membrane. The selective permeation of a certain component through zeolite membranes strongly depends on both the adsorption properties and mobility of the compo- nent in the zeolite. Zeolite powder samples are commonly used to study the adsorption of components on zeolites. * Corresponding author. Fax: +46-31-7723035. E-mail address: [email protected] (D. Creaser). 1 On leave from Department of Chemical Engineering, Gadjah Mada Uni- versity, Indonesia. However, a direct adsorption study using a zeolite film with crystal morphology similar to that of the membranes can lead to a better understanding of the adsorption and trans- port properties for a membrane. Recently, it was possible to coat monolithic and other structured support materials with binder-free zeolite films [1–3], and the films were cat- alytically active [2,3]. However, it has been found that the presence of defects in thick films could increase the effective diffusivity and eventually reduce catalyst selectivity [4,5]. NO x adsorption on catalytic materials has been an im- portant research topic for the development of transport and stationary exhaust after treatment systems. Investigations of NO x adsorption on cation-exchanged zeolites have been re- ported in a number of publications. It has been found that NO is much more weakly adsorbed than NO 2 on several cation-exchanged zeolites [6,7] and requires a low temper- ature for storage [8,9]. To obtain storage of NO, oxidation to NO 2 is required [6,10,11]. Depending on the nature of the zeolite, various adsorbed NO x species may exist. Infrared studies, mostly at near-ambient temperatures, show that in most cation-exchanged zeolites, surface nitrate species are formed after NO x exposure, and the species are mainly lo- cated on the metal sites [7,11–14]. 0021-9517/$ – see front matter 2005 Elsevier Inc. All rights reserved. doi:10.1016/j.jcat.2005.06.007
-
Upload
ubrawijaya -
Category
Documents
-
view
3 -
download
0
Transcript of NO x adsorption over a wide temperature range on Na-ZSM-5 films
t
s
n
ctor.rature, threel hydroxylrestability
Journal of Catalysis 234 (2005) 219–229
www.elsevier.com/locate/jca
NOx adsorption over a wide temperature range on Na-ZSM-5 film
Indra Perdanaa,∗,1, Derek Creasera, Olov Öhrmanb, Jonas Hedlundb
a Department of Chemical Engineering and Environmental Science, Chalmers University of Technology, SE-412 96, Gothenburg, Swedeb Div. of Chemical Technology, Luleå University of Technology, SE-971 87, Luleå, Sweden
Received 16 March 2005; revised 30 May 2005; accepted 9 June 2005
Available online 21 July 2005
Abstract
NOx adsorption over a wide temperature range (30–350◦C) on monolith supported Na-ZSM-5 films were studied with a gas flow reaThe nature of the adsorbed species was further investigated by in situ infrared spectroscopy. Depending on the adsorption tempedifferent ranges of thermally stable species were observed on Na-ZSM-5 films. In addition to the role of cationic sites and residuagroups in zeolite frameworks, it was found that the formation of nitric acid plays an important role in NO2 adsorption. Nitrate species weformed during adsorption by two mechanisms. The nitrates formed via nitric acid and involving NO formation had lower thermalthan those formed through an NO2 disproportionation reaction. 2005 Elsevier Inc. All rights reserved.
Keywords:NO adsorption; Monolith; ZMS-5 films; Adsorption mechanisms
ys-en-the
anges ofsingonge.,
ter-ingrtains onpo-nly
ites.
ithcanans-ibleials-etive
im-and
ns ofn re-that
r-oedat in
x
1. Introduction
Zeolites are alumina silicates with a well-defined crtalline structure with cavities and pores of molecular dimsions. Positively charged cations are often required instructure to balance the charge. These cations are exchable and influence the catalytic and transport propertiethe zeolite. These characteristics make zeolites promimaterials for catalysis and separation applications. Amthe different types of zeolites, the MFI type in particular (i.ZSM-5 and silicalite-1) is widely used and studied.
For separation applications, zeolite crystals may be ingrown to form a film on a porous support material, resultin a zeolite membrane. The selective permeation of a cecomponent through zeolite membranes strongly dependboth the adsorption properties and mobility of the comnent in the zeolite. Zeolite powder samples are commoused to study the adsorption of components on zeol
* Corresponding author. Fax: +46-31-7723035.
E-mail address:[email protected](D. Creaser).1 On leave from Department of Chemical Engineering, Gadjah Mada Uni-versity, Indonesia.
0021-9517/$ – see front matter 2005 Elsevier Inc. All rights reserved.doi:10.1016/j.jcat.2005.06.007
-
However, a direct adsorption study using a zeolite film wcrystal morphology similar to that of the membraneslead to a better understanding of the adsorption and trport properties for a membrane. Recently, it was possto coat monolithic and other structured support materwith binder-free zeolite films[1–3], and the films were catalytically active[2,3]. However, it has been found that thpresence of defects in thick films could increase the effecdiffusivity and eventually reduce catalyst selectivity[4,5].
NOx adsorption on catalytic materials has been anportant research topic for the development of transportstationary exhaust after treatment systems. InvestigatioNOx adsorption on cation-exchanged zeolites have beeported in a number of publications. It has been foundNO is much more weakly adsorbed than NO2 on severalcation-exchanged zeolites[6,7] and requires a low tempeature for storage[8,9]. To obtain storage of NO, oxidation tNO2 is required[6,10,11]. Depending on the nature of thzeolite, various adsorbed NOx species may exist. Infrarestudies, mostly at near-ambient temperatures, show th
most cation-exchanged zeolites, surface nitrate species areformed after NOx exposure, and the species are mainly lo-cated on the metal sites[7,11–14].
of Ca
rn-eO
rite-d inch-ive-
ritethe
hasd
hy-ith
t-oniaast1 Mltra-rom
on
a-the
ult-at
am-
mi-oncetal-thee
gas-artzandt onera-cou-wasgas
plesolithmo-reasf thep-ctor-
-aturegas
n-rs.
ollerher-terad-
bedper-
d tociesi-tin.n ar-ce
-gasncead-ering,
per-00ple
220 I. Perdana et al. / Journal
However, there is no information now available conceing NOx adsorption on the zeolite in the form of a film. Thpresent work is devoted to a study of the adsorption of Nx
on an oriented Na-ZSM-5 film supported on a cordiemonolith. The presence of adsorbed NOx species is studied by temperature-programmed desorption (TPD) ansitu DRIFT spectroscopy. In this report an adsorption meanism is also proposed. The results from this work gvaluable insights into NOx adsorption and transport in NaZSM-5 films or membranes.
2. Experimental
2.1. Sample preparation
The Na-ZSM-5 film samples were prepared on cordiemonoliths. The monoliths consist of 188 channels incross section with a channel dimension of 1× 1 mm. A de-tailed description of the sample preparation procedurebeen reported elsewhere[2]. The monoliths were seedewith 60-nm silicalite-1 seeds[15,16] and hydrothermallytreated repeatedly at atmospheric pressure at 75◦C for 48 h.The seeded monolith samples used in this work weredrothermally treated 12 times in a synthesis solution wa molar composition of 3 TPAOH:25 SiO2:0.25 Al2O3:1Na2O:1600 H2O:100 EtOH. Between hydrothermal treaments the samples were rinsed with 0.1 M aqueous ammsolution and treated with ultrasound for 10 min. After the lhydrothermal treatment the samples were rinsed in a 0.aqueous ammonia solution for 4 days and treated with usound for 1 h each day. To remove precipitated zeolite fthe ends of the monoliths, the monoliths were polishedeach side to a length of 75 mm.
A powder sample for in situ DRIFT spectroscopy mesurements was prepared from a synthesis solution withsame composition as that used for film growth. The resing ZSM-5 crystals were hydrothermally treated for 72 h100◦C, but without the support and silicalite-1 seeds[2]. Toremove the template material, the monolith and powder sples were finally calcined at 550◦C for 6 h with a heatingand cooling rate of 1.75◦C min−1.
The samples were characterized by scanning electroncroscopy (SEM) (Philips XL 30) and with nitrogen sorpti(Micromeritics ASAP 2010). It was found that the surfaarea of the support is negligible compared with the tosurface area of the sample[5]. Therefore, the zeolite loading was determined from gas sorption data (BET), withsurface area of ZSM-5 powder (415 m2/g) as a referenc
[5,17]. The elemental content of the powder sample wasdetermined by inductively coupled plasma atomic emissionspectroscopy (ICP-AES).talysis 234 (2005) 219–229
2.2. Adsorption–desorption measurements
NO2 adsorption measurements were performed in aflow reactor. The reactor consisted of a horizontal qutube with a length of 880 mm and a diameter of 22 mmwas equipped with a circular electrical heating elementhe outer surface of the tube. To regulate the gas tempture and measure the sample temperature, two thermoples were placed in the reactor. The monolith samplesealed in the quartz tube with glass wool to prevent theflow from bypassing the channels. The two thermocouwere inserted into channels near the center of the monand from the downstream end of the monolith. One thercouple was inserted about 5 mm into the monolith, whethe second thermocouple traversed the entire length omonolith so that it protruded about 10 mm out of the ustream end. We minimized heat loss by enclosing the reawith glass wool insulation. Before NO2 adsorption, the sample was pretreated with 8% O2 in argon at 500◦C for 15 minat a total flow rate of 3000 ml/min (STP). After the pretreatment, the sample was cooled to the adsorption temperand equilibrated in an argon flow. For the adsorption, amixture at a total flow rate of 2600 ml/min (STP) containing600 ppm NO2 in argon was prepared in a gas mixer (Evironics 2000) consisting of several mass flow controlleThe temperature was regulated with a temperature contr(Eurotherm), with the use of the measurement from the tmocouple positioned 10 mm in front of the sample. Afadsorption, the sample was flushed with only argon at thesorption temperature. Finally, to release all of the adsorspecies, the sample was heated from the adsorption temature to 550◦C with a temperature ramp of 20◦C/min in anargon atmosphere during TPD.
In some experiments, the sample was also exposeNO in argon. The influence of NO on the adsorbed spewas investigated at 350◦C. The sample was first equilbrated with 600 ppm NO2 for 20 min. After establishmenof equilibrium, the sample was flushed with argon for 5 mSubsequently, at the same temperature, 600 ppm NO igon was introduced at the inlet. In addition, the influenof NO was further studied by NO2/NO co-adsorption experiments. During adsorption and desorption the outletcomposition was analyzed online with a chemiluminesedetector (Ecophysics CLD 700 EL ht). The amount ofsorbed/desorbed NOx was quantified from the area undcorresponding concentration curves of adsorption, flushand TPD.
2.3. In situ DRIFT spectroscopy measurements
In situ DRIFT spectroscopy measurements wereformed with a rapid scan method with a Bio Rad FTS60spectrometer. The zeolite powder was placed in a sam
holder assembly in a Harrick Praying Mantis DRIFT cell.The gases were supplied by individual mass flow controllerswith a total flow rate of 200 ml/min (STP). Before NO2 ad-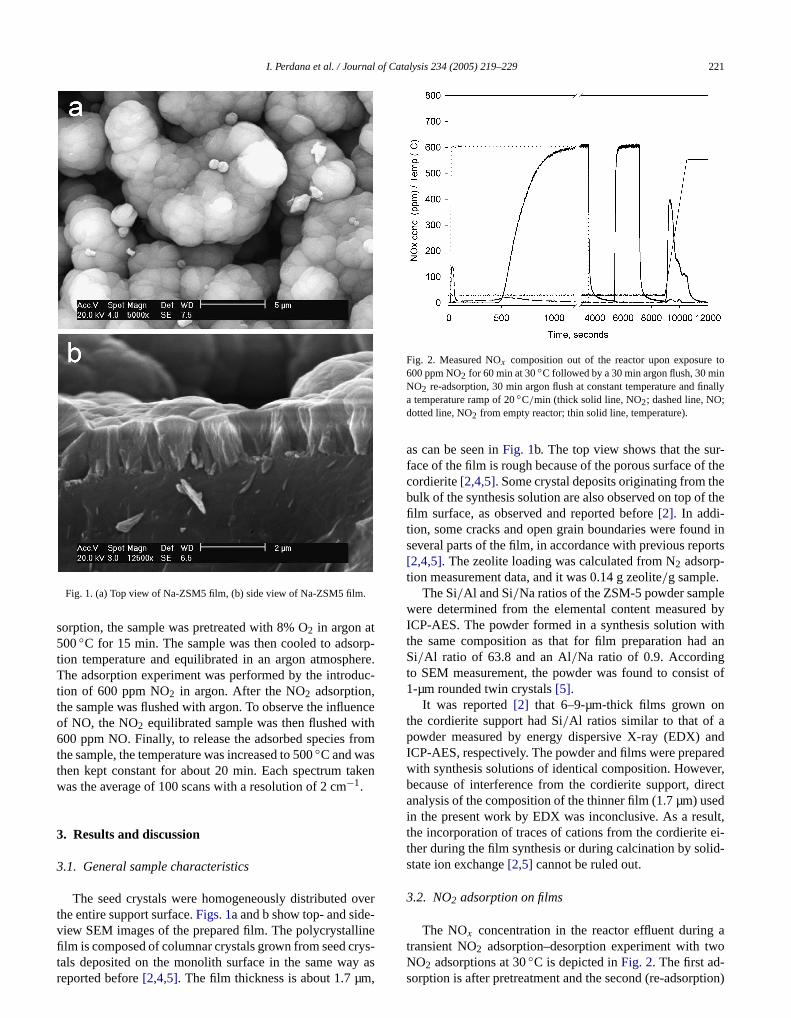
l of C
rp-ereuc-
nceithfrom
ken
over-
ine
tonnally
r-f thehef the
d inorts
led byithan
t of
andreder,rected
ult,ei-
lid-
a
I. Perdana et al. / Journa
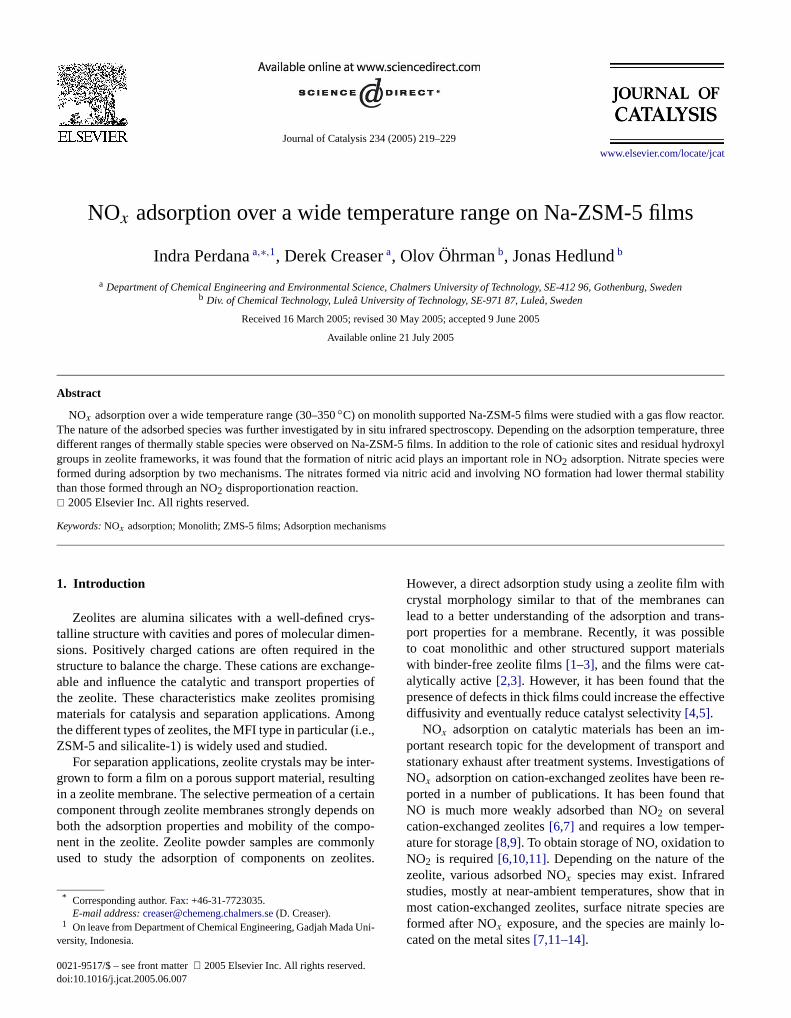
Fig. 1. (a) Top view of Na-ZSM5 film, (b) side view of Na-ZSM5 film.
sorption, the sample was pretreated with 8% O2 in argon at500◦C for 15 min. The sample was then cooled to adsotion temperature and equilibrated in an argon atmosphThe adsorption experiment was performed by the introdtion of 600 ppm NO2 in argon. After the NO2 adsorption,the sample was flushed with argon. To observe the influeof NO, the NO2 equilibrated sample was then flushed w600 ppm NO. Finally, to release the adsorbed speciesthe sample, the temperature was increased to 500◦C and wasthen kept constant for about 20 min. Each spectrum tawas the average of 100 scans with a resolution of 2 cm−1.
3. Results and discussion
3.1. General sample characteristics
The seed crystals were homogeneously distributedthe entire support surface.Figs. 1a and b show top- and sideview SEM images of the prepared film. The polycrystall
film is composed of columnar crystals grown from seed crys-tals deposited on the monolith surface in the same way asreported before[2,4,5]. The film thickness is about 1.7 µm,atalysis 234 (2005) 219–229 221
.
Fig. 2. Measured NOx composition out of the reactor upon exposure600 ppm NO2 for 60 min at 30◦C followed by a 30 min argon flush, 30 miNO2 re-adsorption, 30 min argon flush at constant temperature and fia temperature ramp of 20◦C/min (thick solid line, NO2; dashed line, NO;dotted line, NO2 from empty reactor; thin solid line, temperature).
as can be seen inFig. 1b. The top view shows that the suface of the film is rough because of the porous surface ocordierite[2,4,5]. Some crystal deposits originating from tbulk of the synthesis solution are also observed on top ofilm surface, as observed and reported before[2]. In addi-tion, some cracks and open grain boundaries were founseveral parts of the film, in accordance with previous rep[2,4,5]. The zeolite loading was calculated from N2 adsorp-tion measurement data, and it was 0.14 g zeolite/g sample.
The Si/Al and Si/Na ratios of the ZSM-5 powder sampwere determined from the elemental content measureICP-AES. The powder formed in a synthesis solution wthe same composition as that for film preparation hadSi/Al ratio of 63.8 and an Al/Na ratio of 0.9. Accordingto SEM measurement, the powder was found to consis1-µm rounded twin crystals[5].
It was reported[2] that 6–9-µm-thick films grown onthe cordierite support had Si/Al ratios similar to that of apowder measured by energy dispersive X-ray (EDX)ICP-AES, respectively. The powder and films were prepawith synthesis solutions of identical composition. Howevbecause of interference from the cordierite support, dianalysis of the composition of the thinner film (1.7 µm) usin the present work by EDX was inconclusive. As a resthe incorporation of traces of cations from the cordieritether during the film synthesis or during calcination by sostate ion exchange[2,5] cannot be ruled out.
3.2. NO2 adsorption on films
The NOx concentration in the reactor effluent during
transient NO2 adsorption–desorption experiment with twoNO2 adsorptions at 30◦C is depicted inFig. 2. The first ad-sorption is after pretreatment and the second (re-adsorption)
of Ca
ng
pm
lithOthe
thesn,
ion.
trp-ase
flux
stemtheult-
erytedatarb
her
be-ly
hed-bedesisveryndwedNO-pty
er-ad-thefullyrgoionhesh-
as
ious
tion
ut
oncenwith
rtedfilm
orp-tures.
atgasOntra-
k in-sites,ch
ra-
gD
-, for
222 I. Perdana et al. / Journal
is after argon flushing following the first adsorption. Durithe first adsorption, a large uptake of NO2 is observed, indi-cated by the long time needed to reach equilibrium (600 pNO2 in effluent). In contrast, the NO2 response is only afew seconds for an empty reactor (reactor without monosample) experiment. When the sample is exposed to N2 apeak in NO concentration is observed immediately, andconcentration of NO in the effluent remains low whensample is equilibrated with NO2. This observation indicatethat NO2 adsorption likely involves a fast surface reactioresulting in simultaneous NO formation and NO desorptAs shown inFig. 2, the adsorption at 30◦C proceeds with avery low concentration of NO and NO2 present over abou8 min. This period is mainly dependent on the total adsotion capacity. Further adsorption time results in an increin NO2 concentration in the effluent because the NO2 con-vective transport through the monolith exceeds the totalof NO2 transported into the zeolite film. Although the NO2
concentration in the effluent steeply increases, the sydoes not reach equilibrium immediately. Furthermore,adsorption still proceeds with the production of NO, resing in a very low concentration of NO in the effluent.
Szanyi et al. reported that zeolites adsorb NO vweakly, even at room temperature[7]. As a result, mosnet NO produced because of NO2 storage should leave thzeolite surface by desorption into the gas phase. Thein Fig. 2. in combination with the fact that zeolites adsomainly NO2 and only a small amount of NO, show that tNO2 storage at 30◦C resulting in NO formation accounts foonly a small part of the total storage of NO2. Furthermore,since a high concentration of NO is observed only in theginning of NO2 adsorption; this indicates that NO mainforms when NO2 is adsorbed on a strong site.
After equilibrium was reached, the sample was fluswith argon.Fig. 2 shows that mostly NO2 is released during this treatment. The release is mainly from physisorspecies. However, because of a high mass transport rtance in the film at low temperature, the release occursslowly. Experiments with different film samples (0.8- a1.9-µm-thick films), as we have reported elsewhere, shothat mass transport resistance influenced the rate of2adsorption. In contrast, a drop in NO2 concentration was observed within a few seconds in an experiment with an emreactor.
NO2 re-adsorption after argon flushing gives a diffent concentration profile compared with the previoussorption. Equilibrium is reached much faster duringre-adsorption. It seems that the re-adsorption successrecovers the physisorbed species released during aflushing. In contrast to the first adsorption, NO desorptis absent from the NO2 re-adsorption. This suggests that tspecies resulting from NO formation are stable during flu
ing with argon and still occupy surface sites and that thesespecies are adsorbed strongly. An argon flushing followingthe equilibration releases the physisorbed species again withtalysis 234 (2005) 219–229
-
n
Fig. 3. Measured NOx composition out of the reactor when the sample wexposed to 600 ppm NO2 at 350◦C for 20 min followed by a 5 min argonflush and NO2 re-adsorption for 5 min (thick solid line, NO2; dashed line,NO; dotted line, NO2 from empty reactor; thin solid line, temperature).
the same effluent concentration profile as in the prevflushing.
Similar adsorption phenomena arise from the adsorpat higher temperatures.Fig. 3 shows that NO2 adsorptionat 350◦C also occurs with simultaneous NO formation breaches equilibrium more quickly than at 30◦C. The NOconcentration in the effluent increases instantaneouslythe sample is exposed to NO2, resulting in a concentratiopeak. However, the NO concentration decreases slowlyadditional adsorption time, resulting in a broad peak.
In comparison with the adsorption at 30◦C, the sam-ple obviously has a lower storage capacity at 350◦C, sinceequilibrium is reached after a shorter time. As we repoelsewhere, adsorption and mass transport in the zeoliteare thermally activated, so that the rates of both adstion and mass transport are faster at elevated temperaThe smaller effect of mass transport resistance in the film350◦C is also indicated by the quicker responses of theconcentrations during flushing and re-adsorption. The N2gas concentration in the effluent reaches the feed concetion rapidly. The peak of NO from the adsorption at 350◦Cis broader and has a lower maximum. The broader peadicates that the time needed to saturate the adsorptionleading to NO formation, is longer probably due to the mulower NO2 concentration in the film at the higher tempetures.
After NO2 adsorption at both 30◦C (Fig. 2) and 350◦C(Fig. 3), it is predominately NO2 that is desorbed durinTPD. A small amount of NO was desorbed during TPafter adsorption at 30◦C (Fig. 2). It is probably mostlyphysisorbed NO released from NO2 adsorption at low temperatures. However, at higher adsorption temperatures
◦
example 350C in Fig. 2, no desorption of NO was detected.Since the quantity of NO2 entering the reactor is known,the amount of adsorbed/desorbed NOx can be quantified by
l of C
per-
s ofad-
esoftindi
per-The
in
theorredif-cte
turearerbednd,d-and
ace,
thesedthes
he
tor-
witht thebleeciestion.ther
ing
er a
Dsh-ciestion
isOrior
e torate
fur-r
en-ifi-s has
d NOifi-
I. Perdana et al. / Journa
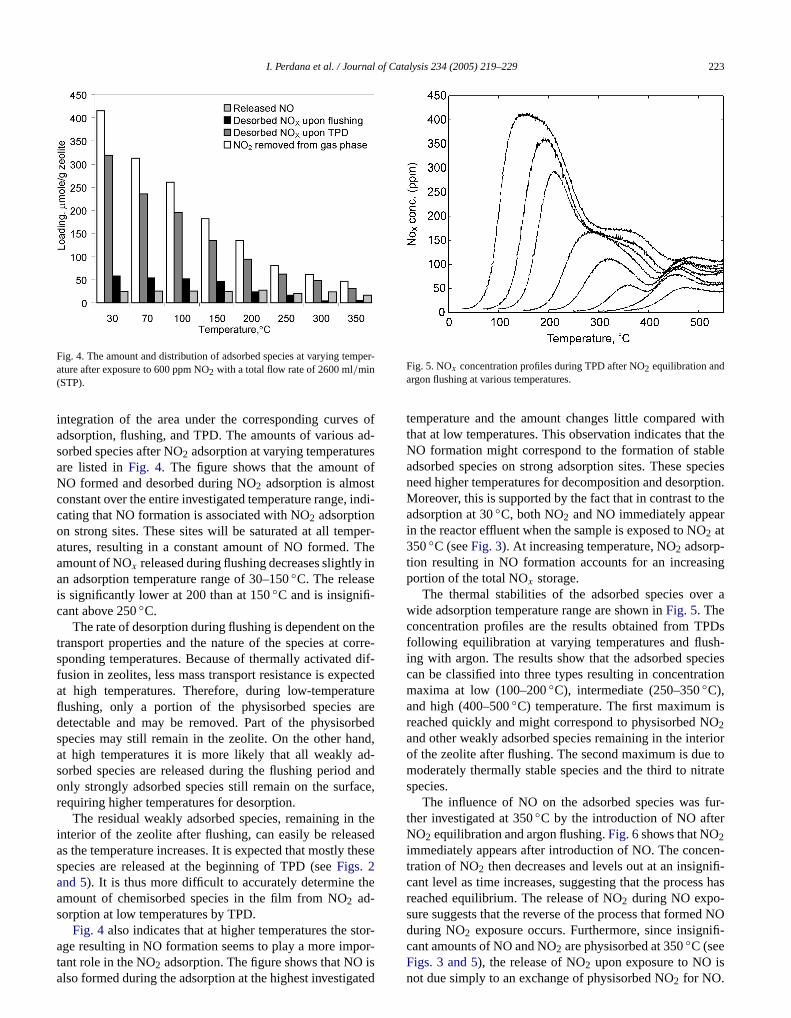
Fig. 4. The amount and distribution of adsorbed species at varying temature after exposure to 600 ppm NO2 with a total flow rate of 2600 ml/min(STP).
integration of the area under the corresponding curveadsorption, flushing, and TPD. The amounts of varioussorbed species after NO2 adsorption at varying temperaturare listed inFig. 4. The figure shows that the amountNO formed and desorbed during NO2 adsorption is almosconstant over the entire investigated temperature range,cating that NO formation is associated with NO2 adsorptionon strong sites. These sites will be saturated at all tematures, resulting in a constant amount of NO formed.amount of NOx released during flushing decreases slightlyan adsorption temperature range of 30–150◦C. The releaseis significantly lower at 200 than at 150◦C and is insignifi-cant above 250◦C.
The rate of desorption during flushing is dependent ontransport properties and the nature of the species at csponding temperatures. Because of thermally activatedfusion in zeolites, less mass transport resistance is expeat high temperatures. Therefore, during low-temperaflushing, only a portion of the physisorbed speciesdetectable and may be removed. Part of the physisospecies may still remain in the zeolite. On the other haat high temperatures it is more likely that all weakly asorbed species are released during the flushing periodonly strongly adsorbed species still remain on the surfrequiring higher temperatures for desorption.
The residual weakly adsorbed species, remaining ininterior of the zeolite after flushing, can easily be releaas the temperature increases. It is expected that mostlyspecies are released at the beginning of TPD (seeFigs. 2and 5). It is thus more difficult to accurately determine tamount of chemisorbed species in the film from NO2 ad-sorption at low temperatures by TPD.
Fig. 4 also indicates that at higher temperatures the s
age resulting in NO formation seems to play a more impor-tant role in the NO2 adsorption. The figure shows that NO isalso formed during the adsorption at the highest investigatedatalysis 234 (2005) 219–229 223
-
-
d
e
Fig. 5. NOx concentration profiles during TPD after NO2 equilibration andargon flushing at various temperatures.
temperature and the amount changes little comparedthat at low temperatures. This observation indicates thaNO formation might correspond to the formation of staadsorbed species on strong adsorption sites. These spneed higher temperatures for decomposition and desorpMoreover, this is supported by the fact that in contrast toadsorption at 30◦C, both NO2 and NO immediately appeain the reactor effluent when the sample is exposed to NO2 at350◦C (seeFig. 3). At increasing temperature, NO2 adsorp-tion resulting in NO formation accounts for an increasportion of the total NOx storage.
The thermal stabilities of the adsorbed species ovwide adsorption temperature range are shown inFig. 5. Theconcentration profiles are the results obtained from TPfollowing equilibration at varying temperatures and flusing with argon. The results show that the adsorbed specan be classified into three types resulting in concentramaxima at low (100–200◦C), intermediate (250–350◦C),and high (400–500◦C) temperature. The first maximumreached quickly and might correspond to physisorbed N2and other weakly adsorbed species remaining in the inteof the zeolite after flushing. The second maximum is dumoderately thermally stable species and the third to nitspecies.
The influence of NO on the adsorbed species wasther investigated at 350◦C by the introduction of NO afteNO2 equilibration and argon flushing.Fig. 6shows that NO2immediately appears after introduction of NO. The conctration of NO2 then decreases and levels out at an insigncant level as time increases, suggesting that the procesreached equilibrium. The release of NO2 during NO expo-sure suggests that the reverse of the process that formeduring NO2 exposure occurs. Furthermore, since insign
◦
cant amounts of NO and NO2 are physisorbed at 350C (seeFigs. 3 and 5), the release of NO2 upon exposure to NO isnot due simply to an exchange of physisorbed NO2 for NO.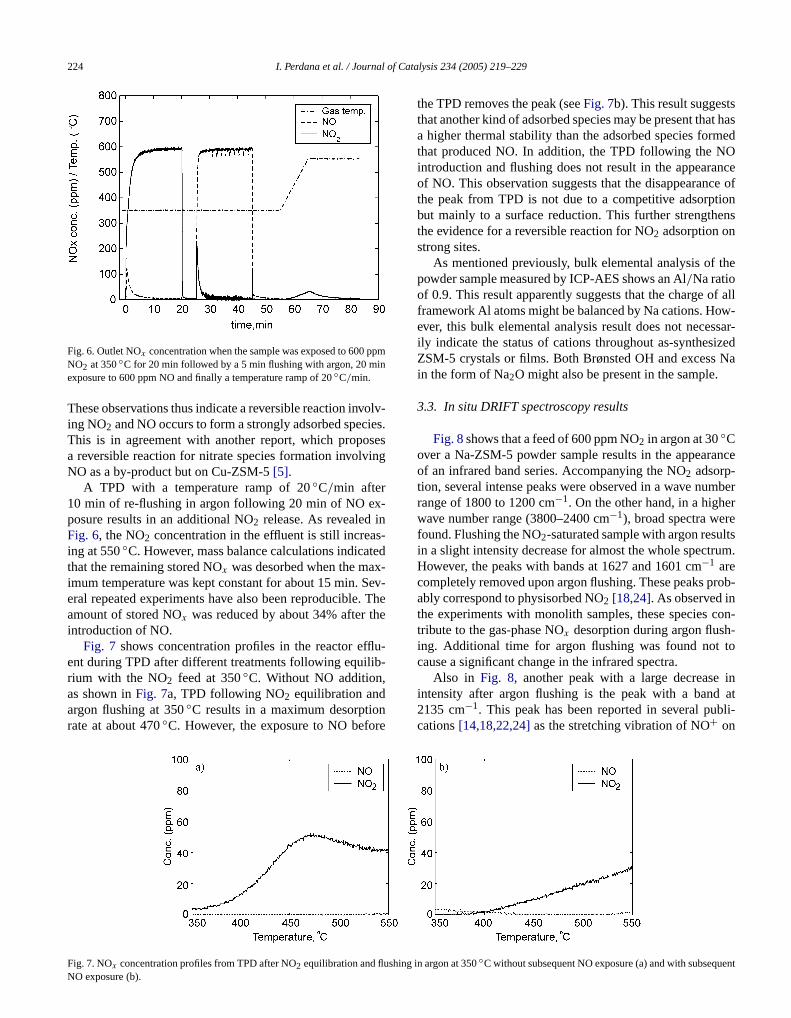
of Ca
ppmin
olv-ies.sesing
-ns-tedx-ev-
. Thhe
u-ib-
st has
medOnce
ce oftionens
the
f allw-
ssar-izedNa
nce
mberr
eltsum.
rob-
con--to
in
224 I. Perdana et al. / Journal
Fig. 6. Outlet NOx concentration when the sample was exposed to 600NO2 at 350◦C for 20 min followed by a 5 min flushing with argon, 20 mexposure to 600 ppm NO and finally a temperature ramp of 20◦C/min.
These observations thus indicate a reversible reaction inving NO2 and NO occurs to form a strongly adsorbed specThis is in agreement with another report, which propoa reversible reaction for nitrate species formation involvNO as a by-product but on Cu-ZSM-5[5].
A TPD with a temperature ramp of 20◦C/min after10 min of re-flushing in argon following 20 min of NO exposure results in an additional NO2 release. As revealed iFig. 6, the NO2 concentration in the effluent is still increaing at 550◦C. However, mass balance calculations indicathat the remaining stored NOx was desorbed when the maimum temperature was kept constant for about 15 min. Seral repeated experiments have also been reproducibleamount of stored NOx was reduced by about 34% after tintroduction of NO.
Fig. 7 shows concentration profiles in the reactor efflent during TPD after different treatments following equilrium with the NO2 feed at 350◦C. Without NO addition,
as shown inFig. 7a, TPD following NO2 equilibration andFig. 7. NOx concentration profiles from TPD after NO2 equilibration and flushinNO exposure (b).
talysis 234 (2005) 219–229
e
the TPD removes the peak (seeFig. 7b). This result suggestthat another kind of adsorbed species may be present thaa higher thermal stability than the adsorbed species forthat produced NO. In addition, the TPD following the Nintroduction and flushing does not result in the appearaof NO. This observation suggests that the disappearanthe peak from TPD is not due to a competitive adsorpbut mainly to a surface reduction. This further strengththe evidence for a reversible reaction for NO2 adsorption onstrong sites.
As mentioned previously, bulk elemental analysis ofpowder sample measured by ICP-AES shows an Al/Na ratioof 0.9. This result apparently suggests that the charge oframework Al atoms might be balanced by Na cations. Hoever, this bulk elemental analysis result does not neceily indicate the status of cations throughout as-synthesZSM-5 crystals or films. Both Brønsted OH and excessin the form of Na2O might also be present in the sample.
3.3. In situ DRIFT spectroscopy results
Fig. 8shows that a feed of 600 ppm NO2 in argon at 30◦Cover a Na-ZSM-5 powder sample results in the appearaof an infrared band series. Accompanying the NO2 adsorp-tion, several intense peaks were observed in a wave nurange of 1800 to 1200 cm−1. On the other hand, in a highewave number range (3800–2400 cm−1), broad spectra werfound. Flushing the NO2-saturated sample with argon resuin a slight intensity decrease for almost the whole spectrHowever, the peaks with bands at 1627 and 1601 cm−1 arecompletely removed upon argon flushing. These peaks pably correspond to physisorbed NO2 [18,24]. As observed inthe experiments with monolith samples, these speciestribute to the gas-phase NOx desorption during argon flushing. Additional time for argon flushing was found notcause a significant change in the infrared spectra.
Also in Fig. 8, another peak with a large decrease
intensity after argon flushing is the peak with a band atbli-
argon flushing at 350◦C results in a maximum desorptionrate at about 470◦C. However, the exposure to NO before2135 cm−1. This peak has been reported in several pucations[14,18,22,24]as the stretching vibration of NO+ on
g in argon at 350◦C without subsequent NO exposure (a) and with subsequent
l of C
aktot-
Oor-an
in-as
ra-es-7of
plethatater
nedas-as
NO
cid
st.
rede
ais
psl-hisups
ith-
Othe
ateda
k of
67is
00–in
k
heseir in-
I. Perdana et al. / Journa
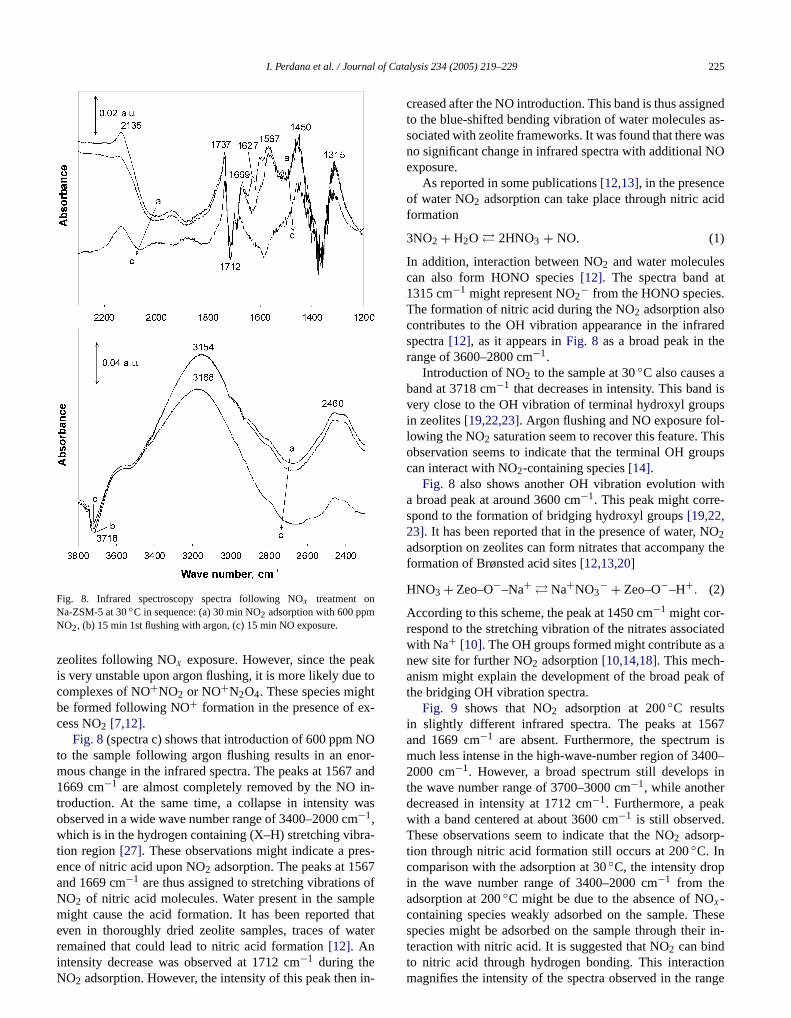
Fig. 8. Infrared spectroscopy spectra following NOx treatment onNa-ZSM-5 at 30◦C in sequence: (a) 30 min NO2 adsorption with 600 ppmNO2, (b) 15 min 1st flushing with argon, (c) 15 min NO exposure.
zeolites following NOx exposure. However, since the peis very unstable upon argon flushing, it is more likely duecomplexes of NO+NO2 or NO+N2O4. These species mighbe formed following NO+ formation in the presence of excess NO2 [7,12].
Fig. 8(spectra c) shows that introduction of 600 ppm Nto the sample following argon flushing results in an enmous change in the infrared spectra. The peaks at 15671669 cm−1 are almost completely removed by the NOtroduction. At the same time, a collapse in intensity wobserved in a wide wave number range of 3400–2000 cm−1,which is in the hydrogen containing (X–H) stretching vibtion region[27]. These observations might indicate a prence of nitric acid upon NO2 adsorption. The peaks at 156and 1669 cm−1 are thus assigned to stretching vibrationsNO2 of nitric acid molecules. Water present in the sammight cause the acid formation. It has been reportedeven in thoroughly dried zeolite samples, traces of w
remained that could lead to nitric acid formation[12]. Anintensity decrease was observed at 1712 cm−1 during theNO2 adsorption. However, the intensity of this peak then in-atalysis 234 (2005) 219–229 225
d
creased after the NO introduction. This band is thus assigto the blue-shifted bending vibration of water moleculessociated with zeolite frameworks. It was found that there wno significant change in infrared spectra with additionalexposure.
As reported in some publications[12,13], in the presenceof water NO2 adsorption can take place through nitric aformation
3NO2 + H2O � 2HNO3 + NO. (1)
In addition, interaction between NO2 and water moleculecan also form HONO species[12]. The spectra band a1315 cm−1 might represent NO2− from the HONO speciesThe formation of nitric acid during the NO2 adsorption alsocontributes to the OH vibration appearance in the infraspectra[12], as it appears inFig. 8 as a broad peak in thrange of 3600–2800 cm−1.
Introduction of NO2 to the sample at 30◦C also causesband at 3718 cm−1 that decreases in intensity. This bandvery close to the OH vibration of terminal hydroxyl grouin zeolites[19,22,23]. Argon flushing and NO exposure folowing the NO2 saturation seem to recover this feature. Tobservation seems to indicate that the terminal OH grocan interact with NO2-containing species[14].
Fig. 8 also shows another OH vibration evolution wa broad peak at around 3600 cm−1. This peak might correspond to the formation of bridging hydroxyl groups[19,22,23]. It has been reported that in the presence of water, N2adsorption on zeolites can form nitrates that accompanyformation of Brønsted acid sites[12,13,20]
(2)HNO3 + Zeo–O−–Na+ � Na+NO3− + Zeo–O−–H+.
According to this scheme, the peak at 1450 cm−1 might cor-respond to the stretching vibration of the nitrates associwith Na+ [10]. The OH groups formed might contribute asnew site for further NO2 adsorption[10,14,18]. This mech-anism might explain the development of the broad peathe bridging OH vibration spectra.
Fig. 9 shows that NO2 adsorption at 200◦C resultsin slightly different infrared spectra. The peaks at 15and 1669 cm−1 are absent. Furthermore, the spectrummuch less intense in the high-wave-number region of 342000 cm−1. However, a broad spectrum still developsthe wave number range of 3700–3000 cm−1, while anotherdecreased in intensity at 1712 cm−1. Furthermore, a peawith a band centered at about 3600 cm−1 is still observed.These observations seem to indicate that the NO2 adsorp-tion through nitric acid formation still occurs at 200◦C. Incomparison with the adsorption at 30◦C, the intensity dropin the wave number range of 3400–2000 cm−1 from theadsorption at 200◦C might be due to the absence of NOx-containing species weakly adsorbed on the sample. Tspecies might be adsorbed on the sample through the
teraction with nitric acid. It is suggested that NO2 can bindto nitric acid through hydrogen bonding. This interactionmagnifies the intensity of the spectra observed in the range
of Ca
n,pa-rvedtrk-
utesrbedera-ingdi-
the
0
ge in
h-
re-over
.ser,ec-thatctra
anda-
ture
high-
fterH
nbutess ofs in
-ctra
ly,
peak
in-ter arva-hould
226 I. Perdana et al. / Journal
Fig. 9. Infrared spectroscopy spectra following NOx treatment onNa-ZSM-5 at 200◦C in sequence: (a) 30 min NO2 adsorption with 600 ppmNO2, (b) 15 min 1st flushing with argon, (c) 15 min NO exposure.
of 3400–2000 cm−1. As mentioned in the previous sectioNO2 adsorption over the monolith sample was accomnied by an almost constant NO production over the obsetemperature range (seeFig. 4). This finding suggests thathe amount of nitric acid formed in the zeolite framewoaccording to reaction(1) is also rather constant with temperature. However, the nitric acid formed might contribto the formation of weakly adsorbed NOx . These specieseem to have a slightly stronger bonding than physisoNO2. This assertion is supported by the fact that a tempture increase carried out over the monolith sample followNO2 equilibration at low temperature resulted in an immeate and large NOx desorption (seeFigs. 2 and 5). However,as mentioned previously, physisorbed NOx remaining in thezeolite framework after flushing might also contribute todesorption.
Infrared spectra generated from the adsorption at 20◦C
as depicted inFig. 9 indicates that the interactions betweenterminal OH and NOx species seem to be absent from theadsorption.Fig. 9 shows that argon flushing following NO2talysis 234 (2005) 219–229
saturation obviously removes peaks at 1602 and 1628 cm−1,which previously were assigned to physisorbed NO2. How-ever, the flushing seems not to cause a significant chanthe other peaks of the spectra.
Introduction of NO to the sample following argon flusing over the NO2 equilibrated sample at 200◦C obviouslyreduces the intensity of the spectra in the OH vibrationgion. The NO exposure seems to be able to slightly recthe spectra in the wave number range of 3000–2000 cm−1.At the same time the band at 1712 cm−1 regains its intensityThese observations suggest that the reversal of reaction(1)and (2)might take place during the NO exposure. Howevit is difficult to observe intensity changes in the nitrate sptra bands because of noise in this region. It was foundthere was no significant change in the intensity of the spewith prolonged NO exposure.
NO2 adsorption at 30 and 200◦C as shown inFigs. 8and 9also resulted in a development of a broad spectra bcentered at 2460 cm−1. This band corresponds to the vibrtion of zeolitic OH groups interacting with NOx-containingspecies and is the B component of the A–B–C strucfrom hydrogen-bonded hydroxyls[10,19,22]. The A and Ccomponents at∼2900 and∼1700 cm−1, respectively, arenot clearly observed, since the peaks are obscured byintensity vibrations of other features. As shown inFigs. 8and 9, these spectra are still clearly observed even aNO introduction. In addition to the presence of zeolitic Ogroups due to the reaction(2), zeolitic OH groups present ithe sample during sample preparation might also contrito the evolution of these spectra. However, the broadnethe B band indicates the heterogeneity of hydroxyl sitethe ZSM-5[26].
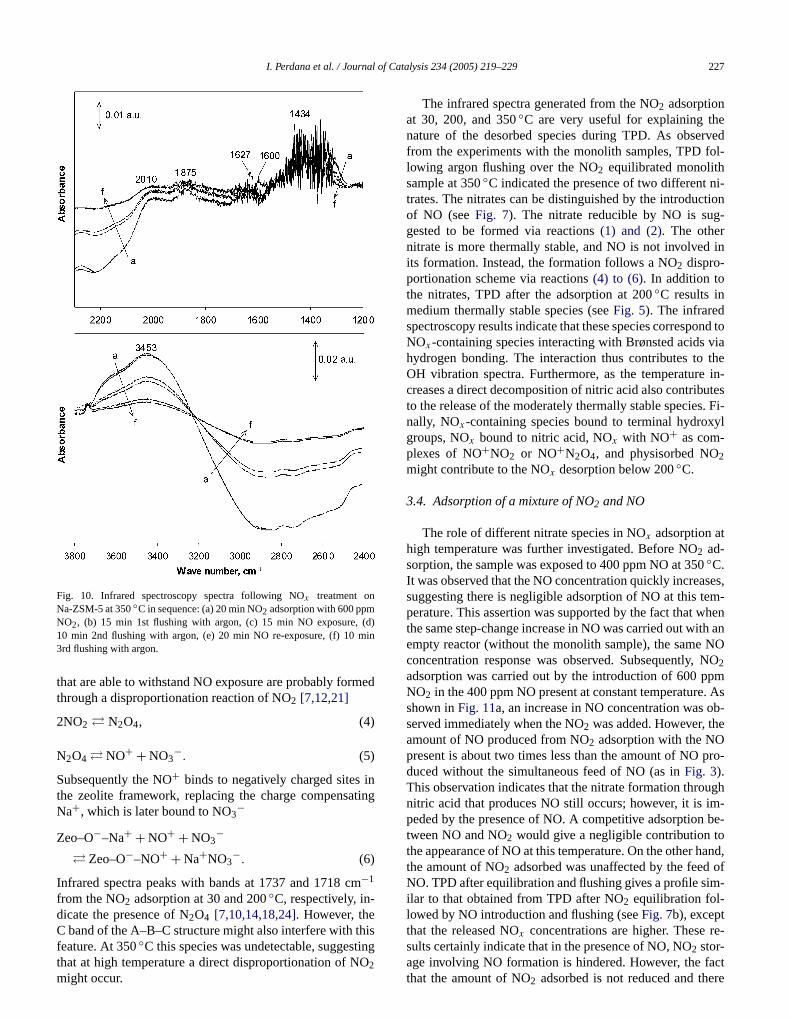
Fig. 10 shows infrared spectra from NO2 adsorption at350◦C. Features similar to those found at 200◦C were ob-served after introduction of 600 ppm NO2 and argon flushing. However, it was observed that the species with spein the wave number range of 3700–3200 cm−1 were almostcompletely removed by NO introduction. Simultaneousthe spectra at lower frequencies (3200–2000 cm−1) also re-covered their intensities. The nitrate peak and anotherwith a band at 2010 cm−1, which is assigned to NO+, arealso affected and seem to decrease in intensity upon NOtroduction. However, these two peaks are still present afrelatively long period of NO exposure. Given these obsetions, it can be asserted that another reaction scheme sbe included to explain the presence of NO+ and the nitratesspecies at 350◦C. It was reported[25,28] that NOx can in-teract with Brønsted acid to form NO+
2Zeo–O−–H+ + NO2 + NO � 2Zeo–O−–NO+ + H2O.(3)
Reaction(3), together with the reverse of reactions(1) and(2), is expected to occur during NO exposure over the NO2-equilibrated sample. In addition, more stable nitrate species
l of C
(d)in
med
inting
m
his
ervedol-
i-tion-
in
nd toviathein-
utes. Fi-yl
ses,m-hen
th anNONOpm. Asb-
e
pro-
ughm-be-
oand,of
m-
re-
I. Perdana et al. / Journa
Fig. 10. Infrared spectroscopy spectra following NOx treatment onNa-ZSM-5 at 350◦C in sequence: (a) 20 min NO2 adsorption with 600 ppmNO2, (b) 15 min 1st flushing with argon, (c) 15 min NO exposure,10 min 2nd flushing with argon, (e) 20 min NO re-exposure, (f) 10 m3rd flushing with argon.
that are able to withstand NO exposure are probably forthrough a disproportionation reaction of NO2 [7,12,21]
2NO2 � N2O4, (4)
(5)N2O4 � NO+ + NO3−.
Subsequently the NO+ binds to negatively charged sitesthe zeolite framework, replacing the charge compensaNa+, which is later bound to NO3−
Zeo–O−–Na+ + NO+ + NO3−
(6)� Zeo–O−–NO+ + Na+NO3−.
Infrared spectra peaks with bands at 1737 and 1718 c−1
from the NO2 adsorption at 30 and 200◦C, respectively, in-dicate the presence of N2O4 [7,10,14,18,24]. However, theC band of the A–B–C structure might also interfere with t
◦
feature. At 350C this species was undetectable, suggestingthat at high temperature a direct disproportionation of NO2might occur.atalysis 234 (2005) 219–229 227
The infrared spectra generated from the NO2 adsorptionat 30, 200, and 350◦C are very useful for explaining thnature of the desorbed species during TPD. As obsefrom the experiments with the monolith samples, TPD flowing argon flushing over the NO2 equilibrated monolithsample at 350◦C indicated the presence of two different ntrates. The nitrates can be distinguished by the introducof NO (seeFig. 7). The nitrate reducible by NO is suggested to be formed via reactions(1) and (2). The othernitrate is more thermally stable, and NO is not involvedits formation. Instead, the formation follows a NO2 dispro-portionation scheme via reactions(4) to (6). In addition tothe nitrates, TPD after the adsorption at 200◦C results inmedium thermally stable species (seeFig. 5). The infraredspectroscopy results indicate that these species correspoNOx-containing species interacting with Brønsted acidshydrogen bonding. The interaction thus contributes toOH vibration spectra. Furthermore, as the temperaturecreases a direct decomposition of nitric acid also contribto the release of the moderately thermally stable speciesnally, NOx-containing species bound to terminal hydroxgroups, NOx bound to nitric acid, NOx with NO+ as com-plexes of NO+NO2 or NO+N2O4, and physisorbed NO2might contribute to the NOx desorption below 200◦C.
3.4. Adsorption of a mixture of NO2 and NO
The role of different nitrate species in NOx adsorption athigh temperature was further investigated. Before NO2 ad-sorption, the sample was exposed to 400 ppm NO at 350◦C.It was observed that the NO concentration quickly increasuggesting there is negligible adsorption of NO at this teperature. This assertion was supported by the fact that wthe same step-change increase in NO was carried out wiempty reactor (without the monolith sample), the sameconcentration response was observed. Subsequently,2adsorption was carried out by the introduction of 600 pNO2 in the 400 ppm NO present at constant temperatureshown inFig. 11a, an increase in NO concentration was oserved immediately when the NO2 was added. However, thamount of NO produced from NO2 adsorption with the NOpresent is about two times less than the amount of NOduced without the simultaneous feed of NO (as inFig. 3).This observation indicates that the nitrate formation thronitric acid that produces NO still occurs; however, it is ipeded by the presence of NO. A competitive adsorptiontween NO and NO2 would give a negligible contribution tthe appearance of NO at this temperature. On the other hthe amount of NO2 adsorbed was unaffected by the feedNO. TPD after equilibration and flushing gives a profile siilar to that obtained from TPD after NO2 equilibration fol-lowed by NO introduction and flushing (seeFig. 7b), exceptthat the released NOx concentrations are higher. These
sults certainly indicate that in the presence of NO, NO2 stor-age involving NO formation is hindered. However, the factthat the amount of NO2 adsorbed is not reduced and there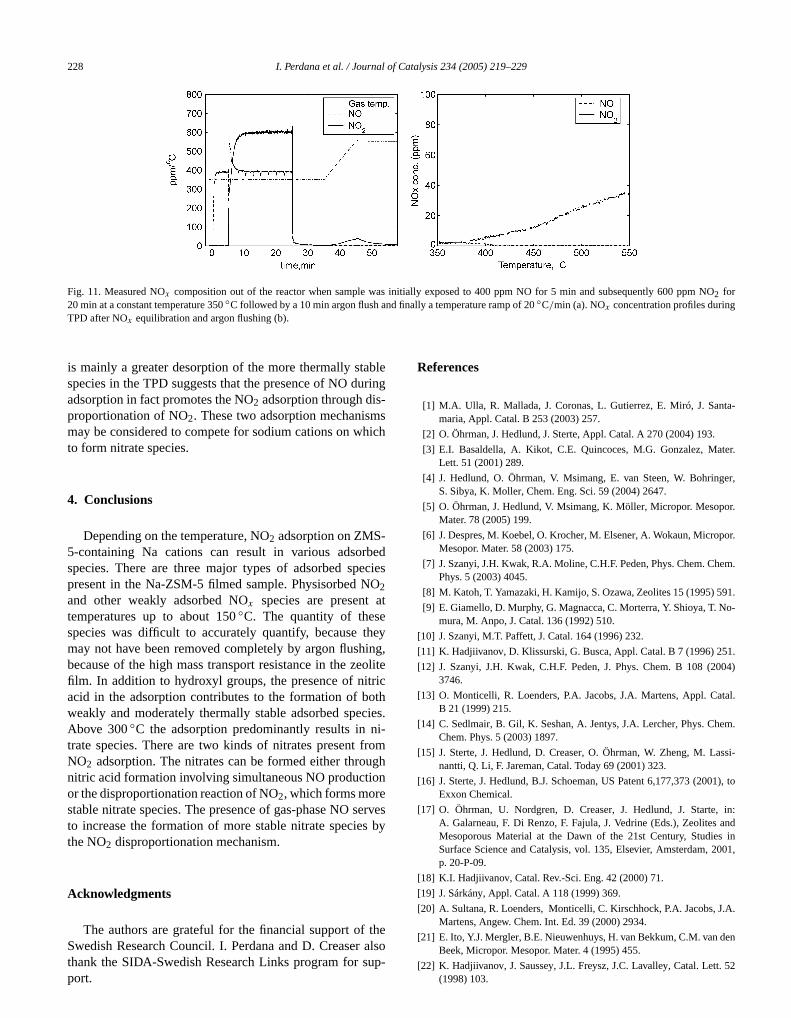
NO
228 I. Perdana et al. / Journal of Catalysis 234 (2005) 219–229
Fig. 11. Measured NOx composition out of the reactor when sample was initially exposed to 400 ppm NO for 5 min and subsequently 600 ppm2 for◦ ◦
20 min at a constant temperature 350C followed by a 10 min argon flush and finally a temperature ramp of 20C/min (a). NOx concentration profiles duringbleuring-
shich
bedecieO
at
heying,olit
ricothciesni-fromughon
erves by
the
ta-
ter.
ger,
or.
or.
em.
91.
o-
1.
004)
tal.
em.
ssi-
1), to
, in:ands in001,
J.A.
en
TPD after NOx equilibration and argon flushing (b).
is mainly a greater desorption of the more thermally staspecies in the TPD suggests that the presence of NO dadsorption in fact promotes the NO2 adsorption through disproportionation of NO2. These two adsorption mechanismmay be considered to compete for sodium cations on wto form nitrate species.
4. Conclusions
Depending on the temperature, NO2 adsorption on ZMS-5-containing Na cations can result in various adsorspecies. There are three major types of adsorbed sppresent in the Na-ZSM-5 filmed sample. Physisorbed N2
and other weakly adsorbed NOx species are presenttemperatures up to about 150◦C. The quantity of thesespecies was difficult to accurately quantify, because tmay not have been removed completely by argon flushbecause of the high mass transport resistance in the zefilm. In addition to hydroxyl groups, the presence of nitacid in the adsorption contributes to the formation of bweakly and moderately thermally stable adsorbed speAbove 300◦C the adsorption predominantly results intrate species. There are two kinds of nitrates presentNO2 adsorption. The nitrates can be formed either thronitric acid formation involving simultaneous NO productior the disproportionation reaction of NO2, which forms morestable nitrate species. The presence of gas-phase NO sto increase the formation of more stable nitrate speciethe NO2 disproportionation mechanism.
Acknowledgments
The authors are grateful for the financial support of
Swedish Research Council. I. Perdana and D. Creaser alsthank the SIDA-Swedish Research Links program for sup-port.s
e
.
s
References
[1] M.A. Ulla, R. Mallada, J. Coronas, L. Gutierrez, E. Miró, J. Sanmaria, Appl. Catal. B 253 (2003) 257.
[2] O. Öhrman, J. Hedlund, J. Sterte, Appl. Catal. A 270 (2004) 193.
[3] E.I. Basaldella, A. Kikot, C.E. Quincoces, M.G. Gonzalez, MaLett. 51 (2001) 289.
[4] J. Hedlund, O. Öhrman, V. Msimang, E. van Steen, W. BohrinS. Sibya, K. Moller, Chem. Eng. Sci. 59 (2004) 2647.
[5] O. Öhrman, J. Hedlund, V. Msimang, K. Möller, Micropor. MesopMater. 78 (2005) 199.
[6] J. Despres, M. Koebel, O. Krocher, M. Elsener, A. Wokaun, MicropMesopor. Mater. 58 (2003) 175.
[7] J. Szanyi, J.H. Kwak, R.A. Moline, C.H.F. Peden, Phys. Chem. ChPhys. 5 (2003) 4045.
[8] M. Katoh, T. Yamazaki, H. Kamijo, S. Ozawa, Zeolites 15 (1995) 5
[9] E. Giamello, D. Murphy, G. Magnacca, C. Morterra, Y. Shioya, T. Nmura, M. Anpo, J. Catal. 136 (1992) 510.
[10] J. Szanyi, M.T. Paffett, J. Catal. 164 (1996) 232.
[11] K. Hadjiivanov, D. Klissurski, G. Busca, Appl. Catal. B 7 (1996) 25
[12] J. Szanyi, J.H. Kwak, C.H.F. Peden, J. Phys. Chem. B 108 (23746.
[13] O. Monticelli, R. Loenders, P.A. Jacobs, J.A. Martens, Appl. CaB 21 (1999) 215.
[14] C. Sedlmair, B. Gil, K. Seshan, A. Jentys, J.A. Lercher, Phys. ChChem. Phys. 5 (2003) 1897.
[15] J. Sterte, J. Hedlund, D. Creaser, O. Öhrman, W. Zheng, M. Lanantti, Q. Li, F. Jareman, Catal. Today 69 (2001) 323.
[16] J. Sterte, J. Hedlund, B.J. Schoeman, US Patent 6,177,373 (200Exxon Chemical.
[17] O. Öhrman, U. Nordgren, D. Creaser, J. Hedlund, J. StarteA. Galarneau, F. Di Renzo, F. Fajula, J. Vedrine (Eds.), ZeolitesMesoporous Material at the Dawn of the 21st Century, StudieSurface Science and Catalysis, vol. 135, Elsevier, Amsterdam, 2p. 20-P-09.
[18] K.I. Hadjiivanov, Catal. Rev.-Sci. Eng. 42 (2000) 71.
[19] J. Sárkány, Appl. Catal. A 118 (1999) 369.
[20] A. Sultana, R. Loenders, Monticelli, C. Kirschhock, P.A. Jacobs,Martens, Angew. Chem. Int. Ed. 39 (2000) 2934.
[21] E. Ito, Y.J. Mergler, B.E. Nieuwenhuys, H. van Bekkum, C.M. van d
o Beek, Micropor. Mesopor. Mater. 4 (1995) 455.[22] K. Hadjiivanov, J. Saussey, J.L. Freysz, J.C. Lavalley, Catal. Lett. 52(1998) 103.

l of C
ey ion,
4)
I. Perdana et al. / Journa
[23] A. Dryer, An Introduction to Zeolite Molecular Sieves, John Willand Sons, New York, 1988, p. 122.
[24] K. Hadjiivanov, Micropor. Mesopor. Mater. 24 (1998) 41.[25] A. Penkova, K. Hadjiivanov, Catal. Commun. 4 (2003) 485.[26] J. Datka, M. Boczar, B. Gill, Langmuir 9 (1992) 2496.
atalysis 234 (2005) 219–229 229
[27] J.W. Niemantsverdriet, Spectroscopy in Catalysis: An IntroductWilley, New York, 2000.
[28] M. Mihaylov, K. Hadjiivanov, D. Panayotov, Appl. Catal. B 51 (20033.