NMR as a Tool for Structure Determination - S.Aravamudhan
133
Sankarampadi Aravamudhan NMR as a Tool for Structure Determination BaSci cS f oF f aSteF acceSS to adv anceS AFav amudhan
-
Upload
khangminh22 -
Category
Documents
-
view
1 -
download
0
Transcript of NMR as a Tool for Structure Determination - S.Aravamudhan

Sankarampadi Aravamudhan
NMR as a Tool for Structure Determination
BaScicS foF faSteF acceSS to advanceSAFavam
udhan

Sankarampadi Aravamudhan
NMR as a Tool for Structure Determination
PREFACE
The Part-A of the contents of this book was originally drafted as an invite article to be published in a Journal of Physics Education. Due to certain reasons this article could not be published after submission even though the article was found good when submitted. Recently when the Acquisition Editor of Scholars Press enquired with me about my contributions available in NEHU archives and expressed willingness to receive them for publication in Scholars Press series, it was a pleasant occasion to begin with this article on "NMR as a Tool for Structure Determination". Since NMR is a well known technique for researchers in chemistry and there are several books on NMR from various perspectives, the initiative to write on this subject is to enable the several of the well documented internet resources on this subject to be available as references in a guide book. Thus the emphasis is self-learning and distance education as the preferable method than being totally dependent on contact classes and formal teaching of the subject. It is a generally formed impression that more and more informal methods within the frame work of formalized institutions would enable the required faster rates of knowledge acquisition ensuring quality education as the outcome. Contents of this book are meant for beginners in NMR. And enough detailed explanations have been included on those kind of thumb rules which can, without requiring “learning the basics", enable the use of the technique reasonably effectively. Such an apparent progress does not have a necessity for enquiring about individual's improvement on the ability to get to the basics and strengthen the foundations for better insights to be original in their research methods. In this book basics and elementary aspects have been dealt with at length, mainly to impress upon the necessity to get better insight into the intricacies more than what can be discussed in the books. A multi-disciplenary elearning would be the outcome. An individual would be better enabled to grasp the advances from the insights gained at the early stages while reaching out for an advanced technique.
The references include standard reference books on NMR and also equally important lecture notes of several instructors who have generously made it available as free internet resources which the readers would find as valuable convenient documentation on the subject matter. Visualization of motion of objects
and progress of events as animation features would require a computer with internet connection as a companion all through in the learning process. At the end of the list of references I have included a URL which is a MS WORD document of the list of references in this book and while using this guidebook if this document is also in a computer, clicking on the hot links included in the references would display the reference material from the internet. As much as possible from the current provisions I have ensured that the materials can be available durably. Suggestions for improvements would be of immense help.
Prof. S. AravamudhanAugust 1, 2016 Deptt of Chemistry
North Eastern Hill UniversitySHILLONG 793022
Page 1 of 123
CONTENTS
PART-A: SCOPE OF NMR SPECTROSCOPY
A-1 INTRODUCTION -3-
A-2 ELEMENTS OF NMR SPECTROSCOPY -9-
A-3 INTERACTIONS OF NUCLEAR SPINS
AND SPECTRAL PARAMETERS -20-
A-4 AN OUTLOOK ON THE UTILITY FOR
STRUCTURE DETERMINATION -44-
PART-B: GETTING ACQUAINTED WITH NMR IN PRACTICE
B-1 ACQUIRING AN NMR SPECTRUM -51-
B-2 THEORY OF NMR EXPERIMENTS -57-
B-3 HAMILTONIAN FOR ENERGY OF NUCLEAR INTERACTIONS -65-
B-4 EXPERIMENTS TO SIMPLIFY COMPLICATIONS IN SPECTRA -69-
B-5 The Quality of a Recorded NMR Spectrum -83-
PART-C: ANALYSIS, ASSIGNMENTS & STRUCTURE DETERMINATION -99-
References: -114-
Page 2 of 123
NMR as a Tool for Structure Determination
S. ARAVAMUDHAN
Department of Chemistry, North Eastern Hill University, Shillong 793002 Meghalaya
ABSTRACT
Nuclear Magnetic Resonance [NMR] is a phenomenon, which occurs because of the intrinsic magnetic moments of the nuclei. These nuclei naturally occur in materials and molecules. These systems containing such nuclei, when placed in an externally applied magnetic field, can exhibit resonance absorption of energy from the electromagnetic radiation of appropriate frequency. For such a resonance phenomenon, the strength of the externally applied magnetic field and the frequency of the incident electromagnetic radiation are related through the constants characteristic of the particular nuclear species in terms of certain universal constants. This resonance phenomenon provides a potential spectroscopic tool for the determination of structural parameters in detail. The details, which this NMR spectroscopic tool can reveal, depends on the extent to which the advanced instrumentation techniques are availed in the detection of resonance signal, in the acquisition of spectra and in further processing the spectral data. The greater the incorporation of such technical advances, the more seems to be the benefits in utilizing this tool for structural determination. In turn, the better the instrumental provisions, the more seems to be possibility of designing new NMR techniques with the better insights in the theoretical understanding of the NMR phenomenon. This seem to provide a perennial cycle that the improved understanding puts demand on the instrumentation to be improved, and technology ensuring the necessary instrumental criteria provides even better insights into the NMR phenomenon resulting in new experimental schemes for availing the Nuclear Magnetic Resonancespectral features. The NMR technique being a tool for structural studies would be dealt with in this article. The essential criteria would be enlisted with illustrative applications and the specialty of this technique for structural study would beemphasized. However, it is not intended to provide exhaustive enumeration, as the coverage to such an extent cannot be contained within the purview of this only article. Thus the Scope of this contribution is to appeal to beginners in Spectroscopic Methods who would want to gain more specialized skill in NMR. Thus the entire article has been made to be an elementary reading, at the same time and appropriate places references have been included as superscript which gives a lead
way that every succeeding section provides an elementary reading of further details on the basis of the contents of the previous section. This style of organizing the subject matter should specifically appeal to the experienced researchers and specialists in various subjects, but not so well acquainted with the Nuclear Magnetic Spectroscopic Technique. At the same time beginners can find this an easy reading, and leading references have been included for the beginners to get a thorough exposure to the details and practical inputs for handling the advances in the NMR theory and experiments. A few of the figures have been made out to be examples for learning the simulation techniques in spectroscopy. The References and Suggested reading include important contributions of the some of the early original investigators to the most recent updates on the Internet webpages and online service facilities in NMR.

Page 3 of 123
PART-A: SCOPE OF NMR SPECTROSCOPY
1. INTRODUCTION
Nuclear Magnetic Resonance [NMR] has been found to be a possible
spectroscopic tool for the determination of crystal Structure and molecular
structure1. The nuclei can resonate at their characteristic frequencies in the
radio frequency [RF] range of the electro magnetic radiation spectrum when
placed in a specified magnetic field. This frequency can be set in the NMR
spectrometer, which is capable of transmitting electro magnetic radiations to
the nuclear spin system. The sample containing these nuclei can be placed in
the Magnet of the Spectrometer system with the magnetic field strength set
to the corresponding value. The choice of a particular nuclear species for
NMR studies depends upon the specific requirements of the molecular or
crystal system (which may contain several nuclear species within itself as
constituents) to be studied. From this point of view, the nuclei studied are,
most often, 1H, 13C, 31P and 15N. Spectrometers have become available2 with
the provision for studying these nuclei by the NMR technique. When it is the
study of protons [1H] in crystal/molecular system by the NMR technique, it
is specifically referred to as PMR studies, which stands for Proton Magnetic
Resonance, provided the context is familiar enough to not confuse with the
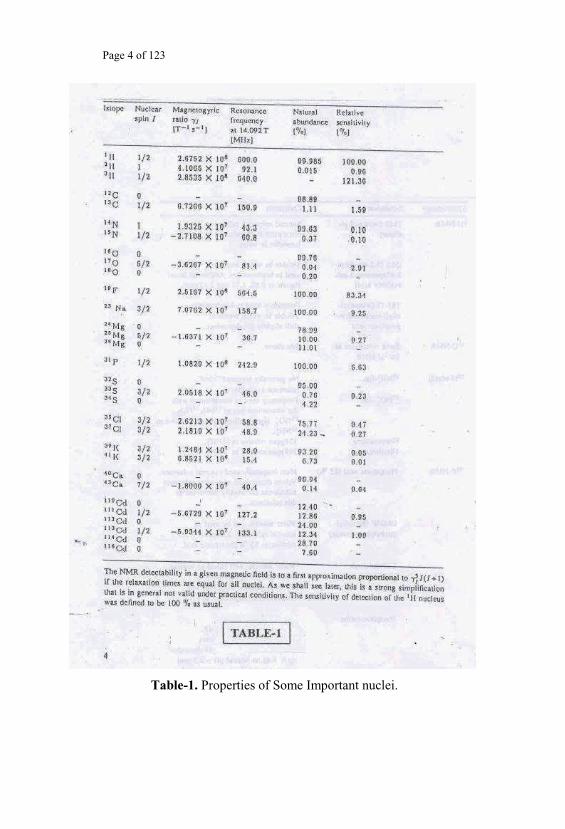
uncommon when the resonance observed is that of 13C nucleus. The Table-1
reproduces the relevant characteristic properties of these nuclei and the
corresponding Nuclear Magnetic Resonance frequencies, all at the same
given magnetic field strength at which the Spectrometer Magnet system has
been set. The prepared sample would be placed inside the sample-coil where
the sample can be exposed to the RF radiation. This sample-coil assembly is
Page 4 of 123
Table-1. Properties of Some Important nuclei.
Page 5 of 123
located in the probe of the NMR spectrometer and this entire probe assembly
would be firmly held fixed within the Magnet bore of the spectrometer
system. Inside the magnet bore a homogeneous magnetic field of the
required field strength would be set up for the NMR signal to be detected.
When the Spectrometer frequency can be varied, from the value for the
resonance of one nucleus, to the frequency of resonance for observing
another nucleus then, it is that the NMR probe be electronically tuned for the
NMR frequency. This tuning of the probe happens to be the major alteration
in the settings whenever a different nuclear species [in the same sample or in
different samples] is to be studied. Thus in a simple NMR experiment, there
would be RF radiation at only one frequency at any given time for detecting
a specified nuclear spin species in the sample. If the spectrometer system has
such a probe installed that, this same probe, at a given time, can be tuned to
the frequency of any one of the frequencies from the list of the Resonance
Frequencies of several nuclear species, as required for the variety of Nuclear
systems [the number of such nuclei can be more than the only four
mentioned earlier] then, this is the instance of a Multinuclear capability3 of
the magnetic resonance spectrometer system.
There are nuclear magnetic resonance techniques, in which observations are
made by applying RF radiations at more than one frequency simultaneously,
at the given magnetic field strength. This is the requirement for detecting
two or more nuclei of the sample at the same time by irradiating at two or
more nuclear magnetic resonance frequencies4. Thus when radiations at two
frequencies are simultaneously applied, then it is the case of a double
resonance technique5. When three radiations are present, it can be the triple
resonance studies. In general, this technique is included under the class of
multiple resonance techniques. Further, a double resonance technique could
be homo nuclear double resonance when two proton resonance lines, within
the PMR spectrum of the same system, are irradiated. It would be a hetero
Page 6 of 123
nuclear double resonance technique, if the two simultaneously applied
frequencies correspond to two different nuclear species of the same sample
under study. 1H and 13C combination is typical, and it is the most familiarly
used hetero nuclear double resonance technique.
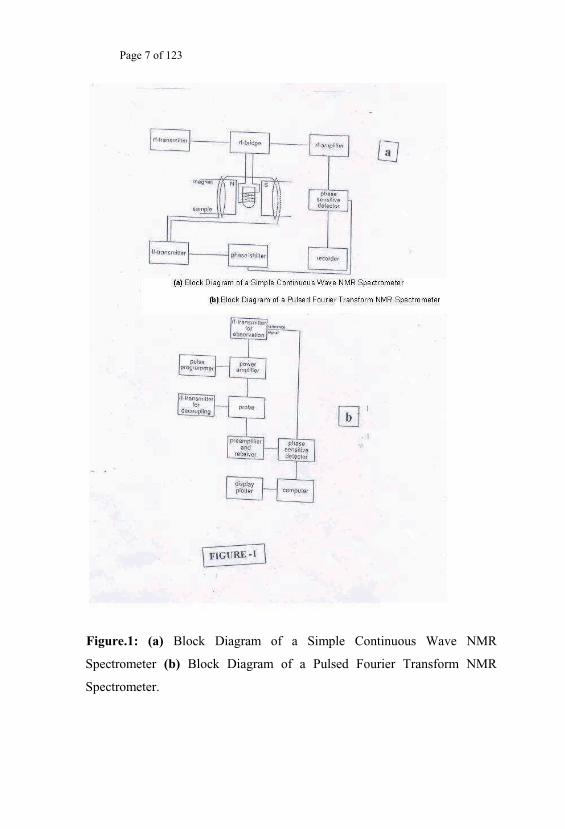
The detection technique and the associated requirements of the Electronic &
Instrumentation have made possible another way to classify the NMR
experimental techniques. These are the Continuous Wave5a (CW) RF
experiments and the Pulsed5b RF experiments (Fig.1). The operation of the
Spectrometers with these two different features can be difficult without
adequate training. An assiduous practice with sound knowledge of NMR
phenomena-the principles and the theoretical basis are the prerequisites
besides familiarity with the spectrometer operating principles, to be versatile
with the applications of NMR technique for structure determinations. In
both, the CW and Pulsed, techniques there are corresponding multiple
resonance techniques in use6a.
The most recent advances in NMR technique7a, particularly the NMR
imaging and its pervasive applications in the clinical practices do have the
basis from the structure determinations, but the present day advanced
applications would appear too remote from the grass-root structure
determination aspects.
The structure determination8 entails the following broad considerations
about the system (the sample or specimen as it may be referred to) under
study using the available tools. Out of these tools NMR spectroscopy is a
tool which is the topic in this article. Most of the time, before bringing the
sample for the detailed structural considerations of the constituents, the
sample would have been well characterized for its authenticity, and in
particular, with respect to its source, purity and the molecular formula of the
molecular system which is a constituent in the sample. This enables the
choice as to which of nuclear species contained in the system would be most
Page 7 of 123
Figure.1: (a) Block Diagram of a Simple Continuous Wave NMR
Spectrometer (b) Block Diagram of a Pulsed Fourier Transform NMR
Spectrometer.
Page 8 of 123
suitable for study by NMR technique for the required structural information.
In the case of structural studies of crystals, this would be mostly to
supplement the information known from X-ray diffraction technique,
essentially the locations of the nuclei, and hence, the locations of the
corresponding atoms in the unit cell of a single crystal or the location of
atoms which are substituting the regular atomic constituents at few places,
for example, as in the case of doped materials. As it would be evident, it is
all mainly the geometrical aspects for determining the relative positions of
the atomic constituents. In other words, it is the seeking after the situational
inter nuclear and intermolecular distances. These considerations come under
the realm of solid-state NMR studies where the un-averaged anisotropic
interactions provide more elaborate structural information.
When it is the question of molecular structure9, whether it is in the solid
state, liquid state or gaseous state, the study entails the seeking of
information on the relative positions of atomic nuclei which in the bonded
situation thus making up the molecule. Further inferences could be on
providing explanations as to why the respective locations are preferred by
the atoms in the molecule, and, how the characteristic properties of the
molecule are dependent on such fixed locations that the atoms prefer to hold
within the molecule. These are typically the concerns of the nature of the
chemical bonding in molecules and, in turn, the study of molecular
electronic structure.
The molecule could be a small molecule (molecular weight typically of the
order of 10 to 1000) which is a chemical compound taken up as sample for
the study. On the other hand, it could be a large macromolecule; a polymer7c
or a biologically important molecule7b. In all these cases the task is to
determine all the necessary details and exhaustively cover all the relevant
atoms so that there are no ambiguities in the conclusions from the study.
Page 9 of 123
With this broad based outline provided till now on the kind of queries
addressed to in structure determination, in the following section, the relevant
elements of the NMR spectroscopic tool required for structural studies would
be enlisted with the description of the salient features of NMR technique
which can be effective.
2. ELEMENTS OF NMR SPECTROSCOPY
The basic equation which governs the occurrence of Nuclear Magnetic
Resonance is given by: either ----- Eq.1(a); or -----
Eq.1(b) where, in these equations, H is the intensity of the externally
applied magnetic field (the field strength) in units of Gauss; is the
frequency of electromagnetic radiation (usually in the radio frequency [RF]
region) in units of Hertz [Hz] with 1Hz=1 cycle per second [cps]; is the
angular velocity in radians per second corresponding to the frequency
defining the in terms of the frequency by ; is the nuclear Bohr
Magneton; g is the nuclear g factor and is the gyro magnetic ratio for that
nucleus. The above equations 1(a) and 1(b) can be derived starting form the
relation between the magnetic moment of the nucleus and the intrinsic spin
angular momentum I of that nucleus as given by: I ----Eq.2 with
1)I ( I I the symbol I under the square root is the spin quantum
number of the nucleus. The magnetic moment can interact with the
externally applied magnetic field as governed by the equation for the
Potential Energy P.E. = H -- Eq.3. Therefore, the nucleus tends to get
aligned along the magnetic field direction. However, there are quantum
restrictions on the allowed values for the component of I (the nuclear angular
momentum vector) measurable along the specified direction. Hence, the
component of nuclear magnetic moment correspondingly has certain discrete
values along the specified direction. These restrictions result in the different
Page 10 of 123
discrete energy levels for the nuclear spin system. Depending on the criteria
of the quantum mechanical selection rule, transitions can be caused between
a pair of the discrete energy levels when the electromagnetic radiation of the
right frequency and appropriate polarization is applied to the spin system in
the magnetic field. For a set of values of H and as given by equation 1(a),
the electromagnetic radiation must be polarized in the plane perpendicular to
the magnetic field direction for inducing observable transitions.
If a small molecule containing protons is chosen for the proton nuclear
magnetic resonance, the possible features of the PMR spectrum would
depend on the following factors. If this molecule has number of protons,
and, if the sample consists of number of such molecules (all identical),
then the sample would account for the presence of number of protons.
That is the system consists of protons by way of the n protons per
molecule, for each of the N molecules. If all these protons, every one of
them, have the same resonance frequency at the applied field H in which that
sample is placed, then, all the protons will exhibit resonance at the same
field value for the same applied electromagnetic RF radiation frequency.
This is because the set of equations 1(a) and 1(b) do not contain any terms or
factors that would differentiate one proton from any of the other protons in
the sample.
The differentiating factor in the NMR studies can arise, because the protons
present within a given molecule are not all in the same electronic
surrounding due to the distinctly different nature of chemical bonding, of the
protons, to the atoms to which they are attached in the molecule. Thus the
molecular electronic structural variations cause differences in the induced
magnetic fields at the site of a given nuclei in a molecule. If these variations
in the magnetic fields at the nuclear sites within the molecule are taken into
account, and, if the nuclei in the molecule have all distinctly different
resonance frequencies, then, the molecule can give rise to n number of
Page 11 of 123
distinctly different resonance signals corresponding to the number of protons
present per molecule. The capability of a nuclear magnetic resonance
spectrometer to detect and display the n distinct resonance signals is referred
to as the specification10 for the spectrometer. If the
spectrometer cannot detect the differences distinctly, then there can be
overlapping of the resonance lines. This means more lines will tend to merge
and appear as one line. If more than one proton contributes to the signal
around a frequency then, this may appear as a resonance line with larger
intensity than the resonance line for a single proton. This would be stated as
one of the resonance lines being more than another line in the
NMR spectrum. The intensity of the detected resonance line (signal) in NMR
spectroscopy is usually obtained by procedure. The integrated
value for each one of the NMR line in the spectrum is the intensity of the
line and this would be indicative of the number protons contributing at a
given resonance value in the spectrum. This in turn leads to the 10 of the spectrometer, by which, it is specified, as to the
minimum number of spins required in the sample, which can give rise to a
observable NMR signal in that spectrometer. There are possibilities that the
protons (nuclei) having different resonance frequencies do not get resolved,
but result in broad single lines in the spectrum. Or, the molecular electronic
structure may provide for the same contributions to the induced fields at two
different proton (nuclear) sites. Such nuclei will then resonate at the same
frequency.
Having considered the protons in the same single molecule, the next query
would be whether there can be any influence of the other molecules in the
system (inter molecular effects), on the resonance of the protons of a given
molecule. If the study is in liquid state (usually solutions) or in gaseous state
most of the time, the concentrations can be maintained at such low levels,
that any interaction from any neighboring molecules becomes negligible.
Page 12 of 123
Thus, this ensures that the entire spin ensemble of the sample can be
considered as made up of spins located in different molecules, all the
molecules being identical and every one of the identical molecules being
completely independent from any of the other molecule in the system. In
solid state, the studies are not usually on any such dilute spin systems and
there are efforts to understand solid-state NMR studies as an exclusive topic
of the NMR spectroscopy. It is this solid-state NMR aspect, which are
pertinent for the study of crystal structures with the NMR techniques.
A simple illustration is given in Fig.2 (a)-(d), of how the nuclei within the
molecules can be differentiated by NMR on the basis of the nature of
bonding within the molecules. These are 13C NMR spectra, not from a
spectrometer, but, Calculated using software, which can calculate the
resonance frequency differences within the molecule for the Carbon nuclei
and display the spectrum constructed from the calculated values. At this
introductory stage, adding the following could be a digression. But, here, it
may be found to be an incentive for the reader who is a beginner. This would
serve as an incentive because, even without many of the details at this
moment, these illustrations can easily show, as to how; the recent advances
have made this NMR tool a potential device for structure determination. The
actual use would require greater appreciation of the intricacies of the NMR
technique that would be the discussion in the remaining part of this article.
What has to be appreciated here is that there are four molecules drawn and
their corresponding calculated 13C NMR spectra are given. These have been
calculated using a powerful geometry optimizing Software PROGRAM
called COSMOS. This program calculates also the chemical shift (which will
be explained in the later part of this article) parameters which indicates the
relative line positions in the spectrum. Thus in all the spectra the carbon of
the methyl group occurs at 23.5 ppm. The CH2 (methylene group) carbon
nucleus occurs at 35.196 ppm in 2(a) but in 2(d) it occurs at 62.155 ppm.

Page 13 of 123
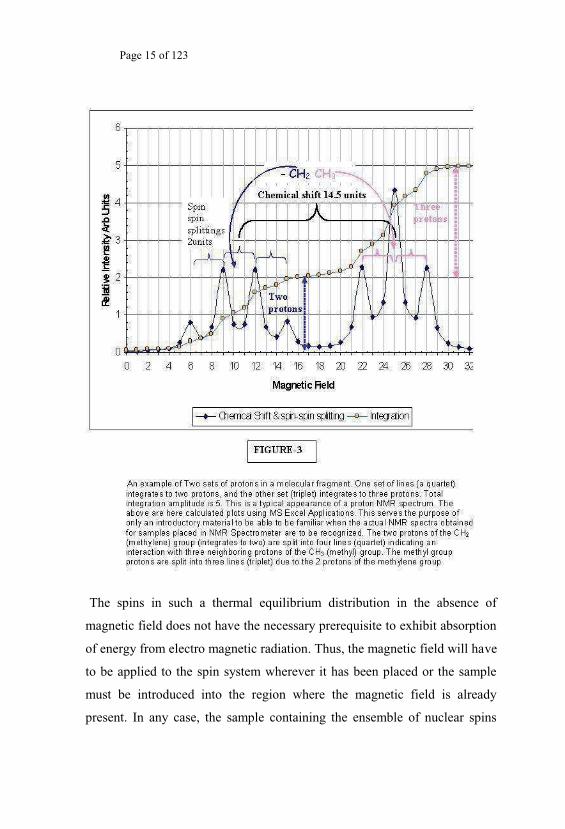
Figure-2. (a)-(d) Simulated 13C Nuclear Magnetic Resonance Spectra with the Chemical Shift values Calculated using a PROGRAM (http://www.cosmos-software.de). This is typically how the NMR spectrum from a Spectrometer would look with Broad Band Decoupling at the Protons so that the spin-spin splittings due to the heteronuclear 13 C-H spin-spin interactions do not appear in the Carbon Spectrum.
Page 14 of 123
This large difference is because this carbon in 2(d) is attached to Oxygen
atom but in 2(a) it is attached to a carbon atom. If a carbon atom is bonded to
a Oxygen atom as in 2(c) and 2(b) not the same way as in 2(b) then these
atoms occur at respectively 152.5 and 146.3 which are much larger than the
62.15 of 2(d) and 35.6 of 2(a). These outputs to obtain from the soft ware
does not require more than 20 minutes since the molecules can be drawn
with a Structure Editor and then selecting from the menu for the Geometry
optimization and running paves the way further similarly to calculate the
NMR parameter (chemical shift)19a and display also as spectral plot. Thus
by drawing the molecules for the several variations in the substituted groups
and atoms, the carbon resonance line shifts can be seen associated with the
corresponding molecular bonding nature and the electronic structures. The
interaction with the external magnetic field is the responsible factor for what
has been described until now. In presence of the magnetic field, when the
spins have aligned and (are in thermal equilibrium), then, there can be time-
independent interaction among the nuclear spins themselves which can
cause changes in the energy levels in addition to the Zeeman splitting. This
spin- 19b effect
with characteristic coupling constants indicative of the structural aspects in
the molecule( these features are absent in conventional CMR spectra and
hence, in Fig.2(a)-(d) as well. The reason for this would be evident from the
discussions in subsequent sections). The calculated typical PMR (proton
spectrum) of Fig.3 exhibits the above features of spin-spin coupling with
chemical shift consequences.
The alignment of the spins with respect to the magnetic field, soon after
placing the spins in the magnetic field, does not happen instantaneously. In
the absence of any magnetic fields in the Laboratory, the spins in the system
(in a diamagnetic sample) are, directionally, in a non-preferential state and
the magnetic moments of the nuclei do not have any specific orientation.
Page 15 of 123
The spins in such a thermal equilibrium distribution in the absence of
magnetic field does not have the necessary prerequisite to exhibit absorption
of energy from electro magnetic radiation. Thus, the magnetic field will have
to be applied to the spin system wherever it has been placed or the sample
must be introduced into the region where the magnetic field is already
present. In any case, the sample containing the ensemble of nuclear spins
Page 16 of 123
gets an exposure to the magnetic field at the time when it has not been
exposed to that magnetic field before. Now, the spin alignment with respect
to the direction of external magnetic field begins. Then, for it to reach a
thermal equilibrium in the external magnetic field takes some time, which is
significant and measurable in most of the NMR samples. Depending upon
the nature of the sample, this time can be from few milliseconds to several
hours or even days. This characteristic time of the spin system is referred to
as the -lattic relaxation time6b symbolized as T1 relaxation time
(Fig.4a). At any time when the spin system has to redistribute (from a non-
equilibrium distribution) its populations (the number of spins in a
particular discrete energy level) in the energy levels, then this characteristic
relaxation time would be encountered in the process of the reaching an
equilibrium under the different state for the spin systems. This redistribution
among the energy levels due to the magnetic field (Zeeman splitting) is
reached
surrounding of the nucleus with regard to the presence of other nuclear
moments. If in a molecule there are other nuclei closer to the resonating
nucleus are present (as in the CH3 above there are 3 protons) then the
resonating nuclei 13 C has a much faster relaxation time than for example in
the case of a 13 method also can be envisaged
n-
useful in CMR. An example of such an application in PMR is depicted in
Fig 4c. -state NMR
applications15 as well.
There is another kind of relaxation mechanism called -spin
(symbolized as T2) which gets a preferential treatment in NMR
of solids, but it may not have a direct significance for structure related
queries in HR NMR in liquids. Hence this T2 would not be considered in
Page 17 of 123
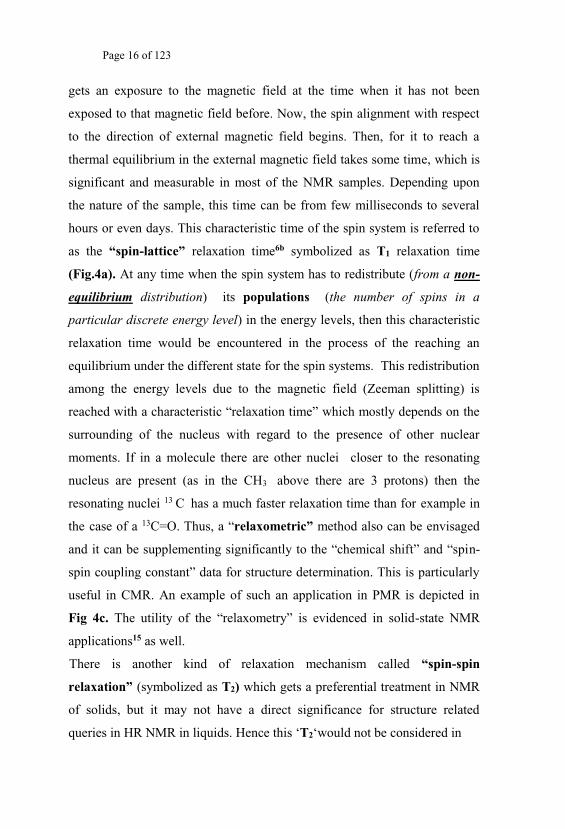
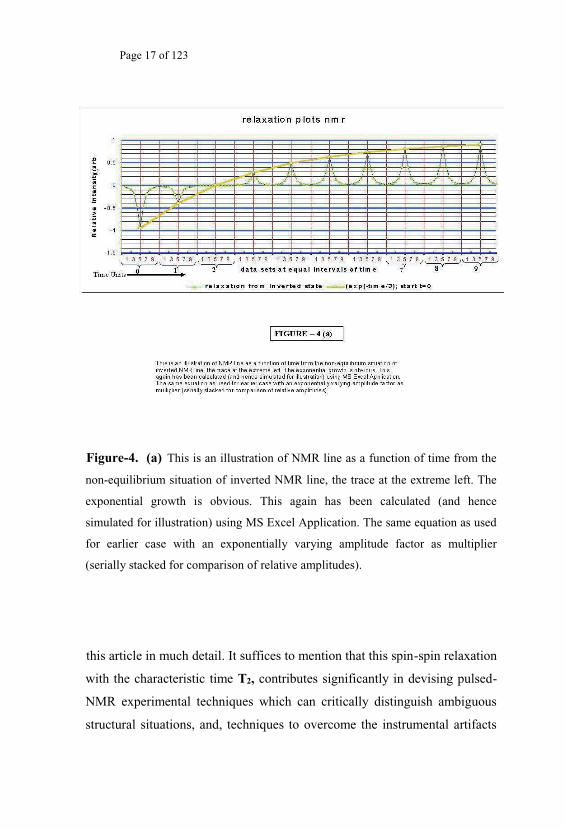
Figure-4. (a) This is an illustration of NMR line as a function of time from the
non-equilibrium situation of inverted NMR line, the trace at the extreme left. The
exponential growth is obvious. This again has been calculated (and hence
simulated for illustration) using MS Excel Application. The same equation as used
for earlier case with an exponentially varying amplitude factor as multiplier
(serially stacked for comparison of relative amplitudes).
this article in much detail. It suffices to mention that this spin-spin relaxation
with the characteristic time T2, contributes significantly in devising pulsed-
NMR experimental techniques which can critically distinguish ambiguous
structural situations, and, techniques to overcome the instrumental artifacts

Page 18 of 123
which can dominate even while the NMR spectrum, as obtained form the
spectrometer, contains abundantly overwhelming structural information.
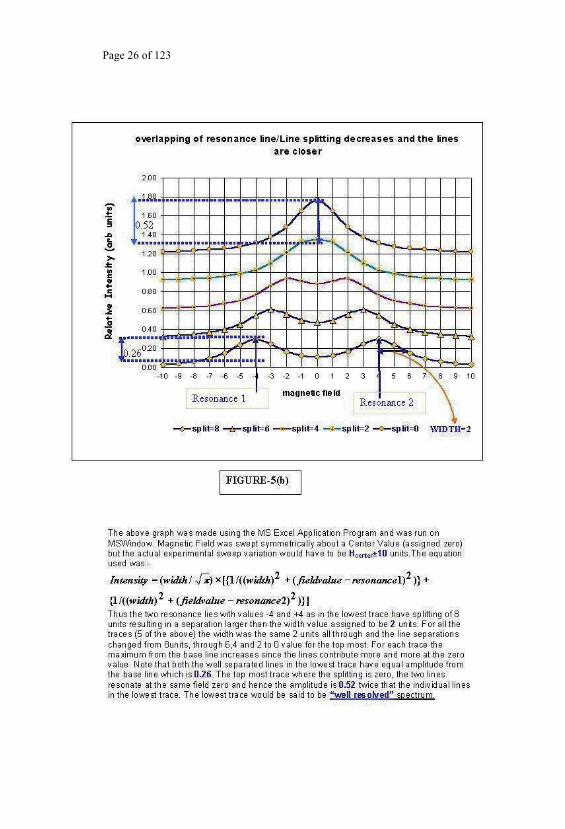
At this point digressing to Fig 5b could be a useful exercise for students to
acquaint with spectroscopic data analysis. Fig.5b indicates the use of a MS
Excel Application for simulating the experimental spectra with a probable
line shape. The simulated two-line pattern of resonance lines illustrates what
is a spectrum and what are the consequences of overlap in
the limit causing a coalescence of the two lines. A similar coalescence
phenomenon in NMR occurs when a given nucleus exchanges position
between two sites in the sample as illustrated in Fig. 5c. The resonance
frequency might be slightly (but measurably) differing in the two positions
where the same nuclei would be found alternately. If this difference in
resonance frequency is - -
e then the NMR
spectrum of such a system would consists of NMR signals from both the
sites distinctly only if 1/ << e (exchange rate) is varied by
changing the temperature of the sample, then by an increase of temperature
the 1/ can be made very large compared to the resonance frequency
he
two different sites would coalesce to a single resonance line at an average
value for the resonance frequency. The broadening that occurs in the NMR
signals is indicative of the changes in the T2 (transverse) relaxation processes
mentioned earlier. This has the consequences of finding such features in the
NMR spectra is to indicate the structural positions where the possible
In Fig.4a [parallel stacked-plots] and Fig.4b [serially stacked plots],
calculated relaxation ( longitudinal relaxation T1) curves are given
graphically and these again can be exercises for using the Information
technology tools to make simple simulations which makes the student be
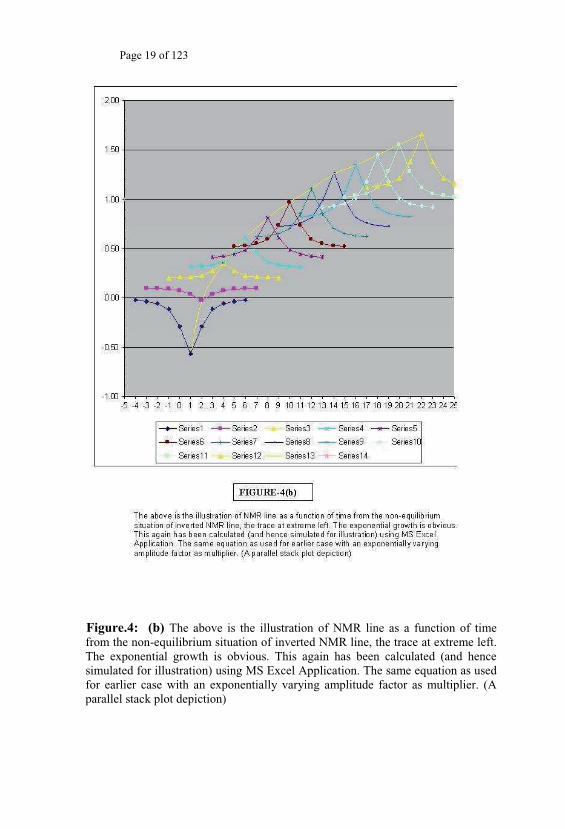
Page 19 of 123
Figure.4: (b) The above is the illustration of NMR line as a function of time from the non-equilibrium situation of inverted NMR line, the trace at extreme left. The exponential growth is obvious. This again has been calculated (and hence simulated for illustration) using MS Excel Application. The same equation as used for earlier case with an exponentially varying amplitude factor as multiplier. (A parallel stack plot depiction)
Page 20 of 123
familiar with the trends and the equations to describe them. There are
instances such familiarity particularly the use of the IT tools for such
calculation can make the structure determination extremely simple.
3. INTERACTIONS OF NUCLEAR SPINS AND SPECTRAL
PARAMETERS
The equation 1(a), as it was pointed out earlier, does not have any terms that
can differentiate nuclear spins on the basis of their specific location and
occurrence within a molecule which typically may constitute the spin
ensemble. The equation can be rewritten by including specifically the terms
which distinguish the spins on the basis of the nature of the interactions
characteristic of the given nuclear spin site. These interactions can be
characterized by a constant indicating the extent of the specific interaction at
a specified site. Even if another spin has contributions due to interactions of
similar nature, the strength of the interaction may be different at different
nuclear sites, and these differences may consequentially appear in the
spectrum enabling the structure of the matrix (molecule/lattice) in which the
nucleus is situated. This is a general form for including such site-specific
differences in the basic interaction, which is the interaction with the external,
strong and steady Magnetic Field. Compared to this term ( referring to the
corresponding energy of interaction) all the site-specific interactions are
usually small, and in this sense theoretical treatments can specify a
approximation for conveniences of obtaining simple equations for
evaluation. In this section the nature of the various site-specific interactions,
with the associated constants as the spectral parameter, would be enlisted
for the benefit that, in the further sections, the examples of applications can
refer to these spectral parameters for determining structures.
Page 21 of 123
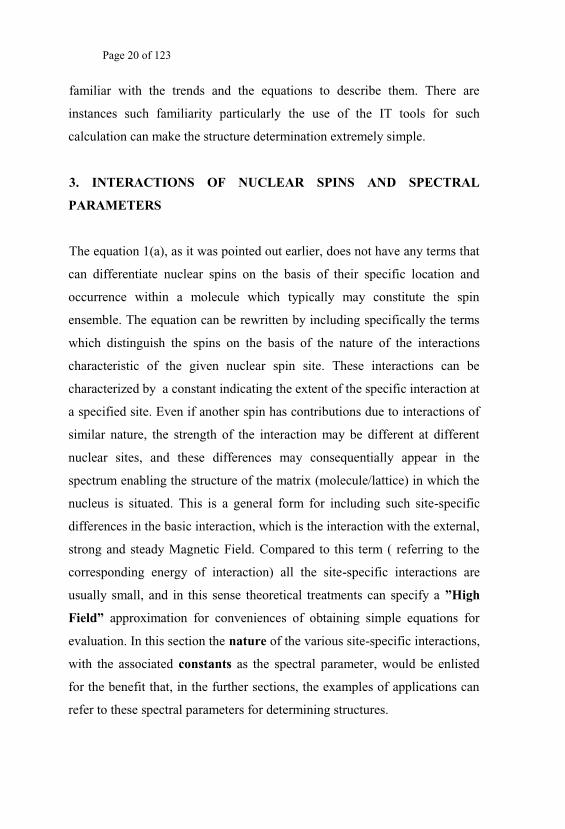
Figure.4: (c) Experimental results from an Inversion recovery Experiment on a
Proton Sample. By pulsed methods initial population distributions can be prepared
in such a way the populations in the energy levels at thermal equilibrium can be
inverted and hence a NMR signal with negative intensity is obtained. Then this
signal is allowed to reach thermal equilibrium situation and periodically the
growth is monitored. The group of peaks at lower field (i.e., to the left) all have
slightly longer T1 -field group.
Page 22 of 123
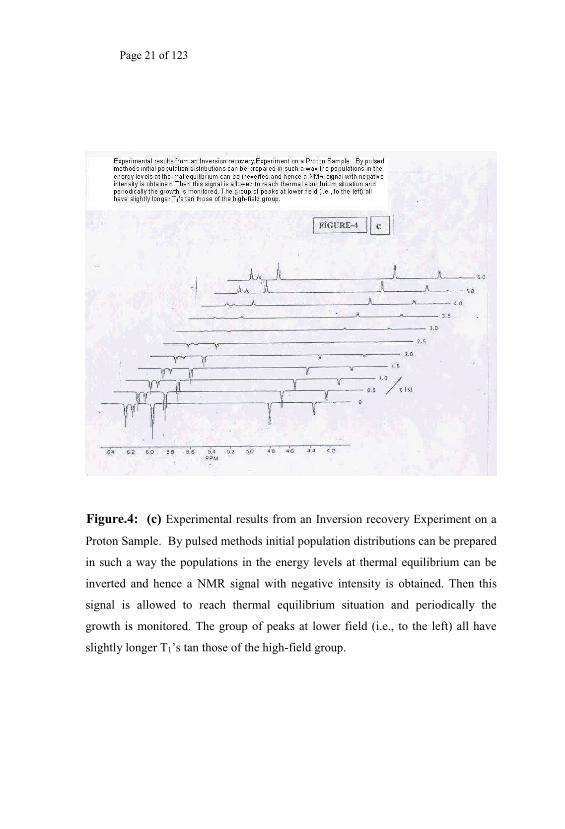
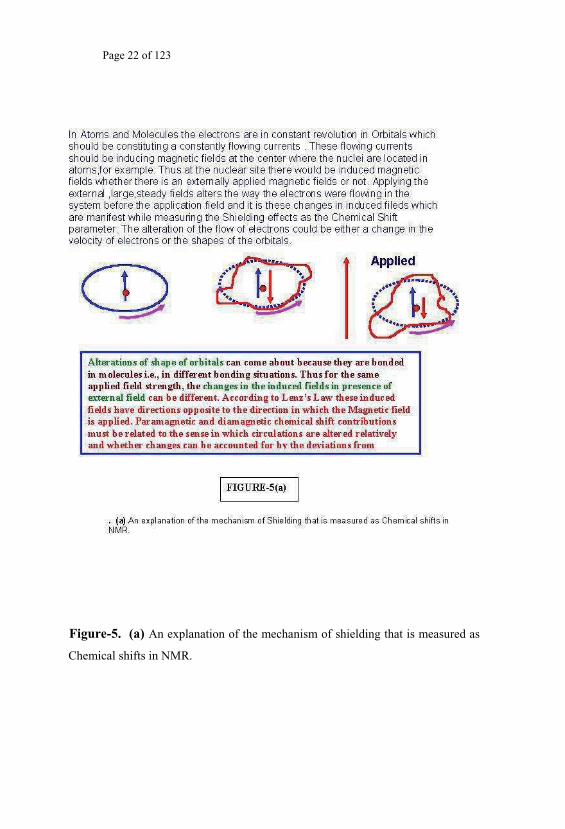
Figure-5. (a) An explanation of the mechanism of shielding that is measured as
Chemical shifts in NMR.

Page 23 of 123
The nature of the interaction that leads to shielding of nuclei is explained
further in Fig.5a. These descriptions account for the shifts, which can be
observed with respect to the bare nuclei which do not have any electron
systems surrounding. Since referencing the nuclear system with respect to
bare nuclei, even though possible, but, is not practicable for the
conveniences of regular spectral measurements, a chemical molecule which
is relatively inert chemically and has a single-line NMR spectrum is used as
reference compound and added to all the samples. The single reference
compound line can be set to zero, or, to a certain specified value. The other
resonance line positions can be measured relative to the reference line. Such
values of shifts measured from the standard reference line are termed the
chemical shift18a values. Hence, an unknown electronic surrounding around
the nuclei can be ascertained, by measuring these relative shielding values
which are called chemical shifts, and by the comparison with previously
measured chemical shifts (as in Table-4) for known electronic surrounding
for such nuclei.
As explained earlier, for any particular nucleus, the resonance frequency
value calculated by the equation 1(a) corresponds to the NMR signal of a
, which is not surrounded by any electrons. An addition of
electron into its surrounding starts contributing by induced fields at the
nucleus, which is resonating. Addition of electrons and hence the presence of
electronic charge cloud induces magnetic fields at the nucleus because of the
fact that the electrons also gets placed in the External Magnetic field where
the nucleus is. If we consider only the electron charge cloud without any
unpaired electron spins, typically diamagnetic systems, then the induced
fields are in the direction opposite to the direction of external magnetic field.
Thus the nucleus would now be exposed to Field strength some what less
Page 24 of 123
than if the electrons are absent. Since the field values at the nuclear sites are
reduced by the presence of electrons, the electrons are said to be shielding
the nuclei from the external field. Thus to the equation 1(a) a term
corresponding to this shielding is added. The effect of electron is given a
value as shielding constant and it is subtracted from the strength of the
externally applied field indicating the shielding nature of this interaction.
Hence the Equation 1(a) is now written as: )( /HHgh where H/ refers
to the strength of the induced field in the opposite direction to H. The
induced field being caused by the External field its magnitude becomes
proportional to the strength of the external field if the other conditions of the
sample are held the same. Hence, it is conventional to write HH /
where is the shielding constant. Then equation 1(a) is rewritten as
)1(Hgh ---Eq.4. The now represents the site-specific shielding
effects and its value reflects the electronic structural surrounding of the
nucleus. This is not always a simple scalar constant, but in general a
second rank tensor. In solution state NMR Spectra, only the trace of the
tensor appears in the equation, which is a scalar number. Only when the
situation demands the full significance of the Shielding Tensor would be
referred to in this article. Otherwise, the relative shielding constant values
would be used to illustrate the utility in the NMR structural studies. For
-Methyl
TMS) with molecular formula Si (CH3)4 is the standard reference
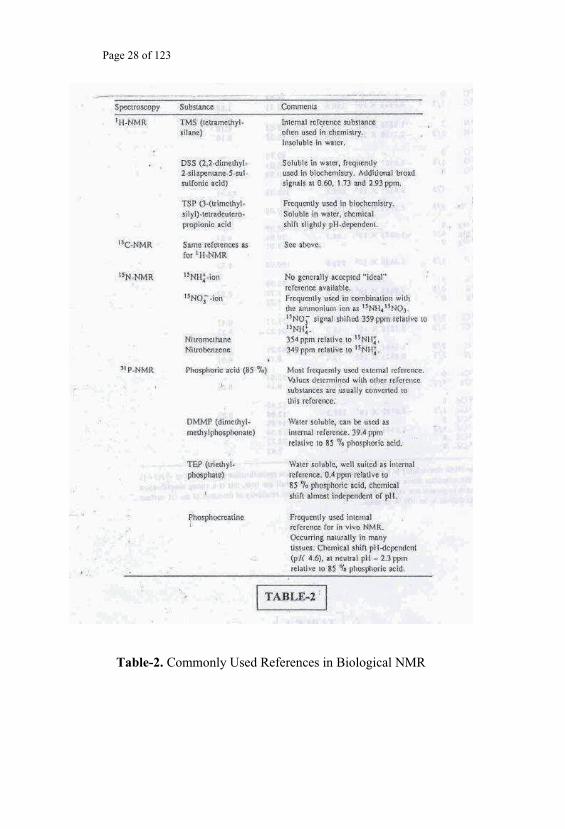
compound. Table-2 contains a list of compounds useful as standard
references in NMR spectroscopy. This molecule has 12 protons and because
of the symmetrical location in the molecule, all the 12 protons have the same
resonance frequency [a set of 12 equivalent protons]. Hence, the proton
NMR spectrum of TMS consists of a single line corresponding to the

Page 25 of 123
resonance of the 12 protons because of which it gives a strong single line
NMR signal even when its concentration is small.
Page 26 of 123
Page 27 of 123
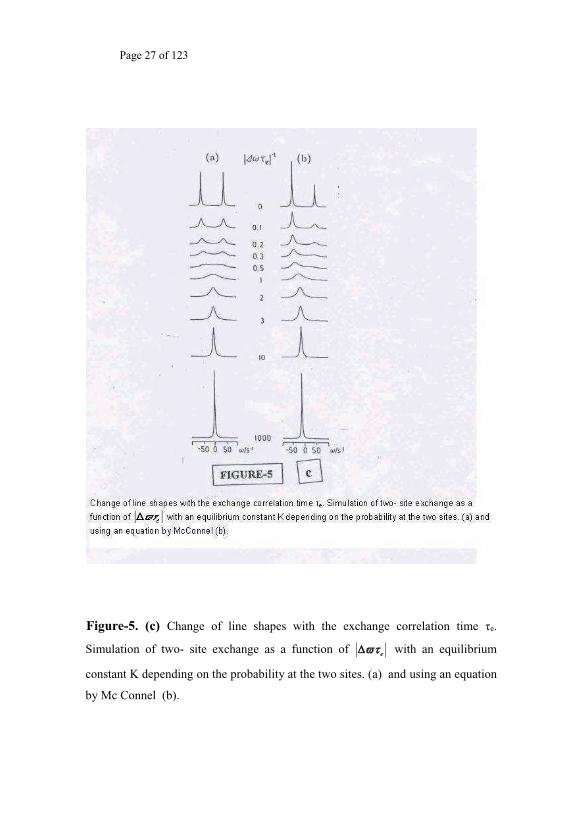
Figure-5. (c) e.
Simulation of two- site exchange as a function of e with an equilibrium
constant K depending on the probability at the two sites. (a) and using an equation
by Mc Connel (b).
Page 28 of 123
Table-2. Commonly Used References in Biological NMR
Page 29 of 123
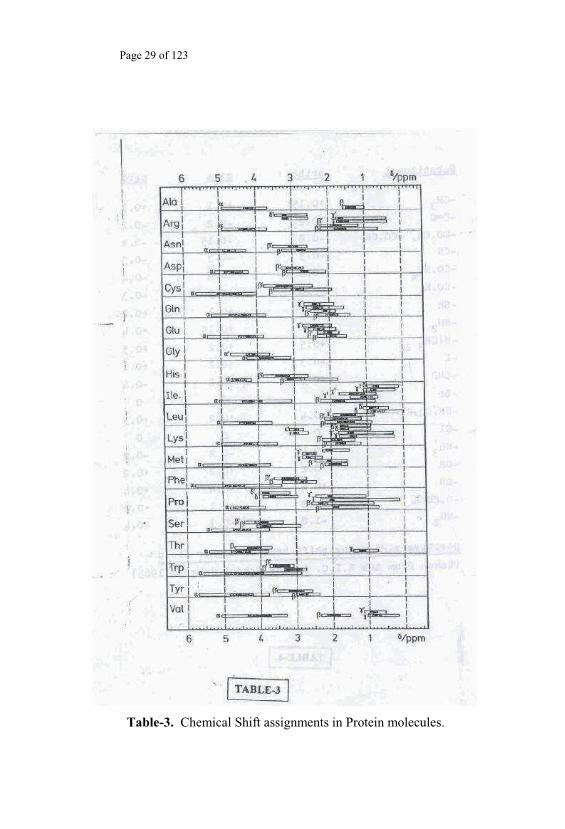
Table-3. Chemical Shift assignments in Protein molecules.

Page 30 of 123
Page 31 of 123
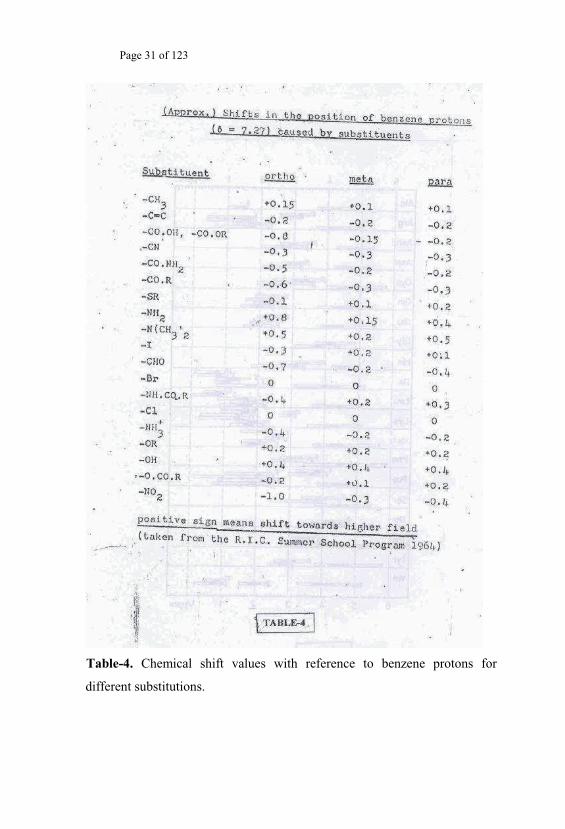
Table-4. Chemical shift values with reference to benzene protons for
different substitutions.
Page 32 of 123
This compound is chemically relatively inert. It is a volatile liquid at normal
temperature and pressure. It is easily miscible with most of the organic
solvents used in NMR spectroscopy namely, Chloroform CH Cl3 , Acetone
CH3 CO CH3 , Carbon Tetrachloride C Cl4 . Thus referenced NMR spectra
can be easily obtained, by adding a small amount of TMS to the sample
solution as an external reference to the actual molecule of interest. The CH3
of the TMS have the most shielding electronic surrounding as compared to
the electronic surrounding of the protons many of the other known chemical
molecular compounds. Therefore, this TMS, added as an external reference,
can yield a reference NMR line that can be reliably located at one end of the
observed proton NMR spectrum even when an unknown structure of a
chemical molecule has to be determined. In the chemical shift -scale,
The protons from other molecules
with several variety of different electronic environment are found to result in
NMR signals all on one side of this line and can be assigned a positive
numerical value proportional to the deviation [chemical shift
line from the TMS. Mostly, no NMR line occurs on the negative side of such
a spectral chart (Fig.6).
Such shielding (chemical shift) due to the changes in electronic structure
around the protons can be measured in frequency units. As known now for
the case of protons the maximum range for this shift measured in frequency
units are found to be 1KHz in a 100MHz (Proton) NMR spectrometer, 2KHz
in 200MHz spectrometer, 3KHz in 300MHz spectrometer and so on. From
this it should be obvious that the Spectrometer magnetic field would be
different for these spectrometer systems. In order to express the shielding
and chemical Shift in a scale which is independent of the Spectrometer
frequency, the following definition is convenient. Since in each one of the
above, dividing the range of chemical shift by the spectrometer frequency
yields a dimensionless number 10 10-6, this range is termed as 10 ppm
Page 33 of 123
[Parts per Million] units. It is found that when the chemical shift values are
has the same spectral chemical shift value assigned irrespective of what the
spectrometer frequency was [independent of the operating frequency of the
spectrometer] and at which Magnetic Field Strength the spectrum was
obtained. This characteristic of the Shielding Effect will be further stressed
later while emphasizing the importance of seeking Spectrometers, which can
operate at Higher Magnetic Field Strength; consequently, for a given nuclear
species, at Higher spectrometer frequencies.
The next important interaction to be cons spin-spin
interaction -independent [as the shielding
interactions] and manifests in a NMR spectrum of a chemical compound.
Except for the fact that, the externally applied strong field provides a
direction along which all the spins get quantized, there is no dependence for
the spin-spin interaction on the presence or the strength of the external
magnetic field. The strength of this interaction is measured by the spin-spin
coupling constant from the NMR spectrum. But the spin-spin coupling
constants are measured, particularly for structure determinations, only from
the NMR spectra obtained in presence of strong externally applied magnetic
field. All the spins are aligned along the magnetic field direction and the
corresponding nuclear magnetic moments experience an additional magnetic
field due to the presence of the neighboring nuclear magnetic moment. This
spin spin interaction causes a splitting of the energy levels in addition to the
splitting due to the Zeeman interaction (the interaction of the spin with the
external magnetic field.
Page 34 of 123
Page 35 of 123
Depending upon the number of neighboring spins with which a given spin
interacts, the number of lines into which the NMR line splits can vary. This
results in multiplet line structures in NMR spectra, with characteristic
intensity ratio of the lines. The distance of separation observable within the
multiplet lines yields the spin-spin coupling parameter from the NMR
spectrum.
Mainly, there are two different and characteristic ways by which this spin-
spin interaction can occur in the spin systems. The first type of spin-spin 18b spin-spin interaction.
This arises because of the possible extent to which the magnetic dipolar field
due to one nuclear spin magnetic moment can be affecting the neighboring
nuclear magnetic moment at a different site. Considering the point-dipoles to
be representing the nuclear magnetic moments, each pair of nuclear
moments can be related by a point-to-point distance and the
corresponding inter nuclear axis can be assigned a definite angle that it
-dipole interaction depends on the distance and the
angle which can be the target parameter to measure from NMR spectra
for structural measurement. The PMR studies on single crystal of Malonic
Acid how the direct dipole-dipole interaction between the two methylene
protons results in the measurement of the H-H vector direction to be 6±2º
tilted away from the perpendicular to the c-c-c plane. Also the HR PMR
measurement on the same sample reveals the anisotropic shielding tensor
properties. This Wideline (In solids the NMR lines are much broader than it
is in the case of liquids. Because of this larger widths the NMR lines are
wider and hence the name Wideline NMR) and High Resolution PMR study
(HR PMR study in Solids requires specially designed pulse sequences to
average out the anisotropic line-brodening interactions among the spins) on
Page 36 of 123
the single crystal of the Malonic acid proves18d the importance of NMR
technique for structural measurement. As pointed out in the earlier section,
this is under the realm of the solid-state NMR studies.
The other type of spin-spin interaction is the 18c or -
interaction which is characterized by a spin-spin coupling constant This
interaction contrasting with the dipole-
dipole interaction which characteristically requires a well defined distance of
separation between the two spins measurably. The through-bond
interaction is necessarily mediated by the electron clouds in the bonding
region. This interaction requires that the nuclear magnetic moment should
affect the electron charge cloud around it, and, this effect in turn is
transmitted to the neighboring bonded nucleus by way of an induced
magnetic field change. This type of transmission requires that the electron
charge cloud has orbital characteristics, which has a non-vanishing
charge density value at the site of the nucleus. Hence, the
-spin
variation in the electronic structure as much as the chemical shielding (shift).
But, the dependence of the J and on the given electronic structure is not
the same even if it is in the same molecular system. Hence, these two
parameters, together, can span the electronic structures to a greater detail
advantageously than any one of the parameter alone.
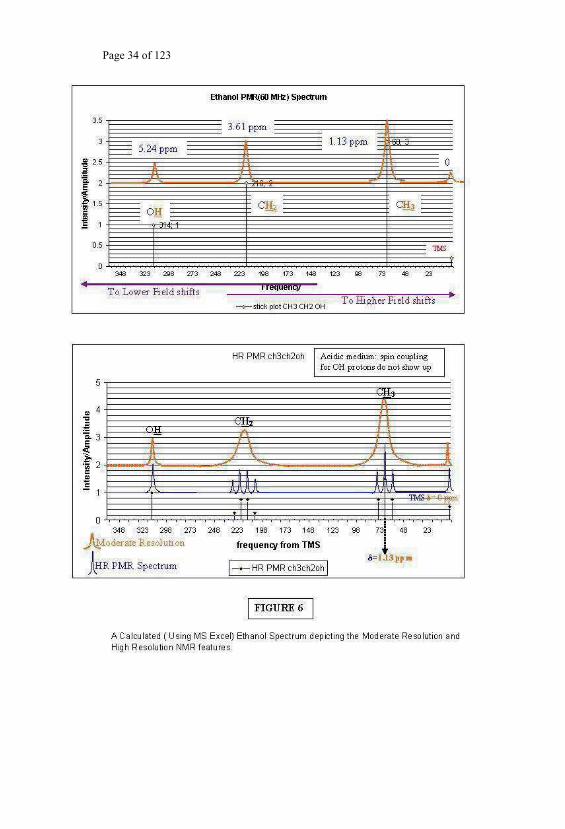
Ethanol (Ethyl alcohol) has the molecular formula CH3 CH2 OH. The PMR
spectrum of this compound contains three signals at the positions
corresponding to the chemical shift of CH3 protons (1.13 ppm), - CH2
protons (3.61ppm) and the OH protons (5.24 ppm). The number of lines
(signals) mentioned above is without taking into consideration the possible
splitting due to the spin-spin interaction of the CH3 protons with - CH2 , and
the - CH2 protons with CH3 and OH protons and the OH protons with -
Page 37 of 123
CH2 . When integrated for the intensities, these lines would have the
integration height values indicating intensity ratio of 3:2:1. Such a spectrum
is obtainable when the spectrometer does not have high enough resolution
and produces only three lines above for the PMR of ethanol. This is a
moderately resolved spectrum since, chemical shift differences are
resolvable, but not the spin-spin splitting patterns. The line width in such
moderately resolved chemical shift patterns could be of the order of 20-30
Hz. This would appear to be of the order of 0.5 ppm width in a 60MHz PMR
spectrometer. The resolution of the spectrometer can be improved by
improving the magnetic field homogeneity of the of the magnet system. This
magnet system. The High Resolution Magnet Systems can have the
homogeneity good enough to yield spectra with resolution of the order of
0.2Hz. Such resolutions are achieved with any kind of stable magnets,
independent of the steady magnetic field value for which the magnet is set
for and hence independent of the operating frequency of the spectrometer.
Such a spectrometer is refereed to as the High Resolution [HR] NMR
Spectrometer. The spectrum of ethanol in presence of trace of acid in the
medium, and from a High Resolution spectrometer would result in a triplet
centered at 1.13 ppm for the CH3 protons because of its coupling with the
CH2 protons. The three lines triplet would have the intensity ratio 1:2:1. The
CH2 protons would be split into a quartet (intensity ratio 1:3:3:1) centered at
3.61 ppm. The four lines arise because of the coupling of the CH2 protons
with the three protons of the methyl group. The magnitude of the spin-spin
splitting is 7Hz. The neat ethanol sample would contain in the PMR
spectrum the spin-spin interaction of the OH protons also and because of its
coupling with the CH2 protons there would be a triplet centered at 5.24 ppm
with coupling constant value of 4.5Hz. Each of the four lines in the quartet
of the CH2 protons, in this case, would be further split into sets of doublet
Page 38 of 123
lines due to the presence of one proton of the OH group. A similar spin-spin
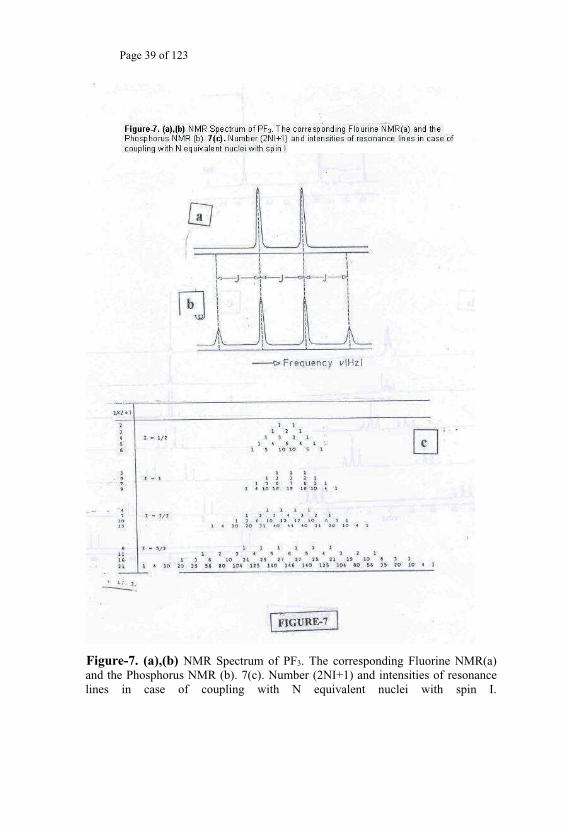
splitting for the case of PF3 appears in Fig. 7a and 7b. This is a case of
hetero nuclear spin-spin splitting between the 31P and the 19F nuclei due to
the coupling between the Phosphorus and Fluorine nuclei as evidenced in
their respective NMR spectra. The multiplicity pattern due to the interaction
n
well-defined relation relating the resulting number of split-lines to the value
resulting multiplicity patterns (Fig. 7c).
As it is evident, the group of 3 protons in the CH3 part of the ethanol do not
have any spin-spin splitting features manifesting in the NMR spectrum
which can be attributed to the spin-spin interaction among the three methyl
protons themselves. That it is a group of three protons can be inferred only
by the multiplicity pattern it causes in the NMR of neighboring bonded
protons. Thus, this set of three protons of methyl group is known among the
category of equivalent set of protons. Similarly the two protons of the CH2
group form a set of equivalent protons among which the splitting cannot be
seen in the spectrum. The main criterion for the set of equivalence of the
protons is that they all have the same chemical shift values being present in
the same electronic environment due to the nature of bonding in the
molecule. Thus it is necessary to classify the spectrum on the basis of these
patterns that can be observed depending upon the number of equivalent
protons with a particular value of chemical shift, and the neighboring
equivalent protons interacting with each set of equivalent protons. Even
though the multiplicity patterns are governed by simple relations, these
relations are simple only under certain approximations.
Page 39 of 123
Figure-7. (a),(b) NMR Spectrum of PF3. The corresponding Fluorine NMR(a) and the Phosphorus NMR (b). 7(c). Number (2NI+1) and intensities of resonance lines in case of coupling with N equivalent nuclei with spin I.
Page 40 of 123
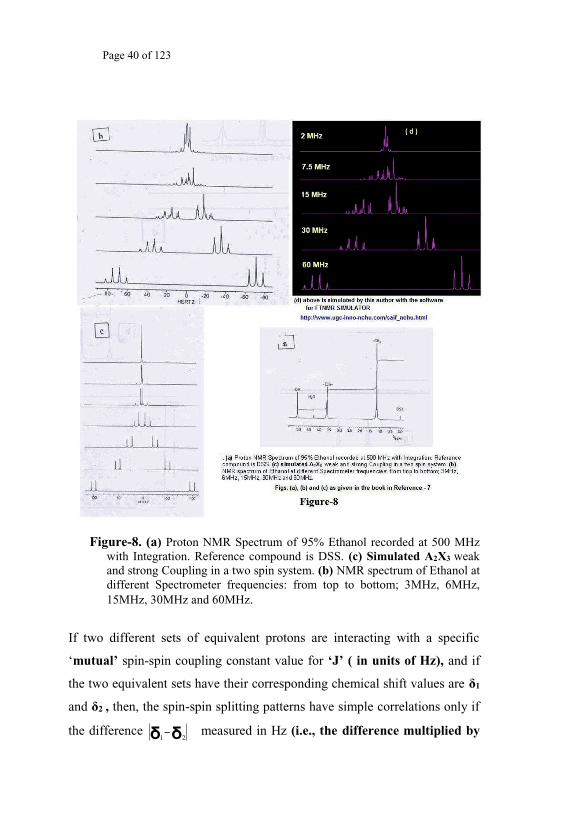
Figure-8. (a) Proton NMR Spectrum of 95% Ethanol recorded at 500 MHz with Integration. Reference compound is DSS. (c) Simulated A2X3 weak and strong Coupling in a two spin system. (b) NMR spectrum of Ethanol at different Spectrometer frequencies: from top to bottom; 3MHz, 6MHz, 15MHz, 30MHz and 60MHz.
If two different sets of equivalent protons are interacting with a specific
spin-spin coupling constant value for and if
the two equivalent sets have their corresponding chemical shift values are 1
and 2 , then, the spin-spin splitting patterns have simple correlations only if
the difference 21
measured in Hz (i.e., the difference multiplied by
Page 41 of 123
the spectrometer frequency) is larger than the J value by an order of
magnitude. This means 1021J
. Then the resulting pattern is said to be a
first order spectrum, which is the simplest case for interpretation. There are
definite set of rules based on the theoretical considerations for characterizing
the multiplicity patterns even when the above ratio is not as high.
These patterns appear tabulated (Fig-8) as a function of the varying values
of the ratio until that value beyond which the pattern remains simple enough.
All these require developing a systematic set of nomenclature11 to refer to
the patterns without having all the time to show the spectra during the
discussions after gaining familiarity. It is to be well comprehended that the
spin- J
independent of Spectrometer frequency, and the Chemical shift measured in
ppm -scale is independent, in numerical value, of the spectrometer
frequency. Thus the ratio of the chemical shift difference to the spin-spin
coupling constant is dependent on spectrometer frequency [and the magnetic
field] for the same sample. Thus it is possible to convert a complicated
pattern into a simple pattern by taking the spectra in a spectrometer working
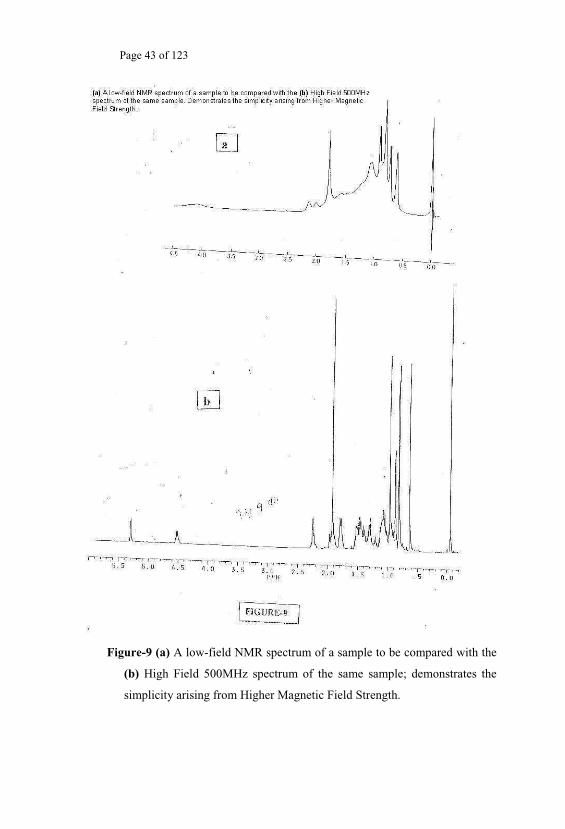
at higher Magnetic field strength. This simple method of working at higher
magnetic fields [Fig.9] is a simplest way of obtaining easily interpretable
spectra, provided the technology permits to that limit for a given sample.
All the above considerations illustrated for the PMR spectra, have similar
counter parts for the multi nuclear NMR. The possibilities for homo nuclear
and hetero nuclear combinations are many and once, in principle the
mechanisms are understood and by gaining familiarity with the use of NMR
for structure determinations, it should be possible to realize the full potential
of this tool in the varied contexts as becomes necessary. As was pointed out
earlier, the protons in the various chemical environments have chemical
Page 42 of 123
shifts within the range of mostly 10ppm. But, the chemical shift ranges for
all the nuclear species are not the same. For example, the 13C- Carbon NMR,
the resonance frequency for which is approximately ¼ th of the proton
resonance frequency at the same given magnetic field, spans a range of about
250 ppm in comparison to the 10 ppm range for protons. Thus if the PMR
spectrometer frequency is 100MHz [at 23.5 Kilo Gauss], then 1ppm is
100Hz so that the protons have a range of 1KHz. At this same field, the 13C
resonate at 25.6MHz and the 200 ppm would correspond to 200 x 25.6 =
5.12KHz.The observed chemical shift range for 15N is about 1000 ppm; and
for 31P the range is about 350 ppm. The 31P nuclei in biological samples
cover a range of about 30 ppm. Thus the sample coil tuning of the probe-
system and the signal detecting would have to take into considerations such
variations in ranges which are closer the Audio frequency range values of the
electromagnetic spectrum, while the resonance (operating) frequencies are in
the radio frequency [MHz] ranges. The technological advances have
nowadays made it possible to have NMR spectrometers which can operate at
Magnetic Filed strengths of 14.092 Tesla which is 140.92 Kilo Gauss
values.
Page 43 of 123
Figure-9 (a) A low-field NMR spectrum of a sample to be compared with the
(b) High Field 500MHz spectrum of the same sample; demonstrates the
simplicity arising from Higher Magnetic Field Strength.
Page 44 of 123
4. AN OUTLOOK ON THE UTILITY FOR STRUCTURE DETERMINATION
On the basis of the nature of the interaction described and the corresponding
NMR spectral features, a guideline can be worked out for interpreting the
values of the parameters obtained from NMR spectra by carefully
analyzing12 the correlations between structure and the values of chemical
shifts and coupling constants.
The convention in NMR spectroscopy is to choose a compound with,
possibly, only one equivalent set of most shielded nuclei and set it as
reference with zero value on the - This is the extreme, right most
end of the spectrum in a conventionally produced chart-paper for NMR
spectra. The direction from left to right is towards higher-field resonance
values; when the spectrometer frequency is held constant at a set value then
the resonance field must vary depending upon the extent of shielding at a
particular nucleus. According to Eq.4, the product - must remain
constant if is held constant. Whence, as the shielding of nucleus, and
value, increases from bare nucleus value 0
max is set as
=0, the chemical shift value can be at its
maximum max. Thus shielding must be measured with reference to Bare
Nucleus (no-shielding), and chemical shift with reference to the resonance in
the conventional chemical compound (containing typically most shielded
nuclei). The direction from left to right is towards higher-field resonance
values. This convention, as above, for routinely measuring NMR parameters
from the spectra on chart papers obtained form the spectrometers, provides
Page 45 of 123
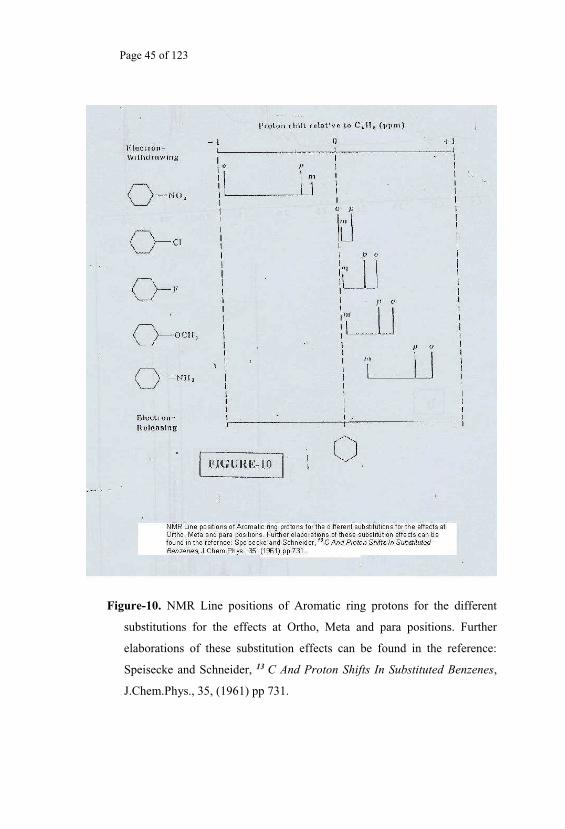
Figure-10. NMR Line positions of Aromatic ring protons for the different
substitutions for the effects at Ortho, Meta and para positions. Further
elaborations of these substitution effects can be found in the reference:
Speisecke and Schneider, 13 C And Proton Shifts In Substituted Benzenes,
J.Chem.Phys., 35, (1961) pp 731.
Page 46 of 123
the following convenient descriptions to indicate the structural situations
around the nucleus in the given sample.
When, due to the molecular bonding and the electronic structure, there
happens to be more electron charge density around a nucleus (Fig.10), then,
the possibility of diamagnetic shielding13 effect increases. If the electron
charge cloud can undergo changes in the electron-circulation characteristics
(the velocity of circulation and/or the radius of circulation due to the nature
diamagnetic shielding effect can increase with increase in the velocity of
circulation and decrease in the radius of circulation. The opposite trends can
be described as paramagnetic deshielding effects. Till now the nucleus had
been considered to be at the center of (within) the relevant charge clouds. If
the nucleus under consideration is situated in a region near by, but outside,
the electron charge cloud, even then the changes in the charge cloud and its
characteristics can influence the nucleus in the neighborhood. Then the
reasoning must be based on the dipolar field distributions around a point
dipole14. The considerations of whether, the point-dipole approximations can
be valid for explaining the neighbor group contributions can add to the
strength of the arguments for the derived structures or can act as constraints
when there is necessity to restrict the possibilities of equivalent assignments.
This typically is the approach while trying to work out structures of large
molecules where the double resonance techniques (the nuclear Overhauser
effect) provide the necessary inter nuclear distance constraints while trying
to obtain optimized structures. It is possible that such types of correlations
open up an endless possibility so that a structure can be solved entirely based
on NMR spectral information without having to resort to any other tool.
The spin-spin interactions are much smaller in magnitude as compared to the
chemical shift difference in frequency units. These interactions depend upon
more critically on the nature of the molecular electronic structure in the
Page 47 of 123
region where the interacting nuclei are situated rather than being specific
about only a given nuclear site. The possible immense structural
correlations to the nature of the bonding provide detailed information with
reference to the number of bonds between the interacting nuclei, multiple
bond formations and, to the corresponding hybridization of the atomic
orbital, which have to be invoked to account for the shapes and charge
distributions due to these bonds. These are in addition to what the chemical
shift information can provide.
The spin-spin coupling constants and the Chemical shift values can be
correlated to result in a consistent set of assignments which fits in with the
chemically feasible and favorable structures. But this requires enormous
effort when the system under study is large and several sets of parameters
close to one another resulting in complicated appearance of the spectrum.
Typically the kind of effort required can be ascertained from the fact that
certain spin-spin splitting patterns observed in NMR would require elaborate
simulation techniques to ascertain the nature of the interacting spin system
and the corresponding chemical shift and coupling constants. The multi
dimensional NMR techniques provide the advantage of greatly simplifying
the task of correlating the chemical shifts with the corresponding possibility
that a pair of nuclei with the assigned chemical shifts can in principle be
coupled or not. Once it is established, that given two spins with specified
chemical shifts are coupled by spin-spin interactions, then the pulsed
multidimensional NMR techniques provide a range of experiments which
can be designed to extract the magnitudes of these coupling constants as
well. These types of assignments were made conventionally by double
-5,17.
The analogous experiments in the multidimensional NMR techniques are the
COrrelated SpectroscopY 1 6 a and the Nuclear Overhauser
Page 48 of 123
E f fect SpectroscopY 1 6 b . The correlated spectroscopy produces a
spectral pattern, which correlates the chemical shifts plotted on two
frequency axes (with the possibility that the chemical shifts of one axis could
be from a spin system coupled with another spin system with chemical shifts
as displayed on the second axis). These types of multidimensional spectra
experiments can result in cross peaks only for spin systems, which are
coupled. Between spin systems which do not exhibit sin spin interactions in
dimensional spectral plots. Once it is established by the correlated
spectroscopy that certain sets of spins in the systems are coupled, then the
multidimensional NMR techniques have a series of experiments which can
be resulting in the determination of the spin-spin coupling constant values as
well. Typically what is named as - 20 two dimensional NMR
technique (homo-nuclear as well as hetero-nuclear), along one of the axis
chemical shift values of the nuclei are plotted and on the other axis their
corresponding spin-spin coupling patterns only without any reference on that
axis to the chemical shifts. With the possibilities of obtaining such
multidimensional NMR spectra in spectrometers at high a Magnetic field
strengths as 14.02 Tesla (corresponds to resonance frequency of 600 MHz
for Protons), the NMR holds promise for the application as a tool for
structure determination. The Nuclear Overhauser Effect Spectroscopy can
produce cross peaks in two dimensional spectra provided the two spin
systems (with one system on the one of the chemical shift axis and the other
systems on the second axis) are placed geometrically in such proximity
(even though by directly bonding) by the stereochemical dispositions, that
the direct (through space) dipole-dipole interaction which is time dependent
(because of the variation of the polar angle of their inter nuclear vector) due
to the molecular motions exercises an influence by relaxation mechanisms.
Page 49 of 123
In such event there can be a cross peak which would indicate the stereo
chemical proximity, an information about the non-bonded dispositions of the
spin-systems in molecules.
Even at such high fields, for macromolecules, the resulting spectra may be
projecting out only certain recognizable spectral structural patterns instead of
the display of discrete line spectra as is possible for small molecules. Thus
besides the finger prints of spin-spin splitting patterns for spin systems
within molecules, it may be possible to document finger prints of molecules
which occur conspicuously as familiar fragments(Table-3) in macro
molecules. When several of such familiar fragments are present together in a
macro molecule, then the resulting spectral features may not contain any
explicitly visible pattern corresponding to any of the documented21b single
molecular fragment but a overall pattern must have to be analyzed for the
constituent patterns and further into constituent spin-spin splitting structures.
Thus an elaborate pattern recognition21a procedure would have to be
programmed and implemented. Even though, this description seems to be
that of a formidable task, propping out a question, whether it is all worthy
enough or not (to spend time on this tool for structure determination), the
actual situation in the practice of NMR is providing pleasingly encouraging
possibilities.
The present day spectrometers24 have built in automated programs to set up
pulsed experiments of the type of Correlated Spectroscopy, J-resolved
Spectroscopy, Nuclear Overhauser effect Spectroscopy and many more. Not
only that the spectrometers can produce spectra for visual display23, they can
also store the entire spectral information as data bases convenient enough to
process them with the available spectral data processing software packages
in the dedicated computers. Hence all the required experimental acquisitions
and the data processing options can be setup finally to yield, from the
computer aided NMR Spectrometers, the final structural information as

Page 50 of 123
required for understanding the molecular structures and their functions. Thus
the NMR in the present day is a potential tool for structure determination.
When by the studies in liquid state the NMR can reveal so much of structural
information, then, the natural inquisitiveness to know about studies in solids
cannot be dormant. But, in this article not much can be covered about how
much more details can be acquired from solid state NMR and what are the
additional aspects that have to be invoked for those advantages in solid states
from the perspectives of the basic interactions discussed till now in view of
the liquid state of the samples.
Basically the difference in solid state22 is that there are no tumbling motions
of the molecules and hence there are no time averages to be considered when
the spin systems have dependences on the orientation of their inter nuclear
axes with respect to the external magnetic field direction. Thus the
anisotropy of all the interactions do not get averaged and the resulting tensor
parameters of the system for the basic interactions scan the electronic
structure of molecules spatially to reveal the nature of bonding precisely. To
what extent the combined information wide line NMR and the high
resolution solid state NMR studies can reveal about the nature of molecular
packing in crystals and the effect of inter molecular shielding interactions
and the inter nuclear distances can be ascertained by looking through the
discussions in some of the typical solid state NMR studies and the references
there in. In fact by grasping the possibilities with the HR NMR in liquid
studies it is only a matter of some more reading of the nature of the un-
averaged interactions which would make it evident what the solid state NMR
studies holds for structural studies. Along with the advances and
achievements in the experimental aspects of NMR, the theoretical
calculations of the NMR parameters are providing a supportive basis for the
experimental findings and the gain there by is getting the right clues to
improve the theoretical formalisms.
Page 51 of 123
PART-B: GETTING ACQUAINTED WITH NMR IN PRACTICE
1.ACQUIRING AN NMR SPECTRUM
NMR technique to practice requires an acquaintance with the methods of
preparing the samples and obtaining the spectrum recorded from
Spectrometers. The elementary introduction as was given in Part-A consists
essentially of materials to acquaint with the terminology related to the
Principles of NMR and the description of NMR Phenomenon for the
consequences of getting information from NMR spectrum, particularly the
spectral features and spectral parameters which are important for
determining structure of molecules. All these aspects have to be related to
the advances in NMR instrumentation which makes structure determination
facile, and thus the significance of experimental conditions in terms of the
instrumental settings by appropriately assigning the significance in
accordance with the corresponding changes in the spectral patterns. Certain
complications in the structural features would require critically
distinguishing the settings from what is required under routine conditions.
As one may infer from the contents of Part-A the diagrams in the various
figures were drawn using the Microsoft Office applications which are
provided as default features as part of Microsoft operating systems. The
purpose of such an approach was twofold: one, beginners do not have to
make special effort to procure software applications; the second being use of
readily available general purpose software applications would require the
learner to look for the basic equations which are applicable for such tasks
which enables them to gain confidence on simulations and data processing.
Once the learners become familiar with the simulation processing techniques
in elementary terms then, acquainting with more advanced packages requires
Page 52 of 123
not much effort. In the figure captions the equations which were used are
also clearly mentioned as much as possible.
Reference 4: Suggested Reading, consists of a macroscopic model of the
NMR phenomenon which is the point to make a beginning (if one knows
college Physics, chemistry and Mathematics) to learn about NMR
experiment for the principles of detection. NMR videos Playlist (Reference
8; Suggested Reading) the first video is on the elementary definition of NMR
which has the required supplementary animated illustrative material for the
descriptions on the macroscopic model of F.Verburugge in reference:4
mentioned above. Even though the descriptions begin with single spin
interaction with externally applied intense steady magnetic field, the
experimental measurements are with spin ensembles. Then what difference it
makes to be dealing with ensembles and describing with single spin
interaction? This is an important factor which is all the time to reckon with
in spectroscopic studies that describe the phenomenon with single isolated
particle and experiment with ensemble and derive structural information by
measuring spectral quantities from such spectra on ensembles. This
difference is elucidated in the Playlist video . The
Pulsed NMR experiment is described in the third Video of the playlist. Thus
the 12 Videos in the play list provide the necessary introduction for the
NMR spectroscopic technique covering as much details as necessary for the
beginners, particularly the operating principles of NMR instruments. The
actual spectrometer settings6 and the functional features are to be acquainted
with by visiting the sites of NMR instruments and getting to know the
spectral print outs from the spectrometers. Mainly, acquisition parameters,
data processing parameters, and plotting parameters are the parameter
categories. Acquisition parameters consist of the specific pulse sequence of
the intended NMR technique, with the Pulse widths, Pulse delays, RF Power
level settings, Automatic Gain control parameter, Number of data points to
Page 53 of 123
be acquired per scan, Number of scans required for the appropriate signal to
noise ratio, a sample code to identify the stored spectrum and for subsequent
retrieval etc. At the outset the particular nucleus to resonate the spectrometer
probe must be tuned to appropriate frequency. The signal to noise ratio, the
number of scans and the over-all experiment time to get the plotted spectra
would all be dependent upon the natural abundance of the particular nucleus,
sample concentration determining the sensitivity. The probe sample coil
quality factor would be determining factor for the spectrometer sensitivity.
In PART-A these aspects have been explained with references cited for
specialized discussions on the various aspects. No effort has been made to
particularly to describe the
mostly used NMR spectrometers in several NMR Centers are the ones
manufactured by BRUKER GMBH and these manufacturers have website
documenting several aspects of their spectrometer series with technical
reports and contact information to the application scientists who specialize in
the various spectrometer aspects. Further there are frequently held BRUKER
WEBINARS which can be useful to keep one updated with the current
trends. Some of these webinar recordings can be found enlisted in the
webpage at reference 25.
Integrating Spectral Analysis into Academic
Research & Teaching26 gives an outlook on the role of spectroscopy in
academic pursuits and indicates what to look for while trying to avail the
spectroscopic techniques in research. The Fourier Transform technique has
made possible several varieties of NMR experiments and the major
classification being the popular 1D (one-dimensional) and 2D (two
dimensional) FT NMR techniques. In principle one can talk of Multi-
dimensional NMR, an n-dimensional FT NMR experiments, depending upon
the instrumental features. Critical could be provisions in terms of
Page 54 of 123
spectrometer capabilities with associated computerized storing and
processing of the data.
One of the important factor that determines the efficient use of the NMR
technique and the selection of appropriate NMR experiments for the
problem at hand is how well one is able to relate the reference frames in the
Laboratory space, Molecular point groups and the Spin space. The
descriptions of experiments in Laboratory fixed frame and the Rotating
frames of reference can be making all the efforts to keep track of the results
elusive, thus making the interpretations ambiguous and difficult. As a
consequence the entire effort of chemical structure determination a multi-
disciplinary task. Depending upon whether or not the requirement of NMR
spectroscopy as structure is a lasting necessity, it may be necessary at the
very outset the spectrometer environment and the various reference frames
related to one another. For example it is usual practice to refer to pulses as x-
pulse or y-pulse, depending upon the rotating reference frame axis along
which the rotating magnetic field vector is when the pulse is on. If one
knows the RF oscillations in sample coil (mostly solenoid shape), the
magnetic field oscillations are along the axis of the solenoid, and the
solenoid axis fixed in the Laboratory frame. Thus it is necessary then, to
know that the solenoid axis linear oscillations have to be subjected to an
Euler Equation of complex quantity, the real part would correspond to the
actual linear oscillation along the solenoid axis. To grasp this point it is
hereby suggested to refer to the NMR Video Play list (of Ref.8, Suggested
contains in slide #6 &7 animated features and explanations that would
interrelate the theory of NMR experiment and the actualities of Laboratory
frame and rotating frame events. These slide contents in conjunction with the
10th and 11th in the Play list namely euleexp_1.WMV and euleexp_2.WMV
on the animated explanation of the mathematical equation Euler Expansion
Page 55 of 123
could be adequate for acquainting with the required transformation operators
under pulses and the references to various coordinate axes reference frames.
Such references to axes related to the applied RF pulses find importance in
the Phase Cycling Sequences. Phase Cycling (http://www-
keeler.ch.cam.ac.uk/lectures/Irvine/index.html Chapter 9) is used most of
the time in FT NMR experiments to obtain the chosen parameters manifest
unambiguously in the spectra for convenient determination. Further in the
general list of videos, the one entitled transform_tensors.WMV can be
helpful in relating molecular axes systems, principal axes systems of Tensor
interaction parameters with the laboratory axes system. It is also possible to
view the 30mins-45mins animated feature content of the Presentation File
and the Video file which can be comprehensively a lecture content to
often encountered in multiple pulse experiments (Experiments requiring a
sequence of pulses separated by delays of various magnitudes) and the
6_NMR_SpinEcho_Pulsesequence. WMV along with
the geometrical illustration of the mathematical process
To make a remark at this stage is inevitable: that there are two approaches to
opt for whenever an NMR aspect is to be clarified or explained. The first is
the familiar Vector Model which is more tractable in the early stages of
acquainting with NMR phenomenon. The single spin treatment to explain
the interaction of the nuclear magnetic moment with external magnetic field
the precession phenomena giving the equation relating the precession
frequency with the strength of the magnetic field and related resonance
condition can all be explained with classical vector model, with the notion of
quantization of Angular Momentum implicitly taken for granted. There is the
other approach of quantized energy level diagram derivable from the Eigen
Page 56 of 123
values and the Eigen functions corresponding to the Hamiltonian operator
expressed in terms of the Spin angular momentum operator. This also has a
simple description for the single spin interaction with external magnetic field
and the resonance phenomenon. When the consideration of the spin
ensemble arises, then the single spin versions have to get appropriate
ensemble version, carefully appreciating the differences and that such
differences are essential for the detection of NMR and the advanced NMR
experiments. The classical vector model gets the description in terms of the
basic angular momentum vector of the nuclei related to nuclear magnetic
moment. In transcending from the single spin angular momentum to the
ensemble magnetization, relaxation phenomena play an important role. A
thermal equilibrium between the spin degrees of freedom and the other
degrees of freedom of the spin ensemble (macroscopic sample) is to be
established before the sample is used for NMR experiments. The process of
exchange of energy between the spin system and the lattice (non-spin
degrees of freedom) is the longitudinal (T1 relaxation) relaxation process.
Once the thermal equilibrium is established in the magnetic field, then steady
state NMR observations require all through the acquisition NMR spectrum,
this thermal equilibrium is always maintained. The Continuous Wave (CW)
NMR detection are this class of steady state29 technique. On a sample in
thermal equilibrium, NMR information can be acquired by setting a non-
equilibrium state for the spins and while the thermal equilibrium is being
established the NMR information can be acquired. These are transient
techniques of NMR detection. Once the spin system are set in a non-
equilibrium situation, there are two kinds of processes available for spin
systems: 1) the spin order originally present in the system (under non
equilibrium conditions) changes with time due to spin-spin interaction in
which case the exchange of energy is among the spins by simultaneous
Page 57 of 123
upward & downward transitions for example, which does not require any
interaction with Lattice and exchange of energy with lattice. Thus such spin-
spin relaxation process has different energy exchange considerations (in
principle the spin energy within the spin system itself) as compared to spin
lattice processes. This difference makes one process to be treated as
independent on the other in favorable cases. Thus spin-spin relaxation time
(the T2 or transverse relaxation time) can be different from spin-lattice
relaxation time (T1 or longitudinal relaxation time). The terms longitudinal
and transverse makes the visualization of the phenomena convenient in the
vector model. Significantly, in solid state, the spin systems may have strong
spin-spin interactions and this can give rise to short relaxation times, while
the lattice is made up of atoms in fixed motionless positions, the spin-lattice
interactions may not be as much strong thus rendering the spin system
characterized by very long spin-lattice relaxation times. Since the spin-spin
equilibrium is established much more quickly than the spin-lattice
equilibrium (thermal equilibrium with lattice), there is a well defined spin
temperature to reckon with as different from the lattice temperature. Thus the
Liquid State NMR conditions can be much different from that for NMR in
solid-state. By interpretation of NMR it is usually meant that it is the High
Resolution NMR in liquids is the technique. The kind of structural
information one obtains from solid state is different from that from liquid
state. The Solid state aspects would not be emphasized much in this article.
2.THEORY OF NMR EXPERIMENTS
While the NMR spectral information is rich and lends itself to be interpreted
from several points of view relating to several disciplines, all this usefulness
is possible mainly because of the theoretical aspects which are the basis for
devising and developing NMR technique to be useful. The reason that the
Page 58 of 123
nuclear magnetic resonance (for the entire available range of field values) is
in the RF region of the electromagnetic radiation is a distinct difference as
compared to the other spectroscopic techniques which are in the visual and
ultraviolet ranges of the electromagnetic radiations. The nature of the
radiation itself being coherent in the RF region, as compared to the extent of
incoherence encountered in the much higher frequency ranges makes certain
NMR experimental conditions inherently advantageous. Since such
discussions are much too far-fetched in the present context, the instrumental
aspects are not discussed in as much in detail as the fact that these
considerations prevail over the current advances in Instrumentation.
Even if it be only to a limited extent, knowing the descriptions of spin
system used in the context of the evolution of the spin system under transient
NMR techniques could be a facility; particularly while trying to acquire an
NMR spectrum and to derive information from the spectrum about the spin
system. It was mentioned earlier that there is a difference in the descriptions
when considering an ensemble of spins as compared to single spin
description. To make a beginning with the theory of experiments, it is
pertinent to point out that these differences arise mainly because of the spin-
spin interactions playing a role as compared to non-interacting system. It was
also mentioned that the term magnetization describes more conveniently the
ensemble of spin system, than the description based on magnetic moments of
individual spin spins. Thus first making the description in terms of single
spin for the basic interaction in presence of magnetic field, the terms relevant
for spin ensemble gets defined in terms of the single spin moment and the
components along the quantizing direction and perpendicular to it. It was
also mentioned that the vector model and energy level versions are prevalent
to describe NMR experiments.
In principle the net measurable quantity in an ensemble is to be due the
corresponding individual physical property of the single spins. How the
Page 59 of 123
measurable quantity changes with time spontaneously (without any external
the free evolution of the spin system. That the spin system can evolve freely
on its own to enable the measurable ensemble quantity to be different from
the straight forward summed totality of the individual spin property is all
about the beginning to the theory of experiment. The time dependent
changes in the system can be characterized when the changes occur slowly
enough to be monitored by instruments, then a characteristic time called
usually a time-constant can be associated with the process. It is necessary
thus those changes which can occur in the spin system which can be termed
instantaneous, and those which have characteristic evolution time to be
associated with. In the video (Reference 8, Suggested Reading) among the
wherein at Slide #5 there
d those which have
finite evolution times for the spin system changes. To know the spectral
features that are containing information for the consequence of structure
determination, it is necessary to identify processes at the outset which occur
instantaneously and which can be characterized as an evolution. Such
evolutions of the spin system are governed by Equations Motion, which are
solved for obtaining the functional forms of the time dependent changes of
the system. To determine experimental conditions to enable such changes,
these processes must be identified with the part of the Hamiltonian that is
responsible for the changes (evolutions). Since the spin systems can interact
with externally set conditions, such interactions are characterized by the
Hamiltonian, which can be termed External Hamiltonians; and, those
interactions which occur due to the characteristics of the nuclear spins, that
part of the Hamiltonian representing only spin operators and lattice
parameters are termed Internal Hamiltonians. One may find that usually the
Page 60 of 123
under the External Hamiltonians operating on the state of the spin-system.
The so termed free evolution, are the evolutions under internal Hamiltonians.
This awareness of the external and internal to the system would greatly
simplify the setting up of appropriate experiments, since the internal
Hamiltonian parts can be corresponding to the information on the measured
spectral parameters which in turn are related to the system characteristics
specifically to the structural aspects. How these parameters (internal
Hamiltonian) influences the evolution can be ascertained and experimenter
can set external Hamiltonians that can alter the courses of this evolution at
certain instants, and then further let the system evolve. These lead to certain
selectivity in the evolution under internal parameters so that the final
spectrum evidences the structural aspects more selectively for simplifying
the task of structure determination.
The Hamiltonian for the interaction of spins with external magnetic field
consists of nuclear spin operator and the operator for external magnetic
field vector31. As much as this applied field is a Steady Field (constant in
time) and is present all the time throughout the duration of NMR experiment,
interacting with magnetic field vector of the externally applied
electromagnetic field, but the pulses are applied only for short time periods
(pulse widths- PW) during the entire single-scan of multi-pulse NMR
experiment, and these pulse widths are small compared to delay periods for
- so named specifically because it is in the absence of (free
from the presence of) external radiation. Thus the pulses effect a rotation of
the magnetization vectors, and these are time dependent Hamiltonians. The
free evolution also described by time dependent Hamiltonian, under a time
independent interaction the evolution is characterized by time dependent
changes in the spin system. The spin-spin coupling operator contains only
Page 61 of 123
spin operators and no external field for the interaction. This implies that the
spin-spin interaction is present even when there is no applied, external
magnetic field (steady field or pulsed RF field). During the evolution period,
this spin-spin interaction also would be present. It would require finding a
set of constituent pulses to make a sequence to be effective and be selective32
to a specified interaction from among the several interactions present at a
time.
The theory of the experiment would require the awareness of the Quantum
mechanical operators governing the interactions, and the standing of these
operators with respect to the real laboratory world in which the experiments
are carried out and quantities are measured. To begin with consider the
equations of PART-A Section-2; the Eq.1, Eq.2 and Eq.3. These equations
come about from the descriptions of classical bar magnet possessing
magnetic moment |µ|, which is the magnitude of vector quantity µ, which
can interact with Magnetic Field of strength |H0|, the magnetic field being
the vector quantity H0. From the equation for energy E of interaction of
magnetic moment with the magnetic field E= µ.H0 the operator form of the
interaction of Nuclear Magnetic Moment with External Magnetic Field is
obtained, since nuclear magnetic moments are related to the nuclear spin
angular momentum operators, the nuclear magnetic moment interaction is
describable in terms of alignment of spin angular momentum. This aspect is
illustrated in the Video enlisted as .
From the sequence of properties and phenomena described what has to be
laboratory coordinate system, and when the nuclear moment is in this field, it
is the quantization of nuclear angular momentum (in turn due to the
associated magnetic moment) that enables the spin operators to be related to
the laboratory. Thus the direction of magnetic field is the quantizing axis in
this case. This implicit role of interaction of the magnetic moment (not
Page 62 of 123
quantized) interacting with magnetic field which makes the magnetic
moment follow the quantization governing spin angular momentum. This
awareness becomes even more important as one encounter advanced multi
pulse NMR experiments and the advantages they bring about. Fundamentally
the difference between a Magnetic Field (between North Pole and South
Pole) and the Magnetic Moment (made up by North Pole and South Pole)
must be appreciated33 to know where the matter is important and how it
relates to the materials exposed to fields. An understanding of such
differences and relevance to laboratory axes system must be in-built in the
appreciation of the contents of other reference31, 32 materials as well. At this
juncture it may be worth the while to recapitulate the following from the
abstract at the beginning.
extent to which the advanced instrumentation techniques are availed in the
detection of resonance signal, in the acquisition of spectra and in further
processing the spectral data. The greater the incorporation of such
technical advances, the more seems to be the benefits in utilizing this tool
for structural determination. In turn, the better the instrumental
provisions, the more seems to be possibility of designing new NMR
techniques with the better insights in the theoretical understanding of the
NMR phenomenon. This seem to provide a perennial cycle that the
improved understanding puts demand on the instrumentation to be
improved, and technology ensuring the necessary instrumental criteria
provides even better insights into the NMR phenomenon resulting in new
experimental schemes for availing the Nuclear Magnetic Resonance
The potential of this Technique for Structure Determination requires a
comprehensive appreciation of all the aspects even if one is not fully armed
Page 63 of 123
with all the necessary NMR tools. A quick grasp of the problem at hand, thus
would enable the working out of the details as is appropriate for the context.
Quantum Mechanical operators set up for the evaluation of various
interaction energies, all operate on the state function of the spin system. For
an isolated spin the wave functions are good enough for the necessary
description of the state of the spin system; but, a different kind of description
of the spin system state of an ensemble of such spins is preferred. This is
because one must be able to adequately describe the Magnetization along the
field (Z-direction) and in the plane (XY-plane) perpendicular the field.
Although Thermal equilibrium is characterized by the zero magnetization in
the XY plane, it is only when an XY Magnetization is created by causing a
non-thermal equilibrium condition, the Magnetic Resonance is detected.
What is the kind of quantum mechanical description available for describing
the presence of XY-plane magnetization is the query that can clearly point
out the Density Matrix description based on the single spin-wave functions,
rather than the wave functions themselves which is preferred. This aspect is
well illustrated and discussed in the book34 .
Even at the outset, the density matrix elements, classified as diagonal
elements and off-diagonal elements, respectively would conveniently
describe, equilibrium populations and the non-stationery part under the
external perturbation that renders the spin system in a non-equilibrium state
spin-system. Further fall out would be that the evolution of the spin system
to equilibrium from the non-equilibrium state, would be describable by how
diagonal elements vary with time (a T1 process) and how the off-diagonal
elements vary with time (a T2 Process). The off-diagonal states created by
the application of an RF filed are termed as coherences (in the context of
pulsed experiments, tilting of magnetization towards plane perpendicular to
Magnetic Field direction - the non equilibrium orientation of magnetization
Page 64 of 123
is referred to as coherences of first order are being generated; in the CW
as
distinct from the Term Populations for the diagonal terms. While a Vector
descriptions are convenient to describe in terms of populations ( number of
spins occupying a eigenstate (stationary state) related to lengths of the
magnetization vector, the non-equilibrium magnetization vector components
in the XY plane do not correspond to number of spins occupying (stationary
state) Eigen-functions. These off-diagonal elements so created would have
transitory existence unlike the populations which are time independent for
(the given Zeeman Filed) a steady external applied field. It a convenience to
use density matrix description, and necessarily reconciliation would be
called for when the non-equilibrium state has vector descriptions; all these
aspects have been adequately illustrated and discussed34 by Malcom Levitt in
the book referred to at the end.
While the magnetization along the field direction is simply described in a
vector representation, the XY-component has significances of more general
context which cannot be described in such simple terms of vector
description. The importance of the XY magnetization is that it is this
component which is responsible for the detection of NMR. And, there are
such non-stationary states which are simultaneously generated with the
creation of XY component under the experimental conditions. This calls for
the term Coherence35, preferably over the magnetization. This detectable
magnetization, that also has a simple vector description, is the first order
coherence which is detectable. The variety of pulse sequences and useful
NMR experiments (for obtaining simplified spectra from a complex Proton
system in a molecule) all come about because of the Higher Order
coherences that can be generated by pulse techniques. And it is only the first
order coherence which is detectable, although the higher order coherences
carry useful information. Thus higher order coherences have to be (at some
Page 65 of 123
stage in the experiment) converted into first order coherences to detect. Once
it is specifically a particular higher order coherence which is converted into
detectable first order coherence, then the spectral content of higher order
coherence becomes detectable. What are the coherence orders which are
important for a specific kind of information about the proton system is all
about the advantages of advanced theory of NMR experiments and this
aspect is covered as an exclusive part of NMR experiments this class of
experiments depend on the 35 . These
coherences and the consequent notations have given rise to different type of
diagrammatic representation which has no similarity with the vector
diagram. The mathematical description correspondingly turns out to be
conveniently in terms of density matrix, mostly the off diagonal elements are
considered for the various aspects of Coherence and Coherence Selection
Pathways. In the case of spin systems the density matrix for the spin-state
description of ensemble gets a mathematical density operator in terms of
spin angular momentum operator as much as the Hamiltonian of interaction.
This makes the correspondences more viable to relate the interaction
parameters and the variable in the laboratory coordinates.
3.HAMILTONIAN FOR ENERGY OF NUCLEAR INTERACTIONS
The symbols, notations and presentations would be closely following the
discussion in Ref. 36. For a Single nuclear spin the Hamiltonian of
Interaction can be expressed as:
I .AL. X
Where is the gyro magnetic ratio of the nucleus, a universal constant that is
characteristic of the interacting nucleus, and I the spin angular momentum
operator of the nucleus ( I I = , the
magnetic moment) and X represents the operator for the physical quantity
Page 66 of 123
with which the nucleus interacts, and AL contains the parameter which
determines the strength of the interaction depending on the local structure.
Thus I and X define the nature of interaction which is being considered and
AL is the parameter determining the magnitude of the interaction. It is also
possible to include the constants required for the context, such as , in AL by
definition. For the case of nucleus interacting with external magnetic field,
AL. X part can be represented by symbol BL.
= I . BL = I . AL. X = . B0
The interaction is with a magnetic field strength BL at the site of the nucleus.
When the nucleus is present in a molecule, the interaction of surrounding
electron with the external magnetic field modifies the field at the nuclear site
BL to be different from the actual strength B0 of the applied field. This makes
possible to express the BL as AL. B0, so that AL is the, sample dependent
factor and B0 being the actual strength of applied field. Thus if the
interaction is of the nuclear spin with externally applied field, it is referred to
as the Zeeman Interaction. The modifying sample dependent factor in the
Hamiltonian would be the Chemical Shift20 characteristic of the electronic
surrounding at the location of the interacting nucleus. Thus the Hamiltonian
can be of the form:
I . . B0.
Considering two spins in the sample namely, Ii and Ij ,
i Ii . i . B0 + j Ij . j . B0
The spin-spin interaction part of the Hamiltonian is of the form:
Ii . Dij . Ij
with the factor D contains the nucleus characteristic universal constants, and,
the space dependent part relating one spin Ii in the sample at its location, to
the other spin Ij in another location in the sample. The factors and D are in
general Tensors of Second Rank and each can in turn be expanded in terms
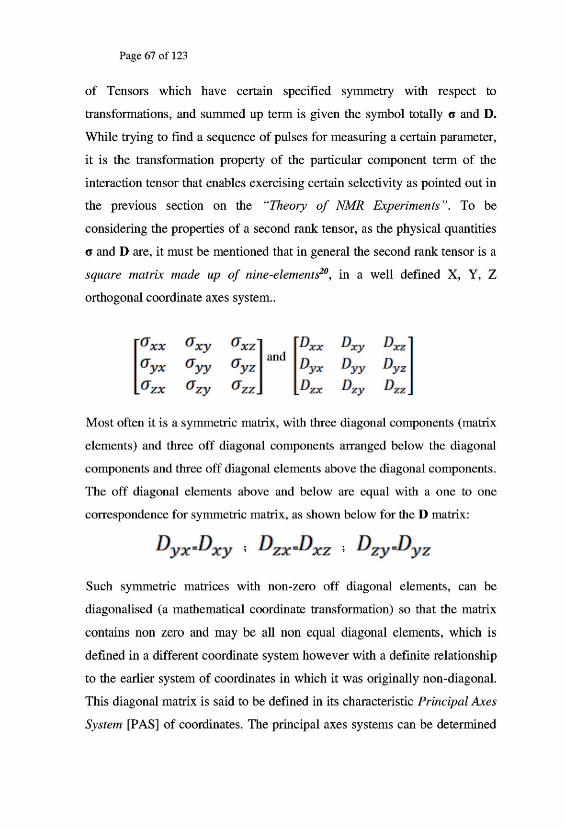
Page 68 of 123
by molecular symmetry point groups. But to assign the X, Y, Z with a
defined convention, could be outside the purview of an entirely symmetry
consideration.
At this stage, it is worth pointing out that in solutions (liquid state) the NMR
spectra contain only isotropic information where as in general the tensor
characterizes an anisotropic property. Isotropic values are simply the average
values of the three diagonal elements, in turn these quantities thus obtained
as the trace of the tensor, represent isotropic part of in the nature of the
specific interaction. This isotropic part is also called the scalar quantity. This
way the isotropic part of the tensor alone manifests in solution spectra,
means a selective averaging of the anisotropic part of the interaction38.
Chemical shift values in the solution spectra are the corresponding isotropic,
orientation (of molecules with external magnetic field) independent scalar
value, and this averaging away of anisotropic part is due to the fast tumbling
motion of the molecules in which occur random orientation of the molecule
at such fast rates, that the anisotropic part averages out. This is an averaging
in coordinate space. There are selective averaging methods by averaging in
spin space37, also termed as coherent averaging of interactions in spin space.
Such techniques enable solid state High Resolution Spectra; otherwise
normally in solid state it would be a wide-line NMR spectrum with much
larger line widths than in (liquid state) solutions.
The kind of selective averaging referred to in connection with the coherent
averaging in spin space for High Resolution Proton NMR in Solids is what is
currently referred to a selective averaging method, where as the earlier
averaging by tumbling motions in liquids is simply called a motional
averaging. The difference being, that the motional averaging results in the
vanishing of second rank component of the Tensor interaction, leaving the
zero rank tensor part of the same interaction. The scalar (isotropic) part is
the zero rank tensor (of chemical shift) while the anisotropic part is the
Page 69 of 123
second rank (traceless) tensor (of chemical shift). Whereas by coherent
averaging in spin space it is possible to average the anisotropic part of the
SPIN-SPIN interaction, leaving the anisotropic part of the Chemical Shift
interaction still measurable. Thus this selective averaging is a special kind
that it can average one interaction in presence of another similar (similar in
transformation characteristics) interaction. By spin space averaging a
selection between two different, almost otherwise inseparable interactions, is
possible for averaging out one and leaving the other being still measurable.
Selection between the different tensor ranks of the same interaction, known
much before, were not originally referred to as Selective Averaging. In solid
state NMR experiments, there is the coordinate space averaging method
called Magic Angle Sample Spinning method. This method is not a selective
averaging method because it averages out the anisotropic part of both the
Chemical Shift and the Spin-Spin interaction. The advantage being, it results
in liquid state like spectra for samples in solid state. What is inherently
present in liquid state (the random tumbling motion) is absent in solid state
and the magic angle sample spinning accomplishes in solid state, that which
is caused by what is inherently present in the sample.
4.EXPERIMENTS TO SIMPLIFY COMPLICATIONS IN SPECTRA
In practice the NMR spectra need not be always simple. Thus it is necessary
to have good theoretical understanding of the interactions to know how the
complications arise, and device experiments to obtain simplified spectra of
that specimen which at the first instance result in complicated spectra. As
one tries to interpret spectra (assigning chemical shifts and identifying
interacting nuclear spin systems), complicated spectra present ambiguities in
assignments and identifications. Then the theoretical basis would provide a
way for reducing the ambiguities either by simulation techniques or by
Page 70 of 123
special NMR experiments which can enable unraveling the actualities and
resolve the ambiguities. The spectrometer settings and the spectral patterns
that require attention can be categorized as in the list below:
1Magnetic field in-homogeneities.
2Signal to noise ratio.
3Recognizing multiplet-patterns in proton spectra.
4Overlapping lines, small differences in chemical shifts.
Most of those who requisition spectra for samples are usually people who do
not have to know all about the spectrometer operation; but, they are required
to be knowing about how to specify which features of spectrum have to be
given special attention from the point of view of the possible structures of
molecules contained in the sample which they submit. Field-shimming is an
automated routine procedure in the NMR spectrometer operation, before a
spectrum is obtained for a sample. Particularly for matters of resolving
possible small differences in chemical shifts, one must be able to recognize a
well resolved spectrum, with inherent narrow lines, from field in-
homogeneity broadened spectra. It may be necessary on special occasions
run a well known standard spectrum under the spectrometer conditions to
know whether the spectrometer is optimally well set. The transverse
relaxation time (the FID decay time) observed is a combination of the T2
relaxation time of the protons due to their spin-spin interactions (limit of
natural line width in spectroscopic terms) and the dephasing effect on the
XY magnetization due to field in-homogeneities. It is usual that the inherent
natural line widths are much smaller than the extent of remnant field in-
homogeneity present with the best possible shimming conditions. This
transverse relaxation time is referred to as T2 so that
1/T2 = 1/T2 + 1/T2
Page 71 of 123
The spectra with 1/T2 is obtainable from the spectrometers and the line
widths of single well resolved NMR line could be much less than 0.2 Hz
with the currently available NMR systems. Thus, even after the FID has
completely decayed, it is possible that the spin system still has the XY
components available to recover if at any stage the effect of in-homogeneity
is overcome. This kind of consideration has given rise to the discovery spin-
echo formations. Even after the complete decay of the FID monitored, it is
possible to reverse the decay caused by the in-homogeneity by applying an
appropriate pulse, and an echo of the NMR signal can be observed. The
decay due to the inherent T2 (due to spin-spin interactions) is not reversible.
Thus it is necessary to have the condition T2 >> T2 . Thus during the T2
time duration there could be several T2 time-slots, and at the end of every
T2 time-slot the magnetization evolution trend can be reversed to get
NMR signal. This phenomenon is the multiple echo formation. The spin
echo pulse sequence is illustrated in animated sequence in the Video with
6_NMR_SpinEcho_Pulsesequence.WMV in the YouTube video-
playlist referred to earlier. It is also to be remarked at this juncture, that the
solution state spectra are High Resolution spectra (Fig.6), in the sense that
the multiplicity patterns due to proton spin-spin interaction are well resolved;
and, so well displayed in the spectra to enable a measurement of Chemical
shift of each equivalent set of protons, and the spin-spin coupling constants
7_NMR
in the Video playlist; in this video, certain
parameters related to spectral line shapes and spectrometer settings have
been explained). The extent of resolution obtainable is indicated by the FID
time constants which are determined by the transverse relaxation times.
Invariably even in the most recent models of the Spectrometers the in-
homogeneities in magnetic field is the determining factor for FID time
constant and amenable to operators through the magnetic field shimming
Page 72 of 123
procedures. The protons inherently have much longer relaxation times and
thus the spectra in principle can be much better resolved than what is at
present possible, provided technology provides for much better shimming
and reduce the magnetic field in-homogeneities. In fact, reducing the sample
volume to a much smaller value than with the 5mm OD sample tubes can
improve the resolution under a given best shimmed conditions. Sample
spinning around the magnetic field axis (~20 Hz) averages the in-
homogeneities to enable better resolution. This sample spinning is an
averaging of entirely a factor external to the sample as much as the
refocusing effect causing an echo after the FID. Spin echo can be observed
also under efficient sample spinning for averaging the in-homogeneities. To
show by theory that effect of refocusing finally is an averaging is a simple
exercise; from the theory point of view it is not much discussed as it seems
trivial to be detailing the steps. While sample spinning is an averaging in
coordinate space, the refocusing by - pulse sequence gets into the realms of
spin space averaging. Thus by the sample spinning, the in-homogeneities at
the nuclear site are reduced and the nucleus experiences a time averaged
homogenous magnetic field. On the other hand, the in-homogeneity
experienced by nucleus is unaltered but the spins are made to evolve in the
opposite sense to reverse the defocusing effect of homogeneity and results in
refocusing. In both time durations the external in-homogeneity remains the
same. It is precisely because the in-homogeneity is the same that the
evolution of spins gets reversed so precisely after the - pulse.
A further consequence of such spin space reversibility is a class of
experiments called Pulse Field Gradient (PFG) experiment. In order to
achieve a highly homogenous condition, shimming is an effort to reduce
field gradients of all orders. The PFG class of experiments consists of
applying pulses (not of RF radiation, but) of external field gradients to
Page 73 of 123
increase the in-homogeneity, when the signals would reduce for a short
period and then the allowed to appear after the Gradient Pulse.
During the Field Gradient (magnitudes larger than that can be improved by
shimming provisions) Pulse, the signal would be rendered below the noise
level, so that the signal to noise ratio much below the level required for the
given spectrometer sensitivity. After the PFG duration when the pulse is
absent, the signal is restored (this aspect requires an explanation, presently
deferred to the later part of this description of PFG) to the value for
homogeneous field conditions. Even in the case of a sample with sufficient
sample (enough number of spins) concentration, the signal to noise ratio can
be set to such an adverse value that the spectrometer receiver does not get
any signal. What could be the consequence of such spin state for a short time
periods, for the spectral content in terms of information for structure
determination is a matter of considering the evolution of spins during the
Field Gradient Pulse and the period after such a pulse. This would not be the
same as the way of considering the RF Pulse effects which tilts the
magnetization away from the applied magnetic field direction. Because,
during the Field Gradient pulse, the total magnetization vector (tilted to the
xy-
RF Pulse tilts the magnetization, the component of Magnetization along
magnetic field direction may be zero but the non-zero magnetization vector
could be entirely in a perpendicular direction. It is at this stage that the
earlier deferred explanation falls due. As explained for spin echo occurrence,
the in-homogeneities cause the vanishing of xy-magnetization, and to
recover this magnetization a reversing pulse becomes necessary. Thus the
PFG pulse itself requires an explanation as to what constitutes a PFG pulse.
Mostly a PFG pulse applied is in the z-direction (the direction of magnetic
field) designated to as GZ-pulse. In principle the Field Gradient can be
applied in any direction, GX, GY, or GZ. The field gradient along Z-axis
Page 74 of 123
causes varying precession (precession occurs due to interaction with
Magnetic field in the Z-direction, which is by definition the Z-axis of the
laboratory system of coordinates) rates of spins in the sample unlike the
homogeneous field. This causes the isochromats (components making up the
net XY-magnetization vector) to diphase rapidly. Hence ensuring that the
dephasing is complete under the PFG due to the +GZ, adjacent to the
duration a -GZ, should follow to refocus the vectors as much as in the echo
formation, but the defocusing and refocusing occur at much smaller
durations compared to the Free defocusing and refocusing to form an echo.
Thus a PFG may be considered as the pair [+GZ: -GZ] subsequent to which
the vector stands restored. The corresponding Hamiltonian forms can be
known and described for the consequence of defocusing and refocusing
operation. The actual pulses field gradient experiments would be dealt with
later while describing the variety of pulse sequences and the spectral changes
accomplished. Even though, there is defocusing and refocusing due to pulsed
field gradients, one should not be considering these in any sense of
averaging effect, and the consequences on the spin system may not be any
kind of averaging of interactions, in coordinate or spin space.
The signal to noise ratio as it is appearing in the spectrum depends on the
sources of signal and the noise. The noise is inherent from the electronic
system, the receiver (in which detectors is a integral part). The primary
consideration is that the signal induced in the sample coil as in the NMR
probe, must be strong enough. The signal and noise are determined by the
corresponding amplitudes measured in volts. While the NMR coil itself may
not be contributing much to the noise, what matters most is what is the
voltage that is induced by the XY- magnetization of the sample. Magnitude
of XY-magnetization constitutes the strength of the flux, and the frequency
of precession determines the rate at which the flux changes. The induced
Page 75 of 123
voltage depends on the rate of change of flux (figure-13), which in turn
depends on the magnitude of the rotating magnetization vector in the XY-
plane and the frequency of rotation. The frequency of rotation (precession
frequency) would increase with external magnetic field. Magnetic field
strength would also determine the magnetization vector magnitude by the
Boltzmann factor that determines the population difference. For a given
magnetic field strength an increase in number of spins (equivalently increase
in sample concentration; the consequences on increase in sensitivity differ
for the two instances of increasing the concentration of sample and
increasing the magnetic field strength) increases the population difference
between the two energy levels of the proton spin. Sample concentration, and
increase in spectrometer frequency (external magnetic field strength) both
cause increase in signal. Choosing the spectrometer operation to higher
values has two-fold advantages; first, due to the increase in population
difference (increase in magnitude-strength of flux-of magnetization vector)
and the second, due to increase in rate of change of -flux- that vector). This
indicates the conditions for optimum induced signal strength. The noise
observed can change with receiver gain setting, and receiver gain is
increased when the signal detected is generally weak. The modern
spectrometers have an Automatic Gain Control (AGC) feature which
optimizes the setting of gain for the given sample in the probe. Thus the
signal to noise ratio is determined by experimental factors related to sample
preparation and choice of appropriate spectrometer.
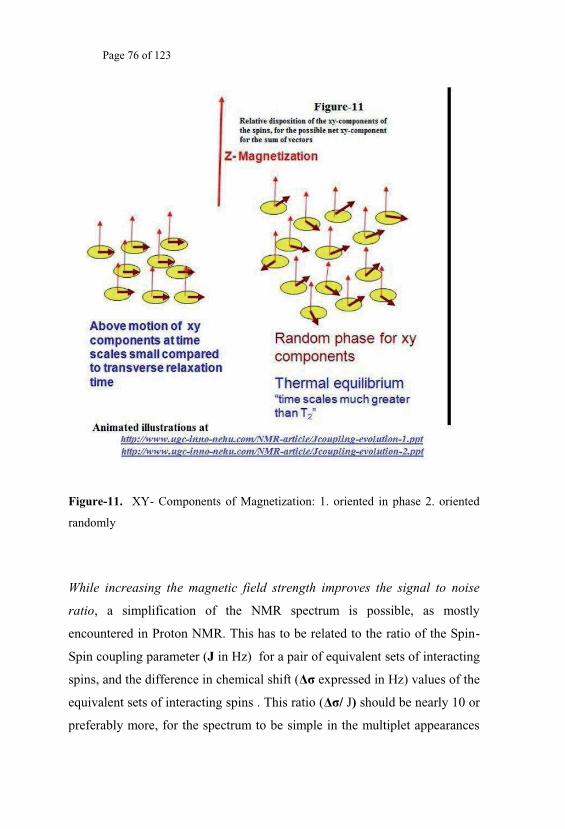
Page 76 of 123
Figure-11. XY- Components of Magnetization: 1. oriented in phase 2. oriented
randomly
While increasing the magnetic field strength improves the signal to noise
ratio, a simplification of the NMR spectrum is possible, as mostly
encountered in Proton NMR. This has to be related to the ratio of the Spin-
Spin coupling parameter (J in Hz) for a pair of equivalent sets of interacting
spins, and the difference in chemical shift ( expressed in Hz) values of the
equivalent sets of interacting spins . This ratio ( / J) should be nearly 10 or
preferably more, for the spectrum to be simple in the multiplet appearances
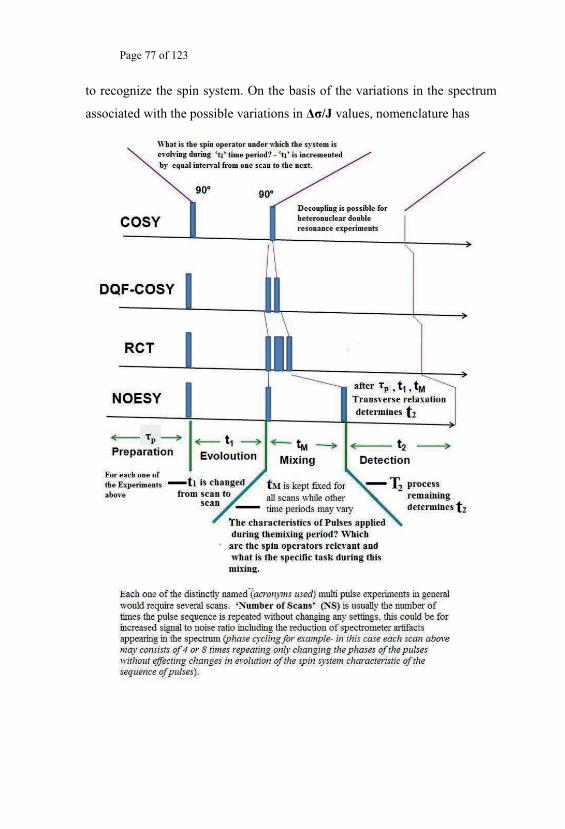
Page 77 of 123
to recognize the spin system. On the basis of the variations in the spectrum
associated with the possible variations in values, nomenclature has
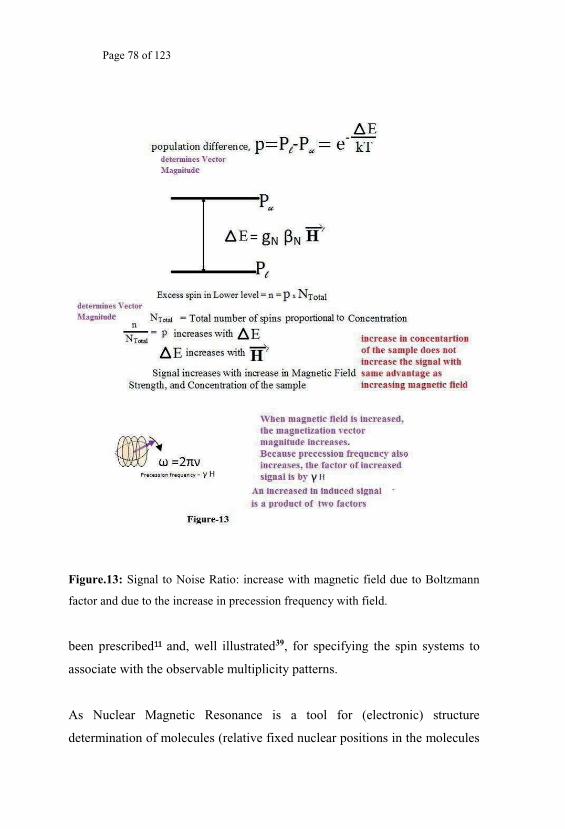
Page 78 of 123
Figure.13: Signal to Noise Ratio: increase with magnetic field due to Boltzmann
factor and due to the increase in precession frequency with field.
been prescribed and, well illustrated39, for specifying the spin systems to
associate with the observable multiplicity patterns.
As Nuclear Magnetic Resonance is a tool for (electronic) structure
determination of molecules (relative fixed nuclear positions in the molecules
Page 79 of 123
are known by X-ray techniques to a great accuracy), it is necessary to remark
the following. When, for the same sample, spectra are obtained in varying
Magnetic Fields the spectrum changes even though, the chemical compound
is not changed or its thermodynamic state. How an interaction not to be
reckoned as chemical change brings about a change in the spectrum just by
physically transferring a sample from one place to another, to place it in
different spectrometers - all working under the same principles for causing
transitions and for the detection of resonance.
The essential difference between the Shielding (chemical shift) mechanism
and the spin-spin interaction is that the Shielding occurs only when the
molecule is placed in an external magnetic field. The spin-spin interaction is
integral part of the nature of the spins in the molecule and is present all the
time not influenced by conditions external to the molecule. In principle, if
one can device an experiment or by any other appropriate spectroscopic
technique, it should be possible to measure spin-spin coupling constants
even when no external magnetic field are present. Not only that the spin-spin
coupling occurs without any external agency, also the spin-spin interaction
does not get affected by the application of such strong magnetic fields that
makes the quantity chemical shift expressed in units of frequency increase
with the strength of the external field. Thus the ratio of the Chemical shift to
spin-spin coupling constant (both expressed in the same units Hz or
ppm) increases with strength of external magnetic field. This aspect was
explained in PART-A, Section-3, but the emphasis at this point is the
fundamental difference (Figure-14) between the two mechanisms. This
difference could be helpful in getting to terms with several novel
experiments which could be envisaged with the advent of multi-dimensional
FT NMR technique. A detailed discussion of the corresponding Hamiltonian
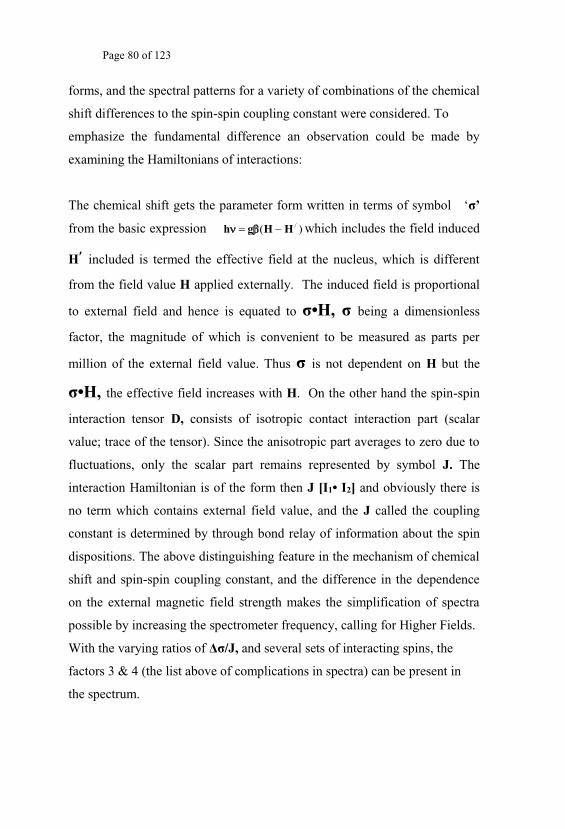
Page 80 of 123
forms, and the spectral patterns for a variety of combinations of the chemical
shift differences to the spin-spin coupling constant were considered. To
emphasize the fundamental difference an observation could be made by
examining the Hamiltonians of interactions:
The chemical shift gets the parameter form written in terms of symbol
from the basic expression )( /HHgh which includes the field induced
H included is termed the effective field at the nucleus, which is different
from the field value H applied externally. The induced field is proportional
to external field and hence is equated to being a dimensionless
factor, the magnitude of which is convenient to be measured as parts per
million of the external field value. Thus is not dependent on H but the
the effective field increases with H. On the other hand the spin-spin
interaction tensor D, consists of isotropic contact interaction part (scalar
value; trace of the tensor). Since the anisotropic part averages to zero due to
fluctuations, only the scalar part remains represented by symbol J. The
interaction Hamiltonian is of the form then J [I1 2] and obviously there is
no term which contains external field value, and the J called the coupling
constant is determined by through bond relay of information about the spin
dispositions. The above distinguishing feature in the mechanism of chemical
shift and spin-spin coupling constant, and the difference in the dependence
on the external magnetic field strength makes the simplification of spectra
possible by increasing the spectrometer frequency, calling for Higher Fields.
With the varying ratios of /J, and several sets of interacting spins, the
factors 3 & 4 (the list above of complications in spectra) can be present in
the spectrum.
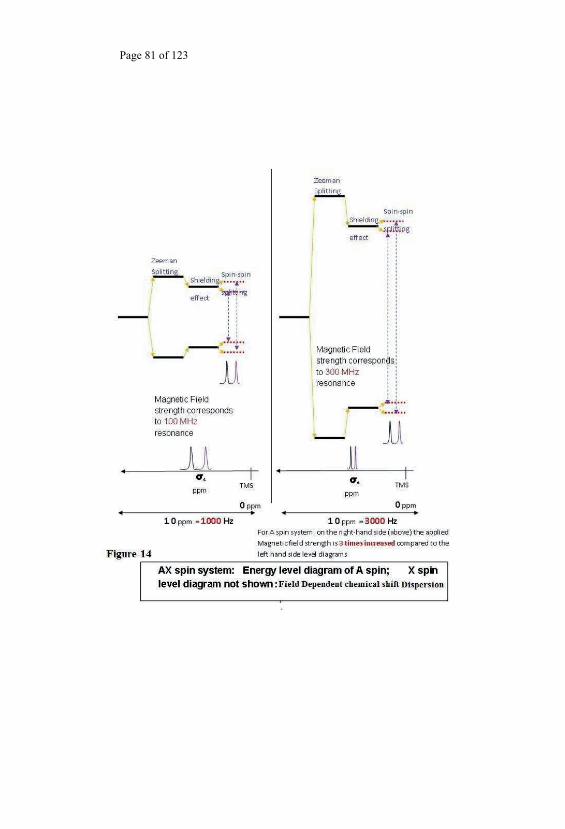
Page 81 of 123
Page 82 of 123
Simplifications can come about with double resonance experiments5 when
these features are present in the conventional spectrum obtained with one
irradiation frequency corresponding to the proton resonance frequency. The
spectrometer then would have a provision for the observation of
conventional spectra and second channel, also having provision to irradiate
the sample with a second frequency, the second frequency being chosen at
any point corresponding to a spectral line in the spectrum. The second
channel is called the irradiation frequency since usually this would be
applied continuously not necessarily in the pulse form, even if the FT NMR
technique is the operating mode. While this irradiation is continuous (longer
durations of time compared to pulse widths) the irradiating power also would
be high since the second frequency irradiation is intended for saturating any
particular proton set. In the case of proton NMR- a homo-nuclear double
resonance two kinds of experiments are possible. The first kind is an
experiment on the coupled system of protons; the purpose would be to look
for simplifying spectra by decoupling an interacting set by saturation. Since
the coupling occurs by through bond interactions, the irradiation is on a
proton set which is at a distance of one bond to up to three bonds. The
second kind of experiment is the irradiation of proton set that in the spatial
proximity not necessarily because the proton is connected by bonds. This is
the Dynamic Polarization experiment popularly known as Nuclear
Overhauser effect (NOE) experiment. The spin decoupling experiments of
the first kind results in reducing the complications by specifying which
proton is coupled to which by the disappearance of the coupling pattern.
Under varied irradiating power settings, certain other kinds of consequences
are possible that lead to favorable features for interpreting the spectra.
However, the spin decoupling experiments are the mostly preferred double
resonance experiment. The second kind of NOE experiment results in
intensity changes of protons in the proximity of a given set of protons. The
Page 83 of 123
intensity changes are quantitatively measured and the distance estimate made
possible. The nuclear Overhauser effect enhancements are obtained by
continuous irradiations in a steady state Overhauser effect condition. And in
two dimensional experiments a corresponding Nuclear Overhauser Effect
experiment is carried out by introducing pulses during mixing periods in the
pulse sequences, and such experiments are based on the Transient
Overhauser effect.
5.The Quality of a Recorded NMR Spectrum
For proceeding to measure out the spectral parameters and try to solve the
structure, it is necessary that while looking at a spectrum to be able to get an
impression of the quality of the recorded spectrum. After the discussion on
the various aspects related to the topic of NMR in practice, there are four
criteria to be listed out to ascertain for the quality of the recorded spectrum.
1)What is the resolution and is it optimum, or the best resolution possible.
2) To what extent it is evident from the spectrum, as to whether the group
of lines can be categorized as arising from chemical shift differences
and when is it exclusively a multiplicity arising due to spin-spin
coupling.
3)The extent of resolution and the extent of chemical shift dispersion
good enough for an unambiguous analysis of the spectra.
4)And, what is the dynamic range for the computer storage of the NMR
spectrum. The dynamic range is relating to the sensitivity of detection,
signal to noise ratio, and the maximum signal intensity that the
computer memory can hold without a memory overflow or saturation
as it would be appropriate.
These aspects would be obvious if carefully monitored, and lack of
experience could lead to uncertainties. Important in analysis of the spectrum
is the stage of identifying equivalent sets of nuclei, coupling patterns and the
Page 84 of 123
chemical shifts of sets of protons and the magnitudes of coupling constants30.
Increasing the spectrometer frequency (means choosing a spectrometer
working at correspondingly a higher magnetic field strength) enables
chemical shift dispersion ( chemical shift measured in ppm units being the
same, as the spectrometer frequency increases one ppm unit would
proportionately increase if expressed infrequency units). Thus relative to
spin-spin coupling value (usually measured in frequency units), the chemical
shift differences in frequency units increase. This simplifies the spectrum for
analysis. The more recent trend is to look for connectivity information from
two-dimensional-chemical-shift-correlated spectroscopy, to assign coupling
constants and chemical shift values to interacting spin systems. In short a
thorough familiarity with analysis of first order and higher order spectra is
necessary11,12 and exercise with A2, AA , AB, AX and the corresponding two
spin patterns would be helpful in recognizing patters of multiplet patterns of
system with more than 2-spins. A two spin system is the simplest of the
coupled spin systems and the range of spectral patterns one obtains from the
AX to AB to AA to A2 is not simple to explain; it involves all the way from
a simple classical dipole-dipole to quantum mechanical mixing of energy
levels and the corresponding selection rule consequences, and the variation
in transition probabilities due to mixing of Eigen functions. Hence in the
following paragraphs more details of this system of coupled spins are
described. The consequences to the multiple-spin (more than 2) coupled
systems would possibly be tractable on the basis of the discussion on two
spin-systems.
The operator forms and the corresponding principles of quantum mechanics
which explain the differences between the coupled spin systems, chemically
equivalent sets, magnetically equivalent sets, is all a matter of college level
exercises in a course in quantum mechanics. It is necessary to be thoroughly
Hp-Pavilion
Highlight
Page 85 of 123
conversant with this aspect, to further grasp coherence order, multiple
quantum coherences, and the necessity to transfer coherences from one
order to another so that any particular specified order of coherence can be
observed under the given selection rule constraint that only the first order
coherence is (allowed transition) detectable. And, soon after the preparation
pulse, the magnetization is brought to XY plane from Z-direction means that
only the first order coherence signals are available for detection. After that
pulse (usually during a
more than one pulse) would cause (generate) all the other possible coherence
orders for that spin system be available and then by appropriate coherence
selection pathway31,32,34,35, a coherence order not detectable- would have to
into a first order coherence
information generated as the undetectable order of coherence. One of the
popular two dimensional experiments is the correlation spectroscopy, where
in it is the presence of spin-spin coupling in the system which enables the
information retrieval by off diagonal peaks in homo nuclear case, the name
in general is the spin connectivity features in the two dimensional FT NMR
spectroscopy. This importance19.20.21.22 of spin-spin coupling is to be realized
and enough effort must be put in to familiarize with the quantum mechanical
perspectives related to the spectral features. This would enable getting well
equipped with the necessary tools of analysis for the FT NMR technique to
be used for structure determination.
It should be possible to infer about all the interacting spin systems and if
necessary enable devising experiments or choose from already existing list
of experiments to enable the complete assignment of the spectral parameters
(chemical shift and spin-spin couplings) to the appropriate nuclear
subsystems in the chemical molecule. Unless this assignment is
Hp-Pavilion
Highlight
Page 86 of 123
unambiguous, it may not be possible to infer on the electronic structure. The
geometry of the molecules can be determined even for macromolecules to
visualize three dimensional structures, from the current trends of
experimental results from NMR measurements. Such a quality of NMR
spectrum would reveal the importance of the J-coupling and the
consequences of its presence for the variety of pulse sequences and the
advanced NMR experiments, without the possibility of the spin-spin
coupling, most of the effects that arise in the NMR experiments would not
have been possible. In fact it should be possible to find the role of spin-spin
coupling in complicating the spectral features and minimize the
complications by pulse sequences and double resonance experiments. This
way of knowing the presence, and specifically eliminating them by certain
designs, enables unique and unambiguous assignments. So that NMR
experiments infuse more confidence in the users for structural determination.
And, there are databases and empirical calculation methods for getting input
parameters for analysis if one begins with a guess structure. Experimental
chemists may not be grasping the significance of the spin-spin coupling, but
the data base can enable an analysis and reasonably good explanations. It is
necessary to be aware of the role of J parameter for an efficient use of the
NMR experiments. One of the advantages of the two dimensional spectra is
the cross peaks (off-diagonal in homo nuclear correlated spectroscopy)
indicating the coupled spins. This connectivity information is helpful in
analyzing the spectra and to improve the quality of one dimensional
spectrum. When multiple spin systems are present, multiple quantum
coherences can be generated (in presence of appropriate non vanishing
coupling parameter). It would be possible to design pulse sequences to
enable filtering of the required order of coherence and highly selective
information can be obtained in a complicated and crowded spectrum as in
the case of Biological macromolecules. Such are the sequences and NMR
Hp-Pavilion
Highlight
Page 87 of 123
experiments which currently enable three dimensional structure
determinations of macromolecules in solutions. Depending on the medium
characteristics in vivo conditions could be simulated in an in vitro
experiment. With appropriate instrumental provisions in vivo studies and real
time monitoring of biological processes become possible.
Figures 13 to 17 contain the required basics well illustrated and described for
the criteria to know and assess the quality of spectra. In summary, an insight
into the actual utility of information for structure determination is gained by
the appreciation of the role of the spin-spin coupling (measured as J Hz) and
the consequences of Quantum Mechanical methods necessary to ascertain
the various spectral features in the context of multiple spin couplings. The
simplest two-spin interactions discussed in full detail should pave the way
for n-spin interactions. Coherence is entirely a quantum mechanical
manifestation and there have been considerable effort thus to describe
coupled spin systems by unconventional (non classical) vector diagrams. In
particular the evolutions during the pulse and during the delays following the
pulses are describable with judicious combinations of classical and quantum
mechanical terms. The main part of the Hamiltonian of two spin system is
the individual spin Zeeman term followed by the spin-spin interaction term J
IA B. The IA B operator in turn has the IAZIBZ which commutes with the
Zeeman Term (and hence classical descriptions are amenable), and the
½(IA+IB-+ IA-IB+) term which does not commute with the Zeeman Terms.
Thus when the energy level differences are small this term mixes the Eigen
functions and causes quantum mechanical aspects to predominate while
explaining the experimental consequences.
Hp-Pavilion
Highlight
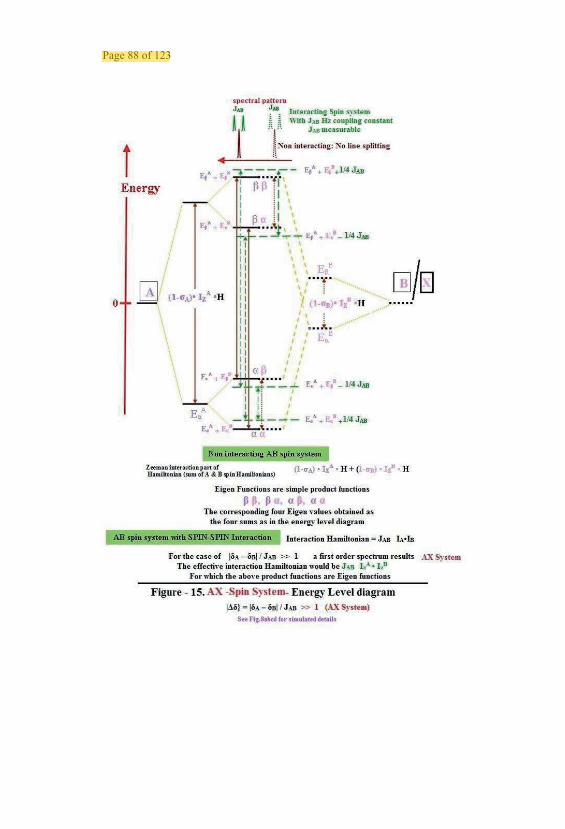
Page 88 of 123
Hp-Pavilion
Highlight
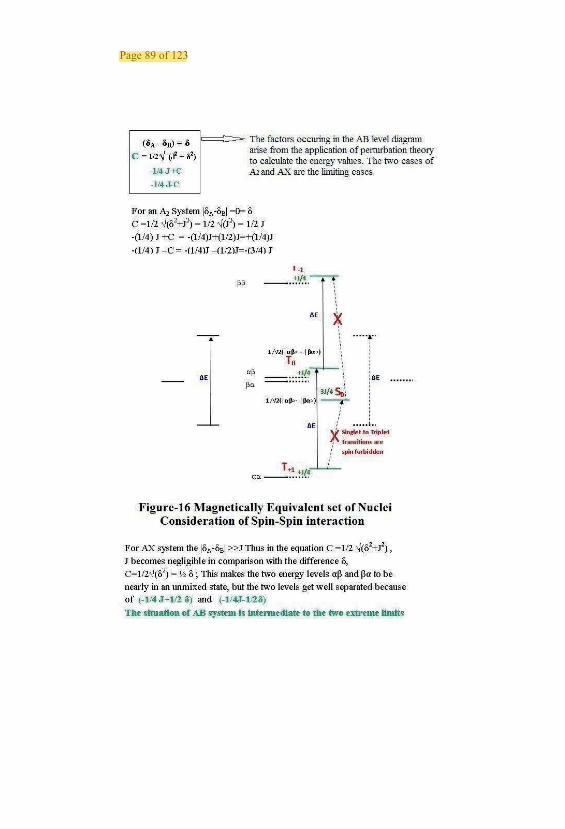
Page 89 of 123
Hp-Pavilion
Highlight
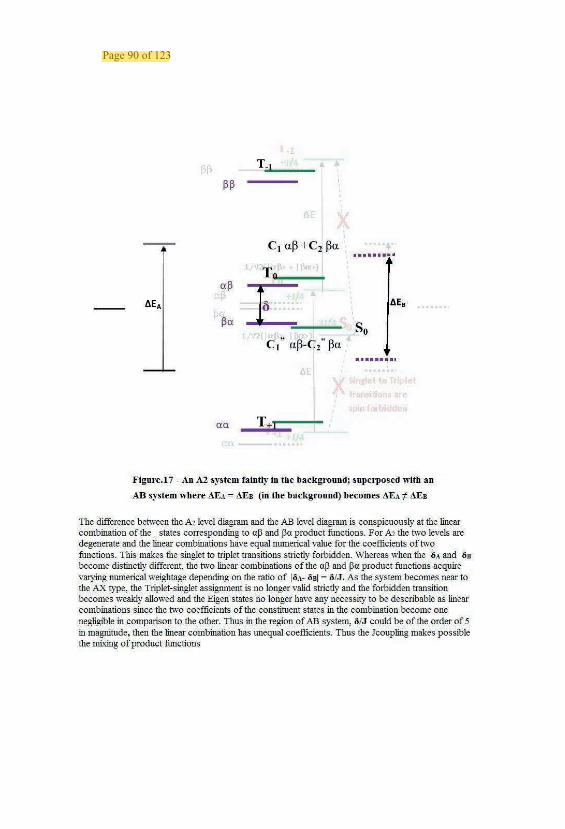
Page 90 of 123
Hp-Pavilion
Highlight
Page 91 of 123
More illustrations and comments can be found in the PowerPoint
Presentation file made for exclusively depicting the consequences of J
Coupling. Precisely because of such quantum mechanical predominance,
multiple quantum coherences (Figure-18) become explainable and further
selection of appropriate coherences. Filtering by use of such coherences to
simplify the spectral appearances and other variations in experiments
become possible. The kind of experiments called sensitivity enhancement of
the rare nuclei signals by population transfer from more abundant nuclei
(protons) require the comprehension of energy level diagrams of coupled
spin system and the principle of equilibrium between the rare nuclei and the
abundant nuclei. In the hetero nuclear double resonance class of
experiments, the spectral editing or the attached proton tests and the
experiments named Distortionless Enhancement by Polarization Transfer are
useful to extract detailed spectral information related to structure of
molecules. With the basic aspects described in detail hitherto, further efforts
to explain and provide insights into the theoretical and experimental aspects
can be found in the books31, 34, 35, 36 cited in references. Animated PowerPoint
presentations40 can be helpful in trying to grasp the significance of
Magnetization and Coherence. These to be more quantitative in treatment
would require differential equations set up for the time evolution of density
matrix of spin systems using the product operator formalisms. The solutions
would lead to the proper descriptions and quantitative expressions which are
the discussions found elaborately in the text books cited as references on this
subject. How the classical descriptions would fail in the case of two coupled
systems and necessitating quantum mechanical descriptions are not dealt
with in so much in detail in the books cited in the references as in the present
context.
Hp-Pavilion
Highlight
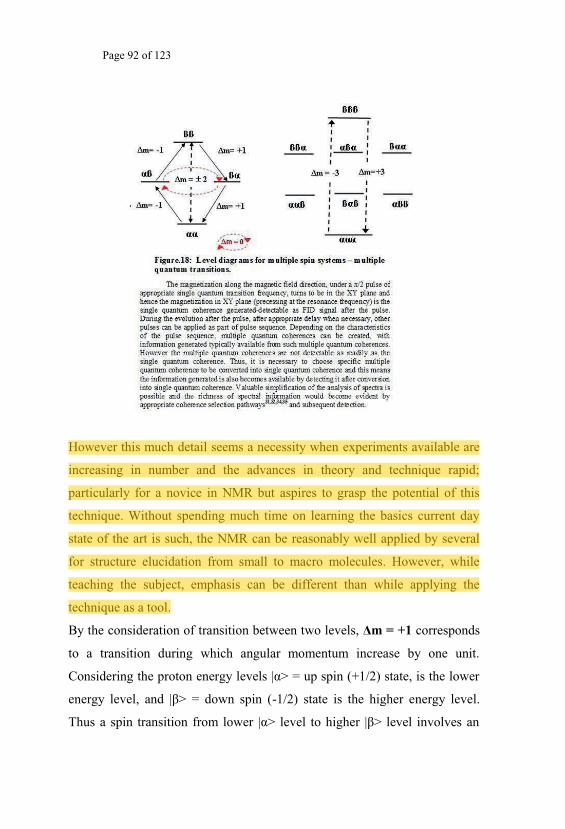
Page 92 of 123
However this much detail seems a necessity when experiments available are
increasing in number and the advances in theory and technique rapid;
particularly for a novice in NMR but aspires to grasp the potential of this
technique. Without spending much time on learning the basics current day
state of the art is such, the NMR can be reasonably well applied by several
for structure elucidation from small to macro molecules. However, while
teaching the subject, emphasis can be different than while applying the
technique as a tool.
By the consideration of transition between two levels, = +1 corresponds
to a transition during which angular momentum increase by one unit.
-1/2) state is the higher energy level.
Hp-Pavilion
Highlight
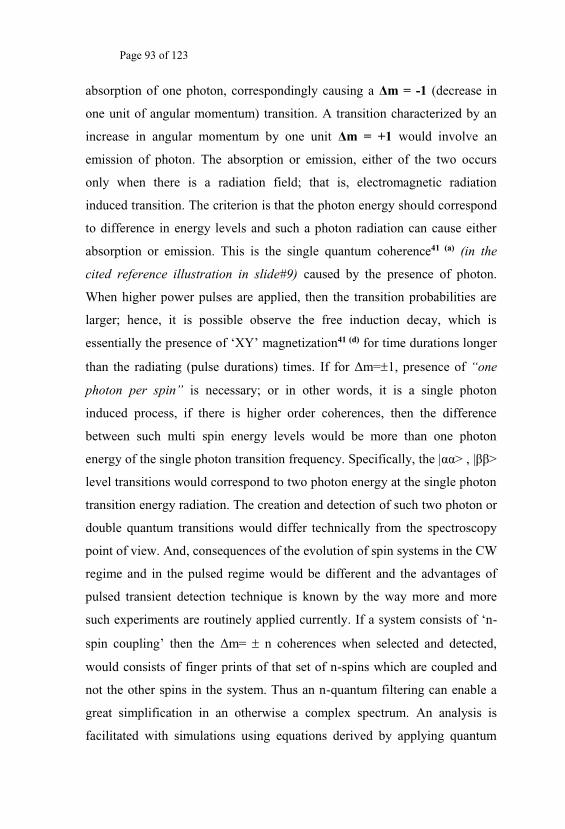
Page 93 of 123
absorption of one photon, correspondingly causing a -1 (decrease in
one unit of angular momentum) transition. A transition characterized by an
increase in angular momentum by one unit = +1 would involve an
emission of photon. The absorption or emission, either of the two occurs
only when there is a radiation field; that is, electromagnetic radiation
induced transition. The criterion is that the photon energy should correspond
to difference in energy levels and such a photon radiation can cause either
absorption or emission. This is the single quantum coherence41 (a) (in the
cited reference illustration in slide#9) caused by the presence of photon.
When higher power pulses are applied, then the transition probabilities are
larger; hence, it is possible observe the free induction decay, which is
essentially the presence of XY magnetization41 (d) for time durations longer
than the radiating (pulse durations) times. 1, presence of one
photon is necessary; or in other words, it is a single photon
induced process, if there is higher order coherences, then the difference
between such multi spin energy levels would be more than one photon
energy of
level transitions would correspond to two photon energy at the single photon
transition energy radiation. The creation and detection of such two photon or
double quantum transitions would differ technically from the spectroscopy
point of view. And, consequences of the evolution of spin systems in the CW
regime and in the pulsed regime would be different and the advantages of
pulsed transient detection technique is known by the way more and more
such experiments are routinely applied currently. -
n coherences when selected and detected,
would consists of finger prints of that set of n-spins which are coupled and
not the other spins in the system. Thus an n-quantum filtering can enable a
great simplification in an otherwise a complex spectrum. An analysis is
facilitated with simulations using equations derived by applying quantum

Page 94 of 123
mechanical formalisms since classical vector visualization and reaching out
for spectrometer settings may not fetch much information or effective
simplifications. It is necessary to start appreciating41 (d) (in the cited reference
in slide#5 an introductory illustration depicts the distinction between single
quantum coherence and population difference) this trend from the double
quantum case of two spin systems. The situation of coupled spins is so
simply stated most of the time as thumb rules to apply and it is sufficient
enough to go about using the current advanced NMR experiments which
reveal much about the structure of molecules. However, when it is a question
of grasping the basic aspects to go beyond what is already available as
packages and prescriptions, one has to enquire how and why of every aspect
of evolution of spins under external and internal perturbations. Some of the
PowerPoint presentation40 files can bring about the complexity in such a way
that one knows how the preoccupation with NMR as tool for structure
determination can lead to which basic principles have to be grasped better
and require more attention. While considering the evolutions40 in it may be
worth the while to consider the requirements for uncoupled and coupled
situations as elucidated in fig-19 and schematic vector representation in fig-
19a, and fig-20.
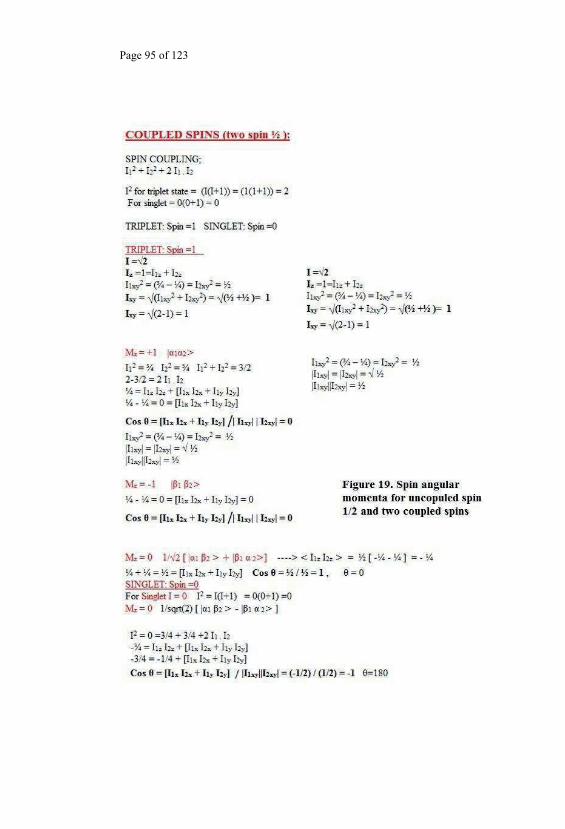
Page 95 of 123
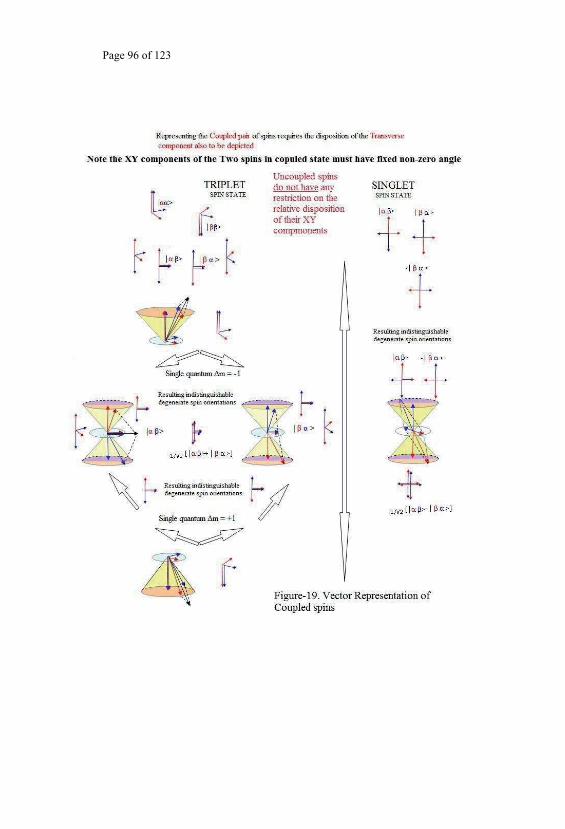
Page 96 of 123
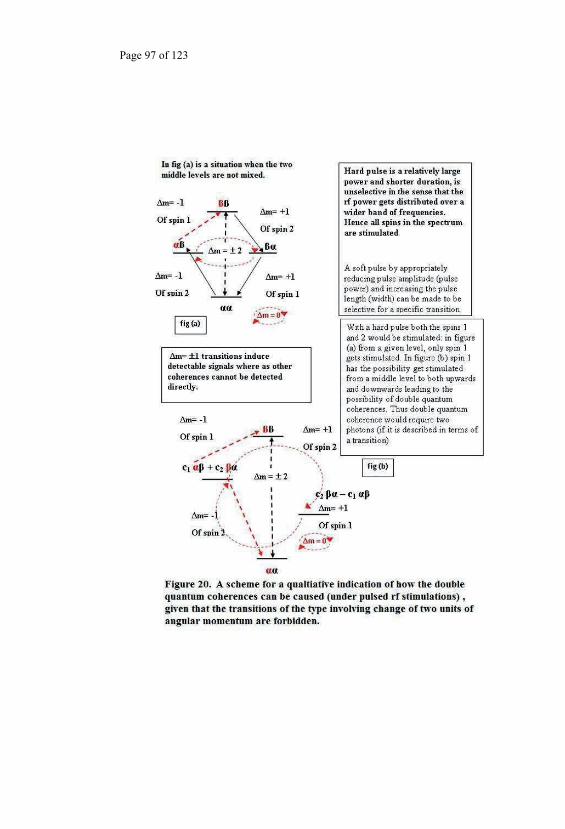
Page 97 of 123
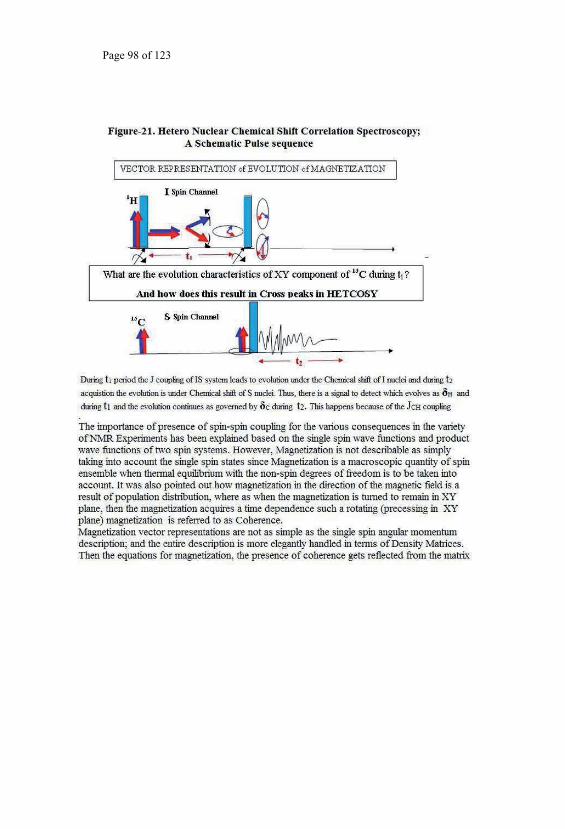
Page 98 of 123
Page 99 of 123
PART-C: ANALYSIS, ASSIGNMENTS & STRUCTURE DETERMINATION
The Bruker compilation42 cited as reference has all the experiments that the
spectrometer can be set to with the corresponding acronyms and conditions.
This also gives the experience of referring to manuals provided along with
the installed NMR instruments. The spectral analysis is the process by
which, soon after obtaining the spectrum, it is aimed to sort out a list of
distinct chemical shifts, and the coupling constants by recognizing the
multiplet lines and their characteristics from the spectrum. Once such a list
could be made, then it must be ascertained as to which are the nuclear sets
that interact with another set by finding the chemical shifts of interacting
nuclei and the coupling constant. In this process several experiments may be
necessary to come out with an unambiguous list, when the chemical shift
parameters and coupling constants get assigned to the appropriate nuclei.
From the guess structure of the unknown compound if a characterization
could be possible as to the names of the pattern (classification11 of proton
spectra) the analysis and assignments can concomitantly progress
simplifying the procedure of structure determination.
There are well compiled databases and tables of chemical shifts and coupling
constants referring to the functional groups and possible variations in
electronic structure as compared to the typical chemical molecules. And
these are cited in the references42,43,44,45 which are internet resources and
some of these are graduate level NMR course contents with lecture- notes
also made available. Thus after the reading through Parts-A and Part-B, a
good grasp of the intricate NMR spectroscopic aspects should be within the
reach so that what are the basic science subject-knowledge is required would
be evident for mastering NMR technique and effectively apply. These
internet resources have most of these mentioned but not dealt with as much
Page 100 of 123
in detail as in the above two parts. What an NMR practitioner would
eventually know as experience is gained has been mentioned preemptively
which makes the online resource materials more readable. This perspective
is an unusual trend but in the present context this trend is opted here in and
which may give an impression of several repetitive contents are included.
The initial effort is to get a glimpse of the spectrum and ascertain to the best
possible extent the various multiplet patterns that may be present in the
complex spectrum. Then the next step is to look for the possible sets of
coupled proton systems which can account for these patterns so that the
appropriate chemical shift assignment also become evident. This is what
experience NMR analyst can routinely and quickly arrive at and the further
details and complications have to be simplified by spectral simulations with
quantum chemical computation of chemical shifts and referring to already
available database and tables compiled and reported in NMR books which
were referred to during the textual descriptions and examples have been
included as Table-1 to Table-4 in Part-A. For this a beginner has to go
through certain exercises for which several authors have made compilations
of example and made it available as internet resources. The beginners may
have difficulties about recognizing these resources for which it is necessary
-30 at the
end, there are three internet resources which were found adequate for
beginners; also note the remark about author and authenticity of the resource.
But just on this count it is not necessary to ignore these materials, but if
found useful secure them with appropriate precautionary remark. In these
days of information explosion, there would be abundant resources of this
useful variety made available. Ref-30(a) is an explanation of the chemical
shift scale and the coupling patterns in the spectra. Ref-30 (b) lists out what
to look for in the spectrum with illustrations. Ref-
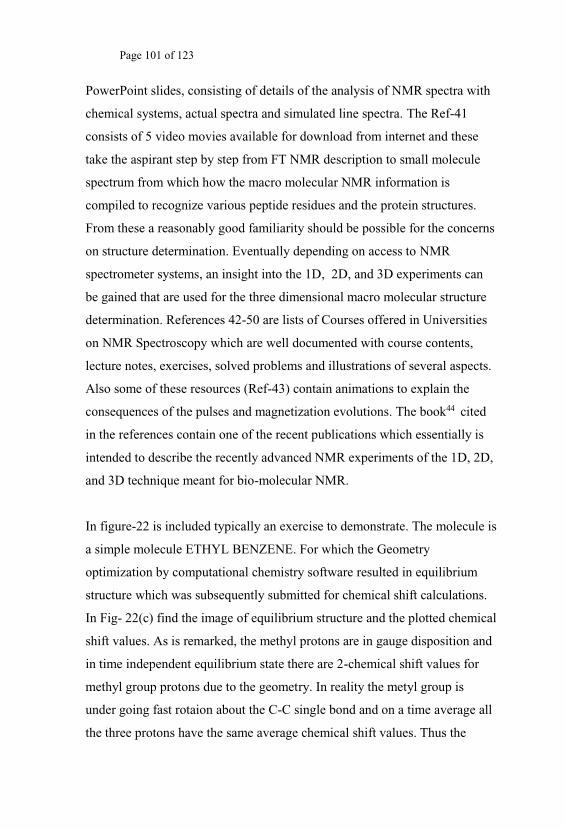
Page 101 of 123
PowerPoint slides, consisting of details of the analysis of NMR spectra with
chemical systems, actual spectra and simulated line spectra. The Ref-41
consists of 5 video movies available for download from internet and these
take the aspirant step by step from FT NMR description to small molecule
spectrum from which how the macro molecular NMR information is
compiled to recognize various peptide residues and the protein structures.
From these a reasonably good familiarity should be possible for the concerns
on structure determination. Eventually depending on access to NMR
spectrometer systems, an insight into the 1D, 2D, and 3D experiments can
be gained that are used for the three dimensional macro molecular structure
determination. References 42-50 are lists of Courses offered in Universities
on NMR Spectroscopy which are well documented with course contents,
lecture notes, exercises, solved problems and illustrations of several aspects.
Also some of these resources (Ref-43) contain animations to explain the
consequences of the pulses and magnetization evolutions. The book44 cited
in the references contain one of the recent publications which essentially is
intended to describe the recently advanced NMR experiments of the 1D, 2D,
and 3D technique meant for bio-molecular NMR.
In figure-22 is included typically an exercise to demonstrate. The molecule is
a simple molecule ETHYL BENZENE. For which the Geometry
optimization by computational chemistry software resulted in equilibrium
structure which was subsequently submitted for chemical shift calculations.
In Fig- 22(c) find the image of equilibrium structure and the plotted chemical
shift values. As is remarked, the methyl protons are in gauge disposition and
in time independent equilibrium state there are 2-chemical shift values for
methyl group protons due to the geometry. In reality the metyl group is
under going fast rotaion about the C-C single bond and on a time average all
the three protons have the same average chemical shift values. Thus the
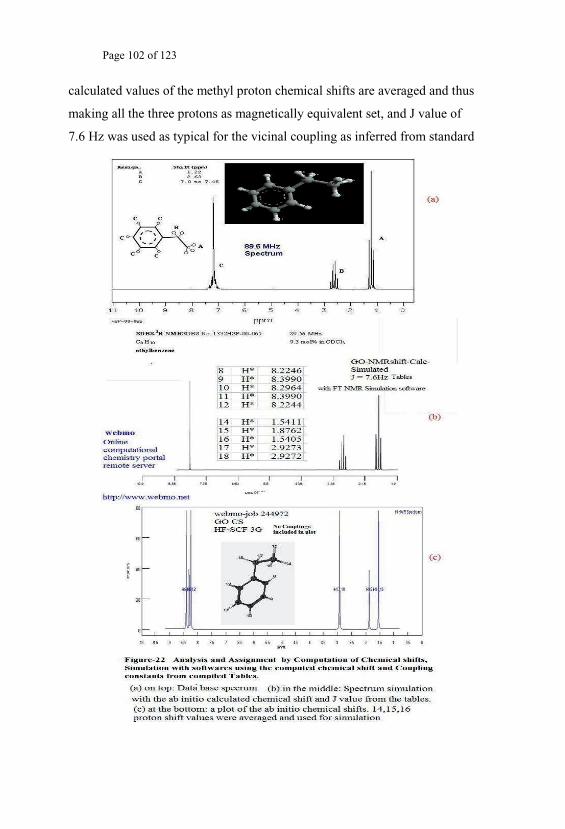
Page 102 of 123
calculated values of the methyl proton chemical shifts are averaged and thus
making all the three protons as magnetically equivalent set, and J value of
7.6 Hz was used as typical for the vicinal coupling as inferred from standard
Page 103 of 123
tables. The J couplings are typically dependent on local electronic structure
as information through bonds and may not vary in such relative magnitudes
like the chemical shifts from one molecule to the other in a series of
compounds.
The next is an example of using a semi empirical MO calculation to illustrate
how one can derive information from NMR. No reference to experimental
spectra are made below. On the LHS is the cluster structure made up of 11
water molecules. Whether it is before, or after the Geometry Optimization,
and even the snap shot views during a molecular dynamics simulation all
are static dispositions and no time dependence of coordinates. At every
instance the coordinate of the set of atoms remain fixed during the
calculation of the numerical value by QM/MM calculations. In a GO
structure sequence, the static situation of any stage is derived from the
previous static values of coordinates sometimes by imperceptible
differences. In the structure above the cluster has been subjected to the
energy minimization by a semi empirical QM method.
The PMR spectra on the RHS are are obtained using the Chemical shift
values calculated by QM ab initio method, the plots are obtained with the
same soft ware tools soon after the calculation. The plot below and above are
with the same set of chemical shifts but differ only in the value of width of
individual lines. When the LW value is 0.001 ppm the upper trace is the
result which is almost a stick plot. For the lower plot the value of the LW
parameter has been 0.1 ppm, by a factor of 100 larger. This width value
results in a broad line shape, so broad that the individual lines which
contribute to this band shape cannot be distinctly seen. Since these are
theoretical structures no specific mention can be made as to whether such a
cluster would in condensed solid/liquid phase or it pertains to a gaseous
Page 104 of 123
phase distribution.
The broad line spectrum resembles a solid state spectrum, but the NMR
experiments for line narrowing cannot be a consideration in this context
since while varying the line width parameter by a factor of 100, no
mechanism is specified for the origin of the line width. And all the line-
narrowing experiments are based on the mechanism that causes the line
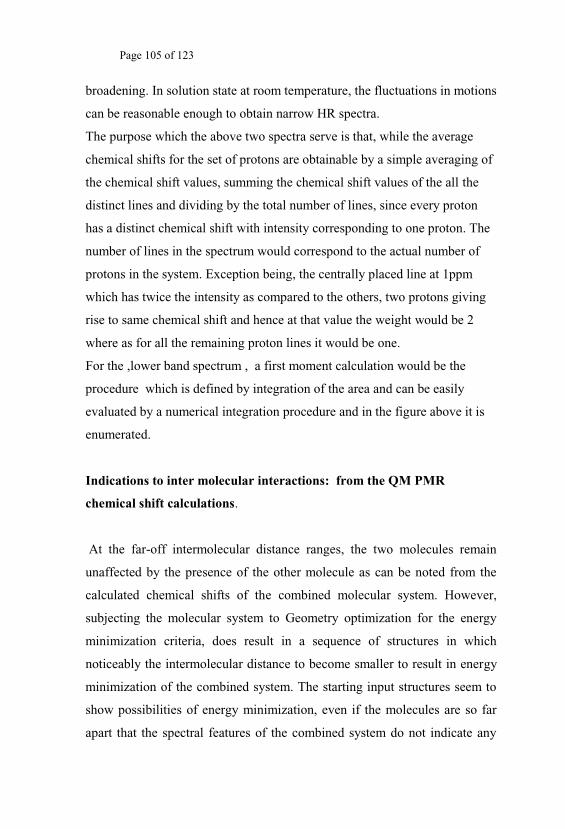
Page 105 of 123
broadening. In solution state at room temperature, the fluctuations in motions
can be reasonable enough to obtain narrow HR spectra.
The purpose which the above two spectra serve is that, while the average
chemical shifts for the set of protons are obtainable by a simple averaging of
the chemical shift values, summing the chemical shift values of the all the
distinct lines and dividing by the total number of lines, since every proton
has a distinct chemical shift with intensity corresponding to one proton. The
number of lines in the spectrum would correspond to the actual number of
protons in the system. Exception being, the centrally placed line at 1ppm
which has twice the intensity as compared to the others, two protons giving
rise to same chemical shift and hence at that value the weight would be 2
where as for all the remaining proton lines it would be one.
For the ,lower band spectrum , a first moment calculation would be the
procedure which is defined by integration of the area and can be easily
evaluated by a numerical integration procedure and in the figure above it is
enumerated.
Indications to inter molecular interactions: from the QM PMR
chemical shift calculations.
At the far-off intermolecular distance ranges, the two molecules remain
unaffected by the presence of the other molecule as can be noted from the
calculated chemical shifts of the combined molecular system. However,
subjecting the molecular system to Geometry optimization for the energy
minimization criteria, does result in a sequence of structures in which
noticeably the intermolecular distance to become smaller to result in energy
minimization of the combined system. The starting input structures seem to
show possibilities of energy minimization, even if the molecules are so far
apart that the spectral features of the combined system do not indicate any
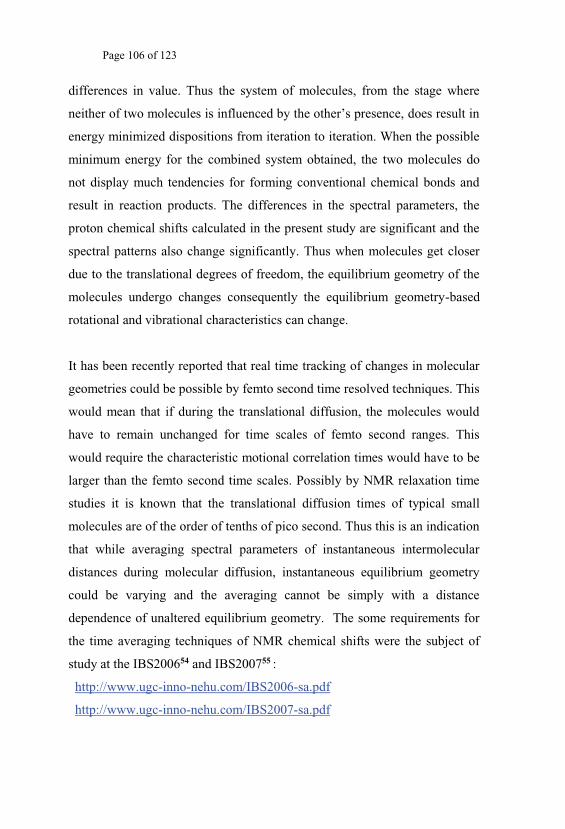
Page 106 of 123
differences in value. Thus the system of molecules, from the stage where
energy minimized dispositions from iteration to iteration. When the possible
minimum energy for the combined system obtained, the two molecules do
not display much tendencies for forming conventional chemical bonds and
result in reaction products. The differences in the spectral parameters, the
proton chemical shifts calculated in the present study are significant and the
spectral patterns also change significantly. Thus when molecules get closer
due to the translational degrees of freedom, the equilibrium geometry of the
molecules undergo changes consequently the equilibrium geometry-based
rotational and vibrational characteristics can change.
It has been recently reported that real time tracking of changes in molecular
geometries could be possible by femto second time resolved techniques. This
would mean that if during the translational diffusion, the molecules would
have to remain unchanged for time scales of femto second ranges. This
would require the characteristic motional correlation times would have to be
larger than the femto second time scales. Possibly by NMR relaxation time
studies it is known that the translational diffusion times of typical small
molecules are of the order of tenths of pico second. Thus this is an indication
that while averaging spectral parameters of instantaneous intermolecular
distances during molecular diffusion, instantaneous equilibrium geometry
could be varying and the averaging cannot be simply with a distance
dependence of unaltered equilibrium geometry. The some requirements for
the time averaging techniques of NMR chemical shifts were the subject of
study at the IBS200654 and IBS200755 :
http://www.ugc-inno-nehu.com/IBS2006-sa.pdf
http://www.ugc-inno-nehu.com/IBS2007-sa.pdf

Page 107 of 123
It is obvious that the confident handling of the bio molecule motions would
require inputs from the study of smaller chemical molecules.
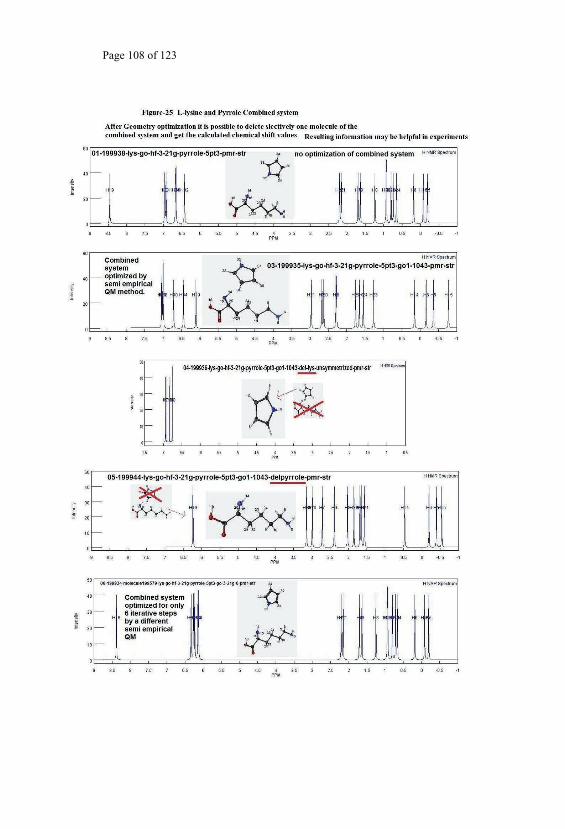
Page 108 of 123

Page 109 of 123
QM Calculations of PMR shifts in Aid: when structure determination is ambiguous
T
NMR spectra - -
been not straightforward in particular with biological macromolecules. The
organic molecular polymers are included among the category of
macromolecules whose structures have been characterized by NMR
spectroscopy by Heatley and Bovey (2). Among these, the specific instance
of Polystyrene stands out as a typical case where the backbone proton NMR
spectrum of isotactic polystyrene lends itself for an exact simulation but
only by invoking a cyclic (dimeric-) structure presenting 6 spin system,
that structure which is stated not to be taken too literally. Such a fictitious
structure makes possibile the inclusion of certain spin-spin coupling
constants for simulation which, otherwise, is not simple enough to infer.
Obviously these Spin-Spin interactions occur by mechanisms
transmitted through bonds , and it is surprising that a structure which is
through-bond routes by which the exact
simulation of the observed NMR spectra. Hence, it was considered
worth the while, trying to find out the possibility of the stability criterion for
a dimeric Styrene with the possible QM methods by Geometry Optimization
and verify with the calculation of the chemical shifts for such a dimer. A
thorough literature survey of the possibility for the occurrence of such
dimeric structure of styrene molecule was not be undertaken lest those
ab initio Calculations. There have been reports earlier on Biological
molecules extensively using merely the SCF method with STO 3G basis sets,
calculating mainly using the Specifically varied fixed geometries, inferring
on the environments in biological systems; and, no detailed potential energy

Page 110 of 123
surfaces were profiled. Only limited structures and resulting plots were
seemed to enable quite a lot to infer. Hence, a similar approach using the
Abinitio SCF method with the STO 3G basis set at the working online-demo
version of the http://www.webmo.net certain convincing trends arrived at.
The progress of such Optimization calculations could be conveniently
displayable material, which can be downloaded at any convenient terminal
for a review. This case study and its convenience have been indicted56 along
with the simulated Spectra and Optimized Geometries in Figures 26, 27,
&28.
Chiral discrimination by NMR Spectroscopy is currently developing and the
utility of this technique is reported56,57 in recent publications.
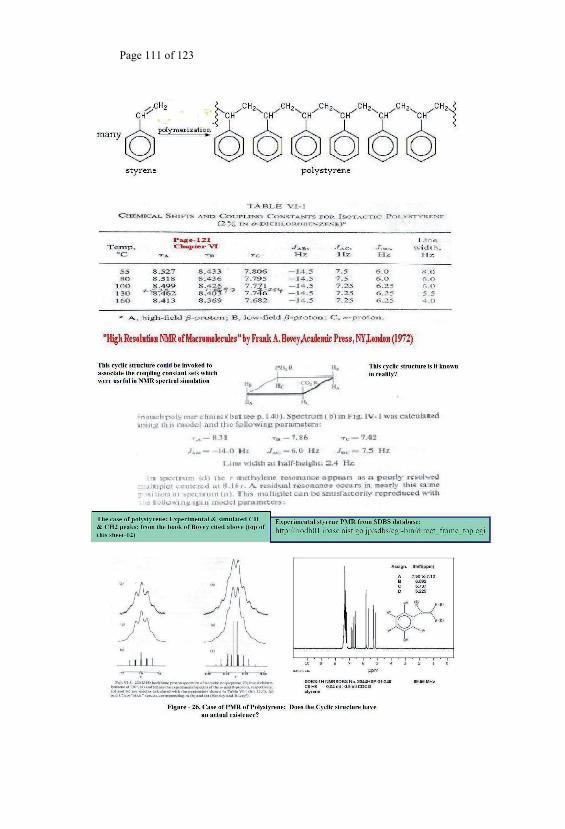
Page 111 of 123
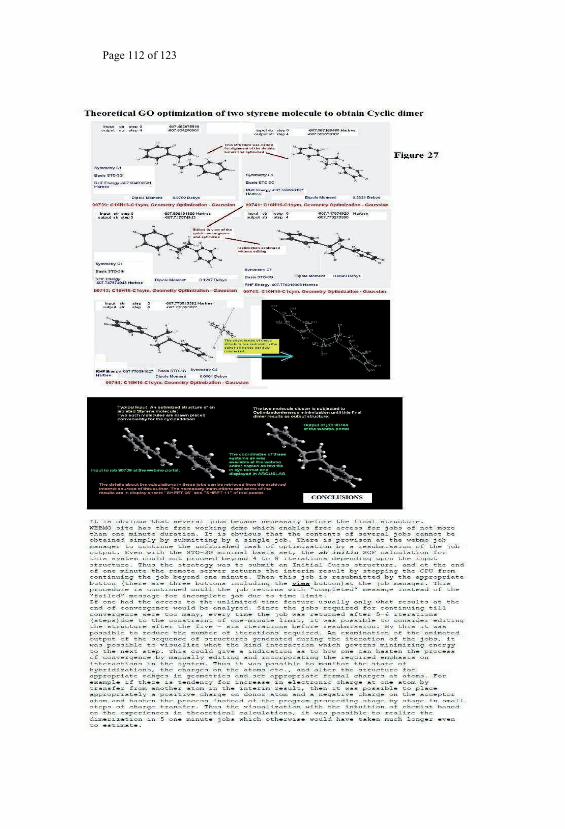
Page 112 of 123
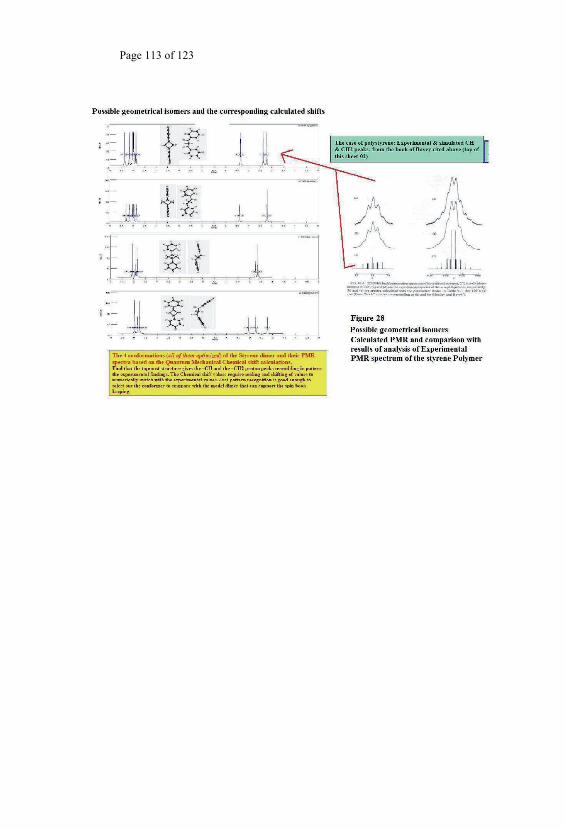
Page 113 of 123
Page 114 of 123
REFERENCES
1. a. H.S.Gutowsky, Physical Methods in Organic Chemistry, 3rd Edition, Part 4, Ed., A.Wessberger, Vol.1 of Techniques of Organic Chemistry Interscience, New York ( 1960). b. J.C.Martin, Journal of Chemical Education, Vol.38, (1961) pp286 c. A. Carrington and A.D.McLachlan, Introduction to Magnetic
Resonance, Harper and Row, New York 1967. d. N. Bloembergen, Nuclear Magnetic Relaxation, Benjamin, New
York (1961) e. R.Andrew, Nuclear Magnetic Resonance, Cambridge University
Press, Cambridge (1955). f. https://www.weizmann.ac.il/ISMAR/education/books
2. a. D.G. Howrey, Journal of Chemical Education, Vol.48, A327 (1971) b. M.C. Martin, J.J.Delpeuch and G.S.Martin, Practical NMR Spectroscopy, Heyden, London (1980).
3. R.K.Harris, Nuclear Magnetic Resonance Spectroscopy, Pitman, London (1983).
4. A. Abragam, The Principles of Nuclear Magnetism, Oxford, Clarendon Press (1961).
5. W. Von philipsborn, Methods and Applications of Nuclear Magnetic Resonance, Angewandte Chemie, International Edition, Vol.10, (1971) pp 472-490 in particular an instance has been cited on Page Nuclear Overhauser Epossible technique to characterize isomeric aza bicyclo (2,2,2) octane in a mixture, in which, it was not possible to isolate the two isomeric forms from one another.
a. http://www.ugc-inno-nehu.com/esr_display_xpversion.ppt b. At http://www.youtube.com/user/aram1121944/ click on the
and display the list of In the list of NMR videos 3
Page 115 of 123
Hotlink: https://www.youtube.com/watch?v=oGpk8vUgc6o&list=PL158BAC87668F5D5A&index=3
6. A.Derome, Modern NMR Techniques for Chemistry Research, (Organic Chemistry Series, Vol.6) Pergamon Press, (1987).
a. Chapters 1 and 2. b. Chapter 4, Section 4.4. c. http://www-keeler.ch.cam.ac.uk/lectures/Irvine/index.html
7. K.H.Hauser and H.R.Kalbitzer, NMR in Medicine and Biology: Structure Determination, Tomography, In Vivo Spectroscopy, Physics in Life Series, Springer-Verlag, Berlin-Heidelberg- New York (1989).
a. Chapter 4 NMR Tomography.b. Chapter 3 NMR Spectroscopy of Bilogical Macromolecules.c.M.E.A Cudby & H.A. Willis, Nuclear Magnetic Resonance of Polymers, Annual Reports on NMR Spectroscopy, Vol. 4- Ed., E.F.Mooney, Academic Press, New York (1971).
8. a. E.D.Becker, High Resolution NMR, 3rd Edition, Academic Press, New York (199)
b. C.A. Fyfe, Solid State NMR for Chemists, CFC Press, Guelph, Ontario, CANADA.
9. a. L.M.Jackman, Nuclear Magnetic Resonance Spectroscopy, Pergamon Press, New York (1959).
b. E.Fluck, Die Kern Magnetische Resonanz und Ihre Anwendung in der Anorganische Chemie, Anorganische und Algemeine Chemie in Einzeldarstellungen, Band V, Springer Verlag, Berlin (1963).
10 . A.Derome, as in ref.6 above. Chapter 3. Basic Experimental Methods At http://www.youtube.com/user/aram1121944/ click on the and display the list of The NMR Videos (each of 10 minutes duration) start with a Video movie with an elementary definition of NMR; and subsequent videos explain the phenomenon, detection principles, instrumental aspects,and NMR technique as tool for structure determination of small organic molecules to larger biological molecules.
.
Page 116 of 123
11.B.Dischler, Classification and Analysis of NMR Spectra, Angewandte Chemie, International Edition, Vol.5 No.7 (1966) PP 623.
12.Russel S.Drago, Physical Methods in Inorganic Chemistry, Chapter 8, -
314.Interpretation of NMR Spectra
13. a. As it has been enumerated in Table-3. b. As illustrated in Fig.10 in accordance with Table 4.
14. a. H.M.McConnel, J.Chem.Phys., Vol.27, (1957) pp226. b. http://aravamudhan-s.ucoz.com/CRSI_NSC6_IITK.html c. The article (by Sankarampadi Aravamudhan) Chemical Shift Calculations to Infer on the Long Range Aromatic Ring Current-Induced Field http://www.ugc-inno-nehu.com/JMSE-A5-2015-p181-SA.pdf would further substantiate the contents of the article in JCP cited above.
15. a. Adriaensens, R.Rego, R.Carleer, B.Ottenbourgs, J.Gelan., Solid State NMR Relaxometry Study of Phenolic Resins, Polymer International, Vol.52, No.10, (2000), pp 1647-1652. An article by John C.Edward, http://www.process-nmr.com/pdfs/NMR%20Overview.pdf contains comparison the NMR and NIR spectroscopy for process controls and discusses methods for processing data for High-Through-Put analyses.
16. A.Derome, As in Ref.6 above. Chapters 8,9 & 10.
18. A.Derome, As in Ref.6. above. Chapter 5. Nuclear Overhauser effect. Also, See Ref.5 above in this article.
19. K.H.Hauser & H.R.Kalbitzer, As in Ref No.7 above. a. Chapter 1. Section 1.2.1 Chemical Shift b. Section 1.2.2 Dipole-Dipole Coupling c. Section 1.2.3 Indirect Spin-Spin Coupling d. S.F.Sagnowski, S.Aravamudhan and U.Haeberlen, Wide line and
High Resolution Proton magnetic Resonance in Single crystals of Malonic Acid, Journal of Magnetic Resonance, Vol.28 (1977) pp 271-288. Take particular note of the results page 276 where the inferences
Page 117 of 123
from the Wide line NMR studies on the geometry of CH2 group are discussed.
20.A. Carrington and A.D.McLachlan, As in Chapter 4 of Ref.1C. above a. Section 4.2 Chemical shifts b. Section 4.3Spin-Spin Coupling
21. A.Derome, As in Ref. No.6 above. Chapter 10. Spin Echoes and J Spectroscopy
22. a. K.H.Hauser and H.R.Kalbitzer, As in Ref.No.7. Above. Chapter 3. Section 3.5.1.Pattern Recognition in Two Dimensional NMR Spectra. b.C.J.Pouchert and J.Behnke, The Aldrich Library of 13C and 1H (FT NMR) Spectra, Aldrich Chemicals, Milwankee wl1992 4, 300 pages. This catalogue of NMR spectra is a three volumes set containing 12,000 High Resolution NMR Spectra (300MHz proton and 75MHz 13C FT NMR) arranged according to functionality. Book Z23, 103-7 and CD ROM Z54, 126-5
23.Melinda Duer, Black Well Publishing Limited UK (2004) Paperback ISBN 1-4051-0914-
24.G.A.Web, edited Annual Reports on NMR Spectroscopy, Graphics Aided NMR Academic Press.
25. http://www.process-nmr.com/ An On Line Announcement of an NMR service facility, appealing to users with a wide variety of NMR spectrometers.
26. https://www.bruker.com/service/education-training/webinars/nmr- webinars.html
http://www.ugc-inno-nehu.com/saif_nehu.html https://www.bruker.com/
27. https://www.youtube.com/watch?v=w8yFyOwOLL4&feature=youtbe http://www.ugc-inno-nehu.com/saif_nehu.html
28. http://www.ugc-inno-nehu.com/PULSEDFTNMR.ppt http://www.ugc-inno-nehu.com/PULSEDFTNMR.WMV
Page 118 of 123
https://www.youtube.com/watch?v=vLAnWxFL6kk
29. http://www.ugc-inno-
nehu.com/NMR_animation/0_7_SA_TrnstnRates_RlxnTimes_CW_pulse.ppt
30. (a) http://www.ugc-inno-nehu.com/How-to-interpret-NMR.html
(b) http://www.ugc-inno-nehu.com/nmrarticle-ref-1.pdf
(Examination of Proton NMR) (c) http://www.ugc-inno-nehu.com/nmrarticle-ref-2.pdf (Spectral Features and Parameters for Structure Determination) The two later references of the three, have also been obtained as internet Resource, only the first one had the reference to the author. The authors of the other two are not mentioned in the document, but contents are well suited for an exposition to beginners in NMR techniques and spectral interpretation.
31. Introduction and General theory: Chapter 1, of (and references therein) by Narayanan
Chandrakumar and Sankaran Subramanian, © 1987 Springer-Verlag, New York Inc., ISBN 0-387-96327-8 & ISBN 3-540-96327-8 Springer-Verlag.
32. Chapter 2: Introduction to Solid-State NMR Spectroscopy, (Ref.23 above of this article ) by Melinda J. Duer, © 2004 by Blackwell Publishing Ltd.; Essential Techniques for Solid State NMR, ISBN 1-4051-0914-9
33. http://www.ugc-inno-nehu.com/NMR_animation/1_1_Terminology_Magnetism_descrptns.ppt
subdirectory: http://www.ugc-inno-nehu.com/NMR_animation/ are an effort to
stress on the basic essential aspects. 34. Spin Dynamics: Basics of Nuclear Magnetic Resonance. Levitt, M.H.(2001); John Wiley and Sons. ISBN-13: 978-0470511176; ISBN-10:0470511176
35. Principles of Nuclear Magnetic Resonance in One and Two Dimensions (International Series of Monographs on Chemistry) by Richard R. Ernst, Geoffrey Bodenhausen, Alexander Wokaun , Oxford Science Publication, ISBN-13: 978-0198556473 ; ISBN-10: 0198556470 ; and, the relevant chapters in Ref. 34. Ref. 31.; Chapter 1 of Ref.32
Page 119 of 123
36. Chapter1: (page-37) Introduction to Solid-State NMR Spectroscopy, (Ref.23 above of this article ) by Melinda J. Duer, © 2004 by Blackwell Publishing Ltd.; Essential Techniques for Solid State NMR, ISBN 1-4051-0914-9
37. Reference 31. Particular page 86.
38. http://aravamudhan-s.ucoz.com/inboxnehu_sa/IBS2006/ForIbs2006.html
39. http://www.chem.wisc.edu/areas/reich/chem605/index.htm Sections 5.07 to 5.16
40. http://www.ugc-inno-nehu.com/NMR-article/Jcoupling-evolution-1.ppthttp://www.ugc-inno-nehu.com/NMR-article/Jcoupling-evolution-2.ppt
41.(a) 9 1 FTNMR 2012 SAIF https://www.youtube.com/watch?v=TVDx9Mm85oM&index=10&list=PL158BAC87668F5D5A
(b) 9 2 FTNMR 2012 SAIF 2 https://www.youtube.com/watch?v=d6PyErmI0aw&index=11&list=PL158BAC87668F5D5A
(c) 9 3 FTNMR 2012 SAIF 3 https://www.youtube.com/watch?v=rHNfAgDGlWw&index=12&list=PL158BAC87668F5D5A
(d) 9 4 FTNMR 2012 SAIF 4 https://www.youtube.com/watch?v=WOd9wpEE-38&index=13&list=PL158BAC87668F5D5A
(e) 9 5 FTNMR 2012 SAIF 5 https://www.youtube.com/watch?v=e4YgFgW7IkY&index=14&list=PL158BAC87668F5D5A
41. http://www.ugc-inno-nehu.com/NMR-article/NMR-Basic-Experiments.pdf
42. http://www.cis.rit.edu/htbooks/nmr/inside.htm http://www.ugc-inno-nehu.com/NMR-article/NMR-Basics-of-NMR.htm
This internet resource has vector animations similar to the Ref.44
43. NMR Primer: An HSQC- Based Approach with Vector animations by Steven M.Pascal, IM Publications www.impublications.com/nmrprimer/
44.http://www.ugc-inno-nehu.com/NMR-article/NMR-Chem605-Spectroscopy.mht
45. http://www.ugc-inno-nehu.com/NMR-article/NMR-Index-of-ekwan-nmr-pdfs.htm
46. http://www.ugc-inno-nehu.com/NMR-article/NMR-L3_3_97-web.pdf
Page 120 of 123
47.http://www.ugc-inno-nehu.com/NMR-article/NMR-Why-don't-equivalent-hydrogens-cause-splitting-in-NMR.htm
48. http://www.ugc-inno-nehu.com/NMR-article/NMR_why-dont-equivalent-hydrogens- cause-splitting-in-nmr.pdf
49.http://www.ugc-inno-nehu.com/NMR-article/NMR-notes-8-tech-9-2D.pdf
50.http://www.ugc-inno-nehu.com/NMR-article/NMR-harvard-EKwanlecture-3.pdf
51. http://www.ugc-inno-nehu.com/NMR-article/NMR-URLs-for-article.doc
52. http://www.ugc-inno-nehu.com/events-2015.html#E07
53. http://www.ugc-inno-nehu.com/IBS2006-sa.pdf
54. http://www.ugc-inno-nehu.com/IBS2007-sa.pdf
55. http://www.ugc-inno-nehu.com/events-2015.html#E10
56. http://www.ugc-inno-nehu.com/avbedekar/
57. http://www.ugc-inno-nehu.com/compile/07-2013-ICETCS-CUG-sa.pdf
58. http://www.ugc-inno-nehu.com/NMR-article/sp-ref-list.doc
Page 121 of 123
SUGGESTED READING
1.John E.Wertz, Nuclear and Electronic Spin Magnetic Resonance,Chemical Reviews,
Vol.55, (1955) page 829-901
2.K.H.Hausser, Elektronen-und Kernresonanz als Methode der Molekul Forschung, Angewandte Chemie, Vol.68, No.23 (1956) pp 729-752; Kern Magnetische Resonanz KMR pp 737
3.http://www.cis.rit.edu/htbooks/nmr/ The Basics of NMR (Internet On Line Book) by Joseph P.Hornak ( listed at URL: https://www.weizmann.ac.il/ISMAR/free-online-books-about-nmr-esr-and-nqr )
4.F.Verburugge: An interesting Laboratory macroscopic Model to Magnetic Resonance
the influence of an alternating magnetic field has been described. This model demonstrates the magnetic resonance phenomena on a macroscopic dimensions using a bar magnet in the place of a nuclear magnetic moment.. American Journal of Physics, Vol.21 (1953) pp 653. There may be requirement (in particular for supplementing the mainly Chemistry background) for refreshing the school/college basic physics and the feature at this URL: http://www.ugc-inno-nehu.com/Physlet-Physics.htm could be helpful simultaneously to learn physics as well as online interactive feature enabled self-learning.
5.H.Friebolin, Basic One- and Two- Dimensional NMR Spectrosciopy,VCH Publications (1993).
6.K.Mullen and P.S.Pregogin, Fourier Transform NMR Techniques, A Practical Approach. Academic Press, London-New York (1976).
7. M.D.Grand and R.K.Harris, Eds., Encyclopedia of Magnetic Resonance, Wiley, Chichester, (1996).
8. A play list with the list name has been created in the YouTube
http://www.youtube.com/user/aram1121944/ which consists of 12 video files uploaded all on NMR technique and the Spectroscopic
Page 122 of 123
aspects. The link URL: https://www.youtube.com/playlist?list=PL158BAC87668F5D5Awould display the videos in the list to click and view. These videos have been arranged in a sequence starting from the elementary definitions to the NMR (for structure determination) of biological molecules, the mathematical concept of Euler expansion for complex numbers explained for its geometric significance (this is a basic expansion used in any spectroscopy particularly using the EM radiations)
.jpg pictures drawn by this author. Going through these videos (each of them about 10 minutes duration) in the same sequence as they are found in the play list can be helpful illustrations clarifying the points in the discussions on NMR. Certain aspects explained in these NMR
above, with the associated textual material to the context. "One particularly appealing feature is the fact that the operators have a
clear physical meaning and that the effects of pulses and delays can be thought of as geometrical rotations, much in the same way as we did for the vector model in Chapter 3" by James Keeler. http://www-keeler.ch.cam.ac.uk/lectures/Irvine/index.html AS mentioned by James Keeler in Chapter 6
http://www-keeler.ch.cam.ac.uk/lectures/Irvine/chapter6.pdf Find in Slides Number 2 & 3 of NMR Video the "Pulse Experiment"; and
the corresponding rotation operators are indicated
https://www.youtube.com/watch?v=cGnEjB5UIsc&index=4&list=PL158BAC87668F5D5A
Also see in item #3 in this list of suggested reading.
9. The article of this author published in the International Journal of Recent Development Volume 4, Issue 8, August 2015 could be useful in knowing about the advantages of using the Information Technology tools in self learning. http://www.ijrdet.com/Volume4Issue8.php
http://www.ugc-inno-nehu.com/IJRDET_0815_05.pdf
10. http://www.ugc-inno-nehu.com/NMR-article/sp-ref-list.doc

Page 123 of 123


NMR as a Tool for Structure Determination Introduction to Nuclear Magnetic Resonance with references to advanced discussions on theory and experiments. Emphasis on internet resources for self learning and as aid to teachers of NMR. The multi dimensional NMR aspects are introduced with references to the details. intended to be a guide book to use with references to resources. connection.
Read internet
the book with a computer featuring internet
Since 1985 S. Aravamudhan is teaching at the Chemistry Deptt North Eastern Hill University, Shillong; attained the age of superannuation (thus retired) on 30th Nov. 2006; and, is active at the same department as Emeritus Professor preoccupied with research in the specialized area of study: Magnetic Resonance- Theory,Instrumentation and Application.
978-3-659-83832-3
BaScic
S fo
F faSte
F acce
SS to
advance
S
AFa
vam
udhan