Panamgama Pizzi !3C NMR MUF MF
14
A 13C-NMR Analysis Method for MUF and MF Resin Strength and Formaldehyde Emission 1. A. PANANCAMA' and A. PIZZI2,* 'Department of Chemistry, University of the Witwatersrand, Johannesburg, South Africa; *ENSTIB, Universite de Nancy 1, B.P. 1041, Epinal, France SYNOPSIS A method based on the use of W-NMR relative peak intensity ratios for chemical groups known to contribute to melamine-urea-formaldehyde (MUF) and melamine-formaldehyde (MF) resin strength and formaldehyde emission is presented. The method relates results obtained by 13C-NMR analysis of liquid MUF and MF resins with their strength and formaldehyde emission in the hardened state. Correlation of different peak ratios with experimental results showed that, contrary to other formaldehyde-based resins, the NMR analysis for the MUF and MF resins needs only to take into account the triazine/substituted triazines and the urea/substituted ureas peak ratios to allow the proposal of equations correlating a single spectrum of the liquid resin with the physical properties of the boards bound with the same resin in its hardened state. Correlation equations are developed for both the case in which variation of the amine : formaldehyde molar ratio is directly induced at the resin preparation stage as well as the case in which it is induced at the glue-mixing stage, the latter by addition of different types of resin accelerators and resin scavengers. 0 1996 John Wiley & Sons, Inc. INTRODUCTION Melamine-formaldehyde (MF) resins, and, in par- ticular, their more economical important variant, melamine-urea-formaldehyde (MUF) resins, are widely used as adhesives for the manufacture of ex- terior and moisture-resistant wood products, in par- ticular, for particleboard.' The evaluation of the cured strength of MUF and MF adhesives and the determination of their capacity for formaldehyde emission, once the resin has become the hardened binder of a board, is a long procedure needing re- petitive testing as it is subject to fairly large exper- imental errors. These are induced by the need to pass through the board manufacturing stage. The testing is further complicated by the need to test the strength of the hardened resin in the board both dry and after 2 h boiling (or less, according to dif- ferent standard specification^).^,^ Determination of formaldehyde emission is vital, in general, in prod- * To whom correspondence should be addressed. Journal of Applied Polymer Science, Vol. 59,2055-2068 (1996) 0 1996 John Wiley & Sons, Inc. CCC 0021-8995/96/132055-14 ucts bonded with aminoplastic resins, but, in par- ticular, for any adhesive in which urea is used even in part. Recently, methods for the correlation of a single 13C-NMR spectrum of a liquid resin to the strength and formaldehyde emission of wood products bonded with it, thus for the resin in its hardened state, were proposed for urea-formaldehyde (UF)'9495and phe- nol-formaldehyde ( PF)'y6 adhesive resins. These methods are based on the correlation found between the ratio of NMR peak intensities of relevant chem- ical groups in the liquid resin spectrum with the strength of the hardened resin, of the board bonded with it, and with its formaldehyde emission. The application of such methods appears considerably more complicated for MUF resins, in which NMR bands characteristic of MFs, UFs, and their copol- ymers are evident in the spectrum. This article then presents a method to identify which of the main chemical groups in a liquid MUF resin contribute to its hardened strength and form- aldehyde emission, as well as to correlate their 13C- NMR signal ratios from a single spectrum of the liquid resin with both the I.B. strength (tensile 2055
Transcript of Panamgama Pizzi !3C NMR MUF MF
A 13C-NMR Analysis Method for MUF and MF Resin Strength and Formaldehyde Emission
1. A. PANANCAMA' and A. PIZZI2,*
'Department of Chemistry, University of the Witwatersrand, Johannesburg, South Africa; *ENSTIB, Universite de Nancy 1, B.P. 1041, Epinal, France
SYNOPSIS
A method based on the use of W-NMR relative peak intensity ratios for chemical groups known to contribute to melamine-urea-formaldehyde (MUF) and melamine-formaldehyde (MF) resin strength and formaldehyde emission is presented. The method relates results obtained by 13C-NMR analysis of liquid MUF and MF resins with their strength and formaldehyde emission in the hardened state. Correlation of different peak ratios with experimental results showed that, contrary to other formaldehyde-based resins, the NMR analysis for the MUF and MF resins needs only to take into account the triazine/substituted triazines and the urea/substituted ureas peak ratios to allow the proposal of equations correlating a single spectrum of the liquid resin with the physical properties of the boards bound with the same resin in its hardened state. Correlation equations are developed for both the case in which variation of the amine : formaldehyde molar ratio is directly induced at the resin preparation stage as well as the case in which it is induced at the glue-mixing stage, the latter by addition of different types of resin accelerators and resin scavengers. 0 1996 John Wiley & Sons, Inc.
INTRODUCTION
Melamine-formaldehyde (MF) resins, and, in par- ticular, their more economical important variant, melamine-urea-formaldehyde (MUF) resins, are widely used as adhesives for the manufacture of ex- terior and moisture-resistant wood products, in par- ticular, for particleboard.' The evaluation of the cured strength of MUF and MF adhesives and the determination of their capacity for formaldehyde emission, once the resin has become the hardened binder of a board, is a long procedure needing re- petitive testing as it is subject to fairly large exper- imental errors. These are induced by the need to pass through the board manufacturing stage. The testing is further complicated by the need to test the strength of the hardened resin in the board both dry and after 2 h boiling (or less, according to dif- ferent standard specification^).^,^ Determination of formaldehyde emission is vital, in general, in prod-
* To whom correspondence should be addressed. Journal of Applied Polymer Science, Vol. 59,2055-2068 (1996) 0 1996 John Wiley & Sons, Inc. CCC 0021-8995/96/132055-14
ucts bonded with aminoplastic resins, but, in par- ticular, for any adhesive in which urea is used even in part.
Recently, methods for the correlation of a single 13C-NMR spectrum of a liquid resin to the strength and formaldehyde emission of wood products bonded with it, thus for the resin in its hardened state, were proposed for urea-formaldehyde (UF)'9495 and phe- nol-formaldehyde ( PF)'y6 adhesive resins. These methods are based on the correlation found between the ratio of NMR peak intensities of relevant chem- ical groups in the liquid resin spectrum with the strength of the hardened resin, of the board bonded with it, and with its formaldehyde emission. The application of such methods appears considerably more complicated for MUF resins, in which NMR bands characteristic of MFs, UFs, and their copol- ymers are evident in the spectrum.
This article then presents a method to identify which of the main chemical groups in a liquid MUF resin contribute to its hardened strength and form- aldehyde emission, as well as to correlate their 13C- NMR signal ratios from a single spectrum of the liquid resin with both the I.B. strength (tensile
2055

Tab
le I
(a
) The
Sta
tist
ical
Sch
eme
Use
d f
or t
he
Pre
par
atio
n o
f A
dh
esiv
e S
yste
ms;
(b)
Res
ult
s of
Par
ticl
eboa
rd P
rep
ared
M
UF
Adh
esiv
e S
yste
ms
wit
h D
iffe
rent
Perc
enta
ge C
hart
" %
Sol
ids
Cha
rth
Res
in S
olid
s A
ccel
erat
or
Scav
enge
r R
esin
Sol
ids
Acc
eler
ator
Sc
aven
ger
100%
0
%
0%
0%
0%
10%
10
%
10%
10
%
15%
15
%
15%
15
%
20%
20
%
20%
20
%
0%
10%
15
%
20%
0%
10
%
15%
20
%
0%
10%
15
%
20%
0%
10
%
15%
20
%
8%
7.2%
6.
8%
6.4%
7.
2%
6.4%
6%
5.
6%
6.8%
6%
5.
6%
5.2%
6.
4%
5.6%
5.
2%
4.8%
0%
0%
0%
0%
0.
8%
0.8%
0.
8%
0.8%
1.
2%
1.2%
1.
2%
1.2%
1.
6%
1.6%
1.
6%
1.6%
0%
0.8%
1.
2%
1.6%
0%
0.
8%
1.2%
1.
6%
0%
0.8%
1.
2%
1.6%
0%
0.
8%
1.2%
1.
6%

Tab
le I
(C
onti
nu
ed f
rom
the
prev
iou
s p
ag
e)
(b)
UF
Acc
eler
ator
, U
F H
CH
O S
cave
nger
M
F A
ccel
erat
or,
MF
HC
HO
Sca
veng
er
HC
HO
H
CH
O
UF
UF
Em
issi
on
Em
issi
on
Acc
eler
ator
Sc
aven
ger
Boa
rd
1.B.
d B
oard
I.B
. m
g/10
0 G
el
Boa
rd
I.B.
Boa
rd
I.B.
mg/
100
Gel
on
Adh
esiv
e on
Adh
esiv
e D
ensi
ty
Dry
D
ensi
ty
VlO
O
g T
ime/
D
ensi
ty
Dry
D
ensi
ty
VlO
O
g T
ime/
So
lids (96)"
Solid
s (%
)"
(g ~
m-
~)
(MP
a)
(g ~
rn-~
) (M
Pa)
B
oard
M
inut
es
(g ~
m-
~)
(MP
a)
(g ~
m-
~)
(MP
a)
Boa
rd
Min
utes
Non
e N
one
Non
e N
one
0.8
0.8
0.8
0.8
1.2
1.2
1.2
1.2
1.6
1.6
1.6
1.6
Non
e 0.
8 1.
2 1.
6 N
one
0.8
1.2
1.6
Non
e 0.
8 1.
2 1.
6 N
one
0.8
1.2
1.6
0.70
9 0.
685
0.69
0 0.
702
0.69
1 0.
709
0.70
6 0.
700
0.71
3 0.
721
0.70
3 0.
718
0.70
5 0.
696
0.73
6 0.
701
0.80
3 0.
680
0.72
8 0.
663
0.69
0 0.
752
0.64
0 0.
586
0.60
4 0.
734
0.65
3 0.
744
0.65
2 0.
697
0.73
6 0.
456
0.69
9 0.
697
0.69
7 0.
680
0.68
8 0.
711
0.70
5 0.
699
0.71
2 0.
713
0.70
0 0.
736
0.70
3 0.
696
0.69
8 0.
718
0.40
1 0.
220
0.26
0 0.
185
0.21
1 0.
200
0.08
4 0.
078
0.14
5 0.
067
0.05
3 0.
052
0.13
5 0.
089
0.08
5 0.
015
75.9
6 54
.84
42.9
1 37
.80
65.6
3 54
.74
45.2
6 34
.43
84.8
4 50
.77
41.3
1 37
.73
72.5
3 55
.39
42.8
8 38
.39
1.88
2.
07
2.33
2.
77
1.81
2.
17
2.27
2.
47
1.68
1.
90
2.00
2.
57
1.65
2.
07
2.55
2.
85
0.70
9 0.
721
0.72
8 0.
712
0.69
2 0.
733
0.72
7 0.
715
0.70
6 0.
701
0.70
3 0.
712
0.70
1 0.
703
0.69
6 0.
702
0.80
3 0.
696
0.67
5 0.
568
0.71
2 0.
680
0.62
6 0.
603
0.70
3 0.
576
0.61
3 0.
559
0.71
1 0.
587
0.43
7 0.
523
MF
Acc
eler
ator
, UF
HC
HO
Sca
veng
er
0.69
9 0.
716
0.71
3 0.
719
0.69
4 0.
716
0.71
7 0.
699
0.71
1 0.
699
0.69
7 0.
726
0.69
6 0.
687
0.71
7 0.
694
0.40
1 0.
346
0.26
1 0.
200
0.31
1 0.
178
0.19
0 0.
131
0.21
7 0.
155
0.16
4 0.
098
0.27
5 0.
098
0.07
9 0.
074
75.9
6 1.
88
52.7
3 2.
46
47.4
3 2.
90
43.7
8 3.
48
67.8
7 2.
53
52.1
5 3.
02
48.0
1 3.
98
47.2
7 5.
58
87.0
6 2.
68
58.6
4 3.
60
56.1
9 4.
33
50.4
7 5.
65
77.1
5 2.
88
56.4
3 3.
67
55.7
0 5.
40
52.6
6 7.
80
UF
Acc
eler
ator
, M
F H
CH
O S
cave
nger
MF
U
F H
CH
O
Acc
eler
ator
Sc
aven
ger
Boa
rd
I.B.
Boa
rd
I.B.
Em
issi
on
Gel
on
Adh
esiv
e on
Adh
esiv
e D
ensi
ty
Dry
D
ensi
ty
VlO
O
mg/
100
g T
ime/
So
lids
(%)"
So
lids
(%)"
(g
~rn
-~)
(MP
a)
(g cr
n-')
(MP
a)
Boa
rd
Min
utes
HC
HO
B
oard
I.B
. B
oard
I.B
. E
mis
sion
G
el
Den
sity
D
ry
Den
sity
V
lOO
m
g/10
0g
Tim
e/
(g ~
rn-~
) (M
Pa)
(g
~m
-~
) (M
Pa)
B
oard
M
inut
es
Non
e N
one
0.70
9 0.
803
0.69
9 0.
401
75.9
6 1.
88
0.70
9 0.
803
0.69
9 0.
401
75.9
6 1.
88
Non
e 0.
8 0.
685
0.68
0 0.
697
0.22
0 54
.84
2.07
0.
721
0.69
6 0.
716
0.34
6 52
.73
2.46
N
one
1.2
0.69
0 0.
728
0.69
7 0.
260
42.9
1 2.
33
0.72
8 0.
675
0.71
3 0.
261
47.4
3 2.
90
Non
e 1.
6 0.
702
0.66
3 0.
680
0.18
5 37
.80
2.77
0.
712
0.56
8 0.
719
0.20
0 43
.78
3.48
0.
8 N
one
0.69
2 0.
712
0.69
4 0.
311
67.8
7 2.
53
0.69
1 0.
690
0.68
8 0.
211
65.6
3 1.
81
0.8
0.8
0.68
4 0.
582
0.65
6 0.
138
66.8
2 2.
62
0.68
4 0.
541
0.71
3 0.
139
59.2
0 2.
97
t4 0
Q 4

Tab
le I
(C
onti
nu
ed fr
om
the
prev
iou
s page)
N
0
Q
00
MF
Acc
eler
ator
, UF
HC
HO
Sca
veng
er
UF
Acc
eler
ator
, MF
HC
HO
Sca
veng
er
MF
U
F
HC
HO
H
CH
O
v G
el
Boa
rd
I.B.
Boa
rd
I.B
. E
mis
sion
G
el
* A
ccel
erat
or
Scav
enge
r B
oard
I.B
. B
oard
I.B
. E
mis
sion
Solid
s (%
)"
Soli
ds (%
)"
(g ~
m-
~)
(MP
a)
(g ~
m-
~)
(MP
a)
Boa
rd
Min
utes
(g
~m
-~
) (M
Pa)
(g
~m
-~
) (M
Pa)
B
oard
M
inut
es
3 * on
Adh
esiv
e on
Adh
esiv
e D
ensi
ty
Dry
D
ensi
ty
VlO
O
mg/
100
g T
ime/
D
ensi
ty
Dry
D
ensi
ty
VlO
O
mg/
100
g T
ime/
z
0.8
1.2
0.70
7 0.
620
0.68
7 0.
138
53.6
2 3.
05
0.71
1 0.
467
0.71
8 0.
099
5 1.6
5 3.
03
F 3 1.
2 1.
2 0.
686
0.58
3 0.
706
0.09
8 50
.11
3.22
0.
695
0.46
6 0.
717
0.07
9 52
.34
3.22
;
0.8
1.6
0.69
4 0.
628
0.69
5 0.
119
43.9
1 3.
15
0.69
5 0.
509
0.71
4 0.
124
47.1
7 3.
47
* 1.
2 N
one
0.70
6 0.
703
0.71
1 0.
217
87.0
6 2.
68
0.71
3 0.
604
0.71
2 0.
145
84.8
4 1.
68
1.2
0.8
0.69
7 0.
676
0.70
1 0.
182
60.5
1 3.
05
0.73
2 0.
603
0.71
9 0.
170
64.9
6 2.
83
1.2
1.6
0.69
4 0.
571
0.70
4 0.
092
34.6
5 3.
75
0.69
2 0.
463
0.71
4 0.
113
43.6
5 3.
47
N,
1.6
Non
e 0.
701
0.71
1 0.
696
0.27
5 77
.15
2.88
0.
705
0.65
2 0.
703
0.13
5 72
.53
1.65
1.
6 0.
8 0.
730
0.55
9 0.
695
0.09
4 49
.04
3.18
0.
744
0.73
2 0.
693
0.19
1 42
.62
2.58
1.
6 1.
2 0.
714
0.55
4 0.
684
0.04
7 47
.29
3.57
0.
725
0.54
5 0.
703
0.09
5 39
.86
2.70
1.
6 1.
6 0.
725
0.55
8 0.
696
0.06
0 44
.88
4.52
0.
708
0.56
9 0.
725
0.08
2 28
.62
3.97
MU
F A
ccel
erat
or, M
UF
HC
HO
Sca
veng
er
MU
F
MU
F
HC
HO
A
ccel
erat
or
Scav
enge
r B
oard
I.B
. B
oard
I.B
. E
mis
sion
G
el
on A
dhes
ive
on A
dhes
ive
Den
sity
D
ry
Den
sity
V
lOO
m
g/10
0 g
Tim
e/
Solid
s (%
)"
Soli
ds (%
)' (g
cm
-7
(MP
a)
(g ~
m-
~)
(M
Pa)
B
oard
M
inut
es
Non
e N
one
Non
e N
one
0.8
0.8
0.8
0.8
1.2
1.2
1.2
1.2
1.6
1.6
1.6
1.6
Non
e 0.
8 1.
2 1.
6 N
one
0.8
1.2
1.6
Non
e 0.
8 1.
2 1.
6 N
one
0.8
1.2
1.6
0.70
9 0.
698
0.70
8 0.
739
0.71
5 0.
695
0.73
1 0.
727
0.72
1 0.
698
0.69
9 0.
717
0.67
3 0.
777
0.67
0 0.
684
0.80
3 0.
688
0.58
8 0.
586
0.74
2 0.
627
0.66
3 0.
545
0.75
8 0.
666
0.52
5 0.
578
0.53
8 0.
702
0.46
5 0.
477
0.69
9 0.
715
0.71
9 0.
677
0.71
6 0.
722
0.70
8 0.
707
0.70
0 0.
712
0.74
4 0.
709
0.76
1 0.
672
0.74
3 0.
701
0.40
1 0.
237
0.15
8 0.
146
0.30
7 0.
167
0.19
8 0.
119
0.20
1 0.
190
0.08
6 0.
094
0.11
2 0.
077
0.10
1 0.
062
75.9
6 49
.84
45.0
9 37
.57
82.7
1 49
.85
45.5
5 41
.92
60.7
8 59
.06
58.4
9 40
.43
77.9
6 70
.89
54.2
7 32
.42
1.88
2.
17
2.43
2.
70
1.68
2.
23
2.52
2.
83
1.72
2.
47
2.58
2.
68
1.83
2.
13
2.43
3.
72
Tot
al r
esin
sol
ids
cont
ent o
n dr
y w
ood
= 8
%.
a Pe
rcen
tage
bas
ed o
n M
UF
resi
n so
lids
basi
s.
Perc
enta
ge o
n dr
y w
ood
basi
s.
' Per
cent
age
on M
UF
resi
n so
lids
cont
ent.
I.B
. val
ues
base
d on
10
spec
imen
s eac
h.

%NMR ANALYSIS FOR MUF AND MF RESINS 2059
Table I1 13C Peak Assignments for MF, MUF, and U F Resins
Chemical Shift (pprn)
Name Structure MF"*b Resin MUFb Resin UFb Resin
Triazine nucleus
Urea residue
Methylenes
Methylol group
Methyl ether of methylol group
Dimethylene ether group and hemi formal form of methylol group
Methanol methoxymethylene
Methylene glycol species
Hemiformal form of methylol group
167.2 (167.3)
166.5 (166.4)
166.2
- - -
47.3 (47.9) 52.2 (53.8) -
64.8 (65.5) 69.8 (71.6)
73.0 (73.7) 77.4 (78.2)
69.8 (69.7) 69.8 (69.7) 73.0 (75.0) 73.0 (75.0)
50.7 (50.0) 55.3 (55.6)
82.1 (83.0) 85.2 (86.6) 89.5 (90.6) 93.9 (95.0)
86.2 (87.1) 86.2 (87.1)
167.2
166.3
163.2 161.4 159.9
47.4 53.6 -
65.0 71.3
73.2 78.2
69.3 69.3 74.8 74.8
50.0 55.4
83.0 86.6 90.6 95.0
87.1 87.1
-
-
-
163.6 161.9 160.2
47.7 53.8 60.0
65.1 71.7
73.2 79.7
69.4 69.4 76.0 76.0
50.0 55.6
83.1 86.6 90.7 95.0
87.1 87.1
In MUF resin, parentheses values were calculated by method in footnote b. a Chemical shift was calculated by defining 13C of DMSO-ds as 39.5 ppm.
Chemical shift in water was calculated by defining 13C of external dioxane as 47.3 ppm.
strength perpendicular to the board surface = in- ternal bond = I.B.) and formaldehyde emission of the particleboard bonded with it.
EXPERIMENTAL
Resins Preparation
Formurea, 132 parts by mass (a formaldehyde con- centrate composed of 57% formaldehyde and 22% urea in water solution) and 4.5 parts of urea were
mixed with 60 parts water in a laboratory glass re- actor furnished with a reflux/distillation condenser and a mechanical stirrer. The mixture was heated under continuous mechanical stirring to 92-94°C and the pH adjusted to 10.0-10.4 with 33% NaOH solution. Heating at 94°C was continued for 1.5 h under continuous mechanical stirring. The pH was then adjusted to 9.5-10, and 41 parts by mass of melamine were added. The pH was maintained at 9.5-10 while checking the turbidity point every 10 min. Approximately 1 h later, when the hydropho- bicity point is of approximately 30096, 6.5 parts by

2060 PANANGAMA AND PIZZI
Table I11 Selected Integrated Peak Areas from NMR Spectra of MUF Resin Systems
(A) System: MUF Resin + UF Accelerator + UF Scavenger
Triazine Nucleus Urea Residue
Primary Secondary Primary Secondary Resin Name Peak Peaks Peak Peaks
1. 2. 3. 4. 5. 6. 7. 8. 9.
10. 11. 12. 13. 14. 15. 16. 17. 18.
MUF A1 MUF A2 MUF A3 MUF A4 MUF A5 MUF A6 MUF A7 MUF A8 MUF A9 MUF A10 MUF A l l MUF A12 MUF A13 MUF A14 MUF A15 MUF A16 UF activator UF scavenger
9.434 7.901 4.882 8.754 21.265 5.893 6.226 4.041 4.343 6.610
18.637 20.147 15.474 9.701
15.613 20.913 -
22.241 15.287 9.111
13.352 68.688 11.226 11.146 5.903
11.305 12.477 32.887 28.418 51.215 21.301 26.304 29.326 -
3.284 6.620 5.930
11.580 11.681 6.344 9.309 7.834 2.099 4.679
25.111 33.402 9.440
12.106 21.418 36.260
37.515 -
26.324 45.692 34.602 55.057 154.23 37.697 47.946 30.704 28.252 39.027
149.535 151.188 137.459 92.418
127.500 197.317 22.062 15.704
(B) System: MUF Resin + MF Accelerator + MF Scavenger
Triazine Nucleus Urea Residue
Primary Secondary Primary Secondary Resin Name Peak Peaks Peak Peaks
1. MUF B1 6.746 21.103 2.052 32.418 2. MUF B2 8.247 22.827 2.352 26.467 3. MUF B3 15.324 26.109 3.699 32.166 4. MUF B4 18.482 30.894 4.599 36.546 5. MUF B5 7.331 20.531 2.479 34.061 6. MUF B6 45.088 77.886 9.336 117.454 7. MUF B7 55.344 76.610 9.401 96.899 8. MUF B8 6.875 9.044 1.236 8.036 9. MUF B9 2.070 5.268 1.193 10.257
10. MUF B10 8.616 16.134 1.732 18.285 11. MUF B11 16.981 27.489 3.139 31.741 12. MUF B12 14.230 18.232 2.501 19.536 13. MUF B13 6.015 15.141 1.242 20.274 14. MUF B14 30.467 51.950 5.177 46.174 15. MUF B15 28.075 38.996 4.671 35.361 16. MUF B16 16.274 22.400 11.173 13.268 17. MF activator 12.910 19.456 18. MF scavenger 10.233 7.520
- - - -

13C-NMR ANALYSIS FOR MUF AND MF RESINS 2061
Table I11 (Continued from the previous page)
(C) System: MUF Resin + MF Accelerator + MF Scavenger
Triazine Nucleus Urea Residue
Primary Secondary Primary Secondary Resin Name Peak Peaks Peak Peaks
1. 2. 3. 4. 5. 6. 7. 8. 9.
10. 11. 12. 13. 14. 15. 16. 17. 18.
MUF C1 MUF C2 MUF C3 MUF C4 MUF C5 MUF C6 MUF C7 MUF C8 MUF C9 MUF C10 MUF C11 MUF C12 MUF C13 MUF C14 MUF C15 MUF C16 MF activator UF scavenger
14.680 9.361
28.004 16.169 20.875 31.050 25.040 20.996 8.692
16.589 13.457 58.096 12.699 19.809 18.909 15.429 18.137
46.828 17.426 41.365 31.596 54.908 52.741 34.643 35.821 23.033 27.314 17.579 94.115 32.723 29.727 23.454 15.638 28.077
5.988 7.055
13.070 19.384 7.498
12.237 9.665
13.188 2.190
11.899 7.626
56.152 4.020
14.449 16.398 19.267
55.475 -
76.591 48.718
103.864 93.405 93.648
112.383 90.283 78.162 23.376 61.140 46.760
258.527 62.284 80.336 74.402 67.724
25.485 -
(D) System: MUF Resin + UF Accelerator + MF Scavenger
Triazine Nucleus Urea Residue
Primary Secondary Primary Secondary Resin Name Peak Peaks Peak Peaks
1. 2. 3. 4. 5. 6. 7. 8. 9.
10. 11. 12. 13. 14. 15. 16. 17. 18. -
MUF D l 6.223 20.837 1.465 28.538 MUF D2 15.964 26.496 2.736 41.544 MUF D3 12.480 19.934 2.318 19.243 MUF D4 87.807 107.496 11.938 110.538 MUF D5 22.343 49.876 15.082 130.657 MUF D6 8.618 22.014 3.153 41.352 MUF D7 48.364 56.508 12.355 78.122 MUF D8 44.102 41.040 10.623 52.860 MUF D9 36.537 70.465 27.236 220.004 MUF D10 24.537 22.969 10.371 59.138 MUF D11 27.026 21.026 10.158 51.321 MUF D12 5.694 3.688 2.036 7.284 MUF D13 3.886 14.013 1.551 38.050 MUF D14 11.599 25.504 3.535 56.036 MUF D15 22.296 35.803 5.585 53.730 MUF D16 22.677 30.248 5.378 42.327
- 22.062 UF activator - - MF scavenger 10.233 7.520 - -
2062 PANANGAMA AND PIZZI
Table I11 (Continued from the previous page)
(E) System: MUF Resin + MUF Accelerator + MUF Scavenger
Triazine Nucleus Urea Residue
Primary Secondary Primary Secondary Resin Name Peak Peaks Peak Peaks
1. 2. 3. 4. 5. 6. 7. 8. 9.
10. 11. 12. 13. 14. 15. 16. 17. 18.
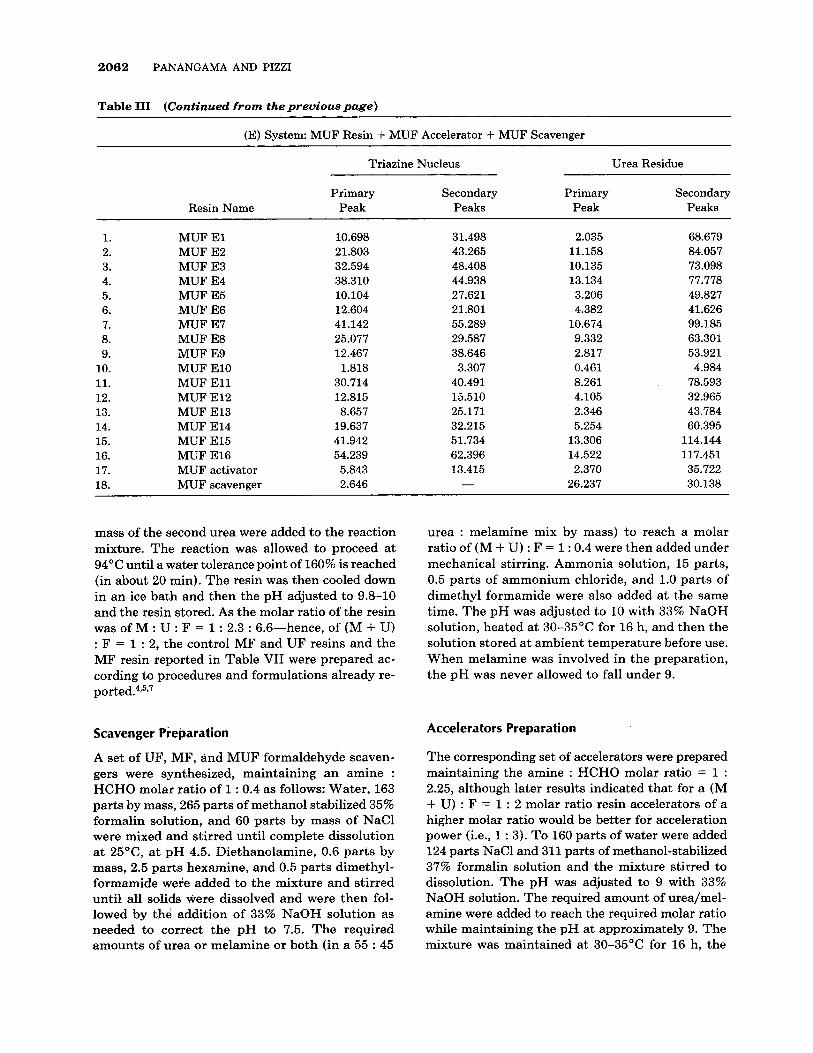
MUF E l MUF E2 MUF E3 MUF E4 MUF E5 MUF E6 MUF E7 MUF E8 MUF E9 MUF El0 MUF E l l MUF El2 MUF El3 MUF El4 MUF El5 MUF El6 MUF activator MUF scavenger
10.698 21.803 32.594 38.310 10.104 12.604 41.142 25.077 12.467 1.818
30.714 12.815 8.657
19.637 41.942 54.239 5.843 2.646
31.498 43.265 48.408 44.938 27.621 21.801 55.289 29.587 38.646 3.307
40.491 15.510 25.171 32.215 51.734 62.396 13.415 -
2.035 11.158 10.135 13.134 3.206 4.382
10.674 9.332 2.817 0.461 8.261 4.105 2.346 5.254
13.306 14.522 2.370
26.237
68.679 84.057 73.098 77.778 49.827 41.626 99.185 63.301 53.921 4.984
78.593 32.965 43.784 60.395
114.144 117.451 35.722 30.138
mass of the second urea were added to the reaction mixture. The reaction was allowed to proceed at 94°C until a water tolerance point of 160% is reached (in about 20 min). The resin was then cooled down in an ice bath and then the pH adjusted to 9.8-10 and the resin stored. As the molar ratio of the resin was of M : U : F = 1 : 2.3 : 6.6-hence, of (M + U) : F = 1 : 2, the control MF and UF resins and the MF resin reported in Table VII were prepared ac- cording to procedures and formulations already re- ported.4~~9~
Scavenger Preparation
A set of UF, MF, and MUF formaldehyde scaven- gers were synthesized, maintaining an amine : HCHO molar ratio of 1 : 0.4 as follows: Water, 163 parts by mass, 265 parts of methanol stabilized 35% formalin solution, and 60 parts by mass of NaCl were mixed and stirred until complete dissolution at 25"C, a t pH 4.5. Diethanolamine, 0.6 parts by mass, 2.5 parts hexamine, and 0.5 parts dimethyl- formamide were added to the mixture and stirred until all solids were dissolved and were then fol- lowed by the addition of 33% NaOH solution as needed to correct the pH to 7.5. The required amounts of urea or melamine or both (in a 55 : 45
urea : melamine mix by mass) to reach a molar ratio of (M + U) : F = 1 : 0.4 were then added under mechanical stirring. Ammonia solution, 15 parts, 0.5 parts of ammonium chloride, and 1.0 parts of dimethyl formamide were also added at the same time. The pH was adjusted to 10 with 33% NaOH solution, heated at 30-35°C for 16 h, and then the solution stored at ambient temperature before use. When melamine was involved in the preparation, the pH was never allowed to fall under 9.
Accelerators Preparation
The corresponding set of accelerators were prepared maintaining the amine : HCHO molar ratio = 1 : 2.25, although later results indicated that for a (M + U) : F = 1 : 2 molar ratio resin accelerators of a higher molar ratio would be better for acceleration power (i.e., 1 : 3). To 160 parts of water were added 124 parts NaCl and 311 parts of methanol-stabilized 37% formalin solution and the mixture stirred to dissolution. The pH was adjusted to 9 with 33% NaOH solution. The required amount of urea/mel- amine were added to reach the required molar ratio while maintaining the pH at approximately 9. The mixture was maintained at 30-35°C for 16 h, the
Tab
le I
V
13C
-NM
R P
eak
s In
tegr
ated
Are
as R
atio
s fo
r D
iffe
rent
MU
F A
dh
esiv
e S
yste
ms
Ure
a R
esid
ue
Ure
a R
esid
ue
Ure
a R
esid
ue
Pri
mar
y : S
econ
dary
P
rim
ary
: Sec
onda
ry
Pri
mar
y : S
econ
dary
T
riaz
ine
Nuc
leus
T
riaz
ine
Nuc
leus
T
riaz
ine
Nuc
leus
Res
in N
ame
Pri
mar
y : S
econ
dary
+ T
erti
ary
Res
in N
ame
Pri
mar
y : S
econ
dary
+ T
erti
ary
Res
in N
ame
Pri
mar
y :
Seco
ndar
y t
Ter
tiar
y
1. M
UF
Al
2.
MU
FA
2 3.
M
UF
A3
4.
MU
FA
4 5.
MU
FA
5 6.
MU
FA
6 7.
MU
FA
7 8.
MU
FA
8
9. M
UF
A9
10.
MU
FA
10
11.
MU
FA
ll
12.
MU
FA
12
13.
MU
FA
13
14.
MU
FA
14
15.
MU
FA
15
16.
MU
FA
16
17.
UF
act
ivat
or
18.
UF
scav
enge
r
1 :
2.35
8 1 :
1.93
5 1 :
1.86
6 1 :
1.52
5 1 :
3.23
0 1 :
1.90
5 1 :
1.79
0 1 :
1.46
1 1 :
2.60
3 1 :
1.88
8 1 :
1.76
4 1 :
1.41
1 1 :
3.31
0 1 :
2.19
6 1 :
1.68
5 1 :
1.40
2
1 :
8.01
6 1 :
6.90
2 1 :
5.83
5 1 :
4.75
4 1 :
13.2
03
1 :
5.94
2 1 :
5.15
0 1 :
3.91
9 1 :
13.4
60
1 :
8.34
1 1 : 5
.955
1 :
4.52
6 1 :
14.5
61
1 :
7.63
4 1 :
5.95
3 1 :
5.44
2
1 :
0.41
9
MU
F B
1 M
UF
B2
MU
F B
3 M
UF
B4
MU
F B
5 M
UF
B6
MU
F B
7 M
UF
B8
MU
F B
9 M
UF
B10
M
UF
B11
M
UF
B12
M
UF
B13
M
UF
B14
M
UF
B15
M
UF
B16
M
F a
ctiv
ator
M
F sc
aven
ger
1 :
3.12
8 1 :
2.76
8 1 :
1.70
4 1 :
1.67
2 1 :
2.80
1 1 :
1.72
7 1 :
1.38
4 1 :
1.31
5 1 :
2.24
5 1 :
1.87
3 1 :
1.61
9 1 :
1.28
1 1 :
2.51
7 1 :
1.70
5 1 :
1.38
9 1 :
1.37
6 1 :
1.50
7 1 :
0.73
5
1 :
15.7
98
1 :
11.2
53
1 : 8
.696
1 :
7.94
7 1 :
13.7
40
1 :
12.5
81
1 :
10.3
07
1 :
6.50
2 1 : 8
.598
1 :
10.5
57
1 :
10.1
12
1 :
7.81
9 1 :
16.3
24
1 :
8.91
9 1 :
7.57
0 1 :
1.18
8
MU
F C
1 M
UF
C2
MU
F C
3 M
UF
C4
MU
F C
5 M
UF
C6
MU
F C
7 M
UF
C8
MU
F C
9 M
UF
C10
M
UF
C11
M
UF
C12
M
UF
C13
M
UF
C14
M
UF
C15
M
UF
C16
M
F a
ctiv
ator
U
F s
cave
nger
1 : 3
.190
1 :
1.86
2 1 :
1.47
7 1 :
1.95
4 1 :
2.63
0 1 :
1.69
9 1 :
1.38
4 1 :
1.70
6 1 :
2.65
0 1 :
1.64
7 1 :
1.30
6 1 :
1.62
0 1 :
2.57
7 1 :
1.50
1 1 :
1.24
0 1 :
1.01
4 1 :
1.54
8 -
1 :
12.7
69
1 :
6.90
5 1 :
7.94
7 1 : 4
.819
1 :
12.4
90
1 :
9.18
4 1 : 9
.341
1 :
5.93
8 1 :
10.6
74
1 :
5.13
8 1 : 6
.132
1 : 4
.604
1 :
15.4
94
1 :
5.56
0 1 : 4
.537
1 : 3
.515
5 9
1 : 0
.459
Tri
azin
e N
ucle
us
Ure
a R
esid
ue
Tri
azin
e N
ucle
us
Ure
a R
esid
ue
>
Pri
mar
y : S
econ
dary
P
rim
ary
: Sec
onda
ry +
Ter
tiar
y 5 I?
R
esin
Nam
e P
rim
ary
: Se
cond
ary
Pri
mar
y : S
econ
dary
+ Te
rtia
ry
Res
in N
ame
MU
F D
1 1 :
3.34
8 1 :
19.4
80
MU
F E
l 1 :
2.94
4 1 :
33.7
49
5
MU
F D
5 1 :
2.23
2 1 :
8.66
30
MU
F E
5 1 :
2.73
4 1 :
15.5
42
5: M
UF
D6
1 :
2.55
4 1 :
13.1
15
MU
F E
6 1 :
9.49
9 5 5 z m w
MU
F D
2 1 :
1.66
0 1 :
15.1
84
MU
F E
2 1 :
1.98
4 1 :
7.53
3 M
UF
D3
1 :
1.59
7 1 :
8.30
2 M
UF
E3
1 :
1.48
5 1 :
7.21
2 0
3
MU
F D
4 1 :
1.22
4 1 :
9.25
9 M
UF
E4
1 :
1.17
3 1 :
5.92
2
1 :
1.73
0 1 :
1.16
8 1
: 6.3
23
MU
F E
7 1 :
1.34
4 1 :
9.29
2 M
UF
D7
MU
F D
8 1 :
0.93
1 1 :
4.97
6 M
UF
E8
1 :
1.18
0 1 :
6.78
3 M
UF
D9
1 :
1.92
9 1 :
8.07
8 M
UF
E9
1 :
3.01
0 1 :
19.1
41
1 :
10.8
11
MU
F D
10
1 :
0.93
6 1 :
5.70
2 M
UF
El0
1 :
1.81
9 M
UF
D11
1 : 0
.778
1 :
5.05
3 M
UF
Ell
1 :
1.31
8 1 :
9.51
4 3
MU
F D
12
1 :
0.64
8 1 :
3.57
8 M
UF
El2
1 :
1.21
0 1 :
8.03
0 M
UF
D13
1 :
3.60
6 1 :
24.5
33
MU
F E
l3
1 :
2.90
8 1 :
18.6
33
MU
F D
14
1 :
2.19
9 1 :
15.8
52
MU
F E
l4
1 :
1.64
1 1 :
11.4
95
MU
F D
15
1 :
1.60
6 1 :
9.62
0 M
UF
El5
1 :
1.23
3 1 :
8.57
8 M
UF
D16
1 :
1.33
4 1 :
7.87
0 M
UF
El6
MF
scav
enge
r 1 :
0.73
5 -
MU
F sc
aven
ger
-
1 :
1.14
9
5 N
0
1 :
8.08
8 0
1 :
1.15
0 U
F a
ctiv
ator
-
1 : 2
.575
M
UF
act
ivat
or
1 :
2.29
6 1 :
15.0
73
Q

2064 PANANGAMA A N D PIZZI
Table V Peak Ratios with I.B. Strength and Formaldehyde Emission
Coefficients of Correlation of 13C-NMR
Triazine/ Substituted Urea/Substituted
Triazine (YJ Urea ( Y2)
Dry Boil/Dry Dry Boil/Dry
I.B. dry
Resin series A 0.725 Resin series B 0.887 Resin series C 0.814 Resin series D 0.791 Resin series E 0.798
HCHO emission
Resin series A 0.971 Resin series B 0.926 Resin series C 0.973 Resin series D 0.969 Resin series E 0.932
% Scavenger content
0.911 0.637 0.956 0.754 0.938 0.745 0.682 0.691 0.862 0.830
0.968 0.780 0.909 0.895 0.961
0.882 0.804 0.867 0.643 0.853
Resin series A 0.990 Resin series B 0.975 Resin series C 0.988 Resin series D 0.966 Resin series E 0.996
0.991 0.990 0.960 0.942 0.986
pH readjusted to 9, and then cooled in an ice bath and stored at ambient temperature.
Adhesive Resins Systems
Adhesive resin systems were prepared taking the resin solids content of each resin into consideration according to the statistical scheme in Table I. NH&l hardener, 2%, was added as a 25% water solution on a total resin solids basis for the glue mix.
Particleboard Preparation and Testing
Duplicate (Pinus rudiatu) one-layer core-only par- ticleboards of 350 X 350 X 12 mm dimensions were prepared from the modified resins to determine the strength of the resin. The following set of conditions were kept the same for each of the boards prepared Total resin solids, 8% (including accelerator and scavenger solids content) was used for all panels, with a glued particle moisture content of 10-11%. The pH of the resins before use were in the range 9.8-10.0. A light water spray was applied to the sur-
faces of the panels' furnish before pressing. The total pressing time used was 7.5 min to bring the panels to their ultimate strength, with a cycle of 2 min from press contact to maximum pressure and maximum pressure holding, with a pressure of 23 kg/cm2, fol- lowed by 2.5 min at 12 kg/cm2 and 3 min at 3 kg/ cm2 at a press temperature of 180°C. After pressing, the panels were cooled and left standing in a well- vented room for 2 weeks before analysis. Internal bond (I.B.) strength dry, I.B. strength after 2 h boil- ing followed by 16 h drying at 105°C, and HCHO emission measurement by the WKI method' and so- dium sulfite titration method' were carried out.
13C-NMR Spectroscopy
I3C-NMR spectra of the liquid resins were ob- tained on a Bruker AC 200 FT-NMR spectrom- eter, a t a frequency of 50.3 MHz with the sample spectra a t 35 Hz. Chemical shifts were calculated relative to (CH3)3Si(CH2)3S03Na for NMR con- trol. (CH3)3Si(CH2)3S03Na was dissolved in D20, run separately, and the signals for the four signals were set. About 1 mL of liquid 55% solids resin glue mix, without a hardener, was placed in an NMR tube and diluted with about 0.4 mL deute- rium oxide added directly to the sample. All spec- tra were run overnight. Acquisition time was 1.8 s with the number of transients a t 10,000. The spin-lattice relaxation time of 13C-NMR is an im- portant factor in setting the pulse intervals.loJ1 Tomita and Hatono12 suggested that a pulse in- terval of 5 s was needed to obtain a reliable spec- trum. All spectra were run with a relaxation delay of 5 s and were accurate to 1 ppm. The spectra were run with nOe enhancement, the spectral width was 15,000, and the digital resolution was 0.825. The 13C-NMR band areas reported in the tables are integrated areas. These were used for all the ratios investigated. The area of the spectra which gave the best correlations with the physical properties of the resins were the 160-170 ppm re- gion, where the very sensitive peaks of the triazine nucleus of melamine, urea, and their substituted counterparts are located. The interpretation of the 13C-NMR bands were taken from the litera- ture.13-16 Peak assignments are reported in Table 11. Potentially significant peak intensity ratios are reported in Table 111. Correlation of the relevant NMR peak ratios with the I.B. strength and HCHO emission of the boards was carried out by an iterative Levenby-Marquardt polynomial ap- proximation method.

13C-NMR ANALYSIS FOR MUF AND MF RESINS 2065
Table VI Emission as a Function of the 13C-NMR Peak Ratios of Different Liquid MUF Resin Systems
Correlation Equations of Particleboard I.B. Strength and HCHO
Resin series A MUF resin + UF accelerator + UF scavenger
I.B. dry (MPa) = -0.409Y1 + 0.633Y2 + 0.795 I.B. boil/dry (MPa) = -0.888Y1 + 1.429Y2 + 0.393 In HCHO emission (mg/100 g) = -1.0554Y1 - 2.4584Y2 + 4.8511
s.d. = 0.083 s.d. = 0.088 s.d. = 0.118
Resin series B: MUF resin + MF accelerator + MF scavenger
I.B. dry (MPa) = -0.473Y1 - o.060Y2 + 0.887 I.B. boil/dry (MPa) = -o.522Y1 - 0.063Y2 + 0.505 In HCHO emission (mg/100 g) = -o.945Y1 + 0.0940Y2 + 4.564 In HCHO emission (mg/100 g) = -0.752y1 - 0.165Y2
s.d. = 0.057 s.d. = 0.052 s.d. = 0.153
s.d. = 0.144* + 0.531(F/Me) + 4.366
Resin series C: MUF resin + MF accelerator + UF scavenger
I.B. dry (MPa) = -0.199Yl - 0.222Y2 + 0.811 I.B. boil/dry (MPa) = -o.273Y1 - 0.370Y2 + 0.414 In HCHO emission (mg/100 g) = -1.312Y1 + 0.004Y2 + 4.735
s.d. = 0.053 s.d. = 0.060 s.d. = 0.189
Resin series D: MUF resin + UF accelerator + MF scavenger
I.B. dry (MPa) = -0.081Yl - o.733Y2 + 0.750 I.B. boil/dry (MPa) = -o.076Y1 - 1.144Y2 + 0.262 In HCHO emission (mg/100 g) = -0.923Y1 + 3.798Y2 + 4.161
s.d. = 0.073 s.d. = 0.086 s.d. = 0.263
Resin series E: MUF resin + MUF accelerator + MUF scavenger
I.B. dry (MPa) = -0.397Y1 + 0.221Y2 + 0.847 I.B. boil/dry (MPa) = - 0.348Y1 + 0.316Y2 + 0.351 In HCHO emission (mg/100 g) = -0.520Y1 - 3.760Y2 + 4.690
s.d. = 0.074 s.d. = 0.072 s.d. = 0.150
* Free formaldehyde/methylenes ratio taken into consideration.
DISCUSSION
The absolute intensities of 13C-NMR peaks can never be taken as a measure of the abundance of a particular chemical group. Recent work on the cor- relation between liquid UF4r5 and PF6 resin 13C- NMR with the physical characteristics of the hard- ened network produced indicated that the ratios of the integrated areas of peaks characteristic of chemical groups known to contribute to the cured strength and formaldehyde emission of the resin ap- pear to indicate excellent correlation with the ex- perimental real it^.^-^
Furthermore, MUF copolymers are generally prepared at fairly constant mass ratios of mela- mine to urea (50 : 50 to 40 : 60), near to the op- timum applied performance of the resin. Variation of the relative proportions of the materials then often relies on the addition of cure accelerators and formaldehyde scavengers. These are both, in
general, UF or MF prepolymers-hence, methy- lolated monomeric and dimeric species of urea or melamine. The correlation of MUF resin 13C-NMR spectra with the physical characteristics of the cured resin network is complicated by having to take into account this peculiarity in the applica- tion of these resins as adhesives. Thus, five series of mixes based on the same MUF basic resin were studied (i) MUF resin + UF accelerator + UF scavenger, (ii) MUF resin + MF accelerator + MF scavenger, (iii) MUF resin + UF accelerator + MF scavenger, (iv) MUF resin + MF accelerator + UF scavenger, and (v) MUF resin + MUF accelerator + MUF scavenger, in each of which the relative proportions of resin, accelerator, and scavenger supplied the differences in mass and molar ratio of the adhesive mix. As a consequence, the use of this approach for a MUF resin appears, then, more complicated than for the UF and PF resin cases where a direct variation of the molar ratio of the

2066 PANANGAMA AND PIZZI
Table VII Strengths, NMR Unsubstituted/ Substituted Yl and Y2 Peak Ratios, and Correlation Equations for MUF Resins in Which the Relative Proportion of (M + U) : F Are Changed Directly During the Preparation of the Resin
I.B. 0.5 h (M + U) : F I.B. Dry Boil/Dry Molar Ratio Yl Yz (MPa) (MPa)
~
1 : 1.24 0.658 2.083 0.49 0.18 1 : 1.39 0.862 2.564 0.55 0.23 1 : 1.82 1.695 6.250 0.82 0.58 1 : 2.00 2.083 8.333 0.94 0.55
I.B. dry (MPa) = 0.165Y1 + 0.034Y2 + 0.316, s.d. = 0.013; I.B. 0.5 h boil/dry (MPa) = 0.793Y1 - 0.113Y2 - 0.124, s.d. = 0.087.
components was carried out directly a t the resin preparation level.
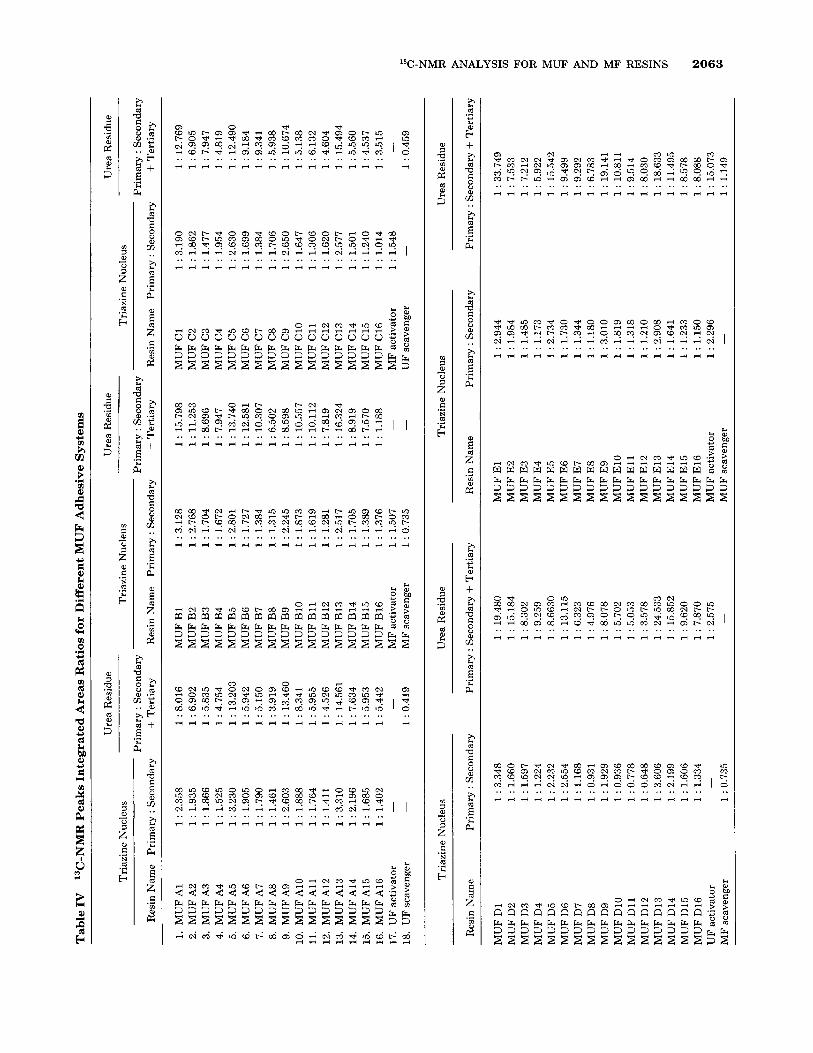
In Table I, the experimental results for I.B. strength and formaldehyde emission for each com- bination of proportions of each resin system are re- ported (in total 76 different combinations). The 13C- NMR peak assignments to different chemical groups are reported in Table 11. The experimental 13C-NMR peaks integrated areas of species which were found to contribute to the hardened strength of an MUF resin are reported in Table 111: The data for other groups which contributed to other resin ~ y s t e m s ~ - ~ but which did not contribute to the MUF resin case are also available17 but are not reported here. Table IV shows the ratios of the integrated areas of the peaks reported in Table 111.
Table V shows the 13C-NMR species ratio cor- relation to the I.B. strength, formaldehyde emission, and percentage scavenger content for all the five series of resins. Correlations for each series, with higher correlation coefficients, were also obtained, but these additional values are available e1~ewhere.l~ While other groups such as methylol content, meth- ylene content, and free formaldehyde can sometime also correlate well with one or other physical prop- erty within a single series of resins and have been checked,17 this is not the case for the total of the resin combinations. The heterogeneity of the system chosen achieves an acceptable correlation with physical properties only through the very sensitive band ratios of nonsubstituted/substituted triazine (at around 170 ppm)1,7,17,19 and the nonsubstituted/ substituted urea (at around 160-165 ppm).1,7,17,19 The correlation coefficients are better for I.B. strength after boiling and drying (rather than for dry I.B.
strength) due to the expected flattening out of the results in this type of test and for formaldehyde emission.
Contrary to the UF and PF resin cases, the com- bination of just two variables (Yl = triazine/sub- stituted triazine; Yz = urea/substituted urea) already appear to explain to an acceptable level the behavior of an MUF system. The equations correlating the two variables Yl and Yz to resin crosslinking, hence, to experimental I.B. strength, and to formaldehyde emission are shown in Table VI. The standard de- viations obtained are acceptable for both I.B. strength and formaldehyde emission.
One of the most interesting findings is that dif- ferently from UF and PF resins the influence on formaldehyde emission of the free formaldehyde left in the resin does not need to be taken into account in the correlation equations for MUF resins. The free formaldehyde peak intensity in different ratios has been found to have little or no correlation with, and, hence, little or no bearing on, MUF resin (and by inference MF resins) formaldehyde emission from the cured network. To illustrate this point, in Table VI (B resins), an equation in which the free form- aldehyde/methylene peak ratio has been included as a variable in the correlation equation is also pre- sented as an example: The very similar values of the standard deviations for the two equations indicate that taking into account the free formaldehyde present does not help in explaining the phenomenon to a higher level of significance. This is an unusual finding, as free formaldehyde always contributes to a greater or lesser extent to both UF and PF resin emission. There are two reasons why free formal- dehyde might not appear to contribute in the equa- tion: The first is because the amount of free form- aldehyde is reflected in the lower or higher substi- tution of the amino groups on the triazine ring of melamine and the amido groups of urea: The more substituted are such groups, the lower the amount of free formaldehyde, and the less substituted, the higher the amount of free formaldehyde. A term based on the free formaldehyde signal is redundant as already represented by Yl and Yz. The second reason is that considering the high reactivity toward formaldehyde of melamine, and that crosslinking to hardening in MUF resins occurs almost exclusively through the melamine moieties, all the free form- aldehyde is mopped up during hardening. The ad- ditional equation for formaldehyde emission in Ta- ble VI (resin series B) shows that both reasons are valid. The balance of the coefficients of the equation changes with the introduction of the free formal- dehyde term, with the apparent contribution of Yl
13C-NMR ANALYSIS FOR MUF AND MF RESINS 2067
and Y2 decreasing (-0.94 + 0.09 + 4.56 = 3.71; -0.75 -0.16 + 0.53 + 4.37 = 3.99), indicating that ap- proximately half of the lack of influence of free formaldehyde on the correlation is due to reactions with melamine and urea during hardening and ap- proximately half to the redundancy of the term. It must be pointed out that the coefficients of the equations in Table VI are unique for each homolo- gous series of resins. The coefficients would change for resins synthesized and boards prepared under different conditions.
An important conclusion which can be deduced from the results in Table VI is that the physical properties of a hardened resin can be related to the ratio of species in the liquid resin before curing. In the equation in Table VI, it is important to note that the Yl and Y2 terms are the ratios of nonsub- stituted/substituted species. When the amount of unsubstituted urea and triazine are greater, the resin is less reacted and, thus, the results of I.B. strength will be lower: The term in this form then subtracts from the I.B. strength of the resin. This means that, within the limits and under the conditions used, the more advanced is the resin-hence, the more sub- stituted are the triazine and urea nuclei-the higher is the strength of the cured resin. It is easy to see then that the addition of a scavenger or an accel- erator, in both cases monomeric and dimeric meth- ylolated species of different amine/formaldehyde molar ratio, does always reduce the I.B. strength of the total resin system. The accelerator then has just the function of accelerating resin curing and in real- ity does not improve the ultimate cured strength of the resin.
The situation is different for the HCHO emission equations (Table VI), from which it appears that in the melamine part of the resin accelerators and scavengers always contribute to diminish formal- dehyde emission (the Yl coefficient is always neg- ative) of the finished product. The urea part of the resin instead contributes to increase the formalde- hyde emission (i) considerably in the case in which a UF accelerator (high F : U molar ratio) is used (D resins series) and (ii) minimally when a UF scav- enger (low F : U molar ratio) is used (C resins series) or no UF additives are used (B resins series) or (iii) does not contribute or, better, it scavenges formal- dehyde when the MUF accelerator and scavenger are used (E resins series) and when the UF scavenger and accelerator are used (A resins series).
The above indicates again that a three-part sys- tem is not very useful as regards formaldehyde emission, as better results can be obtained by just using an MUF resin + a scavenger only. However,
a better balance of overall properties, both strength and emission, can be obtained by using a three-part system. In this respect, from the results it becomes evident that an efficient accelerator should have a higher molar ratio than used here and be used in smaller proportions.
Correlation of the 13C-NMR spectra by variation of the molar ratio (M + U) : F directly in the prep- aration of the MUF resin, without additives, as al- ready reported for UF and PF resins, is also possible1p18 (Table VII). From this, it appears that in the case of just the MUF resin, without additives, the contribution to crosslinking during resin hard- ening is due mostly to melamine moieties if one compares the relative proportions of the Yl and Y2
coefficients, this being even more evident for the I.B. strength after boiling and drying. This confirms in a different manner results already reported show- ing that hardening is almost exclusively through the melamine moieties of an MUF This is not the case when the variation in different proportions of M : U : F is achieved through addition of scav- engers and accelerators. The latter is then a method to address, along a different route, the hardening of MUF resins. Of equal interest is that the standard deviation in the dry I.B. correlations is smaller when the M : U : F molar ratio is varied directly during preparation of the resin than if postadditives are used, indicating that the former method of prepa- ration tends to give resins of better consistency and performance.
REFERENCES
1.
2.
3.
4.
5.
6.
7.
8.
A. Pizzi, Advanced Wood Adhesives Technology, Mar- cel Dekker, New York, 1994. German Standard DIN 68763, Spanplatten: Flach- pressplatten fur das Bauwesen, Beuth Verlag, Berlin, 1982; German Standard DIN EN 120, Spanplatten: Bestimmung der Formaldehyde-gehalts- Extrakti- onenverfahren genannt perforatormethode, Beuth Verlag, Berlin, 1984. South African Bureau of Standards SABS 1300-1980. Specification for particleboard, exterior and flooring type, 1980. E. E. Ferg, A. Pizzi, and D. C. Levendis, J. Appl. Polym. Sci., 50,907 (1993). E. E. Ferg, A. Pizzi, and D. C. Levendis, Holzforsch. Holzuerwert., 45(5), 88 (1993). L. A. Panamgama and A. Pizzi, J. Appl. Polym. Sci., 55, 1007 (1995). T. A. Mercer and A. Pizzi, Holzforsch. Holzverwert., 46(3), 51 (1994). E. Roffael and L. Melhorn, Holz-Zentralblatt, 102, 2202 (1976).

2068 PANANGAMA AND PIZZI
9. R. Marutzky, in Wood Adhesives Chemistry and Technology, A. Pizzi, Ed., Marcel Dekker, New York, 1989, Vol. 2, Chap. 10.
10. E. Breitmaier and W. Voelter, Carbon-13 NMR Spec- troscopy, 3rd ed., VCH, Weinheim, 1987.
11. E. Pretsch, T. Clerc, J. Seibl, and W. Simon, Tables of Spectral Data for Structural Determination of Or- ganic Compounds, 2nd ed., Springer, Berlin, 1989.
12. B. Tomita and S. Hatono, J. Polym. Sci. Chem. Ed., 16, 2509 (1978).
13. J. R. Ebdon and P. E. Heaton, Polymer, 18, 971 (1978).
14. M. Dowbarn, J. R. Ebdon, and S. J. Hewill, Polymer, 19, 1309 (1978).
15. B. Tomita and H. Ono, J. Appl. Polym. Sci., 17,3205 ( 1979).
16. R. Rammon, W. E. Johns, J. Magnuson, and K. Dunker, J. Adhes., 19, 115 (1986).
17. L. A. Panamgama, PhD Thesis, University of the Witwatersrand, Johannesburg, South Africa, 1995.
18. T. A. Mercer, MSc Thesis, University of the Witwa- tersrand, South Africa, 1993.
19. L. A. Panamgama and A. Pizzi, J. Appl. Polym. Sci., 58,109 (1995).
20. M. Higuchi, J.-K. Roh, S. Tajima, H. Irita, T. Honda, and I. Sakata, in Proceedings from the Adhesives and Bonded Wood Symposium, C.-Y. Hse and B. Tomita, Eds., Proceedings No. 4735, Forest Products Society, Madison, Wisconsin, 1994.
Received April 11, 1995 Accepted October 5, 1995