NKOMAZI LOCAL MUNICIPALITY FINAL INTEGRATED ...
263
1 NKOMAZI LOCAL MUNICIPALITY FINAL INTEGRATED DEVELOPMENT PLAN (2017-2021) REVIEW 2020/2021 4 TH REVIEW
-
Upload
khangminh22 -
Category
Documents
-
view
9 -
download
0
Transcript of NKOMAZI LOCAL MUNICIPALITY FINAL INTEGRATED ...
1
NKOMAZI LOCAL MUNICIPALITY FINAL INTEGRATED DEVELOPMENT PLAN (2017-2021)
REVIEW 2020/2021 4TH REVIEW
2
TABLFE OF CONTENTS Acronyms ................................................................................................................................ 9
Glossary ................................................................................................................................ 10
Message From The Executive Mayor ................................................................................... 11
Municipal Overview - Municipal Manager .......................................................................... 12
Legislations Underpinning IDP In South Africa .................................................................. 13
1.1. Development Principles For The For Planning, Drafting, Adopting And Review Of
IDP 18
1.1.1. Section 26 Core Components Of The IDP .............................................................. 18
1.2. WHO ARE WE? Municipal Background ................................................................... 20
1.2.1. Municipal Wards And Traditional Authority ......................................................... 22
1.3. How was the Plan developed? .................................................................................... 26
1.4. Communication Plan for Public Participation ............................................................ 26
1.4.1. Below is an advert placed on the Municipal website .............................................. 28
1.4.2. Other activities that followed .................................................................................. 28
1.5. key development challenges facing the Municipality ................................................ 28
1.5.1. Summary of the Ranked Priorities for 2020/21 IDP ............................................... 31
1.6. Long term Vision of the Municipality. ....................................................................... 32
Vision .................................................................................................................................... 32
Mission ................................................................................................................................. 32
Municipality’s Core Values ................................................................................................ 32
1.7. Municipal Goals; ........................................................................................................ 32
1.8. Strategic Objective Priority Areas .............................................................................. 32
1.8.1. Municipal Long-Term Strategy and Nkomazi Six Point Plan ................................ 33
1.8.2. Outputs, Outcomes and Deliverables, over the Next (3) Three Years.................... 34
1.9. How will our progress be Measured? ......................................................................... 37
1.9.1. Key Performance Areas and how will they measure the approach and
Methodology for the 5 Year IDP Developed? ...................................................................... 38
IDP/Budget Process Management Plan ................................................................................ 38
1.10. Nkomazi Role Players............................................................................................. 43
1.10.1. Roles and Responsibilities .................................................................................. 43
1.11. Government Policies & Imperatives ....................................................................... 45
1.11.1. Planning and Development Principles: ............................................................... 45
3
1.11.2. Table: Planning and Development Principles ..................................................... 46
1.11.3. National and Provincial Programmes .................................................................. 47
1.12. Sustainable Development Goals ............................................................................. 48
1.12.1. National Development Plan ................................................................................ 48
1.12.2. Integrated Urban Development Framework [ IUDF] .......................................... 50
1.12.3. The Eight levers are premised on the understanding that: .................................. 51
1.12.4. 14 National Outcomes ......................................................................................... 51
1.12.5. Delivery Agreement: Outcome 9 .......................................................................... 52
1.12.6. Back to Basics ..................................................................................................... 52
1.12.7. Key Performance Areas for the back-to-basics Approach .................................. 53
1.12.8. Medium – Term Strategic Framework (MTSF) .................................................. 53
1.13. State of the Nation Address 2020 ........................................................................... 55
1.14. Situational Analysis ................................................................................................ 61
1.15. Key Performance Areas .......................................................................................... 79
1.15.1. KPA: Spatial Rationale ....................................................................................... 79
1.15.1.1. Spatial Development Framework .................................................................... 79
1.15.1.2. Strategic Development Concept ...................................................................... 79
1.15.1.3. Compaction of the Rural South ....................................................................... 80
1.15.1.4. Central Conservation Zone .............................................................................. 80
1.15.1.5. Municipal SDF, as part of the IDP .................................................................. 81
1.15.1.6. The Municipal Land Use Management Scheme.............................................. 81
1.15.1.7. Town Planning Tribunal .................................................................................. 82
1.15.1.8. Human Settlements .......................................................................................... 83
1.15.1.8.1. The current running Projects of The Municipality: ......................................... 83
1.15.1.8.2. Staff Composition ............................................................................................ 83
1.15.2. KPA: Disaster Management ................................................................................ 83
1.15.3. KPA: Environmental Management ..................................................................... 94
1.15.3.1. Climate............................................................................................................. 94
1.15.3.2. Topography ...................................................................................................... 95
1.15.3.3. Slope ................................................................................................................ 95
1.15.3.4. In terms of Topography, the following is concluded: ..................................... 95
1.15.3.5. Geology ........................................................................................................... 95
1.15.3.6. Agriculture Potential........................................................................................ 96
1.15.3.6.1. Soil Potential.................................................................................................... 96
4
1.15.3.6.2. Agricultural Land Capability ........................................................................... 96
1.15.3.6.3. High Potential Agricultural Land .................................................................... 97
1.15.3.7. State of the Environment ................................................................................. 97
1.15.3.7.1. General ............................................................................................................. 97
1.15.3.7.2. Conservation Areas.......................................................................................... 97
1.15.3.7.3. Biodiversity Assets .......................................................................................... 98
1.15.3.7.4. Natural Ecology ............................................................................................... 98
1.15.3.8. Nature Conservation ........................................................................................ 99
1.15.3.8.1. Conservation Areas........................................................................................ 100
1.15.4. KPA: Municipal Institutional Development and Transformation ..................... 100
1.15.4.1. Municipality’s Organisational Structures ...................................................... 100
1.15.4.2. Institutional Leadership ................................................................................. 101
1.15.4.3. Human Resource Strategy ............................................................................. 102
1.15.4.3.1. Human Resource Planning Process ............................................................... 103
1.15.4.3.2. Vacancy Rate ................................................................................................. 106
1.15.4.3.3. Critical Posts (MM & Section 56 Posts) and their Qualification ................. 106
1.15.4.4. Powers and Functions of Municipality .......................................................... 106
1.15.4.5. More specifically, the Objectives of Local Government are:- ...................... 107
1.15.4.6. Snapshot of the current workforce profile for Nkomazi Local Municipality 107
1.15.4.7. ICT Policy Framework .................................................................................. 108
1.15.4.7.1. Information Communication Technology ..................................................... 108
1.15.4.7.2. Challenges facing the ICT Section ................................................................ 109
1.15.4.8. Municipal Portfolio Committees and Municipal Departments and the Status
Quo 109
1.15.4.9. Organisational Performance Management System ........................................ 110
1.15.4.9.1. Performance Management Model ................................................................. 110
1.15.4.9.2. Performance Agreement 2018/19 .................................................................. 110
1.15.4.9.3. Schedule for Performance Reporting and Reviewing ................................... 110
1.15.4.9.4. Staff complement of Performance Management System .............................. 111
1.15.4.10. Monitoring and Evaluation ............................................................................ 111
1.15.4.10.1. Introduction .................................................................................................. 111
1.15.4.10.2. The Legislative Framework Underpinning Monitoring and Evaluation ...... 111
1.15.4.10.3. The Section of Monitoring and Evaluation was Established in 2017. It was
established to:...................................................................................................................... 111
1.15.4.11. Conclusion ..................................................................................................... 112
5
1.15.5. KPA: Basic Service and Infrastructure Development ...................................... 112
1.15.5.1. Main Source of Water .................................................................................... 112
1.15.5.2. Toilet Facilities .............................................................................................. 113
1.15.5.3. Access to Electricity ...................................................................................... 114
1.15.5.4. Refuse Removal ............................................................................................. 116
1.15.6. KPA: Local Economic Development and Tourism........................................... 118
1.15.6.1. LED Strategy ................................................................................................. 118
1.15.6.1.1. The Objectives of the Strategy; ..................................................................... 119
1.15.6.1.2. The main challenges facing the Implementation of the Strategy are: ........... 119
1.15.6.2. Stakeholder Participation ............................................................................... 119
1.15.6.3. Community Works Program (CWP) ............................................................. 120
1.15.6.3.1. Statistics for Gender and Disabled of the CWP employees .......................... 120
1.15.6.4. By-Laws (Draft) ............................................................................................ 120
1.15.6.5. The Municipality supports SMME’S through the following......................... 120
1.15.6.6. Umsebe Accord ............................................................................................. 120
1.15.6.7. Nkomazi Special Economic Zone ................................................................. 121
1.15.6.7.1. Vision of the Nkomazi SEZ ........................................................................... 121
1.15.6.7.2. Introduction and Background ........................................................................ 121
1.15.6.7.3. Objectives of the Nkomazi SEZ .................................................................... 121
1.15.6.7.4. The Strategic Location of SEZ in Nkomazi .................................................. 122
1.15.6.7.5. Location’s Comparative Advantages ............................................................. 122
1.15.6.7.6. Macro-Economic Benefits ............................................................................. 122
1.15.6.7.7. Responding to the regions severe social challenges ...................................... 123
1.15.6.7.8. Strategic Intent ............................................................................................... 123
1.15.6.7.9. Figure: The transformative nature of the Nkomazi SEZ Strategy ................ 123
1.15.6.7.10. Industrial Focus ............................................................................................ 124
1.15.6.7.11. Opportunities earmarked for SMMEs .......................................................... 124
1.15.6.7.12. SEZ Operator Capabilities ........................................................................... 125
1.15.6.7.13. Green Infrastructure ..................................................................................... 125
1.15.6.7.14. Defining the SEZ Implementation Plan ....................................................... 126
1.15.6.7.15. Stakeholders and Stakeholder engagement .................................................. 126
1.15.6.8. Tourism .......................................................................................................... 127
1.15.6.8.1. Introduction and Background ........................................................................ 127
1.15.6.8.2. The role of Local Government to Tourism sector ......................................... 127
6
1.15.6.8.3. Key Tourism projects/programmes for the Municipality .............................. 128
• SMMEs Support Program ............................................................................................ 128
• Tourism Capacity Building .......................................................................................... 128
• Schools Tourism Awareness Program ......................................................................... 128
• Border Posts Awareness ............................................................................................... 128
• Durban Tourism Indaba ............................................................................................... 128
• Kingdom of Eswatini International Trade Fair ............................................................ 128
• Samora Machel Monument Commemoration .............................................................. 128
• Upgrading of Mahhushe Shongwe ............................................................................... 128
1.15.6.8.4. The Performance highlights........................................................................... 128
SMMEs Support Program ................................................................................................... 128
1.15.6.8.5. Data base of Tourism establishment .............................................................. 128
1.15.6.8.6. Tourism Learnerships Program ..................................................................... 128
1.15.6.8.7. The following are the challenges for the Tourism Unit ................................. 128
1.15.7. KPA: Municipal Financial Viability and Management analysis ....................... 129
1.15.7.2. Revenue Enhancement Strategy .................................................................... 131
1.15.7.3. Allocation for Operations and Maintenance .................................................. 132
1.15.7.4. Mscoa............................................................................................................. 132
1.15.7.5. IDP and Service Delivery and Budget Implementation Plan ........................ 132
1.15.7.6. Legislation Compliance Status ...................................................................... 132
1.15.7.7. The National and Provincial Priorities, Policies and Strategies of importance
include amongst others: ...................................................................................................... 134
1.15.8. KPA: Good Governance & Public Participation Analysis ................................ 134
1.15.8.1. Internal Audit ................................................................................................. 134
1.15.8.2. Customer care standards are important to ensure .......................................... 135
1.15.8.3. Public Participation........................................................................................ 136
1.15.8.3.1. Public Participation Strategy ......................................................................... 137
1.15.8.3.2. Geographic names change Committee .......................................................... 137
1.15.8.3.3. Ward Committees .......................................................................................... 137
1.15.8.3.4. IDP Representative Forum ............................................................................ 137
1.15.8.3.5. Audit Committee ........................................................................................... 137
1.15.8.3.6. Municipal Bid Committees ............................................................................ 138
1.15.8.3.7. Municipal Public Accounts Committee (MPAC ........................................... 138
1.15.8.3.8. Risk Management .......................................................................................... 138
7
1.18.3.8.1.1. Risk Management Committee ..................................................................... 139
1.18.3.8.1.2. Responsibility for Risk Management; ......................................................... 140
1.18.3.8.1.3. Main Risk Categories and Risk Sub-Categories defined ............................ 140
1.18.3.8.4. AG Comments and Response /Action Plan ................................................... 158
1.18.3.8.5. Municipal Safety Plan ................................................................................... 161
1.18.3.8.6. Vision, Goals, Objectives and Strategies....................................................... 161
2. Section B: Strategy ................................................................................................... 162
2.1. Institutional SWOT Analyses ................................................................................... 162
2.1.1. Strategic Objective and Programs ......................................................................... 162
2.1.2. Municipal 5 Year Implementation Strategy .......................................................... 163
2.1.3. Municipal 6-Point ................................................................................................. 164
2.2. Linkages of Plans...................................................................................................... 164
2.3. Municipal Five Year Plan ......................................................................................... 167
2.3.1. The National Priority Outcomes. .......................................................................... 167
2.3.1.1. The 2020/21 Annual Budget Herewith Presented Provides The Appropriation Of
Funds In The MTREF As Follows: .................................................................................... 173
2.3.1.2. Own Revenue .................................................................................................... 174
2.3.1.3. Dora Allocation ................................................................................................. 175
2.3.1.4. Transfers and Grant Receipts ............................................................................ 175
2.3.1.5. Collection Rate .................................................................................................. 175
2.3.1.6. Percentage of Capital spending ......................................................................... 176
2.4. Organisational Performance Management System ................................................... 176
2.4.1. Legislative Requirements...................................................................................... 176
2.4.2. Municipal Five Year Plan ..................................................................................... 177
Section: C Projects .............................................................................................................. 190
3. The following is a Map containing Mapped Projects for the year 2020/2021 Projects
the Municipality is Planning to implement ......................................................................... 190
3.1. Planned Operational Projects and Programmes for 2020/2021 financial year ............ 191
3.2. Planned Capital Projects and Programme for the financial year 2020/2021 ............... 195
3.3. Sector Department Projects and priorities ................................................................ 202
3.3.2.1.Department of Public Works, Roads and Transport.......................................................... 206
3.3.2.2. Department of Economic Development and Tourism ...................................................... 206
3.3.2.3. Department of Agriculture ....................................................................................................... 207
3.3.2.3. Department of Education .................................................................................................. 209
8
3.3.2.4. Department of health ......................................................................................................... 222
3.3.2.5. Department of Social Development ............................................................................... 223
3.3.2.6. Department of Culture, Sports and Recreation ........................................................... 223
3.3.2.7. Mega Projects ...................................................................................................................... 224
3.3.2.8. Department of Human Settlements ................................................................................ 224
3. Section D: Integration ............................................................................................... 227
4.1. Municipal Plans, Policies And Strategies ................................................................. 227
4.1.1. Financial Management Plan .................................................................................. 227
4.1.2. Local Economic Development .............................................................................. 227
4.1.3. Water Services Development Plan........................................................................ 228
4.1.4. Sanitation Master Plan .......................................................................................... 228
4.1.5. Roads and Storm Water Plan ................................................................................ 229
4.1.6. Comprehensive Infrastructure Plan....................................................................... 229
4.1.7. Electricity Master Plan .......................................................................................... 229
4.1.8. Integrated Waste Management Plan ..................................................................... 230
4.1.9. HIV/AIDS Strategy ............................................................................................... 230
4.1.10. Youth Policy ...................................................................................................... 230
4.1.11. Recruitment and Retention Strategy ................................................................. 231
4.1.12. Employment Equity Plan .................................................................................. 231
4.1.13. Performance Management Service Plan ........................................................... 232
4.1.14. Housing Development Plan/Housing Chapter .................................................. 232
4.1.15. Indigent Policy .................................................................................................. 232
4.1.16. Environmental Management ............................................................................. 232
4.1.17. Social Cohesion Plan ......................................................................................... 232
4.1.18. Integrated Water Resources Management Plan ................................................ 233
4.2. Integrated Sector Plans Status Quo .......................................................................... 233
Annexure: Public Notice ..................................................................................................... 236
5. Public Notice ............................................................................................................ 236
6. Annexure: Community Needs Per Ward .................................................................. 237
6.1. Community Priorities vs Problem Statements. ........................................................... 257
6.3. Submission by Bambanani Mlambo Trust Traditional Authorities ............................. 262
9
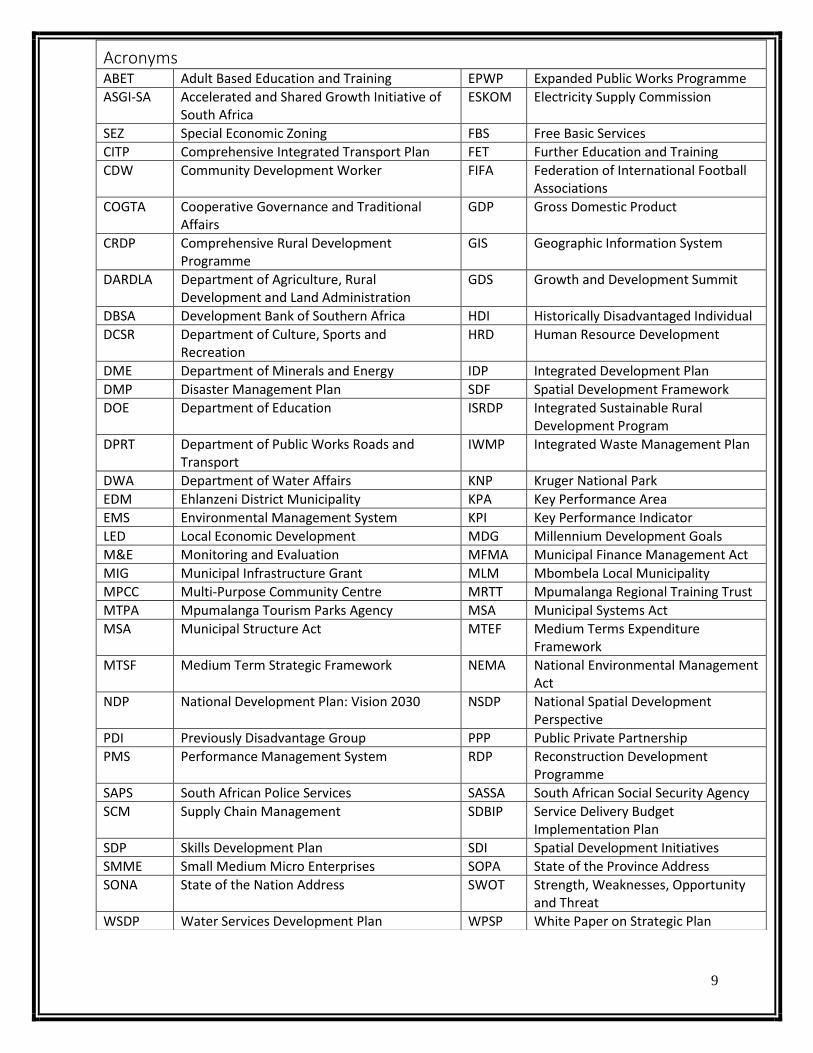
Acronyms ABET Adult Based Education and Training EPWP Expanded Public Works Programme
ASGI-SA Accelerated and Shared Growth Initiative of South Africa
ESKOM Electricity Supply Commission
SEZ Special Economic Zoning FBS Free Basic Services
CITP Comprehensive Integrated Transport Plan FET Further Education and Training
CDW Community Development Worker FIFA Federation of International Football Associations
COGTA Cooperative Governance and Traditional Affairs
GDP Gross Domestic Product
CRDP Comprehensive Rural Development Programme
GIS Geographic Information System
DARDLA Department of Agriculture, Rural Development and Land Administration
GDS Growth and Development Summit
DBSA Development Bank of Southern Africa HDI Historically Disadvantaged Individual
DCSR Department of Culture, Sports and Recreation
HRD Human Resource Development
DME Department of Minerals and Energy IDP Integrated Development Plan
DMP Disaster Management Plan SDF Spatial Development Framework
DOE Department of Education ISRDP Integrated Sustainable Rural Development Program
DPRT Department of Public Works Roads and Transport
IWMP Integrated Waste Management Plan
DWA Department of Water Affairs KNP Kruger National Park
EDM Ehlanzeni District Municipality KPA Key Performance Area
EMS Environmental Management System KPI Key Performance Indicator
LED Local Economic Development MDG Millennium Development Goals
M&E Monitoring and Evaluation MFMA Municipal Finance Management Act
MIG Municipal Infrastructure Grant MLM Mbombela Local Municipality
MPCC Multi-Purpose Community Centre MRTT Mpumalanga Regional Training Trust
MTPA Mpumalanga Tourism Parks Agency MSA Municipal Systems Act
MSA Municipal Structure Act MTEF Medium Terms Expenditure Framework
MTSF Medium Term Strategic Framework NEMA National Environmental Management Act
NDP National Development Plan: Vision 2030 NSDP National Spatial Development Perspective
PDI Previously Disadvantage Group PPP Public Private Partnership
PMS Performance Management System RDP Reconstruction Development Programme
SAPS South African Police Services SASSA South African Social Security Agency
SCM Supply Chain Management SDBIP Service Delivery Budget Implementation Plan
SDP Skills Development Plan SDI Spatial Development Initiatives
SMME Small Medium Micro Enterprises SOPA State of the Province Address
SONA State of the Nation Address SWOT Strength, Weaknesses, Opportunity and Threat
WSDP Water Services Development Plan WPSP White Paper on Strategic Plan
10
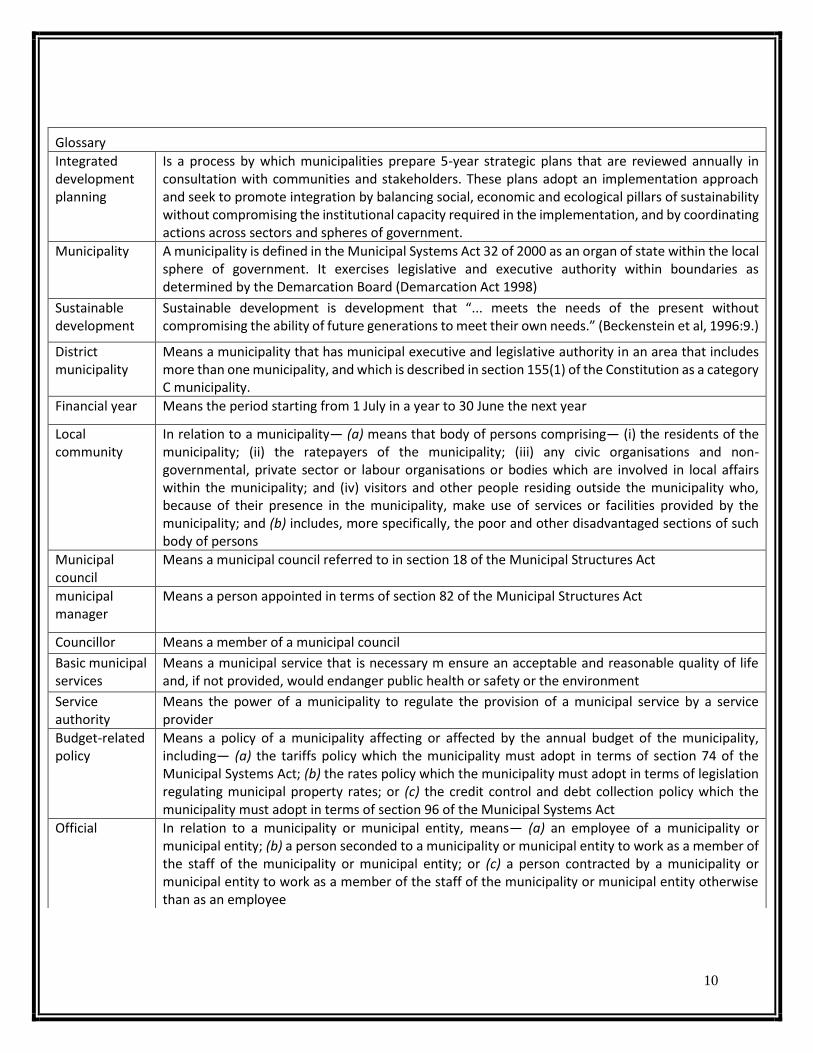
Glossary
Integrated development planning
Is a process by which municipalities prepare 5-year strategic plans that are reviewed annually in consultation with communities and stakeholders. These plans adopt an implementation approach and seek to promote integration by balancing social, economic and ecological pillars of sustainability without compromising the institutional capacity required in the implementation, and by coordinating actions across sectors and spheres of government.
Municipality A municipality is defined in the Municipal Systems Act 32 of 2000 as an organ of state within the local sphere of government. It exercises legislative and executive authority within boundaries as determined by the Demarcation Board (Demarcation Act 1998)
Sustainable development
Sustainable development is development that “... meets the needs of the present without compromising the ability of future generations to meet their own needs.” (Beckenstein et al, 1996:9.)
District municipality
Means a municipality that has municipal executive and legislative authority in an area that includes more than one municipality, and which is described in section 155(1) of the Constitution as a category C municipality.
Financial year Means the period starting from 1 July in a year to 30 June the next year
Local community
In relation to a municipality— (a) means that body of persons comprising— (i) the residents of the municipality; (ii) the ratepayers of the municipality; (iii) any civic organisations and non-governmental, private sector or labour organisations or bodies which are involved in local affairs within the municipality; and (iv) visitors and other people residing outside the municipality who, because of their presence in the municipality, make use of services or facilities provided by the municipality; and (b) includes, more specifically, the poor and other disadvantaged sections of such body of persons
Municipal council
Means a municipal council referred to in section 18 of the Municipal Structures Act
municipal manager
Means a person appointed in terms of section 82 of the Municipal Structures Act
Councillor Means a member of a municipal council
Basic municipal services
Means a municipal service that is necessary m ensure an acceptable and reasonable quality of life and, if not provided, would endanger public health or safety or the environment
Service authority
Means the power of a municipality to regulate the provision of a municipal service by a service provider
Budget-related policy
Means a policy of a municipality affecting or affected by the annual budget of the municipality, including— (a) the tariffs policy which the municipality must adopt in terms of section 74 of the Municipal Systems Act; (b) the rates policy which the municipality must adopt in terms of legislation regulating municipal property rates; or (c) the credit control and debt collection policy which the municipality must adopt in terms of section 96 of the Municipal Systems Act
Official In relation to a municipality or municipal entity, means— (a) an employee of a municipality or municipal entity; (b) a person seconded to a municipality or municipal entity to work as a member of the staff of the municipality or municipal entity; or (c) a person contracted by a municipality or municipal entity to work as a member of the staff of the municipality or municipal entity otherwise than as an employee
11
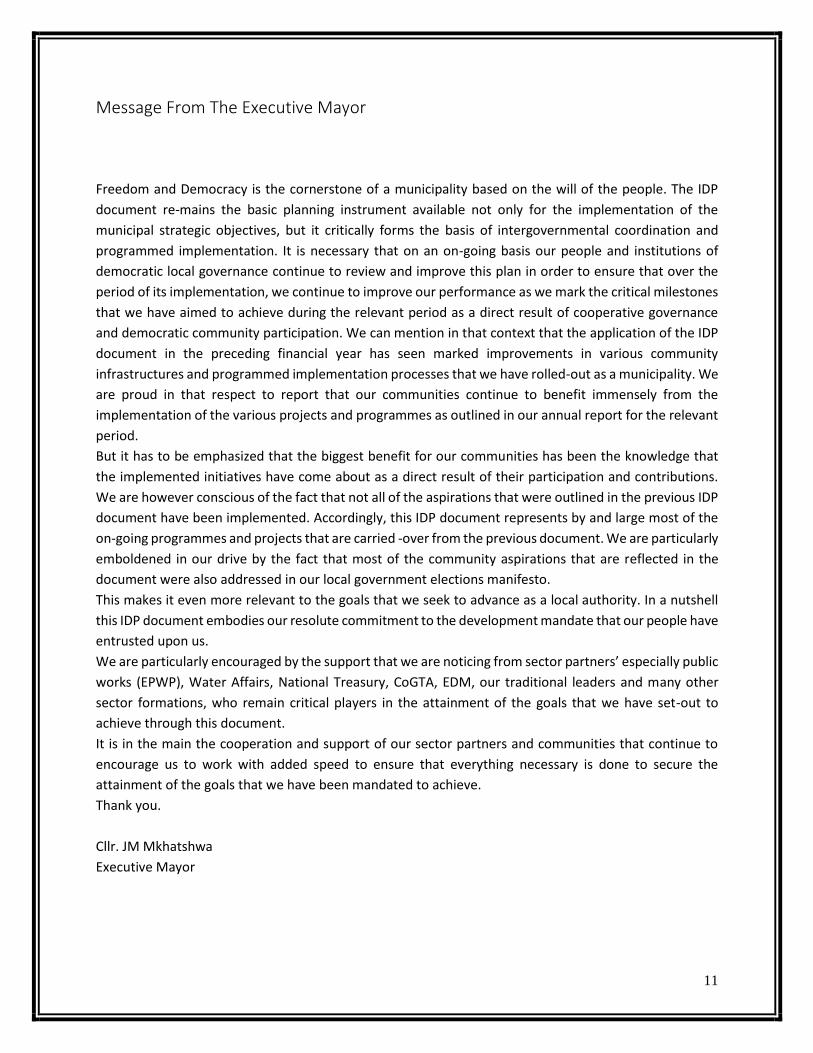
Message From The Executive Mayor
Freedom and Democracy is the cornerstone of a municipality based on the will of the people. The IDP
document re-mains the basic planning instrument available not only for the implementation of the
municipal strategic objectives, but it critically forms the basis of intergovernmental coordination and
programmed implementation. It is necessary that on an on-going basis our people and institutions of
democratic local governance continue to review and improve this plan in order to ensure that over the
period of its implementation, we continue to improve our performance as we mark the critical milestones
that we have aimed to achieve during the relevant period as a direct result of cooperative governance
and democratic community participation. We can mention in that context that the application of the IDP
document in the preceding financial year has seen marked improvements in various community
infrastructures and programmed implementation processes that we have rolled-out as a municipality. We
are proud in that respect to report that our communities continue to benefit immensely from the
implementation of the various projects and programmes as outlined in our annual report for the relevant
period.
But it has to be emphasized that the biggest benefit for our communities has been the knowledge that
the implemented initiatives have come about as a direct result of their participation and contributions.
We are however conscious of the fact that not all of the aspirations that were outlined in the previous IDP
document have been implemented. Accordingly, this IDP document represents by and large most of the
on-going programmes and projects that are carried -over from the previous document. We are particularly
emboldened in our drive by the fact that most of the community aspirations that are reflected in the
document were also addressed in our local government elections manifesto.
This makes it even more relevant to the goals that we seek to advance as a local authority. In a nutshell
this IDP document embodies our resolute commitment to the development mandate that our people have
entrusted upon us.
We are particularly encouraged by the support that we are noticing from sector partners’ especially public
works (EPWP), Water Affairs, National Treasury, CoGTA, EDM, our traditional leaders and many other
sector formations, who remain critical players in the attainment of the goals that we have set-out to
achieve through this document.
It is in the main the cooperation and support of our sector partners and communities that continue to
encourage us to work with added speed to ensure that everything necessary is done to secure the
attainment of the goals that we have been mandated to achieve.
Thank you.
Cllr. JM Mkhatshwa
Executive Mayor
12
Municipal Overview - Municipal Manager
Integrated Development planning is the process through which the municipality prepares a strategic
developmental plan, which is the principal strategic instrument guiding all planning, management,
investment, development and implementation decisions, taking into account input from all
stakeholders. By so doing we believe we will realize the National Development Plan set by the
Presidency of the Republic of South Africa. This IDP serves as a consolidated instrument that
departmental divisions are linked physically, socially, institutionally and economic components of
planning and development with management and development structure. It also integrated and
aligned planning in different spheres of government and therefore enforcing and upholding the spirit
of co-operative governance in the public sector though we still have challenges in realizing that due to
lack of resources and of course failure to integrate our services accordingly.
As we celebrate our hard earned 26 Years of Democracy and already in the sixth National and Provincial
Cabinet we must always revert to the constitution of the Republic of South Africa (1996), which
commits government to take reasonable measures, within its available resources, to ensure that all
South Africans have access to adequate housing, health care, education, food, water and social
security. It is also worth pointing out that the geographical location of our municipality poses a great
challenge in terms of neighbouring states (Swaziland and Mozambique). We tend to be found
unprepared for the influx of people coming to reside within our municipality and the sporadic increase
of villages. This becomes a serious impediment as our equitable share is measured against registered
residents which does not collaret with the actual number on the ground.
This document serves as a planning instrument which manages and guides all planning, development
and decision making in the municipality. That is to consolidate all various plans and actions of the
municipality in order to achieve our vision and mission which can be loosely said “a better life, impilo
lencono”. Prior to coming-up with this document public consultation has been made through the
existing forums or platforms deemed to be workable within Nkomazi as outlined by the law of the
country. Community participation processes have been exhausted. This will be our bible which ensures
that we plan short and long-term future developments within our jurisdiction and we believe that it
will provide the guidelines as to how to use the land within the municipality, which resources to use,
and how to protect the environment. All strategic planning within the municipality has taken place
within the framework of the IDP.
MR. M.D NGWENYA
MUNICIPAL MANAGER
13
Section A: Executive Summary
WHAT IS AN IDP?
Legislations Underpinning IDP In South Africa
In terms of the Local Government: Municipal Systems Act (Act 32 of 2000), Section 25(1) each Municipal
council must, within a pre-scribed period after the start of its elected term, adopt a single, inclusive and
strategic plan for the development of the municipality which, inter alia, links, integrates and co-ordinates
plans and takes into account proposals for the development of the municipality and aligns the resources
and capacity of the municipality. As far as the status of the IDP is concerned, section 35 of the act clearly
states that an integrated development plan adopted by the council of a municipality is the principal
strategic planning instrument, which guides and informs all planning and development, and all decisions
with regard to planning, management and development in the municipality. It binds the municipality in
the exercise of its executive authority, except to the extent of any inconsistency between a municipality’s
integrated development plan and national or provincial legislation, in which case such legislation prevails.
Section 36 furthermore stipulates that a municipality must give effect to its integrated development plan
and conduct its affairs in a manner which is consistent with its integrated development plan.
Section 34 of the Act provides for the annual review of the IDP in accordance with an assessment of its
performance measurements and to the extent that changing circumstances so demands. This document
is a 2017— 2022 IDP for the Nkomazi local municipality. The strategic objectives and targets contained in
this document were reached subsequent to extensive systematic and structured internal and external
consultation through various public participation mechanisms with the community and stakeholders
within the Nkomazi Local Municipal area of jurisdiction.
An IDP is one of the key tools for Local Government to cope with its new developmental role. Furthermore,
it seeks to facilitate strategic decisions on issues of Municipal Budgets for the following Key Performance
Areas: Basic Service Delivery – (Infrastructure and Community Services), Local Economic Development,
Municipal Transformation and Organizational Development, Municipal Financial Viability and
Management, Spatial Development Framework and Good Governance and public participation. The
Municipal Systems Act which provides a framework for the preparation of IDPs recommends that once in
place, each IDP must be reviewed annually to re-assess and re -evaluate Municipal’s development priori-
ties and challenges and to accommodate new developments in local government processes
President, Cyril Ramaphosa in the State of the Nation Address (SoNA) indicated that it is time for
government to break away from the silo mentality of working and went on to introduce a new approach
called the District Development Model (DDM). The DDM was subsequently adopted by cabinet on the
21stof August 2019. The District Development Model (DDM) is an operational model for improving
Cooperative Governance aimed at building a capable, ethical Developmental State. It embodies an
14
approach by which the three spheres of government and state entities work in unison in an impact-
oriented way, and where there is higher performance and accountability for coherent service delivery and
development outcomes. It is a method of government operating in unison focusing on the municipal
district and metropolitan spaces as the impact areas of joint planning, budgeting and implementation.
The President also highlighted that the DDM will help government address the triple challenges of
poverty, unemployment and inequality.
Informed by the National Development Plan (NDP) and the Integrated Urban Development Framework
(IUDF) and other government policies, legislations and previous similar programmes, the DDM seeks to
ensure maximum coordination and cooperation among all three spheres of government (National,
provincial and local). Amongst others, the Model will be implemented through a collaborative process to
develop One Plans for all 44 districts and 8 Metropolitan Municipalities which will be further synchronized
with Integrated Development Plans (IDPs) of municipalities.
Each district and metro plan will develop a long-term government agenda in these spaces and unpack at
least the following developmental issues:
• Managing urbanisation, growth and development;
• Supporting local economic drivers;
• Accelerating land release and land development;
• Investing in infrastructure for integrated human settlement, economic activity and the provision
of basic services; and
• Addressing service delivery in municipalities.
Difference between IUDF and the DDM
The IUDF is our National Urban Policy which marks a New Deal for South African cities and towns. The
framework will steer urban growth towards a sustainable model of compact, connected and coordinated
towns and cities. It provides a roadmap to implement the NDP’s vision for spatial transformation –
creating liveable, inclusive and resilient towns and cities while reversing the apartheid spatial legacy.
15
The IUDF provides key principles and policy levers for creating better urban spaces. It seeks to strengthen
urban-rural linkages, promote urban resilience, create safe urban spaces and ensure that the needs of the
most vulnerable groups are addressed
The alignment of the DDM with the IUDF
As a start, to illustrate that the DDM has not replaced the IUDF, we must acknowledge that the IUDF is a
national urban policy of the South Africa while the DDM is an approach that government has adopted to
tackle the deep rooted silo mentality that exists in how government plans, budgets, and deliver services
across the three spheres of government, while not capitalizing on opportunity that exist to mobilize other
actors in the private sector, NGOs and communities to achieve social compact. Both the DDM and the
IUDF subscribe to the concept of social compact, an all of society approach towards improving the lives of
people and lastly spatial transformation. These are critical philosophies that the 5thand 6thadministration
is determined to decisively address.
The DDM as a way of working and doing things differently will play a key role in enhancing the
implementation of the IUDF, for instance, one of the short term priorities of the IUDF is to institutionalise
long-term planning. The DDM, through the introduction of the One Plan, is on course to make this a reality.
While the IUDF advocates for greater involvement of Premiers and MECs in planning and development,
the DDM also advocates for the same intervention across all three spheres of government, i.e. the recent
nomination of political district champions at a national level that cascades to district level is a perfect
example of how the IUDF and the DDM complement one another.
While the IUDF assists with focusing in our cities and towns, the DDM takes on a district wide approach.
The complementarity can be seen in a sense that, the IUDF provides a more granular focus within a district,
i.e. cities and towns, while DDM takes on a regional posture. This may also mean that IUDF interventions
in cities and towns will be critical to provide a district wide perspective, especially in areas of integrated
urban planning and management, integrated sustainable human settlement, integrated urban
infrastructure, efficient land governance and management, inclusive economic development etc
The DDM is not divorced from existing government policies such as the IUDF but if implemented properly,
will amplify and seek to facilitate the implementation of the short- and long-term priorities of the IUDF.
District and metropolitan spaces are a perfect starting point to improve the performance and coherent
service delivery as they are close to the ground which ensures that the whole of government is responsive
16
to the need of communities. The vision for the district model has been articulated through the slogan:
“One District, One Budget and One Plan”, which directly correlates with IUDF’s vision of reaping the urban
dividend. The IUDF describes the urban dividend as “an optimal situation where the increasing
concentration of an economically active population translates into higher levels of economic activity,
greater productivity and higher rates of growth” To optimise the urban dividend we must focus on three
areas 1. People (enhancing their capabilities) 2. Economy( More resilient productive and job creation) 3.
Place (More liveable pleasure, greater social integration, safety and access to opportunities). The common
theme between the DDM and IUDF is the need to invest in people the economy and environment to
improve quality of life.
The DDM has since been piloted in two district municipalities and one metropolitan municipality, OR
Tambo, Waterberg and Ethekwini respectively. There has been some cross-cutting lessons from the
piloting phase that further buttress how interlinked the IUDF and DDM are. The pilots revealed that there
are high levels of youth unemployment, and a high number of women and child- headed households in
our district spaces which is what IUDF lever 7 seeks to address through empowering communities to be
active citizens in the economy and access job opportunities. There is also a challenge in high rural to urban
migration which is also a cross-cutting theme in the IUDF where urban-rural interdependency is advocated
for.
It is therefore clear that the DDM has not replaced or duplicated the work of the IUDF but the two need
to be perceived as complimentary. It is a myth and it is not factual that the DDM is the new sheriff in town
that has replaced the IUDF. Therefore, better communication strategies and approach need to be
employed to educate and mobilize all of society to be more aware of the two policies and how they can
be utilised in addressing socio- economic challenges.
Progress to date on the DDM and how it will be complimented by the IDP.
The DDM is a long term framework for development and service delivery of the space within the District
Municipality, this plan is envisaged to cover a latitude of between 30-50 years. It should embrace the
aspirations and the developmental vision of the all citizens, private sector and businesses, government
and public institutions and civic groups of the society and other social partners. The Plan since it forges
the integrated planning of development and service delivery should be a concerted effort of all the above
stakeholders and sectors. Whilst the plan is long term in nature, the IDP will then become a subunit of the
17
plan covering the five year space which will spell out the short to medium term targets prioritised for the
district space. The IDP then becomes the 5-year segment review of the District Development Model
(DDM). When the new council takes over the administration at the start of the term of office, they are to
review the DDM by developing a 5 year IDP.
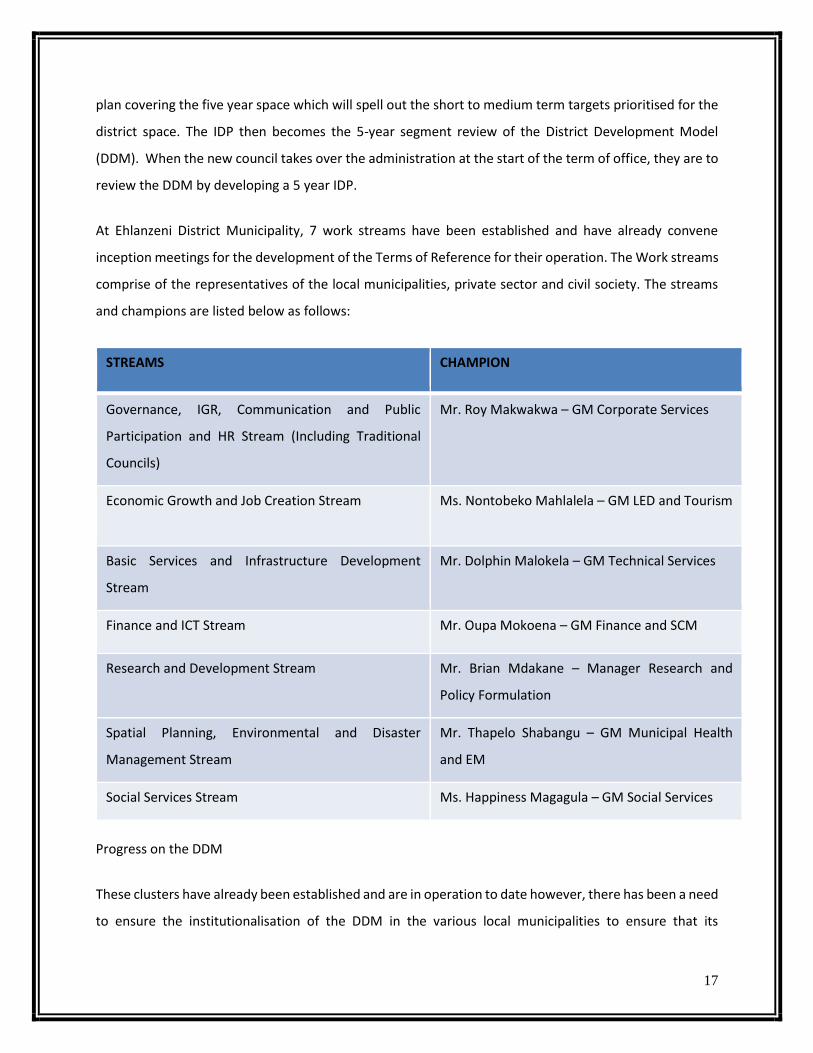
At Ehlanzeni District Municipality, 7 work streams have been established and have already convene
inception meetings for the development of the Terms of Reference for their operation. The Work streams
comprise of the representatives of the local municipalities, private sector and civil society. The streams
and champions are listed below as follows:
STREAMS CHAMPION
Governance, IGR, Communication and Public
Participation and HR Stream (Including Traditional
Councils)
Mr. Roy Makwakwa – GM Corporate Services
Economic Growth and Job Creation Stream Ms. Nontobeko Mahlalela – GM LED and Tourism
Basic Services and Infrastructure Development
Stream
Mr. Dolphin Malokela – GM Technical Services
Finance and ICT Stream Mr. Oupa Mokoena – GM Finance and SCM
Research and Development Stream Mr. Brian Mdakane – Manager Research and
Policy Formulation
Spatial Planning, Environmental and Disaster
Management Stream
Mr. Thapelo Shabangu – GM Municipal Health
and EM
Social Services Stream Ms. Happiness Magagula – GM Social Services
Progress on the DDM
These clusters have already been established and are in operation to date however, there has been a need
to ensure the institutionalisation of the DDM in the various local municipalities to ensure that its
18
aspiration is carried and supported by all the local municipalities. At the District Municipality, the Research
Unit will now carry the responsibilities of driving and fulfilling the mandates of the Model.
1.1. Development Principles For The For Planning, Drafting, Adopting And Review Of IDP
Section 27, 28, 29: process for planning, drafting, adopting/review of IDP and management of the drafting
process:
The municipality must have a predetermined programme specifying timeframes for the different steps
within their process plan which must include IDP structure sittings for stakeholder consultations.
Create a platform for IDP technical meetings to ensure involvement of other spheres of government in
the planning and drafting of the IDP.
• The Municipal Manager must manage the IDP process to ensure full institutional support on the
IDP.
• The Executive Mayor and Mayoral Committee should assume full non-delegated responsibility of
the oversight function on the IDP, Budget, PMS and Budget process.
• The IDP and Budget Steering Committee must be chaired by the Municipal Manager and shall not
be delegated. It must sit at the beginning and/or end of the IDP phases to guide and process the
output of the IDP review process.
• Section 24 and 26 (d): The municipal IDP must not only reflect the national and provincial sectoral
plans, planning requirements and priorities but must indicate plans in place to align and
contribute to the achievement of government priorities/objectives.
1.1.1. Section 26 Core Components Of The IDP
Integrated Development Planning
The constitution instructs a Municipality to structure and manage its administration, budgeting and
planning process to give priority to the basic needs of the community and to promote the social and
economic Development community. The most important instrument that the Municipality uses to
implement these constitution instructions is Integrated Development Plan (IDP) which should consolidate
all the Municipal planning into a comprehensive strategy that is linked to the Municipal budget. It is
important to note that the IDP is an intergovernmental process, in that sense it is articulation of local,
provincial and National planning within the Municipal area.
The Municipal Systems Act clearly state that an IDP adopted by a Municipal Council must be compatible
with Nation and Provincial development plans and planning requirements binding on the Municipality in
terms of Legislation.
19
• The IDP must contain a situational analysis that indicating an assessment of the level of
development not only indicating households without access to basic services but also institutional
transformation and all other key performance areas’ needs.
• The municipality in the next 5-year IDP development must consider the review of sector plans
such as Spatial Development Framework (SDF), Local Economic Development (LED), infrastructure
(water, sanitation, electricity, environment, roads, transport and so forth), maintenance and
operations plans and other operational plans (including disaster, institutional and financial plan)
to guide planning and resource allocation.
• The IDP priorities must be informed by the municipal sector plans to promote long-term planning
and the achievement of the development vision contained in the approved sector or master plans.
• The IDP must include a 5-year performance plan indicating strategic goals & objectives,
performance targets, programmes and projects spanning over the 5-year period.
• The municipality must develop the 5-year financial plan with 3-year budget projections as per the
MSA regulations to support the implementation of the 5-year council objectives
1.1.2. The Municipal Systems Act provides for the development of a Municipal IDP which must be
aligned and complement the development plans as well as the strategies to give effect to the
principles of corporate governance contained in section 41 of the constitution, following are
the process that were followed when developing the Nkomazi IDP:
Preliminary phase
The Ehlanzeni District Municipality developed the IDP Frame Work Plan which informed the IDP Process
Plan for all the local municipalities within the district. Nkomazi municipality developed its municipal
Process Plan in line with the district frame work plan. The process plan was adopted by council on the 30
of August 2019 under council resolution no NLM: S-GCM: A071/2019
Analysis Phase
This phase comprised of key stakeholder’s engagement wherein the 33 wards committees were trained.
Traditional Leaders and other key stakeholders were engaged during this IDP phase. The first two sessions
were made up of all ward committees from the 33 wards. A detailed IDP review process was presented
to the members with all the documents required during the process. Ward committees were in turn
afforded an opportunity to conduct meetings in their wards giving feedback on projects implementation
and future plans. A situational analysis was conducted to determine whether the Municipal Departments
are executing their mandates as per the legislation. The analysis phase commenced on the 5th of October
and ended on the 27 of October 2019.
Strategy Phase
This phase comprised of strategies associated with each of the priority issues as identified in the analysis
phase. A broad inter-departmental dialogue was employed with regard to the most appropriate ways and
means of tackling priority issues under consideration of policy guidelines and principles, available
resources, inter linkages, competing requirements. This phase was completed in March 2020.
20
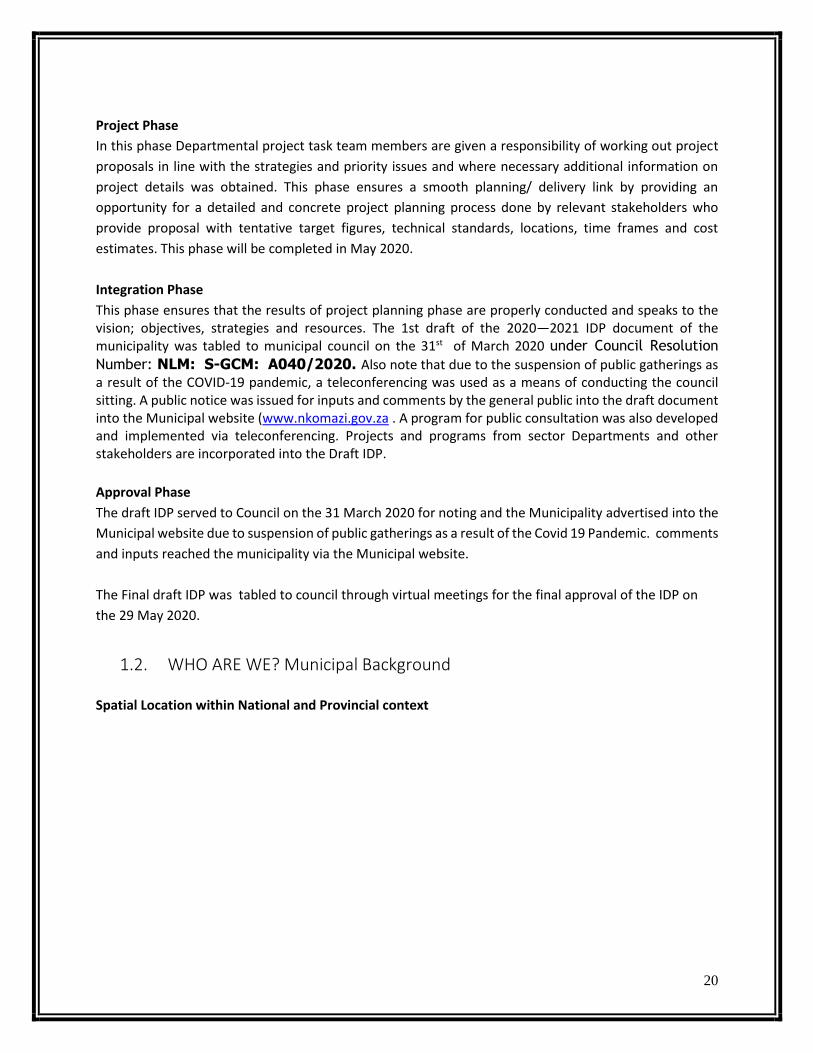
Project Phase
In this phase Departmental project task team members are given a responsibility of working out project
proposals in line with the strategies and priority issues and where necessary additional information on
project details was obtained. This phase ensures a smooth planning/ delivery link by providing an
opportunity for a detailed and concrete project planning process done by relevant stakeholders who
provide proposal with tentative target figures, technical standards, locations, time frames and cost
estimates. This phase will be completed in May 2020.
Integration Phase
This phase ensures that the results of project planning phase are properly conducted and speaks to the vision; objectives, strategies and resources. The 1st draft of the 2020—2021 IDP document of the municipality was tabled to municipal council on the 31st of March 2020 under Council Resolution
Number: NLM: S-GCM: A040/2020. Also note that due to the suspension of public gatherings as a result of the COVID-19 pandemic, a teleconferencing was used as a means of conducting the council sitting. A public notice was issued for inputs and comments by the general public into the draft document into the Municipal website (www.nkomazi.gov.za . A program for public consultation was also developed and implemented via teleconferencing. Projects and programs from sector Departments and other stakeholders are incorporated into the Draft IDP.
Approval Phase
The draft IDP served to Council on the 31 March 2020 for noting and the Municipality advertised into the
Municipal website due to suspension of public gatherings as a result of the Covid 19 Pandemic. comments
and inputs reached the municipality via the Municipal website.
The Final draft IDP was tabled to council through virtual meetings for the final approval of the IDP on
the 29 May 2020.
1.2. WHO ARE WE? Municipal Background
Spatial Location within National and Provincial context
21
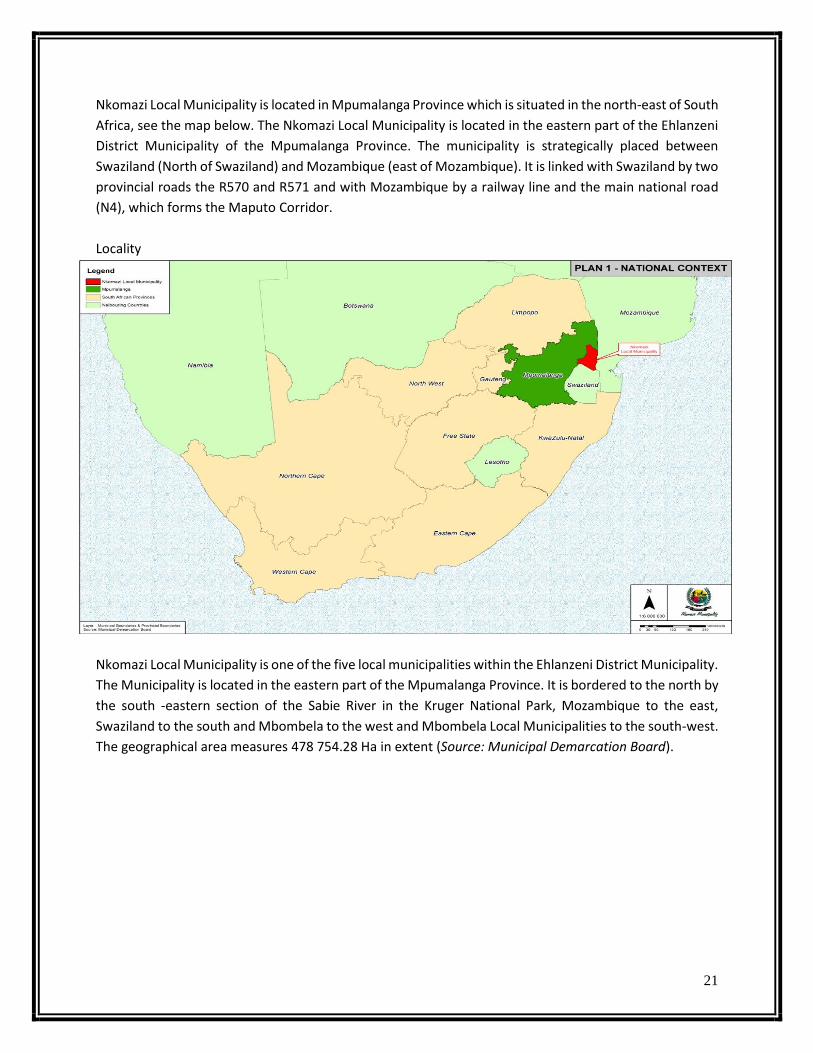
Nkomazi Local Municipality is located in Mpumalanga Province which is situated in the north-east of South
Africa, see the map below. The Nkomazi Local Municipality is located in the eastern part of the Ehlanzeni
District Municipality of the Mpumalanga Province. The municipality is strategically placed between
Swaziland (North of Swaziland) and Mozambique (east of Mozambique). It is linked with Swaziland by two
provincial roads the R570 and R571 and with Mozambique by a railway line and the main national road
(N4), which forms the Maputo Corridor.
Locality
Nkomazi Local Municipality is one of the five local municipalities within the Ehlanzeni District Municipality.
The Municipality is located in the eastern part of the Mpumalanga Province. It is bordered to the north by
the south -eastern section of the Sabie River in the Kruger National Park, Mozambique to the east,
Swaziland to the south and Mbombela to the west and Mbombela Local Municipalities to the south-west.
The geographical area measures 478 754.28 Ha in extent (Source: Municipal Demarcation Board).
22
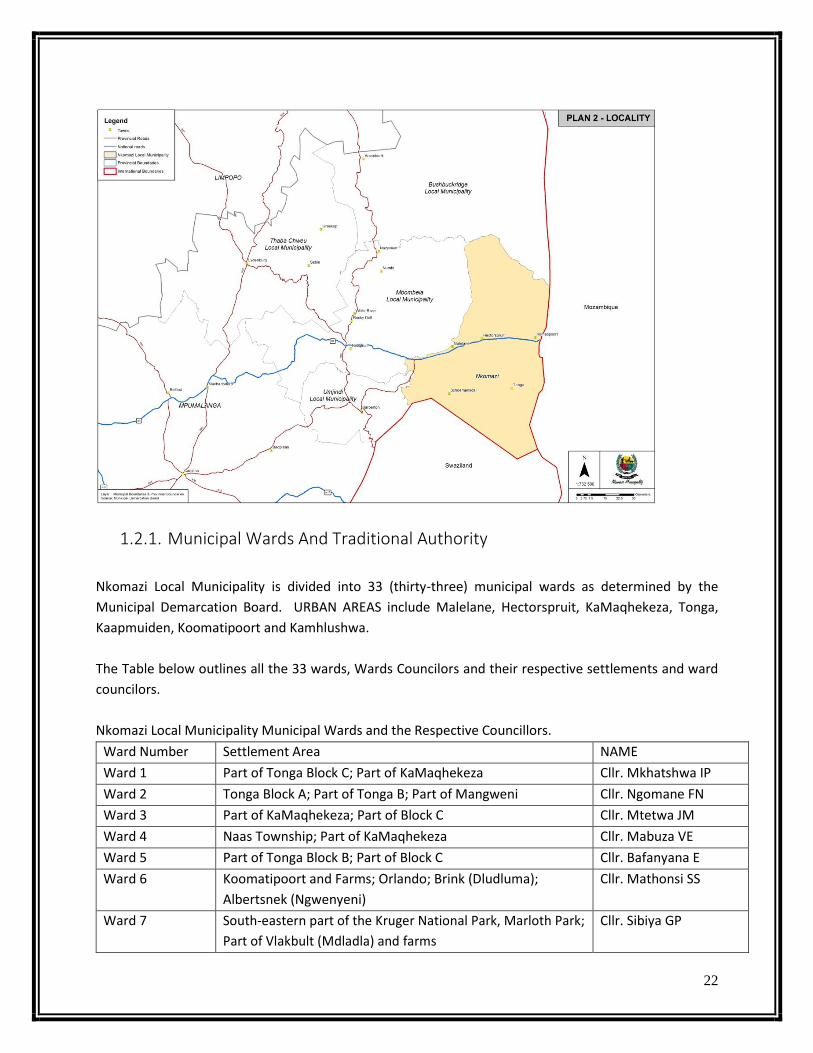
1.2.1. Municipal Wards And Traditional Authority
Nkomazi Local Municipality is divided into 33 (thirty-three) municipal wards as determined by the
Municipal Demarcation Board. URBAN AREAS include Malelane, Hectorspruit, KaMaqhekeza, Tonga,
Kaapmuiden, Koomatipoort and Kamhlushwa.
The Table below outlines all the 33 wards, Wards Councilors and their respective settlements and ward
councilors.
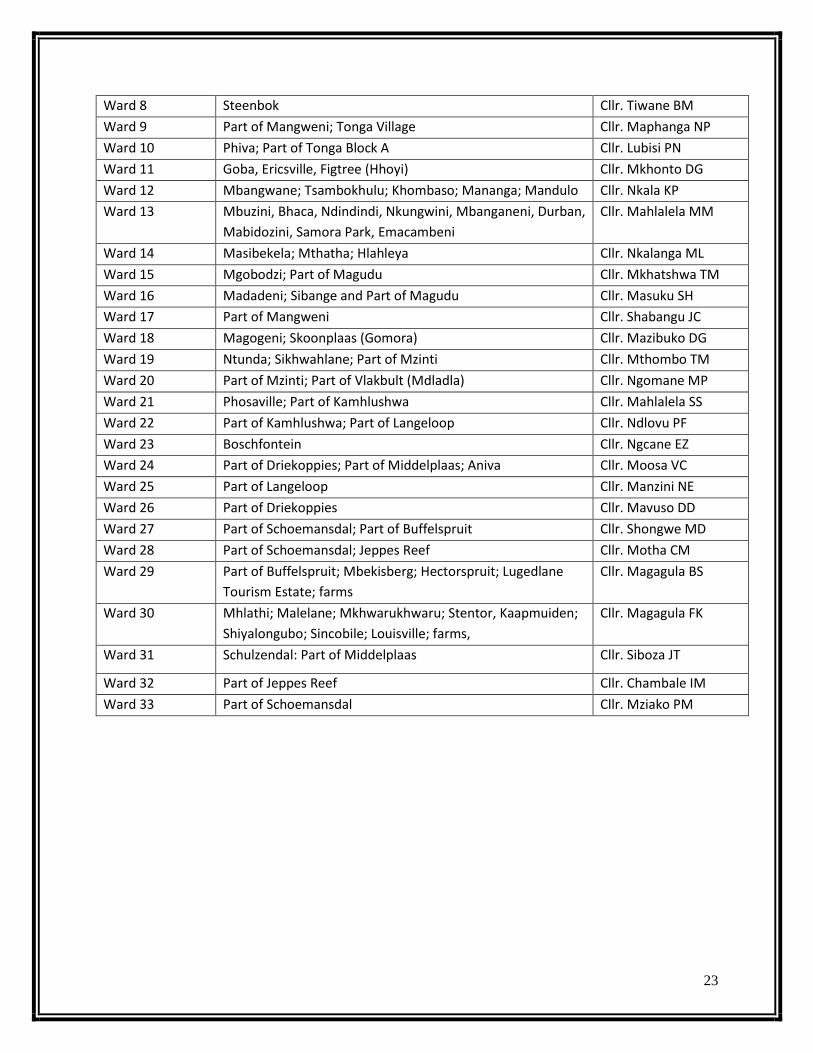
Nkomazi Local Municipality Municipal Wards and the Respective Councillors.
Ward Number Settlement Area NAME
Ward 1 Part of Tonga Block C; Part of KaMaqhekeza Cllr. Mkhatshwa IP
Ward 2 Tonga Block A; Part of Tonga B; Part of Mangweni Cllr. Ngomane FN
Ward 3 Part of KaMaqhekeza; Part of Block C Cllr. Mtetwa JM
Ward 4 Naas Township; Part of KaMaqhekeza Cllr. Mabuza VE
Ward 5 Part of Tonga Block B; Part of Block C Cllr. Bafanyana E
Ward 6 Koomatipoort and Farms; Orlando; Brink (Dludluma);
Albertsnek (Ngwenyeni)
Cllr. Mathonsi SS
Ward 7 South-eastern part of the Kruger National Park, Marloth Park;
Part of Vlakbult (Mdladla) and farms
Cllr. Sibiya GP
23
Ward 8 Steenbok Cllr. Tiwane BM
Ward 9 Part of Mangweni; Tonga Village Cllr. Maphanga NP
Ward 10 Phiva; Part of Tonga Block A Cllr. Lubisi PN
Ward 11 Goba, Ericsville, Figtree (Hhoyi) Cllr. Mkhonto DG
Ward 12 Mbangwane; Tsambokhulu; Khombaso; Mananga; Mandulo Cllr. Nkala KP
Ward 13 Mbuzini, Bhaca, Ndindindi, Nkungwini, Mbanganeni, Durban,
Mabidozini, Samora Park, Emacambeni
Cllr. Mahlalela MM
Ward 14 Masibekela; Mthatha; Hlahleya Cllr. Nkalanga ML
Ward 15 Mgobodzi; Part of Magudu Cllr. Mkhatshwa TM
Ward 16 Madadeni; Sibange and Part of Magudu Cllr. Masuku SH
Ward 17 Part of Mangweni Cllr. Shabangu JC
Ward 18 Magogeni; Skoonplaas (Gomora) Cllr. Mazibuko DG
Ward 19 Ntunda; Sikhwahlane; Part of Mzinti Cllr. Mthombo TM
Ward 20 Part of Mzinti; Part of Vlakbult (Mdladla) Cllr. Ngomane MP
Ward 21 Phosaville; Part of Kamhlushwa Cllr. Mahlalela SS
Ward 22 Part of Kamhlushwa; Part of Langeloop Cllr. Ndlovu PF
Ward 23 Boschfontein Cllr. Ngcane EZ
Ward 24 Part of Driekoppies; Part of Middelplaas; Aniva Cllr. Moosa VC
Ward 25 Part of Langeloop Cllr. Manzini NE
Ward 26 Part of Driekoppies Cllr. Mavuso DD
Ward 27 Part of Schoemansdal; Part of Buffelspruit Cllr. Shongwe MD
Ward 28 Part of Schoemansdal; Jeppes Reef Cllr. Motha CM
Ward 29 Part of Buffelspruit; Mbekisberg; Hectorspruit; Lugedlane
Tourism Estate; farms
Cllr. Magagula BS
Ward 30 Mhlathi; Malelane; Mkhwarukhwaru; Stentor, Kaapmuiden;
Shiyalongubo; Sincobile; Louisville; farms,
Cllr. Magagula FK
Ward 31 Schulzendal: Part of Middelplaas Cllr. Siboza JT
Ward 32 Part of Jeppes Reef Cllr. Chambale IM
Ward 33 Part of Schoemansdal Cllr. Mziako PM
24
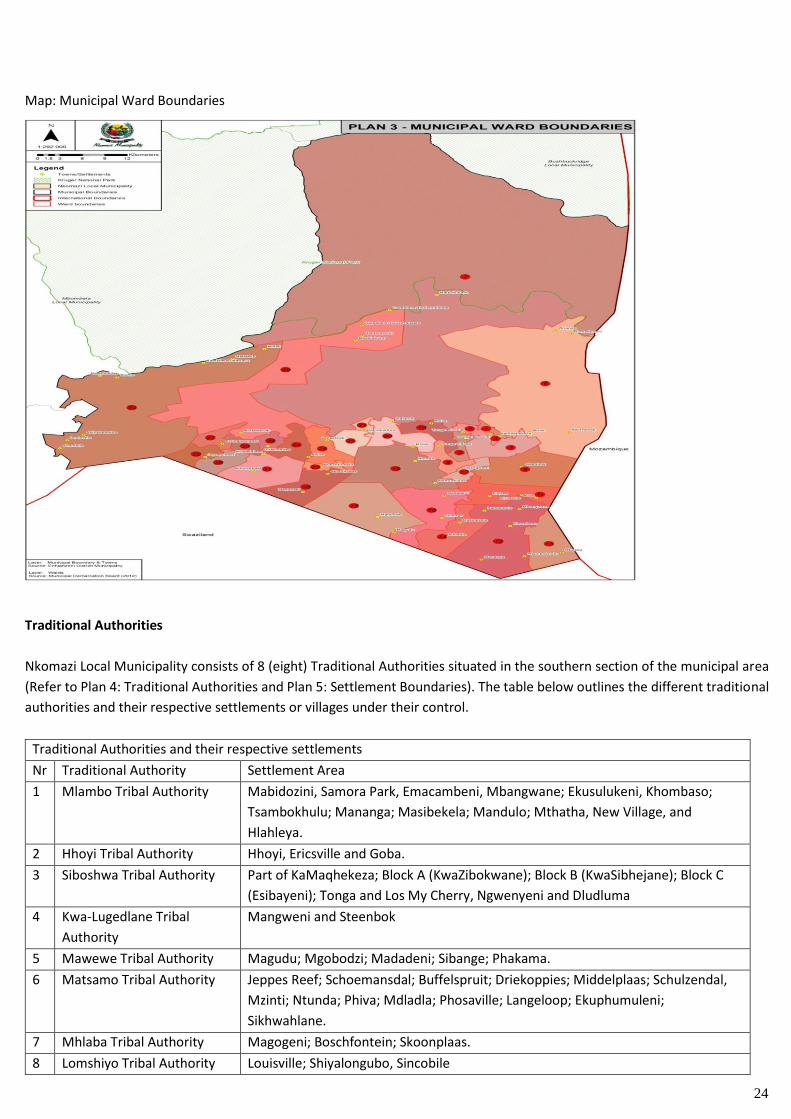
Map: Municipal Ward Boundaries
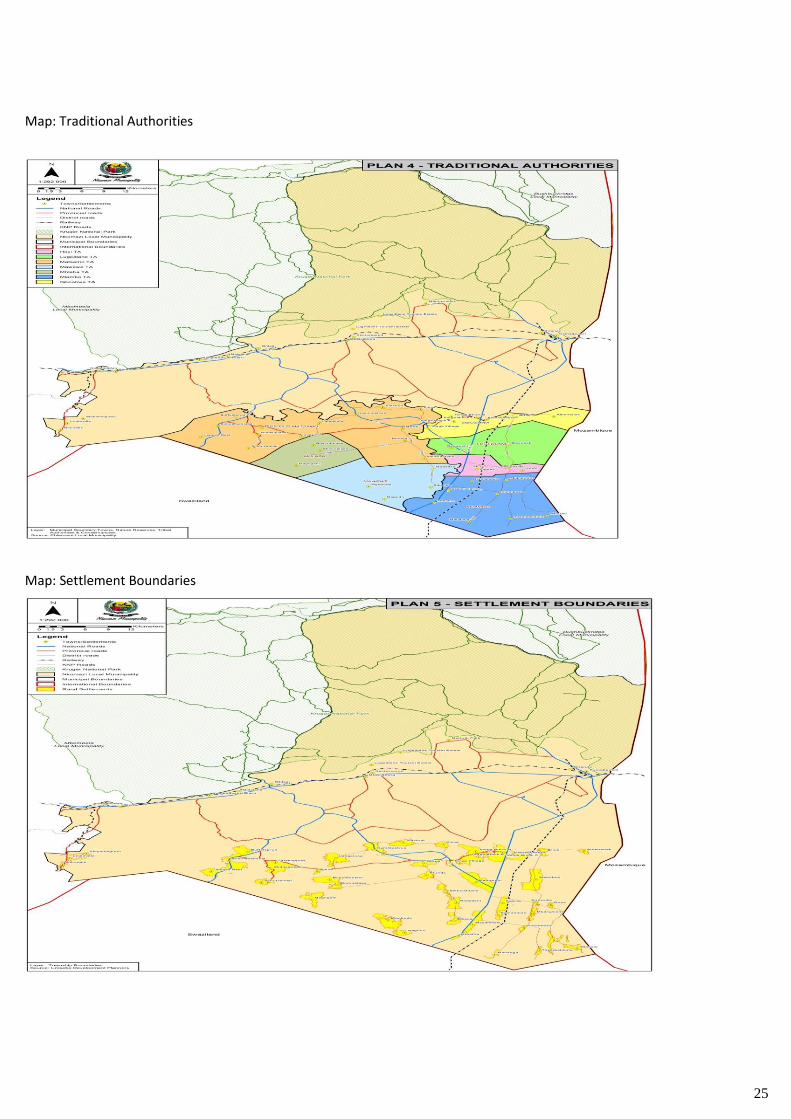
Traditional Authorities
Nkomazi Local Municipality consists of 8 (eight) Traditional Authorities situated in the southern section of the municipal area
(Refer to Plan 4: Traditional Authorities and Plan 5: Settlement Boundaries). The table below outlines the different traditional
authorities and their respective settlements or villages under their control.
Traditional Authorities and their respective settlements
Nr Traditional Authority Settlement Area
1 Mlambo Tribal Authority Mabidozini, Samora Park, Emacambeni, Mbangwane; Ekusulukeni, Khombaso;
Tsambokhulu; Mananga; Masibekela; Mandulo; Mthatha, New Village, and
Hlahleya.
2 Hhoyi Tribal Authority Hhoyi, Ericsville and Goba.
3 Siboshwa Tribal Authority Part of KaMaqhekeza; Block A (KwaZibokwane); Block B (KwaSibhejane); Block C
(Esibayeni); Tonga and Los My Cherry, Ngwenyeni and Dludluma
4 Kwa-Lugedlane Tribal
Authority
Mangweni and Steenbok
5 Mawewe Tribal Authority Magudu; Mgobodzi; Madadeni; Sibange; Phakama.
6 Matsamo Tribal Authority Jeppes Reef; Schoemansdal; Buffelspruit; Driekoppies; Middelplaas; Schulzendal,
Mzinti; Ntunda; Phiva; Mdladla; Phosaville; Langeloop; Ekuphumuleni;
Sikhwahlane.
7 Mhlaba Tribal Authority Magogeni; Boschfontein; Skoonplaas.
8 Lomshiyo Tribal Authority Louisville; Shiyalongubo, Sincobile
25
Map: Traditional Authorities
Map: Settlement Boundaries
26
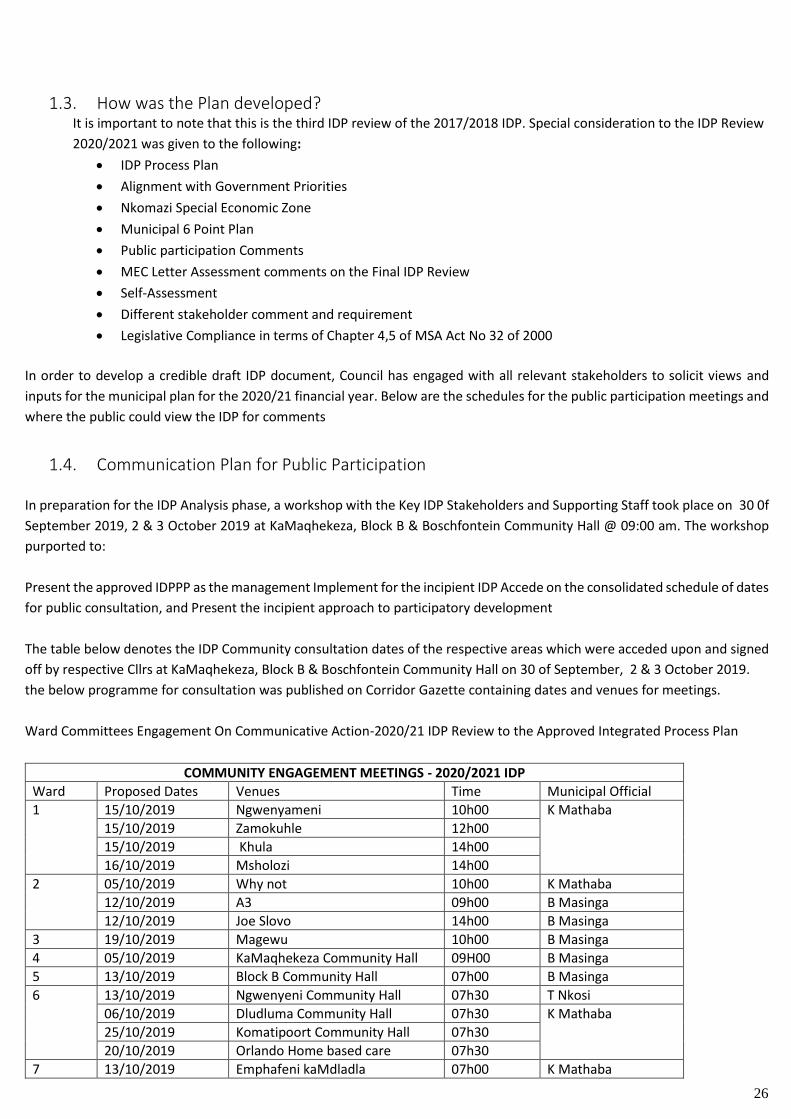
1.3. How was the Plan developed? It is important to note that this is the third IDP review of the 2017/2018 IDP. Special consideration to the IDP Review
2020/2021 was given to the following:
• IDP Process Plan
• Alignment with Government Priorities
• Nkomazi Special Economic Zone
• Municipal 6 Point Plan
• Public participation Comments
• MEC Letter Assessment comments on the Final IDP Review
• Self-Assessment
• Different stakeholder comment and requirement
• Legislative Compliance in terms of Chapter 4,5 of MSA Act No 32 of 2000
In order to develop a credible draft IDP document, Council has engaged with all relevant stakeholders to solicit views and
inputs for the municipal plan for the 2020/21 financial year. Below are the schedules for the public participation meetings and
where the public could view the IDP for comments
1.4. Communication Plan for Public Participation
In preparation for the IDP Analysis phase, a workshop with the Key IDP Stakeholders and Supporting Staff took place on 30 0f
September 2019, 2 & 3 October 2019 at KaMaqhekeza, Block B & Boschfontein Community Hall @ 09:00 am. The workshop
purported to:
Present the approved IDPPP as the management Implement for the incipient IDP Accede on the consolidated schedule of dates
for public consultation, and Present the incipient approach to participatory development
The table below denotes the IDP Community consultation dates of the respective areas which were acceded upon and signed
off by respective Cllrs at KaMaqhekeza, Block B & Boschfontein Community Hall on 30 of September, 2 & 3 October 2019.
the below programme for consultation was published on Corridor Gazette containing dates and venues for meetings.
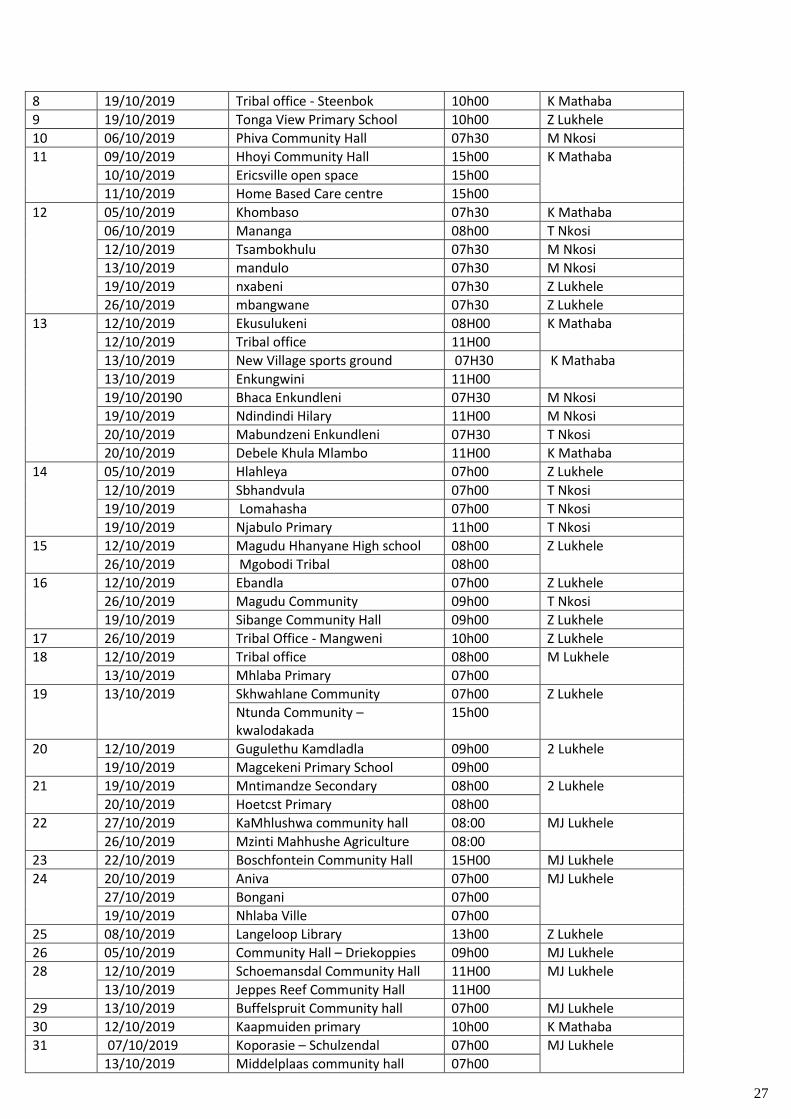
Ward Committees Engagement On Communicative Action-2020/21 IDP Review to the Approved Integrated Process Plan
COMMUNITY ENGAGEMENT MEETINGS - 2020/2021 IDP
Ward Proposed Dates Venues Time Municipal Official
1 15/10/2019 Ngwenyameni 10h00 K Mathaba
15/10/2019 Zamokuhle 12h00
15/10/2019 Khula 14h00
16/10/2019 Msholozi 14h00
2 05/10/2019 Why not 10h00 K Mathaba
12/10/2019 A3 09h00 B Masinga
12/10/2019 Joe Slovo 14h00 B Masinga
3 19/10/2019 Magewu 10h00 B Masinga
4 05/10/2019 KaMaqhekeza Community Hall 09H00 B Masinga
5 13/10/2019 Block B Community Hall 07h00 B Masinga
6 13/10/2019 Ngwenyeni Community Hall 07h30 T Nkosi
06/10/2019 Dludluma Community Hall 07h30 K Mathaba
25/10/2019 Komatipoort Community Hall 07h30
20/10/2019 Orlando Home based care 07h30
7 13/10/2019 Emphafeni kaMdladla 07h00 K Mathaba
27
8 19/10/2019 Tribal office - Steenbok 10h00 K Mathaba
9 19/10/2019 Tonga View Primary School 10h00 Z Lukhele
10 06/10/2019 Phiva Community Hall 07h30 M Nkosi
11 09/10/2019 Hhoyi Community Hall 15h00 K Mathaba
10/10/2019 Ericsville open space 15h00
11/10/2019 Home Based Care centre 15h00
12 05/10/2019 Khombaso 07h30 K Mathaba
06/10/2019 Mananga 08h00 T Nkosi
12/10/2019 Tsambokhulu 07h30 M Nkosi
13/10/2019 mandulo 07h30 M Nkosi
19/10/2019 nxabeni 07h30 Z Lukhele
26/10/2019 mbangwane 07h30 Z Lukhele
13 12/10/2019 Ekusulukeni 08H00 K Mathaba
12/10/2019 Tribal office 11H00
13/10/2019 New Village sports ground 07H30 K Mathaba
13/10/2019 Enkungwini 11H00
19/10/20190 Bhaca Enkundleni 07H30 M Nkosi
19/10/2019 Ndindindi Hilary 11H00 M Nkosi
20/10/2019 Mabundzeni Enkundleni 07H30 T Nkosi
20/10/2019 Debele Khula Mlambo 11H00 K Mathaba
14 05/10/2019 Hlahleya 07h00 Z Lukhele
12/10/2019 Sbhandvula 07h00 T Nkosi
19/10/2019 Lomahasha 07h00 T Nkosi
19/10/2019 Njabulo Primary 11h00 T Nkosi
15 12/10/2019 Magudu Hhanyane High school 08h00 Z Lukhele
26/10/2019 Mgobodi Tribal 08h00
16 12/10/2019 Ebandla 07h00 Z Lukhele
26/10/2019 Magudu Community 09h00 T Nkosi
19/10/2019 Sibange Community Hall 09h00 Z Lukhele
17 26/10/2019 Tribal Office - Mangweni 10h00 Z Lukhele
18 12/10/2019 Tribal office 08h00 M Lukhele 13/10/2019 Mhlaba Primary 07h00
19 13/10/2019
Skhwahlane Community 07h00 Z Lukhele Ntunda Community –
kwalodakada 15h00
20 12/10/2019 Gugulethu Kamdladla 09h00 2 Lukhele 19/10/2019 Magcekeni Primary School 09h00
21 19/10/2019 Mntimandze Secondary 08h00 2 Lukhele 20/10/2019 Hoetcst Primary 08h00
22 27/10/2019 KaMhlushwa community hall 08:00 MJ Lukhele
26/10/2019 Mzinti Mahhushe Agriculture 08:00
23 22/10/2019 Boschfontein Community Hall 15H00 MJ Lukhele
24 20/10/2019 Aniva 07h00 MJ Lukhele
27/10/2019 Bongani 07h00
19/10/2019 Nhlaba Ville 07h00
25 08/10/2019 Langeloop Library 13h00 Z Lukhele
26 05/10/2019 Community Hall – Driekoppies 09h00 MJ Lukhele
28 12/10/2019 Schoemansdal Community Hall 11H00 MJ Lukhele
13/10/2019 Jeppes Reef Community Hall 11H00
29 13/10/2019 Buffelspruit Community hall 07h00 MJ Lukhele
30 12/10/2019 Kaapmuiden primary 10h00 K Mathaba
31 07/10/2019 Koporasie – Schulzendal 07h00 MJ Lukhele 13/10/2019 Middelplaas community hall 07h00
28
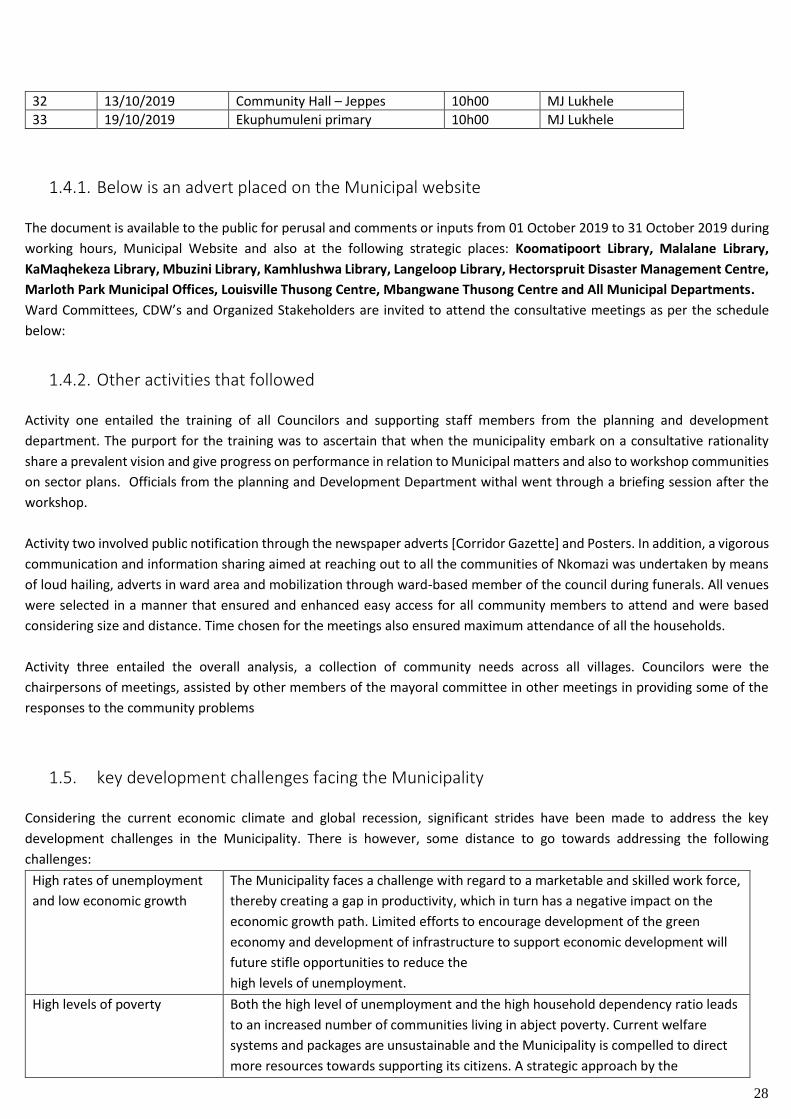
32 13/10/2019 Community Hall – Jeppes 10h00 MJ Lukhele
33 19/10/2019 Ekuphumuleni primary 10h00 MJ Lukhele
1.4.1. Below is an advert placed on the Municipal website
The document is available to the public for perusal and comments or inputs from 01 October 2019 to 31 October 2019 during
working hours, Municipal Website and also at the following strategic places: Koomatipoort Library, Malalane Library,
KaMaqhekeza Library, Mbuzini Library, Kamhlushwa Library, Langeloop Library, Hectorspruit Disaster Management Centre,
Marloth Park Municipal Offices, Louisville Thusong Centre, Mbangwane Thusong Centre and All Municipal Departments.
Ward Committees, CDW’s and Organized Stakeholders are invited to attend the consultative meetings as per the schedule
below:
1.4.2. Other activities that followed
Activity one entailed the training of all Councilors and supporting staff members from the planning and development
department. The purport for the training was to ascertain that when the municipality embark on a consultative rationality
share a prevalent vision and give progress on performance in relation to Municipal matters and also to workshop communities
on sector plans. Officials from the planning and Development Department withal went through a briefing session after the
workshop.
Activity two involved public notification through the newspaper adverts [Corridor Gazette] and Posters. In addition, a vigorous
communication and information sharing aimed at reaching out to all the communities of Nkomazi was undertaken by means
of loud hailing, adverts in ward area and mobilization through ward-based member of the council during funerals. All venues
were selected in a manner that ensured and enhanced easy access for all community members to attend and were based
considering size and distance. Time chosen for the meetings also ensured maximum attendance of all the households.
Activity three entailed the overall analysis, a collection of community needs across all villages. Councilors were the
chairpersons of meetings, assisted by other members of the mayoral committee in other meetings in providing some of the
responses to the community problems
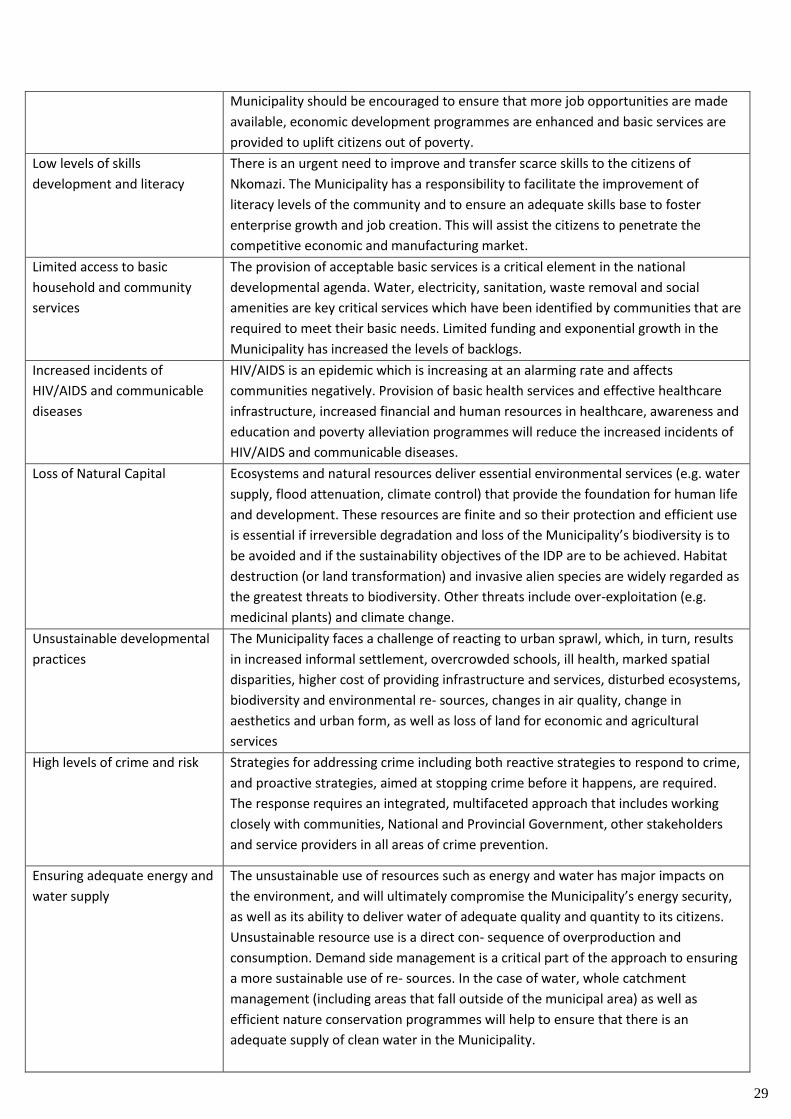
1.5. key development challenges facing the Municipality
Considering the current economic climate and global recession, significant strides have been made to address the key
development challenges in the Municipality. There is however, some distance to go towards addressing the following
challenges:
High rates of unemployment
and low economic growth
The Municipality faces a challenge with regard to a marketable and skilled work force,
thereby creating a gap in productivity, which in turn has a negative impact on the
economic growth path. Limited efforts to encourage development of the green
economy and development of infrastructure to support economic development will
future stifle opportunities to reduce the
high levels of unemployment.
High levels of poverty
Both the high level of unemployment and the high household dependency ratio leads
to an increased number of communities living in abject poverty. Current welfare
systems and packages are unsustainable and the Municipality is compelled to direct
more resources towards supporting its citizens. A strategic approach by the
29
Municipality should be encouraged to ensure that more job opportunities are made
available, economic development programmes are enhanced and basic services are
provided to uplift citizens out of poverty.
Low levels of skills
development and literacy
There is an urgent need to improve and transfer scarce skills to the citizens of
Nkomazi. The Municipality has a responsibility to facilitate the improvement of
literacy levels of the community and to ensure an adequate skills base to foster
enterprise growth and job creation. This will assist the citizens to penetrate the
competitive economic and manufacturing market.
Limited access to basic
household and community
services
The provision of acceptable basic services is a critical element in the national
developmental agenda. Water, electricity, sanitation, waste removal and social
amenities are key critical services which have been identified by communities that are
required to meet their basic needs. Limited funding and exponential growth in the
Municipality has increased the levels of backlogs.
Increased incidents of
HIV/AIDS and communicable
diseases
HIV/AIDS is an epidemic which is increasing at an alarming rate and affects
communities negatively. Provision of basic health services and effective healthcare
infrastructure, increased financial and human resources in healthcare, awareness and
education and poverty alleviation programmes will reduce the increased incidents of
HIV/AIDS and communicable diseases.
Loss of Natural Capital
Ecosystems and natural resources deliver essential environmental services (e.g. water
supply, flood attenuation, climate control) that provide the foundation for human life
and development. These resources are finite and so their protection and efficient use
is essential if irreversible degradation and loss of the Municipality’s biodiversity is to
be avoided and if the sustainability objectives of the IDP are to be achieved. Habitat
destruction (or land transformation) and invasive alien species are widely regarded as
the greatest threats to biodiversity. Other threats include over-exploitation (e.g.
medicinal plants) and climate change.
Unsustainable developmental
practices
The Municipality faces a challenge of reacting to urban sprawl, which, in turn, results
in increased informal settlement, overcrowded schools, ill health, marked spatial
disparities, higher cost of providing infrastructure and services, disturbed ecosystems,
biodiversity and environmental re- sources, changes in air quality, change in
aesthetics and urban form, as well as loss of land for economic and agricultural
services
High levels of crime and risk
Strategies for addressing crime including both reactive strategies to respond to crime,
and proactive strategies, aimed at stopping crime before it happens, are required.
The response requires an integrated, multifaceted approach that includes working
closely with communities, National and Provincial Government, other stakeholders
and service providers in all areas of crime prevention.
Ensuring adequate energy and
water supply
The unsustainable use of resources such as energy and water has major impacts on
the environment, and will ultimately compromise the Municipality’s energy security,
as well as its ability to deliver water of adequate quality and quantity to its citizens.
Unsustainable resource use is a direct con- sequence of overproduction and
consumption. Demand side management is a critical part of the approach to ensuring
a more sustainable use of re- sources. In the case of water, whole catchment
management (including areas that fall outside of the municipal area) as well as
efficient nature conservation programmes will help to ensure that there is an
adequate supply of clean water in the Municipality.
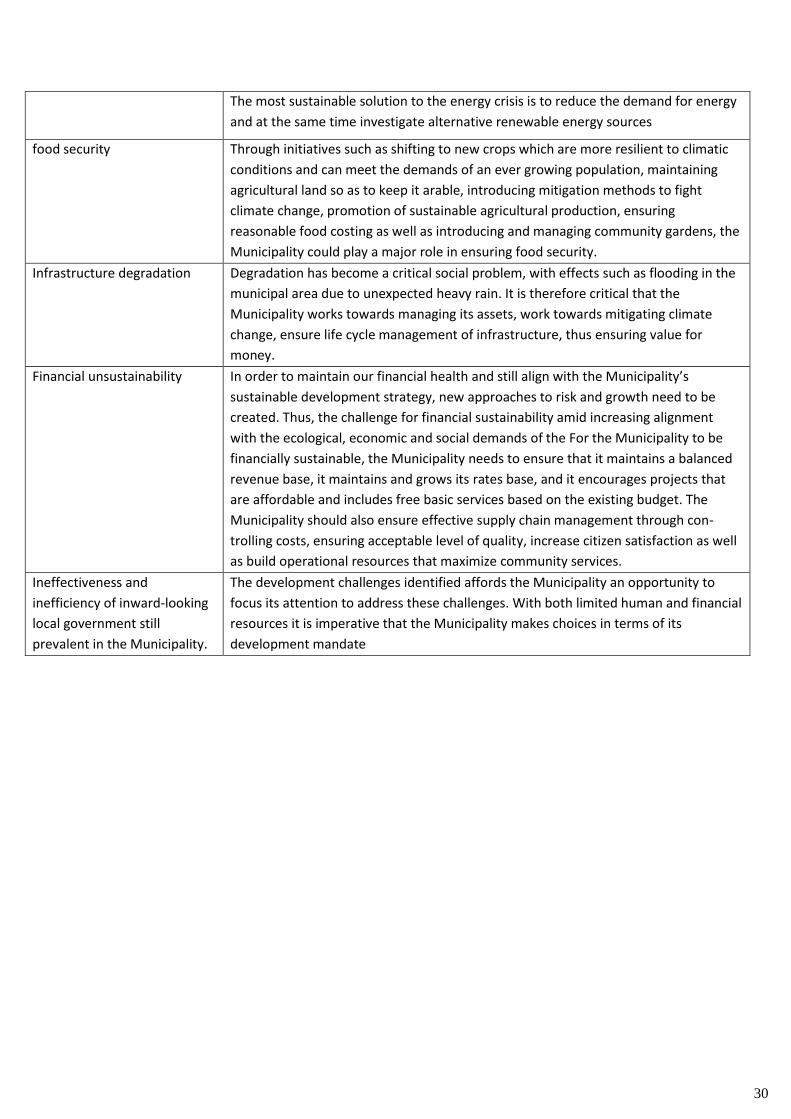
30
The most sustainable solution to the energy crisis is to reduce the demand for energy
and at the same time investigate alternative renewable energy sources
food security Through initiatives such as shifting to new crops which are more resilient to climatic
conditions and can meet the demands of an ever growing population, maintaining
agricultural land so as to keep it arable, introducing mitigation methods to fight
climate change, promotion of sustainable agricultural production, ensuring
reasonable food costing as well as introducing and managing community gardens, the
Municipality could play a major role in ensuring food security.
Infrastructure degradation
Degradation has become a critical social problem, with effects such as flooding in the
municipal area due to unexpected heavy rain. It is therefore critical that the
Municipality works towards managing its assets, work towards mitigating climate
change, ensure life cycle management of infrastructure, thus ensuring value for
money.
Financial unsustainability
In order to maintain our financial health and still align with the Municipality’s
sustainable development strategy, new approaches to risk and growth need to be
created. Thus, the challenge for financial sustainability amid increasing alignment
with the ecological, economic and social demands of the For the Municipality to be
financially sustainable, the Municipality needs to ensure that it maintains a balanced
revenue base, it maintains and grows its rates base, and it encourages projects that
are affordable and includes free basic services based on the existing budget. The
Municipality should also ensure effective supply chain management through con-
trolling costs, ensuring acceptable level of quality, increase citizen satisfaction as well
as build operational resources that maximize community services.
Ineffectiveness and
inefficiency of inward-looking
local government still
prevalent in the Municipality.
The development challenges identified affords the Municipality an opportunity to
focus its attention to address these challenges. With both limited human and financial
resources it is imperative that the Municipality makes choices in terms of its
development mandate
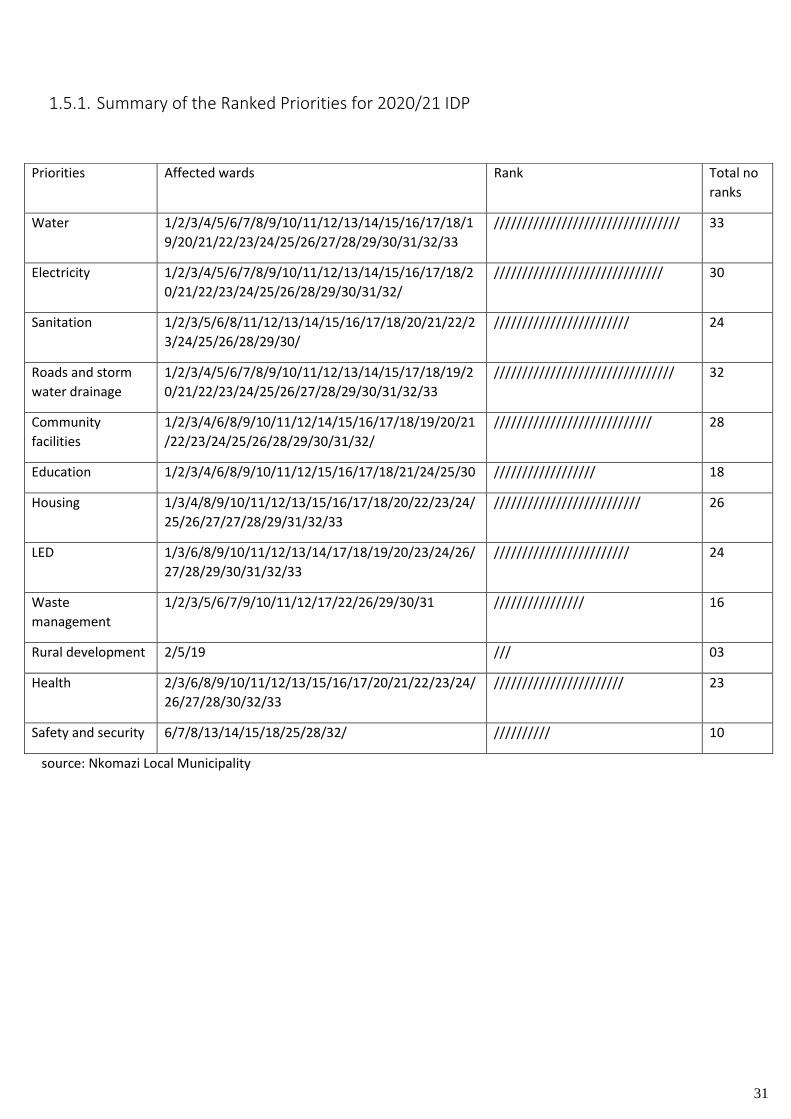
31
1.5.1. Summary of the Ranked Priorities for 2020/21 IDP
source: Nkomazi Local Municipality
Priorities Affected wards Rank Total no
ranks
Water 1/2/3/4/5/6/7/8/9/10/11/12/13/14/15/16/17/18/1
9/20/21/22/23/24/25/26/27/28/29/30/31/32/33
///////////////////////////////// 33
Electricity 1/2/3/4/5/6/7/8/9/10/11/12/13/14/15/16/17/18/2
0/21/22/23/24/25/26/28/29/30/31/32/
////////////////////////////// 30
Sanitation 1/2/3/5/6/8/11/12/13/14/15/16/17/18/20/21/22/2
3/24/25/26/28/29/30/
//////////////////////// 24
Roads and storm
water drainage
1/2/3/4/5/6/7/8/9/10/11/12/13/14/15/17/18/19/2
0/21/22/23/24/25/26/27/28/29/30/31/32/33
//////////////////////////////// 32
Community
facilities
1/2/3/4/6/8/9/10/11/12/14/15/16/17/18/19/20/21
/22/23/24/25/26/28/29/30/31/32/
//////////////////////////// 28
Education 1/2/3/4/6/8/9/10/11/12/15/16/17/18/21/24/25/30 ////////////////// 18
Housing 1/3/4/8/9/10/11/12/13/15/16/17/18/20/22/23/24/
25/26/27/27/28/29/31/32/33
////////////////////////// 26
LED 1/3/6/8/9/10/11/12/13/14/17/18/19/20/23/24/26/
27/28/29/30/31/32/33
//////////////////////// 24
Waste
management
1/2/3/5/6/7/9/10/11/12/17/22/26/29/30/31 //////////////// 16
Rural development 2/5/19 /// 03
Health 2/3/6/8/9/10/11/12/13/15/16/17/20/21/22/23/24/
26/27/28/30/32/33
/////////////////////// 23
Safety and security 6/7/8/13/14/15/18/25/28/32/ ////////// 10
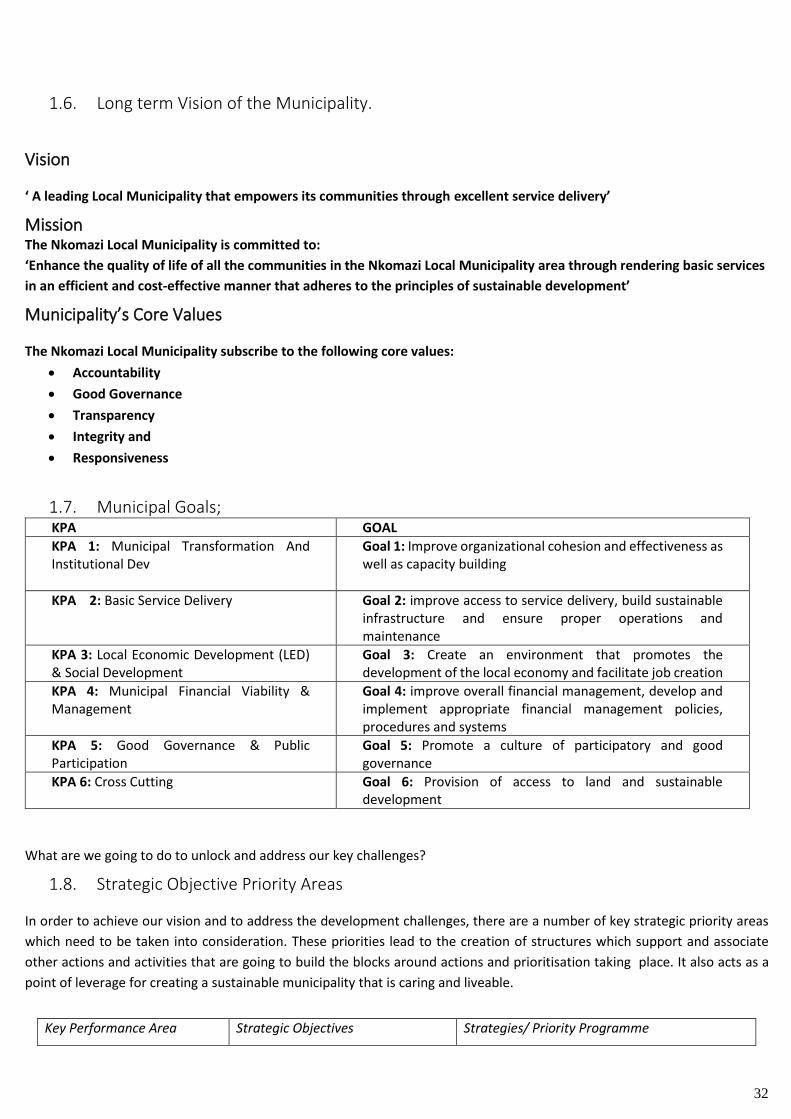
32
1.6. Long term Vision of the Municipality.
Vision
‘ A leading Local Municipality that empowers its communities through excellent service delivery’
Mission The Nkomazi Local Municipality is committed to:
‘Enhance the quality of life of all the communities in the Nkomazi Local Municipality area through rendering basic services
in an efficient and cost-effective manner that adheres to the principles of sustainable development’
Municipality’s Core Values
The Nkomazi Local Municipality subscribe to the following core values:
• Accountability
• Good Governance
• Transparency
• Integrity and
• Responsiveness
1.7. Municipal Goals; KPA GOAL
KPA 1: Municipal Transformation And Institutional Dev
Goal 1: Improve organizational cohesion and effectiveness as well as capacity building
KPA 2: Basic Service Delivery Goal 2: improve access to service delivery, build sustainable infrastructure and ensure proper operations and maintenance
KPA 3: Local Economic Development (LED) & Social Development
Goal 3: Create an environment that promotes the development of the local economy and facilitate job creation
KPA 4: Municipal Financial Viability & Management
Goal 4: improve overall financial management, develop and implement appropriate financial management policies, procedures and systems
KPA 5: Good Governance & Public Participation
Goal 5: Promote a culture of participatory and good governance
KPA 6: Cross Cutting Goal 6: Provision of access to land and sustainable development
What are we going to do to unlock and address our key challenges?
1.8. Strategic Objective Priority Areas
In order to achieve our vision and to address the development challenges, there are a number of key strategic priority areas
which need to be taken into consideration. These priorities lead to the creation of structures which support and associate
other actions and activities that are going to build the blocks around actions and prioritisation taking place. It also acts as a
point of leverage for creating a sustainable municipality that is caring and liveable.
Key Performance Area Strategic Objectives Strategies/ Priority Programme
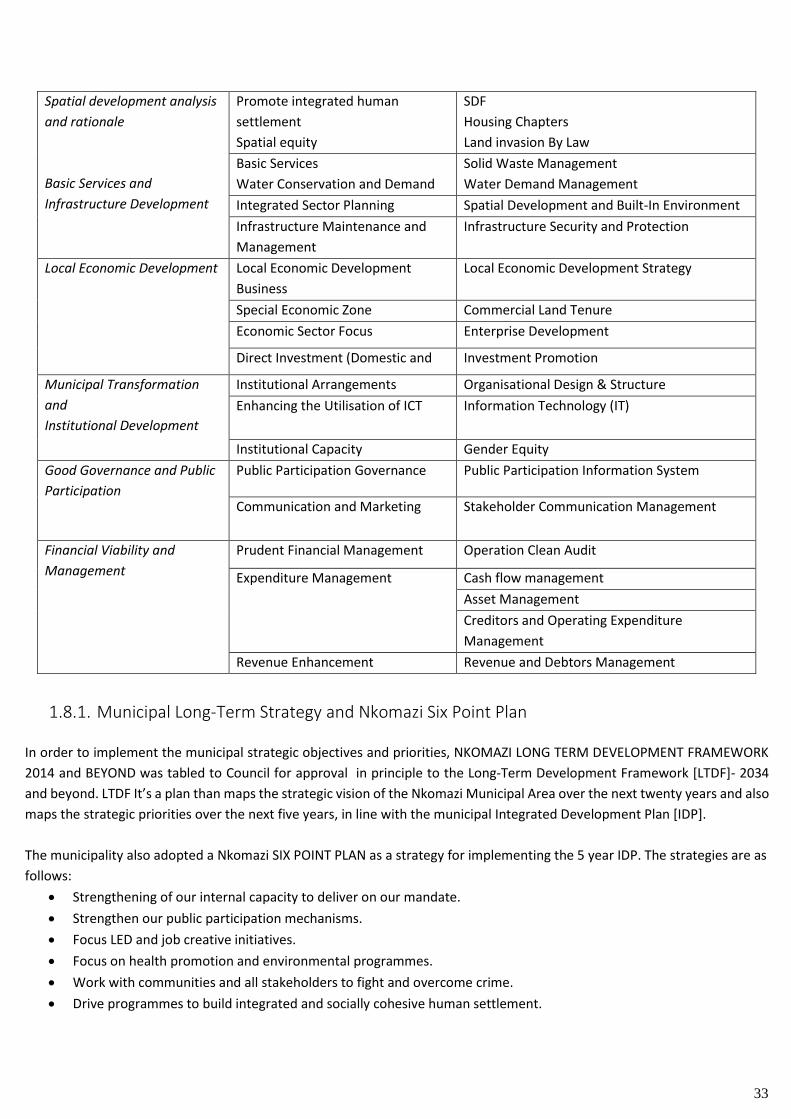
33
1.8.1. Municipal Long-Term Strategy and Nkomazi Six Point Plan
In order to implement the municipal strategic objectives and priorities, NKOMAZI LONG TERM DEVELOPMENT FRAMEWORK
2014 and BEYOND was tabled to Council for approval in principle to the Long-Term Development Framework [LTDF]- 2034
and beyond. LTDF It’s a plan than maps the strategic vision of the Nkomazi Municipal Area over the next twenty years and also
maps the strategic priorities over the next five years, in line with the municipal Integrated Development Plan [IDP].
The municipality also adopted a Nkomazi SIX POINT PLAN as a strategy for implementing the 5 year IDP. The strategies are as
follows:
• Strengthening of our internal capacity to deliver on our mandate.
• Strengthen our public participation mechanisms.
• Focus LED and job creative initiatives.
• Focus on health promotion and environmental programmes.
• Work with communities and all stakeholders to fight and overcome crime.
• Drive programmes to build integrated and socially cohesive human settlement.
Spatial development analysis
and rationale
Basic Services and
Infrastructure Development
Promote integrated human
settlement
Spatial equity
SDF
Housing Chapters
Land invasion By Law
Basic Services
Water Conservation and Demand
Solid Waste Management
Water Demand Management
Integrated Sector Planning Spatial Development and Built-In Environment
Infrastructure Maintenance and
Management
Infrastructure Security and Protection
Local Economic Development Local Economic Development
Business
Local Economic Development Strategy
Special Economic Zone Commercial Land Tenure
Economic Sector Focus Enterprise Development
Direct Investment (Domestic and Investment Promotion
Municipal Transformation
and
Institutional Development
Institutional Arrangements Organisational Design & Structure
Enhancing the Utilisation of ICT Information Technology (IT)
Institutional Capacity Gender Equity
Good Governance and Public
Participation
Public Participation Governance Public Participation Information System
Communication and Marketing Stakeholder Communication Management
Financial Viability and
Management
Prudent Financial Management Operation Clean Audit
Expenditure Management Cash flow management
Asset Management
Creditors and Operating Expenditure
Management
Revenue Enhancement Revenue and Debtors Management
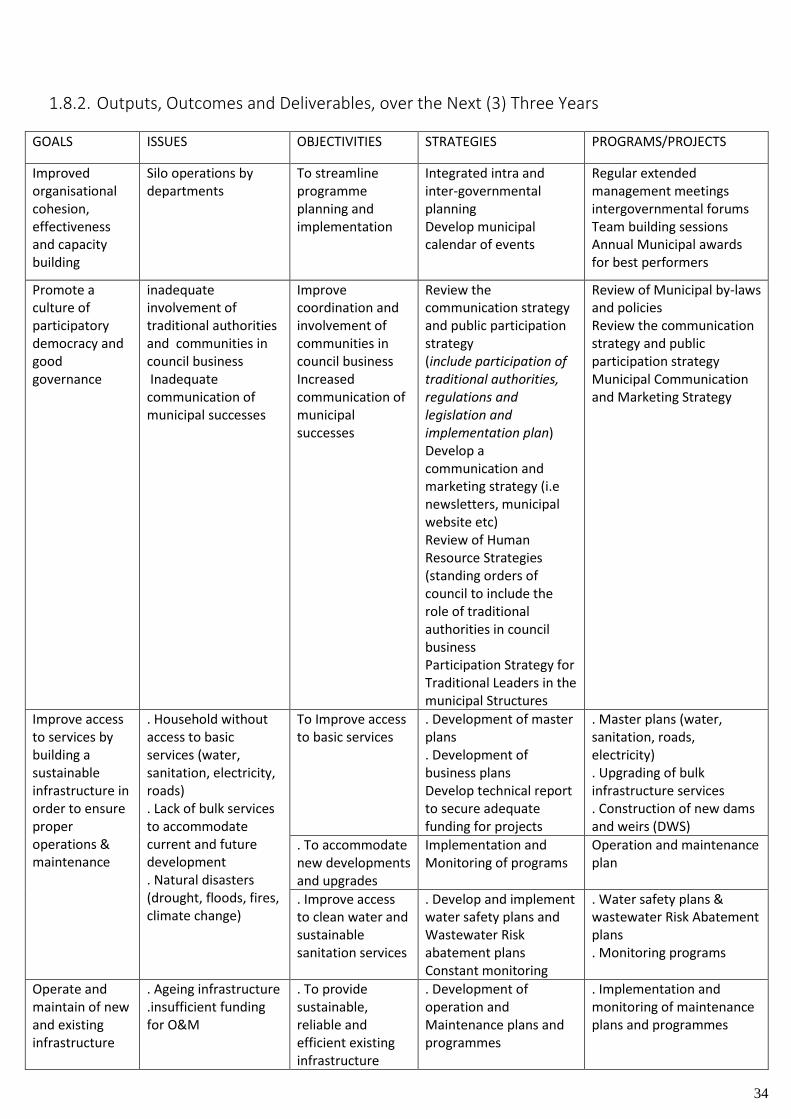
34
1.8.2. Outputs, Outcomes and Deliverables, over the Next (3) Three Years
GOALS ISSUES OBJECTIVITIES STRATEGIES PROGRAMS/PROJECTS
Improved organisational cohesion, effectiveness and capacity building
Silo operations by departments
To streamline programme planning and implementation
Integrated intra and inter-governmental planning Develop municipal calendar of events
Regular extended management meetings intergovernmental forums Team building sessions Annual Municipal awards for best performers
Promote a culture of participatory democracy and good governance
inadequate involvement of traditional authorities and communities in council business Inadequate communication of municipal successes
Improve coordination and involvement of communities in council business Increased communication of municipal successes
Review the communication strategy and public participation strategy (include participation of traditional authorities, regulations and legislation and implementation plan) Develop a communication and marketing strategy (i.e newsletters, municipal website etc) Review of Human Resource Strategies (standing orders of council to include the role of traditional authorities in council business Participation Strategy for Traditional Leaders in the municipal Structures
Review of Municipal by-laws and policies Review the communication strategy and public participation strategy Municipal Communication and Marketing Strategy
Improve access to services by building a sustainable infrastructure in order to ensure proper operations & maintenance
. Household without access to basic services (water, sanitation, electricity, roads) . Lack of bulk services to accommodate current and future development . Natural disasters (drought, floods, fires, climate change)
To Improve access to basic services
. Development of master plans . Development of business plans Develop technical report to secure adequate funding for projects
. Master plans (water, sanitation, roads, electricity) . Upgrading of bulk infrastructure services . Construction of new dams and weirs (DWS)
. To accommodate new developments and upgrades
Implementation and Monitoring of programs
Operation and maintenance plan
. Improve access to clean water and sustainable sanitation services
. Develop and implement water safety plans and Wastewater Risk abatement plans Constant monitoring
. Water safety plans & wastewater Risk Abatement plans . Monitoring programs
Operate and maintain of new and existing infrastructure
. Ageing infrastructure
.insufficient funding for O&M
. To provide sustainable, reliable and efficient existing infrastructure
. Development of operation and Maintenance plans and programmes
. Implementation and monitoring of maintenance plans and programmes
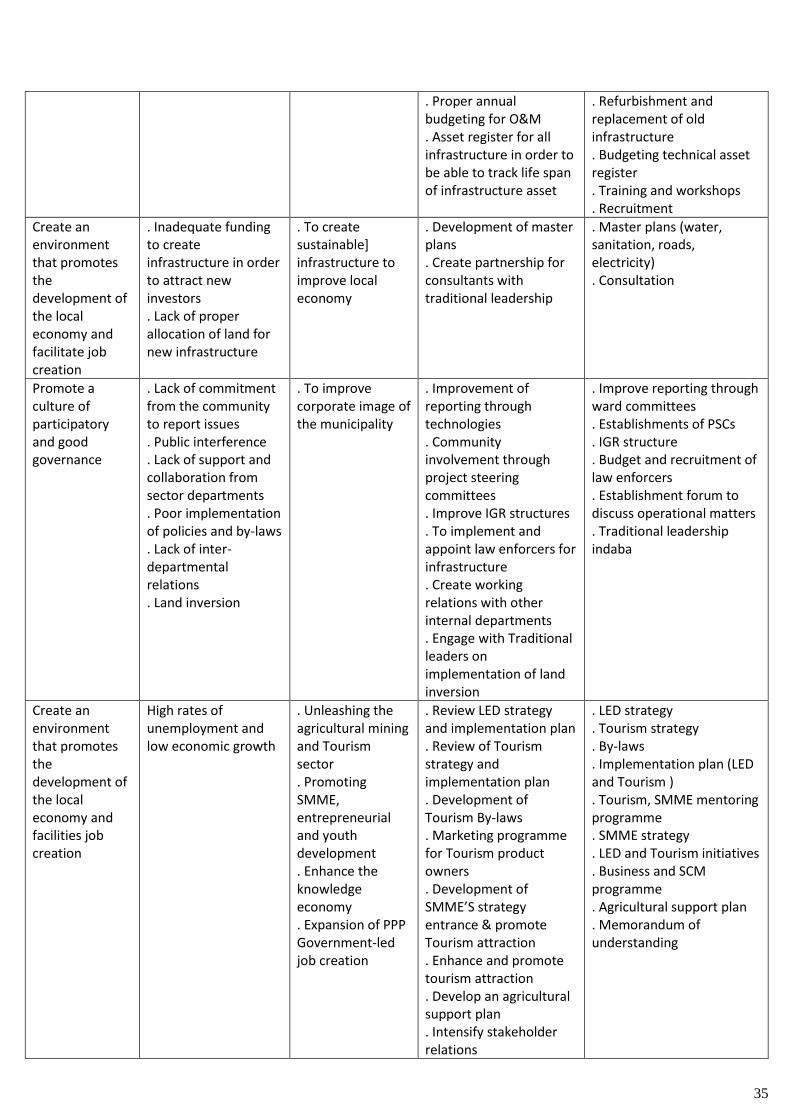
35
. Proper annual budgeting for O&M . Asset register for all infrastructure in order to be able to track life span of infrastructure asset
. Refurbishment and replacement of old infrastructure . Budgeting technical asset register . Training and workshops . Recruitment
Create an environment that promotes the development of the local economy and facilitate job creation
. Inadequate funding to create infrastructure in order to attract new investors . Lack of proper allocation of land for new infrastructure
. To create sustainable] infrastructure to improve local economy
. Development of master plans . Create partnership for consultants with traditional leadership
. Master plans (water, sanitation, roads, electricity) . Consultation
Promote a culture of participatory and good governance
. Lack of commitment from the community to report issues . Public interference . Lack of support and collaboration from sector departments . Poor implementation of policies and by-laws . Lack of inter-departmental relations . Land inversion
. To improve corporate image of the municipality
. Improvement of reporting through technologies . Community involvement through project steering committees . Improve IGR structures . To implement and appoint law enforcers for infrastructure . Create working relations with other internal departments . Engage with Traditional leaders on implementation of land inversion
. Improve reporting through ward committees . Establishments of PSCs . IGR structure . Budget and recruitment of law enforcers . Establishment forum to discuss operational matters . Traditional leadership indaba
Create an environment that promotes the development of the local economy and facilities job creation
High rates of unemployment and low economic growth
. Unleashing the agricultural mining and Tourism sector . Promoting SMME, entrepreneurial and youth development . Enhance the knowledge economy . Expansion of PPP Government-led job creation
. Review LED strategy and implementation plan . Review of Tourism strategy and implementation plan . Development of Tourism By-laws . Marketing programme for Tourism product owners . Development of SMME’S strategy entrance & promote Tourism attraction . Enhance and promote tourism attraction . Develop an agricultural support plan . Intensify stakeholder relations
. LED strategy
. Tourism strategy
. By-laws
. Implementation plan (LED and Tourism ) . Tourism, SMME mentoring programme . SMME strategy . LED and Tourism initiatives . Business and SCM programme . Agricultural support plan . Memorandum of understanding
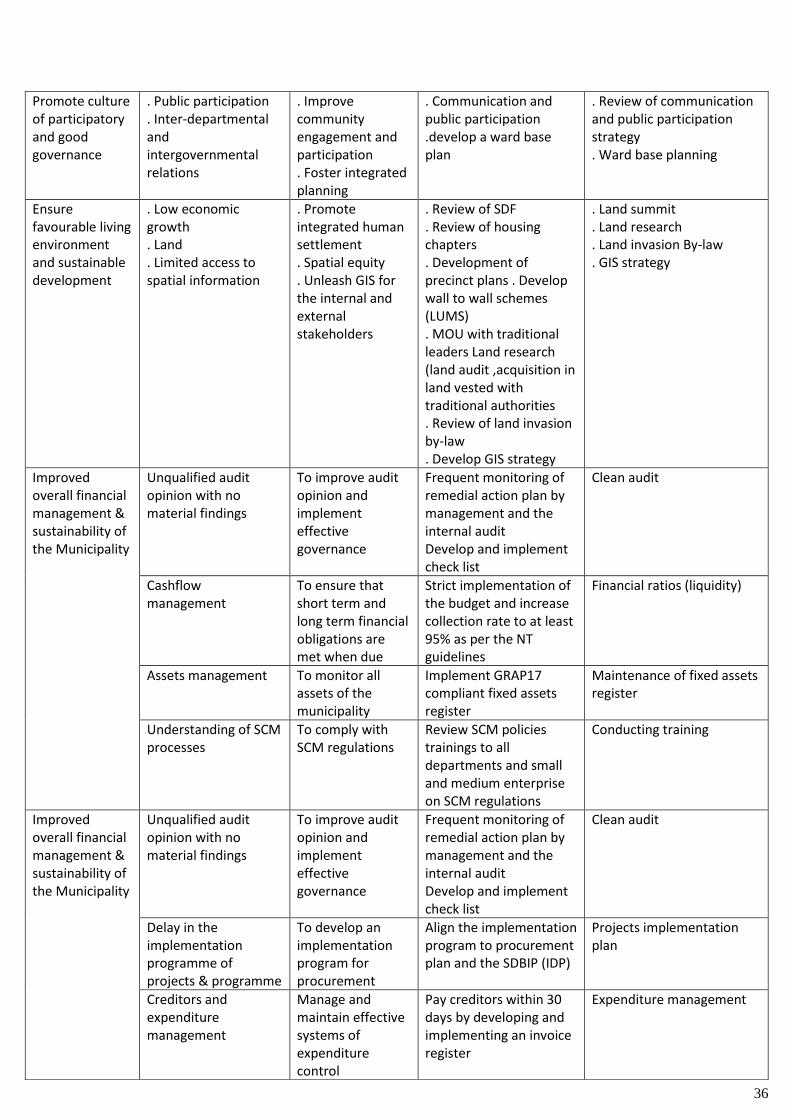
36
Promote culture of participatory and good governance
. Public participation
. Inter-departmental and intergovernmental relations
. Improve community engagement and participation . Foster integrated planning
. Communication and public participation .develop a ward base plan
. Review of communication and public participation strategy . Ward base planning
Ensure favourable living environment and sustainable development
. Low economic growth . Land . Limited access to spatial information
. Promote integrated human settlement . Spatial equity . Unleash GIS for the internal and external stakeholders
. Review of SDF
. Review of housing chapters . Development of precinct plans . Develop wall to wall schemes (LUMS) . MOU with traditional leaders Land research (land audit ,acquisition in land vested with traditional authorities . Review of land invasion by-law . Develop GIS strategy
. Land summit
. Land research
. Land invasion By-law
. GIS strategy
Improved overall financial management & sustainability of the Municipality
Unqualified audit opinion with no material findings
To improve audit opinion and implement effective governance
Frequent monitoring of remedial action plan by management and the internal audit Develop and implement check list
Clean audit
Cashflow management
To ensure that short term and long term financial obligations are met when due
Strict implementation of the budget and increase collection rate to at least 95% as per the NT guidelines
Financial ratios (liquidity)
Assets management To monitor all assets of the municipality
Implement GRAP17 compliant fixed assets register
Maintenance of fixed assets register
Understanding of SCM processes
To comply with SCM regulations
Review SCM policies trainings to all departments and small and medium enterprise on SCM regulations
Conducting training
Improved overall financial management & sustainability of the Municipality
Unqualified audit opinion with no material findings
To improve audit opinion and implement effective governance
Frequent monitoring of remedial action plan by management and the internal audit Develop and implement check list
Clean audit
Delay in the implementation programme of projects & programme
To develop an implementation program for procurement
Align the implementation program to procurement plan and the SDBIP (IDP)
Projects implementation plan
Creditors and expenditure management
Manage and maintain effective systems of expenditure control
Pay creditors within 30 days by developing and implementing an invoice register
Expenditure management
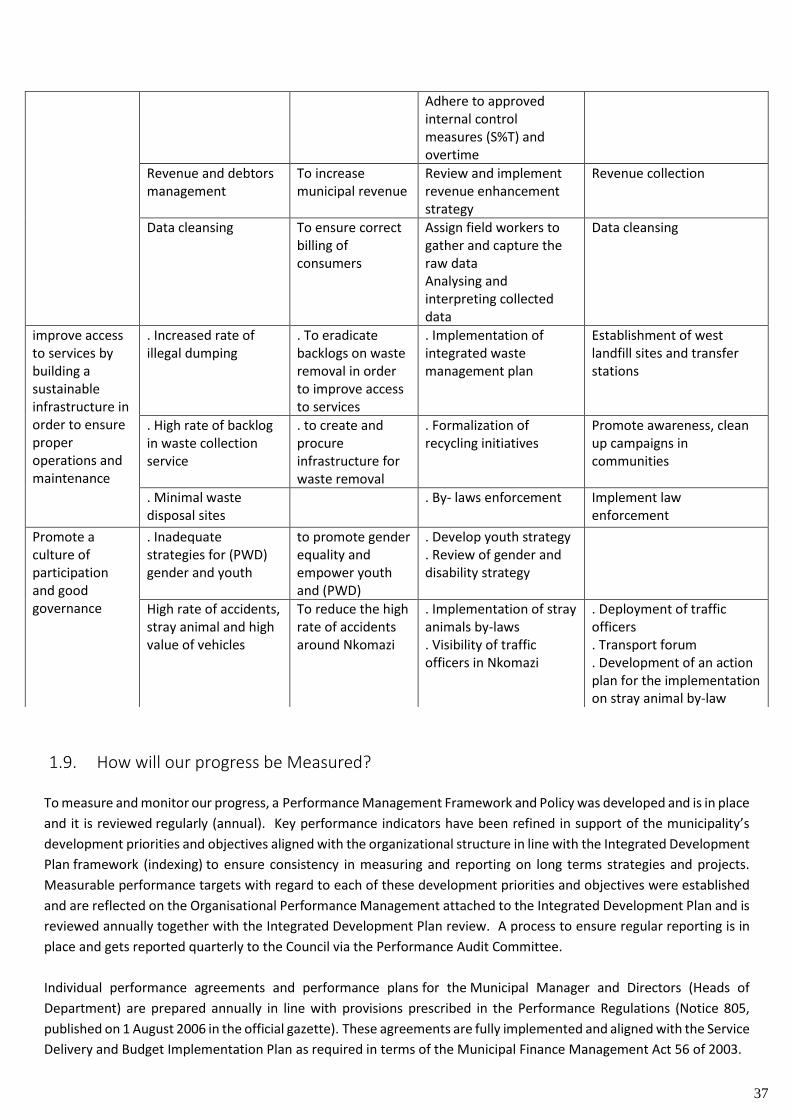
37
1.9. How will our progress be Measured?
To measure and monitor our progress, a Performance Management Framework and Policy was developed and is in place
and it is reviewed regularly (annual). Key performance indicators have been refined in support of the municipality’s
development priorities and objectives aligned with the organizational structure in line with the Integrated Development
Plan framework (indexing) to ensure consistency in measuring and reporting on long terms strategies and projects.
Measurable performance targets with regard to each of these development priorities and objectives were established
and are reflected on the Organisational Performance Management attached to the Integrated Development Plan and is
reviewed annually together with the Integrated Development Plan review. A process to ensure regular reporting is in
place and gets reported quarterly to the Council via the Performance Audit Committee.
Individual performance agreements and performance plans for the Municipal Manager and Directors (Heads of
Department) are prepared annually in line with provisions prescribed in the Performance Regulations (Notice 805,
published on 1 August 2006 in the official gazette). These agreements are fully implemented and aligned with the Service
Delivery and Budget Implementation Plan as required in terms of the Municipal Finance Management Act 56 of 2003.
Adhere to approved internal control measures (S%T) and overtime
Revenue and debtors management
To increase municipal revenue
Review and implement revenue enhancement strategy
Revenue collection
Data cleansing To ensure correct billing of consumers
Assign field workers to gather and capture the raw data Analysing and interpreting collected data
Data cleansing
improve access to services by building a sustainable infrastructure in order to ensure proper operations and maintenance
. Increased rate of illegal dumping
. To eradicate backlogs on waste removal in order to improve access to services
. Implementation of integrated waste management plan
Establishment of west landfill sites and transfer stations
. High rate of backlog in waste collection service
. to create and procure infrastructure for waste removal
. Formalization of recycling initiatives
Promote awareness, clean up campaigns in communities
. Minimal waste disposal sites
. By- laws enforcement Implement law
enforcement
Promote a culture of participation and good governance
. Inadequate strategies for (PWD) gender and youth
to promote gender equality and empower youth and (PWD)
. Develop youth strategy
. Review of gender and disability strategy
High rate of accidents, stray animal and high value of vehicles
To reduce the high rate of accidents around Nkomazi
. Implementation of stray animals by-laws . Visibility of traffic officers in Nkomazi
. Deployment of traffic officers . Transport forum . Development of an action plan for the implementation on stray animal by-law
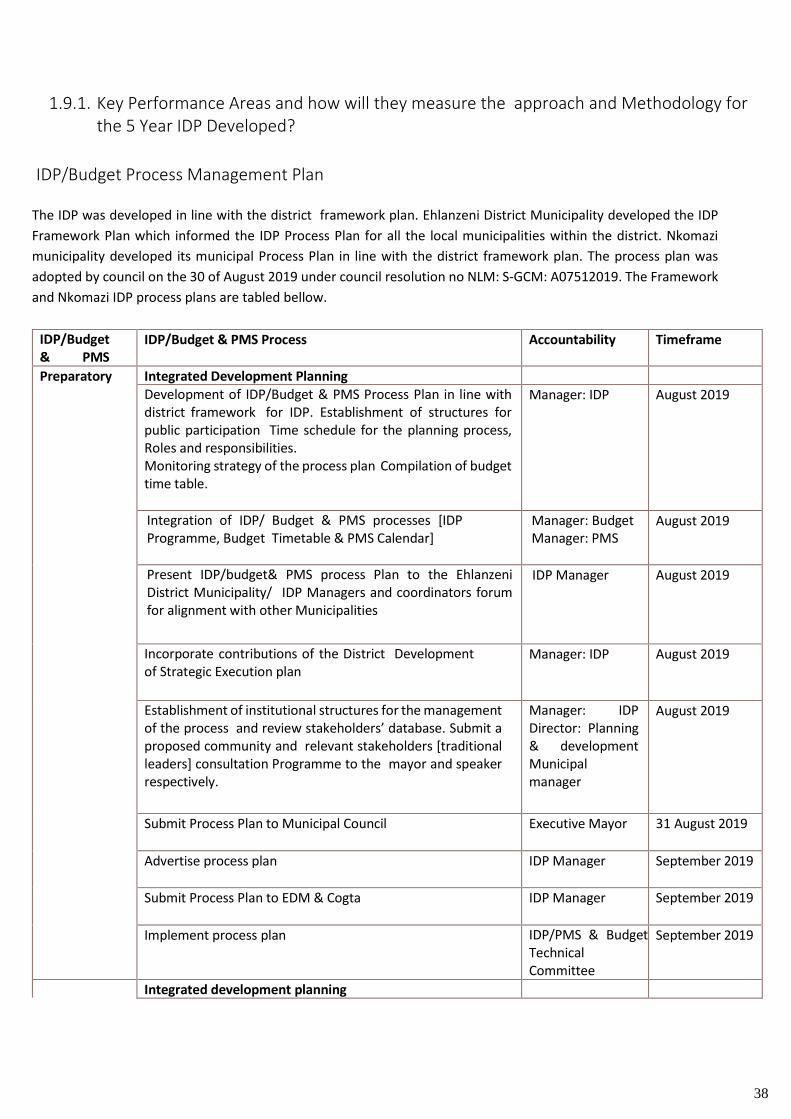
38
1.9.1. Key Performance Areas and how will they measure the approach and Methodology for the 5 Year IDP Developed?
IDP/Budget Process Management Plan
The IDP was developed in line with the district framework plan. Ehlanzeni District Municipality developed the IDP
Framework Plan which informed the IDP Process Plan for all the local municipalities within the district. Nkomazi
municipality developed its municipal Process Plan in line with the district framework plan. The process plan was
adopted by council on the 30 of August 2019 under council resolution no NLM: S-GCM: A07512019. The Framework
and Nkomazi IDP process plans are tabled bellow.
IDP/Budget & PMS Phases
IDP/Budget & PMS Process Accountability Timeframe
Preparatory phase
Integrated Development Planning
Development of IDP/Budget & PMS Process Plan in line with district framework for IDP. Establishment of structures for public participation Time schedule for the planning process, Roles and responsibilities. Monitoring strategy of the process plan Compilation of budget time table.
Manager: IDP August 2019
Integration of IDP/ Budget & PMS processes [IDP Programme, Budget Timetable & PMS Calendar]
Manager: Budget Manager: PMS
August 2019
Present IDP/budget& PMS process Plan to the Ehlanzeni District Municipality/ IDP Managers and coordinators forum for alignment with other Municipalities
IDP Manager August 2019
Incorporate contributions of the District Development of Strategic Execution plan
Manager: IDP August 2019
Establishment of institutional structures for the management of the process and review stakeholders’ database. Submit a proposed community and relevant stakeholders [traditional leaders] consultation Programme to the mayor and speaker respectively.
Manager: IDP Director: Planning & development Municipal manager
August 2019
Submit Process Plan to Municipal Council Executive Mayor 31 August 2019
Advertise process plan IDP Manager September 2019
Submit Process Plan to EDM & Cogta IDP Manager September 2019
Implement process plan IDP/PMS & Budget Technical Committee Municipal Top Management
September 2019
Integrated development planning
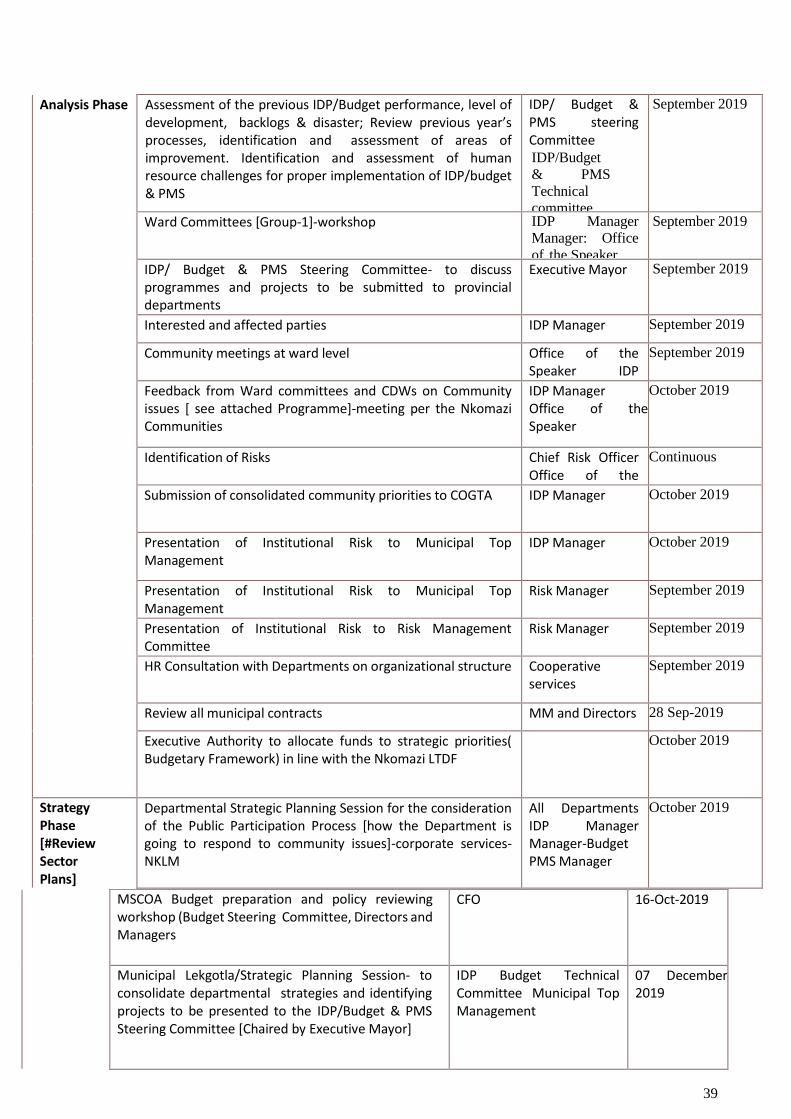
39
Analysis Phase Assessment of the previous IDP/Budget performance, level of development, backlogs & disaster; Review previous year’s processes, identification and assessment of areas of improvement. Identification and assessment of human resource challenges for proper implementation of IDP/budget & PMS
IDP/ Budget & PMS steering Committee IDP/Budget
& PMS
Technical
committee.
September 2019
Ward Committees [Group-1]-workshop IDP Manager
Manager: Office
of the Speaker
September 2019
IDP/ Budget & PMS Steering Committee- to discuss programmes and projects to be submitted to provincial departments
Executive Mayor September 2019
Interested and affected parties IDP Manager September 2019
Community meetings at ward level Office of the Speaker IDP Manager
September 2019
Feedback from Ward committees and CDWs on Community issues [ see attached Programme]-meeting per the Nkomazi Communities
IDP Manager Office of the Speaker
October 2019
Identification of Risks Chief Risk Officer Office of the Speaker
Continuous
Submission of consolidated community priorities to COGTA IDP Manager October 2019
Presentation of Institutional Risk to Municipal Top Management
IDP Manager October 2019
Presentation of Institutional Risk to Municipal Top Management
Risk Manager September 2019
Presentation of Institutional Risk to Risk Management Committee
Risk Manager September 2019
HR Consultation with Departments on organizational structure Cooperative services
September 2019
Review all municipal contracts MM and Directors 28 Sep-2019
Executive Authority to allocate funds to strategic priorities( Budgetary Framework) in line with the Nkomazi LTDF
October 2019
Strategy Phase [#Review Sector Plans]
Departmental Strategic Planning Session for the consideration of the Public Participation Process [how the Department is going to respond to community issues]-corporate services-NKLM
All Departments IDP Manager Manager-Budget PMS Manager
October 2019
MSCOA Budget preparation and policy reviewing workshop (Budget Steering Committee, Directors and Managers
CFO 16-Oct-2019
Municipal Lekgotla/Strategic Planning Session- to consolidate departmental strategies and identifying projects to be presented to the IDP/Budget & PMS Steering Committee [Chaired by Executive Mayor]
IDP Budget Technical Committee Municipal Top Management
07 December 2019
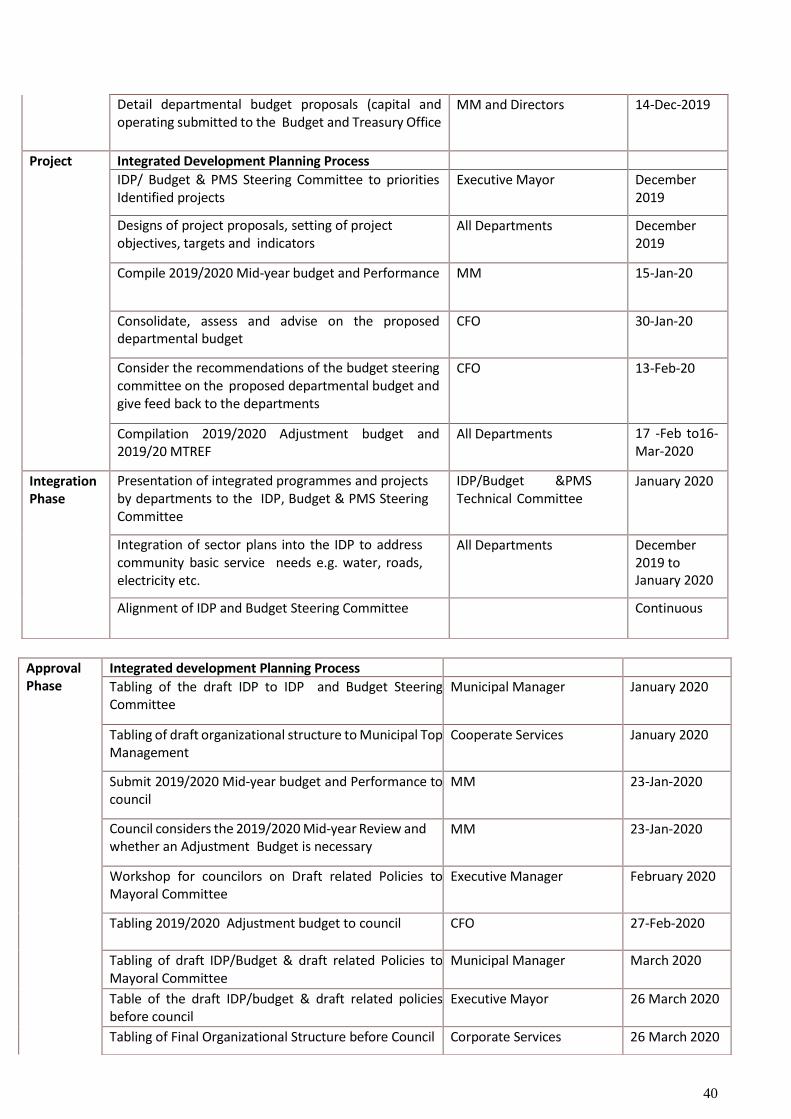
40
Detail departmental budget proposals (capital and operating submitted to the Budget and Treasury Office
MM and Directors 14-Dec-2019
Project Phase
Integrated Development Planning Process
IDP/ Budget & PMS Steering Committee to priorities Identified projects
Executive Mayor December 2019
Designs of project proposals, setting of project objectives, targets and indicators
All Departments December 2019
Compile 2019/2020 Mid-year budget and Performance MM 15-Jan-20
Consolidate, assess and advise on the proposed departmental budget
CFO 30-Jan-20
Consider the recommendations of the budget steering committee on the proposed departmental budget and give feed back to the departments
CFO 13-Feb-20
Compilation 2019/2020 Adjustment budget and 2019/20 MTREF
All Departments 17 -Feb to16- Mar-2020
Integration Phase
Presentation of integrated programmes and projects by departments to the IDP, Budget & PMS Steering Committee
IDP/Budget &PMS Technical Committee
January 2020
Integration of sector plans into the IDP to address community basic service needs e.g. water, roads, electricity etc.
All Departments December 2019 to January 2020
Alignment of IDP and Budget Steering Committee Continuous
Approval Phase
Integrated development Planning Process
Tabling of the draft IDP to IDP and Budget Steering Committee
Municipal Manager January 2020
Tabling of draft organizational structure to Municipal Top Management
Cooperate Services January 2020
Submit 2019/2020 Mid-year budget and Performance to council
MM 23-Jan-2020
Council considers the 2019/2020 Mid-year Review and whether an Adjustment Budget is necessary
MM 23-Jan-2020
Workshop for councilors on Draft related Policies to Mayoral Committee
Executive Manager February 2020
Tabling 2019/2020 Adjustment budget to council CFO 27-Feb-2020
Tabling of draft IDP/Budget & draft related Policies to Mayoral Committee
Municipal Manager March 2020
Table of the draft IDP/budget & draft related policies before council
Executive Mayor 26 March 2020
Tabling of Final Organizational Structure before Council Corporate Services 26 March 2020
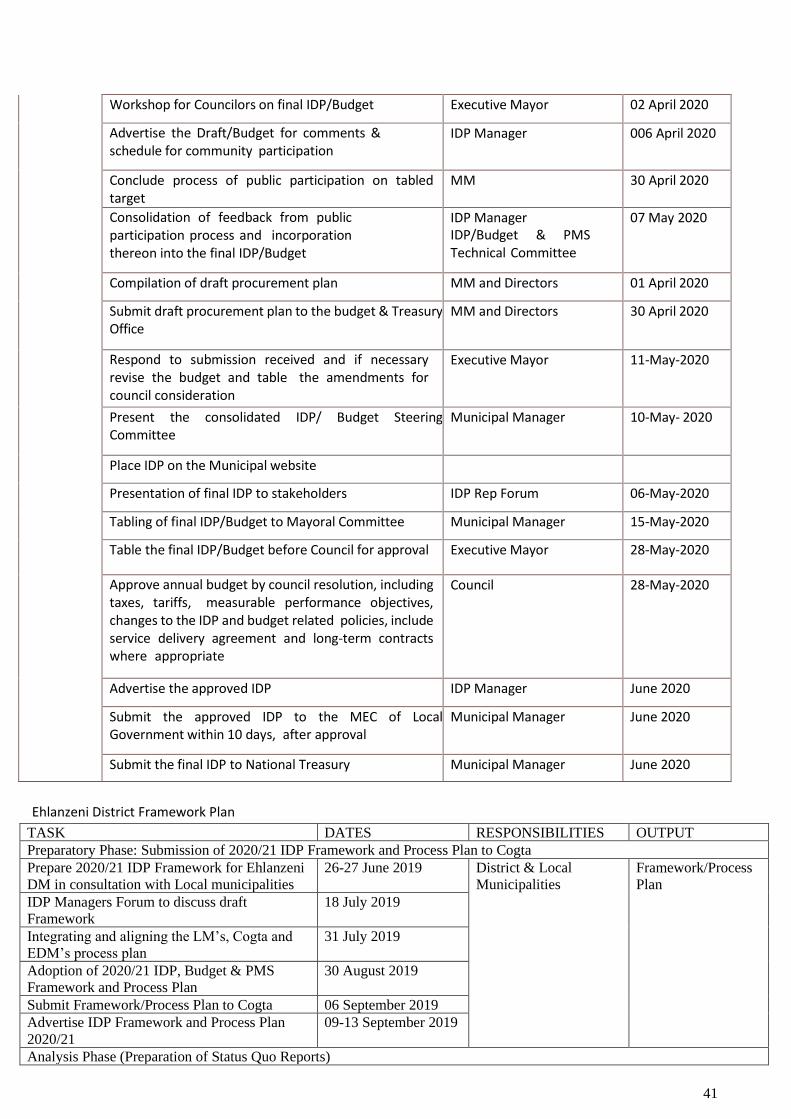
41
Ehlanzeni District Framework Plan
TASK DATES RESPONSIBILITIES OUTPUT
Preparatory Phase: Submission of 2020/21 IDP Framework and Process Plan to Cogta
Prepare 2020/21 IDP Framework for Ehlanzeni
DM in consultation with Local municipalities
26-27 June 2019 District & Local
Municipalities
Framework/Process
Plan
IDP Managers Forum to discuss draft
Framework
18 July 2019
Integrating and aligning the LM’s, Cogta and
EDM’s process plan
31 July 2019
Adoption of 2020/21 IDP, Budget & PMS
Framework and Process Plan
30 August 2019
Submit Framework/Process Plan to Cogta 06 September 2019
Advertise IDP Framework and Process Plan
2020/21
09-13 September 2019
Analysis Phase (Preparation of Status Quo Reports)
Workshop for Councilors on final IDP/Budget Executive Mayor 02 April 2020
Advertise the Draft/Budget for comments & schedule for community participation
IDP Manager 006 April 2020
Conclude process of public participation on tabled target
MM 30 April 2020
Consolidation of feedback from public participation process and incorporation thereon into the final IDP/Budget
IDP Manager IDP/Budget & PMS Technical Committee
07 May 2020
Compilation of draft procurement plan MM and Directors 01 April 2020
Submit draft procurement plan to the budget & Treasury Office
MM and Directors 30 April 2020
Respond to submission received and if necessary revise the budget and table the amendments for council consideration
Executive Mayor 11-May-2020
Present the consolidated IDP/ Budget Steering Committee
Municipal Manager 10-May- 2020
Place IDP on the Municipal website
Presentation of final IDP to stakeholders IDP Rep Forum 06-May-2020
Tabling of final IDP/Budget to Mayoral Committee Municipal Manager 15-May-2020
Table the final IDP/Budget before Council for approval Executive Mayor 28-May-2020
Approve annual budget by council resolution, including taxes, tariffs, measurable performance objectives, changes to the IDP and budget related policies, include service delivery agreement and long-term contracts where appropriate
Council 28-May-2020
Advertise the approved IDP IDP Manager June 2020
Submit the approved IDP to the MEC of Local Government within 10 days, after approval
Municipal Manager June 2020
Submit the final IDP to National Treasury Municipal Manager June 2020
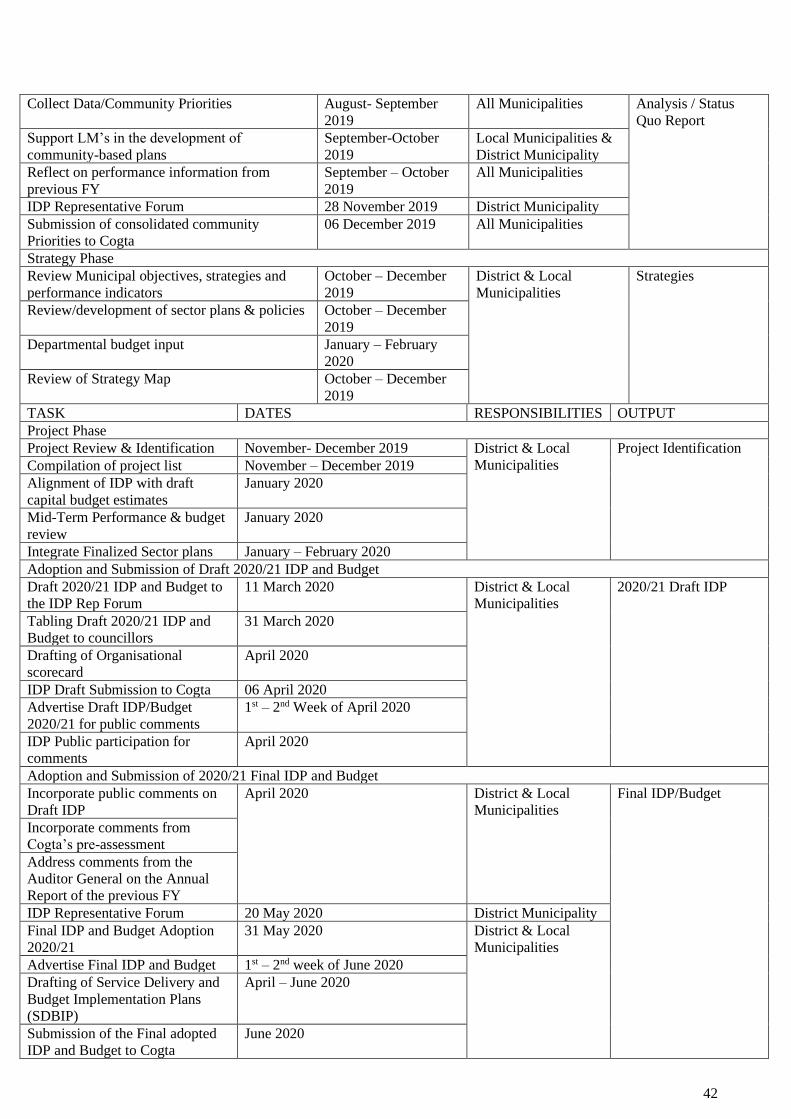
42
Collect Data/Community Priorities August- September
2019
All Municipalities Analysis / Status
Quo Report
Support LM’s in the development of
community-based plans
September-October
2019
Local Municipalities &
District Municipality
Reflect on performance information from
previous FY
September – October
2019
All Municipalities
IDP Representative Forum 28 November 2019 District Municipality
Submission of consolidated community
Priorities to Cogta
06 December 2019 All Municipalities
Strategy Phase
Review Municipal objectives, strategies and
performance indicators
October – December
2019
District & Local
Municipalities
Strategies
Review/development of sector plans & policies October – December
2019
Departmental budget input January – February
2020
Review of Strategy Map October – December
2019
TASK DATES RESPONSIBILITIES OUTPUT
Project Phase
Project Review & Identification November- December 2019 District & Local
Municipalities
Project Identification
Compilation of project list November – December 2019
Alignment of IDP with draft
capital budget estimates
January 2020
Mid-Term Performance & budget
review
January 2020
Integrate Finalized Sector plans January – February 2020
Adoption and Submission of Draft 2020/21 IDP and Budget
Draft 2020/21 IDP and Budget to
the IDP Rep Forum
11 March 2020 District & Local
Municipalities
2020/21 Draft IDP
Tabling Draft 2020/21 IDP and
Budget to councillors
31 March 2020
Drafting of Organisational
scorecard
April 2020
IDP Draft Submission to Cogta 06 April 2020
Advertise Draft IDP/Budget
2020/21 for public comments
1st – 2nd Week of April 2020
IDP Public participation for
comments
April 2020
Adoption and Submission of 2020/21 Final IDP and Budget
Incorporate public comments on
Draft IDP
April 2020 District & Local
Municipalities
Final IDP/Budget
Incorporate comments from
Cogta’s pre-assessment
Address comments from the
Auditor General on the Annual
Report of the previous FY
IDP Representative Forum 20 May 2020 District Municipality
Final IDP and Budget Adoption
2020/21
31 May 2020 District & Local
Municipalities
Advertise Final IDP and Budget 1st – 2nd week of June 2020
Drafting of Service Delivery and
Budget Implementation Plans
(SDBIP)
April – June 2020
Submission of the Final adopted
IDP and Budget to Cogta
June 2020
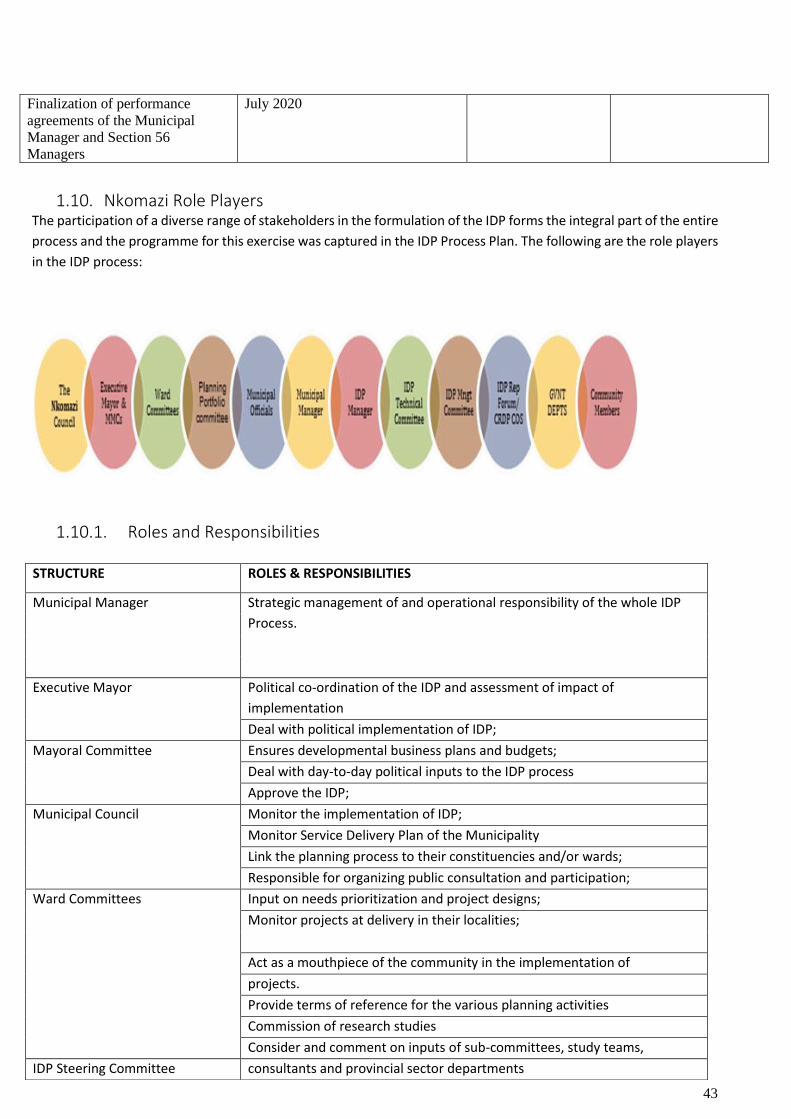
43
Finalization of performance
agreements of the Municipal
Manager and Section 56
Managers
July 2020
1.10. Nkomazi Role Players The participation of a diverse range of stakeholders in the formulation of the IDP forms the integral part of the entire
process and the programme for this exercise was captured in the IDP Process Plan. The following are the role players
in the IDP process:
1.10.1. Roles and Responsibilities
STRUCTURE ROLES & RESPONSIBILITIES
Municipal Manager
Strategic management of and operational responsibility of the whole IDP
Process.
Executive Mayor Political co-ordination of the IDP and assessment of impact of
implementation
Deal with political implementation of IDP;
Mayoral Committee Ensures developmental business plans and budgets;
Deal with day-to-day political inputs to the IDP process
Approve the IDP;
Municipal Council Monitor the implementation of IDP;
Monitor Service Delivery Plan of the Municipality
Link the planning process to their constituencies and/or wards;
Responsible for organizing public consultation and participation;
Ward Committees Input on needs prioritization and project designs;
Monitor projects at delivery in their localities;
Act as a mouthpiece of the community in the implementation of
projects.
Provide terms of reference for the various planning activities
Commission of research studies
Consider and comment on inputs of sub-committees, study teams,
IDP Steering Committee consultants and provincial sector departments
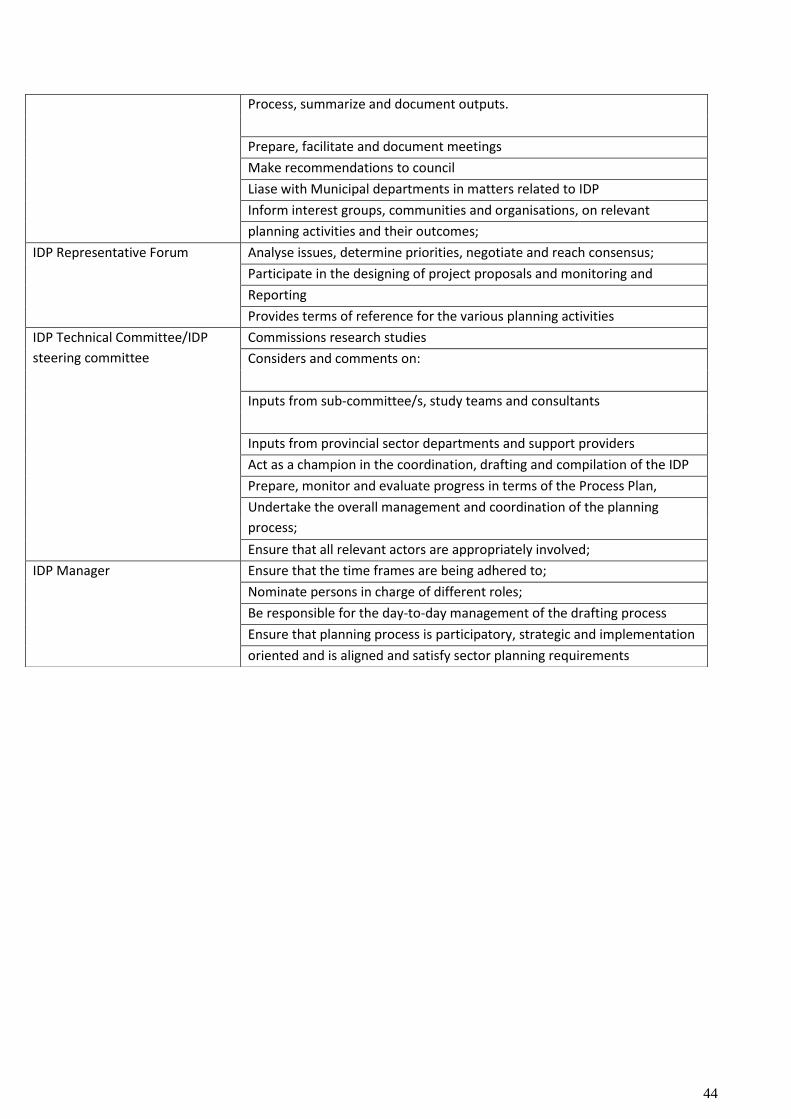
44
Process, summarize and document outputs.
Prepare, facilitate and document meetings
Make recommendations to council
Liase with Municipal departments in matters related to IDP
Inform interest groups, communities and organisations, on relevant
planning activities and their outcomes;
IDP Representative Forum Analyse issues, determine priorities, negotiate and reach consensus;
Participate in the designing of project proposals and monitoring and
Reporting
Provides terms of reference for the various planning activities
IDP Technical Committee/IDP
steering committee
Commissions research studies
Considers and comments on:
Inputs from sub-committee/s, study teams and consultants
Inputs from provincial sector departments and support providers
Act as a champion in the coordination, drafting and compilation of the IDP
Prepare, monitor and evaluate progress in terms of the Process Plan,
Undertake the overall management and coordination of the planning
process;
Ensure that all relevant actors are appropriately involved;
IDP Manager Ensure that the time frames are being adhered to;
Nominate persons in charge of different roles;
Be responsible for the day-to-day management of the drafting process
Ensure that planning process is participatory, strategic and implementation
oriented and is aligned and satisfy sector planning requirements
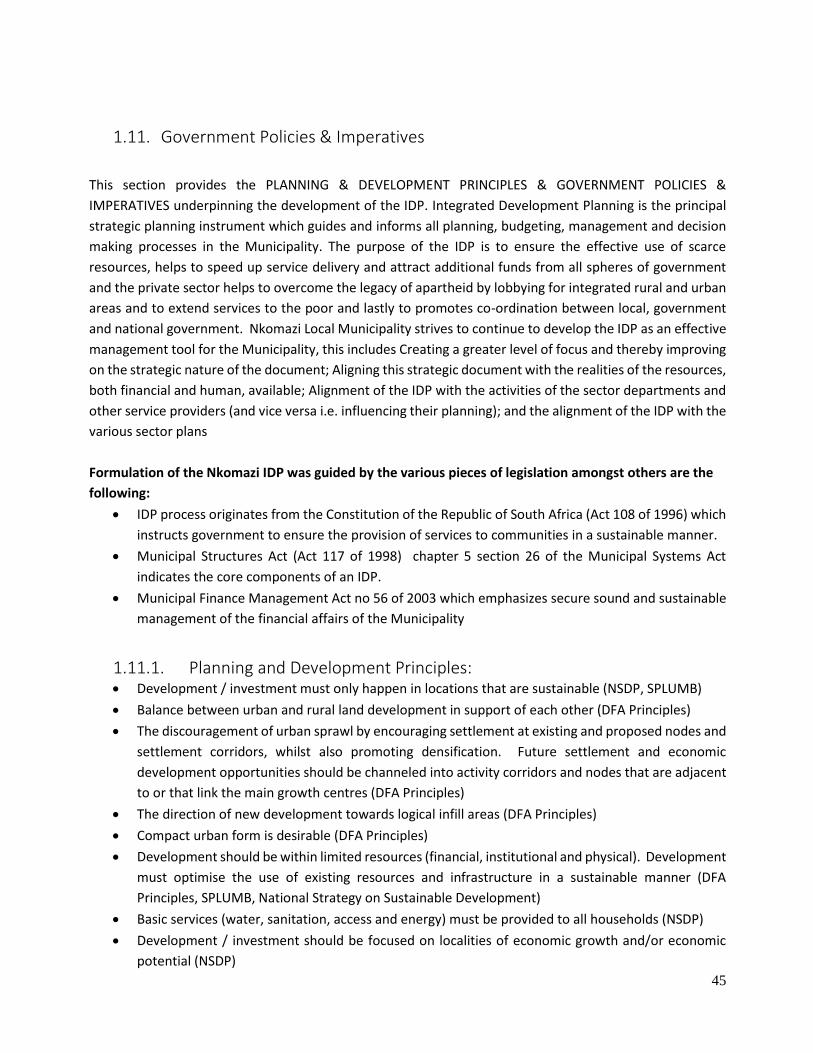
45
1.11. Government Policies & Imperatives
This section provides the PLANNING & DEVELOPMENT PRINCIPLES & GOVERNMENT POLICIES &
IMPERATIVES underpinning the development of the IDP. Integrated Development Planning is the principal
strategic planning instrument which guides and informs all planning, budgeting, management and decision
making processes in the Municipality. The purpose of the IDP is to ensure the effective use of scarce
resources, helps to speed up service delivery and attract additional funds from all spheres of government
and the private sector helps to overcome the legacy of apartheid by lobbying for integrated rural and urban
areas and to extend services to the poor and lastly to promotes co-ordination between local, government
and national government. Nkomazi Local Municipality strives to continue to develop the IDP as an effective
management tool for the Municipality, this includes Creating a greater level of focus and thereby improving
on the strategic nature of the document; Aligning this strategic document with the realities of the resources,
both financial and human, available; Alignment of the IDP with the activities of the sector departments and
other service providers (and vice versa i.e. influencing their planning); and the alignment of the IDP with the
various sector plans
Formulation of the Nkomazi IDP was guided by the various pieces of legislation amongst others are the
following:
• IDP process originates from the Constitution of the Republic of South Africa (Act 108 of 1996) which
instructs government to ensure the provision of services to communities in a sustainable manner.
• Municipal Structures Act (Act 117 of 1998) chapter 5 section 26 of the Municipal Systems Act
indicates the core components of an IDP.
• Municipal Finance Management Act no 56 of 2003 which emphasizes secure sound and sustainable
management of the financial affairs of the Municipality
1.11.1. Planning and Development Principles: • Development / investment must only happen in locations that are sustainable (NSDP, SPLUMB)
• Balance between urban and rural land development in support of each other (DFA Principles)
• The discouragement of urban sprawl by encouraging settlement at existing and proposed nodes and
settlement corridors, whilst also promoting densification. Future settlement and economic
development opportunities should be channeled into activity corridors and nodes that are adjacent
to or that link the main growth centres (DFA Principles)
• The direction of new development towards logical infill areas (DFA Principles)
• Compact urban form is desirable (DFA Principles)
• Development should be within limited resources (financial, institutional and physical). Development
must optimise the use of existing resources and infrastructure in a sustainable manner (DFA
Principles, SPLUMB, National Strategy on Sustainable Development)
• Basic services (water, sanitation, access and energy) must be provided to all households (NSDP)
• Development / investment should be focused on localities of economic growth and/or economic
potential (NSDP)
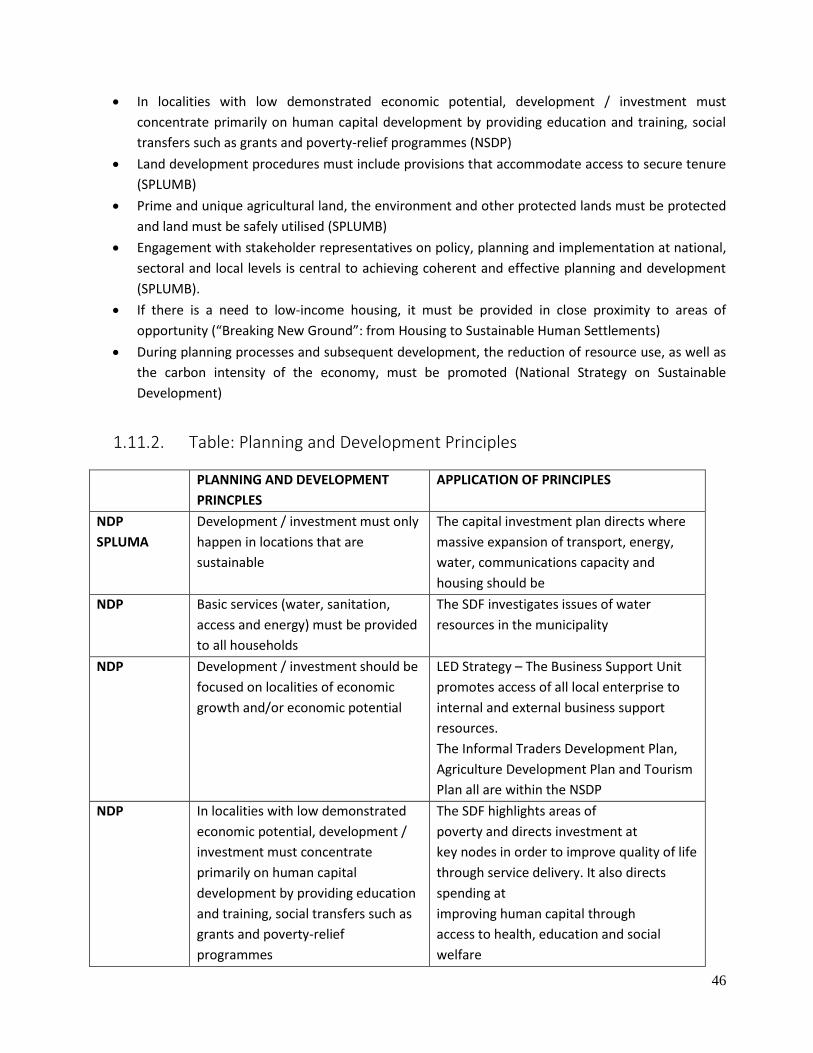
46
• In localities with low demonstrated economic potential, development / investment must
concentrate primarily on human capital development by providing education and training, social
transfers such as grants and poverty-relief programmes (NSDP)
• Land development procedures must include provisions that accommodate access to secure tenure
(SPLUMB)
• Prime and unique agricultural land, the environment and other protected lands must be protected
and land must be safely utilised (SPLUMB)
• Engagement with stakeholder representatives on policy, planning and implementation at national,
sectoral and local levels is central to achieving coherent and effective planning and development
(SPLUMB).
• If there is a need to low-income housing, it must be provided in close proximity to areas of
opportunity (“Breaking New Ground”: from Housing to Sustainable Human Settlements)
• During planning processes and subsequent development, the reduction of resource use, as well as
the carbon intensity of the economy, must be promoted (National Strategy on Sustainable
Development)
1.11.2. Table: Planning and Development Principles
PLANNING AND DEVELOPMENT
PRINCPLES
APPLICATION OF PRINCIPLES
NDP
SPLUMA
Development / investment must only
happen in locations that are
sustainable
The capital investment plan directs where
massive expansion of transport, energy,
water, communications capacity and
housing should be
NDP Basic services (water, sanitation,
access and energy) must be provided
to all households
The SDF investigates issues of water
resources in the municipality
NDP Development / investment should be
focused on localities of economic
growth and/or economic potential
LED Strategy – The Business Support Unit
promotes access of all local enterprise to
internal and external business support
resources.
The Informal Traders Development Plan,
Agriculture Development Plan and Tourism
Plan all are within the NSDP
NDP In localities with low demonstrated
economic potential, development /
investment must concentrate
primarily on human capital
development by providing education
and training, social transfers such as
grants and poverty-relief
programmes
The SDF highlights areas of
poverty and directs investment at
key nodes in order to improve quality of life
through service delivery. It also directs
spending at
improving human capital through
access to health, education and social
welfare
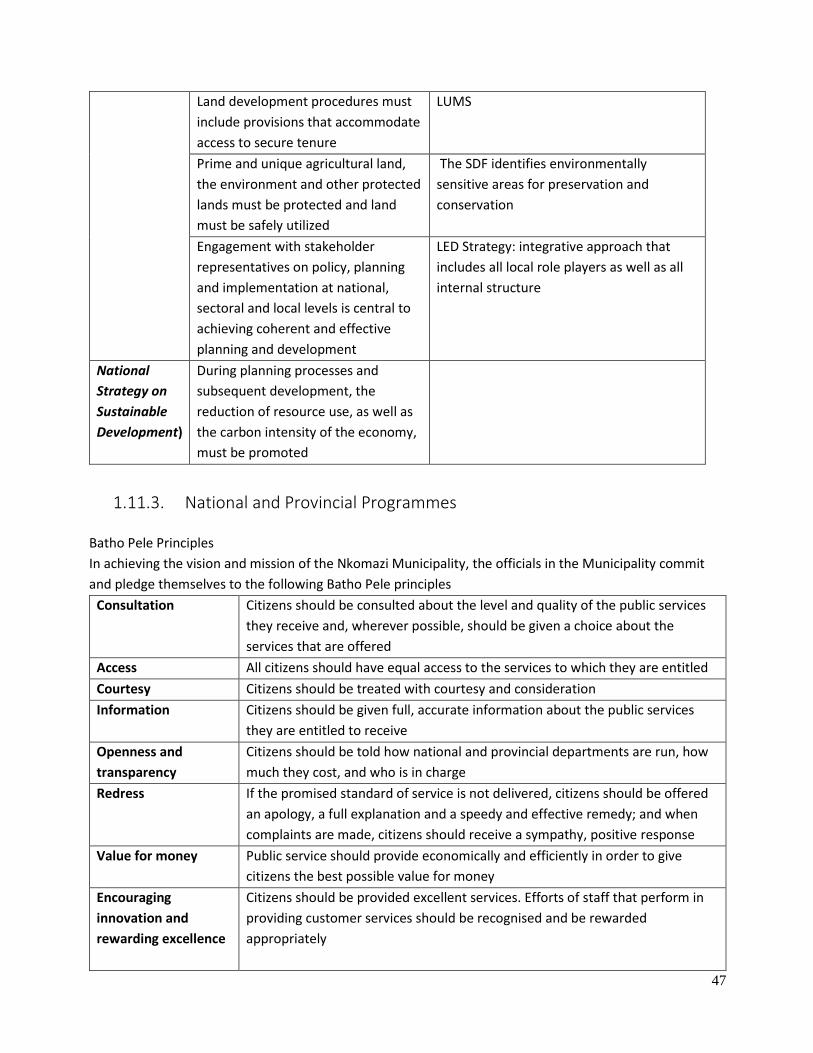
47
Land development procedures must
include provisions that accommodate
access to secure tenure
LUMS
Prime and unique agricultural land,
the environment and other protected
lands must be protected and land
must be safely utilized
The SDF identifies environmentally
sensitive areas for preservation and
conservation
Engagement with stakeholder
representatives on policy, planning
and implementation at national,
sectoral and local levels is central to
achieving coherent and effective
planning and development
LED Strategy: integrative approach that
includes all local role players as well as all
internal structure
National
Strategy on
Sustainable
Development)
During planning processes and
subsequent development, the
reduction of resource use, as well as
the carbon intensity of the economy,
must be promoted
1.11.3. National and Provincial Programmes
Batho Pele Principles
In achieving the vision and mission of the Nkomazi Municipality, the officials in the Municipality commit
and pledge themselves to the following Batho Pele principles
Consultation Citizens should be consulted about the level and quality of the public services
they receive and, wherever possible, should be given a choice about the
services that are offered
Access All citizens should have equal access to the services to which they are entitled
Courtesy Citizens should be treated with courtesy and consideration
Information Citizens should be given full, accurate information about the public services
they are entitled to receive
Openness and
transparency
Citizens should be told how national and provincial departments are run, how
much they cost, and who is in charge
Redress If the promised standard of service is not delivered, citizens should be offered
an apology, a full explanation and a speedy and effective remedy; and when
complaints are made, citizens should receive a sympathy, positive response
Value for money Public service should provide economically and efficiently in order to give
citizens the best possible value for money
Encouraging
innovation and
rewarding excellence
Citizens should be provided excellent services. Efforts of staff that perform in
providing customer services should be recognised and be rewarded
appropriately
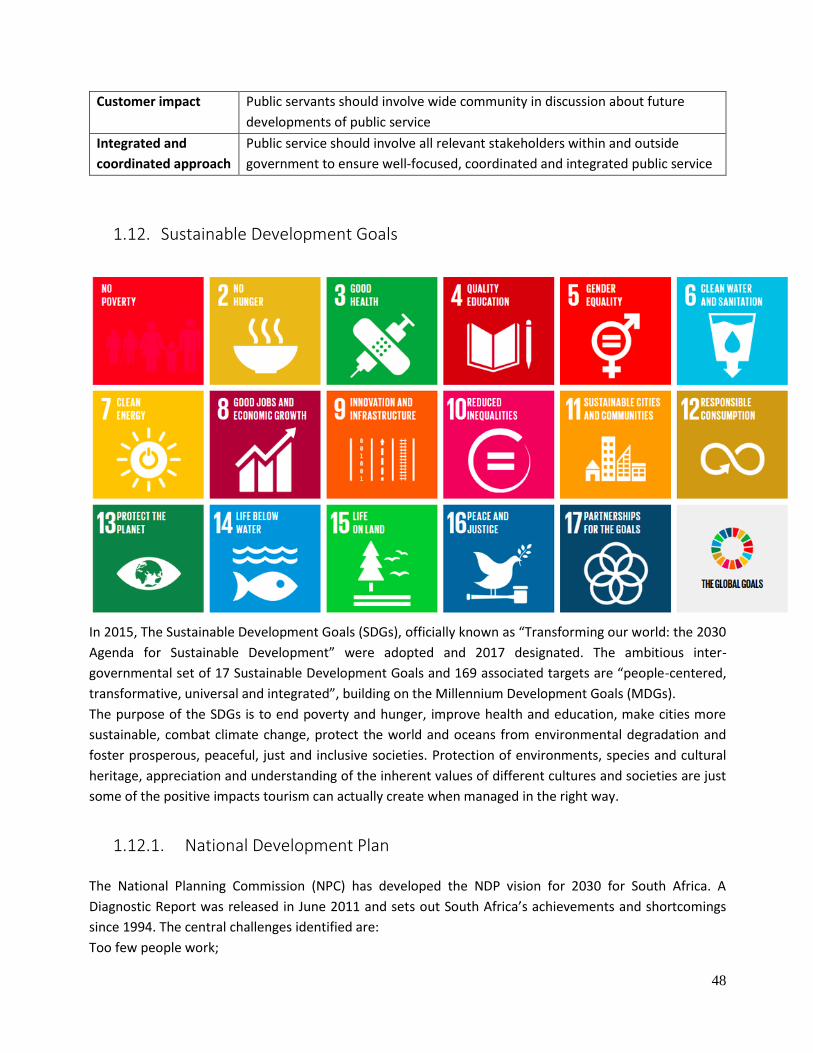
48
Customer impact Public servants should involve wide community in discussion about future
developments of public service
Integrated and
coordinated approach
Public service should involve all relevant stakeholders within and outside
government to ensure well-focused, coordinated and integrated public service
1.12. Sustainable Development Goals
In 2015, The Sustainable Development Goals (SDGs), officially known as “Transforming our world: the 2030
Agenda for Sustainable Development” were adopted and 2017 designated. The ambitious inter-
governmental set of 17 Sustainable Development Goals and 169 associated targets are “people-centered,
transformative, universal and integrated”, building on the Millennium Development Goals (MDGs).
The purpose of the SDGs is to end poverty and hunger, improve health and education, make cities more
sustainable, combat climate change, protect the world and oceans from environmental degradation and
foster prosperous, peaceful, just and inclusive societies. Protection of environments, species and cultural
heritage, appreciation and understanding of the inherent values of different cultures and societies are just
some of the positive impacts tourism can actually create when managed in the right way.
1.12.1. National Development Plan
The National Planning Commission (NPC) has developed the NDP vision for 2030 for South Africa. A
Diagnostic Report was released in June 2011 and sets out South Africa’s achievements and shortcomings
since 1994. The central challenges identified are:
Too few people work;
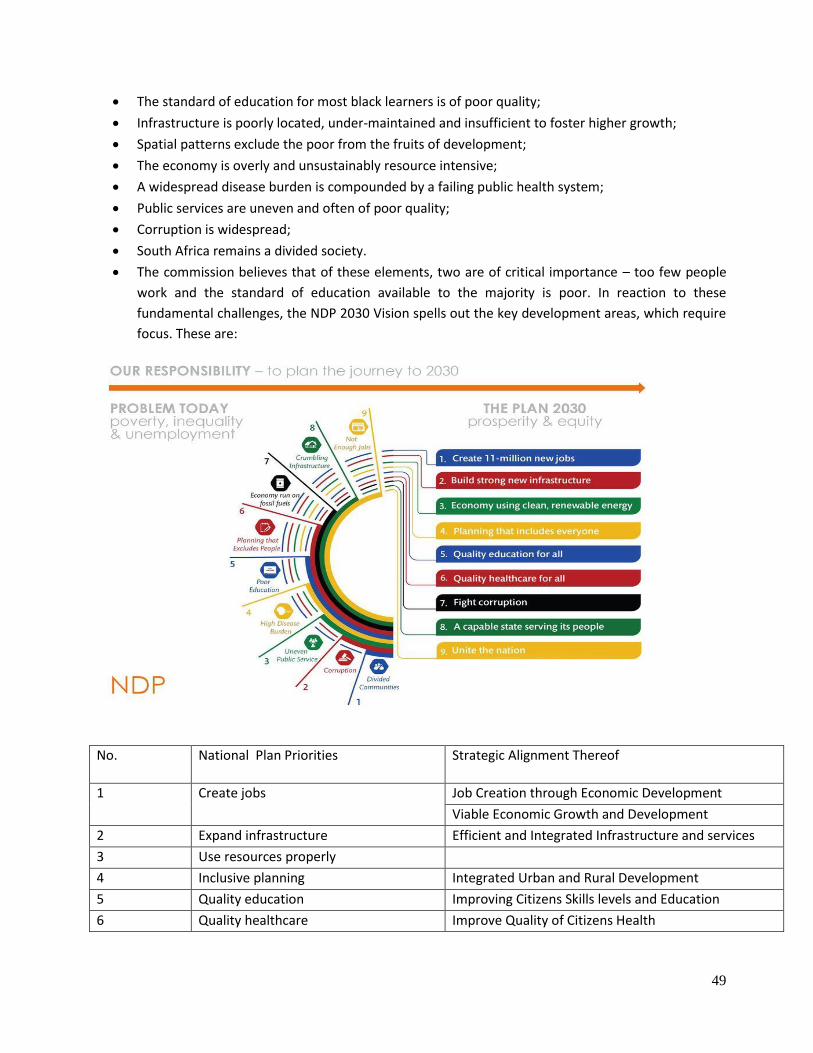
49
• The standard of education for most black learners is of poor quality;
• Infrastructure is poorly located, under-maintained and insufficient to foster higher growth;
• Spatial patterns exclude the poor from the fruits of development;
• The economy is overly and unsustainably resource intensive;
• A widespread disease burden is compounded by a failing public health system;
• Public services are uneven and often of poor quality;
• Corruption is widespread;
• South Africa remains a divided society.
• The commission believes that of these elements, two are of critical importance – too few people
work and the standard of education available to the majority is poor. In reaction to these
fundamental challenges, the NDP 2030 Vision spells out the key development areas, which require
focus. These are:
No. National Plan Priorities Strategic Alignment Thereof
1 Create jobs Job Creation through Economic Development
Viable Economic Growth and Development
2 Expand infrastructure Efficient and Integrated Infrastructure and services
3 Use resources properly
4 Inclusive planning Integrated Urban and Rural Development
5 Quality education Improving Citizens Skills levels and Education
6 Quality healthcare Improve Quality of Citizens Health
50
7 Build a capable state Democratic, Responsible, Transparent, Objective and
Equitable Municipal Governance
8 Fight corruption Public Safety and Living Environment
9 Unite the nation Promoting Social Cohesion
1.12.2. Integrated Urban Development Framework [ IUDF]
The Draft Integrated Urban Development Framework (IUDF) is designed to unlock the development synergy
that comes from coordinated investments in people and places. The IUDF builds on various chapters in the
National Development Plan (NDP) and extends Chapter 8 ‘Transforming human settlements and the national
space economy’, and its vision for urban South Africa:
“By 2030 South Africa should observe meaningful and measurable progress in reviving rural areas and in
creating more functionally integrated, balanced and vibrant urban settlements. For this to happen, the
country must: clarify and relentlessly pursue a national vision for spatial development; sharpen the
instruments for achieving this vision; and build the required capabilities in the state and among citizens.”
The policy framework aims to guide the development of inclusive, resilient and liveable urban settlements,
while squarely addressing the unique conditions and challenges facing South Africa’s cities and towns. It
provides a new approach to urban investment by the developmental state, which in turn guides the private
sector and households.
Its vision is: ‘Liveable, safe, resource-efficient cities and towns that are socially integrated, economically
inclusive and globally competitive, where residents actively participate in urban life’.
Importantly, this vision for South Africa’s urban areas recognises that the country has different types of cities
and towns, which have different roles and requirements. As such, the vision has to be interpreted and
pursued in differentiated and locally relevant ways. To achieve this transformative vision, four overall
strategic goals are introduced bellow and these goals inform the eight priority levers of the strategy.
Strategic goals Objectives
Access:
To ensure people have access to social and economic services,
opportunities and choices.
Growth:
To harness urban dynamism for inclusive, sustainable economic growth and
development.
Governance
To enhance the capacity of the state and its citizens to work together to
achieve social Integration
Spatial Transformation:
To forge new spatial forms in settlement, transport, social and economic
areas.
51
1.12.3. The Eight levers are premised on the understanding that:
• Spatial planning forms the basis for achieving integrated urban development, which follows a
specific sequence of urban policy actions
• Integrated transport that informs targeted investment into integrated human settlements,
underpinned by integrated infrastructure network system
• Efficient land governance which all together trigger economic diversification inclusion and
empowered communities
• Deep governance reform to enable and sustain all of the above
• Breaking New Ground – Human Settlements
• The Breaking New Ground Human Settlement Principles stipulates:
• Low-income housing must be provided in close proximity to areas of opportunity
1.12.4. 14 National Outcomes The 14 National Outcomes that all provincial governments must align to are:
No. National Outcome Strategic Alignment Thereof
1 Improved Quality of basic education Improving Citizens Skills levels and education
2 A long and healthy life for all South Africans Improve Quality of citizens Health
3 All people in South Africa are and feel safe Creation of Secure and Friendly City through fighting
crime
4 Decent employment through inclusive economic
growth
Job Creation through economic development
5 Skilled and capable workforce to support an inclusive
growth path
Municipality Resourced and committed to attaining the
vision and mission of the organization
6 An efficient, competitive and responsive
infrastructure network
Efficient and Integrated infrastructure and services
7 Vibrant, equitable, sustainable rural communities
contributing towards food security for all
Viable Economic Growth and Development
8 Sustainable human settlements and improved quality
of household life
To promote the achievement of a non-racial,
integrated society through the development of
sustainable human settlements and quality housing
9 Responsive, accountable, effective and efficient local
government system
Democratic, Responsible, transparent, Objective and
equitable Municipal Governance
10 Protect and enhance our environmental assets and
natural resources
To promote environmental; conservation and
promotion
11 Create a better South Africa, a better Africa, and a
better world
Promoting Social Cohesion
12 An efficient, effective and development oriented
public service and an empowered, fair and inclusive
citizenship
Democratic, Responsible, transparent, Objective and
equitable Municipal Governance
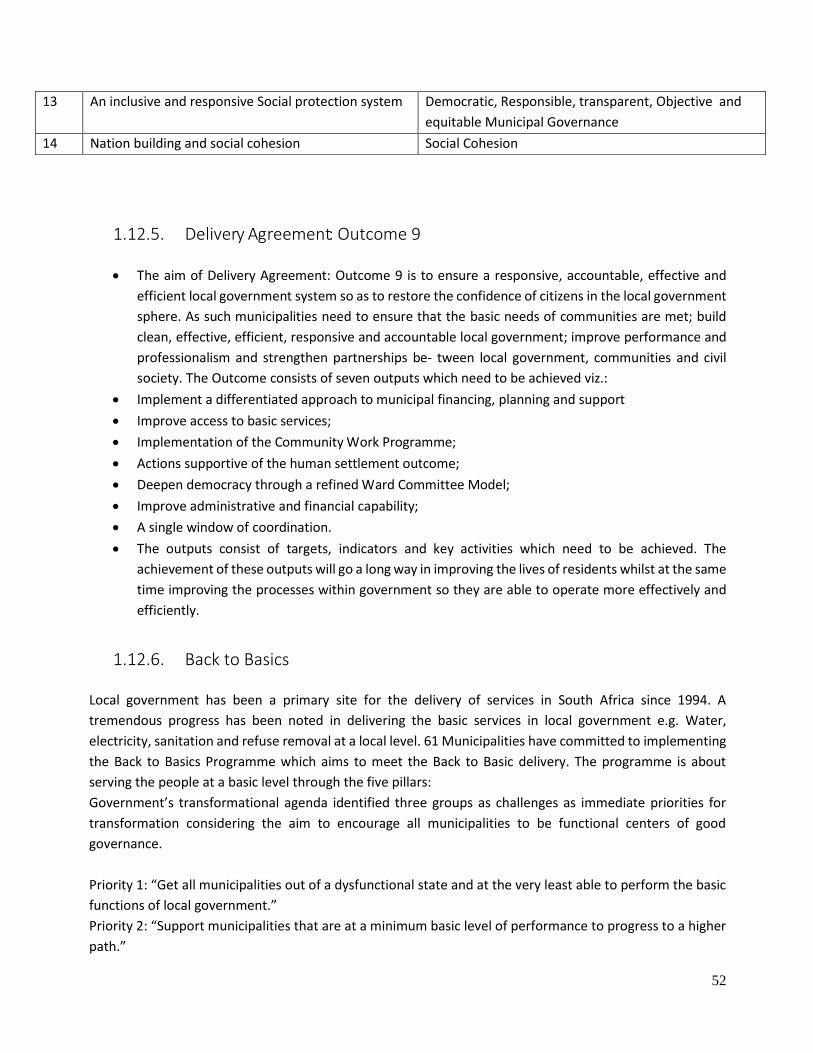
52
1.12.5. Delivery Agreement: Outcome 9
• The aim of Delivery Agreement: Outcome 9 is to ensure a responsive, accountable, effective and
efficient local government system so as to restore the confidence of citizens in the local government
sphere. As such municipalities need to ensure that the basic needs of communities are met; build
clean, effective, efficient, responsive and accountable local government; improve performance and
professionalism and strengthen partnerships be- tween local government, communities and civil
society. The Outcome consists of seven outputs which need to be achieved viz.:
• Implement a differentiated approach to municipal financing, planning and support
• Improve access to basic services;
• Implementation of the Community Work Programme;
• Actions supportive of the human settlement outcome;
• Deepen democracy through a refined Ward Committee Model;
• Improve administrative and financial capability;
• A single window of coordination.
• The outputs consist of targets, indicators and key activities which need to be achieved. The
achievement of these outputs will go a long way in improving the lives of residents whilst at the same
time improving the processes within government so they are able to operate more effectively and
efficiently.
1.12.6. Back to Basics
Local government has been a primary site for the delivery of services in South Africa since 1994. A
tremendous progress has been noted in delivering the basic services in local government e.g. Water,
electricity, sanitation and refuse removal at a local level. 61 Municipalities have committed to implementing
the Back to Basics Programme which aims to meet the Back to Basic delivery. The programme is about
serving the people at a basic level through the five pillars:
Government’s transformational agenda identified three groups as challenges as immediate priorities for
transformation considering the aim to encourage all municipalities to be functional centers of good
governance.
Priority 1: “Get all municipalities out of a dysfunctional state and at the very least able to perform the basic
functions of local government.”
Priority 2: “Support municipalities that are at a minimum basic level of performance to progress to a higher
path.”
13 An inclusive and responsive Social protection system Democratic, Responsible, transparent, Objective and
equitable Municipal Governance
14 Nation building and social cohesion Social Cohesion
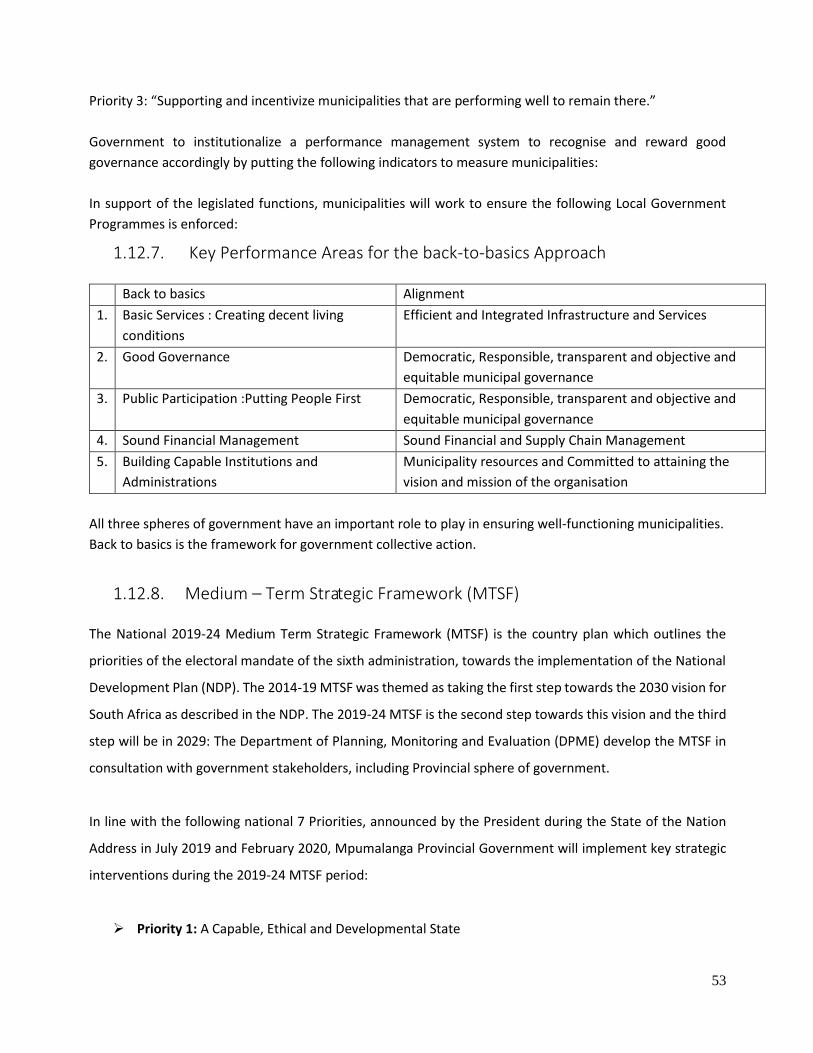
53
Priority 3: “Supporting and incentivize municipalities that are performing well to remain there.”
Government to institutionalize a performance management system to recognise and reward good
governance accordingly by putting the following indicators to measure municipalities:
In support of the legislated functions, municipalities will work to ensure the following Local Government
Programmes is enforced:
1.12.7. Key Performance Areas for the back-to-basics Approach
Back to basics Alignment
1. Basic Services : Creating decent living
conditions
Efficient and Integrated Infrastructure and Services
2. Good Governance Democratic, Responsible, transparent and objective and
equitable municipal governance
3. Public Participation :Putting People First Democratic, Responsible, transparent and objective and
equitable municipal governance
4. Sound Financial Management Sound Financial and Supply Chain Management
5. Building Capable Institutions and
Administrations
Municipality resources and Committed to attaining the
vision and mission of the organisation
All three spheres of government have an important role to play in ensuring well-functioning municipalities.
Back to basics is the framework for government collective action.
1.12.8. Medium – Term Strategic Framework (MTSF)
The National 2019-24 Medium Term Strategic Framework (MTSF) is the country plan which outlines the
priorities of the electoral mandate of the sixth administration, towards the implementation of the National
Development Plan (NDP). The 2014-19 MTSF was themed as taking the first step towards the 2030 vision for
South Africa as described in the NDP. The 2019-24 MTSF is the second step towards this vision and the third
step will be in 2029: The Department of Planning, Monitoring and Evaluation (DPME) develop the MTSF in
consultation with government stakeholders, including Provincial sphere of government.
In line with the following national 7 Priorities, announced by the President during the State of the Nation
Address in July 2019 and February 2020, Mpumalanga Provincial Government will implement key strategic
interventions during the 2019-24 MTSF period:
➢ Priority 1: A Capable, Ethical and Developmental State
54
➢ Priority 2: Economic Transformation and Job Creation
➢ Priority 3: Education, Skills and Health
➢ Priority 4: Consolidating the Social Wage through Reliable and Quality Basic Services
➢ Priority 5: Spatial Integration, Human Settlements and Local Government
➢ Priority 6: Social Cohesion and Safe Communities
➢ Priority 7: A better Africa and World
The NDP Vision 2030 prioritises the significant role of women, youth and people with disabilities in our
society. If these three groups are strong, our whole society will be strong. These are cross-cutting focus areas
that need to be mainstreamed into all elements of South Africa’s developmental future and all programmes
of government. They will inform interventions across the seven priorities in the draft plan.
The Mpumalanga Vision 2030 (MP V2030) seeks to locate the NDP within the provincial space. It provides a
clear roadmap that will guide the Provincial Government in its quest for the realisation of the outcomes
outlined by the NDP. In short, it is a focused and strategic implementation framework that provides a direct
implementation response to the National Development Plan. It further prioritise those important aspects of
the NDP that relates directly to the situation of the Province, including the mechanisms and conditions that
will be pursued to achieve the key priorities, objectives and targets enumerated in the NDP.
In line with the principles of the NDP, the MP V2030 highlights the following socio-economic outcomes as
priorities:
• Employment and economic growth
• Education and training
• Health care for all
• Social protection
These priorities do not imply that the “normal business of government” should be deferred, but rather aim
to focus the activities and decisions of the Province on key areas leveraging high impact for improved and
sustainable long term socio-economic development in Mpumalanga. The achievement of these outcomes is
further dependent on the critical success factors described as “mechanisms” and “conditions” below:
55
Announcing the seven bold priorities, The President Mr. Cyril Ramaphosa said the focus will be on the
following :
– Economic transformation and job creation;
– Education, skills and health;
– Consolidating the social wage through reliable and quality basic services;
– Spatial integration, human settlements and local government;
– Social cohesion and safe communities;
– A capable, ethical and developmental state and
– A better Africa and World
1.13. State of the Nation Address 2020
State of The Nation Address by President Cyril Ramaphosa On Thursday 13 February 2020
Sona is called by the President in terms of Section 42(5) of the Constitution. The address is an opportunity
for the President to provide the nation with an update on government’s progress in meeting its
commitments and outlining the programmes for the new financial year. It is a joint sitting of the two
houses of Parliament, the National Assembly and the National Council of Provinces, and is presided over
jointly by the National Assembly Speaker and the Chairperson of the National Council of Provinces
President Cyril Ramaphosa delivered the State of the Nation Address on 13 February 2020 at 7 pm before a
joint sitting of the two houses of Parliament. The President took the nation into his confidence on the way
forward, set the tone on critical matters and reported back to South Africans on the progress since his last
address in June last year.
President address built on the success of the recent free and fair 2019 General Elections, which served to
renew and strengthen our democracy. He will also use the opportunity to chart the course for the
implementation of the electoral mandate as reflected in the 2019–2024 Medium Term Strategic
Framework.
Since it is a Joint Sitting of both Houses, the Speaker of the NA and the Chairperson of the NCOP host the
event. All the three (3) Arms of the State, namely; the Legislature, the Executive and the Judiciary attend
this event. It is one of the rare moments whereby all three Arms of the State meet in one place.
Key economic takeaways from President Ramaphosa's State of the Nation Address
1. Emergency power procurement
56
• Load shedding was the "inevitable consequence" of struggling power utility Eskom’s inability over
many years to service its power plants, said president Ramaphosa, which he attributed to a
combination of rising debt, lack of capacity and state capture.
• The power utility, under its new CEO Andre de Ruyter, has warned of an increased likelihood of
power cuts over the next 18 months as it takes generating units offline to conduct maintenance.
• To help reduce the power gap, President announced that the state would be taking measures to
"rapidly and significantly" increase generation capacity outside of Eskom, including by making it
easier for independent producers get certification to build and run plants above 1MW.
• The state would also start the procurement of emergency power from projects that can "deliver
electricity into the grid within three to 12 months from approval".
2. Municipalities will be allowed to buy power from independent producers
• Municipalities "in good financial standing" would be allowed to procure their own power from
independent power producers.
• This has been a long-running demand from some municipalities, such as Cape Town, who say they
will be able to reduce or eliminate load shedding if they are able to buy electricity from independent
producers.
President Ramaphosa said the state would "put in place measures" to make this happen, but did not provide
specifics.
3. SA will have a state bank & a sovereign wealth fund
• Finance Minister Tito Mboweni will be give details around the establishment of both a sovereign
wealth fund and a state bank when he delivers his Budget speech later in the month, president said.
The president said the sovereign wealth fund was a "means to preserve and grow the national
endowment of our nation" while the state bank would help "extend access to financial services to
all South Africans".
4. A new plan to fight youth unemployment
• The president announced a new six-pronged plan to fight youth unemployment, which he described
as a "crisis". The plan includes targeted skill building, the expansion of the existing Youth
Employment Service, and reallocation of 1% of the national budget to a youth employment initiative.
• SA's youth faces one of the highest unemployment rates in the world, with almost 6 out of every 10
South African between the ages of 15 and 24 without jobs.
5. SAA must be independently sustainable
• A week ago the president said that the state did not agree with plans to slash the number of routes
flown by embattled flag-carrier, which was placed under business rescue in early December 2019
following years of losses and government bailouts.
• On Thursday his only reference to the practitioners was to say that they were "expected to unveil
their plans for restructuring the airline in the next few weeks".
• He added it is essential that a future restructured airline is "commercially and operationally
sustainable" without the need for government bailouts.
57
6. Commercialisation of hemp
• The state will begin to regulate the commercial use of hemp products, which the president
Ramaphosa said would provide income for small-scale farmers. Government would also formulate
a policy on the use of cannabis products for medicinal purposes to "build this industry in line with
global trends". This comes about in the wake of similar moves in neighbouring Zimbabwe.
7. Spectrum licensing before end of 2020
• The president said that the Independent Communications Authority of South Africa would conclude
the licensing of high demand spectrum for SA industry via auction before the end of 2020. A lack of
available spectrum has been a long-running complaint by SA telecoms groups, who say that it is
needed to reduce data prices.
8. More Investment Conferences
• After holding high-profile investment conferences in 2018 and 2019 in a bid to attract R1.2 trillion
in new investment over five years, Ramaphosa said the country would hold a third conference in
November to "review the implementation of previous commitments and to generate new
investment into our economy".
• The president said that, in the first two years of the investment drive, a total of R664 billion in
investment commitments had been raised.
9. Debt heading towards 'unsustainable' levels
• "Low levels of growth mean that we are not generating enough revenue to meet our expenses. Our
debt is heading towards unsustainable levels, and spending is misdirected towards consumption and
debt-servicing rather than infrastructure and productive activity," said president Ramaphosa.
• The president said that the Minister of Finance would "outline a series of measures to reduce
spending and improve its composition" when he delivers his Budget address later in the month.
• SA is facing a heightened risk of a sovereign credit rating downgrade to junk by Moody's Investors
Service, which changed its outlook from stable to negative late in 2019. Moody's is the sole major
rating agency to not already have downgraded SA's sovereign debt to sub-investment grade, and
has warned about the country's public debt burden.
1.13.1. State of the Province Address
The State of the Province Address is a speech made by the Premier or provincial head.
The event usually marks the official opening of the Provincial Parliament. The speech is delivered in front
of members of the provincial executive, including the Speaker, Deputy Speaker and the Secretary.
The State of the Province Address is a localised version of the State of the Nation Address where Premiers
reflect on their achievements and communicate their programmes of action in respect of government’s
five priority areas - education, health, the fight against crime and corruption, rural development and land
reform as well as jobs for the year ahead. In past years, many provinces have held the event away from the
legislature, in places such as sports grounds and university campuses. This is done to bring the legislature
closer to the public and to accommodate more people at the event.
58
Key Mpumalanga Priorities for 2020/21 from the state of the province address
Transforming the Economy to serve the People
• This will be done by implementing the Mpumalanga Industrial Development Plan, which is aimed at
promoting the development and establishment of Industrial Technology Parks for the prioritized
areas, with a primary focus on;
➢ Agriculture and Forestry;
➢ Mining and Metals; and
➢ Petro-chemicals. Linked to this, is the commitment to supporting Township and Rural economies, as well as small businesses. In this regard, our priority projects remain the Mpumalanga International Fresh Produce Market and its associated Agri-Hubs, as well as the Nkomazi SEZ (Special Economic Zone). Tourism
• In an effort to address the triple challenges of poverty, inequality and unemployment, we are in the
process of optimizing the holistic value proposition of the tourism industry in the Province.
• The importance of tourism is evidenced by its significant contribution to the Provincial GDP. Tourism
contributed approximately 7% to the GDP of the Province.
Infrastructural Development
• There can be no sustainable economic growth without a concomitant investment in our
infrastructure said the Premier Refilwe Mtshweni.
• In the past Financial Year, we have invested over 4 billion Rand in improving our economic and
social infrastructure.
• In the next financial year, we shall invest over 5 billion Rand to infrastructural projects that will aid
our efforts to ensure that we create a conducive environment for socio-economic development
and inclusive growth.
• Furthermore, we have noted with grave concern the dilapidation of some of our infrastructure. To
this effect, all Departments will ring-fence 2% of their capital budgets and apportion it to
maintenance of infrastructure.
Expanding Agricultural Infrastructure and Increasing Production
• The global demand for our agricultural products is consistently increasing. We therefore need to
increase our production in order to grow our net export market share.
• Government is also conducting a feasibility study for the establishment of the Agri-Hub in the
Nkomazi Municipality. A budget of 15 million Rand for the 1st phase of the Agri-Hub and the
conversion of the other to the Pack-house, has been set aside for this purpose.
• To address the Food Security challenges faced by many communities of Mpumalanga, the Province
has intensified Phezukomkhono Mlimi, a programme that provides mechanization and inputs
support to all its farmers and in particular the household, subsistence and emerging famers.
Climate Change
59
• To mitigate against potential food insecurity caused by climate change disasters, the Department
of Agriculture, Land Administration and Environmental Affairs working with our private sector
partners and donors will soon launch fresh vegetable gardens and fish production facilities known
as aquaponics in various communities. This project will be driven by youth and women
cooperatives in both urban and rural areas.
International Trade and Investment relations
• To grow our exports and increase our market share, we have taken an informed decision to market
Mpumalanga as a trade and investment destination to a number of overseas countries.
It was agreed that the areas of collaboration shall be;
➢ industry and trade,
➢ tourism,
➢ culture, research and education.
Local Government and Basic Services
• In recognition of our commitment to ensure that Government operates in an integrated and efficient
manner, we will continue to exercise oversight over Local Government in line with the provisions of
the Constitution.
• Our priority is in ensuring that the people of Mpumalanga are afforded access to basic services.
• Subscribing to the District Delivery Model will enable all tiers of government to operate in an
integrated manner. Through this model, implementation shall be tracked more closely. We will be
able to timeously intervene in order to improve the efficiency of local government.
• Once implemented, this model will result in government being able to holistically address the
challenges associated with rapid urbanisation in our cities, it will stimulate local economic drivers
and allow government to plan efficiently when investing in infrastructure for integrated human
settlements.
• Furthermore, we will avail the necessary resources for the identification of land parcels for servicing
to facilitate future sustainable development in the province’s fastest growing towns.
Human Settlements A total of 5226 sites including those ring-fenced for informal settlements will be completed during the 2020/21 financial year whilst 4481 top structures will be completed. We are mandated to establish Integrated Sustainable Human Settlements across the province which are located in areas within close proximity to work opportunities and transport services. The following projects are prioritised for the current financial year; Nkosi City Project that is situated in the City of Mbombela Municipality. The project will comprise 1747 Fully Subsidized Dwelling Houses, Social Housing with an estimation of 166 Dwelling Units. Finance Linked Individual Subsidies Programme which is planned to deliver 558 dwelling bonded houses, 9 Preschools, 3 Primary Schools, 2 Secondary Schools, TVET College, Training Centres and a Provincial Hospital.
60
Smart City is planned to be in the Nkomazi Municipality and will include; an Integrated Human Settlement, Housing Opportunities, ICT Infrastructure, Bulk Municipal Engineering Infrastructure, Commercial Uses, Retail Uses, Industrial Uses, Logistics related Uses and Agri-Processing Uses. The NDP, Regional Development Model, CRDP and a Capable Developmental State the National Development Plan (NDP) and the New Regional Development Model fits comfortably well within the ambit of the Comprehensive Rural Development Programme (CRDP). The National Development Plan, targets economic transformation with the ultimate intention to transform the social and human development conditions of the vast majority of the people. The ultimate objective is to bring fundamental change in the structure, systems, institutions and patterns of ownership, management and control of the economy Innovation for better Education Outcomes & Early Childhood Education Education lays a strong foundation for the development of all our talents and capabilities and advances the democratic transformation of society. In order for this to come to fruition the education outcomes must continue to improve and respond to the needs of the economy and society at large. As part of our commitment and in line with the Freedom Charter principles of opening the doors of learning and culture to all by creating equal education opportunities, we have planned to build the school for the Deaf which will be housed within the City of Mbombela Municipality. The project is at the design stage. Skills Development As part of our drive to address the shortage of rare skills, we have sent 281 learners to study in Russia. MERSETA has also partnered with us and funded 81 new students who are studying overseas. Our bursary scheme has assisted more than 3 334 learners who are studying in various fields like Medicine, Veterinary Science, Information Technology, Aviation, Education (Maths & Science) and Engineering. Skills and Innovation Hub Our desire and dream to build a skills and innovation hub has finally come true. We have procured a site around eMalahleni and have budgeted R16 million for the initial phase of this project. The Provincial Skills and Innovation Hub will contribute to economic growth in all economic sectors of the province, offering opportunities through skills development, incubation, and innovation and emerging technologies. Innovation for a better Health System Most of our health facilities have reached the end of their life span. Few years ago, we began investing in the infrastructure and some of those projects are now nearing completion We are finalising the appointment of service providers for the remaining hospitals and CHCs in the current financial year. We are also in the process to appointing service providers for the digitalisation of security systems such as installation of CCTV cameras and panic buttons in health facilities. To improve patients waiting times in our health facilities, we conducted waiting times surveys and developed quality improvement plans to close identified gaps. We are also purchasing 67 new ambulances to improve turnaround time and equipping all those that were purchased recently with the necessary life-saving equipment. All these initiatives are meant to respond to the principle of the Freedom Charter which demands that there shall be free medical care and hospitalization shall be provided to all with special care for mothers and children. We are also laying the foundation for the introduction of the National Health Insurance. Innovation for improved Social Development
61
This Administration will not rest until we ensure that we preserve the dignity of young girls in each corner of this Province. This Administration will ensure that no girl child misses a day of school because of a lack of sanitary towels. This is why the Provincial Government, through the Department of Social Development, will continue with the mass roll out of sanitary towels in every District with a particular focus on rural areas. In an effort to empower young people who are not in the formal work space, the Provincial Government is currently rolling out support for 90 Youth Development centres (YDCs) across the Province. Strategic Private Sector Partnerships We call upon all companies that operate from this province to likewise make a meaningful contribution to the well-being of our people. Some of the corporate citizens that are walking the talk and are contributing in a meaningful way include; Sasol, Exxaro, South 32, Glencore, Anglo American, Sappi, Mondi, Seriti, RCL Foods and Mafube Colliery who have taken up the responsibility to produce higher standards of living and quality of life for the communities that surround them and still maintain profitability for stakeholders. Innovation that Promotes Social Cohesion and Social Justice Social cohesion is by and large the glue that keeps us irrespective of colour, race or creed together. Some prefer to look at it as the bond that keeps societies from falling apart. We will continue to host other signature events whilst promoting the culture of learning and reading by building more libraries for our communities. personal safety is a human right. It is a necessary condition for human development, improved quality of life and enhanced productivity. Through effective, coordinated responses of all stakeholders including police, business, community and civil society we will work harder to eradicate all forms of violence particularly that directed against the most vulnerable members of our society.
1.14. Situational Analysis
Municipal profile and situational analysis of the municipality
This chapter provides a status quo of the existing trends and conditions that impact on the Nkomazi Local
Municipality’s area. Acknowledgement is given to the data of STATSSA which assisted the municipality in
the planning and strategic decision-making process. Statistical information in this chapter is derived from,
the community profiles and community surveys.
Demographic overview of the Nkomazi Local Municipality
An overview of the demographic situation in the municipality provides an understanding of the current
scale of the population and allows for the calculations of the future population growth trends. It is said
that the population and household statistics provided will assist the municipality to set accurate and
credible service delivery targets across the 5 year integrated development cycle. A population growth of
this proportion is likely to place a strain on existing backlogs and the municipality’s ability to effectively
service the communities, because of the increase in households which directly demand services.
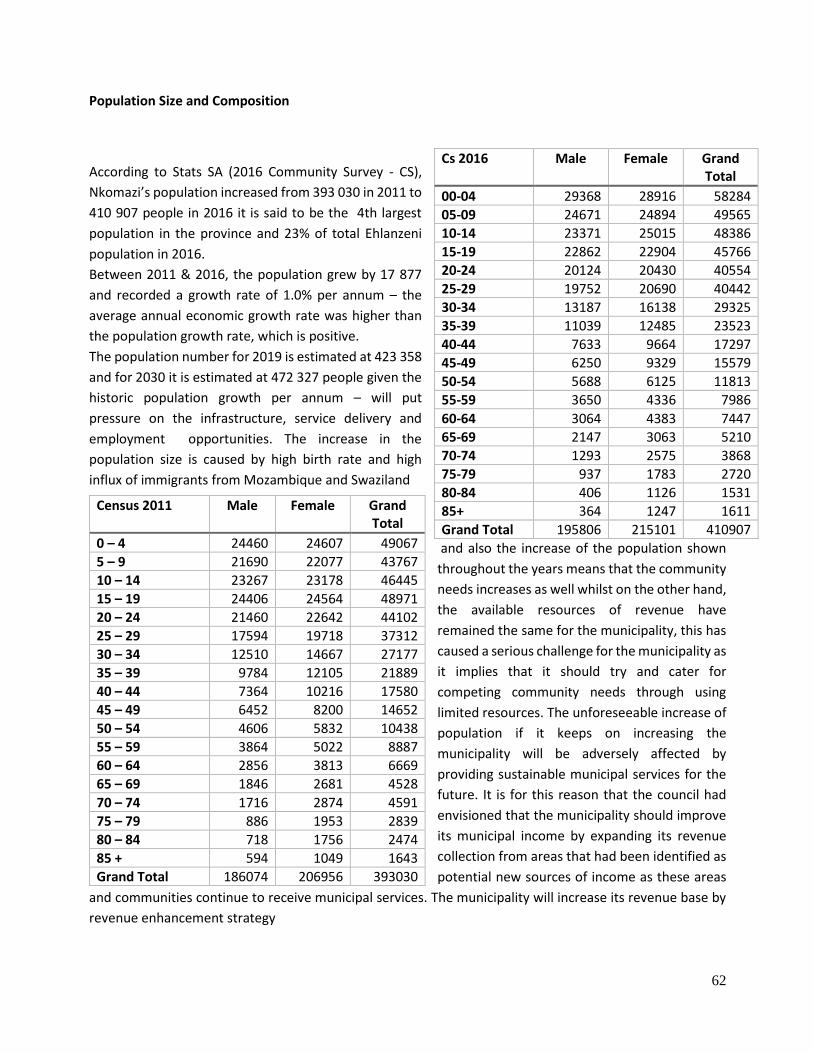
62
Population Size and Composition
According to Stats SA (2016 Community Survey - CS),
Nkomazi’s population increased from 393 030 in 2011 to
410 907 people in 2016 it is said to be the 4th largest
population in the province and 23% of total Ehlanzeni
population in 2016.
Between 2011 & 2016, the population grew by 17 877
and recorded a growth rate of 1.0% per annum – the
average annual economic growth rate was higher than
the population growth rate, which is positive.
The population number for 2019 is estimated at 423 358
and for 2030 it is estimated at 472 327 people given the
historic population growth per annum – will put
pressure on the infrastructure, service delivery and
employment opportunities. The increase in the
population size is caused by high birth rate and high
influx of immigrants from Mozambique and Swaziland
and also the increase of the population shown
throughout the years means that the community
needs increases as well whilst on the other hand,
the available resources of revenue have
remained the same for the municipality, this has
caused a serious challenge for the municipality as
it implies that it should try and cater for
competing community needs through using
limited resources. The unforeseeable increase of
population if it keeps on increasing the
municipality will be adversely affected by
providing sustainable municipal services for the
future. It is for this reason that the council had
envisioned that the municipality should improve
its municipal income by expanding its revenue
collection from areas that had been identified as
potential new sources of income as these areas
and communities continue to receive municipal services. The municipality will increase its revenue base by
revenue enhancement strategy
Census 2011 Male Female Grand Total
0 – 4 24460 24607 49067
5 – 9 21690 22077 43767
10 – 14 23267 23178 46445
15 – 19 24406 24564 48971
20 – 24 21460 22642 44102
25 – 29 17594 19718 37312
30 – 34 12510 14667 27177
35 – 39 9784 12105 21889
40 – 44 7364 10216 17580
45 – 49 6452 8200 14652
50 – 54 4606 5832 10438
55 – 59 3864 5022 8887
60 – 64 2856 3813 6669
65 – 69 1846 2681 4528
70 – 74 1716 2874 4591
75 – 79 886 1953 2839
80 – 84 718 1756 2474
85 + 594 1049 1643
Grand Total 186074 206956 393030
Cs 2016 Male Female Grand Total
00-04 29368 28916 58284
05-09 24671 24894 49565
10-14 23371 25015 48386
15-19 22862 22904 45766
20-24 20124 20430 40554
25-29 19752 20690 40442
30-34 13187 16138 29325
35-39 11039 12485 23523
40-44 7633 9664 17297
45-49 6250 9329 15579
50-54 5688 6125 11813
55-59 3650 4336 7986
60-64 3064 4383 7447
65-69 2147 3063 5210
70-74 1293 2575 3868
75-79 937 1783 2720
80-84 406 1126 1531
85+ 364 1247 1611
Grand Total 195806 215101 410907
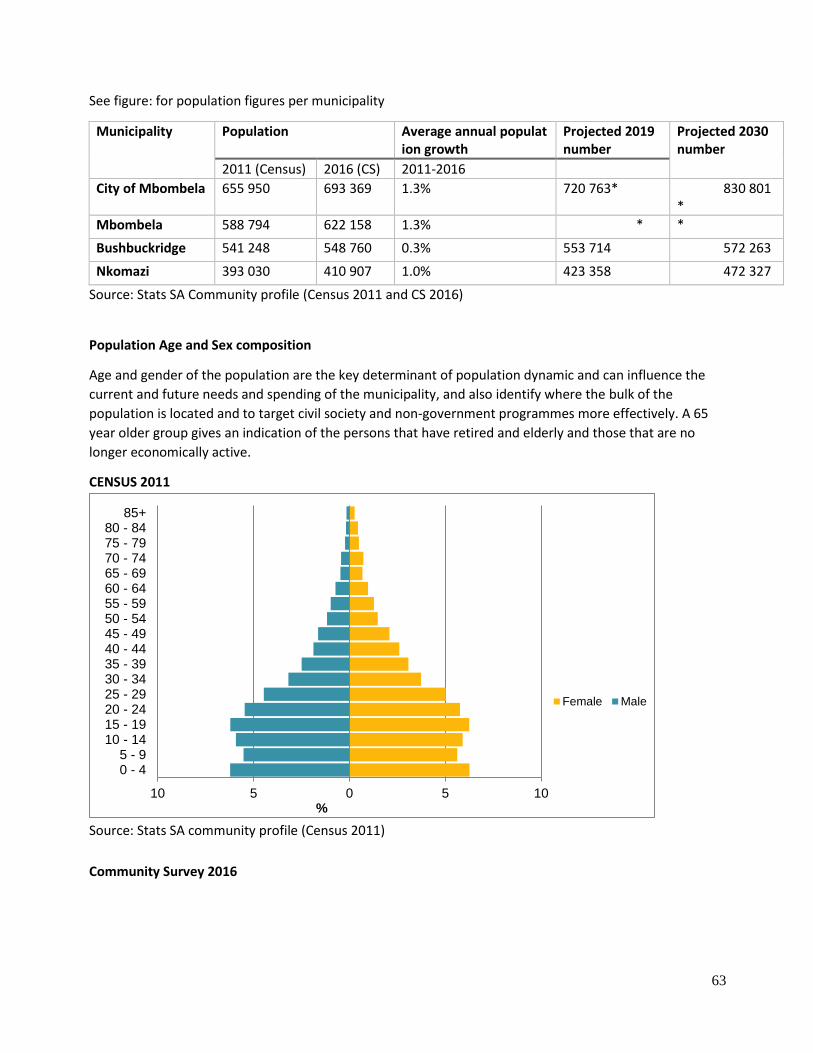
63
See figure: for population figures per municipality
Municipality Population Average annual population growth
Projected 2019 number
Projected 2030 number
2011 (Census) 2016 (CS) 2011-2016
City of Mbombela 655 950 693 369 1.3% 720 763* 830 801*
Mbombela 588 794 622 158 1.3% * *
Bushbuckridge 541 248 548 760 0.3% 553 714 572 263
Nkomazi 393 030 410 907 1.0% 423 358 472 327
Source: Stats SA Community profile (Census 2011 and CS 2016)
Population Age and Sex composition
Age and gender of the population are the key determinant of population dynamic and can influence the
current and future needs and spending of the municipality, and also identify where the bulk of the
population is located and to target civil society and non-government programmes more effectively. A 65
year older group gives an indication of the persons that have retired and elderly and those that are no
longer economically active.
CENSUS 2011
Source: Stats SA community profile (Census 2011)
Community Survey 2016
10 5 0 5 10
0 - 45 - 9
10 - 1415 - 1920 - 2425 - 2930 - 3435 - 3940 - 4445 - 4950 - 5455 - 5960 - 6465 - 6970 - 7475 - 7980 - 84
85+
%
Female Male
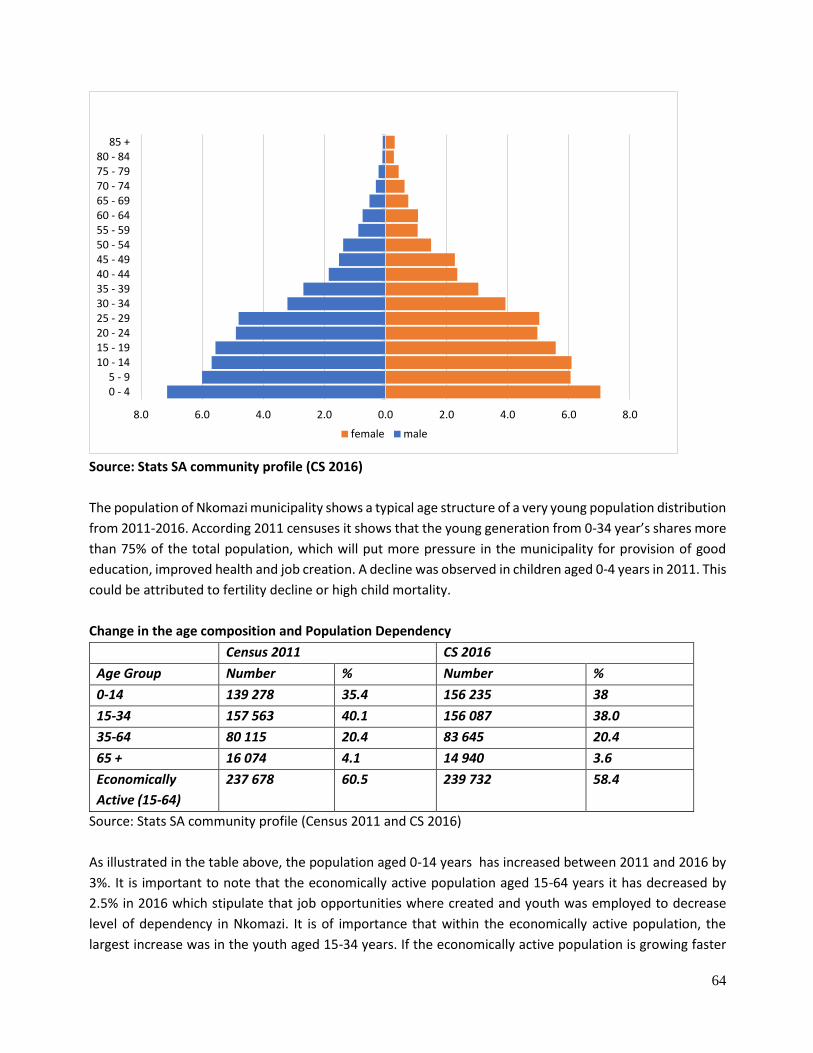
64
Source: Stats SA community profile (CS 2016)
The population of Nkomazi municipality shows a typical age structure of a very young population distribution
from 2011-2016. According 2011 censuses it shows that the young generation from 0-34 year’s shares more
than 75% of the total population, which will put more pressure in the municipality for provision of good
education, improved health and job creation. A decline was observed in children aged 0-4 years in 2011. This
could be attributed to fertility decline or high child mortality.
Change in the age composition and Population Dependency
Census 2011 CS 2016
Age Group Number % Number %
0-14 139 278 35.4 156 235 38
15-34 157 563 40.1 156 087 38.0
35-64 80 115 20.4 83 645 20.4
65 + 16 074 4.1 14 940 3.6
Economically
Active (15-64)
237 678 60.5 239 732 58.4
Source: Stats SA community profile (Census 2011 and CS 2016)
As illustrated in the table above, the population aged 0-14 years has increased between 2011 and 2016 by
3%. It is important to note that the economically active population aged 15-64 years it has decreased by
2.5% in 2016 which stipulate that job opportunities where created and youth was employed to decrease
level of dependency in Nkomazi. It is of importance that within the economically active population, the
largest increase was in the youth aged 15-34 years. If the economically active population is growing faster
8.0 6.0 4.0 2.0 0.0 2.0 4.0 6.0 8.0
0 - 45 - 9
10 - 1415 - 1920 - 2425 - 2930 - 3435 - 3940 - 4445 - 4950 - 5455 - 5960 - 6465 - 6970 - 7475 - 7980 - 84
85 +
female male
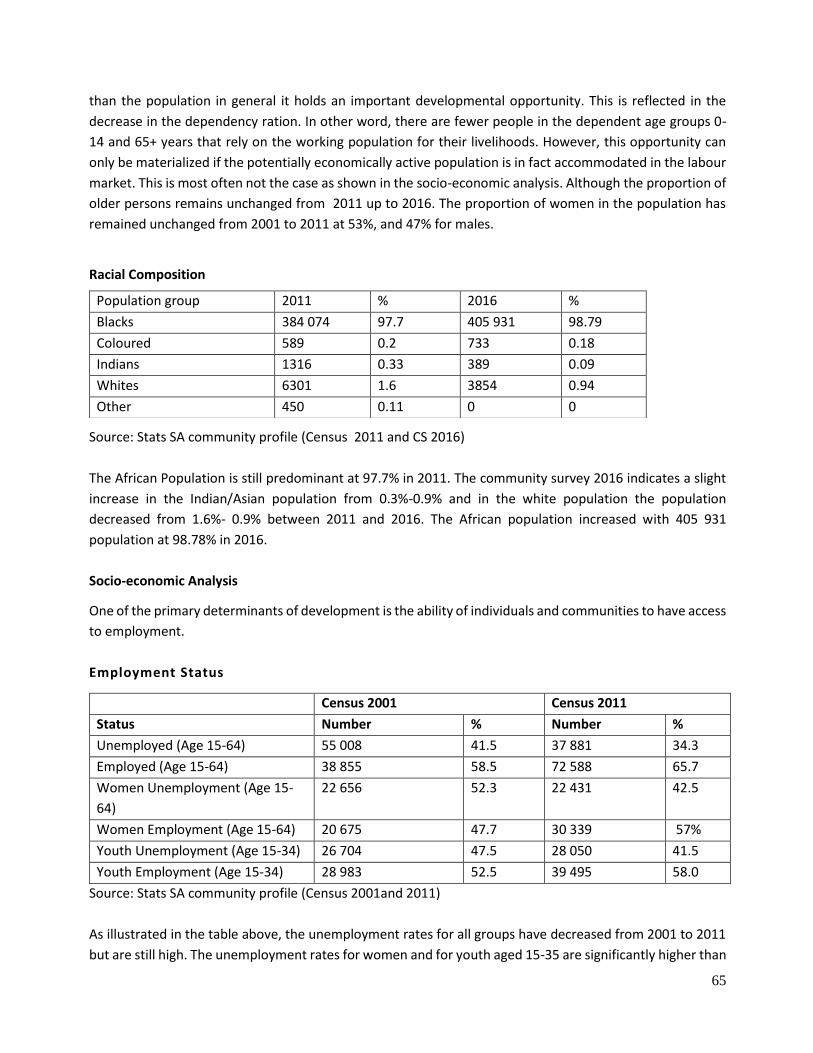
65
than the population in general it holds an important developmental opportunity. This is reflected in the
decrease in the dependency ration. In other word, there are fewer people in the dependent age groups 0-
14 and 65+ years that rely on the working population for their livelihoods. However, this opportunity can
only be materialized if the potentially economically active population is in fact accommodated in the labour
market. This is most often not the case as shown in the socio-economic analysis. Although the proportion of
older persons remains unchanged from 2011 up to 2016. The proportion of women in the population has
remained unchanged from 2001 to 2011 at 53%, and 47% for males.
Racial Composition
Source: Stats SA community profile (Census 2011 and CS 2016)
The African Population is still predominant at 97.7% in 2011. The community survey 2016 indicates a slight
increase in the Indian/Asian population from 0.3%-0.9% and in the white population the population
decreased from 1.6%- 0.9% between 2011 and 2016. The African population increased with 405 931
population at 98.78% in 2016.
Socio-economic Analysis
One of the primary determinants of development is the ability of individuals and communities to have access
to employment.
Employment Status
Census 2001 Census 2011
Status Number % Number %
Unemployed (Age 15-64) 55 008 41.5 37 881 34.3
Employed (Age 15-64) 38 855 58.5 72 588 65.7
Women Unemployment (Age 15-
64)
22 656 52.3 22 431 42.5
Women Employment (Age 15-64) 20 675 47.7 30 339 57%
Youth Unemployment (Age 15-34) 26 704 47.5 28 050 41.5
Youth Employment (Age 15-34) 28 983 52.5 39 495 58.0
Source: Stats SA community profile (Census 2001and 2011)
As illustrated in the table above, the unemployment rates for all groups have decreased from 2001 to 2011
but are still high. The unemployment rates for women and for youth aged 15-35 are significantly higher than
Population group 2011 % 2016 %
Blacks 384 074 97.7 405 931 98.79
Coloured 589 0.2 733 0.18
Indians 1316 0.33 389 0.09
Whites 6301 1.6 3854 0.94
Other 450 0.11 0 0
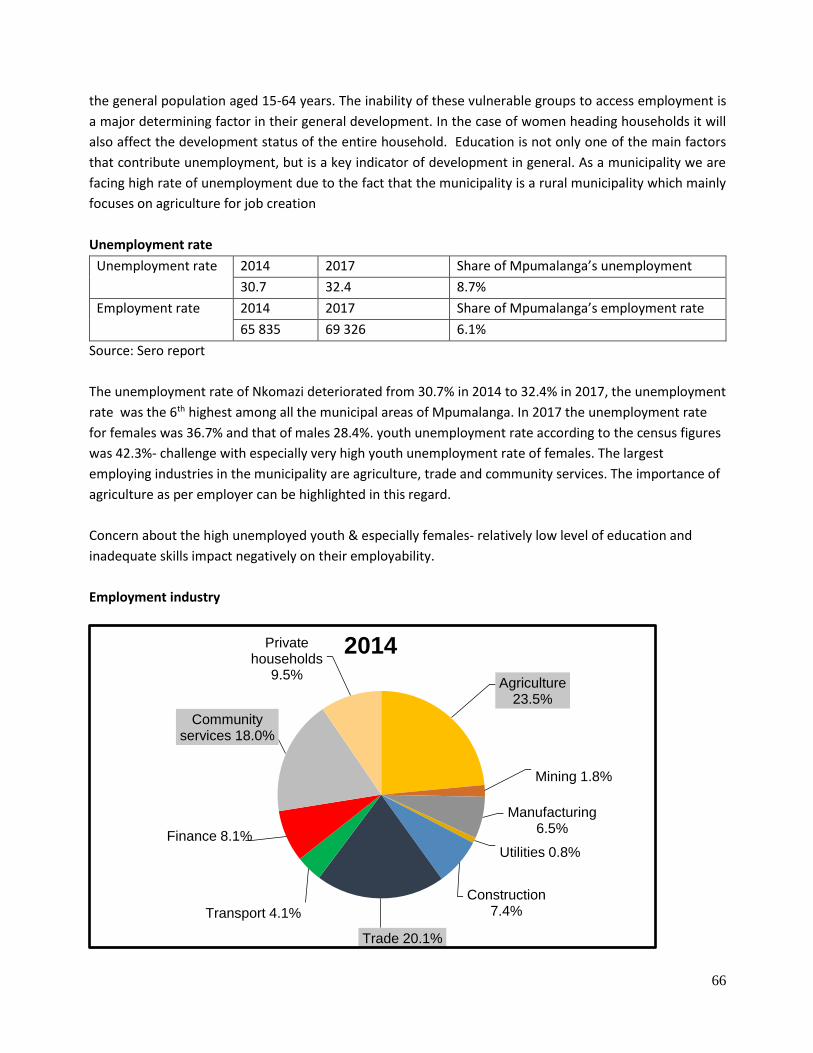
66
the general population aged 15-64 years. The inability of these vulnerable groups to access employment is
a major determining factor in their general development. In the case of women heading households it will
also affect the development status of the entire household. Education is not only one of the main factors
that contribute unemployment, but is a key indicator of development in general. As a municipality we are
facing high rate of unemployment due to the fact that the municipality is a rural municipality which mainly
focuses on agriculture for job creation
Unemployment rate
Unemployment rate 2014 2017 Share of Mpumalanga’s unemployment
30.7 32.4 8.7%
Employment rate 2014 2017 Share of Mpumalanga’s employment rate
65 835 69 326 6.1%
Source: Sero report
The unemployment rate of Nkomazi deteriorated from 30.7% in 2014 to 32.4% in 2017, the unemployment
rate was the 6th highest among all the municipal areas of Mpumalanga. In 2017 the unemployment rate
for females was 36.7% and that of males 28.4%. youth unemployment rate according to the census figures
was 42.3%- challenge with especially very high youth unemployment rate of females. The largest
employing industries in the municipality are agriculture, trade and community services. The importance of
agriculture as per employer can be highlighted in this regard.
Concern about the high unemployed youth & especially females- relatively low level of education and
inadequate skills impact negatively on their employability.
Employment industry
Agriculture23.5%
Mining 1.8%
Manufacturing6.5%
Utilities 0.8%
Construction7.4%
Trade 20.1%
Transport 4.1%
Finance 8.1%
Community services 18.0%
Private households
9.5%
2014
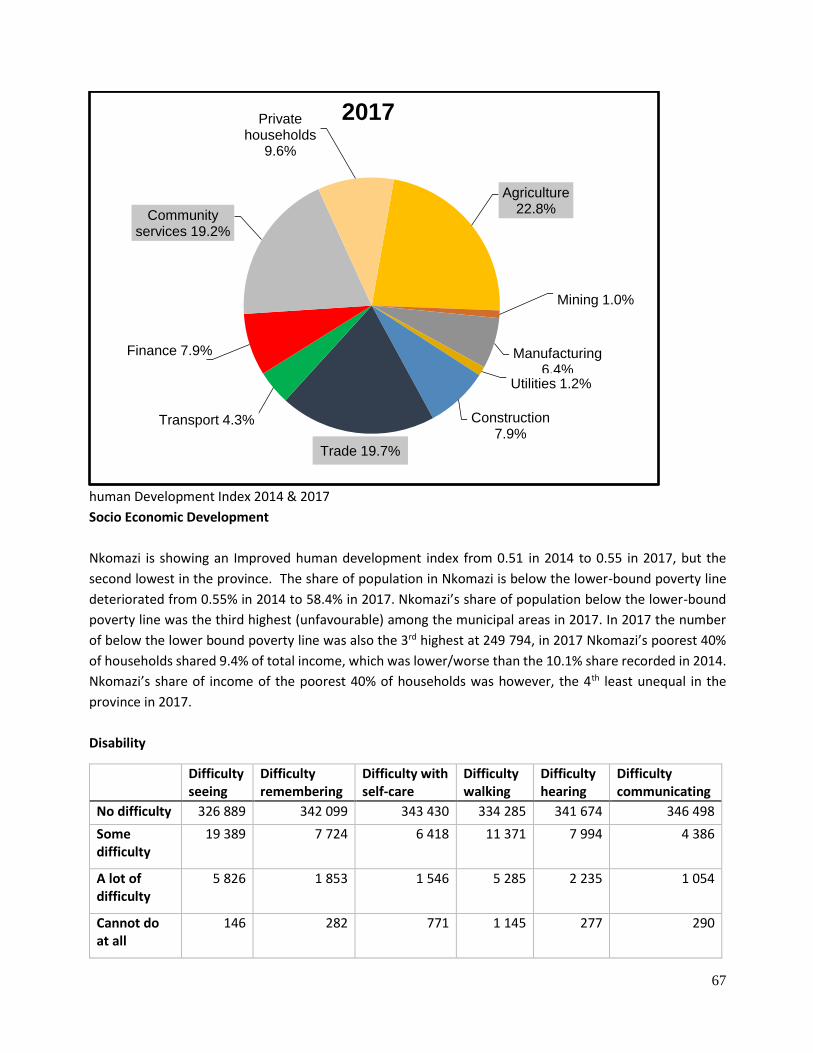
67
human Development Index 2014 & 2017
Socio Economic Development
Nkomazi is showing an Improved human development index from 0.51 in 2014 to 0.55 in 2017, but the
second lowest in the province. The share of population in Nkomazi is below the lower-bound poverty line
deteriorated from 0.55% in 2014 to 58.4% in 2017. Nkomazi’s share of population below the lower-bound
poverty line was the third highest (unfavourable) among the municipal areas in 2017. In 2017 the number
of below the lower bound poverty line was also the 3rd highest at 249 794, in 2017 Nkomazi’s poorest 40%
of households shared 9.4% of total income, which was lower/worse than the 10.1% share recorded in 2014.
Nkomazi’s share of income of the poorest 40% of households was however, the 4th least unequal in the
province in 2017.
Disability
Difficulty seeing
Difficulty remembering
Difficulty with self-care
Difficulty walking
Difficulty hearing
Difficulty communicating
No difficulty 326 889 342 099 343 430 334 285 341 674 346 498
Some difficulty
19 389 7 724 6 418 11 371 7 994 4 386
A lot of difficulty
5 826 1 853 1 546 5 285 2 235 1 054
Cannot do at all
146 282 771 1 145 277 290
Agriculture22.8%
Mining 1.0%
Manufacturing6.4%
Utilities 1.2%
Construction7.9%
Trade 19.7%
Transport 4.3%
Finance 7.9%
Community services 19.2%
Private households
9.6%
2017
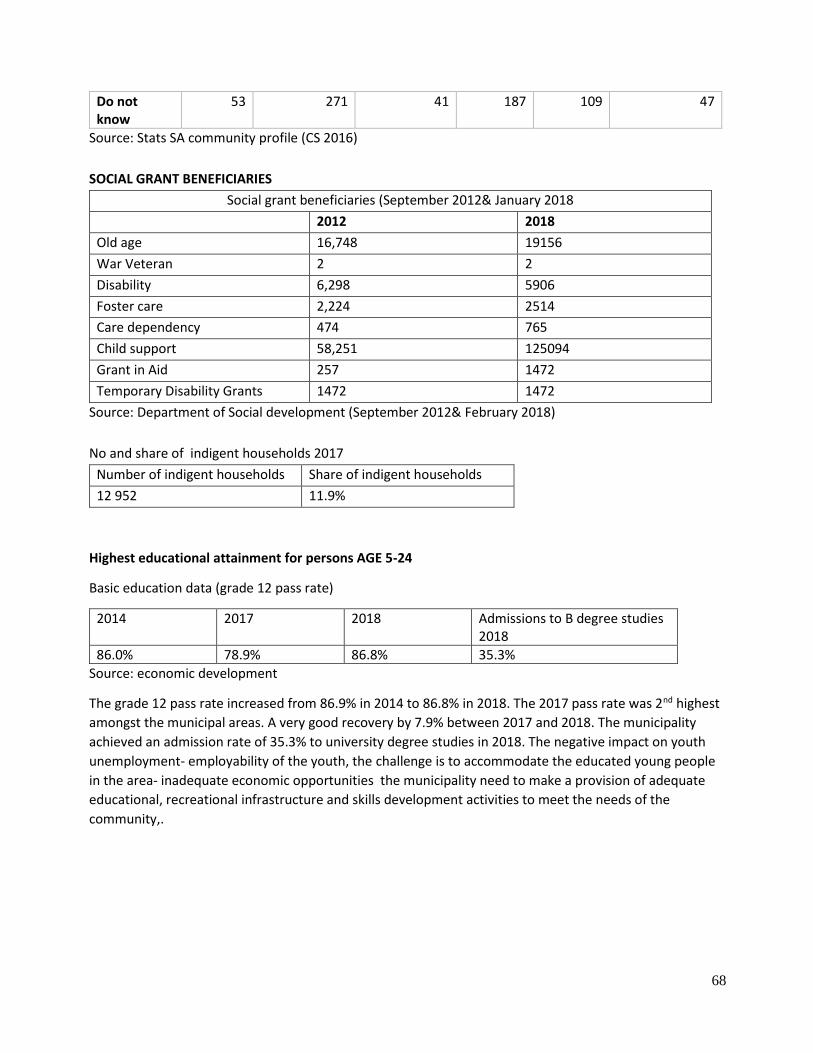
68
Do not know
53 271 41 187 109 47
Source: Stats SA community profile (CS 2016)
SOCIAL GRANT BENEFICIARIES
Social grant beneficiaries (September 2012& January 2018
2012 2018
Old age 16,748 19156
War Veteran 2 2
Disability 6,298 5906
Foster care 2,224 2514
Care dependency 474 765
Child support 58,251 125094
Grant in Aid 257 1472
Temporary Disability Grants 1472 1472
Source: Department of Social development (September 2012& February 2018)
No and share of indigent households 2017
Number of indigent households Share of indigent households
12 952 11.9%
Highest educational attainment for persons AGE 5-24
Basic education data (grade 12 pass rate)
2014 2017 2018 Admissions to B degree studies 2018
86.0% 78.9% 86.8% 35.3%
Source: economic development
The grade 12 pass rate increased from 86.9% in 2014 to 86.8% in 2018. The 2017 pass rate was 2nd highest
amongst the municipal areas. A very good recovery by 7.9% between 2017 and 2018. The municipality
achieved an admission rate of 35.3% to university degree studies in 2018. The negative impact on youth
unemployment- employability of the youth, the challenge is to accommodate the educated young people
in the area- inadequate economic opportunities the municipality need to make a provision of adequate
educational, recreational infrastructure and skills development activities to meet the needs of the
community,.
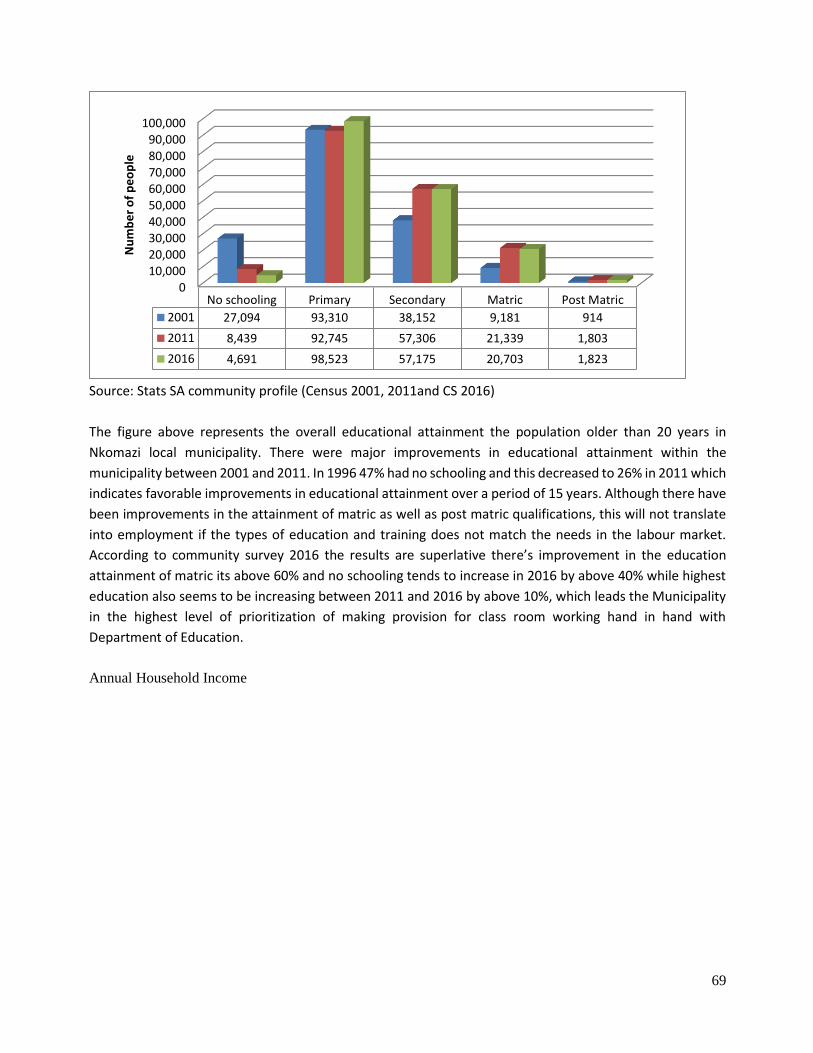
69
Source: Stats SA community profile (Census 2001, 2011and CS 2016)
The figure above represents the overall educational attainment the population older than 20 years in
Nkomazi local municipality. There were major improvements in educational attainment within the
municipality between 2001 and 2011. In 1996 47% had no schooling and this decreased to 26% in 2011 which
indicates favorable improvements in educational attainment over a period of 15 years. Although there have
been improvements in the attainment of matric as well as post matric qualifications, this will not translate
into employment if the types of education and training does not match the needs in the labour market.
According to community survey 2016 the results are superlative there’s improvement in the education
attainment of matric its above 60% and no schooling tends to increase in 2016 by above 40% while highest
education also seems to be increasing between 2011 and 2016 by above 10%, which leads the Municipality
in the highest level of prioritization of making provision for class room working hand in hand with
Department of Education.
Annual Household Income
010,00020,00030,00040,00050,00060,00070,00080,00090,000
100,000
No schooling Primary Secondary Matric Post Matric
2001 27,094 93,310 38,152 9,181 914
2011 8,439 92,745 57,306 21,339 1,803
2016 4,691 98,523 57,175 20,703 1,823
Nu
mb
er
of
pe
op
le
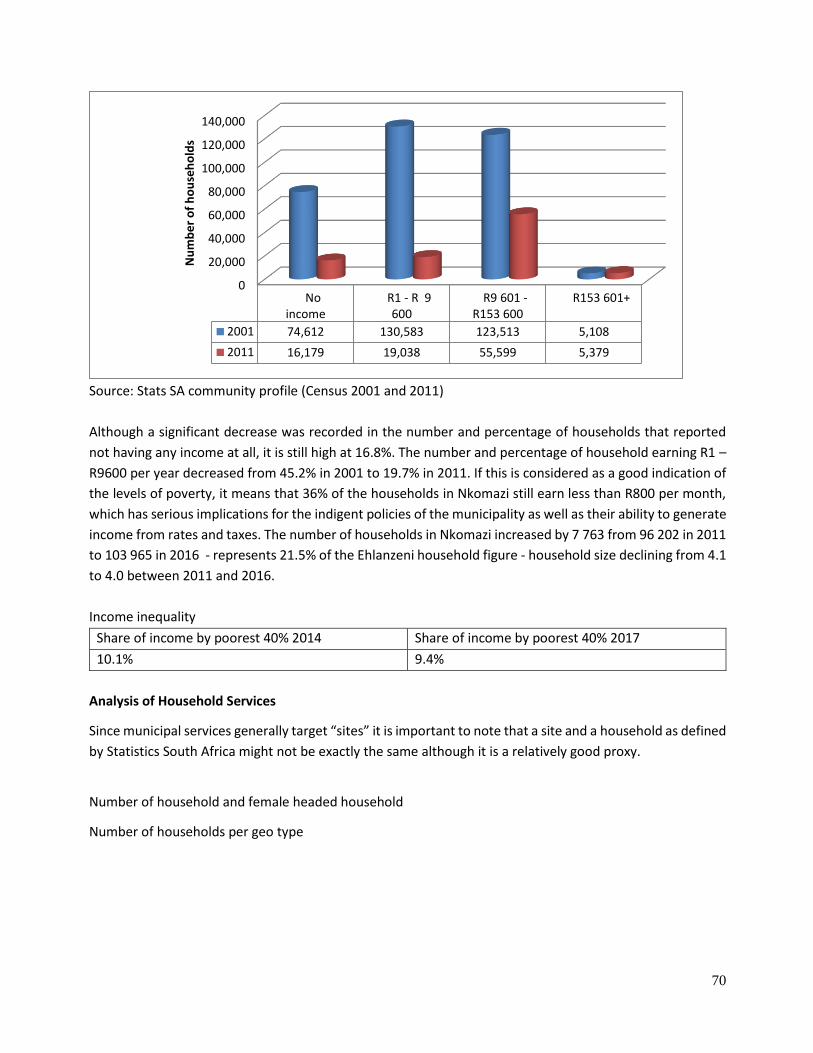
70
Source: Stats SA community profile (Census 2001 and 2011)
Although a significant decrease was recorded in the number and percentage of households that reported
not having any income at all, it is still high at 16.8%. The number and percentage of household earning R1 –
R9600 per year decreased from 45.2% in 2001 to 19.7% in 2011. If this is considered as a good indication of
the levels of poverty, it means that 36% of the households in Nkomazi still earn less than R800 per month,
which has serious implications for the indigent policies of the municipality as well as their ability to generate
income from rates and taxes. The number of households in Nkomazi increased by 7 763 from 96 202 in 2011
to 103 965 in 2016 - represents 21.5% of the Ehlanzeni household figure - household size declining from 4.1
to 4.0 between 2011 and 2016.
Income inequality
Share of income by poorest 40% 2014 Share of income by poorest 40% 2017
10.1% 9.4%
Analysis of Household Services
Since municipal services generally target “sites” it is important to note that a site and a household as defined
by Statistics South Africa might not be exactly the same although it is a relatively good proxy.
Number of household and female headed household
Number of households per geo type
0
20,000
40,000
60,000
80,000
100,000
120,000
140,000
Noincome
R1 - R 9600
R9 601 -R153 600
R153 601+
2001 74,612 130,583 123,513 5,108
2011 16,179 19,038 55,599 5,379
Nu
mb
er
of
ho
use
ho
lds
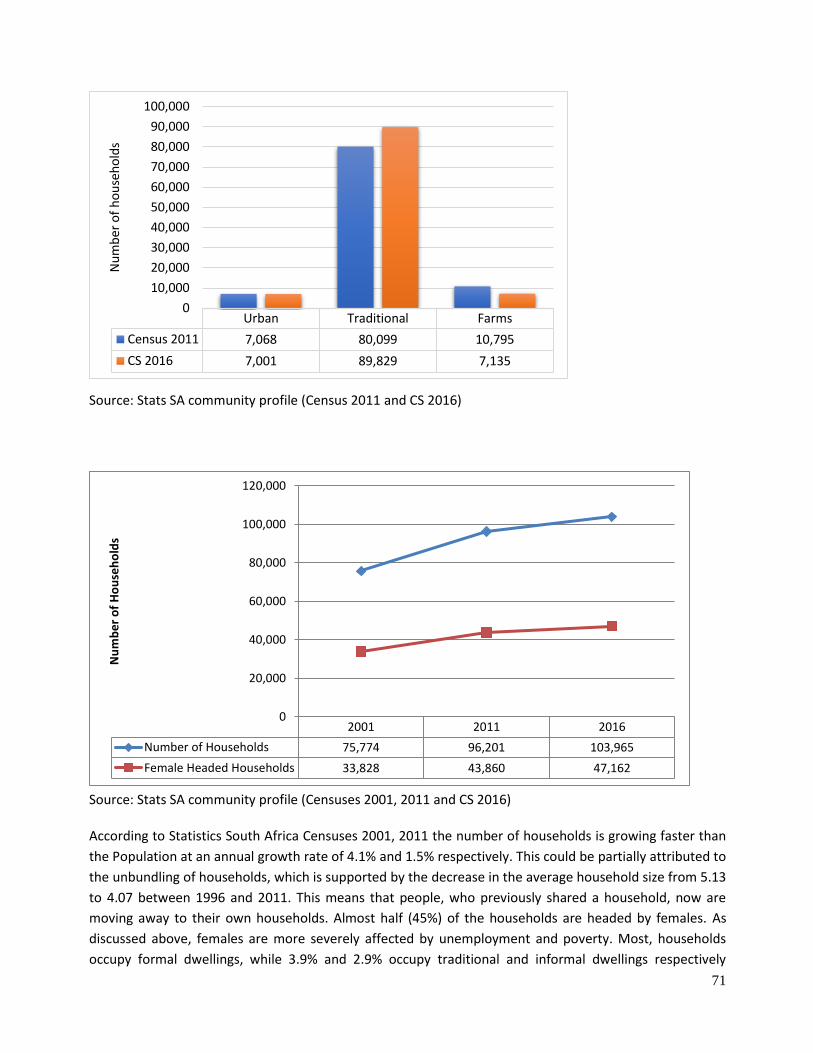
71
Source: Stats SA community profile (Census 2011 and CS 2016)
Source: Stats SA community profile (Censuses 2001, 2011 and CS 2016)
According to Statistics South Africa Censuses 2001, 2011 the number of households is growing faster than
the Population at an annual growth rate of 4.1% and 1.5% respectively. This could be partially attributed to
the unbundling of households, which is supported by the decrease in the average household size from 5.13
to 4.07 between 1996 and 2011. This means that people, who previously shared a household, now are
moving away to their own households. Almost half (45%) of the households are headed by females. As
discussed above, females are more severely affected by unemployment and poverty. Most, households
occupy formal dwellings, while 3.9% and 2.9% occupy traditional and informal dwellings respectively
Urban Traditional Farms
Census 2011 7,068 80,099 10,795
CS 2016 7,001 89,829 7,135
0
10,000
20,000
30,000
40,000
50,000
60,000
70,000
80,000
90,000
100,000N
um
ber
of
ho
use
ho
lds
2001 2011 2016
Number of Households 75,774 96,201 103,965
Female Headed Households 33,828 43,860 47,162
0
20,000
40,000
60,000
80,000
100,000
120,000
Nu
mb
er
of
Ho
use
ho
lds
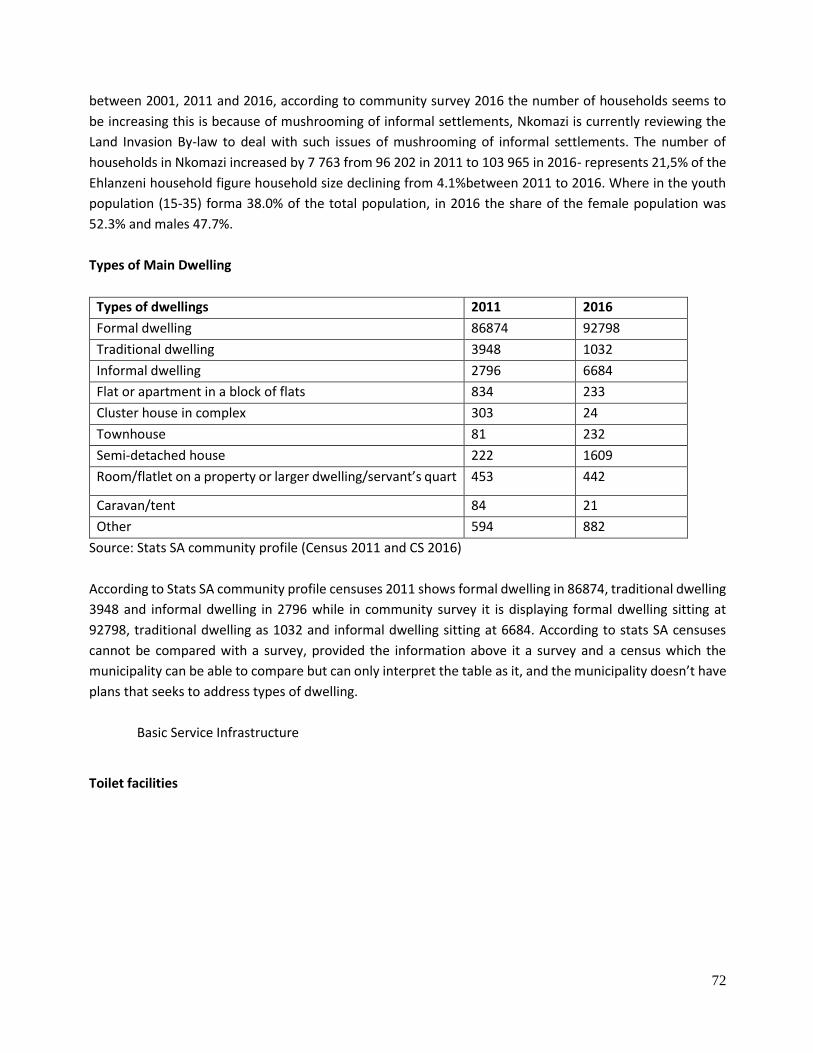
72
between 2001, 2011 and 2016, according to community survey 2016 the number of households seems to
be increasing this is because of mushrooming of informal settlements, Nkomazi is currently reviewing the
Land Invasion By-law to deal with such issues of mushrooming of informal settlements. The number of
households in Nkomazi increased by 7 763 from 96 202 in 2011 to 103 965 in 2016- represents 21,5% of the
Ehlanzeni household figure household size declining from 4.1%between 2011 to 2016. Where in the youth
population (15-35) forma 38.0% of the total population, in 2016 the share of the female population was
52.3% and males 47.7%.
Types of Main Dwelling
Types of dwellings 2011 2016
Formal dwelling 86874 92798
Traditional dwelling 3948 1032
Informal dwelling 2796 6684
Flat or apartment in a block of flats 834 233
Cluster house in complex 303 24
Townhouse 81 232
Semi-detached house 222 1609
Room/flatlet on a property or larger dwelling/servant’s quart 453 442
Caravan/tent 84 21
Other 594 882
Source: Stats SA community profile (Census 2011 and CS 2016)
According to Stats SA community profile censuses 2011 shows formal dwelling in 86874, traditional dwelling
3948 and informal dwelling in 2796 while in community survey it is displaying formal dwelling sitting at
92798, traditional dwelling as 1032 and informal dwelling sitting at 6684. According to stats SA censuses
cannot be compared with a survey, provided the information above it a survey and a census which the
municipality can be able to compare but can only interpret the table as it, and the municipality doesn’t have
plans that seeks to address types of dwelling.
Basic Service Infrastructure
Toilet facilities
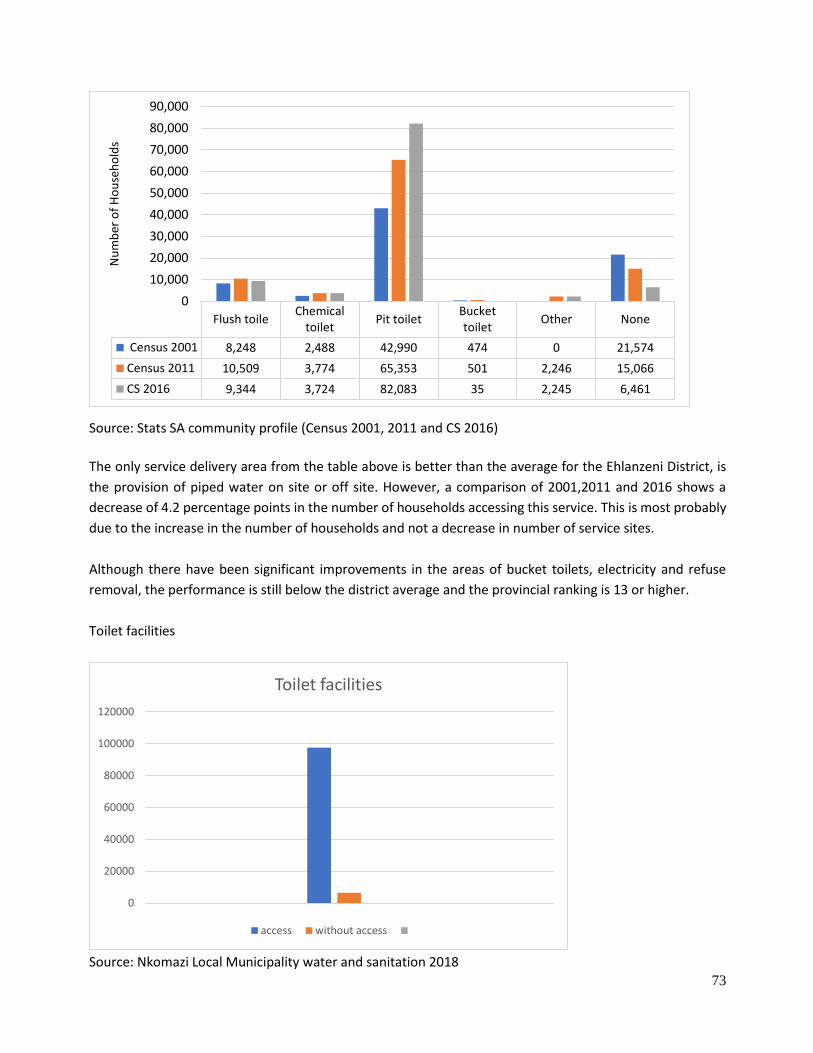
73
Source: Stats SA community profile (Census 2001, 2011 and CS 2016)
The only service delivery area from the table above is better than the average for the Ehlanzeni District, is
the provision of piped water on site or off site. However, a comparison of 2001,2011 and 2016 shows a
decrease of 4.2 percentage points in the number of households accessing this service. This is most probably
due to the increase in the number of households and not a decrease in number of service sites.
Although there have been significant improvements in the areas of bucket toilets, electricity and refuse
removal, the performance is still below the district average and the provincial ranking is 13 or higher.
Toilet facilities
Source: Nkomazi Local Municipality water and sanitation 2018
Flush toileChemical
toiletPit toilet
Buckettoilet
Other None
Census 2001 8,248 2,488 42,990 474 0 21,574
Census 2011 10,509 3,774 65,353 501 2,246 15,066
CS 2016 9,344 3,724 82,083 35 2,245 6,461
0
10,000
20,000
30,000
40,000
50,000
60,000
70,000
80,000
90,000N
um
ber
of
Ho
use
ho
lds
0
20000
40000
60000
80000
100000
120000
Toilet facilities
access without access
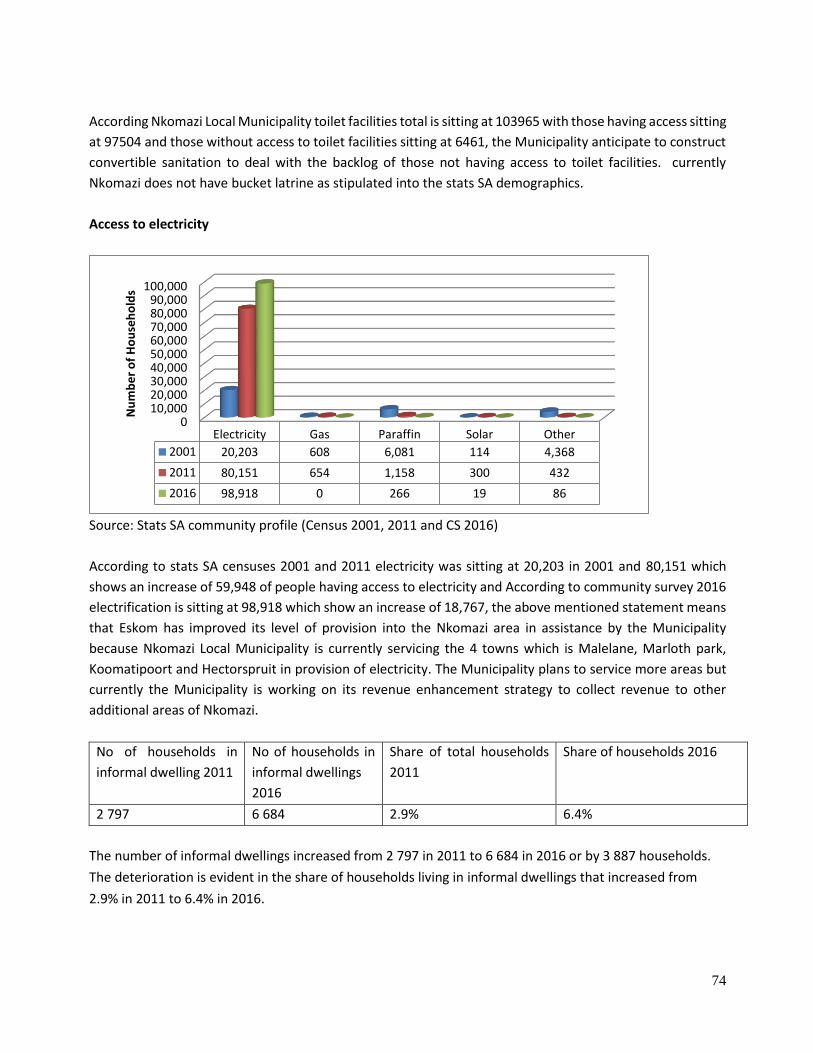
74
According Nkomazi Local Municipality toilet facilities total is sitting at 103965 with those having access sitting
at 97504 and those without access to toilet facilities sitting at 6461, the Municipality anticipate to construct
convertible sanitation to deal with the backlog of those not having access to toilet facilities. currently
Nkomazi does not have bucket latrine as stipulated into the stats SA demographics.
Access to electricity
Source: Stats SA community profile (Census 2001, 2011 and CS 2016)
According to stats SA censuses 2001 and 2011 electricity was sitting at 20,203 in 2001 and 80,151 which
shows an increase of 59,948 of people having access to electricity and According to community survey 2016
electrification is sitting at 98,918 which show an increase of 18,767, the above mentioned statement means
that Eskom has improved its level of provision into the Nkomazi area in assistance by the Municipality
because Nkomazi Local Municipality is currently servicing the 4 towns which is Malelane, Marloth park,
Koomatipoort and Hectorspruit in provision of electricity. The Municipality plans to service more areas but
currently the Municipality is working on its revenue enhancement strategy to collect revenue to other
additional areas of Nkomazi.
No of households in
informal dwelling 2011
No of households in
informal dwellings
2016
Share of total households
2011
Share of households 2016
2 797 6 684 2.9% 6.4%
The number of informal dwellings increased from 2 797 in 2011 to 6 684 in 2016 or by 3 887 households.
The deterioration is evident in the share of households living in informal dwellings that increased from
2.9% in 2011 to 6.4% in 2016.
010,00020,00030,00040,00050,00060,00070,00080,00090,000
100,000
Electricity Gas Paraffin Solar Other
2001 20,203 608 6,081 114 4,368
2011 80,151 654 1,158 300 432
2016 98,918 0 266 19 86
Nu
mb
er
of
Ho
use
ho
lds
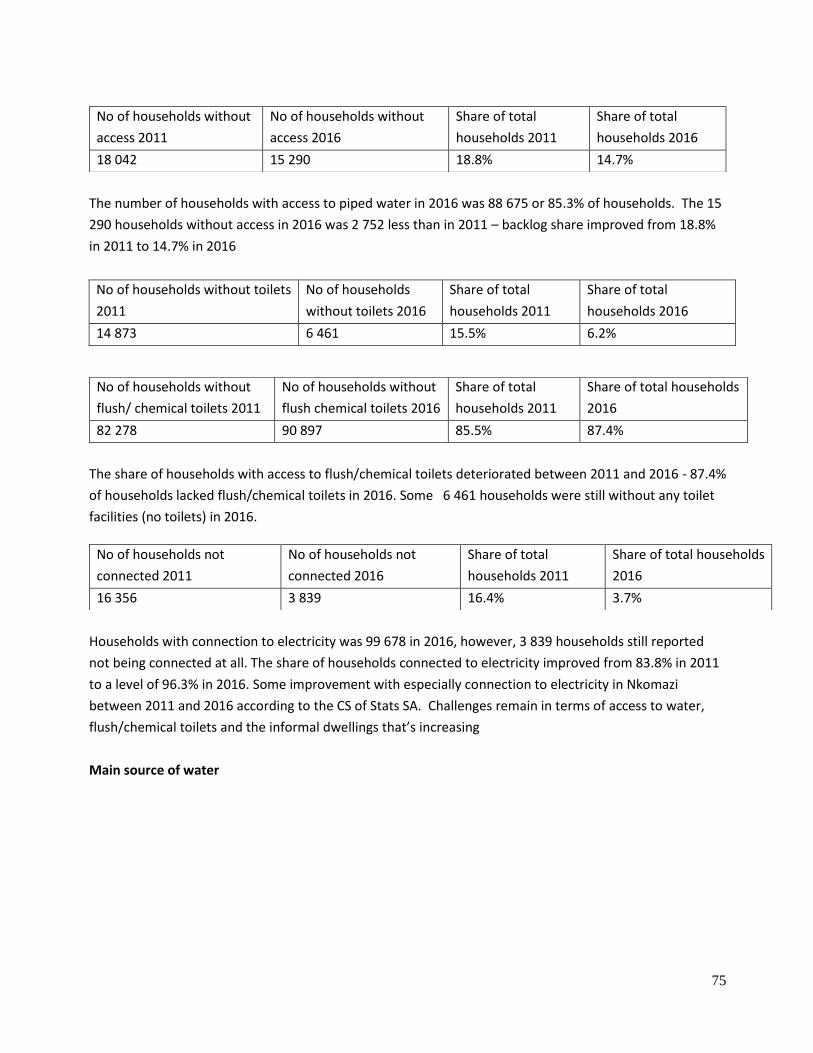
75
The number of households with access to piped water in 2016 was 88 675 or 85.3% of households. The 15
290 households without access in 2016 was 2 752 less than in 2011 – backlog share improved from 18.8%
in 2011 to 14.7% in 2016
No of households without toilets
2011
No of households
without toilets 2016
Share of total
households 2011
Share of total
households 2016
14 873 6 461 15.5% 6.2%
The share of households with access to flush/chemical toilets deteriorated between 2011 and 2016 - 87.4%
of households lacked flush/chemical toilets in 2016. Some 6 461 households were still without any toilet
facilities (no toilets) in 2016.
Households with connection to electricity was 99 678 in 2016, however, 3 839 households still reported
not being connected at all. The share of households connected to electricity improved from 83.8% in 2011
to a level of 96.3% in 2016. Some improvement with especially connection to electricity in Nkomazi
between 2011 and 2016 according to the CS of Stats SA. Challenges remain in terms of access to water,
flush/chemical toilets and the informal dwellings that’s increasing
Main source of water
No of households without
access 2011
No of households without
access 2016
Share of total
households 2011
Share of total
households 2016
18 042 15 290 18.8% 14.7%
No of households without
flush/ chemical toilets 2011
No of households without
flush chemical toilets 2016
Share of total
households 2011
Share of total households
2016
82 278 90 897 85.5% 87.4%
No of households not
connected 2011
No of households not
connected 2016
Share of total
households 2011
Share of total households
2016
16 356 3 839 16.4% 3.7%
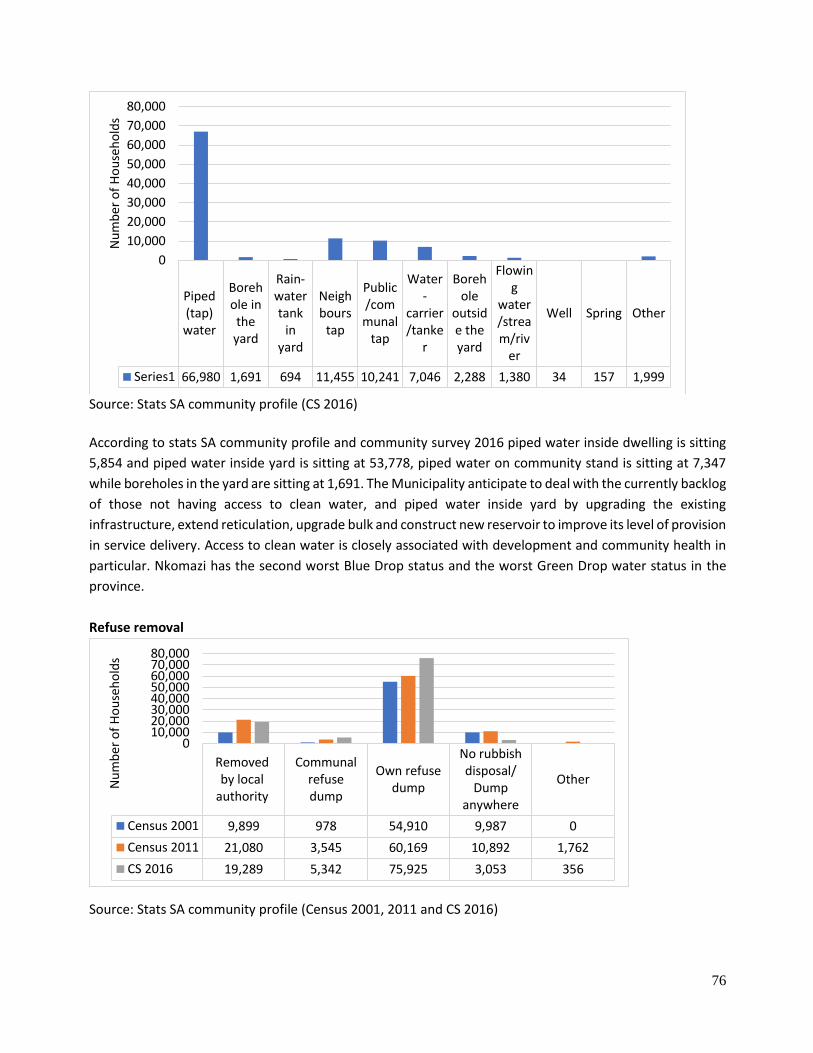
76
Source: Stats SA community profile (CS 2016)
According to stats SA community profile and community survey 2016 piped water inside dwelling is sitting
5,854 and piped water inside yard is sitting at 53,778, piped water on community stand is sitting at 7,347
while boreholes in the yard are sitting at 1,691. The Municipality anticipate to deal with the currently backlog
of those not having access to clean water, and piped water inside yard by upgrading the existing
infrastructure, extend reticulation, upgrade bulk and construct new reservoir to improve its level of provision
in service delivery. Access to clean water is closely associated with development and community health in
particular. Nkomazi has the second worst Blue Drop status and the worst Green Drop water status in the
province.
Refuse removal
Source: Stats SA community profile (Census 2001, 2011 and CS 2016)
Piped(tap)water
Borehole intheyard
Rain-watertank
inyard
Neighbours
tap
Public/communal
tap
Water-
carrier/tanke
r
Borehole
outside theyard
Flowing
water/stream/riv
er
Well Spring Other
Series1 66,980 1,691 694 11,455 10,241 7,046 2,288 1,380 34 157 1,999
0
10,000
20,000
30,000
40,000
50,000
60,000
70,000
80,000N
um
ber
of
Ho
use
ho
lds
Removedby local
authority
Communalrefusedump
Own refusedump
No rubbishdisposal/
Dumpanywhere
Other
Census 2001 9,899 978 54,910 9,987 0
Census 2011 21,080 3,545 60,169 10,892 1,762
CS 2016 19,289 5,342 75,925 3,053 356
010,00020,00030,00040,00050,00060,00070,00080,000
Nu
mb
er o
f H
ou
seh
old
s
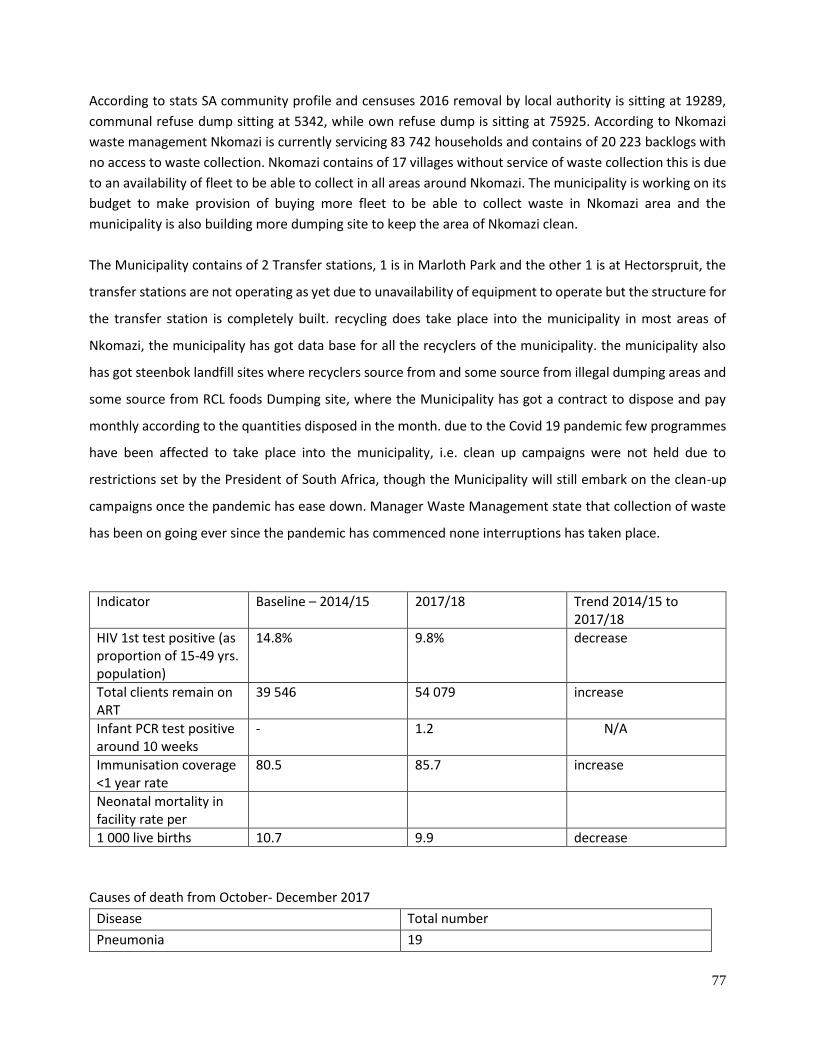
77
According to stats SA community profile and censuses 2016 removal by local authority is sitting at 19289,
communal refuse dump sitting at 5342, while own refuse dump is sitting at 75925. According to Nkomazi
waste management Nkomazi is currently servicing 83 742 households and contains of 20 223 backlogs with
no access to waste collection. Nkomazi contains of 17 villages without service of waste collection this is due
to an availability of fleet to be able to collect in all areas around Nkomazi. The municipality is working on its
budget to make provision of buying more fleet to be able to collect waste in Nkomazi area and the
municipality is also building more dumping site to keep the area of Nkomazi clean.
The Municipality contains of 2 Transfer stations, 1 is in Marloth Park and the other 1 is at Hectorspruit, the
transfer stations are not operating as yet due to unavailability of equipment to operate but the structure for
the transfer station is completely built. recycling does take place into the municipality in most areas of
Nkomazi, the municipality has got data base for all the recyclers of the municipality. the municipality also
has got steenbok landfill sites where recyclers source from and some source from illegal dumping areas and
some source from RCL foods Dumping site, where the Municipality has got a contract to dispose and pay
monthly according to the quantities disposed in the month. due to the Covid 19 pandemic few programmes
have been affected to take place into the municipality, i.e. clean up campaigns were not held due to
restrictions set by the President of South Africa, though the Municipality will still embark on the clean-up
campaigns once the pandemic has ease down. Manager Waste Management state that collection of waste
has been on going ever since the pandemic has commenced none interruptions has taken place.
Indicator Baseline – 2014/15 2017/18 Trend 2014/15 to 2017/18
HIV 1st test positive (as proportion of 15-49 yrs. population)
14.8% 9.8% decrease
Total clients remain on ART
39 546 54 079 increase
Infant PCR test positive around 10 weeks
- 1.2 N/A
Immunisation coverage <1 year rate
80.5 85.7 increase
Neonatal mortality in facility rate per
1 000 live births 10.7 9.9 decrease
Causes of death from October- December 2017
Disease Total number
Pneumonia 19
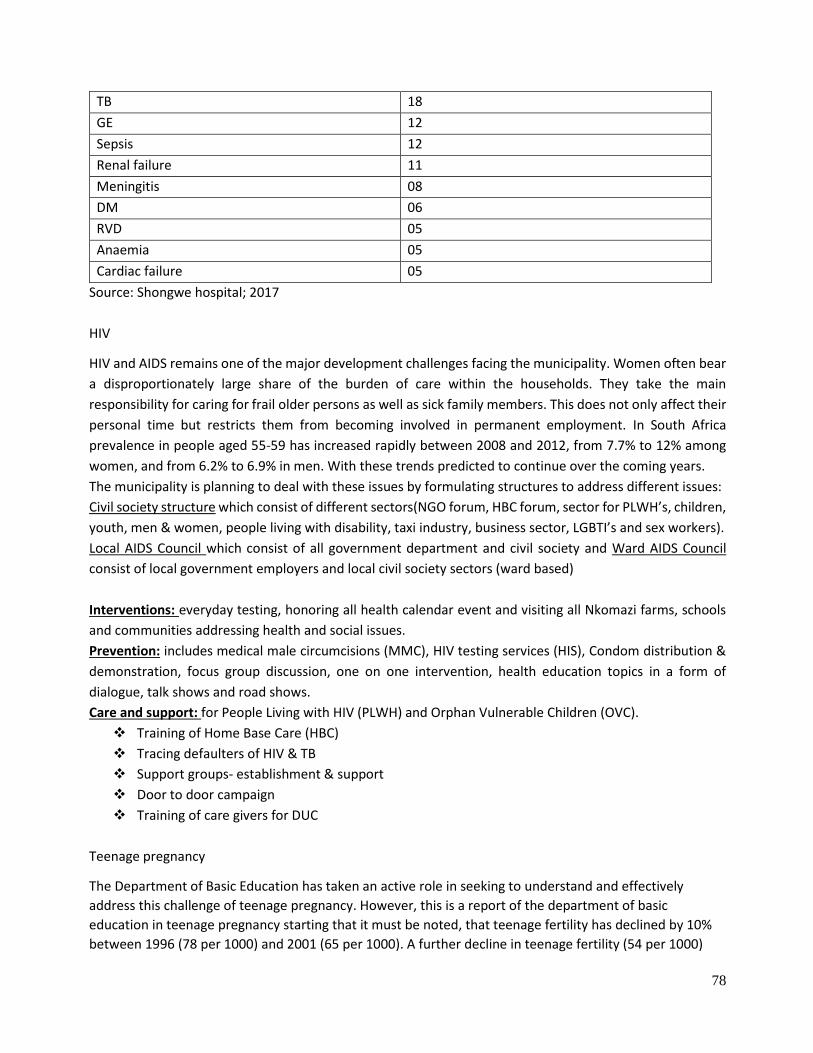
78
TB 18
GE 12
Sepsis 12
Renal failure 11
Meningitis 08
DM 06
RVD 05
Anaemia 05
Cardiac failure 05
Source: Shongwe hospital; 2017
HIV
HIV and AIDS remains one of the major development challenges facing the municipality. Women often bear
a disproportionately large share of the burden of care within the households. They take the main
responsibility for caring for frail older persons as well as sick family members. This does not only affect their
personal time but restricts them from becoming involved in permanent employment. In South Africa
prevalence in people aged 55-59 has increased rapidly between 2008 and 2012, from 7.7% to 12% among
women, and from 6.2% to 6.9% in men. With these trends predicted to continue over the coming years.
The municipality is planning to deal with these issues by formulating structures to address different issues:
Civil society structure which consist of different sectors(NGO forum, HBC forum, sector for PLWH’s, children,
youth, men & women, people living with disability, taxi industry, business sector, LGBTI’s and sex workers).
Local AIDS Council which consist of all government department and civil society and Ward AIDS Council
consist of local government employers and local civil society sectors (ward based)
Interventions: everyday testing, honoring all health calendar event and visiting all Nkomazi farms, schools
and communities addressing health and social issues.
Prevention: includes medical male circumcisions (MMC), HIV testing services (HIS), Condom distribution &
demonstration, focus group discussion, one on one intervention, health education topics in a form of
dialogue, talk shows and road shows.
Care and support: for People Living with HIV (PLWH) and Orphan Vulnerable Children (OVC).
❖ Training of Home Base Care (HBC)
❖ Tracing defaulters of HIV & TB
❖ Support groups- establishment & support
❖ Door to door campaign
❖ Training of care givers for DUC
Teenage pregnancy
The Department of Basic Education has taken an active role in seeking to understand and effectively
address this challenge of teenage pregnancy. However, this is a report of the department of basic
education in teenage pregnancy starting that it must be noted, that teenage fertility has declined by 10%
between 1996 (78 per 1000) and 2001 (65 per 1000). A further decline in teenage fertility (54 per 1000)
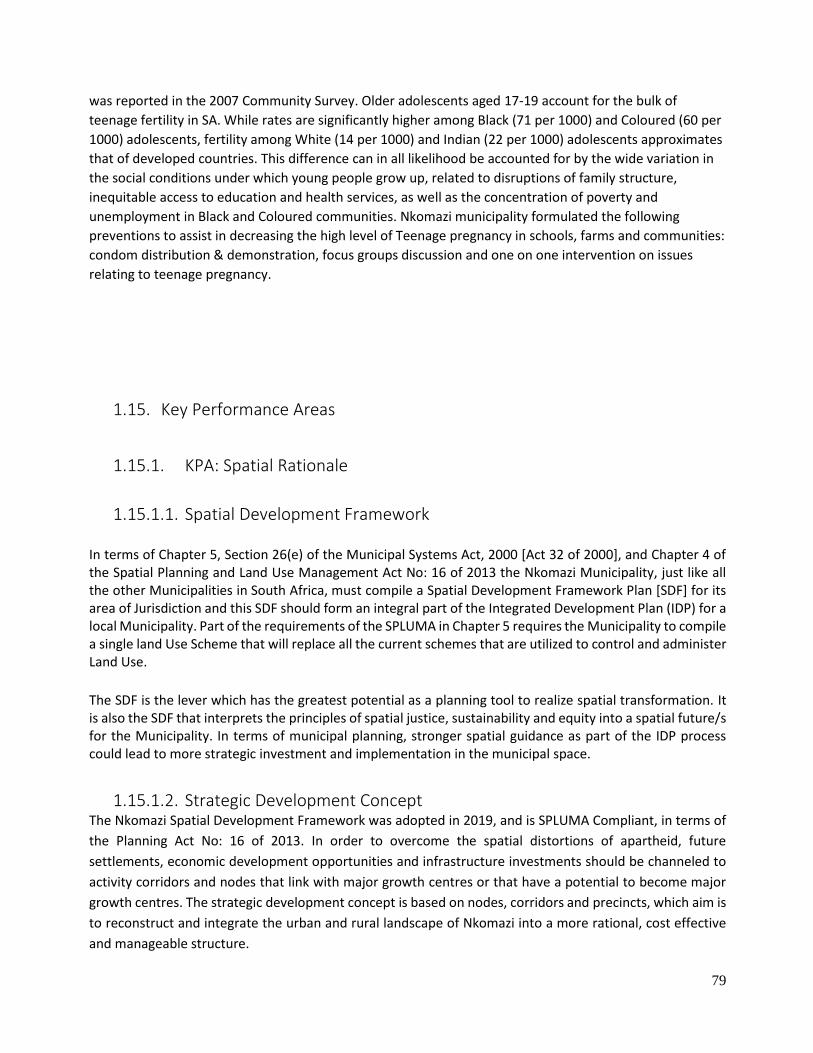
79
was reported in the 2007 Community Survey. Older adolescents aged 17-19 account for the bulk of
teenage fertility in SA. While rates are significantly higher among Black (71 per 1000) and Coloured (60 per
1000) adolescents, fertility among White (14 per 1000) and Indian (22 per 1000) adolescents approximates
that of developed countries. This difference can in all likelihood be accounted for by the wide variation in
the social conditions under which young people grow up, related to disruptions of family structure,
inequitable access to education and health services, as well as the concentration of poverty and
unemployment in Black and Coloured communities. Nkomazi municipality formulated the following
preventions to assist in decreasing the high level of Teenage pregnancy in schools, farms and communities:
condom distribution & demonstration, focus groups discussion and one on one intervention on issues
relating to teenage pregnancy.
1.15. Key Performance Areas
1.15.1. KPA: Spatial Rationale
1.15.1.1. Spatial Development Framework
In terms of Chapter 5, Section 26(e) of the Municipal Systems Act, 2000 [Act 32 of 2000], and Chapter 4 of the Spatial Planning and Land Use Management Act No: 16 of 2013 the Nkomazi Municipality, just like all the other Municipalities in South Africa, must compile a Spatial Development Framework Plan [SDF] for its area of Jurisdiction and this SDF should form an integral part of the Integrated Development Plan (IDP) for a local Municipality. Part of the requirements of the SPLUMA in Chapter 5 requires the Municipality to compile a single land Use Scheme that will replace all the current schemes that are utilized to control and administer Land Use.
The SDF is the lever which has the greatest potential as a planning tool to realize spatial transformation. It is also the SDF that interprets the principles of spatial justice, sustainability and equity into a spatial future/s for the Municipality. In terms of municipal planning, stronger spatial guidance as part of the IDP process could lead to more strategic investment and implementation in the municipal space.
1.15.1.2. Strategic Development Concept The Nkomazi Spatial Development Framework was adopted in 2019, and is SPLUMA Compliant, in terms of
the Planning Act No: 16 of 2013. In order to overcome the spatial distortions of apartheid, future
settlements, economic development opportunities and infrastructure investments should be channeled to
activity corridors and nodes that link with major growth centres or that have a potential to become major
growth centres. The strategic development concept is based on nodes, corridors and precincts, which aim is
to reconstruct and integrate the urban and rural landscape of Nkomazi into a more rational, cost effective
and manageable structure.
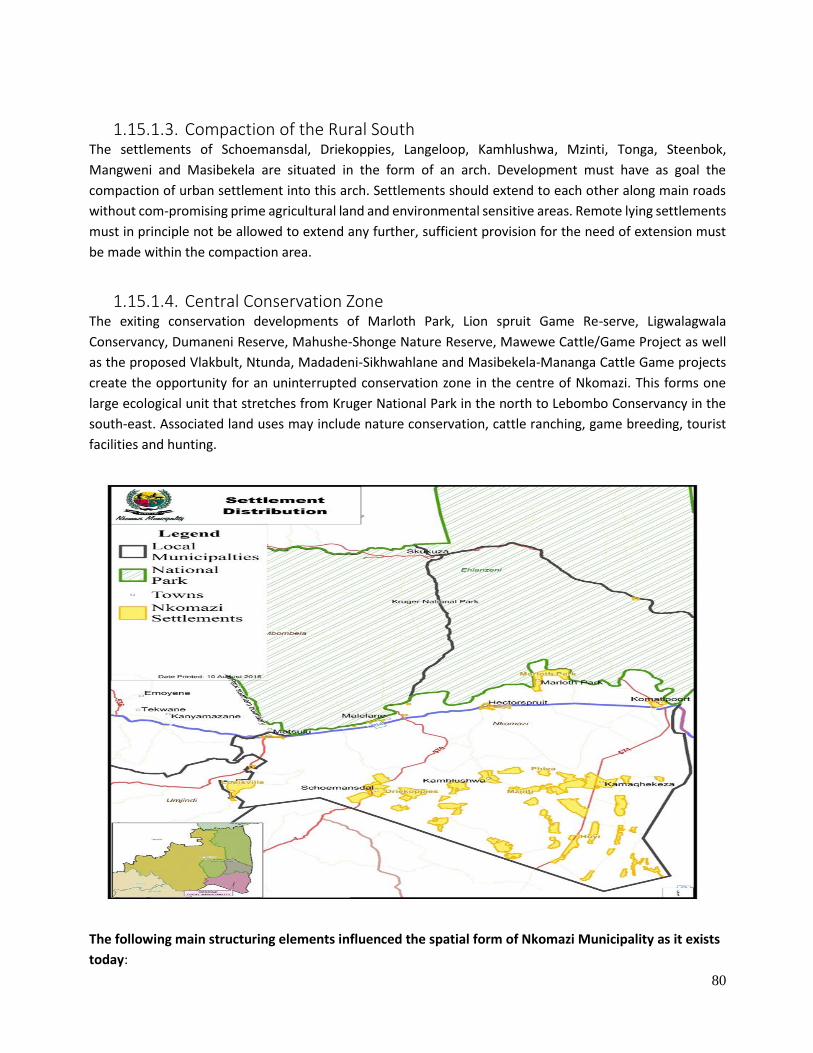
80
1.15.1.3. Compaction of the Rural South The settlements of Schoemansdal, Driekoppies, Langeloop, Kamhlushwa, Mzinti, Tonga, Steenbok,
Mangweni and Masibekela are situated in the form of an arch. Development must have as goal the
compaction of urban settlement into this arch. Settlements should extend to each other along main roads
without com-promising prime agricultural land and environmental sensitive areas. Remote lying settlements
must in principle not be allowed to extend any further, sufficient provision for the need of extension must
be made within the compaction area.
1.15.1.4. Central Conservation Zone The exiting conservation developments of Marloth Park, Lion spruit Game Re-serve, Ligwalagwala
Conservancy, Dumaneni Reserve, Mahushe-Shonge Nature Reserve, Mawewe Cattle/Game Project as well
as the proposed Vlakbult, Ntunda, Madadeni-Sikhwahlane and Masibekela-Mananga Cattle Game projects
create the opportunity for an uninterrupted conservation zone in the centre of Nkomazi. This forms one
large ecological unit that stretches from Kruger National Park in the north to Lebombo Conservancy in the
south-east. Associated land uses may include nature conservation, cattle ranching, game breeding, tourist
facilities and hunting.
The following main structuring elements influenced the spatial form of Nkomazi Municipality as it exists
today:
81
Past Political Ideologies – Apartheid planning resulted in the separation and isolation of the southern part
of Nkomazi, which used to be KaNgwane homeland, from the more developed northern part. This created
a distorted spatial structure and lead to inefficiencies and backlogs in service provision.
Tribal Authority Areas – Dispersed settlements developed with no order. Ad hoc and unsustainable service
and infrastructure development occurred.
International Borders – the borders of Swaziland and Mozambique act as physical barriers limiting the
movement of people, goods and services to Swaziland through Jeppes Reef and Mananga Border Posts and
to Mozambique through the Lebombo Border Post. Continuous influx of illegal immigrants from these
countries contributes further to the mushrooming of informal settlements.
N4 Maputo Development Corridor – the alignments of the N4 highway and railway line have played a vital
role in the development of the main urban centres in the northern part of the municipality i.e. Malelane,
Hectorspruit and Koomatipoort.
Major Roads – the two main provincial roads R570 (P80) and R571 (P179), linking the N4 highway to the
south, have played a significant part in the development of urban settlements along its alignments.
Topography – the topography of the area determined its physical linkages in regional and national context.
The Kaalrug Mountains limits linkages to the west and the Lebombo Mountains limits linkages to the east.
The N4 remains the only link between Maputo and the economic hub of South Africa, i.e. Gauteng.
Kruger National Park – the Kruger National Park dictates the type of land uses to be found adjacent to its
border, including agriculture, tourism related developments i.e. eco areas, conservancies and uses focusing
on nature conservation.
1.15.1.5. Municipal SDF, as part of the IDP The purpose of the Nkomazi SDF is seen to be exactly what it was intended – a broad and indicative guide
that spatially reflects the development vision and objectives of the municipality. Because the SDF does not
contain detail proposals but broader objectives, it will not be revised annually, but will guide IDP decision-
taking over a number of years. It is expected that revision thereof will only be necessary when there is a shift
in the development vision and objectives of the Municipality.
1.15.1.6. The Municipal Land Use Management Scheme The LUMS will provide a detailed, property-bound guideline to assist investment decisions by the
Municipality. It will function through the development of zones that contain detail regulations with regards
to compatible land uses and bulk of development in certain demarcated areas the scheme also incorporated
policy statements with regards to certain developments such as home offices, Taverns and others.
82
Due to the fact that the scheme must give effect to the Municipal SDF and the SDF undergoes a major
change, the change should reflect through to the scheme. Such an amendment is affected by the
Municipality through the application procedures prescribed by the scheme itself.
The Nkomazi Local Municipality’s SDF does not discard existing land rights but intends to guide future land
uses. The proposals in this SDF do not grant any land use right and does not exempt anyone from his or her
obligation in terms of any other act that controls or regulates the use of land. This Spatial Development
Framework for Nkomazi should not be seen as the definitive guide to development in the area, but rather
as a document that guides decision-making, growth and development. The merits of all development
proposals should still be considered and the need and desirability for any specific development has to be
proven by the developer.
1.15.1.7. Town Planning Tribunal • All procedures and processes as tabulated below finds prudence from the 2015, promulgated and
customized by-law, as informed by the provision of SPLUM Act, Act 16 of 2013.
• Spatial planning and land use management by-law, 2015
• The Nkomazi Council resolved to go for the single operational MPT after the promulgation of the by-
law. The Nkomazi Municipal Planning Tribunal thereby established for the Municipal area in
compliance with section 35 of the Act. Part C: Established of Municipal Planning Tribunal for Local
Municipal Area 32 Establishment of Municipal planning Tribunal for Local municipal area subject to
the provisions of part D and E of this Chapter.
• Composition of Municipal Planning Tribunal for Local municipal area
• The Municipal Planning Tribunal consist of no less than 10 members made up as follows:
• As per the publication and council resolution the MPT comprises of 12 members (6 external
members and 7 internal members) such being done in terms in terms of sec 33 of the immediate by-
law.
• Seven of which are officials in the full-time service of the Municipality:
• From the 6, three persons who have knowledge and experience of spatial planning, land use
management and land development or the law related thereto who are not municipal officials.
• 3 externals and 1 internal member constitutes a quorum
• Proceedings of Municipal Planning Tribunal for Municipal area
• Commencement date of operations of Municipal Planning was after publication of the Municipal
resolve and appointment of the mentioned members.
• Currently the Nkomazi Municipal Planning Tribunal has had 6 successful sittings
• The categories of land development and land use management
• Sec 43 sets out the categories of land development and land use management for the Municipality,
as contemplated in section 35(3) of the Act, are as follows:
83
1.15.1.8. Human Settlements The Municipality is in the process of reviewing the Housing Chapter which forms part of the IDP, The
document will be adopted before the financial year of 2019/2020, in order to start with the implementation
of the projects that are outlined in the document as proposals.
1.15.1.8.1. The current running Projects of The Municipality: • CRU FOR Malelane Ext 21
• Township Establishment for Mjejane Township
• Township Establishment for Kamhlushwa Township
• Housing allocation for Military Veterans [20]
• Housing Allocation for Disaster affected houses [various areas]
• Servicing of sites for Komatipoort Ext 18
Informal Settlements upgrading Plans for six [6] areas [Orlando, Mbekisberg, Louisville. Mkhwarukhwaru, stentor and Mangweni
1.15.1.8.2. Staff Composition • Director: Planning and Development – the incumbent is a Professional Planner, who is the
Designated Officer, to consider all the Category B Application which are not adjudicated by the MPT.
• Manager: Land Use Planning – a Qualified Planner, who is supervising all Land Use Development
issues, Spatial Planning and Projects.
• Senior: Land Use Planner – a Qualified Planner, who deals with the day to day Land use Control
matters
• Land Use Planner – a Qualified Planner, who deals with Land Use Control matters.
• Building Inspectors – they regulate building activities around the Municipal area, and monitor in all
phases the construction work.
• Human Settlement Officers – they deal with the monitoring of the human settlement’s projects, and
Quality assurance.
• GIS – the incumbent
1.15.2. KPA: Disaster Management
Introduction This section confirms the arrangements for managing disaster risk and preparing for- and responding to disasters within the Nkomazi Municipality as required by the Disaster Management Act, 2002 (Act 57 of 2002). The Disaster Management Plan for Nkomazi was developed and it is updated annually and adopted by Council ( NLM: GCM: A007/ 2019). The plan confirms the arrangements for managing disaster risk, preparing and responding to disasters within the municipality. The mandatory requirements (in terms of the Disaster Management Act, 2002 (Act 57 of 2002) – hereafter referred to as “the Act”) for a Municipal Disaster Management Plan for the Nkomazi Municipality are:
• To prepare a disaster management plan for its area according to the circumstances prevailing in the area and within the ambit of its municipal disaster management framework.
• The disaster management plan for a municipality must form an integral part of the municipality’s
84
integrated development plan (IDP) (Section 53(2)(a))
• “Applicable disaster management plans” are deemed core components of an IDP (Government: Municipal Systems Act, 2000 (Act 32 of 2000).
• a District Municipality and local municipalities within the area of the district municipality must prepare their disaster management plans after consulting each other (Section 53(3)).
• The Disaster Management (DM) plan, and of any amendment to the plan, must be submitted to the Disaster Management Centre. (Section 53(4)).
Disaster Management Advisory Forum Local Municipalities are encouraged to establish such a forum to coordinate strategic issues related to Disaster Management such as Risk Assessments and to approve and/or review the DMP for the Nkomazi Municipality before it is submitted to Council. The frequency of meetings of such a body is 2 to 4 times per year or as required. Once established, such a forum can play an important role in setting policy and priorities for Disaster Management within the Nkomazi Municipality, and reviewing Risk Assessments and plans from time to time. The Terms of Reference of the Forum is finding statement and will determine its functioning. Alternative existing coordination structures may also be used to perform the functions of an Advisory Forum, thereby reducing administration and costs. Where other existing coordination structures are available to perform the envisaged functions of an Advisory Forum, it would be prudent to reduce costs and administration and use existing structures instead of creating a new dedicated structure. Action: The Nkomazi Municipality will consider the establishment of a dedicated body for interdepartmental Disaster Management coordination, or will assign this responsibility to the top management team (of officials) of the Nkomazi Municipality. The Nkomazi Municipality will also consider the establishment of a Disaster Management Advisory Forum and implement its decision in this regard. This section describes the planning for institutional capacity for Disaster Management within the Nkomazi Municipality, in accordance with KPA 1 of the NDMF. Current Institutional Arrangements within the Nkomazi Municipality Nkomazi Municipality is composed of a political structure (Council) consisting of proportional and ward councillors, supported by an administrative structure of officials
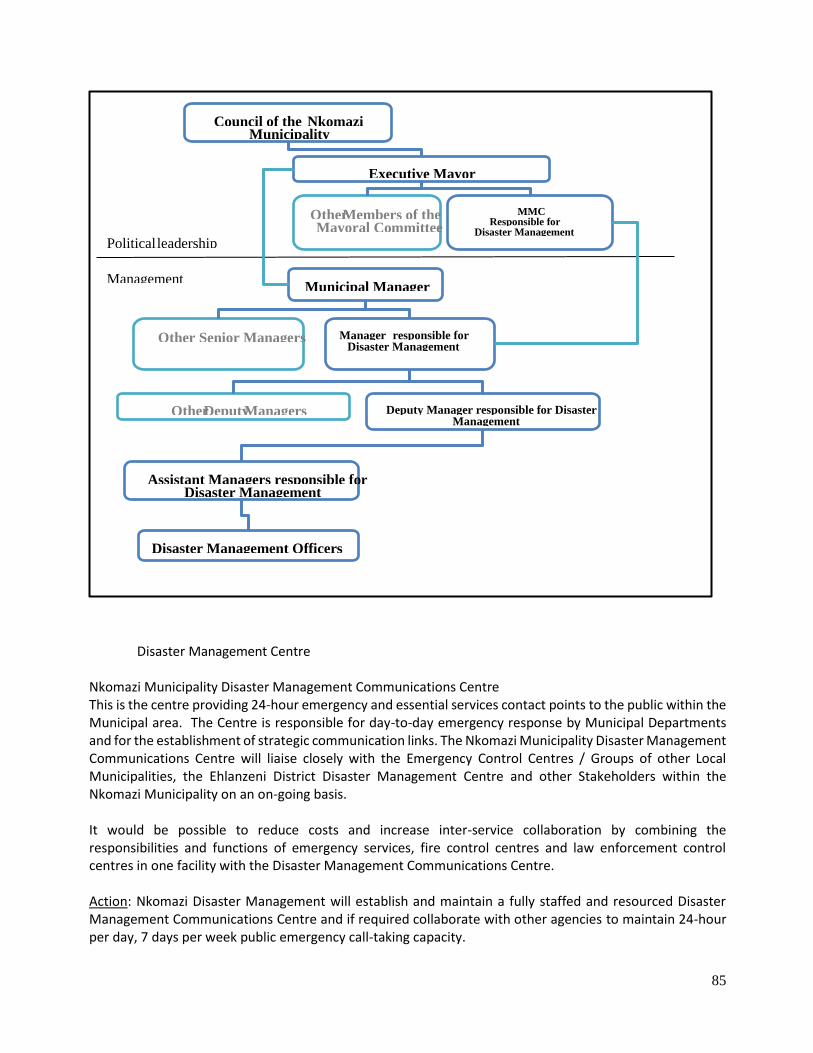
85
Disaster Management Centre Nkomazi Municipality Disaster Management Communications Centre This is the centre providing 24-hour emergency and essential services contact points to the public within the Municipal area. The Centre is responsible for day-to-day emergency response by Municipal Departments and for the establishment of strategic communication links. The Nkomazi Municipality Disaster Management Communications Centre will liaise closely with the Emergency Control Centres / Groups of other Local Municipalities, the Ehlanzeni District Disaster Management Centre and other Stakeholders within the Nkomazi Municipality on an on-going basis. It would be possible to reduce costs and increase inter-service collaboration by combining the responsibilities and functions of emergency services, fire control centres and law enforcement control centres in one facility with the Disaster Management Communications Centre. Action: Nkomazi Disaster Management will establish and maintain a fully staffed and resourced Disaster Management Communications Centre and if required collaborate with other agencies to maintain 24-hour per day, 7 days per week public emergency call-taking capacity.
Council of the Nkomazi Municipality
Executive Mayor
Municipal Manager
Manager responsible for Disaster Management
MMC Responsible for
Disaster Management
Deputy Manager responsible for Disaster Management
Assistant Managers responsible for Disaster Management
Political leadership
Management
Other Senior Managers
Other Deputy Managers
Other Members of the Mayoral Committee
Disaster Management Officers
86
Nkomazi Disaster Operations Centre (DOC) / Joint Operations Centre (JOC) The Nkomazi DOC is a facility equipped to serve as command and coordination centre during disasters, where the joint response & relief management team will convene. Alternative facilities should be identified as back-up to the primary DOC. The term JOC for Joint Operations Centre can also be used for this facility. Action: Nkomazi Disaster Management will identify, establish and maintain a fully staffed and resourced Disaster Operations Centre for activation as required and will identify fall-back or alternative facilities for the same purpose. Figure 6 illustrates how the components described above would interact with each other. It is important to note that this is a proposed organisational structure, but rather a proposal in terms of lines of communication and collaboration. Disaster Risk Assessment: Aerocon Disaster Management Plans Various disaster risks for the Nkomazi Municipality have been identified and assessed during risk assessments executed during 2016 (Technological) and 2018 (Community based). The risk assessment was done by respectively Aurecon South Africa (Pty) Ltd. under instruction of the EDM for all municipalities falling within the auspices of the District. Disaster Risk Assessment is the first step in planning an effective Disaster Risk Reduction programme. A Disaster Risk Assessment examines the likelihood and outcomes of expected disaster events. This includes investigating the related hazards and conditions of vulnerability that increase the chance of loss. Risk Profile of the Nkomazi Municipality Various disaster risks have been identified and assessed as set out in detail in the Nkomazi Local Municipality.
• The first step in developing a risk profile is hazard identification. A hazard is a potentially damaging physical event, phenomenon or human activity, which may cause the loss of life or injury, property damage, social and economic disruption or environmental degradation. Hazards are typically categorised into Natural, Technological and Environmental hazards.
• Natural hazards are natural processes or phenomena occurring in the biosphere that may constitute a damaging event. Natural Hazards are typically classified into:
• Geological Hazards: Natural earth processes or phenomena in the biosphere, which include geological, neo-tectonic, geo-physical, geo-morphological, geo-technical and hydro-geological nature;
• Hydro Meteorological Hazards: Natural processes or phenomena of atmospheric, hydrological or oceanographic nature; and
• Biological Hazards: Processes of organic origin or those conveyed by biological vectors, including exposure to pathogenic micro-organisms, toxins and bioactive substances.
• Technological hazards constitute danger originating from technological or industrial accidents, dangerous procedures or certain human activities, which may cause the loss of life or injury, property damage, social and economic degradation.
• Environmental hazards are processes induced by human behaviour and activities (sometimes combined with natural hazards), that damage the natural resource base or adversely alter natural processes or ecosystems.
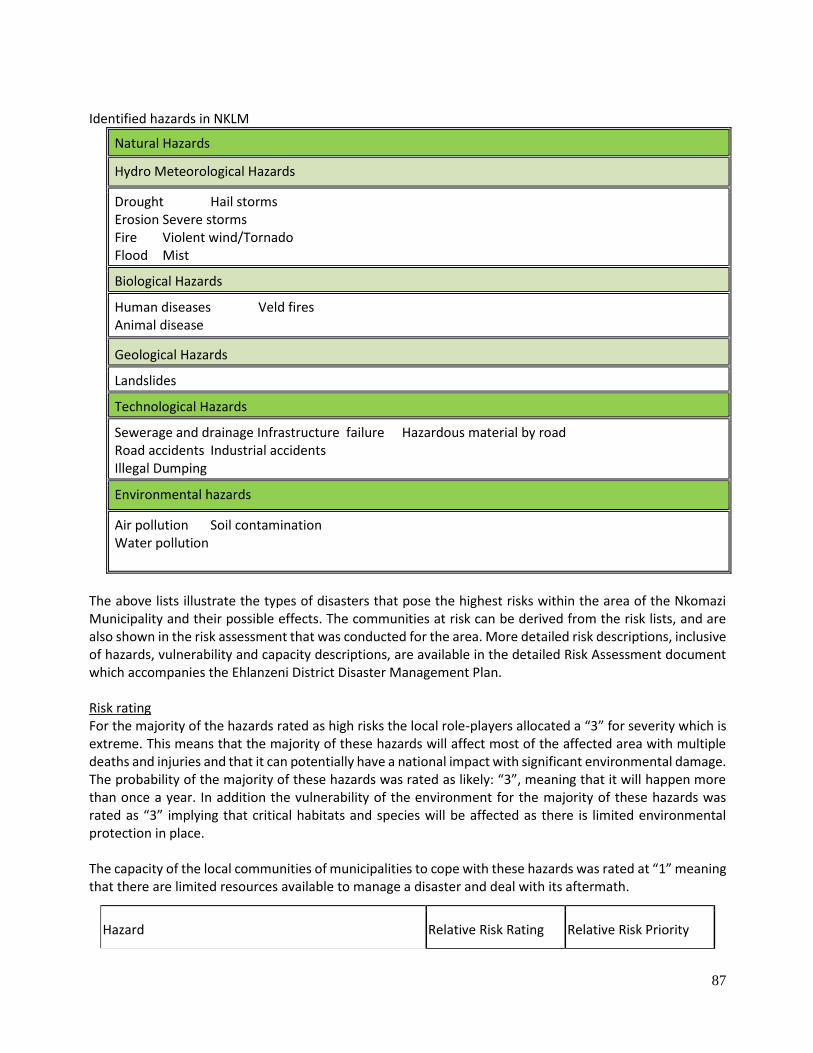
87
Identified hazards in NKLM
Natural Hazards
Hydro Meteorological Hazards
Drought Hail storms Erosion Severe storms Fire Violent wind/Tornado Flood Mist
Biological Hazards
Human diseases Veld fires Animal disease
Geological Hazards
Landslides
Technological Hazards
Sewerage and drainage Infrastructure failure Hazardous material by road Road accidents Industrial accidents Illegal Dumping
Environmental hazards
Air pollution Soil contamination Water pollution
The above lists illustrate the types of disasters that pose the highest risks within the area of the Nkomazi Municipality and their possible effects. The communities at risk can be derived from the risk lists, and are also shown in the risk assessment that was conducted for the area. More detailed risk descriptions, inclusive of hazards, vulnerability and capacity descriptions, are available in the detailed Risk Assessment document which accompanies the Ehlanzeni District Disaster Management Plan. Risk rating For the majority of the hazards rated as high risks the local role-players allocated a “3” for severity which is extreme. This means that the majority of these hazards will affect most of the affected area with multiple deaths and injuries and that it can potentially have a national impact with significant environmental damage. The probability of the majority of these hazards was rated as likely: “3”, meaning that it will happen more than once a year. In addition the vulnerability of the environment for the majority of these hazards was rated as “3” implying that critical habitats and species will be affected as there is limited environmental protection in place. The capacity of the local communities of municipalities to cope with these hazards was rated at “1” meaning that there are limited resources available to manage a disaster and deal with its aftermath.
Hazard Relative Risk Rating Relative Risk Priority
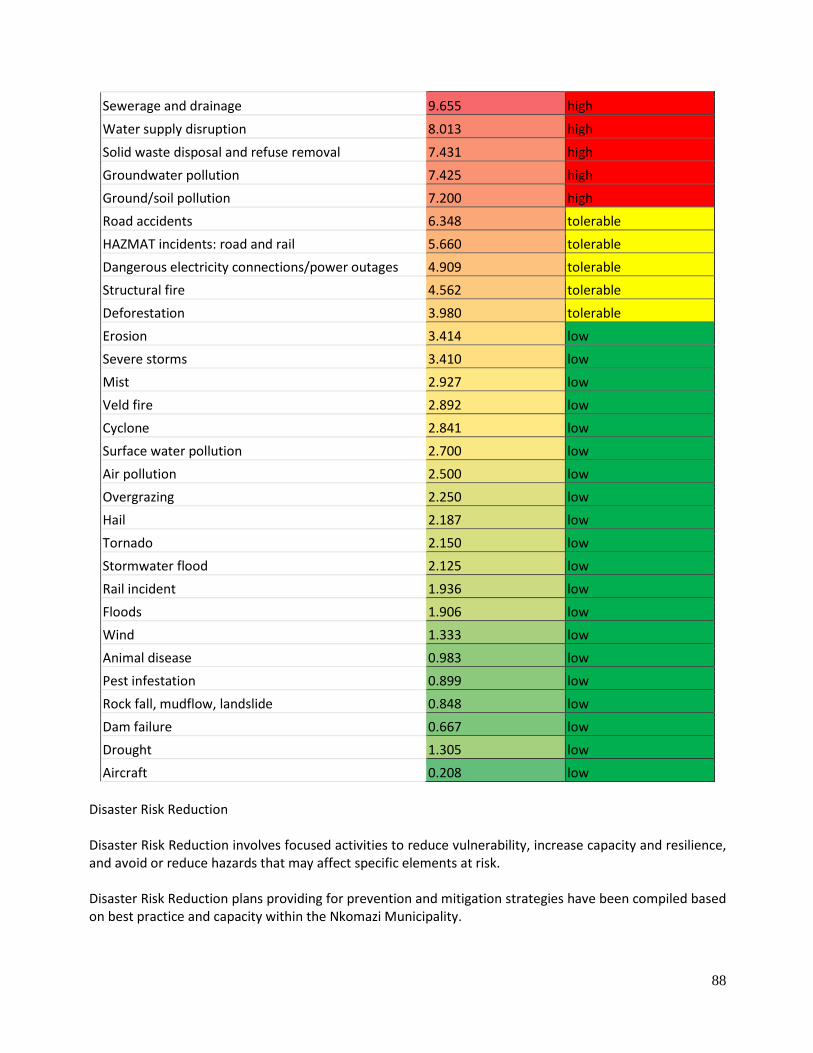
88
Disaster Risk Reduction Disaster Risk Reduction involves focused activities to reduce vulnerability, increase capacity and resilience, and avoid or reduce hazards that may affect specific elements at risk. Disaster Risk Reduction plans providing for prevention and mitigation strategies have been compiled based on best practice and capacity within the Nkomazi Municipality.
Sewerage and drainage 9.655 high
Water supply disruption 8.013 high
Solid waste disposal and refuse removal 7.431 high
Groundwater pollution 7.425 high
Ground/soil pollution 7.200 high
Road accidents 6.348 tolerable
HAZMAT incidents: road and rail 5.660 tolerable
Dangerous electricity connections/power outages 4.909 tolerable
Structural fire 4.562 tolerable
Deforestation 3.980 tolerable
Erosion 3.414 low
Severe storms 3.410 low
Mist 2.927 low
Veld fire 2.892 low
Cyclone 2.841 low
Surface water pollution 2.700 low
Air pollution 2.500 low
Overgrazing 2.250 low
Hail 2.187 low
Tornado 2.150 low
Stormwater flood 2.125 low
Rail incident 1.936 low
Floods 1.906 low
Wind 1.333 low
Animal disease 0.983 low
Pest infestation 0.899 low
Rock fall, mudflow, landslide 0.848 low
Dam failure 0.667 low
Drought 1.305 low
Aircraft 0.208 low
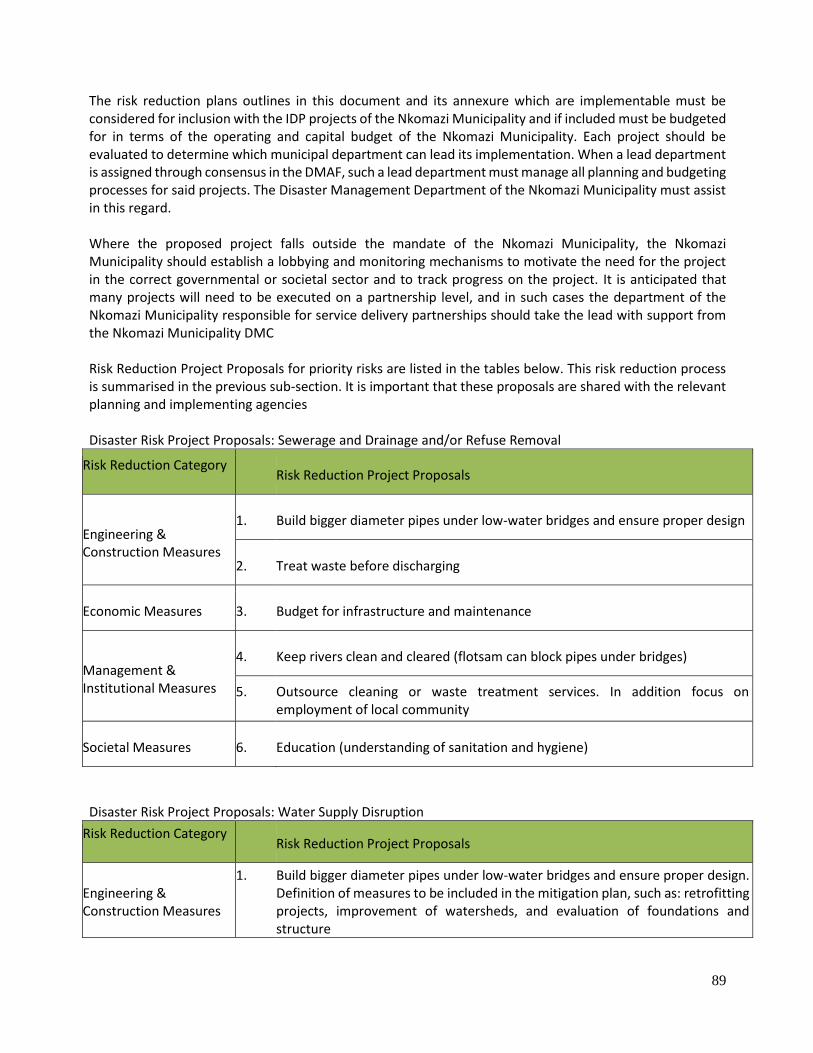
89
The risk reduction plans outlines in this document and its annexure which are implementable must be considered for inclusion with the IDP projects of the Nkomazi Municipality and if included must be budgeted for in terms of the operating and capital budget of the Nkomazi Municipality. Each project should be evaluated to determine which municipal department can lead its implementation. When a lead department is assigned through consensus in the DMAF, such a lead department must manage all planning and budgeting processes for said projects. The Disaster Management Department of the Nkomazi Municipality must assist in this regard. Where the proposed project falls outside the mandate of the Nkomazi Municipality, the Nkomazi Municipality should establish a lobbying and monitoring mechanisms to motivate the need for the project in the correct governmental or societal sector and to track progress on the project. It is anticipated that many projects will need to be executed on a partnership level, and in such cases the department of the Nkomazi Municipality responsible for service delivery partnerships should take the lead with support from the Nkomazi Municipality DMC Risk Reduction Project Proposals for priority risks are listed in the tables below. This risk reduction process is summarised in the previous sub-section. It is important that these proposals are shared with the relevant planning and implementing agencies Disaster Risk Project Proposals: Sewerage and Drainage and/or Refuse Removal
Risk Reduction Category Risk Reduction Project Proposals
Engineering & Construction Measures
1. Build bigger diameter pipes under low-water bridges and ensure proper design
2. Treat waste before discharging
Economic Measures 3. Budget for infrastructure and maintenance
Management & Institutional Measures
4. Keep rivers clean and cleared (flotsam can block pipes under bridges)
5. Outsource cleaning or waste treatment services. In addition focus on employment of local community
Societal Measures 6. Education (understanding of sanitation and hygiene)
Disaster Risk Project Proposals: Water Supply Disruption
Risk Reduction Category Risk Reduction Project Proposals
Engineering & Construction Measures
1. Build bigger diameter pipes under low-water bridges and ensure proper design. Definition of measures to be included in the mitigation plan, such as: retrofitting projects, improvement of watersheds, and evaluation of foundations and structure
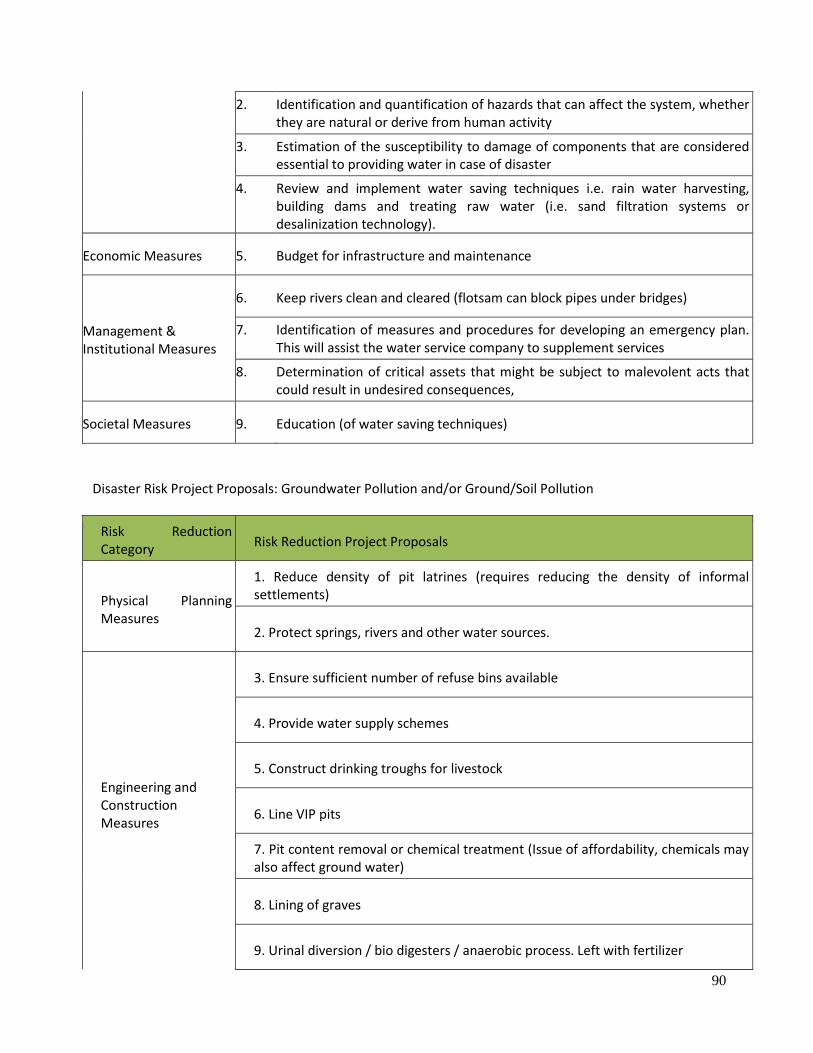
90
2. Identification and quantification of hazards that can affect the system, whether they are natural or derive from human activity
3. Estimation of the susceptibility to damage of components that are considered essential to providing water in case of disaster
4. Review and implement water saving techniques i.e. rain water harvesting, building dams and treating raw water (i.e. sand filtration systems or desalinization technology).
Economic Measures 5. Budget for infrastructure and maintenance
Management & Institutional Measures
6. Keep rivers clean and cleared (flotsam can block pipes under bridges)
7. Identification of measures and procedures for developing an emergency plan. This will assist the water service company to supplement services
8. Determination of critical assets that might be subject to malevolent acts that could result in undesired consequences,
Societal Measures 9. Education (of water saving techniques)
Disaster Risk Project Proposals: Groundwater Pollution and/or Ground/Soil Pollution
Risk Reduction Category
Risk Reduction Project Proposals
Physical Planning Measures
1. Reduce density of pit latrines (requires reducing the density of informal settlements)
2. Protect springs, rivers and other water sources.
Engineering and Construction Measures
3. Ensure sufficient number of refuse bins available
4. Provide water supply schemes
5. Construct drinking troughs for livestock
6. Line VIP pits
7. Pit content removal or chemical treatment (Issue of affordability, chemicals may also affect ground water)
8. Lining of graves
9. Urinal diversion / bio digesters / anaerobic process. Left with fertilizer
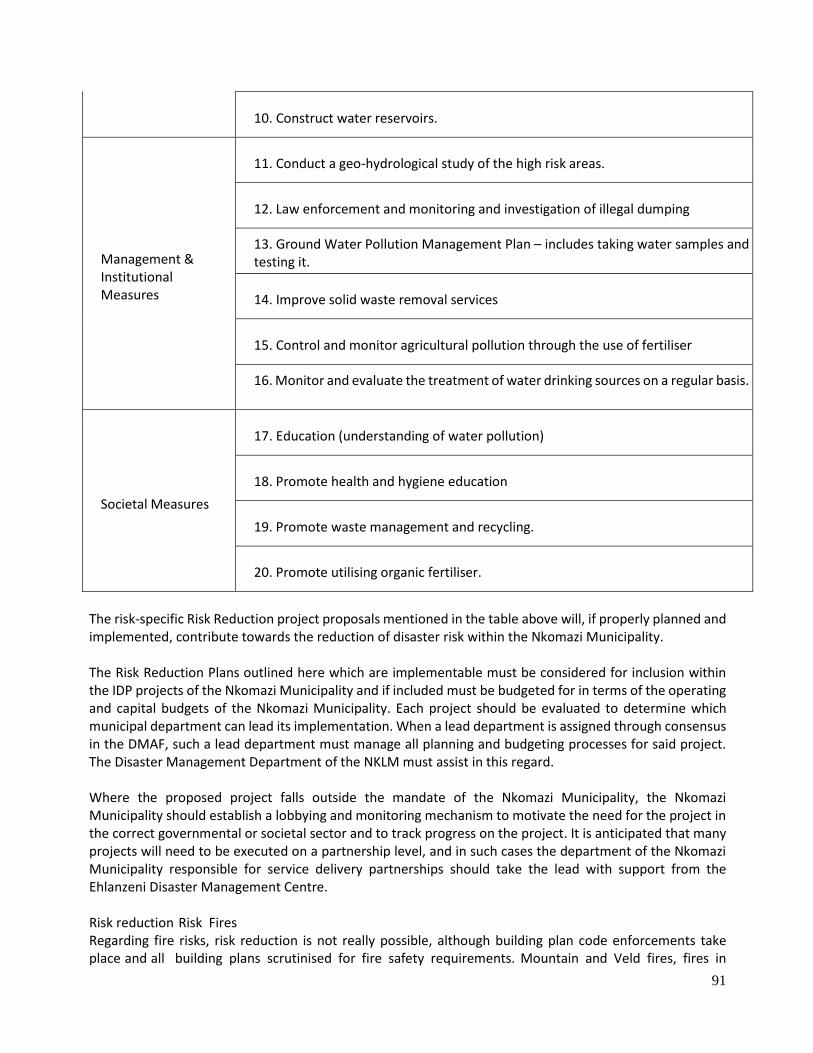
91
10. Construct water reservoirs.
Management & Institutional Measures
11. Conduct a geo-hydrological study of the high risk areas.
12. Law enforcement and monitoring and investigation of illegal dumping
13. Ground Water Pollution Management Plan – includes taking water samples and testing it.
14. Improve solid waste removal services
15. Control and monitor agricultural pollution through the use of fertiliser
16. Monitor and evaluate the treatment of water drinking sources on a regular basis.
Societal Measures
17. Education (understanding of water pollution)
18. Promote health and hygiene education
19. Promote waste management and recycling.
20. Promote utilising organic fertiliser.
The risk-specific Risk Reduction project proposals mentioned in the table above will, if properly planned and implemented, contribute towards the reduction of disaster risk within the Nkomazi Municipality. The Risk Reduction Plans outlined here which are implementable must be considered for inclusion within the IDP projects of the Nkomazi Municipality and if included must be budgeted for in terms of the operating and capital budgets of the Nkomazi Municipality. Each project should be evaluated to determine which municipal department can lead its implementation. When a lead department is assigned through consensus in the DMAF, such a lead department must manage all planning and budgeting processes for said project. The Disaster Management Department of the NKLM must assist in this regard. Where the proposed project falls outside the mandate of the Nkomazi Municipality, the Nkomazi Municipality should establish a lobbying and monitoring mechanism to motivate the need for the project in the correct governmental or societal sector and to track progress on the project. It is anticipated that many projects will need to be executed on a partnership level, and in such cases the department of the Nkomazi Municipality responsible for service delivery partnerships should take the lead with support from the Ehlanzeni Disaster Management Centre. Risk reduction Risk Fires Regarding fire risks, risk reduction is not really possible, although building plan code enforcements take place and all building plans scrutinised for fire safety requirements. Mountain and Veld fires, fires in
92
informal structures and dwelling fires form the general basis of fires in accordance with fire statistics. The Planning for Fire Services are included in a Fire Protection Plan which is annually submitted for consideration and approval by the Nkomazi Municipal Council. It must be noted that regarding this element, municipalities need to do planning and evaluate budgetary priorities from the wards in accordance with National and Provincial Strategic objectives. The Department of Cooperative Governance and Traditional Affairs (CoGTA) assess the progress made by municipalities against five Key Performance Areas (KPAs) and cross‐cutting interventions adopted in the 5 Year Local Government Strategic Agenda. The five KPAs that form the basis of the assessments are: Municipal Transformation and Organisational Development; Basic Service Delivery; Local Economic Development (LED); Municipal Financial Viability and Management; and Good Governance and Public Participation. These elements will become the basis of priority determination when evaluating priorities during the IDP process, project identification and compilation of a budget. This in effect implies that Municipal performance will be measured in terms of these Standards. As Disaster Management is not a function allocated to one discipline, but to all disciplines in a local authority it implies, that the total budget must be evaluated for inclusion of Disaster Mitigation Projects. For instance, provision of housing will be a disaster mitigation project as it implicates the reduction of informal structures, the provision and extension of electrical power in accordance with needs is a disaster mitigation project as it decreases the effects of dwellings without power (e.g. dangers with open fires) with all the consequences this brings. Floods The Nkomazi Municipality is prone to floods. Over the past decade, flooding occurred once per year, Due to effects of Global Warming and Climate changes with resultant „cut-off low‟s‟, it has become increasingly difficult to forecast or predict critical time periods and/or affected areas.
93
The Planning and Development section in the municipality, as contained in the Spatial Development Plan, takes cognisance of the effects and do their planning accordingly in the face of undetermined or ambiguous flood lines in some areas. The restructuring of the R62, from Ashton to Montagu, a Provincial Project will serve greatly to mitigate one of the most critical areas in the Nkomazi Municipal area Risk reduction capacity for the Nkomazi Municipality The organisational structure for risk reduction within the Nkomazi Municipality includes Disaster Management, the Disaster Management Advisory Forum, the top management team of the Nkomazi Municipality, the nodal points for Disaster Management within Municipal Departments within the Nkomazi Municipality, departmental planning groups, risk reduction project teams and preparedness planning groups. The total structure of the Nkomazi Municipality, with every member of personnel and every resource should also be committed to Disaster Risk Reduction. On-going capacity building programmes will be required to ensure the availability of adequate capacity for Risk Reduction. Response and Recovery During response and recovery operations the relevant disaster preparedness plans of the Nkomazi Municipality will be executed by the disaster management structures. Response and recovery is concerned with ensuring effective and appropriate disaster response and recovery by:
• implementing a uniform approach to the dissemination of early warnings;
• averting or reducing the potential impact in respect of personal injury, health, loss of life, property, infrastructure, environments and government services;
• implementing immediate integrated and appropriate response and relief measures when significant events or disasters occur or are threatening to occur; and
• Implementing all rehabilitation and reconstruction strategies following a disaster in an integrated and developmental manner.
• Project evaluation mechanism: Evaluate and prioritise future IDP projects in the context of disaster risk
• The objective of this evaluation mechanism is to evaluate and prioritise future IDP projects in the context of disaster risk. Disaster risk evaluation criteria for approval of for example infrastructure projects should be based on the following questions:
• Does the footprint of the planned project fall within any existing identified disaster risk affected area?
• What will the potential disaster risk exposure of the planned project be (seriousness, manageability, urgency, growth) to existing disaster risks?
• Can the planned project pose any threat to its surroundings in terms of potential hazard impact generated by the project (seriousness, manageability, urgency, growth)?
• Can risk (1) to the project and/or risk (2) from the project be reduced through design changes or other measures?
• If risk is reduced to a level as low as reasonably possible through appropriate measures, will the potential benefit of the project outweigh the remaining potential risk “cost” of the project?
• A procedure should be implemented whereby the DMC reviews all proposed IDP projects with this evaluation mechanism, or where line departments are capacitated to self-evaluate their project proposals. The table below can assist the DMC in evaluating project proposals.
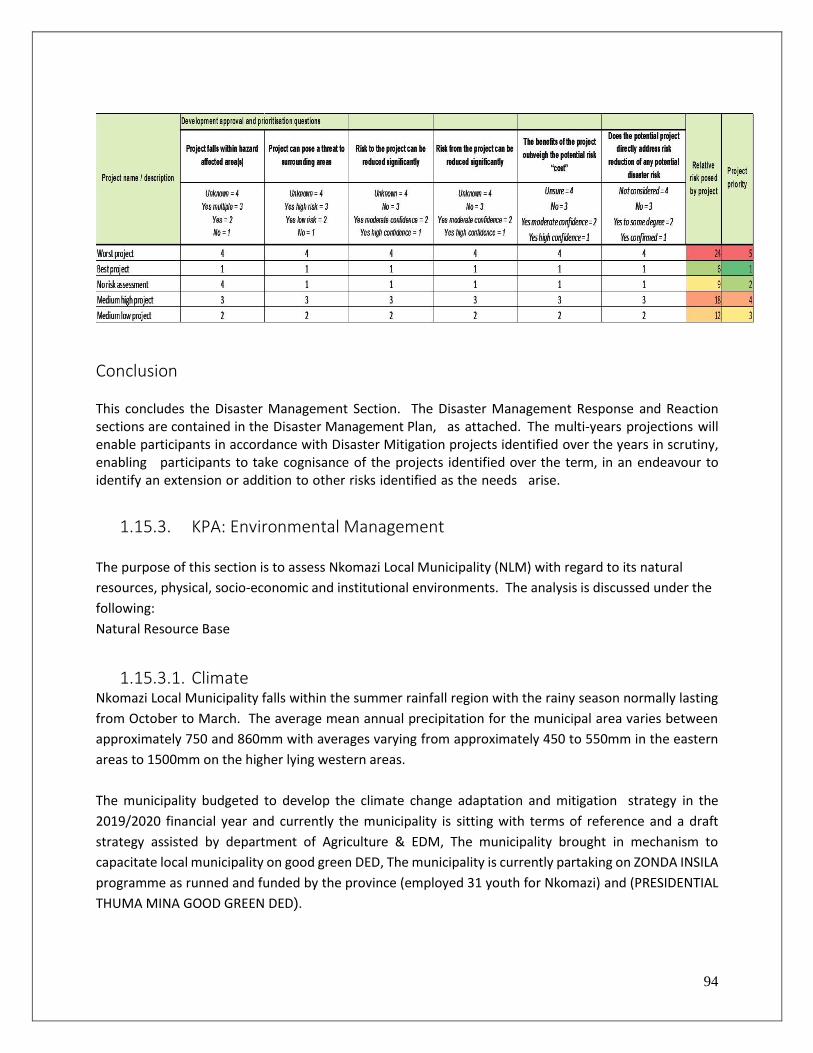
94
Conclusion This concludes the Disaster Management Section. The Disaster Management Response and Reaction sections are contained in the Disaster Management Plan, as attached. The multi-years projections will enable participants in accordance with Disaster Mitigation projects identified over the years in scrutiny, enabling participants to take cognisance of the projects identified over the term, in an endeavour to identify an extension or addition to other risks identified as the needs arise.
1.15.3. KPA: Environmental Management
The purpose of this section is to assess Nkomazi Local Municipality (NLM) with regard to its natural
resources, physical, socio-economic and institutional environments. The analysis is discussed under the
following:
Natural Resource Base
1.15.3.1. Climate Nkomazi Local Municipality falls within the summer rainfall region with the rainy season normally lasting
from October to March. The average mean annual precipitation for the municipal area varies between
approximately 750 and 860mm with averages varying from approximately 450 to 550mm in the eastern
areas to 1500mm on the higher lying western areas.
The municipality budgeted to develop the climate change adaptation and mitigation strategy in the
2019/2020 financial year and currently the municipality is sitting with terms of reference and a draft
strategy assisted by department of Agriculture & EDM, The municipality brought in mechanism to
capacitate local municipality on good green DED, The municipality is currently partaking on ZONDA INSILA
programme as runned and funded by the province (employed 31 youth for Nkomazi) and (PRESIDENTIAL
THUMA MINA GOOD GREEN DED).
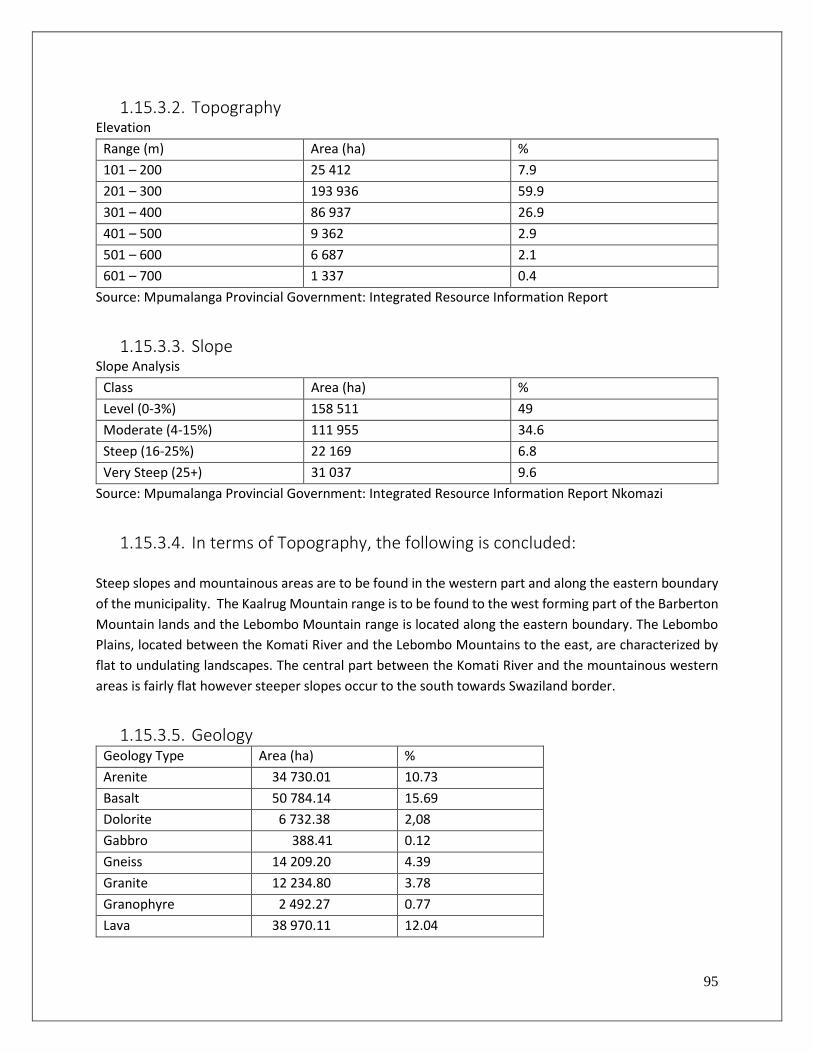
95
1.15.3.2. Topography Elevation
Range (m) Area (ha) %
101 – 200 25 412 7.9
201 – 300 193 936 59.9
301 – 400 86 937 26.9
401 – 500 9 362 2.9
501 – 600 6 687 2.1
601 – 700 1 337 0.4
Source: Mpumalanga Provincial Government: Integrated Resource Information Report
1.15.3.3. Slope Slope Analysis
Class Area (ha) %
Level (0-3%) 158 511 49
Moderate (4-15%) 111 955 34.6
Steep (16-25%) 22 169 6.8
Very Steep (25+) 31 037 9.6
Source: Mpumalanga Provincial Government: Integrated Resource Information Report Nkomazi
1.15.3.4. In terms of Topography, the following is concluded:
Steep slopes and mountainous areas are to be found in the western part and along the eastern boundary
of the municipality. The Kaalrug Mountain range is to be found to the west forming part of the Barberton
Mountain lands and the Lebombo Mountain range is located along the eastern boundary. The Lebombo
Plains, located between the Komati River and the Lebombo Mountains to the east, are characterized by
flat to undulating landscapes. The central part between the Komati River and the mountainous western
areas is fairly flat however steeper slopes occur to the south towards Swaziland border.
1.15.3.5. Geology Geology Type Area (ha) %
Arenite 34 730.01 10.73
Basalt 50 784.14 15.69
Dolorite 6 732.38 2,08
Gabbro 388.41 0.12
Gneiss 14 209.20 4.39
Granite 12 234.80 3.78
Granophyre 2 492.27 0.77
Lava 38 970.11 12.04
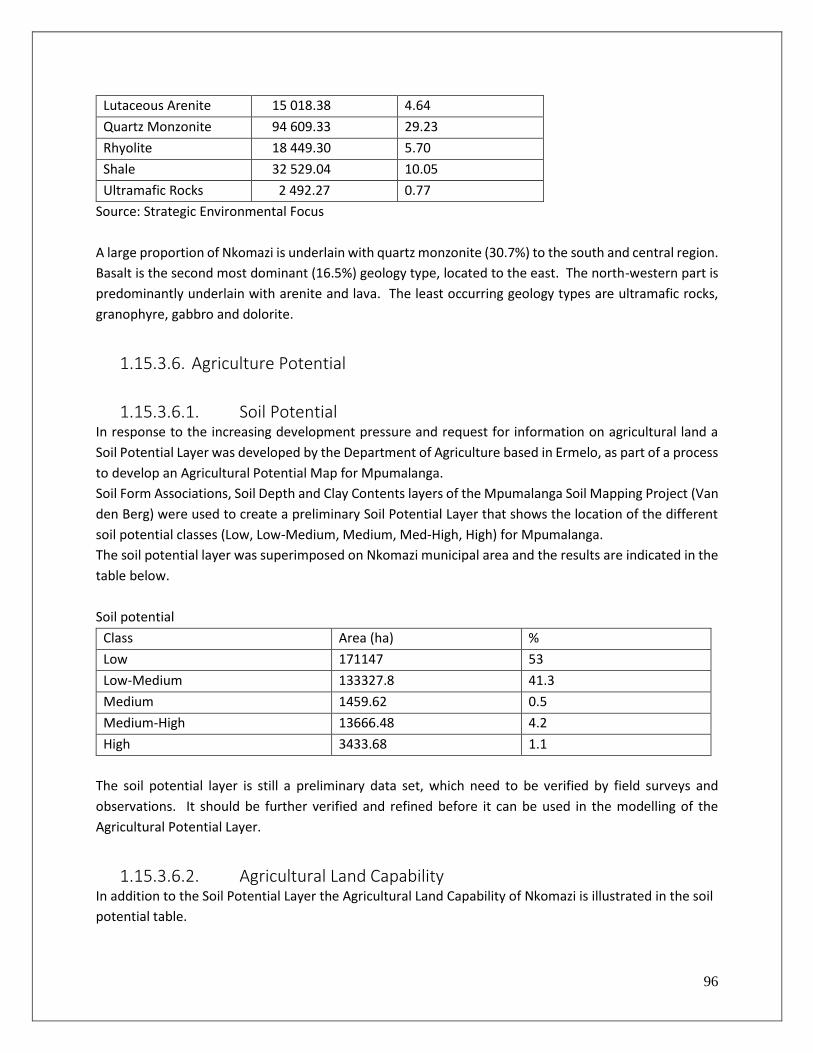
96
Lutaceous Arenite 15 018.38 4.64
Quartz Monzonite 94 609.33 29.23
Rhyolite 18 449.30 5.70
Shale 32 529.04 10.05
Ultramafic Rocks 2 492.27 0.77
Source: Strategic Environmental Focus
A large proportion of Nkomazi is underlain with quartz monzonite (30.7%) to the south and central region.
Basalt is the second most dominant (16.5%) geology type, located to the east. The north-western part is
predominantly underlain with arenite and lava. The least occurring geology types are ultramafic rocks,
granophyre, gabbro and dolorite.
1.15.3.6. Agriculture Potential
1.15.3.6.1. Soil Potential In response to the increasing development pressure and request for information on agricultural land a
Soil Potential Layer was developed by the Department of Agriculture based in Ermelo, as part of a process
to develop an Agricultural Potential Map for Mpumalanga.
Soil Form Associations, Soil Depth and Clay Contents layers of the Mpumalanga Soil Mapping Project (Van
den Berg) were used to create a preliminary Soil Potential Layer that shows the location of the different
soil potential classes (Low, Low-Medium, Medium, Med-High, High) for Mpumalanga.
The soil potential layer was superimposed on Nkomazi municipal area and the results are indicated in the
table below.
Soil potential
Class Area (ha) %
Low 171147 53
Low-Medium 133327.8 41.3
Medium 1459.62 0.5
Medium-High 13666.48 4.2
High 3433.68 1.1
The soil potential layer is still a preliminary data set, which need to be verified by field surveys and
observations. It should be further verified and refined before it can be used in the modelling of the
Agricultural Potential Layer.
1.15.3.6.2. Agricultural Land Capability In addition to the Soil Potential Layer the Agricultural Land Capability of Nkomazi is illustrated in the soil
potential table.
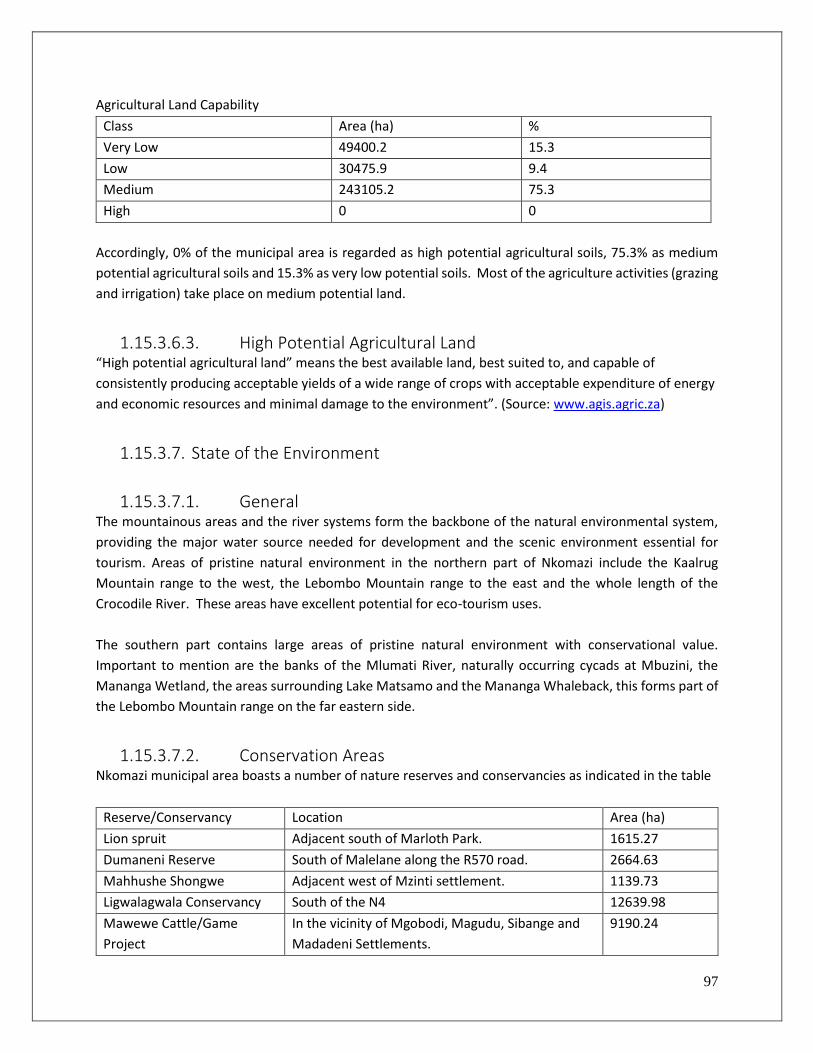
97
Agricultural Land Capability
Class Area (ha) %
Very Low 49400.2 15.3
Low 30475.9 9.4
Medium 243105.2 75.3
High 0 0
Accordingly, 0% of the municipal area is regarded as high potential agricultural soils, 75.3% as medium
potential agricultural soils and 15.3% as very low potential soils. Most of the agriculture activities (grazing
and irrigation) take place on medium potential land.
1.15.3.6.3. High Potential Agricultural Land “High potential agricultural land” means the best available land, best suited to, and capable of
consistently producing acceptable yields of a wide range of crops with acceptable expenditure of energy
and economic resources and minimal damage to the environment”. (Source: www.agis.agric.za)
1.15.3.7. State of the Environment
1.15.3.7.1. General The mountainous areas and the river systems form the backbone of the natural environmental system,
providing the major water source needed for development and the scenic environment essential for
tourism. Areas of pristine natural environment in the northern part of Nkomazi include the Kaalrug
Mountain range to the west, the Lebombo Mountain range to the east and the whole length of the
Crocodile River. These areas have excellent potential for eco-tourism uses.
The southern part contains large areas of pristine natural environment with conservational value.
Important to mention are the banks of the Mlumati River, naturally occurring cycads at Mbuzini, the
Mananga Wetland, the areas surrounding Lake Matsamo and the Mananga Whaleback, this forms part of
the Lebombo Mountain range on the far eastern side.
1.15.3.7.2. Conservation Areas Nkomazi municipal area boasts a number of nature reserves and conservancies as indicated in the table
Reserve/Conservancy Location Area (ha)
Lion spruit Adjacent south of Marloth Park. 1615.27
Dumaneni Reserve South of Malelane along the R570 road. 2664.63
Mahhushe Shongwe Adjacent west of Mzinti settlement. 1139.73
Ligwalagwala Conservancy South of the N4 12639.98
Mawewe Cattle/Game
Project
In the vicinity of Mgobodi, Magudu, Sibange and
Madadeni Settlements.
9190.24
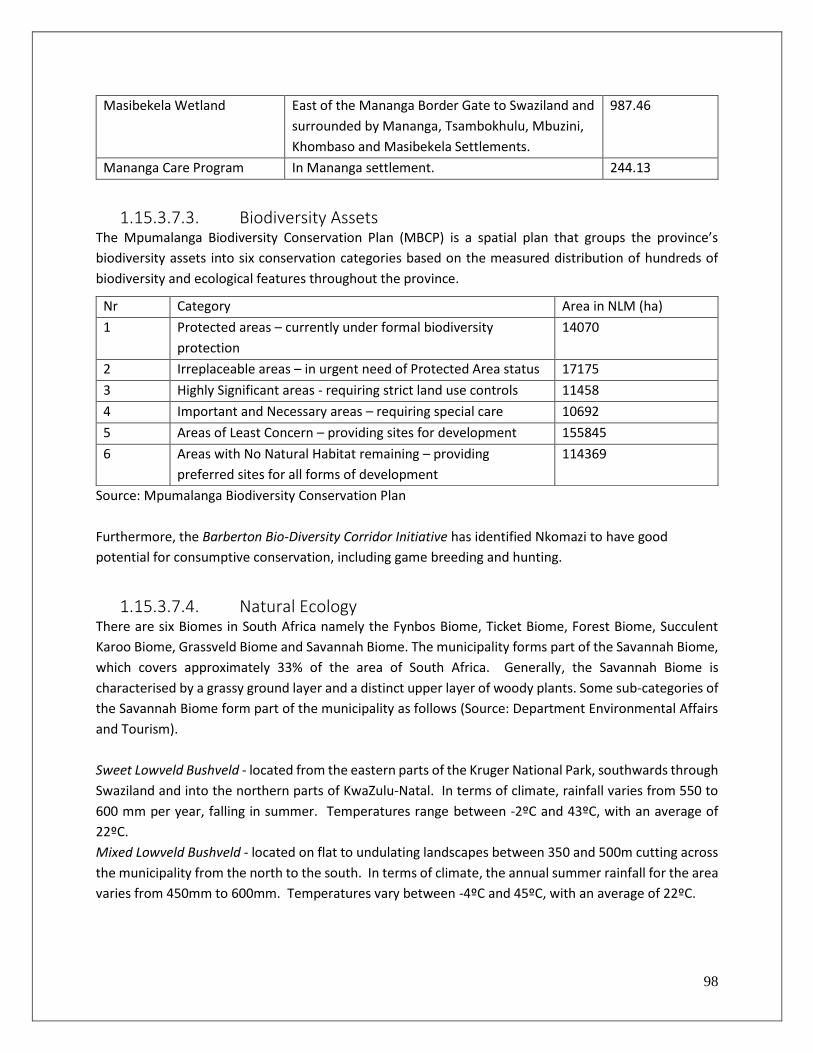
98
Masibekela Wetland East of the Mananga Border Gate to Swaziland and
surrounded by Mananga, Tsambokhulu, Mbuzini,
Khombaso and Masibekela Settlements.
987.46
Mananga Care Program In Mananga settlement. 244.13
1.15.3.7.3. Biodiversity Assets The Mpumalanga Biodiversity Conservation Plan (MBCP) is a spatial plan that groups the province’s
biodiversity assets into six conservation categories based on the measured distribution of hundreds of
biodiversity and ecological features throughout the province.
Source: Mpumalanga Biodiversity Conservation Plan
Furthermore, the Barberton Bio-Diversity Corridor Initiative has identified Nkomazi to have good
potential for consumptive conservation, including game breeding and hunting.
1.15.3.7.4. Natural Ecology There are six Biomes in South Africa namely the Fynbos Biome, Ticket Biome, Forest Biome, Succulent
Karoo Biome, Grassveld Biome and Savannah Biome. The municipality forms part of the Savannah Biome,
which covers approximately 33% of the area of South Africa. Generally, the Savannah Biome is
characterised by a grassy ground layer and a distinct upper layer of woody plants. Some sub-categories of
the Savannah Biome form part of the municipality as follows (Source: Department Environmental Affairs
and Tourism).
Sweet Lowveld Bushveld - located from the eastern parts of the Kruger National Park, southwards through
Swaziland and into the northern parts of KwaZulu-Natal. In terms of climate, rainfall varies from 550 to
600 mm per year, falling in summer. Temperatures range between -2ºC and 43ºC, with an average of
22ºC.
Mixed Lowveld Bushveld - located on flat to undulating landscapes between 350 and 500m cutting across
the municipality from the north to the south. In terms of climate, the annual summer rainfall for the area
varies from 450mm to 600mm. Temperatures vary between -4ºC and 45ºC, with an average of 22ºC.
Nr Category Area in NLM (ha)
1 Protected areas – currently under formal biodiversity
protection
14070
2 Irreplaceable areas – in urgent need of Protected Area status 17175
3 Highly Significant areas - requiring strict land use controls 11458
4 Important and Necessary areas – requiring special care 10692
5 Areas of Least Concern – providing sites for development 155845
6 Areas with No Natural Habitat remaining – providing
preferred sites for all forms of development
114369
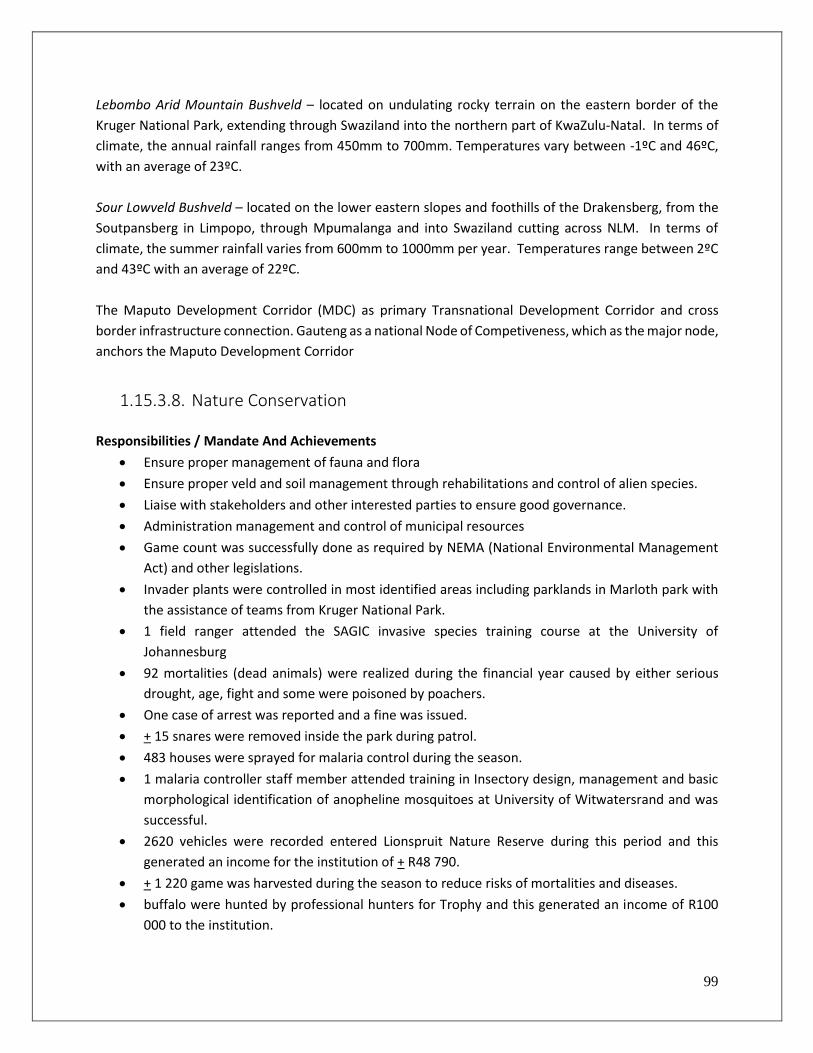
99
Lebombo Arid Mountain Bushveld – located on undulating rocky terrain on the eastern border of the
Kruger National Park, extending through Swaziland into the northern part of KwaZulu-Natal. In terms of
climate, the annual rainfall ranges from 450mm to 700mm. Temperatures vary between -1ºC and 46ºC,
with an average of 23ºC.
Sour Lowveld Bushveld – located on the lower eastern slopes and foothills of the Drakensberg, from the
Soutpansberg in Limpopo, through Mpumalanga and into Swaziland cutting across NLM. In terms of
climate, the summer rainfall varies from 600mm to 1000mm per year. Temperatures range between 2ºC
and 43ºC with an average of 22ºC.
The Maputo Development Corridor (MDC) as primary Transnational Development Corridor and cross
border infrastructure connection. Gauteng as a national Node of Competiveness, which as the major node,
anchors the Maputo Development Corridor
1.15.3.8. Nature Conservation
Responsibilities / Mandate And Achievements
• Ensure proper management of fauna and flora
• Ensure proper veld and soil management through rehabilitations and control of alien species.
• Liaise with stakeholders and other interested parties to ensure good governance.
• Administration management and control of municipal resources
• Game count was successfully done as required by NEMA (National Environmental Management
Act) and other legislations.
• Invader plants were controlled in most identified areas including parklands in Marloth park with
the assistance of teams from Kruger National Park.
• 1 field ranger attended the SAGIC invasive species training course at the University of
Johannesburg
• 92 mortalities (dead animals) were realized during the financial year caused by either serious
drought, age, fight and some were poisoned by poachers.
• One case of arrest was reported and a fine was issued.
• + 15 snares were removed inside the park during patrol.
• 483 houses were sprayed for malaria control during the season.
• 1 malaria controller staff member attended training in Insectory design, management and basic
morphological identification of anopheline mosquitoes at University of Witwatersrand and was
successful.
• 2620 vehicles were recorded entered Lionspruit Nature Reserve during this period and this
generated an income for the institution of + R48 790.
• + 1 220 game was harvested during the season to reduce risks of mortalities and diseases.
• buffalo were hunted by professional hunters for Trophy and this generated an income of R100
000 to the institution.
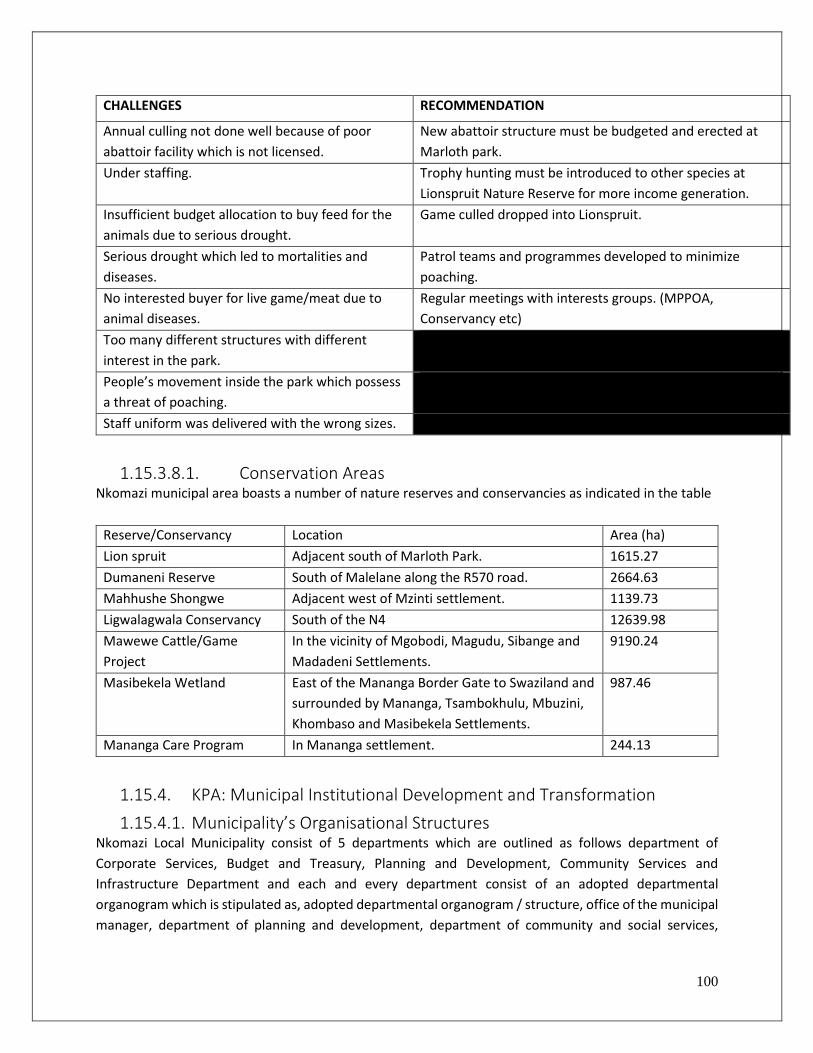
100
CHALLENGES RECOMMENDATION
Annual culling not done well because of poor
abattoir facility which is not licensed.
New abattoir structure must be budgeted and erected at
Marloth park.
Under staffing. Trophy hunting must be introduced to other species at
Lionspruit Nature Reserve for more income generation.
Insufficient budget allocation to buy feed for the
animals due to serious drought.
Game culled dropped into Lionspruit.
Serious drought which led to mortalities and
diseases.
Patrol teams and programmes developed to minimize
poaching.
No interested buyer for live game/meat due to
animal diseases.
Regular meetings with interests groups. (MPPOA,
Conservancy etc)
Too many different structures with different
interest in the park.
People’s movement inside the park which possess
a threat of poaching.
Staff uniform was delivered with the wrong sizes.
1.15.3.8.1. Conservation Areas Nkomazi municipal area boasts a number of nature reserves and conservancies as indicated in the table
Reserve/Conservancy Location Area (ha)
Lion spruit Adjacent south of Marloth Park. 1615.27
Dumaneni Reserve South of Malelane along the R570 road. 2664.63
Mahhushe Shongwe Adjacent west of Mzinti settlement. 1139.73
Ligwalagwala Conservancy South of the N4 12639.98
Mawewe Cattle/Game
Project
In the vicinity of Mgobodi, Magudu, Sibange and
Madadeni Settlements.
9190.24
Masibekela Wetland East of the Mananga Border Gate to Swaziland and
surrounded by Mananga, Tsambokhulu, Mbuzini,
Khombaso and Masibekela Settlements.
987.46
Mananga Care Program In Mananga settlement. 244.13
1.15.4. KPA: Municipal Institutional Development and Transformation
1.15.4.1. Municipality’s Organisational Structures Nkomazi Local Municipality consist of 5 departments which are outlined as follows department of
Corporate Services, Budget and Treasury, Planning and Development, Community Services and
Infrastructure Department and each and every department consist of an adopted departmental
organogram which is stipulated as, adopted departmental organogram / structure, office of the municipal
manager, department of planning and development, department of community and social services,
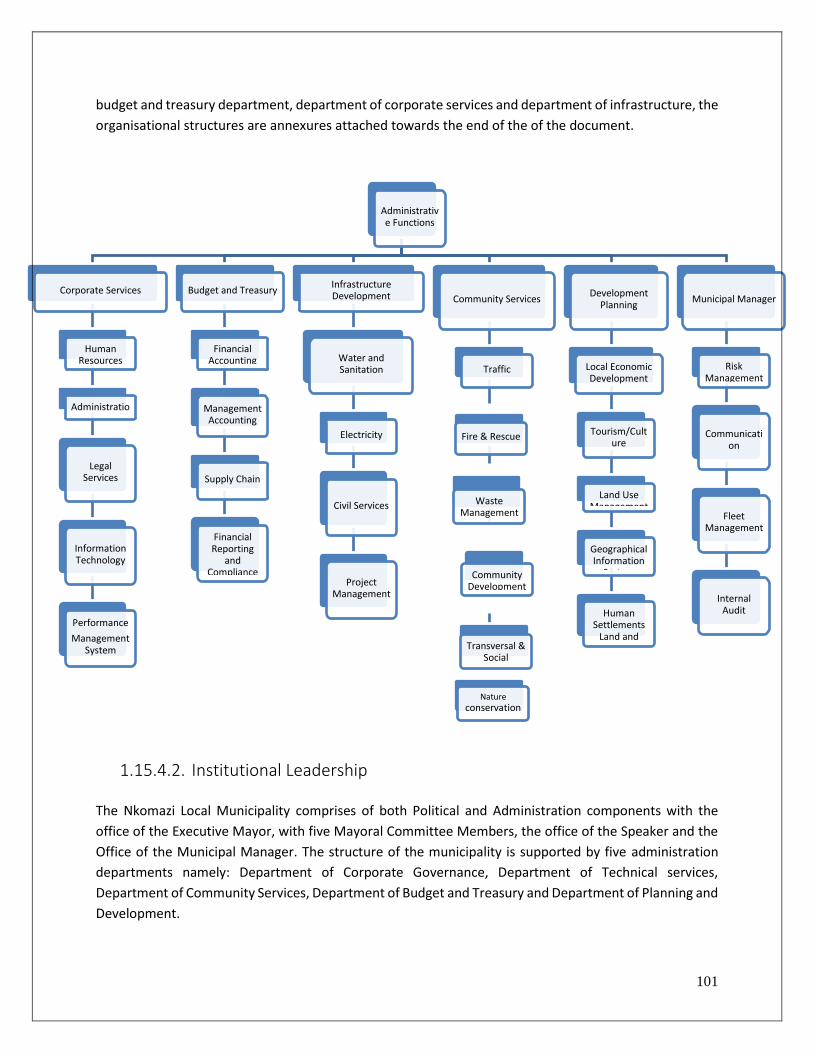
101
budget and treasury department, department of corporate services and department of infrastructure, the
organisational structures are annexures attached towards the end of the of the document.
1.15.4.2. Institutional Leadership
The Nkomazi Local Municipality comprises of both Political and Administration components with the
office of the Executive Mayor, with five Mayoral Committee Members, the office of the Speaker and the
Office of the Municipal Manager. The structure of the municipality is supported by five administration
departments namely: Department of Corporate Governance, Department of Technical services,
Department of Community Services, Department of Budget and Treasury and Department of Planning and
Development.
Administrative Functions
Corporate Services
Human Resources
Administration
Legal Services
Information Technology
Performance Management
System
Budget and Treasury
Financial Accounting
Management Accounting
Supply Chain
Financial Reporting
and Compliance
Infrastructure Development
Water and Sanitation
Electricity
Civil Services
Project Management
Community Services
Traffic
Fire & Rescue
Waste Management
Community Development
Transversal & Social
services
Development Planning
Local Economic Development
Tourism/Culture
Land Use Management
Geographical Information
System
Human Settlements
Land and Estate
Municipal Manager
Risk Management
Communication
Fleet Management
Internal Audit
Nature conservation
102
The Executive Committee or Political Committee of Nkomazi Local Municipality consist of the
following:
• The Executive Mayor ( Head of Executive)
• The Speaker
• The Chief Whip
• MMC: Corporative Services
• MMC: Planning and Development
• MMC: Budget and Treasury
• MMC: Community Services
• MMC: Technical Services
1.15.4.3. Human Resource Strategy The following best practices in the field of HR management will be used as the basis for developing a well-
defined HR systems, policies and practices
• HR planning
• Professional recruitment and selection policies
• Skills development
• OD intervention focusing on organisational culture
• Integrated performance management systems
• Diversity and employment equity integrated
• Knowledge management
• Learning organisation
• Proactive labour relations
• Evaluations of HR systems from customer services perspective
• Modern career management.
The human resource function is the staff or support function to the rest of the organization. Line managers
are responsible for the day-to-day operation of the organization and they contribute directly to the
bottom-line of the business. The challenge for our managers is to create a work environment where
human resource processes can be integrated in the other business processes in order to ensure that
people contribute their optimum to enhance organizational effectiveness. Our managers must be able to
implement human resource activities regarding their specific group of employees. Every manager’s
human resources actions in this regard can have major consequences for our organization.
Human resources planning according to M Meyer and E Botha can be defined as, all the processes,
methods, systems, and procedures employed to attract acquire, develop and manage human resources
to achieve the goals of the organization.
The Human resources management process therefore starts with human resource planning and the
analysis of the jobs needed to achieve our municipality objectives. Employees are recruited, selected,
oriented, and trained to occupy specific jobs. In addition, through the process of performance
management, the performance of employees is directed towards delivering the required outputs.
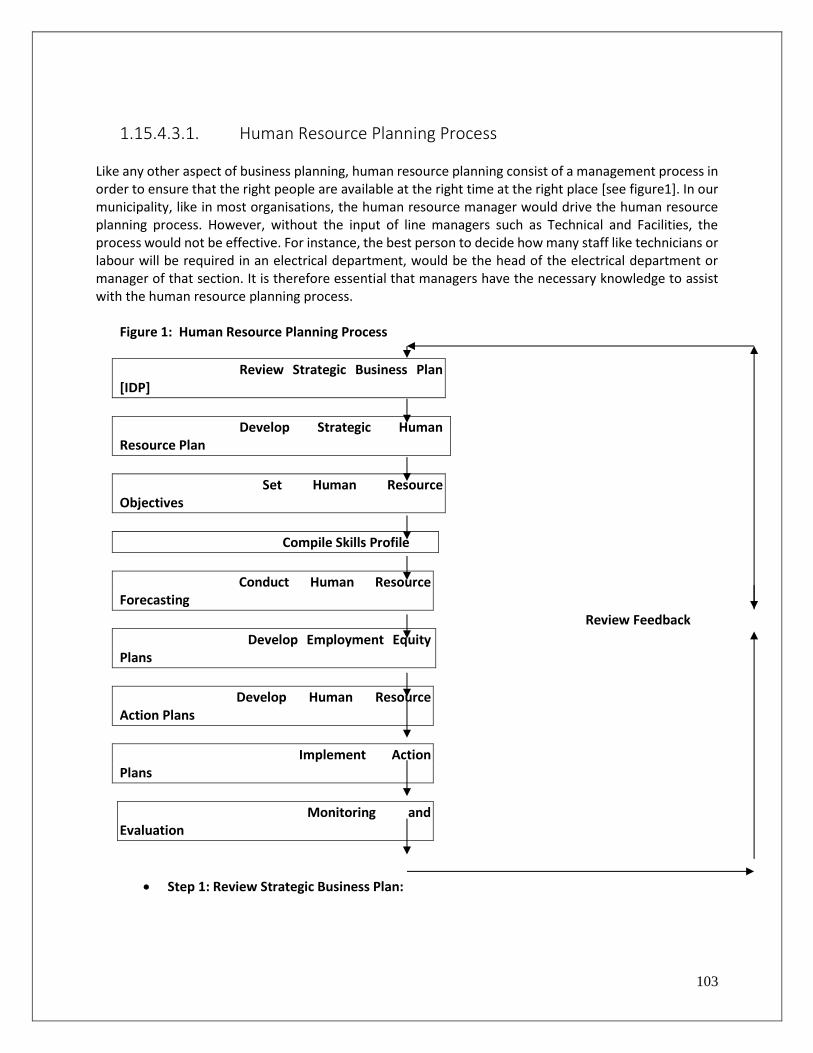
103
1.15.4.3.1. Human Resource Planning Process Like any other aspect of business planning, human resource planning consist of a management process in order to ensure that the right people are available at the right time at the right place [see figure1]. In our municipality, like in most organisations, the human resource manager would drive the human resource planning process. However, without the input of line managers such as Technical and Facilities, the process would not be effective. For instance, the best person to decide how many staff like technicians or labour will be required in an electrical department, would be the head of the electrical department or manager of that section. It is therefore essential that managers have the necessary knowledge to assist with the human resource planning process.
Figure 1: Human Resource Planning Process
Review Strategic Business Plan [IDP]
Develop Strategic Human Resource Plan
Set Human Resource Objectives
Compile Skills Profile
Conduct Human Resource Forecasting
Review Feedback
Develop Employment Equity Plans
Develop Human Resource Action Plans
Implement Action Plans
Monitoring and Evaluation
• Step 1: Review Strategic Business Plan:
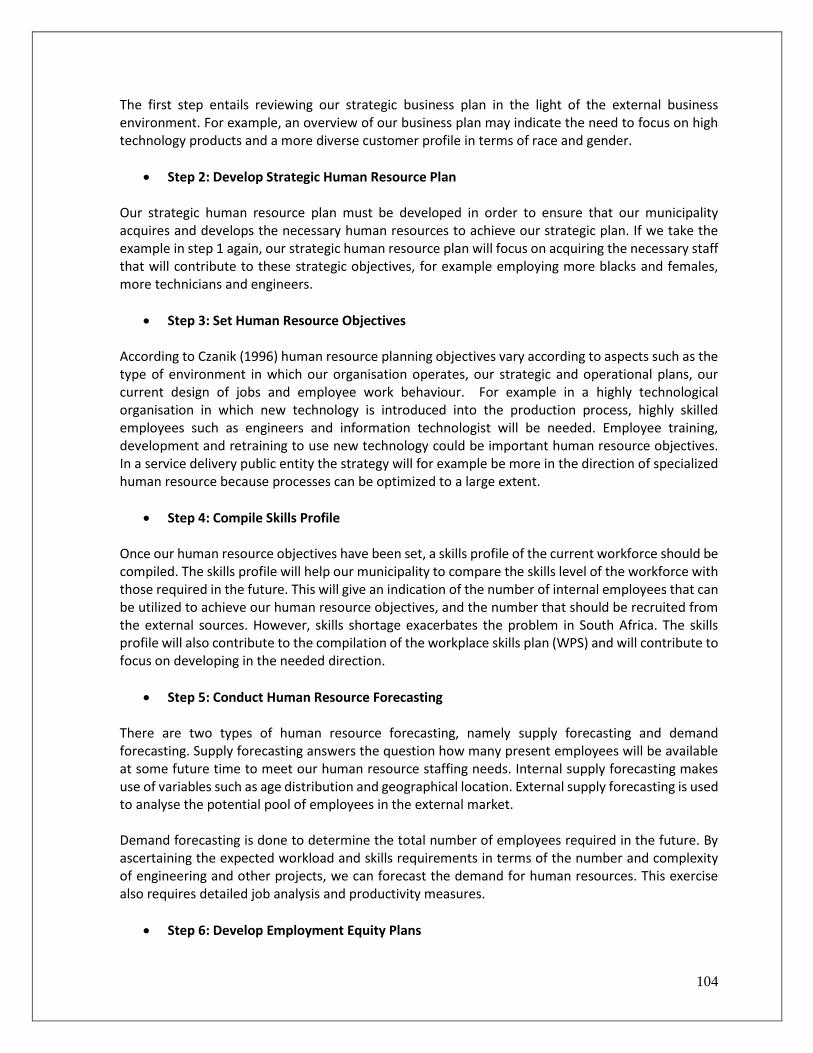
104
The first step entails reviewing our strategic business plan in the light of the external business environment. For example, an overview of our business plan may indicate the need to focus on high technology products and a more diverse customer profile in terms of race and gender.
• Step 2: Develop Strategic Human Resource Plan Our strategic human resource plan must be developed in order to ensure that our municipality acquires and develops the necessary human resources to achieve our strategic plan. If we take the example in step 1 again, our strategic human resource plan will focus on acquiring the necessary staff that will contribute to these strategic objectives, for example employing more blacks and females, more technicians and engineers.
• Step 3: Set Human Resource Objectives According to Czanik (1996) human resource planning objectives vary according to aspects such as the type of environment in which our organisation operates, our strategic and operational plans, our current design of jobs and employee work behaviour. For example in a highly technological organisation in which new technology is introduced into the production process, highly skilled employees such as engineers and information technologist will be needed. Employee training, development and retraining to use new technology could be important human resource objectives. In a service delivery public entity the strategy will for example be more in the direction of specialized human resource because processes can be optimized to a large extent.
• Step 4: Compile Skills Profile Once our human resource objectives have been set, a skills profile of the current workforce should be compiled. The skills profile will help our municipality to compare the skills level of the workforce with those required in the future. This will give an indication of the number of internal employees that can be utilized to achieve our human resource objectives, and the number that should be recruited from the external sources. However, skills shortage exacerbates the problem in South Africa. The skills profile will also contribute to the compilation of the workplace skills plan (WPS) and will contribute to focus on developing in the needed direction.
• Step 5: Conduct Human Resource Forecasting There are two types of human resource forecasting, namely supply forecasting and demand forecasting. Supply forecasting answers the question how many present employees will be available at some future time to meet our human resource staffing needs. Internal supply forecasting makes use of variables such as age distribution and geographical location. External supply forecasting is used to analyse the potential pool of employees in the external market. Demand forecasting is done to determine the total number of employees required in the future. By ascertaining the expected workload and skills requirements in terms of the number and complexity of engineering and other projects, we can forecast the demand for human resources. This exercise also requires detailed job analysis and productivity measures.
• Step 6: Develop Employment Equity Plans
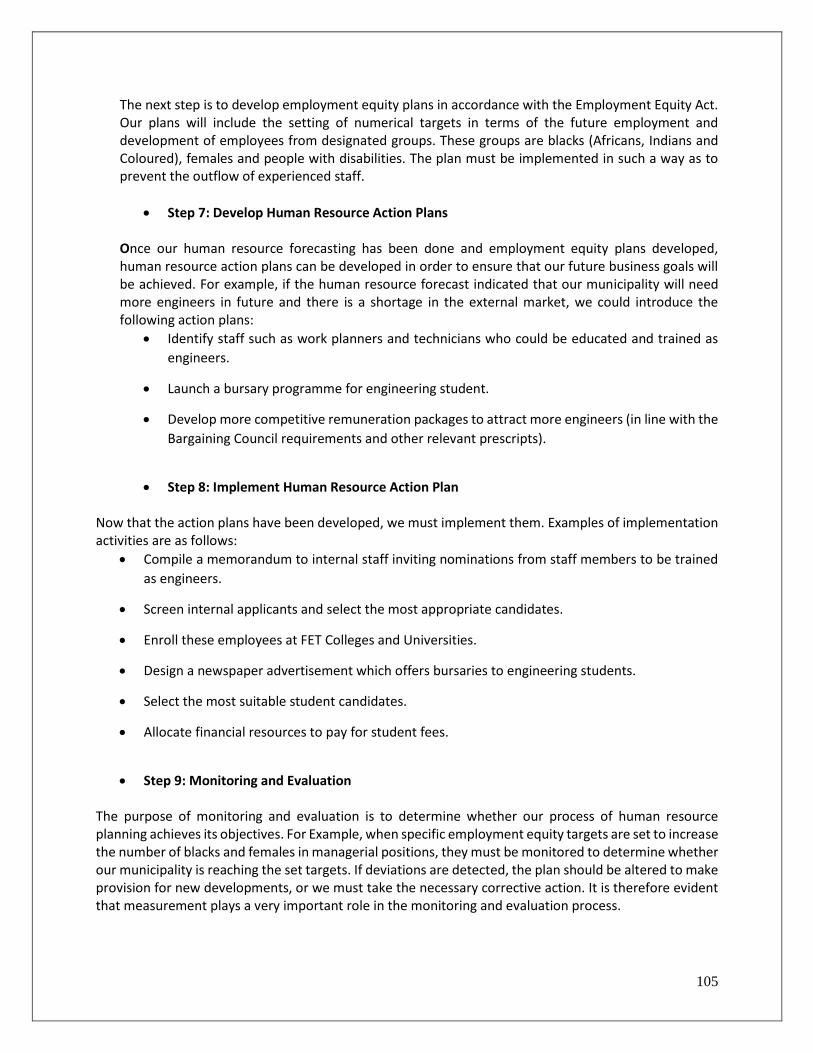
105
The next step is to develop employment equity plans in accordance with the Employment Equity Act. Our plans will include the setting of numerical targets in terms of the future employment and development of employees from designated groups. These groups are blacks (Africans, Indians and Coloured), females and people with disabilities. The plan must be implemented in such a way as to prevent the outflow of experienced staff.
• Step 7: Develop Human Resource Action Plans Once our human resource forecasting has been done and employment equity plans developed, human resource action plans can be developed in order to ensure that our future business goals will be achieved. For example, if the human resource forecast indicated that our municipality will need more engineers in future and there is a shortage in the external market, we could introduce the following action plans:
• Identify staff such as work planners and technicians who could be educated and trained as
engineers.
• Launch a bursary programme for engineering student.
• Develop more competitive remuneration packages to attract more engineers (in line with the
Bargaining Council requirements and other relevant prescripts).
• Step 8: Implement Human Resource Action Plan Now that the action plans have been developed, we must implement them. Examples of implementation activities are as follows:
• Compile a memorandum to internal staff inviting nominations from staff members to be trained
as engineers.
• Screen internal applicants and select the most appropriate candidates.
• Enroll these employees at FET Colleges and Universities.
• Design a newspaper advertisement which offers bursaries to engineering students.
• Select the most suitable student candidates.
• Allocate financial resources to pay for student fees.
• Step 9: Monitoring and Evaluation The purpose of monitoring and evaluation is to determine whether our process of human resource planning achieves its objectives. For Example, when specific employment equity targets are set to increase the number of blacks and females in managerial positions, they must be monitored to determine whether our municipality is reaching the set targets. If deviations are detected, the plan should be altered to make provision for new developments, or we must take the necessary corrective action. It is therefore evident that measurement plays a very important role in the monitoring and evaluation process.
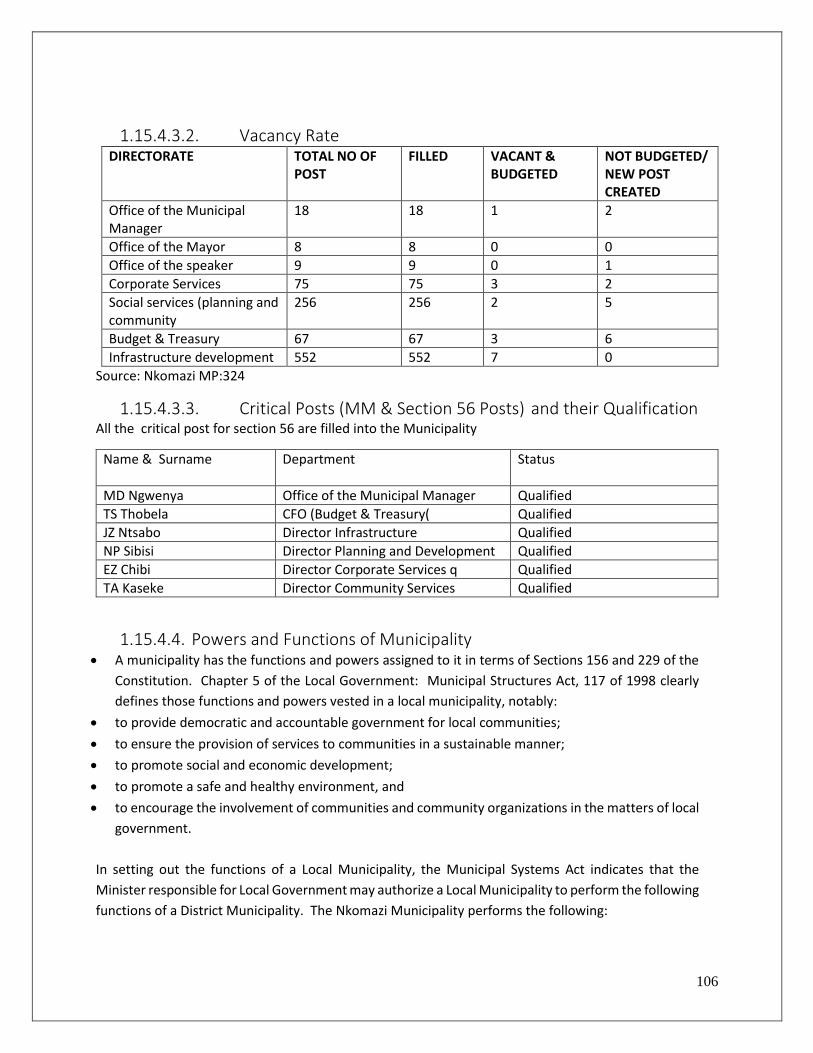
106
1.15.4.3.2. Vacancy Rate DIRECTORATE TOTAL NO OF
POST FILLED VACANT &
BUDGETED NOT BUDGETED/ NEW POST CREATED
Office of the Municipal Manager
18 18 1 2
Office of the Mayor 8 8 0 0
Office of the speaker 9 9 0 1
Corporate Services 75 75 3 2
Social services (planning and community
256 256 2 5
Budget & Treasury 67 67 3 6
Infrastructure development 552 552 7 0
Source: Nkomazi MP:324
1.15.4.3.3. Critical Posts (MM & Section 56 Posts) and their Qualification All the critical post for section 56 are filled into the Municipality
Name & Surname Department
Status
MD Ngwenya Office of the Municipal Manager Qualified
TS Thobela CFO (Budget & Treasury( Qualified
JZ Ntsabo Director Infrastructure Qualified
NP Sibisi Director Planning and Development Qualified
EZ Chibi Director Corporate Services q Qualified
TA Kaseke Director Community Services Qualified
1.15.4.4. Powers and Functions of Municipality • A municipality has the functions and powers assigned to it in terms of Sections 156 and 229 of the
Constitution. Chapter 5 of the Local Government: Municipal Structures Act, 117 of 1998 clearly
defines those functions and powers vested in a local municipality, notably:
• to provide democratic and accountable government for local communities;
• to ensure the provision of services to communities in a sustainable manner;
• to promote social and economic development;
• to promote a safe and healthy environment, and
• to encourage the involvement of communities and community organizations in the matters of local
government.
In setting out the functions of a Local Municipality, the Municipal Systems Act indicates that the
Minister responsible for Local Government may authorize a Local Municipality to perform the following
functions of a District Municipality. The Nkomazi Municipality performs the following:
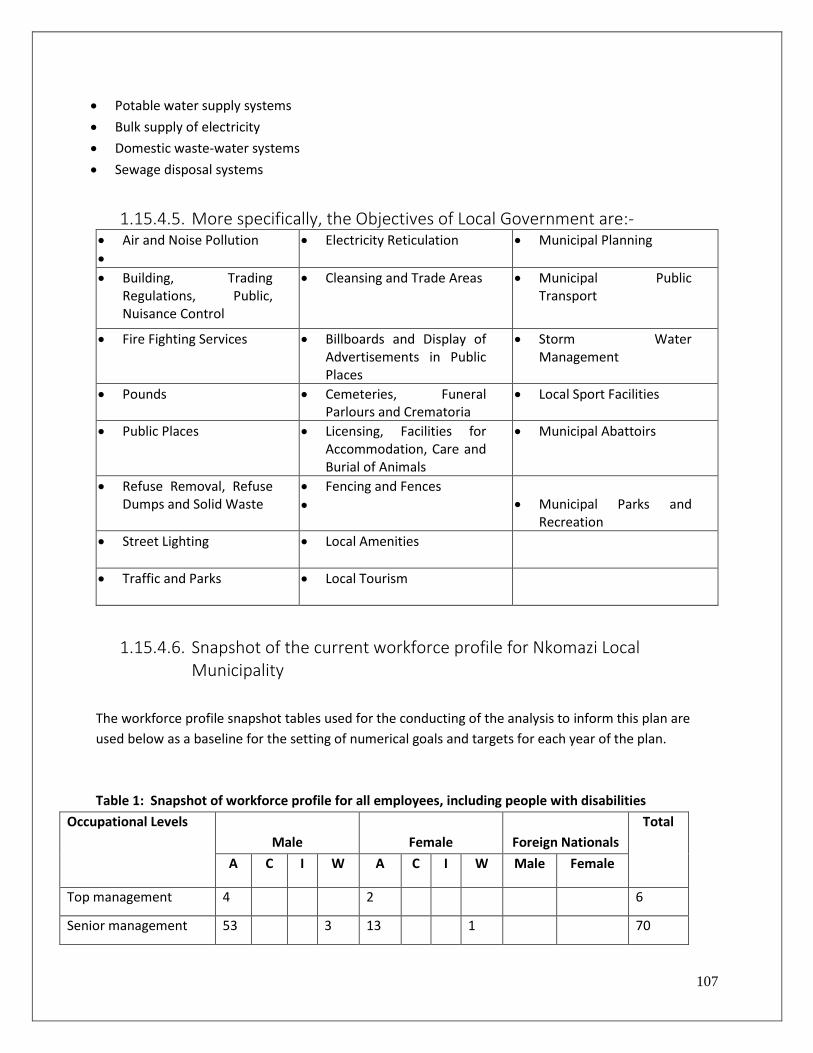
107
• Potable water supply systems
• Bulk supply of electricity
• Domestic waste-water systems
• Sewage disposal systems
1.15.4.5. More specifically, the Objectives of Local Government are:- • Air and Noise Pollution
•
• Electricity Reticulation
• Municipal Planning
• Building, Trading Regulations, Public, Nuisance Control
• Cleansing and Trade Areas
• Municipal Public Transport
• Fire Fighting Services
• Billboards and Display of Advertisements in Public Places
• Storm Water Management
• Pounds
• Cemeteries, Funeral Parlours and Crematoria
• Local Sport Facilities
• Public Places
• Licensing, Facilities for Accommodation, Care and Burial of Animals
• Municipal Abattoirs
• Refuse Removal, Refuse Dumps and Solid Waste
• Fencing and Fences
•
• Municipal Parks and Recreation
• Street Lighting
• Local Amenities
• Traffic and Parks
• Local Tourism
1.15.4.6. Snapshot of the current workforce profile for Nkomazi Local Municipality
The workforce profile snapshot tables used for the conducting of the analysis to inform this plan are
used below as a baseline for the setting of numerical goals and targets for each year of the plan.
Table 1: Snapshot of workforce profile for all employees, including people with disabilities
Occupational Levels
Male
Female
Foreign Nationals
Total
A C I W A C I W Male Female
Top management 4 2 6
Senior management 53 3 13 1 70
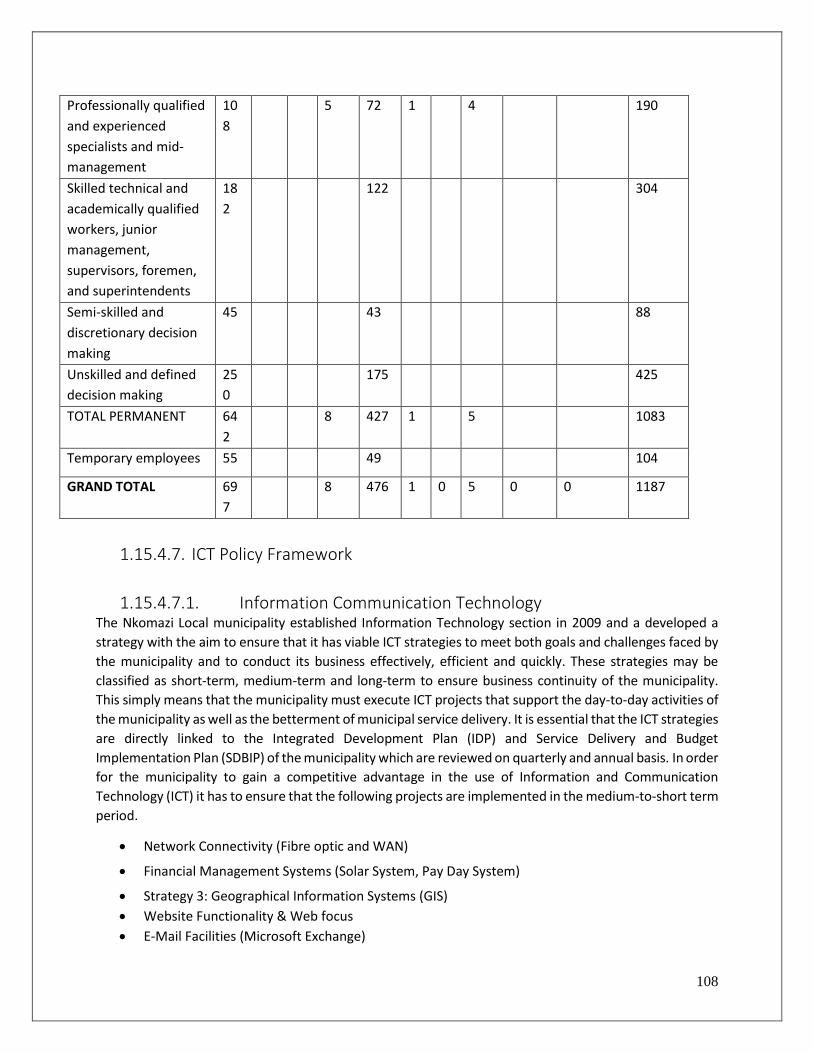
108
Professionally qualified
and experienced
specialists and mid-
management
10
8
5 72 1 4 190
Skilled technical and
academically qualified
workers, junior
management,
supervisors, foremen,
and superintendents
18
2
122 304
Semi-skilled and
discretionary decision
making
45 43 88
Unskilled and defined
decision making
25
0
175 425
TOTAL PERMANENT 64
2
8 427 1 5 1083
Temporary employees 55 49 104
GRAND TOTAL 69
7
8 476 1 0 5 0 0 1187
1.15.4.7. ICT Policy Framework
1.15.4.7.1. Information Communication Technology The Nkomazi Local municipality established Information Technology section in 2009 and a developed a
strategy with the aim to ensure that it has viable ICT strategies to meet both goals and challenges faced by
the municipality and to conduct its business effectively, efficient and quickly. These strategies may be
classified as short-term, medium-term and long-term to ensure business continuity of the municipality.
This simply means that the municipality must execute ICT projects that support the day-to-day activities of
the municipality as well as the betterment of municipal service delivery. It is essential that the ICT strategies
are directly linked to the Integrated Development Plan (IDP) and Service Delivery and Budget
Implementation Plan (SDBIP) of the municipality which are reviewed on quarterly and annual basis. In order
for the municipality to gain a competitive advantage in the use of Information and Communication
Technology (ICT) it has to ensure that the following projects are implemented in the medium-to-short term
period.
• Network Connectivity (Fibre optic and WAN)
• Financial Management Systems (Solar System, Pay Day System)
• Strategy 3: Geographical Information Systems (GIS)
• Website Functionality & Web focus
• E-Mail Facilities (Microsoft Exchange)
109
• Hardware and Software
• Implementation of Document Management Systems
The ICT strategy and related policies were approved in May 2018 and the council resolution is as follows
NKM: S-GCM: A073/2018. The following are the ICT related policies.
• Change Management Policy
• Information and Data Protection Policy
• Contingency Planning Policy
• Email and Messaging Acceptable Use
• It Information Security
• Internet Acceptable Use Policy
• Virus Prevention, Detection, Removal & Spyware
• Data Backup Policy
• Information and Communication Technology Framework
• Copyright Compliance Policy
• Standards and Support Policy
• Network Security Policy
• Patch Management Policy
• User Authorization, Identification and Authentication Policy
The ICT contains of the following staff complement 4 personnel which is the ICT Manager, Snr IT Technician and two IT technicians and currently still have one vacant post for a system administrator, which needs to be filled since the pandemic Covid 19 has started, the Municipality has continued to hold its meetings and all
council meeting sate as per the planned council calendar, for the municipality to make sure that all
meeting sit Information system team has downloaded zoom into all the municipal officials computers
and also installed Microsoft teams to operate and hold council Meetings and public participation meetings
to inform the public on the operations of the municipality. The Municipality hasn’t yet faced any
challenges on the Information system side ever since the pandemic Covid 19 has commenced all
programmes are running and all systems are in place.
1.15.4.7.2. Challenges facing the ICT Section
• That the vacant post for the systems administrator be filled since the current system administrator
is a contractor worker and cannot be given full administrative access i.e. financial system.
1.15.4.8. Municipal Portfolio Committees and Municipal Departments and the Status Quo
The Nkomazi local municipality has successfully established the following council committees
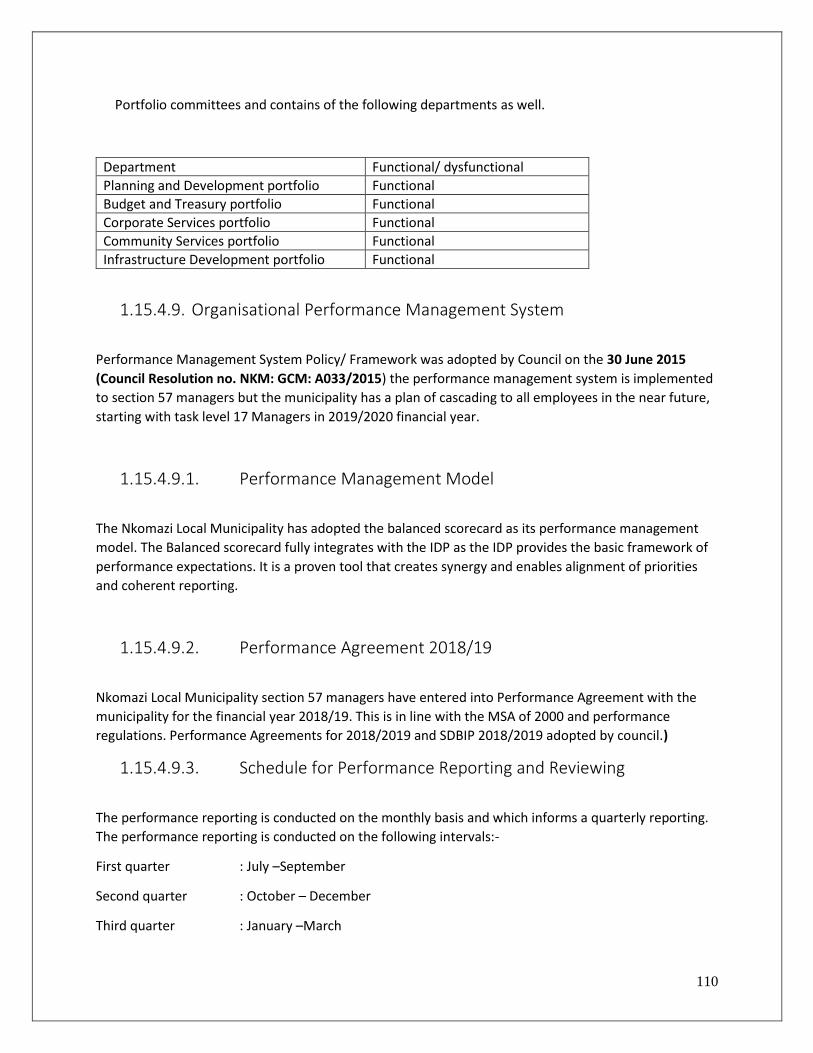
110
Portfolio committees and contains of the following departments as well.
Department Functional/ dysfunctional
Planning and Development portfolio Functional
Budget and Treasury portfolio Functional
Corporate Services portfolio Functional
Community Services portfolio Functional
Infrastructure Development portfolio Functional
1.15.4.9. Organisational Performance Management System
Performance Management System Policy/ Framework was adopted by Council on the 30 June 2015
(Council Resolution no. NKM: GCM: A033/2015) the performance management system is implemented
to section 57 managers but the municipality has a plan of cascading to all employees in the near future,
starting with task level 17 Managers in 2019/2020 financial year.
1.15.4.9.1. Performance Management Model
The Nkomazi Local Municipality has adopted the balanced scorecard as its performance management
model. The Balanced scorecard fully integrates with the IDP as the IDP provides the basic framework of
performance expectations. It is a proven tool that creates synergy and enables alignment of priorities
and coherent reporting.
1.15.4.9.2. Performance Agreement 2018/19
Nkomazi Local Municipality section 57 managers have entered into Performance Agreement with the
municipality for the financial year 2018/19. This is in line with the MSA of 2000 and performance
regulations. Performance Agreements for 2018/2019 and SDBIP 2018/2019 adopted by council.)
1.15.4.9.3. Schedule for Performance Reporting and Reviewing
The performance reporting is conducted on the monthly basis and which informs a quarterly reporting.
The performance reporting is conducted on the following intervals:-
First quarter : July –September
Second quarter : October – December
Third quarter : January –March
111
Fourth quarter : April –June
The Annual Performance Report for 2018/2019 financial year and Mid-Year Report for the financial year
2019/2020 have been adopted by council.
1.15.4.9.4. Staff complement of Performance Management System There are two post filled which is Manager Performance Management system and Senior PMS Officer.
there are 3 vacant posts namely: two PMS officers and PMS clerk.
1.15.4.10. Monitoring and Evaluation
1.15.4.10.1. Introduction Performance monitoring and evaluation is a key mechanism to monitor, evaluate and report on the
implementation of the municipal objectives outlined in the Integrated Development Plan. this means that
if the municipality want to improve in its performance there is a need to reflect on what we are doing and
what we want to achieve against what we have set out in our plans. Key performance indicators and
performance targets will be used as a yardstick to measure performance and to rectify mistakes
1.15.4.10.2. The Legislative Framework Underpinning Monitoring and Evaluation
• The Constitution of the Republic of South Africa
• The Municipal Systems Act of (2000)
• Municipal Finance Management Act
• Municipal Structures Act
• Local Government White Paper (1998)
• Regulations of Systems Act
• Performance Frameworks
• Government Wide Monitoring and Evaluation framework
1.15.4.10.3. The Section of Monitoring and Evaluation was Established in 2017. It was established to:
• Ensure the implementation of plans and projects to realise service delivery.
• To also measure the development impact of plans and projects.
• To ensure the efficient utilisation of resources.
• To measure performance at an organisational and individual level of section 56 and 57 managers.
Key performance indicators and performance targets will be used as a yardstick to measure performance
and to rectify mistakes.
Challenges Recommendation
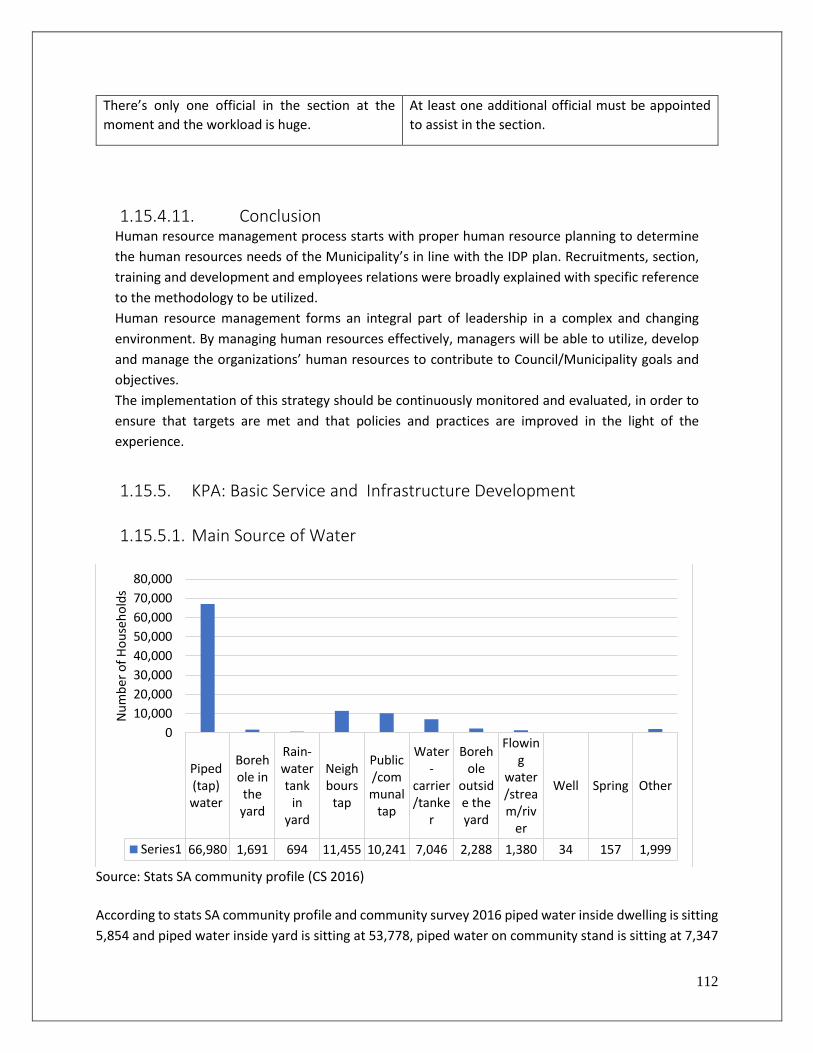
112
There’s only one official in the section at the
moment and the workload is huge.
At least one additional official must be appointed
to assist in the section.
1.15.4.11. Conclusion Human resource management process starts with proper human resource planning to determine
the human resources needs of the Municipality’s in line with the IDP plan. Recruitments, section,
training and development and employees relations were broadly explained with specific reference
to the methodology to be utilized.
Human resource management forms an integral part of leadership in a complex and changing
environment. By managing human resources effectively, managers will be able to utilize, develop
and manage the organizations’ human resources to contribute to Council/Municipality goals and
objectives.
The implementation of this strategy should be continuously monitored and evaluated, in order to
ensure that targets are met and that policies and practices are improved in the light of the
experience.
1.15.5. KPA: Basic Service and Infrastructure Development
1.15.5.1. Main Source of Water
Source: Stats SA community profile (CS 2016)
According to stats SA community profile and community survey 2016 piped water inside dwelling is sitting
5,854 and piped water inside yard is sitting at 53,778, piped water on community stand is sitting at 7,347
Piped(tap)water
Borehole intheyard
Rain-watertank
inyard
Neighbours
tap
Public/communal
tap
Water-
carrier/tanke
r
Borehole
outside theyard
Flowing
water/stream/riv
er
Well Spring Other
Series1 66,980 1,691 694 11,455 10,241 7,046 2,288 1,380 34 157 1,999
0
10,000
20,000
30,000
40,000
50,000
60,000
70,000
80,000
Nu
mb
er o
f H
ou
seh
old
s
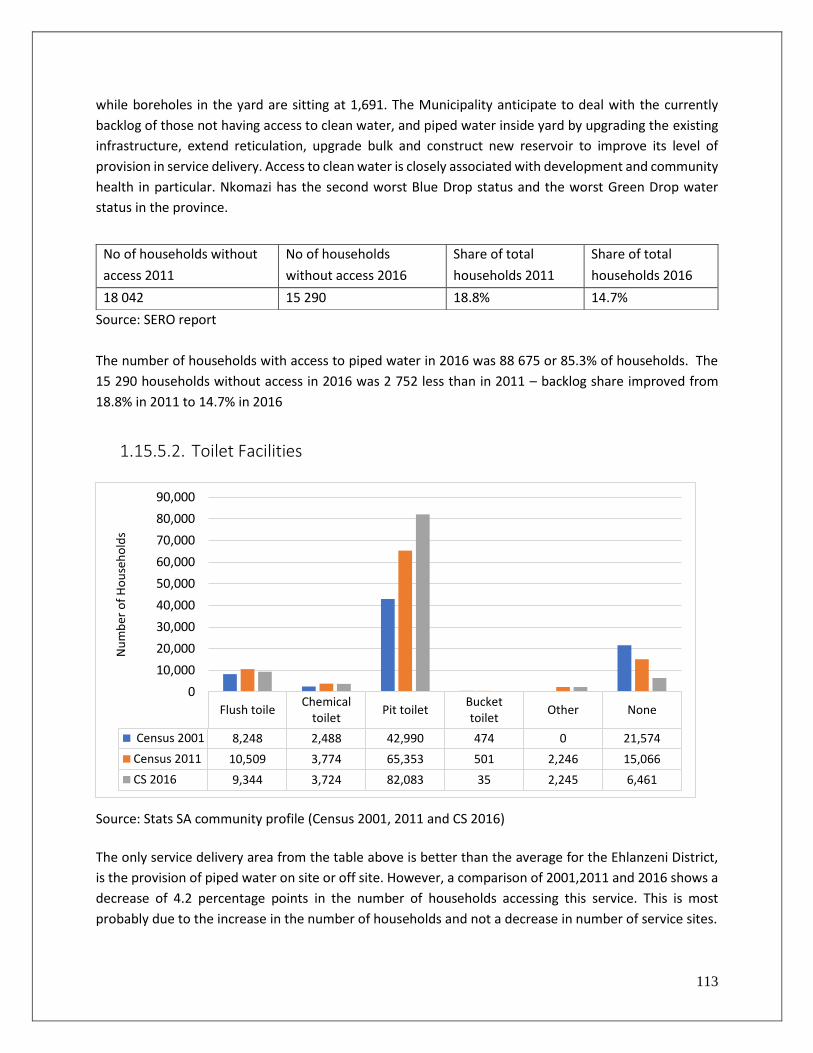
113
while boreholes in the yard are sitting at 1,691. The Municipality anticipate to deal with the currently
backlog of those not having access to clean water, and piped water inside yard by upgrading the existing
infrastructure, extend reticulation, upgrade bulk and construct new reservoir to improve its level of
provision in service delivery. Access to clean water is closely associated with development and community
health in particular. Nkomazi has the second worst Blue Drop status and the worst Green Drop water
status in the province.
Source: SERO report
The number of households with access to piped water in 2016 was 88 675 or 85.3% of households. The
15 290 households without access in 2016 was 2 752 less than in 2011 – backlog share improved from
18.8% in 2011 to 14.7% in 2016
1.15.5.2. Toilet Facilities
Source: Stats SA community profile (Census 2001, 2011 and CS 2016)
The only service delivery area from the table above is better than the average for the Ehlanzeni District,
is the provision of piped water on site or off site. However, a comparison of 2001,2011 and 2016 shows a
decrease of 4.2 percentage points in the number of households accessing this service. This is most
probably due to the increase in the number of households and not a decrease in number of service sites.
Flush toileChemical
toiletPit toilet
Buckettoilet
Other None
Census 2001 8,248 2,488 42,990 474 0 21,574
Census 2011 10,509 3,774 65,353 501 2,246 15,066
CS 2016 9,344 3,724 82,083 35 2,245 6,461
0
10,000
20,000
30,000
40,000
50,000
60,000
70,000
80,000
90,000
Nu
mb
er o
f H
ou
seh
old
s
No of households without
access 2011
No of households
without access 2016
Share of total
households 2011
Share of total
households 2016
18 042 15 290 18.8% 14.7%
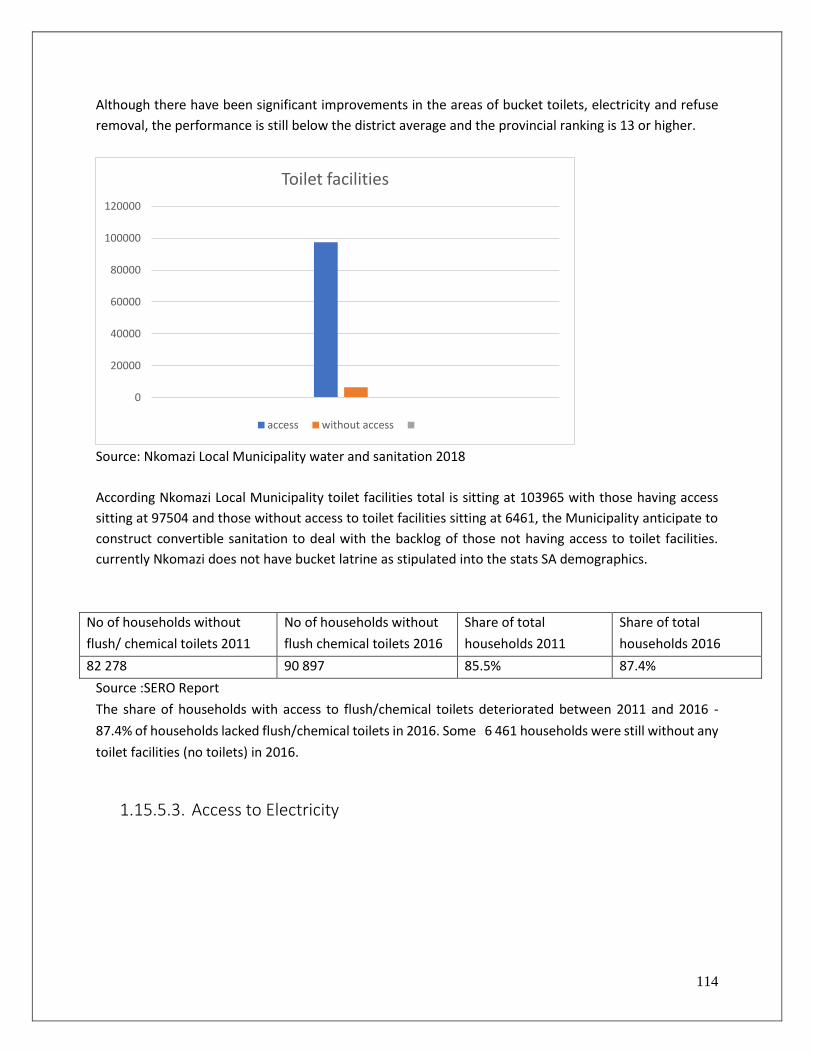
114
Although there have been significant improvements in the areas of bucket toilets, electricity and refuse
removal, the performance is still below the district average and the provincial ranking is 13 or higher.
Source: Nkomazi Local Municipality water and sanitation 2018
According Nkomazi Local Municipality toilet facilities total is sitting at 103965 with those having access
sitting at 97504 and those without access to toilet facilities sitting at 6461, the Municipality anticipate to
construct convertible sanitation to deal with the backlog of those not having access to toilet facilities.
currently Nkomazi does not have bucket latrine as stipulated into the stats SA demographics.
No of households without
flush/ chemical toilets 2011
No of households without
flush chemical toilets 2016
Share of total
households 2011
Share of total
households 2016
82 278 90 897 85.5% 87.4%
Source :SERO Report
The share of households with access to flush/chemical toilets deteriorated between 2011 and 2016 -
87.4% of households lacked flush/chemical toilets in 2016. Some 6 461 households were still without any
toilet facilities (no toilets) in 2016.
1.15.5.3. Access to Electricity
0
20000
40000
60000
80000
100000
120000
Toilet facilities
access without access
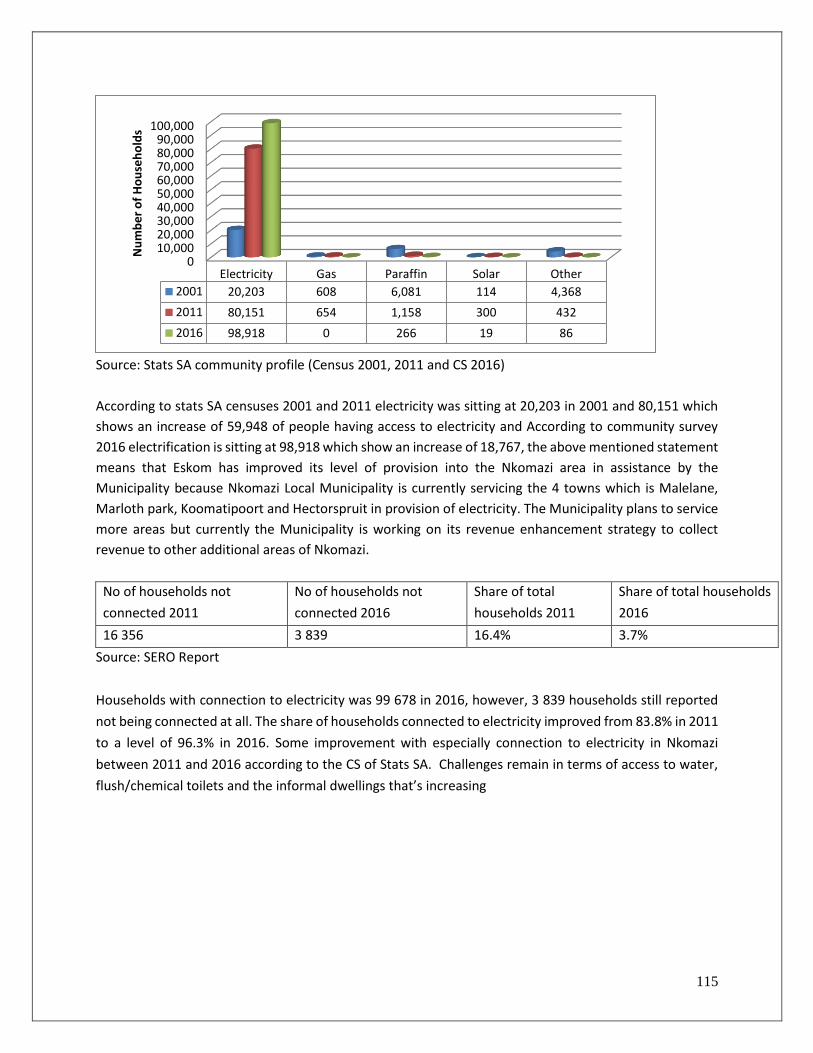
115
Source: Stats SA community profile (Census 2001, 2011 and CS 2016)
According to stats SA censuses 2001 and 2011 electricity was sitting at 20,203 in 2001 and 80,151 which
shows an increase of 59,948 of people having access to electricity and According to community survey
2016 electrification is sitting at 98,918 which show an increase of 18,767, the above mentioned statement
means that Eskom has improved its level of provision into the Nkomazi area in assistance by the
Municipality because Nkomazi Local Municipality is currently servicing the 4 towns which is Malelane,
Marloth park, Koomatipoort and Hectorspruit in provision of electricity. The Municipality plans to service
more areas but currently the Municipality is working on its revenue enhancement strategy to collect
revenue to other additional areas of Nkomazi.
No of households not
connected 2011
No of households not
connected 2016
Share of total
households 2011
Share of total households
2016
16 356 3 839 16.4% 3.7%
Source: SERO Report
Households with connection to electricity was 99 678 in 2016, however, 3 839 households still reported
not being connected at all. The share of households connected to electricity improved from 83.8% in 2011
to a level of 96.3% in 2016. Some improvement with especially connection to electricity in Nkomazi
between 2011 and 2016 according to the CS of Stats SA. Challenges remain in terms of access to water,
flush/chemical toilets and the informal dwellings that’s increasing
010,00020,00030,00040,00050,00060,00070,00080,00090,000
100,000
Electricity Gas Paraffin Solar Other
2001 20,203 608 6,081 114 4,368
2011 80,151 654 1,158 300 432
2016 98,918 0 266 19 86
Nu
mb
er
of
Ho
use
ho
lds
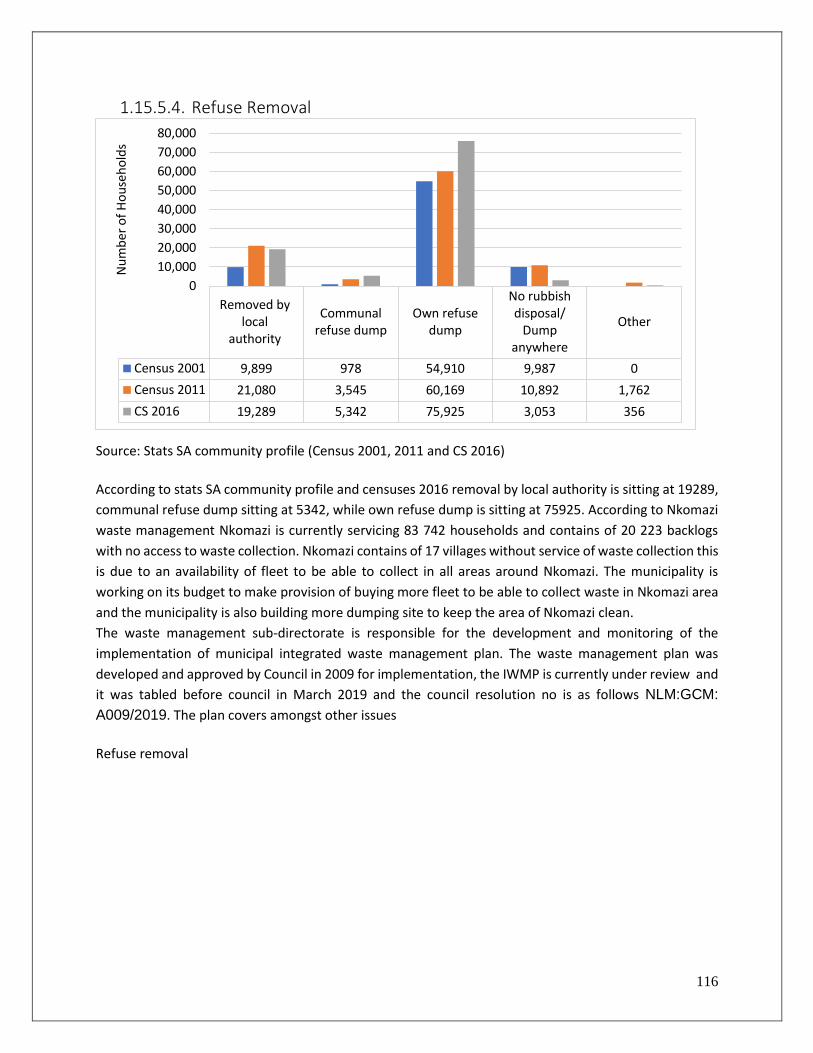
116
1.15.5.4. Refuse Removal
Source: Stats SA community profile (Census 2001, 2011 and CS 2016)
According to stats SA community profile and censuses 2016 removal by local authority is sitting at 19289,
communal refuse dump sitting at 5342, while own refuse dump is sitting at 75925. According to Nkomazi
waste management Nkomazi is currently servicing 83 742 households and contains of 20 223 backlogs
with no access to waste collection. Nkomazi contains of 17 villages without service of waste collection this
is due to an availability of fleet to be able to collect in all areas around Nkomazi. The municipality is
working on its budget to make provision of buying more fleet to be able to collect waste in Nkomazi area
and the municipality is also building more dumping site to keep the area of Nkomazi clean.
The waste management sub-directorate is responsible for the development and monitoring of the
implementation of municipal integrated waste management plan. The waste management plan was
developed and approved by Council in 2009 for implementation, the IWMP is currently under review and
it was tabled before council in March 2019 and the council resolution no is as follows NLM:GCM:
A009/2019. The plan covers amongst other issues
Refuse removal
Removed bylocal
authority
Communalrefuse dump
Own refusedump
No rubbishdisposal/
Dumpanywhere
Other
Census 2001 9,899 978 54,910 9,987 0
Census 2011 21,080 3,545 60,169 10,892 1,762
CS 2016 19,289 5,342 75,925 3,053 356
0
10,000
20,000
30,000
40,000
50,000
60,000
70,000
80,000N
um
ber
of
Ho
use
ho
lds
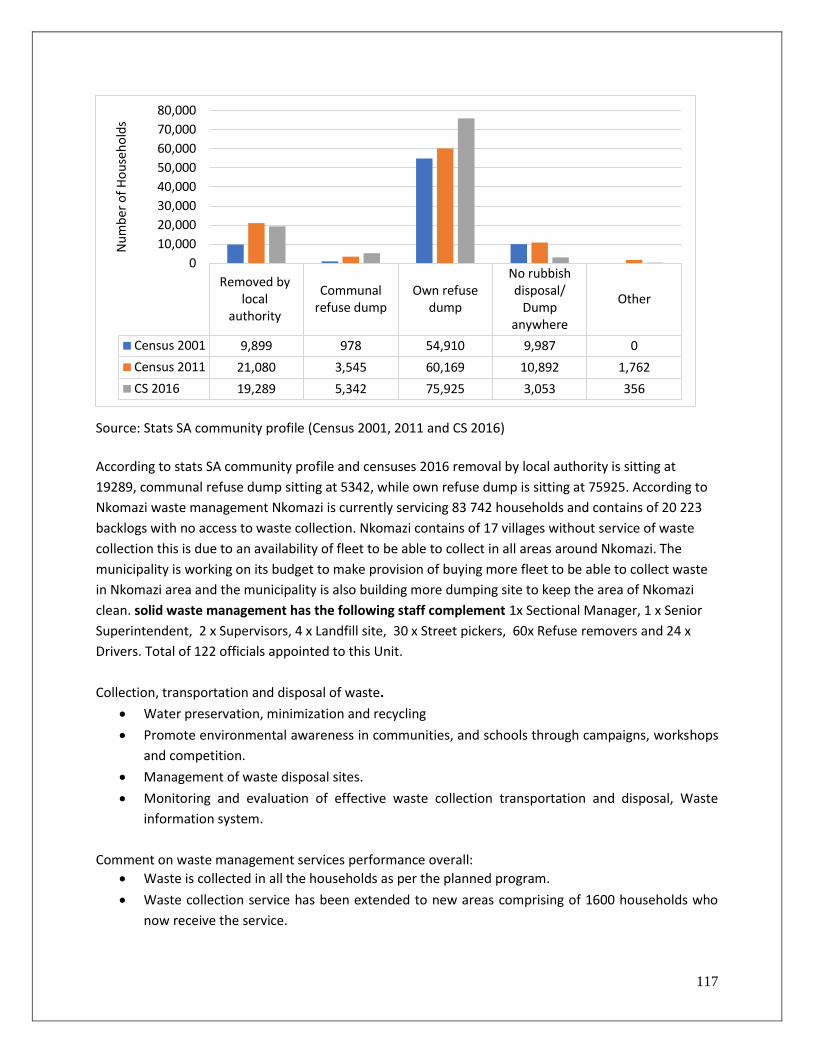
117
Source: Stats SA community profile (Census 2001, 2011 and CS 2016)
According to stats SA community profile and censuses 2016 removal by local authority is sitting at
19289, communal refuse dump sitting at 5342, while own refuse dump is sitting at 75925. According to
Nkomazi waste management Nkomazi is currently servicing 83 742 households and contains of 20 223
backlogs with no access to waste collection. Nkomazi contains of 17 villages without service of waste
collection this is due to an availability of fleet to be able to collect in all areas around Nkomazi. The
municipality is working on its budget to make provision of buying more fleet to be able to collect waste
in Nkomazi area and the municipality is also building more dumping site to keep the area of Nkomazi
clean. solid waste management has the following staff complement 1x Sectional Manager, 1 x Senior
Superintendent, 2 x Supervisors, 4 x Landfill site, 30 x Street pickers, 60x Refuse removers and 24 x
Drivers. Total of 122 officials appointed to this Unit.
Collection, transportation and disposal of waste.
• Water preservation, minimization and recycling
• Promote environmental awareness in communities, and schools through campaigns, workshops
and competition.
• Management of waste disposal sites.
• Monitoring and evaluation of effective waste collection transportation and disposal, Waste
information system.
Comment on waste management services performance overall:
• Waste is collected in all the households as per the planned program.
• Waste collection service has been extended to new areas comprising of 1600 households who
now receive the service.
Removed bylocal
authority
Communalrefuse dump
Own refusedump
No rubbishdisposal/
Dumpanywhere
Other
Census 2001 9,899 978 54,910 9,987 0
Census 2011 21,080 3,545 60,169 10,892 1,762
CS 2016 19,289 5,342 75,925 3,053 356
0
10,000
20,000
30,000
40,000
50,000
60,000
70,000
80,000N
um
ber
of
Ho
use
ho
lds
118
• There is a program on waste management where 220 job opportunities have been created on the
project through the Expanded Public Works Programme and 70 beneficiaries have been
appointed from COGTA.
• Clean-up campaigns are conducted on regular basis in different areas around Nkomazi with
schools, clinics, business, taxi ranks and community members.
• Nkomazi cleanest School competition 2016/2017 was conducted and 49 Schools participated, 21
Schools won prizes in different categories.
• 20 young people have been appointed with assistance of National Department of Environmental
Affairs where they are assisting the waste management section with awareness and waste
administration for a period of 1 year since May 2014 and the contract expired end February 2017
as the project is called Youth Jobs in Waste.
• Consultants have been appointed to commence with feasibility study and site allocation for
Malelane Landfill sites and contractors were appointed to commence with the project of
rehabilitation and decommissioning of Marloth park and Hectorspruit transfer station and
Rehabilitation and Closure of Komatipoort and KaMaqhekeza disposal sites.
• Nkomazi obtained position 2 on the Provincial Greenest Municipality awards (GMC) won R75
000
Challenges
• No extension of waste removal services to communities due to shortage of vehicles
• There is still no revenue collection in rural areas.
• The ageing fleet makes it difficult to render an effective and efficient service
1.15.6. KPA: Local Economic Development and Tourism
1.15.6.1. LED Strategy
The following chapter consists of economic development on how best the municipality can improve its
economic growth as per the constitution of the Republic. Nkomazi Local Municipality has an LED strategy
that was developed and approved by council in 2010. The Local Economic Development is currently
reviewing its LED strategy and a strategic planning session comprising of key stakeholders and the LED
Forum was conducted in February 2020 and a detailed report to guide the review of the strategy has been
compiled and will be incorporated to the draft LED strategy before tabled to Council for adoption.
Review of LED strategy is ongoing, a consultation report have served the portfolio committee for planning
and development. As a section we anticipate that the final report will serve council for approval before
end of second quarter (December)
119
May the MEC take note that appointment for panel experts is secured and development of local economic
recovery plan is on the SDBIP, this is one of the key projects for local economic development. The LED
forum will finalize SLP once all the mines have made their presentations in the LED forum meeting to be
held before end of September.
1.15.6.1.1. The Objectives of the Strategy; • Ensure that social and economic development is prioritised within the IDP plans.
• To conduct economic regeneration studies as part of the IDP’s.
• Establish LED forum within the community to mobilise efforts and resources of local stakeholders
around the Nkomazi region
• To build and maintain economic database to inform decision and act as an early warning system
for the municipality
• Create an enabling environment for local businesses through efficient and effective service and
infrastructure delivery.
• Mobilise civil society to participate in LED and encourage public participation
1.15.6.1.2. The main challenges facing the Implementation of the Strategy are:
• Land claims- most areas in the municipality are under land claims and that has affected most
projects to be funded.
• Land invasion- most part of the municipal land is vested under traditional leaders, traditional
leaders allocate stands which are earmarked for future developments and that affects the
planned projects for the municipality.
• Funding- funding is currently a challenge in implementing most projects in the municipality since
the LED fund has and CRDP has been withdrawn into the municipality. If such initiatives can be
brought back into the municipality an impact can be made, as well as the MIG grant if a certain
percentage can be allocated to the implementation of the LED projects.
1.15.6.2. Stakeholder Participation The municipality has fully fledged Local economic development sub-directorate, consist of seven (7) staff
members that are responsible for the implementation of the strategy. In the light of the above the is a
need to further enhance the implementation of the strategy thereby making provision of additional
staffing and funding to realise fully implementation of the strategy. An LED forum has been established
and its functional, meet once per quarter. In the 2019/2020 financial year the municipality has allocated
a budget to review and align the LED strategy in line with the Spatial Development Framework and the
fourth generation of the IDP. The review process is underway and will be completed by end of June 2020.
The strategy will incorporate a number of sectors that were not included in the initial strategy, among
them is the Investment Attraction Plan, Business Retention Plan, and the Investment Incentive Policy. The
Draft LED strategy is aligned with The Draft Spatial Development Framework.
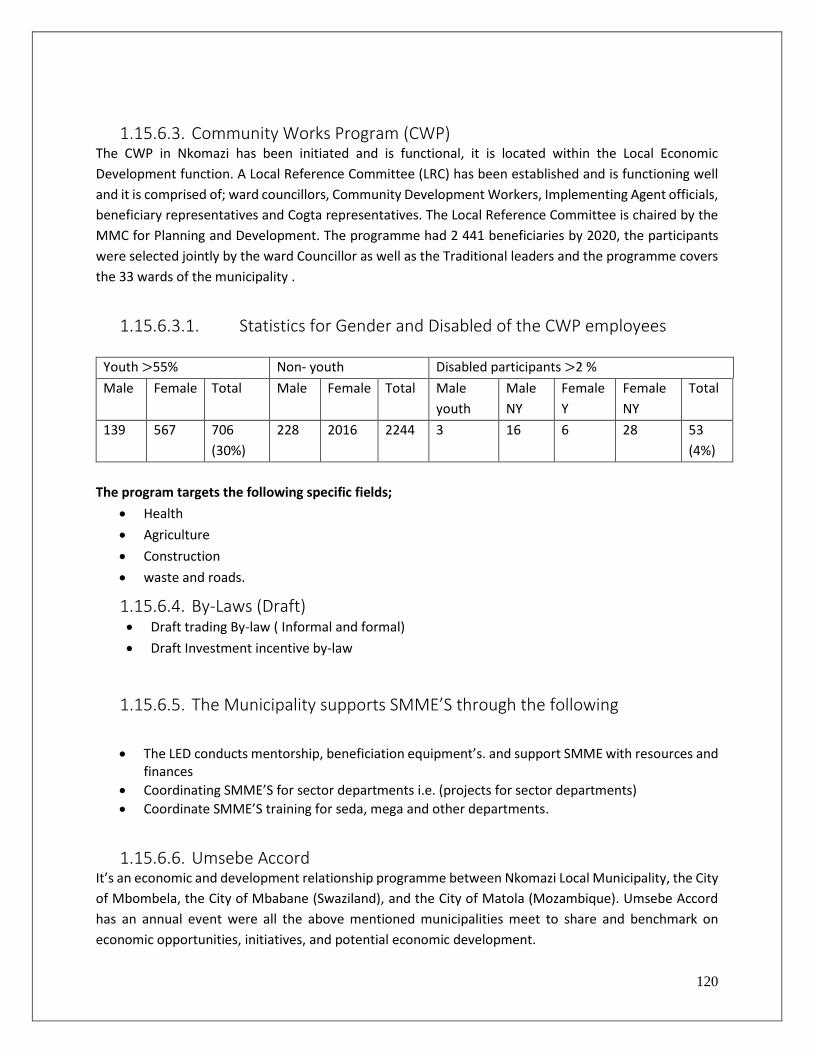
120
1.15.6.3. Community Works Program (CWP) The CWP in Nkomazi has been initiated and is functional, it is located within the Local Economic
Development function. A Local Reference Committee (LRC) has been established and is functioning well
and it is comprised of; ward councillors, Community Development Workers, Implementing Agent officials,
beneficiary representatives and Cogta representatives. The Local Reference Committee is chaired by the
MMC for Planning and Development. The programme had 2 441 beneficiaries by 2020, the participants
were selected jointly by the ward Councillor as well as the Traditional leaders and the programme covers
the 33 wards of the municipality .
1.15.6.3.1. Statistics for Gender and Disabled of the CWP employees
Youth >55% Non- youth Disabled participants >2 %
Male Female Total Male Female Total Male
youth
Male
NY
Female
Y
Female
NY
Total
139 567 706
(30%)
228 2016 2244 3 16 6 28 53
(4%)
The program targets the following specific fields;
• Health
• Agriculture
• Construction
• waste and roads.
1.15.6.4. By-Laws (Draft) • Draft trading By-law ( Informal and formal)
• Draft Investment incentive by-law
1.15.6.5. The Municipality supports SMME’S through the following
• The LED conducts mentorship, beneficiation equipment’s. and support SMME with resources and
finances
• Coordinating SMME’S for sector departments i.e. (projects for sector departments)
• Coordinate SMME’S training for seda, mega and other departments.
1.15.6.6. Umsebe Accord It’s an economic and development relationship programme between Nkomazi Local Municipality, the City
of Mbombela, the City of Mbabane (Swaziland), and the City of Matola (Mozambique). Umsebe Accord
has an annual event were all the above mentioned municipalities meet to share and benchmark on
economic opportunities, initiatives, and potential economic development.
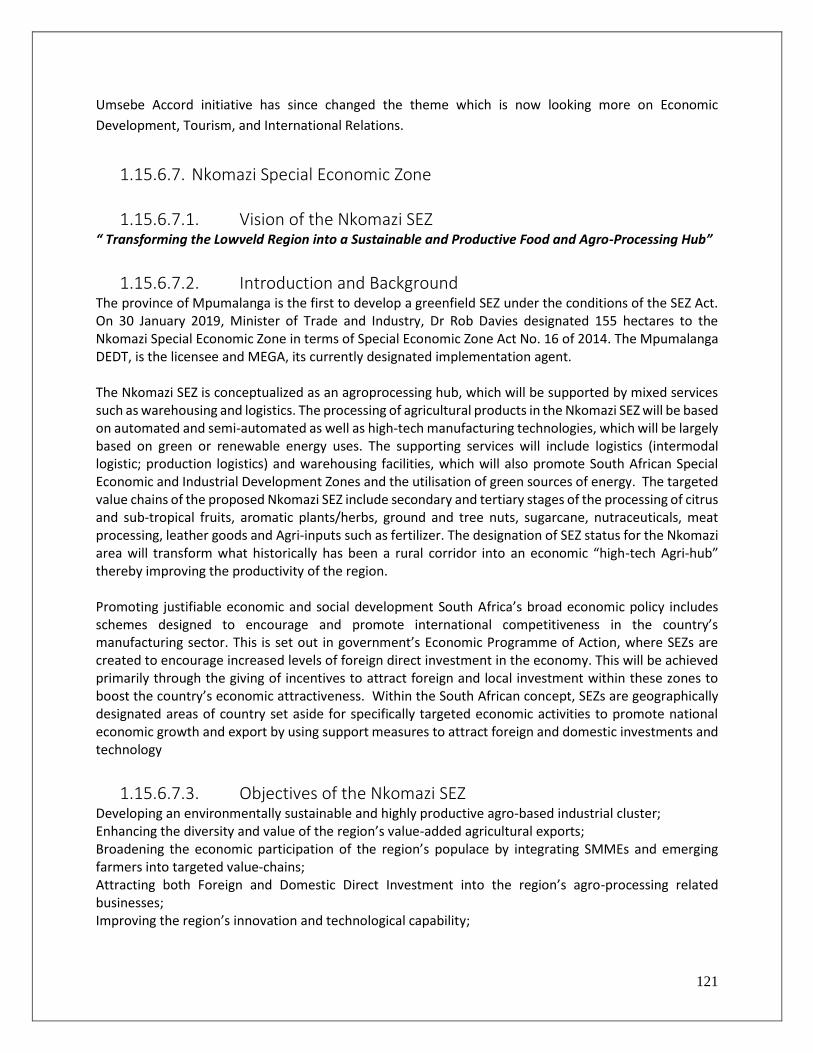
121
Umsebe Accord initiative has since changed the theme which is now looking more on Economic
Development, Tourism, and International Relations.
1.15.6.7. Nkomazi Special Economic Zone
1.15.6.7.1. Vision of the Nkomazi SEZ “ Transforming the Lowveld Region into a Sustainable and Productive Food and Agro-Processing Hub”
1.15.6.7.2. Introduction and Background The province of Mpumalanga is the first to develop a greenfield SEZ under the conditions of the SEZ Act. On 30 January 2019, Minister of Trade and Industry, Dr Rob Davies designated 155 hectares to the Nkomazi Special Economic Zone in terms of Special Economic Zone Act No. 16 of 2014. The Mpumalanga DEDT, is the licensee and MEGA, its currently designated implementation agent. The Nkomazi SEZ is conceptualized as an agroprocessing hub, which will be supported by mixed services such as warehousing and logistics. The processing of agricultural products in the Nkomazi SEZ will be based on automated and semi-automated as well as high-tech manufacturing technologies, which will be largely based on green or renewable energy uses. The supporting services will include logistics (intermodal logistic; production logistics) and warehousing facilities, which will also promote South African Special Economic and Industrial Development Zones and the utilisation of green sources of energy. The targeted value chains of the proposed Nkomazi SEZ include secondary and tertiary stages of the processing of citrus and sub-tropical fruits, aromatic plants/herbs, ground and tree nuts, sugarcane, nutraceuticals, meat processing, leather goods and Agri-inputs such as fertilizer. The designation of SEZ status for the Nkomazi area will transform what historically has been a rural corridor into an economic “high-tech Agri-hub” thereby improving the productivity of the region. Promoting justifiable economic and social development South Africa’s broad economic policy includes schemes designed to encourage and promote international competitiveness in the country’s manufacturing sector. This is set out in government’s Economic Programme of Action, where SEZs are created to encourage increased levels of foreign direct investment in the economy. This will be achieved primarily through the giving of incentives to attract foreign and local investment within these zones to boost the country’s economic attractiveness. Within the South African concept, SEZs are geographically designated areas of country set aside for specifically targeted economic activities to promote national economic growth and export by using support measures to attract foreign and domestic investments and technology
1.15.6.7.3. Objectives of the Nkomazi SEZ Developing an environmentally sustainable and highly productive agro-based industrial cluster; Enhancing the diversity and value of the region’s value-added agricultural exports; Broadening the economic participation of the region’s populace by integrating SMMEs and emerging farmers into targeted value-chains; Attracting both Foreign and Domestic Direct Investment into the region’s agro-processing related businesses; Improving the region’s innovation and technological capability;
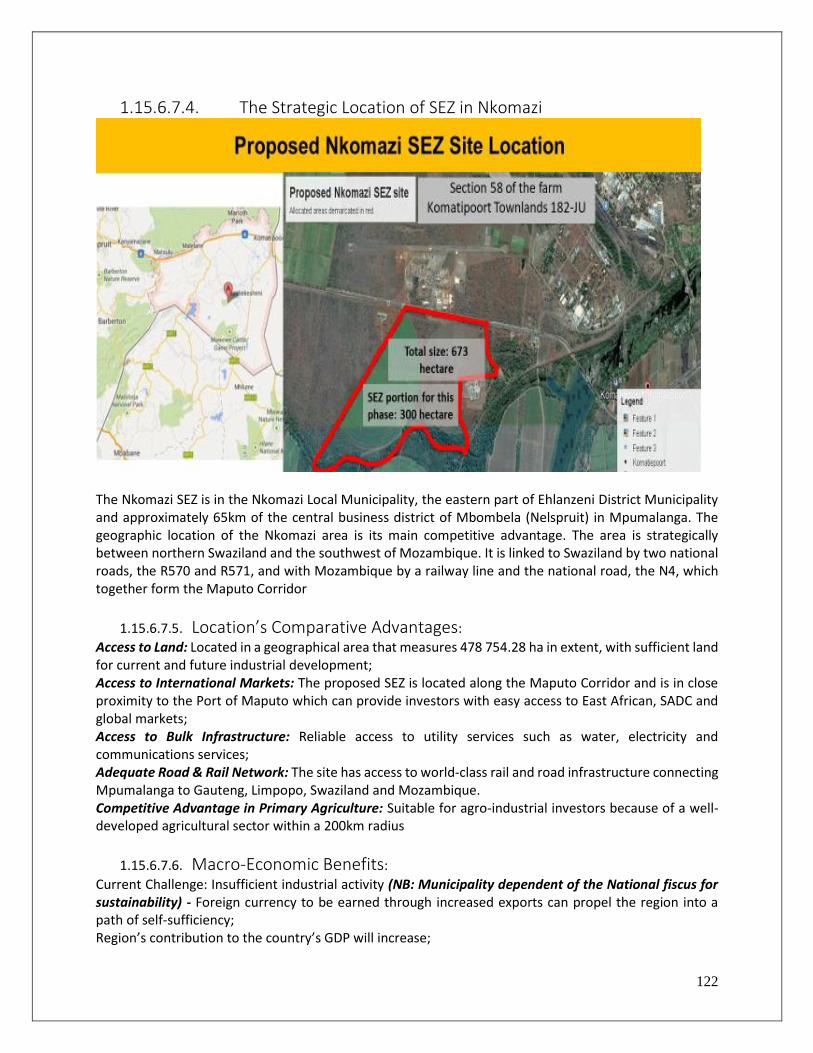
122
1.15.6.7.4. The Strategic Location of SEZ in Nkomazi
The Nkomazi SEZ is in the Nkomazi Local Municipality, the eastern part of Ehlanzeni District Municipality and approximately 65km of the central business district of Mbombela (Nelspruit) in Mpumalanga. The geographic location of the Nkomazi area is its main competitive advantage. The area is strategically between northern Swaziland and the southwest of Mozambique. It is linked to Swaziland by two national roads, the R570 and R571, and with Mozambique by a railway line and the national road, the N4, which together form the Maputo Corridor
1.15.6.7.5. Location’s Comparative Advantages:
Access to Land: Located in a geographical area that measures 478 754.28 ha in extent, with sufficient land for current and future industrial development; Access to International Markets: The proposed SEZ is located along the Maputo Corridor and is in close proximity to the Port of Maputo which can provide investors with easy access to East African, SADC and global markets; Access to Bulk Infrastructure: Reliable access to utility services such as water, electricity and communications services; Adequate Road & Rail Network: The site has access to world-class rail and road infrastructure connecting Mpumalanga to Gauteng, Limpopo, Swaziland and Mozambique. Competitive Advantage in Primary Agriculture: Suitable for agro-industrial investors because of a well-developed agricultural sector within a 200km radius
1.15.6.7.6. Macro-Economic Benefits:
Current Challenge: Insufficient industrial activity (NB: Municipality dependent of the National fiscus for sustainability) - Foreign currency to be earned through increased exports can propel the region into a path of self-sufficiency; Region’s contribution to the country’s GDP will increase;
123
Reducing the number of households dependent on the country’s already severely stressed safety net. Redressing the Regional Spatial Industrial Planning Imbalances: Economic activity in Mpumalanga is still concentrated in Nelspruit, Mbombela (thus negatively affecting the growth of the agricultural sector due to limited investment in industrial infrastructure).
1.15.6.7.7. Responding to the regions severe social challenges:
• Unemployment Official unemployment rate = 32.3% (Q2 2017); The unemployed youth (15-34yr) was 68.9% of the total unemployed.
• Poverty The population below the lower bound poverty line (LBPL) = 42.6% (2015). The 2015 LBPL was R647 per person per month.
• Income Inequality Income inequality (Gini-coefficient) = 0.61 (2016)
1.15.6.7.8. Strategic Intent The Nkomazi SEZ has adopted the theme “From Endowment to Abundance”, indicating its clear focus to beneficiate the natural endowments of the region into financial prosperity derived from significant participation in national and global supply chains, supported by inclusive growth. Its strategic intent can be summarised by the infographic shown in Figure. This industrial engine has the potential to deliver the following tangible outcomes by year 10 of its implementation, given full realisation of its aspiration:
The Nkomazi SEZ Aspiration: A 10 year view
1.15.6.7.9. Figure: The transformative nature of the Nkomazi SEZ Strategy An annual output of R97.6 billion, supporting a significant contribution to the annual GDP of the province and country, from More than 100 new business entities, with up to 50% of them being new entrants to the market;
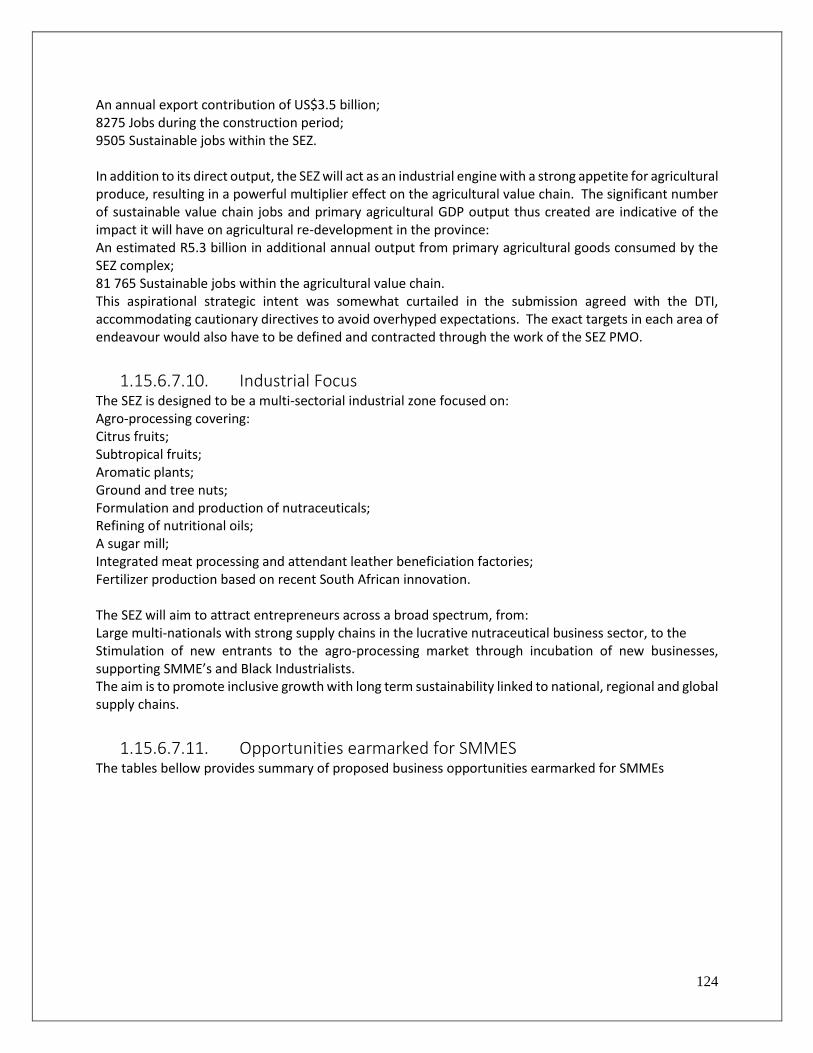
124
An annual export contribution of US$3.5 billion; 8275 Jobs during the construction period; 9505 Sustainable jobs within the SEZ. In addition to its direct output, the SEZ will act as an industrial engine with a strong appetite for agricultural produce, resulting in a powerful multiplier effect on the agricultural value chain. The significant number of sustainable value chain jobs and primary agricultural GDP output thus created are indicative of the impact it will have on agricultural re-development in the province: An estimated R5.3 billion in additional annual output from primary agricultural goods consumed by the SEZ complex; 81 765 Sustainable jobs within the agricultural value chain. This aspirational strategic intent was somewhat curtailed in the submission agreed with the DTI, accommodating cautionary directives to avoid overhyped expectations. The exact targets in each area of endeavour would also have to be defined and contracted through the work of the SEZ PMO.
1.15.6.7.10. Industrial Focus The SEZ is designed to be a multi-sectorial industrial zone focused on: Agro-processing covering: Citrus fruits; Subtropical fruits; Aromatic plants; Ground and tree nuts; Formulation and production of nutraceuticals; Refining of nutritional oils; A sugar mill; Integrated meat processing and attendant leather beneficiation factories; Fertilizer production based on recent South African innovation. The SEZ will aim to attract entrepreneurs across a broad spectrum, from: Large multi-nationals with strong supply chains in the lucrative nutraceutical business sector, to the Stimulation of new entrants to the agro-processing market through incubation of new businesses, supporting SMME’s and Black Industrialists. The aim is to promote inclusive growth with long term sustainability linked to national, regional and global supply chains.
1.15.6.7.11. Opportunities earmarked for SMMES The tables bellow provides summary of proposed business opportunities earmarked for SMMEs
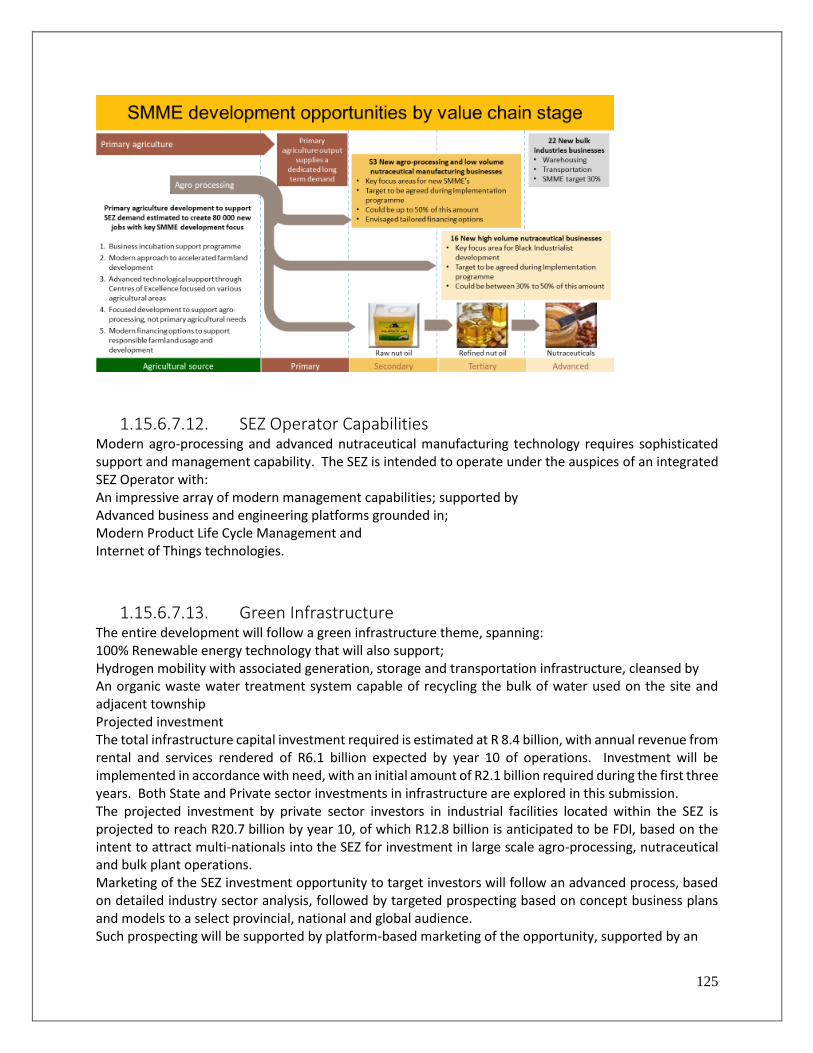
125
1.15.6.7.12. SEZ Operator Capabilities Modern agro-processing and advanced nutraceutical manufacturing technology requires sophisticated support and management capability. The SEZ is intended to operate under the auspices of an integrated SEZ Operator with: An impressive array of modern management capabilities; supported by Advanced business and engineering platforms grounded in; Modern Product Life Cycle Management and Internet of Things technologies.
1.15.6.7.13. Green Infrastructure The entire development will follow a green infrastructure theme, spanning: 100% Renewable energy technology that will also support; Hydrogen mobility with associated generation, storage and transportation infrastructure, cleansed by An organic waste water treatment system capable of recycling the bulk of water used on the site and adjacent township Projected investment The total infrastructure capital investment required is estimated at R 8.4 billion, with annual revenue from rental and services rendered of R6.1 billion expected by year 10 of operations. Investment will be implemented in accordance with need, with an initial amount of R2.1 billion required during the first three years. Both State and Private sector investments in infrastructure are explored in this submission. The projected investment by private sector investors in industrial facilities located within the SEZ is projected to reach R20.7 billion by year 10, of which R12.8 billion is anticipated to be FDI, based on the intent to attract multi-nationals into the SEZ for investment in large scale agro-processing, nutraceutical and bulk plant operations. Marketing of the SEZ investment opportunity to target investors will follow an advanced process, based on detailed industry sector analysis, followed by targeted prospecting based on concept business plans and models to a select provincial, national and global audience. Such prospecting will be supported by platform-based marketing of the opportunity, supported by an
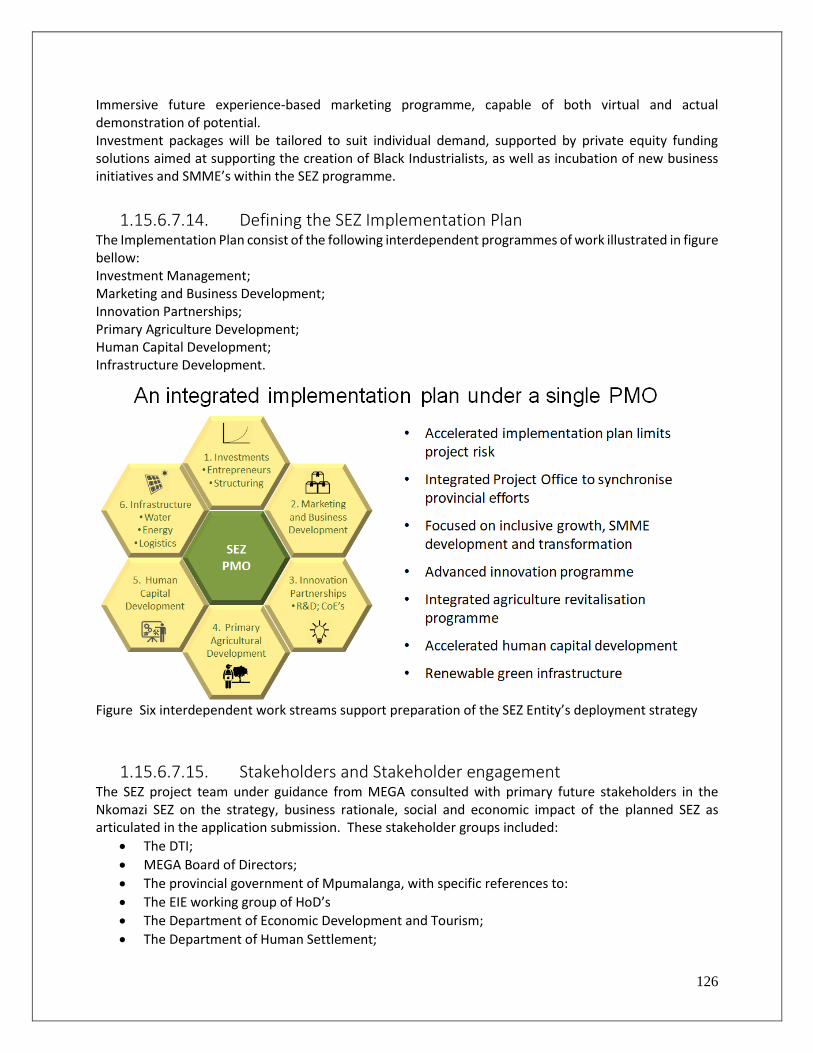
126
Immersive future experience-based marketing programme, capable of both virtual and actual demonstration of potential. Investment packages will be tailored to suit individual demand, supported by private equity funding solutions aimed at supporting the creation of Black Industrialists, as well as incubation of new business initiatives and SMME’s within the SEZ programme.
1.15.6.7.14. Defining the SEZ Implementation Plan The Implementation Plan consist of the following interdependent programmes of work illustrated in figure bellow: Investment Management; Marketing and Business Development; Innovation Partnerships; Primary Agriculture Development; Human Capital Development; Infrastructure Development.
Figure Six interdependent work streams support preparation of the SEZ Entity’s deployment strategy
1.15.6.7.15. Stakeholders and Stakeholder engagement The SEZ project team under guidance from MEGA consulted with primary future stakeholders in the Nkomazi SEZ on the strategy, business rationale, social and economic impact of the planned SEZ as articulated in the application submission. These stakeholder groups included:
• The DTI;
• MEGA Board of Directors;
• The provincial government of Mpumalanga, with specific references to:
• The EIE working group of HoD’s
• The Department of Economic Development and Tourism;
• The Department of Human Settlement;
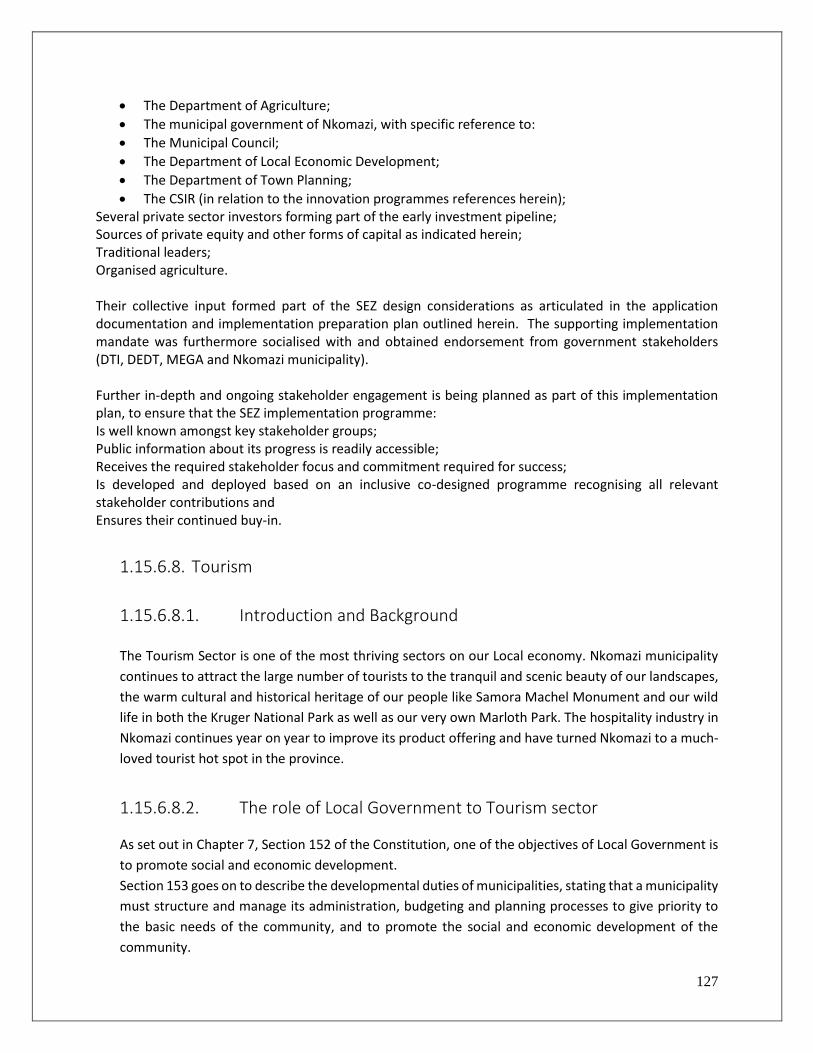
127
• The Department of Agriculture;
• The municipal government of Nkomazi, with specific reference to:
• The Municipal Council;
• The Department of Local Economic Development;
• The Department of Town Planning;
• The CSIR (in relation to the innovation programmes references herein); Several private sector investors forming part of the early investment pipeline; Sources of private equity and other forms of capital as indicated herein; Traditional leaders; Organised agriculture. Their collective input formed part of the SEZ design considerations as articulated in the application documentation and implementation preparation plan outlined herein. The supporting implementation mandate was furthermore socialised with and obtained endorsement from government stakeholders (DTI, DEDT, MEGA and Nkomazi municipality). Further in-depth and ongoing stakeholder engagement is being planned as part of this implementation plan, to ensure that the SEZ implementation programme: Is well known amongst key stakeholder groups; Public information about its progress is readily accessible; Receives the required stakeholder focus and commitment required for success; Is developed and deployed based on an inclusive co-designed programme recognising all relevant stakeholder contributions and Ensures their continued buy-in.
1.15.6.8. Tourism
1.15.6.8.1. Introduction and Background
The Tourism Sector is one of the most thriving sectors on our Local economy. Nkomazi municipality
continues to attract the large number of tourists to the tranquil and scenic beauty of our landscapes,
the warm cultural and historical heritage of our people like Samora Machel Monument and our wild
life in both the Kruger National Park as well as our very own Marloth Park. The hospitality industry in
Nkomazi continues year on year to improve its product offering and have turned Nkomazi to a much-
loved tourist hot spot in the province.
1.15.6.8.2. The role of Local Government to Tourism sector
As set out in Chapter 7, Section 152 of the Constitution, one of the objectives of Local Government is
to promote social and economic development.
Section 153 goes on to describe the developmental duties of municipalities, stating that a municipality
must structure and manage its administration, budgeting and planning processes to give priority to
the basic needs of the community, and to promote the social and economic development of the
community.
128
Section 153 further states that a municipality must participate in national and provincial development
program
Local Tourism is also singled out in Schedule 4 (B) is one of the competency areas of local government;
and also, a concurrent responsibility between National and Provincial government (Schedule 4 (a)).
The Tourism Sector is a national priority sector with enormous potential to promote economic
development, thus requiring of municipalities to promote it and support it.
1.15.6.8.3. Key Tourism projects/programmes for the Municipality
• SMMEs Support Program
• Tourism Capacity Building
• Schools Tourism Awareness Program
• Border Posts Awareness
• Durban Tourism Indaba
• Kingdom of Eswatini International Trade Fair
• Samora Machel Monument Commemoration
• Upgrading of Mahhushe Shongwe
1.15.6.8.4. The Performance highlights
SMMEs Support Program The section provided a one stop shop SMME’s support program which offered a practical demonstration
learning experience which included amongst others Business Licenses, Star grading, SCM (CSD
registration), NEF application, Tourism Incentives Program. The main aim was to practically assist SMMEs
to market their business effectively, understand the importance of building a reputable business profile
as a marketing tool and maintain financial records
1.15.6.8.5. Data base of Tourism establishment The Nkomazi Tourism database consists of approximately 67 accommodations establishments in the
Nkomazi Jurisdiction, 08 Restaurants, 03 arts and Crafts or cultural park, 36 Accommodations
establishment and they are graded, 39 Accommodations establishments are not graded, 49 Business that
are registered, 30 Business are not registered and 06 Attractions. The database is updated every month
as and when new information collected
1.15.6.8.6. Tourism Learnerships Program Thirty Tourism monitors were employed on a contact for the period of 18 months and strategically placed
to tourism route areas which identified as having high crime zone around Nkomazi Municipality, and sixty
students employed on contract basis for the period of 18 months for Fast Food learnership and place in
tourism establishment for experiential learning in Nkomazi
1.15.6.8.7. The following are the challenges for the Tourism Unit • High rate of none registered establishment
129
• No capital budget
• No welcoming Tourism signage on the three-border posts
• No Tourism Route that is established
• No clear direction on development of Driekoppies and Masibekela dam
• SMME development
1.15.7. KPA: Municipal Financial Viability and Management analysis In terms of section 53 of the Municipal Finance Management Act (MFMA) the Executive Mayor of the municipality should provide general political guidance in the budget process and the setting of priorities that must guide the preparation of budget. Chapter 2 of the Municipal Budget and Reporting Regulations states that the mayor of the municipality must establish a Budget Steering Committee to provide assistance to the mayor in terms of the responsibilities set out in section 53 of the MFMA. Legislation stipulates clearly that a municipality must not only give effect to its IDP, but must also conduct its affairs in a manner which is consistent with its IDP. This includes the compilation of the Medium-term Revenue and Expenditure Framework. The municipality’s IDP is its principal strategic planning instruments, which directly guide and inform its planning, budget, management and development actions. This framework is rolled out into objectives, key performance indicators and targets for implementation, which directly informs the Service Delivery and Budget Implementation Plan. During the implementation of the 2020/21 IDP and Budget Process Plan, The President of South Africa declared a nationwide lockdown, where all citizens, except those that form part of essential services, were ordered to stay home for a period of 21 days initially. The nationwide lockdown commenced at midnight on Thursday, 26 March 2020. This announcement broadly affected how municipalities and municipal entities undertake their financial management responsibilities for the remainder of the 2019/20 financial year in terms of the MFMA and more imminently the 2020/21 MTREF budget preparations process. The COVID-19 pandemic introduced new dimensions of volatility, uncertainty, complexity and ambiguity to the task of financial stewardship across all spheres of government. Public policy decision-makers at all levels of government must act with vision, understanding, clarity and agility in responding to the crisis in a resilient manner. This required a fundamental strategic rethink of the way in which we currently conduct our planning, budgeting and implementation processes. As a result of the above mentioned statement, the Minister of Finance issued a conditional Exemption Notice in terms of section 177(1)(b) of the Municipal Finance Management Act, 2003 (Act No. 56 of 2003) (MFMA) on 30 March 2020 to facilitate and enable the performance of legislative responsibilities by municipalities and municipal entities during the national state of disaster. This exemption enabled municipalities and municipal entities to undertake their financial management responsibilities including their budget preparation processes in a manner taking cognisance of the challenges experienced as a result of the announcement of the national state of disaster and the nationwide lockdown. It also provides for a special adjustments budget to address any expenditure relating to COVID-19 for the current municipal financial year ending 30 June 2020. Municipalities were allowed to prepare one Special adjustment budget between the date of the declaration of the national state of disaster and 15 June 2020, which is the date when it is envisaged to end in terms of the Disaster Management Act.(DMA)
1.15.7.1. Budgetary Implications
130
In response to the impact of COVID-19, Nkomazi Local municipality has considered the reprioritisation of their funding allocations for the 2019/20 and 2020/21 financial year. Given the prevailing circumstances, the municipality may be under pressure to grant some form of relief to consumers, such as rates holidays, etc. However, the National Treasury advised municipalities not to make assumptions about the ability of consumers to pay under these circumstances and prematurely grant relief measures as this is not supported by the National Treasury. Municipalities were advised to assess the merits of each case. In doing so, National Treasury recommends that municipalities consider the following guiding principles:
i. Where municipalities consider initiatives to reduce the impact of COVID-19 on businesses and
economic households such as rebates, payment holidays, relaxation of credit control measures
municipalities –
a. must ensure that their liquidity and overall financial sustainability is not compromised;
b. in granting rebates to their consumers, should consider all the relevant legislation,
regulations such as Municipal Property Rates Act (MPRA), MFMA dealing with revenue
management within the disaster management principles;
c. must ensure that the relaxation of levying of interest for overdue payments for municipal
services should be in line with Council’s policies, by-laws and other applicable legislation;
d. must from a tariff perspective, understand that the prohibition on increasing tariffs in terms
of section 28(6) of the MFMA still remains. Any tariff increase required during this national
disaster period will be considered on a case by case basis. Municipalities are however
allowed to decrease their tariffs in-year. With regard to tariffs tabled as part of the draft
budget, the National Treasury views this as “indicative” and might change after the public
consultation process. We therefore advise that whatever tariff is introduced or proposed as
part of the draft budget tabled in March is indicative and municipalities are allowed to change
the tariff (increase or decrease) before the final budget is adopted by the municipal council;
e. must as it relate to public consultation consider section 17(3)(a) of the MFMA which requires
that the draft budget must be accompanied by draft resolutions that amongst others, impose
any municipal taxes and setting any municipal tariff for the specific budget year. If the
indicative tariff that was used to consult the public on the draft budget changed significantly
post consultation, the municipal council will have to consult again on the revised tariff given
the impact on the consumer. The nature of the consultation is the discretion of the
municipality as it is not a legal requirement at the moment to consult again after the initial
draft budget was made public. However, reasons for increasing the tariffs must be provided,
and the municipality must consider special short-term tariff measures, so any increase may
be undertaken on a short-term basis and reversed, depending on a case-by-case basis.
131
f. Expenditure side measures and cost savings on the budget must also allow for limitations on
increases as the levels of affordability for households and business may be breached.
ii. With respect to relief strategies to indigent households, municipalities should consider: a.
reviewing their respective indigent policies to factor in the potential economic impact of COVID-
19 on poor households; and b. the possibility of an increase in the number of indigent households
while the quantum for free basic services remains within the national policy e.g. 6 kilolitres for
water. Municipalities must ensure that financial sustainability is not compromised in
implementing these policies. If the increase is implemented for the remainder of 2019/20
financial year (quarter four), it can be effected as part of the anticipated adjustments budgets
allowed for by the Exemption Notice No. 43181 dated 30 March 2020.
iii. Municipalities are reminded that any expenditure related to COVID-19 should be limited to the
implementation of their mandates as outlined in the Constitution, specifically related to the
provision of basic services i.e. water, sanitation, refuse and electricity amongst others. By
implication avoid creating unfunded mandates for themselves.
With the compilation of the 2020/21 Medium-Term Revenue and Expenditure Framework (MTREF), each department/function had to review its business planning processes taking into account their individual departmental strategies. Business planning links back to priority needs and master planning, and essentially inform the detail operating budget appropriations and three-year capital programme. In the 2019 Medium Term Budget Policy Statement (MTBPS) tabled by the Minister of Finance on 30 October 2019, he stated that, he is tabling the 2019 MTBPS in a difficult global and domestic environment. The global growth forecast for 2019 is the lowest since the 2008 financial crisis, weighed down by mounting trade tensions and political uncertainty.
1.15.7.2. Revenue Enhancement Strategy
Nkomazi Local Municipality is one of the local municipalities in the Mpumalanga Province experiencing
limited revenue base for basic services rendered to the public at large.
In terms of section 75(a) of the Municipal Systems Act no: 32 of 2000, the municipality has powers to levy
and recover fees, charges and tariffs in respect of any function of services of the municipality.
The municipality has considered developing a Revenue Enhancement Strategy to be used as a tool to
enhance and expand the current revenue base. The first step towards achieving the above, is the drafting
and approving of a Revenue Enhancement Strategy together with its implementation plan by Council. The
proposed strategy is still work-in-progress and requires inputs from all departments within the
municipality. The strategy was sent to Council for noting on the 30th of May 2018 under Council resolution
number: NLM: GCM: B007/2018.
132
1.15.7.3. Allocation for Operations and Maintenance Repairs and maintenance is projected to be 1.5% of total assets and 3.7% of operating expenditure. This
is below the norm of 8% as prescribed by National Treasury.
1.15.7.4. MSCOA Mscoa regulations and the accompanying “game changers” signals were introduced as smarter way
forward in strengthening local government finances. In order for the municipality to comply with Mscoa
regulations which requires the municipality to transact on Mscoa system from 1st of July 2017. National
Treasury has released Versions of the Schedule A1 (the Excel Formats) which is aligned to the Versions of
the Mscoa classification framework. The 2020/21 MTREF budget is compile with version 6.3 as required.
Numerous challenges are encountered on the implementation of Mscoa, However, with the assistance of
the National/Provincial Treasury and the service providers, the municipality is being continuously able to
overcome these difficulties.
1.15.7.5. IDP and Service Delivery and Budget Implementation Plan
The municipality’s IDP is its principal strategic planning instrument, which directly guides and informs its
planning, budget, management and development actions. This framework is rolled out into objectives,
key performance indicators and targets for implementation which directly inform the Service Delivery and
Budget Implementation Plan.
The IDP has been taken into a business and financial planning process leading up to the 2019/20 MTREF,
based on the approved 2018/19 MTREF, Mid-year Review and adjustments budget. The business planning
process has subsequently been refined in the light of current economic circumstances and the resulting
revenue projections.
With the compilation of the 2019/20 MTREF, each department/function had to review the business
planning process, including the setting of priorities and targets after reviewing the mid-year and third
quarter performance against the 2018/19 Departmental Service Delivery and Budget Implementation
Plan. Business planning links back to priority needs and master planning, and essentially informed the
detail operating budget appropriations.
1.15.7.6. Legislation Compliance Status
Compliance with the MFMA implementation requirements have been substantially adhered to through the following activities: 1. In year reporting
- Reporting to National Treasury in electronic format was fully complied with on a monthly basis.
Section 71 reporting to the Executive Mayor (within 10 working days).
133
2. Internship programme
- The municipality is participating in the Municipal Financial Management Internship programme
and has so far recruited 13 candidate who was in an internship programme since the inception.
The current 5 interns are expected to complete their two-year programme on 31 August 2020.
3. Audit Committee
- The municipality has established both an audit Committee and the performance Audit
Committee, they are both fully functional.
4. Service Delivery and Implementation Plan
- The executive mayor approved the SDBIP document and it was tabled to council within 28 days
after the approval of the budget for 2020/21 MTREF.
5. Annual Report - Annual report is compiled in terms of the MFMA and National Treasury requirement
134
1.15.7.7. The National and Provincial Priorities, Policies and Strategies of importance include amongst others:
• Green Paper on National Strategic Planning of 2009;
• Government Programme of Action;
• Development Facilitation Act of 1995;
• Provincial Growth and Development Strategy (GGDS);
• National and Provincial spatial development perspectives;
• Relevant sector plans such as transportation, legislation and policy;
• National Key Performance Indicators (NKPIs);
• Accelerated and Shared Growth Initiative (ASGISA);
• National Spatial Development Perspective (NSDP) and
1.15.8. KPA: Good Governance & Public Participation Analysis
1.15.8.1. Internal Audit
The Internal Audit Activity’s mandate emanates from Section 165 (1) of the Municipal Finance Management Act, (Act. 56 of
2003) (MFMA) which states that each municipality must have an Internal Audit Activity. Internal audit should prepare in
consultation with and for approval by, the Audit Committee:
A three-year strategic rolling internal audit plan based on risk assessment of key areas for the Municipality, having regard to
its current operations, those proposed in its Service Delivery and Budget Implementation Plan and its risk register/risk
management strategy;
an annual internal audit operational plan for the first year of the rolling three-year strategic internal audit plan;
plans indicating the proposed scope of each audit in the annual internal audit plan; and
a quarterly report to the Audit Committee detailing its performance against the annual internal audit plan, to allow effective
monitoring and possible intervention.
• Internal Audit Charter
• Internal Audit Methodology
• Facilitate the review of Audit Committee Charter
• Co-ordinate the meetings of Audit Committee as per the approved scheduled of meetings
The role of the internal audit activity is to provide an independent, objective assurance and consulting services designed to
add value and improve the municipality’s operations.
The Internal Audit Activity serves as helps the municipality to accomplish its objectives by bringing a systematic, disciplined
approach to evaluate and improve the effectiveness of risk management, control, and governance processes. The Internal
Audit contains of the following Staff compliment In terms of the approved organisational structure, there are 4 positions,
namely: Manager Internal Audit Unit (Chief Audit Executive), Senior Internal Auditor, 2x Internal Auditors, The municipality
has second 1 Finance Intern to the Internal Audit Unit to assist in the implementation of the annual audit plan for a period of
24 months and Audit Committee and Performance Audit Committee
The municipality has established Audit Committee in terms of section 166 of the MFMA, No. 56 of 2003 to provide an advisory
role to the Municipal Manager and Municipal Council. The committee has 5 members who have various expertise applicable
to the municipality’s mandate, e.g. financial, legal, performance and auditing.
135
The committee is chaired by an independent person (Mrs. ZC Sibanda) and all the other members are not employees of
Nkomazi Local Municipality. The committee has adopted the Audit Committee Charter as part of their terms of reference and
a schedule of meetings.
The performance regulations also require municipalities to budget and appoint a performance audit committee that will play
an advisory role on the overall performance of the municipality. In complying with the provision of the regulations, the
municipality has appointed the members of the audit committee to also serve as performance audit committee and appointed
member, Mr. KV Mokoena, to be the Chairperson of the Audit committee. The terms of reference of the committee are
incorporated into the Audit Committee Charter.
Complaints Management/ Customer Care Customer/Consumer/Community
The Nkomazi Municipality’s Vision:
“A leading Local Municipality that empowers its communities through excellent service delivery”.
In order to achieve this Vision, a Customer Care Policy has been adopted to develop structures to ensure that in our dealing
with customers we demonstrate these values. This is based upon the National Batho Pele principles which has been translated
as “People First” and emphasizes the values of “Customer First”.
Problem Statement It is Nkomazi Municipality’s aim that whenever customers have contact with the Municipality they will consistently experience
standards of service excellence. Our Municipality is committed to ensuring that the human rights principles set out in our
National Constitution, the Batho Pele (People First) principles that aim to transform public service delivery as well as “getting
it right the first time” are experienced whenever customers access our municipal services. In this way we want to display our
commitment to the principle of Customer First and ensure that service excellence is an integral part of the planning and
delivery of all Municipal services to its people.
At first, it was a challenge to report any service related issues to the municipality because of the following;
• No time lines and no accountability.
• Not certain whom you talking to (municipal employee in line with the issue or just misguided communicare)
• No sense of responsibility from the people reported to.
In order to enable or elevate public participation, the community is no longer viewed as a community but
consumers/customers of municipal services thus the customer care center.
1.15.8.2. Customer care standards are important to ensure • That all customers, whether they are residents or visitors to our Municipality will receive the same consistent high
standards of customer care.
• That customer care and customer service is essential to the planning and delivery of all Council services.
• That our staff will always be reminded of their responsibility to put the Customer First and what this means in practical
terms.
• That the Council will eliminate wastage by providing services “Right the First time”.
• In order to achieve this it is important to clearly set goals as to how we can put Customers First. It is important to
define what Service Excellence in Customer Care is so that our staff will know what standards they must maintain. In
addition, we inform customers what standards of customer care they can expect whenever they engage with any staff
of the Municipality. This Customer First principle will be adhered to whenever any policies and procedures are being
considered.
The Customer Care Service
• This was operated on a pilot basis up until it yielded positive results.
• This unit works under the communications unit in partnership with the office of the speaker.
136
• It operates on a 24hr basis.
• The unit has a 24hr telephone line which has dedicated staff to receive complaints, reports of any nature that stands
in the way of service delivery.
• The calls are logged in the system, then forwarded to the relevant department supervisor.
• Logged complaints are communicated to the council through management, the responsible Councilor of that particular
ward/s affected as well as the Executive Mayor and his/her committee through an SMS system which is also copied to
the complainant.
The Feedback System
• All logged complaints are given 72 hours turnaround time depending on the issue at hand and feedback/update is
given to all concerned as per the SMS.
• Once the issue has been resolved the complainant is updated and if not he/she is given proper time lines.
• This allows council and relevant officials to update communities on the issue at hand.
• Stakeholders like the ward committees, CDWs and other government or municipal structures cell phones details are
stored in the municipal system for easy relaying of messages through SMS.
• The phone numbers are stored in a form of categories i.e. Councilors Portfolios, Management, Traditional Authorities,
CDWs, Fraternal Communities, Ward Committees, Schools Circuits and influential community members.
• We also compiled details for residents of our four towns (Rate payers data). Koomatipoort residents, Marloth Park
residents, Hectorspruit residents and Malalane residents.
• We are busy trying to compile ward information (household’s heads throughout the municipality). This will ensure
that people get first-hand information through the SMS system timeously.
How to measure our success The Municipality backs up our Customer Care Policy by specific Customer Service Charters and Customer Care Standards for
each service delivery Unit which is our promise of delivery to Customers. We asked our Customer Care Staff to sign a Pledge
in which they commit themselves to upholding these standards.
We monitor our performance through continuous monitoring, through benchmarking ourselves against other similar
organizations and being subject to regular Performance Audits.
We need to develop methods of receiving customer feedback to find out whether customers are satisfied with the standard
of service they have received. These will be through:
Requesting customers to complete a Customer Satisfaction Questionnaire and post transaction telephone follow-up of a
sample of returns to continuously evaluate customer perceptions of our service.
Making use of the Mystery Shopper programme where all Centres will be evaluated and scored on an objective basis.
Conclusion This has shown positive results in such a way that every person has a access to the institution through the 24hr line.
At some point we escalate the messages to the electronic media (Nkomazi FM and Ligwalagwala FM) to ensure maximum
1.15.8.3. Public Participation. Our social media platforms (Nkomazi Today- WhatsApp group that entails the entire management and strategic people within
the institution, Facebook page) are utilised for enhanced information flow. The municipality has introduced new
communication mechanism for public participation i.e. Microsoft teams, zoom, local radio station, and local newspaper to
communicate and inform the public about the operations of the municipality. since the pandemic has commenced most
programmes where affected to run. though most programmes are running through zoom with stakeholders, i.e. Draft IDP,
Budget and PMS 2020/2021 draft project consultation, ward committees meetings. The Municipality has also initiated in
assisting in funerals for the local areas of Nkomazi there are delegated individuals delegated to partake and also there’s a
137
marshals in all sassa offices to assist social distancing and giving out information about Covid 19 pandemic, and also at post
office and in malls. The Municipality also loud hail to all the villages of Nkomazi for provision of Covid 19 pandemic information
on where to get help if develop signs, and also if you feel that you may be affected.
1.15.8.3.1. Public Participation Strategy Nkomazi local municipality has developed a public participation strategy which was adopted by the Municipal Council. The
main objectives of the strategy include amongst other things Provision of adequate information about services rendered by
the municipalities Projects programmes implemented by the municipality Participation of stakeholders and communities in
policy development and management Communication amongst all parties concerned.
1.15.8.3.2. Geographic names change Committee • The LGNC was re-established in 2019. It is made up of six (6) members, three Councilors and three officials. They have
adopted a program which details on how often they meet. It was formed to perform the following functions: -
• To oversee the naming and re-naming of identified features in the communities
• To facilitate communication with the affected communities.
• To conduct public hearings in the identified areas
• To make recommendations to council on the outcomes of their activities
• The LGNC has further established ward based geographical names committees in March 2013. Priority has been given
to areas where the municipality is extending its revenue enhancement strategy.
1.15.8.3.3. Ward Committees
The Municipality is made up of 33 wards. All the 33 wards have functional ward committees which have been officially
launched. They have monthly meetings and report to the office of the speaker on monthly basis. The municipality has
developed an operational plan which guides all the activities of ward committees. Ward committees are responsible for
extending council functions. They further develop ward operational plans which guide all the activities taking place within the
ward. Sub-committees have been established and represent all the five municipal departments
1.15.8.3.4. IDP Representative Forum The Municipality convened an IDP Rep forum in September 2019 comprising of key stakeholders in three different centres,
Ehlanzeni District Municipality was awarded an opportunity to present their 5 year projects that will be implemented within
the municipal jurisdiction. Another IDP Representative Forum is planned for April 2020 after the sector departments have
finalized their 2020 budget. Sector departments will be presenting their APP’s on the projects being implemented into the
Municipality. The Municipality as well as the sector departments will work on developing an implementation plan to address
the issues raised by communities. Another IDP Representative forum will be held in the last quarter of the year.
1.15.8.3.5. Audit Committee Audit Committee focuses on the robustness of the risk management processes and oversees the Municipality’s strategic risks
register.
Risk management Committee assists the Audit Committee by conducting internal reviews of the Municipality’s operations; in
particular, the review of internal controls in the areas identified in the risk registers.
The registers, comprising the key risks identified, refined and calibrated by Risk Management unit with the responsible
directors, along with detailed action plans, were reviewed by the Audit Committee.
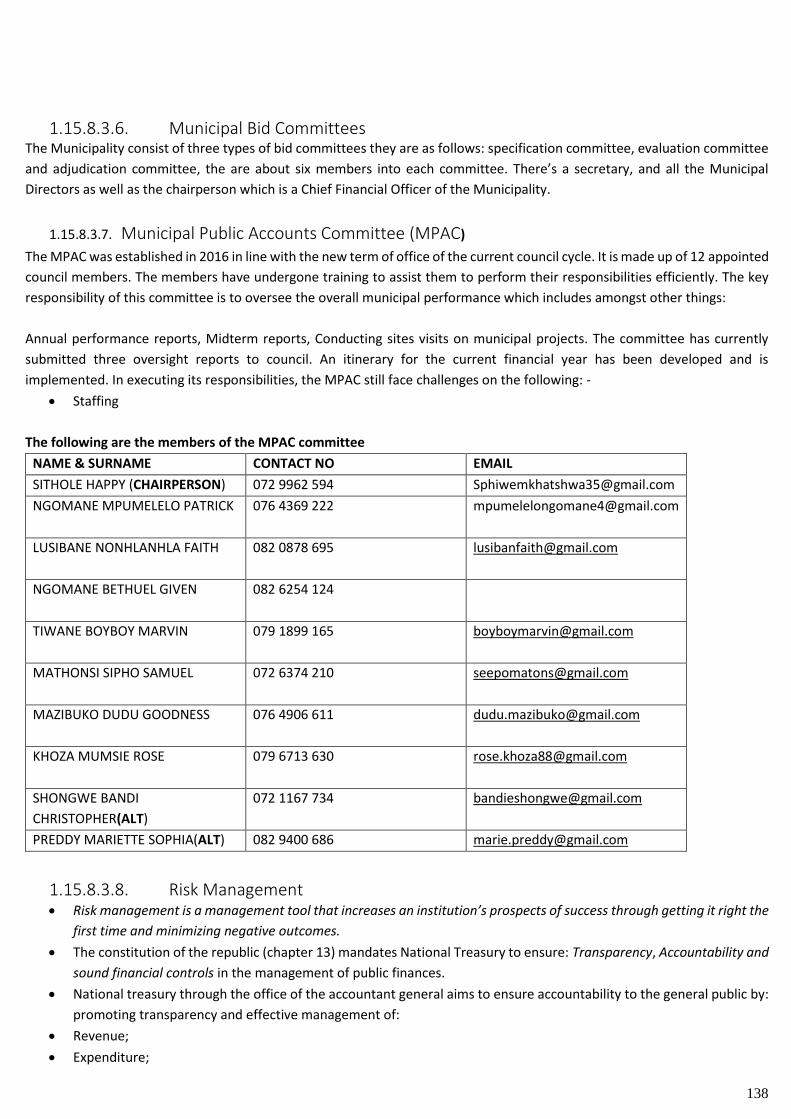
138
1.15.8.3.6. Municipal Bid Committees The Municipality consist of three types of bid committees they are as follows: specification committee, evaluation committee
and adjudication committee, the are about six members into each committee. There’s a secretary, and all the Municipal
Directors as well as the chairperson which is a Chief Financial Officer of the Municipality.
1.15.8.3.7. Municipal Public Accounts Committee (MPAC)
The MPAC was established in 2016 in line with the new term of office of the current council cycle. It is made up of 12 appointed
council members. The members have undergone training to assist them to perform their responsibilities efficiently. The key
responsibility of this committee is to oversee the overall municipal performance which includes amongst other things:
Annual performance reports, Midterm reports, Conducting sites visits on municipal projects. The committee has currently
submitted three oversight reports to council. An itinerary for the current financial year has been developed and is
implemented. In executing its responsibilities, the MPAC still face challenges on the following: -
• Staffing
The following are the members of the MPAC committee
NAME & SURNAME CONTACT NO EMAIL
SITHOLE HAPPY (CHAIRPERSON) 072 9962 594 [email protected]
NGOMANE MPUMELELO PATRICK
076 4369 222 [email protected]
LUSIBANE NONHLANHLA FAITH
082 0878 695 [email protected]
NGOMANE BETHUEL GIVEN
082 6254 124
TIWANE BOYBOY MARVIN
079 1899 165 [email protected]
MATHONSI SIPHO SAMUEL
072 6374 210 [email protected]
MAZIBUKO DUDU GOODNESS
076 4906 611 [email protected]
KHOZA MUMSIE ROSE
079 6713 630 [email protected]
SHONGWE BANDI
CHRISTOPHER(ALT)
072 1167 734 [email protected]
PREDDY MARIETTE SOPHIA(ALT) 082 9400 686 [email protected]
1.15.8.3.8. Risk Management • Risk management is a management tool that increases an institution’s prospects of success through getting it right the
first time and minimizing negative outcomes.
• The constitution of the republic (chapter 13) mandates National Treasury to ensure: Transparency, Accountability and
sound financial controls in the management of public finances.
• National treasury through the office of the accountant general aims to ensure accountability to the general public by:
promoting transparency and effective management of:
• Revenue;
• Expenditure;
139
• Assets & Liabilities; and
• Compliance with applicable laws and regulations.
• Legal and Governance Framework, And Scope of Work
• Legislating risk management in the public-sector institutions is a risk management strategy of Government towards
ensuring the achievement of national goals and objectives. The following legislative instruments provide a legal
foundation for risk management within provincial public entity’s and thus, NKLM.
• Municipal Finance Management Act 56 of 2003 (hereinafter “MFMA”)
1.18.3.8.1.1. Risk Management Committee The municipality has a Risk Management Committee in place, this Committee is appointed by the Accounting Officer/Municipal
Manager to assist the municipality in discharging its responsibilities for risk management. The membership of the committee
comprises both management and external members with the necessary blend of skills, competencies and attributes. The
chairperson of the Risk Management Committee is an independent external person appointed by the Accounting Officer.
In discharging its governance responsibilities relating to risk management, the Risk Management Committee have the
following functions
• Review and recommend for the approval of the Accounting Officer the:
• Risk management policy
• Risk management strategy
• Risk management implementation plan
• Municipality’s risk appetite, ensuring that limits are:
• Supported by rigorous analysis;
• Set for all significant risks individually as well as in aggregate for particular categorisation of risks; and
• Consistent with the materiality and significance framework.
• Municipality’s risk tolerance ensuring that it is supported by rigorous analysis of:
• The municipality’s ability to withstand significant risks; and
• The municipality’s ability to recover financially and operationally from significant risks.
• The municipality’s risk identification and assessment methodologies, after satisfying itself of their effectiveness in
timeously and accurately identifying and assessing the municipality’s risks
• Evaluate the extend and effectiveness risk management’s integration within the municipality;
• Assess implementation of risk management policy and strategy (including plan);
• Evaluate the effectiveness of the mitigation strategies implemented to address the municipality’s significant risks;
• Review the material findings and recommendations by the assurance providers on the system of risk management
and monitor the implementation of such recommendations,
• Develop its own performance indicators for approval by the accounting officer;
• Interact with the audit committee to share information relating to the municipality’s significant risks; and
• Provide timely and useful reports to the accounting officer on the state of risk management together with
recommendations to address any deficiencies identified by the committee.
In terms of section 62(1)(c)(i) the Accounting Officer must develop and maintain:
effective, efficiency and transparent systems of financial and risk management and internal controls; and of internal audit
operating in accordance with any prescribed norms and standards.
King II report on Corporate Governance (hereinafter “King II”)
Entities are encouraged to adhere to the principles encompassed in King II given its promotion of an advanced level of
organisational conduct. King II discusses the following risk management principles, which could be of value to any organisation:
• Introduction and definition of risk management
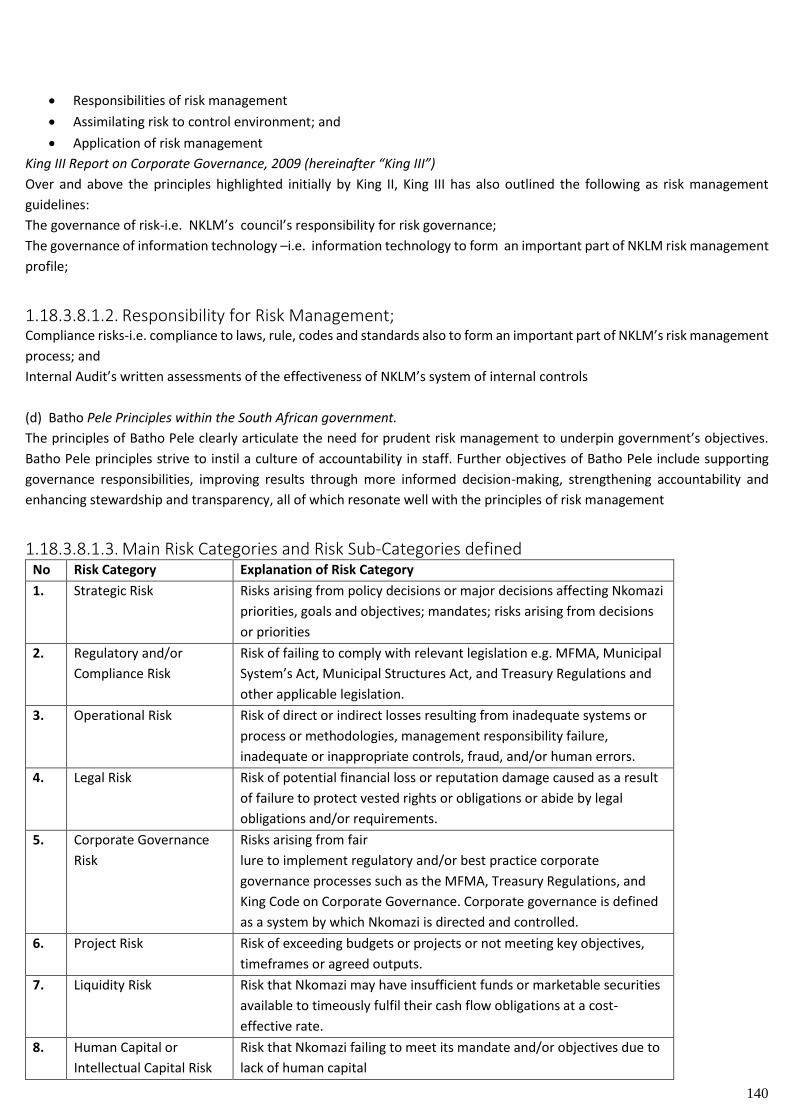
140
• Responsibilities of risk management
• Assimilating risk to control environment; and
• Application of risk management
King III Report on Corporate Governance, 2009 (hereinafter “King III”)
Over and above the principles highlighted initially by King II, King III has also outlined the following as risk management
guidelines:
The governance of risk-i.e. NKLM’s council’s responsibility for risk governance;
The governance of information technology –i.e. information technology to form an important part of NKLM risk management
profile;
1.18.3.8.1.2. Responsibility for Risk Management; Compliance risks-i.e. compliance to laws, rule, codes and standards also to form an important part of NKLM’s risk management
process; and
Internal Audit’s written assessments of the effectiveness of NKLM’s system of internal controls
(d) Batho Pele Principles within the South African government.
The principles of Batho Pele clearly articulate the need for prudent risk management to underpin government’s objectives.
Batho Pele principles strive to instil a culture of accountability in staff. Further objectives of Batho Pele include supporting
governance responsibilities, improving results through more informed decision-making, strengthening accountability and
enhancing stewardship and transparency, all of which resonate well with the principles of risk management
1.18.3.8.1.3. Main Risk Categories and Risk Sub-Categories defined No Risk Category Explanation of Risk Category
1. Strategic Risk
Risks arising from policy decisions or major decisions affecting Nkomazi
priorities, goals and objectives; mandates; risks arising from decisions
or priorities
2. Regulatory and/or
Compliance Risk
Risk of failing to comply with relevant legislation e.g. MFMA, Municipal
System’s Act, Municipal Structures Act, and Treasury Regulations and
other applicable legislation.
3. Operational Risk
Risk of direct or indirect losses resulting from inadequate systems or
process or methodologies, management responsibility failure,
inadequate or inappropriate controls, fraud, and/or human errors.
4. Legal Risk
Risk of potential financial loss or reputation damage caused as a result
of failure to protect vested rights or obligations or abide by legal
obligations and/or requirements.
5. Corporate Governance
Risk
Risks arising from fair
lure to implement regulatory and/or best practice corporate
governance processes such as the MFMA, Treasury Regulations, and
King Code on Corporate Governance. Corporate governance is defined
as a system by which Nkomazi is directed and controlled.
6. Project Risk
Risk of exceeding budgets or projects or not meeting key objectives,
timeframes or agreed outputs.
7. Liquidity Risk
Risk that Nkomazi may have insufficient funds or marketable securities
available to timeously fulfil their cash flow obligations at a cost-
effective rate.
8. Human Capital or
Intellectual Capital Risk
Risk that Nkomazi failing to meet its mandate and/or objectives due to
lack of human capital
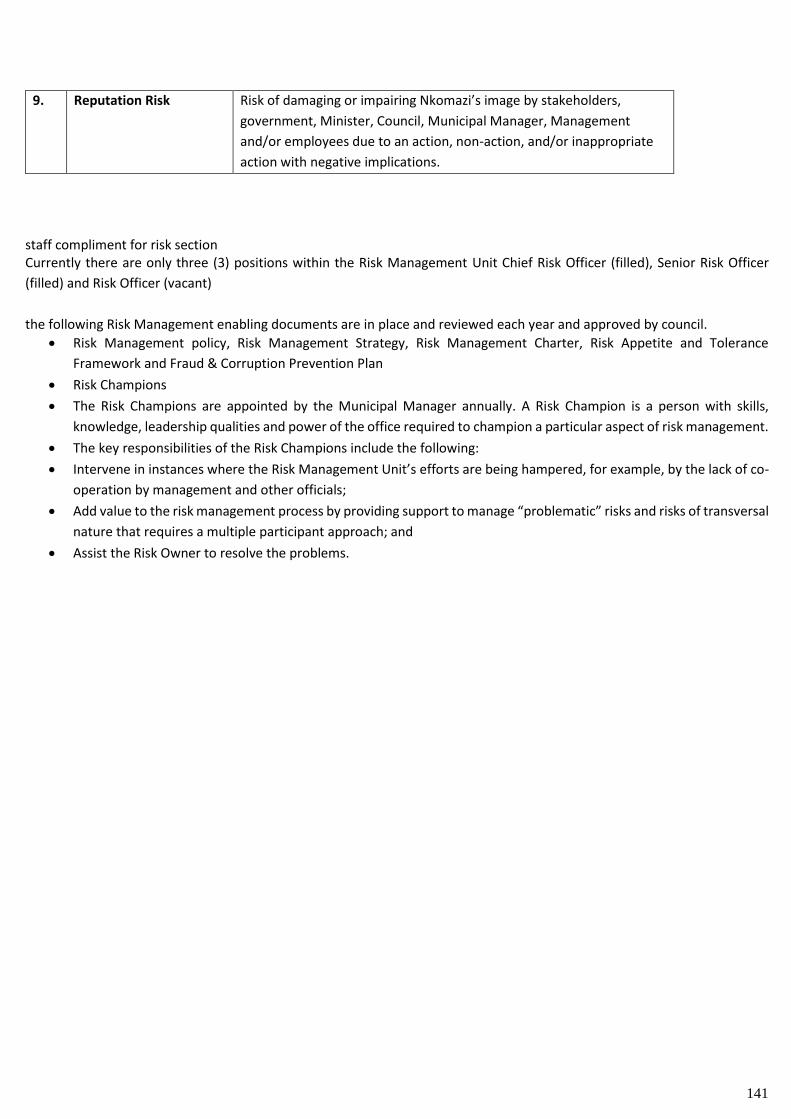
141
9. Reputation Risk
Risk of damaging or impairing Nkomazi’s image by stakeholders,
government, Minister, Council, Municipal Manager, Management
and/or employees due to an action, non-action, and/or inappropriate
action with negative implications.
staff compliment for risk section Currently there are only three (3) positions within the Risk Management Unit Chief Risk Officer (filled), Senior Risk Officer
(filled) and Risk Officer (vacant)
the following Risk Management enabling documents are in place and reviewed each year and approved by council.
• Risk Management policy, Risk Management Strategy, Risk Management Charter, Risk Appetite and Tolerance
Framework and Fraud & Corruption Prevention Plan
• Risk Champions
• The Risk Champions are appointed by the Municipal Manager annually. A Risk Champion is a person with skills,
knowledge, leadership qualities and power of the office required to champion a particular aspect of risk management.
• The key responsibilities of the Risk Champions include the following:
• Intervene in instances where the Risk Management Unit’s efforts are being hampered, for example, by the lack of co-
operation by management and other officials;
• Add value to the risk management process by providing support to manage “problematic” risks and risks of transversal
nature that requires a multiple participant approach; and
• Assist the Risk Owner to resolve the problems.
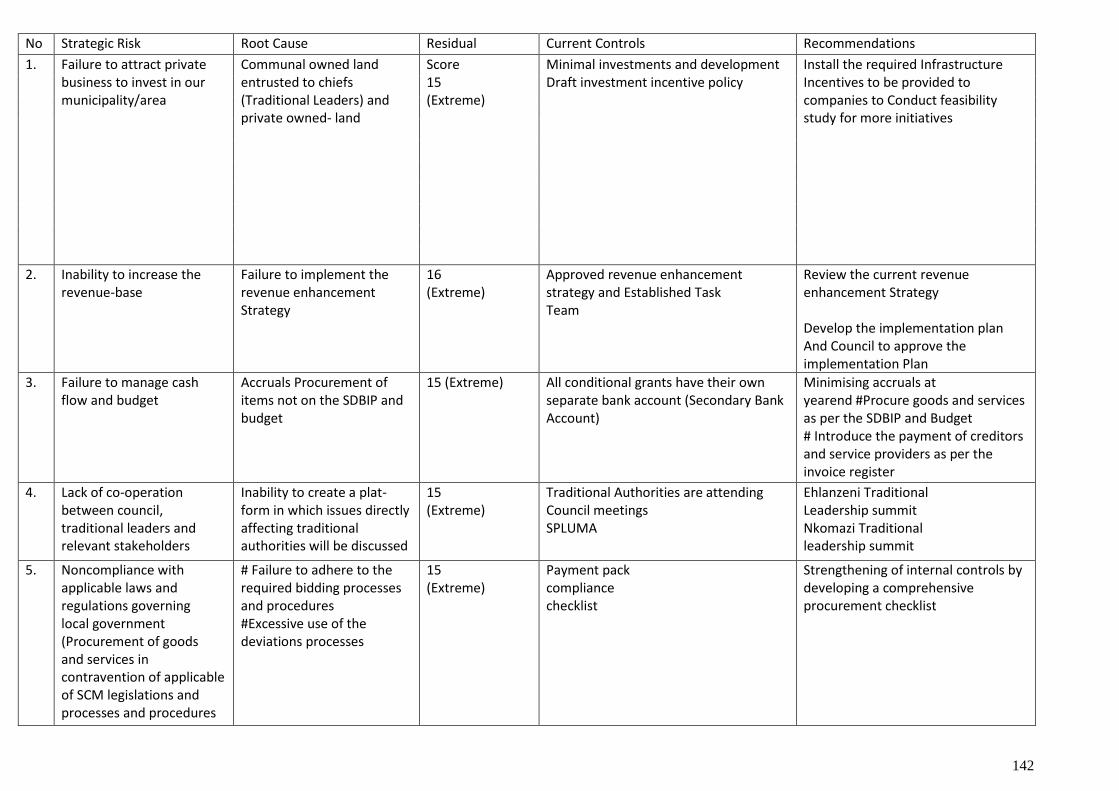
142
No Strategic Risk Root Cause Residual Current Controls Recommendations
1.
Failure to attract private business to invest in our municipality/area
Communal owned land entrusted to chiefs (Traditional Leaders) and private owned- land
Score 15 (Extreme)
Minimal investments and development Draft investment incentive policy
Install the required Infrastructure Incentives to be provided to companies to Conduct feasibility study for more initiatives
2. Inability to increase the revenue-base
Failure to implement the revenue enhancement Strategy
16 (Extreme)
Approved revenue enhancement strategy and Established Task Team
Review the current revenue enhancement Strategy Develop the implementation plan And Council to approve the implementation Plan
3. Failure to manage cash flow and budget
Accruals Procurement of items not on the SDBIP and budget
15 (Extreme) All conditional grants have their own separate bank account (Secondary Bank Account)
Minimising accruals at yearend #Procure goods and services as per the SDBIP and Budget # Introduce the payment of creditors and service providers as per the invoice register
4. Lack of co-operation between council, traditional leaders and relevant stakeholders
Inability to create a plat- form in which issues directly affecting traditional authorities will be discussed
15 (Extreme)
Traditional Authorities are attending Council meetings SPLUMA
Ehlanzeni Traditional Leadership summit Nkomazi Traditional leadership summit
5. Noncompliance with applicable laws and regulations governing local government (Procurement of goods and services in contravention of applicable of SCM legislations and processes and procedures
# Failure to adhere to the required bidding processes and procedures #Excessive use of the deviations processes
15 (Extreme)
Payment pack compliance checklist
Strengthening of internal controls by developing a comprehensive procurement checklist
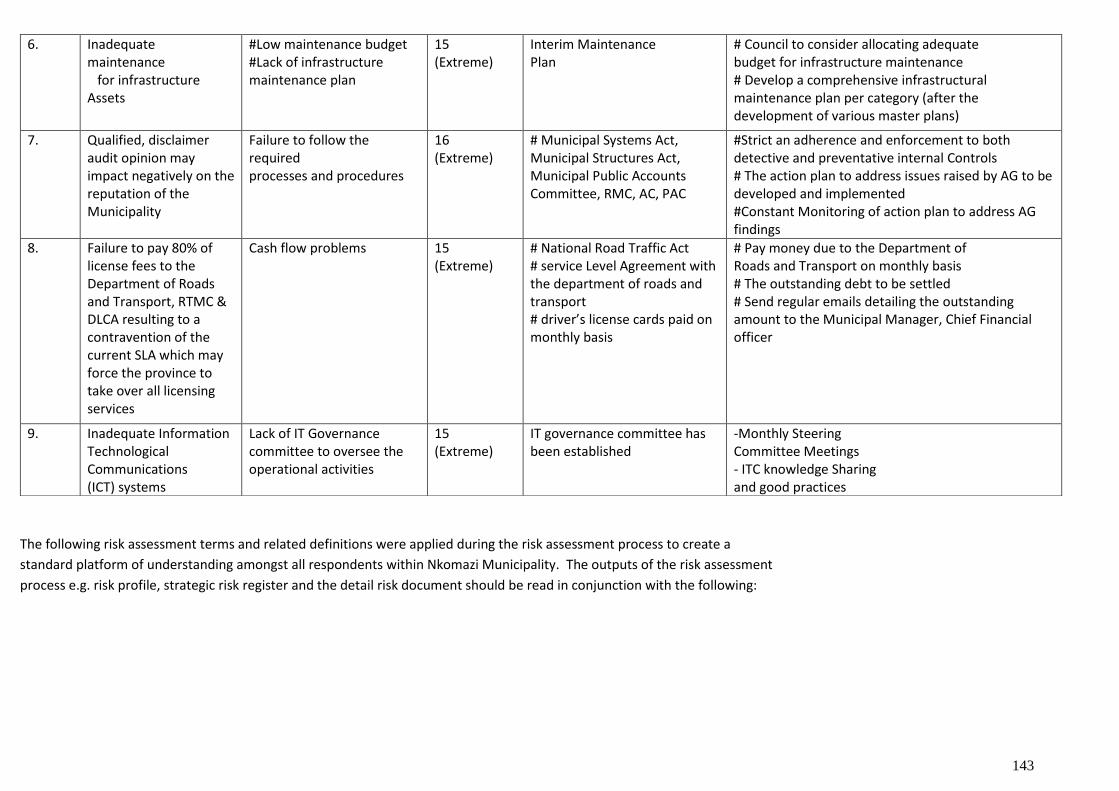
143
The following risk assessment terms and related definitions were applied during the risk assessment process to create a
standard platform of understanding amongst all respondents within Nkomazi Municipality. The outputs of the risk assessment
process e.g. risk profile, strategic risk register and the detail risk document should be read in conjunction with the following:
6. Inadequate maintenance for infrastructure Assets
#Low maintenance budget #Lack of infrastructure maintenance plan
15 (Extreme)
Interim Maintenance Plan
# Council to consider allocating adequate budget for infrastructure maintenance # Develop a comprehensive infrastructural maintenance plan per category (after the development of various master plans)
7. Qualified, disclaimer audit opinion may impact negatively on the reputation of the Municipality
Failure to follow the required processes and procedures
16 (Extreme)
# Municipal Systems Act, Municipal Structures Act, Municipal Public Accounts Committee, RMC, AC, PAC
#Strict an adherence and enforcement to both detective and preventative internal Controls # The action plan to address issues raised by AG to be developed and implemented #Constant Monitoring of action plan to address AG findings
8. Failure to pay 80% of license fees to the Department of Roads and Transport, RTMC & DLCA resulting to a contravention of the current SLA which may force the province to take over all licensing services
Cash flow problems 15 (Extreme)
# National Road Traffic Act # service Level Agreement with the department of roads and transport # driver’s license cards paid on monthly basis
# Pay money due to the Department of Roads and Transport on monthly basis # The outstanding debt to be settled # Send regular emails detailing the outstanding amount to the Municipal Manager, Chief Financial officer
9. Inadequate Information Technological Communications (ICT) systems
Lack of IT Governance committee to oversee the operational activities
15 (Extreme)
IT governance committee has been established
-Monthly Steering Committee Meetings - ITC knowledge Sharing and good practices
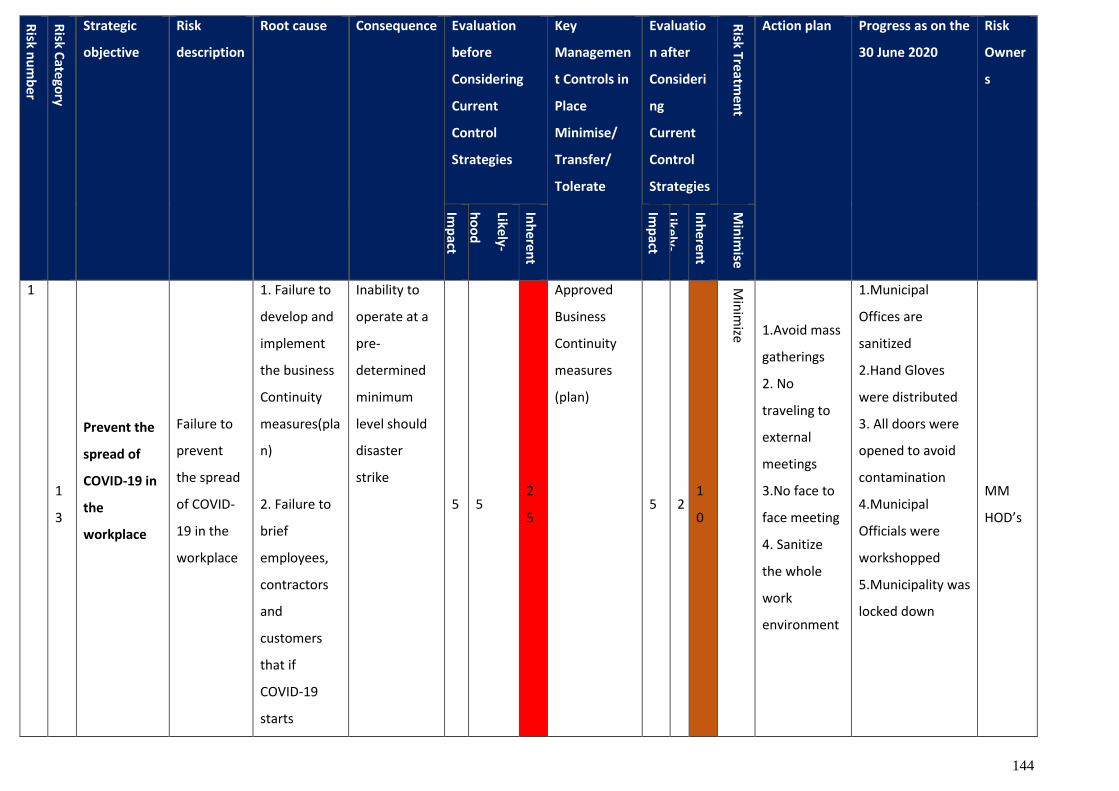
144
Risk n
um
ber
Risk C
atego
ry
Strategic
objective
Risk
description
Root cause Consequence Evaluation
before
Considering
Current
Control
Strategies
Key
Managemen
t Controls in
Place
Minimise/
Transfer/
Tolerate
Evaluatio
n after
Consideri
ng
Current
Control
Strategies
Risk Treatm
ent
Action plan Progress as on the
30 June 2020
Risk
Owner
s
Imp
act
Likely-
ho
od
Inh
ere
nt
Risk Le
vel
Imp
act
Likely-
ho
od
Inh
ere
nt
Risk Le
vel
Min
imise
/ Transfer/
Tole
rate
1
1
3
Prevent the
spread of
COVID-19 in
the
workplace
Failure to
prevent
the spread
of COVID-
19 in the
workplace
1. Failure to
develop and
implement
the business
Continuity
measures(pla
n)
2. Failure to
brief
employees,
contractors
and
customers
that if
COVID-19
starts
Inability to
operate at a
pre-
determined
minimum
level should
disaster
strike
5 5 2
5
Approved
Business
Continuity
measures
(plan)
5 2 1
0
Min
imize
1.Avoid mass
gatherings
2. No
traveling to
external
meetings
3.No face to
face meeting
4. Sanitize
the whole
work
environment
1.Municipal
Offices are
sanitized
2.Hand Gloves
were distributed
3. All doors were
opened to avoid
contamination
4.Municipal
Officials were
workshopped
5.Municipality was
locked down
MM
HOD’s
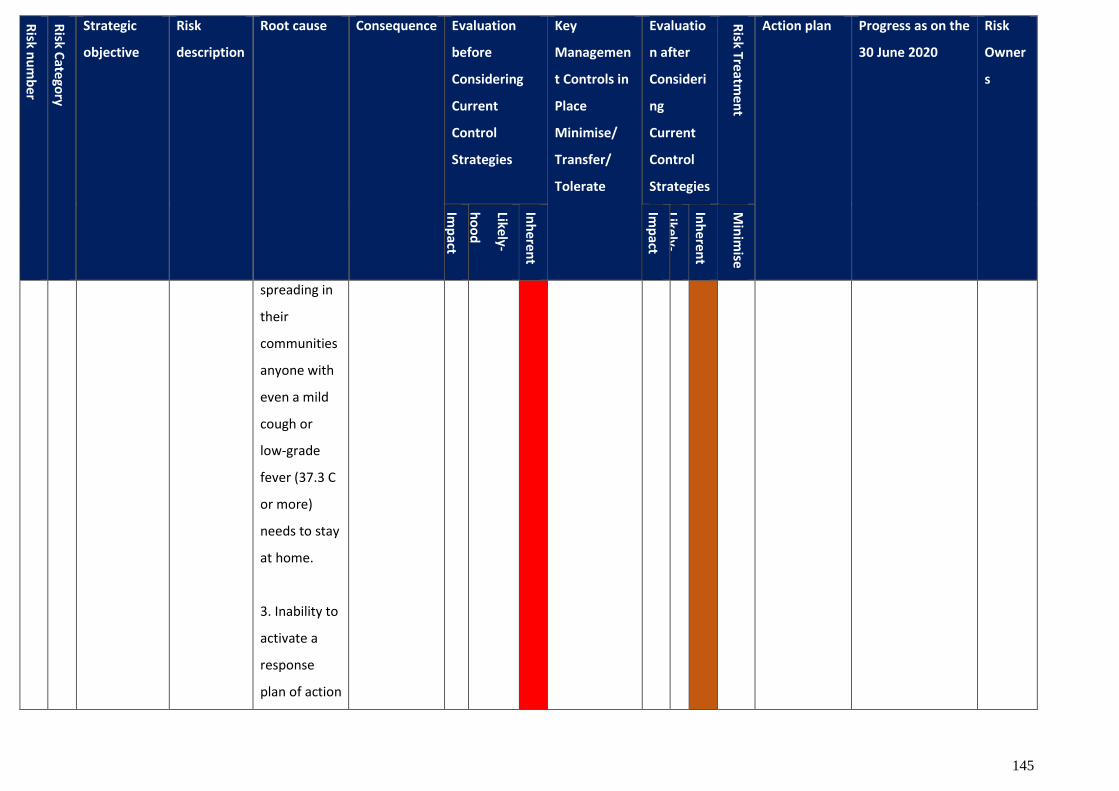
145
Risk n
um
ber
Risk C
atego
ry
Strategic
objective
Risk
description
Root cause Consequence Evaluation
before
Considering
Current
Control
Strategies
Key
Managemen
t Controls in
Place
Minimise/
Transfer/
Tolerate
Evaluatio
n after
Consideri
ng
Current
Control
Strategies
Risk Treatm
ent
Action plan Progress as on the
30 June 2020
Risk
Owner
s
Imp
act
Likely-
ho
od
Inh
ere
nt
Risk Le
vel
Imp
act
Likely-
ho
od
Inh
ere
nt
Risk Le
vel
Min
imise
/ Transfer/
Tole
rate
spreading in
their
communities
anyone with
even a mild
cough or
low-grade
fever (37.3 C
or more)
needs to stay
at home.
3. Inability to
activate a
response
plan of action
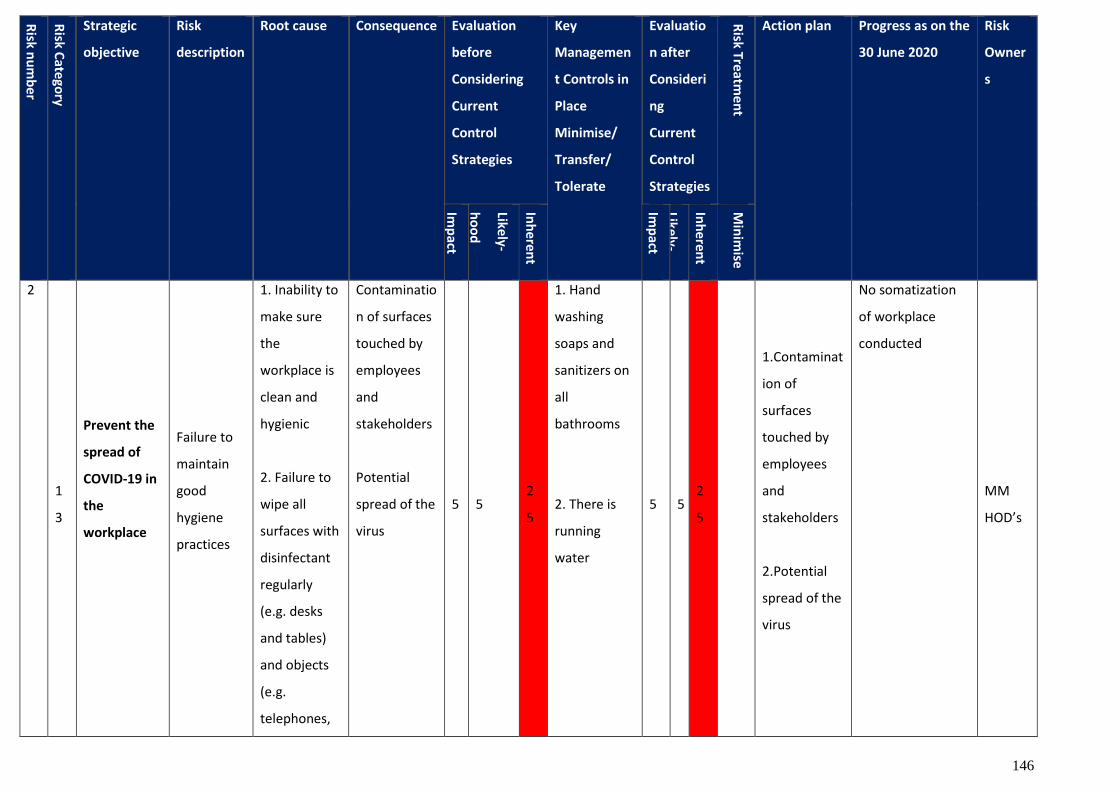
146
Risk n
um
ber
Risk C
atego
ry
Strategic
objective
Risk
description
Root cause Consequence Evaluation
before
Considering
Current
Control
Strategies
Key
Managemen
t Controls in
Place
Minimise/
Transfer/
Tolerate
Evaluatio
n after
Consideri
ng
Current
Control
Strategies
Risk Treatm
ent
Action plan Progress as on the
30 June 2020
Risk
Owner
s
Imp
act
Likely-
ho
od
Inh
ere
nt
Risk Le
vel
Imp
act
Likely-
ho
od
Inh
ere
nt
Risk Le
vel
Min
imise
/ Transfer/
Tole
rate
2
1
3
Prevent the
spread of
COVID-19 in
the
workplace
Failure to
maintain
good
hygiene
practices
1. Inability to
make sure
the
workplace is
clean and
hygienic
2. Failure to
wipe all
surfaces with
disinfectant
regularly
(e.g. desks
and tables)
and objects
(e.g.
telephones,
Contaminatio
n of surfaces
touched by
employees
and
stakeholders
Potential
spread of the
virus
5 5 2
5
1. Hand
washing
soaps and
sanitizers on
all
bathrooms
2. There is
running
water
5 5 2
5
1.Contaminat
ion of
surfaces
touched by
employees
and
stakeholders
2.Potential
spread of the
virus
No somatization
of workplace
conducted
MM
HOD’s

147
Risk n
um
ber
Risk C
atego
ry
Strategic
objective
Risk
description
Root cause Consequence Evaluation
before
Considering
Current
Control
Strategies
Key
Managemen
t Controls in
Place
Minimise/
Transfer/
Tolerate
Evaluatio
n after
Consideri
ng
Current
Control
Strategies
Risk Treatm
ent
Action plan Progress as on the
30 June 2020
Risk
Owner
s
Imp
act
Likely-
ho
od
Inh
ere
nt
Risk Le
vel
Imp
act
Likely-
ho
od
Inh
ere
nt
Risk Le
vel
Min
imise
/ Transfer/
Tole
rate
keyboards)
3. Lack of
disinfectants
in the
institution
4. Delays in
reporting of
symptoms by
employees
5. Failure to
brief
employees,
contractors
and

148
Risk n
um
ber
Risk C
atego
ry
Strategic
objective
Risk
description
Root cause Consequence Evaluation
before
Considering
Current
Control
Strategies
Key
Managemen
t Controls in
Place
Minimise/
Transfer/
Tolerate
Evaluatio
n after
Consideri
ng
Current
Control
Strategies
Risk Treatm
ent
Action plan Progress as on the
30 June 2020
Risk
Owner
s
Imp
act
Likely-
ho
od
Inh
ere
nt
Risk Le
vel
Imp
act
Likely-
ho
od
Inh
ere
nt
Risk Le
vel
Min
imise
/ Transfer/
Tole
rate
customers
that if
COVID-19
starts
spreading in
their
communities
anyone with
even a mild
cough or
low-grade
fever (37.3 C
or more)
needs to stay
at home
6. Failure to
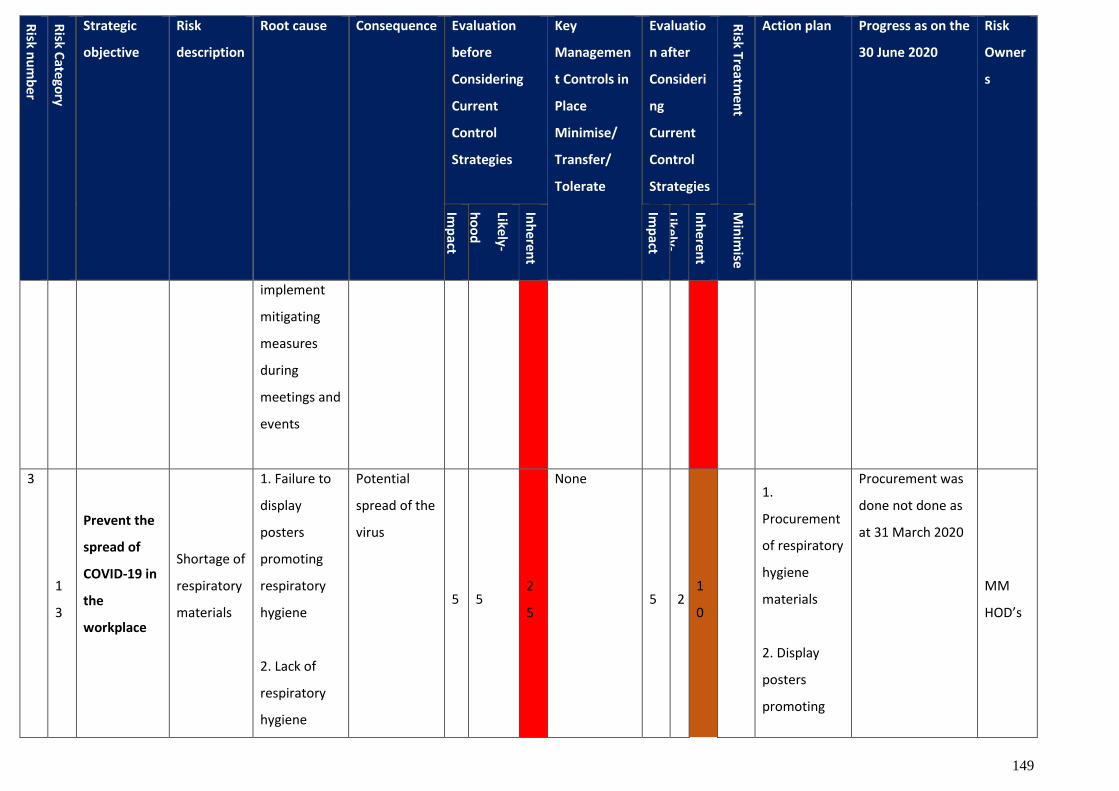
149
Risk n
um
ber
Risk C
atego
ry
Strategic
objective
Risk
description
Root cause Consequence Evaluation
before
Considering
Current
Control
Strategies
Key
Managemen
t Controls in
Place
Minimise/
Transfer/
Tolerate
Evaluatio
n after
Consideri
ng
Current
Control
Strategies
Risk Treatm
ent
Action plan Progress as on the
30 June 2020
Risk
Owner
s
Imp
act
Likely-
ho
od
Inh
ere
nt
Risk Le
vel
Imp
act
Likely-
ho
od
Inh
ere
nt
Risk Le
vel
Min
imise
/ Transfer/
Tole
rate
implement
mitigating
measures
during
meetings and
events
3
1
3
Prevent the
spread of
COVID-19 in
the
workplace
Shortage of
respiratory
materials
1. Failure to
display
posters
promoting
respiratory
hygiene
2. Lack of
respiratory
hygiene
Potential
spread of the
virus
5 5 2
5
None
5 2 1
0
1.
Procurement
of respiratory
hygiene
materials
2. Display
posters
promoting
Procurement was
done not done as
at 31 March 2020
MM
HOD’s
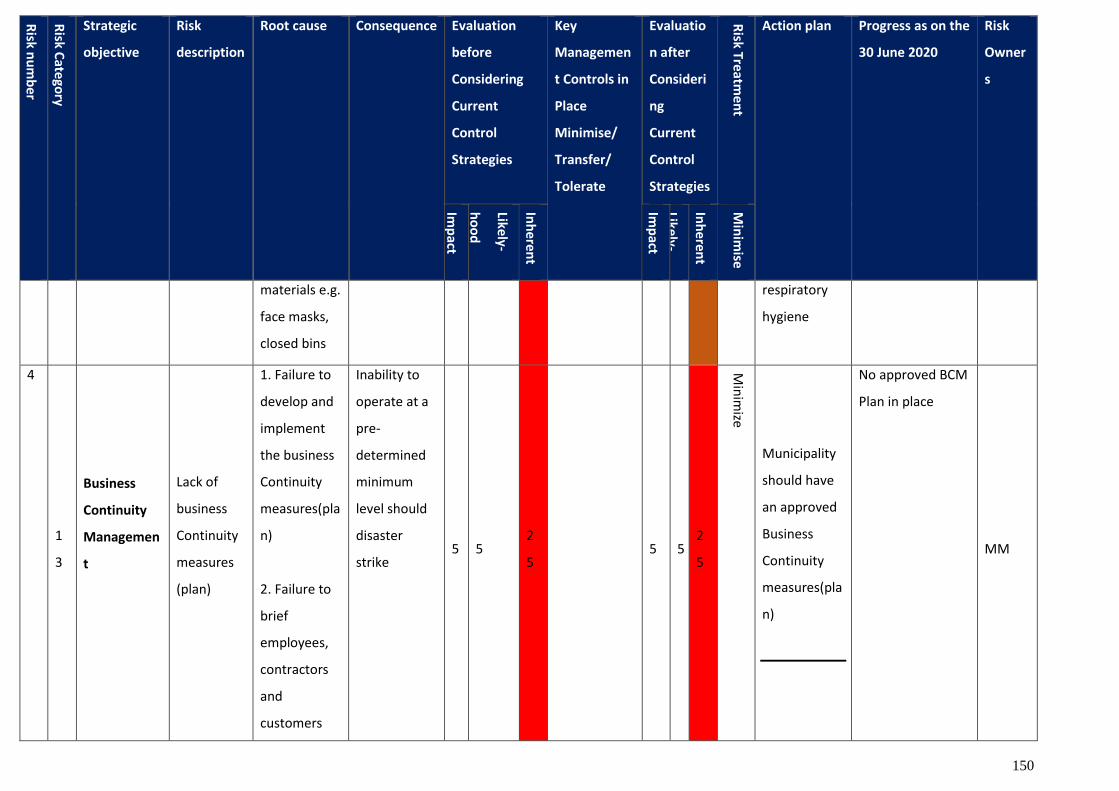
150
Risk n
um
ber
Risk C
atego
ry
Strategic
objective
Risk
description
Root cause Consequence Evaluation
before
Considering
Current
Control
Strategies
Key
Managemen
t Controls in
Place
Minimise/
Transfer/
Tolerate
Evaluatio
n after
Consideri
ng
Current
Control
Strategies
Risk Treatm
ent
Action plan Progress as on the
30 June 2020
Risk
Owner
s
Imp
act
Likely-
ho
od
Inh
ere
nt
Risk Le
vel
Imp
act
Likely-
ho
od
Inh
ere
nt
Risk Le
vel
Min
imise
/ Transfer/
Tole
rate
materials e.g.
face masks,
closed bins
respiratory
hygiene
4
1
3
Business
Continuity
Managemen
t
Lack of
business
Continuity
measures
(plan)
1. Failure to
develop and
implement
the business
Continuity
measures(pla
n)
2. Failure to
brief
employees,
contractors
and
customers
Inability to
operate at a
pre-
determined
minimum
level should
disaster
strike
5 5 2
5
5 5 2
5
Min
imize
Municipality
should have
an approved
Business
Continuity
measures(pla
n)
No approved BCM
Plan in place
MM
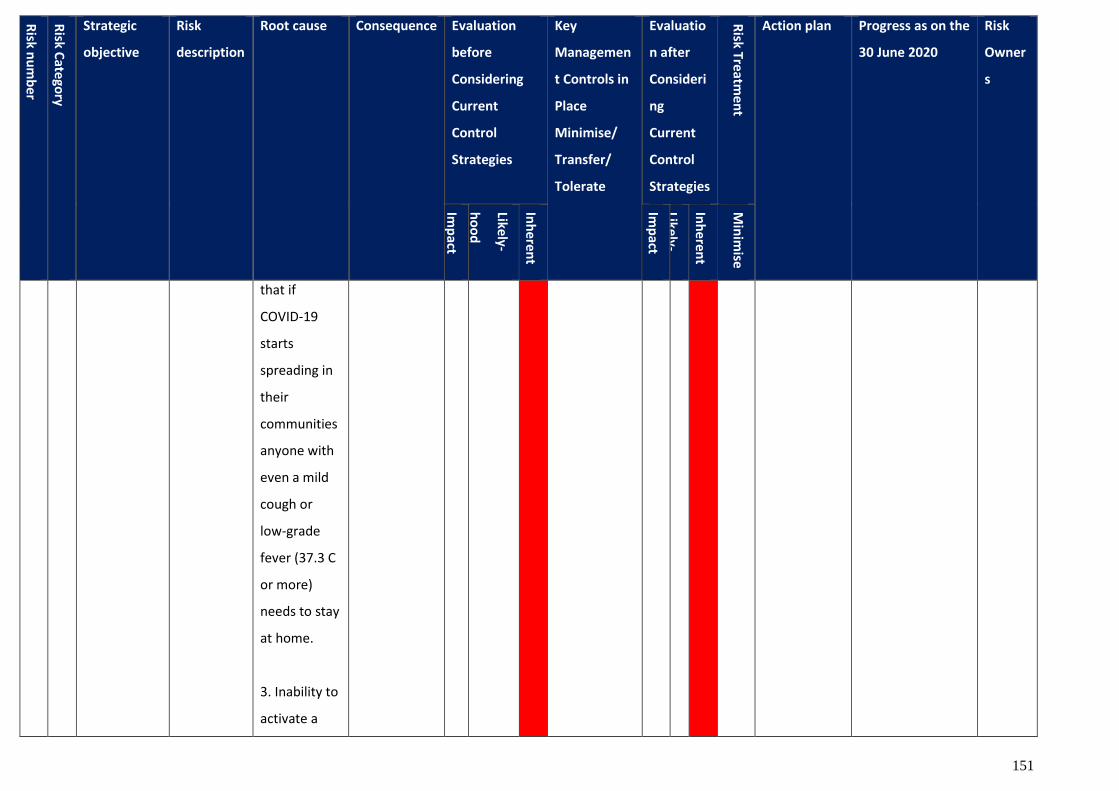
151
Risk n
um
ber
Risk C
atego
ry
Strategic
objective
Risk
description
Root cause Consequence Evaluation
before
Considering
Current
Control
Strategies
Key
Managemen
t Controls in
Place
Minimise/
Transfer/
Tolerate
Evaluatio
n after
Consideri
ng
Current
Control
Strategies
Risk Treatm
ent
Action plan Progress as on the
30 June 2020
Risk
Owner
s
Imp
act
Likely-
ho
od
Inh
ere
nt
Risk Le
vel
Imp
act
Likely-
ho
od
Inh
ere
nt
Risk Le
vel
Min
imise
/ Transfer/
Tole
rate
that if
COVID-19
starts
spreading in
their
communities
anyone with
even a mild
cough or
low-grade
fever (37.3 C
or more)
needs to stay
at home.
3. Inability to
activate a
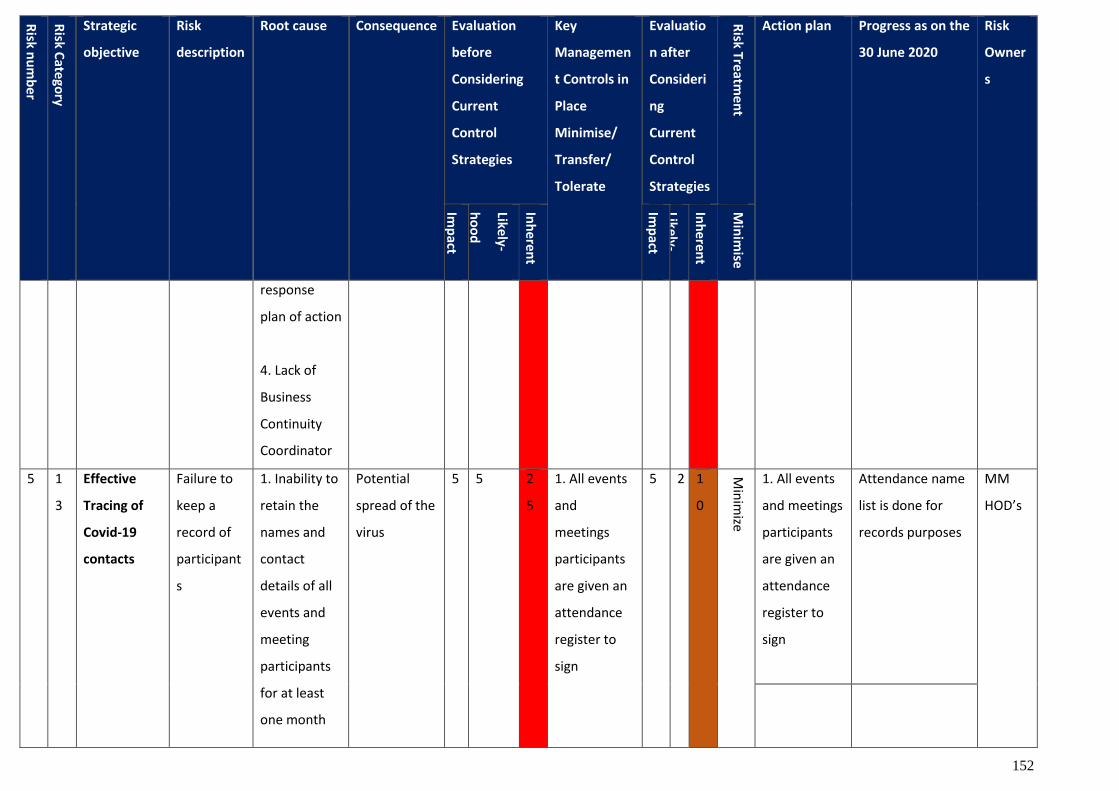
152
Risk n
um
ber
Risk C
atego
ry
Strategic
objective
Risk
description
Root cause Consequence Evaluation
before
Considering
Current
Control
Strategies
Key
Managemen
t Controls in
Place
Minimise/
Transfer/
Tolerate
Evaluatio
n after
Consideri
ng
Current
Control
Strategies
Risk Treatm
ent
Action plan Progress as on the
30 June 2020
Risk
Owner
s
Imp
act
Likely-
ho
od
Inh
ere
nt
Risk Le
vel
Imp
act
Likely-
ho
od
Inh
ere
nt
Risk Le
vel
Min
imise
/ Transfer/
Tole
rate
response
plan of action
4. Lack of
Business
Continuity
Coordinator
5 1
3
Effective
Tracing of
Covid-19
contacts
Failure to
keep a
record of
participant
s
1. Inability to
retain the
names and
contact
details of all
events and
meeting
participants
for at least
one month
Potential
spread of the
virus
5 5 2
5
1. All events
and
meetings
participants
are given an
attendance
register to
sign
5 2 1
0
Min
imize
1. All events
and meetings
participants
are given an
attendance
register to
sign
Attendance name
list is done for
records purposes
MM
HOD’s
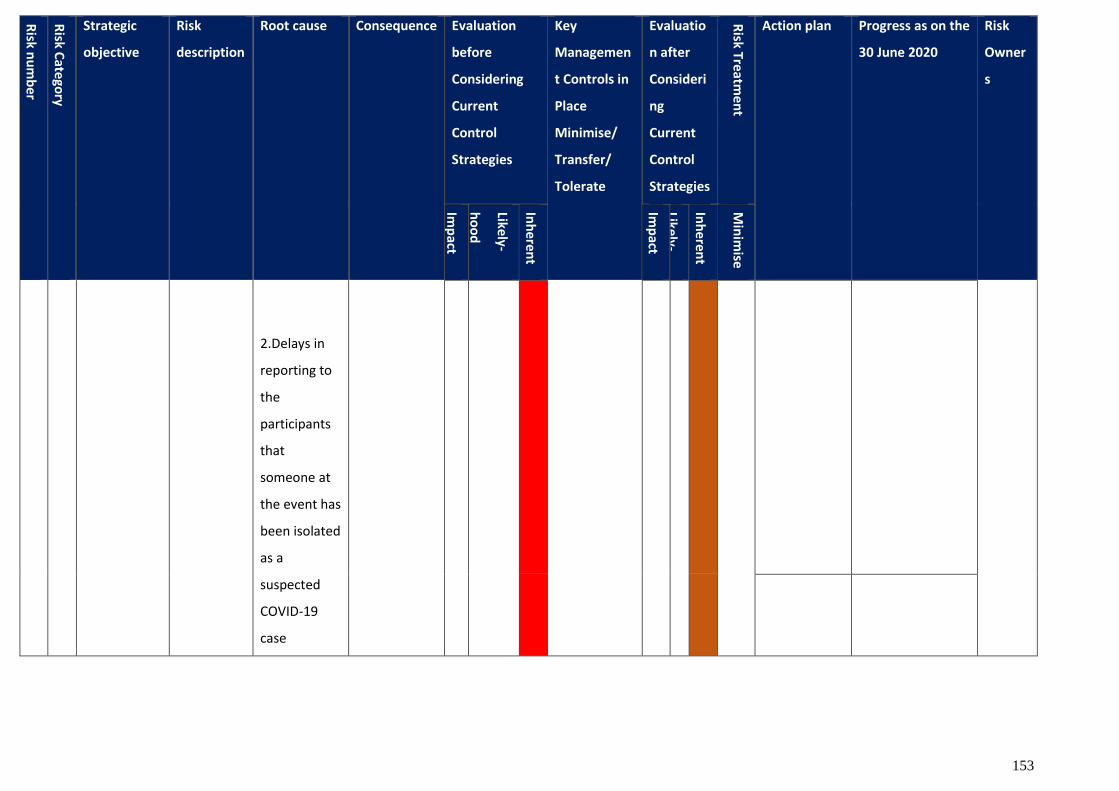
153
Risk n
um
ber
Risk C
atego
ry
Strategic
objective
Risk
description
Root cause Consequence Evaluation
before
Considering
Current
Control
Strategies
Key
Managemen
t Controls in
Place
Minimise/
Transfer/
Tolerate
Evaluatio
n after
Consideri
ng
Current
Control
Strategies
Risk Treatm
ent
Action plan Progress as on the
30 June 2020
Risk
Owner
s
Imp
act
Likely-
ho
od
Inh
ere
nt
Risk Le
vel
Imp
act
Likely-
ho
od
Inh
ere
nt
Risk Le
vel
Min
imise
/ Transfer/
Tole
rate
2.Delays in
reporting to
the
participants
that
someone at
the event has
been isolated
as a
suspected
COVID-19
case
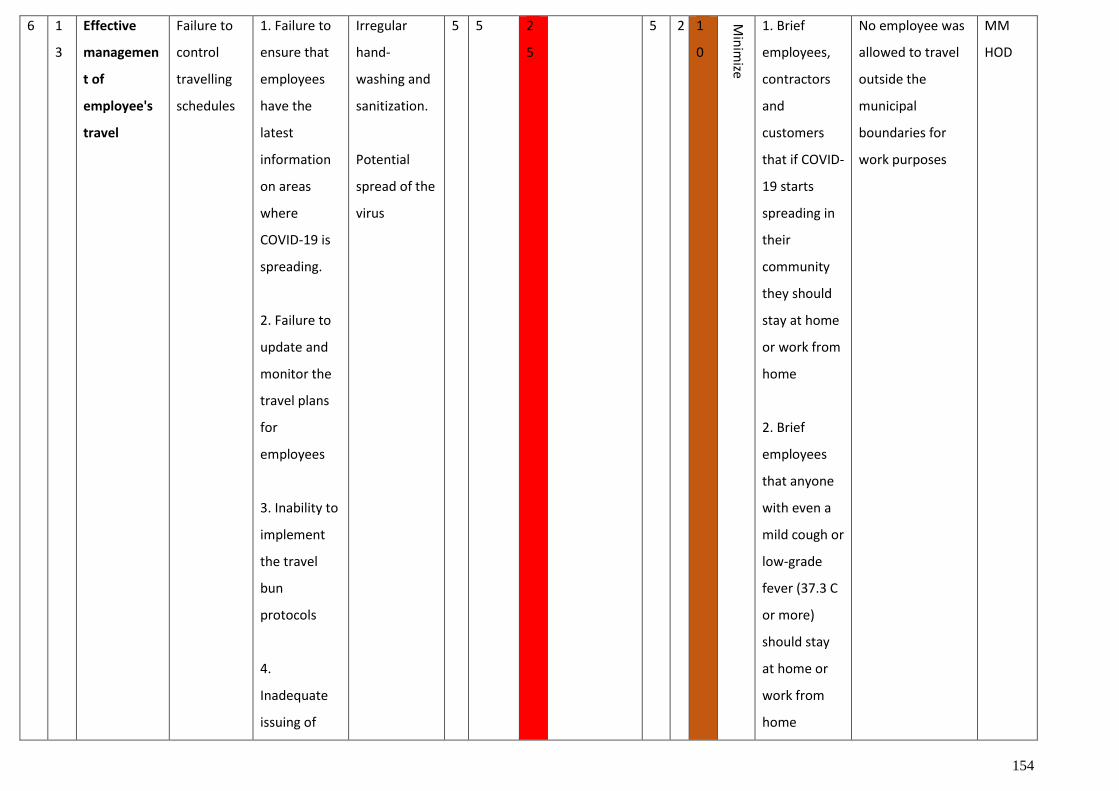
154
6 1
3
Effective
managemen
t of
employee's
travel
Failure to
control
travelling
schedules
1. Failure to
ensure that
employees
have the
latest
information
on areas
where
COVID-19 is
spreading.
2. Failure to
update and
monitor the
travel plans
for
employees
3. Inability to
implement
the travel
bun
protocols
4.
Inadequate
issuing of
Irregular
hand-
washing and
sanitization.
Potential
spread of the
virus
5 5 2
5
5 2 1
0
Min
imize
1. Brief
employees,
contractors
and
customers
that if COVID-
19 starts
spreading in
their
community
they should
stay at home
or work from
home
2. Brief
employees
that anyone
with even a
mild cough or
low-grade
fever (37.3 C
or more)
should stay
at home or
work from
home
No employee was
allowed to travel
outside the
municipal
boundaries for
work purposes
MM
HOD
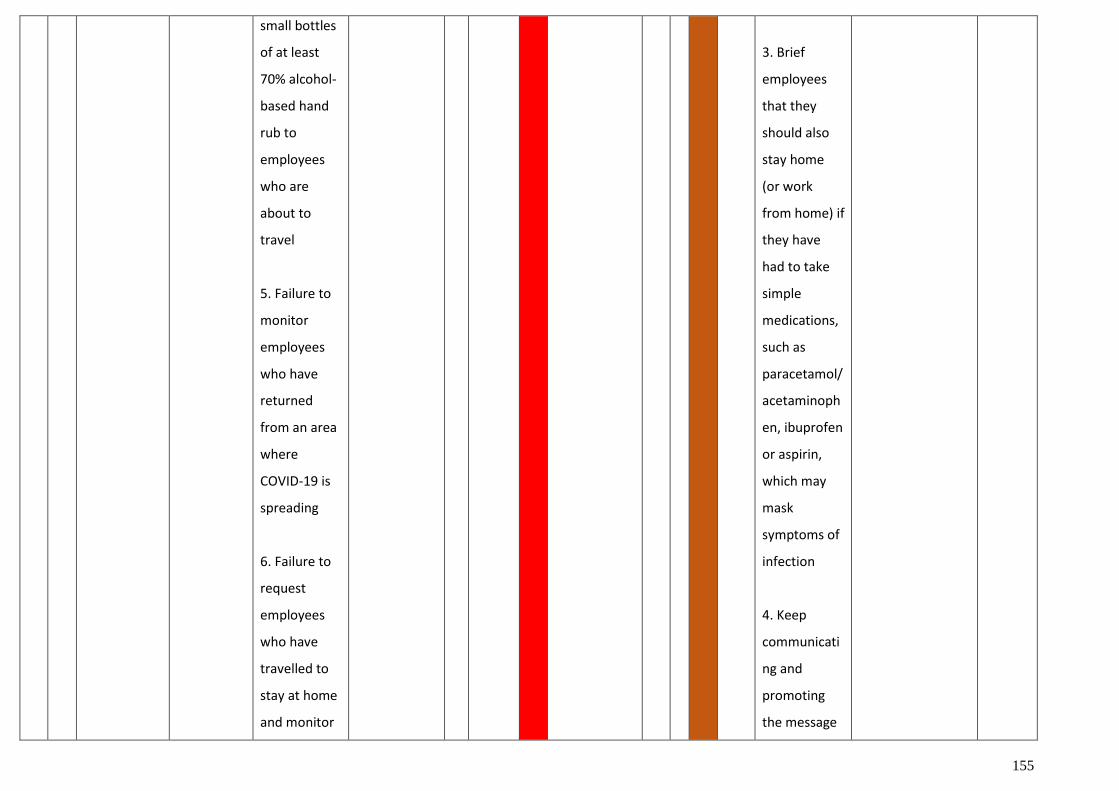
155
small bottles
of at least
70% alcohol-
based hand
rub to
employees
who are
about to
travel
5. Failure to
monitor
employees
who have
returned
from an area
where
COVID-19 is
spreading
6. Failure to
request
employees
who have
travelled to
stay at home
and monitor
3. Brief
employees
that they
should also
stay home
(or work
from home) if
they have
had to take
simple
medications,
such as
paracetamol/
acetaminoph
en, ibuprofen
or aspirin,
which may
mask
symptoms of
infection
4. Keep
communicati
ng and
promoting
the message
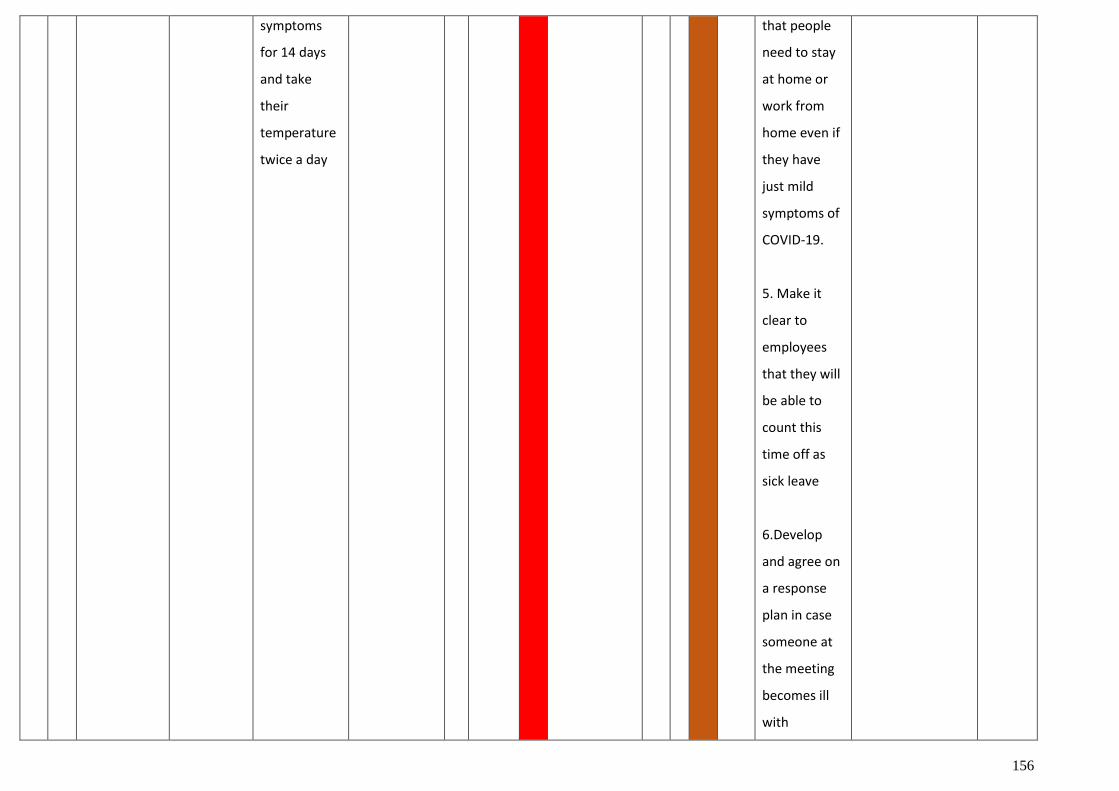
156
symptoms
for 14 days
and take
their
temperature
twice a day
that people
need to stay
at home or
work from
home even if
they have
just mild
symptoms of
COVID-19.
5. Make it
clear to
employees
that they will
be able to
count this
time off as
sick leave
6.Develop
and agree on
a response
plan in case
someone at
the meeting
becomes ill
with
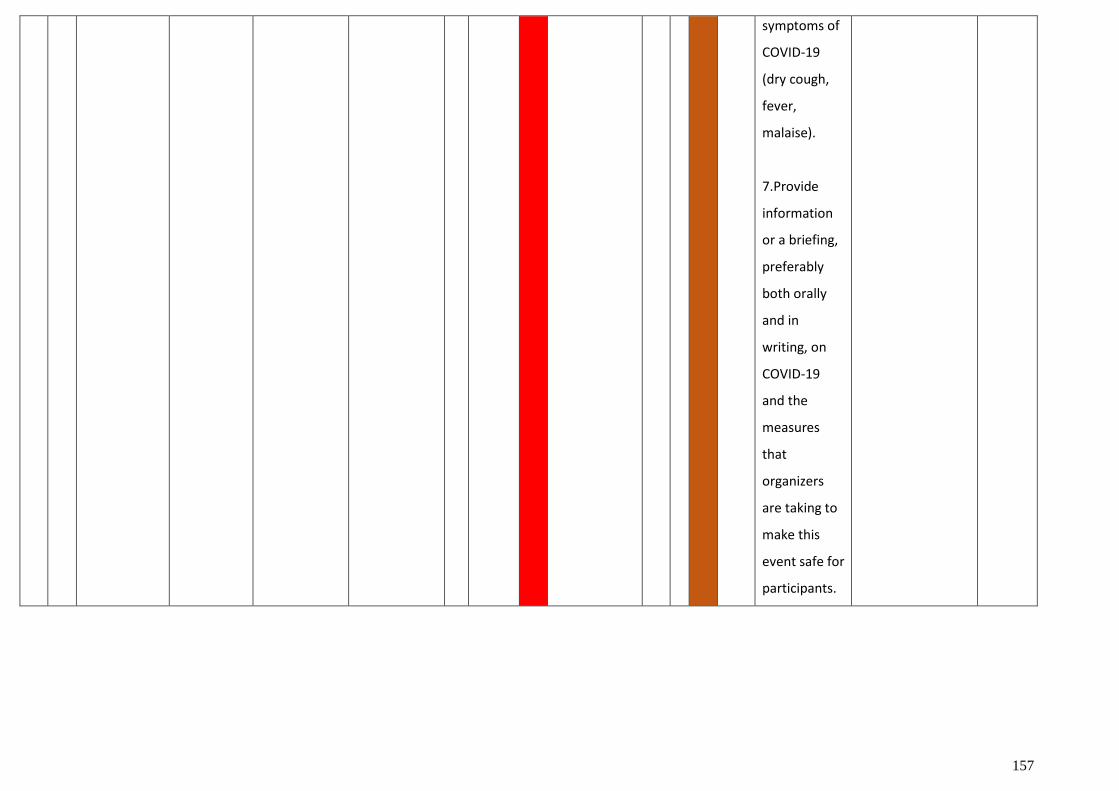
157
symptoms of
COVID-19
(dry cough,
fever,
malaise).
7.Provide
information
or a briefing,
preferably
both orally
and in
writing, on
COVID-19
and the
measures
that
organizers
are taking to
make this
event safe for
participants.
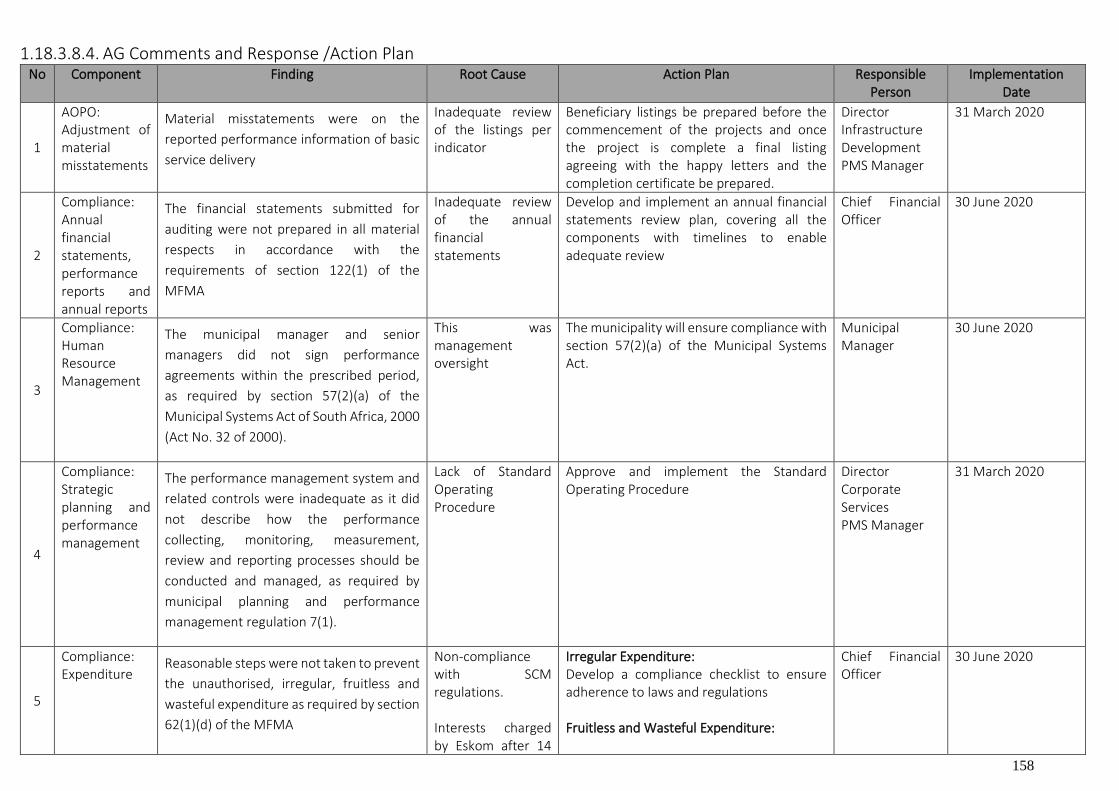
158
1.18.3.8.4. AG Comments and Response /Action Plan No Component Finding Root Cause Action Plan
Responsible
Person Implementation
Date
1
AOPO: Adjustment of material misstatements
Material misstatements were on the
reported performance information of basic
service delivery
Inadequate review of the listings per indicator
Beneficiary listings be prepared before the commencement of the projects and once the project is complete a final listing agreeing with the happy letters and the completion certificate be prepared.
Director Infrastructure Development PMS Manager
31 March 2020
2
Compliance: Annual financial statements, performance reports and annual reports
The financial statements submitted for
auditing were not prepared in all material
respects in accordance with the
requirements of section 122(1) of the
MFMA
Inadequate review of the annual financial statements
Develop and implement an annual financial statements review plan, covering all the components with timelines to enable adequate review
Chief Financial Officer
30 June 2020
3
Compliance: Human Resource Management
The municipal manager and senior
managers did not sign performance
agreements within the prescribed period,
as required by section 57(2)(a) of the
Municipal Systems Act of South Africa, 2000
(Act No. 32 of 2000).
This was management oversight
The municipality will ensure compliance with section 57(2)(a) of the Municipal Systems Act.
Municipal Manager
30 June 2020
4
Compliance: Strategic planning and performance management
The performance management system and
related controls were inadequate as it did
not describe how the performance
collecting, monitoring, measurement,
review and reporting processes should be
conducted and managed, as required by
municipal planning and performance
management regulation 7(1).
Lack of Standard Operating Procedure
Approve and implement the Standard Operating Procedure
Director Corporate Services PMS Manager
31 March 2020
5
Compliance: Expenditure
Reasonable steps were not taken to prevent
the unauthorised, irregular, fruitless and
wasteful expenditure as required by section
62(1)(d) of the MFMA
Non-compliance with SCM regulations. Interests charged by Eskom after 14
Irregular Expenditure: Develop a compliance checklist to ensure adherence to laws and regulations Fruitless and Wasteful Expenditure:
Chief Financial Officer
30 June 2020
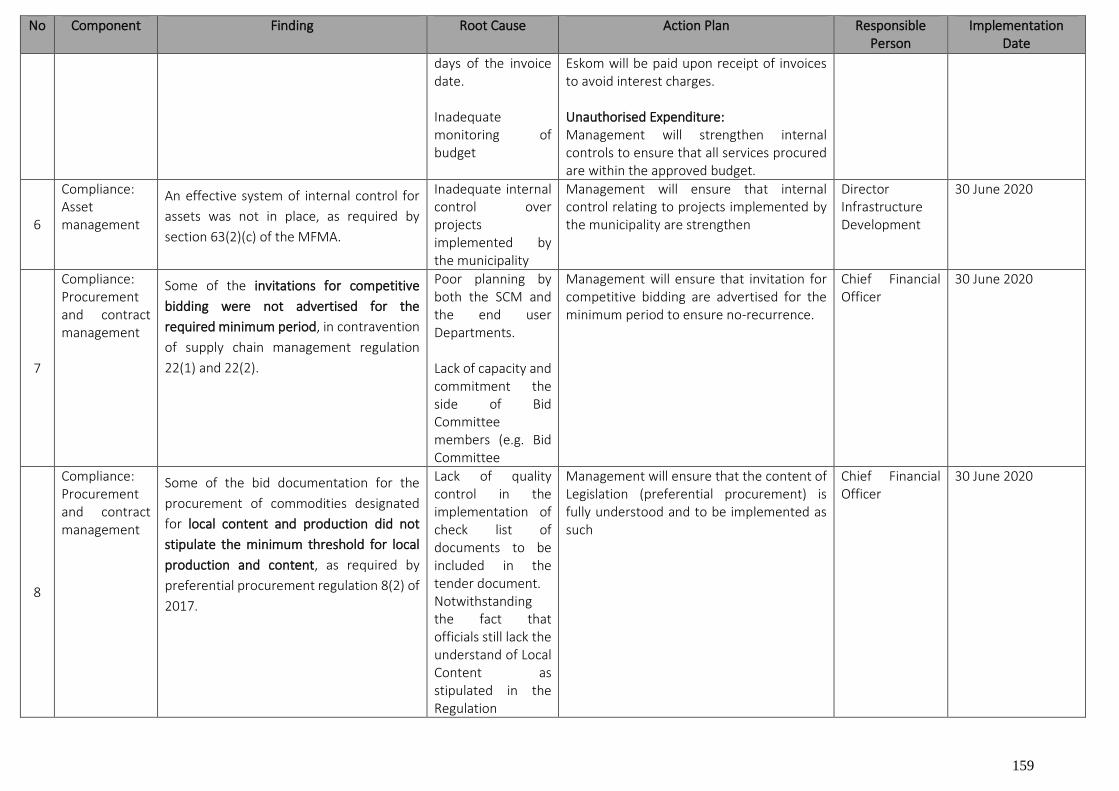
159
No Component Finding Root Cause Action Plan
Responsible Person
Implementation Date
days of the invoice date. Inadequate monitoring of budget
Eskom will be paid upon receipt of invoices to avoid interest charges. Unauthorised Expenditure: Management will strengthen internal controls to ensure that all services procured are within the approved budget.
6
Compliance: Asset management
An effective system of internal control for
assets was not in place, as required by
section 63(2)(c) of the MFMA.
Inadequate internal control over projects implemented by the municipality
Management will ensure that internal control relating to projects implemented by the municipality are strengthen
Director Infrastructure Development
30 June 2020
7
Compliance: Procurement and contract management
Some of the invitations for competitive
bidding were not advertised for the
required minimum period, in contravention
of supply chain management regulation
22(1) and 22(2).
Poor planning by both the SCM and the end user Departments. Lack of capacity and commitment the side of Bid Committee members (e.g. Bid Committee
Management will ensure that invitation for competitive bidding are advertised for the minimum period to ensure no-recurrence.
Chief Financial Officer
30 June 2020
8
Compliance: Procurement and contract management
Some of the bid documentation for the
procurement of commodities designated
for local content and production did not
stipulate the minimum threshold for local
production and content, as required by
preferential procurement regulation 8(2) of
2017.
Lack of quality control in the implementation of check list of documents to be included in the tender document. Notwithstanding the fact that officials still lack the understand of Local Content as stipulated in the Regulation
Management will ensure that the content of Legislation (preferential procurement) is fully understood and to be implemented as such
Chief Financial Officer
30 June 2020
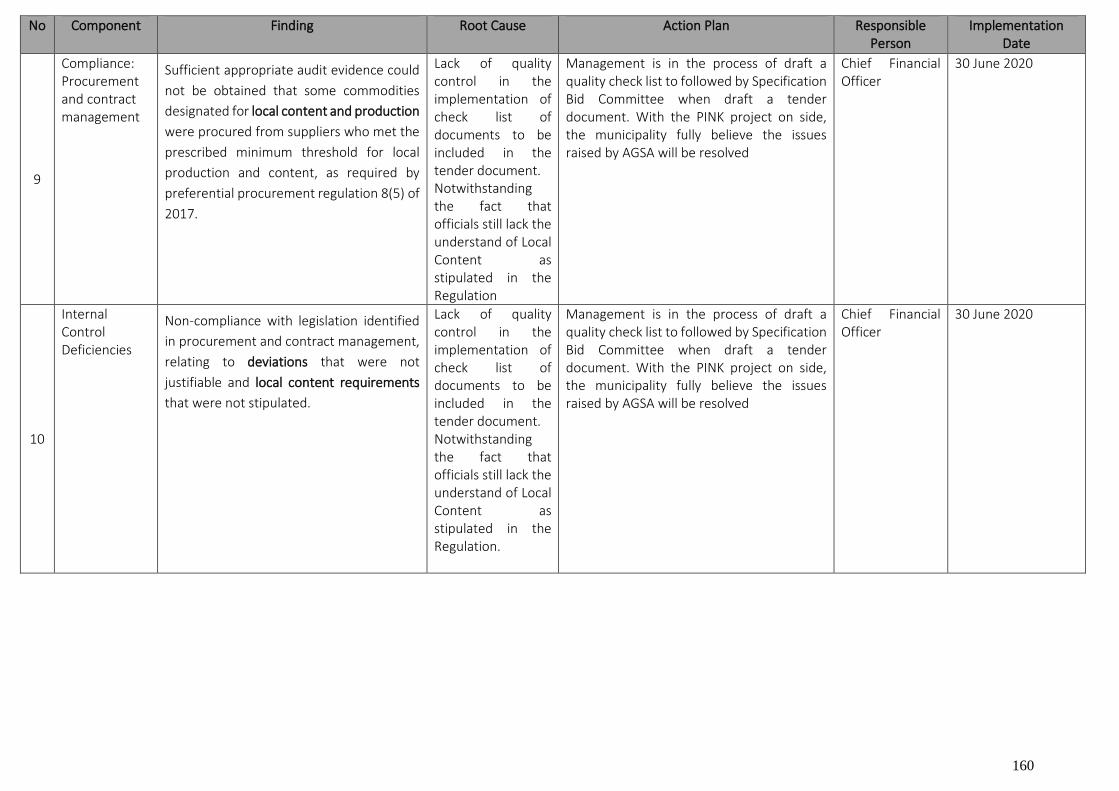
160
No Component Finding Root Cause Action Plan
Responsible Person
Implementation Date
9
Compliance: Procurement and contract management
Sufficient appropriate audit evidence could
not be obtained that some commodities
designated for local content and production
were procured from suppliers who met the
prescribed minimum threshold for local
production and content, as required by
preferential procurement regulation 8(5) of
2017.
Lack of quality control in the implementation of check list of documents to be included in the tender document. Notwithstanding the fact that officials still lack the understand of Local Content as stipulated in the Regulation
Management is in the process of draft a quality check list to followed by Specification Bid Committee when draft a tender document. With the PINK project on side, the municipality fully believe the issues raised by AGSA will be resolved
Chief Financial Officer
30 June 2020
10
Internal Control Deficiencies
Non-compliance with legislation identified
in procurement and contract management,
relating to deviations that were not
justifiable and local content requirements
that were not stipulated.
Lack of quality control in the implementation of check list of documents to be included in the tender document. Notwithstanding the fact that officials still lack the understand of Local Content as stipulated in the Regulation.
Management is in the process of draft a quality check list to followed by Specification Bid Committee when draft a tender document. With the PINK project on side, the municipality fully believe the issues raised by AGSA will be resolved
Chief Financial Officer
30 June 2020
161
1.18.3.8.5. Municipal Safety Plan
NKOMAZI LOCAL MUNICIPALITY with COUNCIL as an EMPLOYER considers its EMPLOYEES to be its most valuable asset and undertakes to safeguard them by providing and maintaining as far as reasonably practical, a working environment that is safe and without risks to the health of its employees and the environment thy work in and is exposed to.
In ensuring a safe and healthy working environment all employees of COUNCIL has to work closely together with the EMPLOYER in minimizing any risk that might jeopardize the health and safety of EMPLOYEES.
Nkomazi Local Municipality is fully committed to safety and health and therefore, efficiently and effectiveness are not the only goals, but also demands for its mutual prosperity and shall be striven for by all councilors and officials.
All personnel must regard their own safety and health as a high priority. A Person or organization as approved by the Department of Labour. The employer shall affix a prominent notice or sign in the workplace indicating where the first aid box is kept as well as the name of the person in charge of the first aid box. Each injury on duty shall be written on prescribed forms and submitted to The Manager Cooperative service who in turn need to oversee the reporting to Compensation Commissioner within 7 (seven) Days of the incident occurring
1.18.3.8.6. Vision, Goals, Objectives and Strategies
The following is the definition of a vision and a goal and the difference between the vision, goal, objectives and strategies of
the municipality
Vision
An aspirational description of what an organization would like to achieve or accomplish in the mid-term or long-term future. It
is intended to serves as a clear guide for choosing current and future courses of action.
Goals
Definition of Goal
A goal is an idea of the future or desired result that a person or a group of people envisions, plans and commits to achieve
Definition of Objective
A specific result that a person or system aims to achieve within a time frame and with available resources
Difference between a goal and objective
As the Municipality we say that the difference between goals and objectives is that a goal is a description of a destination, and
an objective is a measure of the progress that is needed to get to the destination. In this context goals are the long term outcomes
you want or need to achieve.
long term development goals, associated objectives & strategies, structured into 6 Nkomazi KPA’S
In order to achieve our vision and to address the development challenges, there are a number of key strategic priority areas
which need to be taken into consideration. These priorities lead to the creation of structures which support, house and associate
other actions and activities – the building blocks around which actions and prioritisation take place. It also acts as a point
leverage for creating a sustainable municipality that is caring and liveable
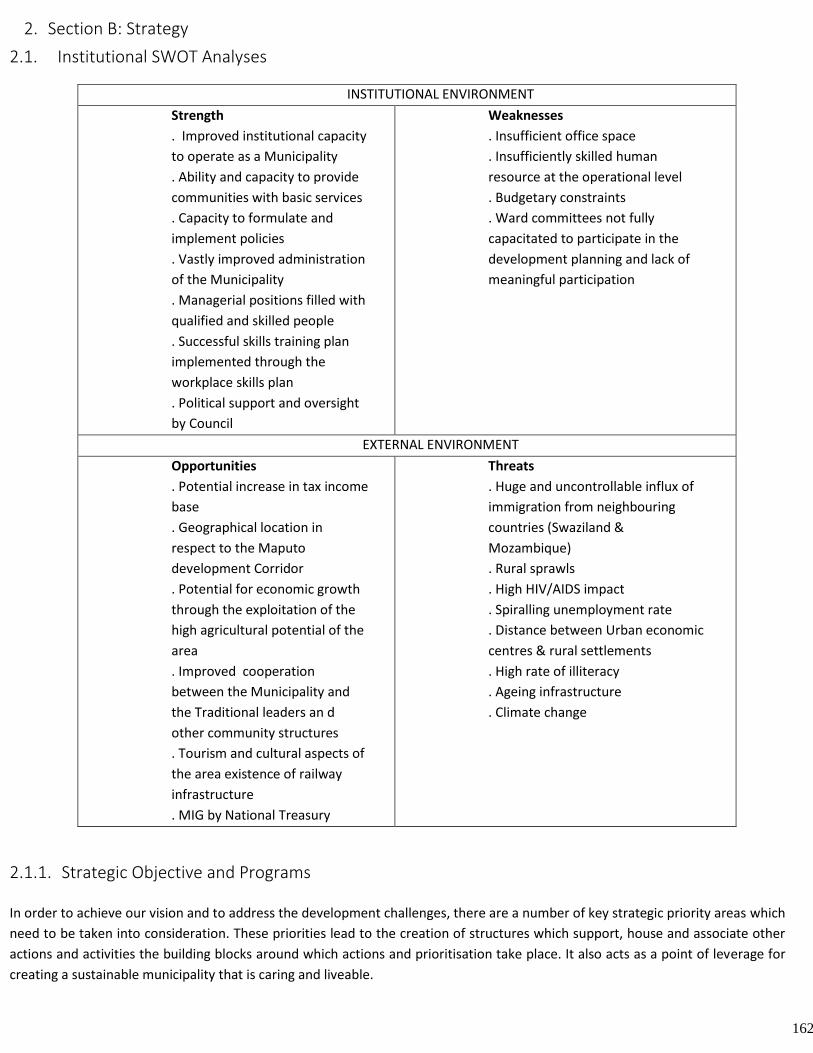
162
2. Section B: Strategy
2.1. Institutional SWOT Analyses
INSTITUTIONAL ENVIRONMENT
Strength
. Improved institutional capacity
to operate as a Municipality
. Ability and capacity to provide
communities with basic services
. Capacity to formulate and
implement policies
. Vastly improved administration
of the Municipality
. Managerial positions filled with
qualified and skilled people
. Successful skills training plan
implemented through the
workplace skills plan
. Political support and oversight
by Council
Weaknesses
. Insufficient office space
. Insufficiently skilled human
resource at the operational level
. Budgetary constraints
. Ward committees not fully
capacitated to participate in the
development planning and lack of
meaningful participation
EXTERNAL ENVIRONMENT
Opportunities
. Potential increase in tax income
base
. Geographical location in
respect to the Maputo
development Corridor
. Potential for economic growth
through the exploitation of the
high agricultural potential of the
area
. Improved cooperation
between the Municipality and
the Traditional leaders an d
other community structures
. Tourism and cultural aspects of
the area existence of railway
infrastructure
. MIG by National Treasury
Threats
. Huge and uncontrollable influx of
immigration from neighbouring
countries (Swaziland &
Mozambique)
. Rural sprawls
. High HIV/AIDS impact
. Spiralling unemployment rate
. Distance between Urban economic
centres & rural settlements
. High rate of illiteracy
. Ageing infrastructure
. Climate change
2.1.1. Strategic Objective and Programs
In order to achieve our vision and to address the development challenges, there are a number of key strategic priority areas which
need to be taken into consideration. These priorities lead to the creation of structures which support, house and associate other
actions and activities the building blocks around which actions and prioritisation take place. It also acts as a point of leverage for
creating a sustainable municipality that is caring and liveable.
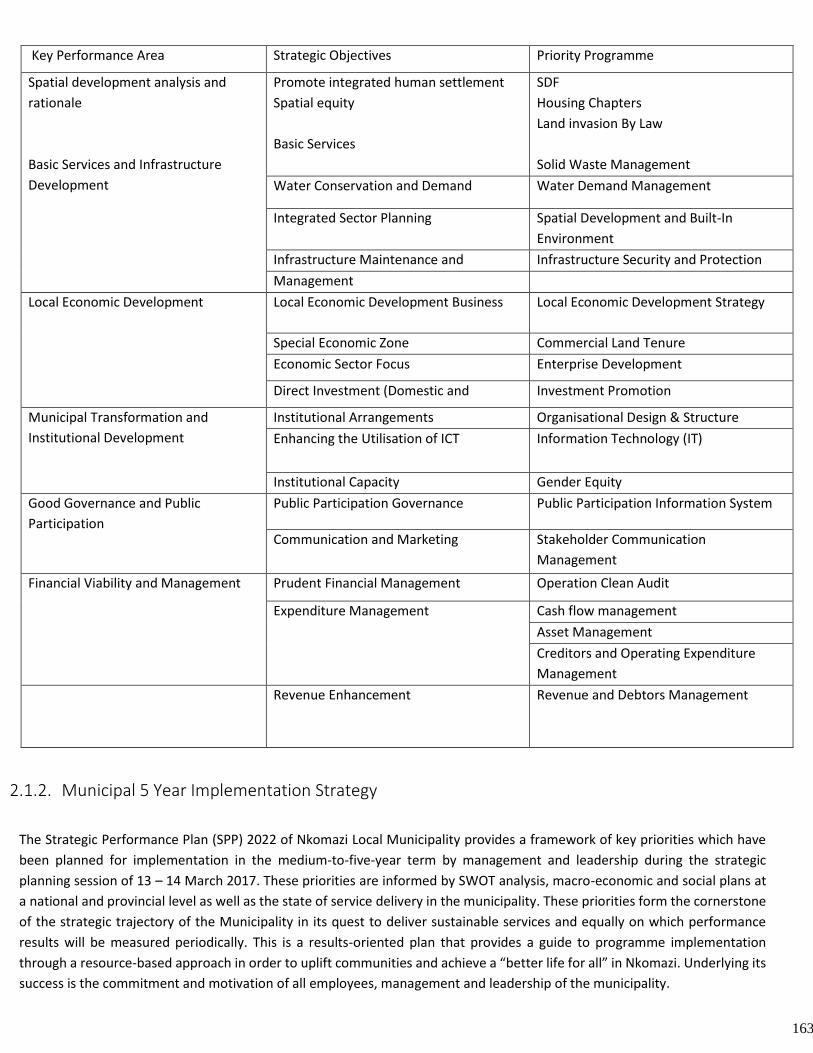
163
2.1.2. Municipal 5 Year Implementation Strategy
The Strategic Performance Plan (SPP) 2022 of Nkomazi Local Municipality provides a framework of key priorities which have
been planned for implementation in the medium-to-five-year term by management and leadership during the strategic
planning session of 13 – 14 March 2017. These priorities are informed by SWOT analysis, macro-economic and social plans at
a national and provincial level as well as the state of service delivery in the municipality. These priorities form the cornerstone
of the strategic trajectory of the Municipality in its quest to deliver sustainable services and equally on which performance
results will be measured periodically. This is a results-oriented plan that provides a guide to programme implementation
through a resource-based approach in order to uplift communities and achieve a “better life for all” in Nkomazi. Underlying its
success is the commitment and motivation of all employees, management and leadership of the municipality.
Key Performance Area Strategic Objectives Priority Programme
Spatial development analysis and
rationale
Basic Services and Infrastructure
Development
Promote integrated human settlement
Spatial equity
Basic Services
SDF
Housing Chapters
Land invasion By Law
Solid Waste Management
Water Conservation and Demand Water Demand Management
Integrated Sector Planning Spatial Development and Built-In
Environment
Infrastructure Maintenance and Infrastructure Security and Protection
Management
Local Economic Development Local Economic Development Business Local Economic Development Strategy
Special Economic Zone Commercial Land Tenure
Economic Sector Focus Enterprise Development
Direct Investment (Domestic and Investment Promotion
Municipal Transformation and
Institutional Development
Institutional Arrangements Organisational Design & Structure
Enhancing the Utilisation of ICT Information Technology (IT)
Institutional Capacity Gender Equity
Good Governance and Public
Participation
Public Participation Governance Public Participation Information System
Communication and Marketing Stakeholder Communication
Management
Financial Viability and Management Prudent Financial Management Operation Clean Audit
Expenditure Management Cash flow management
Asset Management
Creditors and Operating Expenditure
Management
Revenue Enhancement Revenue and Debtors Management
164
The national and provincial imperatives or strategies which had specific implications of developing this plan included – the
National Development Plan (NDP) or Vision 2030; Mpumalanga Growth & Development Path; State of the Nation Address
(SONA) and State of the Province Address (SOPA); and National and Provincial 9-Point Plan.
2.1.3. Municipal 6-Point
In response to the aforesaid strategies NLM devised its Municipal 6-Point Plan which aims at:
• Strengthening the internal municipal capacity to deliver on its mandate
• Strengthening public participation mechanisms
• Focusing LED and Job creation initiatives
• Focusing on health promotion and environmental programmes
• Working with communities and all stakeholders to fight and overcome crime Driving programmes that build
integrated and socially cohesive human settlements
Due to dynamic changes in the operating environment it is of utmost importance that the municipality also
positions itself to fulfil its constitutional mandate and effectively deliver services to its people. This will entail
building on the successes of the previous Council and also providing a roadmap which will support an effective
and sustainable service delivery model. As part of organisational renewal, the municipality needs to implement
the following strategic interventions not only to improve performance and productivity but also deliver on the
Municipal 6-Point Plan.
• Implement a municipal turnaround strategy
• Improve financial viability and management
• Become citizen-centered in terms of service delivery
• Strengthen stakeholder management
• Improve municipal governance
• Ensure integration of planning, performance management, and M&E (monitoring and evaluation) Ensure
effective risk management and internal audit processes/systems
2.2. Linkages of Plans
The table denotes linkages of the 3 spheres of government and they have similar objectives, the main objective for SGD’S is to
gear Governments towards sustainable Development, while an objective for NDP is to satisfy the basic, social & economic
needs through the District and the Provincial priorities which aims at promoting better planning & budgeting synergy across all
spheres of Government in the Province, and also to ensure balanced budgeting & sustainable funding for legislative mandates
and strategic priorities of the province to ensure approved financial resources are spent efficiently, effectively and
economically. The President of South Africa report on the state of the nation’s address which is an annual event where in the
President of South Africa reports on the status of the Nation, normally to the resumption of joint sitting of parliament. (National
Assembly and the National Council)
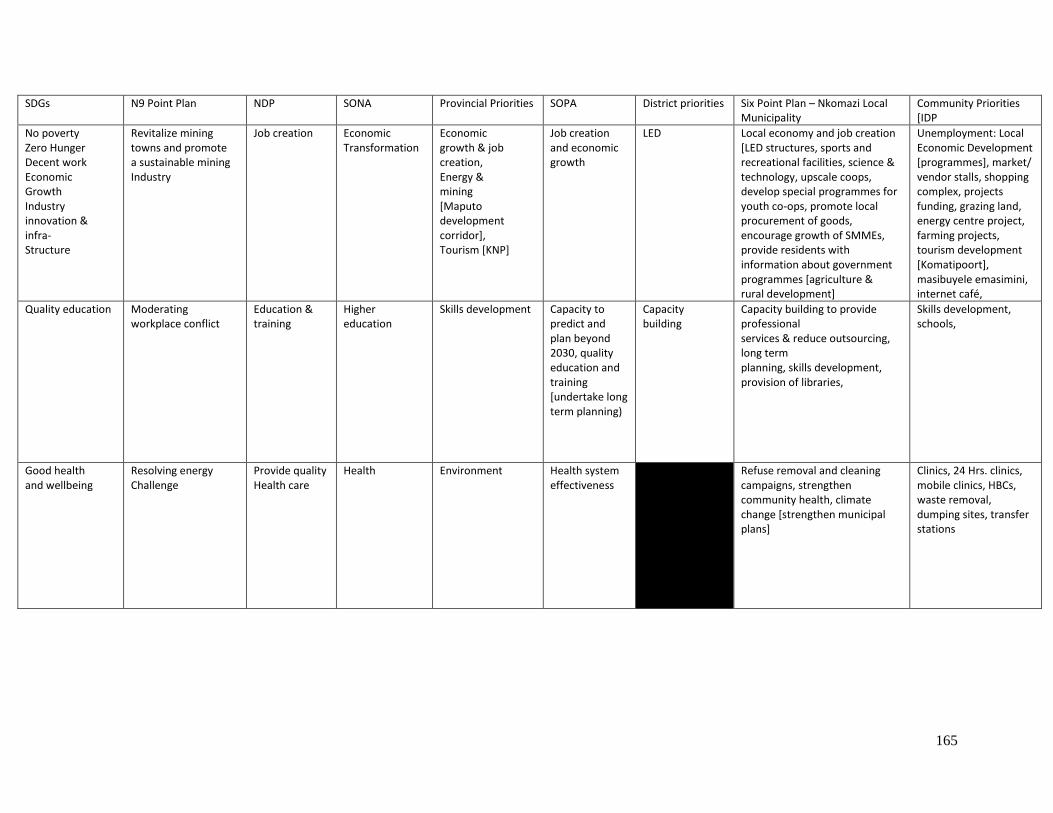
165
SDGs N9 Point Plan NDP SONA Provincial Priorities SOPA District priorities Six Point Plan – Nkomazi Local Municipality
Community Priorities [IDP
No poverty Zero Hunger Decent work Economic Growth Industry innovation & infra- Structure
Revitalize mining towns and promote a sustainable mining Industry
Job creation Economic Transformation
Economic growth & job creation, Energy & mining [Maputo development corridor], Tourism [KNP]
Job creation and economic growth
LED Local economy and job creation [LED structures, sports and recreational facilities, science & technology, upscale coops, develop special programmes for youth co-ops, promote local procurement of goods, encourage growth of SMMEs, provide residents with information about government programmes [agriculture & rural development]
Unemployment: Local Economic Development [programmes], market/ vendor stalls, shopping complex, projects funding, grazing land, energy centre project, farming projects, tourism development [Komatipoort], masibuyele emasimini, internet café,
Quality education Moderating workplace conflict
Education & training
Higher education
Skills development Capacity to predict and plan beyond 2030, quality education and training [undertake long term planning)
Capacity building
Capacity building to provide professional services & reduce outsourcing, long term planning, skills development, provision of libraries,
Skills development, schools,
Good health and wellbeing
Resolving energy Challenge
Provide quality Health care
Health Environment Health system effectiveness
Refuse removal and cleaning campaigns, strengthen community health, climate change [strengthen municipal plans]
Clinics, 24 Hrs. clinics, mobile clinics, HBCs, waste removal, dumping sites, transfer stations
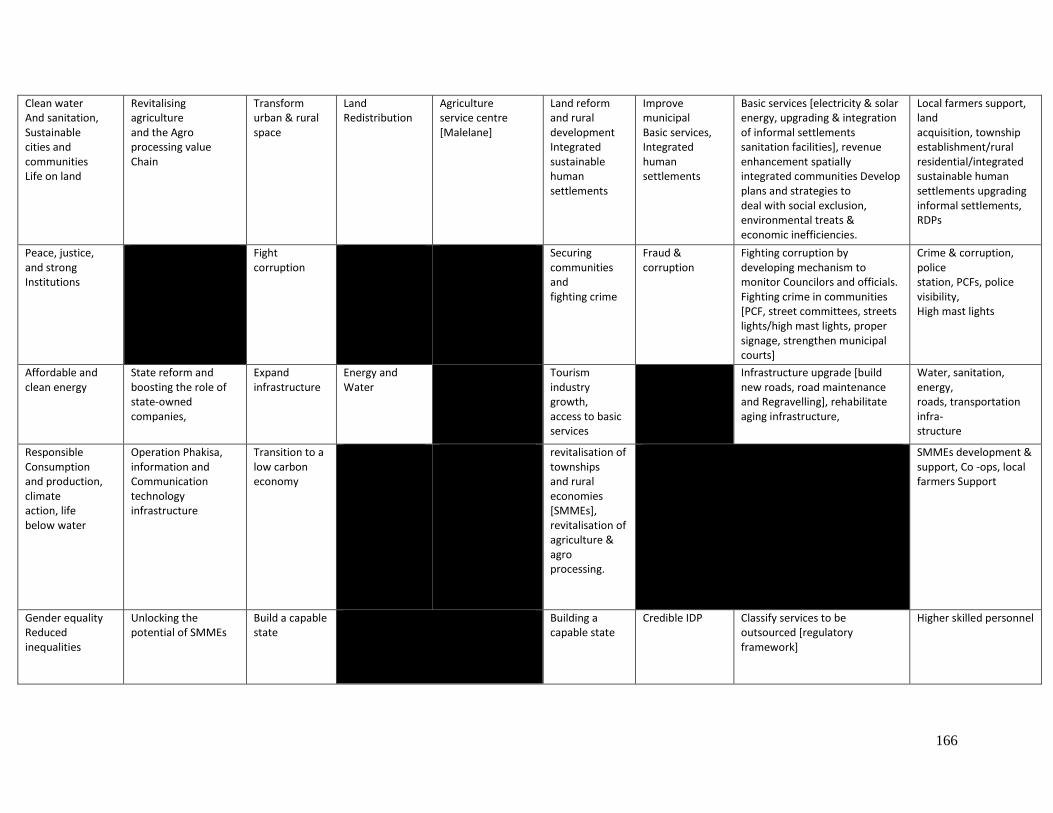
166
Clean water And sanitation, Sustainable cities and communities Life on land
Revitalising agriculture and the Agro processing value Chain
Transform urban & rural space
Land Redistribution
Agriculture service centre [Malelane]
Land reform and rural development Integrated sustainable human settlements
Improve municipal Basic services, Integrated human settlements
Basic services [electricity & solar energy, upgrading & integration of informal settlements sanitation facilities], revenue enhancement spatially integrated communities Develop plans and strategies to deal with social exclusion, environmental treats & economic inefficiencies.
Local farmers support, land acquisition, township establishment/rural residential/integrated sustainable human settlements upgrading informal settlements, RDPs
Peace, justice, and strong Institutions
Fight corruption
Securing communities and fighting crime
Fraud & corruption
Fighting corruption by developing mechanism to monitor Councilors and officials. Fighting crime in communities [PCF, street committees, streets lights/high mast lights, proper signage, strengthen municipal courts]
Crime & corruption, police station, PCFs, police visibility, High mast lights
Affordable and clean energy
State reform and boosting the role of state-owned companies,
Expand infrastructure
Energy and Water
Tourism industry growth, access to basic services
Infrastructure upgrade [build new roads, road maintenance and Regravelling], rehabilitate aging infrastructure,
Water, sanitation, energy, roads, transportation infra- structure
Responsible Consumption and production, climate action, life below water
Operation Phakisa, information and Communication technology infrastructure
Transition to a low carbon economy
revitalisation of townships and rural economies [SMMEs], revitalisation of agriculture & agro processing.
SMMEs development & support, Co -ops, local farmers Support
Gender equality Reduced inequalities
Unlocking the potential of SMMEs
Build a capable state
Building a capable state
Credible IDP Classify services to be outsourced [regulatory framework]
Higher skilled personnel
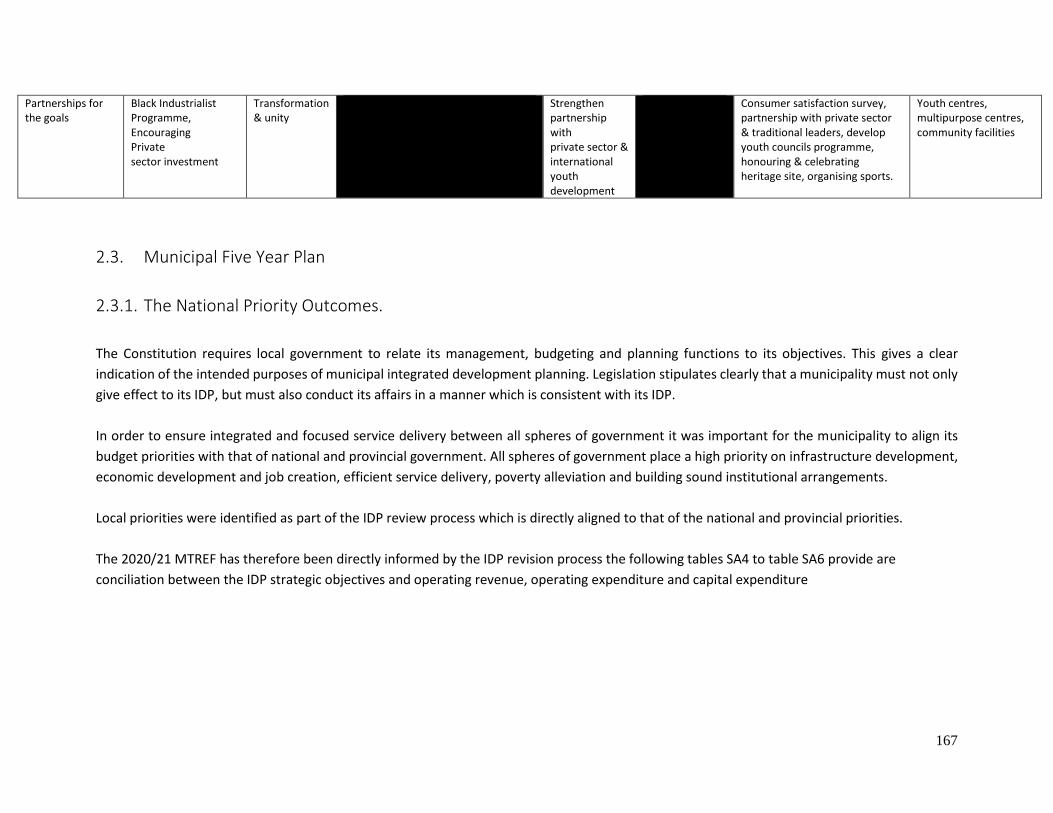
167
Partnerships for the goals
Black Industrialist Programme, Encouraging Private sector investment
Transformation & unity
Strengthen partnership with private sector & international youth development
Consumer satisfaction survey, partnership with private sector & traditional leaders, develop youth councils programme, honouring & celebrating heritage site, organising sports.
Youth centres, multipurpose centres, community facilities
2.3. Municipal Five Year Plan
2.3.1. The National Priority Outcomes.
The Constitution requires local government to relate its management, budgeting and planning functions to its objectives. This gives a clear
indication of the intended purposes of municipal integrated development planning. Legislation stipulates clearly that a municipality must not only
give effect to its IDP, but must also conduct its affairs in a manner which is consistent with its IDP.
In order to ensure integrated and focused service delivery between all spheres of government it was important for the municipality to align its
budget priorities with that of national and provincial government. All spheres of government place a high priority on infrastructure development,
economic development and job creation, efficient service delivery, poverty alleviation and building sound institutional arrangements.
Local priorities were identified as part of the IDP review process which is directly aligned to that of the national and provincial priorities.
The 2020/21 MTREF has therefore been directly informed by the IDP revision process the following tables SA4 to table SA6 provide are
conciliation between the IDP strategic objectives and operating revenue, operating expenditure and capital expenditure
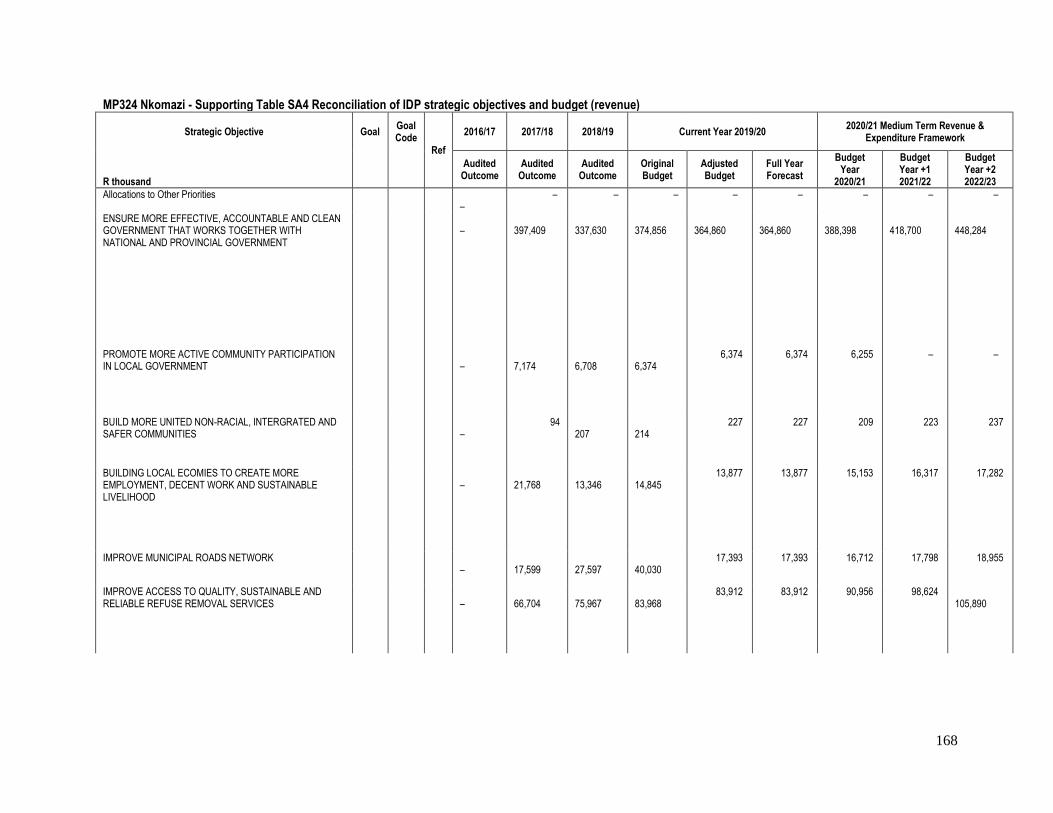
168
MP324 Nkomazi - Supporting Table SA4 Reconciliation of IDP strategic objectives and budget (revenue)
Strategic Objective Goal Goal Code
Ref
2016/17 2017/18 2018/19 Current Year 2019/20 2020/21 Medium Term Revenue &
Expenditure Framework
R thousand
Audited Outcome
Audited Outcome
Audited Outcome
Original Budget
Adjusted Budget
Full Year Forecast
Budget Year
2020/21
Budget Year +1 2021/22
Budget Year +2 2022/23
Allocations to Other Priorities –
– – – – – – – –
ENSURE MORE EFFECTIVE, ACCOUNTABLE AND CLEAN GOVERNMENT THAT WORKS TOGETHER WITH NATIONAL AND PROVINCIAL GOVERNMENT
–
397,409
337,630
374,856
364,860
364,860
388,398
418,700
448,284
PROMOTE MORE ACTIVE COMMUNITY PARTICIPATION IN LOCAL GOVERNMENT
–
7,174
6,708
6,374
6,374 6,374 6,255 – –
BUILD MORE UNITED NON-RACIAL, INTERGRATED AND SAFER COMMUNITIES
–
94 207
214
227 227 209 223 237
BUILDING LOCAL ECOMIES TO CREATE MORE EMPLOYMENT, DECENT WORK AND SUSTAINABLE LIVELIHOOD
–
21,768
13,346
14,845
13,877 13,877 15,153 16,317 17,282
IMPROVE MUNICIPAL ROADS NETWORK –
17,599
27,597
40,030
17,393 17,393 16,712 17,798 18,955
IMPROVE ACCESS TO QUALITY, SUSTAINABLE AND RELIABLE REFUSE REMOVAL SERVICES
–
66,704
75,967
83,968
83,912 83,912 90,956 98,624 105,890
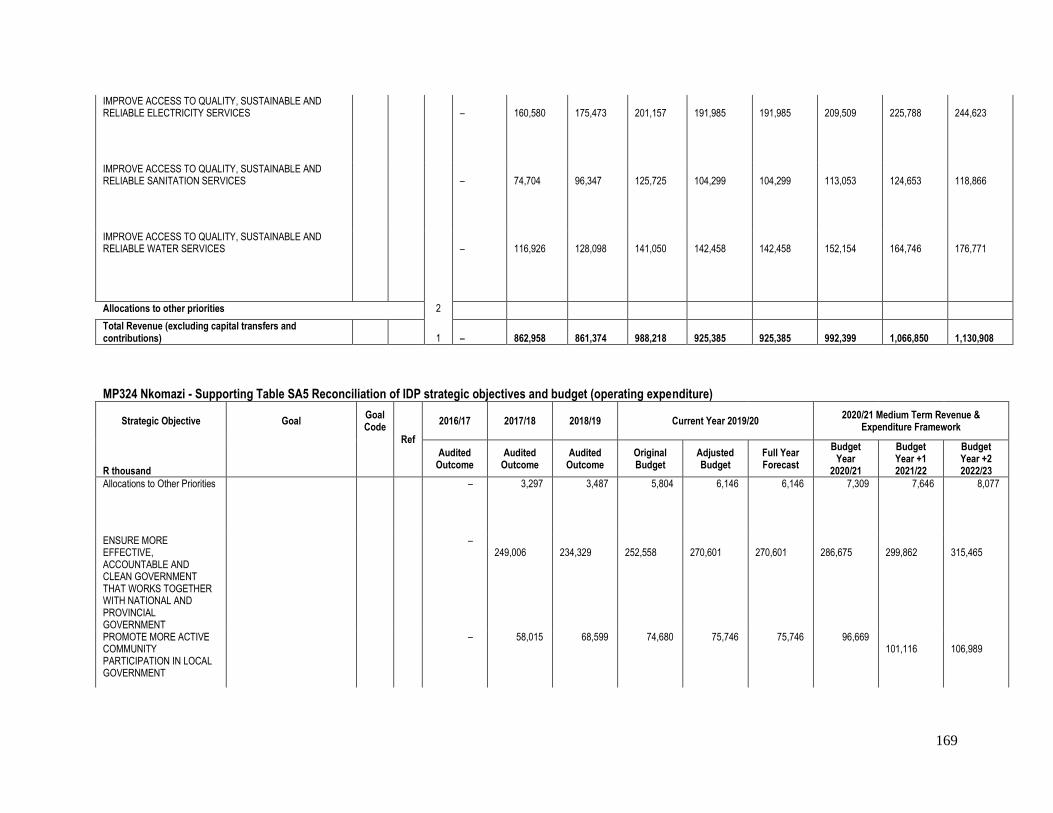
169
IMPROVE ACCESS TO QUALITY, SUSTAINABLE AND RELIABLE ELECTRICITY SERVICES
–
160,580
175,473
201,157
191,985
191,985
209,509
225,788
244,623
IMPROVE ACCESS TO QUALITY, SUSTAINABLE AND RELIABLE SANITATION SERVICES
–
74,704
96,347
125,725
104,299
104,299
113,053
124,653
118,866
IMPROVE ACCESS TO QUALITY, SUSTAINABLE AND RELIABLE WATER SERVICES
–
116,926
128,098
141,050
142,458
142,458
152,154
164,746
176,771
Allocations to other priorities 2
Total Revenue (excluding capital transfers and contributions) 1
–
862,958
861,374
988,218
925,385
925,385
992,399
1,066,850
1,130,908
MP324 Nkomazi - Supporting Table SA5 Reconciliation of IDP strategic objectives and budget (operating expenditure)
Strategic Objective Goal Goal Code
Ref
2016/17 2017/18 2018/19 Current Year 2019/20 2020/21 Medium Term Revenue &
Expenditure Framework
R thousand
Audited Outcome
Audited Outcome
Audited Outcome
Original Budget
Adjusted Budget
Full Year Forecast
Budget Year
2020/21
Budget Year +1 2021/22
Budget Year +2 2022/23
Allocations to Other Priorities – 3,297 3,487 5,804 6,146 6,146 7,309 7,646 8,077
ENSURE MORE EFFECTIVE, ACCOUNTABLE AND CLEAN GOVERNMENT THAT WORKS TOGETHER WITH NATIONAL AND PROVINCIAL GOVERNMENT
– 249,006
234,329
252,558
270,601
270,601
286,675
299,862
315,465
PROMOTE MORE ACTIVE COMMUNITY PARTICIPATION IN LOCAL GOVERNMENT
– 58,015 68,599 74,680 75,746 75,746 96,669 101,116
106,989
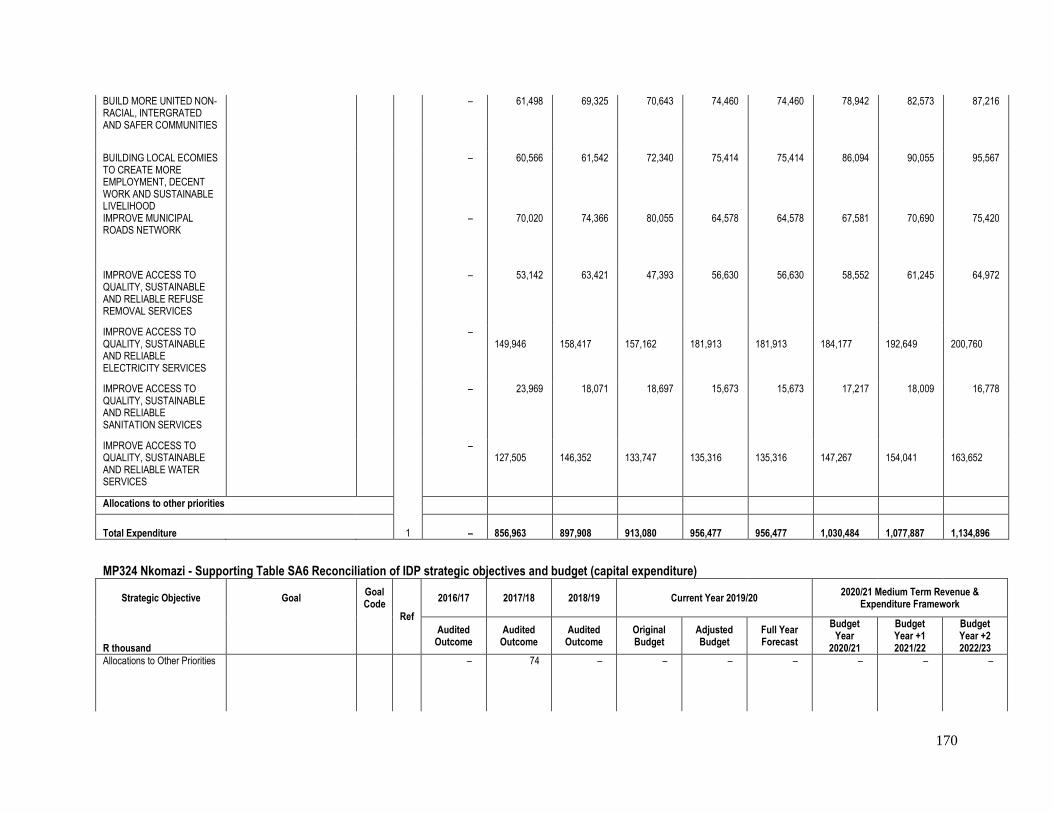
170
BUILD MORE UNITED NON-RACIAL, INTERGRATED AND SAFER COMMUNITIES
– 61,498 69,325 70,643 74,460 74,460 78,942 82,573 87,216
BUILDING LOCAL ECOMIES TO CREATE MORE EMPLOYMENT, DECENT WORK AND SUSTAINABLE LIVELIHOOD
– 60,566 61,542 72,340 75,414 75,414 86,094 90,055 95,567
IMPROVE MUNICIPAL ROADS NETWORK
– 70,020 74,366 80,055 64,578 64,578 67,581 70,690 75,420
IMPROVE ACCESS TO QUALITY, SUSTAINABLE AND RELIABLE REFUSE REMOVAL SERVICES
– 53,142 63,421 47,393 56,630 56,630 58,552 61,245 64,972
IMPROVE ACCESS TO QUALITY, SUSTAINABLE AND RELIABLE ELECTRICITY SERVICES
– 149,946
158,417
157,162
181,913
181,913
184,177
192,649
200,760
IMPROVE ACCESS TO QUALITY, SUSTAINABLE AND RELIABLE SANITATION SERVICES
– 23,969 18,071 18,697 15,673 15,673 17,217 18,009 16,778
IMPROVE ACCESS TO QUALITY, SUSTAINABLE AND RELIABLE WATER SERVICES
– 127,505
146,352
133,747
135,316
135,316
147,267
154,041
163,652
Allocations to other priorities
Total Expenditure 1 – 856,963
897,908
913,080
956,477
956,477
1,030,484
1,077,887
1,134,896
MP324 Nkomazi - Supporting Table SA6 Reconciliation of IDP strategic objectives and budget (capital expenditure)
Strategic Objective Goal Goal Code
Ref
2016/17 2017/18 2018/19 Current Year 2019/20 2020/21 Medium Term Revenue &
Expenditure Framework
R thousand
Audited Outcome
Audited Outcome
Audited Outcome
Original Budget
Adjusted Budget
Full Year Forecast
Budget Year
2020/21
Budget Year +1 2021/22
Budget Year +2 2022/23
Allocations to Other Priorities – 74 – – – – – – –
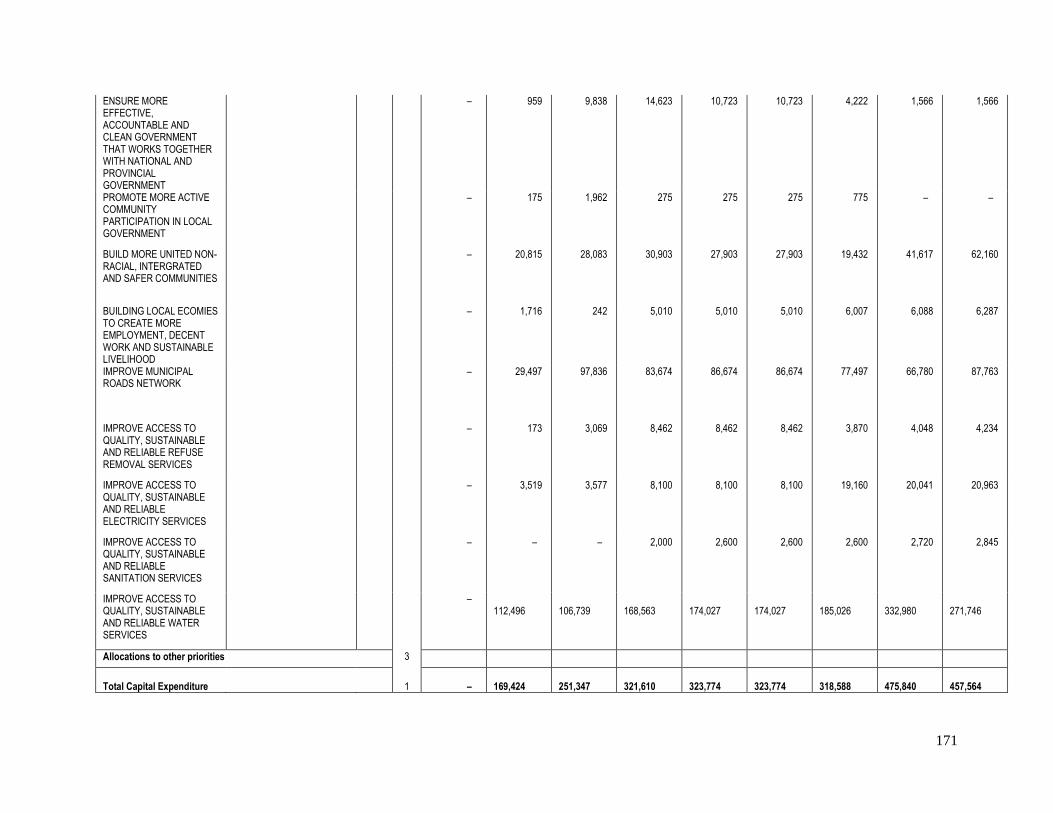
171
ENSURE MORE EFFECTIVE, ACCOUNTABLE AND CLEAN GOVERNMENT THAT WORKS TOGETHER WITH NATIONAL AND PROVINCIAL GOVERNMENT
– 959 9,838 14,623 10,723 10,723 4,222 1,566 1,566
PROMOTE MORE ACTIVE COMMUNITY PARTICIPATION IN LOCAL GOVERNMENT
– 175 1,962 275 275 275 775 – –
BUILD MORE UNITED NON-RACIAL, INTERGRATED AND SAFER COMMUNITIES
– 20,815 28,083 30,903 27,903 27,903 19,432 41,617 62,160
BUILDING LOCAL ECOMIES TO CREATE MORE EMPLOYMENT, DECENT WORK AND SUSTAINABLE LIVELIHOOD
– 1,716 242 5,010 5,010 5,010 6,007 6,088 6,287
IMPROVE MUNICIPAL ROADS NETWORK
– 29,497 97,836 83,674 86,674 86,674 77,497 66,780 87,763
IMPROVE ACCESS TO QUALITY, SUSTAINABLE AND RELIABLE REFUSE REMOVAL SERVICES
– 173 3,069 8,462 8,462 8,462 3,870 4,048 4,234
IMPROVE ACCESS TO QUALITY, SUSTAINABLE AND RELIABLE ELECTRICITY SERVICES
– 3,519 3,577 8,100 8,100 8,100 19,160 20,041 20,963
IMPROVE ACCESS TO QUALITY, SUSTAINABLE AND RELIABLE SANITATION SERVICES
– – – 2,000 2,600 2,600 2,600 2,720 2,845
IMPROVE ACCESS TO QUALITY, SUSTAINABLE AND RELIABLE WATER SERVICES
– 112,496
106,739
168,563
174,027
174,027
185,026
332,980
271,746
Allocations to other priorities 3
Total Capital Expenditure 1 – 169,424
251,347
321,610
323,774
323,774
318,588
475,840
457,564
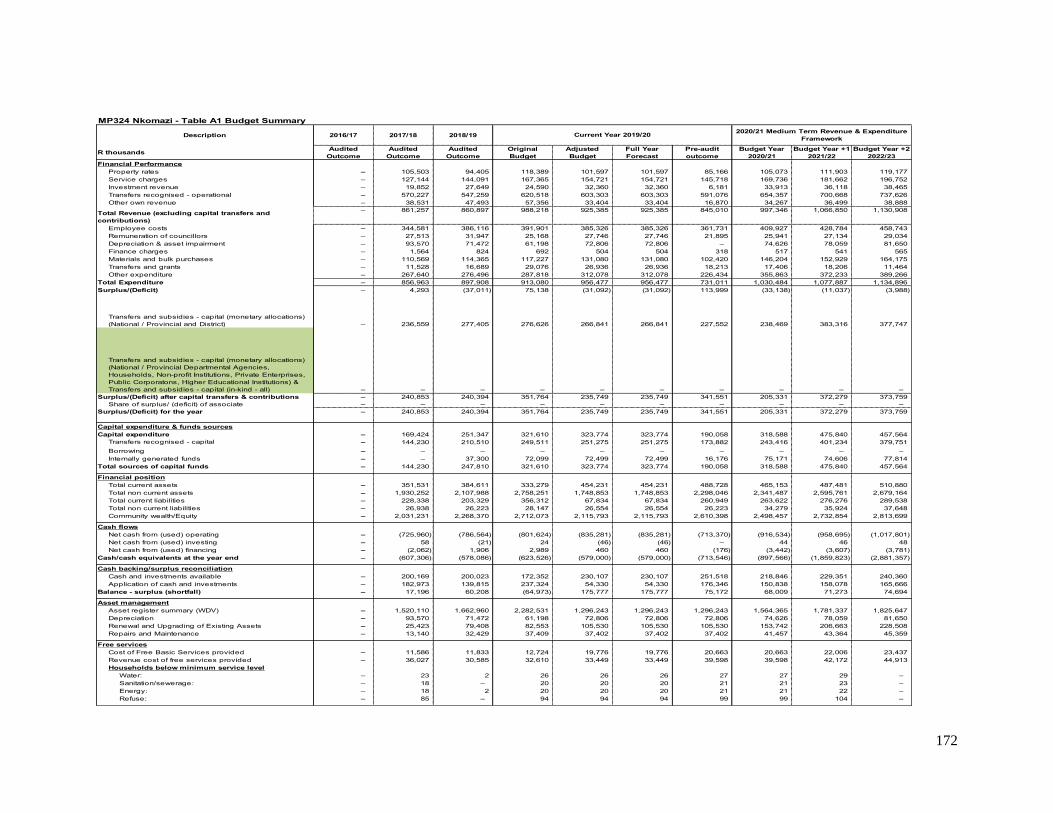
172
Description 2016/17 2017/18 2018/19
R thousandsAudited
Outcome
Audited
Outcome
Audited
Outcome
Original
Budget
Adjusted
Budget
Full Year
Forecast
Pre-audit
outcome
Budget Year
2020/21
Budget Year +1
2021/22
Budget Year +2
2022/23
Financial Performance
Property rates – 105,503 94,405 118,389 101,597 101,597 85,166 105,073 111,903 119,177
Service charges – 127,144 144,091 167,365 154,721 154,721 145,718 169,736 181,662 196,752
Investment revenue – 19,852 27,649 24,590 32,360 32,360 6,181 33,913 36,118 38,465
Transfers recognised - operational – 570,227 547,259 620,518 603,303 603,303 591,076 654,357 700,668 737,626
Other own revenue – 38,531 47,493 57,356 33,404 33,404 16,870 34,267 36,499 38,888
Total Revenue (excluding capital transfers and
contributions)
– 861,257 860,897 988,218 925,385 925,385 845,010 997,346 1,066,850 1,130,908
Employee costs – 344,581 386,116 391,901 385,326 385,326 361,731 409,927 428,784 458,743
Remuneration of councillors – 27,513 31,947 25,168 27,746 27,746 21,895 25,941 27,134 29,034
Depreciation & asset impairment – 93,570 71,472 61,198 72,806 72,806 – 74,626 78,059 81,650
Finance charges – 1,564 824 692 504 504 318 517 541 565
Materials and bulk purchases – 110,569 114,365 117,227 131,080 131,080 102,420 146,204 152,929 164,175
Transfers and grants – 11,528 16,689 29,076 26,936 26,936 18,213 17,406 18,206 11,464
Other expenditure – 267,640 276,496 287,818 312,078 312,078 226,434 355,863 372,233 389,266
Total Expenditure – 856,963 897,908 913,080 956,477 956,477 731,011 1,030,484 1,077,887 1,134,896
Surplus/(Deficit) – 4,293 (37,011) 75,138 (31,092) (31,092) 113,999 (33,138) (11,037) (3,988)
Transfers and subsidies - capital (monetary allocations)
(National / Provincial and District) – 236,559 277,405 276,626 266,841 266,841 227,552 238,469 383,316 377,747
Transfers and subsidies - capital (monetary allocations)
(National / Provincial Departmental Agencies,
Households, Non-profit Institutions, Private Enterprises,
Public Corporatons, Higher Educational Institutions) &
Transfers and subsidies - capital (in-kind - all) – – – – – – – – – –
Surplus/(Deficit) after capital transfers & contributions – 240,853 240,394 351,764 235,749 235,749 341,551 205,331 372,279 373,759
Share of surplus/ (deficit) of associate – – – – – – – – – –
Surplus/(Deficit) for the year – 240,853 240,394 351,764 235,749 235,749 341,551 205,331 372,279 373,759
Capital expenditure & funds sources
Capital expenditure – 169,424 251,347 321,610 323,774 323,774 190,058 318,588 475,840 457,564
Transfers recognised - capital – 144,230 210,510 249,511 251,275 251,275 173,882 243,416 401,234 379,751
Borrowing – – – – – – – – – –
Internally generated funds – – 37,300 72,099 72,499 72,499 16,176 75,171 74,606 77,814
Total sources of capital funds – 144,230 247,810 321,610 323,774 323,774 190,058 318,588 475,840 457,564
Financial position
Total current assets – 351,531 384,611 333,279 454,231 454,231 488,728 465,153 487,481 510,880
Total non current assets – 1,930,252 2,107,988 2,758,251 1,748,853 1,748,853 2,298,046 2,341,487 2,595,761 2,679,164
Total current liabilities – 228,338 203,329 356,312 67,834 67,834 260,949 263,622 276,276 289,538
Total non current liabilities – 26,938 26,223 28,147 26,554 26,554 26,223 34,279 35,924 37,648
Community wealth/Equity – 2,031,231 2,268,370 2,712,073 2,115,793 2,115,793 2,610,398 2,498,457 2,732,854 2,813,699
Cash flows
Net cash from (used) operating – (725,960) (786,564) (801,624) (835,281) (835,281) (713,370) (916,534) (958,695) (1,017,801)
Net cash from (used) investing – 58 (21) 24 (46) (46) – 44 46 48
Net cash from (used) financing – (2,062) 1,906 2,989 460 460 (176) (3,442) (3,607) (3,781)
Cash/cash equivalents at the year end – (607,306) (578,086) (623,526) (579,000) (579,000) (713,546) (897,566) (1,859,823) (2,881,357)
Cash backing/surplus reconciliation
Cash and investments available – 200,169 200,023 172,352 230,107 230,107 251,518 218,846 229,351 240,360
Application of cash and investments – 182,973 139,815 237,324 54,330 54,330 176,346 150,838 158,078 165,666
Balance - surplus (shortfall) – 17,196 60,208 (64,973) 175,777 175,777 75,172 68,009 71,273 74,694
Asset management
Asset register summary (WDV) – 1,520,110 1,662,960 2,282,531 1,296,243 1,296,243 1,296,243 1,564,365 1,781,337 1,825,647
Depreciation – 93,570 71,472 61,198 72,806 72,806 72,806 74,626 78,059 81,650
Renewal and Upgrading of Existing Assets – 25,423 79,408 82,553 105,530 105,530 105,530 153,742 206,663 228,508
Repairs and Maintenance – 13,140 32,429 37,409 37,402 37,402 37,402 41,457 43,364 45,359
Free services
Cost of Free Basic Services provided – 11,586 11,833 12,724 19,776 19,776 20,663 20,663 22,006 23,437
Revenue cost of free services provided – 36,027 30,585 32,610 33,449 33,449 39,598 39,598 42,172 44,913
Households below minimum service level
Water: – 23 2 26 26 26 27 27 29 –
Sanitation/sewerage: – 18 – 20 20 20 21 21 23 –
Energy: – 18 2 20 20 20 21 21 22 –
Refuse: – 85 – 94 94 94 99 99 104 –
2020/21 Medium Term Revenue & Expenditure
FrameworkCurrent Year 2019/20
MP324 Nkomazi - Table A1 Budget Summary
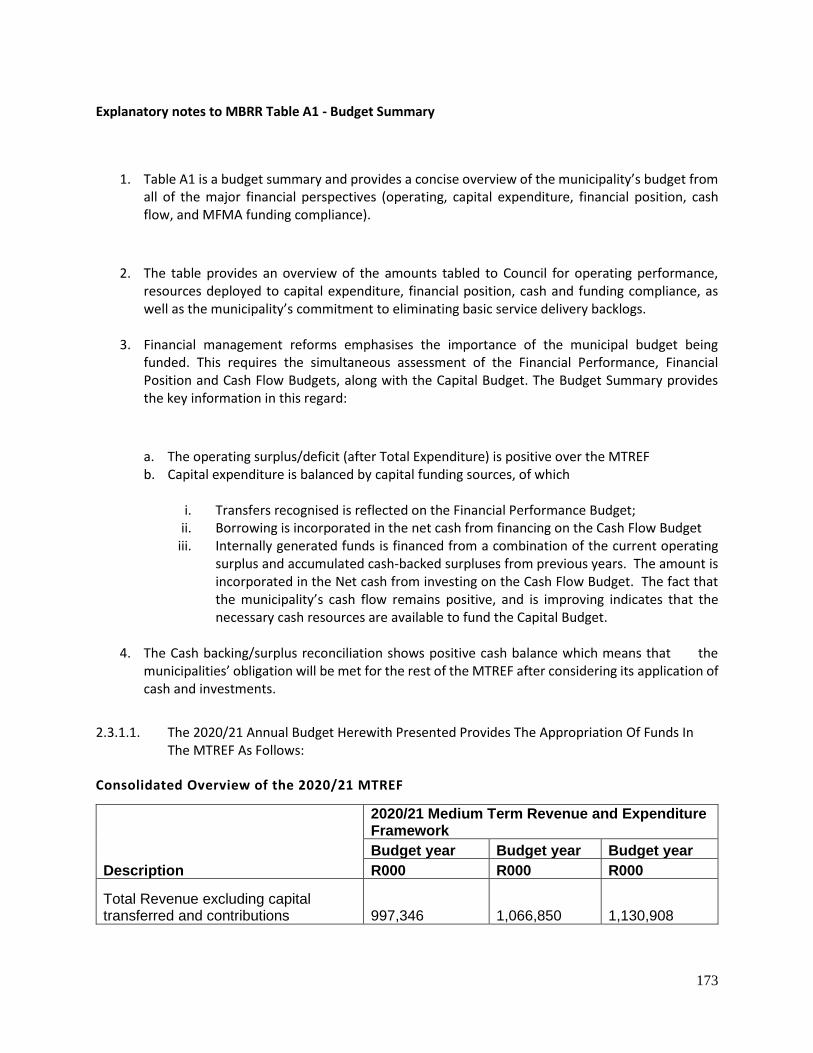
173
Explanatory notes to MBRR Table A1 - Budget Summary
1. Table A1 is a budget summary and provides a concise overview of the municipality’s budget from all of the major financial perspectives (operating, capital expenditure, financial position, cash flow, and MFMA funding compliance).
2. The table provides an overview of the amounts tabled to Council for operating performance, resources deployed to capital expenditure, financial position, cash and funding compliance, as well as the municipality’s commitment to eliminating basic service delivery backlogs.
3. Financial management reforms emphasises the importance of the municipal budget being funded. This requires the simultaneous assessment of the Financial Performance, Financial Position and Cash Flow Budgets, along with the Capital Budget. The Budget Summary provides the key information in this regard:
a. The operating surplus/deficit (after Total Expenditure) is positive over the MTREF b. Capital expenditure is balanced by capital funding sources, of which
i. Transfers recognised is reflected on the Financial Performance Budget;
ii. Borrowing is incorporated in the net cash from financing on the Cash Flow Budget iii. Internally generated funds is financed from a combination of the current operating
surplus and accumulated cash-backed surpluses from previous years. The amount is incorporated in the Net cash from investing on the Cash Flow Budget. The fact that the municipality’s cash flow remains positive, and is improving indicates that the necessary cash resources are available to fund the Capital Budget.
4. The Cash backing/surplus reconciliation shows positive cash balance which means that the municipalities’ obligation will be met for the rest of the MTREF after considering its application of cash and investments.
2.3.1.1. The 2020/21 Annual Budget Herewith Presented Provides The Appropriation Of Funds In The MTREF As Follows:
Consolidated Overview of the 2020/21 MTREF
Description
2020/21 Medium Term Revenue and Expenditure Framework
Budget year Budget year Budget year
R000 R000 R000
Total Revenue excluding capital transferred and contributions
997,346
1,066,850
1,130,908
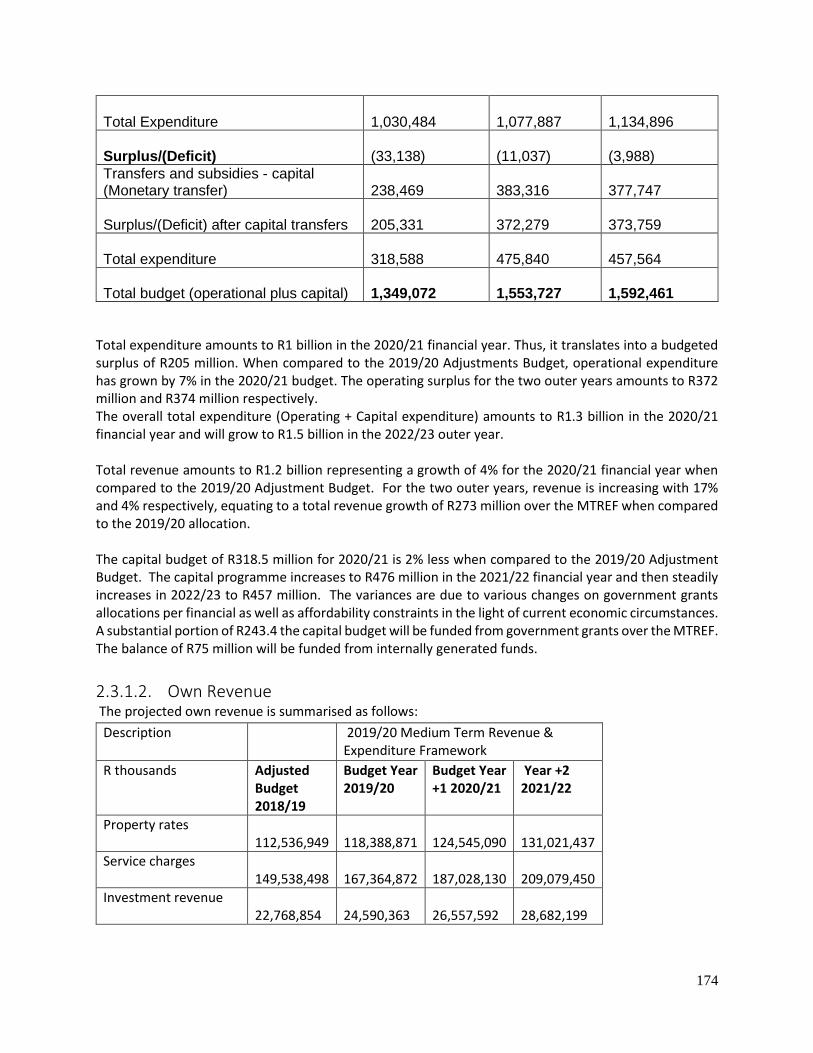
174
Total Expenditure 1,030,484
1,077,887
1,134,896
Surplus/(Deficit) (33,138)
(11,037)
(3,988)
Transfers and subsidies - capital (Monetary transfer)
238,469
383,316
377,747
Surplus/(Deficit) after capital transfers 205,331
372,279
373,759
Total expenditure 318,588
475,840
457,564
Total budget (operational plus capital) 1,349,072
1,553,727
1,592,461
Total expenditure amounts to R1 billion in the 2020/21 financial year. Thus, it translates into a budgeted surplus of R205 million. When compared to the 2019/20 Adjustments Budget, operational expenditure has grown by 7% in the 2020/21 budget. The operating surplus for the two outer years amounts to R372 million and R374 million respectively. The overall total expenditure (Operating + Capital expenditure) amounts to R1.3 billion in the 2020/21 financial year and will grow to R1.5 billion in the 2022/23 outer year. Total revenue amounts to R1.2 billion representing a growth of 4% for the 2020/21 financial year when compared to the 2019/20 Adjustment Budget. For the two outer years, revenue is increasing with 17% and 4% respectively, equating to a total revenue growth of R273 million over the MTREF when compared to the 2019/20 allocation. The capital budget of R318.5 million for 2020/21 is 2% less when compared to the 2019/20 Adjustment Budget. The capital programme increases to R476 million in the 2021/22 financial year and then steadily increases in 2022/23 to R457 million. The variances are due to various changes on government grants allocations per financial as well as affordability constraints in the light of current economic circumstances. A substantial portion of R243.4 the capital budget will be funded from government grants over the MTREF. The balance of R75 million will be funded from internally generated funds.
2.3.1.2. Own Revenue The projected own revenue is summarised as follows:
Description 2019/20 Medium Term Revenue & Expenditure Framework
R thousands Adjusted Budget 2018/19
Budget Year 2019/20
Budget Year +1 2020/21
Year +2 2021/22
Property rates 112,536,949
118,388,871
124,545,090
131,021,437
Service charges 149,538,498
167,364,872
187,028,130
209,079,450
Investment revenue 22,768,854
24,590,363
26,557,592
28,682,199
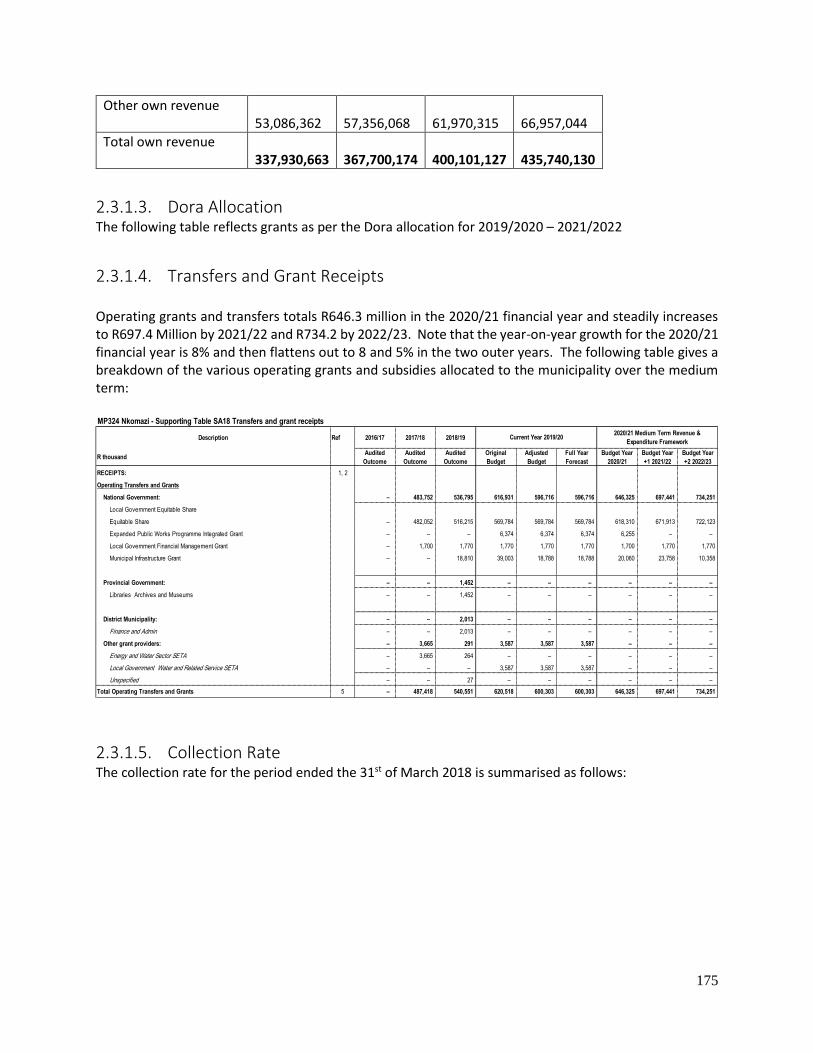
175
Other own revenue 53,086,362
57,356,068
61,970,315
66,957,044
Total own revenue 337,930,663
367,700,174
400,101,127
435,740,130
2.3.1.3. Dora Allocation The following table reflects grants as per the Dora allocation for 2019/2020 – 2021/2022
2.3.1.4. Transfers and Grant Receipts
Operating grants and transfers totals R646.3 million in the 2020/21 financial year and steadily increases to R697.4 Million by 2021/22 and R734.2 by 2022/23. Note that the year-on-year growth for the 2020/21 financial year is 8% and then flattens out to 8 and 5% in the two outer years. The following table gives a breakdown of the various operating grants and subsidies allocated to the municipality over the medium term:
2.3.1.5. Collection Rate The collection rate for the period ended the 31st of March 2018 is summarised as follows:
MP324 Nkomazi - Supporting Table SA18 Transfers and grant receipts
Description Ref 2016/17 2017/18 2018/19
R thousandAudited
Outcome
Audited
Outcome
Audited
Outcome
Original
Budget
Adjusted
Budget
Full Year
Forecast
Budget Year
2020/21
Budget Year
+1 2021/22
Budget Year
+2 2022/23
RECEIPTS: 1, 2
Operating Transfers and Grants
National Government: – 483,752 536,795 616,931 596,716 596,716 646,325 697,441 734,251
Local Government Equitable Share
Equitable Share – 482,052 516,215 569,784 569,784 569,784 618,310 671,913 722,123
Expanded Public Works Programme Integrated Grant – – – 6,374 6,374 6,374 6,255 – –
Local Government Financial Management Grant – 1,700 1,770 1,770 1,770 1,770 1,700 1,770 1,770
Municipal Infrastructure Grant – – 18,810 39,003 18,788 18,788 20,060 23,758 10,358
Provincial Government: – – 1,452 – – – – – –
Libraries Archives and Museums – – 1,452 – – – – – –
District Municipality: – – 2,013 – – – – – –
Finance and Admin – – 2,013 – – – – – –
Other grant providers: – 3,665 291 3,587 3,587 3,587 – – –
Energy and Water Sector SETA – 3,665 264 – – – – – –
Local Government Water and Related Service SETA – – – 3,587 3,587 3,587 – – –
Unspecified – – 27 – – – – – –
Total Operating Transfers and Grants 5 – 487,418 540,551 620,518 600,303 600,303 646,325 697,441 734,251
Current Year 2019/202020/21 Medium Term Revenue &
Expenditure Framework
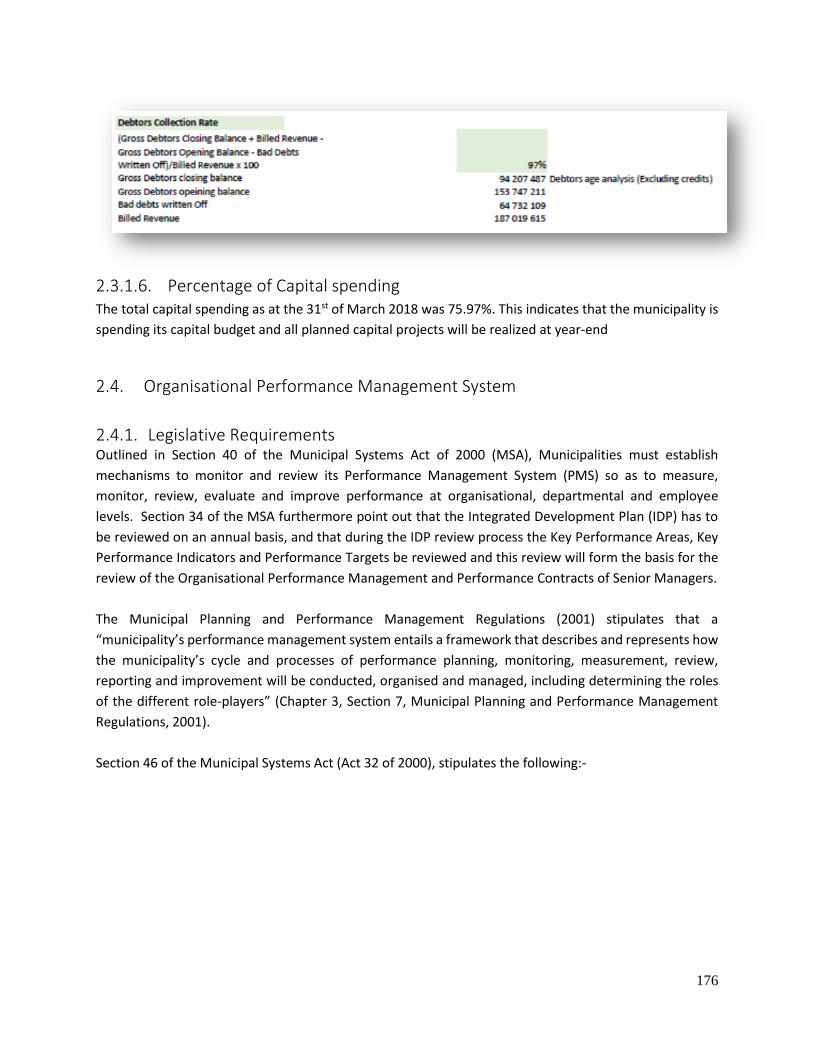
176
2.3.1.6. Percentage of Capital spending The total capital spending as at the 31st of March 2018 was 75.97%. This indicates that the municipality is
spending its capital budget and all planned capital projects will be realized at year-end
2.4. Organisational Performance Management System
2.4.1. Legislative Requirements Outlined in Section 40 of the Municipal Systems Act of 2000 (MSA), Municipalities must establish
mechanisms to monitor and review its Performance Management System (PMS) so as to measure,
monitor, review, evaluate and improve performance at organisational, departmental and employee
levels. Section 34 of the MSA furthermore point out that the Integrated Development Plan (IDP) has to
be reviewed on an annual basis, and that during the IDP review process the Key Performance Areas, Key
Performance Indicators and Performance Targets be reviewed and this review will form the basis for the
review of the Organisational Performance Management and Performance Contracts of Senior Managers.
The Municipal Planning and Performance Management Regulations (2001) stipulates that a
“municipality’s performance management system entails a framework that describes and represents how
the municipality’s cycle and processes of performance planning, monitoring, measurement, review,
reporting and improvement will be conducted, organised and managed, including determining the roles
of the different role-players” (Chapter 3, Section 7, Municipal Planning and Performance Management
Regulations, 2001).
Section 46 of the Municipal Systems Act (Act 32 of 2000), stipulates the following:-
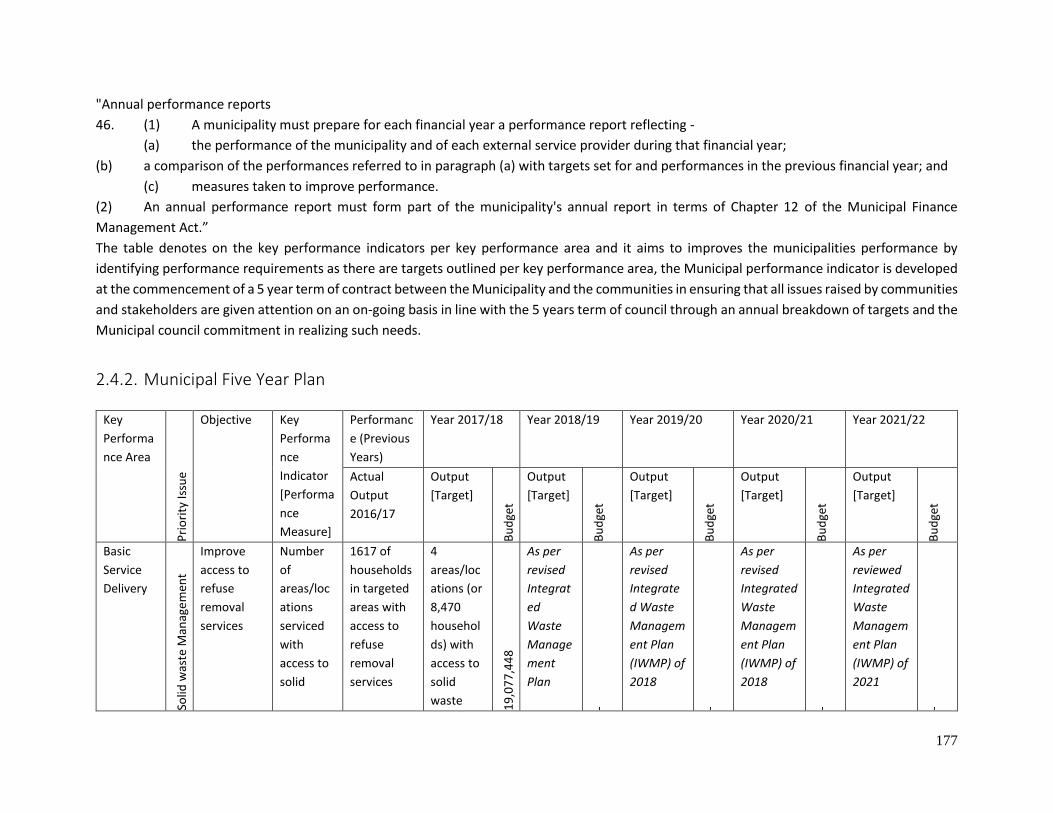
177
"Annual performance reports
46. (1) A municipality must prepare for each financial year a performance report reflecting -
(a) the performance of the municipality and of each external service provider during that financial year;
(b) a comparison of the performances referred to in paragraph (a) with targets set for and performances in the previous financial year; and
(c) measures taken to improve performance.
(2) An annual performance report must form part of the municipality's annual report in terms of Chapter 12 of the Municipal Finance
Management Act.”
The table denotes on the key performance indicators per key performance area and it aims to improves the municipalities performance by
identifying performance requirements as there are targets outlined per key performance area, the Municipal performance indicator is developed
at the commencement of a 5 year term of contract between the Municipality and the communities in ensuring that all issues raised by communities
and stakeholders are given attention on an on-going basis in line with the 5 years term of council through an annual breakdown of targets and the
Municipal council commitment in realizing such needs.
2.4.2. Municipal Five Year Plan
Key
Performa
nce Area
Pri
ori
ty Is
sue
[Pro
gram
me
]
Objective Key
Performa
nce
Indicator
[Performa
nce
Measure]
Performanc
e (Previous
Years)
Year 2017/18 Year 2018/19 Year 2019/20 Year 2020/21 Year 2021/22
Actual
Output
2016/17
Output
[Target] B
ud
get
Output
[Target]
Bu
dge
t
Output
[Target]
Bu
dge
t
Output
[Target]
Bu
dge
t
Output
[Target]
Bu
dge
t
Basic
Service
Delivery
Solid
was
te M
anag
em
ent
Improve
access to
refuse
removal
services
Number
of
areas/loc
ations
serviced
with
access to
solid
1617 of
households
in targeted
areas with
access to
refuse
removal
services
4
areas/loc
ations (or
8,470
househol
ds) with
access to
solid
waste 19
,07
7,4
48
As per
revised
Integrat
ed
Waste
Manage
ment
Plan
-
As per
revised
Integrate
d Waste
Managem
ent Plan
(IWMP) of
2018
-
As per
revised
Integrated
Waste
Managem
ent Plan
(IWMP) of
2018
-
As per
reviewed
Integrated
Waste
Managem
ent Plan
(IWMP) of
2021
-
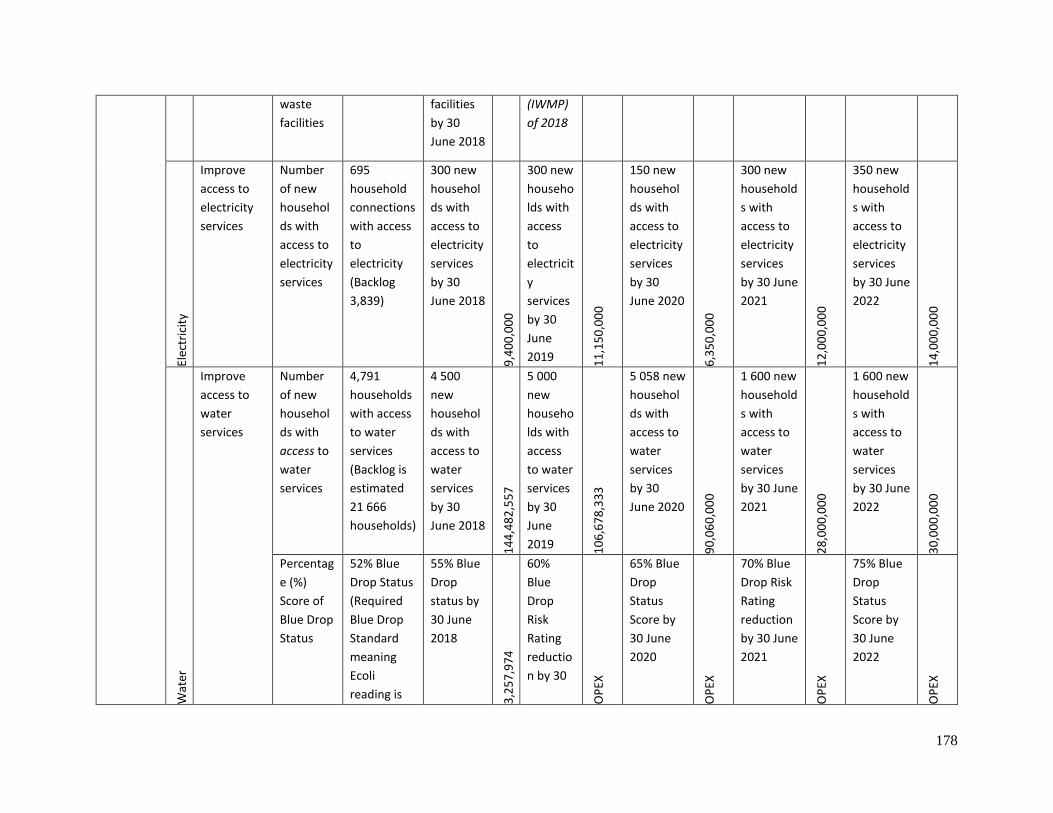
178
waste
facilities
facilities
by 30
June 2018
(IWMP)
of 2018
Elec
tric
ity
Improve
access to
electricity
services
Number
of new
househol
ds with
access to
electricity
services
695
household
connections
with access
to
electricity
(Backlog
3,839)
300 new
househol
ds with
access to
electricity
services
by 30
June 2018
9,4
00
,00
0
300 new
househo
lds with
access
to
electricit
y
services
by 30
June
2019 11
,15
0,0
00
150 new
househol
ds with
access to
electricity
services
by 30
June 2020
6,3
50
,00
0
300 new
household
s with
access to
electricity
services
by 30 June
2021
12
,00
0,0
00
350 new
household
s with
access to
electricity
services
by 30 June
2022
14
,00
0,0
00
Wat
er
Improve
access to
water
services
Number
of new
househol
ds with
access to
water
services
4,791
households
with access
to water
services
(Backlog is
estimated
21 666
households)
4 500
new
househol
ds with
access to
water
services
by 30
June 2018
14
4,4
82
,55
7
5 000
new
househo
lds with
access
to water
services
by 30
June
2019 10
6,6
78
,33
3
5 058 new
househol
ds with
access to
water
services
by 30
June 2020
90
,06
0,0
00
1 600 new
household
s with
access to
water
services
by 30 June
2021
28
,00
0,0
00
1 600 new
household
s with
access to
water
services
by 30 June
2022
30
,00
0,0
00
Percentag
e (%)
Score of
Blue Drop
Status
52% Blue
Drop Status
(Required
Blue Drop
Standard
meaning
Ecoli
reading is
55% Blue
Drop
status by
30 June
2018
3,2
57
,97
4
60%
Blue
Drop
Risk
Rating
reductio
n by 30
OP
EX
65% Blue
Drop
Status
Score by
30 June
2020
OP
EX
70% Blue
Drop Risk
Rating
reduction
by 30 June
2021
OP
EX
75% Blue
Drop
Status
Score by
30 June
2022
OP
EX
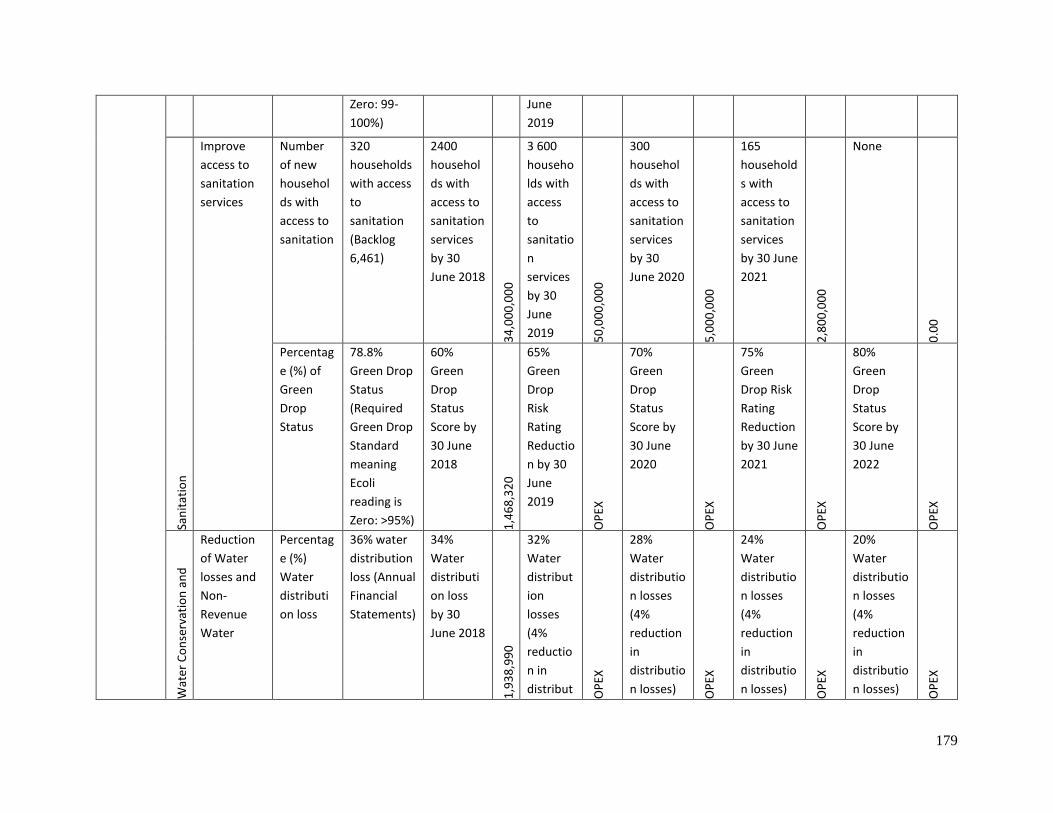
179
Zero: 99-
100%)
June
2019
San
itat
ion
Improve
access to
sanitation
services
Number
of new
househol
ds with
access to
sanitation
320
households
with access
to
sanitation
(Backlog
6,461)
2400
househol
ds with
access to
sanitation
services
by 30
June 2018
34
,00
0,0
00
3 600
househo
lds with
access
to
sanitatio
n
services
by 30
June
2019 50
,00
0,0
00
300
househol
ds with
access to
sanitation
services
by 30
June 2020
5,0
00
,00
0
165
household
s with
access to
sanitation
services
by 30 June
2021
2,8
00
,00
0
None
0.0
0
Percentag
e (%) of
Green
Drop
Status
78.8%
Green Drop
Status
(Required
Green Drop
Standard
meaning
Ecoli
reading is
Zero: >95%)
60%
Green
Drop
Status
Score by
30 June
2018
1,4
68
,32
0
65%
Green
Drop
Risk
Rating
Reductio
n by 30
June
2019
OP
EX
70%
Green
Drop
Status
Score by
30 June
2020
OP
EX
75%
Green
Drop Risk
Rating
Reduction
by 30 June
2021
OP
EX
80%
Green
Drop
Status
Score by
30 June
2022
OP
EX
Wat
er C
on
serv
atio
n a
nd
Wat
er D
em
and
Man
agem
ent
(WC
WD
M)
Reduction
of Water
losses and
Non-
Revenue
Water
Percentag
e (%)
Water
distributi
on loss
36% water
distribution
loss (Annual
Financial
Statements)
34%
Water
distributi
on loss
by 30
June 2018
1,9
38
,99
0
32%
Water
distribut
ion
losses
(4%
reductio
n in
distribut OP
EX
28%
Water
distributio
n losses
(4%
reduction
in
distributio
n losses) OP
EX
24%
Water
distributio
n losses
(4%
reduction
in
distributio
n losses) OP
EX
20%
Water
distributio
n losses
(4%
reduction
in
distributio
n losses) OP
EX
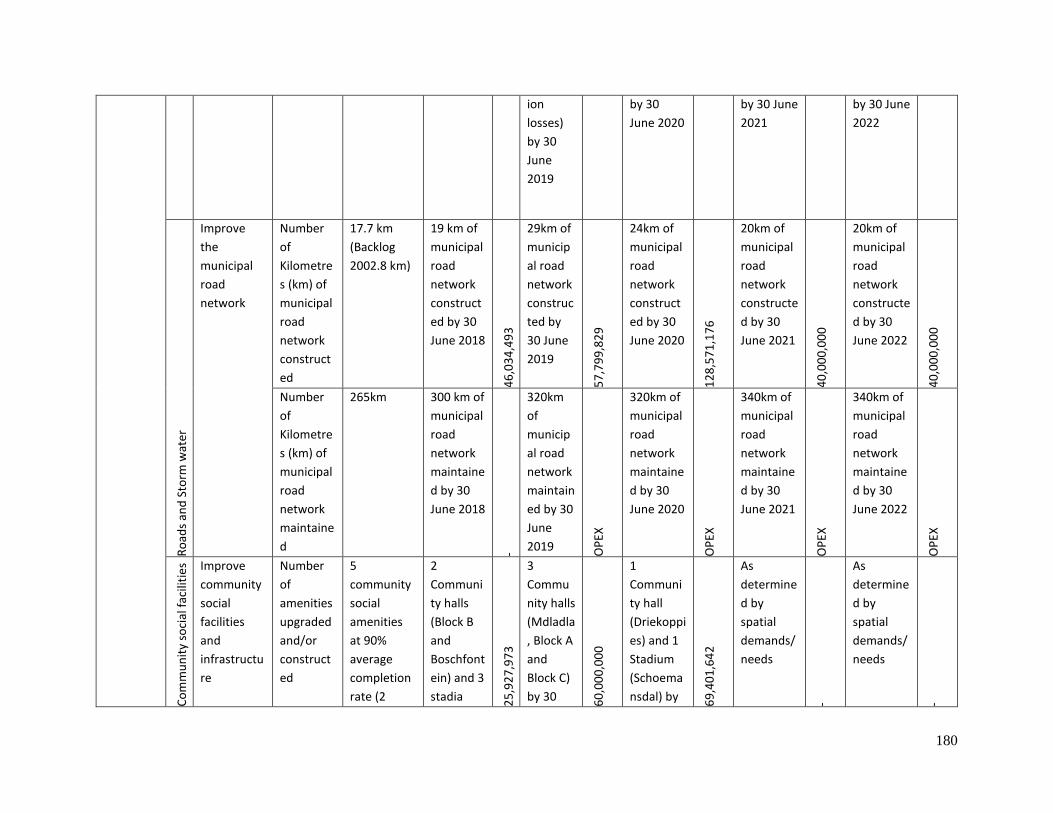
180
ion
losses)
by 30
June
2019
by 30
June 2020
by 30 June
2021
by 30 June
2022
Ro
ads
and
Sto
rm w
ater
Improve
the
municipal
road
network
Number
of
Kilometre
s (km) of
municipal
road
network
construct
ed
17.7 km
(Backlog
2002.8 km)
19 km of
municipal
road
network
construct
ed by 30
June 2018
46
,03
4,4
93
29km of
municip
al road
network
construc
ted by
30 June
2019
57
,79
9,8
29
24km of
municipal
road
network
construct
ed by 30
June 2020
12
8,5
71
,17
6
20km of
municipal
road
network
constructe
d by 30
June 2021
40
,00
0,0
00
20km of
municipal
road
network
constructe
d by 30
June 2022
40
,00
0,0
00
Number
of
Kilometre
s (km) of
municipal
road
network
maintaine
d
265km 300 km of
municipal
road
network
maintaine
d by 30
June 2018 -
320km
of
municip
al road
network
maintain
ed by 30
June
2019 OP
EX
320km of
municipal
road
network
maintaine
d by 30
June 2020
OP
EX
340km of
municipal
road
network
maintaine
d by 30
June 2021
OP
EX
340km of
municipal
road
network
maintaine
d by 30
June 2022
OP
EX
Co
mm
un
ity
soci
al f
acili
tie
s
and
infr
astr
uct
ure
Improve
community
social
facilities
and
infrastructu
re
Number
of
amenities
upgraded
and/or
construct
ed
5
community
social
amenities
at 90%
average
completion
rate (2
2
Communi
ty halls
(Block B
and
Boschfont
ein) and 3
stadia 25
,92
7,9
73
3
Commu
nity halls
(Mdladla
, Block A
and
Block C)
by 30 60
,00
0,0
00
1
Communi
ty hall
(Driekoppi
es) and 1
Stadium
(Schoema
nsdal) by 69
,40
1,6
42
As
determine
d by
spatial
demands/
needs
-
As
determine
d by
spatial
demands/
needs
-
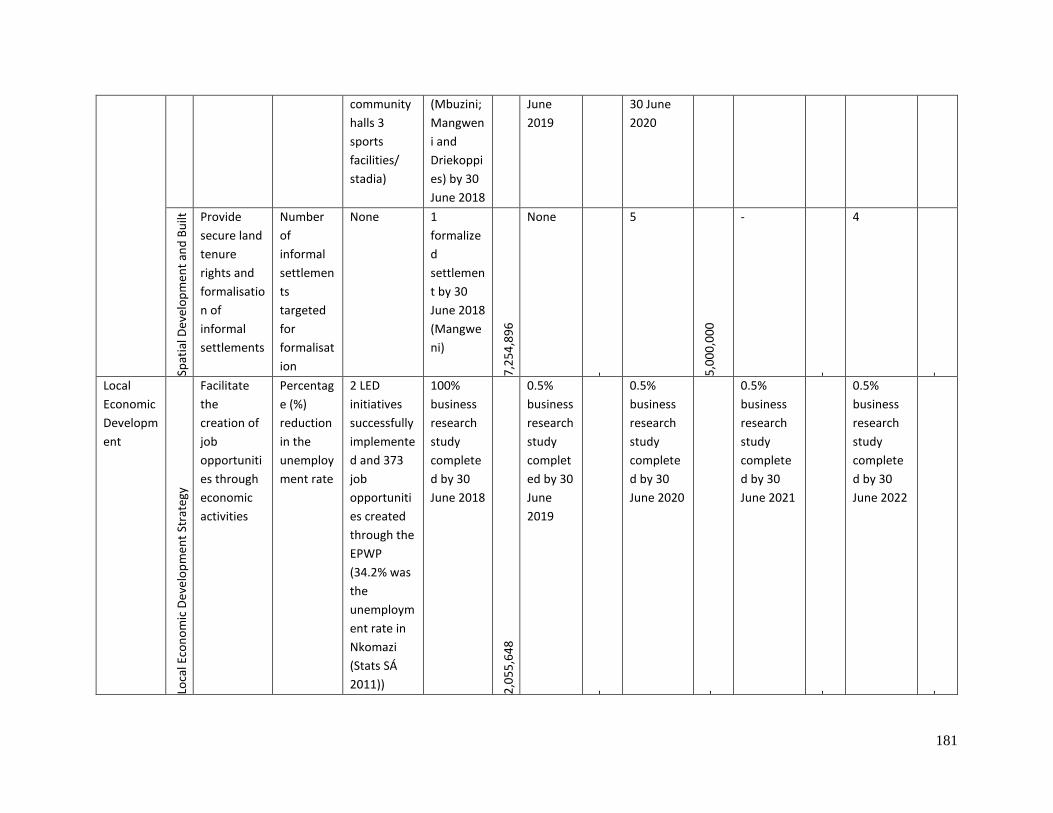
181
community
halls 3
sports
facilities/
stadia)
(Mbuzini;
Mangwen
i and
Driekoppi
es) by 30
June 2018
June
2019
30 June
2020
Spat
ial D
evel
op
men
t an
d B
uilt
Envi
ron
men
t
Provide
secure land
tenure
rights and
formalisatio
n of
informal
settlements
Number
of
informal
settlemen
ts
targeted
for
formalisat
ion
None 1
formalize
d
settlemen
t by 30
June 2018
(Mangwe
ni)
7,2
54
,89
6
None
-
5
5,0
00
,00
0
-
-
4
-
Local
Economic
Developm
ent
Loca
l Eco
no
mic
De
velo
pm
ent
Stra
tegy
Facilitate
the
creation of
job
opportuniti
es through
economic
activities
Percentag
e (%)
reduction
in the
unemploy
ment rate
2 LED
initiatives
successfully
implemente
d and 373
job
opportuniti
es created
through the
EPWP
(34.2% was
the
unemploym
ent rate in
Nkomazi
(Stats SÁ
2011))
100%
business
research
study
complete
d by 30
June 2018 2
,05
5,6
48
0.5%
business
research
study
complet
ed by 30
June
2019
-
0.5%
business
research
study
complete
d by 30
June 2020
-
0.5%
business
research
study
complete
d by 30
June 2021
-
0.5%
business
research
study
complete
d by 30
June 2022
-
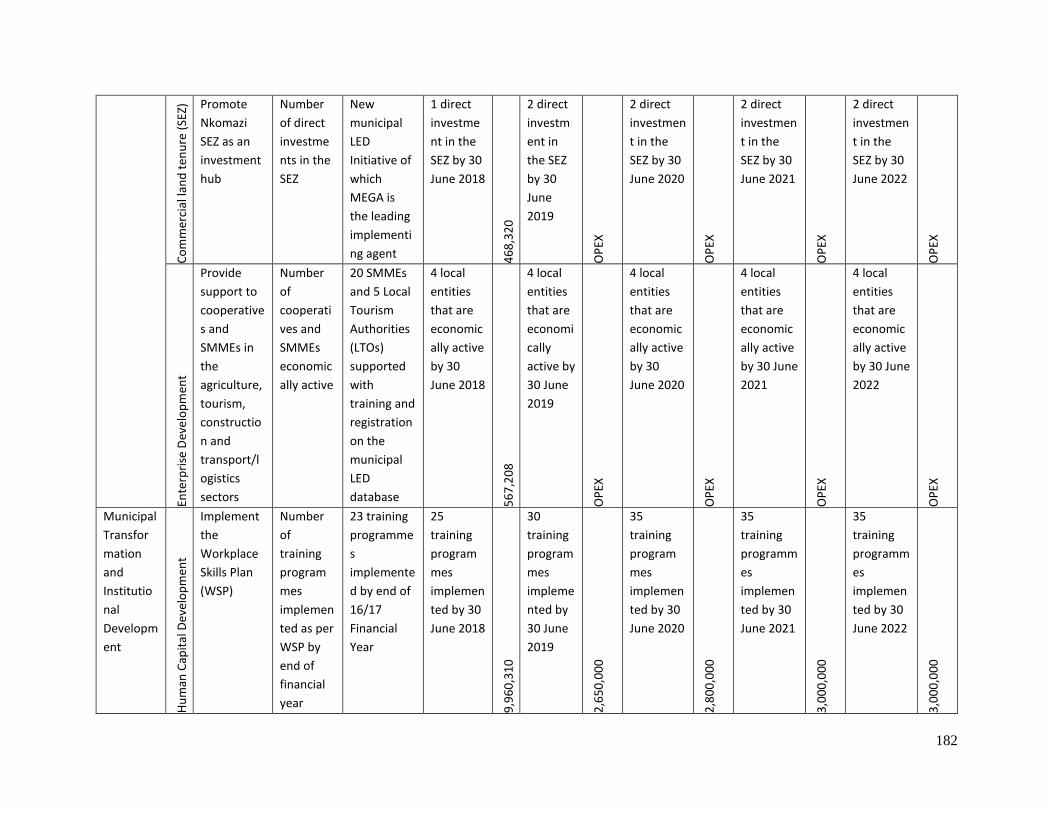
182
Co
mm
erci
al la
nd
ten
ure
(SE
Z) Promote
Nkomazi
SEZ as an
investment
hub
Number
of direct
investme
nts in the
SEZ
New
municipal
LED
Initiative of
which
MEGA is
the leading
implementi
ng agent
1 direct
investme
nt in the
SEZ by 30
June 2018
46
8,3
20
2 direct
investm
ent in
the SEZ
by 30
June
2019
OP
EX
2 direct
investmen
t in the
SEZ by 30
June 2020
OP
EX
2 direct
investmen
t in the
SEZ by 30
June 2021
OP
EX
2 direct
investmen
t in the
SEZ by 30
June 2022
OP
EX
Ente
rpri
se D
evel
op
men
t
Provide
support to
cooperative
s and
SMMEs in
the
agriculture,
tourism,
constructio
n and
transport/l
ogistics
sectors
Number
of
cooperati
ves and
SMMEs
economic
ally active
20 SMMEs
and 5 Local
Tourism
Authorities
(LTOs)
supported
with
training and
registration
on the
municipal
LED
database
4 local
entities
that are
economic
ally active
by 30
June 2018
56
7,2
08
4 local
entities
that are
economi
cally
active by
30 June
2019
OP
EX
4 local
entities
that are
economic
ally active
by 30
June 2020
OP
EX
4 local
entities
that are
economic
ally active
by 30 June
2021
OP
EX
4 local
entities
that are
economic
ally active
by 30 June
2022
OP
EX
Municipal
Transfor
mation
and
Institutio
nal
Developm
ent
Hu
man
Cap
ital
Dev
elo
pm
ent
Implement
the
Workplace
Skills Plan
(WSP)
Number
of
training
program
mes
implemen
ted as per
WSP by
end of
financial
year
23 training
programme
s
implemente
d by end of
16/17
Financial
Year
25
training
program
mes
implemen
ted by 30
June 2018
9,9
60
,31
0
30
training
program
mes
impleme
nted by
30 June
2019
2,6
50
,00
0
35
training
program
mes
implemen
ted by 30
June 2020
2,8
00
,00
0
35
training
programm
es
implemen
ted by 30
June 2021
3,0
00
,00
0
35
training
programm
es
implemen
ted by 30
June 2022
3,0
00
,00
0
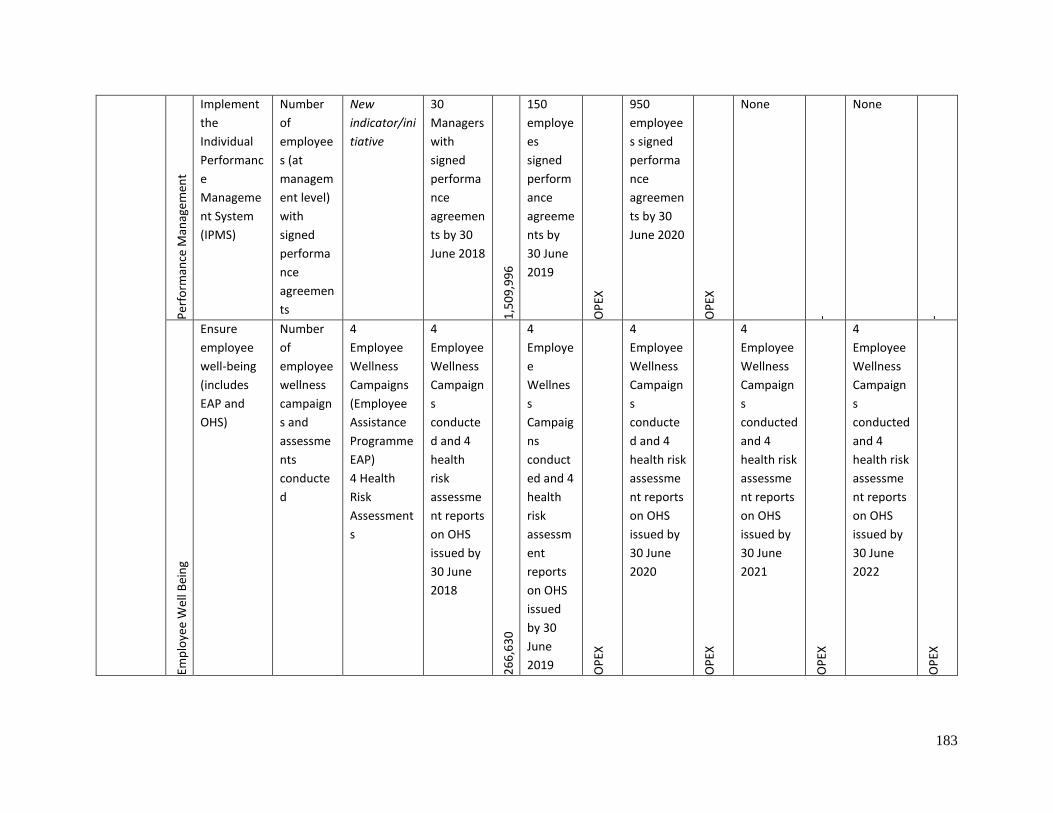
183
Per
form
ance
Man
age
men
t
Implement
the
Individual
Performanc
e
Manageme
nt System
(IPMS)
Number
of
employee
s (at
managem
ent level)
with
signed
performa
nce
agreemen
ts
New
indicator/ini
tiative
30
Managers
with
signed
performa
nce
agreemen
ts by 30
June 2018
1,5
09
,99
6
150
employe
es
signed
perform
ance
agreeme
nts by
30 June
2019
OP
EX
950
employee
s signed
performa
nce
agreemen
ts by 30
June 2020
OP
EX
None
-
None
-
Emp
loye
e W
ell B
ein
g
Ensure
employee
well-being
(includes
EAP and
OHS)
Number
of
employee
wellness
campaign
s and
assessme
nts
conducte
d
4
Employee
Wellness
Campaigns
(Employee
Assistance
Programme
EAP)
4 Health
Risk
Assessment
s
4
Employee
Wellness
Campaign
s
conducte
d and 4
health
risk
assessme
nt reports
on OHS
issued by
30 June
2018
26
6,6
30
4
Employe
e
Wellnes
s
Campaig
ns
conduct
ed and 4
health
risk
assessm
ent
reports
on OHS
issued
by 30
June
2019 OP
EX
4
Employee
Wellness
Campaign
s
conducte
d and 4
health risk
assessme
nt reports
on OHS
issued by
30 June
2020
OP
EX
4
Employee
Wellness
Campaign
s
conducted
and 4
health risk
assessme
nt reports
on OHS
issued by
30 June
2021
OP
EX
4
Employee
Wellness
Campaign
s
conducted
and 4
health risk
assessme
nt reports
on OHS
issued by
30 June
2022
OP
EX
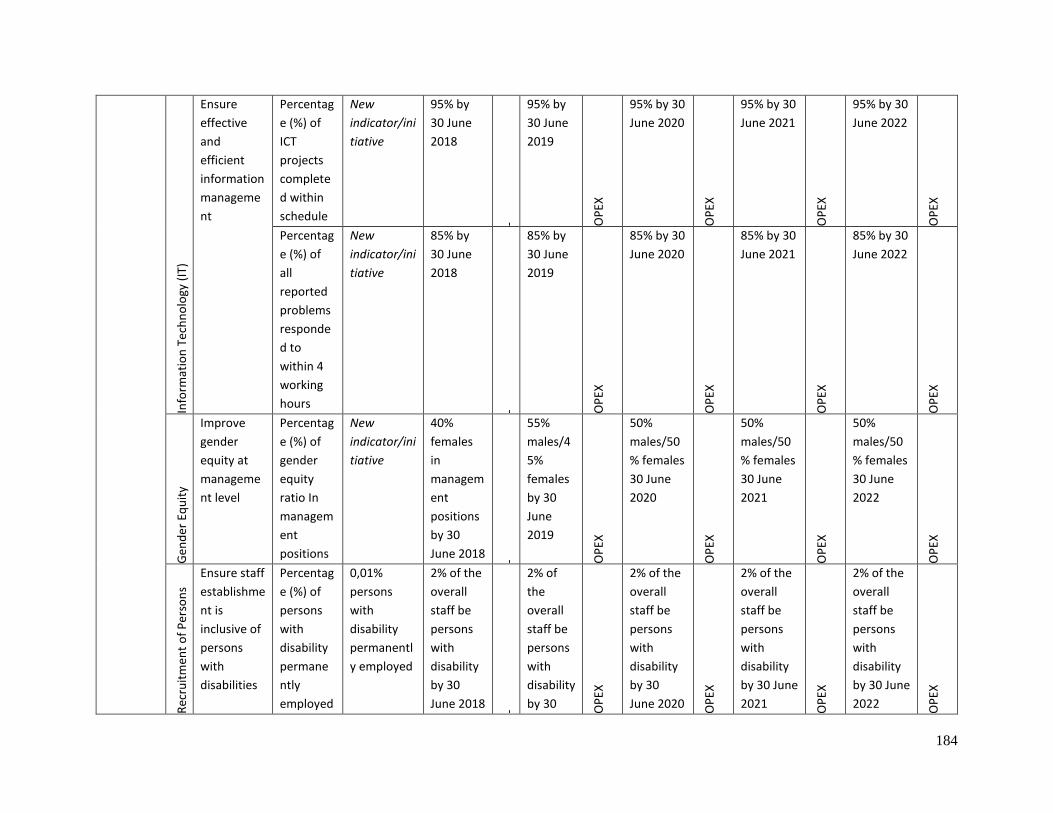
184
Info
rmat
ion
Te
chn
olo
gy (
IT)
Ensure
effective
and
efficient
information
manageme
nt
Percentag
e (%) of
ICT
projects
complete
d within
schedule
New
indicator/ini
tiative
95% by
30 June
2018
-
95% by
30 June
2019
OP
EX
95% by 30
June 2020
OP
EX
95% by 30
June 2021
OP
EX
95% by 30
June 2022
OP
EX
Percentag
e (%) of
all
reported
problems
responde
d to
within 4
working
hours
New
indicator/ini
tiative
85% by
30 June
2018
-
85% by
30 June
2019
OP
EX
85% by 30
June 2020
OP
EX
85% by 30
June 2021
OP
EX
85% by 30
June 2022
OP
EX
Gen
der
Eq
uit
y
Improve
gender
equity at
manageme
nt level
Percentag
e (%) of
gender
equity
ratio In
managem
ent
positions
New
indicator/ini
tiative
40%
females
in
managem
ent
positions
by 30
June 2018 -
55%
males/4
5%
females
by 30
June
2019
OP
EX
50%
males/50
% females
30 June
2020
OP
EX
50%
males/50
% females
30 June
2021
OP
EX
50%
males/50
% females
30 June
2022
OP
EX
Rec
ruit
men
t o
f P
erso
ns
wit
h D
isab
iliti
es
Ensure staff
establishme
nt is
inclusive of
persons
with
disabilities
Percentag
e (%) of
persons
with
disability
permane
ntly
employed
0,01%
persons
with
disability
permanentl
y employed
2% of the
overall
staff be
persons
with
disability
by 30
June 2018 -
2% of
the
overall
staff be
persons
with
disability
by 30 OP
EX
2% of the
overall
staff be
persons
with
disability
by 30
June 2020 OP
EX
2% of the
overall
staff be
persons
with
disability
by 30 June
2021 OP
EX
2% of the
overall
staff be
persons
with
disability
by 30 June
2022 OP
EX
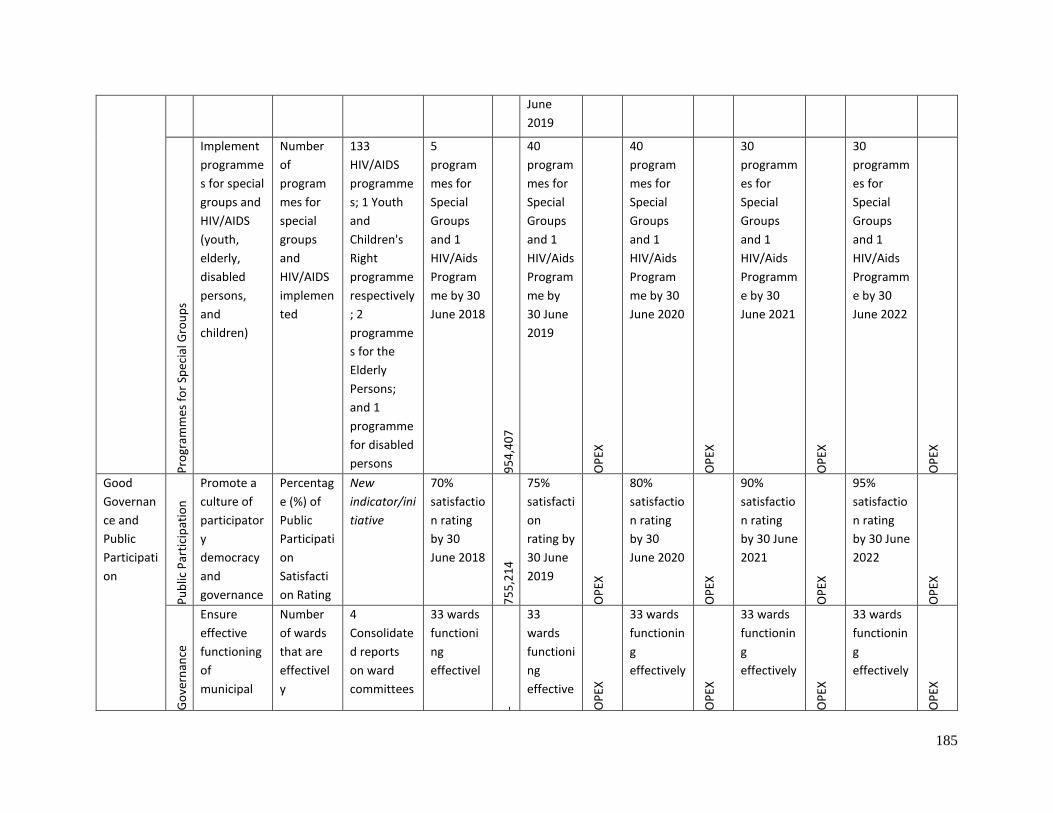
185
June
2019
Pro
gram
mes
fo
r Sp
ecia
l Gro
up
s
Implement
programme
s for special
groups and
HIV/AIDS
(youth,
elderly,
disabled
persons,
and
children)
Number
of
program
mes for
special
groups
and
HIV/AIDS
implemen
ted
133
HIV/AIDS
programme
s; 1 Youth
and
Children's
Right
programme
respectively
; 2
programme
s for the
Elderly
Persons;
and 1
programme
for disabled
persons
5
program
mes for
Special
Groups
and 1
HIV/Aids
Program
me by 30
June 2018
95
4,4
07
40
program
mes for
Special
Groups
and 1
HIV/Aids
Program
me by
30 June
2019
OP
EX
40
program
mes for
Special
Groups
and 1
HIV/Aids
Program
me by 30
June 2020
OP
EX
30
programm
es for
Special
Groups
and 1
HIV/Aids
Programm
e by 30
June 2021
OP
EX
30
programm
es for
Special
Groups
and 1
HIV/Aids
Programm
e by 30
June 2022
OP
EX
Good
Governan
ce and
Public
Participati
on
Pu
blic
Par
tici
pat
ion
Info
rmat
ion
Sys
tem
Promote a
culture of
participator
y
democracy
and
governance
Percentag
e (%) of
Public
Participati
on
Satisfacti
on Rating
New
indicator/ini
tiative
70%
satisfactio
n rating
by 30
June 2018
75
5,2
14
75%
satisfacti
on
rating by
30 June
2019
OP
EX
80%
satisfactio
n rating
by 30
June 2020
OP
EX
90%
satisfactio
n rating
by 30 June
2021
OP
EX
95%
satisfactio
n rating
by 30 June
2022
OP
EX
Go
vern
ance
Stru
ctu
res
Ensure
effective
functioning
of
municipal
Number
of wards
that are
effectivel
y
4
Consolidate
d reports
on ward
committees
33 wards
functioni
ng
effectivel
-
33
wards
functioni
ng
effective
OP
EX
33 wards
functionin
g
effectively
OP
EX
33 wards
functionin
g
effectively
OP
EX
33 wards
functionin
g
effectively
OP
EX
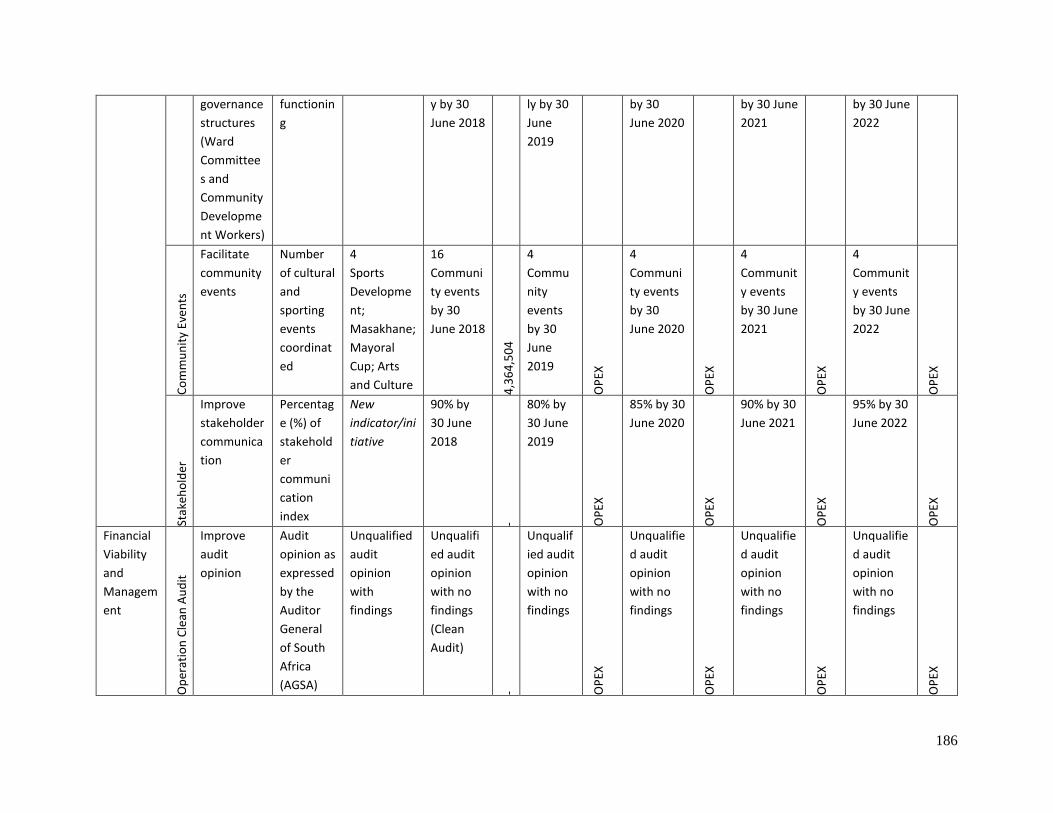
186
governance
structures
(Ward
Committee
s and
Community
Developme
nt Workers)
functionin
g
y by 30
June 2018
ly by 30
June
2019
by 30
June 2020
by 30 June
2021
by 30 June
2022
Co
mm
un
ity
Even
ts
Facilitate
community
events
Number
of cultural
and
sporting
events
coordinat
ed
4
Sports
Developme
nt;
Masakhane;
Mayoral
Cup; Arts
and Culture
16
Communi
ty events
by 30
June 2018
4,3
64
,50
4
4
Commu
nity
events
by 30
June
2019
OP
EX
4
Communi
ty events
by 30
June 2020
OP
EX
4
Communit
y events
by 30 June
2021
OP
EX
4
Communit
y events
by 30 June
2022
OP
EX
Stak
eho
lder
Co
mm
un
icat
ion
Man
agem
ent
Improve
stakeholder
communica
tion
Percentag
e (%) of
stakehold
er
communi
cation
index
New
indicator/ini
tiative
90% by
30 June
2018
-
80% by
30 June
2019
OP
EX
85% by 30
June 2020
OP
EX
90% by 30
June 2021
OP
EX
95% by 30
June 2022
OP
EX
Financial
Viability
and
Managem
ent
Op
erat
ion
Cle
an A
ud
it
Improve
audit
opinion
Audit
opinion as
expressed
by the
Auditor
General
of South
Africa
(AGSA)
Unqualified
audit
opinion
with
findings
Unqualifi
ed audit
opinion
with no
findings
(Clean
Audit)
-
Unqualif
ied audit
opinion
with no
findings O
PEX
Unqualifie
d audit
opinion
with no
findings
OP
EX
Unqualifie
d audit
opinion
with no
findings
OP
EX
Unqualifie
d audit
opinion
with no
findings
OP
EX
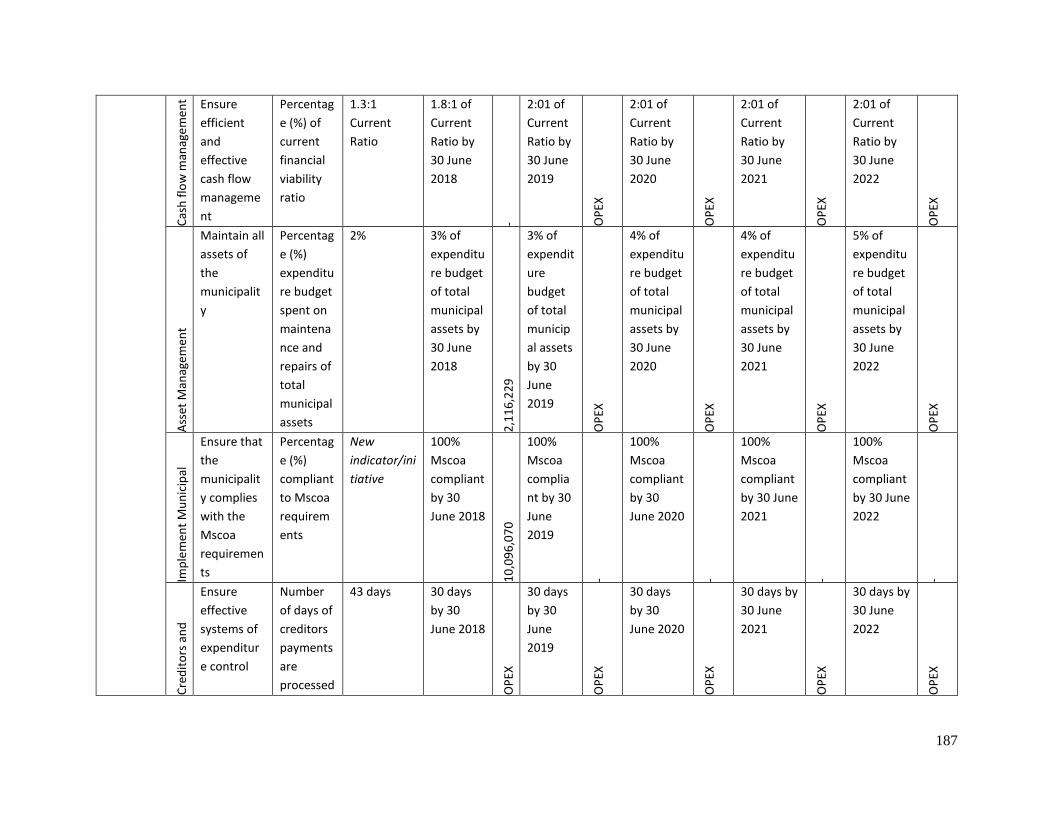
187
Cas
h f
low
man
age
men
t Ensure
efficient
and
effective
cash flow
manageme
nt
Percentag
e (%) of
current
financial
viability
ratio
1.3:1
Current
Ratio
1.8:1 of
Current
Ratio by
30 June
2018
-
2:01 of
Current
Ratio by
30 June
2019
OP
EX
2:01 of
Current
Ratio by
30 June
2020
OP
EX
2:01 of
Current
Ratio by
30 June
2021
OP
EX
2:01 of
Current
Ratio by
30 June
2022
OP
EX
Ass
et M
anag
em
ent
Maintain all
assets of
the
municipalit
y
Percentag
e (%)
expenditu
re budget
spent on
maintena
nce and
repairs of
total
municipal
assets
2% 3% of
expenditu
re budget
of total
municipal
assets by
30 June
2018
2,1
16
,22
9
3% of
expendit
ure
budget
of total
municip
al assets
by 30
June
2019
OP
EX
4% of
expenditu
re budget
of total
municipal
assets by
30 June
2020
OP
EX
4% of
expenditu
re budget
of total
municipal
assets by
30 June
2021
OP
EX
5% of
expenditu
re budget
of total
municipal
assets by
30 June
2022
OP
EX
Imp
lem
ent
Mu
nic
ipal
stan
dar
d c
har
t o
f ac
cou
nts
Ensure that
the
municipalit
y complies
with the
Mscoa
requiremen
ts
Percentag
e (%)
compliant
to Mscoa
requirem
ents
New
indicator/ini
tiative
100%
Mscoa
compliant
by 30
June 2018 1
0,0
96
,07
0
100%
Mscoa
complia
nt by 30
June
2019
-
100%
Mscoa
compliant
by 30
June 2020
-
100%
Mscoa
compliant
by 30 June
2021
-
100%
Mscoa
compliant
by 30 June
2022
-
Cre
dit
ors
an
d
Op
erat
ing
Exp
end
itu
re
Man
agem
ent
Ensure
effective
systems of
expenditur
e control
Number
of days of
creditors
payments
are
processed
43 days 30 days
by 30
June 2018
OP
EX
30 days
by 30
June
2019
OP
EX
30 days
by 30
June 2020
OP
EX
30 days by
30 June
2021
OP
EX
30 days by
30 June
2022
OP
EX
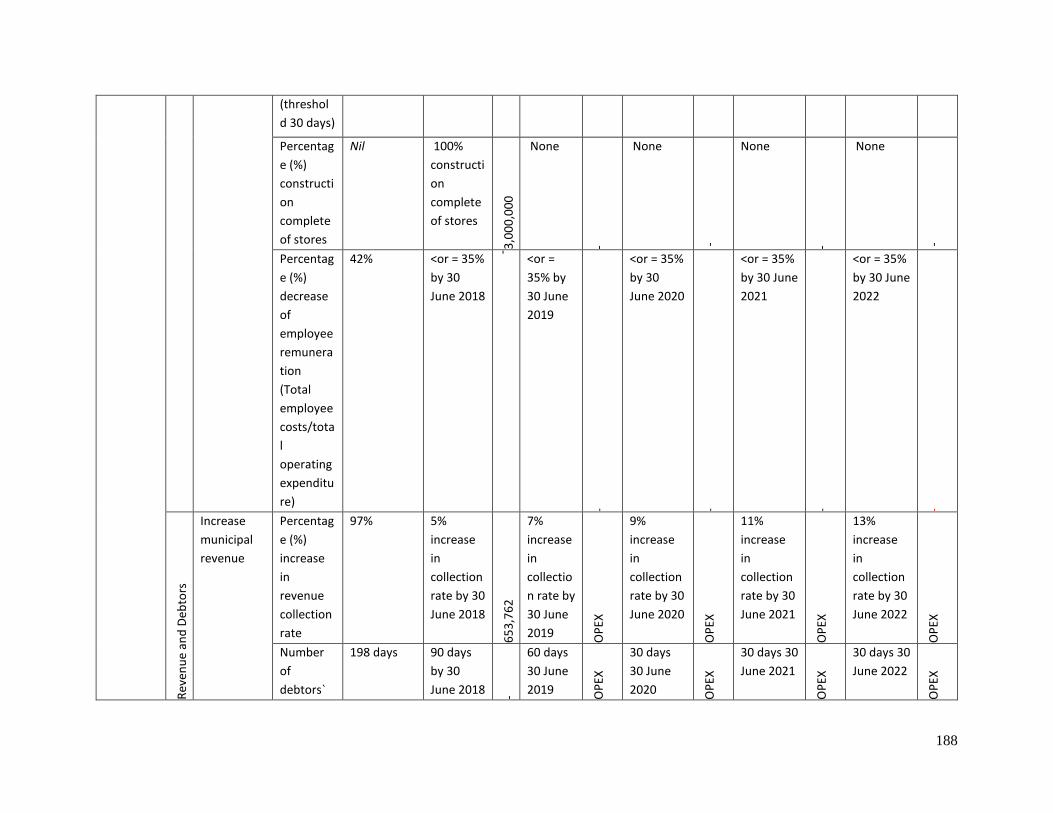
188
(threshol
d 30 days)
Percentag
e (%)
constructi
on
complete
of stores
Nil 100%
constructi
on
complete
of stores
3,0
00
,00
0
None
-
None
-
None
-
None
-
Percentag
e (%)
decrease
of
employee
remunera
tion
(Total
employee
costs/tota
l
operating
expenditu
re)
42% <or = 35%
by 30
June 2018
-
<or =
35% by
30 June
2019
<or = 35%
by 30
June 2020
<or = 35%
by 30 June
2021
<or = 35%
by 30 June
2022
Rev
enu
e an
d D
ebto
rs
Man
agem
ent
Increase
municipal
revenue
Percentag
e (%)
increase
in
revenue
collection
rate
97% 5%
increase
in
collection
rate by 30
June 2018
65
3,7
62
7%
increase
in
collectio
n rate by
30 June
2019 OP
EX
9%
increase
in
collection
rate by 30
June 2020
OP
EX
11%
increase
in
collection
rate by 30
June 2021
OP
EX
13%
increase
in
collection
rate by 30
June 2022
OP
EX
Number
of
debtors`
198 days 90 days
by 30
June 2018 -
60 days
30 June
2019 OP
EX
30 days
30 June
2020 OP
EX
30 days 30
June 2021
OP
EX
30 days 30
June 2022
OP
EX
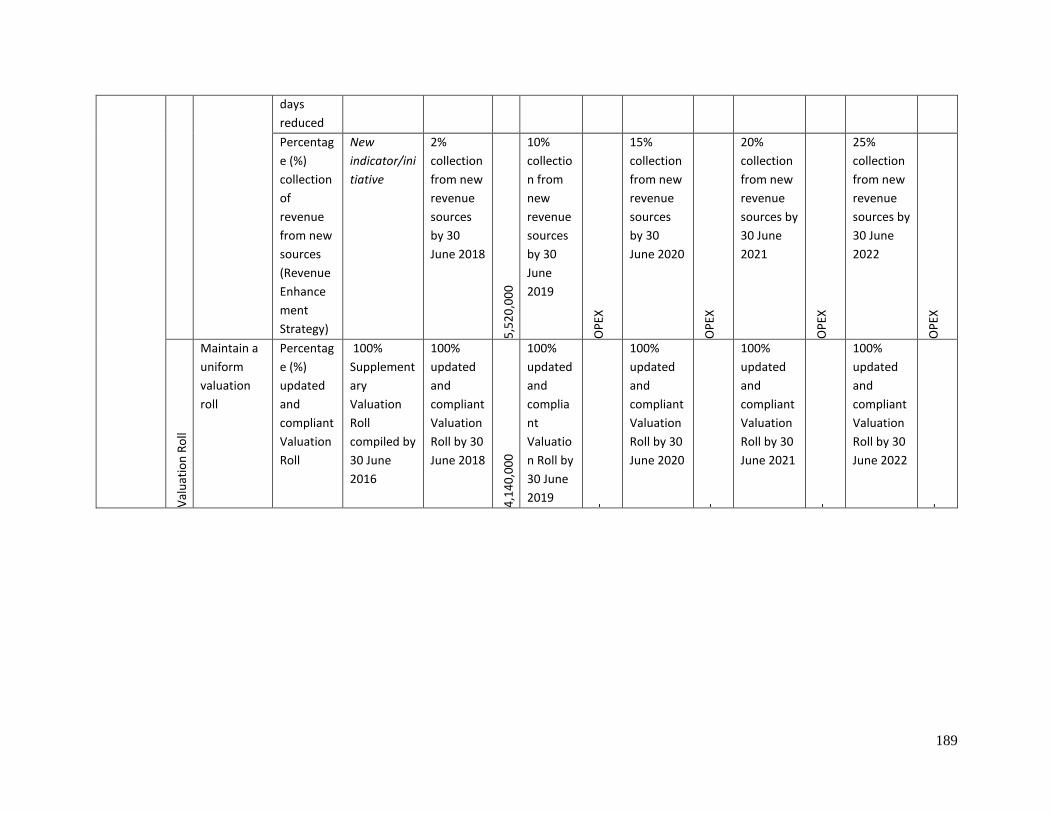
189
days
reduced
Percentag
e (%)
collection
of
revenue
from new
sources
(Revenue
Enhance
ment
Strategy)
New
indicator/ini
tiative
2%
collection
from new
revenue
sources
by 30
June 2018
5,5
20
,00
0
10%
collectio
n from
new
revenue
sources
by 30
June
2019
OP
EX
15%
collection
from new
revenue
sources
by 30
June 2020
OP
EX
20%
collection
from new
revenue
sources by
30 June
2021
OP
EX
25%
collection
from new
revenue
sources by
30 June
2022
OP
EX
Val
uat
ion
Ro
ll
Maintain a
uniform
valuation
roll
Percentag
e (%)
updated
and
compliant
Valuation
Roll
100%
Supplement
ary
Valuation
Roll
compiled by
30 June
2016
100%
updated
and
compliant
Valuation
Roll by 30
June 2018
4,1
40
,00
0
100%
updated
and
complia
nt
Valuatio
n Roll by
30 June
2019 -
100%
updated
and
compliant
Valuation
Roll by 30
June 2020
-
100%
updated
and
compliant
Valuation
Roll by 30
June 2021
-
100%
updated
and
compliant
Valuation
Roll by 30
June 2022
-
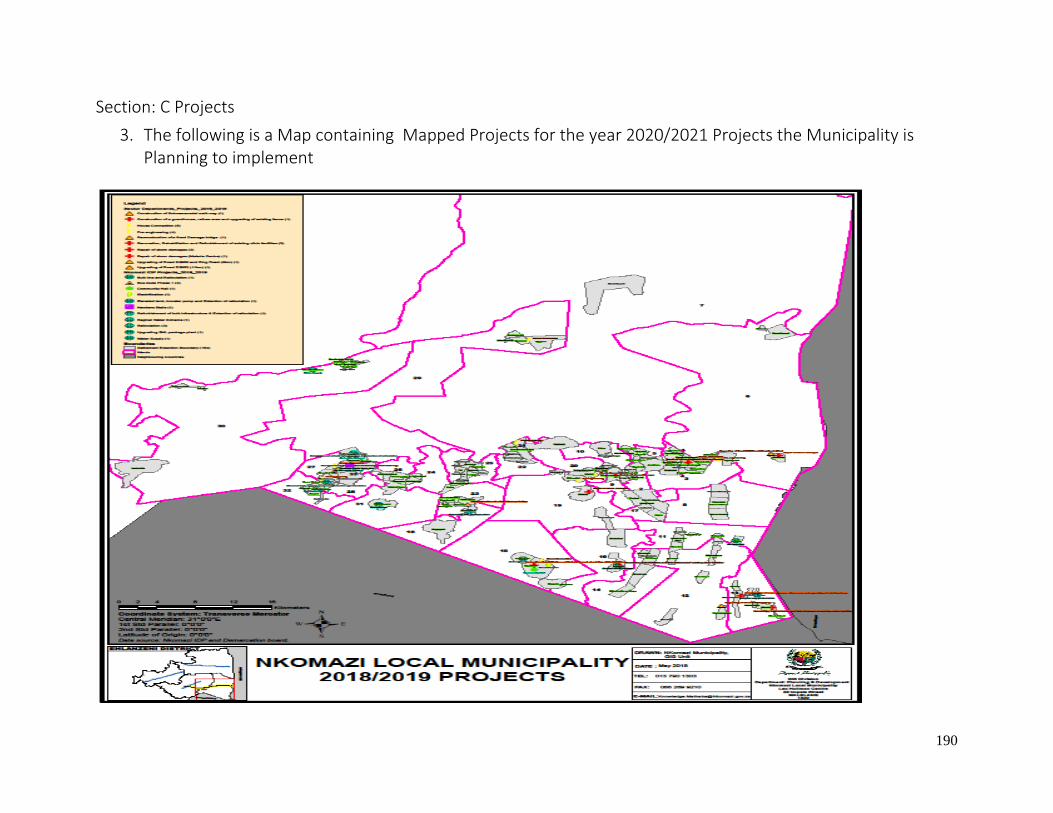
190
Section: C Projects
3. The following is a Map containing Mapped Projects for the year 2020/2021 Projects the Municipality is Planning to implement
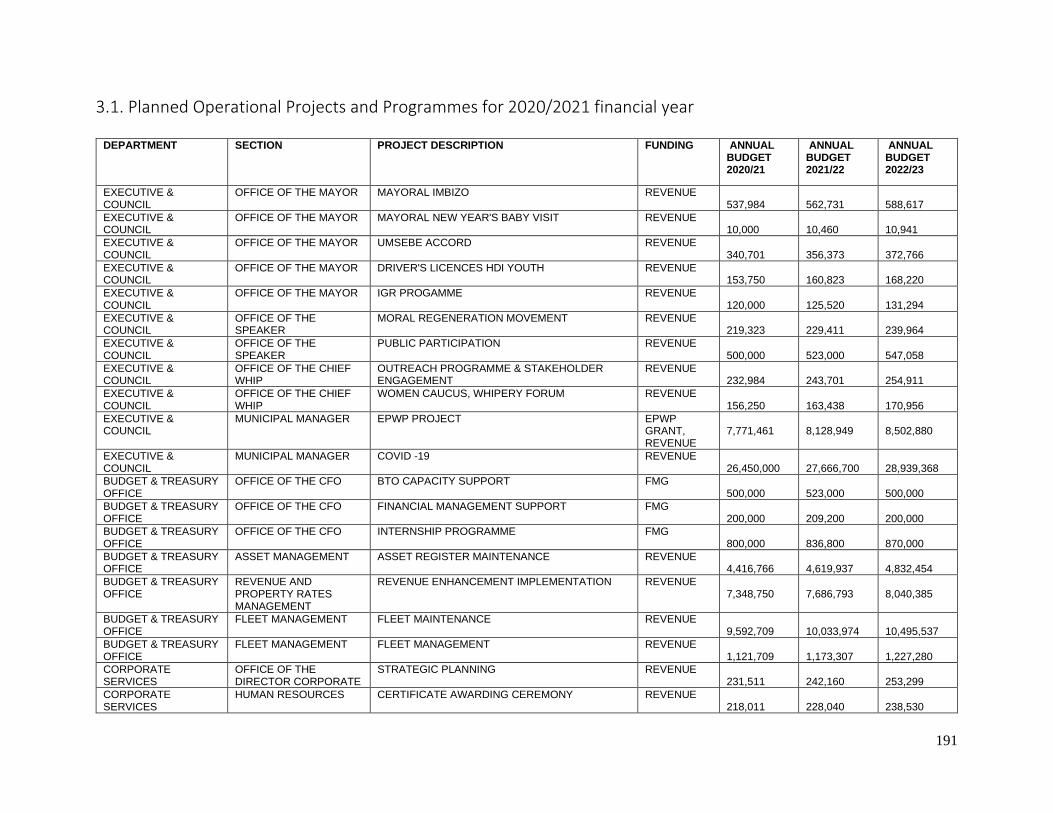
191
3.1. Planned Operational Projects and Programmes for 2020/2021 financial year
DEPARTMENT SECTION PROJECT DESCRIPTION FUNDING ANNUAL BUDGET 2020/21
ANNUAL BUDGET 2021/22
ANNUAL BUDGET 2022/23
EXECUTIVE & COUNCIL
OFFICE OF THE MAYOR MAYORAL IMBIZO REVENUE 537,984
562,731
588,617
EXECUTIVE & COUNCIL
OFFICE OF THE MAYOR MAYORAL NEW YEAR'S BABY VISIT REVENUE 10,000
10,460
10,941
EXECUTIVE & COUNCIL
OFFICE OF THE MAYOR UMSEBE ACCORD REVENUE 340,701
356,373
372,766
EXECUTIVE & COUNCIL
OFFICE OF THE MAYOR DRIVER'S LICENCES HDI YOUTH REVENUE 153,750
160,823
168,220
EXECUTIVE & COUNCIL
OFFICE OF THE MAYOR IGR PROGAMME REVENUE 120,000
125,520
131,294
EXECUTIVE & COUNCIL
OFFICE OF THE SPEAKER
MORAL REGENERATION MOVEMENT REVENUE 219,323
229,411
239,964
EXECUTIVE & COUNCIL
OFFICE OF THE SPEAKER
PUBLIC PARTICIPATION REVENUE 500,000
523,000
547,058
EXECUTIVE & COUNCIL
OFFICE OF THE CHIEF WHIP
OUTREACH PROGRAMME & STAKEHOLDER ENGAGEMENT
REVENUE 232,984
243,701
254,911
EXECUTIVE & COUNCIL
OFFICE OF THE CHIEF WHIP
WOMEN CAUCUS, WHIPERY FORUM REVENUE 156,250
163,438
170,956
EXECUTIVE & COUNCIL
MUNICIPAL MANAGER EPWP PROJECT EPWP GRANT, REVENUE
7,771,461
8,128,949
8,502,880
EXECUTIVE & COUNCIL
MUNICIPAL MANAGER COVID -19 REVENUE 26,450,000
27,666,700
28,939,368
BUDGET & TREASURY OFFICE
OFFICE OF THE CFO BTO CAPACITY SUPPORT FMG 500,000
523,000
500,000
BUDGET & TREASURY OFFICE
OFFICE OF THE CFO FINANCIAL MANAGEMENT SUPPORT FMG 200,000
209,200
200,000
BUDGET & TREASURY OFFICE
OFFICE OF THE CFO INTERNSHIP PROGRAMME FMG 800,000
836,800
870,000
BUDGET & TREASURY OFFICE
ASSET MANAGEMENT ASSET REGISTER MAINTENANCE REVENUE 4,416,766
4,619,937
4,832,454
BUDGET & TREASURY OFFICE
REVENUE AND PROPERTY RATES MANAGEMENT
REVENUE ENHANCEMENT IMPLEMENTATION REVENUE 7,348,750
7,686,793
8,040,385
BUDGET & TREASURY OFFICE
FLEET MANAGEMENT FLEET MAINTENANCE REVENUE 9,592,709
10,033,974
10,495,537
BUDGET & TREASURY OFFICE
FLEET MANAGEMENT FLEET MANAGEMENT REVENUE 1,121,709
1,173,307
1,227,280
CORPORATE SERVICES
OFFICE OF THE DIRECTOR CORPORATE
STRATEGIC PLANNING REVENUE 231,511
242,160
253,299
CORPORATE SERVICES
HUMAN RESOURCES CERTIFICATE AWARDING CEREMONY REVENUE 218,011
228,040
238,530
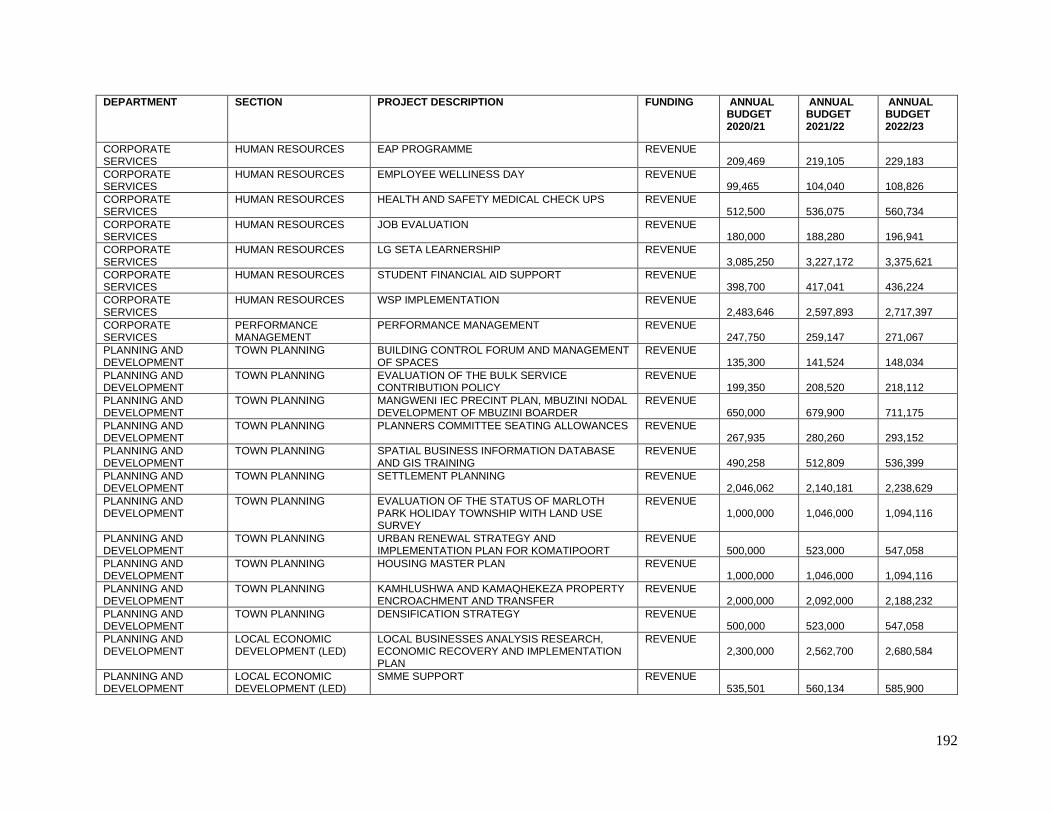
192
DEPARTMENT SECTION PROJECT DESCRIPTION FUNDING ANNUAL BUDGET 2020/21
ANNUAL BUDGET 2021/22
ANNUAL BUDGET 2022/23
CORPORATE SERVICES
HUMAN RESOURCES EAP PROGRAMME REVENUE 209,469
219,105
229,183
CORPORATE SERVICES
HUMAN RESOURCES EMPLOYEE WELLINESS DAY REVENUE 99,465
104,040
108,826
CORPORATE SERVICES
HUMAN RESOURCES HEALTH AND SAFETY MEDICAL CHECK UPS REVENUE 512,500
536,075
560,734
CORPORATE SERVICES
HUMAN RESOURCES JOB EVALUATION REVENUE 180,000
188,280
196,941
CORPORATE SERVICES
HUMAN RESOURCES LG SETA LEARNERSHIP REVENUE 3,085,250
3,227,172
3,375,621
CORPORATE SERVICES
HUMAN RESOURCES STUDENT FINANCIAL AID SUPPORT REVENUE 398,700
417,041
436,224
CORPORATE SERVICES
HUMAN RESOURCES WSP IMPLEMENTATION REVENUE 2,483,646
2,597,893
2,717,397
CORPORATE SERVICES
PERFORMANCE MANAGEMENT
PERFORMANCE MANAGEMENT REVENUE 247,750
259,147
271,067
PLANNING AND DEVELOPMENT
TOWN PLANNING BUILDING CONTROL FORUM AND MANAGEMENT OF SPACES
REVENUE 135,300
141,524
148,034
PLANNING AND DEVELOPMENT
TOWN PLANNING EVALUATION OF THE BULK SERVICE CONTRIBUTION POLICY
REVENUE 199,350
208,520
218,112
PLANNING AND DEVELOPMENT
TOWN PLANNING MANGWENI IEC PRECINT PLAN, MBUZINI NODAL DEVELOPMENT OF MBUZINI BOARDER
REVENUE 650,000
679,900
711,175
PLANNING AND DEVELOPMENT
TOWN PLANNING PLANNERS COMMITTEE SEATING ALLOWANCES REVENUE 267,935
280,260
293,152
PLANNING AND DEVELOPMENT
TOWN PLANNING SPATIAL BUSINESS INFORMATION DATABASE AND GIS TRAINING
REVENUE 490,258
512,809
536,399
PLANNING AND DEVELOPMENT
TOWN PLANNING SETTLEMENT PLANNING REVENUE 2,046,062
2,140,181
2,238,629
PLANNING AND DEVELOPMENT
TOWN PLANNING EVALUATION OF THE STATUS OF MARLOTH PARK HOLIDAY TOWNSHIP WITH LAND USE SURVEY
REVENUE 1,000,000
1,046,000
1,094,116
PLANNING AND DEVELOPMENT
TOWN PLANNING URBAN RENEWAL STRATEGY AND IMPLEMENTATION PLAN FOR KOMATIPOORT
REVENUE 500,000
523,000
547,058
PLANNING AND DEVELOPMENT
TOWN PLANNING HOUSING MASTER PLAN REVENUE 1,000,000
1,046,000
1,094,116
PLANNING AND DEVELOPMENT
TOWN PLANNING KAMHLUSHWA AND KAMAQHEKEZA PROPERTY ENCROACHMENT AND TRANSFER
REVENUE 2,000,000
2,092,000
2,188,232
PLANNING AND DEVELOPMENT
TOWN PLANNING DENSIFICATION STRATEGY REVENUE 500,000
523,000
547,058
PLANNING AND DEVELOPMENT
LOCAL ECONOMIC DEVELOPMENT (LED)
LOCAL BUSINESSES ANALYSIS RESEARCH, ECONOMIC RECOVERY AND IMPLEMENTATION PLAN
REVENUE 2,300,000
2,562,700
2,680,584
PLANNING AND DEVELOPMENT
LOCAL ECONOMIC DEVELOPMENT (LED)
SMME SUPPORT REVENUE 535,501
560,134
585,900
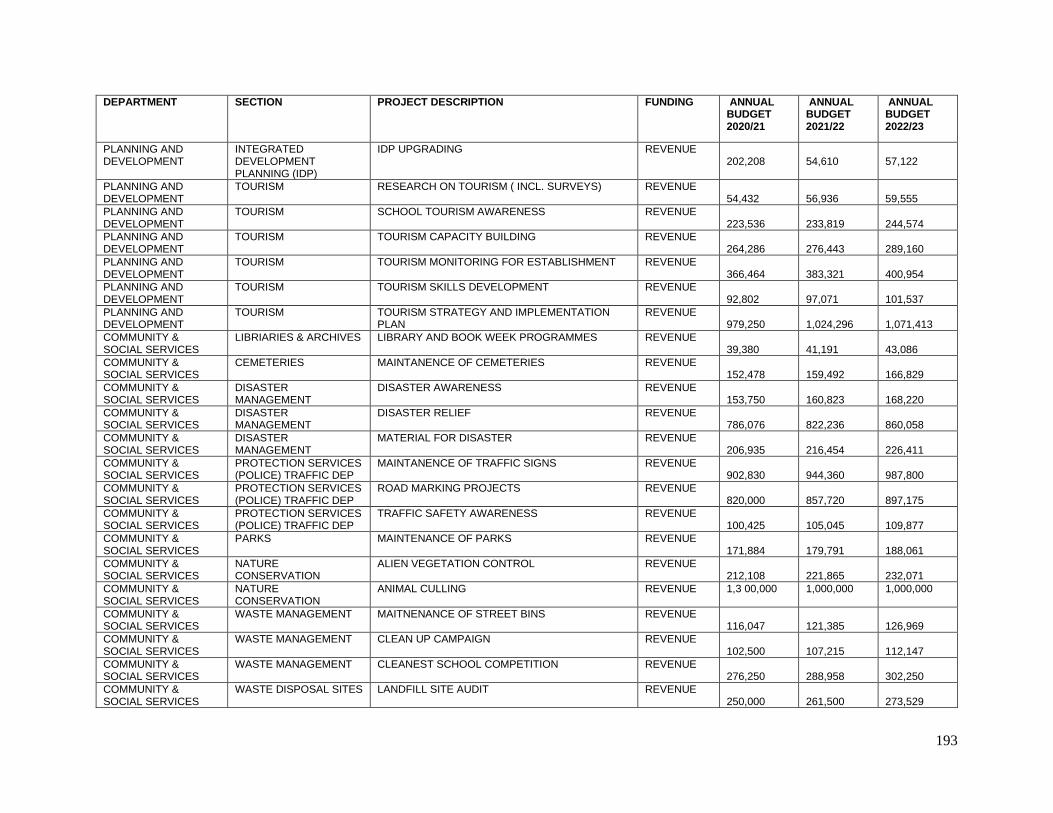
193
DEPARTMENT SECTION PROJECT DESCRIPTION FUNDING ANNUAL BUDGET 2020/21
ANNUAL BUDGET 2021/22
ANNUAL BUDGET 2022/23
PLANNING AND DEVELOPMENT
INTEGRATED DEVELOPMENT PLANNING (IDP)
IDP UPGRADING REVENUE 202,208
54,610
57,122
PLANNING AND DEVELOPMENT
TOURISM RESEARCH ON TOURISM ( INCL. SURVEYS) REVENUE 54,432
56,936
59,555
PLANNING AND DEVELOPMENT
TOURISM SCHOOL TOURISM AWARENESS REVENUE 223,536
233,819
244,574
PLANNING AND DEVELOPMENT
TOURISM TOURISM CAPACITY BUILDING REVENUE 264,286
276,443
289,160
PLANNING AND DEVELOPMENT
TOURISM TOURISM MONITORING FOR ESTABLISHMENT REVENUE 366,464
383,321
400,954
PLANNING AND DEVELOPMENT
TOURISM TOURISM SKILLS DEVELOPMENT REVENUE 92,802
97,071
101,537
PLANNING AND DEVELOPMENT
TOURISM TOURISM STRATEGY AND IMPLEMENTATION PLAN
REVENUE 979,250
1,024,296
1,071,413
COMMUNITY & SOCIAL SERVICES
LIBRIARIES & ARCHIVES LIBRARY AND BOOK WEEK PROGRAMMES REVENUE 39,380
41,191
43,086
COMMUNITY & SOCIAL SERVICES
CEMETERIES MAINTANENCE OF CEMETERIES REVENUE 152,478
159,492
166,829
COMMUNITY & SOCIAL SERVICES
DISASTER MANAGEMENT
DISASTER AWARENESS REVENUE 153,750
160,823
168,220
COMMUNITY & SOCIAL SERVICES
DISASTER MANAGEMENT
DISASTER RELIEF REVENUE 786,076
822,236
860,058
COMMUNITY & SOCIAL SERVICES
DISASTER MANAGEMENT
MATERIAL FOR DISASTER REVENUE 206,935
216,454
226,411
COMMUNITY & SOCIAL SERVICES
PROTECTION SERVICES (POLICE) TRAFFIC DEP
MAINTANENCE OF TRAFFIC SIGNS REVENUE 902,830
944,360
987,800
COMMUNITY & SOCIAL SERVICES
PROTECTION SERVICES (POLICE) TRAFFIC DEP
ROAD MARKING PROJECTS REVENUE 820,000
857,720
897,175
COMMUNITY & SOCIAL SERVICES
PROTECTION SERVICES (POLICE) TRAFFIC DEP
TRAFFIC SAFETY AWARENESS REVENUE 100,425
105,045
109,877
COMMUNITY & SOCIAL SERVICES
PARKS MAINTENANCE OF PARKS REVENUE 171,884
179,791
188,061
COMMUNITY & SOCIAL SERVICES
NATURE CONSERVATION
ALIEN VEGETATION CONTROL REVENUE 212,108
221,865
232,071
COMMUNITY & SOCIAL SERVICES
NATURE CONSERVATION
ANIMAL CULLING REVENUE 1,3 00,000 1,000,000 1,000,000
COMMUNITY & SOCIAL SERVICES
WASTE MANAGEMENT MAITNENANCE OF STREET BINS REVENUE 116,047
121,385
126,969
COMMUNITY & SOCIAL SERVICES
WASTE MANAGEMENT CLEAN UP CAMPAIGN REVENUE 102,500
107,215
112,147
COMMUNITY & SOCIAL SERVICES
WASTE MANAGEMENT CLEANEST SCHOOL COMPETITION REVENUE 276,250
288,958
302,250
COMMUNITY & SOCIAL SERVICES
WASTE DISPOSAL SITES LANDFILL SITE AUDIT REVENUE 250,000
261,500
273,529
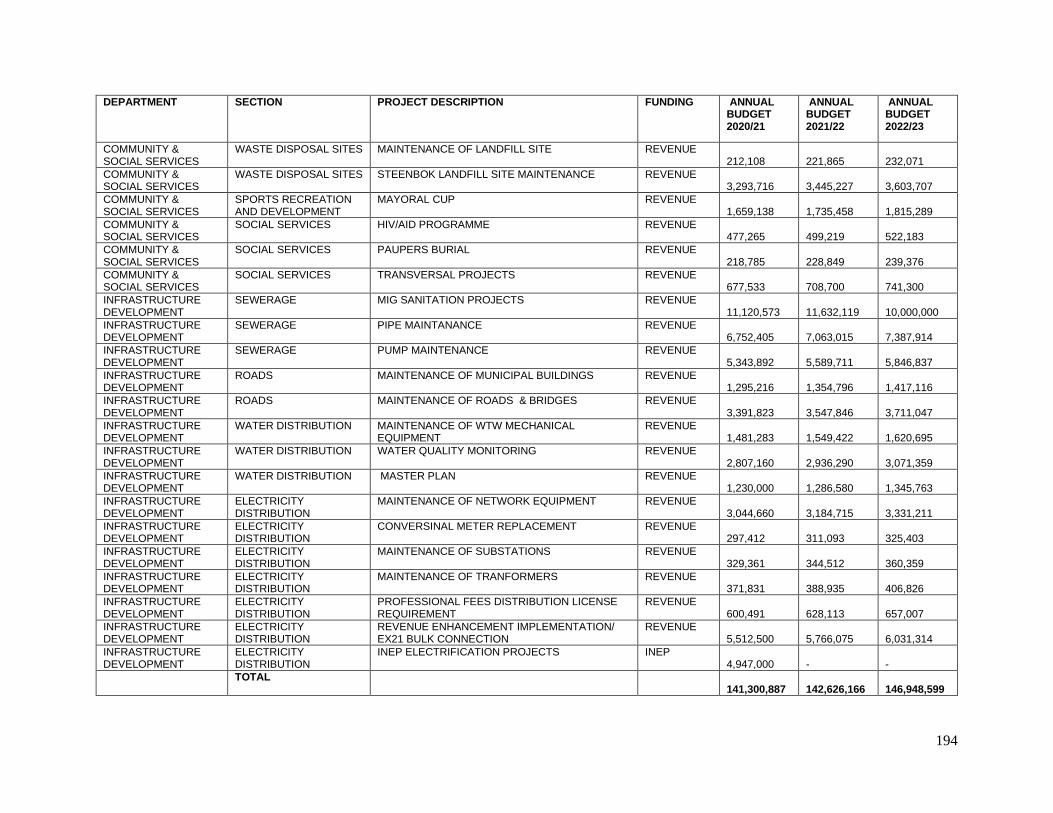
194
DEPARTMENT SECTION PROJECT DESCRIPTION FUNDING ANNUAL BUDGET 2020/21
ANNUAL BUDGET 2021/22
ANNUAL BUDGET 2022/23
COMMUNITY & SOCIAL SERVICES
WASTE DISPOSAL SITES MAINTENANCE OF LANDFILL SITE REVENUE 212,108
221,865
232,071
COMMUNITY & SOCIAL SERVICES
WASTE DISPOSAL SITES STEENBOK LANDFILL SITE MAINTENANCE REVENUE 3,293,716
3,445,227
3,603,707
COMMUNITY & SOCIAL SERVICES
SPORTS RECREATION AND DEVELOPMENT
MAYORAL CUP REVENUE 1,659,138
1,735,458
1,815,289
COMMUNITY & SOCIAL SERVICES
SOCIAL SERVICES HIV/AID PROGRAMME REVENUE 477,265
499,219
522,183
COMMUNITY & SOCIAL SERVICES
SOCIAL SERVICES PAUPERS BURIAL REVENUE 218,785
228,849
239,376
COMMUNITY & SOCIAL SERVICES
SOCIAL SERVICES TRANSVERSAL PROJECTS REVENUE 677,533
708,700
741,300
INFRASTRUCTURE DEVELOPMENT
SEWERAGE MIG SANITATION PROJECTS REVENUE 11,120,573
11,632,119
10,000,000
INFRASTRUCTURE DEVELOPMENT
SEWERAGE PIPE MAINTANANCE REVENUE 6,752,405
7,063,015
7,387,914
INFRASTRUCTURE DEVELOPMENT
SEWERAGE PUMP MAINTENANCE REVENUE 5,343,892
5,589,711
5,846,837
INFRASTRUCTURE DEVELOPMENT
ROADS MAINTENANCE OF MUNICIPAL BUILDINGS REVENUE 1,295,216
1,354,796
1,417,116
INFRASTRUCTURE DEVELOPMENT
ROADS MAINTENANCE OF ROADS & BRIDGES REVENUE 3,391,823
3,547,846
3,711,047
INFRASTRUCTURE DEVELOPMENT
WATER DISTRIBUTION MAINTENANCE OF WTW MECHANICAL EQUIPMENT
REVENUE 1,481,283
1,549,422
1,620,695
INFRASTRUCTURE DEVELOPMENT
WATER DISTRIBUTION WATER QUALITY MONITORING REVENUE 2,807,160
2,936,290
3,071,359
INFRASTRUCTURE DEVELOPMENT
WATER DISTRIBUTION MASTER PLAN REVENUE 1,230,000
1,286,580
1,345,763
INFRASTRUCTURE DEVELOPMENT
ELECTRICITY DISTRIBUTION
MAINTENANCE OF NETWORK EQUIPMENT REVENUE 3,044,660
3,184,715
3,331,211
INFRASTRUCTURE DEVELOPMENT
ELECTRICITY DISTRIBUTION
CONVERSINAL METER REPLACEMENT REVENUE 297,412
311,093
325,403
INFRASTRUCTURE DEVELOPMENT
ELECTRICITY DISTRIBUTION
MAINTENANCE OF SUBSTATIONS REVENUE 329,361
344,512
360,359
INFRASTRUCTURE DEVELOPMENT
ELECTRICITY DISTRIBUTION
MAINTENANCE OF TRANFORMERS REVENUE 371,831
388,935
406,826
INFRASTRUCTURE DEVELOPMENT
ELECTRICITY DISTRIBUTION
PROFESSIONAL FEES DISTRIBUTION LICENSE REQUIREMENT
REVENUE 600,491
628,113
657,007
INFRASTRUCTURE DEVELOPMENT
ELECTRICITY DISTRIBUTION
REVENUE ENHANCEMENT IMPLEMENTATION/ EX21 BULK CONNECTION
REVENUE 5,512,500
5,766,075
6,031,314
INFRASTRUCTURE DEVELOPMENT
ELECTRICITY DISTRIBUTION
INEP ELECTRIFICATION PROJECTS INEP 4,947,000
-
-
TOTAL
141,300,887
142,626,166
146,948,599
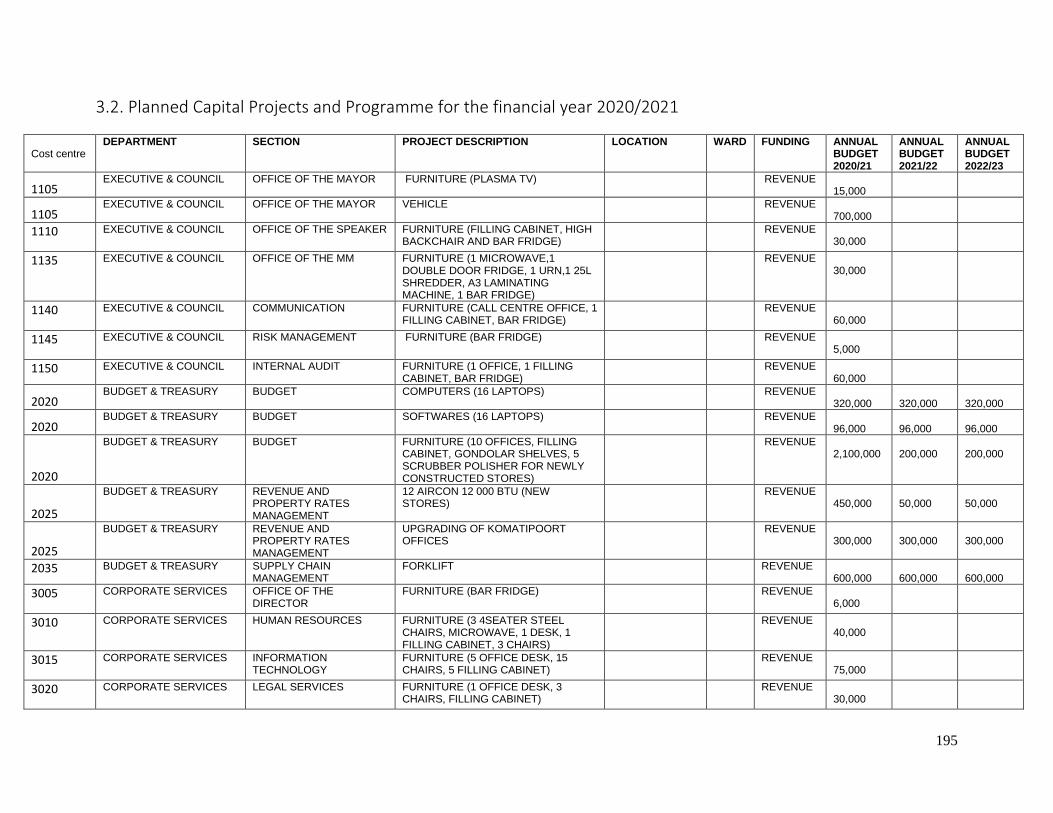
195
3.2. Planned Capital Projects and Programme for the financial year 2020/2021
Cost centre
DEPARTMENT SECTION PROJECT DESCRIPTION LOCATION WARD FUNDING ANNUAL BUDGET 2020/21
ANNUAL BUDGET 2021/22
ANNUAL BUDGET 2022/23
1105 EXECUTIVE & COUNCIL OFFICE OF THE MAYOR FURNITURE (PLASMA TV)
REVENUE
15,000
1105 EXECUTIVE & COUNCIL OFFICE OF THE MAYOR VEHICLE
REVENUE
700,000
1110
EXECUTIVE & COUNCIL OFFICE OF THE SPEAKER FURNITURE (FILLING CABINET, HIGH BACKCHAIR AND BAR FRIDGE)
REVENUE
30,000
1135
EXECUTIVE & COUNCIL OFFICE OF THE MM FURNITURE (1 MICROWAVE,1 DOUBLE DOOR FRIDGE, 1 URN,1 25L SHREDDER, A3 LAMINATING MACHINE, 1 BAR FRIDGE)
REVENUE
30,000
1140
EXECUTIVE & COUNCIL COMMUNICATION FURNITURE (CALL CENTRE OFFICE, 1 FILLING CABINET, BAR FRIDGE)
REVENUE
60,000
1145
EXECUTIVE & COUNCIL RISK MANAGEMENT FURNITURE (BAR FRIDGE)
REVENUE 5,000
1150 EXECUTIVE & COUNCIL INTERNAL AUDIT FURNITURE (1 OFFICE, 1 FILLING CABINET, BAR FRIDGE)
REVENUE
60,000
2020 BUDGET & TREASURY BUDGET COMPUTERS (16 LAPTOPS)
REVENUE
320,000 320,000
320,000
2020 BUDGET & TREASURY BUDGET SOFTWARES (16 LAPTOPS)
REVENUE
96,000 96,000
96,000
2020
BUDGET & TREASURY BUDGET FURNITURE (10 OFFICES, FILLING CABINET, GONDOLAR SHELVES, 5 SCRUBBER POLISHER FOR NEWLY CONSTRUCTED STORES)
REVENUE
2,100,000 200,000
200,000
2025
BUDGET & TREASURY REVENUE AND PROPERTY RATES MANAGEMENT
12 AIRCON 12 000 BTU (NEW STORES)
REVENUE
450,000 50,000
50,000
2025
BUDGET & TREASURY REVENUE AND PROPERTY RATES MANAGEMENT
UPGRADING OF KOMATIPOORT OFFICES
REVENUE
300,000 300,000
300,000
2035 BUDGET & TREASURY SUPPLY CHAIN MANAGEMENT
FORKLIFT
REVENUE 600,000
600,000
600,000
3005
CORPORATE SERVICES OFFICE OF THE DIRECTOR
FURNITURE (BAR FRIDGE)
REVENUE 6,000
3010
CORPORATE SERVICES HUMAN RESOURCES FURNITURE (3 4SEATER STEEL CHAIRS, MICROWAVE, 1 DESK, 1 FILLING CABINET, 3 CHAIRS)
REVENUE
40,000
3015
CORPORATE SERVICES INFORMATION TECHNOLOGY
FURNITURE (5 OFFICE DESK, 15 CHAIRS, 5 FILLING CABINET)
REVENUE
75,000
3020
CORPORATE SERVICES LEGAL SERVICES FURNITURE (1 OFFICE DESK, 3 CHAIRS, FILLING CABINET)
REVENUE
30,000
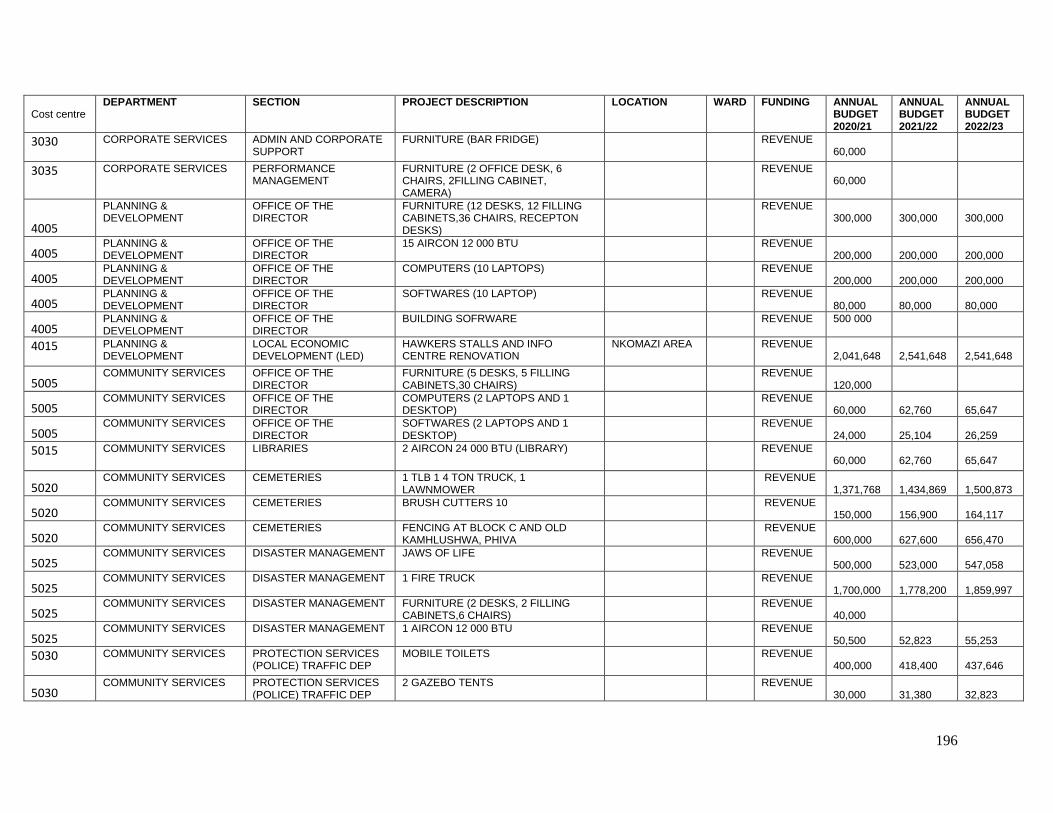
196
Cost centre
DEPARTMENT SECTION PROJECT DESCRIPTION LOCATION WARD FUNDING ANNUAL BUDGET 2020/21
ANNUAL BUDGET 2021/22
ANNUAL BUDGET 2022/23
3030
CORPORATE SERVICES ADMIN AND CORPORATE SUPPORT
FURNITURE (BAR FRIDGE)
REVENUE 60,000
3035
CORPORATE SERVICES PERFORMANCE MANAGEMENT
FURNITURE (2 OFFICE DESK, 6 CHAIRS, 2FILLING CABINET, CAMERA)
REVENUE
60,000
4005
PLANNING & DEVELOPMENT
OFFICE OF THE DIRECTOR
FURNITURE (12 DESKS, 12 FILLING CABINETS,36 CHAIRS, RECEPTON DESKS)
REVENUE
300,000 300,000
300,000
4005 PLANNING & DEVELOPMENT
OFFICE OF THE DIRECTOR
15 AIRCON 12 000 BTU
REVENUE 200,000
200,000
200,000
4005 PLANNING & DEVELOPMENT
OFFICE OF THE DIRECTOR
COMPUTERS (10 LAPTOPS)
REVENUE 200,000
200,000
200,000
4005 PLANNING & DEVELOPMENT
OFFICE OF THE DIRECTOR
SOFTWARES (10 LAPTOP)
REVENUE 80,000
80,000
80,000
4005 PLANNING & DEVELOPMENT
OFFICE OF THE DIRECTOR
BUILDING SOFRWARE REVENUE 500 000
4015
PLANNING & DEVELOPMENT
LOCAL ECONOMIC DEVELOPMENT (LED)
HAWKERS STALLS AND INFO CENTRE RENOVATION
NKOMAZI AREA REVENUE 2,041,648
2,541,648
2,541,648
5005 COMMUNITY SERVICES OFFICE OF THE
DIRECTOR FURNITURE (5 DESKS, 5 FILLING CABINETS,30 CHAIRS)
REVENUE
120,000
5005 COMMUNITY SERVICES OFFICE OF THE
DIRECTOR COMPUTERS (2 LAPTOPS AND 1 DESKTOP)
REVENUE
60,000 62,760
65,647
5005 COMMUNITY SERVICES OFFICE OF THE
DIRECTOR SOFTWARES (2 LAPTOPS AND 1 DESKTOP)
REVENUE
24,000 25,104
26,259
5015
COMMUNITY SERVICES LIBRARIES 2 AIRCON 24 000 BTU (LIBRARY)
REVENUE 60,000
62,760
65,647
5020 COMMUNITY SERVICES CEMETERIES 1 TLB 1 4 TON TRUCK, 1
LAWNMOWER
REVENUE
1,371,768 1,434,869
1,500,873
5020 COMMUNITY SERVICES CEMETERIES BRUSH CUTTERS 10
REVENUE
150,000 156,900
164,117
5020 COMMUNITY SERVICES CEMETERIES FENCING AT BLOCK C AND OLD
KAMHLUSHWA, PHIVA
REVENUE
600,000 627,600
656,470
5025 COMMUNITY SERVICES DISASTER MANAGEMENT JAWS OF LIFE
REVENUE
500,000 523,000
547,058
5025 COMMUNITY SERVICES DISASTER MANAGEMENT 1 FIRE TRUCK
REVENUE
1,700,000 1,778,200
1,859,997
5025 COMMUNITY SERVICES DISASTER MANAGEMENT FURNITURE (2 DESKS, 2 FILLING
CABINETS,6 CHAIRS)
REVENUE
40,000
5025 COMMUNITY SERVICES DISASTER MANAGEMENT 1 AIRCON 12 000 BTU
REVENUE
50,500 52,823
55,253
5030
COMMUNITY SERVICES PROTECTION SERVICES (POLICE) TRAFFIC DEP
MOBILE TOILETS
REVENUE 400,000
418,400
437,646
5030 COMMUNITY SERVICES PROTECTION SERVICES
(POLICE) TRAFFIC DEP 2 GAZEBO TENTS
REVENUE
30,000 31,380
32,823
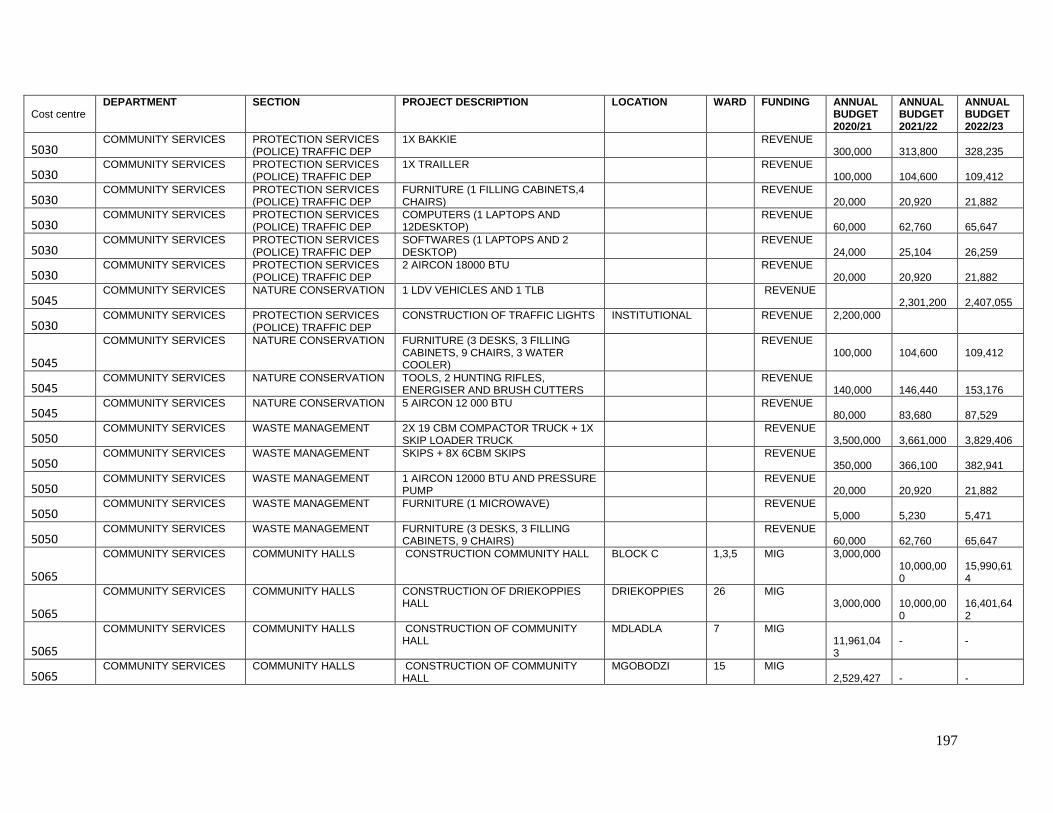
197
Cost centre
DEPARTMENT SECTION PROJECT DESCRIPTION LOCATION WARD FUNDING ANNUAL BUDGET 2020/21
ANNUAL BUDGET 2021/22
ANNUAL BUDGET 2022/23
5030 COMMUNITY SERVICES PROTECTION SERVICES
(POLICE) TRAFFIC DEP 1X BAKKIE
REVENUE
300,000 313,800
328,235
5030 COMMUNITY SERVICES PROTECTION SERVICES
(POLICE) TRAFFIC DEP 1X TRAILLER
REVENUE
100,000 104,600
109,412
5030 COMMUNITY SERVICES PROTECTION SERVICES
(POLICE) TRAFFIC DEP FURNITURE (1 FILLING CABINETS,4 CHAIRS)
REVENUE
20,000 20,920
21,882
5030 COMMUNITY SERVICES PROTECTION SERVICES
(POLICE) TRAFFIC DEP COMPUTERS (1 LAPTOPS AND 12DESKTOP)
REVENUE
60,000 62,760
65,647
5030 COMMUNITY SERVICES PROTECTION SERVICES
(POLICE) TRAFFIC DEP SOFTWARES (1 LAPTOPS AND 2 DESKTOP)
REVENUE
24,000 25,104
26,259
5030 COMMUNITY SERVICES PROTECTION SERVICES
(POLICE) TRAFFIC DEP 2 AIRCON 18000 BTU
REVENUE
20,000 20,920
21,882
5045 COMMUNITY SERVICES NATURE CONSERVATION 1 LDV VEHICLES AND 1 TLB
REVENUE
2,301,200 2,407,055
5030 COMMUNITY SERVICES PROTECTION SERVICES
(POLICE) TRAFFIC DEP CONSTRUCTION OF TRAFFIC LIGHTS INSTITUTIONAL REVENUE 2,200,000
5045
COMMUNITY SERVICES NATURE CONSERVATION FURNITURE (3 DESKS, 3 FILLING CABINETS, 9 CHAIRS, 3 WATER COOLER)
REVENUE
100,000 104,600
109,412
5045 COMMUNITY SERVICES NATURE CONSERVATION TOOLS, 2 HUNTING RIFLES,
ENERGISER AND BRUSH CUTTERS
REVENUE
140,000 146,440
153,176
5045 COMMUNITY SERVICES NATURE CONSERVATION 5 AIRCON 12 000 BTU
REVENUE
80,000 83,680
87,529
5050 COMMUNITY SERVICES WASTE MANAGEMENT 2X 19 CBM COMPACTOR TRUCK + 1X
SKIP LOADER TRUCK
REVENUE
3,500,000 3,661,000
3,829,406
5050 COMMUNITY SERVICES WASTE MANAGEMENT SKIPS + 8X 6CBM SKIPS
REVENUE
350,000 366,100
382,941
5050 COMMUNITY SERVICES WASTE MANAGEMENT 1 AIRCON 12000 BTU AND PRESSURE
PUMP
REVENUE
20,000 20,920
21,882
5050 COMMUNITY SERVICES WASTE MANAGEMENT FURNITURE (1 MICROWAVE)
REVENUE
5,000 5,230
5,471
5050 COMMUNITY SERVICES WASTE MANAGEMENT FURNITURE (3 DESKS, 3 FILLING
CABINETS, 9 CHAIRS)
REVENUE
60,000 62,760
65,647
5065
COMMUNITY SERVICES COMMUNITY HALLS CONSTRUCTION COMMUNITY HALL BLOCK C 1,3,5 MIG 3,000,000 10,000,000
15,990,614
5065
COMMUNITY SERVICES COMMUNITY HALLS CONSTRUCTION OF DRIEKOPPIES HALL
DRIEKOPPIES 26 MIG 3,000,000
10,000,000
16,401,642
5065
COMMUNITY SERVICES COMMUNITY HALLS CONSTRUCTION OF COMMUNITY HALL
MDLADLA 7 MIG 11,961,043
-
-
5065 COMMUNITY SERVICES COMMUNITY HALLS CONSTRUCTION OF COMMUNITY
HALL MGOBODZI 15 MIG
2,529,427 -
-
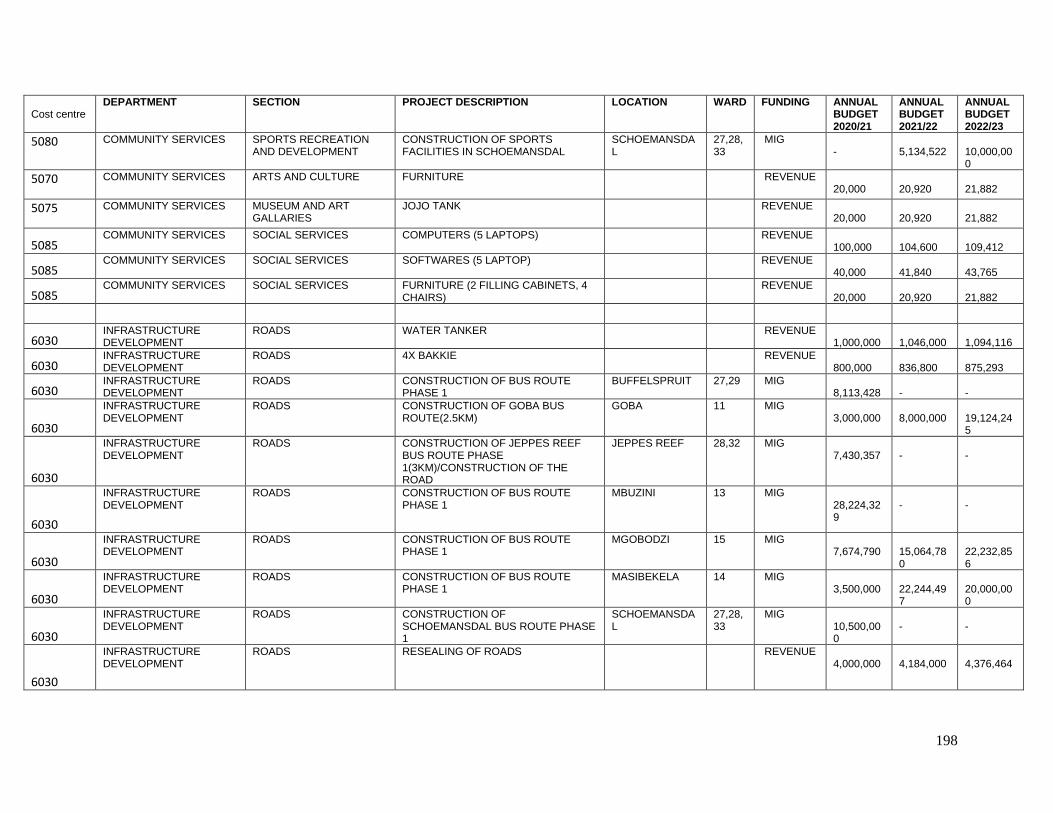
198
Cost centre
DEPARTMENT SECTION PROJECT DESCRIPTION LOCATION WARD FUNDING ANNUAL BUDGET 2020/21
ANNUAL BUDGET 2021/22
ANNUAL BUDGET 2022/23
5080
COMMUNITY SERVICES SPORTS RECREATION AND DEVELOPMENT
CONSTRUCTION OF SPORTS FACILITIES IN SCHOEMANSDAL
SCHOEMANSDAL
27,28,33
MIG -
5,134,522
10,000,000
5070
COMMUNITY SERVICES ARTS AND CULTURE FURNITURE
REVENUE 20,000
20,920
21,882
5075
COMMUNITY SERVICES MUSEUM AND ART GALLARIES
JOJO TANK
REVENUE 20,000
20,920
21,882
5085 COMMUNITY SERVICES SOCIAL SERVICES COMPUTERS (5 LAPTOPS)
REVENUE
100,000 104,600
109,412
5085 COMMUNITY SERVICES SOCIAL SERVICES SOFTWARES (5 LAPTOP)
REVENUE
40,000 41,840
43,765
5085 COMMUNITY SERVICES SOCIAL SERVICES FURNITURE (2 FILLING CABINETS, 4
CHAIRS)
REVENUE
20,000 20,920
21,882
6030 INFRASTRUCTURE DEVELOPMENT
ROADS WATER TANKER
REVENUE 1,000,000
1,046,000
1,094,116
6030 INFRASTRUCTURE DEVELOPMENT
ROADS 4X BAKKIE
REVENUE 800,000
836,800
875,293
6030 INFRASTRUCTURE DEVELOPMENT
ROADS CONSTRUCTION OF BUS ROUTE PHASE 1
BUFFELSPRUIT 27,29 MIG 8,113,428
-
-
6030
INFRASTRUCTURE DEVELOPMENT
ROADS CONSTRUCTION OF GOBA BUS ROUTE(2.5KM)
GOBA 11 MIG 3,000,000
8,000,000
19,124,245
6030
INFRASTRUCTURE DEVELOPMENT
ROADS CONSTRUCTION OF JEPPES REEF BUS ROUTE PHASE 1(3KM)/CONSTRUCTION OF THE ROAD
JEPPES REEF 28,32 MIG 7,430,357
-
-
6030
INFRASTRUCTURE DEVELOPMENT
ROADS CONSTRUCTION OF BUS ROUTE PHASE 1
MBUZINI 13 MIG 28,224,329
-
-
6030
INFRASTRUCTURE DEVELOPMENT
ROADS CONSTRUCTION OF BUS ROUTE PHASE 1
MGOBODZI 15 MIG 7,674,790
15,064,780
22,232,856
6030
INFRASTRUCTURE DEVELOPMENT
ROADS CONSTRUCTION OF BUS ROUTE PHASE 1
MASIBEKELA 14 MIG 3,500,000
22,244,497
20,000,000
6030
INFRASTRUCTURE DEVELOPMENT
ROADS CONSTRUCTION OF SCHOEMANSDAL BUS ROUTE PHASE 1
SCHOEMANSDAL
27,28,33
MIG 10,500,000
-
-
6030
INFRASTRUCTURE DEVELOPMENT
ROADS RESEALING OF ROADS
REVENUE 4,000,000
4,184,000
4,376,464
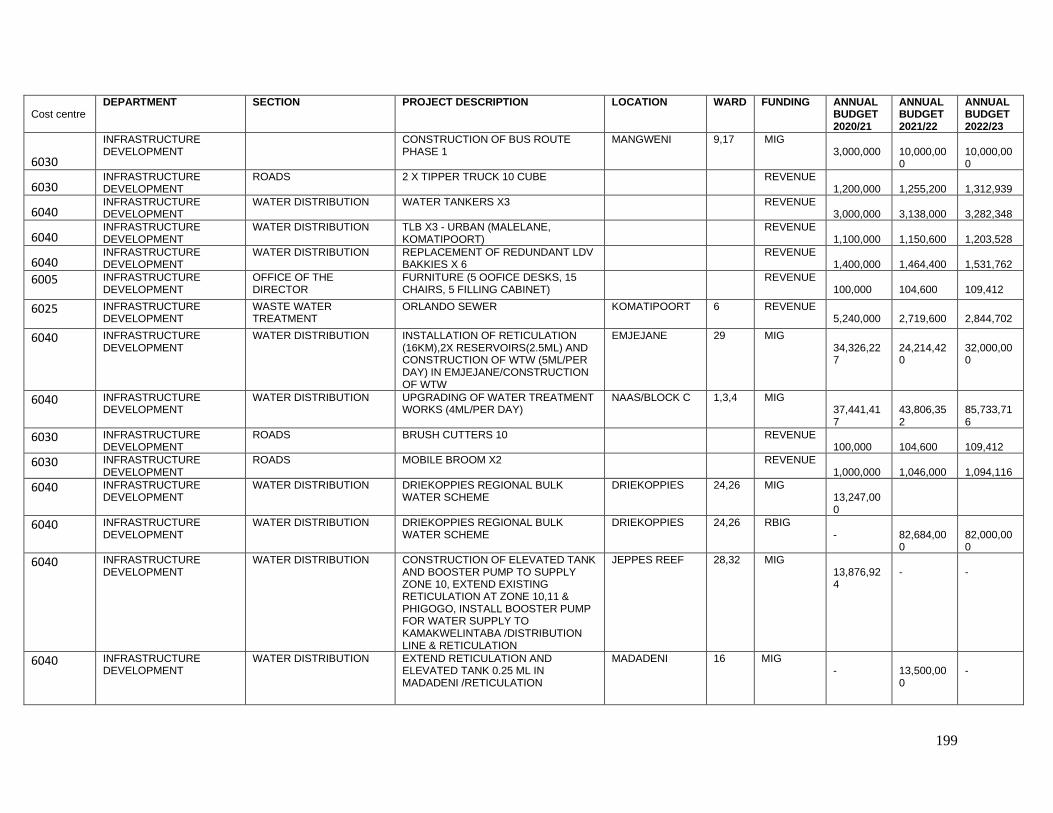
199
Cost centre
DEPARTMENT SECTION PROJECT DESCRIPTION LOCATION WARD FUNDING ANNUAL BUDGET 2020/21
ANNUAL BUDGET 2021/22
ANNUAL BUDGET 2022/23
6030
INFRASTRUCTURE DEVELOPMENT
CONSTRUCTION OF BUS ROUTE PHASE 1
MANGWENI 9,17 MIG 3,000,000
10,000,000
10,000,000
6030 INFRASTRUCTURE DEVELOPMENT
ROADS 2 X TIPPER TRUCK 10 CUBE
REVENUE 1,200,000
1,255,200
1,312,939
6040 INFRASTRUCTURE DEVELOPMENT
WATER DISTRIBUTION WATER TANKERS X3
REVENUE 3,000,000
3,138,000
3,282,348
6040 INFRASTRUCTURE DEVELOPMENT
WATER DISTRIBUTION TLB X3 - URBAN (MALELANE, KOMATIPOORT)
REVENUE
1,100,000 1,150,600
1,203,528
6040 INFRASTRUCTURE DEVELOPMENT
WATER DISTRIBUTION REPLACEMENT OF REDUNDANT LDV BAKKIES X 6
REVENUE
1,400,000 1,464,400
1,531,762
6005
INFRASTRUCTURE DEVELOPMENT
OFFICE OF THE DIRECTOR
FURNITURE (5 OOFICE DESKS, 15 CHAIRS, 5 FILLING CABINET)
REVENUE
100,000 104,600
109,412
6025
INFRASTRUCTURE DEVELOPMENT
WASTE WATER TREATMENT
ORLANDO SEWER KOMATIPOORT 6 REVENUE 5,240,000
2,719,600
2,844,702
6040 INFRASTRUCTURE DEVELOPMENT
WATER DISTRIBUTION INSTALLATION OF RETICULATION (16KM),2X RESERVOIRS(2.5ML) AND CONSTRUCTION OF WTW (5ML/PER DAY) IN EMJEJANE/CONSTRUCTION OF WTW
EMJEJANE 29 MIG 34,326,227
24,214,420
32,000,000
6040 INFRASTRUCTURE DEVELOPMENT
WATER DISTRIBUTION UPGRADING OF WATER TREATMENT WORKS (4ML/PER DAY)
NAAS/BLOCK C 1,3,4 MIG 37,441,417
43,806,352
85,733,716
6030 INFRASTRUCTURE DEVELOPMENT
ROADS BRUSH CUTTERS 10
REVENUE 100,000
104,600
109,412
6030 INFRASTRUCTURE DEVELOPMENT
ROADS MOBILE BROOM X2
REVENUE 1,000,000
1,046,000
1,094,116
6040 INFRASTRUCTURE DEVELOPMENT
WATER DISTRIBUTION DRIEKOPPIES REGIONAL BULK WATER SCHEME
DRIEKOPPIES 24,26 MIG 13,247,000
6040 INFRASTRUCTURE DEVELOPMENT
WATER DISTRIBUTION DRIEKOPPIES REGIONAL BULK WATER SCHEME
DRIEKOPPIES 24,26 RBIG -
82,684,000
82,000,000
6040 INFRASTRUCTURE DEVELOPMENT
WATER DISTRIBUTION CONSTRUCTION OF ELEVATED TANK AND BOOSTER PUMP TO SUPPLY ZONE 10, EXTEND EXISTING RETICULATION AT ZONE 10,11 & PHIGOGO, INSTALL BOOSTER PUMP FOR WATER SUPPLY TO KAMAKWELINTABA /DISTRIBUTION LINE & RETICULATION
JEPPES REEF 28,32 MIG 13,876,924
-
-
6040 INFRASTRUCTURE DEVELOPMENT
WATER DISTRIBUTION EXTEND RETICULATION AND ELEVATED TANK 0.25 ML IN MADADENI /RETICULATION
MADADENI 16 MIG -
13,500,000
-
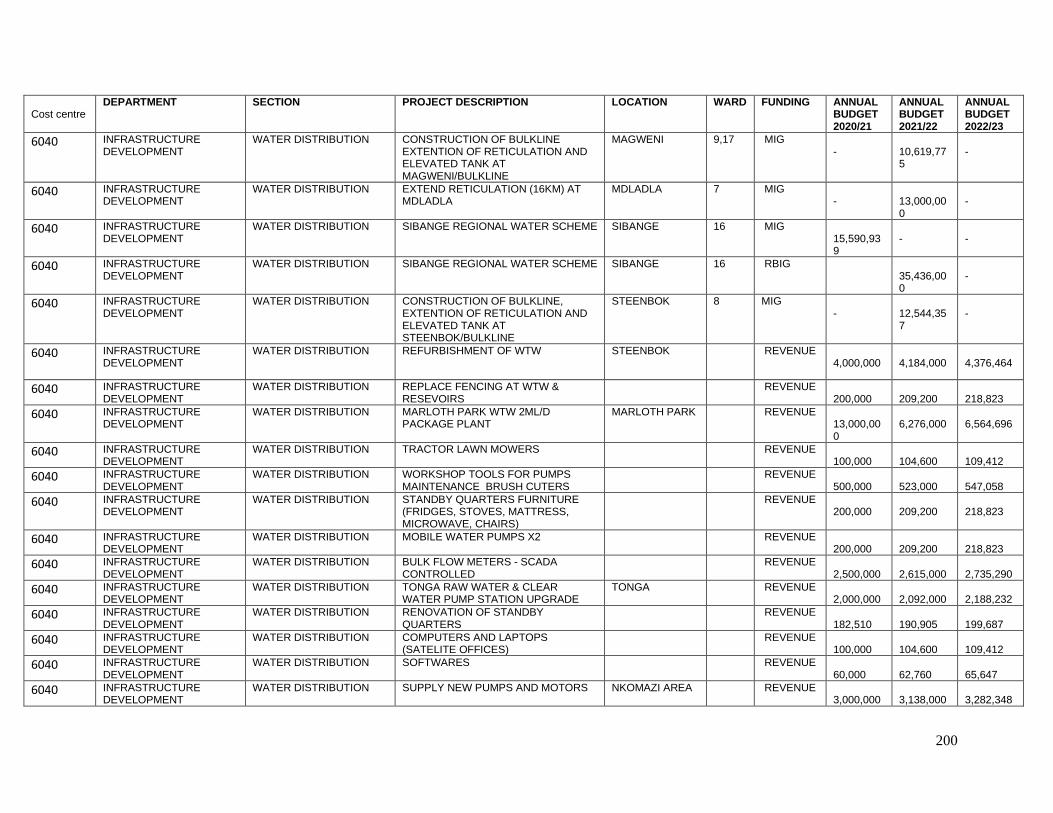
200
Cost centre
DEPARTMENT SECTION PROJECT DESCRIPTION LOCATION WARD FUNDING ANNUAL BUDGET 2020/21
ANNUAL BUDGET 2021/22
ANNUAL BUDGET 2022/23
6040 INFRASTRUCTURE DEVELOPMENT
WATER DISTRIBUTION CONSTRUCTION OF BULKLINE EXTENTION OF RETICULATION AND ELEVATED TANK AT MAGWENI/BULKLINE
MAGWENI 9,17 MIG -
10,619,775
-
6040 INFRASTRUCTURE DEVELOPMENT
WATER DISTRIBUTION EXTEND RETICULATION (16KM) AT MDLADLA
MDLADLA 7 MIG -
13,000,000
-
6040 INFRASTRUCTURE DEVELOPMENT
WATER DISTRIBUTION SIBANGE REGIONAL WATER SCHEME SIBANGE 16 MIG 15,590,939
-
-
6040 INFRASTRUCTURE DEVELOPMENT
WATER DISTRIBUTION SIBANGE REGIONAL WATER SCHEME SIBANGE 16 RBIG
35,436,000
-
6040 INFRASTRUCTURE DEVELOPMENT
WATER DISTRIBUTION CONSTRUCTION OF BULKLINE, EXTENTION OF RETICULATION AND ELEVATED TANK AT STEENBOK/BULKLINE
STEENBOK 8 MIG -
12,544,357
-
6040 INFRASTRUCTURE DEVELOPMENT
WATER DISTRIBUTION REFURBISHMENT OF WTW STEENBOK
REVENUE 4,000,000
4,184,000
4,376,464
6040 INFRASTRUCTURE DEVELOPMENT
WATER DISTRIBUTION REPLACE FENCING AT WTW & RESEVOIRS
REVENUE
200,000 209,200
218,823
6040 INFRASTRUCTURE DEVELOPMENT
WATER DISTRIBUTION MARLOTH PARK WTW 2ML/D PACKAGE PLANT
MARLOTH PARK REVENUE 13,000,000
6,276,000
6,564,696
6040 INFRASTRUCTURE DEVELOPMENT
WATER DISTRIBUTION TRACTOR LAWN MOWERS
REVENUE 100,000
104,600
109,412
6040 INFRASTRUCTURE DEVELOPMENT
WATER DISTRIBUTION WORKSHOP TOOLS FOR PUMPS MAINTENANCE BRUSH CUTERS
REVENUE
500,000 523,000
547,058
6040 INFRASTRUCTURE DEVELOPMENT
WATER DISTRIBUTION STANDBY QUARTERS FURNITURE (FRIDGES, STOVES, MATTRESS, MICROWAVE, CHAIRS)
REVENUE
200,000 209,200
218,823
6040 INFRASTRUCTURE DEVELOPMENT
WATER DISTRIBUTION MOBILE WATER PUMPS X2
REVENUE 200,000
209,200
218,823
6040 INFRASTRUCTURE DEVELOPMENT
WATER DISTRIBUTION BULK FLOW METERS - SCADA CONTROLLED
REVENUE
2,500,000 2,615,000
2,735,290
6040 INFRASTRUCTURE DEVELOPMENT
WATER DISTRIBUTION TONGA RAW WATER & CLEAR WATER PUMP STATION UPGRADE
TONGA REVENUE 2,000,000
2,092,000
2,188,232
6040 INFRASTRUCTURE DEVELOPMENT
WATER DISTRIBUTION RENOVATION OF STANDBY QUARTERS
REVENUE
182,510 190,905
199,687
6040 INFRASTRUCTURE DEVELOPMENT
WATER DISTRIBUTION COMPUTERS AND LAPTOPS (SATELITE OFFICES)
REVENUE
100,000 104,600
109,412
6040 INFRASTRUCTURE DEVELOPMENT
WATER DISTRIBUTION SOFTWARES
REVENUE 60,000
62,760
65,647
6040 INFRASTRUCTURE DEVELOPMENT
WATER DISTRIBUTION SUPPLY NEW PUMPS AND MOTORS NKOMAZI AREA
REVENUE 3,000,000
3,138,000
3,282,348
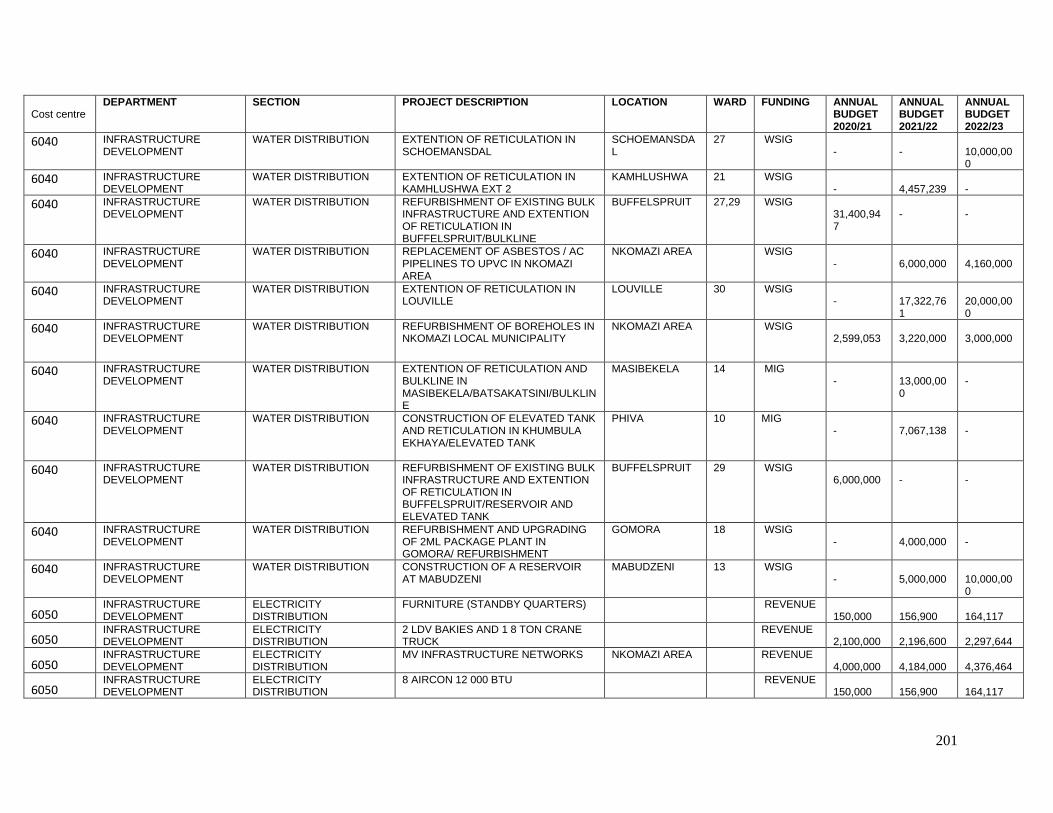
201
Cost centre
DEPARTMENT SECTION PROJECT DESCRIPTION LOCATION WARD FUNDING ANNUAL BUDGET 2020/21
ANNUAL BUDGET 2021/22
ANNUAL BUDGET 2022/23
6040 INFRASTRUCTURE DEVELOPMENT
WATER DISTRIBUTION EXTENTION OF RETICULATION IN SCHOEMANSDAL
SCHOEMANSDAL
27 WSIG -
-
10,000,000
6040 INFRASTRUCTURE DEVELOPMENT
WATER DISTRIBUTION EXTENTION OF RETICULATION IN KAMHLUSHWA EXT 2
KAMHLUSHWA 21 WSIG -
4,457,239
-
6040 INFRASTRUCTURE DEVELOPMENT
WATER DISTRIBUTION REFURBISHMENT OF EXISTING BULK INFRASTRUCTURE AND EXTENTION OF RETICULATION IN BUFFELSPRUIT/BULKLINE
BUFFELSPRUIT 27,29 WSIG 31,400,947
-
-
6040 INFRASTRUCTURE DEVELOPMENT
WATER DISTRIBUTION REPLACEMENT OF ASBESTOS / AC PIPELINES TO UPVC IN NKOMAZI AREA
NKOMAZI AREA
WSIG -
6,000,000
4,160,000
6040 INFRASTRUCTURE DEVELOPMENT
WATER DISTRIBUTION EXTENTION OF RETICULATION IN LOUVILLE
LOUVILLE 30 WSIG -
17,322,761
20,000,000
6040 INFRASTRUCTURE DEVELOPMENT
WATER DISTRIBUTION REFURBISHMENT OF BOREHOLES IN NKOMAZI LOCAL MUNICIPALITY
NKOMAZI AREA
WSIG 2,599,053
3,220,000
3,000,000
6040 INFRASTRUCTURE DEVELOPMENT
WATER DISTRIBUTION EXTENTION OF RETICULATION AND BULKLINE IN MASIBEKELA/BATSAKATSINI/BULKLINE
MASIBEKELA 14 MIG -
13,000,000
-
6040 INFRASTRUCTURE DEVELOPMENT
WATER DISTRIBUTION CONSTRUCTION OF ELEVATED TANK AND RETICULATION IN KHUMBULA EKHAYA/ELEVATED TANK
PHIVA 10 MIG -
7,067,138
-
6040 INFRASTRUCTURE DEVELOPMENT
WATER DISTRIBUTION REFURBISHMENT OF EXISTING BULK INFRASTRUCTURE AND EXTENTION OF RETICULATION IN BUFFELSPRUIT/RESERVOIR AND ELEVATED TANK
BUFFELSPRUIT 29 WSIG 6,000,000
-
-
6040 INFRASTRUCTURE DEVELOPMENT
WATER DISTRIBUTION REFURBISHMENT AND UPGRADING OF 2ML PACKAGE PLANT IN GOMORA/ REFURBISHMENT
GOMORA 18 WSIG -
4,000,000
-
6040 INFRASTRUCTURE DEVELOPMENT
WATER DISTRIBUTION CONSTRUCTION OF A RESERVOIR AT MABUDZENI
MABUDZENI 13 WSIG -
5,000,000
10,000,000
6050 INFRASTRUCTURE DEVELOPMENT
ELECTRICITY DISTRIBUTION
FURNITURE (STANDBY QUARTERS)
REVENUE 150,000
156,900
164,117
6050 INFRASTRUCTURE DEVELOPMENT
ELECTRICITY DISTRIBUTION
2 LDV BAKIES AND 1 8 TON CRANE TRUCK
REVENUE
2,100,000 2,196,600
2,297,644
6050 INFRASTRUCTURE DEVELOPMENT
ELECTRICITY DISTRIBUTION
MV INFRASTRUCTURE NETWORKS NKOMAZI AREA REVENUE 4,000,000
4,184,000
4,376,464
6050 INFRASTRUCTURE DEVELOPMENT
ELECTRICITY DISTRIBUTION
8 AIRCON 12 000 BTU
REVENUE 150,000
156,900
164,117
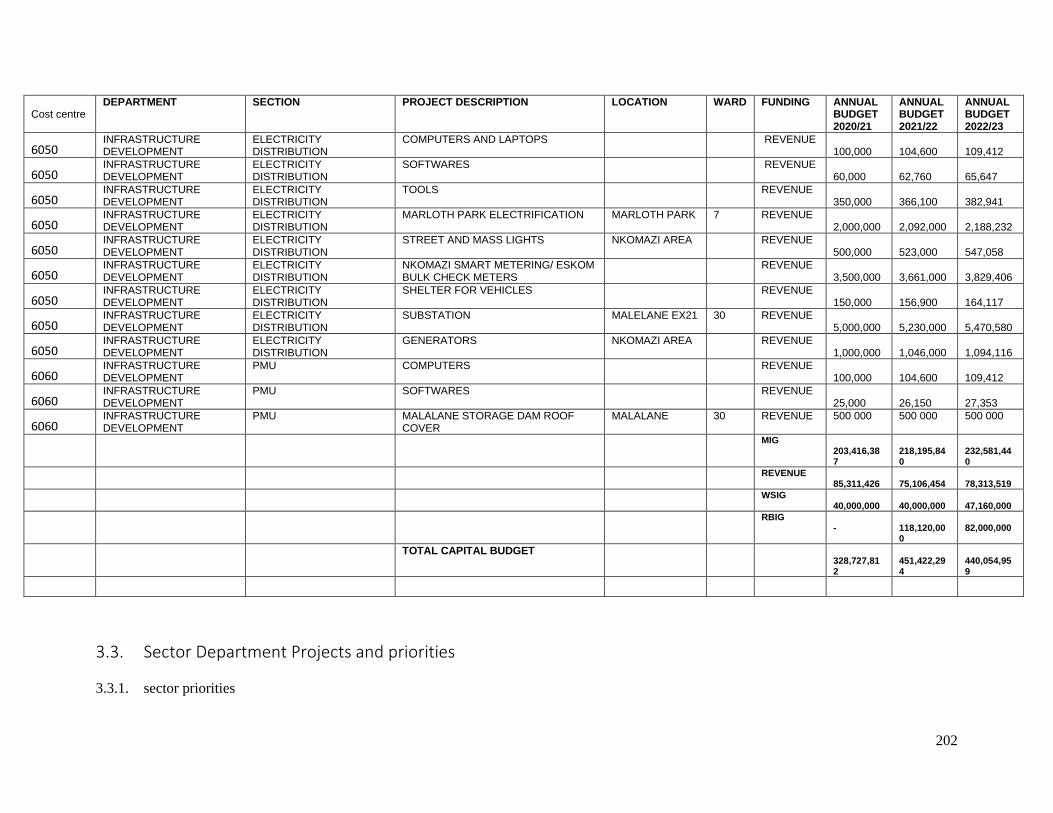
202
Cost centre
DEPARTMENT SECTION PROJECT DESCRIPTION LOCATION WARD FUNDING ANNUAL BUDGET 2020/21
ANNUAL BUDGET 2021/22
ANNUAL BUDGET 2022/23
6050 INFRASTRUCTURE DEVELOPMENT
ELECTRICITY DISTRIBUTION
COMPUTERS AND LAPTOPS
REVENUE 100,000
104,600
109,412
6050 INFRASTRUCTURE DEVELOPMENT
ELECTRICITY DISTRIBUTION
SOFTWARES
REVENUE 60,000
62,760
65,647
6050 INFRASTRUCTURE DEVELOPMENT
ELECTRICITY DISTRIBUTION
TOOLS
REVENUE 350,000
366,100
382,941
6050 INFRASTRUCTURE DEVELOPMENT
ELECTRICITY DISTRIBUTION
MARLOTH PARK ELECTRIFICATION MARLOTH PARK 7 REVENUE 2,000,000
2,092,000
2,188,232
6050 INFRASTRUCTURE DEVELOPMENT
ELECTRICITY DISTRIBUTION
STREET AND MASS LIGHTS NKOMAZI AREA
REVENUE 500,000
523,000
547,058
6050 INFRASTRUCTURE DEVELOPMENT
ELECTRICITY DISTRIBUTION
NKOMAZI SMART METERING/ ESKOM BULK CHECK METERS
REVENUE
3,500,000 3,661,000
3,829,406
6050 INFRASTRUCTURE DEVELOPMENT
ELECTRICITY DISTRIBUTION
SHELTER FOR VEHICLES
REVENUE 150,000
156,900
164,117
6050 INFRASTRUCTURE DEVELOPMENT
ELECTRICITY DISTRIBUTION
SUBSTATION MALELANE EX21 30 REVENUE 5,000,000
5,230,000
5,470,580
6050 INFRASTRUCTURE DEVELOPMENT
ELECTRICITY DISTRIBUTION
GENERATORS NKOMAZI AREA
REVENUE 1,000,000
1,046,000
1,094,116
6060 INFRASTRUCTURE DEVELOPMENT
PMU COMPUTERS
REVENUE 100,000
104,600
109,412
6060 INFRASTRUCTURE DEVELOPMENT
PMU SOFTWARES
REVENUE 25,000
26,150
27,353
6060 INFRASTRUCTURE DEVELOPMENT
PMU MALALANE STORAGE DAM ROOF COVER
MALALANE 30 REVENUE 500 000 500 000 500 000
MIG 203,416,387
218,195,840
232,581,440
REVENUE 85,311,426
75,106,454
78,313,519
WSIG 40,000,000
40,000,000
47,160,000
RBIG -
118,120,000
82,000,000
TOTAL CAPITAL BUDGET
328,727,812
451,422,294
440,054,959
3.3. Sector Department Projects and priorities
3.3.1. sector priorities
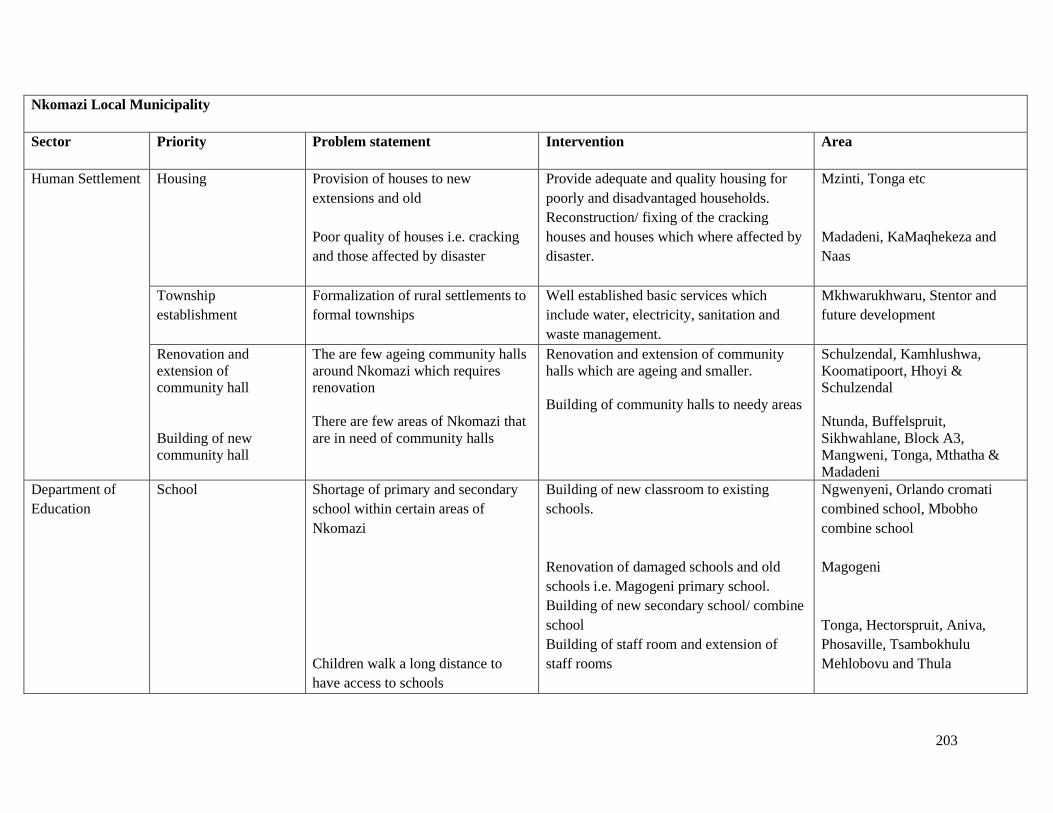
203
Nkomazi Local Municipality
Sector Priority Problem statement Intervention Area
Human Settlement Housing Provision of houses to new
extensions and old
Poor quality of houses i.e. cracking
and those affected by disaster
Provide adequate and quality housing for
poorly and disadvantaged households.
Reconstruction/ fixing of the cracking
houses and houses which where affected by
disaster.
Mzinti, Tonga etc
Madadeni, KaMaqhekeza and
Naas
Township
establishment
Formalization of rural settlements to
formal townships
Well established basic services which
include water, electricity, sanitation and
waste management.
Mkhwarukhwaru, Stentor and
future development
Renovation and
extension of
community hall
Building of new
community hall
The are few ageing community halls
around Nkomazi which requires
renovation
There are few areas of Nkomazi that
are in need of community halls
Renovation and extension of community
halls which are ageing and smaller.
Building of community halls to needy areas
Schulzendal, Kamhlushwa,
Koomatipoort, Hhoyi &
Schulzendal
Ntunda, Buffelspruit,
Sikhwahlane, Block A3,
Mangweni, Tonga, Mthatha &
Madadeni
Department of
Education
School Shortage of primary and secondary
school within certain areas of
Nkomazi
Children walk a long distance to
have access to schools
Building of new classroom to existing
schools.
Renovation of damaged schools and old
schools i.e. Magogeni primary school.
Building of new secondary school/ combine
school
Building of staff room and extension of
staff rooms
Ngwenyeni, Orlando cromati
combined school, Mbobho
combine school
Magogeni
Tonga, Hectorspruit, Aniva,
Phosaville, Tsambokhulu
Mehlobovu and Thula
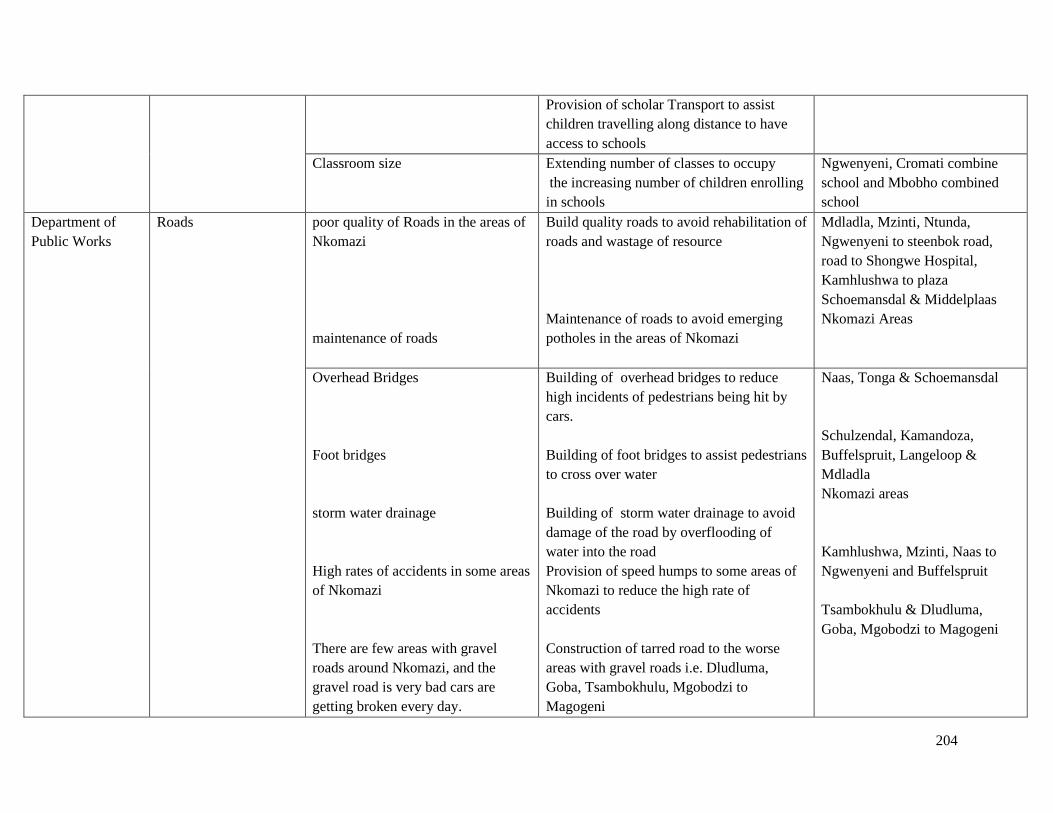
204
Provision of scholar Transport to assist
children travelling along distance to have
access to schools
Classroom size Extending number of classes to occupy
the increasing number of children enrolling
in schools
Ngwenyeni, Cromati combine
school and Mbobho combined
school
Department of
Public Works
Roads poor quality of Roads in the areas of
Nkomazi
maintenance of roads
Build quality roads to avoid rehabilitation of
roads and wastage of resource
Maintenance of roads to avoid emerging
potholes in the areas of Nkomazi
Mdladla, Mzinti, Ntunda,
Ngwenyeni to steenbok road,
road to Shongwe Hospital,
Kamhlushwa to plaza
Schoemansdal & Middelplaas
Nkomazi Areas
Overhead Bridges
Foot bridges
storm water drainage
High rates of accidents in some areas
of Nkomazi
There are few areas with gravel
roads around Nkomazi, and the
gravel road is very bad cars are
getting broken every day.
Building of overhead bridges to reduce
high incidents of pedestrians being hit by
cars.
Building of foot bridges to assist pedestrians
to cross over water
Building of storm water drainage to avoid
damage of the road by overflooding of
water into the road
Provision of speed humps to some areas of
Nkomazi to reduce the high rate of
accidents
Construction of tarred road to the worse
areas with gravel roads i.e. Dludluma,
Goba, Tsambokhulu, Mgobodzi to
Magogeni
Naas, Tonga & Schoemansdal
Schulzendal, Kamandoza,
Buffelspruit, Langeloop &
Mdladla
Nkomazi areas
Kamhlushwa, Mzinti, Naas to
Ngwenyeni and Buffelspruit
Tsambokhulu & Dludluma,
Goba, Mgobodzi to Magogeni
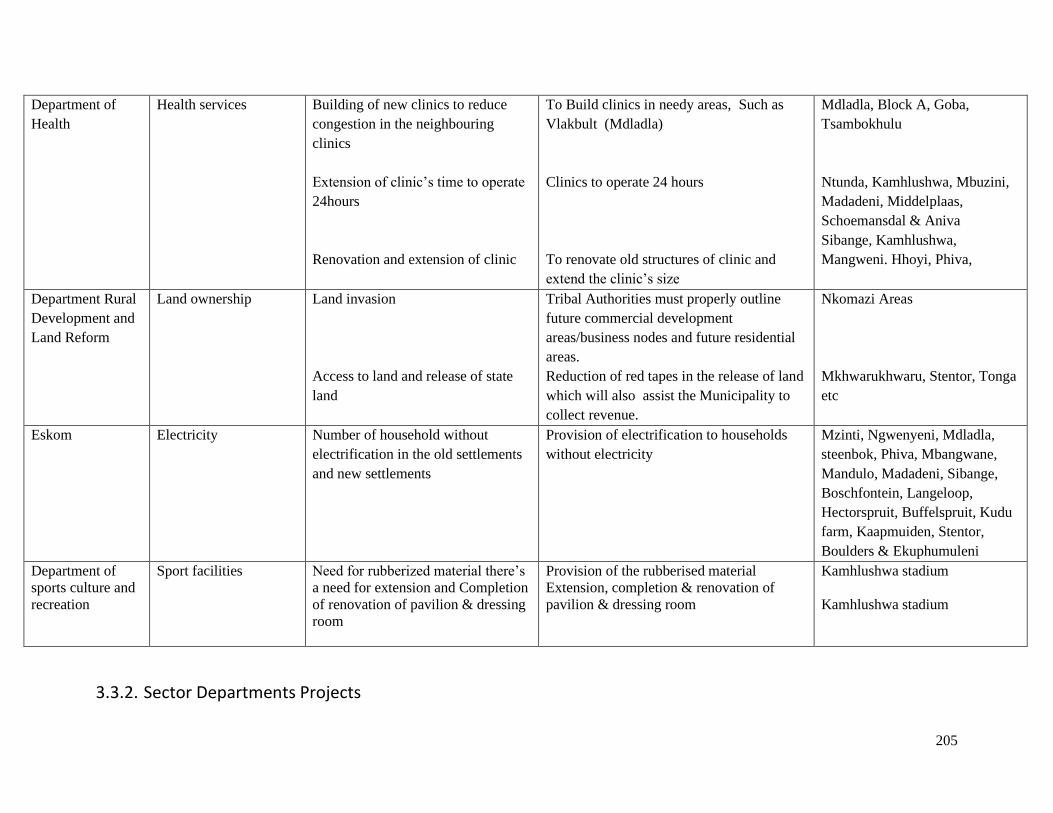
205
Department of
Health
Health services Building of new clinics to reduce
congestion in the neighbouring
clinics
Extension of clinic’s time to operate
24hours
Renovation and extension of clinic
To Build clinics in needy areas, Such as
Vlakbult (Mdladla)
Clinics to operate 24 hours
To renovate old structures of clinic and
extend the clinic’s size
Mdladla, Block A, Goba,
Tsambokhulu
Ntunda, Kamhlushwa, Mbuzini,
Madadeni, Middelplaas,
Schoemansdal & Aniva
Sibange, Kamhlushwa,
Mangweni. Hhoyi, Phiva,
Department Rural
Development and
Land Reform
Land ownership Land invasion
Access to land and release of state
land
Tribal Authorities must properly outline
future commercial development
areas/business nodes and future residential
areas.
Reduction of red tapes in the release of land
which will also assist the Municipality to
collect revenue.
Nkomazi Areas
Mkhwarukhwaru, Stentor, Tonga
etc
Eskom Electricity Number of household without
electrification in the old settlements
and new settlements
Provision of electrification to households
without electricity
Mzinti, Ngwenyeni, Mdladla,
steenbok, Phiva, Mbangwane,
Mandulo, Madadeni, Sibange,
Boschfontein, Langeloop,
Hectorspruit, Buffelspruit, Kudu
farm, Kaapmuiden, Stentor,
Boulders & Ekuphumuleni
Department of
sports culture and
recreation
Sport facilities
Need for rubberized material there’s
a need for extension and Completion
of renovation of pavilion & dressing
room
Provision of the rubberised material
Extension, completion & renovation of
pavilion & dressing room
Kamhlushwa stadium
Kamhlushwa stadium
3.3.2. Sector Departments Projects
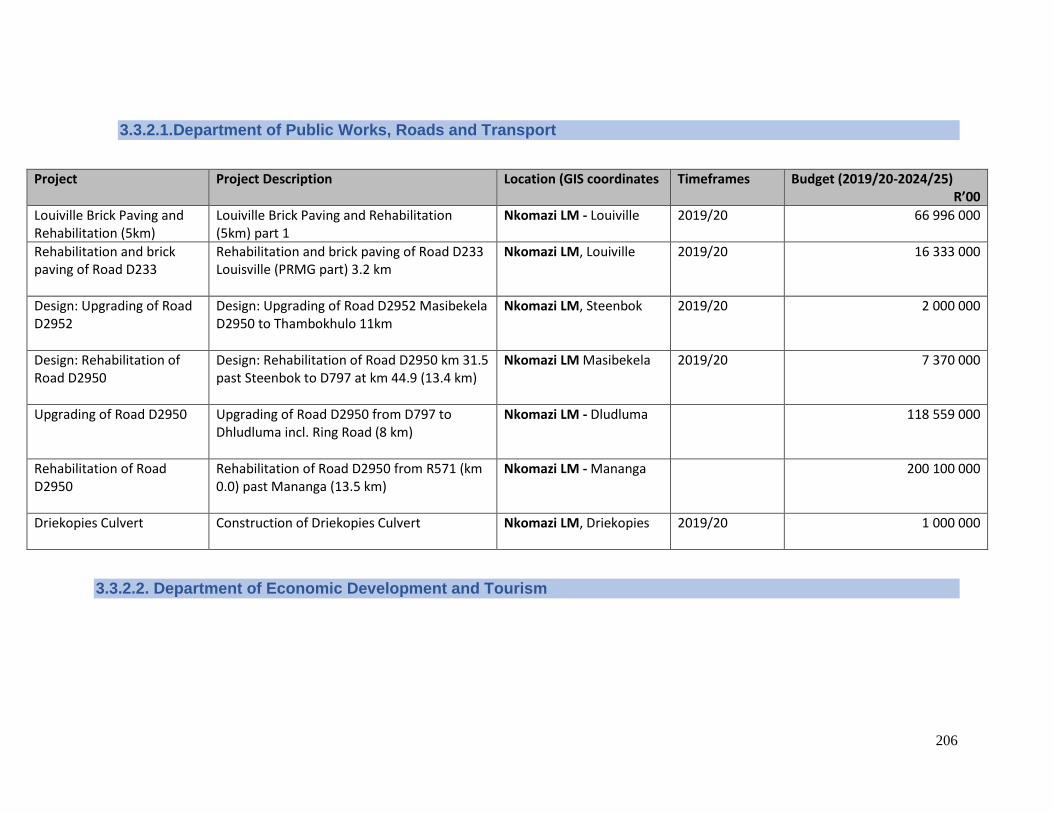
206
3.3.2.1.Department of Public Works, Roads and Transport
Project Project Description Location (GIS coordinates Timeframes Budget (2019/20-2024/25) R’00
Louiville Brick Paving and Rehabilitation (5km)
Louiville Brick Paving and Rehabilitation (5km) part 1
Nkomazi LM - Louiville
2019/20 66 996 000
Rehabilitation and brick paving of Road D233
Rehabilitation and brick paving of Road D233 Louisville (PRMG part) 3.2 km
Nkomazi LM, Louiville
2019/20 16 333 000
Design: Upgrading of Road D2952
Design: Upgrading of Road D2952 Masibekela D2950 to Thambokhulo 11km
Nkomazi LM, Steenbok 2019/20 2 000 000
Design: Rehabilitation of Road D2950
Design: Rehabilitation of Road D2950 km 31.5 past Steenbok to D797 at km 44.9 (13.4 km)
Nkomazi LM Masibekela
2019/20 7 370 000
Upgrading of Road D2950 Upgrading of Road D2950 from D797 to Dhludluma incl. Ring Road (8 km)
Nkomazi LM - Dludluma
118 559 000
Rehabilitation of Road D2950
Rehabilitation of Road D2950 from R571 (km 0.0) past Mananga (13.5 km)
Nkomazi LM - Mananga 200 100 000
Driekopies Culvert
Construction of Driekopies Culvert
Nkomazi LM, Driekopies
2019/20 1 000 000
3.3.2.2. Department of Economic Development and Tourism
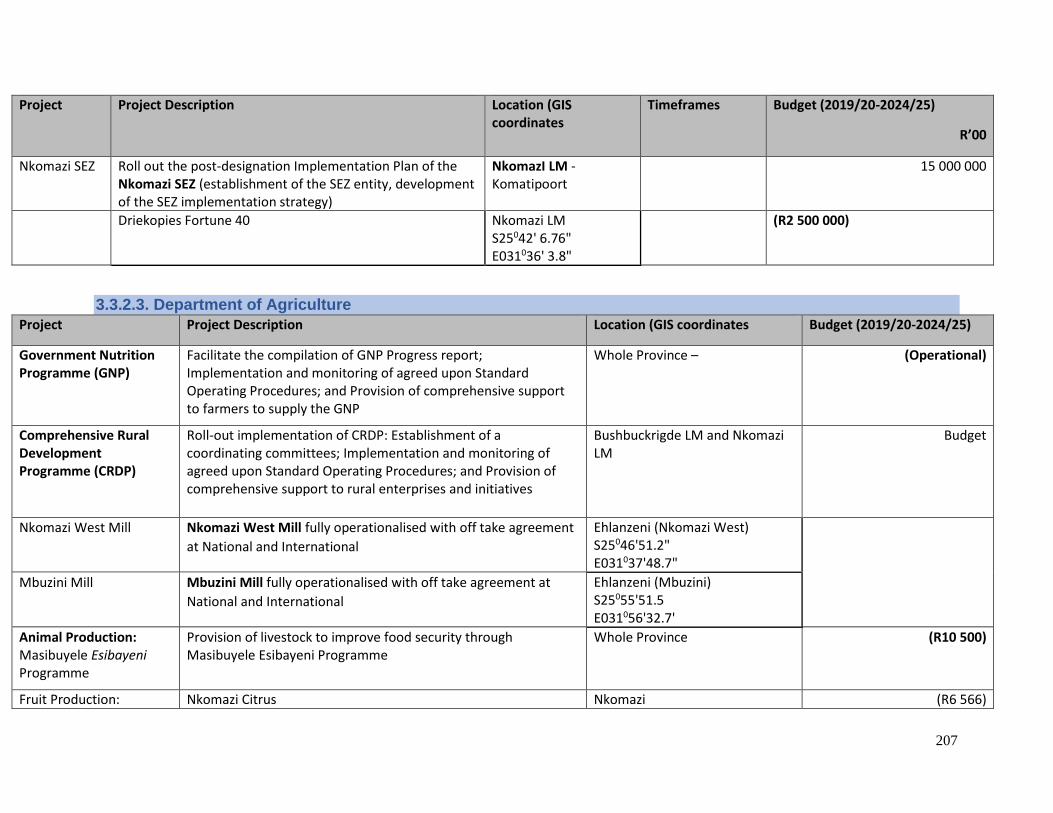
207
Project Project Description Location (GIS coordinates
Timeframes Budget (2019/20-2024/25)
R’00
Nkomazi SEZ Roll out the post-designation Implementation Plan of the Nkomazi SEZ (establishment of the SEZ entity, development of the SEZ implementation strategy)
NkomazI LM - Komatipoort
15 000 000
Driekopies Fortune 40
Nkomazi LM S25042' 6.76" E031036' 3.8"
(R2 500 000)
3.3.2.3. Department of Agriculture
Project Project Description Location (GIS coordinates Budget (2019/20-2024/25)
Government Nutrition Programme (GNP)
Facilitate the compilation of GNP Progress report; Implementation and monitoring of agreed upon Standard Operating Procedures; and Provision of comprehensive support to farmers to supply the GNP
Whole Province – (Operational)
Comprehensive Rural Development Programme (CRDP)
Roll-out implementation of CRDP: Establishment of a coordinating committees; Implementation and monitoring of agreed upon Standard Operating Procedures; and Provision of comprehensive support to rural enterprises and initiatives
Bushbuckrigde LM and Nkomazi LM
Budget
Nkomazi West Mill Nkomazi West Mill fully operationalised with off take agreement
at National and International
Ehlanzeni (Nkomazi West) S25046'51.2" E031037'48.7"
Mbuzini Mill Mbuzini Mill fully operationalised with off take agreement at
National and International
Ehlanzeni (Mbuzini) S25055'51.5 E031056'32.7'
Animal Production: Masibuyele Esibayeni Programme
Provision of livestock to improve food security through Masibuyele Esibayeni Programme
Whole Province (R10 500)
Fruit Production: Nkomazi Citrus Nkomazi (R6 566)
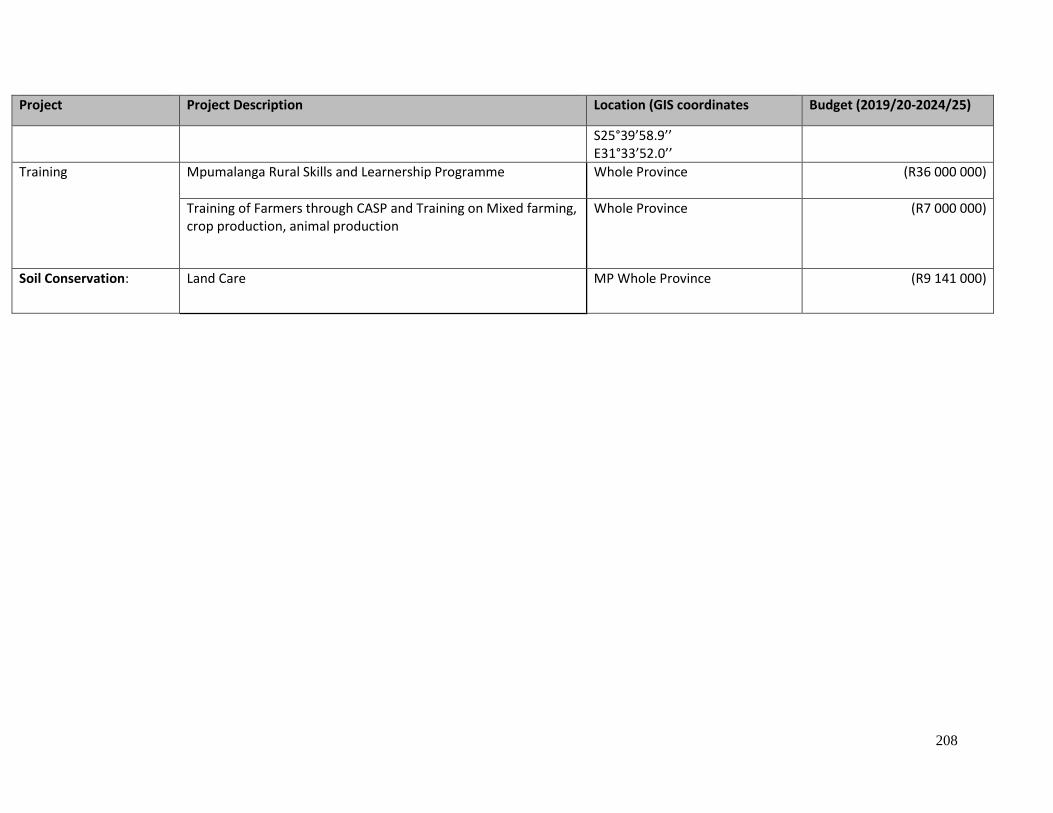
208
Project Project Description Location (GIS coordinates Budget (2019/20-2024/25)
S25°39’58.9’’ E31°33’52.0’’
Training
Mpumalanga Rural Skills and Learnership Programme
Whole Province (R36 000 000)
Training of Farmers through CASP and Training on Mixed farming, crop production, animal production
Whole Province (R7 000 000)
Soil Conservation:
Land Care
MP Whole Province (R9 141 000)
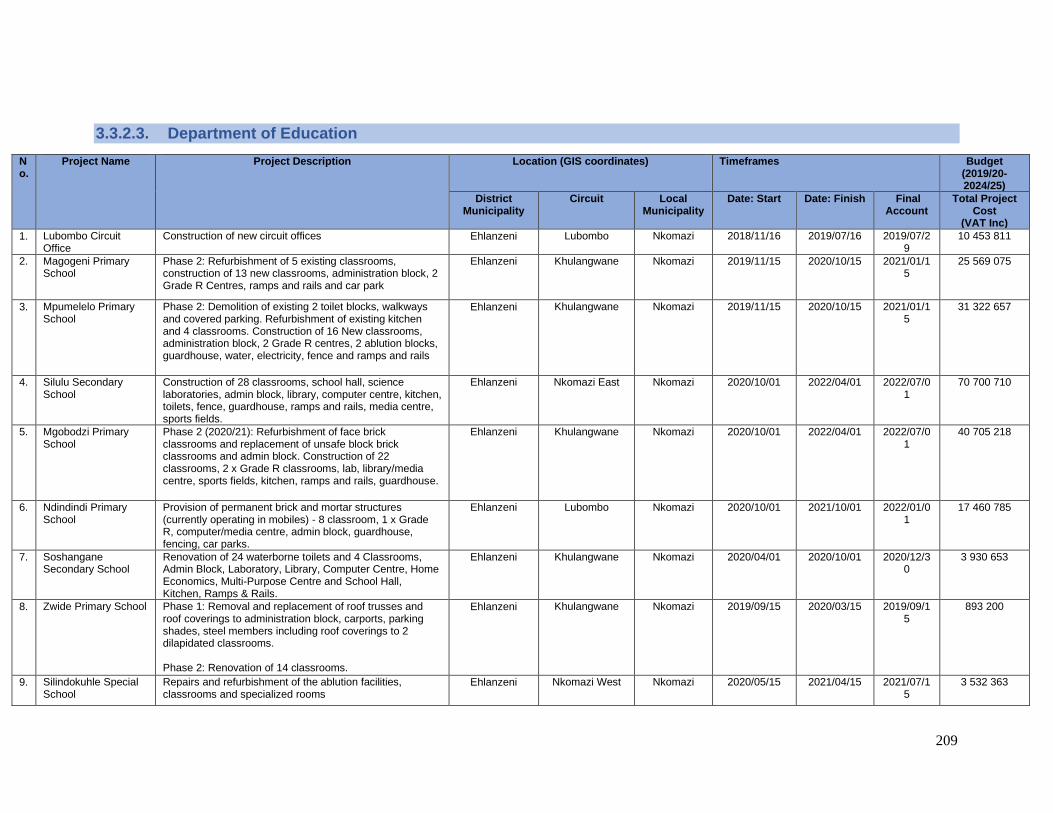
209
3.3.2.3. Department of Education
No.
Project Name Project Description Location (GIS coordinates) Timeframes Budget (2019/20-2024/25)
District Municipality
Circuit Local Municipality
Date: Start Date: Finish Final Account
Total Project Cost
(VAT Inc)
1. Lubombo Circuit Office
Construction of new circuit offices Ehlanzeni Lubombo Nkomazi 2018/11/16 2019/07/16 2019/07/29
10 453 811
2. Magogeni Primary School
Phase 2: Refurbishment of 5 existing classrooms, construction of 13 new classrooms, administration block, 2 Grade R Centres, ramps and rails and car park
Ehlanzeni Khulangwane Nkomazi 2019/11/15 2020/10/15 2021/01/15
25 569 075
3. Mpumelelo Primary School
Phase 2: Demolition of existing 2 toilet blocks, walkways and covered parking. Refurbishment of existing kitchen and 4 classrooms. Construction of 16 New classrooms, administration block, 2 Grade R centres, 2 ablution blocks, guardhouse, water, electricity, fence and ramps and rails
Ehlanzeni Khulangwane Nkomazi 2019/11/15 2020/10/15 2021/01/15
31 322 657
4. Silulu Secondary School
Construction of 28 classrooms, school hall, science laboratories, admin block, library, computer centre, kitchen, toilets, fence, guardhouse, ramps and rails, media centre, sports fields.
Ehlanzeni Nkomazi East Nkomazi 2020/10/01 2022/04/01 2022/07/01
70 700 710
5. Mgobodzi Primary School
Phase 2 (2020/21): Refurbishment of face brick classrooms and replacement of unsafe block brick classrooms and admin block. Construction of 22 classrooms, 2 x Grade R classrooms, lab, library/media centre, sports fields, kitchen, ramps and rails, guardhouse.
Ehlanzeni Khulangwane Nkomazi 2020/10/01 2022/04/01 2022/07/01
40 705 218
6. Ndindindi Primary School
Provision of permanent brick and mortar structures (currently operating in mobiles) - 8 classroom, 1 x Grade R, computer/media centre, admin block, guardhouse, fencing, car parks.
Ehlanzeni Lubombo Nkomazi 2020/10/01 2021/10/01 2022/01/01
17 460 785
7. Soshangane Secondary School
Renovation of 24 waterborne toilets and 4 Classrooms, Admin Block, Laboratory, Library, Computer Centre, Home Economics, Multi-Purpose Centre and School Hall, Kitchen, Ramps & Rails.
Ehlanzeni Khulangwane Nkomazi 2020/04/01 2020/10/01 2020/12/30
3 930 653
8. Zwide Primary School Phase 1: Removal and replacement of roof trusses and roof coverings to administration block, carports, parking shades, steel members including roof coverings to 2 dilapidated classrooms. Phase 2: Renovation of 14 classrooms.
Ehlanzeni Khulangwane Nkomazi 2019/09/15 2020/03/15 2019/09/15
893 200
9. Silindokuhle Special School
Repairs and refurbishment of the ablution facilities, classrooms and specialized rooms
Ehlanzeni Nkomazi West Nkomazi 2020/05/15 2021/04/15 2021/07/15
3 532 363
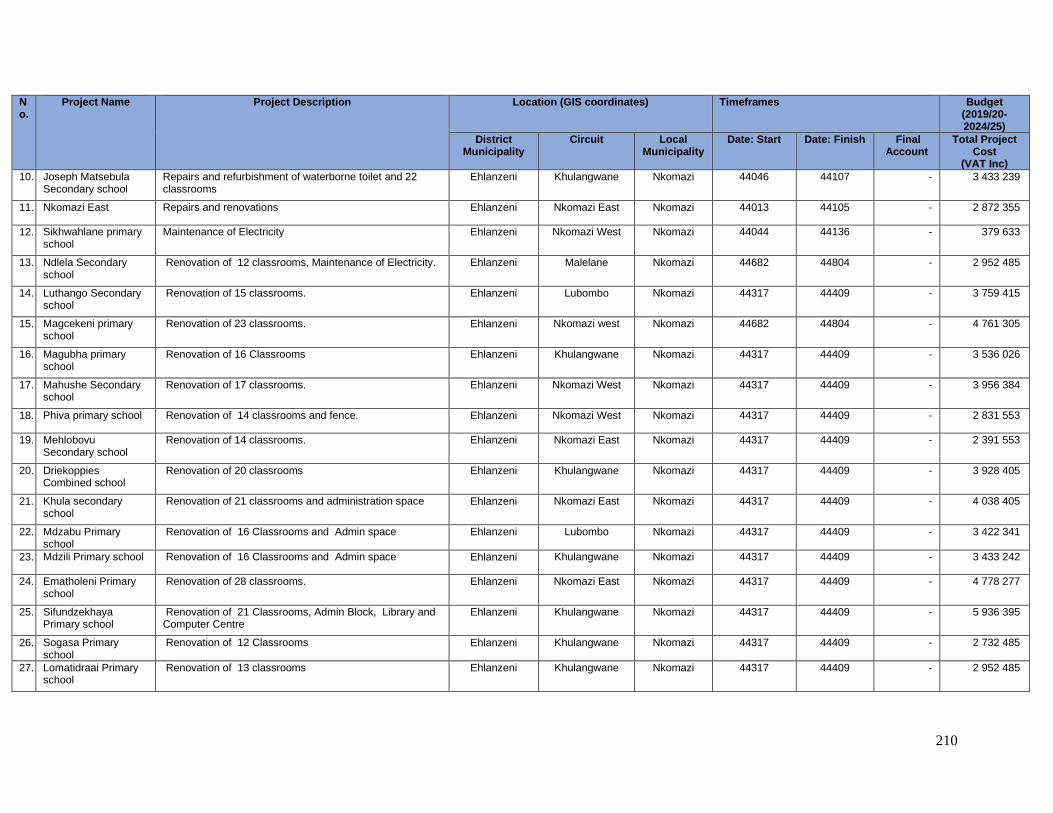
210
No.
Project Name Project Description Location (GIS coordinates) Timeframes Budget (2019/20-2024/25)
District Municipality
Circuit Local Municipality
Date: Start Date: Finish Final Account
Total Project Cost
(VAT Inc)
10. Joseph Matsebula Secondary school
Repairs and refurbishment of waterborne toilet and 22 classrooms
Ehlanzeni Khulangwane Nkomazi 44046 44107 - 3 433 239
11. Nkomazi East Repairs and renovations Ehlanzeni Nkomazi East Nkomazi 44013 44105 - 2 872 355
12. Sikhwahlane primary school
Maintenance of Electricity Ehlanzeni Nkomazi West Nkomazi 44044 44136 - 379 633
13. Ndlela Secondary school
Renovation of 12 classrooms, Maintenance of Electricity. Ehlanzeni Malelane Nkomazi 44682 44804 - 2 952 485
14. Luthango Secondary school
Renovation of 15 classrooms. Ehlanzeni Lubombo Nkomazi 44317 44409 - 3 759 415
15. Magcekeni primary school
Renovation of 23 classrooms. Ehlanzeni Nkomazi west Nkomazi 44682 44804 - 4 761 305
16. Magubha primary school
Renovation of 16 Classrooms Ehlanzeni Khulangwane Nkomazi 44317 44409 - 3 536 026
17. Mahushe Secondary school
Renovation of 17 classrooms. Ehlanzeni Nkomazi West Nkomazi 44317 44409 - 3 956 384
18. Phiva primary school Renovation of 14 classrooms and fence. Ehlanzeni Nkomazi West Nkomazi 44317 44409 - 2 831 553
19. Mehlobovu Secondary school
Renovation of 14 classrooms. Ehlanzeni Nkomazi East Nkomazi 44317 44409 - 2 391 553
20. Driekoppies Combined school
Renovation of 20 classrooms Ehlanzeni Khulangwane Nkomazi 44317 44409 - 3 928 405
21. Khula secondary school
Renovation of 21 classrooms and administration space Ehlanzeni Nkomazi East Nkomazi 44317 44409 - 4 038 405
22. Mdzabu Primary school
Renovation of 16 Classrooms and Admin space Ehlanzeni Lubombo Nkomazi 44317 44409 - 3 422 341
23. Mdzili Primary school Renovation of 16 Classrooms and Admin space Ehlanzeni Khulangwane Nkomazi 44317 44409 - 3 433 242
24. Ematholeni Primary school
Renovation of 28 classrooms. Ehlanzeni Nkomazi East Nkomazi 44317 44409 - 4 778 277
25. Sifundzekhaya Primary school
Renovation of 21 Classrooms, Admin Block, Library and Computer Centre
Ehlanzeni Khulangwane Nkomazi 44317 44409 - 5 936 395
26. Sogasa Primary school
Renovation of 12 Classrooms Ehlanzeni Khulangwane Nkomazi 44317 44409 - 2 732 485
27. Lomatidraai Primary school
Renovation of 13 classrooms Ehlanzeni Khulangwane Nkomazi 44317 44409 - 2 952 485
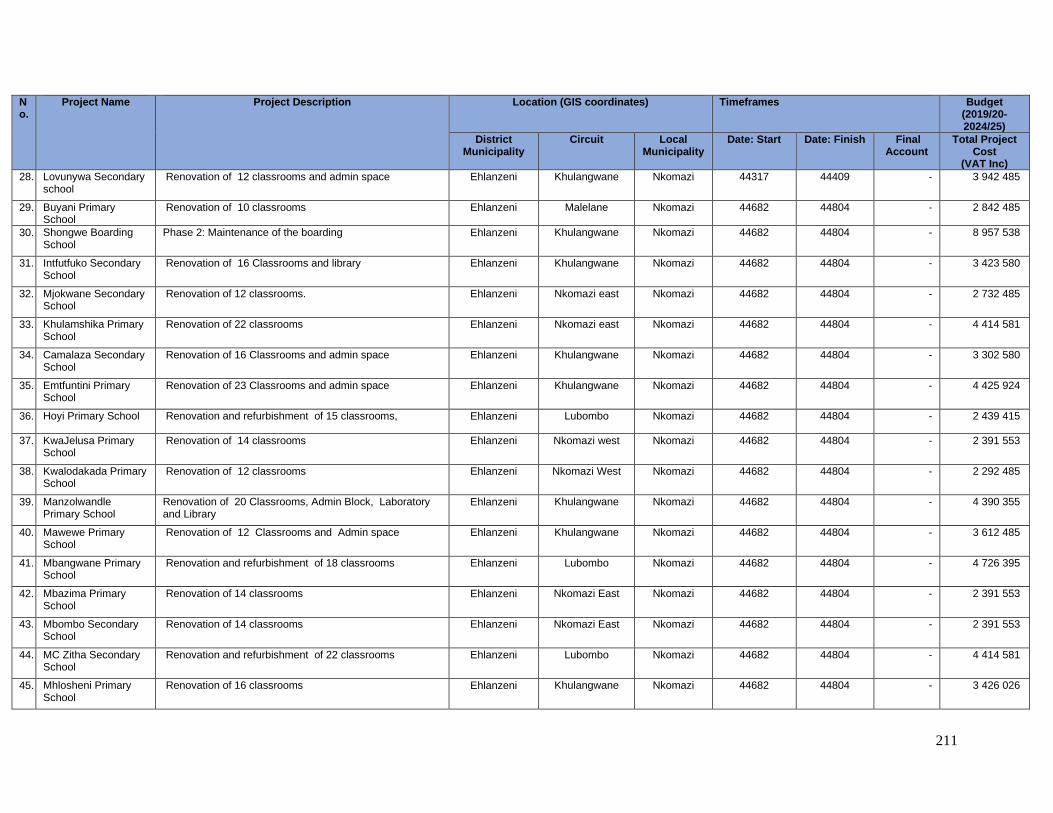
211
No.
Project Name Project Description Location (GIS coordinates) Timeframes Budget (2019/20-2024/25)
District Municipality
Circuit Local Municipality
Date: Start Date: Finish Final Account
Total Project Cost
(VAT Inc)
28. Lovunywa Secondary school
Renovation of 12 classrooms and admin space Ehlanzeni Khulangwane Nkomazi 44317 44409 - 3 942 485
29. Buyani Primary School
Renovation of 10 classrooms Ehlanzeni Malelane Nkomazi 44682 44804 - 2 842 485
30. Shongwe Boarding School
Phase 2: Maintenance of the boarding Ehlanzeni Khulangwane Nkomazi 44682 44804 - 8 957 538
31. Intfutfuko Secondary School
Renovation of 16 Classrooms and library Ehlanzeni Khulangwane Nkomazi 44682 44804 - 3 423 580
32. Mjokwane Secondary School
Renovation of 12 classrooms. Ehlanzeni Nkomazi east Nkomazi 44682 44804 - 2 732 485
33. Khulamshika Primary School
Renovation of 22 classrooms Ehlanzeni Nkomazi east Nkomazi 44682 44804 - 4 414 581
34. Camalaza Secondary School
Renovation of 16 Classrooms and admin space Ehlanzeni Khulangwane Nkomazi 44682 44804 - 3 302 580
35. Emtfuntini Primary School
Renovation of 23 Classrooms and admin space Ehlanzeni Khulangwane Nkomazi 44682 44804 - 4 425 924
36. Hoyi Primary School Renovation and refurbishment of 15 classrooms, Ehlanzeni Lubombo Nkomazi 44682 44804 - 2 439 415
37. KwaJelusa Primary School
Renovation of 14 classrooms Ehlanzeni Nkomazi west Nkomazi 44682 44804 - 2 391 553
38. Kwalodakada Primary School
Renovation of 12 classrooms Ehlanzeni Nkomazi West Nkomazi 44682 44804 - 2 292 485
39. Manzolwandle Primary School
Renovation of 20 Classrooms, Admin Block, Laboratory and Library
Ehlanzeni Khulangwane Nkomazi 44682 44804 - 4 390 355
40. Mawewe Primary School
Renovation of 12 Classrooms and Admin space Ehlanzeni Khulangwane Nkomazi 44682 44804 - 3 612 485
41. Mbangwane Primary School
Renovation and refurbishment of 18 classrooms Ehlanzeni Lubombo Nkomazi 44682 44804 - 4 726 395
42. Mbazima Primary School
Renovation of 14 classrooms Ehlanzeni Nkomazi East Nkomazi 44682 44804 - 2 391 553
43. Mbombo Secondary School
Renovation of 14 classrooms Ehlanzeni Nkomazi East Nkomazi 44682 44804 - 2 391 553
44. MC Zitha Secondary School
Renovation and refurbishment of 22 classrooms Ehlanzeni Lubombo Nkomazi 44682 44804 - 4 414 581
45. Mhlosheni Primary School
Renovation of 16 classrooms Ehlanzeni Khulangwane Nkomazi 44682 44804 - 3 426 026
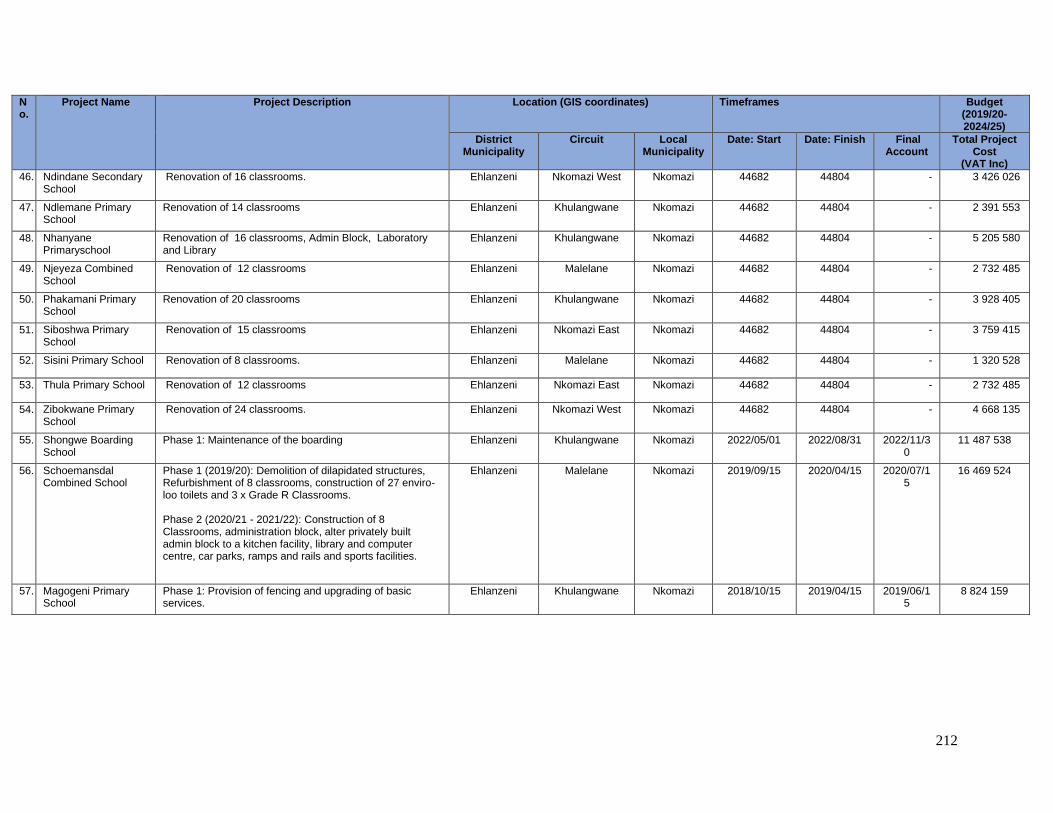
212
No.
Project Name Project Description Location (GIS coordinates) Timeframes Budget (2019/20-2024/25)
District Municipality
Circuit Local Municipality
Date: Start Date: Finish Final Account
Total Project Cost
(VAT Inc)
46. Ndindane Secondary School
Renovation of 16 classrooms. Ehlanzeni Nkomazi West Nkomazi 44682 44804 - 3 426 026
47. Ndlemane Primary School
Renovation of 14 classrooms Ehlanzeni Khulangwane Nkomazi 44682 44804 - 2 391 553
48. Nhanyane Primaryschool
Renovation of 16 classrooms, Admin Block, Laboratory and Library
Ehlanzeni Khulangwane Nkomazi 44682 44804 - 5 205 580
49. Njeyeza Combined School
Renovation of 12 classrooms Ehlanzeni Malelane Nkomazi 44682 44804 - 2 732 485
50. Phakamani Primary School
Renovation of 20 classrooms Ehlanzeni Khulangwane Nkomazi 44682 44804 - 3 928 405
51. Siboshwa Primary School
Renovation of 15 classrooms Ehlanzeni Nkomazi East Nkomazi 44682 44804 - 3 759 415
52. Sisini Primary School Renovation of 8 classrooms. Ehlanzeni Malelane Nkomazi 44682 44804 - 1 320 528
53. Thula Primary School Renovation of 12 classrooms Ehlanzeni Nkomazi East Nkomazi 44682 44804 - 2 732 485
54. Zibokwane Primary School
Renovation of 24 classrooms. Ehlanzeni Nkomazi West Nkomazi 44682 44804 - 4 668 135
55. Shongwe Boarding School
Phase 1: Maintenance of the boarding Ehlanzeni Khulangwane Nkomazi 2022/05/01 2022/08/31 2022/11/30
11 487 538
56. Schoemansdal Combined School
Phase 1 (2019/20): Demolition of dilapidated structures, Refurbishment of 8 classrooms, construction of 27 enviro-loo toilets and 3 x Grade R Classrooms. Phase 2 (2020/21 - 2021/22): Construction of 8 Classrooms, administration block, alter privately built admin block to a kitchen facility, library and computer centre, car parks, ramps and rails and sports facilities.
Ehlanzeni Malelane Nkomazi 2019/09/15 2020/04/15 2020/07/15
16 469 524
57. Magogeni Primary School
Phase 1: Provision of fencing and upgrading of basic services.
Ehlanzeni Khulangwane Nkomazi 2018/10/15 2019/04/15 2019/06/15
8 824 159
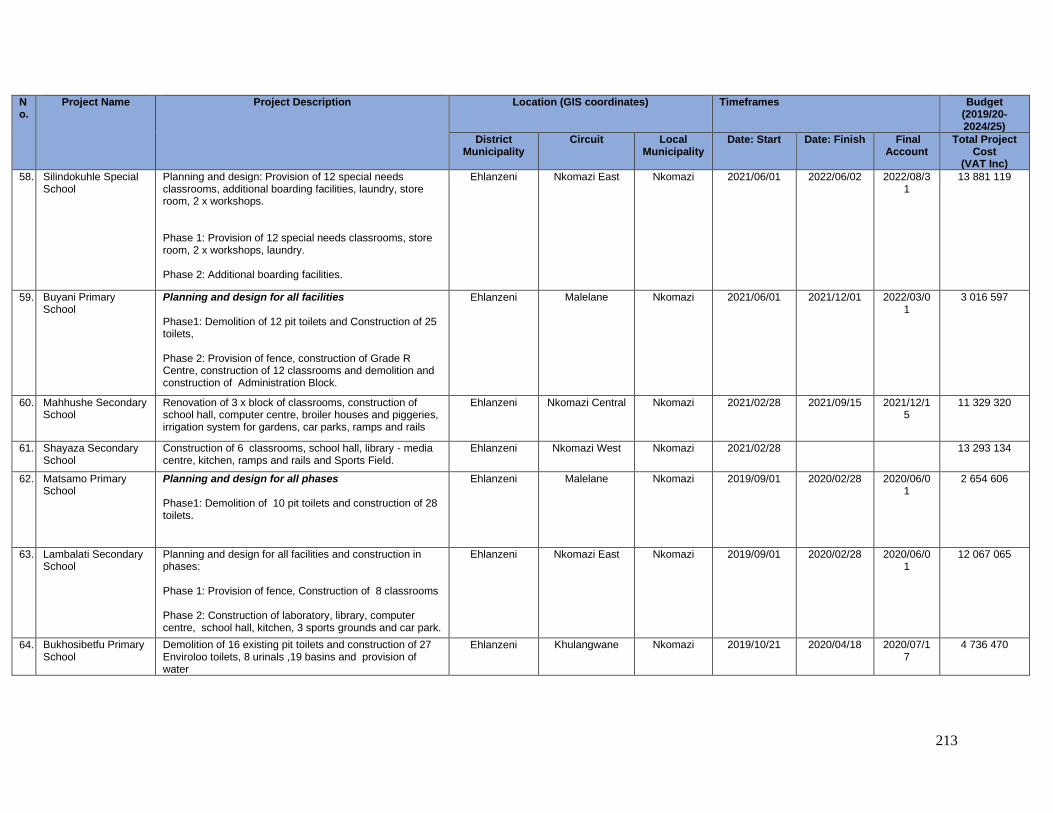
213
No.
Project Name Project Description Location (GIS coordinates) Timeframes Budget (2019/20-2024/25)
District Municipality
Circuit Local Municipality
Date: Start Date: Finish Final Account
Total Project Cost
(VAT Inc)
58. Silindokuhle Special School
Planning and design: Provision of 12 special needs classrooms, additional boarding facilities, laundry, store room, 2 x workshops. Phase 1: Provision of 12 special needs classrooms, store room, 2 x workshops, laundry. Phase 2: Additional boarding facilities.
Ehlanzeni Nkomazi East Nkomazi 2021/06/01 2022/06/02 2022/08/31
13 881 119
59. Buyani Primary School
Planning and design for all facilities Phase1: Demolition of 12 pit toilets and Construction of 25 toilets, Phase 2: Provision of fence, construction of Grade R Centre, construction of 12 classrooms and demolition and construction of Administration Block.
Ehlanzeni Malelane Nkomazi 2021/06/01 2021/12/01 2022/03/01
3 016 597
60. Mahhushe Secondary School
Renovation of 3 x block of classrooms, construction of school hall, computer centre, broiler houses and piggeries, irrigation system for gardens, car parks, ramps and rails
Ehlanzeni Nkomazi Central Nkomazi 2021/02/28 2021/09/15 2021/12/15
11 329 320
61. Shayaza Secondary School
Construction of 6 classrooms, school hall, library - media centre, kitchen, ramps and rails and Sports Field.
Ehlanzeni Nkomazi West Nkomazi 2021/02/28 13 293 134
62. Matsamo Primary School
Planning and design for all phases Phase1: Demolition of 10 pit toilets and construction of 28 toilets.
Ehlanzeni Malelane Nkomazi 2019/09/01 2020/02/28 2020/06/01
2 654 606
63. Lambalati Secondary School
Planning and design for all facilities and construction in phases: Phase 1: Provision of fence, Construction of 8 classrooms Phase 2: Construction of laboratory, library, computer centre, school hall, kitchen, 3 sports grounds and car park.
Ehlanzeni Nkomazi East Nkomazi 2019/09/01 2020/02/28 2020/06/01
12 067 065
64. Bukhosibetfu Primary School
Demolition of 16 existing pit toilets and construction of 27 Enviroloo toilets, 8 urinals ,19 basins and provision of water
Ehlanzeni Khulangwane Nkomazi 2019/10/21 2020/04/18 2020/07/17
4 736 470
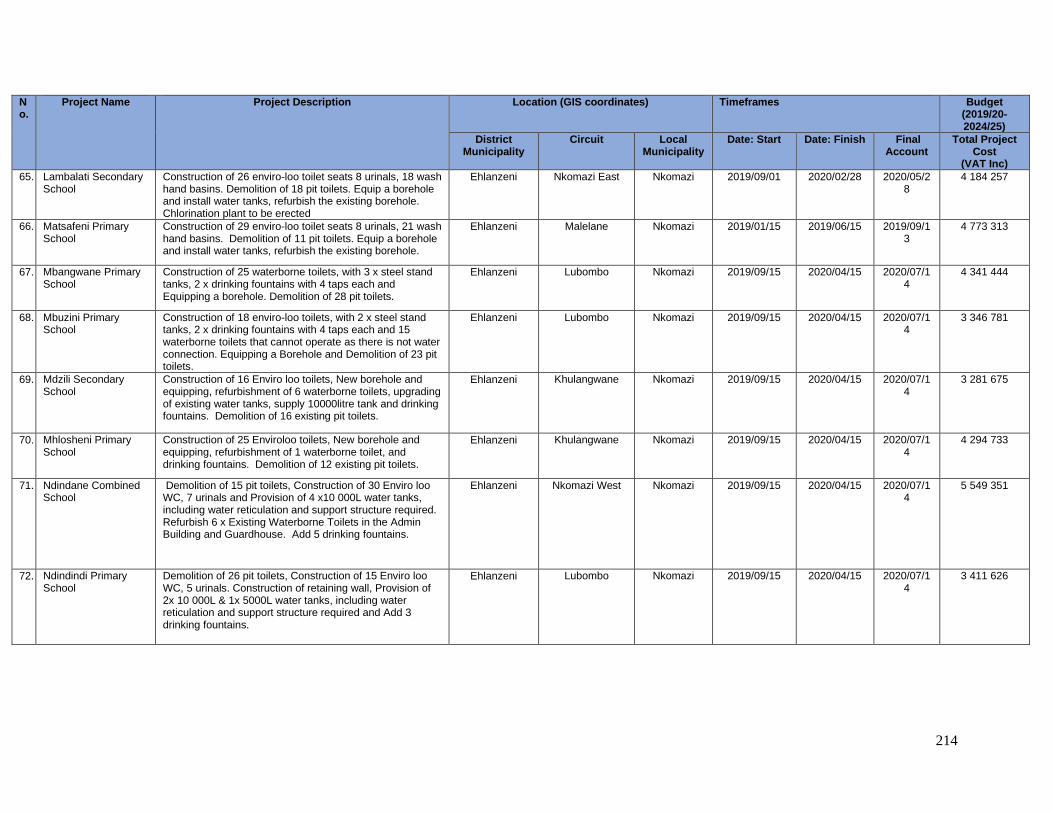
214
No.
Project Name Project Description Location (GIS coordinates) Timeframes Budget (2019/20-2024/25)
District Municipality
Circuit Local Municipality
Date: Start Date: Finish Final Account
Total Project Cost
(VAT Inc)
65. Lambalati Secondary School
Construction of 26 enviro-loo toilet seats 8 urinals, 18 wash hand basins. Demolition of 18 pit toilets. Equip a borehole and install water tanks, refurbish the existing borehole. Chlorination plant to be erected
Ehlanzeni Nkomazi East Nkomazi 2019/09/01 2020/02/28 2020/05/28
4 184 257
66. Matsafeni Primary School
Construction of 29 enviro-loo toilet seats 8 urinals, 21 wash hand basins. Demolition of 11 pit toilets. Equip a borehole and install water tanks, refurbish the existing borehole.
Ehlanzeni Malelane Nkomazi 2019/01/15 2019/06/15 2019/09/13
4 773 313
67. Mbangwane Primary School
Construction of 25 waterborne toilets, with 3 x steel stand tanks, 2 x drinking fountains with 4 taps each and Equipping a borehole. Demolition of 28 pit toilets.
Ehlanzeni Lubombo Nkomazi 2019/09/15 2020/04/15 2020/07/14
4 341 444
68. Mbuzini Primary School
Construction of 18 enviro-loo toilets, with 2 x steel stand tanks, 2 x drinking fountains with 4 taps each and 15 waterborne toilets that cannot operate as there is not water connection. Equipping a Borehole and Demolition of 23 pit toilets.
Ehlanzeni Lubombo Nkomazi 2019/09/15 2020/04/15 2020/07/14
3 346 781
69. Mdzili Secondary School
Construction of 16 Enviro loo toilets, New borehole and equipping, refurbishment of 6 waterborne toilets, upgrading of existing water tanks, supply 10000litre tank and drinking fountains. Demolition of 16 existing pit toilets.
Ehlanzeni Khulangwane Nkomazi 2019/09/15 2020/04/15 2020/07/14
3 281 675
70. Mhlosheni Primary School
Construction of 25 Enviroloo toilets, New borehole and equipping, refurbishment of 1 waterborne toilet, and drinking fountains. Demolition of 12 existing pit toilets.
Ehlanzeni Khulangwane Nkomazi 2019/09/15 2020/04/15 2020/07/14
4 294 733
71. Ndindane Combined School
Demolition of 15 pit toilets, Construction of 30 Enviro loo WC, 7 urinals and Provision of 4 x10 000L water tanks, including water reticulation and support structure required. Refurbish 6 x Existing Waterborne Toilets in the Admin Building and Guardhouse. Add 5 drinking fountains.
Ehlanzeni Nkomazi West Nkomazi 2019/09/15 2020/04/15 2020/07/14
5 549 351
72. Ndindindi Primary School
Demolition of 26 pit toilets, Construction of 15 Enviro loo WC, 5 urinals. Construction of retaining wall, Provision of 2x 10 000L & 1x 5000L water tanks, including water reticulation and support structure required and Add 3 drinking fountains.
Ehlanzeni Lubombo Nkomazi 2019/09/15 2020/04/15 2020/07/14
3 411 626
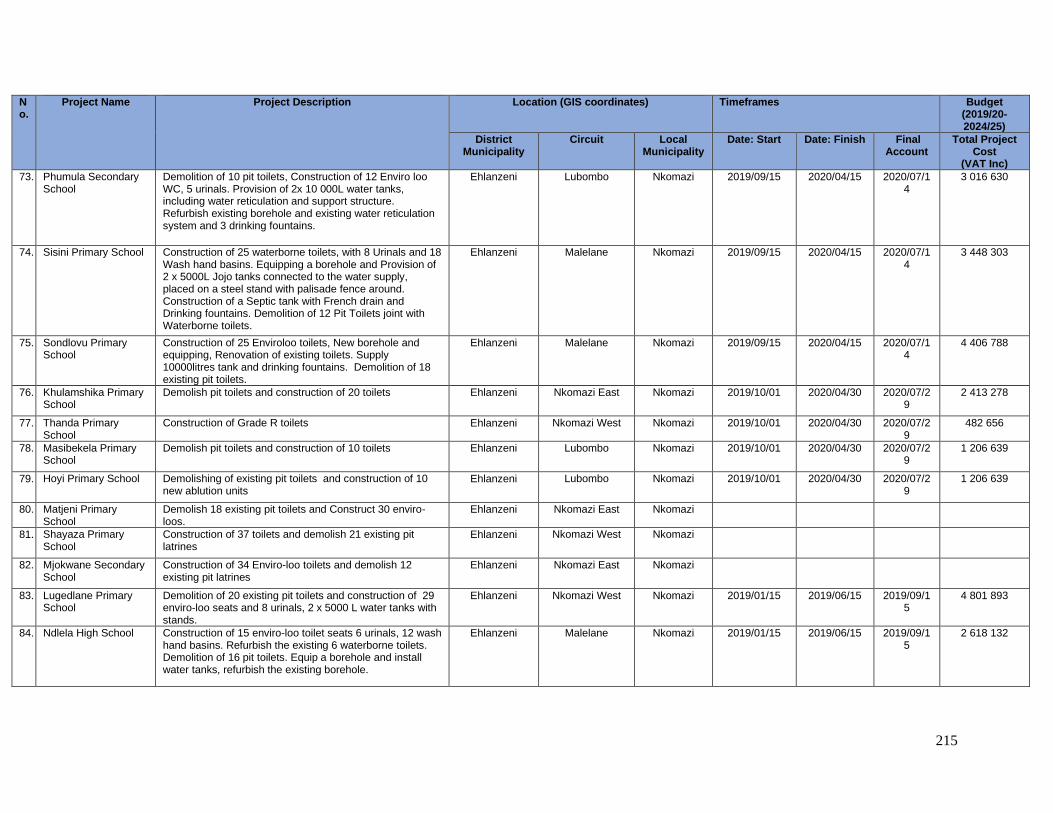
215
No.
Project Name Project Description Location (GIS coordinates) Timeframes Budget (2019/20-2024/25)
District Municipality
Circuit Local Municipality
Date: Start Date: Finish Final Account
Total Project Cost
(VAT Inc)
73. Phumula Secondary School
Demolition of 10 pit toilets, Construction of 12 Enviro loo WC, 5 urinals. Provision of 2x 10 000L water tanks, including water reticulation and support structure. Refurbish existing borehole and existing water reticulation system and 3 drinking fountains.
Ehlanzeni Lubombo Nkomazi 2019/09/15 2020/04/15 2020/07/14
3 016 630
74. Sisini Primary School Construction of 25 waterborne toilets, with 8 Urinals and 18 Wash hand basins. Equipping a borehole and Provision of 2 x 5000L Jojo tanks connected to the water supply, placed on a steel stand with palisade fence around. Construction of a Septic tank with French drain and Drinking fountains. Demolition of 12 Pit Toilets joint with Waterborne toilets.
Ehlanzeni Malelane Nkomazi 2019/09/15 2020/04/15 2020/07/14
3 448 303
75. Sondlovu Primary School
Construction of 25 Enviroloo toilets, New borehole and equipping, Renovation of existing toilets. Supply 10000litres tank and drinking fountains. Demolition of 18 existing pit toilets.
Ehlanzeni Malelane Nkomazi 2019/09/15 2020/04/15 2020/07/14
4 406 788
76. Khulamshika Primary School
Demolish pit toilets and construction of 20 toilets Ehlanzeni Nkomazi East Nkomazi 2019/10/01 2020/04/30 2020/07/29
2 413 278
77. Thanda Primary School
Construction of Grade R toilets Ehlanzeni Nkomazi West Nkomazi 2019/10/01 2020/04/30 2020/07/29
482 656
78. Masibekela Primary School
Demolish pit toilets and construction of 10 toilets Ehlanzeni Lubombo Nkomazi 2019/10/01 2020/04/30 2020/07/29
1 206 639
79. Hoyi Primary School Demolishing of existing pit toilets and construction of 10 new ablution units
Ehlanzeni Lubombo Nkomazi 2019/10/01 2020/04/30 2020/07/29
1 206 639
80. Matjeni Primary School
Demolish 18 existing pit toilets and Construct 30 enviro-loos.
Ehlanzeni Nkomazi East Nkomazi
81. Shayaza Primary School
Construction of 37 toilets and demolish 21 existing pit latrines
Ehlanzeni Nkomazi West Nkomazi
82. Mjokwane Secondary School
Construction of 34 Enviro-loo toilets and demolish 12 existing pit latrines
Ehlanzeni Nkomazi East Nkomazi
83. Lugedlane Primary School
Demolition of 20 existing pit toilets and construction of 29 enviro-loo seats and 8 urinals, 2 x 5000 L water tanks with stands.
Ehlanzeni Nkomazi West Nkomazi 2019/01/15 2019/06/15 2019/09/15
4 801 893
84. Ndlela High School Construction of 15 enviro-loo toilet seats 6 urinals, 12 wash hand basins. Refurbish the existing 6 waterborne toilets. Demolition of 16 pit toilets. Equip a borehole and install water tanks, refurbish the existing borehole.
Ehlanzeni Malelane Nkomazi 2019/01/15 2019/06/15 2019/09/15
2 618 132
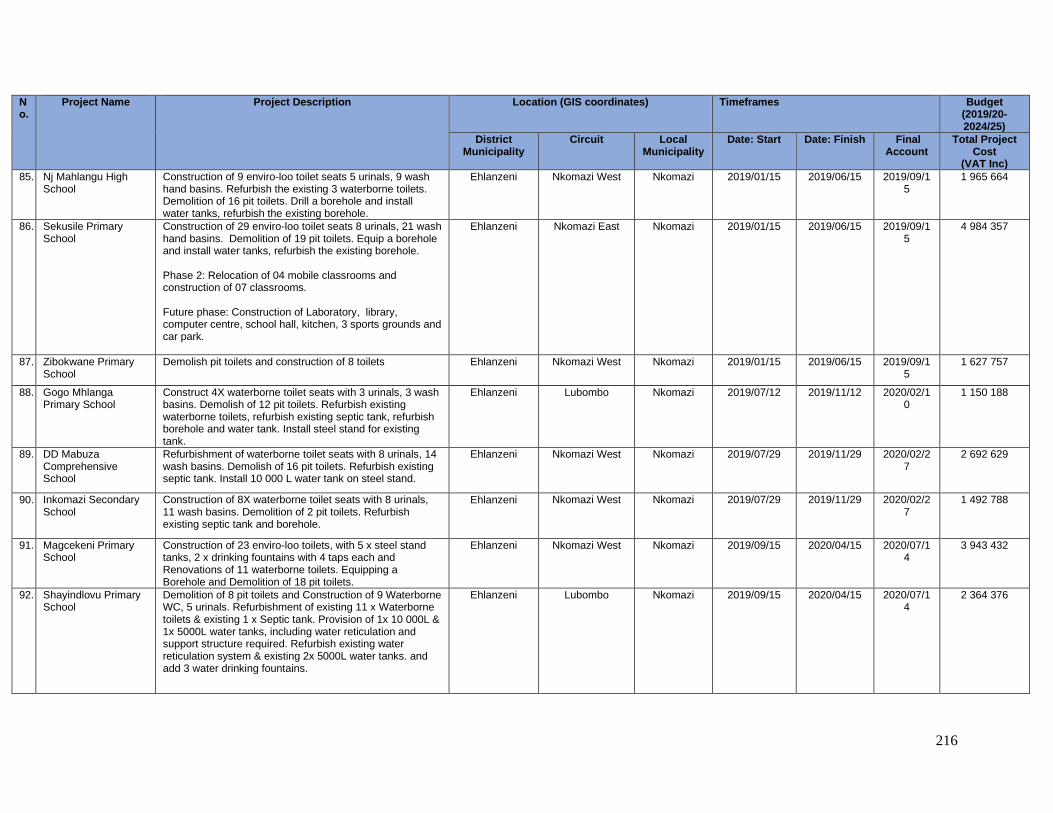
216
No.
Project Name Project Description Location (GIS coordinates) Timeframes Budget (2019/20-2024/25)
District Municipality
Circuit Local Municipality
Date: Start Date: Finish Final Account
Total Project Cost
(VAT Inc)
85. Nj Mahlangu High School
Construction of 9 enviro-loo toilet seats 5 urinals, 9 wash hand basins. Refurbish the existing 3 waterborne toilets. Demolition of 16 pit toilets. Drill a borehole and install water tanks, refurbish the existing borehole.
Ehlanzeni Nkomazi West Nkomazi 2019/01/15 2019/06/15 2019/09/15
1 965 664
86. Sekusile Primary School
Construction of 29 enviro-loo toilet seats 8 urinals, 21 wash hand basins. Demolition of 19 pit toilets. Equip a borehole and install water tanks, refurbish the existing borehole. Phase 2: Relocation of 04 mobile classrooms and construction of 07 classrooms. Future phase: Construction of Laboratory, library, computer centre, school hall, kitchen, 3 sports grounds and car park.
Ehlanzeni Nkomazi East Nkomazi 2019/01/15 2019/06/15 2019/09/15
4 984 357
87. Zibokwane Primary School
Demolish pit toilets and construction of 8 toilets Ehlanzeni Nkomazi West Nkomazi 2019/01/15 2019/06/15 2019/09/15
1 627 757
88. Gogo Mhlanga Primary School
Construct 4X waterborne toilet seats with 3 urinals, 3 wash basins. Demolish of 12 pit toilets. Refurbish existing waterborne toilets, refurbish existing septic tank, refurbish borehole and water tank. Install steel stand for existing tank.
Ehlanzeni Lubombo Nkomazi 2019/07/12 2019/11/12 2020/02/10
1 150 188
89. DD Mabuza Comprehensive School
Refurbishment of waterborne toilet seats with 8 urinals, 14 wash basins. Demolish of 16 pit toilets. Refurbish existing septic tank. Install 10 000 L water tank on steel stand.
Ehlanzeni Nkomazi West Nkomazi 2019/07/29 2019/11/29 2020/02/27
2 692 629
90. Inkomazi Secondary School
Construction of 8X waterborne toilet seats with 8 urinals, 11 wash basins. Demolition of 2 pit toilets. Refurbish existing septic tank and borehole.
Ehlanzeni Nkomazi West Nkomazi 2019/07/29 2019/11/29 2020/02/27
1 492 788
91. Magcekeni Primary School
Construction of 23 enviro-loo toilets, with 5 x steel stand tanks, 2 x drinking fountains with 4 taps each and Renovations of 11 waterborne toilets. Equipping a Borehole and Demolition of 18 pit toilets.
Ehlanzeni Nkomazi West Nkomazi 2019/09/15 2020/04/15 2020/07/14
3 943 432
92. Shayindlovu Primary School
Demolition of 8 pit toilets and Construction of 9 Waterborne WC, 5 urinals. Refurbishment of existing 11 x Waterborne toilets & existing 1 x Septic tank. Provision of 1x 10 000L & 1x 5000L water tanks, including water reticulation and support structure required. Refurbish existing water reticulation system & existing 2x 5000L water tanks. and add 3 water drinking fountains.
Ehlanzeni Lubombo Nkomazi 2019/09/15 2020/04/15 2020/07/14
2 364 376
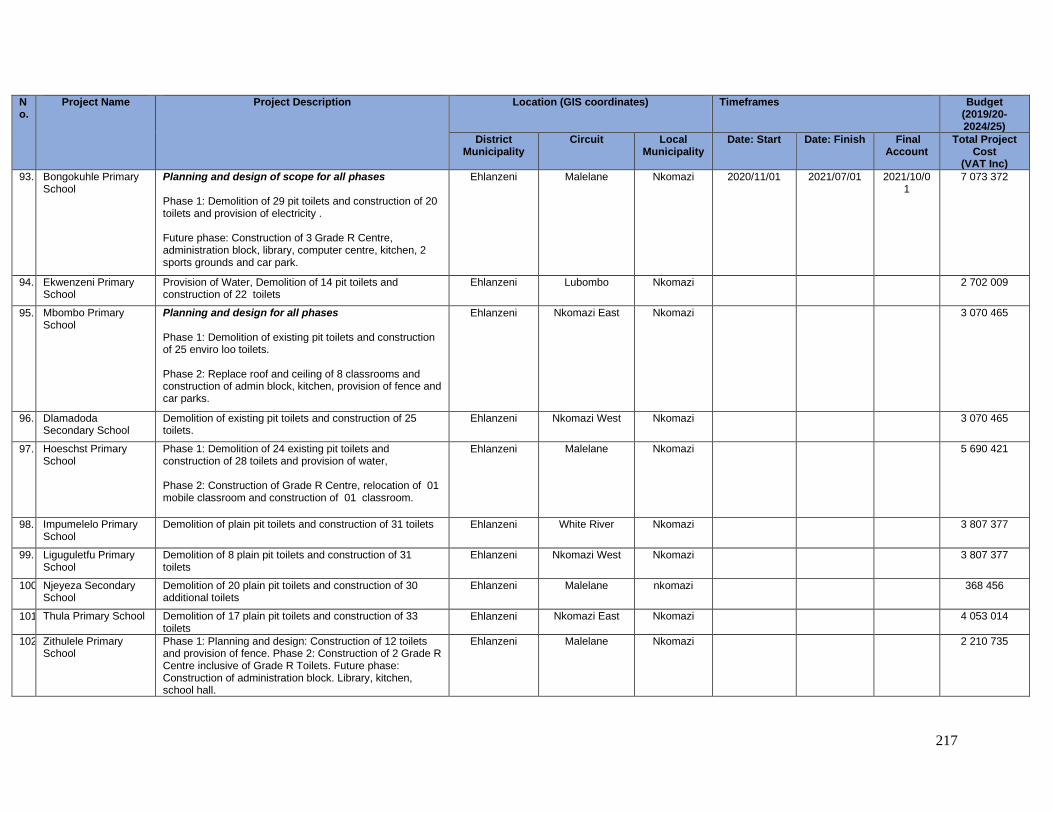
217
No.
Project Name Project Description Location (GIS coordinates) Timeframes Budget (2019/20-2024/25)
District Municipality
Circuit Local Municipality
Date: Start Date: Finish Final Account
Total Project Cost
(VAT Inc)
93. Bongokuhle Primary School
Planning and design of scope for all phases Phase 1: Demolition of 29 pit toilets and construction of 20 toilets and provision of electricity . Future phase: Construction of 3 Grade R Centre, administration block, library, computer centre, kitchen, 2 sports grounds and car park.
Ehlanzeni Malelane Nkomazi 2020/11/01 2021/07/01 2021/10/01
7 073 372
94. Ekwenzeni Primary School
Provision of Water, Demolition of 14 pit toilets and construction of 22 toilets
Ehlanzeni Lubombo Nkomazi 2 702 009
95. Mbombo Primary School
Planning and design for all phases Phase 1: Demolition of existing pit toilets and construction of 25 enviro loo toilets. Phase 2: Replace roof and ceiling of 8 classrooms and construction of admin block, kitchen, provision of fence and car parks.
Ehlanzeni Nkomazi East Nkomazi 3 070 465
96. Dlamadoda Secondary School
Demolition of existing pit toilets and construction of 25 toilets.
Ehlanzeni Nkomazi West Nkomazi 3 070 465
97. Hoeschst Primary School
Phase 1: Demolition of 24 existing pit toilets and construction of 28 toilets and provision of water, Phase 2: Construction of Grade R Centre, relocation of 01 mobile classroom and construction of 01 classroom.
Ehlanzeni Malelane Nkomazi 5 690 421
98. Impumelelo Primary School
Demolition of plain pit toilets and construction of 31 toilets Ehlanzeni White River Nkomazi 3 807 377
99. Liguguletfu Primary School
Demolition of 8 plain pit toilets and construction of 31 toilets
Ehlanzeni Nkomazi West Nkomazi 3 807 377
100. Njeyeza Secondary School
Demolition of 20 plain pit toilets and construction of 30 additional toilets
Ehlanzeni Malelane nkomazi 368 456
101. Thula Primary School Demolition of 17 plain pit toilets and construction of 33 toilets
Ehlanzeni Nkomazi East Nkomazi 4 053 014
102. Zithulele Primary School
Phase 1: Planning and design: Construction of 12 toilets and provision of fence. Phase 2: Construction of 2 Grade R Centre inclusive of Grade R Toilets. Future phase: Construction of administration block. Library, kitchen, school hall.
Ehlanzeni Malelane Nkomazi 2 210 735
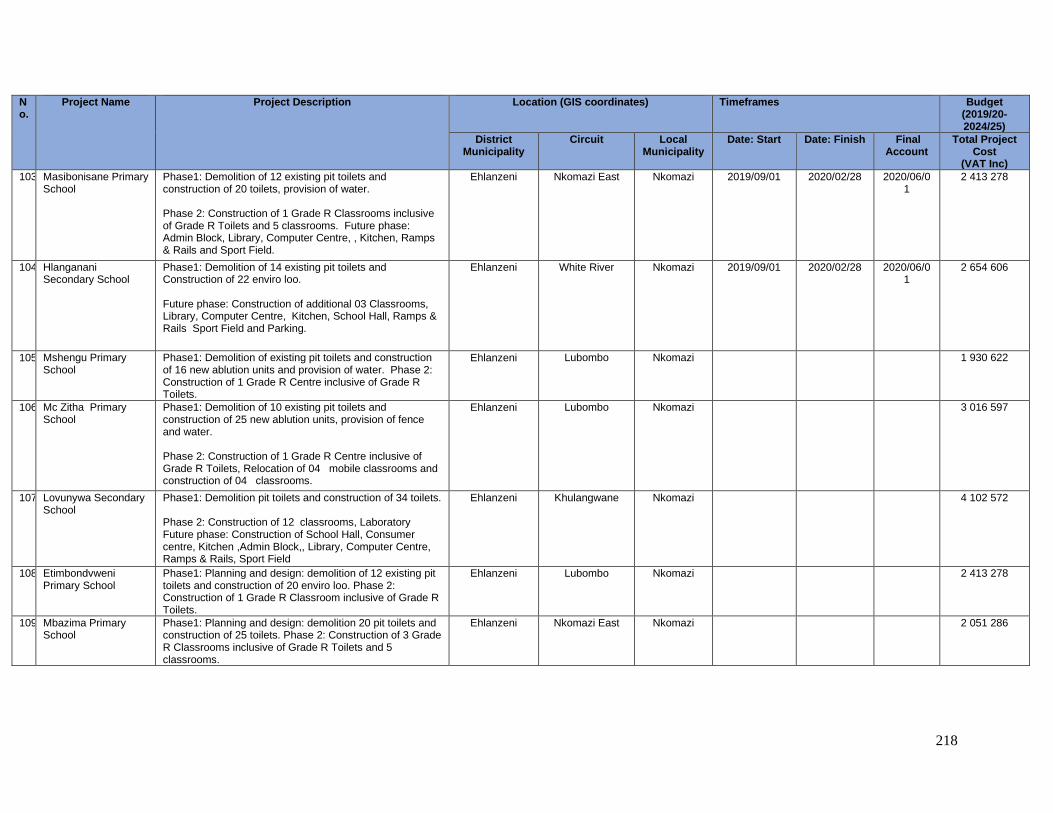
218
No.
Project Name Project Description Location (GIS coordinates) Timeframes Budget (2019/20-2024/25)
District Municipality
Circuit Local Municipality
Date: Start Date: Finish Final Account
Total Project Cost
(VAT Inc)
103. Masibonisane Primary School
Phase1: Demolition of 12 existing pit toilets and construction of 20 toilets, provision of water. Phase 2: Construction of 1 Grade R Classrooms inclusive of Grade R Toilets and 5 classrooms. Future phase: Admin Block, Library, Computer Centre, , Kitchen, Ramps & Rails and Sport Field.
Ehlanzeni Nkomazi East Nkomazi 2019/09/01 2020/02/28 2020/06/01
2 413 278
104. Hlanganani Secondary School
Phase1: Demolition of 14 existing pit toilets and Construction of 22 enviro loo. Future phase: Construction of additional 03 Classrooms, Library, Computer Centre, Kitchen, School Hall, Ramps & Rails Sport Field and Parking.
Ehlanzeni White River Nkomazi 2019/09/01 2020/02/28 2020/06/01
2 654 606
105. Mshengu Primary School
Phase1: Demolition of existing pit toilets and construction of 16 new ablution units and provision of water. Phase 2: Construction of 1 Grade R Centre inclusive of Grade R Toilets.
Ehlanzeni Lubombo Nkomazi 1 930 622
106. Mc Zitha Primary School
Phase1: Demolition of 10 existing pit toilets and construction of 25 new ablution units, provision of fence and water. Phase 2: Construction of 1 Grade R Centre inclusive of Grade R Toilets, Relocation of 04 mobile classrooms and construction of 04 classrooms.
Ehlanzeni Lubombo Nkomazi 3 016 597
107. Lovunywa Secondary School
Phase1: Demolition pit toilets and construction of 34 toilets. Phase 2: Construction of 12 classrooms, Laboratory Future phase: Construction of School Hall, Consumer centre, Kitchen ,Admin Block,, Library, Computer Centre, Ramps & Rails, Sport Field
Ehlanzeni Khulangwane Nkomazi 4 102 572
108. Etimbondvweni Primary School
Phase1: Planning and design: demolition of 12 existing pit toilets and construction of 20 enviro loo. Phase 2: Construction of 1 Grade R Classroom inclusive of Grade R Toilets.
Ehlanzeni Lubombo Nkomazi 2 413 278
109. Mbazima Primary School
Phase1: Planning and design: demolition 20 pit toilets and construction of 25 toilets. Phase 2: Construction of 3 Grade R Classrooms inclusive of Grade R Toilets and 5 classrooms.
Ehlanzeni Nkomazi East Nkomazi 2 051 286
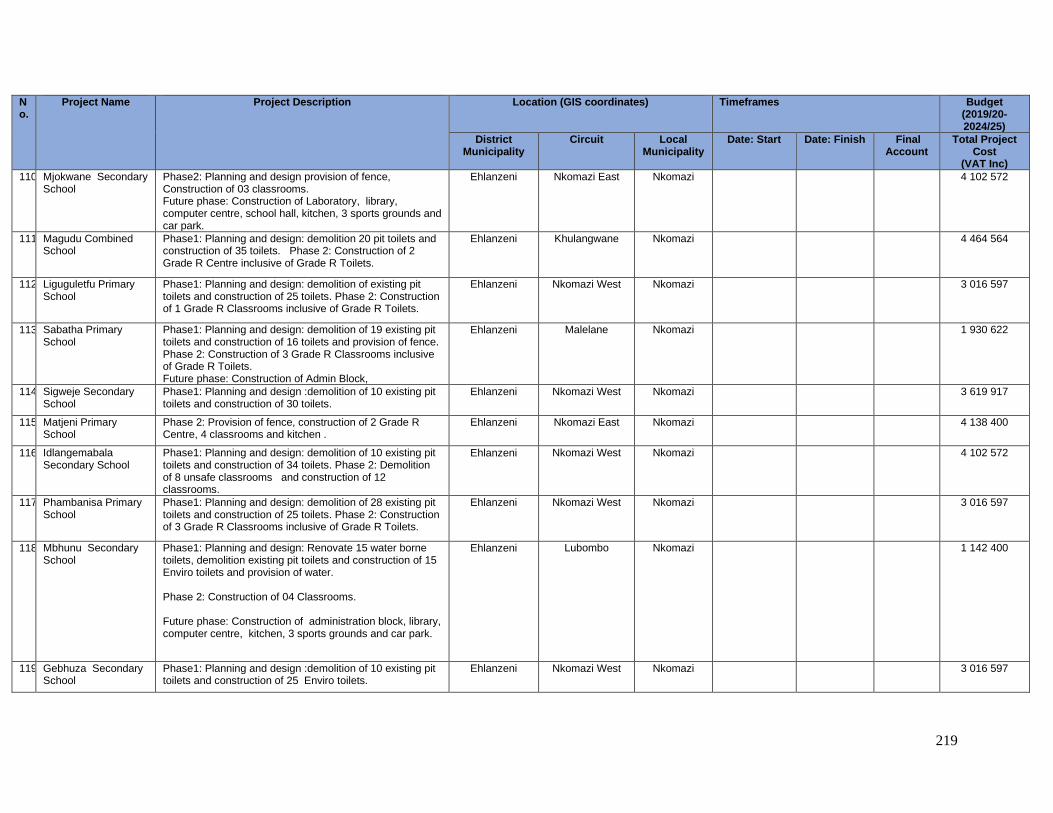
219
No.
Project Name Project Description Location (GIS coordinates) Timeframes Budget (2019/20-2024/25)
District Municipality
Circuit Local Municipality
Date: Start Date: Finish Final Account
Total Project Cost
(VAT Inc)
110. Mjokwane Secondary School
Phase2: Planning and design provision of fence, Construction of 03 classrooms. Future phase: Construction of Laboratory, library, computer centre, school hall, kitchen, 3 sports grounds and car park.
Ehlanzeni Nkomazi East Nkomazi 4 102 572
111. Magudu Combined School
Phase1: Planning and design: demolition 20 pit toilets and construction of 35 toilets. Phase 2: Construction of 2 Grade R Centre inclusive of Grade R Toilets.
Ehlanzeni Khulangwane Nkomazi 4 464 564
112. Liguguletfu Primary School
Phase1: Planning and design: demolition of existing pit toilets and construction of 25 toilets. Phase 2: Construction of 1 Grade R Classrooms inclusive of Grade R Toilets.
Ehlanzeni Nkomazi West Nkomazi 3 016 597
113. Sabatha Primary School
Phase1: Planning and design: demolition of 19 existing pit toilets and construction of 16 toilets and provision of fence. Phase 2: Construction of 3 Grade R Classrooms inclusive of Grade R Toilets. Future phase: Construction of Admin Block,
Ehlanzeni Malelane Nkomazi 1 930 622
114. Sigweje Secondary School
Phase1: Planning and design :demolition of 10 existing pit toilets and construction of 30 toilets.
Ehlanzeni Nkomazi West Nkomazi 3 619 917
115. Matjeni Primary School
Phase 2: Provision of fence, construction of 2 Grade R Centre, 4 classrooms and kitchen .
Ehlanzeni Nkomazi East Nkomazi 4 138 400
116. Idlangemabala Secondary School
Phase1: Planning and design: demolition of 10 existing pit toilets and construction of 34 toilets. Phase 2: Demolition of 8 unsafe classrooms and construction of 12 classrooms.
Ehlanzeni Nkomazi West Nkomazi 4 102 572
117. Phambanisa Primary School
Phase1: Planning and design: demolition of 28 existing pit toilets and construction of 25 toilets. Phase 2: Construction of 3 Grade R Classrooms inclusive of Grade R Toilets.
Ehlanzeni Nkomazi West Nkomazi 3 016 597
118. Mbhunu Secondary School
Phase1: Planning and design: Renovate 15 water borne toilets, demolition existing pit toilets and construction of 15 Enviro toilets and provision of water. Phase 2: Construction of 04 Classrooms. Future phase: Construction of administration block, library, computer centre, kitchen, 3 sports grounds and car park.
Ehlanzeni Lubombo Nkomazi 1 142 400
119. Gebhuza Secondary School
Phase1: Planning and design :demolition of 10 existing pit toilets and construction of 25 Enviro toilets.
Ehlanzeni Nkomazi West Nkomazi 3 016 597
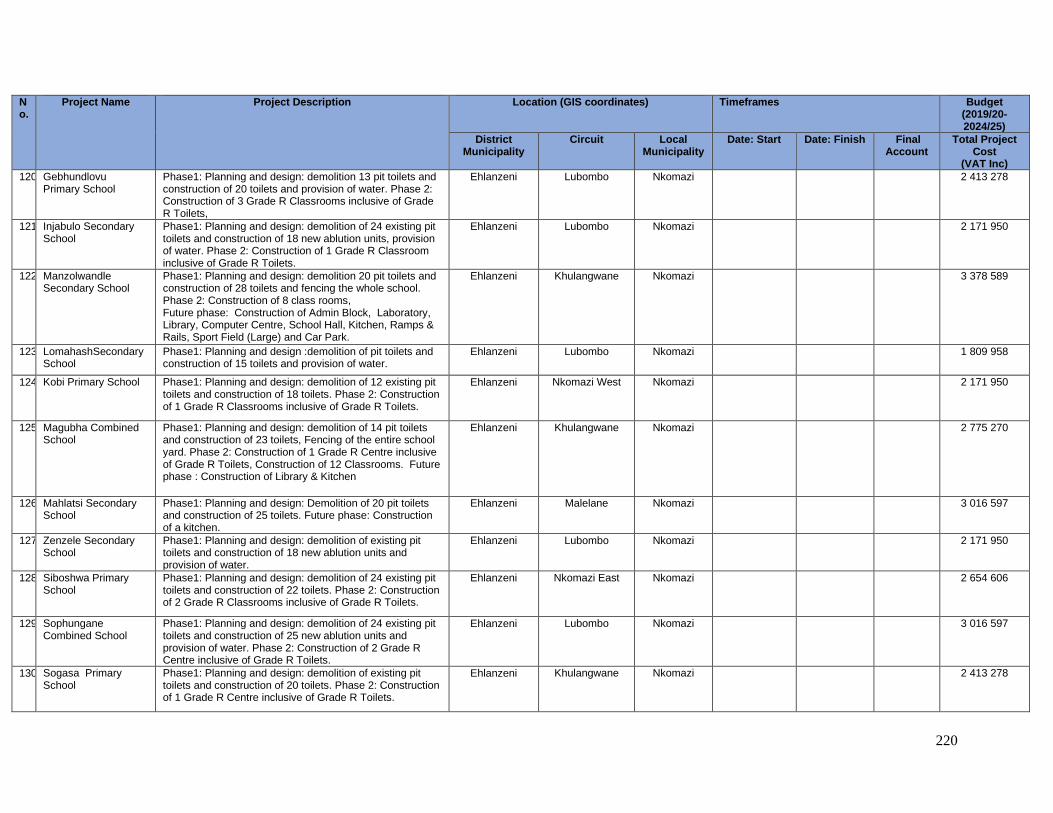
220
No.
Project Name Project Description Location (GIS coordinates) Timeframes Budget (2019/20-2024/25)
District Municipality
Circuit Local Municipality
Date: Start Date: Finish Final Account
Total Project Cost
(VAT Inc)
120. Gebhundlovu Primary School
Phase1: Planning and design: demolition 13 pit toilets and construction of 20 toilets and provision of water. Phase 2: Construction of 3 Grade R Classrooms inclusive of Grade R Toilets,
Ehlanzeni Lubombo Nkomazi 2 413 278
121. Injabulo Secondary School
Phase1: Planning and design: demolition of 24 existing pit toilets and construction of 18 new ablution units, provision of water. Phase 2: Construction of 1 Grade R Classroom inclusive of Grade R Toilets.
Ehlanzeni Lubombo Nkomazi 2 171 950
122. Manzolwandle Secondary School
Phase1: Planning and design: demolition 20 pit toilets and construction of 28 toilets and fencing the whole school. Phase 2: Construction of 8 class rooms, Future phase: Construction of Admin Block, Laboratory, Library, Computer Centre, School Hall, Kitchen, Ramps & Rails, Sport Field (Large) and Car Park.
Ehlanzeni Khulangwane Nkomazi 3 378 589
123. LomahashSecondary School
Phase1: Planning and design :demolition of pit toilets and construction of 15 toilets and provision of water.
Ehlanzeni Lubombo Nkomazi 1 809 958
124. Kobi Primary School Phase1: Planning and design: demolition of 12 existing pit toilets and construction of 18 toilets. Phase 2: Construction of 1 Grade R Classrooms inclusive of Grade R Toilets.
Ehlanzeni Nkomazi West Nkomazi 2 171 950
125. Magubha Combined School
Phase1: Planning and design: demolition of 14 pit toilets and construction of 23 toilets, Fencing of the entire school yard. Phase 2: Construction of 1 Grade R Centre inclusive of Grade R Toilets, Construction of 12 Classrooms. Future phase : Construction of Library & Kitchen
Ehlanzeni Khulangwane Nkomazi 2 775 270
126. Mahlatsi Secondary School
Phase1: Planning and design: Demolition of 20 pit toilets and construction of 25 toilets. Future phase: Construction of a kitchen.
Ehlanzeni Malelane Nkomazi 3 016 597
127. Zenzele Secondary School
Phase1: Planning and design: demolition of existing pit toilets and construction of 18 new ablution units and provision of water.
Ehlanzeni Lubombo Nkomazi 2 171 950
128. Siboshwa Primary School
Phase1: Planning and design: demolition of 24 existing pit toilets and construction of 22 toilets. Phase 2: Construction of 2 Grade R Classrooms inclusive of Grade R Toilets.
Ehlanzeni Nkomazi East Nkomazi 2 654 606
129. Sophungane Combined School
Phase1: Planning and design: demolition of 24 existing pit toilets and construction of 25 new ablution units and provision of water. Phase 2: Construction of 2 Grade R Centre inclusive of Grade R Toilets.
Ehlanzeni Lubombo Nkomazi 3 016 597
130. Sogasa Primary School
Phase1: Planning and design: demolition of existing pit toilets and construction of 20 toilets. Phase 2: Construction of 1 Grade R Centre inclusive of Grade R Toilets.
Ehlanzeni Khulangwane Nkomazi 2 413 278
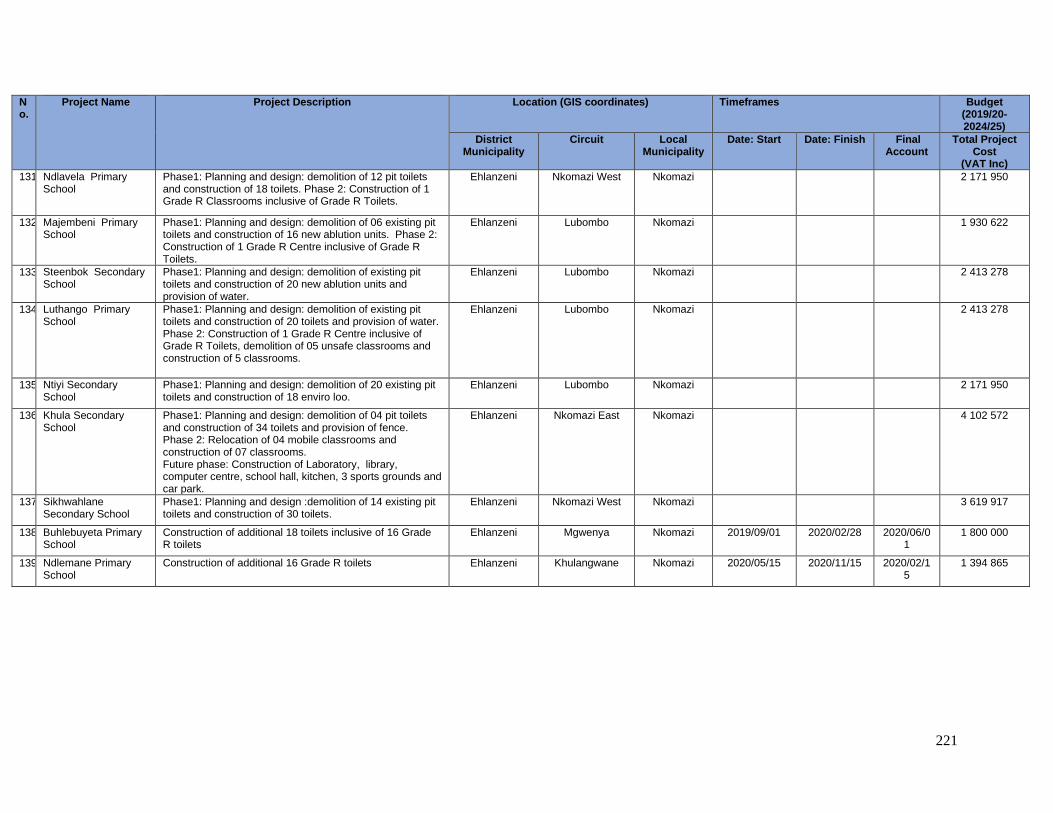
221
No.
Project Name Project Description Location (GIS coordinates) Timeframes Budget (2019/20-2024/25)
District Municipality
Circuit Local Municipality
Date: Start Date: Finish Final Account
Total Project Cost
(VAT Inc)
131. Ndlavela Primary School
Phase1: Planning and design: demolition of 12 pit toilets and construction of 18 toilets. Phase 2: Construction of 1 Grade R Classrooms inclusive of Grade R Toilets.
Ehlanzeni Nkomazi West Nkomazi 2 171 950
132. Majembeni Primary School
Phase1: Planning and design: demolition of 06 existing pit toilets and construction of 16 new ablution units. Phase 2: Construction of 1 Grade R Centre inclusive of Grade R Toilets.
Ehlanzeni Lubombo Nkomazi 1 930 622
133. Steenbok Secondary School
Phase1: Planning and design: demolition of existing pit toilets and construction of 20 new ablution units and provision of water.
Ehlanzeni Lubombo Nkomazi 2 413 278
134. Luthango Primary School
Phase1: Planning and design: demolition of existing pit toilets and construction of 20 toilets and provision of water. Phase 2: Construction of 1 Grade R Centre inclusive of Grade R Toilets, demolition of 05 unsafe classrooms and construction of 5 classrooms.
Ehlanzeni Lubombo Nkomazi 2 413 278
135. Ntiyi Secondary School
Phase1: Planning and design: demolition of 20 existing pit toilets and construction of 18 enviro loo.
Ehlanzeni Lubombo Nkomazi 2 171 950
136. Khula Secondary School
Phase1: Planning and design: demolition of 04 pit toilets and construction of 34 toilets and provision of fence. Phase 2: Relocation of 04 mobile classrooms and construction of 07 classrooms. Future phase: Construction of Laboratory, library, computer centre, school hall, kitchen, 3 sports grounds and car park.
Ehlanzeni Nkomazi East Nkomazi 4 102 572
137. Sikhwahlane Secondary School
Phase1: Planning and design :demolition of 14 existing pit toilets and construction of 30 toilets.
Ehlanzeni Nkomazi West Nkomazi 3 619 917
138. Buhlebuyeta Primary School
Construction of additional 18 toilets inclusive of 16 Grade R toilets
Ehlanzeni Mgwenya Nkomazi 2019/09/01 2020/02/28 2020/06/01
1 800 000
139. Ndlemane Primary School
Construction of additional 16 Grade R toilets Ehlanzeni Khulangwane Nkomazi 2020/05/15 2020/11/15 2020/02/15
1 394 865
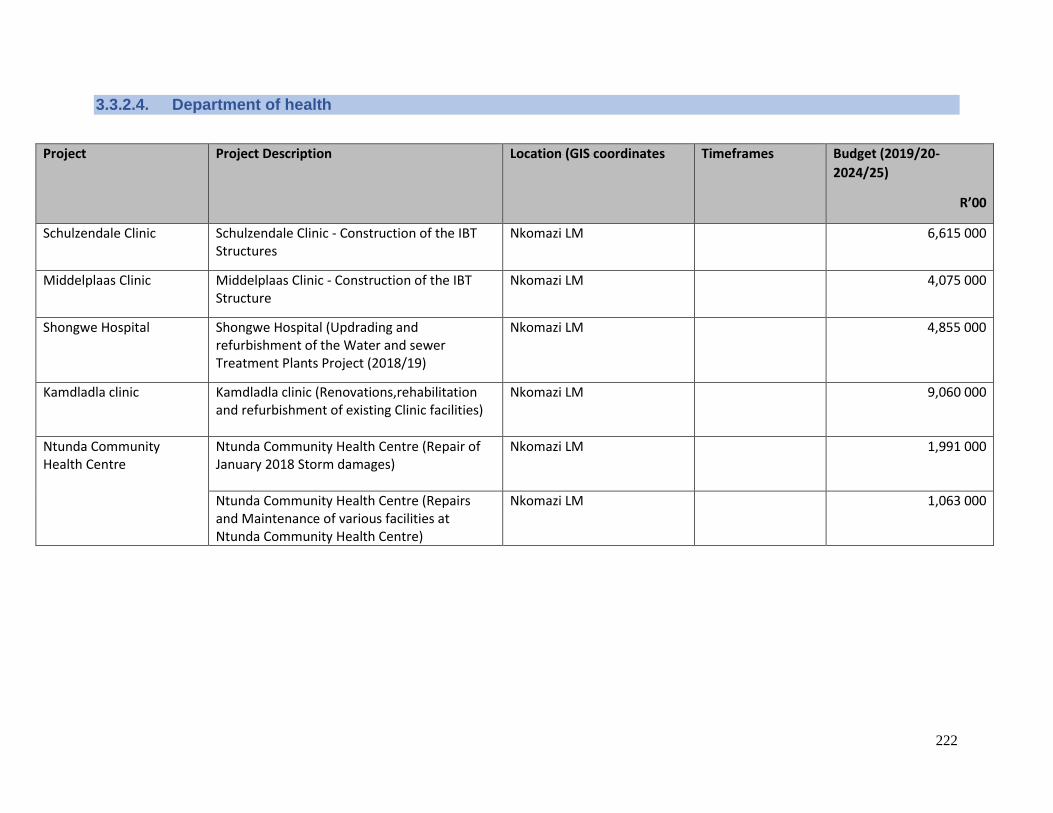
222
3.3.2.4. Department of health
Project Project Description Location (GIS coordinates Timeframes Budget (2019/20-
2024/25)
R’00
Schulzendale Clinic Schulzendale Clinic - Construction of the IBT Structures
Nkomazi LM 6,615 000
Middelplaas Clinic Middelplaas Clinic - Construction of the IBT Structure
Nkomazi LM 4,075 000
Shongwe Hospital Shongwe Hospital (Updrading and refurbishment of the Water and sewer Treatment Plants Project (2018/19)
Nkomazi LM 4,855 000
Kamdladla clinic Kamdladla clinic (Renovations,rehabilitation and refurbishment of existing Clinic facilities)
Nkomazi LM
9,060 000
Ntunda Community Health Centre
Ntunda Community Health Centre (Repair of January 2018 Storm damages)
Nkomazi LM
1,991 000
Ntunda Community Health Centre (Repairs and Maintenance of various facilities at Ntunda Community Health Centre)
Nkomazi LM 1,063 000
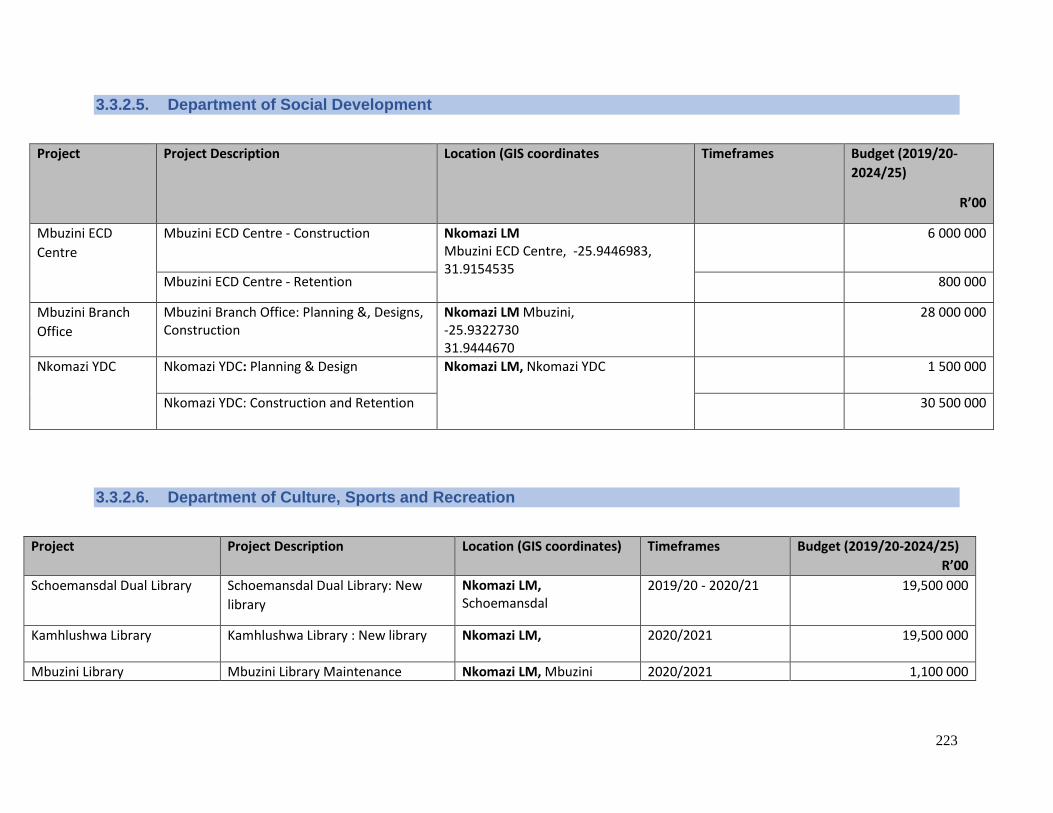
223
3.3.2.5. Department of Social Development
Project Project Description Location (GIS coordinates Timeframes Budget (2019/20-
2024/25)
R’00
Mbuzini ECD
Centre
Mbuzini ECD Centre - Construction Nkomazi LM Mbuzini ECD Centre, -25.9446983, 31.9154535
6 000 000
Mbuzini ECD Centre - Retention 800 000
Mbuzini Branch
Office
Mbuzini Branch Office: Planning &, Designs, Construction
Nkomazi LM Mbuzini, -25.9322730 31.9444670
28 000 000
Nkomazi YDC
Nkomazi YDC: Planning & Design Nkomazi LM, Nkomazi YDC 1 500 000
Nkomazi YDC: Construction and Retention 30 500 000
3.3.2.6. Department of Culture, Sports and Recreation
Project Project Description Location (GIS coordinates) Timeframes Budget (2019/20-2024/25)
R’00
Schoemansdal Dual Library Schoemansdal Dual Library: New
library
Nkomazi LM, Schoemansdal
2019/20 - 2020/21 19,500 000
Kamhlushwa Library Kamhlushwa Library : New library Nkomazi LM,
2020/2021 19,500 000
Mbuzini Library Mbuzini Library Maintenance Nkomazi LM, Mbuzini 2020/2021 1,100 000
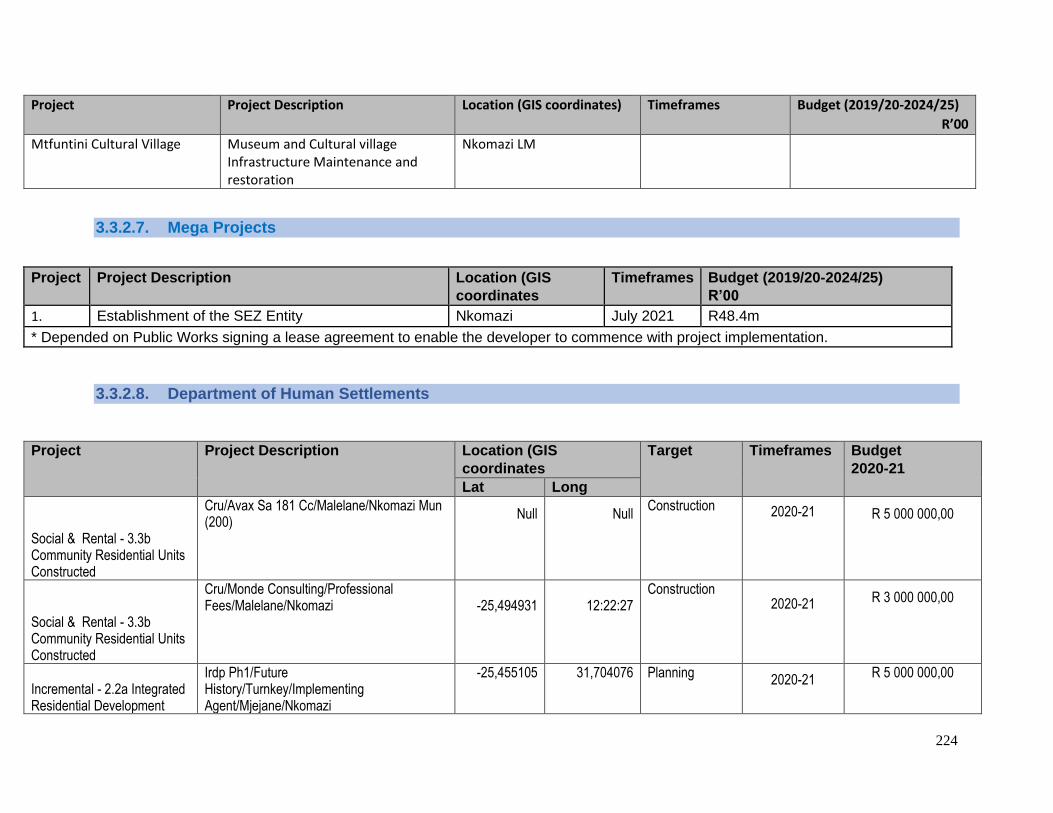
224
Project Project Description Location (GIS coordinates) Timeframes Budget (2019/20-2024/25)
R’00
Mtfuntini Cultural Village Museum and Cultural village Infrastructure Maintenance and restoration
Nkomazi LM
3.3.2.7. Mega Projects
Project Project Description Location (GIS
coordinates Timeframes Budget (2019/20-2024/25)
R’00 1. Establishment of the SEZ Entity Nkomazi July 2021 R48.4m * Depended on Public Works signing a lease agreement to enable the developer to commence with project implementation.
3.3.2.8. Department of Human Settlements
Project Project Description Location (GIS
coordinates Target Timeframes Budget
2020-21 Lat Long
Social & Rental - 3.3b Community Residential Units Constructed
Cru/Avax Sa 181 Cc/Malelane/Nkomazi Mun (200)
Null
Null
Construction 2020-21
R 5 000 000,00
Social & Rental - 3.3b Community Residential Units Constructed
Cru/Monde Consulting/Professional Fees/Malelane/Nkomazi
-25,494931
12:22:27
Construction 2020-21
R 3 000 000,00
Incremental - 2.2a Integrated Residential Development
Irdp Ph1/Future History/Turnkey/Implementing Agent/Mjejane/Nkomazi
-25,455105
31,704076
Planning 2020-21
R 5 000 000,00
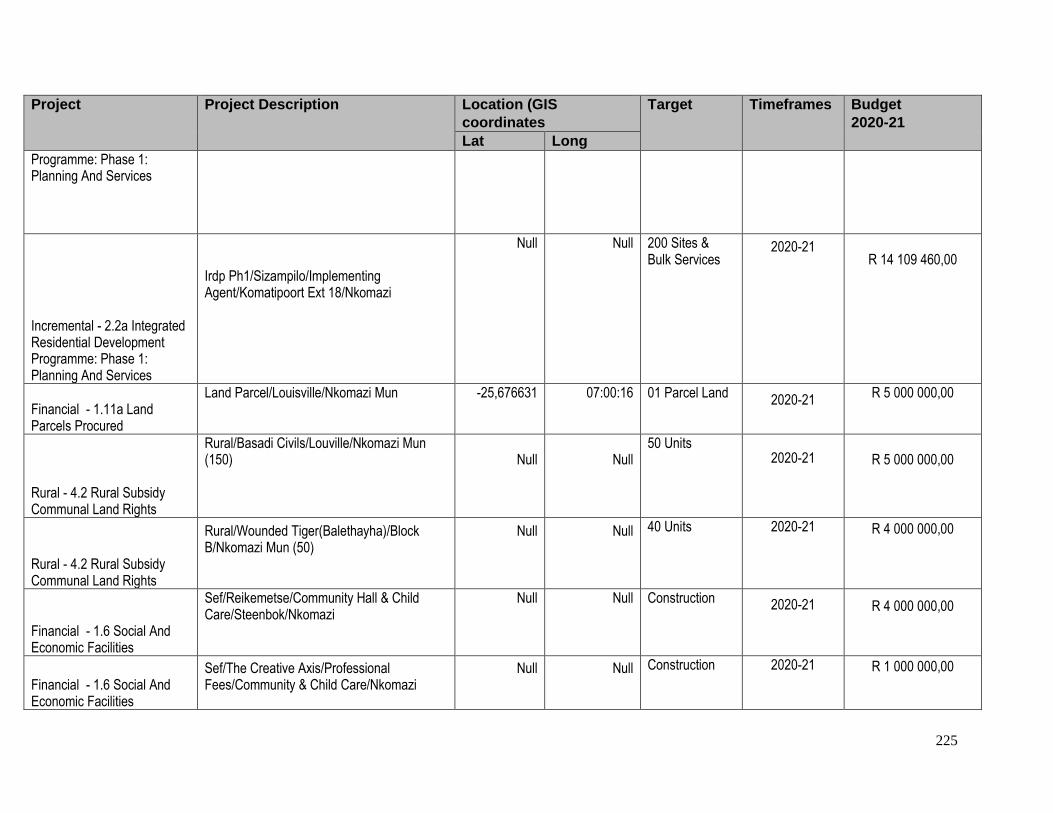
225
Project Project Description Location (GIS
coordinates Target Timeframes Budget
2020-21 Lat Long
Programme: Phase 1: Planning And Services
Incremental - 2.2a Integrated Residential Development Programme: Phase 1: Planning And Services
Irdp Ph1/Sizampilo/Implementing Agent/Komatipoort Ext 18/Nkomazi
Null
Null
200 Sites & Bulk Services
2020-21
R 14 109 460,00
Financial - 1.11a Land Parcels Procured
Land Parcel/Louisville/Nkomazi Mun
-25,676631
07:00:16
01 Parcel Land 2020-21
R 5 000 000,00
Rural - 4.2 Rural Subsidy Communal Land Rights
Rural/Basadi Civils/Louville/Nkomazi Mun (150)
Null
Null
50 Units 2020-21
R 5 000 000,00
Rural - 4.2 Rural Subsidy Communal Land Rights
Rural/Wounded Tiger(Balethayha)/Block B/Nkomazi Mun (50)
Null
Null
40 Units 2020-21
R 4 000 000,00
Financial - 1.6 Social And Economic Facilities
Sef/Reikemetse/Community Hall & Child Care/Steenbok/Nkomazi
Null
Null
Construction 2020-21
R 4 000 000,00
Financial - 1.6 Social And Economic Facilities
Sef/The Creative Axis/Professional Fees/Community & Child Care/Nkomazi
Null
Null
Construction 2020-21
R 1 000 000,00
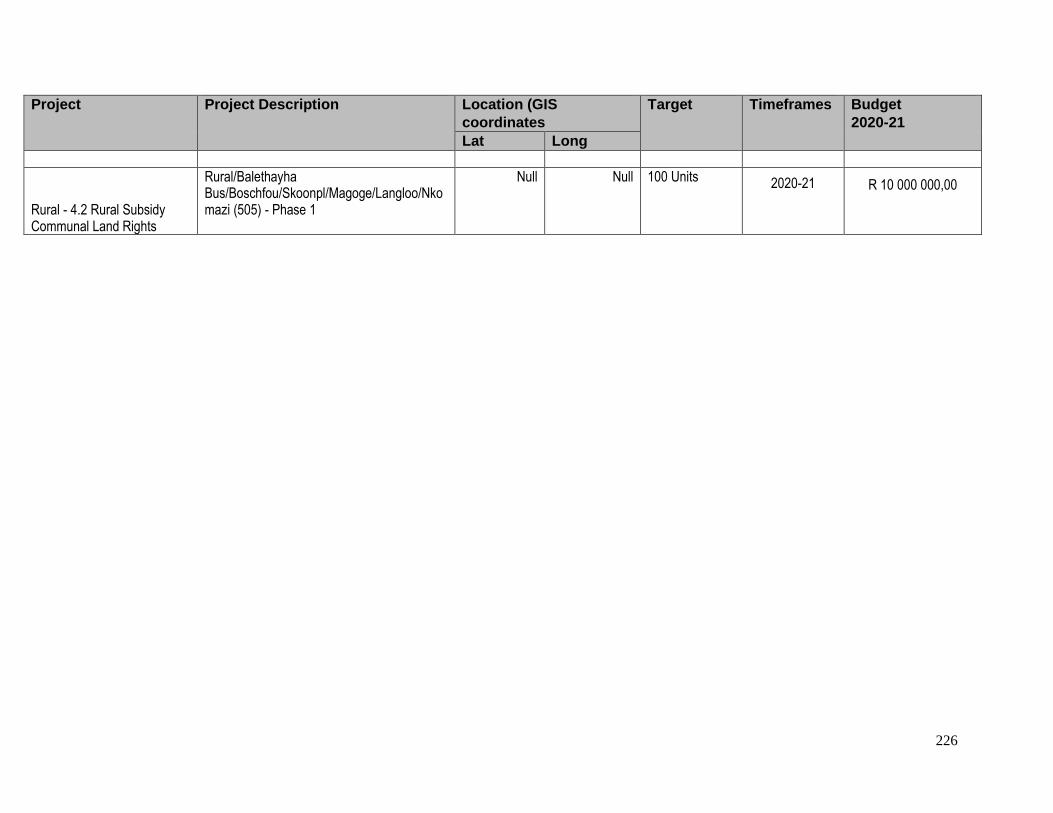
226
Project Project Description Location (GIS
coordinates Target Timeframes Budget
2020-21 Lat Long
Rural - 4.2 Rural Subsidy Communal Land Rights
Rural/Balethayha Bus/Boschfou/Skoonpl/Magoge/Langloo/Nkomazi (505) - Phase 1
Null
Null
100 Units 2020-21
R 10 000 000,00
227
3. Section D: Integration
4.1. Municipal Plans, Policies And Strategies
4.1.1. Financial Management Plan
This Financial Plan is intended to provide a foundation for the development of new revised financial
policies, practices and procedures as they are needed. It is intended to generate, document and evaluate
issues and possible actions surrounding four key financial areas: Cost Recovery, Access to Capital, Financial
Risk Metrics, Good/ Bad Year Financial Planning. Nkomazi Local Municipality expects that the breadth and
depth of issues and actions considered in this Financial Plan will continue to evolve as conditions change
and new ideas are developed and that the ideas described in this document will guide the implementation
of specific, actionable proposals for implementing the financial policies future rates cases. Descriptions of
current budget policies and Nkomazi Local Municipality’s expectations about sustainability of financial
viability and management are summarized below.
The Financial Plan reflects current policies and anticipates those for the future. The purpose is to design
financial policies in line with National Treasury Guidelines and the Municipal Finance Management Act
No.56 of 2003 that will ensure Nkomazi Local Municipality’s ability to increase its revenue base by
providing rate predictability during budget process planning.
This Financial Plan identifies long term financial issues and provides strategies or suggests alternative to
address them. The purpose of the plan is to generate, document and evaluate selected issues within a
financial framework that will help guide Nkomazi Local Municipality’s financial direction. Nkomazi Local
Municipality intends to review, revise and update the Financial Plan periodically on annual basis.
4.1.2. Local Economic Development
Section 152 of the Constitution of the Republic of South Africa states that one of the objects of local
government is to promote this LED mandate emanated from Section 153 of the RSA Constitution which
states that developmental duties of municipalities require them to structure and manage their
administration budgeting and planning processes to give priority to the basic needs of their communities,
some of which relates to economic development.
The municipality has and LED strategy that was approved in 2009 with council resolution number NKM:
GCM A109/2009. strategy is based on identified development needs, opportunities and comparative
advantages of the area, providing the Municipality with guidelines to create and facilitate economic
development, realize the underlying economic development potential, and encourage private sector
investment and job creation. The strategy should foster the exploitation of strengths and opportunities in
order to minimize the weaknesses and threats of the municipality. The strategy should therefore be used
228
as a tool by the municipality to ensure dedicated and effective utilization of available resources and to
promote local economic development in a proactive and dynamic manner.
4.1.3. Water Services Development Plan
The Nkomazi Local Municipality is the authorized Water Services Authority and as such the relevant
sections of the Water Services Act (No 108 of 1997) and the Municipal Systems Act (No 32 of 2000) must
be adhered to. Section 11 of the Water Services Act states, that:
Every water services authority has a duty to all consumers or potential consumers in its area of
jurisdiction to progressively ensure efficient, affordable, economical and sustainable access to water
services.
4.1.4. Sanitation Master Plan
The Nkomazi Local Municipality, in response to the Millennium targets requirements, have prioritized
planning for all their sanitation infrastructure provision to cater for all their citizens by the year 2014.The
municipality has resolved in the preparation of a Multi-Year Business plan for the implementation of a
Rural Sanitation Programme to eradicate all
The rural backlogs by the provision of basic levels of sanitation. This technical report is specifically for
villages where sanitation pro-jects have been implemented in the past, but the backlogs were not fully
eradicated.
It is planned that the programme will for part of the Nkomazi Local Municipality’s 2008/09 IDP and will
implementation will hence commence. The population to be covered is 11,032 households, which do not
have adequate sanitation facilities. The ISD survey carried out as part of preparing this SPTFS shows these
communities to be typically poor rural communities. Not all the households have adequate sanitation
facilities.
The implementation of the recommendations made on this SPTFS will be dependent on the outcomes of
the groundwater protocol study currently been conducted. But based on observations made from
previous sanitation projects, it is assumed that Ventilation Improved Pit (VIP) latrines will be provided as
a basic level of services, with a proper groundwater monitoring and quality management. VIP Toilets were
constructed in the past with no groundwater problems, so it is safe to as-some that the provision of VIPs
in these villages will still be acceptable. Local builders and local communities will be trained to carry out
as much of the project work. Good sanitation, health and hygiene practices will be promoted by the
programme. Activities to achieve this, will include a programme of house to house visits to follow-up,
reinforce and monitor the effect of the health promotion It is expected that the main construction phases
of the programme will be completed in the year 2012, should all the funds required be made available.
229
4.1.5. Roads and Storm Water Plan
The Nkomazi Local Municipality (NLM) is responsible for the planning (in conjunction with Ehlanzeni
District Municipality) and implementation of local roads in the area under its jurisdiction. At the inception
of the roads planning process, NLM identified the development of a Roads Master Plan (RMP) as one of
the strategic projects and formulated its scope in accordance with the Provincial and National
Government requirements, as well as the relevant. Integrated Development and Transport Plans. The
primary purpose of this report is to present the NLM with a Roads Master Plan to guide the basic planning
and development of local and regional roads in the study area.
4.1.6. Comprehensive Infrastructure Plan
Every Municipality needs to compile an Integrated Development Plan that defines a framework for
creating and sustaining integrated human settlements by providing the necessary infrastructure in a
sustainable and coordinated manner. The CIP’s have been formulated to enhance the preparation of the
IDP and consolidates the information from a wide range of planning instruments (SDF, existing IDP, Master
Plans, Sector Plans, etc.). It summarizes the data at ward level by exploring the unique needs of
communities and then formulate plans and projects for providing housing and infrastructure to service
these needs. It therefore creates the basis for confirming the alignment of the different sector plans. It
furthermore addresses the full life cycle management of those assets by considering the refurbishment
and maintenance needs and ensure that the necessary skills and financial resources are available to
achieve the goal of sustainable service delivery is achieved in the medium to long term. This information
feeds back into the IDP process before December of each year for the revision of the IDP.
4.1.7. Electricity Master Plan
Nkomazi Local Municipality is the electricity distributor (license holder) within areas of its service delivery.
However, it be noted that Eskom is also a licensed holder and the service provider in areas which were
previously serviced by TED. Those areas are within the jurisdiction of Nkomazi Local Municipality area of
service delivery. Eskom is the license holder and the service provider for the villages previously supplied
by the former KaNgwane Electricity Corporation lately known as TED (Transitional Electricity
Distributor).Although according to the Municipal Systems Act, the Municipality is the service provider but
could not exercise those rights when the business was auctioned and won by Eskom in 2004.The
department of Minerals and Energy is giving electrification funds to the Municipality as the service
provider. The infrastructure installed using the DME funds is being ring-fenced on Eskom books and shall
be calculated in favour of the Municipality during the RED’s implementation. The maintenance
record/load studies and future network expansion can be obtained from Eskom.
230
4.1.8. Integrated Waste Management Plan
The main goal of integrated waste management (IWM) planning is to integrate and optimise waste
Management in the region by maximizing efficiency and minimizing financial costs and environmental
Impacts in order to improve the quality of life for its citizens. The compilation of an IWMP by a local
authority enables the authority to spell out what its intentions are and how it proposes to achieve these
goals. It sets applicable but reasonable required milestones which it hopes to achieve and then submits
its IWMP to the relevant provincial authority for approval and acceptance. The Integrated Waste
Management Planning process should incorporate all the major stages of the process, namely a review of
the existing baseline situation (status quo) and legal environment, projections of future requirements;
setting objectives; identifying system components (strategic planning); identifying and evaluating
alternative methods/approaches for meeting requirements (systems analysis); and developing and
implementing an integrated waste management plan (master planning).
The IWMP will then be implemented to the best of the local authority's ability, subject to financial
constraints imposed by budget restrictions and sustainability of services rendered. It is important that any
plan, once implemented, is evaluated and reviewed to ensure that the respective objectives are met.
Proper monitoring of the development and implementation process will be necessary to gauge successful
milestone achievements. The IWMP could therefore be utilised to guide the Nkomazi Municipality in the
way forward in respect of cost-effective waste management
4.1.9. HIV/AIDS Strategy
This Nkomazi AIDS Strategy has been developed on the basis of this National strategy and the MDG targets
as the road map to inform AIDS Council Planning and Interventions. This road will be the tool that will
guide the Nkomazi Municipality (Local Government) and its stakeholders in coordinating efforts and
programmes, time, energy and
recourses in the fight against this disease and reducing its impending impact. This document is the product
is the of an AIDS strategy supported and facilitated by the District Municipality, GTZ-MRDP and ETU
involving a number of key role players in the fight against the pandemic, who included, among others,
representatives from the Municipal Council, Government Departments, Municipal Staff, NGOs and CBO’s
and other structures involved in HIV & AIDS programmes within the Jurisdiction of Nkomazi Local
Municipality.
4.1.10. Youth Policy
Nkomazi Municipality is known as poverty and under developed are with the highest population located
in the rural corner of Nkomazi. Nkomazi has been experiencing economic growth through Agriculture and
Tourism. These growth results from the new initiatives on the Tourism Sector that is great potential
competitive advantage through the Maputo Corridor as most of our roots are through the N4.
231
As Nkomazi, it is important to focus on the growth legislative framework mainstreaming youth
development into development by implementing youth development policy.
4.1.11. Recruitment and Retention Strategy
This process places suitable individuals in vacant position where they contribute to the success of the
Nkomazi Municipality and where they can grow and develop to the best of their abilities. The purpose of
the Nkomazi Municipality Recruitment and Selection Policy is to provide guidance on the recruitment of
staff so as to comply with the provision of our Constitution, the Labour Relations Act No. 66 of 1995 and
the Employment Equity Act No 55 of 1998.This further ensures standardization, transparency,
consistency, fairness and best practice with regards to the recruitment process. The critical issue is that
the growing instability of the employment relationship has been the subject of intense scrutiny; schools
have explored implications of the near employment models for organizational identification, employment
practices and the patterns and status of managerial careers. However, prior work experience may include
not only relevant knowledge and skill, but also routines and habits that do not fit in the new organizational
context. Skills define the way that human effort produces outputs; it can be defined as the quality aspect
of human capital. That is the skills we possess determine the ability to convert physical and mental effort
into productive outputs. As such skills are difficult to observe or measure, they relate to talent abilities
that are only observable as an aspect of the residual between outputs and inputs.
4.1.12. Employment Equity Plan
The Municipality is committed to creating a workplace in which no one is denied employment
opportunities or benefits for reasons unrelated to ability and where no one is discriminated against
unfairly. The Municipality recognizes that total commitment from all employees to the goals of its
Employment Equity Policy and Procedures is necessary if it is to succeed. To this end, it has established
the Employment Equity Committee (NEEF) which will be an advisory committee on Employment Equity to
assist in devising equity goals and strategies. Employment equity issues will enjoy priority as key business
objectives and will constitute an integral part of the performance assessments of all line managers and
supervisors.
It is recognised that the goals of employment equity will require specific equity interventions in order that
people from “designated groups” (blacks, women and people with disabilities), are represented at all
levels in the workforce, and reflect the diversity of the economically active population in the region and
sector in which the Municipality’s workplace is situated.
The Municipality remains committed to the promotion, development and recognition of people on merit.
To this end, it will neither make ‘token’ appointments, nor implement any practices or procedures which
establish barriers to the appointment, promotion or advancement of no-designated employees.
232
4.1.13. Performance Management Service Plan
This document provides a framework which serves as the guiding policy for the establishment of a
Performance
Management System in Nkomazi Local Municipality. This is the first review since it was adopted by Council
on 7 December 2006. The review process came as a result of changes taking place in the operating
environment of the organization, and also to ensure that performance management in the municipality
adapts to these changes that impact on the business of service delivery.
While some success has been achieved regarding performance, the policy remains to be effectively
implemented over a period of time in order to improve performance management in the municipality.
One of the most daunting tasks is to gain buy-in from all employees regarding the benefits of establishing
a performance management system. A change management strategy, institutional structures and
leadership remain very critical to the success of establishing a sound performance management system.
4.1.14. Housing Development Plan/Housing Chapter The stated objectives of this Plan are:
Identification of housing backlogs and needs in housing and the setting of delivery goals and priorities
(multi- year plan) Identification and designation of land for housing development
Indication through a participatory process, housing supply objectives and strategies to respond to needs
Recommendations on how to operationalize existing synergies with other sectional programmes
impacting on housing (Integrated human settlements)
4.1.15. Indigent Policy
The Nkomazi Local Municipality believes that an indigent policy should be adopted to promote social and
economic development and to provide services to the poorest of the poor (Indigent Households).
4.1.16. Environmental Management
The Municipality has prioritized the development of a number of Environment related plans during the
2010/2011 financial year, i.e. Air Quality Management Plan and the Environmental Management
Framework with very strong links with the SDF.
4.1.17. Social Cohesion Plan
The Municipality does not have a social cohesion plan. There are however plans to engage with the
Provincial Social Development Department to assist the Municipality with the development of such a plan.
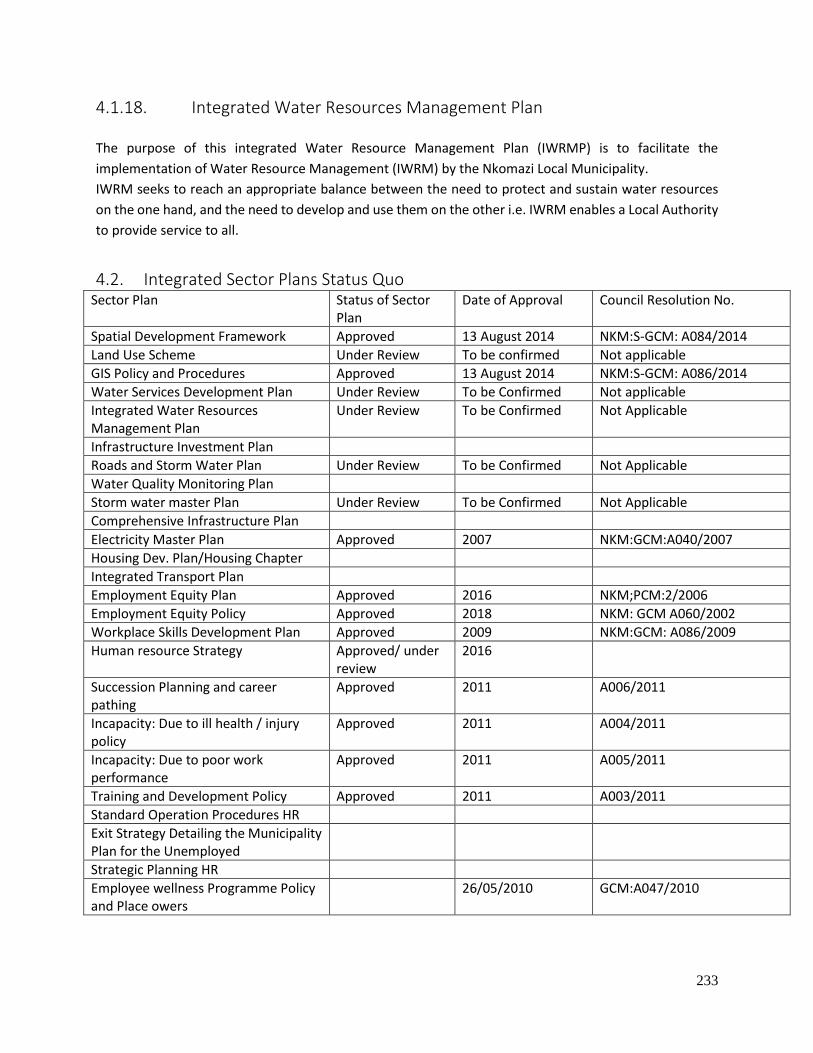
233
4.1.18. Integrated Water Resources Management Plan
The purpose of this integrated Water Resource Management Plan (IWRMP) is to facilitate the
implementation of Water Resource Management (IWRM) by the Nkomazi Local Municipality.
IWRM seeks to reach an appropriate balance between the need to protect and sustain water resources
on the one hand, and the need to develop and use them on the other i.e. IWRM enables a Local Authority
to provide service to all.
4.2. Integrated Sector Plans Status Quo Sector Plan Status of Sector
Plan Date of Approval Council Resolution No.
Spatial Development Framework Approved 13 August 2014 NKM:S-GCM: A084/2014
Land Use Scheme Under Review To be confirmed Not applicable
GIS Policy and Procedures Approved 13 August 2014 NKM:S-GCM: A086/2014
Water Services Development Plan Under Review To be Confirmed Not applicable
Integrated Water Resources Management Plan
Under Review To be Confirmed Not Applicable
Infrastructure Investment Plan
Roads and Storm Water Plan Under Review To be Confirmed Not Applicable
Water Quality Monitoring Plan
Storm water master Plan Under Review To be Confirmed Not Applicable
Comprehensive Infrastructure Plan
Electricity Master Plan Approved 2007 NKM:GCM:A040/2007
Housing Dev. Plan/Housing Chapter
Integrated Transport Plan
Employment Equity Plan Approved 2016 NKM;PCM:2/2006
Employment Equity Policy Approved 2018 NKM: GCM A060/2002
Workplace Skills Development Plan Approved 2009 NKM:GCM: A086/2009
Human resource Strategy Approved/ under review
2016
Succession Planning and career pathing
Approved 2011 A006/2011
Incapacity: Due to ill health / injury policy
Approved 2011 A004/2011
Incapacity: Due to poor work performance
Approved 2011 A005/2011
Training and Development Policy Approved 2011 A003/2011
Standard Operation Procedures HR
Exit Strategy Detailing the Municipality Plan for the Unemployed
Strategic Planning HR
Employee wellness Programme Policy and Place owers
26/05/2010 GCM:A047/2010
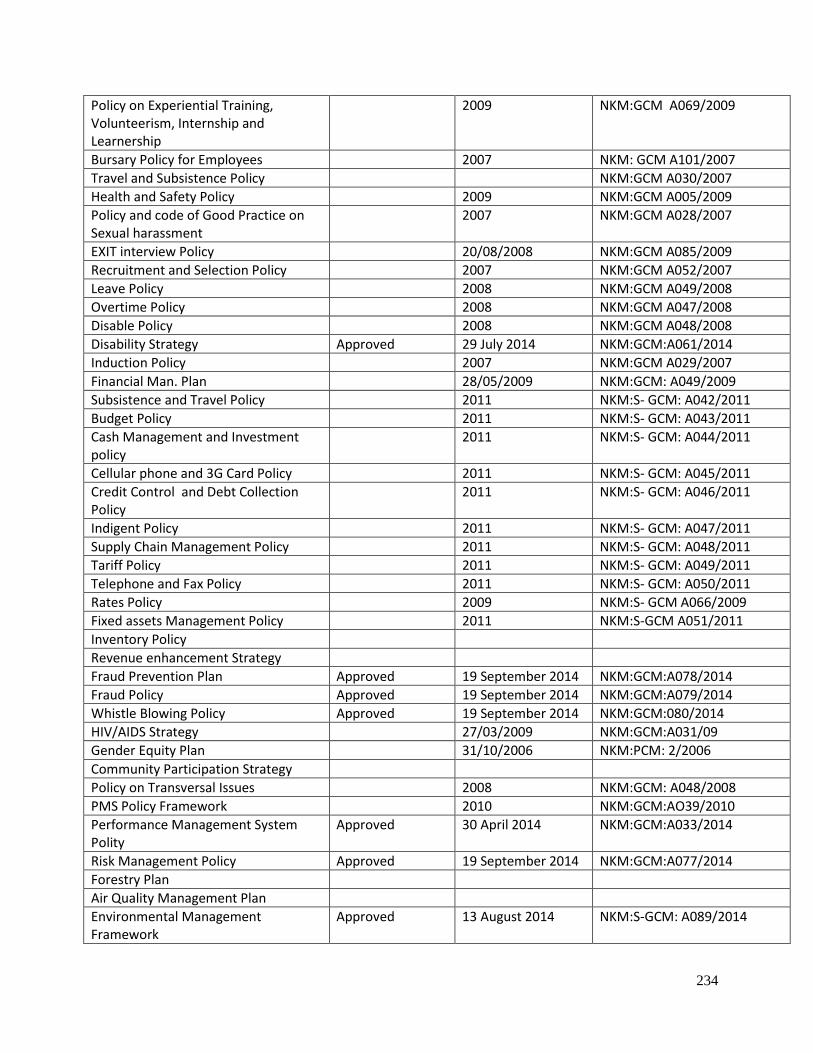
234
Policy on Experiential Training, Volunteerism, Internship and Learnership
2009 NKM:GCM A069/2009
Bursary Policy for Employees 2007 NKM: GCM A101/2007
Travel and Subsistence Policy NKM:GCM A030/2007
Health and Safety Policy 2009 NKM:GCM A005/2009
Policy and code of Good Practice on Sexual harassment
2007 NKM:GCM A028/2007
EXIT interview Policy 20/08/2008 NKM:GCM A085/2009
Recruitment and Selection Policy 2007 NKM:GCM A052/2007
Leave Policy 2008 NKM:GCM A049/2008
Overtime Policy 2008 NKM:GCM A047/2008
Disable Policy 2008 NKM:GCM A048/2008
Disability Strategy Approved 29 July 2014 NKM:GCM:A061/2014
Induction Policy 2007 NKM:GCM A029/2007
Financial Man. Plan 28/05/2009 NKM:GCM: A049/2009
Subsistence and Travel Policy 2011 NKM:S- GCM: A042/2011
Budget Policy 2011 NKM:S- GCM: A043/2011
Cash Management and Investment policy
2011 NKM:S- GCM: A044/2011
Cellular phone and 3G Card Policy 2011 NKM:S- GCM: A045/2011
Credit Control and Debt Collection Policy
2011 NKM:S- GCM: A046/2011
Indigent Policy 2011 NKM:S- GCM: A047/2011
Supply Chain Management Policy 2011 NKM:S- GCM: A048/2011
Tariff Policy 2011 NKM:S- GCM: A049/2011
Telephone and Fax Policy 2011 NKM:S- GCM: A050/2011
Rates Policy 2009 NKM:S- GCM A066/2009
Fixed assets Management Policy 2011 NKM:S-GCM A051/2011
Inventory Policy
Revenue enhancement Strategy
Fraud Prevention Plan Approved 19 September 2014 NKM:GCM:A078/2014
Fraud Policy Approved 19 September 2014 NKM:GCM:A079/2014
Whistle Blowing Policy Approved 19 September 2014 NKM:GCM:080/2014
HIV/AIDS Strategy 27/03/2009 NKM:GCM:A031/09
Gender Equity Plan 31/10/2006 NKM:PCM: 2/2006
Community Participation Strategy
Policy on Transversal Issues 2008 NKM:GCM: A048/2008
PMS Policy Framework 2010 NKM:GCM:AO39/2010
Performance Management System Polity
Approved 30 April 2014 NKM:GCM:A033/2014
Risk Management Policy Approved 19 September 2014 NKM:GCM:A077/2014
Forestry Plan
Air Quality Management Plan
Environmental Management Framework
Approved 13 August 2014 NKM:S-GCM: A089/2014
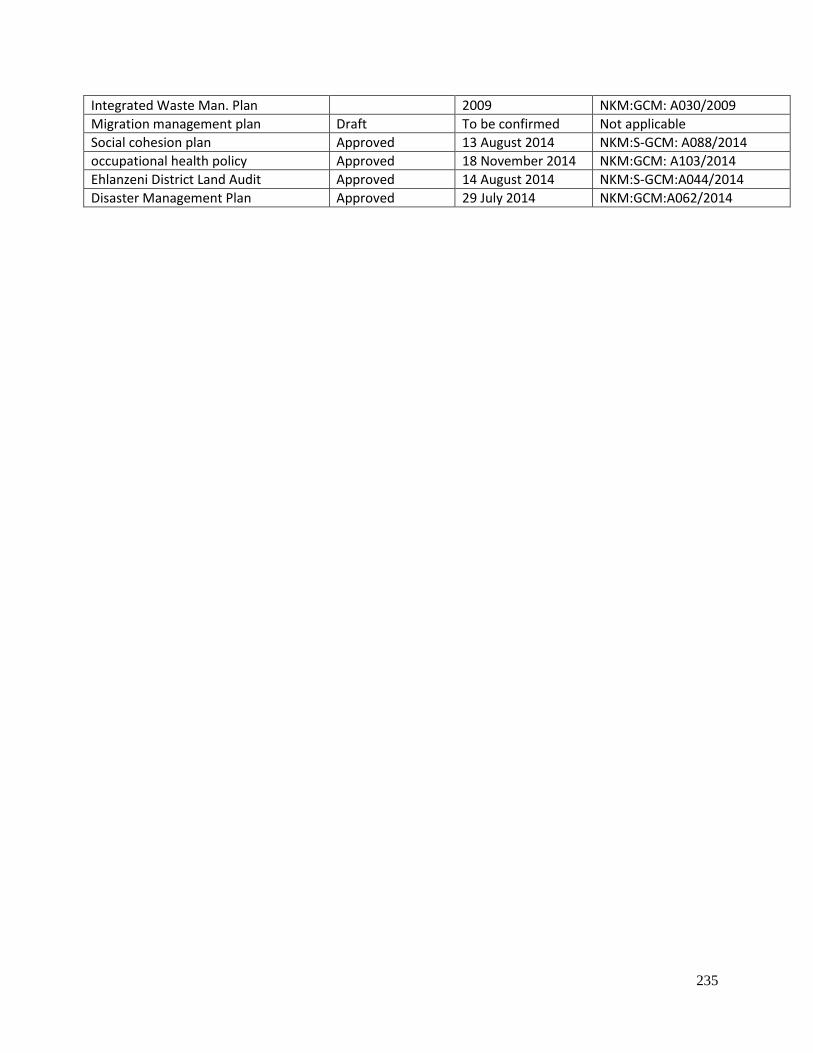
235
Integrated Waste Man. Plan 2009 NKM:GCM: A030/2009
Migration management plan Draft To be confirmed Not applicable
Social cohesion plan Approved 13 August 2014 NKM:S-GCM: A088/2014
occupational health policy Approved 18 November 2014 NKM:GCM: A103/2014
Ehlanzeni District Land Audit Approved 14 August 2014 NKM:S-GCM:A044/2014
Disaster Management Plan Approved 29 July 2014 NKM:GCM:A062/2014
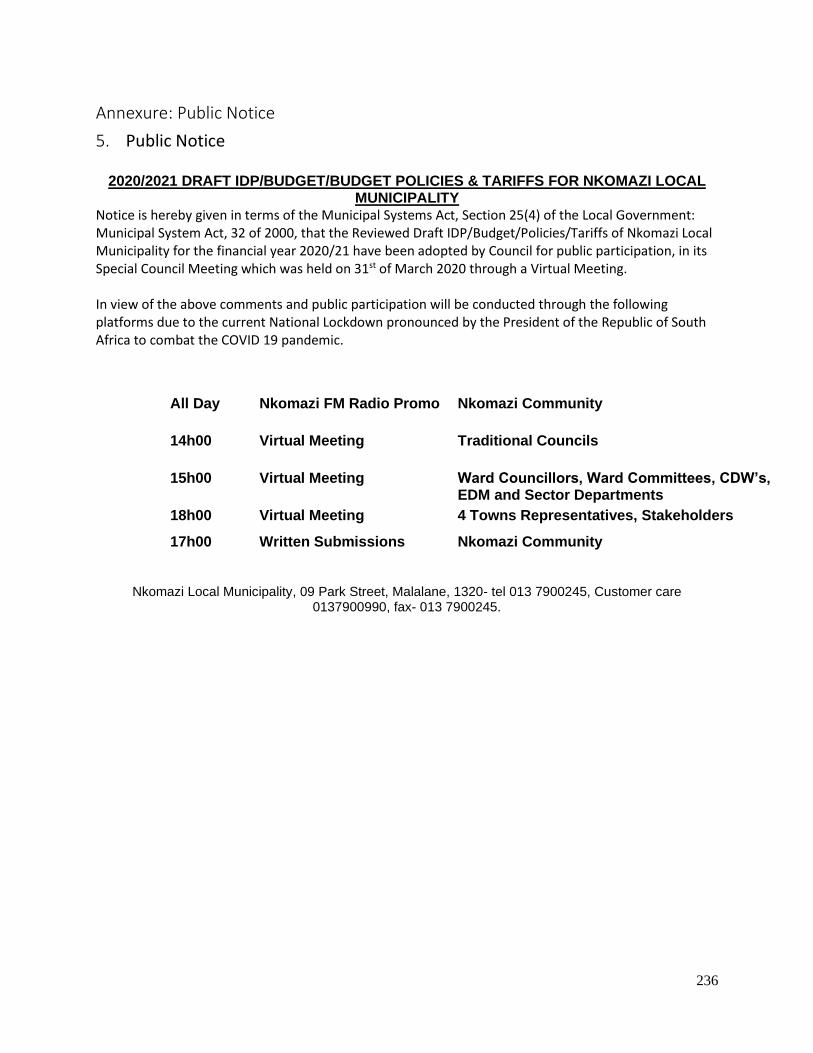
236
Annexure: Public Notice
5. Public Notice
2020/2021 DRAFT IDP/BUDGET/BUDGET POLICIES & TARIFFS FOR NKOMAZI LOCAL MUNICIPALITY
Notice is hereby given in terms of the Municipal Systems Act, Section 25(4) of the Local Government: Municipal System Act, 32 of 2000, that the Reviewed Draft IDP/Budget/Policies/Tariffs of Nkomazi Local Municipality for the financial year 2020/21 have been adopted by Council for public participation, in its Special Council Meeting which was held on 31st of March 2020 through a Virtual Meeting. In view of the above comments and public participation will be conducted through the following platforms due to the current National Lockdown pronounced by the President of the Republic of South Africa to combat the COVID 19 pandemic.
Nkomazi Local Municipality, 09 Park Street, Malalane, 1320- tel 013 7900245, Customer care
0137900990, fax- 013 7900245.
DATE TIME VENUE/PLATFORM PARTICIPANTS
23and24/05/2020 All Day Nkomazi FM Radio Promo Nkomazi Community
25/05/2020 14h00 Virtual Meeting Traditional Councils
26/05/2020 15h00 Virtual Meeting Ward Councillors, Ward Committees, CDW’s, EDM and Sector Departments
26/05/2020 18h00 Virtual Meeting 4 Towns Representatives, Stakeholders
27/05/2020 17h00 Written Submissions Nkomazi Community
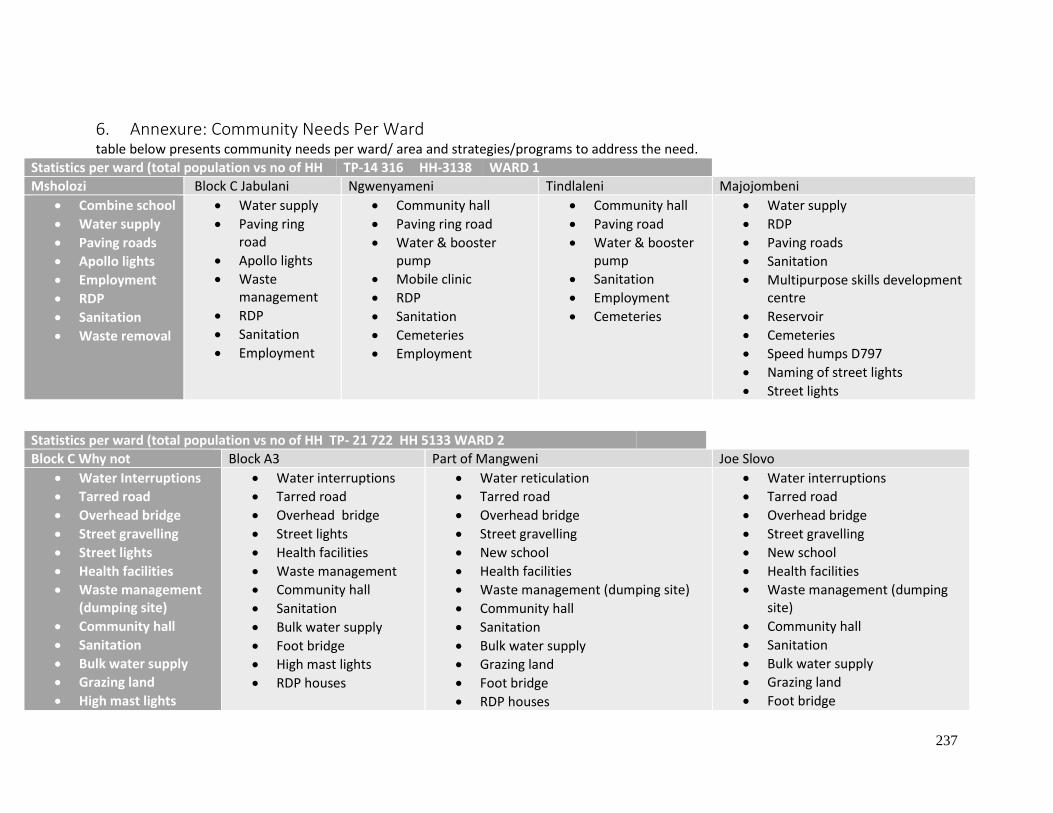
237
6. Annexure: Community Needs Per Ward table below presents community needs per ward/ area and strategies/programs to address the need.
Statistics per ward (total population vs no of HH TP-14 316 HH-3138 WARD 1
Msholozi Block C Jabulani Ngwenyameni Tindlaleni Majojombeni
• Combine school
• Water supply
• Paving roads
• Apollo lights
• Employment
• RDP
• Sanitation
• Waste removal
• Water supply
• Paving ring road
• Apollo lights
• Waste management
• RDP
• Sanitation
• Employment
• Community hall
• Paving ring road
• Water & booster pump
• Mobile clinic
• RDP
• Sanitation
• Cemeteries
• Employment
• Community hall
• Paving road
• Water & booster pump
• Sanitation
• Employment
• Cemeteries
• Water supply
• RDP
• Paving roads
• Sanitation
• Multipurpose skills development centre
• Reservoir
• Cemeteries
• Speed humps D797
• Naming of street lights
• Street lights
Statistics per ward (total population vs no of HH TP- 21 722 HH 5133 WARD 2
Block C Why not Block A3 Part of Mangweni Joe Slovo
• Water Interruptions
• Tarred road
• Overhead bridge
• Street gravelling
• Street lights
• Health facilities
• Waste management (dumping site)
• Community hall
• Sanitation
• Bulk water supply
• Grazing land
• High mast lights
• Water interruptions
• Tarred road
• Overhead bridge
• Street lights
• Health facilities
• Waste management
• Community hall
• Sanitation
• Bulk water supply
• Foot bridge
• High mast lights
• RDP houses
• Water reticulation
• Tarred road
• Overhead bridge
• Street gravelling
• New school
• Health facilities
• Waste management (dumping site)
• Community hall
• Sanitation
• Bulk water supply
• Grazing land
• Foot bridge
• RDP houses
• Water interruptions
• Tarred road
• Overhead bridge
• Street gravelling
• New school
• Health facilities
• Waste management (dumping site)
• Community hall
• Sanitation
• Bulk water supply
• Grazing land
• Foot bridge
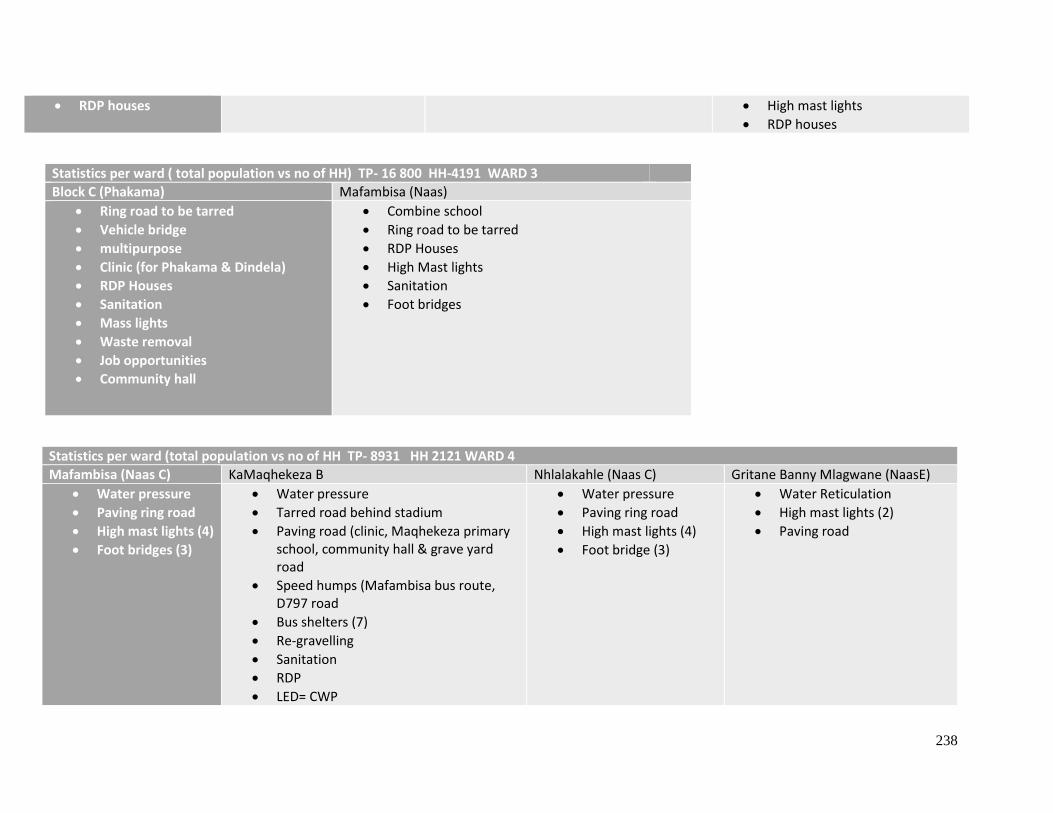
238
• RDP houses
• High mast lights
• RDP houses
Statistics per ward ( total population vs no of HH) TP- 16 800 HH-4191 WARD 3
Block C (Phakama) Mafambisa (Naas)
• Ring road to be tarred
• Vehicle bridge
• multipurpose
• Clinic (for Phakama & Dindela)
• RDP Houses
• Sanitation
• Mass lights
• Waste removal
• Job opportunities
• Community hall
• Combine school
• Ring road to be tarred
• RDP Houses
• High Mast lights
• Sanitation
• Foot bridges
Statistics per ward (total population vs no of HH TP- 8931 HH 2121 WARD 4
Mafambisa (Naas C) KaMaqhekeza B Nhlalakahle (Naas C) Gritane Banny Mlagwane (NaasE)
• Water pressure
• Paving ring road
• High mast lights (4)
• Foot bridges (3)
• Water pressure
• Tarred road behind stadium
• Paving road (clinic, Maqhekeza primary school, community hall & grave yard road
• Speed humps (Mafambisa bus route, D797 road
• Bus shelters (7)
• Re-gravelling
• Sanitation
• RDP
• LED= CWP
• Water pressure
• Paving ring road
• High mast lights (4)
• Foot bridge (3)
• Water Reticulation
• High mast lights (2)
• Paving road
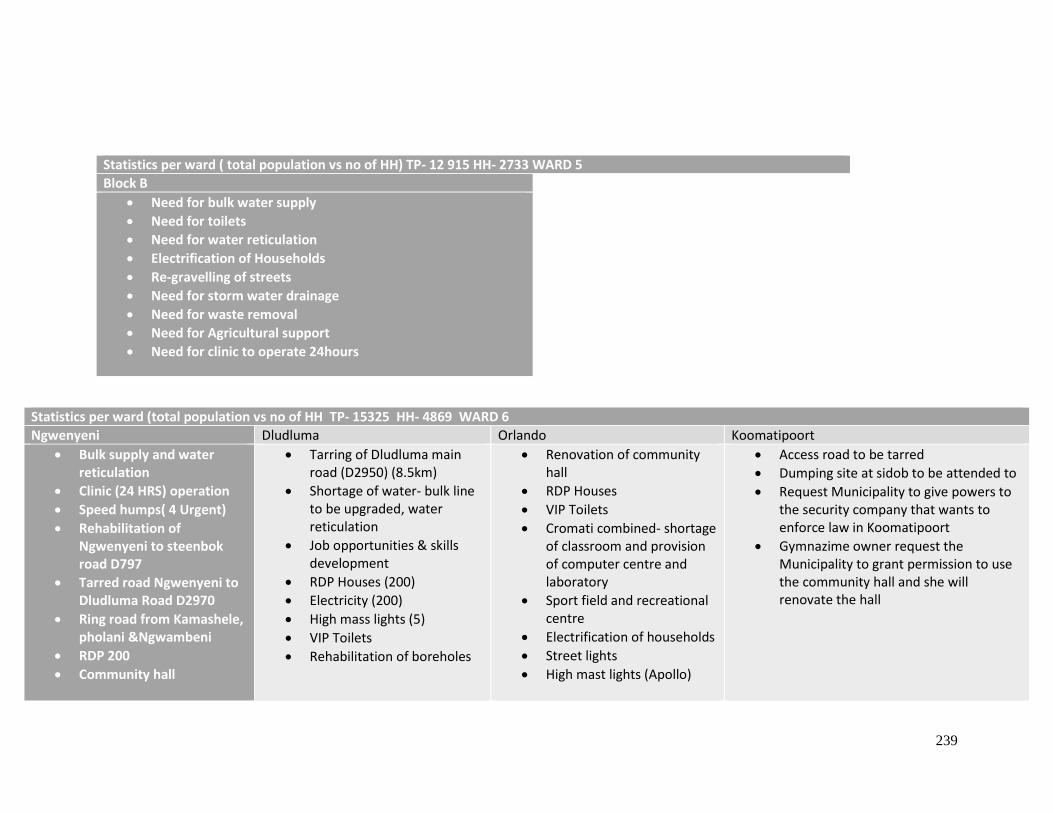
239
Statistics per ward ( total population vs no of HH) TP- 12 915 HH- 2733 WARD 5
Block B
• Need for bulk water supply
• Need for toilets
• Need for water reticulation
• Electrification of Households
• Re-gravelling of streets
• Need for storm water drainage
• Need for waste removal
• Need for Agricultural support
• Need for clinic to operate 24hours
Statistics per ward (total population vs no of HH TP- 15325 HH- 4869 WARD 6
Ngwenyeni Dludluma Orlando Koomatipoort
• Bulk supply and water reticulation
• Clinic (24 HRS) operation
• Speed humps( 4 Urgent)
• Rehabilitation of Ngwenyeni to steenbok road D797
• Tarred road Ngwenyeni to Dludluma Road D2970
• Ring road from Kamashele, pholani &Ngwambeni
• RDP 200
• Community hall
• Tarring of Dludluma main road (D2950) (8.5km)
• Shortage of water- bulk line to be upgraded, water reticulation
• Job opportunities & skills development
• RDP Houses (200)
• Electricity (200)
• High mass lights (5)
• VIP Toilets
• Rehabilitation of boreholes
• Renovation of community hall
• RDP Houses
• VIP Toilets
• Cromati combined- shortage of classroom and provision of computer centre and laboratory
• Sport field and recreational centre
• Electrification of households
• Street lights
• High mast lights (Apollo)
• Access road to be tarred
• Dumping site at sidob to be attended to
• Request Municipality to give powers to the security company that wants to enforce law in Koomatipoort
• Gymnazime owner request the Municipality to grant permission to use the community hall and she will renovate the hall
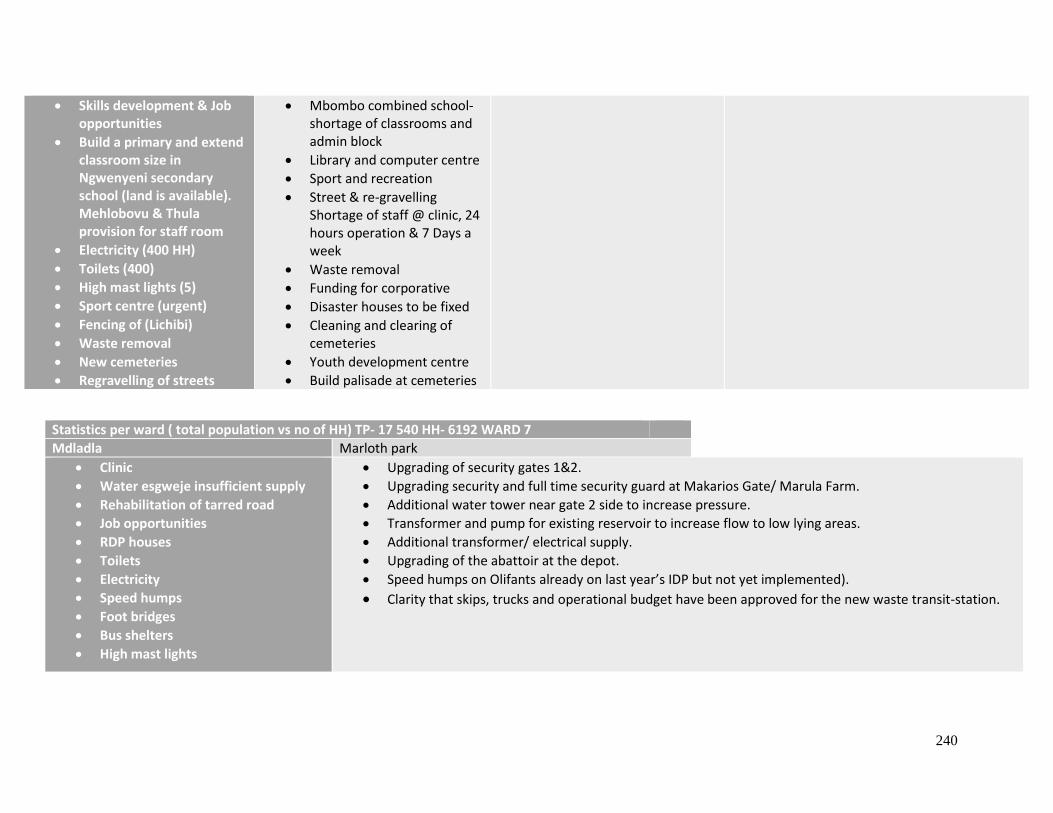
240
• Skills development & Job opportunities
• Build a primary and extend classroom size in Ngwenyeni secondary school (land is available). Mehlobovu & Thula provision for staff room
• Electricity (400 HH)
• Toilets (400)
• High mast lights (5)
• Sport centre (urgent)
• Fencing of (Lichibi)
• Waste removal
• New cemeteries
• Regravelling of streets
• Mbombo combined school- shortage of classrooms and admin block
• Library and computer centre
• Sport and recreation
• Street & re-gravelling Shortage of staff @ clinic, 24 hours operation & 7 Days a week
• Waste removal
• Funding for corporative
• Disaster houses to be fixed
• Cleaning and clearing of cemeteries
• Youth development centre
• Build palisade at cemeteries
Statistics per ward ( total population vs no of HH) TP- 17 540 HH- 6192 WARD 7
Mdladla Marloth park
• Clinic
• Water esgweje insufficient supply
• Rehabilitation of tarred road
• Job opportunities
• RDP houses
• Toilets
• Electricity
• Speed humps
• Foot bridges
• Bus shelters
• High mast lights
• Upgrading of security gates 1&2.
• Upgrading security and full time security guard at Makarios Gate/ Marula Farm.
• Additional water tower near gate 2 side to increase pressure.
• Transformer and pump for existing reservoir to increase flow to low lying areas.
• Additional transformer/ electrical supply.
• Upgrading of the abattoir at the depot.
• Speed humps on Olifants already on last year’s IDP but not yet implemented).
• Clarity that skips, trucks and operational budget have been approved for the new waste transit-station.
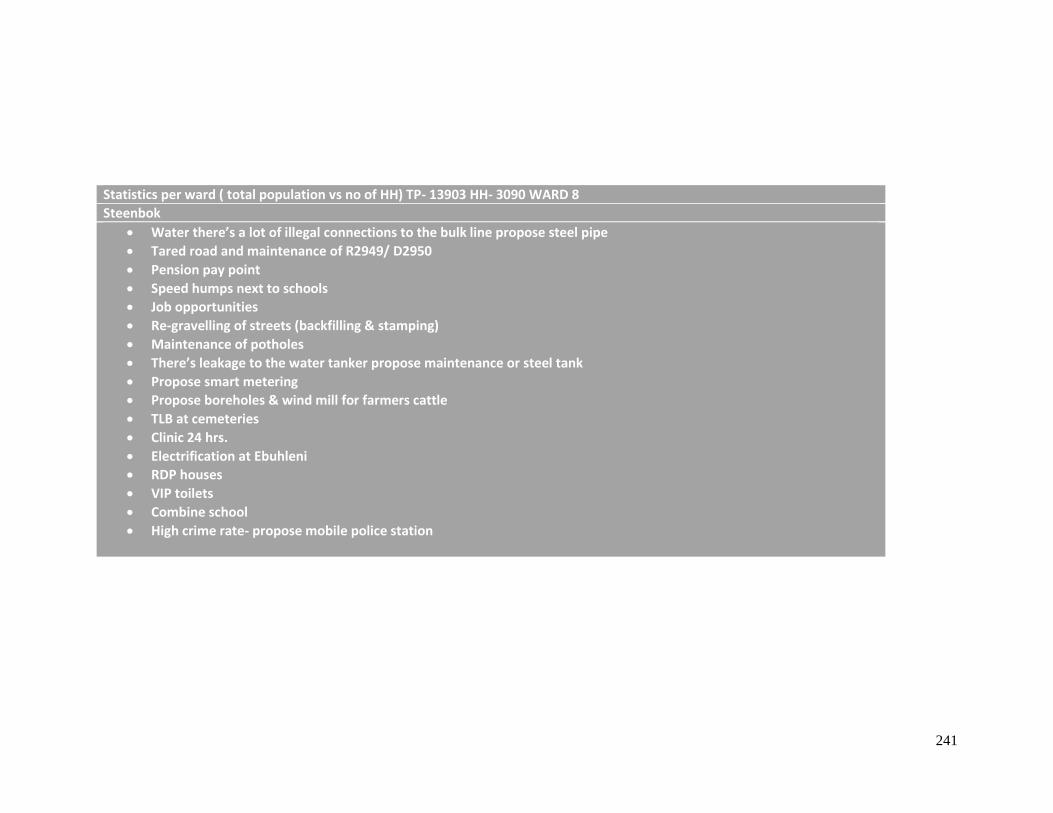
241
Statistics per ward ( total population vs no of HH) TP- 13903 HH- 3090 WARD 8
Steenbok
• Water there’s a lot of illegal connections to the bulk line propose steel pipe
• Tared road and maintenance of R2949/ D2950
• Pension pay point
• Speed humps next to schools
• Job opportunities
• Re-gravelling of streets (backfilling & stamping)
• Maintenance of potholes
• There’s leakage to the water tanker propose maintenance or steel tank
• Propose smart metering
• Propose boreholes & wind mill for farmers cattle
• TLB at cemeteries
• Clinic 24 hrs.
• Electrification at Ebuhleni
• RDP houses
• VIP toilets
• Combine school
• High crime rate- propose mobile police station
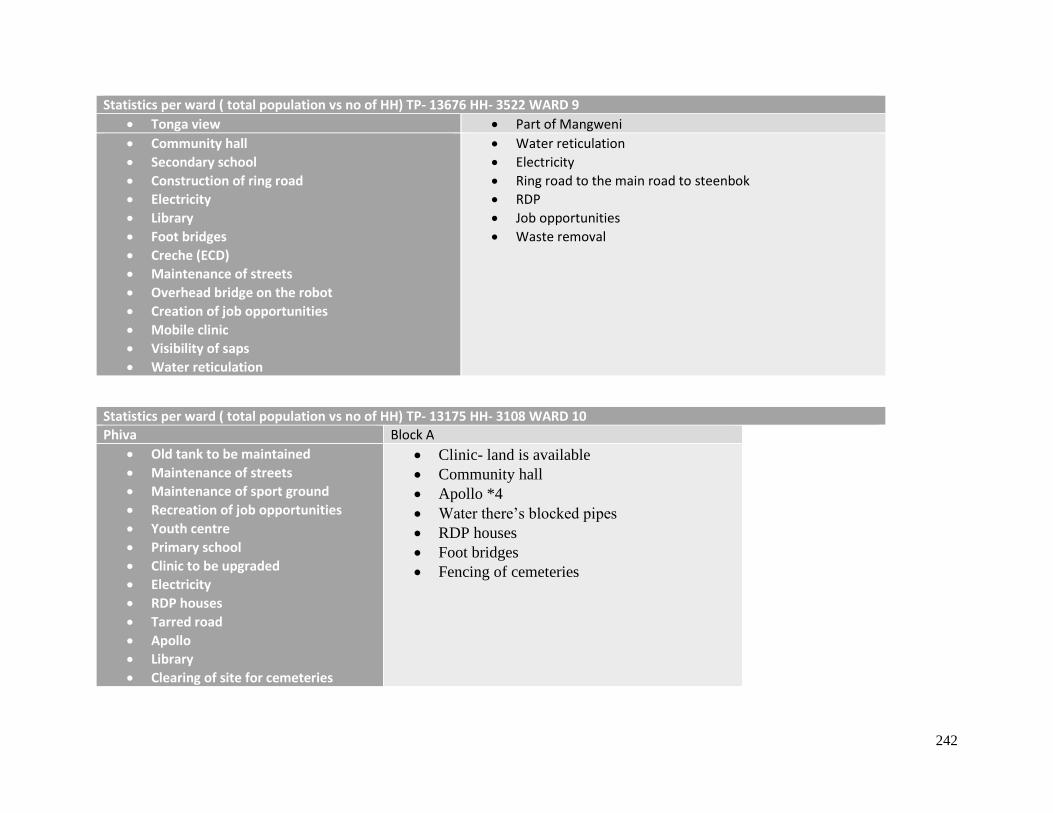
242
Statistics per ward ( total population vs no of HH) TP- 13676 HH- 3522 WARD 9
• Tonga view • Part of Mangweni
• Community hall
• Secondary school
• Construction of ring road
• Electricity
• Library
• Foot bridges
• Creche (ECD)
• Maintenance of streets
• Overhead bridge on the robot
• Creation of job opportunities
• Mobile clinic
• Visibility of saps
• Water reticulation
• Water reticulation
• Electricity
• Ring road to the main road to steenbok
• RDP
• Job opportunities
• Waste removal
Statistics per ward ( total population vs no of HH) TP- 13175 HH- 3108 WARD 10
Phiva Block A
• Old tank to be maintained
• Maintenance of streets
• Maintenance of sport ground
• Recreation of job opportunities
• Youth centre
• Primary school
• Clinic to be upgraded
• Electricity
• RDP houses
• Tarred road
• Apollo
• Library
• Clearing of site for cemeteries
• Clinic- land is available
• Community hall
• Apollo *4
• Water there’s blocked pipes
• RDP houses
• Foot bridges
• Fencing of cemeteries
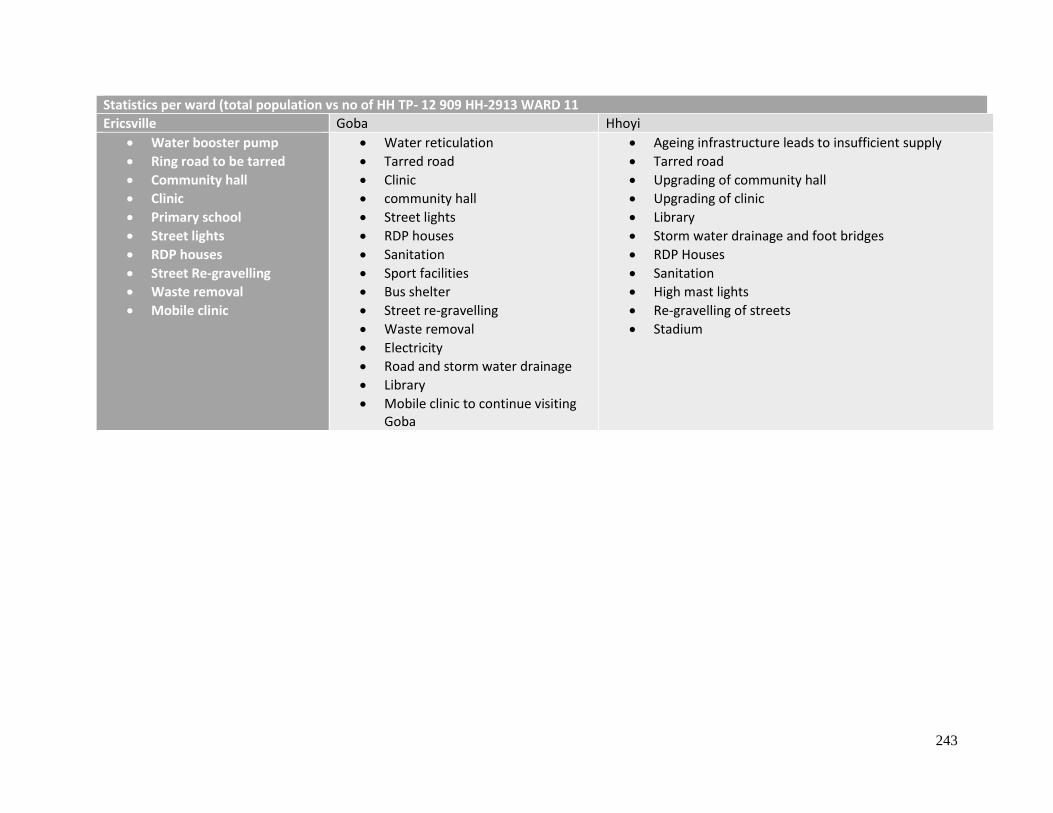
243
Statistics per ward (total population vs no of HH TP- 12 909 HH-2913 WARD 11
Ericsville Goba Hhoyi
• Water booster pump
• Ring road to be tarred
• Community hall
• Clinic
• Primary school
• Street lights
• RDP houses
• Street Re-gravelling
• Waste removal
• Mobile clinic
• Water reticulation
• Tarred road
• Clinic
• community hall
• Street lights
• RDP houses
• Sanitation
• Sport facilities
• Bus shelter
• Street re-gravelling
• Waste removal
• Electricity
• Road and storm water drainage
• Library
• Mobile clinic to continue visiting Goba
• Ageing infrastructure leads to insufficient supply
• Tarred road
• Upgrading of community hall
• Upgrading of clinic
• Library
• Storm water drainage and foot bridges
• RDP Houses
• Sanitation
• High mast lights
• Re-gravelling of streets
• Stadium
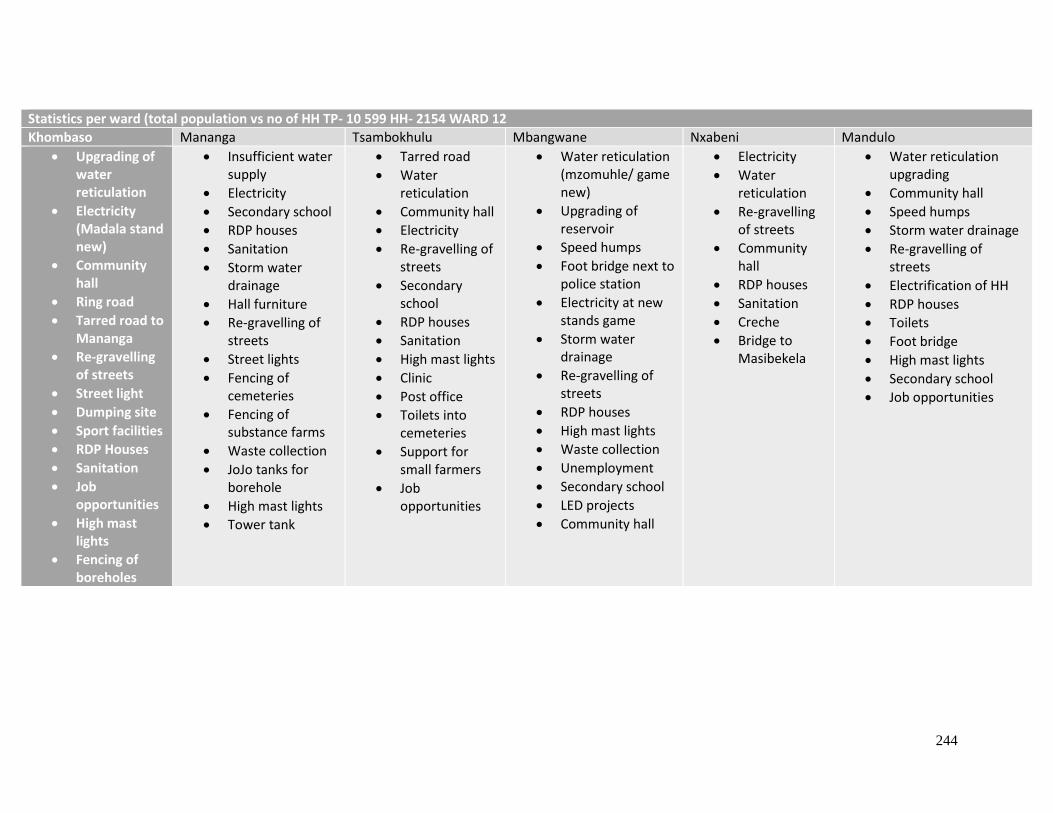
244
Statistics per ward (total population vs no of HH TP- 10 599 HH- 2154 WARD 12
Khombaso Mananga Tsambokhulu Mbangwane Nxabeni Mandulo
• Upgrading of water reticulation
• Electricity (Madala stand new)
• Community hall
• Ring road
• Tarred road to Mananga
• Re-gravelling of streets
• Street light
• Dumping site
• Sport facilities
• RDP Houses
• Sanitation
• Job opportunities
• High mast lights
• Fencing of boreholes
• Insufficient water supply
• Electricity
• Secondary school
• RDP houses
• Sanitation
• Storm water drainage
• Hall furniture
• Re-gravelling of streets
• Street lights
• Fencing of cemeteries
• Fencing of substance farms
• Waste collection
• JoJo tanks for borehole
• High mast lights
• Tower tank
• Tarred road
• Water reticulation
• Community hall
• Electricity
• Re-gravelling of streets
• Secondary school
• RDP houses
• Sanitation
• High mast lights
• Clinic
• Post office
• Toilets into cemeteries
• Support for small farmers
• Job opportunities
• Water reticulation (mzomuhle/ game new)
• Upgrading of reservoir
• Speed humps
• Foot bridge next to police station
• Electricity at new stands game
• Storm water drainage
• Re-gravelling of streets
• RDP houses
• High mast lights
• Waste collection
• Unemployment
• Secondary school
• LED projects
• Community hall
• Electricity
• Water reticulation
• Re-gravelling of streets
• Community hall
• RDP houses
• Sanitation
• Creche
• Bridge to Masibekela
• Water reticulation upgrading
• Community hall
• Speed humps
• Storm water drainage
• Re-gravelling of streets
• Electrification of HH
• RDP houses
• Toilets
• Foot bridge
• High mast lights
• Secondary school
• Job opportunities
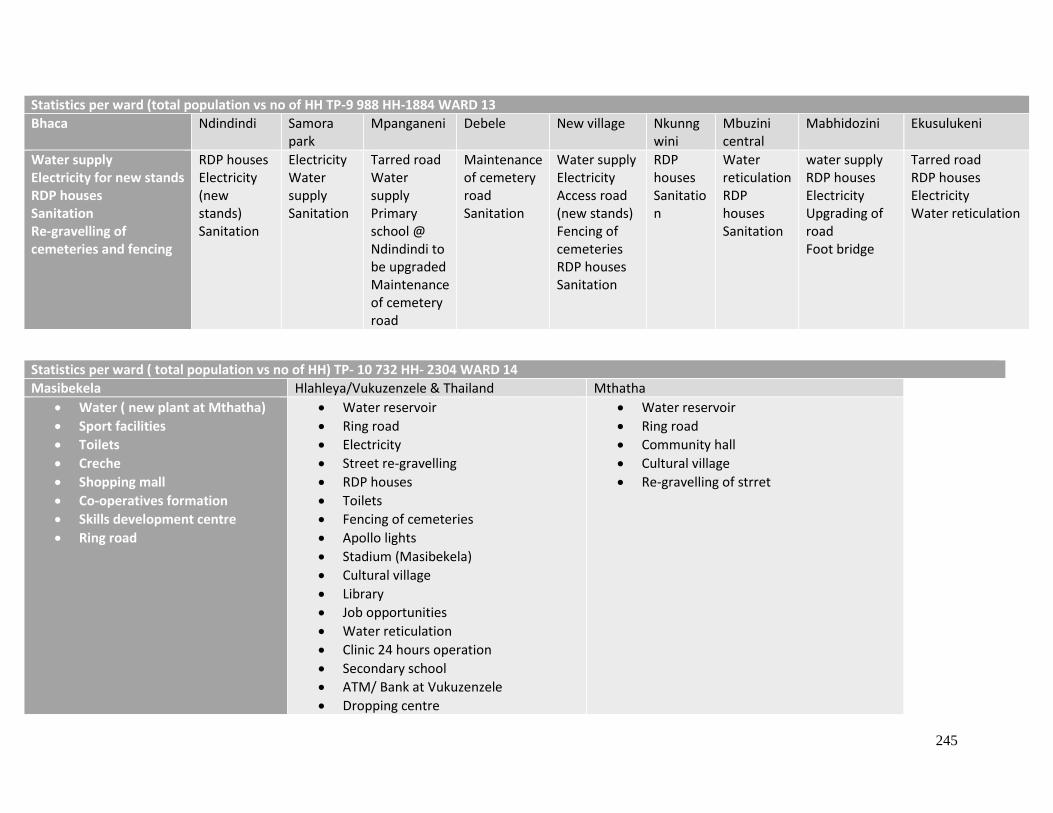
245
Statistics per ward (total population vs no of HH TP-9 988 HH-1884 WARD 13
Bhaca Ndindindi Samora park
Mpanganeni Debele New village Nkunngwini
Mbuzini central
Mabhidozini Ekusulukeni
Water supply Electricity for new stands RDP houses Sanitation Re-gravelling of cemeteries and fencing
RDP houses Electricity (new stands) Sanitation
Electricity Water supply Sanitation
Tarred road Water supply Primary school @ Ndindindi to be upgraded Maintenance of cemetery road
Maintenance of cemetery road Sanitation
Water supply Electricity Access road (new stands) Fencing of cemeteries RDP houses Sanitation
RDP houses Sanitation
Water reticulation RDP houses Sanitation
water supply RDP houses Electricity Upgrading of road Foot bridge
Tarred road RDP houses Electricity Water reticulation
Statistics per ward ( total population vs no of HH) TP- 10 732 HH- 2304 WARD 14
Masibekela Hlahleya/Vukuzenzele & Thailand Mthatha
• Water ( new plant at Mthatha)
• Sport facilities
• Toilets
• Creche
• Shopping mall
• Co-operatives formation
• Skills development centre
• Ring road
• Water reservoir
• Ring road
• Electricity
• Street re-gravelling
• RDP houses
• Toilets
• Fencing of cemeteries
• Apollo lights
• Stadium (Masibekela)
• Cultural village
• Library
• Job opportunities
• Water reticulation
• Clinic 24 hours operation
• Secondary school
• ATM/ Bank at Vukuzenzele
• Dropping centre
• Water reservoir
• Ring road
• Community hall
• Cultural village
• Re-gravelling of strret
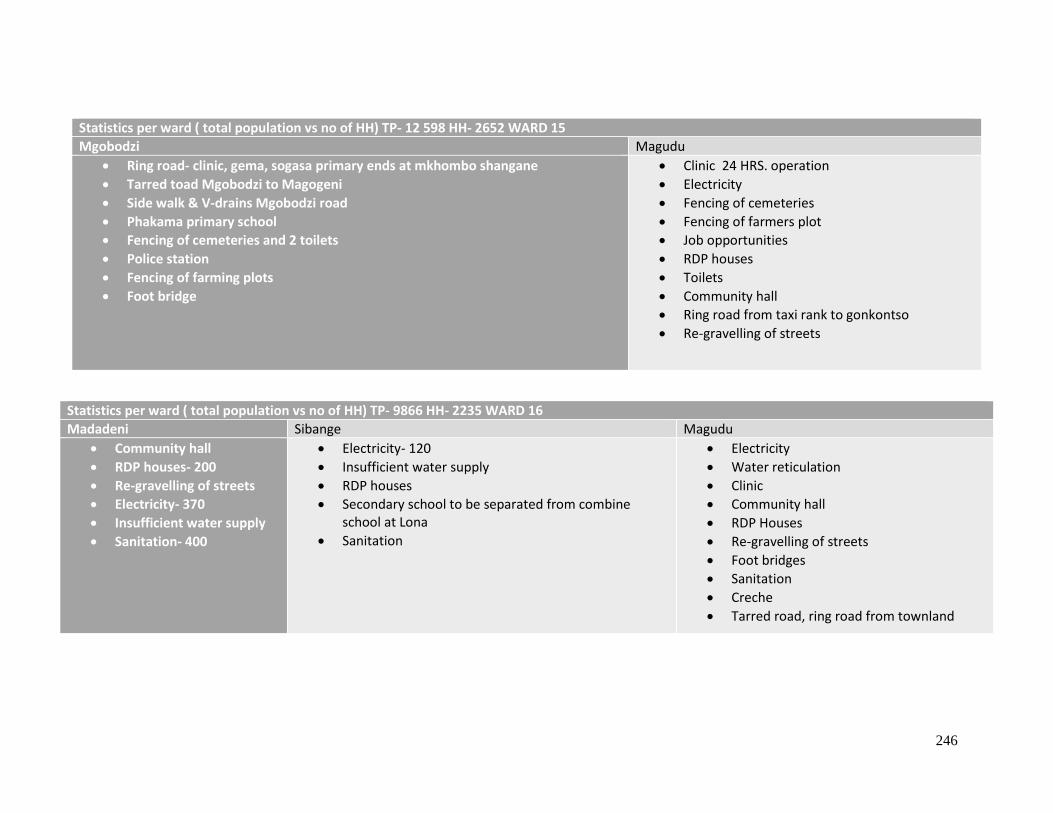
246
Statistics per ward ( total population vs no of HH) TP- 9866 HH- 2235 WARD 16
Madadeni Sibange Magudu
• Community hall
• RDP houses- 200
• Re-gravelling of streets
• Electricity- 370
• Insufficient water supply
• Sanitation- 400
• Electricity- 120
• Insufficient water supply
• RDP houses
• Secondary school to be separated from combine school at Lona
• Sanitation
• Electricity
• Water reticulation
• Clinic
• Community hall
• RDP Houses
• Re-gravelling of streets
• Foot bridges
• Sanitation
• Creche
• Tarred road, ring road from townland
Statistics per ward ( total population vs no of HH) TP- 12 598 HH- 2652 WARD 15
Mgobodzi Magudu
• Ring road- clinic, gema, sogasa primary ends at mkhombo shangane
• Tarred toad Mgobodzi to Magogeni
• Side walk & V-drains Mgobodzi road
• Phakama primary school
• Fencing of cemeteries and 2 toilets
• Police station
• Fencing of farming plots
• Foot bridge
• Clinic 24 HRS. operation
• Electricity
• Fencing of cemeteries
• Fencing of farmers plot
• Job opportunities
• RDP houses
• Toilets
• Community hall
• Ring road from taxi rank to gonkontso
• Re-gravelling of streets
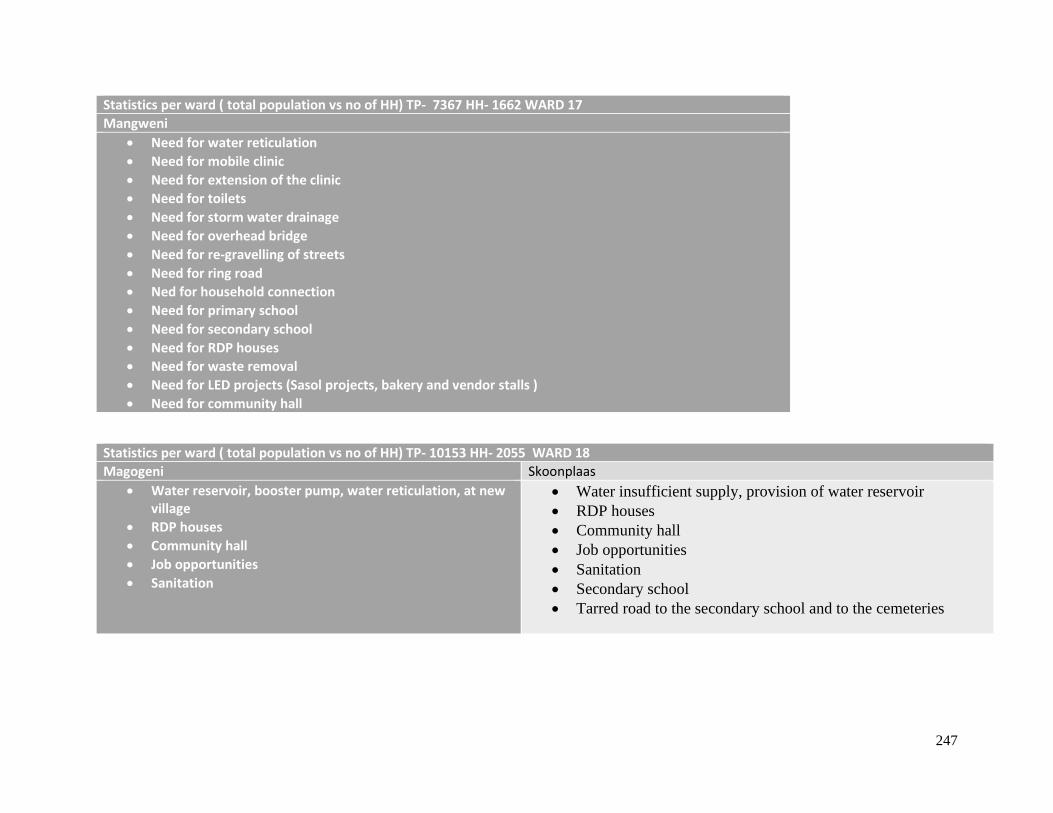
247
Statistics per ward ( total population vs no of HH) TP- 7367 HH- 1662 WARD 17
Mangweni
• Need for water reticulation
• Need for mobile clinic
• Need for extension of the clinic
• Need for toilets
• Need for storm water drainage
• Need for overhead bridge
• Need for re-gravelling of streets
• Need for ring road
• Ned for household connection
• Need for primary school
• Need for secondary school
• Need for RDP houses
• Need for waste removal
• Need for LED projects (Sasol projects, bakery and vendor stalls )
• Need for community hall
Statistics per ward ( total population vs no of HH) TP- 10153 HH- 2055 WARD 18
Magogeni Skoonplaas
• Water reservoir, booster pump, water reticulation, at new village
• RDP houses
• Community hall
• Job opportunities
• Sanitation
• Water insufficient supply, provision of water reservoir
• RDP houses
• Community hall
• Job opportunities
• Sanitation
• Secondary school
• Tarred road to the secondary school and to the cemeteries
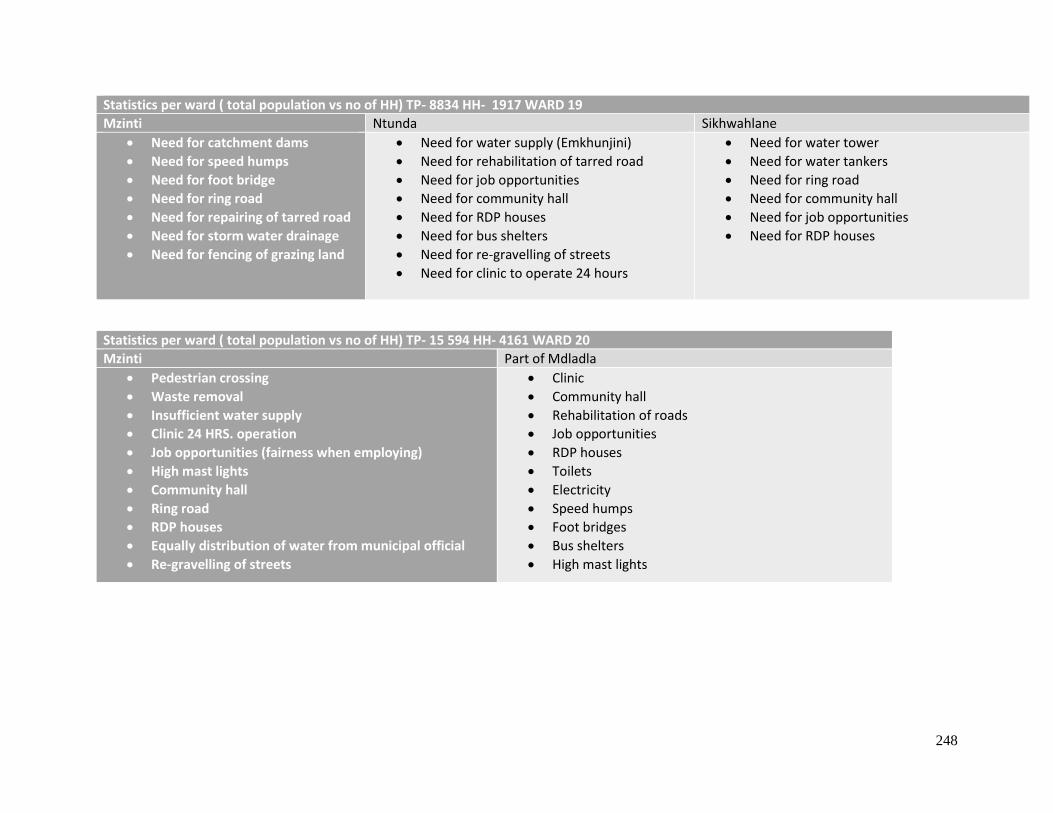
248
Statistics per ward ( total population vs no of HH) TP- 8834 HH- 1917 WARD 19
Mzinti Ntunda Sikhwahlane
• Need for catchment dams
• Need for speed humps
• Need for foot bridge
• Need for ring road
• Need for repairing of tarred road
• Need for storm water drainage
• Need for fencing of grazing land
• Need for water supply (Emkhunjini)
• Need for rehabilitation of tarred road
• Need for job opportunities
• Need for community hall
• Need for RDP houses
• Need for bus shelters
• Need for re-gravelling of streets
• Need for clinic to operate 24 hours
• Need for water tower
• Need for water tankers
• Need for ring road
• Need for community hall
• Need for job opportunities
• Need for RDP houses
Statistics per ward ( total population vs no of HH) TP- 15 594 HH- 4161 WARD 20
Mzinti Part of Mdladla
• Pedestrian crossing
• Waste removal
• Insufficient water supply
• Clinic 24 HRS. operation
• Job opportunities (fairness when employing)
• High mast lights
• Community hall
• Ring road
• RDP houses
• Equally distribution of water from municipal official
• Re-gravelling of streets
• Clinic
• Community hall
• Rehabilitation of roads
• Job opportunities
• RDP houses
• Toilets
• Electricity
• Speed humps
• Foot bridges
• Bus shelters
• High mast lights
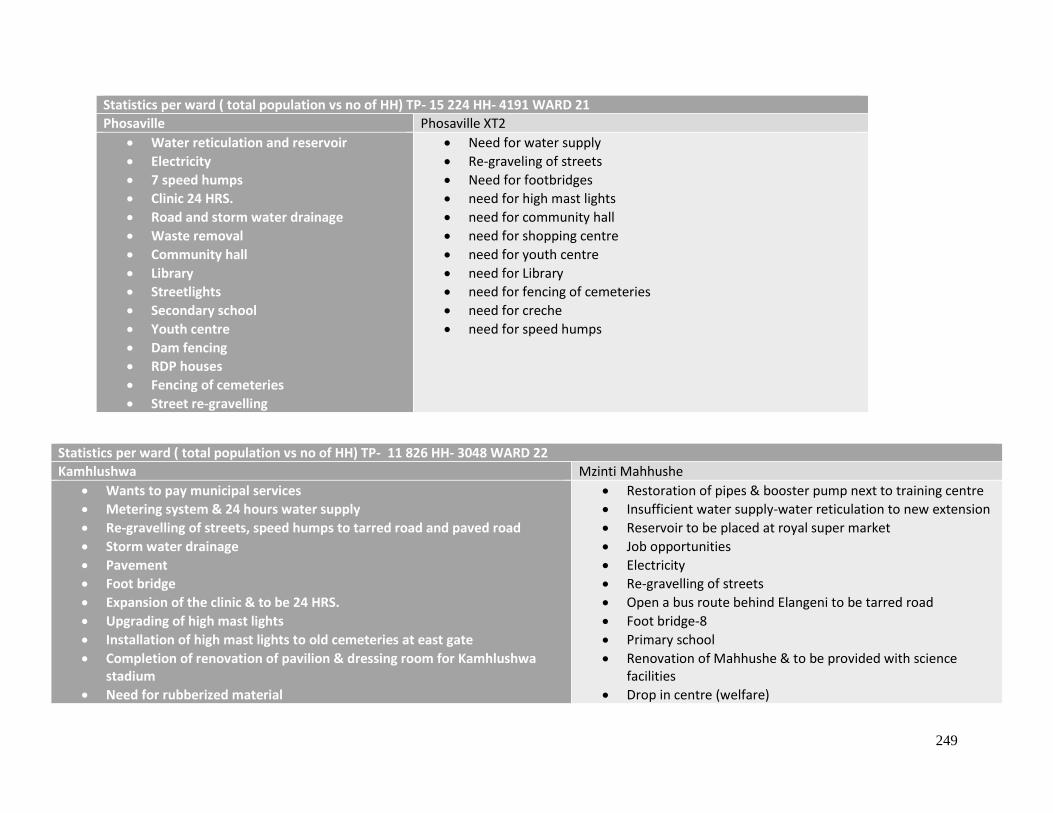
249
Statistics per ward ( total population vs no of HH) TP- 15 224 HH- 4191 WARD 21
Phosaville Phosaville XT2
• Water reticulation and reservoir
• Electricity
• 7 speed humps
• Clinic 24 HRS.
• Road and storm water drainage
• Waste removal
• Community hall
• Library
• Streetlights
• Secondary school
• Youth centre
• Dam fencing
• RDP houses
• Fencing of cemeteries
• Street re-gravelling
• Need for water supply
• Re-graveling of streets
• Need for footbridges
• need for high mast lights
• need for community hall
• need for shopping centre
• need for youth centre
• need for Library
• need for fencing of cemeteries
• need for creche
• need for speed humps
Statistics per ward ( total population vs no of HH) TP- 11 826 HH- 3048 WARD 22
Kamhlushwa Mzinti Mahhushe
• Wants to pay municipal services
• Metering system & 24 hours water supply
• Re-gravelling of streets, speed humps to tarred road and paved road
• Storm water drainage
• Pavement
• Foot bridge
• Expansion of the clinic & to be 24 HRS.
• Upgrading of high mast lights
• Installation of high mast lights to old cemeteries at east gate
• Completion of renovation of pavilion & dressing room for Kamhlushwa stadium
• Need for rubberized material
• Restoration of pipes & booster pump next to training centre
• Insufficient water supply-water reticulation to new extension
• Reservoir to be placed at royal super market
• Job opportunities
• Electricity
• Re-gravelling of streets
• Open a bus route behind Elangeni to be tarred road
• Foot bridge-8
• Primary school
• Renovation of Mahhushe & to be provided with science facilities
• Drop in centre (welfare)
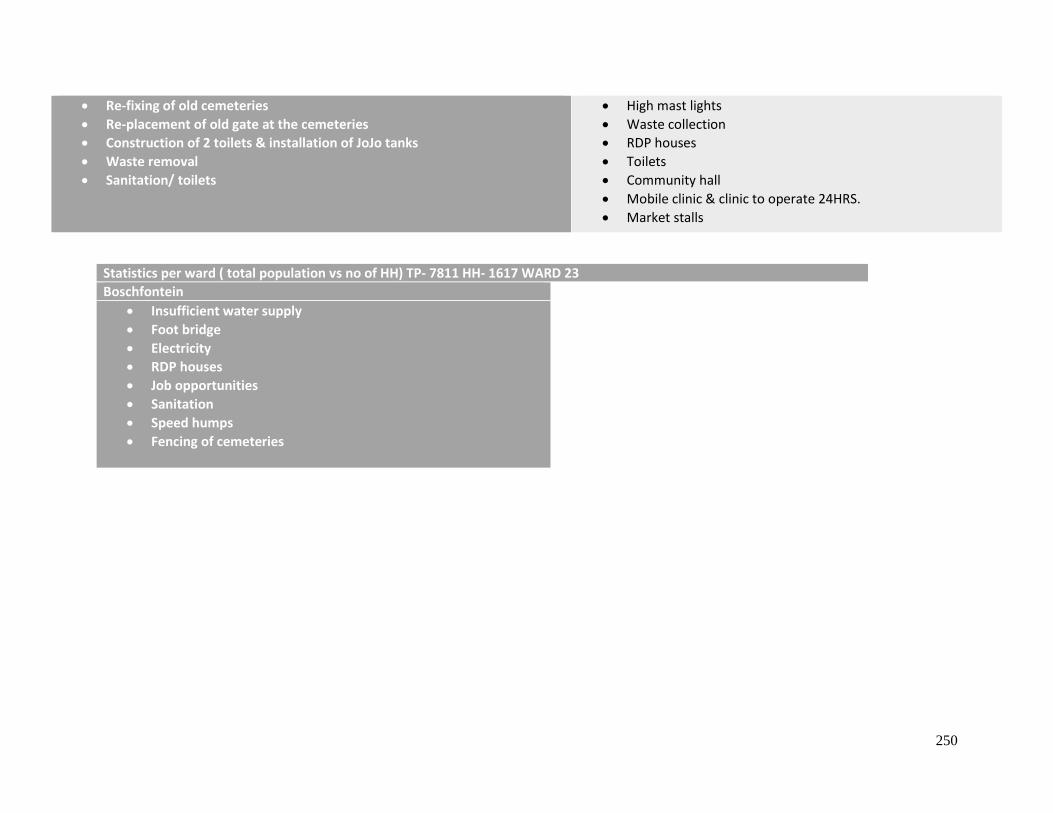
250
• Re-fixing of old cemeteries
• Re-placement of old gate at the cemeteries
• Construction of 2 toilets & installation of JoJo tanks
• Waste removal
• Sanitation/ toilets
• High mast lights
• Waste collection
• RDP houses
• Toilets
• Community hall
• Mobile clinic & clinic to operate 24HRS.
• Market stalls
Statistics per ward ( total population vs no of HH) TP- 7811 HH- 1617 WARD 23
Boschfontein
• Insufficient water supply
• Foot bridge
• Electricity
• RDP houses
• Job opportunities
• Sanitation
• Speed humps
• Fencing of cemeteries
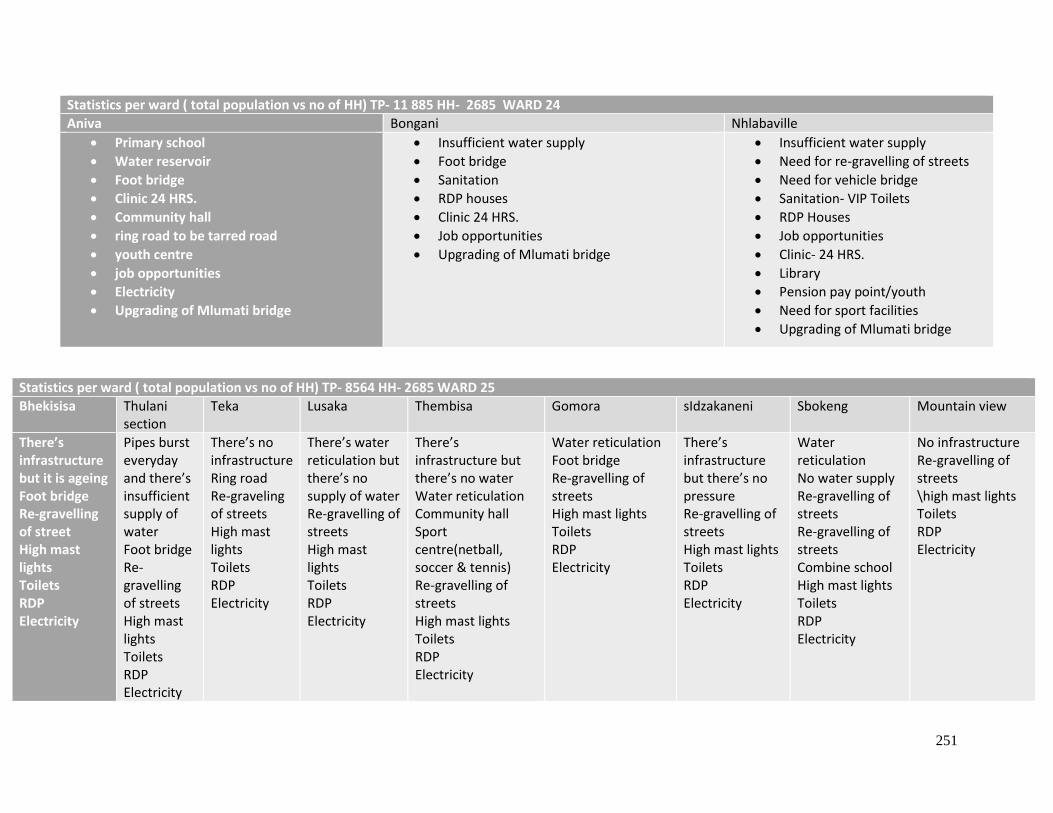
251
Statistics per ward ( total population vs no of HH) TP- 11 885 HH- 2685 WARD 24
Aniva Bongani Nhlabaville
• Primary school
• Water reservoir
• Foot bridge
• Clinic 24 HRS.
• Community hall
• ring road to be tarred road
• youth centre
• job opportunities
• Electricity
• Upgrading of Mlumati bridge
• Insufficient water supply
• Foot bridge
• Sanitation
• RDP houses
• Clinic 24 HRS.
• Job opportunities
• Upgrading of Mlumati bridge
• Insufficient water supply
• Need for re-gravelling of streets
• Need for vehicle bridge
• Sanitation- VIP Toilets
• RDP Houses
• Job opportunities
• Clinic- 24 HRS.
• Library
• Pension pay point/youth
• Need for sport facilities
• Upgrading of Mlumati bridge
Statistics per ward ( total population vs no of HH) TP- 8564 HH- 2685 WARD 25
Bhekisisa Thulani section
Teka Lusaka Thembisa Gomora sIdzakaneni Sbokeng Mountain view
There’s infrastructure but it is ageing Foot bridge Re-gravelling of street High mast lights Toilets RDP Electricity
Pipes burst everyday and there’s insufficient supply of water Foot bridge Re-gravelling of streets High mast lights Toilets RDP Electricity
There’s no infrastructure Ring road Re-graveling of streets High mast lights Toilets RDP Electricity
There’s water reticulation but there’s no supply of water Re-gravelling of streets High mast lights Toilets RDP Electricity
There’s infrastructure but there’s no water Water reticulation Community hall Sport centre(netball, soccer & tennis) Re-gravelling of streets High mast lights Toilets RDP Electricity
Water reticulation Foot bridge Re-gravelling of streets High mast lights Toilets RDP Electricity
There’s infrastructure but there’s no pressure Re-gravelling of streets High mast lights Toilets RDP Electricity
Water reticulation No water supply Re-gravelling of streets Re-gravelling of streets Combine school High mast lights Toilets RDP Electricity
No infrastructure Re-gravelling of streets \high mast lights Toilets RDP Electricity
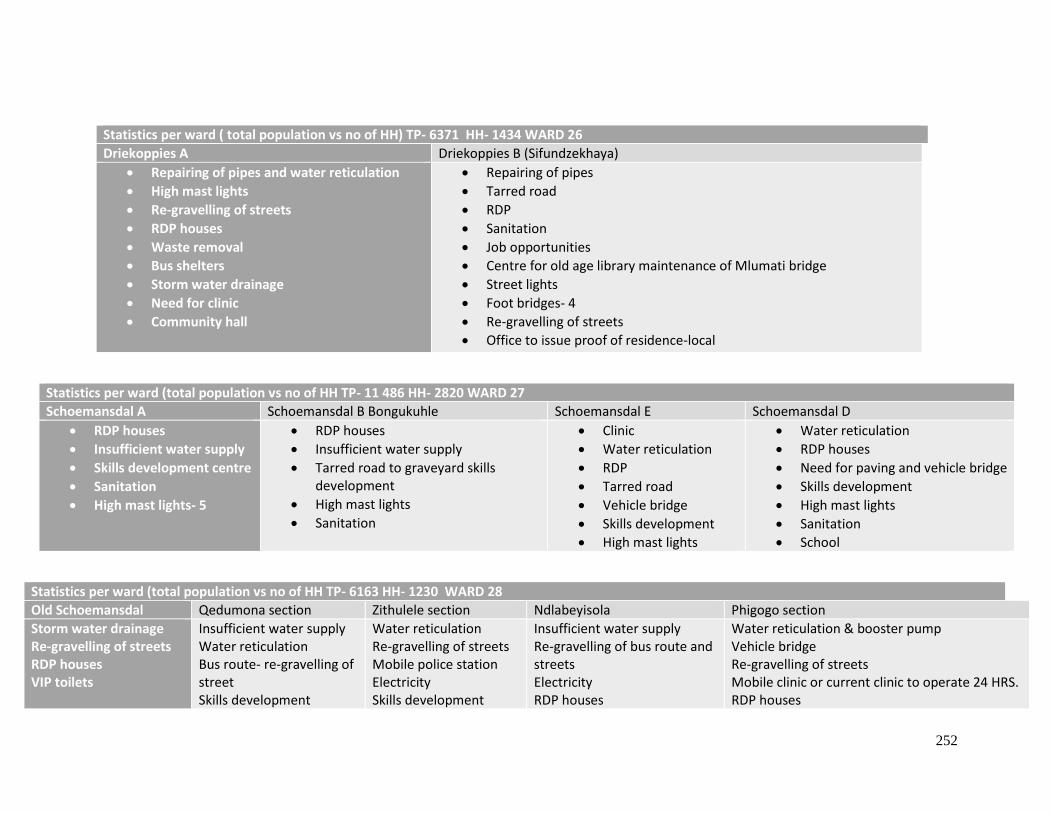
252
Statistics per ward ( total population vs no of HH) TP- 6371 HH- 1434 WARD 26
Driekoppies A Driekoppies B (Sifundzekhaya)
• Repairing of pipes and water reticulation
• High mast lights
• Re-gravelling of streets
• RDP houses
• Waste removal
• Bus shelters
• Storm water drainage
• Need for clinic
• Community hall
• Repairing of pipes
• Tarred road
• RDP
• Sanitation
• Job opportunities
• Centre for old age library maintenance of Mlumati bridge
• Street lights
• Foot bridges- 4
• Re-gravelling of streets
• Office to issue proof of residence-local
Statistics per ward (total population vs no of HH TP- 11 486 HH- 2820 WARD 27
Schoemansdal A Schoemansdal B Bongukuhle Schoemansdal E Schoemansdal D
• RDP houses
• Insufficient water supply
• Skills development centre
• Sanitation
• High mast lights- 5
• RDP houses
• Insufficient water supply
• Tarred road to graveyard skills development
• High mast lights
• Sanitation
• Clinic
• Water reticulation
• RDP
• Tarred road
• Vehicle bridge
• Skills development
• High mast lights
• Water reticulation
• RDP houses
• Need for paving and vehicle bridge
• Skills development
• High mast lights
• Sanitation
• School
Statistics per ward (total population vs no of HH TP- 6163 HH- 1230 WARD 28
Old Schoemansdal Qedumona section Zithulele section Ndlabeyisola Phigogo section
Storm water drainage Re-gravelling of streets RDP houses VIP toilets
Insufficient water supply Water reticulation Bus route- re-gravelling of street Skills development
Water reticulation Re-gravelling of streets Mobile police station Electricity Skills development
Insufficient water supply Re-gravelling of bus route and streets Electricity RDP houses
Water reticulation & booster pump Vehicle bridge Re-gravelling of streets Mobile clinic or current clinic to operate 24 HRS. RDP houses
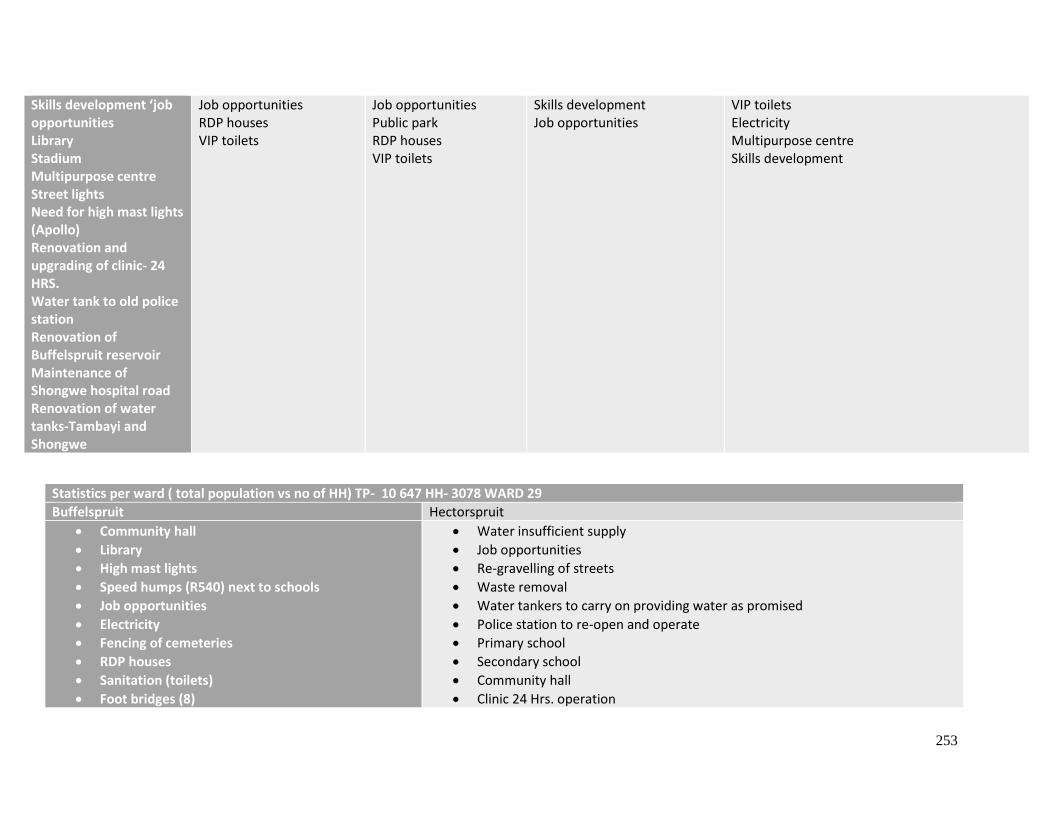
253
Skills development ‘job opportunities Library Stadium Multipurpose centre Street lights Need for high mast lights (Apollo) Renovation and upgrading of clinic- 24 HRS. Water tank to old police station Renovation of Buffelspruit reservoir Maintenance of Shongwe hospital road Renovation of water tanks-Tambayi and Shongwe
Job opportunities RDP houses VIP toilets
Job opportunities Public park RDP houses VIP toilets
Skills development Job opportunities
VIP toilets Electricity Multipurpose centre Skills development
Statistics per ward ( total population vs no of HH) TP- 10 647 HH- 3078 WARD 29
Buffelspruit Hectorspruit
• Community hall
• Library
• High mast lights
• Speed humps (R540) next to schools
• Job opportunities
• Electricity
• Fencing of cemeteries
• RDP houses
• Sanitation (toilets)
• Foot bridges (8)
• Water insufficient supply
• Job opportunities
• Re-gravelling of streets
• Waste removal
• Water tankers to carry on providing water as promised
• Police station to re-open and operate
• Primary school
• Secondary school
• Community hall
• Clinic 24 Hrs. operation
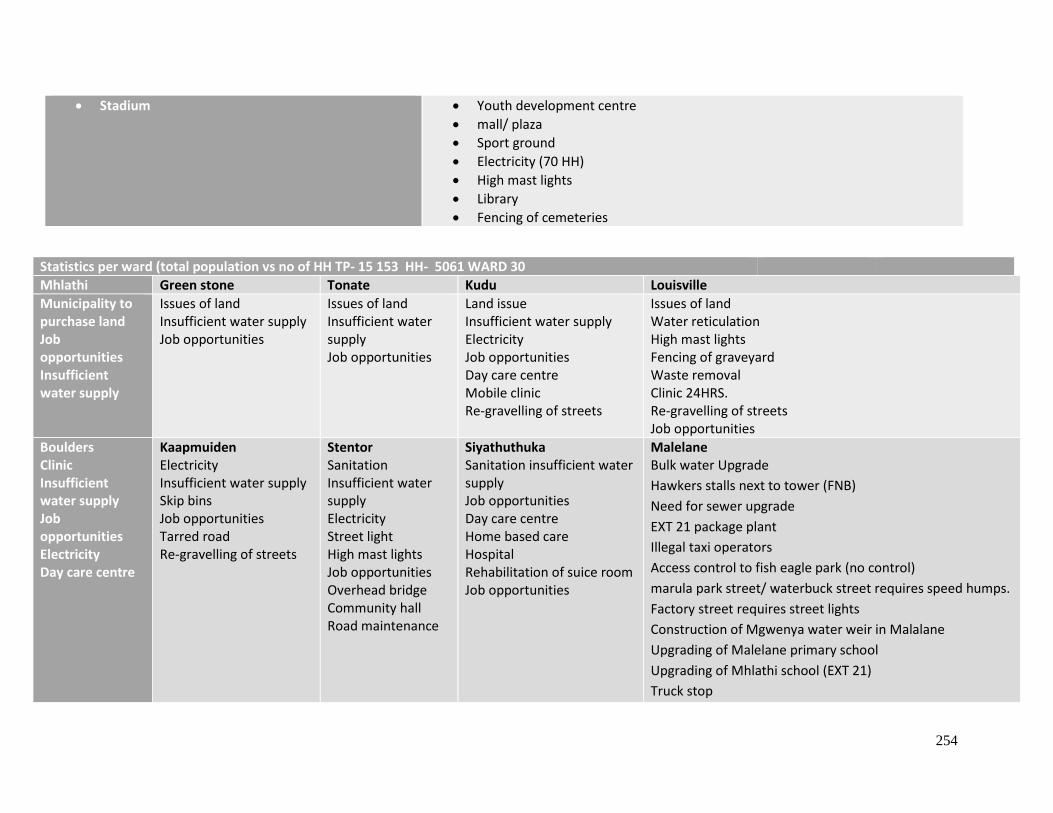
254
• Stadium
• Youth development centre
• mall/ plaza
• Sport ground
• Electricity (70 HH)
• High mast lights
• Library
• Fencing of cemeteries
Statistics per ward (total population vs no of HH TP- 15 153 HH- 5061 WARD 30
Mhlathi Green stone Tonate Kudu Louisville
Municipality to purchase land Job opportunities Insufficient water supply
Issues of land Insufficient water supply Job opportunities
Issues of land Insufficient water supply Job opportunities
Land issue Insufficient water supply Electricity Job opportunities Day care centre Mobile clinic Re-gravelling of streets
Issues of land Water reticulation High mast lights Fencing of graveyard Waste removal Clinic 24HRS. Re-gravelling of streets Job opportunities
Boulders Clinic Insufficient water supply Job opportunities Electricity Day care centre
Kaapmuiden Electricity Insufficient water supply Skip bins Job opportunities Tarred road Re-gravelling of streets
Stentor Sanitation Insufficient water supply Electricity Street light High mast lights Job opportunities Overhead bridge Community hall Road maintenance
Siyathuthuka Sanitation insufficient water supply Job opportunities Day care centre Home based care Hospital Rehabilitation of suice room Job opportunities
Malelane Bulk water Upgrade
Hawkers stalls next to tower (FNB)
Need for sewer upgrade
EXT 21 package plant
Illegal taxi operators
Access control to fish eagle park (no control)
marula park street/ waterbuck street requires speed humps.
Factory street requires street lights
Construction of Mgwenya water weir in Malalane
Upgrading of Malelane primary school
Upgrading of Mhlathi school (EXT 21)
Truck stop
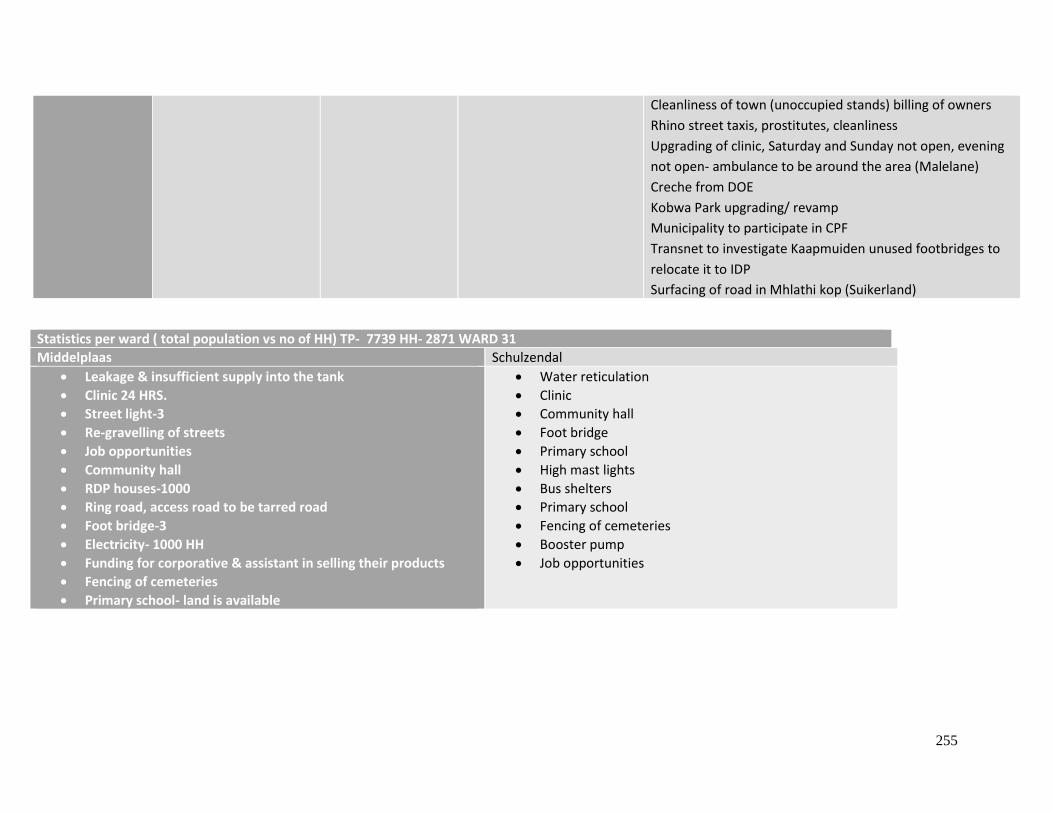
255
Cleanliness of town (unoccupied stands) billing of owners
Rhino street taxis, prostitutes, cleanliness
Upgrading of clinic, Saturday and Sunday not open, evening
not open- ambulance to be around the area (Malelane)
Creche from DOE
Kobwa Park upgrading/ revamp
Municipality to participate in CPF
Transnet to investigate Kaapmuiden unused footbridges to
relocate it to IDP
Surfacing of road in Mhlathi kop (Suikerland)
Statistics per ward ( total population vs no of HH) TP- 7739 HH- 2871 WARD 31
Middelplaas Schulzendal
• Leakage & insufficient supply into the tank
• Clinic 24 HRS.
• Street light-3
• Re-gravelling of streets
• Job opportunities
• Community hall
• RDP houses-1000
• Ring road, access road to be tarred road
• Foot bridge-3
• Electricity- 1000 HH
• Funding for corporative & assistant in selling their products
• Fencing of cemeteries
• Primary school- land is available
• Water reticulation
• Clinic
• Community hall
• Foot bridge
• Primary school
• High mast lights
• Bus shelters
• Primary school
• Fencing of cemeteries
• Booster pump
• Job opportunities
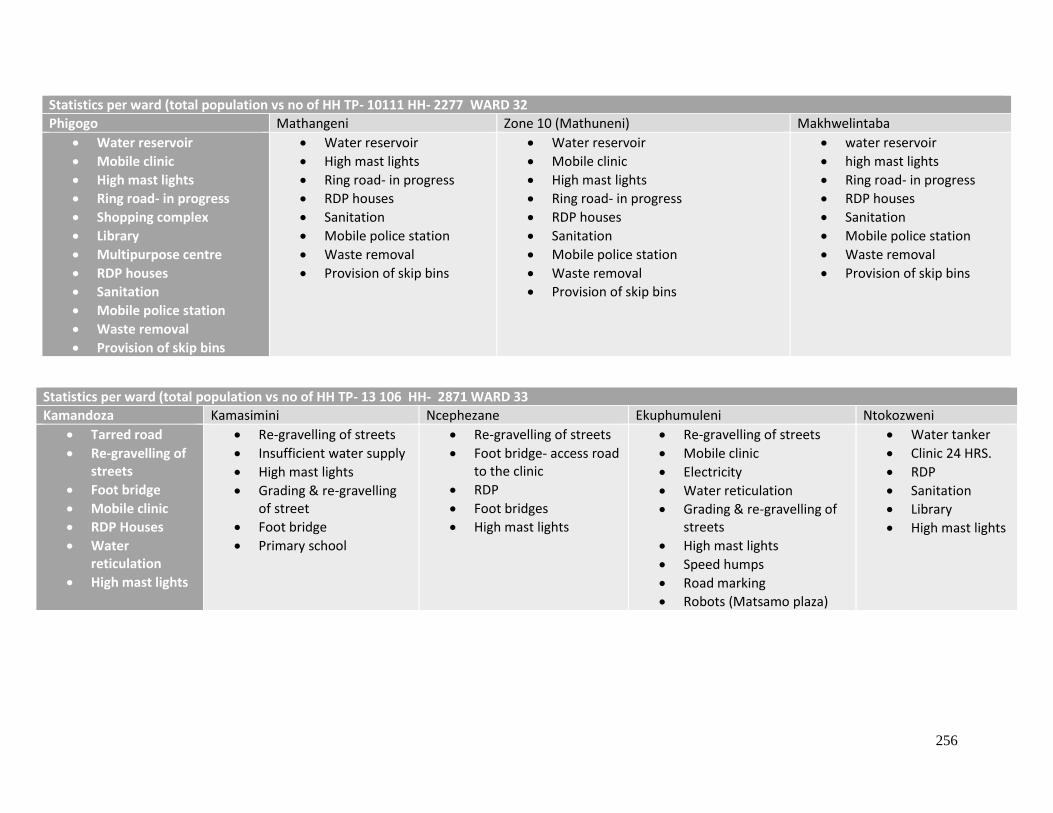
256
Statistics per ward (total population vs no of HH TP- 10111 HH- 2277 WARD 32
Phigogo Mathangeni Zone 10 (Mathuneni) Makhwelintaba
• Water reservoir
• Mobile clinic
• High mast lights
• Ring road- in progress
• Shopping complex
• Library
• Multipurpose centre
• RDP houses
• Sanitation
• Mobile police station
• Waste removal
• Provision of skip bins
• Water reservoir
• High mast lights
• Ring road- in progress
• RDP houses
• Sanitation
• Mobile police station
• Waste removal
• Provision of skip bins
• Water reservoir
• Mobile clinic
• High mast lights
• Ring road- in progress
• RDP houses
• Sanitation
• Mobile police station
• Waste removal
• Provision of skip bins
• water reservoir
• high mast lights
• Ring road- in progress
• RDP houses
• Sanitation
• Mobile police station
• Waste removal
• Provision of skip bins
Statistics per ward (total population vs no of HH TP- 13 106 HH- 2871 WARD 33
Kamandoza Kamasimini Ncephezane Ekuphumuleni Ntokozweni
• Tarred road
• Re-gravelling of streets
• Foot bridge
• Mobile clinic
• RDP Houses
• Water reticulation
• High mast lights
• Re-gravelling of streets
• Insufficient water supply
• High mast lights
• Grading & re-gravelling of street
• Foot bridge
• Primary school
• Re-gravelling of streets
• Foot bridge- access road to the clinic
• RDP
• Foot bridges
• High mast lights
• Re-gravelling of streets
• Mobile clinic
• Electricity
• Water reticulation
• Grading & re-gravelling of streets
• High mast lights
• Speed humps
• Road marking
• Robots (Matsamo plaza)
• Water tanker
• Clinic 24 HRS.
• RDP
• Sanitation
• Library
• High mast lights
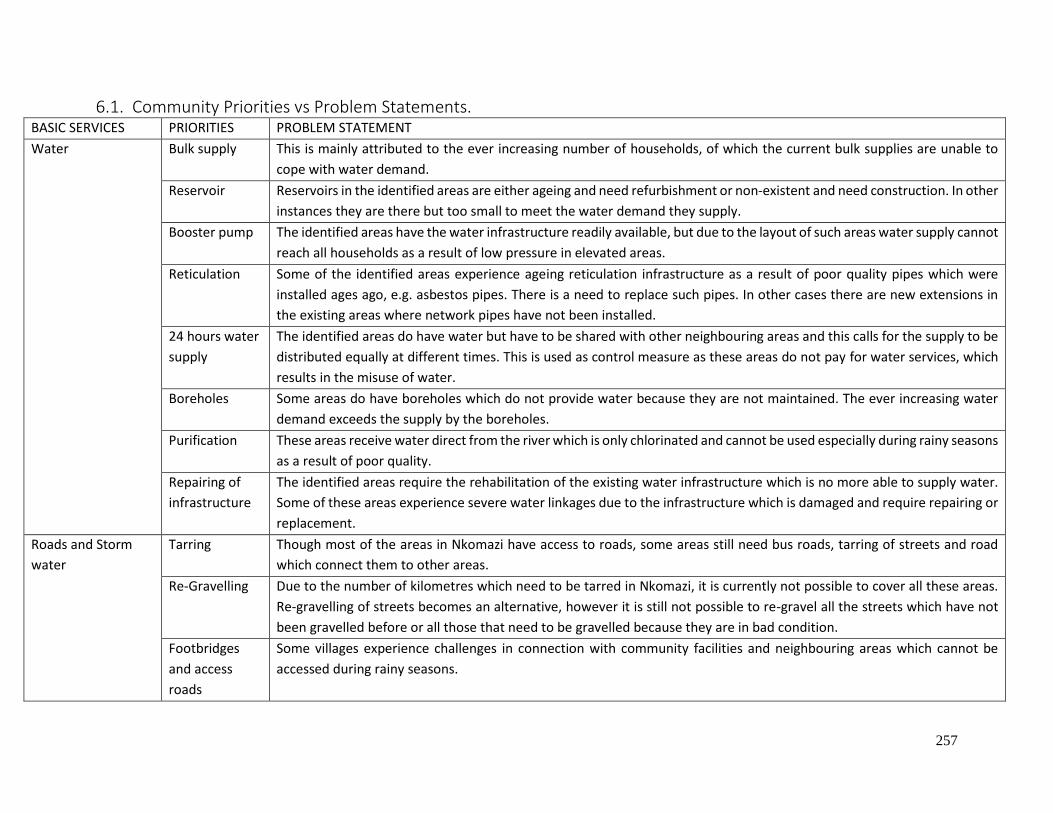
257
6.1. Community Priorities vs Problem Statements. BASIC SERVICES PRIORITIES PROBLEM STATEMENT
Water Bulk supply This is mainly attributed to the ever increasing number of households, of which the current bulk supplies are unable to
cope with water demand.
Reservoir Reservoirs in the identified areas are either ageing and need refurbishment or non-existent and need construction. In other
instances they are there but too small to meet the water demand they supply.
Booster pump The identified areas have the water infrastructure readily available, but due to the layout of such areas water supply cannot
reach all households as a result of low pressure in elevated areas.
Reticulation Some of the identified areas experience ageing reticulation infrastructure as a result of poor quality pipes which were
installed ages ago, e.g. asbestos pipes. There is a need to replace such pipes. In other cases there are new extensions in
the existing areas where network pipes have not been installed.
24 hours water
supply
The identified areas do have water but have to be shared with other neighbouring areas and this calls for the supply to be
distributed equally at different times. This is used as control measure as these areas do not pay for water services, which
results in the misuse of water.
Boreholes Some areas do have boreholes which do not provide water because they are not maintained. The ever increasing water
demand exceeds the supply by the boreholes.
Purification These areas receive water direct from the river which is only chlorinated and cannot be used especially during rainy seasons
as a result of poor quality.
Repairing of
infrastructure
The identified areas require the rehabilitation of the existing water infrastructure which is no more able to supply water.
Some of these areas experience severe water linkages due to the infrastructure which is damaged and require repairing or
replacement.
Roads and Storm
water
Tarring Though most of the areas in Nkomazi have access to roads, some areas still need bus roads, tarring of streets and road
which connect them to other areas.
Re-Gravelling Due to the number of kilometres which need to be tarred in Nkomazi, it is currently not possible to cover all these areas.
Re-gravelling of streets becomes an alternative, however it is still not possible to re-gravel all the streets which have not
been gravelled before or all those that need to be gravelled because they are in bad condition.
Footbridges
and access
roads
Some villages experience challenges in connection with community facilities and neighbouring areas which cannot be
accessed during rainy seasons.
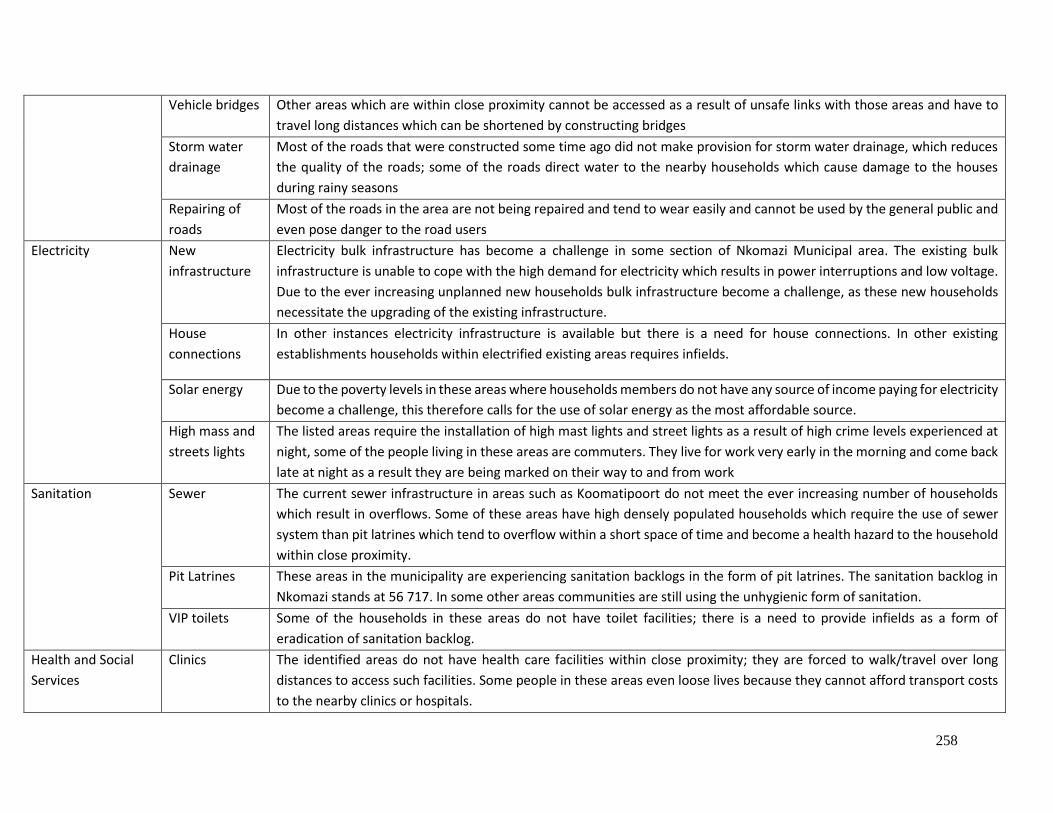
258
Vehicle bridges Other areas which are within close proximity cannot be accessed as a result of unsafe links with those areas and have to
travel long distances which can be shortened by constructing bridges
Storm water
drainage
Most of the roads that were constructed some time ago did not make provision for storm water drainage, which reduces
the quality of the roads; some of the roads direct water to the nearby households which cause damage to the houses
during rainy seasons
Repairing of
roads
Most of the roads in the area are not being repaired and tend to wear easily and cannot be used by the general public and
even pose danger to the road users
Electricity New
infrastructure
Electricity bulk infrastructure has become a challenge in some section of Nkomazi Municipal area. The existing bulk
infrastructure is unable to cope with the high demand for electricity which results in power interruptions and low voltage.
Due to the ever increasing unplanned new households bulk infrastructure become a challenge, as these new households
necessitate the upgrading of the existing infrastructure.
House
connections
In other instances electricity infrastructure is available but there is a need for house connections. In other existing
establishments households within electrified existing areas requires infields.
Solar energy Due to the poverty levels in these areas where households members do not have any source of income paying for electricity
become a challenge, this therefore calls for the use of solar energy as the most affordable source.
High mass and
streets lights
The listed areas require the installation of high mast lights and street lights as a result of high crime levels experienced at
night, some of the people living in these areas are commuters. They live for work very early in the morning and come back
late at night as a result they are being marked on their way to and from work
Sanitation Sewer The current sewer infrastructure in areas such as Koomatipoort do not meet the ever increasing number of households
which result in overflows. Some of these areas have high densely populated households which require the use of sewer
system than pit latrines which tend to overflow within a short space of time and become a health hazard to the household
within close proximity.
Pit Latrines These areas in the municipality are experiencing sanitation backlogs in the form of pit latrines. The sanitation backlog in
Nkomazi stands at 56 717. In some other areas communities are still using the unhygienic form of sanitation.
VIP toilets Some of the households in these areas do not have toilet facilities; there is a need to provide infields as a form of
eradication of sanitation backlog.
Health and Social
Services
Clinics The identified areas do not have health care facilities within close proximity; they are forced to walk/travel over long
distances to access such facilities. Some people in these areas even loose lives because they cannot afford transport costs
to the nearby clinics or hospitals.
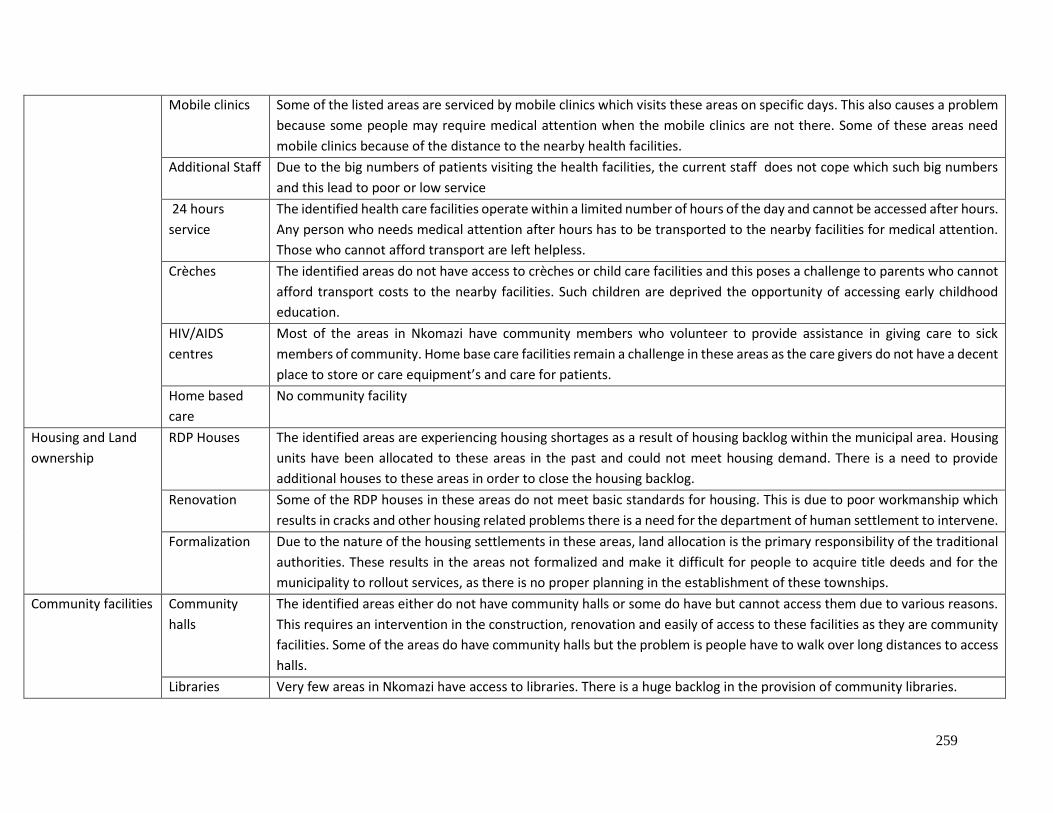
259
Mobile clinics Some of the listed areas are serviced by mobile clinics which visits these areas on specific days. This also causes a problem
because some people may require medical attention when the mobile clinics are not there. Some of these areas need
mobile clinics because of the distance to the nearby health facilities.
Additional Staff Due to the big numbers of patients visiting the health facilities, the current staff does not cope which such big numbers
and this lead to poor or low service
24 hours
service
The identified health care facilities operate within a limited number of hours of the day and cannot be accessed after hours.
Any person who needs medical attention after hours has to be transported to the nearby facilities for medical attention.
Those who cannot afford transport are left helpless.
Crèches The identified areas do not have access to crèches or child care facilities and this poses a challenge to parents who cannot
afford transport costs to the nearby facilities. Such children are deprived the opportunity of accessing early childhood
education.
HIV/AIDS
centres
Most of the areas in Nkomazi have community members who volunteer to provide assistance in giving care to sick
members of community. Home base care facilities remain a challenge in these areas as the care givers do not have a decent
place to store or care equipment’s and care for patients.
Home based
care
No community facility
Housing and Land
ownership
RDP Houses The identified areas are experiencing housing shortages as a result of housing backlog within the municipal area. Housing
units have been allocated to these areas in the past and could not meet housing demand. There is a need to provide
additional houses to these areas in order to close the housing backlog.
Renovation Some of the RDP houses in these areas do not meet basic standards for housing. This is due to poor workmanship which
results in cracks and other housing related problems there is a need for the department of human settlement to intervene.
Formalization Due to the nature of the housing settlements in these areas, land allocation is the primary responsibility of the traditional
authorities. These results in the areas not formalized and make it difficult for people to acquire title deeds and for the
municipality to rollout services, as there is no proper planning in the establishment of these townships.
Community facilities Community
halls
The identified areas either do not have community halls or some do have but cannot access them due to various reasons.
This requires an intervention in the construction, renovation and easily of access to these facilities as they are community
facilities. Some of the areas do have community halls but the problem is people have to walk over long distances to access
halls.
Libraries Very few areas in Nkomazi have access to libraries. There is a huge backlog in the provision of community libraries.
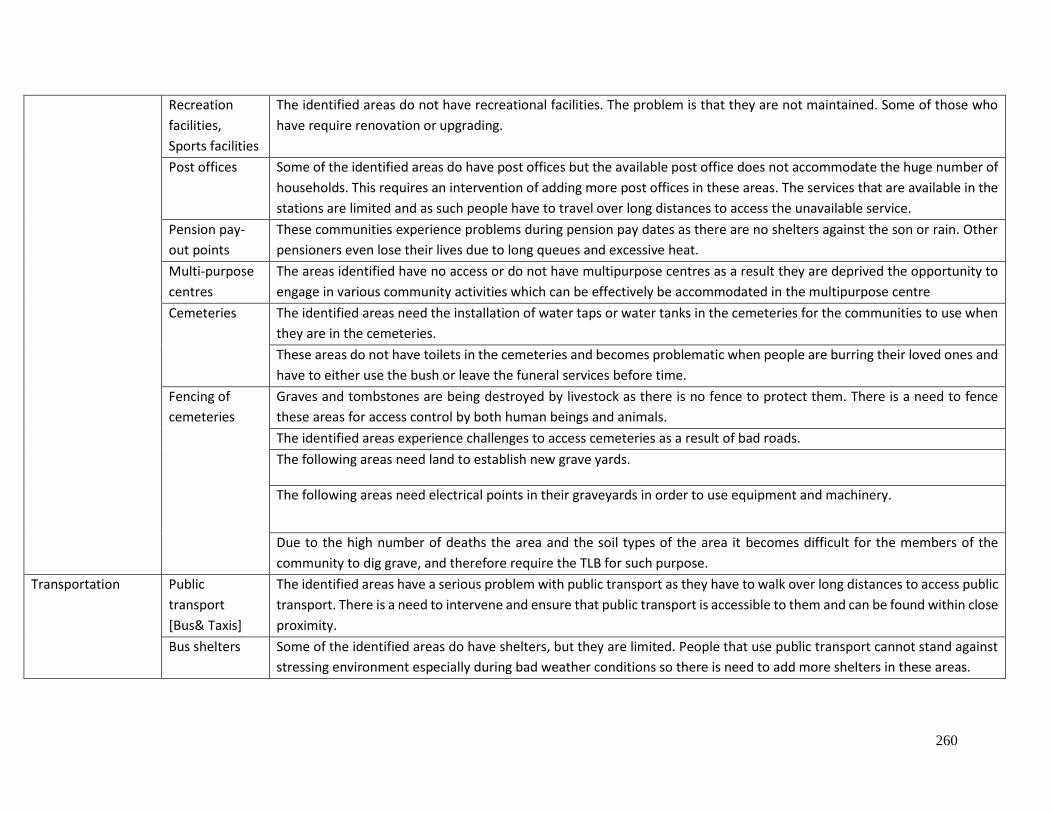
260
Recreation
facilities,
Sports facilities
The identified areas do not have recreational facilities. The problem is that they are not maintained. Some of those who
have require renovation or upgrading.
Post offices Some of the identified areas do have post offices but the available post office does not accommodate the huge number of
households. This requires an intervention of adding more post offices in these areas. The services that are available in the
stations are limited and as such people have to travel over long distances to access the unavailable service.
Pension pay-
out points
These communities experience problems during pension pay dates as there are no shelters against the son or rain. Other
pensioners even lose their lives due to long queues and excessive heat.
Multi-purpose
centres
The areas identified have no access or do not have multipurpose centres as a result they are deprived the opportunity to
engage in various community activities which can be effectively be accommodated in the multipurpose centre
Cemeteries The identified areas need the installation of water taps or water tanks in the cemeteries for the communities to use when
they are in the cemeteries.
These areas do not have toilets in the cemeteries and becomes problematic when people are burring their loved ones and
have to either use the bush or leave the funeral services before time.
Fencing of
cemeteries
Graves and tombstones are being destroyed by livestock as there is no fence to protect them. There is a need to fence
these areas for access control by both human beings and animals.
The identified areas experience challenges to access cemeteries as a result of bad roads.
The following areas need land to establish new grave yards.
The following areas need electrical points in their graveyards in order to use equipment and machinery.
Due to the high number of deaths the area and the soil types of the area it becomes difficult for the members of the
community to dig grave, and therefore require the TLB for such purpose.
Transportation Public
transport
[Bus& Taxis]
The identified areas have a serious problem with public transport as they have to walk over long distances to access public
transport. There is a need to intervene and ensure that public transport is accessible to them and can be found within close
proximity.
Bus shelters Some of the identified areas do have shelters, but they are limited. People that use public transport cannot stand against
stressing environment especially during bad weather conditions so there is need to add more shelters in these areas.
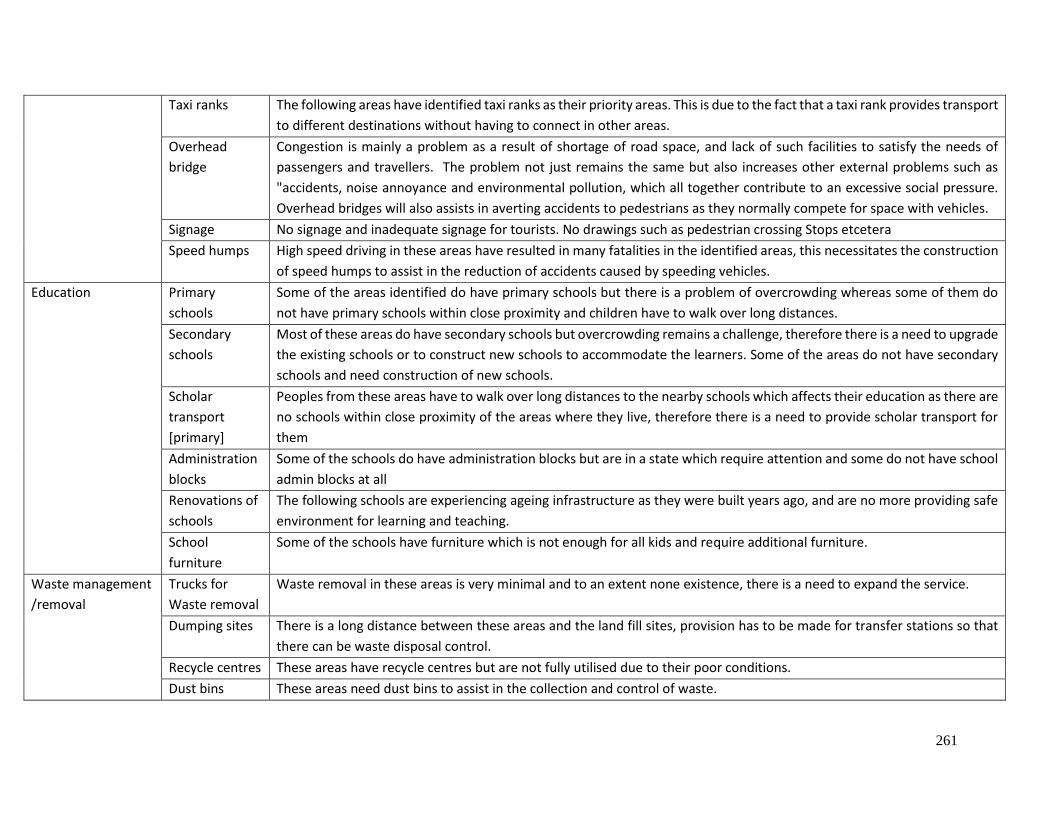
261
Taxi ranks The following areas have identified taxi ranks as their priority areas. This is due to the fact that a taxi rank provides transport
to different destinations without having to connect in other areas.
Overhead
bridge
Congestion is mainly a problem as a result of shortage of road space, and lack of such facilities to satisfy the needs of
passengers and travellers. The problem not just remains the same but also increases other external problems such as
"accidents, noise annoyance and environmental pollution, which all together contribute to an excessive social pressure.
Overhead bridges will also assists in averting accidents to pedestrians as they normally compete for space with vehicles.
Signage No signage and inadequate signage for tourists. No drawings such as pedestrian crossing Stops etcetera
Speed humps High speed driving in these areas have resulted in many fatalities in the identified areas, this necessitates the construction
of speed humps to assist in the reduction of accidents caused by speeding vehicles.
Education Primary
schools
Some of the areas identified do have primary schools but there is a problem of overcrowding whereas some of them do
not have primary schools within close proximity and children have to walk over long distances.
Secondary
schools
Most of these areas do have secondary schools but overcrowding remains a challenge, therefore there is a need to upgrade
the existing schools or to construct new schools to accommodate the learners. Some of the areas do not have secondary
schools and need construction of new schools.
Scholar
transport
[primary]
Peoples from these areas have to walk over long distances to the nearby schools which affects their education as there are
no schools within close proximity of the areas where they live, therefore there is a need to provide scholar transport for
them
Administration
blocks
Some of the schools do have administration blocks but are in a state which require attention and some do not have school
admin blocks at all
Renovations of
schools
The following schools are experiencing ageing infrastructure as they were built years ago, and are no more providing safe
environment for learning and teaching.
School
furniture
Some of the schools have furniture which is not enough for all kids and require additional furniture.
Waste management
/removal
Trucks for
Waste removal
Waste removal in these areas is very minimal and to an extent none existence, there is a need to expand the service.
Dumping sites There is a long distance between these areas and the land fill sites, provision has to be made for transfer stations so that
there can be waste disposal control.
Recycle centres These areas have recycle centres but are not fully utilised due to their poor conditions.
Dust bins These areas need dust bins to assist in the collection and control of waste.
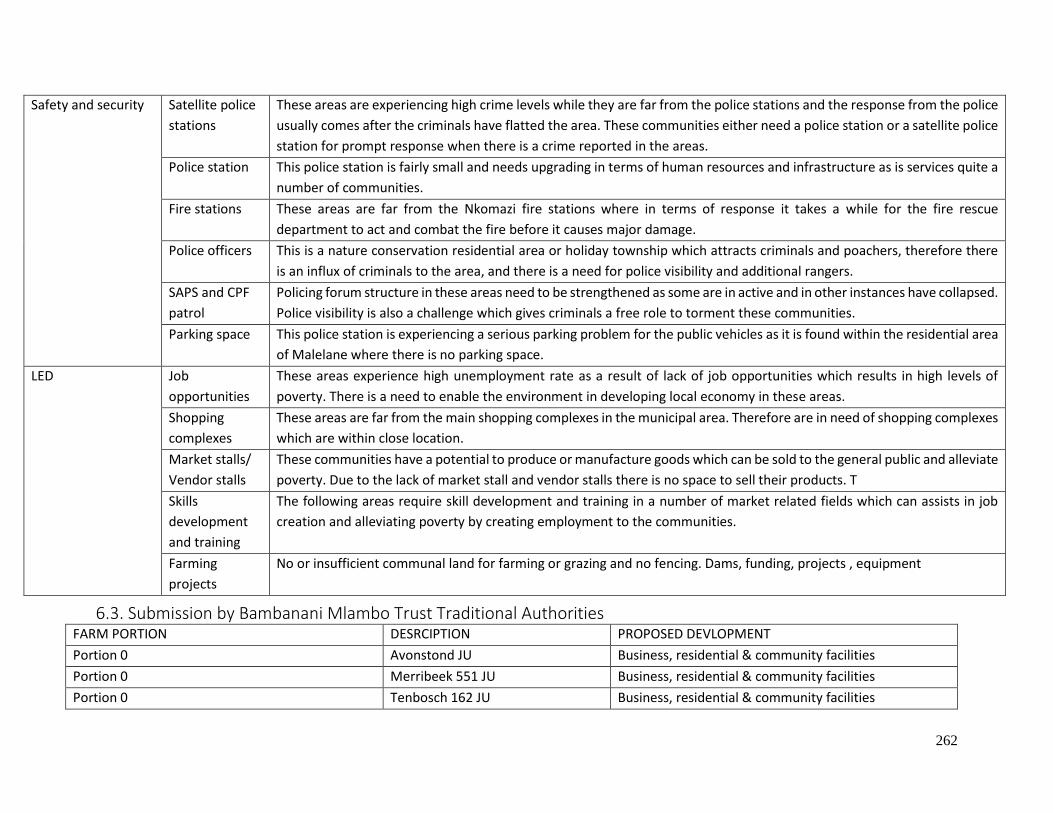
262
Safety and security Satellite police
stations
These areas are experiencing high crime levels while they are far from the police stations and the response from the police
usually comes after the criminals have flatted the area. These communities either need a police station or a satellite police
station for prompt response when there is a crime reported in the areas.
Police station This police station is fairly small and needs upgrading in terms of human resources and infrastructure as is services quite a
number of communities.
Fire stations These areas are far from the Nkomazi fire stations where in terms of response it takes a while for the fire rescue
department to act and combat the fire before it causes major damage.
Police officers This is a nature conservation residential area or holiday township which attracts criminals and poachers, therefore there
is an influx of criminals to the area, and there is a need for police visibility and additional rangers.
SAPS and CPF
patrol
Policing forum structure in these areas need to be strengthened as some are in active and in other instances have collapsed.
Police visibility is also a challenge which gives criminals a free role to torment these communities.
Parking space This police station is experiencing a serious parking problem for the public vehicles as it is found within the residential area
of Malelane where there is no parking space.
LED Job
opportunities
These areas experience high unemployment rate as a result of lack of job opportunities which results in high levels of
poverty. There is a need to enable the environment in developing local economy in these areas.
Shopping
complexes
These areas are far from the main shopping complexes in the municipal area. Therefore are in need of shopping complexes
which are within close location.
Market stalls/
Vendor stalls
These communities have a potential to produce or manufacture goods which can be sold to the general public and alleviate
poverty. Due to the lack of market stall and vendor stalls there is no space to sell their products. T
Skills
development
and training
The following areas require skill development and training in a number of market related fields which can assists in job
creation and alleviating poverty by creating employment to the communities.
Farming
projects
No or insufficient communal land for farming or grazing and no fencing. Dams, funding, projects , equipment
6.3. Submission by Bambanani Mlambo Trust Traditional Authorities FARM PORTION DESRCIPTION PROPOSED DEVLOPMENT
Portion 0 Avonstond JU Business, residential & community facilities
Portion 0 Merribeek 551 JU Business, residential & community facilities
Portion 0 Tenbosch 162 JU Business, residential & community facilities
263
NKOMAZI LOCAL MUNICIPALITY’S IDP IS DEVELOPED TO ENHANCE
THE QUALITY OF LIFE OF ALL THE COMMUNITIES IN THE NKOMAZI
LOCAL MUNICIPALITY AREA THROUGH RENDERING BASIC SERVICES.
Physical Address
21 Impala Street, Malelane 1320
Postal Address
Private Bag X101, Malelane 1320
Contact Number (Office of Municipal Manager)
013 790 0245
Contact Number (Planning and Development)
013 790 1303
Website
www.nkomazi.gov.za
Email Address: Office of Municipal Manager
Mm municipal -manager-office @njomazi.gov.za