2020 Moqhaka Local Municipality FINAL IDP REVIEW 2020
330
1 Moqhaka Local Municipality FINAL IDP REVIEW 2019 – 2020 Moqhaka Local Municipality FINAL IDP REVIEW 2020 – 2021
-
Upload
khangminh22 -
Category
Documents
-
view
3 -
download
0
Transcript of 2020 Moqhaka Local Municipality FINAL IDP REVIEW 2020

1
Moqhaka Local Municipality FINAL IDP REVIEW
2019 – 2020
Moqhaka Local Municipality FINAL IDP REVIEW
2020 – 2021
2
TABLE OF CONTENTS
TABLE OF CONTENTS ................................................................................................................. 2
FOREWORD BY THE EXECUTIVE MAYOR .................................................................................. 8
EXECUTIVE SUMMARY BY THE MUNICIPAL MANAGER ......................................................... 11
Chapter 1: Introduction ..................................................................................................... 13 1.1 Background ................................................................................................................ 13 1.2 Legal Framework ........................................................................................................ 13 1.3 Integrated Development Planning Process ................................................................... 14
Figure 1: IDP Process ............................................................................................................... 15
Table 1: Municipal IDP Process Rollout .................................................................................. 16 1.4 Roles and Responsibilities in the IDP process................................................................ 17
1.4.1 Within the Municipality .......................................................................................... 17 1.4.2 Distribution of Roles and Responsibilities between Municipality and External Role Players 18
Chapter 2: Situational Analysis ......................................................................................... 20 2.1 Introduction ............................................................................................................... 20 2.2 Moqhaka: Geographic location .................................................................................... 20
2.2.1 Urban Development: Hierarchy of Towns................................................................. 22 2.2.2 Urbanisation .......................................................................................................... 23 2.2.3 Growth Points ........................................................................................................ 23 2.2.4 Employment Opportunities ..................................................................................... 23 2.2.5 Agricultural Opportunities....................................................................................... 24 2.2.6 Influencing Factors ................................................................................................. 25
2.3 Information from Census 2011 and Community Survey 2016 ........................................ 26
Table 4: Population and Household Statistics........................................................................ 26
Figure 3: Population and households ..................................................................................... 26
Figure 4: Average household size ........................................................................................... 27
Figure 6: Access to water ........................................................................................................ 29
Figure 7: Access to Water Community Survey 2016 ............................................................. 30
Table 5: Sanitation StatsSA description.................................................................................. 30
Figure 8: Access to sanitation ................................................................................................. 31
Figure 9: Access to Sanitation: Community Survey 2016 ...................................................... 31
Figure 10: Households using electricity .................................................................................. 32
Figure 51: Electricity Access: Community Survey 2016.......................................................... 33
Figure 73: Households by type of main dwelling ................................................................... 34
.................................................................................................................................................. 35
Figure 84: Tenure Status ......................................................................................................... 35
3
Figure 95: Poverty Index ......................................................................................................... 36 2.4 Service Delivery and Infrastructure Development ......................................................... 39
2.4.1 Water .................................................................................................................... 39 2.4.2 Sanitation .............................................................................................................. 43 2.4.3 Electricity ............................................................................................................... 46 2.4.4 Roads and Storm Water .......................................................................................... 48
2.5 Refuse/Waste Services................................................................................................ 51 2.5.1 Waste Management ............................................................................................... 51 2.5.2 Waste Removal ...................................................................................................... 51 2.5.3 Waste Disposal ....................................................................................................... 52
2.6 Social Services ............................................................................................................ 52 2.6.1 Health Services ....................................................................................................... 53 2.6.2 Education............................................................................................................... 53 2.6.3 Safety and Security (Traffic, Fire Services, Disaster Management etc.) ....................... 54
2.7 Public Participation and Good Governance................................................................... 57 2.7.1 Governance Structures ........................................................................................... 58
Table 6: Council ....................................................................................................................... 58
Table 7: Members of the Mayoral Committee....................................................................... 59 2.7.2 Summary of Governance Structures......................................................................... 60 2.7.3 Management and Operational systems .................................................................... 61 2.7.4 HIV/AIDS, YOUTH DEVELOPMENT AND PEOPLE LIVING WITH DISABILITIES................. 61
2.8 Institutional Development and Transformation ............................................................ 62 2.8.1 Executive Management Structure ............................................................................ 62 2.8.2 Departmental Functions.......................................................................................... 62 2.8.3 Municipal Workforce .............................................................................................. 64
2.9 Financial Viability and Management ............................................................................ 65 2.10 Local Economic Development...................................................................................... 66 2.11 Community Development and Social Cohesion ............................................................. 74
2.11.1 Cemeteries............................................................................................................. 74 2.11.2 Sport and Recreation .............................................................................................. 76
2.12 Global Warming (Climate Change) ............................................................................... 79 2.12.1 Agriculture ............................................................................................................. 79 2.12.2 Biodiversity ............................................................................................................ 79
3.1 Introduction ............................................................................................................... 81
Table 4: Ward Description ...................................................................................................... 81 3.2 Population Statistics per ward ..................................................................................... 83
3.2.1 Population and Gender Distribution per ward .......................................................... 83
Figure 106: Total Population by population group ................................................................ 83
Table 5: Distribution of population by population group and gender per ward .................. 84
Figure 117: Gender profile per ward ...................................................................................... 86 3.2.2 Distribution of population aged 5 years and older by level of education per ward ...... 87
Table 6: Distribution of population by level of education per ward ..................................... 87 3.2.3 Distribution of population by age groups and gender per ward ................................. 89
Table 7: Distribution of population by age group and gender per ward .............................. 89 3.2.4 Households by type of tenure.................................................................................. 91
Figure 128: Tenure status........................................................................................................ 91

4
Table 8: Households by type of tenure per ward................................................................... 92 3.2.5 Distribution of households by type of dwelling per ward........................................... 94
Figure 139: Dwelling type for the municipal area .................................................................. 94
Table 9: Households by type of dwelling per ward................................................................ 95 3.3 Service Statistics per Ward .......................................................................................... 97
3.3.1 Households with access to piped (tap) water per ward ............................................. 97
Table 10: Households with access to piped water per ward ................................................. 97 3.3.2 Households by source of water per ward ................................................................. 98
Table 11: Households by source of water per ward .............................................................. 98 3.3.3 Distribution of households by type of energy or fuel for lighting per ward ................101
Table 12: Households by type of energy or fuel for lighting ............................................... 101 3.3.5 Distribution of households by type of energy or fuel for cooking per ward ................103
Table 13: Households by type of energy or fuel for cooking per ward ............................... 103 3.3.5 Distribution of households by type of energy or fuel for heating per ward ................105
Table 14: Households by type of energy or fuel for heating per ward ............................... 105 3.3.6 Households by type of toilet facility ........................................................................107
Table 15: Households by type of toilet facility..................................................................... 107 3.4 Community and Stakeholder Engagements .................................................................108
3.4.1 Ward Development Needs: Ward 1 ........................................................................109 3.4.2 Ward Development Needs: Ward 2 ........................................................................110 3.4.3 Ward Development Needs: Ward 3 ........................................................................111 3.4.4 Ward Development Needs: Ward 4 ........................................................................113 3.4.5 Ward Development Needs: Ward 5 ........................................................................116 3.4.6 Ward Development Needs: Ward 6 ........................................................................118 3.4.7 Ward Development Needs: Ward 7 ........................................................................121 3.4.8 Ward Development Needs: Ward 8 ........................................................................123 3.4.9 Ward Development Needs: Ward 9 ........................................................................125 3.4.10 Ward Development Needs: Ward 10 ....................................................................128 3.4.11 Ward Development Needs: Ward 11 ........................................................................130 IDP Review 2020/21 ..........................................................................................................132 3.4.12 Ward Development Needs: Ward 12 ........................................................................132 3.4.13. Ward Development Needs: Ward 13........................................................................134 3.4.14 Ward Development Needs: Ward 14 ........................................................................136 3.4.15 Ward Development Needs: Ward 15 ........................................................................140 3.4.16 Ward Development Needs: Ward 16 ........................................................................142 3.4.17 Ward Development Needs: Ward 17 ........................................................................144 3.4.18 Ward Development Needs: Ward 18 ........................................................................148 3.4.19 Ward Development Needs: Ward 19 ........................................................................149 3.4.20. Ward Development Needs: Ward 20........................................................................151 IDP Review 2020/21 ..........................................................................................................152 3.4.21 Ward Development Needs: Ward 21 ........................................................................153 IDP Review 2020/21 ..........................................................................................................154 3.4.22 Ward Development Needs: Ward 22 ........................................................................154 3.4.23 Ward Development Plan: Needs 23 ..........................................................................156
3.5 Ward Needs Prioritised ..............................................................................................159 3.6 Sector involvement....................................................................................................162 3.7 Legislation required Sector Plans in the IDP.................................................................165

5
3.8 Summary Overview: Sectoral Plans .............................................................................165 3.9 Back to Basics Approach (B2B)....................................................................................169
Chapter 4: Development Objectives and Strategies ............................................................ 171 4.1 Introduction.....................................................................................................................171 4.2 Strategic Objectives..........................................................................................................173 4.3 Alignment of selected National, Provincial, District and Local objectives..............................174
4.3.1 The value of Planning Alignment ................................................................................174 4.4 Strategic Alignment of key performance area’s and priority areas ................................178
4.4.1 Key Performance Area 1: Basic Service Delivery.......................................................178 4.4.2 Key Performance Area 2: Good Governance and Public Participation .......................187 4.4.3 Key Performance Area 3: Local Economic Development ...........................................193 4.4.5 Key Performance Area 5: Municipal Transformation and Institutional Development..213 4.4.6 Key Performance Area 6: Social and Community Development.................................221
Chapter 5: Long Term Financial Plan .............................................................................. 229 5.1 Introduction ..............................................................................................................229 5.2 Financial Framework......................................................... Error! Bookmark not defined.
5.2.1 Revenue adequacy and Certainty................................... Error! Bookmark not defined. 5.2.2 Cash / liquidity position................................................. Error! Bookmark not defined. 5.2.3 Sustainability................................................................ Error! Bookmark not defined. 5.2.4 Effective and efficient use of resources .......................... Error! Bookmark not defined. 5.2.5 Accountability, transparency and good governance ........ Error! Bookmark not defined. 5.2.6 Equity and redistribution............................................... Error! Bookmark not defined. 5.2.7 Development and investment ....................................... Error! Bookmark not defined. 5.2.8 Borrowing .................................................................... Error! Bookmark not defined.
5.3 Financial Strategies ........................................................... Error! Bookmark not defined. 5.3.1 Revenue raising strategies............................................. Error! Bookmark not defined. 5.3.2 Asset management strategies........................................ Error! Bookmark not defined. 5.3.3 Financial management strategies and programmes ........ Error! Bookmark not defined.
5.4 Financial Policies .............................................................. Error! Bookmark not defined. 5.4.1 General philosophy....................................................... Error! Bookmark not defined. 5.4.2 Budget related policies ................................................. Error! Bookmark not defined. 5.4.3 Revenue policies........................................................... Error! Bookmark not defined. 5.4.4 Credit control policies and procedures ........................... Error! Bookmark not defined. 5.4.5 Supply chain management ............................................ Error! Bookmark not defined. 5.4.6 Asset management policies ........................................... Error! Bookmark not defined. 5.4.7 Investment policies....................................................... Error! Bookmark not defined. 5.4.8 Debt management policies............................................ Error! Bookmark not defined. 5.4.9 Accounting policies ....................................................... Error! Bookmark not defined.
5.5 Budget Assumptions ......................................................... Error! Bookmark not defined. 5.6 Operating Revenue Framework ......................................... Error! Bookmark not defined.
The municipality’s revenue strategy is built around the following key components:
...................................................................................................... Error! Bookmark not defined.
Table 17: Summary of revenue classified by municipal votes... Error! Bookmark not defined.
Table 18: Operating Transfers and Grant Receipts .................... Error! Bookmark not defined.
Table 19: Capital Grants .............................................................. Error! Bookmark not defined. 5.6.1 Operating Revenue by Source ....................................... Error! Bookmark not defined.
Table 16: Summary of Revenue classified by main revenue source ........Error! Bookmark not defined.

6
5.7 Operating Expenditure ...................................................... Error! Bookmark not defined.
Table 20: Summary of operating expenditure by municipal votes ..........Error! Bookmark not defined.
5.7.1 Analysis of operating expenditure ................................. Error! Bookmark not defined. 5.8 Capital expenditure .......................................................... Error! Bookmark not defined.
Table 22: Medium-term capital budget per vote....................... Error! Bookmark not defined. 5.9 Cash Flow Statement ........................................................ Error! Bookmark not defined.
Chapter 6: Performance Management ........................................................................... 251 6.1 Introduction ..............................................................................................................251 6.2 IDP and PMS..............................................................................................................251 6.3 Overview of Performance Management in the Municipality .........................................252
6.3.1 Policy Framework ..................................................................................................252
Figure 14: Functions of a Performance Management System............................................. 253 6.3.2 The Municipal Scorecard ........................................................................................254
Figure 15: Municipal Scorecard............................................................................................. 255 6.3.3 Planning, Monitoring, Reporting and Review of Performance ...................................256
Figure 16: Performance Management cycle......................................................................... 256 6.3.4 Performance Planning............................................................................................256 6.3.5 Performance monitoring ........................................................................................257 6.3.6 Performance Measurement ...................................................................................257 6.3.7 Performance Analysis ............................................................................................257 6.3.8 Performance Reporting and Review ........................................................................258
Table 23: PMS Reporting....................................................................................................... 258 6.4 Conclusion ................................................................................................................260
Chapter 7: Projects and Programmes ............................................................................. 261 7.1 Introduction ..............................................................................................................261 7.2 Corporate Services.....................................................................................................284
Table 25: Capital Expenditure: ICT........................................................................................ 284 7.3 Community and Social Services ..................................................................................284
7.3.1 Solid Waste Management ......................................................................................284 7.3.2 Traffic .......................................................................................................................285
Table 26: Capital Expenditure: Traffic .................................................................................. 285 7.3.3 Public Safety..........................................................................................................286
Table 27: Capital Expenditure: Public Safety ....................................................................... 286 7.3.4 Refurbishment of the Civic Theatre.........................................................................286
Table 28: Capital Expenditure: Fire....................................................................................... 287
Table 29: Capital Expenditure: Disaster Management ........................................................ 288 7.3.5 Local Economic Development and Planning.............................................................289
7.4 Technical Services......................................................................................................292 7.4.1 Sanitation .............................................................................................................292 7.4.2 Water ...................................................................................................................295 7.4.3 Roads and Storm water..........................................................................................297
7.5 Unfunded Projects .....................................................................................................299 7.5.1 Short term: Water and Sanitation issues that must be addressed. ............................299

7
7.5.2 Short term: Gravel Roads to be upgraded to paved Roads........................................300 7.5.3 Short term: Existing paved roads to be urgently reconstructed (Identified by RRAMS process) ............................................................................................................................303 7.5.4 Planned Storm water projects ................................................................................305 7.5.5 Short term: Planned Paved roads to be resealed .....................................................305 7.5.6 Short term: Existing paved roads to be urgently reconstructed.................................307 7.5.7 Planned Storm water projects ................................................................................309 7.5.8 Short term: Planned Pave roads to be resealed .......................................................309
7.6 PROJECTS FROM SECTOR DEPARTMENTS ....................................................................314 7.6.1 Free State Department of Education...............................................................................314
7.6.2 Department of Water and Sanitation…………………………………………………………………………………….310
7.6.3 Department of Police, Roads and Transport………………………………………………………………………….311
7.6.4 Department of Ecinomics, Small Business, Tourism and Enviromental Affairs……………………….313
7.6.5 Department of Enviromental Affairs……………………………………………………………………………………..315
7.6.6 Department of Social Development……………………………………………………………………………………...317
7.6.7 Department of Health……………………………………………………………………………………………………………318
7.6.8 Department of Public Works………………………………………………………………………………………………….321
7.6.9 Departnment of Agriculture………………………………………………………………………………………………….324
7.6.10 Department of Rural Development and Land Reform…………………………………………………………328

8
FOREWORD BY THE EXECUTIVE MAYOR
Honourable Speaker, Cllr Mpho Chakane, Council Whip, Cllr Selloane Khiba, Members of the
Mayoral Committee, all Councillors present in this meeting, officials of the municipality and
most importantly the community of Moqhaka Local Municipality at large.
Firstly, let me take this opportunity to thank the residents of our municipality Moqhaka for
adhering to the lockdown regulations as communicated from time to time by the National
Coimmand Centre and the office of the Minister of Cooperative Governance and Tradition
Affairs Dr Nkosazana Dlamini-Zuma. We are in this situation together and we will fight side by
side and emerge victorious as a united international community against the corona virus pandemic.
Ladies and gentlemen it is a great pleasure for me to stand in this house and table the Draft
Municipal Integrated Development Plan for review for the 2020-2021 planning cycle and
financial year. We are meeting here when the President of our Country, President Cyril
Ramaphosa made an announcement on the state of the Nation Address in 2019 of the seven
bold priorities, which all the three spheres of government will focus on:
Economic transformation and job creation
Education, skills and health
Consolidating the social wage through reliable and quality basic services
Spatial Integration, human settlement and local government
Social cohesion and safe communities
A capable ethical and development state, and
A better Africa and World
We managed to respond to some of these priorities as we approved the Spatial Development
Framework and the Housing Sector Plan in preparation for the accreditation of the
municipality at level one to mention but a few. We will be channelling all our energies towards
the realisation of these priorities during this period under review.
In his state of the Nation Address 2020 President Cyril Ramaphosa mentioned that,
Government is scaling up its efforts to tackle the high levels of unemployment, particularly among the youth.
He explains the two-pronged approach that government will be taking as a solution to the
challenge being, by creating opportunities for youth employment and self-employment.
We welcome this two-pronged approach and we hope our newly appointed young people in
our LED Directorate hit the ground running on this apex priority.
The issuing of sites in all three towns should not be looked in isolation to the clarion call made by our Premier that we need to reverse the spatial disparities created by the 1913 Land Act.
We will work very closely with our Provincial Departments to ensure that basic infrastructure
is installed in all available erven as per the township establishment register.
9
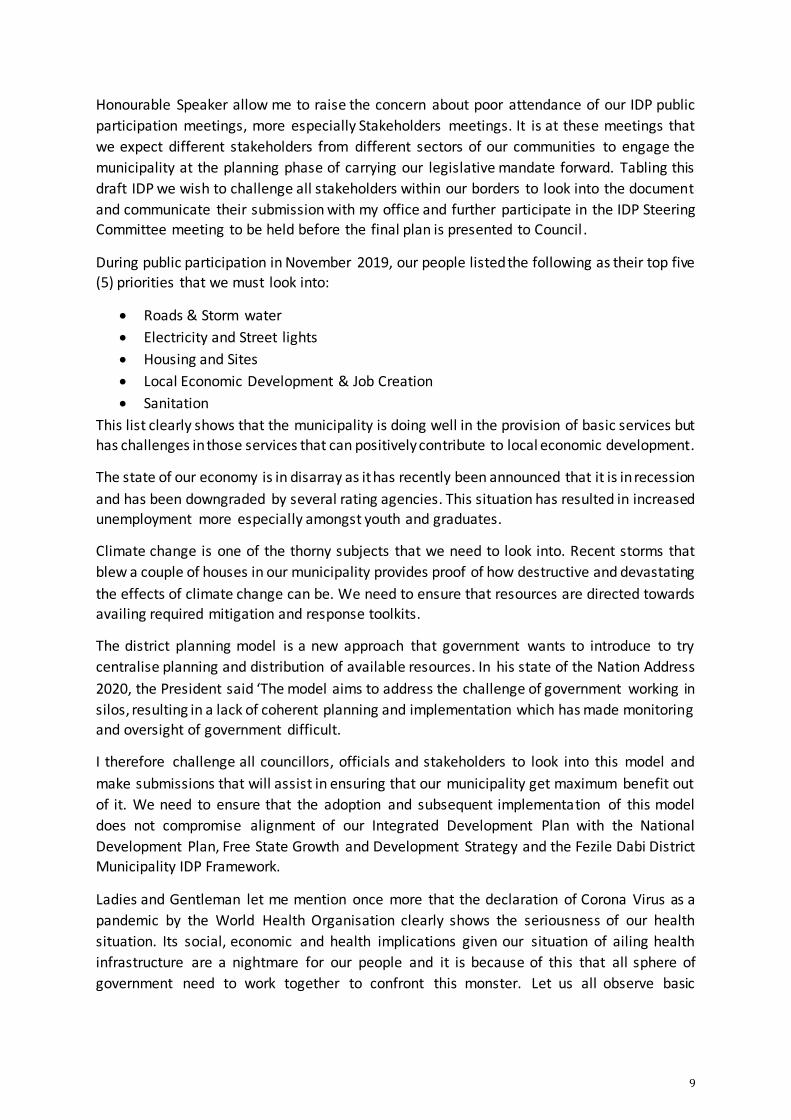
Honourable Speaker allow me to raise the concern about poor attendance of our IDP public
participation meetings, more especially Stakeholders meetings. It is at these meetings that
we expect different stakeholders from different sectors of our communities to engage the
municipality at the planning phase of carrying our legislative mandate forward. Tabling this
draft IDP we wish to challenge all stakeholders within our borders to look into the document
and communicate their submission with my office and further participate in the IDP Steering Committee meeting to be held before the final plan is presented to Council .
During public participation in November 2019, our people listed the following as their top five
(5) priorities that we must look into:
Roads & Storm water
Electricity and Street lights
Housing and Sites
Local Economic Development & Job Creation
Sanitation
This list clearly shows that the municipality is doing well in the provision of basic services but has challenges in those services that can positively contribute to local economic development.
The state of our economy is in disarray as it has recently been announced that it is in recession
and has been downgraded by several rating agencies. This situation has resulted in increased unemployment more especially amongst youth and graduates.
Climate change is one of the thorny subjects that we need to look into. Recent storms that
blew a couple of houses in our municipality provides proof of how destructive and devastating
the effects of climate change can be. We need to ensure that resources are directed towards
availing required mitigation and response toolkits.
The district planning model is a new approach that government wants to introduce to try
centralise planning and distribution of available resources. In his state of the Nation Address
2020, the President said ‘The model aims to address the challenge of government working in
silos, resulting in a lack of coherent planning and implementation which has made monitoring
and oversight of government difficult.
I therefore challenge all councillors, officials and stakeholders to look into this model and
make submissions that will assist in ensuring that our municipality get maximum benefit out
of it. We need to ensure that the adoption and subsequent implementation of this model
does not compromise alignment of our Integrated Development Plan with the National
Development Plan, Free State Growth and Development Strategy and the Fezile Dabi District
Municipality IDP Framework.
Ladies and Gentleman let me mention once more that the declaration of Corona Virus as a
pandemic by the World Health Organisation clearly shows the seriousness of our health
situation. Its social, economic and health implications given our situation of ailing health
infrastructure are a nightmare for our people and it is because of this that all sphere of
government need to work together to confront this monster. Let us all observe basic

10
prevention measures and report any suspected cases while observing and respecting
individual basic rights as enshrined in the Constitution.
Lastly, it should be placed on record that the latest audit opinion by the Auditor General is
totally unacceptable and the office of the Executive Mayor will be working very closely with
all Directorates to ensure that there is improvement and the confidence of our people to the
municipality is restored given the undertaking by administration that it will improve after
allowing the appointment of staff in critical positions.
Ladies and Gentleman I once more wish to thank those individuals and organisations, in
particular the Afri Forum for your conributions and inputs into the draft IDP document. These
has been noted and are already receiving attention from different directorates.
We hope the IDP document as considered by this Council will provide strategic direction to
our municipality to ensure that our people are provided with services consistently and
equitably.
I thank you
P.J. Phooko
Executive Mayor

11
EXECUTIVE SUMMARY BY THE MUNICIPAL MANAGER
Executive Summary by the Municipal Manager
Honourable Executive Mayor allow me to observe protocol as it applies and take this opportunity to
provide and executive summary as we consider the draft Intergraded Development Plan for review
for the 2020-2021 planning cycle.
It should be explained that this exercise takes place in compliance with and to conclude provision of
section 30(a)(b) of the local Government: Municipal Systems Act, Act No 32of 2000 which states that,
the Executive Mayor of a municipality in accordance with section 29, manage the drafting of the
municipality ‘s integrated development plan, and assign responsibilities in this regard to the municipal
manager.
Highlights of this drafting process started with the approval of the process plan, followed by public
participation where at the community of Moqhaka local municipality was given an opportunity as
required by the same Act to participate in the affairs of the municipality and the drafting of the
Integrated Development Plan in particular
Executive Mayor it is clear from our public participation that roads and storm water are a top priority
for our people. The state of our roads in our towns is deteriorating not to mention our streets in our
townships. We have included in this draft an extract from the RRAMS report and a list of our roads
and streets including cost estimates that need to be attended.
We also need to mention that shortage of machinery, equipment and personnel contributes to worsening this but we are working on requisite processes to arrest parts of this situation.
The following are MIG funded projects that we will be executing but it is clear that the need far exceeds our capacity.
Maokeng –Construction of 0,8Km paved road from 16084-15680
Maokeng –Construction of 0,7Km paved road from 13040-13956
Maokeng- Construction of 0,55Km paved road from 10673-10857
Rammulotsi –Construction of 0,61Km paved road from 2325-2330
Rammulotsi –Construction of 0,83Km paved road from 4274-4218
Rammujlitsi –Construction of 0,55Km paved road from 7058-1867
It should also be mentioned that Ntanga Street paved road project has been completed, storm water
channelling in Koekoe village and the upgrading of paved road at 28331- 28348 were completed and are on retention in terms of our project management processes.
We need to acknowledge the fact that housing and provision of sites more especially in Maokeng and
Kroonstad is a critical and urgent need. Led by the office of Executive Mayor we have started with the
issuing of sites and updating our waiting list in Maokeng. A program was developed to issue people
with erf numbers and explain to them challenges that we are phased with in terms of provision of
basic services. The planned projects for the construction of water and sewer reticulation network in
Constantia are aimed at addressing this backlog, but we need to mention that we are engaging with
other departments to assist speed up the process.

12
We also need to mention the fact that most issues raised about electricity services are not about the
provision of that service, but about the debt collection method that goes with the purchasing of
electricity. This, coupled with our meter replacement programme will positively contribute to revenue enhancement for our municipality.
The recently advertised critical posts are being filled and this process is about to be finalised. This is
intended to ensure that administration is properly manned with qualified officials to advance and fulfil
the mandate of services delivery.
The 2019 Festive Season has been one of the best for Kroonpark resort as it recorded the highest rate
of visitors for both day and overnight visitors. This should be seen as a sign of confidence of our people
to this facility and we all know its state that we cannot be proud of. We hope the appointment of the
Director LED and Planning and the resort manage, will help address challenges in this section.
Land for commonages in Viljoenskroon and Steynsrus is another critical issue that needs our undivided
attention such that beneficiaries thereof can be able to participate in the Farmer Production Support
Unit project that has already started in Kroonstad. We will be working closely with Department of
Rural Development and Land Reform to find land and address this challenge. We need to report that
there is progress made towards the external assessment of our municipality for Level 1 accreditation
as a housing developer. This process will open many opportunities for our municipality and create economic spin offs for our communities.
Our audit opinion report for the previous financial year is also a matter if great concern for us and the
community at large. Regress in this opinion can be attributed to shortage of staff, but we need to
mention that the post of an accountant responsible for the compilation of annual financial statements
was filled at a late stage of the audit process and we hope this will assist us reclaim our position of
unqualified opinion and bring back confidence to our people.
Executive Mayor let me mention the fact that our Employee Wellness Section is working tirelessly
together with our Municipal Disaster Managemnt Centre which coordites the muinicipal response and
planning during this state of disaster. We are pleased to mention that the support we are receiving
from political offices is overwhelming more especially during funerals in our residential areas.
Together with our traffic services we are making an impact in ensuring adherence to the regulations governing the state of emergency we find ourselves in.
Lastly we wish to mention that as administration we are ready to hit the ground running and reclaim
our unqualified audit opinion as we implement the municipal Inegrated Development Plan as reviewed.
I thank you
Municipal Manager
13
Introduction
1.1 Background
The Municipal Systems Act (No.32) of 2000 requires that local government structures prepare
Integrated Development Plans (IDPs). The IDP serves as a tool for the facilitation and management
of development within the areas of jurisdiction. In conforming to the Act’s requirements, Moqhaka
Municipality’s Council has delegated the authority to the Municipal Manager to prepare the IDP.
Moqhaka Municipality’s (MLM) commitment to developing an investment destination has been the
focal point of the 2017/2022 IDP, with a specific emphasis to translate the Municipality’s strategy into
action.
The aim of the new 5-Year IDP2017/2022 for Moqhaka is to present a coherent plan to improve the
quality of life for people living in the area. The intention of this IDP is to link, integrate and co-
ordinate development plans for the municipality, which is aligned with national, provincial and
district development plans and planning requirements binding on the municipality in terms of
legislation.
This second review is intended to ensure compliance with legislation and monitor implementation
and consistency with the aim, vision and mission of the municipality.
Moqhaka Local Municipality is a category B municipality – comprising Kroonstad, Maokeng,
Viljoenskroon, Rammulotsi, Steynsrus, and Matlwangtlwang in the Fezile Dabi District.
1.2 Legal Framework
The IDP is compiled in terms of Chapter 5 of the Local Government: Municipal Systems Act (MSA)
(Act 32 of 2000).
Section 26 of the MSA states that the following core components should be included in the plan:
the municipal council’s vision for the long term development of the municipality with special
emphasis on the municipality’s most critical development and internal transformation needs;
an assessment of the existing level of development in the municipality, which must include an
identification of communities which do not have access to basic municipal services;
the council’s development priorities and objectives for its elected term, including its local
economic development aims and its internal transformation needs;
the council’s development strategies which must be aligned with any national or provincial
sectoral plans and planning requirements binding on the municipality in terms of legislation;
14
a spatial development framework which must include the provision of basic guidelines for a land
use management system for the municipality;
the council’s operational strategies;
applicable disaster management plans;
a financial plan, which must include a budget projection for at least the next three years; and
key performance indicators and performance targets.
Moqhaka Municipal Council adopted the 2017-2022 IDP as its “single, inclusive and strategic
plan” that will guide and inform the development of the municipality, and this second review is
intended to monitor and amend the plan to achieve this objective.
1.3 Integrated Development Planning Process
Two processes are identified during compilation:
Drafting of the master plan – this refers to the compilation of a long-term strategic plan for the
municipal area (2017 – 2022) as prescribed in Section 25 of the MSA. This master plan is not
annually amended, since it is a long-term plan and not an operational plan it is reviewed annually.
Annual Planning – this refers to the review of the IDP as referred to in Section 34 of the MSA.
The process is schematically shown in the figure below:

15
Figure 1: IDP Process
Moqhaka Municipal Council, at its meeting held on the 22 August 2019 approved the IDP Process
Plan and Budget Schedule, detailing the process for the IDP and Budget development for 2020/21.
The municipality utilizes its ward committees as the primary consultative structure with regard to
planning. The inputs of the ward committees in all wards, councillors and officials were taken into
account during this process.
To guide this process, the Executive Mayor, as part of his responsibilities in terms of the Local
Government: Municipal Structures Act, 1998 (Act 117 of 1998) (Structures Act) should have
conducted strategic workshops outlining the process and development of the new 5-year vision,
mission and strategic objectives.
Drafting an IDP requires a comprehensive planning process and the involvement of a wide range of
internal and external role players. Such a process has to be properly organized and prepared. This
preparation is the duty of the Municipal Manager and senior management. The preparation process
will be referred to as the “Process Plan” and should contribute to the institutional readiness of the
municipality to draft and review the IDP.
The elected Council is the ultimate IDP decision-making authority. The role of participatory
democracy is to inform, negotiate and comment on those decisions, in the course of the planning
process.

16
In terms of the Council approved IDP and Budget process plan, Council should approve the final IDP
before the start of the new financial year, that is, no later than 31 May 2020
In order for Moqhaka to prepare a credible IDP, several stakeholders have to be engaged to provide
inputs and guide the final IDP. Stakeholder interventions (timeframes, resources, etc.) are outlined
in the Table below:
Table 1: Municipal IDP Process Rollout
Planning Phase Participation Mechanisms Analysis Phase: Determine local issues, problems, relevant stakeholders, potentials and priorities.
Stakeholder ‘s/ Community Meetings Stakeholder ‘s/ Community Interviews Sectoral Engagements
District IDP Managers Forum Provincial IDP Manager’s Forum
Strategy Phase: Determine vision and objectives, determine strategies, and participate in IGR Structures.
Strategic Meetings with Senior Management Team/ Strategic Workshop with Municipal Council/ District and Provincial Government Engagements/ Municipal Budget Steering Committee
Project Phase: Design projects per strategy Inter-departmental/ sectoral planning Municipal Budget Steering Committee
Integration Phase: Agree on project proposals, and compilation of integrated programmes.
Inter-departmental/ sectoral planning/ IGR Forum
District IDP Forum Approval Phase: Adoption by Council (Provide opportunity for Stakeholder’s comments)
Council and Stakeholder’s Meetings and Interviews/ Approval of Main Budget
Consolidation of SDBIP Monitoring & Evaluation: Ensure economic, efficiency and effective use of resources.
Meeting with Senior Management Team/ Representatives of Stakeholders/ Ward Committees/ Executive Mayoral Committee / Portfolio Committees/ Internal Audit
Audit Committee Council Public
The IDP drives the strategic development of Moqhaka Municipality. The municipality’s budget is
influenced by the strategic objectives identified in the IDP. The Service Delivery Budget
Implementation Plan (SDBIP) ensures that the municipality implements programs and projects based
on the IDP targets and associated budgets. The performance of the municipality is reported in its
Annual Report.
In addition to the above, risk management, forms an integral part of the internal processes of a
municipality. It is a systematic process to identify, evaluate and address risks on a continuous basis
before such risks can impact negatively on the service delivery capacity of Moqhaka Municipality.
17
When properly executed risk management provides reasonable assurance that, the institution will be
successful in achieving its goals and objectives.
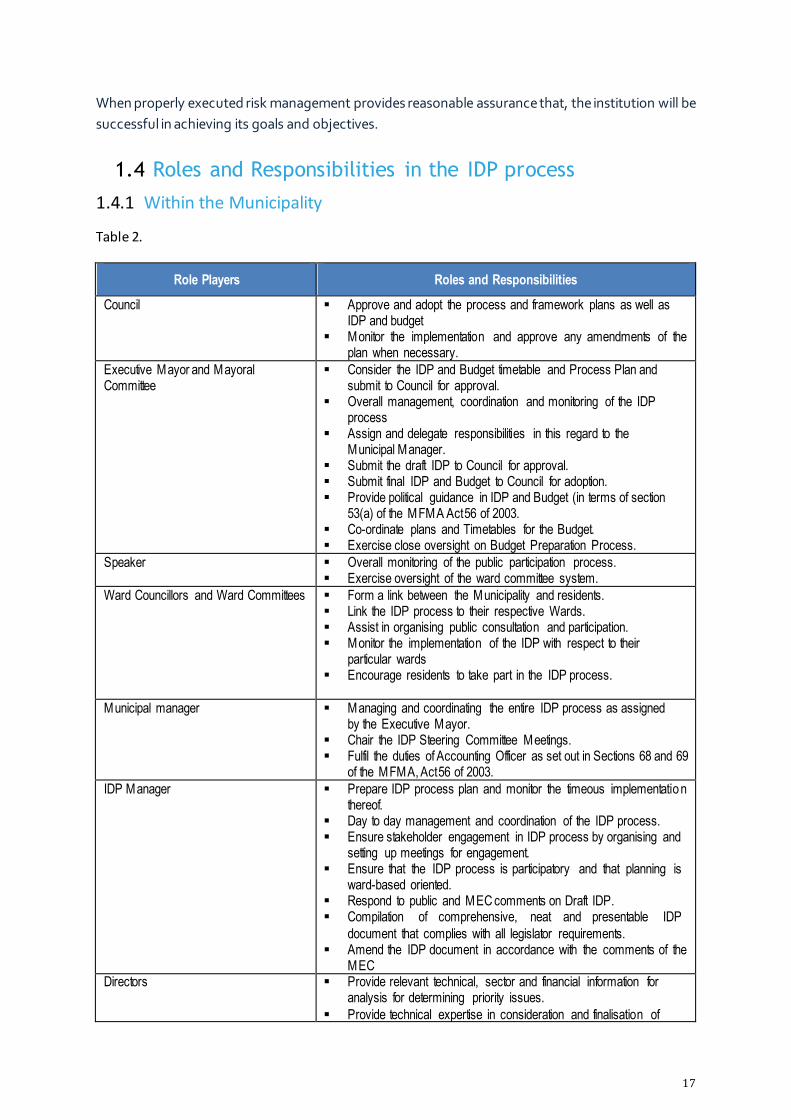
1.4 Roles and Responsibilities in the IDP process
1.4.1 Within the Municipality
Table 2.
Role Players Roles and Responsibilities
Council Approve and adopt the process and framework plans as well as IDP and budget
Monitor the implementation and approve any amendments of the plan when necessary.
Executive Mayor and Mayoral Committee
Consider the IDP and Budget timetable and Process Plan and submit to Council for approval.
Overall management, coordination and monitoring of the IDP process
Assign and delegate responsibilities in this regard to the Municipal Manager.
Submit the draft IDP to Council for approval. Submit final IDP and Budget to Council for adoption. Provide political guidance in IDP and Budget (in terms of section
53(a) of the MFMA Act 56 of 2003. Co-ordinate plans and Timetables for the Budget. Exercise close oversight on Budget Preparation Process.
Speaker Overall monitoring of the public participation process. Exercise oversight of the ward committee system.
Ward Councillors and Ward Committees
Form a link between the Municipality and residents. Link the IDP process to their respective Wards. Assist in organising public consultation and participation. Monitor the implementation of the IDP with respect to their
particular wards Encourage residents to take part in the IDP process.
Municipal manager Managing and coordinating the entire IDP process as assigned by the Executive Mayor.
Chair the IDP Steering Committee Meetings. Fulfil the duties of Accounting Officer as set out in Sections 68 and 69
of the MFMA, Act 56 of 2003.
IDP Manager Prepare IDP process plan and monitor the timeous implementation thereof.
Day to day management and coordination of the IDP process. Ensure stakeholder engagement in IDP process by organising and
setting up meetings for engagement. Ensure that the IDP process is participatory and that planning is
ward-based oriented. Respond to public and MEC comments on Draft IDP. Compilation of comprehensive, neat and presentable IDP
document that complies with all legislator requirements. Amend the IDP document in accordance with the comments of the
MEC Directors Provide relevant technical, sector and financial information for
analysis for determining priority issues.
Provide technical expertise in consideration and finalisation of
18
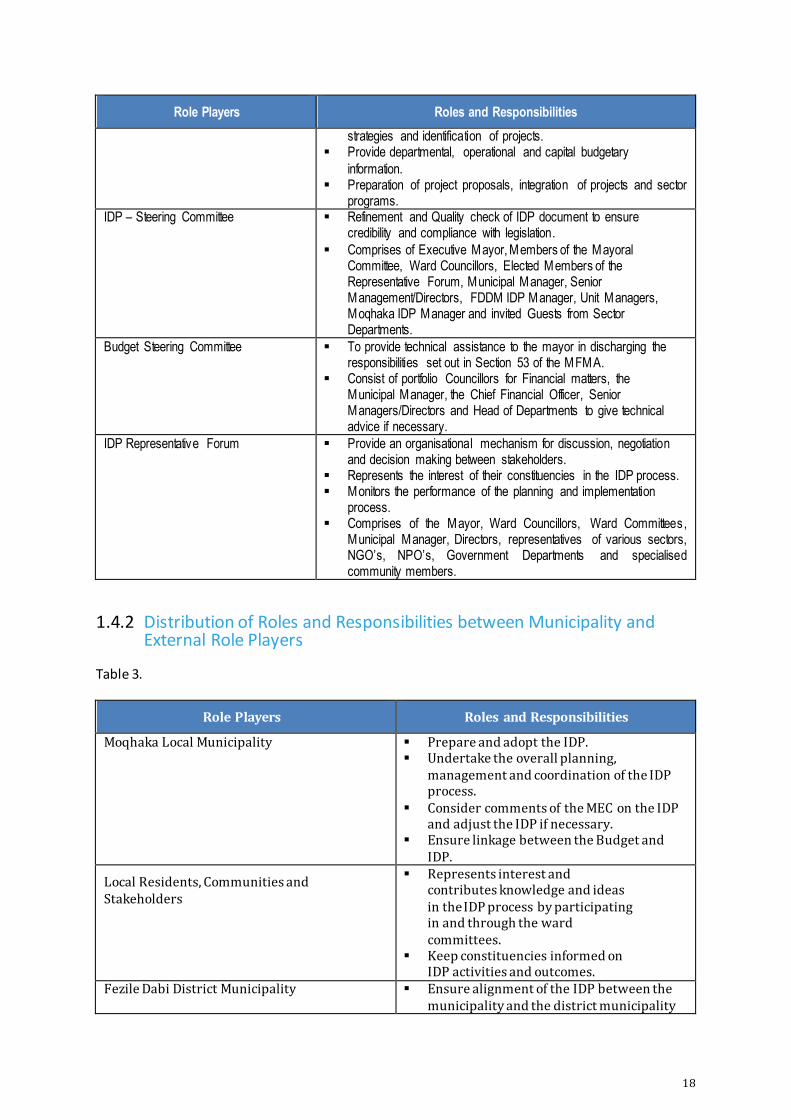
Role Players Roles and Responsibilities
strategies and identification of projects. Provide departmental, operational and capital budgetary
information. Preparation of project proposals, integration of projects and sector
programs. IDP – Steering Committee
Refinement and Quality check of IDP document to ensure credibility and compliance with legislation.
Comprises of Executive Mayor, Members of the Mayoral Committee, Ward Councillors, Elected Members of the Representative Forum, Municipal Manager, Senior Management/Directors, FDDM IDP Manager, Unit Managers, Moqhaka IDP Manager and invited Guests from Sector Departments.
Budget Steering Committee To provide technical assistance to the mayor in discharging the responsibilities set out in Section 53 of the MFMA.
Consist of portfolio Councillors for Financial matters, the Municipal Manager, the Chief Financial Officer, Senior Managers/Directors and Head of Departments to give technical advice if necessary.
IDP Representative Forum Provide an organisational mechanism for discussion, negotiation and decision making between stakeholders.
Represents the interest of their constituencies in the IDP process. Monitors the performance of the planning and implementation
process. Comprises of the Mayor, Ward Councillors, Ward Committees,
Municipal Manager, Directors, representatives of various sectors, NGO’s, NPO’s, Government Departments and specialised community members.
1.4.2 Distribution of Roles and Responsibilities between Municipality and External Role Players
Table 3.
Role Players Roles and Responsibilities
Moqhaka Local Municipality Prepare and adopt the IDP. Undertake the overall planning,
management and coordination of the IDP process.
Consider comments of the MEC on the IDP and adjust the IDP if necessary.
Ensure linkage between the Budget and IDP.
Local Residents, Communities and Stakeholders
Represents interest and contributes knowledge and ideas in the IDP process by participating in and through the ward committees.
Keep constituencies informed on IDP activities and outcomes.
Fezile Dabi District Municipality Ensure alignment of the IDP between the municipality and the district municipality
19
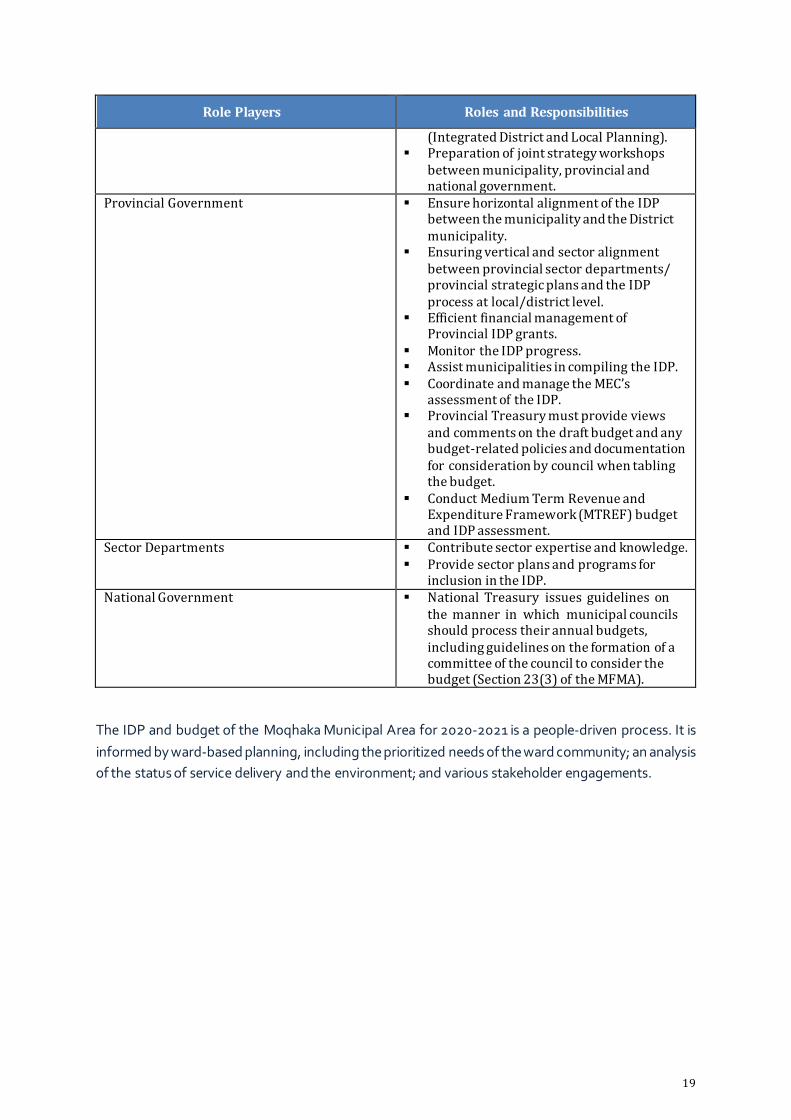
Role Players Roles and Responsibilities
(Integrated District and Local Planning). Preparation of joint strategy workshops
between municipality, provincial and national government.
Provincial Government Ensure horizontal alignment of the IDP between the municipality and the District municipality.
Ensuring vertical and sector alignment between provincial sector departments/ provincial strategic plans and the IDP process at local/district level.
Efficient financial management of Provincial IDP grants.
Monitor the IDP progress. Assist municipalities in compiling the IDP. Coordinate and manage the MEC’s
assessment of the IDP. Provincial Treasury must provide views
and comments on the draft budget and any budget-related policies and documentation for consideration by council when tabling the budget.
Conduct Medium Term Revenue and Expenditure Framework (MTREF) budget and IDP assessment.
Sector Departments Contribute sector expertise and knowledge. Provide sector plans and programs for
inclusion in the IDP. National Government National Treasury issues guidelines on
the manner in which municipal councils should process their annual budgets, including guidelines on the formation of a committee of the council to consider the budget (Section 23(3) of the MFMA).
The IDP and budget of the Moqhaka Municipal Area for 2020-2021 is a people-driven process. It is
informed by ward-based planning, including the prioritized needs of the ward community; an analysis
of the status of service delivery and the environment; and various stakeholder engagements.

20
Situational Analysis
2.1 Introduction
This chapter provides a situational analysis of the existing trends and conditions in the Moqhaka
Municipality, in accordance with the requirements of the Municipal Systems Act in developing an
IDP.
This chapter will also reflect on the key statistics released by Statistics South Africa for Census
2011 and the Community Survey of 2016 and provide an assessment of all critical services
identified for the municipality according to the Local Government Key Performance Areas (KPAs).
It will endeavour to respond to the following questions: Who are we? Where are we concerning the
provision of services that relates to identified critical services?
The status quo assessment will further highlight the challenges confronting the municipality and
indicate the state of affairs in the municipality in relation to the Local Government KPAs.
2.2 Moqhaka: Geographic location
The area of jurisdiction of the Moqhaka Local Municipality is situated in the southern part of the
Fezile Dabi District Municipality. The former Kroonstad, Steynsrus and Viljoenskroon Transitional
Local Councils and sections of the Riemland, Kroonkop and Koepel Transitional Rural Councils are
included in the Moqhaka Local Municipality.
The general tendency of migration from rural to urban areas is also occurring in the area, as is the
case in the rest of the Free State Province. The majority of the rural population is active within the
agricultural sector. Regarding the population distribution (see Table 4), the area is largely
urbanized (78% urban and 22% rural). In comparison to the other municipalities within the Fezile
Dabi District, it appears as if Moqhaka is significantly less urbanised. However, the large rural
population of the concerned region is attributed to the fact that the population of the Vierfontein
and Renovaal villages as well as the Vaal Reefs hostel complex and informal settlement (see Table
6) is included in the rural population of Moqhaka.
The Greater Kroonstad is the centre of a large agriculture community that plays an important role
in the economy of the district. Industrial activities subsequently contribute significantly to the
district’s economy. The Department of Correctional Services and the School of Engineer’s Military
bases are situated in the town. Kroonstad has of late become a distinguished holiday destination
due to the ultra-modern and popular holiday resort of Kroonpark, adjacent to the Vaals River. The
urban area is situated adjacent the N1 National Road and located adjacent one of the largest and
most important four-way railway junctions in South Africa.

21
Figure 2: Map of Moqhaka Local Municipality
The Viljoenskroon/Rammoltsi urban area is located within an area of extreme agricultural
significance. The urban area plays a significant role in providing residential opportunities to the
adjacent Goldfields and mining activities in the North West Province. The provincial roads P15/1
and P15/2 from Kroonstad to Klerksdorp in the North West Province extend through the area from
north to south.
The Steynsrus/Matlwangtlwang urban area is situated approximately 45km east of Kroonstad,
92km west of Bethlehem. The major link road between Bethlehem and Kroonstad stretches
adjacent to the urban area. The area is located in an area of agricultural significance and mainly
provides services in this regard to the surrounding rural areas. Kroonstad as a large service centre
renders more specialised services in close proximity. The accessibility of the town, due to the main
road and railway line, further influences growth in the area.
In addition to the existing formal urban areas, several residential areas and proclaimed town areas
are situated in Moqhaka with reference to Renovaal, Vierfontein and the Vaal Reefs hostel
complex and settlement. Renovaal was established during 1974 adjacent the Vaal River with the
intention to provide residence in the proximity of the gold mining activities in the North West
Province. The town was also later marketed as a leisure residential area with recreation potential
adjacent the Renoster and Vaal Rivers. Development of the town is, however, extremely latent
and only the proposed first phase of the town was established. According to Proclamation No. 167
of 1975, the concerned area represented by General Plan SG No. 459/1974, was proclaimed a
township under the name Renovaal.
22
Vierfontein (referred to as “Vierfontein South”) is also a proclaimed town. The area was initially
developed to provide residence for workers at the adjacent electricity and mine power station and
was owned by Eskom. After mining activities ceased and the power station discontinued, a
township establishment was done to formalize the existing town area during 1993. According to
Proclamation No. 35 of 1995 (Provincial Gazette of 24 February 1995), the concerned area
represented by General Plan SG No. 786/1993, was proclaimed a township under the name
Vierfontein. The individual properties were sold and the majority of the inhabitants of Vierfontein
are retired residents with a limited number of inhabitants that are employed in Viljoenskroon.
To the north of the town Vierfontein, a sectional title scheme was established that is referred to
as “Vierfontein North”. As in the case of Vierfontein, this sectional title scheme also developed to
provide residence for workers at the Vierfontein mine and power station, but most of the current
inhabitants are also retired. The Dutch Reformed Church who was the initial property owner of the
concerned farms developed the area. The concerned farms are currently the property of
Vierfontein Developers Group Scheme who is also the current homeowner’s association.
The Vaal Reefs hostel complex subsequently exists adjacent the Vaal River and in close proximity
of Viljoenskroon. The hostels were developed by AngloGold who is the property owner of the
concerned farms and provide residence to mine workers of the company. Although mining
activities ceased on the Free State side of the Vaal River, the complex still exists and provides
housing to remaining residents.
Apart from the dominant role agriculture plays in the region, no other significant economic activity
exists. The Moqhaka area, like the rest of the Fezile Dabi District, is not considered as a primary
tourist destination, although the area is increasingly becoming a favourite weekend destination.
The hunting and guesthouse industries displayed an exceedingly rapid growth the past few years.
Recreation areas and facilities are predominantly confined to the urban areas. The Kroonpark
recreation and holiday resort in Kroonstad attracts interest throughout the region.
The Vaal River borders Moqhaka to the west. The Vals and Renoster Rivers drain through the area
towards the Vaal River. These rivers play a significant role in providing the raw water supply to
Kroonstad, Steynsrus and Viljoenskroon respectively. The topography of the area is particularly
homogeneous with no prominent features and the area is characterised by extremely moderate
slopes. The western areas, near Viljoenskroon, are known for various shallow and non-perennial
pans.
2.2.1 Urban Development: Hierarchy of Towns
Kroonstad with its strong service character and prominent commercial and industrial
components will remain the main town and growth point of the region and will continue to
render various services to the surrounding smaller towns and rural areas.

23
Viljoenskroon is located in an area of agricultural significance and mainly provides services in
this regard to the surrounding rural areas. Viljoenskroon functions as a satellite town for
residential purposes due to its strategic location in the proximity of the Vaal Reefs mines as
well as the Orkney/Stilfontein mining areas in the North West Province. These towns have the
opportunity for future growth based on industrial development, mining and tourism.
Steynsrus is located in an area of agricultural significance and mainly provides restricted
services in this regard to the surrounding rural communities. Substantial future growth of this
town is not foreseen.
2.2.2 Urbanisation
Future growth is attributed to the strong commercial and industrial component of the region.
Growth is envisaged due to the weekend related tourism potential of the area. Future urbanisation
will principally be attributed to farm workers that settle in the urban areas.
Due to the dominant regional role, Kroonstad plays as a regional service provider and industrial
and commercial development, the focus of urbanisation will probably be in this area.
Smaller towns such as Viljoenskroon and Steynsrus primarily accommodate farm workers
migrating to these towns.
Future directions for residential extension, predominantly in the high-density low cost residential
areas, were identified for all urban areas and indicated on the Spatial Framework. These proposed
directions for extension of the involved urban areas were discussed in detail and generally relates
to the principles of land use development as pertained in the Development Facilitation Act and the
National Environmental Management Act.
2.2.3 Growth Points
Kroonstad will remain a growth point in the region as indicated above.
Viljoenskroon and Steynsrus will continue to serve as small towns with limited economic growth
potential focussing on tourism and providing a service to the agricultural community.
2.2.4 Employment Opportunities
Employment opportunities will mainly be created in Kroonstad as a continuous growth point,
whilst opportunities in the other towns will remain limited and agricultural orientated.
24
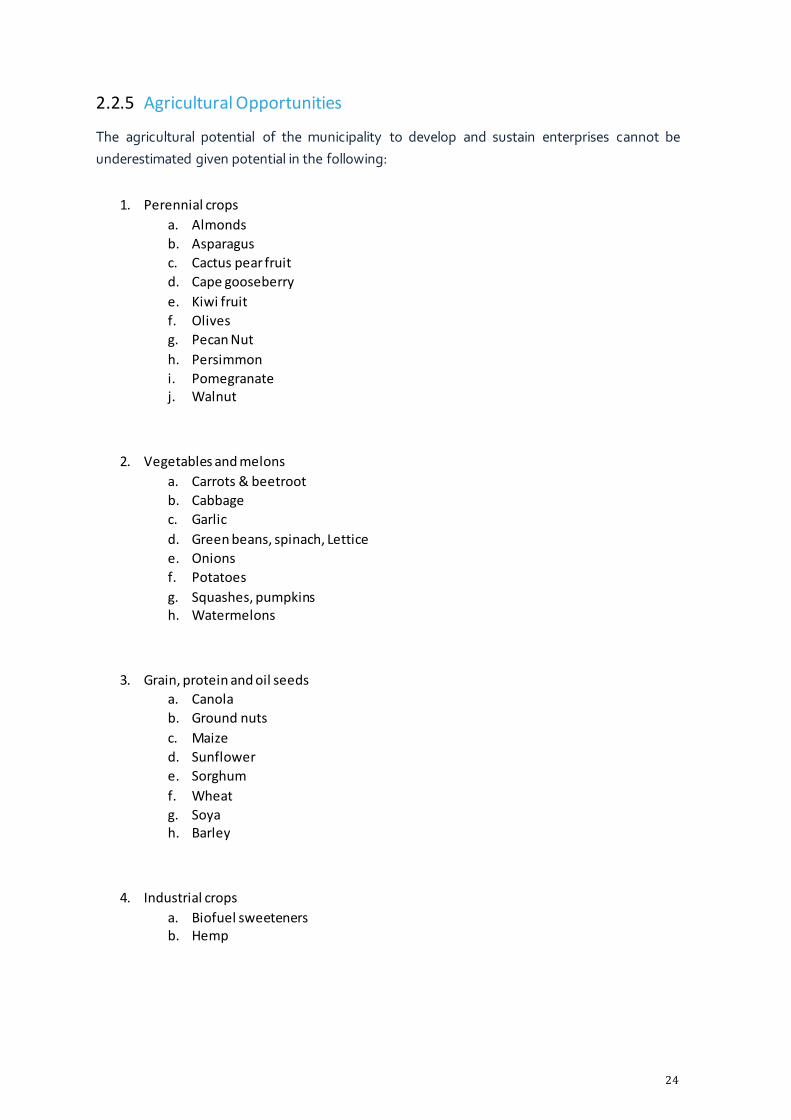
2.2.5 Agricultural Opportunities
The agricultural potential of the municipality to develop and sustain enterprises cannot be
underestimated given potential in the following:
1. Perennial crops
a. Almonds
b. Asparagus
c. Cactus pear fruit
d. Cape gooseberry
e. Kiwi fruit
f. Olives
g. Pecan Nut
h. Persimmon
i. Pomegranate j. Walnut
2. Vegetables and melons
a. Carrots & beetroot
b. Cabbage
c. Garlic
d. Green beans, spinach, Lettice
e. Onions
f. Potatoes
g. Squashes, pumpkins h. Watermelons
3. Grain, protein and oil seeds
a. Canola
b. Ground nuts
c. Maize
d. Sunflower
e. Sorghum
f. Wheat
g. Soya h. Barley
4. Industrial crops
a. Biofuel sweeteners b. Hemp

25
5. Pasture and fodder crops
a. Cactus pear
b. Digitaria eriantha
c. Eragrotis curvula
d. Labla purpureus
e. Lucerne f. Sorghum
6. Livestock
a. Beef cattle
b. Milk cow (dairying)
c. Sheep
d. Goat milk
e. Piggeries
f. Broilers
g. Bird layer unit h. Game
2.2.6 Influencing Factors
The following factors influence economic development and growth in the area:
Road Infrastructure: An effective primary road network exists in the study area. The secondary
road network provides effective access to the above primary road network.
Strategic Location: The study area is situated strategically in close proximity to the Gauteng
and North West Provinces.
Tourism Potential: The study area has a significant weekend related tourism potential that
could contribute to the GGP of the district in the future and should be further exploited.
Agricultural Sector: The agricultural sector of certain areas in the district is extremely
prominent and contributes largely to the GDP of the Fezile Dabi District, which emphasise the
agricultural significance of this district. The latter results to industrial development that is
agricultural orientated.
HIV&AIDS: The impact of AIDS on economic growth patterns is still largely an unknown entity.
An increase in mortality will place a large burden on health services and the cost thereof that
will influence future economic growth.
Competition: The impact of international trade and competition in agricultural products might
result that the agricultural sector is internationally less competitive. The latter implies a
negative effect on economic growth leading to a possible loss in employment.

26
2.3 Information from Census 2011 and Community Survey 2016
The table and figure below indicates that the population of the municipality has decreased by 4.4%
from 167 892 in 2001 to 160 532 persons in 2011. The community survey conducted during 2016
indicated that the population once again decreased with 3.61% to 154 732. Contrary to the
aforementioned, the number of households increased by 10.0% from 41 514 in 2001 to 45 661 and
increased again with 17.39% to 53 601 according to the Community Survey results of 2016.
Table 4: Population and Household Statistics
Census 1996 Census 2001 Census 2011 Community Survey 2016
Population 169 440 167 892 160 532 154 732
Households 37 447 41 514 45 661 53 601
Average Household Size 4.9 4 3.5 2.9
The decline in the population and the similarly increase in the number of households can be seen
in the table below.
An average decline of population by 4% from 2001 may not be attributed to specific variables
which may be attrition as a result of opportunistic diseases, migration as a result of job
opportunities and even studies at tertiary institutions where-after most people don’t come back
to the municipality as they seek job opportunities.
Figure 3: Population and households
169 440 167 892160 532
154 732
37 447 41 514 45 66153 601
0
20 000
40 000
60 000
80 000
100 000
120 000
140 000
160 000
180 000
C E N S U S 1 9 9 6 C E N S U S 2 0 0 1 C E N S U S 2 0 1 1 C O M M U N I TY S U R VE Y 2 0 1 6
P o p u l at ion an d h o u s eh old s
Population Households

27
The figure below shows the decline in the sizes of households within the municipal area.
Figure 4: Average household size
Total Population of Moqhaka Local Municipality by Age and Gender
Table 5
4,9
4
3,5
2,9
CENSUS 1996 CENSUS 2001 CENSUS 2011 COMMUNITY SURVEY 2016
Average Household Size
Age Gender
Total Male Female
00-04 6327 6514 12841
05-09 6159 6571 12729
10-14 6345 6013 12358
15-19 7430 6921 14351
20-24 6857 6663 13520
25-29 7029 6696 13726
30-34 6210 6515 12725
35-39 6367 5142 11509
40-44 4942 4862 9805
45-49 4279 4292 8570
50-54 3792 3555 7347
55-59 3645 3522 7168
60-64 2675 3462 6137
65-69 1748 2847 4594
70-74 1234 2072 3306
75-79 553 1422 1975
80-84 422 868 1290
85+ 179 600 779
Total 76193 78539 154732

28
Population Pyramid of Moqhaka Local Municipality
Figure 5: Population pyramid – Census 2016
The population pyramid here-above shows a bulge from ages 15-19, 20-24 and 25-29 which is a
reflection that Moqhaka Local Municipality consists of a young population that still needs to go to
school and a pool of new entrants into the labour market. The pyramid also shows that males in
those age groups are more than females, whereas from age 70 females are more than males which
means that females outlive males.
Households with access to piped (tap) water inside the dwelling and yard showed a positive
movement and increased from 76.6% in 1996 to 94.2% in 2011, whilst piped water outside the yard
decreased 6.8% over the same period.

29
Figure 6: Access to water
The 2016 Community Survey defined piped water as:-
Piped (tap) water inside the dwelling/house
Piped (tap) water inside yard
Piped water on community stand
Neighbour’s tap Public/communal tap
Piped (tap) water insidedwelling yard
Piped (tap) water on communalstand
No access
Census 1996 76,6% 15,6% 7,8%
Census 2001 83,8% 14,3% 1,9%
Census 2011 94,2% 4,7% 1,0%
Households access to Water
30
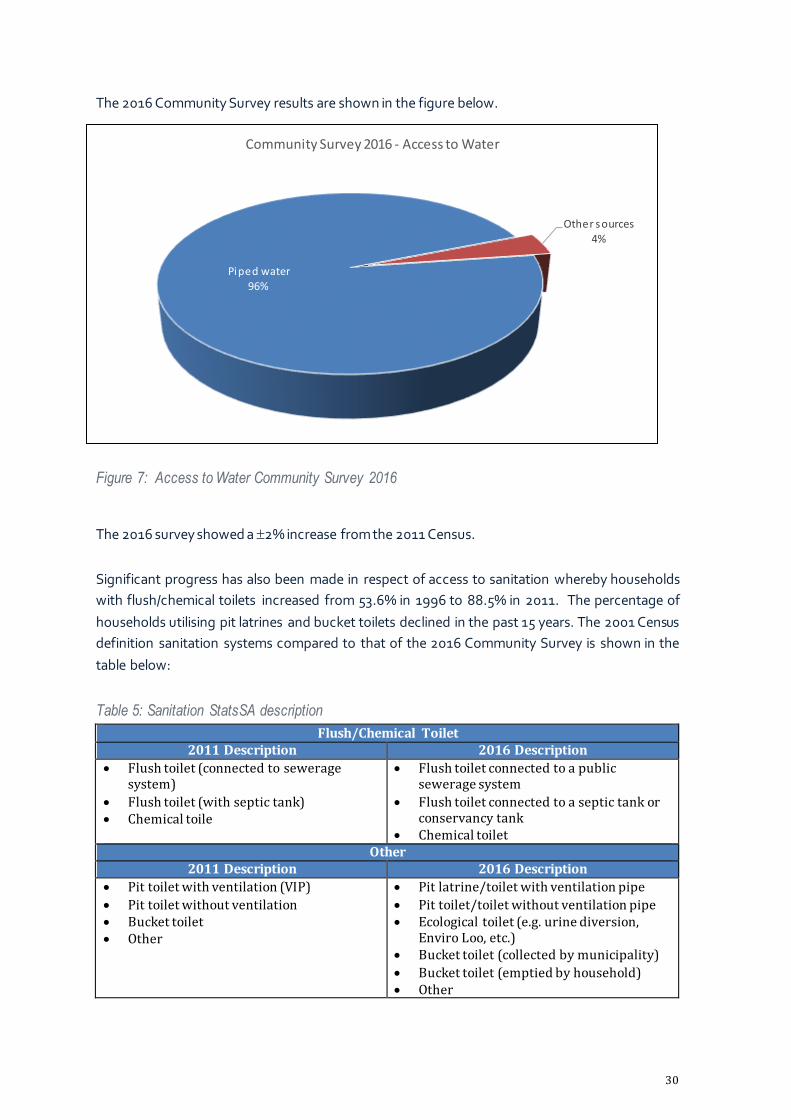
The 2016 Community Survey results are shown in the figure below.
Figure 7: Access to Water Community Survey 2016
The 2016 survey showed a 2% increase from the 2011 Census.
Significant progress has also been made in respect of access to sanitation whereby households
with flush/chemical toilets increased from 53.6% in 1996 to 88.5% in 2011. The percentage of
households utilising pit latrines and bucket toilets declined in the past 15 years. The 2001 Census
definition sanitation systems compared to that of the 2016 Community Survey is shown in the
table below:
Table 5: Sanitation StatsSA description
Flush/Chemical Toilet 2011 Description 2016 Description
Flush toilet (connected to sewerage system)
Flush toilet (with septic tank) Chemical toile
Flush toilet connected to a public sewerage system
Flush toilet connected to a septic tank or conservancy tank
Chemical toilet Other
2011 Description 2016 Description
Pit toilet with ventilation (VIP)
Pit toilet without ventilation Bucket toilet Other
Pit latrine/toilet with ventilation pipe
Pit toilet/toilet without ventilation pipe Ecological toilet (e.g. urine diversion,
Enviro Loo, etc.) Bucket toilet (collected by municipality)
Bucket toilet (emptied by household) Other
Piped water96%
Other sources4%
Community Survey 2016 - Access to Water

31
Due to the abovementioned changes to the descriptions used it was necessary to show the 2016
results in a different figure.
Figure 8: Access to sanitation
The 2016 Community Survey results shown in the figure below and shows a further increase in
access to sanitation.
Figure 9: Access to Sanitation: Community Survey 2016
Flush/Chemical Toilets Pit Latrines Bucket Toilets No Toilets
Census 1996 53,6% 18,8% 22,9% 4,8%
Census 2001 65,2% 14,6% 16,6% 3,6%
Census 2011 88,5% 7,8% 1,6% 2,0%
Households access to Sanitation
Flush/Chemical Toilets92%
Other sources
7%
None1%
Community Survey 2016 - Sanitation Access

32
The 2011 Census information shows that more households utilise electricity for heating, lighting
and cooking compared to the status quo in 1996. 93.3% (up by 34.3%) of households used
electricity for lighting, 88.9% (+44.1%) for cooking and 64.8% (+26.8%) for heating in 2011
compared to 1996.
Figure 10: Households using electricity
The 2016 descriptions used in the community survey for electricity is as follows: -
Connected to electricity (2016)
In‐house conventional meter In‐house prepaid meter
Connected to other source for which the household pays (e.g. connected to neighbour’s line and paying neighbour, paying landlord)
Connected to other source which the household is not paying for (e.g. connected to neighbour’s line and not paying neighbour)
Other Sources for electricity
Generator
Solar home system
Electricity used for lighting Electricity used for cooking Electricity used for heating
Census 1996 59,0% 44,8% 38,0%
Census 2001 83,2% 52,7% 40,7%
Census 2011 93,3% 88,9% 64,8%
Households using electricity for lighting, cooking and heating

33
Battery
Other
Figure 51: Electricity Access: Community Survey 2016
In respect of access to solid waste removal services 85.6% of households in 2011 had their refuse
removed at least once a week showing a 16.6% increase compared to 1996. Households utilising
their own or communal refuse dumps and with no access to solid waste removal services shows a
comparative decline over the same period.
No access to refuse removal information was provided for the 2016 Community Survey. The figure
below shows the information of the 2011 Census.
Figure 62: Households by type of solid waste removal
Connected to Electricity
96,6%
Other Sources0,5%
None2,9%
Community Survey 2016 - Electricity Access
Removed by localauthority/private company
Communal Dump/Ownrefuse dump
No solid waste removal
Census 1996 69,0% 25,4% 5,5%
Census 2001 79,1% 17,6% 3,3%
Census 2011 85,6% 11,9% 2,5%
0%
10%
20%
30%
40%
50%
60%
70%
80%
90%
Access to solid waste removal

34
The figure below shows that percentage of households living in formal dwellings has increased
from 72.1% in 1996 to 89.2% in 2011, whilst the percentage of households living in informal
dwellings has decreased by 11.8% over the same period.
The community Survey of 2016 indicates that that the percentage of households living in formal
dwellings have decreased with 3.3% and the number of households living in informal dwellings
have increased with 2.7%.
In the community Survey of 2016, a formal dwelling is defined as:-
Formal dwelling/house or brick/concrete block structure on a separate stand or yard or on a farm
Flat apartment in a block of flats
Cluster house in complex Townhouse (semi‐detached house in a complex)
Semi‐detached house
Formal dwelling/house/flat/room in backyard Room/flatlet on a property or larger dwelling/servants quarters/granny flat/cottage)
An informal dwelling is defined as: -
1. Informal dwelling/shack in backyard 2. Informal dwelling/shack not in backyard (e.g. in an informal/squatter settlement or on a
farm). A traditional dwelling is defined as a traditional dwelling/hut/structure made of traditional materials.
Figure 73: Households by type of main dwelling
Formal Traditional Informal
Census 1996 72,1% 5,8% 22,2%
Census 2001 82,7% 2,8% 15,5%
Census 2011 89,2% 0,5% 10,4%
Community Survey 2016 85,9% 0,2% 13,1%
0,0%
10,0%
20,0%
30,0%
40,0%
50,0%
60,0%
70,0%
80,0%
90,0%
100,0%
Main Dwelling

35
Figure 84: Tenure Status
Information regarding the tenure status of households in the municipal area was not reported in
the 2016 Community Survey. The information reflected in the figure above is the 2011 Census
statistics.
The 2016 Community Survey have release a poverty headcount. The poverty measures used below
are based on the South African Multidimensional Poverty Index (SAMPI). The SAMPI is an index
that is constructed using eleven indicators across four dimensions, namely health, education,
living standards and economic activity. There are two measures mentioned in the table, namely
the "poverty headcount" and the "intensity of poverty". The poverty headcount shows the
proportion of households that are considered “multidimensional poor" in the defined area. The
intensity of poverty is the average proportion of indicators in which multidimensional poor
households are deprived.
Owned and Fully paidoff
Owned but not yet paidoff
Rented Occupied rent free
Census 2001 18 946 6 553 8 011 8 004
Census 2011 22 231 3 381 12 786 6 046
0
5 000
10 000
15 000
20 000
25 000
Tenure Status

36
Figure 95: Poverty Index
Poverty Headcount Intensity of Poverty
Census 2011 2,7% 41,4%
Community Survey 2016 2,9% 42,7%
0,0%
5,0%
10,0%
15,0%
20,0%
25,0%
30,0%
35,0%
40,0%
45,0%
Poverty
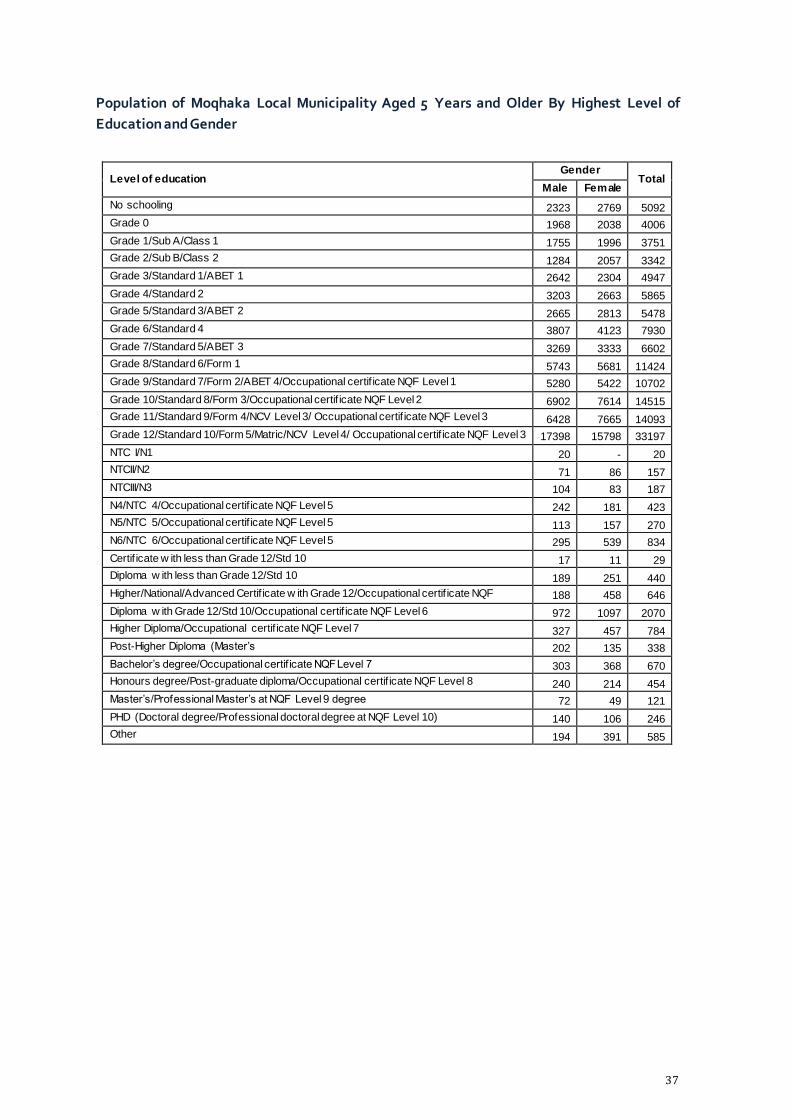
37
Population of Moqhaka Local Municipality Aged 5 Years and Older By Highest Level of
Education and Gender
Level of education Gender
Total Male Female
No schooling 2323 2769 5092
Grade 0 1968 2038 4006
Grade 1/Sub A/Class 1 1755 1996 3751
Grade 2/Sub B/Class 2 1284 2057 3342
Grade 3/Standard 1/ABET 1 2642 2304 4947
Grade 4/Standard 2 3203 2663 5865
Grade 5/Standard 3/ABET 2 2665 2813 5478
Grade 6/Standard 4 3807 4123 7930
Grade 7/Standard 5/ABET 3 3269 3333 6602
Grade 8/Standard 6/Form 1 5743 5681 11424
Grade 9/Standard 7/Form 2/ABET 4/Occupational certif icate NQF Level 1 5280 5422 10702
Grade 10/Standard 8/Form 3/Occupational certif icate NQF Level 2 6902 7614 14515
Grade 11/Standard 9/Form 4/NCV Level 3/ Occupational certif icate NQF Level 3 6428 7665 14093
Grade 12/Standard 10/Form 5/Matric/NCV Level 4/ Occupational certif icate NQF Level 3 17398 15798 33197
NTC I/N1 20 - 20
NTCII/N2 71 86 157
NTCIII/N3 104 83 187
N4/NTC 4/Occupational certif icate NQF Level 5 242 181 423
N5/NTC 5/Occupational certif icate NQF Level 5 113 157 270
N6/NTC 6/Occupational certif icate NQF Level 5 295 539 834
Certif icate w ith less than Grade 12/Std 10 17 11 29
Diploma w ith less than Grade 12/Std 10 189 251 440
Higher/National/Advanced Certif icate w ith Grade 12/Occupational certif icate NQF 188 458 646
Diploma w ith Grade 12/Std 10/Occupational certif icate NQF Level 6 972 1097 2070
Higher Diploma/Occupational certif icate NQF Level 7 327 457 784
Post-Higher Diploma (Master’s 202 135 338
Bachelor’s degree/Occupational certif icate NQF Level 7 303 368 670
Honours degree/Post-graduate diploma/Occupational certif icate NQF Level 8 240 214 454
Master’s/Professional Master’s at NQF Level 9 degree 72 49 121
PHD (Doctoral degree/Professional doctoral degree at NQF Level 10) 140 106 246
Other 194 391 585

38
TRENDS OF SERVICE DELIVERY: COMMUNITY SURVEY 2016 REPORT
This Community Survey report will be updated after the 2021 census, it should be therefore be
seen as a reflection of service improvement over this period.
2015/16 2014/15 2013/14 2012/13 2011/12 Water Blue Drop Score n/a n/a 60.16 0.00 54.93 Is the municipality responsible to provide?
Yes Yes Yes Yes Yes
Does the municipality have infrastructure to provide
Yes Yes Yes Yes Yes
Does the municipality actually provide
Yes Yes Yes Yes Yes
Is the service outsourced / commercialised
No No No No No
Number of households and non-domestic customers to which provided
42 177 42 177 42 080 42 028 34 830
Number of domestic households / delivery points
33 002 33 002 32 851 32 914 32 384
Inside the yard 32 602 32 602 32 451 32 514 31 984
Less than 200m from yard
400 400 400 400 400
More than 200m from yard
0 0 0 0 0
Domestic households with access to free basic services
12 478 11 480 8 919 32 914 32 384
Electricity Is the municipality responsible to provide?
Yes Yes Yes Yes Yes
Does the municipality have infrastructure to provide
Yes Yes Yes Yes Yes
Does the municipality actually provide
Yes Yes Yes Yes Yes
Is the service outsourced / commercialised
No No No No No
Number of households and non-domestic customers to which provided
33 006 33 002 32 851 31 155 31 155
Domestic households with access to free basic services
12 478 11 480 8 919 13 784 9 062
Sewerage and Sanitation Green Drop Score n/a n/a n/a 0 0 Is the municipality responsible to provide?
Yes Yes Yes Yes Yes
Does the municipality have infrastructure to provide
Yes Yes Yes Yes Yes

39
Does the municipality actually provide
Yes Yes Yes Yes Yes
Is the service outsourced / commercialised
No No No No No
Number of households and non-domestic customers to which provided
42 177 42 177 42 080 40 934 32 384
Number households using
Flush toilet – public sewerage
32 252 32 252 32 101 31 070 30 891
Flush toilet – septic tank
0 0 0 0 0
Ventilated pit latrine 0 0 0 0 0
Bucket system 750 750 750 750 750
Other 0 0 0 0 0
Domestic households with access to free basic services
12 478 11 480 8 919 13 784 9 062
Solid Waste Services Is the municipality responsible to provide?
Yes Yes Yes Yes Yes
Does the municipality have infrastructure to provide
Yes Yes Yes Yes Yes
Does the municipality actually provide
Yes Yes Yes Yes Yes
Is the service outsourced / commercialised
No No No No No
Number of households and non-domestic customers to which provided
33 002 33 002 32 851 32 914 31 141
Domestic households with access to free basic services
12 478 11 480 8 919 13 784 9 062
2.4 Service Delivery and Infrastructure Development
The information will indicate the existing level of development in the community, the names of
settlements and their level of service in respect of water sanitation, waste management, electricity
and energy, roads and storm-water, housing, etc
2.4.1 Water
Status of sector plan (WSDP)? Electronic draft currently being updated on DWS website. Module 1 dated 2014
Availability and status of operation and maintenance plan?
day to day operations and maintenance plan not available (Consultant appointed for water services master plan)
Status of bulk supply and storage? Water shortage in all three towns – 1. Kroonstad

40
(a) Raw water shortage due to limited seasonal flow in River.
(b) Additional reservoir capacity required to maintain 48-hour reserve
2. Steynsrus – (a) Raw water shortage due to limited
seasonal flow in River. (b) Additional reservoir capacity
required to maintain 48-hour reserve
3. Viljoenskroon (a) Upgrade of raw water system from
Renovaal required. (b) Additional reservoir capacity
required to maintain 48-hour reserve
National target for water service?
Supply target met as per Paragraph 3.6 of the Strategic Overview of the Water Sector in South Africa (DWS 27 May 2013)
Water loss to be reduced to between 15%-30%
Is the municipality the service authority? Yes X No
If no, indicate the arrangements for the delivery of water.
N/A Approved service level for municipality as informed by the Spatial Development Framework (SDF):
Formal areas
Minimum basic level as per Water Services Act. The minimum standard for basic water supply services is - (a) the provision of appropriate education in respect of effective water use; and (b) a minimum quantity of potable water of 25 litres per person per day or 6 kilolitres per household per month - (i) at a minimum flow rate of not less than 10 litres per minute; (ii) within 200 metres of a household; and (iii) with an effectiveness such that no consumer is without a supply for more than seven full days in any year.
Informal areas Water within 200m distance
Number of HHs with/without access to water:
Total No of HHs No of HH with RDP and above
No of HH Below RDP No of HH without service
34 625 34 625 (Including 205
informal HHs) 0 0
Number of households without access at all, with below standard access and with access. Name of Area or Settlement
Total no. of HHs
Service Level Reasons for lack of service (e.g. no reticulation infrastructure,
no bulk infrastructure,
etc.)
Intervention Required to address backlog
No. of HHs at or above RDP
No. of HHs below RDP
No of HH with no Service
Brentpark 833 833 0 0
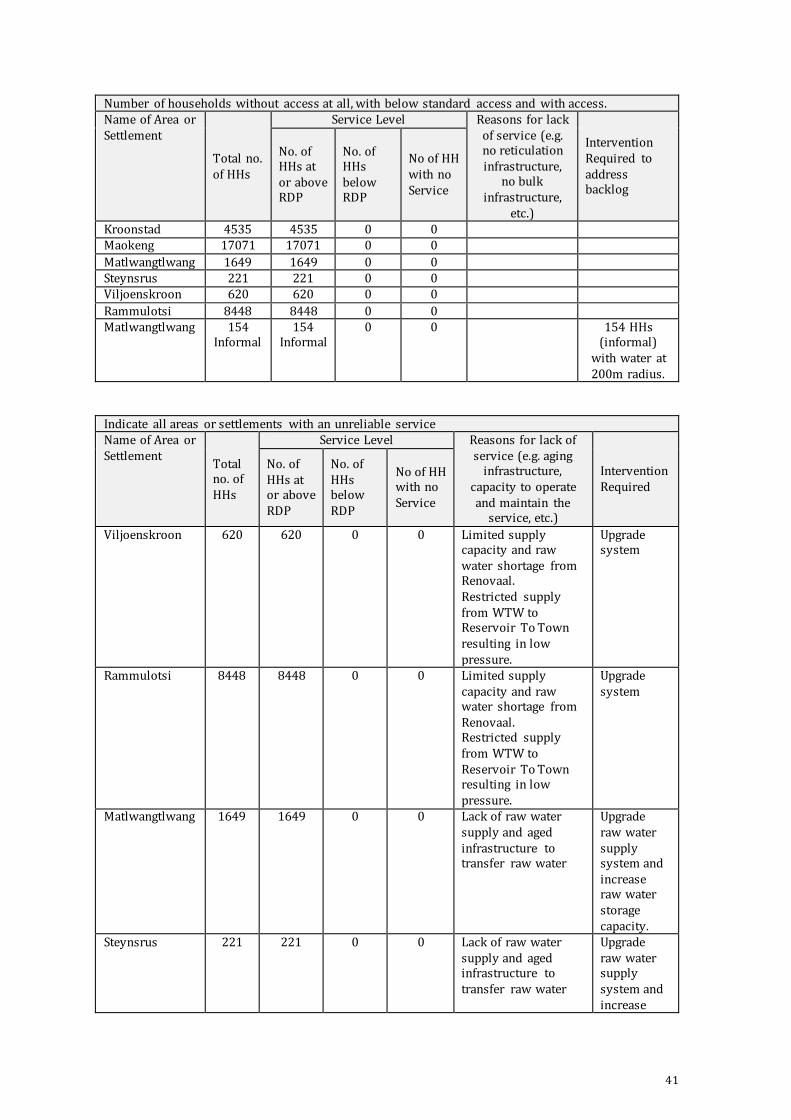
41
Number of households without access at all, with below standard access and with access. Name of Area or Settlement
Total no. of HHs
Service Level Reasons for lack of service (e.g. no reticulation infrastructure,
no bulk infrastructure,
etc.)
Intervention Required to address backlog
No. of HHs at or above RDP
No. of HHs below RDP
No of HH with no Service
Kroonstad 4535 4535 0 0 Maokeng 17071 17071 0 0
Matlwangtlwang 1649 1649 0 0 Steynsrus 221 221 0 0 Viljoenskroon 620 620 0 0
Rammulotsi 8448 8448 0 0 Matlwangtlwang 154
Informal 154
Informal 0 0 154 HHs
(informal) with water at 200m radius.
Indicate all areas or settlements with an unreliable service Name of Area or Settlement
Total no. of HHs
Service Level Reasons for lack of service (e.g. aging
infrastructure, capacity to operate and maintain the
service, etc.)
Intervention Required
No. of HHs at or above RDP
No. of HHs below RDP
No of HH with no Service
Viljoenskroon 620 620 0 0 Limited supply capacity and raw water shortage from Renovaal. Restricted supply from WTW to Reservoir To Town resulting in low pressure.
Upgrade system
Rammulotsi 8448 8448 0 0 Limited supply capacity and raw water shortage from Renovaal. Restricted supply from WTW to Reservoir To Town resulting in low pressure.
Upgrade system
Matlwangtlwang 1649 1649 0 0 Lack of raw water supply and aged infrastructure to transfer raw water
Upgrade raw water supply system and increase raw water storage capacity.
Steynsrus 221 221 0 0 Lack of raw water supply and aged infrastructure to transfer raw water
Upgrade raw water supply system and increase

42
Indicate all areas or settlements with an unreliable service Name of Area or Settlement
Total no. of HHs
Service Level Reasons for lack of service (e.g. aging
infrastructure, capacity to operate and maintain the
service, etc.)
Intervention Required
No. of HHs at or above RDP
No. of HHs below RDP
No of HH with no Service
raw water storage capacity.
Status of the provision of free basic water:
Free basic water available to Indigents only
Is there an approved FBS policy? (Yes/No)
Yes
If No, indicate the reason(s)
How many HHs are benefitting from the Council approved FBS policy?
14 989 (figure obtained from Revenue Manager on the 28 February 2019. Figure is subjected to change as additional indigents are registered and some are taken off the register )
Indicate other challenges not highlighted above:
Lack of skilled workers in supervisor positions (Artisans, special workmen and team leaders etc.)
Lack of a drawing office (and related equipment such as plan copier / plotter that can accommodate up to A0 size paper) to maintain and update information relating to position of infrastructure
Lack of vehicles and equipment, mostly due to old age of vehicles and vehicle types not suitable to function
Silting up of river and dams resulting in loss of capacity. Requires resurvey and possible dredging.
Shortage of raw water in all three towns as a result of current drought and seasonal flow in rivers that are affected by climate change resulting in less flow per year.
Steynsrus raw water shortage on a permanent basis as a result of storage dam with limited capacity and dependence on seasonal flowing river.
Old age of infrastructure (AC and Cast iron pipes that require replacement.) Old age of infrastructure (Pumps and electric motors / panels for which replacement parts
are no longer available)
Proclaimed areas without services: (Greenfields – See the table below)
Extension Description / Location Number of stands
Erf numbers
Maokeng Ext 10 Next to Boitumelo - phase 1
2278 28760 – 31036
Maokeng Ext 13 Next to Boitumelo - phase 1
2848 31038-33869
Brentpark Ext 12 Between Brentpark and Phomolong
326 17891-17896 (streets) 27464-27771 (Erven) 27773-27780 (Erven) 27781-27787 (Parks)
Kroonstad Tuinhof – Above Retief Street Wildebees Slot (Next to N1 / Reitz Street extension
89
20
7114-7203
7576-7594
Kroonstad Heuwelsig 167 7346-7517

43
Extension Description / Location Number of stands
Erf numbers
Kroonstad Elandia (Between Chris Troskie / Vredefort road
200 66757-7550
Viljoenskroon Ext 14
Between Kroonstad access road / Klerksdorp road
109 844-950
Rammulotsi Ext 10 Northleigh Phase 3 1044 10323-11359 (Erven) 11360-11366 (Parks)
11367-11375 (Streets) Rammulotsi (Ext 6) Re planned hostel area 42 5880-5921 Matlwangtlwang Ext 2
Between spruit and Ventersburg road
605 1917-2521
Matlwangtlwang Ext 3
Vogelvlei (Adjacent to Kroonstad road)
831 2531-3368
Availability of water to other associated public facilities: Schools All in urban areas
Hospitals All Clinics All Police stations All in urban areas
2.4.2 Sanitation
Status of sector plan (WSDP)? Electronic draft currently being updated on DWS website. Module 1 dated 2014 available.
Availability and status of operation and maintenance plan?
Have a draft 5- year maintenance plan
Status of sewer treatment plants and related bulk infrastructure?
Kroonstad WWTW was refurbished in 2015 and has sufficient capacity, Viljoenskroon WWTW and Steynsrus WWTW have insufficient capacity
National target for sanitation service? The national target for the eradication of basic services backlogs including sanitation was 2014.
Approved service level for municipality as informed by the Spatial Development Framework (SDF):
Formal areas
Minimum basic level as per Water Services Act. The minimum standard for basic sanitation services is - (a) the provision of appropriate health and hygiene education; and (b) a toilet which is safe, reliable, environmentally sound, easy to keep clean, provides privacy and protection against the weather, well ventilated, keeps smells to a minimum and prevents the entry and exit of flies and other disease-carrying pests. As per Paragraph 3.6 of the Strategic Overview of the Water Sector in South Africa (DWS 27 May 2013): A basic level of sanitation in South Africa is regarded as a Ventilated Improved
Pit Latrine (VIP) which is a “dry” toilet facility. The preferred temporary sanitation solution is a chemical toilet. Bucket toilets are unacceptable.
Informal areas
Not stipulated within the SDF or the Water Services Act
Number of HHs with/without access to Sanitation:
Total No of HHs No of HH with RDP and above
No of HH Below RDP No of HH without service

44
34 029 34 029 405 0
Indicate the type of sanitation systems that are available in the municipality and areas where they are:
Type of sanitation system Ward Name of Area or Settlement Waterborne 1-23 Kroonstad, Maokeng,
Viljoenskroon, Rammulotsi, Steynsrus, Matlwangtlwang
Septic Tanks 2, other wards within Kroonstad
Steynsrus, Kroonstad plots
Enviro-loo (dry sanitation) 23 Rammulotsi VIP (dry sanitation) 1 Matlwangtlwang
Number of households without access at all, with below standard access and with access.
Name of Area or Settlement
Total no. of HHs
Service Level Reasons for lack of service (e.g. no
reticulation infrastructure, no
bulk infrastructure, etc.)
Intervention Required to address backlog
No. of HHs at or above RDP
No. of HHs below RDP
No of HH with no Service
Kroonstad 4535 4535 - -
Maokeng 17071 17071 - - Brentpark 833 833 - - Viljoenskroon 620 620 - - Rammulotsi 8448 8448 - 50 No reticulation
infrastructure Funding
Steynsrus 221 221 - -
Matlwangtlwang 1649 1649 - - Matlwangtlwang Informal Settlement
205 - 205 Informal Settlement, no reticulation infrastructure
Relocate informal settlers to formal stands. But formal stands still need to be surveyed and serviced. Funding will be needed to service the formal stands.
Indicate areas or settlements with good levels of service and Indicate areas with intermediate levels of service.
Name of Area or Settlement with good level of service.
Name of Area or Settlement with intermediate level of service.
Kroonstad CBD Gelukwaarts (Maokeng ward 7) Kroonstad Industrial area Suidrand (Kroonstad) Constantia (Maokeng-ward 10)
Morewag (Kroonstad)
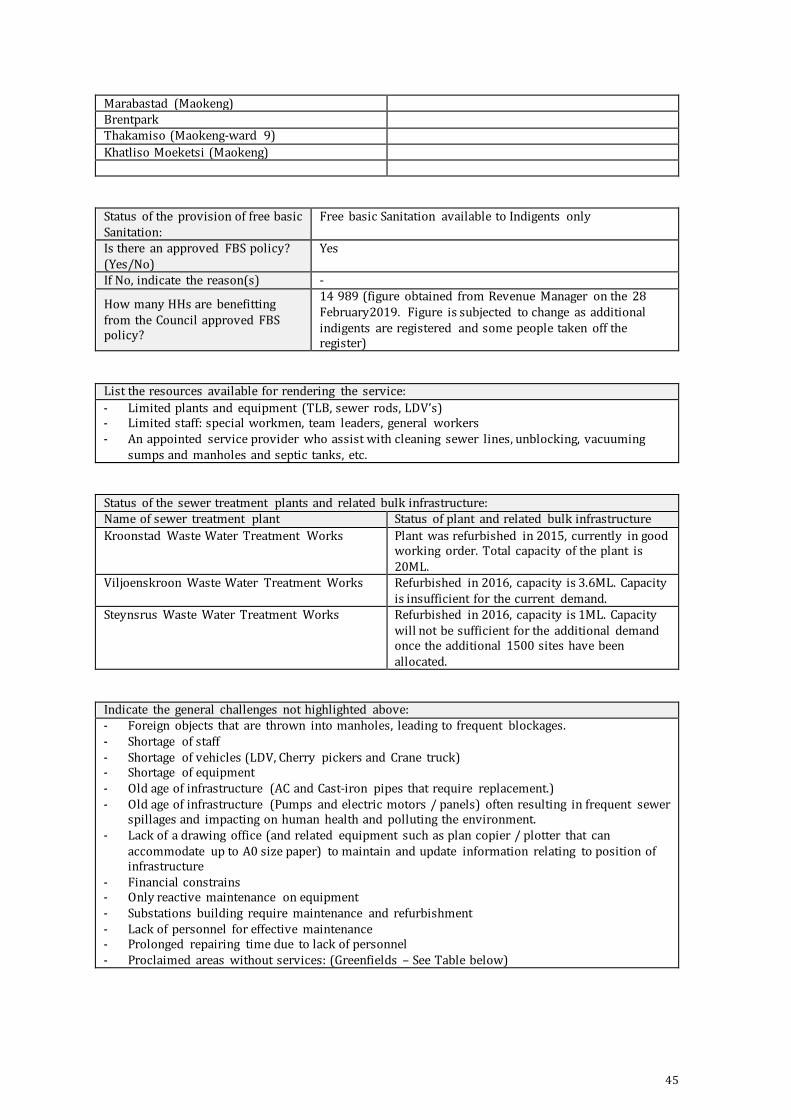
45
Marabastad (Maokeng) Brentpark Thakamiso (Maokeng-ward 9)
Khatliso Moeketsi (Maokeng)
Status of the provision of free basic Sanitation:
Free basic Sanitation available to Indigents only
Is there an approved FBS policy? (Yes/No)
Yes
If No, indicate the reason(s) -
How many HHs are benefitting from the Council approved FBS policy?
14 989 (figure obtained from Revenue Manager on the 28 February2019. Figure is subjected to change as additional indigents are registered and some people taken off the register)
List the resources available for rendering the service:
- Limited plants and equipment (TLB, sewer rods, LDV’s) - Limited staff: special workmen, team leaders, general workers - An appointed service provider who assist with cleaning sewer lines, unblocking, vacuuming
sumps and manholes and septic tanks, etc.
Status of the sewer treatment plants and related bulk infrastructure: Name of sewer treatment plant Status of plant and related bulk infrastructure
Kroonstad Waste Water Treatment Works Plant was refurbished in 2015, currently in good working order. Total capacity of the plant is 20ML.
Viljoenskroon Waste Water Treatment Works Refurbished in 2016, capacity is 3.6ML. Capacity is insufficient for the current demand.
Steynsrus Waste Water Treatment Works Refurbished in 2016, capacity is 1ML. Capacity will not be sufficient for the additional demand once the additional 1500 sites have been allocated.
Indicate the general challenges not highlighted above: - Foreign objects that are thrown into manholes, leading to frequent blockages. - Shortage of staff - Shortage of vehicles (LDV, Cherry pickers and Crane truck) - Shortage of equipment - Old age of infrastructure (AC and Cast-iron pipes that require replacement.) - Old age of infrastructure (Pumps and electric motors / panels) often resulting in frequent sewer
spillages and impacting on human health and polluting the environment. - Lack of a drawing office (and related equipment such as plan copier / plotter that can
accommodate up to A0 size paper) to maintain and update information relating to position of infrastructure
- Financial constrains - Only reactive maintenance on equipment - Substations building require maintenance and refurbishment - Lack of personnel for effective maintenance - Prolonged repairing time due to lack of personnel - Proclaimed areas without services: (Greenfields – See Table below)

46
Extension Description / Location Number of stands
Erf numbers
Maokeng Ext 10 Next to Boitumelo - phase 1
2278 28760 – 31036
Maokeng Ext 13 Next to Boitumelo - phase 1
2848 31038-33869
Brentpark Ext 12 Between Brentpark and Phomolong
326 17891-17896 (streets) 27464-27771 (Erven) 27773-27780 (Erven) 27781-27787 (Parks)
Kroonstad Tuinhof – Above Retief Street Wildebees Slot (Next to N1 / Reitz Street extension
89
20
7114-7203
7576-7594
Kroonstad Heuwelsig 167 7346-7517 Kroonstad Elandia (Between Chris
Troskie / Vredefort road 200 66757-7550
Viljoenskroon Ext 14
Between Kroonstad access road / Klerksdorp road
109 844-950
Rammulotsi Ext 10 Northleigh Phase 3 1044 10323-11359 (Erven) 11360-11366 (Parks)
11367-11375 (Streets) Rammulotsi (Ext 6) Re planned hostel area 42 5880-5921 Matlwangtlwang Ext 2
Between spruit and Ventersburg road
17 1917-2521
Matlwangtlwang Ext 3
Vogelvlei (Adjacent to Kroonstad road)
831 2531-3368
2.4.3 Electricity
Status of sector plan (Energy Plan)? Energy master plan has been compiled, and adopted by Council during the 2018/19 financial year.
Availability and status of operation and maintenance plan?
Not available
National target for electricity service?
The new Household Electrification Strategy approved on 26 June 2016 set the following target: electrification of 97% of households by 2025. Moqhaka Municipality is currently in line with this target. Currently 98% of households have access to electricity within Moqhaka Municipality.
Approved service level for municipality as informed by the Spatial Development Framework (SDF): Formal areas
Informal areas
Number of HHs with/without access to Electricity within Municipal area of distribution:
Total No of HHs No of HH with RDP and above
No of HH Below RDP No of HH without service
25783 Municipal distribution area 8237
Eskom distribution area
25 783Municipal distribution area
205 Informal Settlement Falls within Eskom
area
All HHs have access to the service in the
Municipal distribution area.

47
Number of households without access at all, with below standard access and with access. Name of Area or Settlement
Total no. of HHs
Service Level Reasons for lack of service (e.g. no
reticulation infrastructure, no
bulk infrastructure, etc.)
Intervention Required to address backlog
No. of HHs at or above RDP
No. of HHs below RDP
No of HH with no Service
Brentpark 833 833 Kroonstad 4535 4535
Maokeng 17071 17071 50 Matlwangtlwang 1649 1649 Eskom distribution
area.
Steynsrus 221 221 Viljoenskroon 620 620
Rammulotsi 7660 3 860 Eskom distribution area. Only 372 stands supplied by the municipality.
Matlwangtlwang (Informal area)
205 205 Informal Settlement Occupants to be relocated to formal stands.
Indicate areas with access to public lighting and reliability thereof and areas without access and reasons for this:
Name of Area or Settlement
Street lights (Y/N)
High Mast Lights (Y/N)
Reliability of service
Reasons for no access
Brentpark 245 5 Kroonstad 4051 1 Moakeng 1469 74
Matlwangtlwang 0 14 Steynsrus 198 1 Viljoenskroon 490 3 Rammulotsi 15 37
Indicate the general challenges not highlighted above: - Shortage of staff - Shortage of vehicles (LDV, Cherry pickers and Crane truck) - Shortage of equipment - Aged infrastructure (reach end of working lifespan) - Financial constrains - Only reactive maintenance on equipment - Availability of materials (not shelve items) - Requires outsource of specialized work - Substations building require maintenance and refurbishment - Lack of personnel for effective maintenance - Prolonged repairing time due to lack of personnel - Proclaimed areas without services: (Greenfields – See Table below)
Extension Description / Location Number of stands
Erf numbers

48
Maokeng Ext 10 Next to Boitumelo - phase 1
2278 28760 – 31036
Maokeng Ext 13 Next to Boitumelo - phase 1
2848 31038-33869
Brentpark Ext 12 Between Brentpark and Phomolong
326 17891-17896 (streets) 27464-27771 (Erven) 27773-27780 (Erven) 27781-27787 (Parks)
Kroonstad Tuinhof – Above Retief Street Wildebees Slot (Next to N1 / Reitz Street extension
89
20
7114-7203
7576-7594
Kroonstad Heuwelsig 167 7346-7517 Kroonstad Elandia (Between Chris
Troskie / Vredefort road 200 66757-7550
Viljoenskroon Ext 14
Between Kroonstad access road / Klerksdorp road
109 844-950
Rammulotsi Ext 10 Northleigh Phase 3 1044 10323-11359 (Erven) 11360-11366 (Parks)
11367-11375 (Streets)
Rammulotsi (Ext 6) Re planned hostel area 42 5880-5921 Matlwangtlwang Ext 2
Between Spruit and Ventersburg road
605 1917-2521
Matlwangtlwang Ext 3
Vogelvlei (Adjacent to Kroonstad road)
831 2531-3368
2.4.4 Roads and Storm Water
2.4.4.1 Roads
Status of sector plan (Integrated Transport Plan) Not available Availability and status of operation and maintenance plan
Draft Available to be approved with IDP RRAMS
Status of roads regarding public transport/major economic roads/roads leading to social facilities such as clinics, schools, etc.
Reasonable
Status of arterial roads/internal streets Mostly reasonable but mostly bad
Approved roads service level/standard for municipality1:
No approved Standards
Formal areas Paved roads Informal areas Gravel roads
Indicate areas with access/without access (backlog) in relation to the SDF Name of Area or Settlement
Service Level
Reasons for lack of service
Intervention Required to address backlog
No. of km’s at or above RDP
No. of km’s below RDP
No of km’s with no Service
Kroonstad/Maokeng 232.1 254 0
Lack of funding Funding from Sector Departments/ National
Viljoenskroon/ Rammulotsi
41.4 44.7 0 Lack of funding Funding from Sector
Departments/ National
1 For example: tar roads, paved roads, graded roads, gravel roads, etc.

49
Indicate areas with access/without access (backlog) in relation to the SDF Name of Area or Settlement
Service Level
Reasons for lack of service
Intervention Required to address backlog
No. of km’s at or above RDP
No. of km’s below RDP
No of km’s with no Service
Steynsrus/ Matlwangtlwang
15 29.4 0 Lack of funding Funding from Sector
Departments/ National
What are the reasons for the backlogs in roads services? Lack of funding
Indicate the general challenges not highlighted above: - Shortage of staff - Shortage of vehicles (LDV, Cherry pickers and Crane truck) - Shortage of equipment - Proclaimed areas without services: (Greenfields – See table below)
Extension Description / Location Number of stands
Erf numbers
Maokeng Ext 10 Next to Boitumelo - phase 1
2278 28760 – 31036
Maokeng Ext 13 Next to Boitumelo - phase 1
2848 31038-33869
Brentpark Ext 12 Between Brentpark and Phomolong
326 17891-17896 (streets) 27464-27771 (Erven) 27773-27780 (Erven) 27781-27787 (Parks)
Kroonstad Tuinhof – Above Retief Street Wildebees Slot (Next to N1 / Reitz Street extension
89
20
7114-7203
7576-7594
Kroonstad Heuwelsig 167 7346-7517 Kroonstad Elandia (Between Chris
Troskie/ Vredefort road 200 66757-7550
Viljoenskroon Ext 14
Between Kroonstad access road/ Klerksdorp road
109 844-950
Rammulotsi Ext 10 Northleigh Phase 3 1044 10323-11359 (Erven) 11360-11366 (Parks)
11367-11375 (Streets)
Rammulotsi (Ext 6) Re planned hostel area 42 5880-5921 Matlwangtlwang Ext 2
Between Spruit and Ventersburg road
605 1917-2521
Matlwangtlwang Ext 3
Vogelvlei (Adjacent to Kroonstad road)
831 2531-3368
2.4.4.2 Storm water

50
Availability and status of storm water management plan or system
Not available
Status regarding maintenance Storm water included in draft road maintenance plan to be approved by Council with the IDP
Approved storm water level/standard for municipality:
Not available
Formal areas Concrete pipes and channels
Informal areas Soil channels / concrete where necessary.
What are the reasons for the backlogs in roads services? Lack of funding
Indicate the general challenges not highlighted above: - Shortage of staff - Shortage of vehicles (LDV, Cherry pickers and Crane truck) - Shortage of equipment - Proclaimed areas without services: (Greenfields – See table below)
Extension Description / Location Number of stands
Erf numbers
Maokeng Ext 10 Next to Boitumelo - phase 1
2278 28760 – 31036
Maokeng Ext 13 Next to Boitumelo - phase 1
2848 31038-33869
Brentpark Ext 12 Between Brentpark and Phomolong
326 17891-17896 (streets) 27464-27771 (Erven) 27773-27780 (Erven) 27781-27787 (Parks)
Kroonstad Tuinhof – Above Retief Street Wildebees Slot (Next to N1 / Reitz Street extension
89
20
7114-7203
7576-7594
Kroonstad Heuwelsig 167 7346-7517
Kroonstad Elandia (Between Chris Troskie / Vredefort road
200 66757-7550
Indicate areas with access/without access (backlog) in relation to the SDF Name of Area or Settlement
Service Level
Reasons for lack of service
Intervention Required to address backlog
No. of km’s at or above RDP
No. of km’s below RDP
No of km’s with no Service
Kroonstad/ Maokeng
198.5 254 0 Lack of funding Funding from Sector Departments/ National
Viljoenskroon / Rammulotsi
37 44.7 0 Lack of funding Funding from Sector Departments/ National
Steynsrus / Matlwangtlwang
14 29.4 0 Lack of funding Funding from Sector Departments/ National

51
Extension Description / Location Number of stands
Erf numbers
Viljoenskroon Ext 14
Between Kroonstad access road / Klerksdorp road
109 844-950
Rammulotsi Ext 10 Northleigh Phase 3 1044 10323-11359 (Erven) 11360-11366 (Parks)
11367-11375 (Streets) Rammulotsi (Ext 6) Re planned hostel area 42 5880-5921 Matlwangtlwang Ext 2
Between Spruit and Ventersburg road
605 1917-2521
Matlwangtlwang Ext 3
Vogelvlei (Adjacent to Kroonstad road)
831 2531-3368
2.5 Refuse/Waste Services
2.5.1 Waste Management
Indicate the status of the Integrated Waste Management Plan
To be reviewed by 2019/2020
Provide the percentage of people accessing the service.
100%
Indicate whether the service is rendered internally or externally.
Internally
Indicate strategies employed to reduce, re-use and recycle They are informal recyclers. Some of the recyclers are not registered.
2.5.2 Waste Removal
National Target for waste disposal service At least once a week for private household. Up to three times a week for business, commercial and industrial households depending on the volume of waste generated.
Indicate the service levels adopted in relation to the SDF
At least once a week for private household. Up to three times a week for business, commercial and industrial households depending on the volume of waste generated.
Formal areas Refuse picked up on the pavement
Informal areas Refuse picked up at the end of the street depending on the accessibility of the street.
Indicate areas without solid waste removal at all and reasons for lack of access.
Ward Name of Area or
Settlement Total no. of HHs
No of HH without access
Reasons for lack of service
None
Indicate areas with solid waste removal and frequency of removal and reliability of service.
Name of Area or Settlement
Total no. of HHs
No of HH with access
Frequency of service (e.g. daily, weekly etc.)
Reliability of Service
Kroonstad 4800 4800 Once a week On regular basis Maokeng 16340 16340 Once a week On regular basis
Marabastad 1534 1534 Once a week On regular basis
Brentpark 883 883 Once a week On regular basis

52
Indicate areas with solid waste removal and frequency of removal and reliability of service.
Name of Area or Settlement
Total no. of HHs
No of HH with access
Frequency of service (e.g. daily, weekly etc.)
Reliability of Service
Viljoenskroon 754 754 Once a week On regular basis
Rammulotsi 5463 5463 Once a week On regular basis Steynsrus 348 348 Once a week On regular basis
Matlwangtlwang 2522 2522 Once a week On regular basis
Indicate other challenges not highlighted above: Break downs of refuse compactor trucks leads to refuse not being removed on time. At some points when the trucks are broken the refuse will be left over for the following day. This leads to illegal dumping of refuse as members of the community do not want to keep refuse on their premises after the day of removal
2.5.3 Waste Disposal
Indicate the status of waste disposal in terms of: transfer stations, landfill sites (status regarding licensing, compliance with license conditions, etc.) and transportation mechanisms.
The Kroonstad landfill site is not meeting the minimum operational requirements due to lack of personnel and equipment. The Steynsrus landfill site is operated and managed by a service provided and the conditions have drastically improved. The Viljoenskroon landfill site is operated and managed by a service provider. Though the landfill site is not licensed, the conditions have improved. Application forms for both the new and the closure of the current landfill sites have been submitted to DESTEA.
Indicate the resources available to support the delivery of the service in terms of: personnel, skills and other related requirements.
The only equipment that is available is a tipper truck and a landfill compactor for the Kroonstad landfill site. The Viljoenskroon and the Steynsrus landfill sites have neither equipment nor personnel
Indicate other challenges not highlighted above: Because of the lack of equipment, the life span of the landfill sites is drastically reduced due to operations that are not compliant with the national requirements. Equipment and personnel are urgently needed for the landfill sites to operate within the minimum legislative requirements. The Kroonstad landfill site is both an environmental and health hazard as it is managed below legislatively prescribed standards by NEMWA, which can result into a disaster for the municipality.
2.6 Social Services

53
2.6.1 Health Services
Facility Total No.
Total Backlog2
Location (and/or name of each
facility)
Status of support services
Water Sanitation Electricity Roads
Clinics 10 Bophelong clinic Kroonstad
Brentpark clinic Kroonstad
Lesedi CHC Kroonstad
PAX CHC Viljoenskroon
Rammulotsi Clinic Sedibeng Sa Bophelo Steynsrus
Seisoville Clinic Kroonstad
Thusong Clinic Kroonstad
Tshepong Clinic Kroonstad
Ango Maseola Clinic x Hospitals 2 Boitumelo Hospital
Kroon Private Hospital
Indicate other challenges experienced: Shortage of Health personnel more especially Doctors.
2.6.2 Education
Schools Total No. Total
Backlog3 Status of support services
Water Sanitation Electricity Roads Primary (Farm Schools)
23 Boreholes VIP toilets Only a few
Only those next to National Roads are accessible
Primary 29 Accessible Waterborne Sewerage
Accessible Accessible
Secondary 23 Accessible Accessible Accessible Accessible
Indicate other challenges experienced: Most Primary Schools on farms have no access roads. Platberg primary is situated next to LIONS enclosure which is not safe for children and staff.
2 Backlogs or needs in relation to national norms and standards 3 Backlogs or needs in relation to national norms and standards
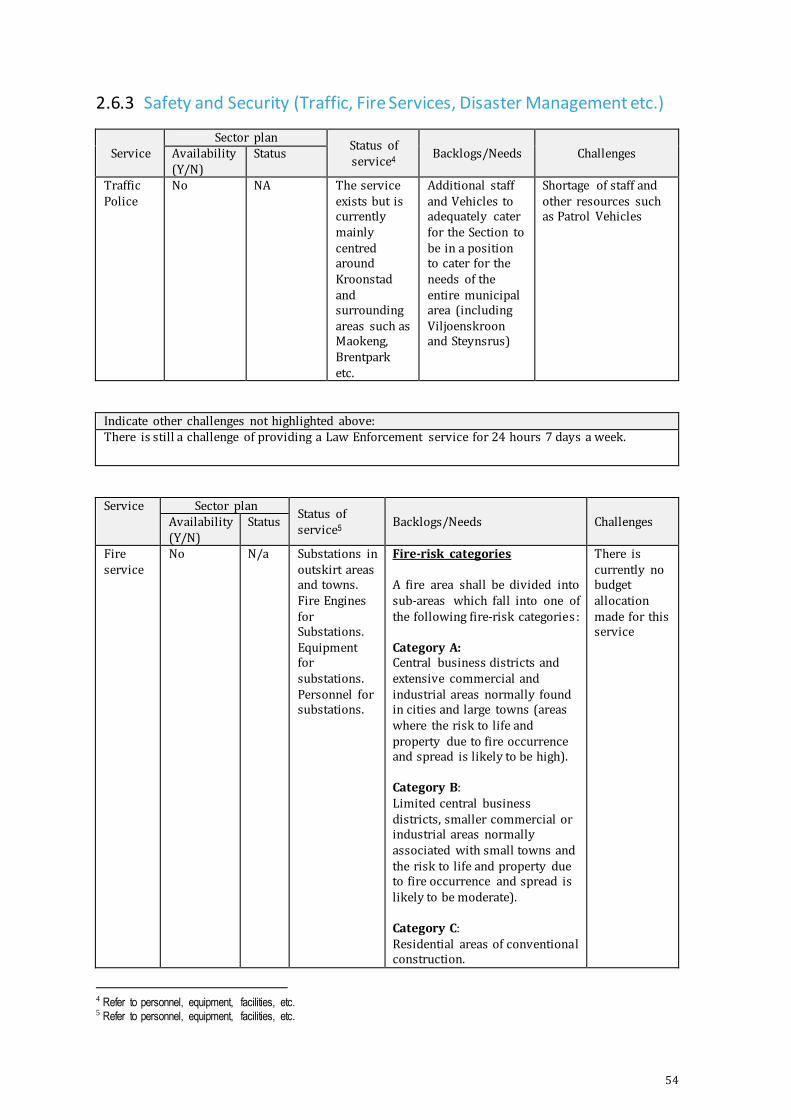
54
2.6.3 Safety and Security (Traffic, Fire Services, Disaster Management etc.)
Service Sector plan
Status of service4
Backlogs/Needs Challenges Availability (Y/N)
Status
Traffic Police
No NA The service exists but is currently mainly centred around Kroonstad and surrounding areas such as Maokeng, Brentpark etc.
Additional staff and Vehicles to adequately cater for the Section to be in a position to cater for the needs of the entire municipal area (including Viljoenskroon and Steynsrus)
Shortage of staff and other resources such as Patrol Vehicles
Indicate other challenges not highlighted above: There is still a challenge of providing a Law Enforcement service for 24 hours 7 days a week.
Service Sector plan Status of service5
Backlogs/Needs Challenges Availability (Y/N)
Status
Fire service
No N/a Substations in outskirt areas and towns. Fire Engines for Substations. Equipment for substations. Personnel for substations.
Fire-risk categories A fire area shall be divided into sub-areas which fall into one of the following fire-risk categories : Category A: Central business districts and extensive commercial and industrial areas normally found in cities and large towns (areas where the risk to life and property due to fire occurrence and spread is likely to be high). Category B: Limited central business districts, smaller commercial or industrial areas normally associated with small towns and the risk to life and property due to fire occurrence and spread is likely to be moderate). Category C: Residential areas of conventional construction.
There is currently no budget allocation made for this service
4 Refer to personnel, equipment, facilities, etc. 5 Refer to personnel, equipment, facilities, etc.

55
Service Sector plan Status of service5
Backlogs/Needs Challenges Availability (Y/N)
Status
Category D: Rural risk areas of limited buildings and remote from urban areas. Category E: Special risk areas. Individual risk areas requiring a pre-determined attendance over and above the predominant risk category in an area. Includes large shopping/entertainment centres, informal settlements, harbours, hospitals, prisons, large airport buildings, and petrochemical plants. The successful control and extinguishing of fires depend on sufficient appliances responding with adequate manpower and arriving within a reasonabl e time. The efficiency of a fire service is judged largely by the attendance time that the fire brigade is capable of achieving. The attendance times shall not exceed those shown in tabl e below. Siting of fire stations and determination of station areas The ability to meet attendance time requirements will be directly influenced by the siting of stations and the size of turnout areas which shall be determined by taking into consideration street grid net-works, speed of appliances, terrain, traffic conditions, etc.
Speed of Response

56
Risk category Maximum call receipt
and turn-out time
(min)
Maximum appliance
travel time (min)
Maximum
attendance time (min)
A 3 5 8
B 3 7 10
C 3 10 13
D 3 20 23
E Within requirement of appropriate risk category
Equipment Required
Risk category Minimum number of
pumping units
Minimum manning level
per appliance
Minimum pumping
capacity of each unit
(L/min)
A 2 5 3 850
B 2 4 3 850
C 1 4 2 250
D 1 4 2 250
E As determined by individual risk assessment
NOTE: Arrangements for vehicle fires, grass/bush fires and special services and the need for
specialist vehicles such as aerial appliances and water carriers will be determined by local
conditions.
Indicate other challenges not highlighted above: No sufficient Fire Safety inspectors No designated vehicles for Fire Safety inspectors No designated hydrant vehicle for hydrant official No training officer Training facilities not conducive for training Implementation of Fire Brigade Services Act, Act 99 of 1987 Implementation SANS 10090:2003

57
Service Sector plan Status of service6
Backlogs/Needs Challenges Availability (Y/N)
Status
Disaster management
Yes Currently under review
Improving since the appointment of its manager.
Full staff complement
There is insufficient budget allocation for this service, and it has been transferred back to the local municipality within the amendment of its governing Act.
Indicate other challenges not highlighted above:
There is a Centre for Disaster Management within Moqhaka Local Municipality but it is dysfunctional. This function is seen as a responsibility of one Directorate while it cuts across the entire municipality therefore, participation of other Directorates need to be improved. The Act, Disaster Management Act, Act 52 of 2002, defines disaster as a progressive or sudden, wide spread or localised, natural or human-caused occurrence which causes or threatens to cause death, injury or disease; damage to property, infrastructure or the environment; or significant disruption of the life of a community; and is of a magnitude that exceeds the ability of those affected by the disaster to cope with its effects using only their own resources; while disaster management means a continuous integrated and multi-sectoral, multi-disciplinary process of planning and implementation of measures aimed at preventing or reducing the risk of disasters; mitigating the severity or consequences of disasters; emergency preparedness; a rapid and effective response to disasters; and post-disaster recovery and rehabilitation. This definition clearly shows that disaster management is everybody’s business. An example can be made of the decaying old infrastructure like asbestos water pipes that can no longer carry the amount of water needed to meet the current demand. Continuous pipe bursts can lead to severe shortage of water to an extend that the municipality can no longer meet the demand such that this develops into a disaster. This definition also qualifies the classification of certain municipal services as essential, i.e water, electricity, sanitation and solid waste.
Service Sector plan Status of service7
Backlogs/Needs Challenges Availability (Y/N)
Status
Security Services
No None Good Insource the service and more Peace Officers required
Financial Constraints
Indicate other challenges not highlighted above: Community participation into assisting the municipality to prevent vandalism and enforcing by-laws.
2.7 Public Participation and Good Governance
6 Refer to personnel, equipment, facilities, etc. 7 Refer to personnel, equipment, facilities, etc.

58
2.7.1 Governance Structures
The Municipal Structures Act (Act 117 of 1998) informs the Governance Structure of Moqhaka
Municipality. This Act stipulates different roles and responsibilities that each structure within the
municipality should perform.
2.7.1.1 Political Structure
Section 53 of the Municipal Systems Act (Act 32 of 2000) stipulates inter alia that the respective
roles and areas of responsibility of each political structure and each Political Office Bearer of the
Municipality and of the Municipal Manager must be defined.
The council performs both legislative and executive functions. They focus on legislative, oversight
and participatory roles and they have delegated their executive function to the Executive Mayor
and the Mayoral Committee. Their role is to debate issues publicly and to facilitate political debate
and discussion. The council plays a very active role in the operations of the Municipality. Apart
from their functions as decision makers, councillors are also actively involved in community work
and the various social programs in the municipal area.
The Council of Moqhaka Municipality comprises of 45 elected Councillors, made up from 23 Ward
Councillor’s and 22 Proportional Representation (PR) Councillors. The portfolio committees
comprise of councillors drawn from all political parties.
Table 6: Council
Name of Councillor Capacity Political Party
Ward or Proportional
Mr T J Marako Councillor ANC 1
Mr S Tladi Councillor ANC 2 Mr N Muller Councillor DA 3 Ms ME Mthunze Councillor ANC 4
Ms M Green Councillor ANC 5 Mr M V Mokoteli Councillor ANC 6 Mr L D Bolofo Councillor ANC 7
Ms M S Mahlatsi Councillor ANC 8 Mr O A Lebeko Councillor ANC 9 Mr M S Chakane Speaker ANC 10 Mr H G Makae Councillor ANC 11
Ms L Mpondo Councillor ANC 12 Mr B rooskrans Councillor ANC 13 Mr M Nhlapo Councillor ANC 14
Mr B S Ramathibe Councillor ANC 15 Ms H M E Boeitjie Councillor DA 16 Mr J Geldenhuis Councillor DA 17 Mr R Moletsane Councillor ANC 18
Mr S Mokoena Councillor ANC 19 Mr L Ramajoe Councillor ANC 20 Mr Z Magadlela Councillor ANC 21
Mr M Yhoyho Councillor ANC 22 Mr J M Baba Councillor ANC 23 Mr K Kokami Councillor ANC PR

59
Name of Councillor Capacity Political Party
Ward or Proportional
Mr C M Dalton Councillor DA PR Mr P J Phooko Executive Mayor ANC PR Ms R Mannefelt Councillor ANC PR Ms J Hattigh Councillor FF+ PR
Mr D N Nzunga Councillor DA PR Dr A Viljoen Councillor FF+ PR Ms L van Schalkwyk Councillor DA PR
Mr D Serapela Councillor EFF PR Mr S H Pittaway Councillor DA PR Mr R Mahlatsi Councillor DA PR
Mr J Mareka Councillor ANC PR Mr D Khasudi Councillor DA PR Mr T Moahlodi Councillor DA PR Mr M I Thajane Councillor COPE PR
Ms A M Malejoene Councillor EFF PR Mr M J Khunyeli Councillor EFF PR Ms S Khiba Council Whip ANC PR
Ms M L Makhanda Councillor EFF PR Mr M J Lithupa Councillor DA PR Mr M E Ramathibe Councillor DA PR
Ms M Pieterson Councillor ANC PR
The Council has an Executive Mayor and its Mayoral Committee consists of the chairpersons of the
various Section 80 Committees. The members of the Mayoral Committee each hold a direct
portfolio as assigned by the Executive Mayor. Moqhaka Municipality has established nine
committees in terms of section 80 of the Municipal Structures Act (Act 17 of 1998). The Portfolios
assigned to the members of the Executive Mayoral Committee are as follows:
Table 7: Members of the Mayoral Committee
Name of Member Capacity Mr P.J. Phooko Executive Mayor
MrE R. Moletsane Chairperson of the Finance, Audit and Risk Management Committee
Mr ZS Magadlela Chairperson of the IDP Portfolio Committee Mr K.Kokami Chairperson of the Municipal Infrastructure and
Technical Services Mr B.Rooskraans Chairperson of the LED and Investment Portfolio
Committee
Mr S.Tladi Chairperson of the Corporate Services Portfolio Committee
Ms L.Mpondo Chairperson of the Public Safety Portfolio Committee
Mr S.Mokoena Chairperson of the Spatial Development and Human Settlement Portfolio Committee
Ms R Manefeldt Chairperson of the Policy Development and Monitoring Portfolio Committee
Ms M Green Chairperson of the Community Service Portfolio Committee
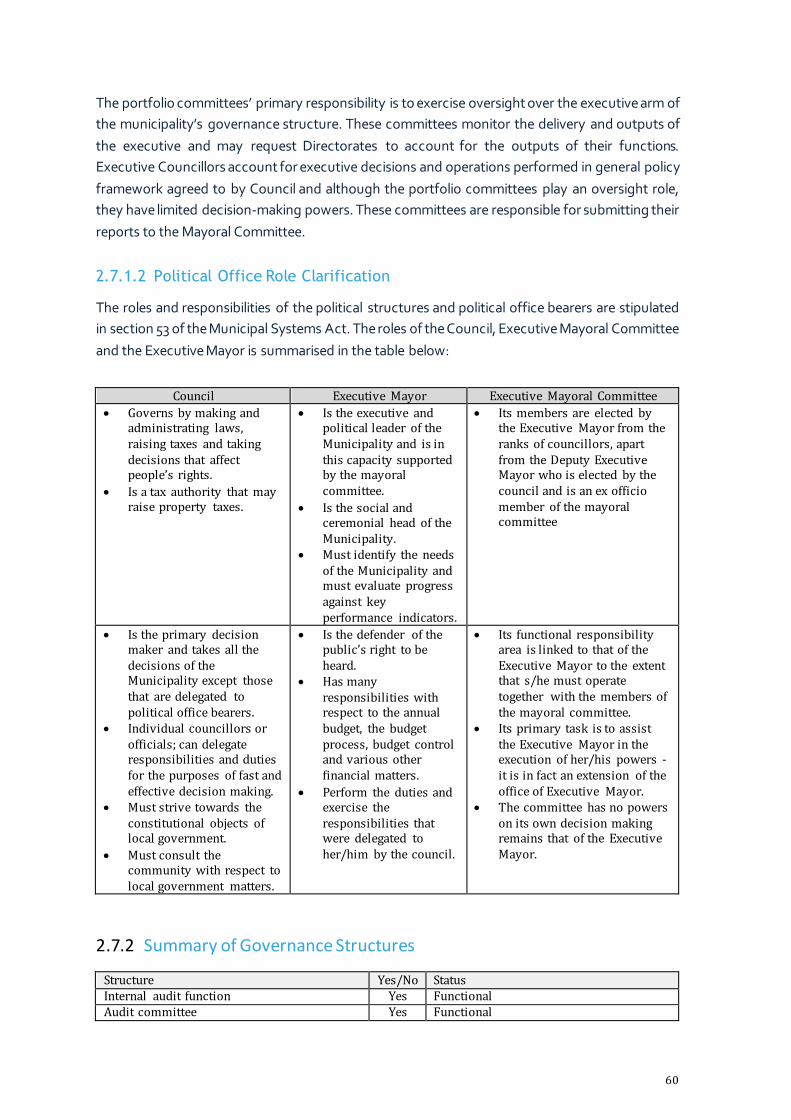
60
The portfolio committees’ primary responsibility is to exercise oversight over the executive arm of
the municipality’s governance structure. These committees monitor the delivery and outputs of
the executive and may request Directorates to account for the outputs of their functions.
Executive Councillors account for executive decisions and operations performed in general policy
framework agreed to by Council and although the portfolio committees play an oversight role,
they have limited decision-making powers. These committees are responsible for submitting their
reports to the Mayoral Committee.
2.7.1.2 Political Office Role Clarification
The roles and responsibilities of the political structures and political office bearers are stipulated
in section 53 of the Municipal Systems Act. The roles of the Council, Executive Mayoral Committee
and the Executive Mayor is summarised in the table below:
Council Executive Mayor Executive Mayoral Committee
Governs by making and administrating laws, raising taxes and taking decisions that affect people’s rights.
Is a tax authority that may raise property taxes.
Is the executive and political leader of the Municipality and is in this capacity supported by the mayoral committee.
Is the social and ceremonial head of the Municipality.
Must identify the needs of the Municipality and must evaluate progress against key performance indicators.
Its members are elected by the Executive Mayor from the ranks of councillors, apart from the Deputy Executive Mayor who is elected by the council and is an ex officio member of the mayoral committee
Is the primary decision maker and takes all the decisions of the Municipality except those that are delegated to political office bearers.
Individual councillors or officials; can delegate responsibilities and duties for the purposes of fast and effective decision making.
Must strive towards the constitutional objects of local government.
Must consult the community with respect to local government matters.
Is the defender of the public’s right to be heard.
Has many responsibilities with respect to the annual budget, the budget process, budget control and various other financial matters.
Perform the duties and exercise the responsibilities that were delegated to her/him by the council.
Its functional responsibility area is linked to that of the Executive Mayor to the extent that s/he must operate together with the members of the mayoral committee.
Its primary task is to assist the Executive Mayor in the execution of her/his powers - it is in fact an extension of the office of Executive Mayor.
The committee has no powers on its own decision making remains that of the Executive Mayor.
2.7.2 Summary of Governance Structures
Structure Yes/No Status Internal audit function Yes Functional Audit committee Yes Functional

61
Risk management function Yes Functional Risk management committee Yes Functional Oversight committee Yes Functional
Portfolio Committees (s80) Yes Functional Ward committees Yes Functional IDP Steering Committee Yes Functional Supply chain committees (SCM) Yes Functional
Section 79 Committees Yes Functional
Indicate other challenges experienced: None.
2.7.3 Management and Operational systems
System Y/N Status Complaints management system Yes Operational Risk management strategy Yes Operational
Fraud prevention plan Yes Operational Communication strategy Yes Draft Public participation strategy/policy Yes Adopted in 2013 needs to be reviewed
2.7.4 HIV/AIDS, YOUTH DEVELOPMENT AND PEOPLE LIVING WITH DISABILITIES
The office of the Executive Mayor is also responsible for Youth development, Disability and
HIV/AIDS programmes coordination.
The HIV/AIDS operational plan serves to mainstream this function by working in partnerships
with different departments like Social Development and different Non-Governmental
Organisations and Community Based Organisations.
The issue of young people dropping out of school as early as grade 10 is a worrying fact for the
office and in mitigating this, the office is working very closely with the Department of
Education and the school governing bodies to combat this scourge.
Youth unemployment more especially amongst graduates is a matter of concern that we try to
address through Youth Economic Development programmes, which emphasise participation
in the economy through small businesses.
Disability programmes entailing the establishment of the Disability Forum, Sporting activities,
Disability Day Celebration, Awareness campaigns and skills development are some of the
activities that we will be engaging in to advance the interests of this sector in our
communities.

62
2.8 Institutional Development and Transformation
2.8.1 Executive Management Structure
The Administration arm of Moqhaka Municipality is headed by the Municipal Manager, who has 5
Section 56 Directors reporting directly to him.
The Municipal Manager as head of the administration is responsible and accountable for tasks and
functions as provided for in Section 55 of the MSA, other functions/tasks as provided for in
legislation as well as functions delegated to him by the Executive Mayor and Council. The Office
of the Municipal Manager consists of:
Internal Audit and Risk Management;
Performance Management and IDP; and Communication and Customer Relations
2.8.2 Departmental Functions
The functions of each of the departments can be summarised as follows:
2.8.2.1 Directorate: Finance
The core function of this Directorate is to ensure sound financial management. This directorate
consists of the Director: Finance as head of the directorate who is responsible for:
Budget and Expenditure
Revenue Management
Assets and
Supply Chain Management.
2.8.2.2 Directorate: LED and Planning
Municipal Manager
Mr. MS Mqwathi
Director Financial Services
Mr. T Marumo
Director Technical Services
Ms. D Ngwenya
Director Corporate and Support
Services
Mr.M Mthwalo
Director Community & Social
Development
Ms. P Tshabalala
Director LED & Planning
Ms S J Monyaki

63
The core functions of this Directorate is to promote economic development initiatives, SMME,
sustainable job creation, poverty reduction and shared growth that integrates and connects the
Municipality, its citizens and its natural resources. The Directorate is also responsible for housing,
town planning and building control. The directorate comprises of the following departments:
Local Economic Development and Rural Development
Housing and Properties Spatial Planning; Town Planning and Building control
2.8.2.3 Directorate: Corporate Services
The Directorate is responsible for cultivating a culture of good governance and administration and
prepare sound systems and structures in the achievement of Council’s Strategic Objectives. The
core function of the Directorate is therefore to ensure that administrative processes take place in
an environment, which promotes productivity. The directorate comprises of the following
departments:
Administration
Committee Services;
Human Resources;
Legal Services;
Records Management.
2.8.2.4 Directorate: Technical Services
The core function of Directorate is to provide bulk infrastructure and services. The directorate
comprises of the following departments:
Civic buildings;
Public works, which includes main roads, storm water and streets;
Sewerage purification services;
Sewerage reticulation services;
Sewerage sanitation services;
Water purification works;
Water reticulation;
electricity distribution and street lighting; and
Management of the Workshop and Depot.
2.8.2.5 Directorate: Community Services
This directorate is responsible for a variety of community services, which include:

64
Solid Waste Management which includes cleansing, refuse removal, and street sweeping;
Management and maintenance of community halls, museums and municipal heritage buildings;
Maintenance of parks, sports fields, recreational areas and maintenance of Public Open Areas;
Municipal By-Law Enforcement
Fire Fighting Services;
Disaster Management;
Traffic and Parking
Cemeteries;
Arts, Culture and Heritage
2.8.3 Municipal Workforce
Based on the strategic and policy decisions made by Council, the Management Team develops
service plans for integration with other sectors within the strategy for the Municipality. They must
measure performance according to agreed indicators, analyse and report regularly. They inform
decision makers timeously of any risk to service delivery initiatives and conduct reviews of service
performance against plans before other reviews. The senior management team is supported by a
municipal workforce of 864 permanent employees, which is structured in the various departments
to implement the IDP strategic objectives.
Section 68(1) of the MSA states that a municipality must develop its human resource capacity to a
level that enables it to perform its functions and exercise its powers in an economical, effective,
efficient and accountable way. The organisational structure should be revisited after the approval
of the IDP and budget to ensure that the municipality still deliver services and the most productive
and sufficient manner.
The approved organogram for the municipality has 1 384 posts. The actual positions filled are
indicated in the tables below by post level and by functional level. A total of 524 posts were vacant
at the end of 2016/17, resulting in a vacancy rate of 37, 86%.
Below is a table that indicates the vacancies within the municipality:
Department Approved Filled Vacant
Office of the Executive Mayor 16 15 1 Office of the Speaker 7 5 2
Office of the Council Whip 4 1 3 Office of the Municipal Manager 24 9 14
Finance Department 84 74 8 Corporate Services Department 95 68 27
Community & Emergency Services 542 402 143

65
Technical Services 542 266 274
Planning & LED 64 18 46
Unit Management Viljoenskroon 3 1 3 Unit Management Steynsrus 3 1 3 Total 1384 860 524
System/Function Y/N Status Information Technology Yes
Availability of skilled staff Yes Skills audit process to be finalized Organisational Structure Yes Structure reviewed and approved by
council on the Council sitting on 27 May 2015
Vacancy rate Yes The municipality has a total of 524 Vacant positions
Skills development plan Yes The municipality submits the WSP to LGSETA annually and is currently on the process of implementation
Human resource management strategy or plan
Yes HR strategy in place and approved by council, the strategy to be reviewed in line with the IDP
Individual performance and organisational management systems
Yes Performance management system approved by council
Monitoring, evaluation and reporting processes and systems
Yes The municipality is submitting monthly and annual reports on trainings implemented to LGSETA. Mid-year performance assessment report also in place for monitoring and evaluation
Indicate other challenges experienced: Finalisation of skills audit Review of the organisational structure.
2.9 Financial Viability and Management
System/function/policies Yes/No Status Tariff policy Yes 2019/20
Property Rates policy Yes 2019/20 SCM policy – staffing, staffing of the finance and SCM units
Yes 2019/20
Payment of creditors Yes 2019/20 Auditor- General findings (action plan) Yes 2019/20
Financial management systems Yes 2019/20 Financial reporting systems Yes 2019/20 Revenue enhancement/management plan Yes 2019/20
Asset management policy and system Yes 2019/20 mSCOA compliance Yes 2019/20 Debt Collection and Credit Control Policy Yes 2019/20 Write off Policy Yes 2019/20
Indigent Policy Yes 2019/20 Asset Management Policy Yes 2019/20 Cashiers Control Policy Yes 2019/20
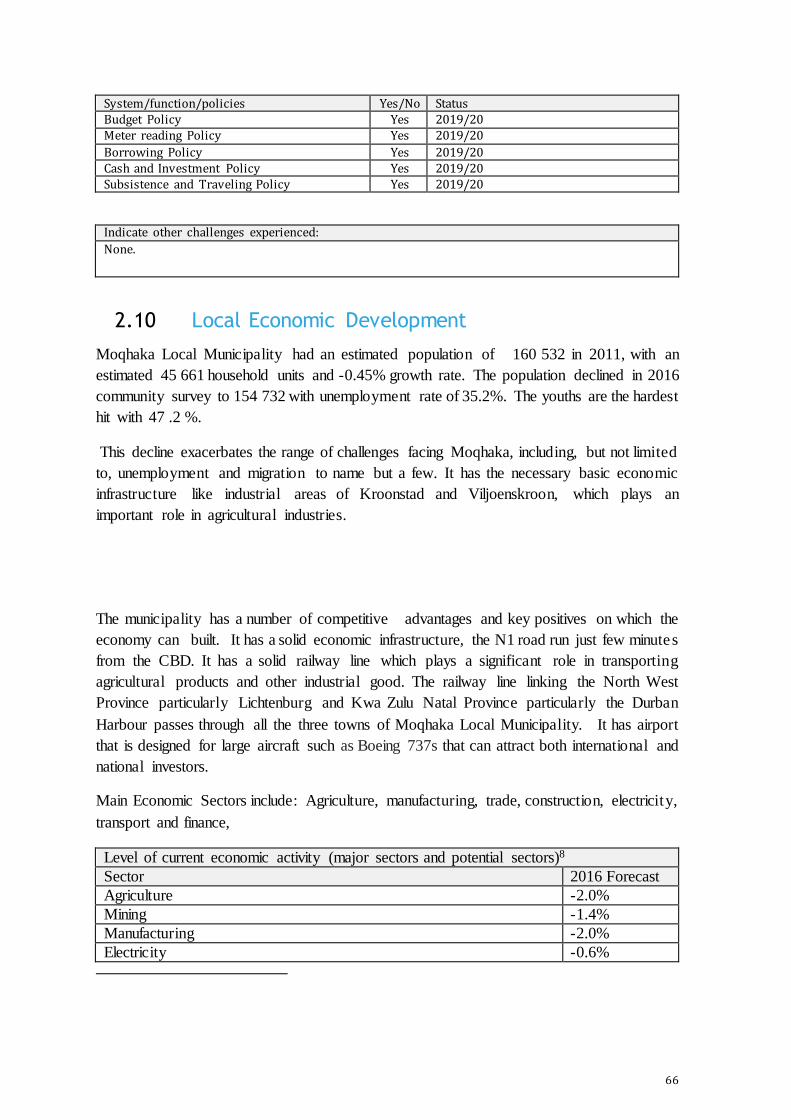
66
System/function/policies Yes/No Status Budget Policy Yes 2019/20 Meter reading Policy Yes 2019/20
Borrowing Policy Yes 2019/20 Cash and Investment Policy Yes 2019/20 Subsistence and Traveling Policy Yes 2019/20
Indicate other challenges experienced:
None.
2.10 Local Economic Development
Moqhaka Local Municipality had an estimated population of 160 532 in 2011, with an
estimated 45 661 household units and -0.45% growth rate. The population declined in 2016
community survey to 154 732 with unemployment rate of 35.2%. The youths are the hardest
hit with 47 .2 %.
This decline exacerbates the range of challenges facing Moqhaka, including, but not limited
to, unemployment and migration to name but a few. It has the necessary basic economic
infrastructure like industrial areas of Kroonstad and Viljoenskroon, which plays an
important role in agricultural industries.
The municipality has a number of competitive advantages and key positives on which the
economy can built. It has a solid economic infrastructure, the N1 road run just few minutes
from the CBD. It has a solid railway line which plays a significant role in transporting
agricultural products and other industrial good. The railway line linking the North West
Province particularly Lichtenburg and Kwa Zulu Natal Province particularly the Durban
Harbour passes through all the three towns of Moqhaka Local Municipality. It has airport
that is designed for large aircraft such as Boeing 737s that can attract both international and
national investors.
Main Economic Sectors include: Agriculture, manufacturing, trade, construction, electricity,
transport and finance,
Level of current economic activity (major sectors and potential sectors)8
Sector 2016 Forecast
Agriculture -2.0%
Mining -1.4%
Manufacturing -2.0%
Electricity -0.6%

67
Construction -0.7%
Trade -0.9%
Transport -0.4%
Finance -0.4%
Community services 0.6%
Total Industries -0.7%
The closure of two diamonds mine in the area, has negatively affected the economic standing
of the municipality which is progressively shifting towards agriculture, tourism and
transport. The largest areas of focus being black emerging farmers and the development
businesses. There are prospects of coal and methane gas in the area
The informal economy in the area is active – mainly wholesale and retail trade, home-based
catering and accommodation. However, are not linked to the town’s main economic
activities.
The economy is progressively shifting towards agriculture. Maokeng commonage
committee were assisted with the 5000L Jojo tank, Pit toilet with pedestal, 40mm plastic
pipe and Water pump generator
The informal economy

68
KRD Taxi rank
In Kroonstad, there is a marked growth in small informal businesses around the Selborne
Square which plays an important role in the economy of the town, the environment in which
the business was operating was (and some is still) just conducive and council intervened by
refurbishing one of the structures at the Taxi rank into stalls. The pictures above show the
environment where they used work. The picture also shows the intervention done
There is a need for a development path for Moqhaka that promotes economic growth,
reduces poverty and social marginalisation, making residents more resilient in terms of its
economy, natural and cultural landscapes. The municipality requires a participatory
approach to local economy where local citizens are consulted to shape the economy of the
area.
Economic Development Strategy
69
While the municipality has LED strategy, it is important to understand that the principal objective
of the Economic Strategy is to grow the economy and create jobs. It must respond to the most
fundamental challenges facing Moqhaka in the years ahead: unemployed, poverty and inequalities.
The council needs a different approach towards the implementation of the strategy. The “Thuma
Mina” campaign by the President suggests that we should not follow “business as usual approach”
As the demand for municipal services increases every year, this trajectory will be unsustainable in
the long-term unless incomes rise, and council revenue from households and businesses increases.
Part of the strategy is to adopt participatory approach focusing on a number of project including
tourism.
The appointment of the Director, Agriculture Development Officer and Enterprise Development
Officer will help see its functions and mandate carried.
Agriculture: Kroonstad is the center of a large agricultural community that plays an important
role in the economy of the district. However, 2016 saw the entire agricultural sector in the
province hit by severe drought that resulted in low harvest output and job losses. In terms of
current plans underway within MLM, supported by Fezile Dabi District. Initiatives have been
prioritized to grow the agricultural sector, such as diversification of agricultural products; and
Introduction of high value crops (“Fezile Dabi IDP 2014/15”). A draft plan, Rural Development
Plan for Moqhaka Local Municipality has been developed by the Department of Rural
Development and Land Reform in partnership with the Provincial Department of Agriculture
and Fezile Dabi District Municipality has been included in this plan and serves as a separate
document for a sector plan.
Mining: Mining remains one of the primary economic sectors within MLM through both De
Beers and Lace Mine diamond within +- 15 KM from Kroonstad CBD. Anglo Gold Ashanti
Kopanong Mine and possible re-opening of Vierfontein Colleries in the area of Viljoenskroon
also play the same important economic role. The Mining sector throughout the country is
under immense pressure that resulted into a bloodbath of job losses. An example of Lace Mine
becomes more relevant whereat 300 people lost their jobs in 2016 as the mine was placed
under business rescue, while De Beers, Voorspoed mine will be closing shop or selling
operations by 2019/20. Has stopped operations and the due to high costs of operation the
mine but confirm the pressure or availability of the kimberlite
Manufacturing: Mmanufacturing through locally based small enterprises in agriculture (for
example) has been identified as critical in growing the national export base necessary to grow
the economy. The Free State Provincial Department of Agriculture has identified areas within
the agriculture machinery that can positively contribute to grow and strengthen the
manufacturing and agro-processing sectors within Moqhaka through the proposed Farmer
Support Units contained in the Rural Development Plan.

70
Electricity: A 30MW power station, Power Station #2 was constructed in Kroonstad and was
commissioned in 1961. This power station replaced Power Station #1, which had reached
inadequate capacity. As Power Station #2 later also could not generate adequate electricity
to provide in the town’s increased demand in energy, it was utilised for peak lobbing and
therefor minimising on the maximum demand received from Eskom and significantly reducing
the monthly Eskom bill.
Unfortunately, the power station was shut down in June 1997 due to high operational costs
and an agreement reached with Eskom regarding favourable energy tariffs. Several services
providers have shown interest in returning the power station to service during the period since
it was shut down, but due to lack of maintenance, copper theft and vandalism considerable
offset capital would be required to refurbish the power station. However, the basic
infrastructure of the power station is still intact and presents an opportunity to be returned to
service.
Construction: This industry started to grow substantially in our historically disadvantaged
communities with the rollout of government’s housing provision to poor households known as
RDP houses. Skills were developed in this sector but not formalised and young people did not
really see the sector as worth investing in in terms of skills and knowledge. Small Medium and
Micro Enterprises continue to benefit in the construction sector through capital projects such
as housing, roads and storm-water infrastructure. These SMME’s are expected to work very
closely with our LED Directorate and other stakeholders like De Beers Voorspoed Mine, Zimele
Bussiness Hub to mentor and monitor their performance such that they become sustainable.
Public Transport Services: The municipality does not provide public transport but provides
requisite infrastructure through grant allocation for such facilities as taxi ranks, roads and
street infrastructure etc. A commuter rail line has historically been one of the main sources of
employment within the municipal jurisdiction. Opportunities for upgrade and maintenance of
the rail line with PRASA needs to be looked into taking into consideration the need to grow
our economy in agriculture, tourism and other related sectors.
Community services: The Department of Correctional Services and the Military School of
Engineering based in Kroonstad play a huge role in skills development and contribute
immensely in the development of the municipality and the Region as a whole.
Tourism: Moqhaka is located within the northern part of the Free State Province, which is
being promoted as one of the primary domestic tourism destination especially for the “week-
enders”. Existing tourism products that would have to be further developed to achieve
maximum value include those around the existing municipal nature conservation and heritage
sites such as the Vals River, Bloemhoek and Serfontein Dams renowned for water sports and
the Vredefort Dome. Extensive marketing of Kroonnpark as a preferred tourist destination in
this region should be closely looked into. The National Maize Producers Organisation

71
(NAMPO) annual show is another tourism venture that needs to be closely looked and invested
into.
DEVELOPMENT SECTOR PLAN ANALYSIS
The Fezile Dabi District Rural Development plan has been endorsed and signed by the District
Executive Mayor on 26/04/2017. This portion of the document is the Department of Rural
Development and Land Reform’s Sector plan to the Integrated Development Plan of the
Moqhaka Local Municipality. This DRDP fulfil the requirements vested in DRDLR by SPLUMA
sec 7(e)(ii) and sec 12(2)(a) of the Spatial Planning and Land Use Management Act, 16 of 2013
(see below) where it is required that we support Municipal Planning:
The following principles apply to spatial planning, land development and land use
management: “Sec 7 (e) (ii) all government departments must provide their sector inputs and
comply with any other prescribed requirements during the preparation or amendment of
spatial development frameworks;”
“Sec 12 (2) (a) The national government, a provincial government and a municipality must
participate in the spatial planning and land use management processes that impact on each
other to ensure that the plans and programmes are coordinated, consistent and in harmony
with each other.”
This document forms part of the current Integrated Development Plan cycle for the 2020/2021
financial year and serves as a sector plan for both the Integrated Development Plan as well as
the Spatial Development Framework as approved by the Council of Moqhaka Local
Municipality.

72
2.10.1 IMPLEMENTATION MATRIX
Moqhaka Municipality is a category B municipality – comprising Kroonstad, Maokeng, Viljoenskroon, Rammulotsi, Steynsrus, Matlwangtlwang in the Fezile
Dabi District. The following Table presents the projects based in the local municipality by category, type, objectives, priority, key stakeholders as well as
rural development alignment per project proposed for the broader Fezile Dabi Agri-park development:
Table 2: Prioritisation matrix and alignment analysis Towns Project Description
Po
vert
y p
ockets
Time Frame Stakeholders Functions
Fu
nc
tio
na
l R
eg
ion
N
um
be
r
Commodity Region Location Project Priority
Score (0-5)
Program 3 Program 4 & 5 2018/2
019
2019/2
020
2020/2
021
2021/2
022
Lo
ng
term
DM
R
DE
ST
EA
DA
RD
RO
AD
S
HE
AL
TH
CO
GT
A
ED
UC
AT
I
ON
RID
RE
ID
NA
RY
SE
C
Lan
d
Refo
rm
RE
CA
P
Pro
pert
y
Ten
ure
Resti
tuti
o
n
No
t
Ag
ricu
ltur
e r
ela
ted
Cere
al
Fru
it &
Veg
s
Fats
&
Oil
s
Po
ult
ry
Pro
tein
Pro
tein
Gam
e
Ag
riH
ub
FP
SU
1H
h1H
a
50/5
0
AL
DR
I
Oth
er
Wate
r
Clu
ste
r
Po
vert
y
Po
cket
Ag
ricu
ltur
e F
ocu
s
Reg
ion
A
gri
Park
/
FP
SU
To
tal
Viljoenskroon Middenspruit M x x x C x x
Kroonstad Zaaiplaats L x x x D x x
Kroonstad Mechanization project L x x x D x x
Kroonstad Brakfontein L x x x D x x
Steynsrust Makkawaans Bank No. 134 M X X B x x x • x
Kroonstad PSP for the design & construction
Monitoring of Kroonstaad FPSU Bulk Services & Logisticts Centre L x X D X x
Kroonstad Construction of Kroonstaad FPSU
Bulk Services & Logisticts Centre & Fencing
L x X D X x
Kroonstad Tot Hierna Toe farm Soil
Rehabilitation Heilbron - AVMP Community Workers
L x X D X x
Steynsrust Vreugde No 218,Uitzicht No 227,Boompe Alleen No.281,The
Kampsruit No.1753 and Begeerte
No. 299 M X X B X X X X X X
Kroonstad Cornerton No 2583 L X X D X X X X X X X X

73
Towns Project Description
Po
vert
y p
ockets
Time Frame Stakeholders Functions
Fu
nc
tio
na
l R
eg
ion
N
um
be
r
Commodity Region Location Project Priority Score (0-5)
Program 3 Program 4 & 5
2018/2
019
2019/2
020
2020/2
021
2021/2
022
Lo
ng
term
DM
R
DE
ST
EA
DA
RD
RO
AD
S
HE
AL
TH
CO
GT
A
ED
UC
AT
I
ON
RID
RE
ID
NA
RY
SE
C
Lan
d
Refo
rm
RE
CA
P
Pro
pert
y
Ten
ure
Resti
tuti
o
n
No
t
Ag
ricu
ltur
e r
ela
ted
Cere
al
Fru
it &
Veg
s
Fats
&
Oil
s
Po
ult
ry
Pro
tein
Pro
tein
Gam
e
Ag
riH
ub
FP
SU
1H
h1H
a
50/5
0
AL
DR
I
Oth
er
Wate
r
Clu
ste
r
Po
vert
y
Po
cket
Ag
ricu
ltur
e F
ocu
s
Reg
ion
A
gri
Park
/
FP
SU
To
tal
Kroonstad Goedehoop No.181
L X X D X X X X X X X X
Table 3: Primary Production Matrix
Town Name
PRIMARY PRODUCTION (CROPS) PRIMARY PRODUCTION (LIVESTOCK) OTHER PRIMARY SUPPORT
PR
IOR
ITIS
ATI
ON
SC
OR
E
FS Agricultural Master Plan Alignment
S o r g h u m
S o y a B e a n s M a i z e
W h e a t C a n o l a S u n
F l o w e r V e g e t a b l e s ( P o t a t o e s e t c ) L u c e r n e
W a l n u t / P e c a n
O li v e s G r o u n d n u t s F r u i t s ( a p p l e s e t c . ) M i x e d
G r a s s C a c t u s P e a r C R O P S S C O R E
H a t c h e r y B r o il e r B a t t e r y F e e d l o t C a t t l e
L i v e s t o c k h a n d li n g f a c il i t y S h e e p
G a m e
F a r m i n g L I V E S T O C K
S C O R E F e n c i n g
T o o l H i r e
L a b o r a t o r y M o b il e
L a b o r a t o r y L o g i s t i c s ( h a n d li n g f a c il i t y ) B a s i c C o ll e c t i o n
f a c il i t y S U P P O R T S C O R E
Edenville 2 2 2 2 2 2 2 0 0 2 2 0 5 2 25 0 0 0 0 2 2 5 5 14 2 0 0 0 0 5 7 46
Kroonstad 0 0 0 0 0 0 0 0 0 2 0 0 5 2 9 0 0 0 0 2 2 5 5 14 2 0 0 0 0 5 7 30
Steynsrus 2 0 0 2 0 0 0 0 0 2 0 0 5 2 13 0 0 0 5 5 5 5 5 25 5 0 0 5 5 5 20 58
Viljoenskroon 5 0 5 5 5 2 2 0 5 5 5 0 5 2 46 0 0 0 5 5 5 5 5 25 5 5 0 5 5 5 25 96
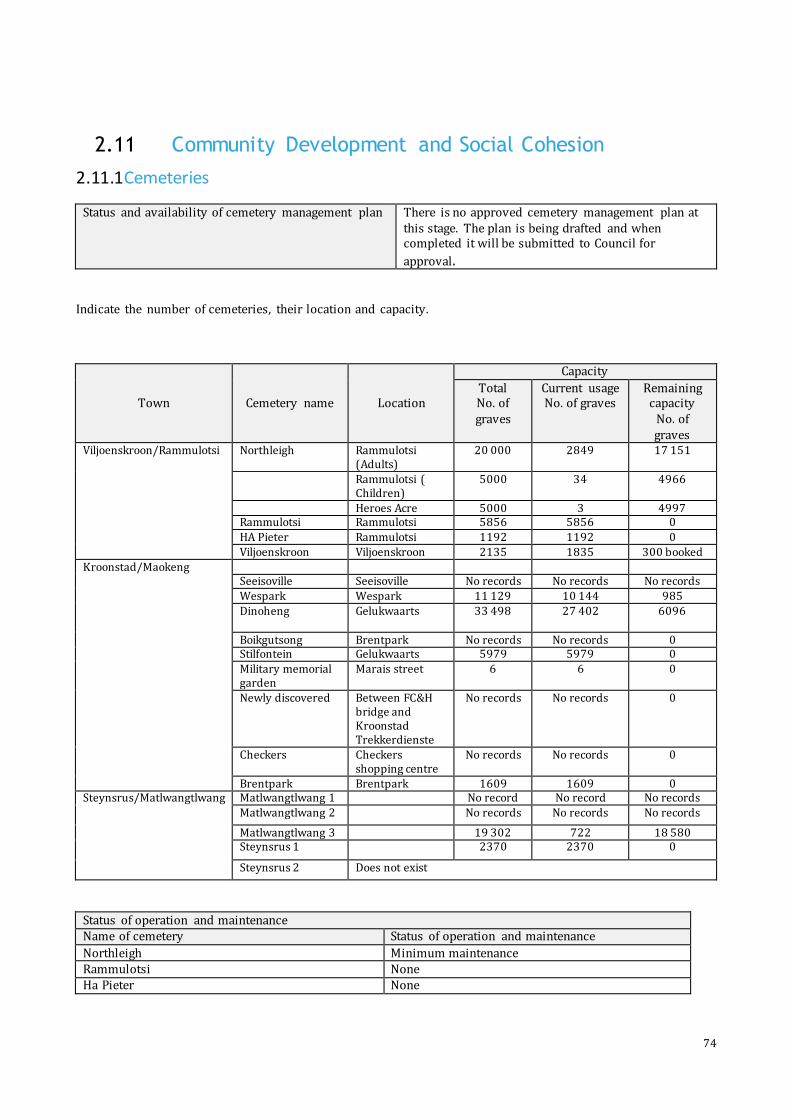
74
2.11 Community Development and Social Cohesion
2.11.1 Cemeteries
Status and availability of cemetery management plan There is no approved cemetery management plan at this stage. The plan is being drafted and when completed it will be submitted to Council for
approval.
Indicate the number of cemeteries, their location and capacity.
Town Cemetery name Location
Capacity
Total No. of graves
Current usage No. of graves
Remaining capacity
No. of graves
Viljoenskroon/Rammulotsi Northleigh Rammulotsi (Adults)
20 000 2849 17 151
Rammulotsi ( Children)
5000 34 4966
Heroes Acre 5000 3 4997 Rammulotsi Rammulotsi 5856 5856 0
HA Pieter Rammulotsi 1192 1192 0 Viljoenskroon Viljoenskroon 2135 1835 300 booked
Kroonstad/Maokeng Seeisoville Seeisoville No records No records No records Wespark Wespark 11 129 10 144 985
Dinoheng Gelukwaarts 33 498 27 402
6096
Boikgutsong Brentpark No records No records 0 Stilfontein Gelukwaarts 5979 5979 0 Military memorial garden
Marais street 6 6 0
Newly discovered Between FC&H bridge and Kroonstad Trekkerdienste
No records No records 0
Checkers Checkers shopping centre
No records No records 0
Brentpark Brentpark 1609 1609 0 Steynsrus/Matlwangtlwang Matlwangtlwang 1 No record No record No records
Matlwangtlwang 2 No records No records No records
Matlwangtlwang 3 19 302 722 18 580 Steynsrus 1 2370 2370 0
Steynsrus 2 Does not exist
Status of operation and maintenance Name of cemetery Status of operation and maintenance
Northleigh Minimum maintenance Rammulotsi None Ha Pieter None
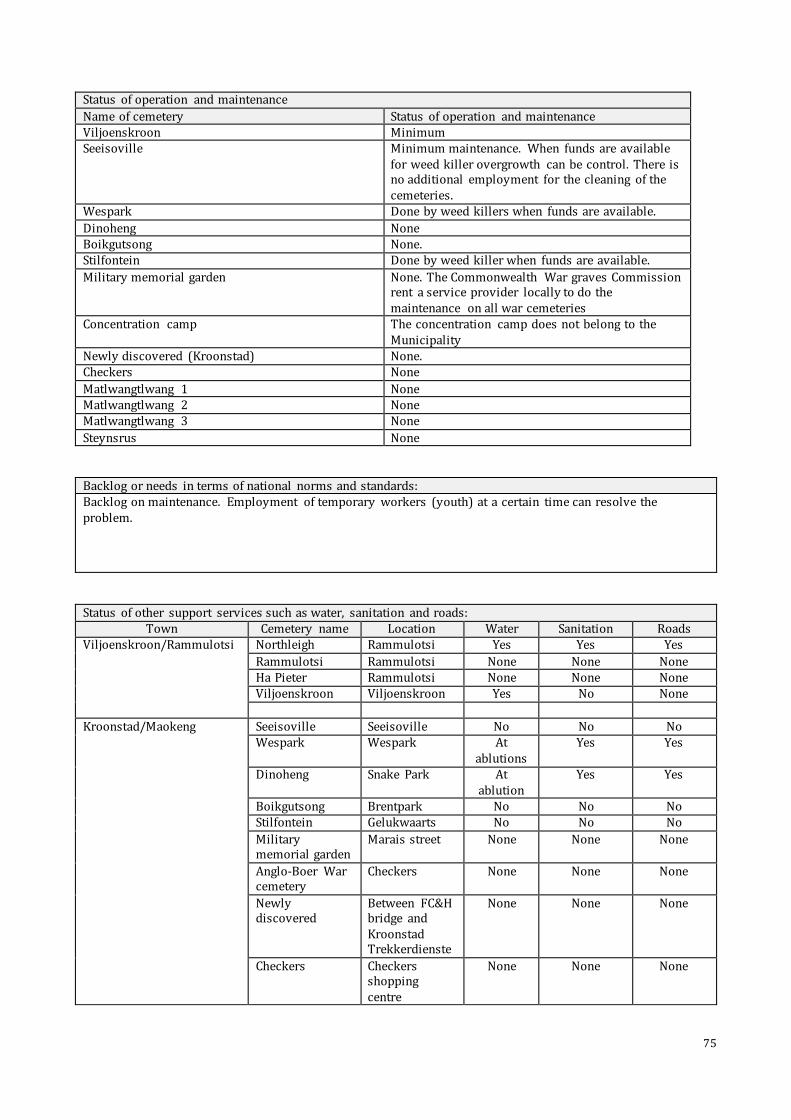
75
Status of operation and maintenance
Name of cemetery Status of operation and maintenance Viljoenskroon Minimum Seeisoville Minimum maintenance. When funds are available
for weed killer overgrowth can be control. There is no additional employment for the cleaning of the cemeteries.
Wespark Done by weed killers when funds are available.
Dinoheng None Boikgutsong None. Stilfontein Done by weed killer when funds are available.
Military memorial garden None. The Commonwealth War graves Commission rent a service provider locally to do the maintenance on all war cemeteries
Concentration camp The concentration camp does not belong to the Municipality
Newly discovered (Kroonstad) None. Checkers None
Matlwangtlwang 1 None Matlwangtlwang 2 None Matlwangtlwang 3 None
Steynsrus None
Backlog or needs in terms of national norms and standards: Backlog on maintenance. Employment of temporary workers (youth) at a certain time can resolve the problem.
Status of other support services such as water, sanitation and roads: Town Cemetery name Location Water Sanitation Roads
Viljoenskroon/Rammulotsi Northleigh Rammulotsi Yes Yes Yes
Rammulotsi Rammulotsi None None None Ha Pieter Rammulotsi None None None Viljoenskroon Viljoenskroon Yes No None
Kroonstad/Maokeng Seeisoville Seeisoville No No No
Wespark Wespark At ablutions
Yes Yes
Dinoheng Snake Park At ablution
Yes Yes
Boikgutsong Brentpark No No No Stilfontein Gelukwaarts No No No
Military memorial garden
Marais street None None None
Anglo-Boer War cemetery
Checkers None None None
Newly discovered
Between FC&H bridge and Kroonstad Trekkerdienste
None None None
Checkers Checkers shopping centre
None None None

76
Status of other support services such as water, sanitation and roads:
Town Cemetery name Location Water Sanitation Roads Steynsrus/Matlwangtlwang Matlwangtlwang
1 No No No
Matlwangtlwang 2
No No No
Matlwangtlwang 3
Yes None None
Steynsrus Yes No None
Indicate other challenges experienced: Budget for expansion of cemeteries.
2.11.2 Sport and Recreation
Status and availability of sport and recreation plan (Sector Plan).
There is a draft policy for sports and Recreational policy which still need to follow the right procedure to be approved. This plan has been sent through to different stakeholders for their inputs and comments.
Indicate the number of facilities, their location and status (condition):
Stadiums
Location Name of Facility Status
(Condition)
Status of Operation and Maintenance
Challenges
Kroonstad Loubserpark Stadium
Good Athletic court completed.
Parking area in a poor state and unsafe. Required equipment for athletics. General workers needed.
Brentpark Brentpark stadium Upgraded but incomplete
Poor No general workers appointed. Ablutions flooded.
Kroonstad-Maokeng Seeisoville stadium Average Average Not according to need and national standard
Kroonstad-Gelukwaarts
No name Very poor No basic services Funds
Viljoenskroon Very poor Cutting of grass done
No fence, no access control. No funds
Matlwangtlwang Matlwangtlwang Poor Poor No employment
Stadium Backlogs: Upgrading not on National standard, work half done at Brentpark, Gelukwaarts and Rammulotsi stadiums. A lack of water in Matlwangtlwang caused playfield unplayable.
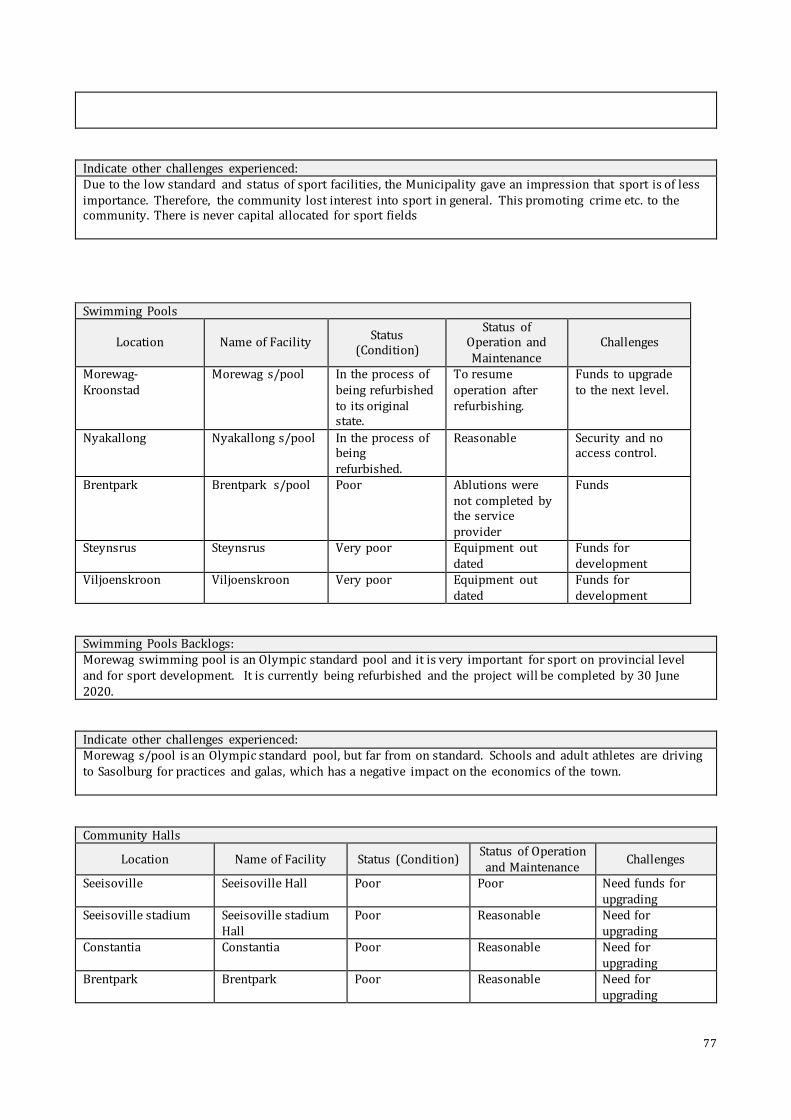
77
Indicate other challenges experienced: Due to the low standard and status of sport facilities, the Municipality gave an impression that sport is of less importance. Therefore, the community lost interest into sport in general. This promoting crime etc. to the community. There is never capital allocated for sport fields
Swimming Pools
Location Name of Facility Status
(Condition)
Status of Operation and Maintenance
Challenges
Morewag- Kroonstad
Morewag s/pool In the process of being refurbished to its original state.
To resume operation after refurbishing.
Funds to upgrade to the next level.
Nyakallong Nyakallong s/pool In the process of being refurbished.
Reasonable Security and no access control.
Brentpark Brentpark s/pool Poor Ablutions were not completed by the service provider
Funds
Steynsrus Steynsrus Very poor Equipment out dated
Funds for development
Viljoenskroon Viljoenskroon Very poor Equipment out dated
Funds for development
Swimming Pools Backlogs: Morewag swimming pool is an Olympic standard pool and it is very important for sport on provincial level and for sport development. It is currently being refurbished and the project will be completed by 30 June 2020.
Indicate other challenges experienced: Morewag s/pool is an Olympic standard pool, but far from on standard. Schools and adult athletes are driving to Sasolburg for practices and galas, which has a negative impact on the economics of the town.
Community Halls
Location Name of Facility Status (Condition) Status of Operation
and Maintenance Challenges
Seeisoville Seeisoville Hall Poor Poor Need funds for upgrading
Seeisoville stadium Seeisoville stadium Hall
Poor Reasonable Need for upgrading
Constantia Constantia Poor Reasonable Need for upgrading
Brentpark Brentpark Poor Reasonable Need for upgrading

78
Community Halls
Location Name of Facility Status (Condition) Status of Operation
and Maintenance Challenges
Nyakallong Nyakallong Poor Reasonable Need for upgrading
Kroonstad Loubserpark Good Good None
Viljoenskroon Viljoenskroon Town Hall
Poor Poor Need for upgrading but no funds
Rammulotsi Tshepahalo hall Some parts were burn
Poor Needs total over haul.
Steynsrus Town Hall Poor Reasonable Need for upgrading
Matlwangtlwang Marlwangtlwang Poor Poor, damaged by public protest
Need for upgrading
Community Halls Backlogs: In a very poor condition. Roofs are leaking; the ablutions of some of the halls are in a terrible stage.
Parks
Location Name of Facility Status (Condition) Status of Operation
and Maintenance Challenges
Elandia Elandia Poor Poor Lack of water Suidrand- informal Siudrand Poor Poor Poor
Parks Backlogs: No development due to a lack of funds
Resorts
Location Name of Facility
Status (Condition) Status of
Operation and Maintenance
Challenges
Maokeng Nyakallong Resort
Undergoing renovations/refurbishment
Poor but will improve as renovation is completed.
No fence, s/pool deteriorating. The Lapa was vandalised.
Resorts Backlogs: None
Indicate other challenges experienced: Due to poor condition of the facilities, it cannot be used to its full capacity, but we hope it will improve after renovation.
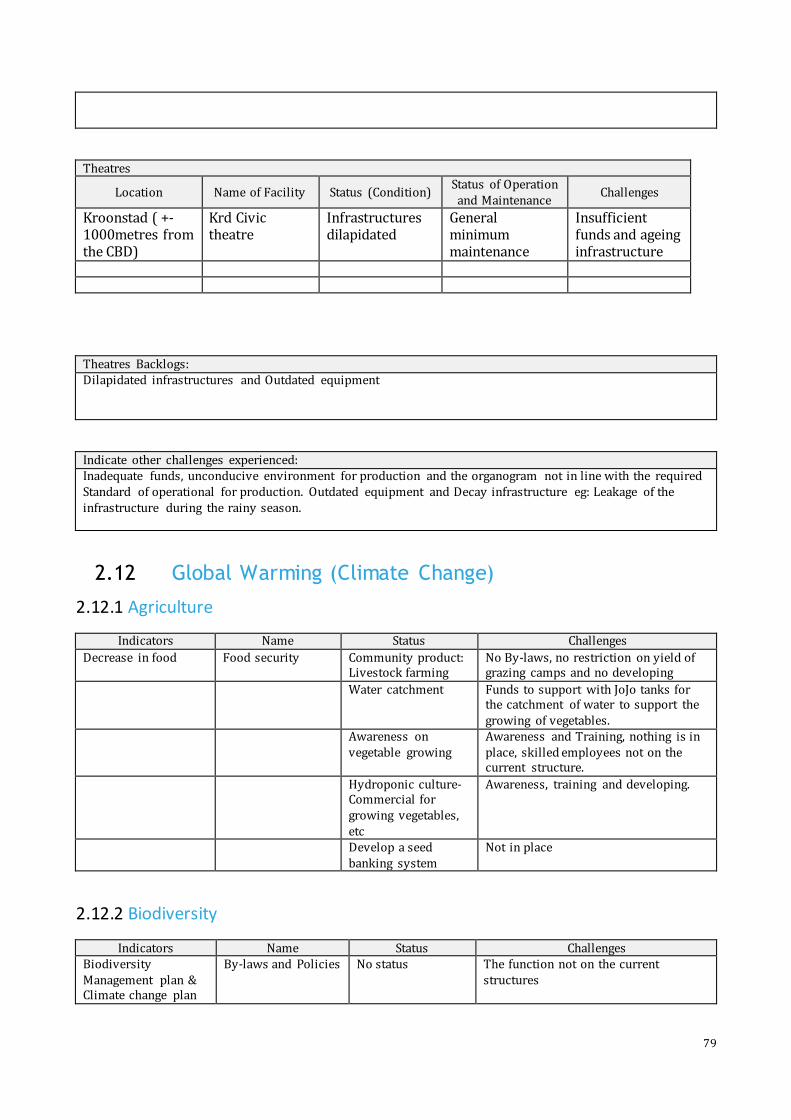
79
Theatres
Location Name of Facility Status (Condition) Status of Operation
and Maintenance Challenges
Kroonstad ( +-1000metres from the CBD)
Krd Civic theatre
Infrastructures dilapidated
General minimum maintenance
Insufficient funds and ageing infrastructure
Theatres Backlogs: Dilapidated infrastructures and Outdated equipment
Indicate other challenges experienced: Inadequate funds, unconducive environment for production and the organogram not in line with the required Standard of operational for production. Outdated equipment and Decay infrastructure eg: Leakage of the infrastructure during the rainy season.
2.12 Global Warming (Climate Change)
2.12.1 Agriculture
Indicators Name Status Challenges
Decrease in food Food security Community product: Livestock farming
No By-laws, no restriction on yield of grazing camps and no developing
Water catchment Funds to support with JoJo tanks for the catchment of water to support the growing of vegetables.
Awareness on vegetable growing
Awareness and Training, nothing is in place, skilled employees not on the current structure.
Hydroponic culture-Commercial for growing vegetables, etc
Awareness, training and developing.
Develop a seed banking system
Not in place
2.12.2 Biodiversity
Indicators Name Status Challenges Biodiversity Management plan & Climate change plan
By-laws and Policies No status The function not on the current structures

80
Water catchment forums
Water catchment forum
None To promote the importance hereof
Greening Planting of trees Low Function not in the Structure.
2.13.2 Housing
Status of sector plan (Housing Sector Plan) Approved National target for housing service Approved service level/standard for municipality. Total HHs RDP and above Below RDP No service Interventions required to
address backlogs 45 661 Provision of bulk
infrastructure services
What are the reasons for HHs without access or below RDP access? Lack serviced residential erven. Erven are planned and surveyed but without infrastructure services.
Name of Area or Settlement No. of Housing Backlog No. of Identified Housing Needs.
Kroonstad 500 Maokeng and Brentpark 9 120 Viljoenskroon 200 Rammulotsi 3 354 Matlwangtlwang 1 060
Indicate other challenges not highlighted above Provision of bulk infrastructure Extension of bulk water services.

81
Chapter 3: Ward Analysis
3.1 Introduction
The IDP is about determining the stakeholder and community needs and priorities which need to be
addressed to contribute to the improvement of the quality of life of residents within the Municipal Area.
Various stakeholders, sector departments and members of the community were involved during the IDP
development process and in the process 22 out of 23 ward and 2 stakeholders’ meetings were held. This
process has been incorporated in the budget process to cover wards left out during the first round of
meetings. It is with inputs from these meetings that we need to start working on the compilation of Ward
Development Plans in pursuit of achieving ward-based planning. Development Plans include an analysis of
the ward, needs identification, and plans to address priorities, support needed from the Municipality and
other stakeholders involved in the IDP process.
The Municipality has also partnered and conducted different engagements that have been introduced in the
province such as Provincial IDP Managers Forum and the District IDP Managers Forum. The IDP meetings
contributes in finding solutions by reaching agreements with sector departments on enhancing service by
addressing community issues that are sector-specific. IDP priorities have been derived from the priorities
from the wards, as have many elements of the plans, as well as IDP projects.
The wards illustrated above can be described as follows:
Table 4: Ward Description
Ward Description
Ward 1 Matlwangtlwang
Ward 2 Steynsrus
Ward 3 Kroonstad
Ward 4 Maokeng
Ward 5 Maokeng
Ward 6 Maokeng
Ward 7 Maokeng
Ward 8 Maokeng
Ward 9 Maokeng
Ward 10 Maokeng
Ward 11 Maokeng
Ward 12 Maokeng
Ward 13 Maokeng
Ward 14 Maokeng
Ward 15 Maokeng

82
Ward Description
Ward 16 Kroonstad
Ward 17 Kroonstad
Ward 18 Rammulotsi
Ward 19 Rammulotsi
Ward 20 Rammulotsi
Ward 21 Rammulotsi
Ward 22 Vierfontein/Vaal Reef
Ward 23 Viljoenskroon/Rammulotsi

83
3.2 Population Statistics per ward
3.2.1 Population and Gender Distribution per ward
The population distribution in the municipal area is shown in the figure below.
Figure 106: Total Population by population group9
Africans are 87.19% and Coloured 2.86% of the total population. Indian/Asian are 0.33% and whites make
out 9.32% of the total population. The population distribution per ward in the municipal area is shown in the
table below. The female population is 50.49% of the total population. The population per population group
and gender per ward is shown in the table below.
9 Data Source: Statistics South Africa, Census 2011 (2016 Boundaries)
0
10000
20000
30000
40000
50000
60000
70000
80000
Black Male BlackFemale
ColouredMale
ColouredFemale
Indian orAsianMale
Indian orAsian
Female
WhiteMale
WhiteFemale
OtherMale
OtherFemale
Total Population
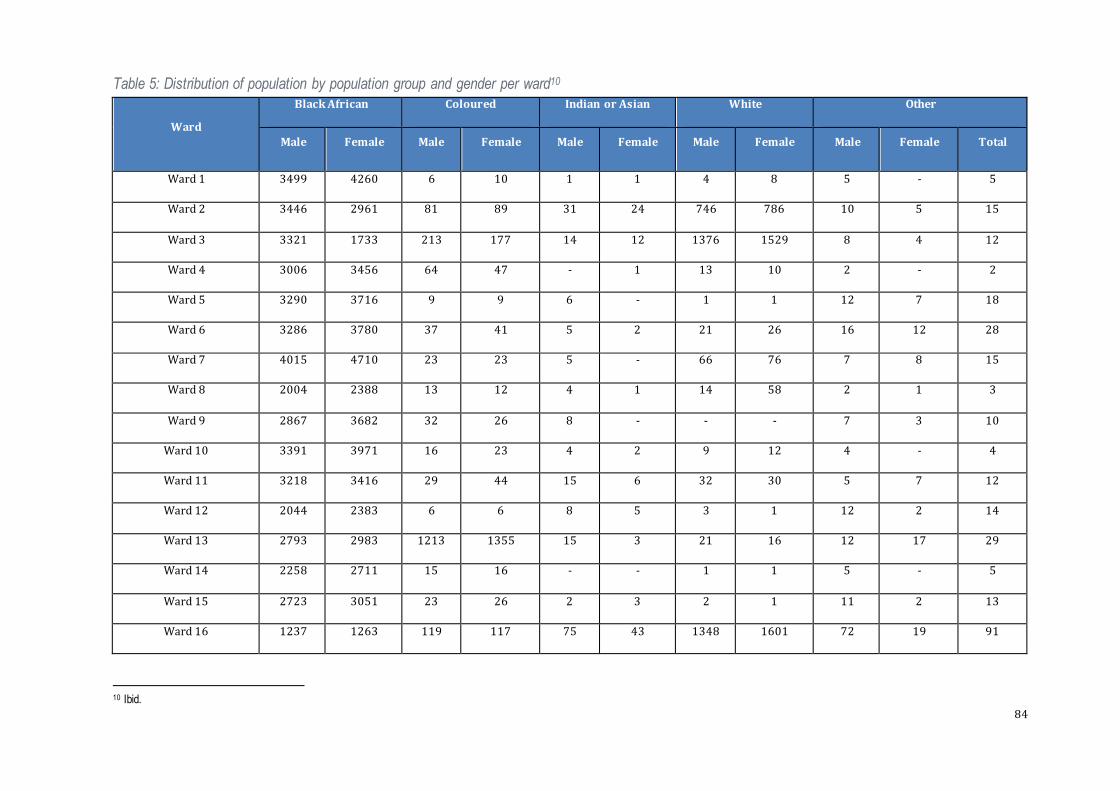
84
Table 5: Distribution of population by population group and gender per ward10
Ward
Black African Coloured Indian or Asian White Other
Male Female Male Female Male Female Male Female Male Female Total
Ward 1 3499 4260 6 10 1 1 4 8 5 - 5
Ward 2 3446 2961 81 89 31 24 746 786 10 5 15
Ward 3 3321 1733 213 177 14 12 1376 1529 8 4 12
Ward 4 3006 3456 64 47 - 1 13 10 2 - 2
Ward 5 3290 3716 9 9 6 - 1 1 12 7 18
Ward 6 3286 3780 37 41 5 2 21 26 16 12 28
Ward 7 4015 4710 23 23 5 - 66 76 7 8 15
Ward 8 2004 2388 13 12 4 1 14 58 2 1 3
Ward 9 2867 3682 32 26 8 - - - 7 3 10
Ward 10 3391 3971 16 23 4 2 9 12 4 - 4
Ward 11 3218 3416 29 44 15 6 32 30 5 7 12
Ward 12 2044 2383 6 6 8 5 3 1 12 2 14
Ward 13 2793 2983 1213 1355 15 3 21 16 12 17 29
Ward 14 2258 2711 15 16 - - 1 1 5 - 5
Ward 15 2723 3051 23 26 2 3 2 1 11 2 13
Ward 16 1237 1263 119 117 75 43 1348 1601 72 19 91
10 Ibid.

85
Ward
Black African Coloured Indian or Asian White Other
Male Female Male Female Male Female Male Female Male Female Total
Ward 17 568 536 86 99 54 60 1675 1797 23 21 44
Ward 18 3953 4243 22 30 8 1 111 101 19 2 21
Ward 19 3526 4058 29 31 21 - 3 4 10 - 10
Ward 20 2386 2620 11 10 7 2 1 2 8 - 8
Ward 21 4406 4513 62 52 28 1 405 317 33 12 45
Ward 22 5259 1376 94 54 26 7 493 480 7 3 10
Ward 23 2862 2803 56 40 16 3 832 930 42 11 53
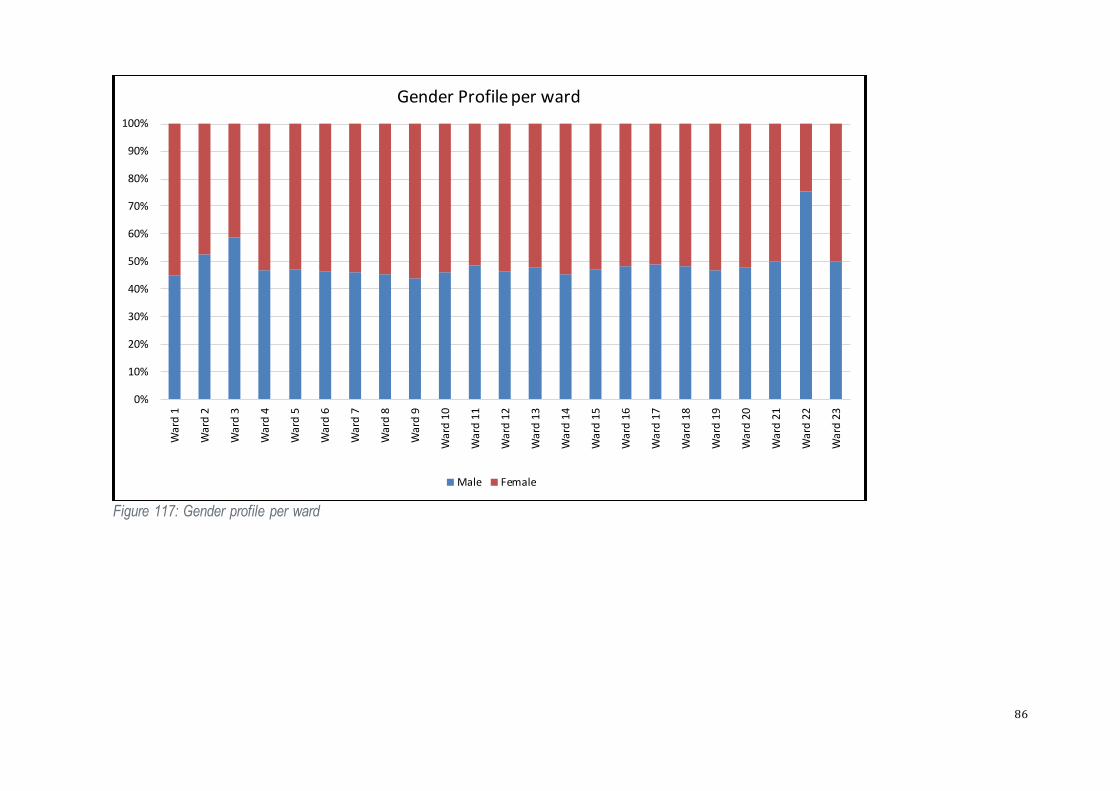
86
Figure 117: Gender profile per ward
0%
10%
20%
30%
40%
50%
60%
70%
80%
90%
100%
W
ard
1
W
ard
2
W
ard
3
W
ard
4
W
ard
5
W
ard
6
W
ard
7
W
ard
8
W
ard
9
W
ard
10
W
ard
11
W
ard
12
W
ard
13
W
ard
14
W
ard
15
W
ard
16
W
ard
17
W
ard
18
W
ard
19
W
ard
20
W
ard
21
W
ard
22
W
ard
23
Gender Profile per ward
Male Female

87
3.2.2 Distribution of population aged 5 years and older by level of education per ward
Table 6: Distribution of population by level of education per ward11
Ward
Level of education
No schooling Some primary Completed
primary Some secondary Grade 12/Std10 Higher
Ward 1 509 2818 444 2129 746 140
Ward 2 475 2159 501 1989 793 371
Ward 3 44 662 98 1313 1715 844
Ward 4 325 1750 347 2123 1221 88
Ward 5 483 1940 377 2188 1151 88
Ward 6 253 1805 361 2408 1394 194
Ward 7 315 2544 478 2483 1893 238
Ward 8 120 920 226 1408 958 267
Ward 9 226 1521 299 2230 1323 352
Ward 10 183 1676 378 2332 1605 507
Ward 11 217 1504 325 2108 1154 312
Ward 12 110 1072 214 1479 921 222
Ward 13 290 2161 507 2758 1496 176
11 Ibid.

88
Ward
Level of education
No schooling Some primary Completed
primary Some secondary Grade 12/Std10 Higher
Ward 14 101 1132 236 1613 1048 351
Ward 15 157 1320 288 1945 1259 277
Ward 16 61 635 121 1319 1956 829
Ward 17 65 612 108 809 1510 1187
Ward 18 389 2642 538 2512 1055 227
Ward 19 803 2270 472 2262 809 115
Ward 20 287 1489 350 1602 566 111
Ward 21 591 2678 686 2925 1315 397
Ward 22 137 736 233 1002 466 148
Ward 23 356 2023 462 2016 1149 435

89
3.2.3 Distribution of population by age groups and gender per ward
Table 7: Distribution of population by age group and gender per ward12
Ward
0 - 14 Children) 15 - 34 (Youth) 35 - 64 (Adult) 65 + (Elderly) Total
Male Female Total Male Female Total Male Female Total Male Female Total Male Female Total
Ward 1 1415 1417 2832 1236 1409 2644 716 1110 1826 148 344 492 3515 4279 7794
Ward 2 1003 958 1961 1628 1385 3014 1413 1222 2635 269 300 569 4314 3866 8179
Ward 3 547 535 1083 2674 1279 3952 1444 1247 2691 266 395 661 4931 3456 8387
Ward 4 1039 1040 2079 1139 1143 2282 795 1083 1878 113 248 360 3085 3514 6599
Ward 5 1142 1128 2270 1253 1247 2499 840 1179 2019 83 179 262 3318 3732 7050
Ward 6 1072 1084 2156 1268 1311 2579 901 1242 2143 124 224 348 3365 3861 7226
Ward 7 1334 1353 2687 1447 1559 3006 1186 1591 2776 149 313 462 4116 4816 8932
Ward 8 583 573 1155 762 765 1527 577 819 1396 115 303 419 2037 2460 4497
Ward 9 852 946 1798 1033 1109 2142 857 1270 2127 173 387 560 2915 3712 6627
Ward 10 1031 1035 2066 1254 1243 2498 986 1441 2427 151 289 440 3423 4008 7431
Ward 11 888 873 1761 1232 1153 2385 1004 1102 2105 175 375 550 3299 3503 6802
Ward 12 583 601 1184 762 739 1501 583 724 1307 145 333 478 2073 2397 4470
Ward 13 1228 1280 2508 1450 1437 2888 1243 1389 2632 133 269 401 4054 4375 8428
Ward 14 711 730 1441 824 903 1727 653 925 1577 91 171 262 2279 2729 5008
Ward 15 783 772 1554 991 1032 2023 855 952 1807 132 328 460 2761 3084 5845
Ward 16 518 502 1020 1086 1114 2200 990 976 1966 258 452 709 2852 3044 5896
Ward 17 513 443 956 556 585 1141 1047 1118 2165 292 368 660 2407 2514 4921
12 Ibid.
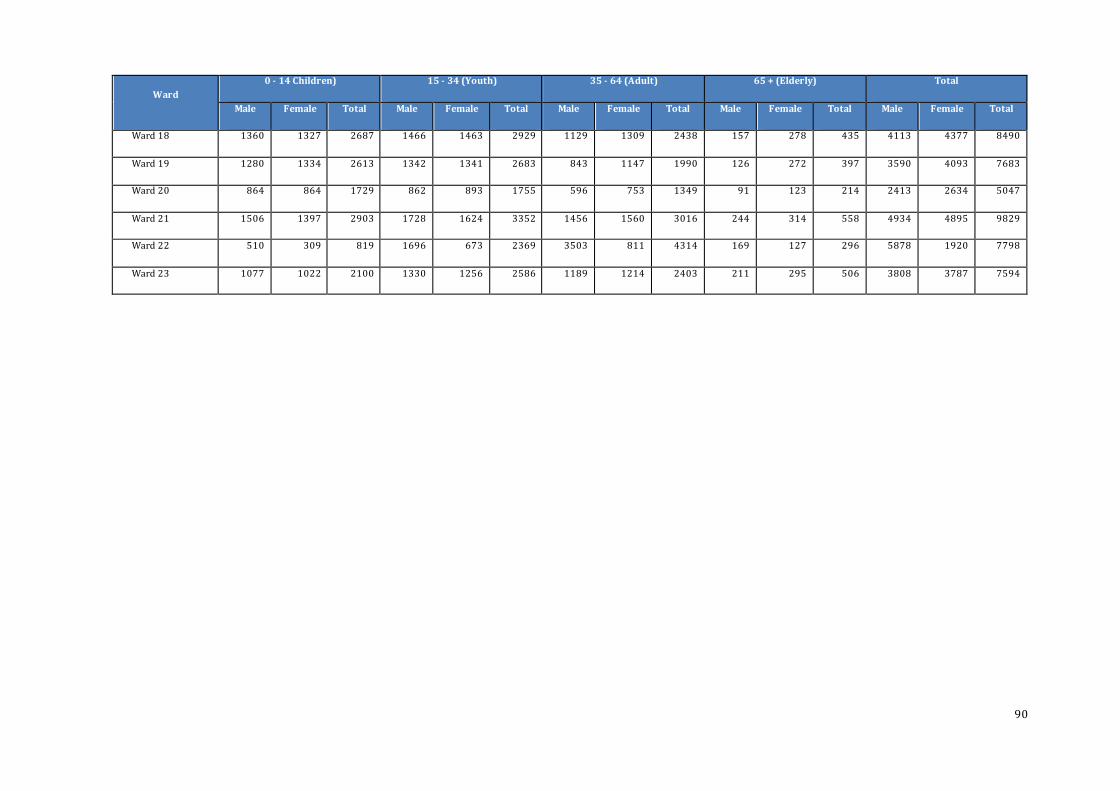
90
Ward
0 - 14 Children) 15 - 34 (Youth) 35 - 64 (Adult) 65 + (Elderly) Total
Male Female Total Male Female Total Male Female Total Male Female Total Male Female Total
Ward 18 1360 1327 2687 1466 1463 2929 1129 1309 2438 157 278 435 4113 4377 8490
Ward 19 1280 1334 2613 1342 1341 2683 843 1147 1990 126 272 397 3590 4093 7683
Ward 20 864 864 1729 862 893 1755 596 753 1349 91 123 214 2413 2634 5047
Ward 21 1506 1397 2903 1728 1624 3352 1456 1560 3016 244 314 558 4934 4895 9829
Ward 22 510 309 819 1696 673 2369 3503 811 4314 169 127 296 5878 1920 7798
Ward 23 1077 1022 2100 1330 1256 2586 1189 1214 2403 211 295 506 3808 3787 7594

91
3.2.4 Households by type of tenure
The total households by type of tenure is shown in the figure below.
Figure 128: Tenure status
28%
7%
13%
49%
3%
Tenure Status
Rented Owned but not yet paid off Occupied rent-free Owned and fully paid off Other

92
Table 8: Households by type of tenure per ward13
Ward
Tenure Status
Total Rented
Owned but not yet
paid off Occupied rent-free
Owned and fully paid
off Other
Ward 1 539 79 210 1312 42 2182
Ward 2 649 134 948 406 35 2172
Ward 3 676 501 40 654 14 1885
Ward 4 378 22 464 935 44 1843
Ward 5 485 61 112 1193 26 1877
Ward 6 454 187 185 1135 9 1970
Ward 7 599 168 225 1433 47 2472
Ward 8 280 33 79 964 1 1357
Ward 9 478 34 209 1412 9 2142
Ward 10 320 296 65 1423 134 2237
Ward 11 880 51 222 810 196 2159
Ward 12 431 1 134 873 7 1446
Ward 13 934 239 415 1040 77 2705
Ward 14 170 186 196 941 20 1513
Ward 15 1015 18 102 993 68 2196
13 Ibid

93
Ward
Tenure Status
Total Rented
Owned but not yet
paid off Occupied rent-free
Owned and fully paid
off Other
Ward 16 1271 332 22 524 17 2165
Ward 17 315 629 117 605 25 1691
Ward 18 533 29 363 1322 18 2265
Ward 19 189 21 201 1277 183 1871
Ward 20 373 31 171 632 72 1278
Ward 21 630 53 902 1218 122 2926
Ward 22 628 62 225 179 14 1107
Ward 23 562 214 442 951 37 2205
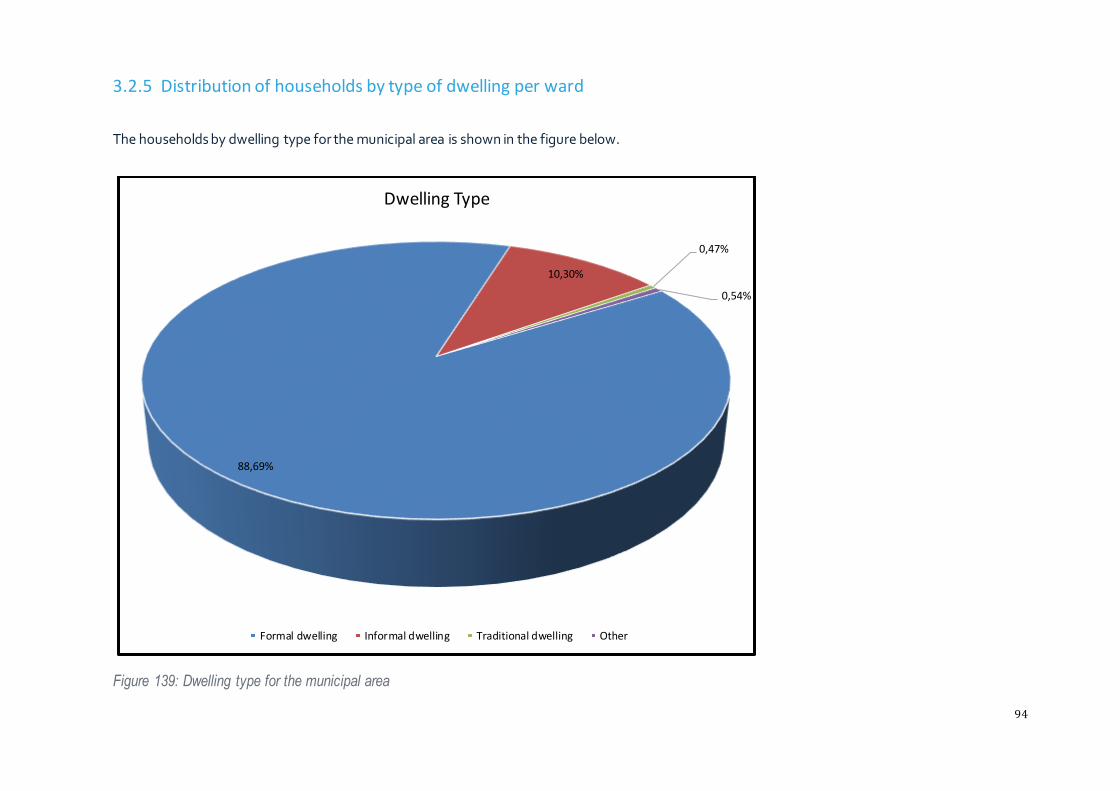
94
3.2.5 Distribution of households by type of dwelling per ward
The households by dwelling type for the municipal area is shown in the figure below.
Figure 139: Dwelling type for the municipal area
88,69%
10,30%
0,47%
0,54%
Dwelling Type
Formal dwelling Informal dwelling Traditional dwelling Other
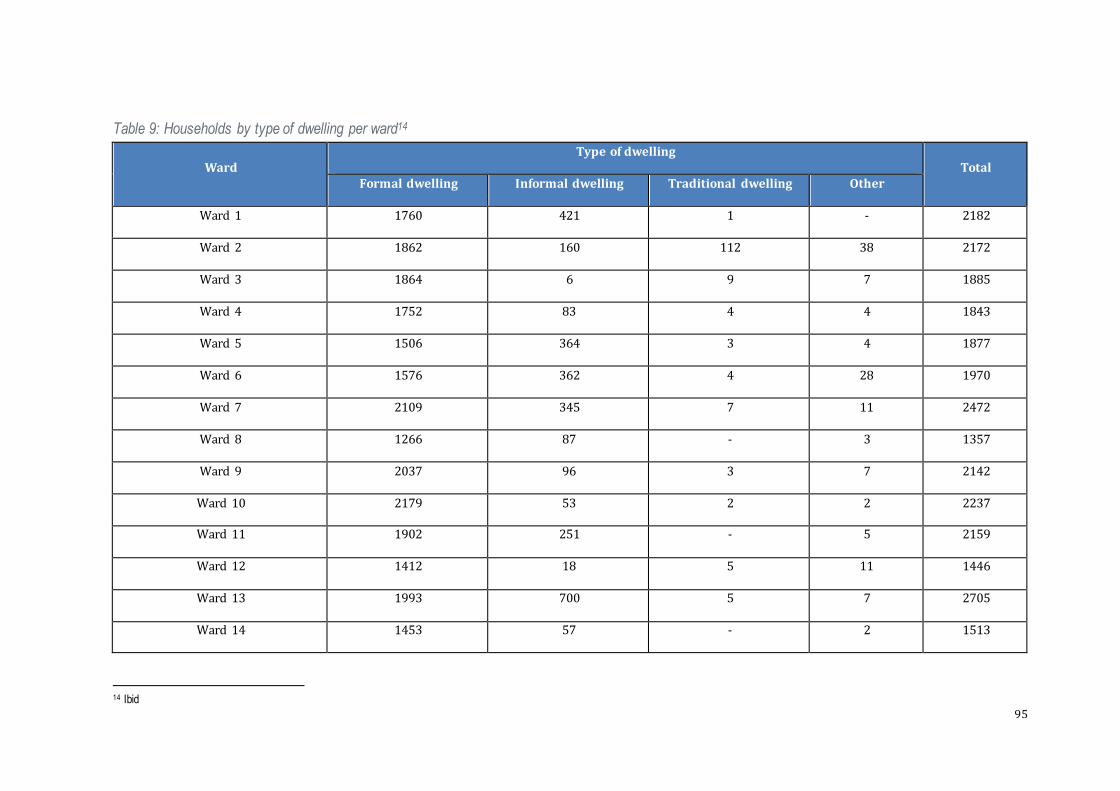
95
Table 9: Households by type of dwelling per ward14
Ward Type of dwelling
Total Formal dwelling Informal dwelling Traditional dwelling Other
Ward 1 1760 421 1 - 2182
Ward 2 1862 160 112 38 2172
Ward 3 1864 6 9 7 1885
Ward 4 1752 83 4 4 1843
Ward 5 1506 364 3 4 1877
Ward 6 1576 362 4 28 1970
Ward 7 2109 345 7 11 2472
Ward 8 1266 87 - 3 1357
Ward 9 2037 96 3 7 2142
Ward 10 2179 53 2 2 2237
Ward 11 1902 251 - 5 2159
Ward 12 1412 18 5 11 1446
Ward 13 1993 700 5 7 2705
Ward 14 1453 57 - 2 1513
14 Ibid
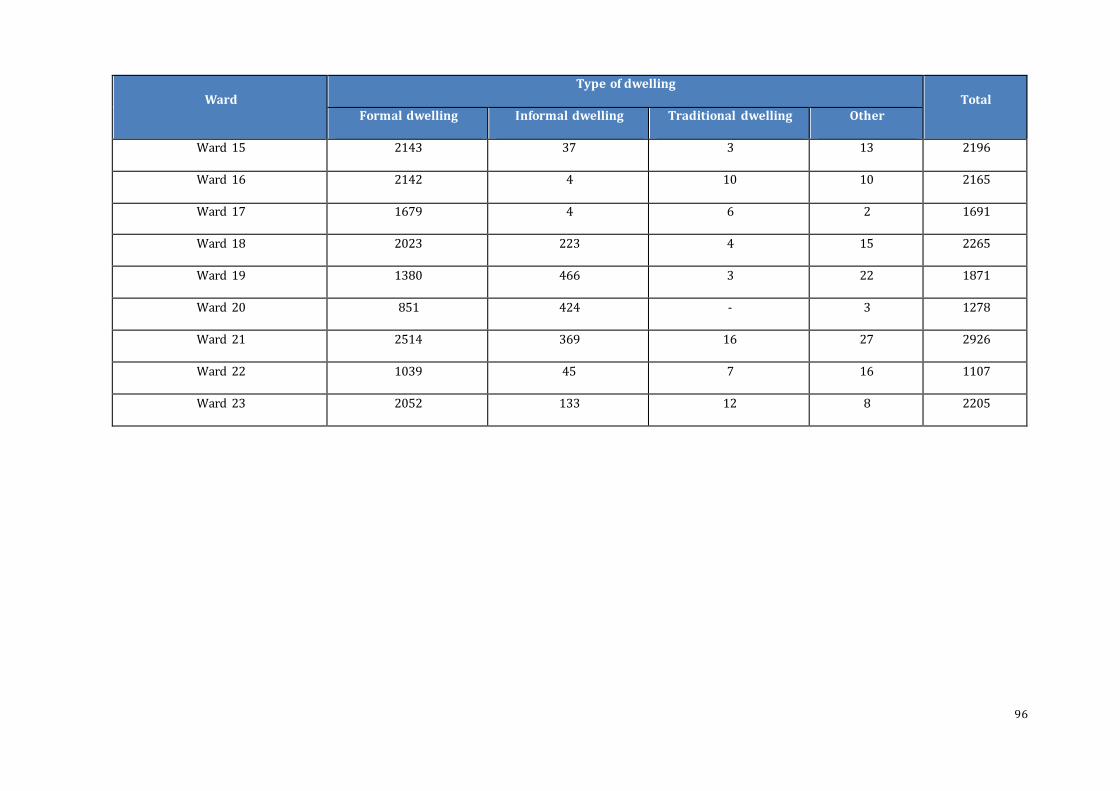
96
Ward Type of dwelling
Total Formal dwelling Informal dwelling Traditional dwelling Other
Ward 15 2143 37 3 13 2196
Ward 16 2142 4 10 10 2165
Ward 17 1679 4 6 2 1691
Ward 18 2023 223 4 15 2265
Ward 19 1380 466 3 22 1871
Ward 20 851 424 - 3 1278
Ward 21 2514 369 16 27 2926
Ward 22 1039 45 7 16 1107
Ward 23 2052 133 12 8 2205

97
3.3 Service Statistics per Ward
The following is a summary of critical ward information based on the Census 2011 results.
3.3.1 Households with access to piped (tap) water per ward
Table 10: Households with access to piped water per ward15
Ward
Piped water
Piped (tap) water inside the
dwelling/yard
Piped (tap) water on community
stand
No access to piped
(tap) water Total
Ward 1 2016 132 33 2182
Ward 2 1691 415 66 2172
Ward 3 1872 8 5 1885
Ward 4 1773 55 14 1843
Ward 5 1866 7 4 1877
Ward 6 1881 79 10 1970
Ward 7 2380 55 37 2472
Ward 8 1350 5 1 1357
Ward 9 2136 2 3 2142
Ward 10 2228 6 3 2237
Ward 11 2120 6 32 2159
15 Ibid

98
Ward
Piped water
Piped (tap) water inside the
dwelling/yard
Piped (tap) water on community
stand
No access to piped
(tap) water Total
Ward 12 1438 4 3 1446
Ward 13 2557 51 96 2705
Ward 14 1508 1 3 1513
Ward 15 2185 7 4 2196
Ward 16 2157 5 3 2165
Ward 17 1648 37 6 1691
Ward 18 2125 119 21 2265
Ward 19 1530 339 1 1871
Ward 20 1085 191 2 1278
Ward 21 2583 253 90 2926
Ward 22 908 187 12 1107
Ward 23 1992 186 28 2205
3.3.2 Households by source of water per ward
Table 11: Households by source of water per ward16
16 Ibid.

99
Ward
Source of water
Total
Regional/local
water scheme
(operated by a
Water Service
Authority or
provider)
Borehole Spring Rain- water
tank
Dam / pool
/ stagnant
water
River/
stream
Water
vendor
Water
tanker Other
Ward 1 2151 2 - 1 - - 5 13 9 2182
Ward 2 394 1574 5 11 36 4 37 95 15 2172
Ward 3 1830 34 2 - - - 9 3 6 1885
Ward 4 1788 16 1 2 - 1 3 18 12 1843
Ward 5 1845 15 - 1 - - 9 6 1 1877
Ward 6 1940 5 - 3 - - 3 11 7 1970
Ward 7 2253 140 2 1 1 1 1 60 12 2472
Ward 8 1350 1 - - - - - 1 4 1357
Ward 9 2131 1 - - - - 2 - 8 2142
Ward 10 2221 8 - 4 - 1 - 1 1 2237
Ward 11 2117 8 - 4 - 1 6 3 19 2159
Ward 12 1426 4 1 4 - - 1 4 7 1446
Ward 13 2578 - 3 5 4 - 18 7 89 2705
Ward 14 1503 1 - - - - 5 2 1 1513
Ward 15 2174 7 2 1 - - 1 6 3 2196
Ward 16 2145 5 - - 1 1 6 2 5 2165

100
Ward
Source of water
Total
Regional/local
water scheme
(operated by a
Water Service
Authority or
provider)
Borehole Spring Rain- water
tank
Dam / pool
/ stagnant
water
River/
stream
Water
vendor
Water
tanker Other
Ward 17 1549 85 - 4 17 25 3 1 8 1691
Ward 18 1787 378 2 22 8 1 3 41 22 2265
Ward 19 1766 4 20 1 - - 15 48 16 1871
Ward 20 1224 2 - - 1 - 1 40 11 1278
Ward 21 1808 852 4 13 5 7 6 223 8 2926
Ward 22 385 598 5 - 3 5 1 106 3 1107
Ward 23 1456 570 4 12 15 4 12 116 16 2205

101
3.3.3 Distribution of households by type of energy or fuel for lighting per ward
Table 12: Households by type of energy or fuel for lighting17
Ward Energy or fuel for lighting
Total Electricity Gas Paraffin Candles Solar Other None
Ward 1 1954 1 26 194 4 - 2 2182
Ward 2 1646 4 12 469 35 - 6 2172
Ward 3 1867 4 1 4 6 - 3 1885
Ward 4 1778 - 11 47 5 - 1 1843
Ward 5 1844 - 2 28 1 - 1 1877
Ward 6 1935 4 5 23 1 - 2 1970
Ward 7 2363 1 3 101 1 - 3 2472
Ward 8 1341 - 5 10 1 - - 1357
Ward 9 2121 - - 16 6 - - 2142
Ward 10 2218 - - 13 2 - 4 2237
Ward 11 2017 3 8 123 8 - - 2159
Ward 12 1425 - - 15 1 - 5 1446
Ward 13 2338 6 38 311 11 - 2 2705
Ward 14 1497 - 4 10 1 - 1 1513
17 Ibid.

102
Ward Energy or fuel for lighting
Total Electricity Gas Paraffin Candles Solar Other None
Ward 15 2127 - 13 52 2 - 1 2196
Ward 16 2148 2 3 8 2 - 2 2165
Ward 17 1670 2 - 13 5 - 1 1691
Ward 18 2146 1 7 104 3 - 3 2265
Ward 19 1537 1 5 317 9 - 2 1871
Ward 20 1064 - 23 187 2 - 2 1278
Ward 21 2562 5 11 336 8 - 3 2926
Ward 22 951 2 22 126 - - 5 1107
Ward 23 2060 2 4 127 9 - 4 2205

103
3.3.5 Distribution of households by type of energy or fuel for cooking per ward
Table 13: Households by type of energy or fuel for cooking per ward18
Ward
Energy or fuel for cooking
Total Electricity Gas Paraffin Wood Coal
Animal
dung Solar Other None
Ward 1 1878 25 187 35 8 46 1 2 - 2182
Ward 2 1418 98 56 499 15 80 1 1 4 2172
Ward 3 1771 98 1 4 - - 4 6 1 1885
Ward 4 1715 23 77 16 3 2 1 - 5 1843
Ward 5 1779 18 67 8 1 1 - - 3 1877
Ward 6 1893 23 40 6 2 - 4 - 1 1970
Ward 7 2279 36 73 75 - - 4 1 3 2472
Ward 8 1298 24 24 3 4 - 1 - 1 1357
Ward 9 2038 39 54 6 1 - 1 - 3 2142
Ward 10 2169 21 33 4 4 - 4 - 1 2237
Ward 11 1931 27 153 25 8 3 6 - 6 2159
Ward 12 1373 15 34 1 7 2 7 1 5 1446
Ward 13 2229 49 391 31 1 - 1 - 1 2705
18 Ibid.

104
Ward
Energy or fuel for cooking
Total Electricity Gas Paraffin Wood Coal
Animal
dung Solar Other None
Ward 14 1466 18 25 1 1 - 1 - - 1513
Ward 15 1987 57 132 6 1 - 4 - 8 2196
Ward 16 2050 93 10 1 - - 4 3 3 2165
Ward 17 1544 124 4 14 - - 3 - 2 1691
Ward 18 2058 33 97 58 2 - 12 - 5 2265
Ward 19 1491 21 307 40 - 1 9 - 1 1871
Ward 20 1035 17 183 36 3 - 2 - 3 1278
Ward 21 2427 79 149 253 5 2 8 - 1 2926
Ward 22 856 64 116 68 - - 3 - - 1107
Ward 23 1908 81 26 177 3 1 5 1 3 2205

105
3.3.5 Distribution of households by type of energy or fuel for heating per ward
Table 14: Households by type of energy or fuel for heating per ward19
Ward
Energy or fuel for heating
Total Electricity Gas Paraffin Wood Coal
Animal
dung Solar Other None
Ward 1 1418 21 126 217 87 103 6 1 202 2182
Ward 2 917 83 28 843 24 85 5 - 187 2172
Ward 3 1531 148 40 13 9 - 7 - 137 1885
Ward 4 1012 36 309 82 47 1 3 - 352 1843
Ward 5 1142 24 206 61 49 2 - - 393 1877
Ward 6 1288 74 332 52 54 1 8 - 161 1970
Ward 7 2221 32 91 105 4 1 1 - 17 2472
Ward 8 1268 16 49 7 8 - 1 - 7 1357
Ward 9 1319 100 359 16 200 1 5 - 143 2142
Ward 10 1664 84 298 24 49 - 2 - 116 2237
Ward 11 1204 59 370 141 172 1 4 - 208 2159
Ward 12 680 58 415 19 127 4 2 - 142 1446
Ward 13 1676 85 414 151 200 - 2 - 176 2705
Ward 14 1115 76 237 5 20 1 1 - 57 1513
19 Ibid.
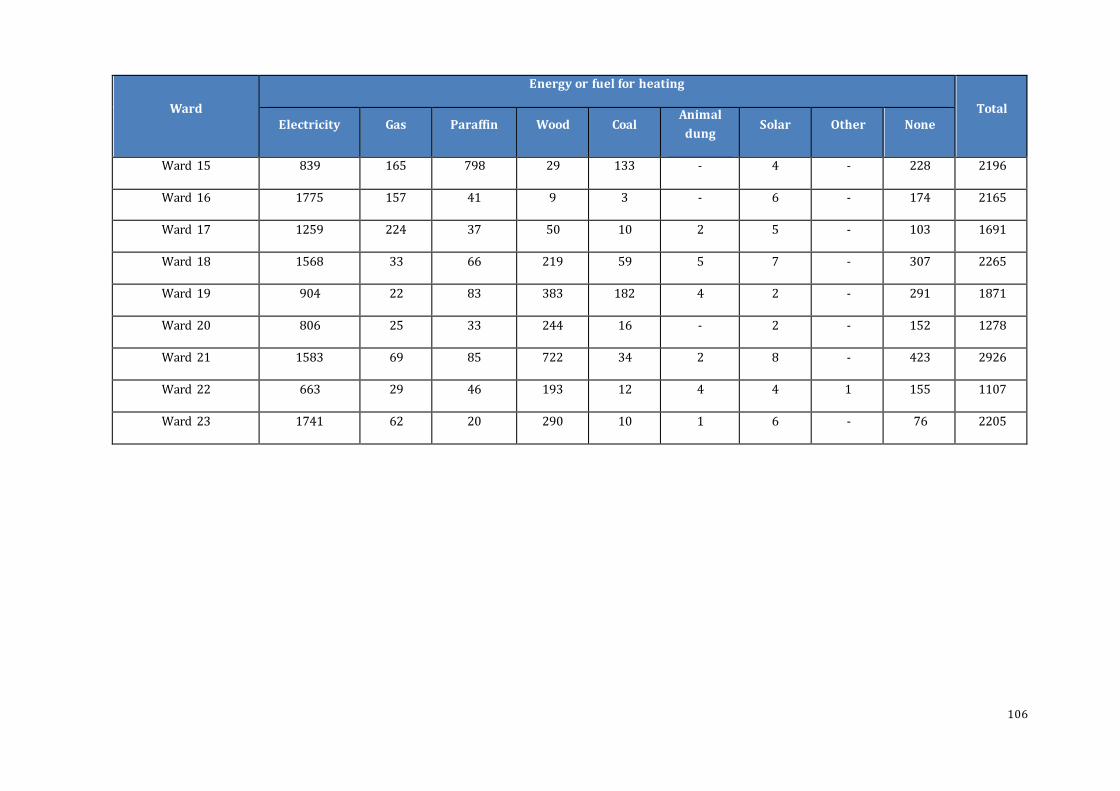
106
Ward
Energy or fuel for heating
Total Electricity Gas Paraffin Wood Coal
Animal
dung Solar Other None
Ward 15 839 165 798 29 133 - 4 - 228 2196
Ward 16 1775 157 41 9 3 - 6 - 174 2165
Ward 17 1259 224 37 50 10 2 5 - 103 1691
Ward 18 1568 33 66 219 59 5 7 - 307 2265
Ward 19 904 22 83 383 182 4 2 - 291 1871
Ward 20 806 25 33 244 16 - 2 - 152 1278
Ward 21 1583 69 85 722 34 2 8 - 423 2926
Ward 22 663 29 46 193 12 4 4 1 155 1107
Ward 23 1741 62 20 290 10 1 6 - 76 2205

107
3.3.6 Households by type of toilet facility Table 15: Households by type of toilet facility20
Ward
Toilet facility
Total Flush toilet
(connected to
sewerage
system)
Flush
toilet
(with
septic
tank)
Chemical
toilet
Pit latrine with
ventilation
(VIP)
Pit latrine
without
ventilation
Bucket
latrine Other None
Ward 1 1411 10 2 583 19 41 20 97 2182
Ward 2 539 213 5 253 837 68 47 208 2172
Ward 3 1834 12 - 13 - 2 3 20 1885
Ward 4 1673 47 - 71 1 20 27 4 1843
Ward 5 1860 4 1 1 1 1 1 7 1877
Ward 6 1947 5 - 3 1 - 4 9 1970
Ward 7 2248 48 - 27 81 34 16 18 2472
Ward 8 1343 8 3 1 - - - 2 1357
Ward 9 2135 - - - - - 5 3 2142
Ward 10 2220 - - - - 1 3 12 2237
Ward 11 2076 11 - 2 - 25 17 27 2159
Ward 12 1430 5 1 1 1 - 2 6 1446
Ward 13 2465 6 - 9 25 5 47 148 2705
20 Ibid.

108
Ward
Toilet facility
Total Flush toilet
(connected to
sewerage
system)
Flush
toilet
(with
septic
tank)
Chemical
toilet
Pit latrine with
ventilation
(VIP)
Pit latrine
without
ventilation
Bucket
latrine Other None
Ward 14 1489 7 - 5 - 2 1 8 1513
Ward 15 2182 12 - - - - 2 - 2196
Ward 16 2142 5 - 1 - 2 8 7 2165
Ward 17 1582 29 1 4 64 1 7 3 1691
Ward 18 1812 52 14 130 134 46 63 13 2265
Ward 19 1557 11 - 2 15 242 30 14 1871
Ward 20 974 47 1 95 24 74 4 59 1278
Ward 21 1956 95 8 102 448 112 115 90 2926
Ward 22 644 58 35 72 155 5 52 85 1107
Ward 23 1585 39 17 121 227 58 105 52 2205
3.4 Community and Stakeholder Engagements
During November 2017 and February 2018, ward meetings were held even though they could not cover all the wards as the remaining ones were to be
attended during budget roadshows. The objective of the meetings was to inform the community, businesses and stakeholders about the review of the
IDP and to gather inputs. The issues and priorities raised were then captured and recorded for each ward as set out below.

109
3.4.1 Ward Development Needs: Ward 1
Focus Area Development Needs
Water Fencing of the dam. Fencing of water treatment plant.
Sanitation VIP toilets next to JMB school.
Roads and Storm water Roads are not in good condition.
Street of Khoetsa Tavern
AME church
11 next to informal settlement
617 to old graye yard
89 to 1903
683 to 758
Other Fencing of the dam.
IDP REVIEW 2018/19
Focus Area Develop Needs
Housing Allocation of sites
Sanitation Provision of basic services to newly established areas.
Sports facilities Need to upgrade and develop new sports facilities.
High mast lights Need to fix and install new high mast lights.
IDP REVIEW 2019/20
Focus Area Development Needs
Water Fencing of the dam near the of new Location Winnie Madikizela Mandela
Bulk Water Infrastructure for new location Winnie Madikizela Mandela
Sanitation flushing toilets
Sanitation for Winnie Madikizela Mandela
Roads and Storm water Street need to be gravel
Electricity Electrification of ward 1
Housing Erf for crèches
RDP House (MR George Young)
High mast lights Additional High Mast lights

110
IDP REVIEW 2020/21
Focus Area Development Needs Roads & Stormwater Maintenance of roads and street in
ward
Sewerage Maintenance of sewer network to curb spillages
LED Employment at projects be communicated with the community
Youth unemployment
Housing Need for sites – 1031 Mr Manabe
3.4.2 Ward Development Needs: Ward 2
Focus Area Development Needs
Electricity Street lights be maintained regularly
Sanitation VIP toilets needs to be maintained in our farm areas
VIP toilets needed at Dorothea farm
Roads and Storm water Urgent need for pavement next to Graveyard
Sidewalks paving (Van Riebeeck Street) from town to location
Paving at Bennett Adam, Vilonel and Steyn Streets
All streets be gravelled continously
Recreation and Sport Soccer field be maintained
Farm dwellers needs descent houses and electricity especially Jaskraal,
Riverside, Cherboss, Dorothea and Makhetha
Other Bulk infrastructure on areas/sides they don’t have
IDP REVIEW 2018/19
Focus Area Development Needs
Housing Need for sites.
Local Economic Development Creation of employment for youth.
Roads and Storm Water. Mphefela sections roads need to paved and storm water installed.
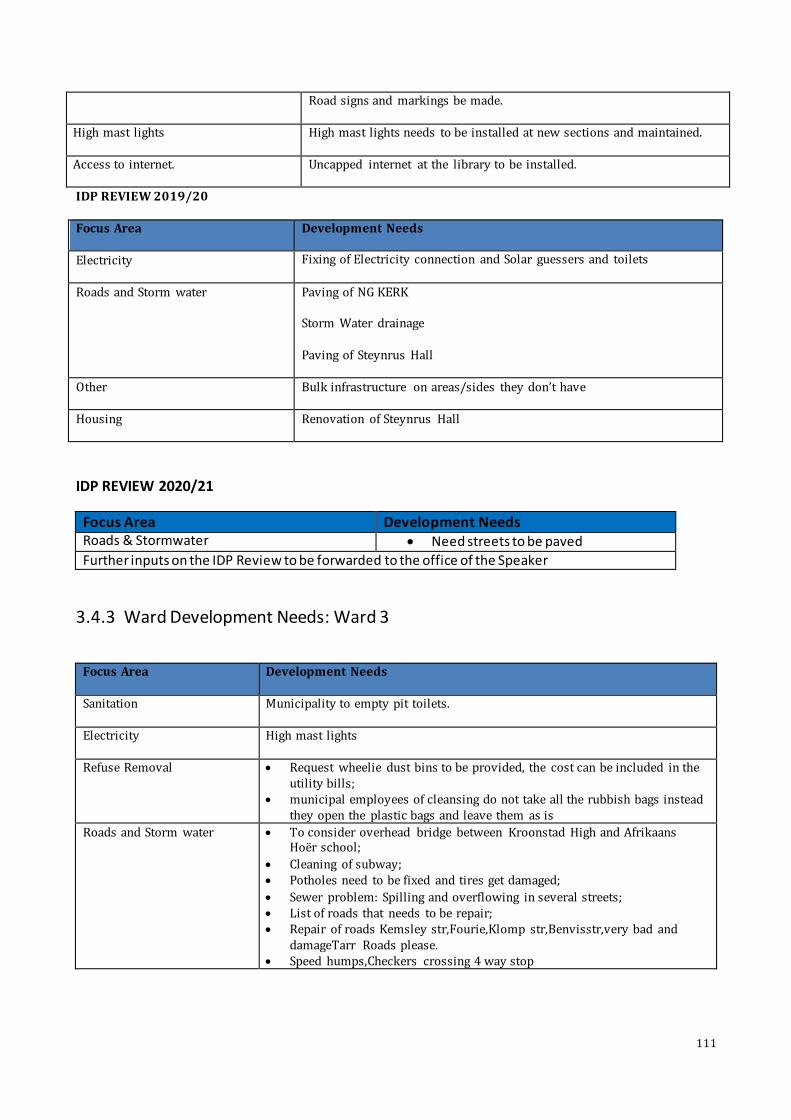
111
Road signs and markings be made.
High mast lights High mast lights needs to be installed at new sections and maintained.
Access to internet. Uncapped internet at the library to be installed.
IDP REVIEW 2019/20
Focus Area Development Needs
Electricity Fixing of Electricity connection and Solar guessers and toilets
Roads and Storm water Paving of NG KERK
Storm Water drainage
Paving of Steynrus Hall
Other Bulk infrastructure on areas/sides they don’t have
Housing Renovation of Steynrus Hall
IDP REVIEW 2020/21
Focus Area Development Needs Roads & Stormwater Need streets to be paved
Further inputs on the IDP Review to be forwarded to the office of the Speaker
3.4.3 Ward Development Needs: Ward 3
Focus Area Development Needs
Sanitation Municipality to empty pit toilets.
Electricity High mast lights
Refuse Removal Request wheelie dust bins to be provided, the cost can be included in the utility bills;
municipal employees of cleansing do not take all the rubbish bags instead they open the plastic bags and leave them as is
Roads and Storm water To consider overhead bridge between Kroonstad High and Afrikaans Hoër school;
Cleaning of subway; Potholes need to be fixed and tires get damaged;
Sewer problem: Spilling and overflowing in several streets; List of roads that needs to be repair; Repair of roads Kemsley str,Fourie,Klomp str,Benvisstr,very bad and
damageTarr Roads please. Speed humps,Checkers crossing 4 way stop

112
Focus Area Development Needs
Recreation and Sport Restoration of current play grounds;
Grass to be cut in open spaces - list attached; Procedure of cutting trees inside and outside erven; Multi purpose centre near kreiksingel and checkers
Near Mervis str,and Volsschensingel ,near Klomp str,near Dykmanstr,next to Voortwaarts school
Other A multi-purpose Centre to be established;
Call Centre not answering when community calls; Need jobs in order to pay our services; old age home to be build
Needs relating to other spheres of government
Safety and Security Police patrol is needed
IDP REVIEW 2018/19
IDP REVIEW 2019/20
Focus Area Development Needs
Roads and Storm water Repairs of roads in Kemsley street, Fouries street, Klomp street and Ben Mervis street
Cleaning of subway in Du Toit street Speed Humps near Checkers crossing four ways
Recreation and Sport Multi Sports Centres:
a. Near Kriesksingel and Checkers
b. Near Ben Mervis Street and Volschenksingel
c. Next to Klomp Street
d. Next to Dykman Street
e. Next to Voorwaarts School
Other Overhead Bridge between Northway and Kroonheuwel School
Needs relating to other spheres of government
Safety and Security Traffic Robot for School Pedestrians

113
IDP REVIEW 2020/21
Focus Area Development Needs Roads & Stormwater Britz Street towards Dawid Malan small
holdings be repaired/reconstructed
Viljoenskroon and Steynsrus roads need to be repaired/reconstructed
All roads in Ward 3 need to be maintained for access by emergency vehicles
Electricity Solar street lights at all entrance and exit points
Traffic Road signage be improved to curb
unnecessary road accidents
Illegal dumping be issued with fines
Sports & Recreation Morewag swimming pool be refurbished and improved
Kroonpark swimming pool roof needs to be repaired
Need soccer field
Outdoor gym
Playpark with swings Cycling team sponsor and support
Safety and Security Support installation of cameras at all
entrances to Kroonstad to curb crime
Empty houses with overgrown grass are a safety risk
Homeless people be provided with safety by housing them somewhere
LED Recycling business be formalised by providing proper place to operate from.
3.4.4 Ward Development Needs: Ward 4
Focus Area Development Needs
Electricity High mast lights;
Electricity meter boxes problem - watts has been decreased; Geysers are not working,
Roads and Storm water Paving of road x3; when rain - houses are flooded; Need street to be graded and soil be put on the street;
Passages flooded when it rains;

114
Focus Area Development Needs
Yard is flooded when it rains x3; Big potholes in roads - cars are struggling to pass some of the roads. Paving from 16352 to 16084,16293 to 16352,16084 to 16067,15699 to
16067.15699 to 15680,15626 to 15667,15888 to 15843,16321 to 16041. Gravel for 16042 to 15470,16197 t o16219,16153 to 16269,1631 to163,
15300 to 15275,15460 to 15135,15038 to 15667 grater. All street must be grated
Recreation and Sport Open space next to 15402 can be used as a park; trees next to Diteneng be
removed
needs sports ground/stadium in this ward;
Other RDP houses not in good condition; need sites; needs community hall,
municipality should employ a contractor that will teach youth in this ward some skills;
Koekoe Village is neglected/rejected. Municipality should communicate with Ahanang Soup Kitchen so that it
can assist youth of this ward with skills and meet to draw up a plan;
15271- house has roofing problem; some people did not get their title deeds;
when it rains, yard get flooded - affected the house foundation;
Needs relating to other spheres of government
Health Need another clinic: - Bophelong clinic is too small for the whole Koekoe Village;
Need mobile clinic in the ward
Safety and Security Police station is needed
Education Need more primary schools in ward;
Need library. IDP REVIEW 2018/19
Focus Area Development Needs
Streets to be paved in Koekoe Village: 16352 -16121
16335 – 16322 15868 – 15868 16528 – 16293
15760 – 16072 15699 – 15608 15602 – 15564
15626 - `15466 15107 – 15169
IDP REVIEW 2019/20

115
Focus Area Development Needs
Electricity Changing of electric meteres for RDP Houses Maintenance of High Mast Lights
Roads and Storm water Paving of Streets
Other Request a Police Station near Lesedi Clinic in Koekoe Village and Request for Paving in Koekoe Village Electrification of Plot next to Mr Sebokgodi.
Request for Maintenance of Roads in Koekoe Village
Needs relating to other spheres of government
Health Need for Mobile Clinic
Safety and Security Police station is needed
IDP REVIEW 2020/21
Focus Area Development Needs Roads & Stormwater 15241 – street needs paving
16717 – street needs paving
Electricity Blocking electricity for credit control needs to be discussed with affected community
Maintenance of electricity network and safety improvements
Housing Need for sites – 16030, 15007, 16062, 15215, Madipanana
Education Need for school to ensure access to
education
Health & Safety Mobile Clinic and Police Station for the ward

116
3.4.5 Ward Development Needs: Ward 5
Focus Area Development Needs
Water water flow in streets
Sanitation Sewage blocks;
Roads and Storm water Storm water drainage x3; Paving of streets x3;
Padding of streets; Mini bridge over storm water should be built, the area is used by kids; Gravel soil be use to fill streets especially when it rains;
Houses flooded when it rains
Recreation and Sport Community Hall for ward especially to be used for funerals, weddings etc.;
Park is needed for children; grass and bushes to be removed in open spaces - dangerous snakes;
Other 2 schools are needed in this ward; Not the first time we have this type of meeting, please don’t lose our
inputs again;
Fast track the issue of land to the community; Building of RDP houses;
How long does it take to complete projects - project needed to create employment for local youth;
Not happy with the way the councillor is hiring people for projects in this
area; was found with last project that some people who were on the list were
removed and replaced with people form Senzela.
Like to meet with the councillor - have Trust that has job opportunities
Needs relating to other spheres of government
Health New, bigger clinic;
Safety and Security Children get raped - safe places is needed; police station is needed - woman
get raped and family members killed
IDP REVIEW 2018/19
Focus Area Developmental Needs
Disaster Management House No. 14883, 13039 and 14706 needs disaster management intervention.
Roads and Storm Water Bridge and channelling at vlei area to be completed.
15169 paving from Tshitso’s plot.

117
Focus Area Development Needs
Local Economic Development Projects be undertaken to alleviate unemployment.
Skills Development Encourage and provide skills to youth through learnerships.
Sports and Recreation Need for sports facilities and recreation park.
Needs relating to other spheres of Government.
Crime Need for mobile police station in Koekoe Village
Health Care Clinic is very small and shortage of staff.
IDP REVIEW 2019/20
Focus Area Development Needs
Water water flow in streets
Sanitation Fixing of Sewage spillage in Koekoe Village
Roads and Storm water Need of storm water drainage in near house number 13599 ,13136 and 14922 Koekoe Village
Recreation and Sport Community Hall for ward especially to be used for funerals, weddings etc.;
Park is needed for children; grass and bushes to be removed in open spaces - dangerous snakes;
Other Building of Primary Schools in Koekoe Village Building of a Bridge
Finishing of Building near Sports Grounds Informal settlement should be identified for people in Kroonstad
Electricity Maintenance of High mast lights in the ward
Like to meet with the councillor - have Trust that has job opportunities
Needs relating to other spheres of government
Health New Clinic in Koekoe Village
Plans to Extend Bophelong Clinic-

118
Focus Area Development Needs
Safety and Security Children get raped - safe places is needed; police station is needed -
woman get raped and family members killed
Focus Area Developmental Needs
Disaster Management Mr Morena 14037 lives in a rented shack and the landlord does not
take care of the property e.g toilet that is leaking water
Roads, Storm Water and Electricity Mr Mping Kokozela 13618 indicated that he is sick and tired of living
in rented spaces, he has been renting for years and the current place
he stays has no electricity or running water
Local Economic Development Youth involvement in the Installation of the Top Set Boxes in the area
3.4.6 Ward Development Needs: Ward 6
Focus Area Development Needs
Water Water meter reading to be taken physically rather than estimation.
Electricity Plan to be implemented to recharge electricity as recharging was done on
electrical pole.
Electricity personnel have tendency of refusing help if token is for R10;
Refuse Removal Pleaded to community to stop dumping on empty spaces
Roads and Storm water Paving x 4; bridges for children x 2; general upgrading of internal streets;
street humps; installing storm drainage system
Recreation and Sport Cutting of grass near houses x 2

119
Focus Area Development Needs
Other The municipality should make proper announcements at all times about interruptions on service delivery e.g. water;
Projects to benefit people who raised concerns e.g. paving need to be done contractor to employ ward people as employees refers people to councillor for project employment;
Person needs a place to stay, he has cleaned 3 unoccupied sites but was kicked out on all three of them;
Establishment of street committees to assist orphans within the ward; Open spaces could be considered for sites allocation as they pose a threat
to community safety; requested a multipurpose sport centre for ward
Needs relating to other spheres of government
Health Clinic to be expanded as the current one can no longer carry the community;
Safety and Security Fully functional police station; small bridges to be built for school children
safety; during rainy season it is unsafe for children as streets are flooded
Education Another primary school and high school and library could be build;
IDP REVIEW 2018/19
Focus Area Development Needs
Roads The following streets need paving:
Matube Street (16664-16703),14098 -11376, 10660-11020)
11170-11246
Street 10526.
Bridge next to Petty’s Tarven and BP Garage.
Bridge between Koekoe Village and Constatia.
Bridge next to Maokeng school.
Paving and Storm water channel from 10660 to 10857,14036 to 14098.
Paving and storm water from St John Block,16660 to 16703
Lechalabe tavern block,Garden inn’s tarvern Block10626 to 10463
Needs relating to other spheres of government
Health Care Need for another clinic.
Education Primary School needed.
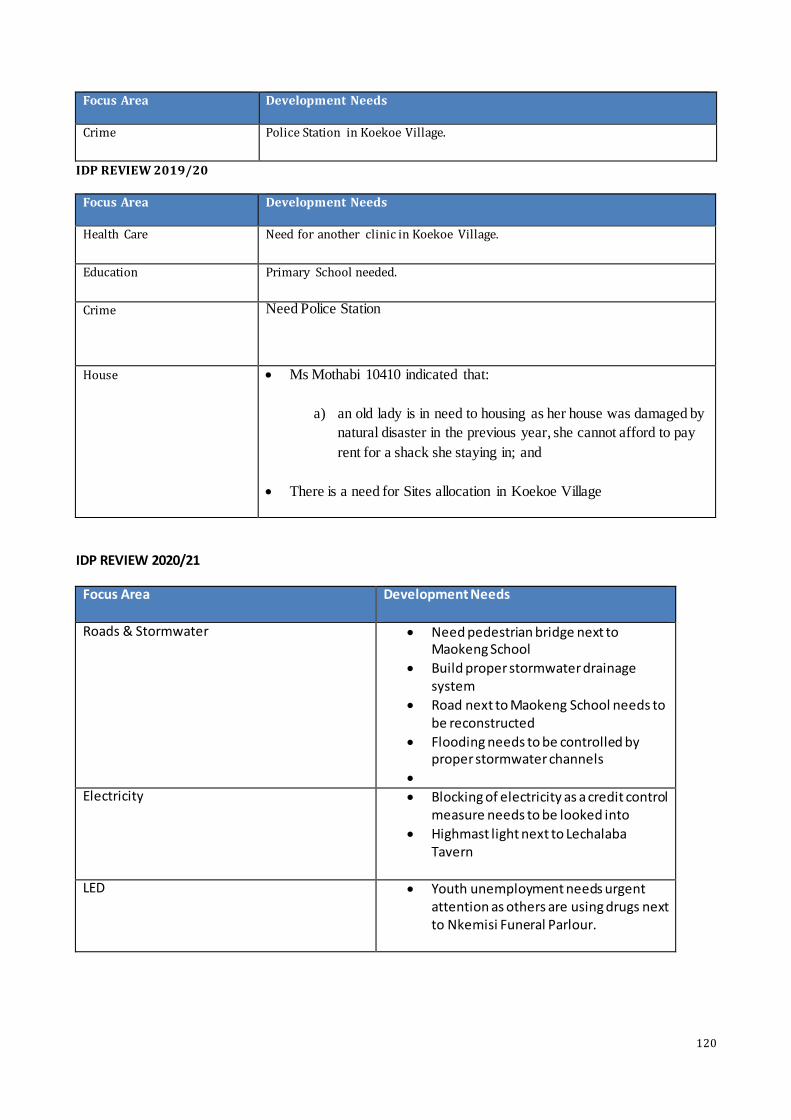
120
Focus Area Development Needs
Crime Police Station in Koekoe Village.
IDP REVIEW 2019/20
Focus Area Development Needs
Health Care Need for another clinic in Koekoe Village.
Education Primary School needed.
Crime Need Police Station
House Ms Mothabi 10410 indicated that:
a) an old lady is in need to housing as her house was damaged by
natural disaster in the previous year, she cannot afford to pay
rent for a shack she staying in; and
There is a need for Sites allocation in Koekoe Village
IDP REVIEW 2020/21
Focus Area Development Needs
Roads & Stormwater Need pedestrian bridge next to Maokeng School
Build proper stormwater drainage system
Road next to Maokeng School needs to be reconstructed
Flooding needs to be controlled by proper stormwater channels
Electricity Blocking of electricity as a credit control
measure needs to be looked into
Highmast light next to Lechalaba Tavern
LED Youth unemployment needs urgent
attention as others are using drugs next to Nkemisi Funeral Parlour.

121
Focus Area Development Needs
Sewerage Proper maintenance of sewerage network and closing of manholes after working on them.
Housing Sites for housing
Parks & Recreation Open spaces turned into dumping sites
3.4.7 Ward Development Needs: Ward 7
Focus Area Development Needs
Water Overflow with water
Sanitation Sewage leaks in street; Main holes blocked;
Sewerage block; Sewage pipes be upgraded to bigger pipes, Public must be made aware not to throw in diapers, plastic, etc.;
Electricity High mast lights x4;
meter no not showing on electric box
Refuse Removal Refuse removal only in certain areas; we see graders only with funerals
Roads and Storm water Roads to be fixed;
Storm water drainage x3; Paving of streets x3, also joining streets; Speed hump in main street/streets x 3;
Roads are filled with large rocks; Crusher is needed for passages; Bridge at low laying area - when it rained no one can use street - very
unsafe to children;
Recreation and Sport Nyakallong needs to be upgraded and fenced, unsafe at night; Nyakallong be given to the youth as it is not attracting any resident or
tourist in Moqhaka; tractors to cut and remove the grass;
grass be cutted in open spaces x3; passages need to be cleaned;
parks to be built for children; can library be used as information centre for youth; youth centre x 2; Wi-Fi facility
Other Business sites need to be developed;
bursaries for children; youth unemployed; opportunities for youth empowerment;
neighbour built a wall - water cannot pass through; NYDA and SEDA to come and have seminars for youth;
employment opportunities should be placed on the notice board; projects for youth - work opportunities
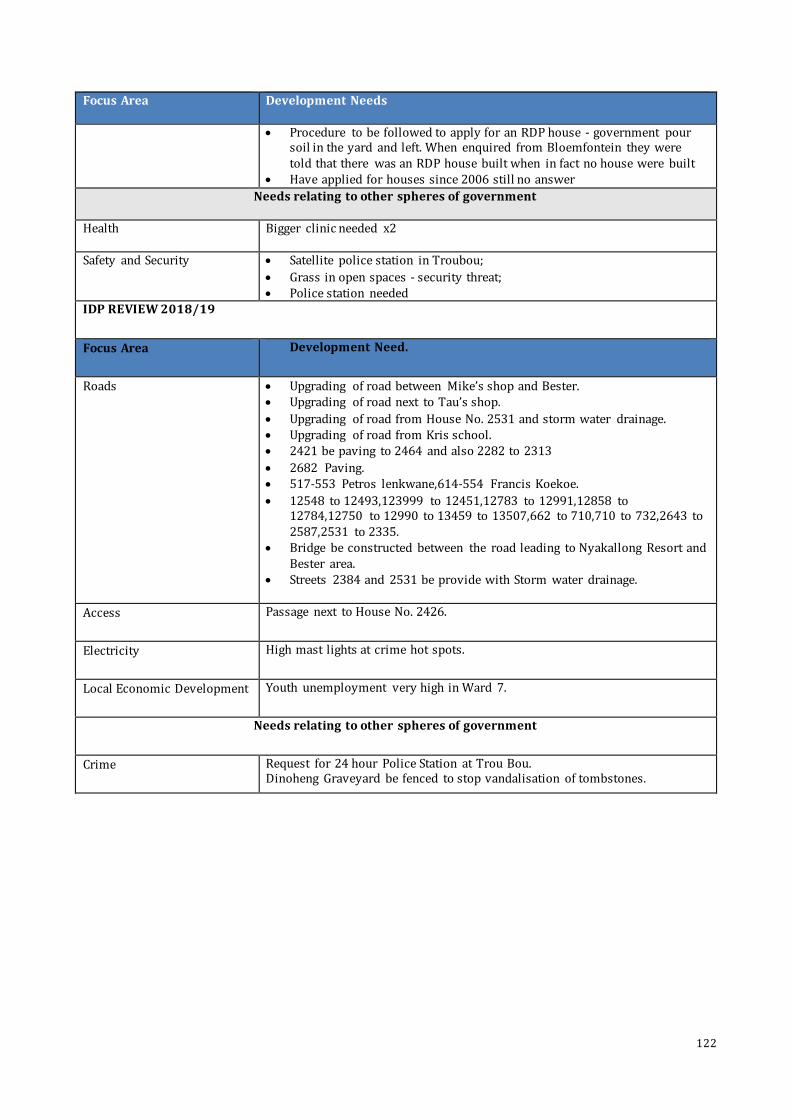
122
Focus Area Development Needs
Procedure to be followed to apply for an RDP house - government pour soil in the yard and left. When enquired from Bloemfontein they were told that there was an RDP house built when in fact no house were built
Have applied for houses since 2006 still no answer
Needs relating to other spheres of government
Health Bigger clinic needed x2
Safety and Security Satellite police station in Troubou;
Grass in open spaces - security threat; Police station needed
IDP REVIEW 2018/19
Focus Area Development Need.
Roads Upgrading of road between Mike’s shop and Bester. Upgrading of road next to Tau’s shop.
Upgrading of road from House No. 2531 and storm water drainage. Upgrading of road from Kris school. 2421 be paving to 2464 and also 2282 to 2313
2682 Paving. 517-553 Petros lenkwane,614-554 Francis Koekoe.
12548 to 12493,123999 to 12451,12783 to 12991,12858 to 12784,12750 to 12990 to 13459 to 13507,662 to 710,710 to 732,2643 to 2587,2531 to 2335.
Bridge be constructed between the road leading to Nyakallong Resort and Bester area.
Streets 2384 and 2531 be provide with Storm water drainage.
Access Passage next to House No. 2426.
Electricity High mast lights at crime hot spots.
Local Economic Development Youth unemployment very high in Ward 7.
Needs relating to other spheres of government
Crime Request for 24 hour Police Station at Trou Bou. Dinoheng Graveyard be fenced to stop vandalisation of tombstones.

123
IDP Review 2020/21
Focus Area Development Needs
Roads & Stormwater Speed bumps next to : 12677, 12724 and ZCC Koekoe Village
Overhead pedestrian bridge Bester Road should be maintained
Maintenance of all roads in the ward
Sewerage 12919, 12724 upgrading of the sewer network
Housing 12919 requested sites for housing
Title deeds
Information Report back meeting be held quarterly to give feedback on IDP
Sport and Recreation Upgrading of Nyakallong Resort to include Indoor Sports Centre.
3.4.8 Ward Development Needs: Ward 8
Focus Area Development Needs
Water Water coming inside the house when it rains
Underground water from 7536 to 7716 Contantia be channelled to vlei area.
Electricity Electricity poles have fallen down, street lights needed,
Roads and Storm water Vlei area is a problem when it is raining, Need bridge to be built; Sewerage spilling;
Paving needed x5; streets not in good condition; speed humps x3 needed; Channel storm water drainage Bridge and road from 7312 to 7342 Constantia
Recreation and Sport Open spaces need to be cleaned
Other Employment problem - the councillor must attend to it; Shopping Centre to be reopened;
Dilapidated houses be demolished; IDP REVIEW 2018/19
Roads and Storm Water Mahabane Street needs paving.
Paving with speed humps to Hall up to the ZCC church. Bridge between BP Garage and Pitso Street.

124
Focus Area Development Needs
Bridge and Storm Water drainage behind shopping centre needs to be upgraded.
Paving from 7027 to 7493,7116 to 7082.7717 to 7476,7716 to 7466,7342 to 7390,7004 to 6989,7435 to 963.
Gravel for 5836,7722,7001,7021,7716,7351 to 7390
Electricity High mast lights to be repaired and maintained next to the shopping centre.
IDP REVIEW 2019/20
Focus Area Development Needs
Electricity Keakgile 6390C Request street lights and maintenance
Paving for House number 7183-7386 and electric pole
Roads and Storm water Paving in Kgaticoe and Matseki streets
Channel storm water drainage
Upgrading of road next to Nyakallong Upgrading of road between Reaitumela and Roman Catholic school
7026-7492
Request upgrading of road between 5829C-7310 Constantia
Request upgrading of roads storm water Upgrading of Roads
Request upgrading of road next to Lepatso
Request paving at Setiloane Str and street lights not working
Request paving between Ward 8 and Ward 9
Recreation and Sport Open spaces need to be cleaned
Other Constantia Shopping Complex to be upgraded Request of upgrading of Seeisoville Hall and Shopping Centre
Roads and Storm Water Mahabane Street needs paving. Water drainage
Sewerage pump station
Electricity High mast lights to be repaired and maintained next to the shopping centre.
IDP Review 2020/21
Focus Area Development Needs
Roads & Stormwater Moeketsi Street and others in the ward
needs to be paved
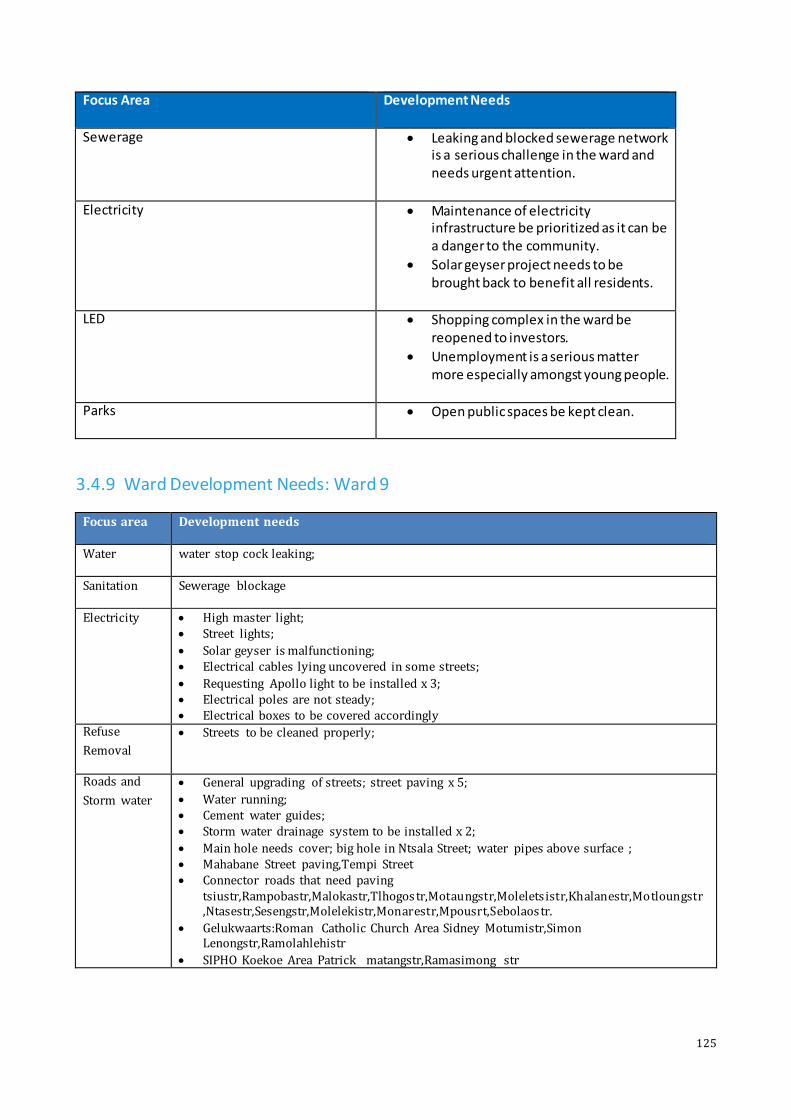
125
Focus Area Development Needs
Sewerage Leaking and blocked sewerage network is a serious challenge in the ward and needs urgent attention.
Electricity Maintenance of electricity infrastructure be prioritized as it can be a danger to the community.
Solar geyser project needs to be brought back to benefit all residents.
LED Shopping complex in the ward be
reopened to investors.
Unemployment is a serious matter more especially amongst young people.
Parks Open public spaces be kept clean.
3.4.9 Ward Development Needs: Ward 9
Focus area Development needs
Water water stop cock leaking;
Sanitation Sewerage blockage
Electricity High master light; Street lights;
Solar geyser is malfunctioning; Electrical cables lying uncovered in some streets;
Requesting Apollo light to be installed x 3; Electrical poles are not steady; Electrical boxes to be covered accordingly
Refuse
Removal
Streets to be cleaned properly;
Roads and
Storm water
General upgrading of streets; street paving x 5;
Water running; Cement water guides; Storm water drainage system to be installed x 2;
Main hole needs cover; big hole in Ntsala Street; water pipes above surface ; Mahabane Street paving,Tempi Street Connector roads that need paving
tsiustr,Rampobastr,Malokastr,Tlhogostr,Motaungstr,Moleletsistr,Khalanestr,Motloungstr,Ntasestr,Sesengstr,Molelekistr,Monarestr,Mpousrt,Sebolaostr.
Gelukwaarts:Roman Catholic Church Area Sidney Motumistr,Simon Lenongstr,Ramolahlehistr
SIPHO Koekoe Area Patrick matangstr,Ramasimong str

126
Focus area Development needs
Recreation
and Sport
Cut grass and trees regularly in open spaces x2;
Requested multipurpose sport centre for the ward
Other Presentation/IDP report 2016-2017 was an insult because it did not cover their previous inputs;
Two roomed houses to be replaced by RDP;
Wanted to know the commencement of house evaluation; Closed firms to be taken over by local government to provide jobs to unemployed; ward
coordinators should embark on door to door visit to witness problems encountered by residents;
Some houses were demolished and no progress up to so far; Eskom to take over the electrical supply and hire local residents; Allocation of sites to be expedited;
Needs relating to other spheres of government
Safety and
Security
Streets are dark and pose security threat, request routine police patrol; police station must
be erected; incidents of robbery and theft occurring more often; re-opening of Moakeng
Police Station.
IDP REVIEW 2018/19
Roads and
Storm Water
Paving in the following streets:
House Numbers 30-98
House Numbers 326 corner house.
House Numbers 1 – 17
House Numbers 68 – 137
House Numbers 148 -191
From Reaitumela School to Dr. Hlahance Surgery.
Ethopian Church to Dr. Hlahane Surgery
Maintenance of roads and patching of potholes.
Sports and
Recreation
Needs for sports grounds and parks.
Electricity High mast light next to Maseko’s shop.
IDP Review 2020/21
Focus Area Development Needs
Roads & Stormwater Speed bumps from Phomolong to Ntha
School should be reconstructed.
Tsiu Street: 8266 to 8292 Tlhogo Street: From shops to 3982
Rampoba Street: 3943 to 3956
Maloka Street: 3776 to 3792
Sebolao Street: 3924 to 4006 Moeletsi Street: 4055 to 4096

127
Focus Area Development Needs
Ntase Street: 6357 to 6146, 6446 to 6466
Mofloung Street: 4224 to 4259
Seseng Street: Two rooms to 4294
Manyanye Street: 4156 to 4222 Monare Street: 5941 to 5965
Tempi Street: 5909 to the end
Motaung Street: 4008 to 4053 Mpou Street: The entire Street
Moleleki Street: 6158 to the end
Motsapole Street: The entire Street Gelukwaarts
Sidney Motumi Street
Simon Lenong Street
Ramolahlehi Street 8521 to 5833 (high priority)
30 to 98 (high priority)
137 to 144 (high priority) Pedestrian bridge near house 98
Passages that need G5 gravel
170 Gelukwaarts.
382 Gelukwaarts 296 Gelukwaarts
179 Gelukwaarts
4366 Constantia 4307 Constantia
5907 Constantia
Sewerage Leaking sewerage network throughout the entire ward 9
Backfilling of trenches after doing repairs
Sewerage pump station next to Sipho Koekoe turned into dumping site, needs to be repaired.
Water Need for a water pumpstation to
ensure consistent supply
Dirty water needs urgent attention
Electricity Collection strategy using blocking of prepaid meters need to be discussed with the community
Misuse and stealing of electricity should be looked into

128
Focus Area Development Needs
High Mast light next to library
Housing Sites next to Boitumelo Hospital must be developed and issued out
Information Sharing Councillors and officials must be readily
available to provide information on municipal services
3.4.10 Ward Development Needs: Ward 10
Focus Area Development Needs
Sanitation Sewer plant smell to be eradicated
Electricity High mast lights between Relebohile and Brentpark.
Be fixed.
Install electric boxes at various households.
Street lights to be installed.
Refuse Removal Dumping site between Relebohile and LTA to be moved.
Roads and Storm water Road towards industrial site (main connector road to be paved.
Road between Church and Brentpark to be upgraded
Roads between Relebohile and Brentpark be fixed.
Road outside the location be paved.
Road towards the old grave yard be upgraded.
Storm water to be installed near Church
Speed humps near Kopele.
Recreation and Sport Hall to be built next to Pitso.
Sport Centre be built in Ward 10.
Swimming pool at to be constructed.
Other Open space towards the 12’s be graded
Cutting of weeds
Corporate Business be established for people who are doing recycling.
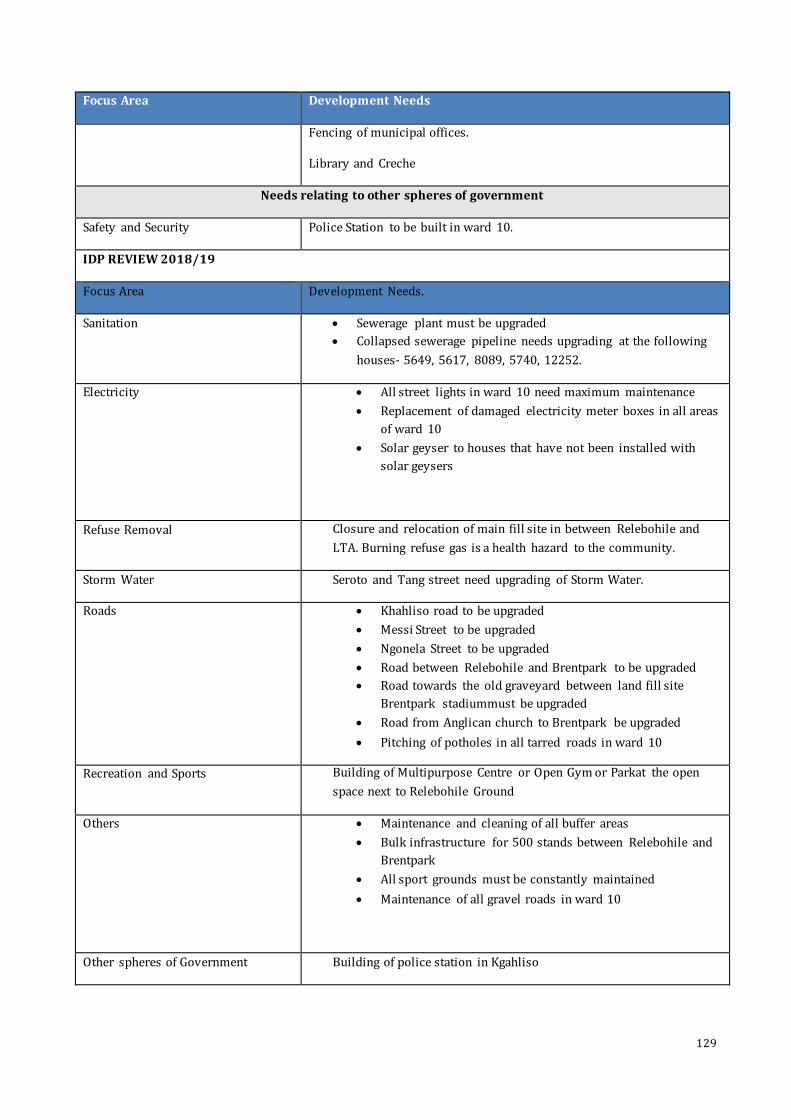
129
Focus Area Development Needs
Fencing of municipal offices.
Library and Creche
Needs relating to other spheres of government
Safety and Security Police Station to be built in ward 10.
IDP REVIEW 2018/19
Focus Area Development Needs.
Sanitation Sewerage plant must be upgraded
Collapsed sewerage pipeline needs upgrading at the following
houses- 5649, 5617, 8089, 5740, 12252.
Electricity All street lights in ward 10 need maximum maintenance
Replacement of damaged electricity meter boxes in all areas
of ward 10
Solar geyser to houses that have not been installed with
solar geysers
Refuse Removal Closure and relocation of main fill site in between Relebohile and
LTA. Burning refuse gas is a health hazard to the community.
Storm Water Seroto and Tang street need upgrading of Storm Water.
Roads Khahliso road to be upgraded
Messi Street to be upgraded
Ngonela Street to be upgraded
Road between Relebohile and Brentpark to be upgraded
Road towards the old graveyard between land fill site
Brentpark stadiummust be upgraded
Road from Anglican church to Brentpark be upgraded
Pitching of potholes in all tarred roads in ward 10
Recreation and Sports Building of Multipurpose Centre or Open Gym or Parkat the open
space next to Relebohile Ground
Others Maintenance and cleaning of all buffer areas
Bulk infrastructure for 500 stands between Relebohile and
Brentpark
All sport grounds must be constantly maintained
Maintenance of all gravel roads in ward 10
Other spheres of Government Building of police station in Kgahliso

130
Focus Area Development Needs
IDP REVIEW 2019/20
Focus Area Development Needs
Electricity 5677 C-Request new electric box
5474 C Goliath-request new meter box
5677 C-Request new electric box
5468 C-Request vendor machine
Mahlatsi Request to volunteer to those who temperd the electricity
House 5672 C Request sites
Water 5734 C-Motsoeneng-There is a water leakage in the yard
IDP Review 2020/21
Focus Area Development Needs
Roads & Stormwater Paving of Sesele Street Grading of streets in ward 10
Provide stormwater drainage where needed
Vlei area between Relebohile and LTA
Refuse Removal Relocate the Landfill Site Stop illegal dumping
Education Upgrading of Relebohile School
Need for Pre-School at Primary
Electricity High Mast light next to 12274 Cemeteries Maintenance of Boikgosong Cemetery
3.4.11 Ward Development Needs: Ward 11
Focus Area Development Needs
Water Resolve water problems at Phomolong

131
Focus Area Development Needs
Electricity Street lights
Roads and Storm
water
Speed humps required where 18A starts till Mr Kabokwane. It’s a busy route that has no speed humps or speed breakers.
Storm water problem from Mr. Leeuw to Kananelo Secondary School.
Storm water channels. Paving Porogo str,Motlhabanestr,Seeco street,Robert sello Leeuw str,down to
kananelo,Dingalo strmain road of post office,Makhetha str,Masimong str,Skelestr
Recreation and Sport Sports facility required as the existing one has become a white elephant.
Revival of Maokeng CBD and Phomolong shopping complex.
Other Shopping complex with paving (CBD) Job creation
Housing needs for Phomolong, Marabastad and plots. Need for stands Solar geysers for RDP houses
Cleaning of grave yard.
Needs relating to other spheres of government
Safety and Security Establish Policing Forum
IDP REVIEW 2018/19
Focus Area Development Needs
Housing Demarcation between erven in Marabastad needs to be addressed. People on RDP waiting list be prioritised for houses. Conversion of hostel into family units be speeded up as people live under toxic
asbestos waste.
Roads and Stormwater Streets and roads must be maintained. Speed humps must be built where needed.
Ward 13 needs a storm water drainage. Roads that carries a lot of water during rainy season must be prioritised for storm water drainage.
Local Economic
Development
Establishment of multipurpose centre in Seeisoville. Multipurpose centre to work with tourism centre to address youth unemployment.
Sports and Recreation Sports grounds be established in every neighbourhood for access to kids and sports fanatics.
IDP REVIEW 2019/20
Focus Area Development Needs
Housing RDP housing allocation
The Elderly Should be prioritised for RDP Allocation Need for RDP Houses in Marabastad indicated by Mr kopane 10 Avenue
Stand Allocation for Mr Petrus in 12 avenue as he was evicted by attorneys at the previous stand.
Roads and Stormwater Streets and roads must be maintained. Speed humps must be built where needed. Extension 9 needs a storm water drainage.
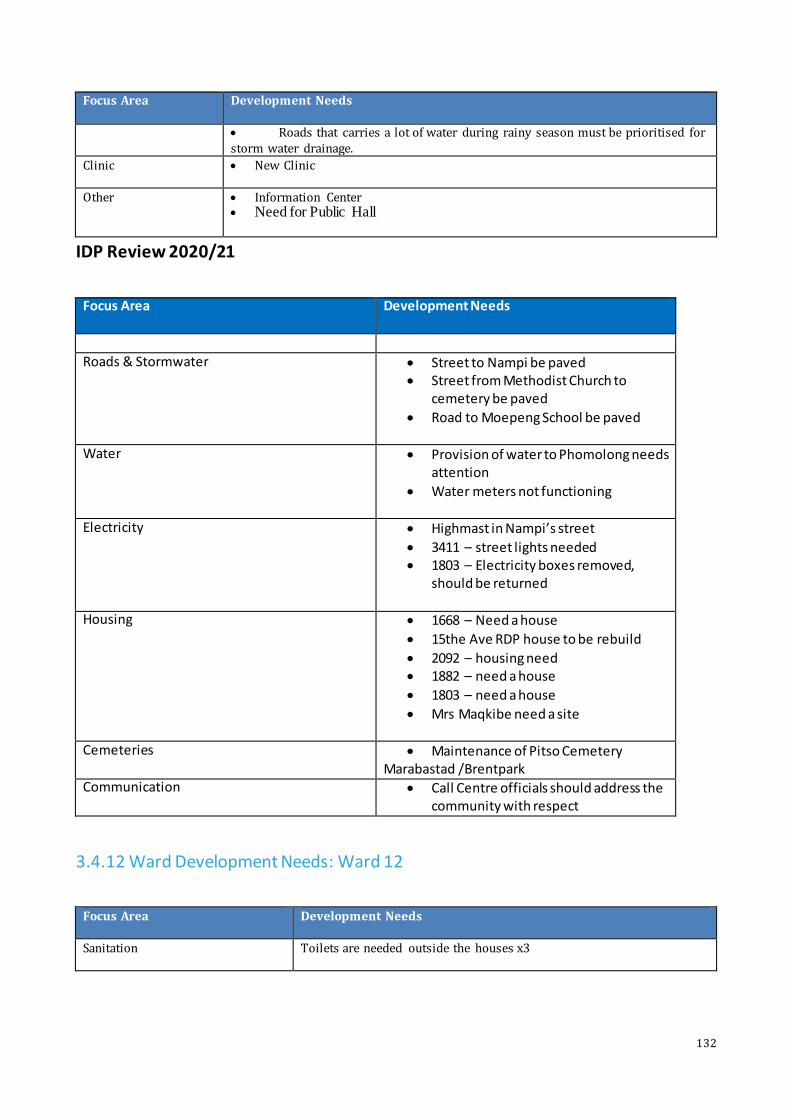
132
Focus Area Development Needs
Roads that carries a lot of water during rainy season must be prioritised for storm water drainage.
Clinic New Clinic
Other Information Center Need for Public Hall
IDP Review 2020/21
Focus Area Development Needs
Roads & Stormwater Street to Nampi be paved Street from Methodist Church to
cemetery be paved
Road to Moepeng School be paved
Water Provision of water to Phomolong needs attention
Water meters not functioning
Electricity Highmast in Nampi’s street
3411 – street lights needed 1803 – Electricity boxes removed,
should be returned
Housing 1668 – Need a house
15the Ave RDP house to be rebuild
2092 – housing need 1882 – need a house
1803 – need a house
Mrs Maqkibe need a site
Cemeteries Maintenance of Pitso Cemetery Marabastad /Brentpark
Communication Call Centre officials should address the community with respect
3.4.12 Ward Development Needs: Ward 12
Focus Area Development Needs
Sanitation Toilets are needed outside the houses x3

133
Focus Area Development Needs
Electricity Problem with electricity box (3105 Porogo Str), problem with
electricity boxes x7, they punch coupon at pole; high mast lights x 5
Roads and Stormwater Porogo street paved; Connecting roads between Lebina and Kananelo
be paved; Sekele Street be paved; Mohlabane Street be paved; Makgetha
Street be paved; Malate street next to Thusanong Clinic Street be paved;
There are rocks in that street Mohlabane so it is not easily for thr cars
to go
Recreation and Sport RDP Houses; tractor to come and cut bushes;
Other Applied for RDP houses in 2006, until date no reply x 3; lost grave
number, we need to erect a tombstone, till date municipality couldn’t
assist us;
Veterans were allocated houses in 1957 to 1958, houses are now
dilapidated and thefore needs to be rebuilt.
IDP REVIEW 2018/19
Focus Area Development Needs
Sanitation Access to sewerage at all households, therefore no need for outside
toilets.
Parks and Recreation Park next to Phomolong School.
Roads and Streets Masimong and Seeko streets need to be paved and be provided with
proper water channeling.
Area lighting Highmast lights next Boiteko Primary School and Masimong Street.
IDP Review 2020/21
Focus Area Development Needs
Roads & Stormwater Paving and speed bumps in Porogu
Street
Phomolong School street (7th ave) be paved
Connector road (Moruti Sebabole & Mr Pule) be paved

134
Focus Area Development Needs
Road to Stilfontein Cemetery be constructed
Need speed bumps in Damane Street and others.
Lebina and Robert Sello connecting streets be paved.
Water Water supply system must be upgraded to be
consistent and minimize disruptions Water meters be provided in ward 12
Electricity Blocking of electricity as a debt collection measure be relooked into
Housing 2133 – Need RDP house 2915 – RDP house 3499 – Need site Houses destroyed by the storm need urgent attention
Information / Communication Officials and Councillors must attend community meetings to help each other with information for the community
Finance Indigence Policy must be reviewed to accommodate tenants
3.4.13. Ward Development Needs: Ward 13
Focus Area Development Needs
Sanitation Upgrading of ablution blocks at cemetery.
Roads and Storm water Upgrading of the following streets: Lawrence street. Colbert street
Canon street David Curry street
11th Avenue.
Recreation and Sport Multipurpose sports ground or facilities Upgrading of Community Hall
Other Fencing of Cemetery
Need for stands. Housing.

135
Focus Area Development Needs
IDP REVIEW 2018/19
Sports and Recreation Multipurpose hall and artificial soccer field in Marabastad and Brentpark
Netball courts in Brentpark stadium
Roads and stormwater Paving of roads
Housing Refurbishment of Seeisoville hostel
IDP REVIEW 2019/20
Electricity Eskom connection of electricity
Main Transformer
Roads and storm water Storm water drainage
Upgrading of road between Brentpark and Anglican Church
Street Maintenance
Paving in the 11 avenue next to the Slaughter House
Paving in cannon street to fisher street and Hardy street
Request for sewerage and water pipes in 11th Avenue
Water, sewerage and pump station
Speed Humps Fisher street and Keeling
Paving on street Van der Ross and Fisher Street
Paving on Seeisoville Stadium
Other Upgrading block at Brentpark cemetery.
Upgrading Brentpark Hall
Request skills Audit for Brentpark
Commissioner Jafta: Request free land
Request for ABET school
Satelite Police Station
Public Gym
Children Parks
Request for Agriculture Equipment for 22 Brand Street
Alternative cemetery
Request for Colbert Street Multipurpose Sports
Fencing of graveyard in Kennings Street
Stadium
Request Parks and mini Post Office
Apolo Light next to the Stadium.
Education Renovation of Boiteko School
Housing Request for Sites allocation Relebohile location and Brentpark
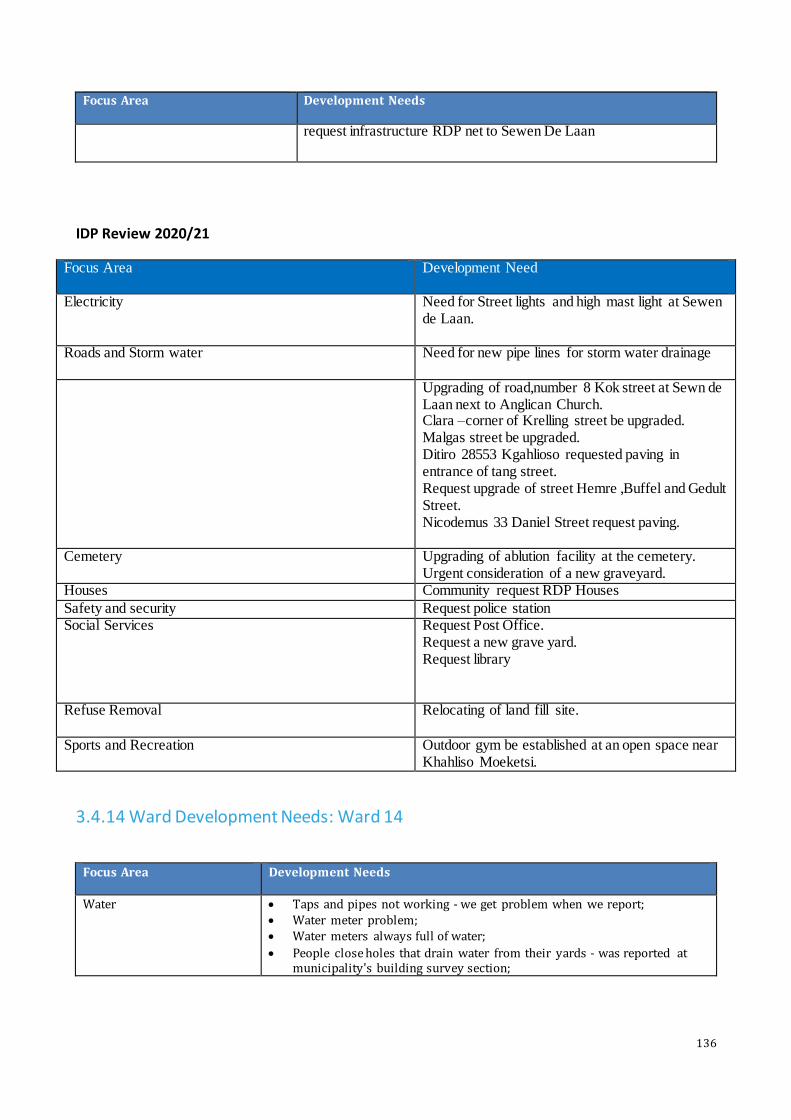
136
Focus Area Development Needs
request infrastructure RDP net to Sewen De Laan
IDP Review 2020/21
Focus Area Development Need
Electricity Need for Street lights and high mast light at Sewen de Laan.
Roads and Storm water
Need for new pipe lines for storm water drainage
Upgrading of road,number 8 Kok street at Sewn de Laan next to Anglican Church. Clara –corner of Krelling street be upgraded. Malgas street be upgraded. Ditiro 28553 Kgahlioso requested paving in entrance of tang street. Request upgrade of street Hemre ,Buffel and Gedult Street. Nicodemus 33 Daniel Street request paving.
Cemetery Upgrading of ablution facility at the cemetery. Urgent consideration of a new graveyard.
Houses Community request RDP Houses
Safety and security Request police station Social Services Request Post Office.
Request a new grave yard. Request library
Refuse Removal Relocating of land fill site.
Sports and Recreation Outdoor gym be established at an open space near Khahliso Moeketsi.
3.4.14 Ward Development Needs: Ward 14
Focus Area Development Needs
Water Taps and pipes not working - we get problem when we report; Water meter problem; Water meters always full of water;
People close holes that drain water from their yards - was reported at municipality's building survey section;
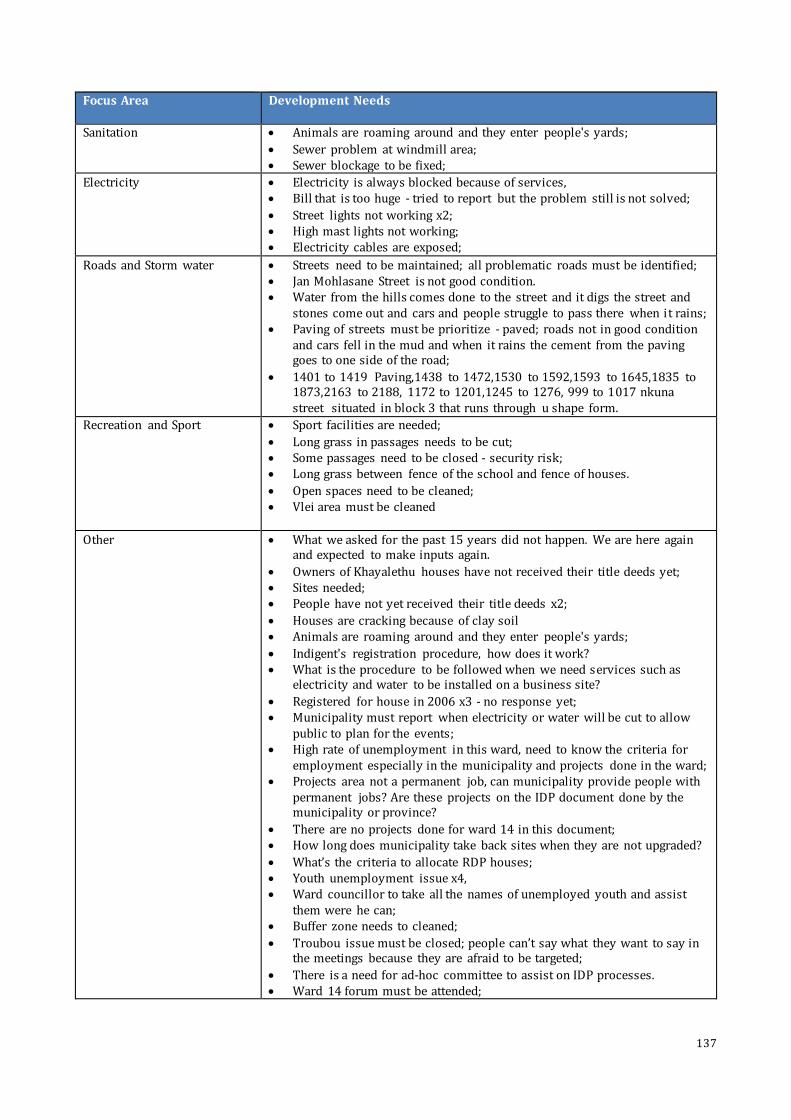
137
Focus Area Development Needs
Sanitation Animals are roaming around and they enter people's yards;
Sewer problem at windmill area; Sewer blockage to be fixed;
Electricity Electricity is always blocked because of services, Bill that is too huge - tried to report but the problem still is not solved;
Street lights not working x2; High mast lights not working; Electricity cables are exposed;
Roads and Storm water Streets need to be maintained; all problematic roads must be identified; Jan Mohlasane Street is not good condition. Water from the hills comes done to the street and it digs the street and
stones come out and cars and people struggle to pass there when it rains; Paving of streets must be prioritize - paved; roads not in good condition
and cars fell in the mud and when it rains the cement from the paving goes to one side of the road;
1401 to 1419 Paving,1438 to 1472,1530 to 1592,1593 to 1645,1835 to 1873,2163 to 2188, 1172 to 1201,1245 to 1276, 999 to 1017 nkuna street situated in block 3 that runs through u shape form.
Recreation and Sport Sport facilities are needed;
Long grass in passages needs to be cut; Some passages need to be closed - security risk; Long grass between fence of the school and fence of houses.
Open spaces need to be cleaned; Vlei area must be cleaned
Other What we asked for the past 15 years did not happen. We are here again and expected to make inputs again.
Owners of Khayalethu houses have not received their title deeds yet; Sites needed; People have not yet received their title deeds x2;
Houses are cracking because of clay soil Animals are roaming around and they enter people's yards;
Indigent's registration procedure, how does it work? What is the procedure to be followed when we need services such as
electricity and water to be installed on a business site?
Registered for house in 2006 x3 - no response yet; Municipality must report when electricity or water will be cut to allow
public to plan for the events; High rate of unemployment in this ward, need to know the criteria for
employment especially in the municipality and projects done in the ward; Projects area not a permanent job, can municipality provide people with
permanent jobs? Are these projects on the IDP document done by the municipality or province?
There are no projects done for ward 14 in this document; How long does municipality take back sites when they are not upgraded?
What’s the criteria to allocate RDP houses; Youth unemployment issue x4, Ward councillor to take all the names of unemployed youth and assist
them were he can; Buffer zone needs to cleaned;
Troubou issue must be closed; people can’t say what they want to say in the meetings because they are afraid to be targeted;
There is a need for ad-hoc committee to assist on IDP processes. Ward 14 forum must be attended;
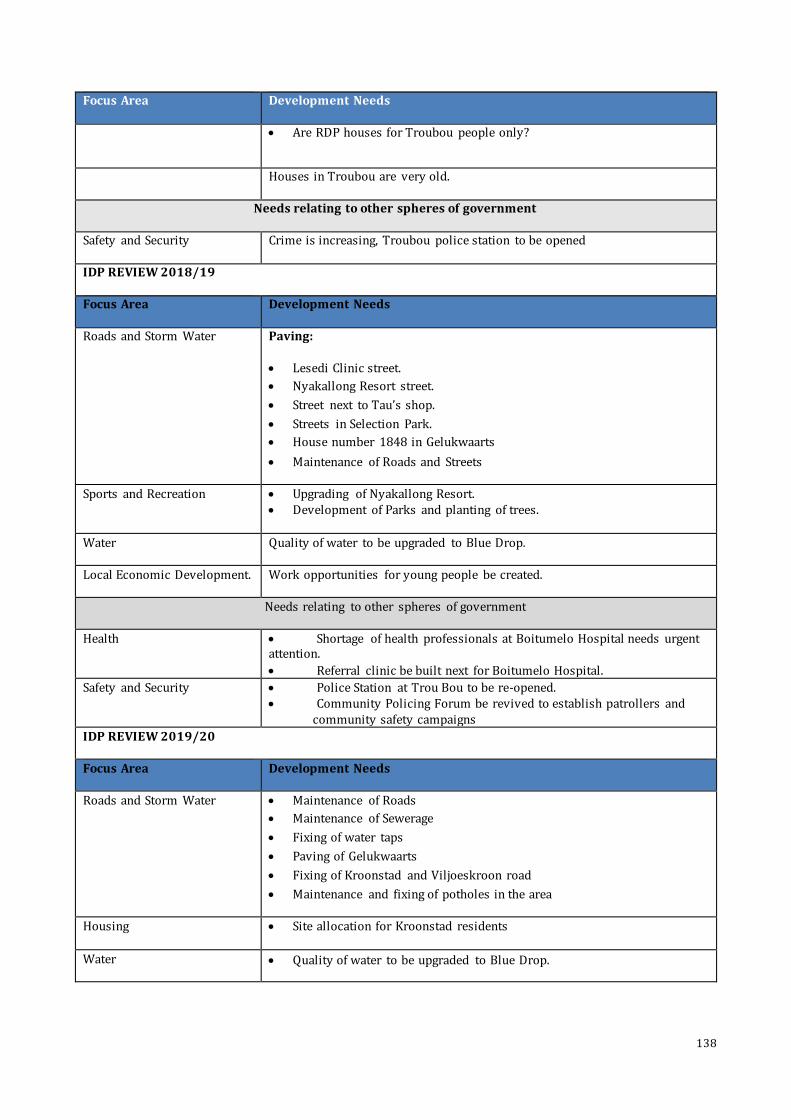
138
Focus Area Development Needs
Are RDP houses for Troubou people only?
Houses in Troubou are very old.
Needs relating to other spheres of government
Safety and Security Crime is increasing, Troubou police station to be opened
IDP REVIEW 2018/19
Focus Area Development Needs
Roads and Storm Water Paving:
Lesedi Clinic street.
Nyakallong Resort street.
Street next to Tau’s shop.
Streets in Selection Park.
House number 1848 in Gelukwaarts
Maintenance of Roads and Streets
Sports and Recreation Upgrading of Nyakallong Resort. Development of Parks and planting of trees.
Water Quality of water to be upgraded to Blue Drop.
Local Economic Development. Work opportunities for young people be created.
Needs relating to other spheres of government
Health Shortage of health professionals at Boitumelo Hospital needs urgent attention.
Referral clinic be built next for Boitumelo Hospital.
Safety and Security Police Station at Trou Bou to be re-opened. Community Policing Forum be revived to establish patrollers and community safety campaigns
IDP REVIEW 2019/20
Focus Area Development Needs
Roads and Storm Water Maintenance of Roads
Maintenance of Sewerage
Fixing of water taps
Paving of Gelukwaarts
Fixing of Kroonstad and Viljoeskroon road
Maintenance and fixing of potholes in the area
Housing Site allocation for Kroonstad residents
Water Quality of water to be upgraded to Blue Drop.

139
Focus Area Development Needs
Local Economic Development. The Municipal Council need to look for job opportunities for Local Youth
Local Companies should be given jobs by the Municipality
Local Companies subcontracting.
Electricity Electric Poles
Installation of water meters
Electrification of demolished Houses
Others Renovation of Seeisoville Stadium Renovation of Seeisoville Hall
Safety and Security Road Safety next to CC Chicken
IDP Review 2020/21
Focus area Development Needs
Water Water meters be installed in Trou Bou Electricity Electricity cable be upgraded.
Re-electrification of demolished houses. Parks Open Space next to Strike ‘s Place to be maintained
Roads and Storm water Maintenance and paving of all roads and streets in the ward. Maintenance and fixing of potholes. Repair/Rebuild the Kroonstad/Viljoenskroon road.
Housing Site allocation for Kroonstad residents.
Water Quality of water needs to be upgraded to Blue Drop. Fixing of water taps to curb leaking and wastage.
Local Economic Development Young people be prioritised for employment and job opportunities. Local companies should be prioritised for projects done by the municipality and other government departments.
Sports and Recreation
Renovation of Seeisoville Hall and Stadium.
Safety and Security
Road safety campaigns be conducted next to CC Chicken.

140
3.4.15 Ward Development Needs: Ward 15
Focus Area Development Needs
Electricity Electricity poles loose near Fora Church and pose a danger to the residents. High mast lights needed At Bodibeng and Phuleng public schools.
Roads and Storm water Baza Baza Street: Water flow is very strong.
Storm water to be upgraded. Speed humps required at 666 Mokobe Street. Paving in Ntanga Street leading to Phuleng Public School.
Paving in Ntoi Street Fixing of Makhoba street
Street from the police station needs paving. Storm water required on the road leading to Bodibent and Phuleng public
schools.
Recreation and Sport Sports Grounds required
Other Houses required as they are old and falling apart.
IDP REVIEW 2018/19
Focus Area Development Needs
Area lighting High mast lights next to Bodibeng school, Veterans houses, Methodist church
and Phuleng Prinmary
Spots and Recreation Municipal halls must be properly maintained
Provision of electricity at these facilities must be improved as it traps from
time to time
Grass cutting Grass should be cut in the ward to avoid illegal dumping and promote the use
of open spaces as training grounds for various sporting codes
Unemployment Young people must be provided with requisite skills in mining and agriculture
to can play meaningful role in building the economy of the municipality
Roads and Stormwater Upgrading of the following streets; Mahabane, Morake, Makobe, Lekitlane,
Tlholwe and Morapedi
Housing Provision of houses must be prioritised
Sewerage Upgrading of sewer lines in Morapedi, Chakane, and Manis streets
IDP REVIEW 2019/20
Focus Area Development Needs
Housing Request for RDP Houses
Electricity Maintenance of Electric Poles

141
Focus Area Development Needs
Maintenance of Apollo Lights
Installation of Water Meters
Local Economic Development Hiring of local residents by Contracting companies
Roads and Stormwater Maintenance of Roads
Others Renovation of Seeisoville
Renovation of Seeisoville Hall
Safety of road next to CC Chicken
IDP Review 2020/21
Focus Area Development Needs
Roads and Storm water All streets need to be paved or tarred. Lekitlane str (493-503) Chekane str (1-910) Morake str (1001-1248) Makobe str (12-813) Makhetha str (371-4190) Mahabane str (99-303) Seheri str (1202-121215) Serame str (324-371) Monamodi str (1035-1051) Musi str (537-546) Ntoi str (537-747) Molise str (1169-1180) Mokitimi str (623-848) Molete str (918-729 Morapeli str(849-930) 1355-1303 1318-1341 1287-1280
Sports and Recreation Seeisoville community hall need to be upgraded Seeisoville stadium refurbishment Mahabane park development Mabala park development
Unemployment There I a need for employment Others Old marabastad need to be cleaned and maintained.
Need for library/information centre Electricity Solar geysers need to be resuscitated and
alsoaccomodate indigent household who did not benefit back then High mast light next to the veterans houses/Bodibeng. High mast light next to Phuleng Primary School.
Health The clinic need to upgraded to accommodate more people as the is new location and it cannot accommodate all patients.

142
3.4.16 Ward Development Needs: Ward 16
Focus Area Development Needs
Water Resolve water problems at Foster and Henry Streets
Sanitation Upgrade sewer networks to reduce spillage
Refuse Removal Keep streets clean by providing waste plastics on every street. Remove squatter camp.
Roads and Storm water Build manhole in every street.
Speed humps on the Hospital street (speed breakers) Drainage system damaged and need to be changed. Storm water channel required.
Van der Linder,Orpan,Fouler,Vermaak,S bridge –prioritised repaired
Recreation and Sport Old park to be renewed. Park for kids after school.
Other Start their own recycling to keep ward clean.
New changes to the Taxi Rank
IDP REVIEW 2018/19
Focus Area Development Needs
Kroonpark The state of Kroonpark under management of the municipality versus
private management as well as river bank.
Sanitation How many buckets still exist in Kroonstad and how many have been
eradicated so far.
Electricity How is electricity prepaid system being rolled out.
IDP REVIEW 2019/20
Focus Area Development Needs
Cleaning and maintenance Maintenance of Reitz Street
Maintenance of S-Bridge
Maintenance of Bike trails
Maintenance of Loubserpark
Maintenance of Parks and Islands
Cleaning of Empty Erfs
Maintenance of Street lights and Traffic Signs
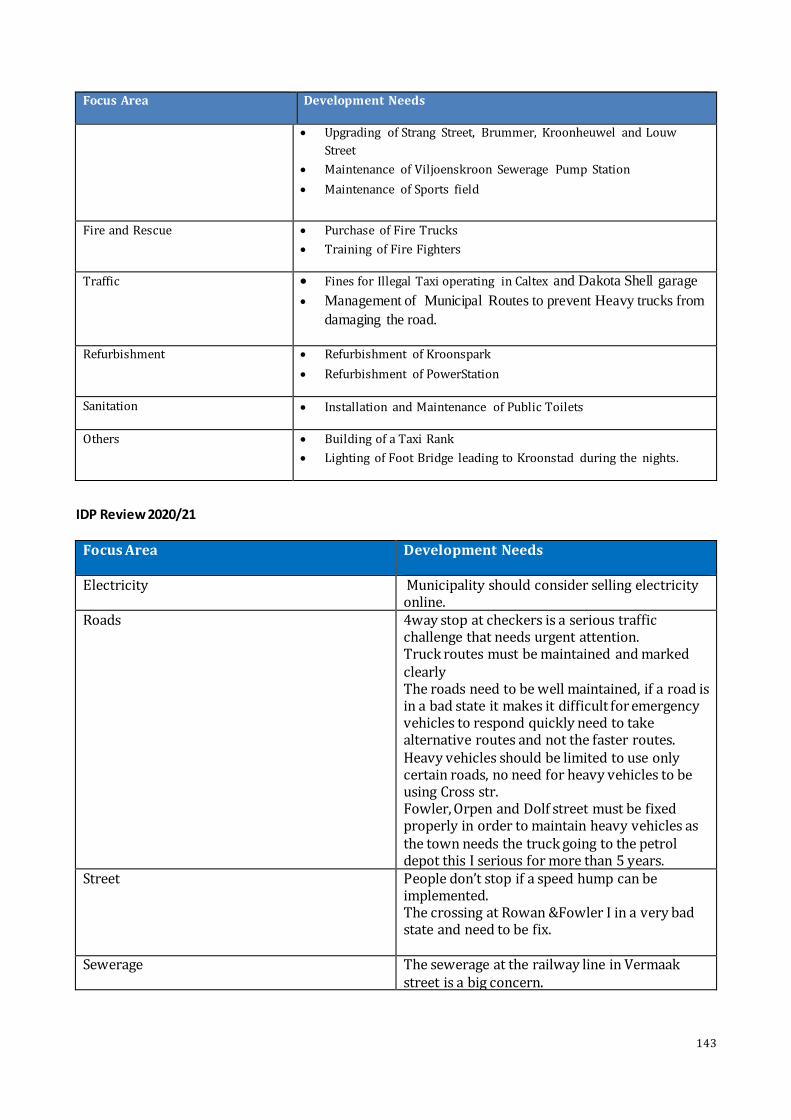
143
Focus Area Development Needs
Upgrading of Strang Street, Brummer, Kroonheuwel and Louw
Street
Maintenance of Viljoenskroon Sewerage Pump Station
Maintenance of Sports field
Fire and Rescue Purchase of Fire Trucks
Training of Fire Fighters
Traffic Fines for Illegal Taxi operating in Caltex and Dakota Shell garage
Management of Municipal Routes to prevent Heavy trucks from
damaging the road.
Refurbishment Refurbishment of Kroonspark
Refurbishment of PowerStation
Sanitation Installation and Maintenance of Public Toilets
Others Building of a Taxi Rank
Lighting of Foot Bridge leading to Kroonstad during the nights.
IDP Review 2020/21
Focus Area Development Needs
Electricity Municipality should consider selling electricity online.
Roads 4way stop at checkers is a serious traffic challenge that needs urgent attention. Truck routes must be maintained and marked clearly The roads need to be well maintained, if a road is in a bad state it makes it difficult for emergency vehicles to respond quickly need to take alternative routes and not the faster routes. Heavy vehicles should be limited to use only certain roads, no need for heavy vehicles to be using Cross str. Fowler, Orpen and Dolf street must be fixed properly in order to maintain heavy vehicles as the town needs the truck going to the petrol depot this I serious for more than 5 years.
Street People don’t stop if a speed hump can be implemented. The crossing at Rowan &Fowler I in a very bad state and need to be fix.
Sewerage The sewerage at the railway line in Vermaak street is a big concern.
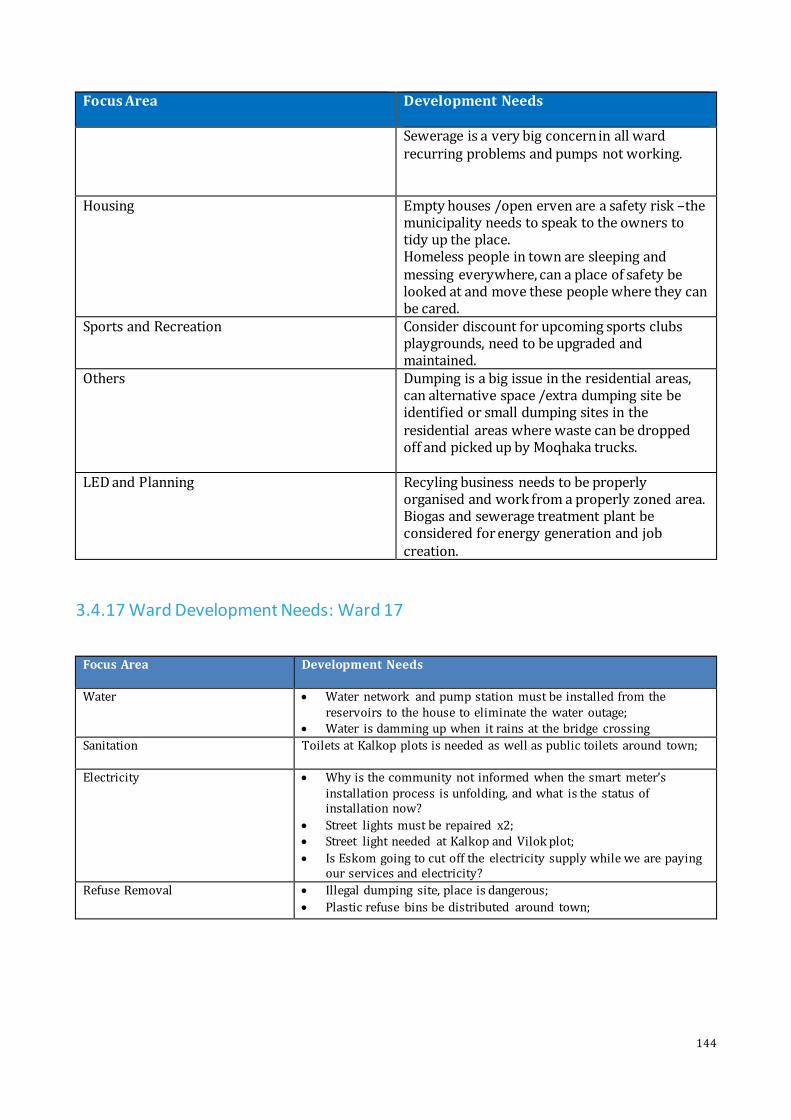
144
Focus Area Development Needs Sewerage is a very big concern in all ward recurring problems and pumps not working.
Housing Empty houses /open erven are a safety risk –the municipality needs to speak to the owners to tidy up the place. Homeless people in town are sleeping and messing everywhere, can a place of safety be looked at and move these people where they can be cared.
Sports and Recreation Consider discount for upcoming sports clubs playgrounds, need to be upgraded and maintained.
Others Dumping is a big issue in the residential areas, can alternative space /extra dumping site be identified or small dumping sites in the residential areas where waste can be dropped off and picked up by Moqhaka trucks.
LED and Planning Recyling business needs to be properly organised and work from a properly zoned area. Biogas and sewerage treatment plant be considered for energy generation and job creation.
3.4.17 Ward Development Needs: Ward 17
Focus Area Development Needs
Water Water network and pump station must be installed from the reservoirs to the house to eliminate the water outage;
Water is damming up when it rains at the bridge crossing
Sanitation Toilets at Kalkop plots is needed as well as public toilets around town;
Electricity Why is the community not informed when the smart meter’s installation process is unfolding, and what is the status of installation now?
Street lights must be repaired x2; Street light needed at Kalkop and Vilok plot;
Is Eskom going to cut off the electricity supply while we are paying our services and electricity?
Refuse Removal Illegal dumping site, place is dangerous;
Plastic refuse bins be distributed around town;
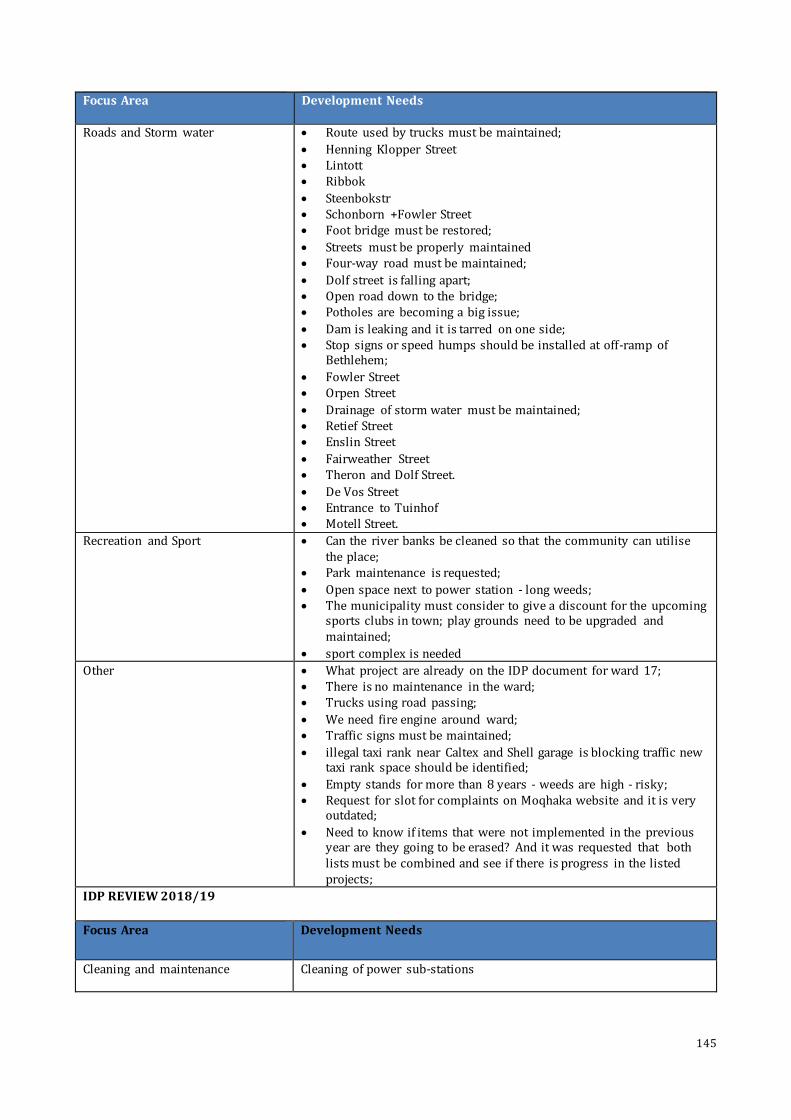
145
Focus Area Development Needs
Roads and Storm water Route used by trucks must be maintained;
Henning Klopper Street Lintott Ribbok
Steenbokstr Schonborn +Fowler Street Foot bridge must be restored;
Streets must be properly maintained Four-way road must be maintained;
Dolf street is falling apart; Open road down to the bridge; Potholes are becoming a big issue;
Dam is leaking and it is tarred on one side; Stop signs or speed humps should be installed at off-ramp of
Bethlehem;
Fowler Street Orpen Street
Drainage of storm water must be maintained; Retief Street Enslin Street
Fairweather Street Theron and Dolf Street.
De Vos Street Entrance to Tuinhof Motell Street.
Recreation and Sport Can the river banks be cleaned so that the community can utilise the place;
Park maintenance is requested;
Open space next to power station - long weeds; The municipality must consider to give a discount for the upcoming
sports clubs in town; play grounds need to be upgraded and maintained;
sport complex is needed
Other What project are already on the IDP document for ward 17; There is no maintenance in the ward; Trucks using road passing;
We need fire engine around ward; Traffic signs must be maintained;
illegal taxi rank near Caltex and Shell garage is blocking traffic new taxi rank space should be identified;
Empty stands for more than 8 years - weeds are high - risky; Request for slot for complaints on Moqhaka website and it is very
outdated;
Need to know if items that were not implemented in the previous year are they going to be erased? And it was requested that both lists must be combined and see if there is progress in the listed projects;
IDP REVIEW 2018/19
Focus Area Development Needs
Cleaning and maintenance Cleaning of power sub-stations

146
Focus Area Development Needs
Fire and Rescue Own working Fire Engine
Traffic Additional truck roads to keep them out of town
Sports and Recreation Astro Field Hockey
Soccer field
Netbal/ Ringball upgrade
IDP REVIEW 2019/20
Focus Area Development Needs
Cleaning and maintenance Maintenance of Reitz Street
Maintenance of S-Bridge
Maintenance of Bike trails
Maintenance of Loubserpark
Maintenance of Parks and Islands
Cleaning of Empty Erfs
Maintenance of Street lights and Traffic Signs
Upgrading of Strang Street, Brummer, Kroonheuwel and Louw
Street
Maintenance of Viljoenskroon Sewerage Pump Station
Maintenance of Sports field
Fire and Rescue Purchase of Fire Trucks
Training of Fire Fighters
Traffic Fines for Illegal Taxi operating in Caltex and Dakota Shell garage
Management of Municipal Routes to prevent Heavy trucks from
damaging the road.
Refurbishment Refurbishment of Kroonspark
Refurbishment of PowerStation
Sanitation Installation and Maintenance of Public Toilets
Others Building of a Taxi Rank
Lighting of Foot Bridge leading to Kroonstad during the nights.
IDP Review 2020/21
Focus Area Development Needs
Roads and Storm water The old” fiets brug” from kroonpark to town needs a serious clean up its very bushy it neds lights and the rails of the bridge stolen which makes it a risk for cyclist and pedestrians using the bridge

147
Focus Area Development Needs School children uses the bridge as a means to get to school but it’s very unsafe Old Kroonpark clean up very urgently suggestion are to look at a walking lane, open for everyone. Tuionhof streets needs to be tarred. Duiker and Steenbok streets need urgent attention for repairs. Steynsrus/La Porte Vase needs a stop sign and street lights Enslin street needs replacement. Steynsrus and Viljoenskroon roads. Establish our municipal road construction unit.
Cleaning and maintenance The playing ground at old Kroonpark needs to be relocated ,suggestion is between Sarel and Cillier bridge and Robot Bridge. Kroonpark needs to be cleaned and restored to its glory Suidrand and Tuinhof are having a problem with pedestrian like mice,rats,and snakes due to the open field not being maintained
Safety Tuinhof street needs urgent attention is Duiker & Steenbok street Tuinhof new development streets are still not tared ,no street lights ,crime is very high N1at tuinhof neds to be fenced of as well as the railway line,its not safe for children Tuinhof also have a problem with wild animals lurking around due to the fact that there are no proper fencing. Van der Lingen /Robert streets –taxis are a very big problem during the early hours of school runs. Kroonstad neighbourhood watch in conjunction with CPF would like to install cameras at all entrances in Kroonstad ,crime is very high at the moment. Jordania from the Reitz street bridge towards Jordania there are no lights ,if possible a high mast light would help. High mast light at Kraalkop. Elandia high mast light is needed
Local Economic Development Recycling business needs to be properly organised and allocated appropriate sites. Biogas and Solar plant be considered to generate electricity and create jobs.
Others Public Toilets at Kraalkop Illegal taxi rank –Loubsher Park Buying electricity online
Sewerage Sewerage problem at Johnny’s dam behind SANDF, near railroad and behind dam sewerage running to the river vir Tuinhof. Sewerage is a big problem concern in ward recurring problems and pumps not working
Water Water damming up at Sarel Cillier Bridge
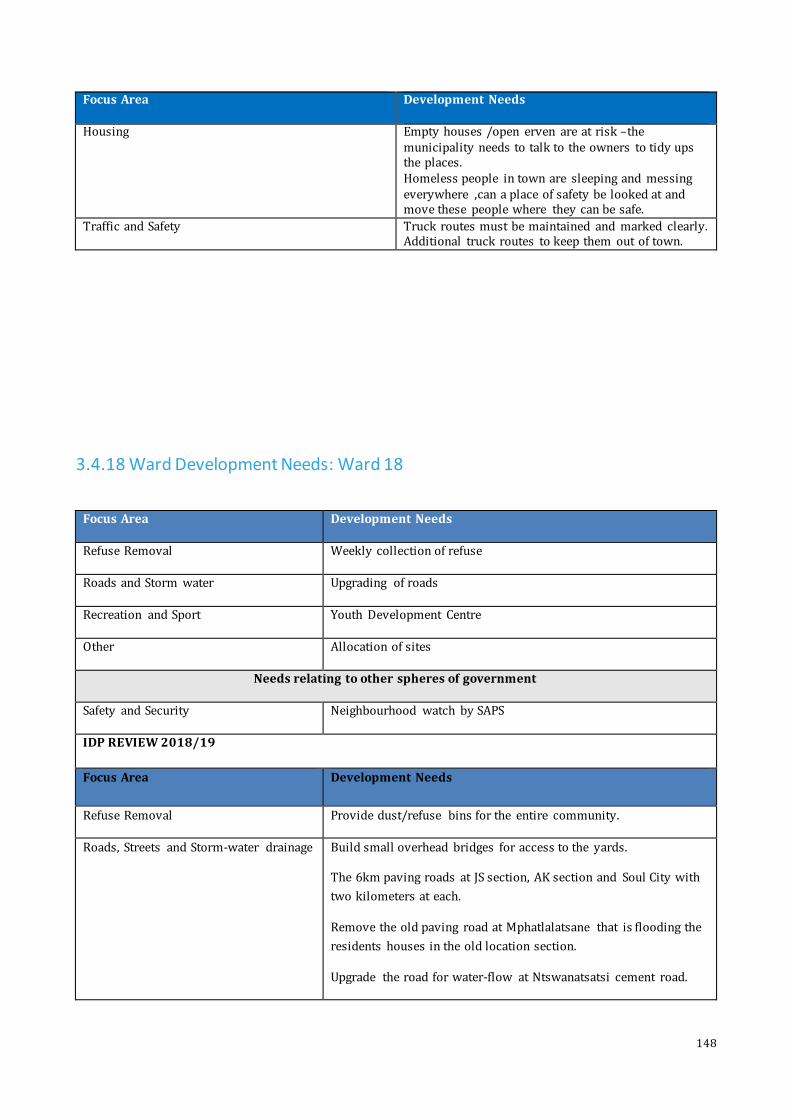
148
Focus Area Development Needs
Housing Empty houses /open erven are at risk –the municipality needs to talk to the owners to tidy ups the places. Homeless people in town are sleeping and messing everywhere ,can a place of safety be looked at and move these people where they can be safe.
Traffic and Safety Truck routes must be maintained and marked clearly. Additional truck routes to keep them out of town.
3.4.18 Ward Development Needs: Ward 18
Focus Area Development Needs
Refuse Removal Weekly collection of refuse
Roads and Storm water Upgrading of roads
Recreation and Sport Youth Development Centre
Other Allocation of sites
Needs relating to other spheres of government
Safety and Security Neighbourhood watch by SAPS
IDP REVIEW 2018/19
Focus Area Development Needs
Refuse Removal Provide dust/refuse bins for the entire community.
Roads, Streets and Storm-water drainage Build small overhead bridges for access to the yards.
The 6km paving roads at JS section, AK section and Soul City with
two kilometers at each.
Remove the old paving road at Mphatlalatsane that is flooding the
residents houses in the old location section.
Upgrade the road for water-flow at Ntswanatsatsi cement road.
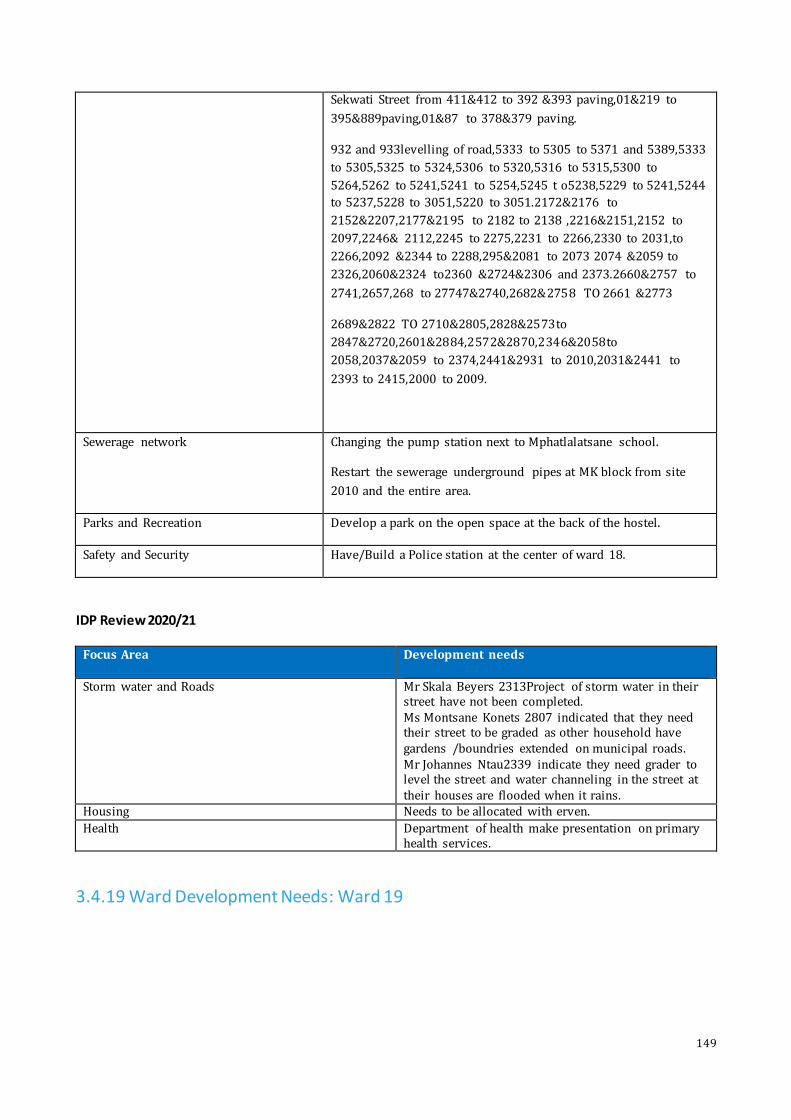
149
Sekwati Street from 411&412 to 392 &393 paving,01&219 to
395&889paving,01&87 to 378&379 paving.
932 and 933levelling of road,5333 to 5305 to 5371 and 5389,5333
to 5305,5325 to 5324,5306 to 5320,5316 to 5315,5300 to
5264,5262 to 5241,5241 to 5254,5245 t o5238,5229 to 5241,5244
to 5237,5228 to 3051,5220 to 3051.2172&2176 to
2152&2207,2177&2195 to 2182 to 2138 ,2216&2151,2152 to
2097,2246& 2112,2245 to 2275,2231 to 2266,2330 to 2031,to
2266,2092 &2344 to 2288,295&2081 to 2073 2074 &2059 to
2326,2060&2324 to2360 &2724&2306 and 2373.2660&2757 to
2741,2657,268 to 27747&2740,2682&2758 TO 2661 &2773
2689&2822 TO 2710&2805,2828&2573to
2847&2720,2601&2884,2572&2870,2346&2058to
2058,2037&2059 to 2374,2441&2931 to 2010,2031&2441 to
2393 to 2415,2000 to 2009.
Sewerage network Changing the pump station next to Mphatlalatsane school.
Restart the sewerage underground pipes at MK block from site
2010 and the entire area.
Parks and Recreation Develop a park on the open space at the back of the hostel.
Safety and Security Have/Build a Police station at the center of ward 18.
IDP Review 2020/21
Focus Area Development needs
Storm water and Roads Mr Skala Beyers 2313Project of storm water in their street have not been completed. Ms Montsane Konets 2807 indicated that they need their street to be graded as other household have gardens /boundries extended on municipal roads. Mr Johannes Ntau2339 indicate they need grader to level the street and water channeling in the street at their houses are flooded when it rains.
Housing Needs to be allocated with erven.
Health Department of health make presentation on primary health services.
3.4.19 Ward Development Needs: Ward 19

150
Focus Area Development Needs
Sanitation There is manhole that is always blocked.
Sewer problems. Manholes blocked.
Refuse Removal Cleaning of Vlei areas.
Roads and Storm water Upgrading of streets in the ward.
Other Need for sites.
Old people need sites where they can plant vegetables.
IDP REVIEW 2018/19
Focus Area Development Needs
Water and Sanitation Water quality is sub-standard and needs to be improved before the
tariff is increased
Local economic development SMME’s be assisted with business plans and funding
Cemeteries Municipality must assist with the digging of graves and people must be
made aware that they can pay for the municipality to dig for them
Housing Sites be allocated to renting residents
IDP REVIEW 2019/20
Focus Area Development Needs
Housing Request for RDP Houses.
Site Allocation
Roads, Streets and Storm-water drainage Paving of Road between Mphatlalatsane and
Ntswanatsatsi
Sewerage network Maintenance and upgrading of sewerage network next to
ZCC Church
Parks and Recreation Develop a park on the open space at the back of the hostel.
Safety and Security Building of a Police station
Other Demolishment of Hostel
IDP Review 2020/21
Area Focus Development needs
Housing Request for RDP Houses 4170

151
Safety Maintenance of high mast light
Roads and Storm Water Upgrading of storm water drainage Pedestrian bridge next to Ward 18
Refuse removal Request open space next to Thabang School to be cleaned or maintained Opened space next to Zweli ‘s tavern be cleaned Problem with illegal dumping sites
Housing Titled deeds Roads Upgrading of roads Sewerage Upgrading of sewerage next to Leboko 4051
3.4.20. Ward Development Needs: Ward 20
Focus Area Development Needs
Sanitation Toilets are needed outside the houses x3
Electricity High mast lights is needed
Roads and
Stormwater
Central Park - Street needs to be paved x5; looked into a borehole system; personnel fixing
the water leaks are taking long before they came out - can utilize youth with plumbing
skills to help them;
4756&4916 to 4902&4989,1616&1627 to 5099&5214,4656&4593 to
4673&4789,5419&5427 to 5437&5410,5425&5373,to 819 to 817thos need paving.
Levelling:4785&4593 to 4717&4702,4784&4725 to 4703 to4757,4866to 4915 to4797 to
4814355 to 1660,4863to 4887 to4881 to4847,4948 to4964 to 4949 to
4964,5040to5028,5041 to 5061 to 5053t o5074,50 75 to 5054 t o5061to 5093to
1400,1409,1430to 1424to 1430to 1426,1511to 1476to 1605,1528to 1458to 1594 to
1527,4307to 4323 to 1666to 4361,4356 to,4355,5111 to 5180,5181to 5110,5180,5124
to5151,5163
to5138,5164to5138to5152to5179,5193to5100,5200to5181,5181to5110,5101to5208,546
1to5462,5487to5427,5477to5483,5462to5497,5493to5492,5400to5425,5410to5409,537
1to5410,5370to5363,5371to5389,5372to5363,5371to5389.
Recreation and
Sport
RDP Houses; tractor to come and cut bushes;
Other Surrounding mines to make direct investments into community e.g. building a school; Wi-
Fi spot for youth to help with job searching; the youth need jobs
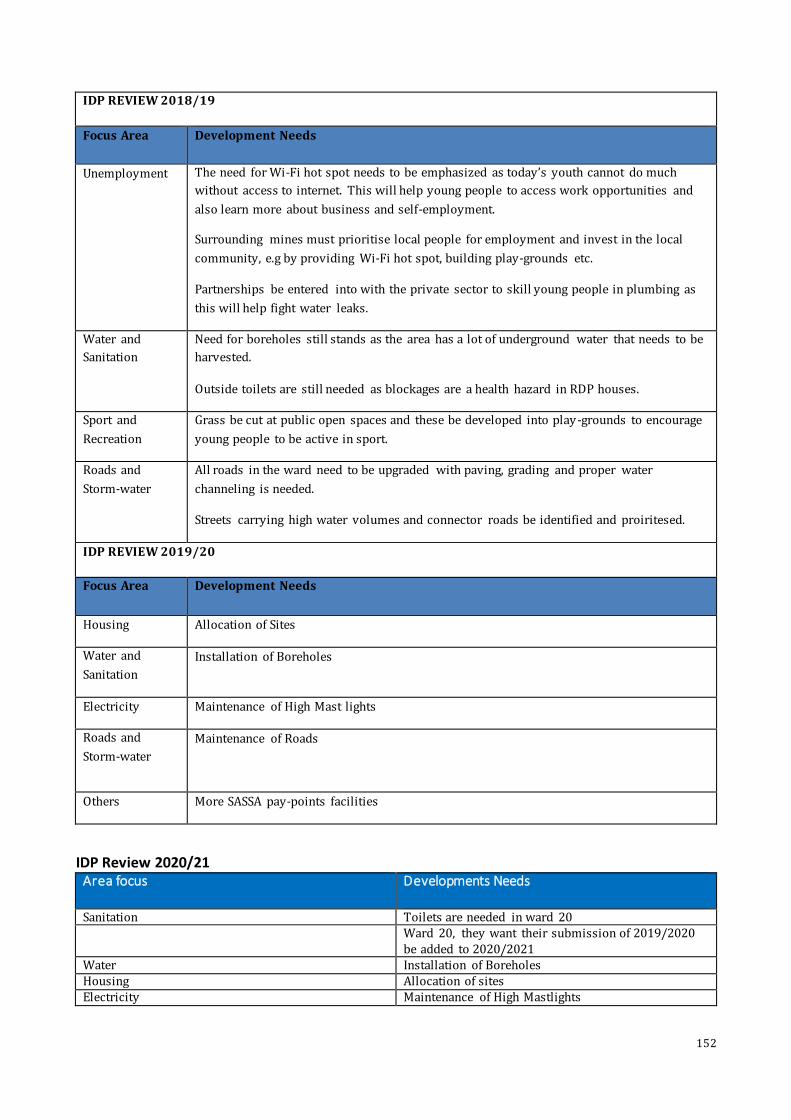
152
IDP REVIEW 2018/19
Focus Area Development Needs
Unemployment The need for Wi-Fi hot spot needs to be emphasized as today’s youth cannot do much
without access to internet. This will help young people to access work opportunities and
also learn more about business and self-employment.
Surrounding mines must prioritise local people for employment and invest in the local
community, e.g by providing Wi-Fi hot spot, building play-grounds etc.
Partnerships be entered into with the private sector to skill young people in plumbing as
this will help fight water leaks.
Water and
Sanitation
Need for boreholes still stands as the area has a lot of underground water that needs to be
harvested.
Outside toilets are still needed as blockages are a health hazard in RDP houses.
Sport and
Recreation
Grass be cut at public open spaces and these be developed into play-grounds to encourage
young people to be active in sport.
Roads and
Storm-water
All roads in the ward need to be upgraded with paving, grading and proper water
channeling is needed.
Streets carrying high water volumes and connector roads be identified and proiritesed.
IDP REVIEW 2019/20
Focus Area Development Needs
Housing Allocation of Sites
Water and
Sanitation
Installation of Boreholes
Electricity Maintenance of High Mast lights
Roads and
Storm-water
Maintenance of Roads
Others More SASSA pay-points facilities
IDP Review 2020/21
Area focus Developments Needs
Sanitation Toilets are needed in ward 20 Ward 20, they want their submission of 2019/2020
be added to 2020/2021 Water Installation of Boreholes Housing Allocation of sites Electricity Maintenance of High Mastlights

153
Others More SASSA pay point facilities
3.4.21 Ward Development Needs: Ward 21
Focus Area Development Needs
Water Water treatment plant to be upgraded.
Sanitation Outside toilets
Electricity High mast lights
Roads and Storm water Paving Roads 854 to 820,1188 to 1230,46to 4675,4364to
4425,705,1891,3410to 4336
Street that need gratering/Scraping4618 to 4675,4651to
4992,4549to4563,4583to4597,1320to1298,3837to3845,816to781,1105
to1139,
Street that need
sands4525to4434,4389to4366,4498to4486,3800to3813,4454to4499,4410to45
25,from 3410to 3436 there is a need for water drainage system to be upgrade.
Other Grass cutting close to 1526 Khaya and other areas
Social Responsibility by Mine around Kroonstad. Houses and stands required by community members Employment
Needs relating to other spheres of government
Safety and Security Police station in Ward 21
IDP REVIEW 2018/19
Focus Area Development Needs
Roads and Storm Water Built roads and storm water be maintained.
Housing Speed up the provision of RDP houses.
Local Economic
Development
Job creation programmes be developed to address high youth unemployment
rate.
Sports and Recreation Maintenance and upgrading of Letshabo Stadium and provision of additional
seats.
IDP REVIEW 2019/20
Focus Area Development Needs
Roads and Storm Water Built roads and storm water be maintained.
Upgrading of Roads

154
Focus Area Development Needs
Upgrading of Road between house number 1230-1118
Maintenance of Water Drainage System
Need for Speed Humps
Housing Speed up the provision of RDP houses.
Electricity Maintenance of Streetlights
Other Passage next Mrs Manana Baleni need to be closed
Need for a Swimming Pool
IDP Review 2020/21
Area Focus Development Need
Storm water and roads Storm water and drainage to be upgraded and be maintained next to Lucky Motaung’s curve Request Lucky Phooko ‘s mother street be maintained. Street between 1161 and 1162 to be closed and used for pedestrians only Corner to Maboloka church storm water drainage to be upgraded and be maintained
Sports and Recreation Upgrading of Hall and Clinic Safety and security Request Satelite Police Station
3.4.22 Ward Development Needs: Ward 22
Focus Area Development Needs
Water Fresh water supply, clean water access x3, accused of stealing water
Sanitation Toilets are needed; Toilets in dilapidated state; Sewerage near houses, creates health hazards; or sewage station
bring the snakes around area; No toilets at some places x 2
Electricity Coupon sales is needed
Recreation and Sport Bushes need to be mowed; Poisonous snakes in area; area to be cleaned

155
Focus Area Development Needs
Other Houses are needed;
RDP houses are needed; Land is need for farming, cows to graze and vegetable gardens, Rental is too high in area,
School are very far from the nearest town; No employment opportunity for youth who finished matric, how can
municipality help them?
Voting stations is needed; Information and communication does not come through as in other
areas;
Needs relating to other spheres of government
Health Struggle with ambulances, they take too long to arrive;
No doctors in the vicinity; A satellite clinic is needed
IDP REVIEW 2018/19
Focus Area Development Needs
Roads Roads from Viljoenskroon to Vierfontein and Bothaville
needs to be repaired
Road from Viljoenskroon to Orkeney
Housing Housing for residents at the Vierfontein number 1 hostel
Sanitation and Electricity No toilets and electricity for residents at the Vierfontein number 1
hostel
IDP REVIEW 2019/20
Focus Area Development Needs
Housing Allocation of Subsidized RDP Houses
Other Satellite Police Station
Fire Bridge Station
Commonages for Farmers
Establishment of Community Policing Forums
Need for a new School in the ward.
Parks and Recreation Opening of parks in Opening Spaces
IDP Review 2020/21
Focus Area Development Needs
Health Health services and wheel chairs for the disabled

156
Focus Area Development Needs
Social Need to be assisted with Identity documents Education Schooling facilities be made available
Need Library /information Centre for learning and research purpose (with free Wi FI)
LOCAL ECONOMIC DEVELOPMENT Need to be allocated land in order to do farming projects ,market place for selling their produce in township
Sanitation and Electricity Solar Energy in their ward for lightning the street
Housing Need to be prioritized and be given erven as well
Labour Intervention for audit on farm labourers i.e for pensions retirements benefits Eviction by farmers needs to be closely looked into.
IDP Review 2020/21
Focus Area Development Needs
Health Health services and wheel chairs for the disabled Social Need to be assisted with Identity documents Education Schooling facilities be made available
Need Library /information Centre for learning and research purpose (with free Wi FI)
LOCAL ECONOMIC DEVELOPMENT Need to be allocated land in order to do farming
projects ,market place for selling their produce in township
Sanitation and Electricity Solar Energy in their ward for lightning the street
Housing Need to be prioritized and be given erven as well
Labour Intervention for audit on farm labourers i.e for pensions retirements benefits Eviction by farmers needs to be closely looked into.
3.4.23 Ward Development Plan: Needs 23
Focus Area Development Needs
Water Houses are flooding when it rains; Clean water is needed
Sanitation Toilets are desperately needed
Electricity Electricity rates still charged at business rates - tuck shop is now closed;
some areas no electricity; municipality has blocked electricity;
high mast lights needed;
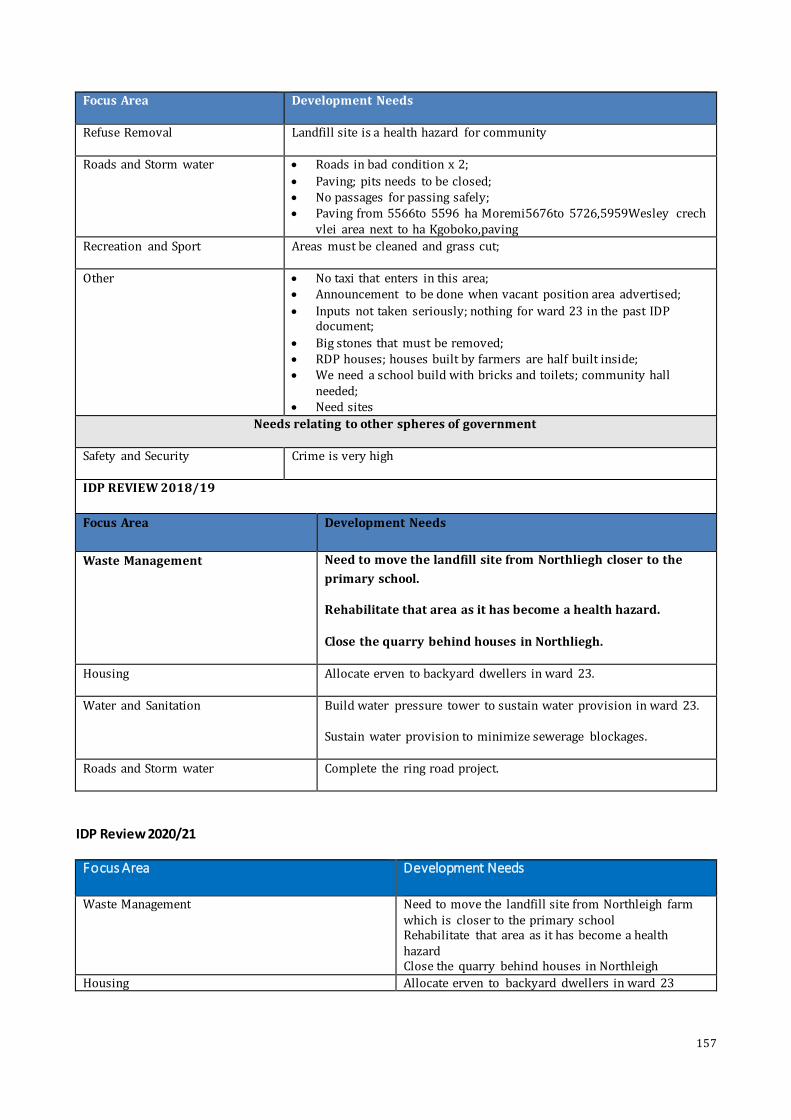
157
Focus Area Development Needs
Refuse Removal Landfill site is a health hazard for community
Roads and Storm water Roads in bad condition x 2;
Paving; pits needs to be closed; No passages for passing safely; Paving from 5566to 5596 ha Moremi5676to 5726,5959Wesley crech
vlei area next to ha Kgoboko,paving
Recreation and Sport Areas must be cleaned and grass cut;
Other No taxi that enters in this area; Announcement to be done when vacant position area advertised;
Inputs not taken seriously; nothing for ward 23 in the past IDP document;
Big stones that must be removed; RDP houses; houses built by farmers are half built inside; We need a school build with bricks and toilets; community hall
needed; Need sites
Needs relating to other spheres of government
Safety and Security Crime is very high
IDP REVIEW 2018/19
Focus Area Development Needs
Waste Management Need to move the landfill site from Northliegh closer to the
primary school.
Rehabilitate that area as it has become a health hazard.
Close the quarry behind houses in Northliegh.
Housing Allocate erven to backyard dwellers in ward 23.
Water and Sanitation Build water pressure tower to sustain water provision in ward 23.
Sustain water provision to minimize sewerage blockages.
Roads and Storm water Complete the ring road project.
IDP Review 2020/21
Focus Area Development Needs
Waste Management Need to move the landfill site from Northleigh farm which is closer to the primary school Rehabilitate that area as it has become a health hazard Close the quarry behind houses in Northleigh
Housing Allocate erven to backyard dwellers in ward 23

158
Water and Sanitation Build water pressure tower to sustain water provision in ward 23 Sustain water provision to minimize sewerage blockage
Roads and storm water Complete the ring road project

159
3.5 Ward Needs Prioritised
The issues raised in the ward development plans were analysed and summarised in the table below.
Wa
rds
Wa
ter
Ele
ctri
city
Re
fuse
Re
mo
va
l
Sa
nit
ati
on
Ro
ad
s a
nd
Sto
rm w
ate
r
Re
cre
ati
on
& S
po
rt
Pa
rks
an
d C
em
ete
rie
s
Un
ha
pp
ine
ss e
xp
ress
ed
wit
h C
ou
nci
l/S
erv
ice
De
liv
ery
/C
ust
om
er
Ca
re
Job
Cre
ati
on
Co
ntr
ol
of
Pu
bli
c
Nu
isa
nce
s
Fe
nce
s a
nd
Fe
nci
ng
Fir
e,
Tra
ffic
Se
rvic
es
&
La
w E
nfo
rce
me
nt
Tra
nsp
ort
Ho
usi
ng
/S
ite
s
He
alt
h
Sa
fety
& S
ecu
rity
Ed
uca
tio
n
So
cia
l S
ecu
rity
Ward 1 ✔ ✔ ✔ ✔✔ ✔ ✔ ✔ ✔ ✔
Ward 2 ✔ ✔ ✔ ✔ ✔ ✔
✔
Ward 3 ✔ ✔ ✔ ✔ ✔ ✔ ✔ ✔ ✔ ✔
Ward 4 ✔ ✔✔ ✔ ✔ ✔ ✔ ✔ ✔
Ward 5 ✔✔ ✔ ✔ ✔✔ ✔ ✔✔ ✔✔ ✔
Ward 6 ✔ ✔ ✔ ✔✔ ✔ ✔ ✔ ✔ ✔✔ ✔ ✔ ✔ ✔
Ward 7 ✔ ✔✔ ✔ ✔ ✔✔ ✔ ✔ ✔✔ ✔ ✔ ✔ ✔✔
Ward 8 ✔ ✔✔ ✔✔ ✔ ✔ ✔
Ward 9 ✔ ✔✔ ✔ ✔ ✔✔ ✔✔ ✔ ✔ ✔ ✔
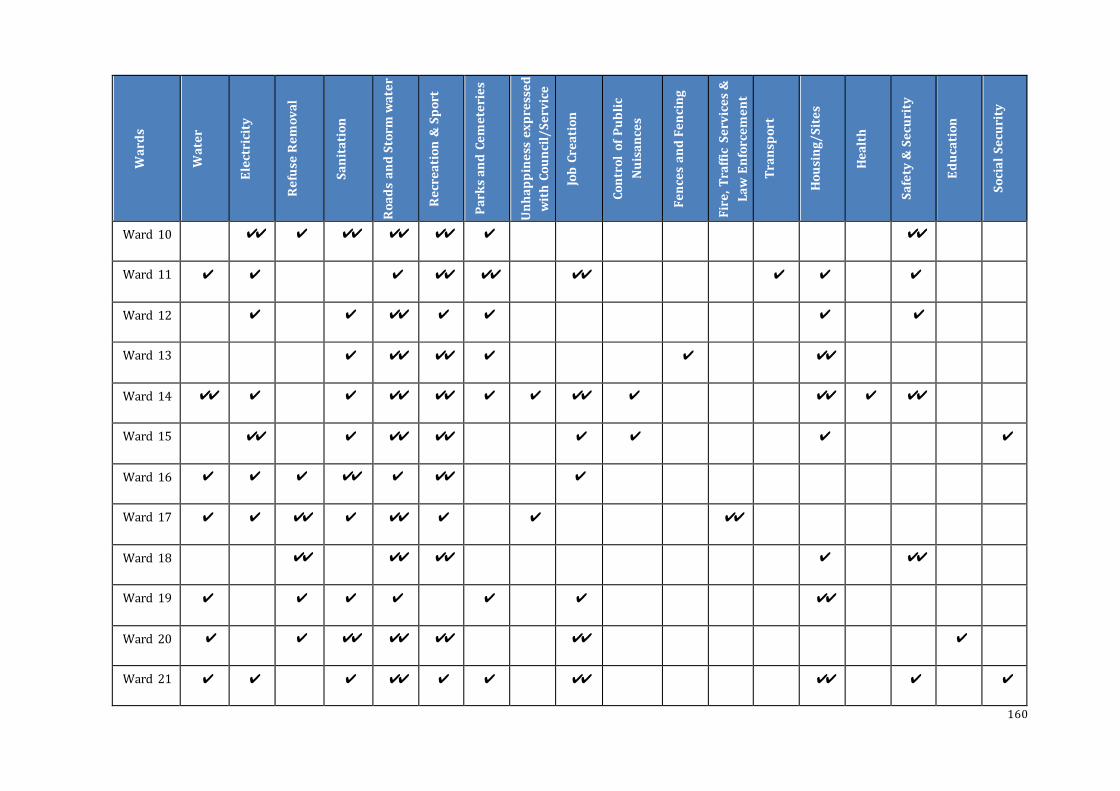
160
Wa
rds
Wa
ter
Ele
ctri
city
Re
fuse
Re
mo
va
l
Sa
nit
ati
on
Ro
ad
s a
nd
Sto
rm w
ate
r
Re
cre
ati
on
& S
po
rt
Pa
rks
an
d C
em
ete
rie
s
Un
ha
pp
ine
ss e
xp
ress
ed
wit
h C
ou
nci
l/S
erv
ice
De
liv
ery
/C
ust
om
er
Ca
re
Job
Cre
ati
on
Co
ntr
ol
of
Pu
bli
c
Nu
isa
nce
s
Fe
nce
s a
nd
Fe
nci
ng
Fir
e,
Tra
ffic
Se
rvic
es
&
La
w E
nfo
rce
me
nt
Tra
nsp
ort
Ho
usi
ng
/S
ite
s
He
alt
h
Sa
fety
& S
ecu
rity
Ed
uca
tio
n
So
cia
l S
ecu
rity
Ward 10 ✔✔ ✔ ✔✔ ✔✔ ✔✔ ✔ ✔✔
Ward 11 ✔ ✔ ✔ ✔✔ ✔✔ ✔✔ ✔ ✔ ✔
Ward 12 ✔ ✔ ✔✔ ✔ ✔ ✔ ✔
Ward 13 ✔ ✔✔ ✔✔ ✔ ✔ ✔✔
Ward 14 ✔✔ ✔ ✔ ✔✔ ✔✔ ✔ ✔ ✔✔ ✔ ✔✔ ✔ ✔✔
Ward 15 ✔✔ ✔ ✔✔ ✔✔ ✔ ✔ ✔ ✔
Ward 16 ✔ ✔ ✔ ✔✔ ✔ ✔✔ ✔
Ward 17 ✔ ✔ ✔✔ ✔ ✔✔ ✔ ✔ ✔✔
Ward 18 ✔✔ ✔✔ ✔✔ ✔ ✔✔
Ward 19 ✔ ✔ ✔ ✔ ✔ ✔ ✔✔
Ward 20 ✔ ✔ ✔✔ ✔✔ ✔✔ ✔✔ ✔
Ward 21 ✔ ✔ ✔ ✔✔ ✔ ✔ ✔✔ ✔✔ ✔ ✔

161
Wa
rds
Wa
ter
Ele
ctri
city
Re
fuse
Re
mo
va
l
Sa
nit
ati
on
Ro
ad
s a
nd
Sto
rm w
ate
r
Re
cre
ati
on
& S
po
rt
Pa
rks
an
d C
em
ete
rie
s
Un
ha
pp
ine
ss e
xp
ress
ed
wit
h C
ou
nci
l/S
erv
ice
De
liv
ery
/C
ust
om
er
Ca
re
Job
Cre
ati
on
Co
ntr
ol
of
Pu
bli
c
Nu
isa
nce
s
Fe
nce
s a
nd
Fe
nci
ng
Fir
e,
Tra
ffic
Se
rvic
es
&
La
w E
nfo
rce
me
nt
Tra
nsp
ort
Ho
usi
ng
/S
ite
s
He
alt
h
Sa
fety
& S
ecu
rity
Ed
uca
tio
n
So
cia
l S
ecu
rity
Ward 22 ✔ ✔✔ ✔✔ ✔ ✔ ✔ ✔ ✔✔ ✔ ✔
Ward 23 ✔✔ ✔ ✔ ✔✔ ✔✔ ✔ ✔ ✔ ✔ ✔✔ ✔ ✔ ✔ ✔
The needs were also prioritised from the most issues raised to the lowest in the table below.
Focus Area/Population Concerns 2017/2022 2018/19 2019/2020 2020/21
Roads and Storm water 21 20 74 76
Recreation & Sport 19 11 21
Electricity 15 8 14 41
Sanitation 15 7 8 17
Water 12 5 7 16
Job Creation 12 9 36 19
Housing/Sites 12 9 30 30
Safety & Security 12 7 29 9

162
Focus Area/Population Concerns 2017/2022 2018/19 2019/2020 2020/21
Refuse Removal 11 3 8 16
Unhappiness expressed with Council/Service Delivery/Customer
Care 8
4 1 13
Parks and Cemeteries 6 5 3 6
Education 6 4 5 6
Health 5 4 7 5
Fences and Fencing 1 3 2
Social Security 3 2 29 9
Control of Public Nuisances 1 2
Fire, Traffic, Emergency Services & Law Enforcement 1 1 5
Transport 2 0 1 1
3.6 Sector involvement
The table below lists the projects and programmes presented by the sector departments. In the instances where a “” is indicated in the column, the
relevant sector department will implement the programme during that financial year. The sector department responses listed below will in some instances
address the issues raised in the various wards for those issues that are not the municipality’s competence.
Department Project Description Implementation year
Sector Department Response 2017/18 2018/19 2019/20 2020/21
Dept. of Education
New Schools DR. Sello Primary School project has started.
This is a totally new project.
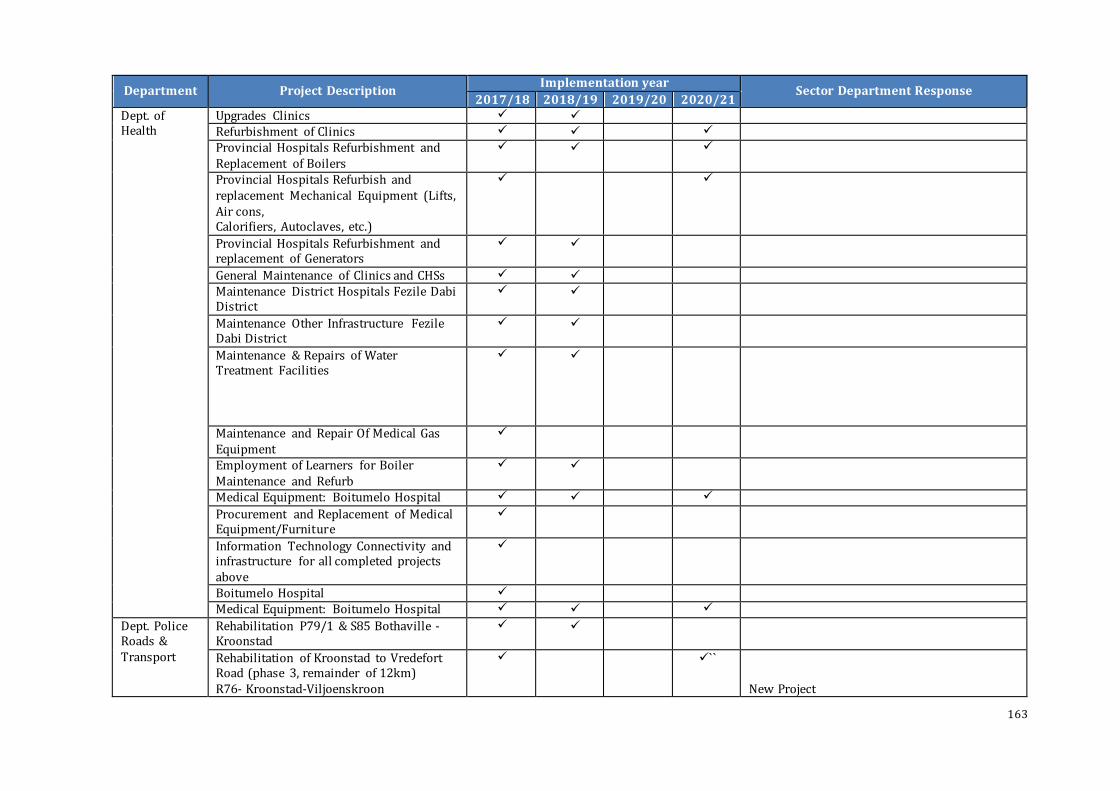
163
Department Project Description Implementation year
Sector Department Response 2017/18 2018/19 2019/20 2020/21
Dept. of Health
Upgrades Clinics Refurbishment of Clinics Provincial Hospitals Refurbishment and Replacement of Boilers
Provincial Hospitals Refurbish and replacement Mechanical Equipment (Lifts, Air cons, Calorifiers, Autoclaves, etc.)
Provincial Hospitals Refurbishment and replacement of Generators
General Maintenance of Clinics and CHSs Maintenance District Hospitals Fezile Dabi District
Maintenance Other Infrastructure Fezile Dabi District
Maintenance & Repairs of Water Treatment Facilities
Maintenance and Repair Of Medical Gas Equipment
Employment of Learners for Boiler Maintenance and Refurb
Medical Equipment: Boitumelo Hospital
Procurement and Replacement of Medical Equipment/Furniture
Information Technology Connectivity and infrastructure for all completed projects above
Boitumelo Hospital Medical Equipment: Boitumelo Hospital
Dept. Police Roads & Transport
Rehabilitation P79/1 & S85 Bothaville - Kroonstad
Rehabilitation of Kroonstad to Vredefort Road (phase 3, remainder of 12km) R76- Kroonstad-Viljoenskroon
`` New Project
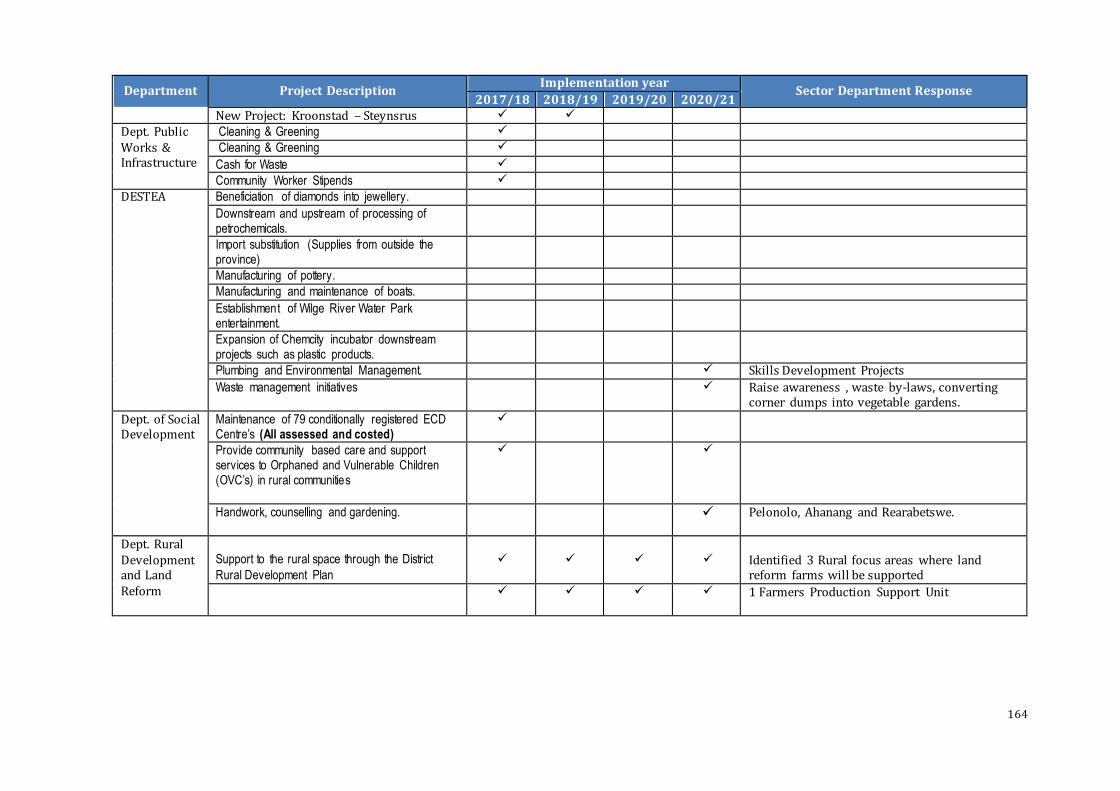
164
Department Project Description Implementation year
Sector Department Response 2017/18 2018/19 2019/20 2020/21
New Project: Kroonstad – Steynsrus Dept. Public Works & Infrastructure
Cleaning & Greening Cleaning & Greening
Cash for Waste Community Worker Stipends
DESTEA Beneficiation of diamonds into jewellery.
Downstream and upstream of processing of petrochemicals.
Import substitution (Supplies from outside the province)
Manufacturing of pottery. Manufacturing and maintenance of boats.
Establishment of Wilge River Water Park entertainment.
Expansion of Chemcity incubator downstream projects such as plastic products.
Plumbing and Environmental Management. Skills Development Projects
Waste management initiatives Raise awareness , waste by-laws, converting corner dumps into vegetable gardens.
Dept. of Social Development
Maintenance of 79 conditionally registered ECD Centre’s (All assessed and costed)
Provide community based care and support services to Orphaned and Vulnerable Children (OVC’s) in rural communities
Handwork, counselling and gardening. Pelonolo, Ahanang and Rearabetswe.
Dept. Rural Development and Land Reform
Support to the rural space through the District
Rural Development Plan
Identified 3 Rural focus areas where land reform farms will be supported
1 Farmers Production Support Unit
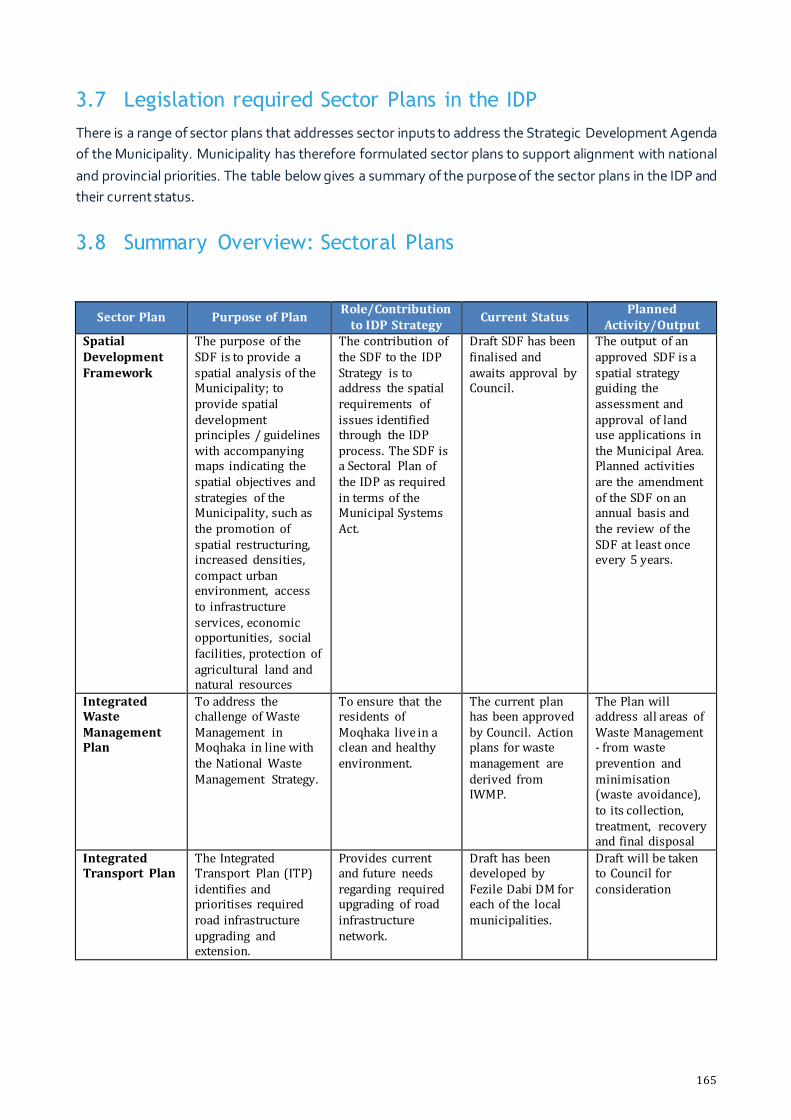
165
3.7 Legislation required Sector Plans in the IDP
There is a range of sector plans that addresses sector inputs to address the Strategic Development Agenda
of the Municipality. Municipality has therefore formulated sector plans to support alignment with national
and provincial priorities. The table below gives a summary of the purpose of the sector plans in the IDP and
their current status.
3.8 Summary Overview: Sectoral Plans
Sector Plan Purpose of Plan Role/Contribution
to IDP Strategy Current Status
Planned Activity/Output
Spatial Development Framework
The purpose of the SDF is to provide a spatial analysis of the Municipality; to provide spatial development principles / guidelines with accompanying maps indicating the spatial objectives and strategies of the Municipality, such as the promotion of spatial restructuring, increased densities, compact urban environment, access to infrastructure services, economic opportunities, social facilities, protection of agricultural land and natural resources
The contribution of the SDF to the IDP Strategy is to address the spatial requirements of issues identified through the IDP process. The SDF is a Sectoral Plan of the IDP as required in terms of the Municipal Systems Act.
Draft SDF has been finalised and awaits approval by Council.
The output of an approved SDF is a spatial strategy guiding the assessment and approval of land use applications in the Municipal Area. Planned activities are the amendment of the SDF on an annual basis and the review of the SDF at least once every 5 years.
Integrated Waste Management Plan
To address the challenge of Waste Management in Moqhaka in line with the National Waste Management Strategy.
To ensure that the residents of Moqhaka live in a clean and healthy environment.
The current plan has been approved by Council. Action plans for waste management are derived from IWMP.
The Plan will address all areas of Waste Management - from waste prevention and minimisation (waste avoidance), to its collection, treatment, recovery and final disposal
Integrated Transport Plan
The Integrated Transport Plan (ITP) identifies and prioritises required road infrastructure upgrading and extension.
Provides current and future needs regarding required upgrading of road infrastructure network.
Draft has been developed by Fezile Dabi DM for each of the local municipalities.
Draft will be taken to Council for consideration

166
Sector Plan Purpose of Plan Role/Contribution
to IDP Strategy Current Status
Planned Activity/Output
Water Services Development Plan
The purpose of the Water Services Development Plan (WSDP) is to progressively ensure efficient affordable, economical and sustainable access to water services that promote sustainable livelihoods and economic development.
Strategic objectives of the IDP are supported through the provision of water and sanitation services.
A new plan must be developed every 5 years and updated as necessary and appropriate in the interim years. Module 1 has been developed.
Environmental Management System
The Environmental Management System (EMS) Plan integrates environmental functions of all sections and ensures compliance with environmental legislation.
Protects the integrity of the environment and ensures sustainability of the Municipality. Ensures participative Greener Governance
Not in place.
Biodiversity Strategy
This strategy is an input to the Environmental Management System (EMS) which protects the integrity of the environment and ensures sustainability of the Municipality. Ensures participative Greener Governance
Protects the integrity of the environment and ensures sustainability of the Municipality. Ensures participative Greener Governance.
Not in place.
Air Quality Management Plan
The Air Quality Management Plan (AQMP) forms an input to the Environmental Management Plan (EMP) which protects the integrity of the environment and ensures sustainability of the Municipality. Ensures participative Greener Governance
Protects the integrity of the environment and ensures sustainability of the Municipality. Ensures participative Greener Governance.
Not in place.
Energy Master Plan
To indicate the Municipality's initiatives to reduce the towns energy usage in a sustainable manner
To ensure that enough energy is available to support existing and developmental needs.
Not in place. Electricity Infrastructure Master Plan was finalised in 2016 but not approved by Council.
Update the draft electricity infrastructure plan and submit it to Council for approval.
LED Strategy Outlines how Council can create an enabling
Local Economic Development is a
Developed and approved.
To be reviewed by June 2019.

167
Sector Plan Purpose of Plan Role/Contribution
to IDP Strategy Current Status
Planned Activity/Output
environment for economic growth that will benefit all the Citizens, especially those that are poor
high strategic priority of Council.
Disaster Management plan
To address any natural or manmade Disaster that may occur.
Disaster Management is an integral part of the IDP to ensure a safer community.
Developed and approved.
To be reviewed in 201
Integrated Sustainable Human Settlement Plan
Aims to initiative a process of ensuring that housing implementation contributes to the creation of vibrant sustainable and integrated communities in the Moqhaka Municipality.
It’s a sector plan that serves to inform the IDP of human settlement plan within the Municipality.
A new Housing Sector plan is being developed and planned to be completed by May 2019, then it will be taken to Council for approval.
To circulate the draft plan for comments by Directors before approval by Council.
Employment Equity Plan
To achieve and maintain representation in the workpl ace by appointing, empowering and developing competent members of staff which are equipped to implement the strategic plans of Council.
Institutional Transformation
Plan is for 2016/2020. (5-year plan) adopted by Council.
Continuous review of the Recruitment and Selection policy. Reaching of targets as set out in the internal Employment Equity Report. Continuous appointment of competent staff members within the goals of the EE Plan.
Housing Sector Plan
To provide Informa tion on Municipal Plan for Huma Settlem ent
To provide current and future needs of Human Settlement
Draft awaits Council Approved
Human Resources Strategic Plan
To ensure that HR serve and support the Municipali ty in achieving its strategic objectives through proper HR practices such as recruitment, training, performance managemen t, health and safety, personnel
Good Governance and Transformation
Plan is for 2016 -2020 (5-year Plan). Adoption– 2016
Continuous recruitment, training and development of staff, individual performance reviews and administration of staff.

168
Sector Plan Purpose of Plan Role/Contribution
to IDP Strategy Current Status
Planned Activity/Output
administration and labour relations
Workplace Skills Plan
To Plan, budget and Implement Staff Training Activities
Transformation Annual report submitted to the LGSETA, the last plan (2016/2017) was submitted on 30 June 2016.
Implementation of the WSP activities and submission of Annual Training reports to the LGSETA.
Performance Management System
Facilitate a performance driven culture and accountabl e Municipali ty.
To set performance indicators and targets that will measure the effectiveness and efficiency of the Municipali ty in implementing its IDP Objectives.
Performance Management Policy Framework adopted by Council in 2015.
To be reviewed in 2018
Long Term Financial Plan
The purpose is to outline the comprehensive multi- year financial plan that will ensure long-term financial sustainability for the Municipality.
The financial plan will ensure financial sustainabili ty of the Municipali ty in the realisation of the IDP objectives.
Financial Plan has been submitte d as part of the IDP.
Will be reviewe d and fully aligned to the revised IDP.
Water and Sewerage Master Plan
The water & sewerage water plans identify and prioritises required bulk water services infrastructure upgrading and extensions.
Provides curren t and future needs regarding required upgrading of water and sewer infrastructure network
Not in place. Water & Sewerage Master Plans to be updated every 2 - 3 years.
Roads and Storm Water Management System
The Roads and Storm Water Management System Addresses Priorities in required maintenance on the roads and systems.
Provides needs regarding required upgrading of storm water network in wards specified. Currently the highest issue raised by wards.
Approved in 2016 To be reviewed in 2018
Pavement Management System
The Paveme nt Management System identifies and prioritises required maintenance and upgrading of streets infrastructure.
Provides curren t and Future needs regarding required maintenance.
Not in place.

169
Sector Plan Purpose of Plan Role/Contribution
to IDP Strategy Current Status
Planned Activity/Output
Housing Sector Plan
To provide information on municipal plan for Human Settlem ent
To determin e current and future needs of Human Settl ement
Draft awaits Council Approval
To Submit to Council for Approval
3.9 Back to Basics Approach (B2B)
The Back to Basic Strategy is essentially a programme geared towards guiding municipalities on what need
to be done to discharge developmental mandates assigned to municipalities by the Constitution of the
Republic of South Africa. A comprehensive account of the status quo of local government was done
informed by extensive research and monthly survey on how municipalities are discharging their
responsibilities, how they interface with stakeholders and communities and good governance institutional
arrangement established by municipalities.
Critically, this extensive review undertaken by the Department of Co-operative Governance and Traditional
Affairs on the state of local government in South Africa, categorised the South African municipalities into
the following three cohorts, viz:
The top third of municipalities have got the basics right and are performing their functions at least
adequately. Within this group, there are a small group of top performers that are doing extremely
well. In these municipalities there are innovative practices to ensure sustainability and resilience.
This small core represents the desired (ideal) state for all our municipalities.
The middle third of municipalities are fairly functional, and overall performance is average. While
the basics are mostly in place and the municipalities can deliver on the main functions of local
government, we also find some areas of poor performance or decline that are worrying signs.
The bottom third of municipalities are frankly dysfunctional, and significant work is required to get
them to function properly. Among others we find endemic corruption, councils which do not
function, no structured community engagement, and poor financial management leading to
continuous negative audit outcomes. There is a poor record of service delivery, and functions such
as fixing potholes, collecting refuse, maintaining public places or fixing street lights are not
performed. While most of the necessary resources to render the functions or maintain the systems
are available, the basic mechanisms to perform these functions are often not in place. It is in these
municipalities that we are failing our people dramatically, and where we need to be intervening
urgently in order to correct the decay in the system.
Importantly, the strategy outlines five key performance areas that embed the Back to Basic Approach that
should be pursued to progressively improve the performance of municipalities. These are:

170
Basic Services – creating decent living conditions
o Develop fundable consolidated infrastructure plans;
o Ensure infrastructure maintenance and repairs to reduce losses in respect to:
Water and sanitation;
Human Settlement;
Electricity;
Waste Management;
Roads; and
Public Transportation
o Ensure the provision of Free Basic Services and the maintenance of Indigent Register
Good governance
o The existence and efficiency of Anti-Corruption measures;
o Ensure compliance with legislation and enforcement of by-laws;
o Ensure the functionality
Public Participation
o Ensure the functionality of ward committees;
o Conduct community satisfaction surveys periodically
Financial Management
o Improve audit opinion;
o Implementation of revenue enhancement strategy

171
Institutional Capacity
o Ensuring that the top six posts (Municipal Manager, Finance, Infrastructure Corporate Services,
Community development and Development Planning) are filled by competent and qualified
persons.
o That the municipal organograms are realistic, underpinned by a service delivery model and
affordable.
o That there are implementable human resources development and management programmes.
o There are sustained platforms to engage organised labour to minimise disputes and disruptions.
o Importance of establishing resilient systems such as billing.
o Maintaining adequate levels of experience and institutional memory.
Municipalities are expected to develop Back to Basic Implementation Plan that are informed by the
reporting template issued by the Department of Cooperative Governance and Traditional Affairs.
Chapter 4: Development Objectives and Strategies
4.1 Introduction
This chapter entails Moqhaka Local Municipality’s Vision and Mission that gives directives to the
developmental agenda of the Municipality. The broader developmental agenda of MLM consists of short,
medium and long term development goals.
MLM is committed to the objectives of local government which are enshrined in section 152 (1) of the
Constitution of the Republic of South Africa, 1996 namely:
(a) To provide democratic and accountable government for local communities;
(b) To ensure the provision of services to communities in a sustainable manner;
(c) To promote social and economic development;
(d) To promote a safe and healthy environment; and
(e) To encourage the involvement of communities and community organisations in the matters of local
government.
Municipality’s development strategies are therefore, crafted within the context of ensuring that efforts are
focused on delivering the expected outcomes of the developmental mandate of the local sphere of
government.

172
Vision
“Moqhaka Local Municipality strives to be a Municipality that creates an enabling environment for socio
economic growth and sustainable development.”
Mission Statement
“To maintain and enhance quality of life by providing effective, efficient quality and affordable services
equitably and facilitating sustainable socio economic growth through active community participation.”
The municipality has through its strategic planning and public participation processes ensured that the
Municipal Strategic Priorities were unpacked by developing key performance areas (KPAs), programmes,
objectives, key performance indicators (KPIs) and targets for each of the KPAs and programmes.
The said objectives, indicators and targets (outlined in the tables below) have been aligned to the Provincial
Priority Outputs, where possible and will form the basis for the development of the municipality’s Service
Delivery and Budget Implementation Plan (SDBIP) and Annual Performance Plans of Senior Management
for the 2020/21 financial year.
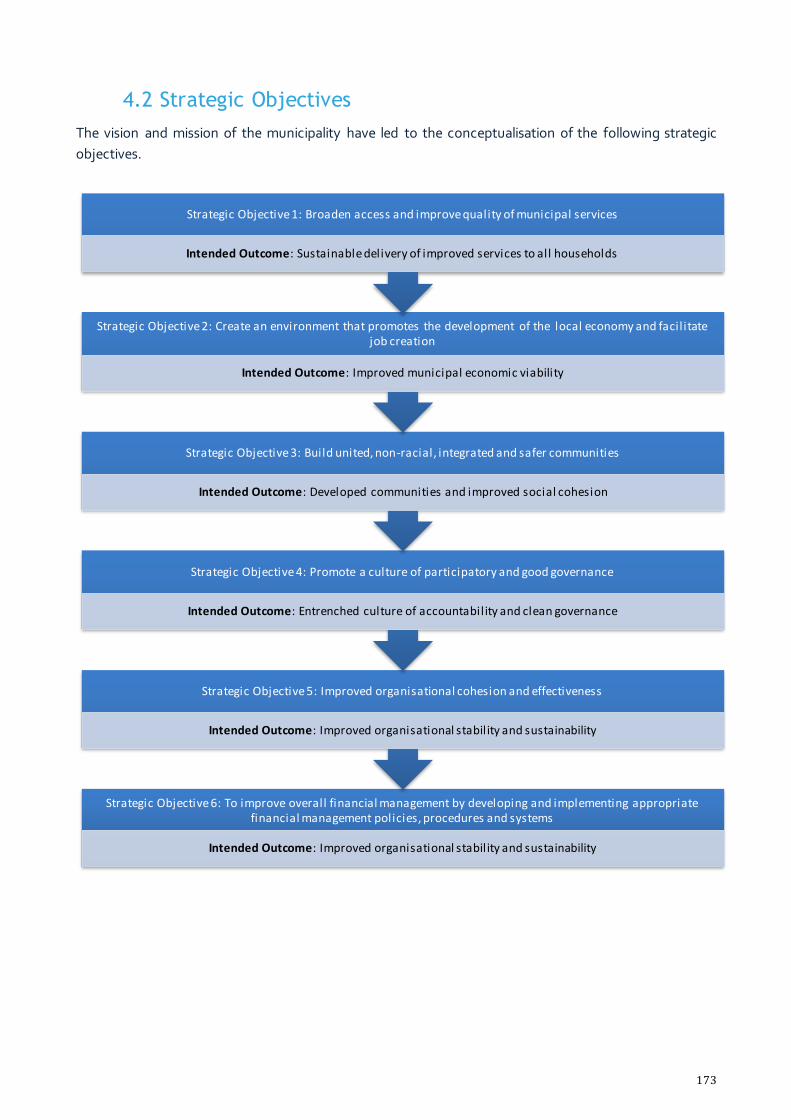
173
4.2 Strategic Objectives
The vision and mission of the municipality have led to the conceptualisation of the following strategic
objectives.
Strategic Objective 6: To improve overall financial management by developing and implementing appropriate financial management policies, procedures and systems
Intended Outcome: Improved organisational stability and sustainability
Strategic Objective 5: Improved organisational cohesion and effectiveness
Intended Outcome: Improved organisational stability and sustainability
Strategic Objective 4: Promote a culture of participatory and good governance
Intended Outcome: Entrenched culture of accountability and clean governance
Strategic Objective 3: Build united, non-racial, integrated and safer communities
Intended Outcome: Developed communities and improved social cohesion
Strategic Objective 2: Create an environment that promotes the development of the local economy and facil itate job creation
Intended Outcome: Improved municipal economic viability
Strategic Objective 1: Broaden access and improve quality of municipal services
Intended Outcome: Sustainable delivery of improved services to all households

174
4.3 Alignment of selected National, Provincial, District and Local objectives.
Section 24 (1) and (2) of the Local Government: Municipal Systems Act (No: 32 of 2000) stipulates the
following about “Municipal planning in co-operative government-
The planning undertaken by a municipality must be aligned with, and complement, the development plans
and strategies of other affected municipalities and other organs of state to give effect to the principles of
co-operative government contained in Section 41 of the Constitution.
Municipalities must participate in national and provincial development programmes as required in Section
153 (b) of the Constitution.”
Furthermore, Regulation 2(1) (d) stipulates that “(1) A municipality’s integrated development must at least
identify-
“(d) all known projects, plans and programmes to be implemented within the municipality by any organ of
state.”
In line with above, Chapter 7 of this document deals extensively with projects that the Sector Departments
of the province will implement within the MLM area. The above are clearly the key planning assumptions
for MLM in the development of its IDP. This is a progressive planning rationale and is based on a clear
legislative framework to ensure consistency and an enhanced quality of the IDP. This planning rationale is
underpinned by the principle of Co-operative Governance as entrenched in the Constitution of the Republic
of South Africa, 1996.
4.3.1 The value of Planning Alignment
The capital markets for municipalities have become extremely complex and difficult to access. A common
basis for this has been the narrow tax base which is adversely affecting most municipalities in the country.
The rapid growth of the area has also sparked a regressive response by some of the key variables in a healthy
economy. This rapid growth seems to be outstripping the Municipal infrastructure’s capacity and as such,
places a huge capital burden on the Municipality. This burden requires an aggressive response by the
Municipality to address the challenges of bulk infrastructure and reticulation infrastructure needs.
It is quite clear that the Municipality alone will not be able to meet all its challenges and therefore it will be
necessary to explore beyond its own means and perhaps the traditional funding sources. High levels of
creativity will be the key ingredient of any strategic response to these massive challenges. Various key
strategies and plans are required to gear for maximum utilisation of available resources. Different strategies
and plans from all spheres must be considered to:
Avoid Duplication of Initiative

175
MLM’s IDP must ensure that cognisance is given to the relevant Sector Departments and respective
strategies and plans. The IDP must be based on and aligned with all plans of relevant Sector Departments
with resource allocations at their respective levels. The powers and functions of the different spheres of
government are the means to avert duplication and funding related to those initiatives.
Ensure efficient utilisation of limited resources
Aligned plans ensure that resources are creatively harnessed and, as such, a lot more is achieved than would
have had there been a piecemeal approach. Both the IDPs of Fezile Dabi District and Moqhaka Local
Municipalities should serve as a platform for all the spheres of government to converge and define the
development path of the District in general and more specifically the Moqhaka Municipal area. The three
main funding sources for the IDP would be the Municipality’s own income (tax base), conditional and
unconditional grants, and lastly, the Provincial and National Governments’ financial interventions. The
latter is very important and this suggests that the alignment of planning instruments in the different spheres
of government should allow for impact to be maximised by ensuring that limited resources are efficiently
utilised. The alignment of selected National, Provincial, District and Local objectives is illustrated in the table
below:

176
COMPANY NAME | BUSINESS REPORT
National 12 Key Outcomes
National: MTSF National: NDP Provincial:
Vision 2030 Local: MLM IDP
1 Improved quality of basic education
Improving education and training
Education, innovation and skills development
Improved Organisational Cohesion and effectiveness
2 A long and healthy life for all South Africans
Improve the health profile of all South Africans
Providing quality health care
Improved quality of life
Broaden access and improve quality of municipal services.
3 All people in South Africa are and feel safe
Intensify the fight against crime and corruption
Transforming society and uniting the nation
Building Social Cohesion.
Promote a culture of participatory and good governance.
4 Decent employment through inclusive growth path
Speed up economic growth and transform the economy to create decent work and sustainable livelihoods
Creating jobs and livelihoods
Inclusive Economic Growth and Sustainable job creation.
Create an environment that promotes the development of the local economy and facilitate job creation
5 A skilled and capable workforce to support an inclusive growth path
Strengthen the skills and human resource base
improving education and training
Education, innovation and skills development
Improved Organisational Cohesion and effectiveness
6 An efficient, competitive and responsive economic infrastructure network
Introduce a massive programme to build economic and social infrastructure
Transitioning to a low-carbon economy
Inclusive Economic Growth and Sustainable job creation.
Create an environment that promotes the development of the local economy and facilitate job creation
7 Vibrant, equitable and sustainable rural communities with food security for all
Develop and implement a comprehensive rural development strategy linked to land and agrarian reform and food security
Transforming urban and rural spaces
Sustainable Rural Development
Build united non-racial, integrated and safer communities
8 Sustainable human settlements and improved quality of household life
Build cohesive, caring and sustainable communities
Transforming society and uniting the nation
Building Social Cohesion.
Build united non-racial, integrated and safer communities
9 A responsive, accountable, effective and
efficient local government system
Build a developmental state, improve public
service and strengthen democratic institution
Fighting corruption and enhancing accountability
Good Governance Broaden access and improve quality of municipal services.
10 Environmental
assets and natural resources that are well protected and continually enhanced
Ensure sustainable
resource management and use
Broaden access and
improve quality of municipal services.

177
COMPANY NAME | BUSINESS REPORT
National 12 Key Outcomes
National: MTSF National: NDP Provincial:
Vision 2030 Local: MLM IDP
11 Create a better South Africa and contribute to a better and safer Africa and World
Pursue African advancement and enhanced international cooperation
12 An efficient, effective and development oriented public service and an empowered, fair and inclusive citizenship
Build a developmental state, improve public service and strengthen democratic institution
Good Governance To improve overall financial Management by developing and implementing appropriate financial management policies, procedures and systems
The municipality has through its strategic planning and public participation processes ensured that the Municipal Strategic
Priorities were unpacked by developing key performance areas (KPAs), programmes, objectives, key performance
indicators (KPIs) and targets for each of the KPAs and programmes.
The said objectives, indicators and targets (outlined in the tables below) have been aligned to the Provincial Priority
Outputs, where possible and will form the basis for the development of the municipality’s Service Delivery and Budget
Implementation Plan (SDBIP) and Annual Performance Plans of Senior Management for the 2020/21 financial year.

178
4.4 Strategic Alignment of key performance area’s and priority areas
4.4.1 Key Performance Area 1: Basic Service Delivery
KPA1: Basic Service Delivery
Electricity
Roads and Storm Water
Sanitation
Water
Solid Waste Removal and Management

179
KPA 1: Service Delivery and Infrastructures Development
Strategic
Objective: Broaden Access and improve quality of municipal services
Intended
Outcome: Sustainable delivery of improved services to all households
IDP
/Ref
No.
IDP
Priority
Area
Activity,
Program
me or
Capital
Projects
Dir
ecto
rate
Municipal
Strategy KPI Calculation
Bas
elin
e
Total
Target
2017/
18
Target
2018/
19
Target
2019/
20
Target
2020/
21
Target
2021/
22
Del
iver
y In
t/E
xt
Fu
nd
ing
Sou
rce
KPI
01 Electricity
Programm
e
Technic
al
Service
s
To expand the
electrification
programme to
any remaining
areas and roll
out solar
energy in any
identified areas
at prescribed
standards
Number of
HH in
municipal
supply area
meet agreed
electricity
service
standards
(connected
to the
national
grid)
Sum of HH with
access to
electricity
(connected to
the National
Grid)
2577
4 24040 24040 24040 25794 25794 25794 Int
ML
M
KPI
02 Electricity
Programm
e
Technic
al
Service
s
By rolling out
electrification
of newly
established
settlements and
those with a
back log
Number of
HH without
access to
minimum
electricity
standards
Sum of HH
without access
to minimum
electricity
services
0 20 50 2 0 52 0 0 Int ML
M
KPI
03 Electricity
Programm
e
Technic
al
Service
s
By ensuring
that capital
proets are
rolled out in
therms of
approved
project paln
Number of
capital
infrastructu
re projects
completed.
Sum of
infrastructure
projects
completed.
0 0 0 6 3 3 Int ML
M

180
IDP
/Ref
No.
IDP
Priority
Area
Activity,
Program
me or
Capital
Projects
Dir
ecto
rate
Municipal
Strategy KPI Calculation
Bas
elin
e
Total
Target
2017/
18
Target
2018/
19
Target
2019/
20
Target
2020/
21
Target
2021/
22
Del
iver
y In
t/E
xt
Fu
nd
ing
Sou
rce
KPI
04 Electricity
Programm
e
Technic
al
Service
s
Reduce
electricity
losses by
improving
inspections and
maintenance.
%
Electricity
distribution
losses.(KWH
billed/KWH
acquired)
(MFMA
Circular 71)
(Number of
Electricity
Units
Purchased and
/ or Generated
- Number of
Electricity
Units Sold) /
Number of
Electricity
Units
Purchased and
/ or Generated)
× 100
18,56
% 14.8% 18.56% 16% 15.8% 15.5% 14.8% Int
ML
M
KPI
05
Roads and
Storm Water
Programm
e
Technic
al
Service
s
By ensuring
that newly built
roads are built
with storm
water drainage
and mobilize
funding for
rehabilitation,
refurbishment
and
replacement of
ageing
infrastructure.
km gravel
roads
maintained
and or re-
gravelled
Sum of km
roads
maintained and
or gravelled
409
km
600km 110km 115km 120km 125km 130km Int ML
M
KPI
06
Roads and
Storm Water
Programm
e
Technic
al
Service
s
By developing
and
implementing a
maintenance
programme
specific to
potholes
m² of
potholes
patched
Sum of m² of
potholes
patched
2500
0m2
130
000m²
25000
m²
25500
m²
26000
m²
26500
m²
27000
m² Int
ML
M
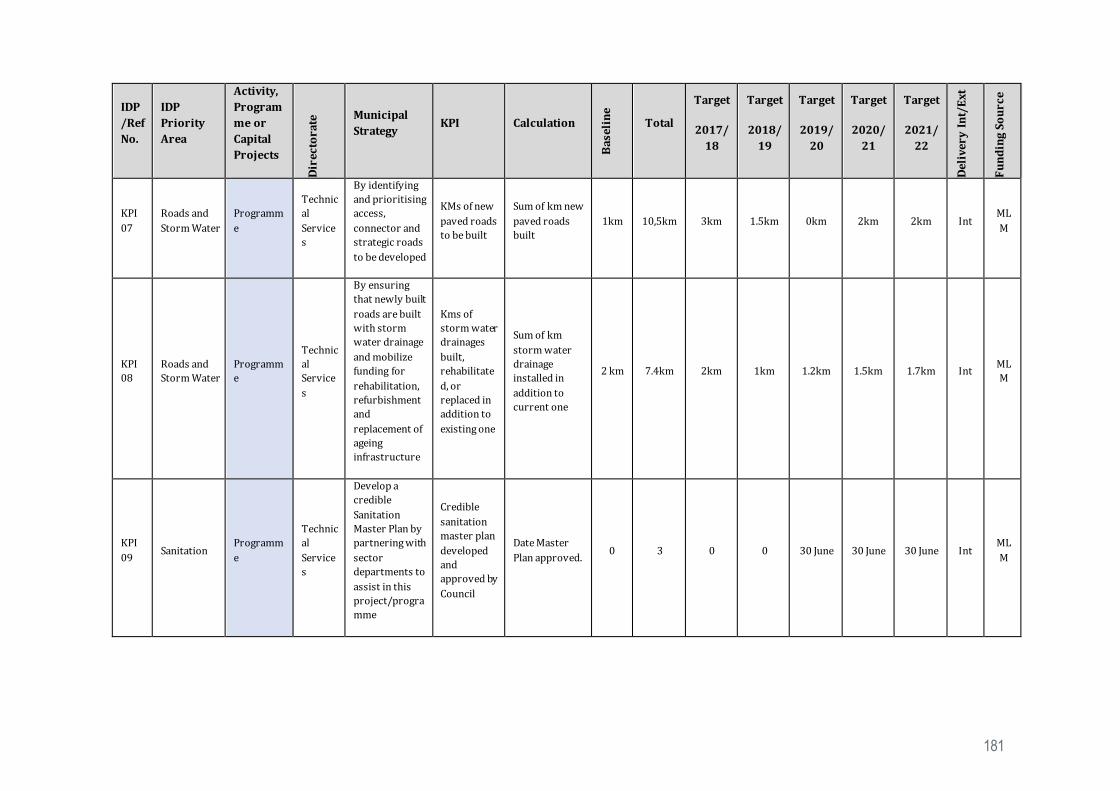
181
IDP
/Ref
No.
IDP
Priority
Area
Activity,
Program
me or
Capital
Projects
Dir
ecto
rate
Municipal
Strategy KPI Calculation
Bas
elin
e
Total
Target
2017/
18
Target
2018/
19
Target
2019/
20
Target
2020/
21
Target
2021/
22
Del
iver
y In
t/E
xt
Fu
nd
ing
Sou
rce
KPI
07
Roads and
Storm Water
Programm
e
Technic
al
Service
s
By identifying
and prioritising
access,
connector and
strategic roads
to be developed
KMs of new
paved roads
to be built
Sum of km new
paved roads
built
1km 10,5km 3km 1.5km 0km 2km 2km Int ML
M
KPI
08
Roads and
Storm Water
Programm
e
Technic
al
Service
s
By ensuring
that newly built
roads are built
with storm
water drainage
and mobilize
funding for
rehabilitation,
refurbishment
and
replacement of
ageing
infrastructure
Kms of
storm water
drainages
built,
rehabilitate
d, or
replaced in
addition to
existing one
Sum of km
storm water
drainage
installed in
addition to
current one
2 km 7.4km 2km 1km 1.2km 1.5km 1.7km Int ML
M
KPI
09 Sanitation
Programm
e
Technic
al
Service
s
Develop a
credible
Sanitation
Master Plan by
partnering with
sector
departments to
assist in this
project/progra
mme
Credible
sanitation
master plan
developed
and
approved by
Council
Date Master
Plan approved.
0 3 0 0 30 June 30 June 30 June Int ML
M

182
IDP
/Ref
No.
IDP
Priority
Area
Activity,
Program
me or
Capital
Projects
Dir
ecto
rate
Municipal
Strategy KPI Calculation
Bas
elin
e
Total
Target
2017/
18
Target
2018/
19
Target
2019/
20
Target
2020/
21
Target
2021/
22
Del
iver
y In
t/E
xt
Fu
nd
ing
Sou
rce
KPI 10
Sanitation Programm
e
Technic
al
Service
s
By ensuring
that basic
sanitation
standards are
communicated
and known to
the community
and the
municipality
adheres to
them
Number of
HH with
access to
basic
sanitation
Sum of HH with
access to basic
sanitation
34
095 33 095 33 095 33 095 34 131 34231 34631 Int
ML
M
KPI
11 Sanitation
Programm
e
Technic
al
Service
s
By expanding
sanitation
services to
cover any back
log and roll it
out to newly
established
settlements
Number of
HH without
access
minimum
sanitation
standards
Sum of HH
without access
minimum
sanitation.
605 50 50 0 200 505 0 Int ML
M
KPI
12
Sanitation Programm
e
Technic
al
Service
s
By improving
quality of
sewerage
effluent.
Waste water
quality
compliance
according to
the water
use license.
No of tests
conducted
complying with
the licence
requirements.
NEW
KPI
98% 0 0 0 98% 98% Int ML
M
KPI
13 Water
Programm
e
Technic
al
Service
s
By reducing
water loss in
the municipal
distribution
area
To reduce
water loss
in
distribution.
(Number of
Kiloliters
Water
Purchased or
Purified -
Number of
Kiloliters
Water Sold) /
Number of
30% 37% 30% 26% 25% 25% 15% Int ML
M

183
IDP
/Ref
No.
IDP
Priority
Area
Activity,
Program
me or
Capital
Projects
Dir
ecto
rate
Municipal
Strategy KPI Calculation
Bas
elin
e
Total
Target
2017/
18
Target
2018/
19
Target
2019/
20
Target
2020/
21
Target
2021/
22
Del
iver
y In
t/E
xt
Fu
nd
ing
Sou
rce
Kiloliters
Water
Purchased or
Purified × 100
KPI
14 Water
Programm
e
Technic
al
Service
s
By ensuring
access to
portable water
by 2021 to
include small
holdings and
surrounding
plots
No of HH in
formal
settlements
including
plots and
small
holdings
that meet
the
minimum
water
services
standard
Number of HH
with access to
water within
200m
3401
1 33 585 33 585 33 585 34131
34 883
34631 Int ML
M
KPI
15 Water
Programm
e
Technic
al
Service
s
By ensuring
that water
quality is
monitored
throughout the
supply network
to ensure
compliance
with applicable
standards
Number of
samples
taken to
measure the
water
quality
Sum of samples
taken 179 800 160 300 300 500 500 Int
ML
M
KPI
16 Water
Programm
e
Technic
al
Service
s
By ensuring
that water
quality is
monitored
throughout the
Percentage
of Drinking
Water
Compliance
to SANS241
Number of
samples
compliant/
total number of
samples taken
NEW
KPI
80% 0 0 0 80% 80% Int ML
M
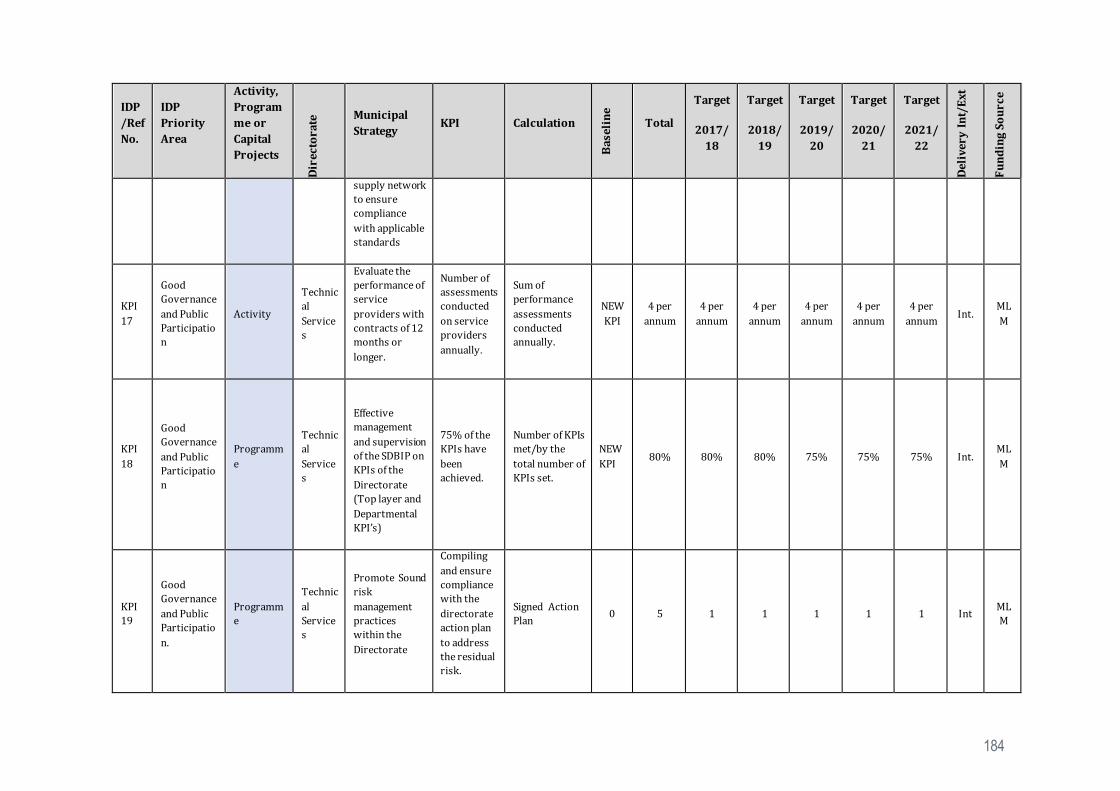
184
IDP
/Ref
No.
IDP
Priority
Area
Activity,
Program
me or
Capital
Projects
Dir
ecto
rate
Municipal
Strategy KPI Calculation
Bas
elin
e
Total
Target
2017/
18
Target
2018/
19
Target
2019/
20
Target
2020/
21
Target
2021/
22
Del
iver
y In
t/E
xt
Fu
nd
ing
Sou
rce
supply network
to ensure
compliance
with applicable
standards
KPI
17
Good
Governance
and Public
Participatio
n
Activity
Technic
al
Service
s
Evaluate the
performance of
service
providers with
contracts of 12
months or
longer.
Number of
assessments
conducted
on service
providers
annually.
Sum of
performance
assessments
conducted
annually.
NEW
KPI
4 per
annum
4 per
annum
4 per
annum
4 per
annum
4 per
annum
4 per
annum Int.
ML
M
KPI
18
Good
Governance
and Public
Participatio
n
Programm
e
Technic
al
Service
s
Effective
management
and supervision
of the SDBIP on
KPIs of the
Directorate
(Top layer and
Departmental
KPI’s)
75% of the
KPIs have
been
achieved.
Number of KPIs
met/by the
total number of
KPIs set.
NEW
KPI 80% 80% 80% 75% 75% 75% Int.
ML
M
KPI
19
Good
Governance
and Public
Participatio
n.
Programm
e
Technic
al
Service
s
Promote Sound
risk
management
practices
within the
Directorate
Compiling
and ensure
compliance
with the
directorate
action plan
to address
the residual
risk.
Signed Action
Plan 0 5 1 1 1 1 1 Int
ML
M
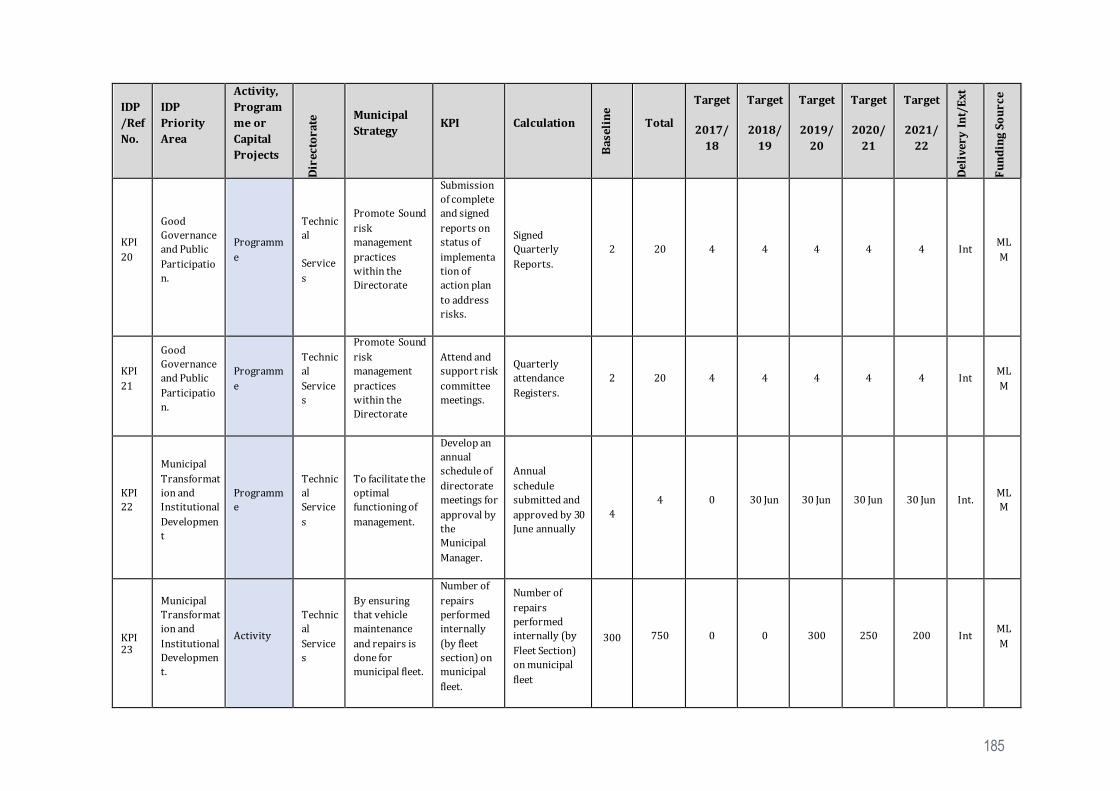
185
IDP
/Ref
No.
IDP
Priority
Area
Activity,
Program
me or
Capital
Projects
Dir
ecto
rate
Municipal
Strategy KPI Calculation
Bas
elin
e
Total
Target
2017/
18
Target
2018/
19
Target
2019/
20
Target
2020/
21
Target
2021/
22
Del
iver
y In
t/E
xt
Fu
nd
ing
Sou
rce
KPI
20
Good
Governance
and Public
Participatio
n.
Programm
e
Technic
al
Service
s
Promote Sound
risk
management
practices
within the
Directorate
Submission
of complete
and signed
reports on
status of
implementa
tion of
action plan
to address
risks.
Signed
Quarterly
Reports.
2 20 4 4 4 4 4 Int ML
M
KPI
21
Good
Governance
and Public
Participatio
n.
Programm
e
Technic
al
Service
s
Promote Sound
risk
management
practices
within the
Directorate
Attend and
support risk
committee
meetings.
Quarterly
attendance
Registers.
2 20 4 4 4 4 4 Int ML
M
KPI
22
Municipal
Transformat
ion and
Institutional
Developmen
t
Programm
e
Technic
al
Service
s
To facilitate the
optimal
functioning of
management.
Develop an
annual
schedule of
directorate
meetings for
approval by
the
Municipal
Manager.
Annual
schedule
submitted and
approved by 30
June annually
4
4 0 30 Jun 30 Jun 30 Jun 30 Jun Int. ML
M
KPI 23
Municipal
Transformat
ion and
Institutional
Developmen
t.
Activity
Technic
al
Service
s
By ensuring
that vehicle
maintenance
and repairs is
done for
municipal fleet.
Number of
repairs
performed
internally
(by fleet
section) on
municipal
fleet.
Number of
repairs
performed
internally (by
Fleet Section)
on municipal
fleet
300
750 0 0 300 250 200 Int ML
M
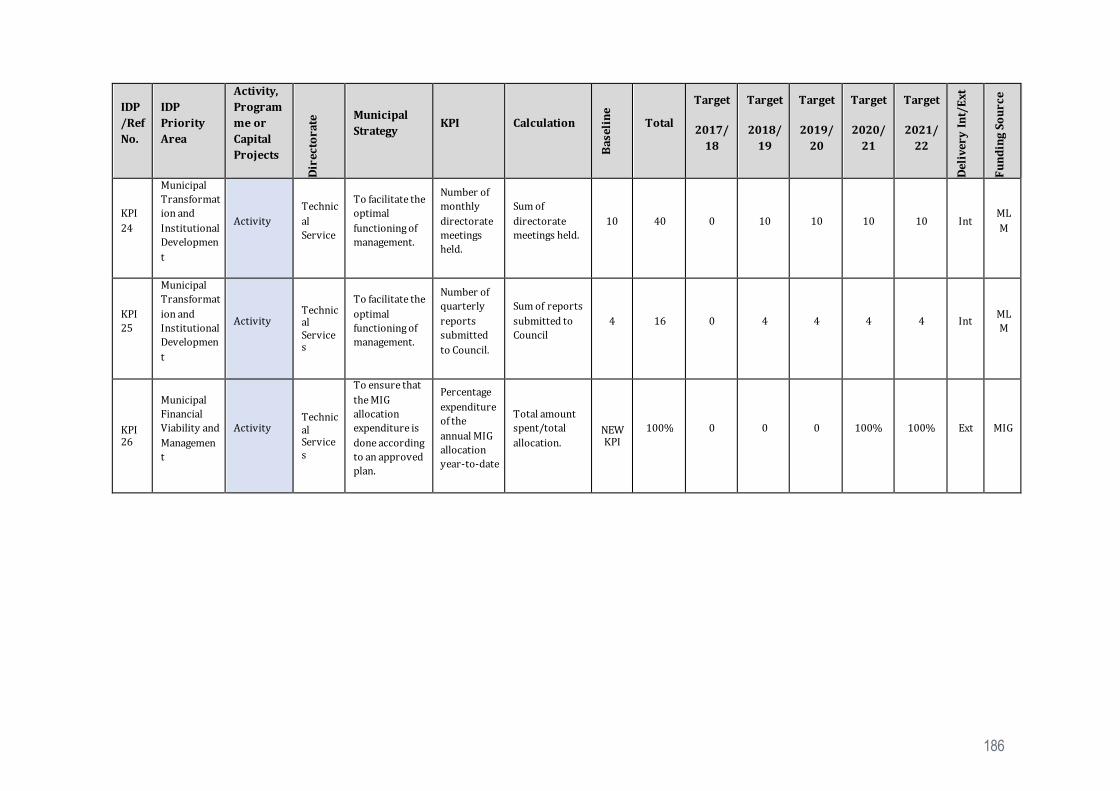
186
IDP
/Ref
No.
IDP
Priority
Area
Activity,
Program
me or
Capital
Projects
Dir
ecto
rate
Municipal
Strategy KPI Calculation
Bas
elin
e
Total
Target
2017/
18
Target
2018/
19
Target
2019/
20
Target
2020/
21
Target
2021/
22
Del
iver
y In
t/E
xt
Fu
nd
ing
Sou
rce
KPI
24
Municipal
Transformat
ion and
Institutional
Developmen
t
Activity
Technic
al
Service
To facilitate the
optimal
functioning of
management.
Number of
monthly
directorate
meetings
held.
Sum of
directorate
meetings held.
10 40 0 10 10 10 10 Int ML
M
KPI
25
Municipal
Transformat
ion and
Institutional
Developmen
t
Activity Technical Services
To facilitate the
optimal
functioning of
management.
Number of
quarterly
reports
submitted
to Council.
Sum of reports
submitted to
Council
4 16 0 4 4 4 4 Int ML
M
KPI 26
Municipal
Financial
Viability and
Managemen
t
Activity Technical Services
To ensure that
the MIG
allocation
expenditure is
done according
to an approved
plan.
Percentage
expenditure
of the
annual MIG
allocation
year-to-date
Total amount
spent/total
allocation. NEW KPI
100% 0 0 0 100% 100% Ext MIG

187
4.4.2 Key Performance Area 2: Good Governance and Public Participation
KPA 2: Good Governance & Public Participation
Customer Satisfaction
Governance
Integrated Development Planning
Audit
Performance Management
Risk Management
Public Participation

188
KPA2: Good Governance and Public Participation
Strategic
Objective: Promote a culture of participatory and good governance
Intended
Outcome Entrenched culture of accountability and clean governance
IDP/Ref No.
IDP Priority
Area
Activity, Program
me or Capital
Projects Dir
ecto
rate
Municipal Strategy
KPI Calculatio
n
Bas
elin
e
Total Target 2017/
18
Target 2018/
19
Target 2019/
20
Target 2020/
21
Target 2021/
22 Del
iver
y
Int/
Ext
F
un
din
g
Sou
rce
KPI 27 Customer Satisfaction
Programme Office of the MM
To ensure that the customer care policy is approved and implemented.
Complete a customer satisfaction survey by end of March and submit report with recommendations to Council
Number of surveys conducted and Number of reports submitted to council
0 1 per
annum 1 1 1 1 1
Int
MLM
KPI 28 Executive and council
Activity Office of the MM
To facilitate the optimal functioning of Council.
Annual Report tabled in council on or before 31 Jan annually
Date annual report tabled
31-Jan
1 per annum 31 Jan
31 Jan 31 Jan 31 Jan 31 Jan 31 Jan Int
MLM
KPI 29 Executive and council
Activity Office of the MM
To facilitate the optimal functioning of Council.
Annual review of IDP completed before the end of May annually.
Date annual review completed
31-May
1 per annum 31 May
31-May 31-May 31-May 31-May 31-May Int
MLM
KPI 30 Executive and council
Programme Office of the MM
To facilitate the optimal functioning of Council.
% of Council Resolutions implemented within prescribed timeframe stipulated on resolution register
Number of council resolutions implemented within time frame divided by total Number of resolutions
85% 85% 85% 85% 85% 85% 85% Int
MLM
KPI 31 IDP Activity Office of the MM
To facilitate the optimal functioning of Council.
IDP Process plan adopted by Council by 31 August annually.
Date Process plan approved by Council
31 Aug
31 Aug 31 Aug 31 Aug 31 Aug 31 Aug 31 Aug Int
MLM

189
IDP/Ref No.
IDP Priority
Area
Activity, Program
me or Capital
Projects Dir
ecto
rate
Municipal Strategy
KPI Calculatio
n
Bas
elin
e
Total Target 2017/
18
Target 2018/
19
Target 2019/
20
Target 2020/
21
Target 2021/
22 Del
ive
ry
Int/
Ext
F
un
din
g
Sou
rce
KPI 32 IDP Activity Office of the MM
To facilitate the optimal functioning of Council.
IDP Completed/reviewed and adopted by Council by 30 June annually.
Date IDP adopted by Council
30 June
30 June 30 June 30 June 30 June 30 June 30 June Int
MLM
KPI 33 Internal Audit
Activity Office of the MM
Develop and monitor repeat findings register to address repeat AG findings.
Reduce repeat AG audit findings by 50% in the first year.
Number of resolved repeat findings/by total number of repeat findings
NEW KPI
50% 60% Int
MLM
KPI 34 Internal Audit
Programme Office of the MM
To ensure a fully functional Audit Unit.
Implementation of the approved audit action plan.
Percentage of audit issues attended to by management as per action plan.
New KPI
100% 0% 100% 100% 100% 100% Int
MLM
KPI 35 Internal Audit
Activity Office of the MM
To ensure a fully functional Audit Unit.
Develop a risk based audit plan with an internal audit plan (RBAP) (MFMA - Section 165(2)(a)) and submit to the Audit Committee by 31 Aug annually.
RBAP with internal audit programme submitted to the Audit Committee by 31 August annually.
15 Aug
1 per annum
15 Aug 15 Aug 31 Aug 31 Aug 31 Aug Int
MLM
KPI 36 Internal Audit
Programme Office of the MM
To ensure a fully functional Audit Unit.
Number of audit committee meetings held per annum
Sum of audit committee meetings held
4 Per
Annum
4 Per
Annum
4 Per
Annum
4 Per
Annum
4 Per
Annum
4 Per
Annum
4 Per
Annum
Int
MLM
KPI 37 Internal Audit
Activity Office of the MM
To ensure a fully functional Audit Unit.
Internal Audit / Committee charter reviewed and
Date IA and AC Charter approved
30 June
30 June 30 June 30 June 30 June 30 June 30 June Int
MLM

190
IDP/Ref No.
IDP Priority
Area
Activity, Program
me or Capital
Projects Dir
ecto
rate
Municipal Strategy
KPI Calculatio
n
Bas
elin
e
Total Target 2017/
18
Target 2018/
19
Target 2019/
20
Target 2020/
21
Target 2021/
22 Del
ive
ry
Int/
Ext
F
un
din
g
Sou
rce
completed annually (reviewed charter must be approved by the Audit Committee before the end of June annually)
KPI 38 Internal Audit
Activity Office of the MM
To ensure a fully functional Audit Unit.
Audit action plan developed to address AG Findings and submitted to council for approval on or before 31 January annually
Date Audit action plan submitted to council for approval
31 Jan
31 Jan
31 Jan
31 Jan
31 Jan
31 Jan
31 Jan
Int
MLM
KPI 39 Internal Audit
Programme Office of the MM
To ensure a fully functional Audit Unit.
Number of internal audit reports produced
Sum of IA reports produced
18 80 20 15 15 15 15 Int
MLM
KPI 40 Internal Audit
Programme Office of the MM
To ensure a fully functional Audit Unit.
Number of performance audits undertaken
Sum of performance audits
1 2 per
annum 2 per
annum 2 per
annum 2 per
annum 2 per
annum 2 per
annum Int
MLM
KPI 41 PMS Programme Office of the MM
To facilitate optimal functioning of Council
Number of signed performance agreements.
Sum of signed performance agreements
NEW KPI
12 0 0 0 6 6 Int
MLM
KPI 42 PMS Activity Office of the MM
To facilitate optimal functioning of Council.
Approval of the SDBIP before the legislative deadline
Date SDBIP approved by EM
New KPI
1 X Approv
ed SDBIP
per annum
1 X Approved SDBIP
per annum
1 X Approved SDBIP
per annum
1 X Approved SDBIP
per annum
1 X Approved SDBIP
per annum
1 X Approved SDBIP
per annum
Int
MLM
KPI 43 PMS Programme Office of the MM
To facilitate optimal functioning of Council.
Submit quarterly reports to council on the actual
Number of SDBIP Top Layer performance reports
4 4 per
annum
4 per annum
4 per annum
4 per annum
4 per annum
4 per annum
Int
MLM

191
IDP/Ref No.
IDP Priority
Area
Activity, Program
me or Capital
Projects Dir
ecto
rate
Municipal Strategy
KPI Calculatio
n
Bas
elin
e
Total Target 2017/
18
Target 2018/
19
Target 2019/
20
Target 2020/
21
Target 2021/
22 Del
ive
ry
Int/
Ext
F
un
din
g
Sou
rce
performance in terms of the Top Layer SDBIP
submitted to council
KPI 44 PMS Activity Office of the MM
To facilitate the optimal functioning of Council.
Submit the previous financial year annual report at the end of Aug annually
Annual Report
1 1 per
annum 1 per
annum 1 per
annum 1 per
annum 1 per
annum 1 per
annum Int
MLM
KPI 45 PMS Activity Office of the MM
To facilitate the optimal functioning of Council.
Review of PMS consistent with new term of office of council tight to MTEF
PMS Framework
New KPI
1 1 0 0 0 1 Int
MLM
KPI 46 PMS Activity Office of the MM
To facilitate the optimal functioning of Council.
Conduct performance assessments’ of the Directors for the first and third quarters.
Sum of performance assessments conducted
0 16 0 4 4 4 4 Int
MLM
KPI 47 Risk Management
Activity Office of the MM
To ensure that an effective and efficient risk management function is established.
Risk register compiled and updated quarterly and approved by MM
Sum of Risk register quarterly updates
2 20 4 4 4 4 4 Int
MLM
KPI 48 Risk Management
Programme Office of the MM
To ensure that an effective and efficient risk management function is established.
Number of RMC meetings held
Sum of RMC meetings held
2 20 4 4 4 4 4 Int
MLM
KPI 49 Risk Management
Activity Office of the MM
To ensure that an effective and efficient risk management function is established.
Approved fraud prevention and anti-corruption strategy annually
Date plan approved
30 Jun
30 Jun 30 Jun 30 Jun 30 Jun 30 Jun 30 Jun Int
MLM

192
IDP/Ref No.
IDP Priority
Area
Activity, Program
me or Capital
Projects Dir
ecto
rate
Municipal Strategy
KPI Calculatio
n
Bas
elin
e
Total Target 2017/
18
Target 2018/
19
Target 2019/
20
Target 2020/
21
Target 2021/
22 Del
ive
ry
Int/
Ext
F
un
din
g
Sou
rce
reviewed on or before 30 June
KPI 50 Activity Council
To ensure that all key municipal stakeholder is engaged.
Number of constituency report back meetings convened by Councillors for improved communication on service delivery including IDPs, SDBIP
Number of constituency report back meetings held
4 4 per
annum 4 4 4 4 4
Int
MLM
KPI 51
Ward Committees and Public Participation
Activity Council
To ensure that functional ward committees are established.
Number of meetings per ward per quarter
Number of meetings held from 1 Jul to 30 Jun
23 23
every year
92 92 92 92 92 Int
MLM
KPI 52
Ward Committees and Public Participation
Activity Council
To ensure that functional ward committees are established.
Number of ward profiles developed and submitted
Sum of completed ward profiles submitted
0 23
every year
23 23 23 23 23 Int
MLM

193
4.4.3 Key Performance Area 3: Local Economic Development
KPA3: Local Economic Development
Local Economic Development
Tourism
Planning and Development

194
KPA 3: Local Economic Development
Strategic
Objective:
Create an environment that promotes the development of the
local economy and facilitate job creation.
Intended
Outcome Improved municipal economic v iability
IDP/Ref No.
IDP Priority Area
Activity, Program
me or Capital
Projects Dir
ect
ora
te
Municipal Strategy
KPI Calculation
Ba
seli
ne
Total Target 2017/1
8
Target 2018/1
9
Target 2019/2
0
Target 2020/2
1
Target 2021/2
2
De
liv
ery
In
t/E
xt
Fu
nd
ing
So
urc
e
KPI 53 LED Activity LED & Planning
Explore the potential for the tourism sector in creating sustainable jobs and income for communities
Develop a Tourism Sector Plan and submit for approval by Council by 30 June annually.
Date Tourism Sector Plan is approved.
NEW KPI
1 0 0
Plan to be
approved by June 2020
1 Review
per annum
1 Review
per annum
Int MLM
KPI 54 LED Activity LED & Planning
To explore commercialisation within the agriculture sector for optimum socio- economic benefits by the local communities.
Develop agriculture Sector plan by 30 June annually
Date Agriculture Sector Plan approved.
NEW KPI
0 0 0
Plan to be
approved by June 2020
30 June 30 June Int MLM
KPI 55 LED Activity LED & Planning
Create an environment that promotes the development of the local economy and facilitate job creation.
Number of jobs created through the municipality’s LED, EPWP and other initiatives (Reg 796)
Sum of jobs created per year
48 235 70 50 55 30 30 Int MLM
KPI 56 LED Programme
LED & Planning
Create an environment that promotes the development of
Review the LED Strategy and submit to Council for approval by
Date LED Strategy approved.
NEW KPI
0 0 0 0 30 June 30 June Int MLM

195
the local economy and facilitate job creation.
30 June annually
KPI 57 Tourism Activity LED & Planning
To support the expansion of the tourism potential of the Municipality
Develop a marketing strategy for the municipality and submit to Council for approval
Date Marketing strategy approved.
NEW KPI
1 0 0 0 30 June 0 Int MLM
KPI 58 Tourism Programme
LED & Planning
To support the expansion of the tourism potential of Kroonpark Holiday Resort
Develop a turnaround strategy for the Resort by 30 June 2021
Date Turnaround strategy approved by the Director.
NEW KPI
1 0 0 0 30 June 0 Int MLM
KPI 59 Tourism Programme
LED & Planning
To support the expansion of the tourism potential of Kroonpark Holiday Resort
Number of visitors at Kroonpark
Sum of visitors at Kroonpark for the period 01 July 2018 to 30 June 2019
24 000
10% averag
e for the
financial year
26 500 24 500 25 000 28 000 26 000 Int MLM
KPI 60 Tourism Capital Projects
LED & Planning
To support the expansion of the tourism potential of Kroonpark Holiday Resort
Number of chalets renovated Sum of chalets
renovated 10 10 10 10 10 10 10 nt MLM
KPI 61 Tourism Capital Projects
LED & Planning
To support the expansion of the tourism potential of Kroonpark Holiday Resort
Number of ablution facilities renovated
Sum of ablution facilities upgraded
2 1 0 1 2 0 0 Int MLM
KPI 62 Tourism Programme
LED & Planning
To support the expansion of the tourism potential of Kroonpark Holiday Resort
Number of annual entertainment activities held
Sum of events held
6 6 6 5 6 6 6 Int MLM
KPI 63 Housing Activity LED & Planning
To review the Housing Sector Plan.
HSP reviewed and approved by the Director annually.
Date Housing Sector Plan approved.
NEW KPI
2 0 0 0 30 June 30 June
Int
MLM

196
KPI 64 Housing Activity LED & Planning
To advance the implementation of the Housing Sector Plan.
Ensure Level 1 accreditation of the Municipality is completed by 30 June 2021.
Date of approval of accreditation application.
NEW KPI
1 0 0 0 30 June 0 Ext
National
KPI 65 Housing Activity LED & Planning
To advance the implementation of the Housing Sector Plan.
Review and customise Housing and Erven Allocation Policy and submit to the Director for approval.
Date of approval by the Director
NEW KPI
1 0 0 0 31 Dec 2020
0 Int MLM
KPI 66 Housing Activity LED & Planning
To ensure land ownership by allocating people residential erven
Number of residential erven allocated.
Sum of residential erven allocated.
NEW KPI
5000 0 0 0 2000 3000 Int MLM
KPI 67 Spatial Planning
Activity Panning & LED
To support the orderly and coordinated development of the urban areas within the municipal area
Reviewed Spatial Development Framework and approve by June annually
Date Reviewed Spatial Development Framework approved.
New KPI
2 0 0 0 30 June 30 June Int MLM
KPI 68 Spatial Planning
Activity Planning & LED
To support the orderly use of all land parcels and to deal with all and use related issues within the municipal area
Review Land Use Scheme and approved by June annually
Date Land Use Scheme approved
New KPI
2 0 0 0 30 June 30 June Int MLM
KPI 69 Spatial Planning
Activity LED & Planning
To support the licencing of businesses governed by the Business Act, 1991
Percentage of business licence applications received and considered within a period of thirty days.
Number of business license applications considered within 30 days/total number of business licence applications received.
NEW KPI
100% 0 0 0 80% 90% Int MLM
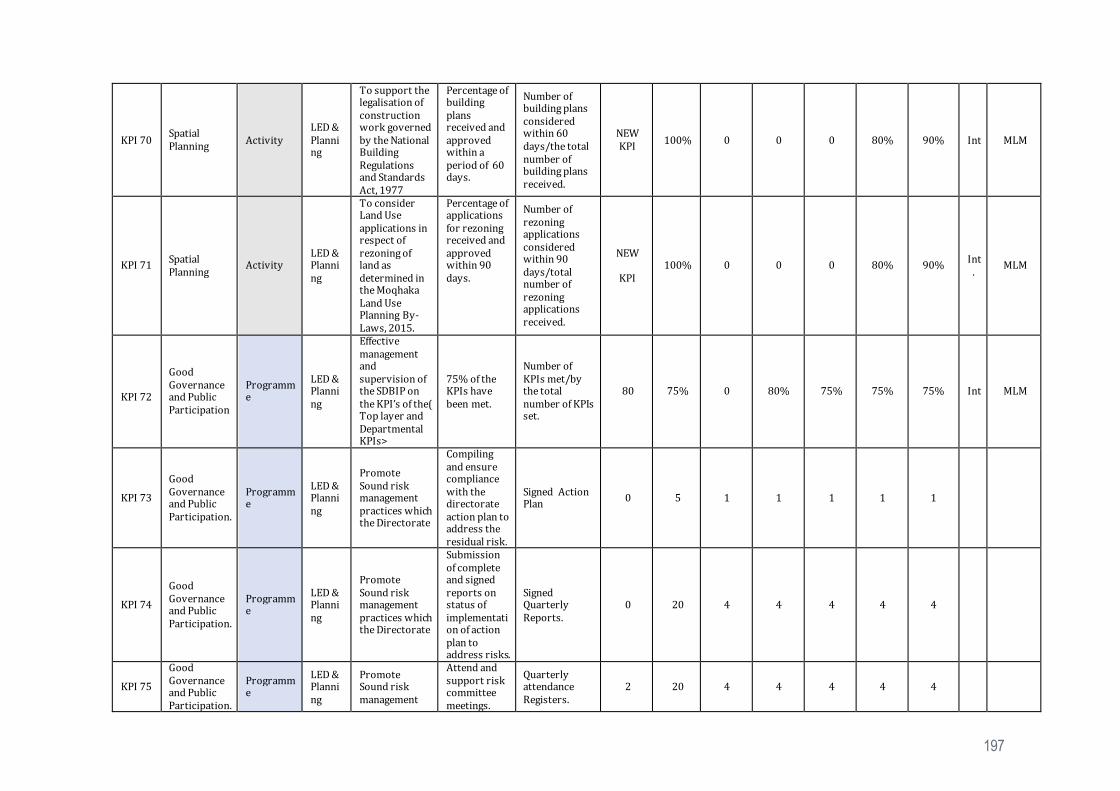
197
KPI 70 Spatial Planning
Activity LED & Planning
To support the legalisation of construction work governed by the National Building Regulations and Standards Act, 1977
Percentage of building plans received and approved within a period of 60 days.
Number of building plans considered within 60 days/the total number of building plans received.
NEW KPI
100% 0 0 0 80% 90% Int MLM
KPI 71 Spatial Planning
Activity LED & Planning
To consider Land Use applications in respect of rezoning of land as determined in the Moqhaka Land Use Planning By-Laws, 2015.
Percentage of applications for rezoning received and approved within 90 days.
Number of rezoning applications considered within 90 days/total number of rezoning applications received.
NEW
KPI 100% 0 0 0 80% 90%
Int.
MLM
KPI 72
Good Governance and Public Participation
Programme
LED & Planning
Effective management and supervision of the SDBIP on the KPI’s of the( Top layer and Departmental KPIs>
75% of the KPIs have been met.
Number of KPIs met/by the total number of KPIs set.
80 75% 0 80% 75% 75% 75% Int MLM
KPI 73
Good Governance and Public Participation.
Programme
LED & Planning
Promote Sound risk management practices which the Directorate
Compiling and ensure compliance with the directorate action plan to address the residual risk.
Signed Action Plan
0 5 1 1 1 1 1
KPI 74
Good Governance and Public Participation.
Programme
LED & Planning
Promote Sound risk management practices which the Directorate
Submission of complete and signed reports on status of implementation of action plan to address risks.
Signed Quarterly Reports.
0 20 4 4 4 4 4
KPI 75
Good Governance and Public Participation.
Programme
LED & Planning
Promote Sound risk management
Attend and support risk committee meetings.
Quarterly attendance Registers.
2 20 4 4 4 4 4

198
practices which the Directorate
KPI 76
Municipal Transformation and Institutional Development
Programme
LED & Planning
To facilitate the optimal functioning of management.
Develop an annual schedule of directorate meetings for approval by the Municipal Manager.
Annual schedule submitted and approved by 30 June annually
1 4 0 1 1 1 1
KPI 77
Municipal Transformation and Institutional Development
Activity LED & Planning
To facilitate the optimal functioning of management.
Number of monthly directorate meetings held.
Sum of directorate meetings held.
10
48
0 12 10 10 10
KPI 78
Municipal Transformation and Institutional Development
Activity LED & Planning
To facilitate the optimal functioning of management.
Number of quarterly reports submitted to Council.
Sum of reports submitted to Council
4 4 16 4 4 4 4

199
4.4.3 Municipal Financial Viability and Management
KPA 4: Municipal Financial Viability & Management
Asset Management
Budget, Reporting & Expenditure
Supply Chain Management
Revenue Management

200
KPA 4: Municipal Financial Viability & Management
Strategic
Objective:
To improve overall financial management by developing & implementing appropriate financial management
policies, procedures & systems
Improved organisational stability and
sustainability
IDP/
Ref
No.
IDP Priority
Area
Activity,
Progra
mme or
Capital
Projects Dir
ect
ora
te
Municipal
Strategy KPI Calculation
Ba
seli
ne
Total
Target
2017/
18
Target
2018/
19
Target
2019/
20
Target
2020/2
1
Target
2021/2
2
De
liv
ery
In
t/E
xt
Fu
nd
ing
So
urc
e
KPI
79
Asset
Management
Program
me
Financial
Services
To ensure the
effective,
efficient and
economical
management of
municipal
assets.
Fixed Asset
Register (FAR)
compiled and
updated
annually on or
before 31 Aug
in line with
GRAP
requirements
Fixed Asset
Register
(FAR)
1
1 per
annu
m
1 per
annum
1 per
annum
1 per
annum
1 per
annum
1 per
annum Int MLM
KPI
80
Budget and
treasury office Activity
Financial
Services
To ensure that
the municipal
budget and
financial
reporting
process are
compliant with
applicable
legislation.
Number of
monthly
budget
statements
(s71 of MFMA)
are compiled
and submitted
to the Mayor,
National and
Provincial
Treasury by no
later than 10
working days
after the end of
each month
Sum of Sec
71 reports
submitted.
12
12
per
annu
m
12 per
annum
12 per
annum
12 per
annum
12 per
annum
12 per
annum Int MLM
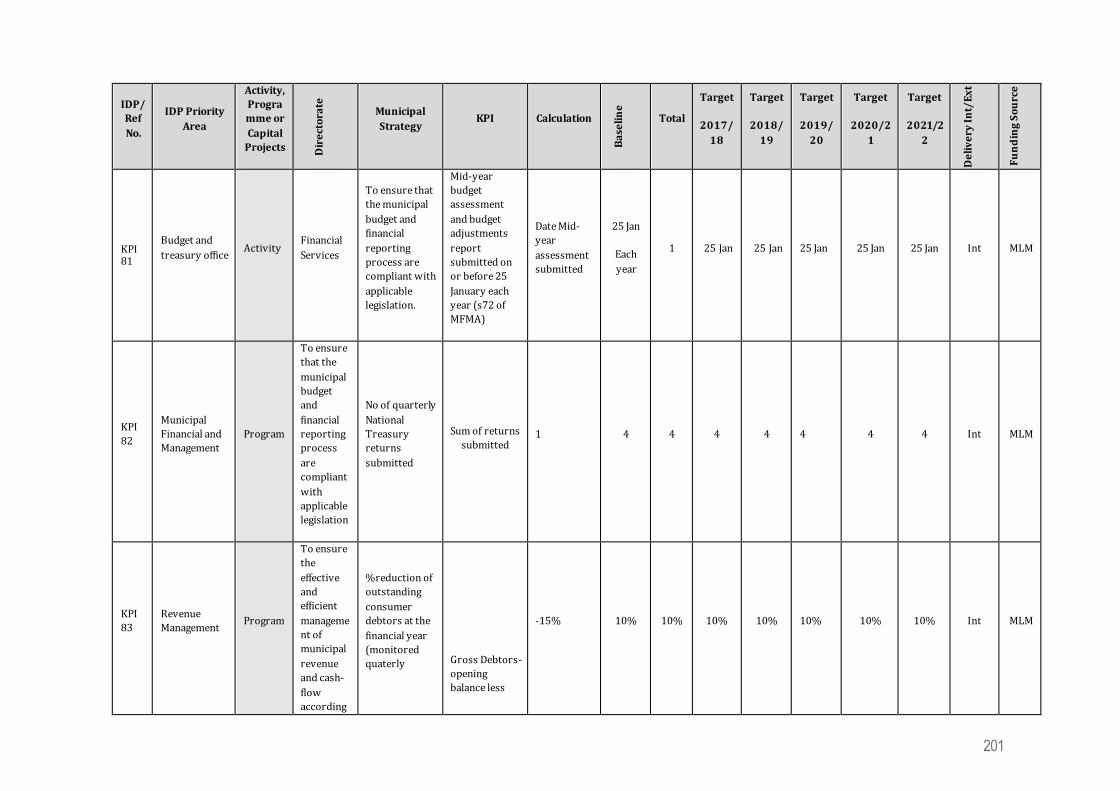
201
IDP/
Ref
No.
IDP Priority
Area
Activity,
Progra
mme or
Capital
Projects Dir
ect
ora
te
Municipal
Strategy KPI Calculation
Ba
seli
ne
Total
Target
2017/
18
Target
2018/
19
Target
2019/
20
Target
2020/2
1
Target
2021/2
2
De
liv
ery
In
t/E
xt
Fu
nd
ing
So
urc
e
KPI 81
Budget and
treasury office Activity
Financial
Services
To ensure that
the municipal
budget and
financial
reporting
process are
compliant with
applicable
legislation.
Mid-year
budget
assessment
and budget
adjustments
report
submitted on
or before 25
January each
year (s72 of
MFMA)
Date Mid-
year
assessment
submitted
25 Jan
Each
year
1 25 Jan 25 Jan 25 Jan 25 Jan 25 Jan Int MLM
KPI
82
Municipal
Financial and
Management
Program
To ensure
that the
municipal
budget
and
financial
reporting
process
are
compliant
with
applicable
legislation
No of quarterly
National
Treasury
returns
submitted
Sum of returns
submitted 1 4 4 4 4 4 4 4 Int MLM
KPI
83
Revenue
Management Program
To ensure
the
effective
and
efficient
manageme
nt of
municipal
revenue
and cash-
flow
according
%reduction of
outstanding
consumer
debtors at the
financial year
(monitored
quaterly
Gross Debtors-
opening
balance less
-15% 10% 10% 10% 10% 10% 10% 10% Int MLM

202
IDP/
Ref
No.
IDP Priority
Area
Activity,
Progra
mme or
Capital
Projects Dir
ect
ora
te
Municipal
Strategy KPI Calculation
Ba
seli
ne
Total
Target
2017/
18
Target
2018/
19
Target
2019/
20
Target
2020/2
1
Target
2021/2
2
De
liv
ery
In
t/E
xt
Fu
nd
ing
So
urc
e
to national
norma and
standars
quarter closing
balance
KPI
84
Budget and
treasury office
Program
me
Financial
Services
To ensure that
the municipal
budget and
financial
reporting
process are
compliant with
applicable
legislation.
% of Operating
Expenditure
Budget
Implementatio
n Indicator
Actual
Operating
Expenditure
/ Budgeted
Operating
Expenditure
x 100
95% ≥95
% 95% 95% 95% 95% 95% Int MLM
KPI
85
Budget and
treasury office
Program
me
Financial
Services
To ensure that
the municipal
budget and
financial
reporting
process are
compliant with
applicable
legislation.
% of Operating
Revenue
Budget
Implementatio
n Indicator
Actual
Operating
Revenue[exc
l Capital
Grant
Revenue] /
Budgeted
Operating
Revenue x
100
95% ≥95
% 95% 95% 95% 95% 95% Int MLM
KPI
86
Budget and
treasury office
Program
me
Financial
Services
To ensure that
the municipal
budget and
financial
reporting
process are
compliant with
applicable
legislation.
Service
Charges and
Property Rates
Revenue
Budget
Implementatio
n Indicator
Actual
Service
Charges and
Property
Rates
Revenue /
Budgeted
Service
Charges and
Property
Rates
95% ≥95
% 95% 95% 95% 95% 95% Int MLM

203
IDP/
Ref
No.
IDP Priority
Area
Activity,
Progra
mme or
Capital
Projects Dir
ect
ora
te
Municipal
Strategy KPI Calculation
Ba
seli
ne
Total
Target
2017/
18
Target
2018/
19
Target
2019/
20
Target
2020/2
1
Target
2021/2
2
De
liv
ery
In
t/E
xt
Fu
nd
ing
So
urc
e
Revenue x
100
KPI
87
Budget and
treasury office
Program
me
Financial
Services
To ensure that
the municipal
budget and
financial
reporting
process are
compliant with
applicable
legislation.
Financial
Viability: Cost
coverage (Reg
796)
((Cash and
Cash
Equivalents
- Unspent
Conditional
Grants -
Overdraft) +
Short Term
Investment)
/ Monthly
Fixed
Operational
Expenditure
excluding
(Depreciatio
n,
Amortisatio
n, and
Provision
for Bad
Debts,
Impairment
and Loss on
Disposal of
Assets))
≥1 ≥1 ≥1 ≥1 ≥1 ≥1 ≥1 Int MLM.
KPI
88
Budget and
treasury office
Program
me
Financial
Services
To ensure that
the municipal
budget and
financial
reporting
process are
compliant with
Financial
Viability: Debt
coverage (Reg
796)
Debt (Short
Term
Borrowing +
Bank
Overdraft +
Short Term
Lease +
Long Term
≤45% ≤45% ≤45% ≤45% ≤45% ≤45% ≤45% Int MLM

204
IDP/
Ref
No.
IDP Priority
Area
Activity,
Progra
mme or
Capital
Projects Dir
ect
ora
te
Municipal
Strategy KPI Calculation
Ba
seli
ne
Total
Target
2017/
18
Target
2018/
19
Target
2019/
20
Target
2020/2
1
Target
2021/2
2
De
liv
ery
In
t/E
xt
Fu
nd
ing
So
urc
e
applicable
legislation.
Borrowing +
Long Term
Lease) /
Total
Operating
Revenue -
Operating
Conditional
Grant
KPI
89
Budget and
treasury office
Program
me
Financial
Services
To ensure that
the municipal
budget and
financial
reporting
process are
compliant with
applicable
legislation.
Financial
Viability:
Service
debtors to
revenue (Reg
796)
Where -
"A"
represents
outstanding
service
debtors to
revenue
"B"
represents
total
outstanding
service
debtors
"C"
represents
annual
revenue
actually
received for
services;
A=(B/C)
90% 95% 95% 95% 95% 95% 95% Int MLM

205
IDP/
Ref
No.
IDP Priority
Area
Activity,
Progra
mme or
Capital
Projects Dir
ect
ora
te
Municipal
Strategy KPI Calculation
Ba
seli
ne
Total
Target
2017/
18
Target
2018/
19
Target
2019/
20
Target
2020/2
1
Target
2021/2
2
De
liv
ery
In
t/E
xt
Fu
nd
ing
So
urc
e
KPI
90
Budget and
treasury office
Capital
Project
Financial
Services
To implement
an effective
and efficient
system of
expenditure
and supply
chain
management.
% of a
municipality’s
capital budget
actually spent
on capital
projects
identified for a
particular
financial year
in terms of the
municipality’s
integrated
development
plan (MFMA
Circular 71)
Actual
Capital
Expenditure
/ Budget
Capital
Expenditure
x 100
95% 95% 95% 95% 95% 95% 95% Int MLM
KPI
91
Budget and
treasury office Activity
Financial
Services
To ensure that
the municipal
budget and
financial
reporting
process are
compliant with
applicable
legislation.
Compliant
annual budget
(MTREF)
compiled and
approved by
end of May
each year
Actual date
budget
approved
30 June
each
year
5
30
June
each
year
30 June
each
year
30 June
each
year
30 June
each
year
30 June
each
year
30 June
each
year
Int MLM
KPI
92 Clean Audit Activity
Financial
Services
To ensure that
the municipal
budget and
financial
reporting
process are
compliant with
applicable
legislation.
Compiled
Annual
Financial
Statement
submitted to
the Auditor-
General by the
end of August
each year
Date annual
financial
statements
submitted to
the AG
31 Aug
each
year
5
31
Aug
31 Aug 31 Aug 31 Aug 31 Aug 31 Aug 31 Aug Int

206
IDP/
Ref
No.
IDP Priority
Area
Activity,
Progra
mme or
Capital
Projects Dir
ect
ora
te
Municipal
Strategy KPI Calculation
Ba
seli
ne
Total
Target
2017/
18
Target
2018/
19
Target
2019/
20
Target
2020/2
1
Target
2021/2
2
De
liv
ery
In
t/E
xt
Fu
nd
ing
So
urc
e
KPI
93
Expenditure
and SCM Activity
Financial
Services
To implement
an effective
and efficient
system of
expenditure
and supply
chain
management.
Number of
SCM reports
submitted to
council Sum of
reports
submitted
4 x
reports
submitt
ed per
annum
4
repor
ts per
annu
m
4 x
reports
submitt
ed per
annum
4 x
reports
submitt
ed per
annum
4 x
reports
submitt
ed per
annum
4 x
reports
submitte
d per
annum
4 x
reports
submitt
ed per
annum
Int. MLM
KPI
94
Expenditure
and SCM
Program
me
Financial
Services
To implement
an effective
and efficient
system of
expenditure
and supply
chain
management.
% actual
expenditure on
repairs and
maintenance
as a percentage
of the
approved/adju
sted budget
Total
Repairs and
Maintenance
Expenditure
/Total
amount
budgeted for
repairs and
maintenance
x 100
84% ≥95
% 95% 95% 95% 95% 95% Int. MLM
KPI
95
Expenditure
and SCM
Program
me
Financial
Services
To implement
an effective
and efficient
system of
expenditure
and supply
chain
management.
Creditors
Payment
period
(Creditors are
paid within 30
days as per Sec
65(2)(e) of the
MFMA
Trade
Creditors
Outstanding
/ Credit
Purchases
(Operating
and Capital)
× 365
321
days
>30
days
<290
days
<260
days
<200
days
<140
days
≤30
days Int. MLM

207
IDP/
Ref
No.
IDP Priority
Area
Activity,
Progra
mme or
Capital
Projects Dir
ect
ora
te
Municipal
Strategy KPI Calculation
Ba
seli
ne
Total
Target
2017/
18
Target
2018/
19
Target
2019/
20
Target
2020/2
1
Target
2021/2
2
De
liv
ery
In
t/E
xt
Fu
nd
ing
So
urc
e
KPI
96
Expenditure
and SCM Activity
Financial
Services
To implement
an effective
and efficient
system of
expenditure
and supply
chain
management.
% of tenders
awarded
within 90 days
of tender
closing date
Number of
tenders
awarded/Te
nders
awarded
within 90
days
New
KPI 95% 95% 95% 95% 95% 95% Int MLM
KPI
97
Poverty
Alleviation
Program
me
Financial
Services
To implement
an effective
and efficient
system of
expenditure
and supply
chain
management.
% of registered
indigent
Households
that receive
free basic
services
No of
households
registered
as
indigent/Tot
al No of HH
X100
43% ≤30% ≤30% ≤30% ≤45% ≤45% ≤45% Int MLM
KPI
98
Poverty
Alleviation
Program
me
Financial
Services
To implement
an effective
and efficient
system of
expenditure
and supply
chain
management.
Rand value of
free basic
services to
indigent
households as
a % of the
equitable share
Rand value
of free basic
services/by
the
equitable
share X 100
27% 33% ≤30% ≤30% ≤33% ≤33% ≤33% Int. MLM
KPI
99
Poverty
Alleviation
Program
me
Financial
Services
To implement
an effective
and efficient
system of
expenditure
and supply
chain
management.
Rand value of
free basic
services to
indigent
households
Sum of value
of free basic
services to
indigent
households.
≤R45 968 17
9
R61.5
m
≤R44 0
00 000
≤R44 0
00 000
≤R15.2
m ≤65m ≤69m Int MLM
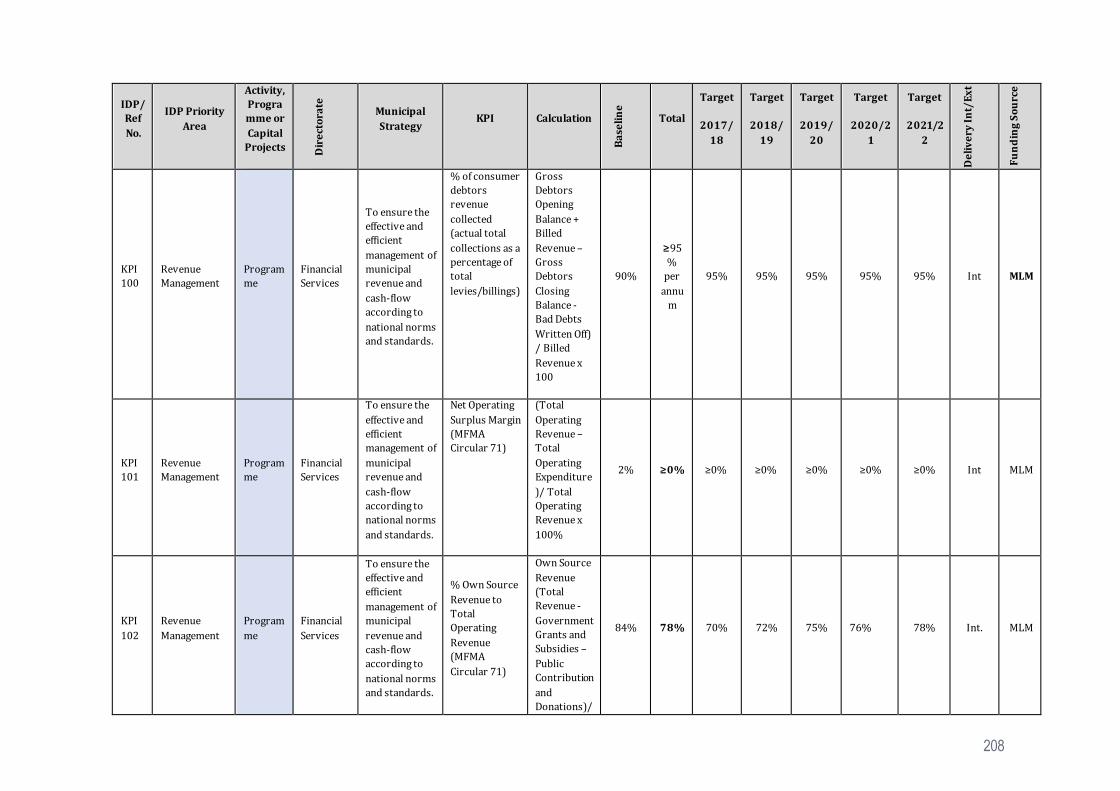
208
IDP/
Ref
No.
IDP Priority
Area
Activity,
Progra
mme or
Capital
Projects Dir
ect
ora
te
Municipal
Strategy KPI Calculation
Ba
seli
ne
Total
Target
2017/
18
Target
2018/
19
Target
2019/
20
Target
2020/2
1
Target
2021/2
2
De
liv
ery
In
t/E
xt
Fu
nd
ing
So
urc
e
KPI
100
Revenue
Management
Program
me
Financial
Services
To ensure the
effective and
efficient
management of
municipal
revenue and
cash-flow
according to
national norms
and standards.
% of consumer
debtors
revenue
collected
(actual total
collections as a
percentage of
total
levies/billings)
Gross
Debtors
Opening
Balance +
Billed
Revenue –
Gross
Debtors
Closing
Balance -
Bad Debts
Written Off)
/ Billed
Revenue x
100
90%
≥95
%
per
annu
m
95% 95% 95% 95% 95% Int MLM
KPI
101
Revenue
Management
Program
me
Financial
Services
To ensure the
effective and
efficient
management of
municipal
revenue and
cash-flow
according to
national norms
and standards.
Net Operating
Surplus Margin
(MFMA
Circular 71)
(Total
Operating
Revenue –
Total
Operating
Expenditure
)/ Total
Operating
Revenue x
100%
2% ≥0% ≥0% ≥0% ≥0% ≥0% ≥0% Int MLM
KPI
102
Revenue
Management
Program
me
Financial
Services
To ensure the
effective and
efficient
management of
municipal
revenue and
cash-flow
according to
national norms
and standards.
% Own Source
Revenue to
Total
Operating
Revenue
(MFMA
Circular 71)
Own Source
Revenue
(Total
Revenue -
Government
Grants and
Subsidies –
Public
Contribution
and
Donations)/
84% 78% 70% 72% 75% 76% 78% Int. MLM

209
IDP/
Ref
No.
IDP Priority
Area
Activity,
Progra
mme or
Capital
Projects Dir
ect
ora
te
Municipal
Strategy KPI Calculation
Ba
seli
ne
Total
Target
2017/
18
Target
2018/
19
Target
2019/
20
Target
2020/2
1
Target
2021/2
2
De
liv
ery
In
t/E
xt
Fu
nd
ing
So
urc
e
Total
Operating
Revenue
(Including
Agency
Services) x
100
KPI
103
Revenue
Management
Program
me
Financial
Services
To implement
an effective
and efficient
system of
expenditure
and supply
chain
management.
Number of
formal
households
connected to
the municipal
electrical
infrastructure
network
(credit and
prepaid
electrical
metering)(Excl
uding Eskom
areas) at 30
June
Number of
households
which are
billed for
electricity or
have pre-
paid meters
(Excluding
Eskom
areas) at 30
June
23107 2318
2 24040 23182 23 950 23 950 23 950 Int. MLM
KPI
104
Revenue
Management
Program
me
Financial
Services
To implement
an effective
and efficient
system of
expenditure
and supply
chain
management.
Number of
households
which are
billed for water
or have pre-
paid meters.
Sum of
households
which are
billed for
water or
have pre-
paid meters.
30836
per
month
3083
6 per
mont
h
30 836 30836 32 500 32 500 32 500 Int MLM
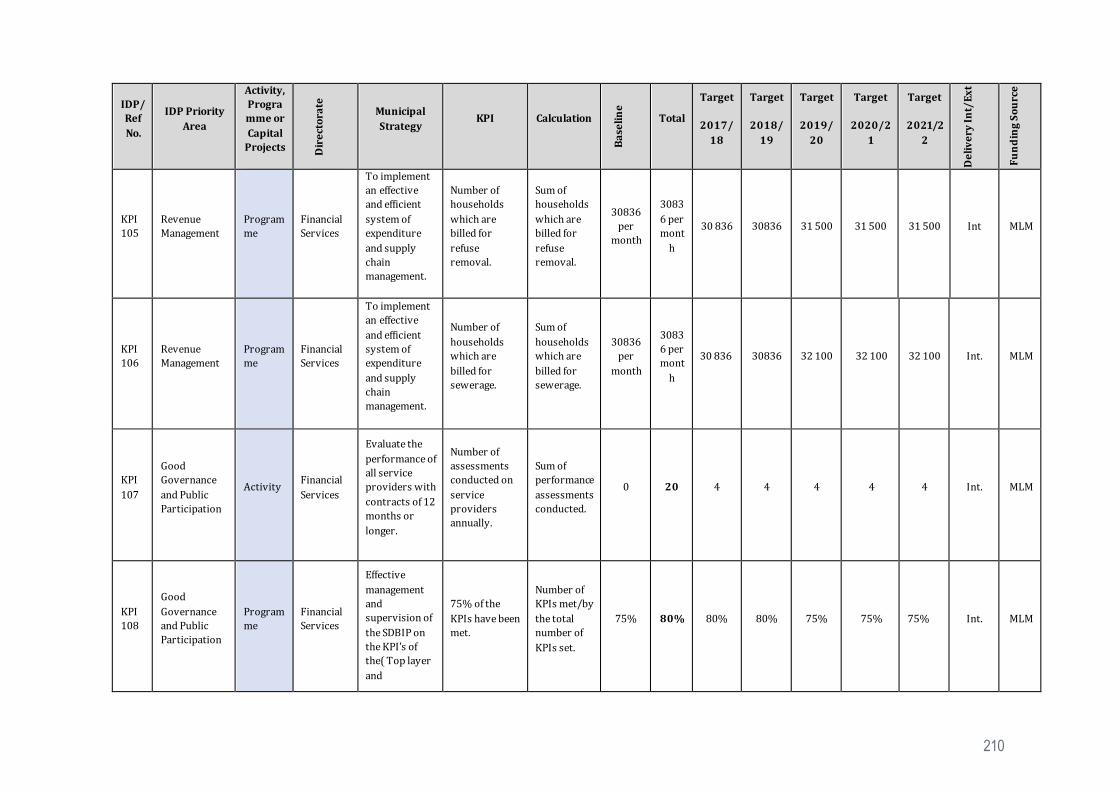
210
IDP/
Ref
No.
IDP Priority
Area
Activity,
Progra
mme or
Capital
Projects Dir
ect
ora
te
Municipal
Strategy KPI Calculation
Ba
seli
ne
Total
Target
2017/
18
Target
2018/
19
Target
2019/
20
Target
2020/2
1
Target
2021/2
2
De
liv
ery
In
t/E
xt
Fu
nd
ing
So
urc
e
KPI
105
Revenue
Management
Program
me
Financial
Services
To implement
an effective
and efficient
system of
expenditure
and supply
chain
management.
Number of
households
which are
billed for
refuse
removal.
Sum of
households
which are
billed for
refuse
removal.
30836
per
month
3083
6 per
mont
h
30 836 30836 31 500 31 500 31 500 Int MLM
KPI
106
Revenue
Management
Program
me
Financial
Services
To implement
an effective
and efficient
system of
expenditure
and supply
chain
management.
Number of
households
which are
billed for
sewerage.
Sum of
households
which are
billed for
sewerage.
30836
per
month
3083
6 per
mont
h
30 836 30836 32 100 32 100 32 100 Int. MLM
KPI
107
Good
Governance
and Public
Participation
Activity Financial
Services
Evaluate the
performance of
all service
providers with
contracts of 12
months or
longer.
Number of
assessments
conducted on
service
providers
annually.
Sum of
performance
assessments
conducted.
0 20 4 4 4 4 4 Int. MLM
KPI
108
Good
Governance
and Public
Participation
Program
me
Financial
Services
Effective
management
and
supervision of
the SDBIP on
the KPI’s of
the( Top layer
and
75% of the
KPIs have been
met.
Number of
KPIs met/by
the total
number of
KPIs set.
75% 80% 80% 80% 75% 75% 75% Int. MLM
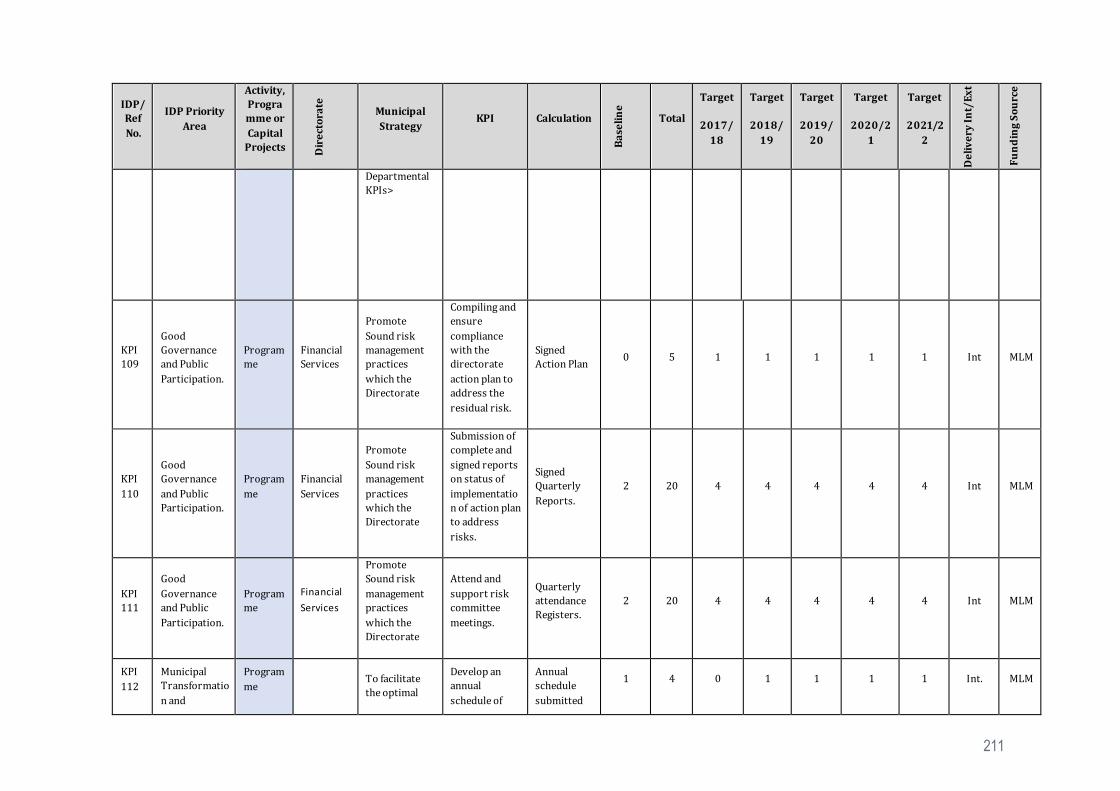
211
IDP/
Ref
No.
IDP Priority
Area
Activity,
Progra
mme or
Capital
Projects Dir
ect
ora
te
Municipal
Strategy KPI Calculation
Ba
seli
ne
Total
Target
2017/
18
Target
2018/
19
Target
2019/
20
Target
2020/2
1
Target
2021/2
2
De
liv
ery
In
t/E
xt
Fu
nd
ing
So
urc
e
Departmental
KPIs>
KPI
109
Good
Governance
and Public
Participation.
Program
me
Financial
Services
Promote
Sound risk
management
practices
which the
Directorate
Compiling and
ensure
compliance
with the
directorate
action plan to
address the
residual risk.
Signed
Action Plan 0 5 1 1 1 1 1 Int MLM
KPI
110
Good
Governance
and Public
Participation.
Program
me
Financial
Services
Promote
Sound risk
management
practices
which the
Directorate
Submission of
complete and
signed reports
on status of
implementatio
n of action plan
to address
risks.
Signed
Quarterly
Reports.
2 20 4 4 4 4 4 Int MLM
KPI
111
Good
Governance
and Public
Participation.
Program
me
Financial
Services
Promote
Sound risk
management
practices
which the
Directorate
Attend and
support risk
committee
meetings.
Quarterly
attendance
Registers.
2 20 4 4 4 4 4 Int MLM
KPI
112
Municipal
Transformatio
n and
Program
me To facilitate
the optimal
Develop an
annual
schedule of
Annual
schedule
submitted
1 4 0 1 1 1 1 Int. MLM
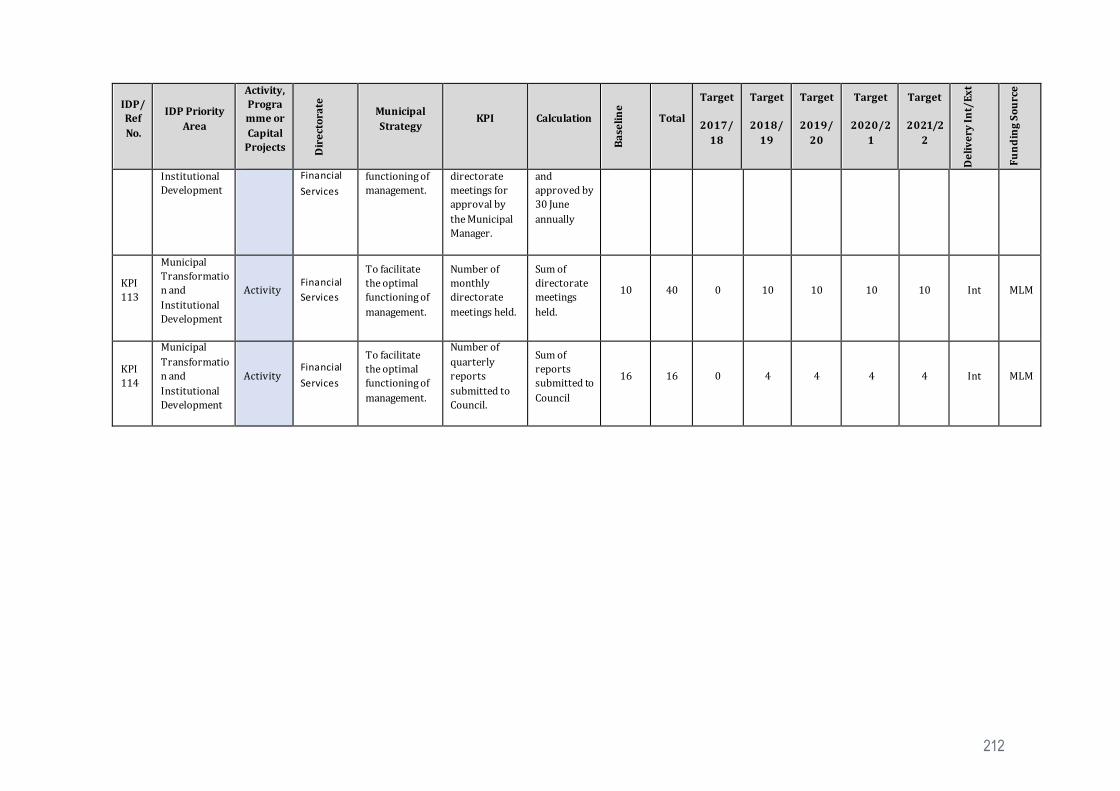
212
IDP/
Ref
No.
IDP Priority
Area
Activity,
Progra
mme or
Capital
Projects Dir
ect
ora
te
Municipal
Strategy KPI Calculation
Ba
seli
ne
Total
Target
2017/
18
Target
2018/
19
Target
2019/
20
Target
2020/2
1
Target
2021/2
2
De
liv
ery
In
t/E
xt
Fu
nd
ing
So
urc
e
Institutional
Development
Financial
Services
functioning of
management.
directorate
meetings for
approval by
the Municipal
Manager.
and
approved by
30 June
annually
KPI
113
Municipal
Transformatio
n and
Institutional
Development
Activity Financial
Services
To facilitate
the optimal
functioning of
management.
Number of
monthly
directorate
meetings held.
Sum of
directorate
meetings
held.
10 40 0 10 10 10 10 Int MLM
KPI
114
Municipal
Transformatio
n and
Institutional
Development
Activity Financial
Services
To facilitate
the optimal
functioning of
management.
Number of
quarterly
reports
submitted to
Council.
Sum of
reports
submitted to
Council
16 16 0 4 4 4 4 Int MLM

213
4.4.5 Key Performance Area 5: Municipal Transformation and Institutional Development
KPA 5: Municipal Transformation & Institutional Development
Committee Services
Employment Equity
Human Resource Management&Development
ICT
Labour Relations
Legal Services

214
KPA 5: Municipal Transformation and Institutional Development
Strategic Objective: Promote a culture of participatory and good governance Intended Outcome Improved organisational stability and sustainability
IDP/Ref No.
IDP Priority
Area
Activity, Program
me or Capital
Projects
Directorate
Municipal Strategy
KPI Calculation
Ba
se
lin
e
Total
Target
2017/18
Target 2018/1
9
Target 2019/2
0
Target 2020/2
1
Target 2021/2
2
De
liv
ery
In
t/E
xt
Fu
nd
ing
S
ou
rce
KPI 115
Committee Services
Programme Corporate Services
To facilitate the optimal functioning of Council
Number of quarterly reports to Management on the tracking of council resolutions (submitted at the end of each quarter - Sept, Dec, Mar & Apr)
Number of reports submitted.
4p/a 4 per
annum
4 X Report
s submit
ted per
annum
4 X Reports submitted per annum
4 X Reports submitted per annum
4 X Reports submitte
d per annum
4 X Reports submitte
d per annum
Int MLM
KPI 116
HRD Activity Corporate Services
To ensure continuous training and development of employees.
WSP, annual training report(ATR) & PIVOTAL report compiled and submitted to LGSETA on 30 April each year.
Date annual training report and WSP submitted to the LGSETA
30 April
5 30
April 30 April 30 April 30 April 30 April Int MLM
KPI 117
HRD Programme Corporate Services
To ensure continuous training and development of employees.
Apprenticeships /Learnerships implemented as per WSP.
Sum of Apprenticeships implemented
1 5 1 1 1 1 1 Int MLM
KPI 118
HRD Programme Corporate Services
To ensure continuous training and development of employees.
Number of skills programmes implemented
Sum of skills programmes implemented
3 15 3 3 3 3 3 Int MLM

215
IDP/Ref No.
IDP Priority
Area
Activity, Program
me or Capital
Projects
Directorate
Municipal Strategy
KPI Calculation
Ba
se
lin
e
Total
Target
2017/18
Target 2018/1
9
Target 2019/2
0
Target 2020/2
1
Target 2021/2
2
De
liv
ery
In
t/E
xt
Fu
nd
ing
S
ou
rce
KPI 119
HRD Programme Corporate Services
To ensure continuous training and development of employees.
Number of Senior & Finance officials trained on MFMP competency levels
Sum of students enrolled
10 54 12 12 10 10 10 Int MLM
KPI 120
HRM Programme Corporate Services
To ensure that the HR function responsibly forecast the future staffing needs and create plans for recruiting, hiring and retaining top talent.
Approved Macro and Micro Organisational Structure to Management
Date condoned by Management by October 2019
0
Approved Macro
and Micro
Organisational
Structure
Structure
reviewed by
Jun 2018
30 June 30 June 30 June 0 Int MLM
KPI 121
HRM Programme Corporate Services
To ensure that the HR function responsibly forecast the future staffing needs and create plans for recruiting, hiring and retaining top talent.
Number of employees undergoing medical tests annually as required by OHSA
Sum of employees undergoing medical tests
400 400 per annum
350 per
annum
400 per annum
400 per annum
400 per annum
400 per annum
Int MLM
KPI 122
Employment Equity
Activity Corporate Services
To ensure that the HR function responsibly forecast the future
Number of EE Reports submitted to DoL by 15 January each
Sum of reports submitted
1 1 plan
annually
EEA4 and
EEA2 form
submit
EEA4 and
EEA2 form
submitt
EEA4 and
EEA2 form
submitt
EEA4 and
EEA2 form
submitted to DoL
EEA4 and
EEA2 form
submitted to DoL
Int MLM

216
IDP/Ref No.
IDP Priority
Area
Activity, Program
me or Capital
Projects
Directorate
Municipal Strategy
KPI Calculation
Ba
se
lin
e
Total
Target
2017/18
Target 2018/1
9
Target 2019/2
0
Target 2020/2
1
Target 2021/2
2
De
liv
ery
In
t/E
xt
Fu
nd
ing
S
ou
rce
staffing needs and create plans for recruiting, hiring and retaining top talent.
year [EEA2 and EEA4]
ted to DoL
ed to DoL
ed to DoL
KPI 123
Employment Equity
Activity Corporate Services
To ensure that the HR function responsibly forecast the future staffing needs and create plans for recruiting, hiring and retaining top talent.
Review of EE Plan and numerical goals and targets annually
Revised EEPLan and Council Resolution
1 1 plan
annually
Annual
Review
Annual Review
Annual Review
Annual Review
Annual Review
Int MLM
KPI 124
Employee wellness
Activity Corporate Services
To ensure that the HR function responsibly forecast the future staffing needs and create plans for recruiting, hiring and retaining top talent.
Submit quarterly reports to the Management regarding activities carried out
Sum of reports submitted
4
4 X Reports submitte
d per annum
4 X Report
s submit
ted per
annum
4 X Reports submitted per annum
4 X Reports submitted per annum
4 X Reports submitte
d per annum
4 X Reports submitte
d per annum
Int MLM

217
IDP/Ref No.
IDP Priority
Area
Activity, Program
me or Capital
Projects
Directorate
Municipal Strategy
KPI Calculation
Ba
se
lin
e
Total
Target
2017/18
Target 2018/1
9
Target 2019/2
0
Target 2020/2
1
Target 2021/2
2
De
liv
ery
In
t/E
xt
Fu
nd
ing
S
ou
rce
KPI 125
Employee Wellness
Programme Corporate Services
To ensure that the HR functions responsibly, focused the future staffing needs and create plans for recruiting, hiring and retaining top talent.
Number of Wellness awareness programmes undertaken.
Sum of wellness awareness programmes undertaken.
8 32 0 8 8 8 8 Int. MLM
KPI 126
ICT Activity Corporate Services
Ensure that an effective and efficient ICT system master plan is developed
Review ICT policy and Strategy biennial (every two years)
Date ICT policy and Strategy approved by Director
1 5
Review ICT policy
and strateg
y
1 1 1 0 Int MLM
KPI 127
Labour Relations
Programme Corporate Services
To ensure the effective functioning of the LLF
Number of LLF meetings held per annum
Sum of LLF meetings held per year
10 10 X per annum
10 X per
annum
10 X per annum
10 X per annum
10 X per annum
10 X per annum
Int MLM
KPI 128
Labour Relations
Programme Corporate Services
To ensure the effective functioning of the LLF
% implementation of LLF resolutions taken (including monitoring of SALGBC collective agreements)
Number of resolutions implemented/Number of resolutions taken
85% 85% 85% 85% 85% 85% 85% Int MLM
KPI 129
Legal Services
Activity Corporate Services
To provide efficient and effective legal services
Number of by-laws developed and approved as per priority functional area
Number of by-laws developed
8 8 8 4 2 1 1 Int MLM

218
IDP/Ref No.
IDP Priority
Area
Activity, Program
me or Capital
Projects
Directorate
Municipal Strategy
KPI Calculation
Ba
se
lin
e
Total
Target
2017/18
Target 2018/1
9
Target 2019/2
0
Target 2020/2
1
Target 2021/2
2
De
liv
ery
In
t/E
xt
Fu
nd
ing
S
ou
rce
KPI 130
Personnel Expenditure
Programme Organisational
To ensure continuous training and development of employees.
% of a municipality’s personnel budget actually spent on implementing its workplace skills plan;
R value spent on training divided by total personnel budget value of the municipality
1% 1% 1% 1% 1% 1% 1% Int MLM
KPI 131
Committee Services
Activity Corporate Services
To facilitate the optimal functioning of Council.
% of agendas for scheduled meetings distributed to Councillors and officials at least 48 hours before the meeting
Number of agendas distributed 48 hours before the meeting divided by the total Number of agendas distributed
98% 98% for
each quarter
98% for
each quarte
r
98% for each
quarter
98% for each
quarter
98% for each
quarter
98% for each
quarter Int MLM
KPI 132
Committee Services
Activity Corporate Services
To facilitate the optimal functioning of Council.
% of Council Minutes submitted to management within 7 working days after each meeting
Number of council minutes submitted to management within 7 days after each council meeting divided by Number of council meetings
98% 98% for
each quarter
98% for
each quarte
r
98% for each
quarter
98% for each
quarter
98% for each
quarter
98% for each
quarter Int MLM
KPI 133
Committee Services
Activity Corporate Services
To facilitate the optimal functioning of Council.
Annual council schedule compiled and approved by end of June each year
Annual Schedule provided on or before due date
1 5 30
June 30 June 30 June 30 June 30 June Int
MLM
.
KPI 134
Good Governance and Public
Programme Corporate Services
Effective management and supervision of the SDBIP
75% of the KPI’s have been met.
Number of KPI’s met divided the total number of KPI’S
75% 75% 0 80% 75% 75% 75% Int. MLM

219
IDP/Ref No.
IDP Priority
Area
Activity, Program
me or Capital
Projects
Directorate
Municipal Strategy
KPI Calculation
Ba
se
lin
e
Total
Target
2017/18
Target 2018/1
9
Target 2019/2
0
Target 2020/2
1
Target 2021/2
2
De
liv
ery
In
t/E
xt
Fu
nd
ing
S
ou
rce
Participation.
on the KPI’s of the Directorate (Top Layer and Departmental KPIs.
KPI 135
Good Governance and Public Participation.
Activity Corporate Services
Evaluate the performance of all service providers with contracts of 12 months or longer.
Number of performance evaluations for services providers.
Number of assessments conducted on service providers annually.
4 16 0 4 4 4 4 Int. MLM
KPI 136
Good Governance and Public Participation.
Programme Corporate Services
Promote Sound risk management practices which the Directorate
Compiling and ensure compliance with the directorate action plan to address the residual risk.
Signed Action Plan
1 5 1 1 1 1 1 Int MLM
KPI 137
Good Governance and Public Participation.
Programme Corporate Services
Promote Sound risk management practices which the Directorate
Submission of complete and signed reports on status of implementation of action plan to address risks.to the risk officer
Signed Quarterly Reports.
2 20 4 4 4 4 4 Int MLM
KPI 138
Good Governance and Public Participation.
Programme Corporate Services
Promote Sound risk management practices which the Directorate
Attend and support risk committee meetings.
Quarterly attendance Registers.
2 20 4 4 4 4 4 Int MLM
KPI 139
Municipal Transformation and Institutional
Programme Corporate Services
To facilitate the optimal functioning of
Develop an annual schedule of directorate meetings for
Annual schedule submitted and approved by 30 June annually
1 4 0 30 June 1 1 1 Int. MLM

220
IDP/Ref No.
IDP Priority
Area
Activity, Program
me or Capital
Projects
Directorate
Municipal Strategy
KPI Calculation
Ba
se
lin
e
Total
Target
2017/18
Target 2018/1
9
Target 2019/2
0
Target 2020/2
1
Target 2021/2
2
De
liv
ery
In
t/E
xt
Fu
nd
ing
S
ou
rce
Development
management.
approval by the Municipal Manager.
KPI 140
Municipal Transformation and Institutional Development
Activity Corporate Services
To facilitate the optimal functioning of management.
Number of monthly directorate meetings held.
Sum of directorate meetings held.
10 30 0 0 10 10 10 Int MLM
KPI 141
Municipal Transformation and Institutional Development
Actiivity Corporate Services
To facilitate the optimal functioning of management.
Number of quarterly reports submitted to Council.
Sum of reports submitted to Council.
NEW KPI
8 0 0 0 4 4 Int MLM

221
4.4.6 Key Performance Area 6: Social and Community Development
KPA 6: Social & Community Development
Arts and Culture
Biodiversity
Cemeteries
Disaster Management
Fire Brigade Services
Planning & Development
Security
Sport & Recreation
Traffic
Waste Management

222
KPA 6: Safety and Environment
Strategic Objective: Build united non-racial, integrated and safer communities. Intended Outcome Developed communities and improved social cohesion
IDP/Ref No.
IDP Priority
Area
Activity, Program
or
Capital Projects D
irecto
rate
Municipal Strategy
KPI Calculation
Baselin
e
Total Target 2017/1
8
Target
2018/
19
Target 2019/20
Target 2020/21
Target 2021/2
2 Delivery
In
t/E
xt
Fu
nd
ing
So
urc
e
KPI 142
Arts and Culture
Programme
Community Services
To optimize community participation in Arts and Culture.
Number of arts and culture activities and events held in the municipal area
Number of activities held
7 25 7 6 2 4 4 Int MLM
KPI 143
Biodiversity
Programme
Community Services
Removing of invasive plants as scheduled in the Biodiversity Act.
Establishment of a Bio-Diversity Unit in all three towns
Unit established on the organogram
New KPI
1 N/A
The unit be
establishe
d
N/A
The unit be
established
N/A Int MLM
KPI 144
Cemeteries
Programme
Community Services
Expansion of cemeteries
Number of expansion of cemeteries
Sum of cemeteries expanded
0 3 2 2 1 2 0 Int MLM
KPI 145
Cemeteries
Capital Projects
Community Services
Effective maintenance of cemeteries.
Fencing of cemeteries
Number of cemeteries fenced.
New KPI
3 1 1 1 1 1 Int MLM
KPI 146
Parks Activity Community Services
Effective maintenance of recreational facilities.
Upgrading of Community Halls.
Sum of Community Halls upgraded.
NEW KPI
4 0 1 1 1 1 Int MLM
KPI 147
Parks Capital Projects
Community Services
Effective maintenance of recreational facilities.
Business plans submitted to request funding for the development of two parks.
Sum of business plans submitted
NEW KPI
2 0 0 0 2 0 Int MLM

223
IDP/Ref No.
IDP Priority
Area
Activity,
Program or
Capital Projects D
irecto
rate
Municipal Strategy
KPI Calculation
Baselin
e
Total Target 2017/1
8
Target
2018/19
Target 2019/20
Target 2020/21
Target 2021/2
2
Delivery
In
t/E
xt
Fu
nd
ing
So
urc
e
KPI 148
Parks Capital Projects
Community Services
Development of Parks for heritage and Recreation purposes
Number of areas identified for parks
Number of sites identified for development of parks
1 10 2 2 2 2 2 Int MLM
KPI 149
Fire Services
Activity Community Services
To provide professional fire services within Stenysrus/Matlwang and Viljoenskroon/ Rammulotsi
Number of business plans submitted to request funding for the two fire stations.
Sum of business plans submitted.
0
2 x per annum
(1 toFDDM and 1 x to Prov
Gov)
2 x per annum
(1 toFDDM and 1 x to Prov Gov
2 x per
annum (1
toFDDM
and 1 x to Prov Gov
1 Per Annun
Viljoenskroon)
1 Per Annun
Viljoenskroon)
0 Int. MLM
KPI 150
Fire Services
Activity Community Services
To provide effective and efficient fire services in Moqhaka to ensure community safety
Number of premises inspected for fire safety and compliance.
Sum of premises inspected for fire safety and compliance.
100 740 over 5 years
120 140 200 280 300 Int. MLM
KPI 151
Disaster Management
Activity Community Services
To ensure that the municipality have an approved Disaster Management Plan for implementation in the event of such a disaster occurring
Disaster Management Plan for the municipality reviewed and approved by Council
Date DMP approved
30 Jun 5 Annual Reviews
done 30 June
30 June
30 Sept 30 June 30 June Int MLM

224
IDP/Ref No.
IDP Priority
Area
Activity,
Program or
Capital Projects D
irecto
rate
Municipal Strategy
KPI Calculation
Baselin
e
Total Target 2017/1
8
Target
2018/19
Target 2019/20
Target 2020/21
Target 2021/2
2
Delivery
In
t/E
xt
Fu
nd
ing
So
urc
e
KPI 152
Disaster Management
Activity Community Services
To ensure implementation of the approved Disaster Management Plan.
Establishment of Interdepartmental Committee of Disaster Management.
Date of established of Interdepartmental Committee.
New KPI
1 0
30 June 0 0 Int MLM
KPI 153
Disaster Management
Activity Community Services
By Developing a comprehensive risk profile for the municipality
Disaster Risk Assessment Report developed by 30 June 2020
Completion Date.
New KPI
Variable risk
profile per risk hazard
0 0 30 June 0 0 Int. MLM
KPI 154
Disaster Management
Activity Community Services
Develop a Municipal Risk Reduction Plan consistent with the Spatial Development Framework
Number of awareness campaigns conducted.
Sum of awareness campaign conducted.
New KPI
1 1 4 4 4 4 Int. MLM
KPI 155
Disaster Management
Activity Community Services
Develop and commission a municipal Disaster Management Centre
Disaster Management Section adequately staffed by June 2021.
Staff appointed by 30 June 2021
New KPI
1 centre adopted
by council
0 0 0 30 June N/A Int MLM
KPI 156
Customer Satisfaction
Activity Office of the MM
To ensure that the customer care policy is approved and implemented.
% of customer complaints handled within 24 hrs.
Number of complaints received/Number of complaints resolved within 24 hours
80% 90% 80% 85% 90% 90% 90% Int MLM
KPI 157
Disaster Management
Activity Community Services
Develop an early warning system
An operational Early system warning developed
Operational early warning system
New KPI
1 0 0 0 1 0 Int MLM
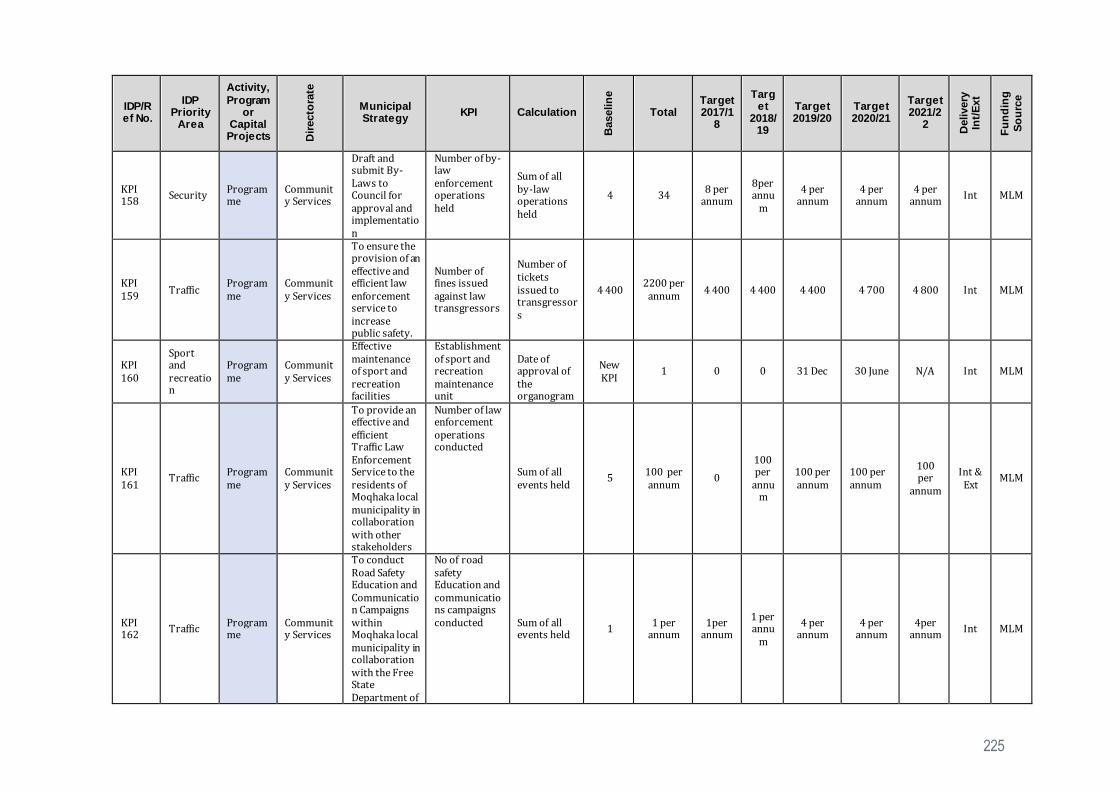
225
IDP/Ref No.
IDP Priority
Area
Activity,
Program or
Capital Projects D
irecto
rate
Municipal Strategy
KPI Calculation
Baselin
e
Total Target 2017/1
8
Target
2018/19
Target 2019/20
Target 2020/21
Target 2021/2
2
Delivery
In
t/E
xt
Fu
nd
ing
So
urc
e
KPI 158
Security Programme
Community Services
Draft and submit By-Laws to Council for approval and implementation
Number of by-law enforcement operations held
Sum of all by-law operations held
4 34 8 per
annum
8per annu
m
4 per annum
4 per annum
4 per annum
Int MLM
KPI 159
Traffic Programme
Community Services
To ensure the provision of an effective and efficient law enforcement service to increase public safety.
Number of fines issued against law transgressors
Number of tickets issued to transgressors
4 400 2200 per
annum 4 400 4 400 4 400 4 700 4 800 Int MLM
KPI 160
Sport and recreation
Programme
Community Services
Effective maintenance of sport and recreation facilities
Establishment of sport and recreation maintenance unit
Date of approval of the organogram
New KPI
1 0 0 31 Dec 30 June N/A Int MLM
KPI 161
Traffic Programme
Community Services
To provide an effective and efficient Traffic Law Enforcement Service to the residents of Moqhaka local municipality in collaboration with other stakeholders
Number of law enforcement operations conducted
Sum of all events held
5 100 per annum
0
100 per
annum
100 per annum
100 per annum
100 per
annum
Int & Ext
MLM
KPI 162
Traffic Programme
Community Services
To conduct Road Safety Education and Communication Campaigns within Moqhaka local municipality in collaboration with the Free State Department of
No of road safety Education and communications campaigns conducted Sum of all
events held 1
1 per annum
1per annum
1 per annu
m
4 per annum
4 per annum
4per annum
Int MLM

226
IDP/Ref No.
IDP Priority
Area
Activity,
Program or
Capital Projects D
irecto
rate
Municipal Strategy
KPI Calculation
Baselin
e
Total Target 2017/1
8
Target
2018/19
Target 2019/20
Target 2020/21
Target 2021/2
2
Delivery
In
t/E
xt
Fu
nd
ing
So
urc
e
Police, Roads and Transport
KPI 163
Waste Management
Programme
Community Services
To ensure that the IWMP is implemented as approved.
Rehabilitation of the old landfill site in Viljoenskroon by 30 June 2021.
Landfill site rehabilitated by 30 June 2021.
30 June 1 0 30 Jun
30 Jun 30 June 0 Int. MLM
KPI 164
Waste management
Programme
Community Services
By ensuring access to solid waste removal services to all HH within the municipal area by 2019.
Number of households in municipal area with access to refuse removal
Sum of households in municipal area with access to refuse removal.
34 625 34 231 34011 3401
1 34011 34 883 34 883 Int MLM
KPI 165
Waste management
Activity Community Services
To curb illegal dumping in the municipal area by implementing the Integrated Waste Management strategy.
Review strategy on how to deal with illegal dumping. Strategy approved by Director on or before 30 Jun 2020..
Date Strategy approved
1 Revised strategy
1 1 1 1 1 Int MLM
KPI 166
Waste management
Activity Community Services
To curb the incidence of illegal dumping which could lead to a disaster.
No of fines issued to perpetrators by law enforcement/ Peace Officers
Sum of fines issued
4 20 4 4 4 4 4 Int MLM
KPI 167
Waste management
Programme
Community Services
To curb the incidence of illegal dumping which could lead to a disaster.
Number of waste awareness campaigns conducted.
Sum of awareness sessions held
4 4 per annum
4 4 4 4 4 Int MLM

227
IDP/Ref No.
IDP Priority
Area
Activity,
Program or
Capital Projects D
irecto
rate
Municipal Strategy
KPI Calculation
Baselin
e
Total Target 2017/1
8
Target
2018/19
Target 2019/20
Target 2020/21
Target 2021/2
2
Delivery
In
t/E
xt
Fu
nd
ing
So
urc
e
KPI 168
Good Governance and Public Participation
Activity Community Services
Evaluate the performance of all service providers with contracts of 12 months or longer.
Number of assessments conducted on service providers annually.
Sum of performance assessments conducted.227
4 20 4 4 2 4 4 Int. MLM
KPI 169
Good Governance and Public Participation
Programme
Community Services
Effective management and supervision of the SDBIP on the KPI’s of the( Top layer and Departmental KPIs>
75% of the KPIs have been met.
Number of KPIs met/by the total number of KPIs set.
80% 75% 80% 80% 75% 75% 75% Int. MLM
KPI 170
Good Governance and Public Participation.
Programme
Community Services
Promote Sound risk management practices within the Directorate
Compiling and ensure compliance with the directorate action plan to address the residual risk.
Signed Action Plan
0 5 1 1 1 1 1 Int MLM
KPI 171
Good Governance and Public Participation.
Programme
Community Services
Promote Sound risk management practices which the Directorate
Submission of complete and signed reports on status of implementation of action plan to address risks.
Signed Quarterly Reports.
2 20 4 4 4 4 4 Int MLM
KPI 172
Good Governance and Public Participation.
Programme
Community Services
Promote Sound risk management practices which the Directorate
Attend and support risk committee meetings.
Quarterly attendance Registers.
2 20 4 4 4 4 4 Int MLM

228
IDP/Ref No.
IDP Priority
Area
Activity,
Program or
Capital Projects D
irecto
rate
Municipal Strategy
KPI Calculation
Baselin
e
Total Target 2017/1
8
Target
2018/19
Target 2019/20
Target 2020/21
Target 2021/2
2
Delivery
In
t/E
xt
Fu
nd
ing
So
urc
e
KPI 173
Municipal Transformation and Institutional Development
Programme
Community Services
To facilitate the optimal functioning of management.
Develop an annual schedule of directorate meetings for approval by the Municipal Manager.
Annual schedule submitted and approved by 30 June annually
30 June 4 0 30 Jun
30 Jun 30 Jun 30 Jun Int. MLM
KPI 174
Municipal Transformation and Institutional Development
Activity Community Services
To facilitate the optimal functioning of management.
Number of monthly directorate meetings held.
Sum of directorate meetings held.
10
40 0 10 10 10 10 Int MLM
KPI 175
Municipal Transformation and Institutional Development
Activity Community Services
To facilitate the optimal functioning of management.
Number of quarterly reports submitted to Council.
Sum of reports submitted to Council
4
76 0 4 24 24 24 Int MLM
229
COMPANY NAME | BUSINESS REPORT
Long Term Financial Plan
5.1 Introduction
The purpose of this chapter is to outline a comprehensive multi-year financial plan that will ensure long-
term financial sustainability for Moqhaka. The Financial Plan is essential to ensure that the Municipality
continues to implement its mandate effectively without impairing its capital base and to move towards self-
sufficiency in meeting the growing demands of service delivery.
The multi-year Financial Plan is prepared for a planning period of five years, paying particular attention to
infrastructure investment which is an important developmental component of the IDP. Through this plan
Moqhaka will focus on greater financial health and sustainability making collaboration of capital investment
projects with other levels of government and private sector investors much easier. It is of utmost importance
that Moqhaka stimulate the macro-economic environment to attract the private sector to investment in
Moqhaka. Through this approach Moqhaka will enhance its ability to have access to much needed financial
resources to invest in new as well as to maintain its current infrastructure assets.
This plan will also focus on the expansion of Moqhaka’s revenue sources in relation to its costs to ensure that
the Municipality stays a financial viable and sustainable going concern. Moqhaka must utilise available
financial resources in an effective, efficient and economical way to ensure that outputs have the desired
outcomes as set out in Chapter 3 of the IDP. The financial strategies detailed in this plan must contribute to
the achievement of these objectives.
It is important to note that this multi-year financial plan will cover key focus areas over the next five years
and even longer. However, due to the fact that budgets in terms of National Treasury’s Municipal Budget
and Reporting Regulations only covers a planning period of the next financial year and the two outer
financial years thereafter; the budget information supplied in this chapter might only cover the next three
financial years. It will also cover the current financial year’s information as well as the previous three financial
years’ audited information.
A discussion will now follow on key focus areas consisting of a financial framework, financial strategies,
financial policies, budget assumptions, operating revenue, operating expenditure, capital expenditure,
capital expenditure funding and a concluding statement.
5.2 Financial Framework
It must be noted that not all municipalities are the same and this should be kept in mind when assessing the
financial health of and the setting of benchmarks for a Municipality. A municipality can be categorised into
a developed or a developing Municipality. Moqhaka can be categorised as a developing or growing
Municipality.

230
COMPANY NAME | BUSINESS REPORT
Developing municipalities will require significant additional resources and funding to conduct the growth
that is expected of them. With the demands for growth come risks that need to be managed. The priority
from the financial perspective is the viability and sustainability of the Municipality.
5.2.1 Revenue adequacy and Certainty
It is essential that Moqhaka has access to adequate sources of revenue from its own operations and
intergovernmental transfers to enable it to carry out its functions. It is furthermore necessary that there is a
reasonable degree of certainty with regard to the source, amount and timing of revenue. The latest DoRA
has laid out the level of funding from National Government that will be received for the 2020/2021 to
2022/2023 financial years.
It is important to track the respective sources of revenue received by the Municipality as they can be quite
different and can vary substantially depending upon the phase that the Municipality is in. Knowledge of the
sources of funds will illustrate the Municipality’s position more accurately, its ability to secure loans relative
to its income and its borrowing capacity.
5.2.2 Cash / liquidity position
Cash and cash management is vital for the short- and long-term survival and good management of any
organisation. This is also the case with Moqhaka municipality. The appropriate benchmarks which can assist
in assessing the financial health of the Municipality are:
(a) The current ratio, which expresses the current assets as a proportion to current liabilities. A current
ratio in excess of two to one (2:1) is considered to be very healthy. Moqhaka as at 30 June 2019 stood at
a ratio of 0.5:1; as at 30 June 2018 was at a ratio of 0.4:1 and as at 30 June 2017 at a ratio of 0.5:1. These
results are seen as highly undesirable in the medium to short term and must be turned around. The
operating budget needs to produce yearly operating surpluses to improve our cash backed reserves
position and all collectable revenue needs to be collected.
(b) Debtor’s turnover ratio, which have a great impact on the liquidity of the Municipality. The
Municipality as at 30 June 2019 took on average 614 days to recover its outstanding debts. This is an
increase when compared to 389 days as at 30 June 2019. Moqhaka envisaged to attempt to reduce the
debtor’s turnover ratio (without provisions for bad debt) to less than 300 days and 240 days in the short-
term. Over the medium- and long-term the Municipality will attempt to decrease it to 150 days
(2017/18), 120 days (2018/19), 90 days (2020/21), 60 days (2021/22) and 30 days (2022/23) respectively.
The acceptable norm is 30 days.
231
COMPANY NAME | BUSINESS REPORT
(c) The collection rate for the 2019/20 financial year 71% which is a decline as compare to the 82% of
2018/19 financial year. Moqhaka will endeavour over the short-, medium- and long-term to increase its
collection rate to 95% and higher.
5.2.3 Sustainability
Moqhaka needs to ensure that its budget is balanced and cash-funded (realistically anticipated revenue to
be received/collected that covers expenditure). As there are limits on revenue, it is necessary to ensure that
services are provided at levels that are affordable; and, that the full costs of service delivery are recovered.
However, to ensure that households which are too poor to pay for even a portion of their basic services at
least have access to these basic services; there is a need for the subsidisation of these households through
an indigent support subsidy.
5.2.4 Effective and efficient use of resources
In an environment of limited resources, it is essential that the Municipality make maximum use of the
resources at its disposal by using them in an effective and efficient manner. Efficiency in operations and
investment will increase poor people’s access to basic services. It is therefore imperative for the operating
budget to be compiled on the zero base budget approach to eliminate any excess cash usually built in a
budget as a result of the incremental budget approach.
5.2.5 Accountability, transparency and good governance
The Municipality is accountable to the people who provide the resources, for what they do with these
resources. The budgeting process and other financial decisions should be open to public scrutiny and public
participation. In addition, the accounting and financial reporting procedures must minimise opportunities
for corruption and fraud. It is also essential that accurate financial information is produced within acceptable
time-frames.
5.2.6 Equity and redistribution
The Municipality must treat people fairly and justly when it comes to the provision of services. In the same
way, the Municipality should be treated equitably by national and provincial government when it comes to
inter-governmental transfers. The “equitable share” from national government will be used primarily for
targeted subsidies to poorer households. In addition, the Municipality will continue to cross-subsidise
between high- and low-income consumers within a specific service or between services.
5.2.7 Development and investment
In order to deal effectively with backlogs in services, there is a need for the Municipality to maximise its
investment in municipal infrastructure.

232
COMPANY NAME | BUSINESS REPORT
5.2.8 Borrowing
The strong capital market in South Africa (commercial banks and other borrowing institutions like the
DBSA, INCA, etc.) provides an additional instrument to access financial resources. However, the
Municipality may not borrow to balance its operating budget and to finance any operating expenditure.
Safeguards need to be put in place to ensure that the Municipality borrows in a responsible manner. In order
to have access to this market, the Municipality will need to have accurate and appropriate financial
accounting and reporting systems. We will have to ensure that we generate enough cash to honour
repayment commitments.
The manner in which the Municipality manages debt or takes on new debt to finance investment activities
will have a significant impact on the solvency and long-term viability of the Municipality.
5.3 Financial Strategies
5.3.1 Revenue raising strategies
The following are some of the programs that have been identified: a) Ward based public participation meeting to create awareness and encourage payment of accounts,
b) Data cleansing to ensure data integrity and complete and accurate billing, c) Enforcement of credit control mechanisms and policy as well as the by-laws to keep accounts up to
date. d) Effective and efficient implementation of debt collection policy. e) Blocking and disconnection of electricity meters for accounts in arrears. f) Sending letters of demand for service accounts in arrears. g) Verification of the indigent register to ensure that only poor households benefit from the scheme and
those who can afford to pay for services rendered do so.
h) The development of a municipal Revenue enhancement strategy.
i) The establishment of a municipal debt collection call centre in order to enable the municipality to collect the outstanding debtors book.

233
COMPANY NAME | BUSINESS REPORT
5.3.2 Asset management strategies
The following are some of the more significant programmes that have been identified:
(a) Development of infrastructure masterplans to enforce cost effective repairs and maintenance and
future rehabilitation or upgrade of the infrastructure;
(b) Capacity building within the Technical and Financial Services in terms of asset management, to relieve
reliance on consultants for both project management and project and asset accounting;
(c) Review of the assets management policy and procedures;
(d) Implementation of the configuration of the asset management system into the mSCOA platform to
comply with the new budget reforms.
5.3.3 Financial management strategies and programmes
The following are some of the more significant programmes that have been identified:
(a) The on-going review of the computerised financial accounting system.
(b) Integration of all computerised systems and acquisition of hardware and software required. The
integration of computerised systems and acquisition of the required hardware and software within the
Municipality to ensure that information is accurate, relevant and prompt, which in turn will facilitate the
smooth running and effective management of the Municipality.
(c) Development of an mSCOA compliant MTREF Budget.
(d) Develop and implement a uniform budget reporting framework compliant with National Treasury’s
Municipal Budget and Reporting Regulations.
(e) Review and update asset, budget and accounting policies and procedures.
(f) Training and development of financial and other staff members. The aim of this project will be to
constantly ensure that the financial and other staff members receive the training they require to ensure
a cost-effective and efficient service to the Municipality and its customers.
(g) Enhance budgetary controls and timeliness of financial data. Building the capacity of the Budget and
Treasury Office to ensure that financial information for reporting purposes is generated timeously. It
will also include the monitoring and reporting on budget variances.

234
COMPANY NAME | BUSINESS REPORT
5.4 Financial Policies
5.4.1 General philosophy
The financial philosophy of Moqhaka is to provide a sound financial base and the resources necessary to
sustain a satisfactory level of municipal services for the citizens of Moqhaka.
It is the goal of the Municipality to achieve a strong financial position with the ability to withstand local and
regional economic impacts; to adjust efficiently to the community’s changing service requirements; to
effectively maintain, improve and expand the Municipality’s infrastructure; to manage the Municipality’s
budget and cash flow to the maximum benefit of the community; to prudently plan, coordinate and
implement responsible and sustainable community development and growth; and to provide a high level of
fire and other protective services to assure public health and safety.
Based on the financial framework, financial strategies and the general financial philosophy statement, the
Municipality have to develop financial policies that support the above. Moqhaka’s financial policies shall
also address the following fiscal goals:
(a) To keep the Municipality in a fiscally sound position in both the long and short term;
(b) To maintain sufficient financial liquidity through regular reviews and adjustments to meet normal
operating and contingent obligations;
(c) To apply credit control policies which maximise collection while providing relief to the indigent;
(d) To implement credit control policies that recognise the basic policy of customer care and convenience;
(e) To operate utilities in a responsive and fiscally sound manner;
(f) To maintain and protect existing infrastructure and capital assets;
(g) To provide a framework for the prudent use of debt financing; and,
(h) To direct the Municipality’s financial resources toward meeting the goals of the Municipality’s
Integrated Development Plan.
5.4.2 Budget related policies
The following budget related policy is place;
(a) Budget Policy

235
COMPANY NAME | BUSINESS REPORT
(b) Indigent Subsidy Policy
(c) Cash and Investment Policy
(d) Cash Control Policy
(e) Petty Cash Policy
(f) Travel and Subsistence Policy
5.4.3 Revenue policies
(a) Tariff Schedule
(b) Tariff Policy
(c) Property Rates Policy
(d) Meter Reading Policy
5.4.4 Credit control policies and procedures
(a) Write-Off Policy
(b) Debt Collection and Credit Control Policy
5.4.5 Supply chain management
(a) Supply Chain Management Policy
(b) SCM Policy for Infrastructure Procurement and Delivery Management
5.4.6 Asset management policies
The objective of the Asset Management Policy is to prescribe the accounting and administrative policies and
procedures relating to Property, Plant and Equipment (PPE), which are immoveable and moveable assets
of Moqhaka, and, computer software which are intangible assets of Moqhaka Municipality. The principles
and policy statements are embedded in the Asset Management Policy of Council.

236
COMPANY NAME | BUSINESS REPORT
5.4.7 Investment policies
In terms of Section 13(2) of the Municipal Finance Management Act each Municipality must establish an
appropriate and effective Cash Management and Investment Policy. Investments of the Municipality shall
be undertaken in a manner that seeks to ensure the preservation of capital in the overall portfolio. The
portfolio shall remain sufficiently liquid to enable the Municipality to meet daily cash flow demands and
conform to all state and local requirements governing the investment of public funds. The preservation of
principal is the foremost objective of the investment program. Moqhaka will continue the current cash
management and investment practices, which are designed to emphasise safety of capital first, sufficient
liquidity to meet obligations second, and the highest possible yield third. These principles are embedded in
the Cash and Investment Policy of Council.
5.4.8 Debt management policies
Moqhaka shall issue debt only when necessary to meet a public need and when funding for such projects is
not available from current revenues, reserves or other sources. Long-term borrowing will be used to finance
capital improvements as approved in the Municipality’s capital projects/plan. Capital projects financed
through the issuance of debt shall be financed for a period not to exceed the expected useful life of the
project. The Municipality will not incur debt to finance current operations. Lease-purchase obligations,
capital outlay notes or other debt instruments may be used as a medium-term method of borrowing for the
financing of vehicles, computers, other specialised types of equipment, or other capital improvements. All
these principles are embedded in the Borrowing Policy of Council.
Borrowing should be limited to 45% of the total operating revenue as required by MFMA Circular No. 71. If
not, the Municipality will become over-indebted and a risk to banking institutions and this will result in loans
over shorter term being at higher interest rates. This will adversely affect the current customer base.
5.4.9 Accounting policies
The principles on which Moqhaka operate with regard to the presentation, treatment and disclosure of
financial information forms part of the Accounting Policy adopted in the compiled yearly annual financial
statements.
5.5 Budget Assumptions
Based on the financial framework, financial strategies and financial policies the MTREF Budget was
compiled. Key assumptions relating to the MTREF Budget also included the following:
(a) National government grants for the years 2020/2021 to 2022/2023 are as per the Division of Revenue
Act (DoRA). For year four and five estimated increases in terms of the increases patterns or CPI were
used.

237
COMPANY NAME | BUSINESS REPORT
(b) Provincial government grants for the years 2020/2021 to 2022/2023 are as per promulgated in the
Provincial Gazettes. For year four and five estimated increases in terms of the CPI were used.
(c) The headline inflation rate (consumer price index or CPI) was 4.5% for the 2020/21 financial year and is
estimated at 4.6% for the 2021/2022 financial year. The estimated CPI for the 2022/23 is at 4.6%.
(d) The South African Local Government Bargaining Council (SALGBC) determines the cost-of-living
increases by mutual agreement between the employer and the unions.
(e) Bulk electricity purchases increased with 6.9% for the 2020/2021 financial year compared with 9.41%
for the 2019/2020 financial year.
(f) Provision has been made for a property rates revenue increase of 7.7% for the 2020/2021 financial year
and 9% for the next four outgoing years.
(g) Budgeted electricity revenue increase with 6.24% for the 2020/2021 financial year. Due to a lack of outer
year projections from National Treasury and NERSA the same revenue increase is projected for the
outer four financial years.
(h) Budgeted water revenue increase with an average of 9.8% for the 2020/2021 financial year and with an
average of 8%, 8.5%, 7.5% and 7% respectively over the four outgoing years. Although lower
consumption will lead to lower costs, this approach will lead to a minimal operating surplus. Water is a
trading service and is supposed to generate an operating surplus and a smaller turnover will reduce the
much-needed profit to subsidise community services that cannot be covered through the unpopular
property rates revenue raised.
(i) Budgeted refuse revenue increase with an average 8.1% for the 2020/2021 financial year, and with an
average of 7%, 6.5%, 6% and 6% respectively over the four outgoing years.
(j) Budgeted sanitation revenue increase with an average of 8.5% for the 2020/2021 financial year, and with
an average of 7.5%, 7%, 8% and 6% respectively over the four outgoing years. Sanitation is an economic
service and needs to break even as determined by Council’s Tariff Policy and MFMA Circulars as issued
by National Treasury.

238
COMPANY NAME | BUSINESS REPORT
5.6 Operating Revenue Framework
In order to serve the community and to render the services needed, revenue generation is fundamental for
financial sustainability. The reality is that we are faced with developmental backlogs and poverty
challenging our revenue generation capacity. The needs (being capital or operational of nature) always
exceed the available financial resources. This becomes more obvious when compiling the annual budget
and marrying it with the community’s needs as recorded in the IDP. This is a worldwide problem and
therefore available financial resources should be utilised where it delivers the biggest impact on outcomes
that will improve the quality of life of our local communities.
The municipality’s revenue strategy is built around the following key components:
National Treasury’s guidelines and macro-economic policy;
Projected growth and growth in demand for services;
Realistic projections of revenue and collection thereof, as well as strategies for debtor’s
management;
Improving the effectiveness of revenue management processes and procedures;
Efficient revenue management, which aims to ensure a 95% annual collection rate for property rates
and service charges as required by MFMA Circular No. 71;
Electricity tariff increases as approved by the National Electricity Regulator of South Africa
(NERSA);
Achievement of full cost recovery of specific user charges especially in relation to trading services;
Paying special attention to cost containment measures by, amongst other things, controlling
unnecessary spending on nice-to-have items and non-essential activities as was highlighted in
MFMA Circular No.82;
Determination of tariffs for trading services in a cost reflective and a cost recovery manner;
Determining the tariff escalation rate by establishing/calculating the revenue requirement of each
service in order to achieve cost reflective tariffs (or Break-Even-Point);
The municipality’s Property Rates Policy approved by Council in terms of the Municipal Property
Rates Act, 2004 (Act 6 of 2004) (MPRA);
The municipality’s Indigent Policy and the rendering of free basic services; and
Curbing consumption of water and electricity by indigents to ensure that they do not exceed their
allocated benefits.
The operating revenue will now be discussed and analysed.
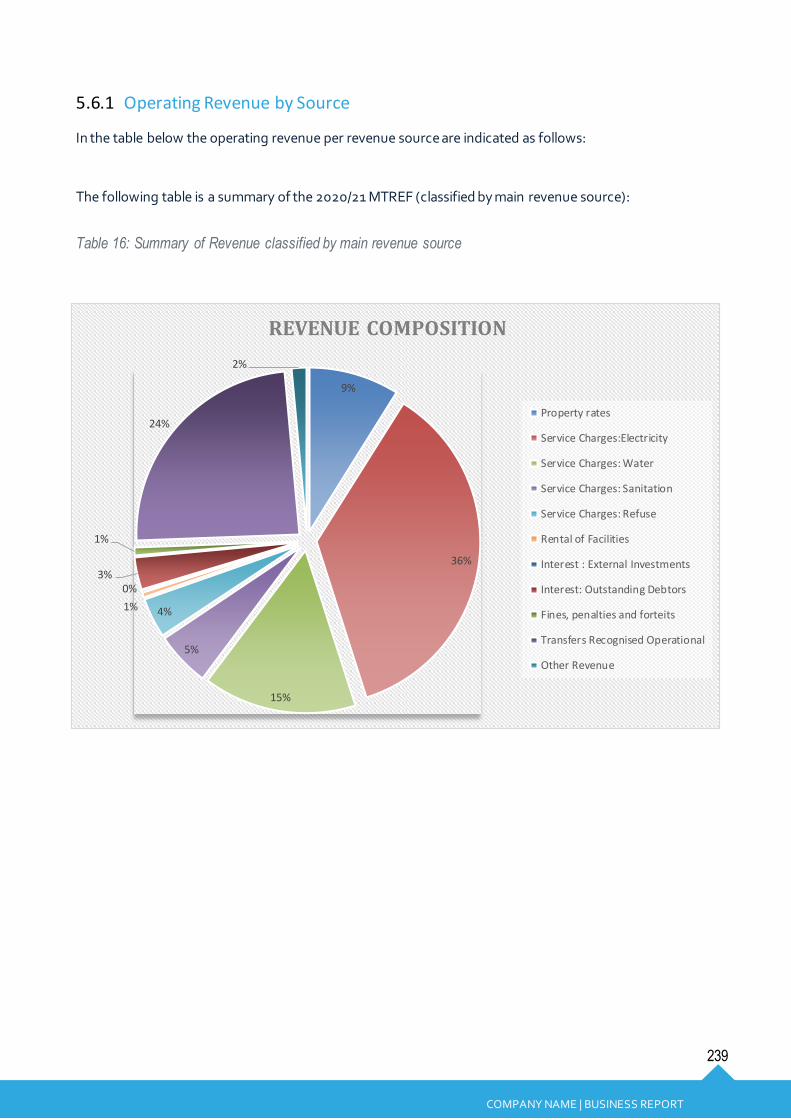
239
COMPANY NAME | BUSINESS REPORT
5.6.1 Operating Revenue by Source
In the table below the operating revenue per revenue source are indicated as follows:
The following table is a summary of the 2020/21 MTREF (classified by main revenue source):
Table 16: Summary of Revenue classified by main revenue source
9%
36%
15%
5%
4%1%
0%3%
1%
24%
2%
REVENUE COMPOSITION
Property rates
Service Charges:Electricity
Service Charges: Water
Service Charges: Sanitation
Service Charges: Refuse
Rental of Facilities
Interest : External Investments
Interest: Outstanding Debtors
Fines, penalties and forteits
Transfers Recognised Operational
Other Revenue
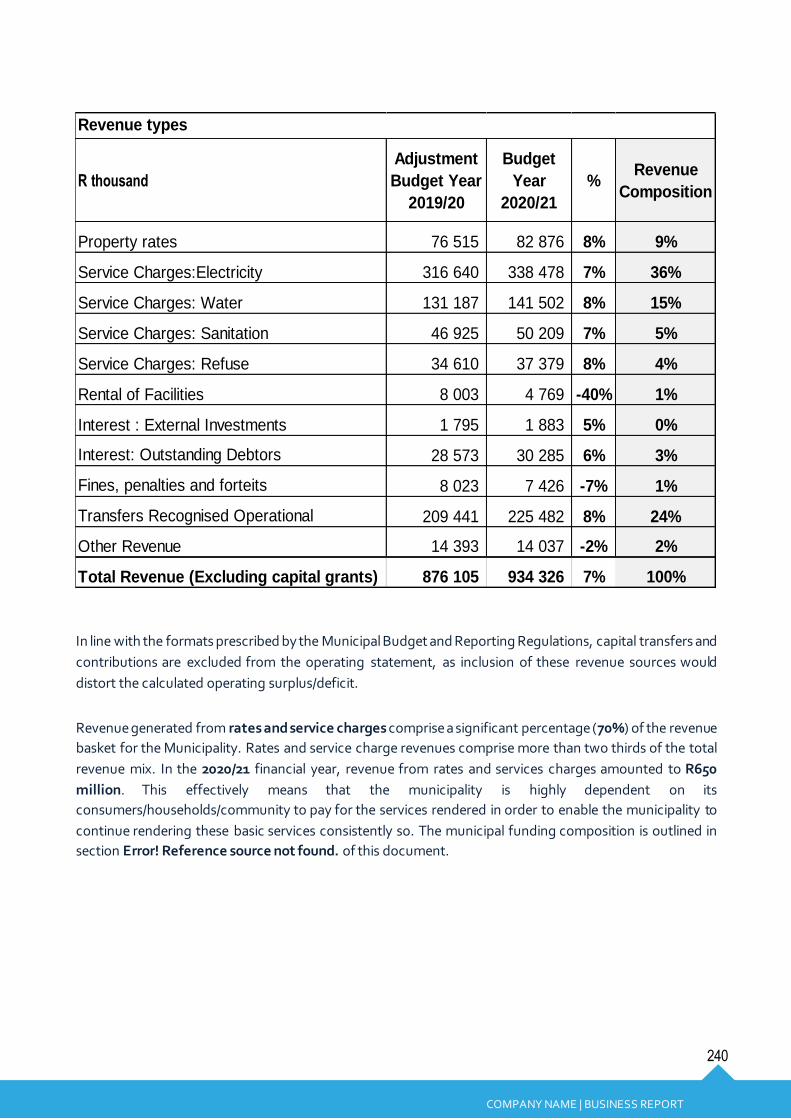
240
COMPANY NAME | BUSINESS REPORT
In line with the formats prescribed by the Municipal Budget and Reporting Regulations, capital transfers and
contributions are excluded from the operating statement, as inclusion of these revenue sources would
distort the calculated operating surplus/deficit.
Revenue generated from rates and service charges comprise a significant percentage (70%) of the revenue
basket for the Municipality. Rates and service charge revenues comprise more than two thirds of the total
revenue mix. In the 2020/21 financial year, revenue from rates and services charges amounted to R650
million. This effectively means that the municipality is highly dependent on its
consumers/households/community to pay for the services rendered in order to enable the municipality to
continue rendering these basic services consistently so. The municipal funding composition is outlined in
section Error! Reference source not found. of this document.
R thousand
Adjustment
Budget Year
2019/20
Budget
Year
2020/21
%Revenue
Composition
Property rates 76 515 82 876 8% 9%
Service Charges:Electricity 316 640 338 478 7% 36%
Service Charges: Water 131 187 141 502 8% 15%
Service Charges: Sanitation 46 925 50 209 7% 5%
Service Charges: Refuse 34 610 37 379 8% 4%
Rental of Facilities 8 003 4 769 -40% 1%
Interest : External Investments 1 795 1 883 5% 0%
Interest: Outstanding Debtors 28 573 30 285 6% 3%
Fines, penalties and forteits 8 023 7 426 -7% 1%
Transfers Recognised Operational 209 441 225 482 8% 24%
Other Revenue 14 393 14 037 -2% 2%
Total Revenue (Excluding capital grants) 876 105 934 326 7% 100%
Revenue types
241
COMPANY NAME | BUSINESS REPORT
TARIFFS REMARKS
Water
Revenues from water services increased on average by 9.8%. The municipality continue to experience major
challenges with regards to its water network, which in most cases leaves the community without water for
extended period of times. The water network is still predominantly asbestos pipelines. This continues to
adversely affect our water distribution infrastructure due to continuous burst pipes, especially during the
winter season due to the type of network in place (asbestos pipes).
The repairs and maintenance cost for the network is funding from the “basic water charge” tariff. It has been
evident from the past 3 years that this tariff does not adequately cover the costs of effectively maintaining
the water network. This tariff continues to experience a higher tariff increase to ensure that adequate
financial resources is available for the rehabilitation of the water infrastructure network.
The developments which the municipality undertook in the last 3 years has seen quite a high demand in
terms of the water supply. Which conversely, puts pressure on the municipality to ensure that water is
supplied accordingly to all residents within its Jurisdiction. The lack of adequate number of reservoirs still
remain a huge challenge for the municipality in ensuring that its residents have water at all times.
Sanitation
Revenues from sanitation services increased on average by 8.5%. The municipality continue to experience
serious challenges with regards to its sanitation network. The network is a clay pipe network and is aged,
while at the same time the municipality is experiencing continuous collapse lines which is very costly to the
municipality to upkeep and maintain. These clay pipes most of the time results in sewer blockages due to
the aging thereof, which also exacerbate the repairs and maintenance costs relating to the sanitation
infrastructure network.
The repairs and maintenance cost for the network are mainly funded from the “basic sanitation charge”
tariff. It has been evident from the past 3 years that this tariff is not adequate to cover the costs of effectively
maintaining the sanitation network. This tariff will experience a higher tariff increase to ensure that
adequate funding is available for the rehabilitation of the sanitation infrastructure network.
REFUSE
Revenues from Solid Waste Management increased on average by 8.1%. The increased tariff is based on
the costs of delivering the respective service. This is a progressive increase in ensuring that the tariffs are
cost reflective, and that the division results in financial sustainability.
242
COMPANY NAME | BUSINESS REPORT
It was also determined by the municipality that one of the contributors to the Solid Waste expenditure
relates to the excessive time spent (which leads to overtime been worked in most cases) collecting refuse
that is kept in containers which does not comply with the required specifications as outlined in the Provincial
Gazette of 13 March 2015,
which defines a “bin” as follows;
“bin - means a standard type of refuse bin with a capacity of 0.1 cubic meters or 85 litres as approved by the
Municipality and which can be supplied by the Municipality. The bin may be constructed of galvanised iron,
rubber or polythene;
bin liner-means a plastic bag approved by the Municipality which is placed inside a bin with a maximum
capacity of 0.1 cubic meters. These bags must be of a dark colour, 950 mm x 750 mm in size, of low density
minimum 40 micrometer diameter or 20 micrometer diameter high density;”
It is against this background that the municipality cannot continue to collect refuse that is not kept in
acceptable containers as indicated above. (it should also be noted that any refuse placed in mealie bags, the
bags will not be returned only the refuse bins will be returned).
OTHER REVENUE
Other revenue component increased on average by 11%. This was as a result of the alignment of the costs
involved in rendering these services, so as to ensure that the municipality does not run these services at a
loss which will ultimately affect the municipality’s going concern.
Other revenue comprises of various items such as income received from building plan fees, connection fees,
rental of properties and advertisement fees. The departments are continuously reviewing the tariffs relating
to these services on an annual basis to ensure they are cost reflective, market related and financially
sustainable. This will also enable the municipality to have sufficient resources to effect the necessary repairs
and maintenance to keep the properties on a good condition.

243
COMPANY NAME | BUSINESS REPORT
Table 17: Summary of revenue classified by municipal votes
Table 18: Operating Transfers and Grant Receipts
Vote Description
R thousandAdjustment Budget
2019/20Budget year 2020/21 Budget year 2021/22 Budget Year 2022/23
Revenue by Vote
Vote 1 - Councillors 149 644 161 591 169 347 177 476
Vote 2 - Office of the municipal manager – – – –
Vote 3 - Corporate Services 863 308 323 339
Vote 4 - Finance 87 272 93 091 97 560 102 243
Vote 5 - Technical Services 624 324 662 138 693 920 727 228
Vote 6 - Community and Emergency Services 54 582 60 543 63 450 66 495
Vote 7 - Local Economic Development and Planning 14 604 11 833 12 401 12 996
Total Revenue by Vote 931 289 989 504 1 037 001 1 086 777
2020/21 MTREF
FS201 Moqhaka - Supporting Table SA18 Transfers and grant receipts
Budget Year 2019/20Budget Year
+2020/21
Budget Year
+2021/22
Budget Year
+2022/23
Adjusted Budget
R thousands
RECEIPTS: 1, 2
Operating Transfers and Grants
National Government: 208 441 224 482 235 257 246 550
Local Government Equitable Share 205 660 222 134 232 796 243 971
LG Seta 566 – – –
Finance Management Grant 2 215 2 348 2 461 2 579
EPWP Incentive 1 000 1 000 1 000 1 000
EPWP Incentive 1 000 1 000 1 000 1 000
District Municipality: – – –
Other grant providers: – – –
Total Operating Transfers and Grants 5 209 441 225 482 236 257 247 550
DESCRIPTION REF

244
COMPANY NAME | BUSINESS REPORT
Table 19: Capital Grants
The revenue and expenditure on the Grants is based on the DORA allocations to the municipality for 2020/21
financial year. No adjustments were made on the Grants Receipt. At Mid-Year the performance of the grants
expenditure was showing positive results to archive 100% spending at year-end.
5.7 Operating Expenditure
Operating expenditure budgeting should be done on a zero-base budget approach. Further best practice
methodologies relating to operating expenditure include infrastructure repairs and maintenance as a
priority; budgeted expenditure to be funded by realistically anticipated cash backed revenues; and,
operational gains and efficiencies to result in operating surpluses to fund capital expenditure from own cash
backed funds. The latter is a great challenge.
The Municipality’s expenditure framework for the 2019/20 budget and MTREF is informed by the following:
The asset renewal strategy and the repairs and maintenance plan;
Balanced budget constraint (operating expenditure should not exceed operating revenue) unless
there are existing uncommitted cash-backed reserves to fund any deficit;
Funding of the budget over the medium-term as informed by Section 18 and 19 of the MFMA;
The capital programme is aligned to the asset renewal strategy and backlog eradication plan;
Operational gains and efficiencies will be directed to funding the capital budget and other core
services; and
FS201 Moqhaka - Supporting Table SA18 Transfers and grant receipts
Budget Year 2019/20Budget Year
+2020/21
Budget Year
+2021/22
Budget Year
+2022/23
Adjusted Budget
R thousands
RECEIPTS: 1, 2
Capital Transfers and Grants
National Government: 55 178 55 178 57 827 60 603
Municipal Infrastructure Grant (MIG) 40 178 40 178 42 107 44 128
Water Services Infrastructure Grant 15 000 15 000 15 720 16 475
EPWP – – – –
DOE – – – –
EPWP Incentive – – – –
District Municipality: – – – –
[insert description]
Other grant providers: – – – –
[insert description]
Total Capital Transfers and Grants 5 55 178 55 178 57 827 60 603
TOTAL RECEIPTS OF TRANSFERS & GRANTS 264 619 280 660 294 084 308 153
DESCRIPTION REF

245
COMPANY NAME | BUSINESS REPORT
Strict adherence to the principle of no project plans no budget. If there is no business plan no funding
allocation can be made.
The following table is a high-level summary of the 2020/21 budget and MTREF (classified per municipal votes):
Table 20: Summary of operating expenditure by municipal votes
The following table is a high-level summary of the 2020/21 budget and MTREF (classified per main type of
operating expenditure)
Table 21: Summary of operating expenditure by standard classification item:

246
COMPANY NAME | BUSINESS REPORT
5.7.1 Analysis of operating expenditure
The operating expenditure for the 2020/21 annual budget is summarised as follows:
Employee related cost 5%
Councillor related cost 4%
Debt impairment 4%
Depreciation & Asset Impairment 8%
General expenditure 8%
Contracted Services 17%
Other Materials 18%
Bulk Purchases 7%
Finance charges -9%
REMARKS
The budgeted allocation for employee related costs for the 2020/21 financial year amounts to R307 million, which equates to 33% of the total operating expenditure. The employee increase percentage is within the threshold as stipulated in the MFMA Circular No. 71.

247
COMPANY NAME | BUSINESS REPORT
The cost associated with the remuneration of councillors is determined by the Minister of Co-operative Governance and Traditional Affairs in accordance with the Remuneration of Public Office Bearers Act, 1998 (Act 20 of 1998). The most recent proclamation in this regard has been taken into account in compiling the respective budget.
The cost associated with the remuneration of the municipality’s senior managers is determined by the Minister of Co-operative Governance and Traditional Affairs in accordance with the Local Government: Upper Limits of Total Remuneration Packages payable to Municipal Managers and Managers directly accountable to Municipal Manager. The most recent proclamation in this regard has been taken into account in compiling the respective budget. Bulk purchases are directly informed by the purchase of electricity from Eskom. The annual price increases as approved by NERSA (National Energy Regulator of South Africa) have been factored at 6.9% into the budget appropriation and directly inform the revenue provisions. The expenditure also incorporates the reticulation losses. The Contracted Services encompasses overall the repairs and maintenance of amongst others; buildings, vehicles, equipment, gardens and traffic and street lights, gardening services, vending costs and security costs. The Other materials mainly relates to stores consumables which is used in the rendering of services to the community at large. This includes; chemicals water and electricity meters, office materials, oil and electricity materials. Provision for depreciation and asset impairment is been faced in over the financial years due to its excessive impact on the revenue tariffs, to provide for the asset renewal as a result of use over the years in line with GRAP 17. Finance charges consist primarily of the repayment of interest on long-term borrowing (cost of capital). The municipality is currently servicing the DBSA loan. The provision of debt impairment was determined based on an annual collection rate of 85%. While this
expenditure is considered to be a non-cash flow item, it informs the total costs associated with rendering
the services of the municipality, as well as the municipality’s realistically anticipated revenues. The debt
impairment provision was also increased taking into account the current outstanding municipal debt.

248
COMPANY NAME | BUSINESS REPORT
5.8 Capital expenditure
The following table provides a breakdown of budgeted capital expenditure by vote:
Table 22: Medium-term capital budget per vote
Vote Description
R thousand
Adjustment
Budget
2019/20
Budget Year
2020/21
Budget Year
2021/22
Budget Year
2022/23
Capital expenditure - Vote
Multi-year expenditure to be appropriated
Vote 1 - Councillors 610 650 681 714
Vote 2 - Office of the municipal manager – – – –
Vote 3 - Corporate Services 11 50 52 55
Vote 4 - Finance 5 10 10 11
Vote 5 - Technical Services 53 014 55 178 57 827 60 602
Vote 6 - Community and Emergency Services 2 483 300 314 329
Vote 7 -LED 200 359 376 394
Capital multi-year expenditure sub-total 56 323 56 547 59 261 62 106
Single-year expenditure to be appropriated
Vote 1 - Councillors 623 35 37 38
Vote 2 - Office of the municipal manager – – – –
Vote 3 - Corporate Services 1 507 2 286 2 396 2 511
Vote 4 - Finance 662 624 654 685
Vote 5 - Technical Services 6 884 1 418 1 486 1 557
Vote 6 - Community and Emergency Services 7 582 10 292 10 786 11 304
Vote 7 -LED 913 845 886 928
Capital single-year expenditure sub-total 18 170 15 500 16 244 17 024
Total Capital Expenditure - Vote 74 494 72 047 75 505 79 130
Capital Expenditure - Functional
Governance and administration 4 439 5 378 5 637 5 907
Executive and council 1 233 685 718 752
Budget and treasury office 3 206 4 693 4 919 5 155
Internal Audit – – – –
Community and public safety 8 322 7 525 7 886 8 265
Community and social services 5 500 6 500 6 812 7 139
Sport and recreation 813 780 817 857
Public safety 2 009 245 257 269
Housing – – – –
Health – – – –
Economic and environmental services 29 023 41 312 43 295 45 373
Planning and development 58 334 350 367
Road transport 28 672 40 678 42 631 44 677
Environmental protection 293 300 314 329
Trading services 32 710 17 832 18 688 19 585
Energy sources – – – –
Water Management 25 464 15 918 16 682 17 483
Waste water management 3 753 – – –
Waste management 3 493 1 914 2 006 2 102
Other –
Total Capital Expenditure - Standard 74 494 72 047 75 506 79 130
Funded by:
National Government 53 169 55 178 57 827 60 602
Provincial Government – – – –
District Municipality – – – –
Internally generated funds 21 325 16 869 17 679 18 527
Total Capital Funding 74 494 72 047 75 505 79 130
2020/21 MTREF
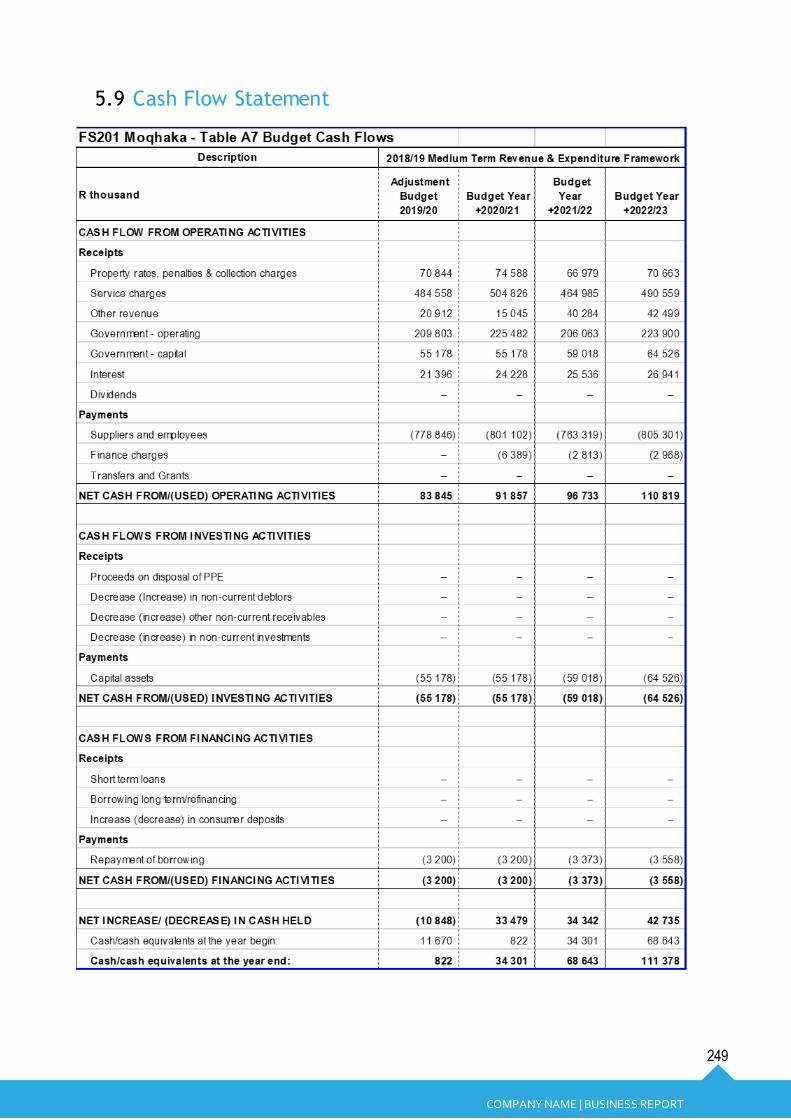
249
COMPANY NAME | BUSINESS REPORT
5.9 Cash Flow Statement
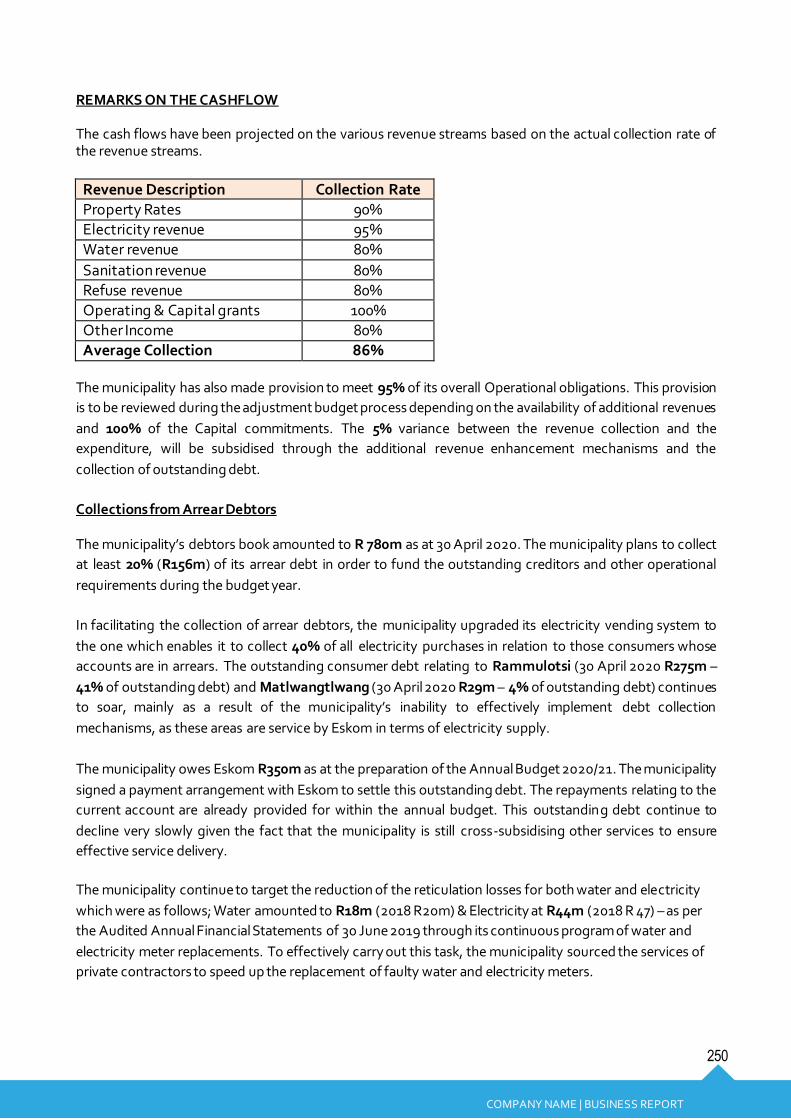
250
COMPANY NAME | BUSINESS REPORT
REMARKS ON THE CASHFLOW
The cash flows have been projected on the various revenue streams based on the actual collection rate of the revenue streams.
Revenue Description Collection Rate
Property Rates 90% Electricity revenue 95%
Water revenue 80%
Sanitation revenue 80%
Refuse revenue 80%
Operating & Capital grants 100% Other Income 80%
Average Collection 86% The municipality has also made provision to meet 95% of its overall Operational obligations. This provision
is to be reviewed during the adjustment budget process depending on the availability of additional revenues
and 100% of the Capital commitments. The 5% variance between the revenue collection and the
expenditure, will be subsidised through the additional revenue enhancement mechanisms and the
collection of outstanding debt.
Collections from Arrear Debtors
The municipality’s debtors book amounted to R 780m as at 30 April 2020. The municipality plans to collect
at least 20% (R156m) of its arrear debt in order to fund the outstanding creditors and other operational
requirements during the budget year.
In facilitating the collection of arrear debtors, the municipality upgraded its electricity vending system to
the one which enables it to collect 40% of all electricity purchases in relation to those consumers whose
accounts are in arrears. The outstanding consumer debt relating to Rammulotsi (30 April 2020 R275m –
41% of outstanding debt) and Matlwangtlwang (30 April 2020 R29m – 4% of outstanding debt) continues
to soar, mainly as a result of the municipality’s inability to effectively implement debt collection
mechanisms, as these areas are service by Eskom in terms of electricity supply.
The municipality owes Eskom R350m as at the preparation of the Annual Budget 2020/21. The municipality
signed a payment arrangement with Eskom to settle this outstanding debt. The repayments relating to the
current account are already provided for within the annual budget. This outstanding debt continue to
decline very slowly given the fact that the municipality is still cross-subsidising other services to ensure
effective service delivery.
The municipality continue to target the reduction of the reticulation losses for both water and electricity
which were as follows; Water amounted to R18m (2018 R20m) & Electricity at R44m (2018 R 47) – as per
the Audited Annual Financial Statements of 30 June 2019 through its continuous program of water and
electricity meter replacements. To effectively carry out this task, the municipality sourced the services of
private contractors to speed up the replacement of faulty water and electricity meters.

251
COMPANY NAME | BUSINESS REPORT
Performance Management
6.1 Introduction
Performance Management refers to the application of activities to ensure that goals in the IDP are
consistently being met in an effective and efficient manner. The overall aim of the Moqhaka Local
Municipality’s (MLM) performance management system is to ensure that the organisation and all its
subsystems are working together in an optimum fashion to achieve desired results. Achieving overall
goals require several continuous activities, including identification and prioritisation of desired results,
establishing means to measure progress towards those results, setting standards for assessing the
achievements of results, tracing and measuring progress towards results, exchange feedback and in
doing so continuously monitor and evaluate progress.
The MLM’s Performance Management Framework, which was approved by Council in November 2015,
is centrally informed by legislation, policy and regulations relevant to performance management in local
government. The contents of relevant documentation provide a framework that local governments should
comply with so as to ensure continuous development that will culminate in the improvement of quality of
lives of local communities. This policy framework needs to be review to give affective reflection on changes
done on the key performance indicators.
The purpose of this Chapter is to reflect on the implementation, monitoring and reporting of the IDP
and SDBIP through the MLM’s Performance Management System.
6.2 IDP and PMS
To comprehend the relationship between IDP review and performance management, the following
quotation from the Performance Management Guide for Municipalities, DPLG, 2001 (draft2, page 16)
becomes relevant:
“The IDP process and the performance management process should appear to be seamlessly integrated.
Integrated development planning fulfils the planning stage of performance management. Performance
management fulfils the implementation management, monitoring and evaluation of the IDP process”.
Although the IDP is a five-year plan, Section 34 of the Municipal Systems Act (2000) states that it has to be
reviewed annually. The IDP has to be handled at the highest level, hence the allocation of the
responsibility to the executive mayor to manage. The executive Mayor may assign responsibilities related
to the development and management of the IDP to the municipal manager. As head of the
administration, the municipal manager in turn is responsible and accountable for the formation of an
efficient and accountable administration to give effect to the IDP.

252
COMPANY NAME | BUSINESS REPORT
The SDBIP is a key management, implementation and monitoring tool, which provides operational
content to the end of-year service delivery targets, set in the budget and IDP. It determines the
performance agreements for the municipal manager and other Section 57 managers, whose
performance can then be monitored through Section 71 monthly reports, and evaluated through the
annual report process.
Municipal Performance Regulations for Municipal Managers and Managers directly accountable to
the Municipal Manager, published in 2006 seek to set out how the performance of municipal managers
will be uniformly directed, monitored and improved. The regulations address both the employment
contract of a municipal manager and the managers directly accountable to the municipal manager
(Section 57 managers). The setting of targets is under investigation to comply with the suggested DPLG
calculator, to present specific scores per target achievement that can advance strategic decision-making,
and to evaluate MLM’s successes against strategic intent.
Good corporate citizenship is therefore seen as the method that municipalities uses to set their priorities
through the performance management system as per the IDP, conduct their business as per the SDBIP
and relate to the community they serve through community input and public participation. The purpose of
the IDP is to ensure that the resources available to the municipality are directed at the delivery of
programmes, projects and processes that meet agreed municipal priority areas.
Once a municipality starts to implement its IDP it is important to monitor that:
The delivery is happening in the planned manner;
The municipality i s using i ts resources most efficiently; and
It i s producing the qual i ty of del ivery envisaged.
6.3 Overview of Performance Management in the Municipality
6.3.1 Policy Framework
In May 2011 the Council adopted a Revised Performance Management Framework regulating the
performance management system in the municipality. The framework provides guidelines on the
development and implementation of the organisational performance management system.

253
COMPANY NAME | BUSINESS REPORT
The objectives of institutionalising a Performance Management System, beyond the fulfilling of legislative
requirements, is to serve as a primary mechanism to monitor, review and improve the implementation of
the municipality’s IDP. In doing so, it should fulfil the following functions:
Figure 14: Functions of a Performance Management System
In doing so it should fulfil the following functions as shown in the picture above
Promoting accountability
Decision-making and resource allocation
Guiding development of municipal capacity-building programmes
Creating a culture for best practice, shared-learning within the municipality
Develop meaningful intervention mechanisms and early warning system
Create pressure for change at various levels
Contribute to the overall development of the Local Government System

254
COMPANY NAME | BUSINESS REPORT
6.3.2 The Municipal Scorecard
A number of performance models are available and any of them could be applied by the Moqhaka Local
Municipality. Some of the available models include the Municipal Scorecard, Balanced Scorecard and the
Key Performance Area Model. However, the Municipality has chosen the Municipal Scorecard (MS) as its
preferred performance management model. In terms of the MS model all indicators are grouped together
into four perspectives as depicted in the figure below e.g. inputs, process, outputs and outcomes.
A Municipal Scorecard Model is a balanced scorecard adapted for measuring key performance on
developmental areas that are relevant to municipal service delivery and the public sector. This municipal
scorecard model groups indicators together under the 5 Year Local Government Strategic Agenda Key
Performance Areas (KPA’s). There are five KPA’s that municipalities are required to align their strategic
planning on and these cut across every functional area of a municipality. The municipal scorecard measures
a municipality’s performance through grouping the municipal indicators under these perspectives:
The Municipal Development Perspective
The Service Delivery Perspective
The Institutional Development Perspective
The Financial Management Perspective
Governance Process Perspective

255
COMPANY NAME | BUSINESS REPORT
Figure 15: Municipal Scorecard

256
COMPANY NAME | BUSINESS REPORT
6.3.3 Planning, Monitoring, Reporting and Review of Performance
The annual process of managing performance at institutional level in the Municipality involves the steps as set out in the
diagram below:
Figure 16: Performance Management cycle
6.3.4 Performance Planning
The performance of the Municipality is to be managed in terms of its IDP and the process of compiling an
IDP and the annual review thereof therefore constitutes the process of planning for performance. It should
be noted that the last component of the cycle is that of performance review and the outcome of such a
review process must inform the next cycle of IDP compilation/review by focusing the planning processes on
those areas in which the Municipality has under-performed.

257
COMPANY NAME | BUSINESS REPORT
The IDP process constitutes the process of planning for performance. It is crucial that for all the priorities in
the IDP, objectives, indicators and targets are developed.
6.3.5 Performance monitoring
Performance monitoring is an ongoing process by which a Director/Manager accountable for a specific
indicator as set out in the institutional scorecard (or a service delivery target contained in an annual SDBIP)
continuously monitors current performance against targets set. The aim of the monitoring process is to take
appropriate and immediate interim (or preliminary) action where the indication is that a target is not going
to be met by the time that the formal process of performance measurement, analysis, reporting and review
is due.
In the instance of the MLM it is recommended that the institutional scorecard of the Municipality be
reported on a quarterly basis to the Mayoral Committee. Performance monitoring requires that in between
the relevant formal cycle of performance measurement appropriate action be taken, should it become
evident that a specific performance target is not going to be met. It is therefore proposed that at least on a
weekly/bi-weekly basis Directors track performance trends against targets for those indicators that fall
within the area of accountability of their respective Departments as a means to early identify performance
related problems and take appropriate remedial action.
6.3.6 Performance Measurement
Performance measurement refers to the formal process of collecting and capturing performance data to
enable reporting to take place for each key performance indicator and against the target set for such
indicator. Given the fact that initially at least the Municipality will have to rely on a manual process to
manage its performance provision has been made in the institutional scorecard for the name of an official
responsible for reporting on each indicator (please note that this might not necessarily be the same official
accountable for performance on an indicator).
This will require that the Municipality sets in place a proper information management system (electronically
or otherwise) so that the internal audit section is able to access information regularly and to verify its
correctness.
6.3.7 Performance Analysis
Performance analysis involves the process of making sense of measurements. It requires interpretation of
the measurements as conducted in terms of the previous step to determine whether targets have been met
and exceeded and to project whether future targets will be met or not. Where targets have not been met
performance analysis requires that the reasons therefore should be examined and corrective action
recommended. Where targets have been met or exceeded, the key factors that resulted in such success
should be documented and shared so as to ensure organisational learning.
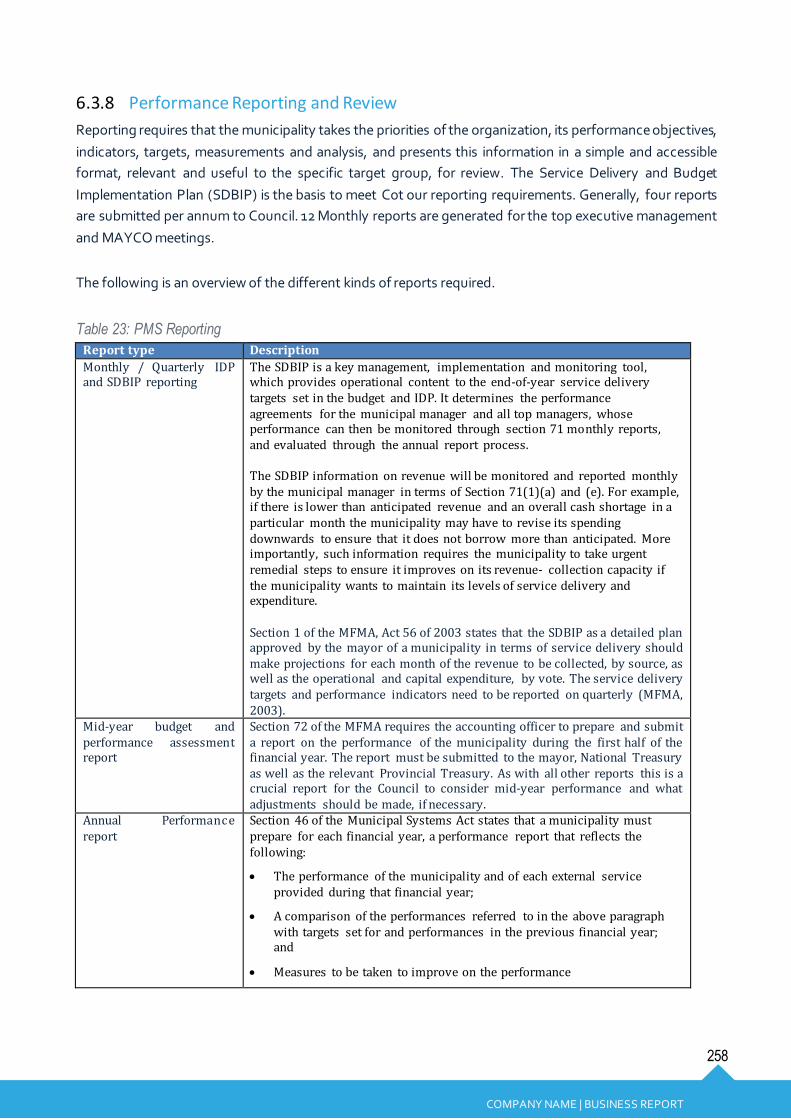
258
COMPANY NAME | BUSINESS REPORT
6.3.8 Performance Reporting and Review
Reporting requires that the municipality takes the priorities of the organization, its performance objectives,
indicators, targets, measurements and analysis, and presents this information in a simple and accessible
format, relevant and useful to the specific target group, for review. The Service Delivery and Budget
Implementation Plan (SDBIP) is the basis to meet Cot our reporting requirements. Generally, four reports
are submitted per annum to Council. 12 Monthly reports are generated for the top executive management
and MAYCO meetings.
The following is an overview of the different kinds of reports required.
Table 23: PMS Reporting
Report type Description
Monthly / Quarterly IDP and SDBIP reporting
The SDBIP is a key management, implementation and monitoring tool, which provides operational content to the end-of-year service delivery targets set in the budget and IDP. It determines the performance agreements for the municipal manager and all top managers, whose performance can then be monitored through section 71 monthly reports, and evaluated through the annual report process. The SDBIP information on revenue will be monitored and reported monthly by the municipal manager in terms of Section 71(1)(a) and (e). For example, if there is lower than anticipated revenue and an overall cash shortage in a particular month the municipality may have to revise its spending downwards to ensure that it does not borrow more than anticipated. More importantly, such information requires the municipality to take urgent remedial steps to ensure it improves on its revenue- collection capacity if the municipality wants to maintain its levels of service delivery and expenditure. Section 1 of the MFMA, Act 56 of 2003 states that the SDBIP as a detailed plan approved by the mayor of a municipality in terms of service delivery should make projections for each month of the revenue to be collected, by source, as well as the operational and capital expenditure, by vote. The service delivery targets and performance indicators need to be reported on quarterly (MFMA, 2003).
Mid-year budget and performance assessment report
Section 72 of the MFMA requires the accounting officer to prepare and submit a report on the performance of the municipality during the first half of the financial year. The report must be submitted to the mayor, National Treasury as well as the relevant Provincial Treasury. As with all other reports this is a crucial report for the Council to consider mid-year performance and what adjustments should be made, if necessary.
Annual Performance report
Section 46 of the Municipal Systems Act states that a municipality must prepare for each financial year, a performance report that reflects the following:
The performance of the municipality and of each external service provided during that financial year;
A comparison of the performances referred to in the above paragraph with targets set for and performances in the previous financial year; and
Measures to be taken to improve on the performance

259
COMPANY NAME | BUSINESS REPORT
Report type Description
The performance report must be submitted at the end of the financial year and will be made public as part of the annual report in terms of chapter 12 of the MFMA. The publication thereof will also afford the public the opportunity to judge the performance of the municipality against the targets set in the various planning instruments.
Annual report Every municipality and every municipal entity under the municipality’s control is required by Section 121 to prepare an annual report for each financial year, which must include:
the annual financial statements of the municipality or municipal entity as submitted to the Auditor-General for audit (and, if applicable, consolidated annual financial statements);
the Auditor-General’s audit report on the financial statements;
an assessment by the accounting officer of any arrears on municipal taxes and service charges;
particulars of any corrective action taken or to be taken in response to issues raised in the audit reports;
any explanations that may be necessary to clarify issues in connection with the financial statements;
any information as determined by the municipality, or, in the case of a municipal entity, the entity or its parent municipality;
any recommendations of the municipality’s audit committee, or, in the case of a municipal entity, the audit committee of the entity or of its parent municipality;
an assessment by the accounting officer of the municipality’s performance against the measurable performance objectives for revenue collection and for each vote in the municipality’s approved budget for the relevant financial year;
an assessment by the accounting officer of the municipality’s performance against any measurable performance objectives set in terms the service delivery agreement or other agreement between the entity and its parent municipality;
the annual performance report prepared by a municipality; and
any other information as may be prescribed.
Section 127 prescribes the submission and tabling of annual reports. In terms of this section:
The accounting officer of a municipal entity must, within six months after the end of a financial year, submit the entity’s annual report for that financial year to the municipal manager of its parent municipality.
The mayor of a municipality must, within seven months after the end of a financial year, table in the municipal council the annual report of the municipality and of any municipal entity under the municipality’s sole or shared control.
If the mayor, for whatever reason, is unable to table in the council the annual report of the municipality, or the annual report of any municipal entity under the municipality’s sole or shared control, within seven months after the end of the financial year to which the report relates, the mayor must:

260
COMPANY NAME | BUSINESS REPORT
Report type Description
submit to the council a written explanation setting out the reasons for the delay, together with any components of the annual report that are ready; and
Submit to the council the outstanding annual report or the outstanding components of the annual report as soon as may be possible.
6.4 Conclusion
Performance management is a process which permeates right through the organisation, from its vision and
mission statement, to its objectives and eventually its staff. It applies to the performance of an organisation
as well as to all persons related to it.
As indicated earlier, the White Paper on Local Government (1997) states that key mechanisms to ensuring
service excellence in municipalities include integrated development planning, performance management
and community participation. As a start there are certain measures that a municipality simply must
implement.
It must:
Establish a performance management system that is commensurate with its resources, best suited to its circumstances and in line with its targets, priorities and objectives contained in its IDP.
Promote a culture of performance management among its political structures, political office -bearers, councillors and administration.
Administer its affairs in an economical, effective, efficient and accountable manner (Municipal Systems Act, 2000).
Appropriate Key Performance Indicators must be established to serve as a yardstick for measuring individual and organisational performance. These key performance indicators should include outcomes and the impact of a performance area with regards to a municipality’s development priorities and objectives as set out in its IDP.

261
Projects and Programmes
7.1 Introduction
The following projects and programmes were identified by each of the directorates for the term of the IDP. The current projects that are in progress are
listed in the table below.
Table 24: Projects
MIG Reference Nr Project Description Project Value Status (Not registered, Registered, Design &
Tender, Construction, Completed,
Retention)
Planned MIG Expenditure for 2020/2021
Planned MIG Expenditure for 2021/2022
Planned MIG Expenditure for 2022/2023
Ward
PMU PMU 2 115 050,00 2 115 050,00 2 267 800,00
MIG/FS1024/SW/14/15 Rammulotsi: Development and fencing of new landfil l site - phase 2 (MIS:215370)
11 858 594,00 Construction 7 397 097,60 3 500 000,00 -
23
MIG/FS1146/CF/18/19 Maokeng/Nyakallong: Upgrading of Community and Sports Facility
(MIS:249771)
4 220 464,00 Retention -
-
8
MIG/FS1174/W/17/19 Maokeng: Installation of Water Meters
2 600 000,00 Completed -
8
MIG/FS1218/R,ST/18/20 Brentpark: Construction of
0.96km paved road and storm water channel to Brentpark Stadium (MIS:269933)
8 102 435,00 Completed
-
-
13
MIG/FS1222/R,ST/18/20 Matlwangtlwang: Construction of 0.62km brick Paved road with
V-Channels storm water
4 852 588,00 Completed -
2

262
MIG Reference Nr Project Description Project Value Status (Not
registered, Registered, Design & Tender,
Construction, Completed, Retention)
Planned MIG
Expenditure for 2020/2021
Planned MIG
Expenditure for 2021/2022
Planned MIG
Expenditure for 2022/2023
Ward
drainage (1800-1722)(MIS:270047)
MIG/FS1223/R,ST/18/20 Seisoville: Construction of
0.750km paved road and storm water drainage at Ntanga street (MIS:272675)
8 200 000,00 Completed
-
-
15
MIG/FS1267/SW/19/21 Maokeng (Koekoe Village): Upgrading of 0.93km Storm
Water System and Channeling of Vlei Areas – Phase 2 (MIS:293760)
9 894 522,49 Construction 5 073 448,94 -
5
MIG/FS1268/R,ST/19/21 Maokeng: Upgrading of paved road 28331 – 28348 (0.56km)
with storm water channels (MIS:290782)
9 522 377,20 Retention -
-
10
MIG/FS1308/W/19/20 Brentpark/Seisoville: Construction of water reticulation network for 265
erven - Phase 1 (MIS:328264)
5 050 594,30 Retention -
-
4
MIG/FS1309/S/19/21 Brentpark/Seisoville: Construction of sewer reticulation network for 265 erven - Phase 1 (MIS:293762)
7 588 965,62 Retention -
-
4
MIG/FS1317/W/19/22 Northleigh: Construction of
Pressure Tower – Phase 1 (MIS:295530)
9 359 735,61 Retention
-
-
23
MIG/FS1339/R,ST/19/21 Maokeng: Construction of 0.8km paved road from 16084 – 15680 with V-drain storm water in
Koekoe Village (MIS:338384)
4 224 283,21 Construction 4 224 283,21 -
-
4

263
MIG Reference Nr Project Description Project Value Status (Not
registered, Registered, Design & Tender,
Construction, Completed, Retention)
Planned MIG
Expenditure for 2020/2021
Planned MIG
Expenditure for 2021/2022
Planned MIG
Expenditure for 2022/2023
Ward
MIG/FS1340/R,ST/19/22 Maokeng: Construction of 0.7km paved road from 13040 – 13956 with V-drain storm water in Koekoe Village (MIS:338399)
6 553 737,19 Construction 3 238 079,15 3 315 658,04 5
MIG/FS1341/R,ST/19/21 Maokeng: Construction of
0.55km paved road from 10673 – 10857 with V-drain storm water in Koekoe Village (MIS:338427)
5 260 330,00 Construction 5 260 330,00
-
6
MIG/FS1342/R,ST/19/21 Rammulotsi: Construction of 0.61km paved road from 2325 –
2330 with V-drain storm water (MIS:338432)
4 539 059,55 Construction 4 539 059,55 -
18
MIG/FS1343/R,ST/19/21 Rammulotsi: Construction of 0.83km paved road from 4274 – 4218 and 0.33km from 4756 –
4902 with V-drain storm water (MIS:338433)
5 221 920,00 Design and Tender
4 077 693,45 1 144 226,55 -
19,20
MIG/FS1344/R,ST/19/22 Rammulotsi: Construction of 0.55km paved road from 7058 –
1867 with V-drain storm water (MIS:338480)
4 105 942,75 Construction 4 105 942,75 -
21
MIG/FS1348/CF/20/22 Upgrading of Phomolong Sports Facility
1 543 047,00 Registered 693 047,00 -
-
9
Gelukwaarts: Upgrading of
2,5km sewer pipe line
11 564 564,51 Not
Registered
605 337,65 10 959 226,89
-
7, 14
Seisoville: Upgrading of sports stadium
3 250 000,00 Not Registered
1 200 000,00 2 050 000,00 -
11
Maokeng (Phomolong): Construction of paved road (,520) with storm water drainage
8 250 000,00 Not Registered
-
6 230 511,44 2 019 488,56 9

264
MIG Reference Nr Project Description Project Value Status (Not
registered, Registered, Design & Tender,
Construction, Completed, Retention)
Planned MIG
Expenditure for 2020/2021
Planned MIG
Expenditure for 2021/2022
Planned MIG
Expenditure for 2022/2023
Ward
Matlwangtlwang: Construction of water reticulation network for 220 erven
6 150 000,00 Not Registered
-
3 888 625,00 2 261 375,00 2
Constantia:: Construction of water reticulation network for
200 erven
4 800 000,00 Not Registered
-
2 596 000,00 2 204 000,00 8-9
Matlwangtlwang: Construction of sewer reticulation network for 220 erven
8 150 000,00 Not Registered
-
3 666 431,49 4 483 568,51 2
Constantia:: Construction of sewer reticulation network for
200 erven
6 838 550,00 Not Registered
-
5 737 520,59 1 101 029,41 8-9
-
-
-
Total 163 816 760,43 42 529 369,30 45 356 000,00 12 069 461,48
42 301 000,00 45 356 000,00 -

265
VILJOENSKROON & RAMMULOTSI
ROAD SECTION ID KM RATING RECOMMENDATION ESTIMATED AMOUNT
FS20101385 0,117 POOR HEAVY REHABILITATION R 585 000,00
FS20101395 0,242 POOR HEAVY REHABILITATION R 1 210 000,00
FS20101397 0,229 POOR HEAVY REHABILITATION R 1 145 000,00
FS20101779 0,065 POOR HEAVY REHABILITATION R 325 000,00
FS20101828 0,346 POOR HEAVY REHABILITATION R 1 730 000,00
FS20101829 0,334 POOR HEAVY REHABILITATION R 1 670 000,00
FS20101830 0,281 VERY POOR HEAVY REHABILITATION R 1 405 000,00
FS20101831 0,144 POOR HEAVY REHABILITATION R 720 000,00
FS20101836 0,229 POOR HEAVY REHABILITATION R 1 145 000,00

266
FS20101837 0,143 VERY POOR HEAVY REHABILITATION R 715 000,00
FS20101838 0,138 VERY POOR HEAVY REHABILITATION R 690 000,00
FS20101839 0,151 VERY POOR HEAVY REHABILITATION R 755 000,00
FS20102123 0,124 POOR HEAVY REHABILITATION R 620 000,00
FS20102124 0,127 POOR HEAVY REHABILITATION R 635 000,00
FS20101378 0,179 VERY POOR HEAVY REHABILITATION R 895 000,00
FS20101761 0,305 VERY POOR HEAVY REHABILITATION R 1 525 000,00
FS20101762 0,647 VERY POOR HEAVY REHABILITATION R 3 235 000,00
FS20101763 0,707 VERY POOR HEAVY REHABILITATION R 3 535 000,00
FS20101764 0,508 VERY POOR HEAVY REHABILITATION R 2 540 000,00
FS20101765 0,553 VERY POOR HEAVY REHABILITATION R 2 765 000,00

267
FS20101766 0,242 VERY POOR HEAVY REHABILITATION R 1 210 000,00
TOTAL R 29 055 000,00
ROAD SECTION ID KM RATING RECOMMENDATION ESTIMATED AMOUNT
FS20101792 0,064 VERY GOOD LIGHT MAINTENANCE R 6 400,00
TOTAL R 6 400,00
ROAD SECTION ID KM RATING RECOMMENDATION ESTIMATED AMOUNT
FS20101575 0,117 FAIR LIGHT REHABILITATION R 222 300,00

268
FS20101601 0,096 FAIR LIGHT REHABILITATION R 182 400,00
FS20101602 0,114 FAIR LIGHT REHABILITATION R 216 600,00
FS20101603 0,307 FAIR LIGHT REHABILITATION R 583 300,00
FS20101605 0,076 FAIR LIGHT REHABILITATION R 144 400,00
FS20101606 0,352 FAIR LIGHT REHABILITATION R 668 800,00
FS20101607 0,464 FAIR LIGHT REHABILITATION R 881 600,00
FS20101777 0,068 FAIR LIGHT REHABILITATION R 129 200,00
FS20101778 0,071 FAIR LIGHT REHABILITATION R 134 900,00
FS20101780 0,064 FAIR LIGHT REHABILITATION R 121 600,00
FS20101827 0,215 FAIR LIGHT REHABILITATION R 408 500,00
FS20101840 0,123 FAIR LIGHT REHABILITATION R 233 700,00
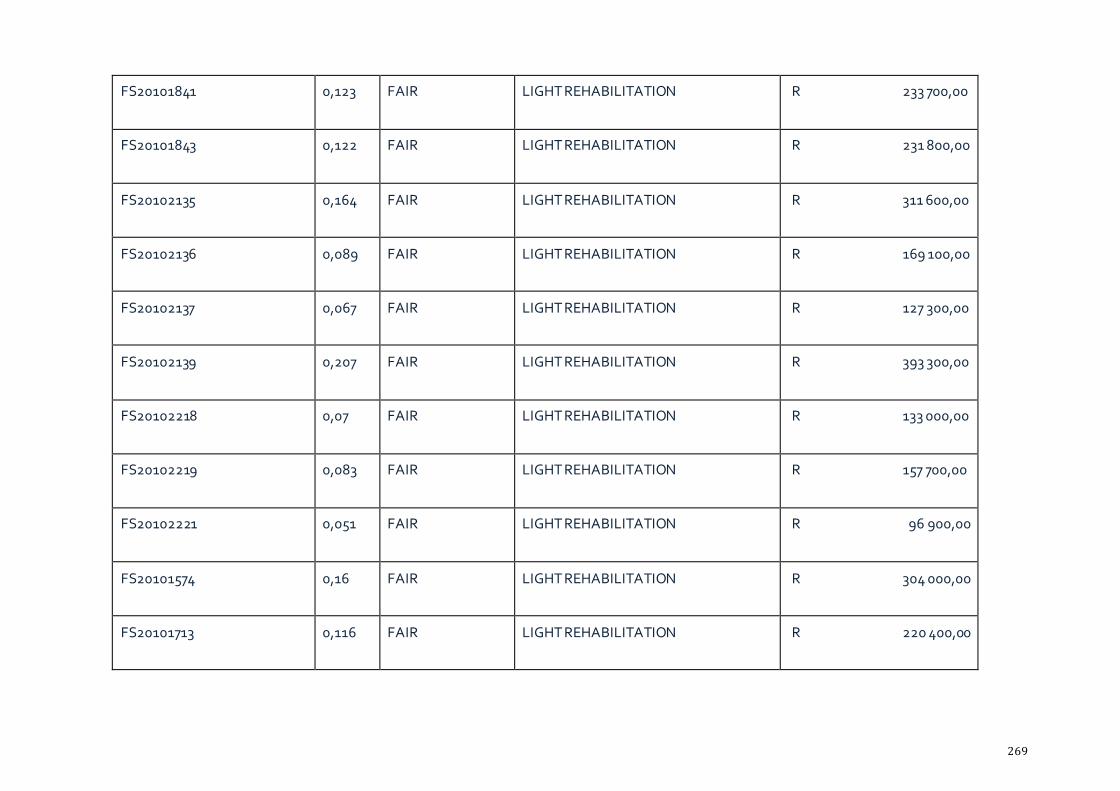
269
FS20101841 0,123 FAIR LIGHT REHABILITATION R 233 700,00
FS20101843 0,122 FAIR LIGHT REHABILITATION R 231 800,00
FS20102135 0,164 FAIR LIGHT REHABILITATION R 311 600,00
FS20102136 0,089 FAIR LIGHT REHABILITATION R 169 100,00
FS20102137 0,067 FAIR LIGHT REHABILITATION R 127 300,00
FS20102139 0,207 FAIR LIGHT REHABILITATION R 393 300,00
FS20102218 0,07 FAIR LIGHT REHABILITATION R 133 000,00
FS20102219 0,083 FAIR LIGHT REHABILITATION R 157 700,00
FS20102221 0,051 FAIR LIGHT REHABILITATION R 96 900,00
FS20101574 0,16 FAIR LIGHT REHABILITATION R 304 000,00
FS20101713 0,116 FAIR LIGHT REHABILITATION R 220 400,00

270
FS20101948 0,151 FAIR LIGHT REHABILITATION R 286 900,00
FS20102178 0,156 FAIR LIGHT REHABILITATION R 296 400,00
FS20102238 0,147 FAIR LIGHT REHABILITATION R 279 300,00
TOTAL R 7 168 700,00
ROAD SECTION ID KM RATING RECOMMENDATION ESTIMATED AMOUNT
FS20101552 0,045 GOOD MAINTENANCE R 22 950,00
FS20101576 0,154 GOOD MAINTENANCE R 78 540,00
FS20101577 0,173 GOOD MAINTENANCE R 88 230,00

271
FS20101578 0,429 GOOD MAINTENANCE R 218 790,00
FS20101579 0,204 VERY GOOD MAINTENANCE R 104 040,00
FS20101580 0,05 VERY GOOD MAINTENANCE R 25 500,00
FS20101588 0,266 GOOD MAINTENANCE R 135 660,00
FS20101593 0,051 GOOD MAINTENANCE R 26 010,00
FS20101597 0,046 GOOD MAINTENANCE R 23 460,00
FS20101599 0,109 GOOD MAINTENANCE R 55 590,00
FS20101604 0,178 GOOD MAINTENANCE R 90 780,00
FS20101793 0,1 GOOD MAINTENANCE R 51 000,00
FS20101794 0,052 GOOD MAINTENANCE R 26 520,00
FS20101861 0,336 VERY GOOD MAINTENANCE R 171 360,00

272
FS20101868 0,059 GOOD MAINTENANCE R 30 090,00
FS20101869 0,086 GOOD MAINTENANCE R 43 860,00
FS20101870 0,11 GOOD MAINTENANCE R 56 100,00
FS20101887 0,053 VERY GOOD MAINTENANCE R 27 030,00
FS20101888 0,195 VERY GOOD MAINTENANCE R 99 450,00
FS20101889 0,128 GOOD MAINTENANCE R 65 280,00
FS20101891 0,233 GOOD MAINTENANCE R 118 830,00
FS20102138 0,092 GOOD MAINTENANCE R 46 920,00
FS20102207 0,085 GOOD MAINTENANCE R 43 350,00
FS20102208 0,075 GOOD MAINTENANCE R 38 250,00
FS20102209 0,091 GOOD MAINTENANCE R 46 410,00

273
FS20102220 0,09 GOOD MAINTENANCE R 45 900,00
FS20102222 0,061 VERY GOOD MAINTENANCE R 31 110,00
FS20102223 0,066 GOOD MAINTENANCE R 33 660,00
FS20102230 0,228 GOOD MAINTENANCE R 116 280,00
FS20103878 0,174 GOOD MAINTENANCE R 88 740,00
FS20101946 0,084 GOOD MAINTENANCE R 42 840,00
FS20101947 0,137 GOOD MAINTENANCE R 69 870,00
FS20102206 0,149 GOOD MAINTENANCE R 75 990,00
FS20101542 0,107 GOOD MAINTENANCE R 54 570,00
FS20101570 0,05 FAIR MAINTENANCE R 25 500,00
FS20101571 0,363 FAIR MAINTENANCE R 185 130,00
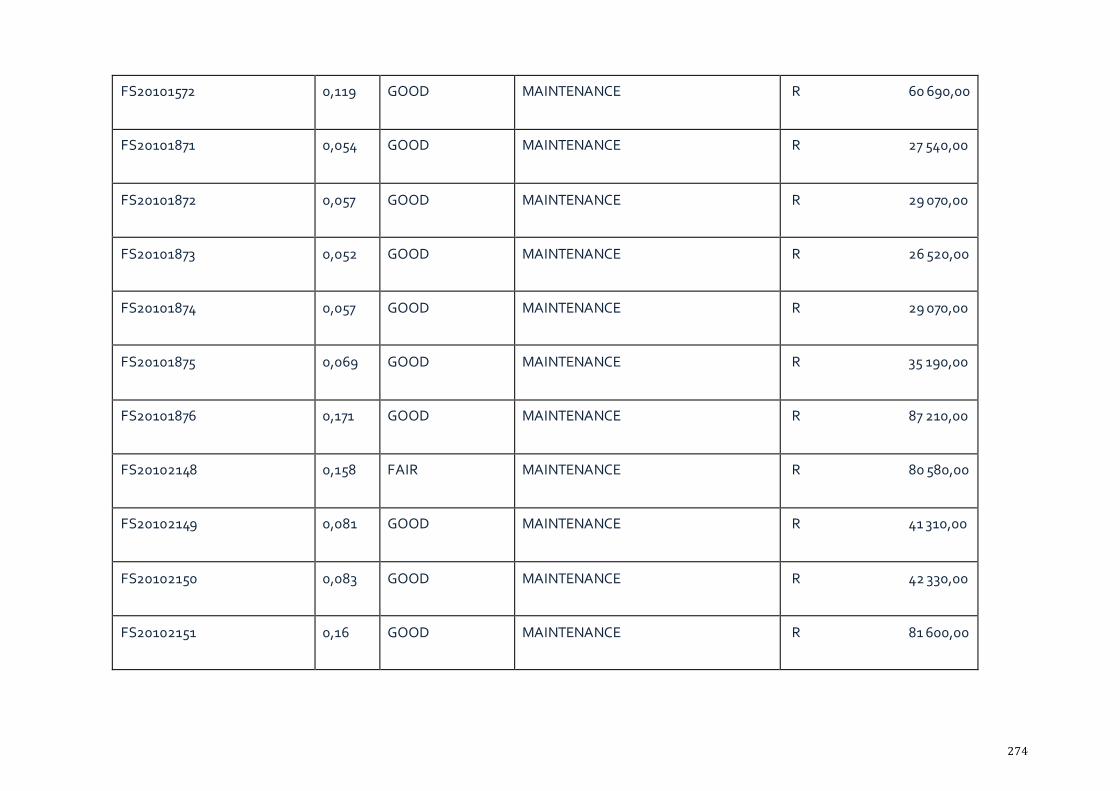
274
FS20101572 0,119 GOOD MAINTENANCE R 60 690,00
FS20101871 0,054 GOOD MAINTENANCE R 27 540,00
FS20101872 0,057 GOOD MAINTENANCE R 29 070,00
FS20101873 0,052 GOOD MAINTENANCE R 26 520,00
FS20101874 0,057 GOOD MAINTENANCE R 29 070,00
FS20101875 0,069 GOOD MAINTENANCE R 35 190,00
FS20101876 0,171 GOOD MAINTENANCE R 87 210,00
FS20102148 0,158 FAIR MAINTENANCE R 80 580,00
FS20102149 0,081 GOOD MAINTENANCE R 41 310,00
FS20102150 0,083 GOOD MAINTENANCE R 42 330,00
FS20102151 0,16 GOOD MAINTENANCE R 81 600,00

275
FS20102187 0,072 GOOD MAINTENANCE R 36 720,00
FS20102188 0,148 GOOD MAINTENANCE R 75 480,00
FS20102189 0,071 GOOD MAINTENANCE R 36 210,00
FS20102325 0,68 GOOD MAINTENANCE R 346 800,00
FS20101553 0,152 GOOD MAINTENANCE R 77 520,00
FS20101608 0,412 GOOD MAINTENANCE R 210 120,00
FS20101686 0,063 GOOD MAINTENANCE R 32 130,00
FS20101881 0,093 GOOD MAINTENANCE R 47 430,00
FS20101882 0,65 GOOD MAINTENANCE R 331 500,00
FS20101883 0,052 GOOD MAINTENANCE R 26 520,00
FS20101884 0,046 GOOD MAINTENANCE R 23 460,00

276
FS20101885 0,151 GOOD MAINTENANCE R 77 010,00
FS20102258 0,152 GOOD MAINTENANCE R 77 520,00
FS20102259 0,053 GOOD MAINTENANCE R 27 030,00
FS20102301 0,174 GOOD MAINTENANCE R 88 740,00
FS20102302 0,12 GOOD MAINTENANCE R 61 200,00
FS20102303 0,217 GOOD MAINTENANCE R 110 670,00
FS20101542 0,107 GOOD MAINTENANCE R 54 570,00
FS20101570 0,05 FAIR MAINTENANCE R 25 500,00
FS20101571 0,363 FAIR MAINTENANCE R 185 130,00
FS20101572 0,119 GOOD MAINTENANCE R 60 690,00
FS20101871 0,054 GOOD MAINTENANCE R 27 540,00

277
FS20101872 0,057 GOOD MAINTENANCE R 29 070,00
FS20101873 0,052 GOOD MAINTENANCE R 26 520,00
FS20101874 0,057 GOOD MAINTENANCE R 29 070,00
FS20101875 0,069 GOOD MAINTENANCE R 35 190,00
FS20101876 0,171 GOOD MAINTENANCE R 87 210,00
FS20102148 0,158 FAIR MAINTENANCE R 80 580,00
FS20102149 0,081 GOOD MAINTENANCE R 41 310,00
FS20102150 0,083 GOOD MAINTENANCE R 42 330,00
FS20102151 0,106 GOOD MAINTENANCE R 54 060,00
FS20102187 0,072 GOOD MAINTENANCE R 36 720,00
FS20102188 0,148 GOOD MAINTENANCE R 75 480,00

278
FS20102189 0,071 GOOD MAINTENANCE R 36 210,00
FS20102325 0,68 GOOD MAINTENANCE R 346 800,00
FS20101553 0,152 GOOD MAINTENANCE R 77 520,00
FS20101608 0,412 GOOD MAINTENANCE R 210 120,00
FS20101686 0,063 GOOD MAINTENANCE R 32 130,00
FS20101881 0,093 GOOD MAINTENANCE R 47 430,00
FS20101882 0,065 GOOD MAINTENANCE R 33 150,00
FS20101883 0,052 GOOD MAINTENANCE R 26 520,00
FS20101884 0,046 GOOD MAINTENANCE R 23 460,00
FS20101885 0,151 GOOD MAINTENANCE R 77 010,00
FS20102258 0,152 GOOD MAINTENANCE R 77 520,00

279
FS20102259 0,053 GOOD MAINTENANCE R 27 030,00
FS20102301 0,17 GOOD MAINTENANCE R 86 700,00
FS20102302 0,12 GOOD MAINTENANCE R 61 200,00
FS20102303 0,217 GOOD MAINTENANCE R 110 670,00
TOTAL R 6 895 200,00
ROAD SECTION ID KM RATING RECOMMENDATION ESTIMATED AMOUNT
FS20101451 0,381 VERY GOOD NO ACTION REQUIRED R -
FS20101452 0,162 VERY GOOD NO ACTION REQUIRED R -
FS20101720 0,361 VERY GOOD NO ACTION REQUIRED R -
FS20101723 0,494 VERY GOOD NO ACTION REQUIRED R -
FS20102299 0,044 VERY GOOD NO ACTION REQUIRED R -

280
FS20102300 0,058 VERY GOOD NO ACTION REQUIRED R -
FS20102304 0,435 VERY GOOD NO ACTION REQUIRED R -
FS20101451 0,381 VERY GOOD NO ACTION REQUIRED R -
FS20101452 0,162 VERY GOOD NO ACTION REQUIRED R -
FS20101720 0,361 VERY GOOD NO ACTION REQUIRED R -
FS20101723 0,494 VERY GOOD NO ACTION REQUIRED R -
FS20102299 0,044 VERY GOOD NO ACTION REQUIRED R -
FS20102300 0,058 VERY GOOD NO ACTION REQUIRED R -
FS20102304 0,435 VERY GOOD NO ACTION REQUIRED R -
TOTAL R -
ROAD SECTION ID KM RATING RECOMMENDATION ESTIMATED AMOUNT
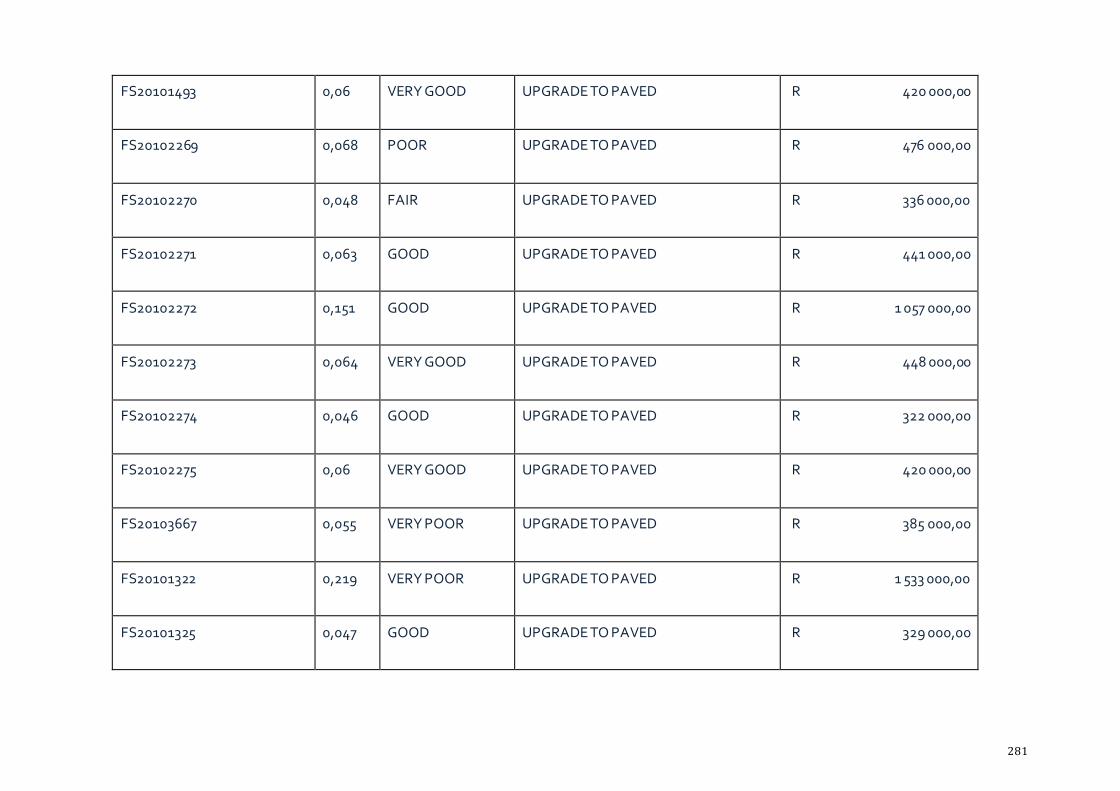
281
FS20101493 0,06 VERY GOOD UPGRADE TO PAVED R 420 000,00
FS20102269 0,068 POOR UPGRADE TO PAVED R 476 000,00
FS20102270 0,048 FAIR UPGRADE TO PAVED R 336 000,00
FS20102271 0,063 GOOD UPGRADE TO PAVED R 441 000,00
FS20102272 0,151 GOOD UPGRADE TO PAVED R 1 057 000,00
FS20102273 0,064 VERY GOOD UPGRADE TO PAVED R 448 000,00
FS20102274 0,046 GOOD UPGRADE TO PAVED R 322 000,00
FS20102275 0,06 VERY GOOD UPGRADE TO PAVED R 420 000,00
FS20103667 0,055 VERY POOR UPGRADE TO PAVED R 385 000,00
FS20101322 0,219 VERY POOR UPGRADE TO PAVED R 1 533 000,00
FS20101325 0,047 GOOD UPGRADE TO PAVED R 329 000,00

282
FS20101326 0,052 POOR UPGRADE TO PAVED R 364 000,00
FS20101348 0,065 GOOD UPGRADE TO PAVED R 455 000,00
FS20101724 0,426 VERY POOR UPGRADE TO PAVED R 2 982 000,00
FS20101801 0,129 GOOD UPGRADE TO PAVED R 903 000,00
FS20101917 0,11 VERY POOR UPGRADE TO PAVED R 770 000,00
FS20101930 0,042 FAIR UPGRADE TO PAVED R 294 000,00
FS20101931 0,098 GOOD UPGRADE TO PAVED R 686 000,00
FS20101932 0,118 FAIR UPGRADE TO PAVED R 826 000,00
FS20101933 0,217 VERY GOOD UPGRADE TO PAVED R 1 519 000,00
FS20101934 0,063 FAIR UPGRADE TO PAVED R 441 000,00
FS20101936 0,078 GOOD UPGRADE TO PAVED R 546 000,00

283
FS20101937 0,037 GOOD UPGRADE TO PAVED R 259 000,00
FS20101938 0,06 FAIR UPGRADE TO PAVED R 420 000,00
FS20103668 0,091 VERY POOR UPGRADE TO PAVED R 637 000,00
TOTAL R 17 269 000,00

284
7.2 Corporate Services
Table 25: Capital Expenditure: ICT
Nr: Project Name Project Description Implementation Date
Cost Comments
1 Backup Tape/Tape Drive Solution
This is a solution for the backup of the IT
infrastructure at head office. The current solution is no longer
adequate for the size of our data farm.
Dec 2020 R1.2M This project has a bearing on the Audit
Report. This finding is a repeat finding for the past 3-4 years.
2 Procurement and deployment of New Server Equipment
(Primary and Replication Servers – HQ)
This is procurement of servers to replace the Blade Server
Environment that crashed in 2018. The current services are running on the device
earmarked for the disaster recovery site.
Dec 2020 R2M This project has a bearing on the Audit Report. This finding is
a repeat finding for the past 3-4 years. This project was pushed back due to
insufficient funds/budget allocation.
3 Disaster Recovery Site Implementation
The disaster recover plan has been
approved, and now needs to be implemented. This
project is the actual building of the server room similar to the one in Kroonstad.
Dec 2020 R800k This project has a bearing on the Audit
Report. This finding is a repeat finding for the past 3-4 years.
This project was pushed back, as this could only be realised when we had a
reliable network between Kroonstad and Viljoenskroon.
7.3 Community and Social Services
The capital projects for the directorate are shown in the tables below.
7.3.1 Solid Waste Management
PROJECT ESTIMATED COST IN RANDS
Rebuilding and building of offices at the landfill sites 2 712 000
Building of ablution facilities at the landfill sites 500 000
Development of the Viljoenskroon landfill site 30 000 000
Procurement of the yellow fleet at the landfill sites 24 660 000
TOTAL 57 872 000
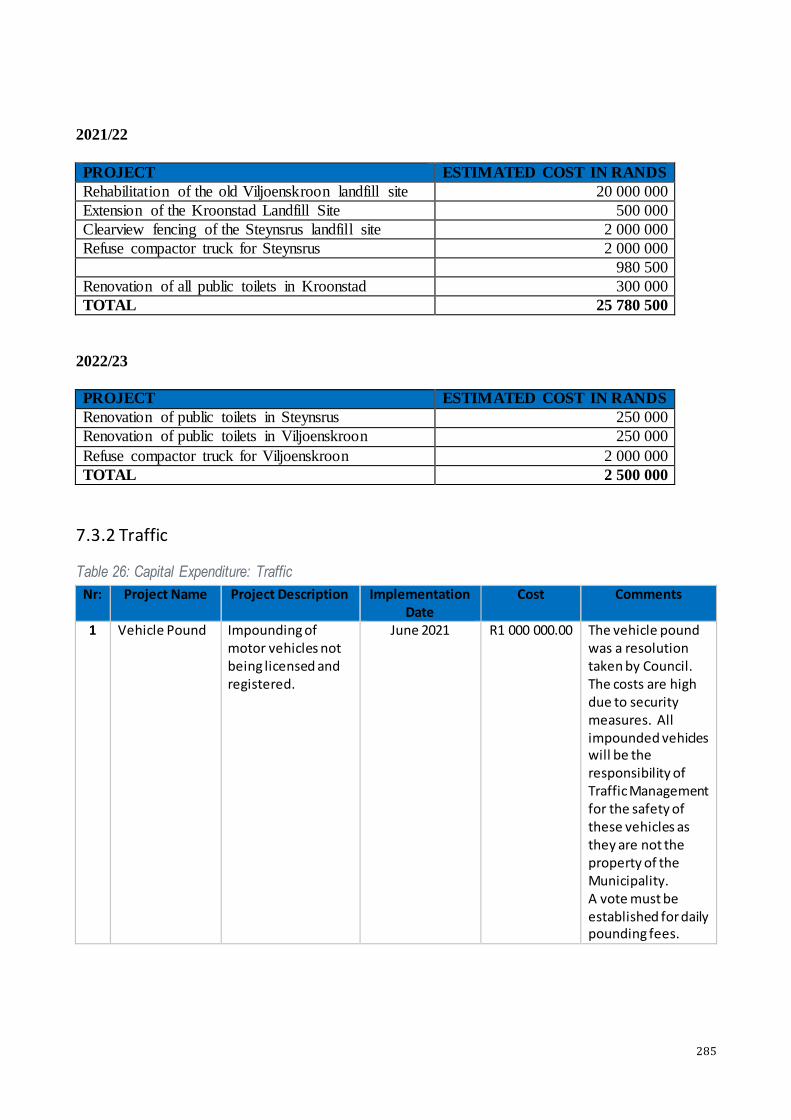
285
2021/22
PROJECT ESTIMATED COST IN RANDS
Rehabilitation of the old Viljoenskroon landfill site 20 000 000
Extension of the Kroonstad Landfill Site 500 000
Clearview fencing of the Steynsrus landfill site 2 000 000
Refuse compactor truck for Steynsrus 2 000 000
980 500
Renovation of all public toilets in Kroonstad 300 000
TOTAL 25 780 500
2022/23
PROJECT ESTIMATED COST IN RANDS
Renovation of public toilets in Steynsrus 250 000
Renovation of public toilets in Viljoenskroon 250 000
Refuse compactor truck for Viljoenskroon 2 000 000
TOTAL 2 500 000
7.3.2 Traffic
Table 26: Capital Expenditure: Traffic
Nr: Project Name Project Description Implementation Date
Cost Comments
1 Vehicle Pound Impounding of motor vehicles not being licensed and registered.
June 2021 R1 000 000.00 The vehicle pound was a resolution taken by Council. The costs are high due to security measures. All impounded vehicles will be the responsibility of Traffic Management for the safety of these vehicles as they are not the property of the Municipality. A vote must be established for daily pounding fees.

286
7.3.3 Public Safety
Table 27: Capital Expenditure: Public Safety
Nr: Project Name Project Description Implementation
Date
Cost
Estimate
Comments
1 Purchasing Of +-
Ten (10) Security
Huts/Offices.
Purchasing Of +- Ten
(10) Security
Huts/Offices To Be
Use At Posts Where
No Accommodation
Are Available.
July 2020 R 150 000.00 When, Funds Are
Available.
(Own Funds)
2 Installation Of
Routers For
Remote Viewing
Of CCTV Systems
Installation Of Seven
(7) Routers For
Remote Viewing Of
CCTV Camera Systems
30 August 2020 R 65 000.00 All New CCTV
Installions Will
Form Part Of
This Project.
(Own Funds)
3 Installation Of
Complete CCTV
System
Installation Of
Complete Alarm
System At Maokeng
Offices
October 2020 R
200 000.00
When Funds Are
Available.
(Own Funds)
7.3.4 Refurbishment of the Civic Theatre
DESCRIPTION ESTIMATED COST
Year 1 Year 2 Year 3 Year 4 Year 5
Civic Theatre Roof R 2,000,000.0 Air-Conditioning of Civic Complex
R 4,500,000.00
Lighting System R 2,000,000.00
Sound System R 2,000,000.0 Foyer floor R 2,000,000.00 Fire Curtain R 1,500,000.0
Auditorium chairs R 1,000,000.0 Auditorium and Balcony Carpet
R 900,000.00
Allen Rautenbach hall (Floor)
R 800,000.00
Venue Ladders R 150,000.0 Refurbish Kiosk, Main Bar, Kitchens, Coffee Bar and Entertainment hall
R 500,000.00
Industrial floor machine
R 70,000.00
New standby Generator
R 5,000,000.0

287
Refurbishment of dressing-rooms, and main Foyer toilets of the upper and lower level
R 1,000,000.00
Stage Bar Robes R 150,000.00 Steel Folding tables with plastic chairs
R 200,000.00
Refurbishment of “front view” of the Civic complex
R 150,000.00
7.3.5 Fire
Table 28: Capital Expenditure: Fire
Nr: Project Name Project Description Implementation Date
Cost (R)
Comments
Establishment of satellite fire station in Viljoenskroon/ Rammulotsi
Building, staffing and equipping new satellite fire station in Viljoenskroon/ Rammulotsi
May/ June 2021 Undetermined Establishment of satellite fire station in Viljoenskroon/ Rammulotsi
Refurbishment of training centre
Refurbishment of training centre and training grounds
August 2020 200 000 Refurbishment of training Centre. To be use as training facility.
Replacement of security fence at training centre
Replacing worn out and dilapidated security fence on northern side of training grounds.
October/November 2020
Fencing in of training centre to keep vagrants and undesirable elements from training grounds and training centre
Extension of fire engine machine room bays
Extend and heighten machine room bays to accommodate new machines
February 2021 500 000 Engine rooms to be extended and roof lifted to accommodate new fire engines
Provision of standby power
at fire and rescue services
Provide standby power for fire and rescue services to operate during time main electricity is off
September 2020 500 000 Standby generator neede for emergency power in the station to enable firefighting to

288
Nr: Project Name Project Description Implementation Date
Cost (R)
Comments
be continued with
5 x Laptops for fire officers and 1x PC for office
assistant.
1. One laptop is a replacement for an outdated machine. The others is for the operational officers that have never had any computer equipment.
2. PC outdated and needs replacement
July 2020 45 000 Needed for administrative work at fire and rescue services by operational, fire safety and administration staff
Rope rescue equipment
Rope rescue equipment for rescues at elevated instances
January /February 2021
200 000 Operation requirement
7.3.5 Disaster Management
Table 29: Capital Expenditure: Disaster Management
Nr: Project Name Project Description Implementation
Date
Cost Comments
1 Disaster
Management centre
Renovation of the
Disaster Centre
2020 8 000
000
2 Disaster
Management centre
Signage for Disaster
Management
2020 180 000
7.4.5.1 PARKS, SPORT AND RECREATION
Nr: Project Name Project Description
Implementation Date
Cost Comments
1. 1 Effective maintenance of Cemeteries
Expansion of Cemeteries: Expand for further space, construction of internal roads & burial blocks. Erection of ablutions and
1 July 2020 R 5 milj in total The projects will be done in phases
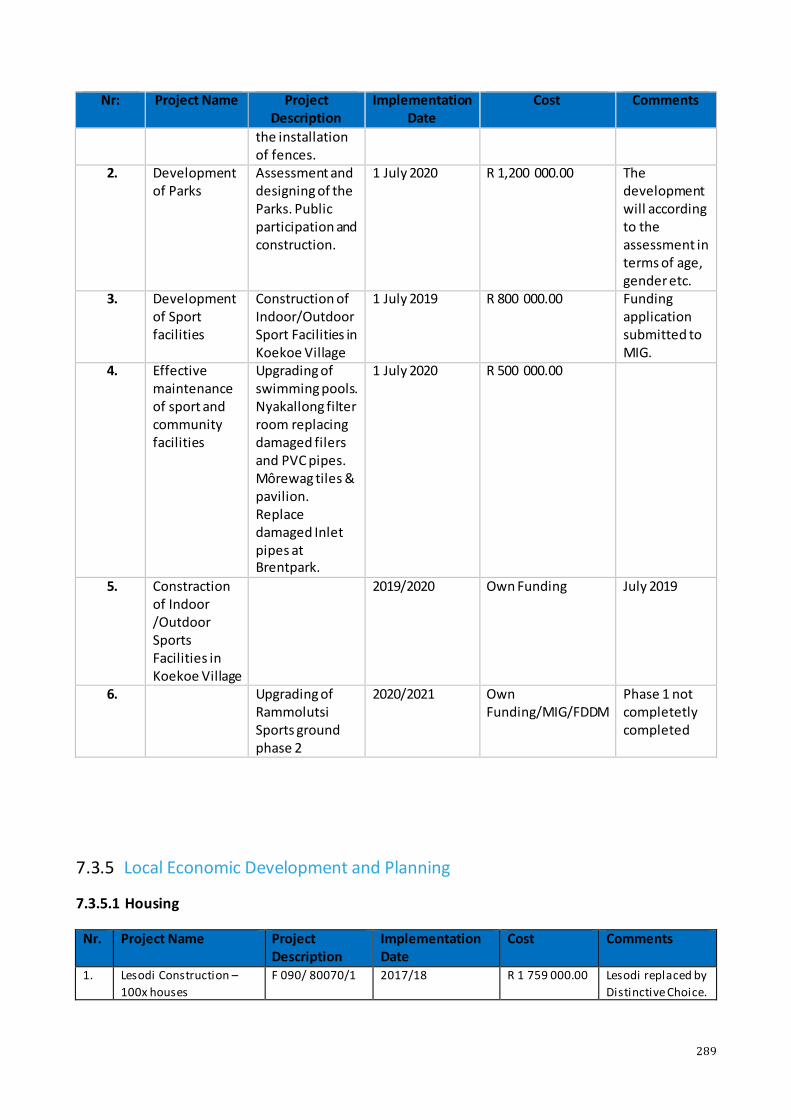
289
Nr: Project Name Project Description
Implementation Date
Cost Comments
the installation of fences.
2. Development of Parks
Assessment and designing of the Parks. Public participation and construction.
1 July 2020 R 1,200 000.00 The development will according to the assessment in terms of age, gender etc.
3. Development of Sport facilities
Construction of Indoor/Outdoor Sport Facilities in Koekoe Village
1 July 2019 R 800 000.00 Funding application submitted to MIG.
4. Effective maintenance of sport and community facilities
Upgrading of swimming pools. Nyakallong filter room replacing damaged filers and PVC pipes. Môrewag tiles & pavilion. Replace damaged Inlet pipes at Brentpark.
1 July 2020 R 500 000.00
5. Constraction of Indoor /Outdoor Sports Facilities in Koekoe Village
2019/2020 Own Funding July 2019
6. Upgrading of Rammolutsi Sports ground phase 2
2020/2021 Own Funding/MIG/FDDM
Phase 1 not completetly completed
7.3.5 Local Economic Development and Planning
7.3.5.1 Housing
Nr. Project Name Project Description
Implementation Date
Cost Comments
1. Lesodi Construction –
100x houses
F 090/ 80070/1 2017/18 R 1 759 000.00 Lesodi replaced by
Distinctive Choice.

290
Nr. Project Name Project Description
Implementation Date
Cost Comments
18 x houses stil l outstanding.
2. Distinctive Choice Land Restitution Project
– 170 x houses
F 090/ 80070/1 2017/18 R Unknown There are stil l 16 x houses
outstanding 3. Thutela Bogolo
Enterprise 350 x houses
F 1011 0004/1 2017/18 R 3 205 780.00 The outstanding
housing units to be verified and checked.
4. Distinctive Choice
(Poloko Trading)
F 1411 0001/1 2017/18 R 1 586 160.00 There are x 8
houses outstanding.
5. Distinctive Choice Military Veterans
F 1501 0009/3 2017/18 R 396 540.00 Houses partially completed x 3 Houses
incomplete. 6. Steynsrus 250 –
Topstructure (phase 1)
F 2001 0014/1 2020/21 R Unknown Project details
unknown.
7. Burewa Trading 191 Rectification of 2 x rooms in Brentpark
F 1909 0005/1 2019/20 R Unknown Project not l isted 6 x house.
8. Wathint Imbokodo 6 x houses
F 1909 0005/1 2019/20 R Unknown Project not l isted x houses.
9. EPHP Viljoenskroon 2018/19 R Unknown There are 17 x
houses outstanding.
10. Molapi Investment ( Viljoenskroon) 2 roomed project (new project)
2020/21 R Unknown There are 2 x houses outstanding
11. Iketsetse PhP F 0309 0020 2020/21 R Unknown There are 14 x
houses outstanding.
12. Fencing at Maokeng offices.
Not registered. 2020/21 R1 200 000.00 Own funding.
7.3.5.2 Planning
Nr: Project Name Project Description
Implementation Date
Cost Comments
PLED01/2020/2021 Marabastad re-planning Address land use problems by subdivision, consolidation and re-planning of portions of land in Marabastad.
01.07.2020 R1 000 000
PLED02/2020/2021 Steynsrus re-layout Re-layout of erven 4 to 16, 454, 455 and
01.07.2020 R290 000

291
457 to 459, Steynsrus.
PLED03/2020/2021 Erf 7342, Constantia Subdivision of erf 7342, Constantia.
01.07.2020 R93 500
PLED04/2020/2021 Erf 22897, Gelukwaarts Re-layout of erf 22897, Gelukwaarts.
01.07.2020 R93 500
PLED05/2020/2021 Kroonstad/Viljoenskroon commonages
Identify and obtain additional farm land for inclusion in the Municipal commonages in Kroonstad and Viljoenskroon.
01.07.2020 R20 000 000
7.3.5.3 Local Economic Development : Kroonpark
Nr: Project Name Project Description Implementation Date
Cost Comments
1 Renovating of 10 Chalets (4 Sleeper
chalets)
Painting, tilling and revamping of cupboards (Chalets 46,47,48,49,50,51,56,57,58 and 59
01 July 2020 To
30 Nov 2020
R100,000
2 Renovating of 10 Chalets
Replacement of thatch roof with concrete roman roof tiles. (Chalets 30-31,33-34,35-36 and 16,17,18,19,20
01 July 2020 To
30 Nov 2020
R100,000
3 Acquire new furniture and electrical equipment for 10 chalets.
TV’s X 10 Four plate stoves X 10 Fridge’s X 10 Micro ovens X 10 Mattress X 10 Air Conditions X 10
30 July 2020 To
30 June 2021
R300,000
4 Renovating of Indoor swimming pool First phase
Replacement of thatch roof with concrete roman roof tiles and sealing of concrete roof slab. Painting of indoor swimming pool and replacing of all broken windows
01 Jan 2021 To
30 June 2021
R60,000
5 Renovating of Ablution no 2
Replacement of thatch roof with IBR steel roof.
01 April 2021 To
30 June 2021
R60,000

292
Nr: Project Name Project Description Implementation Date
Cost Comments
6 Renovating of Bloekom Lapa First phase
Replacement of thatch roof with concrete roman roof tiles and tilling of floors
01 Jan 2021 To
30 June 2021
R60,000
7. Erection of informal trading areas.
Re-arrange informal trading within the central business district.
2020/21 R1 500 000
8. Information Boards and Signs for marketing
Information for marketing. 2020/21 R1 000 000
9. SMME capital support projects.
To provide support to SMMEs 2020/21 R1 500 000
10. Farmers capital support projects.
To provide capital support to small emerging farmers.
2020/21 R1 500 000 To assist input into FSPU.
7.3.5.3 Local Economic Development: Tourism
Nr: Project Name Project Description Implementation Date
Cost Comments
1 Old town hall Upgrade of the old town hall
July 2020 ( as soon as funds are available)
500 000 Old town hall to be upgraded to assist council towards setting of tourism information centre.
2. Fencing Fencing of Commonages
August 2020( as soon as funds are available
500 000 This project will assist in agricultural development
3. Renovation of Ablution block at Northern Park.
To renovate the existing ablution blocks at the Northern park for tourism activities
September 2020( or as soon as funds are available)
R 300 000
The state of the ablution block is too bad. Renovation is needed so that the park can be used again
7.4 Technical Services
7.4.1 Sanitation
Project Description Funding Source
Priority Risk
Upgrading of the Steynsrus Waste Water Treatment Works
Unfunded
High Inadequate capacity of existing plant to cater for
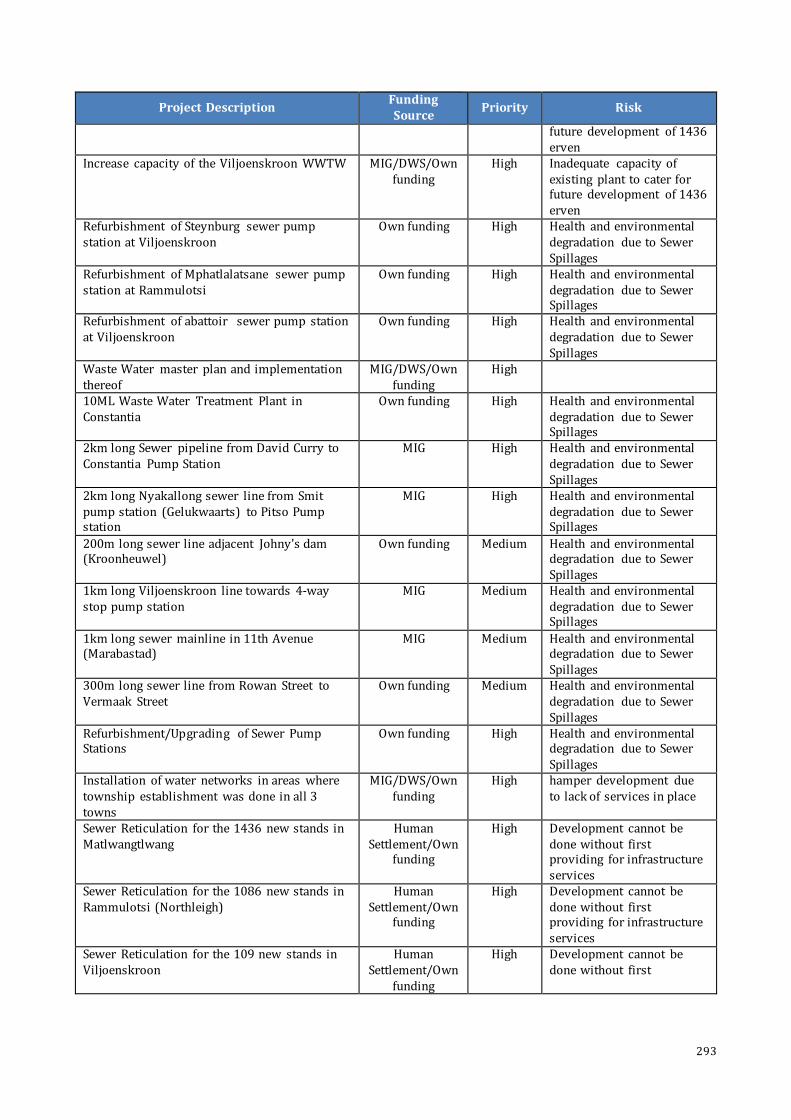
293
Project Description Funding Source
Priority Risk
future development of 1436 erven
Increase capacity of the Viljoenskroon WWTW MIG/DWS/Own funding
High Inadequate capacity of existing plant to cater for future development of 1436 erven
Refurbishment of Steynburg sewer pump station at Viljoenskroon
Own funding High Health and environmental degradation due to Sewer Spillages
Refurbishment of Mphatlalatsane sewer pump station at Rammulotsi
Own funding High Health and environmental degradation due to Sewer Spillages
Refurbishment of abattoir sewer pump station at Viljoenskroon
Own funding High Health and environmental degradation due to Sewer Spillages
Waste Water master plan and implementation thereof
MIG/DWS/Own funding
High
10ML Waste Water Treatment Plant in Constantia
Own funding High Health and environmental degradation due to Sewer Spillages
2km long Sewer pipeline from David Curry to Constantia Pump Station
MIG High Health and environmental degradation due to Sewer Spillages
2km long Nyakallong sewer line from Smit pump station (Gelukwaarts) to Pitso Pump station
MIG High Health and environmental degradation due to Sewer Spillages
200m long sewer line adjacent Johny's dam (Kroonheuwel)
Own funding Medium Health and environmental degradation due to Sewer Spillages
1km long Viljoenskroon line towards 4-way stop pump station
MIG Medium Health and environmental degradation due to Sewer Spillages
1km long sewer mainline in 11th Avenue (Marabastad)
MIG Medium Health and environmental degradation due to Sewer Spillages
300m long sewer line from Rowan Street to Vermaak Street
Own funding Medium Health and environmental degradation due to Sewer Spillages
Refurbishment/Upgrading of Sewer Pump Stations
Own funding High Health and environmental degradation due to Sewer Spillages
Installation of water networks in areas where township establishment was done in all 3 towns
MIG/DWS/Own funding
High hamper development due to lack of services in place
Sewer Reticulation for the 1436 new stands in Matlwangtlwang
Human Settlement/Own
funding
High Development cannot be done without first providing for infrastructure services
Sewer Reticulation for the 1086 new stands in Rammulotsi (Northleigh)
Human Settlement/Own
funding
High Development cannot be done without first providing for infrastructure services
Sewer Reticulation for the 109 new stands in Viljoenskroon
Human Settlement/Own
funding
High Development cannot be done without first

294
Project Description Funding Source
Priority Risk
providing for infrastructure services
Sewer Reticulation for the 5126 new stands in Maokeng
Human Settlement/Own
funding
High Development cannot be done without first providing for infrastructure services
Sewer Reticulation for the 326 new stands in Brentpark
Human Settlement/Own
funding
High Development cannot be done without first providing for infrastructure services
Sewer Reticulation for the 476 new stands in Kroonstad (Tuinhof, Heuwelsig and Elandia)
Human Settlement/Own
funding
High Development cannot be done without first providing for infrastructure services
Refurbishment of purified sewerage effluent irrigation system for parks and schools
MIG/DWS/Own funding
High using clean/potable water for irrigation purposes
Expansion of purified sewerage effluent irrigation system
MIG/DWS/Own funding
High using clean/potable water for irrigation purposes

295
7.4.2 Water
Project Description Funding Source Priority Risk Upgrading of water supply in Viljoenskroon: Water Treatment Works MIG/DWS/Own
funding High
Current capacity of the plant not sufficient to provide water for future developments
Upgrading of water supply in Viljoenskroon: Main pipelines & reservoirs / pressure tower
MIG/DWS/Own funding
High Water supply not reaching certain areas during peak demands
Upgrading of water supply in Viljoenskroon: Network rehabilitation and improving
MIG/DWS/Own funding
Medium Water losses due to frequent burst pipes as a result of aged infrastructure
Upgrading of water networks in all 3 towns by replacing AC pipes with UPVC pipes
MIG/DWS/Own funding
High
Water losses due to frequent burst pipes as a result of aged infrastructure.
Upgrading of water supply between water treatment works, Kroonheuwel reservoir and Maokeng (pipelines replacement)
MIG/DWS/Own funding
High
aged pipeline, may lead to a large parts of the community not getting water if not attended to.
New reservoir at Maokeng to cater for future extensions adjacent to Boitumelo Hospital
MIG/DWS/Own funding
High
The current Maokeng reservoir does not have sufficient capacity to cater for future development in the area
Valve and hydrant replacement and installation of additional valves and hydrants in all 3 towns MIG/DWS/Own
funding High
Currently cannot isolate certain areas when attending to burst pipes, cannot flush the line and ensure clean water at the end of the pipe repair.
Pipeline directly between Bloemhoek dam and Kroonstad water treatment works
MIG/DWS/Own funding
High limited quantity of water flowing from bloehoek to the plant
Augmentation of raw water supply in all 3 towns and/or augmentation of potable water supply during periods of droughts.
MIG/DWS/Own funding
High
Not having sufficient raw water/potable water supply for the community during periods of drought
Refurbishment of remaining filters at Kroonstad water treatment works and backwash recovery system
MIG/DWS/Own funding
Medium Negative impact on the quantity and the quality of water treated at the plant
Installation of water networks in areas where township establishment was done in all 3 towns
MIG/DWS/Own funding
High hamper development due to lack of services in place
Water Reticulation for the 1436 new stands in Matlwangtlwang
Human Settlement/Own funding High
Development cannot be done without first providing for infrastructure services
Water Reticulation for the 1086 new stands in Rammulotsi (Northleigh)
Human Settlement/Own funding High
Development cannot be done without first providing for infrastructure services
Water Reticulation for the 109 new stands in Viljoenskroon
Human Settlement/Own funding High
Development cannot be done without first providing for infrastructure services
Water Reticulation for the 5126 new stands in Maokeng
Human Settlement/Own funding High
Development cannot be done without first providing for infrastructure services

296
Project Description Funding Source Priority Risk
Water Reticulation for the 326 new stands in Brentpark
Human Settlement/Own funding High
Development cannot be done without first providing for infrastructure services
Water Reticulation for the 476 new stands in Kroonstad (Tuinhof, Heuwelsig and Elandia)
Human Settlement/Own funding High
Development cannot be done without first providing for infrastructure services
Interconnecting pipe between Maokeng reservoir, Khatliso and Brentpark
MIG/DWS/Own funding
High water losses due to frequent burst pipes as a result of aged infrastructure
Installation of zonal meters in all towns MIG/DWS/Own funding
High the inability to quantify water going to each area within Moqhaka
Installation of pressure control valves in areas where excessive pressures occur (Tuinhof, Jordania, lower Gelukwaarts & Constantia)
MIG/DWS/Own funding
High
burst pipes and water losses as a result of high pressurised pipes
Replacement of conventional water meters with SMART prepaid water meters and the replacement of faulty meters
MIG/DWS/Own funding
High
Water Reticulation losses (Non-Revenue Water)
Installation of Bulk and zonal meters MIG/DWS/Own funding
High Water Reticulation losses (Non-Revenue Water)
Installation of direct supply lines between main reservoir lines and high lying areas in Maokeng (for instance LTA and upper parts of Constantia / Phomolong)
MIG/DWS/Own funding
High
water not reaching high lying areas when the reservoir level is low
Upgrading of Steynsrus Water Treatment Plant to accommodate future new stands
MIG/DWS/Own funding
High
The current capacity of the plant does not have sufficient capacity to cater for future development in the area
Upgrading of raw water supply to Steynsrus (new dams etc.) MIG/DWS/Own
funding High
Insufficient capacity of current infrastructure to cater for future development
Erection of additional reservoirs in all 3 towns to ensure 48 hour continuous supply
MIG/DWS/Own funding
High
Currently not having 48hr continues supply of water from reservoirs in case of refurbishment work has to be done at the plant or a major supply pipe to the reservoirs bursts
Water master plan and implementation thereof
MIG/DWS/Own funding
High Ad-hoc planning, lack of blue print
Water Services Development Plan and implementation thereof
MIG/DWS/Own funding
High Ad-hoc planning, lack of blue print
Water conservation and demand management system
MIG/DWS/Own funding
High Water losses
Meter replacement and upgrading house connections
MIG/DWS/Own funding
High Water losses, by-passed meters
Rehabilitation of reservoir structures MIG/DWS/Own funding
High aged infrastructure that can fail at any time
Obtaining equipment for water services section to function properly
MIG/DWS/Own funding
High sharing of equipment leading to inefficiencies, slow service delivery pace
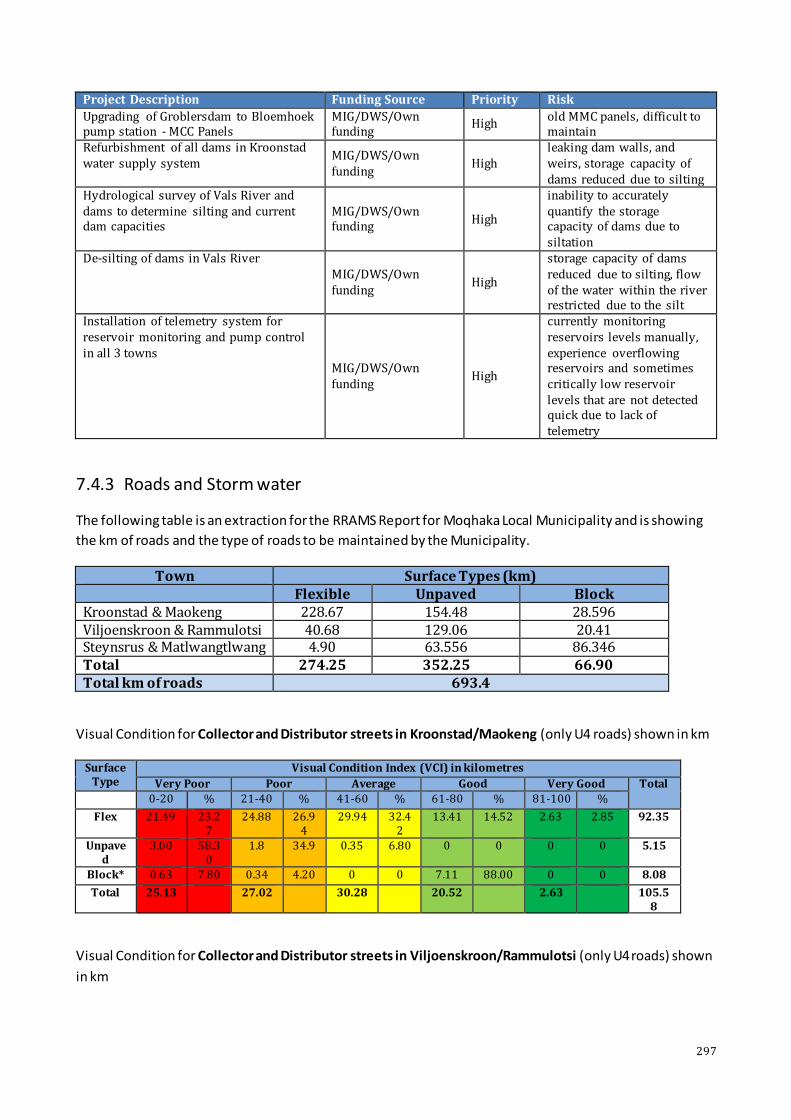
297
Project Description Funding Source Priority Risk
Upgrading of Groblersdam to Bloemhoek pump station - MCC Panels
MIG/DWS/Own funding
High old MMC panels, difficult to maintain
Refurbishment of all dams in Kroonstad water supply system
MIG/DWS/Own funding
High leaking dam walls, and weirs, storage capacity of dams reduced due to silting
Hydrological survey of Vals River and dams to determine silting and current dam capacities
MIG/DWS/Own funding
High
inability to accurately quantify the storage capacity of dams due to siltation
De-silting of dams in Vals River MIG/DWS/Own funding
High
storage capacity of dams reduced due to silting, flow of the water within the river restricted due to the silt
Installation of telemetry system for reservoir monitoring and pump control in all 3 towns
MIG/DWS/Own funding
High
currently monitoring reservoirs levels manually, experience overflowing reservoirs and sometimes critically low reservoir levels that are not detected quick due to lack of telemetry
7.4.3 Roads and Storm water
The following table is an extraction for the RRAMS Report for Moqhaka Local Municipality and is showing
the km of roads and the type of roads to be maintained by the Municipality.
Town Surface Types (km) Flexible Unpaved Block
Kroonstad & Maokeng 228.67 154.48 28.596 Viljoenskroon & Rammulotsi 40.68 129.06 20.41 Steynsrus & Matlwangtlwang 4.90 63.556 86.346 Total 274.25 352.25 66.90 Total km of roads 693.4
Visual Condition for Collector and Distributor streets in Kroonstad/Maokeng (only U4 roads) shown in km
Surface Type
Visual Condition Index (VCI) in kilometres
Very Poor Poor Average Good Very Good Total
0-20 % 21-40 % 41-60 % 61-80 % 81-100 %
Flex 21.49 23.27
24.88 26.94
29.94 32.42
13.41 14.52 2.63 2.85 92.35
Unpaved
3.00 58.30
1.8 34.9 0.35 6.80 0 0 0 0 5.15
Block* 0.63 7.80 0.34 4.20 0 0 7.11 88.00 0 0 8.08
Total 25.13 27.02 30.28 20.52 2.63 105.58
Visual Condition for Collector and Distributor streets in Viljoenskroon/Rammulotsi (only U4 roads) shown
in km
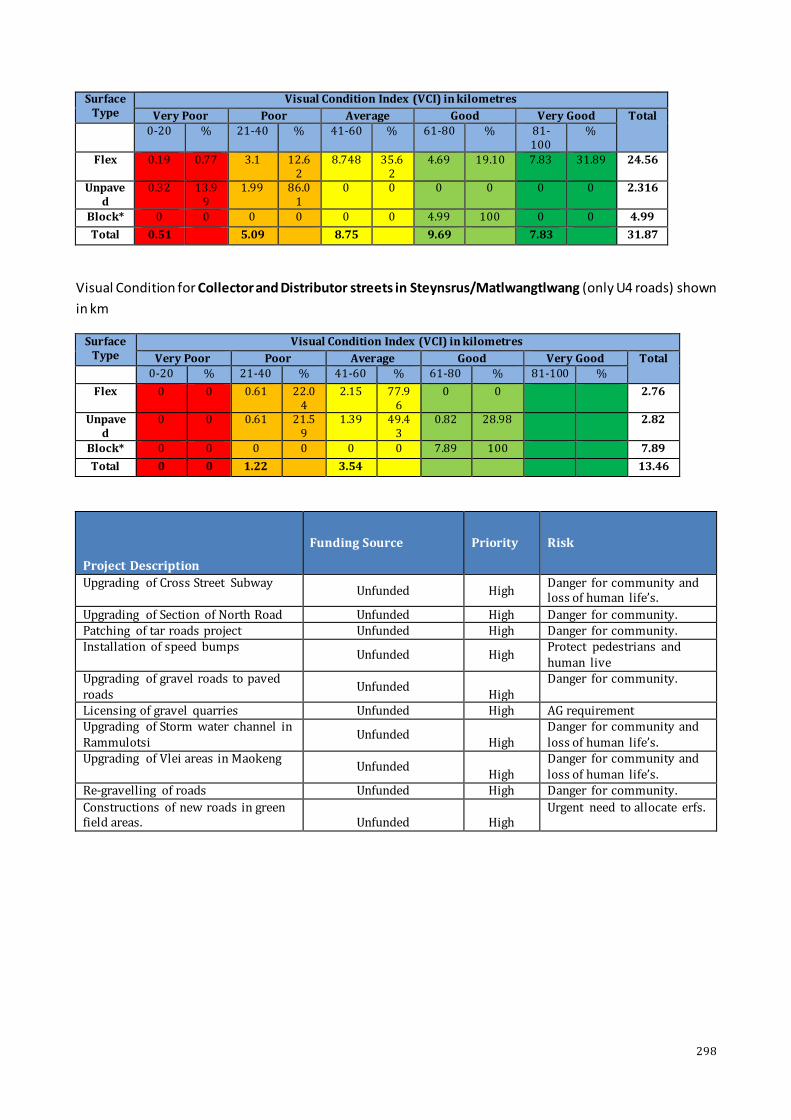
298
Surface Type
Visual Condition Index (VCI) in kilometres
Very Poor Poor Average Good Very Good Total
0-20 % 21-40 % 41-60 % 61-80 % 81-100
%
Flex 0.19 0.77 3.1 12.62
8.748 35.62
4.69 19.10 7.83 31.89 24.56
Unpaved
0.32 13.99
1.99 86.01
0 0 0 0 0 0 2.316
Block* 0 0 0 0 0 0 4.99 100 0 0 4.99
Total 0.51 5.09 8.75 9.69 7.83 31.87
Visual Condition for Collector and Distributor streets in Steynsrus/Matlwangtlwang (only U4 roads) shown
in km
Surface Type
Visual Condition Index (VCI) in kilometres
Very Poor Poor Average Good Very Good Total 0-20 % 21-40 % 41-60 % 61-80 % 81-100 %
Flex 0 0 0.61 22.04
2.15 77.96
0 0 2.76
Unpaved
0 0 0.61 21.59
1.39 49.43
0.82 28.98 2.82
Block* 0 0 0 0 0 0 7.89 100 7.89
Total 0 0 1.22 3.54 13.46
Project Description
Funding Source Priority Risk
Upgrading of Cross Street Subway Unfunded High
Danger for community and loss of human life’s.
Upgrading of Section of North Road Unfunded High Danger for community. Patching of tar roads project Unfunded High Danger for community. Installation of speed bumps
Unfunded High Protect pedestrians and human live
Upgrading of gravel roads to paved roads
Unfunded High
Danger for community.
Licensing of gravel quarries Unfunded High AG requirement Upgrading of Storm water channel in Rammulotsi
Unfunded High
Danger for community and loss of human life’s.
Upgrading of Vlei areas in Maokeng Unfunded
High Danger for community and loss of human life’s.
Re-gravelling of roads Unfunded High Danger for community.
Constructions of new roads in green field areas. Unfunded High
Urgent need to allocate erfs.

299
7.5 Unfunded Projects
7.5.1 Short term: Water and Sanitation issues that must be addressed.
7.5.1.1 Viljoenskroon
Area Project Description Km Estimated
Amount
Funding
Source Remarks
Jordania Upgrade sewer pump station n/a R750 000 Unfunded BP to be submitted
Suidrand Upgrade C sewer pump station n/a R825 000 Unfunded BP to be submitted
Kroonstad/Maokeng AC replacement all areas 180 R63 900 00 Unfunded BP to be submitted
Maokeng Sewer network upgrade (various) Unknown R7 550 000 Unfunded BP to be submitted
Maokeng Alternative line to Khatliso Moketsi 3.5 R1 550 000 Unfunded BP to be submitted
Maokeng Upgrade Gelukwaarts line to make
Smit p/s redundant
4.0 R11 500 00 Unfunded BP to be submitted
Constantia Upgrade Sewer p/s and rising main
to WWTW
5.2 R15 500 00 Unfunded BP to be submitted
Suidrand Upgrading of sewer line between
Rowan str. and C pump station
2.35 R11 600 000 Unfunded BP to be submitted
Kroonstad/Maokeng Backup 600mm water line between
WTW and Kroonheuwel reservoir
R9 650 000 Unfunded BP to be submitted
Kroonheuwel Upgrade tower pump station n/a R875 000 Unfunded BP to be submitted
CBD Upgrading of sewer line between
Truter str and A Pump station
1.3 R11 600 000 Unfunded BP to be submitted
CBD Upgrading of sewer line (Oranje
street)
0.8 R9 650 000 Unfunded BP to be submitted
Elandia/
Kroonheuwel
Upgr4ading of sewer line Marais
street
3.2 R875 000 Unfunded BP to be submitted
Viljoenskroon/
Rammulotsi
Upgrade/replace pipeline to WWTW 1.2 R3 150 000 Unfunded BP to be submitted
Viljoenskroon/
Rammulotsi
Upgrade various problems sewers n/a R1 500 000 Unfunded BP to be submitted
Viljoenskroon/
Rammulotsi
Upgrade various water lines 3 R1 065 000 Unfunded BP to be submitted
Industrial area Upgrade pump station and pipe line 1.4 R975 000 Unfunded BP to be submitted
Viljoenskroon/
Rammulotsi
Upgrade reservoir p/s (grinders etc.) n/a R3 150 000 Unfunded BP to be submitted

300
Area Project Description Km Estimated
Amount
Funding
Source Remarks
Viljoenskroon/
Rammulotsi
Increase WTW capacity n/a R150 000 000 Unfunded BP to be submitted
Viljoenskroon/
Rammulotsi
Increase WWTW capacity n/a R14 364 000 Unfunded BP to be submitted
Viljoenskroon/
Rammulotsi
Additional line from reservoir 22.00 R41 470 000 Unfunded BP to be submitted
Rammulotsi P/S and pipeline to WWTW 3.1 R4 570 000 Unfunded BP to be submitted
Industrial area Provide sewer network n/a R8 550 000 Unfunded BP to be submitted
7.5.1.2 Steynsrus
Area Project Description Km Estimated
Amount
Funding
Source Remarks
Matlwangtlwang Upgrade sewers n/a R2 880 000 Unfunded BP to be submitted
Matlwangtlwang Upgrade water network n/a R1 910 000 Unfunded BP to be submitted
Steynsrus Upgrade water network – infill n/a R850 000 Unfunded BP to be submitted
Steynsrus Upgrade sewer network - infill n/a R975 000 Unfunded BP to be submitted
Steynsrus Upgrade WWTW n/a R31 800 000 Unfunded BP to be submitted
Steynsrus/Matlwangtlwang Upgrade raw water supply n/a R25 000 000 Unfunded BP to be submitted
Matlwangtlwang Sewer services new stands n/a R12 519 000 Unfunded BP to be submitted
Matlwangtlwang Water services new stands n/a R7 704 000 Unfunded BP to be submitted
7.5.2 Short term: Gravel Roads to be upgraded to paved Roads
7.5.2.1 Kroonstad
Area Street name KM Estimated Amount Funding
Source Remarks
Maokeng KKV 14914-14896 0.15 R975 000 Unfunded Should submit BP
Maokeng Phomolong Dingalo str 0.88 R5 720 000 Unfunded Should submit BP
Brentpark Stadium Road 0.6 R6 500 000 Unfunded Should submit BP
Maokeng Seeisoville 1248-1303 0.46 R2 990 000 Unfunded Should submit BP

301
Area Street name KM Estimated Amount Funding
Source Remarks
Maokeng Constantia 7712-7470 0.38 R2 470 000 Unfunded Should submit BP
Maokeng KKV 14898-18336 0.40 R2 600 000 Unfunded Should submit BP
Maokeng KKV 10857-13845 0.45 R2 925 000 Unfunded Should submit BP
Maokeng Constantia 6972-6988 0.11 R715 000 Unfunded Should submit BP
Maokeng Internal Roads KKV 16661 0.86 R5 590 000 Unfunded Should submit BP
Maokeng Ntanga Street 0.26 R1 690 000 Unfunded Should submit BP
Maokeng Constantia 7716-7568 0.39 R2 535 000 Unfunded Should submit BP
Maokeng Constantia 8615 -8610 0.125 R812 500 Unfunded Should submit BP
Maokeng Constantia 6973-6987 0.09 R585 000 Unfunded Should submit BP
Maokeng Constantia 9050-9042 0.05 R325 000 Unfunded Should submit BP
Maokeng Constantia 6972-6988 0.11 R544 500 Unfunded Should submit BP
Maokeng Phomolong 1775-1576 0.11 R715 000 Unfunded Should submit BP
Maokeng Phomolong Robert Sello Str 0.23 R1 495 000 Unfunded Should submit BP
Maokeng Phomolong Drie en Twintigste 0.40 R2 600 000 Unfunded Should submit BP
Maokeng Internal roads Kgahliso
Moeketsi
8.85 R55 250 000 Unfunded Should submit BP
Maokeng Internal roads Ward 4 3 R19 500 000 Unfunded Should submit BP
Maokeng Internal roads Ward 5 3 R19 500 000 Unfunded Should submit BP
Maokeng KKV (16084 – 16293) .520 R 4 420 000.00 Unfunded Should submit BP
Maokeng Mahabani Street .690 R 3 795 000.00 Unfunded Should submit BP
Maokeng Makobe Street .350 R 1 925 000.00 Unfunded Should submit BP
Maokeng KKV (10660 -10857 -14098) 2.39 R 13 167 000.00 Unfunded Should submit BP
Maokeng Gelukwaarts (517 -553) .420 R 2 310 000.00 Unfunded Should submit BP
Maokeng Skele Street 1.1 R 6 050 000.00 Unfunded Should submit BP
Maokeng Gelukwaarts (21419 – 21433) .702 R 38 561 000.00 Unfunded Should submit BP
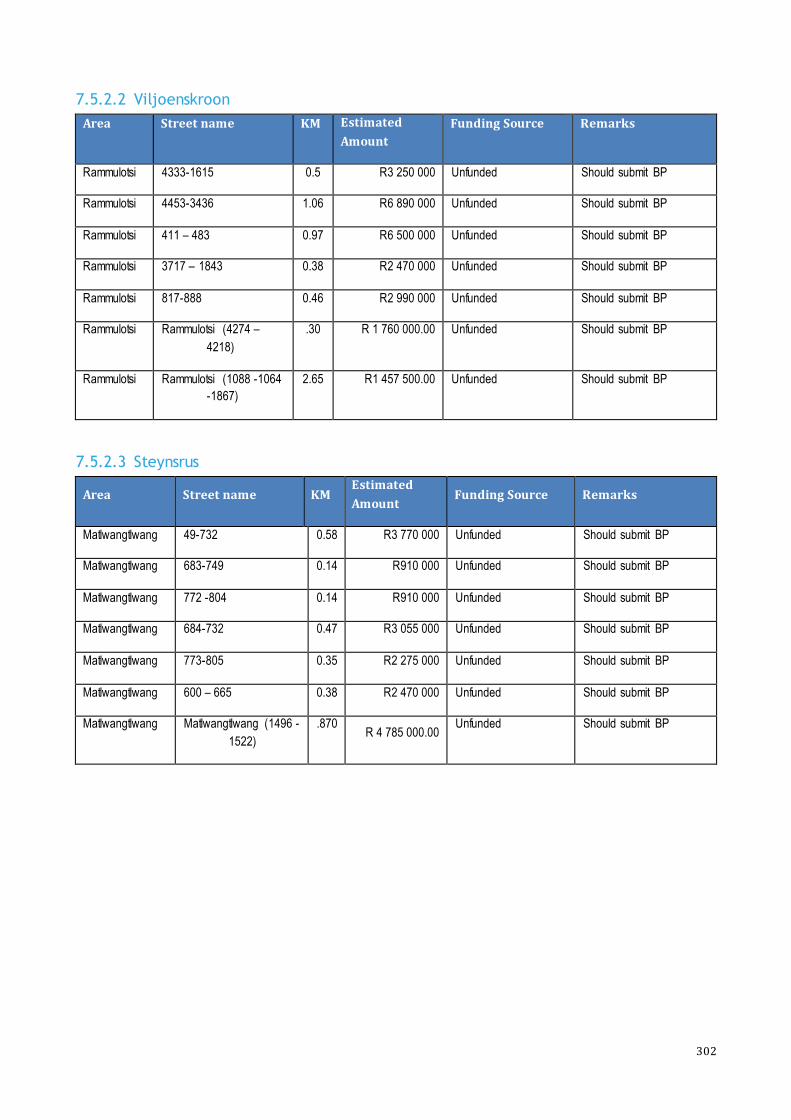
302
7.5.2.2 Viljoenskroon
Area Street name KM Estimated
Amount
Funding Source Remarks
Rammulotsi 4333-1615 0.5 R3 250 000 Unfunded Should submit BP
Rammulotsi 4453-3436 1.06 R6 890 000 Unfunded Should submit BP
Rammulotsi 411 – 483 0.97 R6 500 000 Unfunded Should submit BP
Rammulotsi 3717 – 1843 0.38 R2 470 000 Unfunded Should submit BP
Rammulotsi 817-888 0.46 R2 990 000 Unfunded Should submit BP
Rammulotsi Rammulotsi (4274 –
4218)
.30 R 1 760 000.00 Unfunded Should submit BP
Rammulotsi Rammulotsi (1088 -1064
-1867)
2.65 R1 457 500.00 Unfunded Should submit BP
7.5.2.3 Steynsrus
Area Street name KM Estimated
Amount Funding Source Remarks
Matlwangtlwang 49-732 0.58 R3 770 000 Unfunded Should submit BP
Matlwangtlwang 683-749 0.14 R910 000 Unfunded Should submit BP
Matlwangtlwang 772 -804 0.14 R910 000 Unfunded Should submit BP
Matlwangtlwang 684-732 0.47 R3 055 000 Unfunded Should submit BP
Matlwangtlwang 773-805 0.35 R2 275 000 Unfunded Should submit BP
Matlwangtlwang 600 – 665 0.38 R2 470 000 Unfunded Should submit BP
Matlwangtlwang Matlwangtlwang (1496 -
1522)
.870 R 4 785 000.00
Unfunded Should submit BP
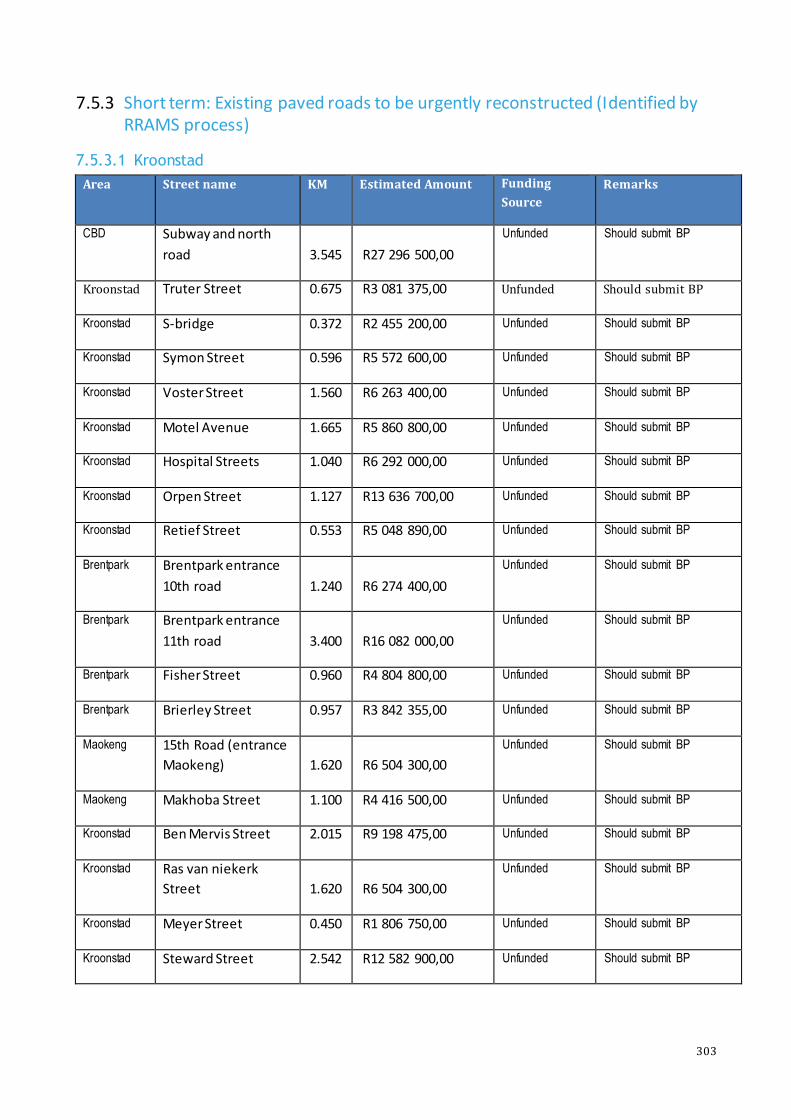
303
7.5.3 Short term: Existing paved roads to be urgently reconstructed (Identified by RRAMS process)
7.5.3.1 Kroonstad
Area Street name KM Estimated Amount Funding
Source
Remarks
CBD Subway and north
road 3.545 R27 296 500,00
Unfunded Should submit BP
Kroonstad Truter Street 0.675 R3 081 375,00 Unfunded Should submit BP
Kroonstad S-bridge 0.372 R2 455 200,00 Unfunded Should submit BP
Kroonstad Symon Street 0.596 R5 572 600,00 Unfunded Should submit BP
Kroonstad Voster Street 1.560 R6 263 400,00 Unfunded Should submit BP
Kroonstad Motel Avenue 1.665 R5 860 800,00 Unfunded Should submit BP
Kroonstad Hospital Streets 1.040 R6 292 000,00 Unfunded Should submit BP
Kroonstad Orpen Street 1.127 R13 636 700,00 Unfunded Should submit BP
Kroonstad Retief Street 0.553 R5 048 890,00 Unfunded Should submit BP
Brentpark Brentpark entrance
10th road 1.240 R6 274 400,00
Unfunded Should submit BP
Brentpark Brentpark entrance
11th road 3.400 R16 082 000,00
Unfunded Should submit BP
Brentpark Fisher Street 0.960 R4 804 800,00 Unfunded Should submit BP
Brentpark Brierley Street 0.957 R3 842 355,00 Unfunded Should submit BP
Maokeng 15th Road (entrance
Maokeng) 1.620 R6 504 300,00
Unfunded Should submit BP
Maokeng Makhoba Street 1.100 R4 416 500,00 Unfunded Should submit BP
Kroonstad Ben Mervis Street 2.015 R9 198 475,00 Unfunded Should submit BP
Kroonstad Ras van niekerk
Street 1.620 R6 504 300,00
Unfunded Should submit BP
Kroonstad Meyer Street 0.450 R1 806 750,00 Unfunded Should submit BP
Kroonstad Steward Street 2.542 R12 582 900,00 Unfunded Should submit BP

304
Area Street name KM Estimated Amount Funding
Source
Remarks
Kroonstad Brummer Street 0.591 R2 795 430,00 Unfunded Should submit BP
Kroonstad Turner Street 0.903 R5 463 150,00 Unfunded Should submit BP
Kroonstad Station Street 0.520 R3 432 000,00 Unfunded Should submit BP
Kroonstad Section Reitz Street 1.017 R11 746 350,00 Unfunded Should submit BP
Kroonstad Brand Street 1.650 R17 696 250,00 Unfunded Should submit BP
Kroonstad Section Murray
Street 0.595 R6 545 000,00
Unfunded Should submit BP
Kroonstad Hatting Street 0.180 R2 079 000,00 Unfunded Should submit BP
Kroonstad Gibbon Street 0.180 R2 079 000,00 Unfunded Should submit BP
Kroonstad Moll Street 0.410 R2 706 000,00 Unfunded Should submit BP
Kroonstad Presedent Street 1.200 R5 676 000,00 Unfunded Should submit BP
Kroonstad Residensie Avenue 0.252 R1 011 780,00 Unfunded Should submit BP
Kroonstad Van der Lingen Street 1.225 R6 468 000,00 Unfunded Should submit BP
Kroonstad Lintott Street 1.045 R4 942 850,00 Unfunded Should submit BP
Kroonstad Schoeman Street 0.940 R3 774 100,00 Unfunded Should submit BP
Kroonstad Border Street 0.780 R3 131 700,00 Unfunded Should submit BP
Kroonstad Strang Street 0.595 R2 814 350,00 Unfunded Should submit BP
Kroonstad King Street 0.595 R2 814 350,00 Unfunded Should submit BP
7.5.3.2 Viljoenskroon
Area Street name KM Estimated
Amount
Funding
Source Remarks
Viljoenskroon Reitz street 0.880 R6 388 800,00 Unfunded Should submit BP
Viljoenskroon Reid street 0.615 R 4 059 000,00 Unfunded Should submit BP

305
7.6.3.3 Steynsrus
Area Street name KM Estimated
Amount
Funding
Source Remarks
Steynsrus Haasbroek street 1.500 R10 725 000,00 Unfunded Should submit BP
7.5.4 Planned Storm water projects
7.5.4.1 Kroonstad
Area Street name Description Estimated
Amount
Funding
Source Remarks
Maokeng KKV Channelling and vehicular R28 520 000 Unfunded Should submit BP
Maokeng Constantia Channelling and Pedestrian R18 500 000 Unfunded Should submit BP
7.5.4.2 Viljoenskroon
Area Street name Description Estimated
Amount
Funding
Source Remarks
Viljoenskroon Storm water
industrial flooding
Channelling and vehicular R5 701 754 Unfunded Should submit BP
Rammulotsi Storm water between
Rammulotsi and
Northleigh
Channelling of vlei areas with
pedestrian crossings
R13 450 000 Unfunded Should submit BP
7.5.5 Short term: Planned Paved roads to be resealed
7.5.5.1 Kroonstad
Area Street name KM Estimated
Amount
Funding Source Remarks
Kroonstad Marais str 2.9 R3 045 000 Unfunded Should submit BP
Kroonstad Bukes Str 1.0 R2 100 000 Unfunded Should submit BP
Kroonstad Van der Lingen str 1.8 R2 160 000 Unfunded Should submit BP
Kroonstad Du Toit str 3.1 R1 953 000 Unfunded Should submit BP
Kroonstad Verwoerd str 0.35 R220 500 Unfunded Should submit BP
Kroonstad Steward str 1.9 R2 660 000 Unfunded Should submit BP
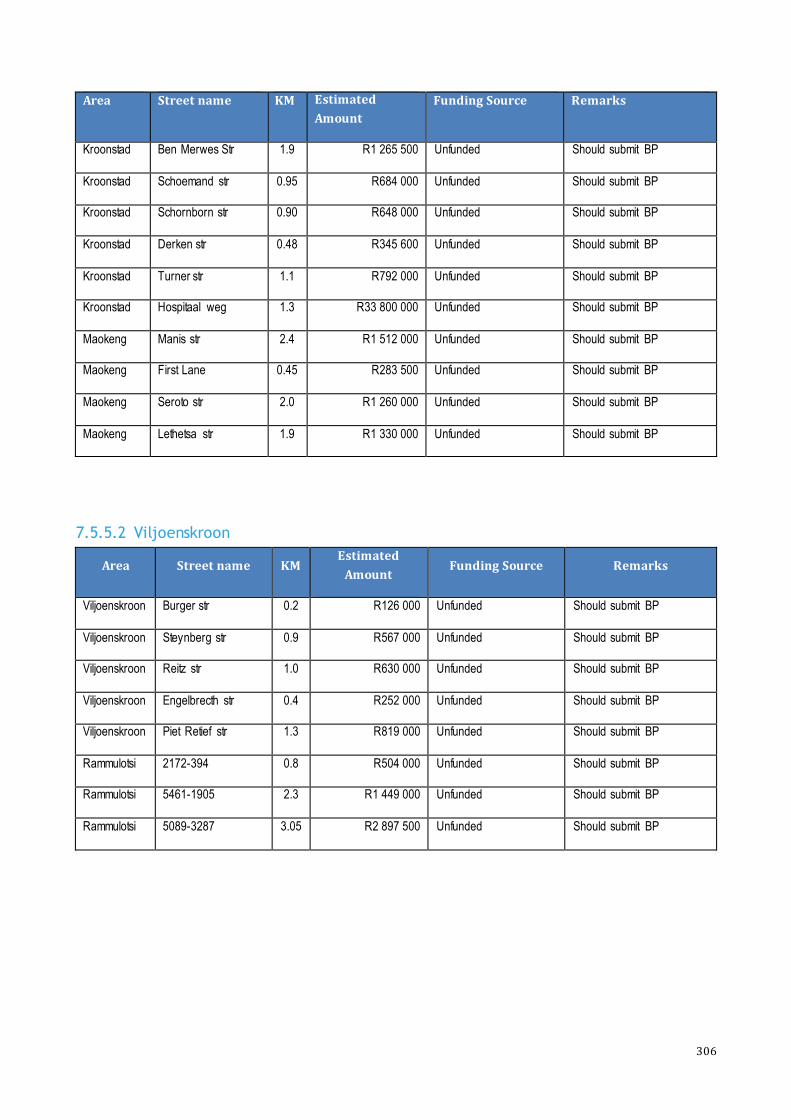
306
Area Street name KM Estimated
Amount
Funding Source Remarks
Kroonstad Ben Merwes Str 1.9 R1 265 500 Unfunded Should submit BP
Kroonstad Schoemand str 0.95 R684 000 Unfunded Should submit BP
Kroonstad Schornborn str 0.90 R648 000 Unfunded Should submit BP
Kroonstad Derken str 0.48 R345 600 Unfunded Should submit BP
Kroonstad Turner str 1.1 R792 000 Unfunded Should submit BP
Kroonstad Hospitaal weg 1.3 R33 800 000 Unfunded Should submit BP
Maokeng Manis str 2.4 R1 512 000 Unfunded Should submit BP
Maokeng First Lane 0.45 R283 500 Unfunded Should submit BP
Maokeng Seroto str 2.0 R1 260 000 Unfunded Should submit BP
Maokeng Lethetsa str 1.9 R1 330 000 Unfunded Should submit BP
7.5.5.2 Viljoenskroon
Area Street name KM Estimated
Amount Funding Source Remarks
Viljoenskroon Burger str 0.2 R126 000 Unfunded Should submit BP
Viljoenskroon Steynberg str 0.9 R567 000 Unfunded Should submit BP
Viljoenskroon Reitz str 1.0 R630 000 Unfunded Should submit BP
Viljoenskroon Engelbrecth str 0.4 R252 000 Unfunded Should submit BP
Viljoenskroon Piet Retief str 1.3 R819 000 Unfunded Should submit BP
Rammulotsi 2172-394 0.8 R504 000 Unfunded Should submit BP
Rammulotsi 5461-1905 2.3 R1 449 000 Unfunded Should submit BP
Rammulotsi 5089-3287 3.05 R2 897 500 Unfunded Should submit BP

307
7.5.5.3 Steynsrus
Area Street name KM Estimated Amount Funding Source Remarks
Steynsrus Main str. 1.3 R33 800 000 Unfunded Should submit BP
7.5.5.4 Viljoenskroon
Area Street name KM Estimated
Amount
Funding Source Remarks
Rammulotsi 4333-1615 0.5 R3 250 000 Unfunded Should submit BP
Rammulotsi 4453-3436 1.06 R6 890 000 Unfunded Should submit BP
Rammulotsi 411 – 483 0.97 R6 500 000 Unfunded Should submit BP
Rammulotsi 3717 – 1843 0.38 R2 470 000 Unfunded Should submit BP
Rammulotsi 817-888 0.46 R2 990 000 Unfunded Should submit BP
7.5.5.5 Steynsrus
Area Street name KM Estimated
Amount Funding Source Remarks
Matlwangtlwang 49-732 0.58 R3 770 000 Unfunded Should submit BP
Matlwangtlwang 683-749 0.14 R910 000 Unfunded Should submit BP
Matlwangtlwang 772 -804 0.14 R910 000 Unfunded Should submit BP
Matlwangtlwang 684-732 0.47 R3 055 000 Unfunded Should submit BP
Matlwangtlwang 773-805 0.35 R2 275 000 Unfunded Should submit BP
Matlwangtlwang 600 – 665 0.38 R2 470 000 Unfunded Should submit BP
7.5.6 Short term: Existing paved roads to be urgently reconstructed
7.5.6.1 Kroonstad
Area Street name KM Estimated
Amount
Funding
Source
Remarks
Maokeng Smaldeel Road (four lanes) 3.9 R58 000 000 Unfunded Should submit BP
Maokeng Makoba and Ntanga Str 0.5 R3 250 000 Unfunded Should submit BP
Kroonstad Orpen Str 1.8 R16 200 000 Unfunded Should submit BP

308
Area Street name KM Estimated
Amount
Funding
Source
Remarks
Kroonstad Reitz str (cross/swart) 1.1 R28 600 000 Unfunded Should submit BP
Kroonstad Section Brand Str (cross to
Swart str)
1.1 R9 900 000 Unfunded Should submit BP
Kroonstad Section Station Str (Cross
to Thesen str)
0.5 R4 500 000 Unfunded Should submit BP
Kroonstad Eight Road Industria 1.4 R15 400 000 Unfunded Should submit BP
Kroonstad Ninth road Industria 0.9 R9 900 000 Unfunded Should submit BP
Kroonstad Sevent road Industria 1.15 R12 650 000 Unfunded Should submit BP
Kroonstad Dolf Street (South Road to
Orpen)
0.65 R5 850 000 Unfunded Should submit BP
Kroonstad Crossing plellisier and Tom
Ferreira Str
0.05 R800 00 Unfunded Should submit BP
Maokeng Makobe Str (Section not
paved)
0.31 R1 488 000 Unfunded Should submit BP
7.5.6.2 Viljoenskroon
Area Street name KM Estimated
Amount
Funding
Source Remarks
Viljoenskroon Industrial area access road 0.47 R3 050 000 Unfunded Should submit BP
Viljoenskroon Burger Street Section 0.30 R1 950 000 Unfunded Should submit BP
Viljoenskroon Steynberg street section 0.30 R1 950 000 Unfunded Should submit BP
Viljoenskroon Link between Renevance
and Fotuna str
0.70 R4 550 000 Unfunded Should submit BP
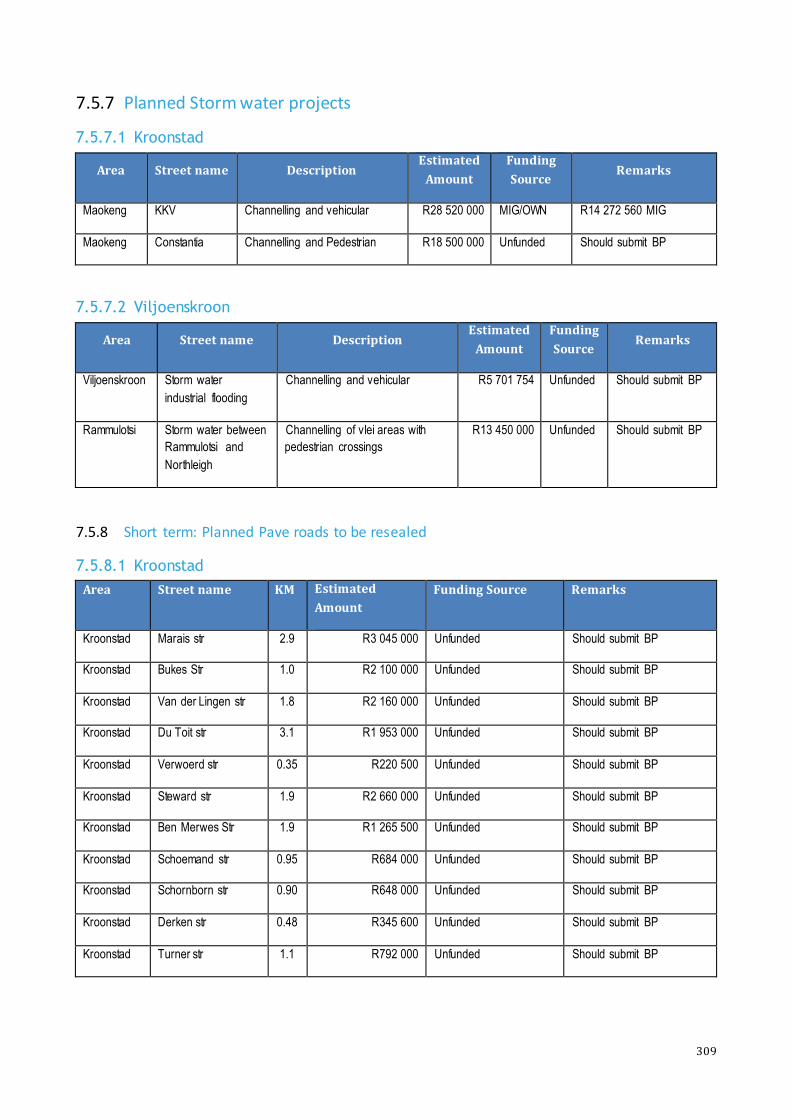
309
7.5.7 Planned Storm water projects
7.5.7.1 Kroonstad
Area Street name Description Estimated
Amount
Funding
Source Remarks
Maokeng KKV Channelling and vehicular R28 520 000 MIG/OWN R14 272 560 MIG
Maokeng Constantia Channelling and Pedestrian R18 500 000 Unfunded Should submit BP
7.5.7.2 Viljoenskroon
Area Street name Description Estimated
Amount
Funding
Source Remarks
Viljoenskroon Storm water
industrial flooding
Channelling and vehicular R5 701 754 Unfunded Should submit BP
Rammulotsi Storm water between
Rammulotsi and
Northleigh
Channelling of vlei areas with
pedestrian crossings
R13 450 000 Unfunded Should submit BP
7.5.8 Short term: Planned Pave roads to be resealed
7.5.8.1 Kroonstad
Area Street name KM Estimated
Amount
Funding Source Remarks
Kroonstad Marais str 2.9 R3 045 000 Unfunded Should submit BP
Kroonstad Bukes Str 1.0 R2 100 000 Unfunded Should submit BP
Kroonstad Van der Lingen str 1.8 R2 160 000 Unfunded Should submit BP
Kroonstad Du Toit str 3.1 R1 953 000 Unfunded Should submit BP
Kroonstad Verwoerd str 0.35 R220 500 Unfunded Should submit BP
Kroonstad Steward str 1.9 R2 660 000 Unfunded Should submit BP
Kroonstad Ben Merwes Str 1.9 R1 265 500 Unfunded Should submit BP
Kroonstad Schoemand str 0.95 R684 000 Unfunded Should submit BP
Kroonstad Schornborn str 0.90 R648 000 Unfunded Should submit BP
Kroonstad Derken str 0.48 R345 600 Unfunded Should submit BP
Kroonstad Turner str 1.1 R792 000 Unfunded Should submit BP
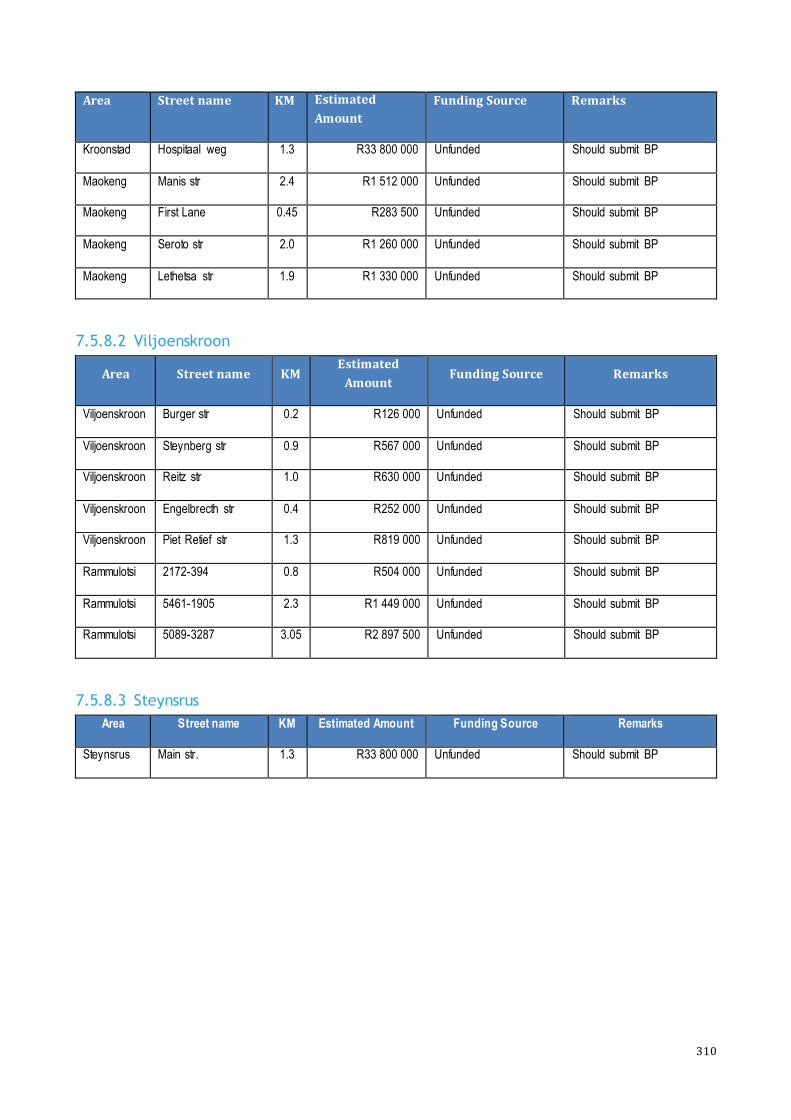
310
Area Street name KM Estimated
Amount
Funding Source Remarks
Kroonstad Hospitaal weg 1.3 R33 800 000 Unfunded Should submit BP
Maokeng Manis str 2.4 R1 512 000 Unfunded Should submit BP
Maokeng First Lane 0.45 R283 500 Unfunded Should submit BP
Maokeng Seroto str 2.0 R1 260 000 Unfunded Should submit BP
Maokeng Lethetsa str 1.9 R1 330 000 Unfunded Should submit BP
7.5.8.2 Viljoenskroon
Area Street name KM Estimated
Amount Funding Source Remarks
Viljoenskroon Burger str 0.2 R126 000 Unfunded Should submit BP
Viljoenskroon Steynberg str 0.9 R567 000 Unfunded Should submit BP
Viljoenskroon Reitz str 1.0 R630 000 Unfunded Should submit BP
Viljoenskroon Engelbrecth str 0.4 R252 000 Unfunded Should submit BP
Viljoenskroon Piet Retief str 1.3 R819 000 Unfunded Should submit BP
Rammulotsi 2172-394 0.8 R504 000 Unfunded Should submit BP
Rammulotsi 5461-1905 2.3 R1 449 000 Unfunded Should submit BP
Rammulotsi 5089-3287 3.05 R2 897 500 Unfunded Should submit BP
7.5.8.3 Steynsrus
Area Street name KM Estimated Amount Funding Source Remarks
Steynsrus Main str. 1.3 R33 800 000 Unfunded Should submit BP

311
7.5.8.4 Electricity Unfunded Projects
Nr: Project Name Project Description Implementation
Date
Cost Comments
Vi l joenskroon NMD increase Premium Supply
Unfunded for financial year
R 47 000 000
Upgrading overloaded LV Network: Seeisoville & Phomolong
Unfunded for financial year
Implementation of Load Control System / smart Metering
Unfunded for financial year
Replacement of 66kV switchgear
Unfunded for financial year
Check meters to verify Eskom accounts
Unfunded for financial year
Construction of Central Substation Kroonstad CBD (Phase4) - Installation of 66kV ring feed cables to Botha Street
Unfunded for financial year
Energy efficient public l ighting
Unfunded for financial year
Upgrade of Main
substation in Steynsrus
Unfunded for
financial year
Upgrade of Main
substation in Viljoenskroon
Unfunded for
financial year
Energy efficient traffic l ights
Unfunded for financial year
Moqhaka Public Lighting Unfunded for financial year
Upgrade MV switchgear panels in Kroonstad Substations
Unfunded for financial year
Electri fication projects Brentpark ext. 12 - 326 erven
Unfunded for financial year
Electri fication projects Elandia - 200 erven Unfunded for financial year
Electri fication projects Heuwelsig - 73 erven Unfunded for financial year
Electri fication projects Maokeng ext. 10 (next to Boitumelo phase 1) - 2278 erven
Unfunded for financial year
R 50 000 000
Electri fication projects Maokeng ext. 13 (next to
Boitumelo phase 2) - 2848 erven
Unfunded for
financial year
Electri fication projects Vi l joenskroon ext. 14 - 109 erven
Unfunded for financial year
Electri fication projects Vogelvlei - 800 erven Unfunded for
financial year
Electri fication projects Northleigh phase 1 - 2126
erven
Unfunded for
financial year
Electri fication projects Northleigh phase 2 - 1964 erven
Unfunded for financial year
Electri fication projects Northleigh phase 3 - 1509 erven
Unfunded for financial year
Electri fication projects Tuinhof - 109 erven Unfunded for financial year – own funding
R2 500 000
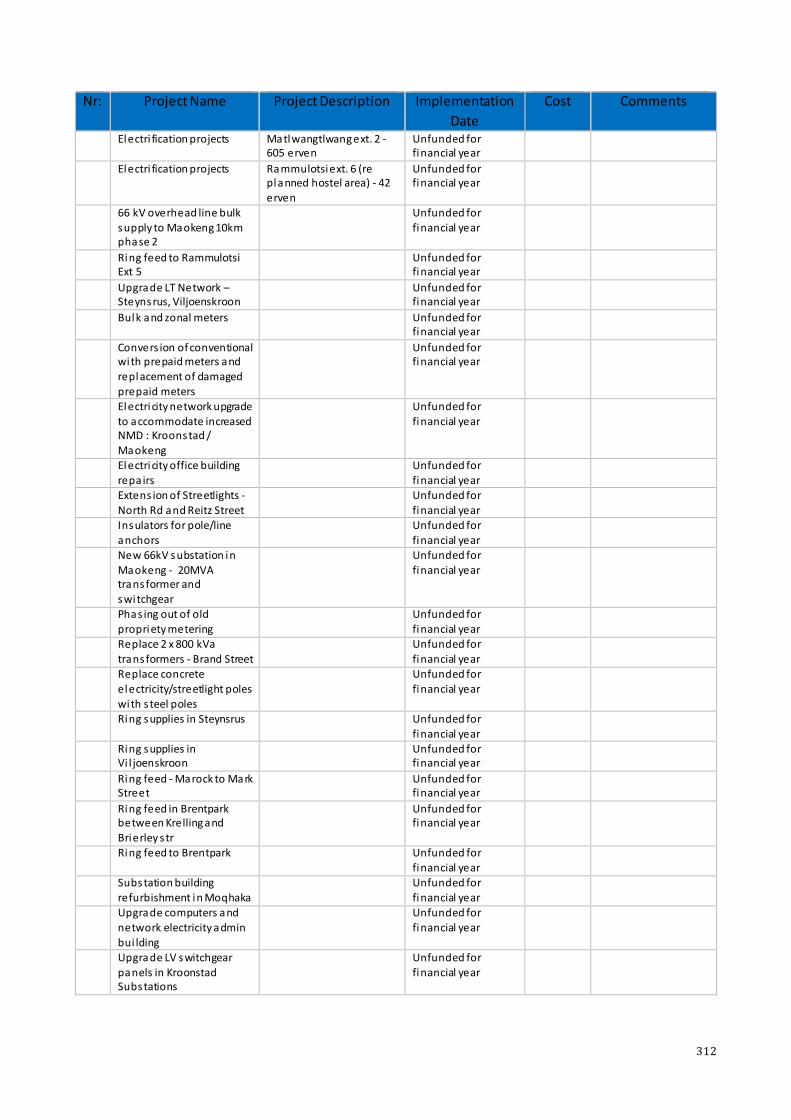
312
Nr: Project Name Project Description Implementation
Date
Cost Comments
Electri fication projects Matlwangtlwang ext. 2 - 605 erven
Unfunded for financial year
Electri fication projects Rammulotsi ext. 6 (re planned hostel area) - 42 erven
Unfunded for financial year
66 kV overhead line bulk supply to Maokeng 10km phase 2
Unfunded for financial year
Ring feed to Rammulotsi Ext 5
Unfunded for financial year
Upgrade LT Network – Steynsrus, Viljoenskroon
Unfunded for financial year
Bulk and zonal meters Unfunded for financial year
Convers ion of conventional with prepaid meters and replacement of damaged
prepaid meters
Unfunded for financial year
Electricity network upgrade to accommodate increased NMD : Kroonstad / Maokeng
Unfunded for financial year
Electricity office building repairs
Unfunded for financial year
Extens ion of Streetlights -
North Rd and Reitz Street
Unfunded for
financial year
Insulators for pole/line
anchors
Unfunded for
financial year
New 66kV substation in Maokeng - 20MVA transformer and switchgear
Unfunded for financial year
Phas ing out of old propriety metering
Unfunded for financial year
Replace 2 x 800 kVa
transformers - Brand Street
Unfunded for
financial year
Replace concrete
electricity/streetlight poles with s teel poles
Unfunded for
financial year
Ring supplies in Steynsrus Unfunded for
financial year
Ring supplies in Vi l joenskroon
Unfunded for financial year
Ring feed - Marock to Mark Street
Unfunded for financial year
Ring feed in Brentpark between Krelling and
Brierley s tr
Unfunded for financial year
Ring feed to Brentpark Unfunded for financial year
Substation building refurbishment in Moqhaka
Unfunded for financial year
Upgrade computers and network electricity admin
bui lding
Unfunded for financial year
Upgrade LV switchgear panels in Kroonstad Substations
Unfunded for financial year

313
Nr: Project Name Project Description Implementation
Date
Cost Comments
Upgrade of Max Demand Meters
Unfunded for financial year
Upgrade of MV and LV network in Brentpark
Unfunded for financial year
Upgrade of overloaded electrical network (2 x 500kVa mini subs) Seeisoville & CBD
Unfunded for financial year
Upgrade transformer protection (Steiner,
Ramsbottom and Piet de Vries subs)
Unfunded for financial year
Vrisgewaagd small holdings Repair and replace of faulty cable
Unfunded for financial year
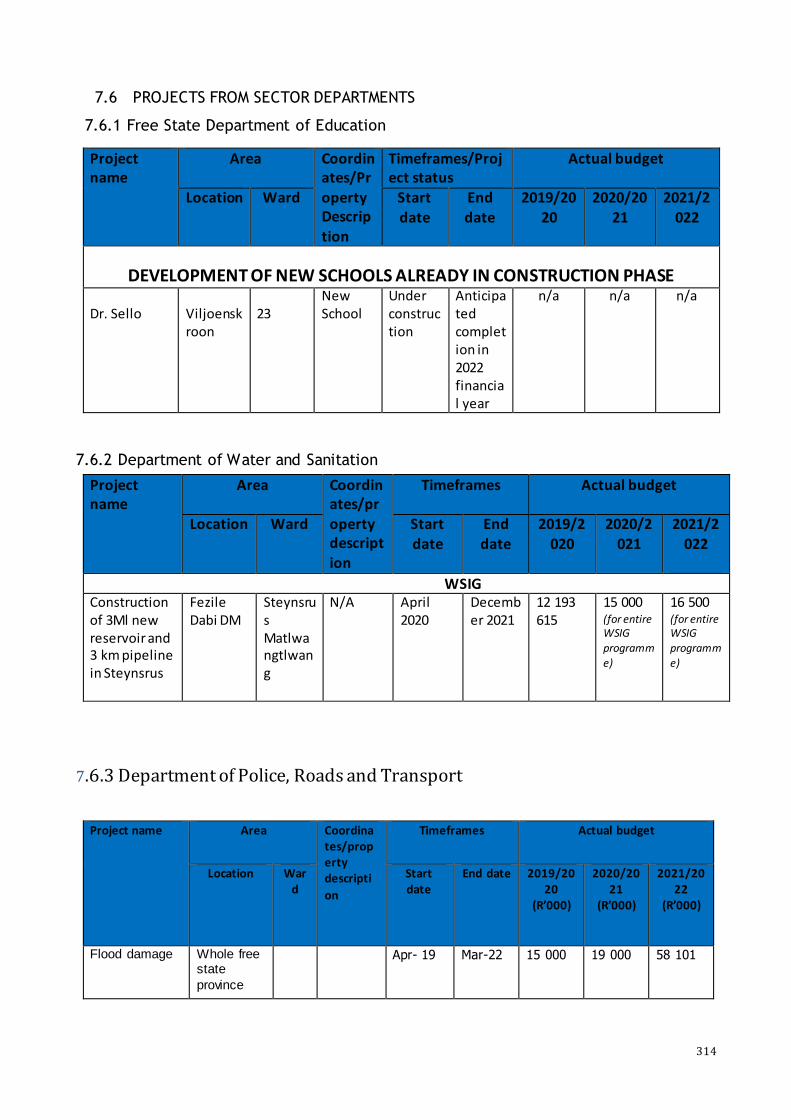
314
7.6 PROJECTS FROM SECTOR DEPARTMENTS
7.6.1 Free State Department of Education
Project name
Area Coordinates/Pr
operty Descrip
tion
Timeframes/Project status
Actual budget
Location Ward Start date
End date
2019/2020
2020/2021
2021/2022
DEVELOPMENT OF NEW SCHOOLS ALREADY IN CONSTRUCTION PHASE Dr. Sello
Viljoenskroon
23
New School
Under construction
Anticipated completion in 2022 financial year
n/a n/a n/a
7.6.2 Department of Water and Sanitation
Project name
Area Coordinates/property description
Timeframes Actual budget
Location Ward Start
date
End
date
2019/2
020
2020/2
021
2021/2
022
WSIG Construction of 3Ml new reservoir and 3 km pipeline in Steynsrus
Fezile Dabi DM
Steynsrus Matlwangtlwang
N/A April 2020
December 2021
12 193 615
15 000 (for entire WSIG
programme)
16 500 (for entire WSIG
programme)
7.6.3 Department of Police, Roads and Transport
Project name Area Coordinates/property descripti
on
Timeframes Actual budget
Location Ward
Start date
End date 2019/2020
(R’000)
2020/2021
(R’000)
2021/2022
(R’000)
Flood damage Whole free state
province
Apr- 19 Mar-22 15 000 19 000 58 101
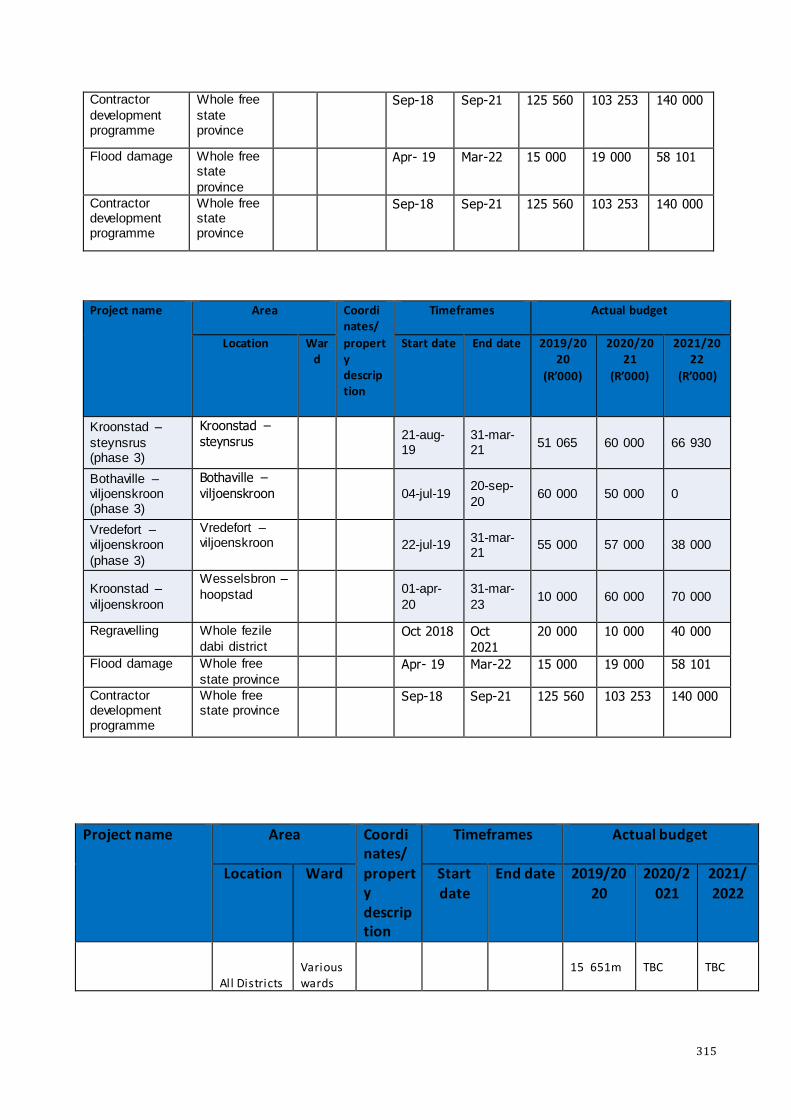
315
Contractor
development programme
Whole free
state province
Sep-18 Sep-21 125 560 103 253 140 000
Flood damage Whole free state
province
Apr- 19 Mar-22 15 000 19 000 58 101
Contractor development programme
Whole free state province
Sep-18 Sep-21 125 560 103 253 140 000
Project name Area Coordi
nates/
property description
Timeframes Actual budget
Location Ward
Start date End date 2019/2020
(R’000)
2020/2021
(R’000)
2021/2022
(R’000)
Kroonstad –
steynsrus (phase 3)
Kroonstad –
steynsrus
21-aug-19
31-mar-21
51 065 60 000 66 930
Bothaville – viljoenskroon (phase 3)
Bothaville –
viljoenskroon
04-jul-19 20-sep-
20 60 000 50 000 0
Vredefort – viljoenskroon
(phase 3)
Vredefort – viljoenskroon
22-jul-19 31-mar-21
55 000 57 000 38 000
Kroonstad –
viljoenskroon
Wesselsbron –
hoopstad
01-apr-
20
31-mar-
23 10 000 60 000 70 000
Regravelling Whole fezile
dabi district Oct 2018 Oct
2021
20 000 10 000 40 000
Flood damage Whole free
state province Apr- 19 Mar-22 15 000 19 000 58 101
Contractor development programme
Whole free state province
Sep-18 Sep-21 125 560 103 253 140 000
Project name Area Coordinates/
property
description
Timeframes Actual budget
Location Ward Start date
End date 2019/2020
2020/2021
2021/2022
All Districts
Various wards
15 651m
TBC
TBC

316
Cleaning and
Greening
Cleaning
and ,beautification of public
areas
1st April
2020
31st March
2021
Community Work Programme
All Districts
Various wards
1st April 2020
31st March 2021
11 183m
TBC
TBC
Cash for Waste
Fezile Dabi
Various wards
Cleaning ,i l legal dumping and
waste collection
1st April 2020
31st March 2021
3 954m
TBC
TBC
National Youth Services ( NYS )
All Districts
Various
wards
Provide work
place skil ls
1st April
2020
1st April
2020
42 4m
TBC
TBC
Contractor Development
Programme ( CDP )
All Districts
Provide construct
ion skil ls
TBC
TBC
5 2m
TBC
TBC
7.6.4 Department Of Economics, Small Business, Tourism And Environmental Affairs Annexure A: District Development Model (SP)
Project
name
Area Coordi
nates/property description
Timeframes Actual budget
Location Ward Start date End date
2019/2020
2020/2021
2021/2022
Development of the Air
Quality Management Plan
All All n/a 01/04/2020 31/03/2021
R500 000
Review of the Integrated
Waste Management Plan
All All n/a 01/04/2020 31/03/2021
R500 000

317
Project name
Area Coordinates/proper
ty descri
ption
Timeframes Actual budget
Location Ward Start date End
date
2019/2
020
2020/2
021
2021/2
022
Review of the Climate Change
Mitigation Plan Adaptation and Response
Implementation Plan
All All n/a 01/04/2020 31/03/2021
R500 000
Development
FS Province Wildlife and Biodiversity Economy
Strategy and Implementation Plan
All All n/a 01/04/2020 31/03/20
21
R1.2
Mill ion
Development of the FS Province
Environment Sector Funding Model
All All n/a 01/04/2020 31/03/2021
R800 000
Development
of the FS Province Waste Township Economy and
Recycling Strategy and Implementatio
n Plan
All All n/a 01/04/2021 31/03/20
22
R800 000
Development of an EIAS Approval
Process Jobs Tracking Model
All All n/a 01/04/2021 31/03/2022
R300 000

318
Project name
Area Coordinates/proper
ty descri
ption
Timeframes Actual budget
Location Ward Start date End
date
2019/2
020
2020/2
021
2021/2
022
Development of a Research
Future Projections of Development
Opportunities within the Environment Sector
All All n/a 01/04/2020 31/03/2021
R400 000
Development
of an MTEF Projects Plan in l ine with the Sector Gender
Strategy and Draft Environment Sector Skil ls
Development Strategy
All All n/a 01/04/2020 31/03/20
21
R100 000
Project name
Area Coordinates/property description
Timeframes Drafted budget awaiting final appropriation budget from Provincial Treasury
Location Ward Start date
End date
2019/2020
2020/2021
2021/2022
Marabastad TRP
Moqhaka
Township Revitalization Programme
31 Mar 2022
R3 500 000
TBC TBC
Steynsrus
TRP
Moqhaka
Township
Revitalization Programme
23 Oct
2019
31 Mar
2022
R3 640
000
TBC TBC

319
Works Design, Construction and Maintenance
Project name Area Coordinates/property
description
Timeframes Drafted budget awaiting final appropriation budget from Provincial Treasury
Location Ward
Start date
End date
2019/2020
2020/2021
2021/2022
Boitumelo Hos T/S Moqhaka Hospital 2019/2020
7.6.5 Department of Environmental Affairs
DISTRICT LOCAL MUNICIPALITY
PROJECT NAME PURPOSE/ ENVISAGED IMPACT
RESPONSIBLE AGENT/ PARTY
TIME FRAME
Fezile Dabi
Moqhaka LM Moqhaka Waste Management
Initiative
Raising awareness, and Waste Bylaws, converting corner
dumps in vegetable gardens and parks
Coke-a-Cola, DESTEA and
DEFF
2020- 2021
Fezile
Dabi
Moqhaka LM Review IWMP Legislatively required
activity on the updating of waste management plans
Fezile Dabi DM,
DEFF:Andrew Motha, DESTEA,
Moqhaka LM and DEFF:LGS
2020-2021
Fezile Dabi
All municipalities
Implementation of Good Green
Deeds Project
Temporary Employment of 132
youth for 24 months as environmental campaigners for cleaning and greening
of environ
All municipalities
within the Fezile Dabi DM, DEFF:EPIP and
DEFF: LGS
2019-2022 (3yrs)
Fezile Dabi
Moqhaka and Mafube LM
Skills Development Training
projects
Plumbing and Environmental Management
DEFF: EPIP and DEFF: LGS
2019-2020
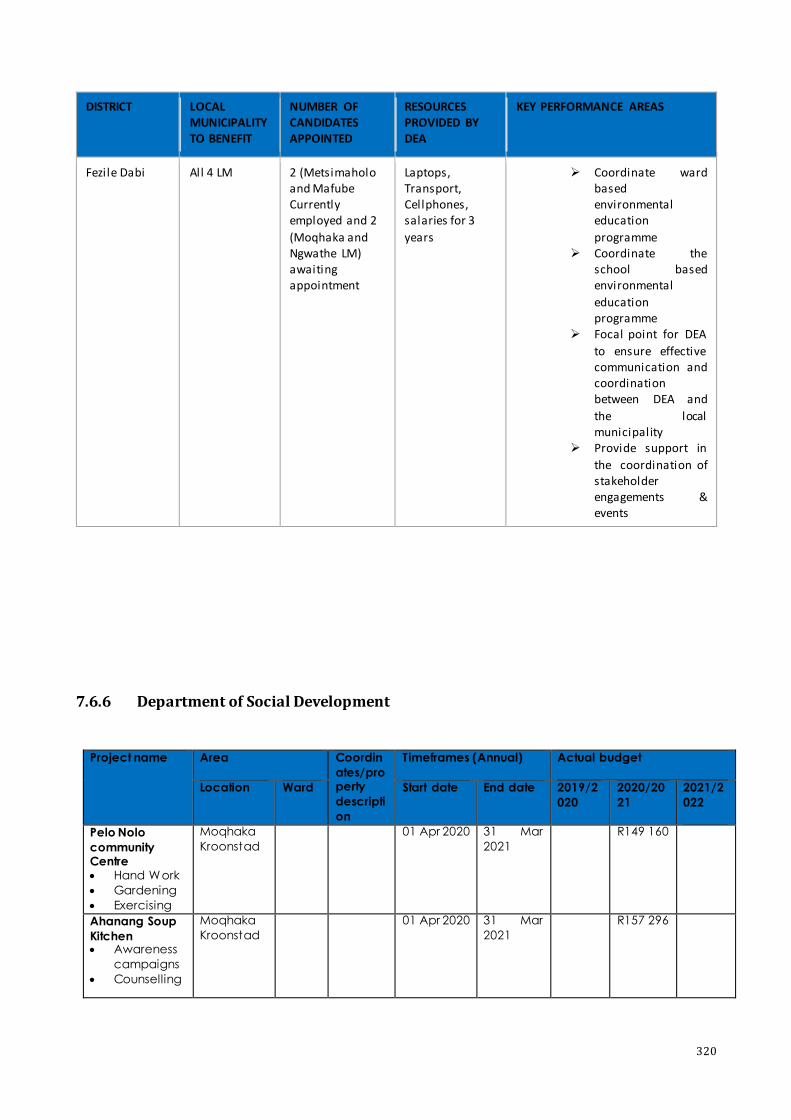
320
DISTRICT LOCAL MUNICIPALITY TO BENEFIT
NUMBER OF CANDIDATES APPOINTED
RESOURCES PROVIDED BY DEA
KEY PERFORMANCE AREAS
Fezile Dabi All 4 LM 2 (Metsimaholo and Mafube Currently employed and 2
(Moqhaka and Ngwathe LM) awaiting appointment
Laptops, Transport, Cellphones, salaries for 3
years
Coordinate ward based environmental education
programme Coordinate the
school based environmental
education programme
Focal point for DEA
to ensure effective communication and coordination between DEA and
the local municipality
Provide support in
the coordination of stakeholder engagements & events
7.6.6 Department of Social Development
Project name Area Coordin
ates/property
descripti
on
Timeframes (Annual) Actual budget
Location Ward Start date
End date 2019/2
020
2020/20
21
2021/2
022
Pelo Nolo
community Centre Hand Work
Gardening
Exercising
Moqhaka
Kroonstad 01 Apr 2020 31 Mar
2021
R149 160
Ahanang Soup
Kitchen Awareness
campaigns
Counselling
Moqhaka
Kroonstad 01 Apr 2020 31 Mar
2021
R157 296

321
Project name Area Coordin
ates/pro
perty descripti
on
Timeframes (Annual) Actual budget
Location Ward Start date
End date 2019/2
020
2020/20
21
2021/2
022
Sports
Activ ities
Rearabetswe
CNDC Gardening
Moqhaka
Steynsrus 01 Apr 2020 31 Mar
2021
R67 800
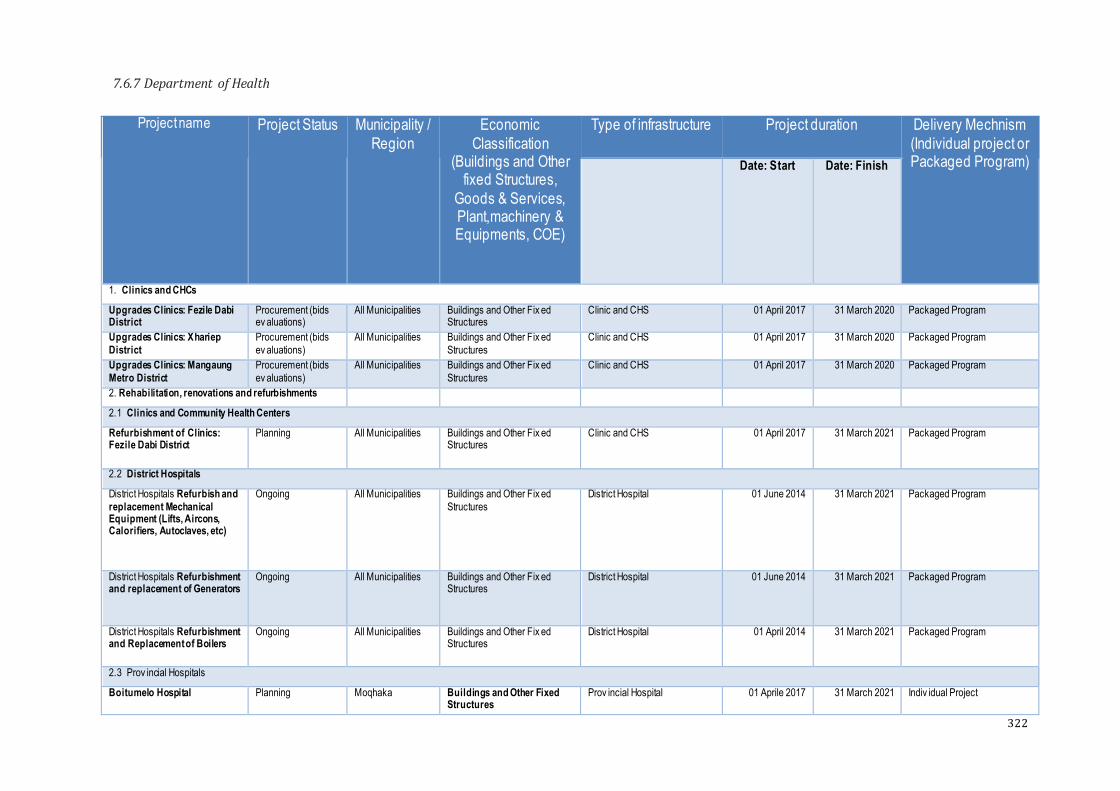
322
7.6.7 Department of Health
Project name Project Status Municipality /
Region
Economic
Classification (Buildings and Other
fixed Structures,
Goods & Services, Plant,machinery & Equipments, COE)
Type of infrastructure Project duration Delivery Mechnism
(Individual project or Packaged Program) Date: Start Date: Finish
1. Clinics and CHCs
Upgrades Clinics: Fezile Dabi District
Procurement (bids ev aluations)
All Municipalities Buildings and Other Fix ed Structures
Clinic and CHS 01 April 2017 31 March 2020 Packaged Program
Upgrades Clinics: Xhariep
District
Procurement (bids
ev aluations)
All Municipalities Buildings and Other Fix ed
Structures
Clinic and CHS 01 April 2017 31 March 2020 Packaged Program
Upgrades Clinics: Mangaung
Metro District
Procurement (bids
ev aluations)
All Municipalities Buildings and Other Fix ed
Structures
Clinic and CHS 01 April 2017 31 March 2020 Packaged Program
2. Rehabilitation, renovations and refurbishments 2.1 Clinics and Community Health Centers
Refurbishment of Clinics: Fezile Dabi District
Planning All Municipalities Buildings and Other Fix ed Structures
Clinic and CHS 01 April 2017 31 March 2021 Packaged Program
2.2 District Hospitals
District Hospitals Refurbish and
replacement Mechanical Equipment (Lifts, Aircons, Calorifiers, Autoclaves, etc)
Ongoing All Municipalities Buildings and Other Fix ed
Structures
District Hospital 01 June 2014 31 March 2021 Packaged Program
District Hospitals Refurbishment and replacement of Generators
Ongoing All Municipalities Buildings and Other Fix ed Structures
District Hospital 01 June 2014 31 March 2021 Packaged Program
District Hospitals Refurbishment and Replacement of Boilers
Ongoing All Municipalities Buildings and Other Fix ed Structures
District Hospital 01 April 2014 31 March 2021 Packaged Program
2.3 Prov incial Hospitals
Boitumelo Hospital Planning Moqhaka Buildings and Other Fixed Structures
Prov incial Hospital 01 Aprile 2017 31 March 2021 Indiv idual Project
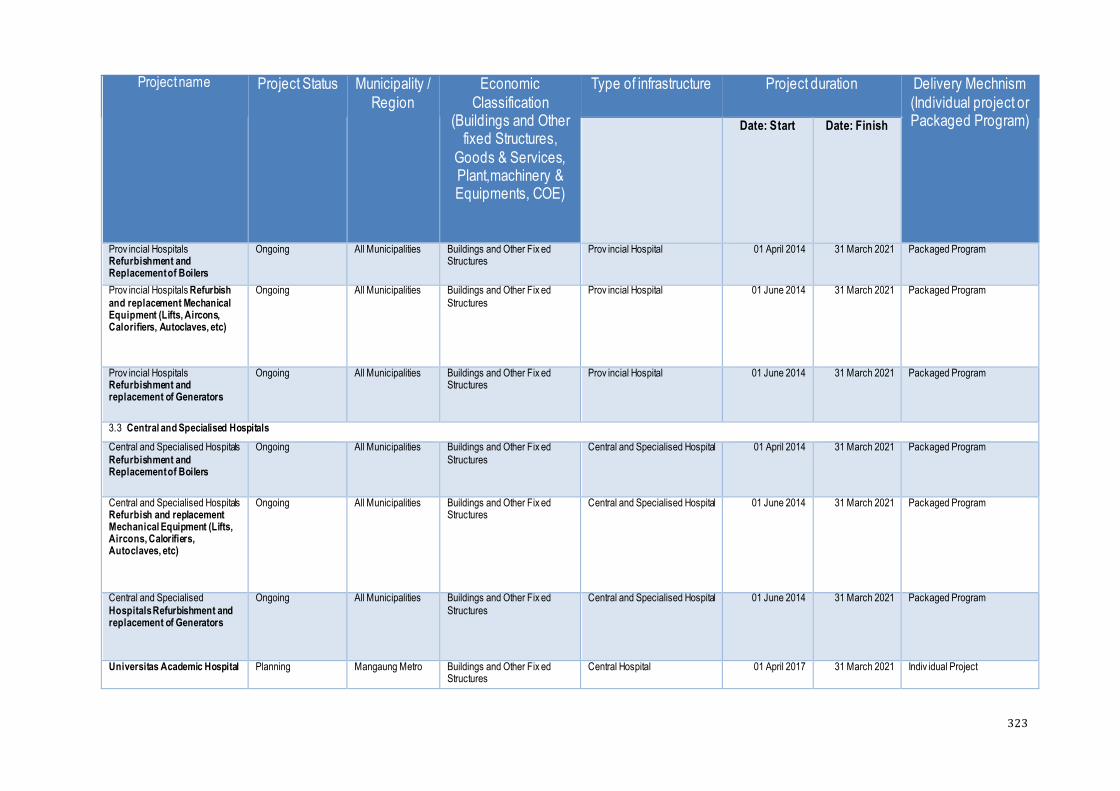
323
Project name Project Status Municipality /
Region
Economic
Classification (Buildings and Other
fixed Structures,
Goods & Services, Plant,machinery & Equipments, COE)
Type of infrastructure Project duration Delivery Mechnism
(Individual project or Packaged Program) Date: Start Date: Finish
Prov incial Hospitals Refurbishment and Replacement of Boilers
Ongoing All Municipalities Buildings and Other Fix ed Structures
Prov incial Hospital 01 April 2014 31 March 2021 Packaged Program
Prov incial Hospitals Refurbish
and replacement Mechanical Equipment (Lifts, Aircons, Calorifiers, Autoclaves, etc)
Ongoing All Municipalities Buildings and Other Fix ed
Structures
Prov incial Hospital 01 June 2014 31 March 2021 Packaged Program
Prov incial Hospitals Refurbishment and replacement of Generators
Ongoing All Municipalities Buildings and Other Fix ed Structures
Prov incial Hospital 01 June 2014 31 March 2021 Packaged Program
3.3 Central and Specialised Hospitals
Central and Specialised Hospitals
Refurbishment and Replacement of Boilers
Ongoing All Municipalities Buildings and Other Fix ed
Structures
Central and Specialised Hospital 01 April 2014 31 March 2021 Packaged Program
Central and Specialised Hospitals Refurbish and replacement Mechanical Equipment (Lifts, Aircons, Calorifiers, Autoclaves, etc)
Ongoing All Municipalities Buildings and Other Fix ed Structures
Central and Specialised Hospital 01 June 2014 31 March 2021 Packaged Program
Central and Specialised
Hospitals Refurbishment and replacement of Generators
Ongoing All Municipalities Buildings and Other Fix ed
Structures
Central and Specialised Hospital 01 June 2014 31 March 2021 Packaged Program
Universitas Academic Hospital Planning Mangaung Metro Buildings and Other Fix ed Structures
Central Hospital 01 April 2017 31 March 2021 Indiv idual Project
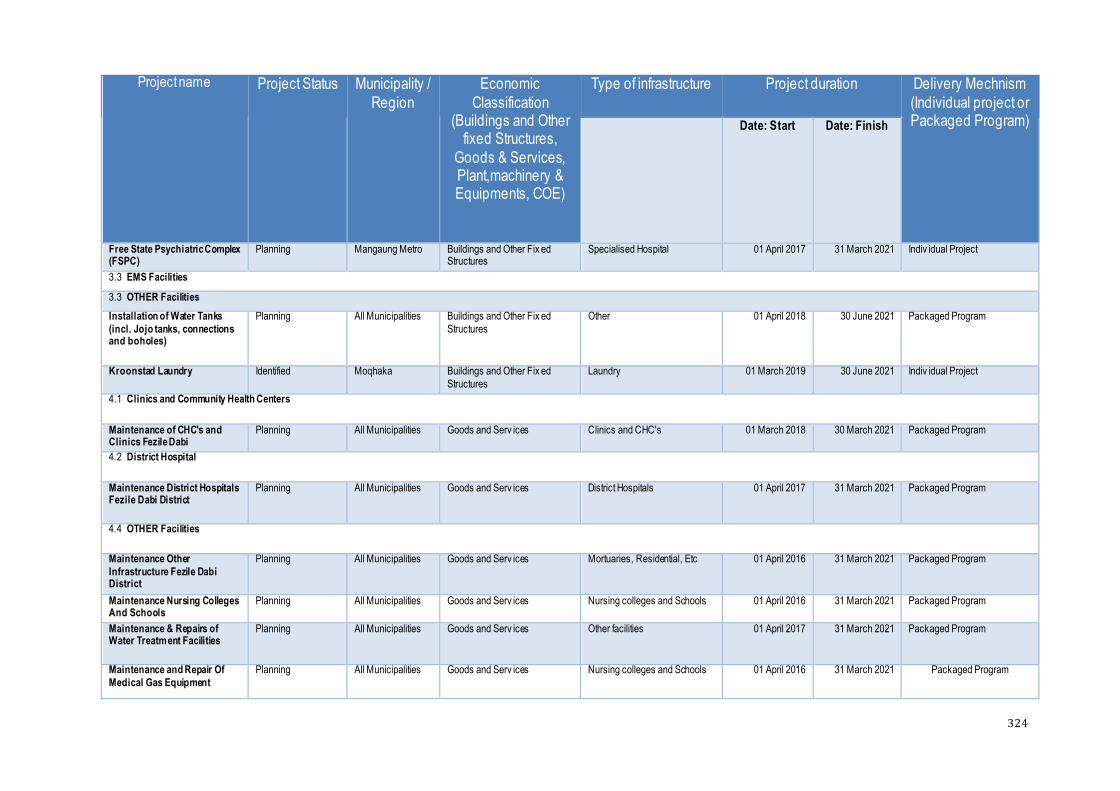
324
Project name Project Status Municipality /
Region
Economic
Classification (Buildings and Other
fixed Structures,
Goods & Services, Plant,machinery & Equipments, COE)
Type of infrastructure Project duration Delivery Mechnism
(Individual project or Packaged Program) Date: Start Date: Finish
Free State Psychiatric Complex (FSPC)
Planning Mangaung Metro Buildings and Other Fix ed Structures
Specialised Hospital 01 April 2017 31 March 2021 Indiv idual Project
3.3 EMS Facilities
3.3 OTHER Facilities
Installation of Water Tanks
(incl. Jojo tanks, connections and boholes)
Planning All Municipalities Buildings and Other Fix ed
Structures
Other 01 April 2018 30 June 2021 Packaged Program
Kroonstad Laundry Identified Moqhaka Buildings and Other Fix ed
Structures
Laundry 01 March 2019 30 June 2021 Indiv idual Project
4.1 Clinics and Community Health Centers
Maintenance of CHC's and Clinics Fezile Dabi
Planning All Municipalities Goods and Serv ices Clinics and CHC's 01 March 2018 30 March 2021 Packaged Program
4.2 District Hospital
Maintenance District Hospitals Fezile Dabi District
Planning All Municipalities Goods and Serv ices District Hospitals 01 April 2017 31 March 2021 Packaged Program
4.4 OTHER Facilities
Maintenance Other
Infrastructure Fezile Dabi District
Planning All Municipalities Goods and Serv ices Mortuaries, Residential, Etc 01 April 2016 31 March 2021 Packaged Program
Maintenance Nursing Colleges And Schools
Planning All Municipalities Goods and Serv ices Nursing colleges and Schools 01 April 2016 31 March 2021 Packaged Program
Maintenance & Repairs of Water Treatment Facilities
Planning All Municipalities Goods and Serv ices Other facilities 01 April 2017 31 March 2021 Packaged Program
Maintenance and Repair Of
Medical Gas Equipment
Planning All Municipalities Goods and Serv ices Nursing colleges and Schools 01 April 2016 31 March 2021 Packaged Program

325
Project name Project Status Municipality /
Region
Economic
Classification (Buildings and Other
fixed Structures,
Goods & Services, Plant,machinery & Equipments, COE)
Type of infrastructure Project duration Delivery Mechnism
(Individual project or Packaged Program) Date: Start Date: Finish
Project Name Program Project Description Project Starting
Date Project completion Date
Total Est. Cost (R’000)
Boitumelo Regional Hosp.(Kroonstad)
8 Completion of revitalization,final contract
01/04/2020 planning 31/03/2022 260,000
Laundry Kroonstad 8 Refurbishment of entire facility and replacement of equipment
01/03/2021 30/06/2023 5,000
Hill Street Clinic (Kroonstad)
8 Constraction of new clinic (Replacement)
01/04/2020 31/03/2024 40,000
Brentpark Clinic (Kroonstad)
8 Refurbishment and upgrading of entire facility
01/042020 30/11/2023 8,000
Lesedi CHC(Kroonstad)
8 Refurbishment and upgrading of entire facility
01/04/2018 30/03/2023 20,000
Pax CHC (Viljoenskroon)
8 Refurbishment and upgrading of entire facility
30/06/2020 30/06/2021 80,000
Bophelong Clinic (Kroonstad)
8 Replacement of Clinic 01/04/2020 31/03/2023 8,000
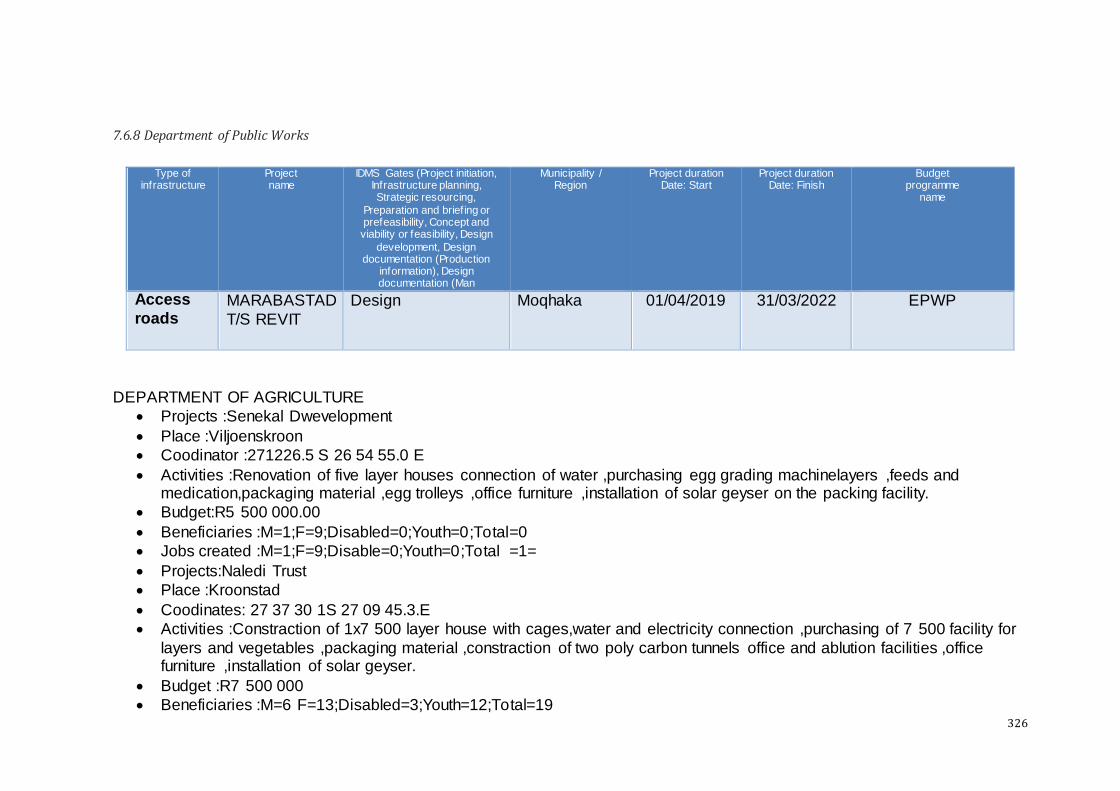
326
7.6.8 Department of Public Works
Type of
infrastructure Project name
IDMS Gates (Project initiation, Infrastructure planning, Strategic resourcing,
Preparation and briefing or prefeasibility, Concept and viability or feasibility, Design
development, Design documentation (Production
information), Design documentation (Man
Municipality / Region
Project duration Date: Start
Project duration Date: Finish
Budget programme
name
Access
roads MARABASTAD
T/S REVIT
Design Moqhaka 01/04/2019 31/03/2022 EPWP
DEPARTMENT OF AGRICULTURE
Projects :Senekal Dwevelopment
Place :Viljoenskroon
Coodinator :271226.5 S 26 54 55.0 E
Activities :Renovation of five layer houses connection of water ,purchasing egg grading machinelayers ,feeds and medication,packaging material ,egg trolleys ,office furniture ,installation of solar geyser on the packing facility.
Budget:R5 500 000.00
Beneficiaries :M=1;F=9;Disabled=0;Youth=0;Total=0
Jobs created :M=1;F=9;Disable=0;Youth=0;Total =1=
Projects:Naledi Trust
Place :Kroonstad
Coodinates: 27 37 30 1S 27 09 45.3.E
Activities :Constraction of 1x7 500 layer house with cages,water and electricity connection ,purchasing of 7 500 facility for
layers and vegetables ,packaging material ,constraction of two poly carbon tunnels office and ablution facilities ,office furniture ,installation of solar geyser.
Budget :R7 500 000
Beneficiaries :M=6 F=13;Disabled=3;Youth=12;Total=19

327
Jobs Created:M=6;F=13; ILIMA/LETSEMA PROJECTS CONT:
Project:Klipan 2(Ramaele Farming)
Place :Steynsrus
Coodinates:27 27.37S 28 38 25.95E
Total Ha:100 ha
Activities :Purchase of 25 cattle @R17 000 and 1 bull @R66 000 planting of maize for 100 ha (12 000/ha including diesel
and machinery)
Budget:R1 791 000
Bebeficiaries:M=2;F=4;Disabled=0;Youth=1;Total =6
Jobs Created:M=2F=4;Disabled=0;Youth=1 Total 6
Project:Jaskraal
Place:Steynsrus
Codinates:27 59 04 5S 27 32 24.7E
Total :Ha: 130 ha
Activities:Planting of maize for 130ha (12 00/ha including diesel and machinery)
Budget:R1 691 000
Beneficiaries M=11;F=6;Disabled=0;Youth=4; Total ILIMA/LETSEMA PROJECTS CONT:
Project:Olivenfontein Farm (Sekekete Farming)
Place :Steynsrus
Total: 27 33 53. 8. 5S 27 33 05 .4E
Total Ha: 200ha
Activities :Planting of maize 20ha (R12 000 including diesel and machinery
Budget: R2 400 000
Beneficiaries:M=4;F=5;Disabled=0;Youth=4;Total=9
Jobs Created:M=4;F=5;Youth=0;To ILIMA/LETSEMA PROJECTS CONT:
Project: Vergenoeg Farm (Phahla Farming)
Place:Viljoenskroon
Coodinates: 27 15 028S 28 31 30.E
Total:Ha 130 ha
Activities :Purchasing of 25 cattle @ R17 000 and 1 bujll @ R66 000 feed and medication.

328
Budget: R550 000
Beneficiaries:M=1;F=0;Disabled=0;Youth=0;Total=1
Jobs Created M=1;F=0;Disabled=0;Youth=0 Total =1 ILIMA/LETSEMA PROJECTS CONT:
Poject: Selai Farming
Place: Kroonstad
Coodinates:
Total Ha 284 ha
Activities Sitting ;drilling and equipping

329
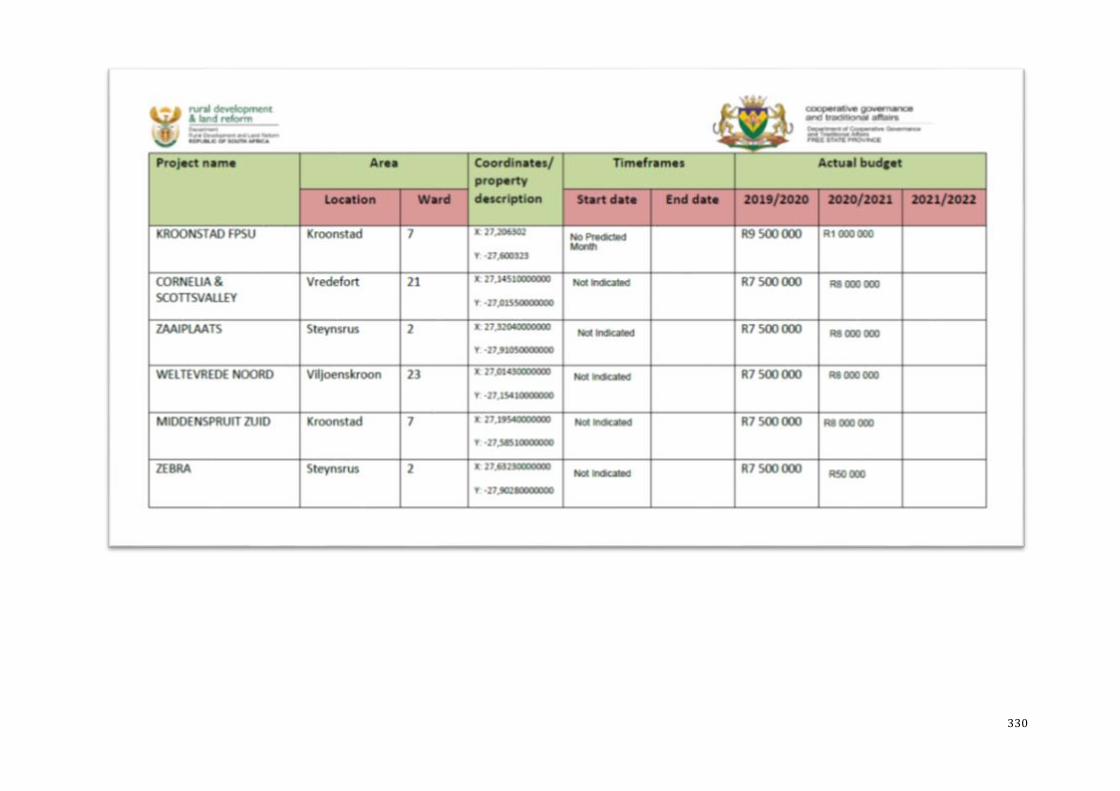
330