DRAFT 2019/2020 IDP - Ugu District Municipality
255
1 DRAFT 2019/2020 IDP
-
Upload
khangminh22 -
Category
Documents
-
view
3 -
download
0
Transcript of DRAFT 2019/2020 IDP - Ugu District Municipality
1
DRAFT
2019/2020 IDP
2
Contents Chapter 1: Executive Summary ............................................................................................................. 10
1.1 Who Are We? ........................................................................................................................ 10
1.1.1 Demographics Overview .............................................................................................. 13
1.2 How was this IDP Developed? .................................................................................................... 13
1.3 Our Key Development Challenges .............................................................................................. 15
1.3.1 Basic Services ....................................................................................................................... 15
1.3.2 Municipal Transformation and Institutional Development ................................................. 15
1.3.3 Local Economic Development .............................................................................................. 16
1.3.4 Municipal Financial Viability and Management ................................................................... 16
1.5 What will we do to unlock and Address our Key Challenges? .................................................. 16
1.5.1 Basic Services ....................................................................................................................... 16
1.5.2 Municipal Transformation and Institutional Development .................................................... 16
1.5.3 Local Economic Development ............................................................................................. 16
1.5.4 Municipal Financial Viability and Management ................................................................. 17
1.5.5 Good Governance and Public Participation ....................................................................... 17
1.5.6 Cross Cutting Issues ............................................................................................................. 17
1.6 What could you expect from us in the next five years? ........................................................... 17
1.7 How will our progress be measured? ........................................................................................ 18
1.7.1 Two Level Scorecard ............................................................................................................ 18
1.7.2 Monitoring and Evaluation ................................................................................................. 19
Chapter 2 Government Priorities ......................................................................................................... 20
2.1 Sustainable Development Goals ................................................................................................ 20
2.1.1 Applicability to Ugu ............................................................................................................. 21
2.2 National Development Plan: 2030 ............................................................................................. 21
2.2.1 Medium Term Strategic Framework (MTSF) ...................................................................... 21
2.2.2 State of the Nation Address ............................................................................................... 22
2.2.3 Applicability to Ugu District ................................................................................................ 23
2.3 KZN Provincial Growth Development Strategy ......................................................................... 23
2.3.1 State of the Province Address ............................................................................................. 24
2.3.2 Applicability to Ugu District ................................................................................................. 25
2.4 Local Government Back to Basics Programme ..................................................................... 25
2.4.1 Applicability to Ugu .............................................................................................................. 26
2.5 Ugu District Growth and Development Plan ............................................................................. 28
2.5.1 Applicability to Ugu ............................................................................................................. 28
2.6 Spatial Planning and Land Use Management Act ..................................................................... 28
3
CHAPTER 3: SITUATIONAL ANALYSIS ................................................................................................... 31
3.1 Cross Cutting Interventions ....................................................................................................... 31
3.1.1 Regional Context ................................................................................................................. 31
3.1.2 Administrative Entities ........................................................................................................ 31
3.1.3 Existing Nodes and Corridors .............................................................................................. 33
3.1.4 Broad Land Use Patterns ..................................................................................................... 37
3.1.5 Land Ownership ................................................................................................................... 42
3.1.6 Land Reform ......................................................................................................................... 44
3.1.7 Land Potential ...................................................................................................................... 44
3.2 Environmental Management Analysis ........................................................................................ 46
3.2.1 Key Hydrological features .................................................................................................... 47
3.2.2 Protected areas .................................................................................................................... 49
3.2.3 Management Effectiveness and Pressures Facing Protected Areas .................................... 51
3.2.4 Biodiversity........................................................................................................................... 54
3.2.5 Households located in hazardous areas .............................................................................. 54
3.2.6 Vegetation ............................................................................................................................ 55
3.2.7 Climate Change .................................................................................................................... 58
3.3 Environmental Health Services (EHS) ......................................................................................... 61
3.3.1 Food Control ........................................................................................................................ 61
3.3.2 Water Quality Monitoring .................................................................................................... 61
3.3.3 Communicable Diseases Control ......................................................................................... 62
3.3.4 Vector Control ...................................................................................................................... 62
3.3.5 Hazardous Chemical Substances .......................................................................................... 62
3.3.6 Disposal of the Dead ............................................................................................................ 63
3.3.7 Surveillance of Premises ...................................................................................................... 63
3.3.8 Environmental Health Education ......................................................................................... 63
3.3.9 Environmental Pollution ...................................................................................................... 64
3.3.10 Waste management control .............................................................................................. 64
3.4 Spatial and Environment Trend Analysis .................................................................................... 65
3.5 Spatial and Environment SWOT Analysis .................................................................................... 66
3.6 Disaster Management ................................................................................................................. 67
3.6.1 Municipal Institutional Capacity .......................................................................................... 67
3.6.2 Risk Assessment ................................................................................................................... 69
3.6.3 District Vulnerability to Disaster Risk 2016/2017 Information ............................................ 70
3.6.4 Risk Reduction and Prevention ............................................................................................ 71
3.6.5 Status of the Disaster Management Plans ........................................................................... 71
4
3.6.6 Response and Recovery ....................................................................................................... 71
3.6.7 Disaster Management Training and Awareness .................................................................. 72
3.6.8 Disaster Management Funding Arrangements .................................................................... 72
3.6.9 Disaster Management SWOT Analysis ................................................................................. 72
3.7 Demographic Characteristics ...................................................................................................... 73
3.7.1 Population ............................................................................................................................ 74
3.7.2 Population Distribution ........................................................................................................ 74
3.7.3 Population Density ............................................................................................................... 75
3.7.4 Households........................................................................................................................... 78
3.7.5 Demographic Analysis Emerging Key Issues ........................................................................ 79
3.8 Municipal Transformation and Institutional Development Analysis .......................................... 79
3.8.1 Powers and Functions .......................................................................................................... 79
3.8.2 Institutional Arrangement ................................................................................................... 80
3.8.3 Municipal Entities ................................................................................................................ 81
3.8.4 Organisational Analysis ........................................................................................................ 82
3.8.5 Human Resources ................................................................................................................ 83
3.8.6 Skills Analysis ........................................................................................................................ 84
3.8.7 Health and Safety in the Workplace .................................................................................... 87
3.8.8 Analysis of Employee Health and Wellness ......................................................................... 88
3.8.9 Analysis of Employee Assistant Programme Provision ........................................................ 89
3.8.10 Employer / Employee relations .......................................................................................... 89
3.8.11 Employment Equity Plan ................................................................................................... 89
3.8.12 Secretariat, Registry, and Auxiliary Services ...................................................................... 90
3.8.13 Fleet Management ............................................................................................................. 91
3.9 Municipal Transformation and Institutional Development SWOT Analysis ............................... 92
3.10 Basic Service Delivery ................................................................................................................ 92
3.10.1 Water Service Provision ..................................................................................................... 92
3.10.2 Sanitation Service Provision ............................................................................................. 104
3.10.3 Solid Waste and Cemeteries ............................................................................................ 110
3.10.4 Transportation Infrastructure .......................................................................................... 113
3.10.5 Electricity .......................................................................................................................... 119
3.10.6 Telecommunications ........................................................................................................ 123
3.10.7 Access to Community Facilities ........................................................................................ 123
3.10.8 Human Settlements ......................................................................................................... 125
3.10.9 Basic Service Delivery SWOT Analysis .............................................................................. 126
3.11 Local Economic Development ................................................................................................. 126
5
3.11.1 Municipal Comparative & Competitive Advantages ........................................................ 127
3.11.2 Main Economic Contributors ........................................................................................... 127
3.11.3 Employment and Income Levels ...................................................................................... 129
3.11.4Creation of Job Opportunities........................................................................................... 134
3.11.5 SMMEs and cooperatives ................................................................................................. 137
3.11.6 Agricultural Sector ........................................................................................................... 137
3.11.7 Tourism ............................................................................................................................ 138
3.11.8 Manufacturing (Industrial) ............................................................................................... 141
3.11.9 Retail Trade ...................................................................................................................... 142
3.11.10 Mining ............................................................................................................................ 143
3.11.11 Local Economic Development SWOT Analysis ............................................................... 143
3.12 Social Development Analysis .................................................................................................. 144
3.12.1 Educational status ............................................................................................................ 144
3.12.2 Health ............................................................................................................................... 146
3.12.3 Broad Based Community Needs ...................................................................................... 148
3.12.4 Safety and Security .......................................................................................................... 149
3.12.5 Nation Building and Social Cohesion ............................................................................... 149
3.12.6 Community Development with Focus on Vulnerable Groups ......................................... 149
3.12.7 Social Development: SWOT Analysis ............................................................................... 151
3.13 Municipal Financial Viability and Management Analysis ........................................................ 152
3.13.1 Financial Ratios ................................................................................................................ 152
3.13.2 Capability to execute Capital Projects ............................................................................. 153
3.13.3 Indigent Support (including Free Basic Services) ............................................................. 154
3.13.4 Revenue Enhancement and Protection Strategies .......................................................... 154
3.13.5 Municipal Consumer Debt Position ................................................................................. 155
3.13.6 Grants and Borrowings .................................................................................................... 156
3.13.7 Municipal Infrastructure Assets and Maintenance .......................................................... 157
3.13.8 Auditor General Report .................................................................................................... 157
13.3.9 Supply Chain Management (SCM) ................................................................................... 157
3.13.10 Cash Flow Management ................................................................................................ 158
3.13.11 Municipal Financial Viability and Management SWOT Analysis .................................... 158
3.14 Good Governance and Public Participation Analysis .............................................................. 159
3.14.1 National and Provincial Programmes rolled-out ............................................................. 159
3.14.2 Intergovernmental Government Relations ...................................................................... 161
3.14.3 Internal Information and Communication Technology ................................................... 163
3.14.4 Municipal Structures ........................................................................................................ 164
6
3.14.5 Internal Audit ................................................................................................................... 167
3.14.6 Community Participation Strategy ................................................................................... 167
3.14.7 Customer Relations .......................................................................................................... 168
3.14.8 Role of Amakhosi and Communities in the IDP ............................................................... 169
3.14.9 Risk Management ............................................................................................................ 169
3.14.10 Annual Report ................................................................................................................ 169
3.16 Key Challenges ........................................................................................................................ 173
Chapter 4: DEVELOPMENT STRATEGIES ............................................................................................ 181
4.1 Vision and Mission .................................................................................................................... 181
4.2 Strategic Framework ................................................................................................................. 182
4.2.1 Who do we serve? ............................................................................................................. 182
4.2.2 Service or product we provide ........................................................................................... 182
4.2.3 Higher Level Benefits Gained ............................................................................................. 182
4.2.4 What do our customers want from us? ............................................................................. 182
4.2.5 Ugu District Municipality Stakeholders .............................................................................. 182
4.2.6 Stakeholders’ interest in Ugu District Municipality ........................................................... 182
4.2.7 Value proposition to customers and stakeholders ............................................................ 183
4.2.8 Our focus areas .................................................................................................................. 183
4.2.9 Expected Results ................................................................................................................ 183
4.3 Strategic Objectives .................................................................................................................. 183
Chapter 5: STRATEGIC MAPPING AND IMPLEMENTATION PLAN ..................................................... 226
5.1 Strategic Mapping ..................................................................................................................... 226
5.1.1 Desired Spatial Outcomes .................................................................................................. 226
5.1.2 Desired Spatial Form and Land Use ................................................................................... 226
5.1.3 Spatial Reconstruction of the Municipality ........................................................................ 227
5.1.4 Land Use Management Guidelines .................................................................................... 229
5.1.5 Spatial Alignment with Neighbouring Municipalities ........................................................ 229
5.1.6 Capital Investment Framework (CIF) ................................................................................. 232
5.1.7 Areas Requiring Strategic Intervention .............................................................................. 233
5.2 Five-Year Implementation Plan ................................................................................................. 236
5.2.1 Catalytic Projects ................................................................................................................ 238
CHAPTER 6: FINANCIAL PLAN ............................................................................................................. 240
6.1 Municipal Budget Overview ...................................................................................................... 240
6.1.1 South African Economy and Inflation Targets ................................................................... 240
6.1.2Proposed Tariffs Increments for 2018 / 2019 ..................................................................... 240
6.1.4 Operating Expenditure Budget 2018 / 2019 – 2020 / 2021 ............................................... 245
7
6.2 Five-Year Financial Plan ............................................................................................................ 247
CHAPTER 7: ORGANISATIONAL PERFORMANCE MANAGEMENT SYSTEM ....................................... 248
7.1 Organisational Performance Management System .................................................................. 248
7.1.1 Departmental Level ............................................................................................................ 249
7.1.2 Strategic / Organisational Level ......................................................................................... 249
7.1.3 Political Level ..................................................................................................................... 250
7.2 Service Delivery and Budget Implementation Plan .................................................................. 250
7.2.1 Legislative Mandates ......................................................................................................... 250
7.2.2 Monitoring Performance ................................................................................................... 250
7.2.3 Performance Evaluation ..................................................................................................... 251
CHAPTER 8: ANNEXURES .................................................................................................................... 252
8
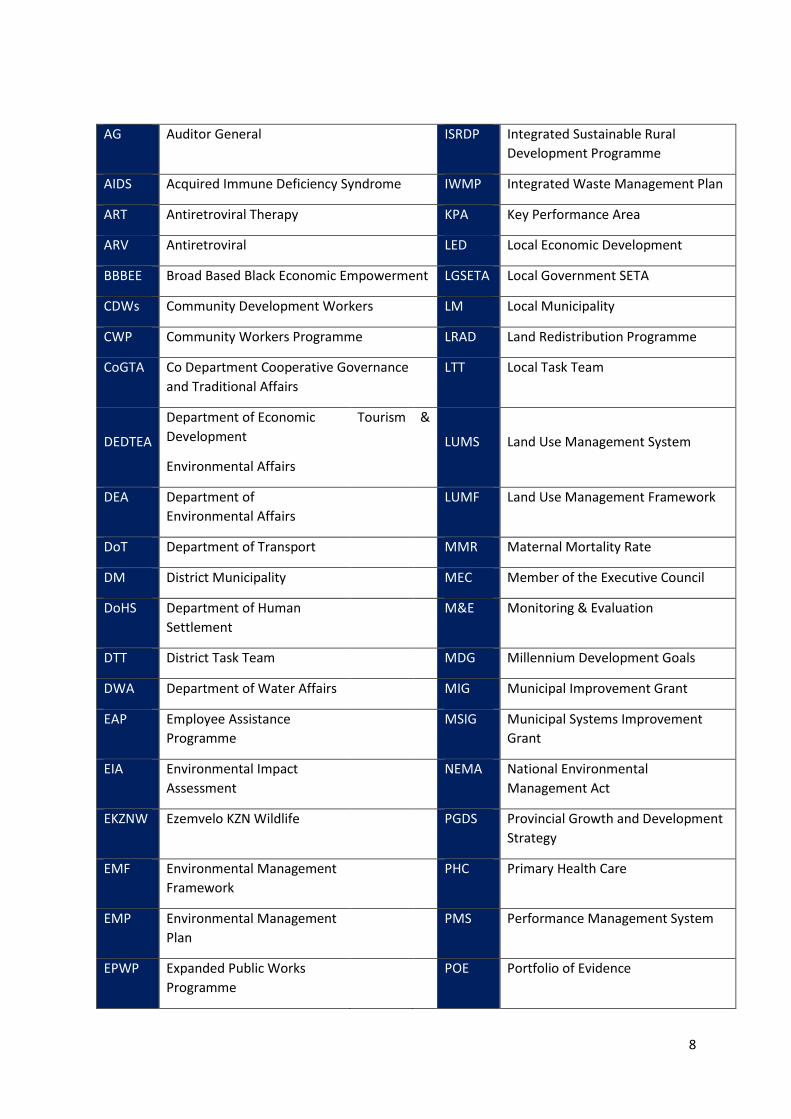
AG Auditor General ISRDP Integrated Sustainable Rural
Development Programme
AIDS Acquired Immune Deficiency Syndrome IWMP Integrated Waste Management Plan
ART Antiretroviral Therapy KPA Key Performance Area
ARV Antiretroviral LED Local Economic Development
BBBEE Broad Based Black Economic Empowerment LGSETA Local Government SETA
CDWs Community Development Workers LM Local Municipality
CWP Community Workers Programme LRAD Land Redistribution Programme
CoGTA Co Department Cooperative Governance
and Traditional Affairs
LTT Local Task Team
DEDTEA
Department of Economic
Development
Environmental Affairs
Tourism &
LUMS Land Use Management System
DEA Department of
Environmental Affairs
LUMF Land Use Management Framework
DoT Department of Transport MMR Maternal Mortality Rate
DM District Municipality MEC Member of the Executive Council
DoHS Department of Human
Settlement
M&E Monitoring & Evaluation
DTT District Task Team MDG Millennium Development Goals
DWA Department of Water Affairs MIG Municipal Improvement Grant
EAP Employee Assistance
Programme
MSIG Municipal Systems Improvement
Grant
EIA Environmental Impact
Assessment
NEMA National Environmental
Management Act
EKZNW Ezemvelo KZN Wildlife PGDS Provincial Growth and Development
Strategy
EMF Environmental Management
Framework
PHC Primary Health Care
EMP Environmental Management
Plan
PMS Performance Management System
EPWP Expanded Public Works
Programme
POE Portfolio of Evidence
9
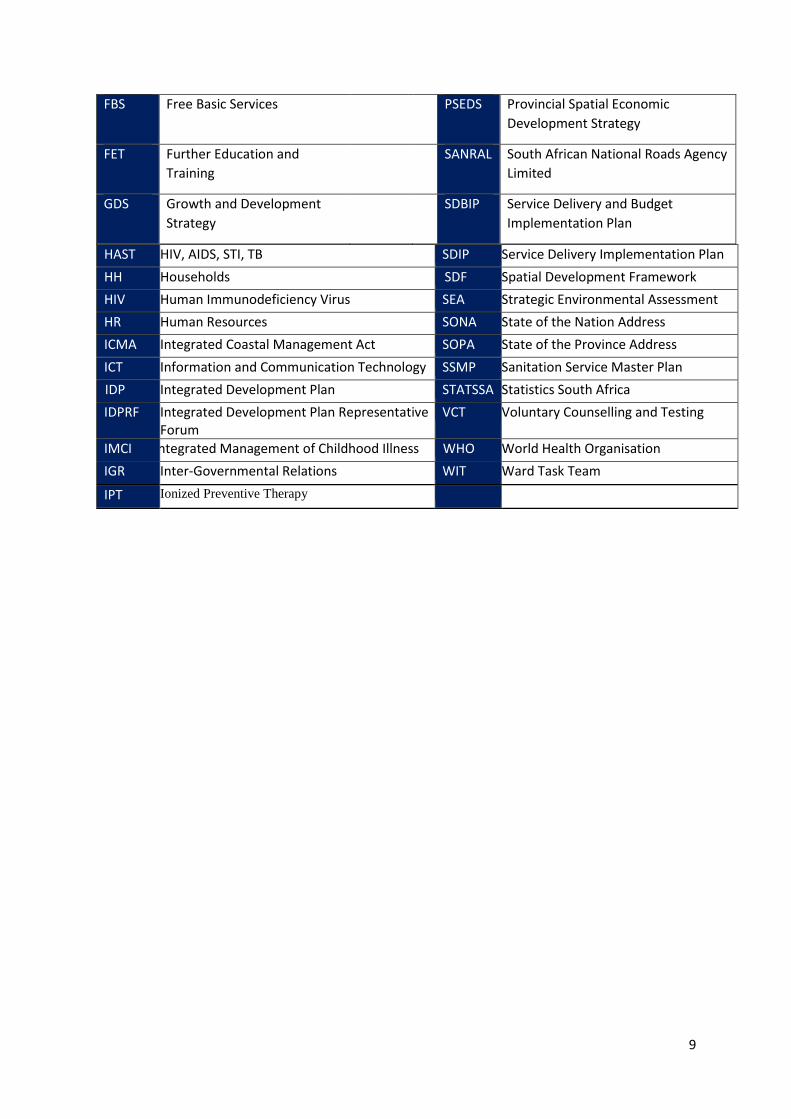
FBS Free Basic Services PSEDS Provincial Spatial Economic
Development Strategy
FET Further Education and
Training
SANRAL South African National Roads Agency
Limited
GDS Growth and Development
Strategy
SDBIP Service Delivery and Budget
Implementation Plan
HAST HIV, AIDS, STI, TB SDIP Service Delivery Implementation Plan
HH Households SDF Spatial Development Framework
HIV Human Immunodeficiency Virus SEA Strategic Environmental Assessment
HR Human Resources SONA State of the Nation Address
ICMA Integrated Coastal Management Act SOPA State of the Province Address
ICT Information and Communication Technology SSMP Sanitation Service Master Plan
IDP Integrated Development Plan STATSSA Statistics South Africa
IDPRF Integrated Development Plan Representative Forum
VCT Voluntary Counselling and Testing
IMCI Integratm Integrated Management of Childhood Illness WHO World Health Organisation
IGR Inter-Governmental Relations WIT Ward Task Team
IPT Ionized Preventive Therapy
10
Chapter 1: Executive Summary In compliance with the Local Government Municipal Systems Act, 32 of 2000, the Ugu District Council adopted
a five-year Integrated Development Plan in June 2018. This plan is meant to provide a basis for both public and
private sector investment in the district and is reviewed on an annual basis.
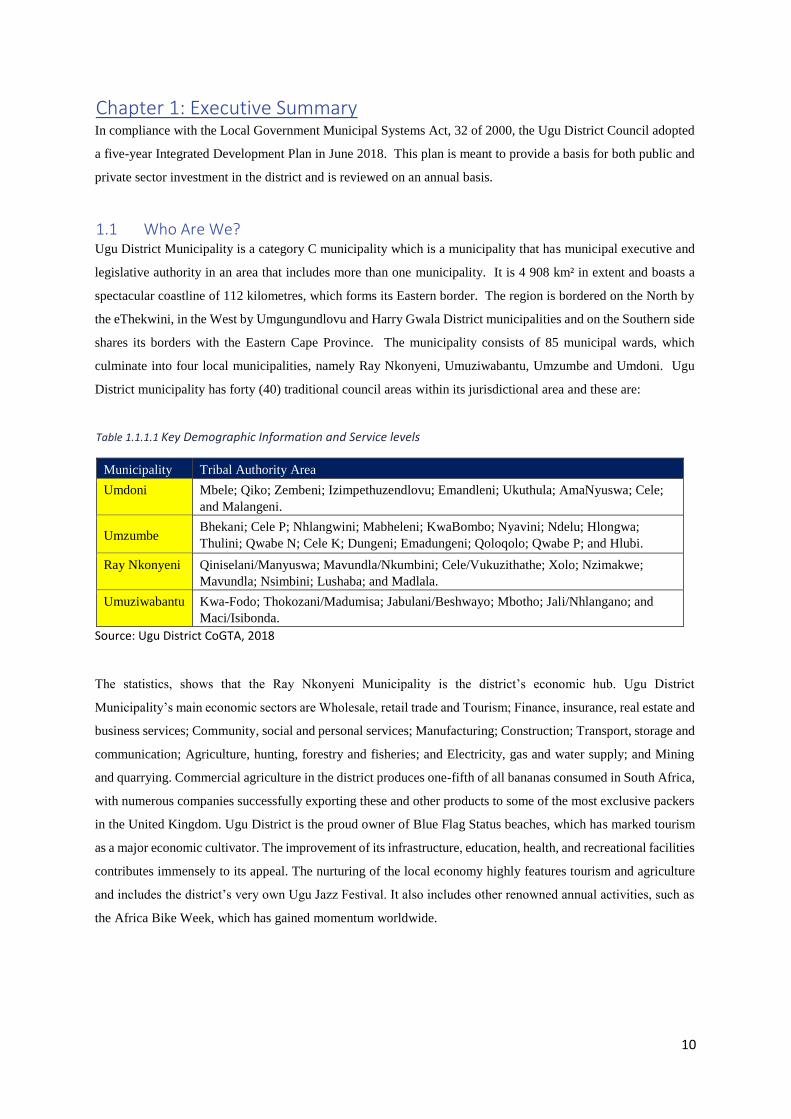
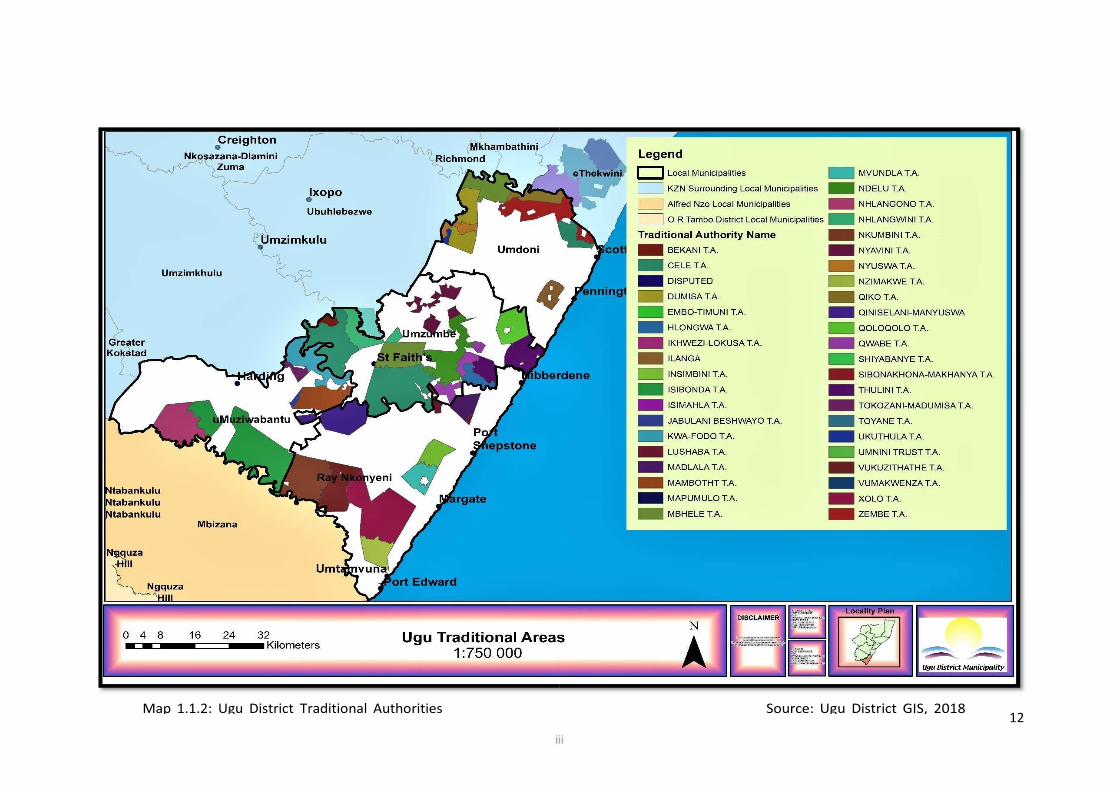
1.1 Who Are We? Ugu District Municipality is a category C municipality which is a municipality that has municipal executive and
legislative authority in an area that includes more than one municipality. It is 4 908 km² in extent and boasts a
spectacular coastline of 112 kilometres, which forms its Eastern border. The region is bordered on the North by
the eThekwini, in the West by Umgungundlovu and Harry Gwala District municipalities and on the Southern side
shares its borders with the Eastern Cape Province. The municipality consists of 85 municipal wards, which
culminate into four local municipalities, namely Ray Nkonyeni, Umuziwabantu, Umzumbe and Umdoni. Ugu
District municipality has forty (40) traditional council areas within its jurisdictional area and these are:
Table 1.1.1.1 Key Demographic Information and Service levels
Municipality Tribal Authority Area
Umdoni Mbele; Qiko; Zembeni; Izimpethuzendlovu; Emandleni; Ukuthula; AmaNyuswa; Cele;
and Malangeni.
Umzumbe Bhekani; Cele P; Nhlangwini; Mabheleni; KwaBombo; Nyavini; Ndelu; Hlongwa;
Thulini; Qwabe N; Cele K; Dungeni; Emadungeni; Qoloqolo; Qwabe P; and Hlubi.
Ray Nkonyeni Qiniselani/Manyuswa; Mavundla/Nkumbini; Cele/Vukuzithathe; Xolo; Nzimakwe;
Mavundla; Nsimbini; Lushaba; and Madlala.
Umuziwabantu Kwa-Fodo; Thokozani/Madumisa; Jabulani/Beshwayo; Mbotho; Jali/Nhlangano; and
Maci/Isibonda.
Source: Ugu District CoGTA, 2018
The statistics, shows that the Ray Nkonyeni Municipality is the district’s economic hub. Ugu District
Municipality’s main economic sectors are Wholesale, retail trade and Tourism; Finance, insurance, real estate and
business services; Community, social and personal services; Manufacturing; Construction; Transport, storage and
communication; Agriculture, hunting, forestry and fisheries; and Electricity, gas and water supply; and Mining
and quarrying. Commercial agriculture in the district produces one-fifth of all bananas consumed in South Africa,
with numerous companies successfully exporting these and other products to some of the most exclusive packers
in the United Kingdom. Ugu District is the proud owner of Blue Flag Status beaches, which has marked tourism
as a major economic cultivator. The improvement of its infrastructure, education, health, and recreational facilities
contributes immensely to its appeal. The nurturing of the local economy highly features tourism and agriculture
and includes the district’s very own Ugu Jazz Festival. It also includes other renowned annual activities, such as
the Africa Bike Week, which has gained momentum worldwide.

11
12

13
1.1.1 Demographics Overview According to the Stats SA Community Survey 2016, the total population of the Ugu District Municipality area of
jurisdiction is 753 336 with a growth rate of 0.042. The district has a relatively young population with the children
and youth making up 38.7% of total population. The dominant population group is Africans making up 90% of
the total population. Indians; Coloureds and Whites makes up the other 10% of the population. Table 1.1.1.1:
shows Key Demographic Information and Service Levels. The sex ratio as per 2011 census is 92 males per 100
females.
Table 1.1.1.1 Key Demographic Information and Service levels
Population Economic Profile
Total Population 753 336 Total Number of Households 175 146
Young (0-14) 286 823 Average Household Size 4 (persons / hh)
Working age (15-
64)
433 417 Access to Piped Water 125 308
Elderly (65+) 33 097 Access to Electricity 149 224
Area in km2 4 908 Access to Sanitation 124 354
Population Density
per km2
153.49 Unemployment(official) 29.1
Growth Rates 0.042 Unemployment Rate (Youth) 36,0
Total Fertility Rate 67.5 Main Occupation Sector Formal sector
Total Mortality
Rate
6.0 Indigent Households 25 750
Sex Ratio
(male/100 women)
92 Social Grants Recipients 288 728
Dependency Ratio 0.74 Literacy Rate 78
Source: Stats SA Community Survey, 2016
The Ugu District Municipality area of jurisdiction has a total number of 175 146 households with an average size
of five persons per household. In terms of access to basic service delivery 67% of the households has access to
water; 74% have access to electricity and 91% has access to sanitation.
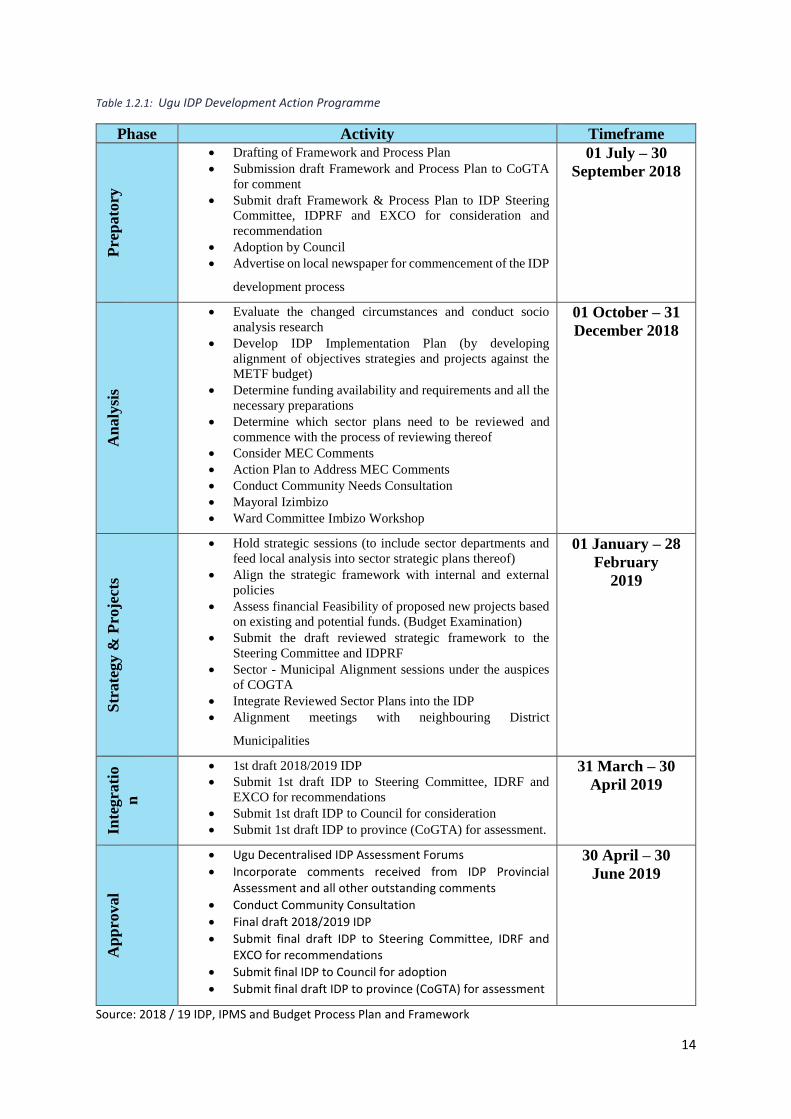
1.2 How was this IDP Developed? The Ugu District Municipality IDP was prepared in terms of the legislative requirements as entailed
in chapter five (5) of the Municipal Systems Act. Consideration was given to the MEC’s comments
that were raised in the 2018 /19 IDP Review. An in-house team led by the Office of the Municipal
Manager was assigned the task of developing the IDP. To ensure ownership of the process and to
gather community inputs, existing municipal structures and systems i.e. IDP Representative Forum,
IDP and Budget Road Shows were also used. Table 1.2.1 below provides a summary of the Process
Plan and its implementation.
14
Table 1.2.1: Ugu IDP Development Action Programme
Phase Activity Timeframe
Pre
pato
ry
• Drafting of Framework and Process Plan
• Submission draft Framework and Process Plan to CoGTA
for comment
• Submit draft Framework & Process Plan to IDP Steering
Committee, IDPRF and EXCO for consideration and
recommendation
• Adoption by Council
• Advertise on local newspaper for commencement of the IDP
development process
01 July – 30
September 2018
An
aly
sis
• Evaluate the changed circumstances and conduct socio
analysis research
• Develop IDP Implementation Plan (by developing
alignment of objectives strategies and projects against the
METF budget)
• Determine funding availability and requirements and all the
necessary preparations
• Determine which sector plans need to be reviewed and
commence with the process of reviewing thereof
• Consider MEC Comments
• Action Plan to Address MEC Comments
• Conduct Community Needs Consultation
• Mayoral Izimbizo
• Ward Committee Imbizo Workshop
01 October – 31
December 2018
Str
ate
gy &
Pro
ject
s
• Hold strategic sessions (to include sector departments and
feed local analysis into sector strategic plans thereof)
• Align the strategic framework with internal and external
policies
• Assess financial Feasibility of proposed new projects based
on existing and potential funds. (Budget Examination)
• Submit the draft reviewed strategic framework to the
Steering Committee and IDPRF
• Sector - Municipal Alignment sessions under the auspices
of COGTA
• Integrate Reviewed Sector Plans into the IDP
• Alignment meetings with neighbouring District
Municipalities
01 January – 28
February
2019
Inte
gra
tio
n
• 1st draft 2018/2019 IDP
• Submit 1st draft IDP to Steering Committee, IDRF and
EXCO for recommendations
• Submit 1st draft IDP to Council for consideration
• Submit 1st draft IDP to province (CoGTA) for assessment.
31 March – 30
April 2019
Ap
pro
val
• Ugu Decentralised IDP Assessment Forums
• Incorporate comments received from IDP Provincial Assessment and all other outstanding comments
• Conduct Community Consultation
• Final draft 2018/2019 IDP
• Submit final draft IDP to Steering Committee, IDRF and EXCO for recommendations
• Submit final IDP to Council for adoption
• Submit final draft IDP to province (CoGTA) for assessment
30 April – 30
June 2019
Source: 2018 / 19 IDP, IPMS and Budget Process Plan and Framework
15
1.3 Our Key Development Challenges The key development challenges that are faced by Ugu District Municipality are summarised as per the five
National Key Performance Area (KPA) in the subsequent subsections.
1.3.1 Basic Services The major basic service challenge faced by the district is the slow pace of backlog eradication and high levels
of aged infrastructure. The ageing infrastructure results in high maintenance costs which have an adverse
effect on the eradication of backlog programme due to limited funding.
This also has a direct impact on the municipality’s compliance with minimum requirement of the No Drop,
Green Drop, and Blue Drop standard. Furthermore, the municipality’s Water and Sanitation Master Plans
and thus prioritisation and planning of projects, is outdated and in the process of development.
There is also a challenge of high levels of illegal connections which further strains the available resources.
1.3.2 Municipal Transformation and Institutional Development The key Municipal Transformation and Institutional Development challenges include but not
limited to:
High Employee Costs;
Disengaged Employees;
Slow Implementation of Individual Performance Management;
Bloated Organisational structure;
Lack of Monitoring and Evaluation;
Manipulation of Recruitment Processes;
Poor Conflict Resolution and Management;
Poor Manager and employee relations;
Lack of Skills Transfers;
Old Aging Fleet;
Clashing of Meetings;
Limited Office Space;
High Security Costs;
High Printing and Copying Costs;
Lack of Human Resource Capacity; and
Delegations of authorities are not clear
16
1.3.3 Local Economic Development The key LED challenge is the triple challenge which is poverty, inequality, and unemployment. Furthermore,
there is no clear District LED mandate which results in duplication of resources and efforts between the district
and local municipalities. LED is still poorly resourced across the district.
1.3.4 Municipal Financial Viability and Management The key Municipal Financial Viability And Management challenges include but not limited to:
Budget Management and Financial Reporting
Supply chain Management
Revenue management
Asset management
Non-compliance with MFMA
Expenditure Management
1.5 What will we do to unlock and Address our Key Challenges? Ugu District Municipality has set in place 23 goals and 33 strategic objectives to unlock the identified key
challenges. These strategic objectives and goals were grouped as per the five National KPAs as discussed in
the subsequent sections.
1.5.1 Basic Services The district is committed to ensuring universal access to basic services, water and sanitation in particular.
Through the planned projects, the district will reduce the current backlogs by 31% for access to water and 21%
for access to decent sanitation for the current period of the IDP. The district will further replace 100 kms of
aged water and sanitation pipelines. The district also has plans in place to ensure compliance to the Blue Drop,
Green Drop, and No Drop minimum requirements. The fight against illegal connections which strains the
existing infrastructure will also be reinforced.
1.5.2 Municipal Transformation and Institutional Development
The district is committed to creating a conducive environment for the highly motivated, skilled, productive, and
disciplined workforce. This is to be done through programmes such as Employee Wellness, Skills
Development, and continuous investment on building team spirit amongst all employees. The district will also
implement vigorous Performance, Monitoring, and Evaluation mechanism, ensure constant renewal of aging
fleet, and explore paperless administration in certain areas of the municipality.
1.5.3 Local Economic Development The district is committed to dealing with the triple threat challenge which is poverty, inequality, and
unemployment. A total of 3 450 job opportunities will be created, and 450 SMMEs, Cooperatives, and Informal

17
Business Sector will be trained during the current IDP period. Furthermore, the district will ensure the
development of the main economic sectors such as agriculture and explore green economic initiatives. In terms
of community development, the municipality will ensure implementation of seven programmes per annum for
vulnerable groups and consistent promotion of youth development.
1.5.4 Municipal Financial Viability and Management In a bid to ensuring that Ugu District Municipality is financially viable and sustainable institution, the
municipality is committed to ensuring:
• There is zero fruitless end wasteful expenditure through optimisation of procurement processes
• There is zero unauthorised, irregular expenditure and payment of creditors within 30 days through
optimisation of expenditure;
• 100% accurate billing to improve revenue collection rate;
• Reduction of overdue debt through the optimisation of debt management;
• GRAP Compliant Asset Register through optimised asset management.
• mScoa compliant budgeting and expenditure
Full compliance with the MFMA will also be ensured for sound financial management.
1.5.5 Good Governance and Public Participation The key Communication and Batho Pele Strategies will be reviewed and institutionalised to ensure effective
communication and stakeholder involvement. The municipality is also committed to achieving Unqualified
Audit Opinion with no matters of emphasis and plans have been put in place. The municipality is determined
to be a clean social government institution and a series of anticorruption awareness campaigns have been
planned to this effect. Furthermore, the public participation mechanisms will be integrated to ensure that the
communities are properly consulted and are involved in the affairs of the municipality. The municipality also
plans in conducting customer satisfaction surveys annually.
1.5.6 Cross Cutting Issues The capacity of Disaster Management will be bolstered across the district to improve disaster prevention and
management. Through various environmental health and management programmes, the municipality will
ensure a healthy, safe, and sustainable environment, as well as enhance the measures to reduce community
exposure to diseases and health risk. Every effort will be made through the development of relevant
development plans to improve planning and coordination in the district.
1.6 What could you expect from us in the next five years? If operational excellence is achieved the result will be good governance and administration, sound financial
management and viability, innovative, effective, and efficient institution, and administration.
18
In general, Ugu District Municipality through stakeholder relations is striving for:
Coordinated, effective and efficient planning and service delivery.
A credible and well informed IDP
Better investments and reduced dependency on grants.
Protest free and happy communities.
Confident investors and partners in service delivery.
Social cohesion.
Quality input and engagements.
Vibrant and active tourism, increasing investment and job opportunities.
Realisation of a developmental state
1.7 How will our progress be measured?
Once the IDP is adopted, the Organisational Scorecard and SDBIP are created. The indicators and targets for
efficiency, effectiveness and impact are set. The Organisational Performance Management System is used as a
tool for:
Monitoring, review and improve the implementation of IDP;
Monitoring actual performance against targets and contractual obligations;
Effective management, including planning, budgeting, implementation, monitoring and reporting; and
Facilitation of effective accountability, identify the scope for improvement, provide early warning signals
and facilitate decision making.
The Service Delivery and Budget Implementation Plan and Organisational Scorecard are tools to:
Regularly plan;
Continuously monitor; and
Periodically measure and review performance.
1.7.1 Two Level Scorecard The municipality utilises the two-level scorecard approach which is the Organisational and SDBIP scorecards.
The Strategic or Organizational Scorecard:
• Reflect KPA’s, objectives, indicators, and targets at a strategic level;
• Align directly with the IDP priorities; and
• Follow SDBIP but would not have monthly financial cash flow projections and the ward level projects.
The SDBIP or Departmental Scorecards reflect objectives, indicators and targets at a departmental level and
informs the individual scorecards of the Section 54 and 56 Managers.
19
The two levels of scorecards form Organisational Performance Management System of the municipality. All
reporting on the municipality’s performance is informed by information derived from the two-level scorecards
and reflect the municipality’s performance on the 23 goals and 33 strategic objectives.
1.7.2 Monitoring and Evaluation The performance monitoring and evaluation is done through a periodic analysis assessment of milestones
achieved which is done quarterly, half yearly and annually. Analysis of planned and actual achievements
considers the assessment of:
Inputs vs. Outputs,
Cost of results achieved
Impact of results
This then assist management with the review of the IDP and setting of new performance targets.
20
Chapter 2 Government Priorities
Alignment of government policies and plans is crucial in the strategic planning processes of the municipality.
Therefore, the relevant binding and non-binding national and provincial policies including programmes and
strategies need to be considered in the municipal development planning process and interventions. Our
implementation and proposed interventions will focus only on the key mandates relevant to the municipal context
in cooperative governance and those will be considered and addressed.
2.1 Sustainable Development Goals
In September 2015, the 2030 Agenda for Sustainable Development, which includes a set of 17 Sustainable
Development Goals (SDGs) to end poverty, fight inequality and injustice and tackle climate change was adopted.
The SDGs build on the Millennium Development Goals (MDG) eight antipoverty targets that the world committed
to achieving by 2015. Enormous progress was made on the MDGs, showing the value of a unifying agenda
underpinned by goals and targets. Despite this success, the indignity of poverty has not been ended for all.
The new Global Goals, and the broader sustainability agenda, go much further than the MDGs, addressing the
root causes of poverty and the universal need for development that works for all people. The SDG is an attempt
at global co-ordinated efforts to ensure that the goals South Africa and the rest of Africa sets itself including
ending poverty and hunger, improving health and education, making cities more sustainable, combating climate
change, and protecting oceans and forests are achieved in the shortest possible time and in the most efficient way
imaginable.
The 17 Sustainable Development Goals are:
1) End poverty in all its forms everywhere
2) End hunger, achieve food security, improved nutrition and promote sustainable agriculture
3) Ensure healthy lives and promote well-being for all at all ages
4) Ensure inclusive and equitable quality education and promote lifelong learning opportunities for all
5) Achieve gender equality and empower all women and girl children
6) Ensure availability and sustainable management of water and sanitation for all
7) Ensure access to affordable, reliable, sustainable, and modern energy for all
8) Promote sustained, inclusive, and sustainable economic growth, full and productive employment and decent
work for all
9) Build resilient infrastructure, promote inclusive and sustainable industrialization and foster innovation
10) Reduce inequality within and among countries
11) Make cities and human settlements inclusive, safe, resilient, and sustainable
12) Ensure sustainable consumption and production patterns
13) Take urgent action to combat climate change and its impacts
14) Conserve and sustainably use the oceans, seas, and marine resources for sustainable development
21
15) Protect, restore, and promote sustainable use of terrestrial ecosystems, sustainably manage forests, combat
desertification, and halt and reverse land degradation and halt biodiversity loss
16) Promote peaceful and inclusive societies for sustainable development, provide access to justice for all and
build effective, accountable, and inclusive institutions at all levels
17) Strengthen the means of implementation and revitalize the global partnership for sustainable development
2.1.1 Applicability to Ugu
The MDGs drove progress in several important areas such as, income, poverty, access to improved sources of
water, primary school enrolment and child mortality. The Ugu District is still committed to these areas.
Furthermore, SDG goal 6 talks directly to the Ugu District’s commitment to availability and sustainable
management of water and sanitation for all.
2.2 National Development Plan: 2030
The National Development Plan aims to eliminate poverty and reduce inequality by 2030. South Africa has the
potential and capacity to eliminate poverty and reduce inequality over the next decade. This requires a new
approach – one that moves from a passive citizenry receiving services from the State to one that systematically
includes the socially and economically excluded, where people are active champions of their own development,
and where government works effectively to develop people’s capabilities to lead the lives they desire. The
achievement of this vision is based on the following nine elements:
i. Creating jobs and livelihoods,
ii. Expanding infrastructure,
iii. Transitioning to a low-carbon economy,
iv. Transforming urban and rural spaces,
v. Improving education and training,
vi. Providing quality health care,
vii. Building a capable state,
viii Fighting corruption and enhancing accountability,
ix. Transforming society and uniting the nation.
2.2.1 Medium Term Strategic Framework (MTSF)
The Medium Term Strategic Framework (MTSF) is Government’s strategic plan for the electoral term. It reflects
the commitments made in the election manifesto of the governing party, including the commitment to implement
the NDP. The MTSF sets out the actions Government will take and targets to be achieved. It also provides a
framework for the other plans of national, provincial, and local government.
22
The aim of the MTSF is to ensure policy coherence, alignment and coordination across government plans as well
as alignment with budgeting processes. Performance agreements between the President and each Minister will
reflect the relevant actions, indicators and targets set out in this MTSF. In the presence of the NDP as an
overarching, long-term plan the MTSF process has been reoriented towards conversion of the NDP into medium
term five-year plans. The intention of the MTSF is to directly inform departments’ planning and oversight of plans
and performance. The 2014 – 2019 MTSF has two overarching themes which are radical economic transformation
and improving service delivery and 14 priority outcomes which are building on previous MTSF and the NDP.
Within each priority outcome there are broad objectives and themes. The 14 priority outcomes are as follows:
1. Quality basic education;
2. A long and healthy life for all South Africans;
3. All people in South Africa are and feel safe;
4. Decent employment through inclusive growth;
5. A skilled and capable workforce to support an inclusive growth path;
6. An efficient, competitive, and responsive economic infrastructure network
7. Vibrant, equitable, sustainable rural communities contributing towards food security for all;
8. Sustainable human settlements and improved quality of household life;
9. Responsive, accountable, effective, and efficient local government;
10. Protect and enhance our environmental assets and natural resources;
11. Create a better South Africa and contribute to a better Africa and a better world;
12. An efficient, effective, and development-oriented public service;
13. A comprehensive, responsive, and sustainable social protection system;
14. A diverse, socially cohesive society with a common national identity.
2.2.2 State of the Nation Address
In the State of the Nation address, His Excellency Cyril Ramaphosa, president of the Republic of South Africa,
pronounced that the 2019 theme is “Following up on our commitments: Making Your Future Work Better”.
He then highlighted five (5) central tasks that should be adopted by all South Africans:
- Acceleration of inclusive economic growth and job creation.
- Improvement in the education system and development of skills.
- Improvement of conditions of life for all South Africans, especially the poor
- Fight against corruption and state capture.
- Strengthening of the capacity of the State to address the needs of the people.
23
2.2.3 Applicability to Ugu District
The Ugu District Municipality has a major role to play in realising the NDP 2030 vision especially with regards
to the expansion of infrastructure which in the case of Ugu is mainly water and sanitation infrastructure to ensure
universal access to clean portable water and sanitation dignity for all people of Ugu area of jurisdiction.
Furthermore, priority outcome nine of the 14 priority outcomes of the MTSF talks to a responsive, accountable,
effective and efficient local government. Given the role at the front line’ of service delivery, local government
has a critical role to play in the NDP’s vision and as a district, Ugu has to ensure co-ordinated effort with its family
of municipalities that the five sub-outcomes are achieved and therefore the five IDPs of the district’s family needs
to address and ensure:
1. Members of society have sustainable and reliable access to basic services
a Intergovernmental and democratic governance arrangements for a functional system
of cooperative governance strengthened
2. Sound financial and administrative management
3. Promotion of social and economic development
4. Ugu District Municipality and its four local municipalities have a task to fight corruption and
state capture
5. Ugu District Municipality and its four local municipalities have a task to develop skills both
internally and externally
Furthermore, the District is currently championing the implementation of Agri-Park in the district in partnership
with the Department of Rural Development. The Operation Phakisa is also being implemented in the district with
Ray Nkonyeni Municipality being a major stakeholder as they have the longest coastline in the district.
2.3 KZN Provincial Growth Development Strategy
The 2012 Provincial Growth and Development Strategy (KZN PGDS) bolsters the Province’s commitment to
achieving the vision of a “Prosperous Province with a healthy, secure and skilled population, acting as a gateway
to Africa and the world”. The PGDS aims to build this gateway by growing the economy for the development
and the improvement of the quality of life of all people living in the Province.
The PGDS provides a reasoned strategic framework for accelerating and sharing economic growth through
catalytic and developmental interventions, within a coherent equitable spatial development architecture, putting
people first, particularly the poor and vulnerable, and building sustainable communities, livelihoods and living
environments. Concomitant attention is also given to the provision of infrastructure and services, to restoring
natural resources, to public sector leadership, delivery and accountability, thus ensuring that these changes are
responded to with resilience, innovation and adaptability. This strategy will lay the foundations for attracting and
instilling confidence from potential investors and to develop social compacts that address the Provincial
challenges.
24
The main purpose of the KZN PGDS can be summarised as, being the primary growth and development strategy
for KwaZulu-Natal to 2030; mobilising and synchronising strategic plans and investment priorities in all spheres
of government, state owned entities, business, higher education institutions, labour, civil society and all other
social partners in order to achieve the desired growth and development goals, objectives and outcomes; to spatially
contextualise and prioritise interventions so as to achieve greater spatial equity; and to develop clearly defined
institutional arrangements that ensure decisive leadership, robust management, thorough implementation and
ongoing review of the growth and development plan.
The KZN PGDS sets out seven goals which are as follows:
1. Inclusive Economic Growth
2. Human Resource Development
3. Human and Community Development
4. Strategic Infrastructure
5. Environmental Sustainability
6. Governance and Policy
7. Spatial Equity
2.3.1 State of the Province Address
The State of the Province Address delivered by the Premier of KwaZulu-Natal Mr. T.W. Mchunu on 27 February
2019 was premised on the theme “We are ready to handover, towards even a better and faster growth and
development of our Province and its people.”. The Premier of KwaZulu-Natal Mr. T.W. Mchunu reiterated the
Province’s
commitment to the realisation of the Country’s as well as the Province’s visions. The provincial vision is to be
realised through continued implementation of the seven provincial strategic goals as outlined in the PGDS. The
following eight (8) provincial priorities were highlighted in the 2019 SOPA:
Build an inclusive Economy that creates decent jobs
Transformation of rural areas
Ensure decent living conditions and sustainable human settlement
Improve and expand education and training
Ensure quality health care for all
Expand comprehensive social security
Fight crime and corruption
Build a united nation and promote social cohesion
Other provincial objectives:
Human and Community Development – To address eradication of poverty and inequality, the
province has reaffirmed its commitments to the ward-based approach to attend to matters related to
the communities.
25
Development of Strategic Infrastructure – Infrastructure is essential in the sustainability of the social
and economic growth and development needs of the province. With this regard, the province is
committing itself to the following:
• Improvement of the facilitation of the coordination of infrastructure delivery;
• Ensure allocation of and appropriate portion of the budget to the development, operation, and
adequate maintenance to extend the lifespan of these strategic assets. The benchmark of at least
20% of the total budget has been set.
• Ensure robust infrastructure planning to attract potential investors.
• Ensure provision of at least 75 litres of water per person per day and that economic growth is
sustained.
Ensuring Environmental Sustainability – The increased tensions between competing land uses, as well
as increasing demand on land for development, requires an intensified focus on land use planning,
management, and governance. Furthermore, increased attention is required to protect and conserve not
only the terrestrial and atmospheric environment, but the marine environment is important within the
context of the marine economy.
Providing Good Governance with clear and relevant policies – A provincial framework for
improved intergovernmental relations has been developed to ensure better functionality and unity.
The province continues to be committed to effectively combat fraud and corruption and reduce
unauthorised, irregular, fruitless, and wasteful expenditure. Special measures will also be put in
place to ensure standards of paying off creditors within 30 days is met.
Striving for Spatial Equity – The need for sustainable rural development focused on all-inclusive,
integrated, and well-coordinated development is required.
2.3.2 Applicability to Ugu District
The Ugu District Municipality as a water services provider will contribute immensely in the development of
strategic infrastructure in its endeavours to eradicate water and sanitation backlogs in the district. Furthermore,
the district municipality as the champion of the Ugu DGDS needs to ensure that the four local municipalities work
together towards a shared vision and that tourism and agriculture which are the core economic sectors are
strategically positioned in the path that the province is taking to ensure that the population of the Ugu District
area of jurisdiction benefits optimally.
2.4 Local Government Back to Basics Programme
The core services that local government provides is clean drinking water, sanitation, electricity, shelter, waste
removal and roads which are basic human rights, essential components of the right to dignity enshrined in the
Constitution and Bill of Rights. The government vision of developmental local government was that it would be
the building block on which the reconstruction and development of the country and society was built, a place in
which the citizens of the country could engage in a meaningful and direct way with the institutions of the state.
26
Local government is where most citizens interface with government, and its foundational ethos must be about
serving people.
Local government has been a primary site for the delivery of services in South Africa since 1994. A tremendous
progress in delivering water, electricity, sanitation and refuse removal at a local level has been made. However,
notwithstanding delivery achievements thus far, it is evidently clear that much needs to be done to support, educate
and where needed, enforce implementation of local government’s mandate for delivery. The transformation of
the local government sector remains a priority for the current administration.
It is against this background that CoGTA introduced the Back to Basics programme. Back to Basics is the
understanding of where local government is, where it could be and what needs to be done to improve performance.
The main goal of Back to Basics is to improve the functioning of municipalities to better serve communities by
getting the basics right.
The Back to Basics approach recognises that there are widely divergent levels of performance between different
categories of municipalities. The aim therefore to encourage all municipalities to become positively functional
centres of good governance and need to set proper standards for municipal performance. The Back to Basics
programme is founded on five pillars which are reflected in Table 2.4.1.
2.4.1 Applicability to Ugu
The Ugu District Municipality in 2014 was amongst those 8 municipalities that were requiring intervention by
CoGTA. CoGTA will aim at the very least, that the municipalities in a requiring intervention state, perform the
basic functions of local government and will do this through enforcement of current policies and legislation,
systematically managing performance and accountability, and ensuring that there are consequences for
underperformance. Minimum performance requirements include ensuring the proper functioning of council
structures and council processes, the provision of basic services, and the appointment of competent staff and these
are non-negotiable.
The Ugu District Municipality has therefore aligned its resources with the Back to Basics programme to ensure
that the functionality is improved, and the district’s community is served better as outlined in Table 2.4.1.
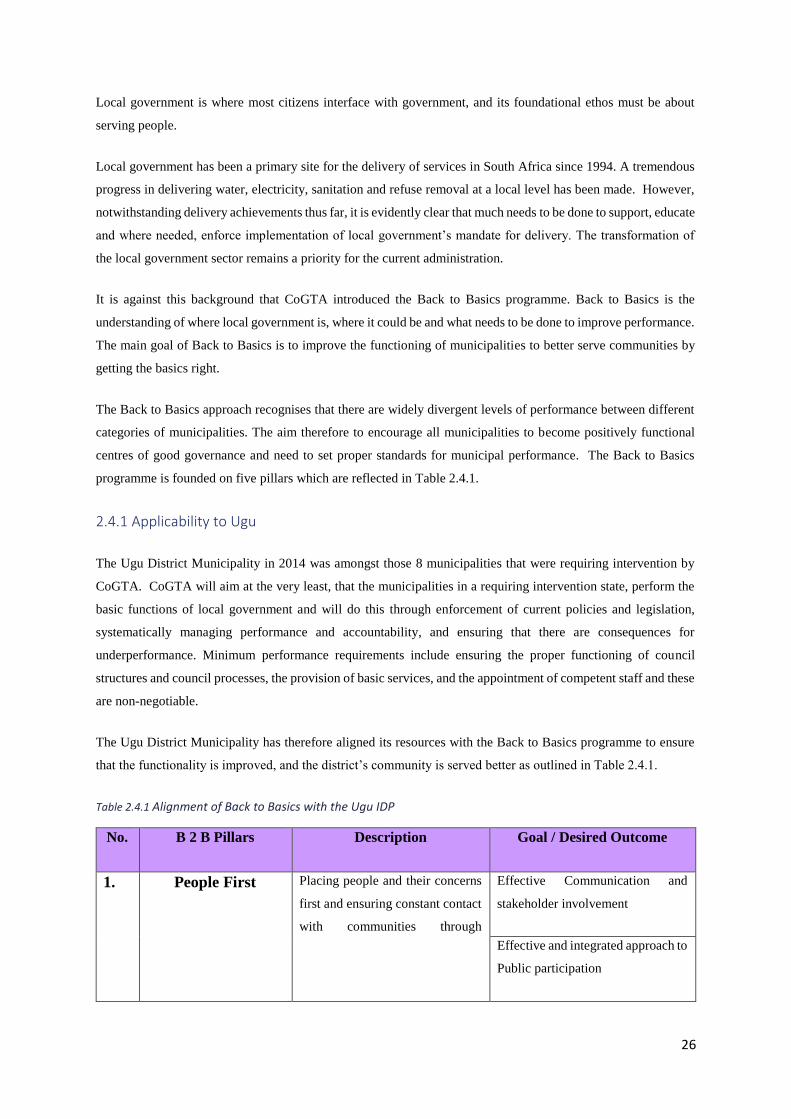
Table 2.4.1 Alignment of Back to Basics with the Ugu IDP
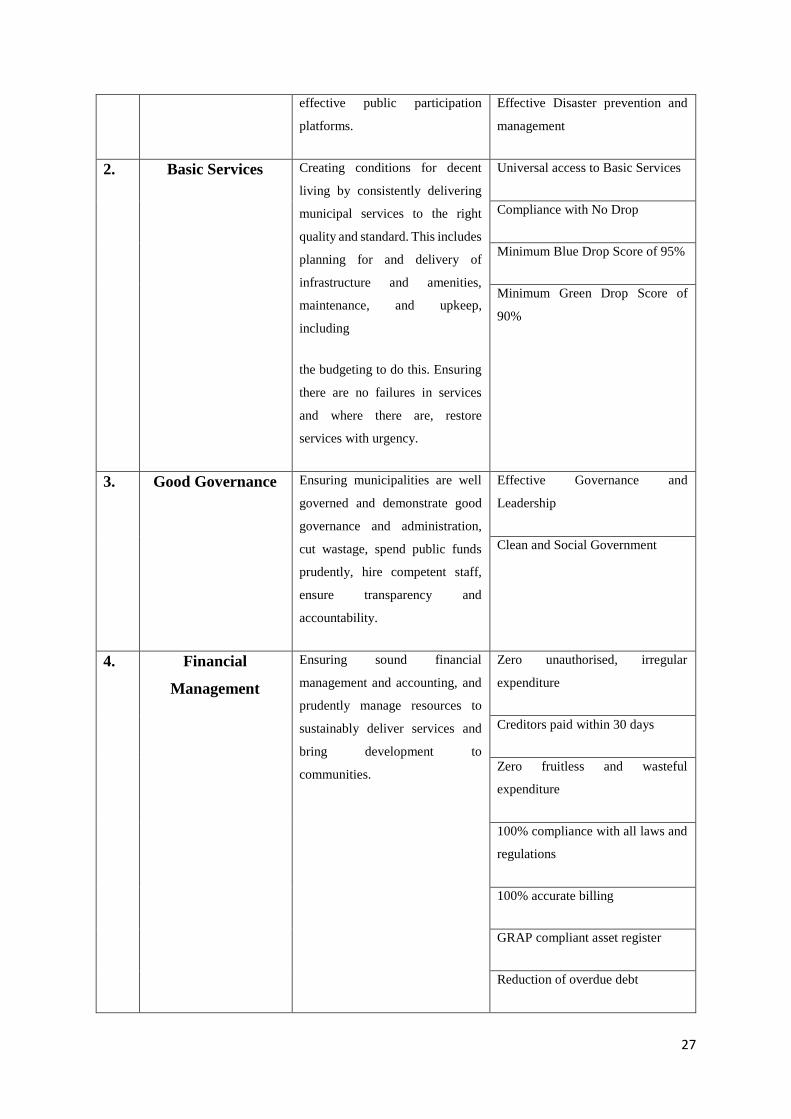
No. B 2 B Pillars Description Goal / Desired Outcome
1. People First
Placing people and their concerns
first and ensuring constant contact
with communities through
Effective Communication and
stakeholder involvement
Effective and integrated approach to
Public participation
27
effective public participation
platforms.
Effective Disaster prevention and
management
2. Basic Services Creating conditions for decent
living by consistently delivering
municipal services to the right
quality and standard. This includes
planning for and delivery of
infrastructure and amenities,
maintenance, and upkeep,
including
the budgeting to do this. Ensuring
there are no failures in services
and where there are, restore
services with urgency.
Universal access to Basic Services
Compliance with No Drop
Minimum Blue Drop Score of 95%
Minimum Green Drop Score of
90%
3. Good Governance Ensuring municipalities are well
governed and demonstrate good
governance and administration,
cut wastage, spend public funds
prudently, hire competent staff,
ensure transparency and
accountability.
Effective Governance and
Leadership
Clean and Social Government
4. Financial
Management
Ensuring sound financial
management and accounting, and
prudently manage resources to
sustainably deliver services and
bring development to
communities.
Zero unauthorised, irregular
expenditure
Creditors paid within 30 days
Zero fruitless and wasteful
expenditure
100% compliance with all laws and
regulations
100% accurate billing
GRAP compliant asset register
Reduction of overdue debt
28
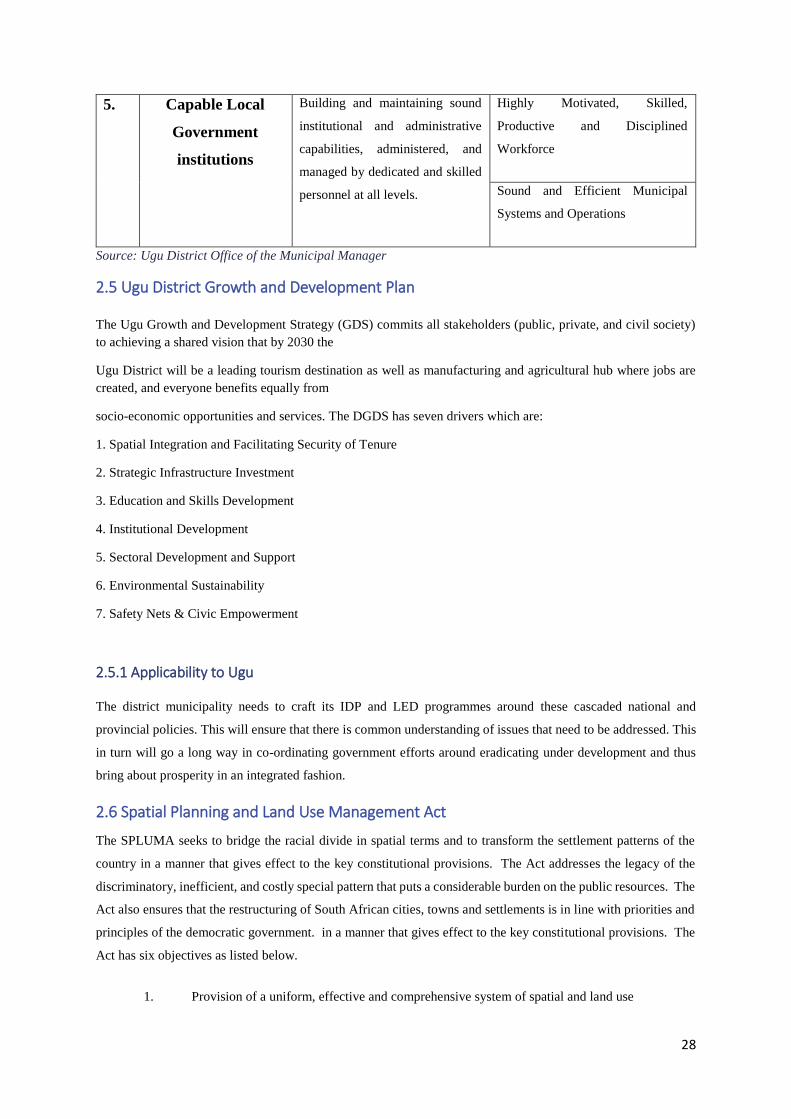
5. Capable Local
Government
institutions
Building and maintaining sound
institutional and administrative
capabilities, administered, and
managed by dedicated and skilled
personnel at all levels.
Highly Motivated, Skilled,
Productive and Disciplined
Workforce
Sound and Efficient Municipal
Systems and Operations
Source: Ugu District Office of the Municipal Manager
2.5 Ugu District Growth and Development Plan
The Ugu Growth and Development Strategy (GDS) commits all stakeholders (public, private, and civil society)
to achieving a shared vision that by 2030 the
Ugu District will be a leading tourism destination as well as manufacturing and agricultural hub where jobs are
created, and everyone benefits equally from
socio-economic opportunities and services. The DGDS has seven drivers which are:
1. Spatial Integration and Facilitating Security of Tenure
2. Strategic Infrastructure Investment
3. Education and Skills Development
4. Institutional Development
5. Sectoral Development and Support
6. Environmental Sustainability
7. Safety Nets & Civic Empowerment
2.5.1 Applicability to Ugu
The district municipality needs to craft its IDP and LED programmes around these cascaded national and
provincial policies. This will ensure that there is common understanding of issues that need to be addressed. This
in turn will go a long way in co-ordinating government efforts around eradicating under development and thus
bring about prosperity in an integrated fashion.
2.6 Spatial Planning and Land Use Management Act
The SPLUMA seeks to bridge the racial divide in spatial terms and to transform the settlement patterns of the
country in a manner that gives effect to the key constitutional provisions. The Act addresses the legacy of the
discriminatory, inefficient, and costly special pattern that puts a considerable burden on the public resources. The
Act also ensures that the restructuring of South African cities, towns and settlements is in line with priorities and
principles of the democratic government. in a manner that gives effect to the key constitutional provisions. The
Act has six objectives as listed below.
1. Provision of a uniform, effective and comprehensive system of spatial and land use
29
management;
2. Ensuring of a spatial planning and land use management system that promotes social and
economic inclusion;
3. Provision of development principles and norms and standards;
4. Provisions for a sustainable and efficient use of land;
5. Provision of cooperative government and intergovernmental relations amongst the national
provincial and local spheres of government; and
6. Redressing imbalance of the past and ensuring of equitable application of spatial development
planning and land use management systems.
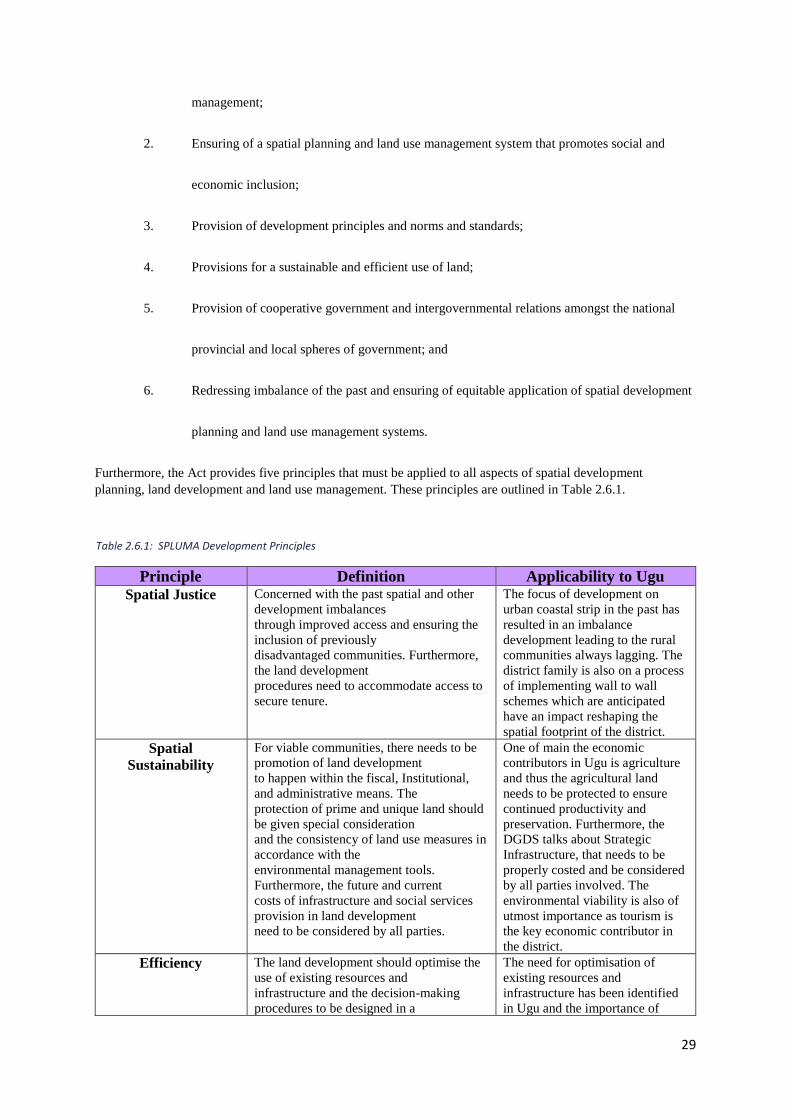
Furthermore, the Act provides five principles that must be applied to all aspects of spatial development
planning, land development and land use management. These principles are outlined in Table 2.6.1.
Table 2.6.1: SPLUMA Development Principles
Principle Definition Applicability to Ugu Spatial Justice Concerned with the past spatial and other
development imbalances
through improved access and ensuring the
inclusion of previously
disadvantaged communities. Furthermore,
the land development
procedures need to accommodate access to
secure tenure.
The focus of development on
urban coastal strip in the past has
resulted in an imbalance
development leading to the rural
communities always lagging. The
district family is also on a process
of implementing wall to wall
schemes which are anticipated
have an impact reshaping the
spatial footprint of the district.
Spatial
Sustainability
For viable communities, there needs to be
promotion of land development
to happen within the fiscal, Institutional,
and administrative means. The
protection of prime and unique land should
be given special consideration
and the consistency of land use measures in
accordance with the
environmental management tools.
Furthermore, the future and current
costs of infrastructure and social services
provision in land development
need to be considered by all parties.
One of main the economic
contributors in Ugu is agriculture
and thus the agricultural land
needs to be protected to ensure
continued productivity and
preservation. Furthermore, the
DGDS talks about Strategic
Infrastructure, that needs to be
properly costed and be considered
by all parties involved. The
environmental viability is also of
utmost importance as tourism is
the key economic contributor in
the district.
Efficiency The land development should optimise the
use of existing resources and
infrastructure and the decision-making
procedures to be designed in a
The need for optimisation of
existing resources and
infrastructure has been identified
in Ugu and the importance of
30
way that limits negative financial, social,
economic, or environmental
impacts.
infrastructure operation and
maintenance plan emphasised to a
longer lifespan. Furthermore, even
the decision making with regards
to infrastructure deployment is
guided by relevant policies and
plans to ensure integrated
implementation.
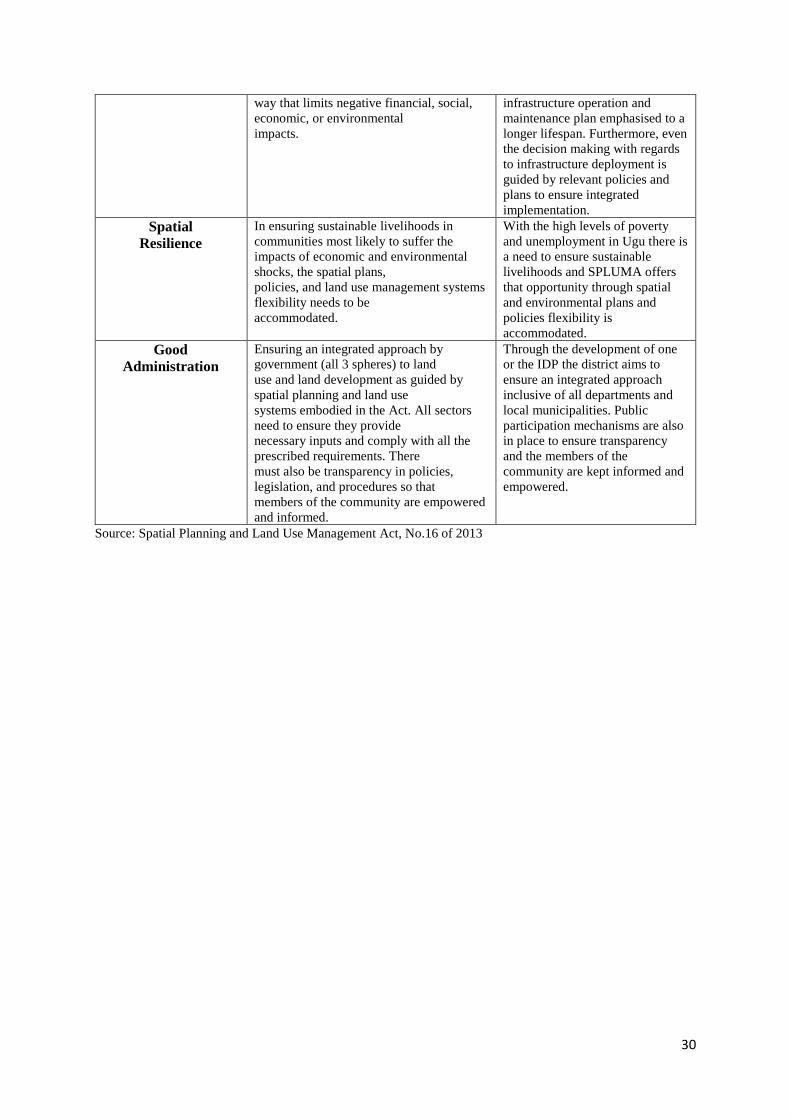
Spatial
Resilience
In ensuring sustainable livelihoods in
communities most likely to suffer the
impacts of economic and environmental
shocks, the spatial plans,
policies, and land use management systems
flexibility needs to be
accommodated.
With the high levels of poverty
and unemployment in Ugu there is
a need to ensure sustainable
livelihoods and SPLUMA offers
that opportunity through spatial
and environmental plans and
policies flexibility is
accommodated.
Good
Administration
Ensuring an integrated approach by
government (all 3 spheres) to land
use and land development as guided by
spatial planning and land use
systems embodied in the Act. All sectors
need to ensure they provide
necessary inputs and comply with all the
prescribed requirements. There
must also be transparency in policies,
legislation, and procedures so that
members of the community are empowered
and informed.
Through the development of one
or the IDP the district aims to
ensure an integrated approach
inclusive of all departments and
local municipalities. Public
participation mechanisms are also
in place to ensure transparency
and the members of the
community are kept informed and
empowered.
Source: Spatial Planning and Land Use Management Act, No.16 of 2013
31
CHAPTER 3: SITUATIONAL ANALYSIS
The Situational Analysis chapter provides a more concise snapshot of the key elements of the Status Quo. The
information presented is a combination of desktop analysis; comprehensive community engagement workshops;
2011 census and 2016 community survey by Statistics South Africa; as well as from targeted interviews and
discussions.
3.1 Cross Cutting Interventions
The Spatial Development Framework which informs the major part of this section forms an integral part of the
IDP. It identifies what physical / spatial development should take place and where and provides the physical
location and spatial interrelationship of social, economic, environmental development. It provides guidance for
all future development in Ugu. The Framework does not identify every detail but establishes the strategic
development direction. Furthermore, this analysis is also informed by the DGDS document.
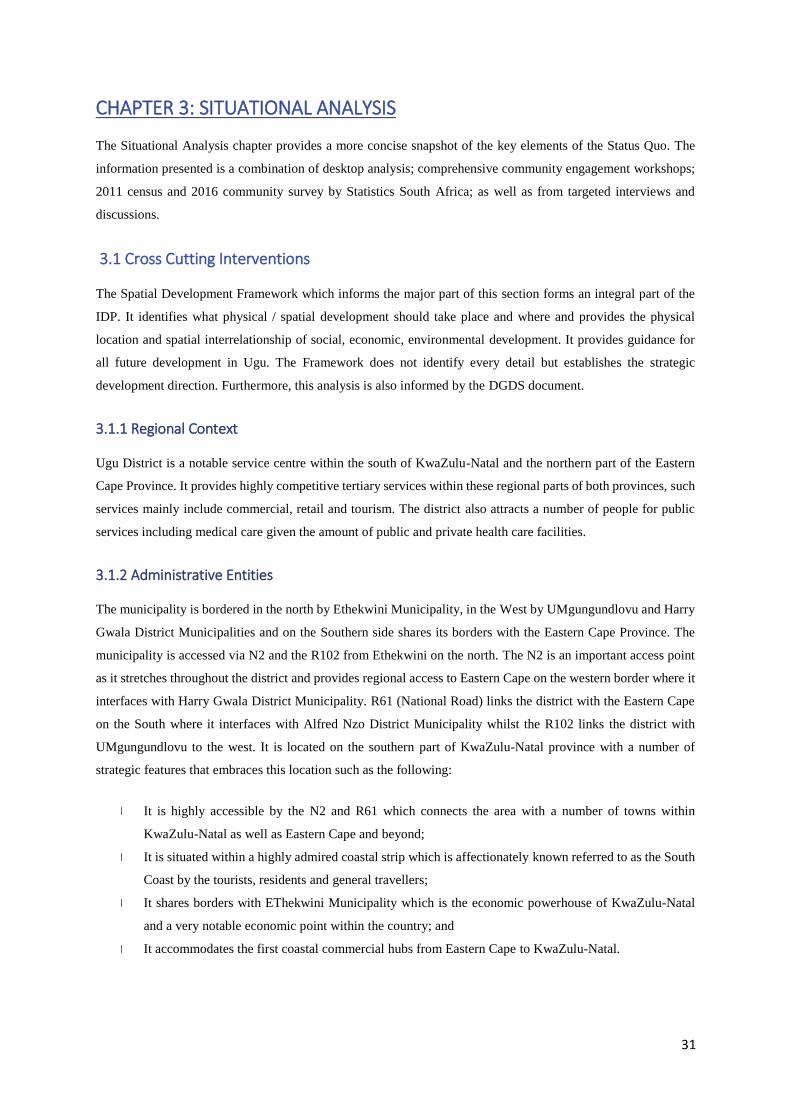
3.1.1 Regional Context
Ugu District is a notable service centre within the south of KwaZulu-Natal and the northern part of the Eastern
Cape Province. It provides highly competitive tertiary services within these regional parts of both provinces, such
services mainly include commercial, retail and tourism. The district also attracts a number of people for public
services including medical care given the amount of public and private health care facilities.
3.1.2 Administrative Entities
The municipality is bordered in the north by Ethekwini Municipality, in the West by UMgungundlovu and Harry
Gwala District Municipalities and on the Southern side shares its borders with the Eastern Cape Province. The
municipality is accessed via N2 and the R102 from Ethekwini on the north. The N2 is an important access point
as it stretches throughout the district and provides regional access to Eastern Cape on the western border where it
interfaces with Harry Gwala District Municipality. R61 (National Road) links the district with the Eastern Cape
on the South where it interfaces with Alfred Nzo District Municipality whilst the R102 links the district with
UMgungundlovu to the west. It is located on the southern part of KwaZulu-Natal province with a number of
strategic features that embraces this location such as the following:
It is highly accessible by the N2 and R61 which connects the area with a number of towns within
KwaZulu-Natal as well as Eastern Cape and beyond;
It is situated within a highly admired coastal strip which is affectionately known referred to as the South
Coast by the tourists, residents and general travellers;
It shares borders with EThekwini Municipality which is the economic powerhouse of KwaZulu-Natal
and a very notable economic point within the country; and
It accommodates the first coastal commercial hubs from Eastern Cape to KwaZulu-Natal.
32
33
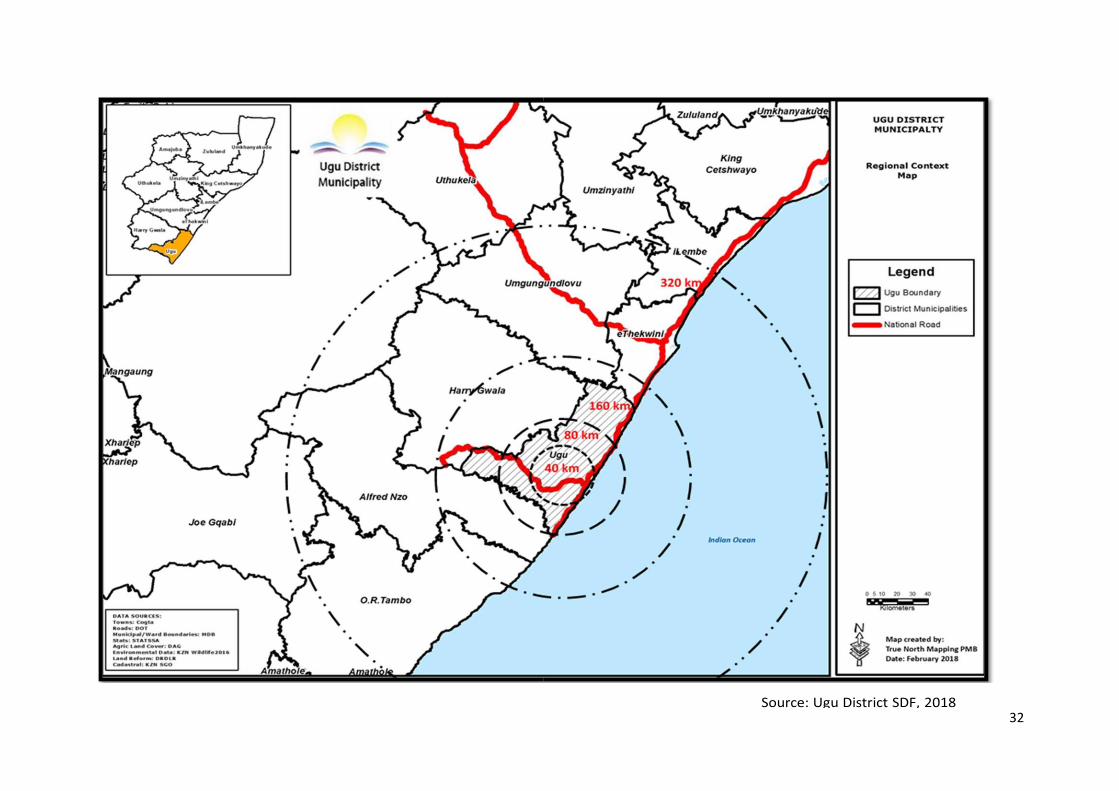
Figure 3.1.3.1: Ugu District System of Activity Nodes
3.1.3 Existing Nodes and Corridors
In August 2015, KZN COGTA published a report titled “Towards a framework for the classification of
development nodes in KwaZulu-Natal – Regional spatial restructuring for an efficient delivery of services” The
aims of the report were to provide a standardised classification of nodes throughout the province. The study
identified the following categories of nodes:
District Development Node
Municipal Development Node
Community Development Node
Neighbourhood/Settlement Development Node
Source: Ugu District SDF, 2018
District development nodes: These nodes play an integral role in the regional economy and contribute substantially
to the provincial economy. They serve as major clusters of economic activities and provincial population. They
have considerably developed and diversified economies. They serve as both economic hubs and administrative
centre, but also perform some service centre functions. Municipal Development Nodes: are physically connected
to each other and to urban centres outside their regions (districts), by frequent and reliable transport and all-
weather roads. They offer diversified commercial, financial, professional and administrative duties and services.
They accommodate sub-regional offices of national government departments and branch offices of provincial
government departments. They provide facilities for large scale and diversified markets, function as
communication nodes for a broad rural hinterland, and provides sites for agri-business and largescale agriculture
processing. They also provide space for the location of small-scale consumer goods industries, repair workshops,
and light durable goods. They offer higher educational opportunities and more specialised vocational training;
and provide diversified and multi-purpose hospitals and health clinics. Municipal offices would mostly be located
in these development nodes.
Community Development Nodes: are small towns that provide an area-wide exchange point household and
common consumer products, and farm inputs. They serve as nodes of transportation and distribution linked to
regional centres within the province. They provide higher-level administrative services that cannot be found in
community development nodes and offer vocational and secondary education, health and childcare services, and
rural commercial services.
Neighbourhood/Settlement Development Nodes: These would locate a settlement or cluster of settlements. Its
service area would be limited to the surrounding settlements and would include lower order public, shopping and
34
small business enterprise facilities. It serves as linkage between the local communities and the major towns as
such they should locate in accessible areas along or at the intersection on public transport routes. The majority of
these are in the rural areas and would be discussed in detail in the local municipality SDF’s.
3.1.3.1 Hierarchy of Development Corridors
Corridors are areas of street or route-oriented uses which incorporate a mix of retail, employment and residential
uses, developed at overall greater densities, located along arterial roads serving as major transit routes. Corridors
link Nodes and important areas of activity within the district and are intended to be key locations for residential
intensification. Corridors may form the boundaries of residential subdivisions or neighbourhoods but should act
as a linear focus for activities and uses within the community. The Districts Corridors provide a significant
opportunity for creating vibrant pedestrian and transit-oriented places through investment in hard and soft
infrastructure, residential intensification, infill and re-development.
The concept of spatial development requires an understanding of the movement networks of people, goods and
services which are channelled along specific routes. These routes are described as networks of interaction. The
level and intensity of activity that these networks of interaction provide result in the concept of “Development
Corridors” which are broad areas of development which are centred on activity and development routes. They are
characterised by dynamic, mutually supporting relationships between land uses and the supporting movement
system. These development corridors are generally supported by a hierarchy of transport services which functions
as an integrated system to facilitate and foster ease of movement for private and public transport users.
A key element of corridor development is intensification. A large portion of the Districts land use intensification
target is directed to Nodes and Corridors. In older Corridors, intensification stabilizes and grows the population,
helping to support local businesses, institutions and community facilities such as community centres, parks and
schools, and returning vitality to these areas. In new or developing corridors, intensification, supported by transit,
provides a diversity of housing types and living environments that reduce the dependency on automobiles, creating
liveable environments.
The SDF recognizes Corridors as key structural elements which for Municipal, neighbourhood and precinct
planning; however, some corridors function as an integral part of a much broader environment with a national,
provincial and district wide impact (N2). Therefore, a central element of corridor planning will be to identify the
unique role played by each corridor and ensure that proper planning co-ordination and guidance is provided for
each of the corridors identified, whilst embracing the general ethos of corridor development planning.
Development corridors in Ugu DM occur at various scales and are dependent on function and categorisation of
the transportation route that forms the basis of the corridor. They carry flows of people and trade between two
points (origin and destination) and foster nodal development at strategic points. Corridor development forms the
basis of spatial structuring, and is a tool for economic growth, seeks to create functional linkages between areas

35
of higher thresholds and economic potential, with those that have insufficient thresholds. This, in turn, enables
areas that are poorly serviced, to be linked to areas of opportunity and benefit and with higher thresholds.
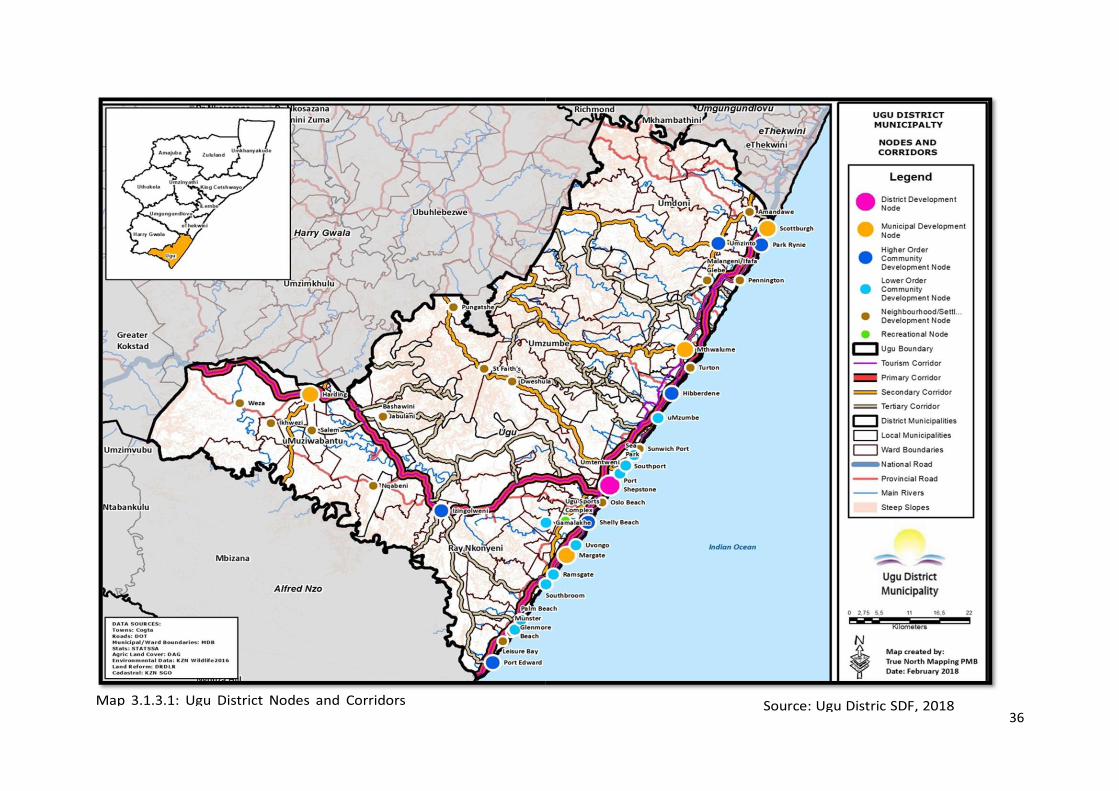
36
37
3.1.4 Broad Land Use Patterns
3.1.4.1 Coastal Tourism Towns and Surrounding Suburbs
There are a number of coastal tourism towns that are located along Marine Drive, Ocean Drive and Finnis Road.
These are mostly dominant within Ray Nkonyeni Local Municipality, specifically along R61 from Port Shepstone
to Port Edward, however coastal tourism is also seen in Scottburgh, Park Rynie, Pennington, Sunwhich Port,
Hibberdene etc. These towns are also surrounded by associated formal suburbs. These towns have a number of
commercial and entertainment activities within it which were introduced in order to embolden this tourism
environment.
3.1.4.2 Urban Towns and Surrounding Suburbs
The main urban centres within the study area are Port Shepstone, Hibberdene, Scottburgh, Margate, Port Edward
and Harding Town. These serves as the main towns for the municipal area with the highest agglomeration of
commercial activities.
3.1.4.3 Rural Town and Surrounding Peri-Urban Settlements
Ezinqolweni is the main rural town that is found within the municipal area. Turton within Umzumbe is
experiencing an increase in density marked by a phenomenal increase in the number of people that live within the
area. It is surrounded by the densely populated rural settlements which have grown around it over the years.
3.1.4.4 Rural Villages and Settlements
Majority of the inland area is occupied by rural villages and settlements. These are spread within different parts
of the administrative boundaries of traditional authorities. These villages and settlements have a number of
commercial and social activities within it. The kind of commercial activities are limited to small local convenient
shops, taverns as well as scale manufacturing activities (block making) and personnel services such as salons and
small-scale agricultural activities (ploughing field and food gardens).
3.1.4.5 Commercial Agriculture
Most commercial agriculture is intensive in one or more ways. Forms that rely especially heavily on industrial
methods are often called industrial agriculture, which is characterised by innovations designed to increase yield.
Techniques include planting multiple crops per year, reducing the frequency of fallow years, and improving
cultivars. It also involves increased use of fertilizers, plant growth regulators, pesticides and mechanised
agriculture, controlled by increased and more detailed analysis of growing conditions, including weather, soil,
water, weeds and pests. This system is supported by ongoing innovation in agricultural machinery and farming
methods, genetic technology, techniques for achieving economies of scale, logistics, and data collection and
analysis technology. Intensive farms are widespread in developed nations and increasingly prevalent worldwide.
38
Most of the meat, dairy, eggs, fruits and vegetables available in supermarkets are produced by such farms. Smaller
intensive farms usually include higher inputs of labour and more often use sustainable intensive methods. The
farming practices commonly found on such farms are referred to as appropriate technology. These farms are less
widespread in both developed countries and worldwide but are growing more rapidly. Most of the food available
in specialty markets such as farmers markets is produced by these smallholder farms.
The district municipality has an abundant amount of agricultural land which is geographically located between
the urban and rural areas in the form of commercial agricultural farms. The agricultural pattern within the area is
primarily due to the undulating topography, which prescribes the available land parcels out of the valley lines and
along other major structuring elements. The agricultural industry is a prominent feature within the KwaZulu-Natal
south coast, and therefore becomes a predominant land use within the area. The predominance is due to the rich
natural resources and climatic conditions, which allow for the farming of produces such as sugar, bananas, timber,
pawpaw’s, coffee, tea and exotic nuts along the coast, maize, legumes, cattle, vast pine, commercial forestry,
wattle and eucalyptus plantations inland. Commercial agriculture activity is concentrated largely within a central
band located south-east of Harding.
3.1.4.6 Subsistence Agriculture/ Grazing Land
Rural subsistence farming activity is generally equated with the traditional settlement areas of specifically the
rural areas. The agricultural practices within the Traditional Settlement areas of Ugu are diversified with many
households producing food for subsistence purposes. Rural subsistence agriculture is far more extensive in the
southern traditional authority areas of KwaJali and KwaMachi in Harding. Due to the often-large degree of
transformation of these areas in terms of grazing cover as well as institutional factors, grazing capacity and other
resource constraints limit the extent to which livestock as well as farming could be expanded. Settlements such as
Odidini, Imfume, Dududu, Mikhunya, Kenterton, Qolodolo, Msinsini, Dweshula, Assissi, Qiniseleni and
Izingolweni villages are low density settlements which still practice subsistence agriculture.
3.1.4.7 Conservation and Environmentally Sensitive Areas
The Conservation areas comprise a composite of Core Environmental areas, steep slope areas unsuitable for
development and the 30m flood line buffers. There are two important grassland areas to the south and east of
Odidini. These grassland areas are of high conservation value as they form part of the Interior South Coast
Grasslands Belt, a Critically Endangered ecosystem. These grasslands occur within a Traditional Authority Area
and have relatively low levels of settlement. Imfume is an area of grassland to the east, which is also of high
conservation value as it forms part of the Interior South Coast Grasslands Belt, a Critically Endangered ecosystem.
This area also provides an important wildlife corridor between the conservation areas along the iLovu River,
Umgababa River, and the Umkhomazi River. This grassland occurs within a Traditional Authority Area and has
relatively low levels of settlement.
39
Umkhomazi River Valley is a large area of Eastern Valley Bushveld, situated in the upper catchment of the
Umkhomazi River, and which forms the northern boundary of the Ugu Municipal Area. Other formal
environmental areas include Umtamvuna, Mbubazi, Mpenjati, Skyline, and Oribi Gorge.This area occurs within
a Traditional Authority Area and has relatively low levels of settlement due to the steep topography. There are
also a number of unprotected environmental areas within the area which are undeveloped /untransformed and
consist of grassland, dense bush and forests. High biodiversity areas represent a substantial fraction of the area.
Mpambanyoni River Valley is an area of Ngongoni Veld (Vulnerable) and Eastern Valley Bushveld situated in
the upper catchment of the Mpambanyoni River. This area occurs within a Traditional Authority Area and has
relatively low levels of settlement. Other river valleys which the district considers crucial, endangered, vulnerable
and are considered environmentally sensitive areas, they include Fafa River Valley, Mtwalume River Valley,
Quha River Valley, Kwa-Malukaka Valley, Mzumbe River Valley, and Umzimkhulu River Valley. There are
several pockets of Scarp Forest occurring within and surrounding Vernon Crookes Nature Reserve. These forests
occur on private properties, between areas of commercial sugarcane. Other forests which are environmentally
sensitive, endangered and must be protected include Ntimbankulu Forest and Weza State Forest.
3.1.4.8 Industrial Hubs There are several industrial hubs which are observed within the region, and they include Weza Sawmill Merensky
which is a theatre of manufacturing and storage/ warehouse activities within Umuziwabantu area, Izotsha
Industrial Development Corridor which is a theatre of manufacturing and storage/ warehouse activities within the
RN area, Other industrial activities are found in towns such as Marburg and Port Shepstone which also extensively
contribute in the economic growth of the municipality. The areas that are currently zoned as industrial areas within
Umdoni include 1 Area in Scottburgh (adjacent to the N2), 1 Area in Park Rynie (adjacent to the N2 off ramp), 1
Area in Esparanza (south), Specific sites in Umzinto North and Specific sites in Umzinto South.
3.1.4.9 Tourism Activities and Farms Tourism is a key sector which can and should be developed through the development of tourism products based
on the diverse natural and cultural resource base of the municipality. within the area of Umzumbe, it is identified
as one of the economic opportunity areas that requires attention and investment. The district has identified several
tourism opportunities and projects in Umzumbe, with the focus being on agri-heritage and cultural tourism.
Tourism assets which umdoni area is richly blessed with includes; Beaches: Scottburgh Beach and its grass-
covered banks is one of the main attractions as it has established itself as the popular holiday resort destination
for South Africans and foreign dwellers; Golfing: Along the South Coast Umdoni is identified as one of the hidden
treasures of the Golf coast. The Golf course has 18 holes and is situated on 200 hectares of indigenous coastal
forest. It has fauna and flora and magnificent vistas that make it a breath-taking experience to explore; Caravan
Parks and Camp Sites. Scottburgh Caravan parks are privately owned seaside resorts and campsites are owned by
the municipality. TC Robertson Nature Reserve: This nature reserve is located just 10 min walk from the centre
of Scottburgh and from the main beach area. It has become a popular picnic venue with over 180 species of birds,
and bushbuck grey duiker and blue duiker and Croc World.

40
This tourist attraction was established in 1985 and it is popularly known for its spectacular inland valley views
and indigenous trees and plants. It houses a large collection of snakes and showcases endangered other species
such as tortoises and therefore described as the reptile and bird park. Adventure tourism is already an important
draw card for the Ugu District, but to date the focus has been on coastal adventure tourism activities such as
diving, fishing and related water sports. Other tourism activities ensue from Oribi Gorge include but not limited
to hiking, river crafting, zip line, wild swing and sliding.

41
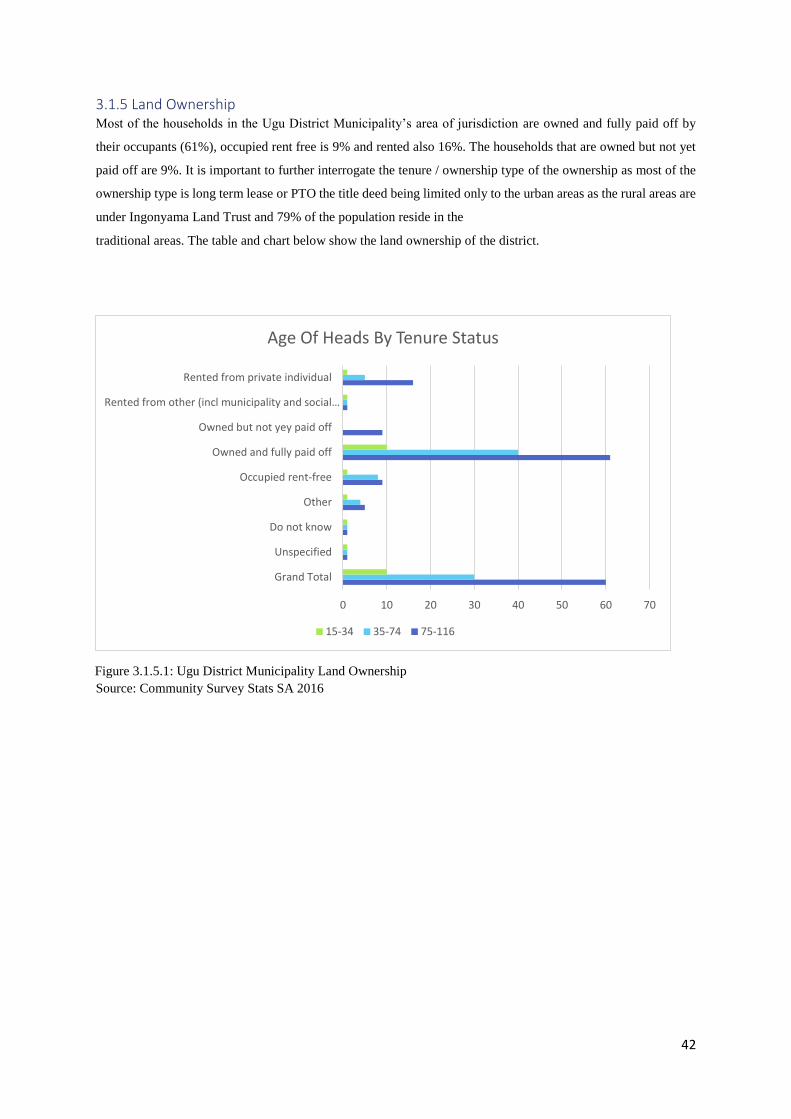
42
3.1.5 Land Ownership Most of the households in the Ugu District Municipality’s area of jurisdiction are owned and fully paid off by
their occupants (61%), occupied rent free is 9% and rented also 16%. The households that are owned but not yet
paid off are 9%. It is important to further interrogate the tenure / ownership type of the ownership as most of the
ownership type is long term lease or PTO the title deed being limited only to the urban areas as the rural areas are
under Ingonyama Land Trust and 79% of the population reside in the
traditional areas. The table and chart below show the land ownership of the district.
Figure 3.1.5.1: Ugu District Municipality Land Ownership
Source: Community Survey Stats SA 2016
0 10 20 30 40 50 60 70
Grand Total
Unspecified
Do not know
Other
Occupied rent-free
Owned and fully paid off
Owned but not yey paid off
Rented from other (incl municipality and social…
Rented from private individual
Age Of Heads By Tenure Status
15-34 35-74 75-116
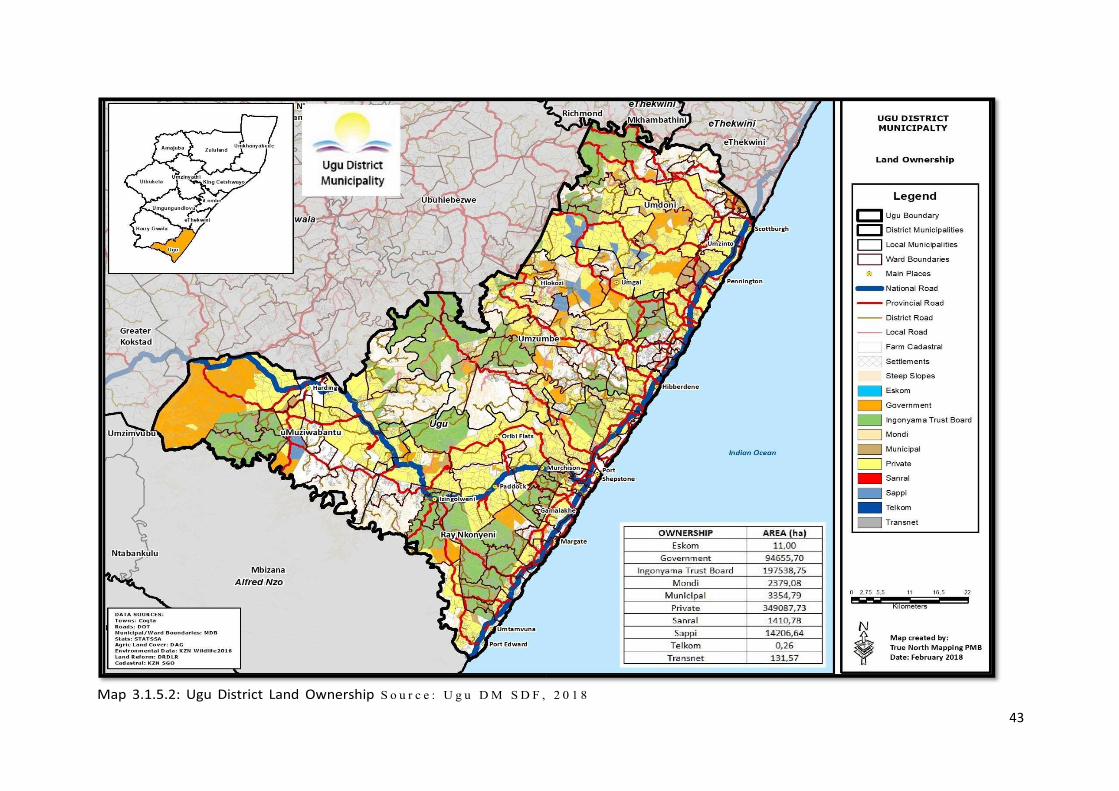
43
44
3.1.6 Land Reform Land reform is an integral part of the transformation of the South African urban and rural landscape and limited
success has been achieved to date across South Africa. Where it has been implemented it has been generally
regarded as unsuccessful leaving communities and individuals destitute. There are quite a number of land claims
that were lodged within the district. However, a few of these claims were transferred into projects, inter alia
such as Nzimkwe, Impenjati and Khoshwani. There are also a number of gazetted restitution claims within the
area. This includes Beshawu claim, Ezinqoleni claim, kwaXolo claim, Madlala claim, Masakhana claim,
Mathulini claim, Mavundla claim and Oshabeni claim. The importance of implementing successful land reform
initiatives can, however, not be doubted. Such initiatives should contribute to improving household food
security and supporting economic development in the District. As the focus of spatial planning is on the
appropriate use of land, it is of specific importance that the impact of spatial planning proposals in the district
on all facets of land reform be considered. The different facets of the land reform programme include: land
redistribution; land restitution; and land tenure.
3.1.7 Land Potential Much of development proposals presented in local economic development strategies require access to land.
Examples of this include the development of industrial areas, the expansion of agricultural production, the
establishment of new residential developments and more. From initial spatial and land use assessment, it has,
however, been concluded that land in the Ugu District should be viewed as a scarce resource. Map 3.1.7.1
quantifies the current land use situation in the Ugu District, and specifically considers the availability of
undeveloped land for development.
Although there appears to be substantial land available for development in the Ugu District, much of this land
has a slope of greater than 13º which severely restricts the development potential. Approximately 30% of the
land in the District can be classified as settled areas (including the urban edge and dense rural settlement). Sugar
cane and forestry occupies 20% of the land with commercial crops and orchards occupying only 0.5% of the
land. The land available for development is generally located in small pockets and / or not well-located (i.e.
located on river flood plains) and therefore not necessarily available for development. Low density rural and
urban settlement areas also continue to expand and reduce the extent of land available for development. Also,
to be considered is that sugar cane land, if used for alternative production or urban land uses, reduces the land
for sugar cane and may impact on the longer-term sustainability of the two sugar mills located in the District.
These are major contributors to the economic output of the District.
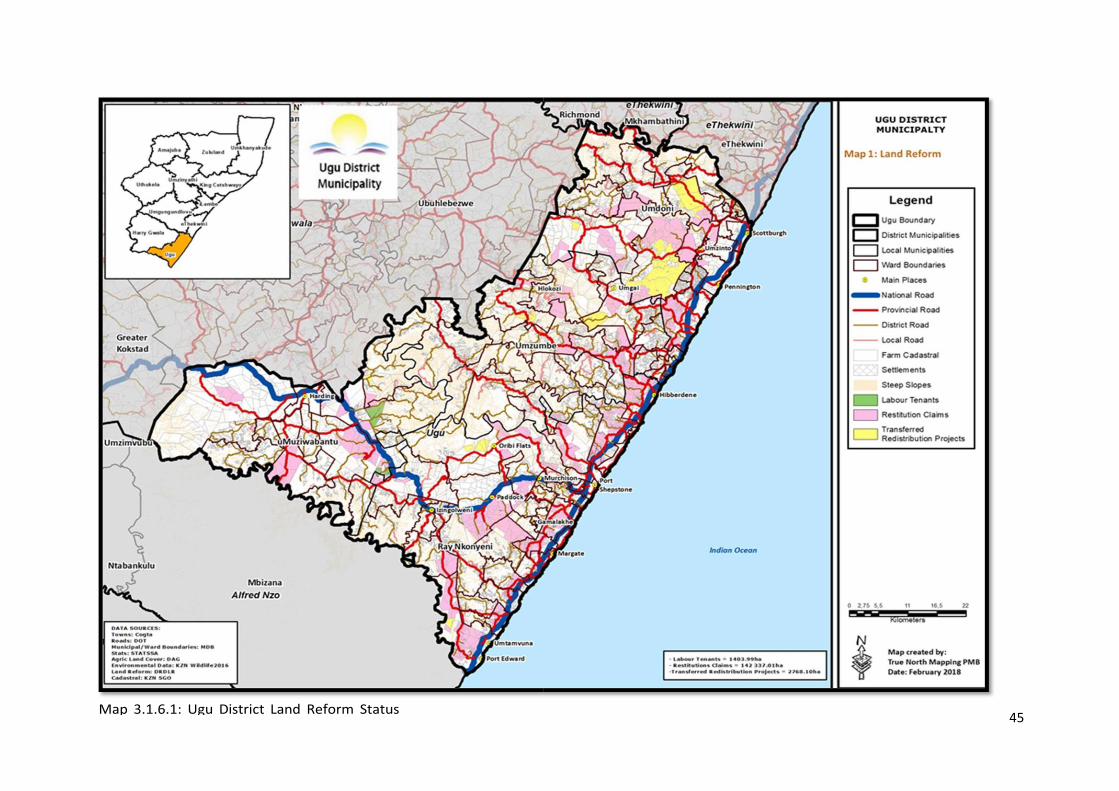
45
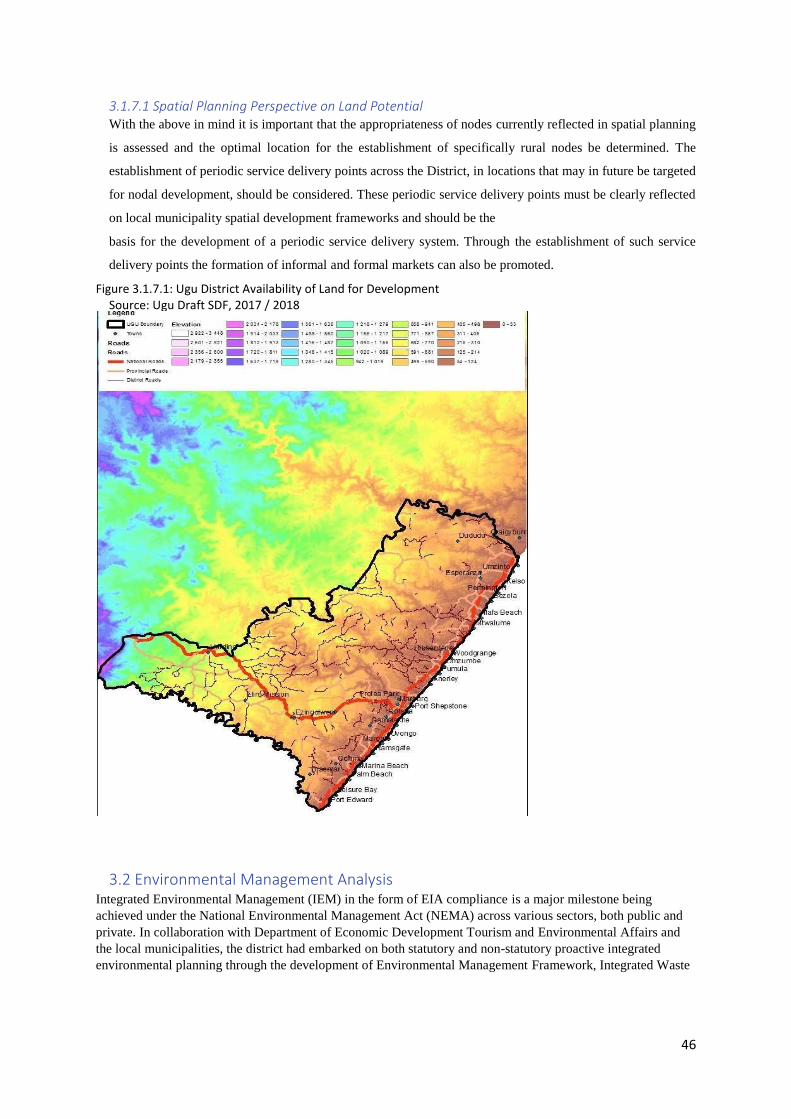
46
3.1.7.1 Spatial Planning Perspective on Land Potential With the above in mind it is important that the appropriateness of nodes currently reflected in spatial planning
is assessed and the optimal location for the establishment of specifically rural nodes be determined. The
establishment of periodic service delivery points across the District, in locations that may in future be targeted
for nodal development, should be considered. These periodic service delivery points must be clearly reflected
on local municipality spatial development frameworks and should be the
basis for the development of a periodic service delivery system. Through the establishment of such service
delivery points the formation of informal and formal markets can also be promoted.
Figure 3.1.7.1: Ugu District Availability of Land for Development Source: Ugu Draft SDF, 2017 / 2018
3.2 Environmental Management Analysis Integrated Environmental Management (IEM) in the form of EIA compliance is a major milestone being
achieved under the National Environmental Management Act (NEMA) across various sectors, both public and
private. In collaboration with Department of Economic Development Tourism and Environmental Affairs and
the local municipalities, the district had embarked on both statutory and non-statutory proactive integrated
environmental planning through the development of Environmental Management Framework, Integrated Waste
47
Management Plan, Air Quality Management Plan, Air Quality Management by-laws, etc. Other pockets of
excellence include intergovernmental and inter-sectoral forums and social responsibility projects. However,
law enforcement on formal mining activities remains a major area of concern. Major gaps were identified when
the five-year IDP was developed in 2017 with respect to Coastal Management programme as required by the
Integrated Coastal Management Act of 2009, Climate Change Adaptation and Mitigation Strategy, Invasive
Alien Species Management Plan, Health, and Hygiene Education Strategy. Some progress has been made to
date the Coastal Management Programme and Climate Change Vulnerability Strategy are in place (See Chapter
8 for all the strategies and plans in place). The municipality will continue to prioritise the development of the
remaining strategies and plans.
3.2.1 Key Hydrological features The National Water Act (1998) recognises that water is a scarce resource and that there is a need for the
integrated management of all aspects of water resources. The SDF promotes the concept of catchment
management as a means of addressing biodiversity management, resource management and settlement
planning. Catchment management therefore proposes that catchment systems be understood as a primary
informant in planning processes for the purpose of improving and integrating the management of land, water
and related natural resources, in order to achieve more sustainable use of available resources.
A critical factor here will be understanding the capacity of catchment systems to supply fresh water and to
sustain land uses and settlement activity within the catchment area, even where land use and settlement growth
is sensibly planned and effectively managed. Applying a catchment management approach means recognising
that the land has limits in terms of its carrying capacity. It means aligning development to the identified limits
to the resources available using catchments as a tool for describing a specific resource unit which is appropriate
for spatial planning at a regional scale. A catchment management approach must align with and respond to the
establishment of the Mzumvubu to Kieskamma Catchment Management Agencies (CMA) to be established in
terms of the National Water Act of 1998 and the latest National Water Resources Strategy.
The banks of these rivers contain high value biodiversity such as natural vegetation and ecosystems. The district
is also characterised by a number of wetlands areas which are connected to the major catchments areas such as
the rivers and the ocean. According to the Ugu Biodiversity Sector Plan (2014) the sub-quaternary catchments
for the Mzimkhulu, Mtamvuna and portions of the Mtwalume catchment have been identified as National
Freshwater Ecosystem Priority Areas (NFEPA) which are a priority for meeting national aquatic conservation
targets.
Furthermore, it is also important to note that these two major perennial rivers are identified as being in a good
condition (A/B class) despite the current levels of modification in the district (Ugu Biodversity Sector Plan). In
the context of Umuziwabantu, the Uvungu River is identified as being moderately affected by modification (C-
class) due to the nature of a coastal area, there are a large number of catchments within the UDM, ranging from
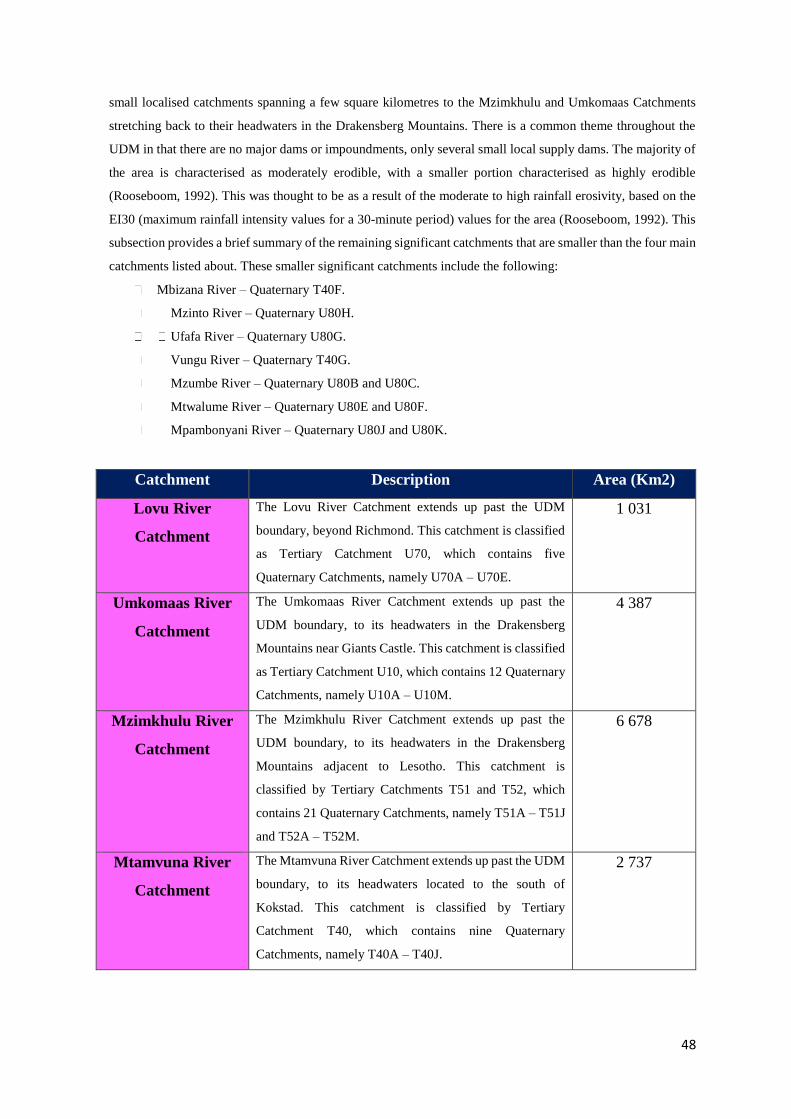
48
small localised catchments spanning a few square kilometres to the Mzimkhulu and Umkomaas Catchments
stretching back to their headwaters in the Drakensberg Mountains. There is a common theme throughout the
UDM in that there are no major dams or impoundments, only several small local supply dams. The majority of
the area is characterised as moderately erodible, with a smaller portion characterised as highly erodible
(Rooseboom, 1992). This was thought to be as a result of the moderate to high rainfall erosivity, based on the
EI30 (maximum rainfall intensity values for a 30-minute period) values for the area (Rooseboom, 1992). This
subsection provides a brief summary of the remaining significant catchments that are smaller than the four main
catchments listed about. These smaller significant catchments include the following:
Mbizana River – Quaternary T40F.
Mzinto River – Quaternary U80H.
Ufafa River – Quaternary U80G.
Vungu River – Quaternary T40G.
Mzumbe River – Quaternary U80B and U80C.
Mtwalume River – Quaternary U80E and U80F.
Mpambonyani River – Quaternary U80J and U80K.
Catchment Description Area (Km2)
Lovu River
Catchment
The Lovu River Catchment extends up past the UDM
boundary, beyond Richmond. This catchment is classified
as Tertiary Catchment U70, which contains five
Quaternary Catchments, namely U70A – U70E.
1 031
Umkomaas River
Catchment
The Umkomaas River Catchment extends up past the
UDM boundary, to its headwaters in the Drakensberg
Mountains near Giants Castle. This catchment is classified
as Tertiary Catchment U10, which contains 12 Quaternary
Catchments, namely U10A – U10M.
4 387
Mzimkhulu River
Catchment
The Mzimkhulu River Catchment extends up past the
UDM boundary, to its headwaters in the Drakensberg
Mountains adjacent to Lesotho. This catchment is
classified by Tertiary Catchments T51 and T52, which
contains 21 Quaternary Catchments, namely T51A – T51J
and T52A – T52M.
6 678
Mtamvuna River
Catchment
The Mtamvuna River Catchment extends up past the UDM
boundary, to its headwaters located to the south of
Kokstad. This catchment is classified by Tertiary
Catchment T40, which contains nine Quaternary
Catchments, namely T40A – T40J.
2 737
49
3.2.2 Protected areas Protected Areas (PAs) fulfil several critical functions within the landscape, most notably they function as the
cornerstones of biodiversity conservation and ecological sustainability, biodiversity retrospectivity, climate
change adaptation, provision of ecosystem goods and services, and socioeconomic (particularly rural)
development (DEA 2009). It is therefore not surprising that protected areas are seen as one of the most important
mechanisms for protecting biodiversity.
Internationally, the Convention on Biological Diversity (CBD) committed governments to protecting a
minimum of 10% of each habitat type by 2010. South Africa’s current protected area network falls far short of
sustaining biodiversity and ecological processes with only approximately 6% of our land surface set aside and
managed as protected areas. This flat target of 10% is relatively arbitrary, with no compelling ecological
rationale. In the South African context, with our globally exceptional levels of biodiversity richness, we need
a higher level of protection (DEAT & SANBI, 2008).
At present, a total of seven terrestrial formally protected and two marine protected areas (Aliwal Shoal &
Trafalgar) occur within the Ugu District (see Table 3.2.2.1). These range in extent from 17 ha (Skyline Nature
Reserve) to over 12, 000 ha (Aliwal Shoal Marine Protected Area). Terrestrial protected areas cover a meagre
8883.1 hectares, representing only a small fraction (1.76%) of the land surface within the District (Figure
3.2.2.1). This figure is clearly well below international benchmarks and is grossly inadequate to protect the
diversity of species, habitats and processes within the District.
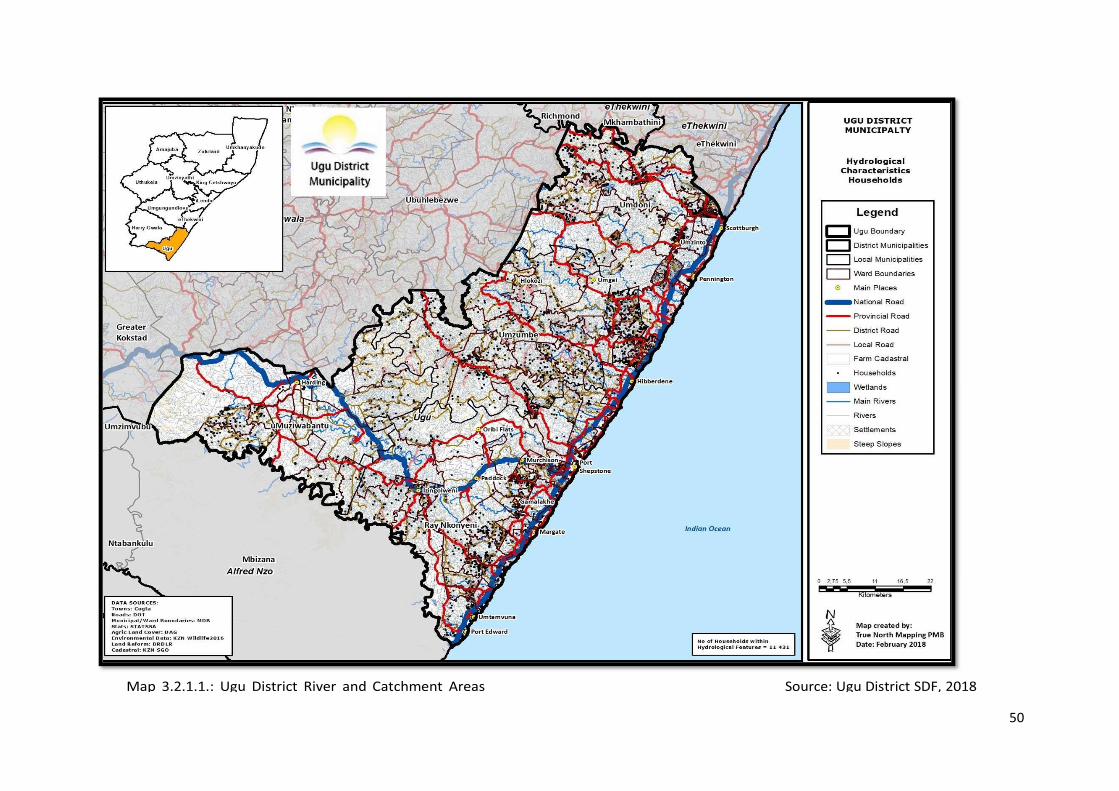
50

51
While several informal conservation areas also exist, these areas are not formally protected by law and therefore
provide little assurance of long-term protection. These areas include community conservation areas, privately
owned reserves, and game ranches. Further efforts are clearly required to expand the existing formal
conservation estate with opportunities for building on existing biodiversity commitments shown by landowners
through these informal conservation initiatives.
Protected area expansion planning has been undertaken at both a National and Regional level to help direct
conservation programs (Figure 3.2.2.1). Unfortunately, these plans have led to little formal action on the ground
apart from the conceptual development of a Big 5 Reserve associated with the Mzimkhulu priority area
identified in the national plan. Priority areas are also quite different with little alignment between the existing
plans. It is hoped that the outcomes of the BSP will help to provide further focus for future conservation efforts.
Site Date Proclaimed Extent (Ha)
Oribi Gorge Nature Reserve 1950 1745.7
Skyline Nature Reserve 1986 17.1
Mbumbazi Nature Reserve 1986 2022.9
Mehlomnyama Nature Reserve
(Managed by DWA) 1908 160.6
Umtamvuna Nature Reserve 1971 2653.0
Vernon Crookes Nature Reserve 1973 2188.9
Mpenjati Nature Reserve 1985 94.9
Total 8883.1 (1.76%)
Marine Protected Areas
Aliwal Shoal Marine Protected Area 2004 12461.5
Trafalgar Marine Reserve 1979 552
Table 3.2.2.1: Formal Protected Areas within Ugu District
Source: Draft EMF, 2013
3.2.3 Management Effectiveness and Pressures Facing Protected Areas An assessment of the management effectiveness of protected areas managed by EKZNW was undertaken in 2010.
This assessment was based largely on the Management Effectiveness Tracking Tool (METT) developed by WWF
and the World Bank (WB) in 2007. The results of the assessment are summarised in Table 3.2.2.2, below. This
clearly shows that all the sites assessed fell short of the 77% minimum standard which was set by the Management
Effectiveness Task Team with sites ranging in scores from
53% to 64%. This suggests that further efforts are required to improve management of existing protected areas
and so ensure that the few biodiversity assets within such areas receive the protection required. The level of
pressure facing different protected areas is also worth noting (see Table 3.2.1.3.2). Of relevance, is the very high
pressure associated
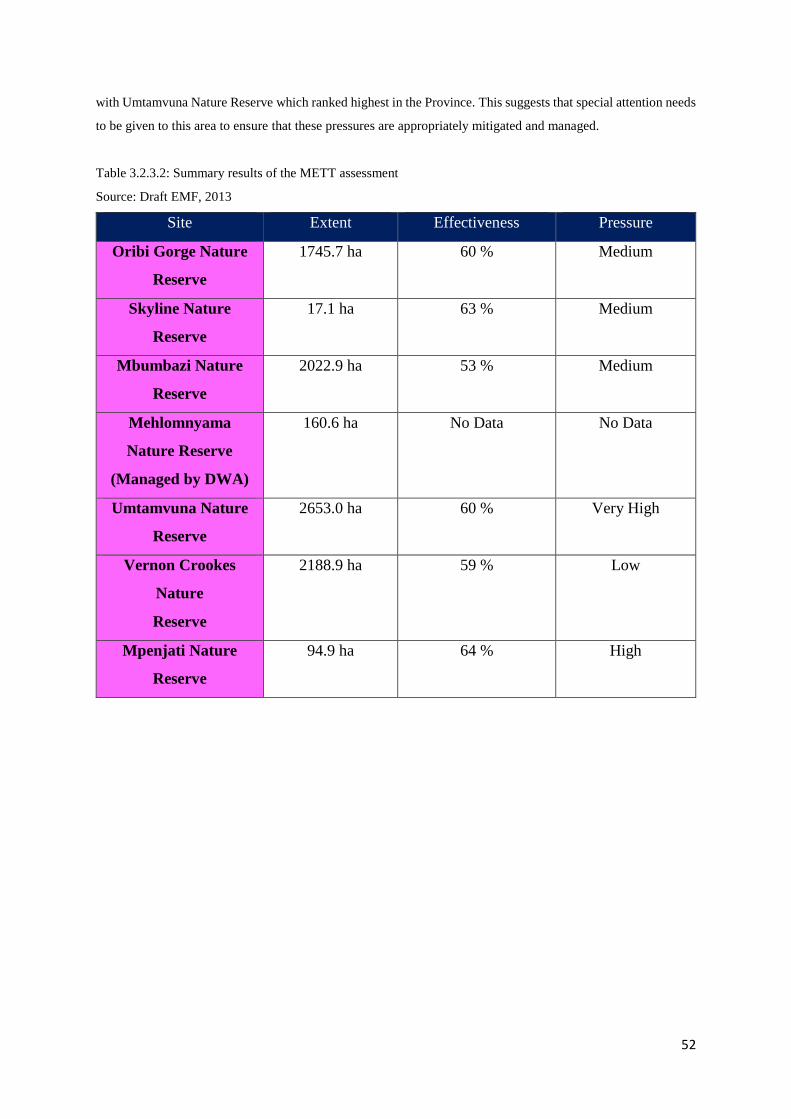
52
with Umtamvuna Nature Reserve which ranked highest in the Province. This suggests that special attention needs
to be given to this area to ensure that these pressures are appropriately mitigated and managed.
Table 3.2.3.2: Summary results of the METT assessment
Source: Draft EMF, 2013
Site Extent Effectiveness Pressure
Oribi Gorge Nature
Reserve
1745.7 ha 60 % Medium
Skyline Nature
Reserve
17.1 ha 63 % Medium
Mbumbazi Nature
Reserve
2022.9 ha 53 % Medium
Mehlomnyama
Nature Reserve
(Managed by DWA)
160.6 ha No Data No Data
Umtamvuna Nature
Reserve
2653.0 ha 60 % Very High
Vernon Crookes
Nature
Reserve
2188.9 ha 59 % Low
Mpenjati Nature
Reserve
94.9 ha 64 % High
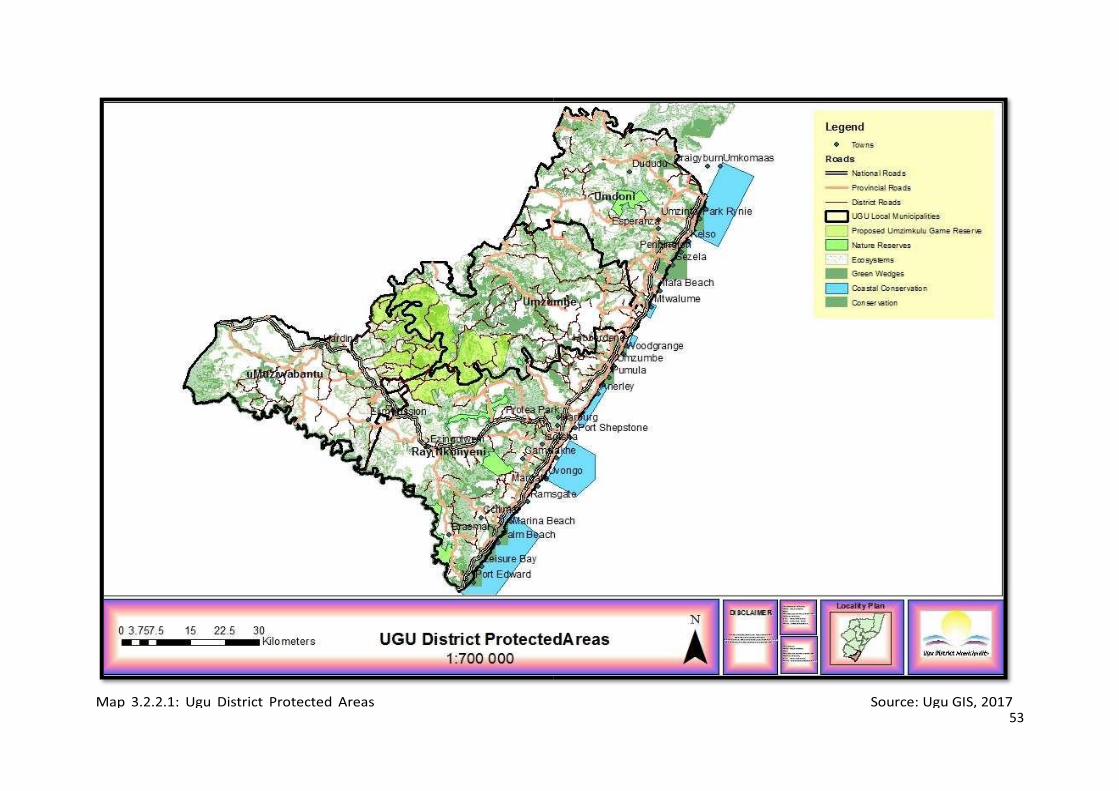
53
54
3.2.4 Biodiversity Critical Biodiversity Areas are natural or near natural landscapes that are considered critical for meeting
biodiversity targets and thresholds, and which safeguard areas required for the persistence of viable populations
of species and the functionality of ecosystems. Critical Biodiversity Areas or CBAs include features, habitats and
landscapes that are considered to be most important for biodiversity conservation and securing the preservation
of important ecosystem functioning and processes. Terrestrial, aquatic, estuarine and marine CBAs. Terrestrial
CBAs describe terrestrial areas within the District which are of particularly high conservation significance.
Protected Areas and sites of conservation importance are automatically included in the CBA network by virtue of
their formal protection status. Additional datasets used to classify and derive the terrestrial CBA layer included
Critical Biodiversity Areas (formally Biodiversity Priority Areas) defined in the EKZNW Terrestrial Systematic
Conservation Plan, irreplaceable linkages using the coverage of Landscape Ecological corridors for the Province
and terrestrial features/areas identified as critically important for terrestrial conservation efforts based on input
from local experts in the District. The majority of these CBA`s are “irreplaceable”, meaning their natural status
meets the biodiversity targets and thresholds and this may require the municipality to adopt mechanisms in dealing
and managing such areas of significance which forms a major component of the municipal natural assets.
3.2.5 Households located in hazardous areas Due to the nature of a coastal area, there are a large number of catchments within the UDM, ranging from small
localised catchments spanning a few square kilometres to the Mzimkhulu and Umkomaas Catchments stretching
back to their headwaters in the Drakensberg Mountains. There is a common theme throughout the UDM in that
there are no major dams or impoundments, only several small local supply dams. These impoundments are
quantified in terms of volume and surface area within each sub-section to follow. The majority of the area is
characterised as moderately erodible, with a smaller portion characterised as highly erodible (Rooseboom, 1992).
This was thought to be as a result of the moderate to high rainfall erosivity, based on the EI30 (maximum rainfall
intensity values for a 30-minute period) values for the area (Rooseboom, 1992).
Furthermore, the majority of wetlands in the Ugu DM occur within higher rainfall areas, resulting in high densities
of wetlands along the coastal region and fewer located inland. As a result of intensive urban development along
the coast and agricultural practices (commercial and informal), an estimated 67% of wetland areas have been
subject to transformation, significantly affecting the ecosystem services derived from these resources. While no
critically endangered wetland types were identified in the provincial assessment, more than 50% of wetlands fall
within an endangered wetland vegetation type. The national assessment paints a worse picture with many wetland
vegetation groups classified as critically endangered in the study area. These are all areas which are considered as
environmentally sensitive due to, inter alia, their ecosystem benefits. There are approximately 7785 households
within Ugu District that are located on hydrologically sensitive areas. The wetlands and the rivers are protected
by various pieces of environmental legislations. With the recent climate change events leading to excessive heavy
rainfall and floods, it has become more important for these situations to be avoided.

55
3.2.6 Vegetation A range of vegetation types extend across the UDM and are grouped within three biomes, namely the Indian
Ocean Coastal belt, Savannah biome inland of the coastal belt, and a small section of the grassland biome west of
Harding and extending north towards Kokstad. Transformation has significantly impacted in the extent of
remaining natural habitat, particularly along the coast and in higher lying inland regions High levels of
transformation in the study area have contributed to five vegetation types being classified as critically endangered
and a further three vegetation types of the study area while 24% of vegetation types are vulnerable, while only
17% are classified as least threatened.
A national process has also been undertaken to identify and list threatened ecosystems. Threatened Ecosystems
are those ecosystems (in this case defined as a vegetation type) that are currently under threat of being transformed
by other land uses. The first national list of threatened terrestrial ecosystems for South Africa was gazetted on 9
December 2011 (National Environmental Management: Biodiversity Act: National list of ecosystems that are
threatened and in need of protection, G 34809, GoN 1002, 9 December 2011). The Biodiversity Act (Act 10 of
2004) provides for listing of threatened or protected ecosystems, in one of four categories: critically endangered
(CR), endangered (EN), vulnerable (VU) or protected.
Table 3.2.3.1: KZN Vegetation Type
KZN Vegetation Name Historical
Area
(Ha)
Extent (%)
of DM
Extent
Remaining
(Ha)
% lost
within DM
Critically Endangered 177755 35.5% 67310
KwaZulu-Natal Coastal Belt
Grassland
124673 24.9% 45294 63.7%
KwaZulu-Natal Coastal
Forests: Southern Mesic
Coastal Lowlands Forest
4467 0.9% 3830 14.3%
KwaZulu-Natal Coastal
Forests: Southern Moist
Coastal Lowlands Forest
1882 0.4% 1646 12.5%
KwaZulu-Natal Dune
Forests: East Coast Dune
Forest
286 0.1% 192 32.9%
KwaZulu-Natal Sandstone
Sourveld
9202 1.8% 2375 74.2%
Pondoland-Ugu Sandstone
Coastal Sourveld
37245 7.4% 13973 62.5%
Endangered 115459 23.0% 45081
Eastern Mistbelt Forests 3005 0.6% 2353 21.7%
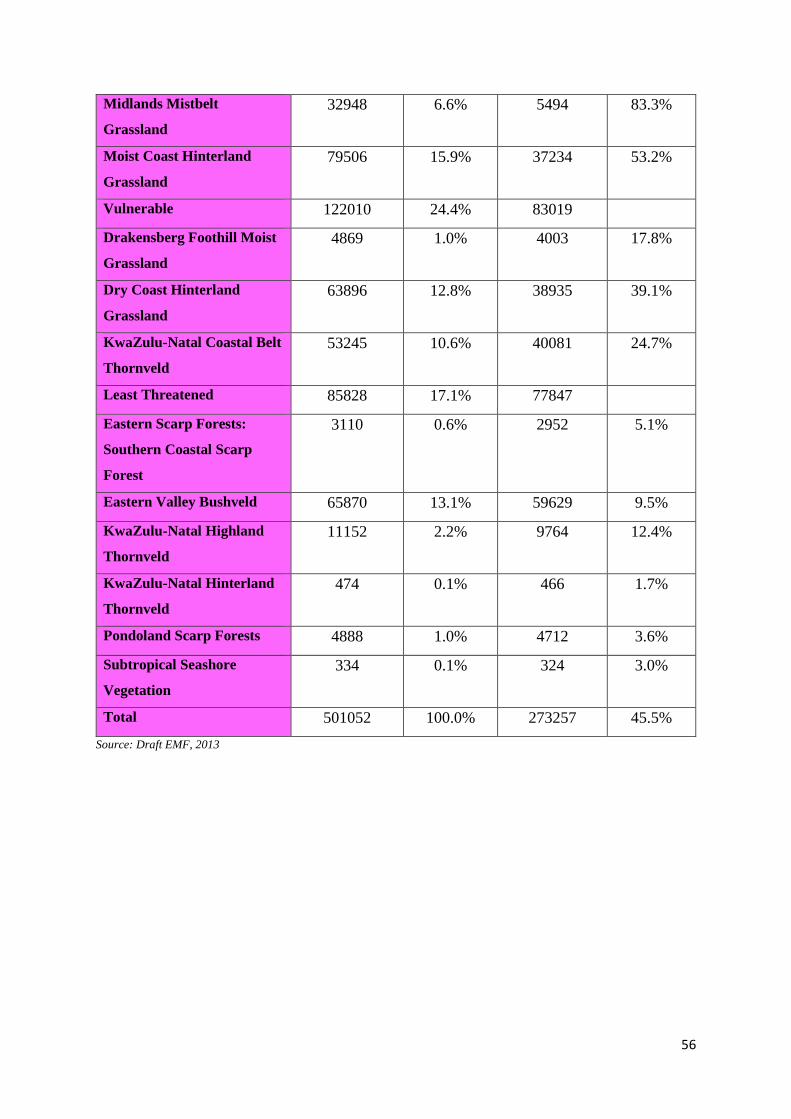
56
Midlands Mistbelt
Grassland
32948 6.6% 5494 83.3%
Moist Coast Hinterland
Grassland
79506 15.9% 37234 53.2%
Vulnerable 122010 24.4% 83019
Drakensberg Foothill Moist
Grassland
4869 1.0% 4003 17.8%
Dry Coast Hinterland
Grassland
63896 12.8% 38935 39.1%
KwaZulu-Natal Coastal Belt
Thornveld
53245 10.6% 40081 24.7%
Least Threatened 85828 17.1% 77847
Eastern Scarp Forests:
Southern Coastal Scarp
Forest
3110 0.6% 2952 5.1%
Eastern Valley Bushveld 65870 13.1% 59629 9.5%
KwaZulu-Natal Highland
Thornveld
11152 2.2% 9764 12.4%
KwaZulu-Natal Hinterland
Thornveld
474 0.1% 466 1.7%
Pondoland Scarp Forests 4888 1.0% 4712 3.6%
Subtropical Seashore
Vegetation
334 0.1% 324 3.0%
Total 501052 100.0% 273257 45.5%
Source: Draft EMF, 2013
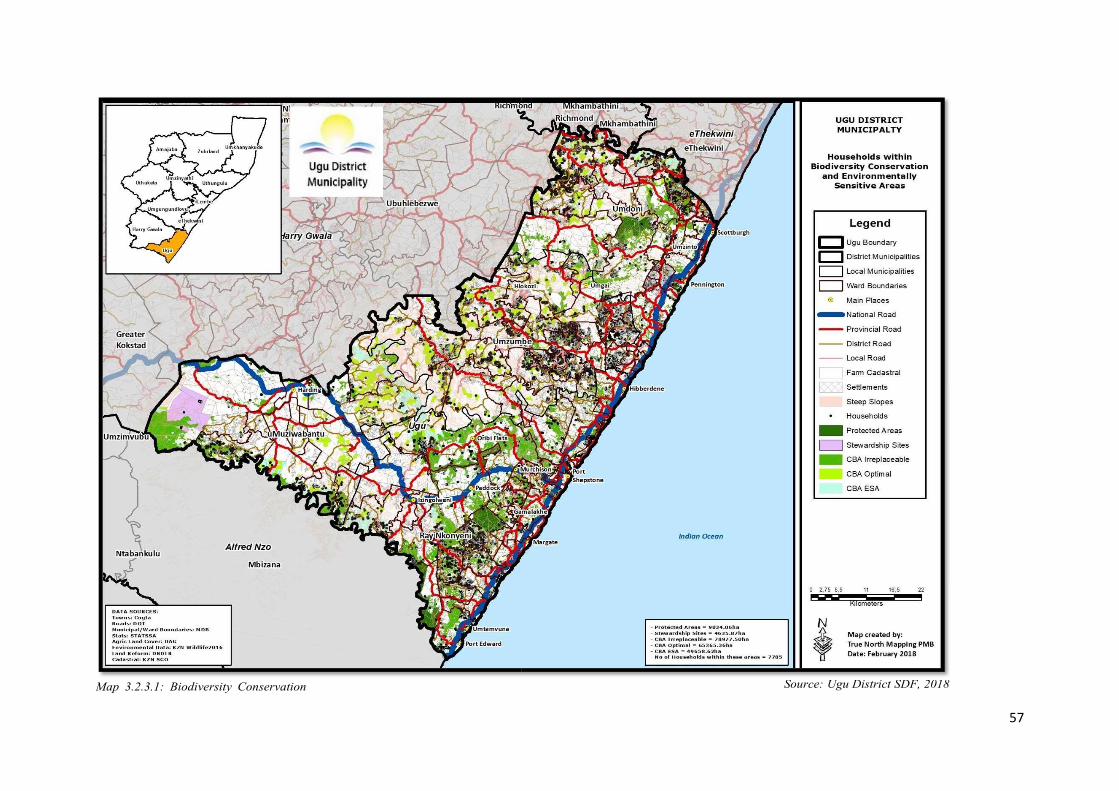
57
58
3.2.7 Climate Change The climate of Ugu DM can be categorised into three distinct climate zones. These are coastal, inland north and
inland south:
The coastal climatology is influenced largely by the proximity to the warm Agulhas Ocean current. The
thermal heat retentive capacity of the ocean reduces the diurnal temperature range and thus results in
more mild temperatures along the coastal areas. The warm ocean current along the eastern coast provides
water that is more predisposed to evaporation. Coastal areas therefore experience high humidity and
significantly more precipitation than inland and west coast areas.
The inland climate zones do not receive the mitigation effect of proximity to the ocean and therefore
have a larger diurnal temperature range. This is particularly noted in the northern inland areas which as
the highest annual average daytime temperature. The inland southern areas partly cover higher altitude
areas and will therefore have a reduced annual average temperature with increased altitude inland. The
precipitation profile is very similar between the inland northern and southern areas and both exhibit
reduced precipitation from that which is noted toward the coast.
The effects of climate change in South Africa are not limited to increased water scarcity in some parts of the
country and drastic qualitative changes in the water supply, but extend to losses in biodiversity and rangelands,
which impacts in the farming and agricultural sector, as well as possible increases in infectious and respiratory
diseases. Climate change will have a significant impact on food availability, food accessibility and food systems
stability. Climate change affects the large proportion of South Africa’s population who have a low resilience to
extreme climate events due to poverty, inadequate housing infrastructure and location. Climate change affects the
decision-making processes of the vulnerable poor people in South African communities, such as; where they
choose to live and which areas are sustainable for their livelihoods. In some household’s people survive on
subsistence farming as they may not have the opportunities to access formal employment channels neither are
they close to any public facilities which could enable them to access employment opportunities. Therefore, in
such cases subsistence farming becomes a way of life and survival. However, because of climate change, this
form of livelihood is mostly threatened leaving subsistence farmers vulnerable to drought or forced to relocate
from one area to another, where there is rainfall or access to water in order to survive. In some cases, the inability
to access potable water forces people to relocate into other areas where water is available. These patterns then
directly affect settlement patterns, in terms of where most informal settlements tend to conglomerate within a Ugu
area of jurisdiction. Furthermore, they determine which parts of municipal areas have the most sporadic
development of informal settlements despite efforts by planners and local authorities to curb housing backlog and
demand. Climate change may also influence the switch from subsistence farming as a form of livelihood to people
moving closer to areas in which they can access public facilities or areas of mobility such that they have access to
economic opportunities in the market. Cities are also required to deal with the rising threats of climate change and
dwindling resources. These constraints mean that cities that do not plan adequately will face higher costs to
residents, a decline in welfare, and reduced economic competitiveness. Preparations for these circumstances
typically require decades of forward-thinking development guidance. Climate change is recognized as the major
environmental problem facing the globe. Escalating greenhouse gas emissions contribute towards climate change
and will ultimately impact on human health, food security, natural resources, sea level rise, land loss and coastal
59
infrastructure. Climate change embraces far more than temperature change and may include changes in rainfall
patterns, sea level rise, the spread of infectious disease such as malaria, increase alien vegetation invasion and
loss of biodiversity:
• An increase in the frequency and intensity of floods and droughts;
• A decrease in water availability due to changed rainfall patterns and increased evaporation; this
will affect subsistence dry land farmers the most.
• An increase in erosional capacity of river courses, resulting in the loss of more top soil, thus
decreasing the agricultural value of land and increasing siltation in dams.
• Infrastructural damage as a result of extreme weather events causing flooding, affecting human
wellbeing and safety as well as insurance costs;
• An increase in erosion of coastal areas due to sea-level rise;
• Higher energy consumption due to increased residential cooling load;
• An increase in economic losses due to property damage and decreased tourism revenue;
• An increase in heat-related vector-borne (e.g. malaria) and water-borne (e.g. cholera) illnesses;
• An increase in heat stress, leading to dehydration, particularly for those that reside in the urban
areas, as well as children and the elderly;
• Changes in the geographical distribution of plants and animals with extinction of species that
are unable to move and an increase in the prevalence of alien invasive species. This will
negatively affect the biodiversity of the Ugu Area of jurisdiction and the associated goods and
services;
• Further loss of critically endangered grassland habitats as they are outcompeted by woody
species able to utilize the higher concentrations of CO2 in the atmosphere.
• A reduction in yield of staple food crops, such as maize;
• Changes in the optimal planting and harvesting dates for crops as well as land suitable for crop
production;
• Heat stress increasing livestock and poultry mortality rates;
• An increase in respiratory problems in the city due to a decrease in air quality (e.g. changes in
the concentration and distribution of near-surface ozone) and increased dampness; and
• Deterioration of foods leading to increased incidents of food-borne diseases.
The likely climate change impacts have been assessed and plans, programmes and projects have been developed
to assist the Ugu District in dealing with these impacts. The mitigation and adaptation work streams of the MCPP
are in the Energy Office and the Environmental Planning and Climate Protection Department respectively.
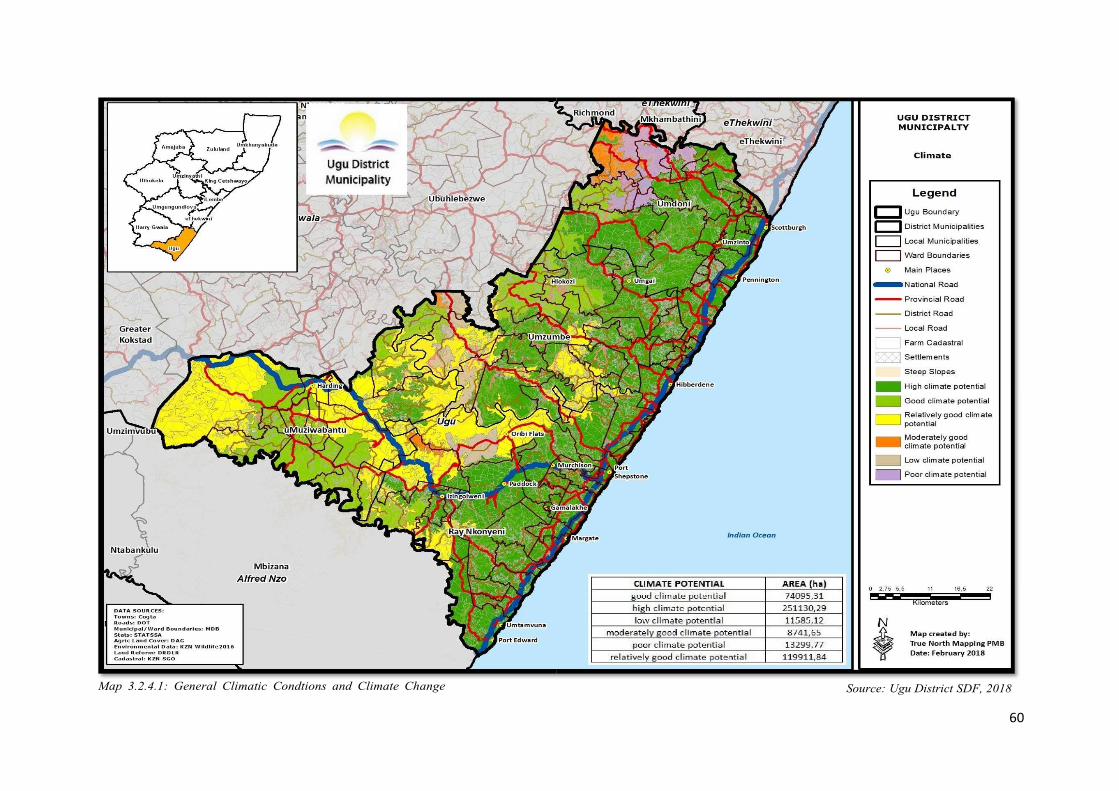
60
61
3.3 Environmental Health Services (EHS) The environment in which people live has the potential to be promotive of health or to impact negatively on health
due to the presence of various environmental health risks. The Economic Development and Environmental
Services Department which is tasked to mitigate against such risks and ensure promotion of a healthy environment.
EHS cannot achieve this in isolation but works with various internal and external role players to impact on the
nine (9) core functional areas of the Municipal Health services as defined in the National Health Act.
3.3.1 Food Control All food outlets are inspected regularly, to ensure that they comply with health requirements and, that food is
prepared under sound and hygienic conditions, to prevent foodborne illnesses. In those instances where
contraventions are found, the necessary statutory notice is served, to ensure compliance. This includes:
i. Food safety in respect of acceptable microbiological and chemical standards and quality of all
food for human consumption and optimal hygiene control throughout the food supply chain
from point of origin, all primary ground, or raw products production up to the point of
consumption.
ii. Food inspection at production, distribution and consumption area
iii. Informal Street Trading Monitoring. iv. Food premises inspection and control of
stationary nuisances.
v. Enforcement of food legislation and Codex Alimentarius.
vi. Food quality monitoring programmes and principles through various techniques e.g. HACCP.
vii. Promote the safe transportation, handling, storage and preparation of food stuffs used in the
Primary School Nutrition programme (PSNP), Prisons, Health Establishments, Airports and ect.
viii. Promote safe handling of meat and meat products including Abattoir inspections.
ix. Promote the safe handling of milk and milk products.
3.3.2 Water Quality Monitoring It is our objective, to ensure that water consumed by the residents of Ugu District, is safe and wholesome and
water utilized for recreational purposes is in compliance to regulations thereby preventing water borne diseases.
To this end, water samples are taken monthly, from various sources, viz. tankers, standpipes, rivers, lagoons, and
boreholes, for testing. Monitoring water quality and availability,
• including mapping of water source. Enforcement of laws and regulations related to water quality
management.
• Ensuring water safety in respect of safe quality (microbiological and chemical), and
accessibility to an adequate quantity for domestic use as well as in respect of the quality of water
for recreational, industrial, food production and any other human and animal use.
• Ensuring that water supplies that are readily accessible to Communities and to the planning,
design, management and health surveillance of community water supplies that are readily
accessible to Communities.

62
• Ensuring monitoring and effective waste water treatment and water pollution control
• Advocacy on proper and safe water and waste water usage.
• Water sampling and testing
3.3.3 Communicable Diseases Control Our role is preventative, rather than curative, therefore, Environmental
Health Practitioners timeously investigate all communicable diseases. Health Education normally reinforce this,
to ensure long term behavioural changes and, to reduce disease morbidity and mortality.
• Health and hygiene promotion is aimed at prevention of environmentally induced diseases and
related communicable diseases.
• Collection analyses and dissemination of epidemiological data and information (c) Use of
Participatory Hygiene and Sanitation Training (PHAST) approaches for effective control
measures at Community Level.
• Epidemiological surveillances of diseases.
• Establishment of effective Environmental Health Surveillance and Information System.
• Develop environmental health measures with protocols reference to epidemics.
3.3.4 Vector Control Vector control monitoring includes:
identification of vectors, their habits and breeding places.
Vector control of public health interest including the control of anthropoids, molluscs, rodents
and other alternative hosts of diseases.
Investigations of issues that have a direct bearing on vector control, such as the infestation of premises with
rodents, cockroaches, and wood borers, is addressed during the routine inspection of all food outlets. It is
mandatory for the owner/ licensee of a food premises, to provide a certificate from a registered pest controller,
indicating that the food premises have been sprayed against disease vectors.
3.3.5 Hazardous Chemical Substances As part of the STOP (safety towards our people) initiative, premises are also inspected for hazardous chemical
substances. It is necessary for those premises, responsible for the handling, storage and sale of hazardous
chemical, substances, to ensure that such premises are registered with the Provincial Department of Health.
In terms of control and monitoring the following is undertaken:
Ensuring that substances are correctly labelled.
Ensuring that all active ingredients are indicated.
Ensuring that warning signs are indicated.
Ensuring that precautions are taken during storage and transportation and all protective gear is utilized
during handling.
63
To control the importation, manufacture, sale, operation, application, modification or dumping of such
substances.
To undertake licensing and registration of premises.
Ensure that empty containers are disposed of according to requirements
3.3.6 Disposal of the Dead All bodies must be disposed in terms of the mortals remains regulations and, provision is also made in our Public
Health By-laws, for such disposal. Disposal of the dead involves the monitoring of funeral undertakers,
mortuaries, embalmers, crematoriums, graves and cemeteries for compliance, and managing, controlling and
monitoring exhumations and the reburial or disposal of human remains. EHPs are responsible for issuing a
certificate of competence to compliant operators.
In order to prevent the occurrence of nuisances at such premises, regulations for governing the establishment and
operation of mortuaries are also explained to undertakers.
3.3.7 Surveillance of Premises Regular inspections are conducted of residential, business and public premises, to ensure they comply with the
necessary health legislation. In the event of non- compliance, the necessary statutory notices are served.
Residential, business and public premises are regularly monitored to ensure that there are no health nuisances inter
-alia, the following.
• Prevention and abatement of any condition on any premises which is likely to constitute a
danger to health includes:
• Assessment of any overcrowded, dirty or unsatisfactory condition in any residential,
commercial, industrial or other occupied premises.
• Monitoring all buildings and all other temporary or permanent physical structure for residential,
public or institutional use (including health care and other care, detainment, work and recreation
including travel, tourism, holiday resorts and camping sites) as well as the facilities in
connection therewith and the immediate precincts thereof.
3.3.8 Environmental Health Education Health education is a very critical aspect of environmental health, as some of the health issues are being taken for
granted by communities. This includes unhygienic food preparations, food contamination because of unhygienic
surroundings and other factors such as non-compliance with basic standards, etc.
The lack of education is a compounding factor to the high levels of ignorance of health-related issues amongst
disadvantaged populations. Health education, being a critical aspect in environmental health, is prioritized for
timely and accurate information to be disseminated to these disadvantaged communities. With more emphasis on
64
appropriate water and sanitation practices and proper prevention techniques regarding food contamination,
unhygienic surroundings can be eliminated.
Health education therefore creates awareness amongst rural and urban communities as people would be able to
identify existing health risks as well as risky behaviour in their surroundings. Health Education also addresses
other natural aspects of health risks in relation to:
• Water resources and general environmental pollution;
• Nurture proper behaviour and provide skills to identify health risks;
• Continuous education at schools, communities, and businesses to sensitize and ensure
prevention before cure;
• Control and containment of communicable diseases; and
• Due to the increase in positive Rabies cases within KZN, a Rabies Action Group (RAG) has
been constituted to promote the vaccination of all dogs annually, and to promote awareness of
the fatal disease. Community Health Workers have been trained and will be assisting in all areas
within the district. The Environmental Health staff assists the Dept. of Veterinary Services with
the Rabies vaccination campaigns.
3.3.9 Environmental Pollution The environment must be free of harmful gases and particulate matter, as the inhaling of such gases, can have a
serious consequential bearing on the health and well- being of residents. Environmental pollutants have various
adverse health effects from early life. Some of the most important harmful effects are perinatal disorders, infant
mortality, respiratory disorders, allergy, malignancies, cardiovascular disorders, increase in stress oxidative,
mental disorders, and various other harmful effects
Environmental Health Officials have a vital role to play in terms of
• Ensuring hygienic working, living and recreational environments
• Identifying the polluting agents and sources of water, air and soil pollution.
• Taking the required preventative measures to ensure that the general environment is free from
health risks
• Ensuring the registration, permitting, monitoring and auditing of all industries, activities, trade
etc which involves controlling the internal effects of pollution on the worker and the external
effects of pollution on the community and the environment.
3.3.10 Waste management control Environmental Health Services, together with the local municipalities, play an important role in the management
of waste, throughout the entire Ugu district. Refuse generated from residential and business premises, must be
properly disposed of, to prevent health nuisance. To this end, recycling initiatives are particularly encouraged
and, clean-up campaigns undertaken at taxi ranks. Environmental Health Services is responsible for monitoring
the collection, storage, transportation and disposal of waste, in terms of the
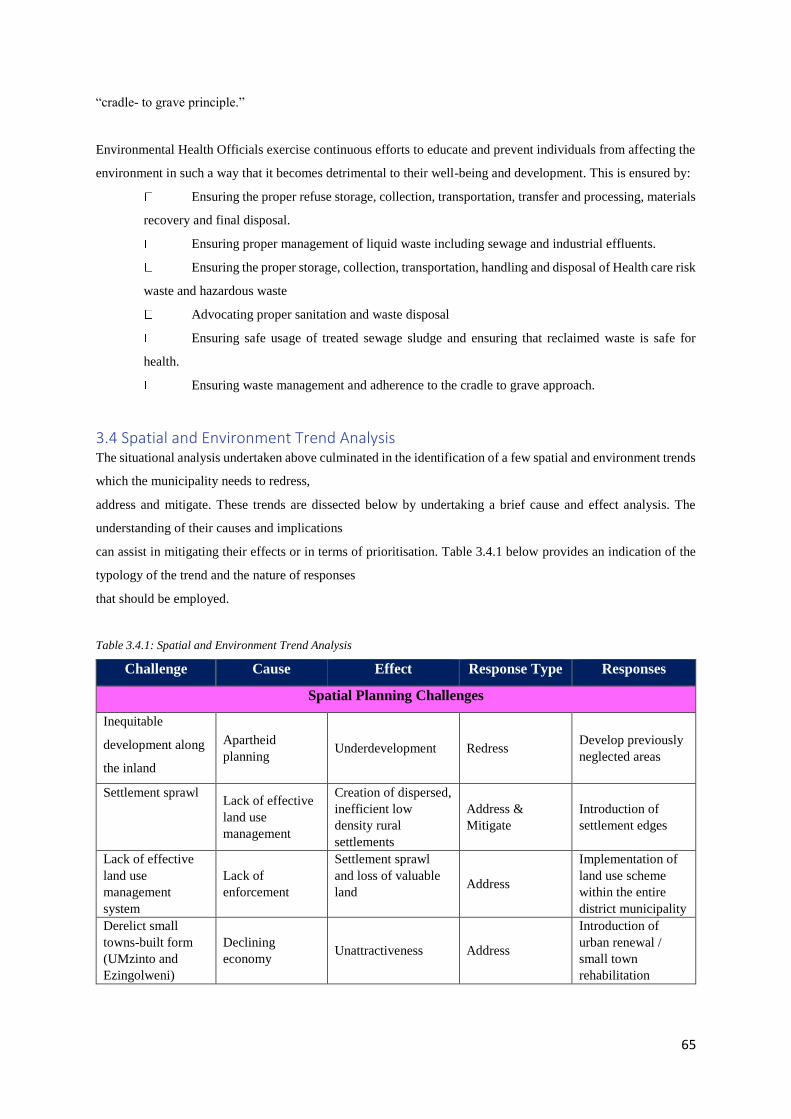
65
“cradle- to grave principle.”
Environmental Health Officials exercise continuous efforts to educate and prevent individuals from affecting the
environment in such a way that it becomes detrimental to their well-being and development. This is ensured by:
Ensuring the proper refuse storage, collection, transportation, transfer and processing, materials
recovery and final disposal.
Ensuring proper management of liquid waste including sewage and industrial effluents.
Ensuring the proper storage, collection, transportation, handling and disposal of Health care risk
waste and hazardous waste
Advocating proper sanitation and waste disposal
Ensuring safe usage of treated sewage sludge and ensuring that reclaimed waste is safe for
health.
Ensuring waste management and adherence to the cradle to grave approach.
3.4 Spatial and Environment Trend Analysis The situational analysis undertaken above culminated in the identification of a few spatial and environment trends
which the municipality needs to redress,
address and mitigate. These trends are dissected below by undertaking a brief cause and effect analysis. The
understanding of their causes and implications
can assist in mitigating their effects or in terms of prioritisation. Table 3.4.1 below provides an indication of the
typology of the trend and the nature of responses
that should be employed.
Table 3.4.1: Spatial and Environment Trend Analysis
Challenge Cause Effect Response Type Responses
Spatial Planning Challenges
Inequitable
development along
the inland
Apartheid
planning Underdevelopment Redress
Develop previously
neglected areas
Settlement sprawl Lack of effective
land use
management
Creation of dispersed,
inefficient low
density rural
settlements
Address &
Mitigate
Introduction of
settlement edges
Lack of effective
land use
management
system
Lack of
enforcement
Settlement sprawl
and loss of valuable
land Address
Implementation of
land use scheme
within the entire
district municipality
Derelict small
towns-built form
(UMzinto and
Ezingolweni)
Declining
economy Unattractiveness Address
Introduction of
urban renewal /
small town
rehabilitation
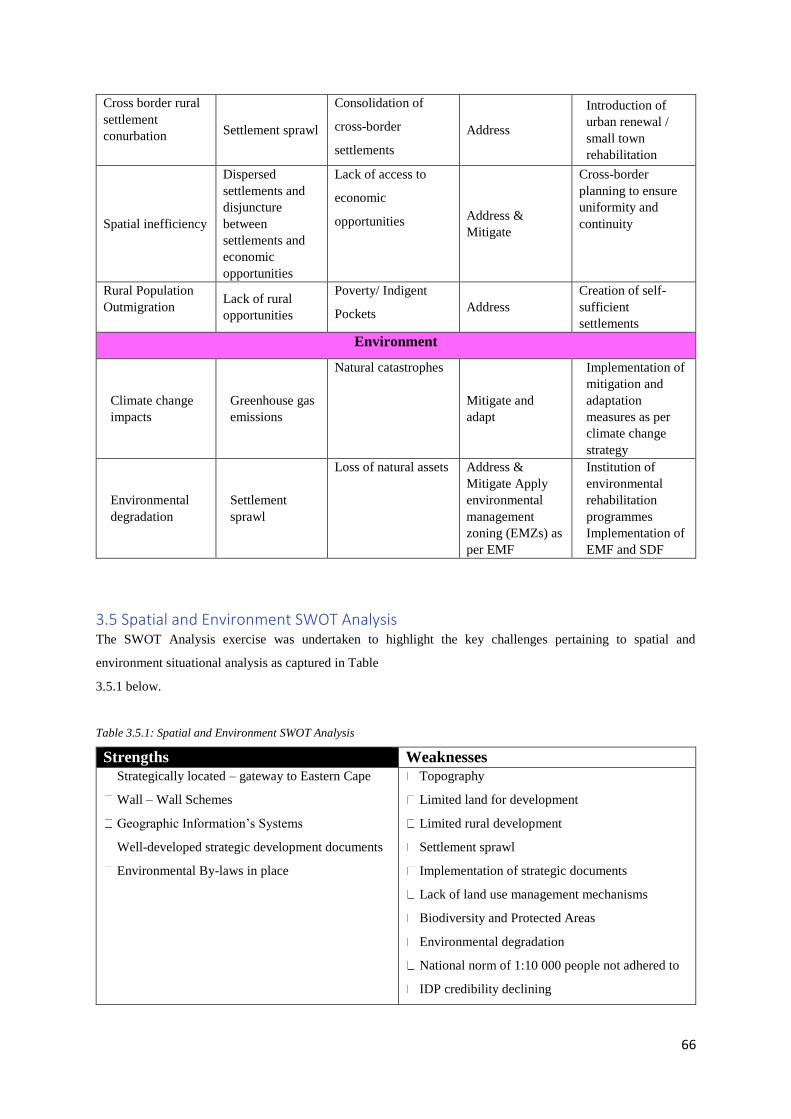
66
Cross border rural
settlement
conurbation Settlement sprawl
Consolidation of
cross-border
settlements
Address
Introduction of
urban renewal /
small town
rehabilitation
Spatial inefficiency
Dispersed
settlements and
disjuncture
between
settlements and
economic
opportunities
Lack of access to
economic
opportunities Address &
Mitigate
Cross-border
planning to ensure
uniformity and
continuity
Rural Population
Outmigration Lack of rural
opportunities
Poverty/ Indigent
Pockets Address
Creation of self-
sufficient
settlements
Environment
Climate change
impacts
Greenhouse gas
emissions
Natural catastrophes
Mitigate and
adapt
Implementation of
mitigation and
adaptation
measures as per
climate change
strategy
Environmental
degradation
Settlement
sprawl
Loss of natural assets Address &
Mitigate Apply
environmental
management
zoning (EMZs) as
per EMF
Institution of
environmental
rehabilitation
programmes
Implementation of
EMF and SDF
3.5 Spatial and Environment SWOT Analysis The SWOT Analysis exercise was undertaken to highlight the key challenges pertaining to spatial and
environment situational analysis as captured in Table
3.5.1 below.
Table 3.5.1: Spatial and Environment SWOT Analysis
Strengths Weaknesses
Strategically located – gateway to Eastern Cape
Wall – Wall Schemes
Geographic Information’s Systems
Well-developed strategic development documents
Environmental By-laws in place
Topography
Limited land for development
Limited rural development
Settlement sprawl
Implementation of strategic documents
Lack of land use management mechanisms
Biodiversity and Protected Areas
Environmental degradation
National norm of 1:10 000 people not adhered to
IDP credibility declining
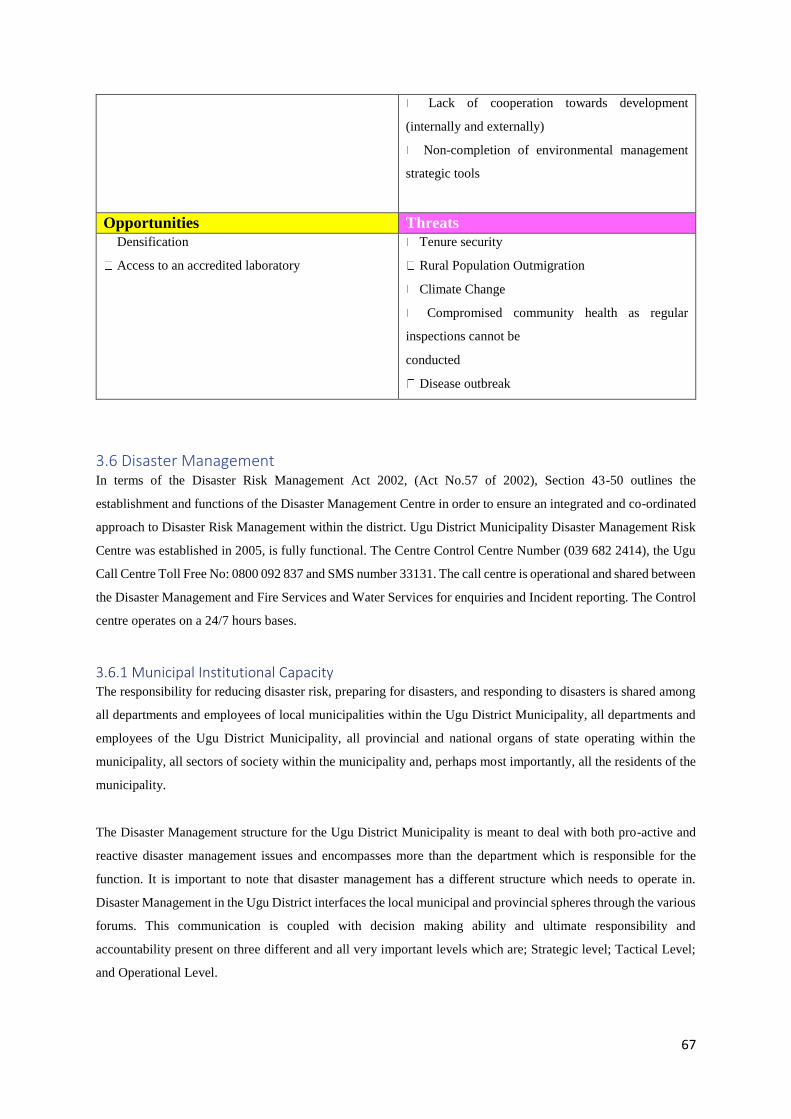
67
Lack of cooperation towards development
(internally and externally)
Non-completion of environmental management
strategic tools
Opportunities Threats
Densification
Access to an accredited laboratory
Tenure security
Rural Population Outmigration
Climate Change
Compromised community health as regular
inspections cannot be
conducted
Disease outbreak
3.6 Disaster Management In terms of the Disaster Risk Management Act 2002, (Act No.57 of 2002), Section 43-50 outlines the
establishment and functions of the Disaster Management Centre in order to ensure an integrated and co-ordinated
approach to Disaster Risk Management within the district. Ugu District Municipality Disaster Management Risk
Centre was established in 2005, is fully functional. The Centre Control Centre Number (039 682 2414), the Ugu
Call Centre Toll Free No: 0800 092 837 and SMS number 33131. The call centre is operational and shared between
the Disaster Management and Fire Services and Water Services for enquiries and Incident reporting. The Control
centre operates on a 24/7 hours bases.
3.6.1 Municipal Institutional Capacity The responsibility for reducing disaster risk, preparing for disasters, and responding to disasters is shared among
all departments and employees of local municipalities within the Ugu District Municipality, all departments and
employees of the Ugu District Municipality, all provincial and national organs of state operating within the
municipality, all sectors of society within the municipality and, perhaps most importantly, all the residents of the
municipality.
The Disaster Management structure for the Ugu District Municipality is meant to deal with both pro-active and
reactive disaster management issues and encompasses more than the department which is responsible for the
function. It is important to note that disaster management has a different structure which needs to operate in.
Disaster Management in the Ugu District interfaces the local municipal and provincial spheres through the various
forums. This communication is coupled with decision making ability and ultimate responsibility and
accountability present on three different and all very important levels which are; Strategic level; Tactical Level;
and Operational Level.
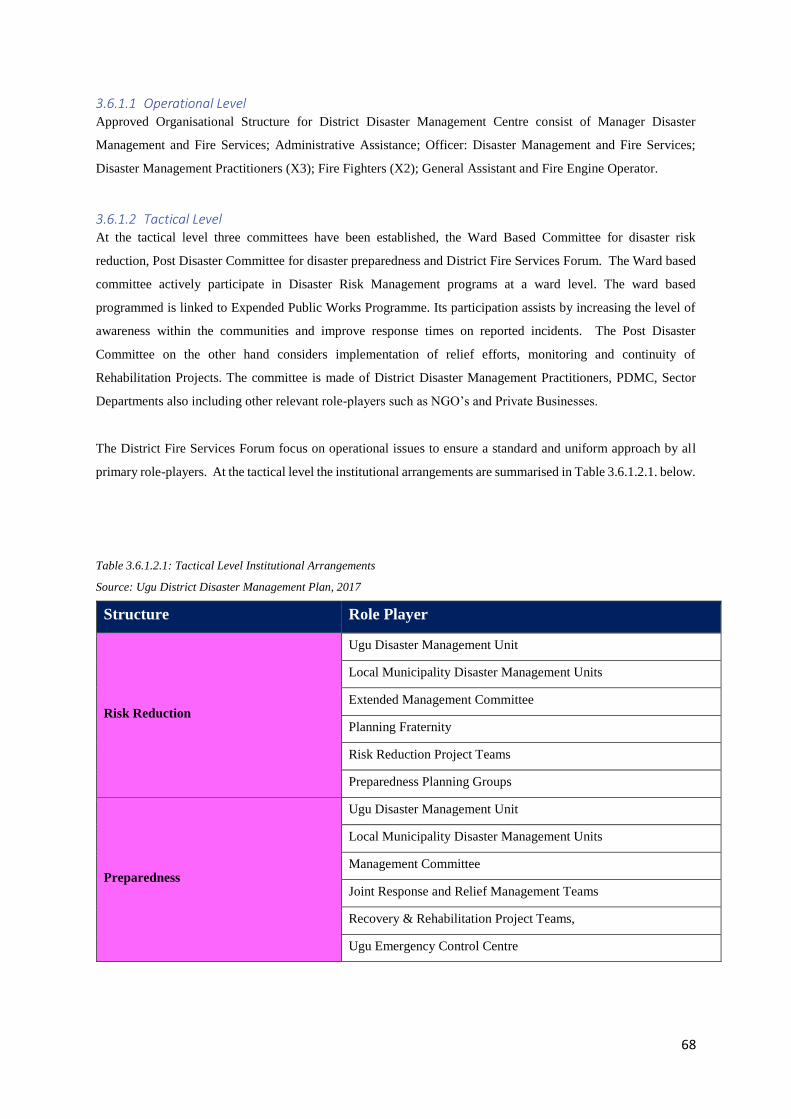
68
3.6.1.1 Operational Level Approved Organisational Structure for District Disaster Management Centre consist of Manager Disaster
Management and Fire Services; Administrative Assistance; Officer: Disaster Management and Fire Services;
Disaster Management Practitioners (X3); Fire Fighters (X2); General Assistant and Fire Engine Operator.
3.6.1.2 Tactical Level At the tactical level three committees have been established, the Ward Based Committee for disaster risk
reduction, Post Disaster Committee for disaster preparedness and District Fire Services Forum. The Ward based
committee actively participate in Disaster Risk Management programs at a ward level. The ward based
programmed is linked to Expended Public Works Programme. Its participation assists by increasing the level of
awareness within the communities and improve response times on reported incidents. The Post Disaster
Committee on the other hand considers implementation of relief efforts, monitoring and continuity of
Rehabilitation Projects. The committee is made of District Disaster Management Practitioners, PDMC, Sector
Departments also including other relevant role-players such as NGO’s and Private Businesses.
The District Fire Services Forum focus on operational issues to ensure a standard and uniform approach by all
primary role-players. At the tactical level the institutional arrangements are summarised in Table 3.6.1.2.1. below.
Table 3.6.1.2.1: Tactical Level Institutional Arrangements
Source: Ugu District Disaster Management Plan, 2017
Structure Role Player
Risk Reduction
Ugu Disaster Management Unit
Local Municipality Disaster Management Units
Extended Management Committee
Planning Fraternity
Risk Reduction Project Teams
Preparedness Planning Groups
Preparedness
Ugu Disaster Management Unit
Local Municipality Disaster Management Units
Management Committee
Joint Response and Relief Management Teams
Recovery & Rehabilitation Project Teams,
Ugu Emergency Control Centre
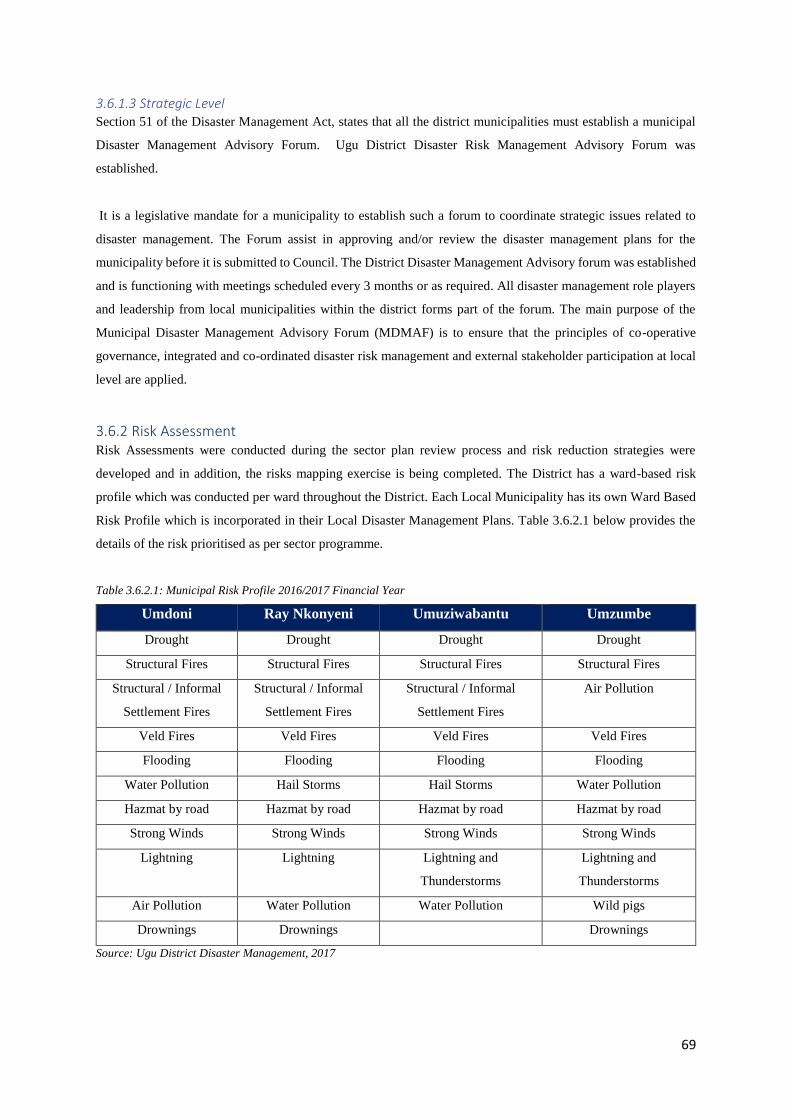
69
3.6.1.3 Strategic Level Section 51 of the Disaster Management Act, states that all the district municipalities must establish a municipal
Disaster Management Advisory Forum. Ugu District Disaster Risk Management Advisory Forum was
established.
It is a legislative mandate for a municipality to establish such a forum to coordinate strategic issues related to
disaster management. The Forum assist in approving and/or review the disaster management plans for the
municipality before it is submitted to Council. The District Disaster Management Advisory forum was established
and is functioning with meetings scheduled every 3 months or as required. All disaster management role players
and leadership from local municipalities within the district forms part of the forum. The main purpose of the
Municipal Disaster Management Advisory Forum (MDMAF) is to ensure that the principles of co-operative
governance, integrated and co-ordinated disaster risk management and external stakeholder participation at local
level are applied.
3.6.2 Risk Assessment Risk Assessments were conducted during the sector plan review process and risk reduction strategies were
developed and in addition, the risks mapping exercise is being completed. The District has a ward-based risk
profile which was conducted per ward throughout the District. Each Local Municipality has its own Ward Based
Risk Profile which is incorporated in their Local Disaster Management Plans. Table 3.6.2.1 below provides the
details of the risk prioritised as per sector programme.
Table 3.6.2.1: Municipal Risk Profile 2016/2017 Financial Year
Umdoni Ray Nkonyeni Umuziwabantu Umzumbe
Drought Drought Drought Drought
Structural Fires Structural Fires Structural Fires Structural Fires
Structural / Informal
Settlement Fires
Structural / Informal
Settlement Fires
Structural / Informal
Settlement Fires
Air Pollution
Veld Fires Veld Fires Veld Fires Veld Fires
Flooding Flooding Flooding Flooding
Water Pollution Hail Storms Hail Storms Water Pollution
Hazmat by road Hazmat by road Hazmat by road Hazmat by road
Strong Winds Strong Winds Strong Winds Strong Winds
Lightning Lightning Lightning and
Thunderstorms
Lightning and
Thunderstorms
Air Pollution Water Pollution Water Pollution Wild pigs
Drownings Drownings Drownings
Source: Ugu District Disaster Management, 2017
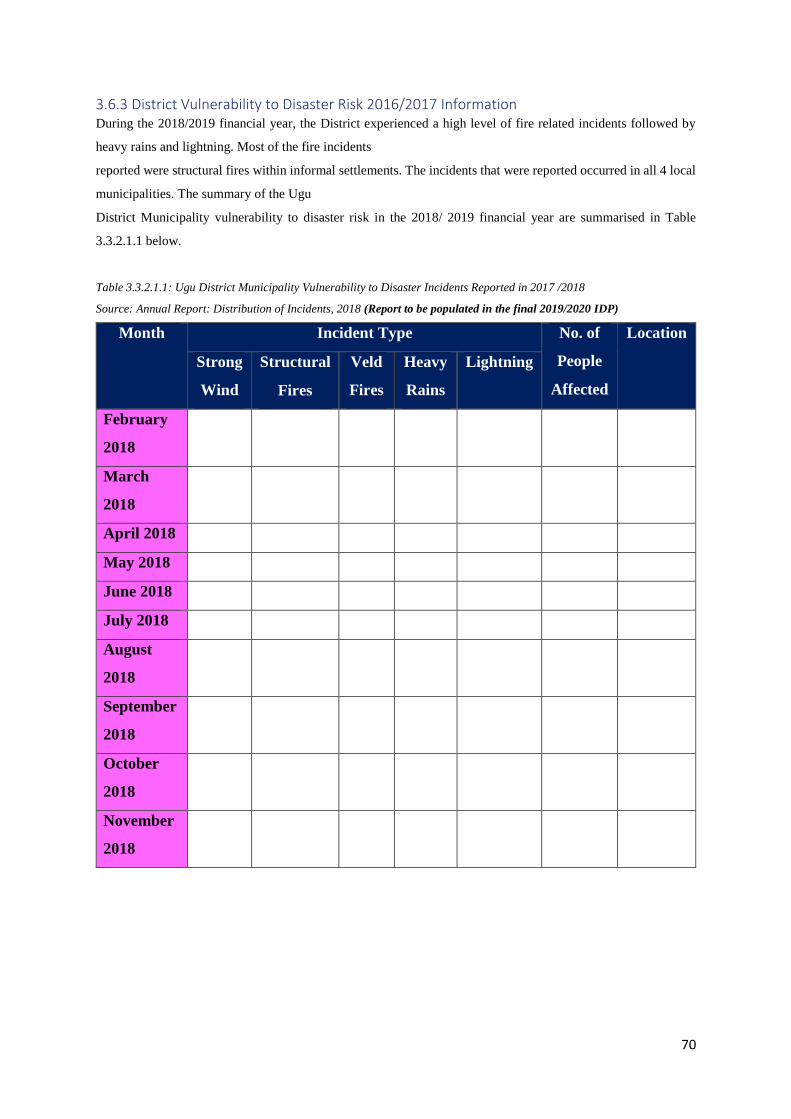
70
3.6.3 District Vulnerability to Disaster Risk 2016/2017 Information During the 2018/2019 financial year, the District experienced a high level of fire related incidents followed by
heavy rains and lightning. Most of the fire incidents
reported were structural fires within informal settlements. The incidents that were reported occurred in all 4 local
municipalities. The summary of the Ugu
District Municipality vulnerability to disaster risk in the 2018/ 2019 financial year are summarised in Table
3.3.2.1.1 below.
Table 3.3.2.1.1: Ugu District Municipality Vulnerability to Disaster Incidents Reported in 2017 /2018
Source: Annual Report: Distribution of Incidents, 2018 (Report to be populated in the final 2019/2020 IDP)
Month Incident Type No. of
People
Affected
Location
Strong
Wind
Structural
Fires
Veld
Fires
Heavy
Rains
Lightning
February
2018
March
2018
April 2018
May 2018
June 2018
July 2018
August
2018
September
2018
October
2018
November
2018
71
Table 3.3.2.1.2: District High Disaster Risk Summary 2017 / 2018
Municipality High Risks
Umdoni
Ray Nkonyeni
Umzumbe
Umuziwabantu
Source: Ugu District Disaster Management Sector Plan, 2017/2018
The District together will Local Municipalities has ensured that plans and strategies are in place to mitigate disaster
risks that have been identified above also to assist in reduction of injuries and fatalities. The immediate actions
taken by the municipalities are:
Risk Reduction initiatives which include: Installation of Lightning Conductors and Fire/Heat Detectors
Education and Training
Community Awareness Campaigns & Road shows
Emergency Relief Programs which include provision of Wendy Houses; Blankets and Food parcels
Ward Committee Members, Amakhosi & Izinduna, Volunteers and Officials were trained on Disaster
Risk Management and Basic Fire Fighting
3.6.4 Risk Reduction and Prevention As part of the risk reduction and prevention initiatives the district embarked on a programme of installation of
Lighting Conductors to reduce the impact of lighting incidents and further reduce fatalities.
In order to enhance Fire capacity, the District secures budget of R16
3.6.5 Status of the Disaster Management Plans The District Disaster Management District Sector Plan is in place and is aligned with the Council IDP. The Risk
Reduction programmes identified as per reviewed Disaster Management Sector Plan will be aligned with the
Municipal 5-year plan.
3.6.6 Response and Recovery With regards to response and recovery the district also has formed a panel of Service Provider who supply the
Emergency Relief stock and ensures availability upon request. Emergency Relief stock includes the following: -
Wendy Houses;
Blankets;
Emergency box
Food Parcels; and
Mattresses.
The District Disaster Management Section has the following Emergency Response Vehicles:
7 x Emergency Response Vehicles
1x Fire Truck
72
1x Rapid DM Response Vehicle
2x Skid Unit
2x Bakkies
1x Customer care
3.6.7 Disaster Management Training and Awareness The Disaster Management Act states that the following concepts should form the basis of disaster management
awareness and training:
• A culture of risk avoidance.
• Promotion of education and training.
• Promotion of research into all aspects of disaster risk management.
This is aimed at achieving the following requirements:
Addresses the requirements for the implementation of education, training and research needs.
The development of an integrated public awareness strategy
Effective use of the media.
The development of education and training for disaster risk management and associated professions.
The inclusion of disaster risk management in school curricula.
As part of community-based risk reduction measures the District embarked on the following awareness
campaigns: -
Community Awareness Campaigns
School Awareness Campaigns
Road Shows
Door to Door Awareness
3.6.8 Disaster Management Funding Arrangements The Ugu District Municipality budgets for all Disaster Risk Management Programs. Budget is separated for
Operations and Capital items. National/Provincial Disaster Management also provides conditional grants for
Reconstruction & Rehabilitation Projects as well as the Construction of Disaster Management Centres. In the
2016 / 2017, the District put aside a budget of R6.9 million for all disaster related programs.
3.6.9 Disaster Management SWOT Analysis From the analysis of the state of Disaster Management in the Ugu District Municipality the following SWOT
Analysis was done.
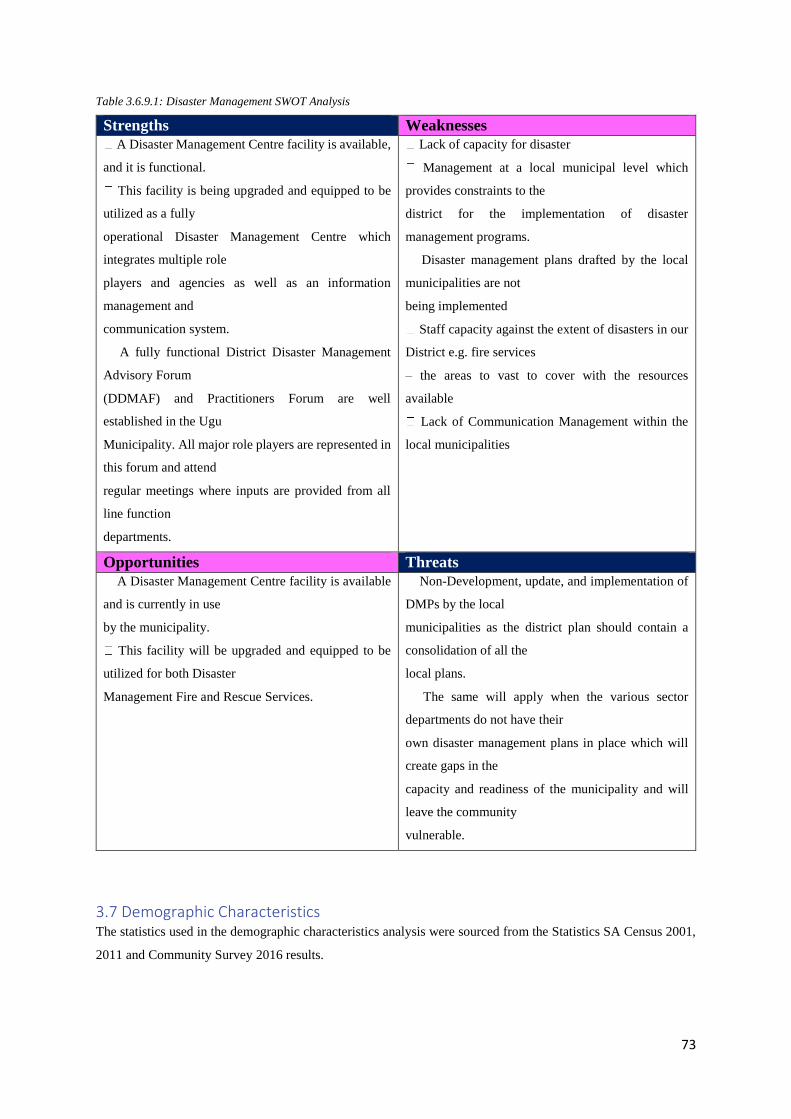
73
Table 3.6.9.1: Disaster Management SWOT Analysis
Strengths Weaknesses
A Disaster Management Centre facility is available,
and it is functional.
This facility is being upgraded and equipped to be
utilized as a fully
operational Disaster Management Centre which
integrates multiple role
players and agencies as well as an information
management and
communication system.
A fully functional District Disaster Management
Advisory Forum
(DDMAF) and Practitioners Forum are well
established in the Ugu
Municipality. All major role players are represented in
this forum and attend
regular meetings where inputs are provided from all
line function
departments.
Lack of capacity for disaster
Management at a local municipal level which
provides constraints to the
district for the implementation of disaster
management programs.
Disaster management plans drafted by the local
municipalities are not
being implemented
Staff capacity against the extent of disasters in our
District e.g. fire services
– the areas to vast to cover with the resources
available
Lack of Communication Management within the
local municipalities
Opportunities Threats
A Disaster Management Centre facility is available
and is currently in use
by the municipality.
This facility will be upgraded and equipped to be
utilized for both Disaster
Management Fire and Rescue Services.
Non-Development, update, and implementation of
DMPs by the local
municipalities as the district plan should contain a
consolidation of all the
local plans.
The same will apply when the various sector
departments do not have their
own disaster management plans in place which will
create gaps in the
capacity and readiness of the municipality and will
leave the community
vulnerable.
3.7 Demographic Characteristics The statistics used in the demographic characteristics analysis were sourced from the Statistics SA Census 2001,
2011 and Community Survey 2016 results.
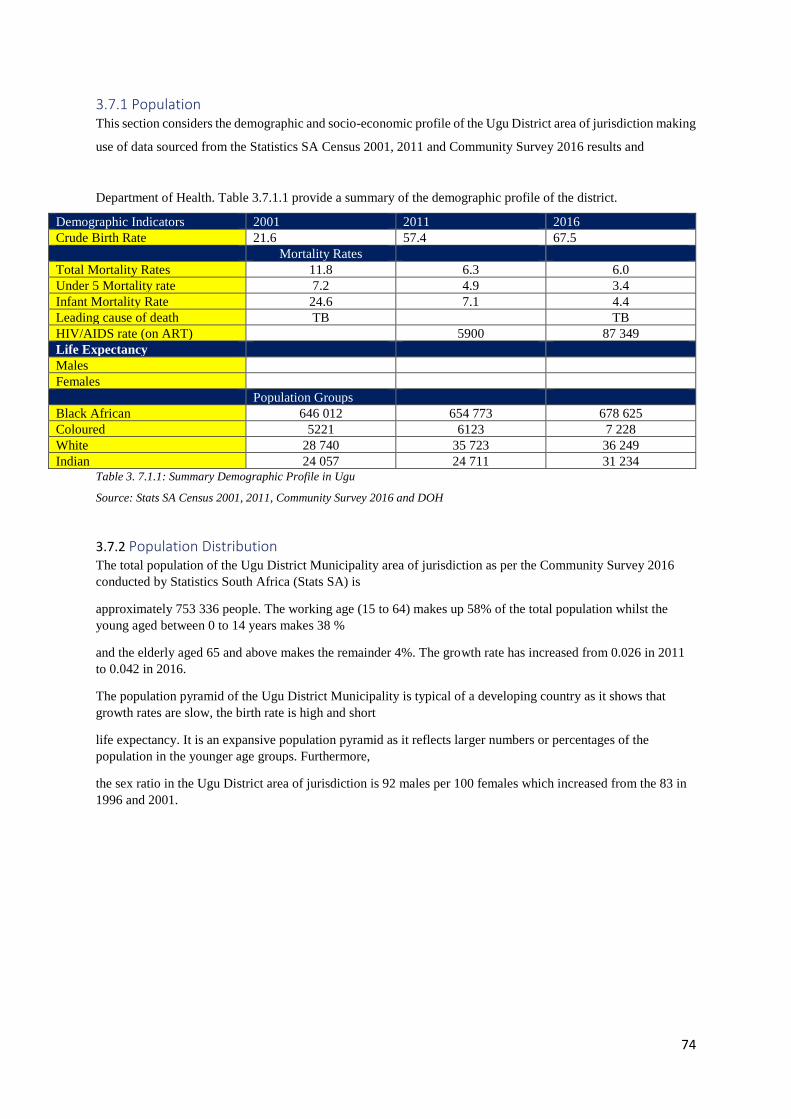
74
3.7.1 Population This section considers the demographic and socio-economic profile of the Ugu District area of jurisdiction making
use of data sourced from the Statistics SA Census 2001, 2011 and Community Survey 2016 results and
Department of Health. Table 3.7.1.1 provide a summary of the demographic profile of the district.
Demographic Indicators 2001 2011 2016
Crude Birth Rate 21.6 57.4 67.5
Mortality Rates
Total Mortality Rates 11.8 6.3 6.0
Under 5 Mortality rate 7.2 4.9 3.4
Infant Mortality Rate 24.6 7.1 4.4
Leading cause of death TB TB
HIV/AIDS rate (on ART) 5900 87 349
Life Expectancy
Males
Females
Population Groups
Black African 646 012 654 773 678 625
Coloured 5221 6123 7 228
White 28 740 35 723 36 249
Indian 24 057 24 711 31 234 Table 3. 7.1.1: Summary Demographic Profile in Ugu
Source: Stats SA Census 2001, 2011, Community Survey 2016 and DOH
3.7.2 Population Distribution The total population of the Ugu District Municipality area of jurisdiction as per the Community Survey 2016
conducted by Statistics South Africa (Stats SA) is
approximately 753 336 people. The working age (15 to 64) makes up 58% of the total population whilst the
young aged between 0 to 14 years makes 38 %
and the elderly aged 65 and above makes the remainder 4%. The growth rate has increased from 0.026 in 2011
to 0.042 in 2016.
The population pyramid of the Ugu District Municipality is typical of a developing country as it shows that
growth rates are slow, the birth rate is high and short
life expectancy. It is an expansive population pyramid as it reflects larger numbers or percentages of the
population in the younger age groups. Furthermore,
the sex ratio in the Ugu District area of jurisdiction is 92 males per 100 females which increased from the 83 in
1996 and 2001.
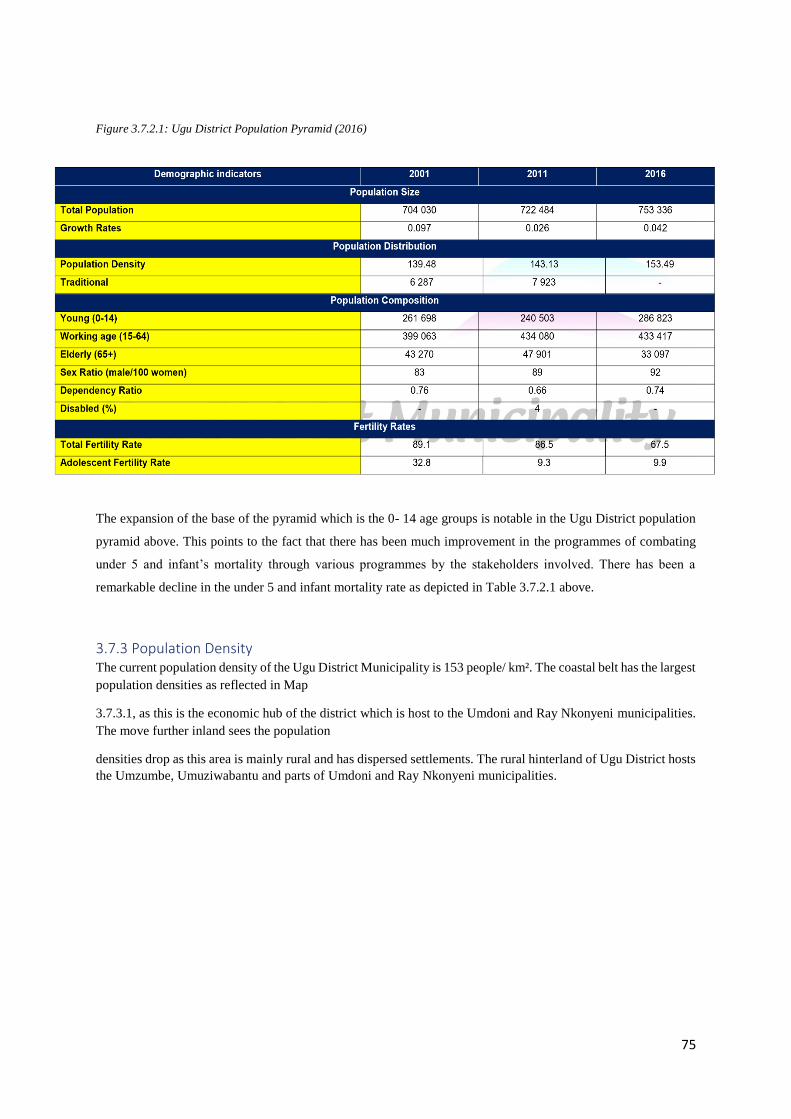
75
Figure 3.7.2.1: Ugu District Population Pyramid (2016)
The expansion of the base of the pyramid which is the 0- 14 age groups is notable in the Ugu District population
pyramid above. This points to the fact that there has been much improvement in the programmes of combating
under 5 and infant’s mortality through various programmes by the stakeholders involved. There has been a
remarkable decline in the under 5 and infant mortality rate as depicted in Table 3.7.2.1 above.
3.7.3 Population Density The current population density of the Ugu District Municipality is 153 people/ km². The coastal belt has the largest
population densities as reflected in Map
3.7.3.1, as this is the economic hub of the district which is host to the Umdoni and Ray Nkonyeni municipalities.
The move further inland sees the population
densities drop as this area is mainly rural and has dispersed settlements. The rural hinterland of Ugu District hosts
the Umzumbe, Umuziwabantu and parts of Umdoni and Ray Nkonyeni municipalities.
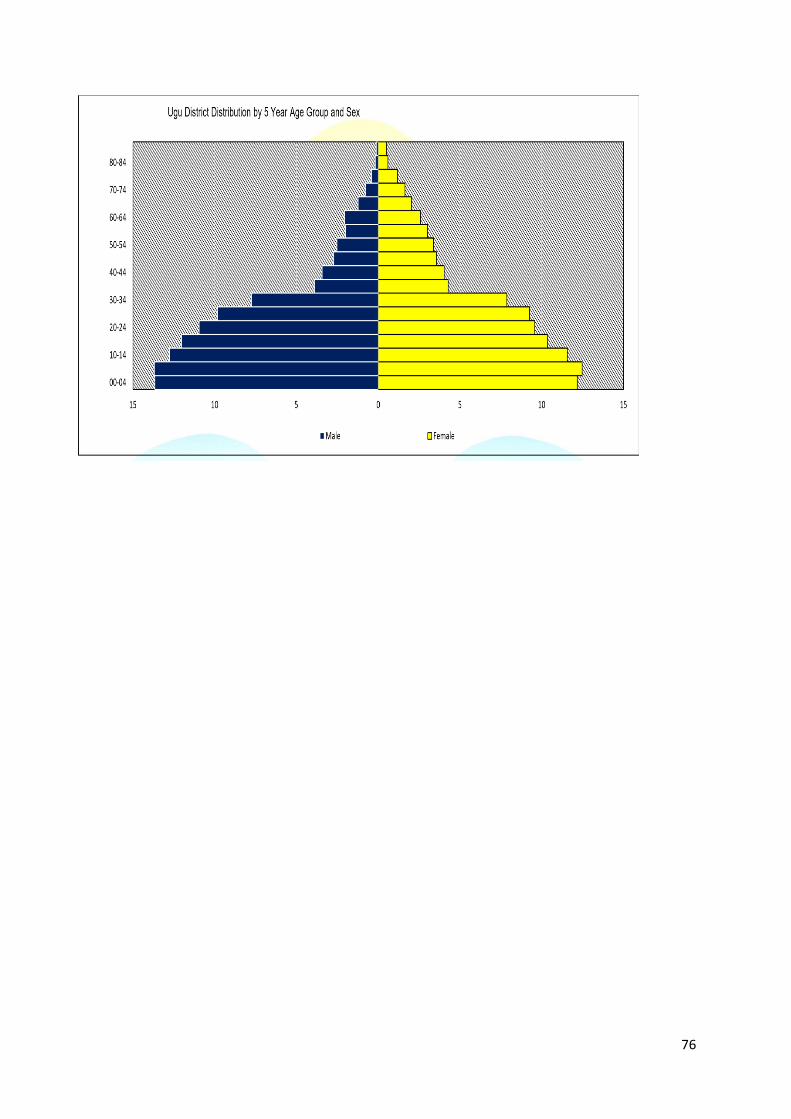
76
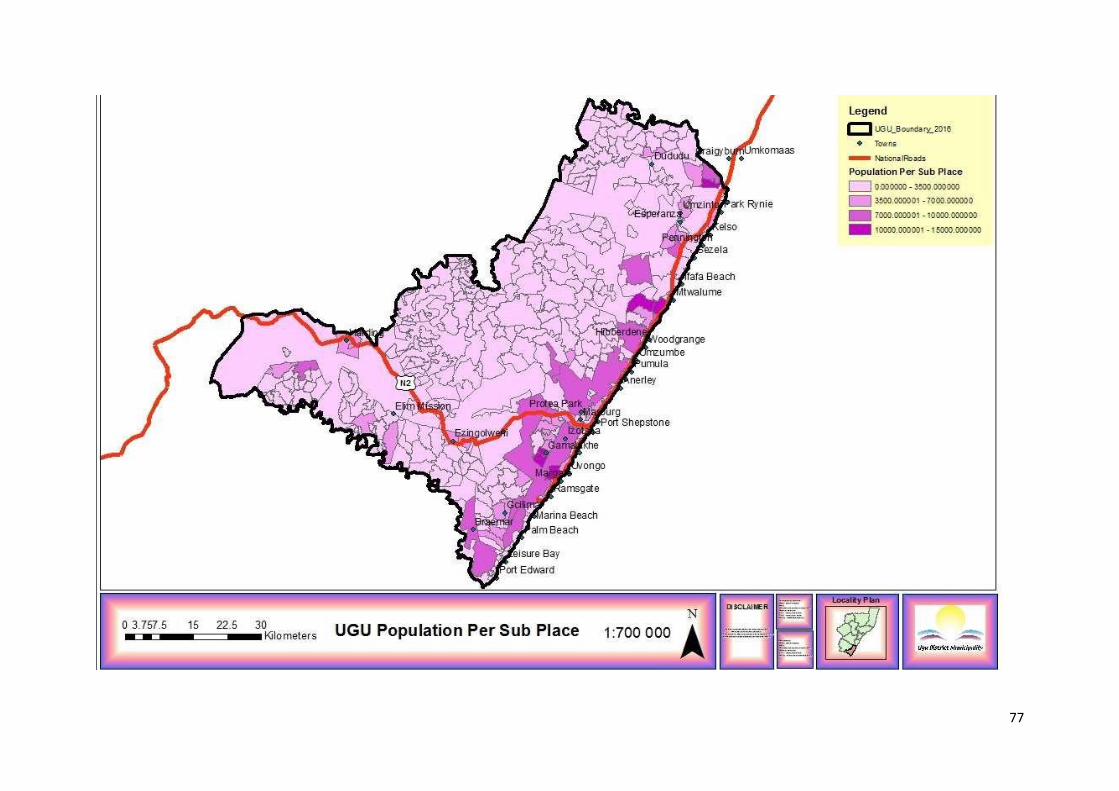
77
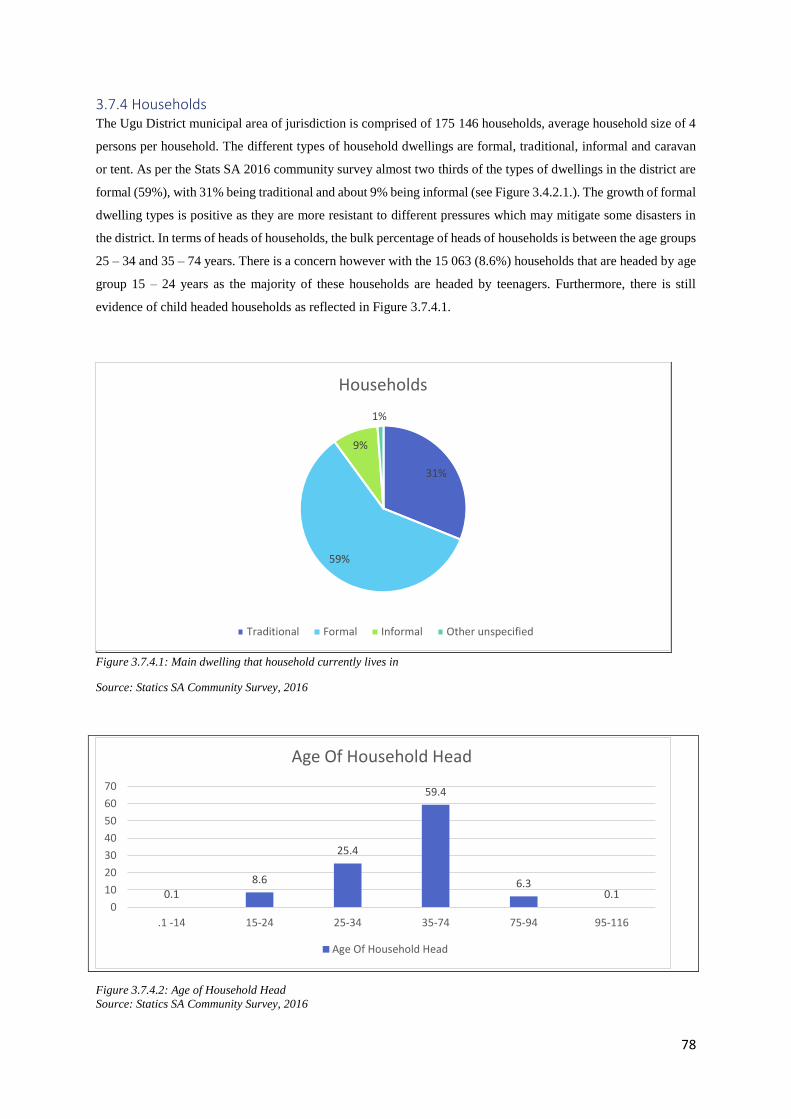
78
3.7.4 Households The Ugu District municipal area of jurisdiction is comprised of 175 146 households, average household size of 4
persons per household. The different types of household dwellings are formal, traditional, informal and caravan
or tent. As per the Stats SA 2016 community survey almost two thirds of the types of dwellings in the district are
formal (59%), with 31% being traditional and about 9% being informal (see Figure 3.4.2.1.). The growth of formal
dwelling types is positive as they are more resistant to different pressures which may mitigate some disasters in
the district. In terms of heads of households, the bulk percentage of heads of households is between the age groups
25 – 34 and 35 – 74 years. There is a concern however with the 15 063 (8.6%) households that are headed by age
group 15 – 24 years as the majority of these households are headed by teenagers. Furthermore, there is still
evidence of child headed households as reflected in Figure 3.7.4.1.
Figure 3.7.4.1: Main dwelling that household currently lives in
Source: Statics SA Community Survey, 2016
Figure 3.7.4.2: Age of Household Head
Source: Statics SA Community Survey, 2016
31%
59%
9%
1%
Households
Traditional Formal Informal Other unspecified
0.18.6
25.4
59.4
6.30.1
0
10
20
30
40
50
60
70
.1 -14 15-24 25-34 35-74 75-94 95-116
Age Of Household Head
Age Of Household Head
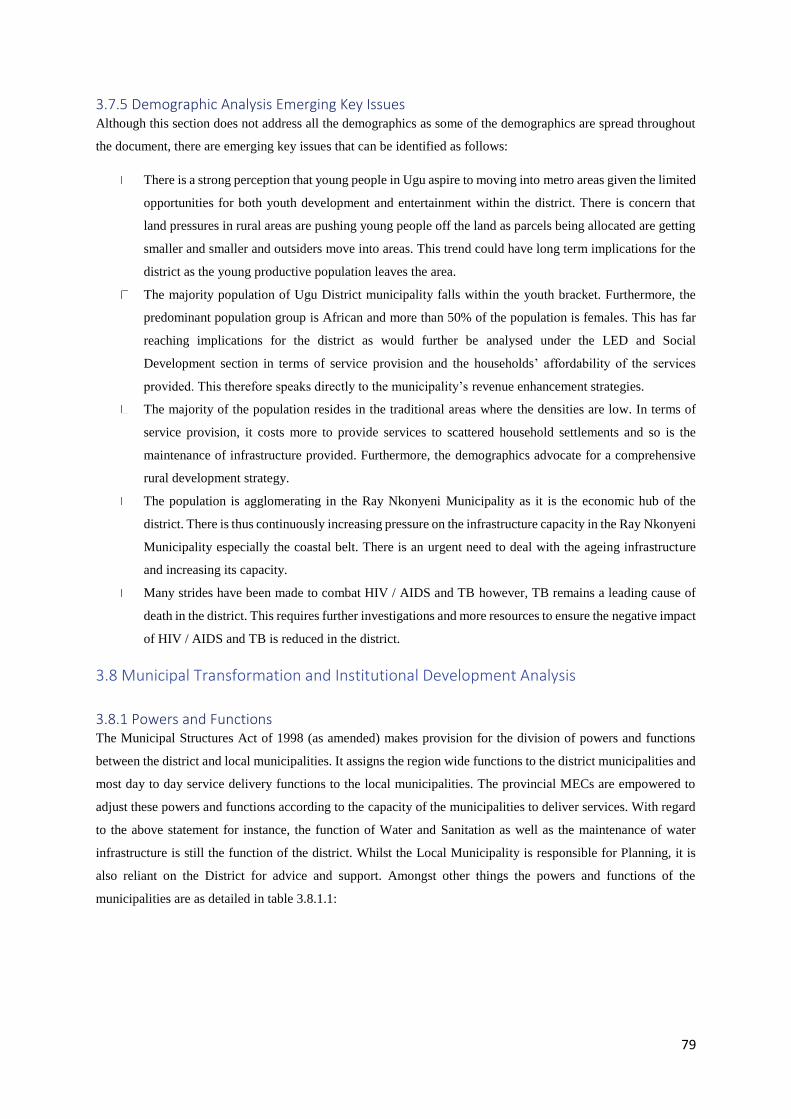
79
3.7.5 Demographic Analysis Emerging Key Issues Although this section does not address all the demographics as some of the demographics are spread throughout
the document, there are emerging key issues that can be identified as follows:
There is a strong perception that young people in Ugu aspire to moving into metro areas given the limited
opportunities for both youth development and entertainment within the district. There is concern that
land pressures in rural areas are pushing young people off the land as parcels being allocated are getting
smaller and smaller and outsiders move into areas. This trend could have long term implications for the
district as the young productive population leaves the area.
The majority population of Ugu District municipality falls within the youth bracket. Furthermore, the
predominant population group is African and more than 50% of the population is females. This has far
reaching implications for the district as would further be analysed under the LED and Social
Development section in terms of service provision and the households’ affordability of the services
provided. This therefore speaks directly to the municipality’s revenue enhancement strategies.
The majority of the population resides in the traditional areas where the densities are low. In terms of
service provision, it costs more to provide services to scattered household settlements and so is the
maintenance of infrastructure provided. Furthermore, the demographics advocate for a comprehensive
rural development strategy.
The population is agglomerating in the Ray Nkonyeni Municipality as it is the economic hub of the
district. There is thus continuously increasing pressure on the infrastructure capacity in the Ray Nkonyeni
Municipality especially the coastal belt. There is an urgent need to deal with the ageing infrastructure
and increasing its capacity.
Many strides have been made to combat HIV / AIDS and TB however, TB remains a leading cause of
death in the district. This requires further investigations and more resources to ensure the negative impact
of HIV / AIDS and TB is reduced in the district.
3.8 Municipal Transformation and Institutional Development Analysis
3.8.1 Powers and Functions The Municipal Structures Act of 1998 (as amended) makes provision for the division of powers and functions
between the district and local municipalities. It assigns the region wide functions to the district municipalities and
most day to day service delivery functions to the local municipalities. The provincial MECs are empowered to
adjust these powers and functions according to the capacity of the municipalities to deliver services. With regard
to the above statement for instance, the function of Water and Sanitation as well as the maintenance of water
infrastructure is still the function of the district. Whilst the Local Municipality is responsible for Planning, it is
also reliant on the District for advice and support. Amongst other things the powers and functions of the
municipalities are as detailed in table 3.8.1.1:
80
Table 3.8.1.1: Ugu District Powers and Function
Government Sphere Function
Local Storm Water Management; Trading Regulations; Billboards and Public
advertising; Cleansing and maintenance; Control of Public Nuisances; Street
Lighting; Traffic and Parking; Beaches and amusement parks; Local
Amenities; Noise Pollution; Pounds; Public Places; Street Trading; Harbours
and Ferries; Local Sports; Street Lighting; Municipal Parks and Recreation;
Municipal roads; and Control of Liquor licenses.
District Municipal Health Services; Environmental Services; Potable Water and
Sanitation.
Shared Functions Fire prevention and control Local Tourism; Municipal Airports; Municipal
Public Transport; Cemeteries, and Crematoria; Markets; Municipal
Abattoirs; Municipal Roads; Refuse Removal and Solid Waste; Municipal
Planning; and Air pollution.
Source: Municipal Structures Act, 1998
3.8.2 Institutional Arrangement The Municipal Structures Act provides for different types of Municipal Systems. The Ugu District Municipality
is using a Collective Executive System.
The establishment of ward committees has been finalised in all Local Municipalities. The Municipality has
customised the generic ward committee policy that was developed by CoGTA. There were a few challenges that
have been identified with regards to the functioning of ward committees such as the lack of capacity among ward
committee members, administrative support, reimbursements for out-of-pocket expenses and the general
dissatisfaction around the election of committees and the selection criteria thereof. These challenges are currently
being addressed and the ward committees are now functioning and have the administrative support and the ward
committee members are being reimbursed for the out of pocket expenses. There are 42 Traditional Councils within
Ugu Municipality. The new legislative developments encourage Traditional Councils and Municipal Councils to
work in partnership on issues of development even though the former is not vested with legislative authority on
Municipal Council matters. There are (seven) 7 elected Amakhosi who form part of the Ugu District Municipal
Council and all 7 Amakhosi serve in the respective Portfolio Committees. Clearly in all instances responsibility
for decision making lies with the Council and the responsibility for implementation of Council Resolutions lies
with the Municipal Manager and the officials.
3.8.2.1 Council The executive and legislative authority of a municipality is vested in its Municipal Council. The pre-eminent roles
of the Council, amongst others, are the approval of by-laws, budgets, policies, IDP, tariffs for rates and service
charges. The Council consists of thirty-five (35) members, eight (8) of whom are full-time. Furthermore, seven
(7) Traditional Leaders are participants in the Ugu District Municipal Council.
81
3.8.2.2 Executive Committee Structure The Executive Committee has delegated plenary powers to exercise the powers, duties and functions of Council,
excluding those plenary powers expressly delegated to other standing committees and those powers which are
wholly resolved to the Ugu District Council. Notwithstanding the above, the Executive Committee is authorised
to exercise any of those plenary powers delegated to other Standing Committees in circumstances where any
matters from these committees are referred to the Executive Committee. In line with Section 80 of the Municipal
Structures Act, the Municipality currently has five multi-party Portfolio Committees, which are, Portfolio
Committee on Finance; Water and Sanitation; Local Economic Development; Special Programmes; and Sound
Governance and Human Resource.
These Portfolio Committees continue to assist the Executive Committee in policy development and monitoring
to accelerate service delivery, as well as the oversight of strategic programmes and projects.
3.8.2.3 Municipal Departments and their functions The Municipal Manager heads the administration of the Municipality. The Municipality has five administrative
departments, each being headed by a General Manager. The departments are:
Office of the Municipal Manager - The Office of the Municipal Manager is responsible for the following
functions: Corporate Strategy and Shared Services; Internal Audit; Mayoralty and Communication;
Legal Services; Youth Development; Special Programmes; and Customer Relations Management.
Corporate Services Department - Corporate Services includes: Human Resources, Registry, Auxiliary
Services and Secretariat, Information, and Communication Technology (ICT), Disaster Management and
Fleet Management Services.
Budget and Treasury Office Department - The Budget and Treasury Office is headed by the General
Manager BTO and includes: Equity and Accounts, Grants and Expenditure, Budget Control and Supply
Chain Management.
Economic Development and Environmental Services Department - The Economic Development and
Environmental Services Department is headed by the General Manager EDES is made up of the
following sections: Environmental Services, EDES Finance and LED.
Water Services Department - The following are the sections which make up the Water Services
Department headed by the General Manager Water Services: Water Services Operations and Water
Services Authority (WSA), Administration and Project Management Unit.
3.8.3 Municipal Entities The Ugu District Municipality has two entities which are namely, Ugu South Coast Tourism and South Coast
Development Agency. The Ugu –South Coast Tourism (USCT) has been mandated to identify market gaps and
needs, develop new tourist projects, attract new tourist (domestic and international) and strategically market the
destination. Since its formal inception there’s been in improving the distribution of tourism spend in the entire
district, better improvement of the events that are hosted by the municipal areas outside our tourist hub.
Challenges range from lack of skills, lack of well packaged tourism products, lack of well packaged black
economic empowerment transactions in the industry and failure to unlock public sector owned land for the tourism
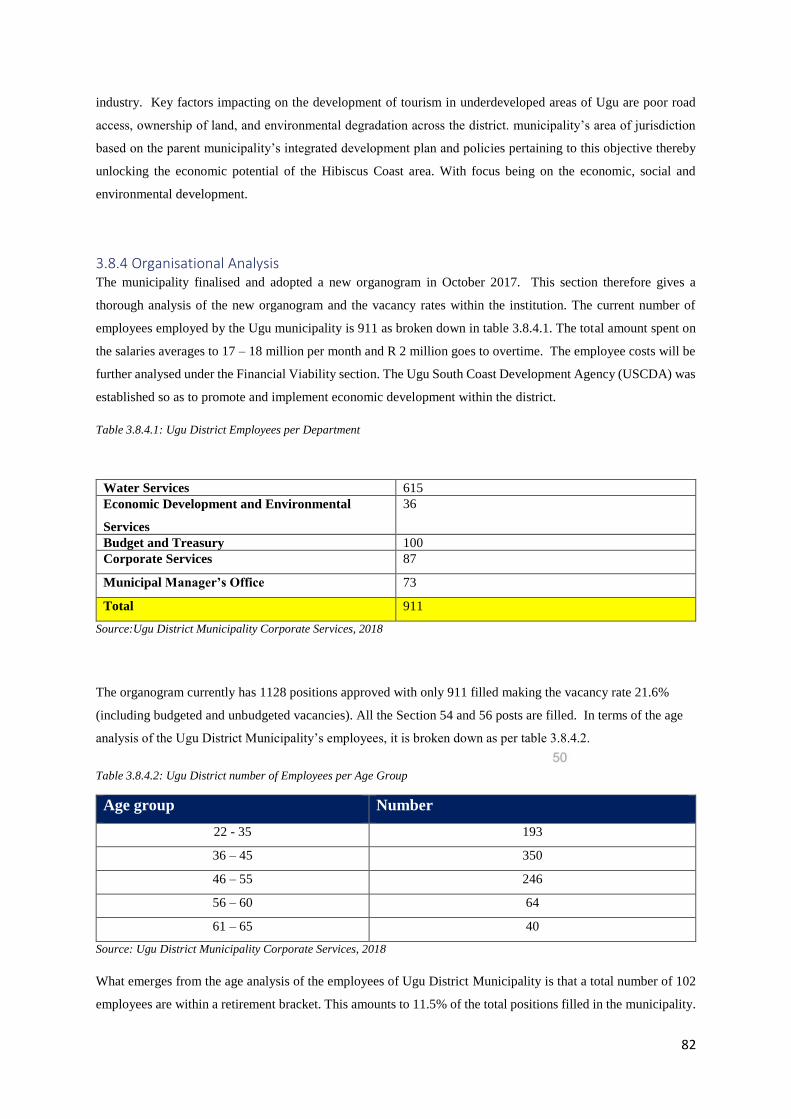
82
industry. Key factors impacting on the development of tourism in underdeveloped areas of Ugu are poor road
access, ownership of land, and environmental degradation across the district. municipality’s area of jurisdiction
based on the parent municipality’s integrated development plan and policies pertaining to this objective thereby
unlocking the economic potential of the Hibiscus Coast area. With focus being on the economic, social and
environmental development.
3.8.4 Organisational Analysis The municipality finalised and adopted a new organogram in October 2017. This section therefore gives a
thorough analysis of the new organogram and the vacancy rates within the institution. The current number of
employees employed by the Ugu municipality is 911 as broken down in table 3.8.4.1. The total amount spent on
the salaries averages to 17 – 18 million per month and R 2 million goes to overtime. The employee costs will be
further analysed under the Financial Viability section. The Ugu South Coast Development Agency (USCDA) was
established so as to promote and implement economic development within the district.
Table 3.8.4.1: Ugu District Employees per Department
Water Services 615
Economic Development and Environmental
Services
36
Budget and Treasury 100
Corporate Services 87
Municipal Manager’s Office 73
Total 911
Source:Ugu District Municipality Corporate Services, 2018
The organogram currently has 1128 positions approved with only 911 filled making the vacancy rate 21.6%
(including budgeted and unbudgeted vacancies). All the Section 54 and 56 posts are filled. In terms of the age
analysis of the Ugu District Municipality’s employees, it is broken down as per table 3.8.4.2.
Table 3.8.4.2: Ugu District number of Employees per Age Group
Age group Number
22 - 35 193
36 – 45 350
46 – 55 246
56 – 60 64
61 – 65 40
Source: Ugu District Municipality Corporate Services, 2018
What emerges from the age analysis of the employees of Ugu District Municipality is that a total number of 102
employees are within a retirement bracket. This amounts to 11.5% of the total positions filled in the municipality.
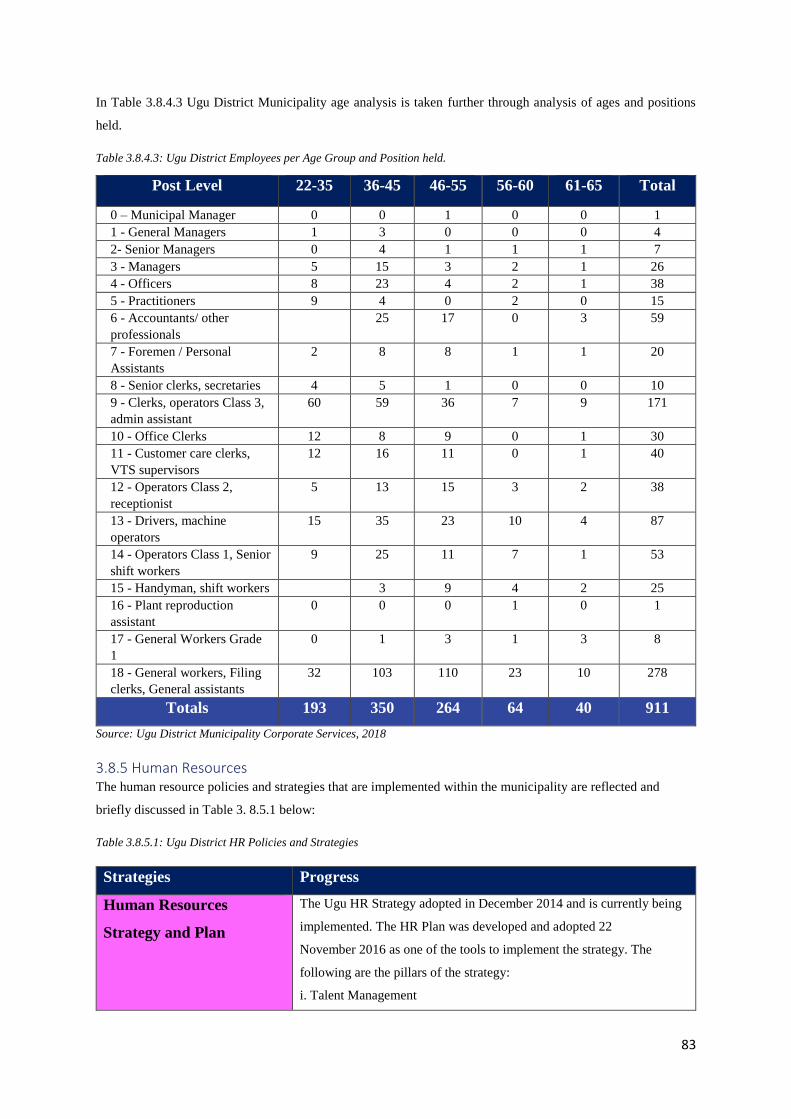
83
In Table 3.8.4.3 Ugu District Municipality age analysis is taken further through analysis of ages and positions
held.
Table 3.8.4.3: Ugu District Employees per Age Group and Position held.
Post Level 22-35 36-45 46-55 56-60 61-65 Total
0 – Municipal Manager 0 0 1 0 0 1
1 - General Managers 1 3 0 0 0 4
2- Senior Managers 0 4 1 1 1 7
3 - Managers 5 15 3 2 1 26
4 - Officers 8 23 4 2 1 38
5 - Practitioners 9 4 0 2 0 15
6 - Accountants/ other
professionals
25 17 0 3 59
7 - Foremen / Personal
Assistants
2 8 8 1 1 20
8 - Senior clerks, secretaries 4 5 1 0 0 10
9 - Clerks, operators Class 3,
admin assistant
60 59 36 7 9 171
10 - Office Clerks 12 8 9 0 1 30
11 - Customer care clerks,
VTS supervisors
12 16 11 0 1 40
12 - Operators Class 2,
receptionist
5 13 15 3 2 38
13 - Drivers, machine
operators
15 35 23 10 4 87
14 - Operators Class 1, Senior
shift workers
9 25 11 7 1 53
15 - Handyman, shift workers 3 9 4 2 25
16 - Plant reproduction
assistant
0 0 0 1 0 1
17 - General Workers Grade
1
0 1 3 1 3 8
18 - General workers, Filing
clerks, General assistants
32 103 110 23 10 278
Totals 193 350 264 64 40 911
Source: Ugu District Municipality Corporate Services, 2018
3.8.5 Human Resources The human resource policies and strategies that are implemented within the municipality are reflected and
briefly discussed in Table 3. 8.5.1 below:
Table 3.8.5.1: Ugu District HR Policies and Strategies
Strategies Progress
Human Resources
Strategy and Plan
The Ugu HR Strategy adopted in December 2014 and is currently being
implemented. The HR Plan was developed and adopted 22
November 2016 as one of the tools to implement the strategy. The
following are the pillars of the strategy:
i. Talent Management
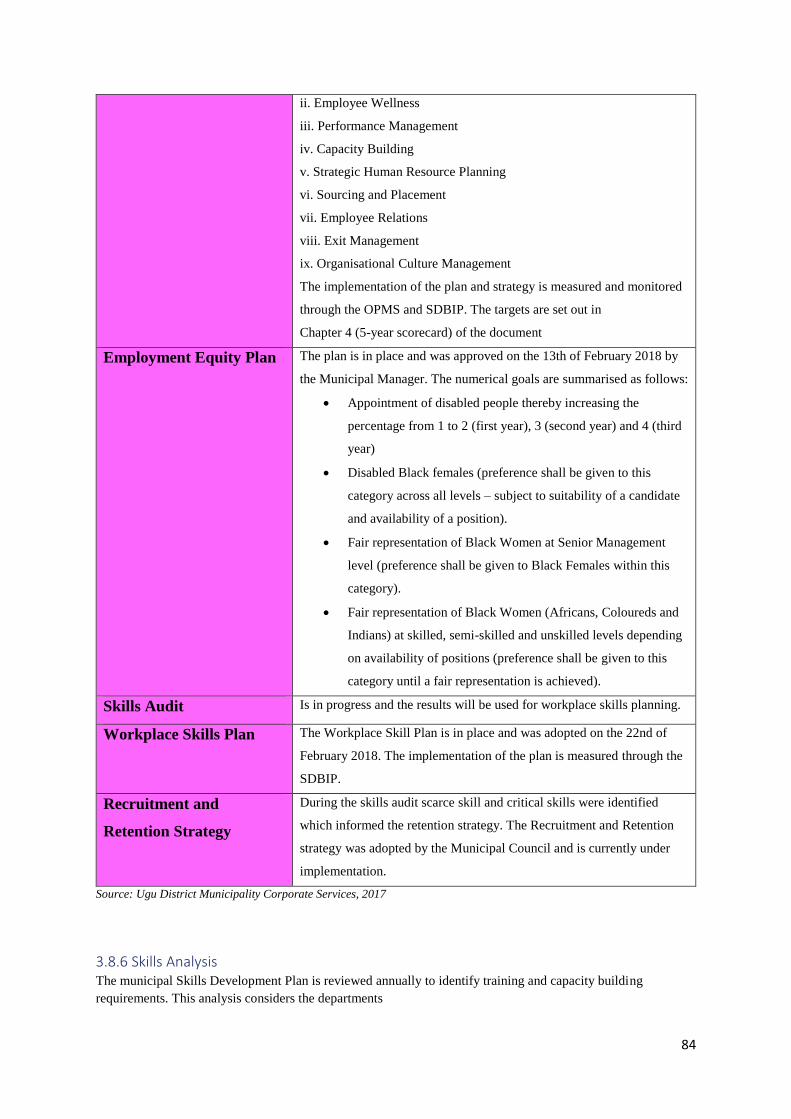
84
ii. Employee Wellness
iii. Performance Management
iv. Capacity Building
v. Strategic Human Resource Planning
vi. Sourcing and Placement
vii. Employee Relations
viii. Exit Management
ix. Organisational Culture Management
The implementation of the plan and strategy is measured and monitored
through the OPMS and SDBIP. The targets are set out in
Chapter 4 (5-year scorecard) of the document
Employment Equity Plan The plan is in place and was approved on the 13th of February 2018 by
the Municipal Manager. The numerical goals are summarised as follows:
• Appointment of disabled people thereby increasing the
percentage from 1 to 2 (first year), 3 (second year) and 4 (third
year)
• Disabled Black females (preference shall be given to this
category across all levels – subject to suitability of a candidate
and availability of a position).
• Fair representation of Black Women at Senior Management
level (preference shall be given to Black Females within this
category).
• Fair representation of Black Women (Africans, Coloureds and
Indians) at skilled, semi-skilled and unskilled levels depending
on availability of positions (preference shall be given to this
category until a fair representation is achieved).
Skills Audit Is in progress and the results will be used for workplace skills planning.
Workplace Skills Plan The Workplace Skill Plan is in place and was adopted on the 22nd of
February 2018. The implementation of the plan is measured through the
SDBIP.
Recruitment and
Retention Strategy
During the skills audit scarce skill and critical skills were identified
which informed the retention strategy. The Recruitment and Retention
strategy was adopted by the Municipal Council and is currently under
implementation.
Source: Ugu District Municipality Corporate Services, 2017
3.8.6 Skills Analysis The municipal Skills Development Plan is reviewed annually to identify training and capacity building
requirements. This analysis considers the departments
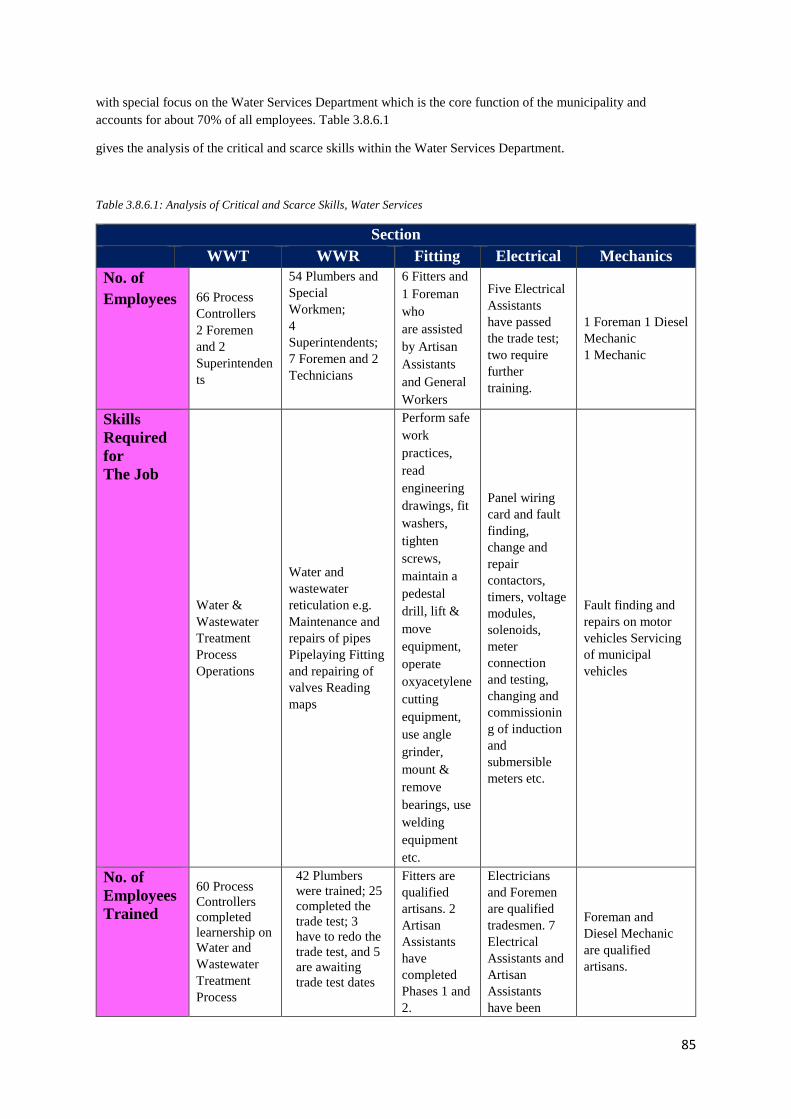
85
with special focus on the Water Services Department which is the core function of the municipality and
accounts for about 70% of all employees. Table 3.8.6.1
gives the analysis of the critical and scarce skills within the Water Services Department.
Table 3.8.6.1: Analysis of Critical and Scarce Skills, Water Services
Section
WWT WWR Fitting Electrical Mechanics
No. of
Employees 66 Process
Controllers
2 Foremen
and 2
Superintenden
ts
54 Plumbers and
Special
Workmen;
4
Superintendents;
7 Foremen and 2
Technicians
6 Fitters and
1 Foreman
who
are assisted
by Artisan
Assistants
and General
Workers
Five Electrical
Assistants
have passed
the trade test;
two require
further
training.
1 Foreman 1 Diesel
Mechanic
1 Mechanic
Skills
Required
for
The Job
Water &
Wastewater
Treatment
Process
Operations
Water and
wastewater
reticulation e.g.
Maintenance and
repairs of pipes
Pipelaying Fitting
and repairing of
valves Reading
maps
Perform safe
work
practices,
read
engineering
drawings, fit
washers,
tighten
screws,
maintain a
pedestal
drill, lift &
move
equipment,
operate
oxyacetylene
cutting
equipment,
use angle
grinder,
mount &
remove
bearings, use
welding
equipment
etc.
Panel wiring
card and fault
finding,
change and
repair
contactors,
timers, voltage
modules,
solenoids,
meter
connection
and testing,
changing and
commissionin
g of induction
and
submersible
meters etc.
Fault finding and
repairs on motor
vehicles Servicing
of municipal
vehicles
No. of
Employees
Trained
60 Process
Controllers
completed
learnership on
Water and
Wastewater
Treatment
Process
42 Plumbers
were trained; 25
completed the
trade test; 3
have to redo the
trade test, and 5
are awaiting
trade test dates
Fitters are
qualified
artisans. 2
Artisan
Assistants
have
completed
Phases 1 and
2.
Electricians
and Foremen
are qualified
tradesmen. 7
Electrical
Assistants and
Artisan
Assistants
have been
Foreman and
Diesel Mechanic
are qualified
artisans.
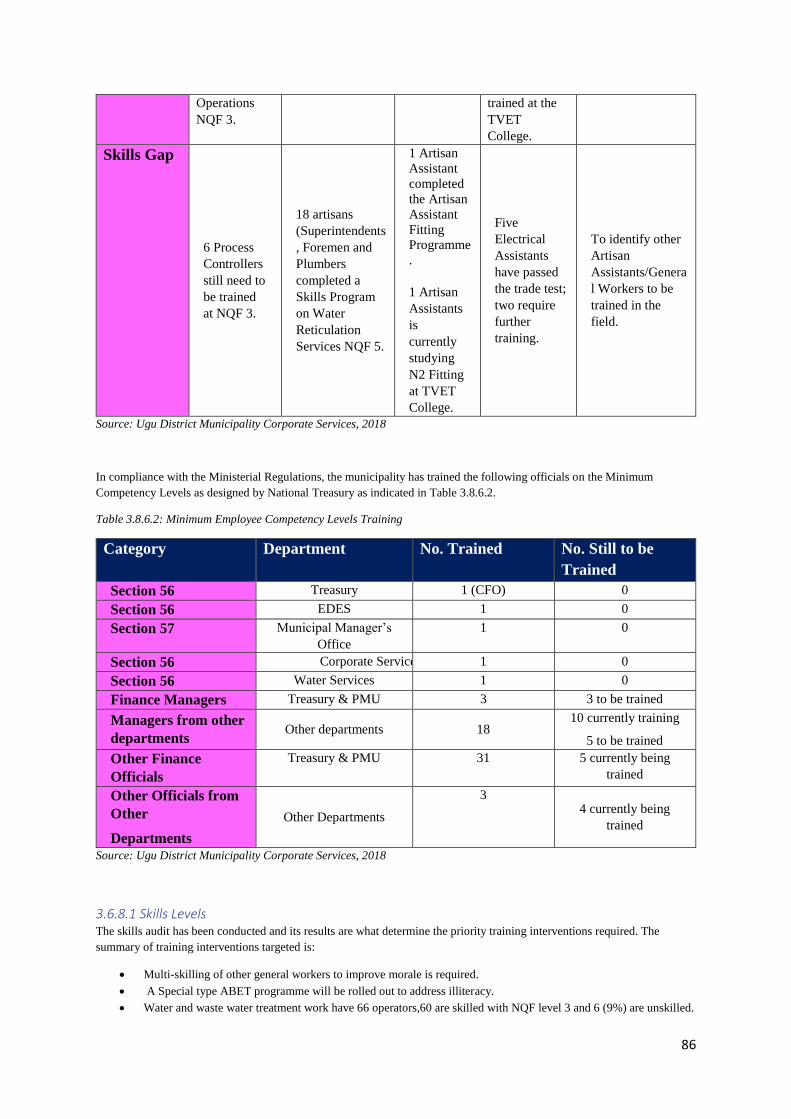
86
Operations
NQF 3.
trained at the
TVET
College.
Skills Gap
6 Process
Controllers
still need to
be trained
at NQF 3.
18 artisans
(Superintendents
, Foremen and
Plumbers
completed a
Skills Program
on Water
Reticulation
Services NQF 5.
1 Artisan
Assistant
completed
the Artisan
Assistant
Fitting
Programme
.
1 Artisan
Assistants
is
currently
studying
N2 Fitting
at TVET
College.
Five
Electrical
Assistants
have passed
the trade test;
two require
further
training.
To identify other
Artisan
Assistants/Genera
l Workers to be
trained in the
field.
Source: Ugu District Municipality Corporate Services, 2018
In compliance with the Ministerial Regulations, the municipality has trained the following officials on the Minimum
Competency Levels as designed by National Treasury as indicated in Table 3.8.6.2.
Table 3.8.6.2: Minimum Employee Competency Levels Training
Category Department No. Trained No. Still to be
Trained
Section 56 Treasury 1 (CFO) 0
Section 56 EDES 1 0
Section 57 Municipal Manager’s
Office
1 0
Section 56 Corporate Services 1 0
Section 56 Water Services 1 0
Finance Managers Treasury & PMU 3 3 to be trained
Managers from other
departments Other departments 18
10 currently training
5 to be trained
Other Finance
Officials
Treasury & PMU 31 5 currently being
trained
Other Officials from
Other
Departments
Other Departments
3
4 currently being
trained
Source: Ugu District Municipality Corporate Services, 2018
3.6.8.1 Skills Levels The skills audit has been conducted and its results are what determine the priority training interventions required. The
summary of training interventions targeted is:
• Multi-skilling of other general workers to improve morale is required.
• A Special type ABET programme will be rolled out to address illiteracy.
• Water and waste water treatment work have 66 operators,60 are skilled with NQF level 3 and 6 (9%) are unskilled.
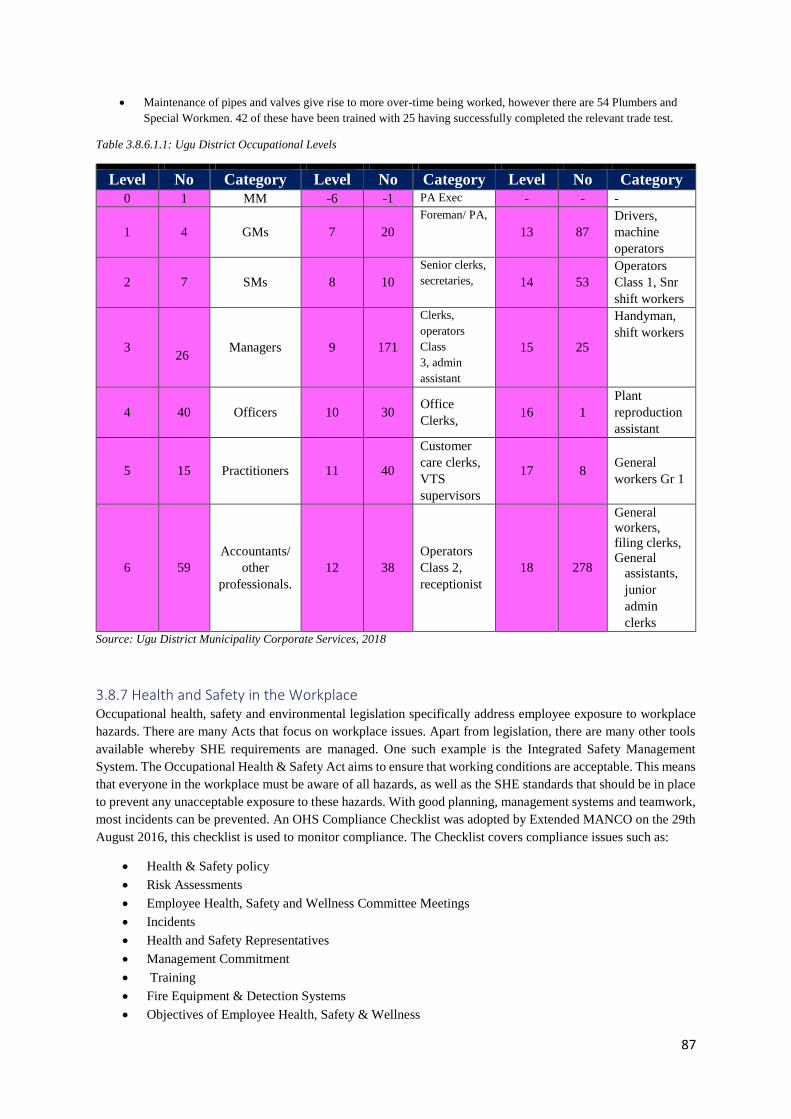
87
• Maintenance of pipes and valves give rise to more over-time being worked, however there are 54 Plumbers and
Special Workmen. 42 of these have been trained with 25 having successfully completed the relevant trade test.
Table 3.8.6.1.1: Ugu District Occupational Levels
Level No Category Level No Category Level No Category
0 1 MM -6 -1 PA Exec - - -
1 4 GMs 7 20
Foreman/ PA,
13 87
Drivers,
machine
operators
2 7 SMs 8 10
Senior clerks,
secretaries, 14 53
Operators
Class 1, Snr
shift workers
3
26 Managers 9 171
Clerks,
operators
Class
3, admin
assistant
15 25
Handyman,
shift workers
4 40 Officers 10 30 Office
Clerks, 16 1
Plant
reproduction
assistant
5 15 Practitioners 11 40
Customer
care clerks,
VTS
supervisors
17 8 General
workers Gr 1
6 59
Accountants/
other
professionals.
12 38
Operators
Class 2,
receptionist
18 278
General
workers,
filing clerks,
General
assistants,
junior
admin
clerks
Source: Ugu District Municipality Corporate Services, 2018
3.8.7 Health and Safety in the Workplace Occupational health, safety and environmental legislation specifically address employee exposure to workplace
hazards. There are many Acts that focus on workplace issues. Apart from legislation, there are many other tools
available whereby SHE requirements are managed. One such example is the Integrated Safety Management
System. The Occupational Health & Safety Act aims to ensure that working conditions are acceptable. This means
that everyone in the workplace must be aware of all hazards, as well as the SHE standards that should be in place
to prevent any unacceptable exposure to these hazards. With good planning, management systems and teamwork,
most incidents can be prevented. An OHS Compliance Checklist was adopted by Extended MANCO on the 29th
August 2016, this checklist is used to monitor compliance. The Checklist covers compliance issues such as:
• Health & Safety policy
• Risk Assessments
• Employee Health, Safety and Wellness Committee Meetings
• Incidents
• Health and Safety Representatives
• Management Commitment
• Training
• Fire Equipment & Detection Systems
• Objectives of Employee Health, Safety & Wellness
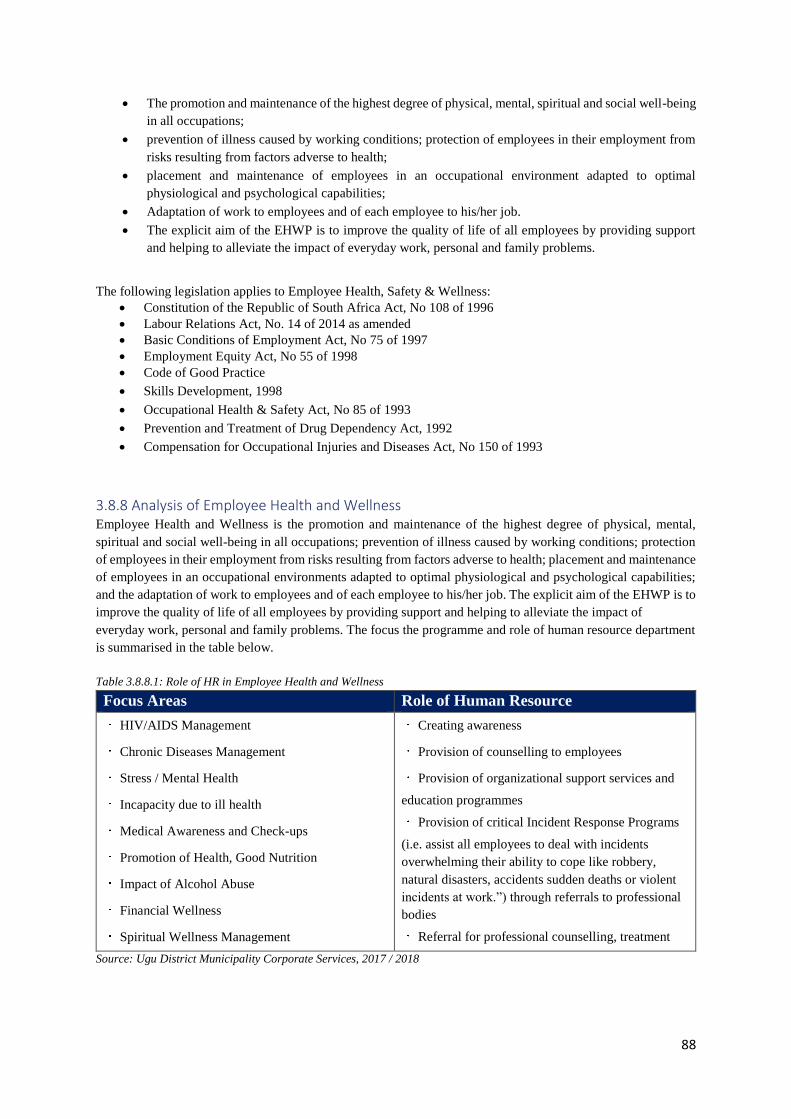
88
• The promotion and maintenance of the highest degree of physical, mental, spiritual and social well-being
in all occupations;
• prevention of illness caused by working conditions; protection of employees in their employment from
risks resulting from factors adverse to health;
• placement and maintenance of employees in an occupational environment adapted to optimal
physiological and psychological capabilities;
• Adaptation of work to employees and of each employee to his/her job.
• The explicit aim of the EHWP is to improve the quality of life of all employees by providing support
and helping to alleviate the impact of everyday work, personal and family problems.
The following legislation applies to Employee Health, Safety & Wellness:
• Constitution of the Republic of South Africa Act, No 108 of 1996
• Labour Relations Act, No. 14 of 2014 as amended
• Basic Conditions of Employment Act, No 75 of 1997
• Employment Equity Act, No 55 of 1998
• Code of Good Practice
• Skills Development, 1998
• Occupational Health & Safety Act, No 85 of 1993
• Prevention and Treatment of Drug Dependency Act, 1992
• Compensation for Occupational Injuries and Diseases Act, No 150 of 1993
3.8.8 Analysis of Employee Health and Wellness Employee Health and Wellness is the promotion and maintenance of the highest degree of physical, mental,
spiritual and social well-being in all occupations; prevention of illness caused by working conditions; protection
of employees in their employment from risks resulting from factors adverse to health; placement and maintenance
of employees in an occupational environments adapted to optimal physiological and psychological capabilities;
and the adaptation of work to employees and of each employee to his/her job. The explicit aim of the EHWP is to
improve the quality of life of all employees by providing support and helping to alleviate the impact of
everyday work, personal and family problems. The focus the programme and role of human resource department
is summarised in the table below.
Table 3.8.8.1: Role of HR in Employee Health and Wellness
Focus Areas Role of Human Resource
HIV/AIDS Management
Chronic Diseases Management
Stress / Mental Health
Incapacity due to ill health
Medical Awareness and Check-ups
Promotion of Health, Good Nutrition
Impact of Alcohol Abuse
Financial Wellness
Spiritual Wellness Management
Creating awareness
Provision of counselling to employees
Provision of organizational support services and
education programmes
Provision of critical Incident Response Programs
(i.e. assist all employees to deal with incidents
overwhelming their ability to cope like robbery,
natural disasters, accidents sudden deaths or violent
incidents at work.”) through referrals to professional
bodies
Referral for professional counselling, treatment
Source: Ugu District Municipality Corporate Services, 2017 / 2018
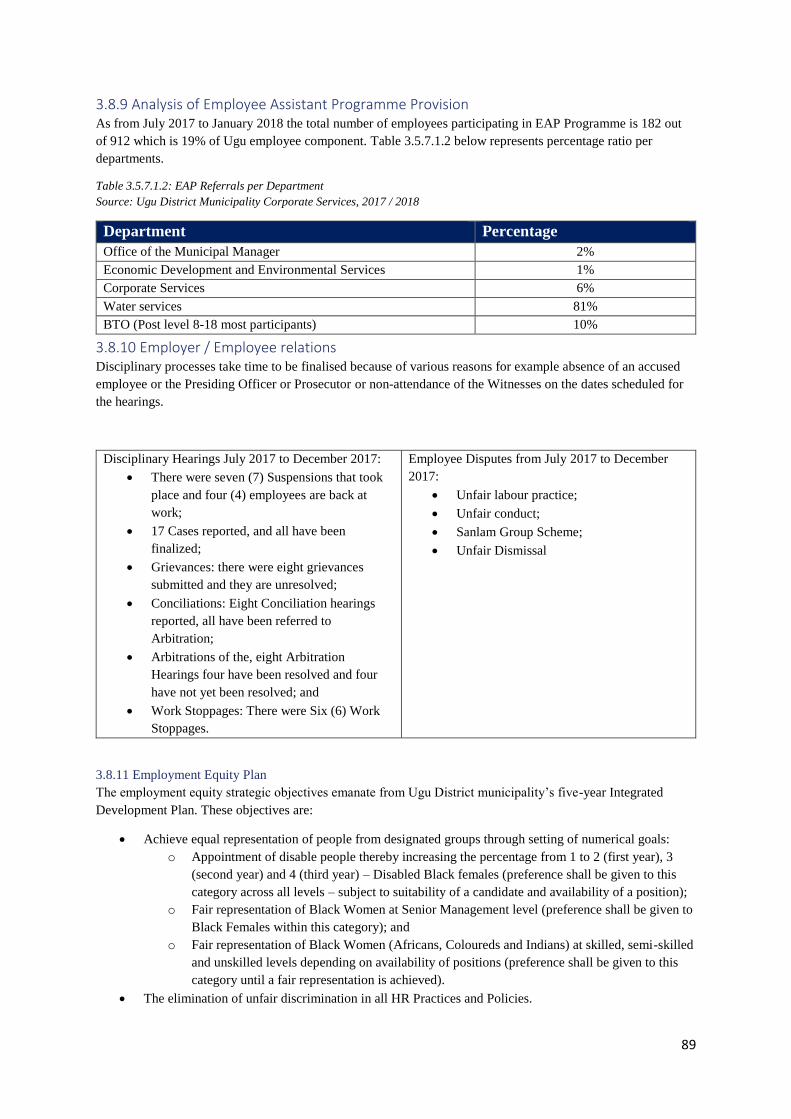
89
3.8.9 Analysis of Employee Assistant Programme Provision As from July 2017 to January 2018 the total number of employees participating in EAP Programme is 182 out
of 912 which is 19% of Ugu employee component. Table 3.5.7.1.2 below represents percentage ratio per
departments.
Table 3.5.7.1.2: EAP Referrals per Department
Source: Ugu District Municipality Corporate Services, 2017 / 2018
Department Percentage
Office of the Municipal Manager 2%
Economic Development and Environmental Services 1%
Corporate Services 6%
Water services 81%
BTO (Post level 8-18 most participants) 10%
3.8.10 Employer / Employee relations Disciplinary processes take time to be finalised because of various reasons for example absence of an accused
employee or the Presiding Officer or Prosecutor or non-attendance of the Witnesses on the dates scheduled for
the hearings.
Disciplinary Hearings July 2017 to December 2017:
• There were seven (7) Suspensions that took
place and four (4) employees are back at
work;
• 17 Cases reported, and all have been
finalized;
• Grievances: there were eight grievances
submitted and they are unresolved;
• Conciliations: Eight Conciliation hearings
reported, all have been referred to
Arbitration;
• Arbitrations of the, eight Arbitration
Hearings four have been resolved and four
have not yet been resolved; and
• Work Stoppages: There were Six (6) Work
Stoppages.
Employee Disputes from July 2017 to December
2017:
• Unfair labour practice;
• Unfair conduct;
• Sanlam Group Scheme;
• Unfair Dismissal
3.8.11 Employment Equity Plan
The employment equity strategic objectives emanate from Ugu District municipality’s five-year Integrated
Development Plan. These objectives are:
• Achieve equal representation of people from designated groups through setting of numerical goals:
o Appointment of disable people thereby increasing the percentage from 1 to 2 (first year), 3
(second year) and 4 (third year) – Disabled Black females (preference shall be given to this
category across all levels – subject to suitability of a candidate and availability of a position);
o Fair representation of Black Women at Senior Management level (preference shall be given to
Black Females within this category); and
o Fair representation of Black Women (Africans, Coloureds and Indians) at skilled, semi-skilled
and unskilled levels depending on availability of positions (preference shall be given to this
category until a fair representation is achieved).
• The elimination of unfair discrimination in all HR Practices and Policies.

90
o Auditing of HR Policies and practices to ensure integration with EE measures;
o Removing barriers in work environment, ensuring reasonable accommodation by PWDs;
o Implement HIV/AIDS Education and prevention programmes; and
o Increase the pool of available candidates through community investment and implementation of
bridging programmes to increase the number of potential candidates.
• Taking Affirmative Action measures that are in line with the Act. This is a policy or a program that
seeks to redress past discrimination through active measures to ensure equal opportunity, as in
education and employment. The measures include: -
o Training to focus more on members from designated groups;
o Succession and experiential training;
o Retention strategy address the retention of employees from designated groups; and
o Employment Equity awareness programmes.
• Ensuring legitimacy of the process through sustained communication and consultation. The main
responsibility of the municipality with regards to EEP is to observe its implementation in relation to
numerical goals.
3.8.12 Secretariat, Registry, and Auxiliary Services The Secretariat Unit is an administrative wing of the Municipality through which the taking of resolutions for
implementation is done. This is done by providing secretariat support to the Committees of the District Municipal
Council such as Council, Exco, Portfolio Committees, Sub-Committees, and Forums. This supporting structure
serves as both the catalyst and the hub of information or engine room that suitably co-ordinates and records all
the proceedings of the decision-making bodies for future references and implementation. This is also regarded as
a confluence of information from all Departments that the Municipality has. The kind of support this Unit provides
is indispensable throughout the organisation. The Primary focus areas are:
• Scheduling of Meetings;
• Collation of Items / Reports;
• Compilation of Agendas;
• Maintenance of a Resolutions Register for Council, the Executive Committee and Management Meetings
• Dispatch of Agendas;
• Attending Meetings;
• Taking Minutes / Compilation of Minutes; and
• All other logistics associated with Meetings Management.
Records Management has improved quite a lot as per the monthly statistics being recorded within the Registry
Unit. Staff attend regular training on records management and the importance thereof is highlighted at these
trainings, so staff are more compliant with records management file plan, policy and procedures. The tender room
was maintained to ensure that bid documents are well controlled. All bid processes from specification to
adjudication are conducted in the Tender Room and original documents are not moved for any reason. The filing
is done according to approved standards. This has proven valuable in ensuring that bid documents and supporting
bid information is available at all times to duly authorised personnel. The Tender Room is under 24-hour
surveillance system, making it is one of the safest and contributing towards a municipality that takes honesty,
transparency, and accountability seriously in ensuring that we subscribe to good governance principles of an
ethical institution with sound leadership. The Building Maintenance Plan was developed and focussed on ongoing
and preventative maintenance to some of the Municipal facilities. This has been implemented very well within a
few of the sites identified by Water Services in conjunction with Corporate Services. A few of the sites which
have benefitted from this Plan are as follows: -
• Umtamvuna Water Treatment Works – Upgrade and refurbishment of the standby quarters as well as the
offices.
• Umbango Waste Water Treatments Works – Refurbishment of the standby quarters including new
appliances and furniture.
91
• Gamalakhe Waste Water Treatment Works – Complete fencing of the Waste Water Treatment Works
and also the refurbishment of the offices at the Treatment Works.
• Shelly Beach WWTW – Complete fencing and repairs and maintenance done
• Ramsgate WWTW – Complete fencing and repairs and maintenance of the offices (inside and outside)
• Munster Ponds – Complete fencing and maintenance
• Red Desert – Complete fencing, repairs and maintenance of offices
• Umzinto WWTW – Complete fencing, repairs and maintenance of the offices and guard house.
• Conversion of a garage into a canteen for when there are trainings taking place in the training centre at
28 Connor Street.
Building Maintenance Plan is ongoing within all UGU DM Offices and reactive maintenance is done only in
unforeseeable circumstances. The project for the development and upgrade of fixed property is underway where
the accommodation of the growing organisation in the long term is being proactively focussed on, these projects
include the development of the Oslo Beach offices phase 3 to include buildings which will accommodate the Ugu
South Coast development agency and the Ugu South coast tourism entities. The Disaster Management Phase 2
was handed over on 27 February 2017 and construction is in progress which includes the fire tender and the
storage facilities for the Disaster centre. Standby Quarters for Harding has been purchased and forms part of the
maintenance plan for 2017/2018. Park Rynie Standby Quarters have been fully refurbished, workshops upgraded,
and storage garages constructed, this project commenced in July 2016 and was completed in June 2017.
3.8.13 Fleet Management Fleet Management plays a very integral part in the execution of daily activities in the Municipality and is one of
the biggest spenders of the operational budget thus its proper management is of utmost importance. Fleet
Management involves the following functions:
• Identification of vehicles for replacement and disposal;
• Repair and maintenance of vehicles;
• Licensing of vehicles;
• Monitoring fuel usage and vehicle abuse;
• Annual verification of vehicles and driver’s licenses; and
• Accident management.
Ugu District municipality has 283 vehicles within its Fleet, used primarily for water services provision. During
the 2016/17 financial year, 29 vehicles were replaced, utilising the R11,800,000 budget allocation provided on
the Municipality’s capital budget. In addition, 1 TLB was ordered to add to the fleet. A vehicle maintenance
schedule plan is in place and the vehicles under 100 000 kms are maintained by the Agents to secure warranties.
The in-house mechanics currently does some minor repairs. The coordination of new vehicle licensing and
renewals at relevant intervals is also of importance to ensure all vehicles at all times are road worthy. The
municipality spends approximately R1.3million per month on fuel which includes vehicles, generators, grass
cutters and all the service plant operations. A challenge still exists on the monitoring of fuel usage and the Fleet
Management Section reports quarterly to the Management Committee on the statistics per department to create
awareness of use. In addition, a cross cutting SDBIP target was implemented in the 2016/17 financial year
whereby all Departments were expected to save at least 15 % on fuel usage, which is measured in litres. Many
departments have struggled with achieving this target and it is an ongoing area of focus. A trip authorisation
system has been implemented and all vehicles are expected to complete trip authorisation forms per trip and same
should be approved by the Section Manager. This was workshopped at the 3 areas; North, South and South West
with all drivers to ensure understanding and compliance with this requirement. The municipality encounters
several accidents per annum, many of which are due to negligence and in such cases, are investigated and where
necessary, officials disciplined.
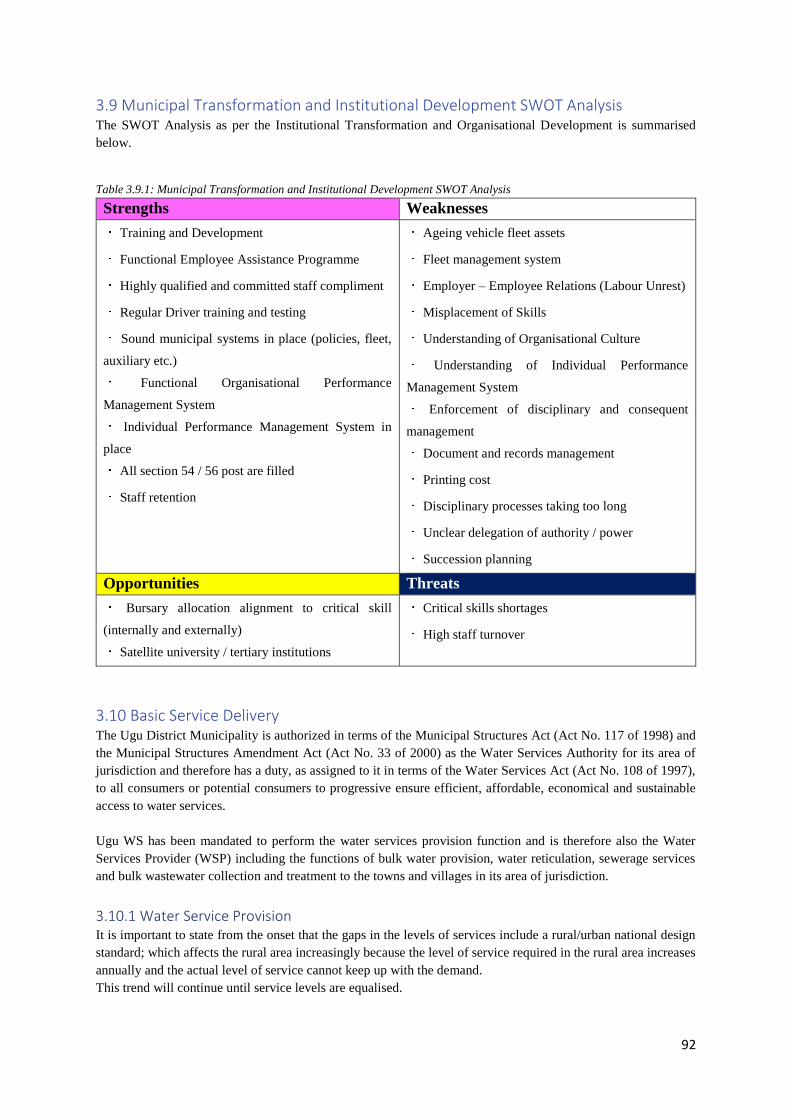
92
3.9 Municipal Transformation and Institutional Development SWOT Analysis The SWOT Analysis as per the Institutional Transformation and Organisational Development is summarised
below.
Table 3.9.1: Municipal Transformation and Institutional Development SWOT Analysis
Strengths Weaknesses
Training and Development
Functional Employee Assistance Programme
Highly qualified and committed staff compliment
Regular Driver training and testing
Sound municipal systems in place (policies, fleet,
auxiliary etc.)
Functional Organisational Performance
Management System
Individual Performance Management System in
place
All section 54 / 56 post are filled
Staff retention
Ageing vehicle fleet assets
Fleet management system
Employer – Employee Relations (Labour Unrest)
Misplacement of Skills
Understanding of Organisational Culture
Understanding of Individual Performance
Management System
Enforcement of disciplinary and consequent
management
Document and records management
Printing cost
Disciplinary processes taking too long
Unclear delegation of authority / power
Succession planning
Opportunities Threats
Bursary allocation alignment to critical skill
(internally and externally)
Satellite university / tertiary institutions
Critical skills shortages
High staff turnover
3.10 Basic Service Delivery The Ugu District Municipality is authorized in terms of the Municipal Structures Act (Act No. 117 of 1998) and
the Municipal Structures Amendment Act (Act No. 33 of 2000) as the Water Services Authority for its area of
jurisdiction and therefore has a duty, as assigned to it in terms of the Water Services Act (Act No. 108 of 1997),
to all consumers or potential consumers to progressive ensure efficient, affordable, economical and sustainable
access to water services.
Ugu WS has been mandated to perform the water services provision function and is therefore also the Water
Services Provider (WSP) including the functions of bulk water provision, water reticulation, sewerage services
and bulk wastewater collection and treatment to the towns and villages in its area of jurisdiction.
3.10.1 Water Service Provision It is important to state from the onset that the gaps in the levels of services include a rural/urban national design
standard; which affects the rural area increasingly because the level of service required in the rural area increases
annually and the actual level of service cannot keep up with the demand.
This trend will continue until service levels are equalised.
93
Furthermore, aged water and sanitation infrastructure, lack of capacity of key treatment plants continues to be
challenges and result in many interruptions and service delivery challenges. The key programmes around this still
present challenge for the urban coastal strip are:
Refurbishment of sanitation infrastructure;
Waterborne sanitation - only 18% reticulated;
Septic and Conservancy tanks - 16%;
Augmentation of water bulk supply schemes;
Development of water resources (Dams); and
Sustainable sanitation for low cost housing projects.
The major infrastructure for water services therefore includes the Dams 7; Pipelines 4 300 km (estimate);
Reservoirs 153; Pump Stations 125; Water Treatment Works 18; and Waste Water Treatment Works 20.
3.10.1.1 Existing Water Infrastructure As indicated in the Water Service Development Plan the existing water infrastructure suggests that the formal
urban coastal areas have well developed bulk infrastructure and networks and historically was the focus for
infrastructure development in the District. The coastal areas remain the highest concentration of the population
and are also the main economic centres for the District. Infrastructure development in the rural areas was
historically done in a haphazard manner and this resulted in several standalone rural water schemes that many
times are supplied from unsustainable water sources. The Regional master planning initiatives that were
completed in 2006 corrected the lack of planning in the rural areas and shifted the focus towards the
implementation of more sustainable Regional Water schemes. The existing and planned future infrastructure in
Ugu is shown in figure 3.6.1.1.1 below. Furthermore, a number of bulk supply sources (water treatment works or
external bulk supply sources) that form the basis of the current and future water supply systems in the District
were identified. Each one of the bulk supply sources supplies a specific zone that could be ring fenced and used
as the basis for further analysis. These supply zones were not always clearly definable, especially in the urban
areas where several interconnections exist to allow certain areas to be supplied from more than one bulk supply
source. Nonetheless an attempt was made to ring fence back-to-back supply zones that cover the entire District.
The supply zones also formed the building blocks for the development of the water demand model and the water
demands were ring fenced within the supply zones and linked back to the respective bulk supply sources. The
water demands could then be compared with the ability of the bulk infrastructure and water sources to meet the
current and future water demands.
3.10.1.2 Water Delivery Standards The water supply to the District is derived from dams, rivers, ground water and bulk purchases from eThekwini
and Umgeni Water. The water is then treated at several treatment plants, owned by Ugu before being distributed
to households. Distribution of water is done via more than 42 000 private household connections and over 5000
communal stand taps which mainly service the inland rural areas.
The demographics of the Ugu district vary from dense formal urban settlements to scattered rural settlements and
must to be dealt with differently when planning for the provision of water services. Different levels of service are
appropriate for each settlement category and the “CSIR Guidelines for Human Settlement Planning and Design”
was used as a guideline to determine the water delivery standards per settlement category as indicated in table
3.10.1.2.1.
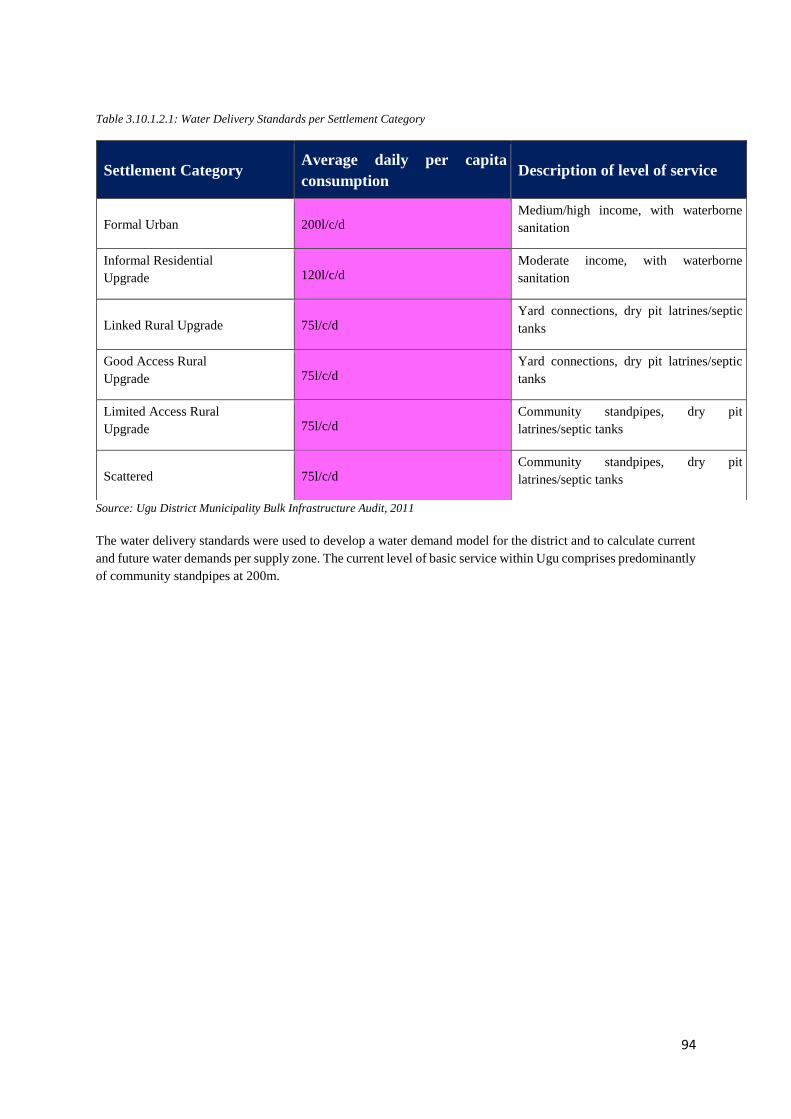
94
Table 3.10.1.2.1: Water Delivery Standards per Settlement Category
Source: Ugu District Municipality Bulk Infrastructure Audit, 2011
The water delivery standards were used to develop a water demand model for the district and to calculate current
and future water demands per supply zone. The current level of basic service within Ugu comprises predominantly
of community standpipes at 200m.
Settlement Category Average daily per capita
consumption Description of level of service
Formal Urban 200l/c/d Medium/high income, with waterborne
sanitation
Informal Residential
Upgrade 120l/c/d Moderate income, with waterborne
sanitation
Linked Rural Upgrade 75l/c/d Yard connections, dry pit latrines/septic
tanks
Good Access Rural
Upgrade 75l/c/d Yard connections, dry pit latrines/septic
tanks
Limited Access Rural
Upgrade 75l/c/d Community standpipes, dry pit
latrines/septic tanks
Scattered 75l/c/d Community standpipes, dry pit
latrines/septic tanks
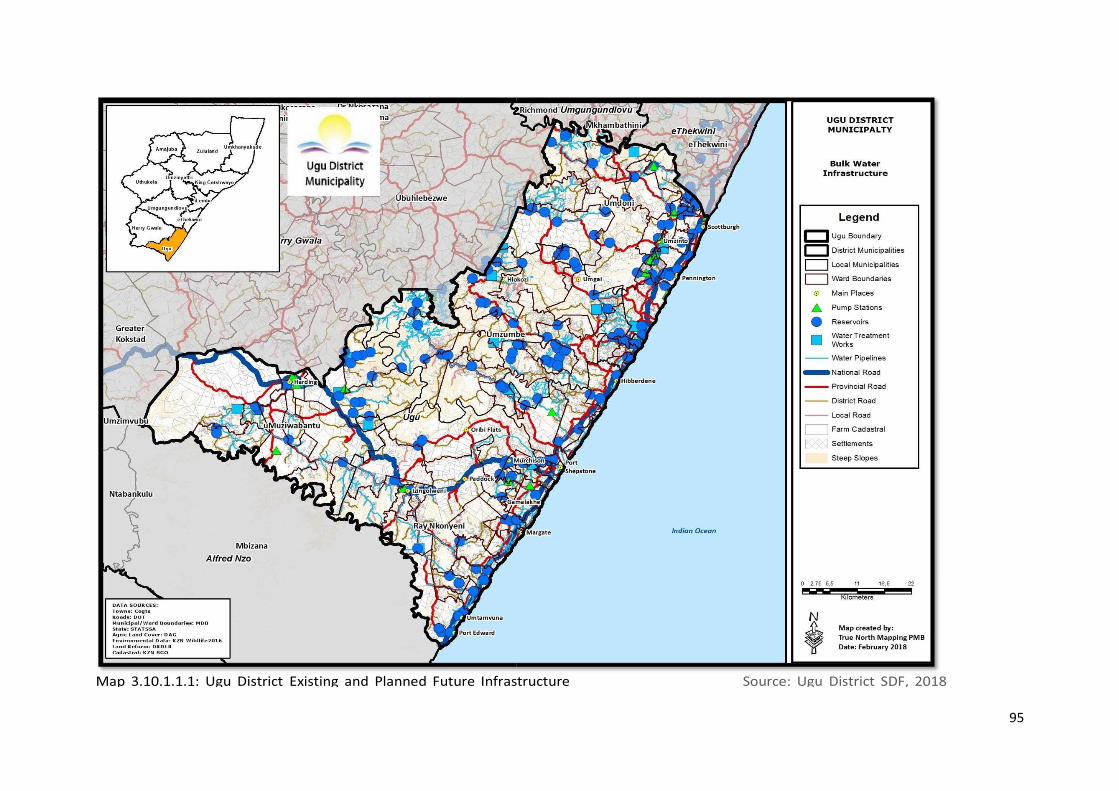
95
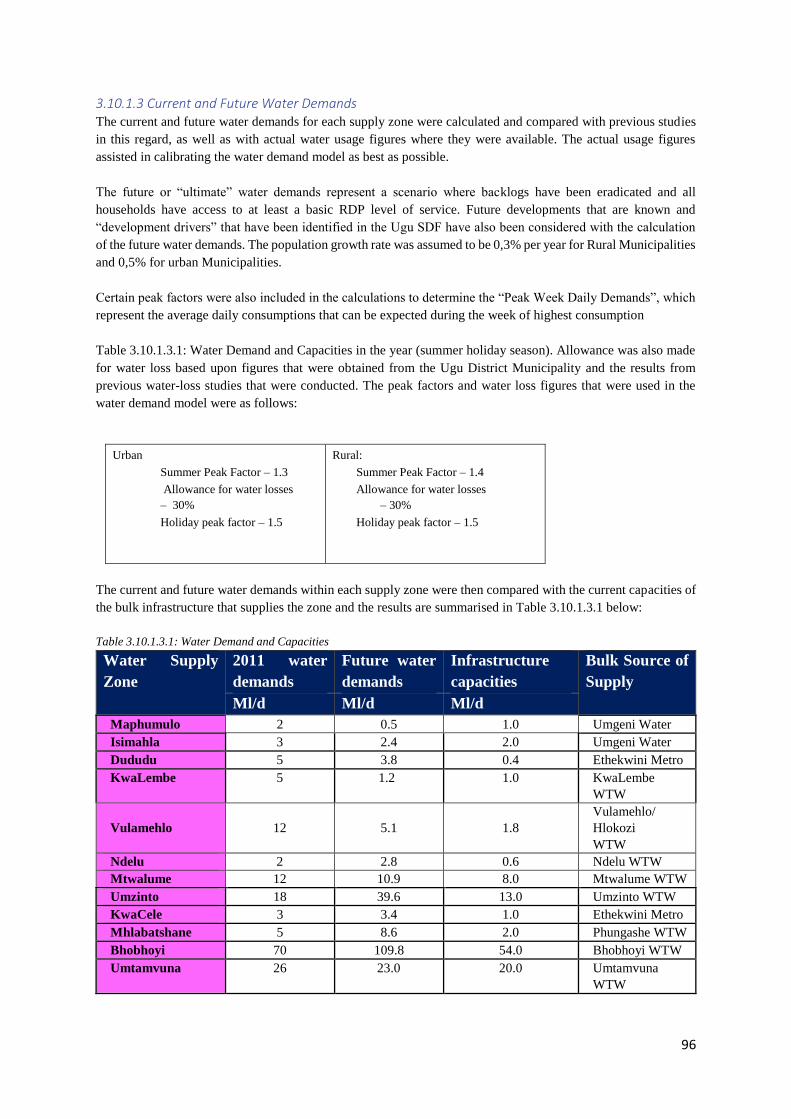
96
3.10.1.3 Current and Future Water Demands The current and future water demands for each supply zone were calculated and compared with previous studies
in this regard, as well as with actual water usage figures where they were available. The actual usage figures
assisted in calibrating the water demand model as best as possible.
The future or “ultimate” water demands represent a scenario where backlogs have been eradicated and all
households have access to at least a basic RDP level of service. Future developments that are known and
“development drivers” that have been identified in the Ugu SDF have also been considered with the calculation
of the future water demands. The population growth rate was assumed to be 0,3% per year for Rural Municipalities
and 0,5% for urban Municipalities.
Certain peak factors were also included in the calculations to determine the “Peak Week Daily Demands”, which
represent the average daily consumptions that can be expected during the week of highest consumption
Table 3.10.1.3.1: Water Demand and Capacities in the year (summer holiday season). Allowance was also made
for water loss based upon figures that were obtained from the Ugu District Municipality and the results from
previous water-loss studies that were conducted. The peak factors and water loss figures that were used in the
water demand model were as follows:
Urban
Summer Peak Factor – 1.3
Allowance for water losses
– 30%
Holiday peak factor – 1.5
Rural:
Summer Peak Factor – 1.4
Allowance for water losses
– 30%
Holiday peak factor – 1.5
The current and future water demands within each supply zone were then compared with the current capacities of
the bulk infrastructure that supplies the zone and the results are summarised in Table 3.10.1.3.1 below:
Table 3.10.1.3.1: Water Demand and Capacities
Water Supply
Zone
2011 water
demands
Future water
demands
Infrastructure
capacities
Bulk Source of
Supply
Ml/d Ml/d Ml/d
Maphumulo 2 0.5 1.0 Umgeni Water
Isimahla 3 2.4 2.0 Umgeni Water
Dududu 5 3.8 0.4 Ethekwini Metro
KwaLembe 5 1.2 1.0 KwaLembe
WTW
Vulamehlo 12 5.1 1.8
Vulamehlo/
Hlokozi
WTW
Ndelu 2 2.8 0.6 Ndelu WTW
Mtwalume 12 10.9 8.0 Mtwalume WTW
Umzinto 18 39.6 13.0 Umzinto WTW
KwaCele 3 3.4 1.0 Ethekwini Metro
Mhlabatshane 5 8.6 2.0 Phungashe WTW
Bhobhoyi 70 109.8 54.0 Bhobhoyi WTW
Umtamvuna 26 23.0 20.0 Umtamvuna
WTW
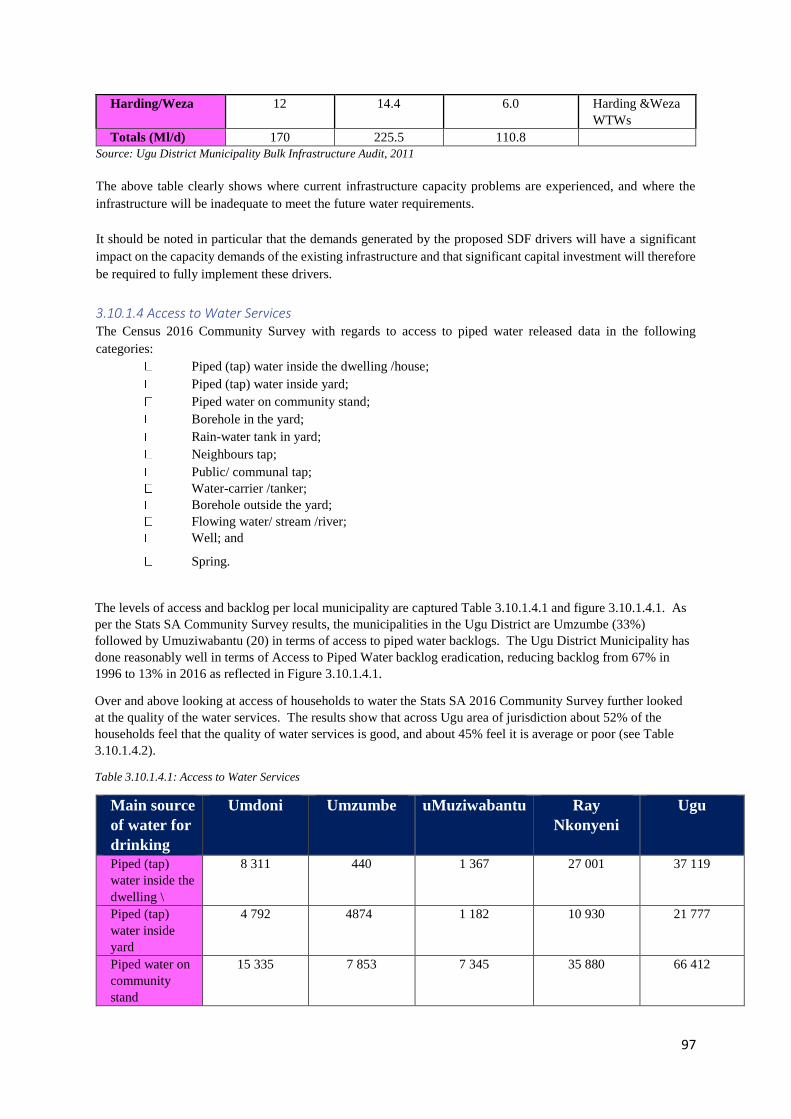
97
Harding/Weza 12 14.4 6.0 Harding &Weza
WTWs
Totals (Ml/d) 170 225.5 110.8
Source: Ugu District Municipality Bulk Infrastructure Audit, 2011
The above table clearly shows where current infrastructure capacity problems are experienced, and where the
infrastructure will be inadequate to meet the future water requirements.
It should be noted in particular that the demands generated by the proposed SDF drivers will have a significant
impact on the capacity demands of the existing infrastructure and that significant capital investment will therefore
be required to fully implement these drivers.
3.10.1.4 Access to Water Services The Census 2016 Community Survey with regards to access to piped water released data in the following
categories:
Piped (tap) water inside the dwelling /house;
Piped (tap) water inside yard;
Piped water on community stand;
Borehole in the yard;
Rain-water tank in yard;
Neighbours tap;
Public/ communal tap;
Water-carrier /tanker;
Borehole outside the yard;
Flowing water/ stream /river;
Well; and
Spring.
The levels of access and backlog per local municipality are captured Table 3.10.1.4.1 and figure 3.10.1.4.1. As
per the Stats SA Community Survey results, the municipalities in the Ugu District are Umzumbe (33%)
followed by Umuziwabantu (20) in terms of access to piped water backlogs. The Ugu District Municipality has
done reasonably well in terms of Access to Piped Water backlog eradication, reducing backlog from 67% in
1996 to 13% in 2016 as reflected in Figure 3.10.1.4.1.
Over and above looking at access of households to water the Stats SA 2016 Community Survey further looked
at the quality of the water services. The results show that across Ugu area of jurisdiction about 52% of the
households feel that the quality of water services is good, and about 45% feel it is average or poor (see Table
3.10.1.4.2).
Table 3.10.1.4.1: Access to Water Services
Main source
of water for
drinking
Umdoni Umzumbe uMuziwabantu Ray
Nkonyeni
Ugu
Piped (tap)
water inside the
dwelling \
8 311 440 1 367 27 001 37 119
Piped (tap)
water inside
yard
4 792 4874 1 182 10 930 21 777
Piped water on
community
stand
15 335 7 853 7 345 35 880 66 412
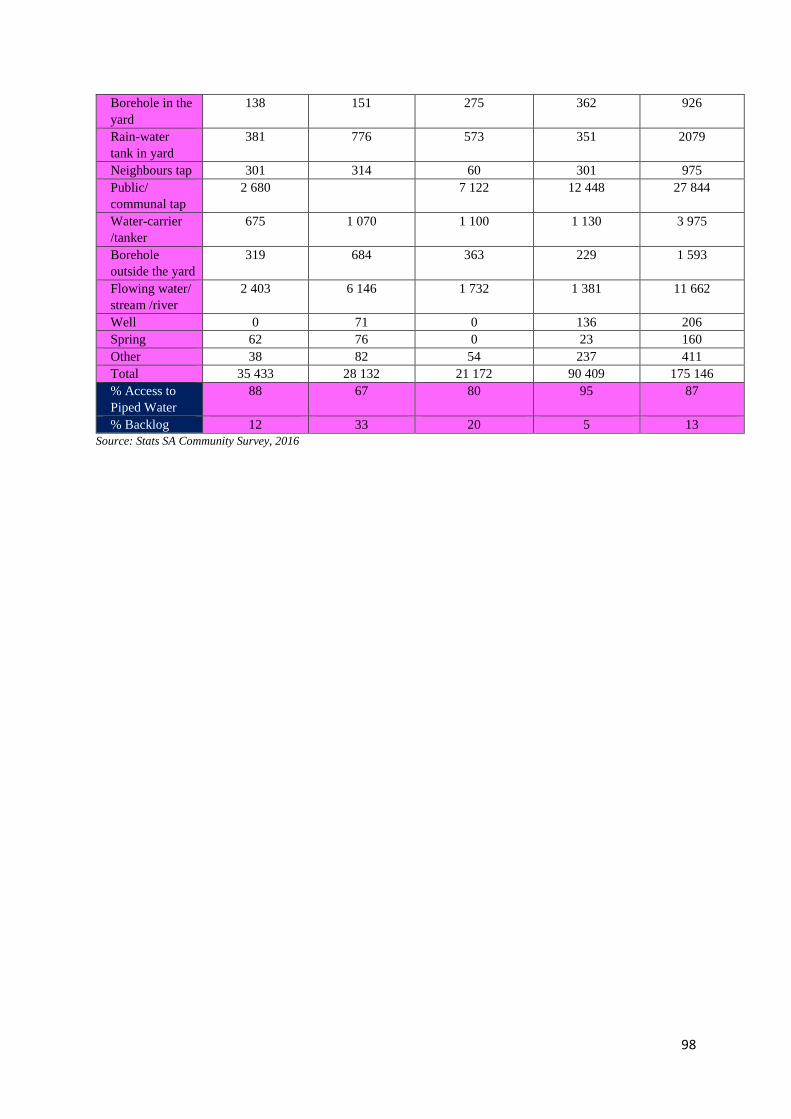
98
Borehole in the
yard
138 151 275 362 926
Rain-water
tank in yard
381 776 573 351 2079
Neighbours tap 301 314 60 301 975
Public/
communal tap
2 680 7 122 12 448 27 844
Water-carrier
/tanker
675 1 070 1 100 1 130 3 975
Borehole
outside the yard
319 684 363 229 1 593
Flowing water/
stream /river
2 403 6 146 1 732 1 381 11 662
Well 0 71 0 136 206
Spring 62 76 0 23 160
Other 38 82 54 237 411
Total 35 433 28 132 21 172 90 409 175 146
% Access to
Piped Water
88 67 80 95 87
% Backlog 12 33 20 5 13
Source: Stats SA Community Survey, 2016
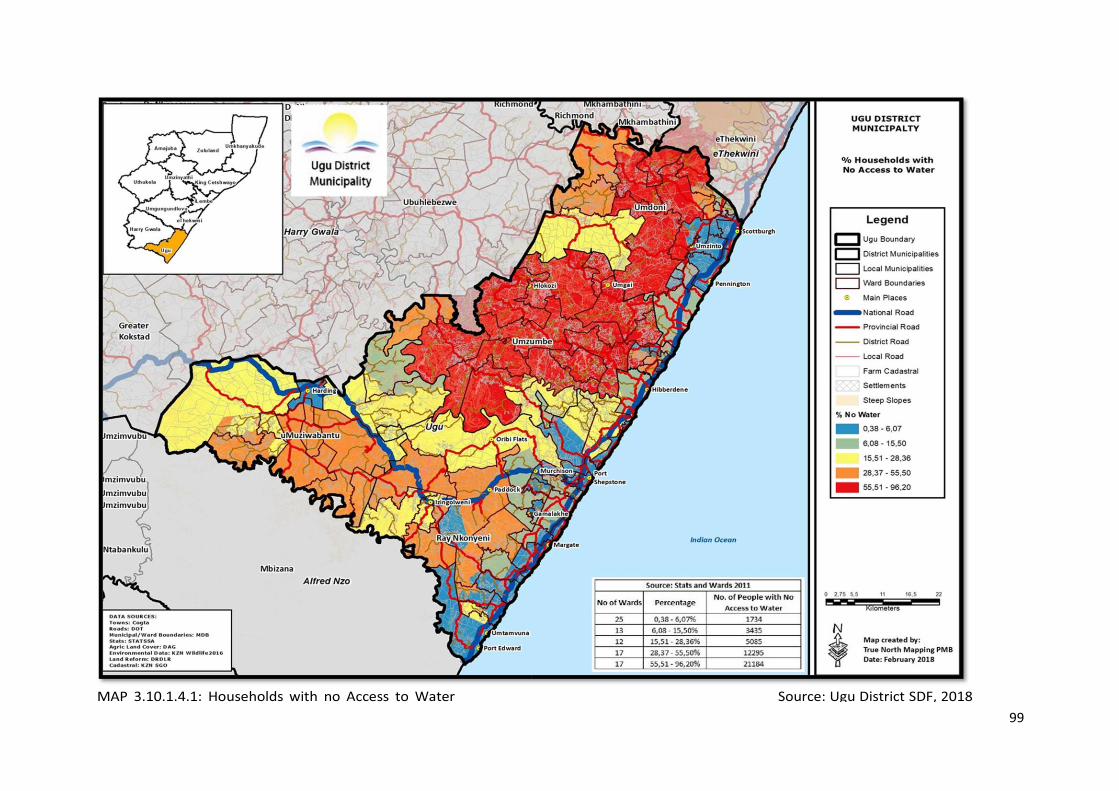
99
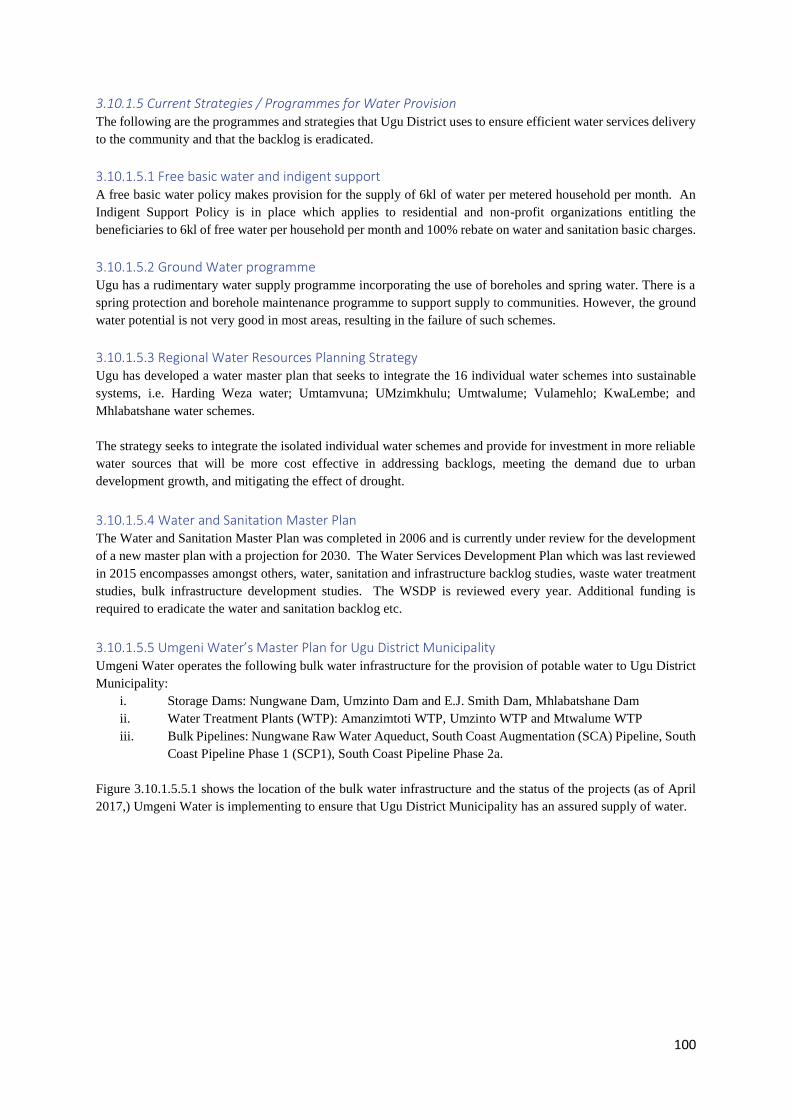
100
3.10.1.5 Current Strategies / Programmes for Water Provision The following are the programmes and strategies that Ugu District uses to ensure efficient water services delivery
to the community and that the backlog is eradicated.
3.10.1.5.1 Free basic water and indigent support A free basic water policy makes provision for the supply of 6kl of water per metered household per month. An
Indigent Support Policy is in place which applies to residential and non-profit organizations entitling the
beneficiaries to 6kl of free water per household per month and 100% rebate on water and sanitation basic charges.
3.10.1.5.2 Ground Water programme Ugu has a rudimentary water supply programme incorporating the use of boreholes and spring water. There is a
spring protection and borehole maintenance programme to support supply to communities. However, the ground
water potential is not very good in most areas, resulting in the failure of such schemes.
3.10.1.5.3 Regional Water Resources Planning Strategy Ugu has developed a water master plan that seeks to integrate the 16 individual water schemes into sustainable
systems, i.e. Harding Weza water; Umtamvuna; UMzimkhulu; Umtwalume; Vulamehlo; KwaLembe; and
Mhlabatshane water schemes.
The strategy seeks to integrate the isolated individual water schemes and provide for investment in more reliable
water sources that will be more cost effective in addressing backlogs, meeting the demand due to urban
development growth, and mitigating the effect of drought.
3.10.1.5.4 Water and Sanitation Master Plan The Water and Sanitation Master Plan was completed in 2006 and is currently under review for the development
of a new master plan with a projection for 2030. The Water Services Development Plan which was last reviewed
in 2015 encompasses amongst others, water, sanitation and infrastructure backlog studies, waste water treatment
studies, bulk infrastructure development studies. The WSDP is reviewed every year. Additional funding is
required to eradicate the water and sanitation backlog etc.
3.10.1.5.5 Umgeni Water’s Master Plan for Ugu District Municipality Umgeni Water operates the following bulk water infrastructure for the provision of potable water to Ugu District
Municipality:
i. Storage Dams: Nungwane Dam, Umzinto Dam and E.J. Smith Dam, Mhlabatshane Dam
ii. Water Treatment Plants (WTP): Amanzimtoti WTP, Umzinto WTP and Mtwalume WTP
iii. Bulk Pipelines: Nungwane Raw Water Aqueduct, South Coast Augmentation (SCA) Pipeline, South
Coast Pipeline Phase 1 (SCP1), South Coast Pipeline Phase 2a.
Figure 3.10.1.5.5.1 shows the location of the bulk water infrastructure and the status of the projects (as of April
2017,) Umgeni Water is implementing to ensure that Ugu District Municipality has an assured supply of water.
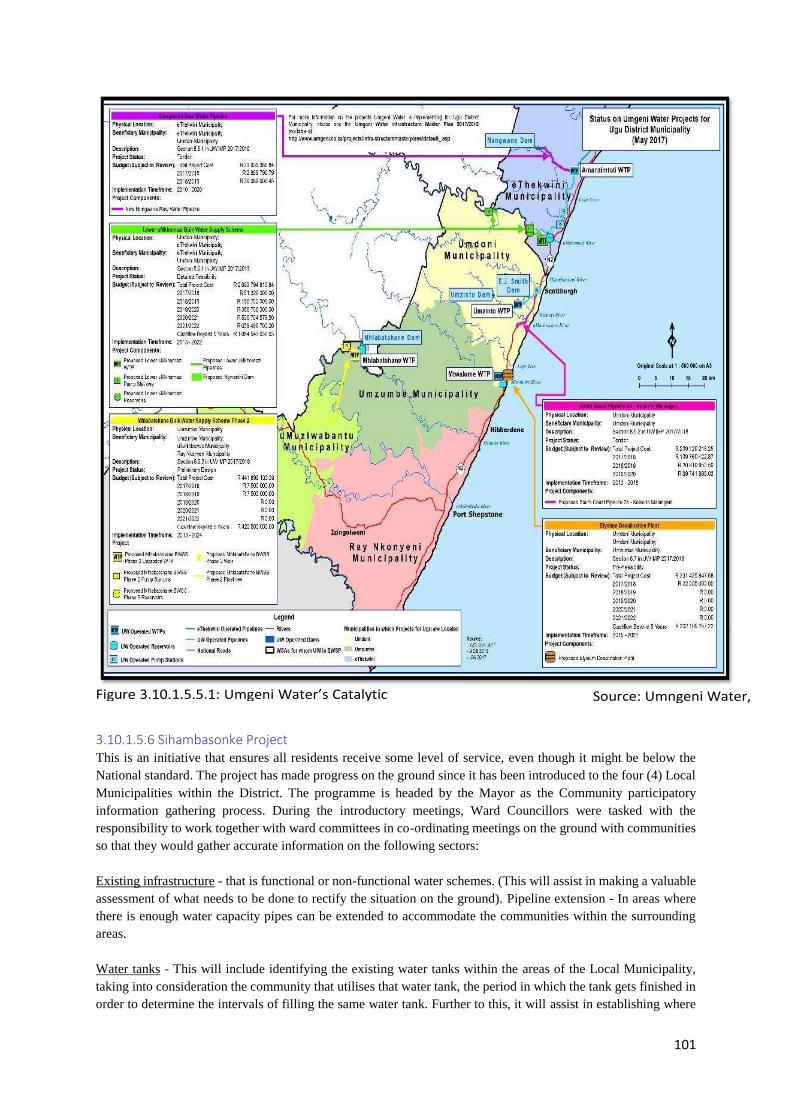
101
3.10.1.5.6 Sihambasonke Project This is an initiative that ensures all residents receive some level of service, even though it might be below the
National standard. The project has made progress on the ground since it has been introduced to the four (4) Local
Municipalities within the District. The programme is headed by the Mayor as the Community participatory
information gathering process. During the introductory meetings, Ward Councillors were tasked with the
responsibility to work together with ward committees in co-ordinating meetings on the ground with communities
so that they would gather accurate information on the following sectors:
Existing infrastructure - that is functional or non-functional water schemes. (This will assist in making a valuable
assessment of what needs to be done to rectify the situation on the ground). Pipeline extension - In areas where
there is enough water capacity pipes can be extended to accommodate the communities within the surrounding
areas.
Water tanks - This will include identifying the existing water tanks within the areas of the Local Municipality,
taking into consideration the community that utilises that water tank, the period in which the tank gets finished in
order to determine the intervals of filling the same water tank. Further to this, it will assist in establishing where
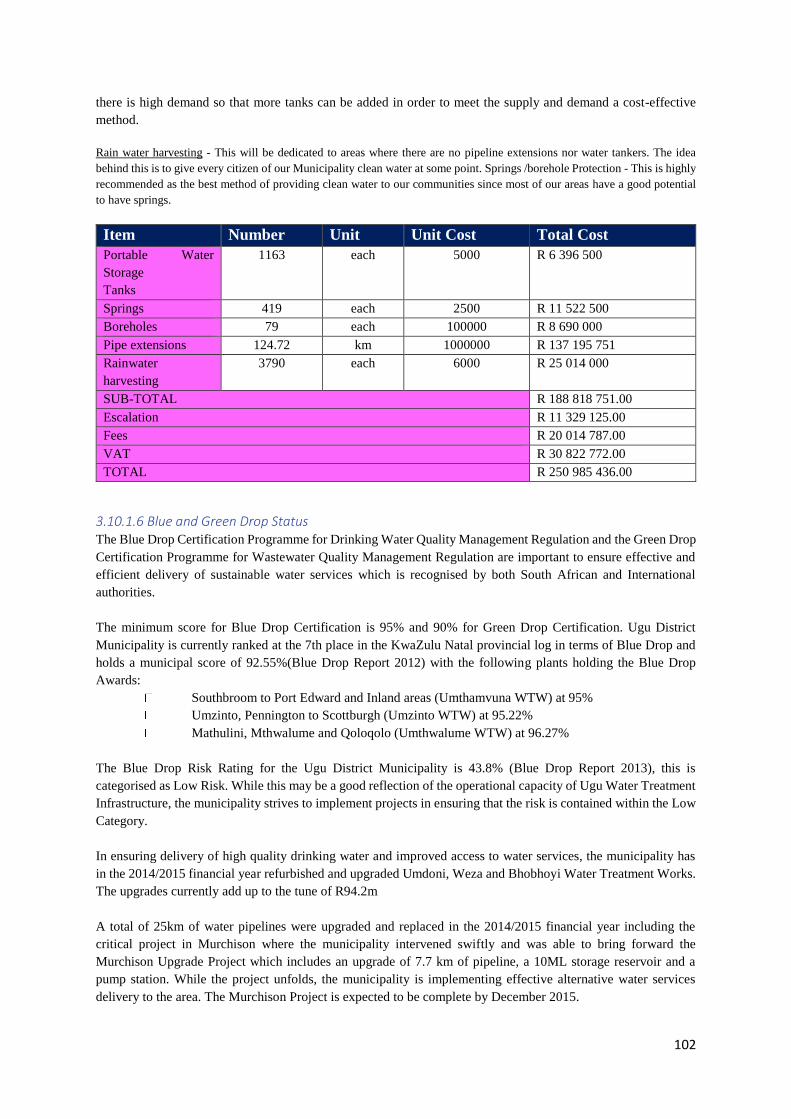
102
there is high demand so that more tanks can be added in order to meet the supply and demand a cost-effective
method.
Rain water harvesting - This will be dedicated to areas where there are no pipeline extensions nor water tankers. The idea
behind this is to give every citizen of our Municipality clean water at some point. Springs /borehole Protection - This is highly
recommended as the best method of providing clean water to our communities since most of our areas have a good potential
to have springs.
Item Number Unit Unit Cost Total Cost
Portable Water
Storage
Tanks
1163 each 5000 R 6 396 500
Springs 419 each 2500 R 11 522 500
Boreholes 79 each 100000 R 8 690 000
Pipe extensions 124.72 km 1000000 R 137 195 751
Rainwater
harvesting
3790 each 6000 R 25 014 000
SUB-TOTAL R 188 818 751.00
Escalation R 11 329 125.00
Fees R 20 014 787.00
VAT R 30 822 772.00
TOTAL R 250 985 436.00
3.10.1.6 Blue and Green Drop Status The Blue Drop Certification Programme for Drinking Water Quality Management Regulation and the Green Drop
Certification Programme for Wastewater Quality Management Regulation are important to ensure effective and
efficient delivery of sustainable water services which is recognised by both South African and International
authorities.
The minimum score for Blue Drop Certification is 95% and 90% for Green Drop Certification. Ugu District
Municipality is currently ranked at the 7th place in the KwaZulu Natal provincial log in terms of Blue Drop and
holds a municipal score of 92.55%(Blue Drop Report 2012) with the following plants holding the Blue Drop
Awards:
Southbroom to Port Edward and Inland areas (Umthamvuna WTW) at 95%
Umzinto, Pennington to Scottburgh (Umzinto WTW) at 95.22%
Mathulini, Mthwalume and Qoloqolo (Umthwalume WTW) at 96.27%
The Blue Drop Risk Rating for the Ugu District Municipality is 43.8% (Blue Drop Report 2013), this is
categorised as Low Risk. While this may be a good reflection of the operational capacity of Ugu Water Treatment
Infrastructure, the municipality strives to implement projects in ensuring that the risk is contained within the Low
Category.
In ensuring delivery of high quality drinking water and improved access to water services, the municipality has
in the 2014/2015 financial year refurbished and upgraded Umdoni, Weza and Bhobhoyi Water Treatment Works.
The upgrades currently add up to the tune of R94.2m
A total of 25km of water pipelines were upgraded and replaced in the 2014/2015 financial year including the
critical project in Murchison where the municipality intervened swiftly and was able to bring forward the
Murchison Upgrade Project which includes an upgrade of 7.7 km of pipeline, a 10ML storage reservoir and a
pump station. While the project unfolds, the municipality is implementing effective alternative water services
delivery to the area. The Murchison Project is expected to be complete by December 2015.
103
As the year comes to the end, the municipality is proud to have provided access to water to an additional 2200HH
constituted by the areas of Mbiyane, Egoli, Maphumulo, Gumatane, Phongolo, Nhlalwane and Ncengesi. Various
other water projects were implemented in this financial year with assistance from grants such as Municipal Water
Infrastructure Grant (MWIG), Municipal Infrastructure Grant (MIG), Regional Grant Infrastructure Grant (RBIG)
and Massification Grants. All the municipal grants will be 100% spent by the end of the 2014/2015 financial year
assuring the public that Ugu District Municipality is here to deliver to the mandate of water and sanitation services
provision.
The municipality positively looks ahead to the 2015/2016 financial year as it aims to continue with the plight of
rendering services to its communities in spite of the drought challenge that is upon us. Out of the R253 million
MIG allocations for the 2015/2016 financial year, the district will continue and complete the Bhobhoyi Water
Treatment Works upgrade and commence the uMthamvuna Water Treatment Works Upgrade from 20ML/day to
40ML/day and the Mistake Farm Water Project.
Responding to the drought challenge, the municipality by July 2015 spent the R10.8m drought relief allocation.
In the 2015/2016 financial year, the municipality will intensify programmes on water loss management from the
MWIG allocation of R100m through its Non-Revenue Water Programme.
For the 2014 Blue Water Services Audits, the municipality participated in the first assessment of No Drop Awards.
The results for the assessment have not been published however the municipality is proud to contain its Non-
Revenue Water Score at 30% being one of the lowest in the country. The municipality continues to implement
measures to reduce its Non-Revenue Water from 30% to a projected 23% by the year 2017.
2012 was a gap year for Green Drop Awards however in the year 2013, the municipality’s Green Drop Score
improved from 70% to 73.91% with the following plant getting a Green Drop Award (Red Desert Waste Water
Treatment Works at 90.3%)
In the 2014/2015 financial year, the municipality spent R75 000 000.00 of its MIG allocation towards sanitation
projects, these including the refurbishment of 25 sanitation pump stations to ensure minimal sewage spillages due
to aged infrastructure. The Umzinto Waste Water Treatment Works is at its final stages of upgrade for the
assurance of service in the Umzinto areas and ready to take on Low Cost Housing Developments. The municipality
will for the 2015/2016 financial year commence and complete critical sanitation projects such as Malangeni Waste
Water Upgrade, Harding Sanitation Project and Margate Sewer Pipeline Upgrade.
The municipality has heeded to the need for effective operations and maintenance budget and will in the year
2015/2016 increase the budget a
few percentages up to the generally accepted norm of 7% of the municipal budget. At 7.3% operations and
maintenance budget, the municipality will engage into the implementation of the council adopted Water Safety
Plans ensuring efficient and effective delivery of compliant water in line with the South African National
Standards 241:2011. Technology in the modern day is an excellent enabler towards delivery of effective service,
the municipality starting from 2015/2016 financial year will implement a continuous upgrade of its telemetry
system as a means to swift response to remote infrastructure breakdown. The municipality will continue to invest
into its technical human resources by adding four more officials into its register of Professionally Registered
Officials in line with the Engineering Profession Act 46 of 2000.
3.10.1.7 Capital Requirements for Backlog Eradication The Ugu District Municipality, as a delegated Water Services Authority (WSA), is in the process of progressively
rolling out water services to all consumers in the District, as per the National Government’s mandate of servicing
all households with at least an RDP level of service by 2014. The estimated cost and time frames to eradicate the
backlog, based on the available funding, has been calculated and is indicated in Table 3.6.2.5.1.
The following benchmark costs were used in the calculation:
R 45 000 to service per urban households
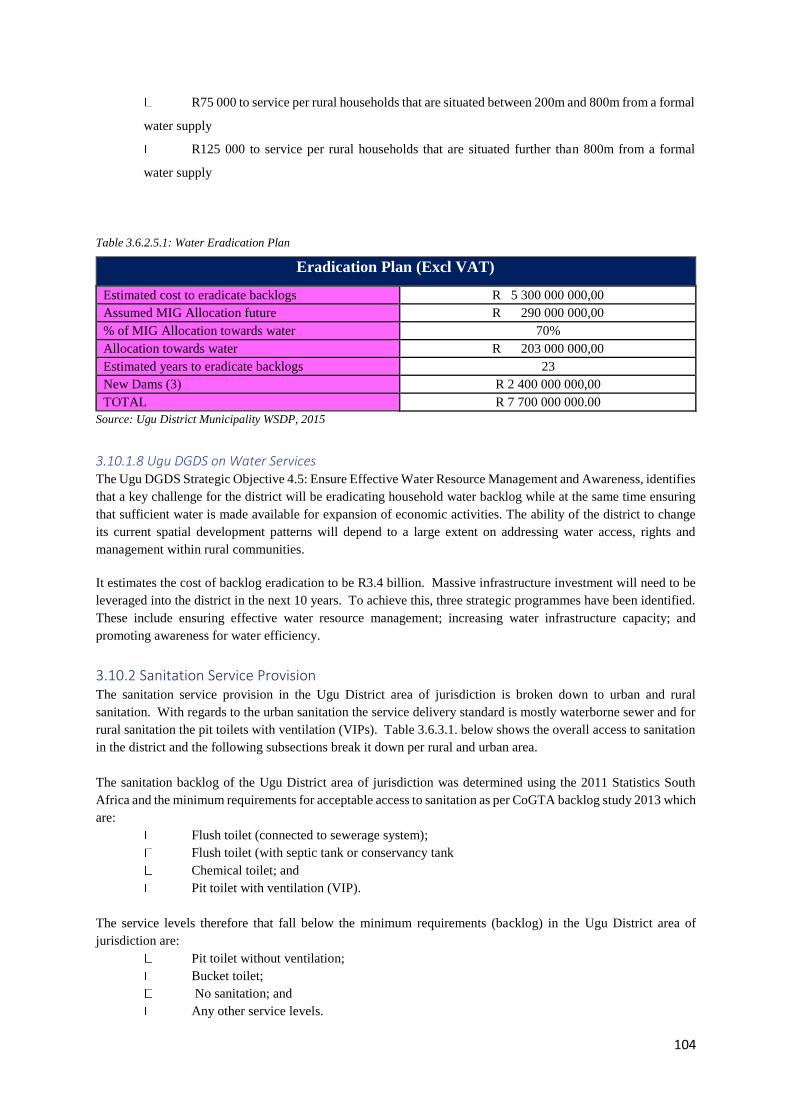
104
R75 000 to service per rural households that are situated between 200m and 800m from a formal
water supply
R125 000 to service per rural households that are situated further than 800m from a formal
water supply
Table 3.6.2.5.1: Water Eradication Plan
Eradication Plan (Excl VAT)
Estimated cost to eradicate backlogs R 5 300 000 000,00
Assumed MIG Allocation future R 290 000 000,00
% of MIG Allocation towards water 70%
Allocation towards water R 203 000 000,00
Estimated years to eradicate backlogs 23
New Dams (3) R 2 400 000 000,00
TOTAL R 7 700 000 000.00
Source: Ugu District Municipality WSDP, 2015
3.10.1.8 Ugu DGDS on Water Services The Ugu DGDS Strategic Objective 4.5: Ensure Effective Water Resource Management and Awareness, identifies
that a key challenge for the district will be eradicating household water backlog while at the same time ensuring
that sufficient water is made available for expansion of economic activities. The ability of the district to change
its current spatial development patterns will depend to a large extent on addressing water access, rights and
management within rural communities.
It estimates the cost of backlog eradication to be R3.4 billion. Massive infrastructure investment will need to be
leveraged into the district in the next 10 years. To achieve this, three strategic programmes have been identified.
These include ensuring effective water resource management; increasing water infrastructure capacity; and
promoting awareness for water efficiency.
3.10.2 Sanitation Service Provision The sanitation service provision in the Ugu District area of jurisdiction is broken down to urban and rural
sanitation. With regards to the urban sanitation the service delivery standard is mostly waterborne sewer and for
rural sanitation the pit toilets with ventilation (VIPs). Table 3.6.3.1. below shows the overall access to sanitation
in the district and the following subsections break it down per rural and urban area.
The sanitation backlog of the Ugu District area of jurisdiction was determined using the 2011 Statistics South
Africa and the minimum requirements for acceptable access to sanitation as per CoGTA backlog study 2013 which
are:
Flush toilet (connected to sewerage system);
Flush toilet (with septic tank or conservancy tank
Chemical toilet; and
Pit toilet with ventilation (VIP).
The service levels therefore that fall below the minimum requirements (backlog) in the Ugu District area of
jurisdiction are:
Pit toilet without ventilation;
Bucket toilet;
No sanitation; and
Any other service levels.
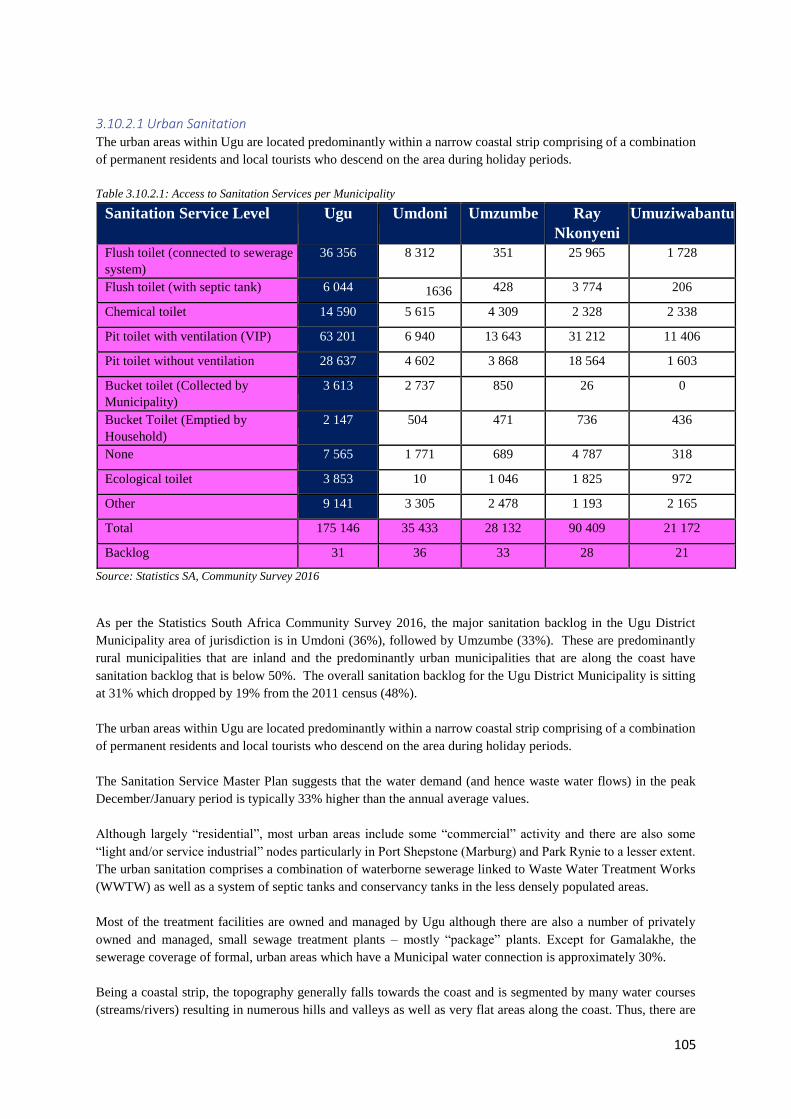
105
3.10.2.1 Urban Sanitation The urban areas within Ugu are located predominantly within a narrow coastal strip comprising of a combination
of permanent residents and local tourists who descend on the area during holiday periods.
Table 3.10.2.1: Access to Sanitation Services per Municipality
Sanitation Service Level Ugu Umdoni Umzumbe Ray
Nkonyeni
Umuziwabantu
Flush toilet (connected to sewerage
system)
36 356 8 312 351 25 965 1 728
Flush toilet (with septic tank) 6 044 1636 428 3 774 206
Chemical toilet 14 590 5 615 4 309 2 328 2 338
Pit toilet with ventilation (VIP) 63 201 6 940 13 643 31 212 11 406
Pit toilet without ventilation 28 637 4 602 3 868 18 564 1 603
Bucket toilet (Collected by
Municipality)
3 613 2 737 850 26 0
Bucket Toilet (Emptied by
Household)
2 147 504 471 736 436
None 7 565 1 771 689 4 787 318
Ecological toilet 3 853 10 1 046 1 825 972
Other 9 141 3 305 2 478 1 193 2 165
Total 175 146 35 433 28 132 90 409 21 172
Backlog 31 36 33 28 21
Source: Statistics SA, Community Survey 2016
As per the Statistics South Africa Community Survey 2016, the major sanitation backlog in the Ugu District
Municipality area of jurisdiction is in Umdoni (36%), followed by Umzumbe (33%). These are predominantly
rural municipalities that are inland and the predominantly urban municipalities that are along the coast have
sanitation backlog that is below 50%. The overall sanitation backlog for the Ugu District Municipality is sitting
at 31% which dropped by 19% from the 2011 census (48%).
The urban areas within Ugu are located predominantly within a narrow coastal strip comprising of a combination
of permanent residents and local tourists who descend on the area during holiday periods.
The Sanitation Service Master Plan suggests that the water demand (and hence waste water flows) in the peak
December/January period is typically 33% higher than the annual average values.
Although largely “residential”, most urban areas include some “commercial” activity and there are also some
“light and/or service industrial” nodes particularly in Port Shepstone (Marburg) and Park Rynie to a lesser extent.
The urban sanitation comprises a combination of waterborne sewerage linked to Waste Water Treatment Works
(WWTW) as well as a system of septic tanks and conservancy tanks in the less densely populated areas.
Most of the treatment facilities are owned and managed by Ugu although there are also a number of privately
owned and managed, small sewage treatment plants – mostly “package” plants. Except for Gamalakhe, the
sewerage coverage of formal, urban areas which have a Municipal water connection is approximately 30%.
Being a coastal strip, the topography generally falls towards the coast and is segmented by many water courses
(streams/rivers) resulting in numerous hills and valleys as well as very flat areas along the coast. Thus, there are

106
numerous pump stations in the reticulated areas whilst the WWTWs are generally located inland of the coastal
strip such that many of the pump stations deal with pumping heads which exceed those readily achievable with
open impeller pumps operating at low speeds.
The SMMP notes further that “the geology of the coastal strip may be described in general terms as having rock
outcrops all along the coast overlain by one to two metres of sand and with some of these areas being characterised
by a high, perched water table” – clearly not ideal for the use of septic tanks with sub-soil percolation drains and
as a result there are numerous conservancy tanks within the urban strip.
3.10.2.2 Urban sanitation delivery standards The SSMP deals with sewage demands and individual scheme options/preliminary designs in greater detail. For
the purposes of this audit and a broad assessment of the status quo, the following standards were adopted:
Table 3.10.2.1: Urban Sanitation Standards
Settlement Categories Sub-Category Flow Unit
Formal Urban
Formal Urban 600 l/d/100m2
Industrial/Commercial NA NA
Informal Residential Upgrade 120 l/c/d
Source: Ugu District Municipality WSDP, 2015
3.10.2.3 Urban Backlog Eradication Plan
Other than maintenance issues and upgrades/extensions of existing sewerage schemes based on the rationale
contained in the SSMP, it stands to reason that formal township development requires the provision of adequate
water and sanitation and as such there are in effect very few backlogs other than those “informal urban upgrade”
areas adjoining the coastal urban strip which by nature of their density should be provided with reticulated
waterborne sewerage as opposed to a basic level of service - septic tanks.
The Local Municipalities have allowed residents to construct septic tanks in wetland areas resulting in serious
pollution in many areas. Replacing the septic tanks with waterborne sanitation will be very costly and also difficult
because the area is built up with well-established gardens and boundary walls. Cost recovery and affordability is
also an issue. Most residents are pensioners that cannot afford the exorbitant cost to install waterborne sanitation.
A total estimated capital investment of the order of R 3 billion is required to reticulate and upgrade sanitation
within the urban strip.
The refurbishment / upgrading of certain existing assets and the proper management of sludge disposal were
identified as immediate priorities and some of this work has already been accomplished by Ugu.
3.10.2.4 Rural Sanitation There is no reliable data spatially or otherwise pertaining to either the location or age of Ventilated Improved Pit
Latrines (VIPs) constructed within Ugu. This poses a major challenge as there is no reliable data with which to
plan for de-sludging/re-location of VIPs when full and further prevents the accurate determination of the backlog.
Therefore, in order to obtain a better understanding regarding the status quo of the rural sanitation within Ugu, a
number of random sample surveys were undertaken within each local municipal area.
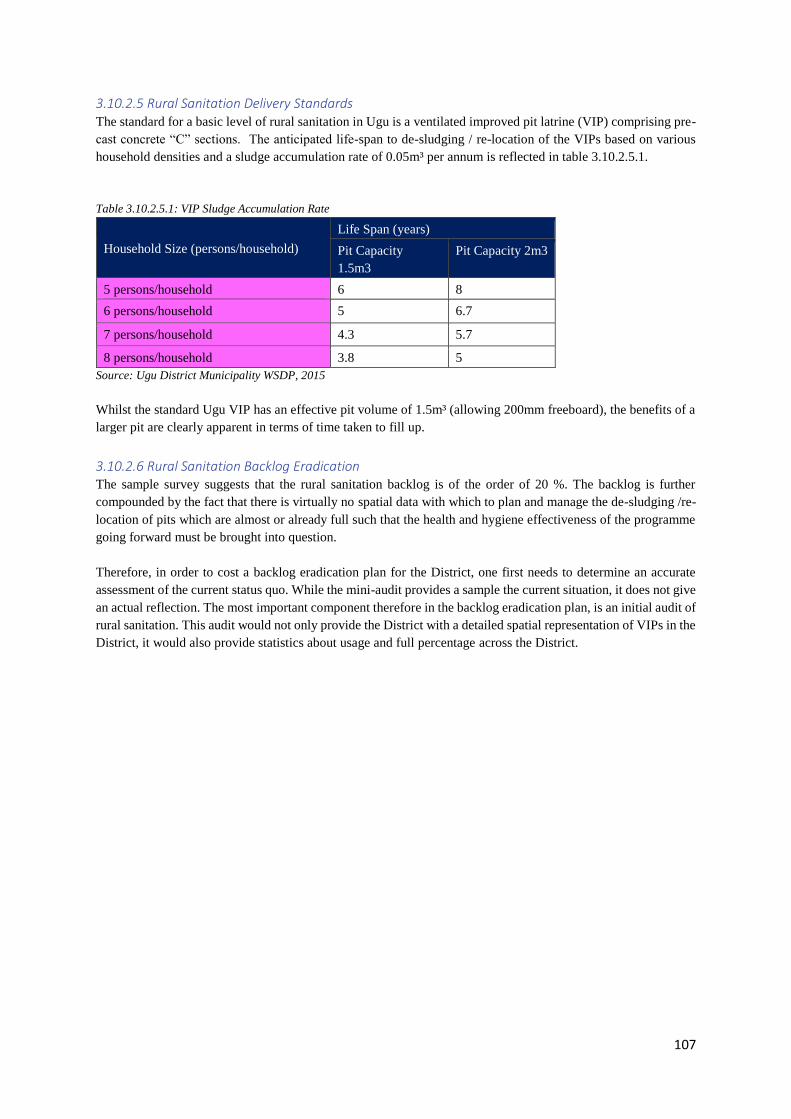
107
3.10.2.5 Rural Sanitation Delivery Standards The standard for a basic level of rural sanitation in Ugu is a ventilated improved pit latrine (VIP) comprising pre-
cast concrete “C” sections. The anticipated life-span to de-sludging / re-location of the VIPs based on various
household densities and a sludge accumulation rate of 0.05m³ per annum is reflected in table 3.10.2.5.1.
Table 3.10.2.5.1: VIP Sludge Accumulation Rate
Household Size (persons/household)
Life Span (years)
Pit Capacity
1.5m3
Pit Capacity 2m3
5 persons/household 6 8
6 persons/household 5 6.7
7 persons/household 4.3 5.7
8 persons/household 3.8 5
Source: Ugu District Municipality WSDP, 2015
Whilst the standard Ugu VIP has an effective pit volume of 1.5m³ (allowing 200mm freeboard), the benefits of a
larger pit are clearly apparent in terms of time taken to fill up.
3.10.2.6 Rural Sanitation Backlog Eradication The sample survey suggests that the rural sanitation backlog is of the order of 20 %. The backlog is further
compounded by the fact that there is virtually no spatial data with which to plan and manage the de-sludging /re-
location of pits which are almost or already full such that the health and hygiene effectiveness of the programme
going forward must be brought into question.
Therefore, in order to cost a backlog eradication plan for the District, one first needs to determine an accurate
assessment of the current status quo. While the mini-audit provides a sample the current situation, it does not give
an actual reflection. The most important component therefore in the backlog eradication plan, is an initial audit of
rural sanitation. This audit would not only provide the District with a detailed spatial representation of VIPs in the
District, it would also provide statistics about usage and full percentage across the District.
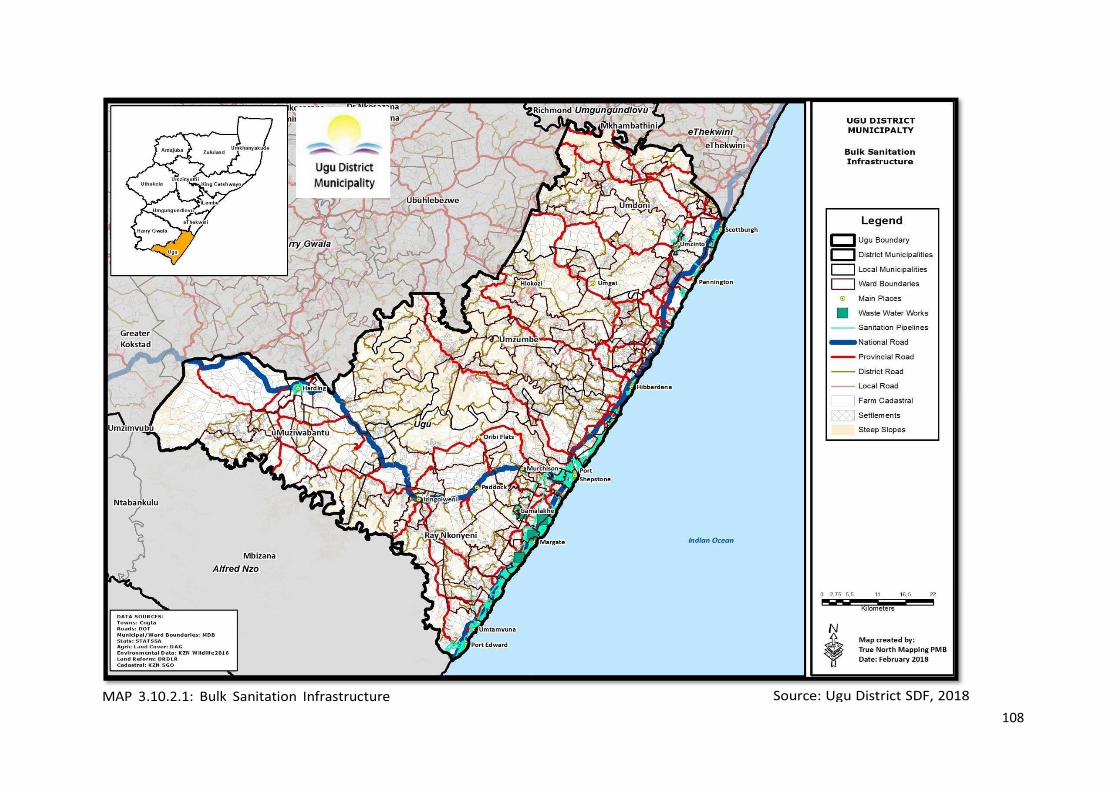
108

109
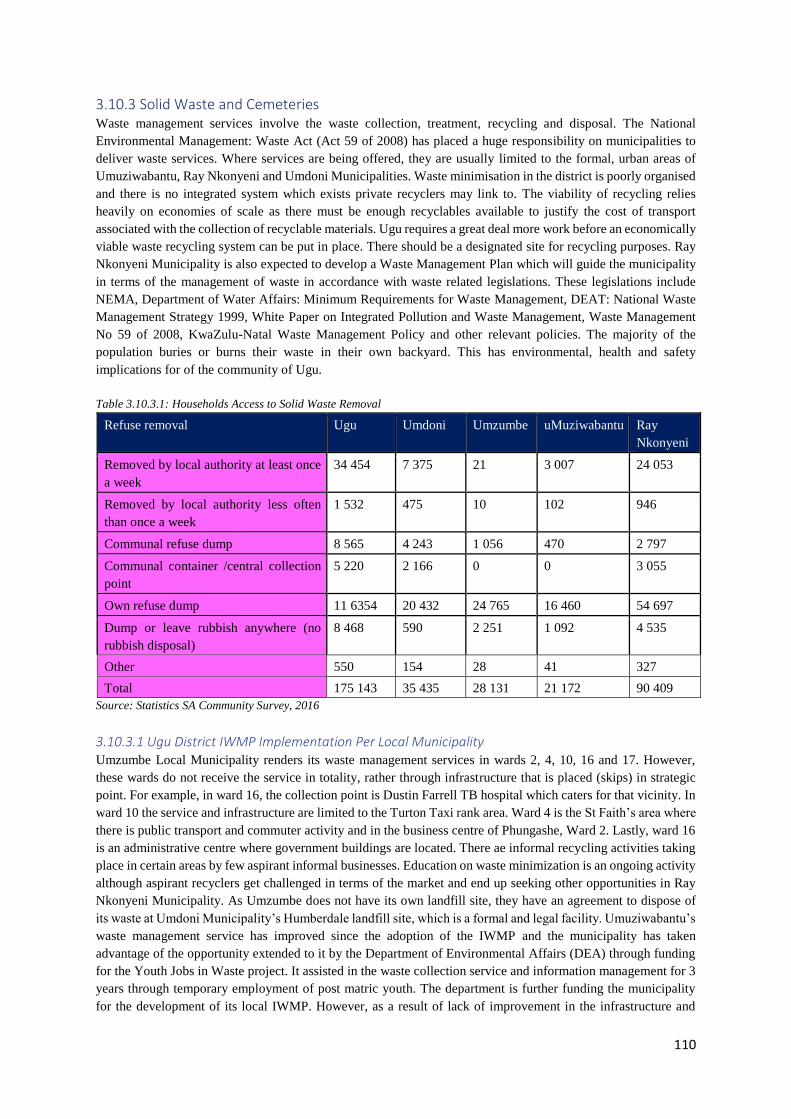
110
3.10.3 Solid Waste and Cemeteries Waste management services involve the waste collection, treatment, recycling and disposal. The National
Environmental Management: Waste Act (Act 59 of 2008) has placed a huge responsibility on municipalities to
deliver waste services. Where services are being offered, they are usually limited to the formal, urban areas of
Umuziwabantu, Ray Nkonyeni and Umdoni Municipalities. Waste minimisation in the district is poorly organised
and there is no integrated system which exists private recyclers may link to. The viability of recycling relies
heavily on economies of scale as there must be enough recyclables available to justify the cost of transport
associated with the collection of recyclable materials. Ugu requires a great deal more work before an economically
viable waste recycling system can be put in place. There should be a designated site for recycling purposes. Ray
Nkonyeni Municipality is also expected to develop a Waste Management Plan which will guide the municipality
in terms of the management of waste in accordance with waste related legislations. These legislations include
NEMA, Department of Water Affairs: Minimum Requirements for Waste Management, DEAT: National Waste
Management Strategy 1999, White Paper on Integrated Pollution and Waste Management, Waste Management
No 59 of 2008, KwaZulu-Natal Waste Management Policy and other relevant policies. The majority of the
population buries or burns their waste in their own backyard. This has environmental, health and safety
implications for of the community of Ugu.
Table 3.10.3.1: Households Access to Solid Waste Removal
Refuse removal Ugu Umdoni Umzumbe uMuziwabantu Ray
Nkonyeni
Removed by local authority at least once
a week
34 454 7 375 21 3 007 24 053
Removed by local authority less often
than once a week
1 532 475 10 102 946
Communal refuse dump 8 565 4 243 1 056 470 2 797
Communal container /central collection
point
5 220 2 166 0 0 3 055
Own refuse dump 11 6354 20 432 24 765 16 460 54 697
Dump or leave rubbish anywhere (no
rubbish disposal)
8 468 590 2 251 1 092 4 535
Other 550 154 28 41 327
Total 175 143 35 435 28 131 21 172 90 409
Source: Statistics SA Community Survey, 2016
3.10.3.1 Ugu District IWMP Implementation Per Local Municipality Umzumbe Local Municipality renders its waste management services in wards 2, 4, 10, 16 and 17. However,
these wards do not receive the service in totality, rather through infrastructure that is placed (skips) in strategic
point. For example, in ward 16, the collection point is Dustin Farrell TB hospital which caters for that vicinity. In
ward 10 the service and infrastructure are limited to the Turton Taxi rank area. Ward 4 is the St Faith’s area where
there is public transport and commuter activity and in the business centre of Phungashe, Ward 2. Lastly, ward 16
is an administrative centre where government buildings are located. There ae informal recycling activities taking
place in certain areas by few aspirant informal businesses. Education on waste minimization is an ongoing activity
although aspirant recyclers get challenged in terms of the market and end up seeking other opportunities in Ray
Nkonyeni Municipality. As Umzumbe does not have its own landfill site, they have an agreement to dispose of
its waste at Umdoni Municipality’s Humberdale landfill site, which is a formal and legal facility. Umuziwabantu’s
waste management service has improved since the adoption of the IWMP and the municipality has taken
advantage of the opportunity extended to it by the Department of Environmental Affairs (DEA) through funding
for the Youth Jobs in Waste project. It assisted in the waste collection service and information management for 3
years through temporary employment of post matric youth. The department is further funding the municipality
for the development of its local IWMP. However, as a result of lack of improvement in the infrastructure and
111
collection, the service is only limited to ward 3, which is the urban strip of Umuziwabantu. There is one landfill
site that is not formalised yet, where all collection is disposed. As part of the IWMP development and status quo
establishment, DEA conducted a survey of waste stream for categorisation purposes and found that the best
managed waste in Umuziwabantu is the health care risk waste. The health facilities fully comply with responsible
disposal of HCRW. Umdoni collects waste mostly in the urban coastal strip and a few rural areas of Amandawe,
Dududu and some parts of informal Umzinto. Recycling is mostly taking place in a few urban areas through
municipal and community driven initiatives. Schools are a great part of waste management initiatives. Humberdale
landfill site is the formal and legal site of Umdoni municipality, which has been extended to Phase through
Environmental Protection and Infrastructure funding from the Department of Environmental Affairs. Youth Jobs
in Waste was also implemented in Umdoni municipality. While there is no local IWMP for Umdoni municipality,
they rely on the high level IWMP of Ugu DM. With respect to waste management, Ray Nkonyeni municipality is
the most advanced local municipality in terms of policy, strategy, information management, perations and
financial allocation. Like other local municipalities, most coverage of the waste collection services is still in the
urban coastal strip. Waste services is focused on the urban coastal strip with 26.6% of households receiving weekly
waste collection. The majority (60.1%) utilise their own refuse dump and 5% having no facility to dispose of
waste. The municipality thus conducts a level 4 service for the coastal areas and a level 3/4 in 21 other wards that
are densely populated areas/townships. The combined level of service comprises both awareness campaigns,
supervision and provision of refuse bags with recyclable waste collected. Upliftment frequencies range from
weekly to quarterly. The coverage of service delivery is thus 69.4% of the municipality.
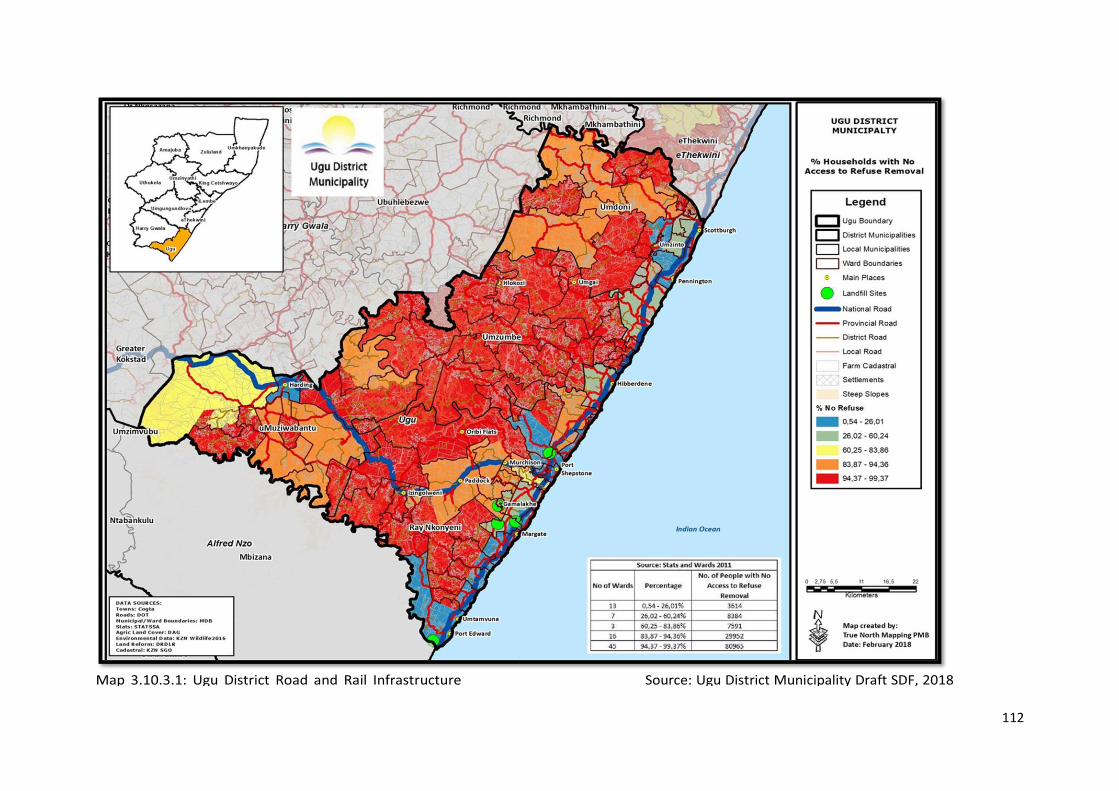
112
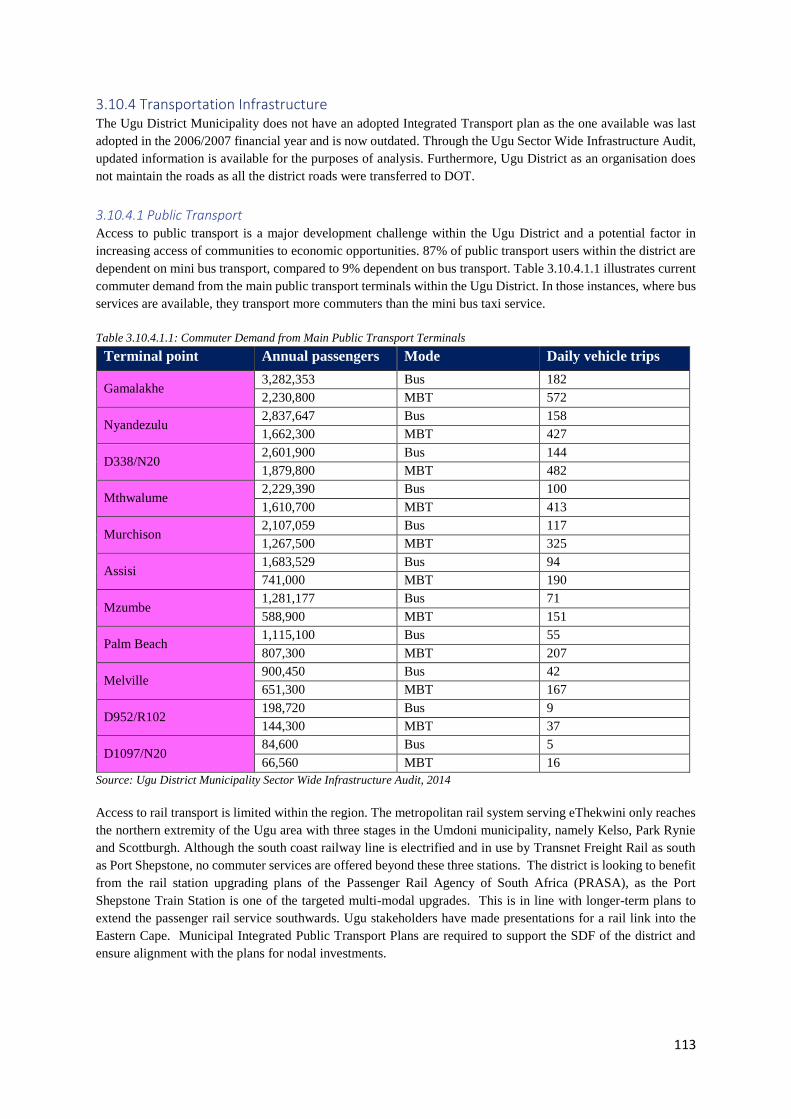
113
3.10.4 Transportation Infrastructure The Ugu District Municipality does not have an adopted Integrated Transport plan as the one available was last
adopted in the 2006/2007 financial year and is now outdated. Through the Ugu Sector Wide Infrastructure Audit,
updated information is available for the purposes of analysis. Furthermore, Ugu District as an organisation does
not maintain the roads as all the district roads were transferred to DOT.
3.10.4.1 Public Transport Access to public transport is a major development challenge within the Ugu District and a potential factor in
increasing access of communities to economic opportunities. 87% of public transport users within the district are
dependent on mini bus transport, compared to 9% dependent on bus transport. Table 3.10.4.1.1 illustrates current
commuter demand from the main public transport terminals within the Ugu District. In those instances, where bus
services are available, they transport more commuters than the mini bus taxi service.
Table 3.10.4.1.1: Commuter Demand from Main Public Transport Terminals
Terminal point Annual passengers Mode Daily vehicle trips
Gamalakhe 3,282,353 Bus 182
2,230,800 MBT 572
Nyandezulu 2,837,647 Bus 158
1,662,300 MBT 427
D338/N20 2,601,900 Bus 144
1,879,800 MBT 482
Mthwalume 2,229,390 Bus 100
1,610,700 MBT 413
Murchison 2,107,059 Bus 117
1,267,500 MBT 325
Assisi 1,683,529 Bus 94
741,000 MBT 190
Mzumbe 1,281,177 Bus 71
588,900 MBT 151
Palm Beach 1,115,100 Bus 55
807,300 MBT 207
Melville 900,450 Bus 42
651,300 MBT 167
D952/R102 198,720 Bus 9
144,300 MBT 37
D1097/N20 84,600 Bus 5
66,560 MBT 16
Source: Ugu District Municipality Sector Wide Infrastructure Audit, 2014
Access to rail transport is limited within the region. The metropolitan rail system serving eThekwini only reaches
the northern extremity of the Ugu area with three stages in the Umdoni municipality, namely Kelso, Park Rynie
and Scottburgh. Although the south coast railway line is electrified and in use by Transnet Freight Rail as south
as Port Shepstone, no commuter services are offered beyond these three stations. The district is looking to benefit
from the rail station upgrading plans of the Passenger Rail Agency of South Africa (PRASA), as the Port
Shepstone Train Station is one of the targeted multi-modal upgrades. This is in line with longer-term plans to
extend the passenger rail service southwards. Ugu stakeholders have made presentations for a rail link into the
Eastern Cape. Municipal Integrated Public Transport Plans are required to support the SDF of the district and
ensure alignment with the plans for nodal investments.
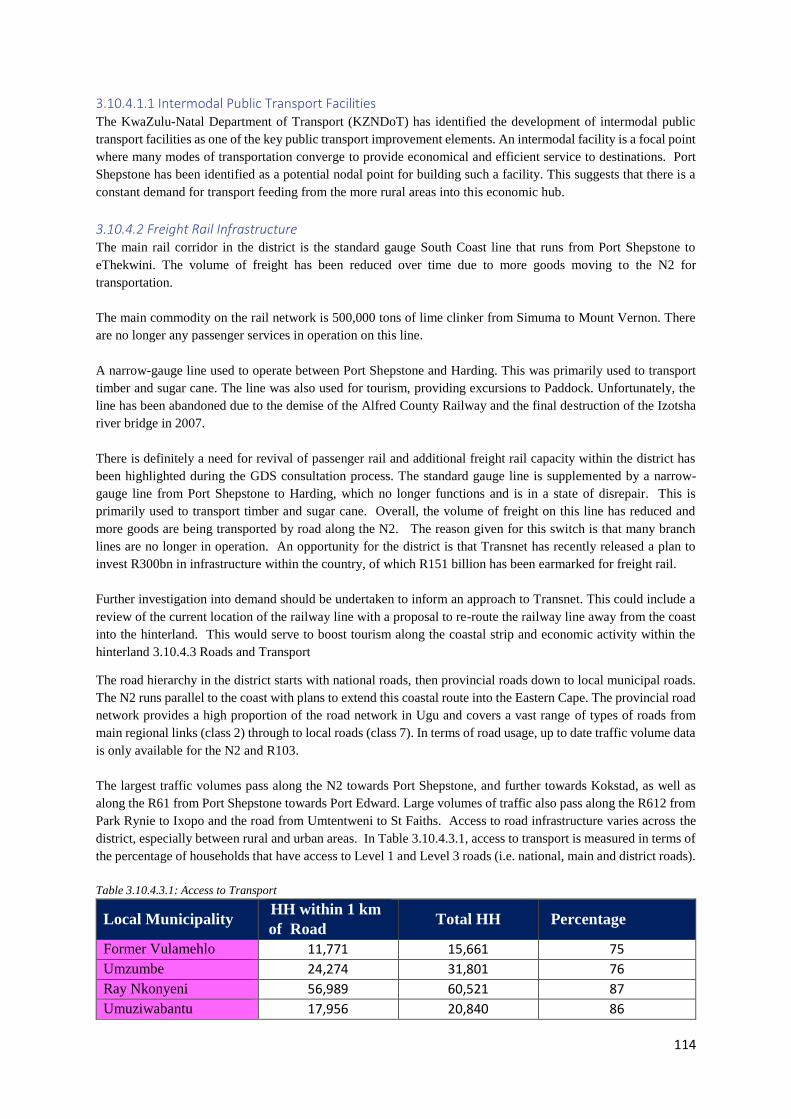
114
3.10.4.1.1 Intermodal Public Transport Facilities The KwaZulu-Natal Department of Transport (KZNDoT) has identified the development of intermodal public
transport facilities as one of the key public transport improvement elements. An intermodal facility is a focal point
where many modes of transportation converge to provide economical and efficient service to destinations. Port
Shepstone has been identified as a potential nodal point for building such a facility. This suggests that there is a
constant demand for transport feeding from the more rural areas into this economic hub.
3.10.4.2 Freight Rail Infrastructure The main rail corridor in the district is the standard gauge South Coast line that runs from Port Shepstone to
eThekwini. The volume of freight has been reduced over time due to more goods moving to the N2 for
transportation.
The main commodity on the rail network is 500,000 tons of lime clinker from Simuma to Mount Vernon. There
are no longer any passenger services in operation on this line.
A narrow-gauge line used to operate between Port Shepstone and Harding. This was primarily used to transport
timber and sugar cane. The line was also used for tourism, providing excursions to Paddock. Unfortunately, the
line has been abandoned due to the demise of the Alfred County Railway and the final destruction of the Izotsha
river bridge in 2007.
There is definitely a need for revival of passenger rail and additional freight rail capacity within the district has
been highlighted during the GDS consultation process. The standard gauge line is supplemented by a narrow-
gauge line from Port Shepstone to Harding, which no longer functions and is in a state of disrepair. This is
primarily used to transport timber and sugar cane. Overall, the volume of freight on this line has reduced and
more goods are being transported by road along the N2. The reason given for this switch is that many branch
lines are no longer in operation. An opportunity for the district is that Transnet has recently released a plan to
invest R300bn in infrastructure within the country, of which R151 billion has been earmarked for freight rail.
Further investigation into demand should be undertaken to inform an approach to Transnet. This could include a
review of the current location of the railway line with a proposal to re-route the railway line away from the coast
into the hinterland. This would serve to boost tourism along the coastal strip and economic activity within the
hinterland 3.10.4.3 Roads and Transport
The road hierarchy in the district starts with national roads, then provincial roads down to local municipal roads.
The N2 runs parallel to the coast with plans to extend this coastal route into the Eastern Cape. The provincial road
network provides a high proportion of the road network in Ugu and covers a vast range of types of roads from
main regional links (class 2) through to local roads (class 7). In terms of road usage, up to date traffic volume data
is only available for the N2 and R103.
The largest traffic volumes pass along the N2 towards Port Shepstone, and further towards Kokstad, as well as
along the R61 from Port Shepstone towards Port Edward. Large volumes of traffic also pass along the R612 from
Park Rynie to Ixopo and the road from Umtentweni to St Faiths. Access to road infrastructure varies across the
district, especially between rural and urban areas. In Table 3.10.4.3.1, access to transport is measured in terms of
the percentage of households that have access to Level 1 and Level 3 roads (i.e. national, main and district roads).
Table 3.10.4.3.1: Access to Transport
Local Municipality HH within 1 km
of Road Total HH Percentage
Former Vulamehlo 11,771 15,661 75
Umzumbe 24,274 31,801 76
Ray Nkonyeni 56,989 60,521 87
Umuziwabantu 17,956 20,840 86
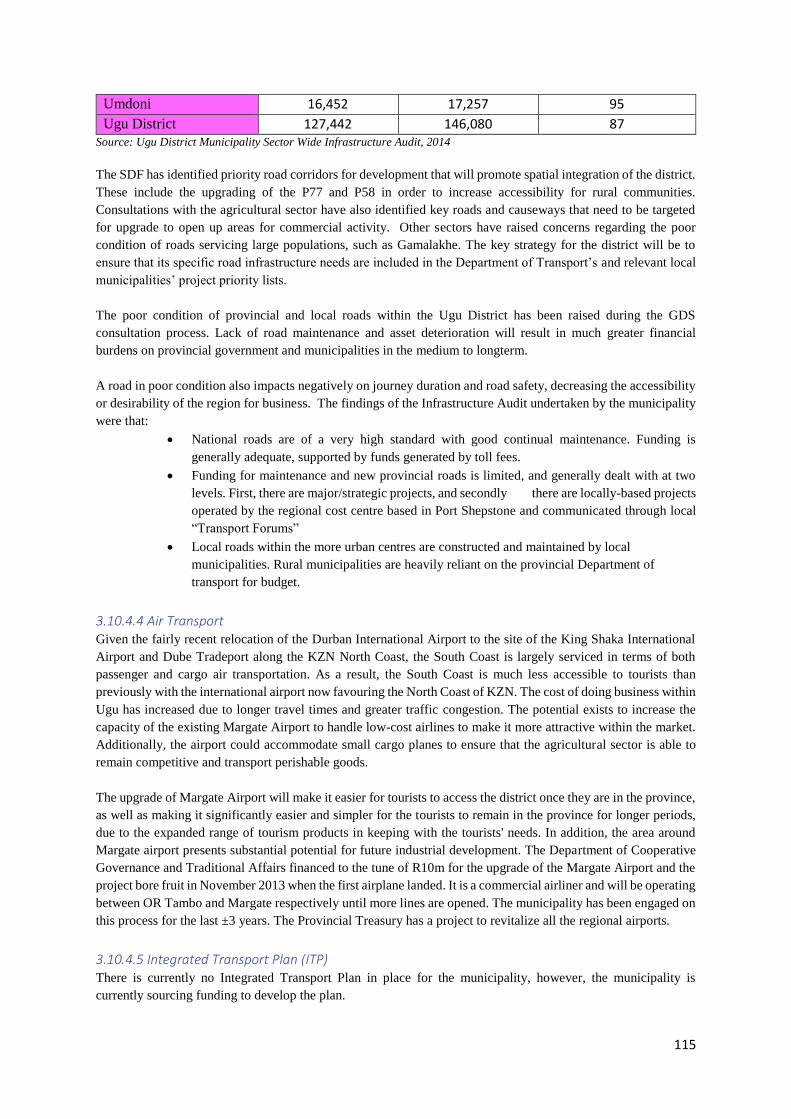
115
Umdoni 16,452 17,257 95
Ugu District 127,442 146,080 87 Source: Ugu District Municipality Sector Wide Infrastructure Audit, 2014
The SDF has identified priority road corridors for development that will promote spatial integration of the district.
These include the upgrading of the P77 and P58 in order to increase accessibility for rural communities.
Consultations with the agricultural sector have also identified key roads and causeways that need to be targeted
for upgrade to open up areas for commercial activity. Other sectors have raised concerns regarding the poor
condition of roads servicing large populations, such as Gamalakhe. The key strategy for the district will be to
ensure that its specific road infrastructure needs are included in the Department of Transport’s and relevant local
municipalities’ project priority lists.
The poor condition of provincial and local roads within the Ugu District has been raised during the GDS
consultation process. Lack of road maintenance and asset deterioration will result in much greater financial
burdens on provincial government and municipalities in the medium to longterm.
A road in poor condition also impacts negatively on journey duration and road safety, decreasing the accessibility
or desirability of the region for business. The findings of the Infrastructure Audit undertaken by the municipality
were that:
• National roads are of a very high standard with good continual maintenance. Funding is
generally adequate, supported by funds generated by toll fees.
• Funding for maintenance and new provincial roads is limited, and generally dealt with at two
levels. First, there are major/strategic projects, and secondly there are locally-based projects
operated by the regional cost centre based in Port Shepstone and communicated through local
“Transport Forums”
• Local roads within the more urban centres are constructed and maintained by local
municipalities. Rural municipalities are heavily reliant on the provincial Department of
transport for budget.
3.10.4.4 Air Transport Given the fairly recent relocation of the Durban International Airport to the site of the King Shaka International
Airport and Dube Tradeport along the KZN North Coast, the South Coast is largely serviced in terms of both
passenger and cargo air transportation. As a result, the South Coast is much less accessible to tourists than
previously with the international airport now favouring the North Coast of KZN. The cost of doing business within
Ugu has increased due to longer travel times and greater traffic congestion. The potential exists to increase the
capacity of the existing Margate Airport to handle low-cost airlines to make it more attractive within the market.
Additionally, the airport could accommodate small cargo planes to ensure that the agricultural sector is able to
remain competitive and transport perishable goods.
The upgrade of Margate Airport will make it easier for tourists to access the district once they are in the province,
as well as making it significantly easier and simpler for the tourists to remain in the province for longer periods,
due to the expanded range of tourism products in keeping with the tourists' needs. In addition, the area around
Margate airport presents substantial potential for future industrial development. The Department of Cooperative
Governance and Traditional Affairs financed to the tune of R10m for the upgrade of the Margate Airport and the
project bore fruit in November 2013 when the first airplane landed. It is a commercial airliner and will be operating
between OR Tambo and Margate respectively until more lines are opened. The municipality has been engaged on
this process for the last ±3 years. The Provincial Treasury has a project to revitalize all the regional airports.
3.10.4.5 Integrated Transport Plan (ITP) There is currently no Integrated Transport Plan in place for the municipality, however, the municipality is
currently sourcing funding to develop the plan.

116
3.10.4.6 Ugu DGDS on transportation Infrastructure The DGDS identifies the recent relocation of the Durban International Airport to the site of the King Shaka
International Airport and Dube Tradeport along the KZN North Coast, as leaving the South Coast largely un-
serviced in terms of both passenger and cargo air transportation, thus the South Coast left much less accessible
to tourists than previously and the cost of doing business within Ugu increasing due to longer travel times and
greater traffic congestion. It therefore advocates for an increased need to develop Margate Airport to address
these challenges.
It further identifies the potential of the coastline to drive development through harbours, sea transport and other
maritime sector investments, which is largely unexplored by both the public and private sectors. Included within
this sub-sector are small-craft harbours, which have the potential to enhance tourism, and create a waterfront
node within the Ugu District.
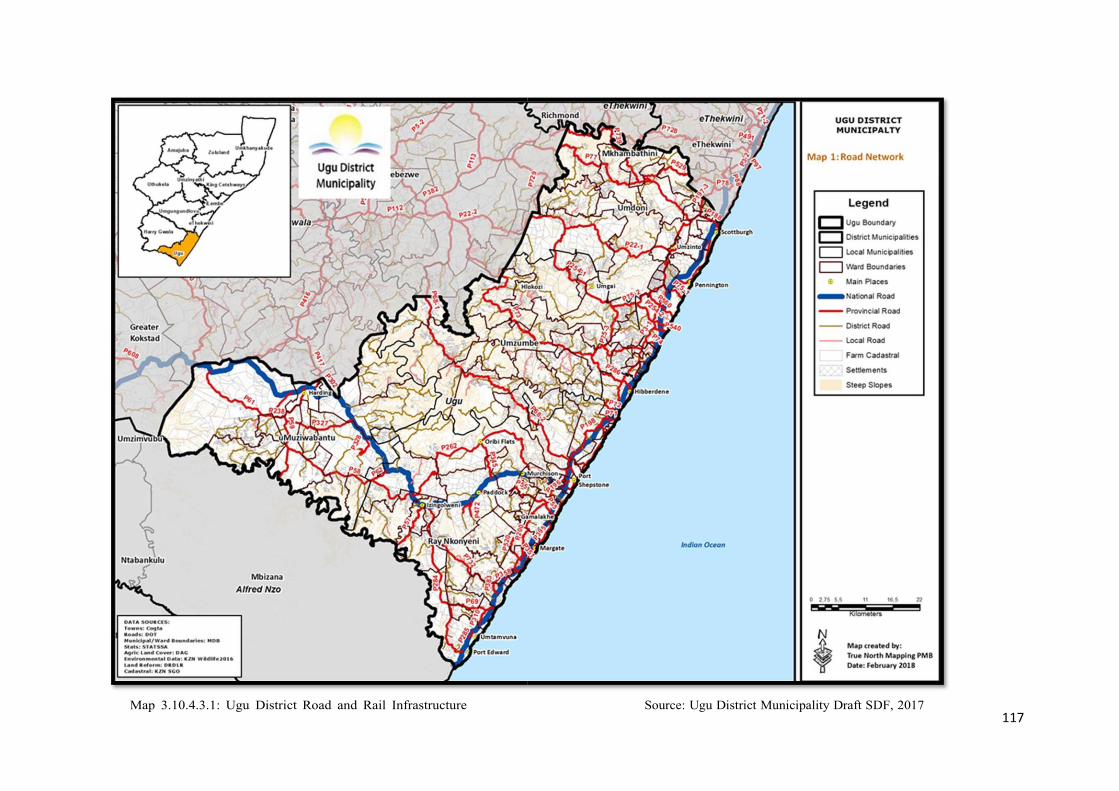
117
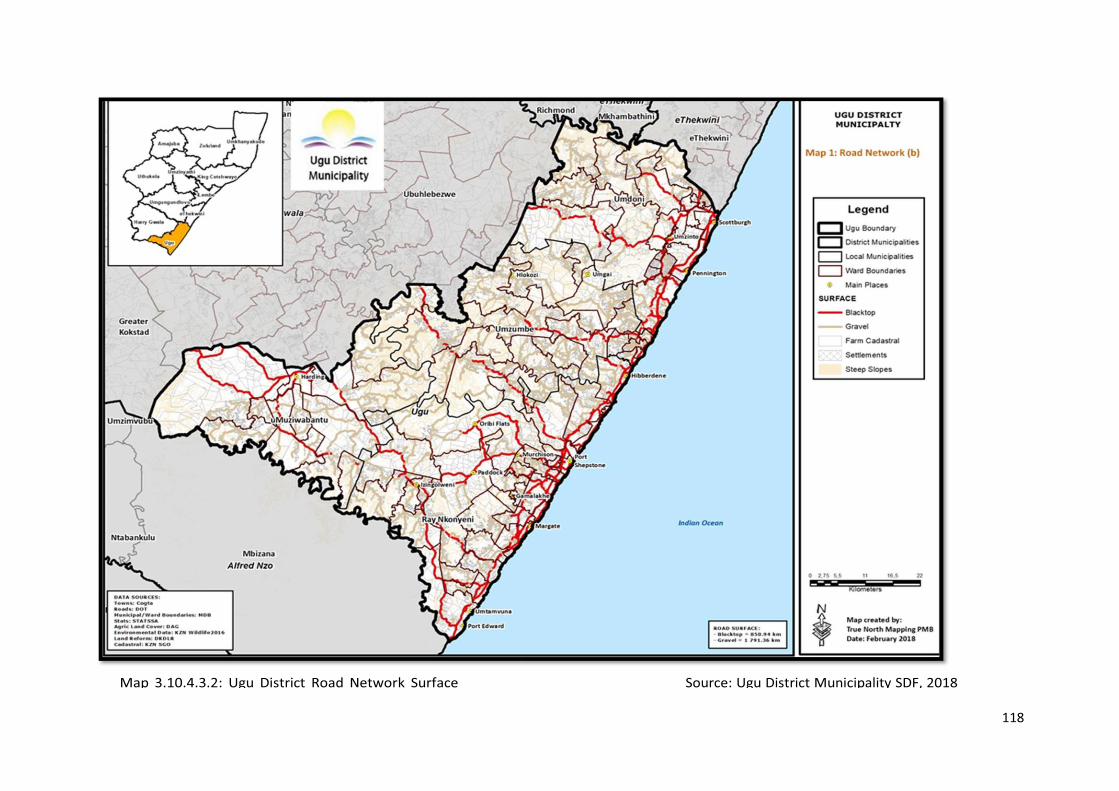
118
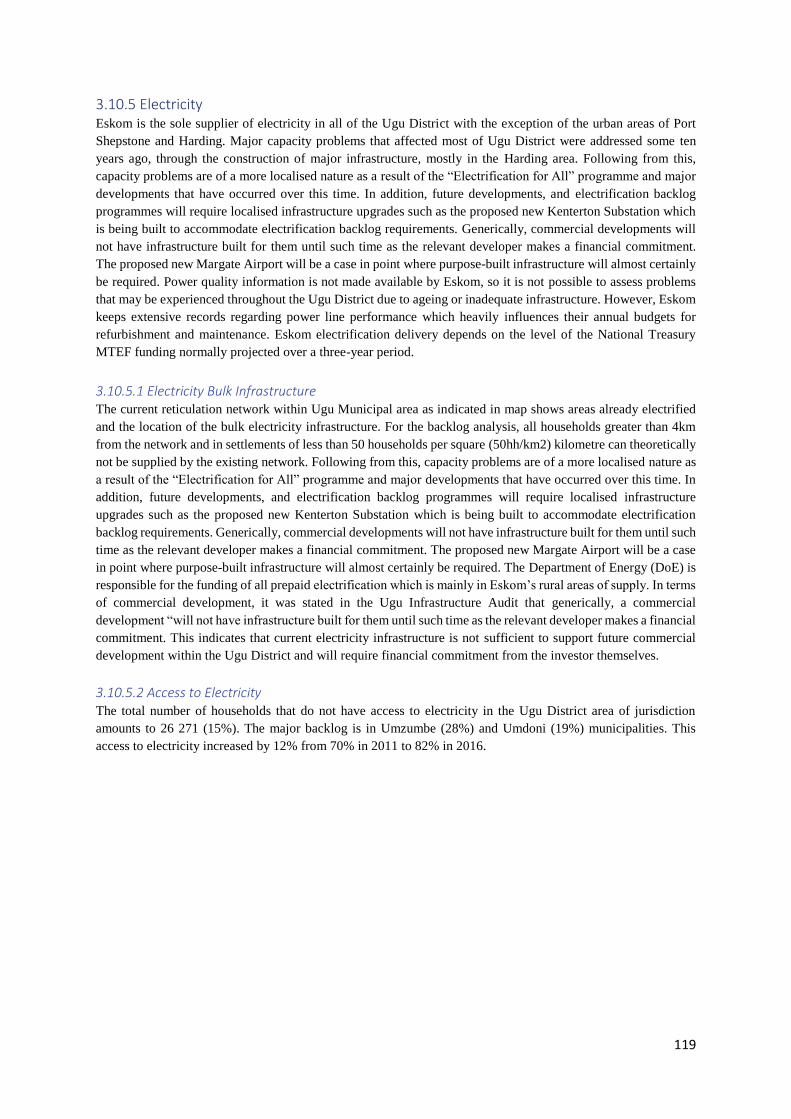
119
3.10.5 Electricity Eskom is the sole supplier of electricity in all of the Ugu District with the exception of the urban areas of Port
Shepstone and Harding. Major capacity problems that affected most of Ugu District were addressed some ten
years ago, through the construction of major infrastructure, mostly in the Harding area. Following from this,
capacity problems are of a more localised nature as a result of the “Electrification for All” programme and major
developments that have occurred over this time. In addition, future developments, and electrification backlog
programmes will require localised infrastructure upgrades such as the proposed new Kenterton Substation which
is being built to accommodate electrification backlog requirements. Generically, commercial developments will
not have infrastructure built for them until such time as the relevant developer makes a financial commitment.
The proposed new Margate Airport will be a case in point where purpose-built infrastructure will almost certainly
be required. Power quality information is not made available by Eskom, so it is not possible to assess problems
that may be experienced throughout the Ugu District due to ageing or inadequate infrastructure. However, Eskom
keeps extensive records regarding power line performance which heavily influences their annual budgets for
refurbishment and maintenance. Eskom electrification delivery depends on the level of the National Treasury
MTEF funding normally projected over a three-year period.
3.10.5.1 Electricity Bulk Infrastructure The current reticulation network within Ugu Municipal area as indicated in map shows areas already electrified
and the location of the bulk electricity infrastructure. For the backlog analysis, all households greater than 4km
from the network and in settlements of less than 50 households per square (50hh/km2) kilometre can theoretically
not be supplied by the existing network. Following from this, capacity problems are of a more localised nature as
a result of the “Electrification for All” programme and major developments that have occurred over this time. In
addition, future developments, and electrification backlog programmes will require localised infrastructure
upgrades such as the proposed new Kenterton Substation which is being built to accommodate electrification
backlog requirements. Generically, commercial developments will not have infrastructure built for them until such
time as the relevant developer makes a financial commitment. The proposed new Margate Airport will be a case
in point where purpose-built infrastructure will almost certainly be required. The Department of Energy (DoE) is
responsible for the funding of all prepaid electrification which is mainly in Eskom’s rural areas of supply. In terms
of commercial development, it was stated in the Ugu Infrastructure Audit that generically, a commercial
development “will not have infrastructure built for them until such time as the relevant developer makes a financial
commitment. This indicates that current electricity infrastructure is not sufficient to support future commercial
development within the Ugu District and will require financial commitment from the investor themselves.
3.10.5.2 Access to Electricity The total number of households that do not have access to electricity in the Ugu District area of jurisdiction
amounts to 26 271 (15%). The major backlog is in Umzumbe (28%) and Umdoni (19%) municipalities. This
access to electricity increased by 12% from 70% in 2011 to 82% in 2016.
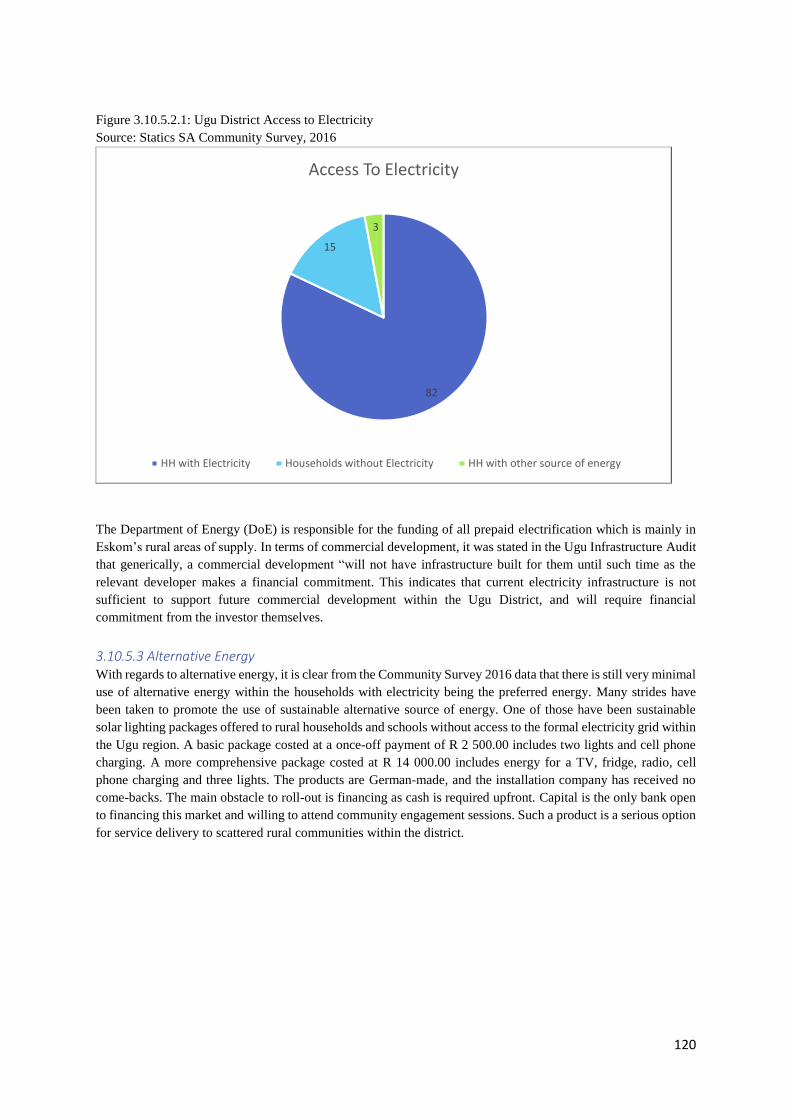
120
Figure 3.10.5.2.1: Ugu District Access to Electricity
Source: Statics SA Community Survey, 2016
The Department of Energy (DoE) is responsible for the funding of all prepaid electrification which is mainly in
Eskom’s rural areas of supply. In terms of commercial development, it was stated in the Ugu Infrastructure Audit
that generically, a commercial development “will not have infrastructure built for them until such time as the
relevant developer makes a financial commitment. This indicates that current electricity infrastructure is not
sufficient to support future commercial development within the Ugu District, and will require financial
commitment from the investor themselves.
3.10.5.3 Alternative Energy With regards to alternative energy, it is clear from the Community Survey 2016 data that there is still very minimal
use of alternative energy within the households with electricity being the preferred energy. Many strides have
been taken to promote the use of sustainable alternative source of energy. One of those have been sustainable
solar lighting packages offered to rural households and schools without access to the formal electricity grid within
the Ugu region. A basic package costed at a once-off payment of R 2 500.00 includes two lights and cell phone
charging. A more comprehensive package costed at R 14 000.00 includes energy for a TV, fridge, radio, cell
phone charging and three lights. The products are German-made, and the installation company has received no
come-backs. The main obstacle to roll-out is financing as cash is required upfront. Capital is the only bank open
to financing this market and willing to attend community engagement sessions. Such a product is a serious option
for service delivery to scattered rural communities within the district.
82
15
3
Access To Electricity
HH with Electricity Households without Electricity HH with other source of energy

121
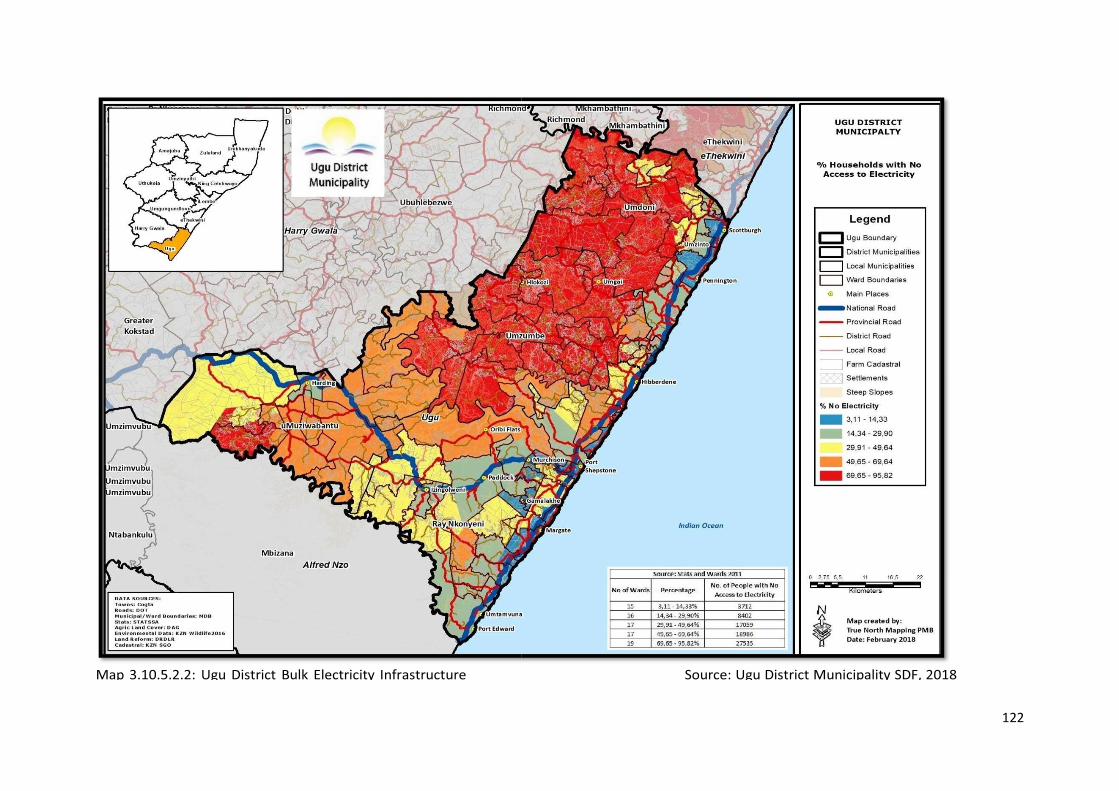
122
123
3.10.6 Telecommunications Telecommunications data is not easily accessible for the district especially regarding the infrastructure on the
ground. Whilst no detailed indication of fixed line or broadband services was available, it has been noted that
broadband services are limited and only available in major centres. In response to this need, the Ugu DM has
initiated a broadband project for the region.
3.10.7 Access to Community Facilities Major facilities exist and are evenly spread throughout the District and the entire District is well served for the
most part with a range of facilities. Some facilities serve immediate and “local” level populations; while other
facilities require large thresholds of support, and consequently serve large areas. Educational facilities have to
spread in relation to settlement patterns as they are “local” level facilities and health facilities require large
thresholds and consequently will tend to be located at appropriate interceptor locations, mainly at appropriate
“Nodes”.
In terms of health care facilities, there are about 75 structures which range from a Mobile Clinic to a regional
hospital. The Ugu District area of jurisdiction with regards to Primary Health Care (PHC) facilities has two
community health centres, 15 mobile clinics and 53 clinics with the greatest number of these facilities being
concentrated in Ray Nkonyeni Municipality having four of its facilities functioning as 24-hour clinics located in
Gamalakhe, Izingolweni, Gcilima and Ntabeni.
With regards to physical educational infrastructure, there are 519 registered public and independent ordinary
schools in the Ugu District of which 492 are ordinary public schools, 16 are ordinary independent schools and 3
are special needs schools and 8 are Pre-primary schools.
There are 29 libraries in Ugu District area of jurisdiction which are largely concentrated in the Ray Nkonyeni
Municipality; however, there is at least one library in each local municipality. There are only two museums which
are all located in the Ray Nkonyeni Municipality. There is a reasonable spread of sport fields in the Ugu District
area of jurisdiction with over 50 fields across the district.
The civic centres are only limited to the predominantly urban municipalities and are only three, which are namely,
Port Shepstone, Umzinto and Scottburgh Civic Centres. There is however, a wide distribution of community halls
across the district which are 47 in total. There are 14 police stations spread across in the district.

124
125
3.10.8 Human Settlements The South African Constitution (1996) names access to adequate housing as a basic human right and as a
government department mandated to carry out the roll out of adequate housing, the Department of Human
Settlements has its work cut out of for itself. Through various partnerships and other government departments
supporting the cause. Though in recent years there has been a shift as far as focusing on housing as the product
but rather taking on a more holistic view as far as sustainable human settlements, where citizens benefit from
housing situated in favourable locations, near the necessary amenities such as healthcare facilities, police stations,
recreational facilities etc. these human settlements are also required to come equipped with the necessary
infrastructure including water and sanitation, electricity, a well-maintained and accessible road network etc.
Though the UGU District contains four local municipalities, the pattern of a densely-populated coastline with a
sparsely populated hinterland is the overlaying theme and thus the delivery of sustainable human settlements must
be planned to address these developmental imbalances. To ensure the vision of sustainable human settlements is
fulfilled it is important that all stakeholders’ plans align accordingly including that of the district to provide water
and sanitation services.
3.10.8.1 Housing Need There are two main ways of determining housing demand/need within municipal areas. The first method uses
census statistics. The housing backlog estimates based on census data takes into account both the population
residing in informal settlements, and the creation of housing
opportunities for those in inadequate formal shelter, such as outhouses, shaky mud structures or under conditions
of over-crowding. The number of beneficiaries identified through project identification should be treated as an
interim measure while the municipality prepares a housing list. The data derived from the housing list will
complement this data.
3.10.8.2 Informal settlements The Informal Settlement Eradication Strategy for KwaZulu-Natal (2011) identifies Ray Nkonyeni Municipality
as one of the 15 strategic priority areas for strategies and plans to address informal settlements. It identifies four
informal settlements and suggests that approximately 4 483 households reside in these areas. The areas being:
Bhobhoyi Phase 2 with 1100 households.
Louisiana with 1000 households.
Masinenge with 1542 households.
Mkholombe with 1600 households.
However, the municipality has been very progressive in the eradication of informal settlements. The Municipal
strategy predominantly aims at providing new Greenfields housing developments near the current informal
settlements.
3.10.8.3 Rural Housing Rural housing projects are at different stages from construction to planning (see chapter 5). Implementation and
completion is dependent upon Human Settlement Grant funding from the Provincial Department of Human
Settlements (annually). Rural housing projects are implemented mainly on communal land and are based on
functional land tenure rights.
3.10.8.4 Gap Housing The gap housing market comprises people who typically earn between R3500 and R10 000 per month, which is
too little to enable them to participate in the private property market, yet too much to qualify for state assistance.
It is difficult to estimate precisely how large the demand for the gap-housing product is, as it fluctuates with
interest rate changes and employment levels.
126
3.10.8.5 Greenfield housing In addition to the eradication of informal settlements and rural housing projects, the Municipality is also
implementing a number of greenfield housing projects. Many these are urban and will contribute significantly
towards addressing the housing backlog as it affects both the low income and middle-income communities.
3.10.9 Basic Service Delivery SWOT Analysis The Service Delivery and Infrastructure Development SWOT analysis are summarised below.
Strengths Weaknesses
The coastal strip has good access to basic services
Infrastructure Grant Expenditure availability to
speed up
backlog eradication
Availability of fresh water resources (plans to
undertake/
implement regional schemes)
Good road infrastructure already in place
Even spread of community facilities (reasonable
access across
the district)
Inadequate maintenance of infrastructure
(reservoirs)
Aged water and sanitation infrastructure
Outdated Water and Sanitation Masterplan
Lack of capacity of key treatment plants
Historic haphazard infrastructure development in
rural areas
Basic services backlog concentration in the rural
areas
Below minimum standards No, Blue, and Green
Drop scores
Poorly organised waste minimisation and lack of
integrated recycling system
Limited access to public transport
Outdated Integrated Transport Plan
Limited telecommunications data for analysis
Informal settlements
Illegal Connections
Opportunities Threats
Alternative water sources
Alternative energy
Natural adversities such as droughts and flooding
Urbanisation and rural population outmigration
Immigration – the district is the Eastern Cape
gateway to KZN, the arrival of
people seeking better opportunities often further
burdens the already
stretched infrastructure.
3.11 Local Economic Development This section provides a brief overview of the economic indicators of the Ugu District Municipality area of
jurisdiction. The data that has been used was sourced
from the Statistics SA Census 2011 and 2016 Community Survey results, DGDS, Ugu LED Strategy, Department
of Education, and Department of Health.
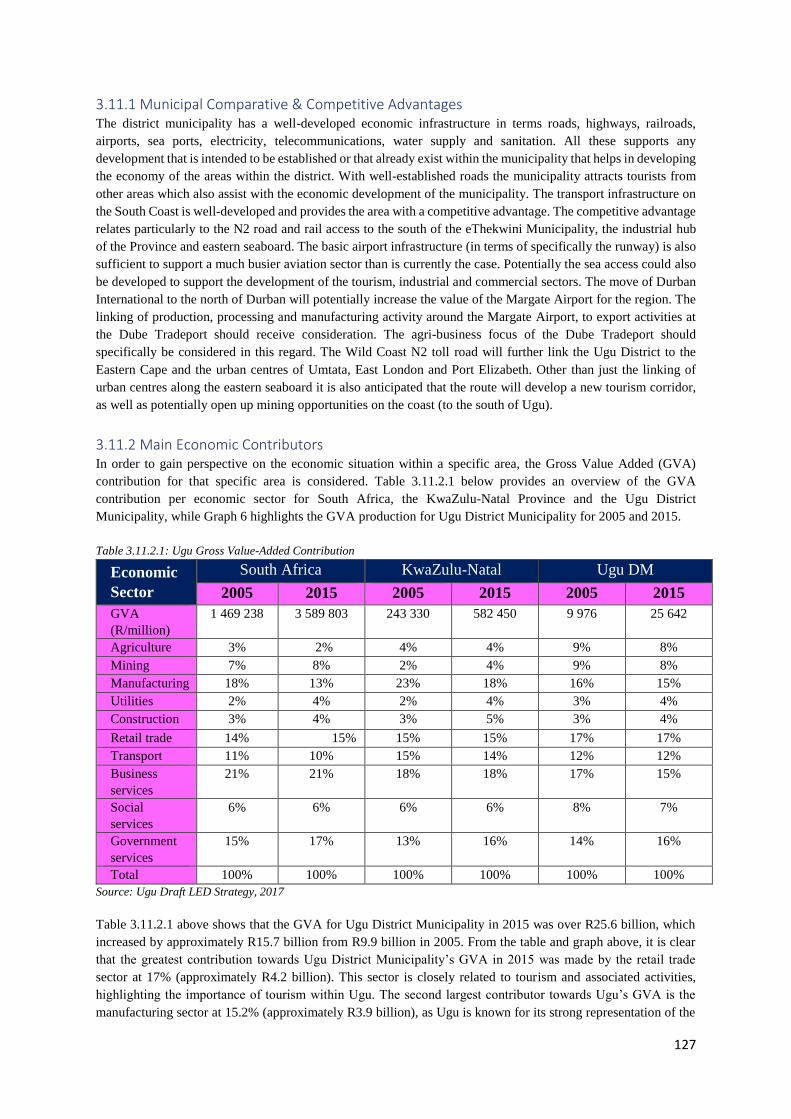
127
3.11.1 Municipal Comparative & Competitive Advantages The district municipality has a well-developed economic infrastructure in terms roads, highways, railroads,
airports, sea ports, electricity, telecommunications, water supply and sanitation. All these supports any
development that is intended to be established or that already exist within the municipality that helps in developing
the economy of the areas within the district. With well-established roads the municipality attracts tourists from
other areas which also assist with the economic development of the municipality. The transport infrastructure on
the South Coast is well-developed and provides the area with a competitive advantage. The competitive advantage
relates particularly to the N2 road and rail access to the south of the eThekwini Municipality, the industrial hub
of the Province and eastern seaboard. The basic airport infrastructure (in terms of specifically the runway) is also
sufficient to support a much busier aviation sector than is currently the case. Potentially the sea access could also
be developed to support the development of the tourism, industrial and commercial sectors. The move of Durban
International to the north of Durban will potentially increase the value of the Margate Airport for the region. The
linking of production, processing and manufacturing activity around the Margate Airport, to export activities at
the Dube Tradeport should receive consideration. The agri-business focus of the Dube Tradeport should
specifically be considered in this regard. The Wild Coast N2 toll road will further link the Ugu District to the
Eastern Cape and the urban centres of Umtata, East London and Port Elizabeth. Other than just the linking of
urban centres along the eastern seaboard it is also anticipated that the route will develop a new tourism corridor,
as well as potentially open up mining opportunities on the coast (to the south of Ugu).
3.11.2 Main Economic Contributors In order to gain perspective on the economic situation within a specific area, the Gross Value Added (GVA)
contribution for that specific area is considered. Table 3.11.2.1 below provides an overview of the GVA
contribution per economic sector for South Africa, the KwaZulu-Natal Province and the Ugu District
Municipality, while Graph 6 highlights the GVA production for Ugu District Municipality for 2005 and 2015.
Table 3.11.2.1: Ugu Gross Value-Added Contribution
Economic
Sector
South Africa KwaZulu-Natal Ugu DM
2005 2015 2005 2015 2005 2015
GVA
(R/million)
1 469 238 3 589 803 243 330 582 450 9 976 25 642
Agriculture 3% 2% 4% 4% 9% 8%
Mining 7% 8% 2% 4% 9% 8%
Manufacturing 18% 13% 23% 18% 16% 15%
Utilities 2% 4% 2% 4% 3% 4%
Construction 3% 4% 3% 5% 3% 4%
Retail trade 14% 15% 15% 15% 17% 17%
Transport 11% 10% 15% 14% 12% 12%
Business
services
21% 21% 18% 18% 17% 15%
Social
services
6% 6% 6% 6% 8% 7%
Government
services
15% 17% 13% 16% 14% 16%
Total 100% 100% 100% 100% 100% 100%
Source: Ugu Draft LED Strategy, 2017
Table 3.11.2.1 above shows that the GVA for Ugu District Municipality in 2015 was over R25.6 billion, which
increased by approximately R15.7 billion from R9.9 billion in 2005. From the table and graph above, it is clear
that the greatest contribution towards Ugu District Municipality’s GVA in 2015 was made by the retail trade
sector at 17% (approximately R4.2 billion). This sector is closely related to tourism and associated activities,
highlighting the importance of tourism within Ugu. The second largest contributor towards Ugu’s GVA is the
manufacturing sector at 15.2% (approximately R3.9 billion), as Ugu is known for its strong representation of the

128
manufacturing sector, amongst others. This is also a good reflection of the Ugu GDS’ vision for the District, which
aims to become a leading tourism destination and manufacturing hub. The business services sector contributed
approximately 15% towards the District’s GVA (approximately R3.8 billion), holding the third largest share. The
business sector in Ugu is well established with existing networks and road linkages to greater business regions
such as Durban. The three poorest performing sectors within Ugu is the construction sector, holding 5% of the
GVA share (approximately R1.3 billion), the utilities sector at 4% (approximately R1.1 billion) and the mining
sector which holds a mere 1% of the GVA share, contributing only R181 million towards the GVA production
for Ugu District Municipality.
Table 3.11.2.2 below shows the local GVA sectoral contribution for each of the local municipalities contained
within Ugu District Municipality. The sectors performing best overall in the District (i.e. retail trade,
manufacturing and business services) are also performing well within each of the local municipalities – however,
the government services sector holds the greatest GVA share in UMuziwabantu, and second largest in Umdoni
and Umzumbe Local Municipalities. A high dependency on the government services sector is a negative indication
as income from the government does not represent new income generation.
Table 3.11.2.2: Sectoral share of GVA at current basic prices per LM within Ugu DM, 2015
Economic
Sector
Umdoni Umzumbe Umuziwabantu Ray Nkonyeni
Agriculture 10% 6% 12% 7%
Mining 0% 0% 1% 1%
Manufacturing 15% 12% 13% 16%
Utilities 4% 4% 3% 5%
Construction 4.7% 6% 5% 5%
Retail trade 16% 20% 17% 16%
Transport 13% 13% 14% 11%
Business services 13% 13% 9% 17%
Social services 7% 8% 7% 7%
Government
services
16% 17% 18% 15%
Total 100% 100% 100% !00%
Source: Ugu Draft LED Strategy, 2017
From Table 3.11.2.3 below, it is very clear that Ray Nkonyeni’s economy contribute the most towards the District
GVA, both in total and for each sector within
the District economy. This can be attributed to a number of factors, which include the fact that Ray Nkonyeni
covers the greatest area out of all four local
municipalities (1 487 km²) and holds the biggest population. Ray Nkonyeni furthermore contains a number of key
towns, manufacturing hubs and tourism
destinations, of which Margate and surrounds is the biggest and most popular. The established transportation
networks, especially the N2 that run through the
hinterland and the R61, R620 and R102 which runs along the coast ensures greater connectivity across Ray
Nkonyeni, allowing the movement of goods and people to occur more efficiently than in the other local
municipalities.
Table 3.11.2.3: Contribution of LMs to sectoral GVA of the Ugu DM, 2015
Economic
Sector
Umdoni Umzumbe Umuziwabantu Ray Nkonyeni
Agriculture 26% 7% 13% 54%
Mining 6% 6% 13% 76%
Manufacturing 20% 8% 7% 65%
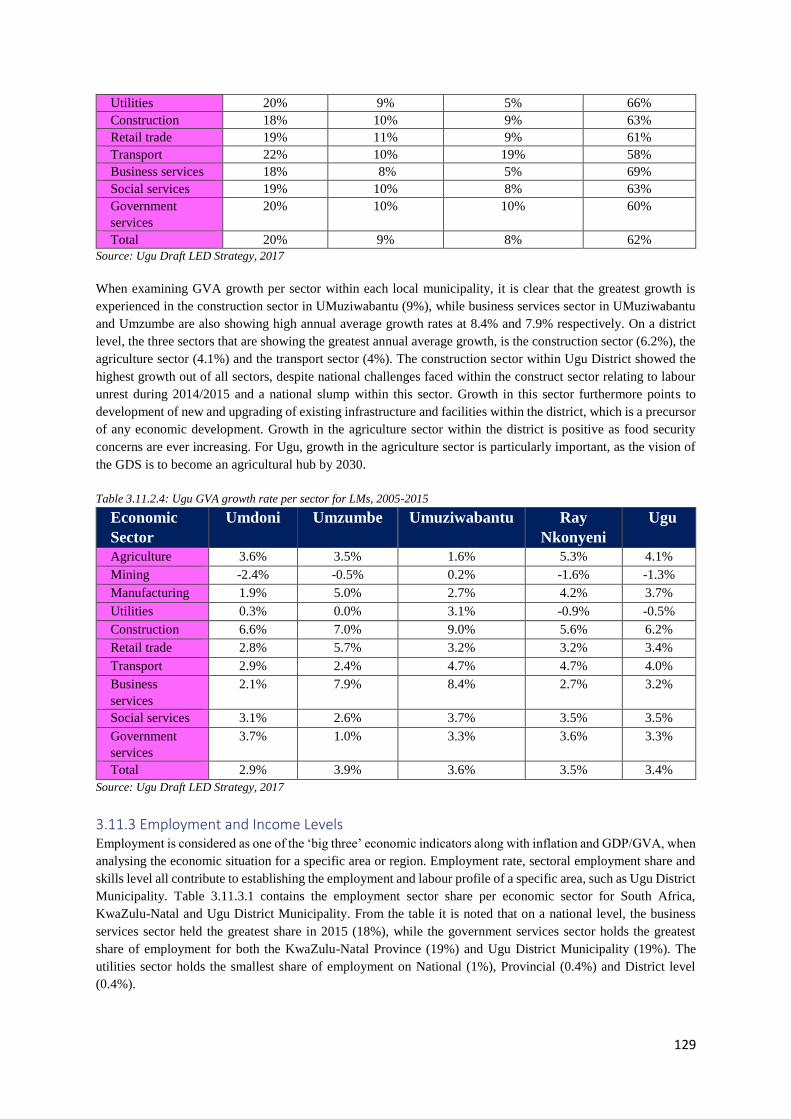
129
Utilities 20% 9% 5% 66%
Construction 18% 10% 9% 63%
Retail trade 19% 11% 9% 61%
Transport 22% 10% 19% 58%
Business services 18% 8% 5% 69%
Social services 19% 10% 8% 63%
Government
services
20% 10% 10% 60%
Total 20% 9% 8% 62%
Source: Ugu Draft LED Strategy, 2017
When examining GVA growth per sector within each local municipality, it is clear that the greatest growth is
experienced in the construction sector in UMuziwabantu (9%), while business services sector in UMuziwabantu
and Umzumbe are also showing high annual average growth rates at 8.4% and 7.9% respectively. On a district
level, the three sectors that are showing the greatest annual average growth, is the construction sector (6.2%), the
agriculture sector (4.1%) and the transport sector (4%). The construction sector within Ugu District showed the
highest growth out of all sectors, despite national challenges faced within the construct sector relating to labour
unrest during 2014/2015 and a national slump within this sector. Growth in this sector furthermore points to
development of new and upgrading of existing infrastructure and facilities within the district, which is a precursor
of any economic development. Growth in the agriculture sector within the district is positive as food security
concerns are ever increasing. For Ugu, growth in the agriculture sector is particularly important, as the vision of
the GDS is to become an agricultural hub by 2030.
Table 3.11.2.4: Ugu GVA growth rate per sector for LMs, 2005-2015
Economic
Sector
Umdoni Umzumbe Umuziwabantu Ray
Nkonyeni
Ugu
Agriculture 3.6% 3.5% 1.6% 5.3% 4.1%
Mining -2.4% -0.5% 0.2% -1.6% -1.3%
Manufacturing 1.9% 5.0% 2.7% 4.2% 3.7%
Utilities 0.3% 0.0% 3.1% -0.9% -0.5%
Construction 6.6% 7.0% 9.0% 5.6% 6.2%
Retail trade 2.8% 5.7% 3.2% 3.2% 3.4%
Transport 2.9% 2.4% 4.7% 4.7% 4.0%
Business
services
2.1% 7.9% 8.4% 2.7% 3.2%
Social services 3.1% 2.6% 3.7% 3.5% 3.5%
Government
services
3.7% 1.0% 3.3% 3.6% 3.3%
Total 2.9% 3.9% 3.6% 3.5% 3.4%
Source: Ugu Draft LED Strategy, 2017
3.11.3 Employment and Income Levels Employment is considered as one of the ‘big three’ economic indicators along with inflation and GDP/GVA, when
analysing the economic situation for a specific area or region. Employment rate, sectoral employment share and
skills level all contribute to establishing the employment and labour profile of a specific area, such as Ugu District
Municipality. Table 3.11.3.1 contains the employment sector share per economic sector for South Africa,
KwaZulu-Natal and Ugu District Municipality. From the table it is noted that on a national level, the business
services sector held the greatest share in 2015 (18%), while the government services sector holds the greatest
share of employment for both the KwaZulu-Natal Province (19%) and Ugu District Municipality (19%). The
utilities sector holds the smallest share of employment on National (1%), Provincial (0.4%) and District level
(0.4%).
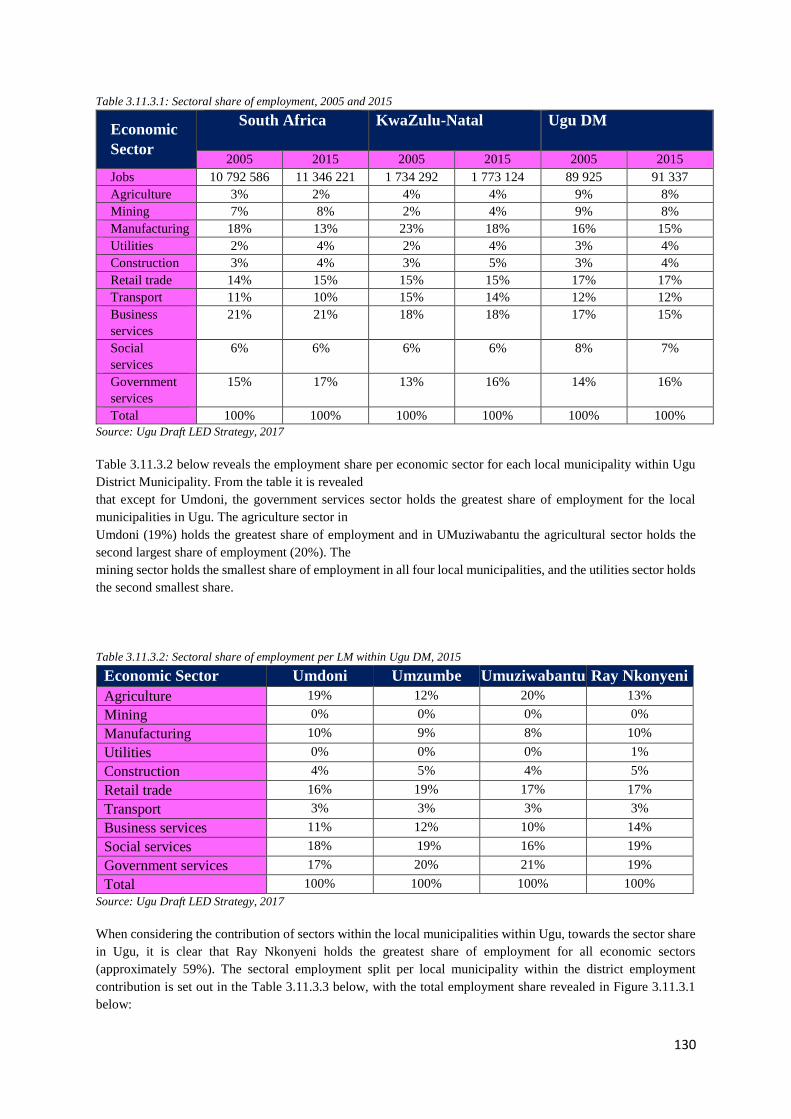
130
Table 3.11.3.1: Sectoral share of employment, 2005 and 2015
Economic
Sector
South Africa
KwaZulu-Natal Ugu DM
2005 2015 2005 2015 2005 2015
Jobs 10 792 586 11 346 221 1 734 292 1 773 124 89 925 91 337
Agriculture 3% 2% 4% 4% 9% 8%
Mining 7% 8% 2% 4% 9% 8%
Manufacturing 18% 13% 23% 18% 16% 15%
Utilities 2% 4% 2% 4% 3% 4%
Construction 3% 4% 3% 5% 3% 4%
Retail trade 14% 15% 15% 15% 17% 17%
Transport 11% 10% 15% 14% 12% 12%
Business
services
21% 21% 18% 18% 17% 15%
Social
services
6% 6% 6% 6% 8% 7%
Government
services
15% 17% 13% 16% 14% 16%
Total 100% 100% 100% 100% 100% 100%
Source: Ugu Draft LED Strategy, 2017
Table 3.11.3.2 below reveals the employment share per economic sector for each local municipality within Ugu
District Municipality. From the table it is revealed
that except for Umdoni, the government services sector holds the greatest share of employment for the local
municipalities in Ugu. The agriculture sector in
Umdoni (19%) holds the greatest share of employment and in UMuziwabantu the agricultural sector holds the
second largest share of employment (20%). The
mining sector holds the smallest share of employment in all four local municipalities, and the utilities sector holds
the second smallest share.
Table 3.11.3.2: Sectoral share of employment per LM within Ugu DM, 2015
Economic Sector Umdoni Umzumbe Umuziwabantu Ray Nkonyeni
Agriculture 19% 12% 20% 13%
Mining 0% 0% 0% 0%
Manufacturing 10% 9% 8% 10%
Utilities 0% 0% 0% 1%
Construction 4% 5% 4% 5%
Retail trade 16% 19% 17% 17%
Transport 3% 3% 3% 3%
Business services 11% 12% 10% 14%
Social services 18% 19% 16% 19%
Government services 17% 20% 21% 19%
Total 100% 100% 100% 100%
Source: Ugu Draft LED Strategy, 2017
When considering the contribution of sectors within the local municipalities within Ugu, towards the sector share
in Ugu, it is clear that Ray Nkonyeni holds the greatest share of employment for all economic sectors
(approximately 59%). The sectoral employment split per local municipality within the district employment
contribution is set out in the Table 3.11.3.3 below, with the total employment share revealed in Figure 3.11.3.1
below:

131
Table 3.11.3.3: Contribution of LMs to sectoral employment, 2015
Economic
Sector
Umdoni Umzumbe Umuziwabantu Ray
Nkonyeni
Ugu
Agriculture 27% 9% 13% 52%
Mining 5% 6% 16% 73% 100%
Manufacturing 21% 10% 8% 61% 100%
Utilities 20% 9% 6% 66% 100%
Construction 19% 11% 9% 6% 100%
Retail trade 20% 12% 10% 59% 100%
Transport 23% 10% 10% 58% 100%
Business
services
18% 10% 7% 65% 100%
Social services 21% 11% 8% 60% 100%
Government
services
19% 11% 11% 58% 100%
Total 21% 10% 10% 59% 100%
Source: Ugu Draft LED Strategy, 2017
Figure 3.11.3.1: Contributions of LMS to Employment
Source: LED Draft Strategy, 2018
Table 3.11.3.4 below provides a summary of growth in employment between 2005 and 2015 and seeks to reveal
the employment trends for Ugu District Municipality for the same period. From the table it is clear that Ugu
District Municipality has seen a very small increase in employment between 2005 and 2015, with a total gain of
only 1 412 jobs at an annual growth rate of 0.2%, and an average of 141 new jobs created per year. It should be
noted that only four sectors within Ugu showed positive employment growth; the government services sector
(3%), business services sector (1.1%), utilities sector (1.1%) and the retail trade sector (0.1%).
Table 3.11.3.4: Ugu Average per annum employment growth, 2005-2015
21
10
10
59
Employment Distribution
Umdoni Umzumbe Umuziwantu Ray Nkonyeni
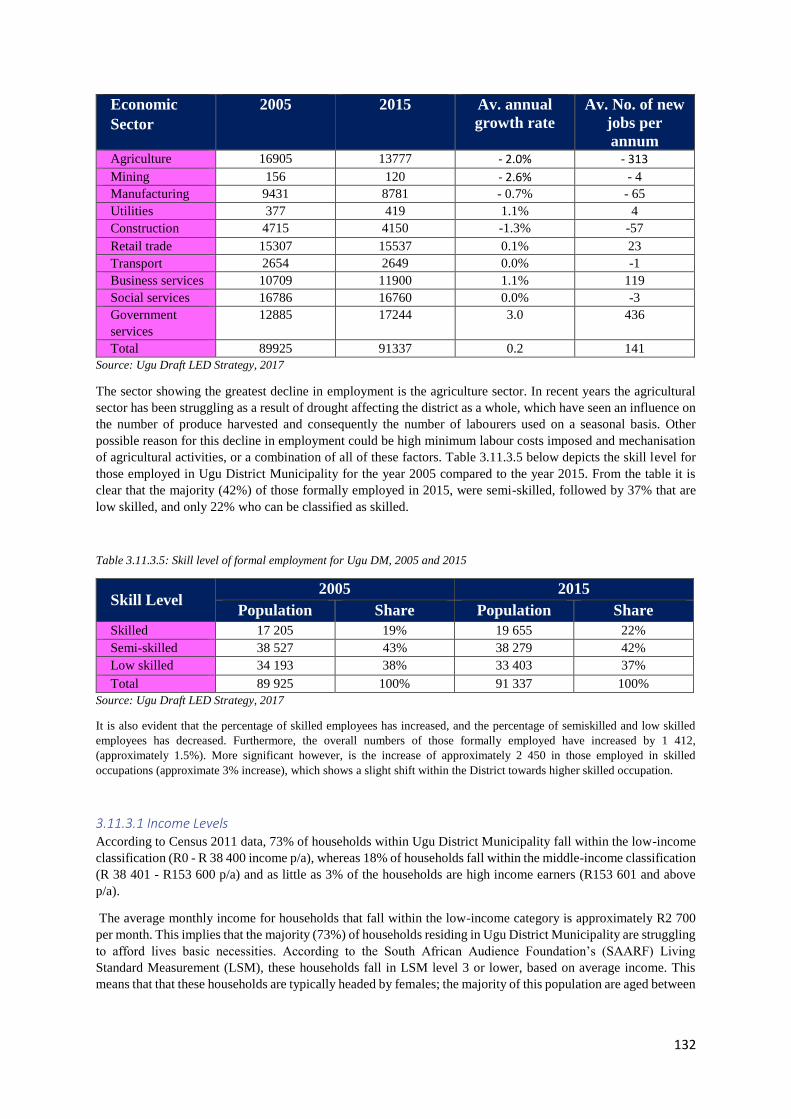
132
Economic
Sector
2005 2015 Av. annual
growth rate
Av. No. of new
jobs per
annum Agriculture 16905 13777 - 2.0% - 313
Mining 156 120 - 2.6% - 4
Manufacturing 9431 8781 - 0.7% - 65
Utilities 377 419 1.1% 4
Construction 4715 4150 -1.3% -57
Retail trade 15307 15537 0.1% 23
Transport 2654 2649 0.0% -1
Business services 10709 11900 1.1% 119
Social services 16786 16760 0.0% -3
Government
services
12885 17244 3.0 436
Total 89925 91337 0.2 141
Source: Ugu Draft LED Strategy, 2017
The sector showing the greatest decline in employment is the agriculture sector. In recent years the agricultural
sector has been struggling as a result of drought affecting the district as a whole, which have seen an influence on
the number of produce harvested and consequently the number of labourers used on a seasonal basis. Other
possible reason for this decline in employment could be high minimum labour costs imposed and mechanisation
of agricultural activities, or a combination of all of these factors. Table 3.11.3.5 below depicts the skill level for
those employed in Ugu District Municipality for the year 2005 compared to the year 2015. From the table it is
clear that the majority (42%) of those formally employed in 2015, were semi-skilled, followed by 37% that are
low skilled, and only 22% who can be classified as skilled.
Table 3.11.3.5: Skill level of formal employment for Ugu DM, 2005 and 2015
Skill Level 2005 2015
Population Share Population Share
Skilled 17 205 19% 19 655 22%
Semi-skilled 38 527 43% 38 279 42%
Low skilled 34 193 38% 33 403 37%
Total 89 925 100% 91 337 100%
Source: Ugu Draft LED Strategy, 2017
It is also evident that the percentage of skilled employees has increased, and the percentage of semiskilled and low skilled
employees has decreased. Furthermore, the overall numbers of those formally employed have increased by 1 412,
(approximately 1.5%). More significant however, is the increase of approximately 2 450 in those employed in skilled
occupations (approximate 3% increase), which shows a slight shift within the District towards higher skilled occupation.
3.11.3.1 Income Levels According to Census 2011 data, 73% of households within Ugu District Municipality fall within the low-income
classification (R0 - R 38 400 income p/a), whereas 18% of households fall within the middle-income classification
(R 38 401 - R153 600 p/a) and as little as 3% of the households are high income earners (R153 601 and above
p/a).
The average monthly income for households that fall within the low-income category is approximately R2 700
per month. This implies that the majority (73%) of households residing in Ugu District Municipality are struggling
to afford lives basic necessities. According to the South African Audience Foundation’s (SAARF) Living
Standard Measurement (LSM), these households fall in LSM level 3 or lower, based on average income. This
means that that these households are typically headed by females; the majority of this population are aged between
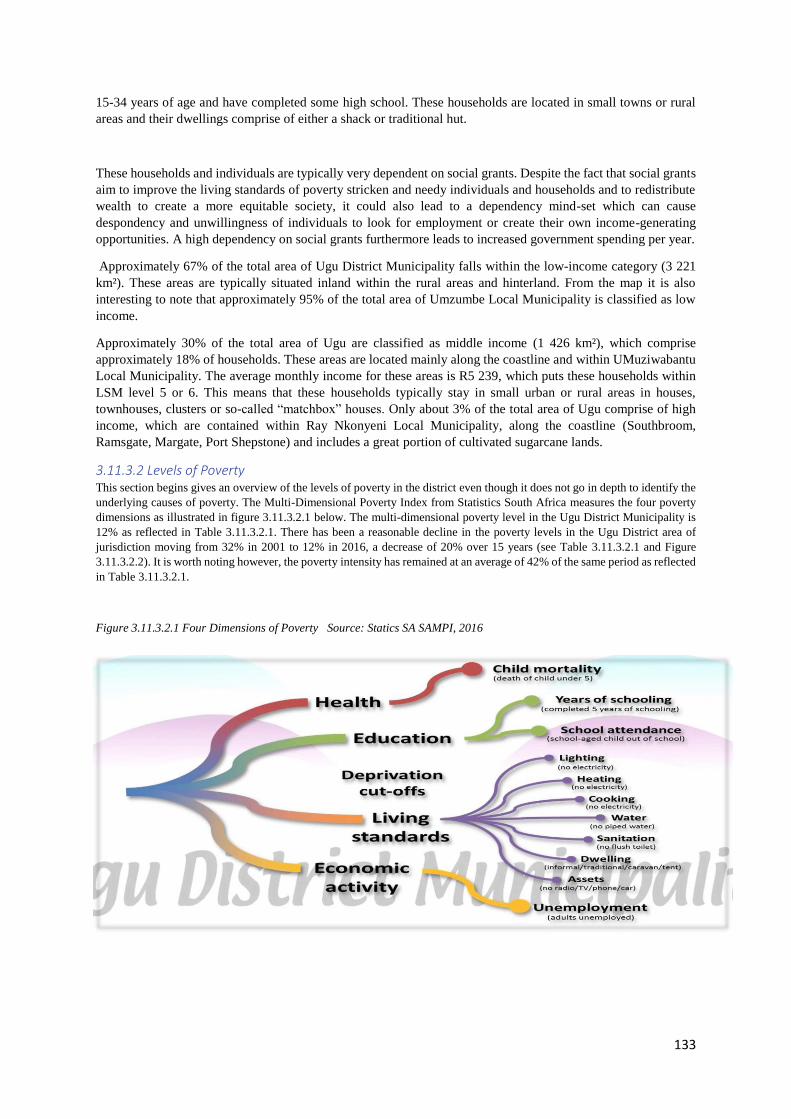
133
15-34 years of age and have completed some high school. These households are located in small towns or rural
areas and their dwellings comprise of either a shack or traditional hut.
These households and individuals are typically very dependent on social grants. Despite the fact that social grants
aim to improve the living standards of poverty stricken and needy individuals and households and to redistribute
wealth to create a more equitable society, it could also lead to a dependency mind-set which can cause
despondency and unwillingness of individuals to look for employment or create their own income-generating
opportunities. A high dependency on social grants furthermore leads to increased government spending per year.
Approximately 67% of the total area of Ugu District Municipality falls within the low-income category (3 221
km²). These areas are typically situated inland within the rural areas and hinterland. From the map it is also
interesting to note that approximately 95% of the total area of Umzumbe Local Municipality is classified as low
income.
Approximately 30% of the total area of Ugu are classified as middle income (1 426 km²), which comprise
approximately 18% of households. These areas are located mainly along the coastline and within UMuziwabantu
Local Municipality. The average monthly income for these areas is R5 239, which puts these households within
LSM level 5 or 6. This means that these households typically stay in small urban or rural areas in houses,
townhouses, clusters or so-called “matchbox” houses. Only about 3% of the total area of Ugu comprise of high
income, which are contained within Ray Nkonyeni Local Municipality, along the coastline (Southbroom,
Ramsgate, Margate, Port Shepstone) and includes a great portion of cultivated sugarcane lands.
3.11.3.2 Levels of Poverty This section begins gives an overview of the levels of poverty in the district even though it does not go in depth to identify the
underlying causes of poverty. The Multi-Dimensional Poverty Index from Statistics South Africa measures the four poverty
dimensions as illustrated in figure 3.11.3.2.1 below. The multi-dimensional poverty level in the Ugu District Municipality is
12% as reflected in Table 3.11.3.2.1. There has been a reasonable decline in the poverty levels in the Ugu District area of
jurisdiction moving from 32% in 2001 to 12% in 2016, a decrease of 20% over 15 years (see Table 3.11.3.2.1 and Figure
3.11.3.2.2). It is worth noting however, the poverty intensity has remained at an average of 42% of the same period as reflected
in Table 3.11.3.2.1.
Figure 3.11.3.2.1 Four Dimensions of Poverty Source: Statics SA SAMPI, 2016
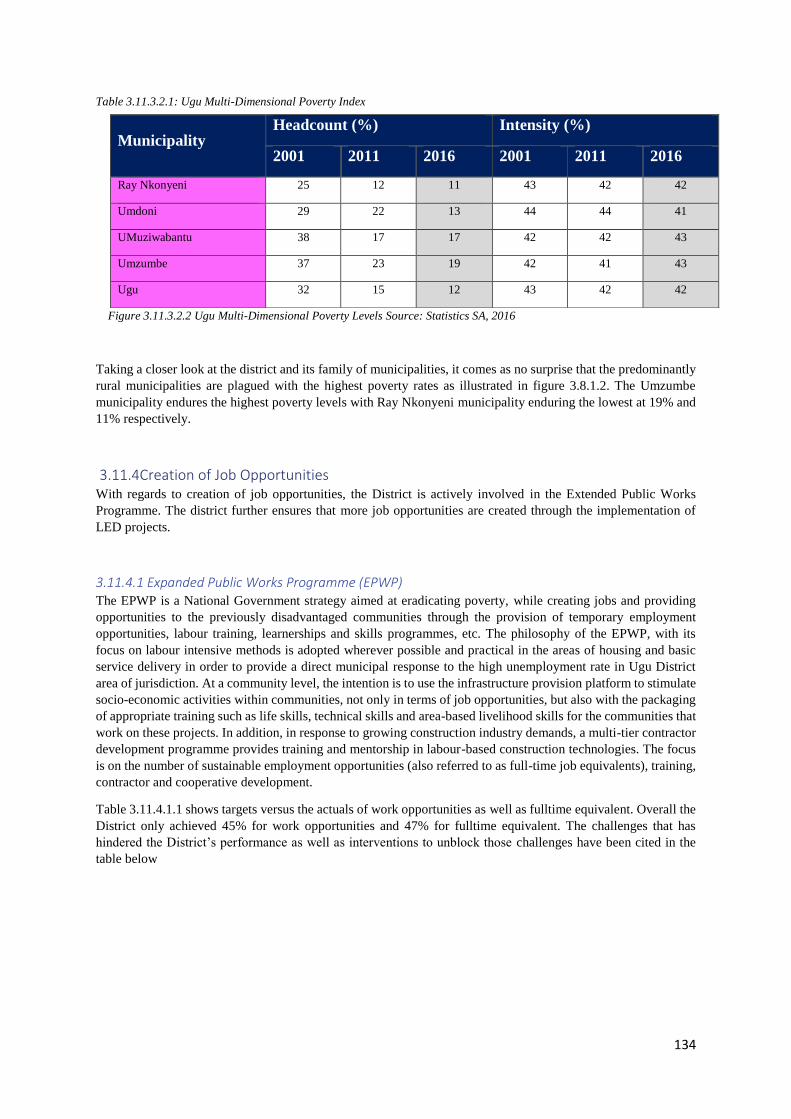
134
Table 3.11.3.2.1: Ugu Multi-Dimensional Poverty Index
Figure 3.11.3.2.2 Ugu Multi-Dimensional Poverty Levels Source: Statistics SA, 2016
Taking a closer look at the district and its family of municipalities, it comes as no surprise that the predominantly
rural municipalities are plagued with the highest poverty rates as illustrated in figure 3.8.1.2. The Umzumbe
municipality endures the highest poverty levels with Ray Nkonyeni municipality enduring the lowest at 19% and
11% respectively.
3.11.4Creation of Job Opportunities With regards to creation of job opportunities, the District is actively involved in the Extended Public Works
Programme. The district further ensures that more job opportunities are created through the implementation of
LED projects.
3.11.4.1 Expanded Public Works Programme (EPWP) The EPWP is a National Government strategy aimed at eradicating poverty, while creating jobs and providing
opportunities to the previously disadvantaged communities through the provision of temporary employment
opportunities, labour training, learnerships and skills programmes, etc. The philosophy of the EPWP, with its
focus on labour intensive methods is adopted wherever possible and practical in the areas of housing and basic
service delivery in order to provide a direct municipal response to the high unemployment rate in Ugu District
area of jurisdiction. At a community level, the intention is to use the infrastructure provision platform to stimulate
socio-economic activities within communities, not only in terms of job opportunities, but also with the packaging
of appropriate training such as life skills, technical skills and area-based livelihood skills for the communities that
work on these projects. In addition, in response to growing construction industry demands, a multi-tier contractor
development programme provides training and mentorship in labour-based construction technologies. The focus
is on the number of sustainable employment opportunities (also referred to as full-time job equivalents), training,
contractor and cooperative development.
Table 3.11.4.1.1 shows targets versus the actuals of work opportunities as well as fulltime equivalent. Overall the
District only achieved 45% for work opportunities and 47% for fulltime equivalent. The challenges that has
hindered the District’s performance as well as interventions to unblock those challenges have been cited in the
table below
Municipality Headcount (%) Intensity (%)
2001 2011 2016 2001 2011 2016
Ray Nkonyeni 25 12 11 43 42 42
Umdoni 29 22 13 44 44 41
UMuziwabantu 38 17 17 42 42 43
Umzumbe 37 23 19 42 41 43
Ugu 32 15 12 43 42 42
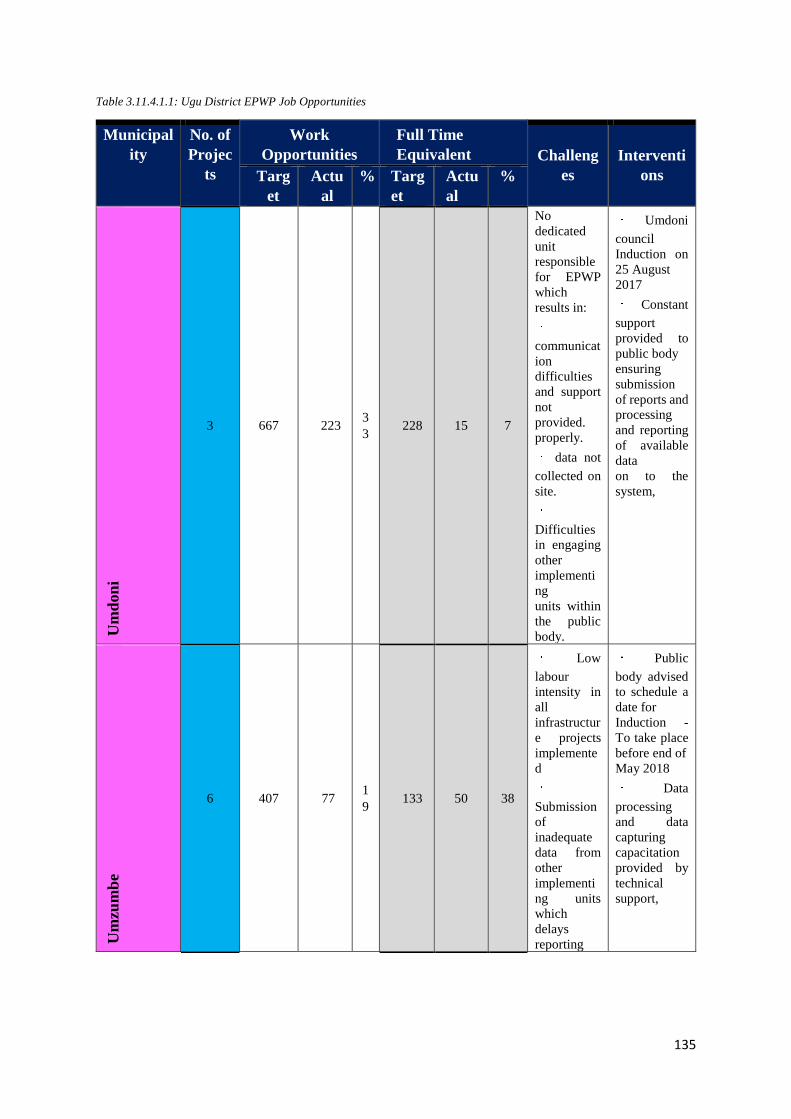
135
Table 3.11.4.1.1: Ugu District EPWP Job Opportunities
Municipal
ity
No. of
Projec
ts
Work
Opportunities
Full Time
Equivalent Challeng
es
Interventi
ons Targ
et
Actu
al
% Targ
et
Actu
al
%
Um
don
i
3 667 223 3
3 228 15 7
No
dedicated
unit
responsible
for EPWP
which
results in:
communicat
ion
difficulties
and support
not
provided.
properly.
data not
collected on
site.
Difficulties
in engaging
other
implementi
ng
units within
the public
body.
Umdoni
council
Induction on
25 August
2017
Constant
support
provided to
public body
ensuring
submission
of reports and
processing
and reporting
of available
data
on to the
system,
Um
zum
be
6 407 77 1
9 133 50 38
Low
labour
intensity in
all
infrastructur
e projects
implemente
d
Submission
of
inadequate
data from
other
implementi
ng units
which
delays
reporting
Public
body advised
to schedule a
date for
Induction -
To take place
before end of
May 2018
Data
processing
and data
capturing
capacitation
provided by
technical
support,

136
Um
uzi
wab
an
tu
10 266 126 4
7 87 52 60
Other
units within
the public
body not
submitting
data to
EPWP
championin
g unit. (LED
unit)
TS
engaged with
technical unit
Manager
to schedule
an
appointment
with the unit.
Ray
Nk
on
yen
i
27 1 028 787 7
7 298 336
11
3
Ugu
34 3 188 1 292 4
1 1 044 381 36
Infrastructu
re unit
projects not
creating
enough
WOs to
assist the
public body
in achieving
EPWP
annual
target.
Service
providers
bringing
permanent
staff to
projects.
The
correct
recruitment
and
selection
strategy not
followed
LIC
workshop
scheduled for
the 26th of
March
emanated
from
stakeholder
meeting
which was
attended by
the MM.
All issues
pertaining to
recruitment
and selection
strategy,
Labour
intensive
methods and
any other
issues that led
to
poor
performance
will be
discussed.
To
tal 80 5 556 2 399
4
5 1 790 834 47
Source: Ugu PMU, 2014
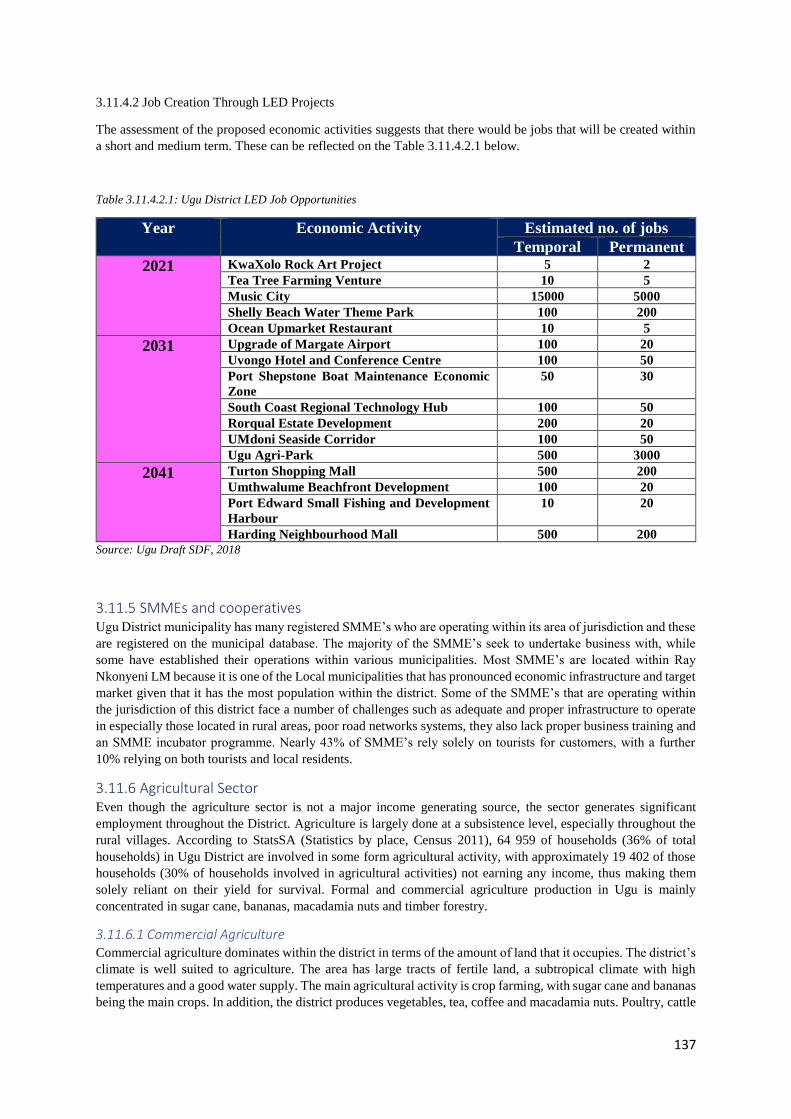
137
3.11.4.2 Job Creation Through LED Projects
The assessment of the proposed economic activities suggests that there would be jobs that will be created within
a short and medium term. These can be reflected on the Table 3.11.4.2.1 below.
Table 3.11.4.2.1: Ugu District LED Job Opportunities
Year Economic Activity Estimated no. of jobs
Temporal Permanent
2021 KwaXolo Rock Art Project 5 2
Tea Tree Farming Venture 10 5
Music City 15000 5000
Shelly Beach Water Theme Park 100 200
Ocean Upmarket Restaurant 10 5
2031 Upgrade of Margate Airport 100 20
Uvongo Hotel and Conference Centre 100 50
Port Shepstone Boat Maintenance Economic
Zone
50 30
South Coast Regional Technology Hub 100 50
Rorqual Estate Development 200 20
UMdoni Seaside Corridor 100 50
Ugu Agri-Park 500 3000
2041 Turton Shopping Mall 500 200
Umthwalume Beachfront Development 100 20
Port Edward Small Fishing and Development
Harbour
10 20
Harding Neighbourhood Mall 500 200
Source: Ugu Draft SDF, 2018
3.11.5 SMMEs and cooperatives Ugu District municipality has many registered SMME’s who are operating within its area of jurisdiction and these
are registered on the municipal database. The majority of the SMME’s seek to undertake business with, while
some have established their operations within various municipalities. Most SMME’s are located within Ray
Nkonyeni LM because it is one of the Local municipalities that has pronounced economic infrastructure and target
market given that it has the most population within the district. Some of the SMME’s that are operating within
the jurisdiction of this district face a number of challenges such as adequate and proper infrastructure to operate
in especially those located in rural areas, poor road networks systems, they also lack proper business training and
an SMME incubator programme. Nearly 43% of SMME’s rely solely on tourists for customers, with a further
10% relying on both tourists and local residents.
3.11.6 Agricultural Sector Even though the agriculture sector is not a major income generating source, the sector generates significant
employment throughout the District. Agriculture is largely done at a subsistence level, especially throughout the
rural villages. According to StatsSA (Statistics by place, Census 2011), 64 959 of households (36% of total
households) in Ugu District are involved in some form agricultural activity, with approximately 19 402 of those
households (30% of households involved in agricultural activities) not earning any income, thus making them
solely reliant on their yield for survival. Formal and commercial agriculture production in Ugu is mainly
concentrated in sugar cane, bananas, macadamia nuts and timber forestry.
3.11.6.1 Commercial Agriculture Commercial agriculture dominates within the district in terms of the amount of land that it occupies. The district’s
climate is well suited to agriculture. The area has large tracts of fertile land, a subtropical climate with high
temperatures and a good water supply. The main agricultural activity is crop farming, with sugar cane and bananas
being the main crops. In addition, the district produces vegetables, tea, coffee and macadamia nuts. Poultry, cattle
138
and goat farming occur on a limited scale with the harvesting of crayfish and oysters taking place in Port Edward.
As a sector, the performance of the agricultural within the Ugu district has followed provincial trends with a
worrying -3.2% average GVA decline rate between 2001 and 2011 and 24 053 job losses in the same period. The
performance of subsectors within agriculture has varied. Commercial timber plantations are situated in the high
rainfall areas in Harding, in the northern areas of former Vulamehlo and in the central areas of Umzumbe and
former Ezinqoleni. Commercial timber plantations are situated in the high rainfall areas in Harding, in the northern
areas of former Vulamehlo and in the central areas of Umzumbe and former Ezinqoleni. The general decline is
disturbing though, as the agricultural sector in the Ugu district should be performing strongly due to a large number
of favourable conditions. These include: rainfall of +/- 1100 mm per annum; abundant water supply in high flow
periods, which could be conserved in off-stream storage for supplementary irrigation; a large labour supply and
specialized infrastructure.
The key agricultural activities taking place in the district include: sugar cane production and milling; timber
production and processing for pulp and sawn timber; bananas for local and international markets; macadamia nuts
for local and international markets; limited coffee production for local consumption and livestock for commercial
and subsistence (beef, dairy, poultry, piggeries and goats). There is high demand for vegetables in the area and
vegetable farming also offers export opportunities. Commercial plantations are situated in the high rainfall areas
in Harding, in the north areas of Umdoni LM and in the central areas of Umzumbe and the Ray Nkonyeni.
About 200 small-sawmills process the municipality’s extensive wattle, gum and pine plantations. Expansion of
the forestry and timber industry in the Ugu district means adding value by manufacturing timber products such as
doors, windows and furniture and the like. There are a number of businesses successfully exporting timber
products of high quality (to ISO9000 standards) and taking advantage of the exchange rates.
3.11.6.2 Subsistence Farming Subsistence farming areas exhibit low levels of crop and stock farming, largely due to the small number of dams
in the district. The subsistence farming practice is mainly found within tribal land. Emerging agricultural sector
face major challenges such as a lack of access to sufficient capital and operational funds, experience and
equipment’s. The small-scale farmers also battle to access formal markets and compete with established
commercial farmers. Ugu district is characterised largely by needy rural interior falling under the Ingonyama Trust
with some large commercial farms and many struggling subsistence farmers. The subsistence farming areas
exhibit low levels of livestock and poultry due to a very few small dams that are in the district. Small scales of
farmers are also found in areas like Hlokozi, KwaJali, Ezingolweni and Umzumbe.
3.11.7 Tourism The Tourism industry is a key contributor to the KZN and Ugu economy which is buoyant with the major activities
based on the sea and associated activities. The development and implementation in the Ugu region is driven and
headed by the Ugu South Coast Tourism Entity. The reputation of the area’s tourism sector is based on some of
the following
aspects:
• Approximately 115km of pristine coastline with seven Blue Flag Beaches
• The world renown Aliwal Shoal as well as many other diving spots
• A variety of opportunities for fishing, both surf and off shore
• Numerous adventure activities on offer such as the Big Swing at Oribi Gorge
• A number of pristine, top class golf courses
• Excellent scenery, landscapes and nature reserves
• An increasing number of events for both sports people and the general public
• Accommodation establishments such as the Blue Marlin Hotel
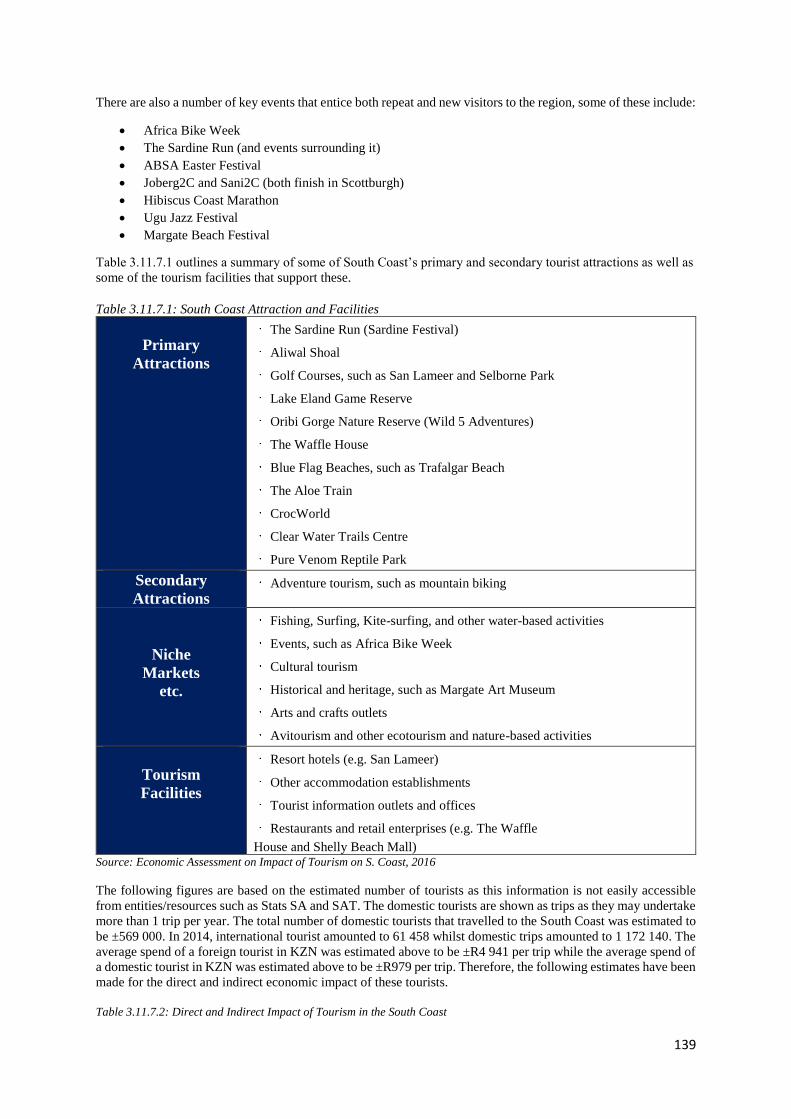
139
There are also a number of key events that entice both repeat and new visitors to the region, some of these include:
• Africa Bike Week
• The Sardine Run (and events surrounding it)
• ABSA Easter Festival
• Joberg2C and Sani2C (both finish in Scottburgh)
• Hibiscus Coast Marathon
• Ugu Jazz Festival
• Margate Beach Festival
Table 3.11.7.1 outlines a summary of some of South Coast’s primary and secondary tourist attractions as well as
some of the tourism facilities that support these.
Table 3.11.7.1: South Coast Attraction and Facilities
Primary
Attractions
The Sardine Run (Sardine Festival)
Aliwal Shoal
Golf Courses, such as San Lameer and Selborne Park
Lake Eland Game Reserve
Oribi Gorge Nature Reserve (Wild 5 Adventures)
The Waffle House
Blue Flag Beaches, such as Trafalgar Beach
The Aloe Train
CrocWorld
Clear Water Trails Centre
Pure Venom Reptile Park
Secondary
Attractions Adventure tourism, such as mountain biking
Niche
Markets
etc.
Fishing, Surfing, Kite-surfing, and other water-based activities
Events, such as Africa Bike Week
Cultural tourism
Historical and heritage, such as Margate Art Museum
Arts and crafts outlets
Avitourism and other ecotourism and nature-based activities
Tourism
Facilities
Resort hotels (e.g. San Lameer)
Other accommodation establishments
Tourist information outlets and offices
Restaurants and retail enterprises (e.g. The Waffle
House and Shelly Beach Mall) Source: Economic Assessment on Impact of Tourism on S. Coast, 2016
The following figures are based on the estimated number of tourists as this information is not easily accessible
from entities/resources such as Stats SA and SAT. The domestic tourists are shown as trips as they may undertake
more than 1 trip per year. The total number of domestic tourists that travelled to the South Coast was estimated to
be ±569 000. In 2014, international tourist amounted to 61 458 whilst domestic trips amounted to 1 172 140. The
average spend of a foreign tourist in KZN was estimated above to be ±R4 941 per trip while the average spend of
a domestic tourist in KZN was estimated above to be ±R979 per trip. Therefore, the following estimates have been
made for the direct and indirect economic impact of these tourists.
Table 3.11.7.2: Direct and Indirect Impact of Tourism in the South Coast
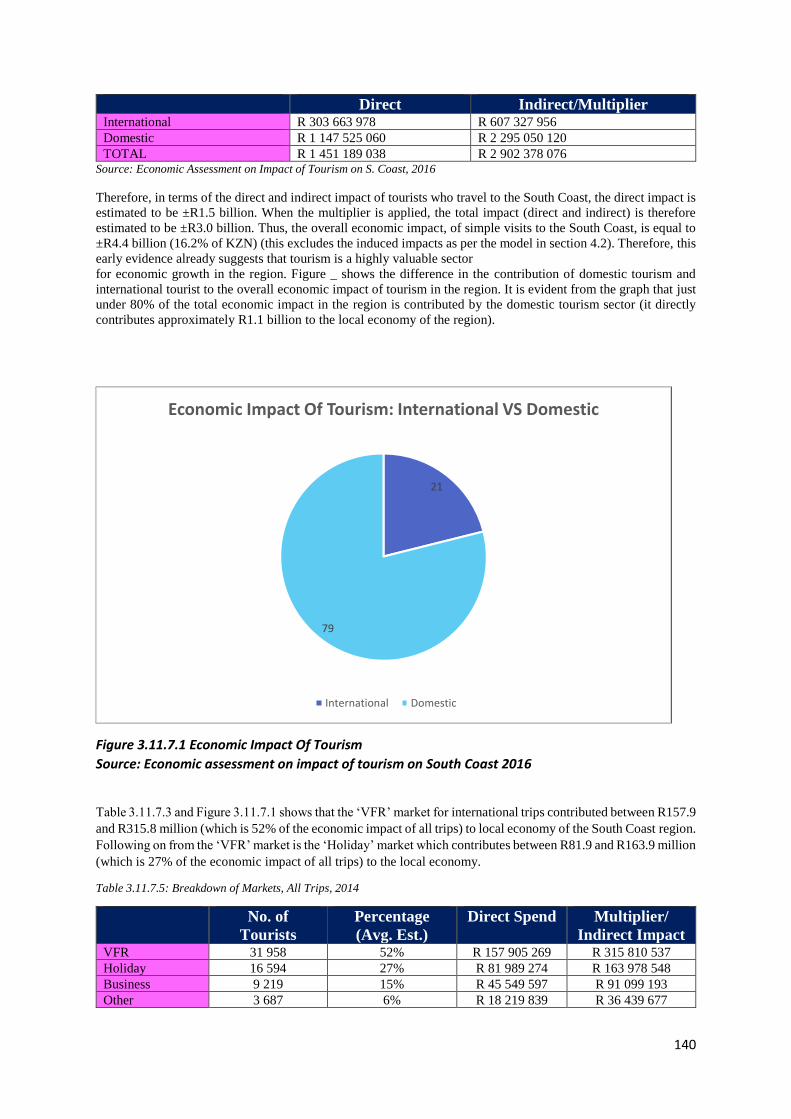
140
Direct Indirect/Multiplier International R 303 663 978 R 607 327 956
Domestic R 1 147 525 060 R 2 295 050 120
TOTAL R 1 451 189 038 R 2 902 378 076 Source: Economic Assessment on Impact of Tourism on S. Coast, 2016
Therefore, in terms of the direct and indirect impact of tourists who travel to the South Coast, the direct impact is
estimated to be ±R1.5 billion. When the multiplier is applied, the total impact (direct and indirect) is therefore
estimated to be ±R3.0 billion. Thus, the overall economic impact, of simple visits to the South Coast, is equal to
±R4.4 billion (16.2% of KZN) (this excludes the induced impacts as per the model in section 4.2). Therefore, this
early evidence already suggests that tourism is a highly valuable sector
for economic growth in the region. Figure _ shows the difference in the contribution of domestic tourism and
international tourist to the overall economic impact of tourism in the region. It is evident from the graph that just
under 80% of the total economic impact in the region is contributed by the domestic tourism sector (it directly
contributes approximately R1.1 billion to the local economy of the region).
Figure 3.11.7.1 Economic Impact Of Tourism
Source: Economic assessment on impact of tourism on South Coast 2016
Table 3.11.7.3 and Figure 3.11.7.1 shows that the ‘VFR’ market for international trips contributed between R157.9
and R315.8 million (which is 52% of the economic impact of all trips) to local economy of the South Coast region.
Following on from the ‘VFR’ market is the ‘Holiday’ market which contributes between R81.9 and R163.9 million
(which is 27% of the economic impact of all trips) to the local economy.
Table 3.11.7.5: Breakdown of Markets, All Trips, 2014
No. of
Tourists
Percentage
(Avg. Est.)
Direct Spend Multiplier/
Indirect Impact VFR 31 958 52% R 157 905 269 R 315 810 537
Holiday 16 594 27% R 81 989 274 R 163 978 548
Business 9 219 15% R 45 549 597 R 91 099 193
Other 3 687 6% R 18 219 839 R 36 439 677
21
79
Economic Impact Of Tourism: International VS Domestic
International Domestic
141
Total Int.Trips 61 458 100% R 303 663 978 R 607 327 956 Source: Economic Assessment on Impact of Tourism on S. Coast, 2016
The biggest challenge of the district when it comes to tourism remains the difference between the developed /
tourist coastal strip and the underdeveloped / rural hinterland. The other challenges facing the tourism sector in
the district are:
• There is a small range of tourism products in the district as the tourism product in the area revolves
largely around the beaches.
• There is a general lack of skill amongst local people especially the rural people as they do not have an
understanding of what kind of tourism businesses could be successful.
• There is poor accessibility to areas outside the coastal strip as the roads leading into the inland section of
the district are very poor and as a consequence, very few tourists venture that way.
3.11.8 Manufacturing (Industrial) Manufacturing / Industrial can be classified to Light and Agro-industrial areas in the Ugu District Municipal area
of jurisdiction.
3.11.8.1 Agro-Industrial Areas The Ugu Fresh Produce Market provides retailing and limited agro-processing opportunities as well as a link to
the Durban and Eastern Cape markets. The Market has a large area of land available for the expansion of agro-
processing facilities ranging from fresh food to dry goods packaging. The market acts as a distribution point for
fresh produce from all over South Africa. Since the Ugu District consists of both rural, poor inland areas and the
more affluent South Coast towns, many of which are holiday destinations, the potential customer base of the
market is large. Therefore, the agriculture sector in Ugu has a huge potential, provided that the local farmers can
be mobilised to meet the needs of the Ugu Fresh Produce Market. The site also offers an opportunity for the
investors who would wish to invest in agriculture facilities dealing with any business within the fresh produce
value chain.
3.11.8.2 Light Industrial Areas Manufacturing activity is also concentrated along the coastal strip with some light industrial parks such as
Marburg, Park Rynie and Margate. There are also, a number of industrial development points in the hinterland
such as Harding and some that are related to the activities of large firms, such as Idwala NPC, Sezela Sugar Mill,
Umzimkulu Sugar Mill and the Weza Saw Mill. The developed industrial areas in Ugu are situated in Port
Shepstone/ Marburg, Park Rynie, Umzinto North, Umzinto South, Margate Quarry, Margate Airport and Harding.
Ugu has been earmarked primarily as a furniture manufacturing hub (Harding and/or Marburg) and secondly, as
a perishable goods processing hub. There are other industrial areas which specialise with various manufacturing
and Table 3.11.8.2.1 below provides details what they manufacture and where are they strategically located.
Table 3.11.8.2.1: Ugu District Spatial Distribution of Manufacturing Activity
Area Basic Description Type of Industry
Marburg Industrial
This is the only major industrial
zone in the District. It has been
developed on the N2 to the
south-west of the Port
Shepstone CBD. The land is
not flat, but the topography is
reasonable for industrial
development. A large variety of
manufacturing and service
Most industrial sectors are
represented in the area.
Furniture, textile and clothing
and food seem to dominate.
Sizes range from small service
industries to major plants.
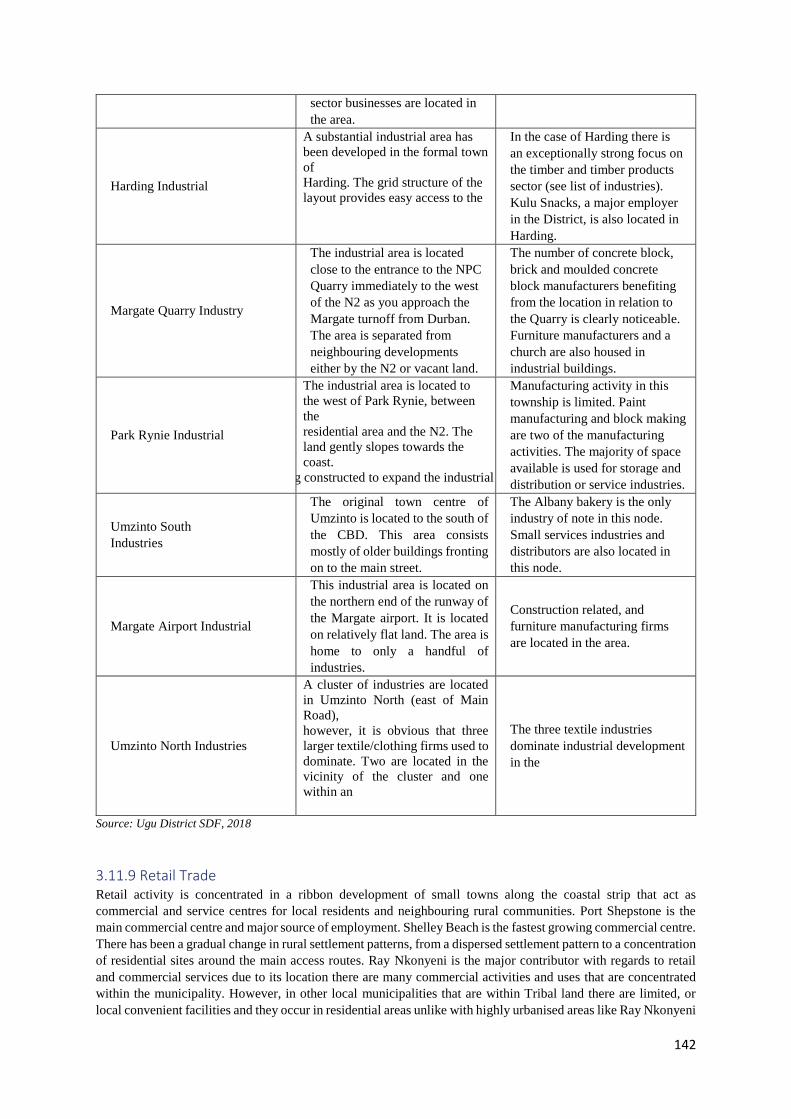
142
sector businesses are located in
the area.
Harding Industrial
A substantial industrial area has
been developed in the formal town
of
Harding. The grid structure of the
layout provides easy access to the
industries.
In the case of Harding there is
an exceptionally strong focus on
the timber and timber products
sector (see list of industries).
Kulu Snacks, a major employer
in the District, is also located in
Harding.
Margate Quarry Industry
The industrial area is located
close to the entrance to the NPC
Quarry immediately to the west
of the N2 as you approach the
Margate turnoff from Durban.
The area is separated from
neighbouring developments
either by the N2 or vacant land.
The number of concrete block,
brick and moulded concrete
block manufacturers benefiting
from the location in relation to
the Quarry is clearly noticeable.
Furniture manufacturers and a
church are also housed in
industrial buildings.
Park Rynie Industrial
The industrial area is located to
the west of Park Rynie, between
the
residential area and the N2. The
land gently slopes towards the
coast.
Roads are currently being constructed to expand the industrial area.
Manufacturing activity in this
township is limited. Paint
manufacturing and block making
are two of the manufacturing
activities. The majority of space
available is used for storage and
distribution or service industries.
Umzinto South
Industries
The original town centre of
Umzinto is located to the south of
the CBD. This area consists
mostly of older buildings fronting
on to the main street.
The Albany bakery is the only
industry of note in this node.
Small services industries and
distributors are also located in
this node.
Margate Airport Industrial
This industrial area is located on
the northern end of the runway of
the Margate airport. It is located
on relatively flat land. The area is
home to only a handful of
industries.
Construction related, and
furniture manufacturing firms
are located in the area.
Umzinto North Industries
A cluster of industries are located
in Umzinto North (east of Main
Road),
however, it is obvious that three
larger textile/clothing firms used to
dominate. Two are located in the
vicinity of the cluster and one
within an
Umzinto
The three textile industries
dominate industrial development
in the
Source: Ugu District SDF, 2018
3.11.9 Retail Trade Retail activity is concentrated in a ribbon development of small towns along the coastal strip that act as
commercial and service centres for local residents and neighbouring rural communities. Port Shepstone is the
main commercial centre and major source of employment. Shelley Beach is the fastest growing commercial centre.
There has been a gradual change in rural settlement patterns, from a dispersed settlement pattern to a concentration
of residential sites around the main access routes. Ray Nkonyeni is the major contributor with regards to retail
and commercial services due to its location there are many commercial activities and uses that are concentrated
within the municipality. However, in other local municipalities that are within Tribal land there are limited, or
local convenient facilities and they occur in residential areas unlike with highly urbanised areas like Ray Nkonyeni
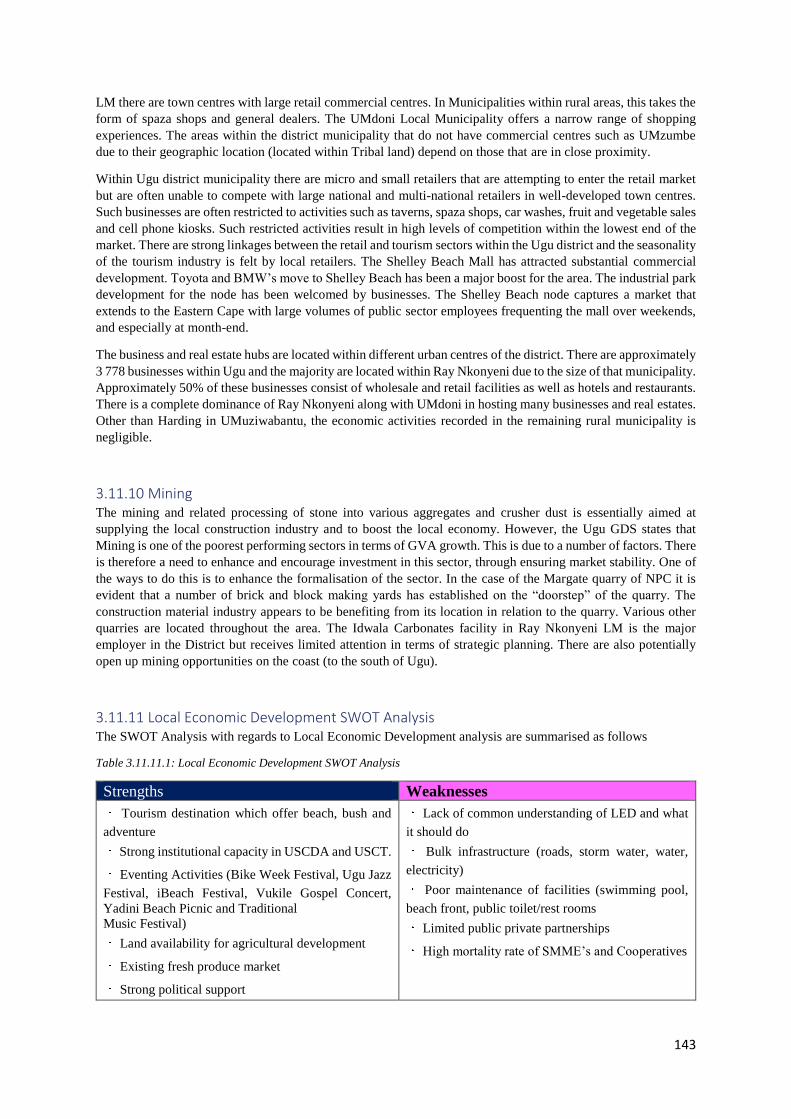
143
LM there are town centres with large retail commercial centres. In Municipalities within rural areas, this takes the
form of spaza shops and general dealers. The UMdoni Local Municipality offers a narrow range of shopping
experiences. The areas within the district municipality that do not have commercial centres such as UMzumbe
due to their geographic location (located within Tribal land) depend on those that are in close proximity.
Within Ugu district municipality there are micro and small retailers that are attempting to enter the retail market
but are often unable to compete with large national and multi-national retailers in well-developed town centres.
Such businesses are often restricted to activities such as taverns, spaza shops, car washes, fruit and vegetable sales
and cell phone kiosks. Such restricted activities result in high levels of competition within the lowest end of the
market. There are strong linkages between the retail and tourism sectors within the Ugu district and the seasonality
of the tourism industry is felt by local retailers. The Shelley Beach Mall has attracted substantial commercial
development. Toyota and BMW’s move to Shelley Beach has been a major boost for the area. The industrial park
development for the node has been welcomed by businesses. The Shelley Beach node captures a market that
extends to the Eastern Cape with large volumes of public sector employees frequenting the mall over weekends,
and especially at month-end.
The business and real estate hubs are located within different urban centres of the district. There are approximately
3 778 businesses within Ugu and the majority are located within Ray Nkonyeni due to the size of that municipality.
Approximately 50% of these businesses consist of wholesale and retail facilities as well as hotels and restaurants.
There is a complete dominance of Ray Nkonyeni along with UMdoni in hosting many businesses and real estates.
Other than Harding in UMuziwabantu, the economic activities recorded in the remaining rural municipality is
negligible.
3.11.10 Mining The mining and related processing of stone into various aggregates and crusher dust is essentially aimed at
supplying the local construction industry and to boost the local economy. However, the Ugu GDS states that
Mining is one of the poorest performing sectors in terms of GVA growth. This is due to a number of factors. There
is therefore a need to enhance and encourage investment in this sector, through ensuring market stability. One of
the ways to do this is to enhance the formalisation of the sector. In the case of the Margate quarry of NPC it is
evident that a number of brick and block making yards has established on the “doorstep” of the quarry. The
construction material industry appears to be benefiting from its location in relation to the quarry. Various other
quarries are located throughout the area. The Idwala Carbonates facility in Ray Nkonyeni LM is the major
employer in the District but receives limited attention in terms of strategic planning. There are also potentially
open up mining opportunities on the coast (to the south of Ugu).
3.11.11 Local Economic Development SWOT Analysis The SWOT Analysis with regards to Local Economic Development analysis are summarised as follows
Table 3.11.11.1: Local Economic Development SWOT Analysis
Strengths Weaknesses
Tourism destination which offer beach, bush and
adventure
Strong institutional capacity in USCDA and USCT.
Eventing Activities (Bike Week Festival, Ugu Jazz
Festival, iBeach Festival, Vukile Gospel Concert,
Yadini Beach Picnic and Traditional
Music Festival)
Land availability for agricultural development
Existing fresh produce market
Strong political support
Lack of common understanding of LED and what
it should do
Bulk infrastructure (roads, storm water, water,
electricity)
Poor maintenance of facilities (swimming pool,
beach front, public toilet/rest rooms
Limited public private partnerships
High mortality rate of SMME’s and Cooperatives
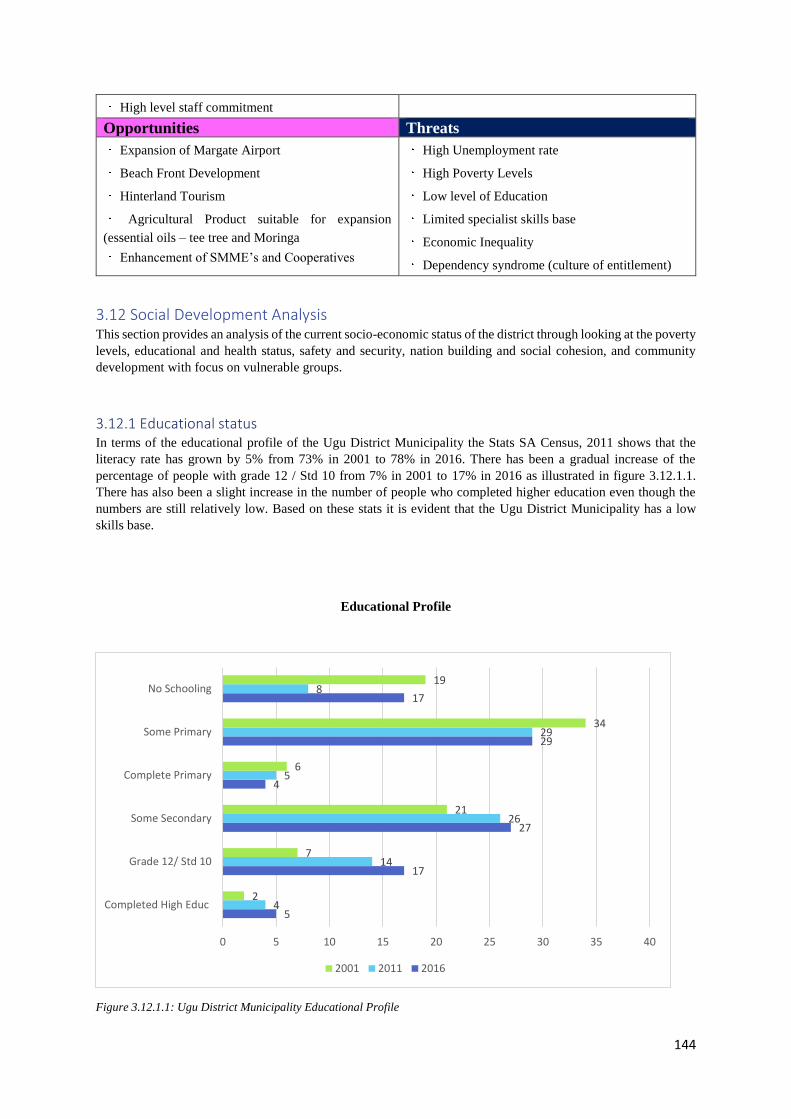
144
High level staff commitment
Opportunities Threats
Expansion of Margate Airport
Beach Front Development
Hinterland Tourism
Agricultural Product suitable for expansion
(essential oils – tee tree and Moringa
Enhancement of SMME’s and Cooperatives
High Unemployment rate
High Poverty Levels
Low level of Education
Limited specialist skills base
Economic Inequality
Dependency syndrome (culture of entitlement)
3.12 Social Development Analysis This section provides an analysis of the current socio-economic status of the district through looking at the poverty
levels, educational and health status, safety and security, nation building and social cohesion, and community
development with focus on vulnerable groups.
3.12.1 Educational status In terms of the educational profile of the Ugu District Municipality the Stats SA Census, 2011 shows that the
literacy rate has grown by 5% from 73% in 2001 to 78% in 2016. There has been a gradual increase of the
percentage of people with grade 12 / Std 10 from 7% in 2001 to 17% in 2016 as illustrated in figure 3.12.1.1.
There has also been a slight increase in the number of people who completed higher education even though the
numbers are still relatively low. Based on these stats it is evident that the Ugu District Municipality has a low
skills base.
Educational Profile
Figure 3.12.1.1: Ugu District Municipality Educational Profile
5
17
27
4
29
17
4
14
26
5
29
8
2
7
21
6
34
19
0 5 10 15 20 25 30 35 40
Completed High Educ
Grade 12/ Std 10
Some Secondary
Complete Primary
Some Primary
No Schooling
2001 2011 2016
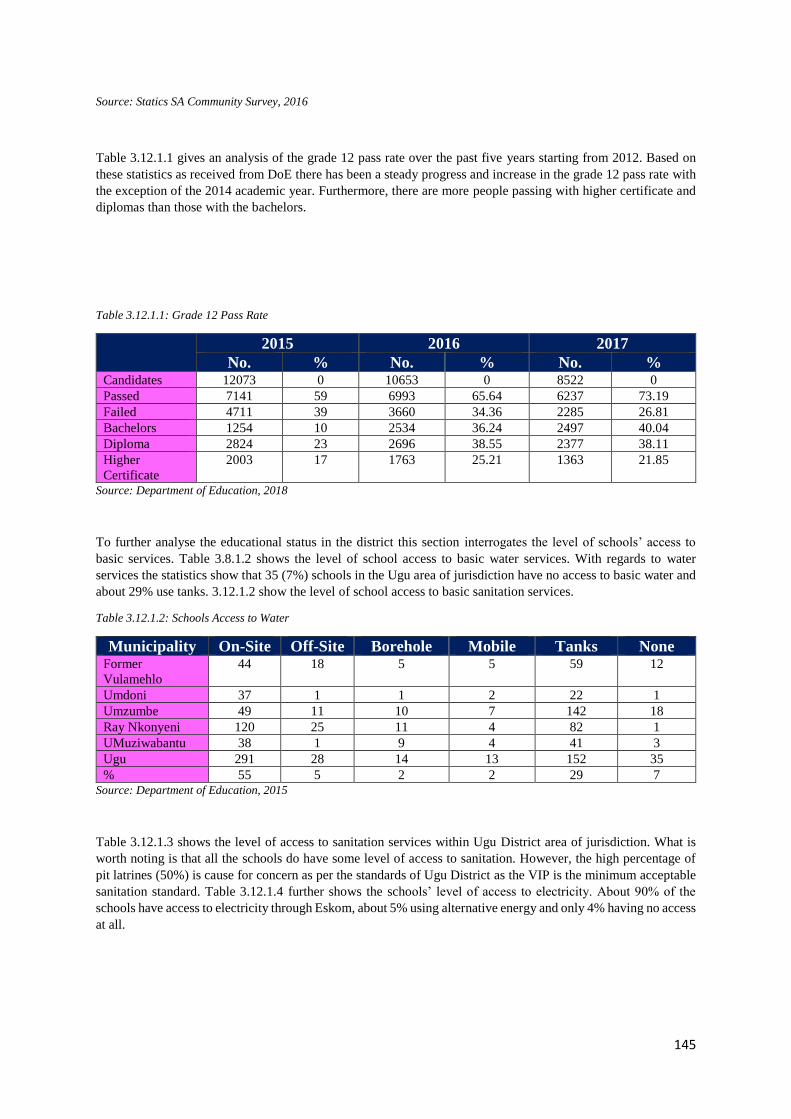
145
Source: Statics SA Community Survey, 2016
Table 3.12.1.1 gives an analysis of the grade 12 pass rate over the past five years starting from 2012. Based on
these statistics as received from DoE there has been a steady progress and increase in the grade 12 pass rate with
the exception of the 2014 academic year. Furthermore, there are more people passing with higher certificate and
diplomas than those with the bachelors.
Table 3.12.1.1: Grade 12 Pass Rate
2015 2016 2017
No. % No. % No. % Candidates 12073 0 10653 0 8522 0
Passed 7141 59 6993 65.64 6237 73.19
Failed 4711 39 3660 34.36 2285 26.81
Bachelors 1254 10 2534 36.24 2497 40.04
Diploma 2824 23 2696 38.55 2377 38.11
Higher
Certificate
2003 17 1763 25.21 1363 21.85
Source: Department of Education, 2018
To further analyse the educational status in the district this section interrogates the level of schools’ access to
basic services. Table 3.8.1.2 shows the level of school access to basic water services. With regards to water
services the statistics show that 35 (7%) schools in the Ugu area of jurisdiction have no access to basic water and
about 29% use tanks. 3.12.1.2 show the level of school access to basic sanitation services.
Table 3.12.1.2: Schools Access to Water
Municipality On-Site Off-Site Borehole Mobile Tanks None Former
Vulamehlo
44 18 5 5 59 12
Umdoni 37 1 1 2 22 1
Umzumbe 49 11 10 7 142 18
Ray Nkonyeni 120 25 11 4 82 1
UMuziwabantu 38 1 9 4 41 3
Ugu 291 28 14 13 152 35
% 55 5 2 2 29 7 Source: Department of Education, 2015
Table 3.12.1.3 shows the level of access to sanitation services within Ugu District area of jurisdiction. What is
worth noting is that all the schools do have some level of access to sanitation. However, the high percentage of
pit latrines (50%) is cause for concern as per the standards of Ugu District as the VIP is the minimum acceptable
sanitation standard. Table 3.12.1.4 further shows the schools’ level of access to electricity. About 90% of the
schools have access to electricity through Eskom, about 5% using alternative energy and only 4% having no access
at all.
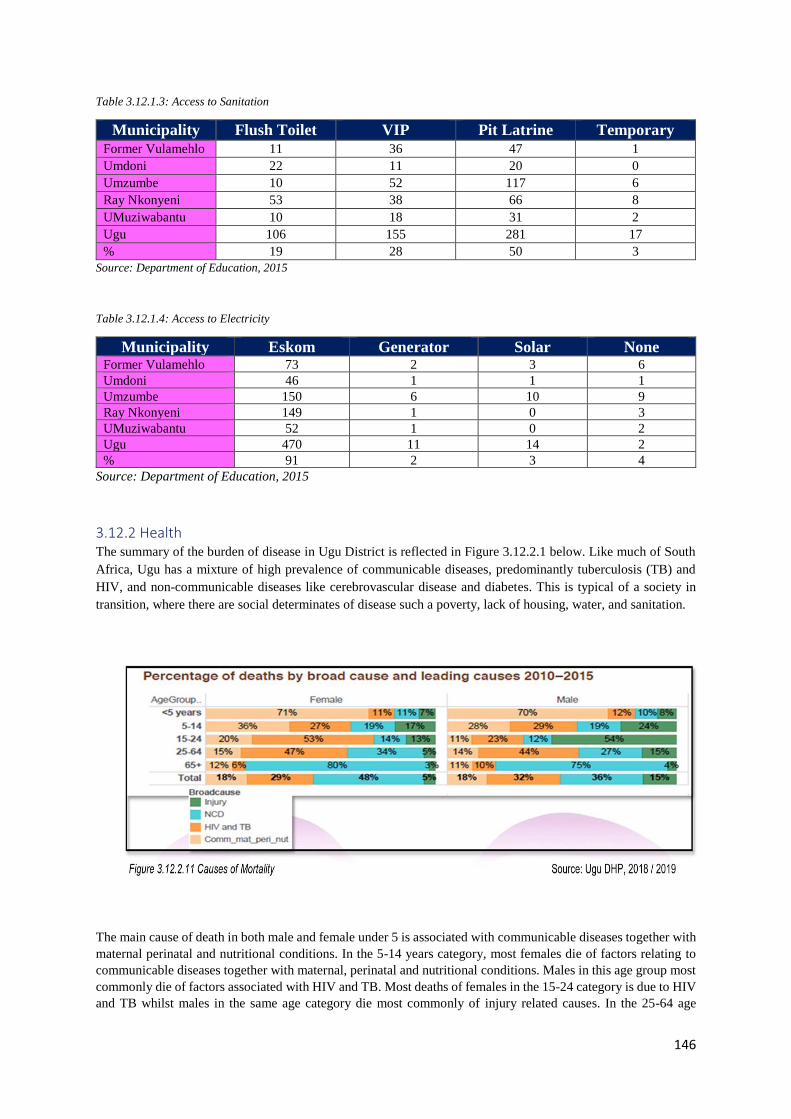
146
Table 3.12.1.3: Access to Sanitation
Municipality Flush Toilet VIP Pit Latrine Temporary
Former Vulamehlo 11 36 47 1
Umdoni 22 11 20 0
Umzumbe 10 52 117 6
Ray Nkonyeni 53 38 66 8
UMuziwabantu 10 18 31 2
Ugu 106 155 281 17
% 19 28 50 3
Source: Department of Education, 2015
Table 3.12.1.4: Access to Electricity
Municipality Eskom Generator Solar None Former Vulamehlo 73 2 3 6
Umdoni 46 1 1 1
Umzumbe 150 6 10 9
Ray Nkonyeni 149 1 0 3
UMuziwabantu 52 1 0 2
Ugu 470 11 14 2
% 91 2 3 4
Source: Department of Education, 2015
3.12.2 Health The summary of the burden of disease in Ugu District is reflected in Figure 3.12.2.1 below. Like much of South
Africa, Ugu has a mixture of high prevalence of communicable diseases, predominantly tuberculosis (TB) and
HIV, and non-communicable diseases like cerebrovascular disease and diabetes. This is typical of a society in
transition, where there are social determinates of disease such a poverty, lack of housing, water, and sanitation.
The main cause of death in both male and female under 5 is associated with communicable diseases together with
maternal perinatal and nutritional conditions. In the 5-14 years category, most females die of factors relating to
communicable diseases together with maternal, perinatal and nutritional conditions. Males in this age group most
commonly die of factors associated with HIV and TB. Most deaths of females in the 15-24 category is due to HIV
and TB whilst males in the same age category die most commonly of injury related causes. In the 25-64 age
147
groups, most of the deaths of both male and female are due to HIV and TB. NCD is the leading cause of death to
those over 65.
Ugu has a higher incidence of hypertension at 22.4 compared with the South African incidence of 13.9, and the
Provincial incidence of 19.1. As already stated these lifestyle type diseases are increasing among males in the
Province. Mental Health admission rate in also high in Ugu at 25.3, whereas in the Province it is 1.0. The district
aims to improve marketing of Integrated Ideal clinical services management (ICSM) to improve adherence to
treatment and appointments.
3.12.2.1 HIV / AIDS and TB Control (HAST) TB remains the top major underlying cause of death in Ugu and the TB incidence remains high. The drug resistant
TB success rate is around 53% and is short of the target of 63%. SA Stats (2015) estimate that in Ugu 19.1% of
the population are HIV positive, and the Annual ANC Seroprevalence 2014 found in Ugu had 40.1% of pregnant
women HIV positive.
Ugu has a growing number of people on ART (89200 as at Q3 17/18).
3.12.2.2 Child Mortality Rates Child mortality is decreasing in South Africa and Ugu district is no exception with the under 5 in facility deaths
declining from 4.6 per in 15/16 to 3.3 per 1000 in 2017/18 (q3). Ugu faces the challenge of poor immunisation
coverage at 75.8% below the KZN average of 85.4%. PCR testing IS THE third HIGHEST in the Province at
1.4%. Modifiable factors that will be prioritised for action include close monitoring of immunisation performance,
development of counselling skills on and marketing of safe infant feeding and management of shock at accident
and emergency units.
Maternal mortality has dropped since 2014/15 in which 112 died per 100 000 live births and 2015/16 in which
92.4 died per 100 000. The 2017/18 quarterly reports project a rate of 80 maternal deaths per 100 000 which is a
further drop. At 86%, Ugu is not performing well for the number of HIV positive pregnant women initiated on
ART falling both below the district target of 99% and the Provincial target of 98%. The strategies to improve
maternal and child outcomes include management of asphyxia related births, correction of data errors in reporting
ANC started on ART. Youth friendly services will be prioritised to target teenage pregnancies, and there will be
continued support of facility clinical governance strategies.
3.12.2.3 Accessibility to Health Facilities The access to health facilities has already been covered under section 3.10.7. This section provides only the
catchment populations and catchment areas. The District Health Plan projects a Low PHC utilisation rate of 3 vs
target of 3.4 for 17/18. Strategies to improve utilisation include optimal management of outreach teams namely
tracing teams, school health, ward-based outreach teams and mobile clinics as well as mobilizing men towards
early health seeking behaviour. Ugu is the 11th highest district for grade 8 screening coverage in the country and
top District in KZN.AT fixed facilities, strategies to reduce waiting times and improve client satisfaction will be
prioritized. The Provincial changes in TB regime has resulted in improved client outcomes, better community
management and the reduced need to hospitalize clients on TB treatment. The resultant drop in hospital efficiency
at Dunstan Farrell TB hospital (29%) has led the Province to initiate the decommissioning of the hospital.
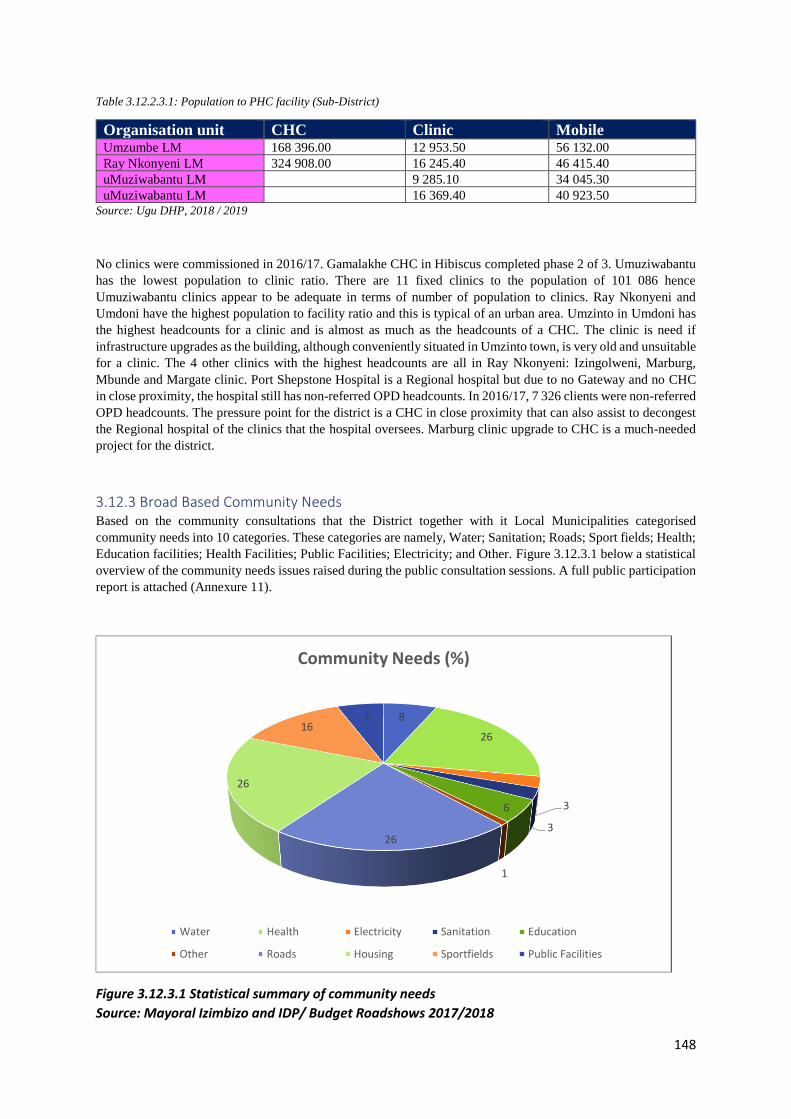
148
Table 3.12.2.3.1: Population to PHC facility (Sub-District)
Organisation unit CHC Clinic Mobile Umzumbe LM 168 396.00 12 953.50 56 132.00
Ray Nkonyeni LM 324 908.00 16 245.40 46 415.40
uMuziwabantu LM 9 285.10 34 045.30
uMuziwabantu LM 16 369.40 40 923.50 Source: Ugu DHP, 2018 / 2019
No clinics were commissioned in 2016/17. Gamalakhe CHC in Hibiscus completed phase 2 of 3. Umuziwabantu
has the lowest population to clinic ratio. There are 11 fixed clinics to the population of 101 086 hence
Umuziwabantu clinics appear to be adequate in terms of number of population to clinics. Ray Nkonyeni and
Umdoni have the highest population to facility ratio and this is typical of an urban area. Umzinto in Umdoni has
the highest headcounts for a clinic and is almost as much as the headcounts of a CHC. The clinic is need if
infrastructure upgrades as the building, although conveniently situated in Umzinto town, is very old and unsuitable
for a clinic. The 4 other clinics with the highest headcounts are all in Ray Nkonyeni: Izingolweni, Marburg,
Mbunde and Margate clinic. Port Shepstone Hospital is a Regional hospital but due to no Gateway and no CHC
in close proximity, the hospital still has non-referred OPD headcounts. In 2016/17, 7 326 clients were non-referred
OPD headcounts. The pressure point for the district is a CHC in close proximity that can also assist to decongest
the Regional hospital of the clinics that the hospital oversees. Marburg clinic upgrade to CHC is a much-needed
project for the district.
3.12.3 Broad Based Community Needs Based on the community consultations that the District together with it Local Municipalities categorised
community needs into 10 categories. These categories are namely, Water; Sanitation; Roads; Sport fields; Health;
Education facilities; Health Facilities; Public Facilities; Electricity; and Other. Figure 3.12.3.1 below a statistical
overview of the community needs issues raised during the public consultation sessions. A full public participation
report is attached (Annexure 11).
Figure 3.12.3.1 Statistical summary of community needs
Source: Mayoral Izimbizo and IDP/ Budget Roadshows 2017/2018
8
26
3
3
6
1
26
26
167
Community Needs (%)
Water Health Electricity Sanitation Education
Other Roads Housing Sportfields Public Facilities

149
Based on the 2017 / 2018 consultation sessions as reflected in Figure 3.12.3.1, the 3 broad based community needs
are:
Water;
Roads; and
Housing.
3.12.4 Safety and Security Some communities have converted the Community Policing Forums into Safety and Security Committee. There
was also a safety and security strategy that was developed by the Department of Community Safety and Liaison
in 2009, which is due to be reviewed and it is at the same level where the District Safety and Security Forum will
be established.
3.12.5 Nation Building and Social Cohesion Ugu District Sports Council was launched in 2009. Ugu District Municipality also participates in SALGA-KZN
Games. There are Sport Development Hubs that were established by the Department of Art, Culture Sports and
Recreation. The District Youth Council is also responsible for the coordination of social cohesion activities
targeted at the youth.
3.12.6 Community Development with Focus on Vulnerable Groups Community development with focus on vulnerable groups addresses the development of youth; people with
disabilities; women; people affected by HIV / AIDS, drugs, crime, etc.; and early childhood. The district has a
dedicated Special Programmes Unit which cater for the needs of these special groups.
3.12.6.1 Youth Development The youth in Ugu District is 38.7% of the total population. In terms of educational attainment 65% of the youth
have completed matric, however only 4% have a tertiary qualification. The low percentage of youth with tertiary
qualification further emphasises the skills shortage challenge in the district. Furthermore, 34% of the households
in the Ugu District area of jurisdiction are headed by the youth. The Ugu District Youth Development Policy
Framework 2016 – 2021 identified a host of challenges facing the Ugu District area of jurisdiction youth amongst
which is the poor-socio-economic conditions characterized by poverty, poor living conditions, abuse,
unemployment and a lack of access to education and recreational facilities. Furthermore, the prevalent poor socio-
economic conditions severely impinge on the youth’s holistic wellbeing and further exacerbate their vulnerability
to peer pressure, substance abuse, crime, and ill-health.
In response to the host of challenges that are identified by the youth policy framework, six strategic interventions
are proposed as follows:
• Social Cohesion;
• Education, Training and Skills Development;
• Economic Development and Transformation;
• Health and Social Well-being;
• Arts and Culture;
• Sports and Recreation.
The actual youth programmes and projects to be implanted in the 2016 –2021 period of this IDP are captured in
chapter 4 and 5 of the document.
3.12.6.2 Development of the People with Disabilities The challenges that is facing people living with disabilities have been well documented across the country and
Ugu Districtict area of jurisdiction is no exception. About 22 061 people receives grants for different forms of
150
disability they live with. The district remains committed to ensuring that Ugu District is environmentally friendly
to people living with disabilities. To that effect the municipality has established Disability Programme which is
based on the following pillars:
• To encourage Government Departments to integrate disability issues into their line function activities.
• To promote awareness of disability by government and civil society.
• To coordinate, facilitate and monitor the implementation of the Integrated National Disability Strategy.
• To foster equal and transparent partnerships with relevant stakeholders.
The municipality has established Disability Forum through which on an annual basis implements programmes
such as, Sanitary Dignity Campaign in Special Schools; Disability Awareness Campaign; Therapy Session for
Mothers with Disabled Children; Disability Sports Day; Disability NPO Grant Support; and People with
Disabilities assisted with Drivers Licence.
3.12.6.3 Development of the Elderly As per the 2016 Community Survey done by Statistics South Africa, the elderly makes up 6.7% of the total
population of the Ugu District area of jurisdiction. Furthermore, 15.8% of the Ugu District area of jurisdiction
households are headed by the elderly. The elderly people are vulnerable in many aspects and thus the district
commitment to ensuring protection and care of its senior citizens. The District has a Senior Citizen Programme
which is underpinned by the following pillars:
• Creation of an enabling and supportive environment for senior citizens;
• Community-based care and support services;
• Advancement of healthy well-being;
• Ensuring community-based care and support services; and
• Promotion of protection and safety
The District Municipality has a Senior Citizens Forum is in place. Through this forum the municipality on annual
basis implement programmes such as; Golden Games; Centenarians Programmes; Support to Destitute Elderly;
and Awareness Campaigns.
3.12.6.4 Development of Women As per the 2016 Community Survey done by Statistics South Africa, the female makes up 52.1% of the total
population of the district. The challenges facing women, not only in Ugu, but the entire world has been well
documented. The district is therefore committed to the realisation of women empowerment goals and development
of the women in general. However, the district does not look at development of women in isolation but
acknowledges the importance of gender equity. It is for this reason that the district established the Gender
Programme which is based on the following pillars:
• Empowerment of women through the elimination of discrimination to achieve gender equality;
• Harmonise the implementation of various legislative frameworks on gender equality;
• Address emerging gender issues and concerns;
• Coordination and facilitation of a comprehensive agenda to the promotion and protection of women’s
rights and involvement of men;
• Ensuring government translates its constitutional and global commitments into measurable and
meaningful programmes;
• Monitoring and evaluation of gender mainstreaming into government programmes, projects, policies and
day to day work; and
• Establishment gender forums to mainstream and monitor rights of women, men, boy- and girl-child,
disabled people and senior citizens
The district has established Gender, Men’s, and Widow’s For a through which on an annual basis implements
programmes such as, Sanitary Dignity Campaign; Women Empowerment Session; Men Empowerment Session;
Moral Regeneration Campaign; and Reed Dance.
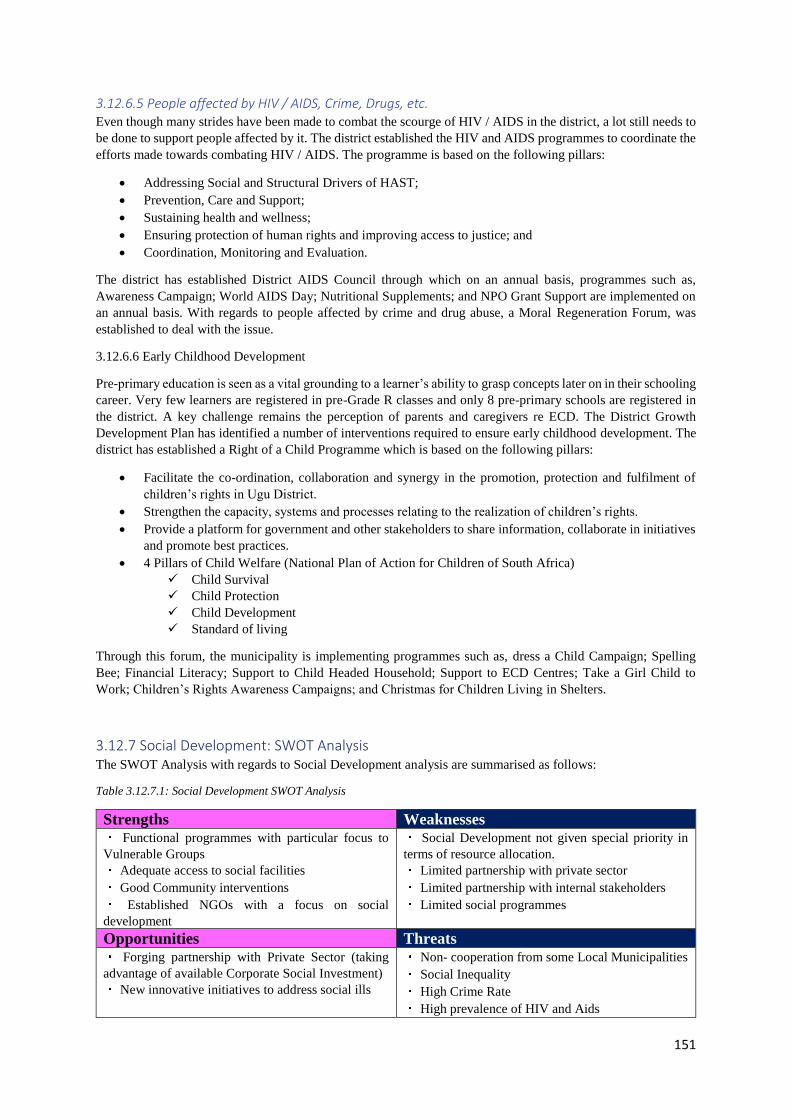
151
3.12.6.5 People affected by HIV / AIDS, Crime, Drugs, etc. Even though many strides have been made to combat the scourge of HIV / AIDS in the district, a lot still needs to
be done to support people affected by it. The district established the HIV and AIDS programmes to coordinate the
efforts made towards combating HIV / AIDS. The programme is based on the following pillars:
• Addressing Social and Structural Drivers of HAST;
• Prevention, Care and Support;
• Sustaining health and wellness;
• Ensuring protection of human rights and improving access to justice; and
• Coordination, Monitoring and Evaluation.
The district has established District AIDS Council through which on an annual basis, programmes such as,
Awareness Campaign; World AIDS Day; Nutritional Supplements; and NPO Grant Support are implemented on
an annual basis. With regards to people affected by crime and drug abuse, a Moral Regeneration Forum, was
established to deal with the issue.
3.12.6.6 Early Childhood Development
Pre-primary education is seen as a vital grounding to a learner’s ability to grasp concepts later on in their schooling
career. Very few learners are registered in pre-Grade R classes and only 8 pre-primary schools are registered in
the district. A key challenge remains the perception of parents and caregivers re ECD. The District Growth
Development Plan has identified a number of interventions required to ensure early childhood development. The
district has established a Right of a Child Programme which is based on the following pillars:
• Facilitate the co-ordination, collaboration and synergy in the promotion, protection and fulfilment of
children’s rights in Ugu District.
• Strengthen the capacity, systems and processes relating to the realization of children’s rights.
• Provide a platform for government and other stakeholders to share information, collaborate in initiatives
and promote best practices.
• 4 Pillars of Child Welfare (National Plan of Action for Children of South Africa)
✓ Child Survival
✓ Child Protection
✓ Child Development
✓ Standard of living
Through this forum, the municipality is implementing programmes such as, dress a Child Campaign; Spelling
Bee; Financial Literacy; Support to Child Headed Household; Support to ECD Centres; Take a Girl Child to
Work; Children’s Rights Awareness Campaigns; and Christmas for Children Living in Shelters.
3.12.7 Social Development: SWOT Analysis The SWOT Analysis with regards to Social Development analysis are summarised as follows:
Table 3.12.7.1: Social Development SWOT Analysis
Strengths Weaknesses Functional programmes with particular focus to
Vulnerable Groups
Adequate access to social facilities
Good Community interventions
Established NGOs with a focus on social
development
Social Development not given special priority in
terms of resource allocation.
Limited partnership with private sector
Limited partnership with internal stakeholders
Limited social programmes
Opportunities Threats Forging partnership with Private Sector (taking
advantage of available Corporate Social Investment)
New innovative initiatives to address social ills
Non- cooperation from some Local Municipalities
Social Inequality
High Crime Rate
High prevalence of HIV and Aids
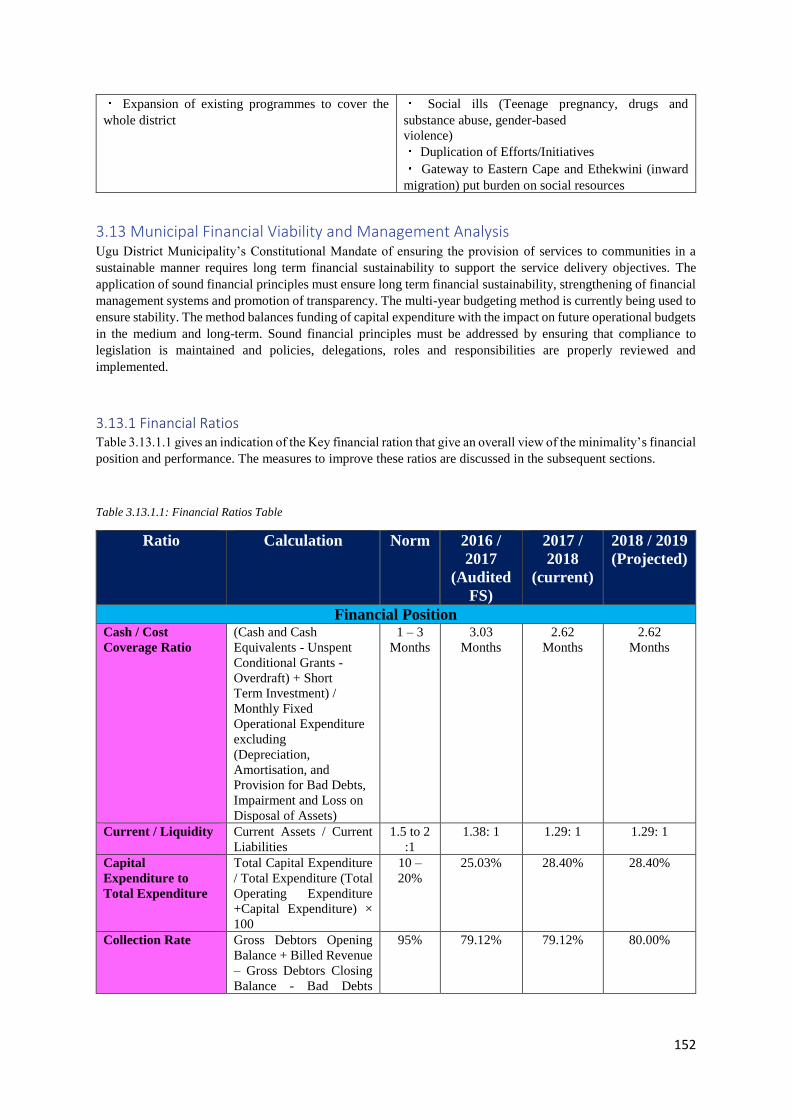
152
Expansion of existing programmes to cover the
whole district
Social ills (Teenage pregnancy, drugs and
substance abuse, gender-based
violence)
Duplication of Efforts/Initiatives
Gateway to Eastern Cape and Ethekwini (inward
migration) put burden on social resources
3.13 Municipal Financial Viability and Management Analysis Ugu District Municipality’s Constitutional Mandate of ensuring the provision of services to communities in a
sustainable manner requires long term financial sustainability to support the service delivery objectives. The
application of sound financial principles must ensure long term financial sustainability, strengthening of financial
management systems and promotion of transparency. The multi-year budgeting method is currently being used to
ensure stability. The method balances funding of capital expenditure with the impact on future operational budgets
in the medium and long-term. Sound financial principles must be addressed by ensuring that compliance to
legislation is maintained and policies, delegations, roles and responsibilities are properly reviewed and
implemented.
3.13.1 Financial Ratios Table 3.13.1.1 gives an indication of the Key financial ration that give an overall view of the minimality’s financial
position and performance. The measures to improve these ratios are discussed in the subsequent sections.
Table 3.13.1.1: Financial Ratios Table
Ratio Calculation Norm 2016 /
2017
(Audited
FS)
2017 /
2018
(current)
2018 / 2019
(Projected)
Financial Position Cash / Cost
Coverage Ratio
(Cash and Cash
Equivalents - Unspent
Conditional Grants -
Overdraft) + Short
Term Investment) /
Monthly Fixed
Operational Expenditure
excluding
(Depreciation,
Amortisation, and
Provision for Bad Debts,
Impairment and Loss on
Disposal of Assets)
1 – 3
Months
3.03
Months
2.62
Months
2.62
Months
Current / Liquidity Current Assets / Current
Liabilities
1.5 to 2
:1
1.38: 1 1.29: 1 1.29: 1
Capital
Expenditure to
Total Expenditure
Total Capital Expenditure
/ Total Expenditure (Total
Operating Expenditure
+Capital Expenditure) ×
100
10 –
20%
25.03% 28.40% 28.40%
Collection Rate Gross Debtors Opening
Balance + Billed Revenue
– Gross Debtors Closing
Balance - Bad Debts
95% 79.12% 79.12% 80.00%
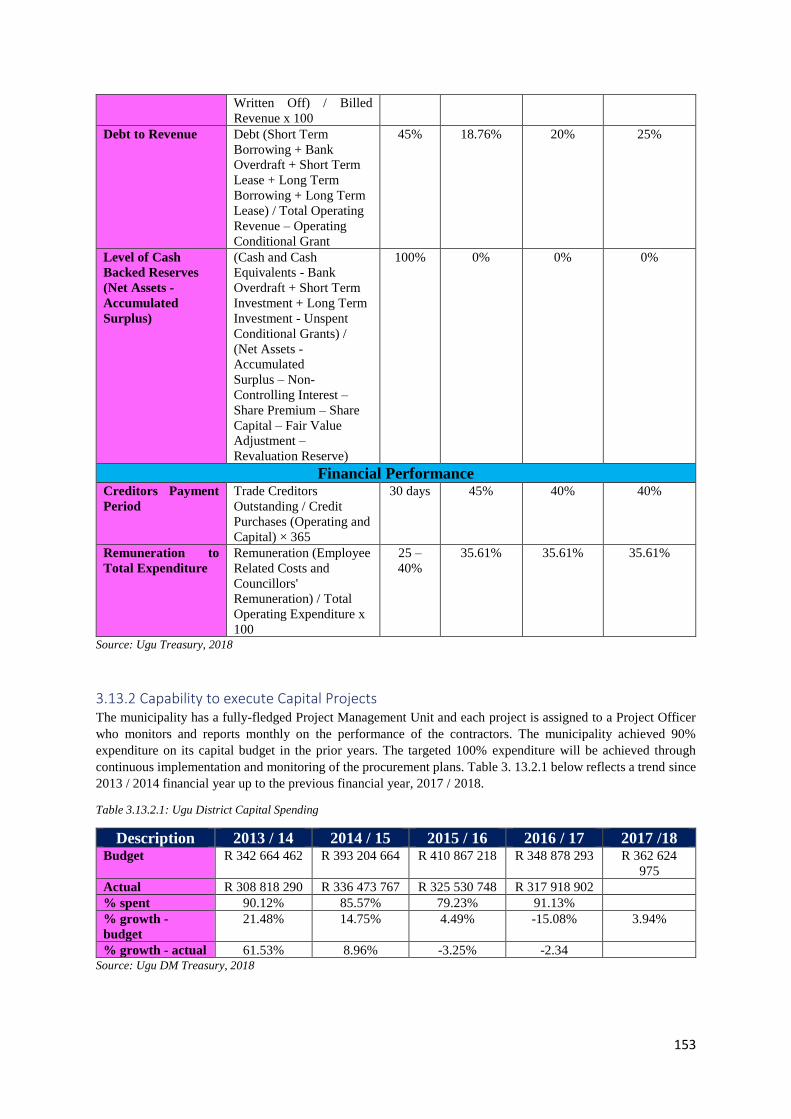
153
Written Off) / Billed
Revenue x 100
Debt to Revenue Debt (Short Term
Borrowing + Bank
Overdraft + Short Term
Lease + Long Term
Borrowing + Long Term
Lease) / Total Operating
Revenue – Operating
Conditional Grant
45% 18.76% 20% 25%
Level of Cash
Backed Reserves
(Net Assets -
Accumulated
Surplus)
(Cash and Cash
Equivalents - Bank
Overdraft + Short Term
Investment + Long Term
Investment - Unspent
Conditional Grants) /
(Net Assets -
Accumulated
Surplus – Non-
Controlling Interest –
Share Premium – Share
Capital – Fair Value
Adjustment –
Revaluation Reserve)
100% 0% 0% 0%
Financial Performance Creditors Payment
Period
Trade Creditors
Outstanding / Credit
Purchases (Operating and
Capital) × 365
30 days 45% 40% 40%
Remuneration to
Total Expenditure
Remuneration (Employee
Related Costs and
Councillors'
Remuneration) / Total
Operating Expenditure x
100
25 –
40%
35.61% 35.61% 35.61%
Source: Ugu Treasury, 2018
3.13.2 Capability to execute Capital Projects The municipality has a fully-fledged Project Management Unit and each project is assigned to a Project Officer
who monitors and reports monthly on the performance of the contractors. The municipality achieved 90%
expenditure on its capital budget in the prior years. The targeted 100% expenditure will be achieved through
continuous implementation and monitoring of the procurement plans. Table 3. 13.2.1 below reflects a trend since
2013 / 2014 financial year up to the previous financial year, 2017 / 2018.
Table 3.13.2.1: Ugu District Capital Spending
Description 2013 / 14 2014 / 15 2015 / 16 2016 / 17 2017 /18 Budget R 342 664 462 R 393 204 664 R 410 867 218 R 348 878 293 R 362 624
975
Actual R 308 818 290 R 336 473 767 R 325 530 748 R 317 918 902
% spent 90.12% 85.57% 79.23% 91.13%
% growth -
budget
21.48% 14.75% 4.49% -15.08% 3.94%
% growth - actual 61.53% 8.96% -3.25% -2.34 Source: Ugu DM Treasury, 2018
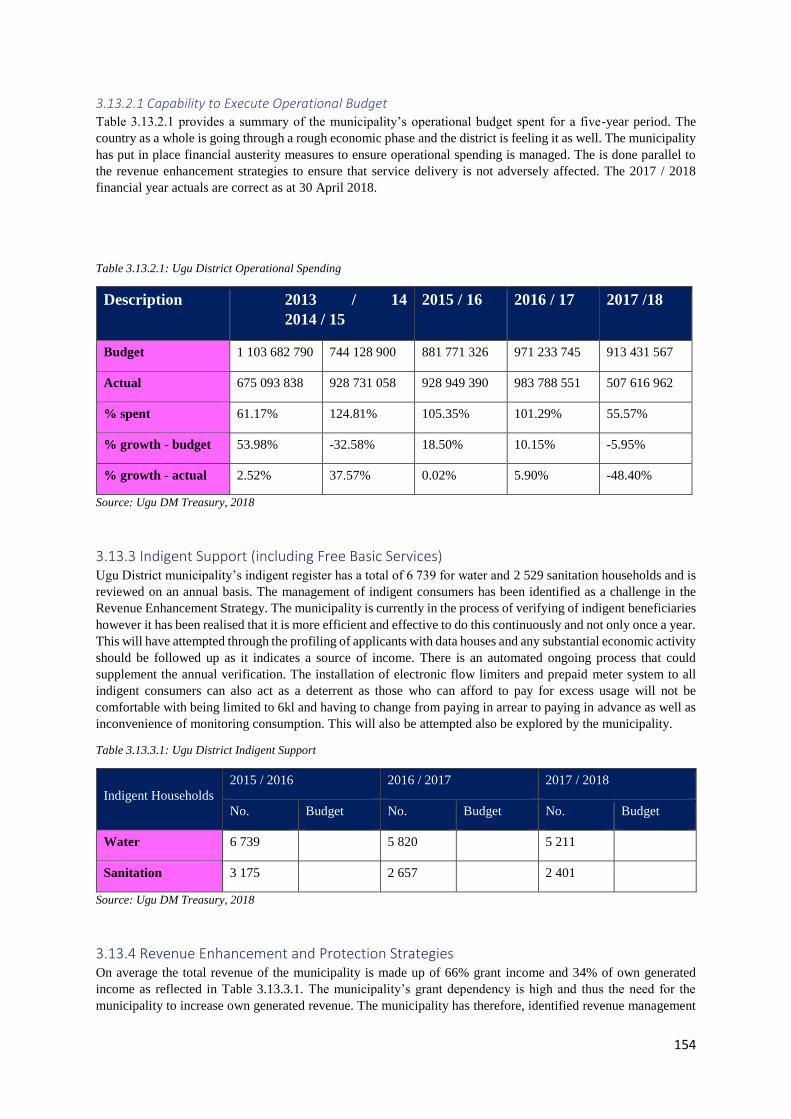
154
3.13.2.1 Capability to Execute Operational Budget Table 3.13.2.1 provides a summary of the municipality’s operational budget spent for a five-year period. The
country as a whole is going through a rough economic phase and the district is feeling it as well. The municipality
has put in place financial austerity measures to ensure operational spending is managed. The is done parallel to
the revenue enhancement strategies to ensure that service delivery is not adversely affected. The 2017 / 2018
financial year actuals are correct as at 30 April 2018.
Table 3.13.2.1: Ugu District Operational Spending
Description 2013 / 14
2014 / 15
2015 / 16 2016 / 17 2017 /18
Budget 1 103 682 790 744 128 900 881 771 326 971 233 745 913 431 567
Actual 675 093 838 928 731 058 928 949 390 983 788 551 507 616 962
% spent 61.17% 124.81% 105.35% 101.29% 55.57%
% growth - budget 53.98% -32.58% 18.50% 10.15% -5.95%
% growth - actual 2.52% 37.57% 0.02% 5.90% -48.40%
Source: Ugu DM Treasury, 2018
3.13.3 Indigent Support (including Free Basic Services) Ugu District municipality’s indigent register has a total of 6 739 for water and 2 529 sanitation households and is
reviewed on an annual basis. The management of indigent consumers has been identified as a challenge in the
Revenue Enhancement Strategy. The municipality is currently in the process of verifying of indigent beneficiaries
however it has been realised that it is more efficient and effective to do this continuously and not only once a year.
This will have attempted through the profiling of applicants with data houses and any substantial economic activity
should be followed up as it indicates a source of income. There is an automated ongoing process that could
supplement the annual verification. The installation of electronic flow limiters and prepaid meter system to all
indigent consumers can also act as a deterrent as those who can afford to pay for excess usage will not be
comfortable with being limited to 6kl and having to change from paying in arrear to paying in advance as well as
inconvenience of monitoring consumption. This will also be attempted also be explored by the municipality.
Table 3.13.3.1: Ugu District Indigent Support
Indigent Households
2015 / 2016 2016 / 2017 2017 / 2018
No. Budget No. Budget No. Budget
Water 6 739 5 820 5 211
Sanitation 3 175 2 657 2 401
Source: Ugu DM Treasury, 2018
3.13.4 Revenue Enhancement and Protection Strategies On average the total revenue of the municipality is made up of 66% grant income and 34% of own generated
income as reflected in Table 3.13.3.1. The municipality’s grant dependency is high and thus the need for the
municipality to increase own generated revenue. The municipality has therefore, identified revenue management
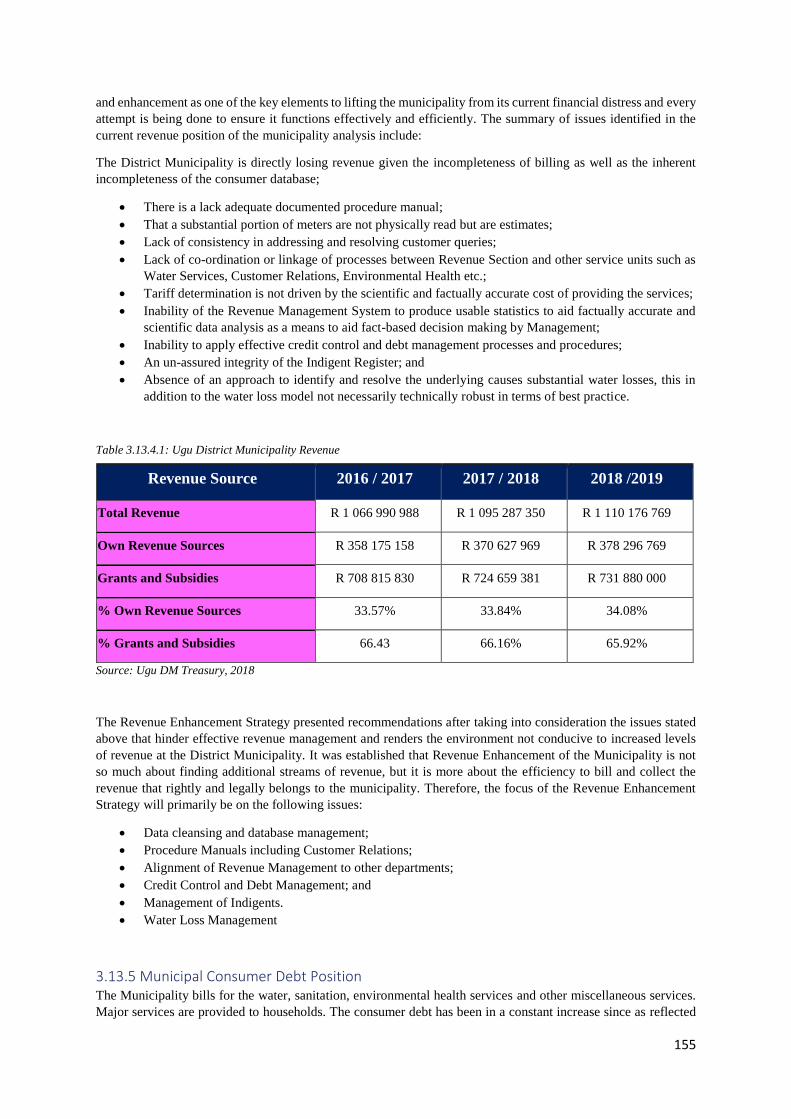
155
and enhancement as one of the key elements to lifting the municipality from its current financial distress and every
attempt is being done to ensure it functions effectively and efficiently. The summary of issues identified in the
current revenue position of the municipality analysis include:
The District Municipality is directly losing revenue given the incompleteness of billing as well as the inherent
incompleteness of the consumer database;
• There is a lack adequate documented procedure manual;
• That a substantial portion of meters are not physically read but are estimates;
• Lack of consistency in addressing and resolving customer queries;
• Lack of co-ordination or linkage of processes between Revenue Section and other service units such as
Water Services, Customer Relations, Environmental Health etc.;
• Tariff determination is not driven by the scientific and factually accurate cost of providing the services;
• Inability of the Revenue Management System to produce usable statistics to aid factually accurate and
scientific data analysis as a means to aid fact-based decision making by Management;
• Inability to apply effective credit control and debt management processes and procedures;
• An un-assured integrity of the Indigent Register; and
• Absence of an approach to identify and resolve the underlying causes substantial water losses, this in
addition to the water loss model not necessarily technically robust in terms of best practice.
Table 3.13.4.1: Ugu District Municipality Revenue
Source: Ugu DM Treasury, 2018
The Revenue Enhancement Strategy presented recommendations after taking into consideration the issues stated
above that hinder effective revenue management and renders the environment not conducive to increased levels
of revenue at the District Municipality. It was established that Revenue Enhancement of the Municipality is not
so much about finding additional streams of revenue, but it is more about the efficiency to bill and collect the
revenue that rightly and legally belongs to the municipality. Therefore, the focus of the Revenue Enhancement
Strategy will primarily be on the following issues:
• Data cleansing and database management;
• Procedure Manuals including Customer Relations;
• Alignment of Revenue Management to other departments;
• Credit Control and Debt Management; and
• Management of Indigents.
• Water Loss Management
3.13.5 Municipal Consumer Debt Position The Municipality bills for the water, sanitation, environmental health services and other miscellaneous services.
Major services are provided to households. The consumer debt has been in a constant increase since as reflected
Revenue Source 2016 / 2017 2017 / 2018 2018 /2019
Total Revenue R 1 066 990 988 R 1 095 287 350 R 1 110 176 769
Own Revenue Sources R 358 175 158 R 370 627 969 R 378 296 769
Grants and Subsidies R 708 815 830 R 724 659 381 R 731 880 000
% Own Revenue Sources 33.57% 33.84% 34.08%
% Grants and Subsidies 66.43 66.16% 65.92%
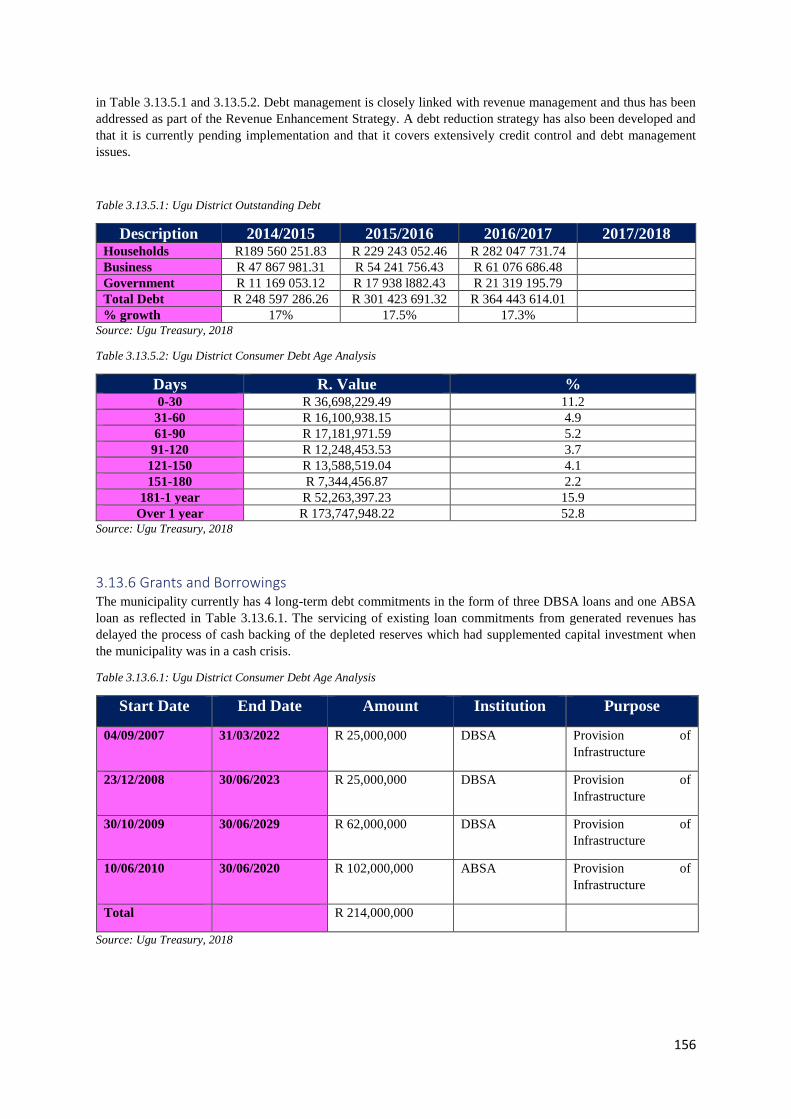
156
in Table 3.13.5.1 and 3.13.5.2. Debt management is closely linked with revenue management and thus has been
addressed as part of the Revenue Enhancement Strategy. A debt reduction strategy has also been developed and
that it is currently pending implementation and that it covers extensively credit control and debt management
issues.
Table 3.13.5.1: Ugu District Outstanding Debt
Description 2014/2015 2015/2016 2016/2017 2017/2018 Households R189 560 251.83 R 229 243 052.46 R 282 047 731.74
Business R 47 867 981.31 R 54 241 756.43 R 61 076 686.48
Government R 11 169 053.12 R 17 938 l882.43 R 21 319 195.79
Total Debt R 248 597 286.26 R 301 423 691.32 R 364 443 614.01
% growth 17% 17.5% 17.3% Source: Ugu Treasury, 2018
Table 3.13.5.2: Ugu District Consumer Debt Age Analysis
Days R. Value % 0-30 R 36,698,229.49 11.2
31-60 R 16,100,938.15 4.9
61-90 R 17,181,971.59 5.2
91-120 R 12,248,453.53 3.7
121-150 R 13,588,519.04 4.1
151-180 R 7,344,456.87 2.2
181-1 year R 52,263,397.23 15.9
Over 1 year R 173,747,948.22 52.8 Source: Ugu Treasury, 2018
3.13.6 Grants and Borrowings The municipality currently has 4 long-term debt commitments in the form of three DBSA loans and one ABSA
loan as reflected in Table 3.13.6.1. The servicing of existing loan commitments from generated revenues has
delayed the process of cash backing of the depleted reserves which had supplemented capital investment when
the municipality was in a cash crisis.
Table 3.13.6.1: Ugu District Consumer Debt Age Analysis
Start Date End Date Amount Institution Purpose
04/09/2007 31/03/2022 R 25,000,000 DBSA Provision of
Infrastructure
23/12/2008 30/06/2023 R 25,000,000 DBSA Provision of
Infrastructure
30/10/2009 30/06/2029 R 62,000,000 DBSA Provision of
Infrastructure
10/06/2010 30/06/2020 R 102,000,000 ABSA Provision of
Infrastructure
Total R 214,000,000
Source: Ugu Treasury, 2018
157
3.13.7 Municipal Infrastructure Assets and Maintenance The asset management unit which comprises of technical and financial sections are in place and is currently
addressing historic asset management challenges and bringing about a reform in the municipality. In the 2016 /
2017 financial year, the municipality received a qualified audit report with a few asset management matters as
emphasis. The municipality has put plan in place to ensure that the asset management challenges are addressed.
The municipality is committed to:
• Ensure management, accounting and information system that accounts for the assets, long term liabilities,
investments and leases;
• Ensure that assets, liabilities, investments and leases are valued in accordance with standards of
Generally Recognized Accounting Practice (GRAP) i.e. GRAP 17;
• Ensure a system of internal control of assets, loans, investments and leases including registers;
• Develop and implement asset, loans, investments and leases management framework, policies, strategies,
assets repairs and maintenance plans;
• Coordination of Disposal of Fixed Assets;
• Assist with Replacement of Fixed Assets; and
• Ensure appropriate assets counts.
3.13.8 Auditor General Report Table 3.13.8.1 gives a summary of the Auditor-General’s Report on the Ugu District Municipality Financial Management of the past three years. Table 3.13.8.1: Summary Auditor-General’s Report 2015 - 2017
Financial Year Audit Outcome Basis for Audit
Opinion
2014 / 2015 Unqualified
2015 / 2016 Unqualified
2016 / 2017 Qualified
Revenue
Assets Management
Commitments
Source: Auditor-General’s Reports, 2015 – 2017
The details of the 2016 / 2017 auditor general findings and action plans to address them thereof are captured in
Annexure 2.
13.3.9 Supply Chain Management (SCM) MFMA section 110 - 119; SCM Regulations 2005; and relevant MFMA circulars set out required processes and
guidance manuals to help ensure that SCM arrangements provide appropriate goods and services, offer best value
for money and minimize the opportunities for fraud and corruption. The Municipality's supply chain management
functions are centralised in the Budget and Treasury Office Supply Chain Management Unit. All bid committees
are in place, effective and they sit as per the adopted roster of bid committees. The coordination of the procurement
of goods and services, management of supplier database, inventory management and contract management are
performed within the Supply Chain Management Unit. The Supply Chain Management Policy and Standard
Operating Procedures are in place and will be reviewed for the 2018 / 2019 financial year.
There is an updated contract register that is populated with all contracts for the municipality. They have all been
procured through the SCM process, they are all valid written contracts with the terms and conditions stipulated in
the contract. The period of the contract is specified in the contract register. A contract administrator is responsible
for the management of all the municipal contracts. All officials in the Supply Chain Management Unit meet the
prescribed competency levels as required by the Municipal Finance Management Act (MFMA)
Demand management is managed through the Procurement Plan that was adopted annually as a working
document for the Municipality. There is still a need for improvement in the following areas:
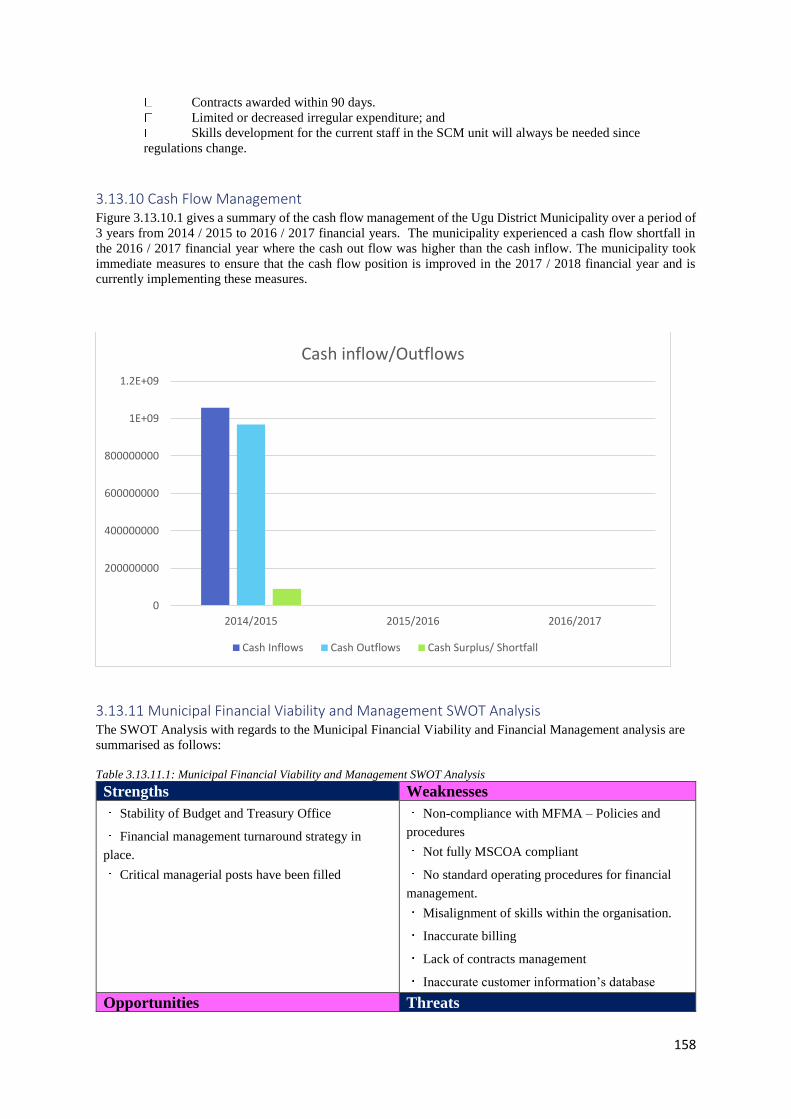
158
Contracts awarded within 90 days.
Limited or decreased irregular expenditure; and
Skills development for the current staff in the SCM unit will always be needed since
regulations change.
3.13.10 Cash Flow Management Figure 3.13.10.1 gives a summary of the cash flow management of the Ugu District Municipality over a period of
3 years from 2014 / 2015 to 2016 / 2017 financial years. The municipality experienced a cash flow shortfall in
the 2016 / 2017 financial year where the cash out flow was higher than the cash inflow. The municipality took
immediate measures to ensure that the cash flow position is improved in the 2017 / 2018 financial year and is
currently implementing these measures.
3.13.11 Municipal Financial Viability and Management SWOT Analysis The SWOT Analysis with regards to the Municipal Financial Viability and Financial Management analysis are
summarised as follows:
Table 3.13.11.1: Municipal Financial Viability and Management SWOT Analysis
Strengths Weaknesses
Stability of Budget and Treasury Office
Financial management turnaround strategy in
place.
Critical managerial posts have been filled
Non-compliance with MFMA – Policies and
procedures
Not fully MSCOA compliant
No standard operating procedures for financial
management.
Misalignment of skills within the organisation.
Inaccurate billing
Lack of contracts management
Inaccurate customer information’s database
Opportunities Threats
0
200000000
400000000
600000000
800000000
1E+09
1.2E+09
2014/2015 2015/2016 2016/2017
Cash inflow/Outflows
Cash Inflows Cash Outflows Cash Surplus/ Shortfall
159
Potential for investment to enhance economic
development and revenue collection.
Larger Urban areas to enhance revenue
Support from National and Provincial treasury and
CoGTA
Financial management trainings are not specific
to the Treasury department.
Under collection of revenue threatens cash flow.
Non-performance of service providers
Limited financial resources
3.14 Good Governance and Public Participation Analysis Good governance as per the democratic principles can be achieved through effective public participation. Public
participation allows constituents to monitor the governance record of its elected officials and further encourages
the public to take an active interest in the performance of their municipality and region. It is through broad public
participation that citizens can recognise that their interests are taken to heart – especially the needs of the most
vulnerable members of society. The Ugu District has therefore made every attempt to ensure it allows all of its
citizens to be heard in determining the political, social and economic priorities through the establishment of a
broad societal consensus that includes civil society, government and the private sector. However, community
participation alone is not sufficient in ensuring that good governance practices are adopted. Institutional integrity
is of equal importance and therefore, Ugu District Municipality has ensured that its Finance Committee, Audit
Committee, Council and sub-committees are fully functional. This was done through the adoption of effective by-
laws and policies that entrench the effective performance of all aspects of municipal governance.
3.14.1 National and Provincial Programmes rolled-out The Ugu District Municipality is two National and Provincial Programmes which are Batho Pele and Operation
Sukuma Sakhe.
3.14.1.1 Batho Pele Programme Batho Pele, a Sesotho word meaning “people first”, is a notion which was adopted in 1994 and became a policy
in 1997. The Batho Pele concept has as a main objective of addressing service delivery improvement by
introducing principles which guide the transformation of service delivery to be people centric. In Ugu DM, Batho
Pele was implemented in 2007. Since then a lot has been done towards implementing it such as Batho Pele
principles and in SDIP, flagship projects such as Municipal Service week
and Know your Service Right Campaigns. In 2008/2009 Ugu obtained a Golden Award in the Premier’s Service
Excellence Award. The legislative framework calls for setting up of service standards, defining outputs and
targets, and benchmarking performance indicators against international standards. Similarly, it also calls for the
introduction of monitoring and evaluation mechanism and structures to measure progress on a continuous basis.
Batho Pele Principles: Nationally there are eight principles that govern the transformation of service delivery
according to Batho Pele White Paper. The province added three more Principles and adheres to eleven principles
in
the Citizens Charter, as listed below-:
• Consultation
• Service Standards
• Access
• Courtesy
• Openness and Transparency
• Information
• Redress
• Value for Money
• Encouraging innovation and rewarding excellence
• Leadership and strategic direction
• Service Delivery Impact
3.14.1.2 Service Delivery Impact Under the direction and guidance of DPSA Batho Pele implementation has focused on principles and Service
Delivery Improvement Plan. Batho Pele Belief which says, “We Belong, We Care, We Serve.” is a value system
which clearly captures the revitalized Batho Pele culture. More still needs to be done relevant to belief sets. A
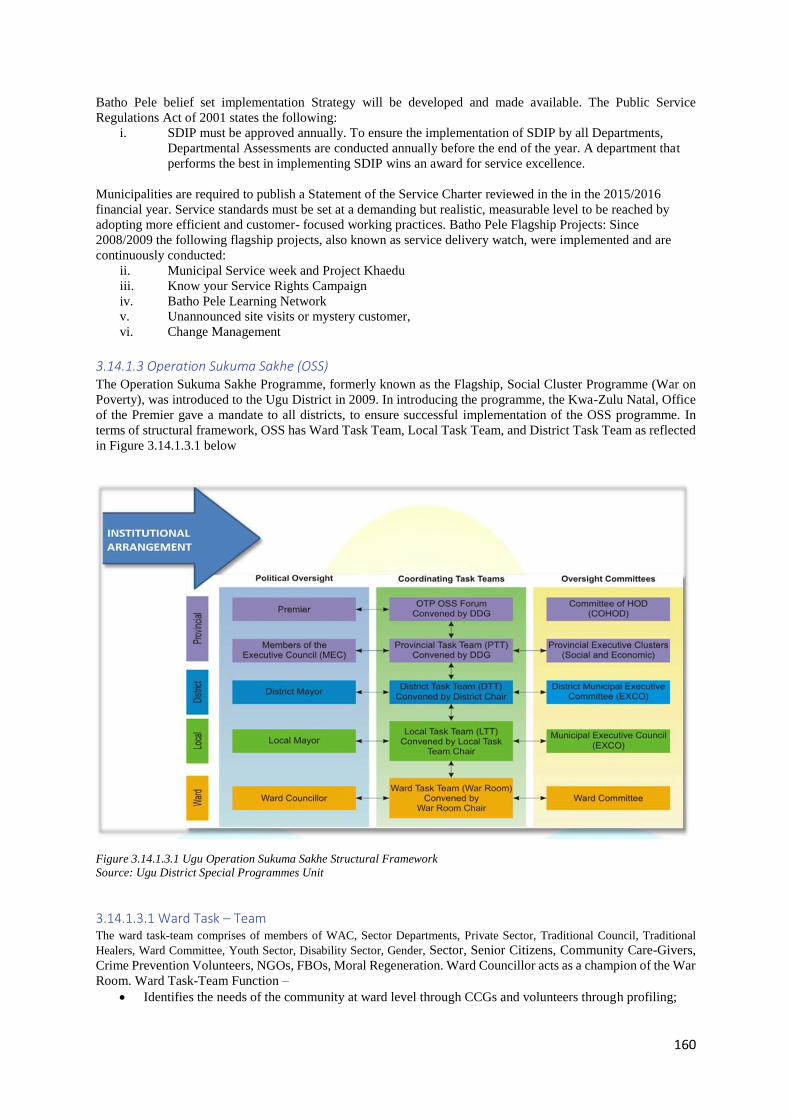
160
Batho Pele belief set implementation Strategy will be developed and made available. The Public Service
Regulations Act of 2001 states the following:
i. SDIP must be approved annually. To ensure the implementation of SDIP by all Departments,
Departmental Assessments are conducted annually before the end of the year. A department that
performs the best in implementing SDIP wins an award for service excellence.
Municipalities are required to publish a Statement of the Service Charter reviewed in the in the 2015/2016
financial year. Service standards must be set at a demanding but realistic, measurable level to be reached by
adopting more efficient and customer- focused working practices. Batho Pele Flagship Projects: Since
2008/2009 the following flagship projects, also known as service delivery watch, were implemented and are
continuously conducted:
ii. Municipal Service week and Project Khaedu
iii. Know your Service Rights Campaign
iv. Batho Pele Learning Network
v. Unannounced site visits or mystery customer,
vi. Change Management
3.14.1.3 Operation Sukuma Sakhe (OSS) The Operation Sukuma Sakhe Programme, formerly known as the Flagship, Social Cluster Programme (War on
Poverty), was introduced to the Ugu District in 2009. In introducing the programme, the Kwa-Zulu Natal, Office
of the Premier gave a mandate to all districts, to ensure successful implementation of the OSS programme. In
terms of structural framework, OSS has Ward Task Team, Local Task Team, and District Task Team as reflected
in Figure 3.14.1.3.1 below
Figure 3.14.1.3.1 Ugu Operation Sukuma Sakhe Structural Framework
Source: Ugu District Special Programmes Unit
3.14.1.3.1 Ward Task – Team The ward task-team comprises of members of WAC, Sector Departments, Private Sector, Traditional Council, Traditional
Healers, Ward Committee, Youth Sector, Disability Sector, Gender, Sector, Senior Citizens, Community Care-Givers,
Crime Prevention Volunteers, NGOs, FBOs, Moral Regeneration. Ward Councillor acts as a champion of the War
Room. Ward Task-Team Function –
• Identifies the needs of the community at ward level through CCGs and volunteers through profiling;
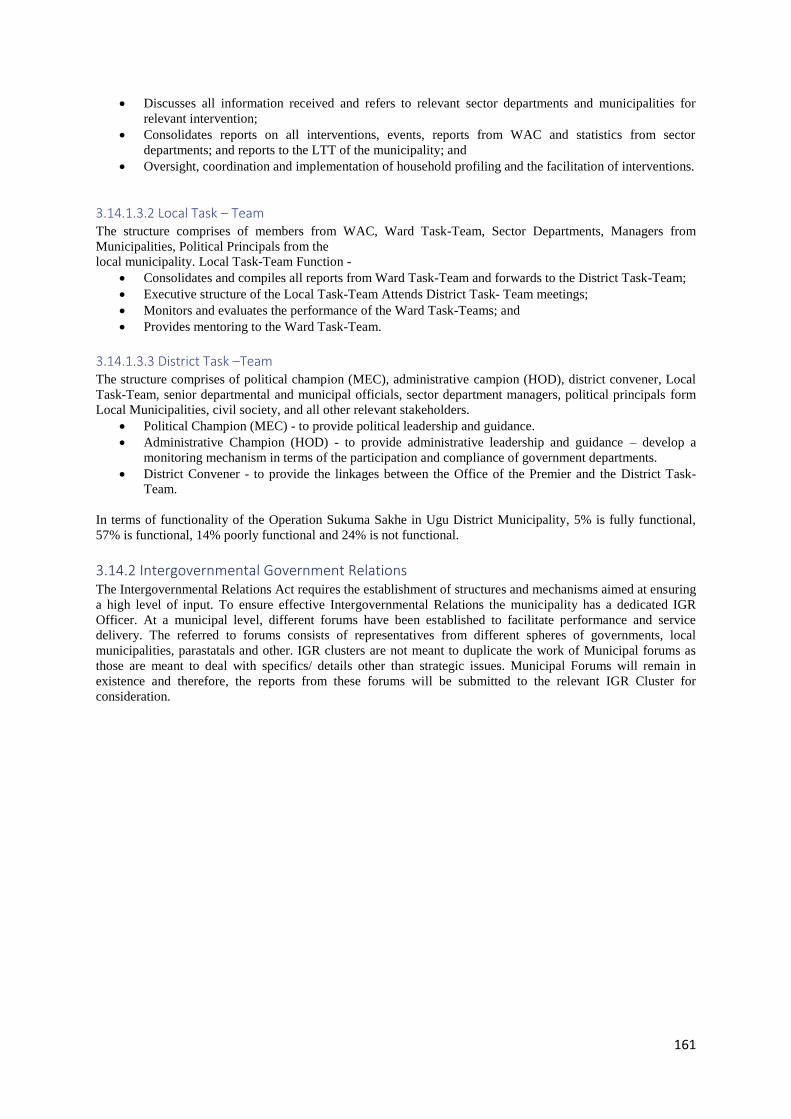
161
• Discusses all information received and refers to relevant sector departments and municipalities for
relevant intervention;
• Consolidates reports on all interventions, events, reports from WAC and statistics from sector
departments; and reports to the LTT of the municipality; and
• Oversight, coordination and implementation of household profiling and the facilitation of interventions.
3.14.1.3.2 Local Task – Team The structure comprises of members from WAC, Ward Task-Team, Sector Departments, Managers from
Municipalities, Political Principals from the
local municipality. Local Task-Team Function -
• Consolidates and compiles all reports from Ward Task-Team and forwards to the District Task-Team;
• Executive structure of the Local Task-Team Attends District Task- Team meetings;
• Monitors and evaluates the performance of the Ward Task-Teams; and
• Provides mentoring to the Ward Task-Team.
3.14.1.3.3 District Task –Team The structure comprises of political champion (MEC), administrative campion (HOD), district convener, Local
Task-Team, senior departmental and municipal officials, sector department managers, political principals form
Local Municipalities, civil society, and all other relevant stakeholders.
• Political Champion (MEC) - to provide political leadership and guidance.
• Administrative Champion (HOD) - to provide administrative leadership and guidance – develop a
monitoring mechanism in terms of the participation and compliance of government departments.
• District Convener - to provide the linkages between the Office of the Premier and the District Task-
Team.
In terms of functionality of the Operation Sukuma Sakhe in Ugu District Municipality, 5% is fully functional,
57% is functional, 14% poorly functional and 24% is not functional.
3.14.2 Intergovernmental Government Relations The Intergovernmental Relations Act requires the establishment of structures and mechanisms aimed at ensuring
a high level of input. To ensure effective Intergovernmental Relations the municipality has a dedicated IGR
Officer. At a municipal level, different forums have been established to facilitate performance and service
delivery. The referred to forums consists of representatives from different spheres of governments, local
municipalities, parastatals and other. IGR clusters are not meant to duplicate the work of Municipal forums as
those are meant to deal with specifics/ details other than strategic issues. Municipal Forums will remain in
existence and therefore, the reports from these forums will be submitted to the relevant IGR Cluster for
consideration.
162
3.14.2.1 IGR Challenges Coordination of IGR meetings has occasionally posed a challenge due to competing provincial meetings, mostly urgent. However, despite this, the municipality still managed
to achieve the objective to discuss matters of common interest. There is still a challenge with the participation of sector departments in IGR Rep forum however once they are
represented they do show commitment to the structure and participate well. It is still evident in areas like projects affecting more than just the municipality, e.g. construction of
houses. It has been found that a housing project would be at implementation before the bulk supply of water or sewerage system is finalised, leading to delayed occupation.
Mayors Forum
Functional: Yes
Sitting: Quarterly
Municipal managers Forum
Functional: Yes
Sitting: Quarterly
Chief Financial Officer's
Forum
Sitting: Quarterly
Functional: No
Basic Infrastructure Forum
Sitting: Quarterly
Functional: Yes
Local Economic
Development Forum
Sitting: Quarterly
Functional: Yes
Development Planning Forum
Sitting: Quarterly
Functional: Yes
Communications Forum
Sitting: Quarterly
Functional: No
Corporate Services
Forum
Sitting: Quarterly
Functional: Yes
Figure 3.14.2.1: Ugu District IGR Structures
Source: Ugu OMM, 2018
163
3.14.2.2 IGR Achievements In the previous year sub technical IGR committees could not convene until the structure of the committees was
adjusted and the District HODs convened committees within the district within their portfolios. The Governance
subcommittee gave birth to an ICT forum who have in addition to innovative discussion and sharing resources or
information where needed, held a successful inaugural ICT forum in 2017. International cooperation like the
Waste Management programme and Water management programmes with the different Swedish Municipalities
are not restricted to the district nor relevant local municipality only. All municipalities have a participatory role
in the partnerships. This has even extended to the country where Swedish embassy has established a networking
structure with all municipalities who have a relationship with Sweden. There is generally a good working relation
among all the spheres of government within the district.
3.14.3 Internal Information and Communication Technology The ICT Section, placed within the Corporate Services Department is primarily responsible for the
implementation, monitoring and reporting for the following ICT services supplied to the Municipality:
Infrastructure planning, maintenance, and support;
Production, Test and Disaster Recovery environment establishment and protection;
Information and Communication Technology Strategy;
Information and Communication Technology Governance;
Business relationship management;
Change control management
Systems Configuration management
Continuous Improvement Incident management and request fulfilment Information
security management.
Quarterly ICT Steering Committee Management reviews
Continuous Measurement of ICT Services
Problem management
Systems Release and deployment management
Service continuity and availability management
Service design
Service level management and quarterly reviews of service levels
Service reporting
Over and above problem resolution, the unit continues to take the Municipality forward and strategically targeted
and achieved the following within ICT:
• Implementation of 7 additional sites into the MPLS network. The average network uptime per
month, consistently for the financial year was 95% and measured over a 24/7.
• Incident Management System with continuous reporting and fault analysis.
• The review of and successful full testing of the Disaster Recovery Plan.
• Monthly documented backups of core financial system data, monthly documented restoration
tests and monthly off-site storage of all backups.
• The internal maintenance of the Ugu website and Intranet on a Microsoft SharePoint platform.
164
• Rigorous ICT security review sessions with all staff and the use of the ICT security policy DVD
presentation for all new staff.
• The review and alignment of the ICT Policy Strategy, ICT Governance Framework and Charter
and ICT total policy reviews and adoption with the IDP
• The monitoring of ICT Governance through the monitoring tool and achieving above required
governance goals for the Municipality for both Governance phases.
• VOIP implementation across all network sites, enabling sites with no previous voice
telecommunications to be online and operational at negligible costs, leveraging on existing
infrastructure.
• Ensure licencing and software applications are aligned and only licensed software is installed
on Municipal equipment.
• Upgrade of the PBX equipment in line with the latest versions ensuring technological
advancement in the Voice service
• The LAN infrastructure technology Refresh project was successfully implemented which
introduced wireless networks to all offices and Network Management Software to monitor all
network uptime.
• Mobile devices assigned to ICT Technicians to enable notification received by them while in
the field, with the impact that incidents are attended to faster
During the 2017 calendar year, the established ICT District Forum compromising of the 4 Municipalities
within the District met 6 times. A successful ICT Seminar was held with the topic of “Network planning and
optimization of existing infrastructure within the Ugu District” and had representation from all membership
and other stakeholders. The ICT Forum did a knowledge management excursion to the Dube Tradeport
Datacentre for research into effective disaster recovery and systems replication models.
3.14.4 Municipal Structures In line with Section 80 of the Municipal Structures Act, the Municipality currently has five multi-party
Portfolio Committees, namely:
• Finance Portfolio Committee;
• Water and Sanitation Portfolio Committee;
• Local Economic Development Portfolio Committee;
• Special Programmes Portfolio Committee; and
• Sound Governance and Human Resource Portfolio Committee.
These Portfolio Committees continue to assist the Executive Committee in policy development and
monitoring to accelerate service delivery, as well as the oversight of strategic programmes and projects.
Figure 3.14.4.1 gives the functionality of these committees.
There is also a Municipal Public Accounts Committee (MPAC). The primary function of a MPAC is to help
council to hold the executive and the municipal administration to account and to ensure the efficient and
effective use of municipal resources. It will do this by reviewing public accounts and exercising oversight on
behalf of the Council. The committee examines the following:
• financial statements of all executive organs of council;
• any audit reports issued on those statements;
165
• any reports issued by the AG on the affairs of any municipal entity;
• any other financial statements or reports referred to the committee by council; and to
council and
• the annual report on behalf of council and make recommendations to council.
Thereafter the MPAC may:
• report on any of those financial statements or reports to council;
• initiate and develop the annual oversight report based on the annual report;
• initiate any investigation in its area of competence; and
• perform any other function assigned by resolution of council.
3.14.4.1 Municipal BID Committees The municipality has put in place the BID Committees and are all functional. The sittings of committees
are based on the roster that is scheduled on annual basis. The committees are comprised as follows:
3.14.4.1.1 BID Specification Committee The BID Specification Committee is a committee of three and two members make up the quorum. The
committee is made up of the following members:
• GM: Water Services (Chairperson)
• Senior Manager Operations
• Manager: Fleet
• Contracts Co-ordinator
Manager ICT is the representative from user departments are on by invitation
3.14.4.1.2 BID Evaluation Committee The BID Evaluation Committee is a committee of five and three members makes up the quorum. The
committee is made up of the following members:
• Manager SCM (Chairperson)
• Contracts Co-ordinator
• Manager Assets
• Manager Environmental Health
• Manager ICT – Alternate Member
The representative from user departments are by invitation.
3.14.4.1.3 BID Adjudication The BID Evaluation Committee is a committee of five and three members makes up the quorum. The
committee is made up of the following members:
• GM: Budget and Treasury Office (Chairperson)
• Manager Financial Services (Deputy Chairperson)
• Manager: PMU
• Manager: Environmental Services
• Manager Disaster Management – Alternate Member
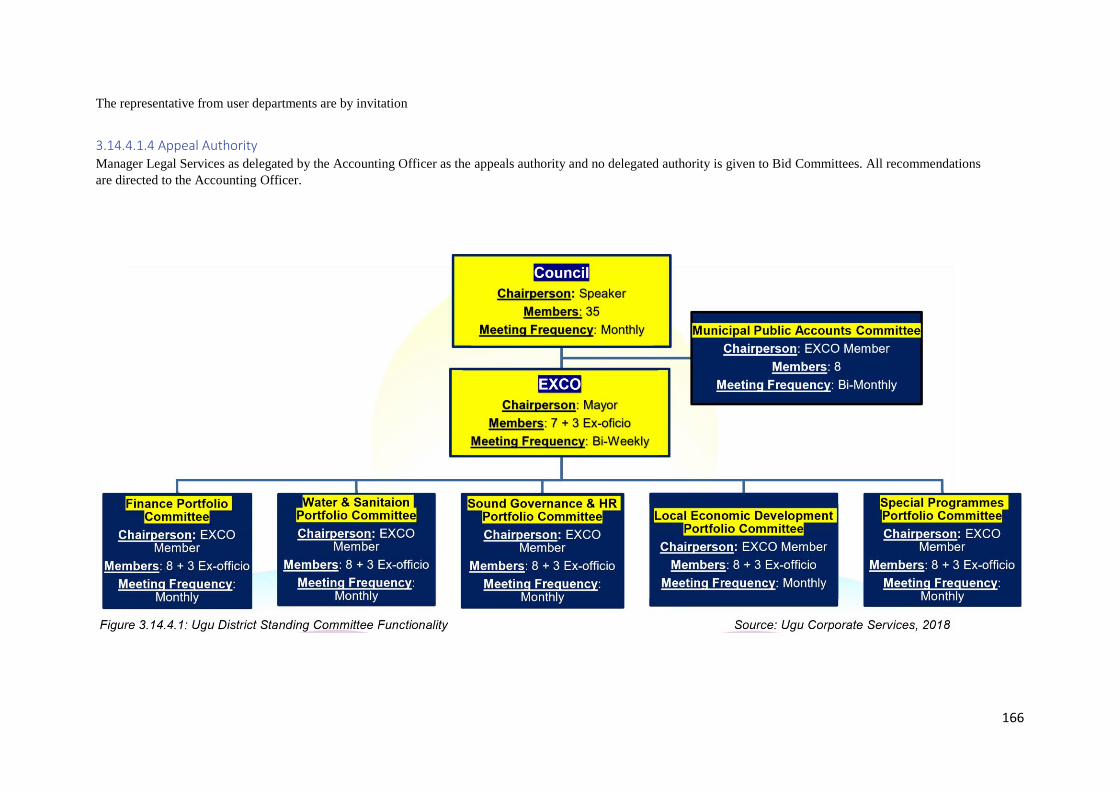
166
The representative from user departments are by invitation
3.14.4.1.4 Appeal Authority Manager Legal Services as delegated by the Accounting Officer as the appeals authority and no delegated authority is given to Bid Committees. All recommendations
are directed to the Accounting Officer.

167
3.14.5 Internal Audit In terms of section 165 of the MFMA, an in house Internal Audit section has been in operation since 2004.
The following functions are discharged in accordance with an approved Internal Audit Charter:
• To examine, evaluate and improve the adequacy and effectiveness of the municipality’s
governance, risk management processes and systems of internal control:
• Governance: assisting senior management in achieving the goals of the municipality by evaluating
and approving the process through which goals & values are established, communicated and
monitored accountability is ensured and municipal values preserved;
• Risk Management: assisting the Executive Committee and senior management in identifying,
evaluating and assessing significant organisational risks and providing assurance as to the
effectiveness of the related internal controls;
• Internal Controls: evaluating the effectiveness and efficiency of the information systems
environment, financial and operational information, operations, safeguarding of assets and
compliance with laws, regulations and controls;
• To conduct special investigations and other ad hoc projects at the request of management; and
• To report to the Audit Committee and Municipal Manager.
Internal Audit completes internal audit reviews in accordance with an approved three-year strategic plan. The plan
is formulated using a risk-based approach and includes evaluating the effectiveness and efficiency of the
information systems environment, financial and operational information, operations, safeguarding of assets and
compliance with laws, regulations & controls.
3.14.5.1 Forensic Services The Internal Audit unit also conducts forensic investigations and fraud risk management services. The District
Municipality together with its local municipalities have
committed themselves to fight against fraud and corruption. They have strengthened their fraud prevention and
detection techniques by jointly procuring an Anti-Fraud and Corruption Hotline from an independent service
provider where members of the public can anonymously blow the whistle on fraud and corruption.
The contact details for the Anti-Fraud and Corruption Hotline are as follows:
Toll Free: 0801 111 660 – Email: [email protected] – Fax:
086 5222 816 - P. O. Box 51006, Musgrave, 4001
3.14.5.2 Internal Audit Committee The Internal Audit Committee is functional and sits on a quarterly basis or as and when the need arises. The
members are appointed on a three-year term. There are currently four members appointed. Two of the
members are Chattered Accountants, one member is in the field of law, and the other a person who has
experience in the field of Municipal Performance Management.
3.14.6 Community Participation Strategy A Community Participation Strategy has been developed which is aimed at consolidating and formalising
these initiatives to ensure that there is an effective, well-co-ordinated and ongoing interaction between the
municipality and the communities it serves on municipal affairs. The municipality’s intention is to strengthen
community participation processes however, there is a need to implement interventions to improve the level
of participation by the community, especially the urban based members of the public. Although this strategy
is in existence, its adequacy in terms of communication could not be ascertained. Within Ugu District, one
way of implementing the Community Participation Strategy and involving communities within the IDP and
Budget process is through the IDP/Budget road shows and Mayoral Izimbizo. Community inputs made during
Mayoral Izimbizo inform the budget processes of the municipality as it is part of the consultation process
aimed at improving public participation in the affairs of the District. The Ugu District Public Participation
Forum was established which is comprised of CoGTA representatives, local municipalities and all Public
Participation Practitioners and is responsible for the coordination of public participation activities.
168
3.14.6.1 Ward Committees The district includes for local municipalities with 85 wards and all ward committees have been established.
However, the key challenges that hinder effectiveness of ward committees includes administration / logistics
support and the vastness and inaccessibility of rural wards. Some of the areas are serviced by the Community
Development Workers who have a dual responsibility to report to Department of Cooperative Governance
and Traditional Affairs and local municipalities. Findings on the Role of Ward Committees Challenges: Ward
committee training and workshop was conducted; the following concerns were found to be primary to ward
committees and were raised as issues that required immediate and utmost attention:
• There is a high level of frustration from the Ward Committee Members complaining there is no
space created for them to use all the information and skills they receive from all these workshops.
This is a general feeling from the Ward Committee Members that they have enough knowledge and
skill now but are being underutilized and overlooked in the municipal affairs and decisions.
• There is still a high number of Ward Committees that feel there is tension between them and the
Chairpersons. This is coupled with a complain that the Chairpersons of the Ward Committees do
not make themselves available for workshops of this kind where issues hindering development as a
result of unclear roles that must be played by both parties are explained and interrogated.
• The unstable relationship between the Chairpersons and the rest of ward committee members were
sighted to have been based on the Chairperson feeling insecure as far as their positions are concerned
thus, active ward committee members being perceived by as declaring their ambitions for
councillorship.
• There is a communication breakdown between the municipalities and the Ward Committees which
affects information flow. There is no feedback on the community needs that the Ward Committees
submit to the municipality for inclusion in the IDP or explanations as to why some projects are
prioritised and others not. Furthermore, the Ward Committees are not informed of the proposed or
planned development thus cannot inform the community timelessly and effectively and cannot
answer to the community.
• There are limited resources to carry out the expected duties of Ward Committees, such as
loudhailers, stationery, and other necessary office equipment. Furthermore, the stipend amount
needs to be reviewed as it only covers telephone costs and falls short in travelling costs.
• Ward committees need to be capacitated continuously in accredited courses that will equip them
with certificates so that they are able to utilise them in their endeavour to advance their careers and
not just the consultation workshops.
• Municipal documents and materials to be translated into isiZulu in a bid to accommodate the
majority people of the district.
3.14.7 Customer Relations Customer relations unit is concerned with the customers’ perception of the services rendered by the
municipality and to instil and establish a positive image of the municipality in the customer’s mind. The main
function performed include:
• Being an ambassador for the municipality – both internally and externally;
• To resolve customer conflicts when are not provided as expected and the customer contacts the
municipality;
• To answer questions from the municipality’s current and potential customers;
• To create and propose innovative solutions to solidify the partnership between the municipality and
the customer; and
• To be in communication with the customers through Customer Satisfaction Surveys to understand
their needs and to stay updated on the customers’ perception of the municipality’s services.
The analysis of customer satisfaction within Ugu DM is informed by an annual customer satisfaction survey
as well as records of received complaints during each financial year. The survey findings included the
following:
169
• That most wards and/communities have access to water and sanitation, however there are water
interruptions experienced more often due to aging infrastructure and drought;
• A need to improve on communication and information transmission to rural communities in
particular; and
• The survey conducted was focused on general household district wide, soliciting views on integrated
services rendered by all spheres of government hence, the need for a more specific and focused
survey.
Analysis of received complaints also revealed the following:
i. That there are several water shortages and burst pipes which is also due to aging infrastructure and
drought. There are several mechanisms put in place in order to ensure that communities are satisfied
with the services they receive from the municipality.
ii. Customer Care Bus: The purchase of the mobile office allowed the municipality to reach all
communities especially the rural areas. It brings the services and information to the people.
iii. Service Commitment Charter: The reviewed and approved Service Commitment Charter is in place
and employees are workshopped on it to ensure that they are aware, comply and meet the service
standards set by the municipality in delivering services.
iv. Complaints Handling Procedure: It is in place and assists employees in dealing with the complaints
received properly and meeting the turnaround times.
v. Community Outreach Programmes: These are in place and assist in educating communities about
the services they receive, their rights and responsibilities.
vi. Quality Assurance: In place to ensure that work is done properly and timely and also determine
whether or not consumers are satisfied with the service rendered.
vii. Batho Pele: Its programmes are in place to ensure Service Delivery improvement putting
customers first and doing things right the first time for customer satisfaction.
3.14.8 Role of Amakhosi and Communities in the IDP The internal and external role players have roles and responsibilities in terms of the IDP development process.
The IDP Representative Forum consists of representatives from all local municipalities, the House of Traditional
Leaders, civil society, and service providers / sector departments. This forum provides public and private sector
input into the IDP. Ugu District Municipality has ensured the continual participation of all the role players to
ensure maximum input into the IDP process. Amakhosi have also been incorporated into the District Municipal
Council Furthermore, Amakhosi also form part of the municipal portfolio committees.
3.14.9 Risk Management Risk Management is one of Management’s core responsibilities in terms of section 62 of the Municipal Finance
Management Act (MFMA) and is an integral part of the internal processes of a municipality. It is a systematic
process to identify, evaluate and address risks on a continuous basis before such risks can impact negatively on
service delivery by a municipality. When properly executed risk, management provides reasonable assurance that
the institution will be successful in achieving its goals and objectives. The Municipality conducts Risk
Assessments (Enterprise wide, IT and Fraud Risk Assessments) annually and develops an organisational Risk
Register. The Risk Register is compiled to determine the magnitude of risk exposure by assessing the likelihood
of the risk materialising and the impact that it would have on the achievement of objectives. The identified risks
are prioritised which enables Management to focus more time, effort and resources on higher risk areas. The
Municipality has a Risk Management Committee in place. There is a framework in place incorporating the Risk
Management Policy, Risk Management Committee Charter, Risk Management Implementation Plan, Risk
Management Strategy and Mitigation Plan.
3.14.10 Annual Report An annual report for the 2017/2018 financial year will be compiled and issued in terms of the Municipal Finance
Management Act. The report will be made available to interested stakeholders. The 2016 / 2017 Annual Report
has been adopted by Council and been distributed to all the relevant stakeholders. The 2018 / 2019 IDP Review
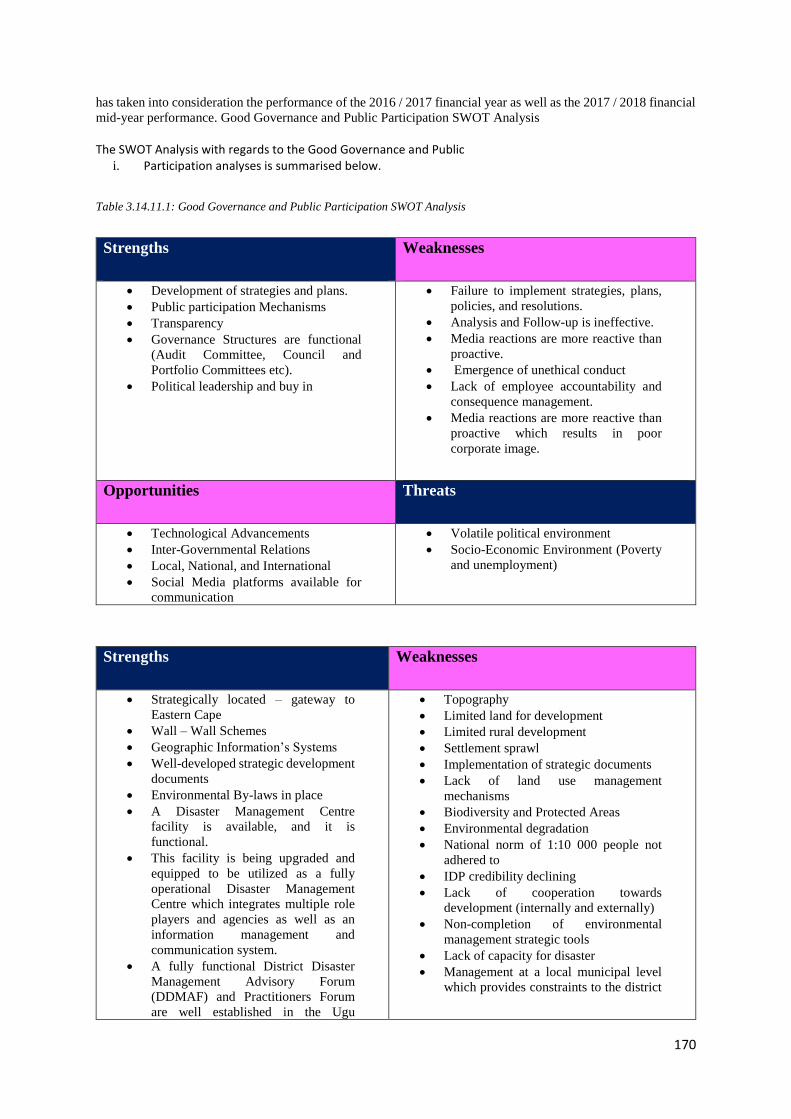
170
has taken into consideration the performance of the 2016 / 2017 financial year as well as the 2017 / 2018 financial
mid-year performance. Good Governance and Public Participation SWOT Analysis
The SWOT Analysis with regards to the Good Governance and Public
i. Participation analyses is summarised below.
Table 3.14.11.1: Good Governance and Public Participation SWOT Analysis
Strengths Weaknesses
• Development of strategies and plans.
• Public participation Mechanisms
• Transparency
• Governance Structures are functional
(Audit Committee, Council and
Portfolio Committees etc).
• Political leadership and buy in
• Failure to implement strategies, plans,
policies, and resolutions.
• Analysis and Follow-up is ineffective.
• Media reactions are more reactive than
proactive.
• Emergence of unethical conduct
• Lack of employee accountability and
consequence management.
• Media reactions are more reactive than
proactive which results in poor
corporate image.
Opportunities Threats
• Technological Advancements
• Inter-Governmental Relations
• Local, National, and International
• Social Media platforms available for
communication
• Volatile political environment
• Socio-Economic Environment (Poverty
and unemployment)
Strengths Weaknesses
• Strategically located – gateway to
Eastern Cape
• Wall – Wall Schemes
• Geographic Information’s Systems
• Well-developed strategic development
documents
• Environmental By-laws in place
• A Disaster Management Centre
facility is available, and it is
functional.
• This facility is being upgraded and
equipped to be utilized as a fully
operational Disaster Management
Centre which integrates multiple role
players and agencies as well as an
information management and
communication system.
• A fully functional District Disaster
Management Advisory Forum
(DDMAF) and Practitioners Forum
are well established in the Ugu
• Topography
• Limited land for development
• Limited rural development
• Settlement sprawl
• Implementation of strategic documents
• Lack of land use management
mechanisms
• Biodiversity and Protected Areas
• Environmental degradation
• National norm of 1:10 000 people not
adhered to
• IDP credibility declining
• Lack of cooperation towards
development (internally and externally)
• Non-completion of environmental
management strategic tools
• Lack of capacity for disaster
• Management at a local municipal level
which provides constraints to the district
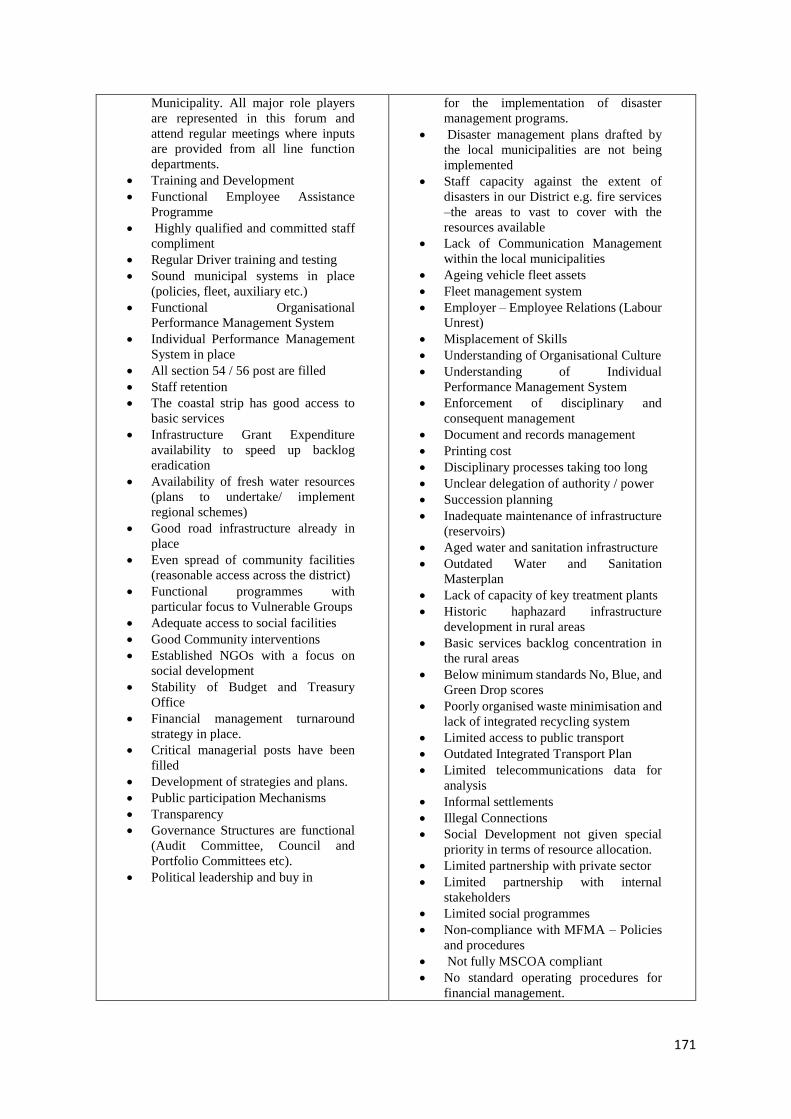
171
Municipality. All major role players
are represented in this forum and
attend regular meetings where inputs
are provided from all line function
departments.
• Training and Development
• Functional Employee Assistance
Programme
• Highly qualified and committed staff
compliment
• Regular Driver training and testing
• Sound municipal systems in place
(policies, fleet, auxiliary etc.)
• Functional Organisational
Performance Management System
• Individual Performance Management
System in place
• All section 54 / 56 post are filled
• Staff retention
• The coastal strip has good access to
basic services
• Infrastructure Grant Expenditure
availability to speed up backlog
eradication
• Availability of fresh water resources
(plans to undertake/ implement
regional schemes)
• Good road infrastructure already in
place
• Even spread of community facilities
(reasonable access across the district)
• Functional programmes with
particular focus to Vulnerable Groups
• Adequate access to social facilities
• Good Community interventions
• Established NGOs with a focus on
social development
• Stability of Budget and Treasury
Office
• Financial management turnaround
strategy in place.
• Critical managerial posts have been
filled
• Development of strategies and plans.
• Public participation Mechanisms
• Transparency
• Governance Structures are functional
(Audit Committee, Council and
Portfolio Committees etc).
• Political leadership and buy in
for the implementation of disaster
management programs.
• Disaster management plans drafted by
the local municipalities are not being
implemented
• Staff capacity against the extent of
disasters in our District e.g. fire services
–the areas to vast to cover with the
resources available
• Lack of Communication Management
within the local municipalities
• Ageing vehicle fleet assets
• Fleet management system
• Employer – Employee Relations (Labour
Unrest)
• Misplacement of Skills
• Understanding of Organisational Culture
• Understanding of Individual
Performance Management System
• Enforcement of disciplinary and
consequent management
• Document and records management
• Printing cost
• Disciplinary processes taking too long
• Unclear delegation of authority / power
• Succession planning
• Inadequate maintenance of infrastructure
(reservoirs)
• Aged water and sanitation infrastructure
• Outdated Water and Sanitation
Masterplan
• Lack of capacity of key treatment plants
• Historic haphazard infrastructure
development in rural areas
• Basic services backlog concentration in
the rural areas
• Below minimum standards No, Blue, and
Green Drop scores
• Poorly organised waste minimisation and
lack of integrated recycling system
• Limited access to public transport
• Outdated Integrated Transport Plan
• Limited telecommunications data for
analysis
• Informal settlements
• Illegal Connections
• Social Development not given special
priority in terms of resource allocation.
• Limited partnership with private sector
• Limited partnership with internal
stakeholders
• Limited social programmes
• Non-compliance with MFMA – Policies
and procedures
• Not fully MSCOA compliant
• No standard operating procedures for
financial management.

172
• Misalignment of skills within the
organisation.
• Inaccurate billing
• Lack of contracts management
• Inaccurate customer information’s
database
• Failure to implement strategies, plans,
policies, and resolutions.
• Analysis and Follow-up is ineffective.
• Media reactions are more reactive than
proactive.
• Emergence of unethical conduct
• Lack of employee accountability and
consequence management.
• Media reactions are more reactive than
proactive which results in poor corporate
image.
Opportunities Threats
• Densification
• Access to an accredited laboratory
• A Disaster Management Centre facility is
available and is currently in use by the
municipality.
• This facility will be upgraded and equipped
to be utilized for both Disaster Management
Fire and Rescue Services.
• Bursary allocation to be aligned to critical
skill (internally and externally)
• Satellite university / tertiary institutions
• Alternative water sources
• Alternative energy
• Forging partnership with Private Sector
(taking advantage of available Corporate
Social Investment)
• New innovative initiatives to address social
ills
• Expansion of existing programmes to cover
the whole district
• Potential for investment to enhance
economic development and revenue
collection.
• Larger Urban areas to enhance revenue
• Support from National and Provincial
treasury and CoGTA
• Technological Advancements
• Inter-Governmental Relations
• Local, National, and International
• Social Media platforms available for
communication
• Tenure security
• Rural Population Outmigration
• Climate Change
• Compromised community health as regular
inspections cannot be conducted
• Disease outbreak
• Non-Development, update, and
implementation of DMPs by the local
municipalities as the district plan should
contain a consolidation of all the local plans.
• The same will apply when the various sector
departments do not have their own disaster
management plans in place which will create
gaps in the capacity and readiness of the
municipality and will leave the community
vulnerable.
• Critical skills shortages
• High staff turnover
• Natural adversities such as droughts and
flooding
• Urbanisation and rural population
outmigration
• Immigration – the district is the Eastern Cape
gateway to KZN, the arrival of people
seeking better opportunities often further
burdens the already stretched infrastructure.
• Non- cooperation from some Local
Municipalities
• Social Inequality
• High Crime Rate
• High prevalence of HIV and Aids
• Social ills (Teenage pregnancy, drugs and
substance abuse, gender-based violence)
• Duplication of Efforts/Initiatives
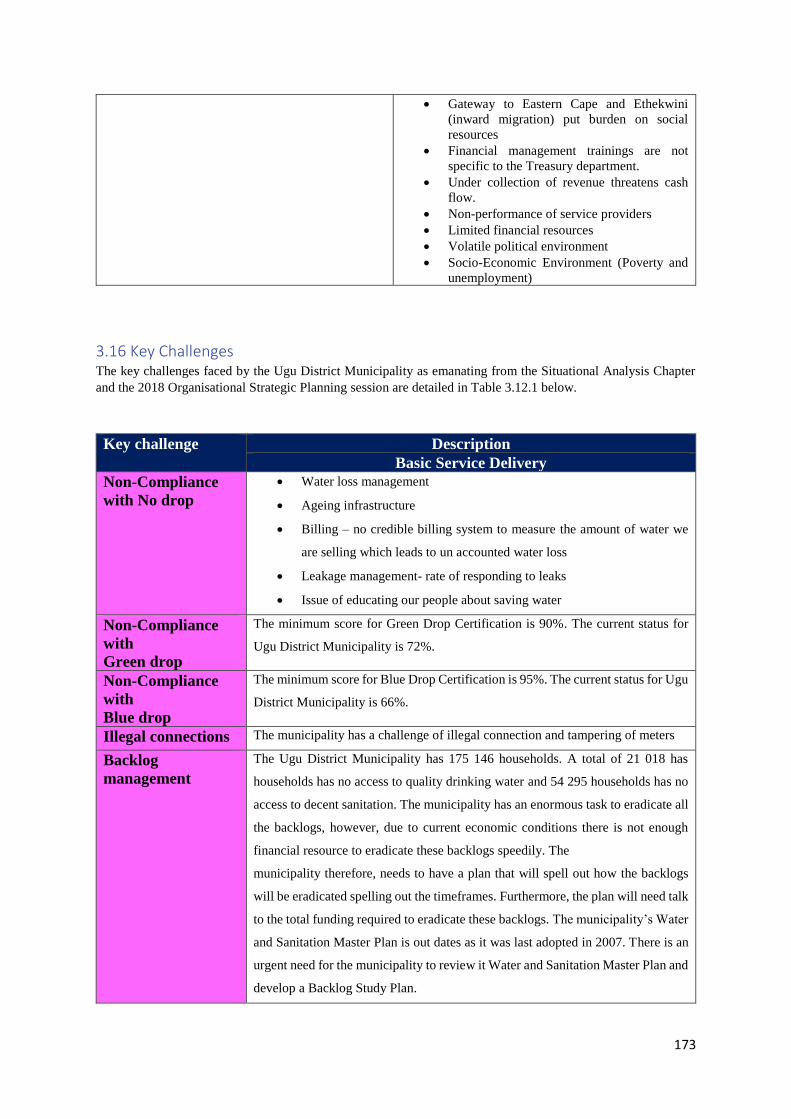
173
• Gateway to Eastern Cape and Ethekwini
(inward migration) put burden on social
resources
• Financial management trainings are not
specific to the Treasury department.
• Under collection of revenue threatens cash
flow.
• Non-performance of service providers
• Limited financial resources
• Volatile political environment
• Socio-Economic Environment (Poverty and
unemployment)
3.16 Key Challenges The key challenges faced by the Ugu District Municipality as emanating from the Situational Analysis Chapter
and the 2018 Organisational Strategic Planning session are detailed in Table 3.12.1 below.
Key challenge Description
Basic Service Delivery
Non-Compliance
with No drop
• Water loss management
• Ageing infrastructure
• Billing – no credible billing system to measure the amount of water we
are selling which leads to un accounted water loss
• Leakage management- rate of responding to leaks
• Issue of educating our people about saving water
Non-Compliance
with
Green drop
The minimum score for Green Drop Certification is 90%. The current status for
Ugu District Municipality is 72%.
Non-Compliance
with
Blue drop
The minimum score for Blue Drop Certification is 95%. The current status for Ugu
District Municipality is 66%.
Illegal connections The municipality has a challenge of illegal connection and tampering of meters
Backlog
management
The Ugu District Municipality has 175 146 households. A total of 21 018 has
households has no access to quality drinking water and 54 295 households has no
access to decent sanitation. The municipality has an enormous task to eradicate all
the backlogs, however, due to current economic conditions there is not enough
financial resource to eradicate these backlogs speedily. The
municipality therefore, needs to have a plan that will spell out how the backlogs
will be eradicated spelling out the timeframes. Furthermore, the plan will need talk
to the total funding required to eradicate these backlogs. The municipality’s Water
and Sanitation Master Plan is out dates as it was last adopted in 2007. There is an
urgent need for the municipality to review it Water and Sanitation Master Plan and
develop a Backlog Study Plan.
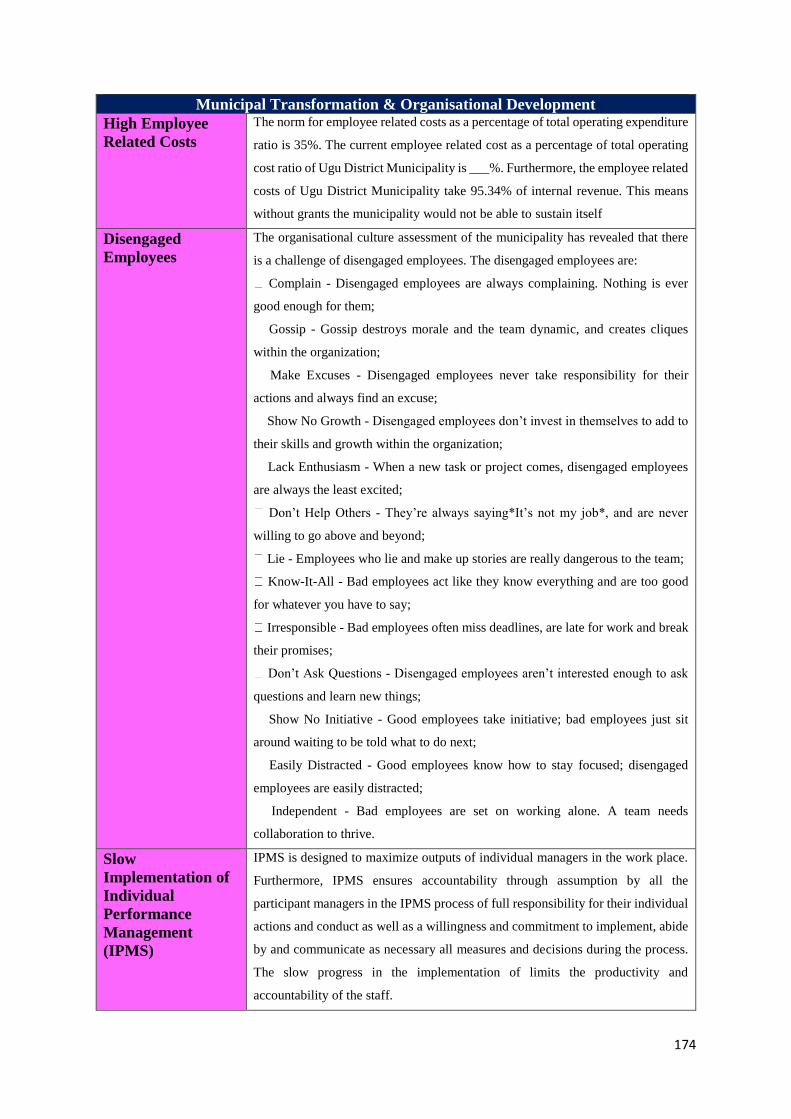
174
Municipal Transformation & Organisational Development
High Employee
Related Costs
The norm for employee related costs as a percentage of total operating expenditure
ratio is 35%. The current employee related cost as a percentage of total operating
cost ratio of Ugu District Municipality is ___%. Furthermore, the employee related
costs of Ugu District Municipality take 95.34% of internal revenue. This means
without grants the municipality would not be able to sustain itself
Disengaged
Employees
The organisational culture assessment of the municipality has revealed that there
is a challenge of disengaged employees. The disengaged employees are:
Complain - Disengaged employees are always complaining. Nothing is ever
good enough for them;
Gossip - Gossip destroys morale and the team dynamic, and creates cliques
within the organization;
Make Excuses - Disengaged employees never take responsibility for their
actions and always find an excuse;
Show No Growth - Disengaged employees don’t invest in themselves to add to
their skills and growth within the organization;
Lack Enthusiasm - When a new task or project comes, disengaged employees
are always the least excited;
Don’t Help Others - They’re always saying*It’s not my job*, and are never
willing to go above and beyond;
Lie - Employees who lie and make up stories are really dangerous to the team;
Know-It-All - Bad employees act like they know everything and are too good
for whatever you have to say;
Irresponsible - Bad employees often miss deadlines, are late for work and break
their promises;
Don’t Ask Questions - Disengaged employees aren’t interested enough to ask
questions and learn new things;
Show No Initiative - Good employees take initiative; bad employees just sit
around waiting to be told what to do next;
Easily Distracted - Good employees know how to stay focused; disengaged
employees are easily distracted;
Independent - Bad employees are set on working alone. A team needs
collaboration to thrive.
Slow
Implementation of
Individual
Performance
Management
(IPMS)
IPMS is designed to maximize outputs of individual managers in the work place.
Furthermore, IPMS ensures accountability through assumption by all the
participant managers in the IPMS process of full responsibility for their individual
actions and conduct as well as a willingness and commitment to implement, abide
by and communicate as necessary all measures and decisions during the process.
The slow progress in the implementation of limits the productivity and
accountability of the staff.
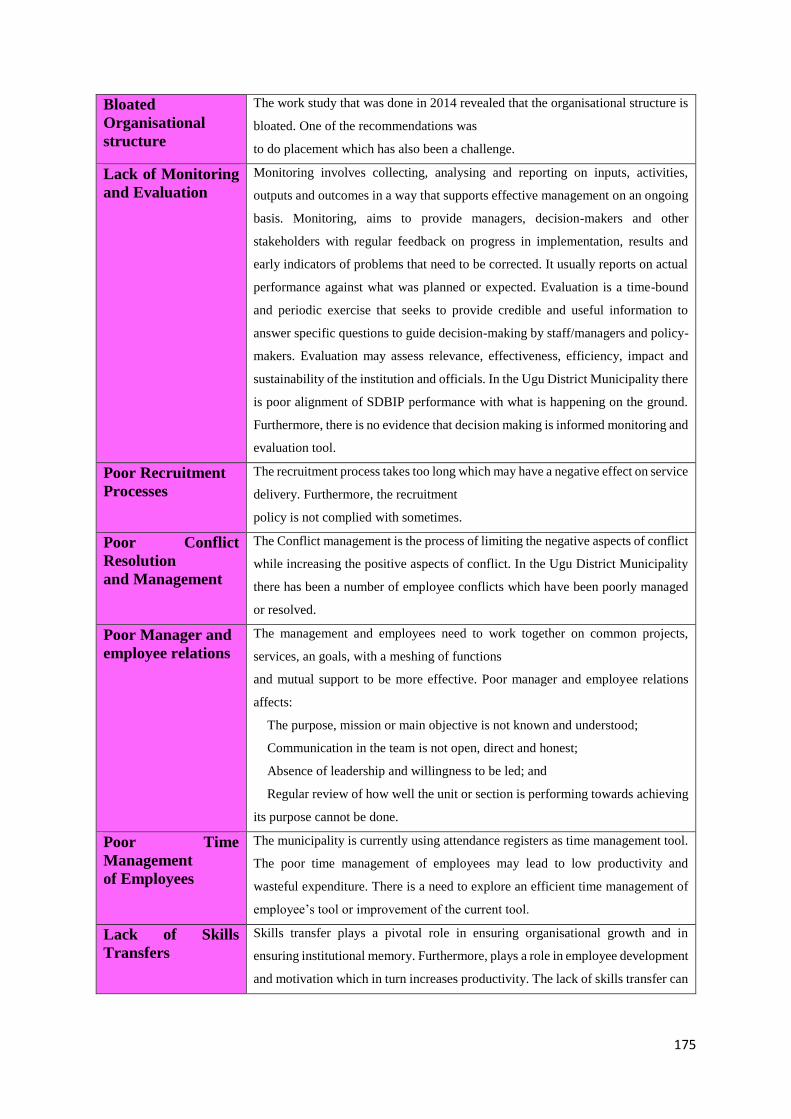
175
Bloated
Organisational
structure
The work study that was done in 2014 revealed that the organisational structure is
bloated. One of the recommendations was
to do placement which has also been a challenge.
Lack of Monitoring
and Evaluation
Monitoring involves collecting, analysing and reporting on inputs, activities,
outputs and outcomes in a way that supports effective management on an ongoing
basis. Monitoring, aims to provide managers, decision-makers and other
stakeholders with regular feedback on progress in implementation, results and
early indicators of problems that need to be corrected. It usually reports on actual
performance against what was planned or expected. Evaluation is a time-bound
and periodic exercise that seeks to provide credible and useful information to
answer specific questions to guide decision-making by staff/managers and policy-
makers. Evaluation may assess relevance, effectiveness, efficiency, impact and
sustainability of the institution and officials. In the Ugu District Municipality there
is poor alignment of SDBIP performance with what is happening on the ground.
Furthermore, there is no evidence that decision making is informed monitoring and
evaluation tool.
Poor Recruitment
Processes
The recruitment process takes too long which may have a negative effect on service
delivery. Furthermore, the recruitment
policy is not complied with sometimes.
Poor Conflict
Resolution
and Management
The Conflict management is the process of limiting the negative aspects of conflict
while increasing the positive aspects of conflict. In the Ugu District Municipality
there has been a number of employee conflicts which have been poorly managed
or resolved.
Poor Manager and
employee relations
The management and employees need to work together on common projects,
services, an goals, with a meshing of functions
and mutual support to be more effective. Poor manager and employee relations
affects:
The purpose, mission or main objective is not known and understood;
Communication in the team is not open, direct and honest;
Absence of leadership and willingness to be led; and
Regular review of how well the unit or section is performing towards achieving
its purpose cannot be done.
Poor Time
Management
of Employees
The municipality is currently using attendance registers as time management tool.
The poor time management of employees may lead to low productivity and
wasteful expenditure. There is a need to explore an efficient time management of
employee’s tool or improvement of the current tool.
Lack of Skills
Transfers
Skills transfer plays a pivotal role in ensuring organisational growth and in
ensuring institutional memory. Furthermore, plays a role in employee development
and motivation which in turn increases productivity. The lack of skills transfer can
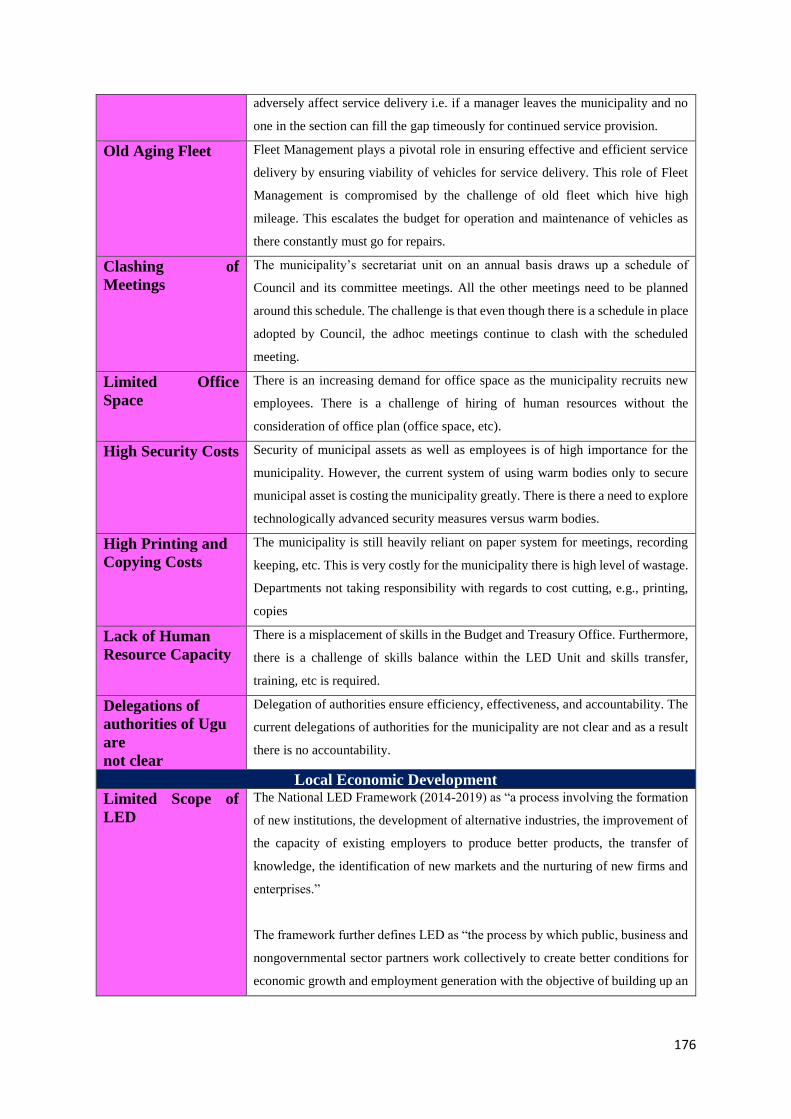
176
adversely affect service delivery i.e. if a manager leaves the municipality and no
one in the section can fill the gap timeously for continued service provision.
Old Aging Fleet Fleet Management plays a pivotal role in ensuring effective and efficient service
delivery by ensuring viability of vehicles for service delivery. This role of Fleet
Management is compromised by the challenge of old fleet which hive high
mileage. This escalates the budget for operation and maintenance of vehicles as
there constantly must go for repairs.
Clashing of
Meetings
The municipality’s secretariat unit on an annual basis draws up a schedule of
Council and its committee meetings. All the other meetings need to be planned
around this schedule. The challenge is that even though there is a schedule in place
adopted by Council, the adhoc meetings continue to clash with the scheduled
meeting.
Limited Office
Space
There is an increasing demand for office space as the municipality recruits new
employees. There is a challenge of hiring of human resources without the
consideration of office plan (office space, etc).
High Security Costs Security of municipal assets as well as employees is of high importance for the
municipality. However, the current system of using warm bodies only to secure
municipal asset is costing the municipality greatly. There is there a need to explore
technologically advanced security measures versus warm bodies.
High Printing and
Copying Costs
The municipality is still heavily reliant on paper system for meetings, recording
keeping, etc. This is very costly for the municipality there is high level of wastage.
Departments not taking responsibility with regards to cost cutting, e.g., printing,
copies
Lack of Human
Resource Capacity
There is a misplacement of skills in the Budget and Treasury Office. Furthermore,
there is a challenge of skills balance within the LED Unit and skills transfer,
training, etc is required.
Delegations of
authorities of Ugu
are
not clear
Delegation of authorities ensure efficiency, effectiveness, and accountability. The
current delegations of authorities for the municipality are not clear and as a result
there is no accountability.
Local Economic Development
Limited Scope of
LED
The National LED Framework (2014-2019) as “a process involving the formation
of new institutions, the development of alternative industries, the improvement of
the capacity of existing employers to produce better products, the transfer of
knowledge, the identification of new markets and the nurturing of new firms and
enterprises.”
The framework further defines LED as “the process by which public, business and
nongovernmental sector partners work collectively to create better conditions for
economic growth and employment generation with the objective of building up an
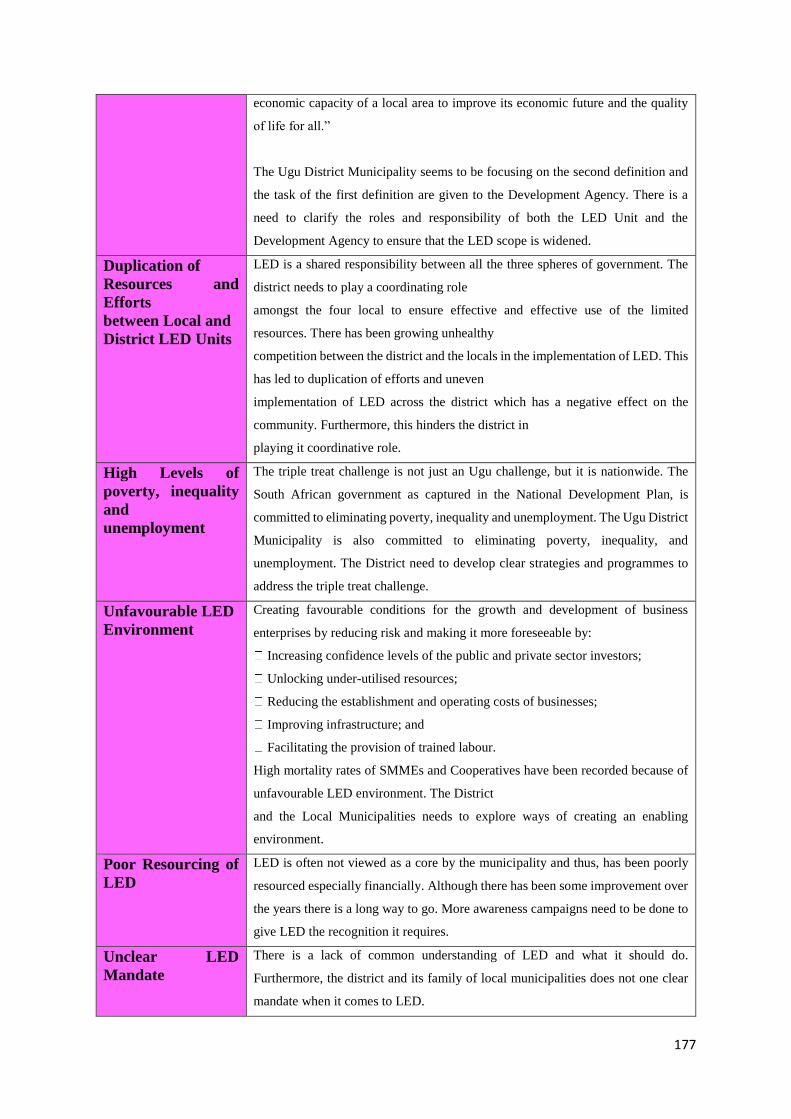
177
economic capacity of a local area to improve its economic future and the quality
of life for all.”
The Ugu District Municipality seems to be focusing on the second definition and
the task of the first definition are given to the Development Agency. There is a
need to clarify the roles and responsibility of both the LED Unit and the
Development Agency to ensure that the LED scope is widened.
Duplication of
Resources and
Efforts
between Local and
District LED Units
LED is a shared responsibility between all the three spheres of government. The
district needs to play a coordinating role
amongst the four local to ensure effective and effective use of the limited
resources. There has been growing unhealthy
competition between the district and the locals in the implementation of LED. This
has led to duplication of efforts and uneven
implementation of LED across the district which has a negative effect on the
community. Furthermore, this hinders the district in
playing it coordinative role.
High Levels of
poverty, inequality
and
unemployment
The triple treat challenge is not just an Ugu challenge, but it is nationwide. The
South African government as captured in the National Development Plan, is
committed to eliminating poverty, inequality and unemployment. The Ugu District
Municipality is also committed to eliminating poverty, inequality, and
unemployment. The District need to develop clear strategies and programmes to
address the triple treat challenge.
Unfavourable LED
Environment
Creating favourable conditions for the growth and development of business
enterprises by reducing risk and making it more foreseeable by:
Increasing confidence levels of the public and private sector investors;
Unlocking under-utilised resources;
Reducing the establishment and operating costs of businesses;
Improving infrastructure; and
Facilitating the provision of trained labour.
High mortality rates of SMMEs and Cooperatives have been recorded because of
unfavourable LED environment. The District
and the Local Municipalities needs to explore ways of creating an enabling
environment.
Poor Resourcing of
LED
LED is often not viewed as a core by the municipality and thus, has been poorly
resourced especially financially. Although there has been some improvement over
the years there is a long way to go. More awareness campaigns need to be done to
give LED the recognition it requires.
Unclear LED
Mandate
There is a lack of common understanding of LED and what it should do.
Furthermore, the district and its family of local municipalities does not one clear
mandate when it comes to LED.
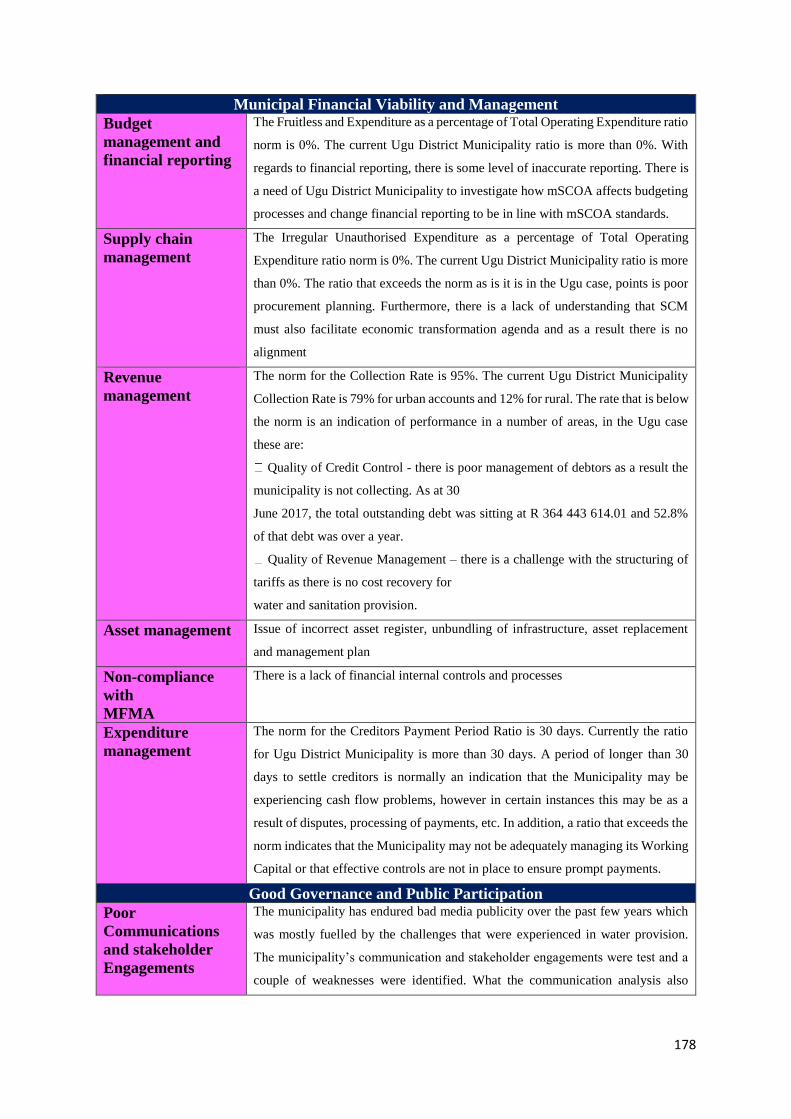
178
Municipal Financial Viability and Management
Budget
management and
financial reporting
The Fruitless and Expenditure as a percentage of Total Operating Expenditure ratio
norm is 0%. The current Ugu District Municipality ratio is more than 0%. With
regards to financial reporting, there is some level of inaccurate reporting. There is
a need of Ugu District Municipality to investigate how mSCOA affects budgeting
processes and change financial reporting to be in line with mSCOA standards.
Supply chain
management
The Irregular Unauthorised Expenditure as a percentage of Total Operating
Expenditure ratio norm is 0%. The current Ugu District Municipality ratio is more
than 0%. The ratio that exceeds the norm as is it is in the Ugu case, points is poor
procurement planning. Furthermore, there is a lack of understanding that SCM
must also facilitate economic transformation agenda and as a result there is no
alignment
Revenue
management
The norm for the Collection Rate is 95%. The current Ugu District Municipality
Collection Rate is 79% for urban accounts and 12% for rural. The rate that is below
the norm is an indication of performance in a number of areas, in the Ugu case
these are:
Quality of Credit Control - there is poor management of debtors as a result the
municipality is not collecting. As at 30
June 2017, the total outstanding debt was sitting at R 364 443 614.01 and 52.8%
of that debt was over a year.
Quality of Revenue Management – there is a challenge with the structuring of
tariffs as there is no cost recovery for
water and sanitation provision.
Asset management Issue of incorrect asset register, unbundling of infrastructure, asset replacement
and management plan
Non-compliance
with
MFMA
There is a lack of financial internal controls and processes
Expenditure
management
The norm for the Creditors Payment Period Ratio is 30 days. Currently the ratio
for Ugu District Municipality is more than 30 days. A period of longer than 30
days to settle creditors is normally an indication that the Municipality may be
experiencing cash flow problems, however in certain instances this may be as a
result of disputes, processing of payments, etc. In addition, a ratio that exceeds the
norm indicates that the Municipality may not be adequately managing its Working
Capital or that effective controls are not in place to ensure prompt payments.
Good Governance and Public Participation
Poor
Communications
and stakeholder
Engagements
The municipality has endured bad media publicity over the past few years which
was mostly fuelled by the challenges that were experienced in water provision.
The municipality’s communication and stakeholder engagements were test and a
couple of weaknesses were identified. What the communication analysis also

179
found is that the communication field is vastly becoming digital and the
municipality is lagging behind in this aspect.
The internal communications standard practices are not adhered to which leads to
miscommunication and communication breakdowns between departments. This
has had an adverse effect on service delivery and has resulted in unnecessary
delays in the implementation of projects and programmes.
The external communication is urban biased and is limited in the hinterland. The
main language of written communication is English which further marginalise the
rural hinterland. Furthermore, there is no standard system in place to engage
stakeholders and lack of stakeholder analysis.
Customer services not being embraced internally but rather seen as an external
service, there is no systems in place to ensure
that this is being done. The communication strategy need to be reviewed to
accommodate the rapidly changing communication environment. Customer
satisfaction survey needs to be undertaken. The Batho Pele needs to be re-
institutionalised as well.
Disintegrated
Public
Participation
Public participation is a key element of ensuring that the public is consulted and is
involved in the running of the municipality. The current public participation
mechanisms are not as effective as they should be. Furthermore, there is no
standard coherent system followed by different municipal departments to consult
the public. There is a need to review the Public Participation Strategy and explore
new innovative public participation mechanisms. Revitalisation of ward
committee engagements needs to also be explored.
Lack of Inter
Departmental
Collaboration
There is a lack of Internal partnerships in terms of projects being implemented for
the community which result in duplication because departments are not talking to
each other.
Unfavourable
Environment for
Civil
Society Group to
Participate in
Municipal
Structures
Most of the organised civil groups representative are unemployed. Due to the
vastness of the district, travelling for these representatives become too expensive
and they often have transport challenges. This limits the civil society participation
and representation in the municipal structure. The challenge will be further
exacerbated the cost cutting measures of the municipality. The organised civil
groups representative that participate in the municipal structure will have to also
bear the cost of providing own lunch.
Limited
Information
Communications
Technology (ICT)
ICT plays a critical role in the vastly digitalising world. Technology is upgrading
rapidly, and the district needs to keep up with the pace which is costly. Due to the
current economic condition the ICT infrastructure budget is shrinking and that
poses a huge challenge in the day to day running’s of the municipality.
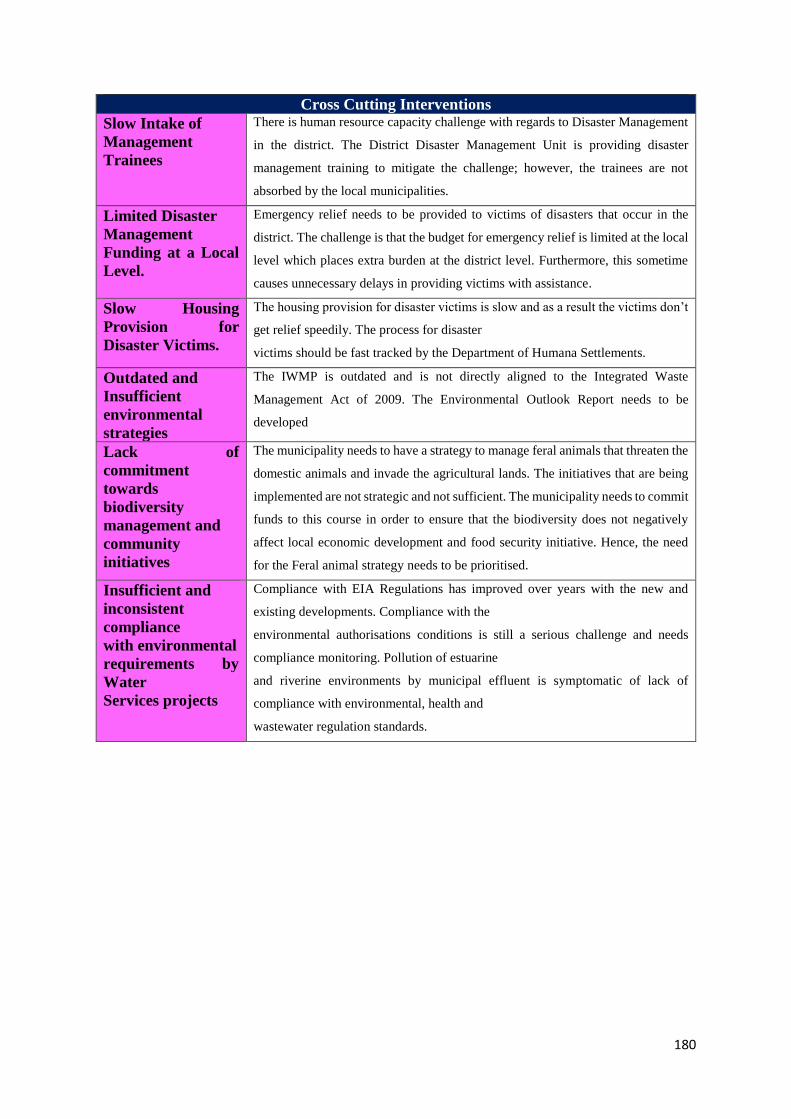
180
Cross Cutting Interventions
Slow Intake of
Management
Trainees
There is human resource capacity challenge with regards to Disaster Management
in the district. The District Disaster Management Unit is providing disaster
management training to mitigate the challenge; however, the trainees are not
absorbed by the local municipalities.
Limited Disaster
Management
Funding at a Local
Level.
Emergency relief needs to be provided to victims of disasters that occur in the
district. The challenge is that the budget for emergency relief is limited at the local
level which places extra burden at the district level. Furthermore, this sometime
causes unnecessary delays in providing victims with assistance.
Slow Housing
Provision for
Disaster Victims.
The housing provision for disaster victims is slow and as a result the victims don’t
get relief speedily. The process for disaster
victims should be fast tracked by the Department of Humana Settlements.
Outdated and
Insufficient
environmental
strategies
The IWMP is outdated and is not directly aligned to the Integrated Waste
Management Act of 2009. The Environmental Outlook Report needs to be
developed
Lack of
commitment
towards
biodiversity
management and
community
initiatives
The municipality needs to have a strategy to manage feral animals that threaten the
domestic animals and invade the agricultural lands. The initiatives that are being
implemented are not strategic and not sufficient. The municipality needs to commit
funds to this course in order to ensure that the biodiversity does not negatively
affect local economic development and food security initiative. Hence, the need
for the Feral animal strategy needs to be prioritised.
Insufficient and
inconsistent
compliance
with environmental
requirements by
Water
Services projects
Compliance with EIA Regulations has improved over years with the new and
existing developments. Compliance with the
environmental authorisations conditions is still a serious challenge and needs
compliance monitoring. Pollution of estuarine
and riverine environments by municipal effluent is symptomatic of lack of
compliance with environmental, health and
wastewater regulation standards.

181
Chapter 4: DEVELOPMENT STRATEGIES
UGu District Municipality held Strategic Planning Session for the development of the 2017 / 2018 to 2021 / 2022
Integrated Development Plan on the 20th – 21st October 2016 at The Estuary Hotel in Port Edward. The long-
term vision and mission was developed. The 2019 / 2020 review of the five IDP had to look at the progress that
has been made to date and make the necessary adjustment to ensure that municipality remains on track to achieve
the long-term vision.
4.1 Vision and Mission
The Ugu District Municipality developed a long-term vision that is aligned with the National, Provincial, and
District long term vision. The Vision and Mission for the district are as follows:
Mission
To ensure all our communities have access
to quality drinking water, decent sanitation,
sustainable economic opportunities
underpinned by the active participation of
our citizens in exemplary government.
Vision
By 2035 Ugu District Municipality will provide
adequate access to basic services in an
efficient and sustainable manner, enhancing
the quality of its citizens in an inclusive
progressive economy.
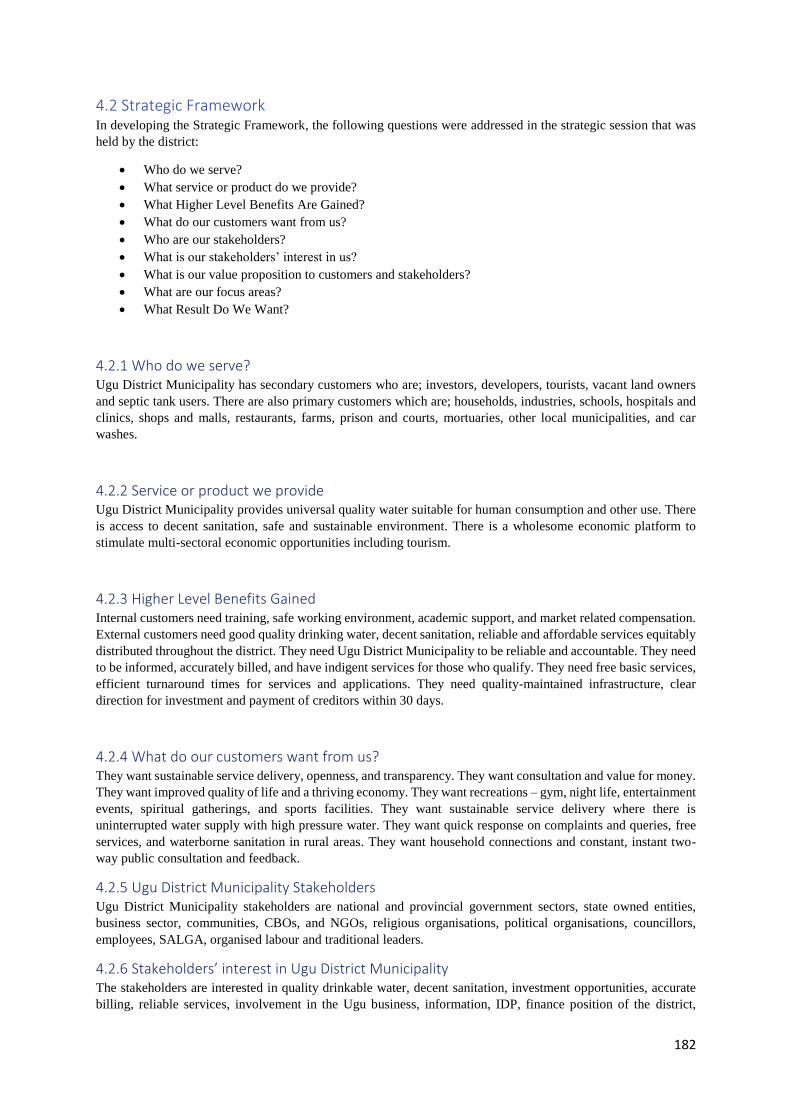
182
4.2 Strategic Framework In developing the Strategic Framework, the following questions were addressed in the strategic session that was
held by the district:
• Who do we serve?
• What service or product do we provide?
• What Higher Level Benefits Are Gained?
• What do our customers want from us?
• Who are our stakeholders?
• What is our stakeholders’ interest in us?
• What is our value proposition to customers and stakeholders?
• What are our focus areas?
• What Result Do We Want?
4.2.1 Who do we serve? Ugu District Municipality has secondary customers who are; investors, developers, tourists, vacant land owners
and septic tank users. There are also primary customers which are; households, industries, schools, hospitals and
clinics, shops and malls, restaurants, farms, prison and courts, mortuaries, other local municipalities, and car
washes.
4.2.2 Service or product we provide Ugu District Municipality provides universal quality water suitable for human consumption and other use. There
is access to decent sanitation, safe and sustainable environment. There is a wholesome economic platform to
stimulate multi-sectoral economic opportunities including tourism.
4.2.3 Higher Level Benefits Gained Internal customers need training, safe working environment, academic support, and market related compensation.
External customers need good quality drinking water, decent sanitation, reliable and affordable services equitably
distributed throughout the district. They need Ugu District Municipality to be reliable and accountable. They need
to be informed, accurately billed, and have indigent services for those who qualify. They need free basic services,
efficient turnaround times for services and applications. They need quality-maintained infrastructure, clear
direction for investment and payment of creditors within 30 days.
4.2.4 What do our customers want from us? They want sustainable service delivery, openness, and transparency. They want consultation and value for money.
They want improved quality of life and a thriving economy. They want recreations – gym, night life, entertainment
events, spiritual gatherings, and sports facilities. They want sustainable service delivery where there is
uninterrupted water supply with high pressure water. They want quick response on complaints and queries, free
services, and waterborne sanitation in rural areas. They want household connections and constant, instant two-
way public consultation and feedback.
4.2.5 Ugu District Municipality Stakeholders Ugu District Municipality stakeholders are national and provincial government sectors, state owned entities,
business sector, communities, CBOs, and NGOs, religious organisations, political organisations, councillors,
employees, SALGA, organised labour and traditional leaders.
4.2.6 Stakeholders’ interest in Ugu District Municipality The stakeholders are interested in quality drinkable water, decent sanitation, investment opportunities, accurate
billing, reliable services, involvement in the Ugu business, information, IDP, finance position of the district,
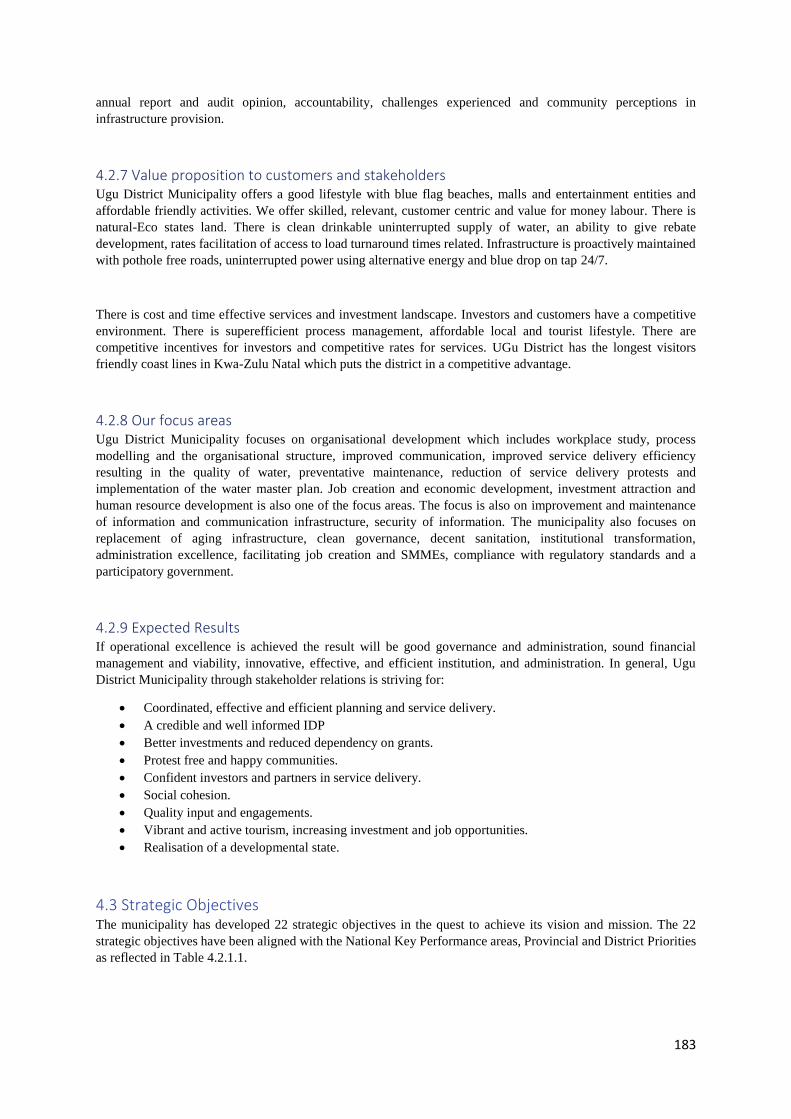
183
annual report and audit opinion, accountability, challenges experienced and community perceptions in
infrastructure provision.
4.2.7 Value proposition to customers and stakeholders Ugu District Municipality offers a good lifestyle with blue flag beaches, malls and entertainment entities and
affordable friendly activities. We offer skilled, relevant, customer centric and value for money labour. There is
natural-Eco states land. There is clean drinkable uninterrupted supply of water, an ability to give rebate
development, rates facilitation of access to load turnaround times related. Infrastructure is proactively maintained
with pothole free roads, uninterrupted power using alternative energy and blue drop on tap 24/7.
There is cost and time effective services and investment landscape. Investors and customers have a competitive
environment. There is superefficient process management, affordable local and tourist lifestyle. There are
competitive incentives for investors and competitive rates for services. UGu District has the longest visitors
friendly coast lines in Kwa-Zulu Natal which puts the district in a competitive advantage.
4.2.8 Our focus areas Ugu District Municipality focuses on organisational development which includes workplace study, process
modelling and the organisational structure, improved communication, improved service delivery efficiency
resulting in the quality of water, preventative maintenance, reduction of service delivery protests and
implementation of the water master plan. Job creation and economic development, investment attraction and
human resource development is also one of the focus areas. The focus is also on improvement and maintenance
of information and communication infrastructure, security of information. The municipality also focuses on
replacement of aging infrastructure, clean governance, decent sanitation, institutional transformation,
administration excellence, facilitating job creation and SMMEs, compliance with regulatory standards and a
participatory government.
4.2.9 Expected Results If operational excellence is achieved the result will be good governance and administration, sound financial
management and viability, innovative, effective, and efficient institution, and administration. In general, Ugu
District Municipality through stakeholder relations is striving for:
• Coordinated, effective and efficient planning and service delivery.
• A credible and well informed IDP
• Better investments and reduced dependency on grants.
• Protest free and happy communities.
• Confident investors and partners in service delivery.
• Social cohesion.
• Quality input and engagements.
• Vibrant and active tourism, increasing investment and job opportunities.
• Realisation of a developmental state.
4.3 Strategic Objectives The municipality has developed 22 strategic objectives in the quest to achieve its vision and mission. The 22
strategic objectives have been aligned with the National Key Performance areas, Provincial and District Priorities
as reflected in Table 4.2.1.1.

184
Table 4.2.1.1.: Alignment of Strategic Objectives
Code KPA
PGDS Goal DGDS Driver Goal /
Desired
Outcome
S.O.
No. Strategic
Objective
BSD Basic Service
Delivery
Strategic
Infrastructure
Strategic
Infrastructure
Investment
Universal
access to
Basic Services
BSD 1
To increase access to
adequate basic
services
BSD 2
To ensure access to
free basic water
BSD 3
To increase
infrastructure
capacity
Compliance
with No
Drop
BSD 4 To reduce water loss
BSD 5
To replace and
maintain ageing
infrastructure
Minimum Blue
Drop
Score of 95%
BSD 6
To ensure
compliance with
access to quality
drinking water
standards
Minimum
Green
Drop Score of
90%
BSD 7
To ensure
compliance with
decent sanitation
standards
Eradication of
Illegal
Connections
BSD 8 To reduce illegal
connections
MTID
Municipal
Transformation
and
Institutional
Development
Human Resource
Development
Education and Skills
Development
Highly
Motivated,
Skilled,
Productive
and
Disciplined
Workforce
MTID
1
To optimise the
workforce potential
MTID
2
To improve skills
and capacity of work
force
Institutional
Development
Sound and
Efficient
Municipal
Systems and
Operations
MTID
3
To optimise systems
and operations
Code KPA
PGDS Goal DGDS Driver Goal /
Desired
Outcome
S.O.
No. Strategic
Objective
MTID
Municipal
Transformation
and
Institutional
Human Resource
Development
Institutional
Development
Sound
Performance,
Monitoring and
MTID
4
To increase
performance,
monitoring and
evaluation
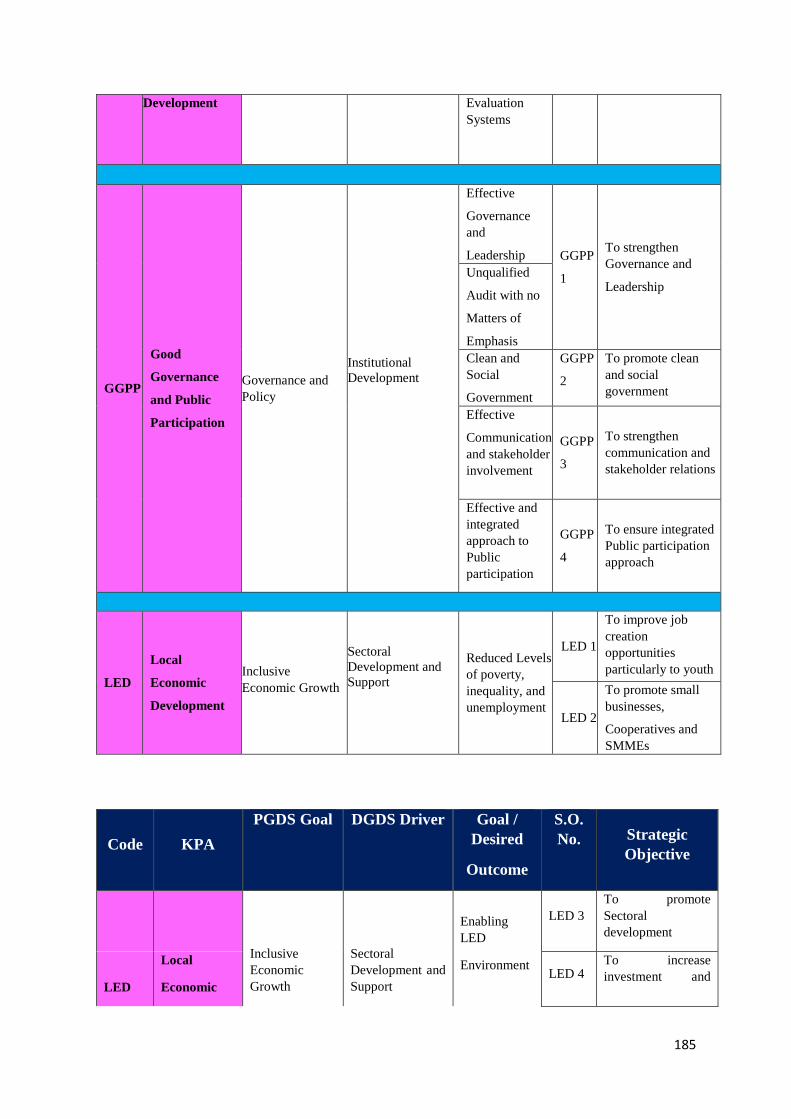
185
Development Evaluation
Systems
GGPP
Good
Governance
and Public
Participation
Governance and
Policy
Institutional
Development
Effective
Governance
and
Leadership GGPP
1
To strengthen
Governance and
Leadership Unqualified
Audit with no
Matters of
Emphasis
Clean and
Social
Government
GGPP
2
To promote clean
and social
government
Effective
Communication
and stakeholder
involvement
GGPP
3
To strengthen
communication and
stakeholder relations
Effective and
integrated
approach to
Public
participation
GGPP
4
To ensure integrated
Public participation
approach
LED
Local
Economic
Development
Inclusive
Economic Growth
Sectoral
Development and
Support
Reduced Levels
of poverty,
inequality, and
unemployment
LED 1
To improve job
creation
opportunities
particularly to youth
LED 2
To promote small
businesses,
Cooperatives and
SMMEs
Code KPA
PGDS Goal DGDS Driver Goal /
Desired
Outcome
S.O.
No. Strategic
Objective
Inclusive
Economic
Growth
Sectoral
Development and
Support
Enabling
LED
Environment
LED 3
To promote
Sectoral
development
LED
Local
Economic LED 4
To increase
investment and
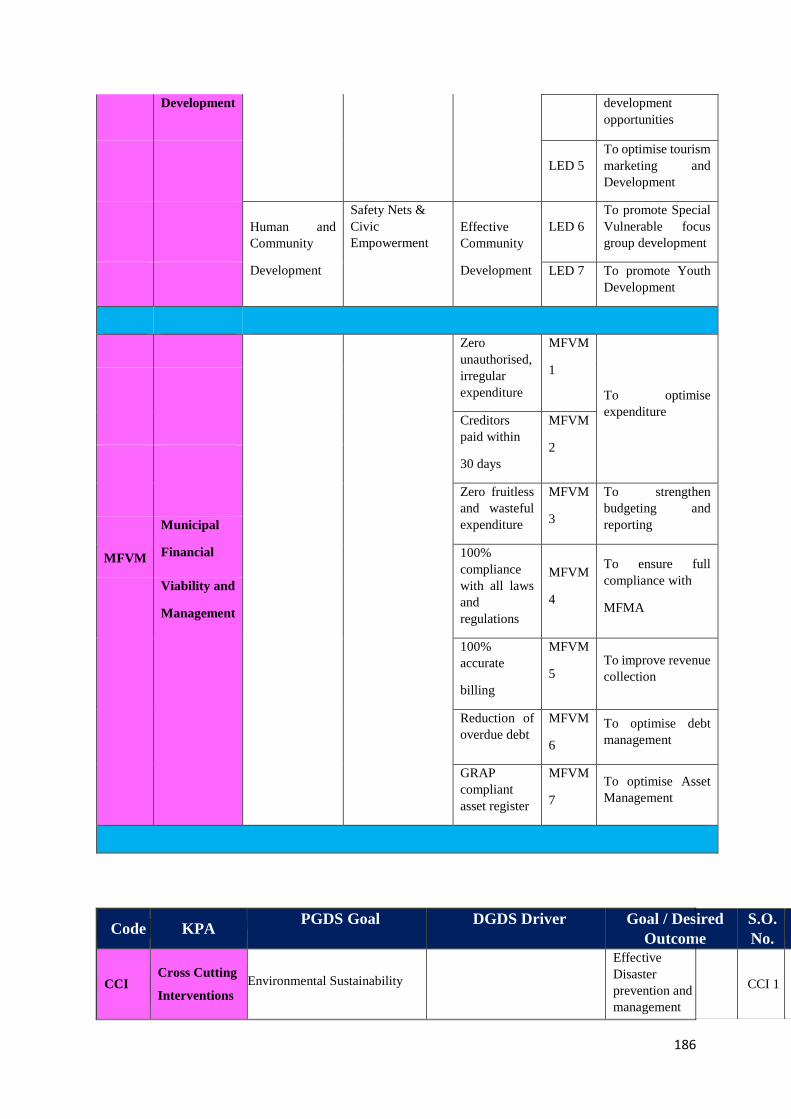
186
Development development
opportunities
LED 5
To optimise tourism
marketing and
Development
Human and
Community
Development
Safety Nets &
Civic
Empowerment
Effective
Community
Development
LED 6
To promote Special
Vulnerable focus
group development
LED 7 To promote Youth
Development
Zero
unauthorised,
irregular
expenditure
MFVM
1
To optimise
expenditure
Creditors
paid within
30 days
MFVM
2
Zero fruitless
and wasteful
expenditure
MFVM
3
To strengthen
budgeting and
reporting
MFVM
Municipal
Financial 100%
compliance
with all laws
and
regulations
MFVM
4
To ensure full
compliance with
MFMA
Viability and
Management
100%
accurate
billing
MFVM
5 To improve revenue
collection
Reduction of
overdue debt
MFVM
6
To optimise debt
management
GRAP
compliant
asset register
MFVM
7
To optimise Asset
Management
Code KPA PGDS Goal DGDS Driver Goal / Desired
Outcome
S.O.
No. Strategic Objective
CCI Cross Cutting
Interventions Environmental Sustainability
Effective
Disaster
prevention and
management
CCI 1 To improve Disaster prevention and
management
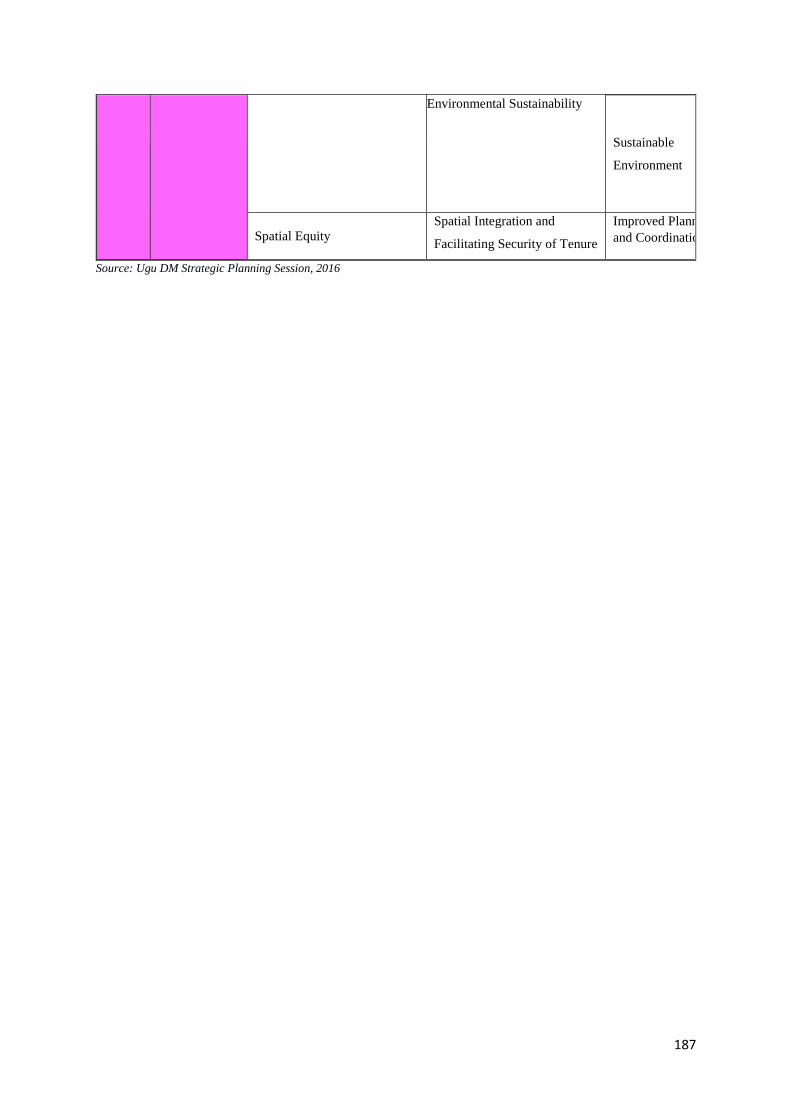
187
Environmental Sustainability
Sustainable
Environment
CCI 2
To promote a healthy, safe, and
sustainability environment
CCI 3
To enhance measures to reduce
community exposure to diseases and
health risk
Spatial Equity Spatial Integration and
Facilitating Security of Tenure
Improved Planning
and Coordination CCI 4 To improve planning and coordination
Source: Ugu DM Strategic Planning Session, 2016

188

189
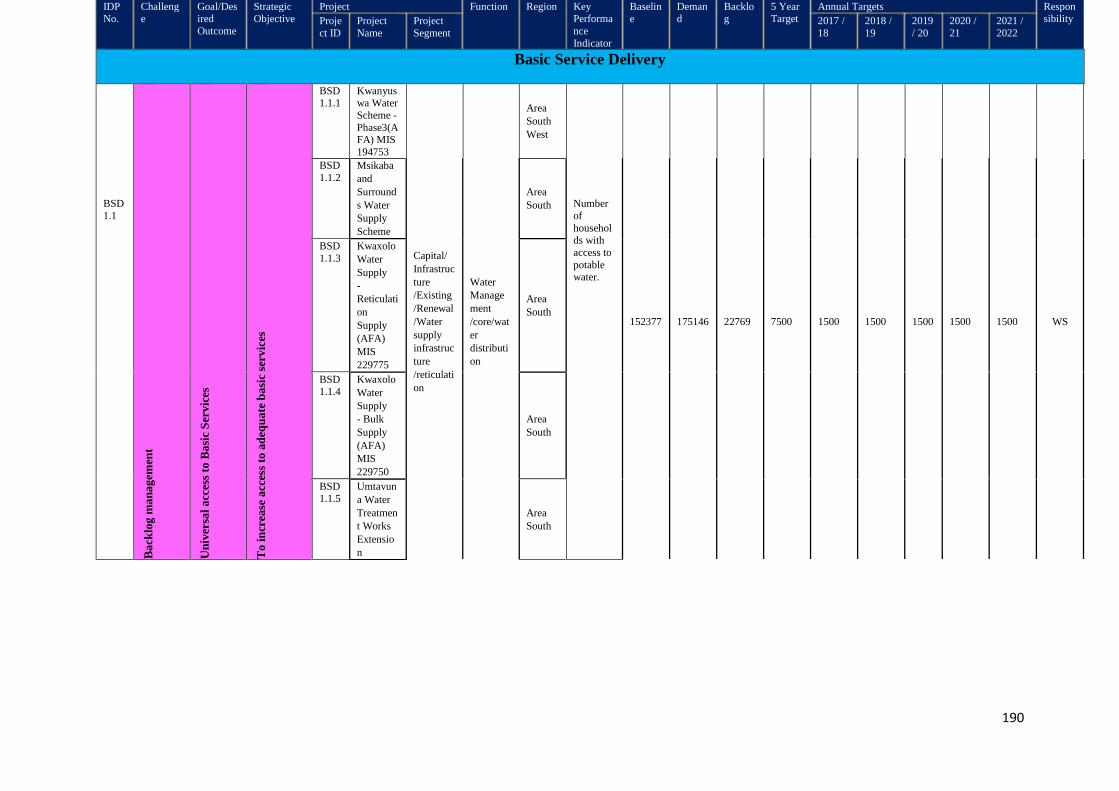
190
IDP No.
Challenge
Goal/Desired
Outcome
Strategic Objective
Project Function Region Key Performa
nce
Indicator
Baseline
Demand
Backlog
5 Year Target
Annual Targets Responsibility Proje
ct ID
Project
Name
Project
Segment
2017 /
18
2018 /
19
2019
/ 20
2020 /
21
2021 /
2022
Basic Service Delivery
BSD
1.1
Ba
cklo
g m
an
ag
emen
t
Un
iver
sal
acc
ess
to B
asi
c S
erv
ices
To
in
crea
se a
cces
s to
ad
equ
ate
ba
sic
serv
ices
BSD 1.1.1
Kwanyuswa Water
Scheme -
Phase3(AFA) MIS
194753
Capital/
Infrastruc
ture
/Existing
/Renewal
/Water
supply
infrastruc
ture
/reticulati
on
Water
Manage
ment
/core/wat
er
distributi
on
Area
South
West
Number
of
households with
access to
potable water.
152377 175146 22769 7500 1500 1500 1500 1500 1500 WS
BSD
1.1.2 Msikaba
and
Surround
s Water
Supply
Scheme
Area
South
BSD
1.1.3
Kwaxolo
Water
Supply
-
Reticulati
on
Supply
(AFA)
MIS
229775
Area
South
BSD 1.1.4
Kwaxolo
Water
Supply
- Bulk
Supply
(AFA)
MIS
229750
Area
South
BSD 1.1.5
Umtavun
a Water
Treatmen
t Works
Extensio
n
Area
South
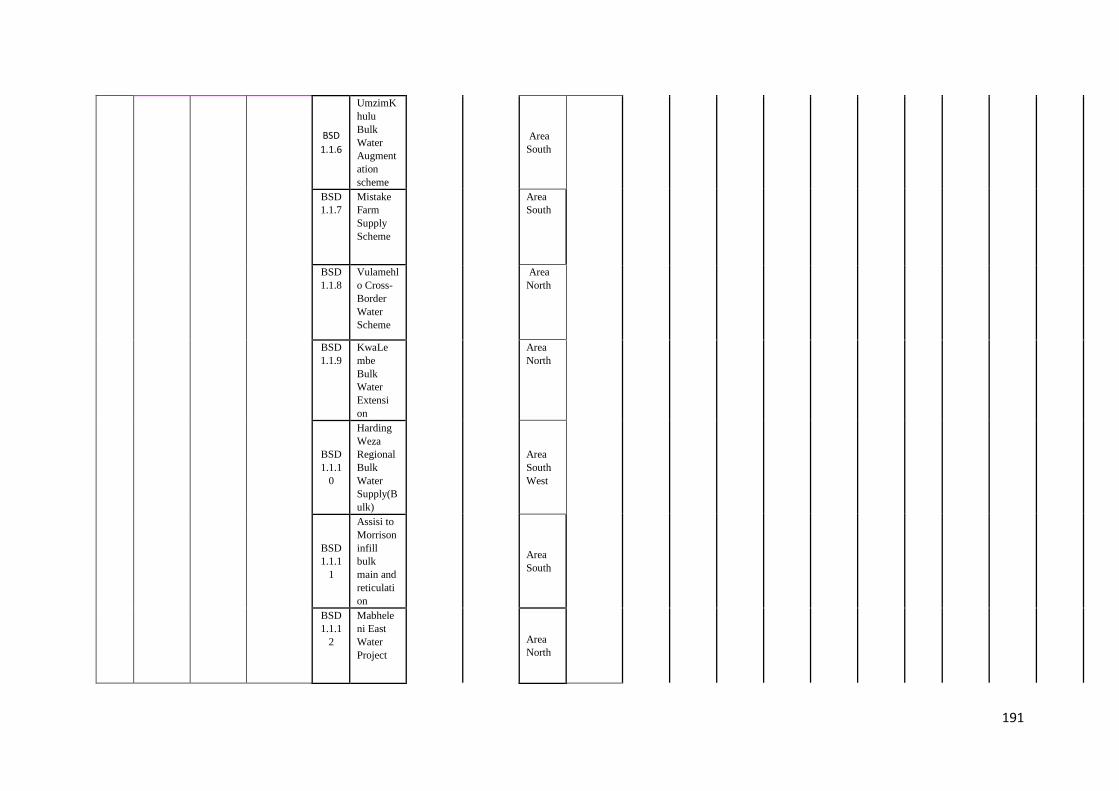
191
BSD 1.1.6
UmzimK
hulu
Bulk
Water
Augment
ation
scheme
Area
South
BSD
1.1.7
Mistake
Farm
Supply
Scheme
Area
South
BSD
1.1.8
Vulamehl
o Cross-
Border
Water
Scheme
Area
North
BSD
1.1.9
KwaLe
mbe
Bulk
Water
Extensi
on
Area
North
BSD
1.1.1
0
Harding
Weza
Regional
Bulk
Water
Supply(B
ulk)
Area
South
West
BSD
1.1.1
1
Assisi to
Morrison
infill
bulk
main and
reticulati
on
Area
South
BSD
1.1.1
2
Mabhele
ni East
Water
Project
Area
North
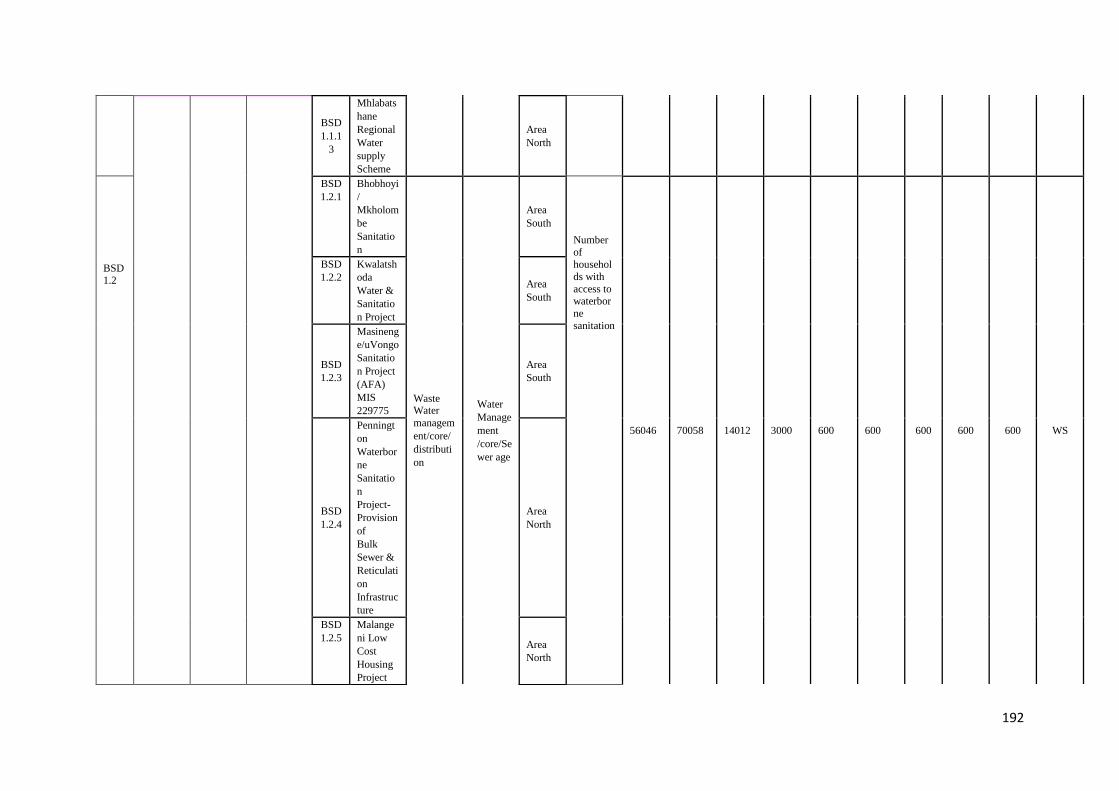
192
BSD
1.1.1
3
Mhlabats
hane
Regional
Water
supply
Scheme
Area
North
BSD1.2
BSD
1.2.1
Bhobhoyi
/
Mkholom
be
Sanitatio
n
Waste Water
managem
ent/core/
distributi
on
Water
Manage
ment
/core/Se
wer age
Area
South
Number
of
househol
ds with
access to waterbor
ne
sanitation
56046 70058 14012 3000 600 600 600 600 600 WS
BSD
1.2.2
Kwalatsh
oda
Water &
Sanitatio
n Project
Area
South
BSD
1.2.3
Masineng
e/uVongo
Sanitatio
n Project
(AFA)
MIS
229775
Area
South
BSD
1.2.4
Penningt
on
Waterbor
ne
Sanitatio
n
Project-
Provision
of
Bulk
Sewer &
Reticulati
on
Infrastruc
ture
Area
North
BSD
1.2.5
Malange
ni Low
Cost
Housing
Project
Area
North
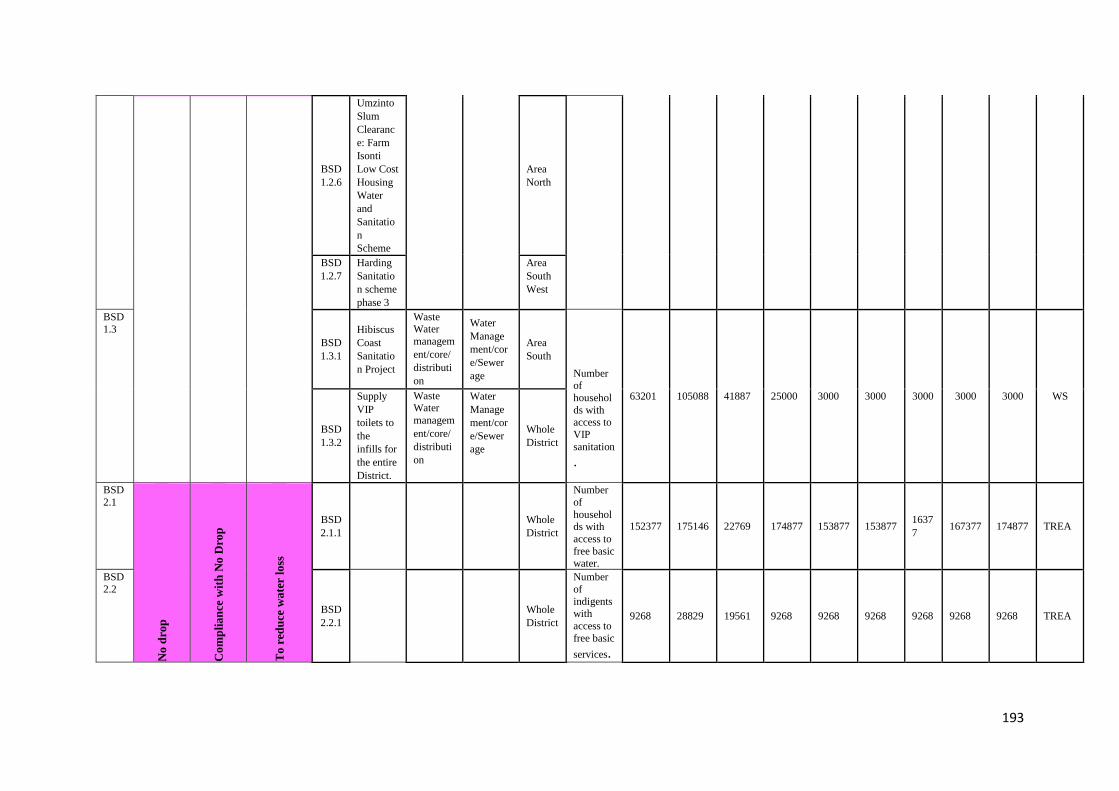
193
BSD
1.2.6
Umzinto
Slum
Clearanc
e: Farm
Isonti
Low Cost
Housing
Water
and
Sanitatio
n
Scheme
Area
North
BSD
1.2.7
Harding
Sanitatio
n scheme
phase 3
Area
South
West
BSD
1.3
BSD
1.3.1
Hibiscus
Coast
Sanitatio
n Project
Waste Water
managem
ent/core/
distributi
on
Water
Manage
ment/cor
e/Sewer
age
Area
South
Number of
househol
ds with access to
VIP
sanitation
.
63201 105088 41887 25000 3000 3000 3000 3000 3000 WS
BSD
1.3.2
Supply
VIP
toilets to
the
infills for
the entire
District.
Waste Water
managem
ent/core/
distributi
on
Water
Manage
ment/cor
e/Sewer
age
Whole
District
BSD
2.1
No
dro
p
Co
mp
lia
nce
wit
h N
o D
rop
To
red
uce
wa
ter
loss
BSD
2.1.1
Whole
District
Number
of
households with
access to
free basic water.
152377 175146 22769 174877 153877 153877 1637
7 167377 174877 TREA
BSD
2.2
BSD
2.2.1
Whole
District
Number
of
indigents with
access to
free basic
services.
9268 28829 19561 9268 9268 9268 9268 9268 9268 TREA
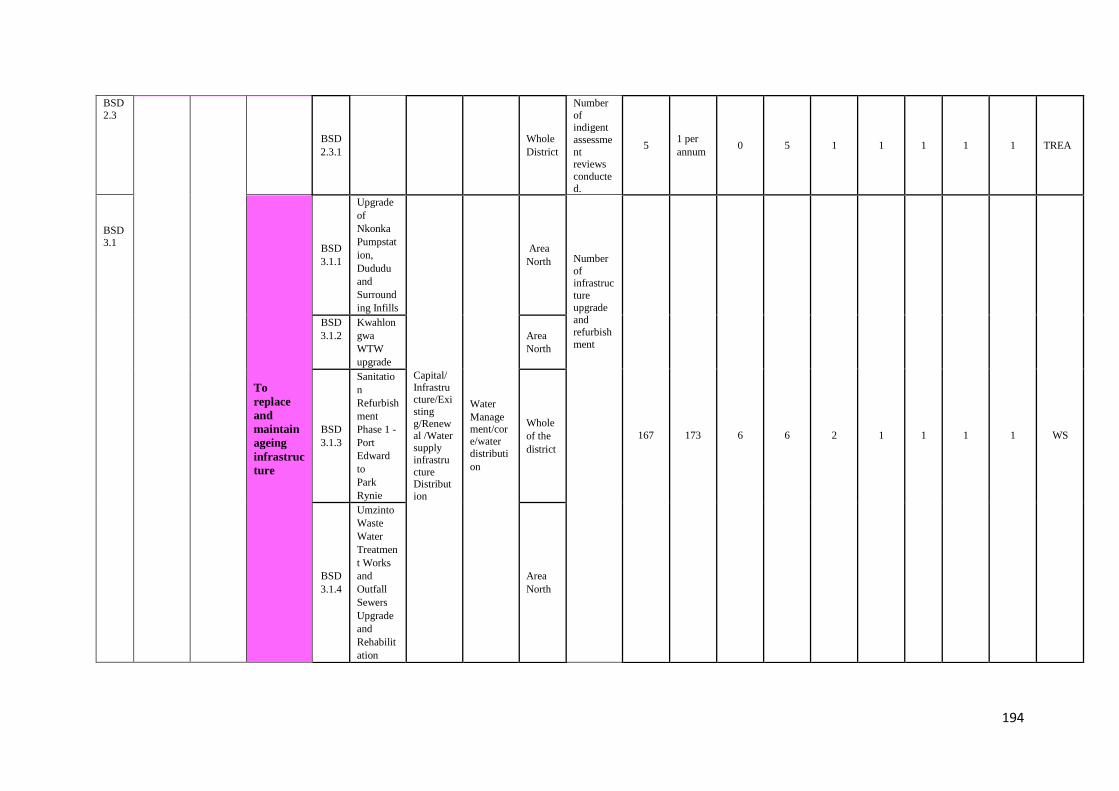
194
BSD
2.3
BSD
2.3.1
Whole
District
Number
of indigent
assessme
nt reviews
conducte
d.
5 1 per
annum 0 5 1 1 1 1 1 TREA
BSD
3.1
To
replace
and
maintain
ageing
infrastruc
ture
BSD
3.1.1
Upgrade
of
Nkonka
Pumpstat
ion,
Dududu
and
Surround
ing Infills
Capital/ Infrastructure/Existing g/Renewal /Water
supply infrastructure Distribution
Water
Management/cor
e/water
distributi
on
Area
North
Number
of infrastruc
ture
upgrade and
refurbish
ment
167
173
6
6
2
1
1
1
1
WS
BSD
3.1.2
Kwahlon
gwa
WTW
upgrade
Area
North
BSD
3.1.3
Sanitatio
n
Refurbish
ment
Phase 1 -
Port
Edward
to
Park
Rynie
Whole
of the
district
BSD
3.1.4
Umzinto
Waste
Water
Treatmen
t Works
and
Outfall
Sewers
Upgrade
and
Rehabilit
ation
Area
North
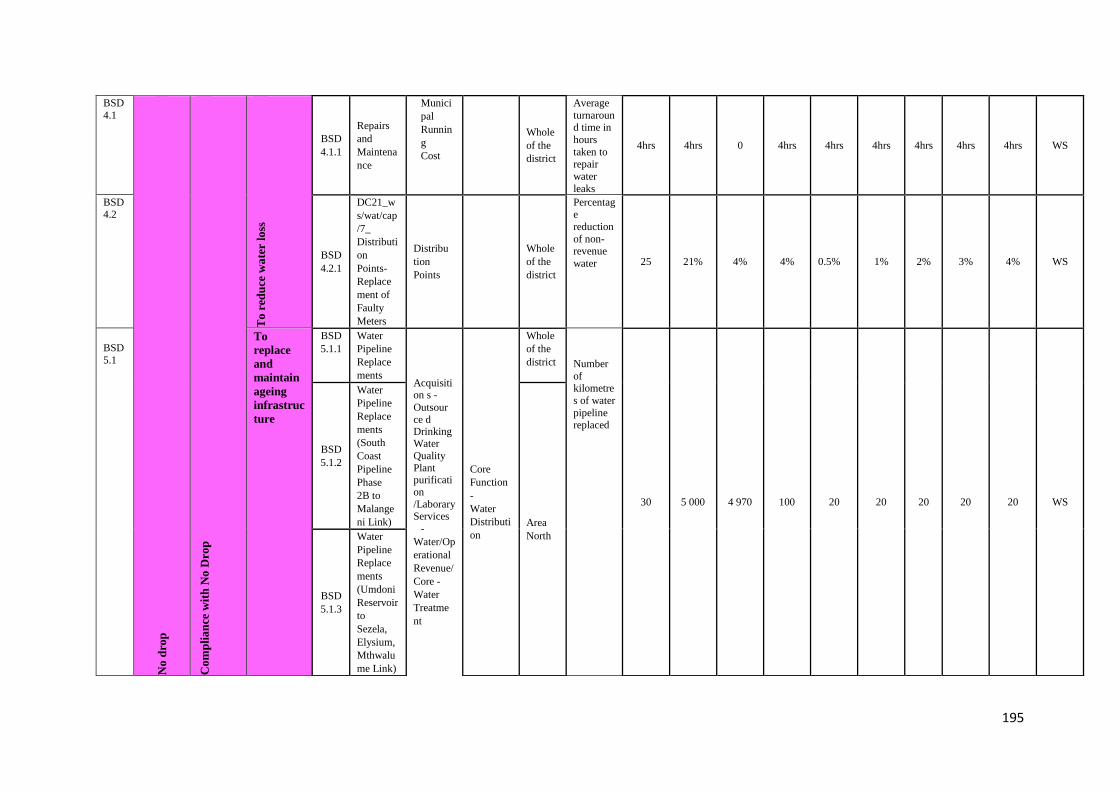
195
BSD
4.1
No
dro
p
Co
mp
lia
nce
wit
h N
o D
rop
To
red
uce
wa
ter
loss
BSD
4.1.1
Repairs
and
Maintena
nce
Munici
pal
Runnin
g
Cost
Whole
of the
district
Average
turnaround time in
hours
taken to repair
water
leaks
4hrs 4hrs 0 4hrs 4hrs 4hrs 4hrs 4hrs 4hrs WS
BSD4.2
BSD
4.2.1
DC21_w
s/wat/cap
/7_
Distributi
on
Points-
Replace
ment of
Faulty
Meters
Distribu
tion
Points
Whole
of the
district
Percentage
reduction
of non-revenue
water 25 21% 4% 4% 0.5% 1% 2% 3% 4% WS
BSD
5.1
To
replace
and
maintain
ageing
infrastruc
ture
BSD
5.1.1
Water
Pipeline
Replace
ments Acquisition s -
Outsource d Drinking Water
Quality Plant purification /Laborary Services
-
Water/Op
erational
Revenue/
Core -
Water
Treatme
nt
Core
Function
-
Water
Distributi
on
Whole
of the
district
Number
of kilometre
s of water
pipeline replaced
30 5 000 4 970 100 20 20 20 20 20 WS
BSD
5.1.2
Water
Pipeline
Replace
ments
(South
Coast
Pipeline
Phase
2B to
Malange
ni Link) Area
North
BSD
5.1.3
Water
Pipeline
Replace
ments
(Umdoni
Reservoir
to
Sezela,
Elysium,
Mthwalu
me Link)
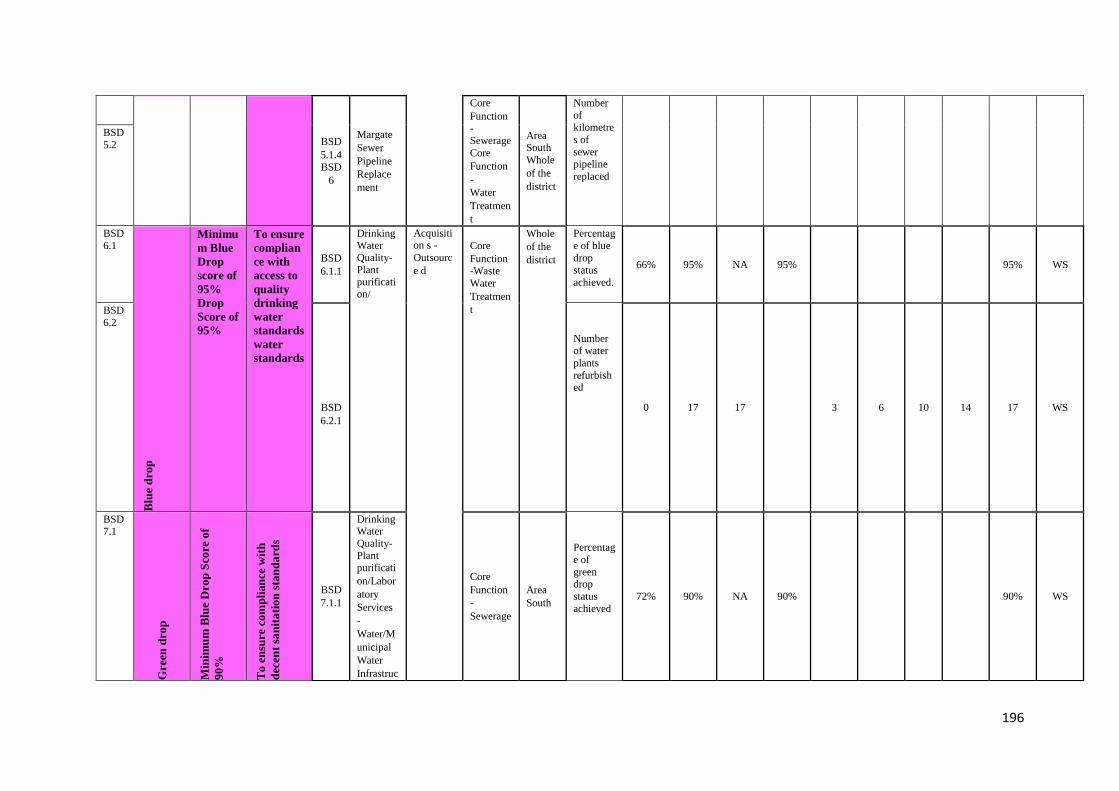
196
BSD
5.1.4
BSD
6
Margate
Sewer
Pipeline
Replace
ment
Core
Function -
Sewerage
Core
Function
-
Water
Treatmen
t
Area South
Whole
of the
district
Number
of kilometre
s of
sewer pipeline
replaced
BSD
5.2
BSD
6.1
Blu
e d
rop
Minimu
m Blue
Drop
score of
95%
Drop
Score of
95%
To ensure
complian
ce with
access to
quality
drinking
water
standards
water
standards
BSD
6.1.1
Drinking Water Quality-
Plant purification/
Acquisition s -
Outsourc
e d
Core
Function
-Waste
Water
Treatmen
t
Whole
of the
district
Percentag
e of blue
drop
status
achieved. 66% 95% NA 95% 95% WS
BSD
6.2
BSD
6.2.1
Number of water
plants
refurbished
0 17 17 3 6 10 14 17 WS
BSD7.1
Gre
en d
rop
Min
imu
m B
lue
Dro
p S
core
of
90
%
To
en
sure
co
mp
lian
ce w
ith
dec
ent
san
ita
tio
n s
tan
da
rds
BSD
7.1.1
Drinking Water Quality-Plant
purificati
on/Labor
atory
Services
-
Water/M
unicipal
Water
Infrastruc
Core
Function
-
Sewerage
Area
South
Percentag
e of
green drop
status
achieved 72% 90% NA 90% 90% WS
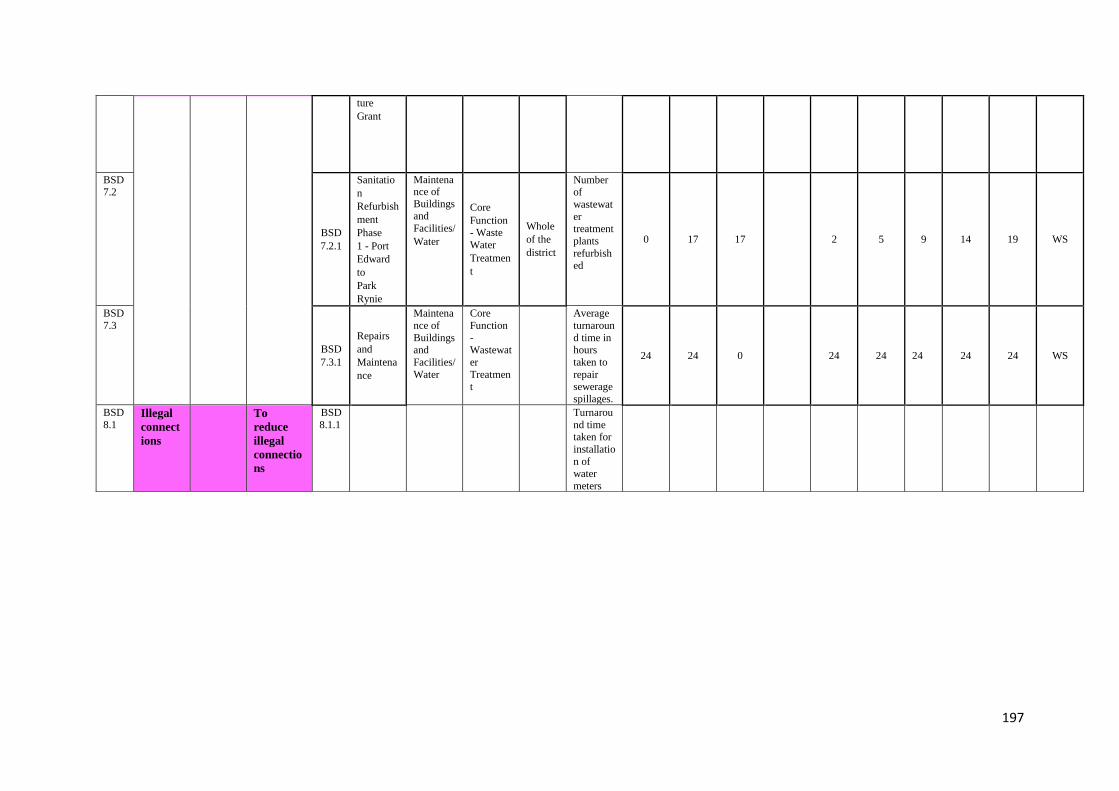
197
ture
Grant
BSD7.2
BSD
7.2.1
Sanitatio
n
Refurbish
ment
Phase
1 - Port
Edward
to
Park
Rynie
Maintenance of Buildings and
Facilities/
Water
Core
Function - Waste
Water
Treatmen
t
Whole
of the
district
Number of
wastewat
er treatment
plants
refurbish
ed
0 17 17 2 5 9 14 19 WS
BSD
7.3
BSD
7.3.1
Repairs
and
Maintena
nce
Maintena
nce of
Buildings and
Facilities/
Water
Core
Function
-Wastewat
er
Treatment
Average
turnaroun
d time in hours
taken to
repair sewerage
spillages.
24 24 0 24 24 24 24 24 WS
BSD
8.1 Illegal
connect
ions
To
reduce
illegal
connectio
ns
BSD
8.1.1
Turnarou
nd time taken for
installatio
n of water
meters
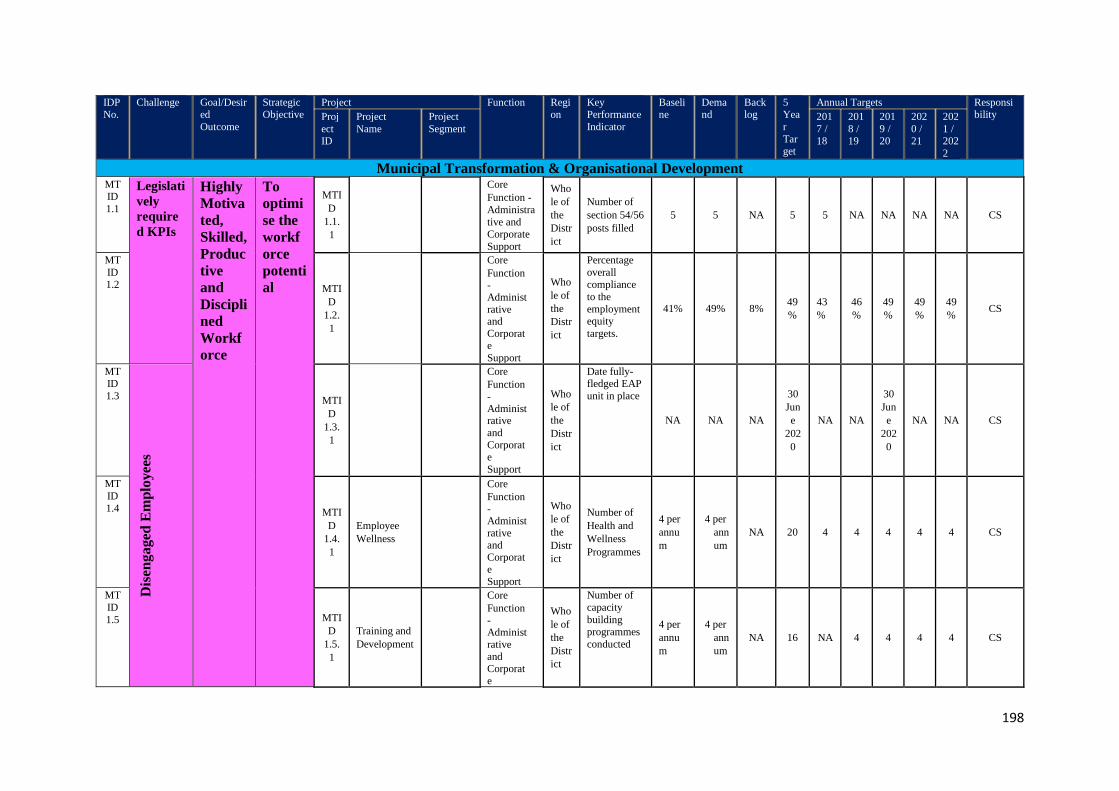
198
IDP No.
Challenge Goal/Desired
Outcome
Strategic Objective
Project Function Region
Key Performance
Indicator
Baseline
Demand
Backlog
5 Yea
r
Target
Annual Targets Responsibility Proj
ect ID
Project
Name
Project
Segment
201
7 / 18
201
8 / 19
201
9 / 20
202
0 / 21
202
1 / 202
2
Municipal Transformation & Organisational Development MTID
1.1
Legislati
vely
require
d KPIs
Highly
Motiva
ted,
Skilled,
Produc
tive
and
Discipli
ned
Workf
orce
To
optimi
se the
workf
orce
potenti
al
MTI
D 1.1.
1
Core Function -
Administra
tive and Corporate
Support
Who
le of
the
Distr
ict
Number of
section 54/56
posts filled
5 5 NA 5 5 NA NA NA NA CS
MT
ID 1.2 MTI
D 1.2.
1
Core Function - Administrative and Corporate Support
Who
le of
the
Distr
ict
Percentage
overall compliance
to the
employment equity
targets.
41% 49% 8% 49
%
43
%
46
%
49
%
49
%
49
% CS
MTID
1.3
Dis
en
ga
ged
Em
plo
yee
s
MTI
D 1.3.
1
Core Function - Administrative and
Corporate Support
Who
le of
the
Distr
ict
Date fully-fledged EAP
unit in place
NA NA NA
30
Jun
e
202
0
NA NA
30
Jun
e
202
0
NA NA CS
MT
ID
1.4 MTI
D 1.4.
1
Employee
Wellness
Core Function - Administrative and Corporate Support
Who
le of
the
Distr
ict
Number of
Health and
Wellness
Programmes
4 per
annu
m
4 per
ann
um
NA 20 4 4 4 4 4 CS
MT
ID
1.5 MTI
D 1.5.
1
Training and
Development
Core Function
- Administrative and Corporate
Who
le of
the
Distr
ict
Number of
capacity
building programmes
conducted
4 per
annu
m
4 per
ann
um
NA 16 NA 4 4 4 4 CS
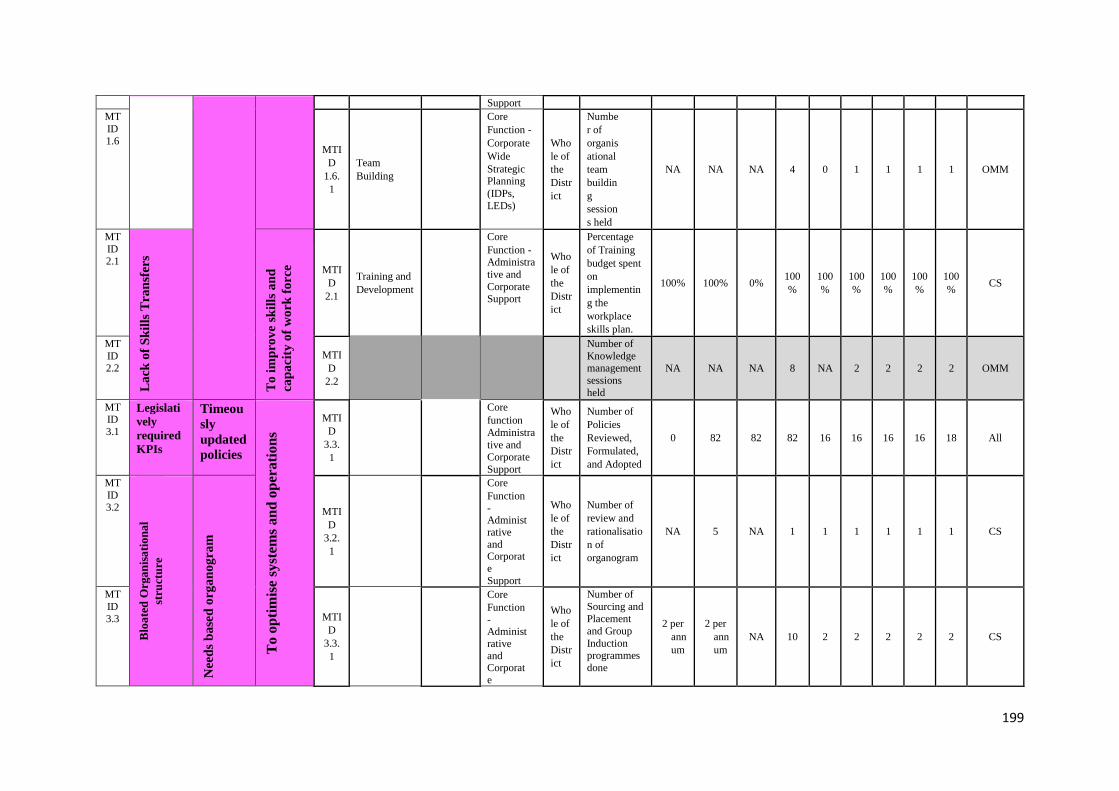
199
Support MT
ID 1.6
MTI
D 1.6.
1
Team
Building
Core Function - Corporate Wide Strategic Planning (IDPs,
LEDs)
Who
le of
the
Distr
ict
Numbe
r of
organis
ational
team
buildin
g
session
s held
NA NA NA 4 0 1 1 1 1 OMM
MT
ID 2.1
La
ck o
f S
kil
ls T
ran
sfer
s
To
im
pro
ve
skil
ls a
nd
cap
aci
ty o
f w
ork
fo
rce MTI
D 2.1
Training and
Development
Core Function - Administra
tive and
Corporate Support
Who
le of
the
Distr
ict
Percentage
of Training
budget spent
on
implementin
g the
workplace
skills plan.
100% 100% 0% 100
%
100
%
100
%
100
%
100
%
100
% CS
MT
ID 2.2
MTI
D 2.2
Number of
Knowledge management
sessions
held
NA NA NA 8 NA 2 2 2 2 OMM
MTID
3.1
Legislati
vely
required
KPIs
Timeou
sly
updated
policies
To o
pti
mis
e s
yst
ems
an
d o
per
ati
on
s
MTI
D 3.3.
1
Core
function
Administra
tive and Corporate
Support
Who
le of
the
Distr
ict
Number of
Policies
Reviewed,
Formulated,
and Adopted
0 82 82 82 16 16 16 16 18 All
MT
ID 3.2
Blo
ate
d O
rga
nis
ati
on
al
stru
ctu
re
Nee
ds
ba
sed
org
an
og
ram
MTI
D 3.2.
1
Core
Function - Administrative and Corporate
Support
Who
le of
the
Distr
ict
Number of
review and
rationalisatio
n of
organogram
NA 5 NA 1 1 1 1 1 1 CS
MT
ID
3.3 MTI
D 3.3.
1
Core
Function
- Administrative and Corporate
Who
le of
the
Distr
ict
Number of
Sourcing and
Placement
and Group
Induction programmes
done
2 per
ann
um
2 per
ann
um
NA 10 2 2 2 2 2 CS
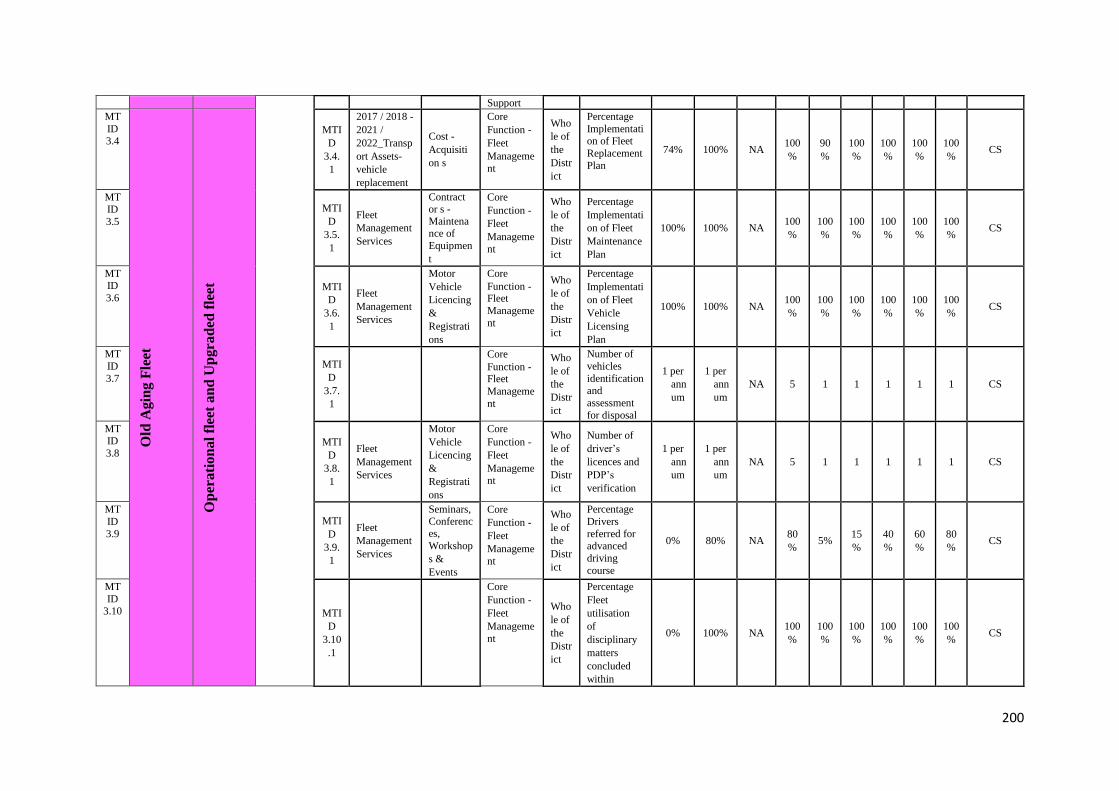
200
Support MT
ID 3.4
Old
Agin
g F
leet
Op
erati
on
al
flee
t an
d U
pgra
ded
fle
et
MTI
D 3.4.
1
2017 / 2018 -
2021 /
2022_Transp
ort Assets-
vehicle
replacement
Cost -
Acquisiti
on s
Core
Function -
Fleet
Manageme
nt
Who
le of
the
Distr
ict
Percentage
Implementation of Fleet
Replacement
Plan
74% 100% NA 100
%
90
%
100
%
100
%
100
%
100
% CS
MTID
3.5
MTI
D 3.5.
1
Fleet
Management
Services
Contractor s - Maintenance of
Equipmen
t
Core
Function -
Fleet
Manageme
nt
Who
le of
the
Distr
ict
Percentage
Implementati
on of Fleet
Maintenance
Plan
100% 100% NA 100
%
100
%
100
%
100
%
100
%
100
% CS
MTID
3.6 MTI
D 3.6.
1
Fleet
Management
Services
Motor
Vehicle
Licencing
&
Registrati
ons
Core
Function - Fleet
Manageme
nt
Who
le of
the
Distr
ict
Percentage
Implementati
on of Fleet
Vehicle
Licensing
Plan
100% 100% NA 100
%
100
%
100
%
100
%
100
%
100
% CS
MT
ID
3.7
MTI
D 3.7.
1
Core
Function - Fleet
Manageme
nt
Who
le of
the
Distr
ict
Number of
vehicles
identification and
assessment
for disposal
1 per
ann
um
1 per
ann
um
NA 5 1 1 1 1 1 CS
MT
ID
3.8 MTI
D 3.8.
1
Fleet
Management
Services
Motor
Vehicle
Licencing
&
Registrati
ons
Core
Function -
Fleet
Management
Who
le of
the
Distr
ict
Number of
driver’s
licences and
PDP’s
verification
1 per
ann
um
1 per
ann
um
NA 5 1 1 1 1 1 CS
MT
ID
3.9
MTI
D 3.9.
1
Fleet
Management
Services
Seminars, Conferences,
Workshop
s &
Events
Core
Function -
Fleet
Manageme
nt
Who
le of
the
Distr
ict
Percentage
Drivers
referred for advanced
driving
course
0% 80% NA 80
% 5%
15
%
40
%
60
%
80
% CS
MT
ID 3.10 MTI
D 3.10
.1
Core
Function -
Fleet
Manageme
nt
Who
le of
the
Distr
ict
Percentage
Fleet
utilisation
of
disciplinary
matters
concluded
within
0% 100% NA 100
%
100
%
100
%
100
%
100
%
100
% CS
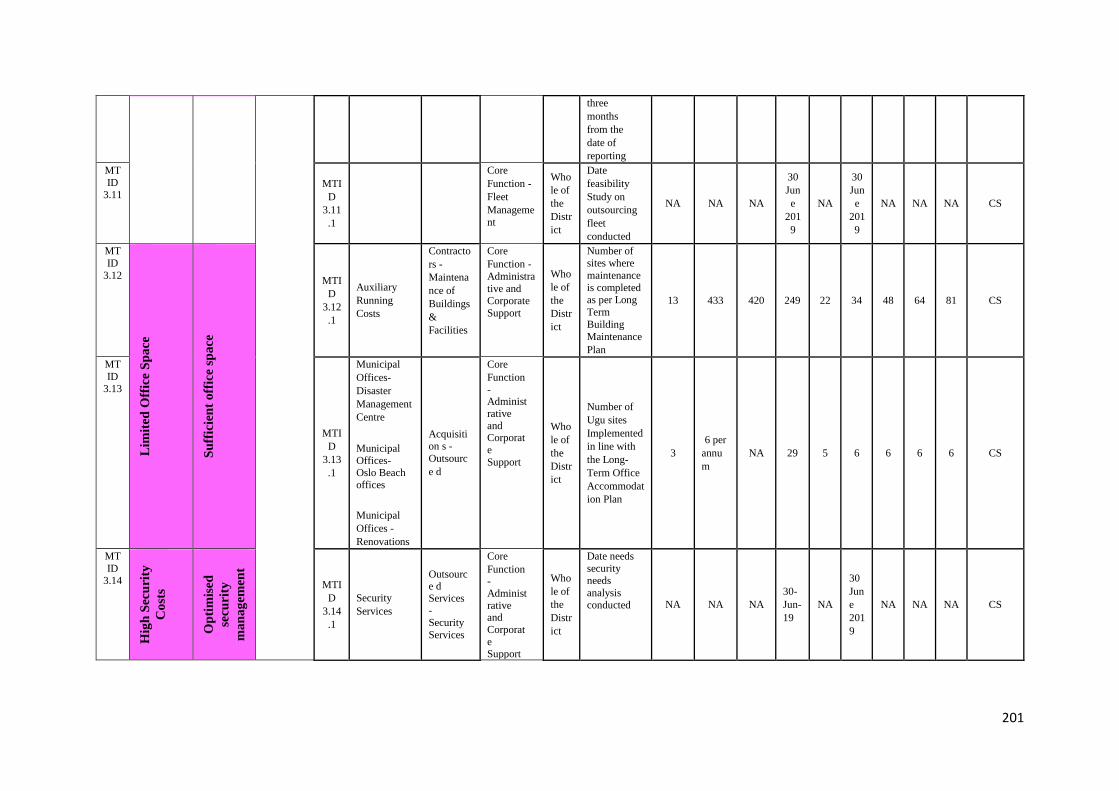
201
three
months
from the
date of
reporting
MT
ID 3.11
MTI
D 3.11
.1
Core
Function -
Fleet
Manageme
nt
Who
le of
the
Distr
ict
Date
feasibility
Study on
outsourcing
fleet
conducted
NA NA NA
30
Jun
e
201
9
NA
30
Jun
e
201
9
NA NA NA CS
MT
ID
3.12
Lim
ited
Off
ice
Sp
ace
Su
ffic
ien
t o
ffic
e sp
ace
MTI
D 3.12
.1
Auxiliary
Running
Costs
Contracto
rs -
Maintena
nce of
Buildings
&
Facilities
Core
Function -
Administra
tive and Corporate
Support
Who
le of
the
Distr
ict
Number of
sites where
maintenance
is completed as per Long
Term
Building
Maintenance
Plan
13 433 420 249 22 34 48 64 81 CS
MT
ID 3.13
MTI
D 3.13
.1
Municipal
Offices- Disaster
Management Centre
Municipal Offices- Oslo Beach offices
Municipal
Offices -
Renovations
Acquisiti
on s -
Outsourc
e d
Core
Function -Administrative and Corporat
e
Support
Who
le of
the
Distr
ict
Number of
Ugu sites
Implemented
in line with
the Long-
Term Office
Accommodat
ion Plan
3
6 per
annu
m
NA 29 5 6 6 6 6 CS
MT
ID 3.14
Hig
h S
ecu
rity
Co
sts
Op
tim
ised
secu
rity
ma
na
gem
ent
MTI
D 3.14
.1
Security
Services
Outsource d Services -
Security
Services
Core
Function - Administrative and
Corporate Support
Who
le of
the
Distr
ict
Date needs
security needs
analysis conducted NA NA NA
30-
Jun-
19
NA
30
Jun
e
201
9
NA NA NA CS
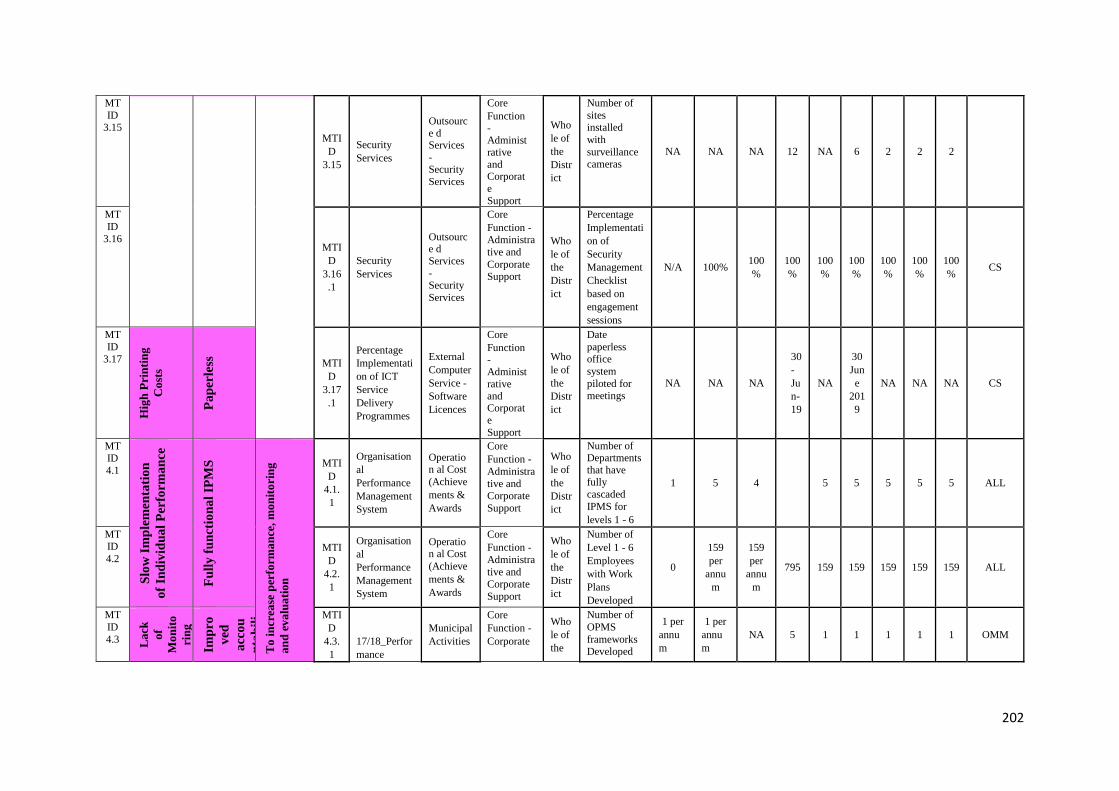
202
MT
ID 3.15
MTI
D 3.15
Security
Services
Outsource d Services - Security
Services
Core
Function - Administrative and Corporate
Support
Who
le of
the
Distr
ict
Number of
sites installed
with
surveillance cameras
NA NA NA 12 NA 6 2 2 2
MT
ID 3.16
MTI
D 3.16
.1
Security
Services
Outsource d Services
- Security
Services
Core
Function - Administra
tive and
Corporate Support
Who
le of
the
Distr
ict
Percentage
Implementati
on of
Security
Management
Checklist
based on
engagement
sessions
N/A 100% 100
%
100
%
100
%
100
%
100
%
100
%
100
% CS
MT
ID 3.17
Hig
h P
rin
tin
g
Co
sts
Pa
per
less
MTI
D 3.17
.1
Percentage Implementati
on of ICT Service
Delivery Programmes
External
Computer
Service -
Software
Licences
Core
Function - Administrative and Corporate
Support
Who
le of
the
Distr
ict
Date
paperless office
system
piloted for meetings
NA NA NA
30
-
Ju
n-
19
NA
30
Jun
e
201
9
NA NA NA CS
MTID
4.1
Slo
w I
mp
lem
enta
tio
n
of
Ind
ivid
ua
l P
erfo
rma
nce
Fu
lly
fu
nct
ion
al
IPM
S
To
in
crea
se p
erfo
rma
nce
, m
on
ito
rin
g
an
d e
va
lua
tio
n
MTI
D 4.1.
1
Organisation
al Performance Management
System
Operation al Cost
(Achieve
ments &
Awards
Core
Function -
Administra
tive and Corporate
Support
Who
le of
the
Distr
ict
Number of Departments that have fully cascaded
IPMS for
levels 1 - 6
1 5 4 5 5 5 5 5 ALL
MTID
4.2 MTI
D 4.2.
1
Organisation
al Performance Management
System
Operation al Cost
(Achieve
ments &
Awards
Core
Function -
Administra
tive and Corporate
Support
Who
le of
the
Distr
ict
Number of
Level 1 - 6
Employees
with Work
Plans
Developed
0
159
per
annu
m
159
per
annu
m
795 159 159 159 159 159 ALL
MT
ID
4.3 La
ck
of
Mo
nit
o
rin
g
an
d
Ev
alu
a
tio
n
Imp
ro
ved
acc
ou
nta
bil
i
ty
MTI
D 4.3.
1
17/18_Perfor
mance
Municipal
Activities
Core
Function -
Corporate
Who
le of
the
Number of
OPMS
frameworks Developed
1 per
annu
m
1 per
annu
m
NA 5 1 1 1 1 1 OMM
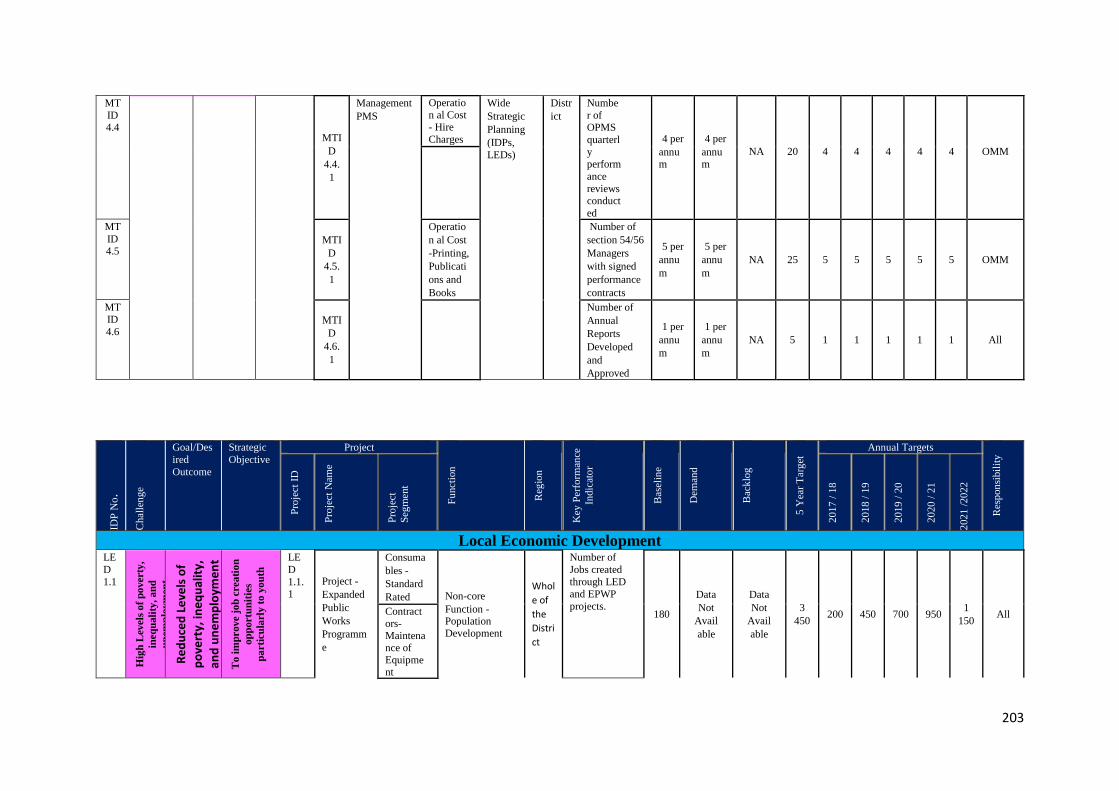
203
MT
ID 4.4
MTI
D 4.4.
1
Management
PMS Operation al Cost - Hire
Charges
Wide
Strategic
Planning
(IDPs,
LEDs)
Distr
ict
Numbe
r of OPMS
quarterl
y perform
ance
reviews conduct
ed
4 per
annum
4 per
annum
NA
20
4
4
4
4
4
OMM
MT
ID 4.5
MTI
D 4.5.
1
Operatio
n al Cost
-Printing,
Publicati
ons and
Books
Number of
section 54/56
Managers
with signed
performance
contracts
5 per
annu
m
5 per
annu
m
NA 25 5 5 5 5 5 OMM
MTID
4.6 MTI
D 4.6.
1
Number of
Annual
Reports
Developed
and
Approved
1 per
annu
m
1 per
annu
m
NA 5 1 1 1 1 1 All
IDP
No.
Chal
len
ge
Goal/Des
ired
Outcome
Strategic
Objective Project
Fu
nct
ion
Reg
ion
Key
Per
form
ance
Indic
ato
r
Bas
elin
e
Dem
and
Bac
klo
g
5 Y
ear
Tar
get
Annual Targets
Res
pon
sibil
ity
Pro
ject
ID
Pro
ject
Nam
e
Pro
ject
Seg
men
t
2017
/ 1
8
2018
/ 1
9
2019
/ 2
0
2020
/ 2
1
2021
/20
22
Local Economic Development LE
D
1.1
Hig
h L
evels
of
po
verty
,
ineq
uali
ty, a
nd
un
em
plo
ym
en
t
Re
du
ced
Le
vels
of
po
vert
y, in
eq
ual
ity,
and
un
em
plo
yme
nt
To i
mp
rove j
ob
cre
ati
on
op
portu
nit
ies
pa
rti
cu
larl
y t
o y
ou
th
LE
D
1.1.1
Project -
Expanded
Public
Works
Programm
e
Consuma
bles -
Standard
Rated Non-core
Function -Population Development
Whol
e of
the Distri
ct
Number of
Jobs created
through LED and EPWP
projects. 180
Data
Not
Avail
able
Data
Not
Avail
able
3
450 200 450 700 950
1
150 All Contract
ors- Maintenance of Equipment
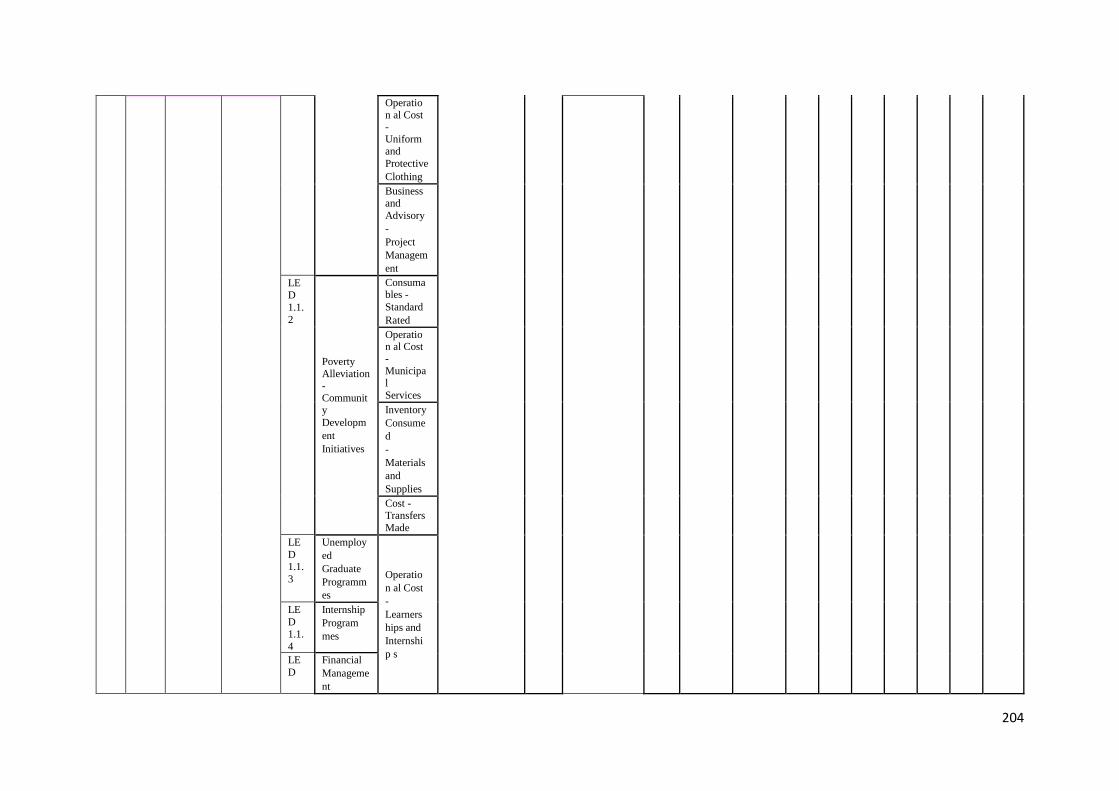
204
Operation al Cost - Uniform and
Protective
Clothing
Business and
Advisory
-
Project
Managem
ent
LED
1.1.
2
Poverty Alleviation - Community
Developm
ent
Initiatives
Consumables -
Standard
Rated
Operation al Cost - Municipal
Services
Inventory
Consume
d
-
Materials
and
Supplies
Cost - Transfers
Made
LE
D 1.1.
3
Unemploy
ed
Graduate
Programm
es
Operatio
n al Cost
-
Learners
hips and
Internshi
p s
LE
D 1.1.
4
Internship
Program
mes
LE
D
Financial
Manageme
nt
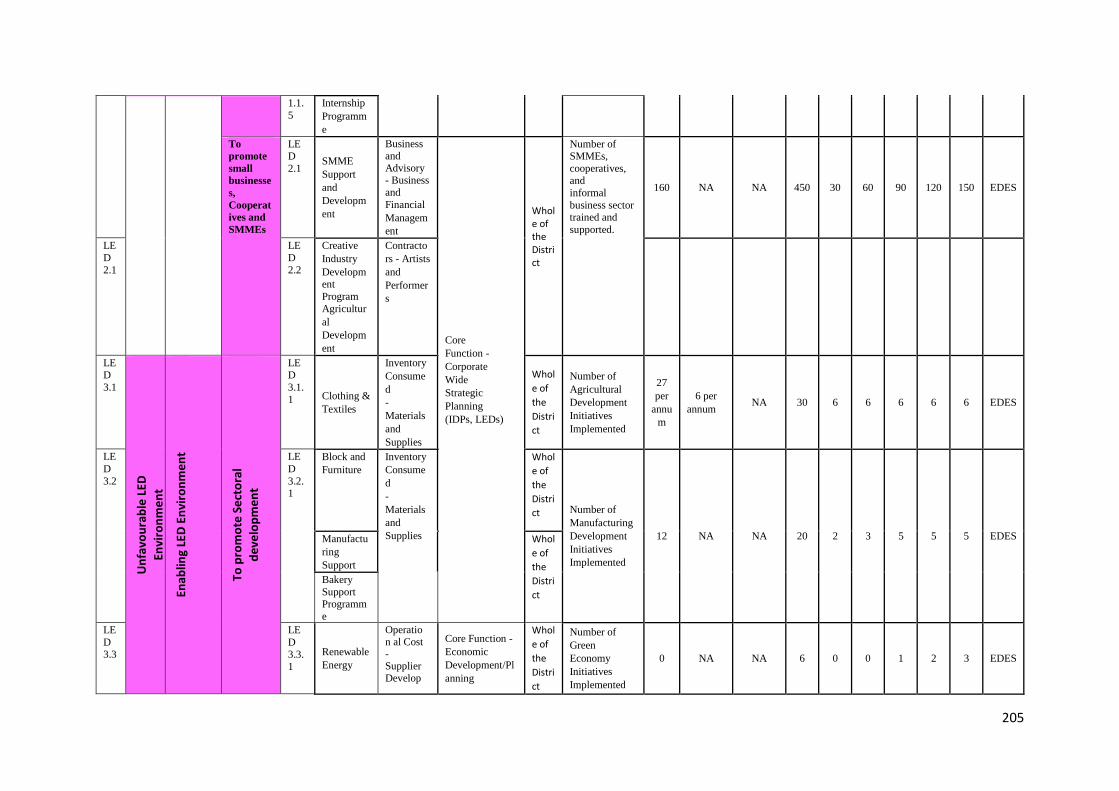
205
1.1.
5
Internship
Programm
e
To
promote
small
businesse
s,
Cooperat
ives and
SMMEs
LED
2.1 SMME
Support
and
Developm
ent
Business and Advisory - Business and
Financial
Managem
ent
Core
Function -
Corporate
Wide
Strategic
Planning
(IDPs, LEDs)
Whole of the District
Number of SMMEs,
cooperatives, and
informal
business sector trained and
supported.
160 NA NA 450 30 60 90 120 150 EDES
LE
D
2.1
LE
D
2.2
Creative
Industry
Development
Program
Agricultur
al
Developm
ent
Contracto
rs - Artists
and
Performer
s
LED
3.1
Un
favo
ura
ble
LED
Envi
ron
me
nt
Enab
ling
LED
En
viro
nm
en
t
To p
rom
ote
Se
cto
ral
de
velo
pm
en
t
LED
3.1.
1 Clothing &
Textiles
Inventory
Consume
d
-
Materials
and
Supplies
Whol
e of
the Distri
ct
Number of
Agricultural
Development
Initiatives
Implemented
27
per
annu
m
6 per
annum NA 30 6 6 6 6 6 EDES
LE
D
3.2
LE
D
3.2.1
Block and
Furniture
Inventory
Consume
d
-
Materials
and
Supplies
Whol
e of
the Distri
ct Number of
Manufacturing
Development
Initiatives
Implemented
12 NA NA 20 2 3 5 5 5 EDES Manufactu
ring
Support
Whol
e of
the
Distri
ct Bakery
Support Programm
e
LE
D 3.3
LE
D 3.3.
1
Renewable
Energy
Operation al Cost - Supplier Develop
Core Function -
Economic
Development/Pl
anning
Whol
e of
the Distri
ct
Number of
Green
Economy
Initiatives
Implemented
0 NA NA 6 0 0 1 2 3 EDES
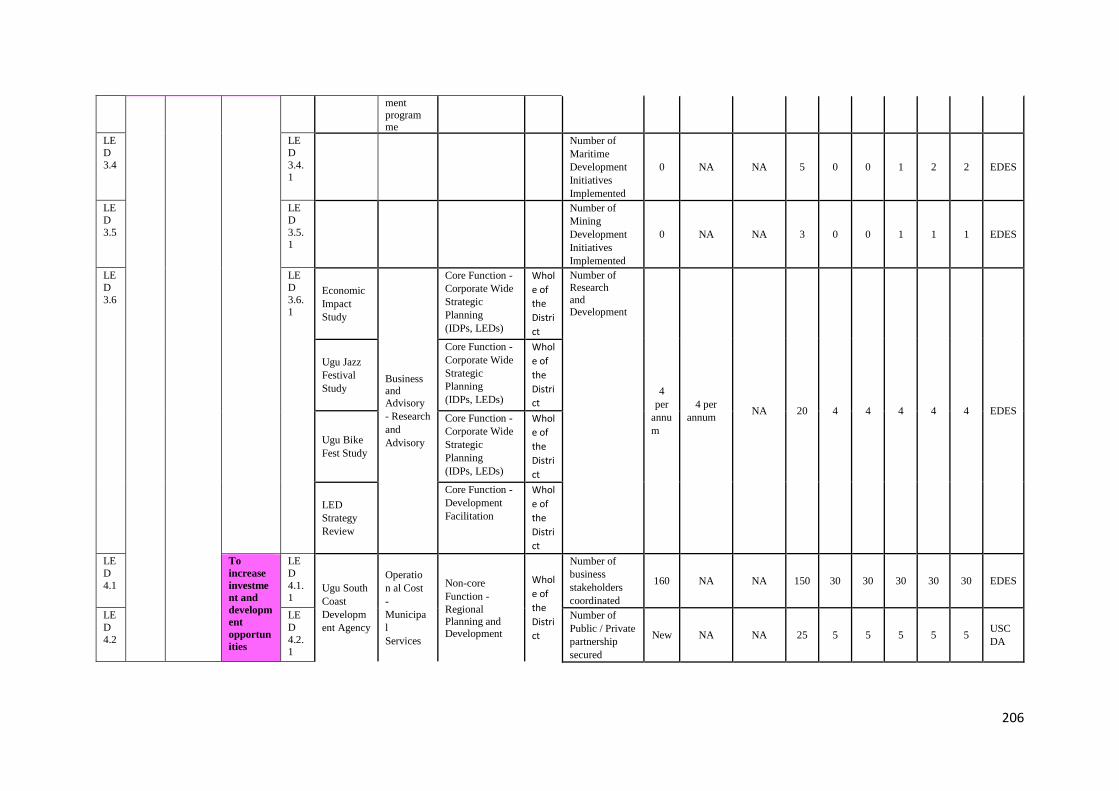
206
ment programme
LE
D
3.4
LE
D
3.4.1
Number of
Maritime
Development
Initiatives
Implemented
0 NA NA 5 0 0 1 2 2 EDES
LE
D
3.5
LE
D
3.5.1
Number of
Mining
Development
Initiatives
Implemented
0 NA NA 3 0 0 1 1 1 EDES
LE
D
3.6
LE
D
3.6.1
Economic
Impact
Study
Business and
Advisory
- Research
and
Advisory
Core Function -
Corporate Wide
Strategic
Planning
(IDPs, LEDs)
Whol
e of
the Distri
ct
Number of
Research
and Development
Initiative Implemented
4
per
annu
m
4 per
annum NA 20 4 4 4 4 4 EDES
Ugu Jazz
Festival
Study
Core Function -
Corporate Wide
Strategic
Planning
(IDPs, LEDs)
Whol
e of
the Distri
ct
Ugu Bike
Fest Study
Core Function -
Corporate Wide
Strategic
Planning
(IDPs, LEDs)
Whol
e of
the Distri
ct
LED
Strategy
Review
Core Function -
Development
Facilitation
Whol
e of
the Distri
ct LE
D
4.1
To
increase
investme
nt and
developm
ent
opportun
ities
LE
D
4.1.1
Ugu South
Coast
Developm
ent Agency
Operatio
n al Cost
-
Municipa
l
Services
Non-core
Function -
Regional
Planning and Development
Whol
e of
the Distri
ct
Number of
business
stakeholders
coordinated
160 NA NA 150 30 30 30 30 30 EDES
LE
D
4.2
LE
D
4.2.1
Number of
Public / Private
partnership
secured
New NA NA 25 5 5 5 5 5 USC
DA
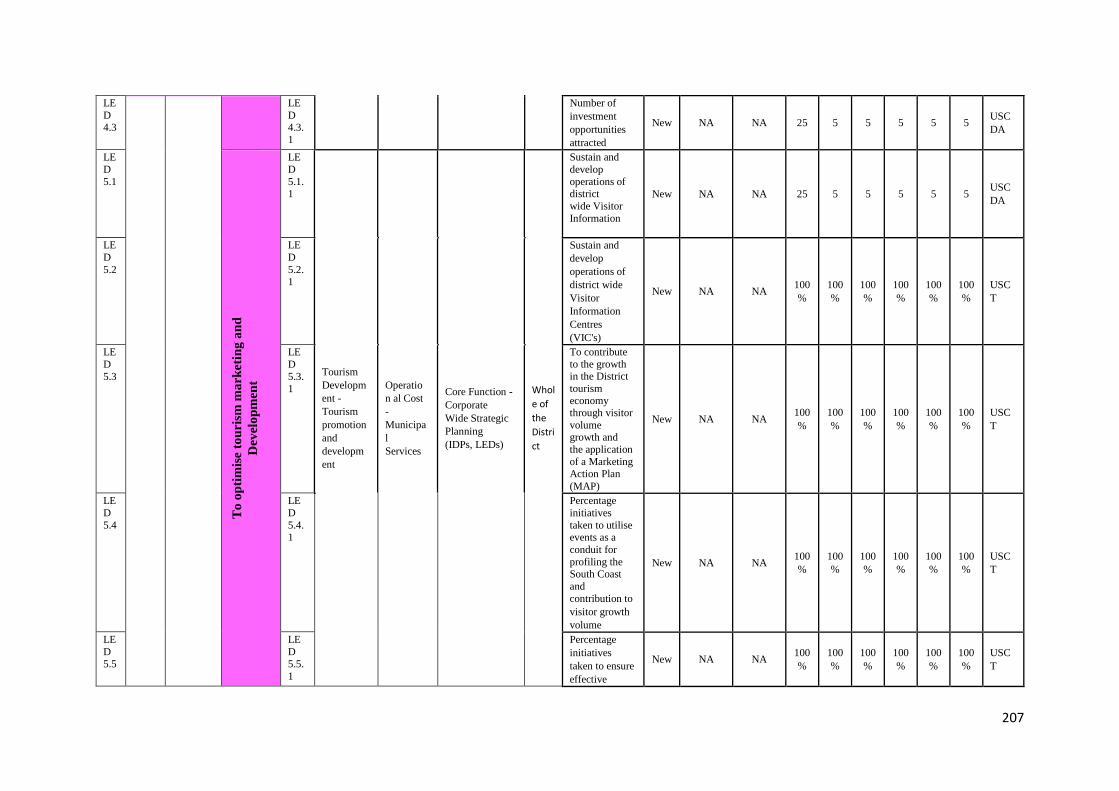
207
LE
D 4.3
LE
D 4.3.
1
Number of
investment
opportunities
attracted
New NA NA 25 5 5 5 5 5 USC
DA
LE
D
5.1
To
op
tim
ise
tou
rism
ma
rket
ing
an
d
Dev
elo
pm
ent
LE
D
5.1.1
Tourism
Developm
ent -
Tourism
promotion
and
developm
ent
Operatio
n al Cost
-
Municipa
l
Services
Core Function -
Corporate
Wide Strategic
Planning
(IDPs, LEDs)
Whol
e of
the
Distri
ct
Sustain and
develop
operations of district
wide Visitor
Information
Centres (VIC's)
New NA NA 25 5 5 5 5 5 USC
DA
LE
D
5.2
LE
D
5.2.1
Sustain and
develop
operations of
district wide
Visitor
Information
Centres
(VIC's)
New NA NA 100
%
100
%
100
%
100
%
100
%
100
%
USC
T
LE
D
5.3
LE
D
5.3.1
To contribute to the growth in the District
tourism economy through visitor
volume growth and
the application
of a Marketing Action Plan
(MAP)
New NA NA 100
%
100
%
100
%
100
%
100
%
100
%
USC
T
LE
D
5.4
LE
D
5.4.1
Percentage
initiatives
taken to utilise events as a
conduit for
profiling the South Coast
and
contribution to
visitor growth
volume
New NA NA 100
%
100
%
100
%
100
%
100
%
100
%
USC
T
LE
D 5.5
LE
D 5.5.
1
Percentage
initiatives
taken to ensure
effective
New NA NA 100
%
100
%
100
%
100
%
100
%
100
%
USC
T
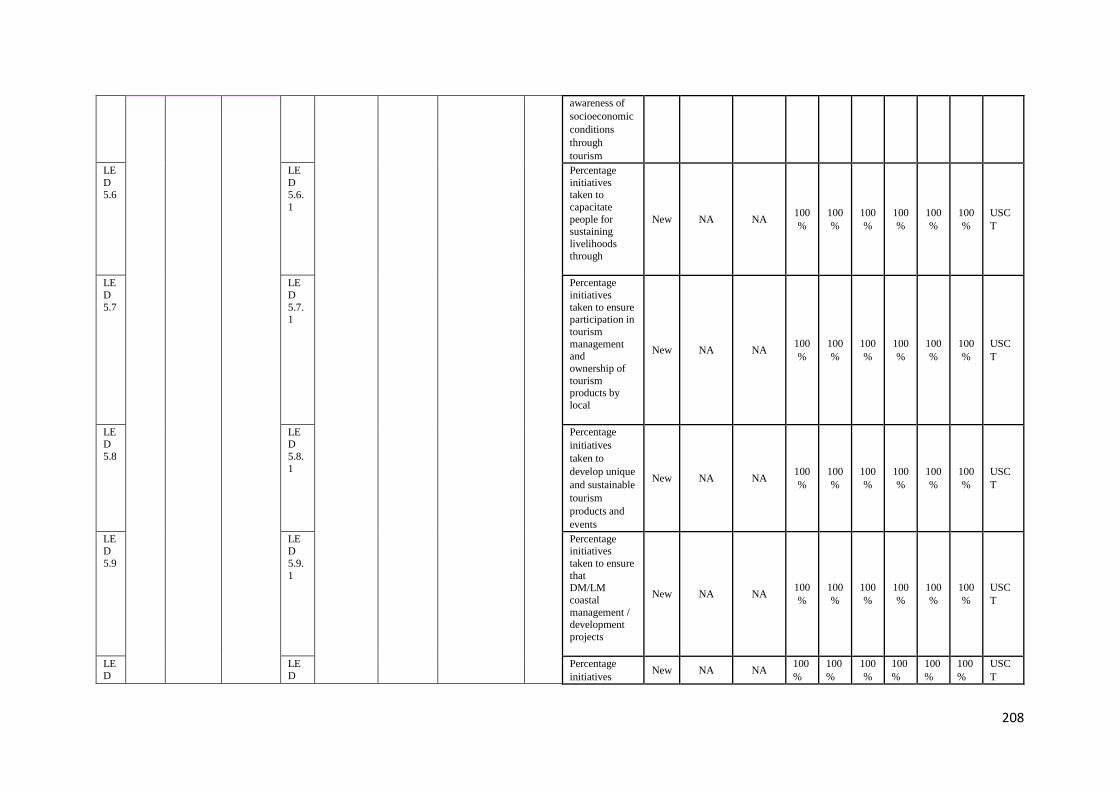
208
awareness of
socioeconomic
conditions
through
tourism
LE
D 5.6
LE
D 5.6.
1
Percentage
initiatives taken to
capacitate
people for sustaining
livelihoods
through
tourism
New NA NA 100
%
100
%
100
%
100
%
100
%
100
%
USC
T
LE
D
5.7
LE
D
5.7.1
Percentage
initiatives
taken to ensure participation in
tourism
management and
ownership of
tourism products by
local
communities
New NA NA 100
%
100
%
100
%
100
%
100
%
100
%
USC
T
LE
D
5.8
LE
D
5.8.
1
Percentage
initiatives
taken to
develop unique
and sustainable
tourism
products and
events
New NA NA 100
%
100
%
100
%
100
%
100
%
100
%
USC
T
LED
5.9
LED
5.9.
1
Percentage initiatives
taken to ensure
that DM/LM
coastal
management /
development
projects
are activated
New NA NA 100
%
100
%
100
%
100
%
100
%
100
%
USC
T
LED
LED
Percentage
initiatives New NA NA
100
%
100
%
100
%
100
%
100
%
100
%
USC
T
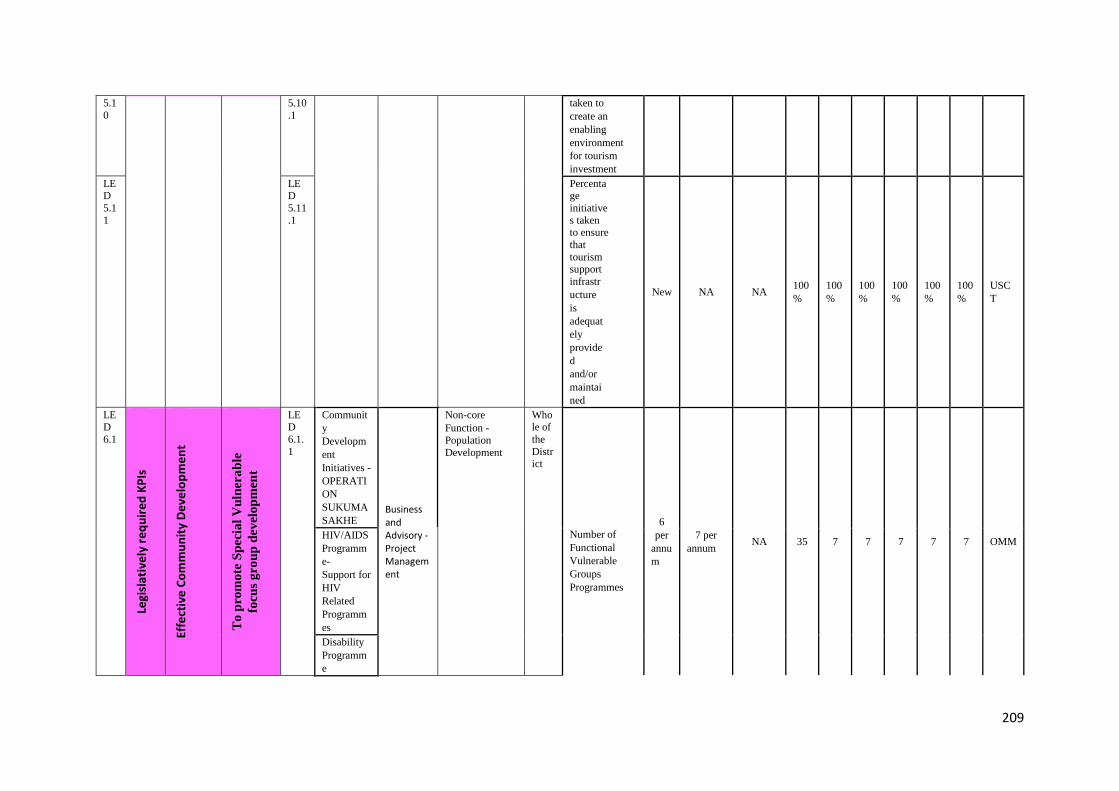
209
5.1
0
5.10
.1
taken to
create an
enabling
environment
for tourism
investment
LED
5.1
1
LED
5.11
.1
Percentage
initiative
s taken to ensure
that
tourism
support
infrastr
ucture
is
adequat
ely
provide
d
and/or
maintai
ned
New NA NA 100
%
100
%
100
%
100
%
100
%
100
%
USC
T
LED
6.1
Legi
slat
ive
ly r
eq
uir
ed
KP
Is
Effe
ctiv
e C
om
mu
nit
y D
eve
lop
me
nt
To
pro
mo
te S
pec
ial
Vu
lner
ab
le
focu
s g
rou
p d
evel
op
men
t
LED
6.1.
1
Communit
y
Developm
ent
Initiatives -
OPERATI
ON
SUKUMA
SAKHE Business and Advisory - Project Management
Non-core
Function -
Population
Development
Whole of
the
District
Number of
Functional
Vulnerable
Groups
Programmes
6
per
annu
m
7 per
annum NA 35 7 7 7 7 7 OMM
HIV/AIDS
Programm
e-
Support for
HIV
Related
Programm
es
Disability
Programm
e
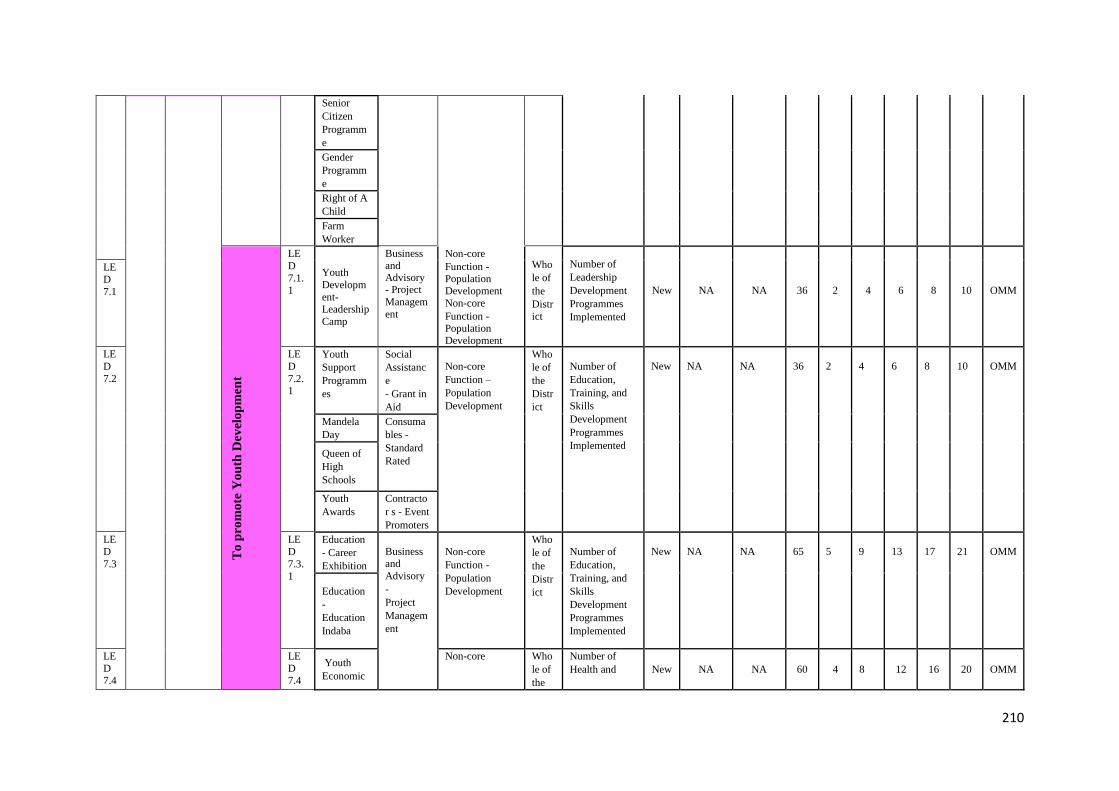
210
Senior
Citizen
Programm
e
Gender
Programm
e
Right of A
Child
Farm
Worker
T
o p
rom
ote
Yo
uth
Dev
elo
pm
ent
LE
D
7.1.1
Youth
Developm
ent- Leadership
Camp
Business
and Advisory - Project
Managem
ent
Non-core
Function - Population Development
Non-core
Function - Population Development
Who
le of
the
Distr
ict
Number of
Leadership
Development
Programmes
Implemented
New
NA
NA
36
2
4
6
8
10
OMM
LE
D
7.1
LE
D
7.2
LE
D
7.2.1
Youth
Support
Programm
es
Social
Assistanc
e
- Grant in
Aid
Non-core
Function –
Population
Development
Who
le of
the
Distr
ict
Number of
Education,
Training, and
Skills
Development
Programmes
Implemented
New
NA
NA
36
2
4
6
8
10
OMM
Mandela
Day
Consuma
bles -
Standard
Rated
Queen of
High
Schools
Youth
Awards
Contracto
r s - Event
Promoters
LE
D
7.3
LE
D
7.3.1
Education
- Career
Exhibition
Business and
Advisory
-
Project
Managem
ent
Non-core
Function -
Population
Development
Who
le of
the
Distr
ict
Number of
Education,
Training, and
Skills
Development
Programmes
Implemented
New
NA
NA
65
5
9
13
17
21
OMM
Education
-
Education
Indaba
LE
D 7.4
LE
D 7.4
Youth
Economic
Non-core Who
le of
the
Number of
Health and New NA NA 60 4 8 12 16 20 OMM
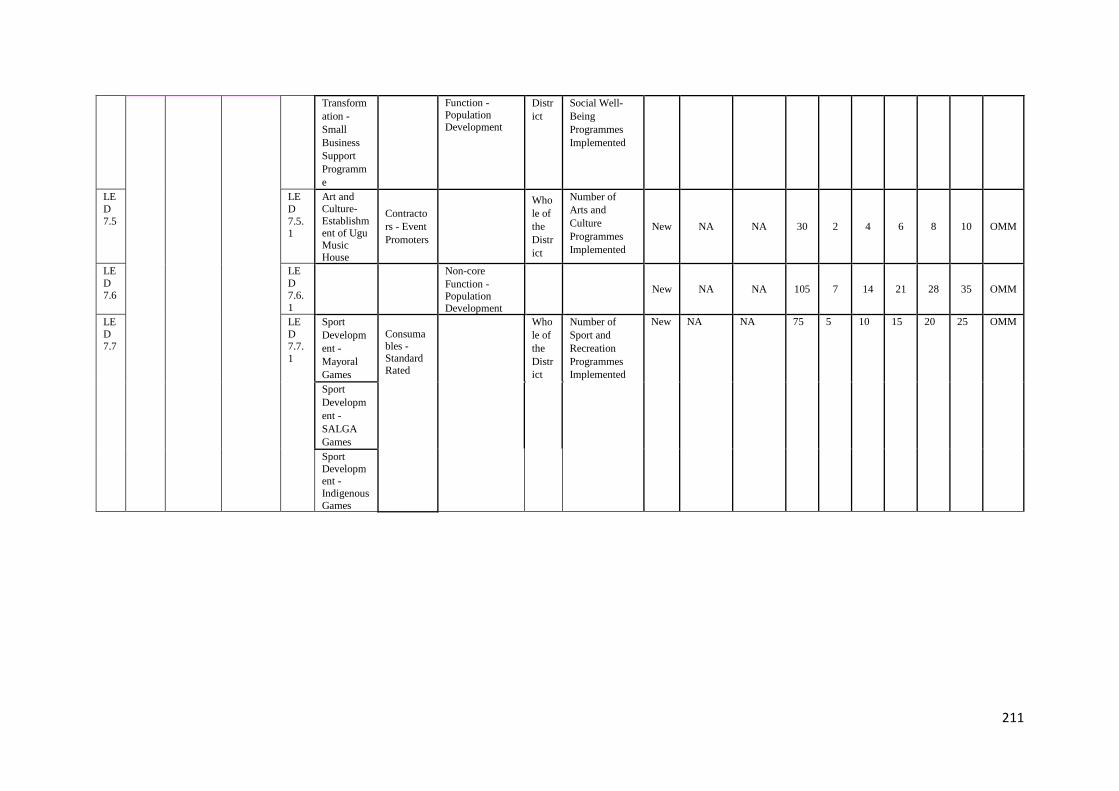
211
Transform
ation -
Small
Business
Support
Programm
e
Function - Population Development
Distr
ict
Social Well-
Being
Programmes
Implemented
LE
D
7.5
LE
D
7.5.1
Art and Culture- Establishment of Ugu Music House
Contracto
rs - Event
Promoters
Who
le of
the
Distr
ict
Number of
Arts and
Culture
Programmes
Implemented
New NA NA 30 2 4 6 8 10 OMM
LE
D 7.6
LE
D 7.6.
1
Non-core
Function - Population Development
New NA NA 105 7 14 21 28 35 OMM
LE
D 7.7
LE
D 7.7.
1
Sport
Developm
ent -
Mayoral
Games
Consumables - Standard Rated
Who
le of
the
Distr
ict
Number of
Sport and
Recreation
Programmes
Implemented
New NA NA 75 5 10 15 20 25 OMM
Sport
Developm
ent -
SALGA
Games
Sport
Development -
Indigenous
Games
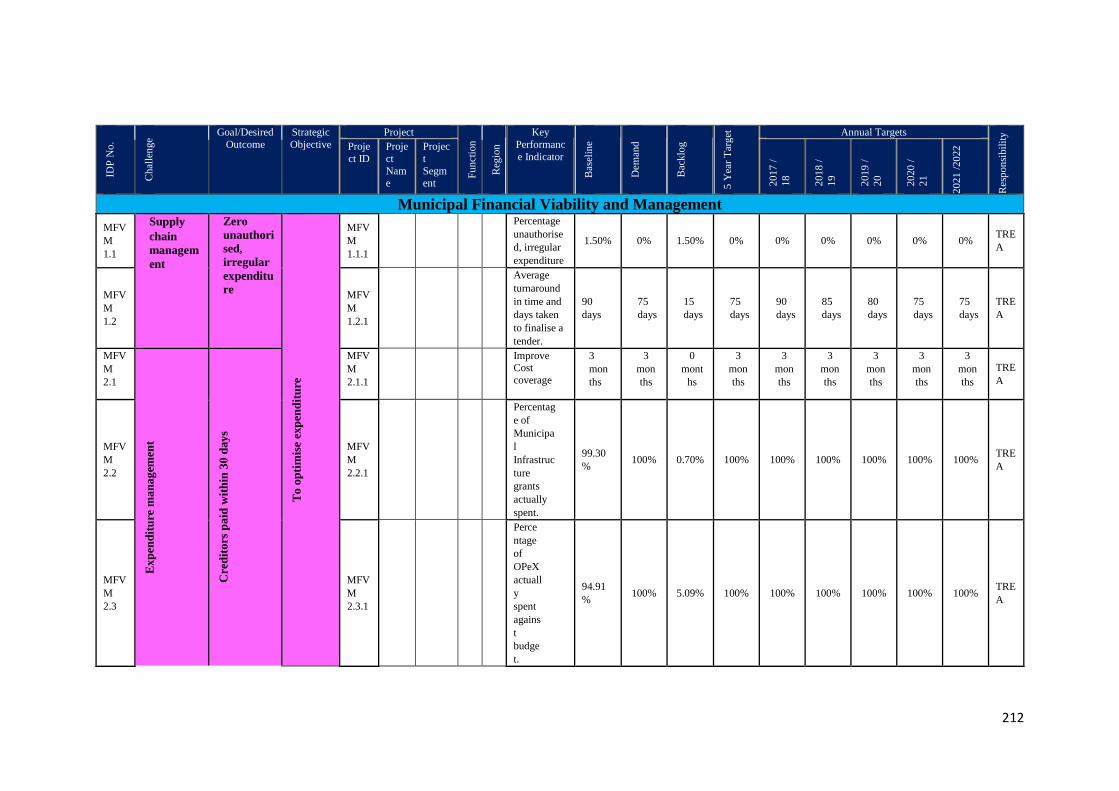
212
ID
P N
o.
Chal
len
ge
Goal/Desired
Outcome
Strategic
Objective
Project
Fu
nct
ion
Reg
ion
Key
Performanc
e Indicator
Bas
elin
e
Dem
and
Bac
klo
g
5 Y
ear
Tar
get
Annual Targets
Res
pon
sibil
ity
Proje
ct ID Proje
ct
Name
Projec
t
Segment 2
017
/
18
2018
/
19
2019
/
20
2020
/
21
2021
/20
22
Municipal Financial Viability and Management
MFV
M
1.1
Supply
chain
managem
ent
Zero
unauthori
sed,
irregular
expenditu
re T
o o
pti
mis
e ex
pen
dit
ure
MFV
M
1.1.1
Percentage
unauthorise
d, irregular
expenditure
1.50% 0% 1.50% 0% 0% 0% 0% 0% 0% TRE
A
MFV
M
1.2
MFV
M
1.2.1
Average
turnaround
in time and
days taken
to finalise a
tender.
90
days
75
days
15
days
75
days
90
days
85
days
80
days
75
days
75
days
TRE
A
MFV
M
2.1
Ex
pen
dit
ure
ma
na
gem
ent
Cre
dit
ors
pa
id w
ith
in 3
0 d
ay
s
MFV
M
2.1.1 Improve Cost
coverage
ratio.
3
mon
ths
3
mon
ths
0
mont
hs
3
mon
ths
3
mon
ths
3
mon
ths
3
mon
ths
3
mon
ths
3
mon
ths
TRE
A
MFV
M
2.2
MFV
M
2.2.1
Percentag
e of
Municipa
l
Infrastruc
ture
grants
actually
spent.
99.30
% 100% 0.70% 100% 100% 100% 100% 100% 100%
TRE
A
MFV
M
2.3
MFV
M
2.3.1
Perce
ntage
of
OPeX
actuall
y
spent
agains
t
budge
t.
94.91
% 100% 5.09% 100% 100% 100% 100% 100% 100%
TRE
A
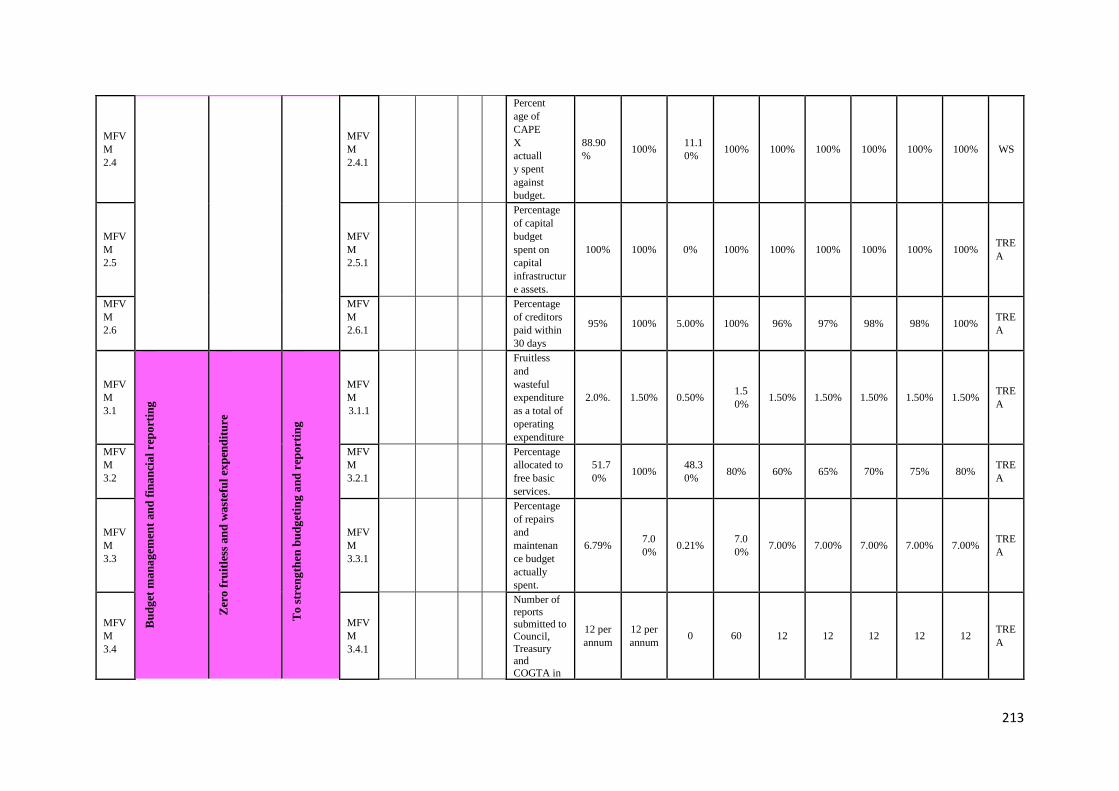
213
MFV
M
2.4
MFV
M
2.4.1
Percent
age of
CAPE
X
actuall
y spent
against
budget.
88.90
% 100%
11.1
0% 100% 100% 100% 100% 100% 100% WS
MFV
M
2.5
MFV
M
2.5.1
Percentage
of capital
budget
spent on
capital
infrastructur
e assets.
100% 100% 0% 100% 100% 100% 100% 100% 100% TRE
A
MFV
M
2.6
MFV
M
2.6.1 Percentage
of creditors
paid within
30 days
95% 100% 5.00% 100% 96% 97% 98% 98% 100% TRE
A
MFV
M
3.1
Bu
dg
et m
an
ag
emen
t an
d f
ina
nci
al
rep
ort
ing
Zer
o f
ruit
less
an
d w
ast
efu
l ex
pen
dit
ure
To
str
eng
then
bu
dg
etin
g a
nd
rep
ort
ing
MFV
M
3.1.1
Fruitless
and
wasteful
expenditure
as a total of
operating
expenditure
2.0%. 1.50% 0.50% 1.5
0% 1.50% 1.50% 1.50% 1.50% 1.50%
TRE
A
MFV
M
3.2
MFV
M
3.2.1 Percentage
allocated to
free basic
services.
51.7
0% 100%
48.3
0% 80% 60% 65% 70% 75% 80%
TRE
A
MFV
M
3.3
MFV
M
3.3.1
Percentage
of repairs
and
maintenan
ce budget
actually
spent.
6.79% 7.0
0% 0.21%
7.0
0% 7.00% 7.00% 7.00% 7.00% 7.00%
TRE
A
MFV
M
3.4
MFV
M
3.4.1
Number of
reports
submitted to
Council,
Treasury and
COGTA in
12 per
annum
12 per
annum 0 60 12 12 12 12 12
TRE
A
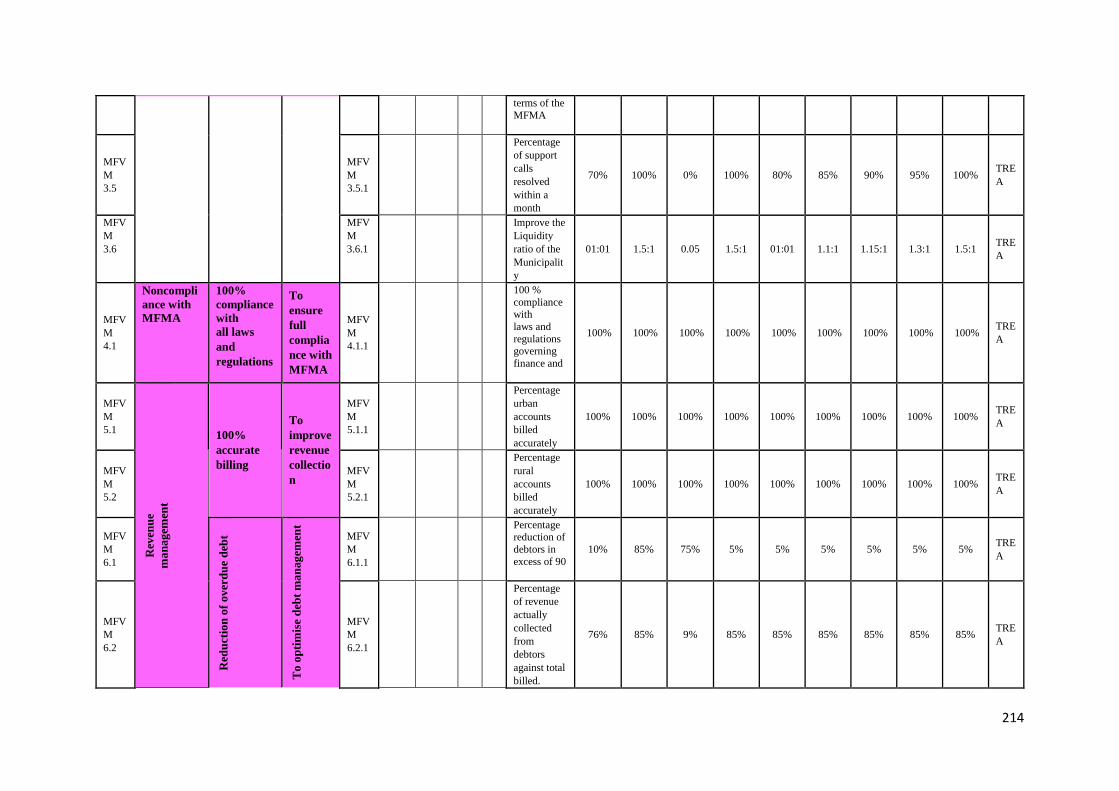
214
terms of the
MFMA
calendar of reporting.
MFV
M
3.5
MFV
M
3.5.1
Percentage
of support
calls
resolved
within a
month
70% 100% 0% 100% 80% 85% 90% 95% 100% TRE
A
MFV
M
3.6
MFV
M
3.6.1 Improve the
Liquidity
ratio of the
Municipalit
y
01:01 1.5:1 0.05 1.5:1 01:01 1.1:1 1.15:1 1.3:1 1.5:1 TRE
A
MFV
M
4.1
Noncompli
ance with
MFMA
100%
compliance
with
all laws
and
regulations
To
ensure
full
complia
nce with
MFMA
MFV
M
4.1.1
100 %
compliance with
laws and
regulations governing
finance and
updated checklist
100% 100% 100% 100% 100% 100% 100% 100% 100% TRE
A
MFV
M
5.1
Rev
enu
e
ma
na
gem
ent
100%
accurate
billing
To
improve
revenue
collectio
n
MFV
M
5.1.1
Percentage
urban
accounts
billed
accurately
100% 100% 100% 100% 100% 100% 100% 100% 100% TRE
A
MFV
M
5.2
MFV
M
5.2.1
Percentage
rural
accounts
billed
accurately
100% 100% 100% 100% 100% 100% 100% 100% 100% TRE
A
MFV
M
6.1
Red
uct
ion
of
ov
erd
ue
deb
t
To
op
tim
ise
deb
t m
an
ag
emen
t
MFV
M
6.1.1
Percentage reduction of
debtors in
excess of 90
days
10% 85% 75% 5% 5% 5% 5% 5% 5% TRE
A
MFV
M
6.2
MFV
M
6.2.1
Percentage
of revenue
actually
collected
from
debtors
against total
billed.
76% 85% 9% 85% 85% 85% 85% 85% 85% TRE
A
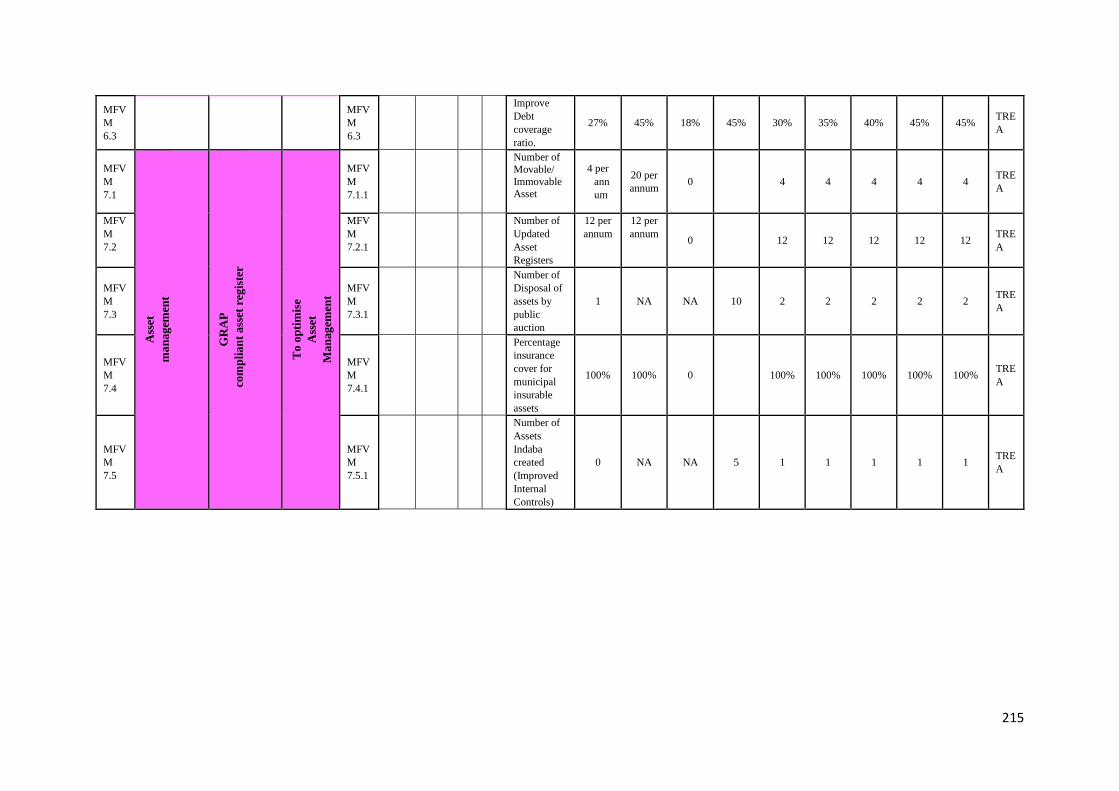
215
MFV
M
6.3
MFV
M
6.3
Improve
Debt
coverage
ratio.
27% 45% 18% 45% 30% 35% 40% 45% 45% TRE
A
MFV
M
7.1
Ass
et
ma
na
gem
ent
GR
AP
com
pli
an
t a
sset
reg
iste
r
To
op
tim
ise
Ass
et
Ma
nag
emen
t
MFV
M
7.1.1
Number of
Movable/
Immovable Asset
Verifications conducted
4 per
ann
um
20 per
annum 0 4 4 4 4 4
TRE
A
MFV
M
7.2
MFV
M
7.2.1 Number of
Updated
Asset
Registers
12 per
annum
12 per
annum 0 12 12 12 12 12
TRE
A
MFV
M
7.3
MFV
M
7.3.1
Number of
Disposal of
assets by
public
auction
1 NA NA 10 2 2 2 2 2 TRE
A
MFV
M
7.4
MFV
M
7.4.1
Percentage
insurance
cover for
municipal
insurable
assets
100% 100% 0 100% 100% 100% 100% 100% TRE
A
MFV
M
7.5
MFV
M
7.5.1
Number of
Assets
Indaba
created
(Improved
Internal
Controls)
0 NA NA 5 1 1 1 1 1 TRE
A
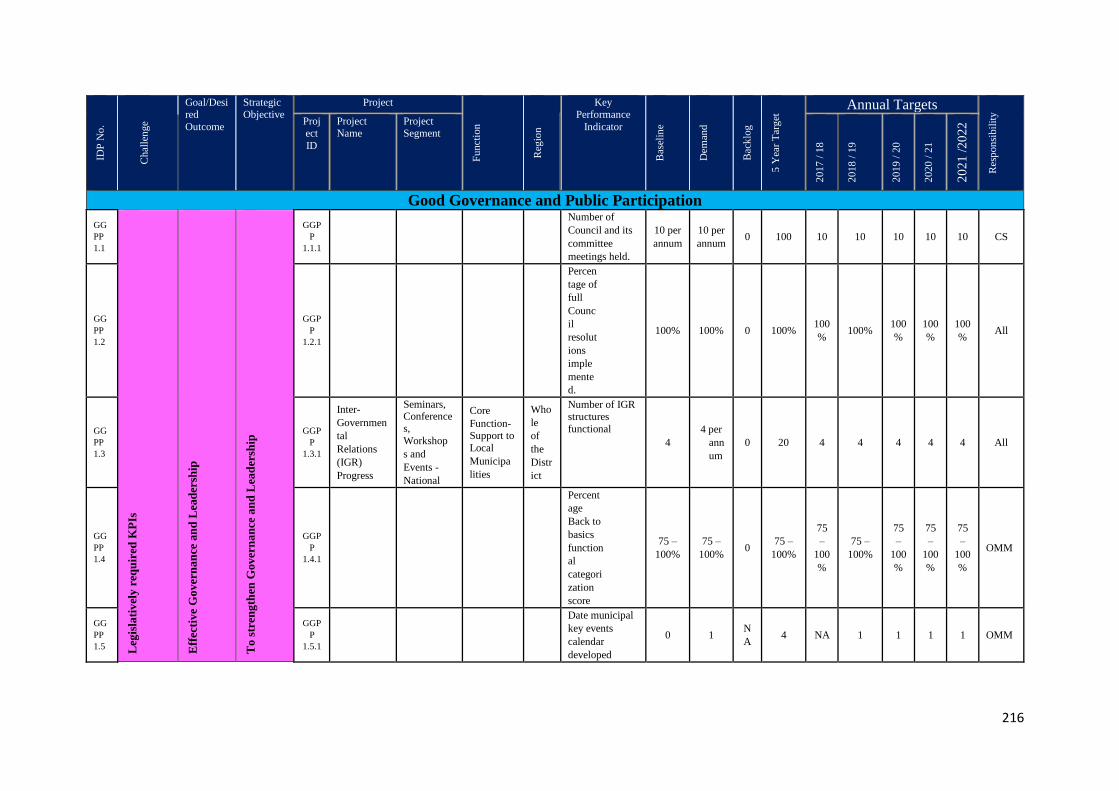
216
IDP
No
.
Chal
len
ge
Goal/Desired
Outcome
Strategic Objective
Project
Fu
nct
ion
Reg
ion
Key Performance
Indicator
Bas
elin
e
Dem
and
Bac
klo
g
5 Y
ear
Tar
get
Annual Targets
Res
pon
sibil
ity
Project
ID
Project Name
Project Segment
2017
/ 1
8
2018
/ 1
9
2019
/ 2
0
2020
/ 2
1
20
21
/2
022
Good Governance and Public Participation
GG
PP
1.1
Leg
isla
tiv
ely
req
uir
ed K
PIs
Eff
ecti
ve
Go
ver
na
nce
an
d L
ead
ersh
ip
To
str
eng
then
Gov
ern
an
ce a
nd
Lea
der
ship
GGP
P
1.1.1
Number of
Council and its
committee
meetings held.
10 per
annum
10 per
annum 0 100 10 10 10 10 10 CS
GG
PP
1.2
GGP
P
1.2.1
Percen
tage of
full
Counc
il
resolut
ions
imple
mente
d.
100% 100% 0 100% 100
% 100%
100
%
100
%
100
% All
GG
PP
1.3
GGP
P
1.3.1
Inter-
Governmen
tal
Relations
(IGR)
Progress
Seminars, Conferences,
Workshop
s and
Events -
National
Core
Function- Support to
Local
Municipa
lities
Who
le
of
the
Distr
ict
Number of IGR structures
functional
Structures functional 4
4 per
ann
um
0 20 4 4 4 4 4 All
GG
PP
1.4
GGP
P
1.4.1
Percent
age
Back to
basics
function
al
categori
zation
score
75 –
100%
75 –
100% 0
75 –
100%
75
–
100
%
75 –
100%
75
–
100
%
75
–
100
%
75
–
100
%
OMM
GG
PP
1.5
GGP
P
1.5.1
Date municipal
key events
calendar
developed
0 1 N
A 4 NA 1 1 1 1 OMM
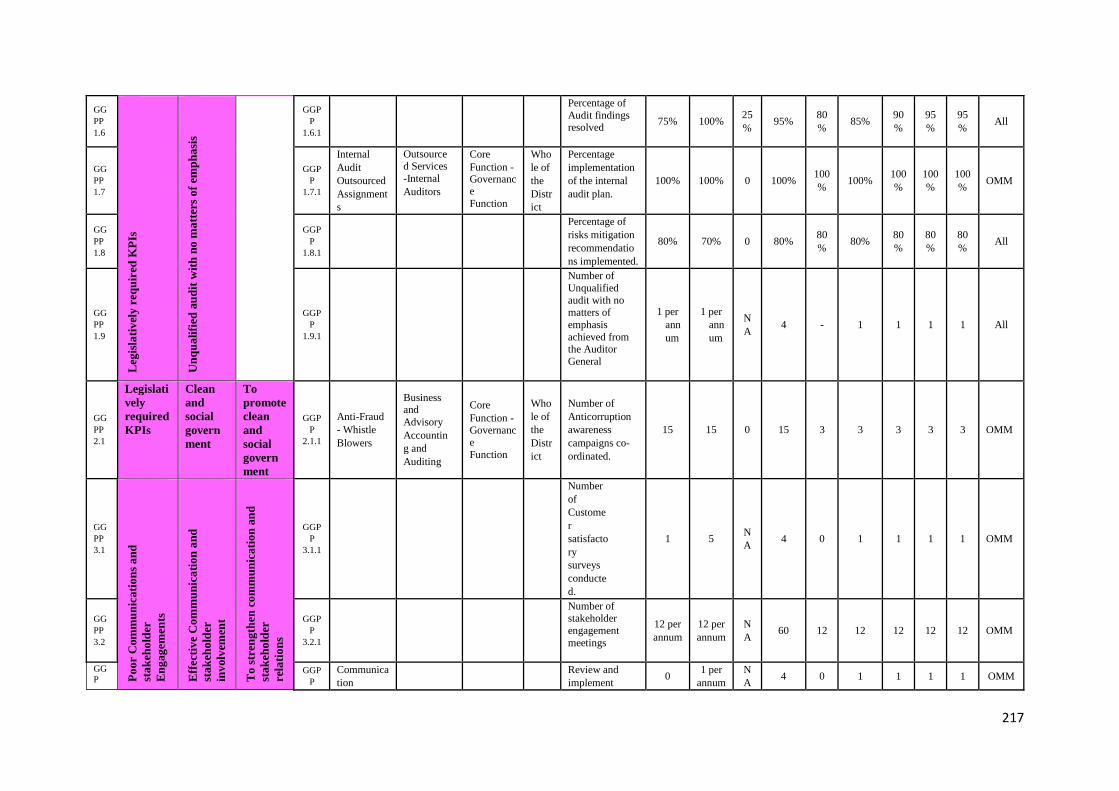
217
GG
PP
1.6 L
egis
lati
vel
y r
equ
ired
KP
Is
Un
qu
ali
fied
au
dit
wit
h n
o m
att
ers
of
emp
ha
sis
GGP
P
1.6.1
Percentage of
Audit findings resolved
findings resolved.
75% 100% 25
% 95%
80
% 85%
90
%
95
%
95
% All
GG
PP
1.7
GGP
P
1.7.1
Internal
Audit
Outsourced
Assignment
s
Outsource d Services
-Internal
Auditors
Core
Function - Governance
Function
Who
le of
the
Distr
ict
Percentage
implementation
of the internal
audit plan.
100% 100% 0 100% 100
% 100%
100
%
100
%
100
% OMM
GG
PP
1.8
GGP
P
1.8.1
Percentage of
risks mitigation
recommendatio
ns implemented.
80% 70% 0 80% 80
% 80%
80
%
80
%
80
% All
GG
PP
1.9
GGP
P
1.9.1
Number of
Unqualified
audit with no matters of
emphasis
achieved from the Auditor
General
the Auditor General.
1 per
ann
um
1 per
ann
um
N
A 4 - 1 1 1 1 All
GG
PP
2.1
Legislati
vely
required
KPIs
Clean
and
social
govern
ment
To
promote
clean
and
social
govern
ment
GGP
P
2.1.1
Anti-Fraud
- Whistle
Blowers
Business and
Advisory
Accountin
g and
Auditing
Core
Function - Governanc
e
Function
Who
le of
the
Distr
ict
Number of
Anticorruption
awareness
campaigns co-
ordinated.
15 15 0 15 3 3 3 3 3 OMM
GG
PP
3.1
Po
or
Com
mu
nic
ati
on
s a
nd
sta
keh
old
er
En
gag
emen
ts
Eff
ecti
ve
Co
mm
un
ica
tio
n a
nd
sta
keh
old
er
inv
olv
emen
t
To
str
eng
then
co
mm
un
icati
on
an
d
sta
keh
old
er
rela
tio
ns
GGP
P
3.1.1
Number
of
Custome
r
satisfacto
ry
surveys
conducte
d.
1 5 N
A 4 0 1 1 1 1 OMM
GG
PP
3.2
GGP
P
3.2.1
Number of
stakeholder
engagement
meetings
held.
12 per
annum
12 per
annum
N
A 60 12 12 12 12 12 OMM
GG
P GGP
P
Communica
tion
Review and
implement 0
1 per
annum
N
A 4 0 1 1 1 1 OMM
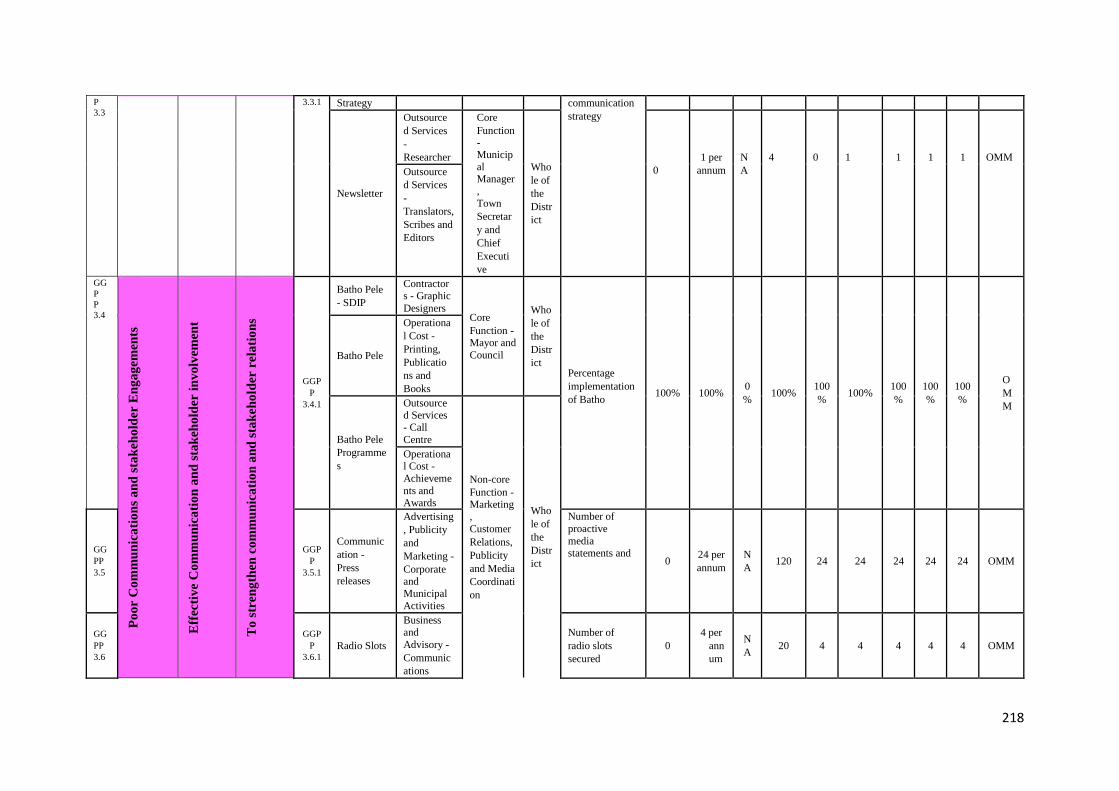
218
P
3.3
3.3.1 Strategy communication
strategy
Newsletter
Outsource
d Services
-
Researcher
Core
Function - Municipal Manager,
Town
Secretar
y and
Chief
Executi
ve
Who
le of
the
Distr
ict
0
1 per
annum
N
A
4
0
1
1
1
1
OMM
Outsource
d Services
-
Translators,
Scribes and
Editors
GG
P
P
3.4
Po
or
Co
mm
un
ica
tio
ns
an
d s
tak
eho
lder
En
ga
gem
ents
Eff
ecti
ve
Co
mm
un
ica
tio
n a
nd
sta
keh
old
er i
nv
olv
emen
t
To
str
en
gth
en c
om
mu
nic
ati
on
an
d s
tak
eho
lder
rela
tio
ns
GGP
P
3.4.1
Batho Pele
- SDIP
Contractors - Graphic
Designers Core
Function - Mayor and
Council
Who
le of
the
Distr
ict Percentage
implementation
of Batho
Pele Strategy
100% 100% 0
% 100%
100
% 100%
100
%
100
%
100
%
O
M
M
Batho Pele
Operationa
l Cost -
Printing,
Publicatio
ns and
Books
Batho Pele
Programme
s
Outsource d Services - Call
Centre
Non-core
Function - Marketing,
Customer
Relations,
Publicity
and Media
Coordinati
on
Who
le of
the
Distr
ict
Operational Cost -
Achieveme
nts and Awards
GG
PP
3.5
GGP
P
3.5.1
Communic
ation -
Press
releases
Advertising
, Publicity
and
Marketing -
Corporate and Municipal
Activities
Number of
proactive
media statements and
press releases 0 24 per
annum
N
A 120 24 24 24 24 24 OMM
GG
PP
3.6
GGP
P
3.6.1
Radio Slots
Business and
Advisory -
Communic
ations
Number of
radio slots
secured
0
4 per
ann
um
N
A 20 4 4 4 4 4 OMM
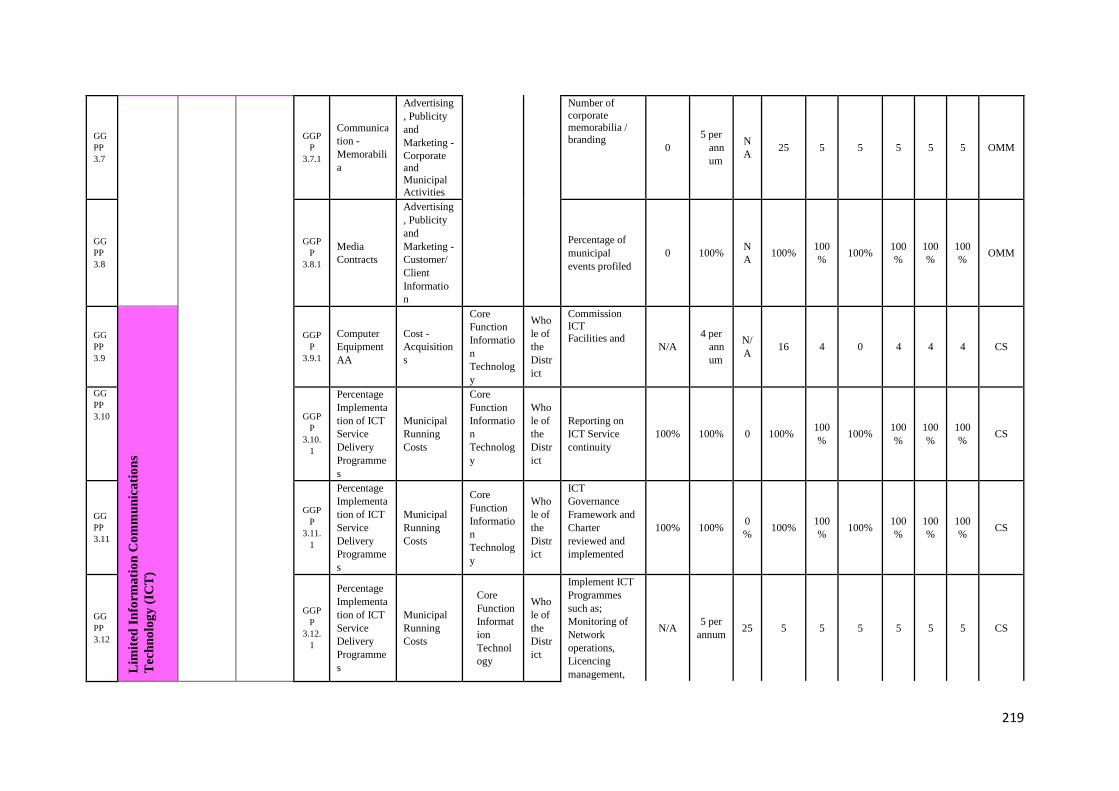
219
GG
PP
3.7
GGP
P
3.7.1
Communica
tion -
Memorabili
a
Advertising
, Publicity
and
Marketing -
Corporate and Municipal
Activities
Number of
corporate memorabilia /
branding
items produced 0
5 per
ann
um
N
A 25 5 5 5 5 5 OMM
GG
PP
3.8
GGP
P
3.8.1
Media
Contracts
Advertising
, Publicity
and
Marketing -
Customer/
Client
Informatio
n
Percentage of
municipal
events profiled
0 100% N
A 100%
100
% 100%
100
%
100
%
100
% OMM
GG
PP
3.9
Lim
ited
In
form
ati
on
Co
mm
un
ica
tio
ns
Tec
hn
olo
gy
(IC
T)
GGP
P
3.9.1
Computer
Equipment
AA
Cost -
Acquisition
s
Core
Function
Informatio
n
Technolog
y
Who
le of
the
Distr
ict
Commission
ICT
Facilities and
Infrastructure N/A
4 per
ann
um
N/
A 16 4 0 4 4 4 CS
GG
PP
3.10 GGP
P
3.10.
1
Percentage
Implementa
tion of ICT
Service
Delivery
Programme
s
Municipal
Running
Costs
Core
Function
Informatio
n
Technolog
y
Who
le of
the
Distr
ict
Reporting on
ICT Service
continuity
100% 100% 0 100% 100
% 100%
100
%
100
%
100
% CS
GG
PP
3.11
GGP
P
3.11.
1
Percentage
Implementa
tion of ICT
Service
Delivery
Programme
s
Municipal
Running
Costs
Core
Function
Informatio
n
Technolog
y
Who
le of
the
Distr
ict
ICT
Governance
Framework and
Charter
reviewed and
implemented
100% 100% 0
% 100%
100
% 100%
100
%
100
%
100
% CS
GG
PP
3.12
GGP
P
3.12.
1
Percentage
Implementa
tion of ICT
Service
Delivery
Programme
s
Municipal
Running
Costs
Core
Function
Informat
ion
Technol
ogy
Who
le of
the
Distr
ict
Implement ICT
Programmes
such as;
Monitoring of
Network
operations,
Licencing
management,
N/A 5 per
annum 25 5 5 5 5 5 5 CS
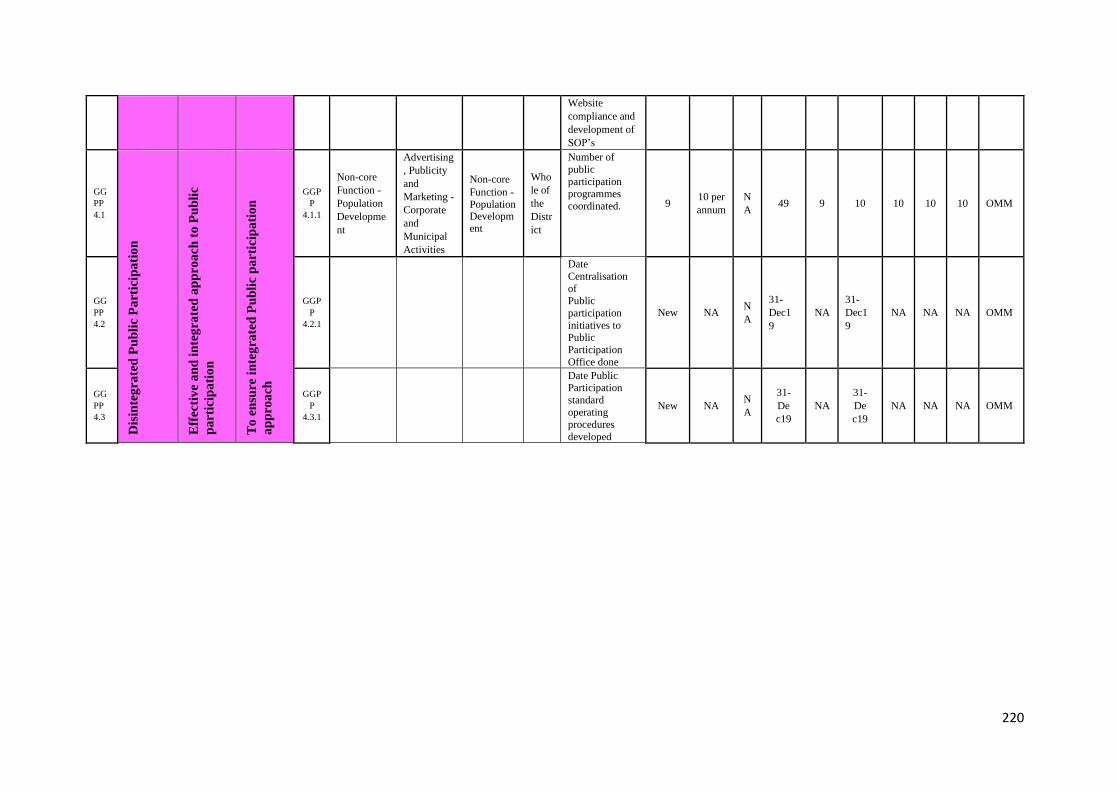
220
Website
compliance and
development of
SOP’s
GG
PP
4.1
Dis
inte
gra
ted
Pu
bli
c P
art
icip
ati
on
Eff
ecti
ve
an
d i
nte
gra
ted
ap
pro
ach
to
Pu
bli
c
pa
rtic
ipa
tio
n
To
en
sure
in
teg
rate
d P
ub
lic
pa
rtic
ipa
tio
n
ap
pro
ach
GGP
P
4.1.1
Non-core
Function -
Population
Developme
nt
Advertising
, Publicity
and
Marketing -
Corporate
and
Municipal
Activities
Non-core
Function - Population Development
Who
le of
the
Distr
ict
Number of
public
participation programmes
coordinated. 9 10 per
annum
N
A 49 9 10 10 10 10 OMM
GG
PP
4.2
GGP
P
4.2.1
Date
Centralisation
of Public
participation
initiatives to Public
Participation
Office done
New NA N
A
31-
Dec1
9
NA
31-
Dec1
9
NA NA NA OMM
GG
PP
4.3
GGP
P
4.3.1
Date Public Participation
standard
operating procedures
developed
New NA N
A
31-
De
c19
NA
31-
De
c19
NA NA NA OMM

221
IDP
No
.
Chal
len
ge
Goal/Desired
Outcome
Strategic
Object
ive
Project
Fu
nct
ion
Reg
ion
Key Performanc
e Indicator
Bas
elin
e
Dem
and
Bac
klo
g
5 Y
ear
Tar
get
Annual Targets
Res
pon
sibil
ity
Pro
ject
ID
Pro
ject
Nam
e
Pro
ject
Seg
men
t
2017
/ 1
8
2018
/ 1
9
2019
/ 2
0
2020
/ 2
1
2021
/20
22
Cross Cutting Interventions
C
CI
1.1
La
ck o
f ca
pa
city
for
dis
ast
er
En
vir
on
men
tal
Su
stain
ab
ilit
y
To
im
pro
ve
Dis
ast
er p
reven
tion
an
d m
an
agem
ent
CC
I
1.1.
1
Number of
Coordinate
d
Disaster
Risk
Reduction
initiatives
Seminars,
Conferenc
es,
workshops
& Events
Non-core
function
Disaster
Manageme
nt
Whol
e of
the
Distr
ict
Number of Integrated
Institutiona
l Capacity
for Disaster
Risk
Reduction programme
s conducted
2 per
annum
2 per
annu
m
0 10 2 2 2 2 2 CS
C
CI
1.2
Manageme
nt at a local
municipal
level which
provides
constraints
to the
district for
the
implementa
tion of
disaster
manageme
nt
programs.
CC
I
1.2.
1
Disaster
Risk
Assessment
Outsourced Services
- Fire
Services
Non-core function
firefighting
and protection
Whole of
the
District
Number of Disaster
Risk
Assessments conducted
4 per annum
4 per
annu
m
0 20 4 4 4 4 4 CS
C
CI
1.3
CC
I
1.3.
1
Number of
Coordinate
d
Disaster Risk
Reduction
initiatives
Seminar s,
Conferenc
es,
workshops
& Events
Non-core
function
Disaster Manageme
nt
Whol
e of
the Distr
ict
Number of
Coordinated Disaster
Risk
Reduction initiatives
15 per
annum
23 per
annu
m
0 111 23 22 22 22 22 CS
C
CI
1.4
CC
I
1.4.
1
Turnaroun
d time to
respond to
disasters
Inventory
Consumed
- Material
s and
Supplies
Non-core
function Disaster
Manageme
nt
Whol
e of the
Distr
ict
Turnaround time to
Disaster
response and
recovery
24hour
s
24ho
urs 0
24ho
urs
24ho
urs
24ho
urs
24ho
urs
24ho
urs
24ho
urs CS
C
CI
1.5
CC
I
1.5.
1
Capacity
Building
Disaster &
Fire
Business
&
Advisory
Non-core
function firefighting
and
protection
Whol
e of the
Distr
ict
Number of
Milestones achieved
on the
Implementation of Fire
and Rescue
Strategy
1 per
annum
1 per annu
m
N/
A 5 1 1 1 1 1 CS
CCI
2.1
Ins
uff
i
cien t
com
mu
nit
y
inv
olv
e
me
nt
on
env
i
ron
me
nta
l
issu es
To
pro
mo
te a
hea lth y,
saf
e,
an
d
sus
tai
na
b
ilit y
env
iro
nm
ent CC
I
Capacity
Building
Workshop
s,
Core Function -
Developme
Whole of
the
Number of environmen
tal and
795 1000 N
A 250 50 50 50 50 50
EDE
S
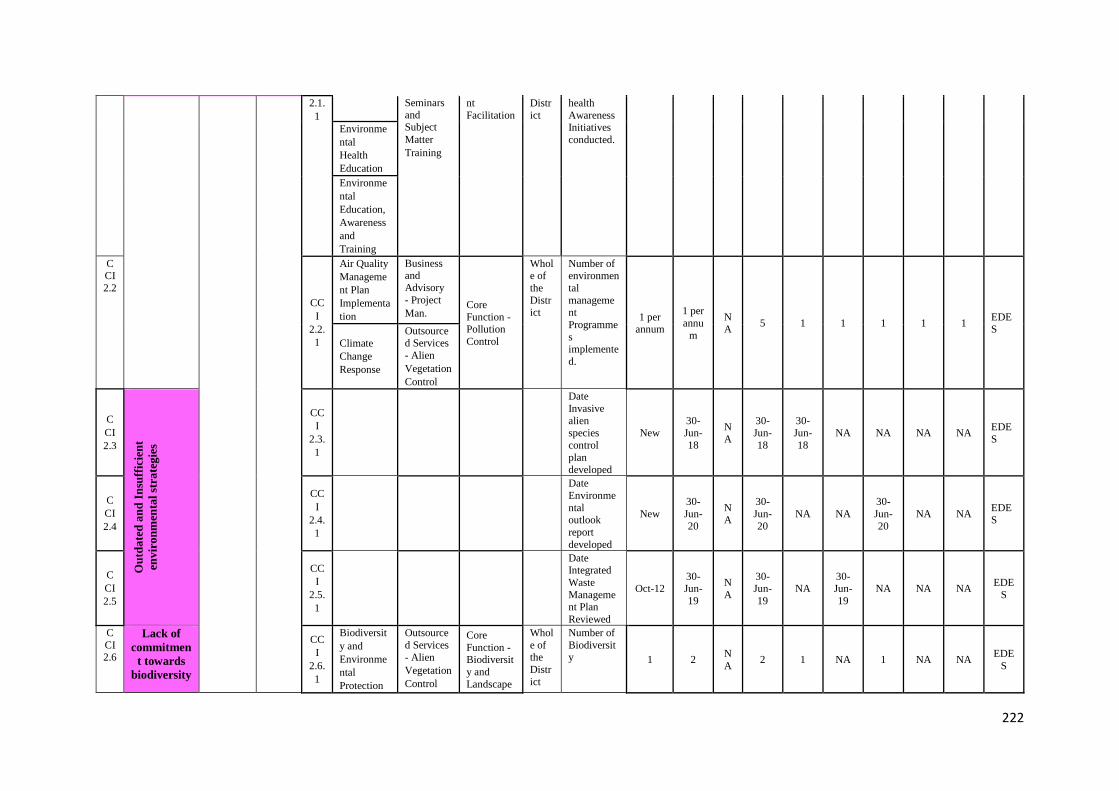
222
2.1.
1
Seminars and Subject
Matter
Training
nt
Facilitation
Distr
ict
health
Awareness Initiatives
conducted. Environme
ntal
Health
Education
Environme
ntal
Education,
Awareness
and
Training
CCI
2.2
CC
I
2.2.
1
Air Quality
Manageme
nt Plan
Implementa
tion
Business and Advisory
- Project
Man. Core
Function - Pollution
Control
Whole of
the
District
Number of environmen
tal
management
Programme
s implemente
d.
1 per annum
1 per
annu
m
NA
5 1 1 1 1 1 EDES
Climate
Change
Response
Outsourced Services
- Alien
Vegetation
Control
C
CI
2.3
Ou
tda
ted
an
d I
nsu
ffic
ien
t
env
iro
nm
enta
l st
rate
gie
s
CC
I
2.3.
1
Date
Invasive
alien species
control
plan developed
New 30-Jun-
18
N
A
30-Jun-
18
30-Jun-
18
NA NA NA NA EDE
S
C
CI
2.4
CC
I
2.4.
1
Date
Environme
ntal outlook
report
developed
New
30-
Jun-
20
NA
30-
Jun-
20
NA NA
30-
Jun-
20
NA NA EDES
C
CI
2.5
CC
I
2.5.
1
Date Integrated
Waste
Management Plan
Reviewed
Oct-12 30-Jun-
19
N
A
30-Jun-
19
NA 30-Jun-
19
NA NA NA EDE
S
C
CI 2.6
Lack of
commitmen
t towards
biodiversity
CC
I
2.6.
1
Biodiversit
y and
Environme
ntal
Protection
Outsource
d Services
- Alien
Vegetation
Control
Core
Function - Biodiversit
y and
Landscape
Whol
e of the
Distr
ict
Number of
Biodiversity 1 2
N
A 2 1 NA 1 NA NA
EDE
S
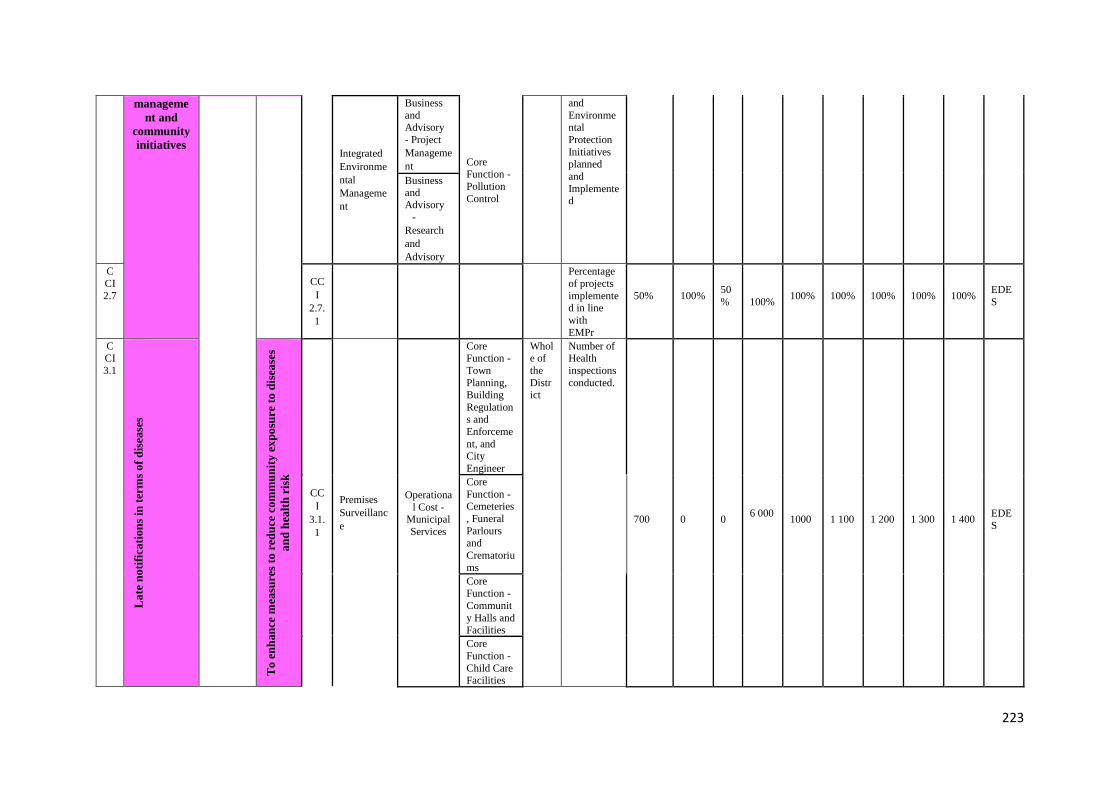
223
manageme
nt and
community
initiatives Integrated
Environme
ntal
Manageme
nt
Business
and Advisory
- Project
Manageme
nt Core Function -
Pollution
Control
and
Environmental
Protection
Initiatives planned
and
Implemented
Business and Advisory
-
Research
and
Advisory
C
CI
2.7
CC
I
2.7.
1
Percentage
of projects
implemented in line
with
EMPr
50%
100%
50
%
100%
100%
100%
100%
100%
100%
EDE
S
CCI
3.1
La
te n
oti
fica
tion
s in
ter
ms
of
dis
ease
s
To
en
han
ce m
easu
res
to r
edu
ce c
om
mu
nit
y e
xp
osu
re t
o d
isea
ses
an
d h
ealt
h r
isk
CC
I
3.1.
1
Premises
Surveillanc
e
Operationa
l Cost - Municipal
Services
Core Function -
Town
Planning, Building
Regulations and
Enforceme
nt, and City
Engineer
Whole of
the
District
Number of Health
inspections
conducted.
700
0
0
6 000 1000
1 100
1 200
1 300
1 400
EDE
S
Core
Function - Cemeteries
, Funeral
Parlours and
Crematoriu
ms
Core Function -
Communit
y Halls and Facilities
Core
Function -
Child Care Facilities
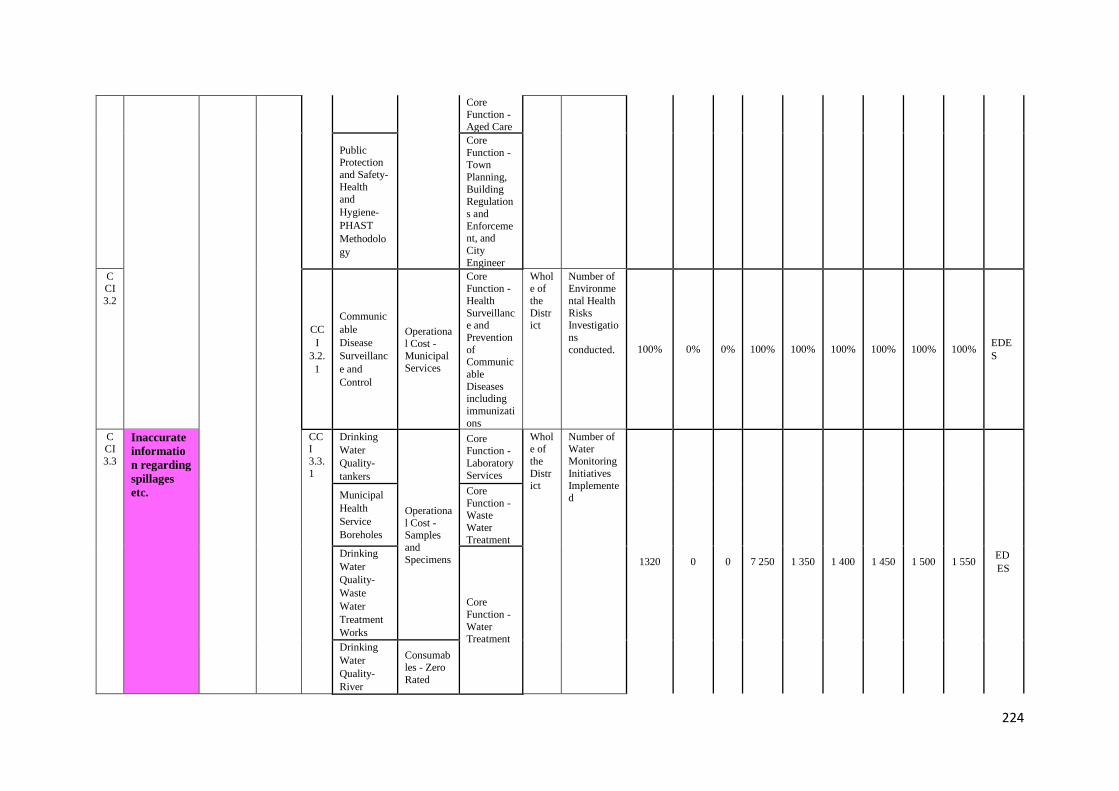
224
Core Function -
Aged Care
Public Protection
and Safety-
Health
and
Hygiene-
PHAST
Methodolo
gy
Core
Function - Town
Planning,
Building Regulation
s and
Enforcement, and
City
Engineer
CCI
3.2
CC
I
3.2.
1
Communic
able
Disease
Surveillanc
e and
Control
Operational Cost -
Municipal
Services
Core Function -
Health
Surveillance and
Prevention
of Communic
able
Diseases including
immunizati
ons
Whole of
the
District
Number of Environme
ntal Health
Risks Investigatio
ns
conducted. 100% 0% 0% 100% 100% 100% 100% 100% 100% EDE
S
C
CI
3.3
Inaccurate
informatio
n regarding
spillages
etc.
CC
I
3.3.
1
Drinking
Water
Quality-
tankers
Operationa
l Cost - Samples
and
Specimens
Core
Function -
Laboratory
Services
Whol
e of
the
District
Number of
Water
Monitoring
Initiatives Implemente
d
1320 0 0 7 250 1 350 1 400 1 450 1 500 1 550 ED
ES
Municipal
Health
Service
Boreholes
Core
Function - Waste
Water
Treatment
Drinking
Water
Quality-
Waste
Water
Treatment
Works
Core
Function -
Water Treatment
Drinking
Water
Quality-
River
Consumab
les - Zero
Rated
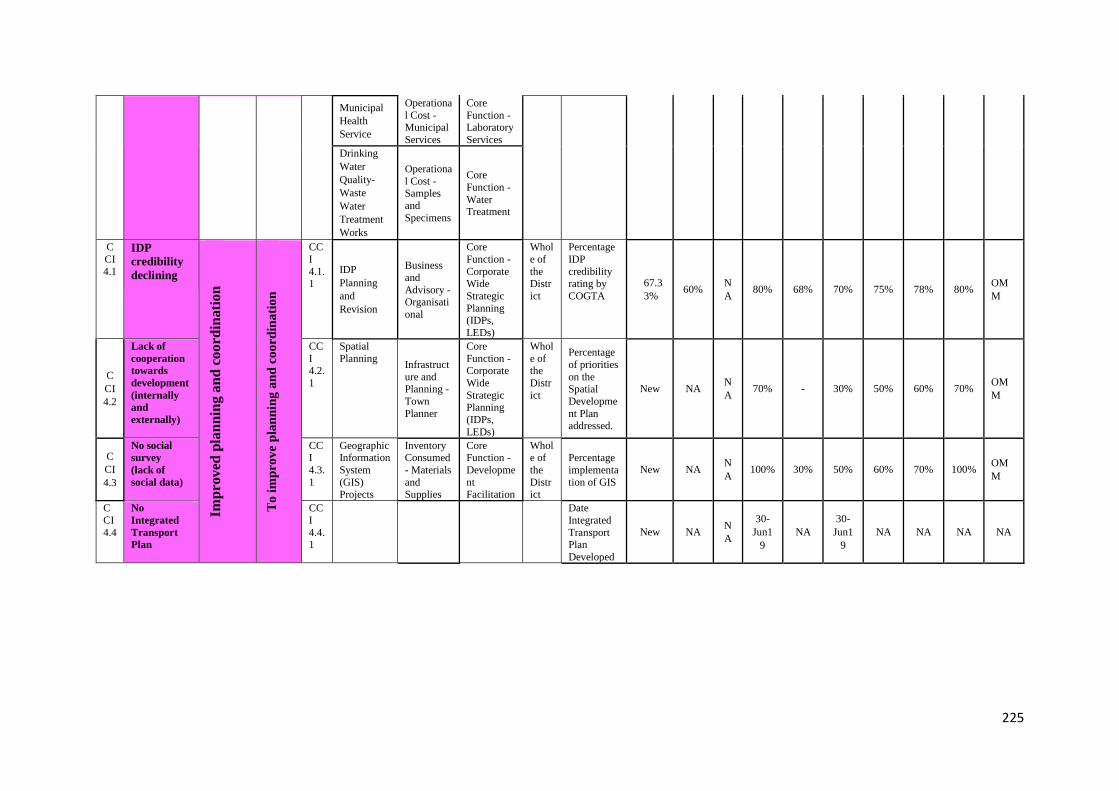
225
Municipal
Health
Service
Operationa
l Cost - Municipal
Services
Core
Function - Laboratory
Services
Drinking
Water
Quality-
Waste
Water
Treatment
Works
Operationa
l Cost - Samples
and
Specimens
Core
Function -
Water Treatment
C
CI
4.1
IDP
credibility
declining
Imp
rov
ed p
lan
nin
g a
nd
coord
inati
on
To
im
pro
ve
pla
nn
ing
an
d c
oo
rdin
ati
on
CC
I
4.1.1
IDP
Planning
and
Revision
Business
and
Advisory - Organisati
onal
Core
Function -
Corporate Wide
Strategic
Planning (IDPs,
LEDs)
Whol
e of
the Distr
ict
Percentage
IDP
credibility rating by
COGTA
67.3
3% 60%
N
A 80% 68% 70% 75% 78% 80%
OM
M
C
CI
4.2
Lack of
cooperation
towards
development
(internally
and
externally)
CC
I 4.2.
1
Spatial
Planning Infrastruct
ure and Planning -
Town
Planner
Core
Function - Corporate
Wide
Strategic Planning
(IDPs,
LEDs)
Whol
e of the
Distr
ict
Percentage
of priorities
on the Spatial
Developme
nt Plan addressed.
New NA N
A 70% - 30% 50% 60% 70%
OM
M
C
CI
4.3
No social
survey
(lack of
social data)
CCI
4.3.
1
Geographic Information
System
(GIS) Projects
Inventory Consumed
- Materials
and Supplies
Core Function -
Developme
nt Facilitation
Whole of
the
District
Percentage
implementa
tion of GIS
New NA N
A 100% 30% 50% 60% 70% 100%
OM
M
C
CI
4.4
No
Integrated
Transport
Plan
CC
I
4.4.1
Date
Integrated
Transport Plan
Developed
New NA N
A
30-
Jun1
9
NA
30-
Jun1
9
NA NA NA NA
226
Chapter 5: STRATEGIC MAPPING AND IMPLEMENTATION PLAN
5.1 Strategic Mapping This section indicates the desired growth and development (addressing issues and trends highlighted in the
situational analysis Chapter) of the document, and must reflects the desired spatial outcomes; land use guidelines;
spatial reconstruction of the Municipality; strategic guidance in respect of the location and nature of development
within the municipality; Spatial alignment with neighbouring municipalities; Comprehensive Infrastructure
Investment (CIF); areas where strategic intervention is required; and areas where priority spending is required.
5.1.1 Desired Spatial Outcomes The proposed Ugu SDF Vision:
“By 2035 Ugu District will be a spatially, socially and economically transformed living environment its
economy and natural resources accessible to all its people through targeted actions to provide better living,
social and economic opportunities.”
The vision commits the District to champion economic and social transformation within its key sectors, this
includes the delivery new opportunities closer to major economic centres (e.g. GAP Housing) The attainment of
this vision requires the municipality to facilitate the development of a spatial system that promotes social,
economic, financial, institutional and environmental sustainability. The District spatial vision aims to achieve
the following: -
• Transformation of the economy and inclusion of the previously disenfranchised into the mainstream
economy
• Restructuring of the spatial geography through spatial planning and strategically catalytic projects (e.g.
IFAFA Industrial Park)
• Investments are directed towards nodes in order to strengthen their sustainability and impact
• Medium to high density Settlements are contained within urban edges to reduce the cost of services and
optimise capital investments
• Enhance existing sustainable economic development opportunities;
• Protect and enhances the quality of the environmental assets and harmonise with human development
through planning; and
• Facilitates non-discriminate access to a range of services and development opportunities; develops
sustainable human settlements where residents can lead enriched, healthy and convenient lives.
5.1.2 Desired Spatial Form and Land Use Based on the challenges identified in the situational analysis chapter careful consideration was given to finding a
new regeneration strategic direction for the Ugu District. This should enable the authorities to meaningfully deal
with the above challenges in such a way that it would meet the requirements of national, provincial and local
planning policies and at the same time benefit the people of Ugu. Provision has been made for the establishment
of one primary node and four secondary nodes which are intended to house the majority of the future population
growth over the next 20 years. These growth centres would need to be structured such that they include
opportunities for public-private investment in the agriculture; tourism; commerce; retail, Social and Utility
Services; and a range of Housing Options and Densities sectors.
This would allow them to benefit from higher levels of social and utility services and locally based employment
opportunities. It is argued in national policies that investment in high density urban areas is more cost effective
and sustainable for municipalities than attempting to extend low level services throughout rural areas. Following
these policies, the aim in rural settlements is to discourage further growth in housing. This is necessary in order
to maintain areas of good agricultural land for cultivation and livestock production as the economic basis of these
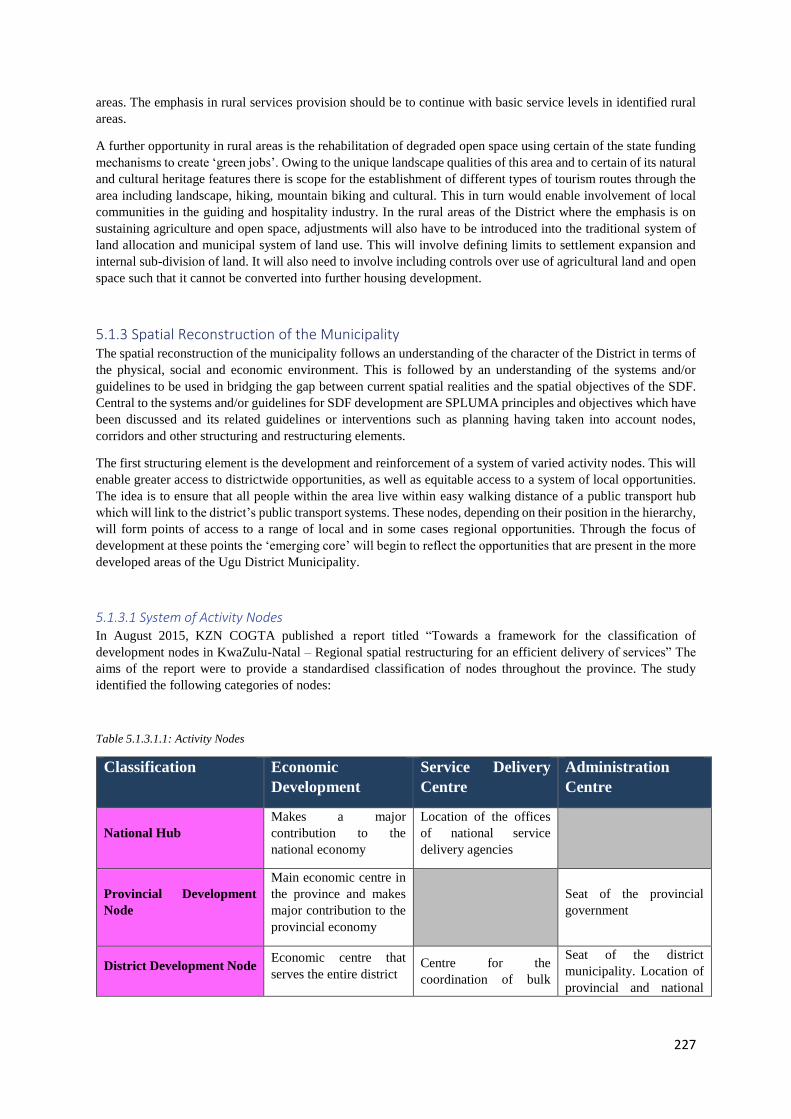
227
areas. The emphasis in rural services provision should be to continue with basic service levels in identified rural
areas.
A further opportunity in rural areas is the rehabilitation of degraded open space using certain of the state funding
mechanisms to create ‘green jobs’. Owing to the unique landscape qualities of this area and to certain of its natural
and cultural heritage features there is scope for the establishment of different types of tourism routes through the
area including landscape, hiking, mountain biking and cultural. This in turn would enable involvement of local
communities in the guiding and hospitality industry. In the rural areas of the District where the emphasis is on
sustaining agriculture and open space, adjustments will also have to be introduced into the traditional system of
land allocation and municipal system of land use. This will involve defining limits to settlement expansion and
internal sub-division of land. It will also need to involve including controls over use of agricultural land and open
space such that it cannot be converted into further housing development.
5.1.3 Spatial Reconstruction of the Municipality The spatial reconstruction of the municipality follows an understanding of the character of the District in terms of
the physical, social and economic environment. This is followed by an understanding of the systems and/or
guidelines to be used in bridging the gap between current spatial realities and the spatial objectives of the SDF.
Central to the systems and/or guidelines for SDF development are SPLUMA principles and objectives which have
been discussed and its related guidelines or interventions such as planning having taken into account nodes,
corridors and other structuring and restructuring elements.
The first structuring element is the development and reinforcement of a system of varied activity nodes. This will
enable greater access to districtwide opportunities, as well as equitable access to a system of local opportunities.
The idea is to ensure that all people within the area live within easy walking distance of a public transport hub
which will link to the district’s public transport systems. These nodes, depending on their position in the hierarchy,
will form points of access to a range of local and in some cases regional opportunities. Through the focus of
development at these points the ‘emerging core’ will begin to reflect the opportunities that are present in the more
developed areas of the Ugu District Municipality.
5.1.3.1 System of Activity Nodes In August 2015, KZN COGTA published a report titled “Towards a framework for the classification of
development nodes in KwaZulu-Natal – Regional spatial restructuring for an efficient delivery of services” The
aims of the report were to provide a standardised classification of nodes throughout the province. The study
identified the following categories of nodes:
Table 5.1.3.1.1: Activity Nodes
Classification Economic
Development
Service Delivery
Centre
Administration
Centre
National Hub
Makes a major
contribution to the
national economy
Location of the offices
of national service
delivery agencies
Provincial Development
Node
Main economic centre in
the province and makes
major contribution to the
provincial economy
Seat of the provincial
government
District Development Node Economic centre that
serves the entire district Centre for the
coordination of bulk
Seat of the district
municipality. Location of
provincial and national
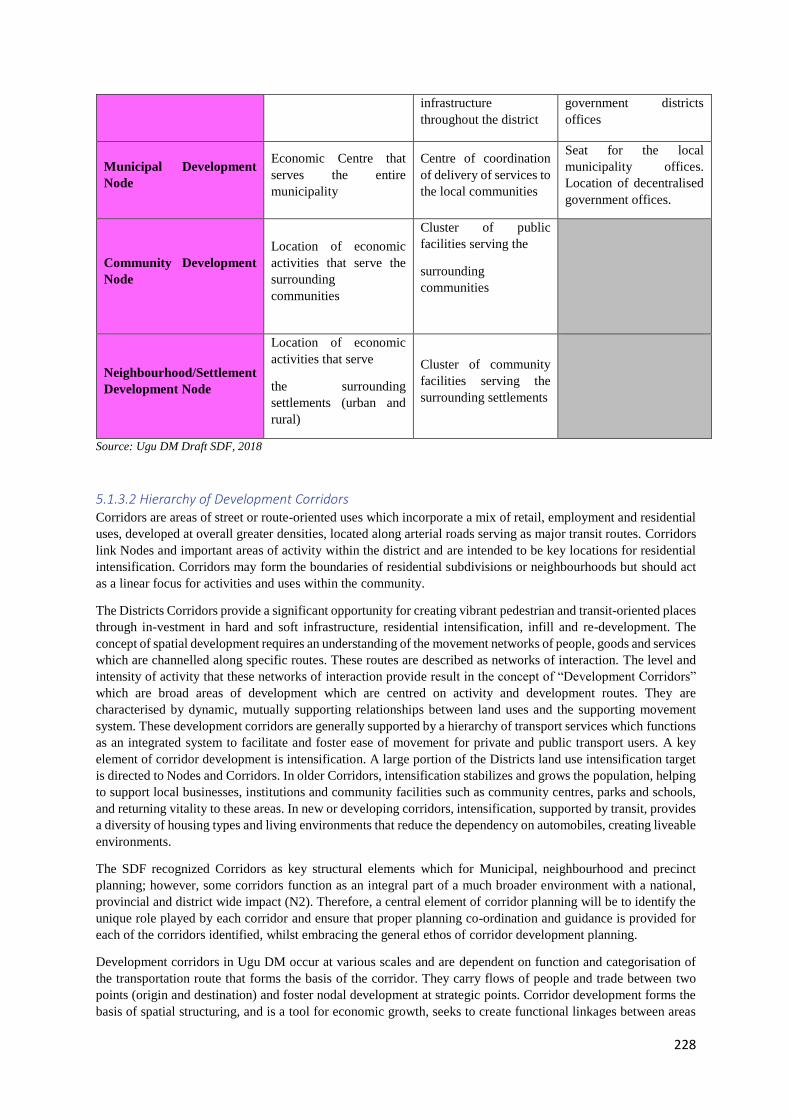
228
infrastructure
throughout the district
government districts
offices
Municipal Development
Node
Economic Centre that
serves the entire
municipality
Centre of coordination
of delivery of services to
the local communities
Seat for the local
municipality offices.
Location of decentralised
government offices.
Community Development
Node
Location of economic
activities that serve the
surrounding
communities
Cluster of public
facilities serving the
surrounding
communities
Neighbourhood/Settlement
Development Node
Location of economic
activities that serve
the surrounding
settlements (urban and
rural)
Cluster of community
facilities serving the
surrounding settlements
Source: Ugu DM Draft SDF, 2018
5.1.3.2 Hierarchy of Development Corridors Corridors are areas of street or route-oriented uses which incorporate a mix of retail, employment and residential
uses, developed at overall greater densities, located along arterial roads serving as major transit routes. Corridors
link Nodes and important areas of activity within the district and are intended to be key locations for residential
intensification. Corridors may form the boundaries of residential subdivisions or neighbourhoods but should act
as a linear focus for activities and uses within the community.
The Districts Corridors provide a significant opportunity for creating vibrant pedestrian and transit-oriented places
through in-vestment in hard and soft infrastructure, residential intensification, infill and re-development. The
concept of spatial development requires an understanding of the movement networks of people, goods and services
which are channelled along specific routes. These routes are described as networks of interaction. The level and
intensity of activity that these networks of interaction provide result in the concept of “Development Corridors”
which are broad areas of development which are centred on activity and development routes. They are
characterised by dynamic, mutually supporting relationships between land uses and the supporting movement
system. These development corridors are generally supported by a hierarchy of transport services which functions
as an integrated system to facilitate and foster ease of movement for private and public transport users. A key
element of corridor development is intensification. A large portion of the Districts land use intensification target
is directed to Nodes and Corridors. In older Corridors, intensification stabilizes and grows the population, helping
to support local businesses, institutions and community facilities such as community centres, parks and schools,
and returning vitality to these areas. In new or developing corridors, intensification, supported by transit, provides
a diversity of housing types and living environments that reduce the dependency on automobiles, creating liveable
environments.
The SDF recognized Corridors as key structural elements which for Municipal, neighbourhood and precinct
planning; however, some corridors function as an integral part of a much broader environment with a national,
provincial and district wide impact (N2). Therefore, a central element of corridor planning will be to identify the
unique role played by each corridor and ensure that proper planning co-ordination and guidance is provided for
each of the corridors identified, whilst embracing the general ethos of corridor development planning.
Development corridors in Ugu DM occur at various scales and are dependent on function and categorisation of
the transportation route that forms the basis of the corridor. They carry flows of people and trade between two
points (origin and destination) and foster nodal development at strategic points. Corridor development forms the
basis of spatial structuring, and is a tool for economic growth, seeks to create functional linkages between areas
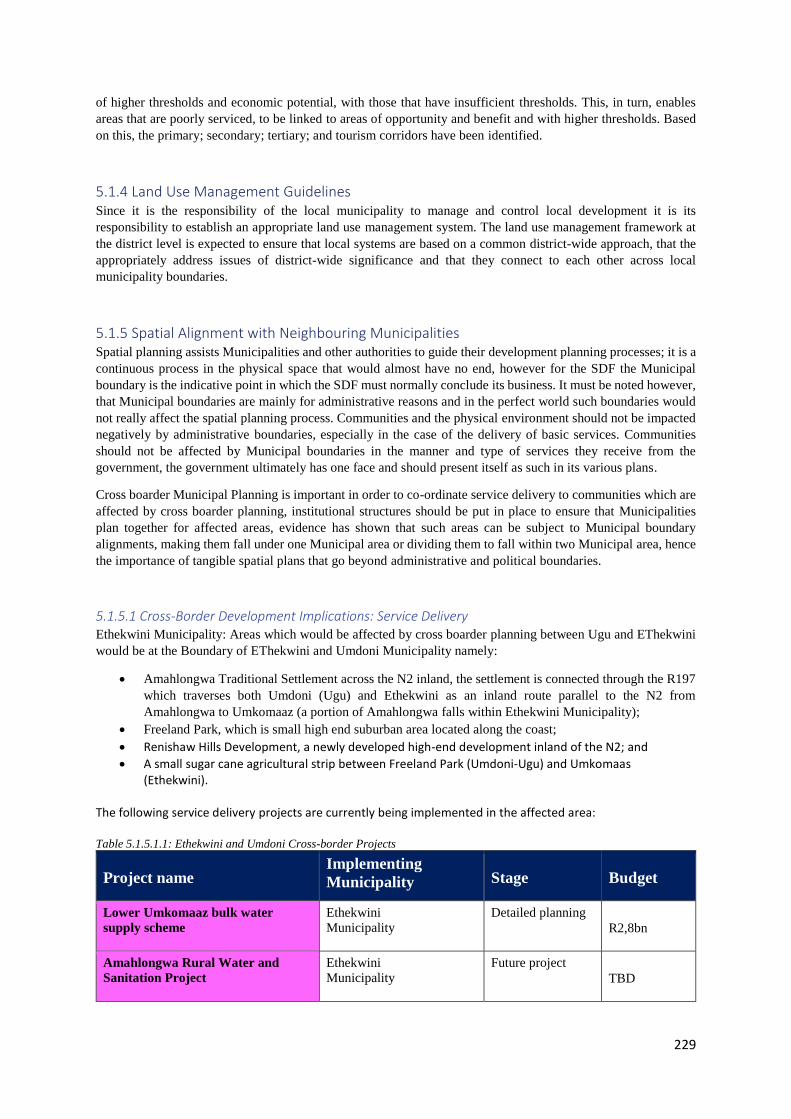
229
of higher thresholds and economic potential, with those that have insufficient thresholds. This, in turn, enables
areas that are poorly serviced, to be linked to areas of opportunity and benefit and with higher thresholds. Based
on this, the primary; secondary; tertiary; and tourism corridors have been identified.
5.1.4 Land Use Management Guidelines Since it is the responsibility of the local municipality to manage and control local development it is its
responsibility to establish an appropriate land use management system. The land use management framework at
the district level is expected to ensure that local systems are based on a common district-wide approach, that the
appropriately address issues of district-wide significance and that they connect to each other across local
municipality boundaries.
5.1.5 Spatial Alignment with Neighbouring Municipalities Spatial planning assists Municipalities and other authorities to guide their development planning processes; it is a
continuous process in the physical space that would almost have no end, however for the SDF the Municipal
boundary is the indicative point in which the SDF must normally conclude its business. It must be noted however,
that Municipal boundaries are mainly for administrative reasons and in the perfect world such boundaries would
not really affect the spatial planning process. Communities and the physical environment should not be impacted
negatively by administrative boundaries, especially in the case of the delivery of basic services. Communities
should not be affected by Municipal boundaries in the manner and type of services they receive from the
government, the government ultimately has one face and should present itself as such in its various plans.
Cross boarder Municipal Planning is important in order to co-ordinate service delivery to communities which are
affected by cross boarder planning, institutional structures should be put in place to ensure that Municipalities
plan together for affected areas, evidence has shown that such areas can be subject to Municipal boundary
alignments, making them fall under one Municipal area or dividing them to fall within two Municipal area, hence
the importance of tangible spatial plans that go beyond administrative and political boundaries.
5.1.5.1 Cross-Border Development Implications: Service Delivery Ethekwini Municipality: Areas which would be affected by cross boarder planning between Ugu and EThekwini
would be at the Boundary of EThekwini and Umdoni Municipality namely:
• Amahlongwa Traditional Settlement across the N2 inland, the settlement is connected through the R197
which traverses both Umdoni (Ugu) and Ethekwini as an inland route parallel to the N2 from
Amahlongwa to Umkomaaz (a portion of Amahlongwa falls within Ethekwini Municipality);
• Freeland Park, which is small high end suburban area located along the coast;
• Renishaw Hills Development, a newly developed high-end development inland of the N2; and
• A small sugar cane agricultural strip between Freeland Park (Umdoni-Ugu) and Umkomaas (Ethekwini).
The following service delivery projects are currently being implemented in the affected area: Table 5.1.5.1.1: Ethekwini and Umdoni Cross-border Projects
Project name Implementing
Municipality Stage Budget
Lower Umkomaaz bulk water
supply scheme
Ethekwini
Municipality
Detailed planning
R2,8bn
Amahlongwa Rural Water and
Sanitation Project
Ethekwini
Municipality
Future project
TBD
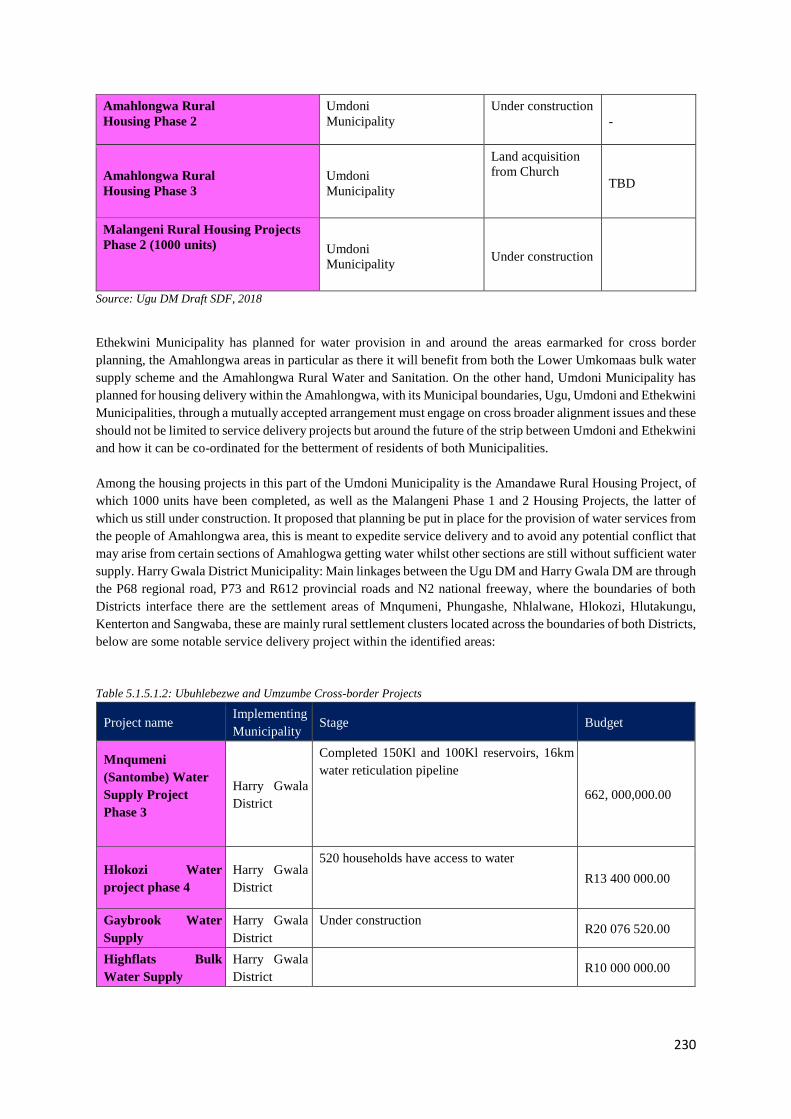
230
Amahlongwa Rural
Housing Phase 2
Umdoni
Municipality
Under construction
-
Amahlongwa Rural
Housing Phase 3
Umdoni
Municipality
Land acquisition
from Church TBD
Malangeni Rural Housing Projects
Phase 2 (1000 units) Umdoni
Municipality Under construction
Source: Ugu DM Draft SDF, 2018
Ethekwini Municipality has planned for water provision in and around the areas earmarked for cross border
planning, the Amahlongwa areas in particular as there it will benefit from both the Lower Umkomaas bulk water
supply scheme and the Amahlongwa Rural Water and Sanitation. On the other hand, Umdoni Municipality has
planned for housing delivery within the Amahlongwa, with its Municipal boundaries, Ugu, Umdoni and Ethekwini
Municipalities, through a mutually accepted arrangement must engage on cross broader alignment issues and these
should not be limited to service delivery projects but around the future of the strip between Umdoni and Ethekwini
and how it can be co-ordinated for the betterment of residents of both Municipalities.
Among the housing projects in this part of the Umdoni Municipality is the Amandawe Rural Housing Project, of
which 1000 units have been completed, as well as the Malangeni Phase 1 and 2 Housing Projects, the latter of
which us still under construction. It proposed that planning be put in place for the provision of water services from
the people of Amahlongwa area, this is meant to expedite service delivery and to avoid any potential conflict that
may arise from certain sections of Amahlogwa getting water whilst other sections are still without sufficient water
supply. Harry Gwala District Municipality: Main linkages between the Ugu DM and Harry Gwala DM are through
the P68 regional road, P73 and R612 provincial roads and N2 national freeway, where the boundaries of both
Districts interface there are the settlement areas of Mnqumeni, Phungashe, Nhlalwane, Hlokozi, Hlutakungu,
Kenterton and Sangwaba, these are mainly rural settlement clusters located across the boundaries of both Districts,
below are some notable service delivery project within the identified areas:
Table 5.1.5.1.2: Ubuhlebezwe and Umzumbe Cross-border Projects
Project name Implementing
Municipality Stage Budget
Mnqumeni
(Santombe) Water
Supply Project
Phase 3
Harry Gwala
District
Completed 150Kl and 100Kl reservoirs, 16km
water reticulation pipeline
662, 000,000.00
Hlokozi Water
project phase 4
Harry Gwala
District
520 households have access to water
R13 400 000.00
Gaybrook Water
Supply
Harry Gwala
District
Under construction R20 076 520.00
Highflats Bulk
Water Supply
Harry Gwala
District R10 000 000.00
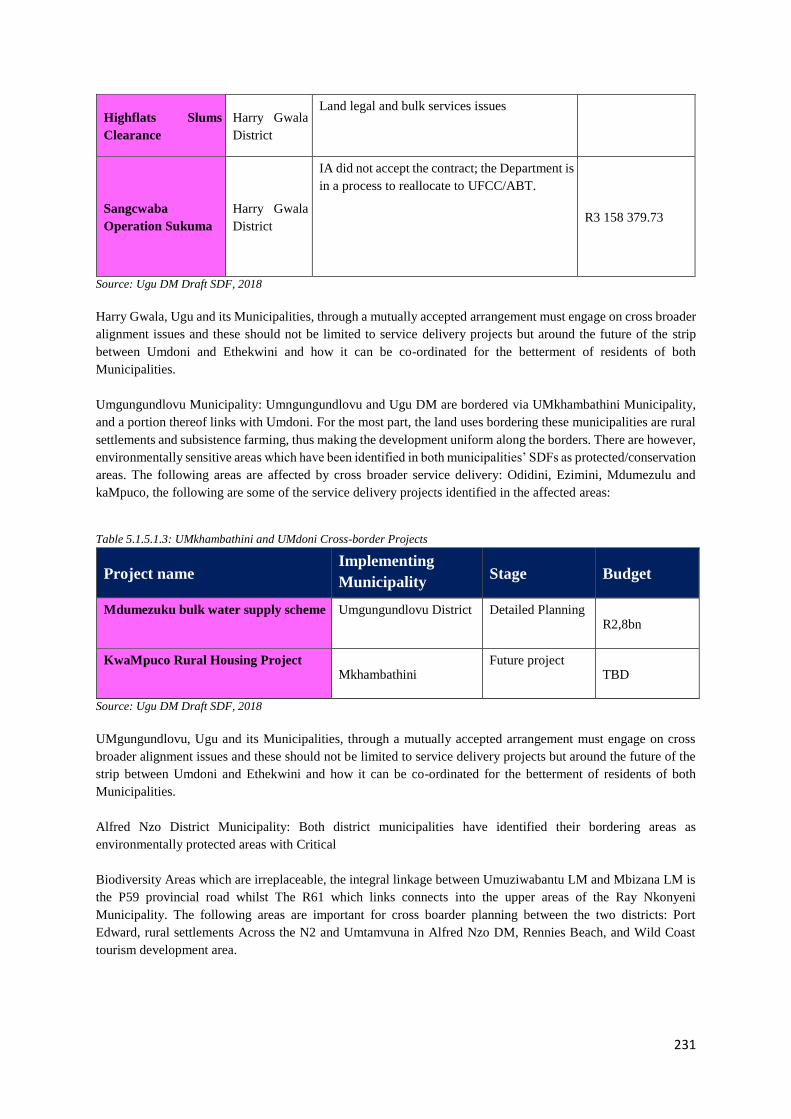
231
Highflats Slums
Clearance
Harry Gwala
District
Land legal and bulk services issues
Sangcwaba
Operation Sukuma
Harry Gwala
District
IA did not accept the contract; the Department is
in a process to reallocate to UFCC/ABT.
R3 158 379.73
Source: Ugu DM Draft SDF, 2018
Harry Gwala, Ugu and its Municipalities, through a mutually accepted arrangement must engage on cross broader
alignment issues and these should not be limited to service delivery projects but around the future of the strip
between Umdoni and Ethekwini and how it can be co-ordinated for the betterment of residents of both
Municipalities.
Umgungundlovu Municipality: Umngungundlovu and Ugu DM are bordered via UMkhambathini Municipality,
and a portion thereof links with Umdoni. For the most part, the land uses bordering these municipalities are rural
settlements and subsistence farming, thus making the development uniform along the borders. There are however,
environmentally sensitive areas which have been identified in both municipalities’ SDFs as protected/conservation
areas. The following areas are affected by cross broader service delivery: Odidini, Ezimini, Mdumezulu and
kaMpuco, the following are some of the service delivery projects identified in the affected areas:
Table 5.1.5.1.3: UMkhambathini and UMdoni Cross-border Projects
Project name Implementing
Municipality Stage Budget
Mdumezuku bulk water supply scheme Umgungundlovu District Detailed Planning R2,8bn
KwaMpuco Rural Housing Project Mkhambathini
Future project TBD
Source: Ugu DM Draft SDF, 2018
UMgungundlovu, Ugu and its Municipalities, through a mutually accepted arrangement must engage on cross
broader alignment issues and these should not be limited to service delivery projects but around the future of the
strip between Umdoni and Ethekwini and how it can be co-ordinated for the betterment of residents of both
Municipalities.
Alfred Nzo District Municipality: Both district municipalities have identified their bordering areas as
environmentally protected areas with Critical
Biodiversity Areas which are irreplaceable, the integral linkage between Umuziwabantu LM and Mbizana LM is
the P59 provincial road whilst The R61 which links connects into the upper areas of the Ray Nkonyeni
Municipality. The following areas are important for cross boarder planning between the two districts: Port
Edward, rural settlements Across the N2 and Umtamvuna in Alfred Nzo DM, Rennies Beach, and Wild Coast
tourism development area.
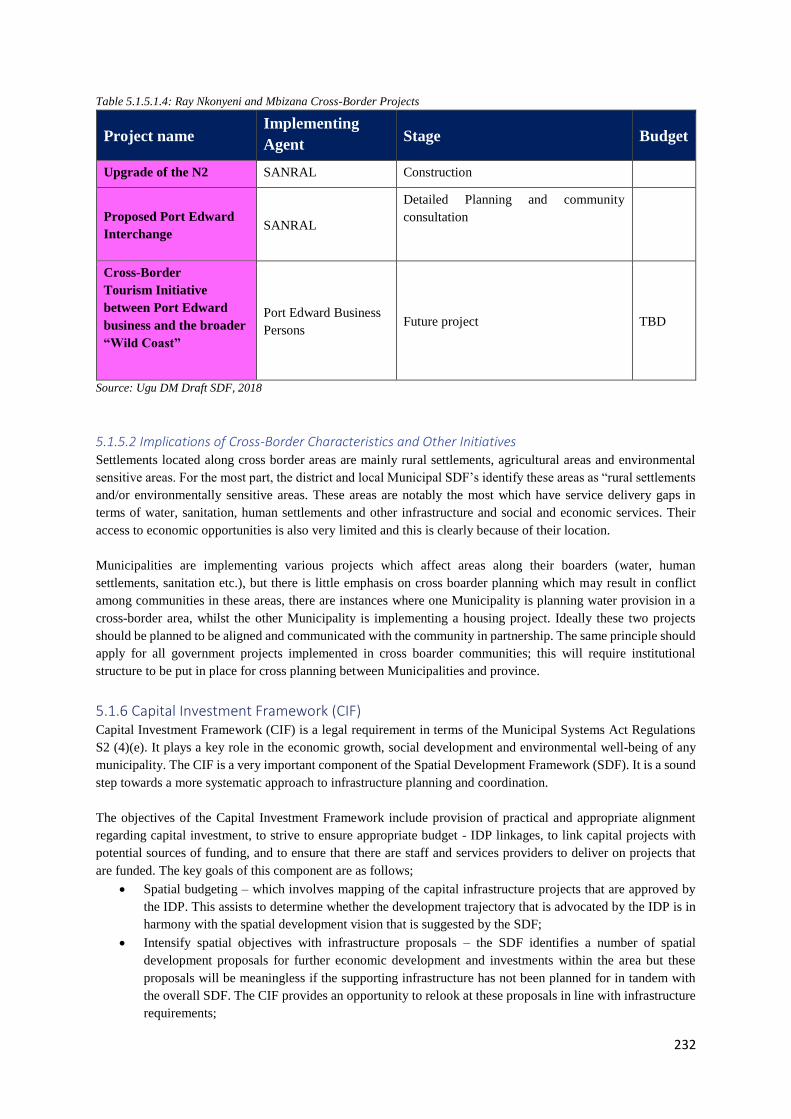
232
Table 5.1.5.1.4: Ray Nkonyeni and Mbizana Cross-Border Projects
Project name Implementing
Agent Stage Budget
Upgrade of the N2 SANRAL Construction
Proposed Port Edward
Interchange SANRAL
Detailed Planning and community
consultation
Cross-Border
Tourism Initiative
between Port Edward
business and the broader
“Wild Coast”
Port Edward Business
Persons Future project TBD
Source: Ugu DM Draft SDF, 2018
5.1.5.2 Implications of Cross-Border Characteristics and Other Initiatives Settlements located along cross border areas are mainly rural settlements, agricultural areas and environmental
sensitive areas. For the most part, the district and local Municipal SDF’s identify these areas as “rural settlements
and/or environmentally sensitive areas. These areas are notably the most which have service delivery gaps in
terms of water, sanitation, human settlements and other infrastructure and social and economic services. Their
access to economic opportunities is also very limited and this is clearly because of their location.
Municipalities are implementing various projects which affect areas along their boarders (water, human
settlements, sanitation etc.), but there is little emphasis on cross boarder planning which may result in conflict
among communities in these areas, there are instances where one Municipality is planning water provision in a
cross-border area, whilst the other Municipality is implementing a housing project. Ideally these two projects
should be planned to be aligned and communicated with the community in partnership. The same principle should
apply for all government projects implemented in cross boarder communities; this will require institutional
structure to be put in place for cross planning between Municipalities and province.
5.1.6 Capital Investment Framework (CIF) Capital Investment Framework (CIF) is a legal requirement in terms of the Municipal Systems Act Regulations
S2 (4)(e). It plays a key role in the economic growth, social development and environmental well-being of any
municipality. The CIF is a very important component of the Spatial Development Framework (SDF). It is a sound
step towards a more systematic approach to infrastructure planning and coordination.
The objectives of the Capital Investment Framework include provision of practical and appropriate alignment
regarding capital investment, to strive to ensure appropriate budget - IDP linkages, to link capital projects with
potential sources of funding, and to ensure that there are staff and services providers to deliver on projects that
are funded. The key goals of this component are as follows;
• Spatial budgeting – which involves mapping of the capital infrastructure projects that are approved by
the IDP. This assists to determine whether the development trajectory that is advocated by the IDP is in
harmony with the spatial development vision that is suggested by the SDF;
• Intensify spatial objectives with infrastructure proposals – the SDF identifies a number of spatial
development proposals for further economic development and investments within the area but these
proposals will be meaningless if the supporting infrastructure has not been planned for in tandem with
the overall SDF. The CIF provides an opportunity to relook at these proposals in line with infrastructure
requirements;
233
• Comparison of areas of greatest needs and where services or infrastructure proposals are directed to –
this is intended to establish if the areas that encounters backlogs are receiving attention to address that.
There are areas within the municipal area which suffers from historical and institutional neglect from
benefiting from services. It is the role of a developmental government to be pro-active at developing
these areas. This is part of the reconstruction and developmental mandate.
The normative aims and objectives are:
• To inform public and private sector investment decision-making.
• To influence municipal capital infrastructure project allocation.
• To serve as a strategic infrastructure guide for economic infrastructure priority areas.
• To map out all service delivery priority areas.
• To identify all major infrastructure priority areas including the projects currently underway.
• To determine if spatial proposal can be resourced by sufficient infrastructure resources.
• To integrate Capital Investment Framework with the IDP
• The framework aligns future capital spending with settlement hierarchy (nodes) and corridors, not just
mapping of municipal and Sector Department projects and Tables of sector department or municipal
expenditure. It maps out longer- term projects and programmes Municipal Sector Plan projects (up to 20
years).
5.1.7 Areas Requiring Strategic Intervention With respect to areas requiring strategic intervention, areas where development intensity should be increased or
decreased has been identified.
5.1.7.1 Areas where Development Intensity Should Increase The following proposal is made in terms of direction for future growth:
• Outward expansion of the nodes. This should involves linking the existing nodes through activity or
mobility route in a manner that promotes infill and interface development. This should be prioritized for
District, Municipal and Community Development Nodes; and
• The existing nodes are still low in terms of densification. Inward densification could be encouraged
within the District and Municipal Development Nodes. However, this should be supported provided that
there is sufficient infrastructure capacity to warrant it.
5.1.7.2 Areas where Development Intensity Should Decrease The following proposal is made in terms of direction for future growth:
• Some of the nodes on the northern part of the municipality are surrounded by agricultural land. Expansion
of these nodes to high potential agricultural land would be undesirable.
• Expansion of the nodes to environmentally sensitive areas is prohibited. This includes expansion to KZN
CBA Irreplaceable zones and KZN ESA zones.

234
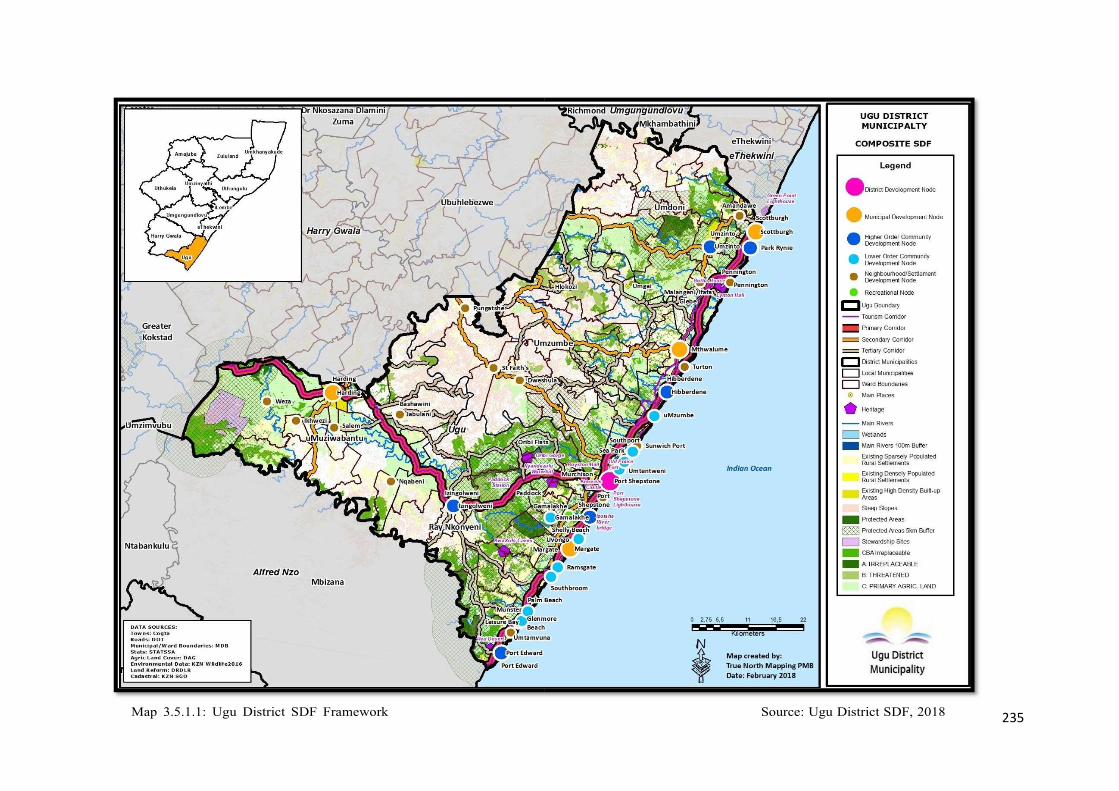
235

236
5.2 Five-Year Implementation Plan The purpose of this section is to outline how the rest of the state is geared to support Ugu District Municipality to
achieve its development goals as stated in the Integrated Development Plan. The implementation plan shows the
alignment of service delivery implementation in the Ugu District area of jurisdiction. This is an attempt to ensure
that the sector departments, state owned enterprises, NGOs and local municipalities are mobilised towards the
implementation of the NDP, PGDS and DGDS. A significant amount of financial resources for the implementation
of projects lies with sector departments. The availability of the IDP therefore, provides guidance to the
departments as to where their services are required and hence where to allocate their resources.
The alignment of implementation of projects within the Ugu District area of jurisdiction have been aligned to the
PGDS giving full details of each project in the Service Delivery / Implementation Plan as attached in Annexure
10 of which the summary is given in this section. Figure 5.2.1 gives a summary of the Service Delivery /
Implementation Plan Catalytic Projects. A total estimated sum of R 8 603 757 499.00 is estimated to be spent
towards the implementation of the 27 IDP Goals, 7 DGDS Drivers and 7 PDGS Goals.
The bulk of the budget goes towards Strategic Infrastructure Goal which is 84.19 %. The Human and Community
Development, Spatial Equity, and Inclusive Economic Growth goals accounts for 9.33%, 3.73% and 2.78%
respectively. The budget for Human Resource Development, Environmental Sustainability, and Governance
Policy are minimal and negligible. This goals that reflect low budget are mainly result of non-participation of their
representative stakeholders not participation in the municipal structures and thus do not submit required
information.
Table 5.2.1: Ugu District Service Delivery / Implementation Plan Summary
PGDS
Strategic
Goal
DGDS
Strategic
Driver
PGDS Strategic Objectives Budget
Inclusive
Economic
Growth
Sectoral
Development
and
Support
Develop and promote the agricultural potential of
KZN
R4,460,200.00
Enhance sectoral development through trade
investment and business retention R7,360,000.00
Enhance spatial economic development R221,850,000.00
Improve the efficiency, innovation and variety of
government-led job creation programmes R1,420,000.00
Promote SMME and entrepreneurial development R3,620,000.00
Enhance the Knowledge Economy R 100 000.00
Goal / Driver Total R 238 810 200.00
Human
Resource
Development
Education and
Skills
Development
Improve early childhood development, primary
and secondary education R 0
Support skills development to economic growth R365,000.00
Enhance youth and adult skills development and
life-long learning
R1,140,000.0
Goal / Driver Total R 1 505 000.00
Human and
Community
Development
Safety Nets and
Civic
Empowerment
Eradicate poverty and improve social welfare
services
R18,000,000.00
Safeguard and enhance sustainable livelihoods and
food security
R2,380,000.00
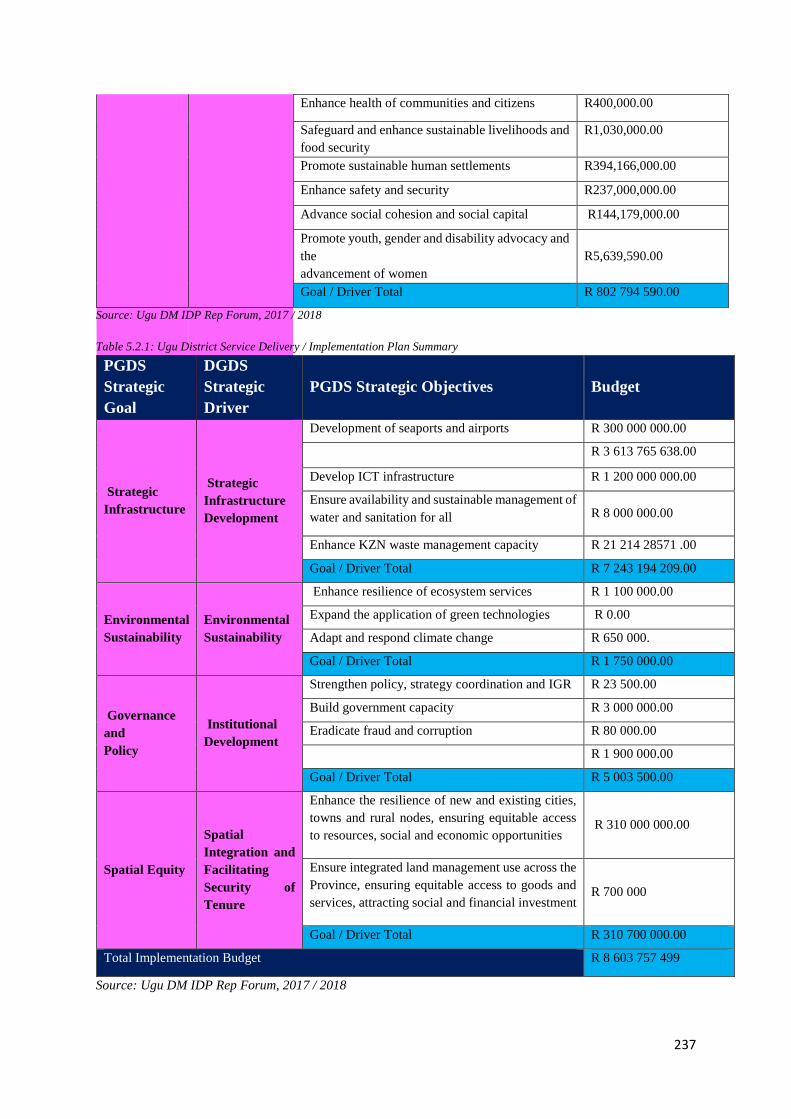
237
Enhance health of communities and citizens R400,000.00
Safeguard and enhance sustainable livelihoods and
food security
R1,030,000.00
Promote sustainable human settlements R394,166,000.00
Enhance safety and security R237,000,000.00
Advance social cohesion and social capital R144,179,000.00
Promote youth, gender and disability advocacy and
the
advancement of women
R5,639,590.00
Goal / Driver Total R 802 794 590.00
Source: Ugu DM IDP Rep Forum, 2017 / 2018
Table 5.2.1: Ugu District Service Delivery / Implementation Plan Summary
PGDS
Strategic
Goal
DGDS
Strategic
Driver
PGDS Strategic Objectives Budget
Strategic
Infrastructure
Strategic
Infrastructure
Development
Development of seaports and airports R 300 000 000.00
R 3 613 765 638.00
Develop ICT infrastructure R 1 200 000 000.00
Ensure availability and sustainable management of
water and sanitation for all R 8 000 000.00
Enhance KZN waste management capacity R 21 214 28571 .00
Goal / Driver Total R 7 243 194 209.00
Environmental
Sustainability
Environmental
Sustainability
Enhance resilience of ecosystem services R 1 100 000.00
Expand the application of green technologies R 0.00
Adapt and respond climate change R 650 000.
Goal / Driver Total R 1 750 000.00
Governance
and
Policy
Institutional
Development
Strengthen policy, strategy coordination and IGR R 23 500.00
Build government capacity R 3 000 000.00
Eradicate fraud and corruption R 80 000.00
R 1 900 000.00
Goal / Driver Total R 5 003 500.00
Spatial Equity
Spatial
Integration and
Facilitating
Security of
Tenure
Enhance the resilience of new and existing cities,
towns and rural nodes, ensuring equitable access
to resources, social and economic opportunities R 310 000 000.00
Ensure integrated land management use across the
Province, ensuring equitable access to goods and
services, attracting social and financial investment R 700 000
Goal / Driver Total R 310 700 000.00
Total Implementation Budget R 8 603 757 499
Source: Ugu DM IDP Rep Forum, 2017 / 2018
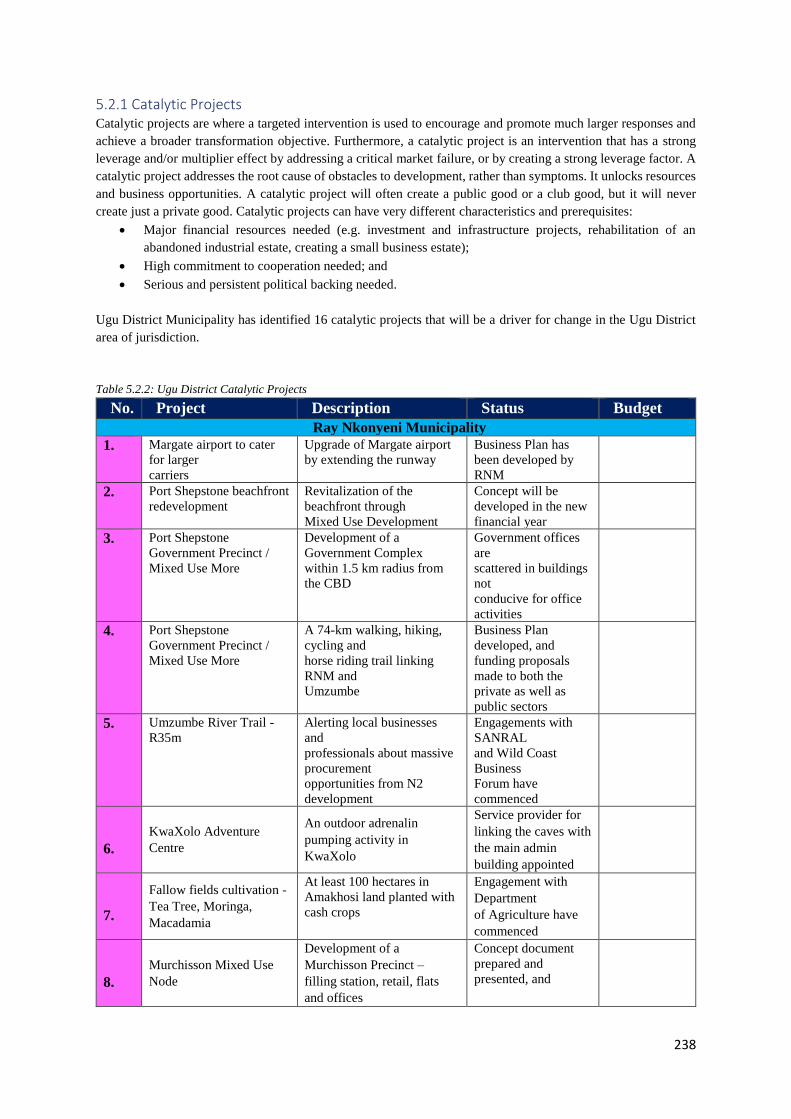
238
5.2.1 Catalytic Projects Catalytic projects are where a targeted intervention is used to encourage and promote much larger responses and
achieve a broader transformation objective. Furthermore, a catalytic project is an intervention that has a strong
leverage and/or multiplier effect by addressing a critical market failure, or by creating a strong leverage factor. A
catalytic project addresses the root cause of obstacles to development, rather than symptoms. It unlocks resources
and business opportunities. A catalytic project will often create a public good or a club good, but it will never
create just a private good. Catalytic projects can have very different characteristics and prerequisites:
• Major financial resources needed (e.g. investment and infrastructure projects, rehabilitation of an
abandoned industrial estate, creating a small business estate);
• High commitment to cooperation needed; and
• Serious and persistent political backing needed.
Ugu District Municipality has identified 16 catalytic projects that will be a driver for change in the Ugu District
area of jurisdiction.
Table 5.2.2: Ugu District Catalytic Projects
No. Project Description Status Budget
Ray Nkonyeni Municipality
1. Margate airport to cater
for larger
carriers
Upgrade of Margate airport
by extending the runway
Business Plan has
been developed by
RNM
2. Port Shepstone beachfront
redevelopment
Revitalization of the
beachfront through
Mixed Use Development
Concept will be
developed in the new
financial year
3. Port Shepstone
Government Precinct /
Mixed Use More
Development of a
Government Complex
within 1.5 km radius from
the CBD
Government offices
are
scattered in buildings
not
conducive for office
activities
4. Port Shepstone
Government Precinct /
Mixed Use More
A 74-km walking, hiking,
cycling and
horse riding trail linking
RNM and
Umzumbe
Business Plan
developed, and
funding proposals
made to both the
private as well as
public sectors
5. Umzumbe River Trail -
R35m
Alerting local businesses
and
professionals about massive
procurement
opportunities from N2
development
Engagements with
SANRAL
and Wild Coast
Business
Forum have
commenced
6.
KwaXolo Adventure
Centre
An outdoor adrenalin
pumping activity in
KwaXolo
Service provider for
linking the caves with
the main admin
building appointed
7.
Fallow fields cultivation -
Tea Tree, Moringa,
Macadamia
At least 100 hectares in
Amakhosi land planted with
cash crops
Engagement with
Department
of Agriculture have
commenced
8.
Murchisson Mixed Use
Node
Development of a
Murchisson Precinct –
filling station, retail, flats
and offices
Concept document
prepared and
presented, and
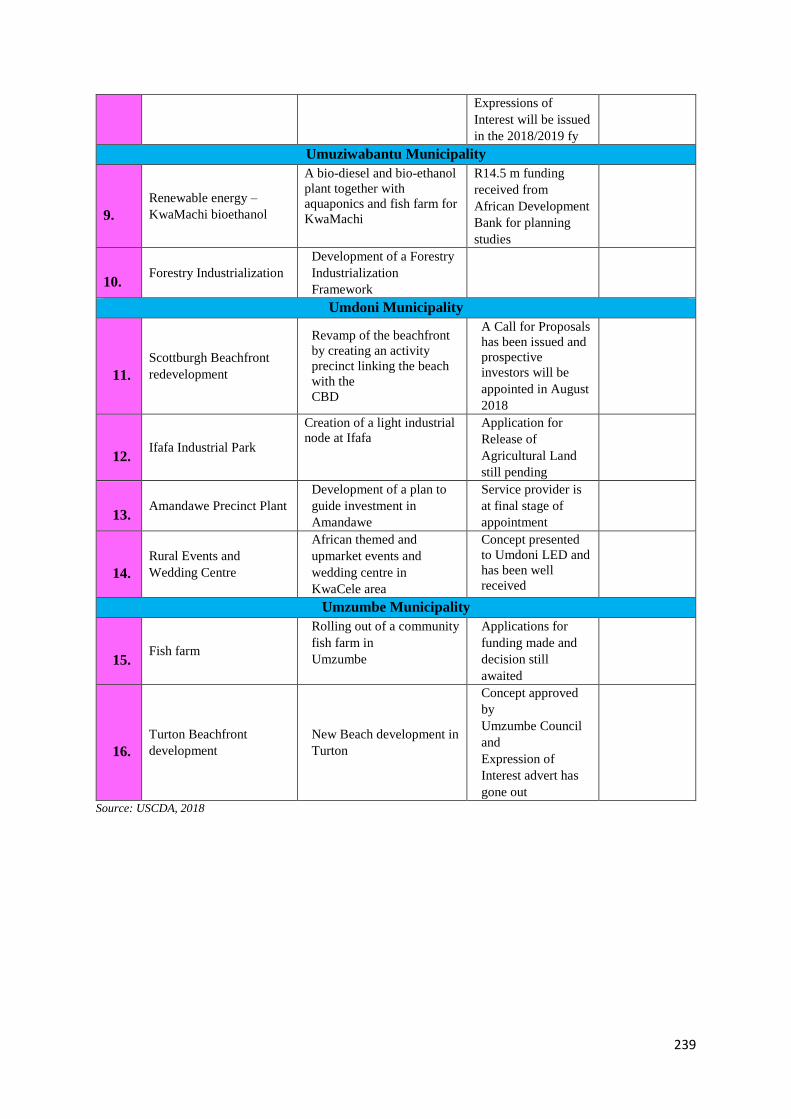
239
Expressions of
Interest will be issued
in the 2018/2019 fy
Umuziwabantu Municipality
9.
Renewable energy –
KwaMachi bioethanol
A bio-diesel and bio-ethanol
plant together with
aquaponics and fish farm for
KwaMachi
R14.5 m funding
received from
African Development
Bank for planning
studies
10. Forestry Industrialization
Development of a Forestry
Industrialization
Framework
Umdoni Municipality
11.
Scottburgh Beachfront
redevelopment
Revamp of the beachfront
by creating an activity
precinct linking the beach
with the
CBD
A Call for Proposals
has been issued and
prospective
investors will be
appointed in August
2018
12. Ifafa Industrial Park
Creation of a light industrial
node at Ifafa
Application for
Release of
Agricultural Land
still pending
13. Amandawe Precinct Plant
Development of a plan to
guide investment in
Amandawe
Service provider is
at final stage of
appointment
14.
Rural Events and
Wedding Centre
African themed and
upmarket events and
wedding centre in
KwaCele area
Concept presented
to Umdoni LED and
has been well
received
Umzumbe Municipality
15. Fish farm
Rolling out of a community
fish farm in
Umzumbe
Applications for
funding made and
decision still
awaited
16.
Turton Beachfront
development
New Beach development in
Turton
Concept approved
by
Umzumbe Council
and
Expression of
Interest advert has
gone out
Source: USCDA, 2018
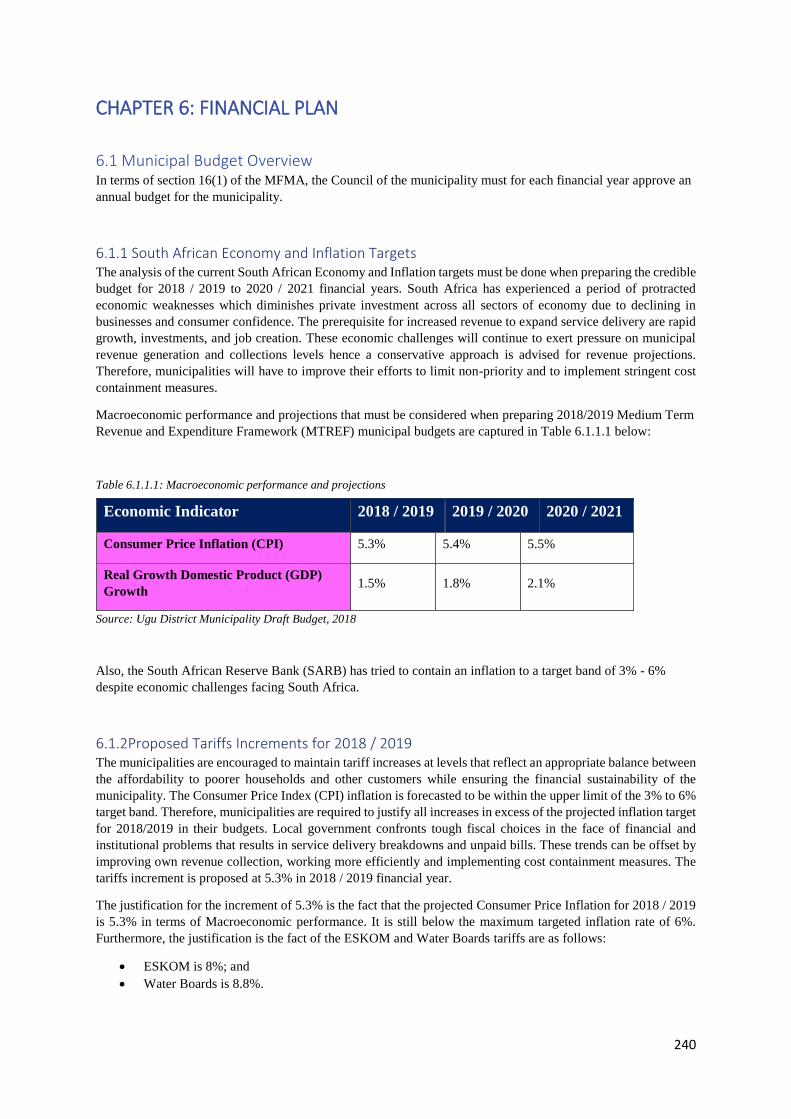
240
CHAPTER 6: FINANCIAL PLAN
6.1 Municipal Budget Overview In terms of section 16(1) of the MFMA, the Council of the municipality must for each financial year approve an
annual budget for the municipality.
6.1.1 South African Economy and Inflation Targets The analysis of the current South African Economy and Inflation targets must be done when preparing the credible
budget for 2018 / 2019 to 2020 / 2021 financial years. South Africa has experienced a period of protracted
economic weaknesses which diminishes private investment across all sectors of economy due to declining in
businesses and consumer confidence. The prerequisite for increased revenue to expand service delivery are rapid
growth, investments, and job creation. These economic challenges will continue to exert pressure on municipal
revenue generation and collections levels hence a conservative approach is advised for revenue projections.
Therefore, municipalities will have to improve their efforts to limit non-priority and to implement stringent cost
containment measures.
Macroeconomic performance and projections that must be considered when preparing 2018/2019 Medium Term
Revenue and Expenditure Framework (MTREF) municipal budgets are captured in Table 6.1.1.1 below:
Table 6.1.1.1: Macroeconomic performance and projections
Source: Ugu District Municipality Draft Budget, 2018
Also, the South African Reserve Bank (SARB) has tried to contain an inflation to a target band of 3% - 6%
despite economic challenges facing South Africa.
6.1.2Proposed Tariffs Increments for 2018 / 2019 The municipalities are encouraged to maintain tariff increases at levels that reflect an appropriate balance between
the affordability to poorer households and other customers while ensuring the financial sustainability of the
municipality. The Consumer Price Index (CPI) inflation is forecasted to be within the upper limit of the 3% to 6%
target band. Therefore, municipalities are required to justify all increases in excess of the projected inflation target
for 2018/2019 in their budgets. Local government confronts tough fiscal choices in the face of financial and
institutional problems that results in service delivery breakdowns and unpaid bills. These trends can be offset by
improving own revenue collection, working more efficiently and implementing cost containment measures. The
tariffs increment is proposed at 5.3% in 2018 / 2019 financial year.
The justification for the increment of 5.3% is the fact that the projected Consumer Price Inflation for 2018 / 2019
is 5.3% in terms of Macroeconomic performance. It is still below the maximum targeted inflation rate of 6%.
Furthermore, the justification is the fact of the ESKOM and Water Boards tariffs are as follows:
• ESKOM is 8%; and
• Water Boards is 8.8%.
Economic Indicator 2018 / 2019 2019 / 2020 2020 / 2021
Consumer Price Inflation (CPI) 5.3% 5.4% 5.5%
Real Growth Domestic Product (GDP)
Growth 1.5% 1.8% 2.1%
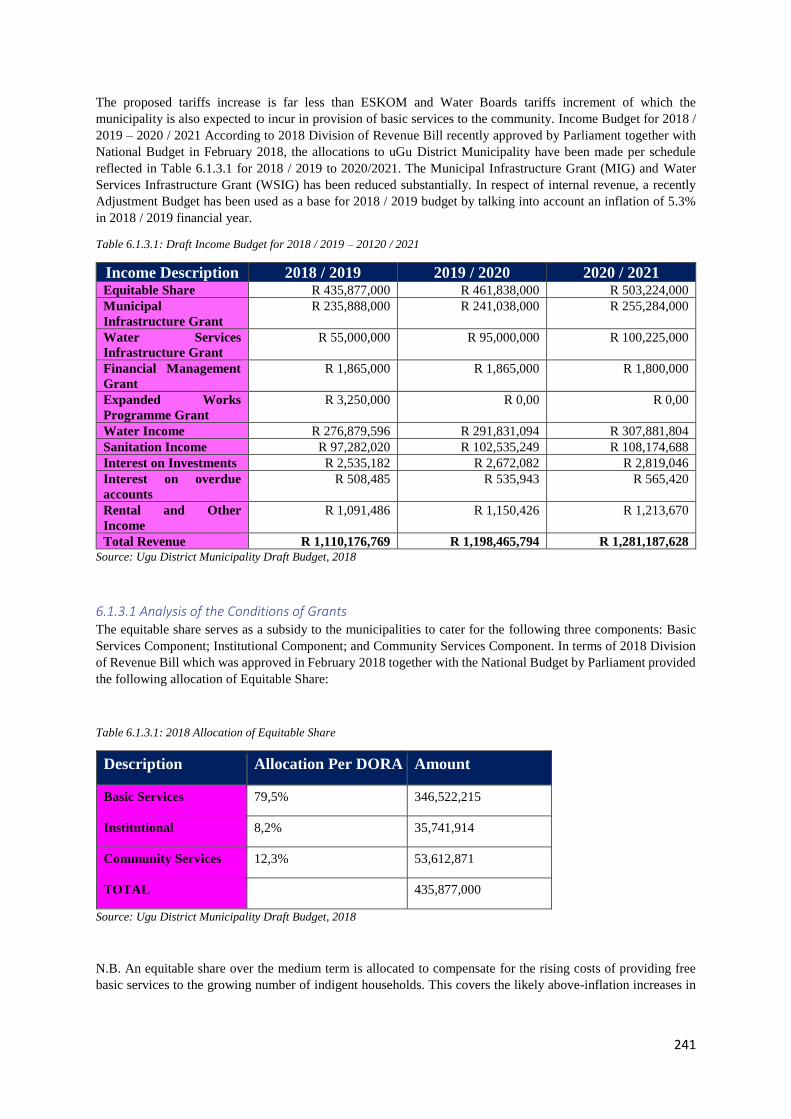
241
The proposed tariffs increase is far less than ESKOM and Water Boards tariffs increment of which the
municipality is also expected to incur in provision of basic services to the community. Income Budget for 2018 /
2019 – 2020 / 2021 According to 2018 Division of Revenue Bill recently approved by Parliament together with
National Budget in February 2018, the allocations to uGu District Municipality have been made per schedule
reflected in Table 6.1.3.1 for 2018 / 2019 to 2020/2021. The Municipal Infrastructure Grant (MIG) and Water
Services Infrastructure Grant (WSIG) has been reduced substantially. In respect of internal revenue, a recently
Adjustment Budget has been used as a base for 2018 / 2019 budget by talking into account an inflation of 5.3%
in 2018 / 2019 financial year.
Table 6.1.3.1: Draft Income Budget for 2018 / 2019 – 20120 / 2021
Income Description 2018 / 2019 2019 / 2020 2020 / 2021 Equitable Share R 435,877,000 R 461,838,000 R 503,224,000
Municipal
Infrastructure Grant
R 235,888,000 R 241,038,000 R 255,284,000
Water Services
Infrastructure Grant
R 55,000,000 R 95,000,000 R 100,225,000
Financial Management
Grant
R 1,865,000 R 1,865,000 R 1,800,000
Expanded Works
Programme Grant
R 3,250,000 R 0,00 R 0,00
Water Income R 276,879,596 R 291,831,094 R 307,881,804
Sanitation Income R 97,282,020 R 102,535,249 R 108,174,688
Interest on Investments R 2,535,182 R 2,672,082 R 2,819,046
Interest on overdue
accounts
R 508,485 R 535,943 R 565,420
Rental and Other
Income
R 1,091,486 R 1,150,426 R 1,213,670
Total Revenue R 1,110,176,769 R 1,198,465,794 R 1,281,187,628
Source: Ugu District Municipality Draft Budget, 2018
6.1.3.1 Analysis of the Conditions of Grants The equitable share serves as a subsidy to the municipalities to cater for the following three components: Basic
Services Component; Institutional Component; and Community Services Component. In terms of 2018 Division
of Revenue Bill which was approved in February 2018 together with the National Budget by Parliament provided
the following allocation of Equitable Share:
Table 6.1.3.1: 2018 Allocation of Equitable Share
Description Allocation Per DORA Amount
Basic Services 79,5% 346,522,215
Institutional 8,2% 35,741,914
Community Services 12,3% 53,612,871
TOTAL 435,877,000
Source: Ugu District Municipality Draft Budget, 2018
N.B. An equitable share over the medium term is allocated to compensate for the rising costs of providing free
basic services to the growing number of indigent households. This covers the likely above-inflation increases in
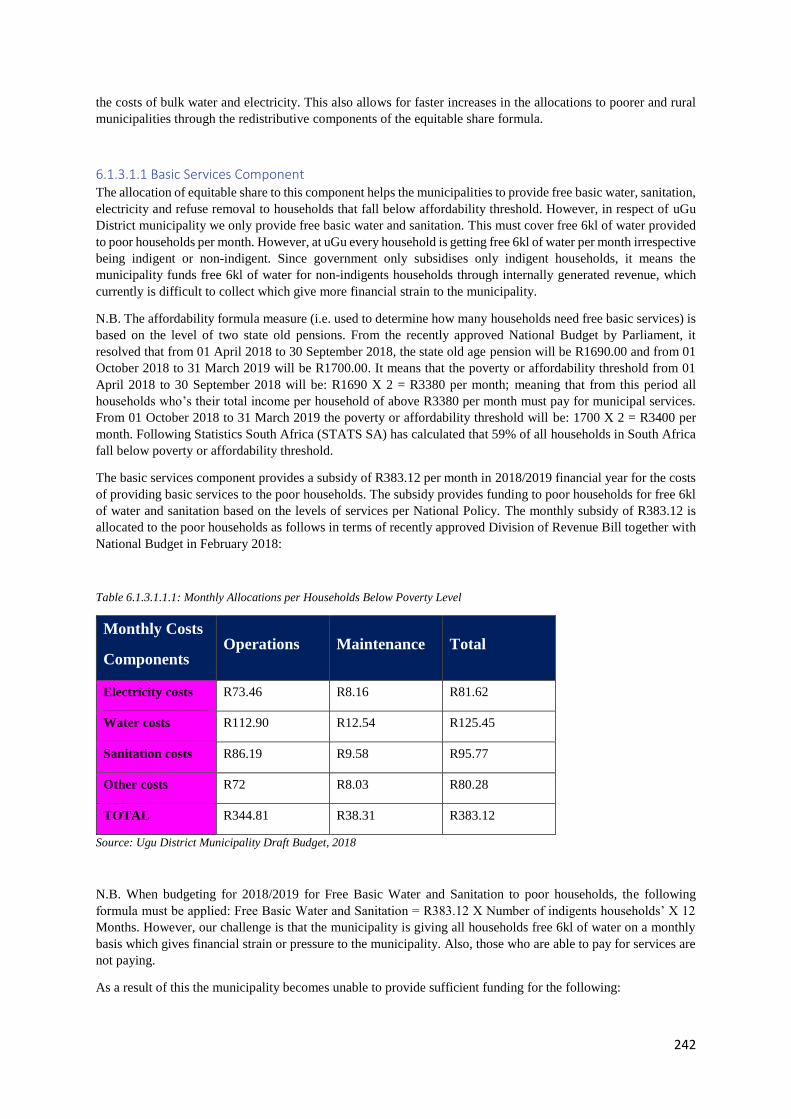
242
the costs of bulk water and electricity. This also allows for faster increases in the allocations to poorer and rural
municipalities through the redistributive components of the equitable share formula.
6.1.3.1.1 Basic Services Component The allocation of equitable share to this component helps the municipalities to provide free basic water, sanitation,
electricity and refuse removal to households that fall below affordability threshold. However, in respect of uGu
District municipality we only provide free basic water and sanitation. This must cover free 6kl of water provided
to poor households per month. However, at uGu every household is getting free 6kl of water per month irrespective
being indigent or non-indigent. Since government only subsidises only indigent households, it means the
municipality funds free 6kl of water for non-indigents households through internally generated revenue, which
currently is difficult to collect which give more financial strain to the municipality.
N.B. The affordability formula measure (i.e. used to determine how many households need free basic services) is
based on the level of two state old pensions. From the recently approved National Budget by Parliament, it
resolved that from 01 April 2018 to 30 September 2018, the state old age pension will be R1690.00 and from 01
October 2018 to 31 March 2019 will be R1700.00. It means that the poverty or affordability threshold from 01
April 2018 to 30 September 2018 will be: R1690 X 2 = R3380 per month; meaning that from this period all
households who’s their total income per household of above R3380 per month must pay for municipal services.
From 01 October 2018 to 31 March 2019 the poverty or affordability threshold will be: 1700 X 2 = R3400 per
month. Following Statistics South Africa (STATS SA) has calculated that 59% of all households in South Africa
fall below poverty or affordability threshold.
The basic services component provides a subsidy of R383.12 per month in 2018/2019 financial year for the costs
of providing basic services to the poor households. The subsidy provides funding to poor households for free 6kl
of water and sanitation based on the levels of services per National Policy. The monthly subsidy of R383.12 is
allocated to the poor households as follows in terms of recently approved Division of Revenue Bill together with
National Budget in February 2018:
Table 6.1.3.1.1.1: Monthly Allocations per Households Below Poverty Level
Monthly Costs
Components Operations Maintenance Total
Electricity costs R73.46 R8.16 R81.62
Water costs R112.90 R12.54 R125.45
Sanitation costs R86.19 R9.58 R95.77
Other costs R72 R8.03 R80.28
TOTAL R344.81 R38.31 R383.12
Source: Ugu District Municipality Draft Budget, 2018
N.B. When budgeting for 2018/2019 for Free Basic Water and Sanitation to poor households, the following
formula must be applied: Free Basic Water and Sanitation = R383.12 X Number of indigents households’ X 12
Months. However, our challenge is that the municipality is giving all households free 6kl of water on a monthly
basis which gives financial strain or pressure to the municipality. Also, those who are able to pay for services are
not paying.
As a result of this the municipality becomes unable to provide sufficient funding for the following:
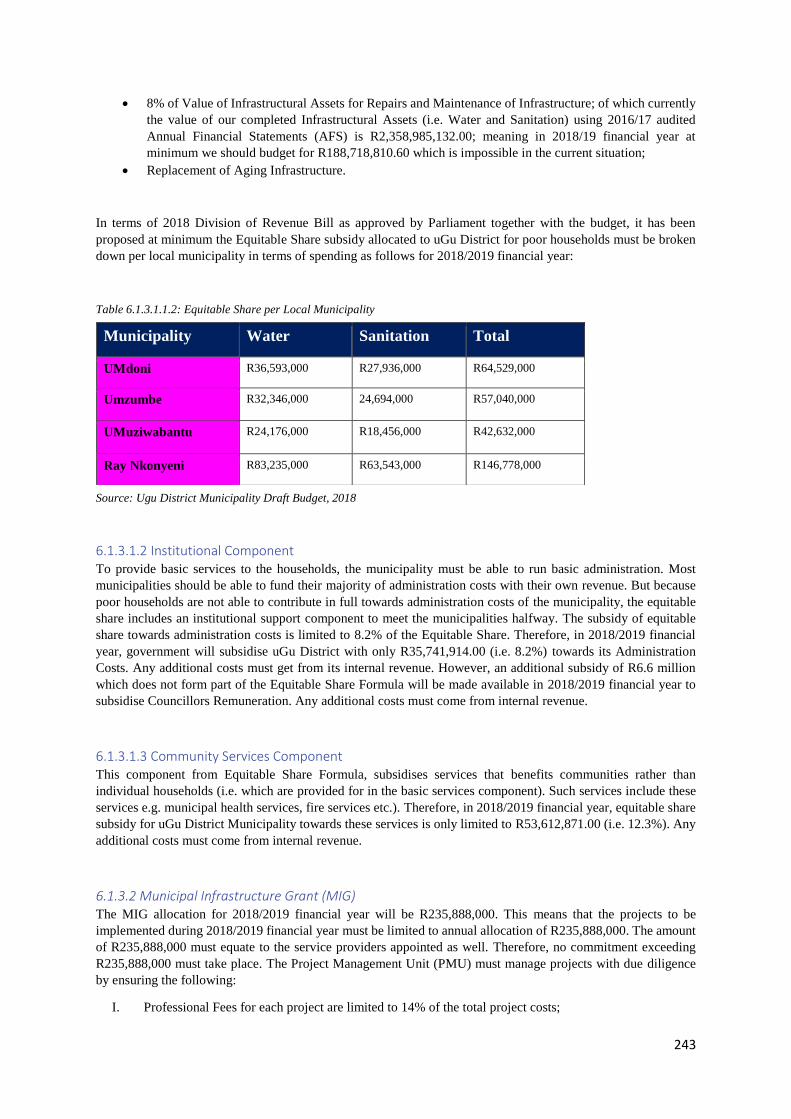
243
• 8% of Value of Infrastructural Assets for Repairs and Maintenance of Infrastructure; of which currently
the value of our completed Infrastructural Assets (i.e. Water and Sanitation) using 2016/17 audited
Annual Financial Statements (AFS) is R2,358,985,132.00; meaning in 2018/19 financial year at
minimum we should budget for R188,718,810.60 which is impossible in the current situation;
• Replacement of Aging Infrastructure.
In terms of 2018 Division of Revenue Bill as approved by Parliament together with the budget, it has been
proposed at minimum the Equitable Share subsidy allocated to uGu District for poor households must be broken
down per local municipality in terms of spending as follows for 2018/2019 financial year:
Table 6.1.3.1.1.2: Equitable Share per Local Municipality
Source: Ugu District Municipality Draft Budget, 2018
6.1.3.1.2 Institutional Component To provide basic services to the households, the municipality must be able to run basic administration. Most
municipalities should be able to fund their majority of administration costs with their own revenue. But because
poor households are not able to contribute in full towards administration costs of the municipality, the equitable
share includes an institutional support component to meet the municipalities halfway. The subsidy of equitable
share towards administration costs is limited to 8.2% of the Equitable Share. Therefore, in 2018/2019 financial
year, government will subsidise uGu District with only R35,741,914.00 (i.e. 8.2%) towards its Administration
Costs. Any additional costs must get from its internal revenue. However, an additional subsidy of R6.6 million
which does not form part of the Equitable Share Formula will be made available in 2018/2019 financial year to
subsidise Councillors Remuneration. Any additional costs must come from internal revenue.
6.1.3.1.3 Community Services Component This component from Equitable Share Formula, subsidises services that benefits communities rather than
individual households (i.e. which are provided for in the basic services component). Such services include these
services e.g. municipal health services, fire services etc.). Therefore, in 2018/2019 financial year, equitable share
subsidy for uGu District Municipality towards these services is only limited to R53,612,871.00 (i.e. 12.3%). Any
additional costs must come from internal revenue.
6.1.3.2 Municipal Infrastructure Grant (MIG) The MIG allocation for 2018/2019 financial year will be R235,888,000. This means that the projects to be
implemented during 2018/2019 financial year must be limited to annual allocation of R235,888,000. The amount
of R235,888,000 must equate to the service providers appointed as well. Therefore, no commitment exceeding
R235,888,000 must take place. The Project Management Unit (PMU) must manage projects with due diligence
by ensuring the following:
I. Professional Fees for each project are limited to 14% of the total project costs;
Municipality Water Sanitation Total
UMdoni R36,593,000 R27,936,000 R64,529,000
Umzumbe R32,346,000 24,694,000 R57,040,000
UMuziwabantu R24,176,000 R18,456,000 R42,632,000
Ray Nkonyeni R83,235,000 R63,543,000 R146,778,000
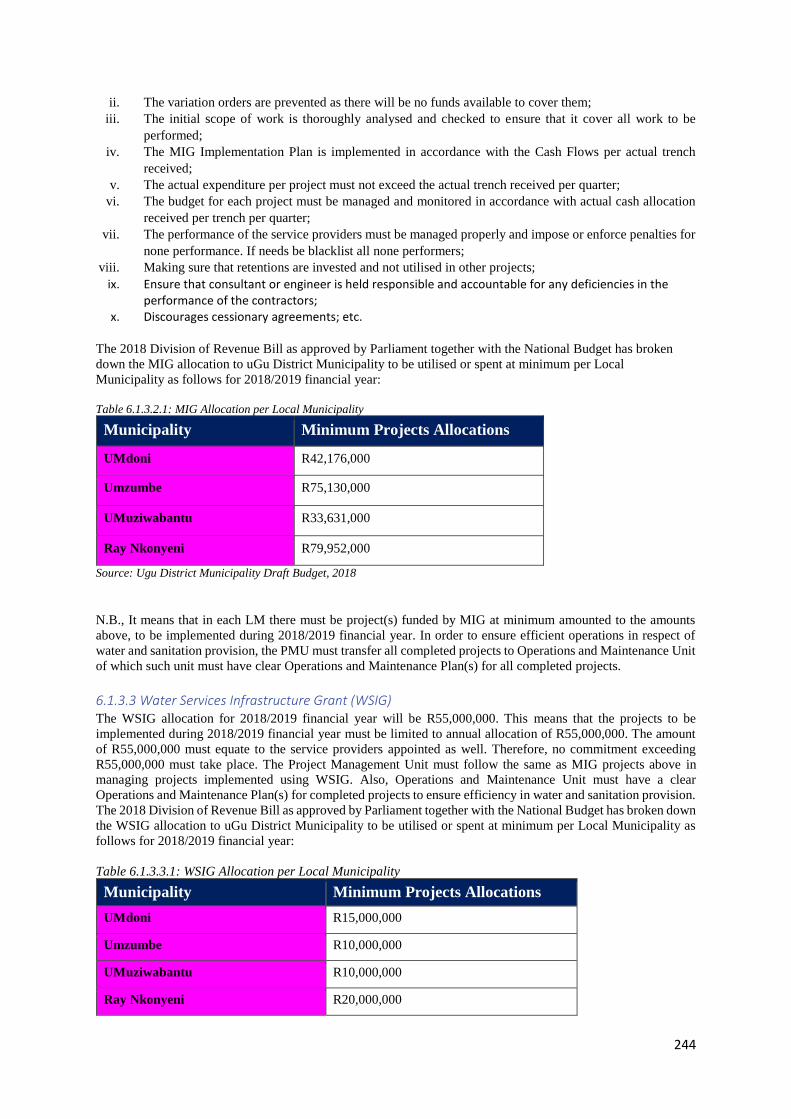
244
ii. The variation orders are prevented as there will be no funds available to cover them;
iii. The initial scope of work is thoroughly analysed and checked to ensure that it cover all work to be
performed;
iv. The MIG Implementation Plan is implemented in accordance with the Cash Flows per actual trench
received;
v. The actual expenditure per project must not exceed the actual trench received per quarter;
vi. The budget for each project must be managed and monitored in accordance with actual cash allocation
received per trench per quarter;
vii. The performance of the service providers must be managed properly and impose or enforce penalties for
none performance. If needs be blacklist all none performers;
viii. Making sure that retentions are invested and not utilised in other projects;
ix. Ensure that consultant or engineer is held responsible and accountable for any deficiencies in the performance of the contractors;
x. Discourages cessionary agreements; etc. The 2018 Division of Revenue Bill as approved by Parliament together with the National Budget has broken
down the MIG allocation to uGu District Municipality to be utilised or spent at minimum per Local
Municipality as follows for 2018/2019 financial year:
Table 6.1.3.2.1: MIG Allocation per Local Municipality
Municipality Minimum Projects Allocations
UMdoni R42,176,000
Umzumbe R75,130,000
UMuziwabantu R33,631,000
Ray Nkonyeni R79,952,000
Source: Ugu District Municipality Draft Budget, 2018
N.B., It means that in each LM there must be project(s) funded by MIG at minimum amounted to the amounts
above, to be implemented during 2018/2019 financial year. In order to ensure efficient operations in respect of
water and sanitation provision, the PMU must transfer all completed projects to Operations and Maintenance Unit
of which such unit must have clear Operations and Maintenance Plan(s) for all completed projects.
6.1.3.3 Water Services Infrastructure Grant (WSIG) The WSIG allocation for 2018/2019 financial year will be R55,000,000. This means that the projects to be
implemented during 2018/2019 financial year must be limited to annual allocation of R55,000,000. The amount
of R55,000,000 must equate to the service providers appointed as well. Therefore, no commitment exceeding
R55,000,000 must take place. The Project Management Unit must follow the same as MIG projects above in
managing projects implemented using WSIG. Also, Operations and Maintenance Unit must have a clear
Operations and Maintenance Plan(s) for completed projects to ensure efficiency in water and sanitation provision.
The 2018 Division of Revenue Bill as approved by Parliament together with the National Budget has broken down
the WSIG allocation to uGu District Municipality to be utilised or spent at minimum per Local Municipality as
follows for 2018/2019 financial year:
Table 6.1.3.3.1: WSIG Allocation per Local Municipality
Municipality Minimum Projects Allocations
UMdoni R15,000,000
Umzumbe R10,000,000
UMuziwabantu R10,000,000
Ray Nkonyeni R20,000,000
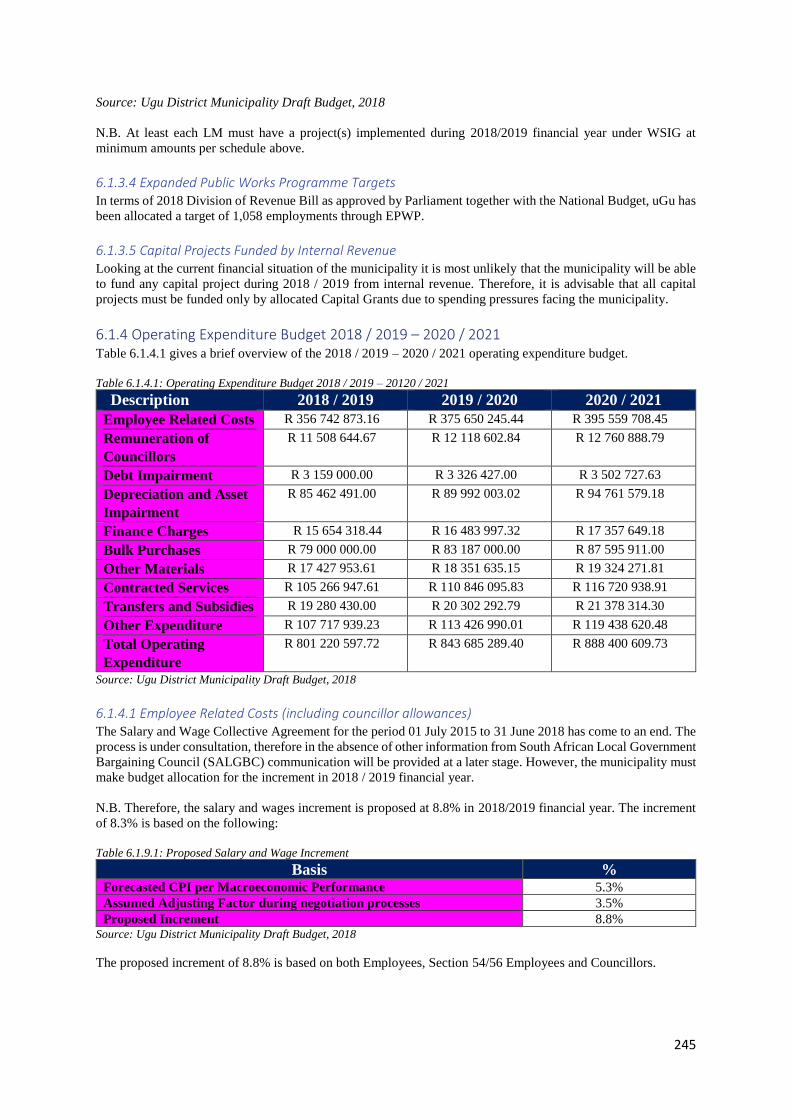
245
Source: Ugu District Municipality Draft Budget, 2018
N.B. At least each LM must have a project(s) implemented during 2018/2019 financial year under WSIG at
minimum amounts per schedule above.
6.1.3.4 Expanded Public Works Programme Targets In terms of 2018 Division of Revenue Bill as approved by Parliament together with the National Budget, uGu has
been allocated a target of 1,058 employments through EPWP.
6.1.3.5 Capital Projects Funded by Internal Revenue Looking at the current financial situation of the municipality it is most unlikely that the municipality will be able
to fund any capital project during 2018 / 2019 from internal revenue. Therefore, it is advisable that all capital
projects must be funded only by allocated Capital Grants due to spending pressures facing the municipality.
6.1.4 Operating Expenditure Budget 2018 / 2019 – 2020 / 2021 Table 6.1.4.1 gives a brief overview of the 2018 / 2019 – 2020 / 2021 operating expenditure budget.
Table 6.1.4.1: Operating Expenditure Budget 2018 / 2019 – 20120 / 2021
Description 2018 / 2019 2019 / 2020 2020 / 2021
Employee Related Costs R 356 742 873.16 R 375 650 245.44 R 395 559 708.45
Remuneration of
Councillors
R 11 508 644.67 R 12 118 602.84 R 12 760 888.79
Debt Impairment R 3 159 000.00 R 3 326 427.00 R 3 502 727.63
Depreciation and Asset
Impairment
R 85 462 491.00 R 89 992 003.02 R 94 761 579.18
Finance Charges R 15 654 318.44 R 16 483 997.32 R 17 357 649.18
Bulk Purchases R 79 000 000.00 R 83 187 000.00 R 87 595 911.00
Other Materials R 17 427 953.61 R 18 351 635.15 R 19 324 271.81
Contracted Services R 105 266 947.61 R 110 846 095.83 R 116 720 938.91
Transfers and Subsidies R 19 280 430.00 R 20 302 292.79 R 21 378 314.30
Other Expenditure R 107 717 939.23 R 113 426 990.01 R 119 438 620.48
Total Operating
Expenditure
R 801 220 597.72 R 843 685 289.40 R 888 400 609.73
Source: Ugu District Municipality Draft Budget, 2018
6.1.4.1 Employee Related Costs (including councillor allowances) The Salary and Wage Collective Agreement for the period 01 July 2015 to 31 June 2018 has come to an end. The
process is under consultation, therefore in the absence of other information from South African Local Government
Bargaining Council (SALGBC) communication will be provided at a later stage. However, the municipality must
make budget allocation for the increment in 2018 / 2019 financial year.
N.B. Therefore, the salary and wages increment is proposed at 8.8% in 2018/2019 financial year. The increment
of 8.3% is based on the following:
Table 6.1.9.1: Proposed Salary and Wage Increment
Basis % Forecasted CPI per Macroeconomic Performance 5.3%
Assumed Adjusting Factor during negotiation processes 3.5%
Proposed Increment 8.8% Source: Ugu District Municipality Draft Budget, 2018
The proposed increment of 8.8% is based on both Employees, Section 54/56 Employees and Councillors.

246
6.1.4.1.1 Employees Salary Budget The employees’ salary and wages for the 2018 / 2019 financial year is R 356 742 873.16 as reflected in Table
6.1.4.1.1.1 below. The employees’ salary and wage budget take about 95.34% of internal revenue of the
municipality. The municipality will be engaging different strategies to bring the salary and wage budget down
such as:
• Re-engineering of the organisational process (e.g. combining some units, freezing of some positions if
they become vacant);
• Reduction of excessive overtime and S&T Travelling claims;
• Reduction of the excessive acting of employees to high positions;
• Elimination of the acting of employees on unfunded positions etc. Table 6.1.4.1.1.1: Employees Salary Budget
Description Monthly 2018 / 19 Budget Gross Actual Current Employees –Cost of warm
bodies per payroll for the month of March 2018 as
a base
R 27 017 683.30 R 324 212 199.60
Proposed Increment of 8.8% R 28 530 673.56
Filling of Critical Vacant Posts from Organogram R 2 500 000.00
Total R 356 742 873.16 Source: Ugu District Municipality Draft Budget, 2018
6.1.4.1.2 Councillors Remuneration and Traditional Leaders The Councillors and Traditional Leaders remuneration for the 2018 / 2019 financial year amounts to R 11 508
644.67 as reflected in Table 6.1.4.1.2.1 below.
Table 6.1.4.1.2.1: Councillors Remuneration and Traditional Leaders
Description Monthly 2018 / 19 Budget Gross Actual Current Employees – Cost of warm
bodies per payroll for the month of March 2018 as
a base
R 650 251.43 R 7 803 017.16
Proposed Increment of 8.8% R 686 665.51
Filling of Deputy Mayor Vacancy R 938 962.00
Sitting Allowance for Traditional Leaders
Tools of Traditional Leaders R 80 000.00
Travelling Claims for Councillors R 200 000.00
Total R 11 508 644.67 Source: Ugu District Municipality Draft Budget, 2018
6.1.4.2 Other Expenditure Table 6.1.4.1.2.2 provides a summary of other operation expenditure of the municipality.
Table 6.1.4.1.2.2: Other Operational Expenditure
Expenditure Description 2018 / 2019 Youth Development Programme R 1 870 496.00
Rights of a Child R 210 795.00
Gender Programmes R 539 096.00
Elderly R 98 670.00
People Living with Disability R 448 500.00
HIV / AIDS R 457 470.00
Sports and Recreation Programmes R 5 249 677.00
Poverty Alleviation Programme (i.e EPWP) R 9 345 495.00
Community Initiatives Support R 448 500.00
Public Participation R 2 500 000.00
SMME Development Support R 500 000.00
Cooperatives Development Support R 500 000.00
Mayoral Bursaries R 500 000.00
Community Skills Development R 8 500 000.00 Source: Ugu District Municipality Draft Budget, 2018
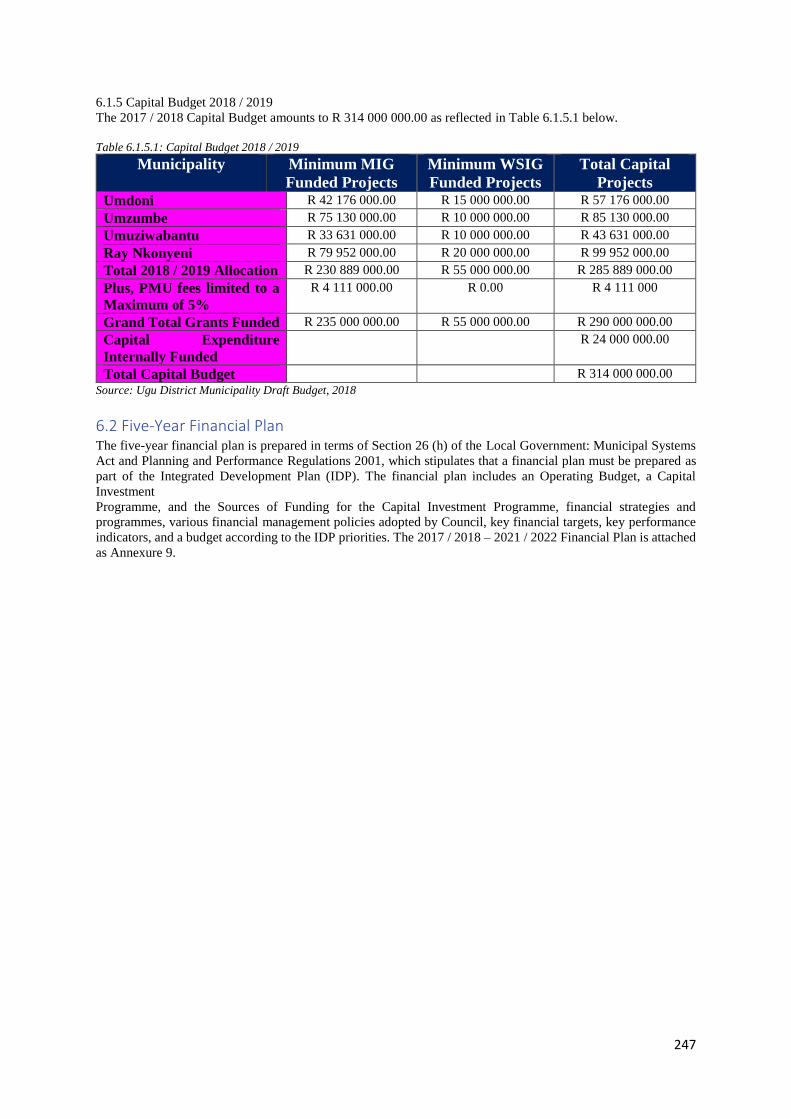
247
6.1.5 Capital Budget 2018 / 2019
The 2017 / 2018 Capital Budget amounts to R 314 000 000.00 as reflected in Table 6.1.5.1 below.
Table 6.1.5.1: Capital Budget 2018 / 2019
Municipality Minimum MIG
Funded Projects
Minimum WSIG
Funded Projects
Total Capital
Projects Umdoni R 42 176 000.00 R 15 000 000.00 R 57 176 000.00
Umzumbe R 75 130 000.00 R 10 000 000.00 R 85 130 000.00
Umuziwabantu R 33 631 000.00 R 10 000 000.00 R 43 631 000.00
Ray Nkonyeni R 79 952 000.00 R 20 000 000.00 R 99 952 000.00
Total 2018 / 2019 Allocation R 230 889 000.00 R 55 000 000.00 R 285 889 000.00
Plus, PMU fees limited to a
Maximum of 5%
R 4 111 000.00 R 0.00 R 4 111 000
Grand Total Grants Funded R 235 000 000.00 R 55 000 000.00 R 290 000 000.00
Capital Expenditure
Internally Funded
R 24 000 000.00
Total Capital Budget R 314 000 000.00
Source: Ugu District Municipality Draft Budget, 2018
6.2 Five-Year Financial Plan The five-year financial plan is prepared in terms of Section 26 (h) of the Local Government: Municipal Systems
Act and Planning and Performance Regulations 2001, which stipulates that a financial plan must be prepared as
part of the Integrated Development Plan (IDP). The financial plan includes an Operating Budget, a Capital
Investment
Programme, and the Sources of Funding for the Capital Investment Programme, financial strategies and
programmes, various financial management policies adopted by Council, key financial targets, key performance
indicators, and a budget according to the IDP priorities. The 2017 / 2018 – 2021 / 2022 Financial Plan is attached
as Annexure 9.
248
CHAPTER 7: ORGANISATIONAL PERFORMANCE MANAGEMENT SYSTEM The Ugu District municipality has an Organisational Performance Management System (OPMS) and the annual
operational plan in place which is the Service Delivery and Budget Implementation Plan (SDBIP). The
municipality has merged OPMS and SDBIP processes to ensure consistent alignment in the implementation. This
is in line with the legislation as the Municipal Systems Act (MSA), 2000 requires municipalities to establish a
performance management system. Further, the MSA and the Municipal Finance Management Act (MFMA)
requires the Integrated Development Plan (IDP) to be aligned to the municipal budget and to be monitored for the
performance of the budget against the IDP via the Service Delivery and the Budget Implementation Plan (SDBIP).
The 2018 / 2019 Scorecards and SDBIP are attached as Annexure 14.
7.1 Organisational Performance Management System The implementation of OPMS involved four main tasks which are namely:
• Creation of the Organisational Scorecard;
• Preparation of Service Delivery Budget Implementation Plan;
• Preparation of the Annual Performance Plans, Performance Agreements and Personal Development
Plans for the Municipal Manager and the Managers that report to the Municipal Manager; and
• Compilation of Portfolios of Evidence.
The first step is concerned with the creation of the Organisational Scorecard which is the log-frame template that
includes:
• A unique consecutive number for each Performance Measure/ Indicator.
• National Key Performance Areas (KPA).
• Strategic Objectives per KPA.
• Measurable Objective (s)/ Output (s) per Strategic Objective.
• Performance Measure (s)/ Indicator (s) per Measurable Objective/ Output.
• Demand data (Number of households requiring the service).
• Baseline data (The status quo at the start of the year).
• Backlog data (Demand minus baseline).
• Quarterly targets for the backlog that will be addressed in the year under review.
• The Department that is responsible for the output.
• The estimated financial implication.
• The Wards that will benefit from the services delivered.
This scorecard is used to monitor the performance of the Municipality and is used to cascade responsibility down
to the Municipal Manager and Managers accountable to the Municipal Manager who prepare more detailed
implementation plans in the form of the SDBIP and Performance Plan which also informs their Performance
Agreements. Step three is concerned with the preparation of the SDBIP which is discussed in detail in section 7.2.
Step four deals with the Preparation of S57 Managers’ Performance Agreements, Annual Performance Plans &
Personal Development Plans which involved three tasks which are:
1. Step 1: Preparation of the Municipal Manager and Managers accountable to the Municipal Managers’
Performance Agreements.
2. Step 2: Preparation of the Municipal Manager, Managers accountable to the Municipal Managers’
Annual Performance Plans
3. Step 3: Preparation of the Municipal Manager and Managers accountable to the Municipal Managers’
Personal Development Plans.
The fourth and last step is the compilation of Portfolio of Evidence which is concerned with the verification of all
the information supplied. The time frames and summary of the tasks involved in the implementation of OPMS in
the Ugu District Municipality is illustrated in Figure 7.1.1. The reporting process commences from a departmental
level from where it flows to the strategic level, political level and on to the community, the users of the services.
The process followed is illustrated in Figure 7.1.2., the entire process is driven by the PMS unit in the Office of
the Municipal Manager and coordinated in co-operation with the PMS Champions in each Department.
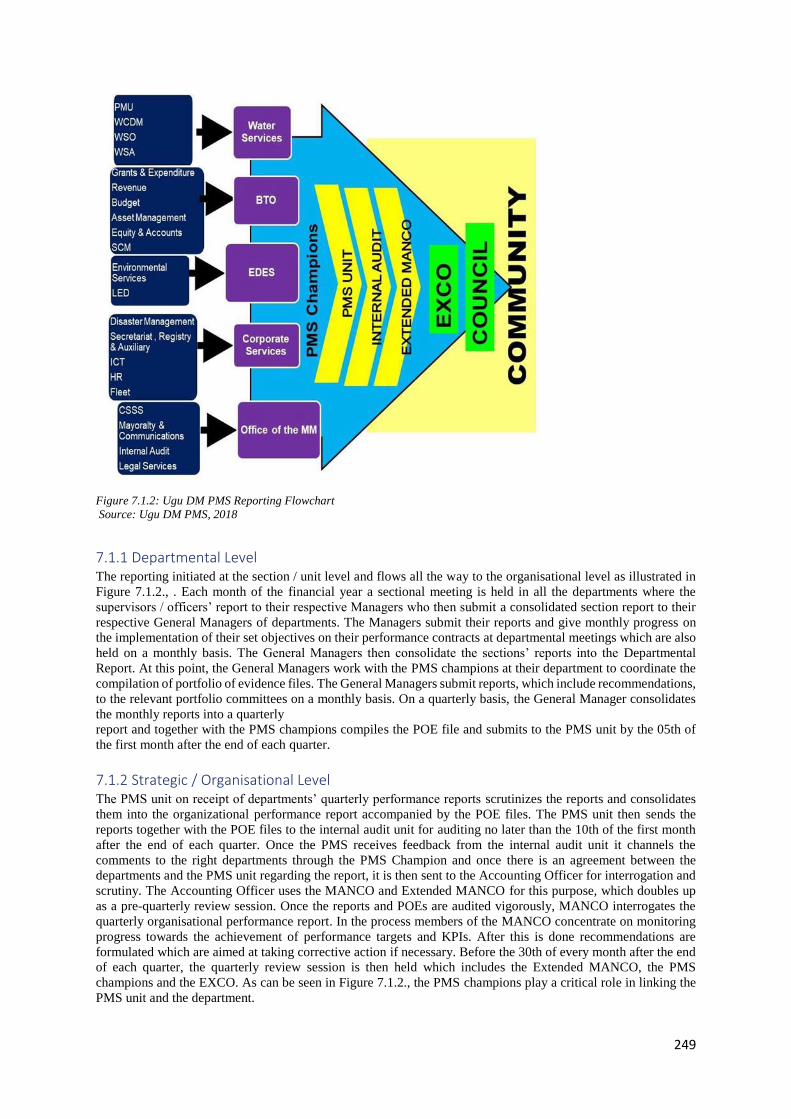
249
Figure 7.1.2: Ugu DM PMS Reporting Flowchart
Source: Ugu DM PMS, 2018
7.1.1 Departmental Level The reporting initiated at the section / unit level and flows all the way to the organisational level as illustrated in
Figure 7.1.2., . Each month of the financial year a sectional meeting is held in all the departments where the
supervisors / officers’ report to their respective Managers who then submit a consolidated section report to their
respective General Managers of departments. The Managers submit their reports and give monthly progress on
the implementation of their set objectives on their performance contracts at departmental meetings which are also
held on a monthly basis. The General Managers then consolidate the sections’ reports into the Departmental
Report. At this point, the General Managers work with the PMS champions at their department to coordinate the
compilation of portfolio of evidence files. The General Managers submit reports, which include recommendations,
to the relevant portfolio committees on a monthly basis. On a quarterly basis, the General Manager consolidates
the monthly reports into a quarterly
report and together with the PMS champions compiles the POE file and submits to the PMS unit by the 05th of
the first month after the end of each quarter.
7.1.2 Strategic / Organisational Level The PMS unit on receipt of departments’ quarterly performance reports scrutinizes the reports and consolidates
them into the organizational performance report accompanied by the POE files. The PMS unit then sends the
reports together with the POE files to the internal audit unit for auditing no later than the 10th of the first month
after the end of each quarter. Once the PMS receives feedback from the internal audit unit it channels the
comments to the right departments through the PMS Champion and once there is an agreement between the
departments and the PMS unit regarding the report, it is then sent to the Accounting Officer for interrogation and
scrutiny. The Accounting Officer uses the MANCO and Extended MANCO for this purpose, which doubles up
as a pre-quarterly review session. Once the reports and POEs are audited vigorously, MANCO interrogates the
quarterly organisational performance report. In the process members of the MANCO concentrate on monitoring
progress towards the achievement of performance targets and KPIs. After this is done recommendations are
formulated which are aimed at taking corrective action if necessary. Before the 30th of every month after the end
of each quarter, the quarterly review session is then held which includes the Extended MANCO, the PMS
champions and the EXCO. As can be seen in Figure 7.1.2., the PMS champions play a critical role in linking the
PMS unit and the department.
250
7.1.3 Political Level In the quarterly performance review sessions, the quarterly performance reports are evaluated critically by the
EXCO members. This evaluation is aimed at determining to what extent the performance targets and KPIs are
positively impacting on the development objectives. Recommendations are then formulated around corrective
actions in this regard if necessary. The quarterly municipal performance report, together with recommendations,
is then forwarded to the council.
7.2 Service Delivery and Budget Implementation Plan The SDBIP facilitates the process of holding management accountable for their performance. It provides the basis
for measuring performance in the delivery of services.
7.2.1 Legislative Mandates The SDBIP is essentially the management and implementation tool which sets in-year information, such as
quarterly service delivery targets, and links each service delivery output to the budget of the municipality, thus
providing credible management information and a detailed plan for how the municipality will provide such
services and the inputs and financial resources to be used (MFMA Circular 13).
The SDBIP therefore serves as a “contract” between the administration, Council and community expressing the
goals and objectives set by the Council as quantifiable outcomes that can be implemented by the administration
over the next twelve months. This provides the basis for measuring performance in service delivery against end
of year targets and implementing the budget.
The SDBIP is a layered plan, with the top layer dealing with consolidated service delivery targets and linking
these targets to management. The next layer will detail each output and activities for each output that are linked
to middle and junior management. Much of this detail will be included in Performance Plans. The top layer cannot
be revised without Council’s approval of an adjustments budget; however, the lower level can be continually
revised.
The SDBIP is an implementation plan approved by the Mayor and not Council, after Council has approved the
budget. The Ugu District used the five (5) components as proposed by National Treasury for the SDBIP, which
are:
• Ward Information.
• Monthly projections of revenue to be collected by source.
• Quarterly projections of service delivery targets and performance indicators for each Vote.
• Monthly projections of operating and capital expenditure and revenue for each Vote.
• Detailed capital works plan broken down by Ward over three (3) years.
7.2.2 Monitoring Performance In terms of monitoring performance, the PMS engages in three main tasks which are:
• Measuring Performance;
• Compilation of Quarterly Performance Reports at a Departmental level;
• Compilation of Consolidated Quarterly, Half-Yearly and Annual Performance Reports at a Municipal
level
Municipal Managers and Managers accountable to the Municipal Manager are responsible for Quarterly
Performance Reports at a Departmental level. These reports are submitted to officials responsible for
Organisational Performance Management Systems and Individual Performance Management Systems. The
individual’s performance is monitored throughout the financial year. The Departmental Performance Reports will
be consolidated to represent the Municipal Performance Reports and monitoring will be performed against the
targets set in the Organisational Scorecard.
In compiling the Municipal Performance Report, the departmental management and the Municipal MANCO team
should evaluate the effectiveness of current programmes and strategies for delivery in order to determine whether
they are on track for delivering the desired outcomes. Key characteristics include:
• Keeps track, oversight, analyses, and documents progress.
• Focuses on inputs, activities, outputs, implementation processes, continued relevance, likely results at
outcome level.
• Answers what activities were implemented, and results achieved.
251
• Alerts managers to problems and provides options for corrective actions.
• Self-assessment by programme Managers, Supervisors, community stakeholders, and donors.
7.2.3 Performance Evaluation Performance evaluation involves three main tasks which are:
• Define Evaluation Objectives
• Review Information Collected during Monitoring
• Document Findings and Formulate Recommendations
Evaluation is a periodic, in-depth analysis of programme performance. It relies on data generated through
monitoring activities as well as information obtained from other sources (e.g., studies, research, in-depth
interviews, focus group discussions, surveys etc.). Evaluations are often (but not always) conducted with the
assistance of external evaluators. Section 47 of the Municipal Systems Act requires the MEC responsible for Local
Government to submit an Annual Report on the performance of municipalities in the province to the Provincial
Legislature, the Minister responsible for Local Government and the National Council for Provinces. In order to
comply with this requirement, all municipalities are required to submit Annual Performance Reports to the MEC.
Key characteristics include:
• A Periodic assessment at important milestones such as the Half- Yearly and Annual Performance Reports
or a Five-Year Review.
• In-depth analysis compares planned to actual achievements.
• Focuses on outputs in relation to inputs, results in relation to cost, processes used to achieve results,
overall relevance, impact, and sustainability.
• Answers why and how results were achieved. Contributes to building theories and models for change.
• Provides Managers with strategy and policy options.
• Internal and/or external analysis by programme Managers, Supervisors, community stakeholders,
donors, and/or external evaluators.
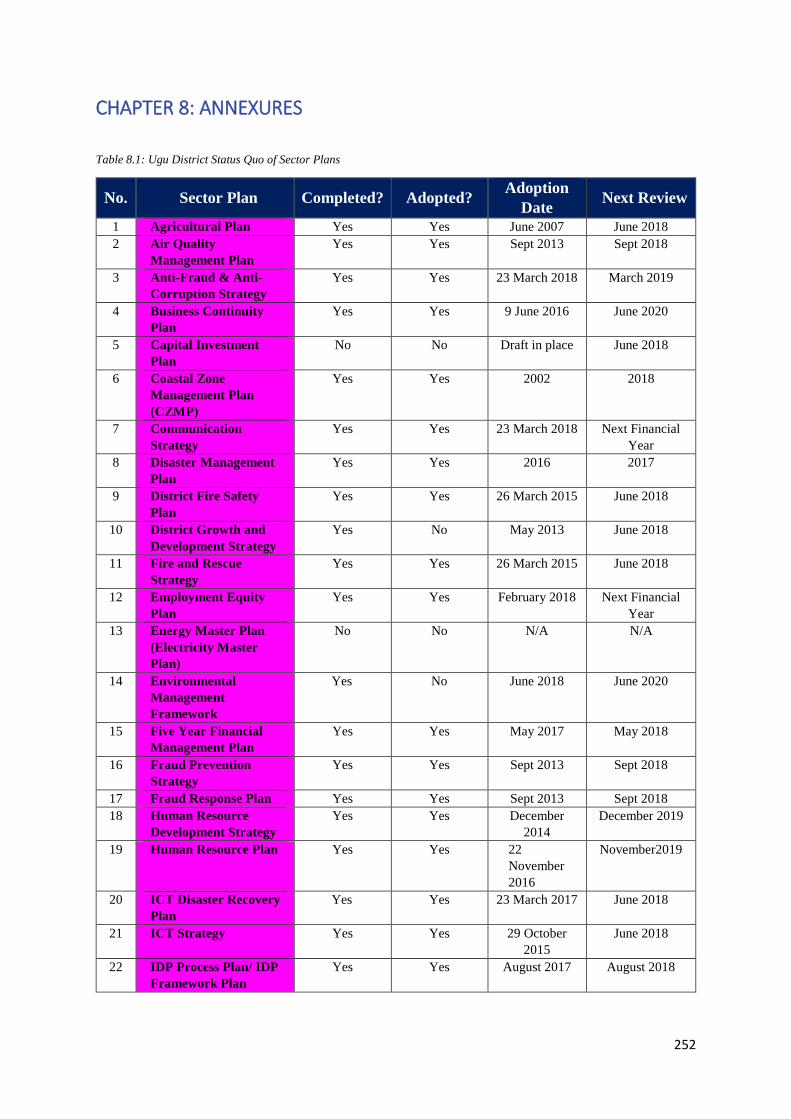
252
CHAPTER 8: ANNEXURES
Table 8.1: Ugu District Status Quo of Sector Plans
No. Sector Plan Completed? Adopted? Adoption
Date Next Review
1 Agricultural Plan Yes Yes June 2007 June 2018
2 Air Quality
Management Plan
Yes Yes Sept 2013 Sept 2018
3 Anti-Fraud & Anti-
Corruption Strategy
Yes Yes 23 March 2018 March 2019
4 Business Continuity
Plan
Yes Yes 9 June 2016 June 2020
5 Capital Investment
Plan
No No Draft in place June 2018
6 Coastal Zone
Management Plan
(CZMP)
Yes Yes 2002 2018
7 Communication
Strategy
Yes Yes 23 March 2018 Next Financial
Year
8 Disaster Management
Plan
Yes Yes 2016 2017
9 District Fire Safety
Plan
Yes Yes 26 March 2015 June 2018
10 District Growth and
Development Strategy
Yes No May 2013 June 2018
11 Fire and Rescue
Strategy
Yes Yes 26 March 2015 June 2018
12 Employment Equity
Plan
Yes Yes February 2018 Next Financial
Year
13 Energy Master Plan
(Electricity Master
Plan)
No No N/A N/A
14 Environmental
Management
Framework
Yes No June 2018 June 2020
15 Five Year Financial
Management Plan
Yes Yes May 2017 May 2018
16 Fraud Prevention
Strategy
Yes Yes Sept 2013 Sept 2018
17 Fraud Response Plan Yes Yes Sept 2013 Sept 2018
18 Human Resource
Development Strategy
Yes Yes December
2014
December 2019
19 Human Resource Plan Yes Yes 22
November
2016
November2019
20 ICT Disaster Recovery
Plan
Yes Yes 23 March 2017 June 2018
21 ICT Strategy Yes Yes 29 October
2015
June 2018
22 IDP Process Plan/ IDP
Framework Plan
Yes Yes August 2017 August 2018
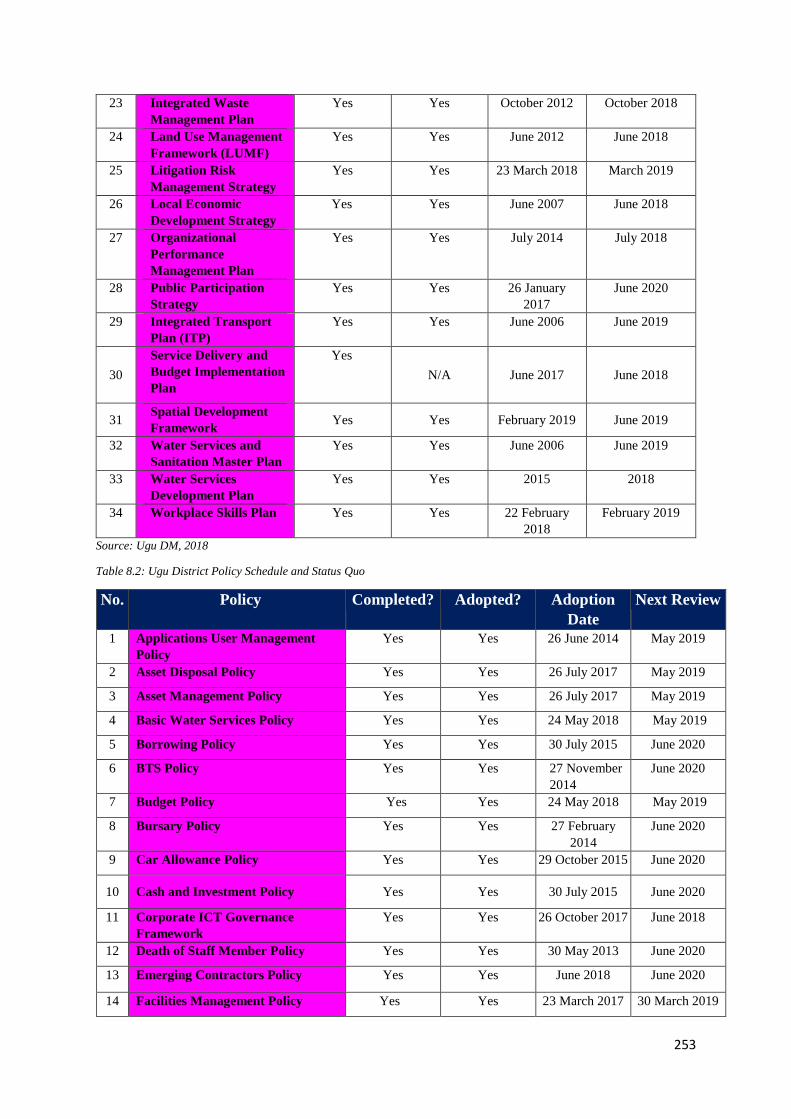
253
23 Integrated Waste
Management Plan
Yes Yes October 2012 October 2018
24 Land Use Management
Framework (LUMF)
Yes Yes June 2012 June 2018
25 Litigation Risk
Management Strategy
Yes Yes 23 March 2018 March 2019
26 Local Economic
Development Strategy
Yes Yes June 2007 June 2018
27 Organizational
Performance
Management Plan
Yes Yes July 2014 July 2018
28 Public Participation
Strategy
Yes Yes 26 January
2017
June 2020
29 Integrated Transport
Plan (ITP)
Yes Yes June 2006 June 2019
30
Service Delivery and
Budget Implementation
Plan
Yes
N/A June 2017 June 2018
31 Spatial Development
Framework Yes Yes February 2019 June 2019
32 Water Services and
Sanitation Master Plan
Yes Yes June 2006 June 2019
33 Water Services
Development Plan
Yes Yes 2015 2018
34 Workplace Skills Plan Yes Yes 22 February
2018
February 2019
Source: Ugu DM, 2018
Table 8.2: Ugu District Policy Schedule and Status Quo
No. Policy Completed? Adopted? Adoption
Date
Next Review
1 Applications User Management
Policy
Yes Yes 26 June 2014 May 2019
2 Asset Disposal Policy Yes Yes 26 July 2017 May 2019
3 Asset Management Policy Yes Yes 26 July 2017 May 2019
4 Basic Water Services Policy Yes Yes 24 May 2018 May 2019
5 Borrowing Policy Yes Yes 30 July 2015 June 2020
6 BTS Policy Yes Yes 27 November
2014
June 2020
7 Budget Policy Yes Yes 24 May 2018 May 2019
8 Bursary Policy Yes Yes 27 February
2014
June 2020
9 Car Allowance Policy Yes Yes 29 October 2015 June 2020
10 Cash and Investment Policy Yes Yes 30 July 2015 June 2020
11 Corporate ICT Governance
Framework
Yes Yes 26 October 2017 June 2018
12 Death of Staff Member Policy Yes Yes 30 May 2013 June 2020
13 Emerging Contractors Policy Yes Yes June 2018 June 2020
14 Facilities Management Policy Yes Yes 23 March 2017 30 March 2019
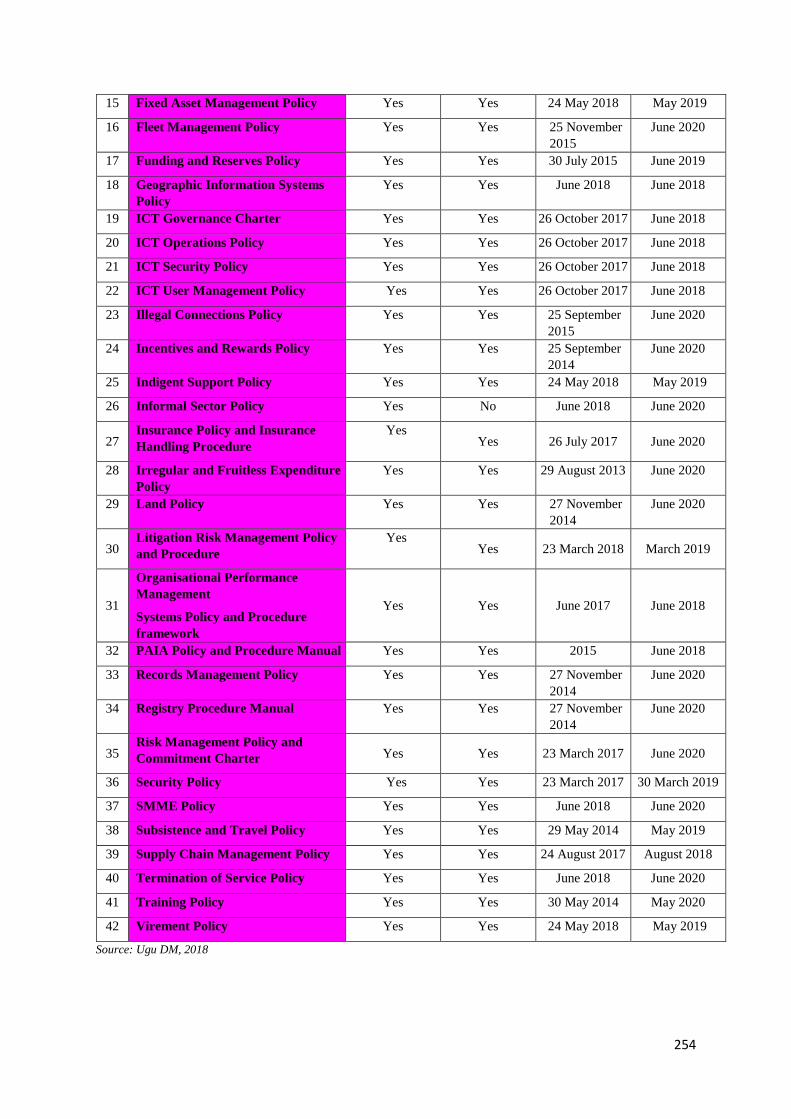
254
15 Fixed Asset Management Policy Yes Yes 24 May 2018 May 2019
16 Fleet Management Policy Yes Yes 25 November
2015
June 2020
17 Funding and Reserves Policy Yes Yes 30 July 2015 June 2019
18 Geographic Information Systems
Policy
Yes Yes June 2018 June 2018
19 ICT Governance Charter Yes Yes 26 October 2017 June 2018
20 ICT Operations Policy Yes Yes 26 October 2017 June 2018
21 ICT Security Policy Yes Yes 26 October 2017 June 2018
22 ICT User Management Policy Yes Yes 26 October 2017 June 2018
23 Illegal Connections Policy Yes Yes 25 September
2015
June 2020
24 Incentives and Rewards Policy Yes Yes 25 September
2014
June 2020
25 Indigent Support Policy Yes Yes 24 May 2018 May 2019
26 Informal Sector Policy Yes No June 2018 June 2020
27 Insurance Policy and Insurance
Handling Procedure
Yes Yes 26 July 2017 June 2020
28 Irregular and Fruitless Expenditure
Policy
Yes Yes 29 August 2013 June 2020
29 Land Policy Yes Yes 27 November
2014
June 2020
30 Litigation Risk Management Policy
and Procedure
Yes Yes 23 March 2018 March 2019
31
Organisational Performance
Management
Systems Policy and Procedure
framework
Yes Yes June 2017 June 2018
32 PAIA Policy and Procedure Manual Yes Yes 2015 June 2018
33 Records Management Policy Yes Yes 27 November
2014
June 2020
34 Registry Procedure Manual Yes Yes 27 November
2014
June 2020
35 Risk Management Policy and
Commitment Charter Yes Yes 23 March 2017 June 2020
36 Security Policy Yes Yes 23 March 2017 30 March 2019
37 SMME Policy Yes Yes June 2018 June 2020
38 Subsistence and Travel Policy Yes Yes 29 May 2014 May 2019
39 Supply Chain Management Policy Yes Yes 24 August 2017 August 2018
40 Termination of Service Policy Yes Yes June 2018 June 2020
41 Training Policy Yes Yes 30 May 2014 May 2020
42 Virement Policy Yes Yes 24 May 2018 May 2019
Source: Ugu DM, 2018
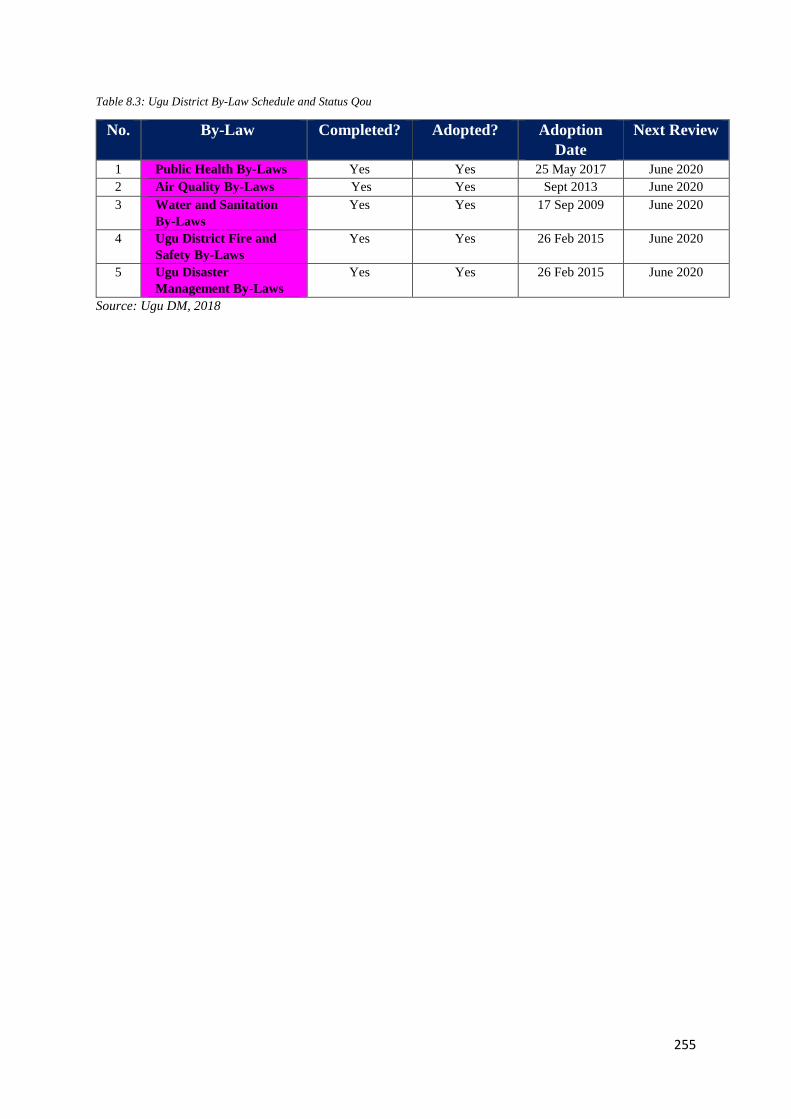
255
Table 8.3: Ugu District By-Law Schedule and Status Qou
No. By-Law Completed? Adopted? Adoption
Date
Next Review
1 Public Health By-Laws Yes Yes 25 May 2017 June 2020
2 Air Quality By-Laws Yes Yes Sept 2013 June 2020
3 Water and Sanitation
By-Laws
Yes Yes 17 Sep 2009 June 2020
4 Ugu District Fire and
Safety By-Laws
Yes Yes 26 Feb 2015 June 2020
5 Ugu Disaster
Management By-Laws
Yes Yes 26 Feb 2015 June 2020
Source: Ugu DM, 2018