report-2013-idp-en.pdf - ReliefWeb
44
-
Upload
khangminh22 -
Category
Documents
-
view
0 -
download
0
Transcript of report-2013-idp-en.pdf - ReliefWeb


The Border Consortium
November 2013
POVERTY, DISPLACEMENT AND LOCAL GOVERNANCE
IN SOUTH EAST BURMA / MYANMAR
With Field Assessments by:
Committee for Internally Displaced Karen People (CIDKP)Human Rights Foundation of Monland (HURFOM)
Karen Environment and Social Action Network (KESAN)Karen Human Rights Group (KHRG)
Karen Offi ce of Relief and Development (KORD)Karen Women Organisation (KWO)
Karenni Evergreen (KEG)Karenni Social Welfare and Development Centre (KSWDC)
Karenni National Women’s Organization (KNWO)Mon Relief and Development Committee (MRDC)
Shan State Development Foundation (SSDF)
The Border Consortium (TBC)12/5 Convent Road, Bangrak, Suite 307, 99-B Myay Nu Street, Sanchaung, Bangkok, Thailand. Yangon, Myanmar.E-mail: [email protected] E-mail: [email protected]
Front cover photos:KORD, Harvesting Paddy Fields, Hpapun, 2012CIDKP, Village Meeting, Thandaunggyi, 2012
CONTENTSEXECUTIVE SUMMARY ........................................................................................... 1
1. INTRODUCTION .................................................................................................. 3 1.1 Context .................................................................................................................................. 4 1.2 Methodology ......................................................................................................................... 6
2. POVERTY ............................................................................................................ 9 2.1 Physical Access ...................................................................................................................... 10 2.2 Shelter ................................................................................................................................... 11 2.3 Water Supply and Sanitation ................................................................................................ 12 2.4 Livelihoods and Food Security ............................................................................................. 13 2.5 Education .............................................................................................................................. 15 2.6 Health Care ........................................................................................................................... 16
3. DISPLACEMENT .................................................................................................. 17 3.1 Displacement......................................................................................................................... 18 3.2 Return and Resettlement ...................................................................................................... 19 3.3 Principles for Return and Reintegration .............................................................................. 20
4. LOCAL GOVERNANCE ......................................................................................... 21 4.1 Civilian Protection ................................................................................................................ 22 4.2 Village Leadership ................................................................................................................. 23 4.3 Natural Resource Management ............................................................................................ 24 4.4 Confl ict Transformation ....................................................................................................... 25
APPENDICES ............................................................................................................ 27 1. Surveyed Village List ............................................................................................................. 28 2. 2013 Survey Framework ....................................................................................................... 32 3. Acronyms and Place Names .................................................................................................. 38
FIGURES 1. Village Survey Reach, 2013 ................................................................................................... 7 2. Main Method of Travel ......................................................................................................... 10 3. Travel Time to Nearest Town ............................................................................................... 10 4. Primary Shelter Type ............................................................................................................ 11 5. Fly-proof Latrines per Capita ............................................................................................... 12 6. Access to Agricultural Land .................................................................................................. 13 7. Main Livelihood Sources ...................................................................................................... 13 8. Access to Agricultural Land .................................................................................................. 13 9. Shocks to Livelihoods ........................................................................................................... 14 10. Staple Food Stocks ................................................................................................................ 14 11. Access to Schools ................................................................................................................... 15 12. Schools, Students and Teachers ........................................................................................... 15 13. Access to Health facilities ..................................................................................................... 16 14. Health Services Provided During Past 12 Months ............................................................... 16 15. Internally Displaced Persons ................................................................................................ 18 16. Returnees .............................................................................................................................. 19 17. Dispute Mechanisms ............................................................................................................. 22 18. Leadership Elections ............................................................................................................. 23 19. Mechanisms for Land Tenure ............................................................................................... 24 20. Priority Needs ....................................................................................................................... 25

EXECUTIVE SUMMARYAs the pace of reform has slowed in Burma/Myanmar1 during 2013, the potential for an inclusive political dialogue process to address the causes of confl ict has increased. The sustainability of national reconciliation will require sensitivity to the concerns and aspirations of ethnic nationality communities in relation to identity, security and justice. This village-level survey describes the challenge of addressing chronic poverty, protracted displacement and weak governance at the community level in South East Myanmar as part of the confl ict transformation process.
The Border Consortium (TBC) collaborated with eleven civil society organisations to design and conduct this assessment in 209 villages spread across 22 townships, 4 states and 2 regions. As the government’s village lists provide an incomplete sampling frame in contested areas, fi eld staffs were advised to select one signifi cant village per village tract. Almost half of the villages surveyed are administered to some degree by non-state armed groups and only 6% have been included in similar processes recently facilitated by UN agencies or other non-government organisations.
Decades of military rule, confl ict and abuse have left rural communities impoverished, lacking basic infrastructure, struggling to cope with shocks to livelihoods and with limited access to social services. The vast majority of villagers are subsistence farmers with insuffi cient access to agricultural land to meet the threshold for self-reliance. While the ceasefi re agreements have enabled greater access for farmers to fi elds and markets, the accompanying infl ux of mining, logging and commercial agriculture companies has exacerbated land grabbing and inequalities. Similarly, while accesses to health and education services are priority needs, there are concerns that the expansion of government services into ethnic areas could be a new form of assimilation and control.
As this year’s survey focused on village profi les across less townships than previously covered, it has not been possible to update last year’s estimate of 400,000 internally displaced persons in rural areas of South East Myanmar. However, new displacement is increasingly caused by natural disasters, such as the fl oods in central Karen State which displaced over 33,000 people in July, and abuses associated with resource extraction rather than armed confl ict.
The scale of return to former villages or resettlement nearby remains limited, with displaced persons consistently reporting that they are waiting for at least some withdrawal or disentanglement of troops fi rst. There is general agreement that conditions are not yet conducive for sustainable and organised return, but that it is time for displaced persons, communities in areas of potential return and indeed all stakeholders to start preparing. However, the construction of sub-township development sites and proposals for pilot return processes have raised concerns that international principles may be neglected.
Local governance mechanisms are primarily dependent on village leaders, who this survey indicates are largely accountable to local households and are the main mechanism for resolving disputes and managing community affairs. Non-state armed groups provide some support in terms of information about security and protection issues, but the fi ndings suggest a widespread lack of trust and confi dence in Myanmar’s township authorities and police force. This will be a signifi cant obstacle to strengthening community-based natural resource management and access to justice in rural areas. Integrating institutional systems between the government and non-state armed groups will be vital to harnessing capacity and reducing the burden for village leaders.
For international aid agencies, the challenge in this process of confl ict transformation is to shift away from responding to basic needs and focus more on being sensitive to protection concerns. This is particularly true given that the legitimacy of the state remains in dispute and so traditional development objectives such as expanding humanitarian access and strengthening government capacities may be counter-productive to building confi dence amongst local communities in the peace process. There is chronic vulnerability spread across all sectors and townships in the South East, but there are also incredibly resilient communities. It is vital that aid agencies seek to support social capital during the peace process, or at least ensure that ill-conceived plans do not undermine local coping strategies.
1 ‘Burma’ and ‘Myanmar’ are used interchangeably in this report, as are the corresponding place names and boundaries for states, regions and townships. No endorsement is intended either way.
1THE BORDER CONSORTIUM

“There has been armed fi ghting in Myanmar since just months after independence from the United Kingdom in 1948. It is the longest running set of armed confl icts anywhere in the world…
The remaining confl icts all have an ethnic character and are rooted in long-standing ethnic grievances and aspirations. And in Myanmar there is not just one non-state armed group but more than a dozen. Please imagine the complexities of any peace process then multiply it by twelve. There are issues of autonomy and self-determination, of power-sharing and resource-sharing, of cultural rights and language policy, of protection against discrimination and security sector reform…
I believe (we) will turn a corner soon. Very possibly, over the coming weeks, we will have a nation-wide ceasefi re and the guns will go silent everywhere in Myanmar for the very fi rst time in over sixty years. This will be a watershed worth celebrating. But it will also be only the fi rst step towards the just and lasting peace we will need to achieve. Diffi cult tasks will follow and hard compromises will need to be made. But it must be done.
And (for) our peace process to be successful, it must be connected to the emergence of a more inclusive national identity. Myanmar people of all ethnic backgrounds and all faiths – Buddhist, Christian, Muslim, Hindu and others – must feel part of this new national identity. We are a multi-cultural, multi-faith nation.
”President Thein Sein,
Chatham House, London, 15 July 2013
2 POVERTY, DISPLACEMENT AND LOCAL GOVERNANCE IN SOUTH EAST BURMA / MYANMAR


1.1 CONTEXT“We are happy and welcome the ceasefi re agreement and want them to continue developing genuine peace. If there is peace, we can live quietly and will not need to worry for our security”.
Kayah Man, Demawso Township, June 2013, KSWDC Interview
The characteristics of ethnic confl ict in Burma/Myanmar refl ect subnational confl icts throughout Asia since World War Two. Under the guise of decolonisation and state-building, political authority over a variety of culturally distinct nationalities has been consolidated in the hands of the urban elite within the dominant ethnic group. Centralised and discriminatory governance, cultural assimilation, and the occupation of ancestral lands have all contributed to perceptions of injustice and a prolonged assault on ethnic minority identities. Armed resistance to the state’s authority has been suppressed by counter-insurgency warfare targeting civilians which exacerbated fears and suspicions. The legitimacy of the state remains a central issue of dispute.2
Notable opportunities for reconciliation and nation-building have been missed at independence in 1948, after the restoration of civilian rule in 1960, during the nation-wide ‘peace parley’ in 1963-64 and during the democracy uprising of 1988. Indeed, the marginalisation of different political and ethnic interests is arguably the nation’s most fundamental failure given that ethnic minorities constitute at least a third of the population. So while the international community’s optimism in creating momentum for change is commendable, the caution of civil society in regards to the current reform process is also understandable.3
The current transition period in Burma/Myanmar provides an opportunity to learn from the lessons of missed opportunities and strive for a transparent and inclusive process of national reconciliation to address the legacy of confl ict and injustice. Rather than avoiding discussion of sensitive issues, the fears and hopes of confl ict-affected communities need to be acknowledged and embraced. Building confi dence and transforming institutions to address concerns relating to identity, security and justice will be keys to the sustainability of the peace process.
Despite a constitution drafted by military appointees and an election widely considered as neither free nor fair, the fi rst half of President Thein Sein’s term has been characterised by liberal reforms. The broadening of political space, release of a signifi cant number of political prisoners and a courageous civil society have encouraged public debate, even though new legislation on issues such as land rights and media freedom has included many restrictive measures. Concerns remain about the Tatmadaw’s continuing political role but there has been legislative reform to devolve authority to state and regional governments and a parliamentary committee formed to review the constitution while public forums discussing federalism are more common.
The government and the non-state armed groups have negotiated 13 ceasefi re agreements which have signifi cantly decreased hostilities. Armed confl ict escalated in Kachin State at the end of 2012, but there has been a signifi cant decrease since dialogue between the Kachin Independence Organisation (KIO) and the government’s Union-level Peacemaking Work Committee (UWPC) resumed in February even if a formal ceasefi re agreement has not been signed. Sporadic skirmishes continue in other areas too, most notably northern and central Shan State, while the ceasefi res have generally coincided with an increase in the deployment of Tatmadaw troops and supplies into contested areas. However, roving counter-insurgency patrols and restrictions on movement have decreased which has enhanced civilian access to fi elds and markets.
The rule of law is compromised throughout Myanmar, but access to justice is particularly problematic in confl ict-affected areas. The absence of independent ceasefi re monitoring and verifi cation mechanisms means the lack of protection for civilians from human rights abuse in contested areas of South East Myanmar continues. While humanitarian access is largely dependent on organisational relations with state-level authorities, there have generally been slight improvements in obtaining authorisation to travel. International staff still require accompaniment in confl ict-affected areas. However, given protracted
2 Parks, Colletta & Oppenheim, 2013, “The Contested Corners of Asia: Subnational Confl ict and International Development Assistance”, The Asia Foundation, Bangkok, pages 1-2, www.asiafoundation.org/confl ictstudy
3 Transnational Institute & Burma Centre Netherlands, Oct. 2013, “Burma’s Ethnic Challenge: From Aspirations to Solutions”, page 3-4, www.tni.org/work-area/burma-project
4 POVERTY, DISPLACEMENT AND LOCAL GOVERNANCE IN SOUTH EAST BURMA / MYANMAR

resistance to “Burmanisation” and the expansion of state control, social services responding to humanitarian needs appear likely to remain limited until protection concerns relating to security and justice are substantively addressed.
Negotiations are ongoing between the government and non-state armed groups about the framework for political dialogue to address these root causes of confl ict. The government and some of the ethnic leaders are hoping a nation-wide ceasefi re to signal the start of political dialogue could be announced before the end of 2013. This framework envisions consultations and negotiations about thematic and constitutional issues feeding into a Panglong-like conference so a set of guiding principles for a national accord could be announced prior to the end of this parliament’s term in 2015. No one is suggesting that decades of confl ict could be resolved in a matter of months, but there is an urgency to seize the opportunity and establish some transitional arrangements so that the peace process can continue and deepen beyond the 2015 elections.
Other ethnic leaders have expressed concerns that the bilateral ceasefi re agreements have not yet been implemented so it is premature to move on to a national ceasefi re. Similarly, there are fears that the proposed framework legitimises the current constitution and military involvement in parliament which are perceived as two key impediments to confl ict transformation. The views of Tatmadaw leaders about the proposed political dialogue process remain unclear, which fuels speculation that a nation-wide ceasefi re announcement could be interpreted as a signal to international investors that Myanmar’s resource-rich borderlands are open for business. In a transitional and unregulated environment, investments could induce another round of grievances and derail the peace process.
This climate of political uncertainty raises hopes and anxieties for displaced and confl ict-affected communities in South East Myanmar and presents a conundrum for humanitarian agencies. 128,000 refugees are currently in camps in Thailand while an estimated 400,000 internally displaced persons are spread across the rural areas of South East Myanmar. Spontaneous return to former villages or resettlement nearby has been limited to date amongst both refugee and internally displaced communities. So the challenge for humanitarian agencies is to support displaced persons and local communities to prepare for the potential return and reintegration processes, without promoting premature and unsustainable movements.4
Previous experience along the Thailand border in regards to ceasefi res and refugee return processes has been riddled with obstacles which have hindered sustainable reintegration. The coerced return of Mon refugees during 1995 into resettlement sites in ceasefi re areas left people stranded and isolated without access to protection, livelihoods or social services. Karenni refugees returned prematurely in the same year before fl eeing again within months when the ceasefi re broke down due to Tatmadaw troop deployments and militarisation. The Wa ceasefi re and relocation programme from 1999-2001 contributed to the displacement of Shan civilians who were subsequently denied access to asylum in Thailand. Even a comprehensive contingency planning process for the voluntary return of Karen refugees in 2004 ended up being shelved after Khin Nyunt was arrested and the ‘gentleman’s agreement’ collapsed.
One of the fundamental lessons learnt from these experiences is that supporting the recovery of confl ict-affected communities is interdependent with creating the conditions which will support sustainable, voluntary and dignifi ed return and reintegration of displaced communities. A holistic approach is required to promote protection and solutions ensuring physical safety, including protection from armed confl ict and landmines; legal security, including access to justice and citizenship; and material security, including access to land and humanitarian assistance. This is a huge challenge given that previous surveys suggest that 59% of households in rural areas of South East Myanmar are impoverished and that human rights abuses have been widespread.5
4 The Border Consortium, “Programme Report: January - June 2013”, www.theborderconsortium.org5 The Border Consortium, Oct 2012, “Changing Realities, Poverty and Displacement in South East Burma/Myanmar”
5THE BORDER CONSORTIUM

1.2 METHODOLOGY“The population in our village area is already dense and there’s no land available for livelihoods. Of course refugees want to come back to their original villages. But there will be water shortages and insuffi cient land for them to cultivate after they return”.
Kayah Man, Demawso Township, June 2013, KSWDC Interview
TBC collaborates with civil society organisations to document conditions in rural areas of South East Myanmar. Annual reports since 2002 have estimated the scale, distribution and characteristics of displacement through interviews with key informants across more than 35 townships and situation updates refl ecting observations from the fi eld. The 2012 report also documented results from poverty assessments conducted with over 4,000 households across 21 townships. This provided standard baseline indicators for vulnerability in rural areas of South East Myanmar which had not previously been disaggregated beyond the state and regional level to the township level and released publicly.6
This year’s survey seeks to supplement TBC’s previous household survey by disaggregating data to the sub-township level and supporting the broader humanitarian community’s efforts to document village profi les in confl ict affected areas. This village-level assessment of poverty, displacement and governance was designed in collaboration with 11 civil society organisations during March and April. Consultation with OCHA, UNICEF and an NGO consortium led by Mercy Corps helped to standardise some of the indicators to facilitate comparison with other village-level assessments recently conducted in the South East across a range of sectors.
The survey design complemented quantitative questionnaires with video documentation of personal testimonies about basic living conditions, the impacts of ceasefi re agreements, protection concerns and perceptions about the potential return of displaced persons. Video documentation of perspectives from local villagers was compiled primarily for distribution to refugees as an information sharing mechanism in local languages, but has also been utilised to interpret results from the questionnaires. TBC staff facilitated orientation and training sessions with fi eld staff from the participating civil society organisations during April and May to introduce the survey tools, GPS units, facilitation skills for focus group discussions, interview skills and video techniques.
There was an incomplete sampling frame for selecting villages as the government’s village lists have limited reach in contested areas and the non-state armed groups are reluctant to identify and potentially incriminate villages under the administration of so-called ‘rebels’. Survey teams were asked to travel to as many village tracts as possible across at least 20 townships, and to survey one signifi cant village per village tract. Villages were supposed to have at least 50 households in lowland areas and at least 20 households in upland areas to be surveyed. A list of villages recently surveyed by UNICEF and the NGO consortium led by Mercy Corps was distributed to avoid duplication, unless the villages were particularly signifi cant.
Civil society organisations conducted focus group discussions in 209 villages during June and July.7 These villages are spread across 155 village tracts as demarcated by the government, which represents 24% of all village tracts in the 22 townships surveyed. 42% of the villages surveyed are in upland areas and 38% include internally displaced persons, while Figure 1 overlays villages onto an indicative map of political infl uence and suggests a comparable proportion of villages surveyed are administered to some degree by non-state armed groups. 40% of villages surveyed are from Karen State, 21% from Karenni/Kayah State and 19% from Tanintharyi Region while only 20% are from Shan State, Bago Region and Mon State combined. Only 13 villages (6%) had also been surveyed by either UNICEF or Mercy Corps during 2013, with 12 of these villages located in Karenni/Kayah State.
Focus groups consisted of a combined total of 2,959 informants, of whom 34% were female. 53% of focus group participants were ordinary villagers while 25% were either village or village tract leaders, 17% were social service providers or religious leaders, 4% were affi liated with non-state armed groups and 1% were affi liated with local government. The combined population of villages surveyed amounted to over 121,000 people, with an average village size of 583 people and the average household size at 5.5 people.
6 TBC, 2012, “Changing Realities, Poverty and Displacement in South East Burma/Myanmar”7 See Appendix 1 for a complete list of villages surveyed.
6 POVERTY, DISPLACEMENT AND LOCAL GOVERNANCE IN SOUTH EAST BURMA / MYANMAR

Figure 1: Village Survey Reach, 2013
M Y A N M A R
T H A I L A N D
L A O S
Surveyed Villages by Population
7THE BORDER CONSORTIUM

The survey was translated into local languages and responses were recorded onto hard copies of the questionnaire in the fi eld. A customised on-line database was developed using Survey Monkey for the participating civil society organisations to enter data upon the return of their respective fi eld staff to administrative offi ces. The merged data was then processed and analysed by TBC staff and the draft fi ndings reviewed by civil society organisations in a joint meeting before the narrative assessment was fi nalised.
The longitude and latitude of every surveyed village was recorded using GPS receivers to enable the issuance of Place-Codes (P-Codes) by the Myanmar Information Management Unit (MIMU) to villages that were not previously recognised by government and international agencies. The geographic references will potentially also facilitate cross-referencing between village profi les compiled by other agencies during 2013. TBC has approached MIMU about providing a common interactive mapping platform to compare results from these complementary initiatives. It is hoped that this will provide an enhanced mechanism for ensuring assessments from individual villages are not lost in aggregated overviews.
Analysis has not yet been validated against fi ndings documented by other agencies in the South East. UNICEF’s survey was conducted in 131 villages in Tanintharyi Region and Kayin State during March 2013.8 Mercy Corps led a consortium of NGOs including ACF, AVSI, CARE and the Metta Development Foundation to facilitate a Socio-economic analysis in Karenni/Kayah State which incorporated 111 quantitative and 53 qualitative village-level assessments during April and May 2013.9 UNHCR have summarised 702 village profi les conducted between 2008 and 2012 in Tanintharyi Region, Mon and Karen States.10 While efforts were made to standardise the surveys conducted in 2013, methodological differences may limit the signifi cance of comparative analysis.
The main limitation for this survey is the lack of a comprehensive village list across contested areas to frame the sampling method. This was compounded by the lack of a common understanding about the demarcation of village tracts and sub-townships. Villagers and civil society organisations are often more familiar with territory as demarcated by non-state armed groups than by the central government. As a result, the determination of which village is most signifi cant in a village tract is problematic and in some cases more than one village was surveyed per village tract.
The decision to focus efforts on collecting more information at the village level has also resulted in a reduction of the number of townships surveyed. As a result, TBC and partners are no longer able to present overall estimates for the scale and distribution of internal displacement in South East Myanmar. For over 10 years, TBC and partners have updated these estimates on an annual basis by interviewing key informants in over 35 townships. As this year’s survey only covers signifi cant villages in 24% of the village tracts across 22 townships, this is no longer possible.
It should also be noted that village-level assessments are generally used for rapid assessments and are less conducive to gender analysis than household surveys. This shortcoming was exacerbated in approximately 10% of the village surveys conducted where fi eld staff lacked experienced facilitating focus group discussions. The fi ndings documented in this report thus need to be considered as supplementary to the household poverty survey published in 2012.
8 UNICEF, June 2013, Initial Rapid Assessment of Selected IDP Settlements in Kayin and Tanintharyi, Myanmar, DRAFT9 Mercy Corps, forthcoming, Kayah State Socio-Economic Analysis 10 UNHCR, September 2013, South East Myanmar: A Report on Village Profi les 2008-2012
8 POVERTY, DISPLACEMENT AND LOCAL GOVERNANCE IN SOUTH EAST BURMA / MYANMAR


2.1 PHYSICAL ACCESS“After the ceasefi re agreement, authorities came to our village and issued ID cards so it is more convenient for us to go to town. Even without ID cards, the checks have stopped”.
Mon Man, Ye Township, June 2013, MRDC Interview
Decades of armed confl ict and government neglect have resulted in a network of dirt tracks and single lane roads which has inhibited both rural development and the deployment of Tatmadaw troops into ethnic territory. However the preliminary ceasefi res, government reforms and proposed regional economic integration have increased interests in upgrading roads and infrastructure to facilitate trans-border trade corridors and investment in resource extraction and other industries. This could potentially foster connectivity and strengthen local livelihoods, but improved physical access in an unregulated environment could also exacerbate land grabbing and aggravate inequalities to the detriment of subsistence farmers.11
The majority of villages surveyed primarily access the nearest towns and markets by motorbike and/or on foot. Figure 2 illustrates how the lack of infrastructure is particularly prominent in the upland areas of northern Karen and Karenni/Kayah States where access is generally limited to travel by foot. The reach and affordability of Chinese-manufactured motorbikes in rural communities is noticeable in low land areas. Only 5% of villages reported car or truck as the main mode of transport, which is indicative of the poor state of rural roads even in the dry season. Boats were also identifi ed as key for transportation by 5% of villages, which highlights the importance of rivers for access to markets and livelihoods.
28% of villages reported being more than 3 hours away from the nearest town by the main mode of transportation, as illustrated in fi gure 3. The imposition of curfews and restrictions on overnight travel has been a key constraint on accessing markets throughout the protracted confl ict. However, one of the primary benefi ts of the ceasefi re agreements has been greater freedom of movement for civilians.
Figure 3: Travel Time to Nearest Town
11 Transnational Institute & Burma Centre Netherlands, February 2013, “Developing Disparity: Regional Investment in Burma’s Borderlands”, www.tni.org/work-area/burma-project
Figure 2: Main Method of Travel
Kyaikmayaw
NayPyiTaw
Yebyu
BAGOREGION
KAYAHSTATE
KAYINSTATE
MONSTATE
SHANSTATE
TANINTHARYIREGION
YANGONREGION
NAYPYITAW
Mongpan Mongton
Loikaw
ShadawDemoso
Hpruso
BawlakheThandaunggyi
Pasaung
Kyaukkyi
Hpapun
Nyaunglebin Shwegyin
Hlaingbwe
HpaAn
Myawaddy
Kawkareik
KyainSeikgyi
Ye
Dawei
Palaw
Tanintharyi
Kyaikhto
Mese
ThreePagodasPass
Yangon
T h a i l a n d
M y a n m a r
Primary Method Used for Travel to Nearby Towns
0%
10%
20%
30%
40%
50%
< 1 Hour
1 to 3 hours
4 to 8 hours
9 hours to 1 day
1 to 2 days
3 days or more
28%
45%
13%
8% 6%1%
% v
illa
ges
Time to nearest town (by main mode of travel)
10 POVERTY, DISPLACEMENT AND LOCAL GOVERNANCE IN SOUTH EAST BURMA / MYANMAR

2.2 SHELTER“If refugees want to return and live here, I will be happy to offer shelter. But on the other hand, the peace process is not stable yet, so I want them to stay there in the camps. I don’t want to say ‘come back’ and I also don’t want to say ‘stay there’”.
Karen Monk, Hpapun Township, May 2013, KESAN/KHRG Interview
Government statistics suggest that 32% of poor households nation-wide have adequate shelter,12 while TBC’s household survey in rural areas of South East Myanmar documented only 20%.13 This likely refl ects the habits of insecure and displaced households in confl ict affected areas to construct two or three temporary shelters rather than one durable house as a coping strategy for dealing with military offensives.
Given protracted conflict and displacement, targeting construction assistance without reinforcing political allegiances is particularly challenging in the shelter and settlement sector. The risk of building materials inducing land confi scation and coerced population movements is especially relevant to the construction of private dwellings as distinct from schools, health clinics and community centres.
Figure 4 represents the primary type of shelter documented by TBC partners in 2013. Households were mainly living in bamboo structures in 57% of villages surveyed, and the prominence of these temporary shelters was widespread across the borderlands. Shelters appear more durable in 33% of the villages profi led where the majority of households were living in wooden frame structures.
There is generally a positive correlation between the durability of housing and the likelihood of having access to electricity. 74% of villages surveyed reported no access to power while the majority of residents in 21% of the villages had access to electricity for less than 4 hours a day.
However, this survey suggests that private generators are the main source of electricity and that just 4% of rural villages in South East Myanmar have access to the national electricity grid. This is a particularly sensitive issue in Karenni/Kayah State, where the Lawpita hydro-electricity station has been providing electricity for the national grid for half a century and yet local villages remain dependent on candlelight. It has also been a contentious issue in Mon communities since the 1995 ceasefire and refugee return was triggered by investment interests to export gas from the Andaman Sea to Thailand.
12 IHLCA, 2011, Integrated Household Living Conditions Survey in Myanmar (2009-10): Poverty Profi le, Ministry of National Planning and Economic Development, UNDP and UNICEF, Yangon, page 62
13 TBC, 2012, “Changing Realities, Poverty and Displacement in South East Burma/Myanmar”, page 42
Figure 4: Primary Shelter Type
Yebyu
BAGOREGION
KAYAHSTATE
KAYINSTATE
MONSTATE
SHANSTATE
TANINTHARYIREGION
YANGONREGION
NAYPYITAW
Mongpan Mongton
Loikaw
ShadawDemoso
Hpruso
Bawlakhe
Thandaunggyi
Pasaung
Kyaukkyi
Hpapun
Nyaunglebin Shwegyin
Hlaingbwe
HpaAn
Myawaddy
Kawkareik
KyainSeikgyi
Ye
Dawei
Palaw
Tanintharyi
Kyaikhto
Mese
ThreePagodasPass
Yangon
T h a i l a n d
M y a n m a r
Primary Shelter Type by Village
11THE BORDER CONSORTIUM

2.3 WATER SUPPLY AND SANITATION“We access a water source up the mountain, but our pipes are plastic and are easily destroyed by forest fi res or animals. Water shortages are also more regular now that trees are almost gone”.
Kayan Woman, MeSe Township, June 2013, KSWDC Interview
A high prevalence of water-borne disease such as cholera and typhoid as well as other ailments such as diarrhoea is generally related to limitations in accessing clean water, sanitary latrines and waste disposal systems. Household surveys in rural areas of South East Myanmar have previously indicated that just 27% of families’ access protected water sources, while only 51% utilise a wet surface or fl y proof latrine.14
This village-level survey found similar results with the majority of households in 65% of villages reportedly accessing unprotected water sources such as hand-dug wells, rivers and unfenced springs. However, natural springs and streams in upland areas may be relatively unpolluted at the moment. The majority of households in 28% of villages were found to be accessing protected water sources such as tube wells, rain water tanks or piped water.
Household water treatment practices will become increasingly important as pollution from mining and logging concessions expand into contested areas. 43% of villages reported that boiling water is currently the primary method for treating water and that 26% depend on a cloth fi lter to remove sediment. Spatial analysis suggests that upland villages are generally more likely to boil water whereas lowland villages may tend to use cloth fi lters or not treat water prior to drinking at all.
In terms of sanitation, Figure 5 illustrates 27% of villages surveyed do not have any fl y-proof latrines while a further 29% of villages have on average more than 20 people competing to use one sanitary latrine. Defecation in fi elds and forests is common practice, and this refl ects poor waste disposal practices more generally. Only 2% of villages surveyed reported using a common dump for discarding material rubbish.
The fi ndings highlight the importance of public health awareness campaigns to promote hygiene standards. Champions of behavioural change need to come from within the ethnic communities. The relatively high prevalence of boiling water as a practice in contested upland areas suggests that health workers affi liated with the ethnic armed groups are key agencies to lead this type of public education.
14 TBC, 2012, “Changing Realities, Poverty and Displacement in South East Burma/Myanmar”, pages 41-42
Yebyu
BAGOREGION
KAYAHSTATE
KAYINSTATE
MONSTATE
SHANSTATE
TANINTHARYIREGION
YANGONREGION
NAYPYITAW
Mongpan Mongton
Loikaw
ShadawDemoso
Hpruso
Bawlakhe
Thandaunggyi
Pasaung
Kyaukkyi
Hpapun
Nyaunglebin Shwegyin
Hlaingbwe
HpaAn
Myawaddy
Kawkareik
KyainSeikgyi
Ye
Dawei
Palaw
Tanintharyi
Kyaikhto
Mese
ThreePagodasPass
Yangon
T h a i l a n d
M y a n m a r
Number of People PerFly-Proof Latrine by Village
Figure 5: Fly-proof Latrines per Capita
12 POVERTY, DISPLACEMENT AND LOCAL GOVERNANCE IN SOUTH EAST BURMA / MYANMAR

2.4 LIVELIHOODS AND FOOD SECURITY“We are concerned about agricultural and mining companies coming into our area. If they come, it is sure that our lands will be grabbed and our livelihoods will become very diffi cult”.
Karen Woman, Tanintharyi Township, June 2013, CIDKP Interview
Rural livelihoods in South East Myanmar are characterised by subsistence agriculture, low levels of market integration and exploitative relations between local authorities and farmers or labourers. Preliminary ceasefi re agreements have led to a decrease in confl ict and roving patrols which has enhanced access to fi elds. However trust-building has not extended to the withdrawal of troops or demarcation of landmines in contested areas. TBC’s surveys have previously indicated that 59% of households are impoverished while a comparable proportion has recorded inadequate food security.15
This village-level assessment identifi ed farming crops and livestock as the main sources of livelihoods in the South East, as documented in Figure 7. Low levels of agricultural productivity are related to a lack of capital assets and irrigation which induces dependence on manual labour, simple hoes and machetes to prepare fi elds for shifting cultivation. However, this is only sustainable if there is enough land to allow the rotation of fi elds over a 4-7 year period so that secondary vegetation can regenerate soil nutrition during the fallow years.
Figure 7: Main Livelihood Sources
At least 2 acres of agricultural land is considered necessary for low land farmers to cultivate enough rice for subsistence needs each year.16 However, this survey found that less than 30% of households meet this threshold for self-reliance, and that is without taking into the account the needs of shifting cultivators for fallow land. Access to land is particularly constrained in Hpapun Township due to the influx of displaced persons from surrounding townships.
Figure 8: Access to Agricultural Land
15 TBC, 2012, “Changing Realities, Poverty and Displacement in South East Burma/Myanmar”, pages 19, 54-5516 WFP, 2011, Food Security Assessment in Northern Rakhine State, Myanmar, page 7; WFP, 2011, Food Security Assessment in
Dry Zone, Myanmar, page 6
Yebyu
BAGOREGION
KAYAHSTATE
KAYINSTATE
MONSTATE
SHANSTATE
TANINTHARYIREGION
YANGONREGION
NAYPYITAW
Mongpan Mongton
Loikaw
ShadawDemoso
Hpruso
Bawlakhe
Thandaunggyi
Pasaung
Kyaukkyi
Hpapun
Nyaunglebin Shwegyin
Hlaingbwe
HpaAn
Myawaddy
Kawkareik
KyainSeikgyi
Ye
Dawei
Palaw
Tanintharyi
Kyaikhto
Mese
ThreePagodasPass
Yangon
T h a i l a n d
M y a n m a r
Access to Agricultural Land by Village
Figure 6: Access to Agricultural Land
0% 20% 40% 60% 80%
Farming Crops
Farming Livestock
Trade
Casual labour
Mining / Logging
Fishing / Hun ng
25%
11%
9%
8%
7%
% Villages
73%
0% 5% 10% 15% 20% 25% 30%
No land
< 2 acres
2 to 5 acres
> 5 acres
7%
13%
25%
16%
8%
8%
15%
10%
% villages
About half of households
Majority of households
13THE BORDER CONSORTIUM

Over 70% of villages surveyed identifi ed natural hazards such as fl oods or unseasonal rains and rats or pests as a signifi cant constraint on livelihoods during the previous 12 months. Figure 9 illustrates the geographic distribution of the main shock for each village, with the impact of landmines in Hpapun of particular concern. It should also be noted that there is a positive correlation between infestations of rats and pests with farmers hiding from military patrols as well as more intensive agriculture induced by population density and increased competition for land.
Local capacities to deal with these shocks determine the sustainability of livelihoods. As this survey was conducted during June and July and the wet season rice crop is harvested around November, subsistence farmers needed about 4 months of rice stocks in order to be self-reliant. Figure 10 suggests that less than 20% of households have suffi cient staple food stocks to survive until the harvest without buying, borrowing or bartering for additional rice. This is not necessarily an impediment for the minority whose livelihoods are based around trade, daily labour, mining or logging. However, seasonal shocks remain a signifi cant threat for subsistence farmers who have very little disposable income to buy additional food supplies.
Figure 10: Staple Food Stocks
Buying cheaper, poorer quality food and borrowing have previously been identifi ed as the main coping strategies for dealing with shocks to livelihoods.17 However, the importance of social capital for the sustainability of livelihoods is highlighted by 88% of villages in this survey identifying family or friends as the primary source of credit. This refl ects the resilience of conflict-affected communities and reluctance to access commercial money lenders, micro-credit associations and fi nancial institutions.
17 TBC, 2012, “Changing Realities, Poverty and Displacement in South East Burma/Myanmar, page 58
Figure 9: Shocks to Livelihoods
Yebyu
BAGOREGION
KAYAHSTATE
KAYINSTATE
MONSTATE
SHANSTATE
TANINTHARYIREGION
YANGONREGION
NAYPYITAW
Mongpan Mongton
Loikaw
ShadawDemoso
Hpruso
Bawlakhe
Thandaunggyi
Pasaung
Kyaukkyi
Hpapun
Nyaunglebin Shwegyin
Hlaingbwe
HpaAn
Myawaddy
Kawkareik
KyainSeikgyi
Ye
Dawei
Palaw
Tanintharyi
Kyaikhto
Mese
ThreePagodasPass
Yangon
T h a i l a n d
M y a n m a r
Main Shock to Livelihood in the Past Year by Village
0% 5% 10% 15% 20% 25%
Less than 1 week
1 to 4 weeks
1 to 4 months
More than 4 months
10%
6%
16%
16%
16%
6%
23%
12%
% villages
half of households
most households
14 POVERTY, DISPLACEMENT AND LOCAL GOVERNANCE IN SOUTH EAST BURMA / MYANMAR

2.5 EDUCATION“We have a school built and run by our villagers. We sent an offi cial letter to the township authorities requesting materials and to send teachers. They said that they are arranging this but we don’t see anything. And no teachers have come”.
Karen Man, Tanintharyi Township, June 2013, CIDKP Interview
The links between education, poverty reduction, empowering girls and human development are widely recognised. However, household surveys have suggested that a third of children between 5 and 12 years of age in rural areas of South East Myanmar are regularly missing school.18 Decades of neglect have left Myanmar’s education system in peril and students without basic literacy and numeracy skills. Meanwhile, the respective ethnic education systems are caught between promoting distinct cultural and linguistic identities and integrating curricula with the Union structure.
In the villages surveyed, 61% had schools which were mainly utilising the government curriculum. However, in many cases local villages are left to cover most of costs for these schools, including the teachers’ housing and board. 13% had schools primarily administered by ethnic education systems, 15% had schools integrating both curricula and 5% had non-formal or monastic schools. Figure 11 illustrates the prominence of Karen Education Department affi liated schools in northern Karen State and a high proportion of schools offering both the government and Mon National curricula in southern Mon State. These two ethnic education systems support over 1,300 schools between them.19
Figure 12: Schools, Students and Teachers
# villages
Type of school#
students#
teachersTeacher/
student ratio
72 Pre-School/Nursery 2,299 156 1 : 15
161 Primary (KG-Gr. 4) 14,434 553 1 : 26
44 Middle School (Gr. 5-8) 9,902 372 1 : 27
5 High School (Gr. 9-10) 946 45 1 : 21
13 No school 0 0 n/a
282 Total 27,581 1,126 1 : 24
6% of surveyed villages did not offer any type of schooling. Accessibility is more of a problem for students continuing beyond primary school, with almost a third of students reportedly moving into boarding houses to attend middle school. That fi gure increases to over 60% of students if they continue on to high school. Apart from distance, other signifi cant reasons for children not attending school include requirements to conduct domestic chores, a lack of interest and inability to pay school fees.
63% of villages reported that the majority of teachers can speak local languages. This is likely to become an increasingly sensitive issue as more teachers are deployed from central Myanmar to facilitate the expansion of the government’s school system.
18 TBC, 2012, “Changing Realities, Poverty and Displacement in South East Burma/Myanmar”, page 4419 See http://ktwg.org/schoolinfo.htm and http://monedu.org/schools.html
Figure 11: Access to Schools
Yebyu
BAGOREGION
KAYAHSTATE
KAYINSTATE
MONSTATE
SHANSTATE
TANINTHARYIREGION
YANGONREGION
NAYPYITAW
Mongpan Mongton
Loikaw
ShadawDemoso
Hpruso
Bawlakhe
Thandaunggyi
Pasaung
Kyaukkyi
Hpapun
Nyaunglebin Shwegyin
Hlaingbwe
HpaAn
Myawaddy
Kawkareik
KyainSeikgyi
Ye
Dawei
Palaw
Tanintharyi
Kyaikhto
Mese
ThreePagodasPass
Yangon
T h a i l a n d
M y a n m a r
Main School Type & Curriculum Available in Village
15THE BORDER CONSORTIUM
2.6 HEALTH CARE“Our village tract has a midwife and a nurse. They are responsible for all the villages in this tract. When we need them, we go and call them. They provide treatment if they can, and if not then we go to the nearest town”.
Karen Man, Tanintharyi Township, June 2013, CIDKP Interview
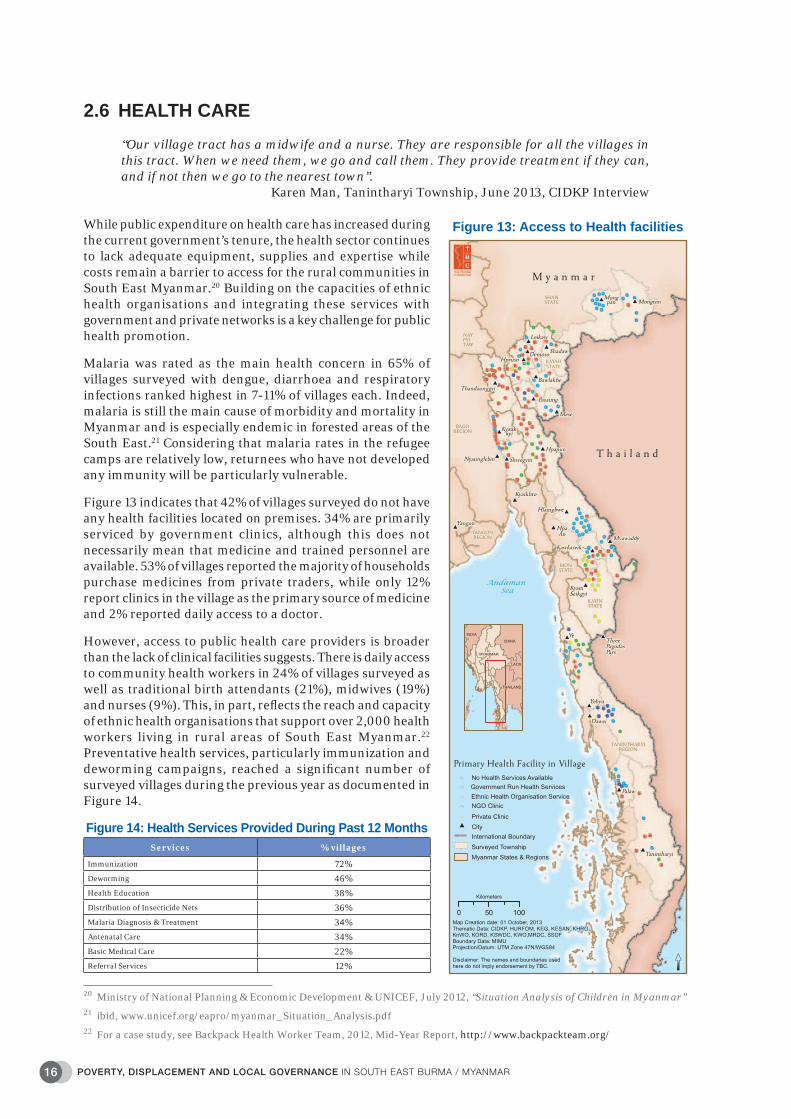
While public expenditure on health care has increased during the current government’s tenure, the health sector continues to lack adequate equipment, supplies and expertise while costs remain a barrier to access for the rural communities in South East Myanmar.20 Building on the capacities of ethnic health organisations and integrating these services with government and private networks is a key challenge for public health promotion.
Malaria was rated as the main health concern in 65% of villages surveyed with dengue, diarrhoea and respiratory infections ranked highest in 7-11% of villages each. Indeed, malaria is still the main cause of morbidity and mortality in Myanmar and is especially endemic in forested areas of the South East.21 Considering that malaria rates in the refugee camps are relatively low, returnees who have not developed any immunity will be particularly vulnerable.
Figure 13 indicates that 42% of villages surveyed do not have any health facilities located on premises. 34% are primarily serviced by government clinics, although this does not necessarily mean that medicine and trained personnel are available. 53% of villages reported the majority of households purchase medicines from private traders, while only 12% report clinics in the village as the primary source of medicine and 2% reported daily access to a doctor.
However, access to public health care providers is broader than the lack of clinical facilities suggests. There is daily access to community health workers in 24% of villages surveyed as well as traditional birth attendants (21%), midwives (19%) and nurses (9%). This, in part, refl ects the reach and capacity of ethnic health organisations that support over 2,000 health workers living in rural areas of South East Myanmar.22 Preventative health services, particularly immunization and deworming campaigns, reached a signifi cant number of surveyed villages during the previous year as documented in Figure 14.
Figure 14: Health Services Provided During Past 12 MonthsServices % villages
Immunization 72%
Deworming 46%
Health Education 38%
Distribution of Insecticide Nets 36%
Malaria Diagnosis & Treatment 34%
Antenatal Care 34%
Basic Medical Care 22%
Referral Services 12%
20 Ministry of National Planning & Economic Development & UNICEF, July 2012, “Situation Analysis of Children in Myanmar”21 ibid, www.unicef.org/eapro/myanmar_Situation_Analysis.pdf22 For a case study, see Backpack Health Worker Team, 2012, Mid-Year Report, http://www.backpackteam.org/
Figure 13: Access to Health facilities
Yebyu
BAGOREGION
KAYAHSTATE
KAYINSTATE
MONSTATE
SHANSTATE
TANINTHARYIREGION
YANGONREGION
NAYPYITAW
Mongpan Mongton
Loikaw
ShadawDemoso
Hpruso
Bawlakhe
Thandaunggyi
Pasaung
Kyaukkyi
Hpapun
Nyaunglebin Shwegyin
Hlaingbwe
HpaAn
Myawaddy
Kawkareik
KyainSeikgyi
Ye
Dawei
Palaw
Tanintharyi
Kyaikhto
Mese
ThreePagodasPass
Yangon
T h a i l a n d
M y a n m a r
Primary Health Facility in Village
16 POVERTY, DISPLACEMENT AND LOCAL GOVERNANCE IN SOUTH EAST BURMA / MYANMAR


3.1 DISPLACEMENT“There was a lot of fi ghting in this area. We were forced to move here and there, and our livelihoods were damaged. That was why a lot of people went to Thailand to look for work”.
Shan Woman, Mong Pan Township, July 2013, SSDF Interview
Given restrictions on access, TBC has been the primary source of information about the scale and distribution of internal displacement in South East Myanmar for over a decade. These estimates have been guided by international standards which include people who have been forced to leave homes due to armed confl ict, natural disaster or human rights abuses. Rather than setting arbitrary time limits for an end to displacement, international standards refer to voluntary return or resettlement, reintegration into society without discrimination and the recovery or restitution of land and property.23
TBC has documented the destruction, forced relocation or abandonment of more than 3,700 villages between 1996 and 2011 and an average annual rate of 75,000 people displaced during the past decade.24 This rate of displacement decreased signifi cantly to approximately 10,000 people between August 2011 and July 2012. However, at least 400,000 internally displaced persons were estimated to remain in the rural areas of 36 townships of South East Myanmar at the end of 2012.25
It is not possible to update these overall estimates in 2013, as the survey focused on 24% of village tracts in just 22 townships. However, fi eld reports suggest low rates of new displacement have primarily been caused by natural disasters and abuses associated with development projects rather than armed confl ict. Flooding in central Karen State at the end of July caused over 33,000 people to fl ee from their homes and was the biggest single cause of displacement during the year in South East Myanmar.
38% of the 209 villages surveyed reported a combined total of 16,000 internally displaced persons, as mapped in Figure 15. This represents 13% of the combined population of all villages surveyed and 35% of the population in villages where displaced persons reside. The proportion of displaced persons is closer to 100% in KNU and NMSP administered areas of Hpapun and Ye Townships.
However, displacement has increased in the west and north just as rates have slowed in South Eastern Myanmar. It is estimated that 140,000 people have been displaced in Rakhine State and over 100,000 in Kachin and northern Shan State since the current government took offi ce.26
23 UN Commission on Human Rights, 1998, Guiding Principles on Internal Displacement.24 TBBC, 2011, “Poverty and Displacement in South East Burma/Myanmar”, pages 16-1825 TBC, 2012, “Changing Realities, Poverty and Displacement in South East Burma/Myanmar”, pages 16-1826 UNHCR, 30 Sept 2013, “Rakhine State Info-graphic”, UNOCHA, July 2013, “Myanmar: Internal Displacement Snapshot - Kachin and northern Shan States”
Yebyu
BAGOREGION
KAYAHSTATE
KAYINSTATE
MONSTATE
SHANSTATE
TANINTHARYIREGION
YANGONREGION
NAYPYITAW
Mongpan Mongton
Loikaw
ShadawDemoso
Hpruso
BawlakheThandaunggyi
Pasaung
Kyaukkyi
Hpapun
Nyaunglebin Shwegyin
Hlaingbwe
HpaAn
Myawaddy
Kawkareik
KyainSeikgyi
Ye
Dawei
Palaw
Tanintharyi
Kyaikhto
Mese
ThreePagodasPass
Yangon
T h a i l a n d
M y a n m a r
Percent of Displaced Persons Currently Residing in Village
Figure 15: Internally Displaced Persons
18 POVERTY, DISPLACEMENT AND LOCAL GOVERNANCE IN SOUTH EAST BURMA / MYANMAR
3.2 RETURN AND RESETTLEMENT“If refugees come back, the government should provide land for shelters. Healthcare assistance should be ready. They should also provide food at the beginning and education can come later. They should provide land for cultivation, or create jobs so there is income for survival”.
Karen Man, Dawei Township, June 2013, CIDKP Interview
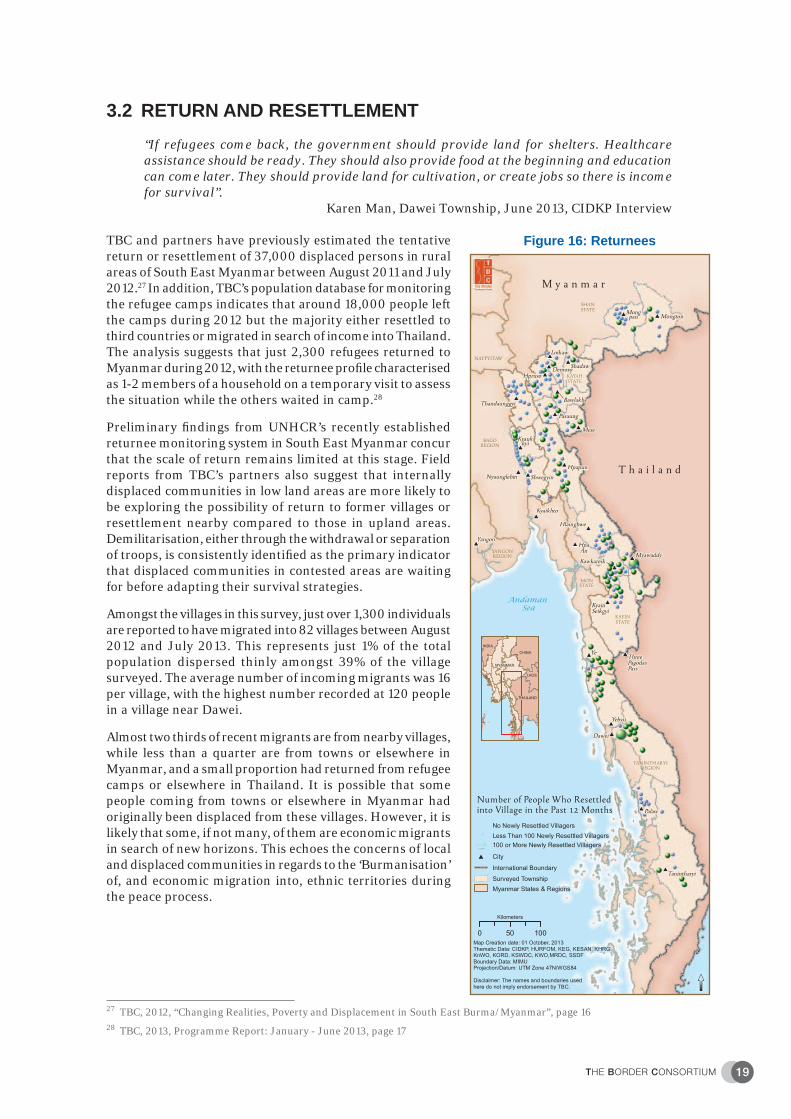
TBC and partners have previously estimated the tentative return or resettlement of 37,000 displaced persons in rural areas of South East Myanmar between August 2011 and July 2012.27 In addition, TBC’s population database for monitoring the refugee camps indicates that around 18,000 people left the camps during 2012 but the majority either resettled to third countries or migrated in search of income into Thailand. The analysis suggests that just 2,300 refugees returned to Myanmar during 2012, with the returnee profi le characterised as 1-2 members of a household on a temporary visit to assess the situation while the others waited in camp.28
Preliminary fi ndings from UNHCR’s recently established returnee monitoring system in South East Myanmar concur that the scale of return remains limited at this stage. Field reports from TBC’s partners also suggest that internally displaced communities in low land areas are more likely to be exploring the possibility of return to former villages or resettlement nearby compared to those in upland areas. Demilitarisation, either through the withdrawal or separation of troops, is consistently identifi ed as the primary indicator that displaced communities in contested areas are waiting for before adapting their survival strategies.
Amongst the villages in this survey, just over 1,300 individuals are reported to have migrated into 82 villages between August 2012 and July 2013. This represents just 1% of the total population dispersed thinly amongst 39% of the village surveyed. The average number of incoming migrants was 16 per village, with the highest number recorded at 120 people in a village near Dawei.
Almost two thirds of recent migrants are from nearby villages, while less than a quarter are from towns or elsewhere in Myanmar, and a small proportion had returned from refugee camps or elsewhere in Thailand. It is possible that some people coming from towns or elsewhere in Myanmar had originally been displaced from these villages. However, it is likely that some, if not many, of them are economic migrants in search of new horizons. This echoes the concerns of local and displaced communities in regards to the ‘Burmanisation’ of, and economic migration into, ethnic territories during the peace process.
27 TBC, 2012, “Changing Realities, Poverty and Displacement in South East Burma/Myanmar”, page 1628 TBC, 2013, Programme Report: January - June 2013, page 17
Yebyu
BAGOREGION
KAYAHSTATE
KAYINSTATE
MONSTATE
SHANSTATE
TANINTHARYIREGION
YANGONREGION
NAYPYITAW
Mongpan Mongton
Loikaw
ShadawDemoso
Hpruso
BawlakheThandaunggyi
Pasaung
Kyaukkyi
Hpapun
Nyaunglebin Shwegyin
Hlaingbwe
HpaAn
MyawaddyKawkareik
KyainSeikgyi
Ye
Dawei
Palaw
Tanintharyi
Kyaikhto
Mese
ThreePagodasPass
Yangon
T h a i l a n d
M y a n m a r
Number of People Who Resettled into Village in the Past 12 Months
Figure 16: Returnees
19THE BORDER CONSORTIUM

3.3 PRINCIPLES FOR RETURN AND REINTEGRATION“It will be diffi cult for the refugees to come back at the moment. Landmines have not yet been removed. We, ourselves, have to be very careful when we go out from our village. The ceasefi re is not stable yet so unless there are assurances of their safety, then better not to come back yet”.
Karen Woman, Thandaunggyi Township, June 2013, KORD Interview
There is general agreement amongst the Governments of Myanmar and Thailand, the non-state armed groups, displaced persons, local communities and the international donor community that conditions are not yet conducive for an organised and sustainable return process on a large scale. Displaced communities are cautious because protection concerns remain, including landmine pollution and militarisation. Non-state armed groups want to formalise independent ceasefi re monitoring mechanisms and address the political causes of confl ict and abuse. The Government of Myanmar needs more time to create an economic climate conducive to job creation in areas of potential return, while it is not in the Royal Thai Government’s interests to dismantle the camps unless the return is going to be sustainable.
Nonetheless, preparing for a sustainable return and reintegration process in South East Myanmar will take time and involve engagement with a range of stakeholders. Displaced persons want to be at the forefront of planning related to their futures while local communities in areas of potential return and resettlement have concerns related to issues such as land, livelihoods and assistance which also need to be addressed. A number of workshops and public forums have been facilitated and statements issued in which civil society organisations from both sides of the border have reaffi rmed their commitment to pursue return according to the principles of voluntariness, safety and dignity.29
International principles and standards have been applied to the local context in two discussion papers. UNHCR Bangkok has articulated a framework to promote the voluntary return of refugees from Thailand. This includes informed consent and free choice without any form of coercion and conditions which ensure physical safety from landmines, violence and armed confl ict; legal security and access to justice; and material security including access to land, livelihoods and assistance.30 UNHCR Yangon has offered a framework for supporting the reintegration of displaced persons in South East Myanmar. This emphasises a protection focus on promoting sustainable solutions rather than the logistical issues of return and outlines a phased approach which starts with engaging internally displaced and local communities.31
The distribution of these discussion papers has been limited, but information fl ows within and between local and displaced communities will be key to building accountability and strengthening civil society’s participation in preparing for return and reintegration. Given that government troops have been the primary perpetrators of violence and abuse, there is a high level of scepticism amongst displaced and local communities that reforms in the cities will lead to changes in ethnic areas.
Civil society organisations have learnt from previous unsustainable and coerced return processes to remain vigilant in the face of promises from government and international agencies. Perhaps the most worrying trends in this preparedness process so far have been proposals for sub-township development sites and pilot return processes. The sub-township construction sites have been associated with land confi scation, the ‘model village’ development paradigm and undermining the principles of consultation and informed consent. Proposals for pilot return processes have been repeatedly rejected by the Karen Refugee Committee as a piecemeal approach which is unrelated from the principles of voluntary return.32
Additional efforts will need to address the aspirations and concerns of ethnic Indian and Rohingya refugees, who represent 8% of the population in Thailand’s camps. The wave of violence targeted against the Muslim community in Myanmar during the past year has been widespread, and has emerged as a key obstacle to a competing vision of multiculturalism and pluralism. Local communities in rural areas of South East Myanmar may well be reluctant to accept ethnic Indian and Rohingya returnees, and statelessness will be prolonged unless access to citizenship can be clarifi ed.
29 Karen Refugee Committee (KRC), March 2013, “Position on Repatriation”; Burma Partnership, December 2012, “Nothing About Us, Without Us” http://www.youtube.com/watch?v=gOW07BsBdrM30 UNHCR, October 2012, “Framework for Voluntary Repatriation: Refugees from Myanmar in Thailand”, Annex II, Bangkok31 UNHCR, June 2013, Supporting Durable Solutions in South East Myanmar: A Framework for UNHCR Engagement, Yangon32 KRC, May 2013, “KRC’s Chairperson met with Chief Minister of Karen State”
20 POVERTY, DISPLACEMENT AND LOCAL GOVERNANCE IN SOUTH EAST BURMA / MYANMAR


4.1 CIVILIAN PROTECTION “We dare not trust the Tatmadaw because instead of withdrawing their troops, they build stronger outposts. We dare not cultivate our hillside paddy fi elds near their outposts” .
Karen Man, Hpapun Township, May 2013, KESAN interview
Addressing protection concerns relating to physical security and access to justice will be the key test for the peace process. While all parties to the confl ict have neglected their obligations to protect civilians, the Tatmadaw’s counter-insurgency strategy has specifically targeted communities in contested areas and been responsible for a large proportion of human rights violations. Stopping widespread and systematic abuses and preventing their reoccurrence will require transforming the climate of impunity and holding perpetrators to account.33
Previous surveys have indicated that approximately half of households in rural areas of South East Myanmar have citizenship cards.34 This survey corroborates these fi ndings with 59% of villages reporting that the majority of members have identity cards, 21% estimating citizenship amongst half of members and 20% reporting a minority or absence of identity card holders.
Only 3% of villages reported the police as the main mechanism for dealing with serious disputes and crimes, which highlights the lack of access to, or confi dence in, Myanmar’s legal system. Village leaders are the primary arbitrators of justice in 73% of sites surveyed, while 22% reported utilising a mix of government and ethnic opposition judicial mechanisms.
Indicators for access to information about national laws reflect a general lack of awareness about rights and responsibilities. The majority of households in 41% of villages surveyed have no reliable access to information while most households in 34% of villages are informed by listening to the radio. Non-state armed groups and village leaders are the most signifi cant formal mechanism for disseminating information in 5% of villages each, but people are otherwise largely dependent on family and friends.
No landmines are reported around 39% of the villages surveyed, but the lack of landmine demarcation is illustrated by majority of households not being aware of the location of landmines in 32% of villages. Warning signs posted on location by any of the armed groups are the means of informing the majority of households in only 3% of villages surveyed. Most households depend on verbal warnings from non-state armed groups in 16% of villages, while it isn’t until a human or animal casualty that landmines become common knowledge in 6% of villages.
33 See US Institute of Peace, June 2013, “Burma/Myanmar Rule of Law Trip Report: Working Document for Discussion”34 TBC, 2012, “Changing Realities, Poverty and Displacement in South East Burma/Myanmar”, page 40
Figure 17: Dispute Mechanisms
Yebyu
BAGOREGION
KAYAHSTATE
KAYINSTATE
MONSTATE
SHANSTATE
TANINTHARYIREGION
YANGONREGION
NAYPYITAW
Mongpan Mongton
Loikaw
ShadawDemoso
Hpruso
BawlakheThandaunggyi
Pasaung
Kyaukkyi
Hpapun
Nyaunglebin Shwegyin
Hlaingbwe
HpaAn
Myawaddy
Kawkareik
KyainSeikgyi
Ye
Dawei
Palaw
Tanintharyi
Kyaikhto
Mese
ThreePagodasPass
Yangon
T h a i l a n d
M y a n m a r
Primary Mechanism for Dealingwith Crimes & Disputes in Villlage
22 POVERTY, DISPLACEMENT AND LOCAL GOVERNANCE IN SOUTH EAST BURMA / MYANMAR

4.2 VILLAGE LEADERSHIP“Confi scated lands have not yet been returned. The land owners are asking but nothing happens. The governing authorities are still the same as before. Policies change but their characters stay the same. I am still suspicious about this ceasefi re agreement”.
Mon Man, Ye Township, June 2013, MRDC Interview
Despite the establishment of state and regional governments, Myanmar’s system of governance remains centralised because of restrictions on political autonomy at the sub-national level, confusion over administrative lines of accountability for public servants and Union oversight of revenue and expenditures. Decentralisation within the existing constitutional constraints will not provide the devolution of authority that the non-state armed groups seek. However, strengthening local governance will contribute to building confidence, accountability and transparency.35
Legislative reform in 2012 enabled the replacement of centrally-appointed village tract administrators with indirectly elected representatives which provide an opportunity to strengthen local governance. The dynamics between government township authorities and village leaders have generally been characterised by a top-down command structure.36 When asked how village leaders access government authorities, half of the villages surveyed indicated that the primary mechanism was waiting until township authorities call a meeting of village tract leaders while 10% have no contact at all. Only 27% of village leaders initiate contact by visiting township authorities or through written correspondence.
Indicators for the accountability of village leaders are more positive and suggest that social capital has generally withstood decades of military rule. Regardless of offi cial procedures, 57% of villages in this survey choose leaders through regular elections for a fi xed term limit while only 15% are appointed by village tract leaders or benefi tted from a hereditary system. Similarly, 68% of villages surveyed indicated that communities are at least consulted by village leaders before important decisions are made about public affairs.
While village leaders are the main mechanism for resolving disputes and managing community affairs, their capacities are increasingly stretched. Non-state armed groups have provided differing degrees of institutional support for local governance, but this affi liation can also induce negative repercussions from government offi cials. The challenge of integrating political, administrative and fi nancial systems between government and non-state armed groups at the local level will be keys to harnessing capacity and reducing the burden for village leaders.
35 Centre for Social and Economic Development and The Asia Foundation, 2013, “State and Region Governments in Myanmar”, http://asiafoundation.org/publications/pdf/1249
36 Kempel & MDR, 2012, “Village Institutions and Leadership in Myanmar: A View from Below”, Unpublished report to UNDP
Figure 18: Leadership Elections
Yebyu
BAGOREGION
KAYAHSTATE
KAYINSTATE
MONSTATE
SHANSTATE
TANINTHARYIREGION
YANGONREGION
NAYPYITAW
Mongpan Mongton
Loikaw
ShadawDemoso
Hpruso
BawlakheThandaunggyi
Pasaung
Kyaukkyi
Hpapun
Nyaunglebin Shwegyin
Hlaingbwe
HpaAn
Myawaddy
Kawkareik
KyainSeikgyi
Ye
Dawei
Palaw
Tanintharyi
Kyaikhto
Mese
ThreePagodasPass
Yangon
T h a i l a n d
M y a n m a r
Primary Way Village LeadersAre Chosen in Village
23THE BORDER CONSORTIUM

4.3 NATURAL RESOURCE MANAGEMENT“I heard that if the ceasefi re agreement becomes stronger, trading will increase in our area. They will take all our valuable resources away from our area. I don’t want to see this. They will benefi t but our farmlands will be destroyed. We will get nothing”.
Karen Woman, Thandaunggyi Township, June 2013, KORD Interview
With investors fl ocking to Asia’s last frontier, there are signifi cant risks that local communities will bear the burden of resource extraction, which includes environmental degradation, land confi scation and displacement. Unless the potential social and environmental impacts are addressed and customary management of natural resources acknowledged, investments are likely to exacerbate local grievances and potentially derail the national peace process.
The Extractive Industries’ Transparency Initiative (EITI) in Myanmar could potentially evolve into a regulatory body to ensure that payments are not misappropriated from government revenue. Community participation in planning and monitoring projects will also be vital at the local level to promote sustainable livelihoods. There are currently village development committees in 37% of villages surveyed and a comparable proportion of forums to promote community-based natural resource management.
No protection from agriculture or other encroachment is currently organised for forests surrounding 59% of the villages surveyed. Only 20% of villages had demarcated signifi cant forests as protected areas with an authority which is widely respected and rarely infringed.
Securing land tenure for customary and displaced subsistence farmers is key to ensuring livelihood opportunities are sustainable and enhancing a sense of justice.37 This survey suggests that at least half of the households in 41% of villages currently depend on village leaders to protect land tenure for housing or agriculture. The majority of households in 30% of villages surveyed have land demarcated and recognised by the government, while non-state armed groups have issued land use certifi cates for most households in 26% of villages.
Given the cessation of hostilities but the absence of any political settlements, investors are expanding into contested areas by exploiting the lack of a regulatory environment. Short term concessions with limited acreage offered by non-state armed groups have been leveraged by private companies into long term deals over vast areas of land with Government authorities. Logging and mining operations are reported nearby 40% and 27% of the surveyed villages respectively, while commercial agricultural plantations and road construction are each in the vicinity of 11% of villages.
37 Displacement Solutions, June 2013, “Bridging the HLP Gap”, Geneva, page 5
Figure 19: Mechanisms for Land Tenure
Yebyu
BAGOREGION
KAYAHSTATE
KAYINSTATE
MONSTATE
SHANSTATE
TANINTHARYIREGION
YANGONREGION
NAYPYITAW
Mongpan Mongton
Loikaw
ShadawDemoso
Hpruso
BawlakheThandaunggyi
Pasaung
Kyaukkyi
Hpapun
Nyaunglebin Shwegyin
Hlaingbwe
HpaAn
Myawaddy
Kawkareik
KyainSeikgyi
Ye
Dawei
Palaw
Tanintharyi
Kyaikhto
Mese
ThreePagodasPass
Yangon
T h a i l a n d
M y a n m a r
Primary Way Land Tenurefor Housing & Agricultural Useis Protected in Village
24 POVERTY, DISPLACEMENT AND LOCAL GOVERNANCE IN SOUTH EAST BURMA / MYANMAR

4.4 CONFLICT TRANSFORMATION“I want the ceasefi re groups and private businessmen to be more transparent. Maybe they are doing goods for our state but they never tell the public what and why they are doing business, so we can have misunderstandings. We can get a genuine peace if they work alongside people”.
Kayah Man, Pruso Township, June 2013, KSWDC Interview
The legacy of military rule and armed conflict in the borderlands of South East Myanmar includes chronic poverty, widespread abuse and enduring insecurity. Traditional development objectives such as increasing economic growth, building government capacities and improving service delivery, may be counterproductive given that the legitimacy of the state is at issue. Strategies which build confi dence in the transition to peace and transform institutions to address security, justice and economic concerns may be more relevant. This will require aid agencies shifting focus away from responding to humanitarian needs to becoming more sensitive to local concerns.38
This survey did not make a distinction between needs and concerns. When focus groups were asked to prioritise the most important needs, the responses ranged from education (21% of villages), to health care (20%), food security and livelihoods (18%), water and sanitation (15%), roads and bridges (10%), electricity (8%) and a small proportion of other sectors. These are all legitimate needs given the lack of public infrastructure in rural areas, and a funding proposal could be justifi ed on this basis alone.
However, the virtual silence regarding concerns about security, justice and the peace process contradicts observations by fi eld staff that these are priority issues for local communities. An enabling and protective environment is a pre-requisite for any of these activities to contribute to the recovery of confl ict-affected communities. One explanation for this apparent anomaly is that the survey led villagers to focus on needs rather than concerns or problems.
Gaps in knowledge and analysis are a key barrier to developing networks between aid agencies, parties to the confl ict and community leaders about linking relief and development programmes to confl ict transformation strategies.39 Decades of censorship and restrictions on access have cultivated a culture of discreet information sharing which needs to be overcome in order to strengthen confl ict analysis. At the same time, the ongoing legal and security constraints that civil society organisations affi liated with non-state armed groups face cannot be ignored. Rather than just focusing on the pace of reforms and the window of opportunity, the sustainability of the peace process will also require listening to the fears and concerns of ethnic communities.
38 Parks, Colletta & Oppenheim, 2013, “The Contested Corners of Asia: Subnational Confl ict and International Development Assistance”, The Asia Foundation, Bangkok
39 Peace Donor Support Group, 22 April 2013, “Desktop Review of Needs and Gaps in Confl ict-Affected Parts of Myanmar”, pages 15-16
Figure 20: Priority Needs
Yebyu
BAGOREGION
KAYAHSTATE
KAYINSTATE
MONSTATE
SHANSTATE
TANINTHARYIREGION
YANGONREGION
NAYPYITAW
Mongpan Mongton
Loikaw
ShadawDemoso
Hpruso
BawlakheThandaunggyi
Pasaung
Kyaukkyi
Hpapun
Nyaunglebin Shwegyin
Hlaingbwe
HpaAn
MyawaddyKawkareik
KyainSeikgyi
Ye
Dawei
Palaw
Tanintharyi
Kyaikhto
Mese
ThreePagodasPass
Yangon
T h a i l a n d
M y a n m a r
Most Important Need Identified by Village
25THE BORDER CONSORTIUM

“Over the past year, the 18 ethnic armed groups have worked together to develop a framework for political dialogue with the Government. Armed groups have committed to this framework in order to ensure that the peace process does not stop with individual ceasefi res. … Each armed group retains the legal authority and mandate to negotiate with the government on behalf of their people.
The process of attaining a nation-wide ceasefi re has involved direct negotiations between the armed groups and the Government, as these confl ict partners must agree to end the armed confl ict. In the political dialogue, additional stakeholders such as political parties, civil society, Parliament, the Burma Army, and key leaders such as Daw Aung San Suu Kyi need to participate actively.
”Saw Mutu Sae Poe, Chairman, Karen National Union, and
Sao Yawd Serk, Chairman, Restoration Council of the Shan StateJoint Statement, 17 July 2013
“The current 2008 Constitution practiced by U Thein Sein Government is not accepted, as it is devoid democratic essence and not in accordance with the principles of federalism. A new Constitution based on genuine federal principles will be drafted and promoted for practice…
In political dialogue and negotiation, the 6 point political programme laid down by the Ethnic Nationality Conference held in September 2012, will be followed. In political dialogue and negotiation, all the resistance organisations are to be represented as a bloc, and not individually.
”Statement of the Ethnic Nationalities Conference,
United Nationalities Federal Council (UNFC),2 August 2013
26 POVERTY, DISPLACEMENT AND LOCAL GOVERNANCE IN SOUTH EAST BURMA / MYANMAR

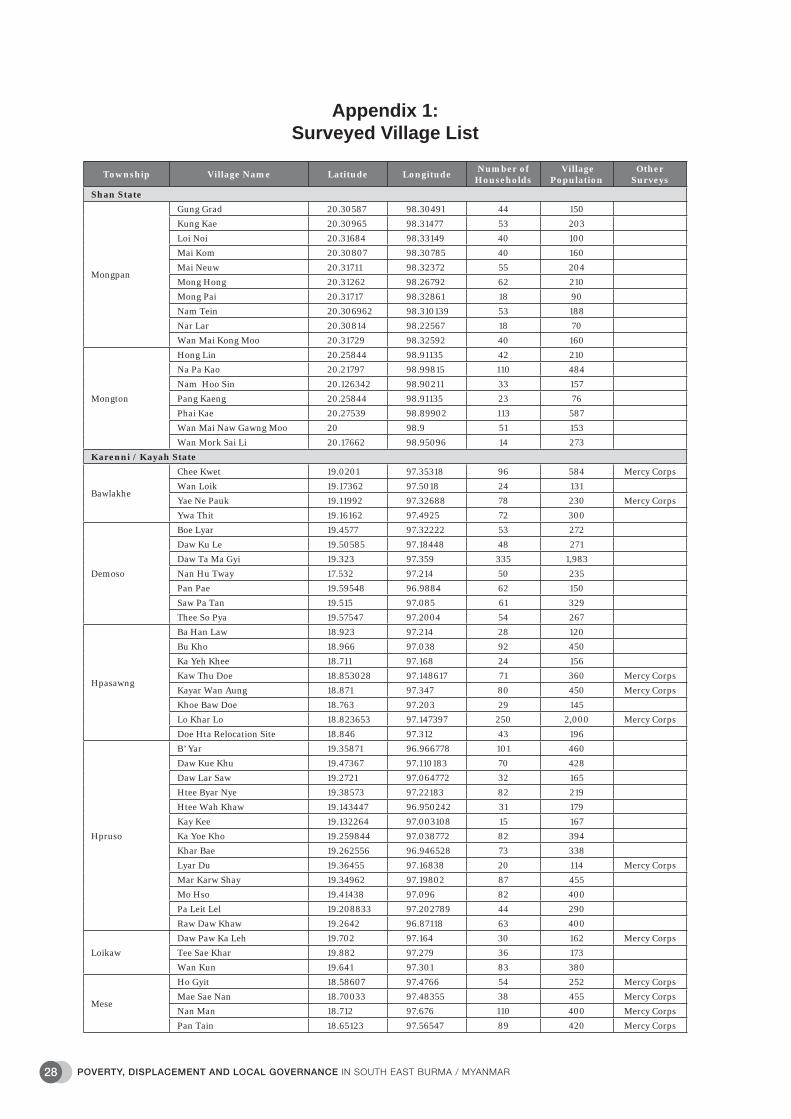
Appendix 1:Surveyed Village List
Township Village Name Latitude LongitudeNumber of
Households Village
PopulationOther
Surveys
Shan State
Mongpan
Gung Grad 20.30587 98.30491 44 150
Kung Kae 20.30965 98.31477 53 203
Loi Noi 20.31684 98.33149 40 100
Mai Kom 20.30807 98.30785 40 160
Mai Neuw 20.31711 98.32372 55 204
Mong Hong 20.31262 98.26792 62 210
Mong Pai 20.31717 98.32861 18 90
Nam Tein 20.306962 98.310139 53 188
Nar Lar 20.30814 98.22567 18 70
Wan Mai Kong Moo 20.31729 98.32592 40 160
Mongton
Hong Lin 20.25844 98.91135 42 210
Na Pa Kao 20.21797 98.99815 110 484
Nam Hoo Sin 20.126342 98.90211 33 157
Pang Kaeng 20.25844 98.91135 23 76
Phai Kae 20.27539 98.89902 113 587
Wan Mai Naw Gawng Moo 20 98.9 51 153
Wan Mork Sai Li 20.17662 98.95096 14 273
Karenni / Kayah State
Bawlakhe
Chee Kwet 19.0201 97.35318 96 584 Mercy Corps
Wan Loik 19.17362 97.5018 24 131
Yae Ne Pauk 19.11992 97.32688 78 230 Mercy Corps
Ywa Thit 19.16162 97.4925 72 300
Demoso
Boe Lyar 19.4577 97.32222 53 272
Daw Ku Le 19.50585 97.18448 48 271
Daw Ta Ma Gyi 19.323 97.359 335 1,983
Nan Hu Tway 17.532 97.214 50 235
Pan Pae 19.59548 96.9884 62 150
Saw Pa Tan 19.515 97.085 61 329
Thee So Pya 19.57547 97.2004 54 267
Hpasawng
Ba Han Law 18.923 97.214 28 120
Bu Kho 18.966 97.038 92 450
Ka Yeh Khee 18.711 97.168 24 156
Kaw Thu Doe 18.853028 97.148617 71 360 Mercy Corps
Kayar Wan Aung 18.871 97.347 80 450 Mercy Corps
Khoe Baw Doe 18.763 97.203 29 145
Lo Khar Lo 18.823653 97.147397 250 2,000 Mercy Corps
Doe Hta Relocation Site 18.846 97.312 43 196
Hpruso
B’ Yar 19.35871 96.966778 101 460
Daw Kue Khu 19.47367 97.110183 70 428
Daw Lar Saw 19.2721 97.064772 32 165
Htee Byar Nye 19.38573 97.22183 82 219
Htee Wah Khaw 19.143447 96.950242 31 179
Kay Kee 19.132264 97.003108 15 167
Ka Yoe Kho 19.259844 97.038772 82 394
Khar Bae 19.262556 96.946528 73 338
Lyar Du 19.36455 97.16838 20 114 Mercy Corps
Mar Karw Shay 19.34962 97.19802 87 455
Mo Hso 19.41438 97.096 82 400
Pa Leit Lel 19.208833 97.202789 44 290
Raw Daw Khaw 19.2642 96.87118 63 400
Loikaw
Daw Paw Ka Leh 19.702 97.164 30 162 Mercy Corps
Tee Sae Khar 19.882 97.279 36 173
Wan Kun 19.641 97.301 83 380
Mese
Ho Gyit 18.58607 97.4766 54 252 Mercy Corps
Mae Sae Nan 18.70033 97.48355 38 455 Mercy Corps
Nan Man 18.712 97.676 110 400 Mercy Corps
Pan Tain 18.65123 97.56547 89 420 Mercy Corps
28 POVERTY, DISPLACEMENT AND LOCAL GOVERNANCE IN SOUTH EAST BURMA / MYANMAR

Township Village Name Latitude LongitudeNumber of
Households Village
PopulationOther
Surveys
Shadaw
Daw Kee Sar 19.6365 97.485467 31 184
Daw Naw Klu 19.89 97.519 62 339 Mercy Corps
Nun Aung Lay 19.827 97.589 56 218
Sa Loung 19.61758 97.59863 52 228
Shadaw Relocation Site 19.63721 97.51931 160 890
Bago Region
Kyaukkyi
Hpo Thaw Su 18.39073 96.70126 85 586
Hto War Saik 18.15271 96.74051 69 401
Kyaw Soo 18.55007 96.69556 180 901
Myeit Yen 18.36511 96.7077 53 302
Naung Kone 18.283049 96.723209 140 865
Nga Laug Teik 18.42415 96.71372 52 588
T’Hkaw Pyaw 18.47142 96.65914 402 2,228
Taw Kyaug Pauk 18.21124 96.69545 136 720
Waya Daw Hko 18.17644 96.70813 186 538
Yae Le 18.31234 96.69163 170 918
Shwegyin
Chaung Kyo 18.06638 96.80334 60 210
Hin Tha 18.12783 96.76153 330 1,752
Hwheh Deh 17.80172 96.88744 110 556
Kaw Tha Say 18.1474 96.84125 94 504
Leh Kaung Wa 18.09269 96.81654 55 296
Leh Pin Wel 18.07553 96.75747 81 408
Me Ka Dee 17.68088 97.11507 132 660
Sa Lu Chaung 17.84441 96.88101 156 1,568
Tha Yet Chaung 17.98672 96.87095 210 1,200
War Pyu Taung 17.59264 97.03008 55 240
Karen / Kayin State
Hlaingbwe
Bi Sa Kat 16.87484 98.07768 156 624
Hti Poe Kein 16.89827 98.03393 123 620
Hty Bu 16.82528 98.08554 100 500
Ka Tay Ko 16.80668 98.07786 90 460
Kawrt lay Poe 16.82932 97.98299 130 650
Kwee Kyn 17.00011 98.06689 35 170
Kyet Tu Yway 16.87488 98.07773 72 360
Ler Dah 16.80282 98.0054 50 260
Mae Pa Ra kee 17.03324 98.06109 120 600
Naung Mya lwe 16.85592 97.99888 75 380
Nor Boe 16.83598 98.07793 80 410
Paung 16.89517 98.04663 226 1,189
Pway Htaw Ru 17.07678 98.0425 70 320
Si Ko 16.89977 98.04909 80 550
Ta Nay Kaw 16.89439 98.00453 60 290
Tha Mo 17.13542 98.01983 92 435
Hpapun
Baw Tho Hta 17.73886 97.41725 104 520
Hkeh Pa Hta 18.14694 97.2757 48 283
Hso Per Hko 18.52553 97.08609 54 372
Htee Baw Hkee 18.44398 97.09993 59 386
Htee Ber Kah Hta 17.95648 97.44298 39 228
Htee Gaw Hta 17.94947 97.34355 56 329
Htee Hsaw Aye Hkee 18.33718 97.2046 15 267
Htee Hswel Ni 18.267 97.37072 56 206
Htee Theh Lay 17.6824 97.45671 220 1,110
Hton Mu 17.80839 97.48824 42 237
Kho Kyaw Der 18.53866 97.13787 42 312
Klaw Hta 17.92322 97.44963 67 521
Lah Eh Der 18.45699 97.23068 15 101
Law Pwo Der 18.08798 97.36051 38 220
Ler Htu Poe 17.96959 97.31047 23 109
Mae Wah Der 18.16497 97.40728 54 383
Pah Heh Der 18.31598 97.19473 24 143
Paw Khaw Plaw 18.51234 97.13821 20 204
Ta Hko Tor Baw 18.41797 97.26184 20 155
Thwa Hko Lo 17.88025 97.41196 45 267
29THE BORDER CONSORTIUM

Township Village Name Latitude LongitudeNumber of
Households Village
PopulationOther
Surveys
Kawkareik
An Hpa Gyi 16.49824 98.25622 170 970
An Kaung 16.46107 98.21815 360 1,850
Kyn Tha Lyn 16.45424 98.23647 130 750
Laung Kaing 16.46826 98.1438 214 1,035
Myo How 16.52384 98.28458 48 240
Set Ka Wet 16.45662 98.2978 313 1,778
Ta Bro 16.34849 98.20101 238 1,322
Ta Ri Ta Khaung 16.41729 98.2119 332 1,660
Ta Tan Ku 16.56406 98.27229 130 160
Taung Kyar Inn 16.49691 98.16 519 2,383
Tha Mein Dut 16.40406 98.1015 315 1,785
Win Ka 16.34724 98.11588 107 1,530
Yae Kyaw Linn 16.5266 98.21728 140 900
Tar Shin 16.4202 98.23534 182 1,041
Kyainseikgyi
Auk Too Hta 16.175778 98.164101 59 336
Hti War Ka Lu 15.582517 98.264018 87 471
Lan Hpar 16.183827 98.193317 30 172
Mae Pleh 16.2332 98.180154 270 1,106
Maw Khe Khee 16.062666 98.240182 115 598
Mea K’ Thu Chaw Pyah 16.13309 98.211639 77 547
Mea Nah Thaw 16.214584 98.185147 29 162
Mea Ta Ler 15.505071 98.324253 52 284
Pein Neh Gon 16.150494 98.20165 69 487
Pu Yea 16.022358 98.245715 167 827
Ther Der Hko 16.050213 98.231494 78 475
Myawaddy
Hpa Lu 16.5702 98.56849 245 1,191
Kwin Ka Lay 16.64816 98.37698 311 2,188
Me Htaw Tha Lay 16.63068 98.53703 500 2,500
Me Ka Lar 16.1885 98.60522 25 100
Me Ka Nei 16.59988 98.4578 40 200
Me Ka Nei 16.67144 98.41895 229 1,241
Me Lah Pei 16.58009 98.57949 400 2,600
Ta O’Hta 16.36253 98.87144 108 600
Thandaunggyi
Chee Thu Saw (Lower) 19.25373 96.66165 65 420
Ha Moh 19.10385 96.54975 29 130
Hker Weh 19.04128 96.73094 115 665
Hplay Hsa Law 18.75209 96.74495 74 400
K’Thwee De Hkee 19.11814 96.69253 28 175
L’Mehgyi 19.01659 96.77612 45 300
Leik Pyar Ay auk 19.21653 96.56859 36 180
Leik Pyar Ka Lay 19.09322 96.69253 28 200
Ma Sa Auk 19.24536 96.62914 53 235
Ma Sa Hkaw 19.26322 96.74949 38 230
Nga Pyaw Daw 19.27516 96.64426 58 350
Saw Law Hko 19.12466 96.83157 20 130
Shaw Wa Der 18.83383 96.84632 53 279
Shwe La Bo 19.14096 96.58313 38 200
Thay Mu Der 18.97555 96.87626 45 200
Mon State
Ye
Ah Yu Taung 15.22545 97.514 52 270
Chei Daik 15.16044 98.08876 95 450
Halockhani 15.16444 98.17867 220 1,260
Joo Hapraoc 15.079402 98.161115 147 760
Kabyar 15.04362 97.49008 150 1,000
Kani 15.12197 98.0405 67 430
Khaw Za Chaung Wa 15.02086 97.4946 615 3,800
Toe Thet Ywa Thit 15.16571 97.5204 197 850
War Zin 15.21698 97.97947 48 222
30 POVERTY, DISPLACEMENT AND LOCAL GOVERNANCE IN SOUTH EAST BURMA / MYANMAR

Township Village Name Latitude LongitudeNumber of
Households Village
PopulationOther
Surveys
Tanintharyi Region
Dawei
Dar Thway Kyauk 14.07747 98.33056 62 312
Hnit Se Thone Maing 14.17355 98.40119 74 450
Hpaung Taw Gyi 14.00685 98.54912 190 975
Ka Lit Gyi 14.16633 98.46536 52 192
Kataungni 13.84928 98.65547 195 1,074
Myitta 14.16142 98.5208 333 1,682
Pyin Thar Taw 14.21077 98.43001 65 350
Shwe Chaung 14.16481 98.46475 63 380
Yam Ma Zu 14.14688 98.32254 76 400
Yinbuwa 14.106 98.46733 62 294
Palaw
Du Yin Pin Shaung 12.97989 98.69351 95 680
Hta Min Ma Sar 13.11989 98.62929 40 700
Ka De 12.93157 98.70147 230 1,100
Mi Kyaung Thaik 13.04077 98.75638 130 700
Pyi Char 13.1839 98.6328 250 1,025
Shan Dut 13.04131 98.68407 97 536
Sin Htoe Nge 13.28398 98.58975 150 750
Zat Di Win 12.96844 98.76156 85 465
Tanintharyi
Ka Nan Kwin 12.10788 99.1437 120 700
Ka Wert Hta 12.554 99.01826 30 131
Kyein Chaung 11.93732 99.24656 84 350
Mei Ngaw 12.27979 99.03394 32 140
Pa Ta Myar 12.28854 99.05993 60 320
Pa Wa Htauk Ma 12.066 98.90313 78 434
Theh Pyu 11.85448 99.28643 130 650
Thin Baw U 12.92577 98.94884 65 365
Yebyu
Alae Sakhan 15.00131 97.5938 330 1,589
Jao Dong 14.87036 98.19236 35 227
Kya Khat Taw 14.4627 97.5742 57 327
Lei Gyi 14.46508 97.5717 105 370
May Gyi 14.44083 97.5742 124 985
Platarao 14.58879 98.03916 62 370
Rar Hpu 14.51003 98.0259 280 1,420 UNICEF
Sin Swei 14.50244 97.5833 100 507
Yin Ye 15.0646 97.4906 418 4,500
31THE BORDER CONSORTIUM

APPENDIX 2:2013 SURVEY FRAMEWORK
“Hello, my name is_________. I work for ________. I would like to learn more about living conditions, social services,
protection and local governance in South East Myanmar. I do not need to know your name, but we will use this information to
increase awareness about the situation in this village. You will not be paid for participating in this survey, and there are no
promises that you will receive aid in the future. Please be completely honest with your answers. Are you willing to give some
time and respond to these questions?”
State / Region (on government maps): ……………………………………………..
Township: ……………………………………………..
Village Tract / Sub-Township: ……………………………………………..
Village: ……………………………………………..
Latitude (dd.ddddd) or (dd mm ss): ……………………………………………..
Longitude (dd.ddddd) or (dd mm ss): ……………………………………………..
Organisation of fi eld staff interviewer: ……………………………………………..
No. of key informants:
1. Male 2. Female
3. Village Tract Leaders 4. Village leaders
5. Teachers, health care workers or religious leaders 6. Other Villagers
7. Local government authorities 8. Non-state armed group representatives
RESPONSE CODE (FOR SELECTED QUESTIONS):
1. All (or almost all) 2. Most 3. Around Half 4. Few 5. None (or almost none)
DEMOGRAPHICS
1. What is the total number of households in this village?
2. What is the total population in this village?
3. How many people displaced by confl ict, abuse or natural disasters stay in this village?
4. How many people have moved out of this village during the past 12 months?
5. Where did people who moved out of this village during the past 12 months go to?
(USE THE RESPONSE CODE)
1. Refugee camps in Thailand 2. Elsewhere in Thailand 3. Nearby Villages in Myanmar
4. Towns or elsewhere in Myanmar 5. Other (please specify): ………………………
6. How many people have moved into this village during the past 12 months?
7. Where did people who moved into village in the past 12 months come from? (USE THE RESPONSE CODE)
1. Refugee camps in Thailand 2. Elsewhere in Thailand 3. Nearby Villages in Myanmar
4. Towns or elsewhere in Myanmar 5. Other (please specify): ………………………
8. What is the religious composition of this village? (USE THE RESPONSE CODE)
1. Animist 2. Buddhist 3. Christian
4. Moslem 5. None 6. Other
9. What is the ethnic composition of this village? (USE THE RESPONSE CODE)
1. Sgaw Karen 2. Pwo Karen 3. Kayah
4. Kayaw 5. Paku 6. Kayan
7. Shan 8. Palaung 9. Pa-O
10. Lahu 11. Mon 12. Burman
13. Other: …….....………….
32 POVERTY, DISPLACEMENT AND LOCAL GOVERNANCE IN SOUTH EAST BURMA / MYANMAR
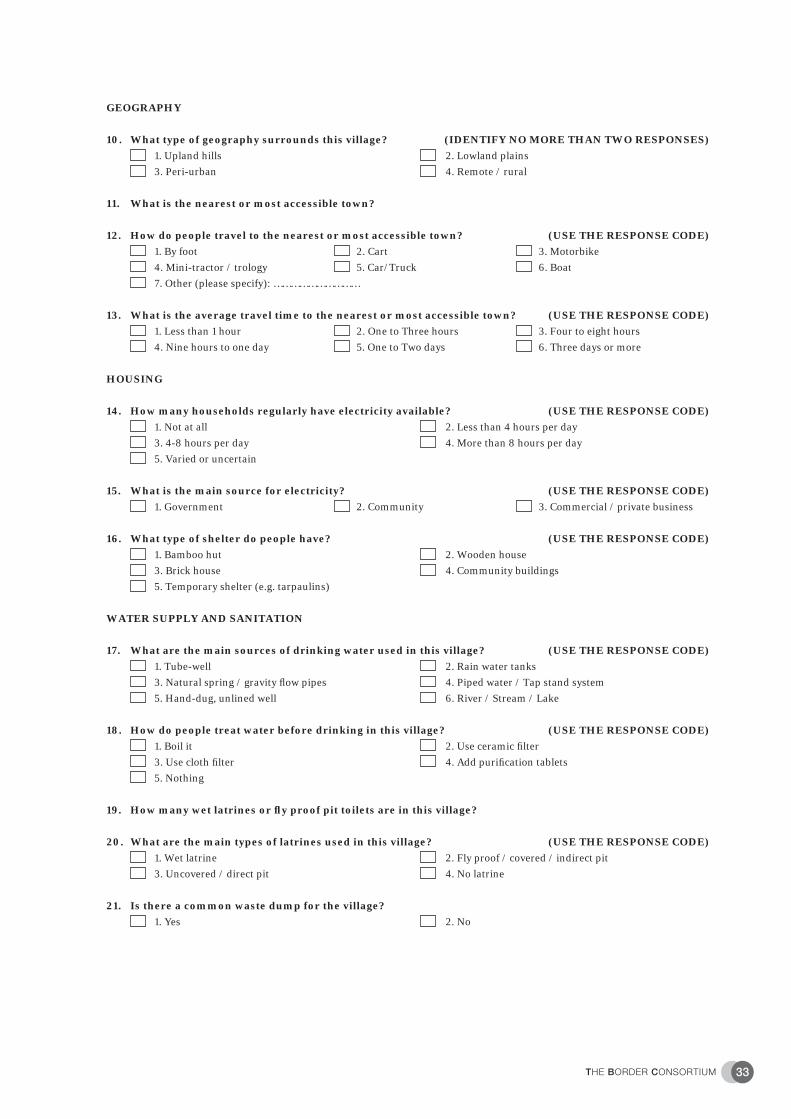
GEOGRAPHY
10. What type of geography surrounds this village? (IDENTIFY NO MORE THAN TWO RESPONSES)
1. Upland hills 2. Lowland plains
3. Peri-urban 4. Remote / rural
11. What is the nearest or most accessible town?
12. How do people travel to the nearest or most accessible town? (USE THE RESPONSE CODE)
1. By foot 2. Cart 3. Motorbike
4. Mini-tractor / trology 5. Car/Truck 6. Boat
7. Other (please specify): …………………………
13. What is the average travel time to the nearest or most accessible town? (USE THE RESPONSE CODE)
1. Less than 1 hour 2. One to Three hours 3. Four to eight hours
4. Nine hours to one day 5. One to Two days 6. Three days or more
HOUSING
14. How many households regularly have electricity available? (USE THE RESPONSE CODE)
1. Not at all 2. Less than 4 hours per day
3. 4-8 hours per day 4. More than 8 hours per day
5. Varied or uncertain
15. What is the main source for electricity? (USE THE RESPONSE CODE)
1. Government 2. Community 3. Commercial / private business
16. What type of shelter do people have? (USE THE RESPONSE CODE)
1. Bamboo hut 2. Wooden house
3. Brick house 4. Community buildings
5. Temporary shelter (e.g. tarpaulins)
WATER SUPPLY AND SANITATION
17. What are the main sources of drinking water used in this village? (USE THE RESPONSE CODE)
1. Tube-well 2. Rain water tanks
3. Natural spring / gravity fl ow pipes 4. Piped water / Tap stand system
5. Hand-dug, unlined well 6. River / Stream / Lake
18. How do people treat water before drinking in this village? (USE THE RESPONSE CODE)
1. Boil it 2. Use ceramic fi lter
3. Use cloth fi lter 4. Add purifi cation tablets
5. Nothing
19. How many wet latrines or fl y proof pit toilets are in this village?
20. What are the main types of latrines used in this village? (USE THE RESPONSE CODE)
1. Wet latrine 2. Fly proof / covered / indirect pit
3. Uncovered / direct pit 4. No latrine
21. Is there a common waste dump for the village?
1. Yes 2. No
33THE BORDER CONSORTIUM

LIVELIHOODS AND FOOD SECURITY
22. How many households are mainly dependent on the following livelihoods? (USE THE RESPONSE CODE)
1. Cultivating crops / plantations 2. Farming livestock
3. Mining 4. Logging
5. trade 6. fi shing / hunting / collecting forest products
7. construction 8. manufacturing
9. public servant / government offi cer 10. Social work / teacher / health care
11. Other (please specify): ……………………
23. How many households access agricultural land for farming in this village? (USE THE RESPONSE CODE)
1. No land for farming 2. Less than 2 acres of land
3. 2-5 acres of land 4. More than 5 acres of land
24. How many households own the following livestock? (USE THE RESPONSE CODE)
1. buffalo / ox 2. cow
3. horse / mule 4. pig
5. chicken / duck / other poultry 6. goat
7. Other (please specify): ……………………………….
25. What have been the main constraints or shocks to livelihoods during the past 12 months?
(RANK 3 MOST IMPORTANT)
1. loss of employment / income 2. fl oods / heavy rains / drought / landslides
3. rats / pests damaged crops 4. commodity price increases
5. sickness / injury 6. interest rates for debt repayment
7. limited availability of land 8. military patrols / restrictions on movement
9. landmines 10. Armed confl ict
11. forced labour 12. Extortion or arbitrary taxation
13. forced displacement 14. No shocks to livelihoods
26. How many households are currently capable of covering basic food needs for the following periods?
(USE RESPONSE CODE)
1. Currently not at all 2. Less than 1 week
3. 1-4 weeks 4. 1-2 months
5. 2-4 months 6. More than 4 months
27. What are the main sources of credit? (RANK 3 MOST IMPORTANT)
1. Family or friends 2. Commercial / private money lender
3. Bank 4. Micro credit Association / Village Fund
5. Employer 6. Religious leader / institution
ACCESS TO HEALTH CARE
28. What kind of health facilities are located in this village? (SELECT ALL THAT APPLY)
1. Hospital (Government) 2. Rural Health Clinic (Government)
3. Rural Health Clinic (Ethnic Health Organisation) 4. Private Clinic
5. NGO Clinic 6. Other (please specify): ……………………………….
29. Who provides health care in this village and how regularly?
(SELECT ALL THAT APPLY & USE CODE FOR HOW OFTEN)
a.How Often: (fi ll in code)
a. Code for how often: 1. Traditional Healer ……………..
1. Daily 2. Traditional birth attendant ……………..
2. Once in 2-3 days 3. Community Health Worker ……………..
3. Once a week 4. Midwife ……………..
4. Once in 2 or 3 weeks 5. Nurse ……………..
5. Once a month or less 6. Doctor ……………..
7. Mobile clinic / Backpack Service ……………..
34 POVERTY, DISPLACEMENT AND LOCAL GOVERNANCE IN SOUTH EAST BURMA / MYANMAR

30. What were the main health concerns that occurred during the last month?
(ASK HEALTH WORKERS TO RANK THREE)
1. Malaria 2. Tuberculosis
3. Diarrhea 4. Skin infections
5. Dysentery 6. Sexually Transmitted Diseases
7. Respiratory Infection 8. Trauma (physical or mental)
9. Dengue 10. Other (please specify): ………………………………………..
31. Which services have been provided during the past 12 months in this village? (SELECT ALL THAT APPLY)
1. Immunization 2. Malaria diagnosis and treatment
3. Basic Medical Care 4. Distribution of insecticide nets
5. Antenatal Care 6. Referral services
7. Health education 8. Deworming
9. Other (please specify): ……………………………….
32. Where do families access medicines? (USE THE RESPONSE CODE)
1. Trader / Shop in the village 2. Trader / Shop in another town
3. Clinic in the village 4. Clinic in another town
5. Health worker / mobile clinic 6. NGO
7. Other (please specify): ……………………………….
ACCESS TO EDUCATION
33. What type of school and curriculum is available in this village? (SELECT ALL THAT APPLY)
1. Government Basic Education 2. Monastic / Non-formal
3. Ethnic Nationality / Non-State System 4. Mixed
5. None (skip to Question 35)
34. What education facilities are available in this village? (SELECT ALL THAT APPLY)
No. Students No. Teachers
1. Pre-school / Nursery ……………….. ………………..
2. Primary (KG – Grade 4) ……………….. ………………..
3. Middle School (Grade 5-8) ……………….. ………………..
4. High School (Grade 9-10) ……………….. ………………..
35. Can teachers in the village school speak the local language? (USE THE RESPONSE CODE)
1. Yes 2. No
36. Where are the nearest schools outside the village?
(SELECT ALL THAT APPLY & USE CODES FOR LOCATION & ACCESS)
a. Location Codes a. Location b. Means of Access
1. nearby (less than 2 hours away) (Use code) (Use code)
2. far away (more than 2 hours away) 1. Pre-school / Nursery ……………….. ………………..
b. Means of access Codes 2. Primary (KG–Grade 4) ……………….. ………………..
1. Motor Vehicle; 2. Bicycle; 3. Middle School (Grade 5-8) ……………….. ………………..
3. By foot; 4. Boarding 4. High School (Grade 9-10) ……………….. ………………..
37. How many children in the village are not regularly attending school? (USE THE RESPONSE CODE)
1. Aged 5-12 2. Aged 12-16
38. What is the main reason why children do not attend school regularly? (USE THE RESPONSE CODE)
1. Illness or hanidcap 2. Cannot pay transport cost / school is too far
3. Cannot pay school fees 4. Security situation is not safe
5. Child needed for domestic chores 6. Child works outside the household for cash or food
7. Child not interested 8. Other (please specify): …………………………………
35THE BORDER CONSORTIUM

PROTECTION
39. What type of identity documents do people in this village have? (USE THE RESPONSE CODE)
1. Citizenship (Pink Cards) 2. Associate Citizenship (Blue Cards)
3. Naturalised Citizenship (Green Cards) 4. Temporary Registration (White Cards)
5. Family List / Household Registration 6. Birth Registration Certifi cate
7. Other (please specify): ………………………………………
40. What are the main mechanisms for dealing with serious disputes and crimes in this village?
(USE THE RESPONSE CODE)
1. Adjudication by village leaders 2. Adjudication by religious leaders or elders
3. Referral to Myanmar Police & Judiciary 4. Referral to local Tatmadaw leaders
5. Referral to non-state armed groups’ judiciary 6. Referral to UN or NGO complaint mechanisms
7. Other (please specify): ……………………………
41. How do people access information about rights and responsibilities under Myanmar law?
(USE THE RESPONSE CODE)
1. Radio 2. Newspaper
3. Booklets / pamphlets 4. Video / DVD
5. Verbally from village leaders 6. Verbally from friends or family
7. Verbally from Myanmar government authorities 8. Verbally from non-state armed groups
9. Verbally from local civil society groups 10. Verbally from UN or international NGOs
42. How do villagers know about the location of landmine fi elds? (USE THE RESPONSE CODE)
1. Verbal warnings from Tatmadaw 2. verbal warnings from non-state armed groups
3. Signs on location from Tatmadaw 4. Signs on location from non-state armed groups
5. Reports of human or animal casualties 6. Warnings from other villagers
7. No landmines in this area 8. Other (please specify): ……………………………
NATURAL RESOURCE MANAGEMENT
43. How is land tenure for housing and agricultural use protected in this village? (USE THE RESPONSE CODE)
1. Recognition from village leaders 2. Community land tenure certifi cate from non-state
armed group
3. Community land tenure certifi cate from Government 4. Private land tend tenure certifi cate from non-state
armed group
5. Private land tenure certifi cate from Government 6. Other (please specify): …………………………………
44. Is any surrounding forest land given special protection from agriculture or other activities?
(ONE RESPONSE ONLY)
1. No 2. Yes, but small area, not widely agreed and often violated
3. Yes, large areas, widely agreed and rarely violated 4. Yes, widely agreed, demarcated and well protected
45. Is there a village committee to promote community-based natural resource management?
(ONE RESPONSE ONLY)
1. No 2. Yes, but weak and lacking legitimacy, authority or capacity
3. Yes, there is an effective committee
46. What types of business exploit natural resources in the surrounding area? (USE THE RESPONSE CODE)
1. Logging 2. Mining
3. Commercial agricultural plantations 4. Road construction
5. Industrial estates / special economic zones 6. Competition for land with migrants from Myanmar
7. Competition for land with returning refugees 8. None
9. Other (please specify): ……………………………………..
36 POVERTY, DISPLACEMENT AND LOCAL GOVERNANCE IN SOUTH EAST BURMA / MYANMAR

LOCAL GOVERNANCE
47. How are village leaders chosen? (ONE RESPONSE ONLY)
1. Hereditary / Birth right 2. Appointment by township or village tract leaders
3. Occasional election as required 4. Regular election for fi xed term limit
5. Other (please specify): ………………………………………….
48. How are important decisions about community affairs most often managed? (ONE RESPONSE ONLY)
1. Village leaders make decisions
2. Village leaders make decisions and inform the community afterwards
3. The community is consulted before village leaders make decisions, and then informed afterwards
4. The community is informed and participates in making decisions together with village leaders
49. How do village leaders access Government authorities at the township level?
(RANK THREE MOST IMPORTANT)
1. None 2. If authorities call village tract meetings
3. If township authorities come to the village 4. Village leaders go to township authorities
5. Written correspondence 6. Via Tatmadaw offi cers
7.Via non-state armed group representatives 8. Other (please specify): ………………………………..
50. Is there a village development committee and plan to improve the community’s well being?
(ONE RESPONSE ONLY)
1. No
2. No, but consultation and preparation have started
3. Yes, but the plan is not widely agreed or funded
4. Yes, there is community support and funding for the plan
SUMMARY
51. List the three most important needs of this village?
1. …………………………………………………………………………………………………………………..................................………………………….
2. …………………………………………………………………………………………………………………..................................………………………….
3. …………………………………………………………………………………………………………………..................................………………………….
37THE BORDER CONSORTIUM

APPENDIX 3:ACRONYMS AND PLACE NAMES
CIDKP Committee for Internally Displaced Karen PeopleHURFOM Human Rights Foundation of MonlandIDP internally displaced personIHLCA Integrated Household Living Conditions AssessmentKEG Karenni EvergreenKESAN Karen Environmental and Social Action NetworkKHRG Karen Human Rights GroupKIO Kachin Indepdence OrganisationKNPP Karenni National Progressive PartyKNU Karen National UnionKNWO Karenni National Womens OrganisationKORD Karen Offi ce of Relief and DevelopmentKRC Karen Refugee CommitteeKSWDC Karenni Social Welfare and Development CentreKWO Karen Womens OrganisationMIMU Myanmar Information Management UnitMRDC Mon Relief and Development CommitteeNGO non government organisationNMSP New Mon State PartyOCHA (UN) Offi ce for the Coordination of Humanitarian AffairsRCSS Restoration Council of Shan StateSHRF Shan Human Rights FoundationSSDF Shan State Development FoundationTBC The Border ConsortiumUNHCR United Nations High Commissioner for RefugeesUNICEF United Nations Children’s FundUPWC Union-level Peacemaking Work CommitteeWFP World Food Program
BURMA PLACE NAMES MYANMAR PLACE NAMES
Irrawaddy Region Ayeyarwady RegionKarenni State Kayah StateKaren State Kayin StateKyaukgyi KyaukkyiMoulmein MawlamyineMergui MyeikPaan Hpa-anPapun HpapunPasaung HpasawngPegu Region Bago RegionSalween River Thanlwin RiverSittaung River Sittoung RiverTavoy Dawei Tenasserim Region Tanintharyi RegionTaungoo ToungooRangoon Yangon
38 POVERTY, DISPLACEMENT AND LOCAL GOVERNANCE IN SOUTH EAST BURMA / MYANMAR