DRAFT IDP REVIEW - Cooperative Governance and ...
415
1 ` DRAFT IDP REVIEW 2020-2021
-
Upload
khangminh22 -
Category
Documents
-
view
0 -
download
0
Transcript of DRAFT IDP REVIEW - Cooperative Governance and ...

1
`
DRAFT IDP REVIEW 2020-2021
2
TABLE OF CONTENTS
Foreword by the Mayor Preface by the Municipal Manager Executive Summary Chapter 1: introduction to Nyandeni Local Municipality Chapter 2: Situational Analysis Chapter 3: Spatial Planning Chapter 4: Institutional Transformation and Organisational Development Chapter 5: Good Governance & Public Participation Chapter 6: Financial Viability and Sustainability Chapter 7: Envision the future of Nyandeni

3
FOREWORD BY THE MAYOR
The Preamble of the Constitution declares:
“We, The People of South Africa
We Therefore through our elected representatives, adopt this Constitution. So as to
Lay the foundations for a democratic and open society in which government is based on the will of the people and every citizen is equally protected by law.
Improve the quality of life of all citizens and free the potential of each person”
Through The National Development Plan, we seek to give express to the founding
values of the Constitution. Therefore the NDP directs that “between now and 2030,
we need to move towards a state that is more capbable, more professional and more
responsive to the needs of the people. The NDP further directs that progress needs
to be pursued most rapidly in areas where state capacity is currently at its weakest,
the ultimate goal is to put South Africa on the right path for building a state that is
capable of promoting national objectives of eliminating poverty and reducing
inequality. To contribute towards the attainment of NDP, we have developed and
adoped VISION 2030 which is a medium to long term council development plan. The
LDP identifies 5 development goals aligned to both the National Development
Plan(NDP) and Provincial Development Plan(PDP), these are
1. Build an inclusive, equitable and gworing economy
2. An educated, innovative citizenry
3. A healthy population
4. Building vibrant and cohesive commynities
5. Building a capable, conscientious and accountable institutions
The LDP in the main seek to address the following challenges
High unemployment rate characterised by dismal performance on the
employment of both the skilled and semi-skilled in the area
High levels of poverty
Slow pace of investment on land and property development.
Lack of Infrastructure to support socio-economic development
Low revenue base
Illegal invasion of land

4
There are serious financial leakages owing to the fact that the large scale of
trade is conducted by people from outside Nyandeni.
There is no congruence between infrastructural and economic development
to enhances and cause major dent to poverty.
We do not have facilities to house manufacturing, production and processing
and thus seeing us having to import even the simplest of consumables.
Our tourist destinations are not sufficiently marketed and developed, and
further that there is not systematic tourist cosmos to complete the life of a
tourist in the area.
In 2019/20 financial we committed to implement the following multy year projects
Libode Precinct Plan funded by NT through Neighbourhood Development Fund
(NDF);
Libode Transport Hub, Libode Landfill Site, Ngqeleni Internal Roads funded by Office
of the Premier (OTP) through Small Towns revitalization (STR);
Upgrade to Surfacing T301/DR08301 (Linking Libode and Ngqeleni) planning and
designs completed and funded by OTP through STR, project requires funding for
construction to an amount over R150 million;
Libode and Ngqeleni Internal Roads funded by Municipal Infrastructure Grant (MIG);
Nyandeni Office Park revived through NDF with assistance by NT;
Construct Public and Inclusive Economic Infrastructure (Transport facilities,
community halls) through MIG funding;

5
In addition to the 2019 priorities , Council has identified the following priorities for
2020-2021
1. Provision of Bulk Infrastructure (Water, Sanitation & Electricity)
2. Waste collection, cleaning and beautifications of towns
3. Repair of street lights,
4. fixing of potholes and maintenance of access roads
5. Land reform, resolution of land claims and Land Use Management
6. Coastal and Tourism development
7. Implementation of RAFI Partnership and other agricultural initiatives
8. SMME and Cooperatives development
9. Development of Light industrial development zone (DLIDZ)
10. Deepen Public Participation and democracy
11. Construction of Early Childhood Development Facilities
12. Property Transfer and Registration
13. Safety and Enforcement of By-Laws
14. Strengthen and implement Revenue Enhancement Strategies
15. Ngqeleni Transport Hub
- - - - - - - - - - - - - - - - - - - - - - - - - - - - - - - - - - -
C L L R M . D N G Q O N D W A N A H O N M A Y O R

6
PREFACE BY THE MUNICIPAL MANAGER
The IDP is informed by Governing Party 2016 manifesto which identifies key 11
committment. These priorities have been translated into Medium Term Strategic
Framework. To give effect to this mandate;
Section 25 of the Municipal Systems Act requires all municipalities to produce a
“single, inclusive and strategic plan” or Integrated Development Plan
• Link, coordinate and integrate plans
• Align resources and capacity
• Form the policy and budgeting framework for the municipality
• Comply with national and provincial development plans.
The IDP Strategic Planning has reaffirmed the centrality of IDP as a Principal strategic planning
instrument which guides and informs all planning and development, and all decisions with regards to
planning, management and development in the municipality.

7
SECTION A :
EXECUTIVE SUMMARY
INTRODUCTION
Defining the Integrated Development Planning
The Municipal Systems Act defines IDP as
(a) “…the principal strategic planning instrument which guides and informs all planning and development, and
all decisions with regard to planning, management and development in the municipality”
(b) “Binds the municipality in the exercise of its executive authority…”
The Nyandeni Local Municipality falls within the OR Tambo District Municipality, which is situated in the eastern
part of the Transkei region of the Eastern Cape Province. Nyandeni consists of the two former magisterial districts
of Libode and Ngqeleni.
The Municipality is bordered to the south-west by the King Sabata Dalindyebo Municipality, to the north by the
Mhlontlo Municipality, to the east by the Ntabankulu, Ingquza Hill and Port St Johns Municipalities. The Indian
Ocean forms the southern boundary of the municipal area.
According to Statistics South Africa, Nyandeni’s total population has grown from 290 391 people in 2011
to 309 702 people in 2016 (See Table 2 and Figure 3). This population of 309 702 people represent 21%
of the district’s total population
Between 2011 and 2016, Nyandeni local municipality grew at the same rate (6.6%) as that of the province
as a whole
In 2016, the municipality had more female (165 899) than male (143 803), however male population has
grown faster at 7.1% than their female counterpart at 6.2%.
Life expectancy is high for female than for male. Figure 2 shows that more female than male reach the
age of 75
The Nyandeni Local Municipality is committed towards ensuring a brighter future for all inhabitants in the region
and its investment strategies aim to enhance competitiveness and encourage sustainable growth that is
inclusive. A stimulus should be created for the local economy to grow, compete and create more jobs. It is all
about competitiveness, about enterprises thriving in competitive markets and locations with the aim to create
sustainable employment at the local level. The main approach to do so is:
o To ensure that an environment and opportunities for more labour-absorbing economic activities is
established;
o To ensure that the fruits of growth are shared in such a way that poverty is largely eliminated; and
o To ensure that severe inequalities that still plague South Africa are considerably reduced.
Organizational structure, systems, processes and personnel capacity
How are we structured?
Political & Council Structures
Mayor
Speaker
Executive Committee
63 Councillors
Administrative Structures
Office of Municipal Manager
Corporate Services
Budget and Treasury Office
Community Services
Infrastructure Department

8
32 Wards & 320 Ward
Committees Members
9 Standing Committees
Municipal Public Accounts
Committee
Ethics and Members Interest
Committee
Public Participation and Petition
Committee
Office of the Chief-whip
Women Caucus
13 Traditional Leadership
Audit Committee
Planning and Development
At the political level, the organization is based upon a strong programme management model and a politically
orientated governance approach, combined with competencies in community based engagement, development
and stakeholder mobilization. This is complimented by the leadership and executive management structures
primarily at a political level. These structures are used to make decisions and inform high level planning for the
achievement of desired objectives of Nyandeni Local Municipality.
The Municipal Manager reports to the Mayor and Council and is selected by this body. Since this body selects
the Municipal Manager, he/she is obliged to support and execute the decisions of this body. In addition, the
Municipal Manager is an integral link between the political and administrative structures.
Administrative Structures
Nyandeni Local Municipality structure is hierarchical based on functional silos represented by five departments
which are supposed to be in aligned to the four core focus areas of the Municipality. The Nyandeni Local
Municipality organizational structure is divided into five functional departments as follows:
a) Office of the Municipal Manager
b) Corporate Services;
c) Budget and Treasury Office;
d) Community Services;
e) Infrastructure Department and
f) Planning and Development
Each Department represents a functional area of work and is further divided into sub-functional components.
The functions are arranged in accordance with National Five Key Performance Areas to ensure alignment and
integration. This integration demands a value chain response from each department in terms of its deliverables.
LEGISLATIVE FRAMEWORK AND POLICY ENVIRONMENT
The Constitution of the Republic of South Africa, 1996, provides the primary overarching framework within the
Local Government planning must be understood. The Constitution gives Local Government a mandate to;
Provide democratic and accountable government for all communities
Ensure provision of services to communities in a sustainable manner
Promote social and economic development
Promote a safe and healthy environment; and
Encourage the involvement of communities and community organizations in the matters of Local
Government

9
Governing Party 2016 Local Government Manifesto identifies 11 key Committement
Basic Services
Municipal Services And Outsourcing
Public Participation And Accountability
Municipal Capacity
Local Economy And Job Creation
Fraud And Corruption And Crime In Communities
Education And Communities
Community Health
Climate Change
Integrated Communities
Social Cohesion And Nation Building
ALIGNMENT WITH NATIONAL AND PROVINCIAL LEGISLATION AS WELL AS MDG GOALS
PRIORITY 1: AN INCLUSIVE, EQUITABLE & GROWING ECONOMY
MTSF SDG INTEGRATED URBAN
DEVELOPMENT
FRAMEWORK
IDP OBJECTIVE
Priority 1: Economic
Transformation and Job
Creation (3)
Decent Work
and Economic
Growth (G8)
Policy lever 6:
Inclusive Economic
Development
To create a conducive
environment for
economic growth by
2022
Outcome 4: decent employment through inclusive economic growth
Outcome 7: Vibrant, Equitable and Sustainable Rural Communities and Food Security
Outcome 6: An efficient, competitive and responsive economic infrastructure network
Role of the municipality
• Create an enabling environment for investment by streamlining planning applications
processes
• Ensuring proper maintenance & rehabilitation of essential services infrastructure
• Improve procurement systems to eliminate corruption & ensure value for money
• Building necessary infrastructure that support economic growth
PRIORITY 2: AN EDUCATED, INNOVATIVE CITIZENRY
MTSF SDG INTEGRATED URBAN DEVELOPMENT FRAMEWORK IDP OBJECTIVE
Outcome 1: Improved quality of basic education
Outcome 6: Outcome 6: An efficient, competitive and responsive economic infrastructure network
Outcome 12: An efficient, effective and development-oriented public service

10
The role of the municipality :
• Build access road infrastructure to ensure easy access to schools and ECDC’s
• Strengthen intergovernmental relations coordination and collaboration
• Support Early Childhood Development program through development of ECDC’s
• Facilitate access access to internet connection through broad band rollout and other
initiatives
• Scale up NARYSEC skills development programs
PRIORITY 3: A HEALTHY POPULATION
MTSF SDG INTEGRATED
URBAN
DEVELOPMENT
FRAMEWORK
IDP OBJECTIVE
• Univ ersal Heal th
Cov erage For All
South Af r icans
Achiev e
• Total Life
Expectancy Of
South Af r icans
Improv ed
Goal 4: Reduce
Chi ld Mortal i ty
Goal 5: Reduce
Maternal
Mortal i ty
Goal : 6 Combat
Hiv /Aids , Malar ia
& Other Diseases
Pol icy Lev er 1;
Integrated Urban
Planning And
Management
To Prov ide And
Maintain Heal thy
Env i ronment
Outcome 2: Improv ing Heal th And Li fe Expectancy
The Role Of The Municipali ty
• Improv e Communi ty Heal th Serv ices Inf rastructure By Prov iding Clean
Water, Sani tat ion And Waste Remov al Serv ices
• Coordinate Heal th Related Awareness Program
11
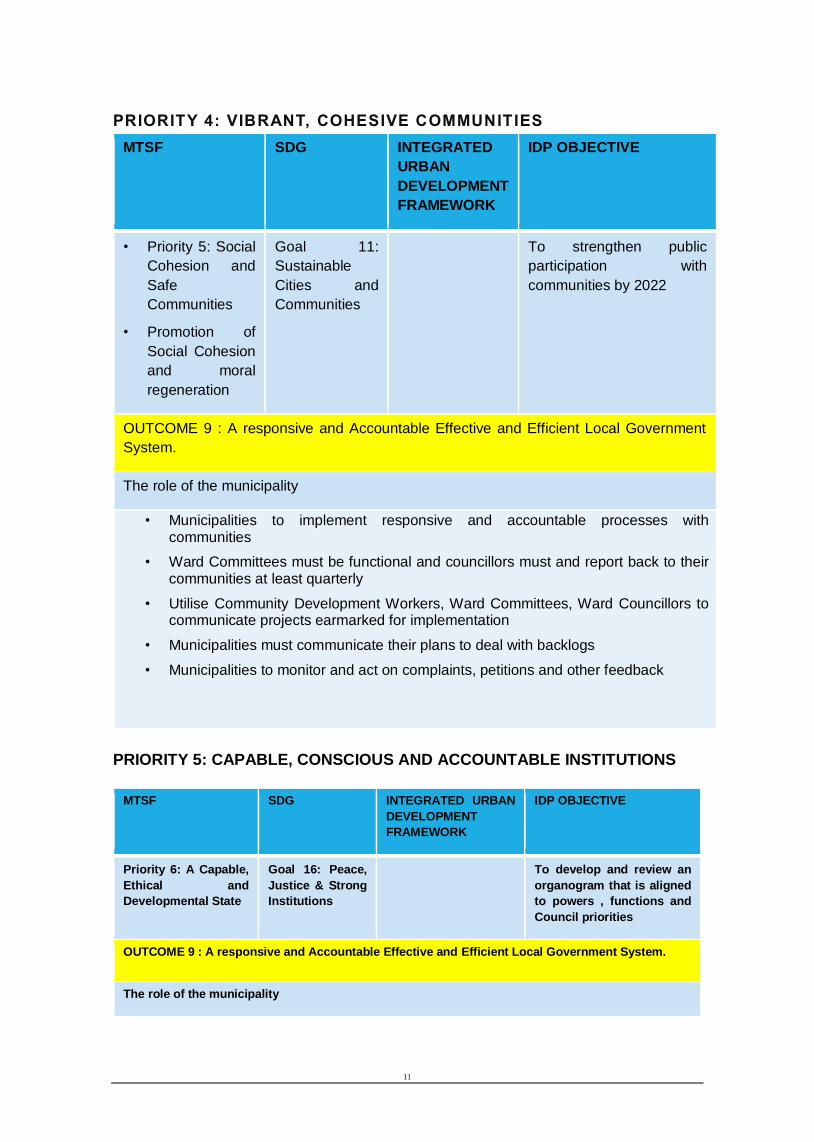
PRIORITY 4: VIBRANT, COHESIVE COMMUNITIES
MTSF SDG INTEGRATED
URBAN
DEVELOPMENT
FRAMEWORK
IDP OBJECTIVE
• Priority 5: Social
Cohesion and
Safe
Communities
• Promotion of
Social Cohesion
and moral
regeneration
Goal 11:
Sustainable
Cities and
Communities
To strengthen public
participation with
communities by 2022
OUTCOME 9 : A responsive and Accountable Effective and Efficient Local Government
System.
The role of the municipality
• Municipalities to implement responsive and accountable processes with communities
• Ward Committees must be functional and councillors must and report back to their communities at least quarterly
• Utilise Community Development Workers, Ward Committees, Ward Councillors to communicate projects earmarked for implementation
• Municipalities must communicate their plans to deal with backlogs
• Municipalities to monitor and act on complaints, petitions and other feedback
PRIORITY 5: CAPABLE, CONSCIOUS AND ACCOUNTABLE INSTITUTIONS
MTSF SDG INTEGRATED URBAN
DEVELOPMENT
FRAMEWORK
IDP OBJECTIVE
Priority 6: A Capable,
Ethical and
Developmental State
Goal 16: Peace,
Justice & Strong
Institutions
To develop and review an
organogram that is aligned
to powers , functions and
Council priorities
OUTCOME 9 : A responsive and Accountable Effective and Efficient Local Government System.
The role of the municipality

12
Strengthening public participation to ensure that all communities participate in municipal programmes and activities
NATIONAL DEVELOPMENT PLAN
The IDP Development has taken into account the National Development Plan which defines South Africa’s
development trajectory by amongst other things investing in a strong network of economic and Social
infrastructure designed to support the country’s medium and long term economic and social objectives and
improving the quality of education, skills development and innovation
NATIONAL DEVELOPMENT PLAN TARGETS FOR 2030
National Development Plan
1. Employment: 13 million in 2010 to 24 million in 2030
2. Raise income from R50 000 a person to R120 000
3. Increase quality education and all children have at two years of preschool education and all children in
grade 6 can read, write and count
4. Establish a competitive base of infrastructure, human resources and regulatory frameworks
5. Reduce poverty and inequality by raising employment, bolstering productivity and incomes, and
broadening the social wage
6. Ensure that professional and managerial posts better reflect the country's demographics
7. Broaden ownership to historically disadvantaged groups
8. Provide quality health care while promoting health and well-being
9. Establish effective and affordable public transport
10. Produce sufficient energy at competitive prices, ensuring access for the poor
11. Ensure that all people have access to clean running water in their homes

13
BACK TO BASICS LOCAL GOVERNMENT STRATEGY
The Back to Basics Local Government Strategy was introduced to stakeholders on 18 September 2015 and have
the following pillars;
N0 BACK TO BASICS PILLARS LG KPA Role of the municipality
1. Put people first
Good Governance and Public
Participation
Implement community
engagement plans targeting
hotspots and potential hotspots
areas
Municipalities to implement
responsive and accountable
processes with communities
Ward Committees must be
functional and councillors must
and report back to their
communities at least quarterly
Utilise Community Development
Workers, Ward Committees,
Ward Councillors to
communicate projects
earmarked for implementation
Municipalities must communicate
their plans to deal with backlogs
Municipalities to monitor and act
on complaints, petitions and
other feedback
2. Delivering Basic Services
Service Delivery and
Infrastructure Planning
Municipalities must delivery
basic services
Municipalities must ensure that
services such as cutting of grass
patching of potholes, working
robots, street lights and constant
refuse removal are provided
Council to ensure proper
maintenance and immediate
addressing of outages or
maintenance issues to ensure
continuity of service provision
3. Good Governance
Good Governance and Public
Participation
Municipalities will ensure
transparency, accountability and
regular engagements with
communities
All municipal council structures
must functional and meet
regularly
Council meeting to seat at least
quarterly
All Council Committees must sit
and process items for council
decisions

14
N0 BACK TO BASICS PILLARS LG KPA Role of the municipality
Clear delineation of roles and
responsibilities between key
leadership structures
Functional oversight committees
must be in place
4. Sound Financial
Management
Financial Viability and
Management
All municipalities must have
functional financial management
system which includes rigorous
internal controls
Cut wasteful expenditure and
implement cost containment
measures
Supply chain management
structures and controls must be
in place according to regulations
and with appropriate oversight
All budget to be cash backed
Ensure that post audit action
plans are addressed
Act decisively against fraud and
corruption
Conduct campaigns against
illegal connections, cable theft,
manhole covers
Conduct campaign on culture of
payment for services led by
councillors
5. Building Capacity
Institutional Transformation and
Development
all municipalities enforce
competency standards for
managers and appoint persons
with the requisite skills,
expertise and qualifications
All staff to sign performance
agreements
Implement and manager
performance management
system
Municipal management to
conduct regular engagement
with labour
EASTERN CAPE MEDIUM TERM STRATEGIC PRIORITY AREAS
Priority 1 – Promoting quality education and skills development
Priority 2- Better health care for all
Priority 3 – Stimulating rural development, land reform and food security
Priority 4 – Transforming the economy to create jobs and sustainable livelihoods
Priority 5 – Intensifying the fight against crime and corruption
Priority 6 – Integrated human settlement and building cohesive communities
Priority 7 – Strengthening the developmental state and good governance

15
SPLUMA
The Spatial Planning and Land Use Management Act, 2013 (SPLUMA) was assented to by the President of the
Republic of South Africa on 5 August 2013. SPLUMA is a framework act for all spatial planning and land use
management legislation in South Africa. It seeks to promote consistency and uniformity in procedures and
decision-making in this field. The other objects include addressing historical spatial imbalances and the
integration of the principles of sustainable development into land use and planning regulatory tools and legislative
instruments
Municipal Finance Management Act
Section 21 of MFMA requires the mayor to coordinate the process for preparing the annual budget and
developing the Integrated Development Plan. The IDP and budget must be one process
Section 21 of the Local Government: Municipal Finance Management Act states that the Mayor must table a
schedule of key deadlines for various budget activities 10 months before the start of the new financial year. The
accounting officer is tasked by section 68 of the MFMA with assisting the mayor in performing the budgetary
functions.
OVERVIEW OF THE IDP PROCESS
Each municipality, within a prescribed period must develop and adopt a process set out in writing to guide the
planning, drafting, adoption and review of its Integrated Development Plan in terms of section 29 of the Municipal
Systems Act.
The municipality must through appropriate mechanisms, processes and procedures established in terms of
section 17 of the municipal systems Act, consult the local community before adopting the process plan.
Status of the Integrated Development Plan
The Integrated Development Plan is a strategic planning instrument that guides and informs all planning,
budgeting, management and decision–making in a municipality. The IDP gives impetus to the implementation of
the government programme of action.
Matters considered during the Development Process
Eastern Cape Government Medium Term Strategic Framework
Municipal Standard Chartered of accounts (mSCOA)
Matters emanating from council strategic planning
Comments emanating from IDP and Budget Public Hearings
Comments emanating from the Mayoral Outreaches
National Treasury Division of Revenue Act Allocations for 2020-21
Sector Plans
MEC Comments for 2019/2020 IDP Assessment
Auditor General’s 2018-18 Audit Opinion
ADOPTION OF THE IDP/PMS AND BUDGET PROCESS PLAN FOR 2020-2021
In accordance with section 21(b) of the Local Government: Municipal Finance Management Act No. 56of 2003
the IDP and Annual Budget Process Plan for the financial year 2019/2020 was tabled and adopted by Council
on 30 August 2019
The Council has fully complied and adhered to the adopted Key schedules of deadlines
TABLING OF DRAFT IDP AND BUDGET FOR 2020/2021 FINANCIAL YEAR
The Draft IDP and budget for 2020/21 were tabled to Council on 26 March 2020 and related budget policies and
adopted as Council documents these documents were also published for comments, inspection and

16
representations in the Regional and Local News Paper. Notice was also placed on the Municipal Website
(www.nyandenilm.gov.za) as well as all municipal Libraries for easy access by communities
ADOPTION OF THE IDP AND ANNUAL BUDGET FOR 2020-2021
The final IDP and Budget was unanimously adopted by Council on May 2020 with Council Resolution No. 2 (to
be updated)
DRAFT SERVICE DELIVERY AND BUDGET IMPLEMENTATION PLAN
The Service Delivery Budget and Implementation Plan for the 2020/2021 Financial year was approved by Council
on 26 March 2020
PUBLICATION AND SUBMISSION
The approved Draft Annual Budget and IDP shall be published on municipal website and newspapers in
accordance with legislation. Furthermore, documents were also submitted National Treasury and COGTA
ISSUES EMANATING FROM THE IDP STRATEGIC PLANNING
Basic Infrastructure and Planning
Ref No ACTIVITY RESPONSIBLE AGENCY TIMEFRAME
1. Convene Council Forum to finalize three
year Capital Plan. ORTAMBO DM to also
attend to provide update on matters
raised
Infrastructure
Department
April 2020
2. Validate District Development Model
High impact Projectts
Office of the
Municipal Manager
April 2020
3. Verification of electricity backlog
(extensions and infills
Infrastructure
Department and
Ward Councillors
May 2020
4. Upload and validate project into the
GIS System
NLM April/May
2020
5. Ward Councilors should submit Non-grid
application for funding
Ward Councillors April 2020
6. New extensions and infills should be
properly assessed and recorded to
inform future planning
Infrastructure April 2020
7. Executive Committee to attend to
identified RISK particularly with regard to
T301 and stopped projects
Infrastructure April 2020

17
8. Issues at behind Spar and house 232 in
Libode not yet resolved
Senior Manager
Infrastructure &
Planning and
Development
April 2020
9. Upgrading of Roads from Libode via
Nyandeni Great Place to N2
Department of Roads
and Transport
2020-2021
Local Economic Development
Ref No ACTIVITY RESPONSIBLE AGENCY TIMEFRAME
1. Support to SMME and Cooperative Planning and
Development
2. Identify opportunities in manufacturing
with aim of creating and support Small
business and job creation (Construction
of Mzimvubu Dam)
Planning and
Development
3. Coordinate Implementation of District
Development Projects
Office of the Municipal
Manager
4. Identify value chain beneficiation in
manufacturing, mining and tourism and
tourism sectors
Planning and
Development
5. Improve interface with the institutions of
high learning
Planning and
Development
2020-2021
6. Support the Small Scale Fisheries
Program implemented the Department
of Agriculture, Forestry and Fisheries
Planning and
Development
2020-2021
Good Governance and Public Participation
No ACTIVITY RESPONSIBLE AGENCY TIMEFRAME
1. Conduct Community/Customer Satisfaction Survey
Council 2020-2021
2. Convene IDP Representative Forum Office of the Municipal
Manager
April 2020
3. Strengthen public participation strategies and heighten communication
Office of the Mayor
and Speaker
Immediately
18
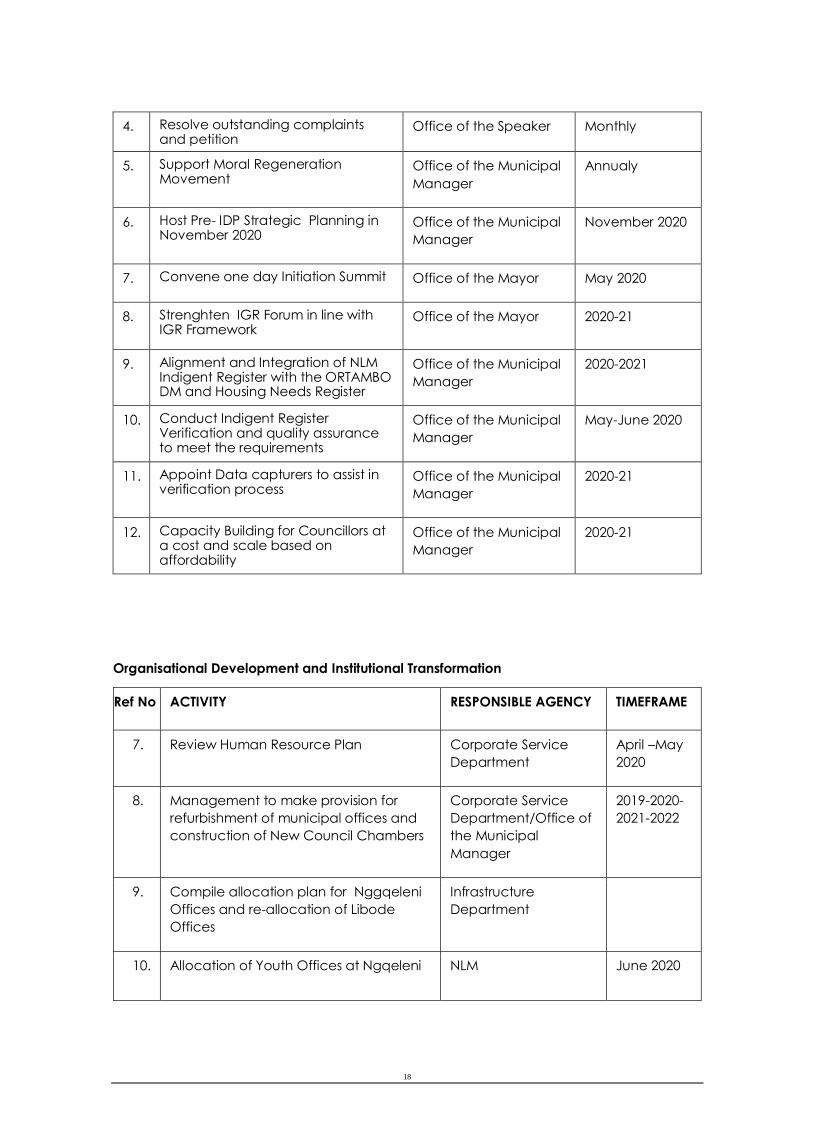
4. Resolve outstanding complaints and petition
Office of the Speaker Monthly
5. Support Moral Regeneration Movement
Office of the Municipal
Manager
Annualy
6. Host Pre- IDP Strategic Planning in November 2020
Office of the Municipal
Manager
November 2020
7. Convene one day Initiation Summit Office of the Mayor May 2020
8. Strenghten IGR Forum in line with IGR Framework
Office of the Mayor 2020-21
9. Alignment and Integration of NLM Indigent Register with the ORTAMBO DM and Housing Needs Register
Office of the Municipal
Manager
2020-2021
10. Conduct Indigent Register Verification and quality assurance to meet the requirements
Office of the Municipal
Manager
May-June 2020
11. Appoint Data capturers to assist in verification process
Office of the Municipal
Manager
2020-21
12. Capacity Building for Councillors at a cost and scale based on affordability
Office of the Municipal
Manager
2020-21
Organisational Development and Institutional Transformation
Ref No ACTIVITY RESPONSIBLE AGENCY TIMEFRAME
7. Review Human Resource Plan Corporate Service
Department
April –May
2020
8. Management to make provision for
refurbishment of municipal offices and
construction of New Council Chambers
Corporate Service
Department/Office of
the Municipal
Manager
2019-2020-
2021-2022
9. Compile allocation plan for Nggqeleni
Offices and re-allocation of Libode
Offices
Infrastructure
Department
10. Allocation of Youth Offices at Ngqeleni NLM June 2020

19
Financial Viability and Management
Ref No ACTIVITY RESPONSIBLE
AGENCY
TIMEFRAME
1. Adoption of the integrated revenue
enhance plan (with the purpose to
realise revenue
BTO/Council May 2020
2. Compilation of the cash-backed and
credible annual budget
BTO March- May 2020-
2021 including
outer years
3. Quarterly monitoring of Grants
expenditure trends
Council 2020-2021
COMMUNITY INPUTS
The following service delivery issues emerged during the IDP consultation process, when
making a determination on priorities council will consider these community needs taking
into account costs, available budget and other resources. These inputs shall be considered
over MTREF period
WARD
ELECTRICITY WATER AND SANITATION
ROADS AND BRIDGES
HOUSING
Ward 1
There are villages with
historic backlog, which
have not been
addressed.
a. Zandukwana village
b. Themebeni Village
c. Ngcolorha Village
d. Mahoyana Village
e. Khalandoda Village
f. Mjobeni Village g. Matolweni
Village
Mhlanganisweni Phase
2 Scheme located at
Coza supplying the
following villages the
pipe has burst and
need repairs.
a. Mjobeni
Village
b. Matolweni
Village
c. Siqikini
a) Maintenance of Zandukwana road which was left incomplete
b) Upgrading of Thembi Access Bridge linking Ngcolora and Mahoyane Communities
c) Maintenance of T173 Provincial Road
Ngcolora 1000 units is blocked
Electrification of
extensions in the
following villages:
Insufficient Jojo Tanks
at Zandukwana Village
only 2 has been
Blading of access
roads leading to the
following VDs

20
WARD
ELECTRICITY WATER AND SANITATION
ROADS AND BRIDGES
HOUSING
h. Zandukwana Village
i. Themebeni Village
j. Ngcolorha Village
k. Mahoyana Village
l. Khalandoda Village
m. Mjobeni Village n. Matolweni
Village o. Siqikini Village
supplied (a Request
for Steel reservoir has
been made)
a) Dumile VD
b) Mjobeni VD
Follow up on a request
for Replacement of
diesel pump with
electric pumps.
436 Households are without toilets The following villages are affected
a) Zandukwana Village
b) Themebeni Village
c) Ngcolorha Village
d) Mahoyana Village
e) Khalandoda Village
f) Mjobeni village g) Matolweni
Village h) Siqikini Village
Ward 2
Gqweza Village 14
households were left
out during the
electrification of the
project was called
Ncithwa project
a) Zibungu and Zele villages which are supplied by Mhlanga Dam last had drinking water in 2014
b) Mzimvubu Dam constructor is on site
c) Four Water JoJo Tanks were delivered at Thungwini, Mahahane and Ludeke Village with no water
d) Mseleni Village still
without water.
The following roads need maintenance
a) Mseleni access road
b) Mahahane access roads
c) Ngcoya access
d) Bele access roads
In the entire ward no houses were built;
a) Ncithwa Village
b) Mahahane Village
c) Ludeke village
d) Gqweza village
e) Bomvini village
f) Ngconco village
g) Thungwini village
h) Tabase Village
i) Ncoya village

21
WARD
ELECTRICITY WATER AND SANITATION
ROADS AND BRIDGES
HOUSING
New extension at Zele
and Bomvini Villages
has been surveyed but
electricity has not been
electrified
The following Villages with no water a) Ncithwa Village b) Mahahane Village c) Ludeke Village d) Gqweza Village e) Bomvini Village f) Ngconco Village g) Thungwini Village h) Tabase Village i) Ncoya Village j) Zibungu Village k) Zele Village l) Mseleni Village
j) Zibungu village
k) Zele village l) Mseleni
village
Follow up with
ORTAMBO DM on the
application for
construction of a
Borehole.
Ward 3
New Extensions with no access to electricity a. Luthubeni New
Extension b. Gabuza new
extension(under Coza A/A
c. Msana New Extension
d. Coza-phezukwamawa
e. Mgqedeni new extension
f. Mhlanganisweni 14 households not connected(Infil
The areas have no access to water
Luthubeni Vllage (Lutheni village is close to Luthubeni Dam but do not have access to water
Coza Mlomo (taps installed but no water
a. Construction of Mhlahlane to Dokodela access road
b. Construction of Nqwitheni access road
c. Construction of T172 linking Ward 1 and Ward 3 (Zandukwana to Nqwitheni
d. Upgrading of Coza Bridge connecting Mabalengwe Secondary and and Coza JSS
Ward 4
The new extensions in the following villages has no electricity a) Mkhotyana Village b) Mhlanga Village c) Zinkumbini Village d) Marhubeni Village e) Mdina Village f) Mcwili Village g) Mbhobheleni
Village h) Dungu Village
The whole ward does not have water and the community put pressure to ward councillor demanding water. The following were the villages; a) Mkhotyana Village b) Mhlanga Village c) Zinkumbini Village d) Marhubeni Village
Construction of the following; a) Mhlanga access
road b) Mdina J.s.s. to
cwili access road Maintenance of the following roads; a) Mkhotyana
Access road
Makhotyana destitute housing project

22
WARD
ELECTRICITY WATER AND SANITATION
ROADS AND BRIDGES
HOUSING
e) Mdina Village f) Mcwili village g) Mbhobheleni
Village h) Dungu Village
b) Mbhobheleni Access road
c) Zaneblom access road
d) Zinkumbini Access road
e) Constructio of Mbhobheleni to Ndlov’aphathwa Bridge
Ward 5
The contractor
delivered the poles at
Nxukhwebe Village but
failed to connect the
households and also
there are villages
which were never
connected
a) Mpindweni
village
b) Ndayeni village
The following
wExtensions
c) Bomvini Village
d) Mangcwangule
ni Village
e) Lwandlana
Village
f) Sompa village
g) Ngolo Village
h) Mthombetsitsa
Village
i) Thafeni Village
There was a promise
of borehole but now
the report does not talk
about that promise and
the district was
requested to consider
that. It was registered
as a concern for the
OR Tambo for
covering only 3 wards
in the sanitation
programme although
there are various
wards that still needs
sanitation
Villages with no
Water
a) Ndayeni village
b) Bomvini Village
c) Mangcwanguleni
d) Lwandlana
e) Sompa Village
f) Ngolo Village
a) Upgrading of b) Nxukhwebe to
Mthombe Tsitsa access road
c) Construction of
phase 3 Ndayeni access rood
d) Construction of e) Bomvini to
Mpindweni access road
f) Maintenance of
T179 and T175 roads
Destitute
households in
these villages has
been provided with
temporal structures.
The department of
human settlement
should supply
permanent houses.
a) Bomvini Village
b) Mangcwangule
ni village
c) Sompa village
d) Ngolo Village
e) Mthombe-tsitsa
Village
f) Thafeni Village
g) Mthombe
Village
h) Nomaweni
Village
i) Nxukhwebe
Village

23
WARD
ELECTRICITY WATER AND SANITATION
ROADS AND BRIDGES
HOUSING
j) Mthombe-
Nomaweni
Village
k) Nxukhwebe
Village
l) Gebane Village
g) Mthombetsitsa
Village
h) Thafeni Village
i) Mthombe-
Nomaweni Village
j) Nxukhwebe Village
k) Mpindweni Village
j) Gebane village
Ward 6
New extensions
a) Ntsonyini 1 and
2
b) Ngqongweni
Village
c) Nodushe
Village
d) Mgwenyane
A/A
(Ntlambela,
Ludwesa)
e) Ngojini A/A
(Ntlangwini,
Gawuza, Cwili,
Gutsi,
Mcothama and
Mgungundlovu)
f) Mngazi A/A
(Makhuzeni,
Masameni,
Village with no Water
a) Ntlambela
village
b) Ntsonyini
eFarmer
c) Ngojini Village
Water engine
supplying
Ntsonyini-
Ngqongweni
needs repairs .
The water pump
was damaged but
until now it has
been fixed .
Mngazi weir is not
functioning.
The following
extension have no
toilets
Construction of the following roads a) Gutsi access
road b) Ntlambela access
road c) Maintanance of
Ntsonyini access road
d) Ntsonyini to
Nodushe access road
e) Nodushe to Ngqongweni access road
f) Bomsi to Ntlangwini access road
T191 T-road 2briges need repairs. Construction of Bridges
Ntsonyini access road has three bridges that need repairs
Ntsonyini to Nodushe Bridge
Nodushe access road with bridge
There are no
houses to the entire
ward and the
following are the
villages in the ward.
a) Ntsonyini 1 and
2
b) Ngqongweni
Village
c) Nodushe
Village
d) Mgwenyane
A/A (Ntlambela,
Ludwesa)
e) Ngojini A/A
(Ntlangwini,
Gawuza, Cwili,
Gutsi,
Mcothama and
Mgungundlovu)

24
WARD
ELECTRICITY WATER AND SANITATION
ROADS AND BRIDGES
HOUSING
Mputshane,
nduna,
Notikane)
g) Cibeni A/A
(Gorha,
Newrest,
Masimini,
Mgwarhume)
A service provider is
currently on site for
electrification infills
a) Ntsonyini 1 and 2
b) Ngqongweni
Village
c) Nodushe Village
d) Mgwenyane A/A
(Ntlambela,
Ludwesa)
e) Ngojini A/A
(Ntlangwini,
Gawuza, Cwili,
Gutsi, Mcothama
and
Mgungundlovu)
f) Mngazi A/A
(Makhuzeni,
Masameni,
Mputshane,
nduna,
Notikane)
g) Cibeni A/A
(Gorha,
Newrest,
Masimini,
Mgwarhume)
Ward 7
Thabo Mbeki and
extension 1 are with
no water
a) The Libode Transport Hub was supposed to be completed on 5 October 2018. Contract ceded due to poor performance
b) Fix of Potholes in Libode Internal Streets.
c) Upgrading of road leading to Thabo Mbheki Location.
Construction of
houses in informal
settlements.
Ward 8
Extension Mphangana Moyeni Tyarha Mamfengwini Magcakini Mdlankomo INFILLS AREAS Households are being electrified in the f
Moyeni, Mamfengwini, Magcakini and Tyarha has an old reticulation system Tyarha water scheme is broken. There is no water at Magcakini Village.
a) Construction of Mphangana access road
b) Moyeni access
road contractor is on site
c) Manfengwini
access road maintenance in progress
d) Maintanance
The following villages have temporal structures and need permanent structures; a) Mdlankomo
Village b) Mamfengwingin
i Village c) Moyeni village d) Tyara village
village

25
WARD
ELECTRICITY WATER AND SANITATION
ROADS AND BRIDGES
HOUSING
a) Mdlannkomo electrificatioj completed
b) Mamfengwingini electrification completed
c) Moyeni In progress d) Tyara village is
outstanding e) Mphangana is
outstanding f) Magcakeni is
outstanding
Mdlankomo Village the municipal system is not yet functioning SANITATION The following are the villages with old sanitation system and its not existing now including extension; a) Mphangana
Village b) Moyeni Village There are no toilets at all to the following extensions a) Tyarha Village b) Mamfengwini
Village c) Magcakini Village d) Mdlankomo Village
e) Tyarha access road
f) Mdlankomo internal road
g) Mphangana
access road require a bridge on your way to Thabo Mbheki)
h) At Mphangana
Access Road require a bridge.
e) Mphangana village
f) Magcakeni village
(these households are reflected in the housing list ) Magcaikini, Mdlankomo and Mamfengwini. The entire ward require RDP houses The following request ECDC a) Mdlankomo
Village
b) Mamfengwingin
i Village
c) Moyeni village
d) Tyara village
village
e) Mphangana
village
f) Magcakeni
village
Ward 9
Extensions a) Misty-Mount Village b) Noorwoord Village c) Dininkosi village d) Gxulu Village e) Mhlabeni Village Infills Cambridge Kungxanga Noorword Dininkosi
There’s no water at Vezamandla (Reticulation) Extensions with no sanitation infrastructure
Diphini
Noorwoord Old system and Their toilets are full
Maintenance Zithathele to Diphini Access Road Nojiya Homestead to Qangule Homestead Mzimkhulu access road Ngwangi Junior Sec Access Road Dininkosi Access Road Vezamandla to Misty Mount Access Road Misty Mount Access Road they need a slab for about 500mitres. Construction Dininkosi to Mhlabeni Access Road T172 Road Misty mount to Bafazi village to maintained
The entire Ward need houses a) Misty Mount b) Noowoord c) Dininkosi d) Gxulu e) Mhlabeni f) Vezamandla g) Mchubakazi h) Cambridge i) Kungxanga j) Diphini

26
WARD
ELECTRICITY WATER AND SANITATION
ROADS AND BRIDGES
HOUSING
Ward 10
Some households in
the following Villages
have not been
connected (number of
affected hh was not
readily available)
a) Ntilini Village
b) Sofaya Village
c) Maqanyeni
Village
d) New Rest Village
e) Ndubungela
Village
f) Lurhasini Village
a) There is no water at Ndubungela and
b) Maqanyeni
Construction of the following access roads Sofaya Access Road (was not appearing on the map fully) New Rest Mqanyeni-Kwamncane Zikhoveni Village Luthuli Village
The following villages have temporal structures and need permanent structures;
Ntilini
Maqanyeni
Extensions with no electricity a) Maqanyeni
Externsion b) Lurhasini Village c) Ntilini Village d) Lutholi Village e) Sofaya Village
Extensions with no access to water a) Maqayeni
Externsion b) Ntilini Ezikhovini c) Sofaya (certain
households in this area have no access to water )
The following road require Maintenance
a) Ndubungela Village
b) Maqanyeni Village
c) Zikhoveni Village
d) Construction of a Bridge connecting Zikhoveni Village to Phase
e) Construction of
a Bridget connecting Ntilini Village and Mpindweni Village Ward 10 (KSD)
The following
villages have never
benefited in
housing
development
a) Ntlini
Village
b) Sofaya
Village
c) Maqanyeni
Village
d) Maqanyeni
Extension
e) Lurhasini
Village
f) Lutholi
Village
g) New Rest
Village
h) Zikhoveni
Village
i) Ndubungel
a Village
Infills with no electricity a) Zikhoveni b) Ntilini c) Luthuli d) New Rest e) Maqanyeni (Kwamncane) f) Ndubungela g) Sofaya
Extensions with no toilets a) Maqanyeni
Extension b) New Bright c) Ntilini Village d) Sofaya e) Maqanyeni f) New Rest

27
WARD
ELECTRICITY WATER AND SANITATION
ROADS AND BRIDGES
HOUSING
h) Lurhasini i) Maqanyeni Extension
Ward 11
a) the contractor has not completed installation of electricity at 23 Ngolo-Ziphunzana extension householsd
b) few households Lukhanyisweni Village have not been electrified
c) two INFILL households Ncambendlana have been left out
d) two infill households at Suncity Village not connected
e) two infill households at Kuyasa Village not connected
Request for High Mast Street Lights
The following Village have no toilets
a) Lukhanyisweni b) Ngqawi village c) Nkanyeni
village d) Sundcity
Village e) Ziphunzana
100 Village f) Ziphunzana T-
Sign g) Kuyasa Village h) Ngolo Village i) Ncabedlana j) Enqubela
Village
Construction of DR08645 road
Construction of a Bridge connecting SANTA and Ngolo Village
800 Units
Lukhanyisweni and
Moyeni villages needs housing
Ward 12
The following extensions with no electricity Ngqubusini Extension Khayelitsha is currently on construction Infills Church Village Ngobozi Village
Villages with no water
a) Ntaphane Village
there is
infrastructure but
tap are dry
b) Part of Galili
village there are no
taps at all
c) Part of Khayelitsha
and Zone 14 there
are no Taps at all.
Maintenance Mthebelezi village poor maintenance was done as a result the road is in trafficable. All the externsions there are no roads they require construction of roads
Destitues needs houses in the entire ward; the list is being prepared.

28
WARD
ELECTRICITY WATER AND SANITATION
ROADS AND BRIDGES
HOUSING
No Toilets at the
following
a) Khayelitsha
Village
b) Zone 14.
Ward 13
Extensions with no electricity
a) Buntville b) Lujecweni c) Mandlovini d) Ncaka
The Villages with no water
a) Buntinville b) Mantanjeni
New extensions with toilets
a) Buntinvile b) Ntsaka c) Mandlovini d) Lujecweni e) Mantanjeni
Construction Mandlovini to Khubisi Bridge access road
Upgrading Sundwane to Bidiza access road
T263 Provincial Road needs upgrading
Maintenance Buntiville and Ntsaka to Mantanjeni are implete(Project has stopped)
Nyandeni 669 Project has stopped , only slaps have been constructed
Nyandeni 370- Project was abandoned incomplete
Awaiting Gxulu 200 and Nyandeni 223
Ward 14
a) At about 95 houses Mqwangqweni No3 has no electricity
b) Mqwagqeni No.2 has 8 households with no electricity
c) Mnqwangweni N1 At about 14 houses with no electricity.
d) Mangwaneni Village) eGxeni) about 18 house holds
e) Edumasi (Thurhwini) about 16 households
f) Mangwaneni 4 households
A contraction connection of infills in the above villages which close to electric line
a) Mqwangqweni No3 b) Mqwagqeni No.2 c) Mnqwangweni N1 d) Mangwaneni
Village) eGxeni) e) Edumasi
(Thurhwini) f) Mangwaneni g) Emagozeni h) Esixhotyeni i) YC Village j) Fama Village k) Magozeni Village l) Mangwaneni
Village 396 households has no toilets a) Mqwangqweni No3 b) Mqwagqeni No.2 c) Mnqwangweni N1 d) Mangwaneni Village) eGxeni)
Construction of new road on the following Dontsa to Mangwaneni access road. Nolitha to Mqonyeni via to Mphathiswa the constructer is on site for maintenance
Mangwaneni Village still waiting for housing development
Ward 15
The following extensions with no
No water and sanitation to all the villages
Contraction of new roads
Villages that needs housing development

29
WARD
ELECTRICITY WATER AND SANITATION
ROADS AND BRIDGES
HOUSING
electricity but the contractor is on site.
a) Khuleka b) Makhwetshube
ni-Mxhosa c) Masameni d) Dokodela e) Ngxokweni f) Ngxokweni-
Kwadlanjwa g) Mtyu h) Katilumla i) University j) Mthonjana
k) Khuleka l) Makhwetshub
eni-Mxhosa m) Masameni n) Dokodela o) Ngxokweni p) Ngxokweni-
Kwadlanjwa q) Mtyu r) Katilumla s) University t) Mthonjana
a) Ngxokweni access road
b) Khuleka access road
c) Mkhwetshubeni access road
The following are the roads that need maintenance. a) Dokodela access
road b) Katilumla access
road c) Mtyu access road d) Masameni
access road e) University access
road f) Mthonjana
access road g) Mxhosa access
road Bridges that connects Mtyu and Ngxokweni village is on planning stage Construction of Didi to Khuleka bridge
a) Khuleka Village b) Makhwetshube
ni-Mxhosa Village
c) Masameni Village
d) Dokodela Village
e) Ngxokweni Village
f) Ngxokweni-Kwadlanjwa Village
g) Mtyu Village h) Katilumla
Village i) University
village j) Mthonjana
Village
Ward 16
The villages with no a) Siwela Village b) Maraba Village c) Njova Village
Extension d) Hiltop Village e) Msintsini f) Mkhankatho
Village g) Deep Level
Village h) Jamani village i) Ntabantsimbi j) Didi Mafini
Village k) Makhuzeni
Village l) Nqwanini
Villages with no Water in new extension Msintsini Ntendele Deep Level Jamani Ntabantsimbi Nqwanini Dalaguba Hiltop Mkhankatho Mkhuzeni Siwela Njova Villages with no toilets in new extensions Msintsini Ntendele Deep Level Jamani Ntabantsimbi Nqwanini Dalaguba Hiltop
Construction of new roads
a) Mafini JJS Access road
b) Siwela Access road
c) Dalaguba Access road
d) Hiltop access road
a) Maintenance b) Maqhingeni
Access Road c) Mkhankatho
access road d) Construction of
DiDi to Ntendele Bridge Ntendele to Jamani Bridge Mafini JSS Bridge
e) R61 old T- Road
a) Msintsini b) Ntendele c) Deep Level d) Jamani e) Ntabantsim
bi f) Nqwanini g) Dalaguba h) Hiltop i) Mkhankath
o j) Mkhuzeni k) Siwela l) Njova

30
WARD
ELECTRICITY WATER AND SANITATION
ROADS AND BRIDGES
HOUSING
Mkhankatho Mkhuzeni Siwela Njova
Ward 17
Villages with historic backlog
a. Phanda Villages
b. Part of Mdumazulu Village
the following have tap but with no access to drinkable water ( some of taps have been damaged
a. Phanda village b. Mdumazulu
Village c. Ludadaka Village d. Mhlahlane
Village e. Mandileni Village f. Noxova Village g. Thonti Village h. Zidikideni Village
The following Access roads a. Katini access
road (phase two b. Ngquba access
road c. Magozeni access
road
Old projects that have not been completed a) Mampondomis
eni 150 project is blocked
b) Mampondomiseni 150 is also blocked
New extension with no access electricity
a. Ludaka new extension
b. Guqa new extension
c. Kantini new extension
d. Mandileni new extension
e. Noxova new extension
f. Mhlahlane new extension
The following Village have no water infrastructure and no access to drinkable water
a. Old Bunting(Ngquba)
b. Katini Village c. Magozeni Village d. Guqa Village
On maintenance; a. Mhlahlane
access road( Contractor currently on site
b. Ngqongweni road linkage (just been completed but should be included in the maintenance plan)
c. Ludaka access road
d. Mdumazulu access road
e. Mandileni access road
The following villages have benefitted at all in RDP Housing
a) Ngquba Village
b) Katini Village c) Guqa Village d) Magozeni
Village e) Ludaka
Village f) Mandileni
Village g) Noxova
Village h) Thonti Village i) Mhlahlane
Village
Infills with no access to electricity
a. Mdumazulu infils
b. Guqa infills c. Mandileni infills d. Katini infills e. Noxova infills f. Mhlahlane
infills
On Sanitation (New extensions with no access to sanitation a. Ludaka new extension b. Guqa new extension d. Mandileni new extension e. Noxova new extension
On T-Roads (T27)
Deyi to Noxova T-road has not yet been completed
Upgrading of Guqa Bridge- connecting ward 17 and Ward 19(Students who attending high school uses this bridge , it is in bad condition
Construction of Ngquba Bridge which provides
a) Phanda Villages
b) Mdumazulu c) Ludaka

31
WARD
ELECTRICITY WATER AND SANITATION
ROADS AND BRIDGES
HOUSING
access to cemetery
Upgrading of Ludaka Bridge
Ward 18
New Extensions The contractor is currently on site for electrification of the following new extensions(248 hh)
a) Bhakaleni New Extensions
b) Zwelitsha New Extension
c) Topia New Extensions
d) Bhukwini New Extensions
e) Manxeweni New Extensions
f) Mlengane New Extensions
The following villages have no access to clean drinkable water
a) Mlengane b) Manxiweni c) Mbiza d) Bhakaleni e) Njiveni f) Mhlatyana g) Nohokoza h) Maqanyeni i) Sikelwini j) Ngidini k) Bhukwini l) Mabheleni
Access to roads a) Ngidini to
Khangisa access road(contractor is currently on site
b) Mabheleni to Pitoli access road
c)
a) Mlengane b) Manxiweni c) Mbiza d) Bhakaleni e) Njiveni f) Mhlatyana g) Nohokoza h) Maqanyeni i) Sikelwini j) Ngidini k) Bhukwini l) Mabheleni
Infills a) Nohokoza
village b) Mabheleni
village c) Njiveni village d) Bhakaleni
Replacement of old sanitation infrastructure
The following access road needs Maintenance
a) Mhlatyana access road
b) Ntlaza to Mbiza access road
Ward 19
The following new extensions have not been connected. Most of this villages have been pegged with the exception which (Lusizini and Sazinge) Zinduneni village Dangeni Village Bandla village Cwele Village Lusizini Village Nomcaba Village Njimaza Village Mnyameni Village Njingeni Village Sazinge Village Villages with infills with no electricity
a. Ziduneni and Njimaza Villages households
Cwele-Bandla Water scheme is currently been repaired. Out of 7 Villages 4 have access to drinkable water and these are
a. Zinduneni b. Dangeni c. Njimaza and d. Mnyameni
The following have no access to clean drinkable water
a. Bandla Village b. Cwele Village c. Lusizini Village
Four Village have no spring protection and these are
The following Villages request new raods a. Njimaza to
Dangeni Access road (new)
b. Mhlongwana to Nomcamba Access road (new)
The following access are due for Maintenance , they are in trafficable a. Ziduneni to
Bandla access road
b. Mvilo access road
c. Lusizini access road
T-29 Provincial Road is in poor state and
The following Villages have not benefitted in the RDP Housing development a. Zinduneni
village b. Dangeni Village c. Bandla village d. Cwele Village e. Lusizini Village f. Nomcaba
Village g. Njimaza Village h. Mnyameni
Village i. Njingeni Village j. Sazinge Village The following Villages are still for implementation of

32
WARD
ELECTRICITY WATER AND SANITATION
ROADS AND BRIDGES
HOUSING
have been connected(Ward Councillor to provide number of hh connected)
b. Dangeni Village
c. Bandla Village d. Cwele Village e. Lusizini Village f. Mhlongwana
Village g. Nomcamba
Village h. Mnyameni
Village i. Njingeni Village j. Sazinge Village
a. Mhlongwana Village
b. Nomcamba Village
c. Njingeni Village
d. Sazinge Village
On Sanitation Ward Councillor to provide information accurate information on new extension that needs sanitation
needs urgent attention Construction Dangeni Bridge (this bridge connect Dangeni, Tekwni and Maqebevu Villages. The Municipality indicated that this bridge requires Environmental Impact Study
Disaster Housing Project
a. Nomcamba Village
b. Zinduneni Village
c. Lusizini Village
d. Mnyameni village and
e. Njingeni Village
Ward 20
New extensions with access to electricity
a) Wataleni New Extension
b) Nothintsila New Extension
c) Ntsundwana New Extension
d) Xhuthidwele New Extension
e) Butsula New Extension
Out of 18 Villages only 1 Village has access to drinkable water, which is Ntsundwana Village
The following access roads needs construction ;
a. Construction of Noxojwana access road
b. Construction of Ntsundwana to Zimbuzana access road
c. Construction of Lucingweni to Xhuthidwele access road
d. Construction Ntsundwana to Mcwabe access road
e. Construction of Nothintsila to Ngxotho access road
f. Construction of Nkanunu to New Town access road
g. Construction of Vinish to Mthakatye access road
h. Construction of Mjanyana to Sonqalo access road
i. Construction of Lucingweni to

33
WARD
ELECTRICITY WATER AND SANITATION
ROADS AND BRIDGES
HOUSING
Phesheyakwetsele access road
j. Construction of Nkalweni to Wataleni access road
k. Construction of Mtsila to Ludakeni access road
l. Construction of Nothintsila to Nkomanzi access road
m. Construction of Nkanunu to Lukhusunca access road
n. Construction of Gangeni to MKhiwaneni
o. Construction of Upgrading of Mthakatye Bridge
p. Construction of Mvilo Bridge connecting Ntsundwane, Ngonqeleni, Mdeni
q. Construction of Mnenu Bridge linking Nyandeni and PSJ Municipality
The following infils has no access to electricity
a. Mboleni Infills (Contractor on site )
b. Ntsundwana infills (contractor is on site)
c. Khephe Infills d. Ngonqelweni
Infills e. Vinish Infills f. Jange Infills g. Lucingweni
Infills h. Mjanyana infills i. Xuthidwele
infills
Villages with no access water
a. Nothintsila Village
b. Darhana Village c. Ngxotho Village d. Goli Village e. Mboleni Village f. Mtswila Village g. Khephe Village h. Vinish Village i. Jange Village j. Xuthidwele
Village k. Lucingweni
Village l. Ngonqelweni
village m. Mjanyane n. Butsula Village
Access road that require maintenance
a. Vinish access road
b. Jange access road
c. Bhutsula access road
d. Mdwina access road
e. Igoli access road
f. Nothintsila to Mvilo access road

34
WARD
ELECTRICITY WATER AND SANITATION
ROADS AND BRIDGES
HOUSING
o. Mdziwina Village p. Gangeni
The following Villages are currently being connected
a. Mvilo Village b. Egoli Village c. Mtswina Village
Access to Sanitation The following new extensions have no access to sanitation a) Wataleni New Extension b) Nothintsila New Extension c) Ntsundwana New Extension d) Xhuthidwele New Extension e) Butsula New Extension
Ward 21
New Extensions with no access to electricity
a. Mposane New Extension
b. Bhantini A/A No.1 & 2
c. Maqanyane New Extension
d. Ndzwakazi New Extension
Installation of High mast street lights at Ngqeleni extension five
Villages with no access to drinkable water a. Mposane Village b. Ndzwakazi c. Maqanyeni Village d. Bhantini Village e. Mngazana Village f. Extension 5 Note: NQGELENI CORRIDOR Water Supply under MIG 1-6 is currently under construction , once completed it will supply water to the above villages Current Projects
Ngqeleni secondary Bulk
Ngqeleni – Libode Regional Bulk
Ngqeleni Sewer
Access roads that needs construction a. Construction of
Ndwakazi internal roads
b. Construction of Mngazana internal roads
c. Construction of Mposane internal Roads leading to Aphambange JSS
d.
The following Villages have not benefited on RDP Housing Development a. Mposane
Village
b. Ndzwakazi
c. Maqanyeni
Village
d. Bhantini Village
e. Mngazana
Village
All the above village have requested replacement of the existing sanitation infrastructure
Access roads to be included in the Maintenance
a. Surfacing of Extension four (4)internal Roads
b. Maintenance of Magcakini A/A internal Roads

35
WARD
ELECTRICITY WATER AND SANITATION
ROADS AND BRIDGES
HOUSING
c. Maintenance of Poulini Internal roads
Ward 22
Historical backlog a. Mgonondi
Village b. Welese Village c. Mthokwane
Village
Area with no access to water
a. Mgonondi b. Mthokwane
Access road for construction
a. Construction of Candzibe access road
b.
The entire wards have not benefitted
a. Candzibe b. Welese c. Nkantsini d. Mgonondi e. Mthokwana
New Extensions a. Welese New
Extensions b. Mgonondi new
extension c. Nkantsini new
extension d. Candzibe new
extension
On access to Sanitation- The following areas needs sanitation infrastructure
a. Welese New Extensions
b. Mgonondi new extension
c. Nkantsini new extension
d. Candzibe new extension
e. Mthokwane –replacement of existing sanitation infrastructure
Access roads that needs maintenance a. Mthokwane
access road b. Construction of
Mthokwane Bridge
c. Bomvana access road
d. Candzibe to Nyuleni access road
e. Welese to Kwazulu access road
Contractor is currently for electrifications of infills
a. Candzibe b. Welese c. Mgonondi d. Mthokwane
Ward 23
New Extensions with no access to electricity
a. Nomadolo new extension
b. Nqayiya new extension
c. Mdepha new extension
d. Phalo new extension
The new extension have no access to drinkable water
a) Nomadolo new extension
b) Cwaka new extension
Access that needs construction a) Ngwenyeni
access road b) Mosi to Bhayi
access road c) Nomadolo access
road
Blocked a) Nyandeni 77 –
project stopped
Infill with access to electricity
a) Manqabeni infills
b) Cwaka Infill c) Bomvana infills d) Nkanti Infills e) Sizane infill
On sanitation- the following new extensions require sanitation infrastructure a. Nomadolo new extension b. Nqayiya new extension c. Mdepha new extension d. Phalo new extension
Access roads to be included in Maintenance Plan
a) Hamsini access road
b) Simanzi access road
c) Mbhepha access road
Gqwarhu access Bridge linking Gqwarhu and Nomadlo Communities
a. Nomadolo
Village b. Hamsini Village c. Cwaka Village d. Sizane Village e. Thekwini
Village f. Nkanti Village g. Mdepha Village h. Manqabeni
Village i. Bukhwezeni
Village

36
WARD
ELECTRICITY WATER AND SANITATION
ROADS AND BRIDGES
HOUSING
Ntsazini access bridge linking Hamsini and Mayalweni Villages
Ward 24
New Extensions with no access electricity
a. Mabhetshe(gxididi new extension )
Areas with no access to drinkable water
a) Malungeni b) Mbange c) Godini d) Ncedana e) Buthongweni
village f) Zaka Village g) Mhlakotshane
village h) Mabhetshe
village
Access roads for construction
a) Construction of Mbange access road
b) Construction of Nkumandeni access raod
c) Construction of Mchaphathi to Ncedana access road
The entire Ward have not benefited in RDP
i) Malungeni j) Mbange k) Godini l) Ncedana m) Buthongwe
ni village n) Zaka
Village o) Mhlakotsha
ne village p) Mabhetshe
village
Contractor is currently on site connecting infills
On access to Sanitation Request to replace old sanitation infrastructure in the above villages
Maintenance of access road
a) Buthongweni access road
b) Godini access road
Infills that are currently being connected (contractor on site) a) Malungeni b) Mbange c) Godini d) Ncedana e) Buthongweni village f) Zaka Village g) Mhlakotshane village h) Mabhetshe village
Construction Buntini and Godi Bridge
Ward 25
Mncibe Village is one of historic backlog still remaining
The following areas have no access to drinkable water
a) Mamolweni Village
b) Mzonyana Village
c) Mphimbo Village
d) Taps at Lwandile have been installed but no water
Construction of Ludaka Bridge linking Ludaka and Mamolweni villages
Mncibe access road needs maintenance
Construction of Mthakatye Bridge linking ward 20 and 25
T33 Provincial Road

37
WARD
ELECTRICITY WATER AND SANITATION
ROADS AND BRIDGES
HOUSING
Maintenance of existing sanitation infrastructure
Ward 26
Historic Backlog at Tshani Mankosi witih 256 households has not electrified. The project implementation date is planned for 2020/2020 financial year
The following areas have no access to clean drinkable water
a) Emandleni Village
b) Ntsimbini Village
c) Mbhaba Village
d) Njiveni Village e) Mtondela
Village f) Manangeni
Village g) Gosa Village h) Zixambuzi
Village i) Mafusini
Village j) Gunqwana
Village k) Zincunkuthwini
Village
The following access road needs construction a) Mbuzweni access
road b) Manangeni to
Mtondela access road
c) Zulu Access road d) Luqolweni to
Mngcibe access road
e) Luqolweni to Mngcibe Bridge linkin Mncgibe community Njilini High School
f) Tholeni access road(project on advert
New Extensions with no access to electricity
a) Zixambozi New Extension
b) Gazini New Extension
On sanitation The following New Extensions have no access to sanitation
a) New Rest in Mevana
b) Zixambozi New Extension
c) Gazini New Extension
On Maintenance a) Mwangwini to
Mthonjeni access road
b) Goso access to road- this road is connecting to Goss Senior Primary School
c) Malizole JSS to Ntsimbini access road
Infills with no access to electricity d) Emandleni Village e) Mbhaba Village f) Njiveni Village g) Goso Village h) Sidabadabeni
Village i) Bomvini Village j) Mwangwini Village k) Mbuzweni Village l) Ngcobo Village
with 18 households not electrified
Replace the existing sanitation infrastructure that full to capacity
a) Construction of T-road from Kop-shop to Mthatha-Mouth as well as the Provincial Road leading to Mdumbi Back Packers
b) Upgrading of Bridge that link Mthatha-Mouth to Coffee Bay (this is a Provincial Road
a) 2009 Disaster Houses have not been reconstructed
b) Mankosi 1000
project is blocked
Ward 27
New extensions with access to electricity
The following villages have no access to
The following access road needs
The Following Villages have

38
WARD
ELECTRICITY WATER AND SANITATION
ROADS AND BRIDGES
HOUSING
a) Nkanga b) Nkonkoni c) Ntshele d) Bhungu e) Dikela f) Lukhuni at
Cumnge g) Kwelimdaka h) Gqwarhu i) Lukhuni ezantsi
water for past seven years
a) Dikela b) Bhungu c) Ntsele d) Nkanga e) Nkonkoni f) Lukhuni
Administrative Area
a) Manqilo access road
b) Langakazi access road
c) Humane access road
requested construction of RDP Houses a) Nkanga
b) Nkonkoni
c) Ntsele
d) Bhungu
e) Dikela
f) Lukhuni
On Sanitation a) Kwelimdaka b)
Maintenance of the following access roads
a) TR175 from Bhekuzulu to Lukhuni to Dikela
b) Nkanga and Nkonkoni access road
c) Ntshele access road
d) Nkonkoni access road
e) Kwelimdaka access road
Ward 28
New extensions a. Sidanda/Hlutha
ni new Extension
b. Ntibane/Thekwini New Extensions
c. Mjolobeni New Extensions
The constructor is on sites Ntibane and Mdeni Regional Water Supply and Buthowe
a. Ntibane/Thekwini area
b. Qhokama Village
c. Luthini Village d. Sidanda
Village e. Mntsholobeni
Village f. Zingonyameni
Village g. Mayalweni
Village
Construction of the following
a) Mfundeni access road
b) Mathangaleni access road
c) Lutwatweni access road
a. Ntibane Village b. Thekwini
Village c. Qokama Village d. Sidanda Village e. Lutsheni Village f. Ntsholobeniv
Village g. Mayalweni
Village h. Lutatweni
Village i. Ngonyameni Sigubudu Village
Villages with infills a. Lutshini Infills b. Sidanda c. Ngonyameni
New extension with access to Sanitation a. Sidanda/Hluthani
new Extension b. Ntibane/Thekwini
New Extensions c. Mtsholobeni New
Extension
On maintenance a) Sidanda access
road b) Ntibane access
road c) Msuzwaneni
access raod d) Ngonyameni
access road e) Ngqeleni-to
Mthatha-Mouth (T30/1

39
WARD
ELECTRICITY WATER AND SANITATION
ROADS AND BRIDGES
HOUSING
Replacement of existing sanitation on the following villages j. Qokama Village k. Sidanda Village l. Lutsheni Village m. Ntsholobeni n. Mayalweni o. Lutatweni Village p. Ngonyameni q. Sigubudu Village
a) Construction of Mtsholobeni to Cadzibe Bridge (This bridge provides access to Cadzibe Hospital
b) Consruction of A Bridge connecting Ntibane to Ward 20
Ward 29
New extensions with no access to electricity
a) Langeni new extension
b) Mpendle new extension
c) Mjezweni new extesion
Out of 11 Villages only two have access to drinking water these are
a) Kawukazi village
b) Langeni Village
Access road that needs construction a) Mnqane to
Zixhotyeni access road
600 Housing Project –Contractor is on site. 72 Houses have been completed
Infills – the Contractor is on site connecting households a) Kawukazi b) Qinisa c) Mpendle – d) Mjezweni –
connection completed
e) Zanoxolo Village –only 7 households remains unconnected
f) Mcane Village (completed)
g) Mdeni Village (completed)
Village with no access to water but water pipes are being installed as part of Ngqeleni Corridor Project
a) Zanoxolo b) Mcane c) Mdeni d) Mjezweni
Access road to be included in the Maintenance plan
a. MJwezweni access road
b. Qinisa to Makhosi access road
c. Mpendle access road
d. Chunu to Polini access road
Areas with no sanitation
a) Bholotwa extension
b) Chunu Extension
c) Mnqane New Extension
d) Mdeni Extension
e) Zanoxolo Extension
f) Mjezweni New Extension
g) Qinisa New Extension
h) Mpendle New Extension
i) Kawukazi New Extension
Construction of Qinisa to Makhosi Access Bridge

40
WARD
ELECTRICITY WATER AND SANITATION
ROADS AND BRIDGES
HOUSING
j) Langeni New Extension
Ward 30
New Extensions with no access to Electricity
a. Mngamnye No 1, 2, 3, 4 & 5
b. Masameni New Extension
c. Kwazulu New Extension
d. Zolani new Extension
e. Church of God New Extension
f. Mchonco new Extension
15 Villages have no access to drinkable water
a. Mngamnye No 1, 2, 3, 4, 5,6, 7,9,10,and 11
b. Masameni New Extension
c. Kwazulu New Extension
d. Zolani new Extension
e. Church of God New Extension
f. Mchonco new Extension
Access Roads a. Lutsheko
access road at No. 6 & 7
b. Mfabantu to Zanokhanyo Secondary School access road
c. T301 Provincial Road linking Libode and Ngqeleni
d. Provincial Road Linking Ntlaza and Ngqeleni
e. Upgrading of Dikela Spring Access Bridge
13 Disaster Houses have been approved. Currently slap have been constructed
Infills , the Contractor is on site the following Villages a. Mngamnye No 1, 2, 3, 4 & 5 b. Masameni New Extension c. Kwazulu New Extension d. Zolani new Extension e. Church of God New Extension f. Mchonco new Extension
New extension have no sanitation infrastructure in all villages
In old villages replacement of existing infrastructure
On maintenance a. Dikela Spring
access road b. Maqanyeni to
Ngxangula Tribal Authority access road
The entire Ward has not been allocated RDP Projects
Request for the High mast street lights to reduce crime
Ward 31
Historic Backlog has not been addressed
a) Rainy Village b) Nyandeni
Village c) Mthomde
Village
The following area has no access to water
Emagqabi at Rainy no access to water
Mthombde new extension
Nyandeni Village (chophetyeni area
Nyandeni Great Place no water
Roads leading to voting stations a. Mthomde access
road b. Khanyisa JSS
access road c. Construction of
Nyandeni internal roads
d. Maintenance of T172 Provincial Road
e. Construction of Mthomde access bridge
a) Rainy Village b) Mthomde
Village c) Nyandei Village d) Gunyeni Village

41
WARD
ELECTRICITY WATER AND SANITATION
ROADS AND BRIDGES
HOUSING
New Extension with no access to electricity and new infills a. Rainy New Extension b. Mthomde New Extension c. Nyandeni new extension Gunyeni new Extension
The entire ward has no access to sanitation infrastructure a. Rainy Village b. Mthomde Village c. Nyandeni Village d. Gunyeni Village
The following access roads
a. Nyandeni access road
b. Gunyeni access road
c. Mthomde access road contractor is on site
Ward 32
Mpindweni New Extension
Mathayi New Extension
Lujizweni No. 5
Mgojweni New Extension
Ndonga New Extension
Mabomvini New Extension
a. Construction of Mawotsheni access road
b. Construction of Msintsini to Dikeni access road
c. Construction of ManziMahle Bridge leading Gxaba Secondary School
d.
The following Areas needs housing development
a. Mgojweni Village
b. Mathayo Village
c. Ndonga Village
d. Mpindweni Village
Infills that needs electricity connection and are beyond the 70 distance
a. Lujizweni No. 1,2,3,5
b. Mabomvini Village
c. Mgojweni Village
d. Ncambedlana Village
e. Ndonga Village f. Mathayi Village g. Mpindweni
Village
The following Village have no access to water a. Lujizweni No. 1,2,3,5 b. Mabomvini Village c. Mgojweni Village d. Ncambedlana Village e. Ndonga Village f. Mathayi Village g. Mpindweni Village
Access roads to be included in the Maintenance Plan a. Bomvana access
road linking Ward 22 and Ward 32
b. Construction new Bridges which links Mpindweni Village Mangqobe Junior Secondary School located in KSD Municipality( this is provincial road)
c. Maintenance Magwiphalish to Manzimahle access raod( this access includes 3 Bridges that are in a poor conditions and posing danger to commuters
d.
The following Villages have not sanitation infrastructure
a. Mpindweni Village

42
WARD
ELECTRICITY WATER AND SANITATION
ROADS AND BRIDGES
HOUSING
b. Ndonga c. Mathayi
Village d. Mawotsheni
Village e. Ncambedlana
Village f. Mabomvini
Village
IDP ASSESSMENT REPORT FOR THE PAST FOUR YEARS
The IDP Assessment results for the past three years indicate improvements in most of the key performance
areas.
KPA 2016/2017 2017-2018 2018-2019 2019/20
SDF High High High High
Service Delivery High High High High
Financial Viability High High High High
Local Economic
Development
High High High High
Good Governance and
Public Participation
High High High High
Institutional Arrangement High High High High
Source (DLGTA)
CONSIDERATION OF INPUTS BY MEC ON 2019-2020 AND IDP ASSSESSMEN ACTION
PLAN
The following MEC inputs were received and duly considered during the review process.
Action Plan was developed and progress is reported
KPA MEC COMMENTS AND
IMPROVEMENT MEASURE
ACTION
PLAN
RESPONSIBLE
AGENCY
TIMEFRAME Progress
SPATIAL
PLANNING,
LAND AND
HUMAN
SETTLEMENT
The municipality did not
reflect land audit report
Planning and
Development
June 2020 To be adopted
in June 2020
The IDP does not reflect the
presence of an air quality
management plan (AQMP) as
contemplated in Section 15(2) of
Develop air
quality
management
plan
2020-21

43
KPA MEC COMMENTS AND
IMPROVEMENT MEASURE
ACTION
PLAN
RESPONSIBLE
AGENCY
TIMEFRAME Progress
the NEMA: Air Quality Act 39 of
2004
Air Quality Management Plan
The municipal IDP did not reflect
the presence of Air Quality
Management Plan
Climate Change
The municipality does a climate
response strategy or activities
that respond to climate change
Natural Environment Analysis
No environmental By-law in
place
Disaster
Management/Emergencies/Fire
Fighting
• The municipality’s SDF
not informed by disaster
vulnerability and risk
assessment reports
• The municipality does
not operate a fulltime fire
services
• The municipality does
not have adopted fire tariffs
• No plan to address veld
and forests fires. Oil spillages or
floods
Service
Delivery and
Infrastructure
Planning
the Municipality doest not have
a Trade Effluent Policy?
Source
funding for
development
of the Trade
Effluent Policy
Senior
Manager
Community
Services
2020-21 This policy
will be
chapter in the
Integrated
Infrastructure
Plan
currently
being
developed
Good
Governance
and Public
Pariticipation
Public Participation
The municipality has not
demonstrated evidence that the
District Municipality contributes
towards development of Ward
Based Plans
Include contribution towards the development of Ward Based Plans
Senior Manager
Operations
2020-21

44
KPA MEC COMMENTS AND
IMPROVEMENT MEASURE
ACTION
PLAN
RESPONSIBLE
AGENCY
TIMEFRAME Progress
Council and Oher Governance
Structures
The municipality has not
reflected the adoption and
existence of Audit Action Plan to
address issues raised by Auditor
General
Include audit action plan in the IDP
Office of the MM May 2020 Will be
included
Are applicable by-laws adopted
and gazetted
Development of Environmental Management By-Law
Senior Manager
Community
Services
Manager/Legal
Services
By-Laws
developed and
Gazetted in
Governent
Gazetted
Dated 24 June
2019 Vol. No.
4259

45
PHASE ACTIVITIES COORDINATING
DEPARTMENT
TIMEFRAME LEGISLTATIVE
FRAMEWORK
AUGUST 2019
Conclude performance agreements for the 2019-2020 Mayor & Municipal
Manager
August 2019 MFMA Sec 53(1)c &
MSA sec 56
Make public the annual performance agreements and
place copies to the municipal website
Office of the
Municipal Manager
11 August 2019 MFMA 53(3)(a)
Place the annual performance agreements on the
municipal website
Office of the
Municipal Manager
16 August 2019 MFMA 75 (1)(d)
Table IDP, PMS and Annual Budget Process Plan for
2020/2021 to the Executive Committee including the
following documents
Annual Financial Statements for 2018/2019 FY
Performance Information report (MSA-s46) 2018-
2019
Draft Annual Report for 2018/2019
Municipal Manager 22 August 2019 MFMA 21(1)(b) &
53 (1) (b)

46
PHASE ACTIVITIES COORDINATING
DEPARTMENT
TIMEFRAME LEGISLTATIVE
FRAMEWORK
Audit Committee Meeting to consider the review the:
Annual Financial Statements for 2018/2019
Performance Information report (MSA-s46) 2018-
2019
Draft Annual Report for 2018/2019
Office of the MM 23 August 2019 MFMA s65 & 66
Tabling of IDP & Annual Budget Process Plan, AFS &
Performance information report to Council for adoption
including the following documents
Annual Financial Statements for 2017/2018
Performance Information report (MSA-s46)
Annual Report for 2017/2018
Mayor 29 August 2019 MFMA 21(1)(b) &
53 (1) (b)

47
PHASE ACTIVITIES COORDINATING
DEPARTMENT
TIMEFRAME LEGISLTATIVE
FRAMEWORK
Printing of Annual Financial Statements and Annual
Performance Assessment Information Report and Draft
Annual Report for the year ending 30 June 2019
MM 29-30 August 2019 MFMA 126 (1) (a)
Submit Annual Financial Statements and Annual
Performance Assessment Information Report and Draft
Annual Report for the year
ending 30 June 2018 to Auditor General Office
Chief Financial
Officer, MM
30 August 2019 MFMA 126 (1) (a)
SEPTEMBER 2019
Advertise and Publish approved 2020/2021 IDP, PMS and
Budget Process Plan on website and newspaper
SM: Operations 06 September 2019 MSA S16 & 21
Submit approved 2020/2021 IDP, PMS and Budget
Process Plan and Framework to CoGTA, and Provincial
Treasury, Auditor General (within 10 days of approval)
SM: Operations 06 September 2019 MFMA Sec 75 (2)

48
PHASE ACTIVITIES COORDINATING
DEPARTMENT
TIMEFRAME LEGISLTATIVE
FRAMEWORK
Intergovernmental Engagements (IGR FORUM)
Mayor 10 September 2019 Constitution of RSA,
s41 & MSA s24
Conduct initial consultation and review, conduct
primary data analysis including financial outlook to
identity need to review financial fiscal strategies
Manager IDP September 2019 Chapter 3,
Constitution of the
RSA, 1996
OCTOBER 2019
Prepare socio-economic profile IDP Manager October 2019
ICT Governance Committee Meeting 3 October 2019
District Planning Forum sitting to share socio-economic
data
ORTAMBO DM October 2019
Consultation and inclusion of Sector Department
information to the IDP
October 2019
Audit Committee Meeting Municipal Audit Unit 23 October 2019
Table first quarter performance report including financial
performance analysis report (s52(d) to Executive
24 October 2019

49
PHASE ACTIVITIES COORDINATING
DEPARTMENT
TIMEFRAME LEGISLTATIVE
FRAMEWORK
Committee
Table first quarter performance report including financial
performance analysis report (s52(d) to Council
Mayor 31 October 2019 MFMA s52(d)
NOVEMBER 2019
Convene IDP Pre Council Strategic Planning Session MM 05 November 2019 IDP Guidelines
Place quarterly performance report on the municipal
website
Office of the
Municipal Manager
05 November 2019 MFMA 75 (1)K &
52(d)
IDP Representative Forum Senior Manager
Operations
08 November 2019
`
Mayoral Imbizo’s to give service delivery feedback and
get community priority needs
12-21 November
2019
MSA s34 & s16
DECEMBER 2019
District Cluster Forums (to present situational analysis and
project identification for 2020/21
December 2019

50
PHASE ACTIVITIES COORDINATING
DEPARTMENT
TIMEFRAME LEGISLTATIVE
FRAMEWORK
Special Exco Meeting 10 December 2019
Special Council Meeting 13 December
2019
JANUARY 2020
ICT Governance Committee Meeting SM: Corporate
Services
8 January 2020
Convene Management Retreat to compile and finalize
Mid-year report, adjustment budget and Revised SDBIP
Municipal Manager &
Senior Managers
15-17 January 2020 MFMA s72 (1) & 11
Special Exco Meeting to Table Mid-year Report, revised
SDBIP and Adjustment Budget for approval and Annual
Report
17 January 2020
Ordinary Audit, Risk & Performance Committee
(Assessment of Mid-year performance)
Internal Audit Unit 22 January 2020
Table Mid-year Report, revised SDBIP and Annual Report Mayor & MM 24 January 2020 MFMA s72 (1) & 11

51
PHASE ACTIVITIES COORDINATING
DEPARTMENT
TIMEFRAME LEGISLTATIVE
FRAMEWORK
to the Special Council Meeting
FEBRUARY 2020
Place the Annual Report for 2018-2019 on the municipal
website
Office of the
Municipal Manager
February 2020 MFMA 75 (1)©
Place the quarterly performance report (s52(d) on the
municipal website
Provincial Treasury Mid-year assessment 17 February 2020
Table 2019/20 Adjustment Budget to Council for
approval. (Possibly Amend IDP and Top Layer SDBIP).
CFO & MM 27 February 2020 MFMA s72 (1) & 11
Convene Strategic Planning Session to review municipal
high level overarching strategies and short term
development objectives
Council 03 – 06 March 2020
MARCH 2020
COUNCI
L SITTING
Presentation of Draft IDP, Annual Budget, Draft SDBIP,
Tariffs and budget related policies to the Executive
Municipal Manager &
CFO
19 March 2020

52
PHASE ACTIVITIES COORDINATING
DEPARTMENT
TIMEFRAME LEGISLTATIVE
FRAMEWORK
Committee
Convene IDP Rep Forum to present Draft IDP 2020/21
Review and Draft budget 2020/21
MM 17 March 2020
Tabling of Draft IDP, Annual Budget, Draft SDBIP, Tariffs
and budget related policies to Council
Mayor 26 March 2020 MFMA s16 (2)
APRIL 2020
ICT Governance Committee Meeting 02 April 2020
Risk Committee 16 April 2020
Policy review consultations by Departments April 2020
IDP and Budget Public Hearings 14-24 April 2020
Audit Committee Meeting 21 April 2020
Special Executive Committee Meeting 23 April 2020

53
PHASE ACTIVITIES COORDINATING
DEPARTMENT
TIMEFRAME LEGISLTATIVE
FRAMEWORK
Table third quarter performance report including
financial performance analysis report to Council
Mayor 30 April 2020 MFMA s52(d)
MAY 2020
MTREF Engagement and Benchmarking(Conducted by
Provincial Treasury)
MM, BTO & SDF 5 May 2020
Council Policy Consultative Workshop Operations 19 – 21 May 2020
Special Exco Meeting Operations 22 May 2020
Table Reviewed IDP, Annual Budget, Tariffs,
Organizational Structure and budget related policies for
approval by Council
Mayor 29 May 2020 MFMA s24 (1)
JUNE 2020
Ordinary Audit, Risk & Performance Committee 21 June 2020
Submit approved annual budget and IDP to NT & PT 10 June 2020 MFMA 24 (3)
Publish the IDP and Budget for 2020-2021 FY 05 June 2020
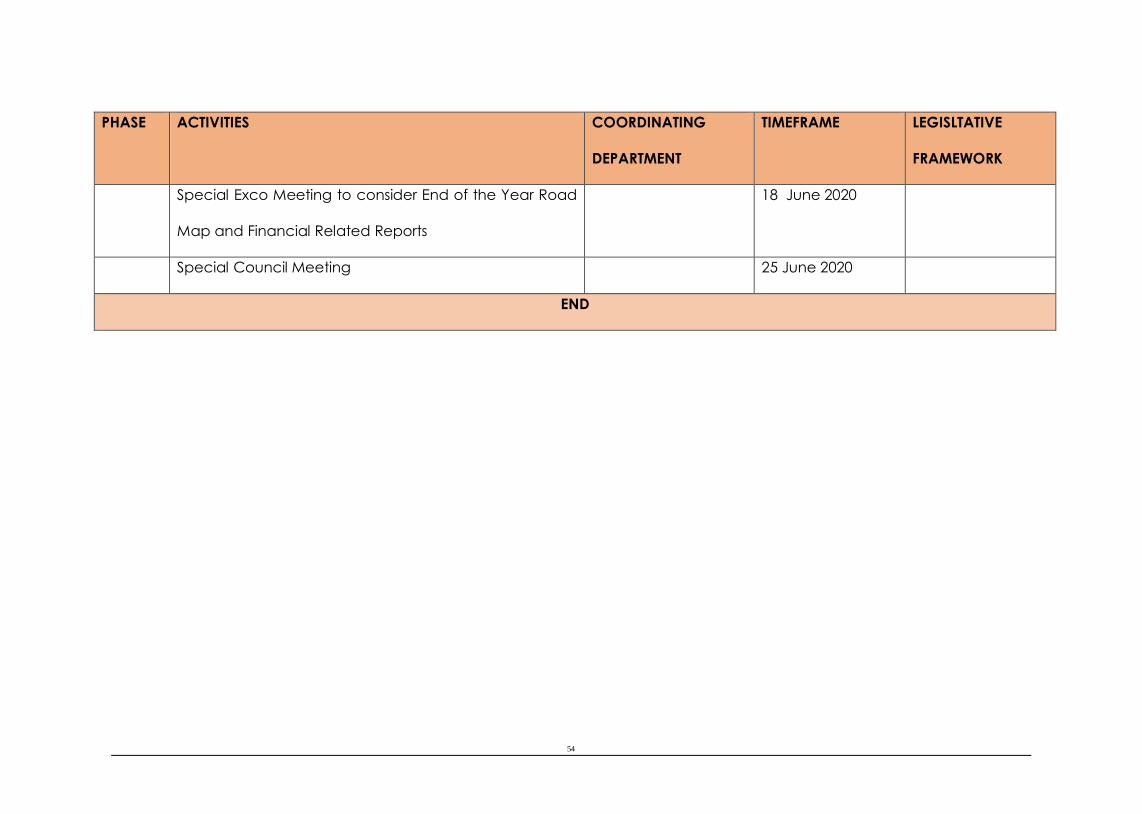
54
PHASE ACTIVITIES COORDINATING
DEPARTMENT
TIMEFRAME LEGISLTATIVE
FRAMEWORK
Special Exco Meeting to consider End of the Year Road
Map and Financial Related Reports
18 June 2020
Special Council Meeting 25 June 2020
END

55
SECTION B:
SITUATION ANALYSIS
CHAPTER 1: INTRODUCTION TO NYANDENI LOCAL MUNICIPALITY
INTRODUCTION
2. Demography
“Demographics” is a shortened term for “population characteristics”. It includes population groups, age and location.
Distributions of values within a demographic variable, and across households, as well as trends over time are of
interest. In this section, an overview is provided of the demography of Nyandeni Local Municipality.
Population
Introduction
In order to form a clear picture of the socio-economic conditions of an area, it is crucial to analyse
the size, spatial distribution, composition and growth patterns of the population with changes in
its magnitudes and possible future patterns, trends and propensities.
The demography of an area provides vital information for policy-makers. The data used in this
section is from the 2016 Community Survey published by Statistics South Africa. The analysis
and results of this section could be used by Nyandeni local municipality for promoting optimal
resource allocation in order to reduce poverty and vulnerability among marginalised people in
municipality.
Demographic results from the 2016 Community Survey
The findings from the 2016 community survey are critical for decision- making not only in the
public sector but also in the private sector. Population size and characteristics can influence
the location of businesses and services to satisfy the needs of the target population.
The total population in Nyandeni local municipality has increased by 6.6% from 290 391
people in 2011 to 309 702 people in 2016
2011 census 2016 Community Survey
Male Female Total Male Female Total
O.R. Tambo 630 090 734 856 1 364 943 679 882 777 502 1 457 384
Ngquza Hill 128 973 149 505 278 481 142 829 160 549 303 379
Port St Johns 71 481 84 654 156 135 77 077 89 701 166 779
Nyandeni 134 241 156 150 290 391 143 803 165 899 309 702
Mhlontlo 87 438 100 788 188 226 88 911 100 264 189 176
KSD 207 951 243 759 451 710 227 261 261 088 488 349
Eastern Cape 3 089 703 3 472 353 6 562 053 3 327 495 3 669 481 6 996 976
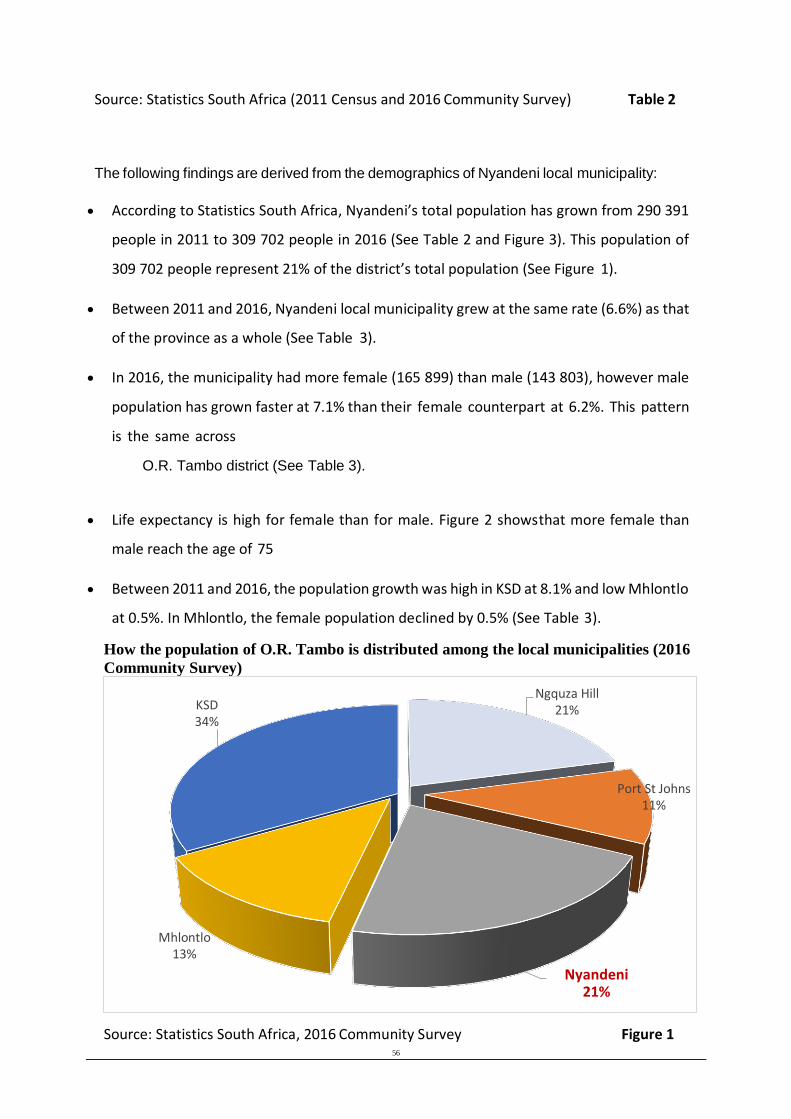
56
Source: Statistics South Africa (2011 Census and 2016 Community Survey) Table 2
The following findings are derived from the demographics of Nyandeni local municipality:
According to Statistics South Africa, Nyandeni’s total population has grown from 290 391
people in 2011 to 309 702 people in 2016 (See Table 2 and Figure 3). This population of
309 702 people represent 21% of the district’s total population (See Figure 1).
Between 2011 and 2016, Nyandeni local municipality grew at the same rate (6.6%) as that
of the province as a whole (See Table 3).
In 2016, the municipality had more female (165 899) than male (143 803), however male
population has grown faster at 7.1% than their female counterpart at 6.2%. This pattern
is the same across
O.R. Tambo district (See Table 3).
Life expectancy is high for female than for male. Figure 2 shows that more female than
male reach the age of 75
Between 2011 and 2016, the population growth was high in KSD at 8.1% and low Mhlontlo
at 0.5%. In Mhlontlo, the female population declined by 0.5% (See Table 3).
How the population of O.R. Tambo is distributed among the local municipalities (2016
Community Survey)
Source: Statistics South Africa, 2016 Community Survey Figure 1
KSD 34%
Ngquza Hill 21%
Port St Johns 11%
Mhlontlo 13%
Nyandeni 21%

57
Overall, demographic development outcomes have an impact on other population variables
such as migration, settlement, fertility, mortality and morbidity rates. These variables give
insight into the living standards of the population and an indication of what policy options to be
undertaken according to the structure of the socio-economic context.
Male population has grown at a faster rate than their female counterpart
2011 and
2016
O.R.T ambo
Ngquza Hill Port
St Johns
Nyandeni
Mhlontlo
KSD
EC
Male 7.9% 10.7% 7.8% 7.1% 1.7% 9.3% 7.7%
Female 5.8% 7.4% 6.0% 6.2% -0.5% 7.1% 5.7%
Total 6.8% 8.9% 6.8% 6.6% 0.5% 8.1% 6.6%
Source: Statistics South Africa (2011 Census and 2016 Community Survey) Table 3
Age pyramid of Nyandeni local municipality
The age pyramid of Nyandeni local municipality shows that more female than male reach the
age of 75 years.
In general, a population with a larger percentage of young, reproductive age individuals will
grow more rapidly than a population with more older, non-reproductive individuals. This is the
case for Nyandeni, a municipality populated largely with very young people.
Age pyramid of Nyandeni local municipality: 2016
Source: Statistics South Africa, 2016 Community Survey Figure 2
Female
75+ 70-74
male 65-69
60-64
55-59
50-54
45-49
40-44
35-39
30-34
25-29
20-24
15-19
10-14
05-09
00-04
-20000 -15000 -10000 -5000 0 5000 10000 15000 20000

58
Figure 2 displays the age pyramid of Nyandeni. It shows how large is the population between
the age zero and nineteen. It is important for Nyandeni local municipality to monitor closely its
population patterns and trends, as a rapidly growing population may need to be followed by
faster investment in household, health and other essential infrastructure to ensure that a
favourable socio-economic environment is maintained. In addition, investigating the dynamics
of a population is vital in attaining the precise viewpoint of those who are likely to be affected
by any prospective policy, project or development.
81% of the Nyandeni population is young below the age of 35
0 to 14 (Children
15 to 34 (Youth) 35 to 64 (Adults)
65+ (Elderly) Grand Total
Ngquza Hill 43% 39% 12% 6% 100%
Port St Johns 43% 39% 12% 7% 100%
Nyandeni 41% 40% 13% 7% 100%
Mhlontlo 39% 38% 15% 9% 100%
KSD 34% 44% 16% 6% 100%
O.R.Tambo 39% 41% 14% 6% 100%
Source: Statistics South Africa, 2016 Community Survey Table 4
The demographic analysis of Nyandeni reveals in Table 4 that the population is young, with
over 80% of the total population being below the age of 35. This implies that expenditure on
social infrastructure such as schools, health care facilities and recreational centers are
crucial. It was also shown in Table 3 that between 2011 and 2016, Nyandeni’s population
grew by 6.6%. With 80% of people being below the age 35, there is a possibility of further
population growth. Thus, the government of Nyandeni must prioritize youth and direct their
resources toward addressing their needs in terms of infrastructure and job opportunities. Since
some of these youth depend on poor people who solely dependent on government grants, the
government of Nyandeni should develop a youth strategy that considers youth as an asset
rather than a liability.
A young and growing population
Demographic changes that a society experiences may lead to a window of opportunity or
higher economic growth, with a greater supply of labour and lower dependency ratios as the
working age population rises in proportion to the number of young and elderly people.
The NDP aims to maximise the benefits of this 'demographic dividend'. More rapid
improvements in health and education, spatial transformation, skills development and greater

59
employment opportunities are all needed for a region, such as Nyandeni, to take advantage
of his demographic opportunity.
Figure 3 provides demographic trends for Nyandeni local municipality. Between the last
census in 2011 and the latest community survey in 2016, population growth in Nyandeni has
been very impressive. This, in turn, has an impact on resource allocation, the consumption of
goods and services and human capital development, which influences factors such as
education, employment, income distribution and the physical well-being of a population.
A Growing Population in Nyandeni Local Municipality
Source: Statistics South Africa and Quantec, 2016 Figure 3
Most of household in Nyandeni are headed by female. For every 10 households in
OR Tambo, 6 are headed by female (See Table 5).
Gender of the head of households
Head of household
Number %
Grand Total Male Female Male Female
Eastern Cape 2 838 166 4 158 810 41% 59% 6 996 976
O.R.Tambo 513 225 944 159 35% 65% 1 457 384
Ngquza Hill 103 583 199 796 34% 66% 303 379
Port St Johns 51 288 115 491 31% 69% 166 779
Nyandeni 112 347 197 355 36% 64% 309 702
Mhlontlo 60 852 128 324 32% 68% 189 176
KSD 185 156 303 193 38% 62% 488 349
315 000
309 702 310 000
305 000
300 000
295 000
290 392
290 000
285 000 283 883
279 623 280 000
275 000
270 000
265 000
260 000
2001 2002 2003 2004 2005 2006 2007 2008 2009 2010 2011 2012 2013 2014 2015 2016

60
Source: Statistics South Africa, 2016 Community Survey Table 5
Observation
This section highlighted two important facts about Nyandeni local municipality. Firstly, its high
growing population could contribute to high demand for goods and services. Secondly, its
strategic location in the coastal area could cause the municipality to play a significant role in
the blue economy. The next section presents the economic developments and prospects of
the municipality.
2.5 Population by ward level
There are 31 wards in the Nyandeni Local Municipality. The population distribution of the
Nyandeni Local Municipality is relatively equally distributed across all wards. The following is a map from the
demarcation board of the latest layout of all the wards in the Nyandeni Local Municipality.
Source: Demarcation Board
The ward with the highest population is ward 11 with a total number of 13 243 people, or 4.6% of the total population
in Nyandeni Local Municipality. The ward with the lowest number of people is ward 27 with 6 598 people currently in
that ward. The percentage share in population by the different wards range between 2.3% and 4.6% with the average
share being 3.2%.

61
TABLE 1. POPULATION BY POPULATION GROUP AND GENDER – WARD LEVEL IN
NYANDENI LOCAL MUNICIPALITY, 2011 [NUMBER]
[Please note: ward 32 information note included]
Ngolo 8 334 eMpangala 1 275 Ntendele 774 Bhantini A 513 Kw aMkw amde 348
Sibangw eni 6 258 Ntsonyini 1 263 Guqa 774 Polini 513 Lucingw eni 345
Libode 4 560 Nyandeni NU 1 242 Nkonkoni 768 Kw aZinja 510 Ncumbe 336
Gxulu 4 059 Dalaguba 1 242 Mncane 768 Ntsaka 498 Hluleka 330
Mdeni 3 765 Kw aDarana 1 233 Ndaya 768 Gqeza 495 Mnceleni 324
Zandukw ana 3 321 eMhlanga 1 209 Dokodela 756 Tonti 495 Upper Matanzima 324
Chophetyeni 3 186 Mchonco 1 203 Taw eni 756 Ngcongco 492 Jovu 318
Mhlanganisw eni 3 018 Buthongw eni 1 203 Mjobeni 753 Ntakw endlela 489 Maqingeni 315
Mampondomiseni 2 769 Lw andile 1 203 Kw aLukuni 753 Kw aDontsa 486 Ngongqeleni 309
Ngqeleni 2 631 Zitatele 1 182 Mposana 753 Ntenza 480 Manzimabi 306
Mdlankomo 2 526 Lujizw eni 1 182 Sidabadabeni 747 Kw aNgolo 477 Lw andlane 306
Mangw aneni 2 490 Kw aBungu 1 167 Nqentsu 735 Mthonjana 477 Ludeke 297
KuMandeni 2 439 Mpotini 1 164 Matanzima 720 Low er Godini 474 Lubanzi 294
Marubeni 2 400 Qinisa 1 143 Mandlovini 720 Komkulu 465 Zimanzi 291
Sundw ane 2 376 Tshani 1 137 Tafeni 714 Ngxanga 462 Eskw eleni 288
Kw aZulu 2 220 Qhankqu 1 134 Coranlay 714 Wicksdale 459 Ndayini 279
Rainy 2 202 Nomcamba 1 128 Bomvane 711 Kw aMathayi 459 Madoloni 273
Mpangeni 2 094 Ezinkozw eni 1 119 Mpimbo 711 Mankozi 456 Mahobeni 270
Zibungu 2 085 Kepe 1 119 Kw aMxhosa 705 Mphutshane 453 Manzimahle 267
Ngxokw eni 2 070 Esiqikini 1 104 Ludaka 687 Bhucula 453 Nduna 258
Mbangisw eni 2 046 Ndindimeni 1 092 Edangeni 681 Nqw akunqw aku 450 Gxeni 258
Male Female Male Female Male Female
1 4 509 5 375 28 54 4 537 5 429
2 3 621 4 400 12 5 3 633 4 405
3 3 505 3 952 13 18 3 518 3 970
4 3 612 4 207 3 3 3 615 4 210
5 4 054 4 572 4 2 4 058 4 574
6 4 468 5 520 13 17 4 481 5 537
7 3 718 4 233 51 41 3 769 4 274
8 3 625 4 233 8 9 3 633 4 242
9 4 751 5 518 78 79 4 829 5 597
10 5 078 5 758 12 13 5 090 5 771
11 6 118 7 070 23 32 6 141 7 102
12 4 880 5 559 95 95 4 975 5 654
13 3 926 4 531 19 15 3 945 4 546
14 3 872 4 422 26 9 3 898 4 431
15 5 373 6 429 42 38 5 415 6 467
16 3 617 4 517 7 5 3 624 4 522
17 4 631 5 611 9 14 4 640 5 625
18 3 724 4 551 9 10 3 733 4 561
19 5 045 5 996 22 31 5 067 6 027
20 5 237 6 182 88 73 5 325 6 255
21 3 476 3 848 53 27 3 529 3 875
22 4 972 5 770 26 12 4 998 5 782
23 4 373 5 012 12 7 4 385 5 019
24 3 493 3 904 5 4 3 498 3 908
25 3 971 4 515 44 28 4 015 4 543
26 5 204 6 139 19 23 5 223 6 162
27 2 982 3 598 7 11 2 989 3 609
28 3 884 4 430 18 9 3 902 4 439
29 4 857 5 293 37 23 4 894 5 316
30 4 722 5 466 95 87 4 817 5 553
31 4 045 4 728 9 3 4 054 4 731
Total 133 343 155 341 898 808 134 241 156 149
% of Total 45.9% 53.5% 0.3% 0.3% 46.2% 53.8%
Source: Stats SA Population census 2011
Ward
African Other Total

62
Maqanyeni 1 902 Langeni 1 074 Ncambedlana 681 Mhlabeni 447 Dumasi 255
Mzonyane 1 863 Lutsheko 1 056 Tukela 675 Nzamo 447 Mntsholobeni 255
Lujecw eni 1 836 Didi 1 053 Kw achum 669 Ncukaba 447 Ntengu 255
Mamfengw ini 1 806 Ndungunyeni 1 047 Norw ood 666 Maqebevu 441 Mfabantu 249
Mtyu 1 803 Dikela 1 032 Mahoyana 663 Ngavu-Ngavu 438 Khukw ini 249
Nkanga 1 770 Tshisabantu 1 020 Ngqw ayi 657 Mazulu 438 Kw aBomvana 246
Marew eni 1 770 Thekw ini 1 017 Kw aNtshele 654 Mantanjeni 438 Hhakaneni 240
Mnqw angqw eni 1 746 New Rest 1 011 Masameni 654 Cw ele 438 Zixholosini 234
Mngcibe 1 737 Mabheleni 1 011 Ngcoya 651 Zinkumbeni 435 Vilo 231
Mandileni 1 719 Ntsundw ane 1 005 Mnyama 648 Mafusini 435 Sixambuzi 228
Jamani 1 698 Canzibe 1 005 Ngcolorha 648 Kw aJange 435 Sikalw eni 225
Misty Mount 1 692 Mbombenkukhu 993 eMboleni 648 Sidanda 429 Ncedane 225
Gonothi 1 692 Ngidini 993 Emnyameni 639 Limdaka 426 eGoli 225
Thembeni 1 680 Mdikane 984 Tshatshi 633 Mhlakotshane 426 Kw aPalo 222
Mtombe 1 650 Kw aXutidw ele 975 Ntsimbini 633 Sazinge 423 Bovini 216
Mtokw ane 1 623 Khonjw ayo 960 Nxukhw ebe 621 Mandulw ini 420 Goli 210
Makhw ethubeni 1 617 Nomadolo 957 Bholotw a 618 Mpumdw eni 420 Mapulazini 201
Kw akombe 1 611 eZinduneni 954 Malungeni 609 Nodushe 417 Gw ali 198
Mlomo 1 608 Magozeni 951 Lotana 603 Ngw enyeni 417 Nzondeni 198
Mbiza 1 572 Khuleka 936 Manxiw eni 603 Ntlanjeni 417 Mseleni 192
Tungw eni 1 569 Makotyana 915 Godini 600 Nqutyana 411 Mvili 192
Mkankato 1 569 Nkanunu 915 Zincukutw ini 594 Meyana 411 Maqabeni 192
Ntibane 1 554 Mdoni 912 Ntlambela 579 Kw aMcapati 408 Ncithw a 180
Ngobozi 1 539 Vinitshi 897 Kw aMhlongw ana 579 Mtakatyi 405 Gqw arhu 174
Njiveni 1 530 Mamolw eni 888 Thusw ini 576 eChibini 402 Mqw anqw eni 168
Jizw eni 5 1 521 eNgojini 882 Dungu 570 Sinw andw eni 399 Gesi 162
Hamsini 1 503 Mandleni 873 eNtshingeni 570 Kw aMatati 399 Wayisi 162
Sigibudu 1 497 Mapapeli 846 Mayalw eni 564 Bhantini B 396 Mabetshe 147
Mdina 1 476 Dininkosi 843 Mthombetsitsa 555 Mjalisw a 393 Nkumandeni 144
eMasameni 1 473 Ngcobo 840 Kw aSompa 555 Ceka 393 Nduli 144
Mdumazulu 1 473 Msitsini 831 Detyana 555 Kateni 390 Gongo 138
Cibeni 1 461 Magcakini 831 Cumngce 552 Dontsa 384 Mpindw eni 123
Nxotsheni 1 455 Ngunjini 825 Gunyeni 552 Njivene 384 Mahane 120
Mcubakazi 1 437 Upper Maqanyeni 822 Mdlakathw eni 552 Mapalo 381 Mthondela 120
Noxova 1 434 Mngamnye 822 eSitshayelw eni 546 Ndasana 378 Nkhw ityini 117
Magcakeni 1 425 Ntabantsimbi 819 Mngazana 543 Kw aZele 378 Nothintsila 114
Mbhojw eni 1 422 Bandla 813 Corana 540 Mageza 375 Ntsaha 99
Gazini 1 404 Mhlahlane 807 Kulambeni 537 Kw aMatumbu 375 Emakhuzeni 93
Lutubeni 1 401 Nquba 807 Xibeni 537 Dangw ana 372 Qhanqeni 84
Mambethu 1 380 Sizindeni 801 Nkaw ukazi 534 Ntotw eni 369 Langakazi 84
Mkhohlombeni 1 353 Qiti 798 Nkantini 531 Masameni B 366 Mboleni 81
Bomvini 1 347 Lurasini 795 Gangeni 528 Ndimakude 366 Qhunqw ana 75
Tyara 1 302 Mqunga 792 Njezeni 519 Chibini 363 Dikeni 72
Zele 1 281 Mazizini 789 Ekulambeni 519 Old Bunting 357 Mgazi 63
Lukhanyisw eni 1 278 Qhokama 786 eGoso 519 Mangcw anguleni 354 Ekukhw ezeni 42
Nontsw abu 1 275 Ntilini 780 Mpendle 513 Kw aMadw atyana 354 Makhuzeni 24
1.6 Number of Households by population group
If the number of households is growing at a faster rate than that of the population it means that the households sizes
is also decreasing and vice versa.
Definition
A household is a group of people who live together, and who provide themselves jointly with food
and/or other essentials for living, or a single person who lives alone. An individual is considered part
of a household if he spends at least four nights a week within the household.
This measure categorises a household according to the population group to which the household
head belongs.
There were 55 112 households in Nyandeni Local Municipality in 2001 and 61 647 in 2011. That equates to an
average annual growth rate of 1.13% over time.
TABLE 2. Number Of Households by Nyandeni Local Municipality Relative To Other Regions, 2001 and 2011
[Numbers And Percentage Growth]

63
The level of the average annual growth in population (and the age composition of the population) places different
demands on the need for health, education and safety services.
The average household size in 2001 was approximately 4.8 individuals per household as compared to the 4.6 persons
per household in 2011. With faster growth in the number of households, compared to the growth in population, in
Nyandeni Local Municipality, marginal demand for housing and basic services compared to that of health, education
and safety services may be relatively higher.
TABLE 3. NUMBER OF HOUSEHOLDS BY POPULATION GROUP IN NYANDENI LOCAL MUNICIPALITY,
2001AND 2011 [NUMBER AND PERCENTAGE GROWTH]
The growth in the number of households for the African population is on average 1.09% per annum for the period
2001 – 2011, which translates to an increase of 6 305 households over the period. The average annual growth in
the number of all the other population groups is 8.29% although it only amounts to 230 households according to the
Census figures.
3. Development
Indicators of development are used to estimate the level of development of the Nyandeni Local Municipality relative
to the rest of South Africa in terms of Human Development Index (HDI), Gini Coefficient (income inequality), poverty
and education. Nyandeni Local Municipality should be a point of departure in the compilation of all policies that aspire
towards a better life for all in the region.
3.1 Human Development Index (HDI)
Definition
The Human Development Index (HDI) is a composite relative index used to compare human
development across population groups or regions. HDI is the combination of three basic dimensions
of human development
A long and healthy life
Knowledge
A decent standard of living
A long and healthy life is typically measured using life expectancy at birth. Knowledge is typically
measured using adult literacy and / or the combination of enrolment in primary, secondary and
tertiary schools. A decent standard of living is typically measured using GDP per capita.
Ngquza Hill Local Municipality 51 160 56 212 0.95%
Port St Johns Local Municipality 29 560 31 715 0.71%
Nyandeni Local Municipality 55 112 61 647 1.13%
Mhlontlo Local Municipality 44 295 43 414 -0.20%
King Sabata Dalindyebo Local Municipality 90 597 105 241 1.51%
O.R.Tambo District Municipality 270 724 298 229 0.97%
Eastern Cape Province 1 535 968 1 687 384 0.94%
South Africa 11 770 276 14 450 163 2.07%Source: Stats SA Population census 2001 & 2011
Region 2001 2011AAGR
2001-2011
Year African Other Total
Number of households:
2001 54 923 189 55 112
2011 61 228 419 61 647
Average annual growth rate:
2001 - 2011 1.09% 8.29% 1.13%Source: Stats SA Population census 2001 & 2011

64
The HDI can assume a maximum value of 1, indicating a very high level of human development. It
has a minimum value of 0, indicating no human development.
It is estimated that in 2011 Nyandeni Local Municipality had an HDI of 0.40. This is significantly lower than the
Eastern Cape which has an HDI of 0.53 and South Africa with its 0.59.
CHART 1. HUMAN DEVELOPMENT INDEX BY REGIONS - 2005, 2008 AND 2011
The HDI has been increasing in South Africa, Eastern Cape, O.R. Tambo District Municipality and the
Nyandeni Local Municipality since 2005. An explanation might be that education and health conditions have
improved and a general increase in income is seen.
3.2 Gini Coefficient
Definition
The Gini coefficient is a summary statistic of income inequality, which varies from 0 to 1. If the Gini
Coefficient is equal to zero it means that income is distributed in a perfectly equal manner,
indicating a low variance between high and low income earners in the population. If the Gini
coefficient is equal to one, income is completely inequitable, with one individual in the population
earning income, whilst everyone else earns nothing.
In practice this coefficient is likely to lie in a range between 0.25 and 0.70.
In 2011, income inequality in Nyandeni Local Municipality at 0.53 was lower than that of the provincial and national
level which was at 0.61 and 0.63 respectively.
0.57 0.58 0.59
0.51 0.510.53
0.41 0.420.43
0.38 0.390.40
0.00
0.10
0.20
0.30
0.40
0.50
0.60
0.70
2005 2008 2011
National Total Eastern Cape O.R.Tambo District Municipality Nyandeni Local Municipality
Source: IHS Global Insight Regional eXplorer version 648

65
TABLE 4. GINI COEFFICIENT OF NYANDENI LOCAL MUNICIPALITY RELATIVE TO OTHER REGIONS, 2005 -
2011
Over time an improvement is noted on all regional levels were the Gini Coefficient declined reflecting a more equal
distribution of income. This also might be due to social welfare and grants, community services employment and a
more accessible economic environment conducive to economic growth and development.
CHART 2. GINI COEFFICIENT OF NYANDENI LOCAL MUNICIPALITY RELATIVE TO OTHER REGIONS,2005,
2008 AND 2011
2005 0.68 0.67 0.66 0.63
2006 0.67 0.66 0.64 0.61
2007 0.66 0.65 0.62 0.59
2008 0.65 0.64 0.60 0.57
2009 0.64 0.63 0.59 0.55
2010 0.63 0.62 0.58 0.54
2011 0.63 0.61 0.57 0.53
Source: IHS Global Insight Regional eXplorer version 648
Year South Africa Eastern Cape
O.R. Tambo
District
Municipality
Nyandeni
Local
Municipality
0.680.65
0.63
0.670.64
0.61
0.66
0.600.57
0.63
0.570.53
0.00
0.10
0.20
0.30
0.40
0.50
0.60
0.70
0.80
0.90
2005 2008 2011
South Africa Eastern Cape O.R. Tambo District Municipality Nyandeni Local Municipality
Source: IHS Global Insight Regional eXplorer version 648
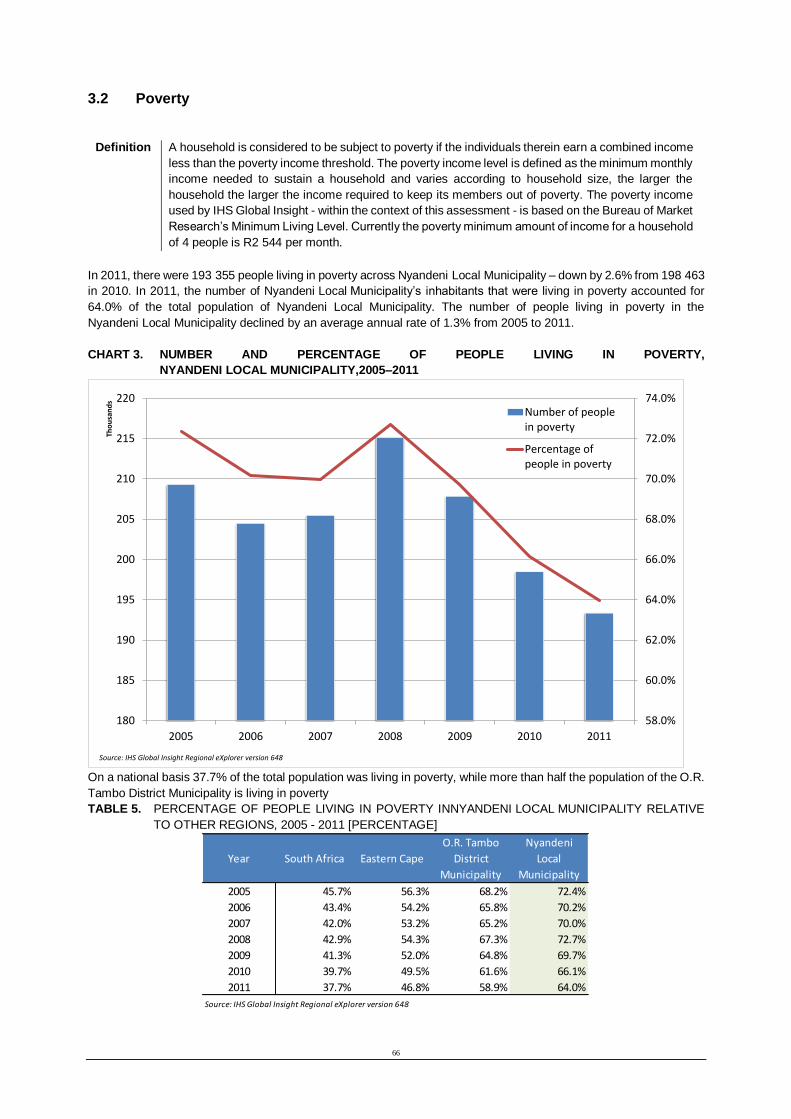
66
3.2 Poverty
Definition
A household is considered to be subject to poverty if the individuals therein earn a combined income
less than the poverty income threshold. The poverty income level is defined as the minimum monthly
income needed to sustain a household and varies according to household size, the larger the
household the larger the income required to keep its members out of poverty. The poverty income
used by IHS Global Insight - within the context of this assessment - is based on the Bureau of Market
Research’s Minimum Living Level. Currently the poverty minimum amount of income for a household
of 4 people is R2 544 per month.
In 2011, there were 193 355 people living in poverty across Nyandeni Local Municipality – down by 2.6% from 198 463
in 2010. In 2011, the number of Nyandeni Local Municipality’s inhabitants that were living in poverty accounted for
64.0% of the total population of Nyandeni Local Municipality. The number of people living in poverty in the
Nyandeni Local Municipality declined by an average annual rate of 1.3% from 2005 to 2011.
CHART 3. NUMBER AND PERCENTAGE OF PEOPLE LIVING IN POVERTY,
NYANDENI LOCAL MUNICIPALITY,2005–2011
On a national basis 37.7% of the total population was living in poverty, while more than half the population of the O.R.
Tambo District Municipality is living in poverty
TABLE 5. PERCENTAGE OF PEOPLE LIVING IN POVERTY INNYANDENI LOCAL MUNICIPALITY RELATIVE
TO OTHER REGIONS, 2005 - 2011 [PERCENTAGE]
58.0%
60.0%
62.0%
64.0%
66.0%
68.0%
70.0%
72.0%
74.0%
180
185
190
195
200
205
210
215
220
2005 2006 2007 2008 2009 2010 2011
Tho
usa
nd
s
Number of peoplein poverty
Percentage ofpeople in poverty
Source: IHS Global Insight Regional eXplorer version 648
2005 45.7% 56.3% 68.2% 72.4%
2006 43.4% 54.2% 65.8% 70.2%
2007 42.0% 53.2% 65.2% 70.0%
2008 42.9% 54.3% 67.3% 72.7%
2009 41.3% 52.0% 64.8% 69.7%
2010 39.7% 49.5% 61.6% 66.1%
2011 37.7% 46.8% 58.9% 64.0%
Source: IHS Global Insight Regional eXplorer version 648
Year South Africa Eastern Cape
O.R. Tambo
District
Municipality
Nyandeni
Local
Municipality

67
3.3 Poverty Gap
Definition
The Poverty Gap measures the difference between each poor household’s income and the poverty
line - measuring the depth of poverty of all poor households combined. In other words, the Poverty
Gap indicates how much extra all of the poor households combined would have to earn each year
to rise up to the poverty income.
The Poverty Gap deals with a major shortcoming of the poverty rate, which does not give any
indication of the depth of poverty.
A shortcoming of the poverty rate as an indicator of poverty is that it does not give any indication of the depth of
poverty i.e. how far the poor households are below the poverty income level. In contrast, the poverty gap proves
useful in that it measures the difference between each poor household’s income and the poverty line. It thus
measures the depth of poverty of each poor household. The aggregate poverty gap is calculated by summing the
poverty gaps of each poor household. It is thus equivalent to the total amount by which the incomes of poor
households need to be raised each year to bring all households up to the poverty line and hence out of poverty.
It is estimated that the poverty gap in Nyandeni Local Municipality amounted to R535 million in 2011. Although the
poverty gap has increased in nominal terms from R433 billion in 2005, in real terms this has come down when we
include the effects of inflation.
TABLE 6. TOTAL POVERTY GAP – NYANDENI LOCAL MUNICIPALITY AND OTHER LOCAL MUNICIPALITIES,
2005-2011 [R MILLIONS, CURRENT PRICES]
YearNgquza Hill Local
Municipality
Port St Johns
Local
Municipality
Nyandeni Local
Municipality
Mhlontlo Local
Municipality
King Sabata
Dalindyebo Local
Municipality
O.R. Tambo
District
Municipality
2005 413 230 433 285 524 1 884
2006 405 225 426 282 526 1 863
2007 419 234 436 290 557 1 936
2008 499 278 515 347 674 2 313
2009 513 284 523 357 686 2 364
2010 509 280 524 359 677 2 350
2011 516 284 535 369 689 2 393
Average annual growth rate:
2005-2011 3.8% 3.6% 3.6% 4.4% 4.7% 4.1%
Source: IHS Global Insight Regional eXplorer version 648

68
In terms of the various local municipalities in O.R. Tambo District Municipality, the largest poverty gap exists in King
SabataDalindyebo equaling R689 million. The smallest poverty gap exists in the Port St Johns Local Municipality with
R284 Million. Take note that the population size should be taken into account when comparing the poverty gap in
different local municipalities.
3.4 Education
Introduction
Education is an important indicator of development due to its correlation with human
capabilities, productivity and, ultimately, income. The level of educational attainment is used
as an indicator of the skill levels of the population, with the higher educational attainment levels
being associated with greater opportunities for higher earnings, better social circumstances
and the potential investment attraction.
Young population aged 0–34 years constitutes 81% of Nyandeni’s total population
The Nyandeni population is made up of 41% children under the age of 14 years. The youth
aged between 14 and 34 years also account for 40% of the total population (See Figure 4). In
total, the young population aged 0–34 years constitutes 81% of Nyandeni’s total population.
The dynamics of this youth cohort will increasingly drive economic development of the
municipality in terms of opportunities for education,
work and social services. Put differently, these are the people who drive the “demand side of
education” in the municipality.
About 80% of Nyandeni population fall between 0-34 years of age
Source: Statistics South Africa, 2016 Community Survey Figure 4
35 to 64 (Adults), 13%
65+ (Elderly), 7%
15 to 34 (Youth), 40%
0 to 14 (Children, 41%

69
The local municipality need to have a strategy on how to build this young dynamic population.
For every 10 people in Nyandeni, 8 are aged between 0-34 years. Education should therefore
be listed among the top priorities in the municipality.
Nyandeni local municipality: Population Age structure, 2016
0 to 14
(Children
15 to 34 (Youth)
35 to 64 (Adults)
65+ (Elderly)
Grand Total
Ngquza Hill 129 862 118 291 37 182 18 044 303 379
Port St Johns 71 249 64 426 20 253 10 851 166 779
Nyandeni 126 156 122 456 40 810 20 280 309 702
Mhlontlo 73 414 71 307 28 290 16 165 189 176
KSD 166 917 216 037 76 402 28 993 488 349
O.R.Tambo 567 597 592 517 202 936 94 333 1 457 384
Source: Statistics South Africa (2016 Community Survey) Table 6 Higher institution and TVET
Table 7 shows the number of people in Nyandeni with higher education and TVET. According
to the 2016 Stats SA community survey, only 4 240 people or 1.4% of the total population had
higher education and 2 046 people or 0.7% with TVET (formerly FET colleges). Of the 2 046
people, 256 did management, 238 engineering, 196 electrical infrastructure construction and
116 information technology (See Table 8).
Higher institution and TVET in Nyandeni, 2016
Higher education institution (University/University of technology)
Tvet (formerly FET)/Private Colleges)
Not applicable
Unspecified
Grand Total
Ngquza Hill 4 086 2 951 294 996 1 347 303 379
Port St Johns 1 569 912 163 912 386 166 779
Nyandeni 4 240 2 046 300 822 2 594 309 702
Mhlontlo 2 447 1 485 184 982 261 189 176
KSD 19 078 7 570 460 905 795 488 349
O.R.Tambo 31 420 14 964 1 405 618 5 382 1 457 384
Source: Statistics South Africa (2016 Community Survey) Table 7
Field of TVET and field of higher education

70
Table 7 revealed that Nyandeni had 4 240 people with higher education. Table 9 provides the
field of higher educational institution. Of these 4 240 people, 428 were in the field of business,
290 in health, 268 in public management and the bulk of 1 647 in the field of education.
Education shapes how people experience the social, political and economic conditions in
society. Consequently, education is central to how we respond to the quest for human
development and flourishing. The basic purpose of education is to provide children, youth
and adults with a socialising

71
experience that enables self-knowledge and develops personal and social attributes to engage
with, change and contribute meaningfully to society.
Field of TVET
O.R.Tambo Ngquza Hill Port St
Johns Nyandeni Mhlontlo KSD
Management 3 147 940 218 256 261 1 473
Marketing 769 76 76 83 40 494
Information technology and computer science 775 161 19 116 81 398
Finance 505 81 18 94 55 256
Office administration 740 193 64 64 119 300
Electrical infrastructure construction 879 137 56 196 43 447
Civil engineering and building construction 766 132 24 19 114 477
Engineering 1 752 337 83 238 94 999
Primary agriculture 241 46 31 48 19 98
Hospitality 334 40 18 43 32 201
Tourism 277 38 18 46 19 156
Safety in soceity 311 96 41 74 63 38
Mechatronics 62 35 - - - 27
Education and development 1 563 337 135 222 241 628
Other 2 659 301 110 496 274 1 479
Do not know 183 - - 51 30 101
Not applicable 1 437 038 299 082 165 481 305 062 187 430 479 984
Unspecified 5 382 1 347 386 2 594 261 795
Grand Total 1 457 384 303 379 166 779 309 702 189 176 488 349
Source: Statistics South Africa (2016 Community Survey) Table 8

72
Field of higher educational institution
O.R.Tambo Ngquza
Hill
Port St
Johns Nyandeni Mhlontlo KSD
Agriculture 532 53 21 102 52 304
Architecture and the built environment 301 32 - 33 20 216
Arts (Visual and performing arts) 227 - - 13 18 195
Business 3 616 232 120 428 84 2 753
Communication 388 69 - 48 17 254
Computer and information sciences 873 117 29 170 48 509
Education 12 199 2 323 831 1 647 1 420 5 978
Engineering 1 683 164 78 102 119 1 220
Health professions and related clinical sciences 3 158 291 166 290 169 2 241
Family ecology and consumer sciences 177 - - 20 27 130
Languages 66 10 - 8 13 34
Law 947 41 44 100 87 675
Life sciences 120 30 - - - 90
Physical sciences 141 12 - 20 - 109
Mathematics and statistics 112 13 7 45 12 35
Military sciences - - - - - -
Philosophy 205 39 - 25 6 135
Psychology 268 11 10 11 15 220
Public management and services 1 423 108 94 268 100 854
Social sciences 1 073 80 91 96 37 770
Other 3 640 464 46 741 202 2 187
Do not know 274 - 33 72 - 168
Not applicable 1 420 582 297 946 164 824 302 868 186 468 468 476
Unspecified 5 382 1 347 386 2 594 261 795
Grand Total 1 457 384 303 379 166 779 309 702 189 176 488 349
Source: Statistics South Africa (2016 Community Survey) Table 9

73
Highest level of education
O.R.Tambo Ngquza Hill Port St
Johns Nyandeni Mhlontlo KSD
No schooling 273 093 55 958 34 153 56 523 32 501 93 957
Grade 0 76 954 16 589 8 663 17 775 10 593 23 334
Grade 1/Sub A/Class 1 56 094 12 182 7 510 12 147 7 548 16 707
Grade 2/Sub B/Class 2 42 999 11 043 5 876 8 952 5 279 11 850
Grade 3/Standard 1/ABET 1 75 193 16 584 9 533 17 362 9 615 22 099
Grade 4/Standard 2 73 965 17 829 10 086 16 130 10 247 19 672
Grade 5/Standard 3/ABET 2 74 716 18 251 10 583 16 001 10 102 19 778
Grade 6/Standard 4 85 465 20 040 10 853 18 899 12 401 23 271
Grade 7/Standard 5/ABET 3 66 131 14 406 8 392 13 807 9 636 19 890
Grade 8/Standard 6/Form 1 91 580 20 581 10 390 19 304 13 329 27 977
Grade 9/Standard 7/Form 2/ABET 4/Occupational certificate NQF Level 1 113 897 24 018 12 771 23 788 16 675 36 645
Grade 10/Standard 8/Form 3/Occupational certificate NQF Level 2
112 697
23 463
11 054
24 126
16 064
37 989
Grade 11/Standard 9/Form 4/NCV Level 3/ Occupational certificate NQF Level 3 127 179 23 934 11 553 28 823 16 443 46 426
Grade 12/Standard 10/Form 5/Matric/NCV Level 4/ Occupational certificate NQF Level 3 131 263 19 942 12 208 26 287 14 098 58 728
NTC I/N1 925 106 82 98 130 509
NTCII/N2 635 163 20 84 83 286
NTCIII/N3 1 146 239 78 200 137 492
N4/NTC 4/Occupational certificate NQF Level 5 2 387 653 205 303 173 1 054
N5/NTC 5/Occupational certificate NQF Level 5 1 415 367 124 161 116 648
N6/NTC 6/Occupational certificate NQF Level 5 2 571 521 158 483 120 1 289
Certificate w ith less than Grade 12/Std 10 361 21 - 33 93 213
Diploma w ith less than Grade 12/Std 10 1 211 138 45 260 249 520
Higher/National/Advanced Certificate w ith Grade 12/Occupational certificate NQF 4 112 636 221 1 242 353 1 660
Diploma w ith Grade 12/Std 10/Occupational certificate NQF Level 6
10 309
1 540
571
1 355
766
6 076
Higher Diploma/Occupational certificate NQF Level 7 4 856 986 230 699 277 2 664
Post-Higher Diploma (Master’s 4 074 524 247 1 181 524 1 599
Bachelor’s degree/Occupational certificate NQF Level 7 9 400 1 093 416 1 276 419 6 196
Honours degree/Post-graduate diploma/Occupational certificate NQF Level 8 4 086 705 275 612 219 2 275
Master’s/Professional Master’s at NQF Level 9 degree 860 133 26 53 72 576
PHD (Doctoral degree/Professional doctoral degree at NQF Level 10) 437 60 27 52 16 282
Other 1 551 259 84 317 229 662
Do not know 4 360 145 286 899 451 2 579
Unspecified 1 463 273 58 471 219 441
Grand Total 1 457 384 303 379 166 779 309 702 189 176 488 349
Source: Statistics South Africa (2016 Community Survey) Table 10
Table 10 shows the highest level of education attained by people in Nyandeni local
municipality. The community survey released by Stats SA reveals that in 2016, O.R. Tambo
had 273 093 people with no schooling of which 93 957 people were in KSD and 56 523 people
in Nyandeni.
In line with the millennium development goals, the government of Nyandeni local municipality
should take measures to eradicate education backlog,

74
especially for the people with no schooling. Education is the best investment that a parent can
provide to his children, because it yields better and long term return.
Monetary return on education
Diagram 1: Monetary return on education and the human capital theory
Education and training should be regarded as an investment and not just a mere consumption
services because education and training provide more than immediate benefits such as
subjective satisfaction and status but a long term monetary rewards through higher earnings
and better life style.
According to the human capital theory, the monetary return on education and training is the
net return which is derived at by taking into accounts both the costs and the benefits of
education and training.
The reason for this illustration here is that when workers are productive the economy grows and
when the economy grows more jobs will be available, and when people find jobs more tax
revenue goes to the government while its expenditure on social welfare declines. Thus less
budget is spent on fighting poverty and creating jobs through government programs such as
the Accelerated Shared Growth and Initiative South Africa (ASGI-SA); the
Education and Training
Increased Productivity
A B
Higher earnings

75
Broad Based Black Economic Empowerment (BBBEE); Small, Micro and Medium Enterprises
(SMMEs) and Co-operations (Coops).
The promotion of these programs will then be on the individual to take active steps to be
innovative and flexible to take up challenges. Government will therefore concentrate more effort
in investing in both economic and social infrastructure.
Conclusion
This section emphasises on the role of education as an important indicator of development. This
is due to its correlation with human capabilities, productivity and, ultimately, income. Therefore,
education is to be regarded as an investment and not just a mere consumption services. The
large number of people with no education should be eradicated in the municipality.
3.9 Population Density
Definition
Population density measures the concentration of people in a region by dividing the population of
the region by the area size of that region. The output of this is the number of people per kilometer
squared and can be broken down according to population group.
In 2011, there were 117.28 persons per square kilometer living in the Nyandeni Local Municipality. Compared to the
other local municipalities, it seems to be on similar level than Ngquza Hill and Port St Johns local municipalities, as well
as to the O.R. Tambo District Municipality.
CHART 4. POPULATION DENSITY BY LOCAL MUNICIPALITY, 2011 [NUMBER OF PEOPLE]
3.10 Crime
The state of crime in South Africa has been the topic of many media articles and papers in the past years. Most people
would acknowledge that the country has a crime problem, but very little research has been done on the relative level of
112.34 120.83117.28
66.54
149.10
0.00
20.00
40.00
60.00
80.00
100.00
120.00
140.00
160.00
Ngquza Hill LocalMunicipality
Port St Johns LocalMunicipality
Nyandeni LocalMunicipality
Mhlontlo LocalMunicipality
King Sabata DalindyeboLocal Municipality
O.R.Tambo DM (112.75)
Source: ReX (Km²) & Stats SA Population census 2011

76
crime. The media tends to publish sensational, exaggerated case studies and ignores the progress and positive side of
combating crime.
3.10.1 IHS Global Insight composite crime index
The IHS Global Insight composite crime index is compiled using official data from the SAPS which is reported in 27 crime
categories ranging from murder to crime injuries. These 27 categories are divided into two groups according to the nature
of the crime—violent crimes and property crimes. Two methods are then used to derive weights for each category of
crime:
(a) Length-of-sentence approach and
(b) Cost-of-crime approach.
Definition
The crime index is a composite weighted index of crime. This variable provides a comparative time
series of the change in the level of crime. The higher the index number, the higher the level of crime
in the selected year and region. However, a single figure by itself is meaningless unless compared
with a figure from either another year or another region.
Although crime is on average very high in South Africa, O.R Tambo District Municipality has the second lowest crime
rate in the Eastern Cape and the Nyandeni Local Municipality is very much on the same level. The IHS Global Insight
Crime Index below represents the violent crime, Property crime and the overall crime index in the
Nyandeni Local Municipality.
TABLE 7. CRIME INDICES OVER TIME IN NYANDENI LOCAL MUNICIPALITY, 2005/06 – 2011/12 FINANCIAL
YEARS
For the period 2005 – 2008 overall crime in Nyandeni Local Municipality decreased at an annual average rate of 9.9%.
Violent crime follows the same pattern at an average annual decrease of 10.4%, while property crimes decreased at an
average annual rate of 0.9% in the Nyandeni Local Municipality from 2005 to 2008.
YearViolent Crime
Index
Property Crime
Index
Overall Crime
Index
2005/2006 71.64 38.89 68.90
2006/2007 56.43 39.68 55.03
2007/2008 59.89 38.66 58.12
2008/2009 51.50 37.89 50.37
2009/2010 51.10 49.04 50.93
2010/2011 61.47 51.40 60.63
2011/2012 55.18 47.12 54.50
Source: IHS Global Insight Regional eXplorer version 648

77
CHART 5. CRIME INDEX BY LOCAL MUNICIPALITY, 2011/2012 FINANCIAL YEAR
42.9
53.3 55.2 54.8
86.7
53.3 51.7
64.1
47.1
65.9
152.9
64.1
43.7
54.2 54.5 55.7
92.2
54.2
0
20
40
60
80
100
120
140
160
180
Ngquza Hill LocalMunicipality
Port St Johns LocalMunicipality
Nyandeni LocalMunicipality
Mhlontlo LocalMunicipality
King SabataDalindyebo Local
Municipality
OR Tambo DistrictMunicipality
Violent Crime Index
Property Crime Index
Overall Crime Index
Source: IHS Global Insight Regional eXplorer version 648

78
It is clear that the local municipality where the economy is more advanced is also more prone to crime. A proof of this is
seen in the King Sabata Dalindyebo Local Municipality where the property crime is above average.
The change on an annual basis is very volatile due to the size of the population of the municipalities. A small increase in
the actual number of crime incidents might reflect as large percentage increase. This trend is true for all the local
municipalities.
INTEGRATED COMMUNITY SAFETY PLAN
To address the escalation of Violent Crimes in Nyandeni municipal Jurisdiction especially in Libode and Ngqeleni Towns,
which is adversely affecting and impacting communities and business the municipaluity in collaboration with ORTAMBO
District Municipality Department of Home Affairs and the Department of Safety and Liasion has developed a Community
Safety Plan. Clear strategies has been developed and will be reviewed quarterly through the Community Safety Forum.
INTEGRATED COMMUNITY SAFETY FORUM
The Integrated Community Safety Forum is in place and functional it is comprised of the following Departments;
South African Polices Services | Department of Safety and Liaison | Department of Justice | Department of Social
Development | ORTTAMBO District Municipality | Traditional Leaders | NGO\s | Departmetn of Roads and Transport
and Department of Social Development.
The Community Safety Forum is convened Quarterly to discuss
4. EMPLOYMENT TRENDS
4. Introduction
The labour market is a major source of interest to policy makers because levels of employment
and unemployment have far-reaching social, economic and political implications. Sector
employment can either be analysed in terms formal employment and informal employment or
by primary, secondary and tertiary sectors.
Productive employment remains the key mechanism through which individuals and
households can sustainably escape poverty. Unfortunately, employment is relatively scarce in
Nyandeni. In an effort to increase jobs, economic opportunity and growth, the municipality will
be required to capitalise on its relative comparative advantages while simultaneously
considering interventions which encourage an economic structure which is more labour
intensive to fully utilise the growing unskilled/ semi-skilled labour. More broadly, greater
incentives for the private sector to grow the economy are an option to explore.

79
4.1 Formal and informal employment
Table 16 shows that in 2015, there were in total 21 754 people employed in Nyandeni’s
economy. Of these, 14 919 people (69%) were employed in the formal sector and 6 835 people
(31%) in the informal sector.
Looking at the skills of the 14 919 people employed in the formal sector, 27% were skilled,
41% semi-skilled and 32% low/unskilled. The Government of Nyandeni should pay much
attention on unskilled labour and those in the informal sector.
The informal sector is characterized by short-term employment opportunities, little or no
prospect of internal promotion, and wages are determined by market forces. In terms of jobs,
it consists primarily of low or unskilled jobs, whether they are blue-collar (manual labour), white-
collar (filing clerks), or service jobs (waiters). These jobs are also characterized by low skill
levels, low earnings, easy entry, job impermanence, and low returns to education or
experience.
Generally, the primary sector is dominated by unskilled labour, while the tertiary industry,
particularly Finance, insurance, real estate and business services has a bigger share of highly
skilled employees. The construction; transport, storage and communication; and wholesale
and retail trade, catering and accommodation sectors have a significant share of informal
labour.
Employment, 2015 (Total number of people employed)
O.R.Tambo Ngquza Hill Port St Johns Nyandeni Mhlontlo KSD
Total formal and informal
Formal: Total
Formal: Skilled
Formal: Semi-skilled
Formal: Low skilled
Informal
140 143
93 545
28 045
37 392
28 108
46 598
21 818
14 333
4 183
5 046
5 104
7 485
8 236
5 733
1 766
2 213
1 754
2 503
21 754
14 919
4 020
6 063
4 836
6 835
17 921
12 360
3 287
4 783
4 290
5 561
70 414
46 200
14 789
19 287
12 124
24 214
Source: Quantec, 2016 Table 16

80
The skills gap in Nyandeni municipality indicates the need for training and development
centres, especially for the young people who account for over 40% of the population. As shown
in the Table 16, in 2015, about three quarter of the employed people are either unskilled or
semi-skilled. The Department of Education will play a major role in Nyandeni. Given limited
resources, Government needs to re-allocate resource in the development of human capital so
that the economy can have more skilled people to occupy strategic positions in the
municipality. Developing human capital will ensure that the skills gap is bridged and more
people are becoming efficient and effective in uplifting the economy.
The development of human capital has a chain reaction. When people are trained and
developed, they will be employed in the formal sectors, and pay taxes that can be used to fund
other activities. As more effort is invested in human capital in the short-term, the long run
economy of the municipality will become promising for future development because people will
use their acquired skills in the economy. “Knowledge economy” is leading regions driven by
innovation; whereby unskilled people are less needed. Hence Government interventions are
critical. Some of these interventions should include the following:
Reduce unskilled labour and increase skilled or highly skilled labour through training and
education of workers,
Upgrade training facilities with the latest technology;
Introduce domestic policies that discourage the outflow of highly skilled workers (brain
drain),
Ensure labour equity is reached; and previously disadvantaged workers (Africans, women
and youth) are trained; and they are fully participating in the main stream labour marker.
This will help to bridge the skill gap.

81
Once these labour interventions are implemented, the positive impact will be felt in the long
run, not only to the individual workers, but also to the economy as whole. Thus, highly skilled
workforce will contribute to improved productivity, leading to economic growth.
Compensation of employee
What are the wages and salaries earned by employed people in Nyandeni? Table 17 shows
the amount paid to workers in the form of compensation of employees. The real compensation
of employee for the 21 754 people employed in Nyandeni’s economy amounted to R1 512
million in 2015 of which, about 96% is paid in the formal sector and 4% in the informal sector.
Nyandeni’s compensation of employee in the formal sector was estimated at R1 460 in 2015
of which
53% was paid to skilled workers;
35% to the semi-skilled workers, and
12% to low/unskilled workers.
Compensation of employee (R million constant 2010 prices)
O.R.Tambo Ngquza Hill Port St Johns Nyandeni Mhlontlo KSD
Total formal and informal
Formal: Total
Formal: Skilled
Formal: Semi-skilled
Formal: Low skilled
Informal
10 777
10 396
5 979
3 326
1 091
381
1 512
1 452
859
408
185
61
620
598
365
163
70
22
1 512
1 460
767
516
177
52
1 218
1 175
676
342
157
43
5 914
5 711
3 312
1 897
502
203
Source: Quantec, 2016 Table 17
Employment trends in Nyandeni
The Eastern Cape vision 2030 developed by the EC Planning Commission highlights
education and job creation as key building blocks for the long term development of South
Africa. The report establishes the following set

82
of priorities as pivotal for the development of the Eastern Cape: (1) An improvement in
education and provide skill needed by employer; (2) Job creation; (3) A more effective drive
to transform and develop our rural regions to boost the economic performance of the province
as a whole. Jobs must also be created in rural areas; and (4) A commitment to improving the
functionality and efficiency of the public sector to ensure key priorities and desired outcomes
are achieved.
Figure 13 shows how employment in Nyandeni stagnated between 1993 and 2000 and how
jobs were created between2003 to 2008. The speed in employment growth was disrupted by
the 2008 and 2009 recession. But since 2013, employment in the municipality has again start
increasing.
Total employment in Nyandeni Local municipality
Source: Quantec, 2016 Figure 13
24 000
21 754
22 000
20 000
18 221
18 000
16 000
13 956
14 000 12 744
12 000
10 000

83
Age Distribution, community survey 2016
0 to 14 (Children
15 to 34 (Youth) 35 to 64 (Adults)
65+ (Elderly) Grand Total
Ngquza Hill 43% 39% 12% 6% 100%
Port St Johns 43% 39% 12% 7% 100%
Nyandeni 41% 40% 13% 7% 100%
Mhlontlo 39% 38% 15% 9% 100%
KSD 34% 44% 16% 6% 100%
O.R.Tambo 39% 41% 14% 6% 100%
Source: Statistics South Africa, 2016 Community Survey Table 18
Looking at the age structure of the municipality, from Table 18, it is clear that 41% of Nyandeni
population is below the age of 14; and 40% of total population is youth between 15 and 34
years of age. In total, more than 80% of the population in Nyandeni is below the age of 35.
Therefore, employment in Nyandeni should focus on the young people.
In order to absorb the younger generation into the labour force, measures should be put in
place to help them enter the labour market through creation of industries that attract young
people, such as IT . The younger generation continue to face unemployment problem because
the majority of them enter the labour market for the first time without any work experience or
skills.
Sector employment in Nyandeni
Which sector employs people in Nyandeni? Figure 19 shows that government sector which
includes community services sector employs about 48% of total employment in Nyandeni.
This means that should Government sector be close in Nyandeni, almost half of workers in
Nyandeni will be without work.

84
Sector employment, 2015 (Total number of people employed) Industry O.R.Tambo Ngquza Hill Port St Johns Nyandeni Mhlontlo KSD
Primary sector 6023 1589 469 627 1956 1382
Agriculture 5446 1456 392 450 1887 1261
Mining 577 133 77 177 69 121
Secondary sector 15081 2491 993 2561 1927 7109
Manufacturing 3768 647 185 425 737 1774
Electricity, gas and water 494 46 24 102 34 288
Construction 10819 1798 784 2034 1156 5047
Tertiary sector 119039 17738 6774 18566 14038 61923
Trade 36171 5647 1704 5367 4040 19413
Transport 4819 558 258 838 579 2586
Finance 14284 1820 621 2076 1316 8451
General government 32729 4964 2304 5146 4004 16311
Community services 31036 4749 1887 5139 4099 15162
Total 140143 21818 8236 21754 17921 70414
Source: Quantec, 2016 Table 19
Unfortunately, the valued added sectors (primary and secondary sectors where most jobs
creation are expected from) only contributes 15% to total employment.
The primary sector employs for 3%,
The secondary sector employs 12%, and
The tertiary sector employs 85%.

85
Government and trade are the largest employers in Nyandeni
Source: Quantec, 2016 Figure 14
An additional consideration is to investigate the earnings potential of prioritised growth sectors,
to ensure that increased employment also equal an increase in standards of living. One of the
challenges for policymaking, as it relates to labour, is to improve the balance between supply
and demand across the various labour markets. This requires growing the supply of skills,
through a range of interventions related to improving education outcomes. Women remain
relatively disadvantaged within the labour market, which should be carefully considered by
policy makers, given the important role women play in stabilising a family unit, which could
impact on broader social ills. High youth unemployment requires an improvement in the
employability of youth, policy makers will need to strengthen current skills development
initiatives.
Community services 24%
Agriculture 2%
Mining 1%
Manufacturing 2%
Construction 9%
Electricity 0%
Trade 25%
General government
24% Finance
9%
Transport 4%

86
Nyandeni employment index
Figure 15 presents employment and compensation of employee indices for Nyandeni
municipality, using 1994 as the base year. It shows that the informal sector has outperformed
the formal sector. Real compensation of employee in the informal sector grew by 297 index
points, and its corresponding employment in the informal sector, by 192 index points. Formal
employment grew the least by 28 index points compared to 297 index points in the informal
sector.
Nyandeni employment and compensation of employee indices (1994 = 100)
Source: Quantec, 2016 Figure 15
Looking at individual sector employment, Figure 16 shows that between 1994 and 2015,
Finance sector grew the most by 269 index points followed by electricity sector which grew by
122 index points.
450
400 397.5
350
300 291.2
250
200
150
184.3
156.0
128.6 100
50
0
Total Employment Formal employment Informal employment
Real compensation Total Real compensation: Formal: Total Real compensation : Informal

87
Finance sector employs highly skilled workers. High growth in this sector may lead to skill
mismatch because the municipality is rural and overpopulated by unskilled labour.
Although Agriculture is regarded as a key sector in the municipality, the sector declined by 24
index point. In fact, the whole primary sector declined 15 index points. This means that
Agriculture sector is shedding jobs in the municipality.
Manufacturing is a small sector with negligible contribution to total employment. Employment
in the sector stagnated at zero index point while the overall growth for the secondary sector
only grew by 14 index points. This implies that manufacturing sector in Nyandeni is not creating
jobs.
Sector employment index: 1994 = 100
Source: Quantec, 2016 Figure 16
500
450
400
350
300
250
200
150
100
50
0
369
1994 2015
222 188
169 169 156 135 125 118 114 114 100 85 76

88
Unemployment trends in Nyandeni
Looking at the level of unemployment in Nyandeni, Figure 17 below shows how the official
unemployment rate dropped dramatically from 46.2% in 2006 to 40.6% in 2008. But due to the
great recession, many companies retrenched workers and since then, unemployment in
Nyandeni climbed again to high level of 43.5% in 2015.
High unemployment rate in Nyandeni local municipality
Source: Quantec, 2016 Figure 17
5. Household Infrastructure
A figure representing household infrastructure is essential and very useful in economic planning and social
development. Measuring household infrastructure involves the measurement of the following four indicators; access
to running water, access to proper sanitation, access to refuse removal and access to electricity. A house is considered
serviced if it has access to all four of these basic services. If not, the household is commonly known as forming part of
the ‘backlog’. However, what defines access to a given service (and how to accurately measure that specific definition
over time) gives rise to some distinct problems. IHS Global Insight has therefore developed a unique model to capture
the number of households and their level of access to the four basic services i.e. sanitation, water, electricity and refuse
removal.
The following sections provide an overview of the household infrastructure that existed in Nyandeni Local Municipality
between 2005 and 2011.
50.0
46.2
45.0 43.5
41.6 40.6
40.0 38.6
34.9 35.0
30.0
25.0
20.0

89
5.1 Households by Dwelling Type
Definition
This time series categorises households according to the type of dwelling unit that they occupy,
using the Stats SA definition of a household and a dwelling unit. A household is a group of persons
who live together and provide themselves jointly with food and/or other essentials for living, or a
single person who lives alone”. A dwelling unit, which is a known as a housing unit, is a unit of
accommodation for a household, which may consist of one structure, or more than one structure
or, part of a structure.
Dwelling units are distributed into 3 categories:
1. Formal Dwellings: structures built according to approved plans, e.g. houses on a separate
stand, flats or apartments, townhouses, rooms in backyards or flatlet elsewhere.
2. Traditional dwellings: Traditional dwellings made of clay, mud, reeds or other locally
available material.
3. Informal Dwellings: shacks or shanties in informal settlements, serviced stands or
proclaimed townships or shacks in the backyards of other dwelling types.
4. Other Dwelling Units: tents, ships, caravans etc.
CHART 6. PERCENTAGE OF HOUSEHOLDS BY DWELLING TYPE – LOCAL MUNICIPALITIES, 2011
In 2011, the Nyandeni Local Municipality had 33.8% or 20 820 formal dwelling units, and 39 815 traditional dwelling
units which translates to 64.6% of the total dwelling units in Nyandeni Local Municipality. Nyandeni Local Municipality
only has 397 informal dwellings units. When comparing the Nyandeni Local Municipality with the other local
municipalities within the O.R. Tambo District Municipality, it is seen that the Nyandeni Local Municipality has the
second highest number of dwelling units. The King SabataDalindyebo Local Municipality has the highest number of
dwelling units with a total of 105 241 units.
TABLE 8. NUMBER OF HOUSEHOLDS BY DWELLING TYPE – LOCAL MUNICIPALITIES, 2011
58.0%
74.0%
64.6% 62.9%
36.7%
54.2%
40.5%
24.6%
33.8% 34.1%
60.3%
43.5%
0%
10%
20%
30%
40%
50%
60%
70%
80%
90%
100%
Ngquza Hill LocalMunicipality
Port St Johns LocalMunicipality
Nyandeni LocalMunicipality
Mhlontlo LocalMunicipality
King SabataDalindyebo Local
Municipality
O.R.Tambo DistrictMunicipality
Formal
Traditional
Informal &Other
Source: Stats SA Population census 2011

90
TypeNgquza Hill Local
Municipality
Port St Johns
Local Municipality
Nyandeni Local
Municipality
Mhlontlo Local
Municipality
King Sabata
Dalindyebo Local
Municipality
O.R.Tambo
District
Municipality
Formal 22 749 7 817 20 820 14 785 63 416 129 587
Informal 541 319 397 1 016 2 087 4 360
Traditional 32 581 23 477 39 815 27 322 38 580 161 775
Other dwelling type 341 102 618 290 1 158 2 509
Total 56 212 31 715 61 650 43 413 105 241 298 231
Source: Stats SA Population census 2011

91
5. ACCESS TO GOODS AND BASIC SERVICES
5. Introduction
Access to basic services is not a privilege but a right. Given persistent inequalities and social
divisions in the province and in Nyandeni local municipality in particular, delays in obtaining
services, lower levels of service and relatively high levels of disconnection in poor
communities, perpetuate undignified living conditions.
Nyandeni local municipality is characterised by a population spread over large distances, high
incidents of poverty, a relatively underdeveloped economic base, low levels of skills
development and low levels of access to basic services and infrastructure. In other part of the
country, such challenges have led to mass protests.
The high incidence of mass protests in South Africa in response to the inadequate service
delivery in recent years can be explained by recourse to the social theory of relative deprivation.
“Relative deprivation” refers to a situation where a demographic segment of the population is
deprived of some goods or services to which they perceive they are entitled, while

92
another segment of the population enjoys such goods or services. The backdrop for the mass
action is social deprivation and lack of basic services, which still negatively impact the majority
of individuals and communities in South Africa and prevent their escaping from the poverty trap.
Government is not the only institution to blame for basic service backlog. Household institution
has also a major role to play in terms of maintaining infrastructure provided by government.
The community has a role to play. Communities and individuals must be active agents for their
development, rather than perpetual passive agents, on the receiving end of governmental or
institutional aid. This shift to a more proactive development approach should not only
ameliorate the basic living conditions of the poor, but also empower them equally as active
stakeholders and responsible individuals within engaged communities.
This section use the 2016 community survey to assess access to basic service in Nyandeni.
The analysis covers topics such as access to water, sanitation, shelter, energy and access to
refuse removal. It includes other topics such as access to goods.
5.2 HOUSEHOLDS WITH ACCESS TO GOODS
Ownership of household’s goods is crucially important in measuring the standard of living for
the household. The ownership of some household goods such as cell phone, electric stove,
TV, fridge, washing machine, DSTV, motor vehicle as well as computer, have seen significant
increases in 2016 as compared to in 2011.
The 2016 Community Survey reveals that few households have access to a landline. This
good has been substituted by cell phone which is seen in Figure 18 as the good accessed
by most households.

93
Access to Goods: Nyandeni, 2016
Source: Statistics South Africa (2016 Community Survey) Figure 18
More than three quarter of households across the province have access to a cell phone.
Access to communication and information technology plays an increasingly important role in
living standards and access to opportunities.
5.3 ACCESS TO SHELTER
Adoption of Housing Sector Plan
The Housing Sector Plan has been reviewed and adopted by Council on 27 June 2019. It is a five year strategic plan to achieve the strategic goals of sustainable human settlement
Housing needs register
Housing register has been developed and is updated annually. To date 38 323 forms and questioners have been captured in the housing needs register. According to Statistics South Africa there is total of 48 187 shortage of housing across all segments of the market.
It is worth noting that Ward 12 has the most backlog of 2330 followed by Ward 25 with a backlog of 2013
Informal Settlement
According to Housing Sector Plan three informal settlement exist in the municipality, namely, Nomzamo informal
Settlement with 50 informal households, Eziteneni Informanl Settlement has 30 households and Ngqeleni Informal
Settlement with 21 households, both Nomzamo and Eziteni Informal Settlement are in the process of beinf formalised
Blocked Projects
According to Housing Sector Plan Mampondomiseni phase 1 and phase 2 located in Ward 17 and Nyandeni 233 are are blocked projects. Numerious attempts have been made with the Department of Human Settlement to resolve the but with no success.
Land Claims
286 429
239 339
210 630
180 615
137 469 122 775
87 525
48 226 34 070
22 639 18 611 15 294 12 641 6 159 5 969 3 053 1 487

94
Land claims remains one of the most significant barriers to socio-economic development and it has its impact on the many catalyst projects for the municipality and the district at large. There is critical and urgent need to address the issues of land owners.
The following land claims are outstanding in the Nyandeni area
Claimant Name Property Description Rural
Private Claim Mafini Location Rural
Buthongweni Location Erf 1. Ngqeleni Commonage Rural
Erft 2.Ngqeeleni Commonage Rural
Erf 3. Ngqeleni Commonage Rural
Private Claim Nolokoza Village Rural
Community Claim Erf 90 Libode Commonage Urban
Migration and its implications
The Integrated Urban Development Framework 2016 is set to change the state of housing in the Republic of South
Africa, which is:
• Housing demand is greater than the pace of formal housing delivery and land released. This is because of
increased urbanisation and changing demographics (smaller households and migration patterns).
• The concentration of poverty in large urban areas is growing although rural areas are relatively more deprived.
• The lack of well-located land and high property prices mean that residential areas continue to be segregated
based on race, social status or class, and housing remains unaffordable to many
South Africans. The Housing Development Agency has acquired land but much of it falls outside the major
urbanisation pressure points.
• The proliferation of marginalised and disconnected settlements (on the periphery of cities), with no integration with
mobility interventions, makes access to socio-economic opportunities difficult, especially for low-income households
that mostly live on the periphery of cities.
• There is a lack of sufficient social and rental housing for the lower end of the market, especially on well-located
land with good access to socio-economic opportunities
Land invasion control mechanism
The municipality has developed and adopted Land Invasion policy to regulate and control land invasions in the
municipal jurisdiction. Furthermore, the By-Law on Undeveloped Sites has been Gazetted. This will provide legal
instrument to enforce By-Laws when there is illegal occupation of municipal land
Projects at procurement
Nyandeni 370
Nyandeni Gxulu 200
Nyandeni 77
Nyandeni 100
Nyandeni 124

95
PROJECT NAME PROJECT UNITS
Ward Comments Approved Budget
Mgwenyane 1000 06a Funding approved for 350 Units
R 190 624 940
Mankosi 1000 26 Funding approved for 350 units
R 190 624 940
Qhokama 1000 28 Funding approved for 350 units
R 190 624 940
Ngcolorha 1000 01 Funding approved for 350 units
R 190 624 940
Libode 1328 1328 07 & 08 Funding approved for 350 units
R 253 149 920.32
Housing entails more than bricks and mortar. The right to adequate housing is one of the most important of all basic
human rights. Section 26(1) of the Constitution stipulates that everyone shall have the right of access to adequate
housing. Accessibility means that the State must create conducive conditions for all its citizens, irrespective of their
economic status, to access affordable housing. To ensure accessibility is achieved, the government has
implemented several programmes within the National Housing Subsidy Scheme. Few examples includes: Rural
Housing Subsidy; Disaster Intervention programme; Project -Linked Subsidy; Consolidation

96
Subsidy; Hostel Redevelopment Programme; Right-Sizing Subsidy; Institutional Subsidy; Individual Subsidy;
Relocation Subsidy; Discount Benefit Scheme; Social Housing Programme; People's Housing Process; Rapid Land
Release Programme, etc.
According to the 2016 Community Survey, about 65% of the population in Nyandeni live in traditional dwelling, huts
or structures made of traditional material; and 34% of population stay in formal dwellings, which includes flats or
apartment in a block of flats (See Table 24).
Access to shelter Households %
Traditional dwelling/hut/structure made of traditional mater 200 719 64.8 Formal dwelling/house or brick/concrete block structure on a 93 419 30.2 Flat or apartment in a block of flats 6 677 2.2
Formal dwelling/house/flat/room in backyard 6 203 2.0
Other 1 275 0.4
Informal dwelling/shack in backyard 719 0.2
Cluster house in complex 215 0.1
Unspecified 138 0.0
Informal dwelling/shack not in backyard (e.g. in an informal 135 0.0
Semi-detached house 103 0.0 Room/flatlet on a property or larger dwelling/servants quart 99 0.0
Townhouse (semi-detached house in a complex) - -
Caravan/tent - -
Grand Total 309 702 100.0
Source: Statistics South Africa (2016 Community Survey) Table 24
As shown in Table 25, more than half (53%) of households in Nyandeni possess a title deed
(see Table below). This proportion is high in Ngquza Hill (73%) and low in Mhlontlo (43%).
Does household possess a title deed? Yes or No
Yes (Number)
Yes (%)
No Do not know
Not applicable
Unspecified
Total
O.R. Tambo 774 250 53% 563 909 53 272 63 572 2 381 1 457 384
Ngquza Hill 222 091 73% 72 913 3 361 4 824 189 303 379
Port St Johns 80 655 48% 77 984 5 651 2 444 45 166 779
Nyandeni 164 662 53% 127 843 10 107 6 265 826 309 702
Mhlontlo 80 602 43% 95 903 9 124 3 398 149 189 176
KSD 226 240 46% 189 266 25 029 46 641 1 172 488 349
Source: Statistics South Africa (2016 Community Survey) Table 25

97
Since the majority of the population stay in traditional dwelling, the solution of RDP is a blessing
for those who have accessed them. However, there is simply not enough money and
resources available to quickly provide everyone who needs a house with a full RDP house.
From a shack to an ‘RDP’ house: In the absence of any alternative, households have not
much choice but to occupy informal settlements. There is an urgent need for the South African
government to expand the number of alternative ways for the poor to access basic shelters.
Table 26 shows that 4% of the population in Nyandeni stays in a RDP house as a main
dwelling. This is compared to 8% in the KSD.
Households with RDP or government subsidised dwelling as the main dwelling;
2016
Number % of total household O.R.Tambo 85 025 6% Ngquza Hill 15 625 5% Port St Johns 11 518 7% Nyandeni 12 703 4% Mhlontlo 8 362 4% KSD 36 817 8%
Source: Statistics South Africa (2016 Community Survey) Table 26
The next sub-sections use definitions provided by the Department of Co- operative
Governance and Traditional Affairs (Cogta) to differentiate between;
High level of service,
Basic level of service,
below basic also referred to as backlog, and
Indigent households receiving Free Basic levels of services.
Access to service is provided under these four categories. As indicated earlier, the data used
in this sub-section is from Statistics South Africa’s 2016 community survey.

98
5.5 ACCESS TO WATER
Water is the main important commodity for life. The provision of water services, particularly
piped water, is a critical priority for national government, given how water provision impacts
the quality of life and investment potential of a region.
Access to Water refers to the number of households receiving basic level of water supply.
Results from the 2016 community surveys shown in Table 27 confirms the views of people in
Nyandeni as access to save and reliable water supply (in Table 20) was perceived by almost
half of the population as the main challenge currently facing the district. Evidence from Table
27 give more light on the inadequacy of supplying potable water to Nyandeni community.
Higher level of service includes piped water inside dwelling. This category is still a luxury
in Nyandeni as only 1 146 people or less than 1% of the population fall into this category.
Basic level of service includes piped water inside yard and piped water within 200m. In
Nyandeni 3% of the population have piped water inside yard.
Below basic level constitutes a backlogs and includes, piped water further than 200m,
springs, rain water tanks, dam/pool/stagnant water and water vendors. The Table 27
demonstrates clearly that more than half of the population fall within this category.
Number of indigent households receiving Free Basic Water refers to an amount of water
determined by government that should be provided free to poor households to meet
basic needs, currently set at 6kl per month per household.

99
Access to water
O.R.Tambo Ngquza Hill Port St
Johns Nyandeni Mhlontlo KSD
Piped (tap) water inside the dwelling/house
66 621
2 186
1 895
1 146
1 635
59 759
Piped (tap) water inside yard 145 492 6 909 6 971 10 175 15 987 105 449
Piped water on community stand 195 458 15 268 8 701 56 988 49 433 65 069
Borehole in the yard 1 498 780 355 205 60 97
Rain-water tank in yard 155 089 15 638 16 464 53 325 13 659 56 003
Neighbours tap 12 745 2 840 955 361 640 7 949
Public/communal tap 71 383 19 736 7 850 13 062 17 512 13 223
Water-carrier/tanker 17 614 2 045 1 858 3 882 1 773 8 057
Borehole outside the yard 8 617 2 100 1 902 1 763 659 2 192
Flowing water/stream/river 705 424 196 224 107 828 164 634 74 334 162 404
Well 8 339 3 282 130 1 212 1 036 2 679
Spring 66 701 36 338 11 779 2 038 11 856 4 690
Other 2 404 33 91 909 592 778
Grand Total 1 457 384 303 379 166 779 309 702 189 176 488 349
O.R.Tambo
Ngquza Hill Port St
Johns
Nyandeni
Mhlontlo
KSD
Piped (tap) water inside the dwelling/house 5% 1% 1% 0% 1% 12% Piped (tap) water inside yard 10% 2% 4% 3% 8% 22% Piped water on community stand 13% 5% 5% 18% 26% 13% Borehole in the yard 0% 0% 0% 0% 0% 0%
Rain-water tank in yard 11% 5% 10% 17% 7% 11% Neighbours tap 1% 1% 1% 0% 0% 2%
Public/communal tap 5% 7% 5% 4% 9% 3% Water-carrier/tanker 1% 1% 1% 1% 1% 2%
Borehole outside the yard 1% 1% 1% 1% 0% 0% Flowing water/stream/river 48% 65% 65% 53% 39% 33% Well 1% 1% 0% 0% 1% 1%
Spring 5% 12% 7% 1% 6% 1% Other 0% 0% 0% 0% 0% 0%
Grand Total 100% 100% 100% 100% 100% 100%
Source: Statistics South Africa (2016 Community Survey) Table 27
Figure 19 shows the percentage of people with access to safe drinking water. The proportion
was low in Ngquza Hill (18%), moderate in Nyandeni (37%) and high in KSD (53%).
The department of water affairs and the department of health should work hand in hand to
ensure that communities have potable water.

100
Access (%) to safe drinking water supply service, 2016
Source: Statistics South Africa (2016 Community Survey) Figure 19
Supplier of the main source of drinking water, 2016
A municipality
Other w ater
scheme (e.g.
community
w ater supply)
A w ater
vendor
Ow n service
(e.g. private Flow ing
borehole; ow n w ater/stream/river/sp
source on a ring/rain w ater
farm; et
Do not
know
Unspecified
Total
O.R.Tambo 398 830 82 950 25 236 40 370 901 959 7 814 225 1 457 384
Ngquza Hill 37 093 10 936 5 838 3 810 245 532 69 101 303 379
Port St Johns 23 539 3 781 1 083 3 753 133 265 1 301 59 166 779
Nyandeni 61 615 20 433 2 010 10 728 214 132 775 9 309 702
Mhlontlo 66 935 22 571 2 661 2 663 93 631 715 - 189 176
KSD 209 649 25 229 13 644 19 417 215 400 4 954 56 488 349
A municipality
Other w ater
scheme (e.g.
community
w ater supply)
A w ater
vendor
Ow n service
(e.g. private Flow ing
borehole; ow n w ater/stream/river/sp
source on a ring/rain w ater
farm; et
Do not
know
Unspecified
Total
O.R.Tambo 27% 6% 2% 3% 62% 1% 0% 100%
Ngquza Hill 12% 4% 2% 1% 81% 0% 0% 100%
Port St Johns 14% 2% 1% 2% 80% 1% 0% 100%
Nyandeni 20% 7% 1% 3% 69% 0% 0% 100%
Mhlontlo 35% 12% 1% 1% 49% 0% - 100%
KSD 43% 5% 3% 4% 44% 1% 0% 100%
Source: Statistics South Africa (2016 Community Survey) Table 28
60%
53%
50% 50%
40% 38% 37%
30%
24%
20% 18%
10%
0%
KSD Mhlontlo O.R.Tambo Nyandeni Port St Johns Ngquza Hill

101
Where do people in Nyandeni get their drinking water? Is the local municipality providing water
to all its citizen? Table 28 shows that the majority of the people in the municipality are relying
of natural flowing water. About 70% of the population in Nyandeni get their drinking water from
flowing or stream water. For every 10 people in Nyandeni, only 2 get drinking water provided
by the municipality.
The issues of water interruption and long distances to access water are among them. Table
29 shows that 17 549 people in Nyandeni had water interruption that lasted more than 14 days
in total over a three month period.
How long the water interruption laste
Less than 2 days in total over a three
month period
2 to 7 days in total over
a three
month period
8 to 14 days in total over
a three
month period
More than a 14 days in total over a
three month period
Do not know
Unspecified
Total
O.R.Tambo 40 883 66 988 35 443 77 991 5 849 1 230 230 1 457 384
Ngquza Hill 906 7 619 3 586 12 081 89 279 099 303 379
Port St Johns
1 834
5 670
442
1 841
431
156 561
166 779
Nyandeni 4 180 4 597 9 004 17 549 2 405 271 967 309 702
Mhlontlo 2 443 8 394 6 291 17 631 21 154 395 189 176
KSD 31 521 40 707 16 120 28 889 2 903 368 209 488 349
Source: Statistics South Africa (2016 Community Survey) Table 29
As indicated earlier, water is the main important commodity for life. Water interruption can
cause health problems. To avoid such, people seeks alternative water sources during
interruptions (See Table 30).
In Nyandeni, the following alternative water sources are used:
River and stream: 16 165 people
Rain water tank: 13 251 people
Borehole: 2 957 people
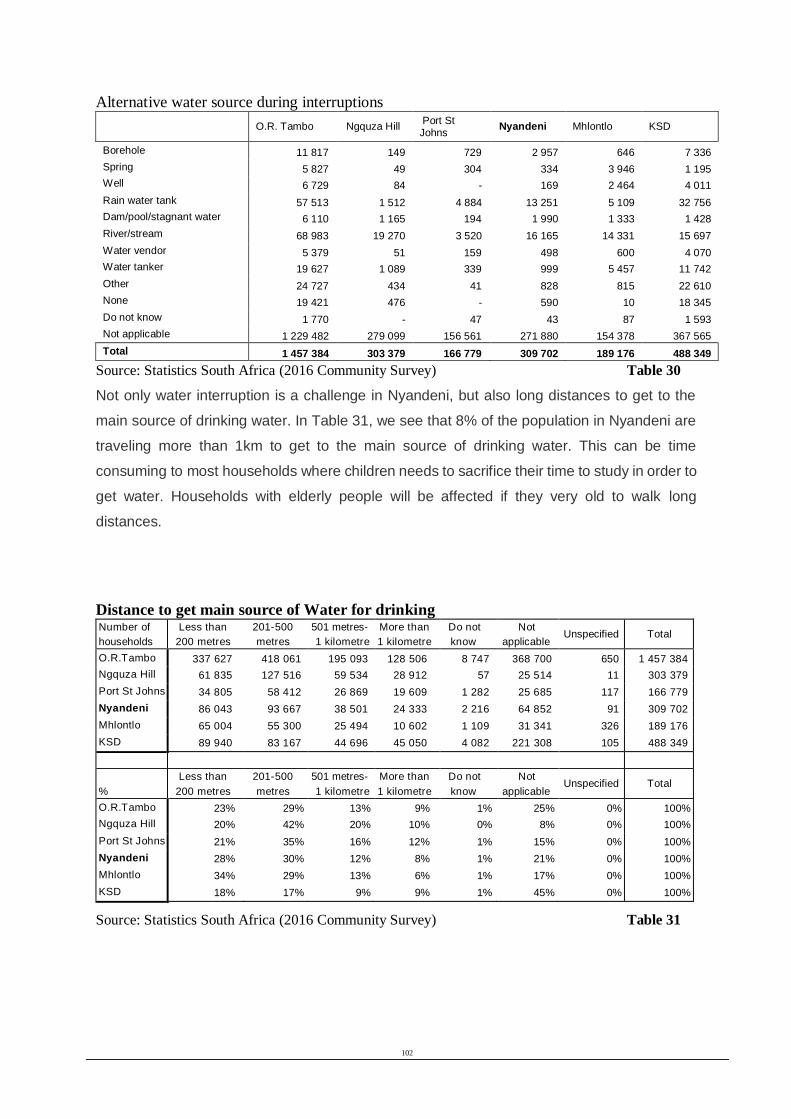
102
Alternative water source during interruptions
O.R. Tambo Ngquza Hill Port St Johns
Nyandeni Mhlontlo KSD
Borehole 11 817 149 729 2 957 646 7 336
Spring 5 827 49 304 334 3 946 1 195
Well 6 729 84 - 169 2 464 4 011
Rain water tank 57 513 1 512 4 884 13 251 5 109 32 756
Dam/pool/stagnant water 6 110 1 165 194 1 990 1 333 1 428
River/stream 68 983 19 270 3 520 16 165 14 331 15 697
Water vendor 5 379 51 159 498 600 4 070
Water tanker 19 627 1 089 339 999 5 457 11 742
Other 24 727 434 41 828 815 22 610
None 19 421 476 - 590 10 18 345
Do not know 1 770 - 47 43 87 1 593
Not applicable 1 229 482 279 099 156 561 271 880 154 378 367 565
Total 1 457 384 303 379 166 779 309 702 189 176 488 349
Source: Statistics South Africa (2016 Community Survey) Table 30
Not only water interruption is a challenge in Nyandeni, but also long distances to get to the
main source of drinking water. In Table 31, we see that 8% of the population in Nyandeni are
traveling more than 1km to get to the main source of drinking water. This can be time
consuming to most households where children needs to sacrifice their time to study in order to
get water. Households with elderly people will be affected if they very old to walk long
distances.
Distance to get main source of Water for drinking Number of
households
Less than
200 metres
201-500
metres
501 metres-
1 kilometre
More than
1 kilometre
Do not
know
Not
applicable Unspecified Total
O.R.Tambo 337 627 418 061 195 093 128 506 8 747 368 700 650 1 457 384
Ngquza Hill 61 835 127 516 59 534 28 912 57 25 514 11 303 379
Port St Johns 34 805 58 412 26 869 19 609 1 282 25 685 117 166 779
Nyandeni 86 043 93 667 38 501 24 333 2 216 64 852 91 309 702
Mhlontlo 65 004 55 300 25 494 10 602 1 109 31 341 326 189 176
KSD 89 940 83 167 44 696 45 050 4 082 221 308 105 488 349
%
Less than
200 metres
201-500
metres
501 metres-
1 kilometre
More than
1 kilometre
Do not
know
Not
applicable Unspecified Total
O.R.Tambo 23% 29% 13% 9% 1% 25% 0% 100%
Ngquza Hill 20% 42% 20% 10% 0% 8% 0% 100%
Port St Johns 21% 35% 16% 12% 1% 15% 0% 100%
Nyandeni 28% 30% 12% 8% 1% 21% 0% 100%
Mhlontlo 34% 29% 13% 6% 1% 17% 0% 100%
KSD 18% 17% 9% 9% 1% 45% 0% 100%
Source: Statistics South Africa (2016 Community Survey) Table 31
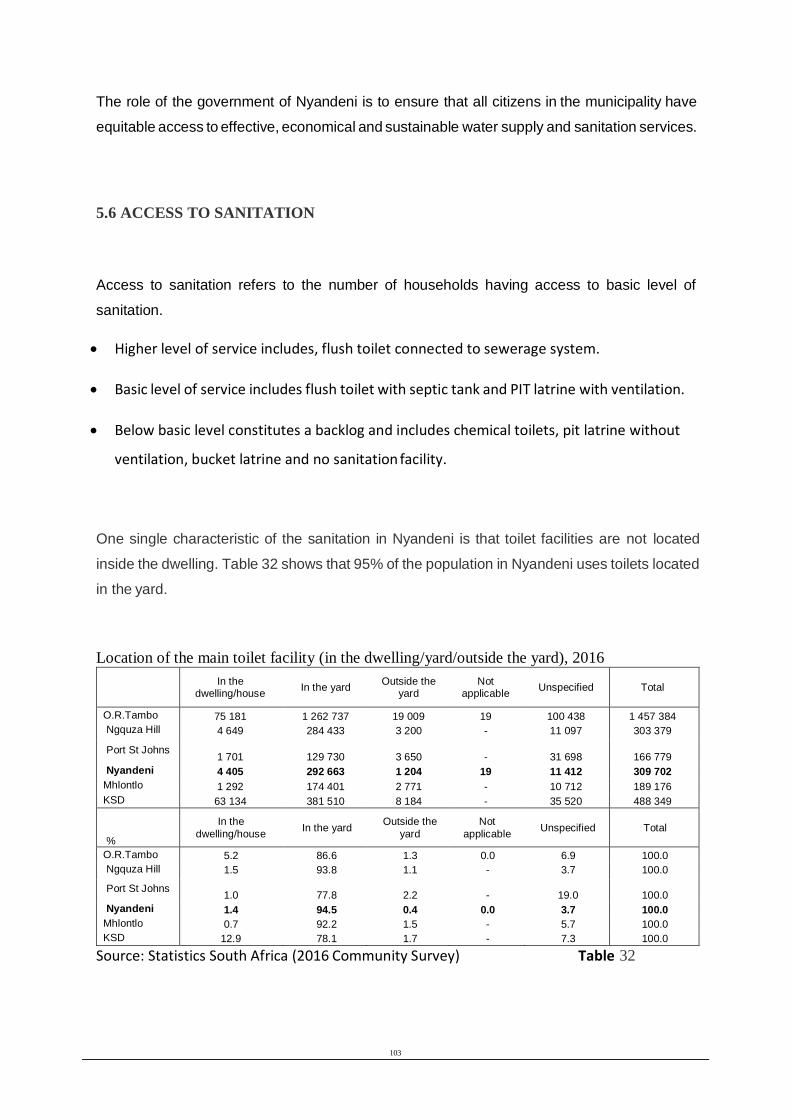
103
The role of the government of Nyandeni is to ensure that all citizens in the municipality have
equitable access to effective, economical and sustainable water supply and sanitation services.
5.6 ACCESS TO SANITATION
Access to sanitation refers to the number of households having access to basic level of
sanitation.
Higher level of service includes, flush toilet connected to sewerage system.
Basic level of service includes flush toilet with septic tank and PIT latrine with ventilation.
Below basic level constitutes a backlog and includes chemical toilets, pit latrine without
ventilation, bucket latrine and no sanitation facility.
One single characteristic of the sanitation in Nyandeni is that toilet facilities are not located
inside the dwelling. Table 32 shows that 95% of the population in Nyandeni uses toilets located
in the yard.
Location of the main toilet facility (in the dwelling/yard/outside the yard), 2016
In the dwelling/house
In the yard
Outside the yard
Not applicable
Unspecified
Total
O.R.Tambo 75 181 1 262 737 19 009 19 100 438 1 457 384
Ngquza Hill 4 649 284 433 3 200 - 11 097 303 379
Port St Johns
1 701
129 730
3 650
-
31 698
166 779
Nyandeni 4 405 292 663 1 204 19 11 412 309 702
Mhlontlo 1 292 174 401 2 771 - 10 712 189 176
KSD 63 134 381 510 8 184 - 35 520 488 349
%
In the
dwelling/house
In the yard Outside the
yard
Not
applicable
Unspecified
Total
O.R.Tambo 5.2 86.6 1.3 0.0 6.9 100.0
Ngquza Hill 1.5 93.8 1.1 - 3.7 100.0
Port St Johns 1.0 77.8 2.2 - 19.0 100.0
Nyandeni 1.4 94.5 0.4 0.0 3.7 100.0
Mhlontlo 0.7 92.2 1.5 - 5.7 100.0
KSD 12.9 78.1 1.7 - 7.3 100.0
Source: Statistics South Africa (2016 Community Survey) Table 32

104
The Medical field has acknowledged that access to efficient and hygienic sanitation services
contributes towards a clean and healthy environment, reduces the spread of communicable
diseases and provides dignity to communities. Access to sanitation services is measured by
households’ access to flush/chemical toilets versus pit or bucket systems of sanitation.
5.7 ACCESS TO ENERGY
Access to electricity refers to the number of households connected to grid network.
Higher level of service includes connection to the grid.
Basic level of service includes 10 Amp connection.
Below Basic electrical supply constitutes a backlog and includes households using any of
the following: Gas; Paraffin; Wood; and Coal.
Total number of indigent households receiving FBE refers to the amount of electricity
determined by government that should be provided free to poor households to meet basic
needs, currently set at 50kW per month per household.
How do households in Nyandeni access electricity? The Table below shows that 81% of the
population in Nyandeni use “in-house prepaid meter”. Very few uses generator, solar and
battery as a source of energy.
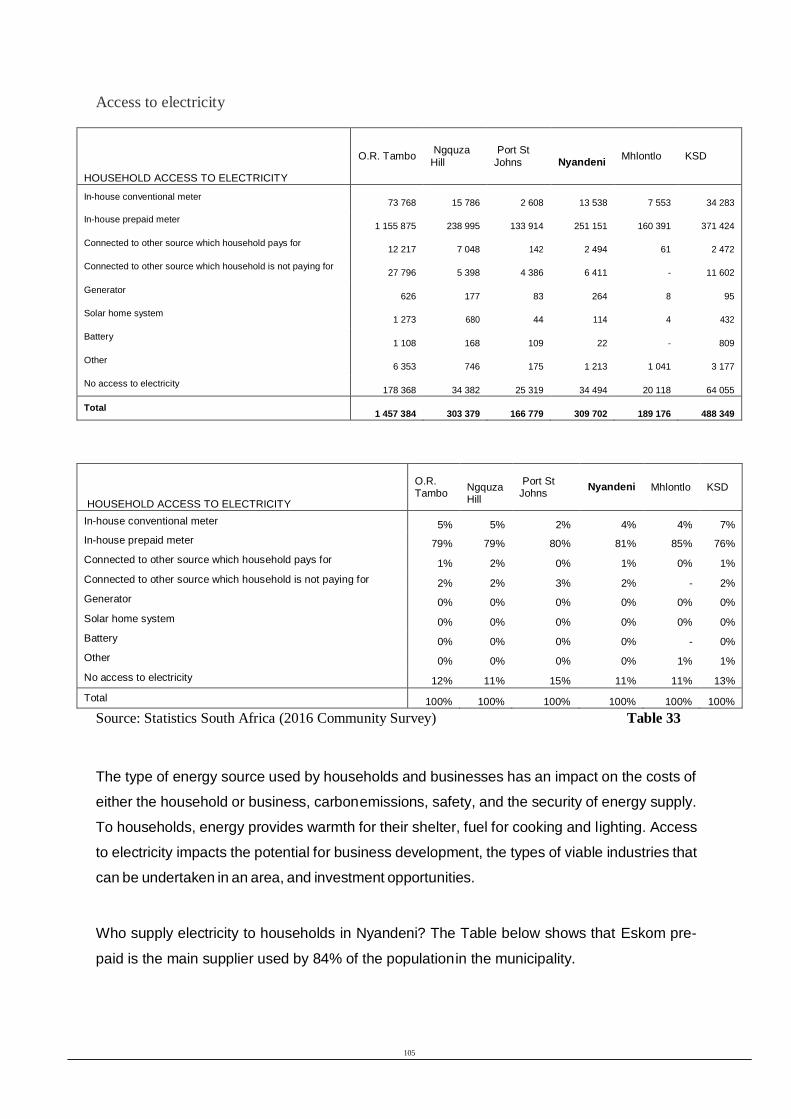
105
Access to electricity
HOUSEHOLD ACCESS TO ELECTRICITY
O.R. Tambo
Ngquza
Hill
Port St
Johns
Nyandeni
Mhlontlo
KSD
In-house conventional meter
73 768
15 786
2 608
13 538
7 553
34 283
In-house prepaid meter
1 155 875
238 995
133 914
251 151
160 391
371 424
Connected to other source which household pays for
12 217
7 048
142
2 494
61
2 472
Connected to other source which household is not paying for
27 796
5 398
4 386
6 411
-
11 602
Generator
626
177
83
264
8
95
Solar home system
1 273
680
44
114
4
432
Battery
1 108
168
109
22
-
809
Other
6 353
746
175
1 213
1 041
3 177
No access to electricity
178 368
34 382
25 319
34 494
20 118
64 055
Total 1 457 384
303 379
166 779
309 702
189 176
488 349
HOUSEHOLD ACCESS TO ELECTRICITY
O.R. Tambo
Ngquza Hill
Port St Johns
Nyandeni
Mhlontlo
KSD
In-house conventional meter 5% 5% 2% 4% 4% 7%
In-house prepaid meter 79% 79% 80% 81% 85% 76%
Connected to other source which household pays for 1% 2% 0% 1% 0% 1%
Connected to other source which household is not paying for 2% 2% 3% 2% - 2%
Generator 0% 0% 0% 0% 0% 0%
Solar home system 0% 0% 0% 0% 0% 0%
Battery 0% 0% 0% 0% - 0%
Other 0% 0% 0% 0% 1% 1%
No access to electricity 12% 11% 15% 11% 11% 13%
Total 100% 100% 100% 100% 100% 100%
Source: Statistics South Africa (2016 Community Survey) Table 33
The type of energy source used by households and businesses has an impact on the costs of
either the household or business, carbon emissions, safety, and the security of energy supply.
To households, energy provides warmth for their shelter, fuel for cooking and lighting. Access
to electricity impacts the potential for business development, the types of viable industries that
can be undertaken in an area, and investment opportunities.
Who supply electricity to households in Nyandeni? The Table below shows that Eskom pre-
paid is the main supplier used by 84% of the population in the municipality.

106
Household electricity Supplier
Municipality-
prepaid
Municipality-
receive bill
from
municipality
Eskom-pre-
paid
Eskom-
receive bill
from eskom
Other supplier
(e.g. metering
services such
as impact
meters
Do not
know
Not
applicable
Unspecified
Total
O.R.Tambo 154 566 8 924 1 053 641 3 289 5 207 2 071 178 368 51 318 1 457 384
Ngquza Hill 2 179 202 250 989 736 - 281 34 382 14 611 303 379
Port St Johns 5 863 86 129 255 485 62 716 25 319 4 994 166 779
Nyandeni 1 794 13 258 869 1 197 1 480 392 34 494 11 462 309 702
Mhlontlo 11 733 155 155 763 140 63 55 20 118 1 148 189 176
KSD 132 996 8 469 258 765 731 3 602 628 64 055 19 102 488 349
Municipality-
prepaid
Municipality-
receive bill
from
municipality
Eskom-pre-
paid
Eskom-
receive bill
from eskom
Other supplier
(e.g. metering
services such
as impact
meters
Do not
know
Not
applicable
Unspecified
Total
O.R.Tambo 11% 1% 72% 0% 0% 0% 12% 4% 100%
Ngquza Hill 1% 0% 83% 0% - 0% 11% 5% 100%
Port St Johns 4% 0% 78% 0% 0% 0% 15% 3% 100%
Nyandeni 1% 0% 84% 0% 0% 0% 11% 4% 100%
Mhlontlo 6% 0% 82% 0% 0% 0% 11% 1% 100%
KSD 27% 2% 53% 0% 1% 0% 13% 4% 100%
Source: Statistics South Africa (2016 Community Survey) Table 34
Households (%) who had interruption in electricity in the past 3 months
Source: Statistics South Africa (2016 Community Survey) Figure 20
Electricity interruption institutions in different ways. It can affect the production process of
factories that have not planned for alternative sources of energy. This will reduce production
output in that industry and if prolonged, it will affect economic growth.
45%
40% 40%
35% 31%
30% 28% 26%
25% 25% 24%
20%
15%
10%
5%
0%
KSD O.R.Tambo Nyandeni Ngquza Hill Mhlontlo Port St Johns

107
Energy sector is one of the biggest constraints to economic growth in the country. It holds
potential for boosting the economy with a number of spin- offs across sectors. The renewable
energy sector is such a sector that has significant potential spin‐offs in technology
development, manufacturing, operation and maintenance. The value chain of the sector also
makes linkages to many traditional key sectors such as manufacturing and construction.
5.8 ACCESS TO REFUSE REMOVAL
Access to refuse removal refers to the number of households receiving refuse removal service
at least once a week.
Higher level of service includes removal by local authorities/private company at least
once a week.
Basic level of service includes a communal skip.
The backlog or below a basic service for refuse removal includes, removal by local
authority/private company less often, communal refuse dump, own refuse dump, no
rubbish disposal and other.
Indigent households benefiting from refuse removal services is defined as the most
appropriate level of waste removal service provided based on site specific circumstances.
Such a basic level of service, be it in an urban or rural set-up, is attained when a
municipality provides or facilitates waste removal through: On-site appropriate and
regularly supervised disposal (applicable mainly to remote rural areas with low density
settlements and farms supervised by the waste management officer); Community
transfer to central collection point (medium density settlements); Organised transfer to
central collection points and/or Kerbside collection (high density settlements).

108
From the Table 35 below, 80% of the population in Nyandeni use their own refuse dump and 10%
of the population do not have rubbish disposal, hence they dump of leave their rubbish anywhere.
This method is not hygienic and communities should not be encouraged to use it.
Refuse removal, 2016
Removed by local Removed by local
authority/private authority/private
company/community company/community
members at least once a members less often than
w eek once a w eek
Communal
refuse dump
Communal
container/central
collection point
Ow n refuse
dump
Dump or leave
rubbish
anyw here (no
rubbish
disposal)
Other
Total
O.R.Tambo 86 054 8 503 40 406 11 253 1 141 181 161 683 8 304 1 457 384
Ngquza Hill 6 325 4 975 4 457 414 240 667 46 417 123 303 379
Port St Johns 497 79 3 313 48 129 872 29 006 3 965 166 779
Nyandeni 2 417 1 814 5 398 496 267 193 31 543 841 309 702
Mhlontlo 2 727 260 7 472 117 157 797 19 366 1 437 189 176
KSD 74 087 1 375 19 765 10 179 345 653 35 351 1 939 488 349
Removed by local Removed by local
authority/private authority/private
company/community company/community
members at least once a members less often than
w eek once a w eek
Communal
refuse dump
Communal
container/central
collection point
Ow n refuse
dump
Dump or leave
rubbish
anyw here (no
rubbish
disposal)
Other
Total
O.R.Tambo 6% 1% 3% 1% 78% 11% 1% 100%
Ngquza Hill 2% 2% 1% 0% 79% 15% 0% 100%
Port St Johns 0% 0% 2% 0% 78% 17% 2% 100%
Nyandeni 1% 1% 2% 0% 86% 10% 0% 100%
Mhlontlo 1% 0% 4% 0% 83% 10% 1% 100%
KSD 15% 0% 4% 2% 71% 7% 0% 100%
Source: Statistics South Africa (2016 Community Survey) Table 35
INTEGRATED WASTE MANAGEMENT
Schedule 5B of the Constitution of South Africa (Act 108 of 1996) outlines the roles, responsibilities and
powers for management of waste and Nyandeni Local Municipality should adopt such powers. This
adoption and rollout of these powers should be used in line with Section 24 of the Republic of South
Africa. The statutory obligation of local government in terms of waste management further enshrined in a
number of laws including the Municipal Systems Act (Act No. 32 of2000), and also the National
Environmental Management Waste Act, Act 58 of 2008 among others.
Generally, the increasing of waste generated by communities, lack of access to waste services and poor
management there of lead to pollution and associated health impact as well as environmental
degradation. Ineffective waste management practices can affect the health and wellbeing of communities
and this can be further exacerbated by the increased illegal dumping and littering. Other problem areas
that contribute towards littering, illegal dumping, lack of waste minimization as well as lack of knowledge
by the citizens on opportunities towards waste management.
SUMMARY OF IWMP
ADOPTION OF THE IWMP
The Municipality has adopted its Integrated Waste Management Plan on 12 December 2012 with (CR
No. 918-12/2012). The IWMP take stock of the situational analysis and identifies objectives, strategies
and action plans to intervene decisively in managing Integrated Waste Management Plan. DEDEA is
currently assisting the municipalty in reviewing IWMP
The IWMP is developed in line with Government Policy as set out in the National Waste Management
Strategy and the National Environment Management: Waste Act, 59 of 2008 (hereafter, Waste Act). The
IWMP‟s should provide the Local Municipalities with an instrument with which to manage waste and
prevent pollution, with particular emphasis on sorting, separation, reduction, recycling, re-use, as well as
the cradle-to-grave approach, thereby achieving high levels of sustainability with waste management.
109
WASTE COLLECTION AND STORAGE
The Libode Landfill site has been granted a waste licence by the Department of Economic Development,
Environmental Affairs and Tourism (DEDEAT). The municipality has the obligation to respond to the
licence conditions. Libode Landfill site is currently under construction and expected to completed before
the end of October 2019
In Ngqeleni area a transfer station feed into Libode Main Landfill site has been completed. Given the
geographical area of the Nyandeni municipality, formal refuse collection is restricted to rural areas
henceforth the gazetted municipal By-law (Gazetted No. 2351 of 19 May 2010) address issues of waste
collection in urban areas
Polluter pays principle - The Polluter Pays Principle is a principle where the polluting party pays for the
impact caused to the environment. With respect to waste management, this generally refers to the
requirement for a waste generator to pay for appropriate disposal of the waste.
Waste hierarchy - The waste hierarchy refers to the "3 R‟s" reduce, reuse and recycle, which classify
waste management strategies according to their desirability in terms of waste minimization. The waste
hierarchy remains the cornerstone of most Waste avoidance and reduction waste minimization strategies.
The aim of the waste hierarchy is to extract the maximum practical benefits from products and to generate
the minimum amount of waste.
Sustainable development requires that the generation of waste is avoided, or where it cannot be avoided,
that it is reduced, re-used, recycled or recovered and only as last resort treated and safely dispose of.
The cradle-to-grave approach in waste management
Cradle to grave is used in reference to a municipality 's perspective on the environmental impact created
by their products or activities from the beginning of its life cycle to its end or disposal.
Free Basic Refuse Removal Policy
The National Policy on Free Basic Refuse Removal (FBRR) services paves the way for municipalities in
South Africa to provide FBRR services within their areas of jurisdiction.
Strategic Plans and tools
Integrated Waste Management Plan, Environmental Bylaws, Landfill operational plan, Waste Recovery
Facilities Operational Plans
Situational Analysis on waste Management
Integrated Waste Management Plan
The municipal IWMP is intended for use as a sector plan within the Nyandeni LM coming IDP revision,
where it is to inform municipal planning and budgeting around waste management within the LM.
Intentions are to ensure that waste management planning within the LM is sustainable, practical,
implementable and acceptable to all key role players and parties expected to implement the plan.
Currently the municipality is reviewing its Integrated Waste Management Plan (IWMP) as per NEMWA
and it is anticipated that IWMP will be adopted by the council by the beginning of the next financial year
and further taken to the MEC for approval.
Waste Management Facilities
The municipality has three waste management facility, the Landfill and Waste Material Recovery facility
(both in Libode) and one Waste Transfer Station in Ngqeleni. Landfill site is complete; however its
operational plan is still on development processes. With regards to waste by-laws, currently the
department is developing its by-laws. For both landfill site operations and development of waste by-laws,
the municipality has appointed a service provider to compile those. Also the municipality has submitted
application form for registration of the MRF to DEDEAT; the application was accompanied by its
operational plan.
a) Landfill site
Nyandeni local municipality landfill site has been constructed through the intervention small town
revitalization fund from office of the premier. Construction is completed and is waiting for the completion
of the landfill operational and maintenance plan (service provider has been appointed).
The landfill site was licensed in 2012 and for 10 years, the license is due for review processes which shall
be started after the first five years of the license. Implications are that in 2022 the license expires; secondly
the processes of review and renewal shall include annual reports to be submitted to DEDEAT comprising
the state of the landfill and its operations.

110
b) Material Recovery Facility and Waste Transfer Station
The MRF is not yet authorized for operation however the application with its operational plan has been
submitted. Both MRF and WTS will be operated by Tulsas Park as a services provider for regional
recycling. Memorandum of Understanding between Nyandeni lm, O.R Tambo and Tulsas Park was
signed and it is available. For human resource, advertisement has been forwarded to the council to come
with personnel that will be responsible for operations of these two facilities.
Staff
See the attached organogram under the human resource component on the IDP
Waste collection and storage
The municipality is collecting waste daily in Peri-urban areas, CBD and in some commercial businesses
in both towns. Collected waste is stored temporarily in 60m3 skip bins in a Peri-urban area, in 80L bins in
the CBD and plastics are distributed to households on a weekly basis. The municipality is not responsible
collecting the medical waste hence the department of health has appointed Campus.
Plastics are provided to tariffs payers differ from place to place i.e commercial business are not paying
same amount as households’ amount. Collection of skip bins based on the schedule developed for skip
loader operations.
Waste Management Fleet
2X Skip loader truck
1x Compactor truck
1x Mini Excavator
Awareness and advocacy programs and projects
Environmental officer together with awareness campaigners are conducting the following programs;
School awareness campaign on waste and environmental management aspect
Community advocacy programs on environmental matters.
Eradication of illegal dumping sites
Green Wednesday initiative
Good Green Deeds program “#Thuma Mina Campaign”
Peri-Urban Cokisa project
Festive season “Siyacoca” intervention project
Supporting two recycling projects
Legal framework adherence
For purpose of compliance the municipality has Appointed Rev Jongikhaya Sikhuni as designated waste
management office as per “section 10 of NEMWA, 2008”
Projected Projects and Programmes on waste management
No Activity Budget
1 Waste management awareness to schools and community
2 Eradication of illegal dumping sites and rehabilitation
3 Land fill daily operations (turning garden waste into compost;
4 Land fill Audit and Monitoring (internal and external)
5 Leachate treatment and monitoring by service provider
6 Mobile Plant for Landfill site (1x Bulldozer, 1x TLB, 1x Tipper Truck)
7 Notice and branding at Landfill; Notices in town entrances
8 Landfill License renewal and annual report about landfill operations
8 Review of waste management tariff structures
9 Recycling programme: Integration of waste pickers (training of waste
recyclers cooperatives).
Collection Of Waste From Developmental Zones And Peri Urban Area
The Municipality has provided refuse collection of waste in the following developmental zones and Peri
Urban Areas of Ntlaza, Corana , Kopshop Junction, Ziphunzana and Thabo Mbeki areas. Mfenetyisi,
community awareness programe are on-going to raise levels of awareness about keeping our town clean.
Various programs are being implemented including enforcement of municipal By-Laws
The municipality is in a process of developing an Trade Effluent Policy to guide decision making

111
Challenges and Priority Programmes
Challenge Intervention/Projects Time Frames
Shortage of Compactor refuse
removal truck
Purchase one additional
compactor truck
201/2019 Financial Year
Shortage of skip loader truck
Enforcement of Municipal By-
laws
Training of Peace Officers on
Environmental Management
inspectorate
ON-going
Illegal dumping Conduct community
awareness campaigns to all
wards
The programme is on-going
Reporting to Waste Information
System
A refuse collection register has
been developed for collection
of data on waste tonnages
Mngazi
Kopshop & Canzibe
Mfenetyisi
For purposes of compliance the municipality has appointed Rev Jongi Khaya Sikhuni as its designated
Waste Management Officer
6 Environmental, Social And Economic Sustainability
State of the environment
Within the context of sustainable development the term environment encompasses the social, economic,
biophysical and political spheres. Section 24 of the Constitution of the Republic of South Africa (RSA,
1996) legally mandates the government to ensure the people of South Africa is not harmed by the
environment and the environment is protected against abuse. The Constitution also provides for co-
operative government thus sharing both the responsibility and obligatory legislative provisions across the
different spheres of government in terms of environmental management and conservation.
The White Paper on Environmental Management Policy (DEAT, 1997a) refers to the conditions and
influences under which any individual or thing exists, lives or develops. Culture, economic considerations,
social systems, politics and value systems determine the interaction between people and the
environment, the use of natural resources, and the values and meanings that people attach to life forms,
ecological systems, physical and cultural landscapes and places. People are part of the environment and
are at the centre of concerns for its sustainability (DEAT, 1997a).
Environmental management and governance therefore comprise a system of tools which include
principles, policies, legislation, regulation and practice. Each of these has a spatial element, i.e. occurs
at global, regional, national, provincial, local, and/or neighbourhood scales. In turn, each of these
elements have components for which government, non-government organisations or civil society would
be responsible for-
a) Ensuring environmental quality, protection and promotion of integrated environmental management;
b) Ensuring biodiversity, conservation and coastal zone management; and
c) Monitoring services rendered by the Wildlife Services (ECWS) and other parastatals
More specifically, like all municipalities, Nyandeni has a responsibility for environmental management and
governance. Our IDP provides a platform through which this commitment can be clearly illustrated in a
binding municipal development document. Critically therefore it addresses environmental issues through
the Integrated Development Plan. The municipality thus understands that IDPs are the master plan for
local development, and thus the manner in which the environment is addressed in such a plan is a
measure of the role and responsibility the municipality accepts for environmental management. The
Municipality further understands that crucial evaluative questions are used to measure the extent of
commitment to environmental management.

112
Does the IDP show an understanding of the policy and legislative framework surrounding the
environment?
Does the IDP show an understanding of the implications of the above policy and legislative framework
for the municipality and their day-to-day operations?
Does the IDP provide a structure and mechanisms for the responsibility and accountability of
environmental issues?
Does the IDP provide Localised Strategic Environmental Guidelines for the development of
strategies?
Is there an Integrated Environmental Program?
Is there an Integrated Waste Management Plan?
Have any projects related to the following been identified?
i. Sanitation and water
ii. Energy
iii. Integrated land and human settlement planning
iv. Environmental health
v. Integrated pollution and waste management
vi. Biodiversity and sensitive areas
vii. Parks and open spaces
viii. Community based natural resource management
Throughout the IDP, has the environment considered in a holistic manner, or does it merely relate to
conservation or ‘green’ issues?
6.1 Biodiversity UPDATE
Biological diversity, often shortened to ‘biodiversity’, is the variety of life on earth. It takes into account the
differences in structure, function, and genetic make-up between living organisms and the ecological
complexes in which they occur (Wilson, 1988). This variability occurs at the genetic, species and
ecosystem levels (Gaston and Spicer, 1998). Biodiversity is important in assessing the state of the
environment, because:
a) It is closely linked to human well-being. For example, 10 of the world’s 25 top-selling drugs are
derived from biological resources (UNDP, UNEP, World Bank and WRI, 2000).
b) Eighty percent of South Africa’s population depends on wild plants and animals for medicines, and
traditional medicinal plants in the Eastern Cape Province are valued at R27 million annually (Dold
and Cocks, 2002).
c) It provides environmental services such as maintaining river catchments and wetlands for sustainable
water production, regulating and controlling floods, maintaining fertile soils, absorbing pollutants from
the atmosphere and water bodies, and pollinating crops (Millennium Ecosystem Assessment, 2003).
d) It provides baseline breeding and seed stocks for crop, livestock and wildlife production and is
therefore essential in ensuring that the world’s population has secure access to food (Millennium
Ecosystem Assessment, 2003).
e) Many species are threatened by extinction, and the status of our biodiversity is therefore an important
reflection of a municipality’s environmental track record.
f) Biodiversity is linked to poverty and health, and this is especially true for a poor province such as
Eastern Cape. Poor people depend heavily on biodiversity and have a stake in its conservation, but
also have a potentially large impact on biodiversity because of their reliance on natural resources
(Koziell and Saunders, 2001).
6.2 Climate
The climate varies according to the distance from the ocean. Coastal areas enjoy mild temperate
conditions ranging between 14 and 23 degrees Celsius, while the inland areas experience slightly more
extreme conditions with temperatures of 5 to 35 degrees Celsius. Inland mountain areas experience
winter snows and summer rainfalls.
More specifically, Nyandeni Local Municipality experiences a large subtropical climate with the more
elevated regions characterized by high temperatures and below the escarpment along the coast are the
wettest areas within the municipality. t
Climate Change Strategy and Sustainable Development COP 17

113
The municipal area is considered generally a high average rainfall area estimated to be above 700mm
per annum. Minimum temperatures range from 8.9 degrees Celsius in the high lying north – West to 15.3
degrees Celsius along the coast with the maximum estimated at 22.8 degrees Celsius along the coats to
23.8 inland. The municipality has a generally steeped topography.
In recognition of the Constitutional obligation, Nyandeni Local Municipality support the environmental management function through the National Environmental Management Act (NEMA), 1998 (Act No.107 of 1998).Healthy, functioning ecosystems are globally recognized as critical in mitigation and as the first line of defense against climate change impacts. Development therefore has to enhance natural ecosystems, and protect biodiversity. Based on this, the Municipality have implemented projects (Libode Eco-Park enhancing biodiversity of the area, Eradication of Alien Invasive plants (Lantana) against water scarcity. The municipality have taken note of the climate change response strategy objectives by prioritisation of mitigation interventions that have potential positive job creation, as some form of response to the challenge of environmental degradation whilst addressing environmental conservation and protection. Projects That Address Environmental Challenges (Water Affairs)
Nyandeni Local Municipality have embarked in numerous projects (e.g Waste transfer Station that gives effect to National Environmental Management: Waste Act, 2008 (Act No. 59 of 2008) and the establishment of its parks and beautification of open spaces which is guided by the climate change response principles entrenched in the South African Constitution.
The Nyandeni economy is dependent on primary sectors such as agriculture. The relationship of such
industrial opportunities, with climate-dependent resources, needs to be considered and integrated in
development planning, as the resources define the production possibilities for the economy as a whole.
The strategy was developed and the responses outlined are aligned with the ORTDM Vulnerability
Assessment which states that our region is increasingly recognized as one of the areas in South Africa
that will be hardest hit by climate change & represents significant opportunities for adaptation and building
local community resilience against extreme hazards and adverse climate change impacts due to its
natural biodiversity and ecosystems resource base. The NDP’s vision for the future, which includes
access to affordable food, safe, and affordable and reliable water and energy services, cannot be based
on an economic model or assumptions of infinite availability of these and other resources.
The reality is that there is limited water and fertile land resources, and there has been steady degradation
of the environment and associated ecosystem resilience.
The climate change response strategy aimed to:-
• Ensure that the municipality is consistent with national priorities, including poverty alleviation, access
to basic amenities including infrastructure development, job creation, rural development, foreign
investment, human resource development and improved health, leading to sustainable economic growth;
• Ensure alignment with the need to consistently use locally available resources;
• Ensure compliance with international obligations;
• Recognize that climate change is a cross cutting issue that demands integration across the work
programmes of other departments and stakeholders, and across many sectors of industry, business and
the community;
• Focus on those areas that promote sustainable development;
• Promote programmes that will build capacity, raise awareness and improve education in climate change
issues;
• Encourage programmes that will harness existing national technological competencies;
• Review the strategy constantly in the light of national priorities and international trends;
• Recognize that South Africa’s emissions, Provincial and Local emissions will continue to increase as
development is realized.
• Ensure that Nyandeni Local municipality IDP prioritizes building climate resilience through planning
human settlements and urban development; provision of municipal infrastructure and services; water and
energy demand management; and local disaster response, amongst others.

114
Situational Analysis
The municipality conducting school and community based awareness that talks to climate change issues
and promotion of sustainable use of natural resources. The municipality is also involved in energy
efficiency practice i.e. Eco-Park are using solar energy for lights instead of using electricity.
Strategic interventions
In Agriculture: Develop Disaster Risk Reduction Strategy and Instruments for the agricultural sector in
2022. Climate change will add to the agricultural sector’s current pressures, namely land degradation,
population increases, growing demand for agricultural resources, and the loss of agricultural land to
development. There are, however, opportunities for new irrigation technologies and tilling and manure
applications, among other techniques, to overcome some of the expected effects.
In Human Settlement: The priorities include the development of Guidelines for Climate Change
Resilience, through updates of SDF.
Projected Projects and Programmes on Climate Change
No Activity Budget
1 Bylaw development on Climate change matters
2 Nyandeni Climate Change Adaptation Response Plan
6.3 Land (topography)
These moderate climatic conditions mentioned above provide favourable conditions for agricultural
development which currently predominate the local livelihood. However, it must also be stated though
that, the agricultural potential of the area can be hindered by the steep nature of the terrain. Almost half
the total land area is covered by scenic steep slopes with approximately 54.74% gently gradient slopes
and 45.26% steep gradient. This topography poses various challenges for development and provision of
infrastructure and general building processes. For instance, in a housing project additional investment
would have to be made to cushion geotechnical challenges and yet another additional funding to reinforce
foundations and provide more building material compared to a flat surface. This also poses a number of
other challenges in terms of land capability.
6.4 The land capability
The land capability is determined by the collective effects of soil, terrain and climate features. It indicates
the most intensive long term and sustainable use of land in rain – fed agriculture and sometimes highlights
the permanent limitations associated with different land use classes. Land capability is therefore a more
general term and conservation oriented than simply land suitability.
There is a strong correlation between the vegetation types and land capability. Land is classified into what
is called land classes. Land class VI and VII have severe limitations that makes them unsuitable for
cultivation and that restricts their use largely to grazing, woodland or wildlife. These limitations include
mainly;
Very steep slopes
Erosion
Shallow soil and
(d) Slopes.
They therefore comprise mainly Thicket Vegetation, Eastern Thorn Bushveld and Moist Upland
Grassland. These classes constitute a significantly proportion of the total land areas estimated at 75.4%,
see Chart 19 below.
Chart 1: Breakdown of land classes at Nyandeni Local Municipality

115
Source: Nyandeni Spatial Development Framework (draft)(2010)
Nyandeni Local Municipality constitutes part of what is referred to as Waster Area Management Number
12 which is considered to be biophysically suitable for commercial forestry. In terms of the strategic
environmental analysis conducted by the Department of Water Affairs (2006) the area from Keiskamma
River to Umzimvubu River has the highest forestry potential with mostly likely, very low hydrological
impact due to its relatively high rainfall and low levels of economic activity taking place. For forestry
development, the area has a very low water requirement. It must be stated though that in terms of this
SEA study, Nyandeni’s area is considered of moderate potential compared to the far eastern side of the
Pondoland from Port St Johns towards Msikaba at Ngquza Hill Local Municipality. See the map below.
% of the total land area ; III; 9,63%
% of the total land area ; IV; 14,16%
% of the total land area ; V; 0,81%
% of the total land area ; VI; 41,12%
% of the total land area ; VII; 34,29%
Breakdown of Land Classes at Nyandeni Local Municipality
III
IV
V
VI
VII

116
A closer analysis of the map will reveal that a significant land area within the municipality in terms of this
study can be considered of environmental sensitive nature.
A
6.5 AIR QUALITY MANAGEMENT
ORTAMBO District Municipality is responsible air quality mananagement for the entire District area.
Accordingly, the district municipality is in a process of developing a district wide air quality management
plan. The municipality will integrate the strategies into its development plan
6.6 Vegetation and environmental sensitivity
Along the steep slopes of the periphery of Nyandeni Local Municipality, there is mainly Thicket (30.4%)
with the exception of the coastal line where there is Coastal Bushveld and Grasslands (5.32%). The
interior comprises mainly of the Eastern Thorn Bushveld (33.45%) with Moist Upland Grassland (28.12%)
in the northern interior and approximately 30.40% being Valley Thicket.
Overview of the vegetation within Nyandeni Local Municipal area
Vegetation type Area (Ha) % of the total Area
Afromontane Forest 4.127.37 1.67%
Coastal Bushveld/Grassland 13.124.46 5.32%
Coastal Forest 2.475.55 1.00%
Coastal Grassland 92.43 0.04%
Dune Thicket 0.71 0.00%
Eastern Thorn Bushveld 82.523.02 33.45%

117
Moist Upland Grassland 69. 369.32 28.12%
Valley Thicket 74.999.90 30.40%
Nyandeni has a huge potential for tourism along the 20km coastal belt which stretches from Mthatha
Estuary in the south west to Mnenu Estuary in the north east. This high tourism potential area is very
important for eco – tourism destination. The area already has a number of forests, areas designated for
nature conservation, estuaries, wildlife etc. Hluleka Game Reserve remains an area with high tourism
potential and can be used to anchor tourism development especially if a cross – boundary nature reserve
could be established between Nyandeni, Mhlontlo and Ngquza Hill Local Municipalities. The municipality
would have to ensure that a good balance is managed between up scaling these areas with tourism
potential into viable commercial tourism ventures and the environmental sensitive and marine protected
areas. Rarely the municipal area provides access to coastal dune forests which are rapidly being eroded
by residential and commercial agricultural development in other areas. This group of vegetation is crucial
due to its high species diversity which may be home to medicinally useful plants, aesthetics, soil binding
and soil erosion prevention characteristics. These types of vegetation also tend to be habitat for wildlife
and serve a very important purpose of tourism and education.
Included in the state of the municipal environment are its wetlands. There are two types of wetlands found
within Nyandeni municipal area. These are Coastal Wetlands that are influenced by tides that contains
water that shows appreciable salinity and there are Inland Wetlands including fresh water areas; these
can be likened to a basin which is filled with soil that has impervious layer such that it retains water.
Wetlands are an important part of the environment and thus key for long term development planning.
They offer a multitude of advantages to the environment viz; (a) replenishes ground water levels, (b)
controlling stream flow velocity thus flood control, (c) provide grazing land for live stock and wildlife, (d)
serve as wildlife habitat and above all (e) provide fresh water.
In Nyandeni Local Municipality the majority of land area is covered in unimproved grassland, this is a total
of 50% of the total area. Cultivated: temporary - semi-commercial/subsistence dry land covers 17.6% of
the total area in the Nyandeni Local Municipality, while 11.9% is degraded: unimproved grassland.
Land degradation
Total Area km2 Degraded area Percentage degraded
2474.02 378.11 15%
RECYCLING AND ENVIRONMENTAL MANAGEMENT
As integral part of implementing Environmental Friendly Practices, Nyandeni has facilitated establishment
of three recycling projects, two in Libode and one in Ngqeleni. However, there is a need to support these
projects with proper infrastructure including proper Building.
PRIORITY PROJECTS FOR 2016/2017
Unti-litter campaign
Greening and Beautification
Expansion of Recycling programme
Conduct waste management Awareness Campaign in all wards
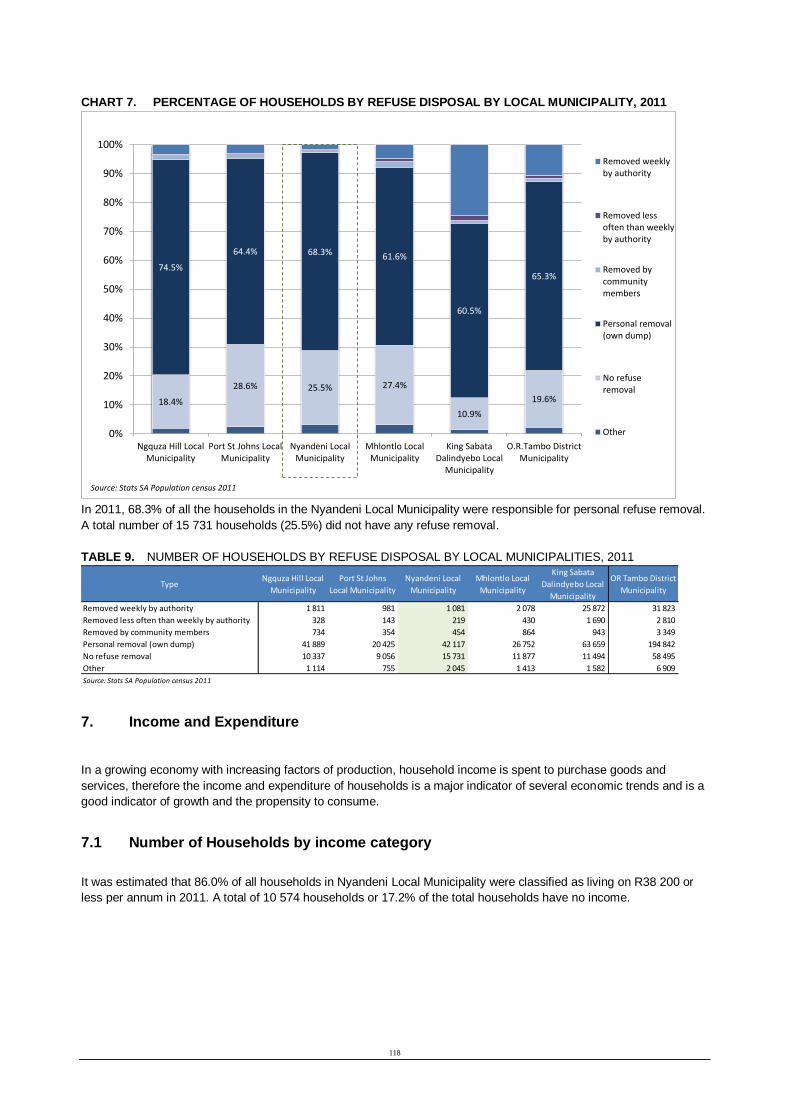
118
CHART 7. PERCENTAGE OF HOUSEHOLDS BY REFUSE DISPOSAL BY LOCAL MUNICIPALITY, 2011
In 2011, 68.3% of all the households in the Nyandeni Local Municipality were responsible for personal refuse removal.
A total number of 15 731 households (25.5%) did not have any refuse removal.
TABLE 9. NUMBER OF HOUSEHOLDS BY REFUSE DISPOSAL BY LOCAL MUNICIPALITIES, 2011
7. Income and Expenditure
In a growing economy with increasing factors of production, household income is spent to purchase goods and
services, therefore the income and expenditure of households is a major indicator of several economic trends and is a
good indicator of growth and the propensity to consume.
7.1 Number of Households by income category
It was estimated that 86.0% of all households in Nyandeni Local Municipality were classified as living on R38 200 or
less per annum in 2011. A total of 10 574 households or 17.2% of the total households have no income.
18.4%
28.6% 25.5% 27.4%
10.9%
19.6%
74.5%
64.4% 68.3% 61.6%
60.5%
65.3%
0%
10%
20%
30%
40%
50%
60%
70%
80%
90%
100%
Ngquza Hill LocalMunicipality
Port St Johns LocalMunicipality
Nyandeni LocalMunicipality
Mhlontlo LocalMunicipality
King SabataDalindyebo Local
Municipality
O.R.Tambo DistrictMunicipality
Removed weeklyby authority
Removed lessoften than weeklyby authority
Removed bycommunitymembers
Personal removal(own dump)
No refuseremoval
Other
Source: Stats SA Population census 2011
TypeNgquza Hill Local
Municipality
Port St Johns
Local Municipality
Nyandeni Local
Municipality
Mhlontlo Local
Municipality
King Sabata
Dalindyebo Local
Municipality
OR Tambo District
Municipality
Removed weekly by authority 1 811 981 1 081 2 078 25 872 31 823
Removed less often than weekly by authority 328 143 219 430 1 690 2 810
Removed by community members 734 354 454 864 943 3 349
Personal removal (own dump) 41 889 20 425 42 117 26 752 63 659 194 842
No refuse removal 10 337 9 056 15 731 11 877 11 494 58 495
Other 1 114 755 2 045 1 413 1 582 6 909
Source: Stats SA Population census 2011

119
TABLE 10. TOTAL NUMBER OF HOUSEHOLDS PER INCOME CATEGORY BY NYANDENI LOCAL MUNICIPALITY
RELATIVE TO OTHER REGIONS, 2011 [NUMBERS]
The total number of households without any income in Nyandeni Local Municipality is at a concerning 17.2%.
Dependency on subsistence farming could be a substitute for income as a means of survival as subsistence farming is
not reported or understood as income by households and is therefore not reported. When a high percentage of
households earn no income it may place an increased burden on state to provide health, education and safety.
The graph below portrays the number of households per income category - for 2001 versus 2011. The number of
households earning more than R38 200 per annum has increased significantly - in 2001, 4.2% of households were
earning more than R38 200 per annum, while in 2011 this percentage increased to 14.0%. The income brackets do not
take inflation into account and “inflation creep” occurs. This implies that - over time - movement of households “up” the
brackets is natural, even if they are not earning any more in real terms.
2011 South Africa Eastern Cape
O.R. Tambo
District
Municipality
Nyandeni Local
Municipality
No income 2 177 538 264 309 50 887 10 574
R 1 - R 4800 648 754 98 769 20 414 4 448
R 4801 - R 9600 1 066 364 165 799 40 244 9 515
R 9601 - R 19 600 2 475 240 384 579 71 892 15 783
R 19 601 - R 38 200 2 740 596 343 052 61 172 12 704
R 38 201 - R 76 400 1 879 235 164 896 22 850 4 292
R 76 401 - R 153 800 1 335 657 113 971 14 765 2 339
R 153 801 - R 307 600 1 045 292 86 222 9 999 1 296
R 307 601 - R 614 400 685 364 46 463 4 417 511
R 614 001 - R 1 228 800 268 934 12 310 835 66
R 1 228 801 - R 2 457 600 79 896 3 895 415 64
R 2 457 601 or more 46 593 3 080 336 56
Unspecified 700 40 5 1
Total 14 450 163 1 687 385 298 231 61 649
Source: Stats SA Population census 2011

120
CHART 8. NUMBER OF TOTAL HOUSEHOLDS PER INCOME BRACKET, NYANDENI LOCAL MUNICIPALITY,
2001 AND 2011
7.2 Annual per household income
Definition
Per household personal income is the annual total personal income of an area divided by the total
number of households within the area and presented by the population group of the head of each
household. Annual total personal income is the total personal income for all households in the
region summed together.
In 2001, the average household income for Nyandeni Local Municipality was R16 800 and it increased at an average
annual rate of 7.4% to R34 254 in 2011.
TABLE 11. ANNUAL PER HOUSEHOLD INCOME INNYANDENI LOCAL MUNICIPALITY RELATIVE TO OTHER
REGIONS, 2001 AND 2011 [CURRENT PRICES, R MILLIONS]
In 2011, the O.R. Tambo District Municipality had a household income of R44 533, which increased at an average
annual growth rate of 16.3% from 2001. The Eastern Cape Province’s household income grew at an average annual
rate of 16.12% and South Africa as a whole with 15.85% average annually.
7.3 Annual total Personal Income
-
2 000
4 000
6 000
8 000
10 000
12 000
14 000
16 000
18 000
2001 2011
Source: Stats SA Population census 2001 & 2011
Ngquza Hill Local Municipality 15 008 38 448 9.9%
Port St Johns Local Municipality 18 916 31 548 5.2%
Nyandeni Local Municipality 16 836 34 254 7.4%
Mhlontlo Local Municipality 14 599 36 246 9.5%
King Sabata Dalindyebo Local Municipality 26 755 61 135 8.6%
O.R.Tambo District Municipality 9 836 44 533 16.30%
Eastern Cape Province 14 717 65 613 16.12%
South Africa 24 005 104 491 15.85%Source: Stats SA Population census 2001 & 2011
Region 2001 2011AAGR
2001-2011

121
Personal Income is a broader concept than labour remuneration discussed in the economics section above. It includes
profits, income from property, net current transfers and net social benefits.
Definition
Annual total personal income is the total personal income for all households in the region summed
together. Income is presented in units of rand million. The definition of “income” is the same as
used in the income brackets variable, and also includes income tax. Annual total personal income
is presented in current prices – this means that inflation has not been taken into account.
It is estimated that total personal income in Nyandeni Local Municipality amounted to R2.1 billion in 2011. This
increased at an average annual rate of 9.0% since 2001 when the total personal income was estimated at
R919 million.
TABLE 12. ANNUAL TOTAL PERSONAL INCOME IN NYANDENI LOCAL MUNICIPALITY RELATIVE TO OTHER
REGIONS[CURRENT PRICES, R MILLIONS]
Comparing Nyandeni Local Municipality with the other municipalities’ it is seen that the municipality is performing
average at an average annual growth rate. The only municipality that stands out with the lowest average annual
growth rate of all the local municipalities was the Port St John Local Municipality with an increase of only 6.1%
annually over the period.
7.4 Annual Per Capita Income
Per capita income is often used as a measure of wealth particularly when comparing different economies or population
groups - and rising per capita income usually alludes to possible increase in demand for consumption.
Definition
Per capita income refers to the income per person and is calculated by dividing the total personal
income per annum equally among the population.
In 2011, the per capita income amounted to R7 969 in Nyandeni Local Municipality
Ngquza Hill Local Municipality 785 322 2 282 696 11.3%
Port St Johns Local Municipality 645 310 1 076 523 5.3%
Nyandeni Local Municipality 919 626 2 186 227 9.0%
Mhlontlo Local Municipality 659 302 1 665 955 9.7%
King Sabata Dalindyebo Local Municipality 2 608 801 6 692 049 9.9%
O.R.Tambo District Municipality 5 618 361 13 903 985 9.48%
Eastern Cape Province 45 322 490 112 692 881 9.54%
South Africa 577 658 701 1 579 385 527 10.58%Source: Stats SA Population census 2001 & 2011
Region 2001 2011AAGR
2001-2011

122
CHART 9. PER CAPITA INCOME IN NYANDENI LOCAL MUNICIPALITY RELATIVE TO OTHER REGIONS, 2001
AND2011 [RAND, CURRENT PRICES]
The per capita income for South Africa in 2011 amounted to R30 507, which is an average increase of 9% per year
from 2001. The Eastern Cape Province has a per capita income of R17 173 and had an average annual growth rate of
9.3%.
7.5 Household Goods
Ownership of a cellphone, television, refrigerator and computer has increased considerably between Census 2001 and
Census 2011. However, the demand for radios and landline telephones has decreased owing to a rise in the popularity
of cellphones.1
Only 32% of the people in South Africa had access to a cell phone in 2001 compared to the 89% in 2011. Households
with access to computers increased from 9% in 2001 to 21% in 2011 in South Africa. 75% of the households in South
Africa owned a TV in 2011 while only 54% of households had a TV in 2001. Only 69% of the households in South Africa
have a refrigerator, even though 82% of the households have electricity connections. The percentage of households
using landline telephones and radios have decreased since 2001. South Africa seems to embrace technology at it
becomes more accessible.
While Nyandeni Local Municipality seems to follow the national trend it does not exhibit the same level of absorption
when compared to South Africa.
1Statistics South Africa
R 12 888
R 7 041
R 4 338R 3 352
R 30 507
R 17 173
R 10 186
R 7 969
-
5 000
10 000
15 000
20 000
25 000
30 000
35 000
South Africa Eastern Cape O.R. Tambo DistrictMunicipality
Nyandeni LocalMunicipality
2001
2011
Source: Stats SA Population census 2001 & 2011

123
TABLE 13. ACCESS TO HOUSEHOLD GOODS IN NYANDENI LOCAL MUNICIPALITY, 2011
It is evident that the majority of households (80.1%) have access to Cell phones. About 50% of households have
access to electric/gas stove, radio or television. Although only 2.9% of households have access to computers, 16.9%
have access to the internet.
7.6 Formal Retail sales
Definition
Annual retails trade sales by product type measure the total retail spend, distributed across
spending categories, by all households within the region. The outputs are presented in units rand
thousands. This measure represents consumption from the supply side (retail) perspective of the
economy. Two important implications are thus:
Only goods that are sold by a shop are counted as a sale. This measure therefore does
not give an accurate account of all consumption in a region, particularly subsistence and
inter-household transfer consumption.
The sale is registered at the place of the sale, and not at the place of the household buying
the good.
Formal retail trade in Nyandeni Local Municipality amounted to R463 million in 2011, which is 10% of the total formal
retail sales within the O.R. Tambo District Municipality.
Access to Yes No % Yes
Cell phone 49349 12298 80.1%
Electric/gas stove 33425 28222 54.2%
Television 30679 30968 49.8%
Radio 30080 31567 48.8%
Refrigerator 22837 38810 37.0%
DVD player 22147 39500 35.9%
Access to internet 10 425 51 223 16.9%
Mail Post box/bag 6 298 55 350 10.2%
Motor-car 5 382 56 266 8.7%
Satellite television 4 169 57 478 6.8%
Washing machine 1 972 59 676 3.2%
Computer 1 762 59 885 2.9%
Mail delivered at residence 1 754 59 894 2.8%
Vacuum cleaner 1 130 60 518 1.8%
Landline/telephone 1 025 60 622 1.7%Source: Stats SA Population census 2011
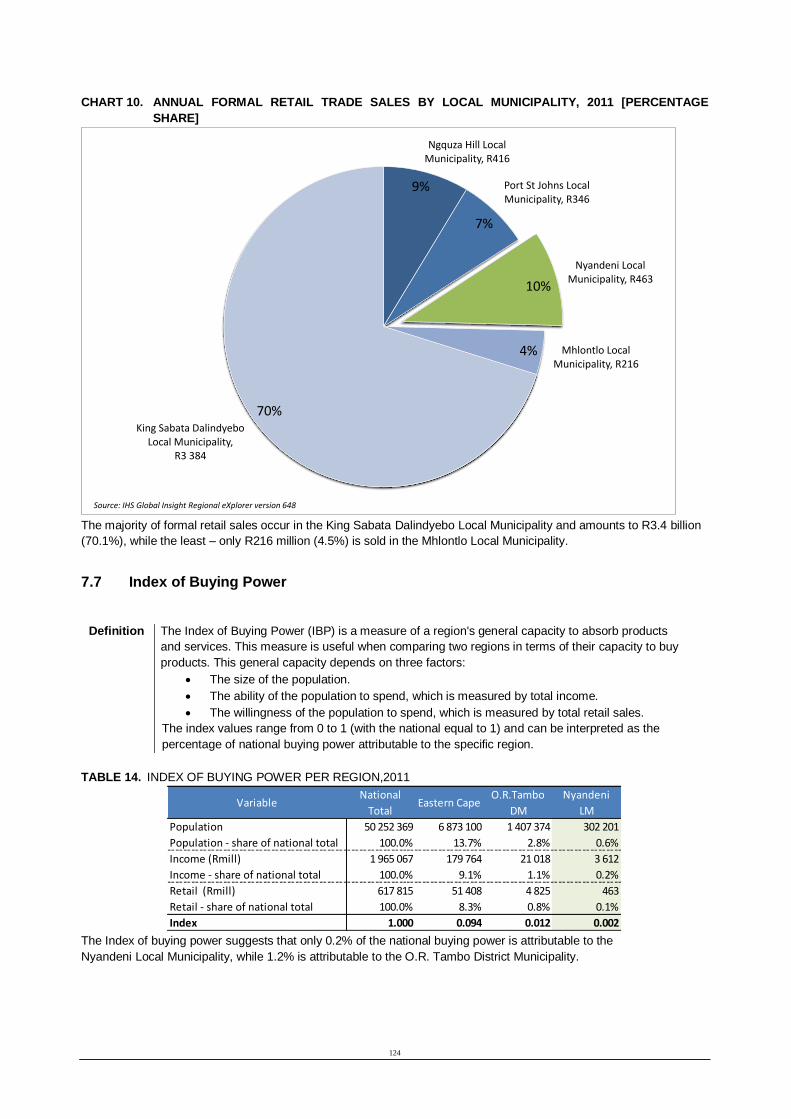
124
CHART 10. ANNUAL FORMAL RETAIL TRADE SALES BY LOCAL MUNICIPALITY, 2011 [PERCENTAGE
SHARE]
The majority of formal retail sales occur in the King Sabata Dalindyebo Local Municipality and amounts to R3.4 billion
(70.1%), while the least – only R216 million (4.5%) is sold in the Mhlontlo Local Municipality.
7.7 Index of Buying Power
Definition
The Index of Buying Power (IBP) is a measure of a region's general capacity to absorb products
and services. This measure is useful when comparing two regions in terms of their capacity to buy
products. This general capacity depends on three factors:
The size of the population.
The ability of the population to spend, which is measured by total income.
The willingness of the population to spend, which is measured by total retail sales.
The index values range from 0 to 1 (with the national equal to 1) and can be interpreted as the
percentage of national buying power attributable to the specific region.
TABLE 14. INDEX OF BUYING POWER PER REGION,2011
The Index of buying power suggests that only 0.2% of the national buying power is attributable to the
Nyandeni Local Municipality, while 1.2% is attributable to the O.R. Tambo District Municipality.
9%
7%
10%
4%
70%
Ngquza Hill Local Municipality, R416
Port St Johns Local Municipality, R346
Nyandeni Local Municipality, R463
Mhlontlo Local Municipality, R216
King Sabata Dalindyebo Local Municipality,
R3 384
Source: IHS Global Insight Regional eXplorer version 648
VariableNational
TotalEastern Cape
O.R.Tambo
DM
Nyandeni
LM
Population 50 252 369 6 873 100 1 407 374 302 201
Population - share of national total 100.0% 13.7% 2.8% 0.6%
Income (Rmill) 1 965 067 179 764 21 018 3 612
Income - share of national total 100.0% 9.1% 1.1% 0.2%
Retail (Rmill) 617 815 51 408 4 825 463
Retail - share of national total 100.0% 8.3% 0.8% 0.1%
Index 1.000 0.094 0.012 0.002

125
8. Economy
4.1 Introduction
South Africa remains a dual economy with one of the highest inequality rates in the world,
perpetuating poverty, inequality and exclusion. This situation is likely to be aggravated by the
current fragile economy, low growth rate, and tight fiscal conditions.
This section presents a brief snapshot of Nyandeni’s economy. It looks at the structure and
performance of the economy, its features, and dynamics and investment trends in Nyandeni.
The analysis deals with the size of Nyandeni economy; its performance and trends since 1994;
the items that households in Nyandeni spend their money on. Household expenditure and its
impact on economic growth is examined. In this section, Nyandeni economic sector analysis
makes reference to selected key sectors which are major contributors to the economic activity
of the municipality and drivers of Nyandeni economic growth. It also focus on the comparative
advantage of Nyandeni local economy and looks at the extent to which the

126
economy of Nyandeni need to be diversified. The section starts with a world and domestic
economic overview
4.2 World economic outlook and domestic economic overview
South African economy is relatively small and accounts for less than 1 per cent of global GDP.
For a small open economy such as South Africa, which is dependent on foreign trade and
attracting foreign savings to prop up domestic investment, the country will not be immune to
external shocks such as the impact of the global financial crisis-induced economic slowdown.
The economic environment remains challenging both internationally and domestically. Weak
growth in key emerging and developing economies such as China and Brazil may not be offset
by the modest improvement in growth recorded in advanced economies (most notably the
United States and Euro Zone). Furthermore, the risks to an already subdued economic outlook
are firmly tilted towards the downside.
Domestic constraints such as electricity shortages, the twin fiscal and current account deficits
and continued labour market concerns exacerbate the global pressures on the national
economy. South Africa’s economic growth forecasts for the 2016 to 2018 have been revised
down, and risks remain to the downside.
Government continues to prioritise raising investment; improving labour relations, certainty
and policy coordination; and making it easier to do business so that the South African economy
is better placed to grow more rapidly in future. Expanded partnerships with business, labour
and civil society to realise the objectives of the National Development Plan will be a key feature
over the medium term. Nyandeni’s economic developments and prospects are presents next.

127
4.3 Economic analysis of Nyandeni local municipality
4.3.1 Size of Nyandeni economy
According to Quantec regional data (2016), the estimated size of the Nyandeni local
municipality economy in terms of total output was R5 972 million in 2015 and the break down
is summarised below (See Table 11):
The Intermediate Consumption Expenditure (ICE), that is the input cost to produce
goods and services at constant 2010 prices, was estimated at R2 862 million
The Gross Value Added (GVA) for all industries (difference between output and input)
at constant 2010 prices was R3 110 million
Quantec estimated the real compensation of employees in Nyandeni (constant 2010
prices) at R1 721 million. This is the amount received by workers in terms of wages and
salaries.
The Gross Operating Surplus was estimated at R1 371 million.
Selected key economic indicators from the National Accounts, 2015
Real Gross value added
at basic prices, R
millions constant 2010
prices
Real Compensation of
employees, R millions
constant 2010 prices
Real Gross operating
surplus, R millions
constant 2010 prices
Real Output at basic
prices, R millions
constant 2010 prices
O.R.Tambo 20 299 11 603 8 283 38 935
Ngquza Hill 2 739 1 578 1 107 5 218
Port St Johns 1 112 681 413 2 101
Nyandeni 3 110 1 721 1 317 5 972
Mhlontlo 2 128 1 289 797 4 115
KSD 11 210 6 333 4 649 21 529
Eastern Cape 210 006 118 940 86 590 467 799
Source: Quantec regional data, 2016 Table 11
Table 11 shows that KSD local municipality had the highest contribution to the District
economy, followed by Nyandeni, Ngquza Hill, Nhlonto and Port St Johns.

128
According to Quantec regional data, in 2015, Nyandeni contributed 15% to
O.R. Tambo district grow value added (See Figure 5).
In 2015, Nyandeni contributed 8.6% to O.R. Tambo district economy
Source: Quantec regional data, 2016 Figure 5
4.3.2 Nyandeni economic performance and trends: (1994-2015)
Looking at the percentage changes in real gross value added of the District, Figure 5 shows that
Nyandeni local municipality followed a similar pattern as that of the O.R. Tambo district. The
municipality was not much affected by the 2008/2009 economic meltdown compared to the
province and other local municipalities in the province.
In 2015, Nyandeni gross value added grew by 1.7% compared to 5.7% attained a decade age
in 2005 (See Figure 6). The economic prospect of the municipality is difficult to predict.
Looking at the provincial growth trajectory, the Eastern Cape economy remain fragile and
unsustainable, hence It is anticipated that grow in Nyandeni will average below 2% until 2018.
Ngquza Hill
14%
Port St Johns 5%
Nyandeni
15%
KSD 55%
Mhlontlo 11%

129
Growth rate in real gross value added: 1994-2015
Source: Quantec regional data, 2016 Figure 6
5.3.3. On what items do households in Nyandeni local municipality spend their money?
Consumption is vital to South Africa’s economy. According to the South African Institute of
Race Relations (SAIRR), household consumption expenditure contributes about 60% to the
GDP. Therefore, analysis of consumer behaviour and spending power in the country is
important as it reveals how the economy depends on consumption expenditure.
Looking at final consumption expenditure by households, Figure 8 shows that households in
Nyandeni spend a quarter of their income on food. This is in line with a study conducted by
SAIRR. According to SAIRR (2015) the single biggest item of household expenditure is food,
beverages, and tobacco, followed by transport and then housing. On average, South Africans
spent 25.3% of their money on Food, beverages, and tobacco, with transport at 18.8%, while
Housing, water, electricity, gas, and other fuels
7.0
6.0
6.2
5.0
4.0
3.0
2.0
1.0
1.7
1.3
-
(1.0)
(2.0)
Eastern Cape O.R.Tambo Nyandeni

130
took up 14.6% of household expenditure. Other notable expenditure are: Health (7.8%);
Recreation, entertainment, and culture (4.2%); Furnishings, household equipment, and routine
maintenance (6.0%); Hotels, cafés, and restaurants (2.6%); Education (3.4%) and Clothing and
footwear (4.8%).
On what items do people in Nyandeni spend their money on? (Final consumption
expenditure by household, 2015)
Source: Quantec regional data, 2016 Figure 7
Comparing expenditure for low income (poor) households and high income (rich) households,
SAIRR (2015) report shows that lower income households are likely to allocate 21.4% of
expenditure on housing, versus 33.1% for higher income earners; Food: 33.5% vs 10.8%;
Miscellaneous 9.2% vs 15.2%; Other 25.8% vs 23.0%; Transport 10.2% vs 17.8%. In
Nyandeni, Transport and telecommunication is the third largest expenditure item.
As households become richer, they are more likely to spend on items such as insurance,
savings, and medical care. It is striking that 25.4% of the
Miscellaneous goods
Recreational and entertainment non-durable goods
Recreational and entertainment durable goods
Durable goods: Other durable goods
Motor car tyres, parts and accessories
Medical and pharmaceutical products
Household textiles, furnishings, glassware, etc
Furniture, household appliances, etc
Household services, including domestic servants
Household consumer goods
Petroleum products
Entertainment & educational services
Household fuel and power
Personal transport equipment
Rent
Clothing and footwear
Medical services
Transport & communication services
Miscellaneous services
Food, beverages and tobacco
0.2%
1.1%
1.8%
2.1%
4.3%
5.4%
6.5%
7.4%
9.6%
25.6%
0.0% 5.0% 10.0% 15.0% 20.0% 25.0% 30.0%

131
expenditure of the richest category of households goes to income tax as opposed to 0.8% of
that of the poorest households. Poor households devote more of their expenditure to goods
such as food and alcohol than rich households.
5.3.4 Household expenditure and its impact on local economic growth
The slower economic growth in Nyandeni in 2015 could largely be attributed to low household
spending together with a moderation in employment growth, particularly in the private sector,
along with a decline in the real private sector wage rate weighed on real disposable income
and therefore consumer spending.
The macroeconomic environment in Nyandeni is expected to remain challenging for consumer
spending. The hike in the interest rate in July last year continues to weigh on disposable
income. Furthermore, the higher interest, higher inflation and slow employment growth
constrain significantly consumer spending in the municipality. Also, a further depreciation in
the Rand/Dollar exchange rate may offset the gains from the lower oil price and erode
disposable income of the few elite who use private vehicle for transportation.
5.3.4. Sector Analysis
This section analyses Nyandeni economic sector and makes reference to selected key sectors
which are major contributors to the economic activity of the municipality and drivers of
Nyandeni economic growth.
Figure 9 shows that Government sector (30%) is the main contributor to Nyandeni economy.
This is followed by Trade sector (19%) and Finance sector (17%). However, contribution by
productive sectors such as agriculture and manufacturing is very negligible.

132
Table 12 provides a detailed breakdown of sub-sectors GVA in Nyandeni and how these sub-
sectors grew since 1995 to 2015. Table 13 shows a detailed breakdown of sub-sectors
compensation of employees. These two tables give a full picture of the sectors that contribute
most to the economy of Nyandeni and the wages and salaries paid in each sub-sector.
Sectors contribution to GVA: Nyandeni, 2015
Source: Quantec, 2016 Figure 9
5.3.4.1. Agri-processing, apriority for Nyandeni LM
The Eastern Cape vision 2030 has identified agriculture-led growth and agricultural value
chains as “clear-cut priorities for accelerated industrialization”. Nyandeni’s prioritisation of this
sector will allow the municipality to benefit from growth opportunities in the region and beyond.
Despite its relatively small direct contribution to GDP, the agricultural sector has been a mainstay
of the Nyandeni’s economy and driver of economic development in this rural municipality. In
rural, it is easy to focus on agriculture as a primary sector to will allow the majority of the people
to
Government 30%
Agric 1%
Mining Manufacturing 2% 3% Electricity
2% Construction
6%
Trade 19%
Transport 9%
Community Services 11% Finance
17%

133
participate in the economy. An inclusive growth strategy through agriculture is presented
below.
5.3.4.2. Inclusive growth in Nyandeni should focus agriculture and manufacturing
Economic growth should as a final outcome cause an improvement in the overall quality of life
as measured by different socio-economic development indicators if the growth is inclusive. On
the other hand, socio-economic improvements also benefit economic growth. Local
government policies directly aimed at these improvements become agents of economic growth
by creating conditions favourable to economic development. High potential sectors are
identified so that government resources can be prioritised towards interventions in a small
number of opportunities rather than spread across the board.
The economic contribution of primary agriculture is supported by various value
chains: its linkages extend to agri-processing producers as
intermediate inputs in the production of consumer goods and as backward linkages to its
suppliers within the manufacturing and services sector. Increasing farmer participation in the
full agriculture value chain via beneficiation of agricultural produce could stimulate inclusive
growth and employment creation.
Key policy implications identified should include the benefits of having manufacturing as a
growth sector is important. Particularly one with an export-orientation, ability to develop and
transmit modern technology and capacity to create employment opportunities. In commodity
production the agricultural value chain remains an important sector in which the region has a
clear comparative advantage. Whilst real growth potential is currently dominated by agricultural
produce and food value chain, there is still a need to add to existing value, and diversify the
sector.

134
Nyandeni GVA: Sectors Trends 1995 - 2015
Real Gross value added at basic prices, R millions
constant 2010 prices 1995
2000
2005
2010
2015
Total 1 526 1 729 2 105 2 724 3 110
Primary sector 78 71 71 71 82
Agriculture, forestry and fishing 20 15 13 19 22
Agriculture 10 9 7 9 11
Forestry 10 6 6 10 12
Fishing 0 0 0 0 0
Mining and quarrying 58 55 59 52 59
Secondary sector 109 128 185 283 340
Manufacturing 44 49 63 85 102
Food, beverages and tobacco 21 21 25 32 36
Food 4 4 5 7 7
Beverages and tobacco 18 18 20 25 29
Textiles, clothing and leather goods 1 2 3 6 8
Textiles 0 0 0 0 0
Wearing apparel 1 1 2 5 7
Leather and leather products - - - - -
Footwear [QSIC 317] 0 0 1 1 1
Wood and paper; publishing and printing 7 7 7 9 10
Wood and wood products 6 6 6 6 7
Paper and paper products - - - - -
Printing , recorded media 1 1 2 3 3
Petroleum products, chemicals, rubber and plastic 2 4 4 5 9
Coke, petroleum products and nuclear fuel 2 3 3 4 7
Basic chemicals - - - - -
Other chemical products 0 1 1 1 1
Rubber products - - - - -
Plastic products - - - - -
Other non-metal mineral products 5 8 14 20 23
Glass and glass products 0 0 0 0 0
Non-metallic mineral products 5 8 14 19 23
Metals, metal products, machinery and equipment 2 3 4 4 6
Basic iron and steel products; casting of metal - - - - -
Non-ferrous metal products - - - - -
Structural metal products 1 1 1 1 2
Other fabricated metal products 1 2 2 2 2
Machinery and equipment 0 0 1 1 2
Electrical machinery and apparatus - - - - -
Electrical machinery - - - - -
Radio, TV, instruments, watches and clocks - - - - -
Radio, television and communication apparatus - - - - -
Professional equipment - - - - -
Transport equipment 2 1 1 1 2
Motor vehicles, parts and accessories 2 1 1 1 2
Other transport equipment - - - - -
Furniture; other manufacturing 3 3 4 7 9
Furniture 1 1 2 2 3
Other manufacturing groups 2 2 3 5 6
Electricity, gas and water 29 38 47 68 73
Electricity and gas 15 20 30 46 47
Water 14 18 17 22 26
Construction 36 41 75 129 165
Tertiary sector 1 339 1 530 1 849 2 370 2 688
Wholesale & retail trade, catering & accommodation 320 356 400 501 572
Wholesale and retail trade 306 339 375 462 532
Catering and accommodation services 14 17 25 38 41
Transport, storage and communication 117 145 196 228 254
Transport and storage 105 130 176 204 232
Communication 13 15 19 24 23
Finance, insurance, real estate & business services 123 173 277 411 515
Finance and insurance 50 44 64 84 91
Business services 73 129 212 327 424
Professional business services 64 100 159 259 326
Business activities n.e.c. 10 29 53 68 97
General government 631 670 746 948 1 027
National and Provincial government 580 606 663 847 909
Local government 51 64 83 101 118
Community, social and personal services 147 186 230 283 319
Education (Private) 29 42 52 76 76
Health and social work (Private) 57 77 93 102 128
Other community, social and personal services 62 67 85 104 116
Total 1 526 1 729 2 105 2 724 3 110
Source: Quantec regional data, 2016 Table 12

135
Nyandeni Compensation of employees: Sector Trends 1995 - 2015 Real Compensation of employees, R millions
constant 2010 prices 1995
2000
2005
2010
2015
Total 936 1 028 1 175 1 494 1 721
Primary sector 20 31 26 21 31
Agriculture, forestry and fishing 6 5 3 4 7
Agriculture 3 3 2 3 3
Forestry 2 1 1 2 4
Fishing 0 0 0 0 0
Mining and quarrying 14 26 23 17 25
Secondary sector 47 53 75 118 144
Manufacturing 18 19 23 41 54
Food, beverages and tobacco 7 7 8 13 17
Food 2 2 2 3 4
Beverages and tobacco 5 5 5 10 13
Textiles, clothing and leather goods 1 1 2 5 7
Textiles 0 0 0 0 0
Wearing apparel 1 1 1 4 6
Leather and leather products - - - - -
Footwear [QSIC 317] 0 0 0 1 1
Wood and paper; publishing and printing 4 5 5 8 7
Wood and wood products 3 4 4 5 4
Paper and paper products - - - - -
Printing , recorded media 1 1 2 3 3
Petroleum products, chemicals, rubber and plastic 1 1 1 1 2
Coke, petroleum products and nuclear fuel 1 1 0 1 1
Basic chemicals - - - - -
Other chemical products 0 0 0 1 1
Rubber products - - - - -
Plastic products - - - - -
Other non-metal mineral products 2 2 3 6 9
Glass and glass products 0 0 0 0 0
Non-metallic mineral products 2 2 3 5 9
Metals, metal products, machinery and equipment 1 2 3 4 5
Basic iron and steel products; casting of metal - - - - -
Non-ferrous metal products - - - - -
Structural metal products 0 0 1 1 1
Other fabricated metal products 1 1 2 2 2
Machinery and equipment 0 0 0 1 2
Electrical machinery and apparatus - - - - -
Electrical machinery - - - - -
Radio, TV, instruments, watches and clocks - - - - -
Radio, television and communication apparatus - - - - -
Professional equipment - - - - -
Transport equipment 1 1 1 1 2
Motor vehicles, parts and accessories 1 1 1 1 2
Other transport equipment - - - - -
Furniture; other manufacturing 1 1 2 3 4
Furniture 0 0 1 2 3
Other manufacturing groups 1 0 1 1 1
Electricity, gas and water 7 12 18 19 20
Electricity and gas 4 7 13 14 12
Water 3 5 4 5 8
Construction 22 22 34 57 70
Tertiary sector 870 944 1 074 1 355 1 545
Wholesale &retail trade, catering & accommodation 144 158 158 176 210
Wholesale and retail trade 135 149 145 162 193
Catering and accommodation services 8 9 12 14 17
Transport, storage and communication 54 55 65 72 72
Transport and storage 45 48 57 61 62
Communication 9 7 7 11 10
Finance, insurance, real estate & business services 46 61 87 126 181
Finance and insurance 23 19 27 35 45
Business services 23 41 60 90 137
Professional business services 17 20 33 56 81
Business activities n.e.c. 6 21 27 34 56
General government 531 555 622 812 882
National and Provincial government 497 513 566 750 805
Local government 35 42 56 62 76
Community, social and personal services 94 116 143 169 200
Education (Private) 13 20 25 33 35
Health and social work (Private) 26 36 44 45 59
Other community, social and personal services 54 60 74 92 106
Total 936 1 028 1 175 1 494 1 721
Source: Quantec regional data, 2016 Table 13

136
The sources of and constraints to high sustainable growth are closely linked to the sector
composition of economic growth and the productivity- enhancing distribution of resources
among industries. Outside of the broad services sector, agriculture and its associated
processing industries, as well as building and construction, stand out for their revealed
comparative advantage in Nyandeni. In Table
5.3.6. Investment trends in Nyandeni
Total Fixed Capital Formation is used as a measure of investment within an economy, and is
comprised of government capital formation, private capital formation and public capital
formation.
Investment in an area can be measured in terms of Gross Domestic Fixed Investment (GDFI)
and/or Fixed Capital Stock (FCS). The total fixed investment provides an indication of
investment within the economy into machinery, equipment, building and land.
GDFI: Gross fixed capital formation (R million), 2016
Source: Quantec regional data, 2016 Figure 10
1 000 906
900
800
700
600 514
500
400
300 231
200 113
100 70
-

137
Figure 10 provides investment trends in Nyandeni since 1993 to 2015. According to Quantec
regional data, the total nominal Gross Domestic Fixed Investment in Nyandeni has almost
double every five years. In 2015, Nyandeni’s Gross Domestic Fixed Investment amounted to
R906 million, representing 16% of O.R.
Tambo district total investment. More than half (56%) of Nyandeni’s Gross Domestic Fixed
Investment is in buildings and construction works (See Figure 11).
Investment distribution in Nyandeni, 2015
Source: Quantec regional data, 2016 Figure 11
Due to lack of economic opportunities in Nyandeni municipality, entrepreneurs seem averse
towards investing in corporations based in this municipality. Lack of infrastructure such as good
roads, telecommunication systems, health care facilities,… do not motivate skilled labour and
businesses to migrate in the district. Also poor infrastructure, in particular poor road
networks, unreliable energy supply and insufficient
GDFI_ Transport equipment
13%
GDFI_ Transfer costs 2%
GDFI_ Machinery and other equipment
29% GDFI_ Buildings and construction works
56%

138
telecommunication facilities create high transaction costs and cause serious obstacles to
operate effectively business in the area.
5.3.7 Comparative advantage of Nyandeni local economy
The municipality prides itself with its 20 km stretch coastline Mthatha Mouth to Mnenu, including 772 ha Hluleka Nature Reserve with six unperturbed and active beaches amongst which Mthatha Mouth and Mdumbu are internationally recognised. The Municipality shares part of the 6 day day hiking trail that traverses to and fro KSD to Port St Johns local Municipalities
Nyandeni Local Municipality’s close proximity to the O.R. Tambo’s economic hub Mthatha makes
it an opportune municipality for expansion and future development. Nyandeni possess vast arable land allowing for economic development initiatives
The Municipality benefits from the R61 upgrade from Mthatha to Port St. Johns and the the N2 Toll road Corridor which is underway. Within the development Corridor stretching along R61 from Mthatha to Ntlaza lies a potential for a corridor development with a higher intensity of land use
alongside. This it due to the proximity of three nodal elements of Ntlaza Junction , Libode and Mthatha (N2 Toll Road)
Mobility Routes: N2 R61, DR18030 road from R61 to Mthatha Mouth via Ngqeleni these routes
carry passing traffic and provide access between local areas in Nyandeni and centres further
afield.
It currently has eight (8) active Rural Service Centres) which have potential to grow as commercial
nodes
The location quotient is an indication of the comparative advantage of an economy. It is used
to identify those local industries that are producing more than is needed for local use and selling
outside the region (exporting) and those that are not meeting local needs and are a source of
consumption leakage (importing). Table 14 show the local municipalities’ location quotients
relative to the district (O.R. Tambo) municipality.
Local Municipality’s location quotient relative to District Municipality (O.R. Tambo)
Total
O.R. Tambo
Ngquza Hill
Port St Johns
Nyandeni
Mhlontlo
KSD
- 1 1 1 1 1
Primary sector - 1.58 1.72 1.28 2.39 0.44
Agriculture - 1.54 1.13 0.54 3.49 0.49
Mining - 1.63 2.43 2.19 1.09 0.39
Secondary sector - 1.01 1.06 1.09 1.08 0.95
Manufacturing - 1.11 0.78 0.83 1.58 0.93
Electricity - 0.58 0.73 1.30 0.54 1.15
Construction - 1.08 1.42 1.25 0.86 0.90
Tertiary sector - 0.99 0.98 0.98 0.96 1.02
Trade - 1.00 0.78 0.97 0.93 1.04
Transport - 0.77 1.00 1.20 0.83 1.04
Finance - 0.91 0.65 0.88 0.69 1.15
General government - 1.04 1.19 0.98 1.07 0.96
Community services - 1.06 1.18 1.05 1.18 0.92
Total 1 1 1 1 1

139
Source: Quantec, 2016 Table 14
When interpreting the data, a location quotient greater than 1.0 indicates that the local
economy is self-sufficient, and may even be exporting the good or service of that particular
industry. On the other hand, a location quotient less than 1.0 suggests that the region is not
self-sufficient and might rely on imports the good or service.

140
According to Quantec regional data (2016), Table 14 shows that Nyandeni’s comparative
advantage relative to the District is in mining, electricity, construction, transport and community
services. Nyandeni’s disadvantages relative to the District are in Agriculture, Manufacturing,
Trade, Finance and General government.
While location quotients can help you better understand your local economy, you should not
rely solely on them for decision-making purposes. Users should keep the following in mind: The
location quotient assumes that local productivity (output per worker) is the same as national
productivity. One interpretation of a “high” location quotient might be that a particular industry
is exporting.
5.3.8 Diversification of Nyandeni local economy
The Tress Index measures the level of concentration or diversification in an economy. An index
score of zero represents a much diversified economy, while a number closer to 100 indicates
a high level of concentration. The economy of Nyandeni appears to be slightly more
concentrated on few industry as it is the case for the District as a whole.
Tress index over 10 industries
1995 2000 2005 2010 2015
O.R.Tambo 62.2 61.6 59.8 59.9 59.3
Ngquza Hill 61.5 61.5 59.5 59.8 59.2
Port St Johns 63.9 63.0 60.0 60.4 59.3
Nyandeni 60.9 60.0 57.6 57.7 56.7
Mhlontlo 61.6 62.0 59.9 59.2 57.0
KSD 64.7 63.3 61.2 61.2 61.0
Source: Quantec, 2016 Table 15
According to Quantec Regional data (2016), the level of concentration in the District has
gradually decreasing. This is an indication the District is gradually diversifying its industries
(See Figure 12).

141
Tress index trend for Nyandeni and O.R. Tambo: 1993 to 2015
Source: Quantec, 2016 Figure 12
5.4 Conclusion
This section has analysed the economy Nyandeni. It showed that economic activities are
concentrated solely in the tertiary sector. GVA contributions by value-add or productive
sectors, such as agriculture and manufacturing, are very insignificant.
10 Social Infrastructure
Social infrastructure is a subset of the infrastructure sector and typically includes assets that accommodate social
services. Examples of social infrastructure assets include schools, universities, hospitals, prisons, libraries,
community halls and community housing. Social infrastructure does not typically extend to the provision of social
services, such as the provision of teachers at a school or custodial services at a prison.
COMMUNITY HALLS
(a) Average number of community halls in the various wards
(b)
One other aspect investigated through this study was that of community halls, their distribution, funders,
personnel and security. The respondents were asked to indicate how many community halls they had in their
wards. Their responses are shown in Figure 5 and illustrate that community halls are not very common in these
communities. Actually, of all the wards that partook of this study, 22 (or 71%) of them do not have any community
halls at all. Sixteen percent (5 wards) of the wards have one community hall each and these are wards 1; 11; 19,
20 and 31. As also illustrated in Figure 5, there are two wards (3%) with 3 and 4 community halls each and these
are wards 6 and 21, respectively. Ward 17 did not indicate if there is a community hall or not in that particular
ward whereas ward 24 has 2 community halls. In total, there are 14 Community Halls in the entire municipality.
63.0
62.0
61.0
60.0
59.0
58.0
57.0
56.0
55.0
Nyandeni O.R.Tambo

142
The following community halls were constructed by various funders in the following wards,01,06,
07,11,19,20,21,24 and 31.
PROPOSED PLANS
Build at least two Community Hall per annum including maintainance
LIBRARY SERVICES
The municipality has a Service Level Agreement (SLA) with Department of Sports, Recreation and Arts & Culture
(DSRAC) to manage public libraries. There are 02 official public libraries (Libode ward 07 and Ngqeleni Town
ward 21). There are 03 modular libraries established by DSRAC at Ward 04, 14, 20 and 25
The municipality took a decision to establish and support school/community libraries, to that effect the
municipality is operating with 07 community/ school libraries (Ward 04, 11, 14,18,19,24 and 31).
10.1 Educational services
EARLY CHILDHOOD DEVELOPMENT
Include Prioritisation of SOPA
The municipality took a decision to contribute to the cognitive development of the child by making a provision of
the child care facility, where a child will be developed emotionally, cognitively, morally, physical and social from
birth to school going age.
Distribution of ECDCs between different wards in the municipality (N=31)
Number of ECDCs per
ward
Frequency Total number of
ECDCs
Wards Number of
villages
00 1 00 20 18
01 2 02 17; 19 19
02 0 00 ------- 00
03 4 12 7; 9; 22; 23 23
04 7 28 1; 3; 4; 5; 15; 25; 30 66
05 4 20 10; 11; 12; 31 24
06 2 12 18; 24 21
71%
16%
4%3% 3%
3%
No Community halls One Community hall Two Community halls
Three Community halls Four Community halls Did not indicate

143
Number of ECDCs per
ward
Frequency Total number of
ECDCs
Wards Number of
villages
07 4 28 8; 26; 27; 29 54
08 1 08 16 10
09 0 00 ------- 00
10 3 30 2; 6; 21 36
11 2 22 13; 28 19
12 1 12 14 10
TOTAL 31 174 31 300
To date the municipality has constructed 8 early childhood centres in the following wards 02, 04, 07, 10, 21,
25,26 28. Additional 2 ECDC’s will be constructed in the 2014/2015 financial year
CHART 11. NUMBER OF STUDENTS FOR EACH EDUCATOR BY LOCAL MUNICIPALITY IN O.R. TAMBO
DISTRICT MUNICIPALITY, 2012
In order to sustain growth in the number of learners, educators are necessary. In Nyandeni Local Municipality
there is a total number of 3 251 educators/teachers which is equal to 33 learners to one educator, which is inline
with the district municipality (32 learners per educator). Comparing that to the other local municipalities the
Mhlontlo Local Municipality has the lowest ratio of 27 learners to one educator.
10.2 Healthcare facilities
Definition
A healthcare facility is, in general, any location at which medicine is practiced regularly. Medical
facilities range from small clinics and doctor's offices to emergency medical centres and large
hospitals with elaborate emergency rooms and trauma centres. The healthcare facilities is
summed in to categories:
Private facilities – all facilities that is for-profit this includes private hospitals and
private clinics. The not-for profit facilities also forms part of the private facilities, but is
only non-medical sites.
36.0 36.1
32.9
27.2
29.4
0.0
5.0
10.0
15.0
20.0
25.0
30.0
35.0
40.0
Ngquza Hill LocalMunicipality
Port St Johns LocalMunicipality
Nyandeni LocalMunicipality
Mhlontlo LocalMunicipality
King Sabata DalindyeboLocal Municipality
O.R. Tambo DM - 31.9
Source: EMIS - Department of Basic Education
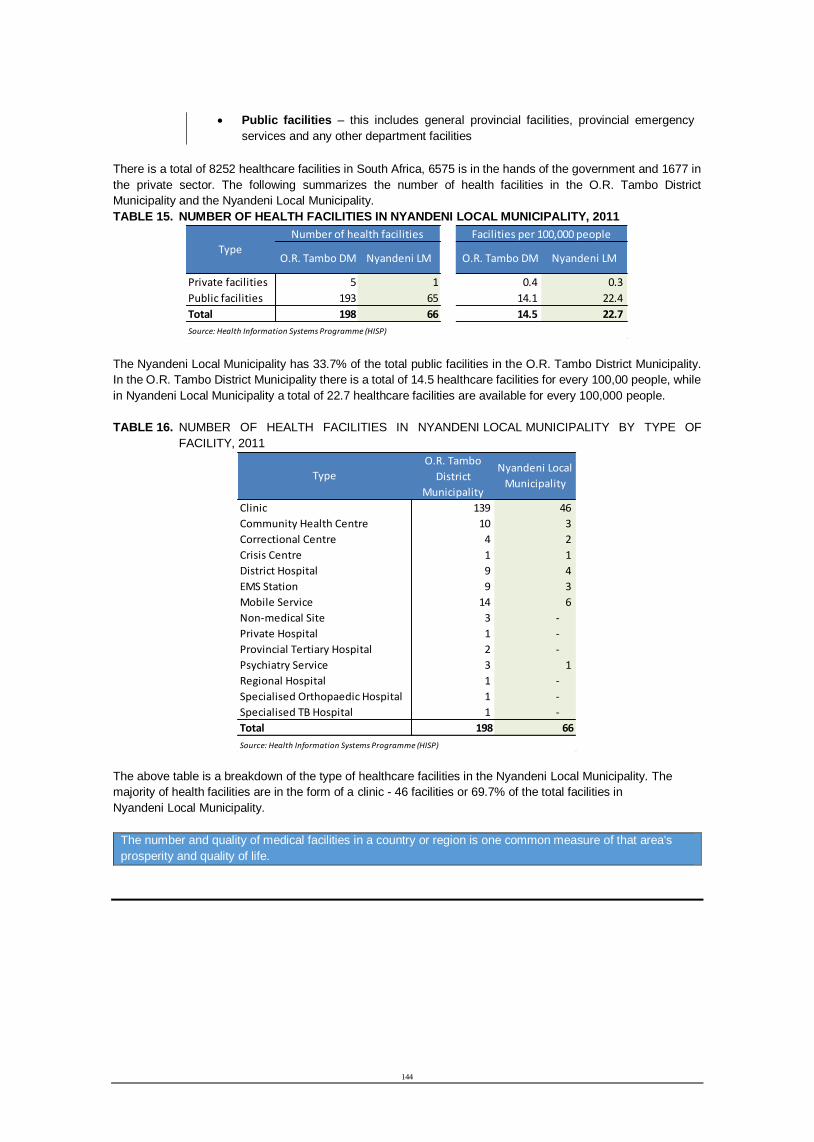
144
Public facilities – this includes general provincial facilities, provincial emergency
services and any other department facilities
There is a total of 8252 healthcare facilities in South Africa, 6575 is in the hands of the government and 1677 in
the private sector. The following summarizes the number of health facilities in the O.R. Tambo District
Municipality and the Nyandeni Local Municipality.
TABLE 15. NUMBER OF HEALTH FACILITIES IN NYANDENI LOCAL MUNICIPALITY, 2011
The Nyandeni Local Municipality has 33.7% of the total public facilities in the O.R. Tambo District Municipality.
In the O.R. Tambo District Municipality there is a total of 14.5 healthcare facilities for every 100,00 people, while
in Nyandeni Local Municipality a total of 22.7 healthcare facilities are available for every 100,000 people.
TABLE 16. NUMBER OF HEALTH FACILITIES IN NYANDENI LOCAL MUNICIPALITY BY TYPE OF
FACILITY, 2011
The above table is a breakdown of the type of healthcare facilities in the Nyandeni Local Municipality. The
majority of health facilities are in the form of a clinic - 46 facilities or 69.7% of the total facilities in
Nyandeni Local Municipality.
The number and quality of medical facilities in a country or region is one common measure of that area's
prosperity and quality of life.
O.R. Tambo DM Nyandeni LM O.R. Tambo DM Nyandeni LM
Private facilities 5 1 0.4 0.3
Public facilities 193 65 14.1 22.4
Total 198 66 14.5 22.7
Source: Health Information Systems Programme (HISP)
Type
Facilities per 100,000 peopleNumber of health facilities
Clinic 139 46
Community Health Centre 10 3
Correctional Centre 4 2
Crisis Centre 1 1
District Hospital 9 4
EMS Station 9 3
Mobile Service 14 6
Non-medical Site 3 -
Private Hospital 1 -
Provincial Tertiary Hospital 2 -
Psychiatry Service 3 1
Regional Hospital 1 -
Specialised Orthopaedic Hospital 1 -
Specialised TB Hospital 1 -
Total 198 66
Source: Health Information Systems Programme (HISP)
O.R. Tambo
District
Municipality
Nyandeni Local
Municipality Type

145
CHAPTER 3: THE SPATIAL DEVELOPMENT FRAMEWORK
Preparation and Adoption
The 2018-2023 Spatial Development Framework was crafted and adopted by Council on 27
June 2019 as key component of the integrated development plan. It is five a year horizon
plan that guide and inform spatial planning processes and key decisions. A thorough
consultative and stakeholder consultation was held during the process of formulating the
SDF.
The formulation of a Spatial Development Framework Plan is a legal requirement, which
every Municipality must adhere to as part of their Integrated Development Planning process
(IDP). Refer: Section 26 (e) of the Municipal Systems Act (Act 32 of 2000).
3.1 Purpose of Spatial Development Framework
The purpose of formulating a Spatial Development Framework Plan for Nyandeni is to provide the municipality
and other development agencies with a tool to assist them in making development decisions, which ensures that
land in Nyandeni is used and managed appropriately and that sustainable development decisions and practices
are implemented.
The Spatial Development Framework essentially creates a map “picture” of what the Nyandeni area will look like
in the future in accordance with the Municipality’s vision and objectives, developed during the IDP process.
In so doing the purpose of the plan is to provide a spatial policy framework:
1. To direct development agencies in decision making which directly or indirectly impacts on the Municipal
area.
2. To direct private and public investment to areas in that would ensure the most sustainable return of
investment.
3. To guide development in a spatially efficient way, ensuring linkage and alignment to regional and
national development policies and programmes.
4. Which in response to locally specific trends and dynamics in Nyandeni, directs investment to areas of
greatest potential and to target areas of greatest need to alleviate poverty and promote economic
growth.
5. This proposes strategic options to improve linkages within Nyandeni and beyond its boundaries to
stimulate effective and sustainable integrated development.

146
3.2 Legal Framework for the SDF
National Development Plan 2016 to 2030
The National Development Plan (NDP) is a plan geared towards poverty elimination and inequality
reduction by the year 2030, by unleashing the energies of all South Africa citizens to grow the
economy, build capacities and enhance the capability of the state and its leaders.
The National Development Plan (NDP), supported by the New Growth Path and other relevant
programs, provides a platform to look beyond the current constraints to the transformation
imperatives over the next 20 to 30 years.

147
The Key Spatial Directive Chapters of the National Development Plan:-
Chapter 5 of the National Development Plan (NDP) focuses on environmental sustainability and
resilience through an equitable transition to a low-carbon economy, which will also have
implications on the way, the spatial planning and development in South Africa is approached.
Chapter 6 sets out specific targets and goals towards establishing a more inclusive rural economy
through integrated rural development. The focus here is on increased investment in new agricultural
technologies, research and the development of adaptation strategies for the protection of rural
livelihoods and expansion of commercial agriculture.
Chapter 8, which focuses on the country’s spatial planning system, requires that: all municipal and
provincial Spatial Development Frameworks (SDFs) are translated into ‘spatial contracts that are
binding across national, provincial and local governments’; the current planning system should
‘actively support the development of plans that cross municipal and even provincial boundaries’,
especially to deal with biodiversity protection, climate-change adaptation, tourism and
transportation; and every municipality should have an ‘explicit spatial restructuring strategy’ which
must include the identification of ‘priority precincts for spatial restructuring’.
Spatial Planning and land use Management Act no. 16 of 2013
Chapter 4; Part A to E of SPLUMA outlines requirements of SDF’s at National, Provincial and at
Municipal level with various sections providing prescription for each sphere of government with
regard to the SDF preparation and content, section 12 of SPLUMA specifically requires that all
spheres of government compile SDF’s for their areas of jurisdiction; Part E provides for the
preparation and content of a Municipal SDF. Part E defines the status of a SDF.
The NLM SDF will serve as a strategy to interpret and represent the Spatial Development Vision of
the municipality. The vision must be designed to enable sustainable development throughout the
municipality while the planning process will address the challenge to balance imperatives of
economic efficient, social and environmental integrity. Furthermore, SPLUMA section 20 provides
that Municipal SDF’s, must be prepared as part of a municipality’s Integrated Economic
Development Plan in accordance with section 26 (e) of the Local Government Municipal Systems
Act No. 32 of 2000 (MSA).

148
The SDF must give effect to the development principles contained in the Spatial Planning & Land
Use Management Act No. 16 of 2013 including:
1. Spatial Justice
2. Spatial Sustainability
3. Efficiency
4. Spatial Resilience; and
5. Good Administration
The Spatial planning and land-use management Act no.16 of 2013 as part of effective landuse
management, requires municipalities to set up municipal planning tribunals and to develop wall to
wall land use schemes by 2020. To this Nyandeni local municipality has an adopted SPLUMA By-law
and has appointed and authorised official and appeals authority in terms of SPLUMA and completed
the categorisation of applications that will be dealt with by the authorised official and by the district
planning tribunal. Nyandeni local municipality has opted to form part of the district planning tribunal
which was established in 2018 and is currently operational. During the 2018-19 financial year the
district planning tribunal has convened atleast 4 times. The composition of the tribunal is made up
of district municipality officials, Nyandeni officials, mhlontlo officials, COGTA officials, Department
of Environment and public works officials. The municipality has further initiated a process of
formulating a comprehensive land use management scheme. In an effort to ensure proper and
informed spatial planning the local municipality has established a G.I.S unit within the Development
planning department. G.I.S technology will assist the municipality with effective land use
management and ensure a properly aligned billing system. The municipality also recognises the need
to deal with unresolved land claims swiftly which are usually delayed as a result of land boundary
disputes. The municipality has therefore embarked on a process of conducting a thorough land audit
of all land parcels within the boundaries of Nyandeni local municipality. The municipality is currently
in a process of hold public engagements with the communities and interested and affected
stakeholders as part of compling a comprehensive land audit process. Once public participation
process has been completed the draft audit report will be sent to the rate payers association, land
claims commission, deeds registry and department of public works. The municipality is anticipating
to complete the land audit process by the 31st September 2019.

149
District Policy Alignment
An assessment of the proposals contained in the District Municipality Spatial Development
Framework plans was carried out in order to ascertain the nature of district spatial policy, areas of
potential, key development issues, the alignment between districts and the nature of spatial
structuring elements being used for land use management and development management.
OR Tambo District Municipality Spatial Development Framework (2018)
The SDF identified several key development issues for the district including:
1. Improved access and linkages in terms of the main modes of transport is critical for ensuring
tourist access and access for the movement of produced and processed goods;
2. The 148 km of coastline is one of the most scenic and undisturbed and can be regarded as
some of the prime assets of the District;
3. Urban centres are all located on main transport routes with Mthatha situated centrally at
the intersection of a number of routes;
4. Informal coastal issues are noted and the legal process to deal with and such developments
have been slow, visible action is required;
5. Housing demand is clearly an urban/peri-urban based issue;
6. Population concentration is the western part of the district is the highest;
7. Extremely high unemployment rate;
SPATIAL VISION
The Spatial Vision aims to guide spatial development within the Municipal and provide the
Municipality with a direction for its spatial growth. The following vision was developed as a spatial
vision as part of the Spatial development Framework process:-
“By 2035, the Nyandeni Local Municipality will be developed as a self-sustaining municipality that
promotes quality human settlements, sustainable environments and ecosystems and the
livelihoods of its residents, through effective service delivery and infrastructure development.”
3.3 Nyandeni Development Nodes
In order to plan efficiently, there needs to be a focus on investing resources in areas of opportunity
in order to create maximum impact, there needs to be certain structuring elements to give guidance
to develop and spatial planning. For the Nyandeni’s Municipality Spatial Development Framework

150
there are four Spatial Structuring Elements that can guide spatial development and decision-making
in the town and these elements include: -
1. Nodes,
2. Corridors
3. Urban Edge,
4. Settlement Edges
Nodes’ are generally described as “areas of mixed use development, usually having a higher intensity
of activities involving retail, transportation, office, industry and residential land uses.”
These are the places where most interaction takes place between people and organisations,
enabling most efficient transactions and exchange of goods and services. Nodes are usually located
at interchanges to provide maximum access and usually act as catalysts for new growth and
development.
Nodes are those places where people and transportation routes congregate. The goal of the
municipality is to have a “compact, transit-orientated, pedestrian-friendly area where high
concentrations of residential, employment, retail and other uses” are located. Nodes area generally
located where two or more transit routes intersect.
Major nodes area places where there is a perceived area of continuous activity surrounded by a
building density that supports it, whereas minor nodes are areas where activity and density are
anticipated to increase over time
The table below provides a summary of the nodal regions within the Nyandeni Municipality which
is aligned to the Provincial and District SDF:-

151
Primary Node Secondary
Node Tertiary Node
Rural Service
Centre
Tourism/
Coastal
Node
Future Metro
Region
Libode 1. 2.
Ngqeleni 3.
Ntlaza Junction 4.
Corona 1.
Canzibe 1.
Nyandeni 2.
Kop Shop 3.
Marubeni 4.
Ngongweni 5.
Entshiuni Junction 1.
Mthatha Mouth 2.
Coffee Bay 3.
Presley Bay 4.
Lwandile 5.
Hluleka 6.
3.4 Development Corridors
A “Development Corridor” is normally used to symbolise the area where important economic activities are to
be encouraged along a particular transport route. There is often difficulty in stakeholder perceptions regarding
the term ‘corridor’ and the purpose of such planning tool. It is proposed that the use of the term ‘transport
route’ be adopted in future because it places emphasis on the transportation activity, which is critical for
economic clusters to grow in both urban and rural environments;
The types of corridors have been identified within the municipality:-
1. Primary Corridor

152
2. Secondary Corridor
3. Tertiary Corridor
4. Tourism Corridor
What is important to understand, is that the corridor needs not take the form of a continuous integrated band
of activity. At points of highest access along the central spine, development will be more intense and of a
higher order while at locations of lower access, lower intensity development or even part of a natural open
space network may be found.
Corridor Type Route Name
Primary Corridor
Economic Corridor
East – West Corridor (R61/ Proposed N2 Toll Route)
North - South Corridor (N2)
Secondary Corridor
Development Corridor
North – South Linkage (Nyandeni to Ngqeleni)
West – East Linkage (Nyandeni to Marubeni)
North – South-East Linkage (Corona to Kop Shop)
East – West Linkage (Ngqeleni to Kop Shop)
Tertiary Corridor
Linkage Corridor
North -South Linkage (Kop Shop to Entshiuni Junction)
North – South Linkage ( Ngqeleni to Wild Coast Meander
Tourism Corridor
East – West Corridor (Wild Coast Meander)
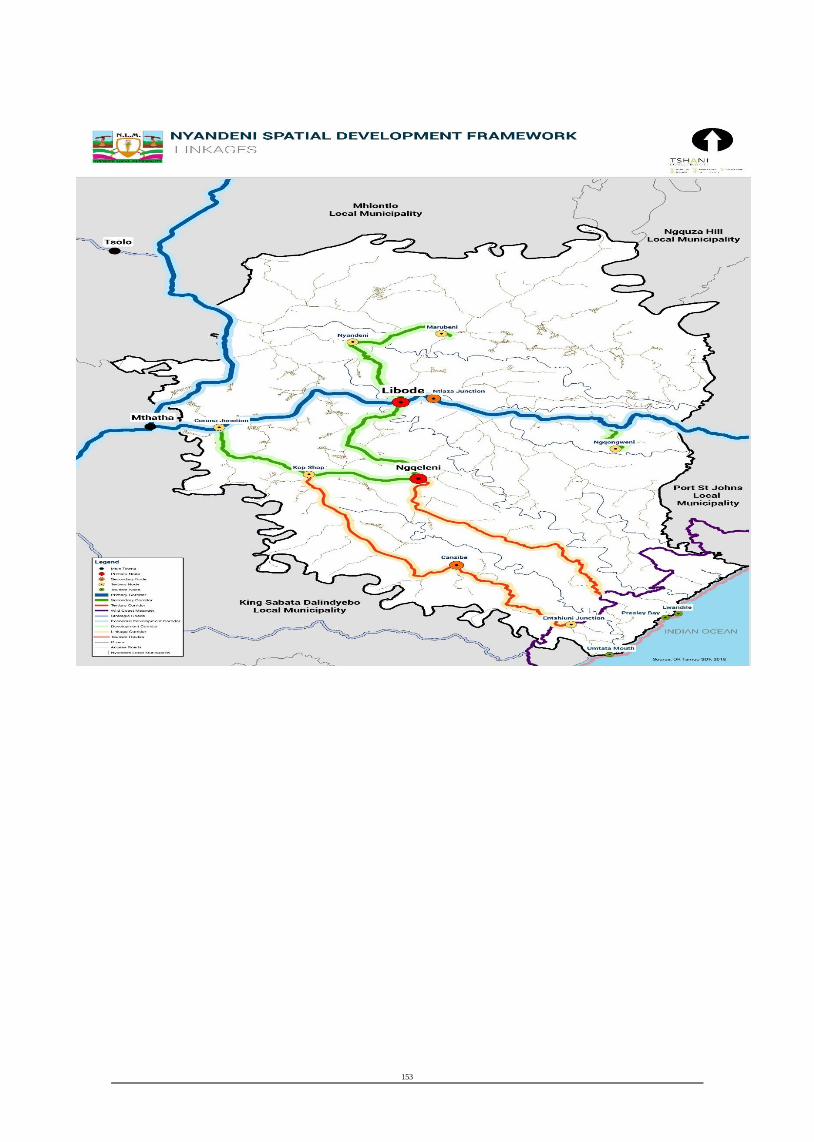
153

154

155

156

157
SPATIAL DEVELOPMENT FRAMEWORK IMPLEMENTATON
Ngqeleni Nodal Precinct identifies the following development priorities
1. Construction of a Tourism Information Centre to cater for the needs of tourist travelling through the town
2. Tourism Sector Plans
3. Resources (Skilled Professional)
4. Preparation of Business Plans
5. Detail Urban design guidelines
6. Tourism and Direction Signage
7. Redevelopment of Taxi Rank with facilities
8. Upgrading of water supply
Development Priorities – Mthatha Mouth/Mdumbi
1. Detail Urban design guidelines
2. Application for funding for township establishment
3. Tourism and Direction Signage
4. Marketing and investment opportunities
5. Upgrading of the main access road
6. Upgrading of water supply
7. Upgrading of sanitation
8. Development of Hotel/Lodge
9. Development of Caravan Park’
10. Development of two resort areas
Development Priorities – Lwandile/Presley Bay Node
1. Upgrading of the main access road
2. Tourism signage and marketing
3. Township Establishment
4. Upgrade of water supply
5. Upgrade of sanitation
6. Development of Hotel/lodge
7. Development of two resort area
8. Development of Caravan Park

158
STRENGTHS WEAKNESSES OPPORTUNITIES THREATS
1. Ntlaza Junction situated at a
transport interchange.
1. High dependency
rate on the local
government sector.
1. Low levels of
employment and
income, which
results in limited
buying power.
1. Densification
of residential
areas is
encouraged.
1. Predominant
residential
component,
instead of a
more
business
orientated
centre.
1. Libode regarded as the
economic hub of Nyandeni
Local Municipality.
1. No legislation in
place to control
development.
1. Ntlaza
Junction
prioritized for
education
facilities,
primary
health care
facilities,
businesses
and other
social
facilities.
1. No projects to
upgrade
roads and
stormwater in
Libode.
1. Vacant land within the town of
Libode is available for
development.
1. Infrastructure
backlog.
1. Road access
to and from
Ntlaza
Junction
prioritized for
maintenance.
1. Water
shortages in
Libode,
particularly in
dry seasons.
1. Favourably located on R61 en-
route to the National N2 Road
and the coast.
1. Existing gravel
roads, with no formal
stormwater
infrastructure.
1. R61
identified as
a ‘Primary
Activity
Corridor’ with
the potential
of being
developed as
a
‘development
corridor’.
1. Illegal
dumping of
refuse by the
Municipality at
the
unlicensed
waste
disposal site.
1. Proposal by SANRAL to
upgrade interchanges along
the R61 into Libode.
1. Water demand is
higher than the
existing supply of
water in Libode.
1. Relatively
high youthful
population
which
reduces the
dependency
ratio.
1. No formal taxi
embayments
along the R61
at Ntlaza
Junction.
1. Proposal to construct a Waste
Water Treatments Works for
Libode.
1. No formalised
waterborne
sewerage
infrastructure.
1. Opportunity
to provide
land tenure to
those settled
1. Rainwater
tanks are
main supply
of water at

159
INFRASTRUCTURE FRAMEWORK
1. Upgrading of the R61
1. Interchange at the eastern access road into Libode
2. Overpass at the currently closed off access near the NLM offices, including pedestrian ramps
and public transport bays
3. Relocation of the western intersection to Libode with the introduction of auxiliary turning lanes
4. Pedestrian bridge at the school along the R61- Libode
5. Central median island along the R61- Ntlaza junction
6. The introduction of a roundabout at the hospital with the relocation of the access to the hospital
off the side road at Ntlaza junction
7. The formalization and redevelopment of the public transport facilities along the R61 in the
vicinity of the Ntlaza junction
8. Rationalization of intersections at the Ntlaza junction
Public Transport Facility in Libode
1. Surfacing and demarcation of the rank
2. Formalization of the informal trading areas
3. Provision of adequate shelters for both informal traders and commuters
4. Dedicated wash bays
5. Ablution and office facilities
6. Adequate municipal services such as water, sewerage, electricity, refuse removal, etc
1. Poor sanitation
services may cause
water pollution.
at Ntlaza
Junction.
Ntlaza
Junction.
1. Electricity supplied by Eskom
and is currently being
upgraded to increase the
supply.
1. Little opportunities
for employment
poses a threat to
development.
1. Opportunity
to prevent
haphazard
development
at Ntlaza
Junction.
1. Non-existent
refuse
removal
service at
Ntlaza
Junction,
which is an
environmental
hazard.

`
Page 160 of 415
BASIC SERVICE DELIVERY AND INFRASTRUCTURE DEVELOPMENT
ROADS, STORM WATER
Adoption
The Storm Management Plan for Ngqeleni and Libode Towns was first adopted by Council on 31 May 2013 and
covers the following areas; The plan has now been updated incorporated in the Infrastructure Plan
Storm Water Management
Scope of Study
The study has the following aim:
Review existing storm water reports, storm water maps, studies, soil maps, and other rainwater data.
Review available drainage information in the study area.
Identification of any storm water hazards/flood risks within the study area.
Evaluation of potential implementation constraints and development of possible storm water drainage
mitigation. Provide relevant information for the planning and design of future storm water drainage
and furniture.
Provide suitable detailed storm water layout and cost estimates.
Objective of Study
This storm water management plan has the following objectives:
To protect all life and property from damage by storm water and floods.
To prevent or better manage erosion of soil by water.
To improve the quality of life of the Libode Town and the affected surrounding communities.
To conserve the natural environment and to protect and enhance water resources in the catchments.
Study area observations and discussion
Flood Risk
The current state of development tends to reduce the natural rainfall infiltration and increase storm runoff in areas
where there is less or no permeability. Downstream flood damage risks will increase unless adequate
management of flood runoff is provided by the municipality either collectively and/or individually.
The design of the major storm water system must address this issue as far as possible, but it is important to note
that each type of land-use and its associated runoff must be catered for in the process of design such that the
current state of development’s flood risks are no greater that the future development flood risks.
The hydrological analysis will advise the degree to which the municipality will have to provide adequate storm
water drainage to ensure that flooding risks are minimized even after land-use changes in the process of
development.
Storm water Management Philosophy
The major storm water system consists of culverts, pipe conduits. It includes V-drains and natural beams to
control storm water. Roadways and their associated drainage structures may form part of the major storm water
system if they result in a significant deflection of storm water from its natural overland flow path.
The minor storm water system consists of any measures provided to accommodate storm water runoff within
sites and road reserves and convey the runoff to the major storm water system. These measures include
conduits, berms, channels, road verges and small watercourses. Storm water runoff should not be concentrated
to an extent that would result in any damage to the environment during storms with a probability frequency more
than 1:10 years and would result in only minor, repairable damage in storms with a probability frequency more
than 1 in 20 years. All elements of the built and natural environment must be able to withstand a 1: 20 year storm

`
Page 161 of 415
event without significant consequential loss and risk to property and life. Note that a “storm frequency” equates
to a “probability of occurrence” of a storm event that should be used to assess the annual budget or insurance
provision for remedial works, should the event occur.
In all catchments, the water courses and built storm water infrastructure must be maintained in a clean state,
free of any rubbish, debris and matter likely to pose any pollution threat to the lower reaches of the water courses.
The Storm water Management Philosophy for the Nyandeni Local Municipality encourages residents, technical
officials and property owners to do the following:
Maintain adequate ground cover at all places and at all times to negate the erosive water.
Prevent concentration of storm water flow at any point where the ground is susceptible to erosion.
Reduce storm water flows as much as possible by the effective use of attenuating devices.
Ensure that their land-use practices do not increase the rate of storm water flow above that which the
natural ground can safely accommodate at any point in the sub-catchments.
Ensure that all storm water control infrastructure are kept in a safe and aesthetic manner in keeping
with the overall environment landscape for the area.
Storm water Runoff Control
When formal underground storm water systems are provided in the overall municipality for the acceptance of
storm water drainage from private properties, it is important that the peak runoff rate from private properties do
not exceed the hydraulic capacities of the elements in the major storm water system. The following are general
guidelines for storm water control from private properties.
Buildings
a) Any building will inevitably result in some degree of flow concentration, or deflection of flow around the building.
b) The owner shall ensure that the flow path of the storm water on his site is adequately protected against erosion
and is sufficiently roughened to retard storm water flow to the same degree, or more, as that found in the natural
c) Where the construction of a building causes a change in the natural environment of the site that might result
in soil erosion, the risk of soil erosion by storm water must be eliminated by the provision of approved artificial
soil stabilisation devices, or alternative grassing suited to the changed conditions on the site.
d) Where a piped storm water system exists, an on-site storm water drainage system should be connected to
this external system. Any inlet to a piped system shall be fitted with a screen, or grating to prevent debris and
refuse from entering the storm water system. This must be done immediately on installation of the pipe system.
e) No building works, earthworks, walls or fences may obstruct or encroach on a watercourse inside or outside
the site without approved plans that do not compromise the objectives of the Storm water Management Plan.
Pre-development state of the site.
Roof Drainage
a) Building designs must adopt the One-Planet-Living-10 principles and rainfall runoff from roofing and other
areas, not subjected to excessive pollution, must be efficiently captured for re-use where possible for on-site
irrigation and non- portable water uses.
b) Where ground conditions permit, rainwater runoff that is not stored and utilised on site must be connected to
infiltration galleries or trenches designed to maximise groundwater recharge. Infiltration facilities must be large
enough to contain at least the first hour of a minor storm’s runoff without overflowing.
c) Infiltration trenches must be aligned along the contour on the downstream side of the property such that any
spillage during major storms results in sheet overland flow.
d) Where a piped storm water system has been provided to a property, surplus runoff should be connected to
this system. Garden and other debris must be trapped on screens or gratings before entering the municipal storm
water system.
Parking Areas and Yards
a) Any external parking area, yard or other paved area must be designed to attenuate storm water runoff from a
major storm to an acceptable degree.

`
Page 162 of 415
b) Any area described in (a) must discharge rainwater flowing over, or falling onto its surface, in a controlled
manner either overland as sheet flow, or into a detention facility, or infiltration gallery suitably sized to
accommodate minor storm runoff.
Driveways
a) Driveways shall not be constructed to deflect or channel runoff onto a roadway, or to concentrate runoff
along a particular path that is not a natural water course, without prior consent.
b) Driveways and paths should be designed and constructed such that the rate of flow of storm water across
and along the driveway or path is not increased when compared with the pre-development state.
c) Where the driveway joins the road, the driveway must not obstruct the flow in any open channel, whether
line or unlined, found along the road verge.
Private Roads
a) The principle of overland flow should apply to roadways where possible and roads should be
designed and graded to avoid concentration of flow along and off the road.
b) Where flow concentration is unavoidable, measures to incorporate the road into the major storm
water system should be taken, with the provision of detention storage facilities at suitable points.
c) Inlet structures at culverts must be designed to ensure that the capacity of the culvert does not exceed
the pre-development storm water flow at that point and detention storage should be provided on the
road and/or upstream of the storm water culvert.
d) Outlet structures at a road culvert or a natural watercourse must be designed to dissipate flow energy
and any unlined downstream channel must be adequately protected against soil erosion.

`
Page 163 of 415
INTEGRATED TRANSPORT PLAN AND ROAD MASTER PLAN The Nyandeni Local Integrated Transport Plan and Road Master Plan have been developed and adopted by Council. It is a 5 year planning document which will guide the decision making and infrastructure investment. The LITP covers the following areas
Local and long distance public transport
Non motorised transport
Road Network
Freight transport
ITEM DESCRIPTION ADMINISTRATOR TOTAL LENGTH (km)
SURFACED (km)
GRAVEL (km)
CLASS 2 ROADS (Other main avenues of communication & of an arterial nature): National Roads
SANRAL 99.47 99.47
CLASS 3 ROADS (All other surfaced roads under control of a road authority): Trunk, main and District Roads
DRPW/SANRAL 489.97 489.97
CLASS 4 ROADS (All gravel roads under control of a road authority): Access roads and minor roads
NLM 1610.71 7.22 1603.49
CLASS 5 (Special purpose roads/ strategic, defence, social)
NLM 0 0 0
TOTAL 2200.15 106.69 2093.46
Status of the public transport facilities
ITEM DESCRIPTION ADMINISTRATOR COMMENT ESTIMATED COSTS
Libode Taxi Rank Nyandeni Lm Upgrading To Intermodal Transport Hub
R 11 000 000.00
Ngqeleni Taxi Rank Nyandeni Lm Designed To Upgrade To Be Intermodal Transport Hub
R 19 000 000.00
Ntlaza Taxi Rank Nyandeni Lm Formalized By Sanral R 2 500 000.00
Polini Taxi Rank Nyandeni Lm Informal Taxi Rank Identified In One Of Economic Nodes
R 7 000 000.00
Libode Dltc Nyandeni Lm Operational And Compliant R 0.00
Ngqeleni Vehicle Registering Authority
Nyandeni Lm Operational And Compliant R 0.00
TOTAL R 39 500 000.00
Source: Nyandeni LITP

`
Page 164 of 415
The maintenance of major routes (i.e. mobility, freight, tourism and strategic routes), as
discussed in Section 3.1.3: Development Corridors, of the Local Integrated Transport Plan
forms an important part of the long term road network plan. The major routes that should
be strategically prioritized for routine maintenance have also been indicated and consist of
the following:
DR08313 (26km) providing access to the Canzibe Hospital;
DR08030 (23.4km) from R61 to Ngqeleni (mobility and freight route);
DR18030 (34.1km) from Ngqeleni to Mthatha Mouth (tourism route);
DR08308 (36.2km) from R61 to Hluleka Nature Reserve (tourism route); and
DR08302 and DR08303 (15.1km) from Ngqeleni to R61 (strategic link route).
Bus Shelters – are provided through national and provincial roads (R61 and N2) under the management of SANRAL within Nyandeni jurisdiction.
Energy Provision
Eskom is both the electricity regulator and provider
ENERGY SECTOR PLAN
Electricity Master Plan has been developed and approved by Council. The purpose of the
plan is to provide concise information to enable decision making in relation funding and
infrastructure requirements. The plan indicates that municipality has a total backlog of 12713
households composed of historical backlog, infills, and extensions. To eradicate backlog the
municipality requires an total amount of R176 867 000
Furthermore, the municipality in collaboration with the Department of Energy (DoE) is has
implemented the provision of alternative energy (solar) to approximately 450 in the previous
financial year, and plan to connect approximately 1050 households. This project will go a
long way in address climate change challenges off grid.
INFRASTRUCTURE INVESTMENT AND INFRASTRUCTURE MASTER PLAN
The municipality has commissioned and professional serives (ZNM Engineers) to prepare Infrastructure Investment Plan and Infrastructure Master Plan. These plans will be bring together various infrastructure plans to inform forward planning for prioritisation of programmes and to ensure seamless integration.

`
Page 165 of 415
Trade Affluent Policy
Trade Affluent Policy will be the Chapter in the Infrastructure Master Plan which is currently being developed
RURAL ROADS ASSET MANAGEMENT SYSTEM
The municipality is implementing Rural Roads Asset Management System herewith refered as (RRAMS) to ensure realible and efficient rural roads asset management system to ensure proper forward planning, proper costing and accounting for roads assests and maintenance. The system is a collaborative effort between ORTAMBO District Municipality and Department of Roads and Transport.
DISASTER MANAGEMEN AND FIRE SERVICES
Nyandeni municipality with the support the ORTAMBO District Municipality has established disaster management and fire services arrangement. Personnel and fire vehicles have been deployed by the municipality to respond to emergency cases.
ORTAMBO DM has conducted a vulnerability and risk assessment for Nyandeni Local Municipality and mitigation plan developed. Coherent strategies and programs have been developed to respond to pontential natural and man-made disasters
STAKEHOLDER AND COMMUNITY INVOLVEMENT IN LED ACTIVITIES (E.G. LED FORUM, BUSINESS
CHAMBERS
An LED forum was established and is functional. It sits on a quarterly basis. It serves as “a Platform
(institutional arrangement) where local residents (private organizations, government, state owned
entities; Non Governmental Organisations (NGO’s), Community Based Organisations (CBO’s) such
as Cooperative Association, farmers Association, the Business Chamber, the Local Tourism
Organisation, the Taxi Association, the Informal Traders Association, traditional authorities within a
particular locality gather, with an aim to share information and experiences, pool resources and solve
problems.”
The roles and responsibilities of the LED Forum
Promote and facilitate partnerships between government, private sector, civil society and
organized labour, for overall economic growth;
Improve Integrated Economic Planning, through broad participation and coordination of
key economic role players (government, business, labor, NGO’s, CBO’s, etc);
Assist to identify and capitalize on local competitive advantage for territorial and sectoral
economic development;
improve the economic performance of the municipality, with respect to all its key sectoral
aspects (Tourism, Agriculture, Retail etc);
In addition to the LED Forum an Economic Infrastructure cluster sits from time to time.
`
Page 166 of 415
MECHANISMS FOR BUSINESS EXPANSION AND RETENTION FOR EXISTING BUSINESSES AND ATTRACTION OF FURTHER INVESTMENT?
The municipality has developed a Retail Sector Strategy as well as the Small Towns Revitalization
Strategy which prioritises CBD development, infrastructure development and rehabilitation, land
development and property management, economic development initiative such commercial
trading infrastructure and facilities such as malls, urban agriculture warehouses to allow for
investment attraction. A Local Economic Development Strategy which identifies key economic
sectors has just been reviewed (2018)
Key other sector development strategies and plans that guide the development of the local
economy have been developed, these include:
Local Economic Development Strategy reviewed in 2018
Tourism Development sector Plan reviewed in 2017
Agriculture Development Plan
Forestry development Plan
SMME and Cooperative development Strategy
Programs implemented by the municipality are in line with objectives of the strategies and plans
TARGETS FOR ENTERPRISE DEVELOPMENT SUPPORT E.G. SMME AND COOPERATIVES? The SMME and Cooperatives Strategy identifies the following key area in support of the sectors:
Creating a conducive regulatory and institutional environment for SMMEs
development;
Improving access to finance and business premises;
Improving access to skills, markets and market exposure;
Provision of bulk infrastructure to small businesses
Municipality to facilitate access to all available sources of funds for SMMEs,
Municipality to facilitate easy access to land and business premises for SMME
development,
to provide training to SMMEs via the existing training institutions and FET Colleges,
To organise a small SMME fair such as SMME flea market once a year in the municipality
where SMMEs can access market opportunities and meet with larger businesses to
explore outsourcing opportunities; and
To develop and roll out a mentorship programme in the Municipality.
Current initiatives of the municipality includes:

`
Page 167 of 415
- Planning and designs for warehouses as part of trading infrastructure
- Holding atleast two (2) Flea Market Exhibitions and Show on an annual bases
- A Capacity building, empowerment and training program funded on an annual basis which
forms part of the municipal SDBIP
- Has adopted one cooperative in the furniture manufacturing field for incubation
- SMME’s and Cooperatives are being funded wherein ten (10) are supported annually.
- The municipality further assist by mobilizing funding from external funding sources to support
small business development.
MECHANISMS TO SUPPORT THE IMPLEMENTATION OF PUBLIC EMPLOYMENT
PROGRAMMES (CWP/EPWP/ANY OTHER)
The municipality is implementing various CWP and EPWP program throughout its wards. It has
managed to create opportunities and useful work 56 through EPWP and 1200 CWP opportunities
SMALL TOWNS REVITALIZATION PROGRAM
The municipality is currently implementing the following projects under the Small Towns
Revitalization
- Surfacing of internal roads in Ngqeleni and Libode
- Installation of high must lights
- Construction of sidewalks
- Construction of transport hubs in Libode and Ngqeleni
- Construction Informal trade infrastructure
- Feasibility studies for warehouses
Most of the projects are implemented in collaboration with the Office of The Premier.
POLICIES TO PROMOTE ECONOMIC DEVELOPMENT E.G. INFORMAL TRADING POLICY
ETC.
The development of the Retail sector strategy considered both formal and informal trading sectors
The municipality has been able to provide street trading facilities for informal traders
Currently the municipality is construction informal traders stall as part of the development of the
transport hubs for Libode and Ngqeleni
A licensing system is being used to ensure protection of Informal traders from illegal traders
A street trading bylaw has also been developed to this effect

`
Page 168 of 415
CHAPTER 4: INSTITUTIOANAL TRANSFORMATION AND ORGANISATIONAL DEVELOPMENT
The central feature of this chaper is to ensuring that an organization has the right number of people, the right
kind of the people, in the right places, at the right time doing things that are economically most useful for the
municipality. This is called Human Resource Plan
Location of Departments
Nyandeni Main Municipal Offices are based in Libode approximately 30km from Mthatha, with a Satellite Office
based in Ngqeleni town. All departments are located in one central area in Libode (Main Offices). Both the
administrative and political seats are based in Libode Town. Council Meetings are held in Libode.
Satellite Office functions
Satellite Office renders the following functions and services
Revenue management
Administration and customer care services
Registering Authority for motor vehicle registration
Pound management and Cemetery services
Refuse removal
Librarty Services
Each function has a Supervisor responble for management and supervision of day to day monitoring and report
directly to the Manager Responsible for each Function.
Expansion of Municipal Offices in Ngqeleni
The municipality has adopted a phase-in approach in expanding Ngeleni Offices this approach is informed by
limited resources in funding the project. It will be implemented at scale and pace taking into account affordability
and cost. the construction on Ngqeleni Offices is expected to practically completed by 30 June 2020. Ngqeleni
Offices allocation plan is currently being developed.
The municipality has also taken a decision to establish Youth Office in Ngqeleni. The office is intended to support
youth development programes
Nyandeni Local Municipality is an integral component of Provincial and National Government and consequently
has a critical role in the development and execution of local government strategy and strategic objectives.
Overall, Nyandeni Local Municipality possesses the competency and capability to translate many of
Government’s vision and related legislation and policy into a blueprint framework through its Integrated
Development Plan document.
4.1 Organisational overview
The institutional capability of Nyandeni Local Municipality is informed by overall organizational functioning, the
interventions of management to engage in organizational leadership, development and management of
organizational systems and processes to promote effective operations and service delivery
through optimum use of resources. It is intended to inform Nyandeni Local Municipality’s organizational
strategy to enhance service delivery to key customers/stakeholders.
Nyandeni Local Municipality is represented by two components in terms of its organization and service delivery
outcomes. These are the political structures represented by the politically elected councilors and the
administrative structure represented by the Municipal Manager, the management team and municipality
employees.

`
Page 169 of 415
4.2 Organizational competency status
Nyandeni Local Municipality posses the required competencies amongst staff as well as the required number of
staff to perform its core functions. However, there exists an urgent need to redesign the organizational structure
to ensure that the appropriate numbers of staff are placed on an organizational structure that is aligned to the
organizational strategy and key strategic objectives. There is a need for a significant increase to core local
government professionals, management, technical and functional posts as well as the enhancing the levels of
competence to enable Nyandeni Local Municipality to develop and enhance the necessary institutional capacity
and capability to deliver on its strategic objectives.
4.3 Functions assigned to the municipality that are being performed or not performed
Section 156 of the Constitution1 provides for the powers and functions of municipalities and states that a
municipality has executive authority in respect of, and has the right to administer:
a) the local government matters listed in Part B of Schedule 4 and Part B of Schedule 5; and
b) Any other matter assigned to it by national or provincial legislation.
As indicated above a municipality may make and administer by-laws for the effective administration of the matters
which it has the right to administer.
Specific functions and the way that the responsibilities for these functions are allocated to the 3 different spheres
of government are detailed in Schedules 4 and 5 of the constitution. Schedules 4B and 5B identifies those
functions allocated to local government.
These Schedules read together with section 84 of the Local Government: Municipal Systems Act provide further
for the distinction between those services which can be delivered by district municipalities and those which can
be run by the local municipalities.
The Nyandeni Municipality has been allocated powers and functions in terms of the Constitution and the
Municipal Structures Act no 117 of 1998. Accordingly, Nyandeni has been granted executive authority over its
area of jurisdiction.
Section 85 of the Structures Act provides further that the MEC for local government in a province may, adjust
the division of functions and powers between a district and a local municipality as set out in section 84 by
allocating, within a prescribed policy framework, any of those functions or powers vested-
a) in the local municipality, to the district municipality; or
b) in the district municipality (excluding a function or power referred to in section 84 (1) (a), (b), (c), (d), (I),
(o) or (p), to the local municipality.
Provincial Notice No. 23 of 2003 dated 5 May 2003 deals with the adjustment of functions and powers between
district and local municipalities in terms of section 85(1) of the Structures Act.
The notice provides as follows:
1. that O.R. Tambo District Municipality performs the following local functions in respect of Nyandeni Local
Municipality:
1. Municipal planning;
2. that NLM performs the following district functions in its local area:

`
Page 170 of 415
a. 84(1)(e) Solid waste disposal sites, in so far as it relates to-
(i) the determination of a waste disposal strategy;
(ii) the regulation of waste disposal;
(iii) the establishment, operation and control of waste disposal sites, bulk waste transfer
facilities and waste disposal facilities for more than one local municipality in the district
b. 84(1) (l) the establishment, conduct and control of cemeteries and crematoria serving the area of
a major proportion of municipalities in the district.
c. 84(1) (n) Municipal public works relating to any of the above functions or any other functions
assigned to the district municipality.
The table below illustrates the powers and functions that the Nyandeni Local Municipality is authorized to perform
in terms of Part B of Schedules 4 and 5 of the Constitution.
Part B of Schedule 4 Part B of Schedule 5
1. Air pollution
2. Building regulations
3. Child care facilities
4. Electricity and gas reticulation
5. Fire-fighting services
6. Local tourism
7. Municipal airport
8. Municipal planning
9. Municipal health services
10. Municipal public transport
11. Pontoons, fairies, settees, piers and
harbours excluding the regulations of
international and national shipping
12. Municipal public works only in respect of the
needs of the municipalities
13. Storm water management system
14. Trading regulations
15. Water and sanitation services (limited to
potable water supply system, domestic
waste water and sewerage disposal
system)
16. 16.Beaches and amusement facilities
17. 17.Billboards and display advertisement in
public places
18. 18.Cemeteries, funeral parlours and
crematoria
19. 19.Cleansing
20. 20.Control of public nuisance
21. Control of undertakings that sell liquor to the
public
22. Facilities for the accommodation care and
burial of animals
23. Fencing and fences
24. Licensing and controlling of undertakings that
sell food to the public
25. Local amenities
26. Local sport facilities
27. Markets
28. Municipal abattoirs
29. Municipal parks and recreation
30. Municipal roads
31. Noise pollution
32. Pounds
33. Public places
34. Refuse removals, refuse dumps and solid
waste disposals
35. Street trading
36. Street lighting
37. Traffic and parking
Of the 39 functions listed in Parts B of Schedules 4 and 5 of the Constitution, Nyandeni has been allocated 34
functions which it is required to deliver on, the following 24 functions are being performed by Nyandeni Local
Municipality:
Part B of Schedule 4 Part B of Schedule 5
1. Solid waste
2. Municipal planning
3. Storm water management system
4. Municipal public transport
5. Trading regulations
6. Local Tourism
7. Building regulations
10. Cemeteries, funeral parlours and crematoria –
including the DM function
11. Cleansing
12. Local sport facilities
13. Municipal parks and recreation
14. Municipal roads
15. Pounds

`
Page 171 of 415
Part B of Schedule 4 Part B of Schedule 5
8. Electricity reticulation(agency)
9. Child Care Facilities
16. Public places
17. Refuse removals, refuse dumps and solid
waste disposal
18. Traffic and parking
19. Municipal public works
20. Beaches and amusement
21. Billboards and display advertisement in public
places
22. Street trading
23. Control of undertakings that sell liquor to the
public
24. Street lighting
The table below reflects function that NLM is authorized to perform but is not being performed:
Part B of Schedule 4 Part B of Schedule 5
Air pollution
Electricity and gas reticulation (not
authorized but included in new
organizational design)
Fire-fighting services
Municipal airport
Municipal public transport
Pontoons and ferries
Electrification reticulation
Control of public nuisance
Fencing and fences
Markets
Municipal abattoirs
Noise pollution
4.4 Effectiveness of the legislative function
The administration, as appropriately delegated, has a responsibility to support the Council in exercising its
powers and functions, including drafting of by-laws for approval by Council. By laws are developed annually as
need arises
4.5 System of delegation within the municipality
Council delegates where appropriate the responsibility to exercise legislative and executive authority to the
relevant structures of the municipality. A delegation framework and register has been developed and approved
by council on the 30 November 2019 with Council Resolution No. 2660/30/11/2018
4.6 Extent of service delivery by the municipality
Nyandeni Local Municipality is enhancing its service delivery by executing the following:
Developing a performance culture at all levels of the organization which is able to clearly indicate a
tangible influence on the key stakeholders within the municipality’s area of jurisdiction in terms of
poverty reduction and enhancement of the quality of life through the development and execution of
an effective sustainable economic development and a job creation strategy;
The efficient use of networks and internal human resources through the delivery of outcomes as opposed
to engaging in significant planning and talk without outcomes to show for effort;

`
Page 172 of 415
Improving governance throughout the organization through controls, accuracy, punctuality, knowledge,
professionalism and work ethic;
Building a team-based organization that is people-oriented with a strong focus upon Batho Pele, with a
general respect and a passion to deliver a quality service to all stakeholders. This includes developing
a strong collective culture in terms of Nyandeni Local Municipality organizational building;
Integrity: ethics, honesty, non-corruptive behavior;
Innovation to face challenges and offer new solutions through a high intensity and work ethic;
A commitment to its constituents, the majority of whom are poor and unemployed who live within the
boundaries of the municipality’s area of jurisdiction.
4.7 Organizational structures, systems, processes and personnel capacity
4.7.1 Organizational Structures
REVIEW AND ADOPTION OF THE ORGANIZATIONAL STRUCTURE
The organizational structure was reviewed and approved by Council on 27 June 2019 with Council Resolution
no...2699/27/06/2019
The approved Organisational structure has a total umber of 338 positions, 1 post not budgeted for and 317 filled
post and 21 vacant posts as at June 2019.
The Organizational structure is fully aligned with the IDP which is five year plan (2017-2022) reviewed annually
and Vision 2030 which is long term plan and is a key institutional factor that determines the institutional capacity
and capability of the municipality in order for it to deliver on its vision, mission and strategic objectives.
Our organizational structure and design has been strongly influenced by the development and optimization of
competencies and capability. This will positively impact on the capacity requirements for Nyandeni Local
Municipality to deliver on its key outputs. The diagram below shows how the Nyandeni Local Municipality is
structured in terms of the different levels of government and the structures within the Municipality.
Nyandeni Local Municipality
Political Structures Administrative Structures
Executive Committee
63 Councillors
32 Wards
Council Standing Committees
Infrastructure Development
Corporate Services
Budget & Treasury
Human Settlement and Rural
Development
Local Economic Development
Municipal Manager
Corporate Services
Budget and Treasury Office
Community Services
Planning and Development
Infrastructure Development

`
Page 173 of 415
Community Service and Public
Safety
Special Programmes and Social
Services
Municipal Planning, IGR and
Research
Political Structures
At the political level, the organization is based upon a strong programme management model and a politically
orientated governance approach, combined with competencies in community based engagement, development
and stakeholder mobilization. This is complimented by the leadership and executive management structures
primarily at a political level. These structures are used to make decisions and inform high level planning for the
achievement of desired objectives of Nyandeni Local Municipality.
Section 79 Committees
Municipal Public Accounts Committee (MPAC)
Ethics and Members Interest Committee
Public Participation and Petitions Committee
Women’s Caucus
Statutory Committees
Performance and Audit Committee
Risk Management Committee
ICT Governance Committee
IDP and Budget Steering Committee
Financial Misconduct Board
Audit Committee
Administrative Structures
Nyandeni Local Municipality structure is hierarchical based on functional silos represented by five departments
which are supposed to be in aligned to the four core focus areas of the Municipality. The Nyandeni Local
Municipality organizational structure is divided into five functional departments as follows:
Office of the Municipal Manager
Corporate Services;
Budget and Treasury Office;
Community Services;
Planning and Development; and
Infrastructure Development

`
Page 174 of 415
Each Department represents a functional area of work and is further divided into sub-functional components.
The five key focus areas attempt to create integration. This integration demands a value chain response from
each department in terms of its deliverables.
4.7.2 HR Strategy, Systems, processes and personnel capacity
The following systems, structure and process exist within the Nyandeni Local Municipality:
4.7.2.1 Systems
Formal budget monitoring and control systems in place. Thus, budget control and management of
operating expenditure is enhance;
Impact assessment and benefits realization from the introduction of financial system; and
Adequate management information systems and reporting tools.
HR Plan that is aligned to the organizational goals
4.7.2.2 Local Labour Forum
Local Labour Forum is functional and convenes on a quarterly basis to address labour related issues as well as
implementation of Bargaining Council Agreement. It is constituted by Union and Employer representatives. In
the last financial it had convened 8 times
Key responsibilities of the Labour
Conflict moderating Forum
It serves as a forum for bargaining
OFFICE OF THE MUNICIPAL MANAGER
Office of the Municipal Manager performs the following focus areas
Legal Services
Internal Audit
Council Affairs
Communication
Risk Management
Municipal Planning
Intergovernmental Relations
Special Programmes and Social Services
Public Participation
Monitoring and Evaluation
COMMUNICATION
The Internal Communication Unit is headed by Manager Communications and is supported by the
Communication Officer and Clerk. The unit has played an important role in the branding of the work performed

`
Page 175 of 415
by Nyandeni Local Municipality. The branding is an important vehicle to create awareness about Nyandeni Local
Municipality amongst the communities. In addition, the core function of the Unit is to ensure effective
communication to all stakeholders.
.
Key Functions
Responsible for developing communications strategy
Municipal branding
Media liaison
Presidential Hotline and complaints management system
Public Participation
LEGAL SERVICES
This unit provides critical support in the management and administration of legal matters that affects the
municipality. It is also responsible for contract management, development, and review of municipal bylaws.
Furthermore, the unit is responsible for the development and review of effective systems of delegation
MUNICIPAL BYLAWS
The following By-laws have been reviewed and developed in the current year
By-law for the Hire and Use of Community Halls, Arts and Culture facilities
Credit Control and Debt Collection By-Law
Credit Management By-Law
Funeral Undertakers By-laws
By-law relating to Nuisances
By-Laws relating to the removal of refuse
Cemetary By-Laws
Library and Information services By-Laws
Parking Grounds By-Laws
Pound By-Laws
Pubic Spaces By-Laws
Waste Management By-Laws
Liquor Trading By-Law
Undeveloped Sites By-Laws
Rates By-Law
COUNCIL AFFAIRS
Council Affairs provides administrative support to the Standing Committees, Section 79 Committees, Executive
Committee and Council play a pivotal role in ensuring that these structures achieve their mandate.
MUNICIPAL PLANNING
Responsible for coordination of Integrated Development Planning, Annual Budget process plan,
Intergovernmental Relations and institutional performance management
4.8 CORPORATE SERVICES
Nyandeni Local Municipality will continue to develop the necessary institutional capacity and organizational
culture required to mobilize the workforce towards the necessary performance levels. The Human Resources
function is geared up in executing the necessary Human Resources processes, systems and policies that will
ensure effective institutional development of Nyandeni Local Municipality. Human Resources Development,

`
Page 176 of 415
transformation, mobilization and the need to create a motivated, competent and effective workforce is the
responsibility of all levels of organizational leadership and management.
The support functions of the Corporate Services Department include the following:
Human Resources Management
Human Resources Development
Integrated Employee Wellness (OHS, EAP & HIV/AIDS)
Employment Equity
Information Communication Technology
Records Management
Facilities Management
Customer Care
The Corporate Services Department is also responsible for Support Services Function which range from
Switchboard Services, Office Accommodation, facilities management; office automation and Registry/Archives
Management. The Support Services Function is in a position to support with the necessary levels of capacity,
competence, technology and resources.
Work Place Skills Plan
The WSP is prepared and submitted to Local Government SETA on an annual basis
The municipality needs to create a skilled workforce to ensure a sustainable economic development and redress
the pool of unskilled workers.
The municipality seek to ensure that as many staff members as possible from the officer level at BTO to top
management level for all departments obtain the Municipal Minimum Competency Training which is required in
terms MFMA section 83,107 and 119- Gazette 29967 of 15 June 2007.
Skills development of employees, Councillors is one of the NLM’s priorities. NLM annually develops WSP which
sets out training needs for staff, Councillors as well as unemployed. WSP is submitted annually on or before
30/04’
HRD programmes such as learnerships, in-service training, internship, skills programmes and bursaries initiated.
Employment Equity Plan
The Department of Employment and Labour conducted a DG Review in 2019 of the EE Plan as per Sec 44 of
the Employment Equity Act. Our EE plan was approved to have complied with the provision of the Act, as a
result the Employment Equity Plan for the period of 01 October 2019-30 September 2021 was approved.
The Department of Employment and Labour had recommended that the municipality should focus on gender
and race equity on occupational levels.

`
Page 177 of 415
Employment Equity Plan is in place and implemented. Employment Equity Report is submitted online to the
Department of Labour annually. Employment equity plan in line with the Employment Equity Policy as adopted
by Council on 1July 2018 and it is a three plan (1 July 2018 – June 2021)
The Skills Development and Employment Equity Committee has been established and convene quarterly to
consider various
In terms of the Eastern Cape Socio Economic Consultative Council (ECSECC) Demographics 2011 (Race), it
shows a high percentage of Africans (98.86%) and low percentages of Whites (0.57%), Coloureds (0.48%) and
Indians (0.09%). Currently the workforce is made up of Africans at 99.64%. The Nyandeni Employment Equity
Plan caters for other races but they do not apply which is why they are not represented.
This therefore means that the Municipality still needs to appoint more Black Females and Coloureds.
The number of female employees in the workforce profile shows a low percentage of
44.% compared to that one of male employees which shows 56.%. The workforce of Nyandeni Municipality is
dominated by males. In terms of ECSECC Demographics 2011 (Gender) Females dominates at 52.50% and
Males are at 47.50%. There is still a need to appoint more female employees in order to reach 52.50%. The
Employment Equity Plan must address this need in the vacant posts that still need to be filled.
According the latest report, the council should pay specific attention to race and gender
JOB EVALUATION PROCESS
Job evaluation is the process of assessing Skills ,Knowledge, Experience and Influence required in
performing duties in the municipality using the TASK system with the aim of developing fair basis for making
pay decisions.
All posts in the organogram have job descriptions. The municipality is part of the O.R. Tambo District Job
Evaluation Unit that is responsible for the evaluation of all Job Descriptions. Planning process for the
implementation of job evaluation will be informed by Job evaluation outcomes.
OCCUPATIONAL LEVEL MALE FEMALE FOREIGN
NATIONAL
TOTAL
A C I W A C I W Male Female
Top Management 0 0 0 0 1 0 0 0 0 0 1
Senior Management 6 0 0 0 0 0 0 0 0 0 6
Professional qualified and
experienced specialist and
mid management
13 0 0 0 5 0 0 0 0 0 18
Skilled technical and
academically qualified
workers, junior
management, supervisors,
foremen, and
superintendents.
32 0 0 0 23 0 0 0 0 0 55
Semi-skilled and
discretionary decision
88 1 0 0 76 0 0 0 0 0 165
Unskilled and defined
decision making
37 0 0 0 34 0 0 0 0 0 71
TOTAL PERMANENT 175 1 0 0 140 0 0 0 0 0 316
Temporary employees 0 0 0 0 0 0 0 0 0 0 0
GRAND TOTAL 175 1 0 0 140 0 0 0 0 0 316

`
Page 178 of 415
PERFORMANCE MANAGEMENT SYSTEM, MONITORING AND EVALUTION
Performance Management Policy and Procedure Manual
Performance Management Policy is currently being reviewed and will beb presented durng the policy workshop
scheduled for the 11-15 May 2020
Annual Performance Agreements
The Municipal Manager and 6 Senior Managers have signed Performance Agreements for 2019/2020 financial
year.
Annual Performance Assessments
Individual performance management assessment is currently implemented at top management Level. The
performance assessment reviews for the Municipal Manager and Senior Managers for 2017/2018. The
assessment for 2018-2019 will be conducted during the 3rd Quarter
The Mid - year individual assessment reviews for the Municipal Manager and Senior Managers are conducted
annually.
all employees shall sign work plans for the 2020-21 financial year
Quarterly Performance Assessments are conducted to review the work done against the pre-determined
objectives and targets. All compliance reports are submitted on time to relevant authorities, these reports
includes MFMA S52 (d) reports, s71, s72 and s121 reports
Government in its Policy Framework for Government-Wide Monitoring and Evaluation System notes that the
government major challenge is to become more effective therefore, M & E processes can assist the public sector
in evaluating its performance and identifying the factors, which contribute to its service delivery outcome.
The monitoring involves collecting, analysis, and reporting data on inputs, activities, outputs, outcomes and
impacts as well as external factors, in a way that supports effective management. But most critically, the
monitoring aims to provide managers, decision makers and other stakeholders with regular feedback on progress
in implementation and results and early indicators of problems that need to be corrected. It usually reports on
actual performance against what was planned or expected.
In accordance with the above framework, the municipality has established Monitoring and Evaluation Unit in the
Office of the Municipal Manager. The unit is charged with the responsibility to track progress in the
implementation of the approved SDBIP, identify deviation and suggest corrective measures. The unit will go a
long way in ensuring that in year monitoring is effective
EMPLOYEE HEALTH AND WELLNESS
Employee Assistant Program deals with life skill empowerment, change management, substance abuse,
disability and incapacity. NLM complies with the requirements of OHS, COID Acts to provide health and safety
to employees, Cllrs and customers. The municipality submits Return of Earnings online annually on or before 31
May.
Key programmes includes, health screenings, observations of national health days, and awareness campaigns
on health. The municipality on 15 November 2018 convened a successful Men’s Health Workshop.

`
Page 179 of 415
HIV/AIDS IN THE WORKPLACE
Awareness raising done though World AIDS Day commemoration, candle light memorials, workplace educational
sessions, aerobics and sport. This is used as a marketing tool for the programme with the goal of involving all
NLM employees.
HUMAN RESOURCES PLANNING
HR Plan Adoption
The Human Resource Plan has been reviewed and adopted by Council on 30 May 2019 with Council Resolution
No. 2695/30/5/2019, it is a five year plan aligned with the IDP Strategic Goals and reviewed annually
Human Resource (HR) planning is the process of ensuring that an organization has the right number of people,
the right kind of the people, in the right places, at the right time doing things that are economically most useful
for the municipality.
The HR Plan also deals with demands such as those posed by the implementation of the Skills Development
Act, other Labour Legislations including programmes and policies related to the HIV and AIDS epidemic. At the forefront of the implementation plan it will be the departmental managers and human resource personnel that
must provide professional support and development of personnel in this municipality.
Nyandeni Local Municipality has developed this HR plan in order to plan and align its human capital with strategic
organizational goals as outlined in the 5 – year Integrated Development Plan. The following approach has been
used:-
The main objectives of the plan are-
To ensure appropriate utilization of available personnel;
To attract and retain scarce skills;
To standardize HR procedures to be followed when an employee exit the municipality;
To ensure that all employees and unemployed have the required competency levels
To create an Environment that promotes employee health and wellbeing
Approach and methodology
The following approach has been used:-
Overview of the municipality and its strategic direction;
Scanning of both internal and external environments in as far as they affect human resource
provisioning;
Profiling of the current workforce;
Identification of gaps in all our HR functions; and
Development of an action plan to close the identified gaps
Human Resource and ICT Policies
The below policies were last reviewed and adopted by Council on 27 June 2019 with Council Resolution
No.2700/27/6/2019
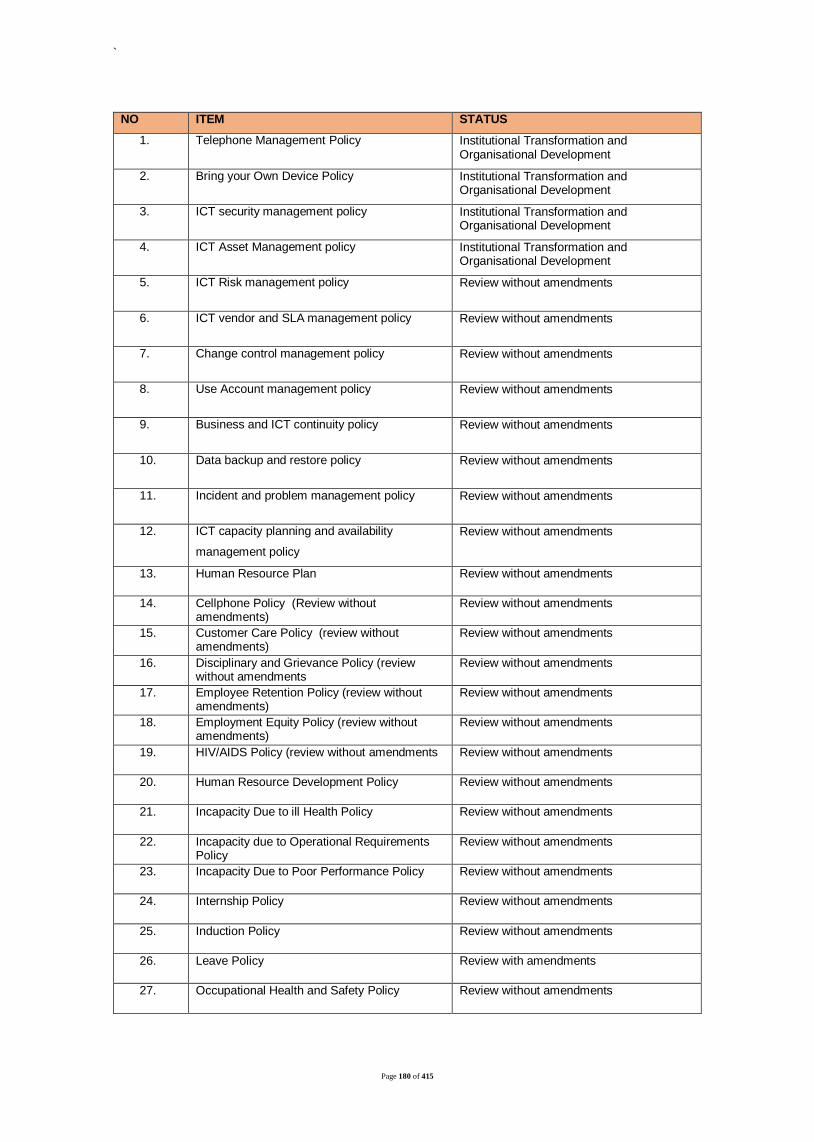
`
Page 180 of 415
NO ITEM STATUS
1. Telephone Management Policy Institutional Transformation and Organisational Development
2. Bring your Own Device Policy Institutional Transformation and Organisational Development
3. ICT security management policy Institutional Transformation and Organisational Development
4. ICT Asset Management policy Institutional Transformation and Organisational Development
5. ICT Risk management policy Review without amendments
6. ICT vendor and SLA management policy Review without amendments
7. Change control management policy Review without amendments
8. Use Account management policy Review without amendments
9. Business and ICT continuity policy Review without amendments
10. Data backup and restore policy Review without amendments
11. Incident and problem management policy Review without amendments
12. ICT capacity planning and availability
management policy
Review without amendments
13. Human Resource Plan Review without amendments
14. Cellphone Policy (Review without amendments)
Review without amendments
15. Customer Care Policy (review without amendments)
Review without amendments
16. Disciplinary and Grievance Policy (review without amendments
Review without amendments
17. Employee Retention Policy (review without amendments)
Review without amendments
18. Employment Equity Policy (review without amendments)
Review without amendments
19. HIV/AIDS Policy (review without amendments Review without amendments
20. Human Resource Development Policy Review without amendments
21. Incapacity Due to ill Health Policy Review without amendments
22. Incapacity due to Operational Requirements Policy
Review without amendments
23. Incapacity Due to Poor Performance Policy Review without amendments
24. Internship Policy Review without amendments
25. Induction Policy Review without amendments
26. Leave Policy Review with amendments
27. Occupational Health and Safety Policy Review without amendments

`
Page 181 of 415
28. Overtime Policy Review with amendments
29. Personnel Regulations Policy Review without amendments
30. Performance Management Policy Review without amendments
31. Placement Policy Review without amendments
32. Policy on Policy Development Guidelines Review with amendments (Title)
33. Policy on Bursary and other forms of Financial Assistance
Review without amendments
34. Policy on Organizational Establishment Review without amendments
35. Probation Policy Review without amendments
36. Records Management Policy Review without amendments
37. Recruitment and Selection Policy Review without amendments
38. Relocation Policy Review without amendments
39. Remuneration Policy Review without amendments
40. S&T Policy Review without amendments
41. Scarce Skills Policy Review without amendments
42. Succession Policy Review without amendments
43. Sexual Harassment Policy Review without amendments
44. Sport & Recreation Policy Review without amendments
45. Smoking Policy Review without amendments
46. Strike Management Policy Review without amendments
47. Termination of Service Policy For Review without amendments
48. Transport Policy For review without amendments
49. Work Attendance Policy Review without amendments
50. Private Work and Declaration of Interest Policy
Review without amendments
51. Job Evaluation Policy Review without amendments
52. Career Pathing and Development Review without amendments
53. Leanership Policy Review without amendments
54. Night Shift and Emergency Work Review without amendments
55. Bereavement Policy Review without amendments
56. Alcohol & Substance Abuse Policy Review without amendments

`
Page 182 of 415
CRITICAL AND SCARCE SKILLS
In accordance with the municipal development strategy and priorities for the next five years and the
development trajectory which is aligned with National and Provincial Development Plans, Vision 2030 the
following critical skills have been identified and have been included in the Human Resource Plan approved by
Council n 30 May 2019
1. Urban & Regional Planner
2. Civil Engineering Technologist
3. Construction Project Manager
4. Architectural professional
5. Mechanical Engineering
6. Horticulture
7. Health & Safety Compliance Risk Officer
8. Civil Engineering Technician
9. Chief Information Officer
10. GIS Specialist
11. Environmental Specialist
12. Building Technician Supervisor
13. Economics
14. Developmental Planning
SUCCESSION PLANNING
Succession planning policy is in place, its purpose is to provide a step by step of compiling a succession plan
document. Reasons for having a succession plan are to ensure the continuity of suitably trained staff in key
positions for the future.
To ensure that someone is always available to fulfill any particular job in the municipal service and ensure that
more than one employee in each department is able to do any particular job. As part of succession planning
strategic officials who are holding key positions have been trained on CPMD, furthermore, bursaries are
being provided particularly on critical skills. The Human Resource Plan indicates when key posts would
affected in terms of expiry of contracts and what plan is in place to address the risk.

`
Page 183 of 415
CODE OF CONDUCT FOR COUNCILLORS AND MUNICIPAL OFFICIALS
All Councilors and municipal officials sign code of conduct when they join the municipality. Annually declaration of interest and disclosure forms are signed by both officials
and councillors, Annually the Office of the Auditor General conducted audit on whether councillors or municipal officials and/or relatives have conducted business with the
municipality, the outcome of the audit forms part of the annual audit report and made public.

`
Page 184 of 415

`
Page 185 of 415

`
Page 186 of 415
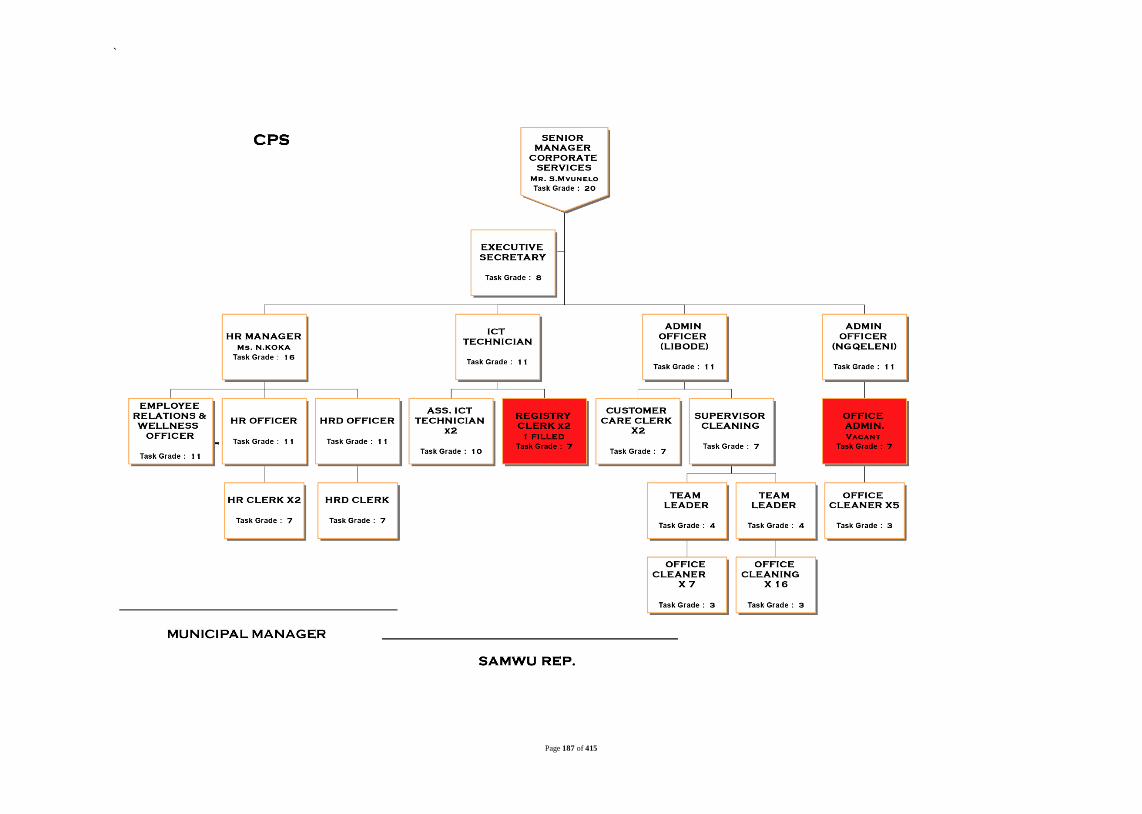
`
Page 187 of 415

`
Page 188 of 415

`
Page 189 of 415

`
Page 190 of 415

`
Page 191 of 415
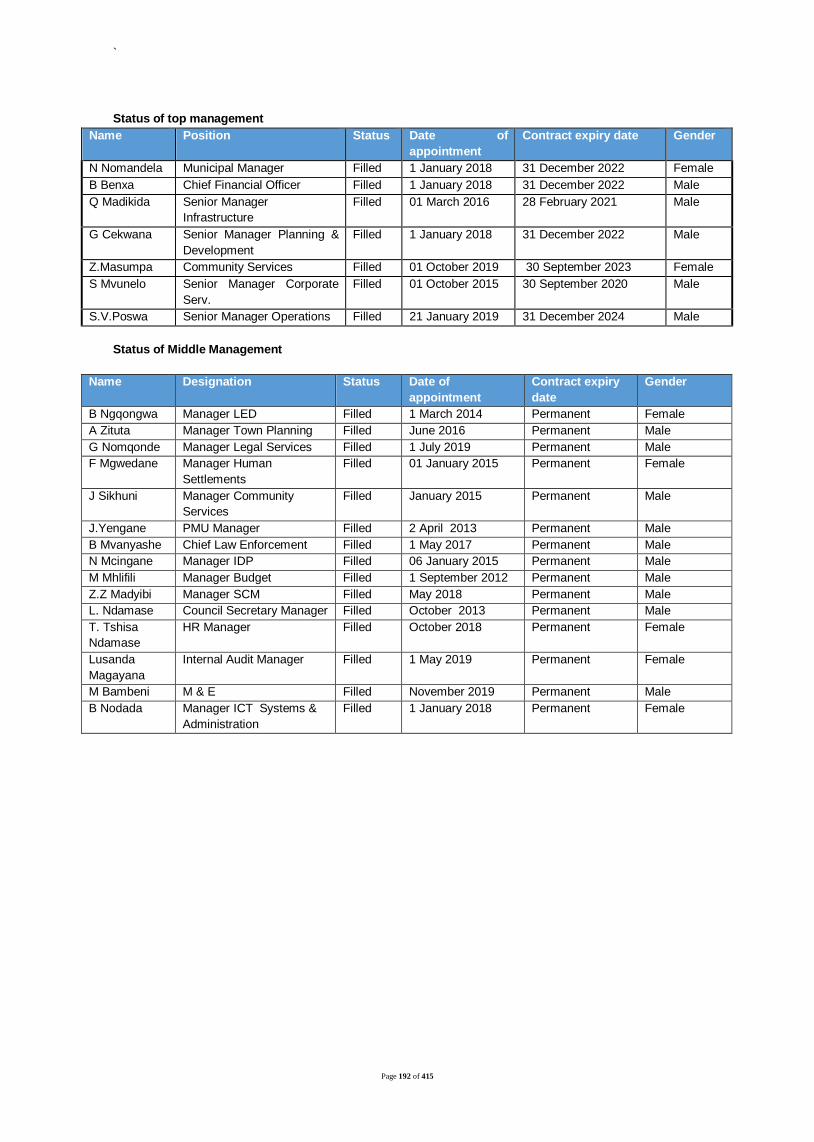
`
Page 192 of 415
Status of top management
Name Position Status Date of
appointment
Contract expiry date Gender
N Nomandela Municipal Manager Filled 1 January 2018 31 December 2022 Female
B Benxa Chief Financial Officer Filled 1 January 2018 31 December 2022 Male
Q Madikida Senior Manager
Infrastructure
Filled 01 March 2016 28 February 2021 Male
G Cekwana Senior Manager Planning &
Development
Filled 1 January 2018 31 December 2022 Male
Z.Masumpa Community Services Filled 01 October 2019 30 September 2023 Female S Mvunelo Senior Manager Corporate
Serv.
Filled
01 October 2015 30 September 2020 Male
S.V.Poswa Senior Manager Operations Filled 21 January 2019 31 December 2024 Male
Status of Middle Management
Name Designation Status Date of
appointment
Contract expiry
date
Gender
B Ngqongwa Manager LED Filled 1 March 2014 Permanent Female A Zituta Manager Town Planning Filled June 2016 Permanent Male G Nomqonde Manager Legal Services Filled 1 July 2019 Permanent Male F Mgwedane Manager Human
Settlements
Filled 01 January 2015 Permanent Female
J Sikhuni Manager Community
Services
Filled January 2015 Permanent Male
J.Yengane PMU Manager Filled 2 April 2013 Permanent Male B Mvanyashe Chief Law Enforcement Filled 1 May 2017 Permanent Male N Mcingane Manager IDP Filled 06 January 2015 Permanent Male M Mhlifili Manager Budget Filled 1 September 2012 Permanent Male Z.Z Madyibi Manager SCM Filled May 2018 Permanent Male L. Ndamase Council Secretary Manager Filled October 2013 Permanent Male T. Tshisa
Ndamase
HR Manager Filled October 2018 Permanent Female
Lusanda
Magayana
Internal Audit Manager Filled 1 May 2019 Permanent Female
M Bambeni M & E Filled November 2019 Permanent Male
B Nodada Manager ICT Systems &
Administration
Filled 1 January 2018 Permanent Female

`
Page 193 of 415
Number of filled/vacant per department and vacancy rate as 26 February 2020
Department(s) Total
No.
of
Posts
Total no of
Funded
posts
Filled Posts Funded Vacant
Posts
Unfunded vacant
Municipal Manager 46 46 44 2 0
Finance 35 35 33 2 0
Planning &Dev 16 16 16 0
Infrastructure 36 36 29 7 0
Comm. Services 67 67 62 5 1(Horticulturalist )
Public Safety 86 86 80 6 0
Corporate Serv. 51 51 49 2 0
TOTALS 337 337 313 24 (7.2%) 1
All posts in the approved organizational structure are budget for in the current financial year

Page 194 of 415
INFORMATION COMMUNICATION TECHNOLOGY
The unit is responsible for the planning and maintenance of ICT infrastructure in accordance with the required standards
of good governance and maintenance of the municipal website to ensure that municipal activities are communicated
both internally and externally, end user support and coordination of the ICT Governance Committee. The unit has rolled
out a data network and voice network which connects the three main sites in Libode and Ngqeleni using the current
technology.
ICT GOVERNANCE
ICT Governance is defines as ‘specifying the decision rights and accountability framework to encourage
desirable behaviour in the use of IT. The complexity and difficulty of explaining IT governance is one of the
most serious barriers to improvement.
ICT governance is about who makes decisions while management is about making and implementing the decisions.
Effective ICT governance for the Municipality will answer three questions:
What decisions must be made
Who should make these decisions
How are they made and monitored
I.C.T. governance framework was approved on the 31st of May 2016 which its aim is to institutionalise the I.C.T. governance as an integral part of corporate governance within the municipality in a uniform and coordinated manner. The municipality has developed an ICT Enterprise Architecture (EA) which defines how the municipality will meet future business problems using Information Communication and Technology (ICT). An EA translates the municipality vision, the organisational structure and behaviour including its information systems into a strategic roadmap. The objective of EA is to maximise investment returns, improve performance and embrace emerging technologies that
support business by focusing on the following aspects:
enable changes to the business strategy with quick-response changes in enabling processes and
technology solutions;
reduces redundancy, hence lower total cost of ownership; and
achieves economies of scale by sharing services
ICT GOVERNANCE COMMITTEE
The ICT Governance Committee has been established and is functional with the full support of the municipal
management. The committee is chaired Mr. Maphanga Thembelani who is an Independent Chairperson and possess
the required ICT expertise and experience, this is to ensure credibility, objectivity and integrity of the Committee. The
main responsibilities of the Committee are as follows.
The ICT Steering Committee is responsible to:
Take action to ensure that the ICT projects are delivered within the agreed budget and timeframe.
Oversee development, approval and implementation of ICT Strategic objective
Make recommendations on ICT related projects
Advise the management and council on all ICT related matters
The following ICT Governance policies were developed, reviewed and adopted by council on 27 June 2019 in
terms of section 11 (2) of the Municipal Systems Act 32 of 2000
Approved polies
1. ICT Governance Framework
2. ICT Network Security Policy
3. Acquisition of Computer Equipment Policy
4. ICT User Account Management Policy
5. ICT Facilities and Environmental Controls Policy
6. Internet, Email and Intranet Usage Policy
7. Acceptable Use of ICT Resources Policy
8. ICT Change Management Policies and Procedures
9. ICT Risk Management Policy

Page 195 of 415
Internal Municipal Network
Currently our municipality has upgraded the network connectivity within its own existing buildings through Vodacom
business network connectivity. Our network connectivity is using microwave link which ensure reliable and fast network
connection with fewer downtime as compared to other network connection types. There is also a fibre network link that
was installed to connect main building and traffic services building.
Disaster recovery
The municipality has purchased a data back-up software that automates data back-up in our laptops and desktops to
ensure that our municipal data is backed-up. Currently the municipality has implemented (procured) an offsite data
backup that ensures that our municipal data is being backed up in a secondary storage that will enable the municipality
to recover the data in case of any natural disaster or man-made disaster that may occur.
The municipality considered the need to store copies of key documents, data and systems away from the main office.
The remote site is at Ngqeleni Unit, it is utilised in the event of a disaster. The municipality appointed Resilient Servers
and Networks to install and configure server mirroring from Libode to Ngqeleni, including supply of a server cabinet
and power strip. This site replicates data from the main office
BROADBAND
The status of ICT in our municipality indicate a need for an integrated broadband network, which will provide voice and
high-speed data connectivity services to address many of the challenges experienced by local Government, local
business and citizens of the municipality. Our community will enjoy the benefit of using a broadband through USAASA
which is Department of Communication’s agency responsible to rollout broadband to our communities. This broadband
rollout it’s a national project that the current government is currently implementing nationally which Nyandeni local
municipality will benefit from it.
SWOT Analysis
STRENGTHS WEAKNESS
1. High levels of staff commitment 1. Slow networks and internet
2. Good relations with stakeholders 2. Poor environmental controls
3. Strong commitment from the municipality to
support ICT initiatives
3. Inadequate ICT policies and standards
4. Dedicated server room 4.Poor network management
5. ICT Steering committee 5.Insufficient ICT budget to meet ICT requirements
6. Shared service agreement with the district 6.Insufficient budget for training ICT staff
OPPORTUNITIES THREATS
1.New technology can enhance municipality
operations
1. Increasingly sophisticated security risks and threats
2.Using ICT to enhance revenue base 2. More stringent audits focusing on controls
3. Speeding up ICT services 3. Focus on ICT by Auditor General
4. Departments make decisions which may impact ICT
without consulting ICT
5. Constantly changing of ICT technologies
10. ICT capacity planning and availability management
11. Incident and problem management
12. ICT asset management
13. Change control management
14. ICT vendor and SLA management
15. Business and ICT continuity
16. Data backup and restore
17. Bring your own device
18. Telephone management policy
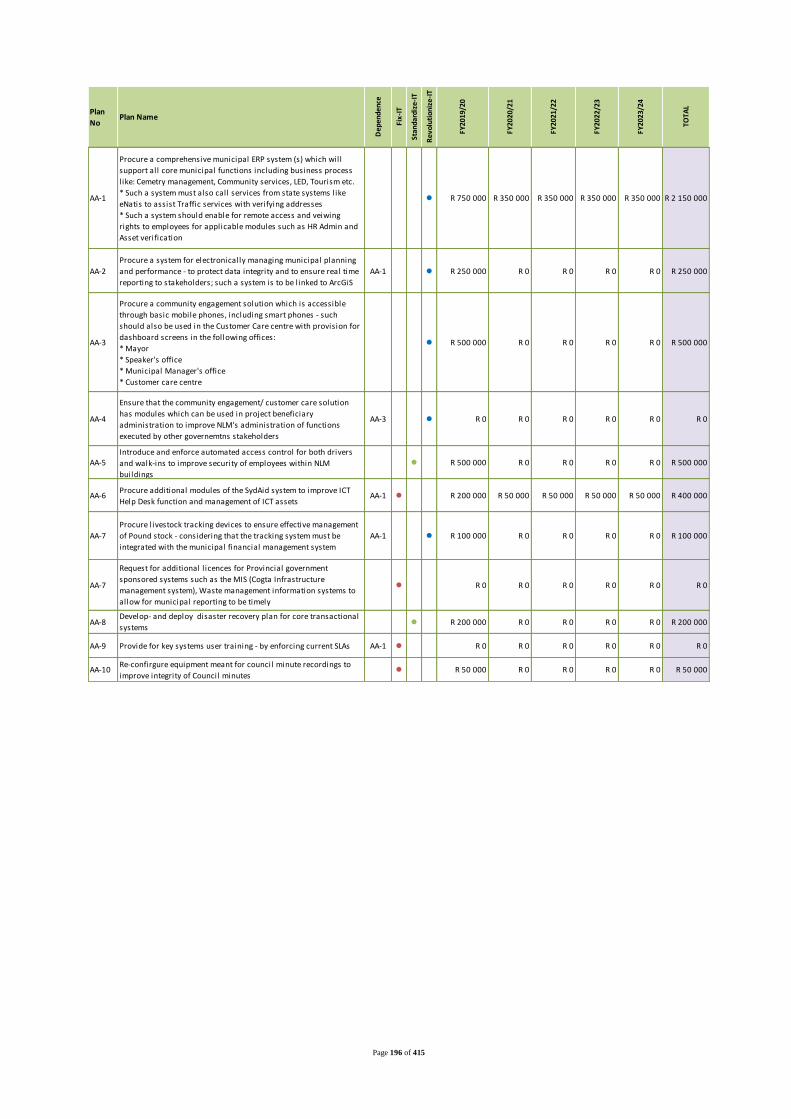
Page 196 of 415
Plan
NoPlan Name
De
pe
nd
en
ce
Fix-
IT
Stan
dar
diz
e-I
T
Re
volu
tio
niz
e-I
T
FY2
01
9/2
0
FY2
02
0/2
1
FY2
02
1/2
2
FY2
02
2/2
3
FY2
02
3/2
4
TOTA
L
AA-1
Procure a comprehensive municipal ERP system (s) which will
support all core municipal functions including business process
l ike: Cemetry management, Community services, LED, Tourism etc.
* Such a system must also call services from state systems like
eNatis to assist Traffic services with verifying addresses
* Such a system should enable for remote access and veiwing
rights to employees for applicable modules such as HR Admin and
Asset verification
l R 750 000 R 350 000 R 350 000 R 350 000 R 350 000 R 2 150 000
AA-2
Procure a system for electronically managing municipal planning
and performance - to protect data integrity and to ensure real time
reporting to stakeholders; such a system is to be linked to ArcGiS
AA-1 l R 250 000 R 0 R 0 R 0 R 0 R 250 000
AA-3
Procure a community engagement solution which is accessible
through basic mobile phones, including smart phones - such
should also be used in the Customer Care centre with provision for
dashboard screens in the following offices:
* Mayor
* Speaker's office
* Municipal Manager's office
* Customer care centre
l R 500 000 R 0 R 0 R 0 R 0 R 500 000
AA-4
Ensure that the community engagement/ customer care solution
has modules which can be used in project beneficiary
administration to improve NLM's administration of functions
executed by other governemtns stakeholders
AA-3 l R 0 R 0 R 0 R 0 R 0 R 0
AA-5Introduce and enforce automated access control for both drivers
and walk-ins to improve security of employees within NLM
buildings
l R 500 000 R 0 R 0 R 0 R 0 R 500 000
AA-6Procure additional modules of the SydAid system to improve ICT
Help Desk function and management of ICT assets AA-1 l R 200 000 R 50 000 R 50 000 R 50 000 R 50 000 R 400 000
AA-7
Procure livestock tracking devices to ensure effective management
of Pound stock - considering that the tracking system must be
integrated with the municipal financial management system
AA-1 l R 100 000 R 0 R 0 R 0 R 0 R 100 000
AA-7
Request for additional l icences for Provincial government
sponsored systems such as the MIS (Cogta Infrastructure
management system), Waste management information systems to
allow for municipal reporting to be timely
l R 0 R 0 R 0 R 0 R 0 R 0
AA-8Develop- and deploy disaster recovery plan for core transactional
systemsl R 200 000 R 0 R 0 R 0 R 0 R 200 000
AA-9 Provide for key systems user training - by enforcing current SLAs AA-1 l R 0 R 0 R 0 R 0 R 0 R 0
AA-10Re-confirgure equipment meant for council minute recordings to
improve integrity of Council minutes l R 50 000 R 0 R 0 R 0 R 0 R 50 000

Page 197 of 415
Strategic action plans for Technology Architecture
RECORDS MANAGEMENT AND ARCHIVING
Archiving and Document Management is regulated by the Promotion of Access to Information Act (PAIA) and
National Archives and Record Service of South Africa and the Records Management Policy and Procedure Manual
and as such it deals with overall document management of the institution. The impending need for proper document
management has necessitated that Nyandeni Local Municipality integrate its systems to ensure that there is
compliance with the relevant Acts and that we properly document institutional information assets. The current
implementation of Electronic Document Management Systems (EDMS) bears testimony to the fact that the institution
is going with times with regards to contemporal issues around archiving. The municipality is using a three phased
approach on implementing EDMS and currently phase one has been implemented. The department is in the process
of disposing old document to provide space for archiving the required documents.
Strategic actions for Application Architecture
5.1 Budget and Treasury Office
The MFMA prescribes that the CFO heads the BTO and that competent finance officials must
support the CFO in his role. The competencies of municipal officials assigned to the budget and
treasury office must meet the minimum prescribed financial competency levels.
Key delegated functions
Budget Planning
Plan No Plan Name
Dep
ende
nce
Fix-
IT
Stan
dard
ize-
IT
Rev
olut
ioni
ze-I
T
FY20
19/2
0
FY20
20/2
1
FY20
21/2
2
FY20
22/2
3
FY20
23/2
4
TOTA
L
TA-1 Establish a fully redundant virtualised server environment l R 100 000 R 0 R 0 R 0 R 0 R 100 000
TA-2 Implement a standardised up-to-date server operating environment l R 150 000 R 0 R 0 R 0 R 0 R 150 000
TA-3
Review and restructure AD / File structuring that supports
centralised and secure management of users (integrate systems /
common structuring/ single log-in to systems)
l R 0 R 0 R 0 R 0 R 0 R 0
TA-4Provide infrastructure and introduce centralised fi le storage and
sharing to improve document management l R 0 R 150 000 R 0 R 0 R 0 R 150 000
TA-5
Establish comprehensive policies and procedures for management
of the network and server rooms - added emphasis to be on
information security and data privacy policies
l R 350 000 R 0 R 0 R 0 R 0 R 350 000
TA-6Review current telephony contracts and ensure fully functional
VOIP services to reduce costs l R 30 000 R 0 R 0 R 0 R 0 R 30 000
TA-7Perform a comprehensive cost/ benefit analysis of internal
provision versus cloud services l R 0 R 0 R 0 R 0 R 0 R 0
TA-8Plan, design and implement a fibre-optic intra-campus ring-feed
WAN solutionl R 750 000 R 0 R 0 R 0 R 0 R 750 000
TA-9Regularly analyse internet util isation and upgrade to meet the
demand l R 0 R 0 R 0 R 0 R 0 R 0
TA-10Perform risk anlaysis and establish back-up internet connectivity
if deemed essential l R 0 R 0 R 0 R 0 R 0 R 0
TA-11 Establish secure remote access capabilities l R 150 000 R 0 R 0 R 0 R 0 R 150 000
TA-12 Provide reliable user wireless connectivity on main building l R 200 000 R 0 R 0 R 0 R 0 R 200 000
TOTAL R 1 730 000 R 150 000 R 0 R 0 R 0 R 1 880 000

Page 198 of 415
The role of the CFO is to assist the accounting officer with budget preparation and budget
implementation amongst other financial management duties in terms of section 81 (1) of the
MFMA
5.1 Community Services
The Community Services Department plays a key role in the delivery of a broad spectrum of Social Services to the
Nyandeni Local Municipality. Some of the core functions of this Department include the following:
a) Safety and Security;
b) Parks and public spaces
c) Cleansing;
d) Refusal Removal and Solid Waste Disposal;
e) Early Childhood Development
f) Traffic and Parking; and
The organizational structure is aligned to support the effective delivery of the mandate in terms of the Integrated
Development Plan. Additional project, programme and technical skills are required if Nyandeni Local Municipality is to
add to the quality and service levels offered to the community.
5.1 Infrastructure Development
Infrastructure Department is the foundation upon which the infrastructure of the entire Nyandeni Local Municipality is
sustained and managed. It is responsible for the key areas as follows:
a) Built Infrastructure provision and maintenance
b) Engineering services
c) Electricity;(maintenance of street lights, high mast provision and electrification of households)
d) Roads and transport services (motorized and non- motorized transport)
e) Public Amenities;
f) Storm water management
g) Transport Planning
h) Construction and project management
Institutional and Social Development
In line with norms and standards the municipality has established the Institutional and Social Development Office and
appointed ISD Officer. The purpose of the Unit is to conduct social facilitation and public participation before the
commencement of the projects. The aim is to mitigate potential community protests and misunderstanding that could
impact the projects negatively.

Page 199 of 415
KPA 5: GOOD GOVERNANCE AND PUBLIC PARTICIPATION
Council has resolved to develop a Good Governance Framework that encapsulate the following governance issues
Synergy and alignment in the manner that the municipality executes its Constitutional obligations;
Decision making that is not only consistent with statutory and policy requirements, but also upholds
Constitutional principles and the values of the Nyandeni Local Municipality,
Accordingly, the objectives of the framework will be to
to outline the processes to be followed in decision making;
to document roles and responsibilities of political and administrative structures, the relationships within these
structures, office bearers, managers and officials; and
to outline the authority of office bearers and managers.
Key principle of good governance is the establishment of ethical leadership within the institution by doing the following
The need to clearly define the roles and responsibilities of leadership and individual leaders in the organization
The embedding within the leadership of an ethical culture based on the vision and values of the institution and
the Constitutional principles
The King III report defines good governance as follows:
“Good corporate governance is essentially about effective, responsible leadership. Responsible leadership is
characterised by the ethical values of responsibility, accountability, fairness and transparency”.
Council ascribes to the following principles of Good Governance
Principles Detail
Openness and Transparency Decision should be taken and enforced in accordance with
legislation and law
There should be access to information by public
Rule of Law Council should abide by the rule of law
Innovation and openness to change Council should embrace new and efficient solutions
Ethical Conduct Public good to be placed before individual interest
There should be effective measures to combat corruption
Competency and capacity Competency of those who delivery governance to be continuously
strengthen to improve output
Sustainability and long term orientation Needs of future generations have to be considered in policies
Sound financial management Prudence to observed in financial management
Planning and Budgeting to done in consultation with citizens
Risk to be properly estimated and managed
Charges should not exceed to cost of services
Accountability Decision makers must take responsibility for their decisions
There should be effective remedies for maladministration, including
consequence management
5.1 Political governance
Nyandeni Local Municipality is a Collective Executive System combined with a ward participatory system and
has Eight Standing Committees which are chaired by Political Heads. The Political and administrative seat is
situated in Libode
Council meetings are opened to the public
Ordinary Council meetings are convened as per the Council Adopted Calendar. In terms of the Good
Governance Framework Council Speaker.
Special Council meetings are convened only when important issues arise that requires urgent and immediate
attention
Council has 32 wards as per the demarcation.

Page 200 of 415
Governance Structures
Structure Function
Council Pass policies, Annual budget, IDP and tariffs
Executive Committee
To identify the needs of the community
Review and evaluate those needs in order of priority
Recommend to the municipal council strategies, programmes and services to
address priority needs
Recommend or determine best methods, including partnership and other
approaches to deliver those strategies, programmes and services
Standing Committees
Defined in terms of section. 80 of the Structures Act as Committees to assist
Executive Committee or Executive Mayor
Municipal Public Accounts
Committee
Appointed in terms of section. 79 of the Municipal Structures Act:
section.79 (1) A Council may establish one or more committees necessary
for the effective and efficient performance of any of its functions or the
exercise of any of its powers.
To consider and evaluate the content of the annual report and to make
recommendations to Council when adopting an oversight report on annual
report
To examine the financial statements and audit report of the municipality
To promote good governance, transparency and accountability on the use
of municipal resources
To perform any other functions assigned to it through a resolution of
council within its area of responsibility
Audit Committee It is appointed in terms of section 166 of the MFMA

Page 201 of 415
Political Parties and traditional leaders represented in Council
Party Total Seats Ward Seats PR Seats
African National
Congress 54 32 22
UDM 3 - 4
DA 3 3
EFF 3 3
Traditional leaders 13 -
-
Total 76 31 30
COUNCIL STANDING COMMITTEES
Structure
Delegated Function
Executive Committee
Member Responsible
Corporate Services Standing Committee
Human Resource Development
Administration
Health and Wellness
Maintenance of municipal buildings
Information Technology and Communication
Cllr. T Mathika
Budget and Treasury Standing Committee
Income and Expenditure
Supply Chain Management
Assets and Fleet Management
Financial viability and Management
Cllr. Z Mevana
Human Settlement , Spatial development
and Disaster management
Spatial Planning
Land Use Management
Human Settlement
Fire Fighting
Natural Disasters
Provision of Responsive Material
Cllr. P Godongwana
Infrastructure development Services
Construction of access roads
Maintenance of access roads
Electricity
Cllr. Z Nondlevu
Local economy and Rural development
LED and Tourism
SMME and Cooperative
Agriculture and forestry
Cllr. N Thiyeka
Special programmes and Social Servicecs,
Sports, Arts and Culture
Special Programmes
Sports and Recreation
Adult programmes
Youth programmes
Children’s programmes
Women programmes
Sports
Arts and Culture
Cllr Zondani

Page 202 of 415
Structure
Delegated Function
Executive Committee
Member Responsible
HIV/AIDS
Free Basic Services
Community Services
Waste management
Social programmes (SASSA, DOSD, DOH,
any government Department charged with
basic services delivery)
Public Amenities (libraries, cemeteries,
pounds)
Early childhood Development
Cllr W Ngaveli
Planning, IGR and Research
PLANNING
Research
IGR
Cllr Diniso
5.1.2 Municipal Public Accounts Committee
a. Municipal Public Accounts Committee was established in terms of section 79 of the Local Government:
Municipal Structures Act, its main purpose is to perform and exercise oversight over the executive
functionaries of council and to ensure good governance in the municipality
b. Council has determined functions of the committee and agreed on the terms of reference
c. The Position of MPAC Chairperson has been designated a fulltime position and comprised of 8
members including opposition parties
Functions of MPAC
a. To consider and evaluate the content of the annual report and to make recommendations to Council
when adopting an oversight report on annual report, Mid-year performance assessment report and IDP
Process Planning
b. To examine the financial statements and audit report of the municipality
c. To promote good governance, transparency and accountability on the use of municipal resources
d. To perform any other functions assigned to it through a resolution of council within its area of
responsibility

Page 203 of 415
5.1.3 Participation of Traditional Leaders in Council
The MEC for Local Government and Traditional Affairs gazzetted the Guidelines/Framework for participation of
Traditional Leaders in Municipal Councils and the names of the identified Traditional Leaders per Provincial Notice no
42 published in the Provincial Gazette No. 2646 dated 19 October 2011
In fulfillment with the provisions of the above gazette, on 18 November 2011 Council Special Meeting was convened
wherein twelve traditional leaders were sworn in. Inter alia, Status of their participation in council is fully expressed in
section 7 of the gazette no.2646
To this far, Traditional Leaders have been trained in Basic Computer Skills, Municipal Governance and Legislation.
Traditional Leaders are playing a meaningful role in promoting social cohesion and rural development through practical
community programmes such as cultural festivals and education awareness
Management Structures
The Accounting Officer has establish the following management structures
Management Committee (MANCO)
ICT Governance Committee
Risk Management Committee
Local Labour Forum
Occupational Health and Safety Committee
5.2 Community and Public Participation
THE VOICE OF PEOPLE IN NYANDENI
This section records the voice of people in Nyandeni in terms of:
the difficulties that the local municipality is facing presently;
the extent to which the municipality is trying to resolve the problem;
how people in the municipality rate the services that they receive; and the importance
of services provided by the municipality.
A question was introduced in the Community Survey 2016 that asked households what they
considered to be the main problem or difficulty they were facing in their municipality presently.
In addition to collecting data about the actual services and the quality of services that
households have access to, asking households what they perceive as their main challenge or

Page 204 of 415
difficulty provides policymakers and planners with key data on how households understand or
feel about their environment and the services in their municipality.
As can be seen, perceived challenges in municipalities differ vastly by municipalities and the
analysis of these challenges is key to understanding and delivering services accordingly
in the respective

Page 205 of 415
province and municipalities (People’s views on how municipalities are trying to resolve the
problem are provided in Annexures 6 and 7).
5.2 Difficulties facing the municipality presently and the extent to which the municipality is trying to resolve the problem
According to the community survey conducted by Stats SA (2016), the top five challenges (in
Table 20) that Nyandeni municipality is facing presently are as follows:
Lack of safe and reliable water supply (47% of the population)
Inadequate housing (17% of the population)
Lack of employment opportunity (10% of the population)
Inadequate road (8% of the population)
Lack of reliable electricity supply (5% of the population)
In O.R. Tambo district, people’s views about the top five challenges facing the District were as
follows:
Lack of safe and reliable water supply (44% of the population)
Inadequate housing (17% of the population)
Lack of employment opportunity (9% of the population)
Inadequate road (9% of the population)
Lack of reliable electricity supply (8% of the population)
Access to save and reliable water supply is perceived by almost half of the population as the
main challenge currently facing the district. This challenge should reflect in the IDP of the district
(and of Nyandeni local municipality) as top priority, or else, it will be an indication that the
municipality is targeting wrong challenges.

Page 206 of 415
Difficulties facing the municipality presently
O.R.Tambo Ngquza Hill Port St
Johns Nyandeni Mhlontlo KSD
Lack of safe and reliable w ater supply 646 872 158 937 84 339 146 693 94 476 162 427
Cost of w ater 62 652 15 219 7 070 13 885 7 927 18 551
Lack of reliable electricity supply 111 097 9 633 12 619 15 687 9 641 63 517
Cost of electricity 28 277 1 460 3 013 4 410 1 458 17 935
Inadequate sanitation/sew erage/toilet services 19 681 1 921 5 515 2 273 3 412 6 560
Inadequate refuse/w aste removal 3 189 462 89 444 498 1 696
Inadequate housing 236 342 65 793 24 015 51 121 16 707 78 706
Inadequate roads 127 855 22 704 13 748 23 144 26 518 41 742
Inadequate street lights 5 620 322 59 631 240 4 368
Lack of/inadequate employment opportunities 130 956 21 043 11 797 31 510 17 536 49 069
Lack of/inadequate educational facilities 4 495 650 397 598 948 1 903
Violence and crime 22 707 1 303 1 461 3 335 3 830 12 779
Drug abuse 10 091 119 692 3 277 1 870 4 133
Alcohol abuse 5 233 298 644 1 246 704 2 341
Gangsterism 782 252 75 107 41 306
Lack of/inadequate parks and recreational area 873 137 38 318 25 355
Lack of/inadequate healthcare services 10 915 968 552 1 554 752 7 089
Lack of/inadequate public transport 4 958 1 198 332 1 438 456 1 533
Corruption 9 529 563 83 1 105 247 7 531
Other 7 133 102 20 3 761 689 2 560
None 7 869 293 220 3 165 1 033 3 158
Unspecified 258 - - - 168 89
Grand Total 1 457 384 303 379 166 779 309 702 189 176 488 349
O.R.Tambo Ngquza Hill Port St
Johns Nyandeni Mhlontlo KSD
Lack of safe and reliable w ater supply 44.4% 52.4% 50.6% 47.4% 49.9% 33.3%
Cost of w ater 4.3% 5.0% 4.2% 4.5% 4.2% 3.8%
Lack of reliable electricity supply 7.6% 3.2% 7.6% 5.1% 5.1% 13.0%
Cost of electricity 1.9% 0.5% 1.8% 1.4% 0.8% 3.7%
Inadequate sanitation/sew erage/toilet services 1.4% 0.6% 3.3% 0.7% 1.8% 1.3%
Inadequate refuse/w aste removal 0.2% 0.2% 0.1% 0.1% 0.3% 0.3%
Inadequate housing 16.2% 21.7% 14.4% 16.5% 8.8% 16.1%
Inadequate roads 8.8% 7.5% 8.2% 7.5% 14.0% 8.5%
Inadequate street lights 0.4% 0.1% 0.0% 0.2% 0.1% 0.9%
Lack of/inadequate employment opportunities 9.0% 6.9% 7.1% 10.2% 9.3% 10.0%
Lack of/inadequate educational facilities 0.3% 0.2% 0.2% 0.2% 0.5% 0.4%
Violence and crime 1.6% 0.4% 0.9% 1.1% 2.0% 2.6%
Drug abuse 0.7% 0.0% 0.4% 1.1% 1.0% 0.8%
Alcohol abuse 0.4% 0.1% 0.4% 0.4% 0.4% 0.5%
Gangsterism 0.1% 0.1% 0.0% 0.0% 0.0% 0.1%
Lack of/inadequate parks and recreational area 0.1% 0.0% 0.0% 0.1% 0.0% 0.1%
Lack of/inadequate healthcare services 0.7% 0.3% 0.3% 0.5% 0.4% 1.5%
Lack of/inadequate public transport 0.3% 0.4% 0.2% 0.5% 0.2% 0.3%
Corruption 0.7% 0.2% 0.0% 0.4% 0.1% 1.5%
Other 0.5% 0.0% 0.0% 1.2% 0.4% 0.5%
None 0.5% 0.1% 0.1% 1.0% 0.5% 0.6%
Unspecified 0.0% - - - 0.1% 0.0%
Grand Total 100% 100% 100% 100% 100% 100%
Source: Statistics South Africa (2016 Community Survey)

Page 207 of 415
The extent to which local municipalities are trying to resolve problem faced by people in
the municipality
Strongly
disagree
Disagree
Neither
agree or
disagree
Agree
Strongly
agree
Not
applicable
Unspecified
Total
O.R.Tambo 734 366 395 685 113 792 157 454 39 593 7 869 8 626 1 457 384
Ngquza Hill 179 326 75 165 24 847 22 538 992 293 218 303 379
Port St Johns 95 012 40 329 11 426 14 998 4 773 220 20 166 779
Nyandeni 139 116 99 071 24 767 36 373 2 978 3 165 4 232 309 702
Mhlontlo 80 303 58 363 13 604 33 241 1 919 1 033 712 189 176
KSD 240 609 122 757 39 148 50 303 28 931 3 158 3 443 488 349
%
O.R.Tambo 50% 27% 8% 11% 3% 1% 1% 100%
Ngquza Hill 59% 25% 8% 7% 0% 0% 0% 100%
Port St Johns 57% 24% 7% 9% 3% 0% 0% 100%
Nyandeni 45% 32% 8% 12% 1% 1% 1% 100%
Mhlontlo 42% 31% 7% 18% 1% 1% 0% 100%
KSD 49% 25% 8% 10% 6% 1% 1% 100%
Source: Statistics South Africa (2016 Community Survey)
People response to the extent to which Nyandeni is trying to resolve the problems faced by
the municipality is as follows:
45% of the population in Nyandeni strongly disagree that the municipality is
trying to resolve the problem;
Another 32% of the population in Nyandeni disagree that the municipality
is trying to resolve the problem;
Only 12% of the population in Nyandeni are in agreement that the municipality is
trying to resolve the problem;
There is a small portion of the population (8%) that are neutral: they neither
agree nor disagree; and
Only 1% of the population in Nyandeni strongly agree that the municipality is
trying to resolve the current problems.
Annexures 6 and 7 provide the responses for other local municipalities in the province.

Page 208 of 415
5.3 Rating the overall quality of services provided by the local municipality
Table 22 shows that of the 309 702 people living in Nyandeni, more than half (53%) are of
the opinion that the quality of public clinic is good while 14% thing that the quality of public
clinic is poor.
Rating the overall quality of services provided by Nyandeni local
municipality, 2016
Good Average Poor No access Do not use Unspecified Total
Quality of public clinic 164333 69454 42518 31913 975 508 309702
Quality of electricity supply services 186367 64863 29804 22617 5550 500 309702
Quality of the local public hospital 156170 73039 48875 27681 3124 813 309702
Quality of the local police services 120943 77720 77529 26572 5891 1046 309702
Quality of refuse removal services 28569 68276 68878 137063 6529 386 309702
Quality of toilet/sanitation services 154287 81230 60653 11337 1449 746 309702
Quality of the local public school 207751 60975 34124 3011 2719 1122 309702
Quality of RDP or gvt subsidised dw elling 6642 3163 2880 17 296999 - 309702
Good Average Poor No access Do not use Unspecified Total
Quality of public clinic 53% 22% 14% 10% 0% 0% 100%
Quality of electricity supply services 60% 21% 10% 7% 2% 0% 100%
Quality of the local public hospital 50% 24% 16% 9% 1% 0% 100%
Quality of the local police services 39% 25% 25% 9% 2% 0% 100%
Quality of refuse removal services 9% 22% 22% 44% 2% 0% 100%
Quality of toilet/sanitation services 50% 26% 20% 4% 0% 0% 100%
Quality of the local public school 67% 20% 11% 1% 1% 0% 100%
Quality of RDP or gvt subsidised dw elling 2% 1% 1% 0% 96% - 100%
Source: Statistics South Africa (2016 Community Survey)
5.4 How importance are the services?
It was indicated in the demographic section that over 80% of the population in Nyandeni is below
the age of 35 years. Table 23 shows how education is viewed by 76% of the population as a
“very important” instrument to improve the standard of living. There were 725 people in
Nyandeni who said education is not important at all. Their honesty is also appreciated.

Page 209 of 415
How people in Nyandeni view the importance of services received from the
municipality
Very
important Important
Not important
at all Unspecified Total
Importance of ow nership of household assets to improve the standard of living for the household 220 991 86 639 715 1 357 309 702
Importance of education to improve the standard of living for the household 235 509 72 506 725 963 309 702
Importance of employment to improve the standard of living for the household 224 597 80 783 3 109 1 213 309 702
Importance of health to improve the standard of living for the household 227 839 80 234 1 326 302 309 702
Importance of living conditions to improve the standard of living for the household 227 646 80 227 1 490 339 309 702
Importance of safety and security to improve the standard of living for the household 217 239 85 484 6 423 555 309 702
Very
important Important
Not important
at all Unspecified Total
Importance of ow nership of household assets to improve the standard of living for the household 71.4% 28.0% 0.2% 0.4% 100%
Importance of education to improve the standard of living for the household 76.0% 23.4% 0.2% 0.3% 100%
Importance of employment to improve the standard of living for the household 72.5% 26.1% 1.0% 0.4% 100%
Importance of health to improve the standard of living for the household 73.6% 25.9% 0.4% 0.1% 100%
Importance of living conditions to improve the standard of living for the household 73.5% 25.9% 0.5% 0.1% 100%
Importance of safety and security to improve the standard of living for the household 70.1% 27.6% 2.1% 0.2% 100%
Source: Statistics South Africa (2016 Community Survey) Table 23
5.5 Conclusion
An attempt was made to record the voice of people in Nyandeni. Four issues were raised:
Firstly, the difficulties that the local municipality is facing presently. Access to save and
reliable water supply was perceived by almost half of the population as the main
challenge currently facing the district.
Secondly, the extent to which the municipality is trying to resolve the problem. 45% of
the population in Nyandeni strongly disagree that the municipality is trying to resolve the
problem
Thirdly, how people in the municipality rate the services that they receive. More than half
(53%) of the population in Nyandeni are of the opinion that the quality of public clinic is
good.
Lastly, 76% of people in Nyandeni said that education is a very important instrument to
uplift the living standard of people.

Page 210 of 415
In deepening democracy at local level, Citizen Participation and empowerment is at the centre of the government
strategy, to this extend. More than 1 million has been allocated for undertaking public participatin programmes
in all wards, civil society education programmes will be conducted quarterly covering the following topics, roles
and responsibilities of citizens in a developmental state, public accountability by politicians and officials and
Municipal Finance Management.
5.2.1 Public Participation Plan and Policy
Public Participation Plan and Policy has been reviewed and adopted by Council on 27 June 2019 and it is a five
plan. The Public Participation Plan encapsulates the following key issues
Procedures, systems, process, structures in the public participation process
Public Participation methods and mechanisms
The public participation mechanism includes the following
In the previous financial year the municipality noted the increase in service delivery protests and
Mayoral Imbizos, these are mayoral public participation meetings conducted by the Executive Committee to
provide feedback on municipal performance assessment. For this review, the first Imbizo was conducted on 13-
14 November 2019 to solicit community inputs on the 2020/21 IDP. The Community and Stakeholder inputs
have been taken into account and incorporated into the Three Year Capital Plan
IDP and Budget Public Hearings will be conducted in April 2020
5.2.2. Ward Committee System
32 Ward Committees (each comprising of 10 members) have been established in terms of section 73 of the
Local Government: Municipal Structures Act. Ward Committees have participated in the IDP development
process and preparation of the annual budget for 2017-2022. In this regard, ward priorities have been considered
and incorporated into the five year Integrated Development Plan
Ward Councilors is functional, it is serves as a network to share information, resolve common service delivery
challenges, serves as performance monitoring and evaluation platform.
Challenges
Process Owner Constraint level
(Input/ Process/
Output)
Constaint Category (Strategy/ Structure/
Process/ System/
Resources)
Priority (Low/ Medium/ High)
Impact (Low/ Medium/ High)
1SM -
OperationsProcess Strategy High High
2SM -
OperationsProcess System High High
3SM -
OperationsProcess System High High
4SM -
OperationsOutput System High High
5SM -
Operations
Input and
Output Strategy High High
6SM -
OperationsOutput System High High
7SM -
OperationsOutput
Strategy and
System High High
8SM -
OperationsOutput
Strategy and
System High High
Inadequate and infrequent communication tools to communicate
directly with customers
Current constraints (pain points)
FUNCTIONAL AREA: Public Participation
Community feedback is sourced from reactive methods such
petitions
Poor analysis of information from petitions, village and ward
committee meetings etc
Over reliance on Ward committees to communitate with customers
No real time information to update communities on project
implementation
Inconsistent reviw of municipal programmes - (Customer Perception
surveys not done consistently)
No mechanisms to review and ascertain that council resolutions are
communicated to communities
Poor tracking of complaints received

Page 211 of 415
Reports from ward committees does not reflect problematic areas at ward level so that the municipality
is able to intervene, as a consequence the municipality has been experiencing sporadic service delivery
protests
Community satisfaction surveys not conducted regularly to ascertain the level of satisfaction or
dissatisfaction thereof
SUPPORT FOR WARD COMMITTEES FUNCTIONING
Allocated cell phones to all Ward Committee Members
R 1500 stipend paid monthly to 32 Ward Administrators
R 1500 stipend paid monthly to 320 ward committee members (proposed )
The municipality is further responsible for Ward Committee transport cost
The municipality is further assisting Ward Committees with wards office management
All ward committees have been trained on ward governance
FUNCTIONALITY OF WARD COMMITTEES
Ward Committee Meetings are convened monthly to consider community issues. Village meetings guided by
Back to Basics priority prorammes. Ward General Meetings are convened quarterly.
Services delivery issues arising from the above mentioned meetings are then escalated to Council through
various Council Committees for consideration and resolutions
As part of the Municipal Support program, the ORTAMBO District municipality has supported Nyandeni
municipality with the training of ward commitees in the area of report writing and governance.
WARD BASED PLANS
The Ward based plans were developed in all 32 Wards in the Nyandeni Municipal jurisdiction. Prioritiy
programmes have been included in the IDP and It will be implemented at scale and pace taking into account
affordability and cost. However, it should be indicated that due to change in circumstances these Ward Based
Plan should be reviewed
IMPLEMENTATION OF THE INTEGRATED SERVICE DELIVERY MODEL
War Rooms have been established in all 32 wards. The ORTAMBO Municipality is currently exploring ways to
strengthen and support the Integrated Service Delivery Model. However, operational weaknesses have identified
will clear strategies developed to address weaknesses
Stakeholder mobilization and engagments
The municipality has developed a stakeholder register, this is to ensure sure that stakeholders actively participate
in areas of interest and where they could make meaningful contribution. To this end, Office of the Mayor has
developed a program with includes meetings with Rate Payers, Organised Labour, youth organisations, business
sector. Annually, a Stakeholder Indaba is convened to discuss various developmental programmes such as the
economy and job creation
5.2.3 Community Development Workers
Community Development workers performance monitoring

Page 212 of 415
The municipality has 29 CDW’s coordinated by CDW Coordinator. Monthly reports are submitted to the CDW
Coordinator, who then compile a consolidated monthly report for submission to the municipality and the
Department of Local Government and Traditional Affairs (DLGTA).
Reported cases are registered in the case register and referred to the relevant department. When a case has
been resolved and concluded, a complainant is being informed about the resolution of that specific case.
Quarterly performance reviews are conduced through a round table excersise
Achievements
A memorandum of understanding has been signed with the Department of Local Government and Traditional
Affairs to strengthen working relations and to ensure effective inter-governmental planning and delivery
coordination and to improve the quality of democratic participation in decision making processes. CDW are part
of the Ward Based War Rooms Committees
Interventions
Nyandeni municipal leadership has committed to promoting sound and good governance culture within the
organisation. The main focus areas identified for good governance interventions in this term includes but not
limited
Training of new ward committees to improve their effectiveness in advancing goals of public
participation
Implementation of the Masiphathisane Integrated Service Delivery Model In all 32 wards
Provision of dedicated administrative support to CDWs and councillors to aid their role as link between
council and communities
Establishment of sound mechanisms and systems to discourage corruption and ensure functional
internal audit
Continuous engagement with sector departments to improve intergovernmental relations and especially
their participation in the implementation of this IDP
Mobilization and coordination of existing resource capacity to enhance our scale of service delivery and
economic growth through such initiatives as establishment of PPPs and participation in district wide
initiatives including the realisation of commitments made at the recent Economic Growth Summit held
by ORTDM and the recent Investment Conference
DEVELOPMENT FORUMS TO SUPPORT PUBLIC PARTICIPATION EFFORT
The following forums have been incporporated into the IGR Cluster system
FORUM RESPONSIBLE KPA
Roads forum Basic Service Delivery
Community Safety and Transport Basic Service Delivery
LED Forum LED
Housing Forum Basic Service Delivery
HIV/Aids/Forum Good Governance
Municipal Coastal Committee LED
5.2.4 INTERGOVERNMENTAL RELATIONS
ADOPTION OF NYANDENI IGR FORUM TERMS OF REFERENCE
Terms of Reference have been adopted and serve as the guidelines in managing IGR Forum affairs. Technical
IGR Forum is in place, its main mandate is to prepare and make recommendations to Political IGR Forum which
is chaired by the Mayor or a delegated person.
NYANDENI IGR CLUSTER ESTABLISHMENT

Page 213 of 415
In accordance with the Eastern Cape Provincial guidelines the following clusters have to be established to co-
ordinate and facilitate development in the Nyandeni Municipal Area
Cluster KPA Key Departments
Governance and
Administration
l Municipal Transformation and
Organizational Development
l Integrated Development
Planning
l Municipal Finance Viability and
Management
l Good Governance and Public
Participation
l Basic Service Delivery
l Performance Management
System
Nyandeni Local Municipality
Department of Local
Government & Traditional
Affairs
Provincial Treasury and
Planning
Office of the Premier
OR Tambo DM
ECSECC
SALGA
Social Transformaton
Cluster
Comprehensive Health Care
Education
Special Programmes
Social Safety Net
Safety and Security
Victim Empowerment
Food Security and Nutrition
Sport and Recreation
l Nyandeni Local Municipality
l Department of Social
Development
l Department of Health
l Department of Home Affairs
l Department of Sports,
Recreation, Arts & Culture
l SASSA
Economic Growth and
Infrastructure Cluster
Local Economic Development
Roads Infrastructure
Second Economy Interventions
Water Resource Management
Electricity
Environmental Management
l Nyandeni Local Municipality
l DEDEA
l Department of Environmental
Affairs
l Department of Agriculture
l Department of Roads and
Transport
l Department of Water Affair
l Department of Water Affairs
and Forestry
l Eskom
l Telkom
l Department of Energy
Theses clusters are also indicative of the core organizational competencies required to support the attainment
of the Integrated Development Plan. Our Integrated Development Plan matches our resources and capabilities
in order to deliver on our mandate.
Challenges
Reduced budget allocation for 2020/2021 particularly on energy provision, human settlement
Non alignment of programs with Government Medium Term Strategic Framework, State of the Province
Address
Information provided is not always adequate to help strategic decision making in unlocking and
accelerating service delivery, this can be attributed to the lack of training on IGR
Fragmented approach in coordination of programmes
Sub-forum are convened but does not systematically feed into the IGR
5.2.5 COMPLAINTS AND PETITION MANAGEMENT SYSTEM

Page 214 of 415
The municipality has established a complaints and petition management Fsystem that clarifies a business
process from receiving complains until it is resolved and closed. These petitions and complains are processed
through various council committeees including Public Participaton and Petitions Committee, Executive
Committee and Council.
The ORTAMBO District Municipaltiy through its IGR and Municipal Support Directorate is supporting the
municipality in resolving some of the complaints particularly on health. water and sanitation. To this end a petition
register has been developed and is updated regularly.
As part of building smart rural municipality and emabracing technology the municipality has developed ICT
Enterprise Architector which identifies amongst other things ICT requirements including a solution to managemet
petitions
Institutional arrangement
The Presidential Hotline and Complains Management System are housed in the Office of the Municipal Manager
of which the Council Speaker is the political champion. 2 users have been trained and are responsible for day to
day capturing and management of complaints and petitions.
5.2.6 SUPPORT TO SPECIAL PROGRAMMES
5.2.6.1 The Special Programmes Unit
The Special Programmes Unit is located in the Office of the Mayor and is currently has a compliment of 3 staff
members and is headed by Senior Manager at the level of Section 57 Manager. The Unit is responsible for policy
formulation and coordination
In the main the unit is responsible for mainstreaming of programmes for designated groups, coordination and
mobilisation of various sectors, monitoring and evaluation and capacity building
5.2.6.2 Liaison and Networking
In this review we express the commitment to strengthen relations with stakeholders and facilitate cooperation.
Achievement
Ward Based structures for youth, disable and women’s structures have been established
Women Caucus Established and conferred MSA section 79 Status inter alia, the Committee
Chairperson was elected by Council on 29 May 2014
Special Programmes includes HIV and Aids, Children, Youth, Women, Physically challenged and Military
Veterans Association.
Key programmes includes
Hosting of Annual Mayoral Tournament
Observing Annual Youth Month Programmes, including Solomon Mahlangu Lecture
Observing of National calendar days
Support to HIV and Aids related programmes
Mainstreaming Local Economic Development programmes
Hosting of Annual Miss Nyandeni to promote youth talent
Support to vulnerable youth in school as well campaign against drug abuse

Page 215 of 415
5.2.7 SOCIAL COHESION
The hosting of Annual Mayoral Tournament wherein 32 wards are participating facilitates Ubuntu and coming
together of various villages. Young people are kept busy and thus have less time to embark on distractive
activities.
Annually the Municipality in partnership with business community, hosts Human Right Road Race (marathon) to
mark Human Rights Day. These programs enjoy the interest and participation of citizens across social and class
spectrum with an ultimately view of promoting nation building. Furhermore the following programmes are hosted
Annual Rugby tournament
Inciyo traditional event
5.2.8 INTER MUNICIPAL RELATIONS
Firstly, Nyandeni local Municipality views Inter-Municipal Relations as a strategic approach in accelerating
service delivery, building capacity and improving municipal planning. Nyandeni Local Municipality has
established inter Municipal Relations with King Sabata Dalinyebo municipality in the areas of Waste
Management, Public Transport and Safety, Spatial Planning and Land Use Management. KSD is assisting
Nyandeni in the collection of refuse along N2 Road.
Furthermore, the municipality is currently engaging PSJ Municipality with the view to collaborate in the area of
Tourism and Coastal management. The Ocean Economy agenda demands that collaboration efforts are
strengthened.
5.2.8 COMMUNICATIONS
The Municipality has a functional Communications Unit headed by Manager Communications, supported by
Communications Officer and a Clerk. A Communication Forum is functional , amongst other things, it is charged
with the responsibility to produce a quarterly news magazine, branding and marketing, Conduct Community
Education awareness campaign in all wards to essentially educate people about the concept of a ‘developmental
local government”, roles and responsibilities of citizenry in the affairs of local government
Communication Strategy has been adopted
Communication Policy has been reviewed and approved by Council on 27 June 2019
5.2.9 MUNICIPAL BYLAWS
The various municipal By-Laws have been adopted by Councol and accordingly Gazetted in the Eastern Cape
Provincial Gazette Date 24 June 2019 Gazette No. 4259 to regulate relations between and the broader
community
By laws By- law for the Hire and use of community,
arts and cultural facilities
Refuse removal bylaw
Waste Management By-law
Public health
Street Trading By-law
Public Space By-law
Parking Ground By-law
Encroachment on property bylaw
Funeral undertakers by-law
Library and Information services by-law
Credit Control and debt collection by Law
Advertising signs
Credit management By -Law
24 June 2019

Page 216 of 415
Cemetery bylaw
Bylaw relating to nuisances
Public road and misilelaneous
Pound Management Bylaw
Liqor trading hours by-law
Undeveloped sites by- law
Enchroachment on property by-law
Public eetings and gatherings by –law
Property rates by- law
5.3 Municipal Audit
The Accounting officer is responsible for preparation and fair presentation of the financial statements to the
Auditor General in a manner required by the Municipal Finance Management Act, 2003 (Act NO. 56 0f 2003)
In the year ending 30 June 2009 the municipality received a Qualified Opinion with one matter of emphasis.
OPERATION CLEAN AUDIT
2013/2014 2014/2015 2015/2016 2016/2017 2017/2018 2018/19
Unqualified
Audit
Opinion
Unqualified
Audit
Opinion
Unqualified
Audit Opinion
with no matters
Unqualified
Audit Opinion
with matters
Unqualified
Audit Opinion
with matters
Unqualified
Audit Opinion
with matters
AUDIT REPORT OVERVIEW
Predetermine Objectives Audit
The audit report for the year ending 30 June 2018 on Pre-determined objectives the Auditor General did not
raise any material findings on the usefulness and reliability of the reported performance information for audited
development prioirities (a) Basic Service Delivery (b) Local Economic Development
PREPARATION OF THE MUNICIPAL AUDIT FILE
MFMA Circular 50 prescribes that a municipality must before the commencement of the annual audit prepare
and submit municipal audit file to the Office of the Auditor General. In accordance with this specific provision, an
audit municipal file for the year ending 30 June 2020 will be compiled and submitted to the Audit Committee to
ensure completeness and accuracy.
5.3.1 FUNCTIONALITY OF THE AUDIT, RISK AND PERFORMANCE COMMITTEE
Section 166 of the MFMA requires each municipality to have an audit committee. The audit committee is an
independent body which must amongst other things advise the municipal council, the political office-bearers, the
accounting officer and the management staff of the municipality on matters relating to internal financial control
and internal audits, risk management and performance management.
The Audit, Riks and Performance Committee is comprised of the following members and will serve for a period
of three year from the date of appointment
NAME DESIGNATION APPOINTMENT DATE
Mr. G.Labane Member responsible for Internal
Audit and Risk
January 2019
Ms. N. Ntshanga Responsible for Finance
Management
January 2019
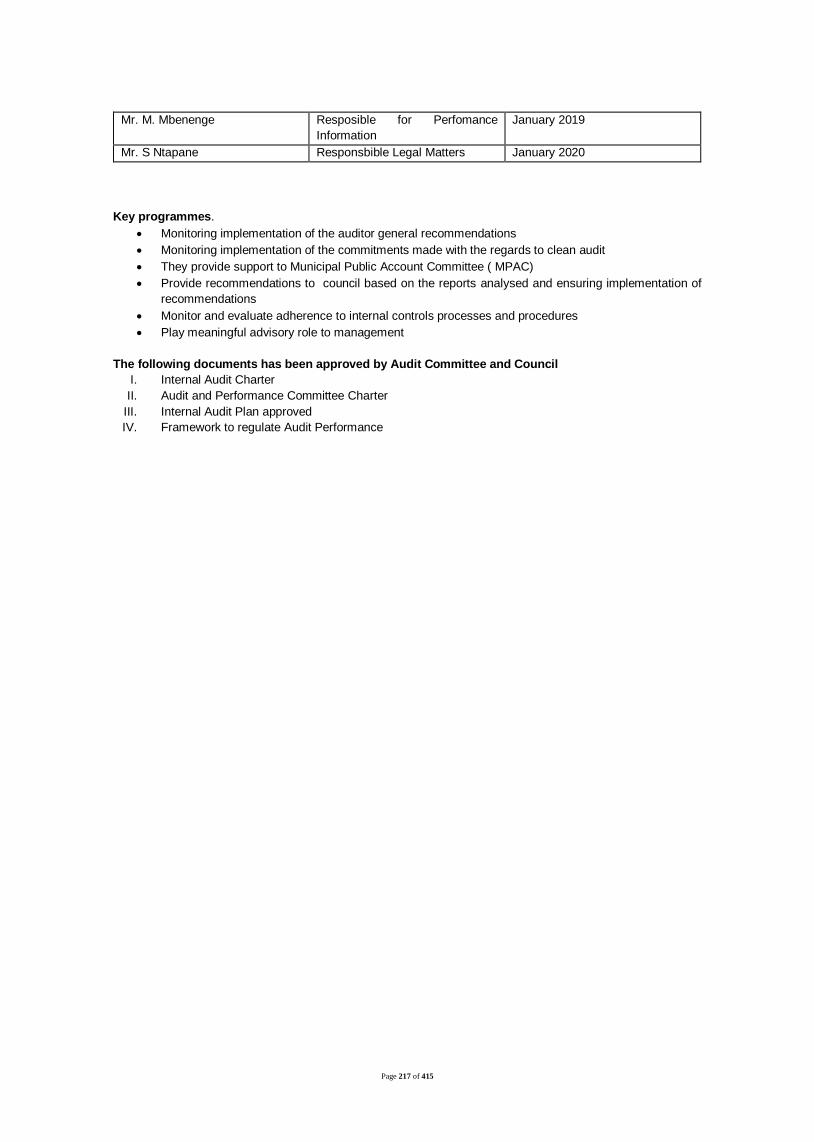
Page 217 of 415
Mr. M. Mbenenge Resposible for Perfomance
Information
January 2019
Mr. S Ntapane Responsbible Legal Matters January 2020
Key programmes.
Monitoring implementation of the auditor general recommendations
Monitoring implementation of the commitments made with the regards to clean audit
They provide support to Municipal Public Account Committee ( MPAC)
Provide recommendations to council based on the reports analysed and ensuring implementation of
recommendations
Monitor and evaluate adherence to internal controls processes and procedures
Play meaningful advisory role to management
The following documents has been approved by Audit Committee and Council
I. Internal Audit Charter
II. Audit and Performance Committee Charter
III. Internal Audit Plan approved
IV. Framework to regulate Audit Performance
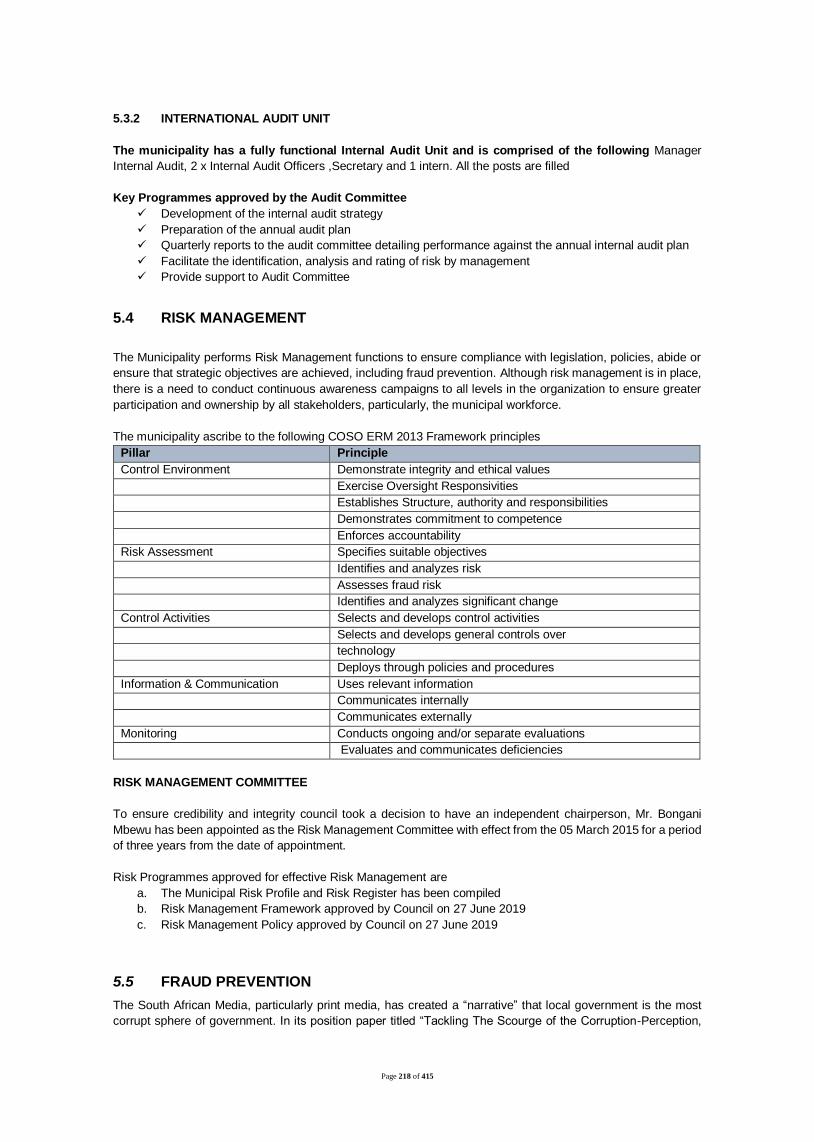
Page 218 of 415
5.3.2 INTERNATIONAL AUDIT UNIT
The municipality has a fully functional Internal Audit Unit and is comprised of the following Manager
Internal Audit, 2 x Internal Audit Officers ,Secretary and 1 intern. All the posts are filled
Key Programmes approved by the Audit Committee
Development of the internal audit strategy
Preparation of the annual audit plan
Quarterly reports to the audit committee detailing performance against the annual internal audit plan
Facilitate the identification, analysis and rating of risk by management
Provide support to Audit Committee
5.4 RISK MANAGEMENT
The Municipality performs Risk Management functions to ensure compliance with legislation, policies, abide or
ensure that strategic objectives are achieved, including fraud prevention. Although risk management is in place,
there is a need to conduct continuous awareness campaigns to all levels in the organization to ensure greater
participation and ownership by all stakeholders, particularly, the municipal workforce.
The municipality ascribe to the following COSO ERM 2013 Framework principles
Pillar Principle
Control Environment Demonstrate integrity and ethical values
Exercise Oversight Responsivities
Establishes Structure, authority and responsibilities
Demonstrates commitment to competence
Enforces accountability
Risk Assessment Specifies suitable objectives
Identifies and analyzes risk
Assesses fraud risk
Identifies and analyzes significant change
Control Activities Selects and develops control activities
Selects and develops general controls over
technology
Deploys through policies and procedures
Information & Communication Uses relevant information
Communicates internally
Communicates externally
Monitoring Conducts ongoing and/or separate evaluations
Evaluates and communicates deficiencies
RISK MANAGEMENT COMMITTEE
To ensure credibility and integrity council took a decision to have an independent chairperson, Mr. Bongani
Mbewu has been appointed as the Risk Management Committee with effect from the 05 March 2015 for a period
of three years from the date of appointment.
Risk Programmes approved for effective Risk Management are
a. The Municipal Risk Profile and Risk Register has been compiled
b. Risk Management Framework approved by Council on 27 June 2019
c. Risk Management Policy approved by Council on 27 June 2019
5.5 FRAUD PREVENTION
The South African Media, particularly print media, has created a “narrative” that local government is the most
corrupt sphere of government. In its position paper titled “Tackling The Scourge of the Corruption-Perception,

Page 219 of 415
Local Government and the People’ on Anti- Corruption South African Local Government Association assert that
“Whatever local government’s protestations of innocence may be, it must learn that as is the case in law, the
perceptions about how it deals with corruption is as important as the reality of measures to combat corruption
within the sector. Intolerance to corruption must not only be a mantra, it must be seen to be done’
Fraud Risk Management Policy, the fraud Risk Management Policy was adopted by council on 27 June 2019
Objectives summarised
The Fraud Risk Management Policy of the NLM supports and fosters a culture of Zero Tolerance
towards fraud and other acts of dishonesty. In addition, all fraud will be investigated and followed up
by the application of all remedies available within the full extent of the law and the implementation of
appropriate prevention and detection controls.
These prevention controls includes the existing financial and other controls and checking
mechanisms as prescribed in the systems, policies, procedures, rules and regulations of the NLM.
The efficient application of the Municipal Management Finance Act (“MFMA”) and instructions
contained in the NLM policies and procedures, circulars and manuals is one of the most important
duties to be applied by every employee in the execution of their daily tasks.
Whistling Blowing Policy
Priority programmes
Conduct fraud awareness campaign both internally and externally
Clarify consequence management process, where there is wrong doing
Develop Fraud Risk Register
5.6 Legal Services and Contract Management
The Municipality has functional legal services unit headed by an admitted attorney which is
responsible for providing legal advice for both political and administrative functionaries, litigation in
general, initiating legal proceeding on behalf of the municipality and defending cases against the
municipality, drafting legal documents and responsible for labour disciplinary matters. The
municipality has an effective legal management system and a litigation register which is audited
annually.
Over the past three years the litigation has significantly been reduced from 15 to 6 outstanding
litigation cases as at 30 May 2019. Consistent with the legislation the litigation register is disclosed
in the Annual Financial Statements
The updated litigations report is submitted to Council on quarterly Basis

Page 220 of 415
Whistle Blowing Policy and its objectives (this policy was approved by council on 27 June 2019
To provide guidance for which whistle blowers may in responsible manner disclosure information
regarding unlawful or irregular conduct by Councilors, Officials of the Municipality and Service Providers
and to provide for the protection of whistle blowers who make a disclosure.
To provides protection of whistle blowers for disclosures made without malice and in good faith, in
defined circumstances in terms of the Protected Disclosure Act, Act 26 of 2000,
To encourage whistle blowers to raise matters of concern responsibly through the procedures laid down
in this policy documents.
To provide for feedback to the whistle blower following a protected disclosure
To present means for redress if a whistle blower is dissatisfied with the response of the Municipality to
a protected disclosure

Page 221 of 415
KPA: FINANCIAL VIABILITY AND MANAGEMENT
Objectives
The objective of the Financial Viability and Management is to secure sound and sustainable management of
the financial affairs of the municipality and to comply with the accounting norms and standards.
National Treasury Municipal revenue budget and expenditure review of 2011 expressly states that “municipal
councils, mayors and municipal managers are responsible for ensuring that available revenues are collected,
that resources are allocated appropriately, and that procurement and service delivery processes are
economical, efficient, effective and equitable”.
6.1 Financial Policies
Adoption process
The following financial policies were reviewed and adopted by Council on 30 May 2019
Sector Plan Detail
IDP and Budget Policy This policy sets out the budgeting principles, which Nyandeni Local
Municipality will follow in preparing each annual budget, as well as the
Integrated Development Planning process through which the municipality
will prepare a strategic development plan, for a five-year period.
Virement Policy This policy aims to provide guidelines to senior management in the use of
virements as a mechanism in their day-to-day management of their budgets
and to allow flexibility in the use of budgeted funds to enable management to
act on occasions such as disasters, unforeseen expenditure or savings, etc.
as they arise to accelerate service delivery in a financially responsible
manner.
Rates Policy To ensure that property rating in Nyandeni Municipality is carried out in a
fair, consistent, considerate and controlled manner, this rate policy is
developed in accordance with the provisions of the Local Government:
Municipal Property Rates Act, (Act 6 of 2004).
Supply Chain
Management Policy
Ensure Supply Chain Management Policy that is fair, equitable,
transparent, competitive and cost effective;
(c) complies with
(I) the Regulations; and
(ii) any minimum norm and standards that may be prescribed in terms of
section 168 of the Act;
(d) is consistent with other applicable legislation;
Fixed Asset Management
Policy
This document is provided to assist management and employees of
Nyandeni Municipality to implement and maintain consistent, effective and
efficient fixed asset management principles.
The objective of this document is aimed at:

Page 222 of 415
Sector Plan Detail
Safeguarding the fixed assets of the Nyandeni Municipality to
ensure effective use of existing resources
Emphasizing a culture of accountability over fixed assets owned
by the Nyandeni Municipality.
Ensuring that effective controls are communicated to
management and staff through clear and comprehensive written
documentation.
Providing a formal set of procedures to ensure that the
Nyandeni Municipality’s fixed asset policies are achieved and
are in compliance with the Municipal Finance Management Act
(MFMA) and National Treasury, GRAP and Accounting
Standards Board directions, instructions, principals and
Guidelines.
Banking and Investment
Policy(cash management)
The policy is aimed at gaining the optimal return on investment, without
incurring undue risks, during those periods when cash revenues are not
needed for capital or operational purposes
Fleet Management Policy To co-ordinate the management of council transport by means of control
measures which are applicable to all political officer bearers, departments,
divisions and sections of the Council’s operation
To prescribe requirements relating to the utilization and maintenance of
such transport by employees and political office bearers
Tariff Policy Guide setting and implementation of tariff
Credit Control and Debt
Collection Policy
Guide credit control implementation in line with the MFMA
Indigent Policy Provision of basis services to communities in a sustainable manner within
the financial and administrative capacity of the Council
To provide guidelines and procedures for the subsidization of basic service
charges to indigent households
Insurance Policy To safeguard municipal assets and minimize risks where the will be a need
of replacement due to natural courses
Nyandeni Rates By Law Gazetted on 24 June 2019 with Government Gazette no, 4259
Credit Control and Debt
Collection By Law
Gazetted on 24 June 2019 with Government Gazette no, 4259
Credit Management By
Law
Gazetted on 24 June 2019 with Government Gazette no, 4259
Coast Containment Policy

6.4. STRATEGY ON REVENUE ENHANCEMENT AND COLLECTION:
The Revenue enhancement strategy was reviewed and adopted by council on 30 May 2019.
The objective of this document is to undertake to address financial and institutional challenges faced by the
municipality. The document focuses in the formulation and implementation of strategies to improve financial
management and controls within the municipality to ensure financial sustainability
In order for the Municipality to develop specific targets and the concomitant strategies to realize them over the life
span of this strategy, it is necessary to take stalk of the current reality that is pertaining in the municipality. To
achieve this, revenue collection data from the financial year 2017/18 was used as a baseline and is presented in
the next session
Finance department
The Finance department is responsible for recording and accounting for all revenue collected or received by the
municipality. This department, however is specifically responsible for the revenue sources as shown in Table A3
below.
Table A3 Revenue collected relating to finance department as at 30 June 2018
Item Amount
Other income 18,719.02
Hall hire 41,565.15
Advertisements 62,527.35
Commission 339,050.77
Tender sales 346,818.44
Property rates 4,604,000.00
Interest on investment 12,519,336.39
Grand Total 17,932,017.12
Weaknesses identified
a) It has been identified that the contracts for billboard advertisements has not been effectively managed to
ensure that the municipality collects maximum possible revenue on advertisements. This is due to the fact
that many contracts were signed long ago and cannot be traced.
b) The municipality has long outstanding debts that are outstanding for a period exceeding 365 days or a
year. Provincial and National public works is leading the pack with larger amounts, however the debt has
reduced drastically over the past 2 years.
c) Incomplete register of indigent customers to enable effective and efficient implementation of the Indigent
Policy of the municipality.

Strategies
i) To contact all companies who have erected the billboards in Libode and Ngqeleni towns and obtain
the Service Level Agreements and review the terms of the contracts to ensure that the rates are
relevant and reasonable.
ii) To engage both Provincial Public Works and National Public Works to resolve the issue of property
ownership to determine which properties are owned by Provincial and which properties are owned by
National. There is currently a few properties that are denied by both departments.
iii) To run a phone call campaign and SMS campaign to remind business and residential debtors to settle
outstanding debts.
iv) To review the Credit Control and Debt collection policy to include a clause of early settlement discount
of 5% to customers settling their total debts outstanding at the end of each financial year.
v) To develop indigent register for rates and refuse customers with households in Libode and Ngqeleni
commonage.
vi) To review the indigent policy of the municipality for effective implementation.
The strategies outlined above will seek to increase the revenue generation from the current state and ensure that
the municipality’s revenue generation is self-sustainable. Table A3.1 below shows the forecast of revenue collection
in the next 3 years after implementation of the strategies above.
Table A3.1 Revenue forecast for the next 3 financial years
Item 2019/2020 2020/2021 2021/2022
Advertisements 66,278.99 150,000.00 159,000.00
Commission 140,000.00 148,400.00 158,788.00
Hall hire 42,000.00 44,520.00 47,636.40
Interest on investment 12,700,000.00 13,335,000.00 14,001,750.00
Tender sales 367,627.55 386,008.92 405,309.37
Property rates 11,500,000.00 12,075,000.00 12,678,750.00
Total 24,815,906.54 26,138,928.92 27,451,233.77
Public safety
Public safety is responsible for the Vehicle Registration Authority, Driving license testing centre and issuing and
administration of traffic fines. Table A4 below shows the total revenue collected for activities in the public safety
department for the year ended 30 June 2018.
Table A4 shows the revenue collected relating to Public Safety.
Item Amount
Traffic fines 125,350.00

RA 435,377.77
DLTC 2,870,737.96
Total 3,431,465.73
Weaknesses identified
a) The classroom capacity for learners licence examination is small therefore the municipality cannot
take big numbers at a time to write learners licence examination, this has got impact to the image of
the testing centre since there is a long waiting list for writing learners licence.
b) The Registration Authority is situated in Ngqeleni only and there is not enough traffic, an additional
terminal is needed in Libode to increase the number of customers utilising the Registration Authority.
c) Traffic officers are not issuing enough fines considering the amount road offences that are committed
in the area.
d) There is no effective process of ensuring that offenders pay for the traffic fines issued.
e) The DLTC is not effectively marketed to ensure that affected communities are aware of the services
that are offered.
Strategies
i) An additional classroom will be built to increase the number of learners who writes examination at a
time.
ii) An application will be made for Grade L DLTC for Ngqeleni to cater for the Ngqeleni community.
iii) An application for an additional terminal in Libode will be made for Registration Authority, currently a
strong room has been identified with few modifications needed in order to meet the requirements to
have a Registration Authority in Libode
iv) All Traffic Officers will be given a target of issuing at least 20 traffic fines per week to curb the reckless
driving as well as other road traffic offences, thereby increasing the revenue for the municipality.
v) The execution of warrants of arrests will be enhanced and an application for administrations marks
will be made for warrants of arrests to ensure that the offenders pay the traffic fines issued.
vi) The speed camera will be utilised to curb excessive speeding in the Nyandeni area as well as to
increase the revenue of traffic fines.
vii) The communication department will engage in a campaign with the Traffic department to raise
awareness to communities about the services offered by both the DLTC and the Registration
Authority.
viii) The Municipality will determine the tariffs for different penalties and updated the law enforcement by-
laws.
ix) To increase the number of Law enforcement officers the municipality will consider partnering the KSD
TVET College and offer learnership programmes for students who are pursuing law enforcement
qualifications.
The strategies listed above aims at increasing the revenue generation for revenue sources for public safety.
Table A4.1 depicts the revenue forecast for the next 3 years 2019/20, 2020/21, 2021/22.

Table 4.1A Revenue forecast of Public safety for the next 3 years
Item 2019/20 2020/21 2021/22
DLTC 3,000,000.00 3,200,000.00 3,400,000.00
RA 500,000.00 550,000.00 605,000.00
Traffic fines 350,000.00 385,000.00 423,500.00
Total 3,850,000.00 4,135,000.00 4,428,500.00
Planning and development
Planning and development is responsible for activities like building plan fees, rezoning fees, business licences fees
etc.
Table A5 shows the revenue for Planning and development for 2017/18 financial
Item Amount
Special consent 1,350.00
Clearance Certificates 2,030.00
Rezoning fees 9,050.00
Removal of restrictions 13,200.00
Building plans 26,629.40
Business licences 89,784.04
Sale of sites 238,587.17
Total 380,630.61
Weaknesses identified
a) The municipality does not have a land use management scheme, this impact on the zoning of properties
which have a direct impact on revenue generation for property rates.
b) There is business properties who are situated in unsurveyed land, thus are not billed for property rates.
c) The major businesses in the rural areas are not subject to business licences fees.
Strategies
i) To finalise the development of land use management scheme.
ii) To engage businesses who are situated in unsurveyed land and persuade them to survey their land
so that the municipality can start billing for property rates.
iii) To engage the major businesses who are situated in the rural areas about paying for business licences
fees.

iv) To charge rental for occupying the warehouses that will be built by the municipality for light industrial
business.
v) The municipality to facilitate the registration of properties registered under name the name of the
municipality to the rightful owners so the municipality can start charging the property rates.
vi) All business sites owned by the municipality to be leased out in order to generate revenue for the
municipality.
vii) The municipality to be involved in identifying the land for site establishment of the construction
contracts and start charging a rental fee for the land used.
The strategies listed above aims at increasing the revenue generation for revenue sources for planning and
development. Table A5.1 depicts the revenue forecast for the next 3 years 2019/20, 2020/21, 2021/22.
Table A5.1 revenue forecast for planning and development for the next 3 years
Item 2019/20 2020/21 2021/22
Building plans 200,000.00 220,000.00 242,000.00
Business licences 100,000.00 110,000.00 200,000.00
Clearance Certificates 2,100.00 2,310.00 2,541.00
Removal of restrictions 15,000.00 16,500.00 18,150.00
Sale of sites 0.00 2,000,000.00 0.00
Rezoning fees 9,100.00 10,010.00 11,011.00
Special consent 1,500.00 1,650.00 1,815.00
Total 327,700.00 2,360,470.00 475,517.00
Community services department
Community services development is responsible for refuse collection, cemetery administration, eco park
management and pound services.
Table A6 Revenue generated by community services for the year 2017/18
Item Amount
Eco park 5,310.00
Cemetery 9,206.81
Refuse 101,047.00
Pound 105,791.75
Total 221,355.56
Strategies to increase revenue generation
i) Review the tariffs for a grave site and include tariff for using municipal TLB when digging.
ii) Review tariffs for rural based who wants to bury loved ones on the municipal cemetery.

iii) Marketing of the eco-park and review of tariffs for the use of eco-park.
iv) Review tariffs for pound management specifically the maximum time an animal can remain impounded
before it can be auctioned to recoup the costs incurred during the impound of the animal
v) Engage the community of Ntlaza and develop a plan to start charging for refuse removal.
The strategies listed above aims at increasing the revenue generation for revenue sources for community
services. Table A6.1 depicts the revenue forecast for the next 3 years 2019/20, 2020/21, 2021/22.
Table A6.1 Revenue forecast for Community services for the nest 3 years
Item 2019/20 2020/21 2021/22
Cemetery 15,000.00 15,750.00 16,537.50
Eco park 5,300.00 5,565.00 5,843.25
Pound 105,000.00 110,250.00 115,762.50
Refuse 102,000.00 107,100.00 112,455.00
Total 227,300.00 238,665.00 250,598.25
In the context of establishing the exact revenue collection gap, the data pertaining to the total revenue collected in
the last financial year provides a clear picture of the shortfall even when measured against the backdrop of the
already small revenue base of the municipality. The data includes all the collectable revenue streams in terms of
the Municipal Systems Act and the policy of the municipality.
6.4.1 Indigents Registration and Policy
The indigent register has been updated and covers all wards under the jurisdiction of Nyandeni Local Municipality.
The municipality will annually update the register and conduct verification process to ensure accuracy and
reliability. Furthermore, Council has adopted an Indigent Policy to guide decision making and allocation of
resources to deserving households
Billing/Ability to Collect / Credit Control / Customer Care:
Approximately 2100 Customers are billed on a monthly basis focusing at Ngqeleni and Libode towns; this
numbers is inclusive of Business, residential and government.
Customer Care in respect of Applications, Terminations of Service, and Enquiries/Queries is timeously dealt
with. A Systematic Dispute/Query Handling System (statutory requirement) to be introduced to ensure that all
queries are dealt with. Customer Care is also a statutory requirement.
Management of the Consumer Database:
Updating consumer information like telephone numbers, ID numbers, etc. Profiling/ Classification of Debtors;
Identifying prescribed debts and irrecoverable debts for write off. Identifying material debt for immediate
collection; Revisit consumer application forms. We need to ensure that all tariffs and also the correct tariffs are
charged. There are several debtors who are not being charged/fully /correctly charged and council loses income,
which it cannot afford.
Identifying Areas for Improvement in Revenue Generation and Collection Processes:
We need to review the Billing Cycle, Accounts Returned/Undelivered. Alternative sources of revenue and Public-
Private-Partnerships should be explored. Grouping of Untraceable Debtors and applying a strategy of appointing
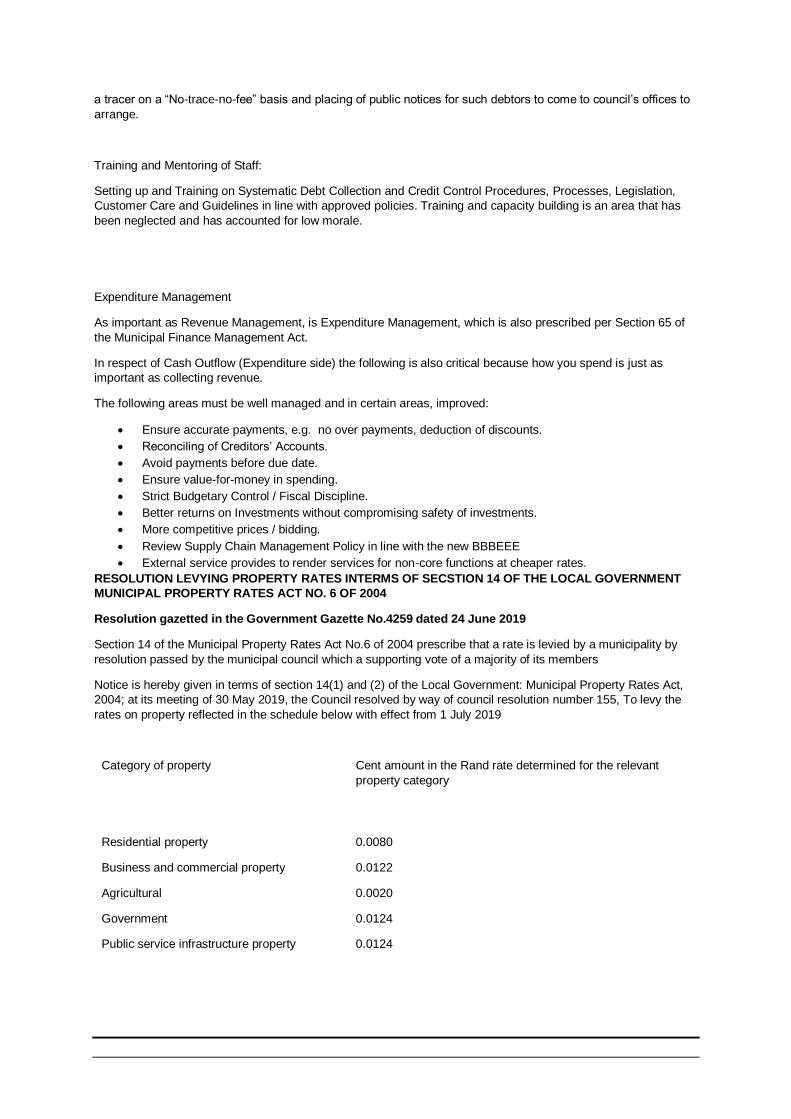
a tracer on a “No-trace-no-fee” basis and placing of public notices for such debtors to come to council’s offices to
arrange.
Training and Mentoring of Staff:
Setting up and Training on Systematic Debt Collection and Credit Control Procedures, Processes, Legislation,
Customer Care and Guidelines in line with approved policies. Training and capacity building is an area that has
been neglected and has accounted for low morale.
Expenditure Management
As important as Revenue Management, is Expenditure Management, which is also prescribed per Section 65 of
the Municipal Finance Management Act.
In respect of Cash Outflow (Expenditure side) the following is also critical because how you spend is just as
important as collecting revenue.
The following areas must be well managed and in certain areas, improved:
Ensure accurate payments, e.g. no over payments, deduction of discounts.
Reconciling of Creditors’ Accounts.
Avoid payments before due date.
Ensure value-for-money in spending.
Strict Budgetary Control / Fiscal Discipline.
Better returns on Investments without compromising safety of investments.
More competitive prices / bidding.
Review Supply Chain Management Policy in line with the new BBBEEE
External service provides to render services for non-core functions at cheaper rates.
RESOLUTION LEVYING PROPERTY RATES INTERMS OF SECSTION 14 OF THE LOCAL GOVERNMENT
MUNICIPAL PROPERTY RATES ACT NO. 6 OF 2004
Resolution gazetted in the Government Gazette No.4259 dated 24 June 2019
Section 14 of the Municipal Property Rates Act No.6 of 2004 prescribe that a rate is levied by a municipality by
resolution passed by the municipal council which a supporting vote of a majority of its members
Notice is hereby given in terms of section 14(1) and (2) of the Local Government: Municipal Property Rates Act,
2004; at its meeting of 30 May 2019, the Council resolved by way of council resolution number 155, To levy the
rates on property reflected in the schedule below with effect from 1 July 2019
Category of property
Cent amount in the Rand rate determined for the relevant
property category
Residential property 0.0080
Business and commercial property 0.0122
Agricultural 0.0020
Government 0.0124
Public service infrastructure property 0.0124

6.5. Summary of Operating and Capital Expenditure for MTERF
4.5.1 Table A1: Budget summary

Explanatory Notes
Table A1 is a budget summary and provides a concise overview of the NLM’s budget from all of the
major financial perspectives which are aligned with the IDP (operating, capital expenditure, financial
position, cash flow, and MFMA funding compliance).
The table provides an overview of the amounts approved by Council for operating performance,
resources deployed to capital expenditure, financial position, cash and funding compliance, as well as
the municipality’s commitment to eliminating basic service delivery backlogs.
Financial management reforms emphasises the importance of the municipal budget being funded.
This requires the simultaneous assessment of the Financial Performance, Financial Position and Cash
Flow Budgets, along with the Capital Budget. The Budget Summary provides the key information in
this regard:

Table A2 : Budgeted financial performance (revenue and expenditure by standard classification)
Explanatory Notes
Table A2 is a view of the budgeted financial performance in relation to revenue and expenditure per
standard classification. The modified GFS standard classification divides the municipal services into
15 functional areas. Municipal revenue, operating expenditure and capital expenditure are then
classified in terms if each of these functional areas which enables the National Treasury to compile
„whole of government‟ reports.
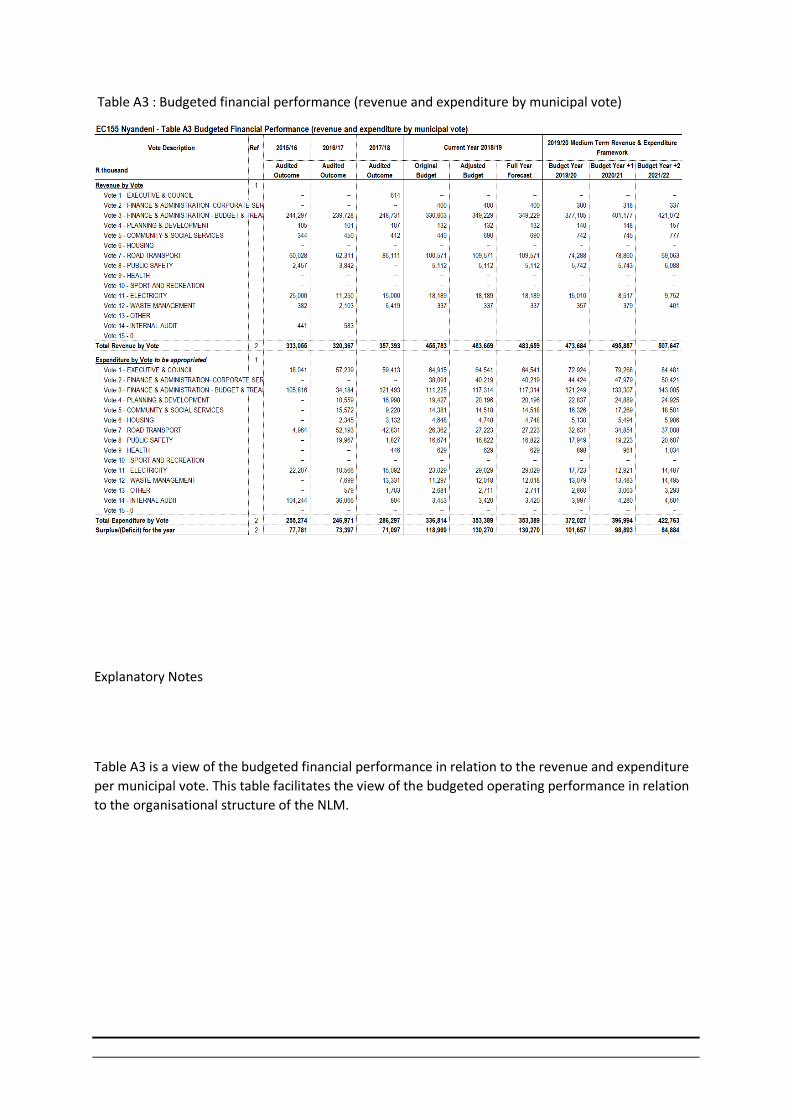
Table A3 : Budgeted financial performance (revenue and expenditure by municipal vote)
Explanatory Notes
Table A3 is a view of the budgeted financial performance in relation to the revenue and expenditure
per municipal vote. This table facilitates the view of the budgeted operating performance in relation
to the organisational structure of the NLM.

Table A4 : Budget financial performance (revenue and expenditure)
Explanatory Notes:
Total revenue (excluding capital transfers and contributions) is R372 million in 2019/20 and escalates
to R396,9 million by 2020/21 and to R422,7 million in 2021/22.

Table A5: Budgeted capital expenditure by vote and funding

Explanatory Notes:
When comparing the previous budget of R130 million (including retention), there is a decrease of
R44 million which is dominated by the decrease of a grant from the Office of the Premier, also the
figure in 2019/20 excludes retention. For 2020/21 budget is R94 million and in 2021/22 budget is
R75,5 million.
Table A6: Budgeted financial position

Explanatory Notes:
Table A6 is consistent with international standards of good financial management practice, and
improves understandability for councillors and management of the impact of the budget on the
statement of financial position (balance sheet).
The municipality cash flow shows a positive position for 2019/20 where current assets reflect an
amount of R197 million.
Short-term call investments increased from R110,2 million in 2018/19 to R149,4 million in 2019/20.
The total assets are R728,7 in 2019/20, R756,7 in 2020/21 and R785 million in 2021/22.
Table A7: Budgeted cash flows

Explanatory Notes
The budgeted cash flow statement is the first measurement in determining if the budget is funded. It
shows the expected level of cash in-flow versus cash out-flow that is likely to result from the
implementation of the budget. The cash flow of the municipality shows that the municipality will be
able to meet its obligations in 2019/20 financial year.
Table A8: Cash backed reserves / accumulated surplus reconciliation

Explanatory Notes.
The municipality have the reserves that are cash backed for 2019/20 MTERF. These reserves are fully
funded by the short term call investments that are kept by the municipality in the FNB Bankers and
Standard Bank Bankers and Ned Bank Bankers.
Table 18: Grants and subsidies
Explanatory notes:
The municipality has budgeted both operating and capital grants as per the Division of Revenue Act.
The municipality has budgeted for the following operating grants:- Equitable share; INEP; EPWP;
FMG and MIG.

Capital grants:- MIG and Small Town Revitalisation grants.
The municipality did not receive grant from the District Municipality in 2018/19 and there is no
budget in 2019/20 and in the next coming two years.
PROGRAMME FOR THE COMPILATION OF FINANCIAL STATEMENTS AND ANNUAL REPORT &
PERFORMANCE INFORMATION FOR THE YEAR ENDING 30 JUNE 2019
PROGRAMME FOR THE COMPILATION OF FINANCIAL STATEMENTS FOR THE YEAR ENDING
30 JUNE 2019

MUNICIPAL GRAP COMPLIANT ASSET REGISTER
Nyandeni Local Municipality have complied with GRAP 17 in compiling the GRAP Asset Register since 2013/14 financial year. All assets are barcoded and
included in the Asset Register.
FINANCIAL RECOVERY PLAN IN PLACE TO ADDRESS CASH FLOW PROBLEMS
Financial recovery has been developed and adopted by Council, inter alia, progress reports are compiled as part of MFMA S71, and 52d report
BANK ACCOUNTS FOR CONDITIONAL GRANTS
The municipality has opened Call Accounts for all conditional grants.
All the reports for conditional grants submitted by regulated time to both National and Provincial Treasury and other relevant stakeholders.
EXPENDITURES:

REPAIRS & MAINTENANCE
The municipality have a Repairs and Maintenance Plan in place and the budget is as follows for the two previous years:-
Year Repairs &
Maintenance
Percentage
2016/17 R 4 572 000 4%
2017/18 R11 289 000 4%
2018/19 R13 324 000 4%
The municipality note the 8% norm as per MFMA Circulars; however, 8% could not be met due to budget constraints.
Capital Budget spending patterns for previous years:
Year Capital Budget Actual Spending Percentage
2015/16 R84 797 000 R84 797 000 100%
2016/17 R79 643 000 R79 643 000 100%
2017/18 R109 951 000 R84 351 000 77%

For the projects that are funded by MIG, the municipality spent 77% in 2017-18 financial year of the overall budget. The municipality applied for the
rollover to National Treasury, R9 million approved and R16 million was approved.
Percentage of salary budget (Councillors remuneration and employees cost) to operational budget
Year Operational
Budget
Salaries
Spending
Percentage
2015/16 R255 273 000 R122 286 000 48%
2016/17 R246 970 000 R132 049 000 53%
2017/18 R319 575 000 R152 888 000 48%
Percentage of repairs and maintenance on total budget operational budget
Year Total Budget Repairs and
maintenance
Spending
Percentage
2015/16 R255 273 000 R 4 964 000 2%
2016/17 R246 970 000 R 4 572 000 2%
2017/18 R319 575 000 R11 289 000 4%

Percentage on Grants usage
FMG
Year Total Budget Amount Spent Percentage
2015/16 R1 600 000 R1 600 000 100%
2016/17 R1 625 000 R1 625 000 100%
2017/18 R1 700 000 R1 700 000 100%
INEP
Year Total Budget Amount spent Percentage
2015/16 R25 000 000 R25 000 000 100%
2016/17 R11 250 000 R11 250 000 100%
2017/18 R15 000 000 R15 000 000 100%
MIG
Year Total Budget Amount spent Percentage
2015/16 R58 809 000 R58 809 000 100%
2016/17 R58 050 000 R58 050 000 100%
2017/18 R70 894 000 R45 472 811 64%
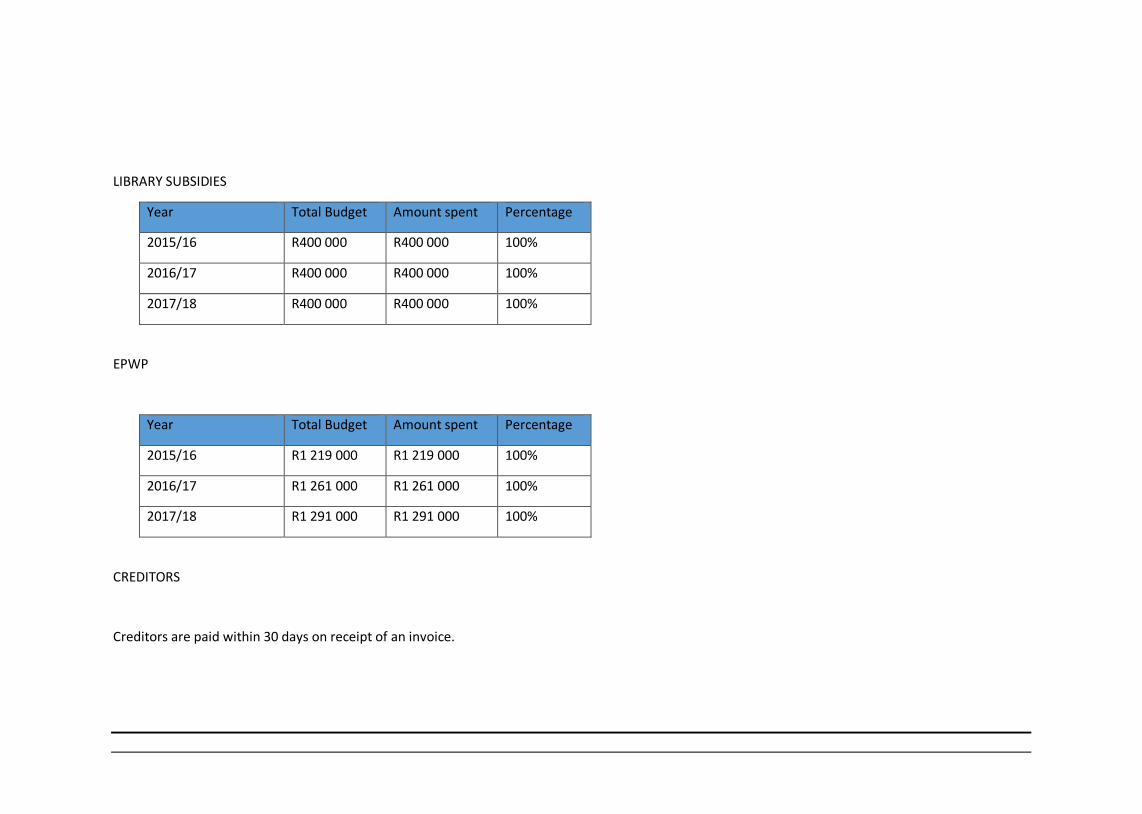
LIBRARY SUBSIDIES
Year Total Budget Amount spent Percentage
2015/16 R400 000 R400 000 100%
2016/17 R400 000 R400 000 100%
2017/18 R400 000 R400 000 100%
EPWP
Year Total Budget Amount spent Percentage
2015/16 R1 219 000 R1 219 000 100%
2016/17 R1 261 000 R1 261 000 100%
2017/18 R1 291 000 R1 291 000 100%
CREDITORS
Creditors are paid within 30 days on receipt of an invoice.

Current Ratio
The municipality had a current ratio of 6.29, which demonstrated that the municipality is in a healthy financial state, where its current assets were almost
4 times the value of the current liabilities. The municipality had a favourable working capital.
Acid Test Ratio
The municipality had an acid test ratio of 6.27, which demonstrated that the municipality had assets that could be quickly turned into cash to settle short
term obligations. The municipality had an inventory of R279 551 at year end which is not that much material hence the Acid Test Ratio is equal to the
Current Ratio.
Working Capital Ratio
The municipality had a favourable working capital of R118 359 319, however the rate of current assets to total assets was 20%, which means 80% of
assets were long term in nature. This is however a small change as compared to previous year where the percentage was 83%.
Financing to Capital expenditure Ratio
The municipality had a ratio of 0%, as there were no long term loans at year end.
Gross Debtors to Annual Revenue Ratio
The municipality had a ratio of 184%. The municipality had a balance of R 10 million of long outstanding debtors. The collection rate is low; the situation is
expected to improve after the implementation of credit control policy and collection initiatives.
Gross debtor days Ratio

The average number of day the debtors are due was 670 days. This demonstrates that the majority of municipal debtors are older than 365 days, thus are
potentially bad.
Net debtors to annual revenue Ratio
The municipality had a ratio of 29%. The collection rate is low, so 71% of debtors were provided for impairment at year end. The situation is expected to
improve after the implementation of credit control policy and collection initiatives.
Net debtor days Ratio
The average number of days the debtors after provision for impairment was 105 days; there has been an increase as compared to 89 days in previous
year, was due to the fact that the municipality did not write off some of its debtors in the current year.
Receivables turnover Ratio
The municipality had a ratio of 218%. This means that the municipality is billing far more that what it is receiving from customers.
Debts written off as a percentage of total expenditure Ratio:
There were no debts written off during the year under review.
Debtors’ impairment Ratio:
The ratio was 155%. This demonstrates that a majority of debtors are not recoverable and as such have to be provided for impairments. The main
contributing factor is the debt from both households and business accounts. The municipality is in the process of implementing and enforcing the credit
control and debt collection policy which will reduce the instance of billing indigent debtors.

Debt Ratio
The debt ratio is 4.7%, which means the municipality’s assets far exceed the liabilities. Therefore there are no going concern issues for the municipality.
Debt / net asset position ratio
The debt ratio is 2147%, which means the municipality’s assets far exceed the liabilities. Therefore there are no going concern issues for the municipality.
Non-current liabilities to revenue Ratio
The ratio is 1.6%. The long term liabilities of R 5 120 061 is far less than the revenue of R 317 269 726, which means the municipality has sufficient funds
to meet its long term liabilities.
Total debt to annual operating revenue Ratio
The ratio is 8.7%; this means the revenue sources are sufficient to cover the total debts.
Debt to cash Ratio
The ratio is 4.46%; this means the revenue sources are sufficient to cover the total debts.

Total investments to total assets Ratio
The ratio is 15% of total assets are investments, which symbolizes the favourable financial position of the municipality. This also demonstrates a
moderate level of liquidity.
Consultancy Ratio
The total amount spent on consultants was R2 730 669 which is 1.1% of the total expenditure cost of R 243 314 468. There has been no material change
in terms of percentage when compared to the previous year. The municipality continued to generate its own internal capacity during the year. This is the
indicator that the municipality is not overly reliant on consultants.
Fruitless & Wasteful Expenditure Ratio
The municipality incurred penalty interest on late payment of overdue accounts amounting to R17 215. This equated to 0.00% of total expenditure
balance of R 243 314 468.
Irregular Expenditure Ratio
The municipality incurred irregular expenditure amounting to R 314 465 536 during the current year. This equated to 129% of the total expenditure
balance of R 243 314 468. The balance includes both current year expenditure as well as current year expenditure relating to previous years. There is an
increase of 47% as compared to previous years. Irregular expenditure was as a result of non-compliance with procurement requirements in current year
and previous financial years.
Unauthorized expenditure Ratio
The municipality did not incur any unauthorised expenditure during the current year under review.

Unspent grants Ratio
The municipality had an amount of R16 million unspent conditional grant in relation to Municipal Infrastructure Grant that was not fully spent at year
end.

FINANCIAL RATIOS (2017-18 Financial Statements)
Current year actual
(2017/2018)
Prior year restated
actual (2016/2017)
Current Assets 193,927,595 = 375% 140 753 765 = 629%
Current Liabilities 51,653,802 22 394 446
(Current Assets - Inventory) 193,661,899 = 375% 140 474 214 = 627%
Current Liabilities 51,653,802 22 394 446
(Current Assets - Current liabilities) 142,273,793 = 20% 118 359 319 = 20%
Total assets 697,459,370 590 646 930
Increase or decrease in long term loans
- = 0%
- = 0%

Cash used in capital expenditure for
the year
87,282,902
75 844 640
Current consumer debtors
11 928 174 = 200%
10 880 639 = 184%
Total revenue billed for services during
the year
5,960,885
5 928 394
Current consumer debtors
11 928 174 = 730.00
10 880 639 = 670.00
Total revenue billed for services during
the year x 365
5,960,885 X365
5 928 394 X365
(Current consumer debtors - Provision
for bad debt)
2,299,295
=
39%
1 702 551
=
29%
Total revenue billed for services
rendered on credit
5,960,885
5 928 394
(Current consumer debtors - Provision
for bad debt)
2,299,295
=
141
1 702 551
105
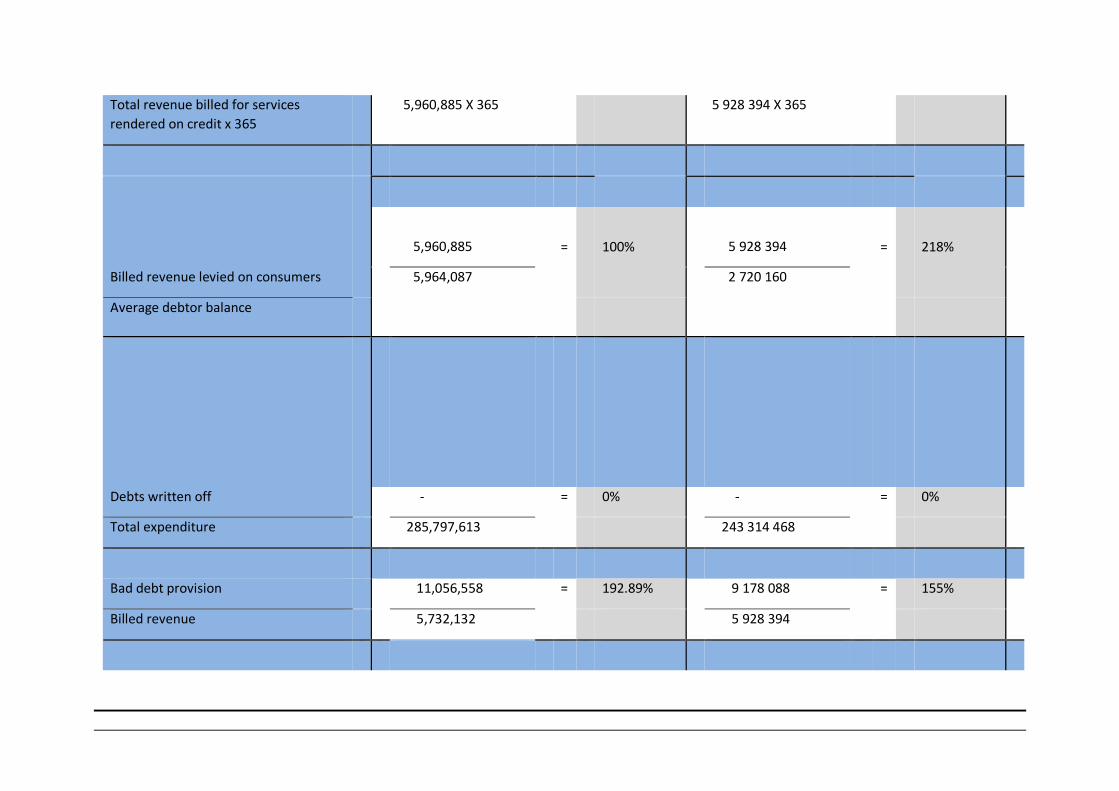
Total revenue billed for services
rendered on credit x 365
5,960,885 X 365
5 928 394 X 365
Billed revenue levied on consumers
5,960,885
=
100%
5 928 394
=
218%
5,964,087 2 720 160
Average debtor balance
Debts written off - = 0% - = 0%
Total expenditure 285,797,613 243 314 468
Bad debt provision 11,056,558 = 192.89% 9 178 088 = 155%
Billed revenue 5,732,132 5 928 394

Total liabilities 57,824,865 = 8.29% 27 514 507 = 4.7%
Total assets 697,459,370 590 646 930
Total assets
697,459,370
=
1206.16%
590 646 930
=
2147%
Total liabilities 57,824,865 27 514 507
Total long term debt 6,171,063 = 1.74% 5 120 061 = 1.6%
Total operating revenue 354,591,722 317 269 726
Total debt 57,824,865 = 16.31% 27 514 507 = 8.7%
Total operating revenue 354,591,722 317 269 726
Long term debt 6,171,063 = 4.5% 5 120 061 = 4.6%
Cash generated from operations 136,516,814 110 542 553
Total investments 150,303,022 = 22% 91 486 416 = 15%
Total assets 697,459,370 590 646 930
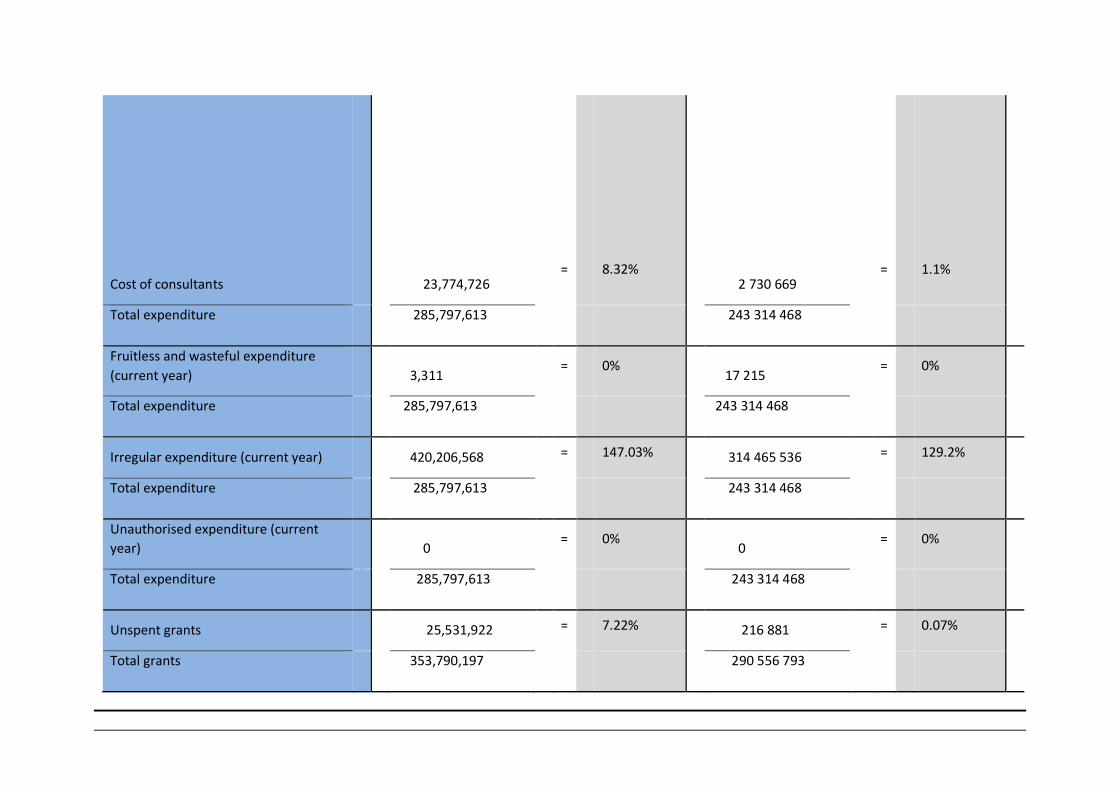
Cost of consultants
23,774,726
=
8.32%
2 730 669
=
1.1%
Total expenditure
285,797,613
243 314 468
Fruitless and wasteful expenditure
(current year) 3,311
=
0%
17 215
=
0%
Total expenditure 285,797,613 243 314 468
Irregular expenditure (current year) 420,206,568 = 147.03% 314 465 536
= 129.2%
Total expenditure 285,797,613 243 314 468
Unauthorised expenditure (current
year) 0
=
0%
0
=
0%
Total expenditure 285,797,613 243 314 468
Unspent grants 25,531,922 = 7.22% 216 881 = 0.07%
Total grants
353,790,197
290 556 793


Current Ratio
The municipality had a current ratio of 3.75, which demonstrated that the municipality is in a
healthy financial state, where its current assets were almost double the value of the current
liabilities. The municipality had a favourable working capital.
Acid Test Ratio
The municipality had an acid test ratio of 3.75, which demonstrated that the municipality had
assets that could be quickly turned into cash to settle short term obligations. The municipality had
an inventory of R265 696 at year end which is not that much material hence the Acid Test Ratio is
equal to the Current Ratio.
Working Capital Ratio
The municipality had a favourable working capital of R142 273 793, however the rate of current
assets to total assets was 20%, which means 80% of assets were long term in nature. This is
however a small change as compared to previous year where the percentage was 83%.
Financing to Capital expenditure Ratio
The municipality had a ratio of 0%, as there were no long term loans at year end.
Gross Debtors to Annual Revenue Ratio
The municipality had a ratio of 184%. The municipality had a balance of R 11 million of long
outstanding debtors. The collection rate is low; the situation is expected to improve after the
implementation of credit control policy and collection initiatives.
Gross debtor days Ratio
The average number of day the debtors are due was 670 days. This demonstrates that the
majority of municipal debtors are older than 365 days, thus are potentially bad.
Net debtors to annual revenue Ratio
The municipality had a ratio of 39%. The collection rate is low, so 61% of debtors were provided
for impairment at year end. The situation is expected to improve after the implementation of
credit control policy and collection initiatives.

Net debtor days Ratio
The average number of days the debtors after provision for impairment was 145 days; there has
been an increase as compared to 109 days in previous year, was due to the fact that the
municipality did not write off some of its debtors in the current year.
Receivables turnover Ratio
The municipality had a ratio of 100%. This means that the municipality is billing far more that what
it is receiving from customers.
Debts written off as a percentage of total expenditure Ratio:
There were no debts written off during the year under review.
Debtors’ impairment Ratio:
The ratio was 192%. This demonstrates that a majority of debtors are not recoverable and as such
have to be provided for impairments. The main contributing factor is the debt from both
households and business accounts. The municipality is in the process of implementing and
enforcing the credit control and debt collection policy which will reduce the instance of billing
indigent debtors.
Debt Ratio
The debt ratio is 8.29%, which means the municipality’s assets far exceed the liabilities. Therefore
there are no going concern issues for the municipality.
Debt / net asset position ratio
The debt ratio is 1206%, which means the municipality’s assets far exceed the liabilities. Therefore
there are no going concern issues for the municipality.

Non-current liabilities to revenue Ratio
The ratio is 1.74%. The long term liabilities of R6,1million is far less than the revenue of R 354,5
million, which means the municipality has sufficient funds to meet its long term liabilities.
Total debt to annual operating revenue Ratio
The ratio is 16.3%; this means the revenue sources are sufficient to cover the total debts.
Debt to cash Ratio
The ratio is 4.5%; this means the revenue sources are sufficient to cover the total debts.
Total investments to total assets Ratio
The ratio is 22% of total assets are investments, which symbolizes the favourable financial position
of the municipality. This also demonstrates a moderate level of liquidity.
Consultancy Ratio
The total amount spent on consultants was R23,7 million which is 8.32% of the total expenditure
cost of R 285.7 million. There has been no material change in terms of percentage when compared
to the previous year. The municipality continued to generate its own internal capacity during the
year. This is the indicator that the municipality is not overly reliant on consultants.
Fruitless & Wasteful Expenditure Ratio
The municipality incurred penalty interest on late payment of overdue accounts amounting to
R3 311. This equated to 0.00% of total expenditure balance of R 285 797 613.
Irregular Expenditure Ratio
The municipality incurred irregular expenditure amounting to R 420 206 565 during the current
year. This equated to 147% of the total expenditure balance of R 285 797 613. The balance
includes both current year expenditure as well as current year expenditure relating to previous
years. There is an increase of 34% as compared to previous years. Irregular expenditure was as a
result of non-compliance with procurement requirements in current year and previous financial
years.

Unauthorized expenditure Ratio
The municipality did not incur any unauthorised expenditure during the current year under review.
Unspent grants Ratio
The municipality had an amount of R25 531 922 unspent conditional grant in relation to the MIG
that was not fully spent at year end.

REVENUE MANAGEMENT
BUDGETED INCOME REALISED IN THE PAST TWO YEARS
2017/18
Approved budget Adjustments Final Budget Actual amounts
on comparable
basis
Statement of Financial Performance
Revenue
Revenue from exchange
transactions
Sale of goods 468 317.00 (35 866.00) 432 451.00 416 286.00
Service charges 260 211.00 - 260 211.00 228 753.00
Rental of facilities and equipment 125 529.00 (83 686.00) 41 843.00 63 342.00
Agency services 400 000.00 - 400 000.00 730 743.00
Licences and permits 4 000 000.00 11 955.00 4 011 955.00 2 960 522.00
Operational Revenue 639 102.00 (400 000.00) 239 102.00 1 918 235.00
Interest received-investment 5 977 552.00 3 011 448.00 8 989 000.00 11 123 938.00
Total revenue from exchange
transactions 11 870 711.00 2 503 851.00 14 374 562.00 17 441 819.00
Taxation revenue
Property rates 6 053 931.83 (1 598 812.00) 4 455 119.83 5 732 132.00
Interest, dividends and Rent on Land - - 35 865.00 1 132 529.00
Transfer revenue
Government grants & subsidies 342 536 000.00 12 354 196.00 354 890 196.00 328 258 275.00
Fines, Penalties and Forfeits 310 090.00 71 731.00 381 821.00 572 492.00
Total revenue from non-exchange
transactions 348 900 021.83 6 371 995.17 355 272 017.00 335 695 428.00
Total Revenue 360 770 732.83 8 875 846.17 369 646 579.00 353 137 247.00

2016/2017
LOANS
The municipality does not have loans and did not have for past three years.
Statement of Comparison of Budget and Actual Amounts 30 June 2017
figures in Rands
Approved
Budget Adjustments Final Budget
Actual
Collection/Billin
gs
Statement of Financial Performance
Revenue
Revenue from exchange transactions
Service charges 244 559.00 244 559.00 244 559.00 202 400.00
Rental of facilities and equipment 185 394.00 185 394.00 258 576.00 178 202.00
Interest received (trading) 1 163 265.00 1 163 265.00
Fees earned
Commissions received
Licences and permits 5 618 000.00 5 618 000.00 5 618 000.00 3 284 167.00
Agency services 500 000.00 500 000.00 500 000.00 361 120.00
Recoveries
Other income 41 643 914.00 72 643 914.00 76 923 932.00 7 403 831.00
Interest received - investment 5 618 000.00 5 618 000.00 8 178 968.00 8 198 053.00
Total revenue from exchange transactions 53 809 867.00 84 809 867.00 92 887 300.00 20 791 038.00
Revenue from non-exchange transactions
Taxation revenue
Property rates 5 689 786 5 689 786 6 678 787 5 725 994.00
Transfer revenue
Government grants & subsidies 284 906 000 286 523 675 290 773 675 290 556 793.00
Traffic fines 56 180 56 180 56 180 195 901.00
Total revenue from nonexchange transactions 290 651 966 292 269 641 297 508 642 296 478 688.00
Total revenue 344 461 833 377 079 508 390 395 942 317 269 726.00

The municipality updates the Debtors Master monthly to keep an accurate data for billing.
The municipality have effective and efficient billing system in place i.e. Promun system owned by
R-data Company.
YEAR CONSUMERS DEBT COLLECTION PERCENTAGE
2015/16 12 599 724 5 604 890 44%
2016/17 10 880 639 7 623 279 70%
2017/18 12 002 922 4 604 206 38%
The municipality has adopted an integrated revenue enhancement strategy that is under
implementation.
ALIGNMENT
The SDBIP is aligned with the Goals and associated Objectives, and the Municipal Budget. (See
attached SDBIP as Annexure 1)
SYSTEMS OF INTERNAL CONTROLS
Systems of Internal Controls are in place and includes the following:
1. Financial management system
2. Segregation of duties
3. Payables
4. Procurement Section
5. Stores
6. Disposal of Assets
7. Debtors
8. Property rates
9. Banking and Receipting

10. Petty cash
11. Safes and strong rooms
12. Inventory
13. Pay Roll
14. Investment Register
15. Bank Reconciliation
16. Leave Management
17. Information, Communication Technology
18. Unauthorised, irregular, fruitless and wasteful expenditure
SUPPLY CHAIN MANAGEMENT SYSTEM
Supply Chain Management Policy
Section 112 of the MFMA prescribes that the each municipality must have a supply chain
management policy is fair, equitable, transparent, competitive and cost effective and complies
with a prescribed regulatory framework for municipal supply chain management
Nyandeni Municipality has adopted a Supply Chain Management Policy as contemplated in the
aforementioned legislative provisions and its regulations. The SCM System is responsible for the
following key components
Demand management, acquisition management, Logistics management and disposal management
The Supply Chain Management Unit
Nyandeni Local Municipality has a functional Supply Chain Management Unit which is directly
accountable to the Chief Financial Officer as prescribed by the MFMA and supported by the
approved SCM Policy. The Unit is composed of the following staff compliment
SCM Manager, two SCM Officers, two SCM Practitioners and Stores Clerk
Supply Chain Management Bid Committees

The municipality has a functional Bid Committees which are appointed by the Accounting Officer
Quarterly and have been trained on SCM
Bid Specification Committee
Bid Evaluation Committee
Bid Adjudication Committee
Training of SCM Staff on Competency levels
Currently SCM Staff is undergoing training with the University of Fort Hare. Bid Committee are
trained two times a year to familiarise them with the reforms introduced by National Treasury.
SUPPLY CHAIN MANAGEMENT TURNAROUND TIME
In line with the SCM policy the average turnaround time for projects above R200 000 is 45
working days while the 7 days quotation is 10 working days.
Contract Management
Contract Management System is in place and composed of the Contract Management Register
which encapsulate the following features
Date of the goods and services advertised
Appointed details of appointed service providers
Contract price and related details
Payment incurred versus awarded prices
Service Level Agreement signed between the municipality and agencies appointed
IMPLEMENTATION OF THE GENERAL VALUATION ROLL
The Municipality approved a General Valuation Roll in the Council that was held on the 27th of
June 2018. That General Valuation Roll was due for implementation on the 1st of July 2018, which
indeed it was implemented. Currently, the municipality is in a process of executing the updating of
the supplementary valuation roll.

The Municipality have the Valuation Roll and updated supplementary valuation roll, which was
implemented in 2017/2018. Valuer for development of a Valuation Roll was appointed which was
effective from 1 July 2018 as determined by the Minister by Notice in the Gazette for submission
of project plan to MEC by municipality: Date of submission 31/03/2017 Section 81 (1B) (a).
Project plan for conducting valuation roll in terms of section 81 (1b) (a) of the local government:
municipal property rates amendment act, 2014. (act no. 29 of 2014) adopted by the Council on the
26 April 2017, Council Resolution No. 2500/26-04-2017.
In 2018/19, the municipality has budgeted R852 532 for development of Supplementary Valuation
Roll and R832 260 in 2019/20.
The Valuation Roll is published in the municipality website.
The municipality does promulgate the notice in terms of section 49 for public inspection of
valuation roll. The Gazette number will be available once General Valuation Roll is available.
FINANCIAL REPORTING
mSCOA
The Council adopted SCOA Gazette on the 02 July 2014 with Council Resolution No. 2081/02-07-
2014.
The implementation plan adopted by the Council on the 11th December 2014 with Council
Resolution No. 2223/11-12-2014.
MSCOA Governance
SCOA Steering Committee; Implementation Team , Project Sponsor, Project Manager and Project
Champion appointment was approved by the Council on the 25th January 2016 with Council
Resolution No. 2380/25-01-2016.

Nyandeni Municiapaity has fully complied with the mSCOA requirement and accordingly
submitted all Governance Documents, IDP Data Strings and mSCOA aligned budget
MFMA PRESCRIPTS
The municipality compiled and submitted the following reports by regulated time:-
Section 71
Section 52d
Section 72 and
Yearly Reports
FREE BASIC SERVICES
The municipality review the indigent register annually and the process of review has started.
Nyandeni Local Municipality subsidise the indigent people with electricity coupons, alternative
energy (gas/paraffin), rates and refuse removal. In the last three years the municipality budgeted
for FBS as follows:-
YEAR BUDGETED
AMOUNT
EXPENDITURE
2015/16 6 064 954 6 064 954
2016/17 5 300 000 1 271 451
2017/18 5 632 072 5 444 442
Nyandeni Local Municipality has a functional Free Basic Services Unit, which is directly accountable
to the Strategic Manager.

The Unit is composed of the following staff compliment:-
Free Basic Services Officer, FBS clerks and 2 Field Workers.
Governance of Free Basic Services
The municipality has established Indigent Steering Committees in 32 Wards, which serves as
advisory bodies in decision-making process as well as dispute resolution platforms. The Indigent
Steering Committees are chaired by Ward Councillors and convened quarterly. The council is the
ultimate decision making body. The Indigent Policy has been reviewed and adopted by Council on
May 2019.
Financial Planning for the next three years with regard to transfers and subsidies is depicted below
YEAR BUDGETED AMOUNT
2018/19 R6 882 000
2019/20 R7 285 000
2020/20 R8 746 000

1. PLANNING THE FUTURE OF NYANDENI LOCAL MUNICIPALITY
Vision
Drives sustainable socio-economic development through efficient and innovative delivery of services
Mission
Nyandeni will achieve her vision through a capable institution that: • provides basic services to all her people • creates an enabling environment for inclusive economic growth and development;
through investments attraction; • provides efficient integration and coordination of the delivery of infrastructure services
Council values
The King III report defines good governance as following:
“Good corporate governance is essentially about effective, responsible leadership. Responsible leadership is
characterised by the ethical values of responsibility, accountability, fairness and transparency. Section 195 of
the Constitution of the RSA, 1996 states that public administration must be govern by the democratic values and
principles enshrined in the Constitution, including
High standard of professional ethics must be promoted and maintained
Efficient, economic and effective use of resources must be promoted
Public administration must be development oriented
In line with the Constitution the municipality has adopted the following values, inter alia, in a process of
developing service standard charter to give meaning and effect to these values
a) Diligence (self-driven public representative and management team, commitment to serving the people,
assertive in representing the interests of Nyandeni inhabitants)
b) Promptness (responding to matters of public and citizens interests within reasonable time including
acknowledging and keeping people informed of all municipal processes)
c) Integrity (transparency, honesty, good democratic ethics, impartial on matters of public good and
interest and building a public service that transcends political and social boundaries)
d) Accountability (responsible, taking ownership, discipline, efficient and implanting a culture of a
demand driven development paradigm)
e) Participative (building a reciprocal relationship between management and all internal stakeholders,
between council and administration, between labour and organizational leadership, and between the
municipality and its citizens and social formations)
f) Responsive (building a customer friendly municipal environment, ensuring a proactive, flexible,
creative and quality conscious service delivery environment)
g) Considerate (implanting a culture of compassionate, caring and emotional intelligent municipal
environment that prioritizes its inhabitants, employees and councillors)
Strategic goals of the municipality
a) To ensure sound governance practices within Nyandeni local municipality
a. Improving and strengthening intergovernmental relations
b. Collaborative planning
c. Fostering strategic partnerships
d. By ensuring good corporate practices
e. Effective municipal leadership and management
f. Wise resource management

g. Seamless programme management
h. Ensuring a stable political environment
i. Broadening and deepening local democracy through ward committees and beyond
j. Ensure local accountability through continuous reporting system, local imbizos etc
k. Implanting a culture of people centred people driven development
l.
b) To provide sustainable services to all inhabitants of the municipality through
a. Physical infrastructure provision
b. Community and social services
c. Effective local economic development planning
d. Spatial development planning
e. Effective intergovernmental collaboration
f. Providing support to business development
g. Strategic sector planning and development
6.1 Products and services as outlined in the powers and functions
a) Physical infrastructure
a. Municipal buildings
b. Plant and equipment
c. Community facilities [halls etc]
d. Access roads
e. Storm water
f. Walkways, transport halts etc
g. Dams (for grazing and to catalyze agriculture and farming)
h. Bulk infrastructure
b) Social services
a. Primary health care
b. Library services
c. Social amenities
d. Public safety
e. Early childhood development
f. Skills development
c) Environmental management
a. Environmental health management services
b. Environmental safety management
c. Pollution control and management
d. Environmental planning
e. Environmental monitoring and compliance
d) Economic services
a. Local economic development planning
b. Tourism planning
c. Land use management planning and zoning schemes
d. Spatial planning
e. Agriculture planning
f. Transport planning
g. Tourism planning
h. Business regulations

Within the spirit and context of sound intergovernmental relations, Nyandeni Local Municipality accept and
therefore locates its current and future strategic areas of focus within the broad national and provincial
planning frameworks in terms of development and growth priorities for the Eastern Cape and nationally.
As these broad frameworks embody the qualitative aspects of the national transformation trajectory, they thus
inform and underpin our development priorities and strategic direction. Accordingly, the municipality crafted
itself a macro-strategy as alluded to earlier and as detailed below.
Medium term macro institutional strategy
Recognizing the numerous and huge challenges it faces, the fact that solutions can potentially be in conflict
with or complement each other, as stated above, the municipality conceptualized a medium term macro
institutional strategy. The objective of this strategy is to equip leadership and management with a guide on
decision making when there are conflicting strategic options. The macro/ overarching strategy will also provide
a basis for the allocation of scarce resources. In addition, the macro strategy/overarching strategy will serve as
a basis to rally collective energies of all employees and councilors in terms of the strategic direction the
municipality is taking. This macro strategy was deduced from myriad institutional deficiencies, advances as
well as development challenges. It is presented in the form of a diagram to illustratively communicate the
dialectical inextricable interconnectedness of the components.
The diagram summarizes the medium term overarching institutional strategy of the municipality. Municipal
objectives and their supporting strategies have been formulated in line with this macro strategy.

VISION 2030 DEVELOPMENT PLAN
Nyandeni Local Municipality has adopted a long term plan envisioning the future herewith refered as VISION
2030.
The overall purpose of Nyandeni LM Vision 2030 Development Plan is to articulate the key long-term
development priorities of the Nyandeni LM between 2017 and 2030 and beyond. It outlines various strategic
priorities and interventions to achieve the related desired district related outcomes linked to the National
Development Plan (NDP) and the Provincial Development Plan (PDP) Vision 2030.
The priorities and interventions were informed by various national and provincial policies, such as the National
Development Plan (2012), the Eastern Cape Provincial Development Plan (2014), the Eastern Cape
Infrastructure Plan (2016), Provincial Economic Development Strategy, etc. It also builds on and complements
the Nyandeni LM IDP (2017 – 2022).

Alongside these 5 Goals, the Nyandeni LM Vision 2030 Development Plan, also includes
the following 5 pillars:
Pillar One: A significant improvement in the provision of public infrastructure and public services (and
a great increase in supporting livelihoods in doing so)
Since the public sector presently dominates the NLM socio-economy it makes strategic sense to try to get better
social value from public spending in the District. Better quality public services are a critical enabler of socio-
economic development. There is also scope to significantly expand employment through public works and local
procurement (particularly locally produced food for school nutrition programmes).
Social infrastructure:
Future priorities are:
Complete VIP toilet provision programme
Eskom to complete household electrification programme
Maintenance of existing and new stand-alone village water schemes
Reticulation from two new Mthatha bulk water corridors into the new NLM urban development zone
Municipal waste services to be delivered in new zone and other tourism and transport nodes.
Health:
Future priorities are:
Programmes to improve child nutrition (early childhood development)
Implementation of NHI upgrading.
Education and training:
Future priorities are:
Improve the quality of education in NLM and reduce classroom backlogs.
KSD TVET campus at Libode to provide skills, particularly for infrastructure, construction and
maintenance and modern farming practices (Itsiya Youth Farming Initiative). Ideally the Libode
campus should be extended and a full range of relevant curricula should be offered (in view of the very
youthful population of NLM)
Development partnerships between Libode TVET campus and, for example, SANRAL, War on Leaks,
Youth Farming Initiatives, etc
Mobilise resources for Libode TVET expansion and upgrading through relevant SETAs, mining
companies etc
NARYSEC should also be scaled-up in NLM
Focus on improving the skills pipeline for growth sectors and major projects and specifically SETA
resource mobilization and curriculum development.
Pillar Two: A well-managed urban development process in which urban nodes are linked by a good
quality road and transport network
NLM is urbanizing in an unplanned and haphazard way. Socio-economic development will be enhanced through
the creation of competitive towns. These must be well connected by good roads to each other and the rest of
SA.
Future priorities are:
Strong urban planning of Libode-Ngqeleni-Mthatha “urban development zone” is required. This requires
joined up planning by NLM, KSD and ORTDM.
Continued focus of public investment in this area, and ensuring that it becomes a competitive and
investment attractive area.
Municipality must acquire more well-located land that can be made available for investors (see section
below on property development).
Road and transport network:
Future priorities are:
Construction of two main planned roads (R61/N2 and Meander)
Ensure that the Meander road links to coastal resorts (such as Hluleka)
Upgrade roads in the new emerging urbanization zone.
Maintain priority road network (preventative)
Use employment-intensive methods as much as possible
Use transport nodes to develop commercial precincts (taxi ranks, hawkers facilities, shops etc)
Recognise the potential of Mthatha Airport cargo facilities for future NLM development.
Pillar Three: Well protected environmental assets
Various environmental issues threaten socio-economic development, and in particular tourism development and
agricultural development.
The environmental issues to be addressed include:
Land degradationi caused by livestock over-grazing (estimated at 30% in NLM), indicating the need for
land rehabilitation projects (and fencing)
Human settlement encroachment on agricultural land.
Untreated sewage flowing into rivers (such as Mthatha river)
Illegal building on the Wild Coast. DEDEAT’s Wild Coast Nature Conservation Plan and the nodal
development approach need to be strictly enforced.
Absence of solid waste disposal and recycling systems
Pillar Four: A growing, innovative/responsive and inclusive economy (increasing value-added from
ICT/knowledge services, smallholder agriculture, tourism, property development and SMME’s/co-ops
etc)
The public sector cannot develop NLM by itself. There is a need to grow the enterprise (SMME) sector. All the
other strategic objectives are enablers of business growth. There is also a need for specific interventions to grow
particular business sectors.

Agriculture:
NLM has the potential to grow the value of production by the farming sector. This is for a number of reasons:
Good rainfall (700 mm/year), sufficient for rain-fed arable farming.
160,000 ha of communal grazing land (unimproved and 30% degraded) and large existing herds of
cattle, sheep and goats. There is potential for growth based on more intensive systems, managed
pastures and feedlots.
40,000 ha of communal arable land.
Estimated 21,000 ha of isitiya.
70% of NLM households engage in unpaid farming activity: at Itsiya and on communal lands. Food
production (meat, maize, vegs, fruit etc) is happening, but with low productivity. There is potential to
grow high-value crops on itsiya (such as berries) with irrigation from roof-water tanks. Logistics systems
would need to be devised for aggregation into large-scale supplies.
A significant proportion of households grow and sell (illegal) cannabis. Household income from this
source could increase by many times with controlled legalisation and international market access.
High potential cultivation zones, such as at Mhlanga (west of Marubeni) and Malungeni (west of
Ngqeleni) are well-located for access to large Mthatha food markets and future business opportunities
associated with the Wild Coast SEZ and air cargo facilities at Mthatha airport.
Future partnerships between NLM farmers and commercial entities being planned by DRDAR.
Opportunities for local production to supply school nutrition programme.
Niche opportunities, such as indigenous medicinal plants at Hluleka and essential oils.
However, the farming sector faces a number of challenges, such as:
Past interventions by DRDAR, AsgiSA, Ntinga etc have not created sustainable and profitable
agricultural production.
Large-scale irrigation from river water is limited by small areas of arable land next to perennial rivers.
Communal land tenure hinders investment by private capital.
Small farmers have inadequate access to farming knowledge and skills; water infrastructure; fencing;
mechanization; inputs (such as seedlings); finance and markets
The future priority is therefore to realise the potentials of the municipality through addressing the various
challenges.
A detailed prospectus for partners and investors should be prepared around agricultural development
opportunities in NLM, including Isitiya Youth Development Programme. This should be a broad-based
programme to unlock the potentials listed and involve a wide-range of partners.
NLM needs better agricultural interventions that can create and support profitable smallholder enterprises
(through, for example, CPPP’s, contract farming arrangements/outgrower schemes, and collection/aggregation
systems).
Forestry:

Large areas of NLM have moderate and good potential for forestry. There is already 7000 ha of indigenous forest
and 3000 ha of plantation forest
Community forestry initiatives are being pursued by Hans Merensky near Qumbu and near Lusikisiki (by Sappi).
ECRDA is involved. These companies could be interested in similar projects in NLM.
There are two main issues with community forestry. Firstly, the economic return to communities are fairly small
(long-term and small, particularly when there are hundreds of household beneficiaries). Secondly, afforestation
takes land away from other land uses (such as grazing and arable farming) that may offer better economic
returns.
Future community forestry projects should therefore be approached with due caution.
Community forestry projects demonstrate that CPPP’s can work. CPPP’s should be more prevalent in more
employment-intensive sectors.
Commerce and manufacturing:
NLM has a commercial sector, with shops in the two towns, six rural service centres/transport nodes and some
villages. The manufacturing sector is extremely small. Future priorities are:
Commercial property developments (see section below)
Upgrade of Transido complexes
Attraction of new incubators
Explore potential of light industry development (e.g. on new N2 Libode-Mthatha corridor).
Tourism:
NLM has considerable tourism development potential based on the eastern coastal escarpment and 20 km of
Wild Coast.
Priority for tourism development include:
Wild Coast Meander linked to new N2 at PSJ
Access roads from Meander to tourism nodes (Hluleka NR and Mdumbi etc)
Investment attraction to tourism nodes
Mdumbi hotel project
Mlengana Mountain ecotourism project
Ntlangano Conservancy project
Possible new hiking trail from Mlengana Mountain to Ntlangano
Property development:
There are many opportunities for private property development in NLM.
Future priorities are:
Resolve land claims speedily (with assistance from the Land Claims Commission)
NLM to do a state land audit and get access to state land for property development.
NLM to acquire communal land for development. DRDLR can assist with this.
Identify and prioritise land to be titled for private investment (such as coastal tourism nodes; transport
nodes; along development corridors and possibly high-potential agricultural zones). This will be in
preparation for the proposed ORTD Land and Economic Investment Summit planned for early 2018.

Start-ups, small/micro enterprises and co-operatives (SMME’s):
Small enterprises are found in all the sectors reviewed above, with great variation in incomes and formality.
Future priorities are:
Use e-connecting and e-learning to form local groups of people that share development interests, and
are experimenting with the possible.
Techniques of ABCD should be more widely known and practised
Virtual and physical (combined) enterprise incubators should be more ubiquitous than at present.
Pillar Five: An efficient and effective public sector with improved ability to give economic governance
leadership
Public sector institutions need to be strengthened to support the achievement of the other strategic objectives.
To achieve its developmental mandate the public sector must have strong leadership and much improved
management capabilities. NDP and ECPDP have proposals on how this can be achieved.
Economic governance leadership in NLM should have:
A well-informed about the economic issues facing NLM
A good understanding of the needs of stakeholders
A clear development vision and agenda
An ability to communicate these persuasively to relevant stakeholders.
An ability to leverage resources from state sector departments and state-owned entities (such as IDC
and PIC).

The strategy hinges on three dialectically inextricable intertwined components. These are:
a) Consolidate institutional stability and robustness
b) Accelerated quality and sustainable service delivery
c) Local economic growth and quality of life
These key components should, and do overlap, in terms of timing. However there is also some sequence in
terms of focus. The initial focus being on building a formidable municipal organisation; thus consolidate
institutional stability and robustness which will, as it is being consolidated, be able to contribute towards
improving living environments. The municipality will commit resources to ensure such institutional efficacy leads
to sound financial management, effective revenue generation and ultimately financial viability. In terms of
governance, although the municipality has managed to establish a functional intergovernmental relations cluster
system at both political and administrative levels, its impact in terms ensuring effective integrated development
planning and management and establishment institutional cohesion between the municipality and all other critical
role partners is still to be realised. The aim is to lobby all other local municipalities within the OR Tambo District
to institutionalize an intergovernmental regime that emphasized a district – wide municipal support system.
a) To support all municipalities in financial administration in order for them to be financially sustainable.
b) To support all municipalities on human resources related issues for the purposes of sound
management systems and a stable environment in terms of their labour force.
c) To support all municipalities in administration for the purpose of effective operations of Council
activities.
d) To support and assist all municipalities on technical issues in order for them to manage their projects
and to handle the technical aspects thereof.
e) To support and assist all municipalities in developing and reviewing their Integrated Development
Plans (IDPs) and the establishment of Performance Management Framework which embeds a
district-wide enjoinment
These programmes should in the main be an outcome of shared institutional knowledge and cross – municipal
– referencing in which outsourcing of certain support functions is the last resort. The ultimate vision is
establishment of a shared services centre towards a seamless district institutional regime. The Nyandeni Local
Municipality is not oblivious to the fact that current intergovernmental relations within OR Tambo District are
experiencing serious challenges.
Over and above this approach towards effective intergovernmental relations, the municipality will strengthen its
advocacy and lobbying capacity towards ensuring improvement of IRG. The strategic focus of such a system
should be the following key objectives. The other crucial element within this component is systematically building
public confidence and a reciprocal relationship between the municipality and its citizenry including all
stakeholders within its jurisdiction.
This will lead to an institutional service delivery efficacy where sustainable and quality service delivery should
lead to development of a law abiding, citizenry with high moral values. This stable economic and political
environment will also lead to improved livelihoods characterized by a healthy and skilled citizenry with high moral
values enjoying employment in a robust employment creating economy which will in turn lead to better payment
for services, better participation in the activities of the municipality, improved accountability by public
representatives and municipal administration to the community. This will lead to a municipality that is
characterized by improved financial viability, good governance, and qualitative public participation. Such a
municipality should be able to deliver services, regulate citizens and businesses, facilitate development, and
provide effective support to all Ward Committees and other organs of development to deepen democracy and
thus high levels of political stability.
All of this will have to happen in a context of, and reinforce effective intergovernmental relationships. This positive
feedback loop will deliver the vision of the municipality. The reversal of the positive feedback loop, anticipated

above, is a real possibility. If the municipality fails to consolidate itself as a robust institution, it will not be able to
accelerate service delivery, it will not be able to create the required environment for local economic growth, and
it will not be able to contribute towards improving living environments. In turn, livelihoods will not improve, leading
to high levels of unemployment with a generally unhealthy and unskilled citizenry with low moral values living in
poverty and a lawless local environment. This will in turn erode the legitimacy of the Nyandeni Local Municipality
as government. The institution will be characterized by citizen apathy, high levels of non-payment for services,
and deteriorating standards of governance. Corruption, in this context, will be inherent and possibly high labour
turn – over. Leadership will therefore have to strive to ensure that the feedback loop is not reversed. Difficult
choices will have to be made and unpopular strategies will be implemented, where necessary, in support of the
positive feedback loop.
In line with this line of strategic thinking, the strategic planning workshop developed a municipal scorecard as
presented below.
2. Strategic scorecard
The municipal strategic scorecard has been developed, aligned and incorporated into the IDP process. For
purposes of this strategic plan, it has not been reviewed. What has been done is a high – level assessment
against the national outcomes and the conclusion is that to a greater extent the scorecard covers all essential
components that should lead to the municipality achieving these national outcomes.
7.1 National outcomes
For easy reference under listed are the national outcomes alluded to above;
a) A responsive, accountable, effective and efficient local government system
b) A developmental – oriented public service and inclusive citizenry
c) Decent employment through inclusive economic growth
d) An efficient, competitive and responsive economic infrastructure network
e) Vibrant, equitable and sustainable rural communities and food security
f) Improve the quality of basic education
g) Improve health and life expectancy
h) All people in South Africa are and feel safe
i) Sustainable human settlements and improved quality of household life
j) A skilled capable workforce to support inclusive growth
7.2 Provincial priorities
The high- level assessment of the scorecard was also administered against the provincial objectives to check
the extent of confluence with the municipal strategic scorecard. For easy reference, these are listed below;
i. Provincial strategic objectives
a) Poverty eradication,
b) Agrarian transformation,
c) Diversification of manufacturing and tourism,
d) Massive infrastructure development,
e) Human resource development and
f) Public sector transformation.
ii. Provincial targets (indicators)
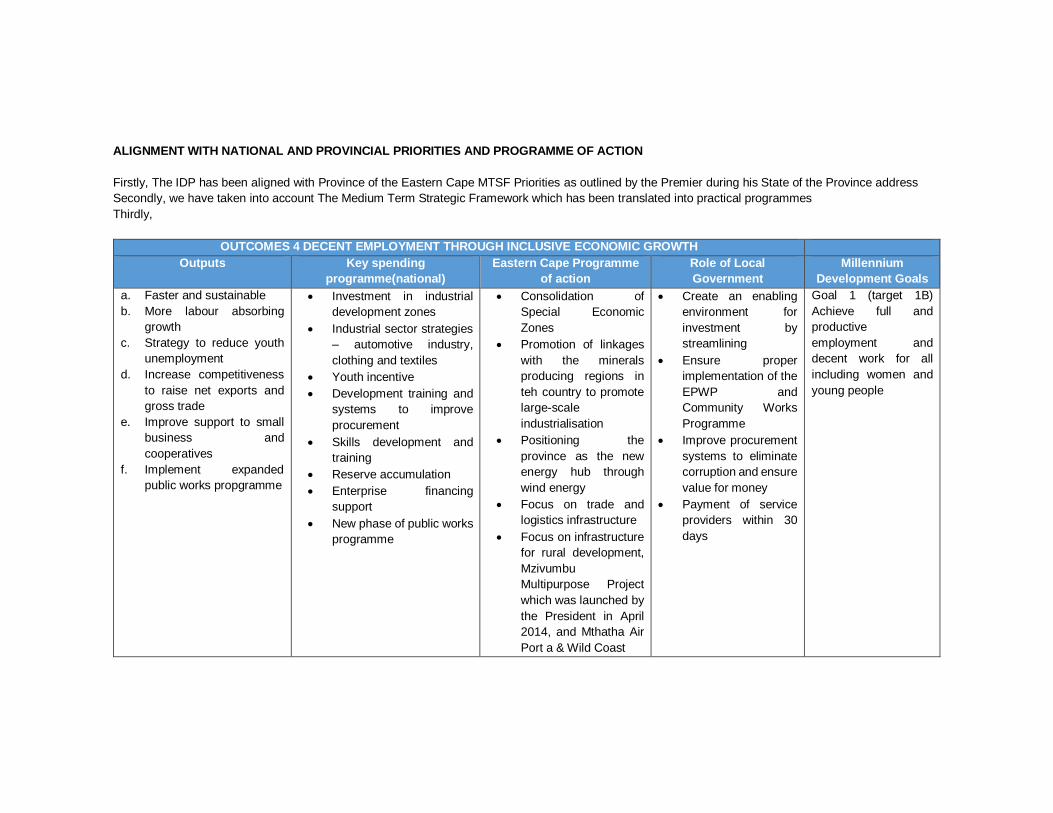
ALIGNMENT WITH NATIONAL AND PROVINCIAL PRIORITIES AND PROGRAMME OF ACTION
Firstly, The IDP has been aligned with Province of the Eastern Cape MTSF Priorities as outlined by the Premier during his State of the Province address
Secondly, we have taken into account The Medium Term Strategic Framework which has been translated into practical programmes
Thirdly,
OUTCOMES 4 DECENT EMPLOYMENT THROUGH INCLUSIVE ECONOMIC GROWTH
Outputs Key spending
programme(national)
Eastern Cape Programme
of action
Role of Local
Government
Millennium
Development Goals
a. Faster and sustainable
b. More labour absorbing
growth
c. Strategy to reduce youth
unemployment
d. Increase competitiveness
to raise net exports and
gross trade
e. Improve support to small
business and
cooperatives
f. Implement expanded
public works propgramme
Investment in industrial
development zones
Industrial sector strategies
– automotive industry,
clothing and textiles
Youth incentive
Development training and
systems to improve
procurement
Skills development and
training
Reserve accumulation
Enterprise financing
support
New phase of public works
programme
Consolidation of
Special Economic
Zones
Promotion of linkages
with the minerals
producing regions in
teh country to promote
large-scale
industrialisation
Positioning the
province as the new
energy hub through
wind energy
Focus on trade and
logistics infrastructure
Focus on infrastructure
for rural development,
Mzivumbu
Multipurpose Project
which was launched by
the President in April
2014, and Mthatha Air
Port a & Wild Coast
Create an enabling
environment for
investment by
streamlining
Ensure proper
implementation of the
EPWP and
Community Works
Programme
Improve procurement
systems to eliminate
corruption and ensure
value for money
Payment of service
providers within 30
days
Goal 1 (target 1B)
Achieve full and
productive
employment and
decent work for all
including women and
young people

Payment of Service
Providers within 30
days
Outcome 6 an efficient, competitive and responsive economic infrastructure network
Outputs Key spending
programme(national)
Eastern Cape
Programme of action
Role of Local Government Millennium
Development Goals
1. Improve competition
and regulation
2. Reliable generation,
distribution and
transmission of
energy
3. Maintain and expand
road and rail
network, and
efficiency, capacity
and competitiveness
of sea ports
4. Maintain bulk water
infrastructure and
ensure water supply
5. Information and
communication
technology
An integrated energy
plan successful
independent power
producers
Passenger Rail
Agency acquisition of
rail rolling
Focus on
infrastructure for
rural development,
Focus on trade
and logistics
infrastructure
Focus on
infrastructure for
rural
development,
Mzivumbu
Multipurpose
Project which
was launched by
the President in
April 2014, and
Mthatha Air Port
a & Wild Coast
Upgrading of R61
and N2
Ensure urban spatial plans provide for
commuter rail corridors, as well as
other modes of public transport
Improve maintenance of municipal
road network
Working together with Eskom and DNE
expand electrification to all households

OUTCOME 7: VIBRANT, EQUITABLE AND SUSTAINABLE RURAL COMMUNITIES AND FOOD SECURITY
Outputs Key spending
programme(national)
Eastern Cape
Programme of action
Role of Local Government Millennium
Development Goals
1. Sustainable agrarian
reform and improved
access to markets for
small farmers
2. Improve access to
affordable diverse
food
3. Improve rural
services and access
to information to
support livelihoods
4. Improve rural
employment
opportunities
5. Enable institutional
environment for
sustainable and
inclusive growth
1. Settle 7000 land
restitution claims
2. Redistribute
283 592ha of land use
3. Support emerging
farmers
4. Soil conservation
measures and
sustainable land use
management
5. Improve rural access
to services
Unleash Massive ploughing
programme in all wards to ensure
food security and good nutrition to
all households
Goal 7 (Target 7A)
Integrate the principles
of sustainable
development into
countries policies and
programmes and
reverse the loss of
environmental
resources
Goal 1 (Target 1C)
Halve, between 1990
and 2015, the
proportion of people
who suffer from hunger

INSTITUTIONAL SCORE-CARD
GOOD GOVERNANCE

STRATEGIC FOCUS AREA
5 YEAR STRATEGIC OBJECTIVE
OBJECTIVE NUMBER
MUNCIPAL STRATEGY
OUTCOME INDICATOR (5 YEARS)
OUTPUT INDICATOR 2020/2021
KPI NUMBER
Baseline 2020/2021 2021/2022 P
ub
lic P
arti
cip
atio
n To
strenghten public participation (with communities) by 2022
GG 01 Promote public participation through civic aducation and war rooms
Improved understanding of the Municipal Affairs by communities 30 June 2022
Number of civic education conducted by 30 June 2021
GG
01
KP
I 01
Four civic education conducted in 2018/19 financial year.
Conduct four civic education by 30 June 2021
Conduct four civic education by 30 June 2022
Pu
blic
Par
tici
pat
ion
To strenghten public participation (with communities) by 2022
GG 01 Decentralised intergovernmental relations through analysis of stakeholder participation by 30 June 2022
Annual Report on on Re established and assesed war rooms by June 30 2021
GG
01
KP
I 02
The war room were established and launched in all 32 wards but not functional
Re-establish and assess war rooms in all 32 Wards by 30 June 2021
Assess war rooms in all 32 wards and submit quarterly reports to council by 30 June 2022 (as part of section 52 (d) report)
Pu
blic
Par
tici
pat
ion
To strenghten public participation (with communities) by 2022
GG 01 Manage complaints and Petitions.
Reduced number of complaints and petitions
Number of complaints and petitions received and attended by 30 June 2021
GG
01
KP
I 03
Complaints register and petitions register is in place
Attend all complaints and petitions received and Update complaints and petition registers and submit report quarterly to
Attend all complaints and petitions received and Update complaints and petition registers and submit report quarterly to

Council (as part of section 52 (d) report) by 30 June 2021
Council (as part of section 52 (d) report) by 30 June 2022
Pu
blic
Par
tici
pat
ion
To strengthen public participation (with communities) by 2022
GG 01 Stakeholder engagement and mobilization
Improved ward committee and community participation in the processes of the municipality by 30 June 2022
Number of Ward committee sittings and community Meetings held by 30 June 2021
GG
01
KP
I 04
Public participation policy is in place and Ward committees are established in all 32 wards
Coordinate 12 ward committee sittings and four community meetings by 30 June 2021
Coordinate 12 ward committee sittings and four community meetings by 30 June 2022
Pu
blic
Par
tici
pat
ion
To strengthen public participation (with communities) by 2022
GG 01 Stakeholder engagement and mobilization
Improved ward committee and community participation in the processes of the municipality by 30 June 2022
Number of IDP & Budget Public Hearings conducted by 30 June 2021
GG
01
KP
I 05
IDP and Budget Public Hearings are conducted annually
Conduct 1 IDP & Budget Public Hearing by June 2021
Conduct 1 IDP & Budget Public Hearing by June 2022
Pu
blic
Par
tici
pat
ion
To strengthen public participation (with communities) by 2022
GG 01 Monitoring and implementation of IDP
Improved ward committee and community participation in the processes of the
Number of community outreach and imbizo programmes conducted
GG
01
KP
I 06
Mayoral Imbizo and outreach are conducted annually
Conduct 2 mayoral Imbizo’s (mid year and annual report) by 30 June 2021
Conduct 2 mayoral Imbizo’s (mid year and annual report) by 30 June 2022

municipality by 30 June 2022
by 30 june 2019
Mu
nic
ipal
Pla
nni
ng To provide
intergrated municipal planning by 2022
GG
02
Conduct community outreach, Imbizo and development of IDP
Approved and monitored implementation of IDP by Council
Approved IDP by Council by 30 June 2020/2021 financial year G
G 0
2 K
PI 0
7
IDP for 2019/2021 was adopted by Council in May 2019
Conduct annual IDP and Budget review for 2021/22 Financial year
Conduct annual IDP and Budget review for 2022/23 Financial year
To provide integrated municipal planning by 2022
GG
02
Strategic Planning session for IDP Review
Approved and monitored implementation of IDP by Council
Approved IDP by Council by 30 June 2021 (for 2021/20 22 financial year)
GG
02
KP
I 08
Strategic palnning held for IDP development review for 2020/2021 Financial Year
convene strategic planning for IDP Review by 30 June 2021
convene strategic planning for IDP Review by 30 June 2022
To provide integrated municipal planning by 2022
GG
02
Community Salinification Survey
Approved and monitored implementation of IDP by Council
number of Customer satisfaction survey
GG
02
KP
I 09
the last survey was conducted in 2017
Conduct 2 community satisfaction survey by 30 June 2021
Conduct 2 community satisfaction survey by 30 June 2022

GG
02
Improve coordination and collaboration on service delivery by all 3 spheres of government through intergovernmental relations
Improved participation by all sector departments through integration of plans on IDP.
Number of IGR Fora conducted by 30 June 2021
GG
02
KP
I 10
IGR fora convened in the 2019/2020 Financial year
Conduct three (3) IGR fora by 30 June2021
Conduct three (3) IGR fora by 30 June 2022
GG
02
Improve coordination and collaboration on service delivery by all 3 spheres of government through intergovernmental relations
Improved participation by all sector departments through integration of plans on IDP.
Number Convene of economic and infrastructure development Cluster meetings convened by 30 June 2021 G
G 0
2 K
PI 1
1
IGR fora convened in the 2019/2020 Financial year
Convene four(4) economic and infrastructure development Cluster by 30 June 2021
Convene four(4) economic and infrastructure development Cluster by 30 June 2022
GG
02
Improve coordination and collaboration on service delivery by all 3 spheres of government
Improved participation by all sector departments through integration of plans on IDP.
Number of Governance and administration cluster meetings convened
GG
02
KP
I 12
IGR fora convened in the 2019/2020 Financial year
Convene four (4) Governance and administration cluster meetings 30 June2021
Convene four (4) Governance and administration cluster meetings 30 June2022
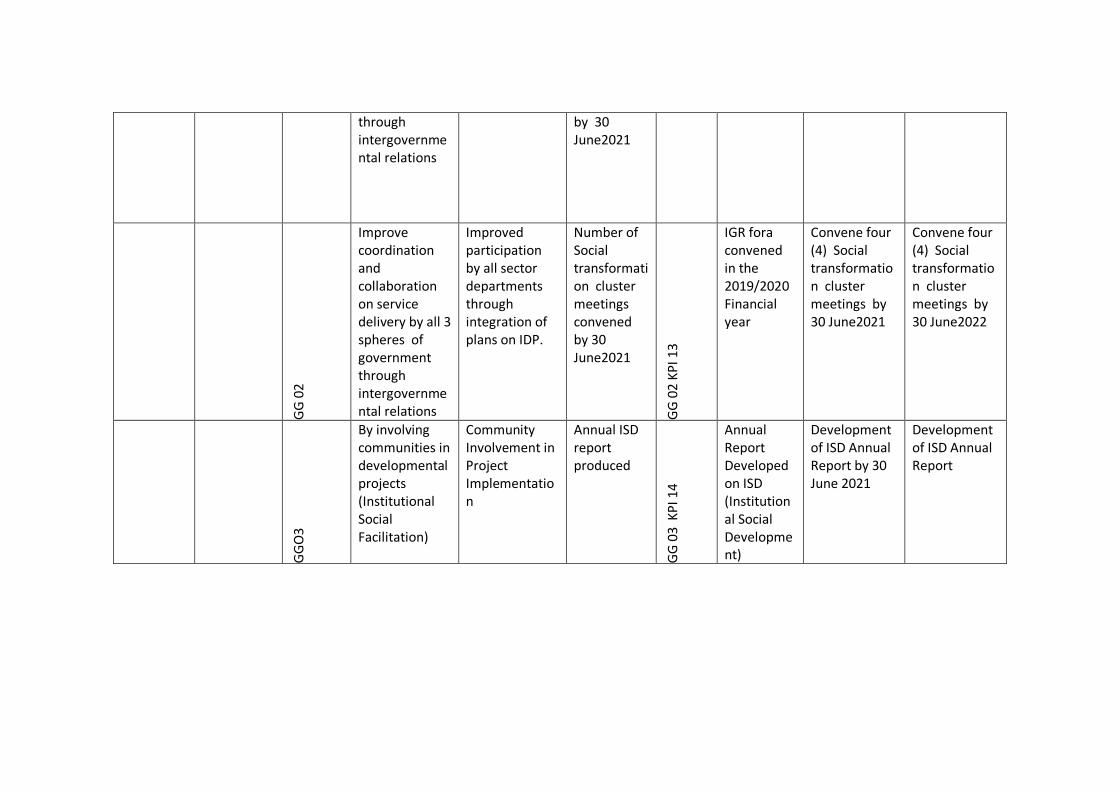
through intergovernmental relations
by 30 June2021
GG
02
Improve coordination and collaboration on service delivery by all 3 spheres of government through intergovernmental relations
Improved participation by all sector departments through integration of plans on IDP.
Number of Social transformation cluster meetings convened by 30 June2021
GG
02
KP
I 13
IGR fora convened in the 2019/2020 Financial year
Convene four (4) Social transformation cluster meetings by 30 June2021
Convene four (4) Social transformation cluster meetings by 30 June2022
GG
O3
By involving communities in developmental projects (Institutional Social Facilitation)
Community Involvement in Project Implementation
Annual ISD report produced
GG
03
KP
I 14
Annual Report Developed on ISD (Institutional Social Development)
Development of ISD Annual Report by 30 June 2021
Development of ISD Annual Report

Lega
l Ser
vice
s an
d B
y-la
ws
To administer legal matters and By-laws by 2022
GG
04
m Better management of litigations through maintainance of a litigation register by June 2022
Updated litigation register by 30 June 2021
GG
04
KP
I 01
5
Litigation register is in place
Update litigation register on old and new cases and submit it to council quarterly as part Section 52 (d) by 30 June 2021
Update litigation register on old and new cases and submit it to council quarterly as part Section 52 (d) by 30 June 2022
G
G 0
4
Develop institutional contract management policy and procedure manual
Legally compliant municipal contracts for all departments
Developed institutional contract management and procedure manual
GG
04
KP
I 01
6
Contract management policy and procedure manual in place
Review institutional contract management policy and procedure manual by 30 June 2021
Review institutional contract management policy and procedure manual by 30 June 2022
GG
04
Coordinate development and review of by-laws.
law and order through enforcement of by-law by 30 June 2022
Gazetted by-laws by 30 June 2021
GG
04
KP
I 017
20 By-laws gazetted
Review five (5) Municipal By-laws by 30 June 2021
Review Five (5) Municipal By-laws by 30 June 2022

GG
04
Develop and Review the delegation register and standing rules and orders
Approved System of Delegations and standing rules and orders by 2022
Approved System of Delegations and Standing Rules and orders by 30 June 2021
GG
04
KP
I 01
8
System of delegation and standing rules and orders are in place and reviewed annually
Review the System of Delegations and Standing Rules and Orders by 30 June 2021
Review the System of Delegations and Standing Rules and Orders by 30 June 2022
Co
mm
uni
cati
on
, pu
blic
ity
and
m
arke
tin
g.
To provide publicity, marketing and media coordination to citizens by 30 June 2022
GG
05
Marketing and branding of municipality.
Access to information and contribution to own revenue regeneration
number of strategic access areas branded; signage installed and branded municipal assets by 30 June 2020 G
G 0
5 K
PI 0
19
marketing and branding is ongoing
1. Install bill boards to strategic points to enhance revenue by 30 June 2021
1. Install signage to key service nodes 2.brand municipal assets to be in line with logo and vision by 30 June 2022
Co
mm
un
icat
ion
, p
ub
licit
y an
d
mar
keti
ng.
To provide publicity, marketing and media coordination to citizens by 30 June 2022 G
G 0
5
Marketing and branding of municipality.
Access to information and contribution to own revenue regeneration
Number of billboards installed by 30 June 2020
GG
05
KP
I 020
Municipality has no billboard in place
Report on installation of billboards by 30 June 2021

Co
mm
uni
cati
on
, pu
blic
ity
and
mar
keti
ng.
To provide publicity, marketing and media coordination to citizens by 30 June 2022
GG
05
Provide accurate, timely and reliable information.
communicate programme and service delivery of the municipality through newsletters by 30 June 2022
Number of newsletters produced and published and distributed by 30 June 2021 G
G 0
5 K
PI 0
21
4 quarterly newsletters are published and distributed annually
Produce and publish 4 quarterly newsletters and distribute 40 000 copies by 30 June 2021
Produce and publish 4 quarterly newsletters and distribute 40 000 copies by 30 June 2022
Inte
rnal
Au
dit
Ser
vice
s
To strengthen internal controls by 30 June 2022
GG
06
Conduct assurance and consulting audits
Guided internal Audit Unit and Audit Committee functioning through approved annual audit committee charter, annual internal audit charter and annual internal audit plan by June 2022
Approved annual audit committee charter, annual internal audit charter and annual internal audit plan by 30 June 2021
GG
06
KP
I 022
Annual audit committee charter, annual internal audit charter and annual internal audit plan for 2019/2020 financial year are in place
Review Audit Committee Charter, Internal Audit Charter and Internal Audit Plan and submit to audit committee by 30 June 2021
Review Audit Committee Charter, Internal Audit Charter and Internal Audit Plan and submit to audit committee by 30 June 2022
Inte
rnal
Au
dit
Se
rvic
es
To strengthen internal controls by 30 June 2022 G
G 0
6
Conduct assurance and consulting audits
Improved internal controls, systems and procedures by 30 June 2022
Number of internal audit unit reports carried out as per Audit G
G 0
6 K
PI 0
23
Internal audit plan had 16 audits in the 2018/19 FY
Carry out and report on 16 audit projects as listed in the internal audit plan for the
Carry out and report on 16 audit projects as listed in the internal audit plan for the

plan by 30 June 2021
year ending 30 June 2021
year ending 30 June 2022
Inte
rnal
Au
dit
Ser
vice
s
To strengthen internal controls by 30 June 2022
GG
06
Provide support to oversight structures.
effective and efficient oversight through improved audit outcomes by 30 June 2022
Number of audit committee meetings convened by 30 June 2021
GG
06
KP
I 02
4
6 Audit committee meetings held in the 2018/19 financial year
Convene 6 audit committee meetings to perform oversight on Municipal internal controls through internal audit reports by 30 June 2021
Convene 6 audit committee meetings to perform oversight on Municipal internal controls through internal audit reports by 30 June 2022
Inst
itu
tio
nal
Ris
k M
anag
emen
t
To strengthen risk management processes within the municipality by 30 June 2022
GG
07
Identify, assess, mitigate and monitor municipal risks
Guided risk management processes through approved risk management strategy, policy, risk register, risk profile and risk management
Reviewed risk management profile, risk management charter and risk management framework by 30 April 2021 G
G 0
7 K
PI 0
25
Risk management profile, risk management charter and risk management framework for 2019/20 financial
Review Risk management profile , risk management charter and risk management framework by 30 June 2021
Review Risk management profile , risk management charter and risk management framework by 30 June 2022

charter by 30 June 2022
year are in place
Inst
itu
tio
nal
Ris
k M
anag
emen
t To strengthen risk management processes within the municipality by 30 June 2022
GG
07
Identify, assess, mitigate and monitor municipal risks
Mitigated fraud and corruption by 30 June 2022
Approved fraud risk management policy, fraud risk management plan and whistle blowing policy by 30 April 2021 G
G 0
7 K
PI 0
26
Fraud management systems are in place
Review fraud risk management policy, fraud risk management plan and whistle blowing policy by 30 June 2021
Review fraud risk management policy, fraud risk management plan and whistle blowing policy by 30 June 2022
Inst
itu
tio
nal
Ris
k M
anag
emen
t
To strengthen risk management processes within the municipality by 30 June 2022 G
G 0
7
Identify, assess, mitigate and monitor municipal risks
Mitigated fraud and corruption by 30 June 2022
Number of anti-fraud awareness campaigns conducted by 30 June 2021
GG
07
KP
I 02
7
Fraud management systems are in place
Conduct 2 anti-fraud awareness campaigns by 30 June 2021
Conduct 2 anti-fraud awareness campaigns by 30 June 2022

Inst
itu
tio
nal
Ris
k M
anag
emen
t
To strengthen risk management processes within the municipality by 30 June 2022 G
G 0
7
Provide support to risk management committee .
Mitigate risk to desired risk rating (low) by 30 June 2022
Number of risk committee management meeting convened by 30 June 2020
GG
07
KP
I 02
8
Risk committee is in place
Convene 4 risk management committee meetings by 30 June 2021
Convene 4 risk management committee meetings by 30 June 2022
Co
un
cil A
ffai
rs
To strengthen effective and efficient performance of council by 30 June 2022
GG 08 Provide political oversight on municipal functions and programs
Effective and efficient oversight through improved reports by 30 June 2022
Number of Standing Committee meetings convened per each committee by 30 June 2021 G
G 0
8 K
PI 0
29
Council committees are in place
Convene six (6) Standing Committee meetings per each committee by 30 June 2021
Convene six (6) Standing Committee meetings per each committee by 30 June 2022
Co
un
cil A
ffai
rs
To strengthen effective and efficient performance of council by 30 June 2022
GG 08 Provide political oversight on municipal functions and programs
Effective and efficient oversight through improved reports by 30 June 2022
Number of ordinary and special Executive Committee Meetings convened by 30 June 2021 G
G 0
8 K
PI 0
30
Executive Committee has been elected and functional
Convene four ordinary and seven special executive committee meetings by 30 June 2021
convene four ordinary and seven special executive committee meetings by 30 June 2022

Co
un
cil A
ffai
rs
To strengthen effective and efficient performance of council by 30 June 2022
GG 08 Provide political oversight on municipal functions and programs
Effective and efficient oversight through improved reports by 30 June 2022
Number of ordinary and special Council sittings convened by 30 June 2020
GG
08
KP
I 03
1
Council is elected and functional
Convene four ordinary and seven special council sittings by 30 June 2021
Convene four ordinary and seven special council sittings by 30 June 2022
Co
un
cil A
ffai
rs
To strengthen effective and efficient performance of council by 30 June 2022 G
G08
Open Council Meeting
Effective and efficient oversight through improved reports by 30 June 2022
Number of open council meetings held by 30 June 2021
GG
08
KP
I 03
2
Public participation policy in place
hold open Council meeting by 30 June 2021
hold open Council Meeting at Libode by 30 June 2022
Co
un
cil A
ffai
rs
To strengthen effective and efficient performance of council by 30 June 2022 GG
08
Improved Governance and decision making
Number of Council Capacity Buildings programmes supported by 30 June 2021
GG
08
KP
I 033
Council capacity building is ongoing
Provide two capacity building programmes for councillors by 30 June 2021
Provide two capacity building programmes for councillors by 30 June 2022

Co
un
cil A
ffai
rs
To strengthen effective and efficient performance of council by 30 June 2022
GG 08 Provide political oversight on municipal functions and programs
Effective and efficient oversight through improved reports by 30 June 2022
Number of Section 79 committee meetings convened by 30 June 2021
GG
08
KP
I 03
4
Section 79 committees in place (women's caucus, public participation and petitions management committee members ‘interest, Municipal Public Accounts Committee)
Convene 16 section 79 committee meetings (in total) by 30 June 2021
Convene 16 section 79 committee meetings (in total) by 30 June 2022
Inst
itu
tio
nal
P
erfo
rman
ce
Man
agem
ent
To provide a system for measuring institutional performance by 30 June 2022 G
G 0
9
Develop tools and mechanisms to manage institutional performance
Incremental implementation of IDP annually
Approved SDBIP by Mayor by 30 June 2020/ 2021
GG
09
KP
I 036
SDBIP for 2019/20 has been approved
Develop and approve SDBIP by 30 June 2021
Develop and approve SDBIP by 30 June 2022
Inst
itu
tio
nal
P
erfo
rman
ce
Man
agem
ent
To provide a system for measuring institutional performanc
GG09 Receive unqualified audit opinion with no matters of emphasis
realisation of good corporate governance principles
unqualified audit opinion with no material findings for
GG
09
KP
I 037
Received unqualified audit opinion with matters
Obtain unqualified audit opinion for 2019/20 audit
Obtain unqualified audit opinion for 2020/21 audit

e by 30 June 2022
2019/20 Audit
(2018/19 FY)
Inst
itu
tio
nal
P
erfo
rman
ce
Man
agem
ent
To provide a system for measuring institutional performance by 30 June 2022
GG
09
By complying with MFMA /MSA and related regulations, S52(d), S72, S121 & MSA 46 reports
compliance with National Treasury regulations, and standards
Number of MFMA & MSA reports submitted by 30 June 2021
GG
09
KP
I 03
8
Reports have been compiled for 2018/19 Financial year
Compilation of MFMA section 52(D), S72, S121 and Section 46 reports by 30 June 2021
Compilation of MFMA section 52(D), S72, S121 and Section 46 reports by 30 June 2022
Inst
itu
tio
nal
Per
form
ance
M
anag
emen
t
To provide a system for measuring institutional performance by 30 June 2022
GG
09
By Implementing Performance Management System through formal assessment for S56 managers
compliance with National Treasury regulations, norms and standards
Number of Section 56 Managers assessed for annual performance 2019/20
GG
09
KP
I 039
Annual Performance assessment was conducted for the year ending 30 June 2018
Conduct formal assessment for annual performance 2019/2020 financial year by 30 June 2021
Conduct formal assessment for annual performance 2020/2021 financial year by 30 June 2022
Inst
itu
tio
nal
P
erfo
rman
ce
Man
agem
ent
To provide a system for measuring institutional performance by 30 June 2022
GG
09
compliance with National Treasury regulations, norms and standards
Number of Section 56 Managers assed for Mid Year Performance by set
GG
09
KP
I 04
0
Annual Performance assessment conducted for 2018/19
Conduct formal assessment for Mid- year for senior Managers 2020/21 Financial year
Conduct formal assessment for Mid- year for senior Managers 2021/2022 Financial year
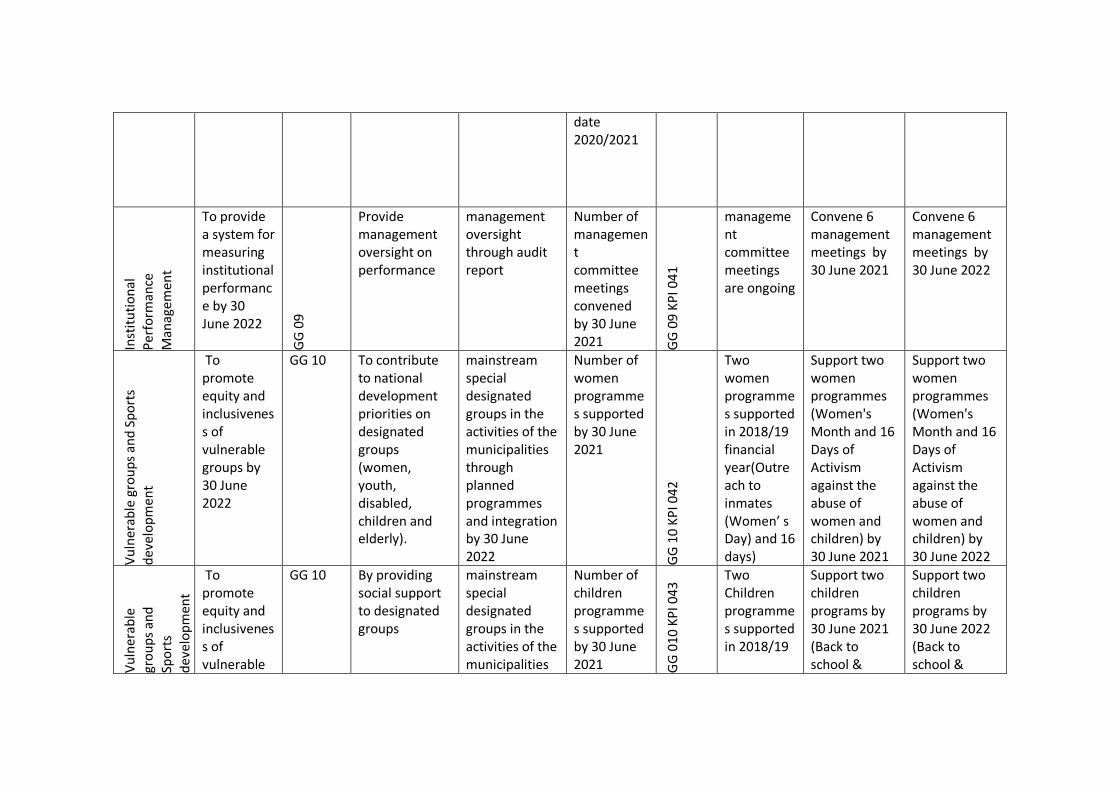
date 2020/2021
Inst
itu
tio
nal
P
erfo
rman
ce
Man
agem
ent
To provide a system for measuring institutional performance by 30 June 2022
GG
09
Provide management oversight on performance
management oversight through audit report
Number of management committee meetings convened by 30 June 2021 G
G 0
9 K
PI 0
41
management committee meetings are ongoing
Convene 6 management meetings by 30 June 2021
Convene 6 management meetings by 30 June 2022
Vu
lner
able
gro
up
s an
d S
po
rts
dev
elo
pm
ent
To promote equity and inclusiveness of vulnerable groups by 30 June 2022
GG 10 To contribute to national development priorities on designated groups (women, youth, disabled, children and elderly).
mainstream special designated groups in the activities of the municipalities through planned programmes and integration by 30 June 2022
Number of women programmes supported by 30 June 2021
GG
10
KP
I 042
Two women programmes supported in 2018/19 financial year(Outreach to inmates (Women’ s Day) and 16 days)
Support two women programmes (Women's Month and 16 Days of Activism against the abuse of women and children) by 30 June 2021
Support two women programmes (Women's Month and 16 Days of Activism against the abuse of women and children) by 30 June 2022
Vu
lner
able
gr
ou
ps
and
Spo
rts
dev
elo
pm
ent
To promote equity and inclusiveness of vulnerable
GG 10 By providing social support to designated groups
mainstream special designated groups in the activities of the municipalities
Number of children programmes supported by 30 June 2021 G
G 0
10
KP
I 043
Two Children programmes supported in 2018/19
Support two children programs by 30 June 2021 (Back to school &
Support two children programs by 30 June 2022 (Back to school &

groups by 30 June 2022
through planned programmes and integration by 30 June 2022
financial year w
Christmas gifts)
Christmas gifts)
Vu
lner
able
gro
up
s an
d S
po
rts
dev
elo
pm
ent
To promote equity and inclusiveness of vulnerable groups by 30 June 2022
GG 10 By providing social support to designated groups
mainstream special designated groups in the activities of the municipalities through planned programmes and integration by 30 June 2022
Number of elderly persons supported by 30 June 2021
GG
01
0 K
PI 0
44
Two Elderly programs supported (golden games and Christmas gifts)
Support two elderly programs by 30 June 2021 (Golden Games & Christmas gifts)
Support two elderly programs by 30 June 2022 (Golden Games & Christmas gifts)
Vu
lner
able
gro
up
s an
d S
po
rts
dev
elo
pm
ent
To promote equity and inclusiveness of vulnerable groups by 30 June 2022
GG 10 By providing social support to designated groups
mainstream special designated groups in the activities of the municipalities through planned programmes and integration by 30 June 2022
Number of youth programs supported by 30 June 2021
GG
01
0 K
PI 0
45
Hosted miss Nyandeni and Youth month for 2018/19 financial year
Support two Youth programs by 30 June 2021 (Miss Nyandeni & Youth Month commemoration)
Support two Youth programs by 30 June 2022 (Miss Nyandeni & Youth Month commemoration)

Vu
lner
able
gro
up
s an
d S
po
rts
dev
elo
pm
ent
To promote equity and inclusiveness of vulnerable groups by 30 June 2022
GG 10 By providing social support to designated groups
Mainstream special designated groups in the activities of the municipalities through planned programmes and integration by 30 June 2022
Number of Disabled persons programs supported by 30 June 2021
GG
01
0 K
PI 0
46
Two programmes for people with disabilities supported in the 2018/19 Financial year
Support two disabled programs by 30 June 2021 (support one project & facilitate training) by 30 June 2021
Support two disabled programs by 30 June 2021 (support one project & facilitate training) by 30 June 2022
Vu
lner
able
gro
up
s an
d S
po
rts
dev
elo
pm
ent
To promote equity and inclusiveness of vulnerable groups by 30 June 2022
GG 10 By providing social support to designated groups
mainstream special designated groups in the activities of the municipalities through planned programmes and integration by 30 June 2022
Number of sporting codes supported by 30 June 2021
GG
010
KP
I 047
Supported 4 sporting programmes (Mayor's Cup, Human rights Marathon, Ntlaza rugby tournament and Horse racing for 2018/19 financial year
Support three sporting programs (Mayors' cup, marathon, Ntlaza Rugby development and horse racing) by 30 June 2021
Support three sporting programs (Mayors' cup, marathon, Ntlaza Rugby development and horse racing) by 30 June 2022

HIV/AIDS & Health Matters
To contribute towards reduction & the spread of communicable and Non communicable diseases by 30 June 2022
GG 11 Provide support to Ward based support groups.
Empowered support groups by 30 June 2022
Number of support groups provided with equipment and capacitated by 30 June 2021
GG
01
1 K
PI 0
48
Local AIDS Council and database for support groups is in place.
Implement HIV/Aids guidelines by Providing material, equipment and seedlings to 8 ward support groups by 30 June 2021
Implement HIV/Aids guidelines by Providing support to vulnerable groups. (material, equipment and seeds) by 30 June 2022
HIV/AIDS & Health Matters
To contribute towards reduction & the spread of communicable and Non communicable diseases by 30 June 2022
GG 11 By engaging with relevant departments, NGO’s and Local Aids Council Sittings
Guided support groups through programs by 30 June 2022
Reviewed guidelines for HIV/Aids support groups by 30 June 2021
GG
011
KP
I 049
Approved guidelines for support groups in place
Review HIV/Aids guidelines for support groups by 30 June 2021
Review HIV/Aids guidelines for support groups by 30 June 2022

HIV/AIDS & Health Matters
To contribute towards reduction & the spread of communicable and Non communicable diseases by 30 June 2022
GG 11 Conduct awareness campaigns through Inkciyo, uKuthwala and Circumcision . (Education, information and support)
Reduce Communicable disease infection by 30 June 2022
Number of Awareness Campaigns conducted by 30 June 2021
GG
01
1 K
PI 0
50
4 Awareness campaigns conducted in 2018/19 financial year
Conduct 4 awareness campaigns on communicable diseases, non communicable diseases, Inkciyo and Initiation by 30 June 2021
Conduct 4 awareness campaigns on communicable diseases, non communicable diseases, Inkciyo and initiation. by 30 June 2022
Emergency &Social Relief
To assist communities interim emergency programmes (when need arises)
GG
12
provide interim support to disaster and special destitute responses (when need arises)
provision of community safety and stability whilst seeking long-term solutions through disaster risk mitigation by 30 June 2022
Annual Report on interim support provided for disaster and special destitute by 30 June 2021
GG
012
KP
I 051
emergency relief intervention conducted annually.
Annually reporting on interim support to disaster and special destitute response (when need arises)
Annually reporting on interim support to disaster and special destitute response (when need arises)
Moral Regeneration
To promote Social cohesion
GG 13 Provide support to moral regeneration programmes
Promotion of social Cohesion by 2022
Annual report on support provided to moral regeneration G
G 1
3 K
PI 0
52
Moral regeneration structure in place
Provide support to Moral Regeneration program as per action
Provide support to Moral Regeneration program as per action

programme by 30 June 2021
plan by 30 June 2021
plan by 30 June 2022

FINANCIAL VIABILITY

Stra
tegi
c Fo
cus
Are
a
5 Year Objective
Ob
ject
ive
N
um
be
r
Programmes/Projects/Strategies
Outcomes Indicator(5 year indicator) In
dic
ato
r N
um
be
r
Output Indicater(2020-2021)
Baseline Annual Targets
Annual Target 2020/2021
Annual Target 2020/2022
Re
ven
ue
Man
age
me
nt
To increase own revenue by 40% in 2022
FV01
Review and implement intergrated Revenue enhancement strategy
Increased own Revenue Base by 40%
FV01
-KP
1
Approved Report on reviewed and implemented Integrated Revenue Enhancement Strategy by 30 June 2021
Approved Revenue Enhanacement Strategy is in place
Review and Implement Integrated Revenue Enhancement Strategy by 30 June 2021
Report on increased own revenue by 40% by 30 June 2022
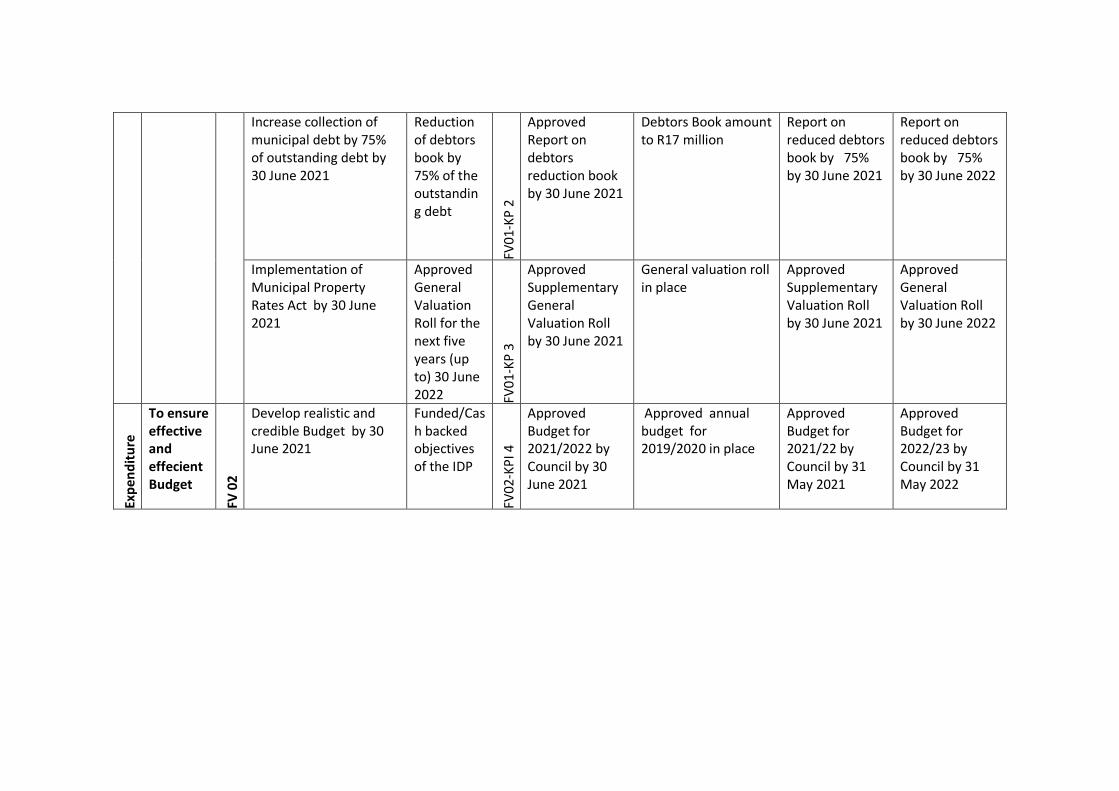
Increase collection of municipal debt by 75% of outstanding debt by 30 June 2021
Reduction of debtors book by 75% of the outstanding debt
FV0
1-K
P 2
Approved Report on debtors reduction book by 30 June 2021
Debtors Book amount to R17 million
Report on reduced debtors book by 75% by 30 June 2021
Report on reduced debtors book by 75% by 30 June 2022
Implementation of Municipal Property Rates Act by 30 June 2021
Approved General Valuation Roll for the next five years (up to) 30 June 2022 FV
01-
KP
3
Approved Supplementary General Valuation Roll by 30 June 2021
General valuation roll in place
Approved Supplementary Valuation Roll by 30 June 2021
Approved General Valuation Roll by 30 June 2022
Exp
end
itu
re
man
agem
en
t
To ensure effective and effecient Budget
FV 0
2
Develop realistic and credible Budget by 30 June 2021
Funded/Cash backed objectives of the IDP
FV02
-KP
I 4
Approved Budget for 2021/2022 by Council by 30 June 2021
Approved annual budget for 2019/2020 in place
Approved Budget for 2021/22 by Council by 31 May 2021
Approved Budget for 2022/23 by Council by 31 May 2022

and Expenditure management
Adhere to budget reforms and DoRA as per MFMA calendar by 30 June 2021
Budget returns, s 52(d) s71, s72 B schedule, and C schedule submitted to Council, Provinical Treasury and National Treasury as per MFMA calendar FV
02-
KP
I 5
Preparation and submission Budget returns, s 52(d) s71, s72 B schedule, and C schedule as per MFMA calendar by 30 June 2021
Complied with MFMA statutoy reporting in 2019/2020
Preparation and submission Budget returns, s 52(d) s71, s72 B schedule, and C schedule as per MFMA calendar
Preparation and submission Budget returns, s 52(d) s71, s72 B schedule, and C schedule as per MFMA calendar
100% spent on on all grants received by the municipality
FV02
-KP
I 6
100% spent on EPWG,MIG,FMG,INEP, STRP(small town revitalisation programme) by 30 June 2021
100% Expenditure on EPWG(Expanded Public Works Grant),MIG,FMG,INEP by 30 June 2020
100% spent on EPWG,MIG,FMG,INEP, STRP(small town revitalisation programme) by 30 June 2021
100% spent on EPWG,MIG,FMG,INEP, STRP(small town revitalisation programme) by 30 June 2022
Payment of creditors within 30 days from receipt of invoice.
Compliance with MFMA S65(2) by 30 June 2022
FMV
02-K
PI 7
100% payment of all invoices paid within 30 days by 30 June 2021
Creditors are paid within 30 days
100% Payment of all invoices paid within 30 days by 30 June 2021
Compliance with MFMA S65(2) by 30 June 2022

Ass
et
man
agem
ent
To ensure proper management of municipal assets
FV 0
3
Compile and update the GRAP compliant Asset Register
GRAP Compliant Asset Register by 30 June 2022 FV
03
-KP
I 8
Updated GRAP Compliant Asset Register by 30 June 2021
2018/2019 GRAP compliant Asset register in place
Compile and update GRAP Compliant Asset Register by 30 June 2021
Compile and update GRAP Compliant Asset Register by 30 June 2022
Safeguard the municipal assets through Insurance and provision of adequate security
Municipal assets insured by 30 June 2022
FV 0
3-K
PI 9
Annual Report on insured municipal assets by 30 June 2021
All municipal assets are insured
Monitor and Report on number of Municipal assets insured by 30 June 2021
Monitor and Report on number of Municipal assets insured by 30 June 2022
To enhance internal controls measures in terms of managing Municipal Fleet.
Fully functional and available municipal fleet to enable departments to function effectively FV
03
-KP
I 10
Implemented fleet management policy and procedures by 30 June 2021
Fleet management Policy and Procedures in place
Implement the fleet management policy and procedure by 30 June 2021
Implement the fleet management policy and procedure by 30 June 2022

Sup
ply
Ch
ain
Man
age
men
t To implement and maintain a fair, equitable and cost effective supply chain management system
FV 0
4
Comply with SCM Policy and regulations on acquisition of goods and services
Complied with SCM Policy and Regulations by June 2022
FV 0
3-K
PI 1
1
Number of reports on the implementation of the SCM policy prepared and submitted to Council, PT and NT by 30 June 2021
Reports on implementation of the SCM policy are submitted quarterly to Council, PT and NT
Quarterly Reports on implementation of the SCM policy and regulations to Council, PT and NT by 30 June 2021
Quarterly Reports on implementation of the SCM policy and regulations to Council, PT and NT by 30 June 2022
Strengthen administration of contract management
Proper monitoring of contracts by June 2022
FV 0
4-K
PI 1
2
Number of Maintained contracts and commitments register by June 2021
Contract register is kept and mantained
Quarterly Reports on maintained contracts and commitments register by 30 June 2021
Quarterly Reports on maintained contracts and commitments register by 30 June 2021
Co-ordinate development of municipal procurement plan, monitor implementation and report thereof
Approved procurement plans for implementation for enhanced service delivery by June 2022
FMV
04
-KP
I 13
Procurement plan developed and implemented by June 2021 and report on progress
Procurement plans developed and implemented in 2019/2020 financial year
Develop and implement Procurement plan by 30 June 2021
Implement procurement plan for 2020/2021 and develop Procurement plan for 2021 -22 financial year by 30 June 2021

Establish and maintain the inventory storage system
Proper management of stores by June 2022
FV 0
4-K
PI 1
4
Fully functional Stores Module on ProMun by 30 June 2021
Stock is reconciled manually
Reports on recording and reconciliation of inventory by 30 June 2021
Reports on recording and reconciliation of inventory by 30 June 2022
Fin
anci
al R
ep
ort
ing
To comply with the provisions of MFMA , norms and standard of
FV 0
5
Develop GRAP Compliant Annual Financial Statements (AFS) annually
Compliance with MFMA (S122) by 31 August after end of each financial year
FV 0
5-K
PI 1
5
Submitted of AFS (19/20) to Treasury, Auditor General by 31 August 2020
GRAP AFS submitted to AG by 31st August 2019.
Prapare AFS for 2019/2 0 and submit to Auditor General, Provincial Treasury and National Treasury by 31 August 2021
Prapare AFS for 2020/21 and submit to Auditor General, Provincila Treasury and National Treasury by 31 August 2021

National Treasury
Implement intergration of MSCOA into the system as per Treasury requirements
Compliance with MSCOA by 30 June 2022
FV 0
5-K
PI 1
6
Submission of mSCOA compliant reports to both Provincial Treasury and national Treasury as per MFMA calendar and number of trainings conducted on MSCOA change management by 30 June 2021
SCOA implementation plan is in place
Submit mSCOA reports to both Provincial Treasury and National Treasury as per MFMA calendar by 30 June 2021
Submit mSCOA reports to both Provincial Treasury and National Treasury as per MFMA calendar by 30 June 2022

INSTITUTIONAL DEVELOPMENT
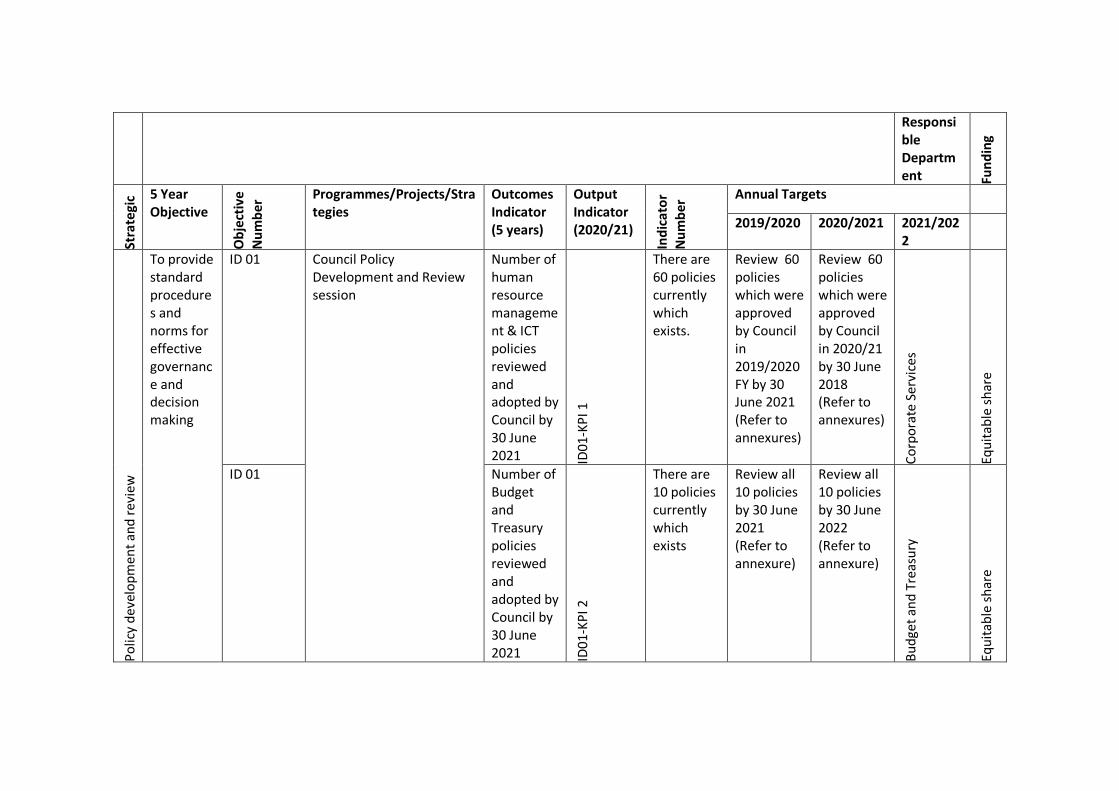
Responsi
ble Department Fu
nd
ing
Stra
tegi
c Fo
cus
Are
a
5 Year Objective
Ob
ject
ive
Nu
mb
er Programmes/Projects/Stra
tegies Outcomes Indicator (5 years)
Output Indicator (2020/21)
Ind
icat
or
Nu
mb
er Annual Targets
2019/2020 2020/2021 2021/2022
Po
licy
dev
elo
pm
ent
and
rev
iew
To provide standard procedures and norms for effective governance and decision making
ID 01 Council Policy Development and Review session
Number of human resource management & ICT policies reviewed and adopted by Council by 30 June 2021 ID
01
-KP
I 1
There are 60 policies currently which exists.
Review 60 policies which were approved by Council in 2019/2020 FY by 30 June 2021 (Refer to annexures)
Review 60 policies which were approved by Council in 2020/21 by 30 June 2018 (Refer to annexures)
Co
rpo
rate
Ser
vice
s
Equ
itab
le s
har
e
ID 01 Number of Budget and Treasury policies reviewed and adopted by Council by 30 June 2021 ID
01-K
PI 2
There are 10 policies currently which exists
Review all 10 policies by 30 June 2021 (Refer to annexure)
Review all 10 policies by 30 June 2022 (Refer to annexure)
Bu
dge
t an
d T
reas
ury
Equ
itab
le s
har
e

ID 01 Number executive and council policies reviewed and adopted by Council by 30 June 2021 ID0
1-K
PI 3
9 Policies are in place
Review all 9 policies (Refer to annexure) by 30 June 2021
Review all 9 policies (Refer to annexure) by 30 June 2022
MM
&Ex
ecu
tive
Equ
itab
le s
har
e
ID 01 Number of community services management policies reviewed and adopted by Council by 30 June 2021 ID
01-K
PI 4
There are three(3 ) policies that exist and
Review 3 policies : Early childhood, Waste management and Library policies by 30 June 2021
Review 3 policies : Early childhood, Waste management and Library policies by 30 June 2022 C
om
mu
nity
Ser
vice
s
Equ
itab
le s
har
e
ID 01 Number of infrastructure policies reviewed, developed and adopted by Council by ID
01
-KP
I 5
There are 6 policies currently which exists
Review all 6 policies (Refer to annexure) by 30 June 2021
Develop 1 policy & Review all 6 policies (Refer to annexure) by 30 June 2022
Infr
astr
uct
ure
Ser
vice
s
Equ
itab
le s
har
e

30 June 2021
ID 01 Number of planning & development policies reviewed and adopted by 30 June 2021 ID
01
-KP
I 6
There are 3 policies which currently exist
Review all 3 policies (Refer to annexure) by 30 June 2021
Review all 3 policies (Refer to annexure) by 30 June 2022
Pla
nn
ing
and
Dev
elo
pm
ent
Equ
itab
le s
har
e
ID 01 LED Strategy Reviewed to inform IDP by June 30 June 2021 ID
01:K
PI 7
LED Strategy in place
Review LED strategy by June 2021
Review LED strategy by June 2022
Equ
itab
le s
har
e
ID 01 Number of Council Policy development and review sessions held by 30 June 2021 ID
01
-KP
I 8
institutional policies are developed and reviewed annually
Convene 1 Policy development and review session by 30 June 2021
Convene 1 Policy development and review session by 30 June 2022
MM
&Ex
ecu
tive
; All
Dep
artm
ents
inp
ut
Equ
itab
le s
har
e

Org
anis
atio
nal
dev
elo
pm
ent
To develop and review an organogram that is aligned to powers, functions and Council priorities
ID 02 Review the Institutional Organogram
Approved Institutional Organogram by Council by 30 June 2021
ID0
2-K
PI 8
Organogram Reviewed in 2018/19
Review organogram by 30 June 2021
Review organogram by 30 June 2022
Co
rpo
rate
Ser
vice
s; A
ll
Dep
artm
ents
inp
ut
Equ
itab
le s
har
e
ID 02 Develop and review Job Descriptions for all posts in the approved organogram
% of Signed job descriptions for all positions in the approved organogram by 30 December 2021
ID02
-KP
I 9
All posts in the current Organogram (2019/20) have signed Job Descriptions
Develop job descriptions for all new positions in the approved organogram by 30 December 2020
Develop job descriptions for all new positions in the approved organogram by 30 December 2021
Co
rpo
rate
Ser
vice
s; A
ll D
epar
tmen
ts in
pu
t
Equ
itab
le s
har
e
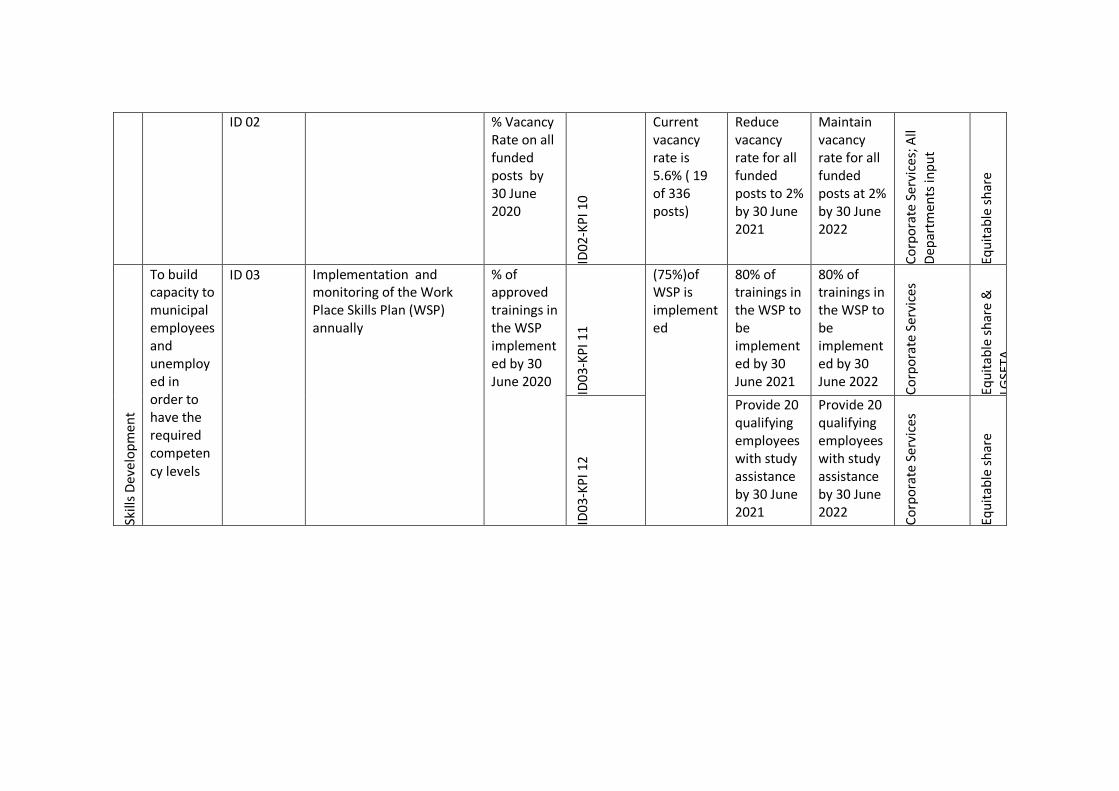
ID 02 % Vacancy Rate on all funded posts by 30 June 2020
ID0
2-K
PI 1
0
Current vacancy rate is 5.6% ( 19 of 336 posts)
Reduce vacancy rate for all funded posts to 2% by 30 June 2021
Maintain vacancy rate for all funded posts at 2% by 30 June 2022
Co
rpo
rate
Ser
vice
s; A
ll
Dep
artm
ents
inp
ut
Equ
itab
le s
har
e
Skill
s D
evel
op
men
t
To build capacity to municipal employees and unemployed in order to have the required competency levels
ID 03 Implementation and monitoring of the Work Place Skills Plan (WSP) annually
% of approved trainings in the WSP implemented by 30 June 2020
ID0
3-K
PI 1
1
(75%)of WSP is implemented
80% of trainings in the WSP to be implemented by 30 June 2021
80% of trainings in the WSP to be implemented by 30 June 2022
Co
rpo
rate
Ser
vice
s
Equ
itab
le s
har
e &
LG
SETA
ID03
-KP
I 12
Provide 20 qualifying employees with study assistance by 30 June 2021
Provide 20 qualifying employees with study assistance by 30 June 2022
Co
rpo
rate
Ser
vice
s
Equ
itab
le s
har
e

ID 03 Implementation of training programmes in line with LGSETA Grant Requirements
% of municipal skills development levy recovered by 30 June 2021
ID0
3-K
P 1
3
Implemented training programmes amounting to R175 513,98
Implement training programmes in line with LGSETA Grant Requirements (R170 000.00) by 30 June 2021
Implement training programmes in line with LGSETA Grant Requirements (R170 000.00) by 30 June 2022 C
orp
ora
te S
ervi
ces
Equ
itab
le s
har
e
Staf
f P
rovi
sio
nin
g
To attract and retain competent personnel
ID 04 Alignment of the institutional human capital with the IDP objectives
Reviewed HR plan by 30 June 2020
ID04
-K
PI 1
5
HR Plan in place
Review HR Strategy (Plan) by 30 June 2021
Review HR Strategy (Plan) by 30 June 2022
Co
rpo
rate
Ser
vice
s
Co
mp
lian
ce w
ith
La
bo
ur
rela
ted
Legi
slat
ion
s an
d
Co
llect
ive
Agr
eem
ents
To comply with Labour related Legislation and SALGBC
ID 05 Compliance with department of labour employer legislation
% of targets achieved in the EE Plan by 30 June 2018
ID0
5-K
PI 1
6
48% of achieved targets in the EE Plan
To achieve 50% of the EE Plan
To achieve 50% of the EE Plan
Co
rpo
rate
Ser
vice
s
Equ
itab
le s
har
e

Main Collective Agreements
EE Report is submitted by 15 January 2020
ID0
5-K
PI 1
7
Submitted by 15 January annually
Submit EER by 15 January 2021
Submit EER by 15 January 2022
Co
rpo
rate
Ser
vice
s
Equ
itab
le s
har
e
Compliance with COIDA Return of Earnings annually by 30 June 2020 ID
05
-KP
I 18
Return of Earnings is submitted annually.
Submission of ROE Report to the DoL by 31 May 2021
Submission of ROE Report to the DoL by 31 May 2022
Co
rpo
rate
Ser
vice
s
Equ
itab
le s
har
e
ID 05 Maintain sound Labour relations through functional local labour forum
Number of LLF meetings convened to discuss employer and employee conditions of service by 30 June 2020 ID
05-K
PI 1
9
Convened four (4) Local Labour Forum in 2018/19 FY
Convene 4 LLF meetings by 30 June 2021
Convene 4 LLF meetings by 30 June 2022
Co
rpo
rate
Ser
vice
s
Equ
itab
le s
har
e

ID 05 Conduct regular Health and Safety inspections and(OHS) on municipal facilities and monitoring meetings as per OHS Act
Number of OHS committee meetings convened by 30 June 2020
ID0
5-K
PI 2
0
OHS policy in place, OHS committee in place and Four OHS meetings convened in 2018/19 FY
Convene 4 OHS Committee meeting to monitor compliance of the Act.
Convene 4 OHS Committee meeting to monitor compliance of the Act.
Co
rpo
rate
Ser
vice
s; In
fras
tru
ctu
re
Serv
ices
, All
Aff
ecte
d D
epar
tmen
ts
Equ
itab
le s
har
e
Emp
loye
e h
ealt
h a
nd
W
elln
ess
To create an Environment that promotes employee health and wellbeing
Develop and implement Wellness Plan for the 2020/21
Motivated Workforce by 30 June 2022
An approved Wellness Plan 2016/17 by MM by 30 June 2020
ID0
6-K
PI 2
1
Employee health and wellness policy in place
Develop and implement wellness plan by 30 June 2021
Develop and implement wellness plan by 30 June 2022
Co
rpo
rate
Ser
vice
s
Equ
itab
le s
har
e

Info
rmat
ion
an
d C
om
mu
nic
atio
n T
ech
no
logy
(IC
T) G
ove
rnan
ce
To develop functional, reliable and Integrated network and applications that will be policy driven
Maintain the offsite backup server to eliminate the loss of information
safeguarding of municipal information and records
Number of back-up reports generated by the offsite backup data server by 30 June 2020
ID0
7-K
PI 2
2
Offsite Backup server in place and hosted by ITNA
12 backup reports generated to ensure functionality of the backup servers annually
12 backup reports generated to ensure functionality of the backup servers annually
Co
rpo
rate
Ser
vice
s
Equ
itab
le s
har
e
Convene ICT Steering Committee meetings
Sustainable ICT that supports business strategy
Number of ICT Steering committee meetings convened by 30 June 2021
ID0
7-K
PI 2
3
ICT Governance framework ,Policies and ICT Steering Committee in place
Convene 4 ICT Steering committee meetings by 30 June 2021
Convene 4 ICT Steering committee meetings by 30 June 2022
Co
rpo
rate
Ser
vice
s; A
ll ap
po
inte
d
com
mit
tee
mem
ber
s
Equ
itab
le s
har
e
Maintain a functional disaster recovery centre at Ngqeleni
Appropriate use of ICT for efficient service delivery
Maintained disaster recovery server at Ngqeleni Unit and server room at Libode by ID
07-K
PI 2
4
Functional disaster recovery server already exists at Ngqeleni Unit
Maintain disaster recovery server at Ngqeleni Unit and server room by 30 June 2021
Establish alternative disaster recovery centre by 30 June 2022
Co
rpo
rate
Ser
vice
s
Equ
itab
le s
har
e

30 June 2021
Provide ICT infrastructure and equipment
Maintained infrastructure and ICT equipment by 30 June 2021
ID0
7-K
PI 2
5
Existing infrastructure and ICT equipment
Provide infrastructure and ICT equipment by 30 June 2021
Maintain infrastructure and IT equipment by 30 June 2021
Co
rpo
rate
Ser
vice
s
Equ
itab
le s
har
e
Rec
ord
s M
anag
emen
t
To comply with national archives and records management
Institutional record management in Libode and Ngqeleni
Progress report on phase 2 implementation of the electronic document management system by 30 June 2021
Functional EDMS for Council Support
Implement phase 2 of the electronic document management system by 30 June 2021
File plan , Records management policy in place and Phase 1 of EDMS Implemented
Implement phase 2 of the electronic document management system by 30 June 2021
Maintain electronic document management system by 30 June 2022

Faci
litie
s a
nd
off
ice
Man
agem
ent
To maintain municipal facilities and office management
Keep municipal building in acceptable conditions
Facility compliant with statutory requirements
Report on facility maintenance provided by 30 June 2021
ID0
9-K
PI 2
9
Building maintenance plan is in place
Provide repairs and maintenance of existing buildings as the need arise by 30 June 2021
Provide repairs and maintenance of existing buildings as the need arise
Co
rpo
rate
Ser
vice
s
Equ
itab
le s
har
e
Municipal Offices at Ngqeleni
Increased Office Space Issued final approval certificate by 30 June 2021
ID0
9-K
PI 3
0
Ngqeleni Offices practicaly completed
Issue final approval certificate for Ngqeleni Offices by 30 June 2021
-
Co
rpo
rate
Ser
vice
s;
Infr
astr
uct
ure
Ser
vice
s
Equ
itab
le s
har
e
Developed design report for expansion of Libode offices by 30 June 2021
Insufficient office space
Develop designs for Libode office expansion by 30 June 2021
_

Cu
sto
mer
Car
e To improve customer care services to communities
Implementing and maintaining Service Standards Charter
Customer care through realisation of Batho Pele principles
Number of awareness workshops conducted on service standards by 30 June 2021
ID0
9-K
PI 3
1
Two awareness workshops conducted on service standards
Conduct 1 awareness workshop on Municipal Service Standards and provide customer suggestion box by 30 June 2021
Conduct 2 awareness workshops on Service Standards by 30 June 2021
Co
rpo
rate
Ser
vice
s; A
ll D
epar
tmen
ts in
pu
t
Equ
itab
le s
har
e

BASIC SERVICE DELIVERY

Strategic Focus Area
5 Year Objective
Objective Number
municipal Strategies
Outcomes Indicator (5 years)
Output Indicator(2019-2020)
Indicator Number
Baseline 2020/2021 2021/2022
Envi
ron
men
tal M
anag
emen
t
To provide and maintain safe and healthy environment
BSD
01
Upgrade and maintain Pound Services.
Safe and healthy environment through pound management services by 30 June 2022
Progress Report for Construction of Ngqeleni and Libode Pound Infrastructure by 30 June 2021
BSD01 KPI 1
Pounds fenced with Boundary wall
Construct Libode Pound Infrastructure by 30 June 2021
Construct Ngqeleni Pound Infrastructure by 30 June 2022
SM Community Services

Envi
ron
men
tal M
anag
emen
t To provide and maintain safe and healthy environment
BSD
01
Acquire Additional land for Cemetery development
Safe and healthy environment cemetery management services by 30 June 2022
Rezoning and subdivision Report by 30 June 2021
BSD01 KPI 2
Two functional cemeteries in both towns
Rezone and Subdivide Ngqeleni Cemetery Services by 30 June 2021
Facilitate relocation of illegal occupants of rezoned land by 30 June 2022
SM Planning
Envi
ron
men
tal M
anag
emen
t
To provide and maintain safe and healthy environment
BSD
01
Provide infrastructure to enhance Waste Management Programmes
Safe and healthy environment through Waste Management services by 30 June 2022
Quarterly Compliance Audit Reports by 30 June 2021
BSD01 KPI 3
Quarterly Compliance Reports Submitted to DEDEAT
Develop Quarterly Compliance Audit Reports by 30 June 2021
Develop Quarterly Compliance Audit Reports by 30 June 2022
Envi
ron
men
tal
Man
agem
ent
To provide and maintain safe and healthy
BSD
01
Provide infrastructure to enhance Waste Management
Safe and healthy environment through Waste Manage
Constructed Infrastructure for Libode Landfill Site and
BSD01 KPI 4
Constructed landfill site at Libode as per business plan
Construct Infrastructure for Libode Landfill Site and Ngqeleni Buy Back Centre by 30 June 2021
Complete Infrastructure for Libode Landfill Site and Ngqeleni

environment
Programmes
ment services by 30 June 2023
Ngqeleni Buy Back Centre by 30 June 2021
Buy Back Centre by 30 June 2022
Envi
ron
men
tal
Man
agem
ent
To provide and maintain safe and healthy environment B
SD 0
1
Implementation of the Integrated Waste Management Plan
Minimised Solid Waste
Reviewed Integrated Waste Management (IWMP)Plan by 30 June 2021
BSD01 KPI 5
Reviewed IWMP
Submit revised IWMP to MEC DEDEAT for endorsement by 30 June 2021
implement revised Integrated waste management plan by 30 June 2022
Envi
ron
men
tal M
anag
emen
t
To provide and maintain safe and healthy environment
BSD
01
Implementation of the Integrated Waste Management Plan
Minimised Solid Waste
Tonnes of municipal solid waste sent to landfill per capita by 30 June 2021
BSD01 KPI 6
200 tonnes sent to KSD landfill site
transfer 200 Tonnes of municipal solid waste sent to landfill per capita by 30 June 2021
transfer 200 Tonnes of municipal solid waste sent to landfill per capita by 30 June 2022

Envi
ron
men
tal M
anag
emen
t To provide and maintain safe and healthy environment
BSD
01
Implementation of the Integrated Waste Management Plan
Increased access to refuse removal
Percentage of known informal/formal settlements receiving integrated waste handling services by 30 June 2021
BSD01 KPI 7
274 households provided with access to refuse removal
provide access to 20% Percentage of known informal/formal settlements receiving integrated waste handling services
provide access to 20% Percentage of known informal/formal settlements receiving integrated waste handling services
Free Basic Services
To provide indigent households with access to free basic services to improve quality of life.
BSD 02
provide free basic service to qualifying indigents
More efficient poverty alleviation
Number of all qualifying households classified as indigents by 30 June 2021
BSD 02 KPI 8
indigent register for 2019/20 reviewed
Update and Review Indigent register by 30 June 2021
Update and Review Indigent register by 30 June 2022
Provide 5500 free basic service to qualifying indigents households according to needs assessment by 30 June 2021
Provide 5500 free basic service to qualifying indigents households according

to needs assessment by 30 June 2022
Continuing projects from 2019/20 financial year: complete and release retention for projects below
Transport and Roads
Provide integrated transport and mobility
BSD 03
Construction of 300km of gravel wearing course
Improved quality of municipal road network
Number of Gravel Road Kilometres Constructed by 30 June 2021
BSD 03 KPI 9
115,1 km's constructed
Transport and Roads
Provide integrated transport and mobility
BSD 03
Construction of 300km of gravel wearing course
Improved quality of municipal road network
Number of Gravel Road Kilometres Constructed by 30 June 2020
BSD 03 KPI 10
115,1 km's constructed
Transport and Roads
Provide integrated transport and mobility
BSD 03
Construction of 300km of gravel wearing course
Improved quality of municipal road network
Number of Gravel Road Kilometres Construct
BSD 03 KPI 11
115,1 km's constructed

ed by 30 June 2021
Transport and Roads
Provide integrated transport and mobility
BSD 03
Construction of 300km of gravel wearing course
Improved quality of municipal road network
Number of Gravel Road Kilometres Constructed by 30 June 2021
BSD 03 KPI 12
115,1 km's constructed
Transport and Roads
Provide integrated transport and mobility
BSD 03
Construction of 300km of gravel wearing course
Improved quality of municipal road network
Number of Gravel Road Kilometres Constructed by 30 June 2021
BSD 03 KPI 13
115,1 km's constructed
Transport and Roads
Provide integrated transport and mobility
BSD 03
Construction of 300km of gravel wearing course
Improved quality of municipal road network
Number of Gravel Road Kilometres Constructed by 30 June 2021
BSD 03 KPI 14
115,1 km's constructed

Transport and Roads
Provide integrated transport and mobility
BSD 03
Construction of 300km of gravel wearing course
Improved quality of municipal road network
Number of Gravel Road Kilometres Constructed by 30 June 2021
BSD 03 KPI 15
115,1 km's constructed
New Projects 2020/21 financial year Construction refer to projects below
Transport and Roads
Provide integrated transport and mobility
BSD 03
Construction of 300km of gravel wearing course
Improved quality of municipal road network
Number of Gravel Road Kilometres Constructed by 30 June 2021
BSD 03 KPI 16
115,1 km's constructed
projects to be costed and finalized refer to 3 year plan
projects to be costed and finalized refer to 3 year plan
Transport and Roads
Provide integrated transport and mobility
BSD 03
Construction of 300km of gravel wearing course
Improved quality of municipal road network
Number of Gravel Road Kilometres Constructed by 30 June 2021
BSD 03 KPI 17
115,1 km's constructed

Transport and Roads
Provide integrated transport and mobility
BSD 03
Construction of 300km of gravel wearing course
Improved quality of municipal road network
Number of Gravel Road Kilometres Constructed by 30 June 2021
BSD 03 KPI 18
115,1 km's constructed
Transport and Roads
Provide integrated transport and mobility
BSD 03
Construction of 300km of gravel wearing course
Improved quality of municipal road network
Number of Gravel Road Kilometres Constructed by 30 June 2021
BSD 03 KPI 19
115,1 km's constructed
Transport and Roads
Provide integrated transport and mobility
BSD 03
Construction of 300km of gravel wearing course
Improved quality of municipal road network
Number of Gravel Road Kilometres Constructed by 30 June 2021
BSD 03 KPI 20
115,1 km's constructed
Transport and Roads
Provide integrated transport and mobility
BSD 03
Construction of 300km of gravel wearing course
Improved quality of municipal road network
Number of Gravel Road Kilometres Construct
BSD 03 KPI 21
115,1 km's constructed

ed by 30 June 2021
Transport and Roads
Provide integrated transport and mobility
BSD 03
Construction of 300km of gravel wearing course
Improved quality of municipal road network
Number of Gravel Road Kilometres Constructed by 30 June 2021
BSD 03 KPI 22
115,1 km's constructed
Transport and Roads
Provide integrated transport and mobility
BSD 03
Construction of 300km of gravel wearing course
Improved quality of municipal road network
Number of Gravel Road Kilometres Constructed by 30 June 2021
BSD 03 KPI 23
115,1 km's constructed
Transport and Roads
Provide integrated transport and mobility
BSD 03
Construction of 300km of gravel wearing course
Improved quality of municipal road network
Number of Gravel Road Kilometres Constructed by 30 June 2021
BSD 03 KPI 24
115,1 km's constructed

Transport and Roads
Provide integrated transport and mobility
BSD 03
Construction of 300km of gravel wearing course
Improved quality of municipal road network
Number of Gravel Road Kilometres Constructed by 30 June 2021
BSD 03 KPI 25
115,1 km's constructed
Transport and Roads
Provide integrated transport and mobility
BSD 03
Construction of 300km of gravel wearing course
Improved quality of municipal road network
Number of Gravel Road Kilometres Constructed by 30 June 2021
BSD 03 KPI 26
115,1 km's constructed
Transport and Roads
Provide integrated transport and mobility
BSD 03
Construction of 300km of gravel wearing course
Improved quality of municipal road network
Number of Gravel Road Kilometres Constructed by 30 June 2020
BSD 03 KPI 27
115,1 km's constructed

Transport and Roads
Provide integrated transport and mobility
BSD 03
Maintenance and rehabilitation of 600km of gravel wearing course
Improved quality of municipal road network
Number of kilometres (gravel road) Maintained by 30 June 2021
BSD 03 KPI 28
142,70 km's maintained
maintain 120km of access roads as per below projects
maintain 120km of access roads as per below projects
Transport and Roads
Provide integrated transport and mobility
BSD 03
Maintenance and rehabilitation of 600km of gravel wearing course
Improved quality of municipal road network
Number of kilometres (gravel road) Maintained by 30 June 2021
BSD 03 KPI 29
Continuing rehabilitation projects from 2019/20 financial year: complete and release retention for projects below
Transport and Roads
Provide integrated transport and mobility
BSD 03
Maintenance and rehabilitation of 600km of gravel wearing course
Improved quality of municipal road network
Number of kilometres (gravel road) Maintained by 30 June 2020
BSD 03 KPI 30

Transport and Roads
Provide integrated transport and mobility
BSD 03
Maintenance and rehabilitation of 600km of gravel wearing course
Improved quality of municipal road network
Number of kilometres (gravel road) Maintained by 30 June 2021
BSD 03 KPI 31
Transport and Roads
Provide integrated transport and mobility
BSD 03
Maintenance and rehabilitation of 600km of gravel wearing course
Improved quality of municipal road network
Number of kilometres (gravel road) Maintained by 30 June 2021
BSD 03 KPI 32
Transport and Roads
Provide integrated transport and mobility
BSD 03
Maintenance and rehabilitation of 600km of gravel wearing course
Improved quality of municipal road network
Number of kilometres (gravel road) Maintained by 30 June 2021
BSD 03 KPI 33
Transport and Roads
Provide integrated transport and mobility
BSD 03
Maintenance and rehabilitation of 600km of gravel
Improved quality of municipal road network
Number of kilometres (gravel road) Maintaine
BSD 03 KPI 34
New Rehabilitation projects for 2020/21 financial year: complete and release retention for projects below

wearing course
d by 30 June 2021
Transport and Roads
Provide integrated transport and mobility
BSD 03
Maintenance and rehabilitation of 600km of gravel wearing course
Improved quality of municipal road network
Number of kilometers (gravel road) Maintained by 30 June 2027
BSD 03 KPI 35
Rehabilitation of Mgonyane AR in Ward 6 by 30 June 2021
Transport and Roads
Provide integrated transport and mobility
BSD 03
Maintenance and rehabilitation of 600km of gravel wearing course
Improved quality of municipal road network
Number of kilometers (gravel road) Maintained by 30 June 2020
BSD 03 KPI 36
Rehabilitation of Old Bunting to Katini AR in Ward 17 by 30 June 2021
projects to determined
Transport and Roads
Provide integrated transport and mobility
BSD 03
Maintenance and rehabilitation of 600km of gravel wearing course
Improved quality of municipal road network
Number of kilometers (gravel road) Maintained by 30 June 2021
BSD 03 KPI 37
Rehabilitation of Ngonyameni AR in Ward 28
projects to determined

Transport and Roads
Provide integrated transport and mobility
BSD 03
Maintenance and rehabilitation of 600km of gravel wearing course
Improved quality of municipal road network
Number of kilometres (gravel road) Maintained by 30 June 2021
BSD 03 KPI 38
Rehabilitation of Bomvana AR in Ward 32 by 30 June 2021
projects to determined
Transport and Roads
Provide integrated transport and mobility
BSD 03
Maintenance and rehabilitation of 600km of gravel wearing course
Improved quality of municipal road network
Number of kilometers (gravel road) Maintained by 30 June 2021
BSD 03 KPI 39
Rehabilitation of Thakatha to Poni JSS AR in Ward 14 by 30 June 2021
projects to determined
Transport and Roads
Provide integrated transport and mobility
BSD 03
Maintenance and rehabilitation of 600km of gravel wearing course
Improved quality of municipal road network
Number of kilometers (gravel road) Maintained by 30 June 2021
BSD 03 KPI 40
Maintain 45 km of Ad-hoc access roads by 30 June 2020 by 30 June 2021
Maintain 25 km of Ad-hoc access roads by 30 June 2021
Transport and Roads
Provide integrated transport and mobility
BSD 03
Maintenance and rehabilitation of 600km of gravel
Improved quality of municipal road network
Number of kilometers (gravel road) Maintaine
BSD 03 KPI 41
Maintain 30 km of Routine access roads by 30 June 2021
Maintain 30 km of Routine access roads

wearing course
d by 30 June 2021
Transport and Roads
Provide integrated transport and mobility
BSD 03
Maintenance and rehabilitation of 600km of gravel wearing course
Improved quality of municipal road network
Number of kilometres (gravel road) Maintained by 30 June 2021
BSD 03 KPI 42
Maintain 30 km of Preventative access roads by 30 June 2021
Maintain 30 km of Preventative access roads
Transport and Roads
Provide integrated transport and mobility
BSD 03
Maintenance and rehabilitation of 600km of gravel wearing course
Improved quality of municipal road network
Number of kilometres (gravel road) Maintained by 30 June 2021
BSD 03 KPI 43
Maintain 20 km of Periodic access roads by 30 June 2021
Maintain 20 km of Periodic access roads by 30 June 2022
Transport and Roads
Provide integrated transport and mobility
BSD 03
Maintenance and rehabilitation of 600km of gravel wearing course
Improved quality of municipal road network
Reported Machinery acquired for repairs and maintenance by 30 June 2021
BSD 03 KPI 44
1 Full Set and half set of machinery
Acquire a set of Machinery (Grader, ) by 30 June 2021
Acquire a set of Machinery

Transport and Roads
Provide integrated transport and mobility
BSD 03
Upgrade 25 km of gravel to surfacing layer
All Weather Surfaced of 25 km's by 30 June 2022
Number of kilometres surfaced by 30 June 2021
BSD 03 KPI 45
9 kilometres surfaced at Libode and Ngqeleni
Finally Complete Construction 2,5 kilometres of surfaced road at Libode by 30 June 2021
Construct 10 kilometres of surfaced road at Libode by 30 June 2022
Transport and Roads
Provide integrated transport and mobility
BSD 03
Upgrade 25 km of gravel to surfacing layer
All Weather Surfaced of 25 km's by 30 June 2023
Number of kilometres surfaced by 30 June 2021
BSD 03 KPI 46
10 kilometres surfaced at Libode and Ngqeleni
Finally Complete Construction of 2,8 kilometres of surfaced road at Ngqeleni by 30 June 2021
Construct 10 kilometres of surfaced road at Ngqeleni by 30 June 2022
Transport and Roads
Provide integrated transport and mobility
BSD 03
Maintain existing surfaced road network
Improved quality of municipal road network
Percentage of surfaced municipal road lanes which has been resealed or resurfaced by 30 June 2021
BSD 03 KPI 47
1 km of existing surfaced road network surfaced
Maintain 13,24 km (8,34 km in Libode and 4,9 km in Ngqeleni) of surfaced roads at Libode and Ngqeleni by 30 June 2021
Maintain 18,92 km (10,84 km in Libode and 8,08 km in Ngqeleni) of surfaced roads at Libode and Ngqeleni

by 30 June 2022
Transport and Roads
Provide integrated transport and mobility
BSD 03
Provide non-motorized transport facilities
Non-motorized paths and lanes as a percentage of the total municipal road network length
Number of Kilometres Surfaced by 30 June 2021
BSD 03 KPI 48
4 kilometres paved
Construct 10 kilometres of non-motorized transport at Libode and Ngqeleni
Construct 15 kilometres of non-motorized transport
Transport and Roads
Provide integrated transport and mobility
BSD 03
BSD 03 KPI 49
Transport and Roads
Provide integrated transport and mobility
BSD 03
Construct public transport facilities
Access to Public Transport Facility
Number of Operational Public Transport Access Points added by 30 June 2021
BSD 03 KPI 50
Nodal Economic Points identified through SDF
Develop Planning Reports for Transport Facilities by 30 June 2021
Construct approved designs for transport facilities

Transport and Roads
Provide integrated transport and mobility
BSD 03
Construct public transport facilities
Increased access to and utilisation of social and community facilities
Issued Completion Certificates by 30 June 2021
BSD 03 KPI 51
Libode and Ngqeleni Transport Hubs Constructed
Complete Defect Liability period for Libode and Ngqeleni Transport Hubs
Transport and Roads
Provide integrated transport and mobility
BSD 03
Construct public transport facilities
Increased access to and utilisation of social and community facilities
Utilized Transport Hubs by 30 June 2021
BSD 03 KPI 52
Libode and Ngqeleni Transport Hubs Constructed
Measure utilization and access to Libode and Ngqeleni Transport hubs by 30 June 2021
Measure utilization and access to Libode and Ngqeleni Transport hubs by 30 June 2022
Infrastructure Development
Provide integrated infrastructure planning and management
BSD 04
Review and implement the integrated master plans
Reviewed Plans (Local Integrated Transport Plan (LITP), Roads Master
Master Plans Reviewed and Developed by 30 June 2021
BSD 04 KPI 52
Approved Plans (LITP, RMP, EMF, Storm Water)
Review of Master plans (Storm water, Energy, Integrated Transport, Roads Master Plan)
Develop Environmental Management Framework

Plan (RMP), Electricity Master Plan (EMP)
Infrastructure Development
Provide integrated infrastructure planning and management
BSD 04
Conform to Public Transport Policies
Approved LITP by MEC for Roads and Transport in EC
Submitted LITP to Department of Roads and Transport in EC by 30 June 2021
BSD 04 KPI 53
LITP Reviewed by Council in 2015
Submit Nyandeni LITP for MEC Comments by 30 June 2020
Infrastructure Development
Provide integrated infrastructure planning and management
BSD 04
Review Infrastructure Investment Plan
Improved Infrastructure
Reviewed IIP by 30 June 2021
BSD 04 KPI 54
Inexistence of Infrastructure Investment Plan (IIP).
Review IIP Review IIP
Housing and Community Facilities
Promote access to community facilities
BSD 05
Establish and Maintain green parks & public
Increased access to and utilisation of social and
Square meters of municipally owned or maintained public
BSD 05 KPI 55
Libode Eco park is operational
Maintain Libode recreation space by 30 June 2021
Rezoning and site survey for Ngqeleni Mini-park

open spaces
community facilities
outdoor recreation space per capita by 30 June 2021
BSD 05
Promote Sports and Recreation
Percentage utilization of sports field by 30 June 2021
BSD 05 KPI 56
Underutilized sport field
Measure access and maintain Libode Sports field by 30 June 2021
Measure access and maintain Libode Sports field by 30 June 2022
BSD 05
Provide access to information
Percentage utilization of Municipal Library by 30 June 2021
BSD 05 KPI 57
Constructed 2 Libraries and provision of 4 modular libraries
Measure access to Municipal Libraries by 30 June 2021
Measure access to Municipal Libraries by 30 June 2022
BSD 05
Provide Infrastructure for Early Childhood Development Facilities
Number of ECDC's Constructed by 30 June 2021
BSD 05 KPI 58
3 ECDC's constructed
Construct 3 ECDC's at Wards Construct 3 ECDC's

Housing and Community Facilities
promote access to community facilities
BSD 06
Provide Infrastructure for Multipurpose Centre and Sports field
Increased access to and utilisation of social and community facilities
Number of Multi Purpose Centres Constructed by 30 June 2021
BSD 06 KPI 59
Constructed 4 Ward Community Halls
Construct Ward 16 Multipurpose Centre and Sports field
Construct Ward 12 Multipurpose Centre and Sports field
Housing and Community Facilities
promote access to community facilities
BSD 06
Provide Infrastructure for Multipurpose Centre and Sports field
Increased access to and utilisation of social and community facilities
BSD 06 KPI 60
Construct Ward 25 Multipurpose Centre and Sports field
Construct Ward 10 Multipurpose Centre and Sports field
Housing and Community Facilities
promote access to community facilities
BSD 06
Provide Infrastructure for Multipurpose Centre and Sports field
Increased access to and utilisation of social and community facilities
BSD 06 KPI 61
Construct Ward 29 Multipurpose Centre and Sports field
Construct Ward 22 Multipurpose Centre and Sports field

Housing and Community Facilities
promote access to community facilities
BSD 06
Provide Infrastructure for Multipurpose Centre and Sports field
Increased access to and utilisation of social and community facilities
BSD 06 KPI 62
Construct Ward 02 Multipurpose Centre and Sports field
Construct Ward 32 Multipurpose Centre and Sports field
Provision of Human Settlement
Provide access Integrated Human Settlement
BSD 07
To coordinate the provision of sustainable rural and urban human settlements in partnership with department of Human settlement
Percentage of households living in adequate housing
Co-ordinated Human Settlement Planning for Provision of Housing by 30 June 2021
BSD 07 KPI 63
301 Units under Construction
Co-ordinate provision of human settlement in Nyandeni in partnership with DOHS quarterly
Co-ordinate provision of human settlement in Nyandeni in partnership with DOHS quarterly

Public Safety & Security
To promote public safety.
BSD 08
Provide traffic services in line with the relevant Legislations.
compliance with road safety legislations, road safety and revenue generation by 30 June 2022
Percentage of processed applications received (Learners, PrDP, and Drivers Licence) by 30 June 2021
BSD 08 KPI 64
1. Receive and Process 3000 Leaners License2. Receive and Process 3200 Driver License3. Receive and Process 600 PrDP by 30 June 2019
Process 100% of received applications (Learners, PrDP, and Drivers Licence) by 30 June 2021
Process 100% of received applications (Learners, PrDP, and Drivers Licence) by 30 June 2022
To promote public safety.
BSD 08
Provide traffic services in line with the relevant Legislations.
Number of registered and licensed vehicles by 30 June 2021
BSD 08 KPI 65
Registered 600 Motor Vehicles by 30 June 2020
Process 100% of applications for Registering Motor Vehicles by 30 June 2021
Process 100% of applications for Registering Motor Vehicles by 30 June 2021

To promote public safety.
BSD 08
Develop and implement road safety programme
Compliance with road safety legislations and revenue generation by 30 June 2022
Number of Road Safety Programmes by 30 June 2021
BSD 08 KPI 66
Conducted 6 road safety programmes annually by June 2019
Conduct Bi-monthly road safety programmes by June 2021
Conduct Bi-monthly road safety programmes by June 2022
To promote public safety.
BSD 08
Provide traffic services
Number of traffic fines issued by the 30 June 2021
BSD 08 KPI 67
Issued 1500 traffic fines by June 2020
Issue 1500 traffic fines by June 2021
Issue 1500 traffic fines by June 2022
To promote public safety.
BSD 08
develop appropriate systems and mechanisms for physical safe guarding of municipal assets and enforcement of by-laws
safeguarding of municipal assets and maintenance of law and order by 30 June 2022
Number of by-laws enforced by 30 June 2021
BSD 08 KPI 68
Enforced 20 Municipal By-laws & relevant legislation by 30 June 2020
Enforce 20 By-laws & relevant legislation by 30 June 2021
Enforce 20 By-laws & relevant legislation by 30 June 2022

To promote public safety.
BSD 08
develop appropriate systems and mechanisms for physical safe guarding of municipal assets and enforcement of by-laws
Developed Security Plan by June 2021
BSD 08 KPI 69
Security Assessment conducted
Developed Nyandeni Municipal Security Plan by June 2021
Implement and Monitor Security Plan by 30 June 2022
Energy and Electricity
To provide access to energy infrastructure by 2022
BSD 09
Improved Access to Electricity
Percentage of dwellings with access to electricity
Number of Dwellings With Access to grid Electrification by 30 June 2021
BSD 09 KPI 70
799 dwellings provided with electrical infrastructure by 30 June 2020
Construct Electrical Infrastructure for 108 Households in Tshani Village Ward 26 by 30 June 2021
Construction of Electrical Infrastructure for 200 Households by 30 June 2022

Energy and Electricity
To provide access to energy infrastructure by 2022
BSD 09
Improved Access to Electricity
Number of Dwellings With Access to grid Electrification by 30 June 2021
BSD 09 KPI 71
799 dwellings provided with electrical infrastructure by 30 June 2020
Construct Electrical Infrastructure (Extensions) for 115 Households in Mafini (90) and Siwela (25) Ward 16 by 30 June 2022
Energy and Electricity
To provide access to energy infrastructure by 2022
BSD 09
Improved Access to Electricity
Number of Dwellings With Access to grid Electrification by 30 June 2021
BSD 09 KPI 72
799 dwellings provided with electrical infrastructure by 30 June 2020
Construct Electrical Infrastructure (Extensions) for 94 Households in Ward 19 by 30 June 2023
Energy and Electricity
To provide access to energy infrastructure by 2022
BSD 09
Improved Access to Electricity
Number of Dwellings With Access to grid Electrification by 30 June 2021
BSD 09 KPI 73
700 dwellings provided with energy (ESKOM) infrastructure by 30 June 2020
Co-ordinated ESKOM for Electrical Infrastructure for 500 Households by 30 June 2021
Construction of Electrical Infrastructure for 500 Households by 30 June 2022

Energy and Electricity
To provide access to energy infrastructure by 2023
BSD 09
Prevent Crime through Installation of High masts and streetlights
Improved Public Safety and Crime Reduction
Number of High masts Installed by 30 June 2021
BSD 09 KPI 74
6 High Masts Installed and maintained
Develop Designs for 6 High masts and Streetlights for Libode and Ngqeleni by 30 June 2021
Install 4 High mast Lights and 30 Streetlights by 30 June 2022
Energy and Electricity
To provide access to energy infrastructure by 2024
BSD 09
Prevent Crime through Installation of High masts and streetlights
Maintained Streetlights
percentage of Planned Maintenance Performed by 30 June 2021
BSD 09 KPI 75
259 Streetlights maintained
Maintain Existing Streetlights Network as per service standards by 30 June 2021
Maintain Existing Streetlights Network as per service standards by 30 June 2022
Spatial Planning and Land use ManagementA62:J68
To provide integrated spatial planning, land use manage
BSD 10
Review and implement Spatial Development Framework.
Uniform spatial planning to guide development
Approved Spatial development framework (SDF) by 30 June 2021
BSD 09 KPI 76
Approved SDF
Implementation of selected and approved projects from SDF by June 2021
Implementation of selected and approved projects from SDF by June 2022

ment and built environment by 2022.
BSD 10
Improve Urban Infrastructure and Aesthetics
Improved Urban Functionality of Libode Node
Implemented Libode Investment Plan by 30 June 2021
BSD 10 KPI 77
Approval of Budget for Technical Assessment by NT
Attain Council approval for Libode Investment Plan by 30 June 2021
Implement Selected projects identified on Libode Investment Plan by 30 June 2022
BSD 10
Institutionalise Geographical Information System.
Spatial mapping of all municipal infrastructure data
Functional GIS System by 30 June 2021
BSD 10 KPI 78
GIS Implementation Report Developed
Data capturing ,maintenance and cleansing by 30 June 2021
Data capturing ,maintenance and cleansing by 30 June 2022
BSD 10
Property Development of Vacant Sites
Increased Property Revenue Base
New township established by 30 June 2021
BSD 10 KPI 79
Approved Libode extension 2 township
Establish New township at Ngqeleni with 100 sites by 30 June 2021
Establish New township at Bhekizulu by 30 June 2022
BSD 10
Property Development of Vacant Sites
Increased Property Revenue Base
New township established by 30 June 2021
BSD 10 KPI 80
Approved Libode extension 2 township
Establish New township at Libode with 82 sites by 30 June 2021

BSD 10
Land Use Management
Uniform spatial planning to promote development though approval of land use scheme
Developed land use scheme by 30 June 2021
BSD 10 KPI 81
SPLUMA in Place
Enforcement of land use management scheme by June 2021
Enforcement of land use management scheme by June 2022
BSD 10
Administration of development planning applications.
SPLUMA compliant land use management
Percentage Report on processed development planning by 30 June 2021
BSD 10 KPI 82
Assess and process all received development planning application by June 2021
Assess and process all received development planning application by June 2022
Building Control
Compliance with Built Environment Norms and Standards
BSD 11
Regulate, Control and comply with regulations on building standards
Compliant Building Structures
Compliant and approved Building plans by 30 June 2021
BSD 11 KPI 83
Building plans register and Building Standards regulations
Process 100% of applications in compliance with building regulations and standards by 30 June 2021
Process 100% of applications in compliance with building regulations and

standards by 30 June 2022
Compliance with Built Environment Norms and Standards
BSD 11
BSD 11 KPI 84
Issued Compliance Certificates for building construction
Monitor Construction of buildings in compliance with approved building plans by 30 June 2021
Monitor Construction of buildings in compliance with approved building plans by 30 June 2022
Real Estate Development
Secure Tenure of Private Property
BSD 12
Identify and facilitate transfer of 100 property registrations by 2022
Increased municipal property rates revenue
Annual Report Developed for property registration by 30 June 2021
BSD 12 KPI 85
Deeds download property valuation of 2018/19
Develop Quarterly Reports of Processed Properties by 30 June 2021
Develop Quarterly Reports of Processed Properties by 30 June 2022


LOCAL ECONOMIC DEVELOPMEMT

Strategic Focus Area
5 Year Objective
Objective Number
municipal Strategies
Outcomes Indicator (5 years)
Indicator Number
Output Indicator (2020/2021)
Baseline Annual Targets
Re
spo
nsi
ble
D
ep
artm
en
ts
Fun
din
g
2020/2021 2021/2022
Soci
o -
Eco
no
mic
dev
elo
pm
ent
To create a conducive environment for economic growth by 2022.
LED 01 Promote sustainable Cooperatives and SMMEs
Well capacitated and empowered Cooperatives and SMMEs through trainings conducted by 30 June 2022
LED
01:
KP
I 1
Number of capacity building provided for SMMEs and Cooperatives by 30 June 2020
60 SMME's and Cooperatives were identified and trained
Provide capacity building for 60 SMME and Cooperatives and 160 unskilled artisans by 30 June 2021
Provide capacity building for 60 SMME and Cooperatives and 160 unskilled artisans by 30 June 2022
Pla
nni
ng
and
Dev
elo
pmen
t
equ
itab
le s
har
e
LED 01
LED
01:
KP
I 2
Number of small scale projects supported with inputs by 30 June 2022
16 small scale projects supported with inputs
Support 16 small scale projects with inputs and equipment by 30 June 2021
Support 16 small scale projects with inputs by 30 June 2022

LED 01
LED
01:
KP
I 3
Supported furniture manufacturing Cooperative by 30 June 2020
Supported and incubated 1 Cooperative
Support one furniture manufacturing cooperative placed on incubation by 30 June 2020/21
Support and incubate 1 SMME/ Cooperative by 30 June 2021/22
Pla
nni
ng
and
Dev
elo
pmen
t
Pla
nni
ng
and
Dev
elo
pmen
t
LED 01
LED
01:
KP
I 4
Number of Flea Markets hosted
Two Flea markets were hosted
Showcase local products through hosting of 2 Flea markets by 30 June 2021
Showcase local products through hosting of 2 Flea markets by 30 June 2022
LED 01
LED
01:
KP
I 5
Number of agricultural shows hosted
One agricultural show hosted
Showcase local products through hosting of 1 agricultural show by 30 June 2021
Showcase local products through hosting of 1 agricultural show by 30 June 2022
Pla
nni
ng
and
Dev
elo
pm
ent
Pla
nni
ng
and
Dev
elo
pm
ent
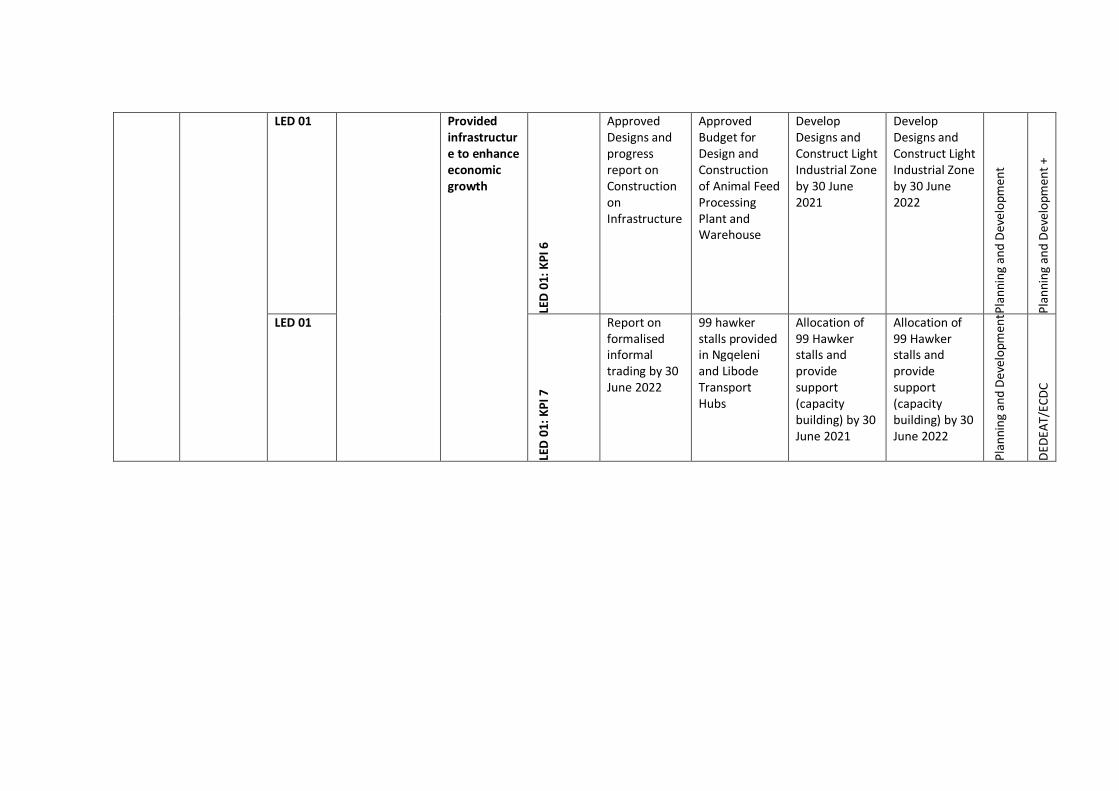
LED 01 Provided infrastructure to enhance economic growth
LED
01:
KP
I 6
Approved Designs and progress report on Construction on Infrastructure
Approved Budget for Design and Construction of Animal Feed Processing Plant and Warehouse
Develop Designs and Construct Light Industrial Zone by 30 June 2021
Develop Designs and Construct Light Industrial Zone by 30 June 2022
Pla
nni
ng
and
Dev
elo
pmen
t
Pla
nni
ng
and
Dev
elo
pmen
t +
po
ssib
le e
xter
nal
fu
ndi
ng
LED 01
LED
01:
KP
I 7
Report on formalised informal trading by 30 June 2022
99 hawker stalls provided in Ngqeleni and Libode Transport Hubs
Allocation of 99 Hawker stalls and provide support (capacity building) by 30 June 2021
Allocation of 99 Hawker stalls and provide support (capacity building) by 30 June 2022
Pla
nni
ng
and
Dev
elo
pmen
t
DED
EAT/
ECD
C

LED 01 Implement comprehensive food security and nutrition programs
Improved food security projects by 30 June 2022
LED
01:
KP
I 8
Number of hectares planted
1413 hectares planted during 2018/19
Plant 200 ha by 30 June 2021
Plant 200 ha by 30 June 2022
Pla
nni
ng
and
Dev
elo
pmen
t
equ
itab
le s
har
e an
d D
RD
AR
; co
ntr
ibu
rio
n b
y
ind
ivid
ual
far
mer
s
LED 01
Operational Animal Feed Processing Plant
Approved funding for implementation
Execute the Implementation Plan for Animal Feed Processing Plant by 30 June 2021
Execute the Implementation Plan for Animal Feed Processing Plan by 30 June 2022
LED 01
Report on Cannabis Research study
Hemp permit for two hectors
Conduct research study on cannabis species by 30 June 2021
Implement research results by 30 June 2022
LED 01
Number of hectors planted
Council resolution approving RAFI implementation
Plant 100 hectors throuh RAFI program by 30 June 2021
Plant 100 hectors throuh RAFI program by 30 June 2022

LED 01
LED
01:
KP
I 9
Number of households supported to plant vegetable gardens by 30 June 2021
320 households supported to plant vegetable gardens
320 households supported to plant vegetable gardens by 30 June 2021
320 households supported to plant vegetable gardens by 30 June 2022
Pla
nni
ng
and
Dev
elo
pm
ent
equ
itab
le s
har
e
LED 01 Improved contribution of Tourism, Natural and Heritage Assets to the economy
LED
01:
KP
I 10
Number of Tourism markerting events conducted and Nyandeni product showcased
Three Tourism markerting events conducted
Showcase tourism products, conduct awareness and debate by 30 June 2021
Showcase tourism products, conduct awareness and debate by 30 June 2022
Pla
nni
g an
d D
evel
opm
ent
equ
itab
le s
har
e

LED
01:
KP
I 11
Number of product owners supported to exhibit in National events
Eight product owners exhibited in the National Event
Support ten product owners to exhibit in National events by 30 June 2021
Support ten product owners to exhibit in National events by 30 June 2022
Pla
nni
g an
d D
evel
opm
ent
equ
itab
le s
har
e

LED 01
LED
01:
KP
I 12
Progress report on National and Provincial Initiaves
Concept documents on National and Provincial Intiatives (Ntlangano and Oceans Economy) in place
Report on progress in the National and Provincial Intiatives (Ntlangano Development, Oceans Economy- coastal development and Working for the Coast) by 30 June 2021
Report on progress in the National and Provincial Intiatives (Ntlangano Development, Oceans Economy - coastal development and Working for the Coast) by 30 June 2022
Pla
nni
g an
d D
evel
opm
ent

THREE TO FIVE YEAR CAPITAL PROJECTS

3-5 YEAR CAPITAL PROJECTS 2019/2020-2021-2022
3-5 YEAR CAPITAL PROJECTS 2019/20-2022/23
CAPITAL PROJECTS 2019/20 to 2022/23 FINANCIAL YEAR
Focus Area
Indicator
Ward No
Project Name Funding Source
Estimated Budget 2019/20
Estimated Budget 2020/21
Estimated Budget 2021/22
Estimated Budget 2022/23
Estimated Budget 2023/24
Project Status
Envi
ron
me
nta
l M
anag
emen
t
Waste Management
8 Libode Landfill Site Office of the Premier (OTP)
R4 000 000.00
Construction
Safe and Healthy
7 Libode Pound Building and Kraal Facilities
Municipal Infrastru
R 2 000 000.00
Inception

Environment
21 Ngqeleni Pound Building and Kraal Facilities
cture Grant (MIG)
R 2 000 000.00
Inception
7 Libode Cemetry Fencing
R 1 500 000.00
Inception
21 Libode Cemetry Fencing
R 1 500 000.00
Inception
Mu
nic
ipal
Fa
cilit
ies
Office Space
21 Ngqeleni Municipal Offices
Equitable Share (ES)
R 9 000 000.00
Construction
7 Libode Municipal Offices
R 3 000 000.00
Inception
Infr
astr
uct
ure
De
velo
pm
ent
(In
tegr
ate
d T
ran
spo
rt
and
Mo
bili
ty)
4 km 21 Ngqeleni Extension 2 Internal roads
OTP R 750 000.00
Completed on defect liability
18 km 07, 21, 29 & 30
DR 08301/T301 (Libode to Polini)
R 39 500 000.00
R 30 000 000.00
Designs Completed
1km and Bridge
16 Didi to Ntlaza Bridge MIG R 500 000.00
Construction
16 km 21 & 30
Maqanyeni to Mngazana AR
R 530 000.00
12.6 km 30 Ndanya Clinic Paved A/R
R 273 200.00
6.5 km 25 Ludaka A/R with Bridge
R 275 000.00
10.5 km 8 Chizela to Moyeni A/R R 260 000.00
10 km 21 Bantini to Kubhodi A/R R 251 136.50

11 km 18 Ngidini to Khangisa A/R
R 267 205.88
5 km 7 Libode Internal roads (Thabo Mbeki)
R 12 208 783.50
R 1 356 531.50
Planning Stage and Inception; Projects Registered on MIG
5.6 km 21 Ngqeleni Internal roads (Extension 4)
R 10 265 135.40
R 1 140 570.60
6.5 km 15 Ngxokweni to Mtyu A/R with Bridge
R 3 680 000.00
R 170 000.00
Designs Completed project to be implemented and registered in 2 phases on MIG/MIS, EIA Approved
4.5 km 15 Ngxokweni to Mtyu A/R with Bridge Phase 2
R 500 000.00
R 4 900 000.00
5.5 km 26 Tholeni A/R Section A R 9 900 890.00
R 500 000.00
Designs Completed to re-register on MIG, EIA Approved
26 Tholeni A/R Section B&C
R 800 000.00
Infr
astr
uct
ure
De
velo
pm
ent
(I
nte
grat
ed
Tra
nsp
ort
an
d
Mo
bili
ty)
10 km 5 Nxukwebe to Mtombetsitsa A/R with Bridge
MIG R 8 361 900.00
R 929 100.00
Designs Completed, Project Registered, and EIA only for Bridge section
13 km 32 Mqwangqweni No1 to No 2 (with 4 Bridges) Magwaz’phalitshi (Lujizweni)
R 980 000.00
R 8 920 000.00
EIA Submitted busy with designs

5 km 27 Langakazi Low Volume A/R
R 12 500 000.00
R 625 000.00
EIA Approved and Designs Completed
6 km 14 Dontsa to Mangwaneni A/R with Bridge
R 4 000 000.00
R 4 450 000.00
Designs Completed, EIA Submitted for Approval
19 km 23 & 28
Ntshazini Bridge to Canzibe Low volume Access road
R 193 800.00
R 7 940 000.00
EIA with ECO Approved and busy with Designs
14 km 27 Dikela A/R R 10 399 000.00
R 1 000 000.00
Designs Completed and Project Registered on MIS/MIG
11 km 10 New Rest to Mncane/Vgate AR
R 1 500 000.00
Designs Completed and EIA submitted to DEDEAT
Bridge 20 Mvilo Bridge R 1 500 000.00
Planning busy with Designs
12 km 8 Mphangane Main Roads
R 1 500 000.00
Full EIA required
5 km 27 Manqilo A/R R 4 447 750.00
R 250 000.00
Project Registered EIA to be submitted
Infr
astr
uct
ure
D
eve
lop
men
t
(In
tegr
ate
d
Tran
spo
rt a
nd
M
ob
ility
)
km 16 Mafini FPSU Access Road
MIG R 200 000.00
Planning Assessments and EIA to be concluded for Preliminary Design
km 9 Dininkosi to Mhlabeni AR
R 200 000.00
km 24 Mbange A/R R 200 000.00

km 3 Majikija to Dokodela AR
R 200 000.00
Reports and Detailed Designs
km 4 Mdina JSS to Mcwili A/R
R 200 000.00
km 29 Qinisa to Makhosi A/R R 200 000.00
km 2 Mabululu to Ncitwa Access Road
R 300 000.00
km 26 Mngcibe Coastal Road R 300 000.00
km 1 Ngcolora to Mahoyana A/R
R 300 000.00
Inception to develop Feasibility Studies and implement planning
km 24 Nkumandeni A/R R 300 000.00
km 11 Ngolo to Corana A/R R 300 000.00
km 15 Khuleka AR R 300 000.00
km 22 Manyoni to Nongxenga A/R
R 300 000.00
km 17 Mdumazulu to Ludaka AR
R 300 000.00
km 4 Makhotyana Main Roads
R 300 000.00
km 13 Biduza to Sundwana AR
MIG R 300 000.00
Inception Stages Projects Identified and Environmental Impact Assessements
km 22 Canzibe Access Road R 300 000.00
km 30 Ngxangula to Lutsheko AR
R 300 000.00

km 26 Coastal Access Road R 300 000.00
requirements to be developed
Infr
astr
uct
ure
De
velo
pm
en
t (
Inte
grat
ed
Tra
nsp
ort
an
d M
ob
ility
)
km 10 Sofia AR R 300 000.00
km 27 Mabusini A/R R 300 000.00
km 3 Dokodela to Gongo R 300 000.00
km 6 Gotsi AR R 300 000.00
km 5 Ndayini Phase 3 AR R 300 000.00
km 26 Mlwamle AR R 300 000.00
km 23 Bukwezeni Phase 2 AR R 300 000.00
km 31 Gunyeni Internal Roads
R 300 000.00
km 19 Njimaza to Dangeni AR R 300 000.00
km 7 Libode Pound AR R 600 000.00
R 4 770 500.00
km 1&3 Zandukwana to Nqitheni Main Road
R 500 000.00
km 28 Mfundweni Internal Roads
MIG R 300 000.00
Projects Identified for Feasibility Studies km 3 Mahobeni to Coza R 300
000.00
km 13 Mandlovini to Khubusi R 300 000.00

km 1 Zandukwana Main Roads
R 300 000.00
km 31 Mtomde Access Road R 300 000.00
km 6 Nodushe Access Road and Bridge
R 300 000.00
km 2 New Area to Magutyana Main Roads
R 300 000.00
km 19 Mhlongwana to Nomcamba
R 300 000.00
km & Bridge
32 Manzimahle to Gxaba AR and Bridge
R 300 000.00
km 11 Ngolo to New Extensions
R 300 000.00
km 7 Libode 1328 units internal roads surfacing
R 1 000 000.00
km 21 Ngqeleni 100 units internal roads surfacing
R 1 000 000.00
Infr
astr
uct
ure
D
eve
lop
men
t
(In
tegr
ate
d
Tran
spo
rt a
nd
M
ob
ility
)
km 23 Hamsini Main Roads R 300 000.00
km 2 Mahahane Access Road
R 300 000.00
km 4 Mbhobheleni to Ndlov'ayiphathwa AR to Bridge
R 300 000.00

km 18 Mabheleni to Pitoli AR R 300
000.00
km 21 Mposane to Upper Mbange JSS
R 300 000.00
Infr
astr
uct
ure
De
velo
pm
ent
(In
tegr
ate
d T
ran
spo
rt a
nd
Mo
bili
ty)
km & Bridge
27 Ngqongweni Bridge and AR
MIG R 500 000.00
Projects Identified for Feasibility Studies
km 31 Khanyisa JSS AR R 500 000.00
km 28 Lutwatweni AR R 500 000.00
km 20 Jange to Vinishi AR R 500 000.00
km 17 Nquba AR R 500 000.00
km 8 Tyarha Main Roads R 500 000.00
km & Bridge
10 Ntilini to Mpindweni KSD
R 500 000.00
km 16 Siwela AR R 500 000.00
km 23 Nomadolo Access Road
R 500 000.00

km& Bridge
30 Dikela Springs Bridge and Road
R 500 000.00
km 26 Manangeni to Mtondela AR
R 500 000.00
km 5 Nxupheko to Mthombetsitsa AR
R 500 000.00
km 9 Misty Mount Main Roads
R 500 000.00
km 1 Matolweni Bridge R 500 000.00
km 12 New Extensions Main Roads
R 500 000.00
km 15 Mkwetshubeni AR R 500 000.00
km 24 Mcaphathi to Ncedana AR
R 500 000.00
km 29 Mnqane to Zixhotyeni AR
R 500 000.00
km 32 Msintsini to Dikeni AR R 500 000.00
km 13 Lujecweni Main Roads R 500 000.00

Infr
astr
uct
ure
De
velo
pm
en
t (
Inte
grat
ed
Tra
nsp
ort
an
d M
ob
ility
) km 18 Mhlatyana AR MIG Outer
Years Projects Identified to source additional funds
km 28 Mathangaleni AR Outer Years
km 21 Ndwakazi Main Roads Outer Years
km 27 Humane AR Outer Years
km 17 Katini AR Outer Years
km 26 Mbuzweni AR Outer Years
km 32 Mawotsheni AR Outer Years
km 23 Mosi to Bhayi AR Outer Years
km 31 Nyandeni Main Roads Outer Years
Infr
astr
uct
ure
D
eve
lop
men
t
(In
tegr
ate
d
Tran
spo
rt a
nd
M
ob
ility
)
5 km of Non-Motorized Transport
21 Ngqeleni Pedestrian Side walks
EPWP R 1 000 000.00
R 1 000 000.00
R 1 000 000.00
R 1 000 000.00
Business plan developed
7 Libode Pedestrian Side walks
EPWP R 1 000 000.00
R 1 000 000.00
R 1 000 000.00
R 1 000 000.00
Business plan developed

Pu
blic
Tra
nsp
ort
Fac
iliti
es
7 Libode Transport Hub Phase 2
OTP R 500 000.00
Construction
21 Ngqeleni Transport Hub
MIG R 18 000 000.00
Construction
22 Canzibe Public Transport Facility
R 1 000 000.00
R 9 000 000.00
Planning
4 Marhubeni Public Transport Facility
R 1 000 000.00
R 9 000 000.00
Planning
29 Kopshop Public Transport Facility
R 1 000 000.00
R 9 000 000.00
Planning
Infr
astr
uct
ure
De
velo
pm
en
t
Earl
y C
hild
ho
od
De
velo
pm
ent
9 Ward 09 Early Childhood Centre
ES R 200 000.00
Designs Completed
20 Ward 20 Early Childhood Centre
R 200 000.00
29 Ward 29 Early Childhood Centre
R 200 000.00
31 Ward 31 Early Childhood Centre
R 200 000.00
32 Ward 32 Early Childhood Centre
R 200 000.00
4 Ward 04 Early Childhood Centre
R 200 000.00
5 Ward 5 Early Childhood Centre
R 200 000.00
12 Ward 12 Early Childhood Centre
R 200 000.00
19 Ward 19 Early Childhood Centre
R 200 000.00
27 Ward 27 Early Childhood Centre
R 200 000.00

Infr
astr
uct
ure
De
velo
pm
en
t
Earl
y C
hild
ho
od
De
velo
pm
ent
8 Ward 08 Early Childhood Centre
R 200 000.00
Planning
14 Ward 14 Early Childhood Centre
R 200 000.00
15 Ward 15 Early Childhood Centre
R 200 000.00
16 Ward 16 Early Childhood Centre
R 200 000.00
23 Ward 23 Early Childhood Centre
R 200 000.00
6 Ward 06 Early Childhood Centre
R 200 000.00
Infr
astr
uct
ure
De
velo
pm
ent
Incl
usi
ve S
oci
o-E
con
om
ic D
eve
lop
me
nt
6 Ward 06 Multipurpose Centre and Sports field
MIG R 3 540 000.00
R 160 000.00
Detailed Designs Completed and Projects Registered on MIG 3 Ward 03 Multipurpose
Centre and Sports field
R 3 540 000.00
R 160 000.00
17 Ward 17 Multipurpose Centre and Sports field
R 3 540 000.00
R 160 000.00
28 Ward 28 Multipurpose Centre and Sports field
R 3 540 000.00
R 160 000.00
16 Ward 16 Multipurpose Centre and Sports field
R 500 000.00
R 6 000 000.00
Planning Designs Underway

25 Ward 25 Multipurpose Centre and Sports field
R 500 000.00
R 6 000 000.00
29 Ward 29 Multipurpose Centre and Sports field
R 500 000.00
R 6 000 000.00
2 Ward 02 Multipurpose Centre and Sports field
R 500 000.00
R 6 000 000.00
31 Ward 31 Multipurpose Centre and Sports field
R 500 000.00
R 6 000 000.00
12 Ward 12 Multipurpose Centre and Sports field
MIG R 10 000 000.00
10 Ward 10 Multipurpose Centre and Sports field
MIG R 10 000 000.00
Planning (EIA or BAR, Design Report)
22 Ward 22 Multipurpose Centre and Sports field
MIG R 10 000 000.00
32 Ward 32 Multipurpose Centre and Sports field
MIG R 10 000 000.00
7 Libode Hawker Stalls MIG R 2 000 000.00
21 Ngqeleni Hawker Stalls
MIG R 2 000 000.00
15 Ntlaza Hawker Stalls MIG R 2 000 000.00

7 Libode Warehouse Storage
MIG R 500 000.00
R 13 000 000.00
Concept Developed
21 Ngqeleni Warehouse Storage
MIG R 500 000.00
R 13 000 000.00
Concept Developed
30 Ward 30 Multipurpose Centre and Sports field
MIG R 10 000 000.00
9 Ward 09 Multipurpose Centre and Sports field
MIG R 10 000 000.00
1 Ward 01 Multipurpose Centre and Sports field
MIG R 1 000 000.00
R 10 000 000.00
Planning (EIA or BAR, Design Report)
14 Ward 14 Multipurpose Centre and Sports field
MIG R 1 000 000.00
R 10 000 000.00
7 Libode Multipurpose Centre
MIG R 1 000 000.00
R 10 000 000.00
20 Ngqeleni Multipurpose Centre
MIG R 1 000 000.00
R 15 000 000.00
21 Ngqeleni Sportsfield MIG R 1 000 000.00
R 15 000 000.00
Infr
astr
uct
ure
D
eve
lop
me
nt
(In
tegr
ate
d
Tran
spo
rt a
nd
M
ob
ility
)
6.5 km and Bridge
1 Matolweni A/R and Bridge
ES R 90 000.00
Construction Phase
7.5 km 17 Mhlahlane A/R R 70 000.00
5,5 km 5 Bomvini A/R R 95 000.00

8 km 14 Mqunyeni A/R to Nolitha Clinic via Mphathiswa
R 100 000.00
7 km 31 Mafusini Northern A/R R 80 000.00
km and Bridge
8 Mamfengwini A/R R 70 000.00
Infr
astr
uct
ure
De
velo
pm
en
t (I
nte
grat
ed
Tra
nsp
ort
an
d
Mo
bili
ty)
km 30 Zanokhanyo High School A/R & Lutsheko A/R
ES R 2 000 000.00
Projects Assessed and Cost Estimates Developed km 10 Maqanyeni A/R R 2 000
000.00
km 23 Hamsini to Mdepha A/R
R 2 000 000.00
km 22 Welese to Kwazulu AR R 2 000 000.00
km 29 Langeni A/R R 2 000 000.00
Infr
astr
uct
ure
De
velo
pm
en
t (I
nte
grat
ed
Tra
nsp
ort
an
d M
ob
ility
)
km 6 Ngonyameni to Sizingeni AR
ES R 2 200 000.00
Planning
km 17 Old Bunting to Katini AR
R 2 200 000.00
km 28 Ngonyameni AR R 2 200 000.00
32 Manzimahle Road and Bridge
R 2 200 000.00
km 14 Thakatha to Pony JSS R 2 200 000.00
km 11 Ngolo to Ziphunzana AR
R 2 200 000.00

km 20 Nothintsila to Mvilo AR
ES R 2 500 000.00
Inception
km 8 Mdlankomo AR R 2 500 000.00
km 15 Mthonjana AR R 2 500 000.00
km 18 Ntlaza to Mbiza AR R 2 500 000.00
km 19 Mvilo AR R 2 500 000.00
km 22 Bomvana AR R 2 500 000.00
Infr
astr
uct
ure
De
velo
pm
ent
(In
tegr
ated
Tra
nsp
ort
an
d
Mo
bili
ty)
km 10 Zikhoveni AR ES R 2 600 000.00
Forecasted based on current trends
km 9 Dininkosi AR R 2 600 000.00
km 2 Ngcoya AR R 2 600 000.00
km 6 Ntsonyeni AR R 2 600 000.00
km 25 Mngcibe AR R 2 600 000.00
km 26 Malizo JSS to Ntsimbini AR
R 2 600 000.00
km 12 Mthebelezi Main Roads
ES R 2 700 000.00
Forecasted based on current trends
km 21 Magcakini AR R 2 700 000.00
km 16 Maqhingeni AR R 2 700 000.00

km 17 Mhlahlane A/R R 2 700 000.00
km 24 Buthongweni AR R 2 700 000.00
km 27 Nkanga AR R 2 700 000.00
Infr
astr
uct
ure
De
velo
pm
ent
(In
tegr
ated
Tra
nsp
ort
an
d M
ob
ility
)
km 2, 6, & 4
Bomz to Marubeni T Road
DOT Outsourced Plant
DRPW Projects
km 07, 08, 04,, 27
T 175 with off roads T 470 and T 179;
Outsourced Plant
km 23, 25, & 26
T313 from Canzibe to Mthatha Mouth
Outsourced Plant
km 25 & 26
T 310 & 311 Mthatha Mouth to Hluleka
Outsourced Plant
km 25 Mamolweni bridge Outsourced Plant
km 31 T 178 Libode to Nyandeni
Outsourced Plant
km 01, 03, & 31
T 173 Zandukwana to Mhlanganisweni;
Outsourced Plant
km 22&23 T 317 Canzibe road to Mthokwana store.
Outsourced Plant
km 08, &31
T172 Renny to Zandukwana AR
DoT Internal Plant
km 6 T 304 Ngqongweni Road
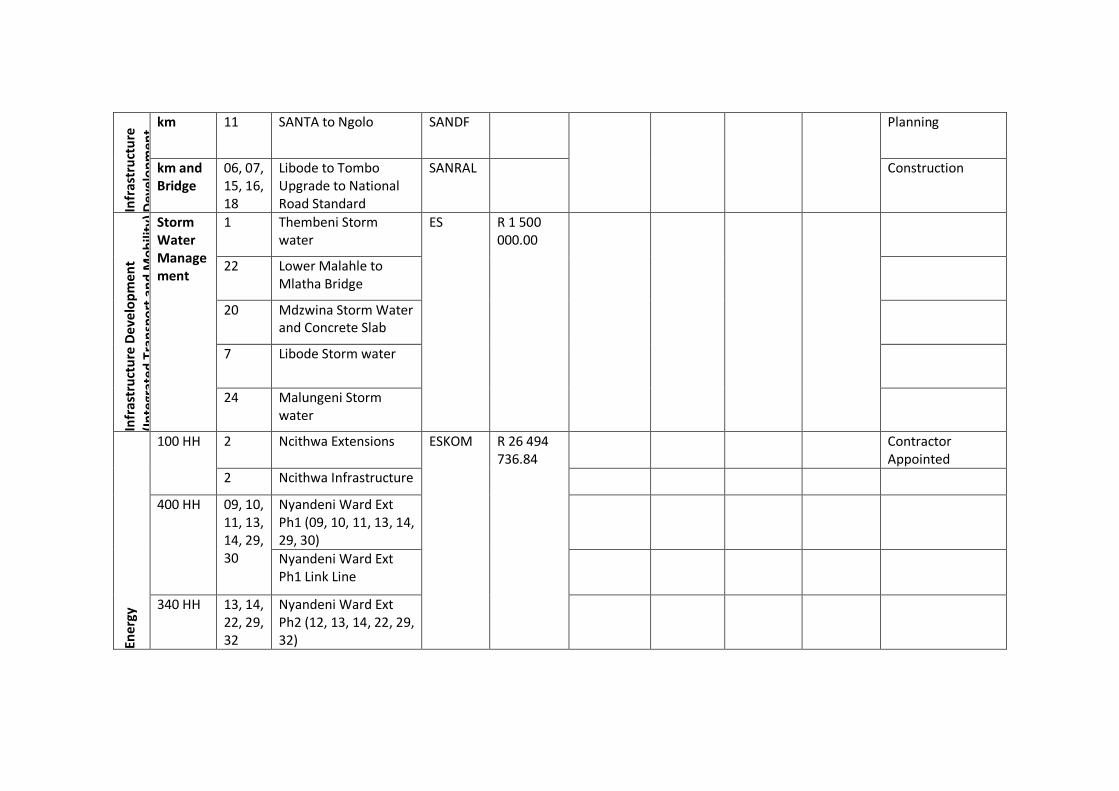
Infr
astr
uct
ure
D
eve
lop
me
nt
(In
tegr
ate
d
Tran
spo
rt a
nd
M
ob
ility
)
km 11 SANTA to Ngolo SANDF Planning
km and Bridge
06, 07, 15, 16, 18
Libode to Tombo Upgrade to National Road Standard
SANRAL Construction
Infr
astr
uct
ure
De
velo
pm
en
t (I
nte
grat
ed
Tra
nsp
ort
an
d M
ob
ility
) Storm Water Management
1 Thembeni Storm water
ES R 1 500 000.00
22 Lower Malahle to Mlatha Bridge
20 Mdzwina Storm Water and Concrete Slab
7 Libode Storm water
24 Malungeni Storm water
Ener
gy
100 HH 2 Ncithwa Extensions ESKOM R 26 494 736.84
Contractor Appointed
2 Ncithwa Infrastructure
400 HH 09, 10, 11, 13, 14, 29, 30
Nyandeni Ward Ext Ph1 (09, 10, 11, 13, 14, 29, 30)
Nyandeni Ward Ext Ph1 Link Line
340 HH 13, 14, 22, 29, 32
Nyandeni Ward Ext Ph2 (12, 13, 14, 22, 29, 32)
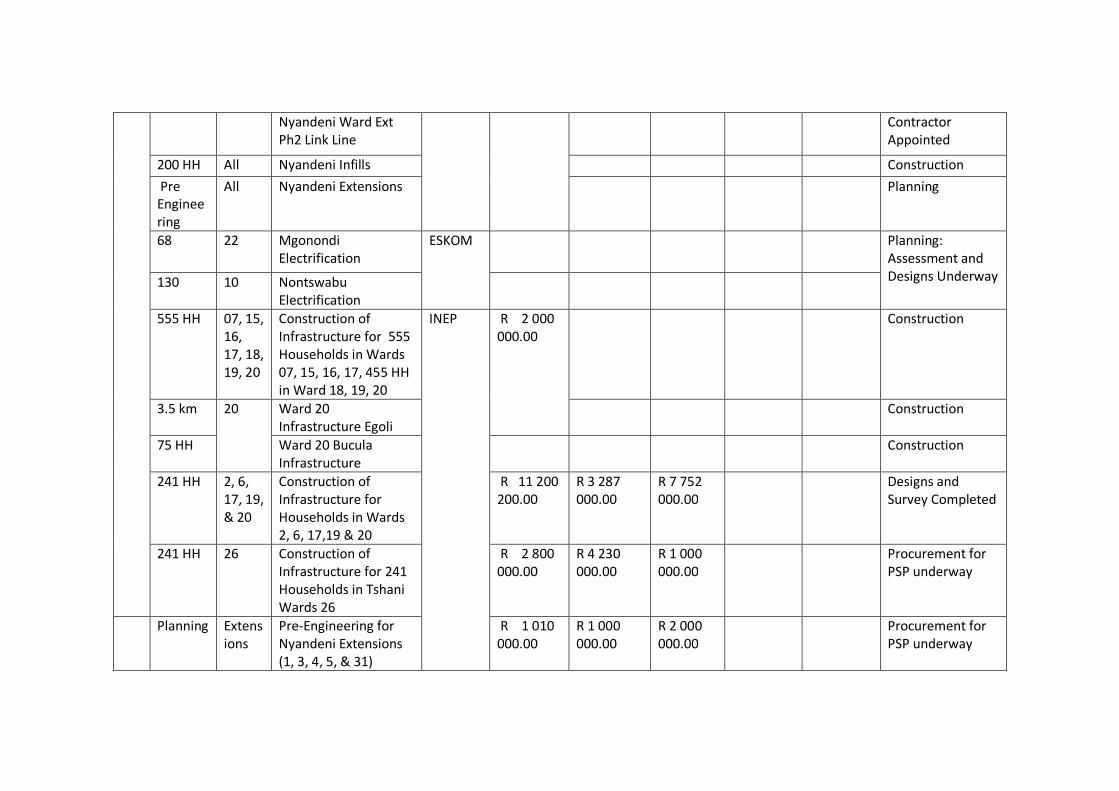
Nyandeni Ward Ext Ph2 Link Line
Contractor Appointed
200 HH All Nyandeni Infills Construction
Pre Engineering
All Nyandeni Extensions Planning
68 22 Mgonondi Electrification
ESKOM Planning: Assessment and Designs Underway 130 10 Nontswabu
Electrification
555 HH 07, 15, 16, 17, 18, 19, 20
Construction of Infrastructure for 555 Households in Wards 07, 15, 16, 17, 455 HH in Ward 18, 19, 20
INEP R 2 000 000.00
Construction
3.5 km 20 Ward 20 Infrastructure Egoli
Construction
75 HH Ward 20 Bucula Infrastructure
Construction
241 HH 2, 6, 17, 19, & 20
Construction of Infrastructure for Households in Wards 2, 6, 17,19 & 20
R 11 200 200.00
R 3 287 000.00
R 7 752 000.00
Designs and Survey Completed
241 HH 26 Construction of Infrastructure for 241 Households in Tshani Wards 26
R 2 800 000.00
R 4 230 000.00
R 1 000 000.00
Procurement for PSP underway
Planning Extensions
Pre-Engineering for Nyandeni Extensions (1, 3, 4, 5, & 31)
R 1 010 000.00
R 1 000 000.00
R 2 000 000.00
Procurement for PSP underway

TOTAL #############
R 215 298 202.10
############
R 84 100 000.00
R 26 200 000.00
District Development Model Projects
Projects that are implemented and those planned for implementation in the Districts and Metropolitan Municipalities
Project Name Project Type (Description e.g. New, Upgrade, Rehab, Main etc)
Project Scope (Scope including no. of units)
Project Status (Initiation, Concept, Design Development, Design Documentation, Works, Closeout, Handover)
Total Project Cost R'000
Nyandeni Rural ICT New Infrastructure Development, ICT Development, Fashion Designer, Editing, Filming, Telenova, Publishing, Trainings and Development, Tour guiding, Heritage, music and film festivals
Concept Stage R60 000
Nyandeni Animal Feed Processing Plant New Planting and Ploughing, Processing, Infrastructure Development, Packaging and transportation, feed manufacturing, Production of Soya Beans, yellow maize, and sunflower, cannabis processing,
Concept Stage R60 000
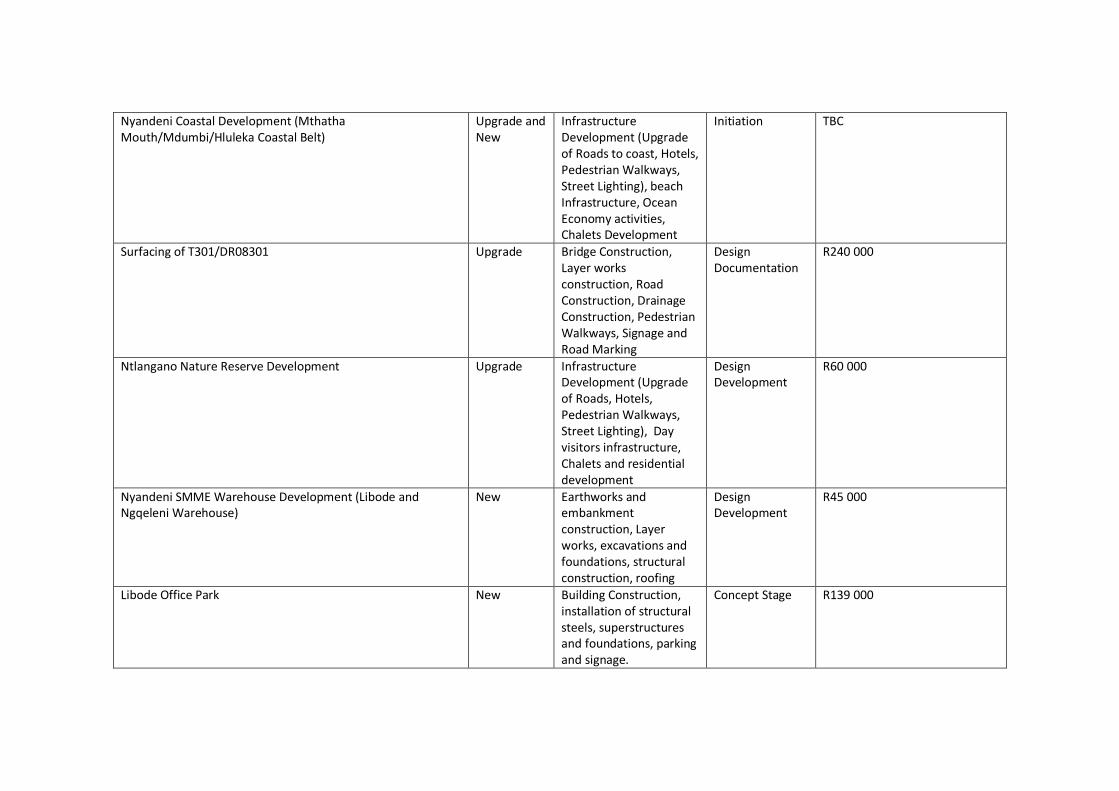
Nyandeni Coastal Development (Mthatha Mouth/Mdumbi/Hluleka Coastal Belt)
Upgrade and New
Infrastructure Development (Upgrade of Roads to coast, Hotels, Pedestrian Walkways, Street Lighting), beach Infrastructure, Ocean Economy activities, Chalets Development
Initiation TBC
Surfacing of T301/DR08301 Upgrade Bridge Construction, Layer works construction, Road Construction, Drainage Construction, Pedestrian Walkways, Signage and Road Marking
Design Documentation
R240 000
Ntlangano Nature Reserve Development Upgrade Infrastructure Development (Upgrade of Roads, Hotels, Pedestrian Walkways, Street Lighting), Day visitors infrastructure, Chalets and residential development
Design Development
R60 000
Nyandeni SMME Warehouse Development (Libode and Ngqeleni Warehouse)
New Earthworks and embankment construction, Layer works, excavations and foundations, structural construction, roofing
Design Development
R45 000
Libode Office Park New Building Construction, installation of structural steels, superstructures and foundations, parking and signage.
Concept Stage R139 000

Nyandeni Cannabis SATIVA Farm New Cultivation and planting, fencing and infrastructure development, zoning of land, Processing and Packaging
Initiation R60 000
Rural Agro Industrialization Finance Initiative New Manufacturing and Supply, Production and Agro processing, packaging and transportation.
Initiation R50 000
Waste Management Program Upgrade Review of IWMP, Upgrade of Asset Data, Construction of reliable Infrastructure, procurement of waste Equipment plant and machinery
Concept Stage R39 000
Electrification of Household backlogs New electrification of households, installation of bulk infrastructure
Concept Stage R175 000
Upgrade of Electrical Capacity in Economic Nodes Upgrade Upgrade of sub stations in Libode and Ngqeleni, provision of 3 phase line in ploughing fields
Initiation R40 000
Rural Agro Industrialization Finance Initiative
Manufacturing and Supply, Production and Agro processing, packaging and transportation.
New R50 000
Development of Parks and Open Spaces
Beautification and landscaping,
New R50 000

Infrastructure Investment
Upgrade of Roads and Stormwater
Intersection Upgrade, surfacing of roads, and Stormwater Development, Traffic Facilities
New R90 000
Precinct Plan(Libode Investment Plan Development of Libode Precinct Plan
New R500 000
Development of Light Industrial Park
Land Packaging and Development of Infrastructure
New R500 million
Sports Academy
Development of the Academy
New R200 000
Bulk Water and Sewer Infrastructure
Development Sewer Reticulation and Waste Water Treatment Works
New R150 000
Development of Light Industrial Park
Land Packaging and Development of Infrastructure
R500 000

This part will be updated before the Final IDP is adopted
INSTITUTIONAL & FINANCE CLUSTER – PRIORITY PROGRAMMES & PROJECTS
KPA OBJ
NO.
WARD NO PROJECT DESCRIPTION FUND
SOURCE
FUNDING YEAR
2019/2020 2020/2021 2021/2022
Good governance &
Admin oversight
01 N/A communication strategy OPEX R77 761 60 R82 271. 77 R87 043 54
N/A Review of institutional policies OPEX R848 000 R897 184 R949 220 .67
N/A Design website and update OPEX R116 176 R122 914.21 R130 043.23
N/A Review of procedure manual OPEX R104 800 R110 983 R117 198
Development of municipal by-laws Opex R111 088.00 R117 531.10 R124 347. 91
Legal Fees Opex R777 616 R822 717.73 R870 435.36
Media Liaison Programmes Opex R377 720 R399 627.76 R422 806.17
Municipal Oversight Opex R318 000 R336 444 R355 957.75
Management Oversight Opex R424 000 R448 592 R474 610.34
Municipal Planning Development of Nyandeni Master
Plan (2030 VISION)
R530 000 R560 740 R503 262.92
IDP R888 704 R940 248.83 R994 783.26
Back to Basics R318 000 R336 444 R355 957.75
Electricity Master Plan R166 632 R176 296.66 R186 521.86
Strategic Planning R888 704 R940 248.83 R994 783.26

KPA OBJ
NO.
WARD NO PROJECT DESCRIPTION FUND
SOURCE
FUNDING YEAR
2019/2020 2020/2021 2021/2022
Intergovernmental
relations
02 N/A IGR Support OPEX R131 083.84 R138 686.70 R146 730.53
Public participation &
support to political
structures
04 N/A Support to Traditional Leaders OPEX R166 632. R176 296.66 R186 521.86
Support for ward admin facilities Opex R3 745 887.36 R3 963 148.83 R 4 193 011.46
05 N/A Public participation OPEX R848 000 R897 184 R949 220.67
Project launches Opex R233 264 R246 793.31 R261 107.32
Sports and recreation Opex R222 176 R235 062.21 R248 695.82
SPU: Children Opex R388 808 R411 358.86 R435 217.68
SPU: Physical challenged Opex R166 632 R176 296.66 R186 521.86
SPU: Women Opex R333 264 R352 593.31 R373 043.72
SPU: Youth Opex R338 352 R357 976.42 R378 739.05
Outreach programmes/Imbizos OPEX R388 808 R411 358.86 R435 217.68
Sectoral support programme Opex R666 528 R705 186.62 R746 087.45
Poverty alleviation fund Opex R333 264 R352 593.31 R373 043.72
All Ward Committee Training Opex R116 176. R122 914.21 R130 043.23
SALGA Capacity Program R1 000 000 R1 058 000 R1 119 364
Council support R212 000 R224 296.00 R237 305.17
Reporting & credit
control
N/A Compilation of valuation roll OPEX R277 720 R293 827.76 R310 869.77
N/A Grap implementation OPEX R1 237 232. R1 308 991.46 R1 384 912.96
Community Awareness campaign OPEX R27 772 R29 382.78 R31 086.98
Audit fees Opex R4 240 000 4 485 920 R4 746 103.36
Asset Management &
Information
Technology
Management
N/A Compilation of GRAP Asset
Register
OPEX R898 880 R951 015.04 R1 006 173.91
N/A Financial management system OPEX R 912 000 R964 896 R1 020 859.97
Implementation of Credit Control
Bylaw
R255 072.15 R269 866.33 R285 518.58
N/A APN Solution OPEX R222 176 R235 062.21 R248 695.82
Computer installation R111 088 R117 531.10 124 347.91
Risk Management N/A Develop Risk Management Plan
and Risk assessment
Opex R222 176 R235 062.21 R248 695.82
Fraud and Prevention R166 632 R176 296.66 R186 521.86
Audit Committee Costs Opex 230 740.80 R244 123.77 R258 228.94

KPA OBJ
NO.
WARD NO PROJECT DESCRIPTION FUND
SOURCE
FUNDING YEAR
2019/2020 2020/2021 2021/2022
Internal Audit N/A Internal Audit costs OPEX R314 400 R332 950 R351 595
Review of procedure manual R111 088 R117 531.10 R124 347.91
Workplace Skills Plan N/A Human resource development fund OPEX R2 000 000 R2 116 000 R2 238 728
Training of interns R111 088 R117 531.10 R124 347.91
Public service week R133 305.60 R141 037.32 R149 217.49
Science week R166 632 R176 296.66 R186 521.86
Employee and
Wellness
N/A Employee assistance programme Opex R555 440 R587 655.52 R621 739.54
Occupational health & safety Opex R555 440 R587 655.52 R621 739.54
PMS & SDBIP N/A Performance management system OPEX R55 544 R58 765.55 R62 173 95
Monitoring and Evaluation R166 632 R176 296.66 R186 521.86

Economic & Environment Cluster – Priority Programmes & Projects
KPA OB
J
NO
.
STRATE
GY
CODE
WAR
D NO
PROJECT
DESCRIPTI
ON
FUND SOURCE FUNDING YEAR
2019/20 2020/21 2021/22
SDF, ,
Tradin
g by-
laws
and
Policie
s)
SMME
17 SDF OPEX R278 000 - -
Urban Area
Land Audit
R100 000 R105 800 R111 936.4
0
Electricity
Master Plan
Opex R157 200 R166 475 R175 797
Small scale
Farming
Opex R318 000 R336 444 R355 957.7
5
Informal
Trading
infrastructure
R559 202
.99
R591 636
.76
R625 951.7
0
Support to
paving
cooperative
R318 000 R336 444 355 957.75
21 E&EC
01
Tourism
Sector Plan
implementati
on
OPEX R407 000 R430 606 R455 581.1
5
Tourism
Development
R388 808 R411 358
.86
R435 217.6
8
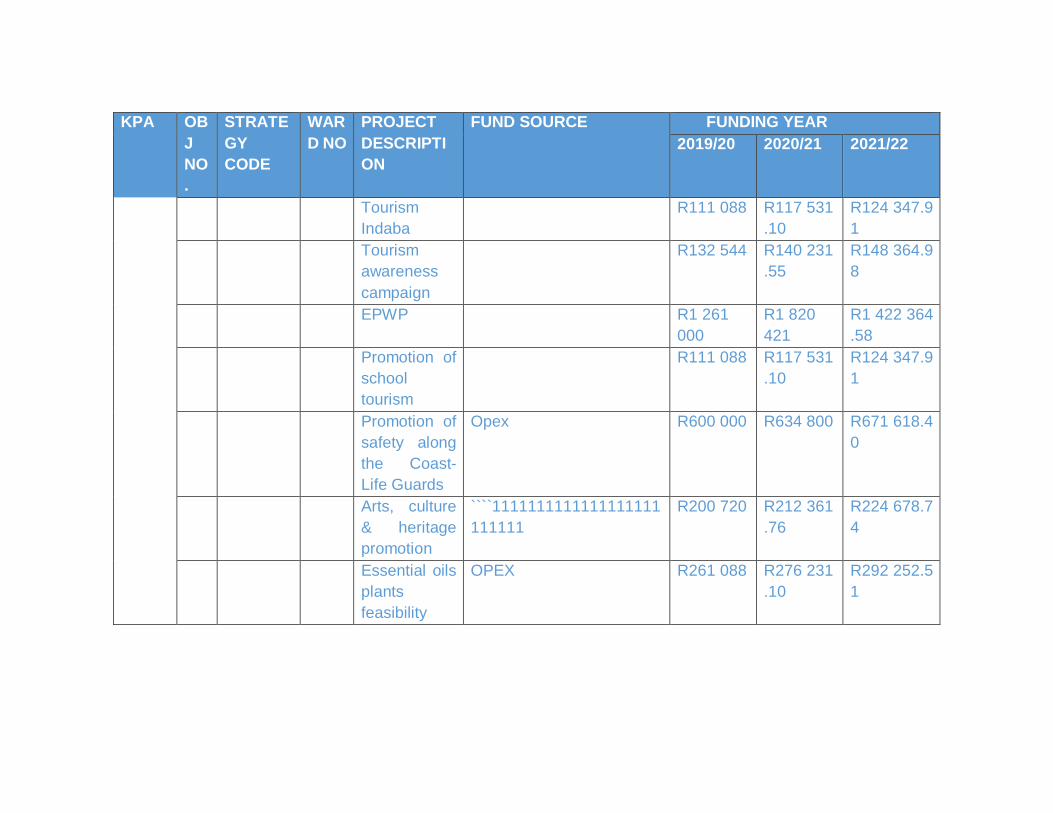
KPA OB
J
NO
.
STRATE
GY
CODE
WAR
D NO
PROJECT
DESCRIPTI
ON
FUND SOURCE FUNDING YEAR
2019/20 2020/21 2021/22
Tourism
Indaba
R111 088 R117 531
.10
R124 347.9
1
Tourism
awareness
campaign
R132 544 R140 231
.55
R148 364.9
8
EPWP R1 261
000
R1 820
421
R1 422 364
.58
Promotion of
school
tourism
R111 088 R117 531
.10
R124 347.9
1
Promotion of
safety along
the Coast-
Life Guards
Opex R600 000 R634 800 R671 618.4
0
Arts, culture
& heritage
promotion
````1111111111111111111
111111
R200 720 R212 361
.76
R224 678.7
4
Essential oils
plants
feasibility
OPEX R261 088 R276 231
.10
R292 252.5
1

KPA OB
J
NO
.
STRATE
GY
CODE
WAR
D NO
PROJECT
DESCRIPTI
ON
FUND SOURCE FUNDING YEAR
2019/20 2020/21 2021/22
Malungeni
Clay
Implementati
on
Opex R166 632 R176 296
.66
R186 521.8
6
Mdumbi
Hotel and
Conference
Centre
To source funding - - -
Crop
production
1 590 000 1 682 220 1 779 788.
76
Hemp
production
R106 000 R112 148 R118 652.5
8
Development
of informal
trade sector
Opex R55 544 R58 765.
55
R62 173.95
SMME &
Cooperatives
R266 569
.60
R282 030
.64
R298 388.4
1
Strategic
partnership
R111 088 R117 531
.10
R124 347.9
1
Branding and
signage
OPEX R55 544 R58 765.
55
R62 173.
95
07 Office Park
Development
Opex - - -

KPA OB
J
NO
.
STRATE
GY
CODE
WAR
D NO
PROJECT
DESCRIPTI
ON
FUND SOURCE FUNDING YEAR
2019/20 2020/21 2021/22
Housing
Consumer
education
OPEX R111 088 R117 531
.10
R124 347.9
1
Housing
needs
register
OPEX R368 000 R389 344 R411 925.9
5
Disaster risk
management
R200 000 R211 600 R223 872.8
0
Housing
emergency
programme
R279 544 R295 757
.55
R312 911.4
9
Housing
Forum
R172 176 R182 162
.21
R192 727.6
2
Housing
sector plan
implementati
on
R31 088 R32 891.
10
R34 798.79
Project
Launches
OPEX R212 000 R224 296 R237 305.1
7
Buildin
g
Contro
Township
establishmen
t
OPEX R166 632 R176 296
.66
R186 521.8
6
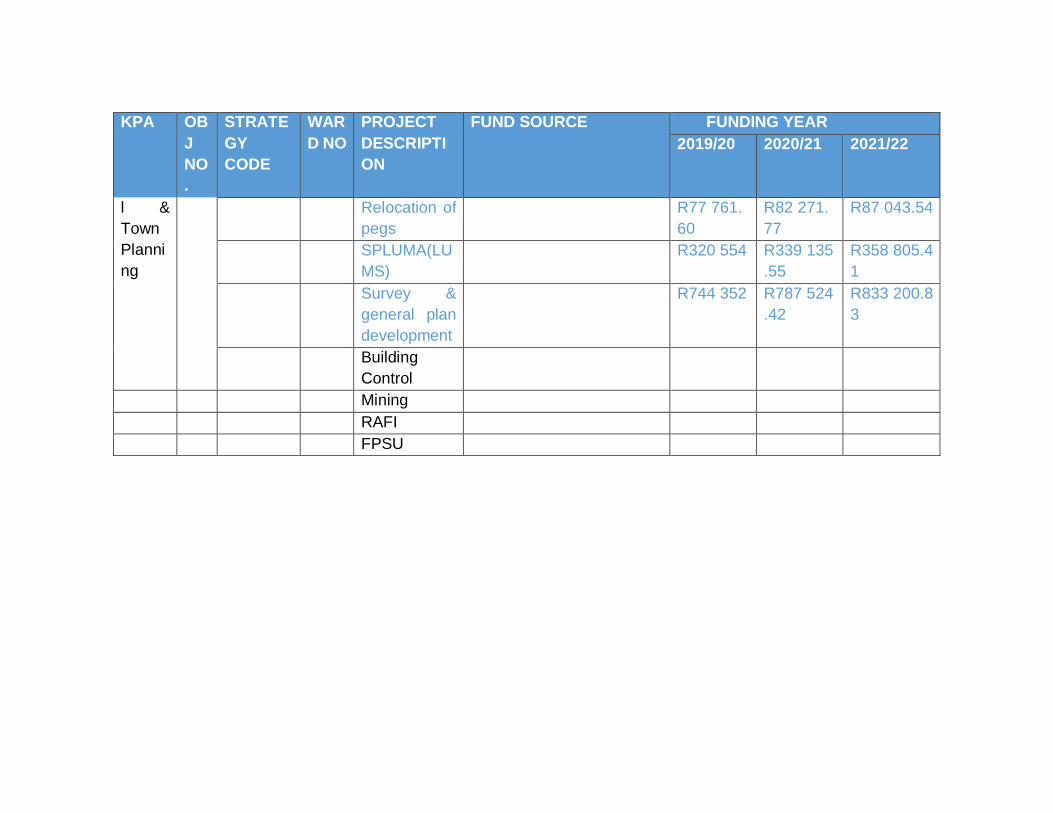
KPA OB
J
NO
.
STRATE
GY
CODE
WAR
D NO
PROJECT
DESCRIPTI
ON
FUND SOURCE FUNDING YEAR
2019/20 2020/21 2021/22
l &
Town
Planni
ng
Relocation of
pegs
R77 761.
60
R82 271.
77
R87 043.54
SPLUMA(LU
MS)
R320 554 R339 135
.55
R358 805.4
1
Survey &
general plan
development
R744 352 R787 524
.42
R833 200.8
3
Building
Control
Mining
RAFI
FPSU

Community Services Cluster – Priority Programmes & Projects
KPA OBJ
NO.
WARD NO PROJECT DESCRIPTION FUND
SOURCE
FUNDING YEAR
2019/2020 2020/21 2021/2022
Waste &
Refuse
Collection
3,14,
16, 23
Waste Management CAPEX R453 283.48 R479 573.92 R507 389.20
21, 7 Construction of refuse removal
Transfer Station in Ngqeleni
MIG/OPEX R408 040 R432 114
R455 881
All Conduct awareness OPEX R55 810.61 R59 047.63 R62 354.29
Tools and equipment R111 088 R117 531.10 R124 347.91
Cleansing 1,7,16,19,21,24 Refuse bags OPEX R223 564.60 R236 531.35 R250 250.16
Pound
Management
21&7 Pound services OPEX
SPCA
R291 174.98 R308 063.13 R325 930.79
Cemeteries 4,5,19,20 Cemeteries OPEX R104 800 R110 983 R117 198
Upgrading of cemeteries R111 088 R117 531.10 R124 347.91
Parks and
Open Spaces
21,7 Parks & open spaces OPEX R134 435 R142 232.23 R150 481.70
Electrification Electrification R9 000 000 R15 0000 000 R20 000 000
Free Basic
Services
Indigent subsidies OPEX R5 300 000 R 5 607 400 R5 932 629
Disaster
Management –
Fire Fighting
All
All HIV/AIDS OPEX/
R277 720 R293 827.76 R310 869.77
Community Liaison
programmes
OPEX R55 544 R58 765.55 R62 056.42
Education,
Early
childhood,
Adult learning
programs
Ematholeni : Children First ECD CAPEX R1 696 000 R1 794 378 R1 894 852.61
Public Safety Community Safety Forum OPEX R59 432.08 R62 879.14 R66 400.37
Regulations Environmental Sector Plan OPEX - - -

KPA OBJ
NO.
WARD NO PROJECT DESCRIPTION FUND
SOURCE
FUNDING YEAR
2019/2020 2020/21 2021/2022
(Environmental
Health)
Traffic safety Vehicle registration authority OPEX R111 088 R117 531.10 R124 347.91
Policing equipment CAPEX R222 176 R235 062.21 R248 695.82
Transport forum OPEX R77 761.60 R82 271.77 R87 043.54
Support to arrive Alive
campaign
OPEX R88 870.40 R94 024.88 R99 478.33
DLTC and ENATIS OPEX R388 808 R411 358.86 R435 217.68
Pauper Burial OPEX R10 020 R10 580.21 R11 193.86
Amenities and community
facilities
OPEX R237 728.32 R251 516.56 R266 104.52
Uniform traffic section R55 440 R587 655.52 R621 739.54
Ematholeni Children First
development forum
OPEX R23 056 R24 416 R25 784
Public security OPEX R144 414.40 R152 790.44 R162 652.28
Library
services
DSRAC R400 000 R400 000 R400 000
Books and publication Opex R33 326.40 R35 259.33 37 233.85

AMENDMENTS AND INCLUSION OF PROJECTS AND IMPLEMENTATION PLAN IN THE REVISED IDP
1.1 Department of Environmental Affairs
MUNICIPALITY PROJECT NAME DESCRPTION BUDGET FOCUS AREA
KSD,NYANDENI & PSJ LM EC WFTC Mbashe River to Manteku River Control invasive alien
vegetation, coastal cleanup and catchment areas, environmental education & awareness 12,65
m WFTC
NYANDENI LM EC- WFTC IP Nyandeni Coastal Facilities Construction of Hiking trail huts in
Mngcibe beach, viewing deck, beach amenities and boardwalk 10 M WFTC
ALL LM’s under OR TAMBO DM OR TAMBO DM GOOD DREEN DEEDS Clearing of illegal
dumps, Environmental Education & Awareness, Clean-ups 11,3 M WOW
NYANDENI LM EC NTLANGANO COMMUNITY CONSERVANCY Construction Of
Accommodation Facility And Associated Infrastructure 15 M P&P
MUNICIPALITY PROJECT NAME DESCRPTION BUDGET FOCUS AREA
NYANDENI LM Ec-Hluleka Nature Reserve Phase Two Tourist Accommodation Development
Infrastructure Development & Upgrade Of Roads And Water Reticulation Of Fence 15 m
P&P
NYANDENI LM Ec- Khonjwayo Eco-Adventure Trail Construction Of Nursery & Educational
Center 8 M GOSM
NYANDENI LM Ec-Ngqeleni Greening 7 Establishment Of Mini-Park Development Of A Park
5 M GOSM
NYANDENI LM EC- Khonjwayo Eco-Adventure Trail Follow Up On The Previous
Interventions, Tree Planting, Control Of Bush Encroachment 10 M WORKING FOR LAND
1.2 Department of Roads and Transport
• Upgrading of Hluleka Nature Reserve road Phase1 48 km commencing in October 2019
• Upgrading of Canzibe Hospital road 26 km commencing in October 2019
• An amount 10 million for maintenance of roads under the authority of the Department
covering both KSD and Nyandeni Local Municipalities
2019/20Budget Distribution
Project Type Description 2019/20 Surfaced Gravel RMC / SURFACED RRM /
GRAVEL
Indicative Figures Estimates Estimates
IRM DRE In-House Nyandeni R 10 362 885.10 35,90% 64.10% R 3 670 159 R 6 692 726.10
Total Budget R 10 362 885.10 R 3 670 159 R 6 692 726.10

1.3 Department of Energy
Allocation for 2019-2019 financial year
Municipality 2019/20
R'000 2020/21
R'000 2021/22R'000
Nyandeni 15 010 8 517 9 752
Project name HH Connections cost
Tshani 260 R 6 110 000.00
Ntsundwana 26 R 520 000.00
Notshintsila 61 R 1 220 000.00
Mngazi 87 R 1 740 000.00
Ntsoyini 80 R 1 600 000.00
Ngojini 21 R 420 000.00
Cibeni 54 R 1080 000.00
Mgwenyane 101 R2 020 000.00
Thungwini 15 R 3000 000.00
1.4 ESKOM
Nyandeni Ext 2019/2020 300 for Phase 1 and 300 for phase 2 covering 600 households, further
details including budget allocation shall be presented on the 28 March 2019
1.5 ORTAMBO DISTRICT MUNICIPALITY
Water and Sanitation
• LIBODE SEWER – TREATMENT WORKS AND SEWER PIPELINE Phase 1
• NTSONYINI/NGQONGWENI REGIONAL WATER SUPPLY PHASE 2A
• LIBODE CORRIDOR –MIG with five (5) contracts in difference phases
• Package 6 : LIBODE CORRIDOR RBIG
• : LIBODE CORRIDOR RBIG (Contract 7) RBIG
• Package 7 : NQGELENI CORRIDOR MIG 1-6
• LIST AND STATUS OF EXISTING STAND ALONE WATER SUPPLY SCHEMES IN NYANDENI
LOCAL MUNICIPALITY
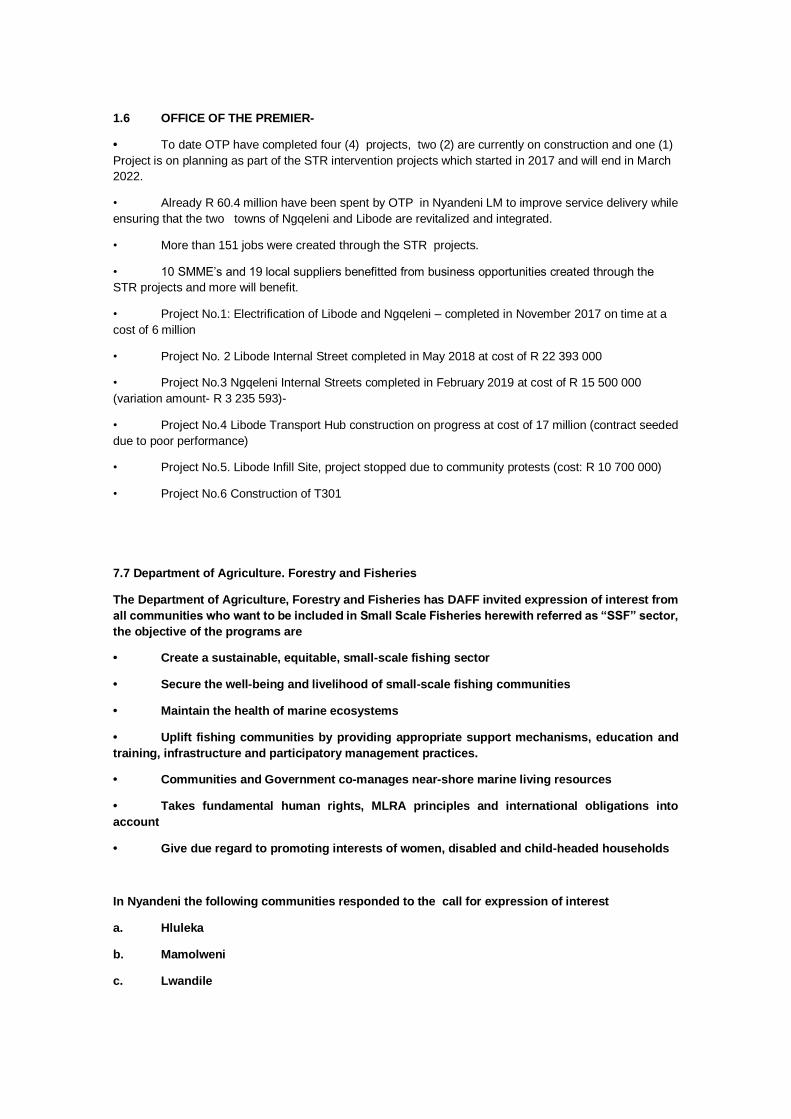
1.6 OFFICE OF THE PREMIER-
• To date OTP have completed four (4) projects, two (2) are currently on construction and one (1)
Project is on planning as part of the STR intervention projects which started in 2017 and will end in March
2022.
• Already R 60.4 million have been spent by OTP in Nyandeni LM to improve service delivery while
ensuring that the two towns of Ngqeleni and Libode are revitalized and integrated.
• More than 151 jobs were created through the STR projects.
• 10 SMME’s and 19 local suppliers benefitted from business opportunities created through the
STR projects and more will benefit.
• Project No.1: Electrification of Libode and Ngqeleni – completed in November 2017 on time at a
cost of 6 million
• Project No. 2 Libode Internal Street completed in May 2018 at cost of R 22 393 000
• Project No.3 Ngqeleni Internal Streets completed in February 2019 at cost of R 15 500 000
(variation amount- R 3 235 593)-
• Project No.4 Libode Transport Hub construction on progress at cost of 17 million (contract seeded
due to poor performance)
• Project No.5. Libode Infill Site, project stopped due to community protests (cost: R 10 700 000)
• Project No.6 Construction of T301
7.7 Department of Agriculture. Forestry and Fisheries
The Department of Agriculture, Forestry and Fisheries has DAFF invited expression of interest from
all communities who want to be included in Small Scale Fisheries herewith referred as “SSF” sector,
the objective of the programs are
• Create a sustainable, equitable, small-scale fishing sector
• Secure the well-being and livelihood of small-scale fishing communities
• Maintain the health of marine ecosystems
• Uplift fishing communities by providing appropriate support mechanisms, education and
training, infrastructure and participatory management practices.
• Communities and Government co-manages near-shore marine living resources
• Takes fundamental human rights, MLRA principles and international obligations into
account
• Give due regard to promoting interests of women, disabled and child-headed households
In Nyandeni the following communities responded to the call for expression of interest
a. Hluleka
b. Mamolweni
c. Lwandile

d. Mngcibe
e. Tshani-Mankosi

Current capital projects (Funded by OR Tambo DM)
Project Name Ward Villages Served Scope Progress
Thekwini Regional Phase
2 Water Supply Ward 23 &26
Njivane, Kwa
Madiba, Entsimbini,
Goso, Enyandeni,
Mpendle, Ntsimbini,
Mgawuza,
Ezincukuthwini and
Mpundweni.
Construction of Storage
Reservoirs, Bulk
Distribution Mains, Break
pressure Tanks,
Reticulation Network and
Refurbishment of the
Nomadolo Pumpstation
88 % Complete
Rosedale - Libode Bulk /1 Ward 7 To Serve the Libode
Town
Construction of Bulk
Distribution Line from 3Ml
Reservoir to Booster
Pump Station.
53 % Complete
Rosedale - Libode Bulk /2 Ward 7 To Serve the Libode
Town
Construction of Bulk
Distribution Line from
Booster Pump Station to
Command Reservoir.
34 % Complete
Rosedale - Libode Bulk /3 Ward 7 To Serve the Libode
Town
Construction of Bulk
Distribution Line from
Command Reservoir to
Libode Town.
15 % Complete
Buthongweni Water
Supply Ward 24 & 28
Kumandeni,
Kwazaka,
Mhlakotshane,
Sigubudu,
Mfundweni, Lutshini,
Mayalweni,
Ngonyameni,
Sizindeni, KwaZulu,
Sidanda, Lutatweni
and Buthongweni
Construction of
Reticulation Network and
Completion of the Water
Treatment Plant.
Project
Complete, 100%
of the Scope
Ntsonyini - Ngqongweni
Water Supply Ward 6
Ntsonyini,
Nohokoza,
Ngqongweni and
Kulambeni
Construction of Storage
Reservoirs, Bulk
Distribution mains, and
Reticulation lines
90 % Complete
Nqgeleni Dam Ward 30 Ngqeleni 27 villages
Construction of an
earthfill storage dam,
gravity main and access
road to dam - completion
of outstanding work
Site
establishment
done (2%
complete)
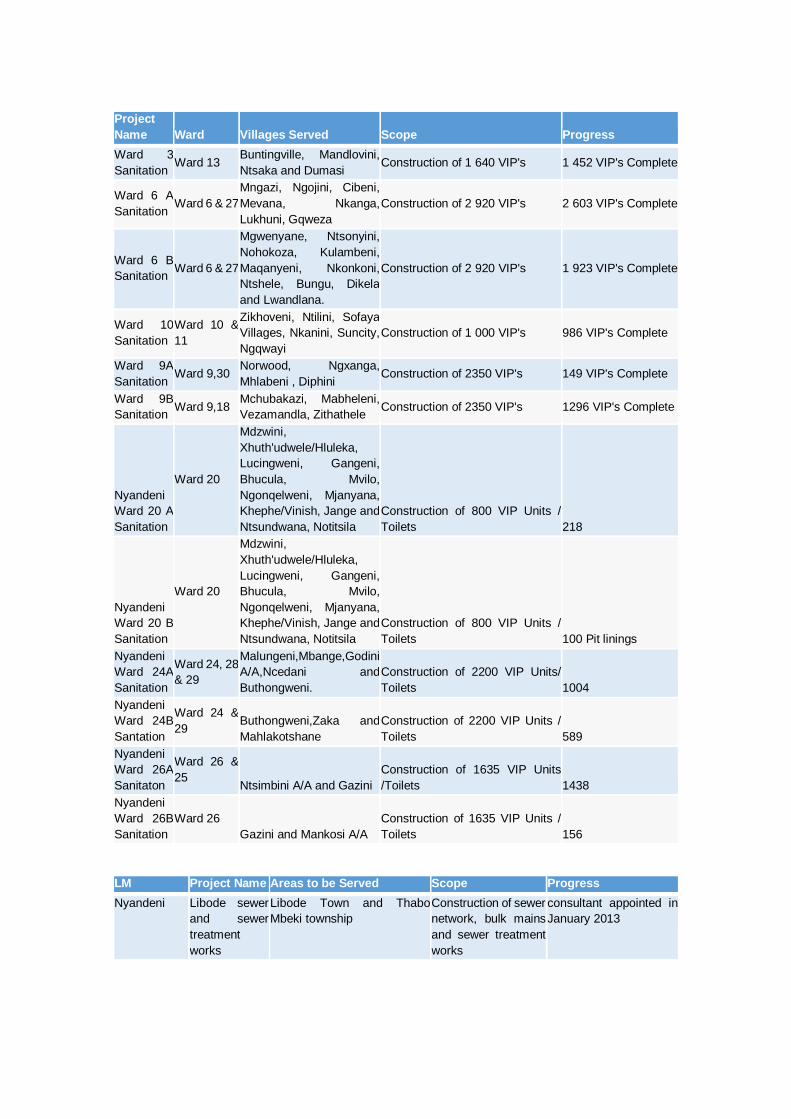
Project
Name Ward Villages Served Scope Progress
Ward 3
Sanitation Ward 13
Buntingville, Mandlovini,
Ntsaka and Dumasi Construction of 1 640 VIP's 1 452 VIP's Complete
Ward 6 A
Sanitation Ward 6 & 27
Mngazi, Ngojini, Cibeni,
Mevana, Nkanga,
Lukhuni, Gqweza
Construction of 2 920 VIP's 2 603 VIP's Complete
Ward 6 B
Sanitation Ward 6 & 27
Mgwenyane, Ntsonyini,
Nohokoza, Kulambeni,
Maqanyeni, Nkonkoni,
Ntshele, Bungu, Dikela
and Lwandlana.
Construction of 2 920 VIP's 1 923 VIP's Complete
Ward 10
Sanitation
Ward 10 &
11
Zikhoveni, Ntilini, Sofaya
Villages, Nkanini, Suncity,
Ngqwayi
Construction of 1 000 VIP's 986 VIP's Complete
Ward 9A
Sanitation Ward 9,30
Norwood, Ngxanga,
Mhlabeni , Diphini Construction of 2350 VIP's 149 VIP's Complete
Ward 9B
Sanitation Ward 9,18
Mchubakazi, Mabheleni,
Vezamandla, Zithathele Construction of 2350 VIP's 1296 VIP's Complete
Nyandeni
Ward 20 A
Sanitation
Ward 20
Mdzwini,
Xhuth'udwele/Hluleka,
Lucingweni, Gangeni,
Bhucula, Mvilo,
Ngonqelweni, Mjanyana,
Khephe/Vinish, Jange and
Ntsundwana, Notitsila
Construction of 800 VIP Units /
Toilets 218
Nyandeni
Ward 20 B
Sanitation
Ward 20
Mdzwini,
Xhuth'udwele/Hluleka,
Lucingweni, Gangeni,
Bhucula, Mvilo,
Ngonqelweni, Mjanyana,
Khephe/Vinish, Jange and
Ntsundwana, Notitsila
Construction of 800 VIP Units /
Toilets 100 Pit linings
Nyandeni
Ward 24A
Sanitation
Ward 24, 28
& 29
Malungeni,Mbange,Godini
A/A,Ncedani and
Buthongweni.
Construction of 2200 VIP Units/
Toilets 1004
Nyandeni
Ward 24B
Santation
Ward 24 &
29 Buthongweni,Zaka and
Mahlakotshane
Construction of 2200 VIP Units /
Toilets 589
Nyandeni
Ward 26A
Sanitaton
Ward 26 &
25 Ntsimbini A/A and Gazini
Construction of 1635 VIP Units
/Toilets 1438
Nyandeni
Ward 26B
Sanitation
Ward 26
Gazini and Mankosi A/A
Construction of 1635 VIP Units /
Toilets 156
LM Project Name Areas to be Served Scope Progress
Nyandeni Libode sewer
and sewer
treatment
works
Libode Town and Thabo
Mbeki township
Construction of sewer
network, bulk mains
and sewer treatment
works
consultant appointed in
January 2013

SANRAL PROJECSTS
LIBODE UPGRADE • Tender awarded to Triamic for R260 million
• Contractor on site April 2014
• Contract period 22 months
• Biggest issue at the moment is land for relocations
Mthatha to Ngqeleni intersection
• Project awarded to Haw & Inglis for R340 million
• Contractor on site in October 2013
• Contract period 30 months
• Busy relocating houses
• Constructing bypasses
• Constructing the Mthatha and Corana bridges
St Barnabas and Ntlaza
• Contract to be completed in June 2014
• 10 SMME are being trained (they currently employ 50 local
labour)
• Construction of the temporary Hospital entrance has been
completed
• Biggest challenge is community strike action
Community development projects
• 3 currently under construction
• Cover community roads across the Nyandeni Municipal area and
are adjacent to the R61, the purpose is to provide all-weather
roads to facilitate vehicle movement due to the closing of a
number of informal access point and formalising of intersections
Bridges Jange bridge
Ngonjini bridge
Zinkumbini bridge
Zixambuzi bridge
21 Maqanyeni bridge
Maqanyeni bridge
Dalaguba to
Mncwili bridge
Ntsundwana to
Mvilo bridge
Malungeni bridge
22 Magwaz’iphalitshi
bridges
R00
000
R0
000
Ndlovayiphathwa
bridge
Mamolweni bridge
Magozeni
Mthomde
Mdlankomo to
Mamfengwini
(material)
Bantini to Godini
Ngqongweni to
Bedla
Bolotwa to
Dimanda SSS

Didi to CHB
Mafusini bridge
Luqolweni
Guqa to
Ngqongwei
Mgojweni bridge
Mngamnye no 1 to
Dikela Springs
JSS
Polini to Bolotwa
bridges
Telecommunication 58 Promote
partnerships for
installation of
signal networks &
telecommunication
infrastructure
OPEX R0 000 R0
000
R0
000
Department of Education
Project name Project Status Municipality / Region
Type of infrastructure
Project duration Budget Programme
Name
Total project
cost
BEN MALI SS
SCHOOL
Stage 1 -
Infrastructure Planning
LIBODE Building & other
fixed structures 2016/01/04 31/03/2020
Public
Ordinary Schools
6 000
CHIEF HENRY BOKLENI SS
SCHOOL
Stage 1 - Infrastructure
Planning
LIBODE Building & other
fixed structures 2016/01/04 31/03/2020
Public Ordinary
Schools
6 000
CIBENI JS SCHOOLS Stage 1 - Infrastructure
Planning
LIBODE Building & other fixed structures
2016/01/04 31/03/2020 Public Ordinary
Schools
7 672
CIBENI SS SCHOOL Stage 1 - Infrastructure Planning
LIBODE Building & other fixed structures
2016/01/04 31/03/2020 Public Ordinary Schools
5 000
D.Z.DUMEZWENI SS SCHOOL
Stage 3 - Package / Project Preparation
LIBODE Building & other fixed structures
2016/01/04 31/03/2018 Public Ordinary Schools
1 392
DALINDYEBO SP SCHOOL
Stage 1 - Infrastructure Planning
LIBODE Building & other fixed structures
2016/01/04 31/03/2020 Public Ordinary Schools
3 324
DIMANDA SS SCHOOL
Stage 1 - Infrastructure Planning
LIBODE Building & other fixed structures
2016/01/04 31/03/2020 Public Ordinary Schools
5 251
DOKODELA SP SCHOOL
Stage 3 -
Package / Project Preparation
LIBODE Building & other fixed structures
2016/01/04 31/03/2019 Early Childhood Development
2 000
DUMEZWENI JS SCHOOL
Stage 1 -
Infrastructure Planning
LIBODE Building & other fixed structures
2016/01/04 31/03/2020
Public
Ordinary Schools
4 949
ENDULINI JS
SCHOOL Stage 7 - Works LIBODE
Building & other
fixed structures 2016/01/04 31/03/2020
Early
Childhood Development
10 887
GCINUMTHETHO SS
SCHOOL
Stage 3 - Package /
Project Preparation
LIBODE Building & other
fixed structures 2016/01/04 31/03/2019
Public
Ordinary Schools
1 326
GOBIZIZWE SP
SCHOOL
Stage 1 - Infrastructure
Planning
LIBODE Building & other
fixed structures 2016/01/04 31/03/2020
Early Childhood
Development
3 577
GXABA SS SCHOOL Stage 7 - Works LIBODE Building & other fixed structures
2016/01/04 31/03/2020 Public Ordinary
Schools
6 370

KWA ZWENI JS
SCHOOLS
Stage 1 -
Infrastructure Planning
LIBODE Building & other
fixed structures 2015/01/04 31/03/2020
Public
Ordinary Schools
799
LANGALITSHONI SP
SCHOOL
Stage 3 - Package /
Project Preparation
LIBODE Building & other
fixed structures 2015/01/04 31/03/2020
Public
Ordinary Schools
961
LOWER MDUMBI JS
SCHOOL Stage 7 – Works LIBODE
Building & other
fixed structures 2015/01/04 31/03/2020
Public
Ordinary Schools
8 092
LOWER MDUMBI JS SCHOOL
Stage 7 – Works LIBODE Building & other fixed structures
2015/01/04 31/03/2020 Early Childhood
Development
3 890
LUKUNI JS SCHOOL Stage 1 - Infrastructure Planning
LIBODE Building & other fixed structures
2015/01/04 31/03/2020 Public Ordinary Schools
3 907
MABALENGWE SS SCHOOL
Stage 3 - Package / Project
Preparation
LIBODE Building & other fixed structures
2015/01/04 31/03/2019 Public Ordinary Schools
672
MABALENGWE SS SCHOOL
Stage 3 - Package / Project
Preparation
LIBODE Building & other fixed structures
2015/01/04 31/03/2019 Public Ordinary Schools
672
MAGOMBENI SP SCHOOL
Stage 1 - Infrastructure Planning
LIBODE Building & other fixed structures
2016/01/04 31/03/2020 Early Childhood Development
3 680
MAJALI TECHNICAL SS SCHOOL
Stage 3 - Package / Project
Preparation
LIBODE Building & other fixed structures
2015/01/04 31/03/2020 Public Ordinary Schools
799
MALIZE SP SCHOOL Stage 1 - Infrastructure Planning
LIBODE Building & other fixed structures
2015/01/04 31/03/2020 Public Ordinary Schools
3 158
MANZIMAHLE SENIOR PRIMARY SCHOOL
Stage 7 – Works LIBODE Building & other fixed structures
2015/01/04 31/03/2020 Public Ordinary Schools
8 505
MAQEBEVU JS SCHOOLS
Stage 1 -
Infrastructure Planning
LIBODE Building & other fixed structures
2015/01/04 31/03/2020
Public
Ordinary Schools
896
MATANDELA JS
SCHOOLS
Stage 1 -
Infrastructure Planning
LIBODE Building & other
fixed structures 2015/01/04 31/03/2020
Early
Childhood Development
6 982
MDUMAZULU JS
SCHOOLS Stage 7 - Works LIBODE
Building & other
fixed structures 2015/01/04 31/03/2019
Public Ordinary
Schools
4 407
MHLANGANISWENI COMM & TECH SS SCHOOL
Stage 7 - Handover
LIBODE Building & other fixed structures
2015/01/04 31/03/2020 Public Ordinary Schools
665
MJONGILE SP SCHOOL
Stage 1 - Infrastructure Planning
LIBODE Building & other fixed structures
2015/01/04 31/03/2020 Public Ordinary Schools
3 158
MKANZINI JUNIOR SECONDARY SCHOOL
Stage 7 – Works LIBODE Building & other fixed structures
2015/01/04 31/03/2020 Public Ordinary Schools
19 713
MKANZINI JUNIOR
SECONDARY SCHOOL
Stage 7 – Works LIBODE Building & other fixed structures
2015/01/04 31/03/2020
Public
Ordinary Schools
18 460
MTIKA SP SCHOOL
Stage 1 -
Infrastructure Planning
LIBODE Building & other
fixed structures 2015/01/04 31/03/2020
Public
Ordinary Schools
799
MTWENI SS SCHOOL Stage 1 - Infrastructure
Planning
LIBODE Building & other
fixed structures 2015/01/04 31/03/2020
Public Ordinary
Schools
8 691
MTWENI SS SCHOOL Stage 1 - Infrastructure Planning
LIBODE Building & other fixed structures
2015/01/04 31/03/2020 Public Ordinary Schools
4 797
MZAMO JS SCHOOL Stage 1 - Infrastructure Planning
LIBODE Building & other fixed structures
2015/01/04 31/03/2020 Public Ordinary Schools
799

NDAMASE SENIOR
SECONDARY SCHOOL
Stage 7 - Works LIBODE Building & other
fixed structures 2015/01/04 31/03/2020
Public
Ordinary Schools
2 850
NDLUMBINI JS
SCHOOLS
Stage 1 - Infrastructure
Planning
LIBODE Building & other
fixed structures 2015/01/04 31/03/2020
Public Ordinary
Schools
4 720
NGQELENI VILLAGE JUNIOR SECONDARY
SCHOOL
Stage 1 - Infrastructure
Planning
LIBODE Building & other fixed structures
2015/01/04 31/03/2020 Public Ordinary
Schools
6 484
NGUBEZULU SENIOR SECONDARY SCHOOL
Stage 7 – Works LIBODE Building & other fixed structures
2015/01/04 31/03/2020 Public Ordinary Schools
7 423
NOGEMANE SENIOR SECONDARY SCHOOL
Stage 7 – Works LIBODE Building & other fixed structures
2015/01/04 31/03/2020 Public Ordinary Schools
7 355
NTAFUFU SENIOR SECONDARY SCHOOL
Stage 1 - Infrastructure Planning
LIBODE Building & other fixed structures
2015/01/04 31/03/2020 Public Ordinary Schools
5 592
NYIKIMENI PRIMARY
SCHOOL
Stage 1 -
Infrastructure Planning
LIBODE Building & other
fixed structures 2015/01/04 31/03/2018
Public
Ordinary Schools
3 832
PANGALELE SENIOR SECONDARY
SCHOOL
Stage 1 - Infrastructure
Planning
LIBODE Building & other
fixed structures 2015/01/04 31/03/2020
Public Ordinary
Schools
10 500
PHIKELELI JS SCHOOLS
Stage 1 - Infrastructure
Planning
LIBODE Building & other fixed structures
2015/01/04 31/03/2020 Public Ordinary
Schools
896
PORT ST JOHNS SENIOR SECONDARY
SCHOOL
Stage 1 - Infrastructure Planning
LIBODE Building & other fixed structures
2015/01/04 31/03/2020 Public Ordinary Schools
6 950
SANDI SENIOR SECONDARY SCHOOL
Stage 1 - Infrastructure Planning
LIBODE Building & other fixed structures
2015/01/04 31/03/2020 Public Ordinary Schools
11 339
SOBABA SS SCHOOL Stage 7 - Works LIBODE Building & other fixed structures
2015/01/04 31/03/2020 Public Ordinary Schools
8 000
ST PATRICK'S SS SCHOOL
Stage 3 - Package / Project Preparation
LIBODE Building & other fixed structures
2015/01/04 31/03/2020 Public Ordinary Schools
2 389
TEKWINI JS SCHOOL Stage 1 - Infrastructure Planning
LIBODE Building & other fixed structures
2015/01/04 31/03/2020 Public Ordinary Schools
11 114
TOLI SS SCHOOL Stage 7 - Handover
LIBODE Building & other fixed structures
2015/01/04 31/03/2020
Public
Ordinary Schools
9 180
TOLIKANA JS
SCHOOLS
Stage 1 -
Infrastructure Planning
LIBODE Building & other
fixed structures 2015/01/04 31/03/2020
Early
Childhood Development
6 982
TUTOR NDAMASE SS
SCHOOL
Stage 1 - Infrastructure
Planning
LIBODE Building & other
fixed structures 2015/01/04 31/03/2020
Public Ordinary
Schools
9 664
UPPER CORANA SS SCHOOL
Stage 6 - Design Documentation
LIBODE Building & other fixed structures
2015/01/04 31/03/2020 Public Ordinary Schools
3 686
VAKELE TECH Stage 1 - Infrastructure Planning
LIBODE Building & other fixed structures
2015/01/04 31/03/2020 Public Ordinary Schools
7 242
VULINDLELA SS SCHOOL
Stage 3 - Package / Project Preparation
LIBODE Building & other fixed structures
2015/01/04 31/03/2020 Public Ordinary Schools
1 706
XHENTSE SS SCHOOL
Stage 1 - Infrastructure Planning
LIBODE Building & other fixed structures
2015/01/04 31/03/2020 Public Ordinary Schools
5 764
ZAMUKANYO JS SCHOOL
Stage 1 - Infrastructure Planning
LIBODE Building & other fixed structures
2015/01/04 31/03/2020 Early Childhood Development
6 982

MGCOTYELWA SP
SCHOOL
Stage 1 -
Infrastructure Planning
LIBODE Building & other
fixed structures 2015/01/04 31/03/2020
Public
Ordinary Schools
637
NDAMASE SSS (PUMP HOUSE)
(NEW)
Stage 7 - Works LIBODE Building & other
fixed structures 2015/01/04 31/03/2020
Public Ordinary
Schools
2 359
NKQUBELA JUNIOR SECONDARY
SCHOOL
Stage 1 - Infrastructure
Planning
LIBODE Building & other fixed structures
2015/01/04 31/03/2020 Public Ordinary
Schools
3 589
NYANGILIZWE SENIOR SECONDARY
SCHOOL
Stage 3 - Package / Project
Preparation
LIBODE Building & other fixed structures
2015/01/04 31/03/2020 Public Ordinary Schools
2 325
ENDULINI JSS (NEW WORKS)
Stage 7 - Works LIBODE Building & other fixed structures
2016/01/04 31/03/2019 Public Ordinary Schools
9 481
LUTSHAYA JUNIOR SECONDARY SCHOOL
Stage 7 - Works LIBODE Building & other fixed structures
2015/01/04 31/03/2020 Public Ordinary Schools
18 638
Department of Housing
Project name Project Municipality / Region Type of infrastructure
Project duration Total project cost
Gxulu 200 (Destitute) Construction Nyandeni Top Structures
2015/07/01 30/03/2019 8 142
Mampondomiseni Phase 1 - 150 Construction Nyandeni Top Structures
2012/01/04 30/03/2019 13 160
Mampondomiseni Phase 2 -150 Construction Nyandeni Top Structures
2017/04/01 30/03/2019 29 497
Mqwangqweni 1000 Construction Nyandeni Top Structures
2015/01/05 30/03/2019 3 404
Ngqeleni 259 Construction Nyandeni Top
Structures 2012/01/04 30/03/2019
10 988
Ntsundwana 1000 Construction Nyandeni Top Structures
21/08/2015 30/03/2019 33 669
Nyandeni 190 Construction Nyandeni Top Structures
2015/01/05 30/03/2019 16 412
Nyandeni 800 Construction Nyandeni Top Structures
2014/08/01 30/03/2019 119 068
NYANDENI LOCAL 370 Construction Nyandeni Top Structures
2015/01/05 30/03/2019 12 527
Office of the Premier Intervention
Project name Project Municipality /
Region Type of infrastructure Project duration
Total project
cost
Libode Town STD
Forward Planning
Nyandeni LM Sanitation ( Waste Management) 2017/01/04 31/03/2018 6 771
Libode Town
STD
Forward
Planning Nyandeni LM Libode Transport Hub(Taxi Rank) 2017/01/04 31/03/2018 6 362
Libode Town STD
Forward Planning
Nyandeni LM Roads ( surfacing of R61 linking Libode and Ngqeleni)
2017/01/04 31/03/2020 45 484
Libode Town
STD
Forward
Planning Nyandeni LM
Roads ( surfacing of internal
streets) 2017/01/04 31/03/2018 4 319

Libode Town STD
Forward Planning
Nyandeni LM Electricity( street high mast lighting)
2017/01/04 31/03/2018 1 167
Ngqeleni
Town STD
Forward
Planning Nyandeni LM
Roads ( surfacing of internal
streets) 2017/01/04 31/03/2018 6 129
Ngqeleni
Town STD
Forward
Planning Nyandeni LM Electrification ( high mast lights) 2017/01/04 31/03/2018 1 167
Small Town Regeneration Programme
STATUS OF SECTOR PLANS AND POLICIES
Sector Plan Detail Date of approval
IDP and Budget Policy This policy sets out the budgeting principles, which
Nyandeni Local Municipality will follow in preparing
each annual budget, as well as the Integrated
Development Planning process through which the
municipality will prepare a strategic development
plan, for a five-year period.
30 May 2019
PMS Policy and Procedure
Manual
Provides mechanisms, procedures and guidelines
in managing performance, reporting and
evaluations
28 March 201T
Public Participation Plan It guides how public participation is to be achieved,
set structures, systems and mechanisms to for
engagements.
Critically, the plan has mechanisms to handle and
to respond to management of petition and
resolutions
27 June 2019
Rates Policy To ensure that property rating in Nyandeni
Municipality is carried out in a fair, consistent,
considerate and controlled manner, this rate policy
is developed in accordance with the provisions of
the Local Government: Municipal Property Rates
Act, (Act 6 of 2004).
30 MAY 2019

Sector Plan Detail Date of approval
Spatial Development
Framework
Is a decision –making tool, which ensures that land
use management and land development is based
on the principle of sustainable development
decisions and practices
27 June 2017
LED Strategy 27 June 2019
LED Socio-economic
Profile
This document is a rapid strategic review
of the local socio-economic environment,
providing an overview of geo-political and
demographic considerations together with
a more detailed analysis and synopsis in
respect of the Nyandeni Municipality’s
local economy’s key indicators, structural
characteristics, comparative and
competitive advantages, opportunities and
constraints.
It is designed to present a more reliable
statistical baseline to inform local
stakeholder choices on local economic
development options for the Nyandeni
Municipality, leading to the review of the
current strategic framework for local
economic development (2007) of
Nyandeni.
27 June 2019
Fraud Risk Management
Policy
In addition to promoting ethical conduct within
Nyandeni, the policy is intended to assist in
preventing, detecting, investigating and sanctioning
fraud and corruption
27 June 2019
Enterprise Risk Management
Framework
27 June 2019
Whistle Blowing Policy 27 June 2019
Risk Management Policy 27 June 219
HR Strategy
Key focus areas of the
strategy
Workforce analysis
Employee wellness
Occupational
health and safety
Individual
performance
management
Education, training
and development
Employment equity
and diversity
management
Recruitment and
selection
Retention
The Human Resource Plan was developed and
adopted by
27 June 2019
Facilitate a culture of public service and
accountability amongst staff
Align roles and responsibilities with priorities and
objectives reflected in the Integrated Development
Plan (IDP);
Organize structures and administration in a flexible
way to respond to changing priorities and
circumstances;
Perform functions through operationally effective
and appropriate administrative units;
Personnel Regulation
Policy
To ensure compliance to the occupational Health
&Safety legislation.
27June 2019

Sector Plan Detail Date of approval
To ensure the effective induction and orientation of
newly appointed employees
To provide guidelines with regard to staff benefits
and allowances for employees.
Human Resource
Development Policy
To create a cultural of life and to provide employees
and councilors with opportunities to acquire new
skills
27 June 2019
To improve the quality of workers and their
prospects of mobility within and outside the
municipality
To facilitate the development of a skilled and
competent workforce and development
Disciplinary Policy To serve as a guide to management and ensures
fair and equal treatment of all employees
27 June 2019
To encourage timely corrective action in the event
of an employees behavior providing to be
unsatisfactory or unacceptable
To ensure that the principles of natural justice are
applied before an employee is penalized for
misconduct
Induction Policy To familiarize and introduce new employees and
new councilors to the institutional culture, including
IDP and budget and related policies
27 June 2019
Employment Equity The purpose of this policy is to outline the broad
principle of employment equity to which the
municipality is committed and to describe in general
how it seeks to realize equity principles
27 June 2019
Employment Retention
Policy
The Municipality is one of the remote rural
municipalities with a high rate of unemployment and
a shortage of skills in particular
27 June 2019
Occupational Health and
Safety
To ensure the compliance with all relevant
statutory requirement including the Municipal
Safety Regulations and Procedures.
27 June 2019
To minimize loss through accident or incident.
To continually strive for the achievement of the
highest level of safety, namely a 5 star rating on
the NOSA rating system, and the maintenance
thereof once this has been achieved.
Employee Retention Policy The Municipality strives to ensure attraction and
retention of a cadre of personnel with the necessary
competency to enable the Municipality, the
retention will periodically reviewed to improve it on
par with the dynamics of the labour market
27 June 2019
Housing Sector Plan Was developed and adopted as a five year horizon
plan and is due for review. Department of Human
Settlement should provide technical support
27 June 2019
Tourism Sector Plan Addresses economic potential of the Nyandeni
Municipal Area
June 2017
Storm Water Management
Plan
Adopted 2013
Integrated Transport Plan Adopted by Council 2015
Integrated Waste
Management Plan
The objective of the IWMP is to manage waste
management
May 2014

Sector Plan Detail Date of approval
Roads Master Plan Road management planning 2015
Forestry Plan Department of Water Affairs should provide
financial support
Electricity Master Plan Energy provision planning 2016
Infrastructure Investment
Plan
Budget Provision has been made 2017
Agricultural Development
Plan
Adopted 2013
By laws Refuse removal bylaw
Waste Management By-law
Public health
Street Trading By-law
Public Space By-law
Parking Ground By-law
Encroachment on property bylaw
Funeral undertakers by-law
Library and Information services by-law
Credit Control and debt collection
Advertising signs
Credit management
Cemetery bylaw
Bylaw relating to nuisances
Public road and misilelaneous
Pound Management Bylaw
24 June 2019
Liquor Trading ByLaw ( Gazetted )
Undeveloped site ByLaw Gazetted
Rates Bylaw
Parks and Recreation Bylaw

APPROVAL
7 THE APPROVAL PROCESS
DECLARATION OF ADOPTION
The Draft IDP was tabled to Council on 26 March 2020
SIGNATURES
DATE: 26 March 2020

ANNEXURE A
SERVICE DELIVERY AND BUDGET IMPLEMENTATION PLAN FOR 2020-2021