NISTIR 7382 Effects of Scanner Height on Fingerprint Capture
58
NISTIR 7382 Page 1 12/14/2006 NISTIR 7382 Effects of Scanner Height on Fingerprint Capture Mary Theofanos Shahram Orandi Ross Micheals Brian Stanton Nien-Fan Zhang Information Access Division Information Technology Laboratory December 2006
-
Upload
khangminh22 -
Category
Documents
-
view
4 -
download
0
Transcript of NISTIR 7382 Effects of Scanner Height on Fingerprint Capture
NISTIR 7382 Page 1 12/14/2006
NISTIR 7382
Effects of Scanner Height on
Fingerprint Capture
Mary Theofanos
Shahram Orandi
Ross Micheals
Brian Stanton
Nien-Fan Zhang
Information Access Division
Information Technology Laboratory
December 2006

NISTIR 7382 Page 2 12/14/2006
NISTIR 7382
Effects of Scanner Height on
Fingerprint Capture
Mary Theofanos
Ross Micheals
Brian Stanton
Nien-Fan Zhang U.S. Department of Commerce
Technology Administration
National Institute of Standards and Technology
Information Technology Lab
Gaithersburg, MD 20899
Shahram Orandi
MitreTek Systems
Falls Church, VA
December 2006
U.S. Department of Commerce
Carlos M. Gutierrez, Secretary
Technology Administration
Robert Cresanti, Under Secretary of Commerce for Technology
National Institute of Standards and Technology
William Jeffrey, Director
NISTIR 7382 Page 3 12/14/2006
Table of Contents
1. BACKGROUND ..............................................................................................................................................7
2. INTRODUCTION............................................................................................................................................8
3. REVIEW OF CURRENT SYSTEMS ............................................................................................................9
3.1 WORK SURFACES ...........................................................................................................................9 3.2 US-VISIT............................................................................................................................................9 3.2.1 Workspace data from US-VISIT..................................................................................................10
3.3 US-VISIT POINT OF ENTRY ..............................................................................................................10 3.3.1 Workspace data from US-VISIT Point of Entry ..........................................................................11
3.4 NIV/TPLS.........................................................................................................................................11 3.4.1 Workspace data from Department of State’s NIV system ...........................................................11
3.5 SUMMARY..........................................................................................................................................11
4. EXPERIMENTAL PROCESS......................................................................................................................12
4.1 DESIGN AND IMPLEMENTATION .........................................................................................................12 4.2 HARDWARE AND SOFTWARE .............................................................................................................13 4.2.1 Digital Fingerprint Scanner..........................................................................................................13 4.2.2 Capture Software..........................................................................................................................13 4.2.3 Process .........................................................................................................................................14
5. FINDINGS......................................................................................................................................................16
5.1 PARTICIPANTS ...................................................................................................................................16 5.2 USABILITY METRICS..........................................................................................................................20 5.2.1 Efficiency.....................................................................................................................................20 5.2.2 Effectiveness ................................................................................................................................26 5.2.3 User Satisfaction ..........................................................................................................................30
6. RECOMMENDATIONS AND CONCLUSIONS .......................................................................................33
7. REFERENCES...............................................................................................................................................34
APPENDIX A.....................................................................................................................................................37
APPENDIX B .....................................................................................................................................................41
APPENDIX C.....................................................................................................................................................45
NISTIR 7382 Page 4 12/14/2006
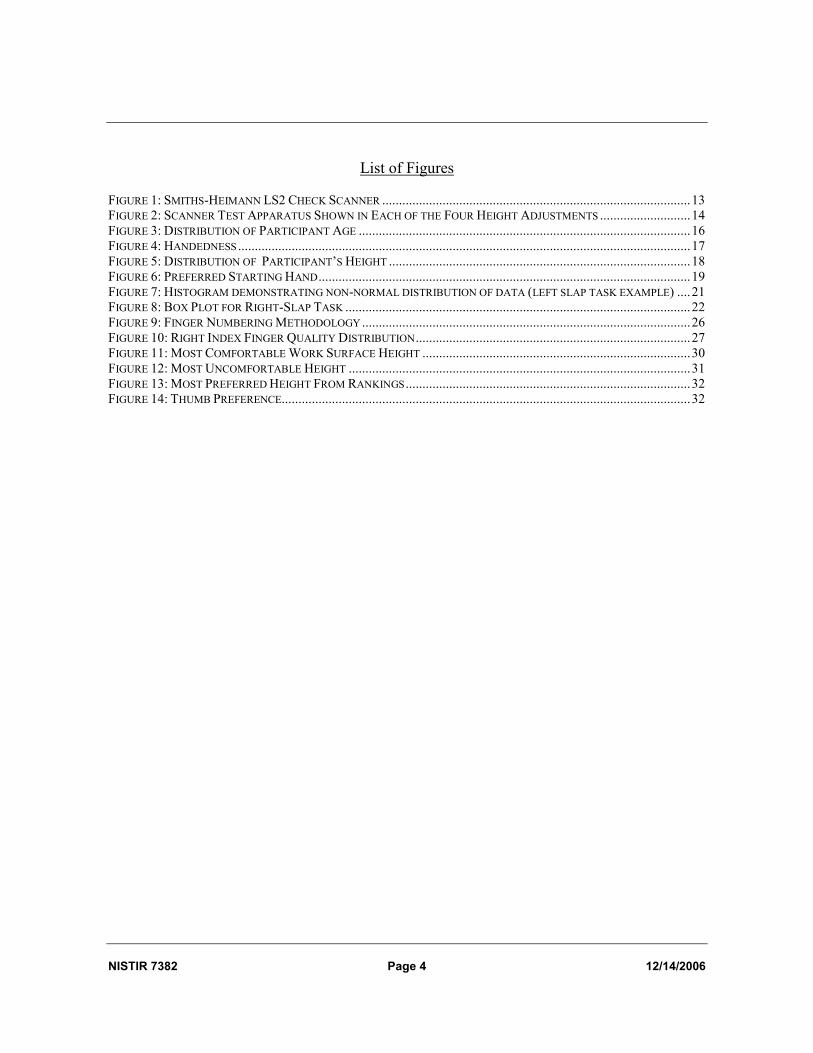
List of Figures
FIGURE 1: SMITHS-HEIMANN LS2 CHECK SCANNER ............................................................................................13 FIGURE 2: SCANNER TEST APPARATUS SHOWN IN EACH OF THE FOUR HEIGHT ADJUSTMENTS ...........................14 FIGURE 3: DISTRIBUTION OF PARTICIPANT AGE ...................................................................................................16 FIGURE 4: HANDEDNESS .......................................................................................................................................17 FIGURE 5: DISTRIBUTION OF PARTICIPANT’S HEIGHT ..........................................................................................18 FIGURE 6: PREFERRED STARTING HAND...............................................................................................................19 FIGURE 7: HISTOGRAM DEMONSTRATING NON-NORMAL DISTRIBUTION OF DATA (LEFT SLAP TASK EXAMPLE) ....21 FIGURE 8: BOX PLOT FOR RIGHT-SLAP TASK .......................................................................................................22 FIGURE 9: FINGER NUMBERING METHODOLOGY ..................................................................................................26 FIGURE 10: RIGHT INDEX FINGER QUALITY DISTRIBUTION..................................................................................27 FIGURE 11: MOST COMFORTABLE WORK SURFACE HEIGHT ................................................................................30 FIGURE 12: MOST UNCOMFORTABLE HEIGHT ......................................................................................................31 FIGURE 13: MOST PREFERRED HEIGHT FROM RANKINGS .....................................................................................32 FIGURE 14: THUMB PREFERENCE..........................................................................................................................32
NISTIR 7382 Page 5 12/14/2006
Executive Summary
Despite the increased deployment of biometric technologies, little attention is being paid to
the human factors that such technologies involve. While numerous usability guidelines exist
for other systems such as interfaces for desktop computers, no such guidelines have been
developed for interacting with biometric hardware and software.
The use of biometric applications will be unfamiliar to many users, who may neither
understand nor be comfortable with the technology. Since user behavior can affect both the
throughput of the system as well as the quality of the captured images, guidelines for
developing interactions with biometric applications that increase throughput and image
quality would be valuable to both developers and end-users. Designs that help end users
understand and comfortably navigate workflow may reduce the time it takes to obtain images
thus improving the process for both the participant and the operator.
This report presents the results of a study that examined the effect of the height of the sensor
on the quality and the time required to collect prints1. The study was designed to answer
three questions:
1. Does work surface height affect the time required to capture fingerprint images? 2. Does work surface height affect the quality of the captured images? 3. Do users prefer a particular work surface height?
Most existing biometric systems are retrofitted into existing infrastructures. A cursory
examination of deployed fingerprint systems identified that work surface heights vary greatly
(from 32 to 50 inches, 813mm to 1270 mm) across facilities. The heights used in the study
were identified via the Department of Defense and commercial guidelines for surface
heights. These guidelines recommend a height of 26.0 inches (660 mm) for tables, 32.0
inches (813mm) for desks, 36.0 inches (914 mm) for counters, and 42.0 inches (1067 mm)
for stand-up counters. The fingerprint scanner used in the experiment had a height of 6.0
inches (152 mm).
1 These tests were performed for the Department of Homeland Security in accordance with section 303 of the Border Security Act, codified as 8 U.S.C. 1732. Specific hardware and software products identified in this
report were used in order to perform the evaluations described in this document. In no case does such
identification imply recommendation or endorsement by the National Institute of Standards and Technology,
nor does it imply that the products and equipment identified are necessarily the best available for the purpose.
NISTIR 7382 Page 6 12/14/2006
The experimental procedure may be summarized as follows. Seventy-five National Institute
of Standards and Technology (NIST) employees participated in the experiment. From each
participant we collected five types of fingerprint images:
• A left slap (all fingers on the left hand except for the thumb)
• A right slap (all fingers on the right hand except for the thumb)
• Individual thumb prints (a left thumb or right thumb)
• Simultaneous thumb prints (both thumbs)
The order of presentation of the slaps and the work surface heights were counter-balanced so
that every possible combination of slaps appeared at each work surface height. The study
population ranged in age from 17 to 67 mirroring the United States Visitor and Immigrant
Status Indicator Technology (US-VISIT) population. The population was also representative
with respect to U.S. population height based on data from the Centers for Disease Control
and Prevention (CDC).
We used the definition of usability in ISO 9241-11, “Ergonomic requirements for office
work with visual display terminals (VDTs),” and measured efficiency, effectiveness, and
user satisfaction. Efficiency was measured as time on task. Statistical analysis shows that
users perform faster at a 36 inch (914mm) work surface height. Effectiveness was measured
by the NIST Fingerprint Image Quality score (NFIQ). Statistical analysis shows that the
image quality was best at the lower surface heights of 26 inch (660mm) and 32 inch (813
mm). Following the collection of the fingerprints for each height, the participants were
asked questions to determine which height was most comfortable and which was least
comfortable. Users preferred the 32 inch (813mm) and 36 inch (914mm) heights and were
the most uncomfortable at the 42 inch (1067mm) height stating that it was difficult,
uncomfortable, and awkward to position both thumbs at 42 inches (1067mm).
Assuming that all five fingerprint images are collected for a given user, the results can be
summarized by the following recommendations for a ten-print capture sequence with a six
inch high sensor:
• a counter height of 36 inches (914 mm) gives the fastest performance
• a counter height of 26 inches (660 mm) gives the highest quality performance
• a counter height of 32 or 36 inches (813 mm or 914 mm) is the most comfortable for
users
• starting a capture sequence with the right slap was most efficient
• capturing individual thumb prints yields higher quality images than capturing
simultaneous thumb prints
• a counter height of 42 inches (1067 mm) or higher does not satisfy the efficiency,
effectiveness, nor satisfaction requirements.
NISTIR 7382 Page 7 12/14/2006
1. BACKGROUND
Since the release of the 9/11 Commission Report [911COM1], there has been an increased
recognition of the importance of the role of national standards in Border and Transportation
Security:
Recommendation: The U.S. border security system should be integrated
into a larger network of screening points that includes our transportation
system and access to vital facilities, such as nuclear reactors.
The President should direct the Department of Homeland Security to
lead the effort to design a comprehensive screening system, addressing
common problems and setting common standards with system wide
goals in mind. Extending those standards among other governments
could dramatically strengthen America and the world’s collective ability
to intercept individuals who pose catastrophic threats.
The Commission Report places a particular emphasis on the use of biometrics in border and
transportation security:
Recommendation: The Department of Homeland Security, properly
supported by the Congress, should complete, as quickly as possible,
a biometric entry-exit screening system, including a single system for
speeding qualified travelers. It should be integrated with the system
that provides benefits to foreigners seeking to stay in the United
States. Linking biometric passports to good data systems and decision making
is a fundamental goal. No one can hide his or her debt by acquiring
a credit card with a slightly different name. Yet today, a terrorist can
defeat the link to electronic records by tossing away an old passport
and slightly altering the name in the new one.
NIST, which has an established expertise in evaluating biometrics, has been assigned,
according to the USA PATRIOT Act (Public Law 107-56) the responsibility of developing
and certifying biometric technology standards for verifying the identity of foreign travelers
entering and existing the US. NIST has been supporting biometric standards and evaluation
activities for over forty years, starting with fingerprint analysis which began in 1965. In the
past few years, NIST has had several major open evaluations. These evaluations have
traditionally focused on performance and error rates of systems and algorithms.
Although the deployment of biometric technologies such as fingerprints is becoming more
widespread, little attention is being paid to the human-computer interaction that such
technologies involve. While numerous guidelines exist for the design of user interfaces for
NISTIR 7382 Page 8 12/14/2006
desktop computers, no such guidelines have been developed for interacting with biometric
hardware and software.
The use of biometrics will be unfamiliar to many users, who will not understand the
technology, nor be comfortable with using it. Since user behavior can affect both throughput
of the system as well as the quality of the captured images, guidelines for developing
interactions with biometric applications that increase throughput and image quality would be
valuable to the biometrics community. This would help them develop hardware, software,
and interaction techniques that would produce good quality biometrics. Designs that help
end users understand the biometric hardware and process would reduce the time it takes to
obtain images improving the process for both the participant and the operator.
2. INTRODUCTION
The quality of captured biometric data is influenced by the human computer interaction and
usability. Low quality biometric data may result in a high rate of false matches/mismatches,
unpredictable data volume growth in the overall system as well as drops in system process
throughput. Biometric data quality can be summarized into the following components
[M1/05-0306]:
1) The physical characteristics of a subject that can be used to uniquely identify that subject.
2) The ability to capture the subject’s unique characteristics in a usable, repeatable and predictable fashion.
3) The ability for the system to utilize the captured characteristics and establish relevance to other captured data.
Most biometric systems employ both hardware and software measures to maximize the
capture quality of the biometric data being presented to the system. Some will actively
interact with users on how to improve the capture process. While these measures are
effective in minimizing error and maximizing quality for the biometric data presented to the
system, the physical presentation of that biometric data by the subject to the system involves
many anthropometric and ergonomic factors that have been largely ignored. Not factoring in
basic ergonomics and anthropometrics can create situations that can range from having to
spend a significant amount of extra time processing a poor quality sample, to the worst case
where a subject simply cannot present their biometric sample to the system for an effective
NISTIR 7382 Page 9 12/14/2006
capture of the biometric data. This study focuses on scanner placement height, and the effect
of height on the quality and the time required to collect fingerprints. 2
3. REVIEW OF CURRENT SYSTEMS
3.1 WORK SURFACES
Work surfaces are typically designed to standards for work surfaces. The Department of
Defense’s guidelines for positioning of a work surface recommend 25.5 inches (648mm) to
36.0 inches (914mm )3 from the floor for a seated console and 36.0 inches (914 mm) for a
standing console [M1472]. A supplement to the Department of Defense’s original guidelines
calls for a work surface to be 36.0±0.6 inches (915±15 mm) from the floor [M759].
Commercial guidelines include suggested surface heights of 26.0 inches (660mm) for tables
used in keyboard data entry and typing, 31.0 inches (787mm) for tables used for sewing, 36.0
inches (914mm) for food service counters and 42.0 inches (1067mm) for bank stand-up
counters [AGS]. These guidelines are typically based on collected anthropometric data and
take into account population usability within the 5th and 95
th percentile of all users.
To better understand the range of the work surfaces of the typical biometric system, the team
visited several operational systems. This section reviews the visited systems and identifies
the configurations for capturing fingerprints.
3.2 US-VISIT
United States Visitor and Immigrant Status Indicator Technology (US-VISIT) is a
biometrically-enhanced identification system primarily situated at border points of entry such
as airports and seaports. US-VISIT processing currently applies to most non-citizens
entering the United States, regardless of country of origin and mode of transportation.
2 These tests were performed for the Department of Homeland Security in accordance with section 303 of the Border Security Act, codified as 8 U.S.C. 1732. Specific hardware and software products identified in this
report were used in order to perform the evaluations described in this document. In no case does such
identification imply recommendation or endorsement by the National Institute of Standards and Technology,
nor does it imply that the products and equipment identified are necessarily the best available for the purpose.
3 Work surface heights of 26 inches, 32 inches, 36 inches and 42 inches are based on common architectural
guidelines for tables, desks, counters and standing counters respectively. SI units for these surface heights are
presented here for reference, but will not be repeated throughout the remainder of this document.
NISTIR 7382 Page 10 12/14/2006
Individuals processed by the US-VISIT entry procedures undergo livescan (digital and
inkless) fingerprint scans as well as a facial imaging via a conventional webcam. This is an
operator assisted capture process with an experienced Customs and Border Protection (CBP)
agent guiding each step of processing. If further processing is required, the individual is
directed to a US-VISIT secondary processing area.
The US-VISIT exit procedure involves an unmanned kiosk that guides the subject by
videos/animation. In the exit procedure, digital fingerprints and photographs are again
collected from the subject.
The US-VISIT process is currently based on a two-print capture process, the left and right
index fingers of the individual.
3.2.1 Workspace data from US-VISIT
The following heights were measured at one US-VISIT location and are provided as a
sample.
US-VISIT Primary
Scanner platen height from floor: 48 inches (1219mm)
Scanner counter height from floor: 46 inches (1168mm)
US-VISIT Secondary
Scanner platen height from floor: 45 inches (1143mm)
Scanner counter height from floor: 43 inches (1092mm)
US-VISIT Exit Kiosk
Scanner platen height from floor: 36 inches (914mm)
3.3 US-VISIT POINT OF ENTRY
The US-VISIT Point of Entry (POE) is a system that is primarily situated at US Customs and
Border Protection Border Patrol stations throughout the country, with an emphasis on
placement at land border stations. Individuals processed by the US-VISIT POE procedures
undergo either livescan fingerprint scans or inked-fingerprint processing utilizing a document
scanner, and a digital photograph is taken of the subject upon entry to the United States.
This process is also operator assisted with an experienced Customs and Border Protection
agent overseeing each step of processing.
The US-VISIT POE process supports either a two-print or ten-print capture process.
NISTIR 7382 Page 11 12/14/2006
3.3.1 Workspace data from US-VISIT Point of Entry
The following heights were measured at one US-VISIT POE location and are provided as a
sample.
Primary workstation (airport configuration, with a 10-print scanner):
Scanner platen height from floor: 36 inches (914mm)
Scanner counter height from floor: 29 inches (737mm)
3.4 NIV/TPLS
The Department of State's Non-Immigrant Visa/Ten Print Live Scan (NIV/TPLS) system is
situated at every US Department of State (DOS) Consular Office throughout the world that
processes visa applications for non-immigrants seeking entry into the US. Individuals
processed by the NIV system undergo livescan fingerprinting. This process is operator
assisted by an experienced Department of State agent overseeing each step of processing.
The NIV process currently supports two-print capture, with a planned upgrade to a ten-print
process in the near future.
3.4.1 Workspace data from Department of State’s NIV system
The following heights were measured at one DOS location and are provided as a sample.
Stand-up counter configuration:
Scanner counter height from floor: 42 inches (1067mm)
Table configuration:
Scanner counter height from floor: 33 inches (838mm)
3.5 SUMMARY
Not surprisingly, we found that most existing biometric systems are retrofitted into existing
physical infrastructures. For example, a biometric enrollment station at a visa processing
facility will most likely be deployed at the existing paper enrollment and processing station.
Mismatches between the originally intended application versus the current operational
application are often a major source of practical facility challenges. For example, a system
that utilizes an Identix TP3000 scanner will have its platen located at approximately 6.3
inches (160mm) from the counter surface. If a counter surface is situated at 42 inches
(1067mm) satisfying the 5th to 95
th percentile of the population for a standing work surface,
NISTIR 7382 Page 12 12/14/2006
placing a scanner that is 6.3 inches (160mm) high on this surface will raise the operational
surface height to 48.3 inches (1227mm). This may result in a work surface that can no
longer satisfy the intended population with respect to usability.
4. EXPERIMENTAL PROCESS
Given the review of various operational systems and the observed differences in work
surface heights, the study objectives were defined to determine if the height of the scanner
affected users’ performance. Does the height of a scanner platen affect the time required to
capture fingerprint images? Does the height of the scanner platen affect the quality of
images captured? Finally, are users more comfortable with or do they prefer a particular
scanner height?
4.1 DESIGN AND IMPLEMENTATION
Fingerprint images were collected from participants at four different standard heights. For
each scanner height the participant was asked to leave a left slap (left hand without the
thumb), a right slap (right hand without the thumb), each individual thumb print, and both
thumb prints together. The four scanner heights corresponded to work table height at 26
inches, desk height at 32 inches, counter height at 36 inches, and standing counter height at
42 inches according to the standards as defined in the architectural design guidelines. Note
that the scanner used for this study is six inches high; the effective height of the scanner
platen is six inches above the work surface height. The order of the scanner heights and the
order of the requested prints were counter-balanced. Participants were randomly assigned
(without replacement) to a height and print order. The order of prints and heights were
provided to the participants as verbal instructions generated by the software. Each image
capture required that the participant leave his/her hand on the scanner for five seconds.
All participants were NIST employees who participated in the study in the course of their
official duties with their management's approval. Prior to the collection of the prints, users
were asked demographic data including age, gender, handedness, and height. Following the
collection, participants were asked preference/satisfaction questions to determine which
height was most comfortable and which was least comfortable. All fingerprints,
demographic, and satisfaction data were anonymous.
NISTIR 7382 Page 13 12/14/2006
4.2 HARDWARE AND SOFTWARE
The experiment consisted of a digital four-print (slap) fingerprint scanner, custom software
that captured images from the fingerprint scanner, and an adjustable shelf system that
allowed for the scanner to be positioned at various heights from the floor.
4.2.1 Digital Fingerprint Scanner
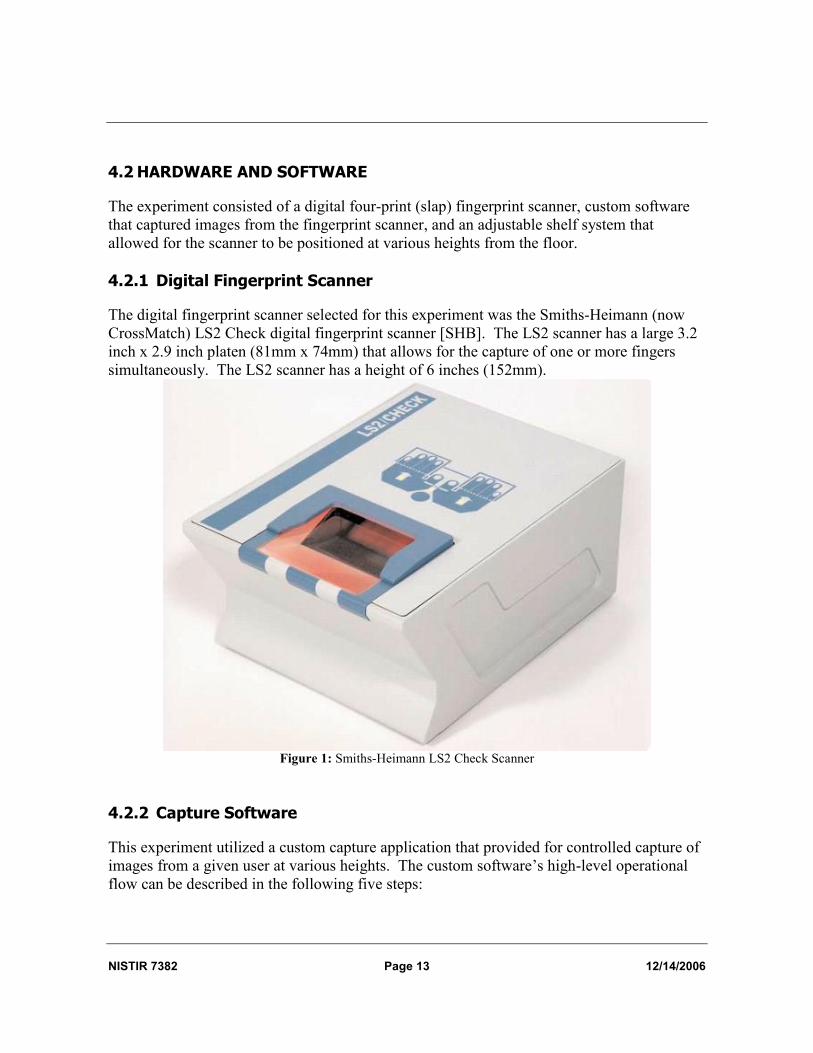
The digital fingerprint scanner selected for this experiment was the Smiths-Heimann (now
CrossMatch) LS2 Check digital fingerprint scanner [SHB]. The LS2 scanner has a large 3.2
inch x 2.9 inch platen (81mm x 74mm) that allows for the capture of one or more fingers
simultaneously. The LS2 scanner has a height of 6 inches (152mm).
Figure 1: Smiths-Heimann LS2 Check Scanner
4.2.2 Capture Software
This experiment utilized a custom capture application that provided for controlled capture of
images from a given user at various heights. The custom software’s high-level operational
flow can be described in the following five steps:
NISTIR 7382 Page 14 12/14/2006
1) Operator is prompted to adjust the scanner to a particular height 2) Participant is prompted for a hand/finger combination 3) Once the hand/finger is detected images are captured for a set amount of time 4) Repeat step 2 for the next finger/hand combination until all combination are complete 5) Repeat step 1 for any remaining experimental heights
Details of the capture process are provided in the process section of this document (section
4.2.3).
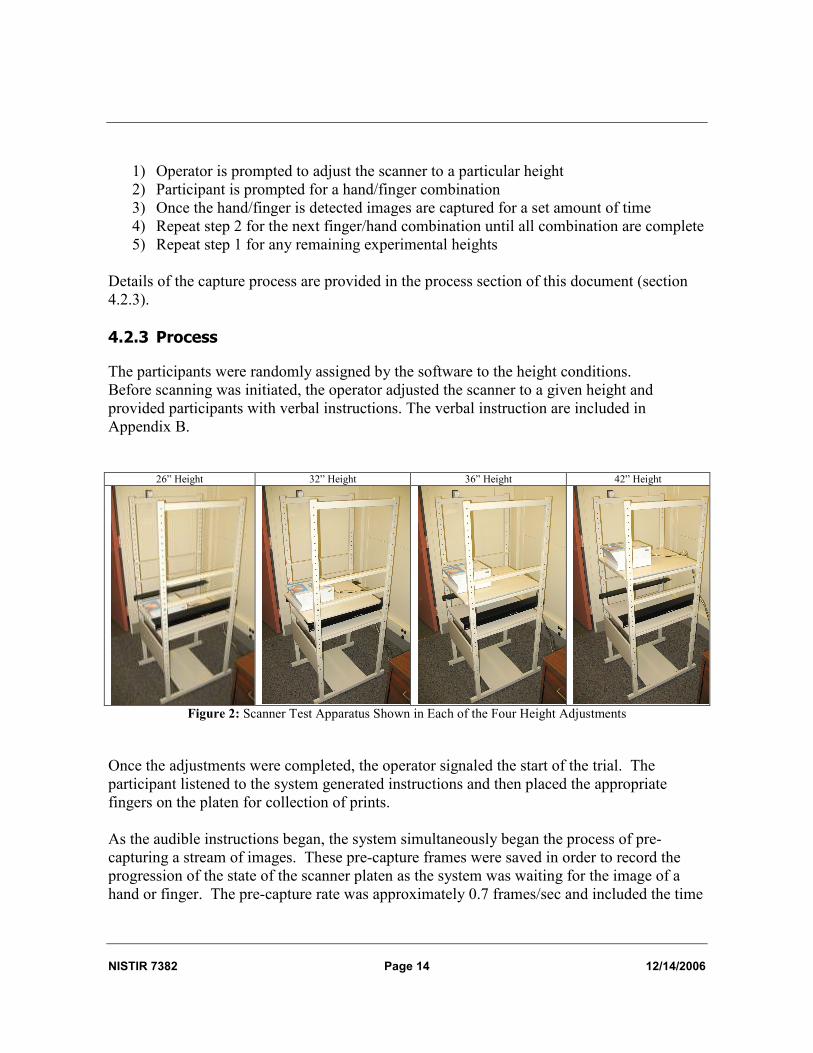
4.2.3 Process
The participants were randomly assigned by the software to the height conditions.
Before scanning was initiated, the operator adjusted the scanner to a given height and
provided participants with verbal instructions. The verbal instruction are included in
Appendix B.
26” Height 32” Height 36” Height 42” Height
Figure 2: Scanner Test Apparatus Shown in Each of the Four Height Adjustments
Once the adjustments were completed, the operator signaled the start of the trial. The
participant listened to the system generated instructions and then placed the appropriate
fingers on the platen for collection of prints.
As the audible instructions began, the system simultaneously began the process of pre-
capturing a stream of images. These pre-capture frames were saved in order to record the
progression of the state of the scanner platen as the system was waiting for the image of a
hand or finger. The pre-capture rate was approximately 0.7 frames/sec and included the time
NISTIR 7382 Page 15 12/14/2006
needed by the system to analyze the platen to see if a hand/finger had been placed on the
platen (defined as reaching a fixed threshold of coverage on the platen). The pre-capture
loop utilizes a circular buffer so if the pre-capture loop had captured 5 images and had not
yet detected a finger, the pre-capture loop continued while overwriting the oldest captured
detection frame in this 5 image buffer.
Once an image was detected, the system began capturing images as quickly as the scanner
could capture them for a predetermined amount of time. The predetermined capture time for
this study was set at five seconds, and given the specific hardware configuration of the test
system the sustained rate of image capture was approximately 1.5 frames/sec. Typically, a
participant yielded one or two pre-capture images and about seven capture images.
At the end of the preset capture period the system stopped capturing images and the
participant was instructed to remove his/her hand/finger from the scanner platen. This
process was repeated for each task until all of the tasks for a given experimental height had
been collected. At the conclusion of all tasks for a given height, the operator manually re-
adjusted the sensor height as necessary for subsequent trial heights. Once all tasks were
completed at all heights for a participant, the scanner platen was then cleaned with isopropyl
alcohol in preparation for the next participant.
NISTIR 7382 Page 16 12/14/2006
5. FINDINGS
5.1 PARTICIPANTS
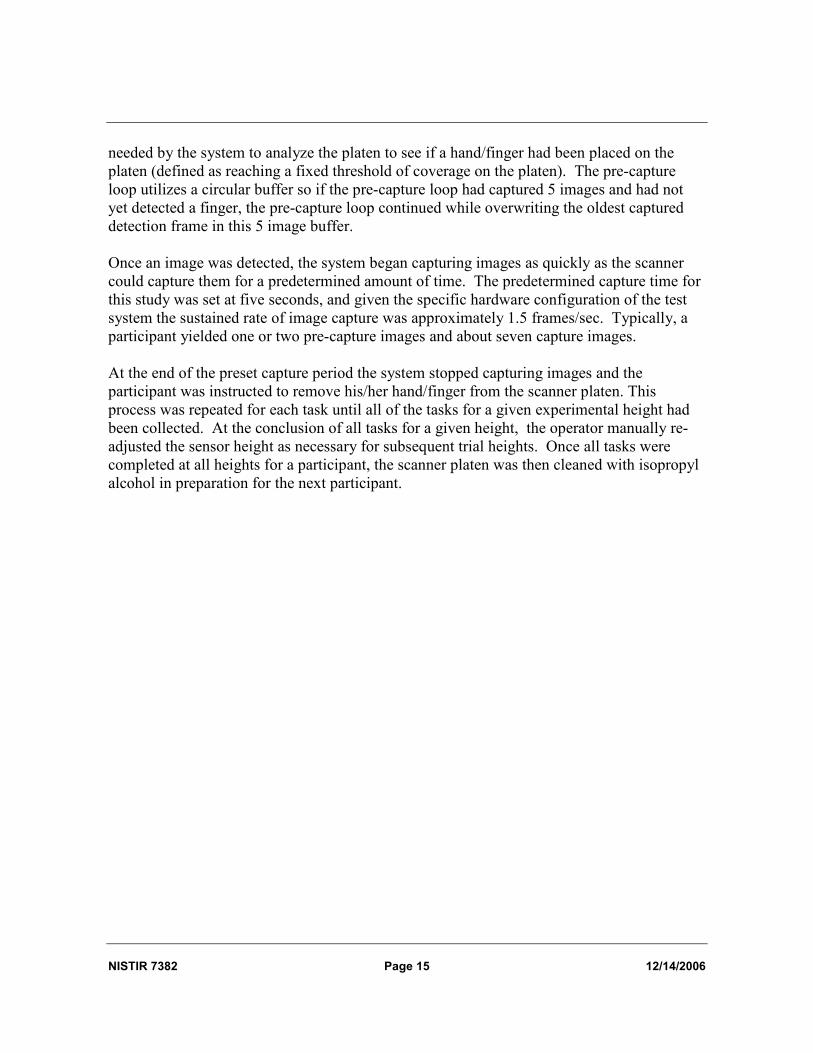
Seventy-five NIST employees volunteered to participate in this study.
The participants ranged in age from 17 to 67 and were distributed fairly uniformly across the
age ranges as shown in Figure 3. The participant pool for this study included 41 men and 34
women.
0
5
10
15
20
25
<30 years 30 to 39 40 to 49 50 to 59 60 to 70
Age
Participant Count
Figure 3: Distribution of Participant Age
NISTIR 7382 Page 17 12/14/2006
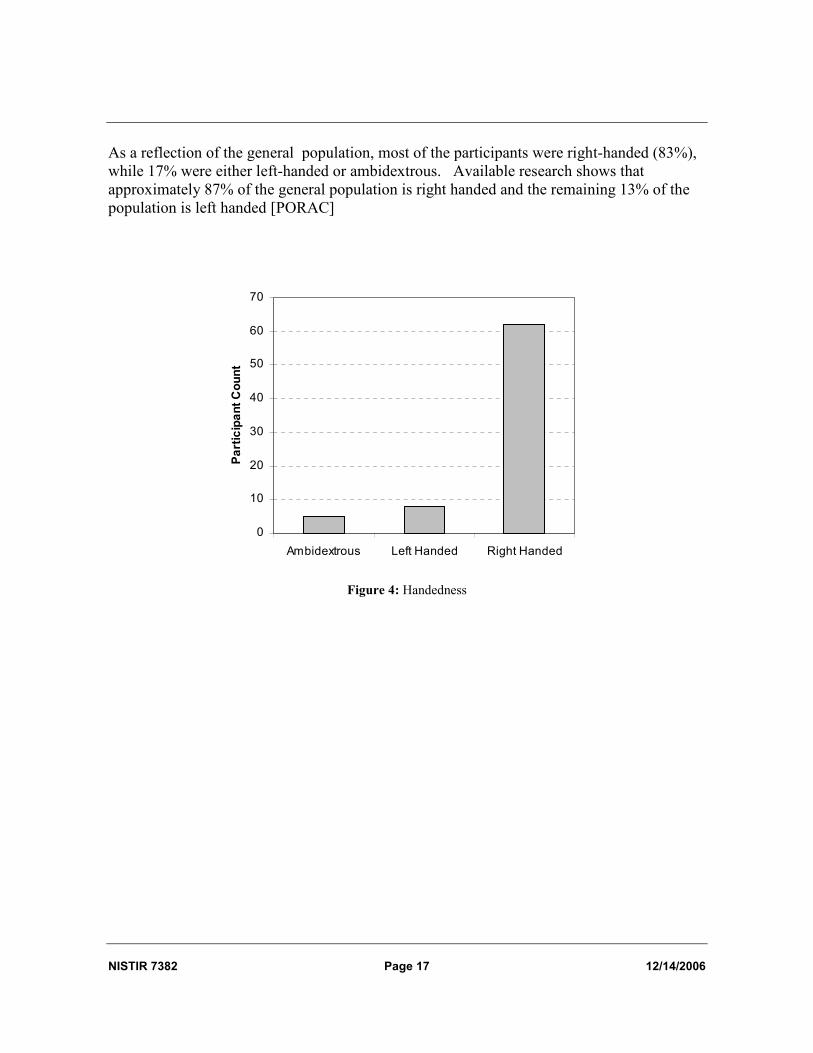
As a reflection of the general population, most of the participants were right-handed (83%),
while 17% were either left-handed or ambidextrous. Available research shows that
approximately 87% of the general population is right handed and the remaining 13% of the
population is left handed [PORAC]
0
10
20
30
40
50
60
70
Ambidextrous Left Handed Right Handed
Participant Count
Figure 4: Handedness
NISTIR 7382 Page 18 12/14/2006
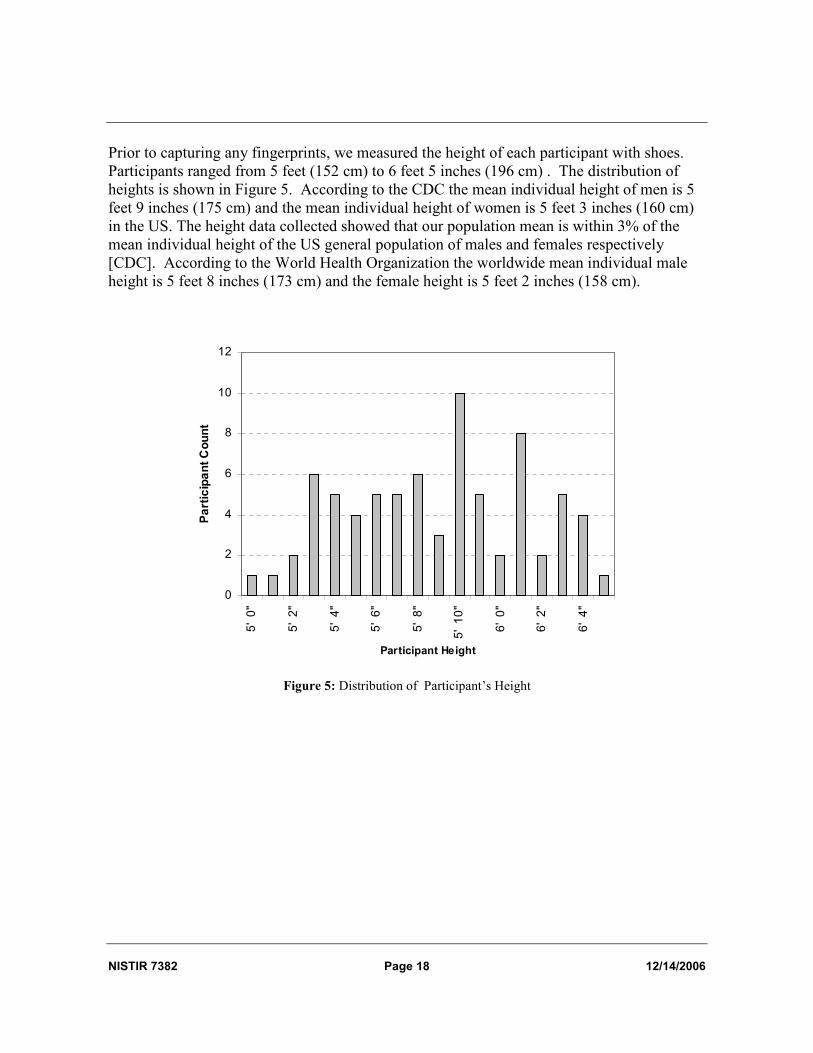
Prior to capturing any fingerprints, we measured the height of each participant with shoes.
Participants ranged from 5 feet (152 cm) to 6 feet 5 inches (196 cm) . The distribution of
heights is shown in Figure 5. According to the CDC the mean individual height of men is 5
feet 9 inches (175 cm) and the mean individual height of women is 5 feet 3 inches (160 cm)
in the US. The height data collected showed that our population mean is within 3% of the
mean individual height of the US general population of males and females respectively
[CDC]. According to the World Health Organization the worldwide mean individual male
height is 5 feet 8 inches (173 cm) and the female height is 5 feet 2 inches (158 cm).
0
2
4
6
8
10
12
5' 0"
5' 2"
5' 4"
5' 6"
5' 8"
5' 10"
6' 0"
6' 2"
6' 4"
Participant Height
Participant Count
Figure 5: Distribution of Participant’s Height
NISTIR 7382 Page 19 12/14/2006
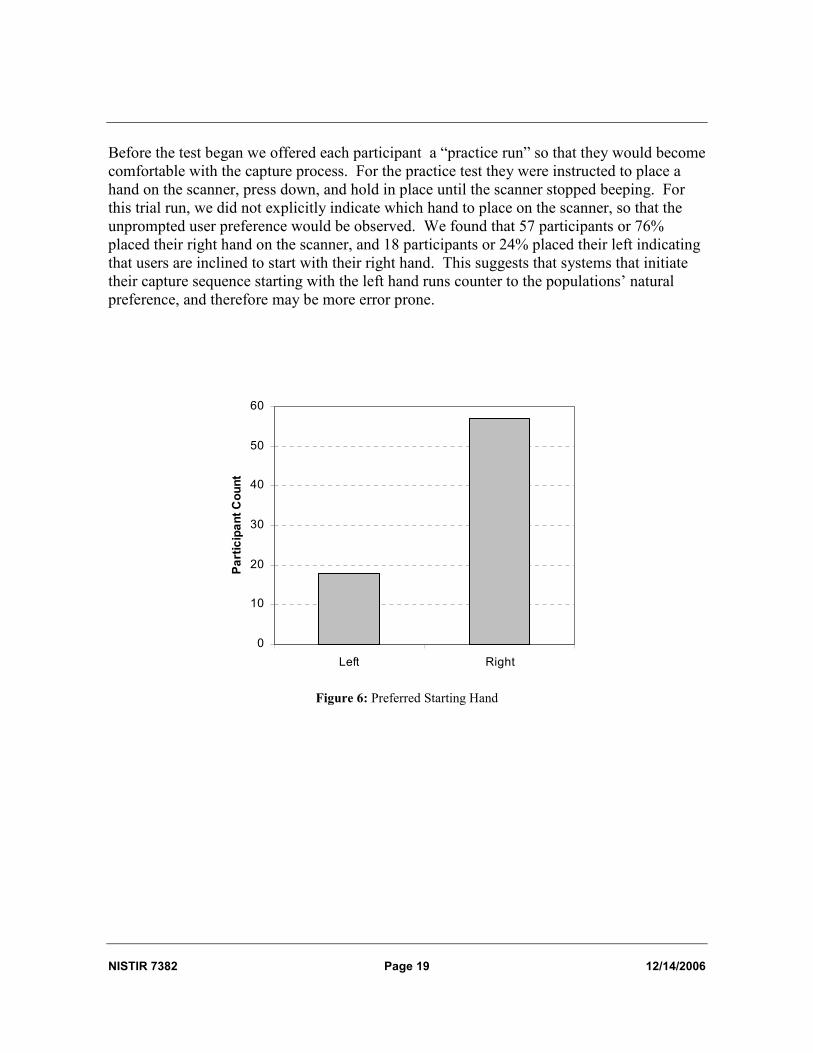
Before the test began we offered each participant a “practice run” so that they would become
comfortable with the capture process. For the practice test they were instructed to place a
hand on the scanner, press down, and hold in place until the scanner stopped beeping. For
this trial run, we did not explicitly indicate which hand to place on the scanner, so that the
unprompted user preference would be observed. We found that 57 participants or 76%
placed their right hand on the scanner, and 18 participants or 24% placed their left indicating
that users are inclined to start with their right hand. This suggests that systems that initiate
their capture sequence starting with the left hand runs counter to the populations’ natural
preference, and therefore may be more error prone.
0
10
20
30
40
50
60
Left Right
Participant Count
Figure 6: Preferred Starting Hand
NISTIR 7382 Page 20 12/14/2006
5.2 USABILITY METRICS
According to ISO 9241-11 [ISO], usability is defined as “the extent to which a product can
be used by specified users to achieve specified goals with effectiveness, efficiency and
satisfaction in a specified context of use”. The standard identifies three areas of
measurement: effectiveness, efficiency, and user satisfaction, where
• effectiveness is a measure of the accuracy and completeness with which users achieve
specified goals. Common metrics include completion rate and quality.
• efficiency is a measure of the resources expended in relation to the accuracy and
completeness with which users achieve goals. Efficiency is related to productivity
and is generally measured as task time.
• user satisfaction is the degree to which the product meets the users’ expectations—a
subjective response in terms of ease of use, satisfaction, and usefulness.
In this study, we used the ISO definition and measured efficiency, effectiveness, and user
satisfaction.
5.2.1 Efficiency
In this experiment, we measured efficiency as the time required to complete a task, where a
task is defined as a right-slap, left-slap, both thumbs, and single thumbs. Each task was
initiated by a voice prompt and the task ended when the system detected that the hand was
placed upon the scanner.
We have five response variables denoted by slYT , srYT , tbYT , tlYT , trYT corresponding to the
left slap (sl), right slap (sr), both thumbs (tb), left thumb (tl), and right thumb (tr) tasks as
defined previously. For each fixed response variable (e.g., slYT ) there are two classification
variables: (a) work surface height (at levels 1 through 4, from low to high) (b) sex (M or F)
as well as two covariates (subject age and subject height). For each response variable, the
following analyses were performed.
NISTIR 7382 Page 21 12/14/2006
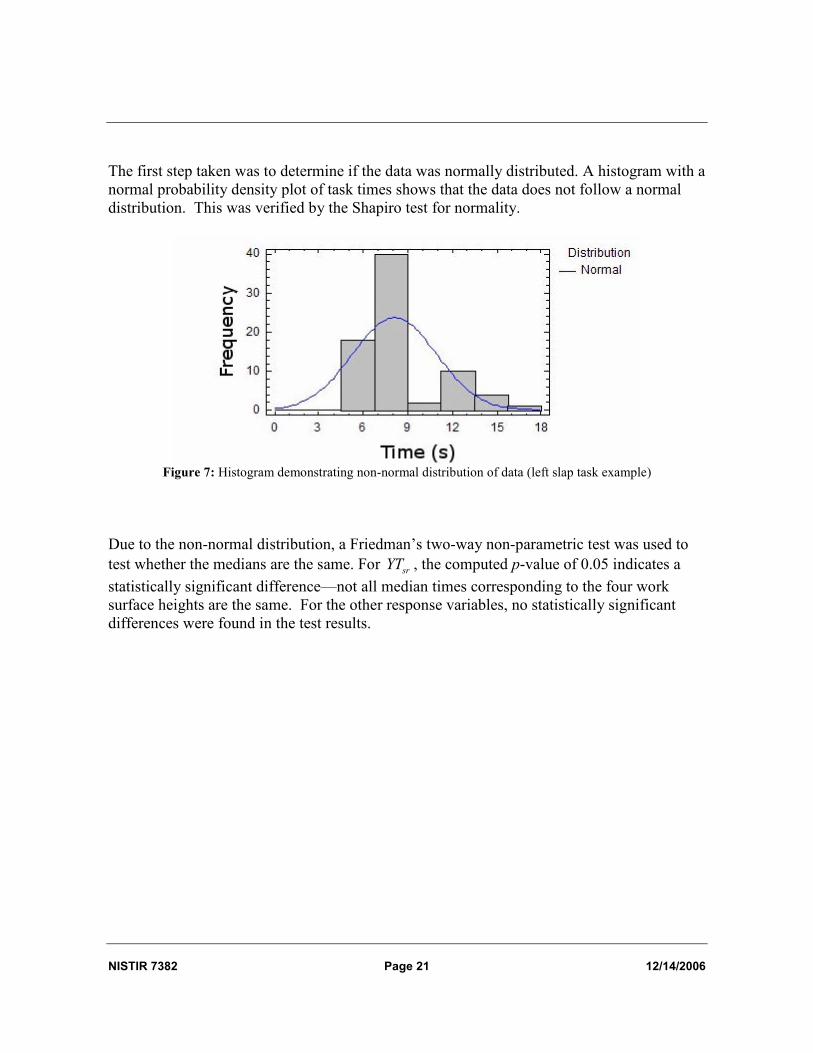
The first step taken was to determine if the data was normally distributed. A histogram with a
normal probability density plot of task times shows that the data does not follow a normal
distribution. This was verified by the Shapiro test for normality.
Figure 7: Histogram demonstrating non-normal distribution of data (left slap task example)
Due to the non-normal distribution, a Friedman’s two-way non-parametric test was used to
test whether the medians are the same. For srYT , the computed p-value of 0.05 indicates a
statistically significant difference—not all median times corresponding to the four work
surface heights are the same. For the other response variables, no statistically significant
differences were found in the test results.
NISTIR 7382 Page 22 12/14/2006
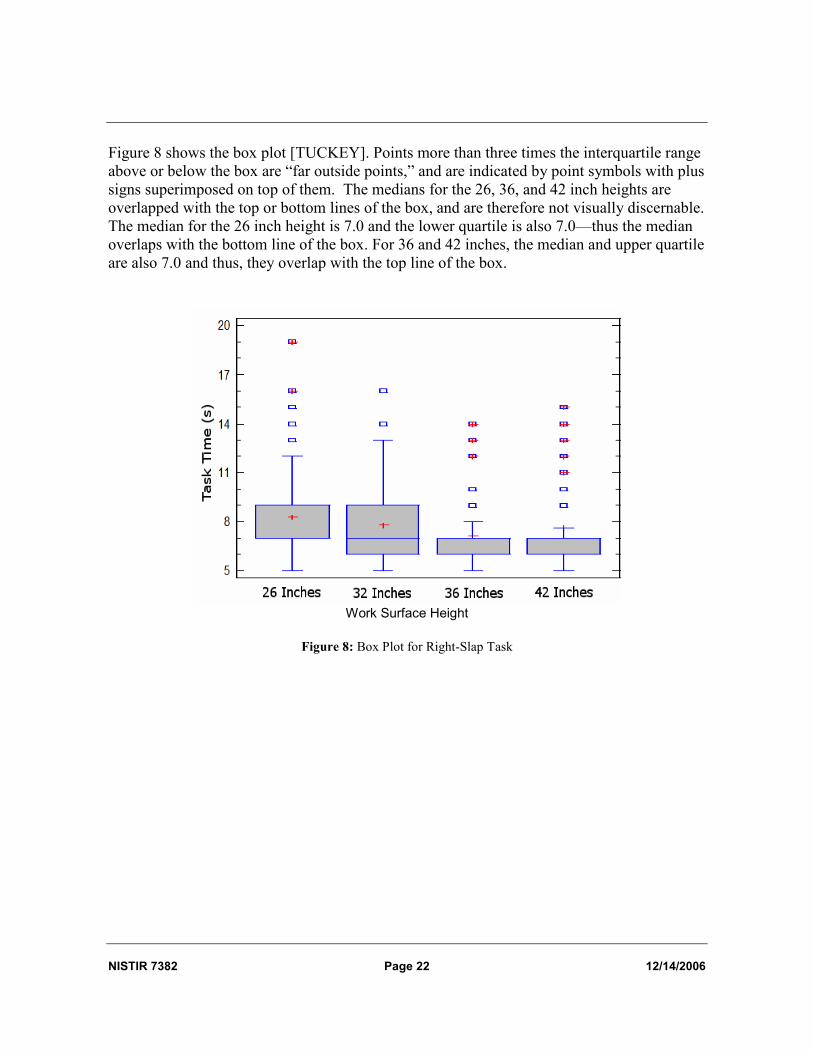
Figure 8 shows the box plot [TUCKEY]. Points more than three times the interquartile range
above or below the box are “far outside points,” and are indicated by point symbols with plus
signs superimposed on top of them. The medians for the 26, 36, and 42 inch heights are
overlapped with the top or bottom lines of the box, and are therefore not visually discernable.
The median for the 26 inch height is 7.0 and the lower quartile is also 7.0—thus the median
overlaps with the bottom line of the box. For 36 and 42 inches, the median and upper quartile
are also 7.0 and thus, they overlap with the top line of the box.
Work Surface Height
Figure 8: Box Plot for Right-Slap Task
NISTIR 7382 Page 23 12/14/2006
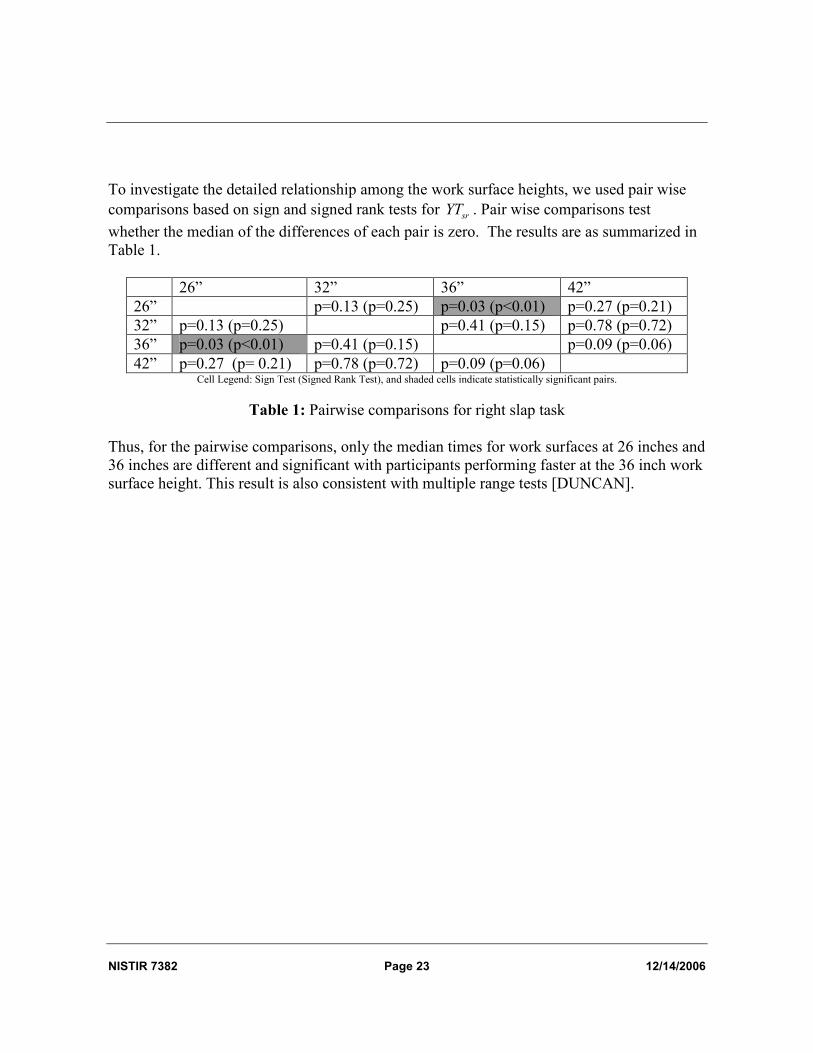
To investigate the detailed relationship among the work surface heights, we used pair wise
comparisons based on sign and signed rank tests for srYT . Pair wise comparisons test
whether the median of the differences of each pair is zero. The results are as summarized in
Table 1.
26” 32” 36” 42”
26” p=0.13 (p=0.25) p=0.03 (p<0.01) p=0.27 (p=0.21)
32” p=0.13 (p=0.25) p=0.41 (p=0.15) p=0.78 (p=0.72)
36” p=0.03 (p<0.01) p=0.41 (p=0.15) p=0.09 (p=0.06)
42” p=0.27 (p= 0.21) p=0.78 (p=0.72) p=0.09 (p=0.06) Cell Legend: Sign Test (Signed Rank Test), and shaded cells indicate statistically significant pairs.
Table 1: Pairwise comparisons for right slap task
Thus, for the pairwise comparisons, only the median times for work surfaces at 26 inches and
36 inches are different and significant with participants performing faster at the 36 inch work
surface height. This result is also consistent with multiple range tests [DUNCAN].

NISTIR 7382 Page 24 12/14/2006
Combining the response variables results provides another view of the data as illustrated in
Table 2.
slYT srYT tbYT tlYT trYT
Table Height (Inches)
Mean (s)
Median (s)
Standard Deviation
Mean (s)
Median (s)
Standard Deviation
Mean (s)
Median (s)
Standard Deviation
Mean (s)
Median (s)
Standard Deviation
Mean (s)
Median (s)
Standard Deviation
26” 8.1 7 (1) 2.9 8.3 7 (2) 3.2 8.0 7 (0) 2.6 8.1 7 (3) 2.8 7.8 7 (1) 3.3
32” 7.5 7 (2) 2.3 7.8 7 (3) 2.8 7.5 7 (2) 2.5 7.9 7 (2) 3.6 8.2 7 (4) 3.4
36” 7.5 7 (1) 2.3 7.2 7 (1) 2.1 8.1 7 (4) 2.8 7.5 7 (3) 2.8 7.7 7 (2) 3.3
42” 7.9 7 (2) 2.6 7.7 7 (1) 2.6 8.1 7 (2) 2.8 7.5 7 (2) 2.9 8.6 7 (3) 4.6
The numbers in the parentheses associated with the medians are the interquartile ranges and shaded cells indicate an optimum value (lowest
time, highest efficiency) for a given column at a particular work surface height.
Legend: Task SL – Left Slap
SR – Right Slap
TB – Both Thumbs
TL – Left Thumb
TR – Right Thumb
Table 2: Mean, Median and Standard Deviation Calculations for Capture Efficiency
Although the table height is not a statistically significant factor for the response variables
except in srYT , the response variables at a table height of 36 inches overall have the smallest
means, smallest standard deviations, smallest medians and smallest interquartile ranges.
However, for operational completeness, we also consider the average time per task to
complete a sequence of tasks. Combining slYT and srYT yields.
2
sl sraslr
YT YTYT
+= .
NISTIR 7382 Page 25 12/14/2006
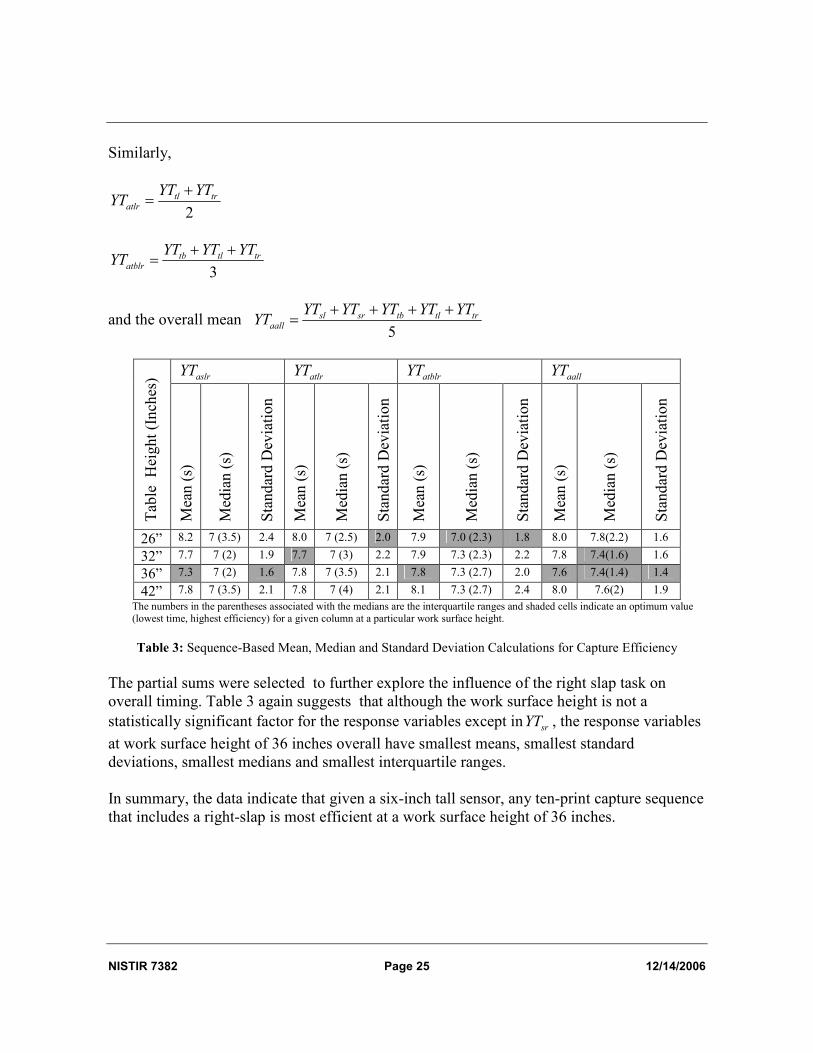
Similarly,
2
tl tratlr
YT YTYT
+=
3
tb tl tratblr
YT YT YTYT
+ +=
and the overall mean 5
sl sr tb tl traall
YT YT YT YT YTYT
+ + + +=
aslrYT atlrYT atblrYT aallYT
Table Height (Inches)
Mean (s)
Median (s)
Standard Deviation
Mean (s)
Median (s)
Standard Deviation
Mean (s)
Median (s)
Standard Deviation
Mean (s)
Median (s)
Standard Deviation
26” 8.2 7 (3.5) 2.4 8.0 7 (2.5) 2.0 7.9 7.0 (2.3) 1.8 8.0 7.8(2.2) 1.6
32” 7.7 7 (2) 1.9 7.7 7 (3) 2.2 7.9 7.3 (2.3) 2.2 7.8 7.4(1.6) 1.6
36” 7.3 7 (2) 1.6 7.8 7 (3.5) 2.1 7.8 7.3 (2.7) 2.0 7.6 7.4(1.4) 1.4
42” 7.8 7 (3.5) 2.1 7.8 7 (4) 2.1 8.1 7.3 (2.7) 2.4 8.0 7.6(2) 1.9
The numbers in the parentheses associated with the medians are the interquartile ranges and shaded cells indicate an optimum value (lowest time, highest efficiency) for a given column at a particular work surface height.
Table 3: Sequence-Based Mean, Median and Standard Deviation Calculations for Capture Efficiency
The partial sums were selected to further explore the influence of the right slap task on
overall timing. Table 3 again suggests that although the work surface height is not a
statistically significant factor for the response variables except in srYT , the response variables
at work surface height of 36 inches overall have smallest means, smallest standard
deviations, smallest medians and smallest interquartile ranges.
In summary, the data indicate that given a six-inch tall sensor, any ten-print capture sequence
that includes a right-slap is most efficient at a work surface height of 36 inches.
NISTIR 7382 Page 26 12/14/2006
5.2.2 Effectiveness
The analysis of the effect of sensor height effectiveness is based on image quality as
formally defined by the NIST Fingerprint Image Quality metric, or NFIQ [NISTSW].
Analysis of quality began by taking each captured image and processing that image with the
NIST Fingerprint Image Software 2 (NFIS2) [NISTSW] segmenter.4 (Pre-capture images
were not considered in the quality analysis.) The NFIS2 segmenter “breaks apart” an image
of multiple fingers into individual finger images. For example, transforming a slap into
separate index, middle, ring and little finger images. Next, the NFIQ score for each
segmented finger was computed. The NFIQ algorithm generates scores ranging from one
(highest quality) to five (lowest quality). Missing image data was assigned a quality score of
five—the lowest NFIQ value. Multiple images were captured for each task sequence over a
specified period of time (see section 4.2.3 for details of the capture process). This image
capture process yielded approximately 360 finger images per subject across all heights and
tasks, or approximately 27,000 images total for all subjects who participated in the
experiment.
Since there is no generally accepted method to determine the quality of a slap overall, this
study examined the distribution of the frequency of NFIQ scores for each finger. The
analysis used the Federal Bureau of Investigation (FBI) numbering for fingers for the right
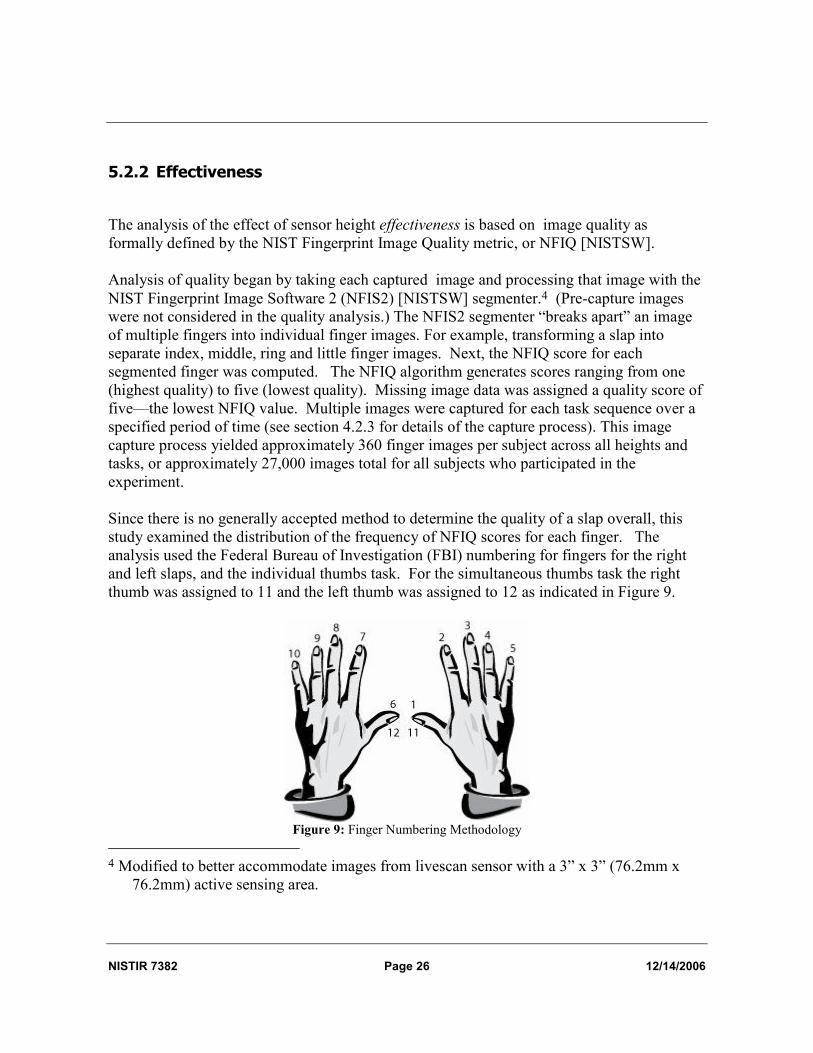
and left slaps, and the individual thumbs task. For the simultaneous thumbs task the right
thumb was assigned to 11 and the left thumb was assigned to 12 as indicated in Figure 9.
Figure 9: Finger Numbering Methodology
4 Modified to better accommodate images from livescan sensor with a 3” x 3” (76.2mm x
76.2mm) active sensing area.
NISTIR 7382 Page 27 12/14/2006
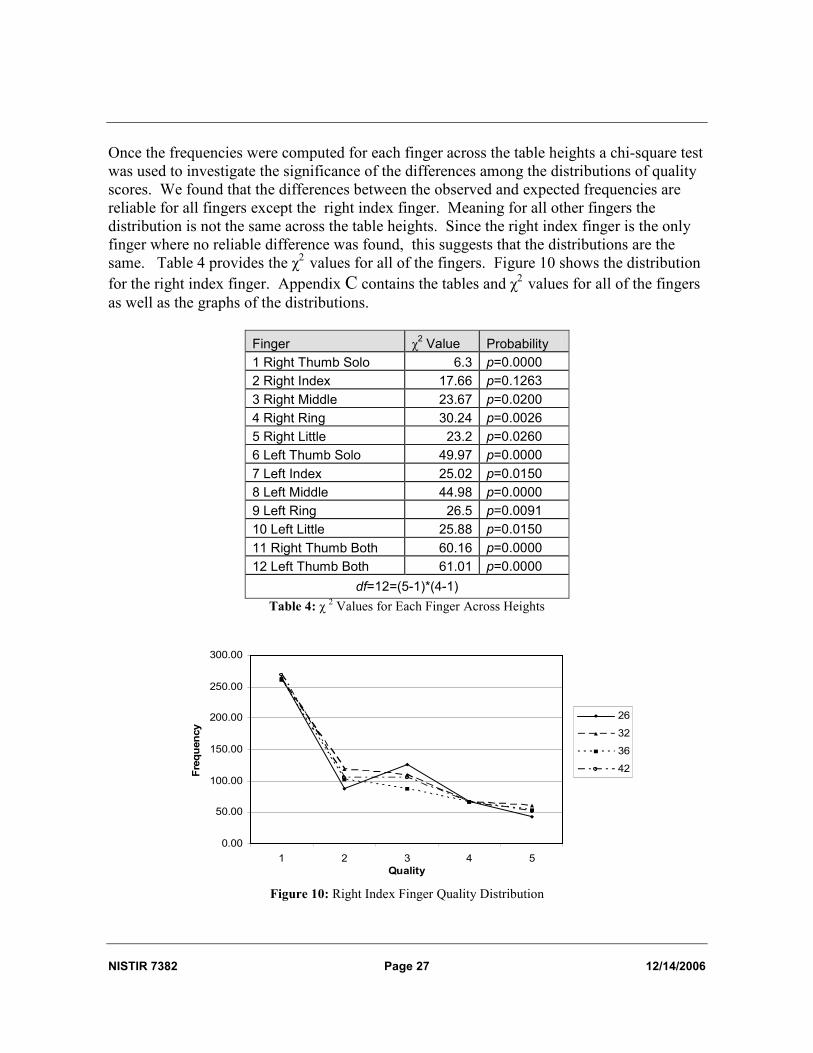
Once the frequencies were computed for each finger across the table heights a chi-square test
was used to investigate the significance of the differences among the distributions of quality
scores. We found that the differences between the observed and expected frequencies are
reliable for all fingers except the right index finger. Meaning for all other fingers the
distribution is not the same across the table heights. Since the right index finger is the only
finger where no reliable difference was found, this suggests that the distributions are the
same. Table 4 provides the χ2 values for all of the fingers. Figure 10 shows the distribution
for the right index finger. Appendix C contains the tables and χ2 values for all of the fingers as well as the graphs of the distributions.
Finger χ2 Value Probability
1 Right Thumb Solo 6.3 p=0.0000
2 Right Index 17.66 p=0.1263
3 Right Middle 23.67 p=0.0200
4 Right Ring 30.24 p=0.0026
5 Right Little 23.2 p=0.0260
6 Left Thumb Solo 49.97 p=0.0000
7 Left Index 25.02 p=0.0150
8 Left Middle 44.98 p=0.0000
9 Left Ring 26.5 p=0.0091
10 Left Little 25.88 p=0.0150
11 Right Thumb Both 60.16 p=0.0000
12 Left Thumb Both 61.01 p=0.0000
df=12=(5-1)*(4-1)
Table 4: χ 2 Values for Each Finger Across Heights
0.00
50.00
100.00
150.00
200.00
250.00
300.00
1 2 3 4 5
Quality
Frequency
26
32
36
42
Figure 10: Right Index Finger Quality Distribution
NISTIR 7382 Page 28 12/14/2006
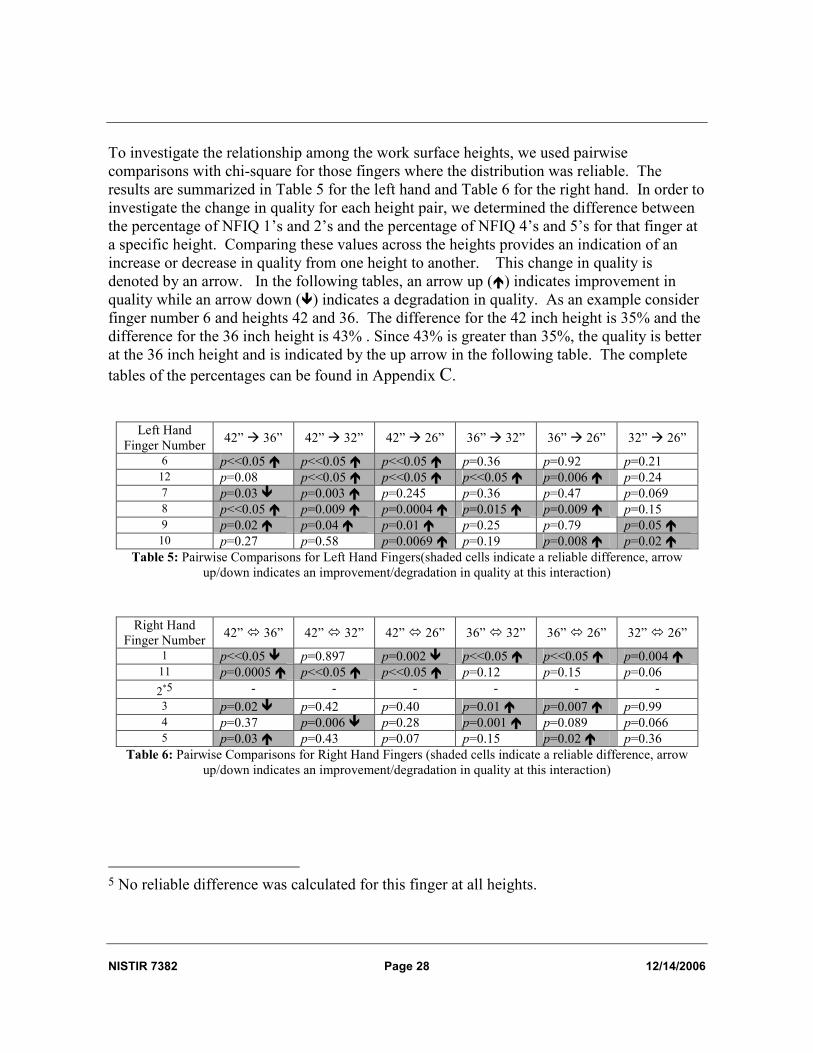
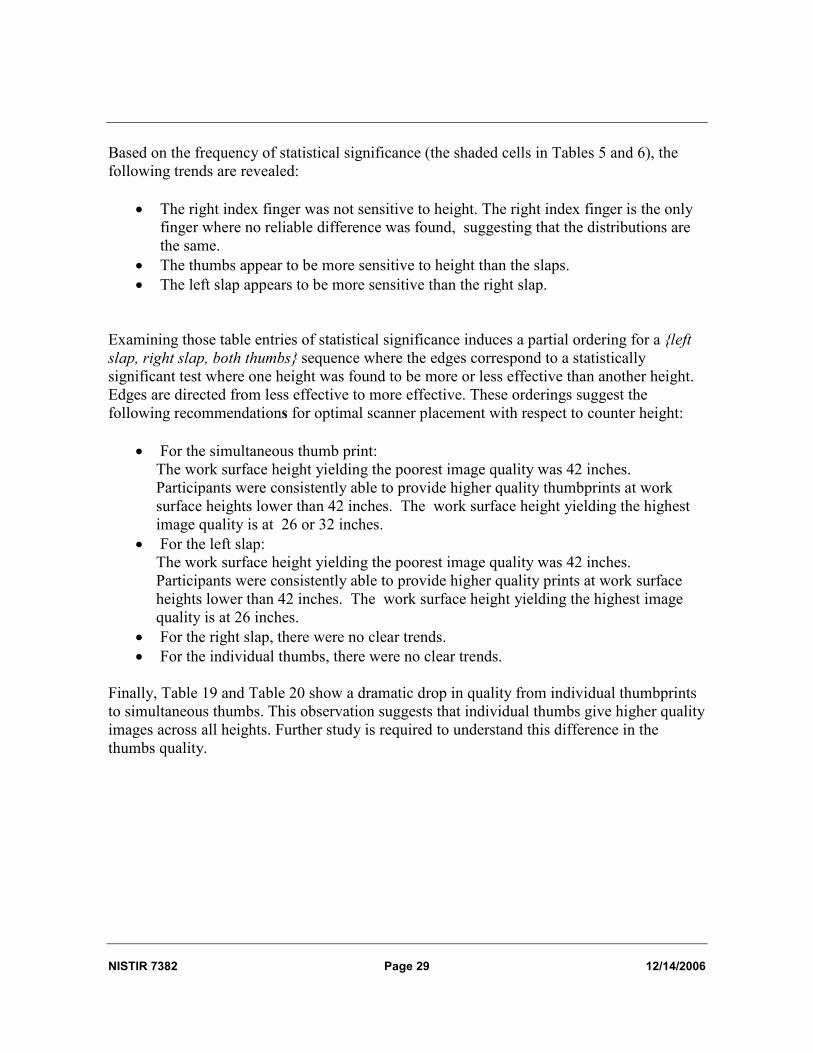
To investigate the relationship among the work surface heights, we used pairwise
comparisons with chi-square for those fingers where the distribution was reliable. The
results are summarized in Table 5 for the left hand and Table 6 for the right hand. In order to
investigate the change in quality for each height pair, we determined the difference between
the percentage of NFIQ 1’s and 2’s and the percentage of NFIQ 4’s and 5’s for that finger at
a specific height. Comparing these values across the heights provides an indication of an
increase or decrease in quality from one height to another. This change in quality is
denoted by an arrow. In the following tables, an arrow up (�) indicates improvement in
quality while an arrow down (�) indicates a degradation in quality. As an example consider
finger number 6 and heights 42 and 36. The difference for the 42 inch height is 35% and the
difference for the 36 inch height is 43% . Since 43% is greater than 35%, the quality is better
at the 36 inch height and is indicated by the up arrow in the following table. The complete
tables of the percentages can be found in Appendix C.
Left Hand
Finger Number 42” � 36” 42” � 32” 42” � 26” 36” � 32” 36” � 26” 32” � 26”
6 p<<0.05 � p<<0.05 � p<<0.05 � p=0.36 p=0.92 p=0.21 12 p=0.08 p<<0.05 � p<<0.05 � p<<0.05 � p=0.006 � p=0.24 7 p=0.03 � p=0.003 � p=0.245 p=0.36 p=0.47 p=0.069 8 p<<0.05 � p=0.009 � p=0.0004 � p=0.015 � p=0.009 � p=0.15 9 p=0.02 � p=0.04 � p=0.01 � p=0.25 p=0.79 p=0.05 � 10 p=0.27 p=0.58 p=0.0069 � p=0.19 p=0.008 � p=0.02 �
Table 5: Pairwise Comparisons for Left Hand Fingers(shaded cells indicate a reliable difference, arrow
up/down indicates an improvement/degradation in quality at this interaction)
Right Hand
Finger Number 42” � 36” 42” � 32” 42” � 26” 36” � 32” 36” � 26” 32” � 26”
1 p<<0.05 � p=0.897 p=0.002 � p<<0.05 � p<<0.05 � p=0.004 � 11 p=0.0005 � p<<0.05 � p<<0.05 � p=0.12 p=0.15 p=0.06
2*5 - - - - - -
3 p=0.02 � p=0.42 p=0.40 p=0.01 � p=0.007 � p=0.99 4 p=0.37 p=0.006 � p=0.28 p=0.001 � p=0.089 p=0.066 5 p=0.03 � p=0.43 p=0.07 p=0.15 p=0.02 � p=0.36
Table 6: Pairwise Comparisons for Right Hand Fingers (shaded cells indicate a reliable difference, arrow
up/down indicates an improvement/degradation in quality at this interaction)
5 No reliable difference was calculated for this finger at all heights.
NISTIR 7382 Page 29 12/14/2006
Based on the frequency of statistical significance (the shaded cells in Tables 5 and 6), the
following trends are revealed:
• The right index finger was not sensitive to height. The right index finger is the only
finger where no reliable difference was found, suggesting that the distributions are
the same.
• The thumbs appear to be more sensitive to height than the slaps.
• The left slap appears to be more sensitive than the right slap.
Examining those table entries of statistical significance induces a partial ordering for a {left
slap, right slap, both thumbs} sequence where the edges correspond to a statistically
significant test where one height was found to be more or less effective than another height.
Edges are directed from less effective to more effective. These orderings suggest the
following recommendations for optimal scanner placement with respect to counter height:
• For the simultaneous thumb print:
The work surface height yielding the poorest image quality was 42 inches.
Participants were consistently able to provide higher quality thumbprints at work
surface heights lower than 42 inches. The work surface height yielding the highest
image quality is at 26 or 32 inches.
• For the left slap:
The work surface height yielding the poorest image quality was 42 inches.
Participants were consistently able to provide higher quality prints at work surface
heights lower than 42 inches. The work surface height yielding the highest image
quality is at 26 inches.
• For the right slap, there were no clear trends.
• For the individual thumbs, there were no clear trends.
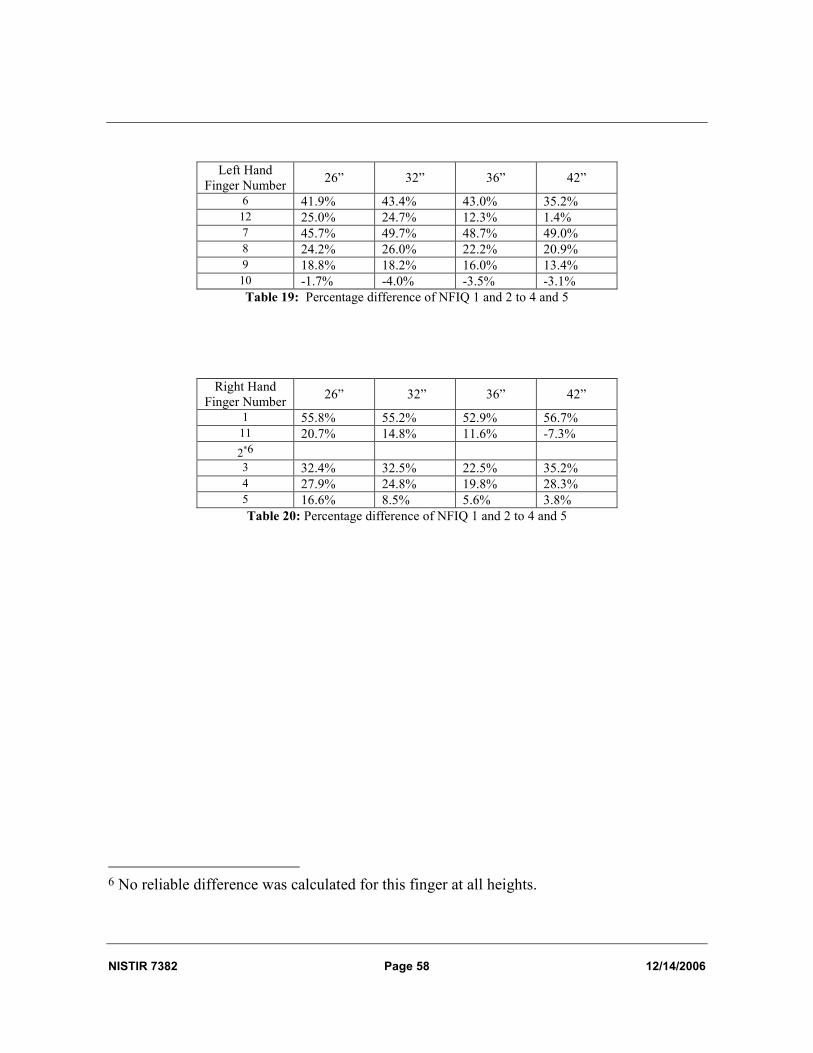
Finally, Table 19 and Table 20 show a dramatic drop in quality from individual thumbprints
to simultaneous thumbs. This observation suggests that individual thumbs give higher quality
images across all heights. Further study is required to understand this difference in the
thumbs quality.
NISTIR 7382 Page 30 12/14/2006
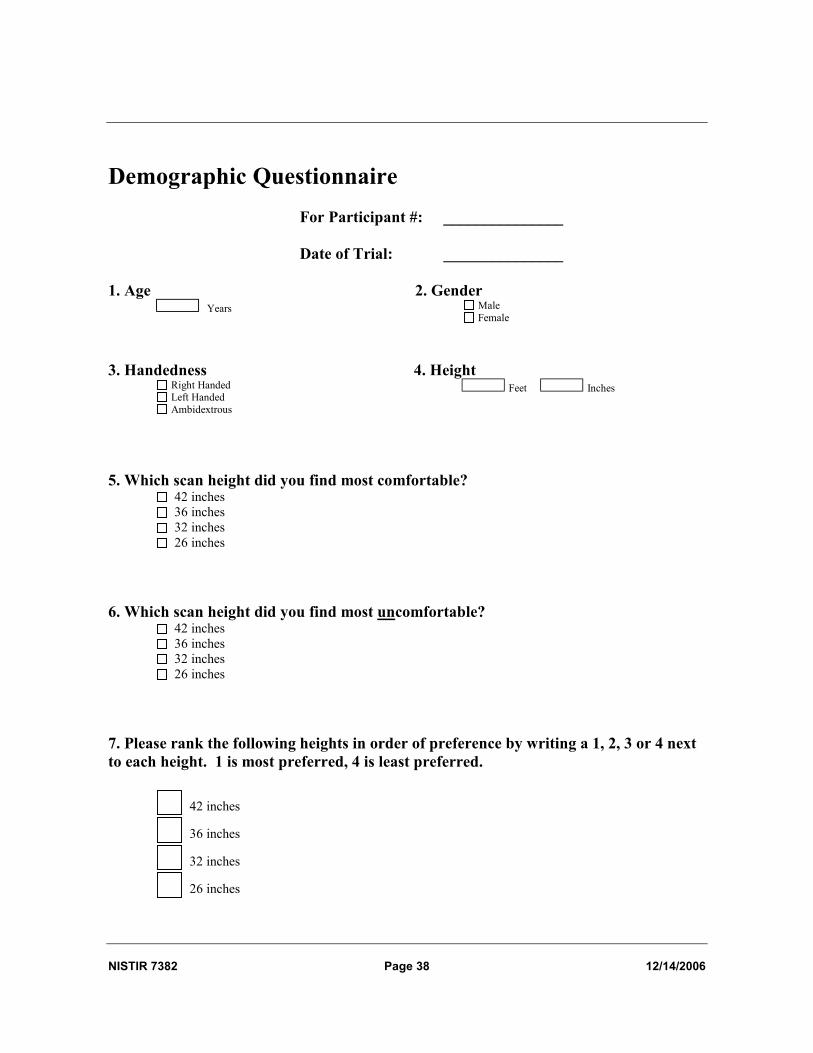
5.2.3 User Satisfaction
Each user was given a satisfaction survey after completing the test (See Appendix A for the
actual questionnaire). The questions included:
1. Which scan height did you find most comfortable?
2. Which scan height did you find most uncomfortable?
3. Please rank the heights in order of preference: 1 is most preferred, 4 is least preferred
4. When prompted for your thumbs, which method did you prefer?
5. Did you have difficulty repositioning yourself for any of the trials? 6. Any additional comments on how we can improve the fingerprint capture process?
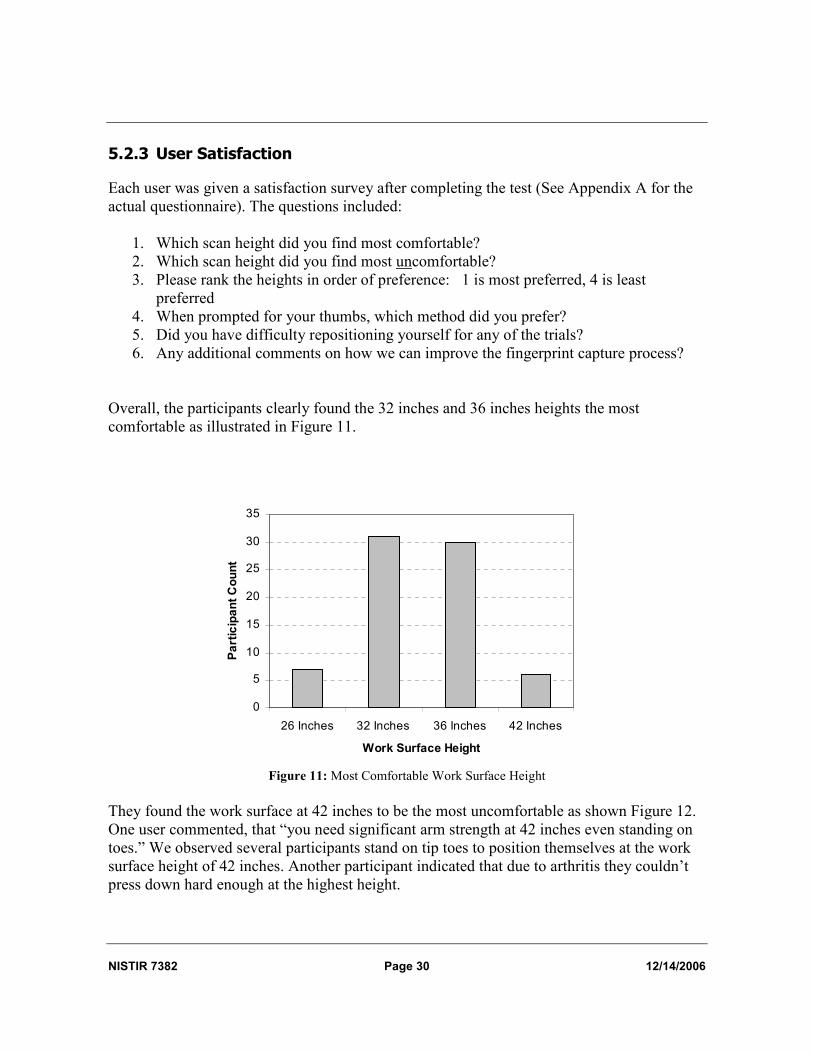
Overall, the participants clearly found the 32 inches and 36 inches heights the most
comfortable as illustrated in Figure 11.
0
5
10
15
20
25
30
35
26 Inches 32 Inches 36 Inches 42 Inches
Work Surface Height
Participant Count
Figure 11: Most Comfortable Work Surface Height
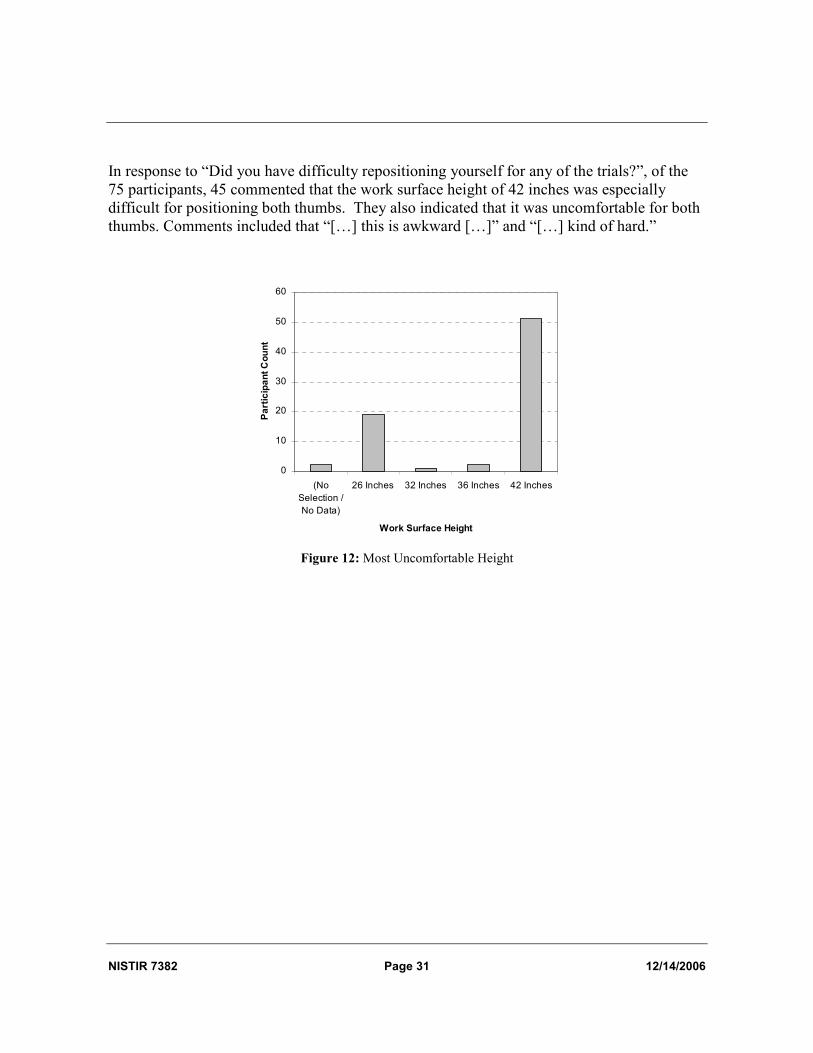
They found the work surface at 42 inches to be the most uncomfortable as shown Figure 12.
One user commented, that “you need significant arm strength at 42 inches even standing on
toes.” We observed several participants stand on tip toes to position themselves at the work
surface height of 42 inches. Another participant indicated that due to arthritis they couldn’t
press down hard enough at the highest height.
NISTIR 7382 Page 31 12/14/2006
In response to “Did you have difficulty repositioning yourself for any of the trials?”, of the
75 participants, 45 commented that the work surface height of 42 inches was especially
difficult for positioning both thumbs. They also indicated that it was uncomfortable for both
thumbs. Comments included that “[…] this is awkward […]” and “[…] kind of hard.”
0
10
20
30
40
50
60
(No
Selection /
No Data)
26 Inches 32 Inches 36 Inches 42 Inches
Work Surface Height
Participant Count
Figure 12: Most Uncomfortable Height

NISTIR 7382 Page 32 12/14/2006
Rankings also suggested that the users preferred the work surface at 32 inches (Figure 13).
0
5
10
15
20
25
30
35
40
45
26 Inches 32 Inches 36 Inches 42 Inches
Work Surface Height
Participant Count
Figure 13: Most Preferred Height From Rankings
Users had no significant preference between both thumbs or one thumb at a time (Figure 14).
Several users who preferred both thumbs indicated that they chose both thumbs since it was
faster than one thumb at a time.
0
5
10
15
20
25
30
Both thumbs
at the same
time
No preference One thumb at
a time (no
starting
preference)
One thumb at
a time (with
right or left
starting
preference)
Participant Count
Figure 14: Thumb Preference
NISTIR 7382 Page 33 12/14/2006
6. RECOMMENDATIONS AND CONCLUSIONS
This study compared work surface heights of 26, 32, 36 and 42 inches not including the
height of the scanner. In this study, we used a scanner that was 6 inches high resulting in a
scanner platen height that was 6 inches above the work surface. In addition, this study was
performed in a controlled environment. This controlled environment did not attempt to
simulate a point of entry environment or the stress associated with traveling and
encountering the fingerprint process.
In this study we observed four main results with respect to the following tasks:
• A left slap (all fingers on the left hand except for the thumb)
• A right slap (all fingers on the right hand except for the thumb)
• Individual thumb prints (a left thumb or right thumb)
• Simultaneous thumb prints (both thumbs)
First, we found that the work surface height does affect how quickly a person can complete
the task—in particular, a sequence that includes a right slap. There is a significant difference
in completion time of the right slap from 36 inches to 26 inches. In general, participants
performed faster at the 36 inch work surface height. Although in absolute terms the
difference in time is small, this small improvement in the user’s ability to provide prints
could translate to a meaningful savings in time when processing a large number of people.
Second, quality or effectiveness, is also affected by the height of the work surface. The
thumbs appear to be more sensitive to height than either the right or left slaps. In addition,
there is a dramatic drop in quality from individual thumbprints to simultaneous thumbs. This
observation suggests that individual thumbs give higher quality images across all heights.
The left slap appears to be more sensitive to height than the right slap. For left slap
participants were consistently able to provide higher quality prints at work surface heights
lower than 42 inches. The work surface height yielding the highest image quality is at 26
inches. This trend was also true for the simultaneous capture of both thumbs, the
participant’s fingerprint quality decreased as the height of the work surface increased. Thus
at the 26 inch or 32 inch work surface, participants left better quality thumbprints. This is
consistent with the participants’ overall claimed and observed discomfort of placing both
thumbs at an effective 48 inch high sensor platen (resulting from placing a 6 inch high
scanner on a 42 inch high work surface).
Third, participants clearly preferred the 32 inch work surface and were the most
uncomfortable at the 42 inch height. There appears to be a relationship between the
participant’s discomfort response to the 42 inch height and the quality of the captured prints.
NISTIR 7382 Page 34 12/14/2006
Over half of the participants commented that it was difficult, awkward, or uncomfortable to
position their two thumbs at 42 inches and the data indicates that quality degrades for both
thumbs as the work surface height increases.
Finally, we observed that when given a choice 76% of the participants would start the
capture process with their right hand. The timing results also showed a significant difference
for the right slap task. These two observations suggest that systems that initiate their capture
sequence starting with the right hand might be less error prone and faster than a process that
does not follow the populations’ natural preference.
To summarize, the following conclusions can be reached, given a 6-inch scanner:
1. Thirty-six inches is the most efficient work surface height (i.e., lowest average capture times). for a capture sequence that includes the right slap.
2. Twenty-six inches is the most effective (i.e., highest average image quality) heights for a capture sequence that includes simultaneous thumbs and a left slap.
3. Users are most satisfied with a work surface height of 32 or 36 inches. 4. Start the sequence with the right hand. 5. Capture individual thumbs instead of simultaneous thumbs.
Given all considerations, placement of a scanner on a 42 inch work surface or higher does
not satisfy the goals of efficiency, effectiveness or satisfaction, and therefore should not be
considered as a viable height for scanner placement.
7. REFERENCES
[911COM1] “Summary of Recommendations”, Final Report of the National
Commission on Terrorist Attacks Upon the United States (The
9/11 Commission Report), B-303692, 2004.
[AGS] Ramsey, Charles George and Harold Reeve Sleeper. “Architectural
Graphic Standards”, New York, John Wiley & Sons, Inc., 1994.
Ninth Edition: p 3-5.
[CDC] “Advanced Data From Vital and Health Statistics”, US
Department of Health and Human Services Centers for Disease
Control and Prevention, October 27, 2004,
http://www.cdc.gov/nchs/data/ad/ad347.pdf
NISTIR 7382 Page 35 12/14/2006
[CROSS] “Cross Match ID 1000 10-Print Live Scan System Specifications”,
Cross Match Corporation, 2005,
http://www.crossmatch.com/pdf/ID_1000_final.pdf
[DUNCAN] Duncan, D.B., “Multiple Range and Multiple F Tests”,
Biometrics, Vol. 11, No. 1, 1955.
[IDENTIX] “TouchPrint Enhanced Definition 3000 Live Scan Specifications”,
Identix Corporation, 2005,
http://www.identix.com/products/pro_livescan_3000_ts.html
[ISO] “Ergonomic requirements for office work with visual display
terminals (VDTs) - Part 11: guidance on usability”, ISO 9241-11,
1998.
[JAIN1] Jain, Anil K., “Multimodal User Interfaces: Who’s the User”,
http://icmi.cs.ucsb.edu/Misc/JainSlides.pdf , 2003, p 9.
[M1/05-0306] “Biometric Sample Quality Standard Draft” (Revision 4), M1/05-
0306, 6 May 2005.
(http://www.incits.org/tc_home/m1htm/docs/m1050306.pdf)
[M1472] “Human Engineering Design Criteria for Military Systems,
Equipment and Facilities” (Revision D), MIL-STD-1472, 14
March 1989, p 154.
[M759] “Handbook for Engineering Design Guidelines” (Revision C),
MIL-HDBK-759C, 31 July 1995, p 143.
[LATTA] N. Latta, “10 Print Scanner Impacts”, U.S. Department of
Homeland Security, October 14, 2005,
http://www.itl.nist.gov/iad/894.03/pact/10pWS/10pWS03-
DHS_Latta_Williams.pdf.
[NISTSW] M.D. Garris, C.I. Watson, R.M. McCabe, C.L. Wilson. User’s
guide to NIST fingerprint image software. NISTIR 6813.
http://fingerprint.nist.gov/NFIS/index.html
[PORAC] C. Porac and S. Coren. “Lateral Preferences and Human
Behavior”, New York, Springer-Verlag, 1981.
NISTIR 7382 Page 36 12/14/2006
[SHB] “Smiths-Heimann LS2 Check Scanner Specifications”, Cross
Match Corporation, 2005, http://www.shb-
jena.com/Products/LS2_CHECK.pdf
[TUKEY] Tukey, J. W., “Exploratory Data Analysis”, Reading,
Massachusetts, Addison-Wesley, 1977.
NISTIR 7382 Page 37 12/14/2006
APPENDIX A
End User Questionnaire
NISTIR 7382 Page 38 12/14/2006
Demographic Questionnaire
For Participant #: _______________
Date of Trial: _______________
1. Age Years
2. Gender Male
Female
3. Handedness Right Handed Left Handed Ambidextrous
4. Height Feet Inches
5. Which scan height did you find most comfortable? 42 inches
36 inches
32 inches
26 inches
6. Which scan height did you find most uncomfortable? 42 inches
36 inches
32 inches
26 inches
7. Please rank the following heights in order of preference by writing a 1, 2, 3 or 4 next
to each height. 1 is most preferred, 4 is least preferred.
42 inches
36 inches
32 inches
26 inches
NISTIR 7382 Page 39 12/14/2006
8. When prompted for your thumbs, which method did you prefer?
Both thumbs at the same time
One thumb at a time, LEFT first
One thumb at a time, RIGHT first
No preference
9. Did you have difficulty repositioning yourself for any of the trials? No
Yes, please elaborate on the difficulty you had:
10. Any additional comments on how we can improve the fingerprint capture process?

NISTIR 7382 Page 40 12/14/2006
NISTIR 7382 Page 41 12/14/2006
APPENDIX B
Test Script
NISTIR 7382 Page 42 12/14/2006
The following test script was verbally presented to each participant in our study by the test
system operator. Portions of this script that have been enclosed in brackets (“[“ and “]”) and
are meant as special instructions for the operator. These special instructions guide the
operator to tailor instructions for the specific participant or to have the operator perform
certain actions.
INTRODUCTION TO PARTICIPANT
[Welcome the participant]
Thank you for taking the time to participate in our study today.
My name is [name] and we’re studying the effectiveness of digital fingerprint scanners at
different placements.
One thing we like to stress is that we’re testing the placement of the equipment and not
your abilities. If you find any part of the test difficult then chances are that others will
also. One of the goals of our study is to identify such difficulties so that we work with
system designers to make such systems better and easier to use.
During your participation there will be [“others” or “one other person”] observing and
I’ll introduce you to [“them”, “him” or “her”] now.
Today’s session will last approximately 15 minutes. If you want to stop at any time just
say so.
DESCRIBE EQUIPMENT
In our study, we’ll be using the a digital fingerprint scanner connected to a computer that
will be running a program to detect and analyze data from the scanner.
The computer is also responsible for prompting you to take certain actions such as
placing your hand on the scanner or removing it.
EXPLANATION OF TASKS
The study is very simple and consists of three basic tasks.
Task #1: In this task the computer will instruct you by voice to place either your left or
right hand on the scanner. Once instructed to do so, place your left or right four fingers
on the scanner and press down until the scanner begins making a continuous beep. Hold
your fingers in place until the beep stops.
Your fingers should be close together and as close to the top edge of the finger guard as
you can get them comfortably. [demonstrate this action to the subject].

NISTIR 7382 Page 43 12/14/2006
Task #2: In this task the computer will instruct you by voice to place either your left or
right thumb on the scanner. Once instructed to do so, place your left or right thumb on
the scanner and press down until the scanner begins making a continuous beep. Hold
your thumb in place until the beep stops [demonstrate this action to the subject].
Task #3: In this task the computer will instruct you by voice to place both of your
thumbs on the scanner. Once instructed to do so, place your left and right thumb side by
side on the scanner and press down until the scanner begins making a continuous beep.
Hold your thumbs in place until the beep stops [demonstrate this action to the subject].
These tasks will be randomized so the order will be different.
There will be one repetition of the 5 tasks for each of the four heights that we will be
testing the scanner at.
Do you have any questions before we begin?
TRIAL START
[Start the software and verify Startup Parameters. Click OK to begin.]
We will begin with a test to get you comfortable with the scanner.
Please place your hand on the scanner. Press down and hold it in place until the scanner
starts making a beep. Keep your hand in place until the beep stops.
Ready? [once acknowledged, proceed to next step]
[When the software prompts, adjust platform to the lowest height and click OK.]
[Software prompts for right or left hand]
Ok… go ahead and place either hand on the scanner.
[Guide the user as needed to trigger scanner. Once beeping starts ask if the user can hear
the beep.]
[*IMPORTANT*: Note which hand the user chose to use. The software will prompt you
for this after the very first scan]
NISTIR 7382 Page 44 12/14/2006
[Follow through additional prompts, repeating the same prompt to the user if he/she did
not hear the prompt or did not understand it]
COMPLETION QUESTIONNAIRE
Thank you for your participation. That concludes the test.
We have a brief questionnaire that we would like you to complete. The information you
provide will be for our use only. Your name is not stored with the questionnaire data.
CONCLUSION
Thanks again for taking the time to participate in our study.
Do you have any comments or questions about today’s test session?

NISTIR 7382 Page 45 12/14/2006
APPENDIX C
Quality Data

NISTIR 7382 Page 46 12/14/2006
26” 32” 36” 42” Total
Quality
1
observed 257.00 238.00 202.00 253.00 950.00
expected 239.24 238.01 235.14 237.60 949.99 41.04%
contribution 1.32% 0.00% 4.67% 1.00%
2
observed 140.00 157.00 192.00 148.00 637.00
expected 160.42 159.59 157.67 159.32 637.00 27.52%
contribution 2.60% 4.00% 7.48% 0.80%
3
observed 114.00 110.00 88.00 105.00 417.00
expected 105.02 104.48 103.21 104.30 417.01 18.01%
contribution 0.77% 0.29% 2.24% 0.00%
4
observed 67.00 52.00 84.00 48.00 251.00
expected 63.21 62.89 62.13 62.78 251.01 10.84%
contribution 0.23% 1.88% 7.70% 3.48%
5
observed 5.00 23.00 7.00 25.00 60.00
expected 15.11 15.03 14.85 15.01 60.00 2.59%
contribution 676.00% 422.00% 415.00% 666.00%
total observed 583.00 580.00 573.00 579.00 2315.00
25.18% 25.05% 24.75% 25.01% 100.00%
Table 7: Finger 1 (Right Thumb Solo)

NISTIR 7382 Page 47 12/14/2006
26” 32” 36” 42” Total
Quality
1
observed 264.00 261.00 261.00 269.00 1055.00
expected
contribution 11.47% 11.34% 11.34% 11.69% 45.84%
2
observed 87.00 119.00 102.00 106.00 414.00
expected
contribution 3.78% 5.17% 4.43% 4.61% 17.99%
3
observed 126.00 108.00 119.00 114.00 467.00
expected
contribution 5.48% 4.69% 5.17% 4.95% 20.29%
4
observed 51.00 27.00 42.00 36.00 156.00
expected
contribution 2.23% 1.17% 1.83% 1.56% 6.79%
5
observed 43.00 61.00 53.00 52.00 209.00
expected
contribution 1.87% 2.65% 2.30% 2.26% 9.08%
total observed 571.00 576.00 577.00 577.00 2301.00
24.82% 25.03% 25.08% 25.08% 100.00%
Table 8: Finger 2 (Right Index)
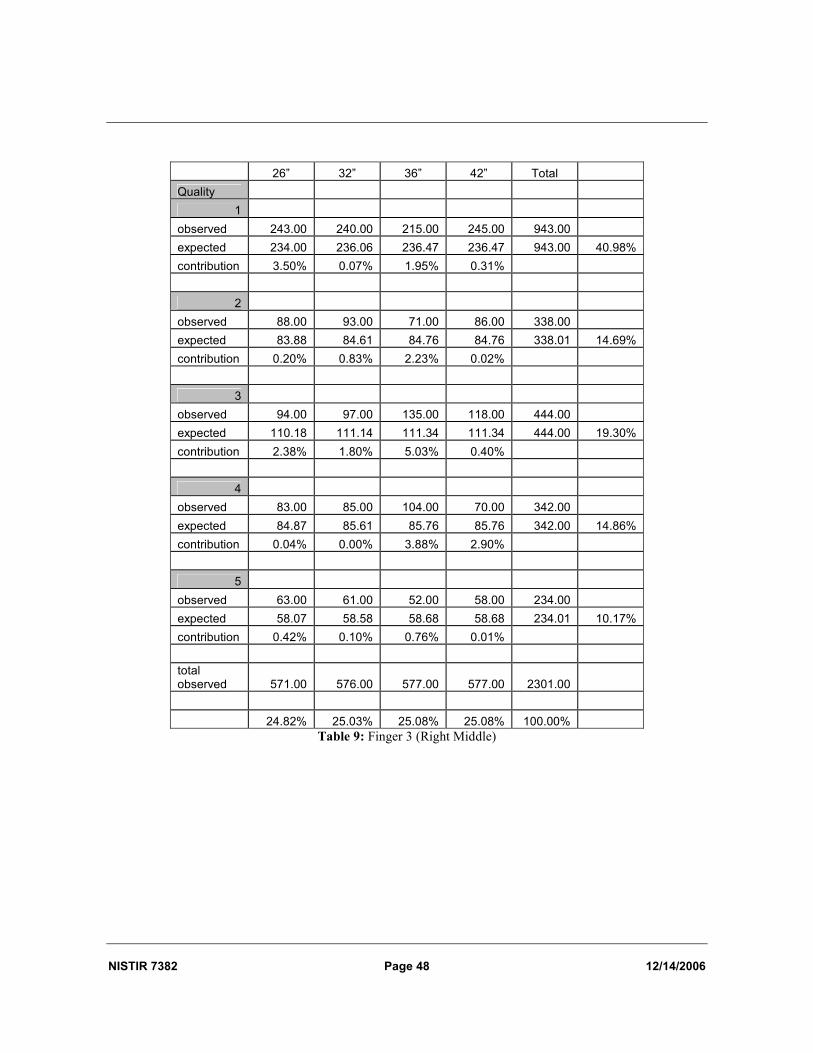
NISTIR 7382 Page 48 12/14/2006
26” 32” 36” 42” Total
Quality
1
observed 243.00 240.00 215.00 245.00 943.00
expected 234.00 236.06 236.47 236.47 943.00 40.98%
contribution 3.50% 0.07% 1.95% 0.31%
2
observed 88.00 93.00 71.00 86.00 338.00
expected 83.88 84.61 84.76 84.76 338.01 14.69%
contribution 0.20% 0.83% 2.23% 0.02%
3
observed 94.00 97.00 135.00 118.00 444.00
expected 110.18 111.14 111.34 111.34 444.00 19.30%
contribution 2.38% 1.80% 5.03% 0.40%
4
observed 83.00 85.00 104.00 70.00 342.00
expected 84.87 85.61 85.76 85.76 342.00 14.86%
contribution 0.04% 0.00% 3.88% 2.90%
5
observed 63.00 61.00 52.00 58.00 234.00
expected 58.07 58.58 58.68 58.68 234.01 10.17%
contribution 0.42% 0.10% 0.76% 0.01%
total observed 571.00 576.00 577.00 577.00 2301.00
24.82% 25.03% 25.08% 25.08% 100.00%
Table 9: Finger 3 (Right Middle)
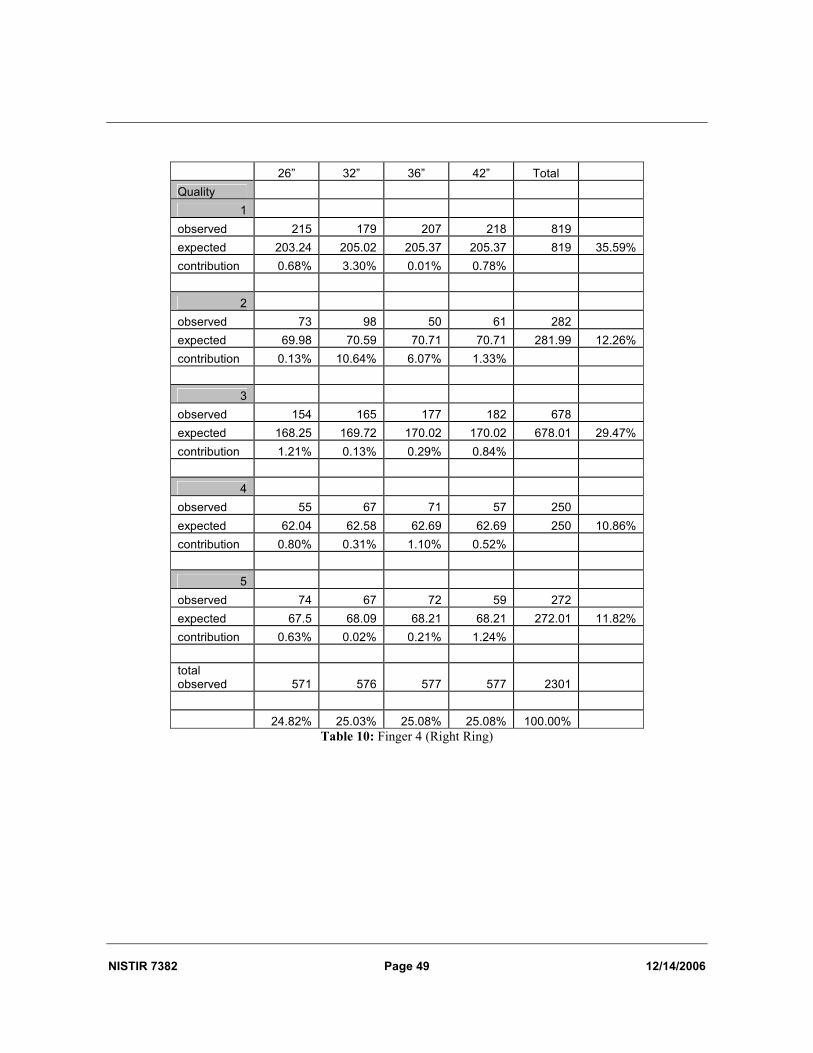
NISTIR 7382 Page 49 12/14/2006
26” 32” 36” 42” Total
Quality
1
observed 215 179 207 218 819
expected 203.24 205.02 205.37 205.37 819 35.59%
contribution 0.68% 3.30% 0.01% 0.78%
2
observed 73 98 50 61 282
expected 69.98 70.59 70.71 70.71 281.99 12.26%
contribution 0.13% 10.64% 6.07% 1.33%
3
observed 154 165 177 182 678
expected 168.25 169.72 170.02 170.02 678.01 29.47%
contribution 1.21% 0.13% 0.29% 0.84%
4
observed 55 67 71 57 250
expected 62.04 62.58 62.69 62.69 250 10.86%
contribution 0.80% 0.31% 1.10% 0.52%
5
observed 74 67 72 59 272
expected 67.5 68.09 68.21 68.21 272.01 11.82%
contribution 0.63% 0.02% 0.21% 1.24%
total observed 571 576 577 577 2301
24.82% 25.03% 25.08% 25.08% 100.00%
Table 10: Finger 4 (Right Ring)
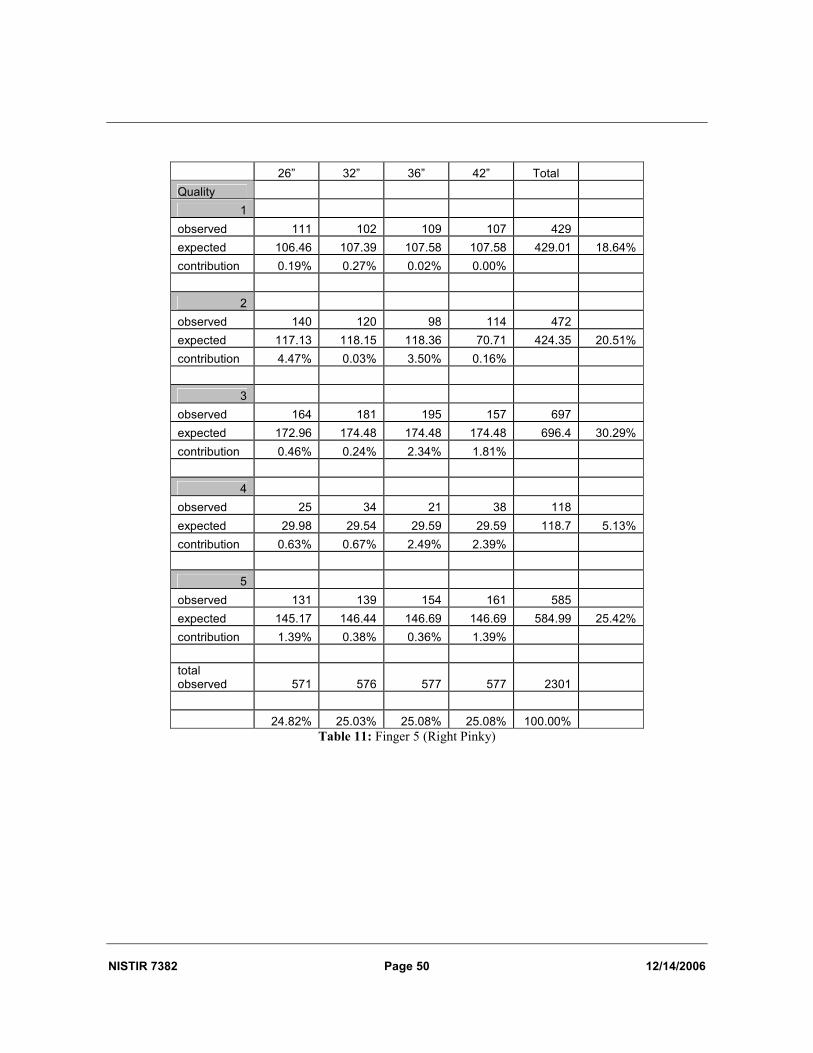
NISTIR 7382 Page 50 12/14/2006
26” 32” 36” 42” Total
Quality
1
observed 111 102 109 107 429
expected 106.46 107.39 107.58 107.58 429.01 18.64%
contribution 0.19% 0.27% 0.02% 0.00%
2
observed 140 120 98 114 472
expected 117.13 118.15 118.36 70.71 424.35 20.51%
contribution 4.47% 0.03% 3.50% 0.16%
3
observed 164 181 195 157 697
expected 172.96 174.48 174.48 174.48 696.4 30.29%
contribution 0.46% 0.24% 2.34% 1.81%
4
observed 25 34 21 38 118
expected 29.98 29.54 29.59 29.59 118.7 5.13%
contribution 0.63% 0.67% 2.49% 2.39%
5
observed 131 139 154 161 585
expected 145.17 146.44 146.69 146.69 584.99 25.42%
contribution 1.39% 0.38% 0.36% 1.39%
total observed 571 576 577 577 2301
24.82% 25.03% 25.08% 25.08% 100.00%
Table 11: Finger 5 (Right Pinky)

NISTIR 7382 Page 51 12/14/2006
26” 32” 36” 42” Total
Quality
1
observed 222 203 213 196 834
expected 209.31 207.87 208.95 207.87 834 36.21%
contribution 0.77% 0.11% 0.08% 0.68%
2
observed 127 154 135 115 531
expected 133.27 132.35 133.04 132.35 531.01 23.06%
contribution 0.29% 3.54% 0.03% 2.27%
3
observed 122 109 129 154 514
expected 129 128.11 128.78 128.11 514 22.32%
contribution 0.38% 2.85% 0.00% 5.23%
4
observed 78 70 71 43 262
expected 65.76 65.3 65.64 65.3 262 11.38%
contribution 2.28% 0.34% 0.44% 7.62%
5
observed 29 38 29 66 162
expected 40.66 40.38 40.59 40.38 162.01 7.03%
contribution 3.34% 0.14% 3.31% 16.26%
total observed 578 574 577 574 2303
25.10% 24.92% 25.05% 24.92% 100.00%
Table 12: Finger 6 (Left Thumb Solo)
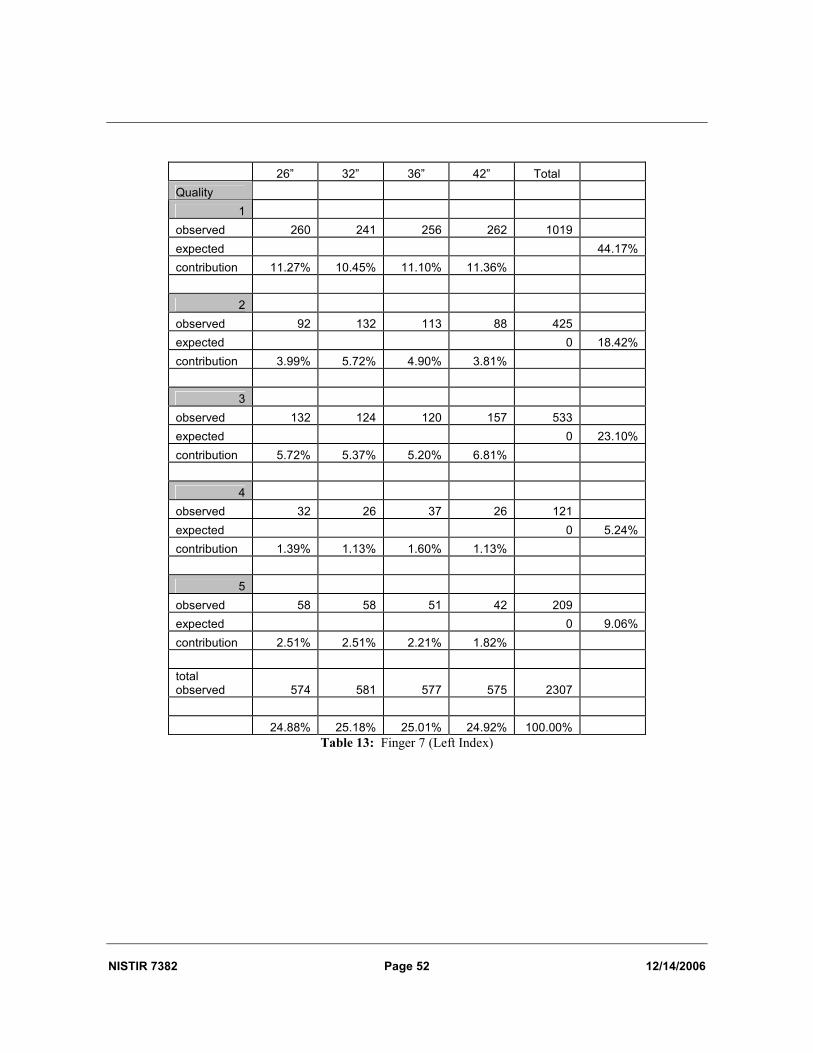
NISTIR 7382 Page 52 12/14/2006
26” 32” 36” 42” Total
Quality
1
observed 260 241 256 262 1019
expected 44.17%
contribution 11.27% 10.45% 11.10% 11.36%
2
observed 92 132 113 88 425
expected 0 18.42%
contribution 3.99% 5.72% 4.90% 3.81%
3
observed 132 124 120 157 533
expected 0 23.10%
contribution 5.72% 5.37% 5.20% 6.81%
4
observed 32 26 37 26 121
expected 0 5.24%
contribution 1.39% 1.13% 1.60% 1.13%
5
observed 58 58 51 42 209
expected 0 9.06%
contribution 2.51% 2.51% 2.21% 1.82%
total observed 574 581 577 575 2307
24.88% 25.18% 25.01% 24.92% 100.00%
Table 13: Finger 7 (Left Index)

NISTIR 7382 Page 53 12/14/2006
26” 32” 36” 42” Total
Quality
1
observed 211 219 171 210 811
expected 201.78 204.24 202.84 202.13 810.99 35.15%
contribution 0.42% 1.07% 5.00% 0.31%
2
observed 63 81 100 75 319
expected 79.37 80.34 79.78 79.51 319 13.83%
contribution 3.38% 0.01% 5.12% 0.26%
3
observed 165 132 163 125 585
expected 145.55 147.33 146.31 145.81 585 25.36%
contribution 2.60% 1.59% 1.90% 2.97%
4
observed 55 60 66 99 280
expected 69.67 70.52 70.03 69.79 280.01 12.14%
contribution 3.09% 1.57% 0.23% 12.23%
5
observed 80 89 77 66 312
expected 77.63 78.57 78.03 77.76 311.99 13.52%
contribution 0.07% 1.38% 0.01% 1.78%
total observed 574 581 577 575 2307
24.88% 25.18% 25.01% 24.92% 100.00%
Table 14: Finger 8 (Left Middle)

NISTIR 7382 Page 54 12/14/2006
26” 32” 36” 42” Total
Quality
1
observed 244 217 233 210 904
expected 224.92 227.67 226.1 225.31 904 39.19%
contribution 1.62% 0.50% 0.21% 1.04%
2
observed 48 58 45 54 205
expected 51.01 51.63 51.27 51.09 205 8.89%
contribution 0.18% 0.79% 0.77% 0.17%
3
observed 98 137 113 124 472
expected 117.44 118.87 118.05 117.64 472 20.46%
contribution 3.22% 2.77% 0.22% 0.34%
4
observed 87 77 83 114 361
expected 89.82 90.92 90.29 89.98 361.01 15.65%
contribution 0.09% 2.13% 0.59% 6.41%
5
observed 97 92 103 73 365
expected 90.81 91.92 91.29 90.97 364.99 15.82%
contribution 0.42% 0.00% 1.50% 3.55%
total observed 574 581 577 575 2307
24.88% 25.18% 25.01% 24.92% 100.00%
Table 15: Finger 9 (Left Ring)
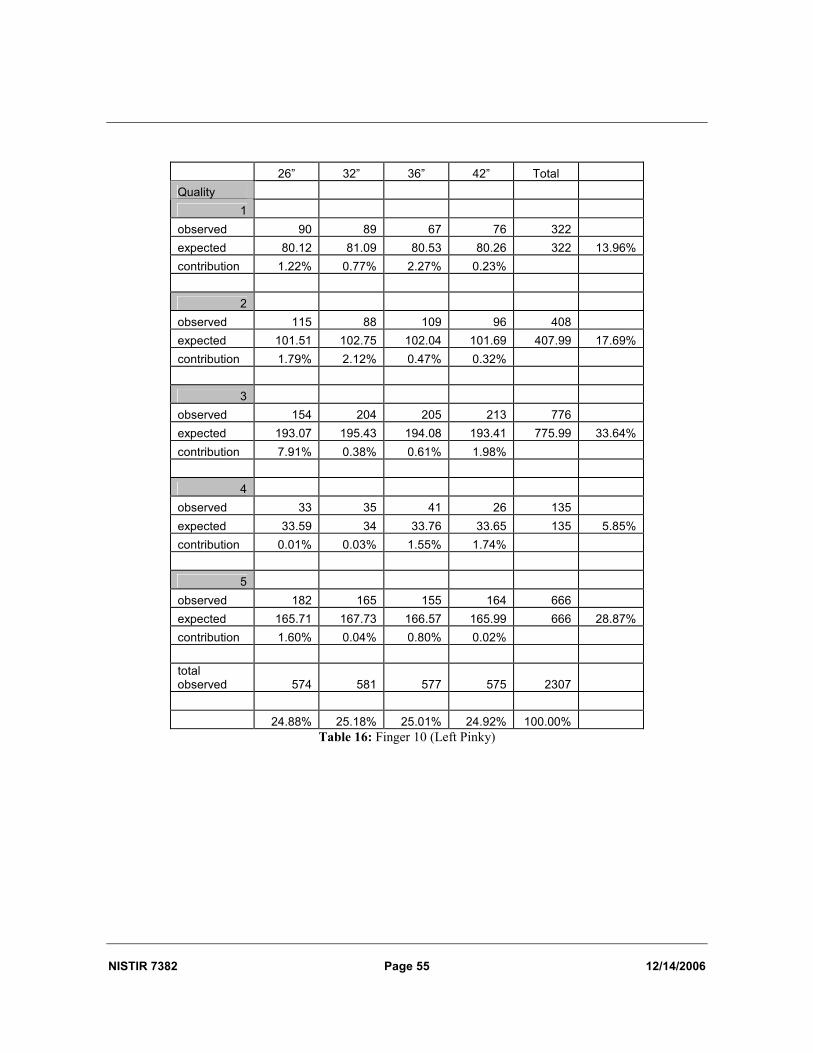
NISTIR 7382 Page 55 12/14/2006
26” 32” 36” 42” Total
Quality
1
observed 90 89 67 76 322
expected 80.12 81.09 80.53 80.26 322 13.96%
contribution 1.22% 0.77% 2.27% 0.23%
2
observed 115 88 109 96 408
expected 101.51 102.75 102.04 101.69 407.99 17.69%
contribution 1.79% 2.12% 0.47% 0.32%
3
observed 154 204 205 213 776
expected 193.07 195.43 194.08 193.41 775.99 33.64%
contribution 7.91% 0.38% 0.61% 1.98%
4
observed 33 35 41 26 135
expected 33.59 34 33.76 33.65 135 5.85%
contribution 0.01% 0.03% 1.55% 1.74%
5
observed 182 165 155 164 666
expected 165.71 167.73 166.57 165.99 666 28.87%
contribution 1.60% 0.04% 0.80% 0.02%
total observed 574 581 577 575 2307
24.88% 25.18% 25.01% 24.92% 100.00%
Table 16: Finger 10 (Left Pinky)
NISTIR 7382 Page 56 12/14/2006
26” 32” 36” 42” Total
Quality
1
observed 241 234 225 166 866
expected 217.44 215.56 216.31 216.69 866 37.42%
contribution 2.55% 1.58% 0.35% 11.86%
2
observed 65 45 59 61 230
expected 57.75 57.25 57.45 57.55 230 9.94%
contribution 0.91% 2.62% 0.04% 0.21%
3
observed 89 103 77 83 352
expected 88.38 87.62 87.92 88.08 352 15.21%
contribution 0.00% 2.70% 1.36% 0.29%
4
observed 70 54 65 56 245
expected 61.51 60.99 61.2 61.3 245 10.59%
contribution 1.17% 0.80% 0.24% 0.46%
5
observed 116 140 152 213 621
expected 155.92 154.58 155.12 155.38 621 26.84%
contribution 10.22% 1.38% 0.06% 21.36%
total observed 581 576 578 579 2314
25.11% 24.89% 24.98% 25.02% 100.00%
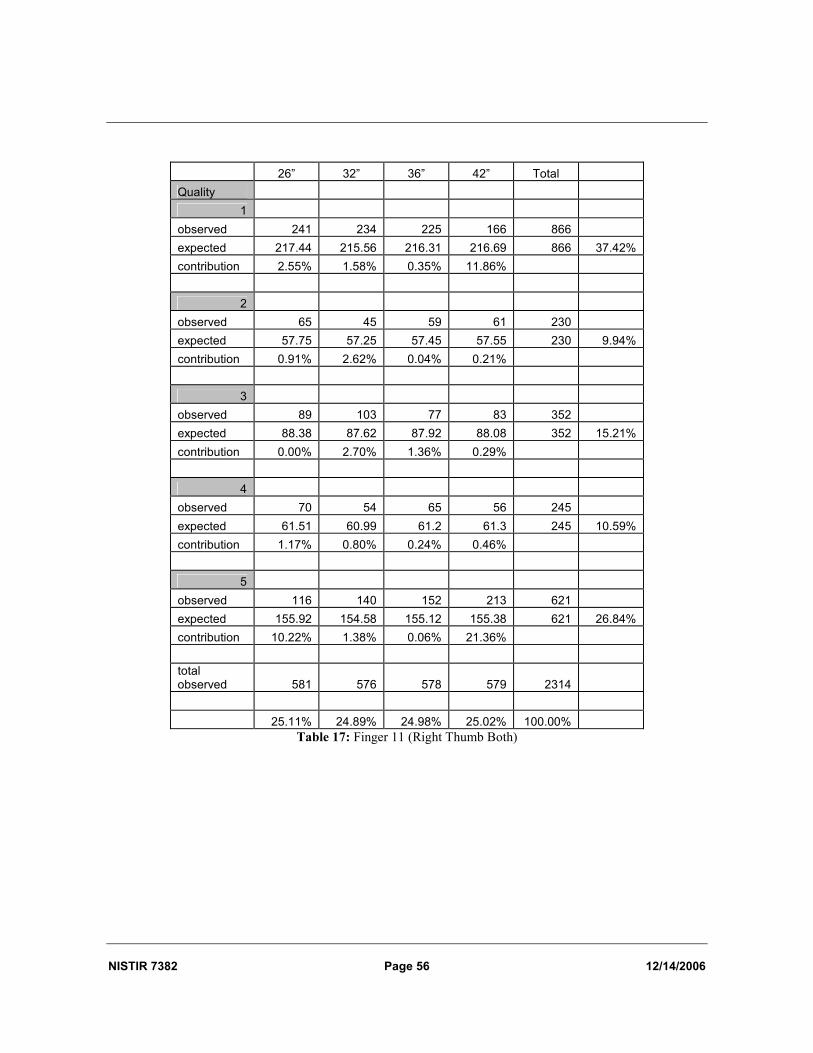
Table 17: Finger 11 (Right Thumb Both)

NISTIR 7382 Page 57 12/14/2006
26” 32” 36” 42” Total
Quality
1
observed 261 277 203 184 925
expected 232.25 230.25 231.05 231.45 925 39.97%
contribution 3.56% 9.49% 3.41% 9.73%
2
observed 74 56 83 76 289
expected 72.56 71.94 72.19 72.31 289 12.49%
contribution 0.03% 3.53% 1.62% 0.19%
3
observed 56 52 77 67 252
expected 63.27 62.73 62.95 63.05 252 10.89%
contribution 0.84% 1.83% 3.14% 0.25%
4
observed 57 44 51 42 194
expected 48.71 48.29 48.46 48.54 194 8.38%
contribution 1.41% 0.38% 0.13% 0.88%
5
observed 133 147 164 210 654
expected 164.21 162.79 163.36 163.64 654 28.26%
contribution 5.93% 1.53% 0.00% 13.10%
total observed 581 576 578 579 2314
25.11% 24.89% 24.98% 25.02% 100.00%
Table 18: Finger 12 (Left Thumb Both)
NISTIR 7382 Page 58 12/14/2006
Left Hand
Finger Number 26” 32” 36” 42”
6 41.9% 43.4% 43.0% 35.2% 12 25.0% 24.7% 12.3% 1.4% 7 45.7% 49.7% 48.7% 49.0% 8 24.2% 26.0% 22.2% 20.9% 9 18.8% 18.2% 16.0% 13.4% 10 -1.7% -4.0% -3.5% -3.1%
Table 19: Percentage difference of NFIQ 1 and 2 to 4 and 5
Right Hand
Finger Number 26” 32” 36” 42”
1 55.8% 55.2% 52.9% 56.7% 11 20.7% 14.8% 11.6% -7.3%
2*6
3 32.4% 32.5% 22.5% 35.2% 4 27.9% 24.8% 19.8% 28.3% 5 16.6% 8.5% 5.6% 3.8%
Table 20: Percentage difference of NFIQ 1 and 2 to 4 and 5
6 No reliable difference was calculated for this finger at all heights.