NH-77 - William J. Hughes Technical Center
35
I o Report 10. FUfao ll o 123 . ..... ?-- FAA WJH Technical Center 111111111111 nllllllllilm mlm 1111111111111 00090866 A PRELIMINARY COMPARISON OF THERMAL DECOMPOSITION PRODUCTS OF AIRCRAFT INTERIOR MATERIALS USING THE NATIONAL BUREAU OF STANDARDS SMOKE CHAMBER AND THE COMBUSTION TUBE FURNACE Louise C. Speitel Ray E. Feher ftIDIG Joe C. Spurgeon t_,A1r·;Y • APRl? '78 . • 4 t '- • • larch 1918 FINAL REPORT Ddcument is availab Ie to the U. S. public through the National Technical Information Service, Springfield, Virginia 22161. Prep.eII for U.S. DEPARTMENT OF TRANSPORTATION FEDERAL AVlAl'lON ADMINISTRATION Systems Rese.eII &Development service Washilglon, D.C. 21M)
-
Upload
khangminh22 -
Category
Documents
-
view
2 -
download
0
Transcript of NH-77 - William J. Hughes Technical Center

I
oReport 10. FUfao llo 123 ~, NH-77~~
. .....?-- FAA WJH Technical Center
111111111111 nllllllllilm II~I mlm 1111111111111 00090866
A PRELIMINARY COMPARISON OF THERMAL DECOMPOSITION
PRODUCTS OF AIRCRAFT INTERIOR MATERIALS USING THE NATIONAL BUREAU OF STANDARDS SMOKE CHAMBER AND
THE COMBUSTION TUBE FURNACE
Louise C. Speitel Ray E. Feher ftIDIG
Joe C. Spurgeon t_,A1r·;Y
• APRl? '78 ~~ .
• 4t '
• •
larch 1918
FINAL REPORT
Ddcument is availab Ie to the U. S. public through the National Technical Information Service,
Springfield, Virginia 22161.
Prep.eII for
U.S. DEPARTMENT OF TRANSPORTATION FEDERAL AVlAl'lON ADMINISTRATION
Systems Rese.eII &Development service Washilglon, D.C. 21M)
.~-'
NOTICE
The United States Government does not endorse products or manufacturers. Trade or manufacturer's names appear herein solely because they are considered essential to the object of this report.
os !l'
METRIC CONVERSION FACTORS
-------Approximltl Convlrsions to Mltric Mllsurn '" -
-
=--..... .. Approximltl Convlrsions from Mltric Mllsuris
SYllIbol Whln You Know Multiply by TI Find SYlllbol
~
---= ~==--SYlllbol Whln You Know Multiply by To Find SYlllbDl
---.. C'o1
--_._,= LENGTH
= Q
LENGTH C"o1
mm millimeters 0.04 inches in ~ ~ cm centimeters 0.4 inches in
in ft yd
inches feet yards
·2.5 30 0.9
centimeters centimeters meters
cm cm m
... ---._= ClO= __ 00'l
---
nl m km
meters meters kilometers
3.3 1.1 0.6
feet yerds mile.
It yd mi
mi milea 1.6 kilometers km !:;
AREA - =- ~ AREA
In2
ft2
yd2
mi Z
aquare inches squsre feet aqulre yarda square mile.
6.5 0.09 0.8 2.6
square centimeters aquare meters aquare meters aquare kilometers
c:m2
m2
m2
km2
en ---:2
... ~
-
cm2
m2
km2
ha
square centimeters square meters square ki lometers hectares (10.000 m2)
0.16 1.2 0.4 2.5
square inches square Vlrda square mi 18S
acres
in2
yd2
mi 2
acrel 0.4 hectare. ha -~
MASS (wlipht) '" - MASS (wlipht)(
!:l 01
Ib ounces pounds short ton8
28 0.45 0.9
grams kilograms tonne8
9 kg I
-- -------=
9 kg t
grams kilograms tonnes (1000 kgl
0.035 2.2 1.1
ounces pounds short tons
01
Ib
(2000 Ib)
VOLUME ...
-----= Q== .. VOLUME = en
ISp Tbsp II 01
leaspoons tablespoons fluid ounces
5 15 30
milliliters milliliter. milliliterll
ml ml ml w
-- ~---------; ml I I
milliliters liters liters
0.03 2.1 1.06
fluid ounces pints quarts
1101
pI ql
c pt qt
cups pinta qwartl
0.24 0.47 0.95
lite,. liters liters
I I I - -
... I m3
m3
liters cubic meters cubic meters
0.26 35
1.3
gallons cubic feet cubic yards
oal fl J
yd J
gal ItJ
yd3
oallons cubic feet cubic yards
3.8 0.03 0.76
liters cubic meters cubic meters
I m3
m3 .. - :: --~ TEMPERATURE (exect)
TEMPERATURE (mct) ... "c Celsius 9/5 (then Fahrenheit " = temperattlre add 321 temperature
'F Fshrenheit 5/9 (afler eel.iut 'c -temperature subtracting temperature 32)
• , II' • 2,5' ll,nlor.:1Iyl, hI' lIttler l· ...aCl CUn\'eiSHlilS ,Inn mor~ lIeUlIIl'!d t<1IJIl:!!;, ~t1(t NB~ MISC. Pull I. 280, Unit. of WlllUhhi itntl M,U!ltiureti. Prlcu $2.:Z~, SO C"ttlluS! No. C'3.tl.l;~86.
~
; . !t ~
---
--
-
.. ~
i y
'F -40
I ,
-40 ·C
0 , , , i I
-20
, I i
32
1 40
! I I 0
98.6
, ,8~ , I' , 120 160 , i
, I
, i , ,
i !
I i i 60 8020 40
37
·F 212
,2~ i i i tl
·C
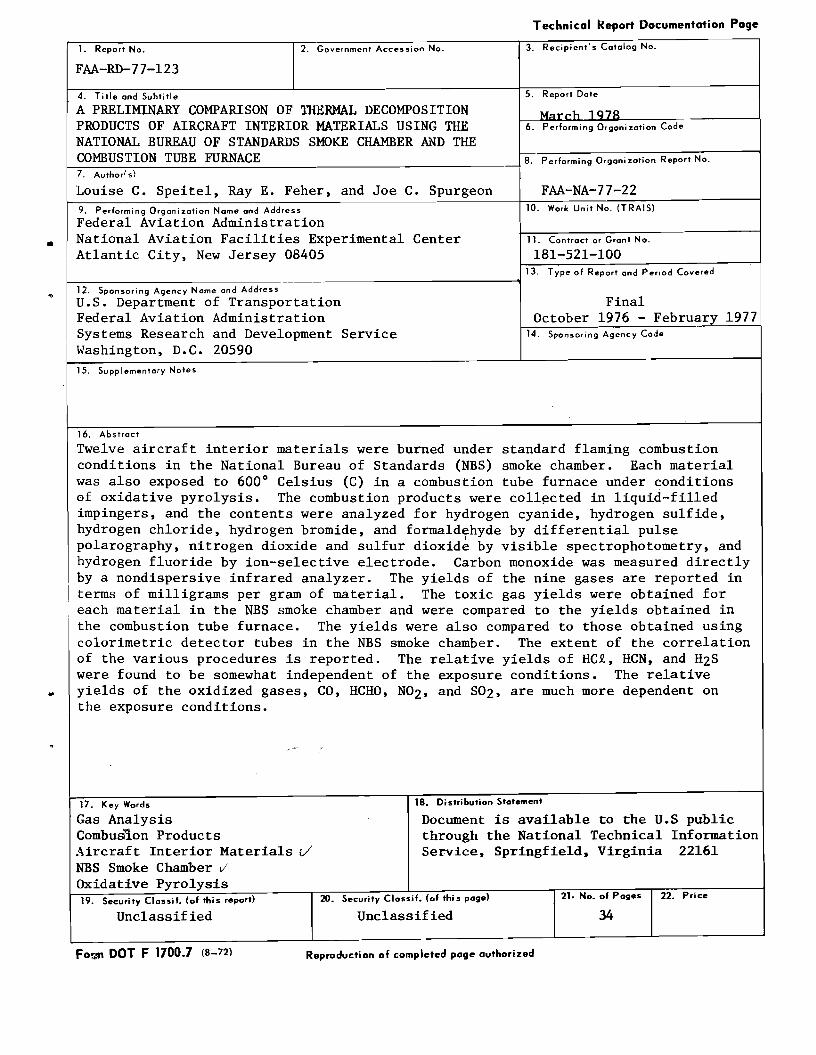
Technical ~eport Documentation Page
3. Recipient's Catalog No.2. Government Accession No.1. Report No.
FAA-RD-77-l23
5. Report Dote4. Title and Subtitle
A PRELIMINARY COMPARISON OF THERMAL DECOMPOSITION PRODUCTS OF AIRCRAFT INTERIOR MATERIALS USING THE 6. Performing Orgoni zotion Code
NATIONAL BUREAU OF STANDARDS SMOKE CHAMBER AND THE COMBUSTION TUBE FURNACE 7. Author!s}
FAA-NA-77-22Louise C. Speitel, Ray E. Feher, and Joe C. Spurgeon 10. Work Unit No. (TRAIS)9. Performing Organization Nome and Address
Federal Aviation Administration National Aviation Facilities Experimental Center 11. Contract or Grant No .• Atlantic City, New Jersey 08405 181-521-100
13. Type of Report and Period Covered f--------------,----,--,------~----------____'1
12. Sponsoring Agency Nome and Address
Final Federal Aviation Administration U.S. Department of Transportation
October 1976 - February 1977 Systems Research and Development Service 14. Sponsoring Agency Code
Washington, D.C. 20590 15. Supplementary Notes
16. Abstract
Twelve aircraft interior materials were burned under standard flaming combustion conditions in the National Bureau of Standards (NBS) smoke chamber. Each material was also exposed to 600 0 Celsius (C) in a combustion tube furnace under conditions of oxidative pyrolysis. The combustion products were coll~cted in liquid-filled impingers, and the contents were analyzed for hydrogen cyanide, hydrogen sulfide, hydrogen chloride, hydrogen bromide, and formaldehyde by differential pulse polarography, nitrogen dioxide and sulfur dioxide
I
by visible spectrophotometry, and hydrogen fluoride by ion-selective electrode. Carbon monoxide was measured directly by a nondispersive infrared analyzer. The yields of the nine gases are reported in terms of milligrams per gram of material. The toxic gas yields were obtained for each material in the NBS smoke chamber and were compared to the yields obtained in the combustion tube furnace. The yields were also compared to those obtained using colorimetric detector tubes in the NBS smoke chamber. The extent of the correlation of the various procedures is reported. The relative yields of HCt, HCN, and H2S were found to be somewhat independent of the exposure conditions. The relative
• yields of the oxidized gases, CO, HCHO, N02' and S02, are much more dependent on the exposure conditions.
17. Key Words
Gas Analysis CombuSion Products Aircraft Interior Materials v NBS Smoke Chamber vi Oxidative Pyrolysis
18. Distribution Stotement
Document is available to the U.S public through the National Technical Information Service, Springfield, Virginia 22161
19. Security Clossif. (of this report) 20. Security Clossif. (of thi s page) 21. No. of Pages 22. Price
Unclassified Unclassified 34
For.m DOT F 1700.7 (8-72) Reproduction of completed page authorized
PREFACE
The authors would Glidewell and Mr. like to thank Mr.
like to acknowledge the assistance provided by Mr. Ross Stanley Sternik in acquiring laboratory data. We would also Louis Allen for reviewing the statistics in this report.
•
The materials utilized in this study were obtained through the cooperation of the Aerospace Industries Association of America and leading aircraft industry seat material suppliers •
•
iii

TABLE OF CONTENTS
Page
INTRODUCTION 1
Purpose 1 Background 1..
EXPERIMENTAL SECTION 1
Aircraft Interior Materials 1 Combustion Tube Furnace 3 NBS Smoke Chamber 3 Methods of Analysis 4 Statistics 6
DISCUSSION OF RESULTS 7
Reproducibility 7
and the NBS Smoke Chamber
Methods of Analysis in the NBS Smoke Chamber
Comparison of Gas Yields for the Combustion Tube Furnace 10
Comparison of Colorimetric Detector Tubes and Instrumental 11
SUMMARY OF RESULTS 13
CONCLUSIONS 14
RECOMMENDATIONS 14
REFERENCES 15
..
v

LIST OF ILLUSTRATIONS
Figure Page
1 Comparison of CO Yields for Flaming Conditions in the NBS 16 Smoke Chamber with Yields from the Combustion Tube Furnace
2 Comparison of HCt Yields for Flaming Conditions in the NBS 17 ..Smoke Chamber with Yields from the Combustion Tube Furnace
3 Comparison of HCN Yields for Flaming Conditions in the NBS 18 Smoke Chamber with Yields from the Combustion Tube Furnace
""-
4 Comparison of H2S Yields for Flaming Conditions in the NBS 19 Smoke Chamber with Yields from the Combustion Tube Furnace
5 Comparison of CO Yields for Flaming and Nonflaming 20 Conditions in the NBS Smoke Chamber
6 Comparison of CO Yields for Flaming and Nonfiaming Condi- 21 tions in the NBS Smoke Chamber on a Weight-Loss Basis
7 Comparison of CO Yields for Nonflaming Conditions in the NBS 22 Smoke Chamber with Yields from the Combustion Tube Furnace
8 Comparison of CO Yields in the NBS Smoke Chamber Obtained 23 Using Colorimetric Detector Tabes with Yields Obtained Using Infrared Analysis
9 Comparison of HCt Yields in the NBS Smoke Chamber Obtained 24 Using Colorimetric Detector Tubes with Yields Obtained Using Polarographic Analysis
10 Comparison of HCN Yields in the NBS Smoke Chamber Obtained 25 Using Colorimetric Detector Tubes with Yields Obtained Using Polarographic Analysis ..
11 Comparison of H2S Yields in the NBS Smoke Chamber Obtained 26 Using Colorimetric Detector Tubes with Yields Obtained Using Polarographic Analysis
12 Comparison of NOx Yields in the NBS Smoke Chamber Obtained 27 Using Colorimetric Detector Tubes with N02 Yields Obtained Using Spectrophotometric Analysis
vi
Table
1
2
• 3
4
5
6
7
8
...
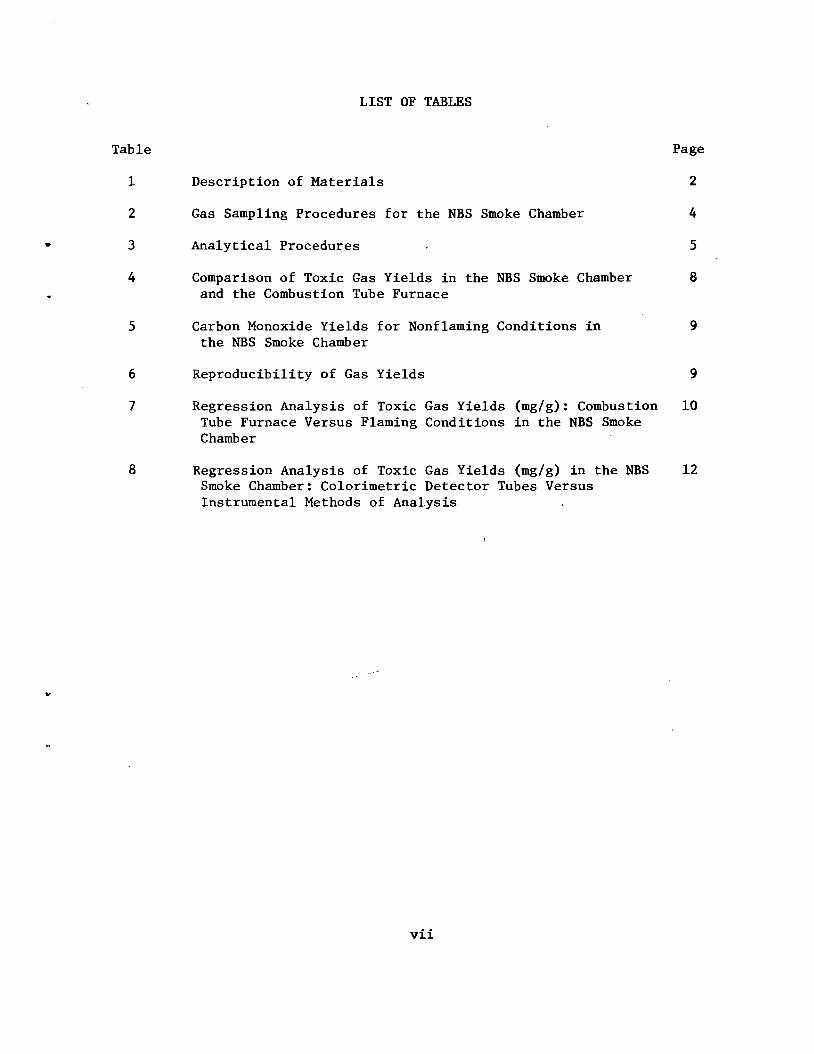
LIST OF TABLES
Page
Description of Materials 2
Gas Sampling Procedures for the NBS Smoke Chamber 4
Analytical Procedures 5
Comparison of Toxic Gas Yields in the NBS and the Combustion Tube Furnace
Smoke Chamber 8
Carbon Monoxide Yields for Nonflaming Conditions in the NBS Smoke Chamber
9
Reproducibility of Gas Yields 9
Regression Analysis of Toxic Gas Yields (mg/g): Combustion Tube Furnace Versus Flaming Conditions in the NBS Smoke Chamber
10
Regression Analysis of Toxic Gas Yields (mg/g) in the NBS Smoke Chamber: Colorimetric Detector Tubes Versus Instrumental Methods of Analysis
12
vii
INTRODUCTION
PURPOSE.
The primary purpose of this report is to compare selected toxic gas yields of aircraft interior materials using the National Bureau of Standards (NBS) smoke chamber and the combustion tube furnace. A secondary objective is to compare selected toxic gas yields obtained with colorimetric detector tubes
• in the NBS smoke chamber with the yields obtained using instrumental methods of analysis.
BACKGROUND.
Two previous studies conducted at the National Aviation Facilities Experimental Center (NAFEC) have involved the analysis of toxic gases generated by thermally decomposing aircraft interior materials. These tests have included 66 materials and nine material components. In the first study (reference 1), the materials were exposed to flaming conditions in the NBS smoke chamber, and selected toxic gases were measured with colorimetric detector tubes. A more recent study (reference 2) involved the thermal decomposition of the same materials in a combustion tube furnace at 600 0 Celsius (C). Instrumental methods of analysis were employed in the latter study to examine the various thermal decomposition products. In addition, the Civil Aeromedical Institute
. (CAMI) has conducted animal toxicity tests by thermally decomposing these materials in a combustion tube furnace (reference 3). Both the recent NAFEC toxic gas program and the animal toxicity studies at CAMI employed similar experimental procedures to generate thermal deoomposition products.
It is generally accepted that exposure conditions play a significant role in determining both the qualitative and quantitative aspects of combustion products (references 1 and 4). It can be argued that a combustion tube furnace is not an appropriate means of generating combustion products, since the thermal environment is assumed to differ rather significantly from that encountered during flaming combustion. The purpose of this study is to compare the thermal decomposition products that are produced using a combustion tube furnace with those obtained under flaming exposure conditions in the NBS smoke chamber. This comparison is based on the qualitative and quantitative analysis of eight thermal decomposition products produced by 12 randomly selected aircraft interior materials.
EXPERIMENTAL SECTION
AIRCRAFT INTERIOR MATERIALS.
The materials utilized in this study were chosen from among those interior materials which were used in wide-bodied aircraft during 1972/1973. Many of these materials are still in current use. The 12 test materials were selected
1
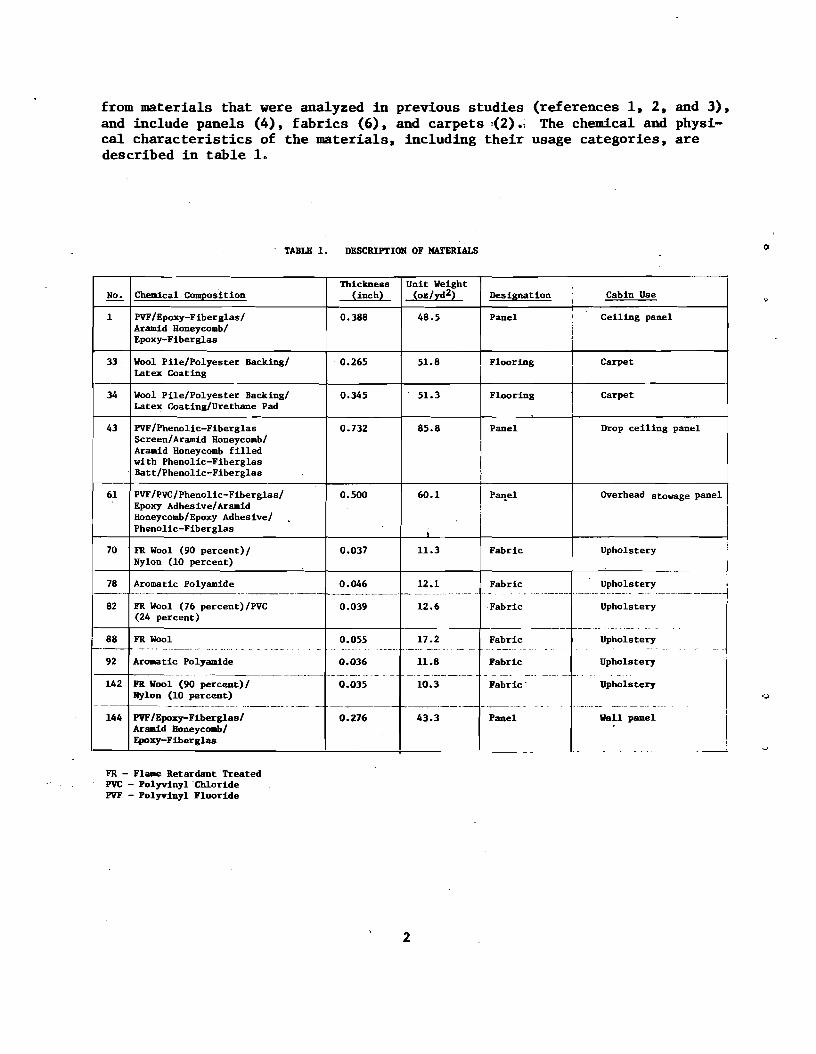
from materials that were analyzed in previous studies (references 1. 2. and 3). and include panels (4). fabrics (6). and carpets '(2).; The chemical and physical characteristics of the materials. including their usage categories. are described in table 1.
TABLE 1. DESCRIPTION OF MATERIALS
No. Chemical Composition Thickness
(inch) Unit Weight
(oz/yd2) Designation , Cabin Use
1 PVF/Epoxy-Fiberglas/ Aramid Honeycomb/ Epoxy-Fiberglas
0.388 48.5 Panel ,
! Ceiling panel
33 Wool Pile/Polyester Backing/ Latex Coating
- 0.265 51.8 Flooring Carpet
34 Wool Pile/Polyester Backing/ Latex Coating/Urethane Pad
0;345 51.3 -Carpet
43 PVF/Phenolic-Fiberglas Screen/Aramid Honeycomb/ Aramid Honeycomb filled with Phenolic-Fiberglas Batt/Phenolic-Fiberglas
0.732 85.8 Drop ceiling panel
61 PVF/PVC/Phenolic-Fiberglas/ Epoxy Adhesive/Aramid Honeycomb/Epoxy Adhesive/ Phenolic-Fiberglas
0.500 60.1 Overhead stowage panel I
I 70
78
82
FR Wool (90 percent)/ Nylon (10 percent)
Aromatic Polyamide _.-_. ---------_._-FR Wool (76 percent)/PVC (24 percent)
0.037
0.046
0.039
11.3
12.1
12.6 Fabric
Upholstery
J
~<::~::::---jl 88
-'-FR Wool 0.055 17.2 Fabric Upholstery
- - - -
92 Aromatic Polyamide 0.036 11.8 Fabric Upholstery I---f-------------------- .--.. -.- .. -- - -- ..---.---. - - --. ._.. ---- .
142 FR Wool (90 percent)/ 0.035 10.3 Fabric' Upholstery Rylon (10 percent)
- -- f----- -.----. --- --. --'-'- -- ------ f-----.----
144 PVF/Epoxy-Fiberglas/ 0.276 43.3 Panel Vall panel Armrld Honeycomb/ Epoxy-Fiberglas
I-_-' ----------'------~------'----__
FR - Flame Retardant Treated PVC - Polyvinyl 'Chloride PVF - Polyvinyl Fluoride
2
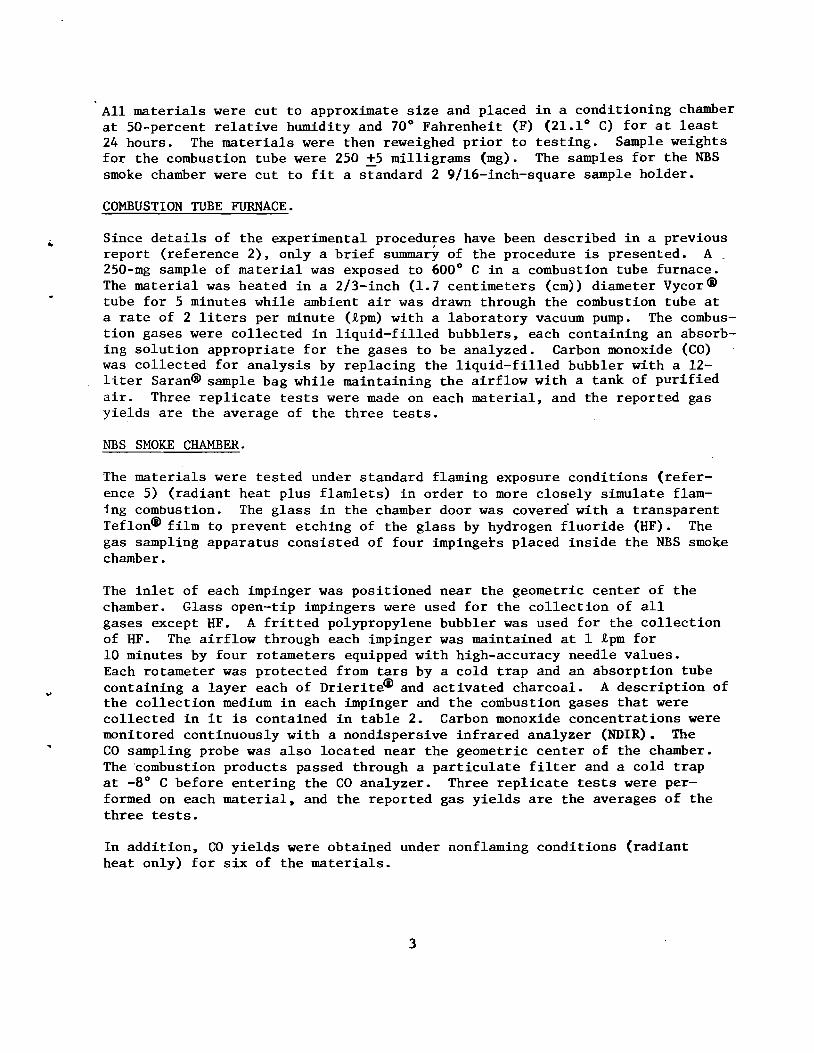
All materials were cut to approximate size and placed in a conditioning chamber at 50-percent relative humidity and 70° Fahrenheit (F) (21.1° C) for at least 24 hours. The materials were then reweighed prior to testing. Sample weights for the combustion tube were 250 +5 milligrams (mg). The samples for the NBS smoke chamber were cut to fit a standard 2 9/l6-inch-square sample holder.
COMBUSTION TUBE FURNACE.
Since details of the experimental procedures have been described in a previous report (reference 2), only a brief summary of the procedure is presented. A 250-mg sample of material was exposed to 600 0 C in a combustion tube furnace. The material was heated in a 2/3-inch (1.7 centimeters (cm» diameter Vycor@ tube for 5 minutes while ambient air was drawn through the combustion tube at a rate of 2 liters per minute (~pm) with a laboratory vacuum pump. The combustion gases were collected in liquid-filled bubblers, each containing an absorbing solution appropriate for the gases to be analyzed. Carbon monoxide (CO) was collected for analysis by replacing the liquid-filled bubbler with a 12liter Saran@ sample bag while maintaining the airflow with a tank of purified air. Three replicate tests were made on each material, and the reported gas yields are the average of the three tests.
NBS SMOKE CHAMBER.
The materials were tested under standard flaming exposure conditions (reference 5) (radiant heat plus flamlets) in order to more closely simulate flaming combustion. The glass in the chamber door was covered with a transparent Teflon@ film to prevent etching of the glass by hydrogen fluoride (HF). The gas sampling apparatus consisted of four impingers placed inside the NBS smoke chamber.
The inlet of each impinger was positioned near the geometric center of the chamber. Glass open-tip impingers were used for the collection of all gases except HF. A fritted polypropylene bubbler was used for the collection of HF. The airflow through each impinger was maintained at 1 ~pm for 10 minutes by four rotameters equipped with high-accuracy needle values. Each rotameter was protected from tars by a cold trap and an absorption tube containing a layer each of Drierite@ and activated charcoal. A description of the collection medium in each impinger and the combustion gases that were collected in it is contained in table 2. Carbon monoxide concentrations were monitored continuously with a nondispersive infrared analyzer (NDIR). The CO sampling probe was also located near the geometric center of the chamber. The 'combustion products passed through a particulate filter and a cold trap at _8 0 C before entering the CO analyzer. Three replicate tests were performed on each material, and the reported gas yields are the averages of the three tests.
In addition, CO yields were obtained under nonflaming conditions (radiant heat only) for six of the materials.
3
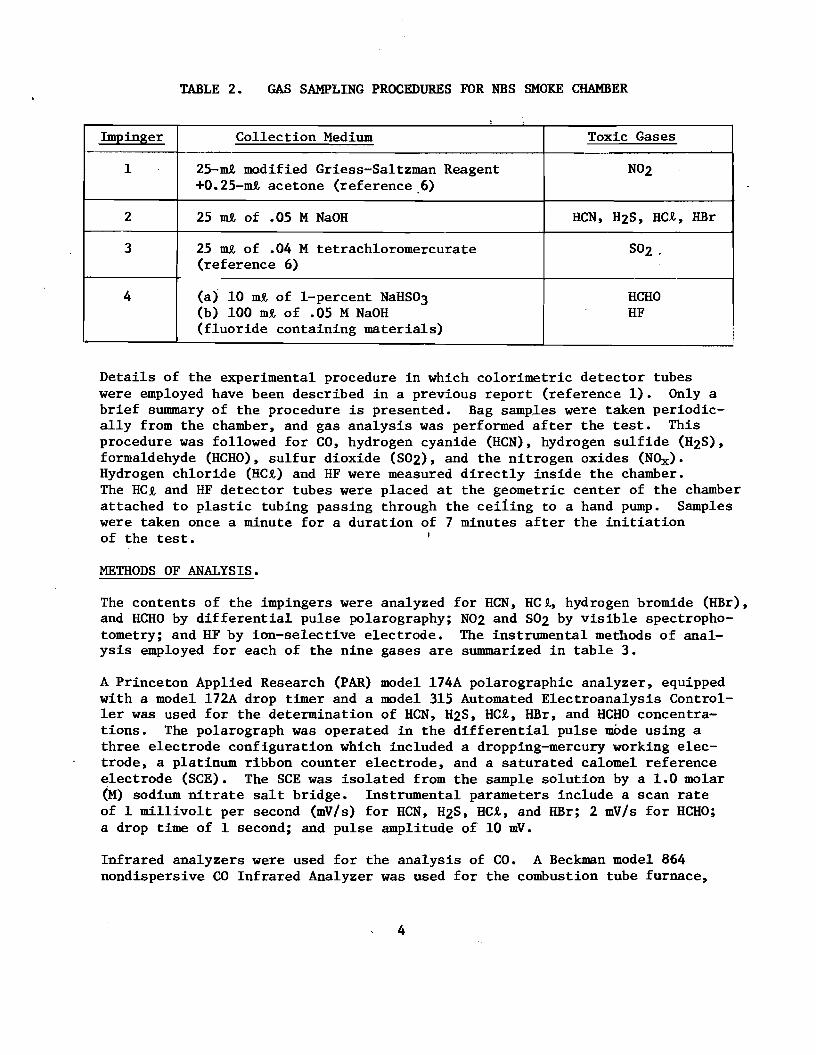
TABLE 2. GAS SAMPLING PROCEDURES FOR NBS SMOKE CHAMBER
,
Impinger
1
2
3
4
Collection Medium
25-m! modified Griess-Saltzman Reagent +0.25-mt acetone (reference.6)
25 mt of .05 M NaOH
25 mi of .04 M tetrachloromercurate (reference 6)
(a) 10 mt of I-percent NaHS03 (b) 100 mt of .05 M NaOH (fluoride containing materials)
Toxic Gases ,
N02
HCN, H2S, HCt, HBr
S02 .
-HCHO HF
i !
Details of the experimental procedure in which colorimetric detector tubes were employed have been described in a previous report (reference 1). Only a brief summary of the procedure is presented. Bag samples were taken periodically from the chamber, and gas analysis was performed after the test. This procedure was followed for CO, hydrogen cyanide (HCN), hydrogen sulfide (H2S), formaldehyde (HCHO), sulfur dioxide (S02), and the nitrogen oxides (NOx). Hydrogen chloride (HCt) and HF were measured directly inside the chamber. The HCt and HF detector tubes were placed at the geometric center of the chamber attached to plastic tubing passing through the ceiiing to a hand pump. Samples were taken once a minute for a duration of 7 minutes after the initiation of the test.
METHODS OF ANALYSIS.
The contents of the impingers were analyzed for HCN, HC~, hydrogen bromide (HBr), and HCHO by differential pulse polarography; N02 and S02 by visible spectrophotometry; and HF by ion-selective electrode. The instrumental methods of analysis employed for each of the nine gases are summarized in table 3.
A Princeton Applied Research (PAR) model l74A polarographic analyzer, equipped with a model l72A drop timer and a model 315 Automated Electroanalysis Controller was used for the determination of HCN, H2S, HCt, HBr, and HCHO concentrations. The polarograph was operated in the differential pulse mode using a three electrode configuration which included a dropping-mercury working electrode, a platinum ribbon counter electrode, and a saturated calomel reference electrode (SCE). The SCE was isolated from the sample solution by a 1.0 molar (M) sodium nitrate salt bridge. Instrumental parameters include a scan rate of 1 millivolt per second (mV/s) for HCN, H2S, HCt, and HBr; 2 mV/s for HCHO; a drop time of 1 second; and pulse amplitude of 10 mV.
Infrared analyzers were used for the analysis of CO. A Beckman model 864 nondispersive CO Infrared Analyzer was used for the combustion tube furnace,
4
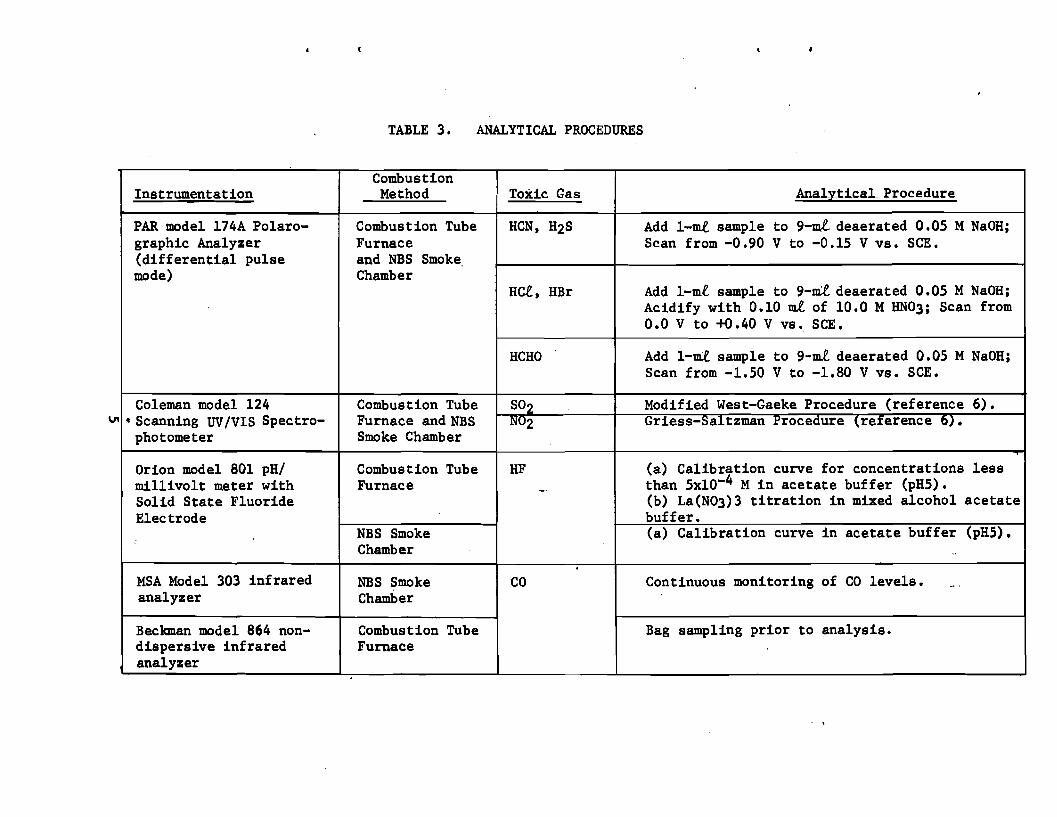
TABLE 3. ANALYTICAL PROCEDURES
VI,
Instrumentation Combustion Method Toxic Gas Analytical Procedure
PAR model 174A Po1arographic Analyzer (differential pulse
Combustion Tube Furnace and NBS Smoke
HCN, H2S Add 1-ml sample to 9-ml deaerated 0.05 M NaOH; Scan from -0.90 V to -0.15 V vs. SCE.
Add 1-mt sample to 9-ml deaerated 0.05 M NaOH; Acidify with 0.10 ml of 10.0 M UN03; Scan from 0.0 V to +0.40 V vs. SCE.
Add 1-ml sample to 9-ml deaerated 0.05 M NaOH; Scan from -1.50 V to -1.80 V vs. SCE.
Modified West-Gaeke Procedure (reference 6).
mode) Chamber HCt, HBr
HCHO
Coleman model 124 Combustion Tube S02 • Scanning uvIVIS Spectro
photometer Furnace and NBS Smoke Chamber
l.'l u2 Griess-Saltzman Procedure (reference 6).
Orion model 801 pHI millivolt meter with Solid State Fluoride Electrode
Combustion Tube Furnace
HF _.
(a) Calibration curve for concentrations less than 5x10⁻⁴ M in acetate buffer (pHS). (b) La(N03)3 titration in mixed alcohol acetate buffer. (a) Calibration curve in acetate buffer (pHS).
..
Continuous monitoring of CO levels. - .
Bag sampling prior to analysis.
: NBS Smoke Chamber
MSA Model 303 infrared analyzer
NBS Smoke Chamber
CO
Beclanan model 864 non-dispersive infrared analyzer
Combustion Tube Furnace

and a Mine Safety Appliances Model 303 continuous infrared CO analyzer was used for the NBS smoke chamber. An Orion model 801 pH/mV meter with an Orion solid state fluoride electrode and Orion double junction reference electrode were used for the analysis of HF. A Coleman model 124 Scanning UV/VIS spectrophotometer was used for the analysis of S02 and N02 • Colorimetric detector tubes were also employed for measuring gases in the NBS smoke chamber (reference 1).
STATISTICS. •
The ability of an equation to describe the test data is best measured by the coefficient of correlation (R) or the coefficient of determination (R2). In the case of a linear relationship, R2 is the ratio of the explained variation to the total variation. R2 is the same regardless of whether X or Y is considered the independent variable. The possible values of R2 range from 0 to 1.0. A value of 1.0 represents a perfectly correlated data set, while a value of zero represents no linear correlation. However, a high R2 value (i.e., near 1.0) does not necessarily indicate a direct interdependence of the vari ables. One also needs to decide whether to regard an observed value of R as a safe indication that the true value of R for the universe is different from zero. This is done by testing to determine if the value of R which was obtained is significantly different from zero at a given probability level (P~) (reference 7). One can determine confidence limits for estimates obtained from the regression line by using the standard error of estimate (Syx) which is the standard deviation of the errors· of estimation. If lines are constructed parallel to the regression line of y on x at the vertical distance of 2syx ' and if the number of data sets, N, is large enough, 95 percent of the sample points would be included between these lines (reference 8).
The relative yields for each gas are compared between the combustion tube furnace and the NBS smoke chamber. Other conditions which are compared are flaming versus nonflaming conditions in the NBS smoke chamber, and colorimetric detector tube analyses versus instrumental methods of analysis in the NBS smoke chamber. Only nonzero yields are compared to avoid biasing the results. The "least squares best fit" to a straight line was obtained for each comparison. The coefficient of correlation, slope, y-intercept (Yo), and Syx were determined for each regression line. All standard errors of estimates in this report are corrected for the small number of data points employed in the calculations (reference 8). The 95-percent (2syx) confidence bands are indicated as dashed lines in figures 1 to 11.
The R value corresponding to the best fit was determined for each comparison. A Textronix 4051 with the Statistical Package Volume 1 was used to calculate the least squares best fit, the coefficient of correlation, the slope, and the y-intercept. The corrected standard error of estimate was computed from a separate least squares program using a NOVA 3/12 minicomputer.
6
DISCUSSION OF RESULTS
REPRODUCIBILITY.
The yields of the nine gases are reported in terms of milligrams per gram (mg/g) of material for the 12 materials tested. Peak concentrations reported for the colorimetric detector tubes and continuous CO analyses have been used to calculate equivalent yields in terms of mg/g. This was necessary in order to compare the NBS smoke chamber data with the combustion tube furnace. All other reported yields are average yields, measured from samples taken continuously over the test duration. These data are contained in tables 4 and 5. Although HBr yields are reported in table 4, they have not been utilized for purposes of comparison since this gas was primarily detected only when using the combustion tube furnace.
Data on the average percent-weight-loss of each material are also included in tables 4 and 5. The relative standard deviation (RSD) in the weight loss was .. determined for the three replicate tests of each material. The RSD is the standard deviation of a set of values divided by the average value. In the combustion tube furnace, small variations in sample weight loss occurred between the three sets of tests. The average of the relative standard deviations (ARSD) of weight loss for the 12 materials tested is 5 percent. In the NBS smoke chamber a greater variation in sample weight loss occurred during the three replicate tests, with an ARSD of 15 percent. This variation could be due to the loss of charred material and dripping of the sample. It could also be due to variations in the combustion process itself for some materials.
Reproducibility is important for regulatory purposes because it is directly related to our ability to differentiate between closely ranked materials. Although NAFEC is not directly involved in the regulatory process, the work we do often contributes to regulatory actions.
A rough determination of the reproducibility of gas yields can be made by looking at the ARSD for each gas. Table 6 contains the ARSD for each of the eight gases in addition to the minimum and maximum RSD for each gas. In the NBS smoke chamber, the ARSD's ranged from 30 to 52 percent for all eight gases. In the combustion tube, the ARSD's range from 9 to 24 percent for CO, HCt, ,HCN, HF, and H2S; and 52 to 69 percent for N02, HCHO, and S02. The reproducibilities for CO, HCN, H2S, and HF were found to be at least twice as good in the combustion tube furnace as in the NBS smoke chamber. Carbon monoxide and HCN are' considered to be of primary importance in regards to the hazards in combustion atmospheres.
FAA WJH Technical Center
111111111111111111111111111111111111111111111111117 00090866
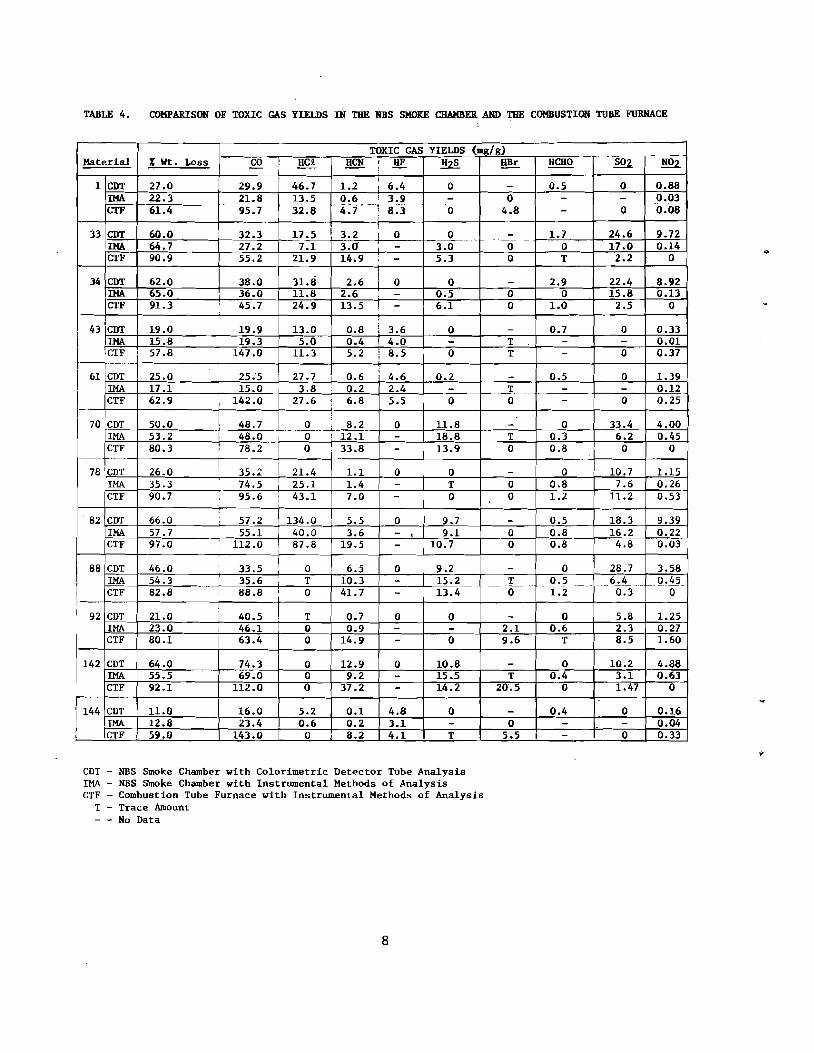
TABLE 4. COMPARISON OF TOXIC GAS YIELDS IN THE NBS SHOKE CHAMBER AND THE COMBUSTION TUBE FURNACE
Material %Wt. Loss CO ! HCR. HeR TOXIC GAS YIELDS
r HF ~
(mg/g) HBr HCHO S02
- ~
1 CDT IMA CTF
27.0 22.3 61.4
29.9 21.8
-- ··~H.T·
46.7 13.5
--ji.8
I
1.2 , 6.4 0.6 ! 3.9 4~r--T8:-3-
0 -0
-0
4.8
0.5 --
0 -0
0.88 0.03 0.08
33 I~ crF
60.0 64.7 90.9
32.3 27.2 55.2
17.5 7.1
21.9
I 3.2 3.<1 14.9
, ,
:
0 --
0 3.0 5.3
---. -0 0
1.7 0 r
24.6 17 .0
2.2
9.72 0.14
0
34 CDr IMA crF
62.0 65.0 91.3
38.0 36.0 45.7
31.8 11.8 24.9
2.6 2.6 13.5
i,
f
0 --
0 0.5 6.1
-0 0
2.9 0
1.0
22.4 15.8
2.5
8.92 0.13
0 I
I 43 CDr
I lMA
f crF
I 61 CDr IMA
I crF
I 70 cor IMA crp
I ,
19.0 15.8 57.8
25.0 17.1 62.9
50.0 53.2 80.3
, I ! I
i
19.9 19.3
147.0
25:5 15.0
142.0
48.7 48.0 78.2
13.0 5.0
11.3
27.7 3.8
27.6
0 0 0
i
, !
0.8 0.4 5.2
0.6 0.2 6.8
8.2 12.1 33.8
I
;
;
3.6 4.0 8.5
4.6 2.4 5.5
0 --
0 -0
0.2 -0
11.8 18.8 13.9
-r r
-r_ 0
-r 0
__ 0 ~
0.7 --
0.5 --
0 0.3 0.8
0 -0
0 -0
33.4 6.2
0
0.33 0.01 0.37
1.39 0.12 0.25
4.00 0.45
0
78 CDr IMA crp
26.0 35.3 90.7
i
\
35.:;: 74.5 95.6
21.4 25.1 43.1
1.1 1.4 7.0
0 --
0 r 0
-0 0
0 0.8 1.2
10.7 7.6
11.2
1.15 0.26 0.53
82 cor IMA crp
66.0 57.7 97.0
: 57.2 55.1
112.0
I 134.0 40.0
! 87.8
5.5 3.6
19.5
0 --
9.7 9.1
10.7
-0 0
0.5 0.8 0.8
18.3 16.2
4.8
9.39 0.22 0.03
88 CDr IMA crF
46.0 54.3 82.8
33.5 35.6 88.8
I
,
0 r 0
6.5 10.3 41.7
0 --
9.2 15.2 13.4
---
--~-
0
0 28.7 __Q...5~_~. 6.4--·a-X"1.2
3.58 9,45.
0
92 CDr lMA crF
21.0 23.0 80.1
! 40.5 46.1 63.4
I r 0 0
0.7 0.9
14.9
0 --
0 -0
-2.1 9.6
0 0.6
r
5.8 2.3 8.5
1.25 0.27 1.60
142 CDr IMA crF
64.0 55.5 92.1
74.3 69.0
112.0
0 0 0
12.9 9.2
37.2
0 --
10.8 15.5 14.2
-r
20.5
0 0.4
0
10.2 3.1 1.47
4.88 0.63
0
144 CDr .L'!A crF
11.0 12.8 59.0
16.0 23.4
143.0
5.2 0.6
0
0.1 0.2 8.2
4.8 3.1 4.1
0 -r
-0
5.5
0.4 --
0 -0
0.16 0.04 0.33
COT - NBS Smoke Chamber with Colorimetric Detector rube Analysis IMA - NBS Smoke Chamber with Instrumental Methods of Analysis CrF - Combustion rube Furnace with Instrumental Methods of Analysis
T - rrace Amount - - No Data
8

TABLE 5. CARBON MONOXIDE YIELDS FOR NONE'LAMING CONDITIONS .IN THE NBS SMOKE CHAMBER :
Material Percent Weight Loss CO Yield (mg/g)
33 40.6 4.9 34 34.1 8.0 78 15.8 9.6 82 51.5 14.1 92 14.2 9.2
142 38.5 12.0 144 13.1 4.3
TABLE 6. REPRODUCIBILITY OF GAS YIELDS
Toxic Gases Reproducibility. CO HCR.-.- HCN HF H2S HCHO N02 S02
, Combustion Tube Furnace
Average RSD (%) 9 24 19 15 15 64 52 69 Minimum. RSD (%) 0.3 5 10 2 9 10 11 12 Maximum RSD (%) 18 30 33 22 28 166 1'62 177
.~._~~-
NBS Smoke Chamber
Average RSD (%) 30 42 52 50 48 48 33 43 Minimum RSD (%) 15 25 9 36 22 35 4 16 Maximum RSD (%) 48 119 183 84 86 60 65 86

COMPARISON OF GAS YIELDS FOR THE COMBUSTION TUBE FURNACE AND THE NBS SMOKE CHAMBER.
Comparisons of gas yields in terms of mg/g for the combustion tube furnace and the NBS smoke chamber are illustrated in figures 1 through 4 for CO, HCt, HCN, and H2S, respectively. The least squares best fit to a straight line was obtained for each significant correlation. The corresponding R values were calculated for each gas and are reported in table 7. The corresponding slope, Yo, and standard error are also reported for all gases.
a
TABLE 7. REGRESSION ANALYSIS OF TOXIC GAS YIELDS (mg/g): COMBUSTION TUBE FURNACE VERSUS FLAMING CONDITIONS IN THE NBS SMOKE CHAMBER
The R values for HCN, H2S, and HCt (O.95<R20.99) are sign~ficant at the I-percent probability level. The yields of these gases are significantly correlated for rather diverse exposure conditions. This suggests that the relative yields of these gases may be somewhat independent of exposure conditions. The ratios of gas yields in the combustion tube furnace to those obtained in the NBS smoke chamber are approximately 3:1 for HCN~ 1:2 for H2S, 2:1 for HCt, and 1:1 for CO with the panels deleted. The CO yields for the panels 1, 43, 61, and 144 are substantially higher in the combustion tube furnace than in the NBS smoke chamber. Further studies are required to determine how the yields of these gases vary with exposure conditions. . .
The observed yields of the oxidized gases such as CO, S02, N02' and HCHO are not significantly correlated. The R values for these gases are not signifi cantly different from zero, even at the 10-percent probability level. The formation of these gases is apparently much more sensitive to exposure conditions. Although a significant correlation was not obtained for HF, this result is less meaningful since only four materials were used in the comparison.
Although the correlation for CO is not significant, the data are plotted in figure 1. As indicated, CO yields for the panels, materials 1, 43, 61, and 144, are substantially higher in the combustion tube furnace and tend to form
10
a distinct group. This is due to the total immersion of the sample in the combustion tube furnace, whereas only the front face ~f the material is exposed in the NBS smoke chamber. This factor substantially affects the results for composite materials. Therefore, the use of one-dimensional heating in the combustion tube furnace should be explored. Deleting the panels does improve the correlation for CO to a point where the R-value (0.74) is significant at the 5-percent probability level. The correlation illustrated in figure 1 is with the panels deleted.
.. Nonflaming conditions in the NBS smoke chamber were also used to measure CO yields for the seven materials listed in table 5. The CO yields obtained . under flaming conditions are correlated with these obtained under nonflaming conditions in the NBS smoke chamber as illustrated in figure 5. The R-value of 0.77 is significant at the 5-percent probability level. The data relevant to figure 5 include a slope of 4.4, a y-intercept of 8.8 and a standard error of estimate of 14. The slope indicates that flaming CO yields are signifi cantly higher than the yields obtained with nonflaming conditions.
However, the correlation for CO is greatly improved if the CO yields are compared in terms of milligrams per gram weight loss of material (mg/6g), as illustrated in figure 6. Comparing CO yields on the basis' of sample weight loss, rather than initial weight, increases the R-value to 0.98, which is significant at the I-percent probability level. This would tend to indicate that the degree of combustion of the sample varies considerably from one test to the next. The relevant data for figure 6 includes a slope of 3.3, a yintercept of 1.1, and a standard error of estimate of l~.
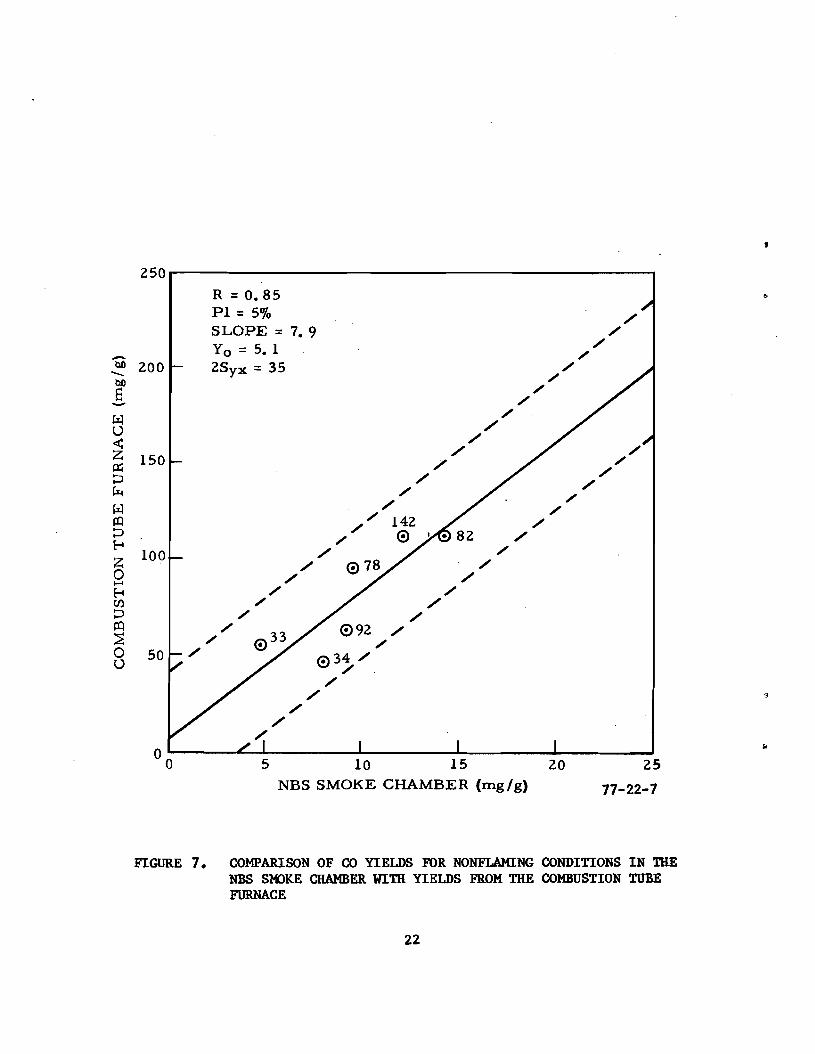
Carbon monoxide yields for nonflaming conditions in the NBS smoke chamber are compared to those obtained with the combustion tube furnace in figure 7. The data for figure 7, deleting panel number 144, include a slope of 7.9, a yintercept of 5.1, and a standard error of estimate of 18. The R-value of 0.85 is significant at the 5-percent probability level. The ratio of CO yields in the combustion tube furnace to those obtained in the NBS smoke chamber with nonflaming conditions is approximately 8:1. The degree of correlation is similar to that obtained for flaming conditions (figure 1), and does not represent an improved correlation for CO.
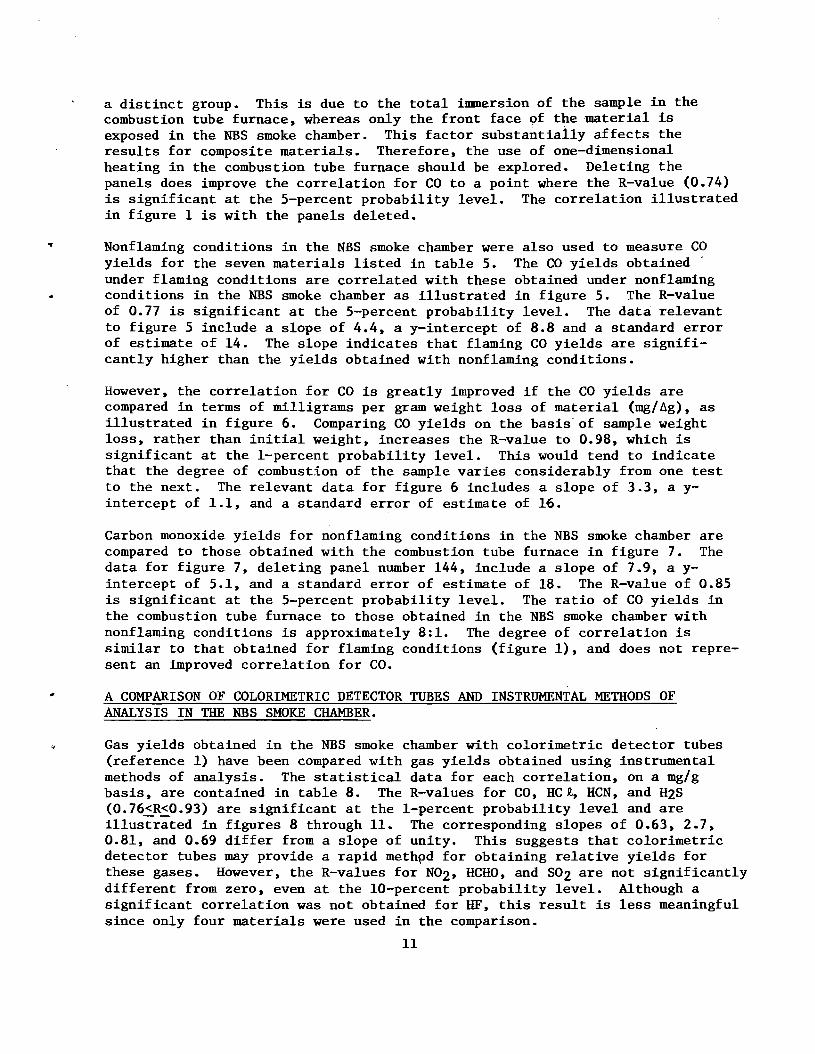
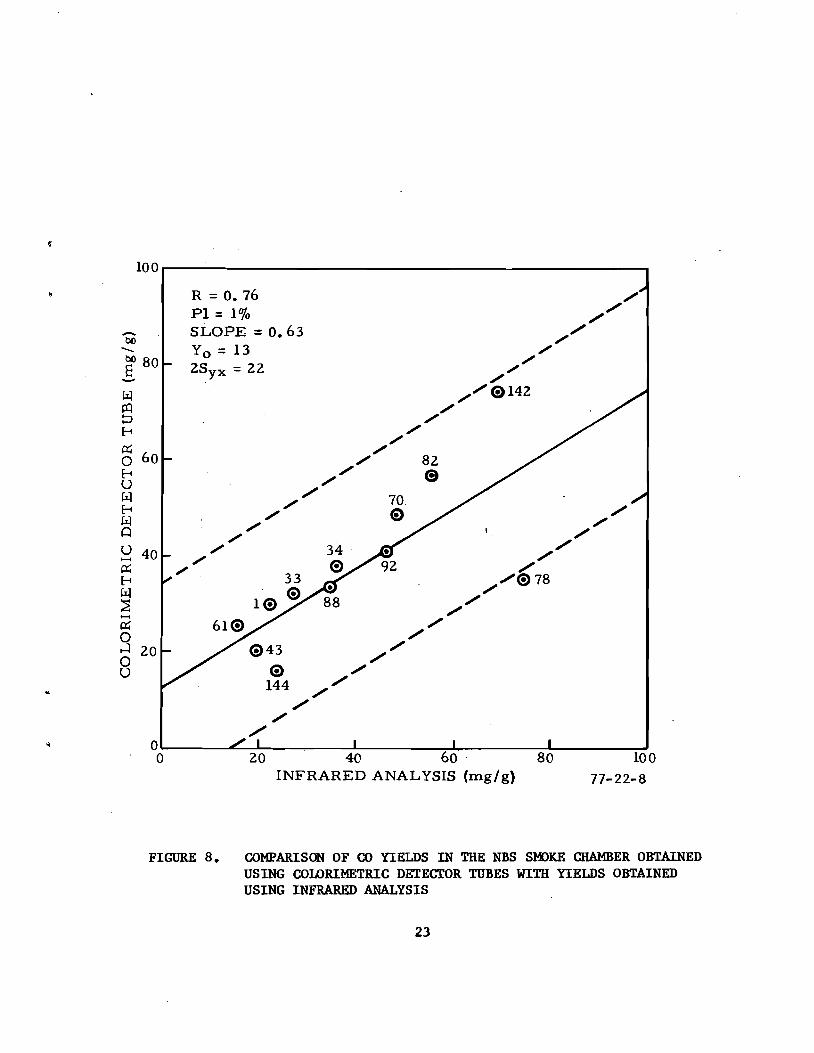
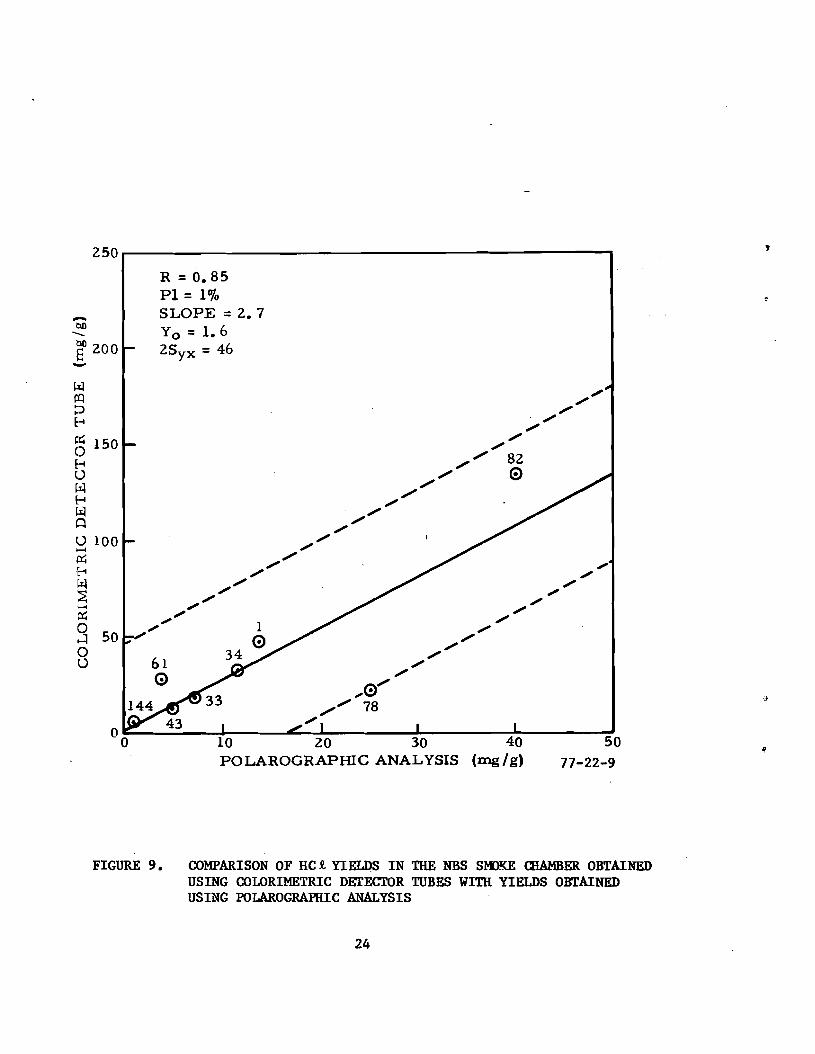
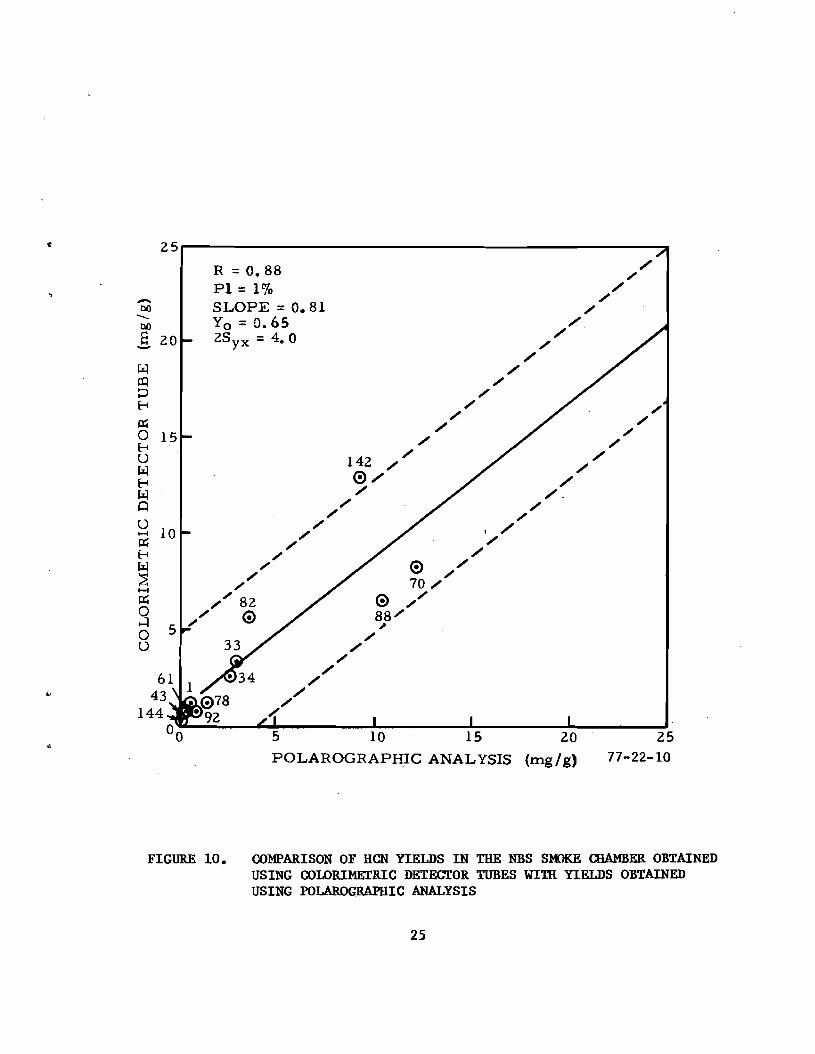
A COMPARISON OF COLORIMETRIC DETECTOR TUBES AND INSTRUMENTAL METHODS OF ANALYSIS IN THE NBS SMOKE CHAMBER.
Gas yields obtained in the NBS smoke chamber with colorimetric detector tubes (reference 1) have been compared with gas yields obtained using instrumental methods of analysis. The statistical data for each correlation, on a mg/g basis, are contained in table 8. The R-values for CO, HCt, HCN, and H2S (0.76<R<0.93) are significant at the I-percent probability level and are illustrated in figures 8 through 11. The corresponding slopes of 0.63, 2.7, 0.81, and 0.69 differ from a slope of unity. This suggests that colorimetric detector tubes may provide a rapid methpd for obtaining relative yields for these gases. However, the R-values for N02, HCHO, and S02 are not significantly different from zero, even at the 10-percent probability level. Although a significant correlation was not obtained for HF, this result is less meaningful since only four materials were used in the comparison.
11
TABLE 8. REGRESSION ANALYSIS OF TOXIC GAS YIELDS (mg/g) IN THE NBS SMOKE CHAMBER: COLORIMETRIC DETECTOR TUBES VERSUS INSTRUMENTAL METHODS OF ANALYSIS
GAS N R PR.(%) Slope Standard Error~
CO 12 0.76 1 0.63 13.0 11.0 ..HC~, 8 0.85 1 2.7 1.6 23.0 HCN 12 0.88 1 0.81 0.65 2.0 H2S 6 0.93 1 0.69 -0.17 2.2 HCHO 7 0 >10 HF 4 0.11 >10 N0 2 12 O.ZO >10 NOZ* 9 0.95 1 7.4 0.11 0.59 SOZ 8 0.36 >10
*Excluding materials 33, 34, and 82.
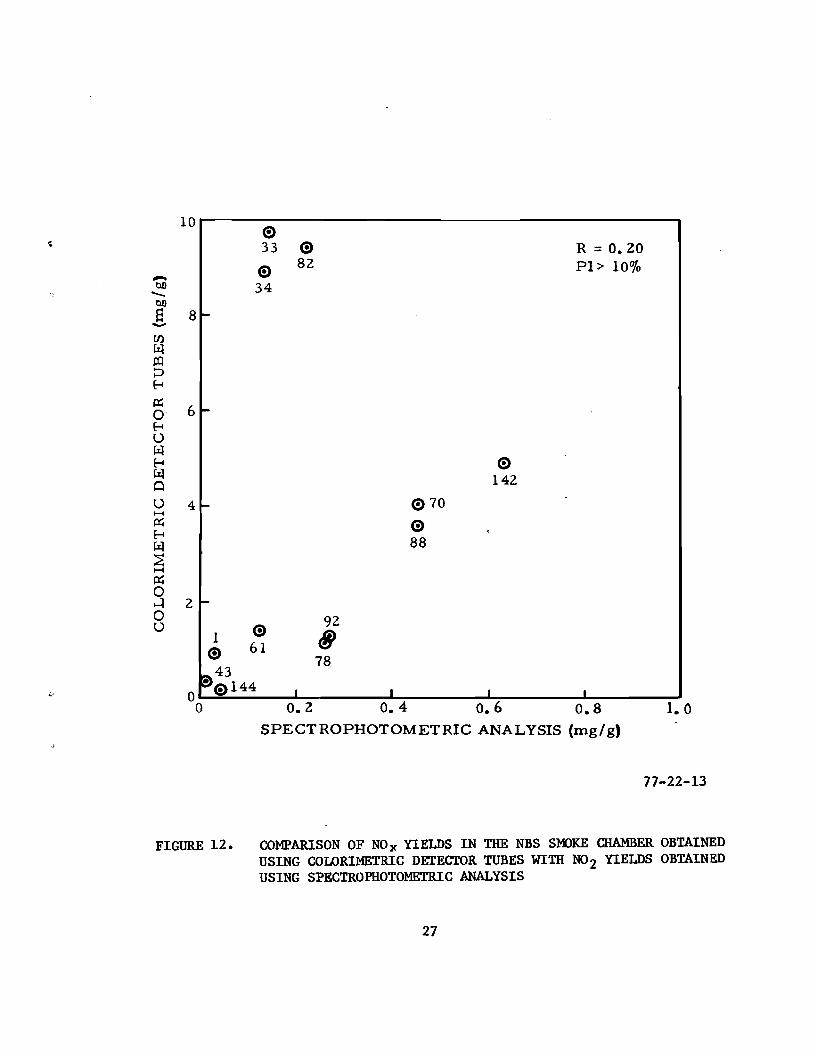
The NOZ detector tube is responsive to total NOx , whereas the Griess-Saltzman ·procedure primarily responds to NOZ concentrations. Therefore, based on figure lZ, it appears that relatively large concentrations of nitrogen oxides other than NOZ may be produced during the combustion of the wool carpets, materials 33 and 34, and the wool/PVC blend, materral 8Z. The carpets exhibited unusually high flames during a substantial portion of the test period. The correlation for NOZ improves. considerably from an R-value of O.ZO to an R-value of 0.95 when these three materials are excluded from the regression analysis.
lZ
SUMMARY OF RESULTS
1. The ARSD for toxic gas yields in the NBS smoke chamber was approximately 43 percent for CO, HCt, HCN, HF, HZS, HCHO, NOZ, and SOZ. In comparison, the ARSD for toxic gas yields in the combustion tube furnace was 9 percent for CO, while it was approximately 18 percent for HCt, HCN, HF, and HZS. The ARSD in the combustion tube furnace was roughly 6Z percent for NOZ, SOZ, and HCHO •
• z. The variation in sample weight loss for three replicate tests was significantly greater in the NBS smoke chamber (ARSD = 15 percent) than the combustion tube (ARSD = 5 percent) for the lZ materials tested.
3. The gas yields of materials in mg/g using the combustion tube furnace correlated well with the gas yields of materials in the NBS smoke chamber for HCt, HCN, and HZS (0.95 ~ R ~ 0.99). The R values are significant at the I-percent probability level. No significant correlation was obtained for CO, HF, HCHO, NOZ, and SOZ. Deleting the panels improves the correlation for CO to a point where the R value (0.74) is significant at the 5-percent probability level.
4. The ratios of gas yields in the combustion tube furnace to those obtained in the NBS smoke chamber are approximately 3:1 for HCN, l:Z for HZS, Z:l for HC£, and 1:1 for CO with the panels deleted. The CO yields for the panels, materials 1, 43, 61, and 144 are substantially higher in the combustion tube furnace than in the NBS smoke chamber.
5. In the NBS smoke chamber, when mg/g rankirtg is used, some correlation exists for CO yields obtained under flaming and nonflaming conditions. The R-value of 0.77 is significant at the 5-percent probability level. However, when a mg/6g basis is used, the coefficient of correlation improves (R=0.98) and is significant at a l-percent probability level.
6. In the NBS smoke chamber, flaming CO yields are approximately four times higher than the yields obtained with nonflaming conditions.
7. There is good correlation between the colorimetric detector tubes and the instrumental methods of analysis for CO, HCN, HZS, and HCt when mg/g ranking is used (0.76 ~ R ~ 0.93). The R values are significant at the I-percent probability level. The corresponding slopes for CO, HCl, HCN, and HZS' are 0.63, Z.7, 0.81, and 0.69, respectively. The R values obtained for HF, HCHO, NOx , and SOZ are not significantly different from zero even at the 10-percent probability level.
13

CONCLUSIONS
1. The reproducibilities of combustion gas yields are dependent upon the method used to thermally decompose the test material.
2. The conditions in the NBS smoke chamber are more oxidative than in the combustion tube furnace for the experimental conditions chosen for these tests.
3. The relative gas yields are somewhat independent of the exposure conditions for HCi, HCN, and H2S, However, CO, HCHO, N02, and S02 relative yield~ are much more dependent on the exposure conditions.
4. Colorimetric detector tubes for HCHO and S02 are less reliable for combustion gas analysis than those for CO, RCi, HCN and H2S,
5. Colorimetric detector tubes provide a rapid method of obtaining relative yields for CO, HCi, HCN, and R2S,
RECOMMENDATIONS
From the conclusions, it is recommended that:
1. Additional laboratory tests be conducted using the combustion tube furnace to determine whether or not a specific set of conditions will simulate the results obtained under flaming combustion conditions in the NBS smoke chamber for both reduced and oxidized combustion gases.
2. Intermediate and full-scale material tests be conducted with the objective of developing and parameterizing a laboratory test which simulates a full-scale fire.
14
REFERENCES
1. Sarkos, C., Measurement of Toxic Gases and Smoke from Aircraft Cabin Interior Materials Using the NBS Smoke Chamber and Colorimetric Tubes, report No. FAA-RD-76-7, 1976
2. Spurgeon, J., Speitel, L., Feher, R., Thermal Decomposition Products of Aircraft Interior Materials, report No. FAA-RD-77-20, 1977
3. Crane, C., Sanders, D., Endecott, B., Abbott, J., Smith, P., Inhalation Toxicology; (I) Design of a Small-Animal Test System (II) Determination of the Relative Toxic Hazards of 75 Aircraft Cabin Materials, FAA-AM-77-9, March 1977
4. Boettner, E., Ball, G., and Weiss, B., Combustion Products from the Incineration of Plastics, report number EPA-670/2-73-049, 1973
5. Lee, T. G., NBS Technical Note 708, Interlaboratory Evaluation of the Smoke Density Chamber, 1971
6. Methods of Air Sampling and Analysis, American Public Health Association; Intersociety Committee, Washington D.C., 1972
7. O'Toole, A., Elementary Practical Statistics"MacMillan Co., New York, 1964, p.272
8. Spiegel, M., Shaums Outline Series, Statistics, McGraw-Hill Book Co., New York, 1961, p. 243
15
40 60 80 100
250r-------------------------, R =O. 74 PI = 5% SLOPE =1.1 Yo = 27 2Syx = 37 -~ 200
Of)
S-~ U ~ Z 43p:; 150 ::> (i) (i) (i) 144 ~
61 ~ t:Q ::> E-t Z 100 o ...... E-t U)
::> t:Q
~ o 50U
NBS SMOKE CHAMBER (mg I g)
77-22-1
FIGURE 1. COMPARISON OF CO YIELDS FOR FLAMING CONDITIONS IN THE NBS SMOKE CHAMBER WITH YIELDS FROM THE COMBUSTION TUBE FURNACE
16

100 "
--OIl 80 OIl
S-u ~
«Z p:j 60 ::> ~
~ I:Q ::> fool
40Z 0..... fool (J)
::> I:Q ~ 0 20u
/ 144 ~
0
/
R =0.99 //
Pl =10/0 / SLOPE =1.9 /
Yo =5.4 / / /
2Syx =17 / / / /
/ / / /
/ // /
/ // /
/ / / /
/ / / /
/ // E) /
/ 78// ,
/ / 61/ /
/Q/
//
/ /
/ /
G) / 43 /
0 10 20 30 40 50 NBS SMOKE CHAMBER (rng/g) 77-22-2
FIGURE 2. COMPARISON OF HCt YIELDS FOR FLAMING CONDITIONS IN THE NBS SMOKE CHAMBER WITH YIELDS FROM THE COMBUSTION TUBE FURNACE
17

50 __----------~~-~~-~,.........-----____1
R =O. 95 / ../PI = ~O/,
/SLOPE =2.9 /Yo =6.6 /- 2Syx =8.5 /~ 40
/tlO
8- / /
~ 0/U ~ /70 Z 30 /p::j ~ / ~ / ~ /P::I / ~ /f-i
/Z o / ...... f-i / U) / ~ /P::I / o ~ / U /
/144 • 0 /61 78 / 43 1 /
/
5 10 15 20 25 NBS SMOKE CHAMBER (mg I gl 77-22-3
FIGURE 3. COMPARISON OF HCN YIELDS FOR FLAMING CONDITIONS IN THE NBS SMOKE CHAMBER WITH YIELDS FROM THE COMBUSTION TUBE FURNACE
18
c 25 .-----------~------------_ R = 0.96 PI =1% SLOPE = o. 52 Yo = 5.3-
~ 20 . 2Syx =2.3
ebll
-
. 00~---""'7----~------l-~--...1.-------J 5 10 15 20 25
NBS SMOKE CHAMBER (mg/g) 77-22-4
FIGURE 4. COMPARISON OF H2S YIELDS FOR FLAMING CONDITIONS IN THE NBS SMOKE CHAMBER WITH YIELDS FROM THE COMBUSTION TUBE
FURNACE
19
100 R =O. 77 / Pl =5% /
/SLOPE =4.4 / /Yo = 8.8 / / 2Syx = 28 / /80
/ ///078
// 142 / /0_. / /
/ / / /
b.O- 60b.O / /
-E / /082 / /CJ .//Z ...... / /
:::E / /< / '/...:l 40 ~; /
034 / /
/ /
/20 /
/ /
/ /
/ o .
0 5 10 15 20 25
NONFLAMING (rng/g) 77-22-5
FIGURE 5. COM!'ARISON OF CO YIELDS FOR FLAMING AND NONFLAMING CONDITIONS IN THE NBS SHlKE CHAMBER
20
iii
250
200 !~
-ao ~ 150·-ao a-lJ Z ..... ~ 100<t: ...:1 ~
50 /
R= 0.98 / PI = 10/0 /
SLOPE = 3.3 /78
. Yo = 1. 1 / <=)
/ 0 92/2Syx = 31 / / /
// // / /
/ / / /
/ / / /
/ i42 / /0 /
/ / / 144 /
/ / / 82 • /
/ / / /
/ / / 34 /
/ 0//
/33 /
/ /
/ /
/
0
/ /
/ /
0 20 40 60
NONFLAMING (mg/ L\g) 80 100
77-22-6
FIGURE 6;. COMPARISON OF CO YIELDS FOR FLAMING AND ~ONFLAMING
CONDITIONS IN THE NBS SMOKE CHAMBER ON A WEIGHT-LOSS BASIS
21
,
250
<R =0.85 PI =5% SLOPE =7.9 Yo =5. 1-btl-00
200 2Syx =35 /
/e ./- ./~ ./U ./<t: ./ ./
././
./ /
./
Z 150 /./l:l:i ./::J ./ ./~ ./ /./~ .//I:Q 142 ././::J 0 .//E-4
./ ./100Z ./ ./0 ./ ./H
./ ./E-4 U) / ./::J ./ ./I:Q ./ 092 ./
/~ /./0 50 0 34 ./U ./ .
./ 9./
./ ./
./
00 5 10 15
NBS SMOKE CHAMBER (mg/g)
20 25
77-22-7
FIGURE 7. COMPARISON OF CO YIELDS FOR NONFLAMING CONDITIONS IN TIlE NBS SK>KE CHAMBER WITII YIELDS FROM THE COMBUSTION TUBE FURNACE
22
(
100r--------------------------___
R = O. 76 Pl = 1% SLOPE = 0.63-tlllYo =13 -eo 80 2Syx =22-
~ p:) o E-4 t::r:; o 60 E-4 U ~ E-4
o ~
~ 40 t::r:; E-4 ~
~ ...... t::r:; o ....:l 20 o U
O.......-_----oI~...L.. __---..L.----....,.....L-------lL..-------J o 20 40 60 80 100
INFRARED ANALYSIS (mg/g) 77-22-8
FIGURE 8. COMPARISON OF CO YIELDS IN THE NBS SMOKE CHAMBER OBTAINED USING COLORIMETRIC DETECTOR TUBES WITH YIELDS OBTAINED USING INFRARED ANALYSIS
23
--
250 r-------------------------..., R =0.85 PI =1% SLOPE = 2.7......
tlOYo = 1.6
tl()2Syx =46l~ 200 .....
[,,4 IlQ ~:> E-l
~3 150 f-l U ~~ E~
~~ l::::l
U 100 1-1
Il:; I~ I;i! '~ '...... 0:;
9 50 o l) 61
G
10 20 30 40 50 POLAROGRAPHIC ANALYSIS (IIlg/g) 77-22-9
FIGURE 9. COMPARISON OF HC t YIELDS IN THE NBS SK>KE CHAMBER OBTAINED USING COLORIMETRIC DETECTOR TUBES WITH YIELDS OBTAINED USING POLAROGRAPHIC ANALYSIS
24
25,---------------------------
-tlO tlO e 20-
R =0.88 PI = 10/0 SLOPE = 0.81 Yo = 0.65 2Syx = 4.0
.;' ,/
.;' ,/
/ /
//.
,/ .;'
,/,/
/o .;',/
70,/ o .;'.;' 88/
,/ " ,/
,/ /
//
,/ /
5 10 15 20 25
POLAROGRAPHIC ANALYSIS (rng/g) 77-22-10
FIGURE 10. COMPARISON OF HCN YIELDS IN THE NBS SMOKE CHAMBER OBTAINED USING COLORIMETRIC DETECTOR TUBES WIlli YIELDS OBTAINED USING POLAROGRAPHIC ANALYSIS
25

5
25
R =o. 93 PI =1% SLOPE =0.69-'-0 Yo =- O. 17
/'-00 20 2Syx =4.4 ,/S ,/ - ,/
~ ,/
~ ,/::J E-4 ,/ " p:;
,/a 15 " ,/E-4
,/U /'
E-4 ~
,/ ,/ ""W
"" ,/ ,/
0 U ...... 10 ""- " p:; "" e>82 ""
,/ " E-4 "" ~ ,/ ,/ "" " ~ ...... ,/ "" ""p:; ,/ "" 0 " ,/...1 5 " a " " "" ,/u ""
,/ " ,/
,/
,/ "" 10 15 20 25
POLAROGRAPHIC ANALYSIS (mg/g) 77-22-11
FIGURE 11. COMPARISON OF H2S YIELDS IN THE NBS SMOKE CHAMBER OBTAINED USING COlDRIMETRIC DETECTOR TUBES WITH YIELDS OBTAINED USING POLAROGRAPHIC ANALYSIS
26
bObO 8-
o 142
4 ... 0 70
<:> 88
1 <:> <:> 61 43
o~e144
2 I
I
92 @ 78
I I I
o 0.2 0.4 0.6 0.8 1.0 SPECTROPHOTOMETRIC ANALYSIS (mg/g)
77-22-13
FIGURE 12. COMPARISON OF NO JC YIELDS IN THE NBS SK>KE CHAMBER OBTAINED USING COLORIMETRIC DETECTOR TUBES WITH N0 2 YIELDS OBTAINED USING SPECTROPHOTOMETRIC ANALYSIS
27