New trends in the economic systems management in the ...
312
New trends in the economic systems management in the context of modern global challenges Collective monograph scientific edited by M. Bezpartochnyi VUZF University of Finance, Business and Entrepreneurship (Sofia, Bulgaria) 2020
-
Upload
khangminh22 -
Category
Documents
-
view
0 -
download
0
Transcript of New trends in the economic systems management in the ...
1
New trends in the economic
systems management in the
context of modern global
challenges
Collective monograph scientific edited by M. Bezpartochnyi
VUZF University of Finance, Business and
Entrepreneurship (Sofia, Bulgaria) 2020

2
Chief Editor: Assoc. Prof. Dr. Grigorii Vazov
Members:
Prof. Doctor of Economic Sciences Metodi Hristov
Prof. Dr. Radoslaw Grabowski
Prof. Dr. Daniela Bobeva
Prof. Dr. Emilia Milanova
Prof. Dr. Virginia Zhelyazkova
Prof. Dr. Grigor Dimitrov
Assoc. Prof. Dr. Yakim Kitanov
Assoc. Prof. Dr. Desislava Yosifova
Assoc. Prof. Dr. Stanislav Dimitrov
Assoc. Prof. Dr. Krassimir Todorov
Assoc. Prof. Dr Daniela Ilieva
Recommended for publication by the Editorial Board of the VUZF
University of Finance, Business and Entrepreneurship
Reviewers (international scientific editoral board):
Maria Krelowska-Kulas – prof. dr hab., Rector, University of
Socio-Economics in Przeworsk, Poland
Vazov Radostin – Assoc. Prof. Dr., Vice-Rector, VUZF University
of Finance, Business and Entrepreneurship, Bulgaria
Tetiana Cherniavska – Doctor in Economics, Professor at the State
University of Applied Sciences in Konin, Poland
New trends in the economic systems management in the context
of modern global challenges: collective monograph / scientific
edited by M. Bezpartochnyi // VUZF University of Finance,
Business and Entrepreneurship. – Sofia: VUZF Publishing
House “St. Grigorii Bogoslov”, 2020. – 309 p.
Reproduction or citation reference is mandatory.
© Collective of Authors
© VUZF Publishing House “St. Grigorii Bogoslov”, Sofia, 2020
ISBN 978-954-8590-85-3
3
New trends in the economic systems
management in the context of
modern global challenges
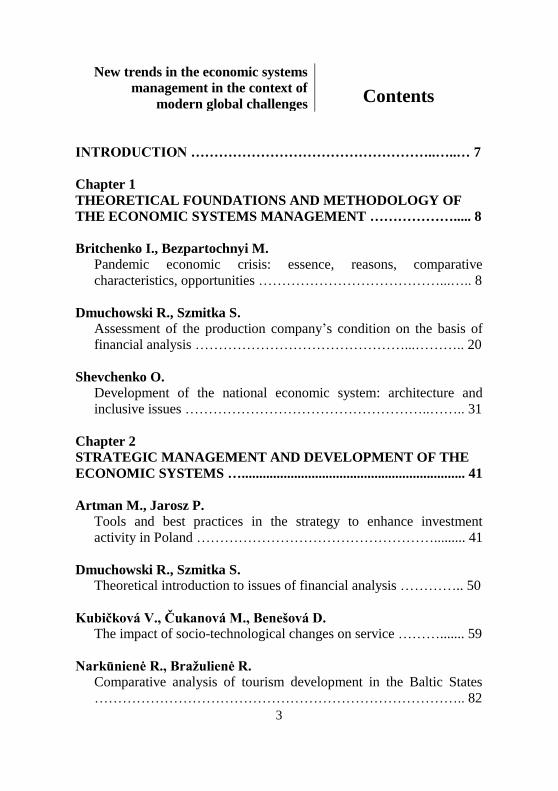
Contents
INTRODUCTION ……………………………………………..…..… 7
Chapter 1
THEORETICAL FOUNDATIONS AND METHODOLOGY OF
THE ECONOMIC SYSTEMS MANAGEMENT ………………..... 8
Britchenko I., Bezpartochnyi M.
Pandemic economic crisis: essence, reasons, comparative
characteristics, opportunities …………………………………...….. 8
Dmuchowski R., Szmitka S.
Assessment of the production company’s condition on the basis of
financial analysis ………………………………………...……….. 20
Shevchenko O.
Development of the national economic system: architecture and
inclusive issues ……………………………………………..…….. 31
Chapter 2
STRATEGIC MANAGEMENT AND DEVELOPMENT OF THE
ECONOMIC SYSTEMS …................................................................ 41
Artman M., Jarosz P.
Tools and best practices in the strategy to enhance investment
activity in Poland ……………………………………………......... 41
Dmuchowski R., Szmitka S. Theoretical introduction to issues of financial analysis ………….. 50
Kubičková V., Čukanová M., Benešová D. The impact of socio-technological changes on service ………....... 59
Narkūnienė R., Bražulienė R.
Comparative analysis of tourism development in the Baltic States
…………………………………………………………………….. 82

4
Németh T., Hegedűs M. Capital structure of SME sector and the strategic development …. 91
Chapter 3
INNOVATION IN THE ECONOMIC SYSTEMS MANAGEMENT
…………………………...………………………………………..… 100
Borowska M.
The role of logistics in the modern economy ………………….... 100
Cherniavskyi B., Vazov R. Impact of progressive innovative technologies on the development of
logistics activities in the context of the coronoviral pandemic …. 111
Lalakulych M., Tsenkler N.
Directions and conditions for development of innovation process in
enterprises …................................................................................. 120
Štangová N., Víghová A. Innovatios in documentation on the functioning of the companies in
Slovakia …..................................................................................... 129
Chapter 4
FINANCIAL-CREDIT AND INVESTMENT ENSURING OF THE
ECONOMIC SYSTEMS MANAGEMENT …………………...... 140
Havrylko P., Hushtan T.
The essence and role of financial planning in enterprises in modern
conditions …………………………………………….…………. 140
Petrenko V., Karnaushenko A.
Assessment competitiveness of innovative enterprises with foreign
investments …………………………………………………….... 149
Sokolovskа A., Tymchenko O. Real estate taxes in the tax policy of inclusive economic growth
………………………………………………………………….... 159

5
Chapter 5
SOCIO-DEMOGRAPHIC PROCESSES IN THE ECONOMIC
SYSTEMS MANAGEMENT …...................................................... 173
Dragan O., Tertychna L., Rybak N.
Modern level of human capital of the Ukrainian enterprises in the
conditions of technological spreads ………………...…………... 173
Pidlypna R., Kovach M., Indus K.
Determination of the vectors of correction and development of the
pension system of Ukraine …………………………………...…. 188
Sydorchuk O.
Safety aspects of development of social response to the pandemic
threat …………………………………………………………….. 200
Chapter 6
MARKETING ENSURE FOR DEVELOPMENT OF THE
ECONOMIC SYSTEMS ……………………………….…………. 208
Kolodiychuk A., Hushtan T.
Organizational and economic principles of quality management in
tourism ………………...…………………………………...……. 208
Kuranovic V.
China logistics industry development import and export main factors
influencing international transport market growing …………….. 217
Nosachenko O., Baldzhy M.
System approach to reserve detection and evaluation in increasing
competitiveness of wholesale trading enterprises ......................... 224
Chapter 7
INTRODUCTION OF MODERN INFORMATION
TECHNOLOGY IN THE ECONOMIC SYSTEMS
MANAGEMENT ……………………………………………….…. 234
Andriushchenko K., Teteruk K.
Agile methodologies as a driver for efficient human capital
management ...................................................................…….….. 234

6
Lalakulych M., Yuhas E., Rybakova L. Accounting innovation in Ukraine in the conditions of European
integration ............................................................…………...….. 245
Mikelsone E., Volkova T., Spilbergs A., Liela E., Frisfelds J.
Idea managements systems application framework in companies
…………………………………………………………………… 254
Chapter 8
ECONOMIC SYSTEMS MANAGEMENT AT THE LEVEL OF
INDUSTRY STRUCTURES …………………………………..…. 267
Bezpartochna O., Britchenko I.
Diagnostics the economic efficiency of agricultural enterprises
…………………………………………………………………… 267
Kurleto M. Applying of modern information and communication technology
strategy to improve efficiency of value creation of commercial
enterprise ..............................................................…………...….. 277
Vlasenko I., Gyrych S. The importance of Vinnytsia airport in the economic development of
Central Ukraine ………………………………………….....…… 287
Yevtushenko N., Malyshko V., Palamarchuk O.
Increasing the level of competitiveness of industries of Ukraine
through the introduction of cluster models ………………...…… 297
CONCLUSION ……………………………………………………. 306

7
INTRODUCTION
Modern global economic challenges caused by the COVID-19
pandemic and various changes in the structure of the world market of
goods and services require the developing of new models of economic
systems management based on appropriate strategic management
methodology, implementation innovation, use of prospects for various
risks caused by the pandemic, implementation mechanisms for ensuring
the security of economic systems. Ensuring effective management of
economic systems in the current global challenges is impossible without
the introduction of a new concept of functioning and sustainable
development of economic entities.
To ensure effective management of economic systems in the context
of modern global challenges it is necessary to determine the state of the
economic process of entities and explore the impact of risks on current
activities, justify and developing a system to overcome negative effects
on economic activity and obtain a positive economic result. The
effectiveness of developed conceptual provisions to ensure effective
management of economic systems is determined by the ability of the
management system to withstand the destructive effects of the external
environment and due to the strengths to direct the resources of economic
entities to maintain the economic process, able ensure to save resources
and cover current costs economic entities, etc.
The purpose of writing this collective monograph is to substantiate
the theoretical and methodological foundations and the formation of
new models of management of economic systems, taking into account
pandemic changes in the market environment of economic entities.
The object of the author’s research was the process of formation and
implementation the models of economic systems management of
economic entities in destabilizing the market environment, reducing the
business activity of actors under the influence of pandemic changes,
closing borders of countries, various restrictions by governments.
The subject of the study were socio-economic, organizational and
institutional processes of formation and effective implementation of new
models of economic systems management of economic entities;
formation of mechanisms for preserving the resource potential of
economic entities; introduction of scientific achievements and
development of innovative potential of economic entities; consideration
of the practice of economic systems management using world
experience in various sectors of the economy.
8
Chapter 1
THEORETICAL FOUNDATIONS AND
METHODOLOGY OF THE ECONOMIC
SYSTEMS MANAGEMENT
Britchenko Igor
Doctor of Economics, Professor
State Higher Vocational School
Memorial of Prof. Stanislaw Tarnowski
in Tarnobrzeg;
Doctor of Economics, Professor
VUZF University of Finance, Business
and Entrepreneurship
Bezpartochnyi Maksym
Doctor of Economics, Professor at the
Department of Economics and
Marketing
National Aerospace University named
after N. Zhukovsky “Kharkiv Aviation
Institute”
(Tarnobrzeg, Poland; Sofia, Bulgaria;
Kharkiv, Ukraine)
PANDEMIC
ECONOMIC CRISIS:
ESSENCE, REASONS,
COMPARATIVE
CHARACTERISTICS,
OPPORTUNITIES
Before pandemic the world economy had a pre-crisis situation which
was characterized by unprecedented imbalances in the global financial
and economic system, the lack of growth in world GDP, which posed a
real threat to the world economic order. Almost all global analysts
predicted a global economic crisis at the end of 2019. For the first time
since time immemorial, bank interest rates in all countries have dropped
to unprecedented low levels. Often interest rates were 0% or even
negative. The EU’s financial system has been so disfigured by the VAT
tax that fraud with this tax has reached a scale far exceeding hundreds of
billions EUR and in fact got out of control of the authorities. The
imperfection of the EU’s financial system led to Brexit, statements by
9
the actually bankrupt Italy, and other countries about their intention to
leave the euro zone. The EU was not able to adopt a budget for the next
7 years. The US trade wars with China, the US with Europe, the
complete impasse of the Russian economy and much more led to the
fact that the global crisis was already on the verge. The global recession
was about to begin.
As a result of the pandemic, four major events occurred:
1) huge reduction in GDP in almost all countries;
2) the USA, the EU and many other countries have adopted laws on
the so-called anti-crisis infusion of money into the economy on an
enormous scale. At the same time, states were allowed to deviate from
the standard proportion of public debt relative to GDP. Typically, such a
standard was 60%. Now there are no legal prohibitions on increasing
public debt under the legalized right of central banks to virtually
unlimited emission. That is, all countries can print money, multiply
government debt almost unlimited;
3) the population as the main consumer of material goods is
frightened and partially deprived of livelihoods, which will gradually
decrease consumer demand around the world;
4) at first the global confrontation of modern energy-saving
technologies with hydrocarbon production began under the flag of
ecology and energy rationality, to which more recently an
unprecedented earlier oil confrontation joined the non-oil market,
smoothly transitioning to the gas market, which has actually already
gone beyond the framework of a purely economic process.
It is important to understand that on the scale of the world economy
apart from these processes nothing significant has happened. All other
processes and phenomena do not have any significant economic
consequences.
A huge monetary emission with a gigantic reduction in global GDP
and solvent demand will indeed lead to tectonic changes in the global
economic order. In order to clearly understand the essence of these
changes it is necessary to understand that in the economy not figures,
formulas or calculations, but proportions, like starting conditions and the
final result of economic processes are of fundamental importance. It is
the proportions of the world economy that will determine the future
world economic order. It is proportions that will form the objective
conditions for the development of the world economy. It is not so
important how much a particular product is worth, as in fact, it is
important how many other products you can buy for it.
10
The fall in world GDP in all countries will be enormous. And it’s not
so important how specifically the percentage will fall. It is important
that a drop in GDP will make the economies of developed countries
even stronger with respect to the economies of less developed countries.
At the same time, the more GDP will fall (that is, the deeper the
economic crisis will be), the more developed countries will become in relation to less developed ones. Such an effect is inevitable even if
the GDP of developed countries decreases by the same percentage as the
GDP of developing countries. At the same time, it should be noted that
the level of decline in GDP of rich countries will be significantly lower
than the level of decline in GDP of undeveloped countries.
Issued cash emissions in almost all countries and an increase in
government loans will lead to a significant depreciation of the money
supply. But here the above effect will also be observed and rich
countries will significantly strengthen their positions in relation to the
poor. And besides, the greater the “anti-crisis injections” into the
economy the greater will be the advantage of rich countries. This effect
is obvious even if the currencies of rich and poor countries were
equivalent. And taking into account the unequal currencies of developed
and undeveloped countries, this effect due to the banking specifics will
be multiplied. First of all, countries whose currencies are global will
win. Moreover, it is they who will carry out the issue and it is they who
will decide where exactly the injections of saving money will be carried
out. The exchange rate differences between currencies and interstate
borrowings will strengthen the rich, developed countries much more
than the changing proportions in the structure of GDP. Therefore, the
most developed countries are actually not very concerned about the fall
in GDP, because they have a much more effective tool – this is what
they control the printing press. In fact, everything is now in their hands,
they are active players, and the rest can only passively react. Such is the
lot of poor economies.
A widespread decline in consumer demand will similarly strengthen
the economies of developed countries. At the same time, the more
solvent demand decreases, the more attractively the solvency of
developed economic countries will grow exponentially.
The “Great Oil War” looks very unusually attractive. In the current
economic conditions, the role of Russia will obviously fall to a
minimum even without an oil conflict. But the oil wars are really
capable of simply resetting Russia to the point of no return. Moreover,
Russia has no chance to resolve the situation peacefully, that is, in an
11
economic way. Arabs have it! Arabs, on the one hand, are not interested
in strengthening the USA, Europe, China, Japan and England, and
obviously understand that the fall in oil prices is working against them.
But unlike Russia, they have a way out and not even one. Just Russia is
stopping them. Here are a few exits for the Arab world. Create a single
monetary union with the Arab countries, from the beginning oil
producing countries, and then attach the currencies of the other Arab
countries to the single Arab currency. Moreover, unlike the EU, they do
not have linguistic and religious diversity. There are other solutions. But
here Russia is like a splinter with its war in Syria and inadequate
imperial behavior in the Arab world. As an option, the Arabs can
generally deliver oil to Europe for almost half a year for free in order to
stop all the wells in Russia that it would be impossible to renew, then to
completely dominate the world oil market and return all losses incurred
earlier. Here a lot will depend on the human factor, that is, on the public
administration system.
What to do in order to maximize the use of the correct forecast for
your own benefit. To understand this, it is necessary to recognize the
two most important factors: 1. Are there any restrictions in the
mechanism for establishing a new world economic order? 2. What is the
pandemic crisis fundamentally different from the economic crisis of
2008-2009 and other world economic crises?
1. It should be noted that there is one limiting factor. This factor is
described by Karl Marx. Thanks to this discovery the United States won
the confrontation with the USSR. This is the labor component of surplus
value. The fall in GDP and the depreciation of the money supply leads
to an even greater depreciation of labor, due to which GDP arises. This
process is enhanced today by unprecedented robotization and
digitalization of production processes. Depreciation in itself is not as
bad for the global economy as imbalances in the labor market. Even
before the crisis, the disproportion in the cost of labor in the world
economy reached a level where the cost of the same labor in developed
and “underdeveloped” countries sometimes differs by a factor of
hundreds, and sometimes by a factor of 1000. The paradox is that both
workers do exactly the same job, but their work is evaluated and paid
differently. The imbalances in wages are increasing, both between
countries and within countries. Such imbalances can lead to irreparable
consequences that can destroy the new world economic order. In fact,
they lead to the collapse of the labor market and the destruction of a just
“social elevator”, which in turn can destroy the new world order from
12
the inside. This restriction is actually very, very serious and does not
allow the superpowers to cross a certain line of the decline in world
GDP and the depreciation of the money supply. In fact, so far no
economy in the world is able to do without human labor as a factor in
creating GDP. Even highly-robotic Japan, it is impossible to abandon
the workforce and in the near future the labor market will remain the
most important market in developed countries. The labor market has
been and will be more important than the currency, stock, commodity
and any other market. It is well known that there are only two ways to
make a person work: motivation or coercion. Homo sapiens already
realized that motivation is a much more effective way of forcing a
person to work (that is, to create GDP). The paradox is that all the
economic power of developed countries is built thanks to mechanisms to
stimulate the work of people. The main task of a developed state is to
maintain and improve such motivation mechanisms, the creation of the
so-called effective “social elevator”. In fact, it was thanks to the creation
and stimulation of such mechanisms that these countries became so
developed, rich and prosperous and were able to win a historical contest
with their opposite – the USSR, whose economy was based mainly on
mechanisms of forced labor. Paradoxical as it may seem, developed
countries have become hostages to the mechanism they created for
involving labor in the process of creating GDP. The world hegemony of
rich countries is based on the presence of economic imbalances; leaders
are interested in maintaining unfair proportions in order to grow rich at
the expense of third world countries. But at the same time, they cannot
afford these proportions to reach absurd proportions that will lead to its
stop or collapse. This is most sensitively manifested and felt on the most
important component of a market economy – the labor market. It is hard
to imagine that a new world order can exist if the imbalance in wages in
the domestic and foreign markets reaches, for example, ten thousand
times. World leaders cannot reduce GDP infinitely; they are limited by
the factor of labor value. The negative is that the experience of many
countries (including India) suggests that the level of GDP decline can be
very large. On the positive side, such imbalances threaten the labor
market of developed countries themselves. One gets the impression that
the absence of any reasonable, justified and understandable deadlines for
quarantine completion indicates that they are testing and looking closely
at how much more safety margin there is to reduce GDP, to issue money
to maximize benefits.
2. It is important to understand how the pandemic crisis 2020
13
fundamentally differs from the economic crisis of 2008-2009. The
previous crisis was caused by the prolonged irrational behavior of a
large number of people who took consumer loans. Irrational behavior of
people has led to a massive inability to return consumer loans to banks.
The most common collateral in consumer lending was real estate.
Massive non-repayment of consumer loans led to the confiscation of this
property and a sharp increase in the supply of secondary real estate
through the sale of collateral, and, as a result, to a significant drop in
property prices. At the same time, there was a drop in demand for
consumer loans. Massive defaults on consumer loans and a drop in
demand for new loans significantly reduced the solvency of American
banks, and many even went bankrupt. The decrease in the solvency of
American banks (and the resulting decrease in their ratings in world
rating agencies) severely limited world trade due to the fact that
American banks are the main guarantors of letters of credit when
concluding international agreements. Falling real estate prices hit
construction and many related sectors of the economy, and the negative
effect was amplified by the animated effect in the banking system. The
fall in world trade has worsened the financial situation of small
countries with small domestic market opportunities, whose economies
are as dependent on exports and world trade as possible. All this
superimposed on the phenomenon of the Greek debt crisis, which, in
fact, was incomparably smaller compared to the credit crisis of the US
banking system, but due to certain specifics, the Greek financial crisis
created a panic effect that overlapped the American crisis has already
erupted, growing into a global one. The panicky nature of the Greek
crisis was that, unlike the United States, it was not caused by irrational
behavior of citizens in the consumer market, but by irrational behavior
of the state, more precisely, politicians representing the state and
authorized by it. In Greece, after a long and fairly successful reign of the
Pasok party led by the Papandreou family, the populist New Democracy
party led by Kostas Karamanlis came to power. To increase its
popularity among the population to the joy of the Greeks, it was decided
to hold the 2004 Olympic Games in Greece, for these and other
purposes, simply fabulous volumes of foreign loans were attracted,
which were irrationally spent on sports infrastructure objects that did not
give profit in the future. The Olympics ended, but the debts remained.
New loans were later attracted to pay off external loans and the debt
group grew in accordance with the laws of the classical financial
pyramid, which collapsed in 2008. The reason for the Greek crisis was
14
the irrational economic policy of the state, while in the United States
and other developed countries the crisis was caused by the massive
irrational behavior of consumer citizens. The Greek crisis caused panic
because on the one hand it coincided and resonated with the global
consumer crisis, and on the other hand it was a crisis of the state, not of
its citizens. You can take a deposit from citizens in order to fully or
partially repay a bank loan, and what to do with the state, especially
with the state belonging to the euro zone and especially with debt in
excess of GDP. But be that as it may, THE REASON FOR ANY
ECONOMIC CRISIS IS INSUITABLE BEHAVIOR. The reason for
the financial crisis of the year is not low incomes but irrational
expenses, therefore, the financial crisis is a mechanism for redistributing
financial and other material resources from those business structures,
people or states that behaved less rational in favor of those who have
more rational economic behavior ... This is the essence and the same is
the big positive side of any economic crisis (including financial or even
pandemic). ANY ECONOMIC CRISIS IS NEW OPPORTUNITIES. If
the disease can occur both with the participation of a person and without
him, but the ECONOMIC CRISIS IS CREATED EXCLUSIVELY BY
PEOPLE. A pandemic economic crisis is different in that it is created by
both the irrational behavior of people and the state. Figuratively
speaking, this is a mutation or combination of the Greek and American financial crisis, combined with the desire of rich countries to establish a
new world order and all this happens in the conditions of the third world oil war. It is clear that such a thermonuclear mixture can radically
change the world economic order. But for those who are able to develop
and implement a rational economic strategy of behavior, the crisis is
able to provide new, unprecedented opportunities (even for countries
that, at first glance, are unpromising and hopeless).
References: 1. Bezpartochnyi M. Methodological tools for assessing suppliers of trade
enterprises. Formation strategy of economic structures: the tools and
practices: [Collective monograph] / edited by A. Berezin, M.
Bezpartochnyi. Riga: «Landmark» SIA, 2016. P. 110–120.
2. Брітченко І.Г. Маркетинг у банках: навч. посіб. /Брітченко І.Г.,
Бєлявцев М.І., Тягунова Н.М.// Полтава: РВЦ ПУСКУ, 2008. - 345
с.
3. Bezpartochnyi M., Živitere M., Riashchenko V. Modern vision of
effective functioning and development of tourist enterprises.
15
Mechanisms and models of development of entities tourist business:
collective monograph / edited by A. Berezin, M. Bezpartochnyi.
ISMA University. Riga: «Landmark» SIA, 2016. P. 8–14.
4. Брітченко І.Г., Момот О.М., Саєнко В.Г. Економічні проблеми
розвитку підприємницької функції в секторах економіки
національного господарства / під наук ред. проф. Брітченко І.Г. –
Донецьк-Полтава: ООО «Техсервіс», 2012. – 640с.
5. Мікловда В.П., Брітченко І.Г., Кубіній Н.Ю., Дідович Ю.О.
Ефективність стратегічного управління підприємствами: сучасні
проблеми та перспективи їх вирішення. - Полтава: ПУЕТ, 2013. -
240 с.
6. Bezpartochnyi M., Živitere M., Riashchenko V. The modern concept of
operation and development of retail. Innovative approaches in the
management of competitiveness of businesses: collective monograph /
edited by A. Berezin, M. Bezpartochnyi. ISMA University. Riga:
«Landmark» SIA, 2016. Vol. 2. P. 8–14.
7. Бритченко И.Г. Маркетинг менеджмент: новые решения / АА
Шубин, РК Перепелиця, ГИ Бритченко. - Донецк: ДонНУЕТ им. М.
Туган-Барановского, 2007. - 326 с.
8. Bezpartochnyi M., Živitere M., Riashchenko V. Use of cluster analysis
to ensure the effective functioning and development of retail. Innovative
approaches in the management of competitiveness of businesses:
collective monograph / edited by A. Berezin, M. Bezpartochnyi, in 2
vol. ISMA University. Riga: «Landmark» SIA, 2016. Vol. 2. P. 51–55.
9. Брітченко І.Г. Переваги застосування нових кредитних технологій
// Схід. − № 3 (53). – 2003. – С. 55–58.
10. Bezpartochnyi M. European model of consumer protection. Legal
mechanisms to ensure the activities of economic entities: collective
monograph. ISMA University. Riga: «Landmark» SIA, 2016. P. 50–65.
11. Брітченко І.Г., Князевич А.О. Контролінг: навч. посіб. // І.Г.
Брітченко, А.О. Князевич. - Рівне: Волинські обереги, 2015. – 280 с.
12. Князевич А.О. Кластерний підхід до створення інноваційної
інфраструктури країни / А.О. Князевич, І.Г. Брітченко // Науковий
вісник Мукачівського державного університету. – Серія
«Економіка». – Вип. 2(4). – Ч. 2. – 2015. – С. 24-28.
13. Bezpartochnyi M., Živitere M., Riashchenko V. Management and
strategies of financial activities of trade enterprises. Organizational
and economic mechanisms of development of the financial system:
collective monograph / edited by M. Bezpartochnyi. ISMA University.
Riga: «Landmark» SIA, 2016. P. 101–117
14. Брітченко І.Г. Концепція виробничого менеджменту
підприємства // Зб. наукових праць “Торгівля і ринок України”. –
16
Випуск 12. – Том II. – Донецьк: ДонДУЕТ, 2001. – С. 31-36.
15. Bezpartochnyi M., Živitere M., Riashchenko V. Specific features of
personnel management system of trade enterprises. Theoretical,
methodological and practical foundations of human resources
management: collective monograph / edited by M. Bezpartochnyi.
ISMA University. Riga: «Landmark» SIA, 2016. P. 10–18.
16. Брітченко І.Г. Формування системи державного управління
інвестиційним процесом як головна передумова економічного
зростання в Україні / Брітченко І.Г., Кужелєв М.А. // Вестник
ДонГУЭТ- №12 - Донецк: ДонГУЭТ, 2001.- С. 15-22.
17. Bezpartochnyi M., Živitere M., Riashchenko V. Creating a marketing
strategy on agriculture market. Formation of modern social, economic
and organizational mechanisms development of entities agrarian
business: collective monograph / edited by M. Bezpartochnyi. ISMA
University. Riga: «Landmark» SIA, 2017. P. 52–68.
18. Брітченко І.Г. Вплив малого бізнесу на регіональний розвиток //
Науковий вісник ПУЕТ. - № 4 (43) / 2010 – Полтава: ПУСКУ, 2010.
– С. 15 - 19.
19. Bezpartochnyi M., Živitere M., Riashchenko V. Organizational and
legal aspects of free trade zone between Ukraine and the European
Union / // Transformation of international economic relations: modern
challenges, risks, opportunities and prospects: collective monograph /
edited by M. Bezpartochnyi. ISMA University. Riga: «Landmark» SIA,
2017. Vol. 1. P. 176–186 .
20. Bezpartochnyi M., Britchenko I. Development the wholesale enterprises
region through business process reengineering. Transformational
processes the development of economic systems in conditions of
globalization: scientific bases, mechanisms, prospects: collective
monograph / edited by M. Bezpartochnyi. ISMA University. Riga:
«Landmark» SIA, 2018. Vol. 1. Р. 10–22.
21. Bezpartochnyi M., Britchenko I., Jarosz P. Reengineering business
processes as a modern innovation of development wholesale
enterprises region. Management of innovative development the
economic entities: collective monograph / edited by M. Bezpartochnyi,
I. Britchenko. Higher School of Social and Economic. Przeworsk:
Wydawnictwo i Drukarnia NOVA SANDEC, 2018. Vol. 1. Р. 10–24.
22. Bezpartochnyi M., Britchenko I., Jarosz P. Economic diagnostics in
ensuring of competitiveness the economic entities. Conceptual aspects
management of competitiveness the economic entities: collective
monograph / edited by M. Bezpartochnyi, I. Britchenko. Higher School
of Social and Economic. Przeworsk: WSSG, 2019. Vol. 1. Р. 10–19.
23. Rjashchenko V., Živitere M., Bezpartochna O. Reengineering of

17
business processes at enterprises of consumer co-operation.
Conceptual aspects management of competitiveness the economic
entities: collective monograph / edited by M. Bezpartochnyi, I.
Britchenko. Higher School of Social and Economic. Przeworsk: WSSG,
2019. Vol. 2. Р. 85–98
24. Ножова Г.В., Брітченко І.Г. Інноваційна діяльність в контексті
стратегічного управління // Науковий вісник ПУЕТ. - № 6 (51) /
2011. Частина 1 – Полтава: ПУЕТ, 2011. – С. 34 –39.
25. Брітченко І.Г., Гаврилко П.П., Завадяк Р.І. Стратегічне
управління інноваційною діяльністю як основа
конкурентоспроможності // Науковий вісник УжНУ. – №
35/2012. Частина 1. – Ужгород: УжНУ, 2012. – С. 27 – 32.
26. Князевич А.О., Брітченко І.Г. Сутність та специфіка формування
соціально-орієнтованої інноваційної інфраструктури // Науковий
журнал "Менеджер". Вісник донецького державного
університету управління. - № 3 (65)/2013. – Донецьк: ДонДУУ,
2013. – С. 68 – 73.
27. Кужелєв М.О., Брітченко І.Г. Корпоративний контроль
інсайдерської ренти // Науковий вісник ПУЕТ - № 1 (56) / 2014 –
Полтава: ПУЕТ, 2014. – С. 281 – 285.
28. Князевич А. А. Организационно-правовые основы регулирования
деятельности субъектов инновационной инфраструктуры
Украины / А. А. Князевич, И. Г. Бритченко // Новая экономика. –
Минск (Беларусь). – № 1(63). – 2014. – С. 137–142.
29. Бритченко И. Модернизация инновационной инфраструктуры
Украины в процессе конвергенции с ЕС / И. Бритченко, А.
Князевич // The international journal «Sustainable development». –
«Технический університет», г. Варна (Болгария). – № 6 (27). –
2015. – С. 4–10.
30. Bezpartochnyi M., Britchenko I., Bezpartochna O., Mikhel V. Economic
diagnostics as a tool for transformation of organizational-legal forms
of economic activity in the field of agriculture. Management
mechanisms and development strategies of economic entities in
conditions of institutional transformations of the global environment:
collective monograph / edited by M. Bezpartochnyi. ISMA University.
Riga: «Landmark» SIA, 2019. Vol. 1. Р. 259–269.
31. Брітченко І.Г. Передумови сталого розвитку національних
соціально-економічних систем, що формують Європейський Союз
/ Брітченко І.Г., Стьопочкін А.І. // Економіка і організація
управління. Збірник наукових праць ДонНУ - Вінниця. - Випуск № 3
(23). - 2016. С. 40-49.
32. Бритченко И.Г. Бизнес в Украине: Социально-экономические
18
процессы ориентированные на внешнеэкономические связи /
Бритченко И.Г., Саенко В.Г. // Науковий вісник УжНУ. Серія:
Міжнародні економічні відносини та світове господарство - № 10
Ч. 1. - Ужгород: УжНУ, 2016. - С. 64-70.
33. Бритченко И.Г. Виртуальные банки и их связь с реальной
банковской системой // Наука, релігія, суспільство. − № 2. – 2001.
– С. 3–10.
34. Бритченко И. Модернизация инновационной инфраструктуры
Украины в процессе конвергенции с ЕС / И. Бритченко, А.
Князевич // The international journal «Sustainable development». –
«Технический університет», г. Варна (Болгария). – № 6 (27). –
2015. – С. 4–10. (Наукометрическая база JIFACTOR).
35. Брітченко І.Г., Перепелиця Р.К. Оцінка кредитоспроможності
емітента корпоративних облігацій // Вісник НБУ. − № 11 (117). –
2005. – С. 32–37.
36. Брітченко І.Г. Підвищення конкурентоспроможності банків на
ринку банківських послуг України // Науковий вісник УжНУ (Серія
економіка). Випуск 1 (45). - Том. 1/ 2015. - С. 176-180.
37. Iryna Diachuk, Igor Britchenko, Maksym Bezpartochnyi Content
marketing model for leading web content management // Advances in
Social Science, Education and Humanities Research, volume 318, pp.
119-126. – 3rd International Conference on Social, Economic, and
Academic Leadership (ICSEAL 2019), Web of Science
38. Serhii Tkachenko, Igor Britchenko, Maksym Bezpartochnyi Leading
methods for promoting finished product quality // Advances in Social
Science, Education and Humanities Research, volume 318, pp. 99-106.
– 3rd International Conference on Social, Economic, and Academic
Leadership (ICSEAL 2019), Web of Science
39. Шубін А.А., Брітченко І.Г., Перепелиця Р.К., Брітченко Г.І.
Маркетинг менеджмент: новые решенияю - Донецьк: ДонНУЕТ
ім. М. Туган-Барановського, 2007. – 326 с.
40. Мікловда В.П., Брітченко І.Г., Кубіній Н.Ю., Колодинський С.Б,
Ціцак Л.М. Стратегічне управління конкурентоспроможністю:
епістомологічні підходи та практична проблематика. - Полтава :
ПУЕТ, 2013. – 307 с.
41. Bezpartochna O. Study of the modern production and economic
relations of the enterprises of agricultural complex in Poltava region /
Bezpartochna O., Britchenko I., Jarosz P., Radochonska-Jarosz R. //
Organizational-economic mechanism of management innovative
development of economic entities: collective monograph / edited by M.
Bezpartochnyi, in 3 Vol. / Higher School of Social and Economic. –
Przeworsk: WSSG, 2019. – Vol. 1. – pp. 142-153.

19
42. Bezpartochnyi M. Modern approaches to formation the mechanisms of
management and regulation the activity of trade enterprises /
Bezpartochnyi M., Britchenko I., Jarosz P., Radochonska-Jarosz R. //
Organizational-economic mechanism of management innovative
development of economic entities: collective monograph / edited by M.
Bezpartochnyi, in 3 Vol. / Higher School of Social and Economic. –
Przeworsk: WSSG, 2019. – Vol. 1. – pp. 300-310.
43. Bezpartochna O. Gamification. Haven’t we overplayed? / Shamshina
T., Koryuhina C., Riashchenko V., Bezpartochna O. // Organizational-
economic mechanism of management innovative development of
economic entities: collective monograph / edited by M. Bezpartochnyi,
in 3 Vol. / Higher School of Social and Economic. – Przeworsk: WSSG,
2019. – Vol. 3. – pp. 275-287.
44. Riashchenko V., Korjuhina J., Bezpartochnyi M. Modern management
decision-making approaches // Strategies for sustainable socio-
economic development and mechanisms their implementation in the
global dimension: collective monograph / edited by M. Bezpartochnyi,
in 3 Vol. // VUZF University of Finance, Business and
Entrepreneurship. – Sofia: VUZF Publishing House “St. Grigorii
Bogoslov”, 2019. – Vol. 1. – pp. 83-91.
45. Bezpartochna O., Britchenko I. Study of etymology of concept “the
economic diagnostics of agricultural enterprises” // Strategies for
sustainable socio-economic development and mechanisms their
implementation in the global dimension: collective monograph / edited
by M. Bezpartochnyi, in 3 Vol. // VUZF University of Finance, Business
and Entrepreneurship. – Sofia: VUZF Publishing House “St. Grigorii
Bogoslov”, 2019. – Vol. 1. – pp. 16-32.
46. Britchenko I., Bezpartochnyi M., Maslii N. (2019) Financial
decentralization in Ukraine: prerequisites, problems, prospects. VUZF
review, No. 4(4), pp. 25-44. ISSN 2534-9228
47. Britchenko I., Bezpartochnyi M., Levchenko Y. (2020) Development of
methodology of alternative rationale for financial ensuring of bridges
building. VUZF review, No. 5(1), pp. 43-49. ISSN 2534-9228
48. Britchenko I., Bezpartochnyi M. Pandemic economy: current
challenges and new risks // Матеріали Міжнародної науково-
практичної Internet-конференції „Інноваційні стратегії та моделі
економічних трансформацій в умовах євроінтеграційних викликів”
15.05.2020 р. – София: Издателство на ВУЗФ “Св. Григорий
Богослов”, 2020. – С. 226-234.
49. В. Товстик Реальний капітал в сучасних умовах / В. Товстик, І.Г.
Брітченко / Донецьк: Схід. - №3 (27). - 1999. – С. 17-24.
20
Dmuchowski Robert
PhD in Economics
Szmitka Stanislaw
PhD in Economics
University of Computer
Sciences and Economics
(Olsztyn, Poland)
ASSESSMENT OF THE
PRODUCTION COMPANY’S
CONDITION ON THE BASIS
OF FINANCIAL ANALYSIS
Introduction
The word condition means “general state of something” (https:
//sjp.pwn.plise/kondycja.html), and in the context of the present article it
is the state or situation of an enterprise. Company’s financial condition
indicates its predispositions to stay on the market. All decisions made by
managers regarding short and long periods of time depend on and affect
its financial condition. The financial condition determines the
company’s assets as well as sources of their coverage. It is a static
aspect of the subject of analysis (Bednarski, 2007, p. 11), determined for
a specific period of time. The continuity of decision making is a
response to changes. Financial results are a dynamic approach, which is
affected by sales revenues, own costs, taxes, subsidies, etc. Profits or
losses may have a positive or negative impact on the company’s
financial condition. This forms a close relationship between the static
and dynamic approach of the subject of analysis.
The study of facts and economic events by dividing them and
examining the relationship between individual elements is of great
importance for companies as well as many institutions, entities or
individuals.
Running business involves a continuous decision-making process.
These decisions not only affect current operations but also the future.
The goal of every enterprise is to maximize profits; therefore, the
rationality and effectiveness of enterprise management are considered
the main issues. Analysis is not only a source of information about the
financial situation, it is also one of the main tools used to eliminate
decision errors. Analysis of the results allows to verify whether previous
decisions were correct and what were their consequences. It also gives
an opportunity to respond to future situations. When assessing the
company’s condition, it is important to select tools, to compare and
21
correctly interpret the obtained results.
The financial analysis of the company “Dębica Joint Stock
Company” in the years 2015-2017 aims to show that financial analysis
allows to detect areas of management that require a change in
management due to the high costs of their operation.
The essence subject and importance of financial analysis
A primary goal of any business is making profit. Sometimes the
costs incurred exceed the revenues obtained and a company brings
losses. In this case, a financial analysis is an irreplaceable tool for
correcting decisions. According to Boleslaw Werste, a financial analysis
is a scientific method in which an examined entity is divided into parts
and each part is discussed separately (Kurtys, 1996, p. 10). It allows to
examine relationships between individual components of controlled data
and between components and the whole entity, and to consider what
factors cause the identified changes. Analysis is a process that assesses
the existing course of action and allows to improve or change the
approach to the issues under consideration, and in particular it gives the
opportunity to check the effectiveness of operations expressed in
financial condition. The goal of financial analysis comes down to
assessing the rationality of the financial management of a company in
the past, diagnosing the current state and determining the further course
of action.
The study and assessment of issues defined in the entire economy is
the domain of macroeconomic analysis. Microeconomic analysis
focuses on entities in the economy, that is: enterprises, households,
groups of people. It also applies to specific areas of economic activity,
e.g. production, inventory management, work efficiency or asset
turnover. The subject of financial analysis is the company’s assets,
financial results and general financial situation, i.e. elements of the
company’s operations expressed in a monetary measure. The subject of
technical and economic analysis are economic figures, whether factual
or personal, and specific sections of economic activity are subject to
examination. The economic analysis, from a time point of view, can be
divided into the one concerning the past period, namely retrospective
(ex-post) and one referring to the future period, i.e. anticipative (cx-
ante) as well as operative. Retrospective analysis is focused on past
economic events and allows to explain the changes that have taken place
in an enterprise. Thanks to this it is possible to prevent undesirable
consequences of decisions and to reduce adverse tendencies. Ex-ante

22
analysis allows to determine the results of anticipated processes, taking
into account factors that have already occurred as well as those that may
appear. This analysis is used most often in a planning process. Ex-post
and ex-ante analyzes can be carried out at all levels of management in a
company. Operative analysis is aimed at preparing analytical data on
economic processes in relatively short timeframes. This analysis can be
directly applied for standardization of deviations from the assumed
parameters in those segments of an enterprise in which the sequence of
processes is crucial from the perspective of the key effects of this
company’s operations.
Financial analysis of “Dębica Joint Stock Company” in the years
2015-2017
The tire company “Dębica Joint Stock Company”, whose head office
is located in Dębica at 1 Maja Street 1, belongs to the American concern
“The Goodyear Tire & Rubber Company”. The concern has been a
strategic investor in the company since 1995. “Dębica Joint Stock
Company” is the largest in Europe and one of the largest Goodyear
factories in the world, and thus a leading manufacturer of tires for
passenger cars, vans and trucks on the Polish market.
The company manufactures tires of brands such as Dębica,
Goodyear, Dunlop, Fulda and Sava
(https://www.debica.com.pl/o_firmie). The company operates in the
Special Economic Zone “Euro-Park Mielec”.
The analysis of the dynamics and structure of the financial
statements of the company “Dębica Joint Stock Company” was based on
the balance sheet, profit and loss account and cash flow statement for
2015-2017.
The analysis of the asset’s dynamics in the tire company “Dębica
Joint Stock Company” based on the three reporting periods shows that
there was an increase in total assets by 1.39% in 2016 and then by
13.56% in 2017. The increase in current assets was higher than fixed
assets. Current assets increased in subsequent years by 5.91% and
30.54%. However, for fixed assets in 2016 there was a decrease of
1.89% and in 2017 an increase of 0.25%. In the analyzed years, the
company’s liabilities increased. Equity changed positively by 2.53% in
2016 and by 8.50% in 2017. Foreign capital decreased by 1.25% in 2016
and increased the following year by 25,70%.
This dynamic of fixed assets was affected by a decrease of value of
intangible and legal assets as well as fixed assets with a simultaneous
23
increase in long-term prepayments. The dynamic increase in inventories
in 2016 by 1.5% and in 2017 by 41.06% contributed to the increase in
current assets. Short-term receivables in 2016 decreased by 9.06%, and
then in 2017 increased by 38.04%. There was an increase in short-term
investments in the years under review, first by 19.75% and then by
23.45%. Supplementary capital and other reserve capitals had the largest
share in the balance sheet total among equity.
Among equity capital, the largest changes occurred in profit and
other reserve capital. Changes in liabilities were related to the decrease
in provisions for liabilities in 2016 and their increase in the following
year and to the increase in long-term liabilities in 2016 by 39.20% and
35.77% in 2017 year. In 2016, short-term liabilities increased by 1.14%
and in 2017 by 28.52%.
In 2015, fixed assets constituted 57.95% of the balance sheet total, of
which the largest, 57.79%, were tangible fixed assets, and the rest were
long-term investments and long-term prepayments, including 0.15%
deferred tax assets (in connection with running a business in the Euro-
Park Mielec Special Economic Zone, Dębica has been using the
discount since 2013 in corporate income tax). The study of the structure
of fixed assets in 2015-2017 indicates their gradual decline. In 2016, the
share was 56.07%, while in 2017 it decreased to 49.50%. In turn, the
share of current assets had an upward trend, from 42.05% in 2015, by
43.93% in 2016 and 50.50% in 2017. The full structure and dynamics of
assets are presented in Table 1.1, it shows the changes that took place in
all individual elements of current assets. The share of equity in sources
of financing assets decreased. In 2015, equity constituted 69.82% of the
balance sheet total, in 2016 70.61%, and in 2017 67.46%. Liabilities and
provisions in 2015 accounted for 0.18% of total liabilities, in 2016
29.39% and 32.54% in 2017. Short-term liabilities had the largest share.
This resulted in an increase in long-term and short-term liabilities. Table
1.2 shows the dynamics and structure of liabilities.
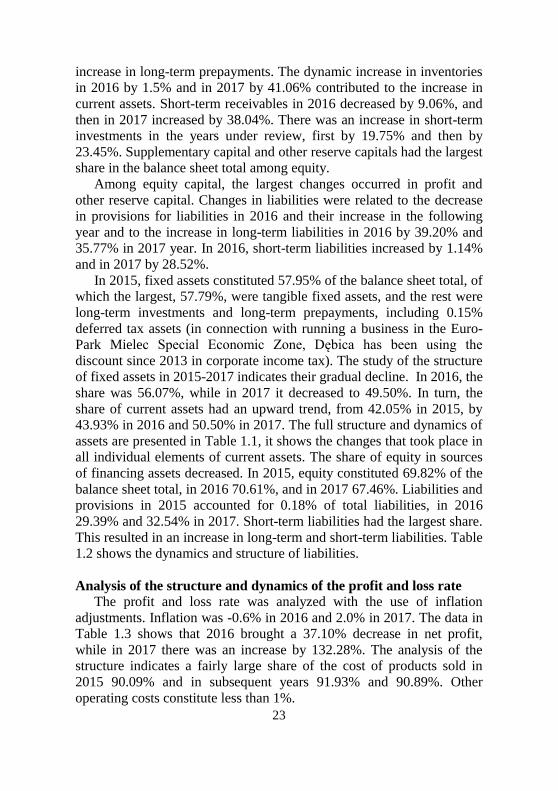
Analysis of the structure and dynamics of the profit and loss rate
The profit and loss rate was analyzed with the use of inflation
adjustments. Inflation was -0.6% in 2016 and 2.0% in 2017. The data in
Table 1.3 shows that 2016 brought a 37.10% decrease in net profit,
while in 2017 there was an increase by 132.28%. The analysis of the
structure indicates a fairly large share of the cost of products sold in
2015 90.09% and in subsequent years 91.93% and 90.89%. Other
operating costs constitute less than 1%.

24
Table 1.1
Analytical approach to part of the balance sheet of “Dębica Joint
Stock Company” – assets
Balance
sheet (in
PLN
thousand)
2015
2016
2017
Indicators
of the
pace of
change
2016/15
Indicators
of the
pace of
change
2017/16
Fixed assets 829765 814042 816061 -1.89% 0.25%
Intangible
assets,
including
goodwill
21 9 0 -57.14% -100.00%
Property,
plant and
equipment
827507 811646 809035 -1.92% -0.32%
Long term
investments
144 144 144 0.00% 0.00%
Long term
financial
assets
144 144 144 0.00% 0.00%
In other
entities
144 144 144 0.00% 0.00%
Long-term
prepayments
2 093 2 243 6 882 7.17% 206.82%
Assets due
to deferred
income tax
2 093 2 097 6 844 0.19% 226.37%
Other
prepayments
0 146 38 14 600% -73.97%
Current
assets
602 183 637 778 832 571 5.91% 30.54%
Inventory 74834 75958 107145 1.50% 41.06%
Short-term
receivables
241975 220043 303744 -9.06% 38.04%
From
related
entities
207331 198957 277513 -4.04% 39.48%
From other
entities
34 644 21 086 26 231 -39.14% 24.40%

25
Table 1.1 (continued) Short-term
investments
284425 340601 420481 19.75% 23.45%
Short-term
financial
assets
284425 340601 420481 19.75% 23.45%
in related
entities
255000 255000 350000 0.00% 37.25%
in other
entities
0 0 0
cash and
other cash
assets
29 425 85 601 70 481 190.9% -17.66%
Short-term
prepayments
949 1 176 1 201 23.92% 2.13%
Total assets 1431948 1451820 1648632 1.39% 13.56% Source: own study based on the balance sheet of the tire company “Dębica Joint
Stock Company”
Table 1.2
Analytical approach to part of the balance sheet of “Dębica Joint
Stock Company” – liabilities
Balance sheet
(in PLN
thousand)
2015
2016
2017
Indicators
of the
pace of
change
2016/15
Indicators
of the
pace of
change
2017/16
Equity 999803 1025080 1112218 2.53% 8.50%
Share capital 110422 110422 110422 0.00% 0.00%
Supplementary
capital
324459 324779 326144 0.10% 0.42%
Revaluation
reserve
68 099 67 779 66 414 -0.47% -2.01%
Other reserve
capitals
417910 457347 489664 9.44% 7.07%
Net profit
(loss)
78 913 64 753 119574 -17.94% 84.66%
Liabilities and
provisions for
liabilities
432145 426740 536414 -1.25% 25.70%

26
Table 1.2 (continued) Provisions for
liabilities
62 519 52 261 54 970 -16.41% 5.18%
Provisions for
deferred
income tax
29 328 15 070 17 251 -48.62% 14.47%
Provisions for
retirement and
similar
benefits
31 744 31 282 34 374 -1.46% 9.88%
long-term 10 235 10 856 9 983 6.07% -8.04%
short-term 21 509 20 426 24 391 -5.04% 19.41%
Other reserves 1 447 5 909 3 345 308.36% -43.39%
long-term 100 67 140 -33.00% 108.96%
short-term 1 347 5 842 3 205 333.70% -45.14%
Long-term
liabilities
1 643 2 287 3 105 39.20% 35.77%
to other
entities
1 643 2 287 3 105 39.20% 35.77%
Current
liabilities
367983 372192 478339 1.14% 28.52%
to related
entities
73 266 77 101 119840 5.23% 55.43%
to other
entities
294165 294760 357944 0.20% 21.44%
Special founds 552 331 555 -40.04% 67.67%
Liabilities
total
1431948 1451820 1648632 1.39% 13.56%
Source: own study based on the balance sheet of the tire company “Dębica Joint
Stock Company”
Financial costs are similar, except that their level does not exceed 0.5%
in the studied years. Gross sales profit had the largest share in sales
revenues and it changed, it decreased by 22.08% in 2016 and then
increased by 29.50% in 2017, but reached a lower level than in 2015.
Other partial results show a similar trend, in 2017 sales profit, operating
profit, business profit and gross profit had a very similar level. Figure
1.1 presents the dynamics of financial results, which allows for a more
detailed analysis of the profit and loss rate.
In 2016, sales revenues fell more than costs decreased, which
contributed to a 22.08% decline in gross profit on sales.

27
Figure 1.1 Dynamics of financial results of the tire company “Dębica
Joint Stock Company” Source: own study based on the profit and loss rate of “Dębica Joint Stock”
In 2017, there was an increase in sales revenues by 14.67%, while
costs increased slightly slower, by 13.37% compared to the previous
year, which resulted in an increase in gross profit on sales by 29.50%. In
2016 profit on sales – a decrease by 39.88% compared to 2015 – was
influenced by an increase in sales costs by 127%, which in the following
year decreased along with general and administrative expenses and
contributed to the increase in profit on sales by 105.84% compared to
2016. Other operating revenues first increased by as much as 471.19%,
then they showed lower dynamics (171.85% as compared to 2016. Other
operating costs decreased in 2016 by 45.22% and in the following year
by 31.71%. This state of other operating income and expenses resulted
in a decrease in operating profit by 37.10% in 2016 and an increase by
132.28% in 2017. Financial revenues increased more slowly than
financial costs, which reduced the profit on business activities in 2016.
In the following year, a faster decrease in financial revenues from costs
had a negative impact on business profit. There were no extraordinary
events, so the gross profit equaled the profit from business activity. The
final net result decreased by 17.45% compared to 2015 and then
increased in 2017 by 81.04%. Table 1.3 presents structure and dynamics
profit and loss rate.
28
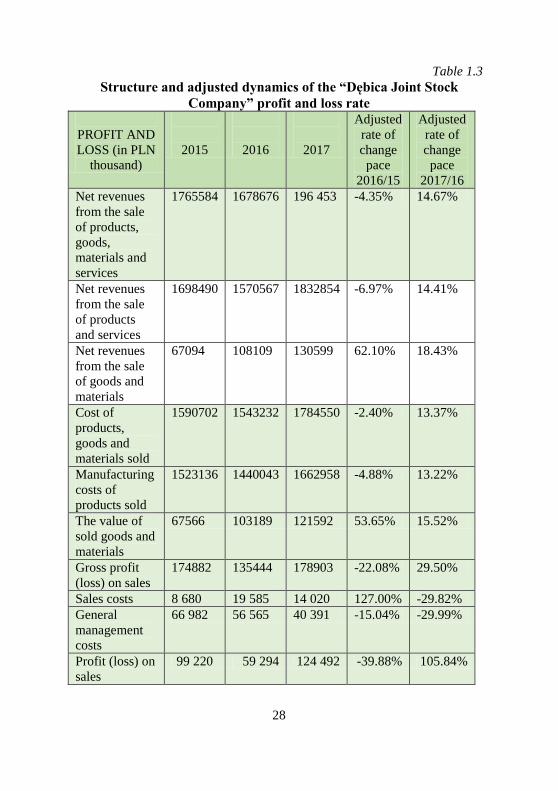
Table 1.3
Structure and adjusted dynamics of the “Dębica Joint Stock
Company” profit and loss rate
PROFIT AND
LOSS (in PLN
thousand)
2015
2016
2017
Adjusted
rate of
change
pace
2016/15
Adjusted
rate of
change
pace
2017/16
Net revenues
from the sale
of products,
goods,
materials and
services
1765584 1678676 196 453 -4.35% 14.67%
Net revenues
from the sale
of products
and services
1698490 1570567 1832854 -6.97% 14.41%
Net revenues
from the sale
of goods and
materials
67094 108109 130599 62.10% 18.43%
Cost of
products,
goods and
materials sold
1590702 1543232 1784550 -2.40% 13.37%
Manufacturing
costs of
products sold
1523136 1440043 1662958 -4.88% 13.22%
The value of
sold goods and
materials
67566 103189 121592 53.65% 15.52%
Gross profit
(loss) on sales
174882 135444 178903 -22.08% 29.50%
Sales costs 8 680 19 585 14 020 127.00% -29.82%
General
management
costs
66 982 56 565 40 391 -15.04% -29.99%
Profit (loss) on
sales
99 220 59 294 124 492 -39.88% 105.84%

29
Table 1.3 (continued) Other
operating
revenues
273 1 550 4 298 471.19% 171.85%
Profit on sale
of non-
financed fixed
assets
0 1 291 753 -42.82%
Other
operating
revenues
273 259 3 545 -4.56% 1 241.8%
Other
operating costs
16 871 9 186 6 399 -45.22% -31.71%
Revaluation of
non-financial
assets
976 1 056 1 466 8.85% 36.10%
Other
operating costs
15 507 8 130 4 933 -47.26% -40.51%
Profit (loss)
from
operations
82 622 51 658 122 391 -37.10% 132.28%
Financial
revenues
6 984 7 010 4 475 0.98% -37.41%
Interest,
including:
6 760 7 010 4 285 4.32% -40.07%
Other 224 0 190 -100.0%
Financial costs 2 787 6 660 5 297 140.41% -22.02%
Interest,
including:
2 787 2 550 2 396 -7.95% -7.88%
Other 0 4 110 2 901 -30.80%
Profit (loss) on
business
activities
86 819 52 008 121 569 -39.73% 129.17%
Gross profit
(loss)
86 819 52 008 121 569 -39.73% 129.17%
Income tax 7 906 -12 745 1 995 -262.1% -115.3%
Net profit
(loss)
78 913 64 753 119 574 -17.45% 81.04%
Source: own study based on the profit and loss rate of the tire company “Dębica
Joint Stock Company”
30
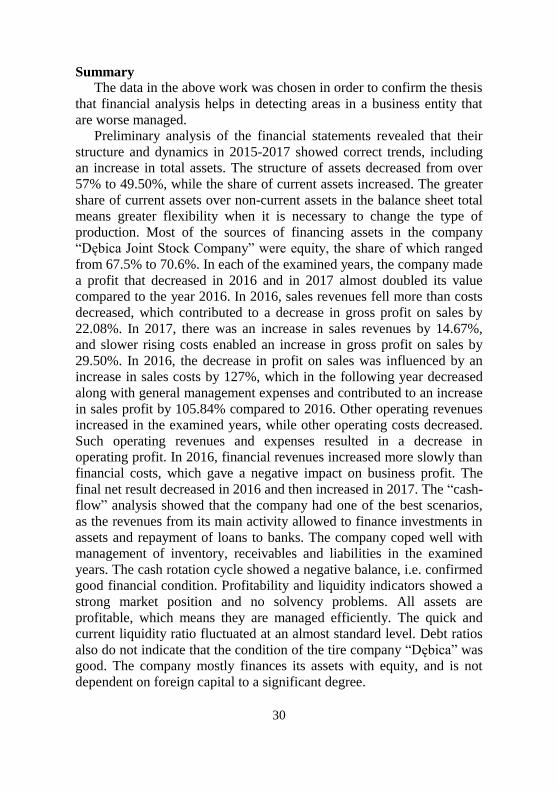
Summary The data in the above work was chosen in order to confirm the thesis
that financial analysis helps in detecting areas in a business entity that
are worse managed.
Preliminary analysis of the financial statements revealed that their
structure and dynamics in 2015-2017 showed correct trends, including
an increase in total assets. The structure of assets decreased from over
57% to 49.50%, while the share of current assets increased. The greater
share of current assets over non-current assets in the balance sheet total
means greater flexibility when it is necessary to change the type of
production. Most of the sources of financing assets in the company
“Dębica Joint Stock Company” were equity, the share of which ranged
from 67.5% to 70.6%. In each of the examined years, the company made
a profit that decreased in 2016 and in 2017 almost doubled its value
compared to the year 2016. In 2016, sales revenues fell more than costs
decreased, which contributed to a decrease in gross profit on sales by
22.08%. In 2017, there was an increase in sales revenues by 14.67%,
and slower rising costs enabled an increase in gross profit on sales by
29.50%. In 2016, the decrease in profit on sales was influenced by an
increase in sales costs by 127%, which in the following year decreased
along with general management expenses and contributed to an increase
in sales profit by 105.84% compared to 2016. Other operating revenues
increased in the examined years, while other operating costs decreased.
Such operating revenues and expenses resulted in a decrease in
operating profit. In 2016, financial revenues increased more slowly than
financial costs, which gave a negative impact on business profit. The
final net result decreased in 2016 and then increased in 2017. The “cash-
flow” analysis showed that the company had one of the best scenarios,
as the revenues from its main activity allowed to finance investments in
assets and repayment of loans to banks. The company coped well with
management of inventory, receivables and liabilities in the examined
years. The cash rotation cycle showed a negative balance, i.e. confirmed
good financial condition. Profitability and liquidity indicators showed a
strong market position and no solvency problems. All assets are
profitable, which means they are managed efficiently. The quick and
current liquidity ratio fluctuated at an almost standard level. Debt ratios
also do not indicate that the condition of the tire company “Dębica” was
good. The company mostly finances its assets with equity, and is not
dependent on foreign capital to a significant degree.
31
The calculations, their analysis and interpretation allowed to state
that the tire company “Dębica Joint Stock Company” was in a good
financial condition and had a stable market position in the examined
period.
References: 1. Bednarski L. (2007), Financial analysis in the enterprise, Warszawa,
PWE.
2. Kurtys E. (1996), Economic analysis of the enterprise, Wrocław,
Wydawnictwo Akademii Ekonomicznej im. Oskara Langego.
Web sources:
http://www.krs-online.com.pl/firma-oponiarska-debica-s-a-krs-
43000.html [dostęp: 03.03.2019 r.] https://notowania.pb.pl/instrument/PLDEBCA00016/debica/inforrna
cje-spolka [dostęp: 03.03.2019r.]
https://sjp.pwn.pliszukaj/kondycja.html [dostęp: 21.01.2019 r.]
https://www.debica.com.pl/o_firmie [dostęp: 02.03.2019 r.]
https://www.debica.com.pl/o_firmie/historia [dostęp: 02.03.2019 r.]
Shevchenko Olena
Doctor of Economics, Associate
Professor
Donbass State Engineering Academy
(Kramatorsk, Ukraine)
DEVELOPMENT OF
THE NATIONAL
ECONOMIC SYSTEM:
ARCHITECTURE AND
INCLUSIVE ISSUES
The development of the world economy at the beginning of the XXI
century was marked by fundamental socio-economic transformations.
The unpredictability and depth of global change, the growing influence
of international organizations on the economic activities of nation states,
the presence of crises in the financial sector and the economy have
become a challenge to economics, real politics and economic practice.
In this regard, there is a need for scientific understanding of modern
world economic change and justification for the creation of an effective
national economic system that would take into account the peculiarities
of socio-economic, national and geopolitical development of Ukraine.
32
Currently, economics, designed to explain reality and offer the most
effective options for transformation, demonstrates inconsistencies,
incompleteness and inadequacy of basic economic concepts and models,
has a number of problems in justifying and predicting the long-term
trajectory of economic development. This is primarily due to the lack of
a complete theory of economic development, especially its market stage,
which would incorporate modern methodology, adequate theoretical
generalizations and goals that would be the basis for improving the
economic system of society and effective decision-making.
In this sense, it becomes clear the growing attention of scientists to
the problem of conceptual awareness and systematic study of the
evolution of the economic system and the formation on this basis of a
new concept of national economy. The question of the necessity and
essence of the study of the evolution of the economic system is the
subject of numerous scientific discussions. The presence of
contradictory assessments and forecasts on the directions, goals,
dynamics of economic growth of the national economy requires
recourse to the intellectual heritage of world and domestic economic
thought, a deep rethinking of the scientific foundations of economic
development, its dependence on the historical track of previous
evolution.
This task becomes especially relevant when the critique of dominant
economic theories, especially neoclassical economic theory, which for
many years played the role of theoretical foundation in the study of
national and globalized economic processes. The question of updating
the methodological tools for understanding the radical changes in the
national and global economy, the formation of new scientific approaches
and principles for their understanding, the combination of economic
theory with business practice is becoming more acute.
Today, Ukraine is developing the parameters of the socio-economic
and geopolitical model of development in the third millennium. The
main national interest of our country can be realized through a well-
structured model of economic development, which is the basis for the
functioning of the national economic system. An effective model of
economic development has not yet been formed and, accordingly, not
implemented, which would fully reflect its national interests and become
a macroeconomic theoretical basis for an effective state economic
policy. Therefore, the Ukrainian economic model is not complete today.
In fact, according to some researchers, it is an eclectically combined
elements of different models: state socialism (inherited from the Soviet

33
era); state-monopoly capitalism (with its clan-oligarchic nature of
development); and people’s capitalism (developing in the country in a
deformed, segmental form).
Models of economic development of individual countries are formed
within a certain economic system, which is a set of all economic
processes occurring in society on the basis of certain institutional,
property and financial relations and organizational forms. In the last one
and a half to two centuries, as already mentioned, there were different
types of economic systems in the world: a market economy based on
free competition (classical capitalism), a mixed economy (modern
capitalism) and two non-market systems – traditional (natural) and
administrative command. In each system, national models of economic
organization are built, which correspond to the existing economic,
resource and cultural potential of the country, its traditions, spirituality
and mentality.
Models of economic development of the national economic system
within the system of modern capitalism have been the subject of
analysis by domestic scientists. Thus, S. Mocherny identifies the
following basic models: 1) market economy with its modifications and
historical forms; 2) a mixed economy, which is the most perfect model
of modern capitalism; 3) post-industrial society; 4) the national
economy; 5) capitalist economy; 6) the national economy. The author
considers the most optimal model for Ukraine to be the model of
national economy, which provides for the use of all types of property
(dominated by labor collective property), comprehensive social
protection and national democratic economic planning.
Ukrainian economist A. Filipenko, analyzing the evolution of models
of economic development in relation to countries liberated from colonial
dependence, the so-called young independent states or developing
countries, notes that modern science identifies the following basic
models of economic development: the model of linear stages; model of
structural transformations; neoclassical free market model; theory of
external dependence; theory of dual development; the concept of
endogenous growth; innovative theory of economic development; model
of sustainable development. The most acceptable for Ukraine the author
considers “an integrated model (characterized by common features of
development strategies inherent in highly developed countries;
developing countries and third world countries) economic development,
which allows to fully realize national interests in the world economy”
[1, p. 596]. Domestic political scientist M. Mykhalchenko identifies four

34
possible models (scenarios) for the future development of the national
economic system, each of which has an economic basis. These are the
following scenario models: 1) “retroidilic”, which is based on a
directive-planned, uncompetitive economy; 2) "monoethnic", which is
based on the idea of creating a “closed population”, a racially pure
ethnic group and a “closed national economy”; 3) “liberal”, which is
based on the liberal values of a market economy; 4) “convergence”,
which involves a combination of the best achievements of the market
economy mechanism with non-market forms of profit redistribution, the
creation of a socially oriented economy by market methods, and which
the author considers most viable for the Ukrainian environment [2, p.
37].
The analysis of the models of economic development of economic
systems that exist within the modern market system and those that
domestic researchers consider acceptable for our country, leads to a
number of generalizations and conclusions. In our opinion, almost all
researchers: try to study Western models of economic development and
in one way or another adapt some of them to Ukrainian realities; they
substantiate the need for Ukraine to have a mixed model of economic
development focused on the interests of the state, financial and
monopolistic groups, and small and medium-sized businesses; insist on
the implementation in Ukraine of such an economic model, which
would provide a combination of state regulation with a market
competitive economy; determining what should be the share of the state
in the economy. At the same time, they rely mainly on the experience of
Russia, as evidenced by the number of references to Russian sources
used for analysis, and note the need for an optimal model of economic
development for Ukraine, but do not carry out thorough and
comprehensive development of such a model adapted to modern
economic problems country systems.
Thus, O. Soskin recognizes the main reasons for the erroneous
reform in the Ukrainian version: 1) the lack of properly formed national
economic interests, the implementation of which should be aimed at the
model of the economy implemented in the country; 2) incorrectly
defined theoretical basis of the economic model of development in the
form of liberal-cosmopolitan concepts of purely monetarist orientation
and automatic observance of advice and uncritical perception of the
experience of their bearers; 3) selection and application of an
unsuccessful mechanism for implementing the overall reform strategy,
the tools of which were mass voucher privatization of the lion’s share of

35
state property, introduction of spontaneous pricing, simultaneous
opening of the economy to private exports and imports, changes in
legislation, social and economic institutions corruption environment,
formation of clan-corporate groups and their merging with the state-
bureaucratic nomenclature [3, p. 276].
Scientists have proposed different approaches, methodologies for the
practical use of the advantages of Western models in the direction of
analyzing the development of economic systems (globalization,
internationalization). We share A. Filipenko’s point of view on the
application of the “integrated model” of economic development in
modern society.
In recent years, the number of publications on the systemic crisis of
capitalism and the need to move to a new model of management has
increased sharply. The report of the World Economic Forum identifies
three categories of economic risks, with the recognition and prevention
of which the current economic system can not cope:
1) macroeconomic risks associated with the unrestrained growth of
financial markets;
2) corruption, organized crime and illegal trade;
3) depletion of natural resources.
The systemic crisis, social in nature, is manifested in the growth of
chronic unemployment, social inequality and dependency,
environmental threats, the crisis of spiritual values, mutual trust and
culture. The current stage of global development is characterized by the
deepening global structural crisis. Many researchers focus on the social
consequences of the global crisis and its financial aspects.
Now under the influence of leading economists, including J. Stiglitz,
P. Krugman, J. Akerlof, R. Schiller and many others, a “new economic
paradigm” is being actively developed – a scientific concept that
actualizes the ideas of J. M. Keynes, I. Fischer and X. Minsk on
financial bubbles and crises. It is designed to explain the conditions of
such extreme phenomena and to form a scientific basis for practical
recommendations in terms of minimizing the negative consequences for
the economy. The methodology for solving such problems is the theory
of complex systems, because the behavior of financial markets, where
“everything depends on everything”, generally corresponds to the
behavior of objects of similar complexity.
The inconsistency of formal and informal institutions, their
inconsistency, extractive nature lead to changes in the economic system,
which inevitably causes a decline in confidence and its crisis. The

36
growth of contradictions and the inhibition of economic development
due to the socio-economic crisis reduce the possibility of transforming
formal and informal institutions, thus creating a trap of inconsistency in
the quality of economic development.
Crises as a natural process of development of the economic system
have a complex nature, which manifests itself as shocks of the socio-
economic sphere of society. Counteracting the destructive processes in
the economic system is associated with the analysis of crises as
derivatives of cognitive-behavioral actions that fit into the frames of
economic and legal institutions. The current crisis of the national
economic system has its own specific features: the transition to a new
frame of reference, the economic basis of which is private property and
its respective forms of management (radical neoliberal transformations
have caused irreversibility), unprecedented depth of economic decline
(loss of competitiveness, crisis) structural deformation of the economic
system (inconsistency of the sectoral structure of the economy), the
structure of the national economy and external relations (anti-
environmental orientation), the transition of some forms of Soviet
economy to the shadow economy of today (forms a corrupt
authoritarian-bureaucratic system), deepening social inequality
management model, a person is not considered as the highest social
value – the model of survival).
In order to prevent existing threats, in the author’s opinion, the
strategic line and the corresponding program of development of the
national economic system should be coordinated with the system of
government and society, formulated goals and scientific substantiation
of methodology, methods and mechanisms for achieving these goals.
Despite the growing number of studies of the characteristics of the
national model of economic development, a single holistic concept has
not been created in the context of determining the vector of development
of the national economic system.
Alternative types of development are a prerequisite for the positive
prevention of uncertainty inherent in the functioning and evolution of
any complex organic formations – economic systems. The concept of
alternatives is revealed through endogenous and exogenous uncertainty,
choice, risks and innovations. Alternative development of the national
economic system is an external prerequisite for the formation of national
strategy, is relevant to the development of methods, tools and
management practices and means alternative ways to achieve target
(desired) levels of socio-economic development.

37
The continuous evolution of the economic system, in particular its
socio-economic component, necessitates the constant development of a
set of tasks, priorities and instruments of economic policy of the state.
The effectiveness (efficiency) of this policy affects the state of
competitive advantage in today’s globalization challenges.
We emphasize that a characteristic feature of the current stage of
global development should be a decrease in the effectiveness of public
policy due to the difficulty of forecasting economic development and the
deformation of the main reactions of the national economic system to
regulatory influences. According to A. Galchynsky, the modern system
“is characterized by the realization of the potential for change through
the mechanisms of bifurcation and chaos” [4, p. 8]. The scientist states
that “… the future ceases to be predictable: it is no longer based on the
foundations of the present… terminate the inherent principles of causal
determinism, rational development, social balance, which form the
foundation of economic methodology”. Thus, the economy “acquires
signs of development of complex disordered dissipative (scattered)
synergetic systems”. V. Bodrov emphasizes that the “global crisis has
demonstrated the failure of traditional anti-crisis tools, which are based
on the absolutization of functional analysis, focusing on the study of
functional relationships and dependencies” [5, p. 72].
In general, the genesis of the modern model of the global economy
and its components is directly related to the trend of liberal organization,
which is inherent in the transformations in the post-Soviet space, and the
“renaissance” of neoliberalism, which existed on the basis of a long
crisis-free period at the turn of XX and XXI centuries, suffered
significant losses due to the crisis of 2008-2009 in the world economy.
In particular, the Polish researcher Gr. Kolodko states the changes as a
consequence of “the crisis of the neoliberal model, which rejected the
regulatory practice of the state and denied institutional interventionism”
[6, p. 9].
According to J. Zhalilo, the loss of effectiveness of the tested
instruments of public policy is a logical continuation of the evolution of
technological processes and organizational relations in the economy
over the past decades. Since this process occurs due to the development
of objective evolutionary processes, the scientist proposes to use the
term “implicit” (defined by explanatory dictionaries as “that which is
not stated openly, but can be understood by understanding what is said
or occurs, revealed through connections with other objects”; used
primarily in the field of psychology) liberalization in the modern
38
economy, which results in a “radical change in the characteristics of the
economic field” [7, p. 41-42]. The latter, according to the definition of
A. Galchinsky, “acquires the characteristics of a dissipative
heterogeneous environment, contains various structural formations that
interact on the principles of self-organization of complex systems”. But
it should be noted the paradox of the situation under study: under
conditions of implicit liberalization, the effectiveness of traditional
policy instruments, which are focused on the liberal model of the
economy, is lost. Macrosocio-economic equilibrium is currently formed
in terms of priority of horizontal relations, the dominance of patterns of
self-organization of individual segments of the economic system, and
finally, according to A. Galchinsky – “erosion of the principle of
economic determinism”.
That is, the phenomena of implicit liberalization are becoming more
and more widely discussed and widespread in economic practice and
dictate the need for balanced significant changes in the tools,
mechanism and priorities of economic policy, in particular, promoting
self-organization of the economic system through advanced
development.
Modern researchers are unanimous in concluding that one of the
main problems in Ukraine in improving its global competitiveness is the
inadequate level of institutional efficiency of the national economic
system. In particular, according to the modern Ukrainian researcher N.
Grazhevska [8, p. 15], post-Soviet institutional changes are
characterized by extreme complexity and inconsistency. We believe that
the "institutional inadequacy" of the state determines the appropriate
institutional environment for the functioning and development of the
economic system is not suitable for effective modernization of the
national economy.
Thus, given the above, the question arises about the development of
a modernized national model with a differentiated strategy for the
functioning of the national economic system. We consider it expedient
to base it on the principle of inclusive growth (ie the choice of
alternatives for the development of the economic system on the basis of
national goals of overcoming inequality and improving the quality of
human life).
Modernization has become one of the main trends in the modern
development of economic systems, but has not created a positive
potential for renewal and overcoming the crisis of the national economic
system. Some researchers consider it necessary to focus not on
39
modernization but on reconstruction. Thus, A. Hrytsenko emphasizes
that “the depth of modernization, which is determined by the transition
from external forms to load-bearing structures of internal content, is the
limit of the transformation of modernization into reconstruction” [9, p.
7]. That is, the reconstructive development of the economic system is a
development that can be achieved by restructuring the basic structures of
the economic system, changing its structure. Since the content of
reconstructive economic development includes the social orientation of
change, it is achieved both in terms of economic growth and at the stage
of recession.
A. Hrytsenko emphasizes in his research the need to take into
account the laws of architecture (fundamental structure of integral
systems) as one of the important features of the paradigm of
reconstructive development of the modern economic system. In real
economic practice, it is necessary to take into account the internal
characteristics and nature of integrity, but this only modifies, adjusts the
proportions, not cancels them. Since the structure of the system (whole)
is deformed, away from equilibrium proportions, it is advisable to
pursue a policy aimed at overcoming imbalances and approaching
equilibrium proportions (with correction of deviations of not more than
15% of the available averages), which is the principle of gradual
equilibrium economic system.
Thus, the problems of modernization of the modern economy, the
“architecture” of the economic system (according to A. Hrytsenko), the
issues of inclusive development are extremely relevant for determining
the vector of development of the national economic system. In the
broadest sense, the concept of inclusive development means the
development of national economies in world economic relations, which
makes it possible to include and reveal the internal potential of all
elements, all actors of the socio-economic system of the country and
ensure its balance. We believe that systemic inclusiveness is needed by
the national economic system. This will provide opportunities to identify
natural, social and cultural benefits of the system ensure sustainable
development and improve the welfare and quality of life of citizens in
society by radically restructuring the economy and developing its
internal potential in reflective interaction of the economic system with
the environment.
40
References: 1. Filipenko A. (2017). Economic world: methodology. Economic theory.
Vol. 3, pp. 5-22.
2. Mikhalchenko M. (2004). Ukraine as a new historical reality: a reserve
player of Europe. NAS of Ukraine; Institute of Political and
Ethnonational Studies. Publishing Company "Renaissance", 487 p.
3. Soskin O. (2014). Narodnyi kapitalizm: ekonomichna modely dlya
Ukrainy. Kyiv: IST Publishing House, 396 p.
4. Galchynsky A. (2013). Political nooeconomics: the beginnings of the
renewed paradigm of economic knowledge. 472 p.
5. Bodrov V. (2002). Transformation of economic systems: concepts,
models, mechanisms of regulation and management: textbook. way.
104 p.
6. Kolodko J. (2010). From the ideology of neoliberalism to the new
pragmatism. Economy of Ukraine. Vol. 9, pp. 4-10.
7. Zhalilo J. (2016). Peculiarities of realization of economic policy of the
state in the conditions of modern tendencies of social development.
Economic theory. Vol. 1, pp. 39-52.
8. Grazhevska N. (2014). Comparative approach to the analysis of global
competitiveness of national economies. Theoretical and applied issues
of economics. Vol. 1 (28), pp. 15-24.
9. Hrytsenko A. (2016). Reconstructive economic development, content,
main directions and vector of social justice. Economic theory. Vol. 4,
pp. 5-19.

41
Chapter 2
STRATEGIC MANAGEMENT AND
DEVELOPMENT OF THE ECONOMIC
SYSTEMS
Artman Monika
Master, Aspirant
VUZF University
Jarosz Piotr
Prof. Dr. hab., Prorector
University of Socio-Economics in
Przeworsk
(Sofia, Bulgaria; Przeworsk, Polska)
TOOLS AND BEST
PRACTICES IN THE
STRATEGY TO
ENHANCE
INVESTMENT
ACTIVITY IN
POLAND
Investments are the main factor among the indicators of economic
growth and integration of the world economic systems of various
countries into the consolidated international economic space.
Determination of an investment structure that would create reliable
conditions for economic stability and ensure Poland’s position as an
influential economic and political partner in the global community is the
main priority of the State as a whole, as well as its constituent regions in
the modern conditions.
The Republic of Poland is one of the most favorable countries for the
investment of foreign equity. It is significant that the Polish economic
system was recognized as safe for organization and conduct of business
by the definitive opinion of international experts; all necessary
conditions for investment, including modern infrastructure support, were
created on its territory. The following key positive factors affecting the
investment attractiveness of the country are identified and analyzed in
the Monograph: location in the center of Europe, political stability based
on the EU and NATO membership, considerable domestic market,
sustainable economic development, one of the most receptive consumer
markets, skilled labor force, relatively low labor costs, reception of
grants from the EU budget, continuous improvement of business
conditions, as well as cost-efficient industries for capital investment.

42
However, a number of problems and pending issues requiring serious
attention of the scientists and practitioners still exist.
Panoramic analysis of the scientific literature has revealed that the
term “investment climate” is used to combine such categories as
"investment attractiveness" and “investment activity”.
Synonymization of “investment attractiveness” and “investment
climate” concepts is fairly common. Most probably, it is due to the
relatively recent active use of the “investment activity” term [1-9],
which is indicative of the attained involvement of available investment
resources on the capital market [1-5, 7-8]. The fact that recording of the
inflow of investment capital into a certain economic territory is an
additional positive “signal” of availability of the investment culture,
which can positively affect the final decision of potential investors on
investing funds, should be noted.
Based on a comprehensive analysis of scientific sources, we have
come to the conclusion that implementation of efficient IA on the
economic territory of the country, as well as successful development of
the investment market in the modern externalities, are impossible
without State intervention. The degree forms and methods of such
intervention should be incorporated in the investment policy of the State
and in its lability (dynamic flexibility – author’s note) to the
requirements of the appropriate response to external changes of various
nature. Being implemented at micro- and meso-levels, it will not only
enable to take into consideration differences in territorial, labor,
production and other nature, but to maximize the efficiency of IA on the
national scale as well.
The presented on Figure 2.1 diagram emphasizes the importance and
significance of the managerial component in the efficient development
of investment activities in the country.
Constant monitoring of changes in the investment climate is one of
the key tasks in ensuring lability of IA managerial system.
The fact that the investment climate is characterized by dynamism and
constant variability should be emphasized. In the view of these reasons,
investment climate should be monitored the on a permanent basis.
Three possible options for monitoring the investment climate are
available in the world practice (Figure 2.2).
Differentiation of Poland regions (voivodeships – author’s note) in
terms of area, resources provision and potential, as well as development
level, determine application of the third investment climate monitoring
option.

43
Figure 2.1 Structural and Dynamic Diagram of IA Development
Management in Poland
Monitoring of macroeconomic data in Poland allows to deduce an
inference on availability of all prerequisites for activation of the
investment activity within its economic territory.
Thus, according to forecasts, GDP growth is expected at the level of
3.9% in 2017, and at 4.1% in 2018, which is the best growth indicator in
Europe. This allowed to abandon the IMF loan in the amount of Euros
9.2 billion. Budgetary Compliance in the reporting year was recorded
with a record surplus of USD 1.36 billion or PLN 4.9 billion [1].
INVESTMENT CLIMATE
Investment attractiveness in the
country and its regions
Investment activity of business entities
State investment policy
INVESTMENT PROCESSES
Investment activity management process
C
o
n
d
i
t
i
o
n
s
O
u
t
c
o
m
e
IA on the economic
territory of the State
IA on the economic
territory of the
regions
IA in the territorial-economic entities
(FEZ)
IA in industries and
types of economic
activity
IA on the territory of
the municipal entities
INVESTMENT POTENTIAL

44
Figure 2.2 Variety of the Investment Climate Monitoring Methods
More importantly, the pro-active approach of the Polish
Government, which allowed not only to maintain its position in the
European market, but to increase it after the country’s accession to the
EU as well, validates the chosen vector for the further socio-economic
development. In particular, it is about domestic agriculture, which
employs about 1/5 of the working population. European integration in
addition to Brussels financial aid in the amount of Euros 1.5 billion
allowed Poland to declare itself as a leader in production of high-quality
organic food products. Apart from that, the investment confidence rating
is increased by Poland’s positioning as a country with highly qualified
personnel potential, high level of production facilities security and
favorable location.
Proactive governmental efforts focused on protection of the national
producers’ interests and thorough examination of the national interests
in the draft laws proposed by the European Parliament have not only
resulted in the positive dynamics of socio-economic development, but in
the influx of foreign investments as well.
In the context of the described above, application of a complex of
tools for strategic management of competitive advantages of Poland and
its regions based on the concept of dynamic capabilities of the resource
approach is considered appropriate. Both the resource approach and the
concept of dynamic capabilities, by focusing on the importance of
decisions on formation resource combinations for the purposes of
obtaining economic effect (mainly the entrepreneurial aspect of the
strategy is manifested in these decisions), simultaneously devote much
attention to internal organizational and functional managerial
Monitoring of the Investment Climate
I. Single-leveled The investment
climate of a State is monitored
without decomposition
into structural elements.
II. Two-leveled The investment
climate is monitored at
macro- and meso-scale
III. Multi-leveled The investment climate of inter-
regional, regional entities and industries
is recorded.

45
mechanisms, which allows to achieve efficiency for the long term.
Along with that, the concept of dynamic capabilities, which considers
the essence of both sources and mechanisms of creation as well as
retention of competitive advantages, is more progressive in terms of
development of organizational and managerial skills as well as skills in
assimilation of new business potential.
The dynamic version of the resource approach undeniably prevails in
managing Poland’s competitive advantages and enhancing investment
activity on its economic territory. The potential of dynamic capability
concept is particularly important, since it allows to add economic
benefits and organizational nature of competitive advantage plus time
factors and managerial factor of managers to the characteristics of the
resource approach.
In view of this, Poland’s investment activity depends on long-term
and sustainable competitive advantages. In this context, the “period of
competitive advantages” means maximization of the interval for
maintaining and improving the overall evaluations (rating) of the
favorable investment climate in the country. “Sustainability of
competitive advantages”, in turn, is determined by the following three
key factors: consistency of the sources of such advantages, quantity and
quality of the sources of competitive advantages, as well as feasibility of
multiplying new sources of such advantages.
According to the degree of sustainability, the following types of
competitive advantages are distinguished most commonly:
- low sustainability level. Such advantages are characteristic of other
States as well, and when the tools of IA incentive mechanism are applied,
can affect the change of geographical localization of investment activity;
- medium sustainability level. This type includes advantages held for
a longer period. In particular, it is the question of production of unique
goods (works, services), possession of progressive technologies,
reputation and prospects of investment facilities, special resource
capabilities, etc.;
- high sustainability level. This type of competitive advantages
requires a combination of a significant amount of capital investment
with high quality IA management. This group includes Poland’s brand
and association of “made in Poland” mark with undeniable quality of
goods produced in the country, new discoveries, new technologies, etc.
The process of formation and support of Poland’s competitive
advantages at medium and high sustainability level covers the entire
economic managerial mechanism. The basic principles for creation and

46
enhancing the complex of national competitive advantages are the
following:
- motivation of innovation and investment entrepreneurship in all
spheres of economic activity by the State Government;
- improvement and expansion of the number of sources of
competitive advantages contributing to strengthening Poland’s position
on the world market;
- implementation of systematic, integrated and balanced approaches
to formation of Poland’s image as a unique country with diverse
competitive advantages.
Taking into consideration the requirements of the system approach,
methodological tools for evaluation the efficiency of investment activity
of the investors based on the concept of balanced indicators system
seems appropriate.
Sustainable investment development support system includes a fairly
wide range of tools that can be used by both national and regional
authorities. Special mention should be made to such a tool as
benchmarking, which has proven itself in world managerial practice.
Benchmarking is a comparative analysis with the best world
practices for the purposes of identifying strengths and weaknesses, as
well as constructing a strategy for the further development.
Benchmarking successfully proved itself as a business practice in the
1980s, gradually gaining importance in the methodological toolset of the
major companies in many world countries. In studies of the post-crisis
period (after the global financial crisis of 2008 – author’s note)
benchmarking was first recognized as one of the most popular
management tools (Rigby & Bilodeau, 2009).
In our opinion, it is the benchmarking analysis or analysis of the best
practices of management of the development of investment activity that
will enable to form an efficient investment strategy for Poland for the
coming period.
Malaysia is one of the best benchmarks of investment development
management. Malaysia is a small but rather successful country.
Economic growth has been observed over the past 9 years, when Najib
Tun Razak, the author of fundamental changes in the strategy for
economic development, entered Prime Minister’s office.
Due to the decisive actions of the Malaysian government, the country
has managed to reduce external dependence on oil from 40% to 14%
over the past six years, as well as reduce budget deficit from 6.4% to
3.1%. The country’s GDP growth amounted to 50%, and investment
47
increment of growth amounted to 12%, with private sector prevailing
over the public in the overall structure. Over the past year, 1.8 million
jobs have been created in the country with 30 million in the total
population in Malaysia. Of the total number of jobs created, 1.5 million
or 83% are in 12 priority sectors of the national economy.
According to ASEAN (Association of South East Asian Nations –
author’s note) Malaysia is recognized as the only country, apart from
Singapore, which has retained investment rating of its liabilities. Many
international institutions have recognized positive changes in the
country, which is confirmed by nominations in international awards for
innovations in public administration.
Reform of the managerial system is implemented according to the
BFR (big fast results) methodology, which includes 8 interrelated
“stages”.
Thus, the amount of GNI (gross national income) rather than GDP
was chosen as the main efficiency criterion. From this perspective,
ranking or prioritization of sectors of the national economy was
performed. As a result, the Malaysian government has identified 12
leading sectors of the economy capable of making the maximum
contribution to the GNI growth.
The next stage involved laboratory testing (research in analytical
groups – author’s note) based on the bottom-up principle. The essence
of the process was in the development of strategies by twelve focus
groups (in the context of each of the 12 priority sectors of the economy
– author’s note). Groups of 30-40 experts formed a priority actions
program, expressed and tested hypotheses, simulated results, etc. for 6
weeks through brainstorming.
Stemming from active stage of strategic analysis and planning, a
program management plan for the next 10 years was developed.
Furthermore, a state supervision system over implementation of the
strategy was developed as well.
The next stage involved consideration of the strategy with the parties
concerned. Arrangements provided for in the strategy were presented to
the general public.
Next, the Roadmap of the Malaysian National Transformation
Program was compiled and published on the PEMANDU website
(https://www.pemandu.org/). It clearly indicated organizations
responsible for a particular project, amount of budget allocated and the
project execution period.
The next stage is called Key Performance Indicators. KPIs were

48
developed and confirmed as early as the laboratory stage and indicated
efficiency of a particular manager based on execution period and degree
of completion of the tasks prescribed by the strategy.
Next comes Implementation stage, which involves a variety of
components. Thus, one of these components is the ministerial scorecard.
The fact is that the Cabinet of Ministers of the country receives
evaluation cards from the Prime Minister, which are published on the
PEMANDU website, every six months. This contributes to concurrence
of government actions with simultaneous monitoring of each leader’s
managerial efficiency.
The methodology is followed by Invitation of External Experts stage
with the aim of conducting an independent and objective evaluation of
the governmental actions in implementation of the national development
strategy. An annual tender has been conducted and auditors from the Big
Four countries have been invited since 2009. The complete audit of
implementation of the national transformation strategy includes analysis
of data on road construction, commissioned infrastructure facilities, etc.
What is more, independent audit expertise is important for evaluation of
the national competitiveness of Malaysia in the context of global
competition.
And finally, the last stage of the methodology under research is
presentation of the annual report [1].
A detailed analysis of the described best practice of investment
development in Malaysia allows to identify efficient mechanisms for
implementation of investment projects on the economic territory of
Poland and improvement in the investment environment of the country
as a whole. Thus, high priority and necessary measures to attract
investment resources to the country’s economy are the following:
- formation of an efficient strategy for managing the IA
development;
- implementation of an efficient promotional campaign for Poland’s
uniqueness as an efficient investments recipient;
- collection of complete information (monitoring – author’s note) on
the socio-economic environment of the country and its regions;
- motivation of local authorities’ incentive in improvement
investment attractiveness of the regions;
- screening (selection – author’s note) of socially responsible
investment projects;
- promotion of public investment or crowdfunding of investment
activities;
49
- involvement of experts (including international – author’s note) to
solve non-diversified and specific IA problems;
- maximization in promoting development of international
cooperation to introduce positive foreign experience into practice.
References: 1. Исаев Н. Польша - постосоциалистический оазис в высыхающей
пустыне мирового капитализма URL:
https://www.crimea.kp.ru/daily/26746.4/3774487/
2. Крылов А.В. Инвестиционный климат, бизнес-среда и их развитие
для регионов и муниципальных образований URL:
http://crimea.gov.ru/content/uploads/files/mohelp/%D0%9E%D0%9A
%D0%9C%D0%9E28.02/investprivlekatelnost.pdf
3. Нехайчук Д. В. Інвестиції як інструмент подолання кризових
явищ: теоретичні аспекти та практична спрямованість / Д. В.
Нехайчук // Вісник соціально-економічних досліджень. – 2012. –
Вип. 3(2). – С. 104-107.
4. Норткотт, Д. Принятие инвестиционных решений [Текст] / Д.
Норткотт: пер. с англ. под ред. А. Н. Шохина. – М.: Банки и
биржи, ЮНИТИ, 1997. – 247 с.
5. Вазов Р. Предприемачество и глабализация, "VUZF Review",Online
journal for economics, Volume 4(8), Number 1, 2019 ISSN 2534-9228
6. Machashchik P., Britchenko I., Cherniavska T. New Trends in
Development of Services in the Modern Economy [Text] / P.
Machashchik, I. Britchenko, T. Cherniavska //Wydawnictwo
Państwowej Wyższej Szkoły Zawodowej im. prof. Stanisława
Tarnowskiego w Tarnobrzegu, Tarnobrzeg, 2018. – 210 p.
7. Боги блокчейна: технология может разрушить бюрократию
государств. URL: http://www.forbes.ru/tehnologii/344141-bogi-
blokcheyna-tehnologiya-mozhet-razrushit-byurokratiyu-gosudarstv
8. Jajuga K. Wprowadzenie do inwestycji finansowych URL:
http://docplayer.pl/928124-Wprowadzenie-do-inwestycji-
finansowych.html
9. Брітченко І.Г. Планування інвестиційних ризиків та механізми їх
мінімізації // Вісник Технологічного університету Поділля – Том 3:
економічні науки, вип. 5.2002 - Хмельницький: ТУП, 2002.- С. 171-
174.
10. Брітченко І.Г. Передумови сталого розвитку національних
соціально-економічних систем, що формують Європейський Союз
/ Брітченко І.Г., Стьопочкін А.І. // Економіка і організація
управління. Збірник наукових праць ДонНУ - Вінниця. - Випуск № 3
(23). - 2016. С. 40-49.

50
Dmuchowski Robert
PhD in Economics
Szmitka Stanislaw
PhD in Economics
University of Computer Sciences and
Economics
(Olsztyn, Poland)
THEORETICAL
INTRODUCTION TO
ISSUES OF
FINANCIAL
ANALYSIS
Introduction
In literature on economics, financial analysis is not always
recognized as a microeconomic science and a lot of scientists treat
financial analysis as an integral part of accounting. As a rule, it is
assumed that it is an integral part of the economic analysis of a
company. The economic analysis of a company includes phenomena
occurring in this company, measurement of relationships and
dependences between the phenomena studied as well as their assessment
(Gabrusewicz, 2014, p. 16). Accounting is characterized by a strictly
defined research subject as well as a research method, and these two
features distinguish it from financial analysis.
The company’s financial analysis is necessary to assess its financial
situation and to make proper future business decisions. Financial
analysis is one of the basic tools to optimize company’s results.
The results obtained thanks to the analysis help the company’s
management in a decision-making process in the field of finance and
control of processes occurring in a company and in comparing them
with the adopted assumptions.
The article presents the sources of financial analysis, thanks to which
a company has a chance to make better decisions and thus to develop
more effectively. It also discusses the types and methods of financial
analysis, its goals, function and role in the company management.
Essence, scope and types of financial analysis Financial analysis deals with static assets and capital at a given
balance sheet moment, i.e. equipping companies with fixed assets and
working capital as well as sources of financing this property with
division into equity and borrowed capital. This is characterized by the
financial situation, i.e.
51
- paying and credit capacity,
- efficient investment of funds, including management of achieved
financial surpluses.
Financial analysis also deals with results, which are a dynamic
subject of the study and determine the effects of operations. The results
are determined in relation to a certain financial period. The analysis
covers net financial result of all activities, partial results obtained in
particular types of activities as well as the factors shaping the financial
result of a company (Grzenkowicz, 2007, p. 16).
A broad range of financial analysis is highlighted in the literature,
including:
- economic analysis of a company;
- company’s environment analysis.
The main task of financial analysis is to study the past. Analyzing
what happened in the recent past is very helpful for a company to draw
quick conclusions that will be useful in the current management.
Analyzing what happened in the past is aimed at explaining the
company’s successes in terms of size, assets, market position and
showing the impact of these achievements on the further development of
this company.
The company’s revenues, costs of obtaining them and achieved
profits are expressed in a financial form, therefore the analysis of the
economic efficiency of company’s operations should be conducted
through its prism.
The assessment of the company’s financial standing is made from
various points of view and on a different scale and is the most important
element of its competitive position, credibility and economic strength on
the market, which has a significant impact on trust of contractors and the
opinions created about this company. Therefore, making a financial
analysis and its results cannot be just an internal matter of a company.
The analysis should also be carried out from the point of view and with
the use of criteria and methods that would be adopted by the partners in
assessing the financial position of a company.
Financial analysis according to the following criteria:
Adopted methods:
Functional analysis is one of the most important types of financial
analysis. It is based on the analysis of segmental phenomena occurring
in a company, often without proper connection with other phenomena.
Of course, in addition to advantages, functional analysis also has
disadvantages, including:
52
- subjectivity of assessments;
- lack of proper selection of information, thus important and
irrelevant information is mixed;
- lack of hierarchy, fragmentation of research without sufficient
consideration of interrelationships and dependencies of the studied
economic phenomenon.
Comprehensive analysis covers all phenomena occurring in
a company at a given time in various relationships and conditions. In
this analysis it is possible to separate important phenomena from
insignificant ones and causes from effects due to the fact that this
analysis organizes all phenomena according to the hierarchy of
importance. Comprehensive analysis is one of the more difficult and
time-consuming analyzes and requires a comprehensive view of a
company. As a result, comprehensive analysis is more accurate
compared to functional analysis. It is a tool to learn and evaluate
economic phenomena occurring in a company.
Decision analysis is focused on providing information that makes it
easier for a company to make specific decisions. This analysis examines
phenomena both in the cause-effect and chronological order. Thanks to
this analysis, a company finds the answer to the question what decision
should be made to have a positive impact on the business and results of
the company in the future. The scope of the analysis depends on nature
of the studied problem:
The scope of analytical research:
The overall analysis applies to all phenomena occurring in
a company.
Depending on the purpose, this analysis can be carried out at a
general or specific level.
Section analysis deals with a selected area of a business activity,
which is why it is often called problem analysis.
Research specificity:
General analysis covers all business activities of a company and is
based on a narrow group of appropriately selected synthetic indicators.
General analysis is useful mainly for general assessment of economic
activity, as it lacks research on interrelationships among economic
phenomena. Its value in making economic decisions is small
(Sierpińska, Jachta, 2007, p. 17).
Detailed analysis involves a detailed and wide range of information
and indicators to study the problem. Detailed analysis is a very labor-
intensive analysis, but it is necessary to improve the areas of business
53
activity and financial condition of a company.
Forms of research:
Ratio analysis provides information on the company’s financial
situation and results of its operations on the basis of a set of logically
related indicators. The value of the indicators, their changes as well as
the relationships between them make it impossible to assess the
company’s activities and constitute the basis for drawing conclusions
regarding the future (Gabrusewicz, 2014, p. 35).
Billing analysis studies the relationships that occur between
economic phenomena. It is helpful in assessment and identification of
factors that shape the studied phenomenon and their impact on the result
of the business activity. This analysis is very labor-consuming and
requires very high knowledge of the problems associated with business.
Time covered by the analysis:
Retrospective analysis includes an assessment of the results of
activities taken in the past. However, it cannot be focused only on
exploring the past without trying to participate in the future of
enterprises. The concentration of all decisions at the enterprise level
shifts the focus from the retrospective assessment of an enterprise to the
prospective assessment. However, retrospective analysis will continue to
be the basis for verifying the correctness of past decisions and starting
point for current and future intentions (Sierpińska, Jachta, 2007, p. 17).
Current analysis concerns collecting information on the
implementation of tasks at a given time, comparing current results with
assumptions, determining deviations so that organizational departments
can react in time. Current analysis is very useful in business
management due to the quick provision of information.
Prospective financial analysis is used to shape the company’s
strategy. It has a decisional character, thanks to which it is very helpful
in making many decisions. Thanks to the methods used for the
prospective method, it allows to evaluate various projects and choose
the best one. Prospective analysis includes not only internal analysis but
also external conditions This analysis facilitates the creation of an
appropriate strategy for the development of a company, based on the
assessment of opportunities and threats from the environment as well as
strengths and weaknesses of this company.
Purpose of analysis:
External analysis is intended for external entities including banks,
shareholders, customers, potential employees, etc. This analysis can be
the basis for cooperation with new contractors.

54
Internal analysis is used to meet the needs of busiensses. It is used to
assess the company’s operations and helps in making decisions. Internal
analysis is generally more detailed than external analysis.
Sources of financial analysis
The balance sheet is the basic element of the company’s financial
statement, it presents the state of assets and sources of their financing at
the time of its preparation. The components of the balance sheet are
presented in Table 2.1. This is a presentation of a company at its static
moment (Sierpińska, Jachta, 2007, p. 50). According to the Accounting
Act, assets are ranked according to increasing liquidity in the balance
sheet, and liabilities according to increasing chargeability (Gołębiowski,
Tłaczała, 2005). The balance sheet is an accounting document and also
one of the elements of the financial statement prepared at the end of
every financial year. The closing balance of a financial year is an
opening balance of a new year. The balance should be absolutely
balanced, i.e. assets and liabilities should show the same value. To
increase its analytical value, the balance sheet includes assets and
liabilities from the current financial year as well as from the previous
financial year. An analysis of the possessed assets which are on the
balance sheet plays an important role in assessing the company’s
resources and its development. The highest cognitive value in terms of
changes in the size of assets is attributed to the growth dynamics rate
(Leszczyński, A. Skowronek-Mielczarek, 2004, p. 81). If the growth
dynamics rate is positive, it means that the company developed in the
time covered in the balance sheet. The structure of assets, thanks to
which it is possible to study relationships in the property structure, is an
important complement in the analysis of any company. The balance
sheet is assessed after calculating the structure and dynamics of assets.
Thanks to this, the person who analyses the financial statements and
assesses a given company on the basis of information it presents in the
balance sheet, has current and historical data – on its basis it is possible
can assess the tendency of changes taking place in an entity (Ambroziak,
2010, p. 45). Assessment of the balance sheet is made by an analyst. The
quality of this assessment depends on their economic knowledge and
skills. The basic principle that should guide this assessment is striving to
find the largest possible number of relationships and dependencies
between changes in individual items of reports and interpretations
against the background of the current situation of both the industry and
the entire economy (Dudycz, 1998, p. 28). When analyzing individual

55
items of the balance sheet, attention should be paid to the share of items
in the structure of the balance sheet total and to dynamics. The
company’s balance sheet gives a picture of the company’s assets and
capital situation. To assess this situation, it is necessary to determine the
relationships that exist between individual company assets and sources
of their financing. Knowledge of the dependencies that occur among
these elements is useful for an entrepreneur for the purpose of company
management, but it can also be useful for other business entities from
their environment.
Table 2.1
Components of the balance sheet
ASSETS LIABILITIES
A. Fixed assets
I. Intangible assets
II. Property, plant and
equipment including:
fixed assets, fixed assets
under construction
III. Long-term receivables
IV. Long-term investments,
including: real estate/assets,
long-term financial assets
V. Long-term accruals
B. Current assets
I. Stocks
II. Short-term receivables,
including: for supplies and
services, including: - up to 12
months, - over 12 months.
III. Short-term investments,
including: short-term
financial assets, including: -
cash in hand and on bank
accounts
IV. Short-term accruals
C. Called up share capital.
D. Own shares.
A. Own capital (fund)
I. Basic capital (fund)
II. Supplementary capital (fund),
including: excess sales value (values issue)
over the nominal value of shares (shares).
III. Revaluation capital (fund),
including: - due to fair value updating.
IV. Other reserve capitals (funds).
V. Profit (loss) from previous years.
VI. Net profit (loss).
VII. Charges to net profit during the
financial year
B. Liabilities and provisions for
liabilities
I. Provisions for liabilities, including: -
provision for retirement and similar
benefits
II. Long-term liabilities, including: - credits
and loans.
III. Short-term liabilities, including:
a) credits and loans
b) for supplies and services, including:
- up to 12 months,
- over 12 months,
c) special funds.
IV. Accruals
ASSETS TOTAL LIABILITIES TOTAL Source: own study based on M. Sierpińska, T. Jachta, Enterprise evaluation
according to world standards, PWN (Polish Scientific Publishers), Warsaw 2007.

56
The company’s balance sheet analysis consists of two stages:
- initial balance sheet analysis;
- indicator balance sheet analysis.
Financial analysis methods
Many research methods are used in financial analysis. Their
selection depends on (Gabrusewicz, 2014, p. 43):
- adopted goal of analysis;
- stage of analysis;
- subjective and time range of analysis.
The methods of financial analysis according to the adopted criterion.
Due to the methodology, the methods of analysis are divided into:
• general methods,
• specific methods,
• induction methods,
• deduction methods,
General methods are based on the principles of logic, on the correct
thinking, combining facts and effects, and on the correct inference. The
task of these methods is to analyze phenomena that are interdependent
and make accurate inferences about their formation. These methods are
most often adopted from various scientific fields, e.g. statistics.
Specific methods are typical methods that can be applied to financial
analysis. They are based on studying the changes in phenomena and
explaining their effects and causes. Specific methods also allow to
analyse the relationships that occur between the studied phenomena.
Due to the order of research, the methods of analysis are divided
into:
Induction method – in induction methods the research begins with
specific phenomena and gradually moves to generalizations and
conclusions as a synthesis of the analytical process. This is a top-down
method, it goes from factors to results and from causes to effects, which
is why it is often called the merging method. Financial analysis carried
out by means of the induction method begins its research from all areas
of company’s operations and factors involved in these operations and
only at the end is it determined what impact the management of these
factors had on the financial result. This method has many advantages,
but unfortunately it also has disadvantages such as the fact that it is
time-consuming.
Deduction method works in the opposite direction as the induction
method, i.e. it conducts research from general to detailed aspects, from
57
results to factors and from effects to causes. This method begins with
the general determination of the research problem and gradually goes
into details, which allows to explain the causes and effects that occur in
general phenomena. With this method, the financial result is analysed as
first and only then the factors that influenced this result are studied. The
deduction method is one of the more difficult methods used in practice.
Due to the stage of analysis, the methods are divided into:
• initial stage (qualitative, comparisons),
• in-depth (causal) stage.
The initial stage of empirical research aims to identify the
phenomenon in question, recognize its essence, measure its size and
possibly intensity. Therefore, in the initial stage, qualitative analysis and
comparison methods are widely used (Gabrusewicz, 2014, p. 47).
The method of comparison, the in-depth stage, compares at least two
quantities, one of which is the subject of comparison and the other its
basis of comparison. The differences between the analyzed phenomenon
and the phenomenon being the basis for comparison are called
deviations.
Due to the form of description, the methods are divided into:
qualitative and quantitative.
Qualitative analysis methods do not give a numerical representation
of the studied phenomenon or relationships and dependencies that occur
among them. The results of this method are presented in a descriptive
form. In the qualitative method, an analytical scheme is chosen to study
phenomena. Such a model contains only significant elements of the
phenomenon under consideration that present simplifications of the
complex reality of the economy, therefore the results of this method are
not always clearly defined. Therefore, the results are not sufficient to
fully recognize the analysed phenomena. However, it is recommended
to use them in two cases:
- when collecting and processing numerical data is not possible or
too costly,
- when qualitative analysis is treated as a preliminary method, after
which in-depth quantitative analysis methods will be used
(Gabrusewicz, 2014, p. 47).
Quantitative methods can be divided into two groups:
- deterministic methods which include: chain substitution method,
differentiation method, partial difference method, functional method and
logarithmic method. The deterministic method determines in advance
the form of dependence as well as the type and number determining this

58
quantity. The purpose of this method is to examine how much of the
deviation in the analysed phenomenon results from the action of
individual factors.
- stochastic methods are more precise than deterministic methods
because they take into account not only the basic factors that had an
impact on the analysed phenomenon but also the influence of secondary
and random factors. Stochastic methods allow for a broader
understanding of the relationships that occur between economic
phenomena. The most important stochastic methods include: statistical
methods, econometric methods, taxonomic methods and discriminatory
methods.
Summary
The article discusses theoretical issues in the field of financial
analysis, which is an indispensable tool for measuring and assessing
a company’s financial result. It also helps to present its property and
capital situation.
The study of the literature on the subject helped to learn about the
issues in the field of economic analysis. It also allowed to learn about
the role of economic analysis in the enterprise management process, as
well as assessment methods and measuring the financial condition of a
company. The knowledge of the above theoretical issues will practically
help companies in assessing financial standing.
Effective management is an important factor. Owing to financial
analysis, a business entity obtains a lot of valuable information about the
financial condition, structure of economic processes and causal relations
between them.
References: 1. Ambroziak M. (2010), Analiza sprawozdań finansowych, C.H,
Warszawa.
2. Buk H. (2005), Sprawozdawczość i analiza finansowa
przedsiębiorstwa, WAE, Katowice.
3. Dudycz T. (1991), Analiza Finansowa, WAE, Katowice.
4. Gabrusewicz W. (2014)., Analiza finansowa przedsiębiorstwa. Teoria i
praktyka, PWE, Warszawa.
5. Gołębiowski G., Tłaczała A. (2005)., Analiza ekonomiczno - finansowa
w ujęciu praktycznym, Difin, Warszawa.
6. Grzenkowicz N. (2007), Analiza ekonomiczna przedsiębiorstwa, WWZ,
Warszawa.
59
7. Leszczyński Z., Skowronek-Mielczarek A. (2004), Analiza ekonomiczno-
finansowa Spółki, PWE, Warszawa.
8. Ostrowska E. (2007), Rynek kapitałowy, PWE, Warszawa.
9. Sierpińska M., Jachta T. (2007), Ocena przedsiębiorstwa według
standardów europejskich, PWE, Warszawa.
doc. Ing. Kubičková Viera, PhD.
Associate Professor
Ing. Čukanová Miroslava, PhD.
Assistant professor
doc. Ing. Benešová Dana, PhD.
Associate Professor
University of Economics in Bratislava
(Bratislava, Slovakia)
THE IMPACT OF
SOCIO-
TECHNOLOGICAL
CHANGES ON
SERVICE
A major feature of the developed economy is the economically
strong service sector. This phenomenon of today’s modern economy –
the economy of services, is present due to globalization, which supports
the processes of de-industrialisation and moves production to the less
developed countries. The level of societal advancement supports the
development of public services, and specialization results in
strengthening of manufacturing services. As a result of these processes,
there is a growth in production and employment in services, which
accounts for 75% of total employment in Europe’s advanced economies
(Belgium, Denmark, the Netherlands, Norway, Sweden) (OECD 2015;
WBG 2016). The transformative power of service innovation
emphasizes the legitimacy of intermediate demand for services. Changes
in the lifestyle of today’s modern man cause new requirements for
demand for market services. These processes are dynamized by the
effects of socio-technological changes. Adaptation to changes is thus a
challenge for the production of services. It is therefore justified to
address the impact of socio-technological changes on demand for
services. The aim of the study is to verify the relationship between
changes of society and technology and the demand for services.
The demand for services reflects the interdependence between the

60
amount of services required and their price. The current evolutionary
demand theory drives interest in assessing the impact of other factors
that change the demand. It also inspires behavioural economics and
changes in consumer behaviour (Valente, 2012). In addition to price and
consumer behaviour, the authors also indicate the possibility of
substitution by other goods, consumer incomes, economic and political
situation influenced by socio-technological changes as relevant factors
(Hachula, Schmeidel, 2016).
A comprehensive approach to the expression of the relationship
between socio-technological change and the demand for services is a
rather complex problem. Partial examinations of the above mentioned
problems are known and stated in Table 2.2 and 2.3. In order to meet the
intent of a comprehensive approach, the study links the theory of
transaction costs and the level of the institutional environment of
economies, to reflect the level of adaptation to changes in the economy.
It uses the Index of Economic Freedom and Networked Readiness
Index. As well as, the work provides a systematization of knowledge
about the impact of changes in society and technology with the impact
on the demand for services.
Societal changes
The world economy is undergoing turbulent changes that are
triggered by many circumstances, many of which are global, others on
the other hand have a more local character (Balбћ, Hamara and
Sopkovб, 2015). The most commonly reported societal changes are
population ageing, migration, globalization and global warming (EC,
2010). Changes in society are the subject of exploration of several social
sciences, such as sociology, psychology, economics, political science, or
anthropology. These changes affect all areas of the society worldwide.
At the societal level, they affect social institutions, politics, economics,
education, technology, the legal system, family, religion and many
others. At the individual level, they form values, attitudes, opinions, and
behaviours. Changes affect and alter our way of life (UNCW, 2016).
According to Sopуci (2007), societal changes are taking place in five
areas (population, family, education, economics, and change in power
relations). However, the authors and relevant studies are expanding this
group in the context of a more rigorous specification. Table 2.2 below
summarizes the theoretical approaches available to authors for societal
changes. At the same time, it refers to departments of services, where

61
demand is changing most markedly due to the effects of societal
changes.
Table 2.2
Areas and Indication of societal changes, consequences for service
demand within these branches
Are
a Indication Authors Exposed impacts on
demand for services
(SERVICE
BRANCHES*)
PO
PU
LA
TIO
N
Ageing of the
population;
Migration;
Differences in living
standards;
Quantitative
population growth;
Extending of
average life span;
Security;
Sopуci,
2007;Pбlenнk, 2012;
Pбlenнk, 2014;
Puљkбrovб, 2016;
Staтek, 2016;
Euromonitor Resear
ch,2015;European
Commission, 2014b;
Kusб, 2015;
Hawkins, Best-
Coney, 1993; Ther,
2016;
Christophorou,
2016; Michalovб, et
al. 2013; Arltovб et
al., 2016; DESA,
2010; Van der
Linden 2015;
Q – increased demand
for health and social
care
Q – increased demand
for nursing services;
G – qualitative and
quantitative changes
in retail with
specialized food,
clothing, medical aids;
R – qualitative and
quantitative changes in
art, entertainment and
recreation;
O, E, N – changes in
demand for public
services and security;
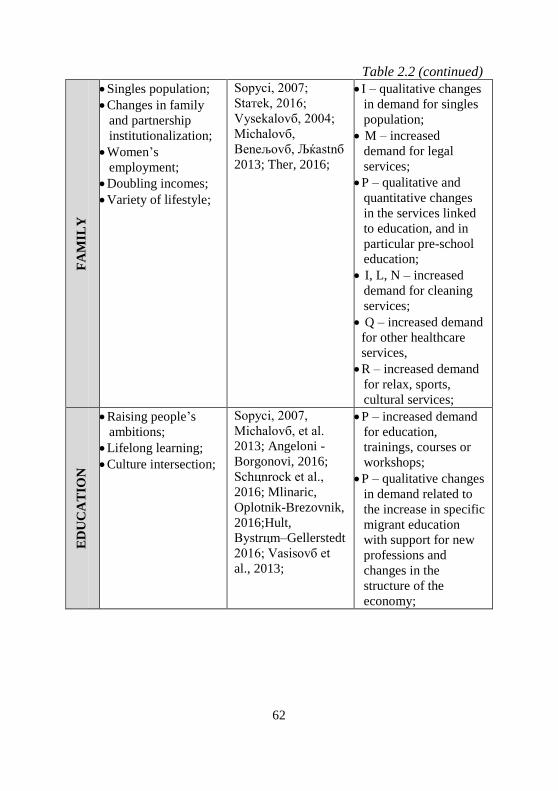
62
Table 2.2 (continued) F
AM
ILY
Singles population;
Changes in family
and partnership
institutionalization;
Women’s
employment;
Doubling incomes;
Variety of lifestyle;
Sopуci, 2007;
Staтek, 2016;
Vysekalovб, 2004;
Michalovб,
Beneљovб, Љќastnб
2013; Ther, 2016;
I – qualitative changes
in demand for singles
population;
M – increased
demand for legal
services;
P – qualitative and
quantitative changes
in the services linked
to education, and in
particular pre-school
education;
I, L, N – increased
demand for cleaning
services;
Q – increased demand
for other healthcare
services,
R – increased demand
for relax, sports,
cultural services;
ED
UC
AT
ION
Raising people’s
ambitions;
Lifelong learning;
Culture intersection;
Sopуci, 2007,
Michalovб, et al.
2013; Angeloni -
Borgonovi, 2016;
Schцnrock et al.,
2016; Mlinaric,
Oplotnik-Brezovnik,
2016;Hult,
Bystrцm–Gellerstedt
2016; Vasiѕovб et
al., 2013;
P – increased demand
for education,
trainings, courses or
workshops;
P – qualitative changes
in demand related to
the increase in specific
migrant education
with support for new
professions and
changes in the
structure of the
economy;
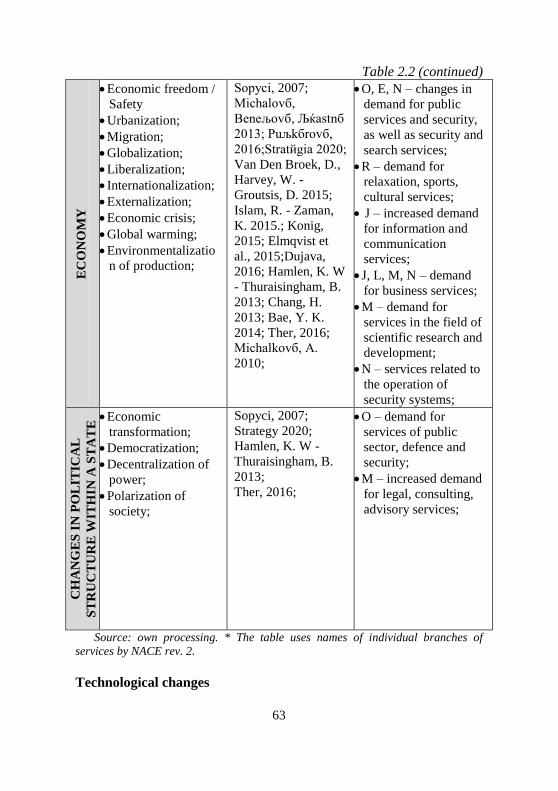
63
Table 2.2 (continued) E
CO
NO
MY
Economic freedom /
Safety
Urbanization;
Migration;
Globalization;
Liberalization;
Internationalization;
Externalization;
Economic crisis;
Global warming;
Environmentalizatio
n of production;
Sopуci, 2007;
Michalovб,
Beneљovб, Љќastnб
2013; Puљkбrovб,
2016;Stratйgia 2020;
Van Den Broek, D.,
Harvey, W. -
Groutsis, D. 2015;
Islam, R. - Zaman,
K. 2015.; Konig,
2015; Elmqvist et
al., 2015;Dujava,
2016; Hamlen, K. W
- Thuraisingham, B.
2013; Chang, H.
2013; Bae, Y. K.
2014; Ther, 2016;
Michalkovб, A.
2010;
O, E, N – changes in
demand for public
services and security,
as well as security and
search services;
R – demand for
relaxation, sports,
cultural services;
J – increased demand
for information and
communication
services;
J, L, M, N – demand
for business services;
M – demand for
services in the field of
scientific research and
development;
N – services related to
the operation of
security systems;
CH
AN
GE
S I
N P
OL
ITIC
AL
ST
RU
CT
UR
E W
ITH
IN A
ST
AT
E Economic
transformation;
Democratization;
Decentralization of
power;
Polarization of
society;
Sopуci, 2007;
Strategy 2020;
Hamlen, K. W -
Thuraisingham, B.
2013;
Ther, 2016;
O – demand for
services of public
sector, defence and
security;
M – increased demand
for legal, consulting,
advisory services;
Source: own processing. * The table uses names of individual branches of
services by NACE rev. 2.
Technological changes

64
Rapid scientific and technological advancements and increased
dependence on technologies affect the labour market, employment and
work organization (Cascio – Montealegre, 2016). Technological
development has fundamentally altered the production of services,
products and strengthened the role of product-related services, thereby
enabling individualization of production (Obadi et al. 2016). The growth
of the service sector in the economy is related to its faster ability to
interact, the ability to communicate with stored information anywhere
and anytime via the Internet (Demirkan, Spohrer and Krishna, 2011. The
following Table 2.3 systematises the theoretical approaches of authors
who identify the demand for services influenced by technological
advances.
Table 2.3
Areas and indication of technological changes, consequences for
service demand within these branches
Are
a
Indication Authors Exposed impacts on
demand for services
(SERVICE
BRANCHES*)
INT
ER
NE
T
ICT expansion;
Accelerating
business
processes;
Network
connection of
enterprises;
E-commerce and
trade;
Social media;
Safety and
security;
Michalová,
Benešová,
Šťastná, 2013;
Stratégia 2020;
Baláž et al.
2015;Gartner,
2016; Thangavel
- Vanmathi,
2015,
Komorowski, M.
et al. 2016;
Pereira et al.,
2015, Noury,
Sevrin - Massot,
2016; Biahmou et
al., 2016
European
Commission,
2014c; Smolarek,
M. - Witkowski,
M. 2015;
G – increase the number of
on-line purchases;
J – demand for ICT
services in connection with
the use of mobile services
and smart devices;
J – demand in IT
consulting;
M – demand for legal
services;
O – changes in demand in
connection with removal of
legislative barriers and
creation of a single market
for services;
N – services related to the
operation of security
systems;

65
Table 2.3 (continued) IN
DU
ST
RY
4.0
Digitalization; Staňek, 2016;
Theorin, 2016;
Foidl - Felderer,
2016; Christmann
et al., 2016;
Biahmou et al.,
2016;
Hlušková, 2016;
Blanchet et al.
2014; Krueger –
Harris, 2015;
J – increased demand for
knowledge-intensive high-
tech services (computer
programming);
M – demand for scientific
research and development;
INT
ER
NE
T O
F
TH
ING
S
Connection of
systems;
Staňek, 2016;
Gartner, 2016;
Suja, 2014;
Reddy et al.
2016; Weber - E.
Studer, 2016;
Biahmou et al.,
2016;
J – increased demand for
knowledge-intensive high-
tech services;
M,O – demand for services
focused on the scientific
research and development;
M – demand for legal
services;
BIG
DA
TA
Modelling and
influencing socio-
economic
processes;
Personalization of
services;
Security;
Staňek, 2016;
Gartner, 2016;
Suja, 2014;
McKinsey -
Company, 2011;
UNECE, 2013;
Anshari - Lim,
2016;
Rehman et al.,
2016; Biahmou et
al., 2016;
M – demand for IT services
in the field of research,
surveys in relation to the
increase in the number of
not-analysed data;
M,O – demand for legal
services with an emphasis
on generating new data
processing and data
protection regulations and
directives;
N – services related to the
operation of security
systems;

66
Table 2.3 (continued) 3
D P
RIN
TE
RS
Individualization
of production;
Staňek, 2016;
Gartner, 2016;
Cutting et al.,
2015; Umair -
Kim, 2015; Ng -
Pang, 2016
Biahmou et al.,
2016;
J – increased demand for
knowledge-intensive high-
tech services, such as
computer programming in
the section;
CL
OU
D
Data range
availability;
Technology
sharing;
Security;
Staňek, 2016;
Gartner, 2016;
Suja, 2014; Joshi,
2016; Yi, Wei -
Song,
2017;Hallová,
2013; Biahmou et
al., 2016; Iqbal, S
et al. 2016;
Kazim, M -
Evans, D. 2016;
J, M – demand for data
processing in the field of
collection, storage, sorting,
transmission, access,
analysis and interpretation
is related to the demand for
knowledge-intensive, high-
tech services;
N – services related to the
operation of security
systems; Source: own processing. * The table uses names of individual branches of
services by NACE rev. 2.
Explaining the level of adaptation of the economy to societal and
technological changes in the context of Institutional and New
Institutional Economic Theory
The way and the extent to which the economy copes with societal
changes are reflected in the level of transaction costs in the context of
Institutional and New Institutional Economic Theories. These theories
are the basis for recognizing transaction costs as a parameter that has the
ability to express the level of institutional set-up in the economy. The
subject of institutionalization are the institutions, their origin,
development, function in the behaviour and decision-making of
economic subjects. According to D. C. North, the institutions represent a
set of formal and informal rules aimed at directing human behaviour in a
certain direction, influencing the behaviour of individuals and thus
reducing uncertainty (Volejnнkovб, 2005, Liљka et al., 2011). If
institutions, which were inherited by the society from the past, cease to
meet new economic conditions and needs, they must adapt or release the
space to new ones (Volejnнkovб, 2005). The impact on economic
67
performance is ascribed to institutions. According to Teja (2009), the
low rate of regional economic growth stemming from an inappropriately
functioning institutional framework, the carrier of institutional quality,
lies behind the problems of low societal and economic development of
lagging regions.
The new institutional economic school developed the knowledge of
transaction costs, which has later become established as a separate
theory (Liљka et al., 2011). These costs significantly determine the set-
up of an institutional framework, performance, and competitiveness at
microeconomic, as well as macroeconomic levels.
According to the New Institutional Economic Theory, the country’s
economy achieves higher efficiency under the conditions of better set-up
institutions that generate lower transaction costs. Socio-technological
changes affect the level of transaction costs. The socio-economic
system, which is able to take advantage of the changes in favour of the
reduction of transaction costs, presents itself with a good institutional
environment supporting economic development. Okruhlica (2013)
suggests measuring the institutional environment using the
Competitiveness Indexes. In order to express the quality of business
environment, or the level of transaction costs in the national economy,
we have used the database of the Index of Economic Freedom from the
Fraser Institute (Gwartney, Lawson, Hall 2016) in accordance with the
principles of the New Institutional Economic Theory.
Index of Economic freedom reflects the ability of economy to
respond to societal changes. This ability is reflected in the conditions
that the existing administrative system in the country promotes
economic freedom. Governments allow for free movement of labour,
capital of goods, services, and abstain from restrictions of freedom
beyond what is necessary to protect and maintain freedom itself. The
Index documents the positive relationship between economic freedom
and economic progress, such as a higher share of GDP per capita,
human development, democracy, poverty eradication and a better
environment (Hall, Lawson 2013).
The impact of technological change on demand for services, as in the
case of societal change, is measurable through competitiveness indices.
We consider the Networked Readiness Index to be the parameter
expressing the adaptation of technological changes in the economy. We
assume that the quality of business environment, measured by the level
of transaction costs in the national economy, is affected by the rate of
infiltration of technological change into socio-economic processes. This
68
thesis is confirmed by several authors who attribute the effects of
increasing labour productivity and a deeper personalization of services
to information and communication technologies (Michalovб,
Beneљovб, Љќastnб, 2013; Kagermann, 2015). Authors Evangelista,
Lucchese, Meliciani (2013) identified the positive impact and strong
dependence of information services and communication technologies on
the international competitiveness of other areas of the economy in the
results of empirical analysis. The presence is marked by digital
transformation, with signs such as digitization, Cloud, Big Data, IoT, 3D
printing and Industry 4.0 (Biahmou et al., 2016). This provides the
opportunity to use an exponentially growing amount of data for goals in
achieving customer satisfaction and the emergence of new business and
managerial options. The Networked Readiness Index is a key parameter
that identifies the degree of landscape adaptation in the digital world. It
defines parameters that depend on whether a particular country has
elements necessary for the development of digital technologies and
whether these technologies actually affect the economy and society. The
Index identifies the use of ICT to increase the competitiveness and well-
being of the company.
Methodology
Based on the study by F. Okruhlica (2013) and in the intentions of the
Institutional and the New Institutional Economic Theory, we have
identified the impact of socio-technological changes on demand through
the correlation and regression analysis of data in 117 countries of the
world. Due to the availability of comparable statistical data, we used the
value-added parameter in services expressed as a share of services in the
total value added in the economy for 2015 (Services_value
added_2015).
In order to identify the impact of societal change, the Index of
Economic Freedom, which was issued in 2015, was selected, but it
characterizes “status quo” of the environment in 2014. So there is a time
shift in the analysis. This means that the demand for services (expressed
as a share of services in total value added in the economy) in 2015 is
determined by the setting of the business (institutional) environment,
which is affected by societal changes, especially in the economic area in
2014. In the case of technological changes, the Networked readiness
index (NRI) for 2015 was chosen as the parameter. Even in this case,
there is a time shift because the NRI issued in 2015 describes the
69
situation in 2014. Due to the time shift in both cases, we assume that the
impact of socio-technological changes on demand for services will be
reflected with a certain time span, which will make the estimated model
more significant. The use of correlation and regression analysis for
selected variables (index and added value) is supported by studies of H.
Rahman and R. D. De Sousa (2014), as well as L. Hudrlнkovб and K.
Vltavskб (2013). The results of the work verify the validity of the
hypothesis 1.
H 1: There is a link between socio-technological change and
demand for services
The input database as a basis for regression and correlation analysis
was based on available data from the group of World Bank (WBG,
2015), the Fraser Institute’s annual report (Gwartney, Lawson, and Hall,
2015) and the Global Information Technology annual report (WEF,
2015). Subsequently, the data was processed by MS Excel. The
graphical method, the regression analysis was processed by Dell
Statistica. The estimated linear regression analysis equation had the
following form:
Services_value added_2015 (% of GDP) = constant + slope * x
The quantification of the link and the internal relations is expressed
by the linear regression analysis and its quality is determined by the
coefficient of determination (r2), t-statistics, p-value, constant (i.e. the
locating constant), slope (expresses the regression coefficient) and the
number of observations (N). Individual dependencies were identified
based on the results of the correlation and regression analysis (Table
2.4).
Results
Both variables were statistically significant at the significance level α
= 0.05. The force of dependence between variables increases with the
increase of the correlation coefficient (r) in absolute value. Strong direct
dependence has been confirmed in both cases, which was further
interpreted by graphical depiction.

70
Table 2.4
Correlation and regression analysis
X & Y
All correlations are significant at p < 0,05000
r(X,Y) r2 t p N Constant
(dep: Y)
Slope
(dep: Y)
Economic_Freedom_Sum
mary_Index
0.57
0.32
7.43
0.00
117
-4.27
9.22
Services_value_added_20
15
Networked_readiness_Ind
ex_2015
0.65
0.43
9.28
0.00
117
24.34
8.79
Services_value_added_20
15
Notes: Own processing based on data from the Annual Report to the Economic
Freedom Index (Gwartney, Lawson, and Hall, 2015), the Annual Report to the
Global Information Technology (WEF) 2015, and statistical data from the databases
of the World Bank (WBG, 2015). Data was processed using Dell Statistica.
Scatterplot of Services_value_added_2015 against Economic_Freedom_Summary_Index_2014
Services_value_added_2015 = -4,2699+9,2205*x
Algeria
Armenia
Bhutan
Brazil
Chad
Cyprus
Guinea
Ireland
Oman
Qatar
SingaporeSweden
United Kingdom
Vietnam
Zimbabwe
4,5 5,0 5,5 6,0 6,5 7,0 7,5 8,0 8,5 9,0 9,5
Econ_Freed_Summ_Index_2014
30
40
50
60
70
80
90
100
Serv
ices_valu
e_added_2015
Finland
Greece
Hong Kong SAR, China
Korea, Rep.
Lebanon
Luxembourg
Madagascar
Norway
Slovak Republic
r = 0,5693; p = 0.0000; r2 = 0,3241
Figure 2.3 Influence of societal changes on demand for services Source: own processing with Dell Statistica.

71
Graphical regression analysis (Figure 2.3) shows a strong correlation
between the dependent variable – the share of services in the total value
added in the economy for the year 2015 and the independent variable –
the Index of Economic Freedom reflecting the state of the environment
for 2014. Data were also analysed at global level with total number of
observations (N) 117. The model explains 32.41% of input data
according to the coefficient of determination. The estimated regression
equation has the following form:
Services_value added_2015 = -4.2699 + 9.2205 * Index of Economic
Freedom
Based on the above equation it can be stated that if the index of
economic freedom is equal to 0, we observe a marked drop in value
added in services to -4.2699%. If the Index of Economic freedom
reaches a maximum of 10, the value added in services will move to
87.94%. The level of economic freedom of countries has been
increasing for the last decade, and the countries that have a higher
economic freedom have higher economic performance (Gwartney,
Lawson and Hall, 2015). These include, in particular, Hong Kong,
Singapore, and United Kingdom. In the case of Qatar, we monitor a high
level of economic freedom (7.91), but a low value added in services
(41.34%), which may be due to the structure of the economy, as Qatar
has a higher industrial representation in the structure of economy.
The graphical results of the regression analysis point to another
extreme, such as the Republic of Chad. The country has a low Index of
Economic freedom (5.12) and a low demand for services (33.42%). The
reason for this position in the analysis can be mainly the structure of the
economy in the Republic of Chad, which is mainly focused on
agriculture, but also the political situation in the country. In the case of
the Republic of Zimbabwe, we monitor a low level of the Index of
Economic freedom (5.28), but a significant share of the services sector
in GDP (58.56%), as retail and tourism are mainly developed in the
republic. The opposite extreme is Hong Kong. Its economy is
characterized by free trade, low tax burden, minimal government
interference and high transparency. Hong Kong thus reaches the highest
level of the Index (9.03) in the world. The share of services in total
value added in the economy is more than 90%. These include, in
particular, financial services, trade and logistics, tourism, including
consumer services, and the provision of expert and manufacturing
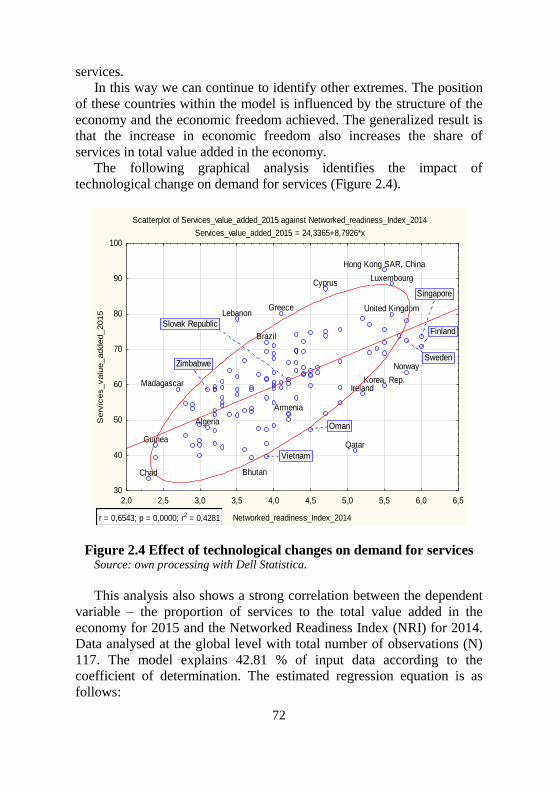
72
services.
In this way we can continue to identify other extremes. The position
of these countries within the model is influenced by the structure of the
economy and the economic freedom achieved. The generalized result is
that the increase in economic freedom also increases the share of
services in total value added in the economy.
The following graphical analysis identifies the impact of
technological change on demand for services (Figure 2.4).
Scatterplot of Services_value_added_2015 against Networked_readiness_Index_2014
Services_value_added_2015 = 24,3365+8,7926*x
Algeria
Armenia
Brazil
Chad
Cyprus
Greece
Guinea
Hong Kong SAR, China
IrelandKorea, Rep.
Lebanon
Luxembourg
Norway
Qatar
United Kingdom
2,0 2,5 3,0 3,5 4,0 4,5 5,0 5,5 6,0 6,5
Networked_readiness_Index_2014
30
40
50
60
70
80
90
100
Serv
ices_valu
e_added_2015
Bhutan
Finland
Madagascar
Oman
Singapore
Slovak Republic
Sweden
Vietnam
Zimbabwe
r = 0,6543; p = 0.0000; r2 = 0,4281
Figure 2.4 Effect of technological changes on demand for services Source: own processing with Dell Statistica.
This analysis also shows a strong correlation between the dependent
variable – the proportion of services to the total value added in the
economy for 2015 and the Networked Readiness Index (NRI) for 2014.
Data analysed at the global level with total number of observations (N)
117. The model explains 42.81 % of input data according to the
coefficient of determination. The estimated regression equation is as
follows:

73
Services_value added_2015 = 24.3365 + 8,7926* index NRI
Based on the above equation it can be stated that if the Networked
Readiness Index is equal to 0, we observe the level of 24.3365% of the
added value in services. Assuming that the NRI reaches a maximum of
8, the value added in services will be at the level of 85.88%. Again, in
this case, we are monitoring the extreme situation of Qatar, which
belongs to the countries with a relatively high Networked Readiness
Index, but low demand for services. The second identified extreme is
Hong Kong. From the point of view of the Networked Readiness Index,
Hong Kong (5.5) slightly lags behind the countries like Finland (6),
Singapore (6) and Norway (5.8), but still belongs to the countries with a
significant added value of services, within that index.
Discussion
The study of the dependence between socio-technological changes
and the production of services is based on the principles of Institutional
and New Institutional Economic Theory. Within them, the low
transaction costs achieved by the institutions are a prerequisite for a
good business background. Socio-technological changes affect the level
of transaction costs. The socio-economic system, which is able to take
advantage of the changes in favour of the reduction of transaction costs,
presents itself with a good institutional environment supporting
economic development.
Institutionalist theories and the transactional cost theory explain the
idea of the company’s establishment in connection with externalisation
of non-specialized activities. We believe that these activities have
become the basis for strengthening the importance of the services sector.
Socio-technological changes increase transaction costs, as they increase
the cost of adapting them in production and value chains. However, the
adaptation of economic processes to these changes, and the associated
specialization has an effect on their reduction. This means that countries
with lower transaction costs are better adapted to current changes in the
company.
The expansion of services in advanced economies can be attributed
to efforts to optimize the level of transaction costs, mainly through the
creation of effective mechanisms for managing and controlling
transactions of a specific nature. In economies, where markets work
badly and the costs associated with their use are high, or where markets
74
operate in a deformed form or do not work at all, the tendency is to
include as many activities as possible in one’s own organization. In
contrast, in economies with advanced market infrastructure, transaction
costs are relatively low. There are many specialized providers whose
supply exceeds demand. Due to the specialization, the costs are usually
lower than if the organization ensured them alone.
These theories are the basis for recognizing transaction costs as a
parameter that has the ability to express the level of institutional set-up
in the economy. In order to express the level of institutional set-up, we
used the Index of Economic Freedom and the Networked Readiness
Index. Demand for services is expressed as a share of services in total
value added in the economy.
The results of analysis confirmed strong dependence between the
studied variables. This means that demand for services (expressed as a
share of services in the total value added in economy) is largely
influenced by socio-technological changes (Index of Economic
Freedom, Networked Readiness Index). The bigger is the extent of
adaptation to socio-technological changes in the economy (the selected
indices have rising values), the higher is the demand for services, which
is reflected in the growing share of GDP. The position of services in the
value chain of economies can thus be labelled as crucial in the process
of society and economy adaptation to changes. However, the effects of
this relationship can be explained also in reverse. High-quality
institutional background provides a background for service
development. Our observations can be expanded in terms of analyses of
dependence on demand for services on the individual parameters
contained in the indices used, or it is possible to examine the impact of
socio-technological changes on selected departments and service
divisions. Demand for services is largely influenced by societal and
technological changes. The limit can be the data complexity. Better
ability of economy to adapt to the socio-technological changes is
reflected in the growing share of services in GDP creation.
Acknowledgement
This paper resulted from a project KEGA No. 007EU-4/2020
“Interactive and interdisciplinary teaching of Services and Tourism
Innovation subjects using information technology”.

75
References: 1. Angeloni, S. & Borgonovi, E. (2016). An ageing world and the
challenges for a model of sustainable social change. Journal of
Management Development. Publisher: Emerald Group Publishing Ltd.
vol. 35, Issue 4, 9 May 2016, 464-485 p. DOI:10.1108/JMD-07-2015-
0101.
2. Anshari, M. & Lim, S. A. (2016). E-Government with Big Data Enabled
through Smartphone for Public Services: Possibilities and Challenges.
International Journal of Public Administration. Publisher: Taylor and
Francis Inc. DOI: 10.1080/01900692.2016.1242619.
3. Arltová, M. et al. (2016). The Ageing of the Population in Developed
Countries - the Economic Consequences in the Czech Republic.
Economics - Sociology. Publisher: Centre of Sociological
Research2016, 9(2), pp.197-219.
4. Bae, Y. K. (2014). Consumer Protection and Product Safety Quality
under Market Competition. Journal of Industrial Economics and
Business. Vol: 27, Issue 3, pp. 1115-1137 Publisher : Korean Industrial
Economic Association.
5. Baláž. P., Hamara, A. & Sopková, G. (2015). Konkurencieschopnosť a
jej význam v národnej ekonomike. Zmeny a výzvy v období globálnej
finančnej krízy. Bratislava: Sprint2. 240 p.
6. Biahmou, A. et al. (2016). Digital master as an enabler for industry
4.0. Advances in Transdisciplinary Engineering. Publisher: IOS Press
BV. vol. 4, 2016, pp. 672-681. DOI: 10.3233/978-1-61499-703-0-672.
7. Blanchet, M. et al. (2014). Industry 4.0. The New Industrial Revolution
How Europe Will Succeed. Retrieved from
https://www.rolandberger.com/publications/publication_pdf/roland_be
rger_industry_40_20160609.pdf
8. Cascio, W. F. & Montealegre, R. (2016). How Technology Is Changing
Work and Organizations. Annual Review of Organizational Psychology
and Organizational Behavior. vol. 3, pp. 349-375.
9. Cutting, S. T. et al. (2015). Implications of 3D printing for the United
States postal service. Postal and Delivery Innovation in the Digital
Economy. Publisher: Springer International Publishing. 336 p. DOI:
10.1007/978-3-319-12874-0_4.
10. Demirkan, H., Spohrer, J. & Krishna, V. (2011). Service systems
implementation. New York: Springer. 326 p.
11. Department of Economic and Social Affairs - DESA. (2010). World
Population Ageing. Retrieved from
http://www.un.org/esa/population/publications/WPA2009/WPA2009-
report.pdf
12. Dujava, D. (2016). Ekonomické krízy a ekonomická veda. Bratislava :

76
Wolters Kluwer, 2016. 186 p.
13. Elmqvist, T. et al. (2015). Benefits of restoring ecosystem services in
urban areas. Current Opinion in Environmental Sustainability.
Publisher: Elsevier. Vol 14, June 01, 2015, pp. 101-108.
14. Euromonitor Research (2015). Challenges and Opportunities in
Targeting the Senior Consumer. Retrieved from
http://blog.euromonitor.com/2015/04/challenges-and-opportunities-in-
targeting-the-senior-consumer.html
15. European Commision (2010). Communication from the Commission
EUROPE 2020. A strategy for smart, sustainable and inclusive growth.
Retrieved from http://eur-lex.europa.eu/legal-
content/EN/TXT/PDF/?uri=CELEX:52010DC2020&from=SK
16. European Commision (2014b). Výskum a Inovácie. 2014. Retrieved
from http://europa.eu/pol/pdf/flipbook/sk/research_sk.pdf
17. European Commision (2014c). Digitálna agenda pre Európu. Retrieved
from http://europa.eu/pol/pdf/flipbook/sk/digital_agenda_sk.pdf
18. Evangelista, R., Lucchese, M. & Meliciani, V. (2013). The contribution
of Business services to the export performances of manufacturing
industries. An empirical study on 5 European countries. Working
Papers 14, Birkbeck Centre for Innovation Management Research,
revised Nov 2013.
19. Foidl, H. & Felderer, M. (2016). Research challenges of industry 4.0
for quality management. Lecture Notes in Business Information
Processing. Publisher: Springer Verlag. vol. 245, pp. 121-137. DOI:
10.1007/978-3-319-32799-0_10.
20. Gartner (2016). Top Strategic Predictions for 2017 and Beyond:
Surviving the Storm Winds of Digital Disruption. Retrieved from
https://www.gartner.com/doc/3471568?refval=-pcp=mpe#a-
1819766141
21. Gwartney, J., Lawson, R. & Hall, J. (2016). Economic Freedom of the
World: 2015 Annual Report. Vancouver B C : Fraser Institute.
Retrieved from
https://www.fraserinstitute.org/sites/default/files/economic-freedom-of-
the-world-2016-exec-summary.pdf
22. Hachuła, P. & Schmeidel, E. (2016). The Model of Demand and
Inventory in a Decline Phase of The Product Life Cycle. Folia
Oeconomica Stetinensia. 2016, 16(1), 208-221. DOI: 10.1515/foli-
2016-0013.
23. Hall, J. & Lawson, R. (2013). Economic freedom index and stock
returns in Malaysia. Contemporary Economic Policy, 32(1), pp. 1–19.
24. Hallova, M. (2013). Cloud computing – definícia, výhody a nevýhody.
Retrieved from http://fem1.uniag.sk/konferencie_a_seminare/zborniky/

77
ki2013/zbornik/Hallova.pdf
25. Hamlen, K.W. & Thuraisingham, B. (2013). Data security services,
solutions and standards for outsourcin. Computer Standards &
Interfaces. Vol. 35, Issue 1, pp. 1-5. Publisher : ELSEVIER,
NETHERLANDS DOI: 10.1016/j.csi.2012.02.001
26. Hawkins. D. I., Best, R. J. & Coney, K. A. (1991). Consumer behavior:
implications for marketing strategy. Boston: IRWIN. 674 p.
27. Hlušková, T. (2016). Porovnanie stratégií Priemyslu 4.0 na Slovensku a
vo vybraných krajinách. Studia commercialia Bratislavensia : scientific
journal of Faculty of Commerce, University of Economics in
Bratislava. Bratislava : Obchodná fakulta Ekonomickej univerzity v
Bratislave, 2016, roč. 9, č. 35, pp. 278-292.
28. Hudrlíková, L. & Vltavská, K. (2013). Competitiveness and Labour
Productivity in Context of Composite Indicators. Statistics and
Economy Journal. 93 (4).
29. Hult, H.V., Byström, K. & Gellerstedt, M. (2016). ICT and learning
usability at work challenges and opportunities for physicians in
everyday practice. Conference Proceeding Lecture Notes in Business
Information Processing 7th Scandinavian Conference on Information
Systems, SCIS 2016. Vol. 259, 2016, pp. 176-190. DOI: 10.1007/978-3-
319-43597-8_1.
30. Chang, H. (2013). The security service rating design for IT
convergence services. Electronic Commerce Research. Vol. 13, Issue 3,
pp. 317-328. Publisher : SPRINGER, NETHERLANDS. DOI:
10.1007/s10660-013-9115-2.
31. Christmann, D. et al. (2016). Vertical integration and adaptive services
in networked production environments. Lecture Notes in Business
Information Processing. Publisher: Springer Verlag. vol. 245, pp. 147-
162. DOI: 10.1007/978-3-319-32799-0_12.
32. Christophorou, C. et al. (2016). ICT Systems and Services for Ageing
Well: Identification and Assessment of an Important Set (Package) of
ICT Services for Active Ageing and Independent Living. Healthcare
Technology Letters. Vol. 3, No. 3. pp. 159 –164.
33. Iqbal, S. et al. (2016). Service delivery models of cloud computing:
security issues and open challenges. Security and Communication
Networks. Vol. 9 Issue: 17. 4726-4750 pp. Publisher :WILEY-
BLACKWELL, NJ USA. DOI: 10.1002/sec.1585.
34. Islam, R. & Zaman, K. (2015). Deadly Migrant Trafficking Trade by
Sea and Restrictive Service Trade by the WTO: Unmasking the linkage
for the Liberalization of Labour-Intensive Service Trade. Journal of
International Trade Law and Policy. Publisher: Emerald Group
Publishing Ltd. Vol 14, (2), 15, pp. 86-104.

78
35. Joshi, P. (2016). Clouds and big data: A compelling combination.
Proceedings of the 10th INDIACom; 2016 3rd International
Conference on Computing for Sustainable Global Development.
Publisher: Institute of Electrical and Electronics Engineers Inc. pp.
2113-2118.
36. Kagermann, H. (2015). Change through digitization—value creation in
the age of industry 4.0. In Horst, A. et al. (2015). Management of
Permanent Change. Publisher: Springer Science Business Media. 240 p.
37. Kazim, M. & Evans, D. (2016). Threat Modeling for Services in Cloud.
Proceedings 2016 Ieee Symposium on Service-Oriented System
Engineering Sose 2016. pp. 84-90. Publisher : IEEE, 345 NEW YORK.
DOI: 10.1109/SOSE.2016.55.
38. Komorowski, M. et al. (2016). Lowering the barriers for online cross-
media usage: Scenarios for a Belgian single sign-on solution.
Telematics and Informatics. Publisher: Elsevier Limited. Vol. 33, Issue
4. pp. 916-924.
39. Konig, M. et al. (2015) The role of resource efficient decentralized
wastewater treatment in smart cities. In 1st IEEE International Smart
Cities Conference, Mexico 25 – 28. October 2015. DOI:
10.1109/ISC2.2015.7366155.
40. Krueger, A. B. & Harris, S. D. (2015). A proposal for modernizing
labor laws for 21st century work: The independent worker. Retrieved
from http://www.hamiltonproject.org/assets/files/modernizing_
labor_laws_for_twenty_first_century_work_krueger_harris.pdf
41. Kusá, A. et al. (2015). Spotrebiteľ a spotrebiteľské správanie v kontexte
psychológie a sociológie trhu. Trnava: UCM Trnava. 123 p.
42. Liška, V., Sluková, K. & Volejníková, J. (2011). Institucionálni
ekonomie. Přibram: Professional Publishing. 235 p.
43. Mckinsey Company (2011). Big data: The next frontier for innovation,
competition and productivity. Retrieved from http://www.mckinsey.com/
business-functions/digital-mckinsey/our-insights/big-data-the-next-
frontier-for-innovation
44. Michalová, V., Benešová, D. & Šťastná, J. (2013). Služby v modernej
ekonomike. Bratislava: Vydavateľstvo EKONÓM, 316 p.
45. Michálková, A. (2010). Regionálne siete v cestovnom ruchu.
Bratislava: Vydavateľstvo EKONÓM. 118 p.
46. Mlinaric, F. Oplotnik, Z. J. & Brezovnik, B. (2016). Key economic
parameters for an optimal pharmacy network in a regulated
environment. Transylvanian Review of Administrative Sciences.
Publisher: Universitatea Babes-Bolyai. Vol. 2016, Issue 49. pp. 60-77.
47. Ng, K.C. & Pang, W. M. (2016). A 3D content cloud: Sharing, trading
and customizing 3D print-ready objects. Conference Proceeding 2nd

79
IEEE International Conference on Multimedia Big Data, Taipei 20 - 22
April 2016. Publisher: Institute of Electrical and Electronics Engineers
Inc. pp. 174-177. DOI: 10.1109/BigMM.2016.82.
48. Noury, N., Sevrin, L. & Massot, B. (2016). From health smart homes to
Living Labs for Health. Conference Proceeding17th International
Conference on E-Health Networking, Application and Services, Boston
13 -17. 10. 2015. Publisher: Institute of Electrical and Electronics
Engineers Inc. DOI: 10.1109/HealthCom.2015.7454492.
49. Obadi, S. M. et al. (2016). Vývoj a perspektívy svetovej ekonomiky.
Vysoké riziká a väčšie neistoty. Bratislava: VEDA, vydavateľstvo SAV.
344 p.
50. OECD. (2015). Labour Force Statistic. Retrieved from
http://stats.oecd.org/Index.aspx?DatasetCode=ALFS_SUMTAB#
51. Okruhlica, F. (2013). Výška transakčných nákladov ako meradlo
kvality podnikateľského prostredia v Slovenskej republike a Českej
republike. In Majtán, Š. et al. (2013). Aktuálne problémy podnikovej
sféry. Bratislava: Vydavateľstvo EKONÓM, 586 p.
52. Páleník, V. et al. (2014). Strieborná ekonomika potenciál na Slovensku.
Bratislava: Ekonomický ústav SAV. 359p.
53. Páleník, V. et al. (2012). Strieborná ekonomika v slovenskom,
európskom a svetovom kontexte. Bratislava: Ekonomický ústav SAV.
300 p.
54. Pereira, L. C. et al. (2015). Characterization of assistance in elderly
men assisted in a mobile emergency care service. Cultura de los
Cuidados. Publisher: University of Alicante. Vol. 29, Issue 41. pp. 126-
134.
55. Puškárová, P. (2016). Utečenecká kríza v EÚ a jej dôsledky na
ekonomiku, spoločnosť i politické vzťahy. In Obadi, S. M. et al. (2016).
Vývoj a perspektívy svetovej ekonomiky. Vysoké riziká a väčšie neistoty.
Bratislava: VEDA, vydavateľstvo SAV. 344 p.
56. Rahman, H. & De Sousa, R .D. (2014). Information Systems and
Technology for Organizational Agility, Intelligence, and Resilience.
Hershey, PA: IGI Global. 355 p. DOI:10.4018/978-1-4666-5970-4
57. Reddy, V. M. et al. (2016). Internet of Things enabled smart switch.
Conference Proceeding 13th International Conference on Wireless and
Optical Communications Networks, WOCN; India; 21 - 23 July 2016.
Publisher: IEEE Computer Society. DOI:
10.1109/WOCN.2016.7759026
58. Rehman, M. et al. (2016). Big data reduction framework for value
creation in sustainable enterprises. International Journal of
Information Management. Publisher: Elsevier Ltd. Volume 36, Issue 6.
pp. 917-928. DOI: 10.1016/j.ijinfomgt.2016.05.013

80
59. Schönrock, S. et al. (2016). What do healthcare workers in elderly care
know about occupational health and safety? An explorative survey.
Journal of Occupational Medicine and Toxicology. Publisher: BioMed
Central. Volume 10, Issue 1, 26 September 2015, Article number 36.
60. Smolarek, M. & Witkowski, M. (2015). Ict Security of a State. 21st
International Conference The Knowledge-Based Organization. Vol: 21,
pp 743-748. Publisher : Nicolae Balcescu-Land Forces Academy,
Romania. DOI: 10.1515/kbo-2015-0125
61. Sopóci, J. (2007). Teórie sociálnej zmeny. Bratislava: Vydavateľstvo
Univerzity Komenského v Bratislave, 216 p.
62. Staňek, P. (2016). Vybrané problémy súčasnej Európy. In Obadi, S. M.
et al. 2016. Vývoj a perspektívy svetovej ekonomiky. Vysoké riziká a
väčšie neistoty. Bratislava: VEDA, vydavateľstvo SAV. 344 s.
63. Suja, R. (2014). Big Data. Retrieved from
http://www.infostat.sk/web2015/sk/_publikacie/Big_Data.pdf
64. Tej, J. (2009). Inštitucionálne a podnikateľské prostredie regiónov.
Acta regionalia et environmentalica : vedecký časopis pre regionálne a
environmentálne vedy. The scientific journal for regional and
environmental sciences, vol. 6, no. 1, pp. 17.
65. Thangavel, N & Vanmathi, M. (2015). Impact of marketing
opportunities with social media networks. International Journal of
Economic Research. Publisher: Serials Publications. vol. 12, Issue 2.
pp. 347-362.
66. Theorin, A. et al. (2016). An event-driven manufacturing information
system architecture for Industry 4.0. International Journal of
Production Research. 2 July 2016. Publisher: Taylor and Francis Ltd.
DOI: 10.1080/00207543.2016.1201604
67. Ther, P. (2016). Nový pořádek na starém kontinente. Příběh
neoliberální Evropy. Praha : Libri. 357 p.
68. Umair, M. & Kim, W.S. (2015). An Online 3D Printing Portal for
General and Medical Fields. Conference proceeding 7th International
Conference on Computational Intelligence and Communication
Networks, India 12 -14 December. Publisher: Institute of Electrical and
Electronics Engineers Inc. pp. 278 - 282. DOI: 10.1109/CICN.2015.62
69. United Nations Economic Commission for Europe – UNECE. (2013).
Classification of Types of Big Data. Retrieved from
http://www1.unece.org/stat/platform/display/bigdata/Classification+of
+Types+of+Big+Data
70. University of North Carolina Wilmington – UNCW. (2016). Top 10
Causes of Global Social Change. Retrieved from
http://people.uncw.edu/pricej/teaching/socialchange/causes%20of%20s
ocial%20change.html
81
71. Valente, M. (2012). Evolutionary Demand: A Model for Boundedly
Rational Consumers. Journal of Evolutionary Economics. 22(5),
pp.1029-1080. DOI: http://dx.doi.org/10.1007/s00191-012-0290-4.
72. Van den Broek, D., Harvey, W. & Groutsis, D. (2015). Commercial
Migration Intermediaries and the Segmentation of Skilled Migrant
Employment. Work, Employment and Society. Publisher: SAGE
Publications Ltd. Vol. 30 (3), pp. 523-534.
73. Van der Linden, L. (2015). Trends in hospitality and the leisure
industry: How social welfare and spending power influence holiday
trends. Educational Strategies for the Next Generation Leaders in
Hotel Management. Publisher: IGI Global. DOI: 10.4018/978-1-4666-
8565-9.
74. Volejníková, J. (2005). Moderní kompendium ekonomických teorií.
Praha: Profess Consulting s.r.o. 378 p.
75. Vasiľová, M. et al. (2013). Inovatívne univerzitné vzdelávanie.
Bratislava : Vydavateľstvo EKONÓM. 176 s. ISBN 978-80-225-3774-2.
76. Vysekalová, J. (2004). Psychologie spotřebitele. Jak zákazníci
nakupují. Praha : Grada Publishing, 2004. 283 p.
77. World Bank Group – WBG. (2016). World Development Indicators.
Retrieved from https://data.worldbank.org/indicator/NV.SRV.TETC.ZS
78. World Economic Forum - WEF. (2015). The Global Information
Technology Report 2015. Retrieved from
http://www3.weforum.org/docs/WEF_Global_IT_Report_2015.pdf
79. Yi, M., Wei, J. & Song, L. (2017). Efficient integrity verification of
replicated data in cloud computing system. Computers and Security.
Publisher:Elsevier Limited. Vol. 65. pp. 202-212.
82
Narkūnienė Ramutė
Master Degrees in Tourism and
Recreation and Educology, Associate
Professor
Utena University of Applied Sciences
Mykolas Romeris University
Bražulienė Rasa
Master Degree in Economics, Lecturer
Utena University of Applied Sciences
Vilnius College of Technologies and
Design Lithuania
(Utena, Vilnius, Lithuania)
COMPARATIVE
ANALYSIS OF
TOURISM
DEVELOPMENT IN
THE BALTIC
STATES
1. INTRODUCTION
Due to the influence of economic, social and political globalization
processes, tourism has become one of the leading industries in many
countries. According to the data of the United Nations World Tourism
Organization (UN WTO) (2017) and the World Travel and Tourism
Council (WTTC) (2017), currently tourism is the third largest economic
sector in the world and on a global scale creates 10% of gross domestic
product (GDP). The tourism sector employs 1 in 10 people worldwide,
revenue from tourism services exports in 2017 accounted for 30% of
global services exports and 7% of global exports of goods and services.
According to the UN WTO, international travel growth in 2018 was 6%
and reached 1, 4 billion.
Relevance of the topic. According to UN WTO analysts, tourism is
currently one of the top five sources of revenue. The rapid growth of
tourism has been largely influenced by the globalization process,
reinforced by the following socio-economic factors: rising personal
income and inheritance, longer lifetime, faster and cheaper air travel,
improved accessibility of various tourist destinations, and intensive use
of information technology. The rapid development of tourism has also
been influenced by general trends in society, which have become one of
the most popular leisure activities.
Research problem. Tourism has a major impact on national
economies, attracting foreign tourist flows and, at the same time,

83
generating income, helping to create new jobs and contributing to
attracting foreign investment. This is a huge business that is growing
and will continue to grow. One of the aims of tourism development is to
attract as many foreign tourists as possible, therefore it is very important
to analyze how the incoming tourist flows are changing and which
markets the Baltic tourism sector should target.
Many scientists have analysed trends in tourism development:
Gartner (1996) analysed theories of tourism development, Noranha
(1976), Butler (1980) and Turner (2003) analysed the stages of tourism
development, Nordin (2003) analyzed the diversity of tourism sectors,
Holloway (2006) explored ways for the government to play a role in
tourism, Hall (2007) complemented tourism development by a new
tradition of sustainable development, Lomine (2007) analyzed strategic
political and economic planning and decision-making in the public and
private sectors, Getz (1987, 2008) worked in tourism planning, etc.
Methodology of research:
1. Analysis of scientific literature.
2. Descriptive-analytical method, based on the analysis of tourism
sector development according to the data of Eurostat and Official
Statistics Department of the Republic of Lithuania
The object of the research: the development of tourism sector in the
Baltic States.
Aim of the research: to carry out a comparative analysis of tourism
sector in the Baltic States and to identify development opportunities.
Objectives of the research are:
1. To carry out the analysis of the tourism sector development by
theoretical aspect;
2. To carry out the analysis of the tourism sector statistics in the
Baltic States and to forecast the development trends.
2. ASPECTS OF DEVELOPMENT OF THE TOURISM
SECTOR IN SCIENTIFIC DISCUSSIONS
The United Nations (UN) Resolution (1954) defines tourism as an
activity outside of one’s usual residence which contributes to the
improvement of health and physical education. The Manila Declaration
on Tourism (1980) describes tourism as an activity which has a
significant impact on life and indirectly determines the social, cultural,
educational and economic spheres of countries and their international
relations. The Hague Declaration (1989) states that tourism is the free
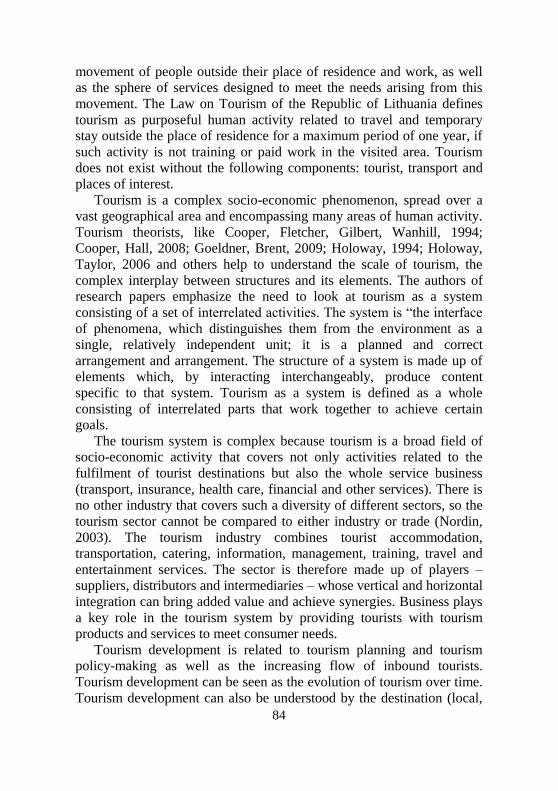
84
movement of people outside their place of residence and work, as well
as the sphere of services designed to meet the needs arising from this
movement. The Law on Tourism of the Republic of Lithuania defines
tourism as purposeful human activity related to travel and temporary
stay outside the place of residence for a maximum period of one year, if
such activity is not training or paid work in the visited area. Tourism
does not exist without the following components: tourist, transport and
places of interest.
Tourism is a complex socio-economic phenomenon, spread over a
vast geographical area and encompassing many areas of human activity.
Tourism theorists, like Cooper, Fletcher, Gilbert, Wanhill, 1994;
Cooper, Hall, 2008; Goeldner, Brent, 2009; Holoway, 1994; Holoway,
Taylor, 2006 and others help to understand the scale of tourism, the
complex interplay between structures and its elements. The authors of
research papers emphasize the need to look at tourism as a system
consisting of a set of interrelated activities. The system is “the interface
of phenomena, which distinguishes them from the environment as a
single, relatively independent unit; it is a planned and correct
arrangement and arrangement. The structure of a system is made up of
elements which, by interacting interchangeably, produce content
specific to that system. Tourism as a system is defined as a whole
consisting of interrelated parts that work together to achieve certain
goals.
The tourism system is complex because tourism is a broad field of
socio-economic activity that covers not only activities related to the
fulfilment of tourist destinations but also the whole service business
(transport, insurance, health care, financial and other services). There is
no other industry that covers such a diversity of different sectors, so the
tourism sector cannot be compared to either industry or trade (Nordin,
2003). The tourism industry combines tourist accommodation,
transportation, catering, information, management, training, travel and
entertainment services. The sector is therefore made up of players –
suppliers, distributors and intermediaries – whose vertical and horizontal
integration can bring added value and achieve synergies. Business plays
a key role in the tourism system by providing tourists with tourism
products and services to meet consumer needs.
Tourism development is related to tourism planning and tourism
policy-making as well as the increasing flow of inbound tourists.
Tourism development can be seen as the evolution of tourism over time.
Tourism development can also be understood by the destination (local,
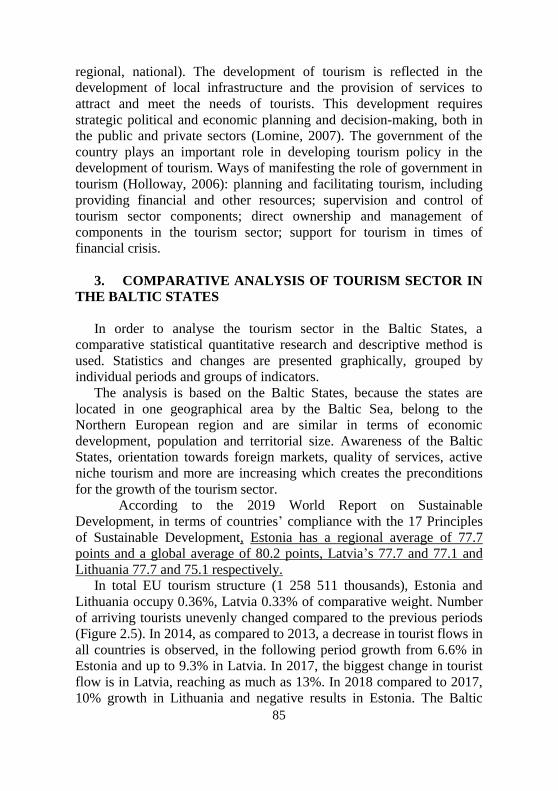
85
regional, national). The development of tourism is reflected in the
development of local infrastructure and the provision of services to
attract and meet the needs of tourists. This development requires
strategic political and economic planning and decision-making, both in
the public and private sectors (Lomine, 2007). The government of the
country plays an important role in developing tourism policy in the
development of tourism. Ways of manifesting the role of government in
tourism (Holloway, 2006): planning and facilitating tourism, including
providing financial and other resources; supervision and control of
tourism sector components; direct ownership and management of
components in the tourism sector; support for tourism in times of
financial crisis.
3. COMPARATIVE ANALYSIS OF TOURISM SECTOR IN
THE BALTIC STATES
In order to analyse the tourism sector in the Baltic States, a
comparative statistical quantitative research and descriptive method is
used. Statistics and changes are presented graphically, grouped by
individual periods and groups of indicators.
The analysis is based on the Baltic States, because the states are
located in one geographical area by the Baltic Sea, belong to the
Northern European region and are similar in terms of economic
development, population and territorial size. Awareness of the Baltic
States, orientation towards foreign markets, quality of services, active
niche tourism and more are increasing which creates the preconditions
for the growth of the tourism sector.
According to the 2019 World Report on Sustainable
Development, in terms of countries’ compliance with the 17 Principles
of Sustainable Development, Estonia has a regional average of 77.7
points and a global average of 80.2 points, Latvia’s 77.7 and 77.1 and
Lithuania 77.7 and 75.1 respectively.
In total EU tourism structure (1 258 511 thousands), Estonia and
Lithuania occupy 0.36%, Latvia 0.33% of comparative weight. Number
of arriving tourists unevenly changed compared to the previous periods
(Figure 2.5). In 2014, as compared to 2013, a decrease in tourist flows in
all countries is observed, in the following period growth from 6.6% in
Estonia and up to 9.3% in Latvia. In 2017, the biggest change in tourist
flow is in Latvia, reaching as much as 13%. In 2018 compared to 2017,
10% growth in Lithuania and negative results in Estonia. The Baltic
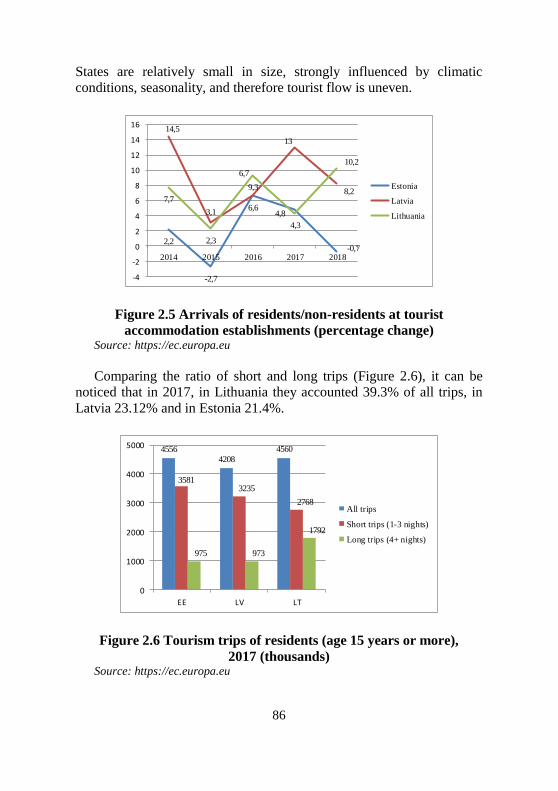
86
States are relatively small in size, strongly influenced by climatic
conditions, seasonality, and therefore tourist flow is uneven.
2,2
-2,7
6,64,8
-0,7
14,5
3,1
6,7
13
8,27,7
2,3
9,3
4,3
10,2
-4
-2
0
2
4
6
8
10
12
14
16
2014 2015 2016 2017 2018
Estonia
Latvia
Lithuania
Figure 2.5 Arrivals of residents/non-residents at tourist
accommodation establishments (percentage change) Source: https://ec.europa.eu
Comparing the ratio of short and long trips (Figure 2.6), it can be
noticed that in 2017, in Lithuania they accounted 39.3% of all trips, in
Latvia 23.12% and in Estonia 21.4%.
4556
4208
4560
35813235
2768
975 973
1792
0
1000
2000
3000
4000
5000
EE LV LT
All trips
Short trips (1-3 nights)
Long trips (4+ nights)
Figure 2.6 Tourism trips of residents (age 15 years or more),
2017 (thousands) Source: https://ec.europa.eu

87
The number of overnight stays by residents/non-residents in tourism
accommodation establishments in the period 2012-2018 tended to
increase in all Baltic States (Figure 2.7). Latvia has the highest growth
rate of 25.36% or 616K units in 2016 compared to 2012, in 2017
compared to 2016 growth was 11.89% or 362K units. In 2018, the
number increased by almost 10%. In Estonia, there is a consistent
decline in both domestic and inbound tourism overnight stays, with the
largest increase in Lithuania in 2012/2016 reaching 22.13% or 593K
units. It can be said that the tourism sector in the Baltic States is
showing positive development results.
5,023,36
0,6
25,36
11,899,86
22,13
4,83
8,91
0
5
10
15
20
25
30
Change 2012/2016 2016/2017 2017-2018
EE
LV
LT
Figure 2.7 Nights spent at tourist accommodation establishments by
residents/non-residents (percentage change) Source: https://ec.europa.eu
The change in the number of residents/non-residents arriving at
tourist accommodation establishments is presented in Figure 2.8. During
the analysed period the biggest decrease was observed in Estonia, where
in 2018 the number of arrivals decreased by 0.72% or 15,612
individuals. The biggest changes are observed in the Latvian state,
where in 2012-2016 over the period, the change was 43.54% or 477, 358
more arrivals. Although growth rates have declined, the number of
arrivals has increased with each period. In Lithuania in 2016, compared
to 2017, 4.34% growth was observed and 10.16% in 2018 or in other
words, 160,932 more people arrived than in 2017.
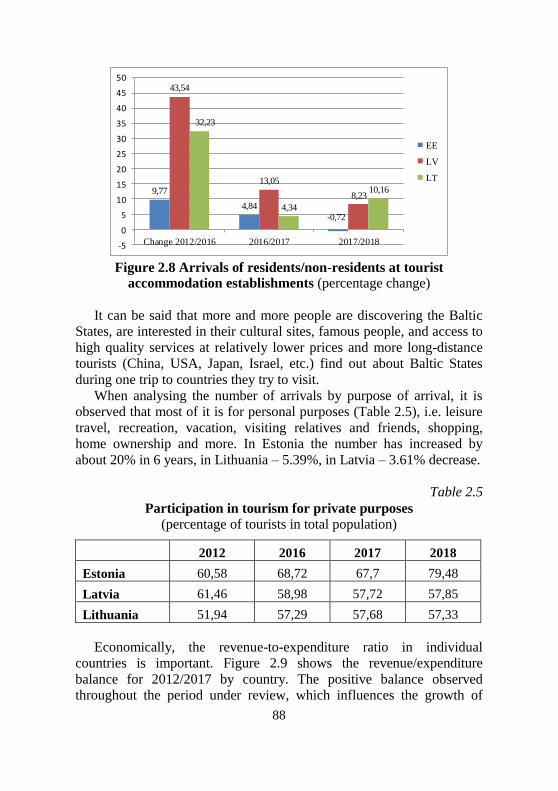
88
9,77
4,84
-0,72
43,54
13,05
8,23
32,23
4,34
10,16
-5
0
5
10
15
20
25
30
35
40
45
50
Change 2012/2016 2016/2017 2017/2018
EE
LV
LT
Figure 2.8 Arrivals of residents/non-residents at tourist
accommodation establishments (percentage change)
It can be said that more and more people are discovering the Baltic
States, are interested in their cultural sites, famous people, and access to
high quality services at relatively lower prices and more long-distance
tourists (China, USA, Japan, Israel, etc.) find out about Baltic States
during one trip to countries they try to visit.
When analysing the number of arrivals by purpose of arrival, it is
observed that most of it is for personal purposes (Table 2.5), i.e. leisure
travel, recreation, vacation, visiting relatives and friends, shopping,
home ownership and more. In Estonia the number has increased by
about 20% in 6 years, in Lithuania – 5.39%, in Latvia – 3.61% decrease.
Table 2.5
Participation in tourism for private purposes
(percentage of tourists in total population)
2012 2016 2017 2018
Estonia 60,58 68,72 67,7 79,48
Latvia 61,46 58,98 57,72 57,85
Lithuania 51,94 57,29 57,68 57,33
Economically, the revenue-to-expenditure ratio in individual
countries is important. Figure 2.9 shows the revenue/expenditure
balance for 2012/2017 by country. The positive balance observed
throughout the period under review, which influences the growth of

89
countries’ GDP (gross domestic product), creates the conditions for the
creation of new jobs and promotes the competitiveness of the country on
a global scale.
1005
1443
620
1106
337
581
838
530639
199
1029
1169
721
984
185
0
200
400
600
800
1000
1200
1400
1600
2012 2017 2012 2017 2017
Receipts Expenditure Balance
EE
LV
LT
Figure 2.9 Travel receipts and expenditure in balance of payments,
2012-2017 (million EUR)
2017 data shows that in Lithuania, compared to the preliminary data
of Estonian and Latvian banks, incoming tourism revenue grew the
fastest (9.7%, while in Estonia over the same period it increased by
8.9%, in Latvia +0.8%) (source: www.tourism.lt).
Although the Baltic States collectively represent only a few percent
of the total tourist arrivals in the overall context of the EU tourism
sector, the geographical location is not particularly favourable for
tourism due to seasonality, but the statistics show that positive and rapid
changes are taking place in the tourism sector, all analysed countries
have a positive income and expenditure balance, an increase in arrivals,
travel and overnight stays, observed an increasing in inbound flows, an
increasing the number of trips and overnight stays, which in turn leads
to an increasing contribution to the GDP of the countries working in the
tourism sector.
CONLUSIONS
1. Researchers emphasize that tourism should be viewed as a system
of interdependent activities. The structure of a system is made up of
elements which, by interacting interchangeably, produce content
specific to that system. The tourism system is complex because tourism
90
is a broad field of socio-economic activity that covers not only activities
related to the fulfilment of tourist destinations but also the whole service
business (transport, insurance, health care, financial and other services).
There is no other industry that covers such a diversity of different
sectors, so the tourism sector cannot be compared to either industry or
trade.
2. A comparative analysis of statistical data shows that tourist flows
increased most in Latvia during the analysed period, while short/long
travel ratios were highest in Lithuania. The overall growth trend of the
tourism sector is observed with travel on local routes and with the
arrival of tourists from distant countries. The largest increase in revenue
from the tourism services sector in the period under review was in
Lithuania, but all Baltic countries have a positive income/expenditure
balance.
References: 1. Butler, R. W. (1980) The Concept of A Tourist Area Cycle of Evolution:
Implications for Management of Resources. Canadian Geographer/ Le
Géographe canadien 24(1):5 – 12.
2. Cooper, C., Hall, C. M. (2008). Contemporary Tourism: An
International Approach. Oxford: Elsevier.
3. Cooper C., Fletcher J., Fyall A., Gilbert D., Wanhill S. (2008) Tourism
principles and practice (4 ed.) Harlow: Pearson Education Limited, p.
707.
4. Department of Official Statistics of the Republic of Lithuania. Available
at: https://osp.stat.gov.lt/informaciniai-pranesimai?articleId=6670132
5. European Comission. European statistics. https://ec.europa.eu/
6. Getz, D. (1987). Tourism Planning and Research: Traditions, Models
and Future. The Australian Travel Research Wokshop. Bunbury:
Western Australia.
7. Goeldner, C. R., Ritchie, J. R. B. (2006). Tourism. Principles,
Practices, Philosophies. John Willey&s, INC, 577 p., ISBN-13:978-
471-45038-2 (cloth) ir ISBN-10:0-471-45038-3 (cloth).
8. Hall, С. М. (2007). Tourism and regional competitiveness. Advances in
Tourism Research, p. 217—230.
9. Holloway, J. C., Taylor, N. (2006). The business of tourism. London:
Pearson Education.
10. Lomine, L. (2007). Tourism in Augustan Society (44BC – AD69). In:
J.K. Waldton (ed.), Histories of Tourism: Representation, Identity and
Conict (pp. 71-87). Clevendon: Channel View Publications.
11. Noranha, R. (1979). Social and cultural dimensions of tourism.

91
WorldBank Staff Working Paper. Washington, D.C: World Bank.
12. Nordin, S. (2003). Tourism clustering and innovation. European
Tourism Research Institute, Mid-Sweden University, Sweden.
13. The Law on Tourism of the Republic of Lithuania.
14. Sustainable Development Sulutions Network. A Global Initiative for
United Nations. Sustainable Development Report 2019
https://sdgindex.org/reports/sustainable-development-report-2019/
15. World Tourism Organization. Tourism Highlights 2018 Edition.
https://www.e-unwto.org/doi/pdf/10.18111/9789284419876
Németh Tamás
PhD student
University of Sopron
Dr. Hegedűs Mihály
István Széchenyi Management
and Organisation
Sciences Doctoral School
(Sopron, Győr, Hungary)
CAPITAL STRUCTURE OF
SME SECTOR AND THE
STRATEGIC DEVELOPMENT
Introduction Nowadays, every business has to make a successful and sustainable
operational strategy in this economic and social environment. The
business needs financial sources to realize their strategies with this,
which can maximize the profitability. The purpose of the research is to
get to know that factors, which are determining the profitability and
have an effect on equity and long-term and short-term liabilities. When
choosing this theme, we basically assumed that the creation of an
optimal capital structure (through increasing profitability and efficiency)
able to increase the profit, furthermore, besides the strategic/investment
decisions of the examined companies, the financing decisions also have
a prominent role to play in gaining a competitive edge in the global
market, as they determine the success of the company and the basis for
its survival. The research analyzes the annual report of 38 Croatian
companies between 2014 and 2017, which were continuously operating
throughout the period and belonged to the SME sector. When making
financing decisions, taking the risk-yield-liquidity relation into
92
consideration, company leaders have to aim at developing such a capital
structure that contributes the most to increasing company value. The
present study looks at the relationship between yield, that is, profitability
and capital structure. We seek to answer the question whether capital
structure choice has an effect on the profitability of businesses, and, if
yes, what the direction and the extent of this relationship is. In this
article, we analyse the development of equity, current and non-current
liabilities and liquidity.
Literature review The relationship of capital structure and profitability is specific
compared to other influencing factors, profitability can be interpreted as
an independent and a dependent variable in the system of relationship
between the two factors. Firstly, the better the company’s self-financing
capacity, the easier it can take out loans and on more favourable terms.
Secondly, debt financing can increase equity yields in case the expected
return on external sources is lower than the total assets earnings power
(Borszéki, 2008).
Studies on the relationship between profitability and capital structure
usually looked at profitability as an independent variable, but the results
are not consistent. On the basis of the capital structure choice theory, it
can be assumed that there is a positive relationship between profitability
and leverage, i.e. high profits encourage companies to take out loans in
order to use the opportunity of tax saving through the taxable income
reducing effect of interests. (Illés et al., 2011) From another perspective,
based on the hierarchy theory, the relationship is negative since
businesses prefer to use their own resources, retained profit and only
turn to external resources when they have exhausted their own.
Therefore, less profitable, volatile and lower cash flow businesses, in
hopes of positive net present value investments, are more likely to rely
on funding from external resources in their resource structure
(Baloghné-Mundaca, 2015). This theory is proved by Rajan és Zingales
(1995), Revoltella (1998), Hirota (1999), Krénusz (2005), Balla (2006),
Szemán (2008), Katits és Szemán (2016). The same was studied by
Szűcs (2015) using a sample of automotive businesses and he found that
businesses with high profitability use a lower ration of debt financing in
their resource structure, mostly in the form of current liabilities.
There are also examples of looking at profitability as a dependent
variable, i.e. how the development of capital structure affects
profitability. In his study on agribusinesses Borszéki (2008) saw
93
improvements in total capital and equity profitability as a result of
another fundraising. Berger and Bonaccorsi di Patti (2006) showed that
a 1 percentage point decrease in equity ratio results in a 16 percentage
point increase in the company’s profitability. Herczeg (2009), who also
studied the relationship of capital structure and profitability using an
agribusiness sample, found that liability structure ratios have a
significant effect on profitability and his calculations proved that there is
a debt-to-equity ratio which can show whether a company operates
efficiently or it is loss-making.
Methodology The 2014-2017 report data on Croatian SMEs used for capital
structure analysis was provided by the Bureau van Dijk (BvD) Orbis
database, which has data about more than 310 million companies from
over 200 countries worldwide. In this article we analyzed from the 21
national economy section data only the “Accounting, bookkeeping and
auditing activities”, which companies used in the NACE Rev. 2 adjusted
to the EU statistical categories, was dealt with at the first, the highest
level.
To ensure the comparability of data, out of the ~18.000 companies
continuously operating as SMEs in the total examined period, 1000
businesses were selected randomly. During data retrieval public and
municipal enterprises, as well as companies with consolidated accounts
were excluded.
It is a general characteristic that business profitability differs from
industry to industry; therefore, it is necessary to examine capital
structure, profitability, liquidity and efficiency indicators and their
relationship by industry (based on NACE Revision 2). In the present
study the development of different indicators is analysed for the entire
sample, however, correlational analysis is only done regarding the
businesses in the Accounting, bookkeeping and auditing activities
NACE Rev. 2 national economy section [M].
The relationship between factors determining capital structure and
profitability indicators were established using correlational analysis
which shows the existence and the strength of the relationship. The
indicators needed for the analysis were produced taking into account the
main items on the balance sheet. With regression analysis examined
quantitative relationships, the regularity of the relationship being
described by regression. Our profitability analysis looks at return on
equity – ROE (earnings after tax/equity), return on assets – ROA
94
(earnings after tax/total asset), and return on sales – ROS (earnings
before tax/gross sales) indicators.
The changes in the capital structure in the study are investigated
using leverage (external capital/equity), liabilities ratio (non-current
liabilities/total liabilities), equity-share capital ratio (equity/share
capital) and equity ratio (equity/total liabilities) indicators. The standard
of management is shown by analysing the relationships of certain items
of assets and liabilities recorded in the balance sheet for the financial
year.
Assessing the liquidity situation means comparing businesses’ liquid
assets and current liabilities, which helps assess whether the business
will be able to fulfil its obligations. (Németh-Gyurcsik, 2019) The
analysis assesses the liquidity ratio (total current assets/current
liabilities) and the cash ratio (total funds/current liabilities).
Results
From the point of view of leverage it can be stated that compared to
small and medium enterprises, micro businesses have the highest equity
rate. Rate of leverage for small and medium enterprises is 18-27%,
whereas for micro businesses the rate is 34-47%. The uniform structure
of the database used for our analysis only highlights share capital and
earnings after tax elements and deals with the other items on the balance
sheet in aggregate; thus, we will not assess these items separately.
When studying profitability and efficiency, one of the most
important groups on the liabilities side of the balance sheet is the
amounts payable. If we look at current and non-current liabilities,
medium enterprises rely on recognised resources as current liabilities
more widely than smaller businesses. For micro and small businesses
the changes in the loan and supplier debt volume are not significant,
they remain nearly the same every year. In the case of medium
enterprises both loans and supplier debt show a substantial increase up
until 2017. The data base used for analysis only highlighted loans and
supplier debt among short-term liabilities, other current liabilities are
aggregated; therefore, these are not dealt with separately.
Regarding these results, in the 2014-2017 period operating surplus
shows a 3.21% increase for small, a 1.87% decrease for micro, and a
125.4% decrease for medium enterprises. The distribution for reference
years is volatile for micro and small businesses, while there is a steady
decline in the case of medium enterprises. Years of increase in supplier
liabilities may point to liquidity problems at the company. Overall, it
95
can be said that medium enterprises have a higher rate of current
liabilities: the rates are over 40% for almost the entire examined period;
whereas the rates for smaller businesses are 35% or less.
During the capital structure analysis, the size of items recognised as
balance sheet assets and liabilities, and their relationships can be
examined, where the changes in capital structure can lead to conclusions
about the standard of management. The development of the capital
structure and profitability situation can also be analysed using
indicators, it has to be taken into account, however, that the changes in
indicators reflect on the specific micro level economic situation of
companies for all businesses.
Usually the financial strength of companies is measured by the
equity ratio. From the examined enterprises average rate increased from
34.7% to 46.2% for micro enterprises, from 30.3% to 35.9% for small
enterprises and from 22.1% to 27.5% in the case of medium enterprises
in the period 2014-2017. Increase can only be interpreted as positive
when own capital comes from the company’s profit-making capabilities.
With regard to effectiveness, it is also important to have as high as
possible equity ratio compared to total capital, since in these cases
companies are less burdened with capital expenses than in the case of
using external sources. The average rate of liabilities decreased from
47.1% to 40.3% for micro, from 41.6% to 38.9% for small, and from
43.2% to 40.1% for medium enterprises.
In addition to studying capital structure, it is worth taking a look at
liquidity indicators. Rate indicators determining short-term financial
capacity measure creditor risks. In the circle of micro enterprises
average cash rate exceeded 1 in the entire period. In 2014 and 2015
above 2 rates, moreover in 2016 and 2017 over 3 rates clearly that show
companies’ available funds could cover current liabilities. Besides these
instruments liquidity rate in the broad sense provides full coverage of
liabilities within one year.
In the case of small enterprises 2014-2015 the rate is above 1, then in
2016-2017 liquidity declines back to an average of 0.923.
Notwithstanding this, liquidity rate in the broader sense covers emerging
short-term liabilities in the entire period at an average rate of 5.649.
In the case of medium enterprises cash ratio in the entire examined
period shows below 1 rates, which suggests that in this circle cash
amounts cannot cover short-term obligations for the extended period of
4 years. However, even in this segment the current assets/current
liabilities ratio reaches the minimum level of liability coverage, the

96
average rate for the examined period is 2.102. The liquidity rate of 1.4-
1.9 confirms with general expectations, which state that the value of
current assets should approximate the double of current liabilities value.
When investigating the relationship between capital structure and
profitability, to ensure correct results, the variables of the correlation
matrix were constructed from the average of indicators generated yearly.
The magnitude and direction of the linear relationship between two
given rates, and their relationship is shown by the correlational ratio,
which indicates if two values are not independent of each other. The
algebraic sign of the correlational ratio (r) shows the direction, whereas
its magnitude shows the strength of the correlation. The value can range
between -1 and 1. (Németh-Gyurcsik, 2019) In our analysis of the
calculated correlation matrix, those items are highlighted in the results
which are not direct consequences of their mode of generation.
Examining the capital structure indicators of the Accounting,
bookkeeping and auditing activities [M] section, it can be said that non-
current liabilities are in strong relationship with fixed assets (0.82) and
current assets (0.79), moreover, current liabilities are also strongly
related to current assets (0.97) and have a moderately strong relationship
with fixed assets (0.63).
Figure 2.10 Accounting, bookkeeping and auditing activities [M]
section correlations Source: own compilation

97
Operating revenue has a strong positive relationship with stocks
(0.94) and short-term liabilities (0.92), and shares a moderately strong
relationship with fixed assets (0.53), equity (0.56) as well as long-term
liabilities (0.69). The strongest relationship can be observed in the
correlation between turnover and stocks, which in the case of turnover
growth can be explained by the faster reaction times than for current and
fixed assets. Working capital also shares a strong positive relationship
with turnover (0.89), and current liabilities (0.92), as well as current
assets (0.95).
Leverage ratio has a strong negative relationship with return on
equity (ROE) (-0.99), and a moderately strong positive relationship with
fixed assets (0.71), non-current liabilities (0.53), and current liabilities
(0.74). No correlation (-0.11) was found between liquidity and turnover
indicators in the examined sample. Among profitability indicators there
is a strong positive relationship between return on total capital and
return on assets (ROA) (0.97).
The analysis of indicators and the results of the correlation matrix
statistically prove that there is a relationship between capital structure
and profitability indicators characterising company management. Return
on equity showed a moderately strong negative relationship with fixed
assets (-0.72), and current liabilities (-0.71) as well as long-term
liabilities (-0.53). Return on sales shows a weak positive relationship
with fixed assets (0.28) and equity (0.27).
Conclusion
To make the appropriate decisions, company leaders need to be well-
informed about their enterprise. This way they can develop a capital
structure that affects company profitability and operational efficiency
positively.
Based on correlation analysis, the relationship between capital
structure choice and profitability indicators describing company
management can be justified.
In connection with the liability structure rate of businesses by SME
sector size it can be stated that the bigger the enterprise, the higher the
annual increase of equity within total capital.
Leverage shows a negative relationship with the return on equity
indicator. The growth of external capital rate is linked with a decrease in
earnings after tax since the reducing effect of interest rate payable is
reflected in the value of taxed earnings. The analysis of the components
of the results has shown that company profitability is mainly determined

98
by the operational activity. In this result category in the examined period
companies have remained profit-making, albeit at differing degrees.
Also using correlation analysis we have diagnosticated the existence
and strength of the relationship between determining factors of the
capital structure and indicators describing it. The positive relationship
between turnover and operating capital suggests a link between the
chosen financing strategy and the magnitude of turnover. It is deserves
attention that there is a strong correlation between turnover and stocks,
which entails the existence of a positive relationship with fixed costs.
Among the resources available to companies, the role of external
capital is still considerable, and as it has been justified that businesses
operating on less external capital have better profitability conditions
than those with a higher rate of liabilities, it can be claimed that liability
structure rates have a significant effect on profitability.
References: 1. Balla A. (2006): Tőkeszerkezeti döntések- empirikus elemzés a magyar
feldolgozóipari vállalatokról 1992-2001 között. In: Közgazdasági
Szemle, 53 (július- augusztus) 681-700. p.
2. Németh T. Gyurcsik P. (2019): Analysis of the capital structure of the
Swedish SME sector between 2009 and 2017;
3. Dr. Hegedűs M. (2019): A versenyképességi problémák
Magyarországon 2019-ben;
4. Baloghné Balla A.- Mundaca, G. (2015): Az exporttevékenység
tőkeszerkezeti döntésre gyakorolt hatása: empirikus vizsgálat a magyar
feldolgozóipari vállalatok esetében. In: Bélyácz I. (szerk.): A vállalati
növekedés tapasztalatai az 1993-2012 közötti időszakban. Akadémia
Kiadó 132-181. p.
5. Berger A. - Bonaccorsi di Patti, E. (2006): Capital structure and firm
performance: A new approach to testing agency theory and an
application to the banking industry. In: Journal of Banking & Finance,
30 (4) 1065-1102. p.
6. Borszéki É. (2008): A jövedelmezőség és a tőkeszerkezet összefüggései
a vállalkozásoknál. In: Bulletin of the Szent István University, Special
Issue Part II. Gödöllő, 391-401. p.
7. Herczeg A. (2009): A tőkeszerkezet és a jövedelmezőség kapcsolat
mezőgazdasági vállalkozásokban. In: Gazdálkodás, 53 (6) 570-476. p.
8. Hirota, S. (1999): Are Corporate Financing Decisions Different in
Japan? An Empirical Study on Capital Structure. In: Journal of the
Japanese and International Economies, 13 (3) 201-229. p.
9. Illés B. Cs. – Hustiné Béres K. – Dunay A. – Pataki L. (2011): Impacts
99
of tax systems on the competiveness of small and medium enterprise in
CEE countries. In: Institute for Export Management Vienna University
of Economics and Business pp. 145-156
10. Illés B. Cs. – Hurta H. – Dunay A (2015): Efficiency and Profitability
Along the Lifecycle Stages of Small Enterprises In: I NTERNATIONAL
JOURNAL OF MANAGEMENT AND ENTERPRISE
DEVELOPMENT 14 (1) pp. 56-69.
11. Katits E.- Szemán J. (2017): A magyar vállalati szektor
tőkeszerkezetének elemzése 1993-2014 között a TOP 5000 adatbázis
alapján. In: Pénzügy- számvitel- statisztika füzetek II. 2016. Miskolci
Egyetemi Kiadó. 65-80. p.
12. Krénusz Á. (2005): Bevezetés a tőkeszerkezet meghatározó tényezőinek
elméletébe és gyakorlatába. In: Hitelintézeti Szemle. 4 (2) 15-35. p.
13. Rajan, R. G.- Zingales, L. (1995): What Do We Know about Capital
Structure? Some Evidence from international Data. In: Journal of
Finance, 50 (5) 1421-1460. p.
14. Revoltella, D. (1998): Financing Enterprises in the Czech Republic: the
importance of firm specific variables. Gennaio: University of Ancona
15. Szemán J. (2008.): A magyar vállalati szektor tőkeszerkezetének
elemzése 1992-2003 között. Ph.D. értekezés, ME Vállalkozáselmélet és
gyakorlat Doktori Iskola
16. Szücs G. (2015): A magyarországi járműgyártás jövedelmezőségének
és forrásszerkezetének statisztikai elemzése. In: Közgazdász Kutatók és
Doktoranduszok II. Téli Konferenciája Tanulmánykötet. 295-305 p.
100
Chapter 3
INNOVATION IN THE ECONOMIC
SYSTEMS MANAGEMENT
Borowska Maria
Senior Lecturer
Faculty of Technical and Economic Sciences
State Higher Vocational School Memorial of
Prof. Stanislaw Tarnowski in Tarnobrzeg
(Tarnobrzeg, Poland)
THE ROLE OF
LOGISTICS IN
THE MODERN
ECONOMY
Introduction The condition for success in the modern economy is the
implementation of modern technologies. Due to the very fast increase in
the importance of logistics in the 21st century, the aforementioned
modern technologies are, in fact, logistics technologies. This subject is
very extensive and diverse.
The aim of the publication is to present logistics in its historical
development and to indicate selected methods and techniques of modern
logistics processes management.
Logistics and its History From the etymological point of view, the word „logistics” derives
from Greek’s logos meaning reason, thought and logistykos which is, the
art of counting, and also a person thinking in accordance with logical
rules.
In French logistique is the one, who logically thinks, whereas in
Latin logisticus means understandable and rational.
The first definition of logistics is in the work of the Byzantine
emperor Lentos VI (886-911) called Tactica and it concerns the
payment of wages to the army, its weaponry, ranking and equipment in
cannons and other war equipment [Gołembska, 2009, p. 10].
In the colloquial sense, “logistics” refers to the planning and delivery
of goods necessary to meet the needs of the population (in the sphere of
civilian activities) and supplies for the army in order to wage wars (in

101
the sphere of military operations).
Until the middle of the 20th century, logistics was associated
primarily with the military. Such perception of logistics resulted from
many years of tradition and various spectacular examples of military
operations, the success of which was significantly supported by
logistics, i.e. proper supply of the army with weapons, ammunition,
necessary technical equipment, fuel, food, uniforms, medical supplies,
accommodation, etc.
However – practically from the beginning of history – logistics has
accompanied man in the civil sphere, as well. People have always taken
actions to satisfy their needs necessary for existence – such as food,
shelter and security. This required the acquisition, transport, storage and
distribution of material goods and the production of technical means
(tools, means of transport, objects to live, etc.) – that is, the pursuit of
activities that are the subject of logistics, indeed.
From the earliest history of humanity, the manifestation of logically
oriented behavior was the establishment of camps and permanent
settlements near water areas: rivers, lakes and seas.
These basins constituted natural communication routes, and also
provided drinking and usable water as well as a source of food (fish,
shellfish, etc.).
The construction of pyramids1 of Egyptian royal tombs erected in the
period of the Old and Middle Kingdom (from around 2780 BC to
around 1625 BC) – as a gigantic engineering enterprise, was one of the
largest logistic operations of the ancient times.
At that time, Egypt was a country rich in stone, but it was not easy to
transport the building material – especially over long distances. The
problem was solved by the Egyptians, transporting heavy rock blocks
(with a mass of many tons) on wooden sleds (in those times the wheel
was not known), pouring water under the skids to reduce friction.
Thanks to the excellent organization of work, it was possible to build
these magnificent buildings using simple technical means. It arouses
admiration even today and constitutes a glorious testimony of
engineering knowledge of those times, even though the creation of the
pyramids was paid by the efforts of thousands of workers and the loss of
many lives (according to Herod, the number of workers was about 100
thousand).
1 The Cheops pyramid was inscribed on the list of seven wonders of the ancient
world and as the only object from this list survived until modern times.
102
The scale of this enormous undertaking made a huge impression,
inter alia, on Napoleon Bonaparte, who calculated that the stone used to
build only three pyramids in Giza could build a wall with a height of 3.3
m surrounding whole France [Furtak].
In the third century BC another gigantic logistics operation was
started in Asia, i.e. the construction of the Great Wall of China2 – a
fortification going from east to west, whose core was made of ground
and rubble, and the upper was paved with stones or bricks. The Great
Wall was to protect the Empire from the nomadic invasions of the
people from the north and – in its heyday – had about 7,000 kilometers
in length.
For many years, the Great Wall served its defensive role and it
seemed to be an impregnable fortification. However, around 1211, the
Mongol chief, Genghis Khan, invaded China and mastered the Empire
for almost 100 years.
The Great Wall is considered the largest building erected by man.
According to historical sources, about 3,5 million slave workers (about
70% of the then Chinese population) were employed in the construction
of the Wall, and about 1 million workers lost their lives. It is estimated
that 300 million m³ of materials were used for the construction of the
wall, which would be enough to build 120 Cheops pyramids or a two-
meter long wall along the entire length of the equator.
According to some sources, the precursor of logistics applications in
the military sphere was Alexander III Macedonian (from 356 BC to 324
BC), regarded as one of the most eminent military commanders in
history, who created an empire extending from Egypt to India.
Alexander III appreciated the importance of the army supply logistics by
introducing officers – quartermasters responsible for the baggage fleet.
As part of this rolling stock, each cavalryman had a slave assigned to
him on a horse and one pack horse with supplies. Such an organization
meant that the soldiers were largely self-sufficient, which increased the
speed and efficiency of conducting combat operations.
Antoine Henri de Jomini, a general of Napoleon’s army, is
considered the father of modern military logistics. In 1837, he published
the work „Précis de l’Art de la Guerre” („Outline of martial arts”), in
which he defined the concept of modern logistics as a part of military
knowledge treated equally with strategy and tactics.
2 In 1987 the Great Wall was inscribed on the UNESCO World Heritage List, and
on 7 July 2007 it was declared one of the seven new wonders of the world.
103
De Jomini introduced the quartermaster function (“marechal des logis”) and formulated 18 duties for army commanders resulting from
logistic tasks.
Jomini is considered, like Carl von Clausewitz – the most eminent
theoretician of the art of the nineteenth century. After the defeat of
Napoleon, Antoine de Jomini went to the Russian service and in 1830
reorganized the Russian Military Academy in St. Petersburg.
During the Second World War, an interdisciplinary team was created
in the US Army to shape and develop mathematical planning models
and their use to solve specific logistical tasks – such as location and
supply of warehouses, transport of cargoes for the army, delineation of
transport routes, etc.
In 1948, the American Association of Marketing published a
definition of logistics as “movement and handling of products from
places of production to places of consumption” [Gołembska, 2009, p.
10].
Published in 1961, E.W. Smykaya, D.J. Bowersax, F.H. Mossman’s
Physical Distribution Management: Logistics Problems of the Firm is
recognized as the first book about logistics.
Established in 1962, the Council of Logistics Management (CLM)
defined logistics as “the process of planning and controlling the costs of
flow, storage and information from sources of raw material extraction to
the place of consumption of the product, according to the client’s
wishes” [Gołembska, 2009, s. 10].
With regard to the sphere of civil activity, the term “logistics” was
used in the USA in 1955 in the publication “Note on the Formulation of
the Theory of Logistics” [Gołembska, 2009]. In Europe, however, the
term has been used since the 1970s [Gołembska, 2009, s. 22].
The aforementioned term in Europe was disseminated at the First
European Congress of the Movement of Materials in Berlin in 1974.
Nowadays, there are many expressions of the word “logistics” in the
literature on the subject, some of them being so little different that they
can be considered as synonyms.
At the beginning of the 1980s, logistics concepts became popular in
the countries of Western Europe, with the largest contribution to the
development of logistics theory and its practical applications primarily
in the Federal Republic of Germany, the Netherlands and Sweden.
Modern definitions distinguish three basic aspects of logistics
perception [Abt, 2001]:
1. As an integrated system of material flow (raw materials, semi-

104
finished products and finished products) and information flows coupled
with them; the goal of such a system is to optimize the acquisition and
transformation of physical goods,
2. As a philosophy of managing the processes of the flow of
physical goods and information, based on the integrated, systematic
recognition of these processes,
3. As an interdisciplinary field of technical, economic and it
knowledge, the subject of which are determinants, regularities and
phenomena of the flow of physical goods and information in the
economy, as well as in its individual links.
Hans Christian Pfohl introduces three categories for defining
logistics [Pfohl, 1998]:
The flow-oriented logistics definition:
as all activities of planning, regulating, executing or controlling
spatial-temporal transformation processes of materials (goods),
quantitative and assortment transformation processes of materials,
manipulative properties and the degree of logistic determination of
goods; thanks to the coordinated implementation of these activities, the
flow of goods is started, which links the delivery point with the
collection point in the most efficient way possible.
The logistics definition oriented to the product life cycle is as
follows.
Society of Logistics Engineers (SOLE) formulates the definition of
logistics:
as planning, control and regulatory management support activities
that during the product lifetime ensure efficient use of resources and
adequate effectiveness of logistic elements during all phases of the
product lifetime, with the effective control over resource consumption
ensured by interfering with the system at the right time.
The service-oriented logistics definition states that:
it is the process of coordination of all intangible activities necessary
to provide the service in a cost-effective manner and in accordance with
the client’s requirements.
The main direction of these activities includes the following three
areas: minimizing the waiting time (order fulfillment), managing the
service potential and providing services through the distribution
channel.
In technical applications, the definitions of logistics oriented to flows
of physical goods are the most widespread. Accordingly, logistics is

105
defined as follows:
as a science about planning, regulating and controlling material
flow systems, energy and capital information,
as a concept (philosophy) of managing the flow processes of
physical goods and information, based on an integrated systemic
approach,
as an interdisciplinary field of technical, IT and economic
knowledge, examining the determinants, regularities and phenomena of
the flow of physical goods and information in the economy, as well as in
its individual links.
Logistics is an interdisciplinary tool operating at the interface
between technology, IT and economics, integrating material and
information flows in order to increase the productivity of enterprises and
increase their competitiveness on the market.
Modern definitions define logistics as an interdisciplinary field
(Figure 3.1), which uses methods and procedures of such scientific
disciplines as planning, control and simulation – in application to
material and information flow processes.
Nowadays, it is recognized that logistics is a method of managing the
supply chain in the enterprise and between enterprises, including
planning, implementation and control of product flow as well as
information and finance flow, and finally, the management process of
production and distribution companies.
Contemporary trends and strategies of modern logistics The success of modern companies depends on many logistic
problems. These are: growing market competition, increasing customer
requirements, reliability and flexibility of operation, or
internationalization of enterprises.
Traditional methods are no longer enough. Therefore, the modern
economy needs support from modern logistics.
Logistics as a field of knowledge is in continuous development. This
development concerns the process of the flow of goods and information
and the management of this flow, as well as the efficiency of its
operation.
All economic entities are currently understood as specific logistic
systems. Each logistics system includes flows of material goods,
information and payments. In addition, more and more often, the reverse
logistics is considered as an important element of the logistics system.
All these processes in the logistics system intermingle.

106
Figure 3.1 Interdisciplinary character of modern logistics
[Korzeń, 1995]
In the process of implementing these various flows, appropriate
logistic technologies are used. These include automatic identification
systems, electronic data exchange, IT systems or telecommunications
technologies and the Internet.
Today, logistic technologies are used in almost every area of the
economy and most often they are a combination of many different
Enterprise economics
LO
GIS
TIC
S
Transport technology
Aquisition of goods
Supply
Production
Sales
Consumption
(use)
Recycling
Communication
techniques
Process
automation
techniques
Information
technology
System
techniques
Production
techniques
Shipment
techniques
107
instruments and methods.
Logistic technologies are used both in enterprises producing material
goods and in entities providing logistic services [Długosz, 2009, p. 15]. In
any case, it is about optimal customer service in accordance with the “7R”
principle [Szymonik, Nowak, 2018, p. 49]: right product, right quantity,
right quality, right time, right place, right information and right cost.
Modern logistics, thanks to the wide use of the latest information and
telecommunication technologies, ensures more and more efficient and
effective supply chain management.
This management includes information gathering and processing
technology, i.e. databases, cooperation between partners covered by the
supply chain and agent technology enabling automation of business
activities. In addition, Enterprise Information Systems (EIS) [Kawa,
Wierzyński, 2006, p. 50-78] make it easier for managers to make
decisions in terms of reducing costs and increasing revenues in order to
effectively manage a company.
At the end of the 20th century, as a result of the evolution of the
existing IT systems, an ERP (Enterprise Resource Planning) system
was created. It supports business management in the areas of planning,
production and distribution, and enables an immediate response to
changes in demand under the influence of market conditions and
restrictions along with comprehensive financial analysis.
The most technically advanced are the Supply Chain Management
(SCM) systems [Adamczewski, 2001, p. 186] including a set of
methodologies for the implementation of procurement, production and
sales processes ensuring maximization of profit by optimizing prices
and maintaining the level of stocks ensuring the continuity of logistics
processes.
Dynamic company management is possible thanks to the use of
automatic identification (AI) systems [Szymczak, 2011, p. 160] using a
bar code, Radio Frequency Identification (RFID), magnetic stripe,
Optical Character Recognition (OCR), vision systems and voice
solution.
Along with the rapid development of the Internet in the current
century, there is a widespread electronic data exchange enabling the
retrieval and processing of information in a simple, fast and secure way.
Electronic data exchange, identified with Electronic Data
Interchange (EDI) systems is a form of data and information exchange
between business partners’ IT systems.
Currently, electronic data exchange is based on eXtensible Markup

108
Language (XML) [Długosz, 2009, p. 115] and on the various applications
created on the basis of this language [Długosz, 2009, p. 115].
The continuous dynamics of the business environment and the
merging of the local and global economy have resulted in the emergence
of so-called network services involving communication between
information systems.
Modern enterprises use mobile technological solutions that enable
managing an economic entity or a logistics chain from anywhere in the
world. All thanks to the wireless communication systems.
Examples of such systems used in logistics are GSM-standard
cellular telephony or GPS satellite navigation, inter alia, to the location
of means of transport or goods, as well as the processing of voice signals
into the digital form in an analog-to-digital converter [Wesołowski,
2003, p. 263].
Modern logistics also uses very complex and diversified
technologies in particular branches of road, rail, air, water and combined
transport [Neider, 2006, p. 130].
Moreover, technological progress also applies to warehouse
solutions in a given company, e.g. automatic transport of goods through
transport equipment, dynamic storage and picking, or the use of voice
picking technologies.
The subject of logistics is also the packaging process, as an
important element of production and distribution, including the
acquisition of raw materials for packaging, their design and production,
the process and the flow of packaging goods, as well as consumption of
packaged goods, re-packaging and packaging waste disposal
[Dudziński, 2007, p. 94].
The use of logistics in the management of waste flows resulted in the
emergence of the concept of reverse logistics and green logistics
associated with the use of environmentally friendly resources, not
threatening the existing environment and favorable to man [Szymonik,
Nowak, 2018, p. 304].
The modern logistic system, therefore, covers all production stages
of material goods: from extracting raw materials, production of semi-
finished products, components and products, packaging and storage,
through transport and distribution with the provision of products to
consumers, as well as recycling and waste management [Jacyna, 2012,
p. 141].
Today’s logistic services stimulate the development of regions and
find a demand in all branches of the national economy in the country

109
and in international relations. Logistics itself becomes an
interdisciplinary science about managing both the enterprise and
enterprises of different countries on different continents in the global
logistics chains of international business.
Conclusion In the global economy of the 21st century, logistics is becoming
more and more important. It serves to rationalize economic and social
processes.
The scope of logistics management covers various spheres of
enterprise functioning. These are primarily demand forecasting,
planning and delivery, warehouse management, returns management,
packaging, transport, information flow and gathering, as well as quality
management and determination of the organization and customers’
needs.
Due to the impact of the economy on the course of social processes
and the functioning of the natural environment, decision problems
concerning the design (operation) of the logistics system are becoming
more and more important. Therefore, mathematical methods are used to
find optimal solutions. They are applicable in both static and dynamic
optimization.
In the first kind of optimization we are looking for fixed values of
parameters that ensure the best fulfillment of the expectations. In
dynamic optimization, when the functioning of a given system can be
influenced, from a set of acceptable solutions, the one for which the
solution evaluation index takes the optimal value is selected. For
instance, in order to determine profit, the maximum of a goal function is
sought, and for the loss estimation – its minimum.
In the search for optimal solutions in logistics, analytical simulation
experiments, which are closely related to mathematical modeling, are
used. Along with the development of mathematical programming and
computer techniques, the search for optimal solutions ceases to be too
difficult, and all decision-making processes in the economy become
inseparable from the use of information technology during all logistics
activities.
References: 1. Abt S. (2001). Logistics in theory and practice. The faculty of Economic
Academy, Poznań.
2. Adamczewski P. (2001). Information Technology furtherance of logistic
110
chain. A.E., Poznań.
3. Bylinko L., Jakubiec M. Kubański M. (2012). The management of
logistics and quality. The scientific faculty of Technical-Humanistic
Academy in Bielsko-Biała, Bielsko-Biała.
4. Ciesielski M. (red.) (2006). Logistics in business. PWE. Warsaw.
5. Długosz J. (red.) (2009). Modern technologies in logistics. PWE,
Warsaw.
6. Dudziński Z. (2007. Packaging at the storage economy. ODDK,
Gdańsk.
7. Frąś J. (2015). Standardization and quality management in logistics.
Academic Publishing of University of Technology in Poznań, Poznań.
8. Furtak A. (2018). Napoleon in Egypt. www.historia.org.pl, Internet
access in March.
9. Gołembska E. (2009). The logistics at the world economics. Academic
Publishing of C. H. Beck, Warsaw.
10. Gołembska E. (2009). The basics of logistics. The faculty of WSK,
Warsaw.
11. Jacyna M. (red.) (2012). Polish logistic system. The Publishing House
of University of Technology in Warsaw.
12. Kawa A., Wierzyński W. (2006). Integrated information technology
systems. w: M. Ciesielski (red.). The tools of logistic management,
PWE, Warsaw.
13. Korzeń Z. (1995). The basics of logistic. Academic Publishing of
University of Technology in Wrocław, IKiEM, Wrocław.
14. Kupiec L. (2010). The basics of logistic. The faculty of Higher Finance
and Management School in Białystok, Białystok.
15. Neider J. (2006). Transport in the international trade. UG, Gdańsk.
16. Nowakowski T. (2011). The reliability of logistic systems. Publishing
House of University of Technology in Wrocław, Wrocław.
17. Pfohl H.-Ch. (1998). Logistic systems. The faculty of ILiM, Poznań.
18. Rydzykowski W. (red.) (2011). Logistics service. Theory and practice.
The faculty of ILiM, Poznań.
19. Szymczak M. (2011). Authomatic identification and lineolate codes. WN
PWN, Poznań.
20. Szymonik A., Nowak I. (2018). Modern logistics. Difin SA, Warsaw.
21. Wesołowski K. (2003). Systems of radio communication of kinesthetic.
WKiŁ, Warsaw.
22. Woźniak A. (2010). Operational research in logistics and production
management. The faculty of State Higher Vocational School Memorial
in Nowy Sącz, Nowy Sącz.
23. В. Товстик Реальний капітал в сучасних умовах / В. Товстик, І.Г.
Брітченко / Донецьк: Схід. - №3 (27). - 1999. – С. 17-24.
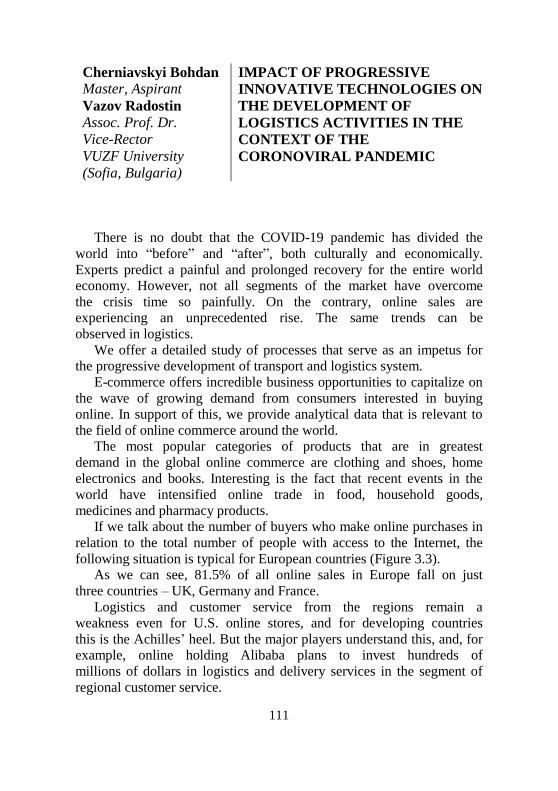
111
Cherniavskyi Bohdan
Master, Aspirant
Vazov Radostin
Assoc. Prof. Dr.
Vice-Rector
VUZF University
(Sofia, Bulgaria)
IMPACT OF PROGRESSIVE
INNOVATIVE TECHNOLOGIES ON
THE DEVELOPMENT OF
LOGISTICS ACTIVITIES IN THE
CONTEXT OF THE
CORONOVIRAL PANDEMIC
There is no doubt that the COVID-19 pandemic has divided the
world into “before” and “after”, both culturally and economically.
Experts predict a painful and prolonged recovery for the entire world
economy. However, not all segments of the market have overcome
the crisis time so painfully. On the contrary, online sales are
experiencing an unprecedented rise. The same trends can be
observed in logistics.
We offer a detailed study of processes that serve as an impetus for
the progressive development of transport and logistics system.
E-commerce offers incredible business opportunities to capitalize on
the wave of growing demand from consumers interested in buying
online. In support of this, we provide analytical data that is relevant to
the field of online commerce around the world.
The most popular categories of products that are in greatest
demand in the global online commerce are clothing and shoes, home
electronics and books. Interesting is the fact that recent events in the
world have intensified online trade in food, household goods,
medicines and pharmacy products.
If we talk about the number of buyers who make online purchases in
relation to the total number of people with access to the Internet, the
following situation is typical for European countries (Figure 3.3).
As we can see, 81.5% of all online sales in Europe fall on just
three countries – UK, Germany and France.
Logistics and customer service from the regions remain a
weakness even for U.S. online stores, and for developing countries
this is the Achilles’ heel. But the major players understand this, and, for
example, online holding Alibaba plans to invest hundreds of
millions of dollars in logistics and delivery services in the segment of
regional customer service.

112
Figure 3.2 The growth dynamics of online trading in the world,
2015-2020 [1]
In the works, it is emphasized that the support of the governments of
the countries for the development of the domestic transport and logistics
system becomes a priority, as this industry is able to generate a
significant increase in gross domestic income to the state budget and
become one of the main sources of competitiveness of the state.
In turn, it is obvious that it is impossible to maintain a high level of
competitiveness without financial support for the introduction of
advanced innovative technologies and developments in the field of
transport and logistics. It is possible to hope for a tendency of growth of
inflow of domestic and foreign investments into this sphere of economy
that will lead to increase of innovative and introduction activity, and
also level of national competitiveness owing to optimization of
expenses for logistics and improvement of quality of given services.
However, according to the author, this task should become one of the
key vectors in the national development strategy.
Statistics support the fact that logistics costs in the supply chain in
different countries range from 10% (USA, for example) to 20% of the
country’s GDP (in Russia and Singapore). The breakdown of these costs
is as follows: transportation costs account for 40-55%, inventory
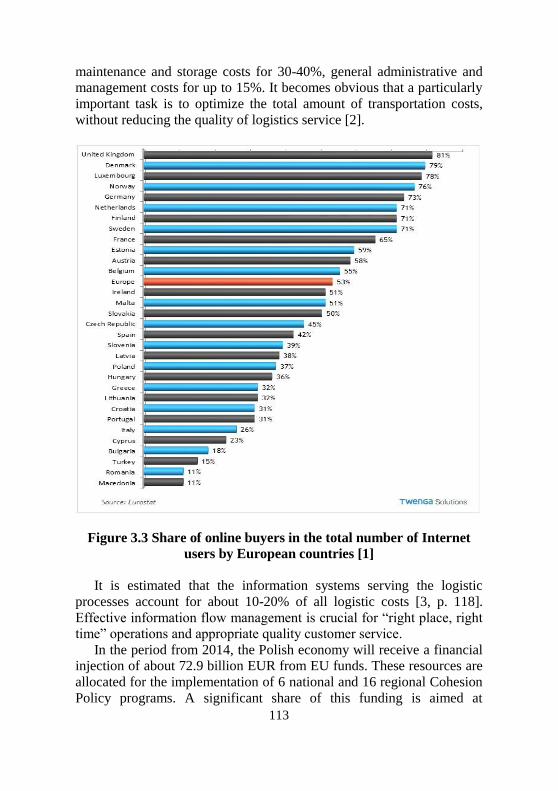
113
maintenance and storage costs for 30-40%, general administrative and
management costs for up to 15%. It becomes obvious that a particularly
important task is to optimize the total amount of transportation costs,
without reducing the quality of logistics service [2].
Figure 3.3 Share of online buyers in the total number of Internet
users by European countries [1]
It is estimated that the information systems serving the logistic
processes account for about 10-20% of all logistic costs [3, p. 118].
Effective information flow management is crucial for “right place, right
time” operations and appropriate quality customer service.
In the period from 2014, the Polish economy will receive a financial
injection of about 72.9 billion EUR from EU funds. These resources are
allocated for the implementation of 6 national and 16 regional Cohesion
Policy programs. A significant share of this funding is aimed at
114
increasing the overall level of business activity of business entities
(including the logistics sector of the Polish economy) and intensifying
investor activity.
In Poland, the Centre for Transport Projects (CEUTP) was
established to implement infrastructure projects in the transport sector
financed from European Union funds. The CEUTP has relative
autonomy in the implementation of projects with low costs and
coordinates with EU funds in the implementation of expensive financial
initiatives for road transport development. It is important to note that the
principles of CEUTP activity are fully constructed and harmonized with
the rules of the Infrastructure and Environment Program and the
transport policy of the Ministry of Infrastructure.
The CEUTP Centre provides comprehensive support to beneficiaries
at every stage of their activities: from consulting with leading specialists
and experts to risk and loss analysis, in-depth analysis of possible
barriers that may hinder project implementation. Close bilateral
cooperation is key to ensuring financial security and maximizing the
leveling of risks and threats.
The European Union Transport Project Centre provides full support
to road transport project participants, from the application for co-
financing to signing the final agreement. In parallel, the CEUTP Centre
coordinates, checks and guarantees that all key EU and Polish
legislation requirements will be met in the implementation of joint
projects through continuous monitoring [4, p. 8].
As noted earlier, in the functioning of the logistics industry
information technology is the basis for all stages of delivery of material
resources to end users without exception. Experience in optimizing
logistics costs in general and transport costs, including the leading
countries in the top 20 according to the World Bank’s LPI rating
(Logistics Performance Indicator) using innovative digital technologies
can be used as a benchmark in other countries. For example, revenue
and expense management with the help of the Smart Logistics Grid
system in Germany can minimize the ratio between supply and return. In
addition, the use of this software significantly reduces transport costs for
delivery and the processing and storage of inventory. And with the
PSItms transport service management system, effective planning of the
logistics process with regard to the situation on the roads and analysis of
available space in loading and unloading areas is achieved by integrating
it with navigation data (GPS). The combined operation of the above
systems with the integrated potential of PSIglobal (PSI Logistics)

115
integrated management and planning systems enables the integration of
global supply chains into the network and their optimization. This takes
into account warehouse location, distribution, coordinated planning and
implementation of transport with procurement and distribution. As a
result, supply chains are formed and managed as a single integrated
system – the so-called integrated communication SCM (supply chain
management), i.e., operational response technology and supply chain
management methodology is formed [2, 5].
Implementing technological innovations in open, globally connected
and intermodal transport systems operated by global carriers, logistics
operators, freight forwarders, consignors, consignees and customs
agencies is certainly more challenging than automating and robotizing
individual Smart Factories production systems.
The globally distributed and locally distributed business partners of
the Polish logistics system are now integrating and processing an
increasing range of data in cloud computing, including: intelligent
transport infrastructure, IoT cargo handling systems at sea and air ports,
transshipment terminals or logistics centers (including sensor systems
and networks), intelligent and autonomous vehicles (manned and
unmanned), digital service platforms in certain modes of transport
(including intermodal transport), electronic infrastructure and transport
registries as well as vehicle registries, digital transport industry
records.
Transport chains and delivery systems, using sensor networks and
satellite navigation systems, create integrated data systems in which the
route and transport conditions are precisely planned and dynamically
updated in real time – according to the current state of roads and traffic
along the route. Digital access to transport data in real time and an
automated processing process allow for the consideration of many
factors for the optimal choice of cargo, vehicle, route and traffic
schedule.
Therefore, one of the most important strategic tasks of an efficient,
competitive Polish logistics market is to increase the volume and scope
of implementation of sensor networks and satellite navigation systems.
The dynamically growing needs for mass data exchange and
processing (e.g. traffic, cargo, operations, vehicle, container/body
condition and transport conditions – temperature, humidity) and for
data sharing and reuse have led to the development of digital data
processing services in private and public cloud computing. For transport
planning and monitoring purposes, many digital service delivery models
116
have been developed, including SaaS (Software as a Service), PaaS
(Platform as a Service), IaaS (Infrastructure as a Service) or CaaS
(Communication as a Service). Increasing demand from many transport
companies for similar services (tracking, delivery notification, electronic
data exchange, etc.) – e.g. in sea and inland ports, logistics centers,
airport centers) has led to the dynamic development of digital service
platforms in SOA (service-oriented architecture), Comprehensive digital
services for goods flows and transport operations (road, rail, sea and air
transport), transshipment and border controls take into account the
connection between the services of digital administration systems and
business in Poland in particular and worldwide. They include national
and international administrative procedures (including digital public
services) and commercial or financial transactions in business processes.
Hence, the basis for the integration of transport processes and mutual
trust between partners in the digital environment is standardization and
data security, unified application information technology,
communication protocols, data access interfaces and digital services
(using, among others, block-chain technologies to guarantee
irreversibility and auditability of electronic transactions). All of the
above is an important strategic vector of development of the Polish
logistics system.
An important strategic point that affects the activation of
international partners in the field of logistics is to ensure security,
especially information security. Requirements for security, transaction
reliability and data exchange in transport chains include a secure
architecture for cross-border digital services, the use of access points for
trans-European transport networks, and the use of information and
communications technologies.
The European Union’s Digital Services Infrastructure (DSI) meets
the requirements of the European Parliament and the Council under
eIDAS Directive 910/2014 for electronic transactions in the domestic
market. The digital settlement of transactions and digital services in
transport chains (including electronic fees, fuel payment, cargo
handling, driver delegation, etc.) requires the integration of these
systems with electronic settlement platforms, electronic payments and
electronic banking operations.
Comprehensive digitization of data and information flows is
particularly important with the development of international trade and
trends in growing global turnover. The speed of data processing is a key
factor in the growth of trade transactions. Increasing requirements for

117
additional services are becoming more and more noticeable: digital and
service booking, operations of info-communication support,
notifications of bank settlement facts on transactions, etc.
Blockchain technology is gaining popularity in this respect.
Published literature analysis has revealed [6 – 8] that blockchain
technology has significant potential and prospects for application in
various fields of economy but the most interesting area for this
technology is logistics.
Given that supply chain is a sequence of delivery points on route
from the origin to destination, information on goods through
decentralized records movement is rather essential. One of the most
universally applicable blockchain technology performance capabilities is
that it can become a successful solution for supply chains elements
recording and controlling while providing entire cycle operations secure
and transparent monitoring [8].
Blockchain, which is bitcoin technology core, in fact, is a very
reliable and effective way of information exchange between the parties.
This creates an immutable digital Transactions Ledger that is maintained
by computers distributed network. This technology sharing potential, its
protected from unauthorized access architecture and complete
transparency make it an ideal tool for today’s supply chain management
methods revolutionizing.
Logistics chains often involve numerous stages and hundreds of
geographical locations. Due to this, transparency in the process (goods
production and transport) assurance, quality and origin of goods to the
ultimate buyer (counterfeit and/or low-quality goods) guaranteeing seem
extremely difficult. This issue is especially acute for the food group
products, where a buyer, for example, can not in any way identify
harvesting, animals and poultry culturing, fishing, etc. location and
environmental conditions.
In this aspect blockchain technology introduction main advantage is
synchronized audit between partners’ provision and the processes in real
time optimization. More importantly, blockchain increases the entire
promotion chain entities trust level, as well as facilitates decision
making process at every stage due to the possibility of providing one-
time access to information that allows processes and actions
synchronizing and anticipating.
Blockchain, even in the most basic version, into the supply chain
introduction allows to ensure the following: unnecessary middlemen
elimination; payment security and fraud protection; decentralization, i.e.
118
possibility of a logistics process entities to participate in the real-time
operations monitoring: in vehicles and goods movement monitoring; in
documents in the form of smart contracts completion and thus errors and
fraud risks reduction; in illegal links in the supply chain eliminating:
goods counterfeit, smuggling and illegal labor, etc.; traceability from
the place of the origin to its final consumer; consumer’s rights and
health safety protection, which allows informed buying decision
making.
In this respect, Maersk in association with IBM experiment result is
of interest. The purpose of this experiment was research of feasibility of
blockchain technology implementation when transporting one container
with flowers from Kenya to Rotterdam. More than 200 interactions with
documents and goods, the most important of which are signatures from
three agencies for exports approval; completion of six documents
confirming origin, chemical composition and quality of the product;
customs formalities, etc. are required in the course of such
transportation.
Main advantages of blockchain technology in logistics application
are: all network participants’ consistency and transparency; handling
operations traceability and recording; errors in auditing and payments
minimization; protection against fraud (hackers); confidence of network
participants and customers increase; real-time feedback, which allows
the supply chain participants to react on a timely basis and improve their
operations; companies’ activity scale expansion.
Along with that, bottlenecks of blockchain in modern logistics
implementation should be noted. Among these are: skepticism as to
innovative technologies, particularly by the traditional supply model
adherents; complexity of participants’ coordination and business
processes standardization; high requirements for personnel
qualifications.
Thus, one of the main barriers to the blockchain introduction is the
lack of trained personnel, i.e. professionals who have experience in
cryptocurrency area and crypto-assets consciousness. Accordingly, a
company, which plans to introduce innovations in its operations, should
learn more about its specific nature and analyze business in order to
assess potential advantages and disadvantages. Along with this, experts
note technological imperfections of the system itself, namely technical
failures and hacker attacks on the data sets. It should be understood that
today blockchain as an innovative technology for supply chain
management introduction is rather slow due to associated risks and

119
skepticism of individual companies, but it is very likely will soon gain
credibility, and its application will increase the industry efficiency [7].
The above arguments allow to summarize the following. Blockchain
introduction guarantees huge potential cost saving benefits for the
industry. Such a system can certainly reduce delivery delays and
likelihood of frauds, saving billions of dollars for every transportation
chain participant. According to the World Trade Organization, barriers
in goods international supply chain elimination will increase global
GDP by 5% and traffic total volume by 15% [8].
References: 1. Федоричак В. Интересные факты об интернет-торговле в мире в
2020 году. URL: https://lemarbet.com/razvitie-internet-
magazina/interesnye-fakty-ob-internet-torgovle/
2. Костов Е. Инновации, как ключевой фактор развития
логистической системы России URL: https://openbooks.itmo.ru/
ru/file/6289/6289.pdf
3. Никифоров В.В. Логистика. Транспорт и склад в цепи поставок.
Создание логистических информационных систем URL:
https://www.xcomp.biz/3-1-sozdanie-logisticheskix-informacionnyx-
sistem/
4. Лемех В. Польский опыт привлечения инвестиций в
логистическую инфраструктуру URL: http://antieconomy.com/
polskij-opyt-privlecheniya-investicij-v-logisticheskuyu-infrastrukturu/
5. Smart Logistics Grid: Разветвленная логистическая система с
процессами взаимодействия, 2015. URL: http://www.upro.ru/library/
logistics/systems/smart_logistics_grid_razvetvlennaja_logisticheskaja.
html
6. Machashchik P., Britchenko I., Cherniavska T. New Trends in
Development of Services in the Modern Economy [Text] / P.
Machashchik, I. Britchenko, T. Cherniavska //Wydawnictwo
Państwowej Wyższej Szkoły Zawodowej im. prof. Stanisława
Tarnowskiego w Tarnobrzegu, Tarnobrzeg, 2018. – 210 p.
7. Боги блокчейна: технология может разрушить бюрократию
государств. URL: http://www.forbes.ru/tehnologii/344141-bogi-
blokcheyna-tehnologiya-mozhet-razrushit-byurokratiyu-gosudarstv
8. Применение blockchain в логистике. URL: https://golos.io/ico/
@paxplus/primenenie-blockchain-v-logistike
9. Britchenko I., Cherniavska T., Cherniavskyi B. / Development of small
and medium enterprises: the EU and East-partnership countries
experience: monograph / Edited by Igor Britchenko and Yevheniia

120
Polishchuk : Wydawnictwo Państwowej Wyższej Szkoły Zawodowej im.
prof. Stanisława Tarnowskiego w Tarnobrzegu, Tarnobrzeg, 2018. —
P. 307 – 318.
Lalakulych Maria
Ph.D. of Economics, Professor
Tsenkler Natalia
Doctor of Economics Uzhgorod Trade and Economic
Institute of the Kiev National Trade
and Economic University
(Uzhgorod, Ukraine)
DIRECTIONS AND
CONDITIONS FOR
DEVELOPMENT OF
INNOVATION PROCESS
IN ENTERPRISES
In the conditions of high competitive pressure and increased risk, one
of the problems of the modern development of the Ukrainian economy
is the solution of the problem of rapid updating of products and
technologies, the collapse of industries that have lost their prospects for
development. The new products complement the product range of the
enterprise and give it the opportunity to compete with the products of
other producers, offering consumers more than competitors, both in the
variety of goods and the ways and conditions of their realization. The
opportunity to realize the competitive advantages of an economic entity
is increased if the enterprise has a sufficiently wide range of products,
each of which is at different stages of the life cycle, the product is
constantly updated. Accordingly, production capacity loading and
stability of the level of profitability of the activity will be ensured almost
always.
The value of innovative entrepreneurship for the development of the
enterprise’s activity and its functioning in the conditions of market
relations in the sphere of economy is increasing, increasing the
responsibility of the entities managing the enterprise for carrying out
innovative activity. At the same time, the spread on domestic enterprises
and the efficiency of innovation activities are reduced in the presence of
a complex of problems in the field of economic theory and management,
as well as in the practice of creating, developing and implementing in
the production of innovative products.

121
There are no normatively regulated methods of accounting and
economic analysis of innovative activity. Accounting reflection of
business transactions related to innovation is complicated by the
unsettledness in the Plan of accounts of accounting of assets, capital,
liabilities and business operations of enterprises and organizations and
the Instruction on its use of accounts and their correspondence on
reflection of expenses, income and results of innovative activity, as well
as the lack of Methodological recommendations for accounting for
innovation activity. The effectiveness of assessing the results of
economic analysis of innovation activity is significantly reduced in the
absence of appropriate methodological developments, in particular,
Methodological recommendations for determining the cost effectiveness
associated with the creation of innovative products, their introduction
into production.
Innovative activity of industrial enterprises is hampered by lack of
financing, including state, difficulties with material resources, crisis in
science, lack of information support of the system of activity
management. The state policy in the sphere of innovations now is not
aimed at increasing and stimulating the activity of innovative activity of
enterprises both in the domestic and international markets of goods and
services. However, in the world practice the scale of market
commercialization of components of scientific and technological
development is constantly increasing.
The complex of existing problems in the sphere of stimulation and
implementation of innovation activity necessitates the strengthening of
the general level of financial and economic requirements to support the
implementation of research and development projects, first of all,
regarding the improvement of accounting and analytical support for the
management of innovation activity at the level of economic entities.
There is not enough scientific research to solve the problem of creating a
system of accounting and analytical support for innovative activities.
The use of foreign experience without taking into account the specifics
of domestic economic entities prevents increased efficiency of
management of innovation activity in order to realize its technical and
socio-economic effect.
The need for introduction of innovations in domestic production is
constantly increasing. The most notable negative effects of extensive
economic development in Ukraine include the predominance of obsolete
fixed assets with high levels of wear and a high level of resource
consumption of manufactured products.
122
Insufficient utilization of part of production capacities, use of old
production technologies make inconsistency of activity of the
overwhelming number of domestic enterprises in the level of labor
productivity and qualitative characteristics of production tough
competition requirements of world markets of goods and services. In
this regard, the study of the economic nature of innovation and
innovation activity is relevant.
The concept of “novation” (innovation) means a progressive
novation involved in the dynamics that is new to the organizational
system that accepts and uses it [7].
Innovation is the subject of research in a number of fundamental
sciences. In the philosophical aspect, in particular, innovations means
new knowledge and solutions to contradictions. Psychologists, above
all, consider the conflicts that arise, the ways as they are resolved, and
the synergistic effects achieved by teams of innovators. In the research
of technical sciences, attention is paid to the technological aspect of the
introduction of fundamentally new technologies. Economists,
considering innovation, explore not only the process of creation and
development, but also the large-scale introduction of innovation. The
most comprehensive is the definition of innovation from the birth of the
idea to the placing on the market, which takes into account both the
objective laws of economic theory and the subjective factors that
influencing on environmental innovation. Understanding the economic
nature of innovative activity makes it possible to effectively use
economic levers to control the development of domestic enterprises and
increase the level of profitability of their activities.
The founder of innovation is the Austrian scientist Joseph A.
Schumpeter (1883-1950), who first introduced into scientific circulation
in the first decade of the twentieth century the concept of “innovation”
as a new economic category. Also, the founders of the innovation
priority in entrepreneurship are M. I. Tugan-Baranovsky, M. D.
Kondratiev, G. Mensch, E. Hansen, E. Mansfield.
According to J. Schumpeter’s point of view, innovation is the main
source of profit: “... profit is, in fact, the result of executing new
combinations” [9, p. 44]. In the work “Economic cycles” (1939) J.
Schumpeter explored the basic concepts of the theory of innovative
processes, considering innovation as a change in technology and
management, as new combinations of resource use. He particularly
emphasized the role of the entrepreneur in the innovation process.
According to his views, the entrepreneur is the link between invention
123
and innovation [10].
An important impetus for scientific research in the field of
innovation and their role in economic development were the works of
M. D. Kondratiev, whom the famous American economist P. Drucker
called the economist “number one” of the XX century [11, p. 8].
Considered by M. D. Kondratiev’s large cycles of conjuncture (long
waves) initiated a further study of the causes of these cycles and their
duration, the most significant reason for which innovation is recognized.
The ideas of M. D. Kondratiev influenced the development of J.
Schumpeter’s theory.
German scientist G. Mensch tried to link the pace of economic
growth and cyclicality with the emergence of basic innovations.
According to him, in a situation where basic innovations are exhausting
their potential, there is a situation of “technological pat” that defines
stagnation in economic development [12, p. 14]. According to G.
Mensch, industrial development is the transition from one technological
pat to another. The scientist argued that as a result of the emergence of
basic innovations, new businesses emerge, whose development cycles
are quite interconnected. The production of new goods at the initial
stage, as a rule, lags behind demand, and therefore is characterized by
high growth rates during this period. G. Mensch linked the cyclicality of
the economy with the cyclicality of innovations and the stages of
development of new businesses. He pointed to the moment when
production of new goods began to exceed demand. Since then,
companies have been looking for entry into foreign markets, the rate of
return has been falling, less and less money is being used for
investments, on the contrary, capital is being channeled to financial
markets. There is a time when speculative financial transactions are
gigantic and the rate of return in the monetary sphere falls below the rate
of return in industry, which, according to G. Mensch, means that the
financial sector is ready for investment in the real sector.
Novation is transformed into innovation as an economic benefit,
primarily through the investment process. Investments that are made to
bring science and technology to production and the social sphere are
called innovative investments or investments in innovations. They are
usually of a long-term nature and include investments in tangible and
intellectual (intangible) assets, as well as financial investments.
Realization of innovations causes growth of real investments as a result
of opening of new resources, development of technology.
In determining the economic nature of innovation, an object-based
124
approach is dominant, in which innovation is regarded as the result of
scientific and technological progress. However, the concept of
“innovation” is broader than the concept of “new technology”, which is
explained by the use of relatively new work instruments, materials,
reagents and other assets used primarily in production. The concept of
“innovation” extends to a new product or service, the way they are
manufactured, innovations in organizational, financial, research and
other fields, any improvement that provides cost savings or creates the
conditions for such savings. In this case, the innovation means the
transition of things to a new quality.
According to the Law of Ukraine “On Innovative Activity”,
innovations are newly created (built) or improved competitive
technologies, products or services, as well as organizational and
technical solutions of industrial, administrative, commercial or other
nature, which significantly improve the structure and quality of
production and social sphere [7]. Thus, the legislative definition of
innovation covers the fields of production, trade, construction and all
kinds of services, including the social sphere.
The most comprehensive approach is to consider innovation as a
result of scientific and technological progress. Yes, according to prof.
M. D. Korinko, innovative activity is oriented on market relations,
which leads to clarification of concepts of “scientific and technological
progress” and “scientific and technological development”, in which the
category of "innovation" is the main driving element. Innovations are
novations using the advances in scientific and technological progress
that ensure the recovery of fixed assets, optimal consumption of
resources, energy conservation in the introduction of new technologies
and have an impact on improving the economic performance of business
entities. The economic essence of innovation is manifested in the
making a profit and competitiveness increasing of the enterprise. Unlike
the developed countries of the world, Ukraine still remains a state where
extensive type of economic development is maintained, which
characterizes the irrational use of natural resource potential [6, p. 149-
154]. The approach to considering innovation as a result of scientific
and technological progress determines their clear orientation to the end
result of applied nature, which provides a certain technical and socio-
economic effect of innovation activity. In their development (lifecycle),
innovations change forms, moving from idea to implementation. The
progress of the innovation process is due to the complex interaction of
many factors.
125
The most important feature of innovation is the novelty of consumer
properties that obtained as a result of its implementation. Innovation
means not only the introduction of a new product to the market, but also
a number of other innovations: new or improved types of products
(product innovations), new or improved services (service innovations),
new or improved production processes and technologies (process and
technological innovations); changed social relations at the enterprise
(social and personnel innovations).
A purposeful system of measures for the development,
implementation, assimilation, production, diffusion and
commercialization of innovations is called innovation activity. In its
content, such activity is the basis of the concept of entrepreneurship as a
special economic category, since the introduction of innovations
contributes to the creation of qualitatively new market demand, increase
of economic activity of economic entities, growth of income. Innovative
activity is one of form of investment activity and is carried out in order
to implement the achievements of scientific and technological progress
in the industrial and social spheres. Herewith innovative activities
include the following areas: production and dissemination of
fundamentally new types of equipment and technologies;
implementation of long-term scientific and technical programs with long
payback periods of cost; financing of basic research to achieve
qualitative changes in productive forces; development and
implementation of new resource-saving technologies designed to
improve the social and environmental environment.
In world practice, the transfer of high technology from the field of
fundamental science to production is due to the use of entrepreneurial
structures such as technoparks and technopoles, in which scientific and
training centers and knowledge-intensive firms are concentrate. The
corresponding state support to the functioning and development of
fundamental science, the formation of the market of innovative services
should contribute to the increasing of economic growth and increase of
the population’s well-being.
Generalization of existing approaches to defining the category of
“innovation” has allowed to establish that during the organization of
accounting and analysis of innovation activity of enterprises it is
advisable to understand by innovation the set of measures aimed at the
use and commercialization of the results of research and development
and the appearance on the market of new competitive products or
services. The concept of “innovative activity”, which herewith emerges,
126
with the legal definition proposed to be interpreted as a process aimed at
finding opportunities to intensify production and meet public needs in
competitive goods and services based on the use of scientific, technical
and intellectual potential), taking into account the change of tasks and
principles of innovation activity in the economic environment and the
economic basis for the creation and use of an innovative product –
technical and socio-economic effect. Innovative activity of industrial
enterprises is constrained by lack of funds, difficulties with material
resources, crisis conditions in science, insufficient state financial
support.
However, in the context of market relations in the sphere of economy
and the need to become a modern model of economic growth, it is
necessary to increase innovation activity. The solution to the issue of
providing an effective mechanism for implementation of innovations
requires building an effective economic system at the level of enterprise
as the main subjects of innovation activity. The tasks of rapid updating
of types of products and technology, the collapse of productions that
have lost perspective in the face of high competitive pressure and
increased risk come to the fore before the management of enterprises.
New products (innovation) add to the product range of the enterprise
and create opportunities for competition with the products of other
producers, offering consumers a more diverse range of products, better
ways and conditions of their sale. The production of various by purpose
and fields of use of goods allows for a stable profit from the sale of
different goods when changing the structure of consumer demand.
Innovation is one of the factors that reduce cost, price, and therefore
increase profits and the level of quality for products. Therefore, it is
necessary for enterprises to develop and implement innovations to
enable them to realize their own competitive advantages in the market of
goods and services.
In order to ensure effective management of innovative activity,
which covers different spheres of activity of the enterprise (capital
investment, material and technical, energy, technical support,
environmental protection), functions of accounting and economic
analysis in their interdependence and connection with other management
functions should form an unbroken management cycle in space and
time, to be subordinate to the goals of a system of managing such
activities to ensure technical and socio-economic effect of innovation.
The study of directions and conditions for the development of the
innovation process at domestic enterprises, taking into account the

127
existing scientific achievements in this field, allowed to do the following
conclusions.
For entering of Ukraine on equal terms in the world economic
system, it is necessary to form an innovative model of economic
development. Achieving the technical and socio-economic effect of
innovation involves the need to deepen the convergence process of
directions of technological and economic research.
The term “innovation activity” encompasses a process aimed at
finding opportunities to intensify production and meet public needs for
competitive goods and services based on the use of scientific, technical
and intellectual potential), which takes into account the change in the
objectives and principles of innovation activity in the economic
environment and such economic basis of creation and use of an
innovative product as a technical and socio-economic effect.
Ensuring an effective mechanism for innovation activity managing
requires the organization of an effective system of management at the
enterprise level as subjects of innovation activity, which can be achieved
by: 1) implementation at the state level of targeted measures that can
create economic opportunities as a precondition for the formation of
mechanisms that stimulating innovative activity, in particular, the
growth of financial allocations to the field of science and innovation
activity; 2) development of the mechanism of interaction of economic
entities, which will ensure the achievement of competitive advantages
through active innovation activity.
Disregard of accounting and analytical support for innovative
activity is caused by the underdevelopment of scientific research in the
field of accounting and economic analysis of such activity. Such activity
covers various spheres of activity of the enterprise (capital investment,
material and technical, energy, technical support, ecological protection).
Accordingly, scientific research in the field of accounting and analysis
should be directed to substantiate the possibility of appropriate
integration into the management process of functions of accounting and
economic analysis in their interdependence and interrelation with other
management functions.
References: 1. Havrylko, P. P., Kolodiychuk, A. V., & Chertoryzhskyy, V. M. (2011).
Faktory innovatsiynoho rozvytku promyslovosti [Factors of innovation
development of industry]. In Naukovyy visnyk NLTU Ukrayiny
[Scientific Bulletin of National Forestry University of Ukraine]: Vol.

128
21.11 (pp. 201-205). [in Ukrainian].
2. Kolodiychuk, A. V. (2015). Innovatsiynyy rozvytok promyslovosti:
zavdannya upravlinnya pry vrakhuvanni umov nedoskonaloyi
konkurentsiyi [Innovative development of industry: the tasks of
management taking into account the conditions of imperfect
competition]. Lviv: League Press. [in Ukrainian].
3. Kolodiychuk, A. V., & Pisnyy, V. M. (2009). Osoblyvosti
funktsionuvannya mashynobudivnykh pidpryyemstv na suchasnomu
etapi rozvytku ekonomiky Ukrayiny [Features of functioning of
machine-building enterprises at the current stage of development of the
economy of Ukraine]. In Naukovyy visnyk NLTU Ukrayiny [Scientific
Bulletin of National Forestry University of Ukraine]: Vol. 19.13 (pp.
172-178). [in Ukrainian].
4. Kolodiychuk, A. V., Pisnyy, V. M., & Semchuk, Zh. V. (2009). Sutnist’
innovatsiy, struktura ta osnovni etapy innovatsiynoho protsesu [The
essence of innovation, the structure and the main stages of the
innovation process]. In Naukovyy visnyk NLTU Ukrayiny [Scientific
Bulletin of National Forestry University of Ukraine]: Vol. 19.9 (pp.
191-196). [in Ukrainian].
5. Korinko, M. D. (2009). Bukhhalters’kyy oblik [Accounting]: Tutorial.
Kyiv: ICC of State Statistics Committee. [in Ukrainian].
6. Korinko, M. D. (2009). Innovatsiyi u diyal’nosti sub”yektiv
hospodaryuvannya [Innovations in the activity of economic entities].
Aktual’ni problemy ekonomiky – Actual problems of the economy, 5
(95), 149-154. [in Ukrainian].
7. Pro innovatsiynu diyal’nist’ [On the innovation activities] (2002): Law
of Ukraine, adopted on 2002, July 4, 40-IV. Vidomosti Verkhovnoyi
Rady Ukrayiny – The Official Bulletin of the Verkhovna Rada of
Ukraine, 36, 266. [in Ukrainian].
8. Sopilnyk, L. I., & Kolodiychuk, A. V. (2009). Upravlinnya
konkurentospromozhnistyu mashynobudivnykh pidpryyemstv na
suchasnomu etapi rozvytku ekonomiky Ukrayiny [Management of
competitiveness of machine-building enterprises at the present stage of
development of Ukrainian economy]. In Naukovyy visnyk NLTU
Ukrayiny [Scientific Bulletin of National Forestry University of
Ukraine]: Vol. 19.10 (pp. 222-227). [in Ukrainian].
9. Schumpeter, J. A. (1992). Innovatsionnost’ i predprinimatel’stvo:
praktika i printsipy [Innovation and entrepreneurship: Practice and
principles]. Moscow: INFRA. [in Russian].
10. Schumpeter, J. A. (1939). Ekonomicheskiye tsikly [Economic cycles].
Moscow: Progress. [in Russian].
11. Drucker, P. F. (1985). Innovations and entrepreneurship: Practice and

129
principles. N. Y.: Harper and Row.
12. Mensch, G. (1977). Das technologische Patt: Innovationen überwinden
du Depression. Frankfurt am Main. [in German].
prof. Ing. Štangová Nora, CSc.
Ph.D. (Econ.), Professor,
Department of Small and Medium-
Sized Enterprises
PhDr. Víghová Agnesa, PhD.
Senior Lecturer
Department of Public Administration
School of Economics and Management
in Public Administration in Bratislava
(Bratislava, Slovakia)
INNOVATIOS IN
DOCUMENTATION
ON THE
FUNCTIONING OF
THE COMPANIES IN
SLOVAKIA
Financial audit, as one of the essential indicators of the behavior and
reporting of companies’ results, is the systematic and independent
acquisition and evaluation of evidence of allegations related to
economic transactions and events, to determine whether activities in a
given area and related results are consistent with the intended intentions
and to determine the degree of consistency between the predetermined
criteria and the claims, also whether these intentions are implemented
effectively and are suitable for achieving the objectives. (Žák, 2012, p.
92)
In Slovakia, the financial audit is regulated by Act no. 423/2015
Coll. Act on Statutory Audit and on Amendments to Act no. 431/2002
Coll. on Accounting as amended and in accordance with International
Standards on Auditing (ISA).
Financial auditors are required to have audited financial statements
of the following entities: cooperative, stock company, simple joint stock
company, limited liability company, public limited company and limited
partnership, which on the date on which the financial statements are
prepared and for the immediately preceding accounting periods at least
two of the following conditions:
1. the total amount of assets exceeds EUR 2 000 000,
2. the net turnover exceeded EUR 4 000 000,
130
3. the average recalculated number of employees in the accounting
period exceeded 30.
In addition to business entities, self-government entities, ie
municipalities, cities, higher territorial units.
The financial audit is performed by an auditor who has obtained a
license, which is issued by the Office for the Supervision of Audit
Performance.
Each financial audit is performed in accordance with International
Standards on Auditing (ISA). ISA defines audit procedures.
1. Audit procedures
Audit procedures are the auditor’s procedures aimed at obtaining
financial information about the relationships between financial and non-
financial data that are contained directly or indirectly in the financial
statements.
The auditor’s objective is to design and perform audit procedures to
obtain sufficient appropriate audit evidence to enable him to reach the
appropriate conclusions, which are the basis for the auditor’s opinion.
Overall, audit procedures can be divided in terms of time, but also in
terms of the objective of the audit into:
- audit procedures related to the complex knowledge of the client
by the auditor,
- audit procedures related to audit planning,
audit procedures related to the actual performance of the audit,
- audit procedures related to the completion of the audit and the
submission of the auditor’s report (Kareš, 2014, p. 11).
Ad a) Audit procedures related to the complex knowledge of the
client by the auditor
In addition to the findings of the overall audit risk, knowing the
entity and its environment is one of the necessary prerequisites for
conducting an audit in accordance with International Standards on
Auditing (ISAs). The reference framework expresses the nature and
level of knowledge, plans the audit and also expresses his professional
judgment about the risk assessment of material misstatements in the
financial statements, and also responds to the risks throughout the audit
(eg considers the appropriateness of accounting policies used, their
proper transformation into financial statements, it examines specific

131
areas such as the entity ‘s related party transactions, it may also analyze
trends to be used in performing analytical procedures, it suggests and
performs additional audit procedures to reduce audit risk to an
acceptable low level, the reference framework also evaluates the
adequacy and appropriateness of the audit evidence obtained).
The main source of information – internal – is the management of
the audited organization, because it can inform about expected events
and various problems that are or may occur in the organization. The
other sources of information could be the external sources, which also
contribute to a better knowledge of the audited organization.
Client knowledge issues are addressed in ISA 315. According to the
auditor, the auditor is required to perform:
- Obtaining of the information from management and others in the
entity. Obtaining information from others explains to the auditor how
the financial statements have been prepared, the effectiveness of the
entity’s internal control, suspicions of fraud, or future trends in the
organization.
- Implementation of the analytical procedures – these help to
identify extraordinary transactions that have an impact on the financial
statements and thus on the audit.
Ad b) Audit procedures related to audit planning
Audit planning is the creation of an overall audit strategy – that is,
the sequence of steps for a particular engagement and the development
of an audit plan to reduce audit risk to an acceptably low level. Audit
planning takes place throughout the audit, but begins shortly after the
auditor’s appointment. (Kareš, 2014, p. 16).
The auditor should develop and document a comprehensive audit
plan describing the expected scope and management of the audit. As the
comprehensive audit plan should be sufficiently detailed to guide the
preparation of the audit program, its form and content will vary with the
size of the entity, the complexity of the audit, and the specific methods
and techniques the auditor will use in the audit. (Kareš, 2010, p. 101).
The audit plan includes:
- a description of the nature of the planned work and the procedures
for assessing the risks of material misstatement (in accordance with ISA
315) and their scope and timing,
- a description of the nature of the additional audit procedures for
each significant transaction, timing and extent (in accordance with ISA
132
330), this plan reflects the auditor’s decision as to whether to test the
operating effectiveness of controls, timing and extent of procedures,
- the audit procedures that must be performed on the engagement to
meet the requirements of International Standards (ISA).
Ad c) Audit procedures related to the actual performance of the
audit
The primary objective of an audit of financial statements, that is, the
financial statements, is to enable the auditor to express an opinion on
whether the financial statements have been prepared in all material
respects in accordance with the applicable financial reporting framework
and whether the annual report is consistent with the financial statements.
Techniques that are designed to measure the overall accuracy of
financial data are collectively referred to as analytical procedures. They
are used for the following reasons:
- to assist the auditor in planning the nature and extent of audit
procedures,
- represent substantive procedures to obtain evidence of specific
assertions in relation to the state of the accounts,
- for the overall verification of the accounting information in the
final examination of the audit results.
So we can talk about analytical procedures:
- in planning, this involves knowing and understanding the entity
and identifying areas, where audit risks may occur,
- used as substantive procedures (substantive procedures) – here the
aim is to reveal material inaccuracies at the level of assertions, which
include tests of details of individual types of transactions, account
balances and information. The auditor may use substantive analytical
procedures instead of detailed verification of items, or a combination of
both, ie detailed verification and substantive analytical procedures,
depending on the auditor’s decision, which is also influenced by the
nature, availability and reliability, accuracy and accuracy of the data.
Deviations from the expected condition, with the auditor considering
which deviation to accept.
Ad d) Audit procedures related to the completion and submission of
the auditor’s report
The final stage of the audit is a summary of the conclusions in order

133
to document the adequacy of the audit work performed and the
appropriateness of the conclusions reached. Prior to issuing the auditor’s
report, the auditor should, based on the assessment of the audit
documentation, ensure that he / she has obtained sufficient appropriate
audit evidence to support the conclusions reached and to issue the
auditor’s report (Kareš, 2004, p. 28).
Thus, the auditor’s objective at this stage is to decide: - whether the identification of risks of material misstatement at the
assertion level is appropriate,
- whether appropriate and sufficient evidence has been obtained to
reduce the risks of material misstatement of the financial statements.
The objective at the beginning of this stage is to obtain sufficient
evidence to reduce the risks of material misstatement of the financial
statements. At the end of this stage, all significant findings are recorded
in the contract document.
In evaluating the financial statements, the auditor needs to evaluate
whether the summary of the misstatements identified in the audit is
significant. The auditor must also conclude, that the audit evidences,
which have been obtained, are appropriate and sufficient to reduce the
risk of material misstatement at the financial statement into the
acceptably low level.
The resulting documents that the auditor always submits to the entity
are:
a) the auditor’s report and opinion,
b) a letter to the accounting management (Kareš, 2004, p. 106).
The auditor is obliged to base the preparation of the auditor’s report
on all the facts that he / she has found, while evaluating each fact found
individually and at the same time in their mutual connection; the auditor
should not conceal any fact that may have a significant effect on the
conclusions of the auditor’s report on the conduct and results of the
audit (Act no. 540/2007 Coll. on Auditors).
The final step in the audit process is to evaluate the conclusions based
on the audit evidences obtained and to prepare a stylized auditor’s report.
The auditor’s report may be of the following nature:
a) conditional opinion
b) rejection of the opinion
c) negative opinion.
The nature of the auditor’s report depends on the deficiencies
identified in the implementation of the audit procedures.

134
2. Audit evidence
The acquisition of significant and credible audit evidence is
considered to be a particularly important part of audit procedures to
provide the auditor with reasonable final conclusions and to provide an
objective basis for the auditor’s opinion. Audit evidence is also defined
by the International Standard on Auditing (ISA). The most common
methods used to obtain evidence include:
- examination: represents the process of verifying accounting
documents and their circulation, physical inspection of assets and
inventories, confirming the correctness of internal and external
documents and records (used to verify the existence of the items),
- observation: pays attention to the process performed by the
delegate or the auditor (limited to the time period in the presence of the
auditor),
- external confirmations: represent confirmations from third parties,
e.g. account balances, confirmation of contractual conditions, resp. the
terms of transactions that the company has established with third parties,
- recalculation: focuses on the mathematical accuracy of documents
(performed electronically and manually),
- re-performance: represents the performance of controls that the
auditor performs independently of the procedures and controls that were
originally performed as a result of the company’s internal control,
- analytical procedures: independent evaluation of financial
information by analyzing the relationships between financial and non-
financial data (the auditor creates his expectations of the item, which he
later confronts with the reported companies),
- obtaining information: The most commonly used method of
obtaining audit evidence (the auditor obtains various financial and non-
financial information from stakeholders orally or in writing throughout
the audit).
The amount of audit evidence required is affected by the risk of
misstatement – the higher the risk, the more audit evidence it is likely to
be obtained, but also the quality of that evidence – the higher the
quality, the less it will be necessary.
3. Audit documentation
Documentation is the key element of any audit, it demonstrates, that

135
the work of the audit is satisfactory, it ensures the readiness to provide
information that has appeared in the audit throughout its history, it
ensures the completeness of the information. Auditors need to be able to
assess the sources of information and how they are balanced. The
concept of audit is inseparable from documentation that is accurate.
High
More evidences needed
Inherent risk, or
Control risk
Less evidences needed
Low
Detection risk High
Figure 3.4 Relationship between the components of audit risk and
the required audit evidence Source: http://www.eca.europa.eu/Lists/ECADocuments/FCAM_2012/FCAM_2
012_SK.pdf
The need for audit documentation is resulting from the riskiness of
the audit profession.
It can be understood in the triple dimension:
1) as an activity connected with the fixation of relevant phenomena,
2) as a formalized result of audit activity,
3) the use of these results for various purposes.
It can be said that this is the only reliable evidence, that the audit was
performed at all, it is an irreplaceable argument and a permanent
summary of the findings from the auditor’s work.
It is the property of the auditor and enables dynamic identification of
the accounting unit, operational refinement of the audit program and
procedure.
The auditor and the auditing company shall keep audit
136
documentation on the course of the audit in accordance with
International Standards on Auditing. The audit documentation also
includes the contract under which the audit, the audit plan and program,
the auditor’s report, the separate financial statements or consolidated
financial statements, the annual report or the consolidated annual report
and other documents documenting the audit process are performed. (Act
540/2007 Coll. on Auditors § 20 par. 1).
Form and content of the audit documentation.
Each audit engagement is different and therefore the form and
content of the audit documentation differ. The form and content are
affected by the following factors:
- the nature of the contract, - the form of the audit report, - subject of assurance, - conditions at the client, - the extent of the inherent, control and detection risk, - the need to control the work performed. The content of the audit documentation must have evidence that:
- the audit was adequately planned, performed and controlled, - the entity’s internal control system was analyzed, which is the
basis for determining the scope and nature of substantive tests, - the audit documentation, procedures and tests obtained provide a
sufficiently qualified basis for the auditor’s opinion on the financial
statements. The auditor should record information in the working documentation
about the planning of the audit work, the nature, timing and extent of the
audit procedures performed, the results of those procedures, and the
conclusions that result from the audit evidence obtained. The working
documentation must contain evidence of all the auditor’s judgments and
considerations and of significant facts, as well as the auditor’s
conclusions and decisions made on their basis. (Kareš, 2004. p. 223).
The audit documentation should contain information that relates to:
- the legal status and organizational structure of the entity, - copies or extracts from relevant legal documents, plans and
contracts, information relating to the industry, legislative and economic
environment in which the entity carries on its business, - evidences related to the planning of the audit, its program and
possible changes, evidences of the understanding of the accounting and
internal control system, evidences of the assessment of natural and
control risk and its changes, as well as evidences of the auditor’s
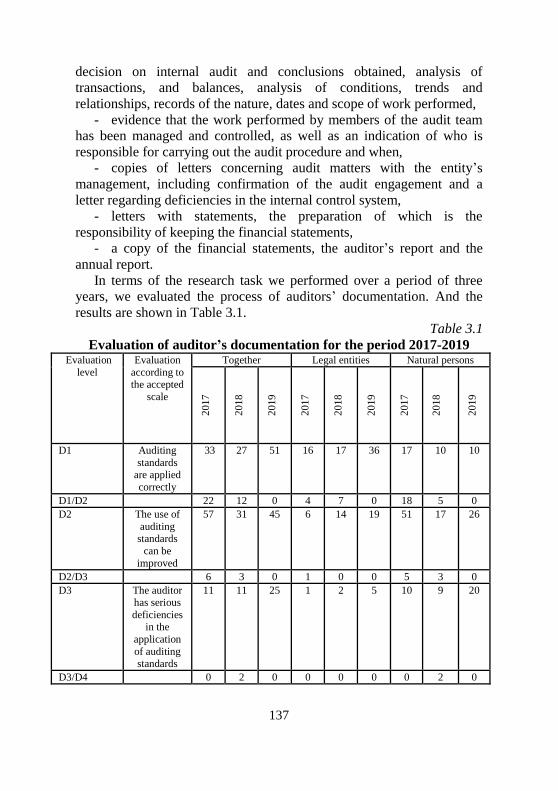
137
decision on internal audit and conclusions obtained, analysis of
transactions, and balances, analysis of conditions, trends and
relationships, records of the nature, dates and scope of work performed, - evidence that the work performed by members of the audit team
has been managed and controlled, as well as an indication of who is
responsible for carrying out the audit procedure and when, - copies of letters concerning audit matters with the entity’s
management, including confirmation of the audit engagement and a
letter regarding deficiencies in the internal control system, - letters with statements, the preparation of which is the
responsibility of keeping the financial statements, - a copy of the financial statements, the auditor’s report and the
annual report. In terms of the research task we performed over a period of three
years, we evaluated the process of auditors’ documentation. And the
results are shown in Table 3.1.
Table 3.1
Evaluation of auditor’s documentation for the period 2017-2019 Evaluation
level
Evaluation
according to the accepted
scale
Together Legal entities Natural persons
2017
2018
2019
2017
2018
2019
2017
2018
2019
D1 Auditing
standards are applied
correctly
33 27 51 16 17 36 17 10 10
D1/D2 22 12 0 4 7 0 18 5 0
D2 The use of
auditing standards
can be
improved
57 31 45 6 14 19 51 17 26
D2/D3 6 3 0 1 0 0 5 3 0
D3 The auditor has serious
deficiencies in the
application
of auditing standards
11 11 25 1 2 5 10 9 20
D3/D4 0 2 0 0 0 0 0 2 0
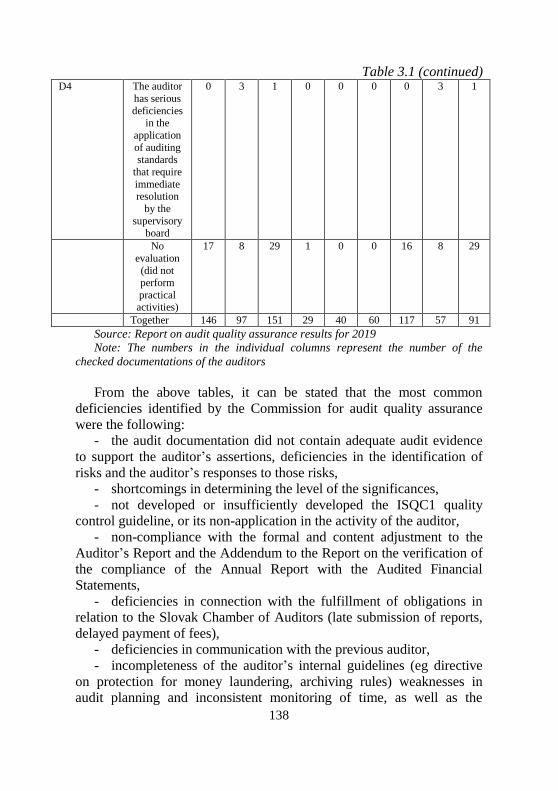
138
Table 3.1 (continued) D4 The auditor
has serious
deficiencies in the
application
of auditing standards
that require
immediate resolution
by the
supervisory board
0 3 1 0 0 0 0 3 1
No
evaluation
(did not perform
practical activities)
17 8 29 1 0 0 16 8 29
Together 146 97 151 29 40 60 117 57 91
Source: Report on audit quality assurance results for 2019
Note: The numbers in the individual columns represent the number of the
checked documentations of the auditors
From the above tables, it can be stated that the most common
deficiencies identified by the Commission for audit quality assurance
were the following:
- the audit documentation did not contain adequate audit evidence
to support the auditor’s assertions, deficiencies in the identification of
risks and the auditor’s responses to those risks,
- shortcomings in determining the level of the significances,
- not developed or insufficiently developed the ISQC1 quality
control guideline, or its non-application in the activity of the auditor,
- non-compliance with the formal and content adjustment to the
Auditor’s Report and the Addendum to the Report on the verification of
the compliance of the Annual Report with the Audited Financial
Statements,
- deficiencies in connection with the fulfillment of obligations in
relation to the Slovak Chamber of Auditors (late submission of reports,
delayed payment of fees),
- deficiencies in communication with the previous auditor,
- incompleteness of the auditor’s internal guidelines (eg directive
on protection for money laundering, archiving rules) weaknesses in
audit planning and inconsistent monitoring of time, as well as the

139
application of the guideline on the duration of the audit and the
subsequent determination of the amount of fees.
Conclusions
The quality of the financial audits performed should be at a high
level, as the auditors’ reports are public and they testify to the
functioning of the organization. In the light of the above assessment, we
see a wider field of possibilities for improvements of the audit work, so
it needs to be given high attention on it and thus it can have an affect on
the higher efficiency of the entire economy in the state.
References: 1. European court of auditors. (2012). Handbook for performing financial
and compliance audits. [Online]
2. Fabian, Š, Majorová, M., : Public sector budgeting. (2011) SÚVAHA
s.r.o., Bratislava, ISBN :978-80-89265-17-6
3. International federation of accountants : Etický kódex pre účtovných
odborníkov. ISBN : 978-80-89265-04-6
4. Kareš, L. 2010. Auditing. (2010) Iura Edition, Bratislava, ISBN 978-
80-8078-334-1
5. Kareš,, L. 2014. Audit Procedures (2014). Wolters Kluwer s.r.o.,
Bratislava. ISBN : 978-80-8168-061-8
6. Overview of ISA adoption in the Eurepean Union, apríl (2015)
Federation of european accountants (FEE) Survey, EU transparency
register is 4713568401-18.
7. Pickett, K. H. Spencer. (2009). The internal auditin handbook. ISBN:
978-0-470-51871-7.
8. Žák, M.a kolektiv. (2002). Large Economic Enclycopaedia
9. Act 540/2007 Coll. on Auditors, Audit and Supervision of Audit
Performance and on Amendments to Act No. 431/2002 Coll. on
accounting as amended by later transcripts § 20 par. 1
10. http://www.eca.europa.eu/Lists/ECADocuments/FCAM_2012/FCAM_
2012_SK.pdf
140
Chapter 4
FINANCIAL-CREDIT AND
INVESTMENT ENSURING OF THE
ECONOMIC SYSTEMS MANAGEMENT
Havrylko Petro
Ph.D. of Economics, Professor
Hushtan Tetiana
Ph.D. of Economics, Associate Professor
Uzhgorod Trade and Economic Institute
of the Kiev National Trade and Economic
University
(Uzhgorod, Ukraine)
THE ESSENCE AND
ROLE OF
FINANCIAL
PLANNING IN
ENTERPRISES IN
MODERN
CONDITIONS
Today’s financial management is the most complex and responsible
link in the system of management of any business entity activity. The
process of enterprise financial management, including financial capacity
management, is carried out within the framework of the financial
management mechanism. The mechanism of financial management is a
system of functional elements governing the process of development
and implementation of management decisions in the field of financial
activity of the enterprise based on the effective use of regulatory and
market mechanisms, resource, production and financial potential of the
enterprise itself. It is possible to distinguish the following elements in
the mechanism of financial management: state regulatory legal support
of financial activity of enterprises (Legal and regulatory frameworks
regulate the financial activity of enterprises, set legal “rules of the
game”); market mechanism of regulation of financial activity of the
enterprise (It is formed within the limits of the action of market laws of
supply and demand, pricing and competition in the sphere of resource
and financial markets in the context of their individual types and
segments); internal mechanisms for regulating certain aspects of
financial activity (These mechanisms are formed and used within the
enterprise itself, regulate certain operational management decisions in
the sphere of its financial activity); system of specific methods and

141
techniques of implementation and management of financial activity of
the enterprise (In the process of implementation and analysis of financial
activities, planning and optimization of financial capacity, making
financial decisions and monitoring their implementation, various
methods and techniques are used to achieve the desired results).
In the context of market relations, enterprises have freed themselves
from government tutelage, but their responsibility for economic and
financial performance has increased sharply. Enterprises began to
operate at the beginning of the commercial calculation, at which costs
should be covered at the expense of their own income. The main source
of production and social development of labor collectives was profit.
Withholding finances had two consequences: on the one hand,
enterprises had more opportunities for commercial and creative activity,
they freed themselves from the care of the state and began to strive to
meet the needs of their customers by improving the quality of products
and reducing prices for it; on the other hand, there was a sharp shortage
of financial resources, without which the normal activity of an economic
entity is impossible. In the acute shortage of own revenues for
development, debt sources of investment remain difficult to reach the
bulk of enterprises. There are many reasons for the depressed
development of economic entities, but the main ones lie in the inertia of
the existing structure of production, its technological backwardness and
physical deterioration of fixed assets, in the absence of priorities of the
state scientific and industrial policy, in the conditions of established
economy and in the result of inefficient economic, financial and tax
changes that prevent businesses from making money for modernization,
in the high cost and inaccessibility of long-term loan and borrowing
financial sources for modernization and reconstruction of enterprises,
etc.
Changes in the economy of Ukraine related to the transition to
market relations require the search for new ways and approaches to
management technologies, including in the field of financial
management. In modern conditions it shows that the deterioration in the
efficiency of financial management is linked to the crisis in the country.
All this necessitates the complex application and development of
modern financial management system tools, which should ensure the
continuous increase of the financial potential of the business entity or at
least prevent its decline.
Management of financial potential is carried out at the enterprises for
achievement of the maximum possible financial result under the
142
following conditions: availability of own capital sufficient to fulfill the
conditions of liquidity and financial stability; opportunities to raise
capital to the extent necessary for the implementation of effective
investment projects; profitability of invested capital; the availability of
effective financial management system that ensures transparency of the
current and future financial position.
Management of financial potential of the enterprise has its own
features, including:
- taking into account the impact of competition;
- definition of financial resources;
- presentation to management object manifestation of management
results through size and timing of cash flows;
- the need for optimal distribution and redistribution of financial
resources;
- development and decision making on reaching a certain
compromise between the requirements of profitability, reliability and
liquidity of capital of industrial enterprises;
- the need to generate financial resources from different sources;
- regulation of structural transformations of financial potential;
- use of methods of managerial influence on financial resources.
Management functions are planning, organization, motivation and
control [5]. The system of financial potential management of an
enterprise includes the following elements: financial planning
(budgeting, planning and forecasting of financial flows, cash income
and receipts); financial regulation (adjustment of planned and actual
parameters of financial resources, including risk management); financial
control in the process of budgeting and realization of financial potential.
The planned (projected) values of financial potential are based, first of
all, on the adjusted indicators of its realization in the previous periods,
taking into account the projected changes in sales volumes, profitability,
equity and debt capitals, ensuring the positive effect of financial and
operating leverage, implementation of investment projects, etc.
Ultimately, financial capacity planning is aimed at ensuring, restoring or
maintaining of financial sustainability.
The transition of the economy to market mechanisms is accompanied
by changes in the forms of financial planning of economic entities. In
circumstances where economic interests are secured through market
self-regulation of the economy, each enterprise plans its own activity,
independently evaluates the need for financial resources and the
efficiency of their use in production or in profitable investments, bears

143
full responsibility for the obtained results. To ensure the co-ordination
of the work of all divisions of the enterprise, control over production
processes and the rational use of resources, the incentive for employees
is increasing the role of financial plans of organizations and enterprises
of all forms of ownership and scale of production.
Financial planning at the enterprise is an element of management
activities related to the process of drawing up financial plans, forecasts
and budgets, monitoring their implementation, identifying the causes of
deviations from the planned parameters. In the general case, it is a list of
actions and sequences of formation of financial potential, bringing under
it the appropriate material, labor and financial resources to achieve the
financial goals and objectives set by the enterprise. Financial planning
must be continuous, plans may not be static, but must be flexible in the
light of changing circumstances. Financial planning as one of the
management functions allows you to anticipate all the necessary actions,
to anticipate the maximum of surprises that may occur in the course of
the activity and to offer ways to minimize the negative consequences of
such surprises.
Financial planning by enterprises has a broad classification structure.
The classification of financial planning is presented in Figure 4.1.
Financial planning is distinguished by the covered timeframe of
financial plan developing as long-term, medium-term and short-term;
they differ from each other by the length of timeframe (periods) required
to meet the planned financial performance. Long-term planning
typically covers long periods of 10 to 25 years.
Medium-term planning specifies the benchmarks identified in the
long-term plan. It is designed for a shorter period. Until recently, the
medium-term planning horizon was five years. However, the
unpredictable nature and speed of environmental change often make the
planned terms shorten from five to three years, and five-year plans are
therefore long-term.
Short-term planning is an annual plans, it includes specific directions
for using the resources needed to achieve the goals set in the medium-
and long-term plans. The content of the short-term plans is detailed by
quarter and month. Long-term, medium-term and short-term plans
should not contradict each other and be as interconnected as possible.
The main purpose of financial planning is to develop and adjust
financial plans that ensure effective management of finances and
financial potential. In this regard, strategic, tactical and operational
financial planning is differs.
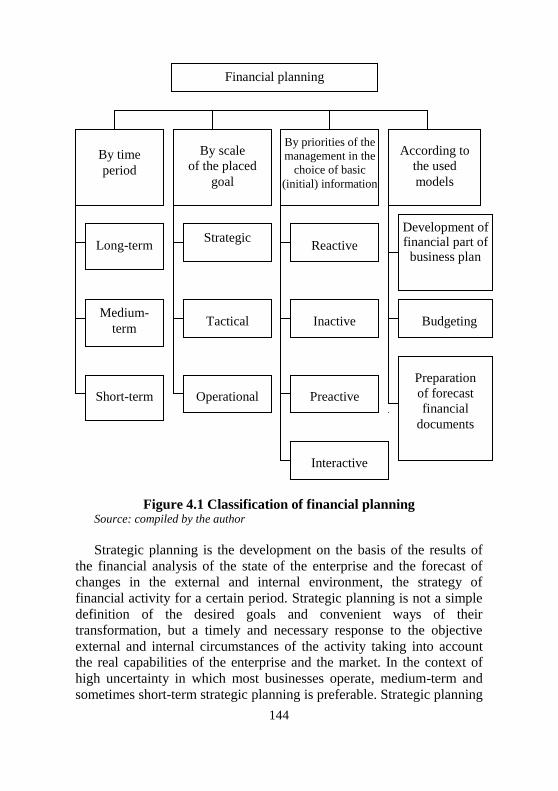
144
Financial planning
By time
period
By scale
of the placed
goal
By priorities of the
management in the
choice of basic
(initial) information
According to
the used
models
Long-term
Medium-
term
Short-term
Strategic
Tactical
Operational
Reactive
Inactive
Preactive
Interactive
Development of financial part of
business plan
Budgeting
Preparation
of forecast
financial
documents
Figure 4.1 Classification of financial planning Source: compiled by the author
Strategic planning is the development on the basis of the results of
the financial analysis of the state of the enterprise and the forecast of
changes in the external and internal environment, the strategy of
financial activity for a certain period. Strategic planning is not a simple
definition of the desired goals and convenient ways of their
transformation, but a timely and necessary response to the objective
external and internal circumstances of the activity taking into account
the real capabilities of the enterprise and the market. In the context of
high uncertainty in which most businesses operate, medium-term and
sometimes short-term strategic planning is preferable. Strategic planning
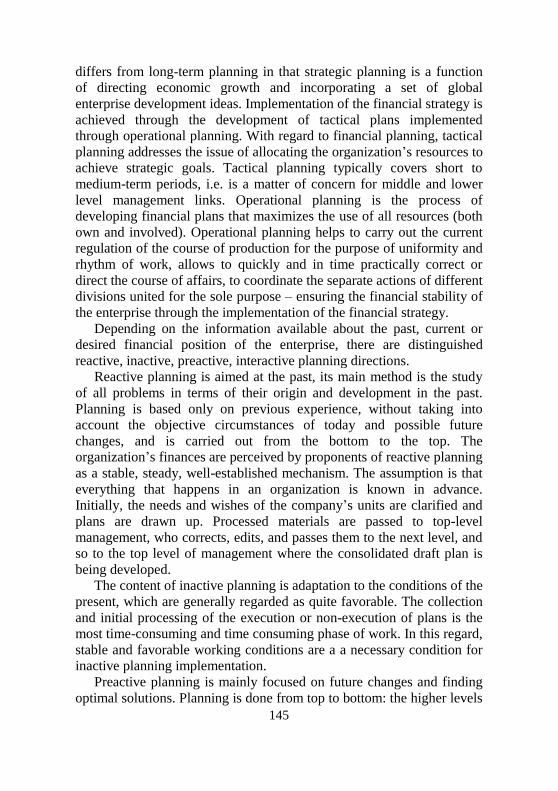
145
differs from long-term planning in that strategic planning is a function
of directing economic growth and incorporating a set of global
enterprise development ideas. Implementation of the financial strategy is
achieved through the development of tactical plans implemented
through operational planning. With regard to financial planning, tactical
planning addresses the issue of allocating the organization’s resources to
achieve strategic goals. Tactical planning typically covers short to
medium-term periods, i.e. is a matter of concern for middle and lower
level management links. Operational planning is the process of
developing financial plans that maximizes the use of all resources (both
own and involved). Operational planning helps to carry out the current
regulation of the course of production for the purpose of uniformity and
rhythm of work, allows to quickly and in time practically correct or
direct the course of affairs, to coordinate the separate actions of different
divisions united for the sole purpose – ensuring the financial stability of
the enterprise through the implementation of the financial strategy.
Depending on the information available about the past, current or
desired financial position of the enterprise, there are distinguished
reactive, inactive, preactive, interactive planning directions.
Reactive planning is aimed at the past, its main method is the study
of all problems in terms of their origin and development in the past.
Planning is based only on previous experience, without taking into
account the objective circumstances of today and possible future
changes, and is carried out from the bottom to the top. The
organization’s finances are perceived by proponents of reactive planning
as a stable, steady, well-established mechanism. The assumption is that
everything that happens in an organization is known in advance.
Initially, the needs and wishes of the company’s units are clarified and
plans are drawn up. Processed materials are passed to top-level
management, who corrects, edits, and passes them to the next level, and
so to the top level of management where the consolidated draft plan is
being developed.
The content of inactive planning is adaptation to the conditions of the
present, which are generally regarded as quite favorable. The collection
and initial processing of the execution or non-execution of plans is the
most time-consuming and time consuming phase of work. In this regard,
stable and favorable working conditions are a a necessary condition for
inactive planning implementation.
Preactive planning is mainly focused on future changes and finding
optimal solutions. Planning is done from top to bottom: the higher levels
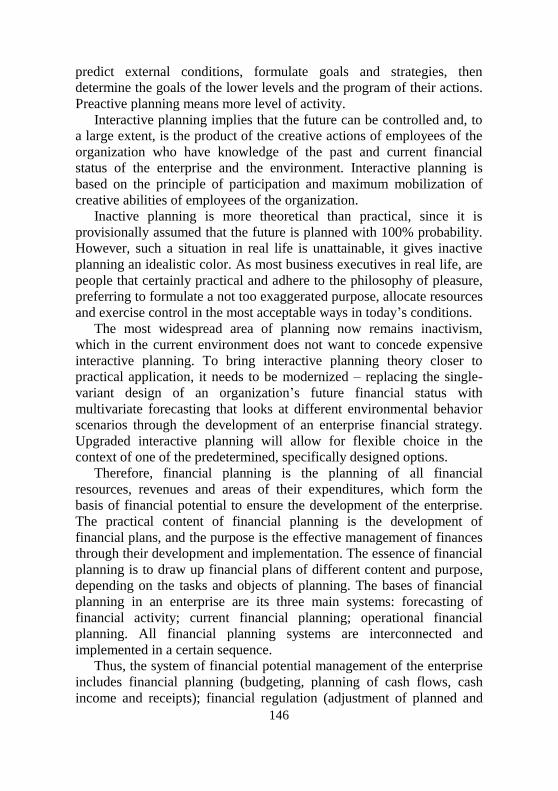
146
predict external conditions, formulate goals and strategies, then
determine the goals of the lower levels and the program of their actions.
Preactive planning means more level of activity.
Interactive planning implies that the future can be controlled and, to
a large extent, is the product of the creative actions of employees of the
organization who have knowledge of the past and current financial
status of the enterprise and the environment. Interactive planning is
based on the principle of participation and maximum mobilization of
creative abilities of employees of the organization.
Inactive planning is more theoretical than practical, since it is
provisionally assumed that the future is planned with 100% probability.
However, such a situation in real life is unattainable, it gives inactive
planning an idealistic color. As most business executives in real life, are
people that certainly practical and adhere to the philosophy of pleasure,
preferring to formulate a not too exaggerated purpose, allocate resources
and exercise control in the most acceptable ways in today’s conditions.
The most widespread area of planning now remains inactivism,
which in the current environment does not want to concede expensive
interactive planning. To bring interactive planning theory closer to
practical application, it needs to be modernized – replacing the single-
variant design of an organization’s future financial status with
multivariate forecasting that looks at different environmental behavior
scenarios through the development of an enterprise financial strategy.
Upgraded interactive planning will allow for flexible choice in the
context of one of the predetermined, specifically designed options.
Therefore, financial planning is the planning of all financial
resources, revenues and areas of their expenditures, which form the
basis of financial potential to ensure the development of the enterprise.
The practical content of financial planning is the development of
financial plans, and the purpose is the effective management of finances
through their development and implementation. The essence of financial
planning is to draw up financial plans of different content and purpose,
depending on the tasks and objects of planning. The bases of financial
planning in an enterprise are its three main systems: forecasting of
financial activity; current financial planning; operational financial
planning. All financial planning systems are interconnected and
implemented in a certain sequence.
Thus, the system of financial potential management of the enterprise
includes financial planning (budgeting, planning of cash flows, cash
income and receipts); financial regulation (adjustment of planned and

147
actual parameters of financial resources, including risk management);
financial control in the process of budgeting and realization of financial
potential.
Financial planning at the enterprise is an element of management
activity related to the process of drawing up financial plans, forecasts
and budgets, monitoring their implementation, identifying the causes of
deviations from the planned parameters. In general, it is a list of actions
and sequence of formation of financial potential, bringing to it the
appropriate material, labor and financial resources to achieve the
financial goals and objectives set by the enterprise. Financial planning
as one of the functions of management allows to anticipate all the
necessary actions, to anticipate the maximum of surprises that may arise
in the process of activity and to offer ways to minimize the negative
effects of “spraying” of financial potential.
The planned (projected) values of financial potential are based, first
of all, on the adjusted indicators of its realization in the previous periods
taking into account the forecast changes in sales volumes, profitability,
equity and loan capital, ensuring the positive effect of financial and
operational leverage, implementation of investment projects and so on.
Ultimately, financial capacity planning is aimed at ensuring, restoring or
maintaining financial sustainability.
Intercompany financial planning is based on the use of its three main
systems: forecasting financial activity; current financial planning;
operational financial planning that is interrelated and implemented in a
certain sequence.
References: 1. Vazhynskyy, F. A., & Kolodiychuk, A. V. (2009). Marketynhovi
doslidzhennya v systemi upravlinnya konkurentospromozhnistyu
pidpryyemstv [Marketing research in the system of competitiveness
management of enterprises]. In Naukovyy visnyk NLTU Ukrayiny
[Scientific Bulletin of National Forestry University of Ukraine]: Vol.
19.1 (pp. 125-130). [in Ukrainian].
2. Vazhynskyy, F. A., & Kolodiychuk, A. V. (2010). Mekhanizm
rehulyuvannya investytsiynoyi diyal’nosti v rehioni [Mechanism for
regulation of investment activity in the region]. In Naukovyy visnyk
NLTU Ukrayiny [Scientific Bulletin of National Forestry University of
Ukraine]: Vol. 20.7 (pp. 138-143). [in Ukrainian].
3. Dolishniy, I. M., & Kolodiychuk A. V. (2010). Motyvatsiya personalu
yak ob”yekt upravlinnya na pidpryyemstvi [Motivation of the personnel

148
as an object of management in the enterprise]. In Naukovyy visnyk
NLTU Ukrayiny [Scientific Bulletin of National Forestry University of
Ukraine]: Vol. 20.5 (pp. 211-216). [in Ukrainian].
4. Yegorov, P. V., Serdyuk-Kopchekchi, Yu. V. (2008). Model’
upravleniya finansovym potentsialom promyshlennogo predpriyatiya
[Model for managing the financial potential of an industrial
enterprise]. In Ekonomika i orhanizatsiya upravlinnya [Economics and
management organization]: Vol. 3 (pp. 17-30). [in Russian].
5. Meskon, M. Kh., Albert, M., & Khedouri, F. (1992). Osnovy
menedzhmenta [Fundamentals of Management]. Translated from
English. Moscow: Business. [in Russian].
6. Puzyryova, P. V. (2008). Otsinka ekonomichnoho ryzyku v upravlinni
finansovym potentsialom pidpryyemstv v Ukrayini Estimation of
economic risk in management of financial potential of enterprises in
Ukraine. In Formuvannya rynkovykh vidnosyn v Ukrayini [Formation
of market relations in Ukraine]: Vol. 10 (pp. 131-134). [in Ukrainian].
7. Serdyuk-Kopchekchi, Yu. V. Osobennosti upravleniya finansovym
potentsialom promyshlennogo predpriyatiya [Features of managing the
financial potential of an industrial enterprise]. In Visnyk Donets’koho
universytetu ekonomiky ta prava [Bulletin of Donetsk University of
Economics and Law]: Vol. 1 (pp. 415-423). [in Russian].
8. Sopilnyk, L. I., & Kolodiychuk, A. V. (2009). Teoretychni aspekty
upravlinnya konkurentospromozhnistyu pidpryyemstv [Theoretical
aspects of enterprise competitiveness management]. In Naukovyy
visnyk NLTU Ukrayiny [Scientific Bulletin of National Forestry
University of Ukraine]: Vol. 19.8 (pp. 183-187). [in Ukrainian].
9. Sopilnyk, L. I., & Kolodiychuk, A. V. (2009). Upravlinnya
konkurentospromozhnistyu mashynobudivnykh pidpryyemstv na
suchasnomu etapi rozvytku ekonomiky Ukrayiny [Management of
competitiveness of machine-building enterprises at the present stage of
development of Ukrainian economy]. In Naukovyy visnyk NLTU
Ukrayiny [Scientific Bulletin of National Forestry University of
Ukraine]: Vol. 19.10 (pp. 222-227). [in Ukrainian].
10. Dolzhanskyy, I. Z., Zahorna, H. O., Udalykh, O. O., Herasymenko, &
I. M., Rashchupkina, V. M. (2006). Upravlinnya potentsialom
pidpryyemstva [Enterprise potential management]. Kyiv: Center for
Educational Literature. [in Ukrainian].
11. Khomyakov, L. I. (2009). Upravlinnya potentsialom pidpryyemstva
[Managing enterprise potential]. Kyiv: Condor. [in Ukrainian].

149
Petrenko Victoriia
D.Sc., Associate Professor
Kherson State University
Karnaushenko Alla
Ph.D., Assistant Professor
Kherson State Agrarian University
(Kherson, Ukraine)
ASSESSMENT
COMPETITIVENESS OF
INNOVATIVE
ENTERPRISES WITH
FOREIGN
INVESTMENTS
Introduction. In recent years, almost all of Ukraine’s foundations
have developed long-term socio-economic development strategies, in
which the formation and development of enterprises with foreign
investments often appear as priorities.
The solution of the problem of increasing competitiveness is
inextricably linked with the assessment of the level of competitiveness.
It is clear that an analysis of the competitive position of the business
entity in the sectoral market, the identification of the main sources and
reserves for increasing competitiveness is impossible without objective
assessment. In the course of the analysis of the reasons for the low
practical applicability of existing methods for assessing the
competitiveness of economic entities, the authors of the dynamic
approach came to the conclusion that the main reason for this is the lack
of a clear definition of the concept of competitiveness of the company
and the criteria for evaluating the analyzed category (as shown in the
first section of this paper).
In general, agreeing with the thesis that the most accurate results of
the assessment of the competitiveness of enterprises can be obtained by
mutually supplemented the strengths of the product and operating
methods, it is obvious that before combining these methods, it would be
nice to get rid of their shortcomings. The desired complementarity can
only be achieved through synthesis, (Krylova N., 2012) but not
mechanistic “accumulation” of techniques, by clarifying the definitions
and criteria for assessing the competitiveness of business entities, but
not the eclectic of heterogeneous categories (as is done in combined
methods) (Borysova T., 2011).
The dynamic approach is based on the assumption that the main way
of making profit in a market economy is the sale of products and the
added value in it. In this case, the production and sale of products is

150
carried out through the use of limited economic resources. It follows that
gaining profit in a market economy is mediated by the efficiency of the
use of economic resources. The ratio of the result obtained and the costs
incurred for its achievement. That is, the essence of market competition
is to fight for maximizing profits by maximizing the efficient use of
economic resources.
Based on the previously mentioned shortcomings of existing
methods to assess the competitiveness of the enterprise, we can
conclude the limited practical application of most of them. An
exception, in our opinion, is a dynamic method of assessing the
competitiveness of enterprises (Polischuk H., (2017). Thus, the study of
evaluation of innovative enterprises with foreign investments in
enhancing competitiveness and ensuring sustainable development of
Ukraine at the present stage is very relevant.
Analysis of recent research and publications. The work of such
scientists as T. Borisova, V. Dikan, N. Kasyanova, N. Krylova, K.
Kuznetsova, M. Moretova, M. Rogozi, Yu Samoilenko, etc were
devoted to the research of the assessment of the competitiveness of the
functioning of innovative enterprises. Despite the significant scientific
contribution made by many scholars in the identified competitiveness of
innovative enterprises, the competitiveness of the dynamic method of
evaluation requires a more detailed consideration.
The purpose of the article is to analyze the competitiveness of
innovative enterprises with foreign investments, based on the dynamic
method of assessing the competitiveness.
Presentation of the main research material. The advantages of the
dynamic method are as follows: it covers the key characteristics of the
enterprise activity and eliminates the duplication of valuation parameters
(Apostoliuk O., 2016); is based on a clearly expressed mathematical
relationship between the established evaluation parameters, which
allows to detect and analyze the dependence of the estimated
competitiveness indicator from the initial parameters in the dynamics;
allows to predict the level of the competitiveness of the enterprise
(groups of enterprises) (Samoylenko Y., 2010); is a universal method,
that is, it allows to assess the competitiveness of individual enterprises
(groups of enterprises) taking into account the purposes of the analysis
and the availability of output data; It is flexible, that is, the ability to
record the conditions and features of the functioning of individual
enterprises (groups of enterprises) (Zaikina, O., 2008); allows to assess
the competitiveness of innovative enterprises with foreign investments
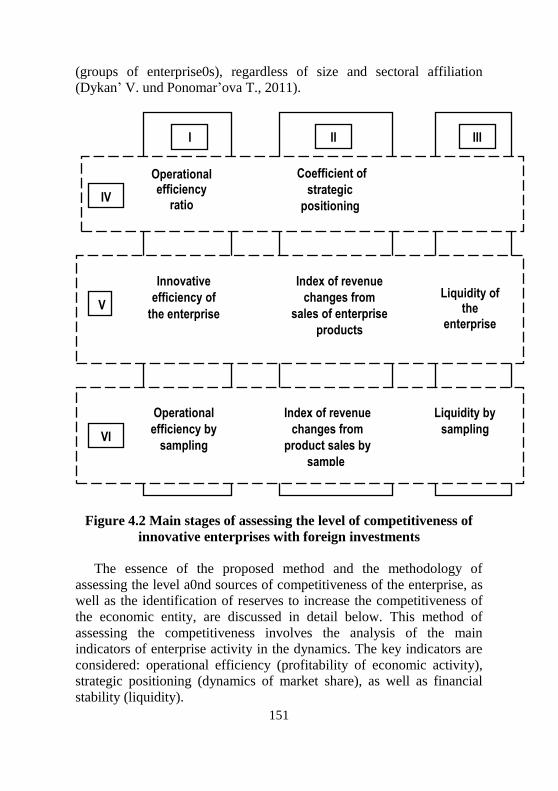
151
(groups of enterprise0s), regardless of size and sectoral affiliation
(Dykan’ V. und Ponomar’ova T., 2011).
Figure 4.2 Main stages of assessing the level of competitiveness of
innovative enterprises with foreign investments
The essence of the proposed method and the methodology of
assessing the level a0nd sources of competitiveness of the enterprise, as
well as the identification of reserves to increase the competitiveness of
the economic entity, are discussed in detail below. This method of
assessing the competitiveness involves the analysis of the main
indicators of enterprise activity in the dynamics. The key indicators are
considered: operational efficiency (profitability of economic activity),
strategic positioning (dynamics of market share), as well as financial
stability (liquidity).
I II III
IV
V
VI
Operational efficiency
ratio
Coefficient of
strategic
positioning
Innovative
efficiency of
the enterprise
Index of revenue
changes from
sales of enterprise
products
Liquidity of the
enterprise
Operational
efficiency by
sampling
Index of revenue
changes from
product sales by
sample
Liquidity by
sampling

152
The essence of operational efficiency is the implementation of
similar types of competition with competitors in order to ensure profit in
the process of implementation of additional value. The main result and
the criterion of operational efficiency can be related to the profitability
(profitability) of production and sales of final products. However, the
result of evaluating operational efficiency through profitability on profit
can be both positive and negative, in connection with which the most
capacious and universal indicator of operational efficiency – the ratio of
proceeds from sales of manufactured goods (goods, works, services) to
costs, incurred in the process of its production and implementation
(Karlsson, E. und Liljevern, J., 2017).
The operational efficiency of the analyzed agrarian enterprise
(Figure 4.2), the cell at the intersection of blocks I and V) is determined
by the formula (4.1):
A
AA
E
SR , (4.1)
where: AR – operational efficiency of the analyzed innovative
enterprises with foreign investments for the reporting period;
AS – proceeds from the sale of products (goods, works, services) of
innovative enterprises with foreign investments, analyzed during the
reporting period;
AE – proceeds for the production and sale of products (goods,
works, services), which include the cost, non-operating expenses,
mandatory payments to budgets of all levels in the analyzed enterprises
for the reporting.
The calculation of operational efficiency by sampling (Figure 4.2,
the cell at the intersection of blocks I and VI) is carried out by the
formula (4.2):
S
SS
E
SR , (4.2)
where: SR – operational efficiency of the sample for the reporting
period;
SS – proceeds from the sale of products (goods, works, services) by
sample for the reporting period;
SE – costs of production and sale of products (goods, works,

153
services), which include cost, non-operating expenses, mandatory
payments to budgets of all levels by sample for the reporting period.
To calculate the operational efficiency (Figure 4.2, block I)
according to formula (4.3), it is necessary to compare the value of the
analyzed index of the analyzed enterprise with the corresponding
indicator on the sample:
S
AR
R
RK , (4.3)
where: RK – efficiency factor of operational activity;
AR – efficiency of operational activity of the analyzed innovative
enterprises with foreign investments for the reporting period;
SR – efficiency of operating activity for the reporting period by
sampling.
The essence of strategic positioning is to create a unique position
based on the implementation of a combination of activities, different
from the activities of competitors. By creating, supporting and
expanding sales markets, strategic positioning provides the very
opportunity for the process of implementing additional value (Krupskyi
O. et al., 2017). The main result and criterion of this indicator is the
change of revenue from the sale of products (goods, works, services)
compared with the previous period. The index of changes of revenue
from the sale of products (goods, works, services) of the enterprise
being analyzed (Figure 4.2, the cell at the intersection of blocks II and
V) is determined by the formula (4.4):
0A
AA
S
SI , (4.4)
where: AI – the index of changes in sales proceeds from the sale of
products (goods, works, services) of innovative enterprises with foreign
investments, analyzed for the reporting period;
AS – proceeds from the sale of products (goods, works, services) of
innovative enterprises with foreign investments, analyzed during the
reporting period;
0AS – proceeds from the sale of products (goods, works, services) of
innovative enterprises with foreign investments, analyzed in the
previous period.
154
Calculation of the index of change of revenue from the sale of
products (goods, works, services) by sampling (Figure 4.2, cell at the
intersection of blocks II and VI) is carried out by the formula (4.5):
0S
SS
S
SI , (4.5)
where: SI – the index of changes in sales proceeds from the sale of
products (goods, works, services) by sample for the reporting period;
SS – proceeds from the sale of products (goods, works, services) by
sample for the reporting period;
0SS – proceeds from sales of products (goods, works, services) by
sample in the previous period.
In order to calculate the strategic positioning factor (Figure 4.2,
block II), in accordance with formula (4.6), it is necessary to compare
the value of the analyzed index of the analyzed enterprise with the
corresponding indicator on the sample:
S
AI
I
IK , (4.6)
where: IK – the coefficient of strategic positioning;
AI – the index of changes in revenues of agrarian enterprises with
foreign investments, analyzed for the reporting period;
SI – the index of changes in revenues by sample over the reporting
period.
The essence of financial sustainability in the short run is to ensure
the availability of current assets by sources of financing. Short-term
financial stability can be characterized by the provision of the
company’s own working capital (Manoilenko, O. and Strokov, Y. E.,
2013). It is important to note that the indicator of financial stability in
comparison with the indicators of operational efficiency and strategic
positioning are large fluctuations, resulting in becoming a key factor
affecting the level of competitiveness of the enterprise. As a result, the
influence of these indicators on the competitiveness of the enterprise
leads to comparable values, by removing from the index of liquidity of
the square root (Kuznyetsova K., 2013).
The liquidity of the analyzed enterprise (Figure 4.2, the cell at the
intersection of blocks III and V) is determined by the formula (4.7):

155
A
AA
CL
CAL , (4.7)
where: AL – the liquidity of the analyzed enterprise at the end of the
reporting period;
ACA – current assets of the enterprise analyzed at the end of the
reporting period;
ACL – short-term liabilities of the analyzed enterprise at the end of
the reporting period.
The calculation of liquidity by sampling (Figure 4.2, the cell at the
intersection of blocks III and VI) is carried out by the formula (4.8):
S
SS
CL
CAL , (4.8)
where: SL – liquidity by sample at the end of the reporting period;
SCA – current assets by sample at the end of the reporting period;
SCL – short-term sample commitments at the end of the reporting
period.
In order to calculate the coefficient of financial condition (Figure
4.2, block III) according to formula (4.9) it is necessary to compare the
value of the analyzed index of the analyzed enterprise with the
corresponding indicator on the sample:
S
AL
L
LK , (4.9)
where: LK – the coefficient of financial state
AL – the liquidity of the analyzed enterprise at the end of the
reporting period;
SL – the liquidity by sample at the end of the reporting period.
Then, taking into account the above expressions (4.3), (4.6) and
(4.9), the only indicator of the competitiveness level of the investigated
enterprise (Figure 4.2, block IV) can be represented by the formula
(4.10):
S
A
S
A
S
A
L
L
I
I
R
RK , (4.10)

156
where: K – the level of competitiveness of the analyzed enterprise;
RK – operational efficiency;
IK – the coefficient of strategic positioning;
LK – coefficient of financial condition.
The values of the coefficient of competitiveness are analyzed as
follows: the higher the coefficient of competitiveness, the more
competitive the analyzed company in relation to the sample. If the
coefficient of competitiveness is greater than zero, but less than one, the
competitiveness of the enterprise in relation to the sample is low. If the
coefficient of competitiveness is equal to one – the competitiveness of
the company is identical to the competitiveness of the sample
(Fatkhutdinov, R.A. 2012). If the coefficient of competitiveness is more
than one – the competitiveness of the enterprise is higher than the
sample.
It is important to note that each of the above-mentioned sources of
competitiveness is individually necessary, but not a sufficient condition
for ensuring the competitiveness of the enterprise. Sustainable
competitiveness of the enterprise can be achieved only by combining all
sources of competitiveness, complementing each other and creating
competitive advantages of the enterprise (Shyshkina O., 2016).
By presenting a general indicator of competitiveness of the enterprise
in terms of sources of competitiveness and objects of comparison, the
assessment of integral values reflects the efficiency of the use of foreign
investment resources by the investigated business entity and the sample
(Szarowská, I., 2017). An analysis of the competitiveness of the
enterprise in terms of the sources of competitiveness and the objects of
comparison makes it possible to identify the main factors that determine
the current level of competitiveness. That, in turn, allows us to
determine the basic reserves for improving the competitiveness of the
investigated entity. The coefficient of efficiency of using the enterprise
resources analyzed (Figure 4.2, block V) is determined by the formula
(4.11) given below:
AAAA LIRK , (4.11)
where: AK – the coefficient of efficiency of using the resources of
the enterprise being analyzed.
The coefficient of efficiency of the use of resources by sampling
(Figure 4.2, block VI) is determined by the formula (4.12) below:

157
SSSS LIRK , (4.12)
where: SK – the coefficient of efficiency of the use of resources by
sampling.
Taking into account that the value of each of the factors used to
calculate the efficiency of the use of resources has a necessary value
greater than one, it can be concluded that the recommended value of the
indicated coefficient is also greater than one. On the basis of the above
methodology it is envisaged to assess the level of competitiveness. And
also to identify the basic reserves for improving the competitiveness of
the investigated business entity.
On the basis of the above analysis of the general situation in the
agrarian sector and the selection of objects of comparison, an estimation
of the level, sources and reserves of the competitiveness of innovative
enterprises with foreign investments is carried out.
In accordance with the previously considered algorithm, in the first
stage, the basic indicators of economic activity of agrarian enterprises
are calculated: the coefficient of operational efficiency by the formula,
the coefficient of strategic positioning by the formula and the coefficient
of financial stability by the formula. On the basis of which the formula
provides an assessment of the level and dynamics of competitiveness.
Conclusion. The proposed methodology for assessing the
competitiveness of innovative enterprises with foreign investments,
based on the dynamic method of assessing competitiveness and taking
into account the weight of each type of product in total, allows to assess
objectively the level of competitiveness of innovative enterprises and
take managerial (strategic) decisions to improve their activities.
References: 1. Samoylenko Y. (2010). Economic mechanism of forming a strategy for
managing the competitiveness of the enterprise. Visnyk ZHDTU.
Ekonomichni nauky. no 3(53), p. 94-100. [in Ukrainian].
2. Dykanʹ V. & Ponomarʹova T. (2011) Methodical Approaches to the
Assessment of the Competitiveness of the Enterprise. Visnyk ekonomiky
transportu i promyslovosti. no 36. p. 101- 106. [in Ukrainian].
3. Rohoza M. & Senenko I. (2013) Management of socio-economic
development of enterprises: mechanisms, models and processes
organization: monograph. Poltava : PUET, p.262. [in Ukrainian].
4. Krylova N. (2012). Methodological approaches to quantifying the
competitiveness of the industry. Teoretychni ta prykladni pytannya
158
ekonomiky. no 27, 3. p. 188. [in Ukrainian].
5. Kasʹyanova N., Solokha D., Moreva V., Byelyakova O. & Balakay O.
(2012). Potential of the enterprise: the formation and use: the textbook.
Donetsʹk: Vydаvo Tsyfrova typohrafiya, p.248. [in Ukrainian].
6. Borysova T. (2011). Competitiveness of the industry: determinants of
formation and modern methods of evaluation. Visnyk Khmelʹnytsʹkoho
natsionalʹnoho universytetu. no 6. 1. p. 56-62. [in Ukrainian].
7. Hryha V. & Lykholet S. (2011). The Essence and Assessment of
Competitiveness and Industries Regional Context. Naukovyy visnyk
Uzhhorodsʹkoho universytetu. no 33 (2). p. 47-53. [in Ukrainian].
8. Kuznyetsova K. (2013). Factors of Influence on the Formation of
Competitiveness of the Enterprise. Zbir. nauk. pratsʹ Aktualʹni
problemy ekonomiky ta upravlinnya. K.: NTUU «KPI». p. 65. [in
Ukrainian].
9. Krupskyi O., Stukalo N., Krasnikova N. & Falkodoi Y. (2017).
Franchising model for expansion of the international travel business.
Problems and Perspectives in Management. no 15, 4. p. 238. –
http://dx.doi.org/10.21511/ppm.15(4-1).
10. Savchuk, V. (2014). Risk management. Basic principles and modern
technologies. Kyiv: Companion Group [in Ukrainian].
11. Apostoliuk O. (2016) Priorities of state financial support of small
business in Ukraine. Efektyvna ekonomika, no 7. (n.d.). Retrived from
http://www.economy.nayka.com.ua [in Ukrainian].
12. Polischuk H. (2017) State support for small business development:
domestic and foreign experience. Aktual’ni problemy derzhavnoho
upravlinnia, 51, 1–9. (n.d.). Retrived from:
http://www.kbuapa.kharkov.ua/e-book/apdu/2017-1/doc/6/03.pdf. [in
Ukrainian].
13. Diial’nist’ sub’iektiv velykoho, seredn’oho, maloho ta
mikropidpryiemnytstva, 2017: statystychnyj zbirnyk [Activities of
subjects of large, medium, small and microenterprises, 2017: statistical
collection]. Derzhavna sluzhba statystyky Ukrainy. [in Ukrainian].
14. Szarowská, I., (2017). Does public R&D expenditure matter for
economic growth? GMM approach. Journal of International Studies,
10(2), 90-103. doi:10.14254/2071-8330.2017/10-2/6 [in English].
159
Sokolovskа Alla
D. Sc. in Economics, Professor,
Deputy Director
SESI “Academy of Financial Management”
Tymchenko Olena
D. Sc. in Economics, Professor
Kyiv National Economic University named
after V. Hetman
(Kyiv, Ukraine)
REAL ESTATE
TAXES IN THE
TAX POLICY OF
INCLUSIVE
ECONOMIC
GROWTH
Introduction. Despite the priority of Ukraine’s economic
development in the near future is to increase economic growth, the
strategic focus of its development that is emphasized in the
Government’s Action Program, is to ensure inclusive economic growth
[1]. In characterizing the relationship between these two priorities –
short-term and strategic – it is necessary to assume that increasing
economic growth is an important precondition for the implementation of
its inclusive focus. However, inclusive growth cannot be assessed only
in terms of GDP or GDP per capita growth. It should also be seen as a
process that creates opportunities for all segments of the population to
work, develop, improve their skills and contribute to the development of
society. In addition, inclusive growth emphasizes on a more dynamic
definition of equity that takes into account the impact of income policies
on people’s well-being throughout their life cycle, as well as the well-
being of generations [2]. Mentioned above is estimated with the
Inclusive Development Index (IDI), developed by the World Economic
Forum, that is based on 12 indicators, which, in addition to GDP per
capita, also include: labor productivity determining the level of wages;
the level of employment as an indicator of economic opportunities and,
ultimately, family security; the expectancy healthy life as an indicator of
quality of life; median household income, characterizing the progress in
the achieved level of living standards; poverty line; Gini coefficient by
income – a standard international indicator of inequality; and the Gini
coefficient for property (wealth) – an indicator of the concentration of
wealth; adjusted net savings – an indicator that measures the actual rate
of savings in the economy after taking into account investment in human
capital, the depletion of natural resources and the damage caused by
160
environmental pollution; public debt as a share of GDP, illustrating the
scale of the current generation’s debt compared to the potential of future
generations; demographic burden that is the main indicator of possible
future pressure on public finances; and the carbon intensity of economic
production that is an indicator of the country’s relative efficiency in the
field of climate change [3].
Given the components of the index of inclusive economic growth, to
provide it is necessary to implement of a set of measures in the
economic, social, environmental, budgetary, debt, tax policy. The
significance of tax policy in the system of instruments for inclusive
economic growth is determined by its ability to influence the
distribution of its results among different segments of the population,
including the global problem of growing inequality in income and
wealth. However, not all tax policy instruments that can improve the
situation with inequality meet the requirements of inclusive economic
growth, but only those one that do not have a negative impact on the
behavior of economic agents, and thus, do not slow down economic
growth. Thus, tax policy of inclusive growth, as noted by Brys, B. et al.
(2016), is associated with the management of a compromise between
fairness and efficiency. This compromise can be reached either by
reducing the loss to provide equity of tax reforms aimed at improving
efficiency, or by reducing the loss of efficiency in tax reforms aimed at
improving fairness, or by implementing tax reforms that increase both
efficiency and fairness [2]. The OECD experts also emphasize the
possibility of implementing a strategy aimed at solving these two tasks
at the same time, emphasizing that inclusive growth oriented taxation
policies should go beyond traditional political trade-offs between
fairness and efficiency. It should reduce inequality without lowering
economic growth [4].
Literature review. The most thoroughly the issues of tax policy
formation of inclusive economic growth are covered in the already
mentioned works [2, 4]. The publication of Akgun, O. et al. (2017), as
well as OECD experts [5, 6] is devoted to the analysis of the cumulative
impact of changes in the tax structure on growth and inequality. The
approaches to the design of tax reforms, developed on the basis of the
rating of different taxes in the context of their impact on economic
growth, are reflected in the OECD Recommendations published in 2008
in the working papers of the Economic Department № 620 “Taxation
and Economic Growth”, and in 2010 – in the working papers of the
same organization “Tax policy reforms and economic growth” [7]. A
161
plenty of publications deal with the tax impact on the redistribution of
income the purpose of which is reducing inequality and poverty
regardless their influence on economic growth [8, 9, 10]. The Ukrainian
scientists have not studied the problems of tax policy of inclusive
economic growth. The publications covered only some aspects of the tax
system functioning (mostly personal income tax) concerning with
income equalization [11-16].
The purpose of the article. The formation of the tax policy for
inclusive economic growth involves identifying areas for the reform of
the entire tax system. In the process of developing measures to reform
the taxes that better meet the requirements of economic efficiency; the
emphasis is on ways to increase their fairness, while for taxes that better
perform the redistributive function the ways to increase their economic
efficiency should be identified. However, due to the limited scope of
this article, it is impossible to cover all direction of a tax system design
focused on inclusive economic growth. The purpose of the article is to
identify ways to reform only real estate taxes that meet both economic
efficiency and equity requirements.
Research methodology. The study is based on the theoretical
foundation of optimal taxation in the welfare economy, in particular, on
the conceptual provisions of the theories of excessive tax burden,
fairness in taxation from the standpoint of benefit and solvency. The
analysis of ways to form a tax system that would meet the requirements
of inclusive growth was conducted using the already compiled rating of
taxes on the criterion of economic efficiency or their impact on
economic growth [7]. The ways of reforming in accordance with the
requirements of social fairness were determined taking into account that
taxes can affect equity in the distribution of income and wealth not only
directly – through the income redistribution effects that are the
consequences of tax payment, they can change taxpayers’ behavior as
well. In addition taxes can provide budgetary revenue that can be used
to pay transfers to the poor. It means that even unfair but financially
effective taxes, provided they are used to fund government programs to
reduce inequality and poverty, can be part of a comprehensive growth-
oriented tax reform. In the process of research the general scientific and
special methods of cognition were used: abstract and logical
assumptions – in the study of compliance of property taxes with the
requirements of economic efficiency and social fairness; critical analysis
of the different approaches to assessing the economic efficiency of
periodic taxes on residential real estate; a combination of theoretical and
162
empirical analysis – in substantiating ways to reform real estate taxes in
order to bring them closer to the requirements of inclusive growth and to
the actual design of such taxes in OECD countries.
Results. According to the OECD Recommendations “Tax Policy
reforms and Economic Growth”, periodic real estate taxes [7] distort the
economic choice of taxpayers the least (and therefore the most
effective). This kind of taxes takes the first place in the ranking
according to this criterion. It means that these taxes are the easiest to
adapt to the requirements of inclusive growth. To do this, it is only
necessary to develop measures that increase their fairness. However,
there are two points of view on this tax in theory, none of which can be
considered the one that has won the majority of supporters. According to
one of them, the real estate tax is neutral, according to another –
distorting. The neutral nature of the real estate tax is substantiated by
representatives of the “benefit theory” (Hamilton, B. (1975) [17],
Fischel, W. (2000) [18]), according to which the tax is a payment for the
benefits that each payer receives from the consumption of public goods
funded with taxes. In turn, taxation on the principle of benefit provides
for certain conditions: 1) mobility of taxpayers who can change their
place of residence in search of jurisdiction (territorial community) that
provides the most acceptable for each individual payer the correlation
between real estate tax and public goods; precise zoning as a
prerequisite for the homogeneity of each jurisdiction by type of building
in which the property tax does not affect the consumption of housing
and eliminates the problem of “free rider”; 3) the presence of a large
number of competing jurisdictions as a prerequisite to realise the payer’s
right to free choice. It is under these conditions the individual
equivalence in real estate taxation is ensured (and the tax itself is
converted into a lump sum (not deforming)), i.e. a correspondence is
achieved between the amount of tax paid and the benefit from the
consumption of public goods. The representatives of traditional and new
views believe that real estate taxes are distorting taxes. In this case,
according to the traditional views (G. Simon, D. Netzer), they are
capitalized in the value of real estate (its price), and the end result of
taxation depends on the elasticity of supply and demand for real estate
by price. Real estate taxes are considered in the context of taxation of
land and capital invested in improvements, including real estate other
than land. The fact that the real estate tax may have different effects on
land in contrast to other forms of capital (invested in real estate other
than land) is a result of the difference in the elasticity of their supply.

163
The supply of capital is considered perfectly elastic, and the supply of
land is considered perfectly inelastic. If the return on capital for owners
is carried out at the nationally determined rent rate for capital (Rn), then
in the result of the introduction of real estate tax (t) (in the context of
capital tax invested in land improvements) the cost of capital will
increase to Rn (1 + t) to keep the return on capital after tax at Rn, and
the amount of capital in the jurisdiction, as well as demand for it will
fall. Instead, the introduction of a land tax will result in its ideal
capitalization in the price of land that will fall [19].
According to the new views (Mieszkowski, P., Zodrow, G. (1984)),
real estate tax has two effects: the effect of “income tax” – the effect that
results in a decrease in net return on capital in the amount of tax, and the
effect of “excise tax” – the effect that causes a net redistribution of
income between owners of factors of production and consumers [20]. To
analyze these effects, Mieszkowski and Zodrow use a model with many
assumptions, the main of which are the full mobility of capital in all
jurisdictions, the division of jurisdictions into zones of high and low
demand for public goods, restrictions on the use of lump-sum (non-
deformable) taxes to fund public goods that encourages communities to
introduce a real estate tax in order to provide additional funding. In the
case of differentiated real estate taxation in jurisdictions with high tax
rates the relative value of housing increases and the return on capital
invested in real estate falls compared to jurisdictions with low tax rates.
The result is an outflow of mobile capital from jurisdictions with high
property taxes, as well as other losses, in particular in the form of job
losses and a reducing of the tax base. The transfer of capital will take
place until its return in all jurisdictions is equalized. In the end, it will be
set at a lower level than before the introduction of real estate tax.
Another direction of capital outflow due to the high real estate tax may
be its outflow from the field of housing construction to other fields that
will reduce the return on capital in the economy as a whole. The excise
effect of the property tax is manifested in a distortion of consumption
that will ultimately result in higher house prices and land prices, as well
as lower wages in both types of jurisdictions. All mentioned above
allowed the authors to conclude that the real estate tax leads to many
distortions, especially in the distribution of capital, and therefore is a
distorting tax.
The representatives of different theories explain the impact of
periodic taxes on real estate and income redistribution in different ways.
According to the theory of benefit, such taxes have limited opportunities
164
for redistribution, because under the conditions of unrestricted mobility,
taxpayers can choose a jurisdiction where real estate tax will be an
adequate payment for the benefits of consuming public goods provided
in this jurisdiction.
According to the traditional views, periodic property taxes, in terms
of land taxation, are progressive, as they fall more on the owners, who
usually have higher incomes. However, a part of the tax burden, that
falls on buildings (improvements) is distributed between economic
agents both on the supply side and on the demand side. Because tenants
tend to have lower incomes, this part of the tax burden is rather
proportional or even regressive [21]. However, Netzer, D. (1966)
suggested that the regression of real estate tax will be less if consumers
who make decisions about housing, consider the prospects of income for
periods exceeding one year [19].
According to the new views, the real estate tax as a form of capital
tax has an important redistributive component, as its main burden is
borne by the owners of capital (capitalists) [20]. At the same time the
tax burden due to the outflow of capital from high to low tax sectors is
distributed among all capital owners. As the latter usually have higher
incomes the real estate tax becomes progressive. Regardless the
theoretical ideas about the real estate tax, it is perceived as unfair in the
public consciousness due to the following reasons: 1) the contradiction
between the high market value of property owned by certain households
and the low levels of their disposable income (due to retirement, job
loss, temporary disability, etc.), in a result of which they may have
difficulties in paying tax obligations; 2) imperfect assessment of the
object of taxation both in the case of its determination on the basis of
real estate area (such assessment does not take into account its quality
and location) and on the basis of value (due to periodic revaluations and
imperfect methods of assessment the object of taxation in the calculation
of the tax liability may be significantly deviate from the market value of
real estate). In particular, the value of real estate for tax purposes is not
updated for many years in many EU member states. If difference
between the appraised and market value of real estate are not
substantiated it can cause unfair and unpopular property taxes.
By eliminating these causes of unfairness of periodic taxes on real
estate (reducing their negative impact) it is possible to achieve their
maximum compliance with the requirements of inclusive economic
growth. To this end, the different approaches are used especially
different types of tax benefits. Some of them, called “Quantity-Based
165
Restrictions” [22], are a kind of protection against excessive tax burden
on low-income taxpayers. They work only when the amount of tax
specified in the declaration exceeds the statutory percentage of income
of the property owner. The consequence of such measures is to limit the
number of beneficiaries and provide it only to those who need it most.
Special benefits in many countries are provided for the elderly and
people with disabilities. For example, in France, low-income people
over the age of 75 are exempt from paying the tax, and in Denmark the
people over the age of 67 pay the tax at a reduced rate with the actual
amount of the benefit depending on the income and value of the
property. In Greece, real estate tax benefits are provided to the
unemployed, the disabled and families with four or more children. In
Hungary, social housing and real estate of up to 100 m2 in villages with
less than 500 inhabitants are exempt from tax [23]. Another type of tax
benefits is a tax rebate called “owner-occupied housing allowance” [2].
Although the latter is provided regardless of income, i.e. to all
homeowners, and provides for tax exemption of part of the value (or
area) of real estate used by the owner as primary housing (it gives
additional progressiveness to real estate tax), the tax benefit can be set
so that the low-income households living in a small house will not pay
tax at all. This tax rebate may also contain a component that allows
taxpayers to cover the depreciation of property – as an approximate
amount of costs incurred by households to obtain imputed income from
real estate. One of the ways to avoid arrears of real estate tax the persons
experiencing temporary difficulties may be allowed to pay it not in a
lump sum, but in installments. In addition, some real estate tax systems
provide for the possibility of deferring the payment of real estate tax
(including for the elderly – indefinitely) without paying penalties until
the sale of property or death of its owner. In particular, there is a
possibility of deferring the property tax in Denmark (for people over
65), France (in case of trouble), Germany, the Netherlands, Spain,
Sweden (in case of unemployment or illness), Turkey and the United
Kingdom [23]. In order to avoid injustice related to the mismatch of the
value of the object of taxation to the market value of real estate, any
increase in periodic real estate taxes should be accompanied by a
revaluation of real estate that should be carried out regularly (for
example, every five years or more), and the value of the property should
be adjusted for inflation between revaluations. However, for certain
groups of taxpayers, especially the elderly, a “frozen assessment" may
be used which involves fixing the appraised value of real estate for tax

166
purposes, despite fluctuations in its market value. As a rule, the increase
in the “frozen assessment” occurs only due to the annual adjustment of
the tax base with the inflation index [24].
The introduction of a tax rate with a slight progressiveness can also
help increase the fairness of the periodic real estate tax. For example, in
Denmark, the residential property tax has a two-class progressive rate
structure: property up to DKK 2.6 million is taxed at a rate of 1%, above
this amount at a rate of 3%. A two-class progressive rate structure for
single-family homes also exists in Germany (0.26% for single-family
properties with an estimated value of up to € 38,347 and 0.35% for
properties with an estimated value exceeding this amount) [23].
As for other property taxes (inheritance taxes, net property taxes,
property transactions taxes), according to the OECD Recommendations,
they are less favourable for economic growth than periodic real estate
taxes and consumption taxes, but more favourable than personal income
taxes. Among them, inheritance taxes are considered the least distorting,
and property transactions taxes are the most distorting. The
characterization of inheritance taxes as sufficiently effective is based on
the assessment of their impact on incentives to work, savings and
investments of both testators and heirs3. In particular, it is considered
that such a tax may, on the one hand, encourage the prudent conduct of
the testator in order to compensate the loss of part of the inherited
income through the payment of tax (income effect). On the other hand,
because of the costs to be incurred for the transfer of the inheritance, the
testator may be interested in increasing his lifetime consumption rather
than saving (substitution effect). Which of the effects outweighs
ultimately depends on the size of the tax rate(s). Given the preferential
conditions of taxation of inheritance received by family members of the
first degree of kinship, as well as the fact that an important motive for
savings is the inheritance of property to immediate heirs, it can be
concluded that in most cases inheritance tax will not demotivate savings.
In addition, inheritance taxes, as a result of their payment after death,
may have less of a negative impact on the testator’s investment
decisions during his or her life than a comprehensive income tax. As for
the impact of the tax on the behavior of the heirs, by reducing the
amount of the inheritance, it can encourage the heir to work harder and
make savings both before and after the inheritance. If we consider the
3 This tax can be withheld both from the testators in the form of inheritance tax and
from the heirs in the form of inheritance tax (on inherited property).
167
inheritance as one that is acquired without the heir’s own efforts, and
therefore is an unforeseen income, then the taxation of it should not
affect the behavior of the heir.
Without making significant distortions in the economic decisions of
taxpayers, inheritance taxes are fair enough. First, the taxation of
property received without the efforts of the heir is fairer than the
taxation of income earned by one’s own labor. Second, inheritance
taxes, especially when they imposed on heirs, reduce the concentration
of wealth and help reduce inequalities in its distribution. Third, they
reduce the unfairness associated with unequal opportunities of
taxpayers. One of them receive inherit, which increases their solvency
while others do not.
To ensure the inheritance taxes to contribute to inclusive growth the
key is their design. In particular, T. Piketti and E. Saez, developing a
theory of optimal capital taxation, found that given the high
concentration of inherited wealth in countries where the share of wills in
national income is high (for example, 15%, as in France) the optimal
linear inheritance tax rate can be up to 60%, and the optimal tax rate
applied to the leading owners of wealth can be even higher (70-80%),
especially if the wills are large [25].
According to modern ideas, it is possible to increase the
redistributive effect of inheritance taxes, and hence the impact on
inequality in the distribution of wealth, by applying differentiated tax
rates depending on the value of inherited property. This approach has
become widespread in European countries such as Belgium (tax is
levied at rates of 3 to 80%; they vary depending on the region,
beneficiary and value of inherited property), Denmark (0-52.7%),
Germany (7- 50%), France (5-45%), the Netherlands (10-40%), Great
Britain (0-40%) and others [26].
One of the main arguments for the use of another property tax – the
tax on the net value of property (net wealth) is its possible impact on the
concentration of wealth that has reached excessive proportions in the
world, and property inequality. Another argument for its introduction
may be the lack of a well-designed personal income tax in the country,
which would cover all types of personal income from capital. However,
despite these arguments, the scope of the property tax in the world is
narrowing. If in 1990 it was levied in 12 the OECD countries, in 2018 –
only in three: Switzerland, Spain and Norway [27]. Austria, Denmark,
Germany, the Netherlands, Finland, Iceland, Luxembourg and Sweden
are among the countries that waived the tax in the mid-1990s. The

168
waiver of this tax can be explained by several reasons:
1) the tax is quite difficult to administer due to the wide range of
objects of taxation, the possibility of evasion of declaring certain assets,
problems with their assessment, the presence of a significant number of
deductions and other tax benefits aimed at reducing the tax burden on
the less affluent people or restrictions the number of its payers including
only rich people4;
2) the objects included in the tax base on net value property (it
includes tangible and intangible assets owned by an individual: the real
estate, financial assets, bank deposits, the share of property in business,
etc., less liabilities on these assets) are also taxed. For example, it can be
real estate tax, personal income tax. Therefore, if the latter are designed
well enough, there is no need to tax the net asset value;
3) taxes on the net value of property are more distorting than taxes
on inheritance and periodic taxes on real estate. In particular, compared
to the latter, they distort the investment decisions of taxpayers, creating
incentives for investment in tax-exempt assets, as well as for
investments made through borrowed funds.
Given this fact, most countries are unlikely to consider the
introduction of a property tax as part of a modern tax reform aimed at
inclusive growth. However, if to use this tax is expedient the following
aspects should be taken into account when the tax design is developed:
1) the possibility of choosing between a tax with a broad base (the
choice in its favour involves solving the problem of preventing double
taxation of assets) and a tax that will be paid only by the rich (this
choice will require finding ways to reduce distortions caused by such
tax); 2) the possibility of effective tax administration; 3) the public
perception of the problem of income inequality and wealth and the
severity of this problem in a particular country. Despite the theoretical
estimates of real estate taxes as the most favorable for economic growth
and the possibility of such a change in their design that would meet the
requirements of inclusive growth, in most countries they do not play a
major role, and the latter is characterized by a declining trend in the long
4 The development of the tax in this direction is evidenced by the changes in its
collection, made in 2019 in Argentina. Among them: the increase of the threshold of
tax exemption from 1 050 000 ARS to 2 000 000 ARS; the introduction of a tax
exemption for residential buildings, which are now subject to wealth tax only if their
estimated value exceeds ARS 18 million; the replacement of the fixed tax rate with
progressive ones, which increase with the value of taxpayers’ assets [28].
169
run. In particular, in the OECD countries, real estate tax revenues
averaged about 8% of total tax revenues in 1965, compared to about
5.7% nowadays. However, during 2000-2017, the dynamics of tax
revenues in different the OECD countries were not characterized by the
same trends: 24 countries reported an increase in real estate tax revenues
as a share of GDP, and 15 countries – a decline. Its largest growth was
in Argentina, Belgium, the United States and France, and its decline – in
Iceland, Sweden and Switzerland. In 2017 the amount of income
collected from real estate taxes ranged from 0.2% of GDP in Indonesia
to 4.4% of GDP in France. The real estate tax reforms have been limited
in recent years, and the potential of this tax is not realized [28].
Conclusions and discussion. Thus, the main task of the tax policy
aimed at ensuring inclusive economic growth is to find ways to resolve
the fundamental contradiction between economic efficiency and social
fairness of taxation. If in theory it can be solved in one of three ways –
either by increasing the fairness of taxes, which are characterized by a
high level of economic efficiency, or by increasing the efficiency of
taxes with high redistributive properties, or by implementing measures
that simultaneously can solve both problems, in practice (due to the
inconsistency of the actual design of a tax to its theoretical model) is
mostly used the third way, which allows to overcome the shortcomings
of different taxes, increasing both their efficiency and fairness. Despite
the fact that in the theory of taxation there is no single point of view in
the assessment of economic efficiency and fairness of periodic real
estate taxes, in the ranking of taxes compiled by the OECD experts on
the criterion of economic efficiency, they take first place. As for other
property taxes (inheritance taxes, net property taxes and property
transaction taxes), according to the OECD Recommendations, they are
less favorable for economic growth than periodic real estate taxes and
consumption taxes, but more favorable than personal income tax and
corporate income tax. Given mentioned above issues the reform of
periodic real estate taxes in the process of building a tax system that
meets the requirements of inclusive economic growth, should be in the
direction of improving their fairness. The latter is possible through the
introduction of tax benefits for the poor and the elderly, installments and
deferrals of tax for those who are experiencing temporary difficulties
and cannot meet tax obligations on time, the use of a moderately
progressive scale of tax rates. Increasing the fairness of inheritance and
gift taxes in the modern world is through the application of
differentiated tax rates depending on the value of inherited property.

170
Regarding the tax on the net value of property, the scope of its use is
characterized by a tendency to narrow.
In general, despite the high positions in the ranking on the criterion
of economic efficiency of property taxes, their place in the tax systems
of most OECD countries is quite modest indicating that their potential is
no realized. One of the reasons for this situation is the narrowing of the
tax base due to large-scale tax benefits that help mitigate tax unfairness.
Thus, on the one hand, it is not possible to reduce the unfairness of
property taxes without the application of tax benefits, but, on the other
hand, their application hinders progressive changes in the structure of
tax systems aimed at shifting the tax burden on real estate taxes. The
ways to resolve this controversy should be the subject of further
research.
References: 1. Verkhovna Rada of Ukraine (2019). Prohrama diialnosti Kabinetu
Ministriv Ukrainy. [Program of activities of the Cabinet of Ministers of
Ukraine]. Kyiv. Available at: http://w1.c1.rada.gov.ua/pls/zweb2/
webproc4_1?pf3511=66959.
2. Brys, B., Perret, S., Thomas, А. and O’Reilly, Р. (2016).Tax Design for
Inclusive Economic Growth. OECD Taxation Working Papers, 26.
Available at: https://www.oecd-ilibrary.org/docserver/5jlv74ggk0g7-
en.pdf?expires=1528197309&id=id&accname=guest&checksum=618
3BCD2ADEF341B4646E9AC2543B049.
3. World Economic Forum (2017). The Inclusive Growth and
Development Report 2017. Geneva. Available at:
http://www3.weforum.org/docs/WEF_Forum_IncGrwth_2017.pdf.
4. OECD (2017). A Fiscal Approach for Inclusive Growth in G7
Countries. Available at: http://www.oecd.org/tax/tax-policy/a-fiscal-
approach-for-inclusive-growth-in-g7-countries.pdf.
5. Akgun, O., Cournède, В. and Fournier, J. (2017). The effects of the tax
mix on inequality and growth. OECD Economics Department Working
Papers, 1447, 46 p. Available at: https://www.oecd-ilibrary.org/
docserver/c57eaa14-en.pdf?expires=1548160070&id=id&accname=
guest&checksum=ACCB5F7512F1163B4063644D9.
6. OECD (2012). Income inequality and growth: The role of taxes and
transfers. OECD Economics Department Policy Notes, 9. Available at:
https://www.oecd.org/eco/public-finance/49417295.pdf.
7. OECD (2010). Tax Policy Reform and Economic Growth. OECD
Publishing. Available at: http://www.oecd-ilibrary.org/taxation/tax-
policy-reform-and-economic-growth_9789264091085-en.

171
8. Causa, O., Hermansen, M. (2017).Income redistribution through taxes
and transfers across OECD countries. OECD Economics Department
Working Papers, 1453. Available at: https://www.oecd-ilibrary.org/
docserver/bc7569c6-en.pdf?expires=1528120070&id=id&accname=
guest&checksum=DDE325D7FDA1B6F4.
9. Inchauste, G. and Lustig, N. еds. (2017). The Distributional Impact of
Taxes and Transfers: Evidence from Eight Low and Middle-Income
Countries. World Bank Group. Available at:
http://commitmentoequity.org/wp-content/uploads/2018/04/The-
Distributional-Impact-of-Taxes-and-Transfers_Inchauste-Lustig.pdf.
10. European Commission (2018). Tax Policies in the European Union.
2018 Survey. Luxembourg: Publications Office of the European Union.
Available at: https://ec.europa.eu/taxation_customs/sites/taxation
/files/tax_policies_survey_2018.pdf.
11. Lunina, I. A. (2013). Mezhdunarodnyi opyt povyshenyia spravedlyvosty
nalohooblozhenyia y vozmozhnosty eho prymenenyia v Ukrayne.
[International experience in increasing the fairness of taxation and the
possibility of its use in Ukraine]. In: I. A. Maiburov, Iu. B. Ivanov and
L. L. Tarangul eds. Economics of tax reform. Kiev. pp. 132–140.
Available at: http://ndi-fp.nusta.com.ua/files/doc/ekonomika-pod-
reform-sereb.pdf.
12. Koliada, T. (2012). Podatkovi instrumenty zabezpechennia sotsialnoi
spravedlyvosti v derzhavi.[Tax instruments to provide social justice in
the states]. Ekonomichnyi analiz - Economic analysis, 11, p.p. 120–
125. Available at: http://irbis-nbuv.gov.ua/cgi-bin/irbis_nbuv/
cgiirbis_64.exe?C21COM=2&I21DBN=UJRN&P21DBN=UJRN&IM
AGE_FILE_DOWNLOAD=1&Image_file_name=PDF/ecan_2012_11
%281%29__28.pdf.
13. Shvabii, K. (2012). Fiskalna efektyvnist podatku na dokhody fizychnykh
osib. [Fiscal efficiency of personal income tax]. Finansy Ukrainy -
Finance of Ukraine, 3, pp. 32–35.
14. Shvabii, K. (2013). Rehuliatyvna efektyvnist podatku na dokhody
fizychnykh osib v Ukraini. [Regulatory efficiency of personal income
tax in Ukraine]. Finansy Ukrainy - Finance of Ukraine, 4, pp. 27–44.
15. Sokolovska, А. (2019). Nerivnist dokhodiv i bahatstva ta podatkovi
instrumenty yii zmenshennia. [Income and wealth inequality and tax
instruments of its decrease]. Finansy Ukrainy - Finance of Ukraine, 6,
pp. 23-41.
16. Sokolovska, А., Rainova, L. (2019). Vplyv podatkiv na nerivnist
dokhodiv v Ukraini. [Influence of taxes on income inequality in
Ukraine]. Finansy Ukrainy - Finance of Ukraine, 7, pp. 72-91.
17. Hamilton, B.W. (1975). Zoning and property taxation in a system of

172
local governments. Urban Studies, 12. Available at:
http://citeseerx.ist.psu.edu/viewdoc/download?doi=10.1.1.467.2161&re
p=rep1&type=pdf.
18. Fischel, W.A. (2000). Municipal corporations, homeowners, and the
benefit view of the property tax. Available at:
https://www.dartmouth.edu/~wfischel/Papers/00-03.pdf.
19. Cameron D.L. (1999). Property Taxes. In: Encyclopedia of Law and
Economics. Available at: https://reference.findlaw.com/
lawandeconomics/6030-property-taxes.pdf.
20. Mieszkowski,Р., Zodrow, G. (1984). The new view of the property tax: a
reformulation. Working Paper, 148l. Available at:
https://www.nber.org/papers/w1481.pdf.
21. Stotski, D., Yudzhelik, M.Z. (1995). Nalohooblozhenye zemly y
sobstvennosty. Posobye po nalohovoi polytyke. [Taxation of land and
property]. In: P. Shomed. 1995. Tax Policy Manual.Washington:
International Monetary Fund. pp. 227-231.
22. Musgrave, R.A., Musgrave, P.B. (2009). Hosudarstvennyie fynansy:
teoryia y praktyka. [Public finance in theory and practice]. Translated
from English. M.: Biznes Atlas.
23. United Nations Human Settlements, n.d. (2013). Property Tax Regimes
in Europe. First published in Nairobi by UN-HABITAT. Available at:
https://www.google.com/search?client=firefox-b-
d&q=Property+Tax+Regimes+in+Europe.
24. Vishnevskiy, V.P. ed. (2011). Nalohovaia polytyka: metodolohyia,
teoryia y praktyka. [Tax policy: methodology, theory and practice].
Donetsk.
25. Piketty, T., Saez, Е.A. (2012). Theory of Optimal Capital
Taxation.NBER Working Paper, 17989. Available at:
https://eml.berkeley.edu/~saez/piketty-saezNBER12optKtax.pdf.
26. Ernst & Young (2019). Worldwide Estate and Inheritance Tax Guide.
Available at: https://www.ey.com/Publication/vwLUAssets/ey-2019-
worldwide-estate-inheritance-guide/$FILE/ey-2019-worldwide-estate-
inheritance-guide.pdf.
27. Leiserson, G., McGrew, W. and Kopparam, R. (2019). Net worth taxes.
What they are and how they work. Available at:
https://equitablegrowth.org/wp-content/uploads/2019/03/032119-
wealth-tax-report.pdf.
28. OECD (2019). Tax Policy Reforms 2019: OECD and Selected Partner
Economies. Available at: ttps://www.oecd-ilibrary.org/sites/da56c295-
en/1/2/3/index.html?itemId=/content/publication/da56c295-
en&mimeType=text/html&_csp_=aa66d87574ea6f0c4c2b5ea287156b0
a&itemIGO=oecd&itemContentType=book#section-d1e3950.

173
Chapter 5
SOCIO-DEMOGRAPHIC PROCESSES IN
THE ECONOMIC SYSTEMS
MANAGEMENT
Dragan Olena
Doctor of Economic Sciences, Professor
Tertychna Liubov
Candidate of Economic Sciences,
Associate Professor
Department of Labor Economics and
management
National University of Food
Technologies
Rybak Nadiia
Candidate of Economic Sciences,
Associate Professor
Department of Economics and
Economic Theory
Bila Tserkva National Agrarian
University
(Kyiv, Bila Tserkva, Ukraine)
MODERN LEVEL OF
HUMAN CAPITAL
OF THE UKRAINIAN
ENTERPRISES IN
THE CONDITIONS
OF
TECHNOLOGICAL
SPREADS
1. Introduction Modern technological spreads quickly displace the borders between
working tasks, that people execute, and tasks that execute machines and
algorithms, causing serious transformations at the labour market.
Advanced technologies change the enormous amount of low-skilled jobs
and open new possibilities, creating terms for appearance of new and
regenerate workplaces, growing the productivity and promoting
efficiency of production. Many specialities today, and, also, in the
nearest future, will require the complex of the special skills ‒ possessing
technologies, ability to settle problems, critical thinking, as interpersonal
skills, such, as zeal, readiness to collaboration and ability to have
compassion. For this reason in Lecture of the World Bank about the

174
world development in 2019 “Change of labour character” the basic role
of human capital in the decision of this problem is underlined [22].
Actuality of human capital topic is predefined by that a person is
examined in the center of economies as inexhaustible resource that is
fundamental in functioning of national economy and certain enterprise.
The rates of innovations introduction are growing, and the enterprises,
as well as country on the whole, for providing the competitiveness in the
future will operate quickly. To take advantage of new technologies and
diminish the problems that were generated by them, they will carry out
investments for the workers ‒ foremost, in protection of education and
health, that are basis of human capital increase.
2. Analysis of the last researches Today, the study of the problem of forming and effective use of
human capital of Ukrainian enterprises is not simply actual, but has the
main value in the structure of socio-economic researches. It envisages
the realization of deep scientific researches of this problem.
Many scientific researches of foreign and home authors are devoted
to the question of of human capital development. Different aspects of
human capital conception are described in researches of famous athors
of economic science as А. Smith, D. Ricardo, V. Patty, K. Marx, А.
Marshall, L. Walrus, I. Fisher and others. As independent direction, the
theory of human capital was formed in the 60th of XX century.
Awarding standard became the world confession of these researches
importance in economy for prominent scientific activity Т. Schultz (in
1979) and H. Becker (in 1992). They got Nobel price. In Ukraine the
research of human capital problems was activated at the beginning of
ХХІ century foremost due to the scientific developments of О.
Hrishnova.
Discussionsof many positions and presence of plenty unsolved
problems stipulate the necessity of further research of questions in
relation to forming, use and development of human capital of both main
factor of competitiveness increase of national economy and separate
enterprises.
3. Research methodology In modern society the human capital becomes basis of wealth.
Exactly the human capital determines the competitiveness of the
economic systems, comes forward as the key resource of their
development. The ability of economy to create and effectively use
human capitals in greater measure determines the economic force of

175
nation and its welfare.
The object of the developed indexes analysis is directly influence on
the level of human capital development of the country, estimation of
Ukraine rating place among other countries of the world for realization
and confession of domestic enterprises’ investments in human capital as
the main asset.
Basic material. Human capital can be determined totality of
productive capabilities, personal lines and motivations of individuals,
that they have in their property, are used in economic activity assist the
increase of labour productivity and due to it influence on the increase of
income (earnings), profit of the enterprise and national income, formed
and developed as the result of investments [2, p. 16-17].
The concept “human capital” means not only the realization of the
person’s main role in the economic system of society but also
confession of of investing necessity in a person, as the capital comes and
increases by investing and brings long by time and integral by the nature
the economic effect. Thus, it follows to take into account, that more
quality investments, though they need money more than time, bring, as a
rule, better and more longtime effect. Thus, at the world level, without
regard to considerable increase in the supply of skilled labour force, the
norm of profit from education presents approximately 9% in a year,
norm of profit for higher and secondary education is almost 15% in a
year [22, p. 19].
Investments in human capital are all types of charges on the oerson’s
development in monetary or other form (on education, health protection,
mobility), that assist intellectual and professional increase of a person,
promote his/her productivity, that influence on future increase of
incomes as individual, enterprise and society on the whole.
From all types of investments in human capital the most essential are
investments in education and health. Universal and special education
improve quality, promote the level and supply of knowledge, the volume
and quality of human capital are also increased. Investments in higher
education assist forming of highly skilled specialists, highly skilled
labour of which carries out the most influence effect on the rates of
economy growing [7].
Thus, all types of charges, that can be estimated in monetary or other
form and that assist to increase productivity and worker’s income in the
future, must be examined as investments in human capital, that the state
(government), enterprises, educational establishments, non-state public
funds and organizations, international funds and organizations, families

176
and separate citizens can be carried out.
The estimation of human capital level can come true on existent
rating lists. Index of human development (HDI) (Human Development
Index, HDI) is the most popular index, it is integral index that accounts
annually for intergovernmental comparison and measures the average
level of achievements in three basic measuring of human development:
health and longevity, knowledge and deserving standard of living [6, p.
25]. The index is published in the special series of UN reports about
human development. In 1990 UNDP published the first “Report about
human development” (Human Development Report 1990. Concept and
Measurement of Human Developmen) [14].
Basic measurings of HDI [6, p. 1] are:
ability to conduct long and healthy life that is measured by the
expected life-span at birth;
ability to get knowledge that is measured by the middle duration
of studies and expected studies duration;
ability to attain the deserving standard of living that is measured
by the index of gross national receipt per capita.
Data are also taken into account about the levels of social security,
indexes of health and cultural development of population, people
participation in making decision, state of criminality, guard of
environment [8].
Rating of countries after the index of human development is annually
folded by the Program of development of UN (UNDP) from 1990 for
187 countries and the confessed UN territories, in 2015 and 2016 ‒ for
188 countries and territories, from 2017 ‒ for 189 and published in
“Reports about human development” (Table 5.1).
As registers in “Reports about human development 2019. After the
scopes of incomes and middle indexes level of nowaday: inequality in
human development in XXI century” on this index according to
statistical data Ukraine in 2018 and 2017 occupied the 88-th place in
rating of the countries of human development index among the 189
countries of the world [15, p. 301] (in 2015it was the 84-th place among
the 188 countries of the world [16], in 2014 it was the 81-st place, in
2013 ‒ 83, in 2012 ‒ 78, in 2010 ‒ 69). Norway, Switzerland, Ireland,
Germany, Hong Kong (China), Australia, Iceland, Sweden, Singapore
and Netherlands are ten states with the very high level of human
development in the world. The USA is on the fifteenth place, dividing
this place with Great Britain, and Russia is on the 49th place.
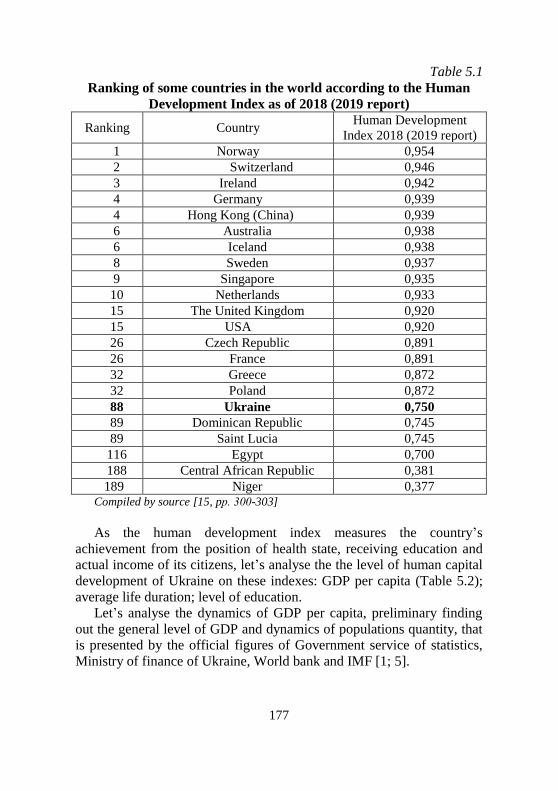
177
Table 5.1
Ranking of some countries in the world according to the Human
Development Index as of 2018 (2019 report)
Ranking Country Human Development
Index 2018 (2019 report)
1 Norway 0,954
2 Switzerland 0,946
3 Ireland 0,942
4 Germany 0,939
4 Hong Kong (China) 0,939
6 Australia 0,938
6 Iceland 0,938
8 Sweden 0,937
9 Singapore 0,935
10 Netherlands 0,933
15 The United Kingdom 0,920
15 USA 0,920
26 Czech Republic 0,891
26 France 0,891
32 Greece 0,872
32 Poland 0,872
88 Ukraine 0,750
89 Dominican Republic 0,745
89 Saint Lucia 0,745
116 Egypt 0,700
188 Central African Republic 0,381
189 Niger 0,377
Compiled by source [15, pр. 300-303]
As the human development index measures the country’s
achievement from the position of health state, receiving education and
actual income of its citizens, let’s analyse the the level of human capital
development of Ukraine on these indexes: GDP per capita (Table 5.2);
average life duration; level of education.
Let’s analyse the dynamics of GDP per capita, preliminary finding
out the general level of GDP and dynamics of populations quantity, that
is presented by the official figures of Government service of statistics,
Ministry of finance of Ukraine, World bank and IMF [1; 5].

178
Table 5.2
Gross Domestic Product per capita in Ukraine for 1990-2018
Years
GDP of
Ukraine
*, billion
USD
Population**, GDP
per
capita,
USD
GDP per capita
growth
thousands
of people
relative
increase,
%
absolute,
+/- $.
relative,
%
1990 293,235 51 891 ‒ 1742 ‒ ‒
2000 32,331 49 177 -5,23 632 -1110 -63,7
2001 39,309 48 662 -1,05 782 150 23,7
2002 43,956 48230 -0,89 879,0 97 12,4
2003 52,010 47801 -0,89 1048,8 169,8 19,3
2004 67,226 47448 -0,74 1367,5 318,7 30,4
2005 89,282 47091 -0,75 1829,2 461,8 33,8
2006 111,885 46771 -0,68 2303,8 474,6 25,9
2007 148,734 46501 -0,58 3069,1 765,3 33,2
2008 188,240 46240 -0,56 3892,5 823,4 26,8
2009 121,552 46044 -0,42 2546,0 -1346,5 -34,6
2010 136,011 45865 -0,39 2974,4 428,4 16,8
2011 163,161 45693 -0,63 3570,8 596,4 20,0
2012 175,707 45577 -0,25 3856,8 286,1 8,0
2013 179,572 45483 -0,21 4030,3 173,5 4,5
2014 132,343 43722 -3,87 3014,6 -1015,7 -25,2
2015 90,939 42836 -2,03 2115,4 -899,2 -29,8
2016 93,263 42668 -0,39 2185,9 70,5 3,3
2017 109,321 42477 -0,45 2640,3 454,4 20,8
2018 130,832 42269 -0,49 3095,2 454,9 17,2 * According to the International Monetary Fund [18].
** Compiled by source [1; 5].
From data of Table 5.2 it is possible to draw conclusion, that the
quantity of Ukrainian population is dicreasing every year. It goes to
show that the death rate exceeds the birth-rate. In relation to the GDP
index per capita we see the negative trend of value of index reduction in
2009, that is related to the world financial and economic crisis. In this
period there was a slump of commercial activity of small and large
enterprises in the country. It resulted to the increase of unemployment
that is negative phenomenon for human capital development on the
whole rate. In the period from 2010-2013 there was a positive tendency
of increase of GDP value, and in 2014-2015 there was a decline of GDP
level, that was predefined by political unstable position and swift
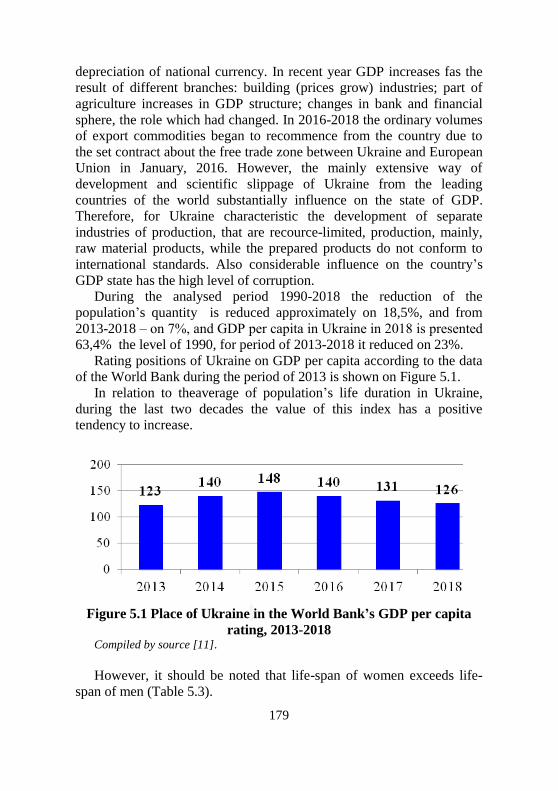
179
depreciation of national currency. In recent year GDP increases fas the
result of different branches: building (prices grow) industries; part of
agriculture increases in GDP structure; changes in bank and financial
sphere, the role which had changed. In 2016-2018 the ordinary volumes
of export commodities began to recommence from the country due to
the set contract about the free trade zone between Ukraine and European
Union in January, 2016. However, the mainly extensive way of
development and scientific slippage of Ukraine from the leading
countries of the world substantially influence on the state of GDP.
Therefore, for Ukraine characteristic the development of separate
industries of production, that are recource-limited, production, mainly,
raw material products, while the prepared products do not conform to
international standards. Also considerable influence on the country’s
GDP state has the high level of corruption.
During the analysed period 1990-2018 the reduction of the
population’s quantity is reduced approximately on 18,5%, and from
2013-2018 ‒ on 7%, and GDP per capita in Ukraine in 2018 is presented
63,4% the level of 1990, for period of 2013-2018 it reduced on 23%.
Rating positions of Ukraine on GDP per capita according to the data
of the World Bank during the period of 2013 is shown on Figure 5.1.
In relation to theaverage of population’s life duration in Ukraine,
during the last two decades the value of this index has a positive
tendency to increase.
Figure 5.1 Place of Ukraine in the World Bank’s GDP per capita
rating, 2013-2018 Compiled by source [11].
However, it should be noted that life-span of women exceeds life-
span of men (Table 5.3).

180
Table 5.3
Average life expectancy in Ukraine at birth, years
Years The average life expectancy of
a person, years
Men,
years
Women,
years
1990 70,42 65,60 74,82
2001 67,89 62,32 73,63
2002¹ 68,32 62,70 74,13
2003¹ 68,24 62,64 74,06
2004¹ 68,22 62,60 74,05
2005¹ 67,96 62,23 73,97
2006¹ 68,10 62,38 74,06
2007¹ 68,25 62,51 74,22
2008¹ 68,27 62,51 74,28
2009¹ 69,29 63,79 74,86
2010¹ 70,44 65,28 75,50
2011 71,02 65,98 75,88
2012 71,15 66,11 76,02
2012 71,15 66,11 76,02
2013 71,37 66,34 76,22
2014 71,37 66,25 76,37
2015 71,38 66,37 76,25
2016 71,68 66,73 76,46
2017 71,98 67,02 76,78
2018 71,76 66,69 76,72 Compiled by source [5; 13, р. 56]
Without regard to the increase of life duration, it still remains most
subzero in Europe, in addition, Ukraine has the biggest difference in life
duration of men and women’ life duration among European countries.
After the index level of life duration in different countries, that is
published in the special report of the UN “Estimation of world
population progress”, Ukraine took the 114th place among 191 countries
of the world (in 2018 life duration was 72) [10]. Leading positions
occupy Hong Kong, Japan with the average duration of life is more than
84 (Table 5.4).
In relation to the level of education index, the Ukrainian population
belongs to the most well educated nations. The estimation level of
education comes true on the basis of index of average duration of
education in the country (Table 5.5).
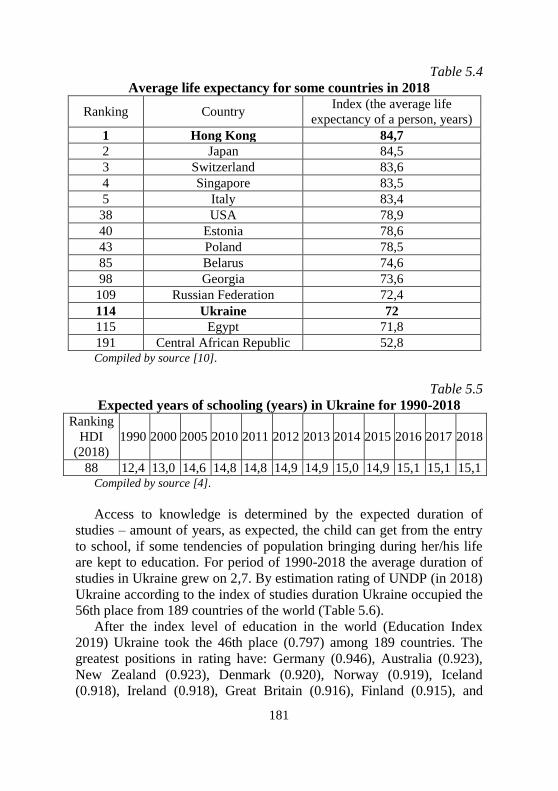
181
Table 5.4
Average life expectancy for some countries in 2018
Ranking Country Index (the average life
expectancy of a person, years)
1 Hong Kong 84,7
2 Japan 84,5
3 Switzerland 83,6
4 Singapore 83,5
5 Italy 83,4
38 USA 78,9
40 Estonia 78,6
43 Poland 78,5
85 Belarus 74,6
98 Georgia 73,6
109 Russian Federation 72,4
114 Ukraine 72
115 Egypt 71,8
191 Central African Republic 52,8
Compiled by source [10].
Table 5.5
Expected years of schooling (years) in Ukraine for 1990-2018 Ranking
HDI
(2018)
1990 2000 2005 2010 2011 2012 2013 2014 2015 2016 2017 2018
88 12,4 13,0 14,6 14,8 14,8 14,9 14,9 15,0 14,9 15,1 15,1 15,1 Compiled by source [4].
Access to knowledge is determined by the expected duration of
studies – amount of years, as expected, the child can get from the entry
to school, if some tendencies of population bringing during her/his life
are kept to education. For period of 1990-2018 the average duration of
studies in Ukraine grew on 2,7. By estimation rating of UNDP (in 2018)
Ukraine according to the index of studies duration Ukraine occupied the
56th place from 189 countries of the world (Table 5.6).
After the index level of education in the world (Education Index
2019) Ukraine took the 46th place (0.797) among 189 countries. The
greatest positions in rating have: Germany (0.946), Australia (0.923),
New Zealand (0.923), Denmark (0.920), Norway (0.919), Iceland
(0.918), Ireland (0.918), Great Britain (0.916), Finland (0.915), and

182
Sweden (0.914). The closest neighbor’s of Ukraine in Index after 2018
are Luxemburg (0.802), Montenegro (0.797), Croatia (0.796) [9].
Table 5.6 Average length of study in some countries in 2017
Ranking
(2017) Country
Higher education
(years)
Average length of
study (years)
1 Australia 22,9 12,9
2 Belgium 19,8 11,8
3 Ireland 19,6 12,5
4 Iceland 19,3 12,4
5 Denmark 19,1 12,6
16 Germany 17 14,1
20 USA 16,5 13,4
24 Poland 16,4 12,3
32 Estonia 16,1 12,7
55 Georgia 15 12,8
56 Ukraine 15 11,3
188 Niger 5,4 2
189 South Sudan 4,9 4,8 Compiled by source [12].
More detailed idea about the state of human capital of Ukrainian
enterprises gives the Global human capital index (Global Human Capital
Index, GHCI), that gives an estimation, both current and expected,
human capital of the country, as an accumulation of skills does not end
with formal education, and permanent application and accumulation of
skills at work are part of human capital development. As marked in
Lecture about human capital after 2017 the World economic forum
(World Economic Forum), “very often economies own necessary talent,
but can not use” it [21, p. 5]. Conducting the analysis of level of human
capital development the World economic forum (World Economic
Forum) applies human capital index (Human Capital Index), at
determination of that constituents, that, in particular, characterize life
duration, are taken into account, even education in the country,
professional training, employment and others like that.
After the of human capital index (HCI) Ukraine in 2015 occupied the
31st position among 124 countries of the world by estimation rating of
human capital development, in 2016 it had the 26th place among 130
countries of the world, in 2017 it had the 24th place among 130 countries

183
of the world, as marked, the efficiency indexes of Ukraine are especially
high to the level of GDP per capita [21, p. 13]. Besides, only 25
countries of the world use 70% of human capital or even anymore,
including Ukraine ‒ 70,28.
It is needed to pay attention, that after the sub-index of mental
abilities (competenses) estimation (Capacity of score), the personnel
reserve is estimated, are people that have the formally accredited
qualifications according to the main base of skills and got qualifications
on more various brief-case of specializations, Ukraine took the 5 place
(from 130 countries) in 2017 – 81,7 points. After the estimation sub-
index of “Now-how” (Know-how score), that determines the potential
for creation of effective cycle of possibilities for new skills acquisition
in the workplace and motivation of investments in development of
highly skilled personnel among private and staterepresentatives, and
also among people, Ukraine took only the 38th place (59,3 points) [21, p.
8].
This situation directly influences on the competitiveness of the
Ukrainian enterprises, that in the conditions of rapid technological
changes acquires priority. Thus, on the estimations of the World
economic forum after the global competitiveness index (Global
Competitiveness Index, GCI), that consists of 113 variables that, in turn,
incorporated in 12 control indexes, in particular innovative potential; the
level of technological development; efficiency of labour-market;
competitiveness of companies; health, primary education; Higher
education, professional training and others like that, Ukraine for the
period of 2014 (76 place among 144) on 2019 (85 place among 141)
has a tendency to worsening the indexes (Table 5.7).
From 2018 the World Bank for realization of measuring and
analytical work with the aim of increase of awareness level and demand
on items in relation to human capital forming and of human capital
index (Human Capital Index, HCI) was worked out, measures the
productivity level of next generation’s workers as compared to the
standard index of complete course of studies and valuable health. The
index value is for the country in that the average worker has valuable
health and has passed the complete course of education that is equal to
1. On this index Ukraine in 2018 was on the 50th position (0,65) among
157 countries [22, p. 62].
About the state of human capital of the Ukrainian enterprises testifies
the highly sought of highly skilled specialists in the country. The data,
given to the report about the state of highly skilled market in the world,

184
Table 5.7
Positions of Ukraine and some countries in the Global
Competitiveness Index 2010-2019
Ranking
GCI 20
10
20
11
20
12
20
13
20
14
20
15
20
16
20
17
20
18
20
19
Ukraine 89 82 73 84 76 79 85 81 83 85
Georgia 93 88 77 72 69 66 59 67 66 74
Turkey 61 59 43 44 45 51 55 53 61 61
Romania 67 77 78 76 59 53 62 68 52 51
Russia 63 66 67 64 53 45 43 38 43 43
Poland 39 41 41 42 43 41 36 39 37 37
Estonia 33 33 34 32 29 30 30 29 32 31 Compiled by source [20].
that is annually published by the French experience institute of INSEAD
together with Adecco Group and Institute of leadership in the sphere of
human capital (HCLI). The global talent competitiveness index (Global
Talent Competitiveness Index) measures, how countries are able to
compete for the most skilled and talented employees. In addition,
countries are estimated by the ability to prepare and keep the most
talented specialists. On this index Ukraine occupied in 2018 the 61st
place among 119 countries, in 2019 it ws the 63rd
among 125 countries.
For the estimation of Global Talent Index (GTI) seven independent
indexes were used by every country: demography; quality of obligatory
education system; quality of studies in universities and business-
schools; quality of environment for skilled personnels training; mobility
and relative openness of labour market; tendencies in providing of
foreign investments and international specialists. The estimation of
Ukrainian GTI indexes in rating of countries by the level of highly
skilled personnel is given in Figure 5.2.
4. Сonclusions As technological spreads are opened out, enterprises are trying to use
new technologies for the achievement of higher levels of production
efficiency and consumption, going into new markets and for new
products competition, the necessity of the use of digital technologies are
growing. However, to use new technological possibilities to the
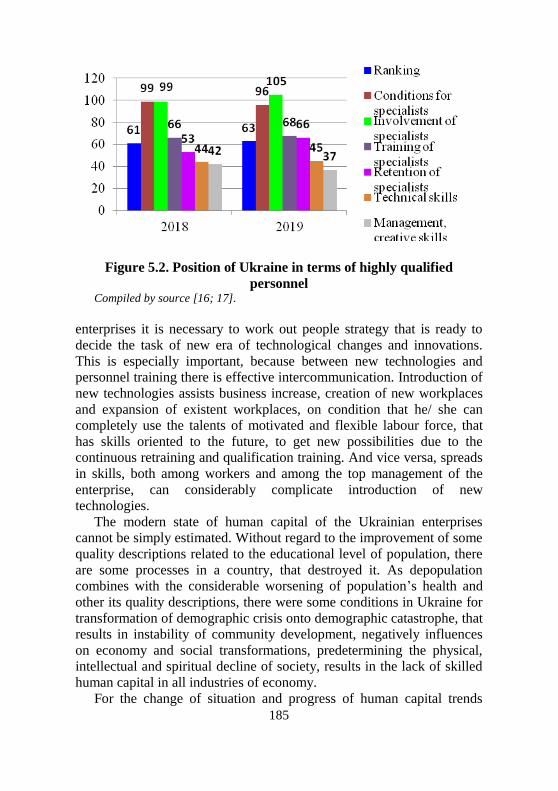
185
Figure 5.2. Position of Ukraine in terms of highly qualified
personnel Compiled by source [16; 17].
enterprises it is necessary to work out people strategy that is ready to
decide the task of new era of technological changes and innovations.
This is especially important, because between new technologies and
personnel training there is effective intercommunication. Introduction of
new technologies assists business increase, creation of new workplaces
and expansion of existent workplaces, on condition that he/ she can
completely use the talents of motivated and flexible labour force, that
has skills oriented to the future, to get new possibilities due to the
continuous retraining and qualification training. And vice versa, spreads
in skills, both among workers and among the top management of the
enterprise, can considerably complicate introduction of new
technologies.
The modern state of human capital of the Ukrainian enterprises
cannot be simply estimated. Without regard to the improvement of some
quality descriptions related to the educational level of population, there
are some processes in a country, that destroyed it. As depopulation
combines with the considerable worsening of population’s health and
other its quality descriptions, there were some conditions in Ukraine for
transformation of demographic crisis onto demographic catastrophe, that
results in instability of community development, negatively influences
on economy and social transformations, predetermining the physical,
intellectual and spiritual decline of society, results in the lack of skilled
human capital in all industries of economy.
For the change of situation and progress of human capital trends
186
purposeful efforts of the enterprises, society and state are needed on the
basis of scientifically reasonable understanding of problems essence and
facilities of their permission.
The prospect of further researches in this direction is determination
of prospects of human capital development of the enterprises in the
conditions of employment patterns change, skills instability caused by
technological changes.
References: 1. Gross Domestic Product: Financial Portal of the Ministry of Finance.
URL: http: // index.minfin.com.ua/ index / gdp /.
2. Grishnova O. (2001) Human capital: formation in the system of
education and vocational training. Kyiv: Knowledge Company, KOO,
254 p.
3. Grayson Jackson K. Jr., O’Dell Carl. (1991) American Management at
the Threshold of the 21st Century. Moscow: Economics, 320 p.
4. Data on human development (1990-2018). UNDP: Human
Development Reports: Website. URL: http://hdr.undp.org/en/data.
5. State Statistics Service of Ukraine: URL: http://www.ukrstat.gov.ua
6. Human Development Indices and Indicators: Updated Statistical Data
2018: UNDP Human Development Report, 2018 / Report. 111 p. URL:
http://hdr.undp.org/sites/default/files/2018_human_development_statist
ical_update_ru.pdf
7. Kravchenko NV, Kovalchuk TM Social investments: essence and role in
formation of resource-competence base of the enterprise. Global and
national problems of economy. 2017. № 15. URL: http: // global-
national.in.ua/issue-15-2017.
8. United Nations Development Program: Human Development Report
2016 URL: http://hdr.undp.org/ en / 2016-report.
9. Rating of the countries of the world by level of education Humanitarian
Encyclopedia: Research. Humanitarian Technology Center: Website.
URL: https://gtmarket.ru/ratings/education-index/education-index-info
10. Rating of the countries of the world in terms of life expectancy.
Humanitarian Encyclopedia: Research. Humanitarian Technology
Center: Website. URL: http://gtmarket.ru/ratings/life-expectancy-
index/life-expectancy-index-info
11. Rating of countries by GDP per capita. NoNews: Website. URL:
https://nonews.co/directory/lists/countries/gdp-per-capita
12. Ranking of countries by length of study: 2018. NoNews: Website. URL:
https://nonews.co/directory/lists/countries/years-schooling
13. Fertility, mortality and average life expectancy tables for 2018:

187
statistical compilation / State Statistics Service of Ukraine. Kyiv, 2019.
66 p. URL: http://ukrstat.gov.ua/druk/publicat/kat_u/2019/zb/08/
zb_tabl_nar_2018.pdf.
14. Human Development Report 1990. Concept and Measurement of
Human Developmen / UNDP. New York, 1991. 189 URL:
http://hdr.undp.org/sites/default/files/reports/219/hdr_1990_en_comple
te_nostats.pdf
15. Human Development Report 2019. Beyond Income, Beyond Averages,
Beyond Today: Inequalities in Human Development in the 21st Century
/ United Nations Development Program One United Nations Plaza.
New York, NY 10017. 366 pp. URL: http://hdr.undp.org/
sites/default/files/hdr2019.pdf
16. INSEAD (2018): The Global Talent Competitiveness Index 2018.
Fontainebleau, France. 357 URL: https://nonews.co/wp-
content/uploads/2018/10/GTCI2018.pdf
17. INSEAD (2019): The Global Talent Competitiveness Index 2019.
Fontainebleau, France. 338 URL: https://nonews.co/wp-
content/uploads/2019/06/GTCI2019.pdf
18. International Monetary Fund, World Economic Outlook Database.
URL: https://www.imf.org/external/pubs/ft/weo/2018/01/
weodata/weorept.aspx?pr.x=77&pr.y=19&sy=1992&ey=2021&scsm=
1&ssd=1&sort=country&ds= . & br = 1 & c = 926 & s =
NGDP_RPCH% 2CNGDP% 2CNGDPD% 2CPPPGDP & grp = 0 & a
19. Tertychna L. I. (2015) Human capital asset management as a
component of company management. Socio-economic aspects of
economics and management: A collection of scientific articles. Vol. 1.
Aspect Publishing of the Budget Printing Center, Taunton, MA 02780,
United States of America, Р. 251-256.
20. The Global Competitiveness Report /World Economic Forum. URL:
https://www.weforum.org/reports/the-global-competitiveness-report.
21. The Global Human Capital Report 2017: Preparing People for the
Future of Work. Insight Report / World Economic Forum, Committed to
improving the state of the world. Geneva, Switzerland, 2017. 203 URL:
https://www.weforum.org/reports/the-global-human-capital-report-
2017
22. World Development Report 2019: The Changing Nature of Work.
International Bank for Reconstruction and Development / The World
Bank. 2019. 151 URL: https://www.worldbank.org/en/publication/
wdr2019.

188
Pidlypna Radmila
Doctor of Economic Sciences,
Professor, Chair of Accounting and
Auditing
Kovach Maria
PhD in Economic Sciences, Associate
Professor, Chair of the Department of
Finance
Indus Kateryna
PhD in Economic Sciences, Associate
Professor, Chair of the Department of
Finance
Uzhgorod Trade and Economic
Institute of the Kiev National Trade
and Economic University
(Uzhgorod, Ukraine)
DETERMINATION OF
THE VECTORS OF
CORRECTION AND
DEVELOPMENT OF
THE PENSION
SYSTEM OF UKRAINE
In the last few years, research on pension systems has become
increasingly important due to reforms, growing interest of the state and
society to the problems of social justice, financial security, the level of
social protection of the people of retirement age and people with social
pension status. The state policy on modernization and improvement of
the pension system is focused on building an updated institutional and
legal framework of the pension system, on structural changes in the
pension system to improve the living standards of the population of
retirement age.
Analysis of the current state of the socio-economic sphere shows that
an important factor in the implementation of reforms and
transformations in Ukraine is the social insecurity of a large part of
citizens, declining incomes, declining quality of life. Therefore, the
pension provision of citizens is an important aspect of socio-economic
relations, especially in the field of labor and income, standard and
quality of life, as well as public finances, budget, taxes. It is obvious that
the pension system of Ukraine is vulnerable and needs additional
measures to ensure its financial stability.
The pension system in the context of economic transformation needs
to be reformed. The need to increase the efficiency of the existing
189
pension system is largely due to significant economic problems that
have arisen in Ukraine as a result of economic crises, significant
shadowing of incomes, adverse demographic trends, deteriorating
employment rates and increasing macroeconomic factors. In this regard,
it is important to study and investigate the existing problems of
reforming the national pension system of Ukraine, identifying ways to
ensure financial stability and its protection from risks.
Pension reform is an important element of life for both citizens and
the state, as it is an important area of strategic interests on which the
social well-being of people and the economic development of the state
depend. Therefore, this industry is attracting more and more attention of
specialists and researchers in the field of finance, demography,
investment, insurance, etc. Problems related to the study of fundamental
problems of pension provision in Ukraine, as well as the ways to solve
them are reflected in the works of such scientists and practitioners as: I.
Chugunov, O. Nasibova, T. Staverska, I. Shevchuk, V. Fedyna, E.
Libanova, V. Rudyk, V. Oleksijko, I. Zagreba, O. Kukurudz and others.
Mainly, I. Chugunov notes that the pension system, which originated on
a social basis, i.e. on the need to support the disabled, needy people,
gradually with social development has become an economic factor that
contains the investment component of economic growth and affects the
quality of reproduction of productive forces in Ukraine [14]. T.
Staverska, I. Shevchuk researched the preconditions and factors
influencing the reform of pension systems in the world, analyzed the
gradual changes in the field of pension provision in Ukraine, proposing
vectors for further pension reform. Scientists emphasized that in Ukraine
the raising of retirement age was veiled and had little effect on solving
the problems of the Pension Fund of Ukraine [12]. V. Fedyna made the
study of factors that led to the restructuring of the national pension
system and the problems of its practical implementation and also
substantiated the need to identify and monitor risks [13]. E. Libanova
notes that the pension system remains socially unjust – both on
occupational and gender grounds [8]. Assessing the state of reforming
the domestic pension system V. Rudik, V. Oleksiyko systematized the
factors of negative impact and determined the priorities of its
development, namely: substantiated some aspects of the introduction of
the funded pension system and suggested to reconcile the parameters of
pension reform with the real state of the domestic economy [11]. Thus,
the researcher I. Zagreba offered recommendations for the introduction
of a funded pension system in the context of attracting investment into

190
the domestic economy, and analyzed the experience of implementing a
funded pension system in some European countries, noting the
possibilities and feasibility of its implementation in Ukraine [4]. At the
same time, O. Kukurudz considers that in the existing pension provision
the principle of insurance is not fully implemented and has an
administrative distribution character and does not ensure the dependence
of the amount of pensions on the amount of paid contributions. There is
also no relationship between the employee’s work and the size of his
pension, there is no interest of the employee in the formation of the
pension budget [7]. Thus, the problem of reforming the existing pension
provision in the new realities of a market economy, a complex
demographic situation requires new approaches.
Thus, given the above, taken into account the significant interest of
researchers in this topic, the pension system of Ukraine remains
inefficient and its reform needs further improvement to achieve higher
standards of socio-economic security of retirees.
An integral feature of all reforms and transformations taking place in
Ukraine is the social insecurity of a significant number of citizens. The
formation of a new pension system that would meet the constitutional
principles and at the same time be adequate to the new property
relations, market relations, distribution and consumption is a very
important issue reviewing the realization of the constitutional right of
citizens to social security. One of the reasons for the socio-economic
significance that led to the objective preconditions for pension reform is
the devaluation of the pension system, which has existed and
transformed into an equal one, and is financed over a long period on a
residual basis.
The main disadvantages of the pension system are financial
instability, weak differentiation of pensions depending on the labor
contribution, the lack of a fair mechanism for increasing the size of
pensions, associated with rising levels of consumption.
The pension system, which was established during a considerable
period on the principle of solidarity, does not have sufficient capacity to
ensure sustainable long-term stability of pension institutions, as well as
to guarantee pensioners a decent standard of living. In well-developed
European countries, this is ensured by the accumulated assets for the
period of active working spell, as well as by measures of additional
social support for retirees.
The national pension system needs to be reformed due to the impact
of both socio-economic and demographic factors.

191
The pension reform introduced a three-tier pension system, which
includes the following levels:
- solidary;
- accumulative obligatory;
- accumulative voluntary.
However, the second level has not been introduced, and private
insurance is too slow, so the basis of the pension system is the solidarity
level.
The modern pension system is faced with the problem of balance,
lack of real sources of material support for pensioners, a significant
deficit of the Pension Fund of Ukraine (PFU): the amount of
expenditures significantly exceeds the amount of revenues.
The financial analysis of incoming and outgoing flows of pension
provision during 2014-2019 was conducted (Table 5.8).
Table 5.8
Dynamics of revenues and expenditures of the Pension Fund of
Ukraine Years Revenues
mln. UAH.
Rate,
(%)
Expenditures
mln. UAH.
Growth rate,
(%)
2014 239871,7 - 240068,6 -
2015 264767,8 10,4 262177,5 9,2
2016 255801,1 -3,4 253448,6 -3,3
2017 292369,8 14,3 291467,3 15,0
2018 352175,3 20,5 358604,6 23,0
2019 434857,8 23,5 435933,6 22,4 Source: [5]
The data presented in Table 5.8 show that during the study period the
fund’s revenues increased by 81.3% (almost UAH 194.986 billion), and
in 2019 amounted to UAH 434.858 billion, which in 23.5% (UAH 82.7
billion) exceeded the corresponding figure of the previous year.
The growth of the revenue part of the PFU in 2019 is partly
explained by changes to its budget, introduced by the Resolution of the
Cabinet of Ministers of 20.02.2019 №137 [9], according to which to
revenues there has been added the position of “the funds the State
Budget of Ukraine for benefits and housing subsidies to citizens to pay
for housing and communal services in cash” in the amount of over UAH
10 billion. According to the Resolution of the Cabinet of Ministers dated
by February 6, 2019 № 62 [10], the Ministry of Social Policy pays
housing subsidies in cash. However, despite such innovations, the

192
provision of the population with other types of social support and
revenues of the budget part of the PFU in 2019, increased compared to
the previous year.
The trend in PFU expenditures is similar, having increased by 81.6%
over the last 6 years (over UAH 195.9 billion).
Systemic underfunding and ever-increasing expenditures, even
despite the steady decline in the number of retirees, lead to a PFU
budget deficit, which is mainly covered by the state budget (Table 5.9).
The obvious increase in external subsidies to the PFU occurs in 2016,
when more funds were allocated from the State Budget of Ukraine than
the institution’s own revenues.
Table 5.9
Comparative dynamics of some indicators of the Pension Fund of
Ukraine Indicators 2014 2015 2016 2017 2018 2019
The average annual
number of retirees,
thousand people
13533 12147 12297 11956 11725 11470
Chain growth rates, % 89,8 101,2 97,2 98,1 97,8
The amount of the
average monthly
pension, UAH.
1526,1 1581,5 1699,5 1828,3 2479,2 2645,7
Chain growth rates, % 103,6 107,5 107,6 135,6 106,7
The amount of
revenues from the
state budget,
mln. UAH.
75813,9 94811,5 142586 133459 150091 129264
in % to the total
amount of the
revenues of PFU
31,3 35,8 53,5 45,5 42,4 31,6
Chain growth rates, % 125,1 150,4 93,6 112,5 86,1 Source: [5]
During the period, arrears of payments to PFU increased, caused by
arrears of SSC payments, wages, difficult financial condition of state-
owned enterprises, arrears of compensation of preferential pensions
(Figure 5.3).
An equally important reason for the growing deficit of the pension
fund is the presence in the structure of Ukraine’s economy of a
significant volume of the shadow sector. Thus, according to the State
Statistics Service of Ukraine, every fourth employee works without

193
registration of employment. Most of such workers are in agriculture
(42.3%), trade (17.9%), construction (16.1%), industry (6.4%), transport
(3.7%). As a result of informal employment, the PFU loses about 30
billion hryvnias annually. Therefore, the problem of de-shadowing of
incomes and legalization of employment should become one of the
important priority areas for ensuring the revenue side of the budget and
the effective functioning of the PFU.
Figure 5.3 Dynamics of arrears of payments to PFU Source: [5]
Thus, the threatening dynamics of the PFU budget deficit, the rapid
deterioration of the financial situation of the population (pension
entities) indicate a lack of efficiency of the current pension system. As a
result, the average size of pension provision for the majority of elderly
Ukrainian citizens is less than the subsistence level and does not meet
even their basic needs (Table 5.10).
The PFU provides management of the solidarity system of the
obligatory state pension insurance. For the full and independent
functioning of the PFU, the main source of income should be its own
income (i.e. contributions of insured people), so it is advisable to
consider the dynamics of this indicator.
During the six years, the share of own revenues ranged from 46.5%
(2016) to 68.7% (2013). The largest dynamic decline in this indicator is
observed at the beginning of the active reform of the pension system,
which led to a significant dependence of PFU revenues on external
sources of funding. In 2017, more than 10.2 million pensioners (87.2%)
had their pension payments increased. At the same time, the increase was
extremely uneven: about 2.3 million people received monthly allowances
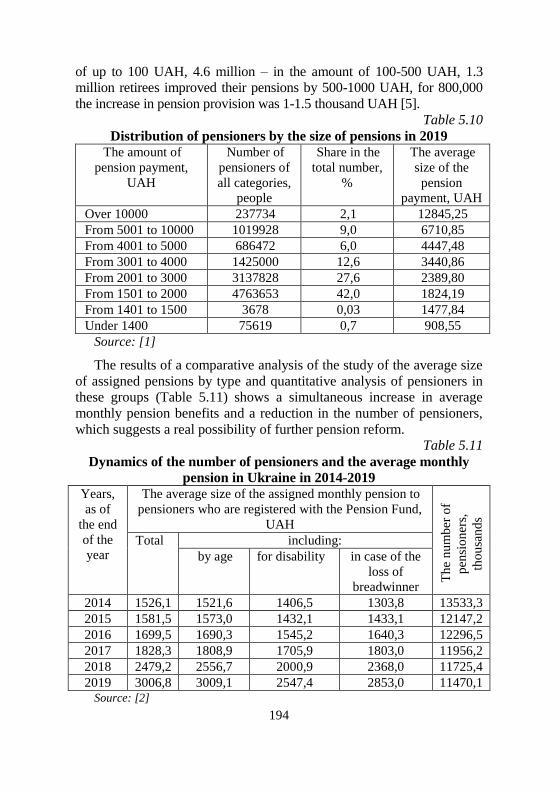
194
of up to 100 UAH, 4.6 million – in the amount of 100-500 UAH, 1.3
million retirees improved their pensions by 500-1000 UAH, for 800,000
the increase in pension provision was 1-1.5 thousand UAH [5].
Table 5.10
Distribution of pensioners by the size of pensions in 2019
The amount of
pension payment,
UAH
Number of
pensioners of
all categories,
people
Share in the
total number,
%
The average
size of the
pension
payment, UAH
Over 10000 237734 2,1 12845,25
From 5001 to 10000 1019928 9,0 6710,85
From 4001 to 5000 686472 6,0 4447,48
From 3001 to 4000 1425000 12,6 3440,86
From 2001 to 3000 3137828 27,6 2389,80
From 1501 to 2000 4763653 42,0 1824,19
From 1401 to 1500 3678 0,03 1477,84
Under 1400 75619 0,7 908,55
Source: [1]
The results of a comparative analysis of the study of the average size
of assigned pensions by type and quantitative analysis of pensioners in
these groups (Table 5.11) shows a simultaneous increase in average
monthly pension benefits and a reduction in the number of pensioners,
which suggests a real possibility of further pension reform.
Table 5.11
Dynamics of the number of pensioners and the average monthly
pension in Ukraine in 2014-2019
Years,
as of
the end
of the
year
The average size of the assigned monthly pension to
pensioners who are registered with the Pension Fund,
UAH
Th
e n
um
ber
of
pen
sio
ner
s,
tho
usa
nd
s
Total including:
by age for disability in case of the
loss of
breadwinner
2014 1526,1 1521,6 1406,5 1303,8 13533,3
2015 1581,5 1573,0 1432,1 1433,1 12147,2
2016 1699,5 1690,3 1545,2 1640,3 12296,5
2017 1828,3 1808,9 1705,9 1803,0 11956,2
2018 2479,2 2556,7 2000,9 2368,0 11725,4
2019 3006,8 3009,1 2547,4 2853,0 11470,1 Source: [2]

195
Using the coefficients of substitution (Сsubst), security (Csec) and
system load (Csl), the efficiency of the solidarity pension system will be
determined (Table 5.12). These rcoefficients are directly related to each
other and highlight the internal logic of building a joint pension system.
Table 5.12
Dynamics of indicators of the efficiency of solidary pension system
functioning
Indicator / Years
2014 2015 2016 2017 2018 2019
The average pension, UAH
1526,1 1581,5 1699,5 1828,3 2479,2 2645,7
Average monthly nominal salary, UAH
3149,5 3661,4 4482,4 6273,5 7810,9 10343,7
The weighted average subsistence level per workable person per month, UAH
1218,0 1271,3 1434,3 1684,0 1808,2 2155,6
Demographic load on the population of people aged 0-14 years (per 1000
people of working age)
212,3 217,6 221,4 225,3 227,4 227,7
Demographic load on the population of people aged 65+ (per 1000 people of
working age)
219,2 225,3 230,8 236,7 242,6 247,1
Сsubst (coefficient of substitution) = the ratio of the average pension to the
average salary
0,48 0,43 0,38 0,29 0,32 0,26
Csec (coefficient of security) = the ratio of the average pension to the
subsistence level
1,25 1,24 1,18 1,09 1,37 1,23
Csl (coefficient of system load) = the ratio of the number of persons insured
with the Social Insurance Fund to the number of pensioners
0,73 0,87 0,88 0,87 1,10 1,11 Source: [1, 2, 5]
It is obvious from the above data that the systemic insufficiency of
PFU’s income is due to the low rate of SSC, the insufficient number of its
payers and the low base for its accrual. It should be noted that the purpose
of reducing the SSC rate was an attempt to institutionally influence the
level of tax evasion. SSC created a particularly significant burden on low-
income people, while the upper limit of the rate leveled such a burden for
the wealthy. Instead, this innovation has not become an effective tool, as
tax evasion is a multidimensional problem, and the separately introduced

196
reduction of the SSC rate has not had a significant impact on the
withdrawal of income from the shadow sector of the economy.
The system load coefficient is also consistently low, which indicates
an insufficient number of SSC payers. This has led to a situation where
the pension rate is in the lowest position among European countries.
Pension income in Ukraine mainly depends on the financial stability
of the solidarity system, however, the replacement coefficient in the
solidarity system tends to decrease due to changes in the labor market
and demographic situation, which will increase in the share of pension
income from additional systems of voluntary or mandatory funded
pension provision Therefore, there is a question of rethinking the
accumulative system of private pension provision.
Non-state pension funds (NPFs) with a fixed contribution have
existed in Ukraine since 2005, however, the non-state pension provision
system has not been successful throughout its existence. As can be seen
from Table 5.13, the overall performance of NPFs remains low.
Table 5.13
General performance indicators of non-state pension funds in
Ukraine
Indicator / Year
2014 2015 2016 2017 2018 2019
Number of NPFs 80 72 64 66 64 62
Number of participants, thousands of people
837,7 836,7 834,0 840,8 855,3 868,7
Number of concluded contracts, thousand
55,1 59,7 62,6 58,7 68,8 70,7
Number of recipients of private pensions, total, thousand
75,6 82,2 81,3 78,8 81,3 83,3
Pension payments, mln. UAH
421,7 557,1 629,9 696,3 809,9 912,9
Pension contribution, mln. UAH, including:
1808,2 1886,8 1895,2 1897,3 2000,5 2112,6
from individuals
71,4 80.3 92,2 124,3 172,1 208,7
from self-employed persons
0,2 0,2 0,2 0,2 0,2 0,2
from legal entities
736,1 1806,3 1895,2 1772,3 1827,7 1903,1 Source: [6]
197
The analysis of quantitative indicators of NPFs activity shows the
gradual development of this segment, however, despite the gradual
increase in the number of NPFs participants, the level of citizen
participation remains significantly low. In our opinion, this may be due
to the low level of awareness of the population in matters of disposal of
their pension savings, low income, distrust of financial and economic
institutions of NPFs.
The transition from solidarity to an accumulative system is caused by
a change in the demographic situation: declining birth rates, rapid aging
of the population of Ukraine, increasing demographic burden on the
working population. All this leads to the impossibility of ensuring a
decent standard of living for the elderly at the expense of the younger
generation and requires the replacement of the principle of solidarity of
generations by the principle of personal responsibility of people for
ensuring the standard of living in retirement. No less important is the
increase in the outflow of population abroad in recent years. Labor
emigration usually occurs in more economically developed countries,
which causes indirect losses to the country’s population, and at the same
time has a negative impact on budget replenishment. Such threats are
not only facing the pension system of Ukraine, they have already
become global problems.
International researchers point to the secondary character of the
demographic factor, believing that the economic determinants of the
functioning of pension systems always dominate. The negative impact
of the deteriorating demographic structure of the population on the
sustainability of the pension system can be leveled by an increase in the
production of goods and services per employee in the sphere of
economy. At the same time, replacing the principle of solidarity
financing of funded pensions without increasing production potential
and labor productivity can only delay the crisis of the pension system:
pension savings not provided with sufficient goods and services will
lead to their depreciation and, consequently, lower living standards.
Thus, despite the fact that the main purpose of reforming the pension
system is to improve the solidarity pension system and ensure fairness in
determining the amount of pension benefits, the trends we have
demonstrated indicate the difficulty of solving this problem. Such steps
were aimed at ensuring a certain stability and equalization of the
financial capacity and results of the solidarity pension system. The
results of the study showed that certain stabilization was achieved, as in
2017-2019 there is already a positive dynamics of the share of own
198
revenues in the PFU budget, and, consequently, an objective reduction
in the burden on the budget of Ukraine. It can be considered that the
next step should be the introduction of mandatory funded pension
insurance and voluntary funded insurance.
The main vectors of the development and improvement of the
pension system and elimination of its shortcomings can be: correction of
pension legislation, clear financial regulation, increase of labor
productivity and salary, reduction of risks associated with labor
migration, increasing the role of insurance experience in forming the
right to pension, correction of methodology calculations of the
replacement coefficient, revision of the principles of the formation of
accumulative component of the pension, effective information work.
Conclusions. The pension sector as a complex socio-economic
system affects the economic processes in the state. At the same time, the
transformation processes in the economy involve evolutionary
transformations in the pension sector. Limited material and financial
resources pose a task for researchers to analyze the combination of
market and non-market bases of the pension sector at a new level. Both
employers and employees are called upon to ensure the organization and
order in the pension system along with the state. At the same time, the
key element in the pension system should be played by the basic
element – the insurance mechanism with the active introduction of
additional voluntary NPFs.
There are a significant number of problems in the pension system of
Ukraine, and partially implemented reform measures cause a number of
contradictions. A real assessment of the current state of the domestic
pension system shows the importance of the pension issue in the context
of ensuring social development, strengthening the potential for
economic growth. Further research should focus on finding stable and
reliable sources of funding for all types of social insurance and the
optimal distribution of resources accumulated through a single
contribution to compulsory state social insurance between social
insurance funds.
References: 1. Pensiinyi Fond Ukrainy (2019). Analytical report on the results of the
Pension Fund of Ukraine in the first half of 2019. Available at :
https://www.pfu.gov.ua/1860752-analitychna-dovidka-pro-pidsumky-
roboty-pensijnogo-fondu-ukrayiny-u-i-pivrichchi-2019-roku
2. Derzhavna sluzhba statystyky Ukrainy (2020). Official site. Available
199
at : http://www.ukrstat.gov.ua
3. Zahoreieva O. Yu. (2017) Problems and directions of reforming the
pension system of Ukraine. Molodyi vchenyi, no. 1.1 (41.1), рр.36-40.
4. Zahreba I. I. (2018) Reforming the pension system and its impact on
the investment attractiveness of Ukraine. Naukovyi visnyk
Uzhhorodskoho natsionalnoho universytetu, vol. 20, part 1, рр. 159-
163.
5. Pensiinyi Fond Ukrainy (2019) Reports on the implementation of the
budget of the Pension Fund of Ukraine for 2014-2019. Available at :
https://www.pfu.gov.ua
6. Pidsumky rozvytku systemy nederzhavnoho pensiinoho zabezpechennia
u za 2014-2019 roky / https://www.nfp.gov.ua
7. Kukurudz O.M. Napriamy reformuvannia pensiinoi systemy Ukrainy //
Materialy Mizhnarodnoi naukovo-praktychnoi konferentsii «Sotsialno-
ekonomichnyi rozvytok Ukrainy ta yii rehioniv: problemy nauky ta
praktyky» (21-23 travnia). – Kharkiv: VD «INZhEK», 2009. – S. 252-
253.
8. Libanova E.M. Pensiina reforma v Ukraini: napriamy realizatsii
[kolektyvna monohrafiia] / za red. E.M. Libanovoi. – K.: Instytut
demohrafii ta sotsialnykh doslidzhen imeni M.V. Ptukhy NAN Ukrainy.
– 2010. – 270 s.
9. Kabinet Ministriv Ukrainy (2019) On Amendments to the Budget of the
Pension Fund of Ukraine: Resolution. Available at :
https://zakon.rada.gov.ua /laws/show/137-2019-%D0%BF .
10. Kabinet Ministriv Ukrainy (2019) On amendments to some resolutions
of the Cabinet of Ministers of Ukraine: resolution. Available at :
https://zakon.rada.gov.ua/laws/show/62-2019-%D0%BF
11. Rudyk V.K., Oleksiiko V.S. (2016) The state of reform of the pension
system in Ukraine. Oblik i finansy, no. 4 (74), рр.106-113
12. Staverska T.O., Shevchuk I.L. (2017) Problematic issues of reforming
the pension system of Ukraine. Ekonomika i suspilstvo, vol. 13,
рр.1221-1228.
13. Fedyna V.V. Problemni pytannia reformuvannia pensiinoi systemy
Ukrainy. Naukovyi visnyk Mizhnarodnoho humanitarnoho universytetu.
2017, vol. 25 (2) , рр. 128-131.
14. Chuhunov I. Evoliutsiia finansovoho mekhanizmu pensiinoho
zabezpechennia / I. Chuhunov, O. Nasibova // Visnyk Kyivskoho
natsionalnoho torhovelno-ekonomichnoho universytetu. – 2016. – №. 1.
– S. 80-97.

200
Sydorchuk Orystlava
Doctor of Economics, Associate
Professor of the Public
Administration Department
Lviv Regional Institute of Public
Administration National Academy
for Public Administration under the
President of Ukraine
(Lviv, Ukraine)
SAFETY ASPECTS OF
DEVELOPMENT OF
SOCIAL RESPONSE TO
THE PANDEMIC
THREAT
Continuous transformation of international social security system is
happenning under influence of globalization processes. Fundamentally
new features of world order are being formed and international
processes become controversial, there are constantly new challenges and
threats. In the present historical moment, when major public efforts to
provide social security are aimed at sustainable development, poverty
reduction and environmental problems, humanity is facing
new pandemic threats that immediately require significant political,
economic and social efforts at all levels of social hierarchical
construction. The problem of providing social security in response to a
pandemic is not a completely new phenomenon in the history of human
civilization, it has been repeatedly actualized at different times, as
evidenced by both the historical events and texts of theological
orientation (Lukanova, 2017). In 2020, a new pandemic challenge has
become a global problem for humanity, the successful solution of which
is determining the future quality of life of most countries’ population in
the world. The extremely rapid pace of development of social response
to the pandemic threat, due to objective uncertainty about the possible
consequences, actualises the need for this study.
The phenomenon of social response to pandemics remains largely
unexplored today. Moreover, since the problem identified is at the
intersection of medico-biological, socio-economic, ecological, social,
psychological and cultural branches of scientific fields, individual
publications of both domestic and foreign scientists partially cover only
certain highly specialized aspects of this large-scale problem. The well-
known epidemiologist B. Cherkassky offers qualitative understanding of
the concept of a pandemic as a global social and environmental

201
epidemiological system that ensures the preservation and spread of
infection on a planetary scale, differentiating it from the concept of the
epidemic (massive infectious affection in a given time and
space) (Cherkassky, 2008).
American epidemiologist A. Omran within his own epidemiologic
transition concept put forward and substantiated the assumption that
social development and massive growth of welfare are not able to
overcome the pandemic risks, and therefore can be considered only as
a situational tool for easening the negative consequences of spreading
socially dangerous diseases (Omran, 2005). The stages of epidemiologic
transition have been defined by this scientist as a reduction in the
mortality rate of the population from the most dangerous infectious
diseases, an overall improvement in living and working conditions, active
promotion of healthy lifestyles and a reduction in mortality among the
most vulnerable population categories (children and older people).
Scientific works of A. Tkachuk are devoted to consideration on
biological hazards connected with the massive spread of infectious
diseases (Tkachuk, 2017). Author reveals the study of the main
reservoirs and sources of mass outbreaks of dangerous diseases, to
which he attributed the uncontrolled release or spread of pathogens,
especially laboratory-modified and with unknown mechanisms of
impact on the ecosystem, their own and transboundary mobility.
Upon investigating aspects of civil protection O. Levchenko and co-
authors emphasize that modern society has rejected the concept of
absolute security, instead it developed the concept of adopted risk, that
can consciously be perceived by its greater part in the time of a
pandemic, and is itself a compromise between the level of security and
the institutional capacity to achieve it in technical, economic, social and
political aspects (Levchenko, Polukarov, Zatsarnyi, 2019). Thus, the
critically low amount of scientific research and the practical
underdevelopment of socio-political and socio-economic responses to
the pandemic’s social dangers are obvious and drive us to explore this
problem.
In March of 2020, WHO has identified the outbreak of a new
coronavirus SARS-CoV-2, which causes affection on COVID-19, as the
pandemic, and providing all governments recommendations to expand
the services to respond to emergencies, to inform the public about the
risks and how to protect themselves, to detect, isolate and treat each
patient, to monitor their communications, and to prepare hospitals, to
train and to protect nursing staff (World Health Organization, 2020).
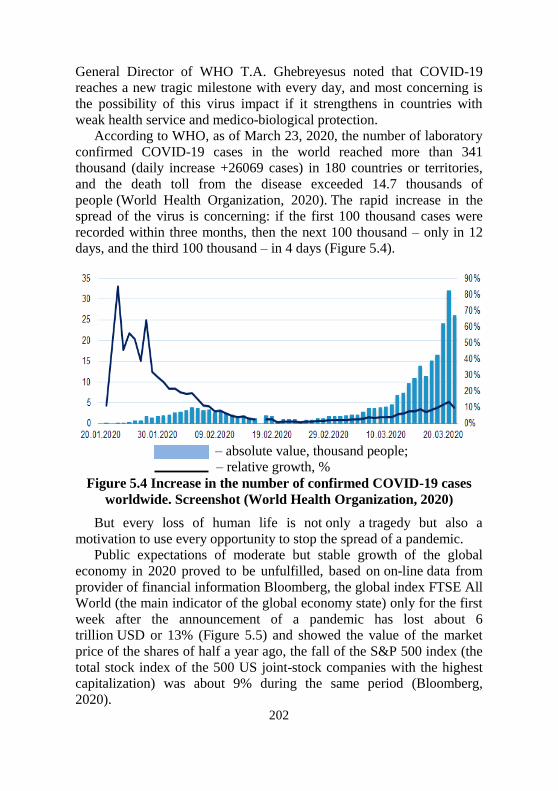
202
General Director of WHO T.A. Ghebreyesus noted that COVID-19
reaches a new tragic milestone with every day, and most concerning is
the possibility of this virus impact if it strengthens in countries with
weak health service and medico-biological protection.
According to WHO, as of March 23, 2020, the number of laboratory
confirmed COVID-19 cases in the world reached more than 341
thousand (daily increase +26069 cases) in 180 countries or territories,
and the death toll from the disease exceeded 14.7 thousands of
people (World Health Organization, 2020). The rapid increase in the
spread of the virus is concerning: if the first 100 thousand cases were
recorded within three months, then the next 100 thousand – only in 12
days, and the third 100 thousand – in 4 days (Figure 5.4).
– absolute value, thousand people;
– relative growth, %
Figure 5.4 Increase in the number of confirmed COVID-19 cases
worldwide. Screenshot (World Health Organization, 2020)
But every loss of human life is not only a tragedy but also a
motivation to use every opportunity to stop the spread of a pandemic.
Public expectations of moderate but stable growth of the global
economy in 2020 proved to be unfulfilled, based on on-line data from
provider of financial information Bloomberg, the global index FTSE All
World (the main indicator of the global economy state) only for the first
week after the announcement of a pandemic has lost about 6
trillion USD or 13% (Figure 5.5) and showed the value of the market
price of the shares of half a year ago, the fall of the S&P 500 index (the
total stock index of the 500 US joint-stock companies with the highest
capitalization) was about 9% during the same period (Bloomberg,
2020).
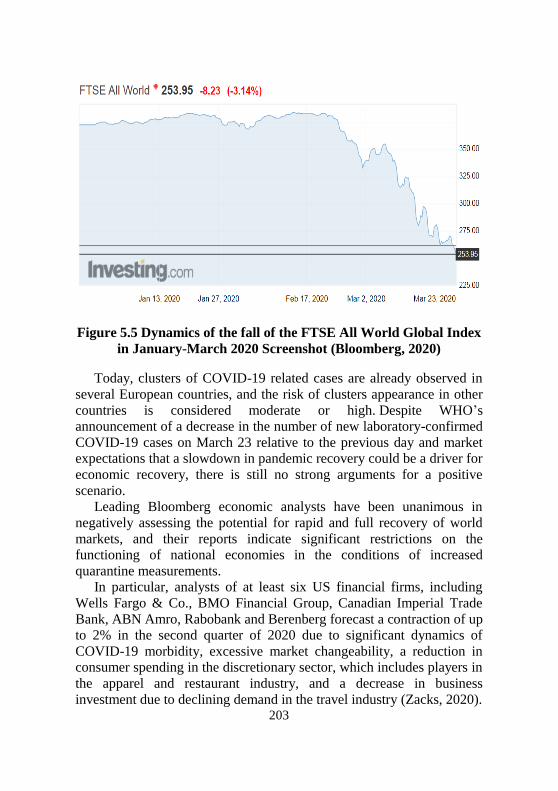
203
Figure 5.5 Dynamics of the fall of the FTSE All World Global Index
in January-March 2020 Screenshot (Bloomberg, 2020)
Today, clusters of COVID-19 related cases are already observed in
several European countries, and the risk of clusters appearance in other
countries is considered moderate or high. Despite WHO’s
announcement of a decrease in the number of new laboratory-confirmed
COVID-19 cases on March 23 relative to the previous day and market
expectations that a slowdown in pandemic recovery could be a driver for
economic recovery, there is still no strong arguments for a positive
scenario.
Leading Bloomberg economic analysts have been unanimous in
negatively assessing the potential for rapid and full recovery of world
markets, and their reports indicate significant restrictions on the
functioning of national economies in the conditions of increased
quarantine measurements.
In particular, analysts of at least six US financial firms, including
Wells Fargo & Co., BMO Financial Group, Canadian Imperial Trade
Bank, ABN Amro, Rabobank and Berenberg forecast a contraction of up
to 2% in the second quarter of 2020 due to significant dynamics of
COVID-19 morbidity, excessive market changeability, a reduction in
consumer spending in the discretionary sector, which includes players in
the apparel and restaurant industry, and a decrease in business
investment due to declining demand in the travel industry (Zacks, 2020).

204
One of the critical risks to the economic environment is a high
degree of uncertainty, since no expert is today able to estimate the time
perspectives of curbing a pandemic, as well as the level of social losses
and financial cost of rebuilding the world economy. More or less clear
indication of that might be revealed only after investors abandon the
massive risk avoid policy.
Moreover, in an environment of sharp deterioration in the economic
climate in practically all countries – economic leaders, the hope of
improvement due to changes in national monetary policies looks rather
illusory. National central banks are unable to overcome the effect of the
shock proposal, which is gaining momentum in a pandemic.
According to the Center for Public Health of Ministry of Healthcare
of Ukraine as of March 23 in Ukraine there were 73 laboratory-
confirmed cases of COVID-19 (daily gain of 26 cases) fixed. Although
the Ukrainian March 2020 morbidity statistics appear more optimistic
than in many European countries, the extremely difficult socio-
economic conditions provide grounds for anticipating a pandemic
activation and significant negative effects on the domestic economy.
Regarding the prospects for the development of the Ukrainian
economy in the quarantine conditions of pandemic expansion, it should
be noted that vulnerability factors due to its own instability are added to
the global risks of deteriorating expectations on the financial markets. In
particular, according to the Ministry of Finance of Ukraine, in 2020, the
amount of servicing the public external debt of Ukraine increases by
more than 25% (up to 6.2 billion USD).
Accumulated at the end of January 2020 gold reserves amounting to
26 billion USD cannot be considered sufficient because it covers only
20% of the country’s gross external debt (Ministry of Finance of
Ukraine, 2020). Additional factors of economic risk are the re-
evaluation of the hryvnia due to its strengthening by 19% in the previous
year, reducing the chances of successful placement of Eurobonds due to
the global tendency of falling in the stock markets, a sharp decrease in
the inflow of foreign investments, a change in attitudes in the foreign
exchange market, a sharp fall in the consumer activity on domestic
market, that go beyond meeting the vital priorities.
In such circumstances, radical measures taken at the highest
institutional level to prevent a pandemic have become a significant risk
factor for ensuring social security for Ukrainian citizens. This includes,
in particular, the temporary closure of borders, restaurants and the non-
food trade, restrictions (and sometimes a complete ban) on public
205
transport, which have led to a decline in activity or forced suspension of
many business entities activity and a significant reduction in workload
for employees of different industries.
In order to prevent the emergence and spread of COVID-19 in
Ukraine, some legislative acts aimed at ensuring the functioning of the
state under quarantine restrictions were urgently amended (Law of
Ukraine, 2020). In the first place, legislative initiatives were concerned
with improving the motivation of healthcare professionals directly
involved in medical manipulations towards a pandemic threat. In
addition, the public procurement procedure was temporarily simplified,
medicines, medical devices and medical equipment intended to prevent
the emergence and spread of COVID-19 were exempted from import
duties and VAT.
The introduction of a set of legal norms defined the special working
conditions during the quarantine period, in particular, confirmed the
possibility of remote work for many workers and civil
servants. Business owners were given the right to change their customer
service regimes.
Due to the situation connected with the announcement of quarantine,
the timing of which may vary depending on the epidemiological
situation in Ukraine, the Ministry of Education and Science of Ukraine
recommended to ensure partial transfer of employees of education and
science institutions, as well as other subordinate organizations to work
in flexible and / or remote mode, to ensure the studying process with the
help of remote technologies in the presence of appropriate conditions, to
prevent forced sending of employees on vacations, in particular, without
pay, to retain the average wage for workers for a period of quarantine.
In addition, a number of social norms, important, first of all, for
maintaining the quality of life of the most vulnerable members of
Ukrainian society in the conditions of pandemic expansion – pensioners
and persons with chronic diseases – were enacted. In particular, the
moratorium on penalties for individuals for late payment obligations on
consumer loans and utilities, as well as a decision on a single payment
of 1 thousand UAH for pensioners with a pension not exceeding 5
thousand UAH.
There will be no real estate tax for citizens during the quarantine
period, and entrepreneurs will be exempted from the obligation to pay a
single fee. Social protection will also increase for able-bodied citizens
who will be out of work during the quarantine period, simplifying the
procedure for providing subsidies for public utilities.
206
Funding for ongoing activities to restrain the spread of the COVID-
19 pandemic in Ukraine today is being implemented within the current
budget. The legislative changes announced above, as noted by their
developers (Law of Ukraine, 2020), do not require additional budgetary
allocations. However, it is obvious that the introduction of social
benefits (only for the payment of 1 thousand UAH to low-income
pensioners, additional losses of the state budget will amount to more
than 10 billion UAH) and a significant reduction of the real sector of the
economy can significantly affect the revenue side of both the state and
local budgets.
It is clear that the largest burden on the financial system of Ukraine
in the case of pandemic expansion will fall on the medical sector. At
present, it is impossible to accurately estimate both the number of
possible cases of infection and the cost of treating one infected patient,
since protocols for diagnosis, treatment and rehabilitation are only being
developed, and WHO is making new recommendations on an expedited
basis.
But in addition to the direct payouts of saving lives, the threat to
social security is also the destruction by the pandemic of the established
logic of financial and economic processes. Long-term ban on entire
industries (tourism, entertainment, restaurant, etc.), the cessation of
foreign exchange earnings from migrant workers who were forced to
evacuate in the wake of the pandemic (in 2019, more than 12 billion
USD was transferred to Ukraine), changing the internal logistics of cash
flows are all force majeure circumstances for the Ukrainian economy,
which will be extremely difficult to overcome. Therefore, it is highly
probable, especially against the backdrop of the threat of a global
recession, that Ukraine may face an economic crisis, for decrease of
which it is important to direct all resources available in the country
today to prevent the spread of a pandemic.
Thus, with the background of the rapid spread of the COVID-19
pandemic in the world and the threat of its spread in Ukraine, new
threats of a social and economic nature are emerging. Absence of
treatment protocols can lead to significant mortality among the
population, and the inability to predict the extent of pandemic outreach
together with the forced ban on the activities of many sectors of the
economy can be a starting mechanism for a significant deterioration in
the quality of life of many citizens and the onset of social and economic
collapse, which requires all state resources to be addressed immediately
to overcome this problem.
207
References: 1. Bloomberg. Official site. Available from: https://www.investing.com/
indices/ftse-all-world.
2. Cherkassky, B. L. (2008). Global epidemiology. Moscow: Practical
Medicine, 447 p.
3. Law of Ukraine "On Amendments to Certain Legislative Acts of
Ukraine aimed at Preventing the Occurrence and Dissemination of
Coronavirus Disease (Covid-19)" No. 530-IX of 17.03.2020. Available
from: http://w1.c1.rada.gov.ua/pls/zweb2/ webproc4_1?pf3511=68397.
4. Levchenko, O.G., Polukarov, O.I., Zatsarnyi, V.V. (2019). Labor
protection and civil protection. Kiev: KPI them. Igor Sikorsky, 420 p.
5. Lukanova, V. V. (2017). The religious-mythological dimension of the
pandemic phenomenon: the binary opposition to the sacral / profane.
Philosophy and political science in the context of contemporary
culture. No. 1 (16), pp. 196–202.
6. Ministry of Finance of Ukraine. The national debt of Ukraine.
Available from: https://index.minfin.com.ua/en/finance/ debtgov/.
7. Tkachuk, A. I. (2017). Features of the study of biological hazards
associated with the mass spread of infectious diseases. Proceedings.
No. 11 (IV), pp. 193-197.
8. World Health Organization. Official site. Available from:
https://www.who.int/emergencies/diseases/novel-coronavirus-2019.
9. Zacks. Investment Research. Available from:
https://www.investing.com/analysis/etfs-to-the-rescue-amid-
coronavirusled-volatility-200516018.

208
Chapter 6
MARKETING ENSURE FOR
DEVELOPMENT OF THE ECONOMIC
SYSTEMS
Kolodiychuk Anatoliy
Ph.D. of Economics, Associate Professor
Hushtan Tetiana
Ph.D. of Economics, Associate Professor
Uzhgorod Trade and Economic Institute
of the Kiev National Trade and Economic
University
(Uzhgorod, Ukraine)
ORGANIZATIONAL
AND ECONOMIC
PRINCIPLES OF
QUALITY
MANAGEMENT IN
TOURISM
Improving of quality is one of the factors that intensify economic
development, improve the efficiency of production processes, and
ensure competitiveness in the world and domestic markets. Quality
management in most advanced economies is seen as a nationwide
problem.
Product quality providing is a set of planned and systematic
measures that create the necessary conditions for fulfilling each stage of
the quality concept in such a way that the product meets the
requirements of the market segment for quality [10, p. 27]. One of the
primary principles behind creating a quality management concept for
tourism is to define the concept of tourism services quality. The quality
of tourist services is considered as a set of properties of tourist services,
processes and conditions of service to meet the stipulated or foreseen
needs of consumers of services from all components of the complex
tourist product.
After summarizing the scientific works of domestic and foreign
authors, the main indicators of quality of tourist service are specified.
These include: destination, ethics, comfort ability, adaptability,
reliability, uniformity, exclusivity, environmental friendliness, safety
and the like.
Indicators of destination of tourist products characterize its functional
209
properties for which it is intended, and determine the scope of its
application. Destination indicators describe the components of the tourism
service, the expected impact and are one of the main areas for evaluating
the activity of a tourism organization. Indicators by destination index
should determine the degree of compliance of the offered service to
customer expectations: consumer performance indicators, composition of
the proposed product, a set of quantitative indicators (journey duration, its
route, schedule, etc.). The compliance of the tourist product with the
requirements of the destination indicators is not subject to competition.
This is a prerequisite for the beginning of competition, that is, the
withdrawal of tourism enterprises in this competitive environment. The
behavior of the travel company in this environment is determined by other
indicators of product quality [4, p. 71].
Ethical quality indicators characterize public opinion, tourists’
opinion on the quality of tourist services and the possibility of achieving
the goal of travel [7, p. 112]. The value of this tourist service includes
the following aesthetic components: harmony, integrity of coverage of
the tourist program, compliance with social expectations, skill level of
service personnel. Ethical indicators can generally be attributed to social
characteristics that express the value of this service. The group of
indicators that determine the ethical quality of the tourism service is
subjective, but it is a significant complement to the balanced system of
quality indicators of the tourism product. The group of ethical quality
indicators is crucial in ensuring the competitiveness of the tourism
product and the tourist operator. Compliance with the tourism product
with ethical quality indicators requires compliance with the high
performing, technological discipline and qualification of the staff and
the appropriate organizational culture of the tourism enterprise [6].
The groups of indicators of comfort are anthropometric;
physiological; psychological; hygienic and other indicators that are of
great importance for consumers of the integrated tourism product.
Requirements for these indicators relate to the composition of the tourist
product, its functional characteristics, construction elements of vehicle,
equipment and interior of hotels and restaurants, etc. Anthropometric
indicators characterize the conformity of the equipment, the interior, the
rooms to the size and shape of the human body and its individual parts.
The physiological and psychological indicators of tourist services are
mainly related to the quality of excursions, their duration and
availability of facilities for recreation and other needs of tourists. Very
often, experts justify the competitiveness of their tourism product by the
210
presence of additional excursions, without taking into account the
increase in physical and psychological load on the tourist.
The group of technical quality include patent law (the presence of a
license, certification of services), compliance the conditions of service
with sanitary standards, compliance of the categories of means of
accommodation with the comfort level of the hotel [7, p. 114]. This
group of indicators is organically linked to groups of indicators that
characterize reliability, environmental friendliness and safety.
Reliability indicators include the guarantee of compliance with the
terms of the contract between the tour operator and the consumer of the
tourist product, the reliability of technical and other means used in the
implementation of tourist services. Reliability indicators cannot be
contrasted with other quality characteristics, but without complying with
them all other service quality indicators lose their meaning. On the other
hand, reliability becomes a true indicator of quality only if it is
combined with other characteristics of tourist services.
Indicator groups that characterize the uniqueness and exclusivity of a
complex tourism product determine the degree of use in a particular
service of standardized, unified, original services. Services that are
performed according to international, national and industry standards are
standardized. Unified services include services provided by the
enterprise standards and used more than in two tourism programs. The
indicators of uniformity indicate the high quality of the tourist product.
Exclusive services are offered exclusively for this complex tourist
product. Exclusivity is characteristic of a segment of high-value tourism
programs that do not fit into the scope of the standard offer. Exclusivity
indicators reflect the uniqueness and individuality of this tourist product.
Ecological indicators characterize the state of the environment in
tourist travel regions. Currently, eco-tourism is receiving considerable
attention, and tourist flows to ecologically clean regions have a positive
dynamic [9, p. 151].
Safety indicators determine the degree of risk to the life and health of
the tourist route, the type of tourist services and the quality of measures
to its counteract 2. Safety factors in tourism are classified by: trauma
safety; environmental impact; fire safety; biological impact;
psychophysiological load; radiation and chemical safety; industrial dust
and pollution; specific risk factors.
Indicators of all established tourist service quality groups are
provided by the staff of various subjects of tourist activity that join
forces in the final product at the following stages of its life cycle:

211
marketing research, design of a new tourist service, technological
preparation of production, production (equipment) of services, control,
promotion and sales in the market and customer service.
A quality tourism product can be provided by a tourism company
with a sufficient level of general management and personnel
management. Quality system means the totality of organizational
structure, responsibilities, methodologies, processes and resources that
necessary for the implementation of general quality management in a
tourism organization [1, p. 115]. The quality management system is
intended for implementation in tourism enterprises in order to ensure the
quality of work and continuous control of the process of conformity of
service provision.
In accordance with international standards, any system that aimed at
ensuring the quality of service must meet a set of interacting and
complementary requirements. The basic structural elements that ensure
the quality of the integrated tourist service are: a system of regulating
relations in the management of the quality of the tourism product and
the activities of the subjects of the tourism industry; quality management
system for the tourism enterprise and its contractors and agents. The
essence of the model is schematically depicted in Figure 6.1.
Regulation of relations in the sphere of quality management of the
tourist product is carried out through a system of normative legal acts,
state, interstate and international standards of quality and service of
tourists. The quality control of tourist services provided by tourist
enterprises is carried out by state and local authorities through the
system of licensing of tourist operators and their counterparties,
standardization and certification.
State regulation of the quality of tourist services through licensing of
activities of tourist operators involves the verification of: availability of
documents for the ownership (or lease) of the premises of the tourist
enterprise; documents certifying education and work experience in the
tourism industry of the head of the tourism enterprise; documents
certifying the financial support of the entrepreneurial activity of the
tourism enterprise; the existence and content of contracts with an
insurance company for the provision of compulsory health insurance
and accident insurance for tourists who are provided with travel
services.
State regulation of the quality of service provision through licensing
is also carried out in the main counterparties of the tourist enterprise:
hotels, motels, transport enterprises, etc. When concluding contracts

212
between a tourist enterprise and counterparty, the position of having a
license is stipulated.
Figure 6.1 The tourism quality management model
Source: compiled by the authors
Standardization of activity of tourist enterprises and counterparties is
aimed at: improving the quality of services in accordance with the needs
of consumers of the tourism product; protection of life and health of
consumers of tourist services, etc.
Certification of services provided by tourism industry enterprises is
carried out in order to harmonize standards, norms and rules with
international standards, recommendations, norms and rules regarding
requirements for visit objects and tourist services, interaction of tour
operators, use of limited tourist resources, quality and types of tourist
services.
The quality management of the subjects of tourism industry (STI)
envisages the introduction of an internal audit system. Quality audit is a
systematic and independent evaluation of the quality of the company.
A specific feature of a tourist service is its provision by various
enterprises. The tourist service is designed by the tourist operator, its
formation and realization is ensured by the coordinated activity between
the tourist operator, travel agent and counterparties of the tourist
enterprise (hotels, motels, transport companies, tour bureaus, insurance
Quality management system
at a tourism company
Quality management system
at enterprises - contractors,
agents
Quality of complex tourist service
Quality criteria Quality indicators
Regulatory impact
Regulation of tourism product quality management
relations
213
companies, etc.). Relations between them are formed on a contractual
basis.
The quality of the complex tourist service is characterized by the
totality of the components of the quality of all provided services and the
culture of tourist service. Quality is expressed through a system of
criteria that reflects the different types of activities for counterparties.
Quality management of tourism services is a process that involves
identifying the nature and scope of customer needs, assessing the actual
level of quality of tourism services, developing, selecting and
implementing measures to ensure and control the planned level of
quality. In order to meet the needs of consumers, a comprehensive
tourist service must satisfy a set of criteria.
No tourist enterprise is able to organize a tour on its own, provide
customers with all the necessary vehicles, provide housing, arrange
meals, etc. For this purpose, agreements are usually concluded with
specialized enterprises - counterparties of the tourist enterprise. Such
entities of the tourism industry include organizations providing
accommodation, catering, providing specific and exclusive services,
providing tourists transportation, providing tourist support and
information services, etc.
In modern conditions it is impossible to provide quality rendering of
complex tourist service without the use of the latest information
technologies. Just their implementation and use in the practical activity
of the subjects of the tourism industry ensures compliance with a set of
interacting requirements for quality management in the tourism sector.
Quality of complex tourist service includes: 1) quality of hotel
services; 2) quality of food services; 3) quality of transport services; 4)
quality of excursion services; 5) quality of information support; 6)
quality and range of specific services.
Quality hotel services include:
- compliance with the characteristics of the hotel category;
- state of logistical base;
- speed of placement;
- range of additional services;
- preservation of property;
- ecological status;
- safety for the life and health of tourists;
- level of hospitality;
- animation, children’s entertainment, others.
Quality food services include:

214
- quality of service staff work;
- conformity of the range of products for type and class of
establishment;
- level of hospitality;
- aesthetics;
- quality of material base of the enterprise;
- safety for the life and health of tourists.
The quality of transport services includes:
- speed of transportation;
- cost of transportation;
- comfort;
- possibility of luggage transportation;
- preservation of property;
- eating conditions on the go;
- environmental conditions;
- safety for the life and health of tourists;
- transfer and more.
Quality excursion services include:
- satisfaction of interests of excursionists;
- optimization of the excursion program;
- reliability;
- guide’s qualification;
- language culture;
- aesthetics;
- safety for the life and health of excursionists;
- others.
The quality of information support includes:
- faithfulness;
- completeness of information;
- accessibility;
- timeliness;
- uniqueness;
- reliability;
- safety for life and health;
- others.
The quality and range of specific services include:
- household;
- excursion;
- cultural and mass;
- sports;

215
- sports and entertainment;
- therapeutic;
- organizational and scientific;
- safety for life and health;
- others.
The use of information technology is a necessary component of
quality management in the tourism sector and the basis for the
relationship between the requirements that shape the quality of tourism
services and the information technology required for this purpose.
Therefore, the tourist enterprise in the market does not operate in
isolation, but in the surround and under the influence of various factors
and entities that make up its immediate external environment.
Relationships between environmental actors and the tourism enterprise
are diverse and interdependent, and by their nature of action, they can
have a direct impact on the quality of the tourism product and the
competitiveness of the tourism enterprise in the tourism market.
Thus, the analysis of scientific researches of domestic and foreign
scientists made it possible to specify the model of quality management
in the sphere of tourism, which has three basic structural elements:
regulation of relations in the sphere of quality of tourism; quality
management of the subjects of the tourism industry and quality of the
tourist service. Regulation of relations in the field of quality is carried
out through a system of normative legal acts, international, interstate,
state standards for quality and tourist services. Quality management of
the subjects of the tourism industry is realized through such tools as:
enterprise quality policy; quality model, voluntary certification through
quality standards. The quality of the tourist service is realized through
quality criteria and indicators. The system of indicators of quality of
tourist product include: destination indicators; ethical and environmental
indicators; indicators of comfort, adaptability, reliability, exclusivity,
uniformity and safety. The above indicators are interrelated, inter-
conditioned and provided by the staff of various actors in the tourism
industry. The system of quality criteria for complex tourist services,
which consists of a set of quality systems for hotel services, catering
services, transport services, tourist-excursion services, information
support, assortment of specific services, is specified.
References: 1. Baumgarten, L. V. (2010). Upravleniye kachestvom v turizme [Quality
management in tourism]. Moscow: Academy. [in Russian].

216
2. Denysenko, M. P. (2013). Orhanizatsiyno-ekonomichnyy mekhanizm
zabezpechennya ekonomichnoyi bezpeky pidpryyemstv turystychnoyi
industriyi [Organizational and economic mechanism of ensuring the
economic security of tourism industry enterprises]. Efektyvna
ekonomika – Effective Economics, 11. Retrieved from
http://www.economy.nayka.com.ua/?op=1&z=2486 [in Ukrainian].
3. Deyneko, L. V., Irtyshcheva, I. O., & Kupchak, P. M. (2009). Sil’s’kyy
turyzm yak odyn iz napryamiv rozvytku pidpryyemnytstva na seli [Rural
tourism as one of the directions of rural entrepreneurship
development]. In Aktual’ni problemy, suchasnyy stan ta perspektyvy
rozvytku industriyi turyzmu v Ukrayini ta Pol’shchi [Actual problems,
current state and prospects of tourism industry development in Ukraine
and Poland]: Materials of the third international research practice
conference, 2009, Oct 8-9, Zhytomyr. Zhytomyr: Ivan Franko Zhytomyr
State University (pp. 59-63). [in Ukrainian].
4. Ghada, A.-A. M. (2007). Service quality of travel agents: the view point
of tourist in Egypt. An International Multidisciplinary Journal of
Tourism, 2(1), 63-87.
5. Kolodiychuk, A. V. (2012). Informatsiya yak faktor innovatsiynoho
rozvytku ekonomiky [Information as a factor of innovation development
of the economy]. In Formuvannya rynkovykh vidnosyn v Ukrayini
[Formation of market relations in Ukraine]: Vol. 5/1(132) (pp. 58-62).
[in Ukrainian].
6. Komppula, R. (2006). Guidelines for professional activity services in
tourism – a discussion about the quality of a tourist experience product.
Managing Tourism and Hospitality Services: Theory and International
Applications. 115-125. Retrieved from http://www.atlas-
webshop.org/Guidelines-for-professional-activity-services-in-tourism-
a-discussion-about-the-quality-of-a-tourist-experience-product
7. Kudla, N. Ye. (2012). Menedzhment turystychnoho pidpryyemstva
[Management of the tourism enterprise]. Kyiv: Knowledge. [in
Ukrainian].
8. Lazorenko, S., & Bakalova, N. (2010, Jun 10). Neznyshchenna
torhivlya [Indestructible Trade]. Nova doba [New Age]: Newspaper.
[in Ukrainian].
9. Pazek, K., & Rozman, C. (2010). Tourist Farm Service Quality
Assessment. Journal for Geography, 5-2, 149-157.
10. Shapoval, M. I. (2002). Osnovy standartyzatsiyi, upravlinnya yakistyu i
sertyfikatsiyi [Basics of standardization, quality management and
certification]: Textbook. 3rd ed., rev. and sup. Kyiv: European
University. [in Ukrainian].

217
Kuranovic Veslav
Vilnius Gediminas
Technical University
(Vilnius, Lithuania)
CHINA LOGISTICS INDUSTRY
DEVELOPMENT IMPORT AND
EXPORT MAIN FACTORS
INFLUENCING INTERNATIONAL
TRANSPORT MARKET GROWING
Introduction
World merchandise trade growth has outpaced growth of Gross
Domestic Product (GDP) since the end of World War II and recently
accelerated due to free trade agreements and the globalization of the
economy (WTO, 2007). In the last decades, China’s booming economy
has greatly benefited from globalization and trade liberalization. China
has found a niche as the world’s manufacturing centre and has become
an engine of Asian growth and increased geopolitical importance
(Mcgregor, 2006).
China is playing a pivotal role in a growing number of global supply
chains. China’s main exports destinations are the United States, the
European Union, Hong Kong, and Japan which represent 68% of
exports by value. Almost 50% of total imports come from Japan, Korea,
Taiwan, and the European Union. For example, Chinese imports
constitute 7.5% of total spending by Americans on consumer goods and
import-wise they comprise 40% of clothing, 80% of toys, and 85% of
footwear imported to the USA (Barboza, 2008).
China’s logistics industry development
This section summarizes the history of Chinese logistics
development in the last three decades. Three periods stand out: a period
of centralized economy pre-1978, a period of liberalization between
1978 and China’s entrance to the World Trade Organization in late
2001, and a recent period of that of continuing trade and economic
growth.
a) The Centralized Economy
In the late seventies, almost 30 years ago, China was a closed
planned economy with scant amount of foreign trade. Prior to 1978,
five-year central economic plans designed and approved by the Chinese
Communist party ran the economy.
Product flows were strictly controlled and followed a hierarchical
system: shipments were moved from state owned factories to tier-1
218
facilities, then to tier-2 province and city centres, and finally to smaller
tier-3 cities and towns (Luk, 1998).
Without competition, state-owned distributors were able to keep 5%
to 17% margins at each layer without offering any value-added and or
logistics service beyond basic transport and warehousing services (Jiang
and Prater, 2002).
b) Liberalization
The beginning of China’s opening to the world economy and the
liberalization of its centralized planning economy took place in the late
seventies. In 1978, the Chinese government initiated the reform of the
three-tier distribution system. In late 1993, further deregulation allowed
greater market competition (Pyke et al., 2000, Luk and Sherriff, 1998).
Foreign trade practices also underwent dramatic transformations in the
eighties. Prior to 1978, the rights to import and export any product were
reserved by foreign trade corporations (FTCs). Any import or export
had to go through FTCs. By the late 1980s, a few domestic enterprises
with large trade volume were permitted to import and export directly
(Baldinger, 1998). In 1993 more domestic distributors and
manufacturers were granted greater autonomy to handle import and
export operations (CGOWP, 2006). By late 1993, foreign investors were
allowed to invest in retail business in certain inland cities and joint
ventures were granted more flexibility in selling products to the
domestic market (Luk and Sherriff, 1998). Initially, foreign capital was
allowed only in joint ventures where Chinese partner held a majority
(Goh and Ling, 2003).
c) Recent and Future Transport Developments
The first few years of the 21st century have been characterized by
the fast construction of transport infrastructure. During the five-year
plan 2001-2005 significant transport infrastructure has been built
including 250,000 kilometres of highways and 24,700 kilometres of
expressways. By the end of 2006, the total length Chinese highway has
reached 3,457,000 kilometres and 77,000 kilometres of railways
(Waters, 2007).
d) Recent Growth Rates
China’s economy has experienced a dramatic and consistent growth
since China started its economic reform in 1978. The rate of Chinese
economic growth clearly reflects the country’s rapid liberalization.
China’s Gross Domestic Product (GDP) reported an average of 10%
annual growth rate between 1980 and 2005. According to National
Bureau of Statistics of China , China’s GDP has risen from RMB 362.4

219
billion in 1978 to RMB 20, 941 billion in 2006 (equivalent to 2006 USA
dollars $2,800 billion). In 2006, China achieved the fifth largest GDP in
the world after the United States, Japan, Germany, and the UK
(Johnson, 2007). In 1999, China’s logistics industry reported an annual
growth rate of 31%, 35% in 2000, and 55% in 2001 (Bolton and Wei,
2003). Between 1992 and 2004, the average annual growth rate of the
China’s logistics industry was 22.2% and logistics expenditures
accounted for an average of 21.8% of the GDP (Wang et al., 2006).
China’s transport and logistics challenges
a) Low efficiency and high logistics costs
The astonishing rate of growth in the Chinese economy and foreign
trade has not brought about the most efficient logistics industry.
Compared with developed countries, the efficiency of China’s logistics
industry is still low in terms of the ratio of logistics expenditures to
GDP. In 2000, China’s logistics expenditures amounted to 20% of the
GDP whereas logistics spending accounted for 10.3% of United States’
GDP, 14% of Japan’s GDP, and 10 to 13% of European Union’s GDP
(Waters, 2007). Adding the costs of packing, transport, storage and
damage, the ratio of total logistics costs to total industry production
ranges from 40% to 60% , whereas in the United States this percentage
is close to 20% (Smyrlis, 2006). If logistics costs are broken down,
transport accounts for 57% of costs, inventory and storage accounts for
29%, and management accounts for 14%. Percentage wise, transport
costs in China are twice as expensive as in developed countries (Waters,
2007).
b) Congestion
Despite recent efforts to upgrade transport infrastructure, China’s
transport infrastructure is still insufficient to satisfy the huge demand
generated by its booming economy. Congestion and shipments delay
are frequent at Chinese seaports due to capacity shortage (Fallows,
2007). Highway construction and transport bottlenecks augment
congestion problems in port areas (Goh and Ling, 2003). Archaic
infrastructure and lack of adequate highway networks connecting the
developed coastal regions to underdeveloped inland provinces increases
rail and river congestion as more companies are moving inland to take
advantage of reduced labour costs (Mongelluzzo, 2007).
c) Lack of a nationally integrated intermodal transport network
There exists poor communication and coordination between Ministry
of Communications, Ministry of Railway, and Civil Aviation
220
Administration that regulate highways, railways, and airways
respectively (Chung, 2007). A “super ministry” has recently been
proposed to streamline government functions and integrate the country’s
transport system (CGOWP, 2008).
d) Entrenched regulation and local protectionism
Despite a reduction in national level regulations since China’s entry
to the WTO, local governments still set up bureaucratic and political
barriers to protect local businesses or products and prevent the entry of
outside competitors. This local protectionism is driven by the desire to
maximize local economic growth, employment, social stability and tax
revenues, and less by concern about the efficient utilization of regional
resources or the creation of an integrated national transport network
(Jiang and Prater, 2002).
e) Railways
Railways cannot alleviate highway congestion in the near future. The
capacity shortage in Chinese rail systems is severe and most of the
freight capacity is used to transport bulk materials such as coal, steel,
and iron. In 2005 less than 1% of container throughputs at major
Chinese ports were moved by a railway service and trucking has been
the dominant transport mode for freight due to its reliability and
flexibility (Roth et al., 2008). The master plan for the China Railway
Container Corporation calls for construction of eighteen inland rail
logistics hubs and the addition of double-stack intermodal service to the
major seaports (Mongelluzzo, 2007).
f) Poor IT infrastructure and inability to use advance technology
China is one of the largest users of mobile and fixed telephone lines
and has the second largest number of internet users after the United
States. However, some interior and mountainous areas still lack cable
and satellite facilities. Frequent blackout and power outages also hinder
logistics development and the modernization of corporate information
technology (IT) systems. The absence of web-enabled tools and know-
how is affecting Chinese companies’ international competitiveness. IT
development is regarded as one of the top challenges for China’s
logistics sector (Goh and Ling, 2003).
g) Underdeveloped warehousing service
Most of China’s warehouses were built as single-storey brick
structures with low ceilings, poor lighting, no or inadequate sprinklers,
poor temperature control devices, and poor dock-levelling. The
percentage of food and perishable goods spoiling are thus high overall
due to the lack of controlled temperature warehouses and unskilled
221
management.
h) Ports
Approximately 90% of China’s international trade volume is handled
through maritime transport. Increased trade volumes, heavy investments
in port infrastructure, and intense competition between ports have lead
to the emergence of highly efficient ports that may easily outshine the
productivity of many European and North American ports (Cullinane et
al., 2004, Song and Yeo, 2004, Yap et al., 2006, Comtois and Dong,
2007). Although port productivity is not an issue, Chinese ports are
affected by inadequate intermodal connections, bureaucratic Custom
procedures, and in some cases low customer service (Song and Yeo,
2004).
Conclusions The objective of this research was to survey the Chinese perspective
on international freight transport chains, the impact of delays on supply
chain costs and operations, companies’ delay and disruption planning,
and future transport and logistics planning from the perspective of
decision makers in the supply chain field. Importers and exporters
indentified transit time and reliability as key transport performance
indicators, however, the impacts of delays clearly differ for importers
and exporters and by the contractual conditions of delivery and supply
chain characteristics. The results of the forty-nine company interviews
in Shenzhen suggest an industry lacking in advance technology,
entrenched in regulation and local protectionism, and increasingly
impacted by growing congestion, which in turn is having a significant
impact on the competitiveness of Chinese companies in the global
market.
The growth in port capacity has kept pace with demand and ports
were not mentioned as major bottlenecks despite regulatory and
administrative burdens. However, as expensive and scant labour in
coastal regions force companies to move west the lack of a reliable
national freight transport network will affect the competitiveness of
Chinese exporters.
For companies located inland these percentages will certainly be
higher, however, the impact of additional inland transport costs will be
smaller when there is a long and expensive port-to-port movement.
Regional imbalances between developed coastal economies and
poor inland provinces hinder companies’ expansion plans; this is
especially true for high value shippers. The appeal of lower labour costs

222
in the Chinese West can be quickly overshadowed by poor
infrastructure, longer lead times, frequent delays, and limited
availability of closely located suppliers. Moving inland will also have
financial implication as extended lead times will affect exporters cash
flows. This is compounded by contracts moving from EX-WORK to
CIF in the Pearl River delta region (Huddersfield, 2008).
Service level, company reputation, loss sales, cash flow, and safety
stock considerations will increasingly affect mode and carrier choice as
companies move inland.
Most of the literature has focused on the identification of attributes
and estimation of values of time and reliability in freight transport
(Shinghal and Fowkes, 2002, Bergantino and Bolis, 2008). Future
research efforts should look towards attempting to quantify the impacts
of delays and disruptions on importers and exporters’ supply chain
operations.
References: 1. BALDINGER, P. (1998) Secrets of the Supply Chain. The China
Business Review, 25, 8.
2. BARBOZA, D. (2008) China’s Inflation Hits American Price Tags. New
York Times, Business Section, February 1st, 2008. New York.
3. BERGANTINO, A. S. & BOLIS, S. (2008) Monetary values of transport
service attributes: land versus maritime ro-ro transport. An application
using adaptive stated preferences. Maritime Policy & Management, 35,
159 - 174.
4. BOLTON, J. M. & WEI, Y. (2003) Distribution and Logistics in
Today’s China. The China Business Review, 30, 8.
5. CHUNG, O. (2007) Hong Kong SMEs Withdraw from Mainland China.
Asia Times Online, Jun 6, 2007. COMTOIS, C. & DONG, J. (2007)
Port competition in the Yangtze River Delta. Asia Pacific Viewpoint,
48, 299-311.
6. CULLINANE, K., FEI, W. T. & CULLINANE, S. (2004) Container
Terminal Development in Mainland China and Its Impact on the
Competitiveness of the Port of Hong Kong.
7. Transport Reviews, 24, 33-56. DREWRY (2007) Container Rate
Benchmark, Drewry Shipping Consultants. Published in The Journal of
Commerce, Volume 8, Issue 32, August 2007.
8. GOH, M. & LING, C. (2003) Logistics Development in China.
International Journal of Physical Distribution & Logistics
Management, 33, 886-917.
9. HUDDERSFIELD, U. K. (2008) Evaluation of factors for carrier

223
selection in the China Pearl River delta. Maritime Policy &
Management, 35, 27-52.
10. JIANG, B. & PRATER, E. (2002) Distribution and Logistics
Development in China: The Revolution Has Begun. International
Journal of Physical Distribution & Logistics Management, 32, 783.
11. JOHNSON, J. C. (2007) CHINA: A Sleeping Giant Arises; Implications
for U.S. Logisticians. Journal of Transportation Law, Logistics, and
Policy, 74, 11.
12. LUK & SHERRIFF, T. (1998) Structural Changes in China’s
Distribution System. International Journal of Physical Distribution &
Logistics Management, 28, 44.
13. LUK, S. T. K. (1998) Structural changes in China’s distribution system.
Management, 28, 44-67.
14. MCGREGOR, R. (2006) The Trillion Dollar Question: China is
Grappling with How to Deploy Its Foreign Exchange Riches. Financial
Times, September 25, 2006.
15. MONGELLUZZO, B. (2007) How the west will be won. Journal of
Commerce, Monday, October 22, 2007.
16. PYKE, D., ROBB, D. & FARLEY, J. (2000) Manufacturing and supply
chain management in China: A survey of state-, collective-, and
privately-owned enterprises. European Management Journal, 18, 577-
589.
17. ROTH, A. V., TSAY, A. A., PULLMAN, M. E. & GRAY, J. V. (2008)
UNRAVELING THE FOOD SUPPLY CHAIN: STRATEGIC INSIGHTS
FROM CHINA AND THE 2007 RECALLS*. Journal of Supply Chain
Management, 44, 22-39.
18. SHINGHAL, N. & FOWKES, T. (2002) Freight mode choice and
adaptive stated preferences. Transportation Research Part E-Logistics
and Transportation Review, 38, 367-378.
19. SMYRLIS, L. (2006) Dancing with the Dragon. (Cover story).
Canadian Transportation & Logistics, 109, 2230. SONG, D. W. &
YEO, K. T. (2004) A Competitive Analysis of Chinese Container Ports
Using the Analytic Hierarchy Process. Maritime Economics &
Logistics, 6, 34-52.
20. WANG, Q., ZANTOW, K., LAI, F. & WANG, X. (2006) Strategic
Postures of Third-party Logistics Providers in Mainland China.
International Journal of Physical Distribution & Logistics
Management, 36, 793.
21. WATERS, D. (2007) Global Logistics New Directions in Supply Chain
Management, KOGAN PAGE, London and Philadelphia.
22. WTO (2007) Trade Statistics, Retrieved on 2007-9-12, from. World
Trade Organization, URL: http://stat.wto.org/CountryProfile/

224
WSDBCountryPFView.aspx?Language=E&Country=CN.
23. YAP, W. Y., LAM, J. S. L. & NOTTEBOOM, T. (2006) Developments in
container port competition in East Asia. Transport Reviews, 26, 167-
188.
Nosachenko Oleksandr
Graduate Student
Baldzhy Maryna
Doctor of Economics, Professor
Department of Economics, Law
and Business Management
Odessa National Economic
University
(Odessa, Ukraine)
SYSTEM APPROACH TO
RESERVE DETECTION AND
EVALUATION IN
INCREASING
COMPETITIVENESS OF
WHOLESALE TRADING
ENTERPRISES
In conditions of high competition, it is extremely important to
identify possible reserves that will help determine specific ways of
development of enterprises. This is especially important in trade, whose
enterprises specialize in wholesale trade and have the necessary
prerequisites for the full range of procurement, sales and warehouse
technological operations [1, p. 51]. The identification and further
evaluation of the reserves to increase competitiveness should be based
on certain principles, thereby ensuring orderliness and relative stability
in the functioning of enterprises. It is the application of a systematic
approach that allows us to reveal the integrity of the object, which is the
activity of wholesalers, and to detect the movement of self-development
and self-organization mechanisms, the determination of endogenous and
exogenous connections and their combination into a single whole.
The complexity and dynamism of market management objectively
involves the use of systems theory for the purpose of a comprehensive
and in-depth analysis of practical marketing and commercial market
activity, the development of a model for its strategy, tactical business
plans, processes and managerial decisions on various aspects of the
functioning of enterprises and organizations and their strategic business
units. This is due to the fact that systemology methods allow rational
modeling, construct and effectively manage commercial activities in
225
various firms of various sizes and forms of ownership, including in the
field of wholesale trade. The research is based on the developments to
determine the nature and content of a systematic approach proposed by
our scientists.
So, V.A. Kharchenko (2013) considers the enterprise within the
framework of a systematic approach as an open system, “the activity of
which is influenced by many different factors, the consideration of
which in the process of business management is the key to the
successful implementation of the long-term goals and objectives of the
enterprise”, focusing on the particular strategic management of the
enterprise when applying a systematic approach [2, p. 158].
V.V. Prokhorova (2009) focuses on the fact that system research
“aims to identify the mechanism of life”, that is, “the functioning and
development of an enterprise in its internal and external (with respect to
its relationship with the environment) characteristics. Conducting a
systematic study of the development of the enterprise creates the
prerequisites for the effective management of the enterprise and allows
you to justify the choice of development direction and determine the
degree to which the goals of the enterprise are achieved; to determine
that in the processes of functioning and development of the enterprise,
the object of management is the dynamics of changes in the level of the
main areas of activity and management subsystems; to distinguish,
respectively, the stages of the enterprise’s life cycle, the type of
enterprise development – crisis, formation, development status
(qualitative and quantitative aspects of growth), utilization efficiency,
decline effect (depletion), to identify and evaluate the properties of
enterprise development, which can increase the efficiency of its
management processes; determine the criteria and indicators of the
effective functioning and development of the enterprise; in accordance
with the objectives to form the optimal structure and the necessary
properties of strategic management; to develop and implement strategic
and tactical measures to manage the development of the enterprise; to
form and effectively solve development problems by generating an
effective managerial decision” [3, p. 163].
Using a systematic approach for ensuring competitiveness requires
the implementation of a scientific justification for the possibility of
applying the concept of „competitive ensuring system” from the point of
view of systems theory. A systematic approach to ensuring the
competitiveness of enterprises determines the effectiveness of the
activities of enterprises and depends on the state of the external

226
environment, relations with other components of the external
environment. The main goals of the systematic approach is to eliminate
the contradictions between the goals of the system for ensuring
competitiveness in enterprise management and achieving coordination
of actions; the search for factors to increase business efficiency and
commercial success in the market, in order to achieve and maintain
competitive advantages [4].
R.V. Lyashenko (2018) identifies the strengths and weaknesses of
the systems approach in the economy, these include:
– strengths:
• determination of goals and criteria for managing the economic
sustainability of the enterprise,
• submission of the established conditions to the general goal of the
enterprise’s functioning,
• consideration of all elements of the system in conjunction,
• application at different levels – from some unit to the entire
enterprise. In each case, the control object is considered as a holistic
system,
• direction to poorly structured problems, the search for the best
solution;
– weaknesses:
• poor orientation to the creation of employees image, that leads to
demotivation,
• Inadequate horizontal integration of critical management functions,
such as recruiting, evaluating, rewarding and developing employees.
Managers perform these functions outside the only integrated approach
to staff,
• insufficient involvement of line managers and employees in the
development and implementation of management concepts,
• ignoring changes in the value orientations of people, indifferent
attitude to the goals of the activities of various groups,
• the use of expensive technologies, automated control systems,
• does not provide decomposition into interrelated procedures both at
the “input” with suppliers, and at the “output” with buyers and
customers [5, p. 299].
A systematic approach to the issue of managing the reserves of an
enterprise implies the realization that such a process is a complex
system of elements, united by a large number of interconnections both
among themselves and with the external environment, therefore this
issue cannot be analyzed in isolation, but it is necessary to take into

227
account the existing system connections. Here it is necessary to take into
account the interconnections of such elements of the enterprise as
financial, marketing, and management subsystems. It is also necessary
to highlight a system of indicators that most fully characterize these
subsystems of the enterprise and their functions, as well as evaluation
criteria that make it possible to obtain the corresponding values of
indicators. The next step in the systematic approach is to identify the
relationships of the enterprise subsystems and indicators characterizing
these relationships [6, p. 216]. So, a systematic approach in identifying
reserves means the ability to identify and summarize them, taking into
account the relationship and interdependence of external and internal
factors.
Wholesale trade is carried out by: specialized wholesale trading
enterprises, wholesalers, brokers and agents, as well as marketing
purchasing offices and branches of manufacturing enterprises. The
competitiveness management of domestic wholesalers is based on a
systematic approach and is aimed at finding all reserves, their
assessment and possible use for further development. Reserves are
unused opportunities for increasing the efficiency and competitiveness
of enterprises, reflecting the degree of use of factors in certain
conditions of a particular enterprise and vary depending on the
development of science and technology, improving production and
management [7, p. 9-10].
Reserves of competitiveness as unused opportunities are associated,
on the one hand, with the features of using certain elements of the
internal potential of the enterprise, and on the other, with the use of
factors of the external market environment. The latter include reserves
in use of rules and norms established by the state and reserves of the
most market mechanisms [8, p. 127].
he functioning stability of enterprises depends on the use of all
reserves, and the search for reserves to increase competitiveness is an
end in itself for each enterprise in the long-term development period [9].
And the effective use of the reserves of wholesalers creates a complex
system containing certain elements and relationships and has a clearly
set goal, which is achieved thanks to the functioning of the system as a
whole.
G. E. Yamnenko (2012) identifies seven groups of reserves, united
by a common goal – increasing the competitiveness of the enterprise.
These groups of reserves allow a selective approach to the
implementation of their assessment.

228
Despite the existing theoretical developments, the systemic
components remain unaccounted for: the object and subject, factors,
relationships, directions, analysis and evaluation of the functioning of
enterprises. Therefore, we propose a generalized logical scheme of the
importance of a systematic approach in identifying and assessing the
reserves of increasing competitiveness for wholesalers, which allows us
to summarize existing developments and outline the directions of the
strategy for their further development (Figure 6.2).
The generalization of the process of identifying and evaluating
reserves in a wholesale enterprise and combining them into a single
system will allow for step-by-step implementation of competitiveness
improvement directions.
The systematic approach scheme allows to identify aspects of the
effective functioning of the enterprise and increase its competitiveness
due to the most productive reserves that take place at a certain time and
for this type of enterprise. Using this method, you can determine the
long-term goal of the enterprise, establish the state of its functioning,
assess the state of development, develop ways to eliminate the
contradictions between the goals of competitiveness, show factors of
increasing competitiveness and commercial success in the market to
achieve competitive advantages, develop the optimal strategy and
determine the necessary components of strategic management.
The identification of reserves to increase competitiveness is based on
the determination of its competitive advantages. When working with
identified reserves of competitiveness, it is important to understand what
kind of concrete form we are dealing, taking into account the features
and specifics of the methodology and tools for assessing the reserve.
We consider it appropriate to allocate reserves based on the object of
occurrence:
- general reserves are reserves of competitiveness that can be applied
by any unit of the enterprise as a system;
- complex reserves – those that may arise in units similar to various
factors;
- partial reserves – arise within the same unit of the enterprise, a
positive effect of which is possible only if they are implemented in this
section.
The use of the competitiveness reserve includes an integrated
process, the main purpose of which is to expand the company’s position
in the domestic and foreign markets.

229
Figure 6.2 The logical scheme of the systems approach
Object - to increase the
competitiveness of wholesale
enterprises
Subject - reserves of wholesale enterprises
торгівлі
- research the components of the
subject;
- research of the subject directly; - research of the subject as an
element of the system
Inte
rnal
fac
tors
E
xtern
al factors
Problem: inventing reserves to increase competitiveness
Search and identification of reserves that increase competitiveness
Reserve 1 Reserve… Reserve n
Analysis and evaluation of reserves that
increase competitiveness
Selection and forecast of reserves that
increase competitiveness
Development of a planning program that
increase competitiveness due to selected reserves
Implementation of program solutions to
increase competitiveness
Development of a strategy to increase the competitiveness of
the wholesale trade enterprise
form
atio
n o
f st
ruct
ure
d a
nd
un
stru
ctu
red
fee
dbac
k
selection
of m
etho
ds in
info
rmatio
n p
rocessin
g

230
Before proceeding with the optimization of the wholesale business
on the basis of the identified reserve, it is necessary to monitor
competitive advantages directly in the analysis of competitiveness. In
the basis of such an analysis, there should be laid the principles of a
systematic approach and comprehensiveness, which form the research
sequence as follows: assessment of the personnel component, analysis of
financial activities, research of production opportunities, diagnostics of
the marketing and strategic component. Due to its features, a systematic
approach will be better adapted in the framework of competitiveness
analysis at its individual stages [10, p. 78], which will make it possible
to use the methods of system analysis, decomposition and deduction and
to attract a set of appropriate tools.
The most important issue in identifying reserves is the issue of
selecting, processing and evaluating results. The first approach to the
selection of reserves is called organizational and structural is based on
the provision that all reserves are identified in accordance with the
organizational and structural model of the enterprise. Reserves are
identified, analyzed, classified and summarized in accordance with each
structural unit (unit) of the enterprise. The result of this identification is
summarized. There is a problem of heterogeneity of influence of the
reserves available at various structural divisions of the enterprise on the
general results of its activity and difficulties, in this connection, in
generalization of partial (on divisions) results of identification. The
second approach that can be used to integrate the results of the
identification of reserves can be logistical. This uses a fairly well-known
concept of “logistic chain”, which can be implemented by any business
entity. In this case, the identification results are considered in
accordance with the sequence of stages, stages of the logistic chain for
each type of product or operation. The difficulty of implementing this
approach is that the company pays for products and activities are
unequal in their role for the company, for the environment, which can
lead to distortion of the true picture and the results of identification [11,
p. 59]. Therefore, one of the possible ways to solve this problem is to
apply a systematic approach that will combine organizational, structural
and logistical areas and justify this relevance. We have built a block
diagram of the implementation of a systematic approach to identify
reserves to increase competitiveness in wholesale enterprises (Figure
6.3).

231
Figure 6.3 The scheme of implementation of the system approach
for identification of reserves of increase of competitiveness at the
enterprises of wholesale trade
Reserves are identified, analyzed, classified and summarized in
accordance with each structural unit (division) of the enterprise. The
result of this identification is summarized, here there is a problem of
heterogeneity of influence of the reserves available at various structural
divisions of the enterprise on the general results of its activity and
difficulties, in this connection there is a discrepancy, in generalization of
partial (on divisions) results of identification. Certain steps in inventing
radical tools in the organizational and structural direction are the
involvement of benchmarking, controlling and outsourcing of personnel.
Benchmarking allows you to explore competitors and, thus, to determine
their own guidelines for further operation. Controlling at the enterprise
is carried out in order to identify “weaknesses” and find ways to
overcome problems. Staff outsourcing allows you to attract companies
that you can work with in the absence of the necessary resources. If
necessary, the company can prepare its own reserves for further process.
The logistics direction determines the chain of work with the product, at
each link of which it is appropriate to trace possible resources and
improve their involvement. It is appropriate to use benchmarking,
controlling and outsourcing in this process.
Organizational and structural
direction
Logistic direction
- identification of reserves in
divisions;
- analysis and classification of
reserves;
- generalization of reserves by
division
- benchmarking ( competitive and
joint)
- controlling
- outsourcing of personnel
- Purchase and supply of
resources;
- Stock conservation;
- Packing of goods;
- Distribution ( including the
shipment of goods from the
finished goods warehouse);
- Implementation;
- Storage of goods;
- Processing / repacking

232
Considering the reserves of sustainable development of the
enterprise from the standpoint of a systems approach, it should be noted
that all the reserves of interaction are interconnected and interdependent.
The introduction of new technologies in the organization and
management requires staff training and, consequently, attracting
additional investment. In addition, the reserves for the use of fixed
assets, financial and human resources are closely interrelated.
In general, the considered provisions of introduction of the system
approach in economy of the enterprises, allow to emphasize that
efficiency of their activity depends not only on a condition of external
environment, relations with other components of the external
environment, but also from the peculiarities of enterprise management
and achieving coherence in the internal space. Thus, the application of a
systematic approach to the identification of reserves means the ability to
identify and summarize them, taking into account the relationship and
interdependence of external and internal factors. The competitiveness
management of domestic wholesale enterprises should be based on a
systematic approach, which allows the invention of probable reserves,
evaluate them and use prospects for further development.
References: 1. Baldzhy, M.D., Dopira, I.A., Odnolko, V A. (2017). Economics and
Organization of Trade: Tutorial. tool. Kiev: Condor.
2. Kharchenko, V.A. (2013). System approach to strategic enterprise
management. Economic Bulletin of Donbass. No. 1 (31), рр.. 157-160.
3. Prokhorov, V.V. (2009). System problems of enterprise development
management research. Problems of systematic approach in economy.
No. 31, рр. 153-164.
4. System approach, available at: https://learn.ztu.edu.ua ›mod› resource
›view.
5. Lyashenko, R.V. (2018). Basic approaches to management in
business.Young scientist. No. 2 (64), рр. 296-301.
6. Vovk, I.P., Vovk, Y.Ya. (2017). Characteristics of a systematic
approach to resource management at a service industry enterprise,
available at: http://elartu.tntu.edu.ua/bitstream/lib/22197/2
/NKTNTU_2017_Vovk_I-Characteristics_of_a_systematic_216-
217.pdf.
7. Shcherbinin, A.V. (2004). Management of reserves of competitiveness
of the machine-building enterprise: author’s abstract. diss. ... Cand.
econom. Sciences: 08.00.05. St. Petersburg, 20, available at: irbis-
nbuv.gov.ua ›cgi-bin› opac ›search› pip ...

233
8. Yamnenko, G.E. (2012). Reserves of increase of competitiveness of the
enterprise. Formation of the market economy. No. 27, рр. 125-134.
9. Ilyina, O. (2013). Analysis of the competitiveness of enterprises and the
reserves of its enhancement, available at: http://conftiapv.at.ua/publ/
konf_24_25_cherven_2010/35_analiz_konkurentospromozhnosti_pidpr
iemstv_ta_rezerviv-10eniji_4iji_4.
10. Glukhova N.N. (2012). Features of the application of the systems
approach. Innovations in science. No. 6, рр. 78–82.
11. Bykovskaya E.V. (2015). Features of using the block-modular approach
to identifying reserves to increase the technological competitiveness of
the enterprise in the long term. Theory and practice of service:
economics, social sphere, technologies. No. 1 (23), рр. 56-59.
234
Chapter 7
INTRODUCTION OF MODERN
INFORMATION TECHNOLOGY IN THE
ECONOMIC SYSTEMS MANAGEMENT
Andriushchenko Kateryna
Doctor of Economic Sciences, Professor
Teteruk Kateryna
PhD Student
Department of Economics and
Entrepreneurship
SHEE “Kyiv National Economic
University named after Vadym Hetman”
(Kyiv, Ukraine)
AGILE
METHODOLOGIES
AS A DRIVER FOR
EFFICIENT
HUMAN CAPITAL
MANAGEMENT
These days IT companies are among the first ones to introduce
innovative ways of management. That is because they are themselves
working with innovative products. That is why increasing productivity
and implementing innovative tools is crucial for them. Numerous
researches [1-5] proved that innovations bring about profits increase for
the company. And the company innovativeness itself majorly depends
on its human capital. This all speaks of the importance of managing
human capital properly to get maximum productivity, though in the way
it also stimulates creativeness and innovation, but not just makes its
human capital exhausted.
In the recent years, there were many studies dedicated to the
importance of soft skills over hard skills [6, 7]. The first type of studies
shows us that in the nowadays world with its digitalization and
transformation to post economic values, the soft skills tend to grow their
importance, especially on top positions (business owners, CEO, CTO,
top managers, etc). At the same type, the workers with a higher level of
soft skills development are more likely to go smoothly to other career
levels. As a results, human capital, especially in the context of soft skills
development bring about positive results for both: the company, as well
as its workers.
235
At the same time, many researches prove the importance of general
company’s human capital development, apart from individual one [8, 9,
10] They show that the well-developed human capital serves to the
general creativeness, as the individual workers’ human capital without
the team interference, ideas sharing and general work may bring much
less results than in case of group knowledge. In case of well
communicational level, the workers share their background, broad
vision, creative ideas and thus increase the level of general human
capital of the company.
This all logically brings to the increase in number of methodologies
and strategies which pay more attention to harmonizing technical and
communicational parts, increase creativity level, soft skills and
company’s human capital as a whole. There are various ways of
managing IT production in the company, depending on the terms, goals
and specifics: Agile model, Waterfall model, V-model, Incremental
model, RAD model, Iterative model, Spiral model. In the latest years
most IT companies transfer to flexible (Agile) methodologies family, as
in most cases it proves to be more efficient than others in the context of
timing, productiveness and human capital boast.
According to official Agile Manifesto, individuals and interactions
are more important than processes and tools, working software is more
important than comprehensive documentation, customer collaboration is
more important than contract negotiation, responding to change is more
important than following a plan [11]. We may draw a conclusion that
Agile methodologies family have flexibility and communication as its
main distinctive features.
In general, we offer to split the Agile Software Development Life
Cycle into two main parts: technical and communicational, as described
by us in Figure 7.1.
The basic cycle may vary, depending on the project, terms and
specifics. It is stated, that for successful project development, it is
crucial for some workers, such as project managers, to develop an
efficient two-way conversation between executor and stakeholders, as
well as plan, manage and monitor it [12]. Among the requirements for
Business Analyst, the globally recognized standard for the practice of
business analysis, among technical work, group the stake holder and
analyze their communicational needs, state the following requirements,
explain the possible solutions to stake holders and their business affects,
keep stakeholders engaged, facilitate communication through formal
meetings, face-to-face final product review, etc. [13]
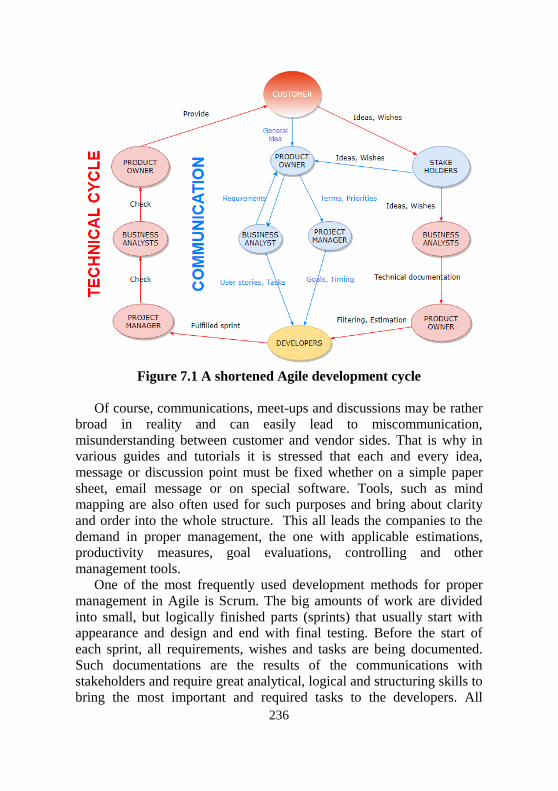
236
Figure 7.1 A shortened Agile development cycle
Of course, communications, meet-ups and discussions may be rather
broad in reality and can easily lead to miscommunication,
misunderstanding between customer and vendor sides. That is why in
various guides and tutorials it is stressed that each and every idea,
message or discussion point must be fixed whether on a simple paper
sheet, email message or on special software. Tools, such as mind
mapping are also often used for such purposes and bring about clarity
and order into the whole structure. This all leads the companies to the
demand in proper management, the one with applicable estimations,
productivity measures, goal evaluations, controlling and other
management tools.
One of the most frequently used development methods for proper
management in Agile is Scrum. The big amounts of work are divided
into small, but logically finished parts (sprints) that usually start with
appearance and design and end with final testing. Before the start of
each sprint, all requirements, wishes and tasks are being documented.
Such documentations are the results of the communications with
stakeholders and require great analytical, logical and structuring skills to
bring the most important and required tasks to the developers. All

237
development process on every sprint should be on full control, as the
development itself is performed rather quickly and should be done
properly, though in case of bugs, they must be reported as soon as
possible and fixed right away.
Agile methodologies were among the first ones to introduce the need
of specialists in between of technicians, developers and the customers.
They have added workers in between, to estimate, control,
communicate, translate general terms into “technical” language and lots
of tasks needed to keep good communication and thus prepare a product
corresponding to the expectations, estimate tasks and goals and control
the development process as a whole. In case we compare the current
methodology to the older ones, such as Waterfall, we may see the major
drawbacks they have: the whole development is a grand step-by step
process, which is not flexible and any change or mistake may be fatal;
the control process is rather complicated and broad as well. One of the
biggest disadvantages of using old development methodologies is the
unharmonized working force. By this we mean that step-by-step big
development brings about the fluctuate load of the workforce, and thus,
either unused potential or a big load that eventually exhausts the human
capital and is notorious for not being enough productive.
Agile methodologies and their principles can be used as a
professional tool for human capital management. One of the common
ways to encourage the team being Agile, control and improve the human
capital efficiency is to measure and improve the level of being “agile”
by dividing the measurement into the following: categories that mean
being Agile, the behaviour itself for being agile, and the methods
through which it is possible to make measurements. The categories that
include being agile may include, but are not limited to the following
ones: personal behaviour (which includes sharing the knowledge and
thus increasing the group knowledge capital, participating in challenges,
etc), which can be measured individually with various indices, team
progress level, timing for reaching certain goals and other; the behaviour
of the entire team (which includes tangible and intangible measures,
such as the level of creativity and innovation, initiative, group
knowledge, the attitude, etc), which can be measured through the level
of reached goals, timing and other; the relationship between the teams
involved (which includes sharing, initiative, readiness for changes,
flexibility, meetings and discussions), which can be measured through
the number of additional requirements (negative index), comments and
feedbacks, number of activities performed together); the results or
238
outcomes (which include the MVP (minimum viable product), growth,
etc), which can be measured through the revenue itself, growth level and
other. Since Agile methodologies may bring most benefits to the ones
who use it with an efficient team in a healthy environment, the
measurements of the general health level also take place in human
capital management. The evaluation includes measuring the mood of the
workers day by day. Such statistics shows the general attitude, as well as
potential and prospective of the team, because one of the accents of
Agile is team work, and each team player has affects other ones and as a
result, may increase or decrease the timing, attitude and as a result,
efficiency and quality of the product. Keeping track of such data may
be carried out with the help of various tools, starting from primitive
methods like filling the tables and ending with professional software and
tools, such as Niko-Niko calendar that tracks the mood of each worker
day by day.
The other crucial point of increasing general efficiency and
managing the team properly managing human capital of the firm is
measuring the team behaviour. One of the ways to do it the way it has
biggest outcomes is performing such measurement on each development
process stage, starting from planning the sprint and ending with the final
review. The main goals that are connected to the team behavior at each
sprint may include the following ones: reaching consensus between
teams, getting to same understandable conclusions, getting same view
on requirements, fast and efficient common work, etc. This can be
measured even with simple questionnaires at the end of the
meeting/conferences/demonstrations, which include questions and point
of view sharing regarding the level of communication clarity, the speed
for responding to new requirements and changes, whether it is easy or
hard to reach the responsible party, whether the skills correspond to the
level of tasks, general experience, etc. By analyzing the data provided,
the team management may get a clear understanding on the cooperation
between involved teams that leads to the general time frames of
delivering/getting a product, its quality and correspondence to the
requirements.
In regards to managing human capital efficiency through team
outcomes in context of bringing business values, it is important to
evaluate the relationship between them. Such, in most of the tasks
(whether it is design or code development), the responsible party should
find the correlation between the task they do and the business value this
task brings – customer satisfaction, higher efficiency, increased revenue

239
or it limits or reduces the drawbacks like risks or bigger costs. Which is
why the worker should be fully aware of how the certain task is applies
to the mentioned values and how it influences them so they may build
the working process in the way it best assures them.
Each iteration in Agile should be guided by the KPI (Key
Performance Indicators) which are vitally important for efficient product
development process.
For the business process optimisation, the organizations may divide
the KPIs, depending on the business stage or type of work. It may be
rather useful to divide them into the following categories: decision-
making KPI, Phases KPI, Sprints KPI, SCRUM KPI as per Figure 7.2.
Figure 7.2 KPI divided into development stages
The decision-making process can be taken as the first stage with the
own performance indicators. The indicators can serve as an efficient tool
for making proper decisions and evaluating them. By using the KPI
within the stage of agreeing, the management may concentrate on both –
main functionality, as well as on strategic goals. Which is why, taking
into consideration main business goals and strategies is being crucial.
Decision-making KPI may vary, depending on the requirements,
software, timing and other specificities. As well, we emphasise on the
importance of the position the certain worker obtains. Such, the
decision-making KPI may include the criteria:
Time spent on creating a meeting plan.
Meeting continuation.
Time spent on version review.
Time spent on discussion.
Time spent on summary report.
Of course, the timing depends on the workers’ professional
knowledge, experience and abilities (the level of their human capital
development). Additionally, some methodologies, such as RACI matrix
and Influence matrix may be used for a better control of the labour and
improving its efficiency and lower the timing. It is reasonable to

240
consider RACI and Influence matrixes as tools of managing human
capital together with KPI. By using them, it is easier to settle the
communication part of business, organise all the stages of such process
(preparation, approval, goals estimation) together with getting an
understanding of responsible parties or workers in each process. These
results in shortening the time, lowering the risks of estimating wrong
goals, disapproval and other issues connected to wrong communication
process (Figure 7.3). Such approach gives managers the tools to
understand and properly evaluate the communication part of work,
which is notorious for being uneasy to be estimated carefully.
Figure 7.3 Tools for efficient human capital management in Agile
decision-making
The other important stage in Agile iterations is sprints. They may be
considered as most important part of the software development. Since
the sprint usually starts with the list of tasks and all supporting
documentation and ends with a release/demonstration, each part of the
sprint should be managed to get best efficiency, including evaluation of
tasks and proper KPI. Such, sprint design is carried on standardly in
Agile, though the design format (style, texts, images, animation, etc) is
affected by the KPI, since the creative processes may be carried on for
different time frames depending on intangible factors, like inspiration or
creativity, which is why the strict time frames, defined in the KPI are
defining the potential design. Of course, introducing KPI to creative
parts in agile may bring about negative changes in case the management
does not have all knowledge of the process and defines the terms which
would either lead to poor quality design, or to tremendous time losses,
which would afterwards affect other stages of the process. For managing
human resources properly, the responsible parties must evaluate
requirements for creative tasks (such as design) and correspond them to
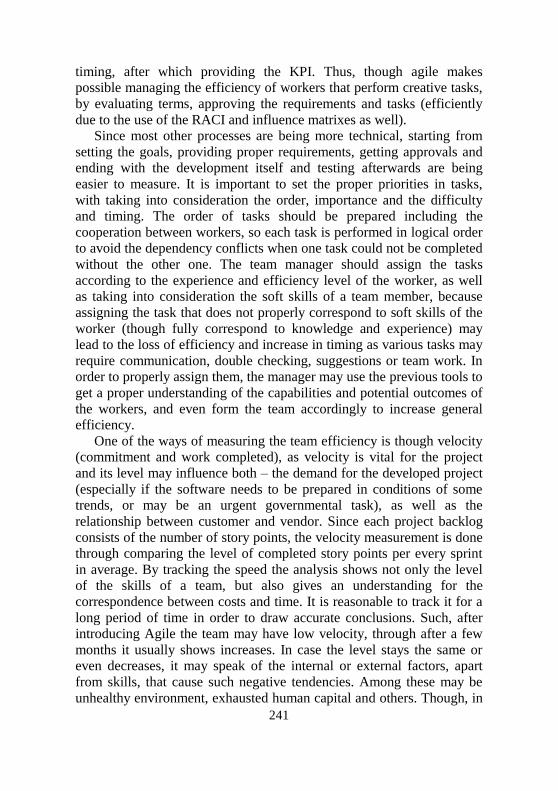
241
timing, after which providing the KPI. Thus, though agile makes
possible managing the efficiency of workers that perform creative tasks,
by evaluating terms, approving the requirements and tasks (efficiently
due to the use of the RACI and influence matrixes as well).
Since most other processes are being more technical, starting from
setting the goals, providing proper requirements, getting approvals and
ending with the development itself and testing afterwards are being
easier to measure. It is important to set the proper priorities in tasks,
with taking into consideration the order, importance and the difficulty
and timing. The order of tasks should be prepared including the
cooperation between workers, so each task is performed in logical order
to avoid the dependency conflicts when one task could not be completed
without the other one. The team manager should assign the tasks
according to the experience and efficiency level of the worker, as well
as taking into consideration the soft skills of a team member, because
assigning the task that does not properly correspond to soft skills of the
worker (though fully correspond to knowledge and experience) may
lead to the loss of efficiency and increase in timing as various tasks may
require communication, double checking, suggestions or team work. In
order to properly assign them, the manager may use the previous tools to
get a proper understanding of the capabilities and potential outcomes of
the workers, and even form the team accordingly to increase general
efficiency.
One of the ways of measuring the team efficiency is though velocity
(commitment and work completed), as velocity is vital for the project
and its level may influence both – the demand for the developed project
(especially if the software needs to be prepared in conditions of some
trends, or may be an urgent governmental task), as well as the
relationship between customer and vendor. Since each project backlog
consists of the number of story points, the velocity measurement is done
through comparing the level of completed story points per every sprint
in average. By tracking the speed the analysis shows not only the level
of the skills of a team, but also gives an understanding for the
correspondence between costs and time. It is reasonable to track it for a
long period of time in order to draw accurate conclusions. Such, after
introducing Agile the team may have low velocity, through after a few
months it usually shows increases. In case the level stays the same or
even decreases, it may speak of the internal or external factors, apart
from skills, that cause such negative tendencies. Among these may be
unhealthy environment, exhausted human capital and others. Though, in

242
case the team members or the team lead has left the certain projects, the
calculations and tracking should be measured from the start to achieve
the proper results.
Another way to manage human capital and increase efficiency is
keeping track of the sprint burndown chart. This method is intended to
show general performance, but not just the number of completed tasks
per team member or the entire team. The sprint burndown chart has a
number of stories that need to be completed in the certain sprint with the
sprint days. It should be filled in and built the way it reflects how many
stories need to be done to finish the sprint. The perfect sprint burndown
chart should be a straight diagonal line from left top corner of the
bottom right corner, meaning all the tasks are approximately the same in
terms of time and difficulty, and are performed gradually at the same
speed. Of course, that is being almost impossible to reach in the real
company performance, since the tasks vary from one another in terms of
skills needed to complete it, the volume, the number of subtasks and
accordingly timing needed to complete it. Though, it is possible to check
the average and general team performance with this chart and make the
forecasts. As well, in case of the tasks are approximately on the same
level, the gaps in the chart may speak of different issues, such as: bad
understanding of the task (poor documentation, low level of
communication), unclarity, disturbing factors and other.
As well, the efficiency of human capital may be increased by
analysing the release burndown chart. This method is often used for
such purposes. This chart shows how much work should be done before
the release. It clearly indicates the current progress, so in case of
managers spot changes or issues in there, they may quickly introduce the
changes in time to deliver the product in a proper time frame. Basically,
the logic of the chart is almost the same as the sprint burn down chart,
though it is more global, as it shows the total amount of sprints
(basically, the whole project) and the amount of them that are left till the
final release. As in the previous case, the perfect flow is a straight line
from left top corner till the bottom right corner. The further it goes from
the perfect one, the bigger are the chances of some issues occurring in
the project. As well, it is possible to manage the working force so it fits
the adjustments that may have been made because of previous changes.
The analysis of this chart allows to make predictions whether the release
would fit the set deadline, and if not, the management may see when and
what may be performed or introduced to speed up the process and not
losing the quality at the same time.
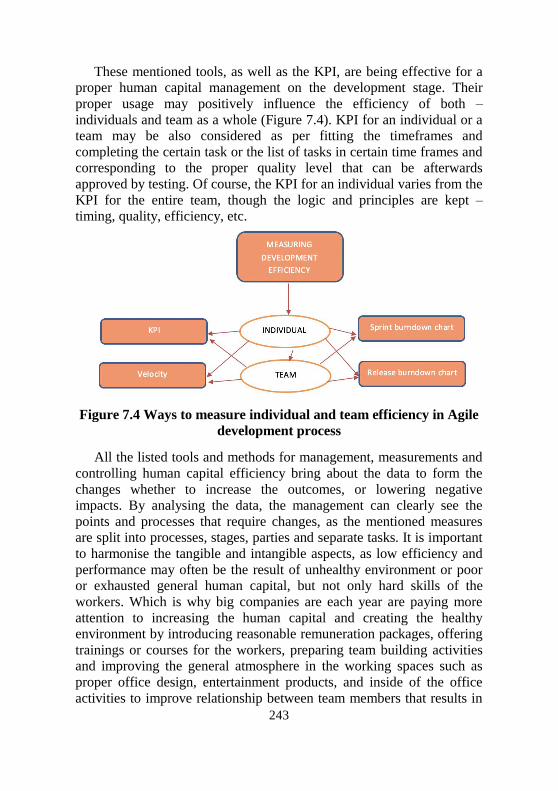
243
These mentioned tools, as well as the KPI, are being effective for a
proper human capital management on the development stage. Their
proper usage may positively influence the efficiency of both –
individuals and team as a whole (Figure 7.4). KPI for an individual or a
team may be also considered as per fitting the timeframes and
completing the certain task or the list of tasks in certain time frames and
corresponding to the proper quality level that can be afterwards
approved by testing. Of course, the KPI for an individual varies from the
KPI for the entire team, though the logic and principles are kept –
timing, quality, efficiency, etc.
Figure 7.4 Ways to measure individual and team efficiency in Agile
development process
All the listed tools and methods for management, measurements and
controlling human capital efficiency bring about the data to form the
changes whether to increase the outcomes, or lowering negative
impacts. By analysing the data, the management can clearly see the
points and processes that require changes, as the mentioned measures
are split into processes, stages, parties and separate tasks. It is important
to harmonise the tangible and intangible aspects, as low efficiency and
performance may often be the result of unhealthy environment or poor
or exhausted general human capital, but not only hard skills of the
workers. Which is why big companies are each year are paying more
attention to increasing the human capital and creating the healthy
environment by introducing reasonable remuneration packages, offering
trainings or courses for the workers, preparing team building activities
and improving the general atmosphere in the working spaces such as
proper office design, entertainment products, and inside of the office
activities to improve relationship between team members that results in
244
better understanding each other, better communication, and thus
flexibility, intention to reach consensus that leads to increased
efficiency.
At the same time, we would like to mention that the tools used in
Agile methodologies, as well as its main principles may be used not
only in IT fields, as the one that is among the first ones to introduce and
experience the new methodologies and studies, but as well in other more
regular fields like transport, manufacture and other. The new era we
came in makes accent on knowledge, communication, relationships and
intangible values, which means the human nature is being changed as
part of an evolutionary process, and as a result the human capital as
whole. Which is why switching to other approaches, methodologies and
thus tools, used for measuring and improving its management is crucial.
References: 1. Schumpeter, Joseph A, and Redvers Opie. The Theory of Economic
Development: An Inquiry into Profits, Capital, Credit, Interest, and the
Business Cycle. Cambridge, Mass: Harvard University Press, 1934.
Print.
2. Diebolt C., Hippe R. (2019). The long-run impact of human capital on
innovation and economic development in the regions of Europe. Taylor
& Francis Journals, vol. 51(5), pp. 542-563, DOI:
10.1080/00036846.2018.1495820, January 2019.
3. Andriushchenko K., Tepliuk M., Vinichenko I., Nesterenko O.,
Yefimenko L., Budiaiev M. (2019). Policy assessment investment appeal
of innovation projects enterprises. International Journal of Recent
Technology and Engineering (IJRTE). Volume 9, Issue 2, December
2019. DOI: 10.35940/ijitee.B7714.129219 Pp.5111-5122.
4. Andriushchenko K., Tepliuk M., Boniar S., Ushenko N., Liezina A.
(2019) Influence of cost drivers on value-oriented management of
investment activity of companies. Investment Management and
Financial Innovations. Vol. 16, pp. 353-364, DOI:
10.21511/imfi.16(3).2019.31
5. Kovtun V., Andriushchenko K., Horbova N., Lavruk O., Muzychka Y.
(2020). Features of the Management Process of Ambidextrous
Companies. TEM Journal. Volume 9, Issue 1, pp. 221-226, ISSN 2217-
8309, DOI: 10.18421/TEM91-31, February 2020.
6. Teteruk K., Datsii N., Kartashov E., Ivashova L., Ortina G. (2020)
Specificity of Forming Human Capital at It-Enterprises in Conditions
of Concept Lifelong Learning. International Journal of Innovative
Technology and Exploring Engineering, Volume 3 (9). pp. 1379-1387.

245
ISSN 2278-3075
7. Bundesministerium für Bildung und Forschung (2016) Report on
Vocational Education and Training. Bonn: Bundesministerium für
Bildung und Forschung. www.bmbf.de/_media/press/pm_0626–080.pdf
8. Bontis N., Chua W., Richardson S. (2000) Intellectual capital and
business performance in Malaysian industries. Journal of intellectual
capital. Volume 1(1), pp. 85-100
9. Bozeman, B., Dietz, J. S., & Gaughan, M. (2001). Scientific and
technical human capital: An alternative model for research evaluation.
International Journal of Technology Management, Volume 22(7-8), Pp.
716-740. https://doi.org/10.1504/IJTM.2001.002988
10. Abdullah D. F., Sofian S. (2012) The relationship between intellectual
capital and corporate performance. Procedia – Social and Behavioral
Sciences. Vol. 40, pp.537-541.
11. https://agilemanifesto.org
12. PMBook, Project management institute. https://www.pmi.org/learning
/library/managing-communications-effectively-efficiently-5916
13. International Institute of Business Analysis. https://www.iiba.org /in-the-
life-of-a-ba/babok-scenarios-in-the-life-of-a-ba-elicitation-preparation/
Lalakulych Mariia
PhD in Economic Sciences, Professor
Yuhas Erika PhD in Economic Sciences, Associate
Professor
Rybakova Lesia
PhD in Economic Sciences
Chair of Accounting and Auditing
Uzhgorod Trade and Economic Institute
of the Kiev National Trade and
Economic University
(Uzhgorod, Ukraine)
ACCOUNTING
INNOVATION IN
UKRAINE IN THE
CONDITIONS OF
EUROPEAN
INTEGRATION
Introduction. Innovative transformations are a major driver of
modern economic space development, but accounting is considered by
both scientists and users to be a conservative and well-established
system. Business planners typically do not set strategic goals for

246
improving accounting and control systems because they do not see these
as real tools to improve their financial performance. Nevertheless,
modern economic systems worldwide are increasingly being
transformed into complexes without isolated links. Therefore, in a post-
industrial society, accounting does not remain in absolute isolation from
the tendencies of vector-oriented towards international standardization,
which can be regarded as strategic management innovation, and
comprehensive digitization, which in this context is quite logical to
perceive as technological innovation.
Literature review. The issues of introducing innovative shifts in the
systems of financial reporting of enterprises have become a subject of
interest of domestic scientists relatively recently. Thus, Benko (2010)
explored the issue of integrating different processing functions of
billing, reference and service information within an automated
workplace. The researcher notes that information systems are able to
respond flexibly to changes in the algorithms of calculation of
indicators, and their interactivity contributes to the most complete
satisfaction of the needs for prompt exchange of information.
Kononenko (2014) dedicated research to the detection of feedbacks in
the accounting information system and proved the need to introduce
active-adaptive accounting systems. Sharing in general the author’s
view of innovation as a generator of new consumer values, it should be
noted that the researcher illustrated this thesis by presenting his own
classification of innovations in accounting as a target subsystem of
innovative activity. Ershova (2016), based on a statistical survey of
innovations, identified their place in the strategic management
accounting system and suggested their copyright classification features.
The author’s valuable work is to determine the impact of innovation on
the quality of accounting and information support of management
decisions. Efimenko, Lovinskaya (2016) defined the theoretical and
methodological principles of the organization of monitoring the
application of the requirements of International Financial Reporting
Standards in Ukraine. The practical guidance provided by the authors is
extremely relevant for innovative changes in the accounting and
reporting system. Mazina, Oliynyk (2019) explored accounting as a
public information system. It is very valuable for researchers to utilize
the capabilities of cloud technology, artificial intelligence and
blockchain in accounting. However, despite the high value of the studies
presented, the question of achieving transparency of information and its
impact on ensuring the sustainable development of the enterprise have

247
remained unresolved.
Much information for further scientific study has been provided by
foreign researchers. Walińska, Jurewicz (2009) have convincingly
demonstrated that innovations dominate daily accounting practices and
are present in both disclosure and detail methodologies and operational
activities. Dainienė, Dagilienė (2014) devoted research to defining and
benchmarking innovations in traditional and modern accounting. Their
conclusion is that traditional financial and management accounting do
not disclose full information about the value of an enterprise’s
innovations, but instead its completeness is fully ensured through the
use of standardized reports. Laux, Stocken (2018) examined accounting
standards and regulations with a view to their potential impact on
entrepreneurial innovation and social well-being. Researchers argue for
the positive effects of adhering to stringent standards, because of their
stimulating role in seeking to raise equity at lower costs and risks. The
Kokina, Blanchette (2019) studies were the closest to the subject of our
study, as they concerned the analysis of robotic organization and
optimization of operational accounting processes, the analysis of
indicators, the tools for ranking tasks, the adjustment of management
structures to include digital reports and review the internal control of the
financial condition of the enterprise. The findings of the authors show
that the company benefits from the automation of accounting processes
that are amenable to structuring and digital identification. At the same
time, however, the question of criterion analysis in the choice of
accounting automation tools based on complex cognitive technologies
still remains unaddressed.
The aim of this study is to identify innovative opportunities for
transformation of accounting procedures in Ukraine in the conditions of
European integration.
The main content of the study The implementation of the strategy of Ukraine’s accession to the sole
economic space with the EU actualizes the issue of transparency of
information flows generated by the accounting system, which requires
the use of uniform rules and methods of information formation.
According to the research by Walińska, Jurewicz (2009), the active
introduction into practice of financial reporting of companies of
international accounting standards increases the efficiency of their
management, in particular by improving the management of finances,
reducing the level of business risks and reducing the cost of raising
capital.

248
International Financial Reporting Standards (IFRS) allow us to unify
financial information about an entity’s assets, liabilities, equity, income,
and expenses (Table 7.1), which further allows it to be used as an
analysis parameter for potential investors in making decisions on the
provision of resources to manage equity and debt (IFRS, 2008).
Table 7.1
Financial reporting elements included in the standards IFRS Paragraph Element Description
Economic
resource
Assets The present economic resource
controlled by the entity as a result of
previous events.
Demand
Obligation The present obligation of the entity to
transfer the economic resource due to
past events
Equity The residual interest in the assets of an
entity after deducting liabilities
Changes in
economic
resources and
requirements that
reflect financial
performance
Income An increase in assets or a decrease in
liabilities that results in an increase in
equity, other than a contribution by
holders of equity requirements.
Costs Decrease in assets or increase in
liabilities resulting in a decrease in
equity other than the allocation of
holders of equity requirements.
Other changes in
economic
resources and
requirements
Contributions from holders of claims on equity and
distribution in their favor
Exchanges of assets or liabilities that do not cause an
increase or decrease in equity.
In accordance with the Law of Ukraine “On Accounting and
Financial Reporting in Ukraine”, public joint-stock companies, natural
monopolies and enterprises of the mining industries prepare
consolidated financial statements according to international standards
(Verkhovna Rada of Ukraine, 2018). The state policy in the field of
international accounting unification provides for the use of taxonomy
tools in a single electronic standard XBRL (eXtensible Business
Reporting Language), with the definition of the paragraphes and
reporting indicators to be disclosed. Compliance monitoring ensures
complete and accurate information on the activities of economic entities
(Figure 7.5), thereby determining the effectiveness of public

249
administration decisions. It should be noted that the terms of the
publication of XBRL-reporting on the web-resources of enterprises with
obligatory disclosure of audit opinion are legally stipulated.
Figure 7.5 The algorithm of state monitoring of compliance with the
standards of financial reporting
However, according to the Ministry of Finance of Ukraine (2018),
other companies retain the right to independently determine the
appropriateness of applying international standards for the preparation
of financial reports.
Therefore, the gradual transition of Ukrainian businesses to IFRS
financial statements and the introduction of modern resource
management standards require systematic IT support for digitization
processes.
It should be noted that the integrated IT systems on the market allow
not only to automate the accounting system and increase the
convenience of using financial information, but also to digitize virtually
all financial and managerial aspects of enterprise activity. In particular,
the accounting module “Accounting by International Financial
Functions of state
administration
Planning and
forecasting
Coordination and
organization
Collection and analysis of the
information
Control
Monitoring
˗ making decisions on state
regulation of the economy;
˗ planning of tax revenues;
˗ increase in time of
investment attractiveness;
˗ regulation of the labor
market and social protection;
˗ assessment of the conditions
of the environment
Providing reliable information
on the activity of enterprises for:

250
Reporting Standards” provides for the tasks of accounting and reporting
according to international standards (Shvets, 2015), parallel accounting
by different standards and transformation of the consolidated financial
statements.
The integration of all business processes of the enterprise into a sole
IT system allows organizing simultaneous receipt of information flows
for further integrated analysis. However, most Ukrainian businesses are
still reluctant to use customary financial and accounting instruments, as
this is not contrary to applicable accounting and financial reporting
legislation. However, it should be borne in mind that the limited
functionality of such tools is not capable of providing sufficient detail
and transparency for effective innovative management systems. It
should be considered that the technological maturity of enterprises is
usually heterogeneous, so the indisputable standards of leaders of
digitization can only serve as a rough guide for investment initiatives for
others. In addition, virtually all Ukrainian enterprises require automation
of tasks that include data interfaces and data processing mechanisms, as
well as improvements in communication systems, in order to optimize
financial and reporting processes.
As revealed by Bochulia’s (2019) study, digitization of accounting
should not take place according to a well-established algorithm that is
the same for all businesses. However, the success of innovative
accounting and analytics transformations requires the mandatory
introduction of elements of the competency management system, taking
into account innovative technologies and trends in the field of activity.
In the Ukrainian business environment, according to Koryagin,
Kutsik (2016) automation of accounting and other management
functions is being provided through the introduction of a wide range of
information systems. Within them, specific economic and managerial
tasks are differentiated by subject technology – a predetermined
sequence of stages of technological modifications of input information
signals into the resulting information blocks. In particular, each
operation accounting process involves obtaining arrays of primary
documentation, which is transformed into accounting entries, reflected
in changes in analytical and synthetic accounting, followed by a
generalization of the period balance.
Most accounting and auditing tasks can be fully automated, even in
businesses with high risk of business uncertainty whose scope of
activity lies in an unstructured environment (science, medicine, etc.) that
have a fairly low digitization potential. At the same time, it should be

251
understood that the processing of arrays of accounting documents is
only a partial task of total automation of financial statements, which
requires the activation of IT modeling processes, taking into account the
increasing complexity of business models and the potential to evaluate
other parameters of financial control. The advantages of investing in the
IT system of the financial and accounting sphere are reducing the share
of routine work, increasing of confidence in the results of the financial
statements, freeing up time and capacity of employees to perform the
tasks of in-depth analysis of detected deviations from the planned
results, etc. In particular, it is advisable to integrate into the IT system
the automation of calculations of production costs, deviations, models of
staff motivation, planning of reserve funds to cover innovative risks, etc.
Electronic circulation, accounting and invoicing systems are one of
the conceptual areas of digitization of accounting, because the
automated processing of large amounts of information, in particular in
specialized accounting organizations or outsourcing companies, can
provide significant savings. With regard to business structures, their
hope of implementing IT accounting systems is rather in the plane of
comfort, efficiency and ease of access to financial information.
Therefore, in this case it is necessary to choose such software solutions
that combine the high functionality of the usual local modules for the
enterprise with the prospects of obtaining new information and
accounting capabilities.
However, the efforts of Ukrainian business to intensify international
cooperation must inevitably lead to an increase in the number of
enterprises that will become IFRS-compliant. Therefore, modeling of
standardized accounting digitization schemes should take these
perspectives into account and focus their own services on ensuring that
standards in the business model that are fully integrated to achieve
enterprise performance targets. Digitization should be seen as a partial
element of systematic planning for productivity growth, cost
management and performance. Most of these enterprises are faced with
the alternative of completely updating the software or at least refining
the functionality of the used accounting systems (for example, 1C
Accounting). The organizational task of planning such innovations is to
introduce additional accounting and financial accounting modules
according to IFRS standards, based on current standard configuration
information systems.
This approach will inevitably lead to changes in the job descriptions
of practicing accountants. IT modeling, which provides cross-cutting
252
coverage of all enterprise business processes in accordance with IFRS
standards, should include the broad involvement of cloud computing
technology and workplace virtualization. This is completely in line with
the recent trend of extending the boundaries of remote jobs, as digitized
data sets will be available to the accountant in real time. The benefits of
this are the ability to significantly save resources by reducing labor costs
(by reducing the number of staff involved) and servicing jobs. Despite
the relatively high initial costs of implementing a virtual model, because
of the prospect of significant cost savings in the future, it can be
attractive while innovatively reformatting existing or creating new
business models.
Conclusions. The systematic implementation of international
accounting standards in the activities of Ukrainian enterprises is a
significant step towards their adaptation to the requirements of the world
market. The implementation of innovative accounting digitization
solutions is ensured by integrated IT systems that allow for objective,
timely and transparent generation of data on the financial and economic
status of the enterprise. Additional benefits of implementing IT systems
are the unification of financial reporting results, the ability to integrate
with other business modules, and the release of employee potential.
References: 1. Benko, M. M. (2010). Information systems and technologies in
accounting: monograph. Kyiv: KNTEU. 336 p.
2. Bochulia, T. (2019). Innovative changes in development of enterprise
information system: digital transformations, behavioral technologies
and new decisions: monograph. Warsaw: Consilium Sp. z o.o. 132 p.
3. Dainienė, R., Dagilienė, L. (2014). Accounting-based Valuation of
Innovation: Challenges and Perspectives. Procedia - Social and
Behavioral Sciences, vol. 156, pp. 589-593. doi:10.1016/j.
sbspro.2014.11.246.
4. Efimenko, T. I., Lovinskaya, L. G. (2016). Monitoring compliance with
and maintaining international financial reporting standards: best
global practices and prospects for implementation in Ukraine. Kyiv:
DNUU “Acad. Finn. Management", 170 p.
5. Ershov, N. Y. (2016). Strategic Management Accounting Innovations.
Scientific Bulletin of the International Humanities University, no. 15,
pp. 132-136.
6. IFRS. (2008). IFRS® Standards and IFRIC® Interpretations.
https://www.ifrs.org/issued-standards/.
253
7. Kokina, J., Blanchette, S. (2019). Early evidence of digital labor in
accounting: Innovation with Robotic Process Automation. International
Journal of Accounting Information Systems, vol. 35, 100431.
8. Kononenko, L. V. (2014). Innovative technologies in accounting.
Finance, Accounting, Banks, no. 1 (20), pp. 161-166.
9. Koryagin, M. V., Kutsik, P. O. (2016). Problems and prospects of
financial statements development: monograph. Kiev: Interservice, 276
p.
10. Laux, V., Stocken, P. C. (2018). Accounting standards, regulatory
enforcement, and innovation. Journal of Accounting and Economics,
vol. 65(2-3), pp. 221-236. doi:10.1016/j.jacceco. 2017.11.001
11. Mazina, O. I., Oliynyk, V. S. (2019). Economic Bulletin. Series:
Finance, Accounting, Taxation, no. 3, pp. 124-132.
12. Ministry of Finance of Ukraine. (2018). Implementation of
International Financial Reporting Standards. Available at:
<https://mof.gov.ua/uk/zaprovadzhennja-mizhnarodnih-standartiv-
finansovoi-zvitnosti> [Accessed 09 April 2020].
13. Shvets, W. G. (2015). On the issue of regulatory support for accounting
and financial reporting in IFRS. Bulletin of the Kyiv National
University. Taras Shevchenko. Avg .: Economics, no. 10 (175), pp. 6-
10.
14. Verkhovna Rada of Ukraine. (2018). Law of Ukraine "On Accounting
and Financial Reporting in Ukraine" (as of September 18, 2018).
Available at: <https://zakon.rada.gov.ua /laws/show/996-14>
[Accessed 09 April 2020].
15. Walińska, E., Jurewicz, A. (2009). System rachunkowości w nurcie
innowacji. In: Rachunkowość w procesie tworzenia wartości
przedsiębiorstwa. Łódz: Wydawnictwo Uniwersytetu Łódzkiego, pp.
131-142.
254
Mikelsone Elina
PhD. Cand., MBA
BA School of Business and Finance
Volkova Tatjana
Dr.oec.
BA School of Business and Finance
Spilbergs Aivars
Dr.oec.
BA School of Business and Finance
Liela Elita
Dr.oec.
BA School of Business and Finance
Frisfelds Janis Masters Student
Maastricht University School of
Business and Economics
(Riga, Latvia; Maastricht, Netherlands)
IDEA
MANAGEMENTS
SYSTEMS
APPLICATION
FRAMEWORK IN
COMPANIES
Introduction
The ongoing changes in the world have made the use of knowledge
and information technologies for the greater good a clear priority
(INSEAD, 2016). There is a scientific and practical topicality of
information technologies that help to manage knowledge and
information. There are different kinds of information management
systems, such as electronic messaging systems, collaborative systems,
group decision support systems, etc. Among such tools are web-based
idea management systems (IMS). In previously conducted research
(Miķelsone, Lielā, 2015), authors have developed a definition of IMS
based on more than 70 literature sources. The definition that has
developed during the research is that IMS is systematic, manageable
tools or tool kits that help users generate, evaluate and continue this
process. The authors consider that this definition have to be
supplemented with the purpose of this process. Therefore, in this article
the authors propose the extended version of the IMS definition that IMS
is systematic, manageable tool or tool kits that help users generate,
evaluate and continue this process for delivering innovative activities

255
leading to ensuring innovations.
First, it is essential to research web-based IMS because it coincides
with global trends. Three trends that the authors think will increase web-
based IMS importance are: (1) in the age of knowledge-based economy
tools that provide means for acquiring, evaluation and development of
knowledge and ideas are extremely important; (2) the growing role of
ICT increase the importance of web-based tools that support innovative
activities process; (3) web-based IMS is becoming more important in the
context of open innovation and co-innovation, giving access to both
internal and external sources of ideas and knowledge.
Efficient use of IMS can contribute to the success of the company if
it is strategically planned and implemented (Fairbank, Williams, 2001;
Brem, Voigt, 2009, 2007). This chapter will look at the framework for
the use of IMS and its constituent elements. As the research method aan
expert interviews have been conducted to verify and supplement the
results obtained.
This paper aims to verify the relationships between the IMS
application types and IM results based on adaptive structuration theory
(AST) for using ideas management systems in companies leading to
increase of the results of ideas management in enterprises.
Theoretical background The study concluded that the IM was described in the context of
innovation management (e.g., Galbraith, 1982; Sandstrom et al., 2010)
IT literature and management literature (e.g., Yu et al, 2006), human
resources management (e.g., Green et al., 1983), knowledge-based
management (Bansemir et al., 2009), management psychology aspects
(e.g., Pundt et al., 2005) etc.
In the IMS study, it is essential to look at what IM is, since IM
literature gives more insight into the concept of IMS by revealing social
(e.g. Selart, Johansen, 2011), structural IM elements (e.g. Deichmann,
2012; Westerski, 2013). The IM literature has mainly studied
commercially available or privately developed IMS, their use and
potential improvements (e.g. Westerski, et al., 2013; Beretta, 2015), but
some researchers study the development of new IMS (e.g. Bothos et al.,
2012; Lowe, Heller, 2014). The research focuses on commercially
available web-based IMS, their use and impact on expected results. A
study of commercially available IMS has been selected as a narrowing
point in order to better identify the sample of the study.

256
Methodology for interviews and their analysis
For the verification of the results, expert interviews are used. The
interview questions are based on literature review and IMS database
analysis, including key questions. Two interview options have been
developed, where question groups do not differ but the wording of the
questions is different.
Criteria were developed for the selection of experts: at least 2 year
experience in innovation management practically and academically. A
total of 10 experts were put forward out of which 6 agreed to the
interview.
The experts interviewed are as follows:
1. Viktors Toropovs, TET, Head of Business Development
Administration.
2. Signe Luksa, AS “Cēsu alus”, project group leader.
3. Kārlis Karolis, SEB bank, Head of innovation at.
4. Iveta Cīrule, an expert on open innovation, external ideas
management consultant.
5. Vita Brakovska, creativity and innovation consultant, a
practitioner of ideas management.
6. Ilze Osīte, Zemgale Region Competencies Development Centre,
an expert at the Business department, idea management consultant.
Basic idea management framework – a Basic process of the idea
management system
See basic framework IM in Figure 7.6.
Figure 7.6 Basic idea management framework – basic process of the
IMS Source: developed by the author, based on theoretical and empirical research
Generation of
ideas
Evaluation of
ideas CONTINUES PROCESS
257
IM traditionally begins with generating ideas, which includes
preparing and creating ideas, collecting, saving and improving the sub-
processes. Next step is the evaluation of ideas, which includes selection,
choice and saving of the ideas. Further is the continuation of the
process, which includes repeated idea generation and evaluation, to
create a concept (improving specific ideas as needed), distributing,
saving and rewarding ideas. This indicates that this step can lead to the
conclusion of the IM process with the preservation and rewarding of
ideas, or to the continuation of the IM with the repeated generation and
evaluation of ideas.
The representation of the IM as a non-linear process is the author’s
contribution to IM literature, as it has so far been portrayed as a linear
process with a beginning and an end. The authors believe that the
experts who advise and consult in IM, the developers and users of IMS,
should understand the potential of using it non-linearly and thus creating
continuing process. This approach is seen in IMS Benovative, which is
used by medical companies, for example, GE Healthcare (Hungary)
which over a period of two weeks, involved over 333 000 employees,
creating 133 ideas that with the continuation of IM process resulted in
23 new patent applications (Benovative, 2018).
1.1. User profile of the idea management systems Based on the results of an empirical study, the authors established a
user profile of the IMS. As a good example of IMS practice abroad, the
experts mention Google, Spotify, Fastte (Canada), Karlsberg, where the
idea generation is centralized and used for all markets. In Latvia – TET
(Lattelekom), A/S SEB bank, Latvenergo, Swedbank, IF, also start-ups
in IT and marketing were mentioned, as they operate in a highly
competitive environment. Based on expert interviews, it is apparent that
IMS is used in companies of different sizes, industries and experience,
which points at the universal use of IMS.
See the profile of potential users in Figure 7.7.
All experts agreed that companies from every industry and size have
the same perspective to use IMS, but industries where the level of
competition is high, it must be a daily routine. Expert Iveta Cīrule
stresses that IMS is particularly important for creative industries.
1.2. Use of idea management systems model types In this section the authors will analyze the use if IMS model types
based on the quality, quantity and engagement of ideas (Figure 7.8).
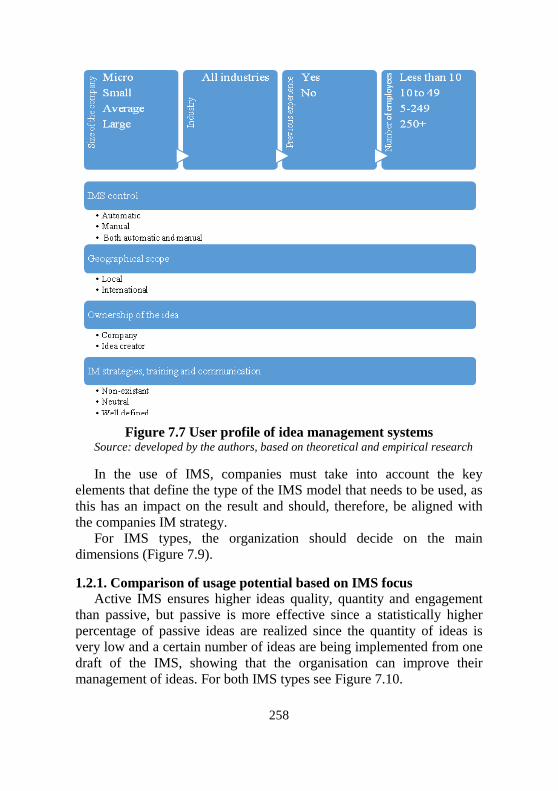
258
Figure 7.7 User profile of idea management systems
Source: developed by the authors, based on theoretical and empirical research
In the use of IMS, companies must take into account the key
elements that define the type of the IMS model that needs to be used, as
this has an impact on the result and should, therefore, be aligned with
the companies IM strategy.
For IMS types, the organization should decide on the main
dimensions (Figure 7.9).
1.2.1. Comparison of usage potential based on IMS focus
Active IMS ensures higher ideas quality, quantity and engagement
than passive, but passive is more effective since a statistically higher
percentage of passive ideas are realized since the quantity of ideas is
very low and a certain number of ideas are being implemented from one
draft of the IMS, showing that the organisation can improve their
management of ideas. For both IMS types see Figure 7.10.
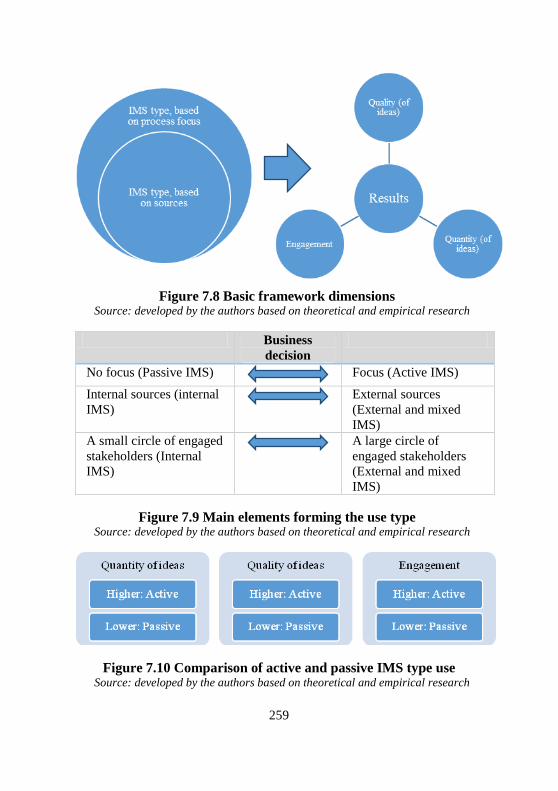
259
Figure 7.8 Basic framework dimensions
Source: developed by the authors based on theoretical and empirical research
Business
decision
No focus (Passive IMS)
Focus (Active IMS)
Internal sources (internal
IMS)
External sources
(External and mixed
IMS)
A small circle of engaged
stakeholders (Internal
IMS)
A large circle of
engaged stakeholders
(External and mixed
IMS)
Figure 7.9 Main elements forming the use type Source: developed by the authors based on theoretical and empirical research
Figure 7.10 Comparison of active and passive IMS type use Source: developed by the authors based on theoretical and empirical research

260
All experts conclude that the largest quantity of ideas is provided by
the active IMS and the higher quality of ideas is also provided by the
active IMS, as well as a higher number of involved is ensured by active
IMS.
The authors recommends the use of an active type of IMS as it
provides better results.
1.2.2. Comparison of usage potential based on ideas management
sources
Based on the sources involved in the IM, the types of IMS use can be
classified as internal or external and mixed (Figure 7.11 for the
comparison).
Figure 7.11 Comparison of the type of internal, external and mixed-
use of IMS Source: developed by the author, based on theoretical and empirical research
All experts have concluded that the largest quantity of ideas is
provided by external IMS when compared to internal IMS; mixed IMS,
when compared to external IMS. Representatives of all the companies
interviewed acknowledge that the quantity of ideas created could be
higher. As a restrictive factor, e.g. TET mentions that the employees
fear the extra work-load. The company intends to address this problem
by paying more attention to process management. A/S “Cēsu alus”
concluded, that the quantity of ideas depended on the task at hand.
Experts have recognised that a higher quality of ideas is provided by
internal IMS when compared with external IMS; mixed, if compared
with external IMS. Business representatives would like a higher quality
of ideas, but by taking into account the amount of work put in, it is
concluded that the quality of ideas is generally satisfactory, because, for
example, TET from the last (2018) innovation championship realized 8
out of 11 ideas, but A/S “Cēsu alus” take 4 to 5 ideas from each idea
sessions. The ideas are also created by marketers, team representatives

261
and ideas are brought in from business trips. Companies believe that to
promote ideas to be of higher value, perhaps, can be done by
encouraging people to participate in the process and by motivating them
by also addressing intellectual property issues.
The results of the empirical study indicate:
1. Passive IMS gives higher idea selection efficiency than active
IMS.
2. Internal IMS gives higher idea selection efficiency than external
IMS.
3. Passive IMS gives higher engagement efficiency than active IMS.
4. Internal IMS provides higher engagement efficiency than external
IMS.
Based on the reliability indicators and modal classes analysed in
chapter 2, types of IMS, the number of ideas and the number of ideas
realised, it can be concluded that although the active IMS shows higher
results, the idea selection shows higher effectiveness in passive IMS.
This is because passive IMS provides both a lower quantity of ideas (in
the sample 3,6 times lower) and quality (in the sample 2 times lower).
A similar situation is with internal IMS since the high-efficiency rate
is likely to be linked to an internal network restriction that prevents
quantitative achievements. On the other hand, quality stability is ensured
by the knowledge of employees on a specific issue. It should be noted
that this issue should be further examined in depth. The same situation is
with the quality and engagement of ideas. For a comparison of the
quality and quantity of ideas, see Figure 7.12 on the following page.
Quality of ideas
Lower Higher
Qu
an
tity
of
idea
s/
En
ga
gem
ent
Higher
A1 Active IMS/
External IMS/
Mixed IMS
Lower A2 Passive IMS
/Internal IMS
Figure 7.12 Quality of ideas and Quantity of ideas/engagement
based on types Source: developed by the authors based on theoretical and empirical research
Based on Wood (2004), the authors recommends that companies use
type A1, that is proven to show higher quality and quantity of ideas, but
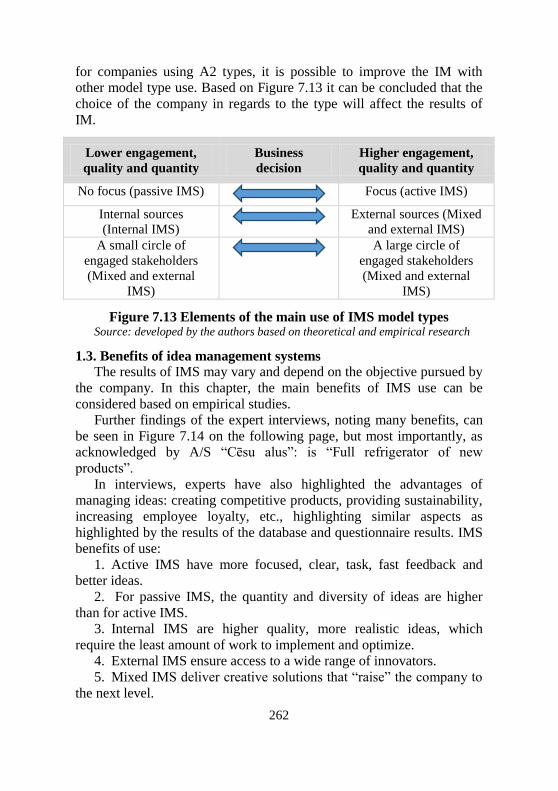
262
for companies using A2 types, it is possible to improve the IM with
other model type use. Based on Figure 7.13 it can be concluded that the
choice of the company in regards to the type will affect the results of
IM.
Lower engagement,
quality and quantity
Business
decision
Higher engagement,
quality and quantity
No focus (passive IMS)
Focus (active IMS)
Internal sources
(Internal IMS)
External sources (Mixed
and external IMS)
A small circle of
engaged stakeholders
(Mixed and external
IMS)
A large circle of
engaged stakeholders
(Mixed and external
IMS)
Figure 7.13 Elements of the main use of IMS model types Source: developed by the authors based on theoretical and empirical research
1.3. Benefits of idea management systems The results of IMS may vary and depend on the objective pursued by
the company. In this chapter, the main benefits of IMS use can be
considered based on empirical studies.
Further findings of the expert interviews, noting many benefits, can
be seen in Figure 7.14 on the following page, but most importantly, as
acknowledged by A/S “Cēsu alus”: is “Full refrigerator of new
products”.
In interviews, experts have also highlighted the advantages of
managing ideas: creating competitive products, providing sustainability,
increasing employee loyalty, etc., highlighting similar aspects as
highlighted by the results of the database and questionnaire results. IMS
benefits of use:
1. Active IMS have more focused, clear, task, fast feedback and
better ideas.
2. For passive IMS, the quantity and diversity of ideas are higher
than for active IMS.
3. Internal IMS are higher quality, more realistic ideas, which
require the least amount of work to implement and optimize.
4. External IMS ensure access to a wide range of innovators.
5. Mixed IMS deliver creative solutions that “raise” the company to
the next level.
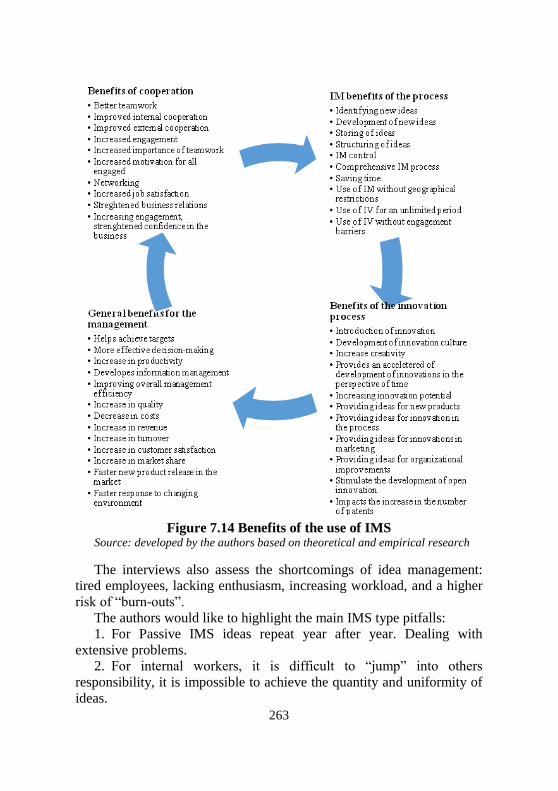
263
Figure 7.14 Benefits of the use of IMS Source: developed by the authors based on theoretical and empirical research
The interviews also assess the shortcomings of idea management:
tired employees, lacking enthusiasm, increasing workload, and a higher
risk of “burn-outs”.
The authors would like to highlight the main IMS type pitfalls:
1. For Passive IMS ideas repeat year after year. Dealing with
extensive problems.
2. For internal workers, it is difficult to “jump” into others
responsibility, it is impossible to achieve the quantity and uniformity of
ideas.
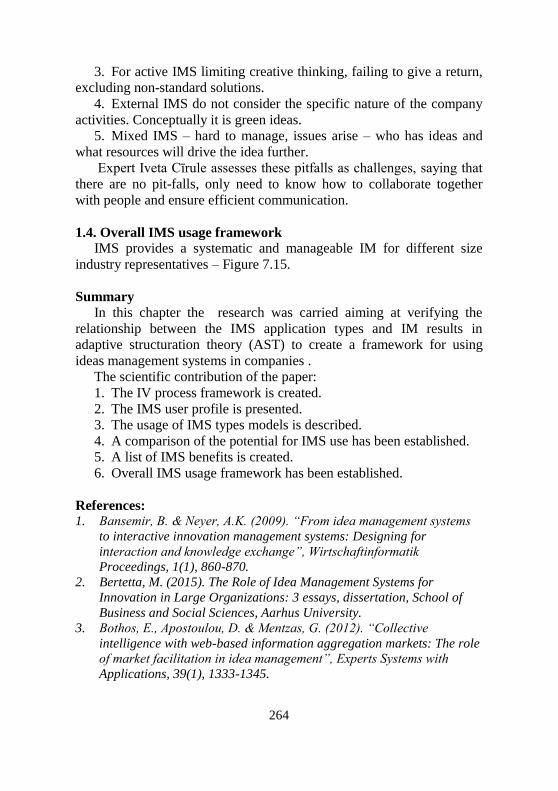
264
3. For active IMS limiting creative thinking, failing to give a return,
excluding non-standard solutions.
4. External IMS do not consider the specific nature of the company
activities. Conceptually it is green ideas.
5. Mixed IMS – hard to manage, issues arise – who has ideas and
what resources will drive the idea further.
Expert Iveta Cīrule assesses these pitfalls as challenges, saying that
there are no pit-falls, only need to know how to collaborate together
with people and ensure efficient communication.
1.4. Overall IMS usage framework IMS provides a systematic and manageable IM for different size
industry representatives – Figure 7.15.
Summary
In this chapter the research was carried aiming at verifying the
relationship between the IMS application types and IM results in
adaptive structuration theory (AST) to create a framework for using
ideas management systems in companies .
The scientific contribution of the paper:
1. The IV process framework is created.
2. The IMS user profile is presented.
3. The usage of IMS types models is described.
4. A comparison of the potential for IMS use has been established.
5. A list of IMS benefits is created.
6. Overall IMS usage framework has been established.
References: 1. Bansemir, B. & Neyer, A.K. (2009). “From idea management systems
to interactive innovation management systems: Designing for
interaction and knowledge exchange”, Wirtschaftinformatik
Proceedings, 1(1), 860-870.
2. Bertetta, M. (2015). The Role of Idea Management Systems for
Innovation in Large Organizations: 3 essays, dissertation, School of
Business and Social Sciences, Aarhus University.
3. Bothos, E., Apostoulou, D. & Mentzas, G. (2012). “Collective
intelligence with web-based information aggregation markets: The role
of market facilitation in idea management”, Experts Systems with
Applications, 39(1), 1333-1345.

265
Figure 7.15 Basic elements for the use of IMS Source: developed by the authors based on theoretical and empirical research
A 2.1. different size businesses
A2.2. different industry representatives
A.2.3. With and without experience
A1 IMS, that ensure IV processes
A2 Users
A3 IMS usage types
A3.3.Internal
A3.4.External
A3.3.Mixed
A.3.1Active
A3.2. Passive
A5 Geographical use
A5.1.Local
A5.2.International
A4 Idea types
A4.1.Product
A4.2.Organizational
A4.3.Marketing
A4.4.Process
A6 Length of task
A6.1. 1-3 days
A6.2. 4-7 days
A6.3. 8-14 days
A6.4. 15 days –
1 month
A6.5. 1- 2 month
A6.6. 2 month
and more
A7 Type of
rewards
A7.1.Financial
A7.2. Non-
financial
A10 Adaptation of
the task
A9 Problem
splitting
level
A8 Sources
Involved
A8.1. Employees
A8.2. Department of inostates
A8.3. Management team
A8.4. Corporation
A8.5.Experts
A8.6.Partners
A8.7. Clients
A8.8. Suppliers
A8.9. NVO
A8.10.
Specific
target group
A8.11.
Universities
A8.12. Competition
A8.13.
Inventors
A11 IMSIMS results
A11.1. Quantity of
Ideas
A11.2. Quality of
Ideas
A11.3.Engagement
A12 Benefits
A12.1.IV benefits
of the process
A12.2.Benefits of
innovation
A12.4.General
benefits of
management
A12.3.Benefits of
cooperation
266
4. Brem, A. & Voigt, K.I. (2007). “Innovation management in emerging
technology ventures – the concept of an integrated idea management”,
Journal of Technology, Policy and Management, 7(3), 304 - 321.
5. Brem, A., & Voigt, K.I. (2009). “Integration of market pull and
tschnology push in the corporate front end and innovation management
- Insights from the German software industry”, Technovation, 29(1),
351-367.
6. Deichmann, D. (2012). Idea Management: Perspectives from
Leadership, Learning, and Network Theory, dissertation, ERIM,
Netherland.
7. Fairbank, J. & Williams, S. (2001). “Motivating creativity and
enhancing innovation through employee suggestion system
technology”, Creativity and Innovation Management, 10 (2), 68-74.
8. Green, S.G., Bean, S.A. & Snavely, B.K. (1983). “Idea management in
R&D as a human information processing analog”, Human Systems
Management, 4(2), 98-112.
9. INSEAD. (2016). “The Global Innovation Index 2016”, available at:
https://www.globalinnovationindex.org/gii-2016-report# (accessed: 21
October 2016).
10. Lowe, M. & Heller, J.E. (2014). “PLM Reference Model for Integrated
Idea and Innovation Management. Product Lifecycle Management for a
Global Market”, IFIP Advances in Information and Communication
Technology, 442(1), 257-266.
11. Mikelsone, E. & Liela, E. (2016). “Idea Management and
Organizational Effectiveness: Research Gap”, Journal of Business
Management, 12(1), 4-24.
12. Pundt, A. & Schyns, B. (2005). „Fuhrung im Ideenmanagement - Der
Zusammenhang zwischen transformationaler Fuhrung und dem
individuellen Engagement im Ideenmanagement“, Zeitschrift fur
Personalpsychologie, 4(2), 55-65.
13. Sandstrom, C. & Bjork, J. (2010). “Idea management systems for a
changing innovation landscape”, International Journal of Product
Development, 11 (3/4), 310-324.
14. Selart, M. & Johansen, S.T. (2011). “Understanding the Role of Value -
Focused Thinking in Idea Management”, Creativity and Innovation
Management, 20(3), 196-206.
15. Westerski, A. (2013). Semantic Technologies in Idea Management
Systems: A Model for Interoperability, Linking and Filtering,
dissertation, Universidad Politecnica de Madrid, Madrid.
16. Westerski, A., Dalamagas, T. & Iglesias, C.A. (2013). “Classifying and
comparing community innovation in Idea Management Systems”,
Decision Support Systems, 54(1), 1316-1326.
267
Chapter 8
ECONOMIC SYSTEMS MANAGEMENT
AT THE LEVEL OF INDUSTRY
STRUCTURES
Bezpartochna Olesia
PhD Student
VUZF University of Finance, Business
and Entrepreneurship
Britchenko Igor
Doctor of Economics, Professor,
Faculty of Technical and Economic
Sciences
State Higher Vocational School
Memorial of Prof. Stanislaw Tarnowski
in Tarnobrzeg
Doctor of Economics, Professor
VUZF University of Finance, Business
and Entrepreneurship
(Sofia, Bulgaria; Tarnobrzeg, Poland)
DIAGNOSTICS THE
ECONOMIC
EFFICIENCY OF
AGRICULTURAL
ENTERPRISES
In order to ensure stable functioning and development of the
enterprise, they evaluate the effectiveness of economic activity. An
effective tool for assessing economic activity in modern conditions is
economic diagnostics, which allows you to analyze the main indicators
of the enterprise, to explore the factors that led to the change in the
relevant results and adversely affected the activities of the enterprise.
Agricultural enterprises also need such methodological tools for
economic diagnostics. However, the existing tools for assessing the
effectiveness of economic activity does not allow for a comprehensive
assessment of indicators. In addition, the management system of
agricultural enterprises raises the requirements for providing a more
effective and justified system of evaluating indicators using economic
diagnostics.
268
The vast majority of agricultural enterprises try to periodically
review their own systems for assessing the effectiveness of economic
activity, taking into account the situation on the domestic and world
agrarian markets, changes in the regulatory framework, the influence of
environmental factors, and investor requirements. Moreover, the
problem lies not only in the excess or lack of assessment indicators
depending on the object of study, but the effectiveness assessment
system itself does not meet the goals of both the current and strategic
management of the enterprise.
The data financial statements of the enterprise do not provide
information on factors that affect changes in production and sales,
market share and income and profits. One of the directions of the search
for estimated performance criteria is the selection of non-financial
indicators that will allow forecasting the future financial results of the
enterprise. Such non-financial indicators are the level of scientific-
research and technical development, innovation in customer service,
reject rate, personnel development.
Since the early 90s of the twentieth century American and Western
European scientists and practitioners have been widely discussing a new
system for evaluating effectiveness – the “Balanced Scorecard”. It was
created on the basis of a study conducted by Harvard University
professor Robert Kaplan and consultant David Norton. In 1990 10
American companies were investigated with the goal of finding new
methods for evaluating performance. The result of scientific research
was the creation of a system of indicators with which you can track
various types of activities at the enterprise – internal business processes,
issues of interaction with customers, interests of shareholders and
investors. R. Kaplan and D. Norton called the new toolkit a “Balanced
Scorecard” and later described it briefly in an article by Harvard
Business Review.
Over the following years, several enterprises have introduced a
balanced scorecard and have achieved good results. According to
American researchers, in the late 90s, about half of the largest US
companies used this system to evaluate performance and successfully
implement the strategy. At the same time, R. Kaplan and D. Norton
recognize the certain limitations of a balanced scorecard, especially the
difficulty in using it as a tool for assessing and motivating personnel.
In our opinion, rethinking the assessment of effectiveness should
begin with a consideration of the concept itself. We believe that a set of
performance indicators should meet the following criteria:
269
– be minimal in a set of indicators. A significant number of
indicators complicates the calculations, the introduction of new
evaluation criteria, as a rule, is carried out due to indicators
interconnected with the available ones;
– cover all directions of activity the enterprise. Ideal indicators cover
the entire enterprise, that is, they can be used everywhere and have
advantages over highly specialized indicators: they can be successively
traced from the lowest to the highest levels of management; their
changes can be analyzed from the bottom up, that is, to evaluate the
effectiveness of the lower levels of management; you can compare them
on a horizontal level between different departments of the enterprise;
– have good predictability for forecasting. Non-financial indicators
should provide for future financial results, that is, such indicators
become determining criteria for efficiency, and financial indicators –of
lags – change and accumulate over time;
– have a stable character. Indicators should change gradually so that
employees are aware of the strategic goals of the enterprise and their
behavior is predictable;
– create opportunities for assessment and motivation personnel.
In contrast to ideal indicators, only two requirements are put forward
to a balanced system of indicators: minimum and usefulness for
forecasting. In real economic practice it is practically impossible to
determine effectiveness indicators that satisfy all of the above criteria.
This is due to several reasons, namely:
– enterprises are overloaded with various indicators, and the problem
of an excessive number of criteria exacerbates the processes of
evaluating economic activity;
– the ability of scientists and practitioners to create and disseminate
indicators is ahead of the ability to separate non-financial indicators,
including information about financial effectiveness in future, from
indicators that do not contain such information;
– few indicators of a non-financial nature are comprehensive for the
enterprise, it is easier to choose universal financial indicators;
– effectiveness indicators, especially non-financial ones are
constantly changing over time, when used they lose their variability,
sometimes quite quickly, and therefore cannot signal high or low
efficiency;
– motivation for several effectiveness indicators is quite complicated.
If indicators are combined according to some formula, employees will
try to ensure that they get the desired result without changing it to
270
growth. If indicators are combined subjectively, people will not
understand the relationship between assessed effectiveness and its
motivation.
There is an even more fundamental reason for the gap between an
ideal and a real assessment of the effectiveness of activity the enterprise.
The modern understanding of efficiency, being, in essence, an economic
concept, does not recognize the possibility of its full measurement. The
modern concept is based on the assessment of future cash flows and
their discount to current value. In other words, an enterprise is regarded
as an asset that is capable of generating cash flows – both today and in
the future. Cash flows in the future cannot be accurately measured, nor
can the long-term sustainability and effectiveness of an enterprise be
assessed, without which cash flows will be reduced or run low.
Realistically assess current cash flows (financial results), factors
affecting future cash flows (non-financial indicators), and give a rough
estimate of future cash flows themselves (for example, prices of
securities of an enterprise).
On the contrary, economic efficiency includes elements of
expectation, or even promise. A noticeable definite contradiction: the
vocabulary definition is turned to the present or the past, and the
economic definition is turned to the future. At the same time, the
definition of effectiveness tends to limit factors and takes into account
certain indicators of evaluation. For example, if evaluate efficiency are
used to financial results (profitability), indicators of business processes,
the level of satisfaction of consumer needs, and innovation and staff are
evaluated, then a balanced scorecard is proposed by R. Kaplan and D.
Norton [1]. Another measure of effectiveness may be the level of
satisfaction of the requirements of the owners of the enterprise
(shareholders or investors).
In an effort to find suitable, even if not ideal, means of assessing the
effectiveness of economic activity, scientists and practitioners are forced
to rethink the activities of the entire enterprise and structural units. All
indicators of the economic activity of the enterprise can be divided into
single and complex, as well as internal (managerial) and external
(financial). Analyzing the whole set of indicators, we can conclude that
the more units in the enterprise, the more diverse the types of activities
and products, the more different indicators must be used to evaluate
effectiveness. This is especially true for agricultural enterprises, which
is due to the directions of their activities – crop and livestock
complexes.
271
Not a single indicator is able to give a comprehensive assessment of
the economic activity of an enterprise. In addition, those factors of
influence that remain assessed will be neglected in an effort to obtain
better results on a single indicator. That is, the more the factor is not
evaluated, the more fraud is possible in an enterprise with a performance
evaluation system. The use of many indicators will make it possible to
obtain a more complete performance effectiveness of an activity than a
single indicator, but it will be more difficult to collect and combine data
for assessment into an aggregated assessment of the overall performance
of an enterprise.
At the same time, the overall financial indicators of the enterprise do
not allow an assessment at the level of individual departments. On the
other hand, it is rather difficult to aggregate the performance indicators
of individual divisions into a single generalized indicator at the level of
the entire enterprise.
Large enterprises with a complex management structure need more
indicators of evaluation than small ones. For small enterprises with a
relatively simple management structure, the purpose of performance
indicators is to evaluate past performance to predict the future situation,
as well as motivating and encouraging employees. In large and more
complex enterprises, it is additionally assumed that performance
indicators can be aggregated by organization level from bottom to top
and distributed in cascades from top to bottom, which helps to compare
the effectiveness of individual branches within the association and
functional units. Given the above, we determine the place and purpose
of indicators for diagnosing the efficiency of economic activity of
agricultural enterprises (Figure 8.1).
The data in Figure 8.1 reflect the place and purpose of the individual
categories of indicators assessment efficiency. Indicators that allow you
to assess the past situation, predict future development, as well as
indicators of employee motivation and encouragement are located
outside the organizational pyramid, since they are common both for
assessing small enterprises and large ones. The indicators intended for
aggregation from bottom to top, cascading distribution from top to
bottom, as well as indicators used for the purpose of comparison are
becoming increasingly important with the increase in the volume of
activity of the enterprise, are located within the pyramid. Indicators for
assessing the past and forecasting the future are at the top of the
pyramid, since these indicators are used to assess the economic
efficiency and past achievements of the enterprise as a whole. The

272
indicators of motivation and remuneration are placed at the base of the
pyramid, since they are designed to motivate and stimulate staff
activities.
Figure 8.1 The place and purpose of indicators for diagnosing the
efficiency of economic activity an agricultural enterprise Source: suggested by the author
The indicators for assessment efficiency the economic activity of an
agricultural enterprise we propose combining performance in four
groups, namely:
1) market assessment of an agricultural enterprise (return on equity,
added market value), designed to assessment the activities of the
enterprise as a whole, and not of its individual structural units,
employees. These indicators cannot be obtained either by aggregation
from bottom to top, or cascading from top to bottom. Directions to the
future market valuation depends on the degree of efficiency of the
financial market, reproduces in its estimates information relating to
future cash flows. The considered indicators are widely used to motivate
and promote the system of top management of an agricultural enterprise;
2) financial indicators (net profit, return on assets, return on
investment, return on sales), which can be used to evaluate the activities
Assessment of the past
Indicators that
are aggregated
from bottom to
top
Indicators that
are cascaded
from top to
bottom
Forecasting the future
Comparison indicators
Promotion indicators Motivation indicators
273
of both the agricultural enterprise as a whole and its individual
components – crop and livestock complexes. But these indicators cannot
be used to evaluate functional units or employees. Financial indicators
are more directed to the past than to the future, as existing performance
is reproduced. Although it is possible to note a partial direction of these
indicators in the future – higher performance results reduce the cost of
attracting financial resources. Financial indicators can be widely used in
the field of motivation and remuneration of personnel at the level of
management of an agricultural enterprise, but not at the level of
structural units. Accordingly, it is possible to point out aggregation and
cascading of financial indicators from the level of the enterprise to the
level of its structural divisions, which makes it possible to compare the
effectiveness of their activities as part of an agricultural enterprise;
3) non-financial indicators (the number of innovative technologies,
product quality, consumer satisfaction, consumer loyalty index), which
are quite complex and ambiguous. On the one hand, these indicators can
cover all aspects of the functioning of an agricultural enterprise (for
example, production, sales, management, marketing, innovation); on the
other hand, since functional units within a single enterprise are usually
specialized, most of the non-financial indicators characterizing the
activities of the agricultural enterprise as a whole cannot be applied to
individual specialized units. Also difficult is the problem of aggregating
non-financial indicators from bottom to top for a generalized assessment
of the effectiveness of several units. A similar question arises when it is
necessary to compare the functioning of various units, both within a
separate agricultural enterprise, and with similar enterprises or with
reference values. Regarding future orientation and application
possibilities for personnel motivation, non-financial indicators are
ambiguous and variable over time, and therefore need constant
monitoring of their effectiveness, review and updating;
4) cost indicators with a limited nature of use compared to other
types of indicators, since they measure only one aspect of efficiency,
namely, costs. Cost estimates are based on past information. Although
the trends in these indicators make it possible to make forecasts for the
future, the inability to control current costs can lead to adverse future
consequences for the agricultural enterprise.
In Table 8.1 we present four groups of indicators for diagnosing the
efficiency of economic activity of an agricultural enterprise, depending
on the level of their use and purpose.
As the data in Table 8.1 show, indicators that are actually or
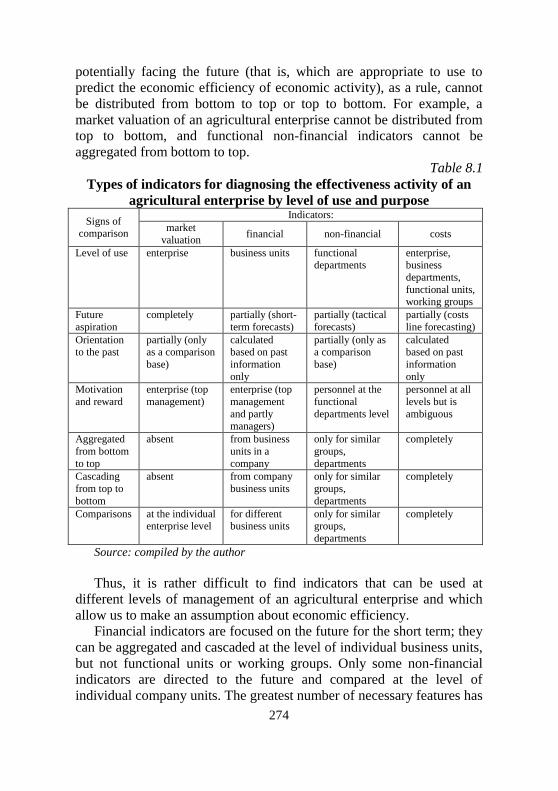
274
potentially facing the future (that is, which are appropriate to use to
predict the economic efficiency of economic activity), as a rule, cannot
be distributed from bottom to top or top to bottom. For example, a
market valuation of an agricultural enterprise cannot be distributed from
top to bottom, and functional non-financial indicators cannot be
aggregated from bottom to top.
Table 8.1
Types of indicators for diagnosing the effectiveness activity of an
agricultural enterprise by level of use and purpose
Signs of comparison
Indicators:
market
valuation financial non-financial costs
Level of use enterprise business units functional departments
enterprise, business
departments,
functional units, working groups
Future
aspiration
completely partially (short-
term forecasts)
partially (tactical
forecasts)
partially (costs
line forecasting)
Orientation
to the past
partially (only
as a comparison
base)
calculated
based on past
information
only
partially (only as
a comparison
base)
calculated
based on past
information
only
Motivation
and reward
enterprise (top
management)
enterprise (top
management
and partly managers)
personnel at the
functional
departments level
personnel at all
levels but is
ambiguous
Aggregated
from bottom
to top
absent from business
units in a
company
only for similar
groups,
departments
completely
Cascading
from top to
bottom
absent from company
business units
only for similar
groups,
departments
completely
Comparisons at the individual enterprise level
for different business units
only for similar groups,
departments
completely
Source: compiled by the author
Thus, it is rather difficult to find indicators that can be used at
different levels of management of an agricultural enterprise and which
allow us to make an assumption about economic efficiency.
Financial indicators are focused on the future for the short term; they
can be aggregated and cascaded at the level of individual business units,
but not functional units or working groups. Only some non-financial
indicators are directed to the future and compared at the level of
individual company units. The greatest number of necessary features has

275
the last group – costs indicators. But they only unilaterally evaluate
efficiency; show a trend in the level of costs, although they are easily
used for aggregation and cascading from top to bottom.
Motivation and remuneration are grouped on the basis of cost
indicators, as a rule, are not used at the enterprise, since it quickly
causes deterioration of other (primarily qualitative) indicators of
economic activity of both individual employees and departments (the
desire of the employees of the logistics department to reduce the cost of
purchasing fuel lubricants for agricultural work leads to the acquisition
of a cheap, but low-quality resource can lead to significant cost overruns
when growing crops, obtaining lower-grade agricultural products, etc.).
Effectiveness assessment systems that are used in agricultural
enterprises based on current and past results, and owners are more
interested in the future prospects and position of the enterprise. That is,
economic efficiency is directed to the future, and its assessment always
has a certain share of uncertainty. The magnitude of the uncertainty
varies depending on the delay (lag) of the influence of factors affecting
the assessment, as well as on the variability of the external environment.
On the other hand, the larger the enterprise and the more complex its
management system, the less perfect is the evaluation of performance
indicators. This occurs for several reasons: the division of labor
becomes deeper, which causes a great need for specialized functional
units; to lead to a unified assessment and comparison of non-financial
indicators at the level of specialized units and financial at the level of
business units and the company as a whole is almost impossible.
Thus, in modern conditions there is a need for the formation and use
of more justified methodological instruments for assessing the efficiency
of economic activities of agricultural enterprises, which combines a
market assessment of economic activity, financial and non-financial
indicators, operating costs. An assessment of the efficiency of economic
activity of agricultural enterprises of Ukraine is carried out, which the
economic entities of the agricultural sector, using the available resource
potential, are trying to use it effectively. However, the economic and
market conditions do not always contribute to the achievement of
positive results, since there is a decrease in the sown area of agricultural
land (especially for growing grain and leguminous crops), an increase in
average prices for the sale of agricultural products is characterized by a
negative trend. The positive dynamics in the activities of agricultural
enterprises of Ukraine is an increase in the volume of cultivation and
yield of certain types of crop production (sugar beets, sunflower seeds,

276
potatoes and vegetables) and livestock production (meat, milk, eggs and
wool).
References: 1. Kaplan R., Norton D. (1992). The balanced scorecard-measures that
drive performance, Harvard Business Review, No. 70, pp. 58-63.
2. Kaplan R., Norton D. (2001). Die strategiefokusierte Organisation:
Fuhren mit der Balanced Scorecard, Stuttgart, 325 p.
3. Lecaillon J.-D., Le Page J.-M. (2004). Economie contemporaine:
Analyse et diagnostics, Bruxelles: De Boeck, 398 р.
4. Marshall A. (1965). Principles of Economics, London, Macmillan, 794 р.
5. Bezpartochnyi M., Britchenko I., Bezpartochna O., Mikhel V. (2019).
Economic diagnostics as a tool for transformation of organizational-
legal forms of economic activity in the field of agriculture,
Management mechanisms and development strategies of economic
entities in conditions of institutional transformations of the global
environment: collective monograph, edited by M. Bezpartochnyi, ISMA
University, Riga, «Landmark» SIA, Vol. 1, pp. 259-269.
6. Bezpartochna O. (2019). Use of economic diagnostics for innovative
ensuring of the economic process of agroindustrial enterprises,
Механізми та стратегії розвитку господарюючих суб’єктів в
умовах інтеграційних процесів: матеріали науково-практичної
INTERNET-конференціяї студентів та молодих вчених з
міжнародною участю, Національний аерокосмічний університет
імені М. Є. Жуковського “Харківський авіаційний інститут”,
Wyższa Szkoła Społeczno-Gospodarcza w Przeworsku, Przeworsk,
WSSG, pp. 143-146.
7. Rjashchenko V., Živitere M., Bezpartochna O. (2019). Reengineering of
business processes at enterprises of consumer co-operation,
Conceptual aspects management of competitiveness the economic
entities: collective monograph, edited by M. Bezpartochnyi, I.
Britchenko. Higher School of Social and Economic, Przeworsk, WSSG,
Vol. 2, pp. 85-98.
8. Bezpartochna O., Britchenko I., Jarosz P., Radochonska-Jarosz R.
(2019). Study of the modern production and economic relations of the
enterprises of agricultural complex in Poltava region, Organizational-
economic mechanism of management innovative development of
economic entities: collective monograph / edited by M. Bezpartochnyi,
in 3 Vol. Higher School of Social and Economic, Przeworsk, Vol. 1, pp.
142-153.
9. Bezpartochna O., Britchenko I. (2019). Study of etymology of concept
“the economic diagnostics of agricultural enterprises”, Strategies for
277
sustainable socio-economic development and mechanisms their
implementation in the global dimension: collective monograph, edited
by M. Bezpartochnyi, in 3 Vol. VUZF University of Finance, Business
and Entrepreneurship, Sofia, VUZF Publishing House “St. Grigorii
Bogoslov”, Vol. 1, pp.16-32.
10. Bezpartochna O., Britchenko I. (2020). Ukraine’s accession to the
WTO: consequences and prospects for agricultural enterprises //
Інноваційні стратегії та моделі економічних трансформацій в
умовах євроінтеграційних викликів: матеріали міжнародної
науково-практичної Internet-конференції (Харків – Ужгород –
Софія – Пшеворськ, 15 травня 2020 р.) / Національний
аерокосмічний університет імені М.Є. Жуковського “Харківський
авіаційний інститут”, Ужгородський торговельно-економічний
інститут КНТЕУ, Висшето училище по застраховане и финанси,
Wyższa Szkoła Społeczno-Gospodarcza w Przeworsku. – Софія:
Издателство на ВУЗФ “Св. Григорий Богослов”, pp. 178-181.
Kurleto Małgorzata
PhD in Organization and
Management, Associate
Professor
Faculty of Management
and Social Communication
Jagiellonian University in
Krakow
Krakow, Poland)
APPLYING OF MODERN
INFORMATION AND
COMMUNICATION
TECHNOLOGY STRATEGY TO
IMPROVE EFFICIENCY OF
VALUE CREATION OF
COMMERCIAL ENTERPRISE
Introduction
The main reason why commercial companies choose an Information
and Communication Technology (ICT) strategy is to update economies
of scale and reap the benefits of information technology [Kearney,
2017]. The dynamics of environmental changes, including expansion of
modern information technologies, means that modern commercial
enterprises must quickly and effectively use all opportunities for
effective business and development. Among the main factors of the
company’s success there is innovation, which contains conditions for
278
understanding the value creation process [Dymitrowski, 2014]. The
resource concept (derived from Resource Based View – RBV) is
undoubtedly the most universal and comprehensive to show the
possibilities of success and development of an enterprise. Nevertheless,
the concept of drawing profits from innovation (PI) focuses directly on
the levers of retaining the value of technological innovations [Najda –
Janoszka, 2013]. In the world for profit, the reason and justification for
existence is the creation of economic values. The retained part of the
generated economic value represents the captured economic value
necessary primarily for the continuation of economic activities. Some
authors emphasizing the possibility of treating modern information
technologies as intangible resources also point to the use of the ICT link
with resource theory for creating value of commercial enterprises
[Marczuk, 2011]. The growth of ICT technology brings many
opportunities, from the use of which the development of modern
business entities depends to a large extent. The Internet and other
modern technology means are increasingly perceived as a tool enabling
the development and quick transfer of information on products and
services of commercial enterprises. By using ICT, it has become
possible that enterprises can more effectively promote their products and
services, conduct marketing research and market analyses. Enterprises
are constantly growing due to the spread of ICT. The Internet, as a
source of information, is increasingly used in the decision-making
process and allows you to reach more customers from offers. Many
companies began to see ICT, not only as a means of advertising and
marketing, but as a medium through which one can successfully run a
business. The impact of information technology on commercial
enterprises can lead to cost reduction when carrying out a sale via
electronic commerce rather than in a traditional store involve physical
establishment, order placement and execution, customer support,
staffing, inventory carrying, and distribution [Lee, 2009].
From the enormity of problems that are related to the use of ICT
strategies by commercial enterprises, this study has focused on the
following: the benefits of the possibility of using modern technologies
(in particular the Internet) by commercial enterprises in the context of
creating value; opportunities and threats that digital marketing gives and
opportunities arising from the use of e-management. The main
hypothesis that the study will try to examine in a broad sense is that
today the Internet is essential for creating value for commercial
enterprises.
279
The Benefits of Using ICTs in Business – in the context of creating
value
Examples of creating economic value can be seen in the activities of
most profit-oriented companies, whether small, regional or global. A
commercial enterprise is a business of people who exchange things or
services for money. Thus, a “commercial enterprise” is an organization
that has a profit motive. For the effectiveness of functioning in
contemporary conditions of life dominated by business activity in the
“network”, the speed of information is most important.
Fast information transfer, which in the modern world allows ICT to
be treated as one of the most important resources in the enterprise.
Information plays a key role in the functioning of any enterprise because
it is a factor in both decision making and knowledge creation. There is
an inseparable connection between information, value creation and
achieving competitive advantage. The value of benefits resulting from
the use of information increases with the level of business complexity
and the development of ICT potential. The goal of ICT strategy is to
create value for or the company. This goal will not be achieved unless
the value is “maximized”. To do this, use the least amount of resources
to get the most profit. Due to the rapid spread of information technology
in the business world, having ICT strategies has become a necessity for
the survival of commercial enterprises. The main reason commercial
companies choose an ICT strategy is to update economies of scale and
acquire the benefits of information technology. Market entities, and
especially enterprises, try to use the opportunities that appear before
them to improve the flow of information both within the organization
and to improve interaction with their business environment. Modern
technologies also allow for structural changes in the organization and
functioning of individual departments of enterprises, in the long run
positively influencing the improvement of their efficiency,
competitiveness and increase of innovativeness of used solutions and
proposed products and services. Technological support serves both the
collection and selection of information. On the one hand, ICT enables
the acquisition, processing, transmission and storage of information at
all stages of processes in an enterprise. The real value of ICT is to
provide the user with information that is useful to him. It should be
noted, however, that the potential benefits of providing information will
only appear if better decisions are made on their basis. Information and
communication technologies support both communication techniques
and the use of information and knowledge resources. At the same time,
280
the possibilities of using ICT are strongly conditioned by a number of
factors, which include digitization, appropriate information
infrastructure and favourable environmental factors [Jain & Jadav,
2017]. These are the basic requirements that must be met for a company
to create value using ICT [Wachnik, 2015]. The ease of searching the
Internet for information about the company and its activities increases
the transparency of activities as factors affecting the success of
enterprises.
Technological progress of commercial enterprises has contributed to
increased production, capital accumulation and the creation of intense
competition among manufacturers [Impacts of information technology
(IT), 2018] Information Technology is an all-pervasive change, which is
affecting the design of many existing commercial enterprises (and their
products and services), as well as the mode of producing and marketing
almost all of them [Kearney, 2018]. The Internet is seen by companies
mainly as a good way to reach potential customers and new markets.
There is no doubt that one of the most significant outcomes of the
progress of information technology is probable electronic commerce
over the Internet, a new way of conducting business. [Lee, 2009].
Nowadays, enterprises have started to notice the potential of the Internet
in other areas of their activity, such as better coordination of cooperation
with partners, lower transaction costs and development of new services.
The main commercial uses of the Internet are the exchange of
information (e.g. e-mail, chat, video conference) and the use of websites
for informational or transactional purposes. The most popular and most
often used form of Internet presence by enterprises is the business
website.
Creating value by commercial enterprises with digital marketing
Digital marketing involves using digital media allows effective way
to reach as many customers as possible. The basic communication
channels are: social media, email, SEO, SEM and the so-called “content
marketing” focusing on content. Strategies for using information from
the network include: maintaining the availability and accuracy of
commercial enterprise business data in all business processes; use of
information infrastructure ensuring high efficiency and reliability of ICT
services for marketing in a commercial enterprise. The ICT strategy in
the business world also includes; supply strategies for a company
operating on the basis of digital marketing requiring ordering and selling
services and products of only the right quality, at the right price and with

281
appropriate control, as well as a strategy for information security
included in digital marketing ensuring protection and controlling
confidentiality, integrity and availability of information [James &
Durham, 2016].
The big advantage of digital marketing is the use of tools and
methods that, thanks to a direct connection to the Internet. This allows to
immediately analysing the marketing activities of commercial
enterprises. This type of marketing includes not only activities on the
Internet, but also SMS, TV, smartphone applications or billboards. In
digital marketing, a necessary step is to plan a digital strategy, by the
way of which various models are usually used. An additional advantage
of digital marketing is called omnichannel, which is the complete
integration of all channels, with no distinction between the online and
the physical channel. Using omnichannel allows for direct creation
content through any ICT channel [Chaffey, 2019]. The SOSTAC model
is a method of planning strategic steps that the company wants to take to
reach a potential customer with its message [Ibid.]. This method works
very well in campaigns conducted on the Internet. This model is very
flexible and adapts to the dynamics of the environment, i.e. the Internet
and clients. And this is very important if we are not able to direct our
strategy to one specific target group. The RACE model (whose name is
short for the first letters) means: [Ibid.]
- Reach, i.e. reaching the target group and making them aware of
the brand
- Act, i.e. the involvement of its clients in interacting with the
company
- Convert, i.e. conversion to the target purchase
- Engage, i.e. creating loyalty with your customers.
Omnichannel, SOSTAC and RACE propose a strategic approach
created to connect communication channels such as: Internet, sms, e-
mail, telephone and video with sales channels. The solution is that the
customer has access to all services offered [Stecyk, 2012]. Social media
(interactive Web 2.0 Internet-based applications including for instance
Facebook, Twitter, YouTube, and corporate blogs) represents a new
trend for companies, too, who are trying to communicate with their
consumers on online or offline media platforms [Gáti & Markos-Kujbus,
2012].
New opportunity for commercial enterprises - digital management
It can be assumed that the company currently functions naturally in a

282
networked environment. Based on the conducted research, Jablonski
after conducting the research stated that the coherence of a strategic
hybrid is built on a business model. Strategy and business processes
constituting a key determinant of the effectiveness of an enterprise
embedded in the network [Jabłoński, 2013]. The Internet network forces
entrepreneurs to create new business models [Wyrębek, 2011]. In a
network economy, the business model can be much more complex, and
innovations can affect any of its elements. The very concept of the
business model appeared in management theory and practice along with
the introduction of the ICT system, which are innovations resulting from
the need to redefine existing operating principles of enterprises. The
business model can be the basis for defining the company’s strategy and
the use of digital management, especially important in enterprises that
are completely based on e-management. Due to the use of the Internet
on the market, companies using the network and virtual companies are
distinguished as e-business. The concept of e-business refers to the use
of Internet technologies for the purposes of communication,
coordination and management in an enterprise. However, in fact a
virtual company have business model, which takes into account the
properties of the Internet to achieve business goals. Modern technology
leads to a change in the way the value creation process is managed.
Enterprises can focus on better meeting customer needs and seek profits
also at individual stages of the value chain such as research,
programming solutions, brand and distribution chain. [Orzechowski,
2008]. In the e-business enterprise model, the Internet becomes a growth
lever for companies, because it creates opportunities to build an
effective network of business connections. This solution has the
potential to create significant added value. In the model solution, the
company becomes a centre for managing the entire value chain, which,
through intelligent marketing, constant contact with the customer and
designs an optimal product, which in turn ensures customer loyalty. The
Internet contributes to the value creation process by providing global
coverage, flexibility and optimized management. The global scale of
operations allows the use of resources from countries with lower
production costs and operating on many markets. On the other hand,
flexible cooperation with suppliers and effective use of distribution
channels leads to improvement of supply chain management. The role of
the Internet as a factor in creating economic value for enterprises
increases with its progressive adoption in the economy due to the
phenomenon of network externalities. Nowadays, an important issue in

283
commercial enterprises is also the pursuit of the best strategic match
between ICT and business. Business- ICT matching means applying
information technology in the right way and at the right time, in
harmony with the strategy, goals and needs of business [Orzechowski,
2008]. Good business fit – ICT affects the business operations in three
main ways: it increases the efficiency of investment in ITC, helps to
gain a competitive advantage through the appropriate application of ICT,
and ensures flexible response of the company’s information system to
new business and technological opportunities [Ibid.]
The fast transfer of information, which in the modern world allows
ICT, can be treated as one of the most important resources of basic
resources in the enterprise. Information plays a key role in the
functioning of any enterprise because it is a factor in both decision
making and knowledge creation. There is an inseparable relationship
between information, value creation and achieving a competitive
advantage. Information is a contribution to a data system that is used to
manage an enterprise. Management leads to value creation, but it is not
enough to maximize it. Therefore, for a company to be able to maximize
value, it must achieve a competitive advantage, whose source is, among
others, unique knowledge and competences [Pisano, 2015].
The accessibility of the internet in the media community is beyond
doubt. This accessibility gives a lot of benefits from the viewpoint of the
business side of commercial enterprises, but on the other hand is
associated with many possibilities of computer crimes. As a result of
computer crimes and computer frauds, companies are sometimes
exposed to large financial losses. It should be emphasised that all
companies need to follow five specific steps to effectively protect
against cyber-attacks: secure your hardware, encrypt and backup all
your data, encourage a security-cantered culture, use robust firewall and
anti-malware software, and invest in cyber security insurance [Popat,
2018]. Many Internet strategy failures are rooted in the perception of the
network only from the perspective of its benefits and capabilities. Every
internet venture requires a rational approach from both a planning and
implementation point of view. It is also worth remembering that the
Internet is a constantly growing business channel that forces enterprises
actively operating online to constantly update their knowledge in this
area. Its dynamic nature also significantly translates into models and
strategies implemented by enterprises in the network. The Internet
allows you to gain a competitive advantage in many ways. The most
important are interactivity and individualization in customer

284
relationships, access to information, choices, convenience, saving time
and costs, creating new communities, entertainment and trust.
Interactive communication is a separate chapter in marketing
connections, helping to solve many existing problems. Interactive
communication has been used, e.g. on the Internet it also enables
conversation on a global scale, even by small enterprises. The added
value generated by the network consists mainly in managing activities,
providing useful information and facilitating contact. The Internet
network is above all a mine of cheap and up-to-date information: about
the market, legal provisions, financial regulations, events of great
importance or market opportunities. Monitoring what is happening on
the web, browsing websites, catalogues and databases allows to keep a
good orientation in the environment, which is an important element of
the role of every entrepreneur and company manager. The network also
creates the possibility of mobile management of companies and running
the office from anywhere in space, which allows better use of time and
freedom of movement. Of course, access to the network also allows
quick and cheap contact with clients and contractors.
In companies where the path for the development of digital strategies
has been clearly marked, the Chief Digital Officer (CDO) is increasingly
appearing as the highest-ranking person responsible for digital
transformation [Musiatowicz-Podbiał, 2020]. According to Singh &
Hess [2017], CDO can perform the functions of “Digital Innovator”,
“Digital Evangelizer”, “Digital Coordinator” in enterprises. The
possibility of performing the fourth function of CDO, namely: “Digital
Lawyer” was noticed by Haffke, I., Kalgovas, B. J., Benlian, A. [2017].
“Digital Lawyer” should appear in organizations that anticipate the
significant impact of digital change on its functioning, but need a person
who will bring a spirit of change and will enthusiastically implement
key people in the company.
Conclusions The analysis confirmed the hypothesis assuming the possibility of
maximizing the efficiency of operations and business results of
commercial enterprises by increasing the use of modern ICT
technologies (mainly the Internet) as well digital marketing and digital
management. It should be noted that the characteristics of individual
social enterprises determine the indirect effectiveness of Internet use.
Organizational effectiveness can be defined as the efficiency with which
a commercial enterprise is able to meet its objectives. The research

285
results show that organizational efficiency of enterprises is a factor on
which the success of using the Internet depends to a large extent.
Internet resources are infrastructure that enables the generation and use
of information resources. Nevertheless, the very fact of having the
highest-value online resources is not an indicator of the highest business
performance. The impact of Internet performance is high in those
commercial enterprises that have used the appropriate business model
and highly qualified personnel with knowledge of information
technology. The scale of benefits from using the Internet depends on the
skilful state of the technology used. The efficiency of using the Internet
is positively related to the size of enterprises. The results of the study
provide empirical confirmation of the role of the Internet as a leverage
of commercial enterprise resources. The analysis also indicates the
existence of synergies associated with the use of the Internet, which in
turn leads to strengthening the competitive advantage resulting from the
complementarity of intangible assets. There is a further need to develop
better interaction between contractors in commercial marketing, identify
the conditions for using the pros and cons of technological innovation in
digital marketing, and use digital management. The future of
commercial enterprises is work in the digital economy. The most
effective ICT strategies are those that not only connect with the
marketing strategy, but also with the management strategy. All these
strategies have a common logical structure, and the differences are
manifested in the specifics of implementing technological solutions. The
business strategies of commercial enterprises, ICT strategy,
management and marketing strategies must be closely coordinated. The
ICT strategy adapts ICT capabilities to the business capabilities of the
enterprise and vice versa. This process is also known as adapting ICT to
business or adapting business to ICT or adapting business technology.
Skilful matching of ICT to business becomes a source of building
company value. Factors conducive to the implementation of
management strategies linked to ICT include: control mechanisms
ensuring the implementation of the strategic business goals of a
commercial enterprise connected to ICT; preparation of an operational
model facilitating digital management through functional adjustment of
business and ICT structures; and mapping business processes and
technologies to enable effective delivery of change, business continuity
and strategic decision making.

286
References: 1. Chaffey, D. (2019), Marketing models that have stood the test of time
https://www.smartinsights.com/digital-marketing-strategy/online-
business-revenue-models/marketing-models/
2. Dymitrowski, A. (2014), The Importance of Innovations Created in the
Internationalization Process for Enterprise Results, PhD Thesis,
http://www.wbc.poznan.pl/ Content/325674/Dymitrowski_Adam_
rozprawa_ doktorska.pdf
3. Gáti, M., Markos-Kujbus, E. (2012), Social Media’s New Role in
Marketing Communication and its Opportunities in Online Strategy
Building, https://www.researchgate. net/publication/
270958563_Social_Media’s_New_Role_in_Marketing_Communication
_ and_its_Opportunities_in_Online_Strategy_Building
4. Haffke, I., Kalgovas, B. J., Benlian, A. (2017), The Transformative Role
of Bimodal IT in an Era of Digital Business Proceedings of the 50th
Hawaii International Conference on System Sciences.
5. Impacts of information technology (IT), 2018, htps://master-iesc-
angers.com/impacts-of-information-technology-it/
6. Jabłoński, A. (2013), Sustainable business models, Difin, Warsaw.
7. Jain, E., Jadav, A. (2017), Marketing and Technology: Role of
Technology in Modern Marketing, https://www.researchgate.net/
publication/317308663_Marketing_and_Technology _ Role_of_
Technology_in_Modern_Marketing
8. James, F., Durham, H. (2016), Fifty Shades of Digital Marketing,
https://www.7boats.com/academy/wp-ontent/uploads/2016/10/50-
shades-of-digital-marketing.pdf
9. Kearney, A.T. (2017), Technology and Innovation for the Future of
Production: Accelerating Value Creation http://www3.weforum. org /
docs / WEF_White_Paper_ Technology_ Innovation _ Future_of
_Production_2017.pdf
10. Kearney, A.T. (2018), Technology and Innovation for the Future of
Production: Acceleration Value Creation, White Paper, World
Economic Forum, ww3.weforum.org/ docs/WEF_White_Paper_
Technology_Innovation_Future _of_Production_2017.pdf
11. Lee, K. R. (2009), Impacts of Information Technology on Society in the
new Century, https://www.zurich.ibm.com/ pdf/news/Konsbruck.pdf
12. Marczuk, M. (2011), Evaluation of the effectiveness of using the
Internet in business activity http://www.wbc.poznan.pl/Content/
236700/PDF/Doktorat_ MarcinMarczuk_2011.pdf
13. Mazurek-Łopacińska, K., Sobocińska, M. (2018), Content Marketing in
the Aspect of the Evolution of Internet Function and the Development
of Marketing Concept, https://www.researchgate.net/publication/
287
330199906_Content_Marketing_in_the_Aspect_of_the_Evolution_of_I
nternet_Function_and_the_Development_of_Marketing_Concept
14. Musiatowicz-Podbiał, G. (2020), Chief Digital Officer - many roles,
many functions. Who exactl is a CDO, https://www.cxo.pl/news/Chief-
Digital-Officer-wiele-rol-many-functions-Who-is-actually-is-CDO,
418284.html
15. Najda – Janoszka, M. (2013), Retaining value from innovation in the
tourism industry Contemporary Management, No. 1, pp. 96-105.
16. Orzechowski, R. (2008), Building enterprise value using IT, SGH
Publishing House, Warsaw.
17. Pisano, G.P. (2015), You Need an Innovation Strategy,
https://hbr.org/2015/06/you-need-an-innovation-strategy
18. Popat A. (2018), Five Ways To Protect Your Company Against Cyber
Attacks, https://www.entrepreneur.com/article/316886
19. Singh, A., Hess, T. (2017), How Chief Digital Officers Promote the
Digital Transformation of their Companies, MIS Quarterly Executive,
March 1, 2017.
20. Stecyk, A. (2012), Internet e-commerce websites, in: Modern
technologies in the field of financial services, edited by B. Świecka,
University of Szczecin Publishing House, Szczecin.
21. Wachnik, B. (2015), Budowanie wartości przedsiębiorstwa z
wykorzystaniem inwestycji w ICT Przegląd Organizacji, nr 12, 57-6.
22. Wyrębek, H. (2011), Scientific Notebooks of the University of Natural
Sciences and Humanities in Siedlce Series: Administration and
Management, 91, pp. 91-104.
Vlasenko Ivan
MD in Economics, Professor
Gyrych Sergiі
PhD in Technics, Associated Professor
Vinnitsia Trade and Economic Institute
of Kyiv National Trade and Economic
University
(Vinnytsia, Ukraine)
THE IMPORTANCE
OF VINNYTSIA
AIRPORT IN THE
ECONOMIC
DEVELOPMENT OF
CENTRAL UKRAINE
The airport is an effective tool to increase the investment and tourist
attractiveness of the city of Vinnytsia as well as the whole region. The
development of the airport determines the multilevel economic impact
288
on the city and the region through the contribution to the region’s GDP
and job creation.
The city of Vinnytsia and its airport are located at the crossroads of
European routes from West to East, connecting the northern border of
Ukraine with Belarus and the southern border with Moldova. The
strategic potential for Vinnytsia will also be played by the GO Highway
project of the Ministry of Infrastructure which is the construction of a
high-speed highway that will connect Vinnytsia with Odesa and Polish
ports on the Black and Baltic Seas, respectively.
Vinnytsia is a unique city in Ukraine, as it is a strategic transport
hub, where the Intercity high-speed railways connect North and South
(in particular, Kyiv and Odesa) and East and West (in particular,
Kharkiv, Kyiv and Lviv). At the same time travel prices for tickets to
and from Vinnytsia are affordable for both domestic and foreign
tourists.
Due to such a favorable location, Vinnytsia Airport can be attractive
not only for residents of Vinnytsia, but also for neighboring regions of
Ukraine, connected by a convenient and inexpensive road and/or
railway.
Almost all of Ukraine’s largest international airports are located near
its borders. Vinnytsia Airport is the only operating international airport
in the central region. There are no other active airports with an
international checkpoint and experience in servicing modern aircraft
A320 and B737-800 within a radius of 200 km.
The city of Vinnytsia has a variety of attractive places that may be of
interest to both domestic and foreign tourists: museums, churches and
cathedrals, the M. Sadovsky Regional Academic Music and Drama
Theater, the Regional Philharmonic, medical institutions and diagnostic
centers. The city offers a variety of entertainment and events that attract
tourists from different cities of Ukraine and abroad.
The number of hotels grows every year to accommodate tourists.
Their level of service and number of rooms increases. The largest 4*
hotel is the Hotel France, and an example of a 3* hotel is the Optima
Hotel of the Reikartz Group. The number of small hotels of 10-15 rooms
also constantly grows.
Vinnytsia region also has a lot to offer for tourists:
– sanatoriums: the most famous and powerful in terms of attracting
domestic and foreign tourists for treatment and recreation are
balneological sanatoriums in Khmilnyk and Nemyriv; with the
development of their infrastructure and service, they can become a key

289
factor in attracting significant incoming tourist flows to Vinnytsia and
Vinnytsia airport;
– religious tourism: Lyadovsky Usiknovensky rock monastery;
annual programs of Tsadik Nahman’s visit to Uman with the arrival of
4-5 thousand aviation tourists-pilgrims from Israel during the Jewish
New Year through the airport “Vinnytsia”;
– active sports: rafting on the Southern Bug River; Butterfly resort
complex, etc.;
– Historical and architectural monuments: Potocki palaces of the
17th-19th centuries in Tulchyn, Dashev and Pechersk; Countess
Scherbatova’s palace in Nemyriv; Nemyriv Dendrological Park, etc.;
– Museums: Voronovytsia Museum of the History of Aviation and
Cosmonautics of Ukraine in the Grokholsky-Mozhaisky Palace and
others;
– events: International Opera Festival “Operafest Tulchyn” (June) in
the park of the Potocki Palace in Tulchyn and others.
In addition to the above popular attractions of the city and region, in
the service area of the airport “Vinnytsia” can also attract tourists to the
airport:
– sanatorium and resort complexes in the town of Sataniv in the
Khmelnytsky region,
– Mezhybizh State Historical and Cultural Reserve and Hasidic
pilgrimage sites to the town of Mezhybizh in the Khmelnytsky Region;
– Sofiyivka Arboretum in Uman, Cherkasy Region, etc.
Thus, Vinnytsia Airport has a significant potential to attract aviation
tourists, airlines and launch new direct flights.
In 2015-2019, charter programs were actively developed from
Vinnytsia Airport, which proves the significant potential of outbound
aviation tourism for the city and the region. Several tour operators are
interested in launching their own charter programs from the airport,
mainly to Turkey in summer and Egypt all year round. The traditional
destinations are Antalya in Turkey and Sharm el-Sheikh in Egypt.
However, since the summer of 2017, charter flights to Turkish Dalaman
have also been operated.
The number of charter flights from the airport was limited mainly
due to insufficient carrying capacity of artificial surfaces, which
necessitates either the use of less commercial loading of flights, which is
not economically feasible, or the limitation of the number of flights.
This applies to Boeing 737 and Airbus 320 aircraft, which carry loads
on hard surfaces at the Airport greater than their current carrying

290
capacity.
The operation of Vinnytsia Airport is significantly influenced by the
export-import activity of the region. The foreign trade balance of the
Vinnytsia region continues to remain positive.
Foreign trade operations with goods of the region’s economic entities
were carried out with partners from 125 countries.
Exports increased the most to Austria, Benin, Georgia, Djibouti,
Egypt, Yemen, Israel, Indonesia, China, Kuwait, Lebanon, Libya, and
the United Arab Emirates.
Among the partners of the Vinnytsia region, the EU countries occupy
a prominent place. The expansion of cooperation with them is especially
important in the context of deteriorating ties with Russia. In recent
years, trade and economic relations between Vinnytsia and EU countries
have significantly deepened.
There are more than 200 industrial enterprises in Vinnytsia,
including PJSC “Vinnytsia Oil and Fat Plant” (industrial group ViOil),
PJSC “Vinnytsia Confectionery Factory” (ROSHEN), LLC “Green
Cool” (holding UBCGroup), SE “Electrical Systems”, including
enterprises with foreign capital: Ukrainian-Spanish joint venture Sperko
Ukraine LLC, Agrana Fruit LLC.
Analyzing the commodity structure of exports with EU countries, it
should be noted that special demand is for vegetable products ($ 164,6
million), wood and wood products ($ 94,8 million), fats and oils of
animal or vegetable origin. ($ 73,9 million), cooked food products ($
73,4 million), machinery, equipment and machinery, electrical
equipment ($ 58,1 million), textiles and textile products ($ 30,4 million)
million dollars), live animals, products of animal origin (26,6 million
dollars), products of chemical and related industries ($ 5,5 million),
mineral products ($ 4,9 million), various industrial goods ($ 4,0 million)
and base metals and articles thereof ($ 2,6 million).
The main items of import revenues of the region from EU countries
are machinery, equipment and mechanisms, electrical equipment ($ 83,3
million), land transport, except rail ($52,1 million), chemical and related
products industries ($ 44,3 million), wood and wood products ($ 25,7
million), polymeric materials, plastics and articles thereof ($ 22,1
million), textiles and textiles articles ($ 18.8 million), base metals and
articles thereof ($ 15,1 million), finished food products ($ 11,9 million),
animal fats and oils rope origin ($ 9,6 million), live animals, animal
products ($ 9,2 million) and wood or other fibrous cellulosic materials
($ 6,4 million).
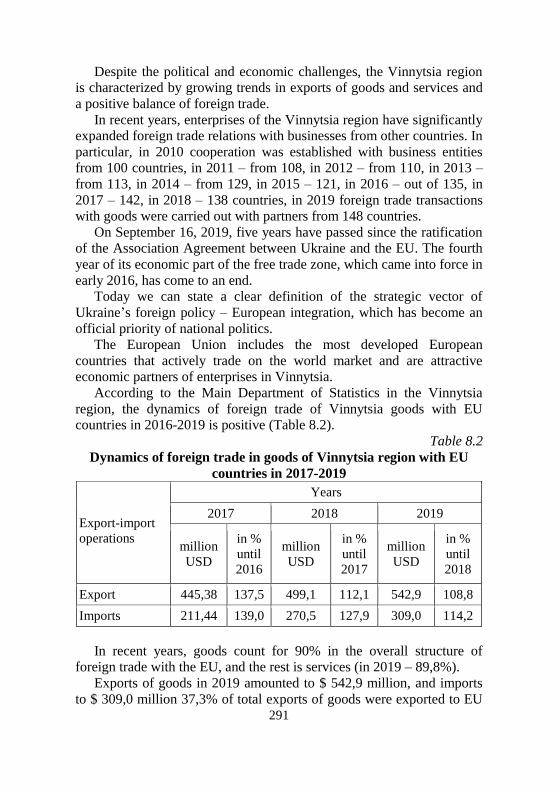
291
Despite the political and economic challenges, the Vinnytsia region
is characterized by growing trends in exports of goods and services and
a positive balance of foreign trade.
In recent years, enterprises of the Vinnytsia region have significantly
expanded foreign trade relations with businesses from other countries. In
particular, in 2010 cooperation was established with business entities
from 100 countries, in 2011 – from 108, in 2012 – from 110, in 2013 –
from 113, in 2014 – from 129, in 2015 – 121, in 2016 – out of 135, in
2017 – 142, in 2018 – 138 countries, in 2019 foreign trade transactions
with goods were carried out with partners from 148 countries.
On September 16, 2019, five years have passed since the ratification
of the Association Agreement between Ukraine and the EU. The fourth
year of its economic part of the free trade zone, which came into force in
early 2016, has come to an end.
Today we can state a clear definition of the strategic vector of
Ukraine’s foreign policy – European integration, which has become an
official priority of national politics.
The European Union includes the most developed European
countries that actively trade on the world market and are attractive
economic partners of enterprises in Vinnytsia.
According to the Main Department of Statistics in the Vinnytsia
region, the dynamics of foreign trade of Vinnytsia goods with EU
countries in 2016-2019 is positive (Table 8.2).
Table 8.2
Dynamics of foreign trade in goods of Vinnytsia region with EU
countries in 2017-2019
Export-import
operations
Years
2017 2018 2019
million
USD
in %
until
2016
million
USD
in %
until
2017
million
USD
in %
until
2018
Export 445,38 137,5 499,1 112,1 542,9 108,8
Imports 211,44 139,0 270,5 127,9 309,0 114,2
In recent years, goods count for 90% in the overall structure of
foreign trade with the EU, and the rest is services (in 2019 – 89,8%).
Exports of goods in 2019 amounted to $ 542,9 million, and imports
to $ 309,0 million 37,3% of total exports of goods were exported to EU
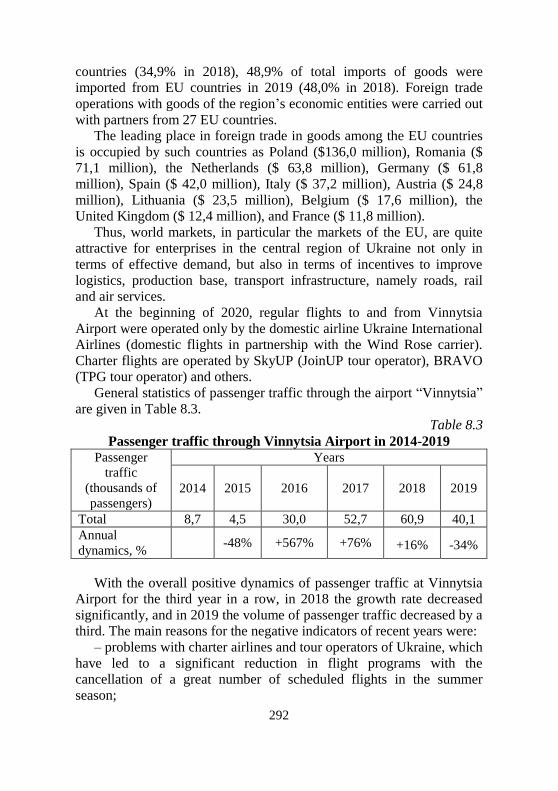
292
countries (34,9% in 2018), 48,9% of total imports of goods were
imported from EU countries in 2019 (48,0% in 2018). Foreign trade
operations with goods of the region’s economic entities were carried out
with partners from 27 EU countries.
The leading place in foreign trade in goods among the EU countries
is occupied by such countries as Poland ($136,0 million), Romania ($
71,1 million), the Netherlands ($ 63,8 million), Germany ($ 61,8
million), Spain ($ 42,0 million), Italy ($ 37,2 million), Austria ($ 24,8
million), Lithuania ($ 23,5 million), Belgium ($ 17,6 million), the
United Kingdom ($ 12,4 million), and France ($ 11,8 million).
Thus, world markets, in particular the markets of the EU, are quite
attractive for enterprises in the central region of Ukraine not only in
terms of effective demand, but also in terms of incentives to improve
logistics, production base, transport infrastructure, namely roads, rail
and air services.
At the beginning of 2020, regular flights to and from Vinnytsia
Airport were operated only by the domestic airline Ukraine International
Airlines (domestic flights in partnership with the Wind Rose carrier).
Charter flights are operated by SkyUP (JoinUP tour operator), BRAVO
(TPG tour operator) and others.
General statistics of passenger traffic through the airport “Vinnytsia”
are given in Table 8.3.
Table 8.3
Passenger traffic through Vinnytsia Airport in 2014-2019
Passenger
traffic
(thousands of
passengers)
Years
2014 2015 2016 2017 2018 2019
Total 8,7 4,5 30,0 52,7 60,9 40,1
Annual
dynamics, % -48% +567% +76% +16% -34%
With the overall positive dynamics of passenger traffic at Vinnytsia
Airport for the third year in a row, in 2018 the growth rate decreased
significantly, and in 2019 the volume of passenger traffic decreased by a
third. The main reasons for the negative indicators of recent years were:
– problems with charter airlines and tour operators of Ukraine, which
have led to a significant reduction in flight programs with the
cancellation of a great number of scheduled flights in the summer
season;

293
– launch by Ukraine International Airlines of domestic flights from
Kyiv on small Embraer 145 aircraft for 48 passengers and termination of
flights to Warsaw on Boeing 737-500 aircraft (112-120 passengers);
– lack of an active marketing campaign in Vinnytsia region to
support the demand for launched flight programs;
– limitation of airport infrastructure.
Successful development of passenger traffic through Vinnytsia
Airport is possible provided that: there is no restriction of infrastructure
for airport development – reconstruction of the aerodrome and
passenger terminal is carried out in 2019-2020 with a minimum time of
airport closure; constant active marketing campaign (participation in
international events, meetings with airlines, advertising, etc.); in 2021-
2023, an airline with efficient regional aircraft with 50-80 seats will start
operating on the Ukrainian air market, which will promote the
development of domestic passenger traffic.
Thus, in the case of the project of reconstruction of the airfield and
terminal in 2019-2020, as well as taking active marketing measures, by
2030 the airport “Vinnytsia” can reach 1.5 million passengers a year.
For the development of air transportation, the availability of
appropriate light-signaling, aeronautical and radio-technical equipment
also plays a critical role. The characteristics of this equipment must meet
the requirements of international airlines to add the airport to their
network of routes. In this case, the airport can count on an increase in
the number of takeoff and landing operations, as shown in Table 8.4. At
the same time, in 2030 it is planned to increase the level of flight
congestion and attract more aircraft with more capacity, which will
increase passenger traffic with the same number of flights as in 2029.
According to the current certificate, Vinnytsia Airport Airport can
service A320 / B737-800 aircraft only with restrictions.
Among the elements of infrastructure those need improvements are:
replacement of obsolete aerodrome equipment, replacement of the
external fence with one that will meet ICAO requirements and
construction of a patrol road.
The passenger terminal has a capacity of 150-180 passengers per hour,
but can only serve an international or domestic flight at a time. Also, the
terminal does not have an equipped business hall or VIP hall. The
terminal is not equipped with modern engineering systems and the use of
the area of the terminal building does not exceed 50%, and accordingly
there is a possibility to increase the capacity of the terminal and install the
necessary equipment and systems without additional space.

294
Table 8.4
Forecast of takeoff and landing operations through the airport
“Vinnytsia” for 2020-2030 (units)
Years Scenario development
optimistic pessimistic average
2020 1098 1098 1098
2021 3068 1529 2298
2022 4544 1856 3200
2023 5586 2093 3839
2024 7148 2488 4818
2025 8168 2846 5507
2026 10028 3334 6681
2027 11128 3614 7371
2028 12116 3980 8048
2029 12824 4088 8456
2030 12824 4088 8456
For a positive decision to launch scheduled flights, the airport must
meet certain basic requirements for technical condition and equipment.
Without meeting these standard basic requirements, airlines do not enter
into commercial negotiations on the terms of flights to the Airport.
According to the forecast of passenger traffic and take-off and
landing operations, the existing configuration of the passenger terminal
will be able to provide non-passenger traffic of up to 120 thousand
passengers per year or 180 passengers per hour.
For efficient service of at least 250-300 thousand passengers per year
it is necessary to reconstruct the passenger terminal and provide:
– possibilities of simultaneous service of international and domestic
flights;
– capacity of the international sector of the terminal: up to 380
passengers per hour one way, including a business hall up to 20
passengers per hour which is the 2nd A320 / B737-800 aircraft per hour;
– capacity of the internal sector of the terminal: up to 150 passengers
per hour, including business halls up to 10 passengers per hour which is
approximately 2 ATR72 / Q400 or one B737 per hour.
It is expected that the airport will be able to agree with airlines on
maximum use of time during the day, to avoid peak loads on the airport
– the need to simultaneously serve more than one aircraft at the airport,
and more than two international and two domestic flights in the
passenger terminal to reach 300-400 thousand passengers per year.
295
After that, the construction of a new passenger terminal and / or the
completion and second reconstruction of the existing terminal will be
relevant. After reaching the number of approximately 600-700 thousand
passengers per year, it may also be necessary to build a section of the
main taxiway (MRD) at least at the main landing course, which will
connect the end of the runway and the platform. And after 2030 and the
achievement of more than 1.5 million passengers per year and more than
12 thousand takeoff and landing operations (ZPO) – may be relevant to
complete the second half of the main taxiway from the other end of the
runway. An appropriate opportunity should be provided when planning
the use of land at the aerodrome and subsequent stages of design and
survey work.
Priority infrastructure projects for the period up to 2021.
1. Reconstruction of the aerodrome.
2. Reconstruction of the passenger terminal.
Elements of the project of reconstruction of the passenger terminal:
– arrangement of technologically independent international and
domestic sectors in the terminal for arrival and departure (with business
halls);
– increasing the capacity of the terminal to 380 passengers per hour.
in the international sector and 150 passengers per hour in the domestic
sector;
– arrangement of a VIP-hall for 15 passengers;
– arrangement of a conference hall for 25-30 participants;
– engineering communications in the terminal and external
engineering networks.
As for the impact of Vinnytsia Airport on the economy of the central
region, it is undoubtedly positive and consists in the creation of
additional jobs (staff expansion) and an increase in gross domestic
product (GDP) due to the intensification of the airport.
Categories of economic impact of the airport according to the
methodology of ASI Europe:
– direct impact – indicators as a result of the main activity in /
around the airport: (the airport itself, airlines, air traffic control,
customs, etc.);
– indirect impact – indicators as a result of related activities: on-
board catering, ticket sales, shops, legal and audit services for the airport
and airlines, etc.;
– the impact – indicators as a result of economic activities not related
to the airport: personal expenses of staff from the first two categories for
296
restaurants, purchase of own cars, real estate, household services, etc.;
– catalyzed impact (extended economic benefits) – indicators that
show the impact of the airport on other sectors of the economy: trade,
investment, tourism, etc.
Thus, in any scenario of airport passenger flow development (and
even pessimistic), Vinnytsia Airport has a significant impact on the
economy of the central region of Ukraine through job creation and
contribution to GDP. At the same time, on average, for each job created
directly at the airport, an additional 6 jobs are created in the region in
related and other industries.
References: 1. Statistics of KP “Vinnytsia Airport” – Available at:
http://airvinnytsia.com/aeroport/statistika/
2. International airports of Ukraine. – Available at:
https://www.airinme.com/ua/blog/staycation/menards-aeroporti-ukraine/
3. Airports of Ukraine. UIF Development Assessment and Proposals. –
Available at: https://www.slideshare.net/UIFuture/ss-78262445
4. Marintseva K.V. (2014) Scientific bases and methods of ensuring the
effective functioning of air transport systems: a monograph. - Kyiv:
NAU. - 504 p.
5. Marintseva K., Yun G., Kachur S. (2015) Resource allocation
improvement in the tasks of airport ground handling operations //
Aviation. – Vol. 19, Issue 1. - pp. 7-13. – Available at:
http://www.tandfonline.com/doi/abs/10.3846/16487788.2015.1015291#
preview
6. Marintseva K.V. (2015) Choosing an investment-attractive airport in
conditions of uncertainty. International Union of Scientists "Science.
Technologies. Production” Monthly scientific journal. Vol. 3 (7). pp.
23-26.

297
Yevtushenko Natalia
PhD in Economics, Associate
Professor, Chair of Finances,
Accounting and Taxation
Malyshko Vitalina
PhD in Economics, Associate
Professor, Chair of Finances,
Accounting and Taxation
Palamarchuk Oksana
PhD in Economics, Associate
Professor, Department of Economics
Pereiaslav-Khmelnytskyi Hryhorii
Skovoroda State Pedagogical
University”
(Pereiaslav, Ukraine)
INCREASING THE
LEVEL OF
COMPETITIVENESS
OF INDUSTRIES OF
UKRAINE THROUGH
THE INTRODUCTION
OF CLUSTER MODELS
Analysis of tendencies of development of industry of Ukraine
demonstrates the need for identifying positive and negative factors of
influence on competitiveness of companies in the industry and finding
ways of improving its level. Providing conditions conducive to
establishment of desired level of competitiveness of the sector, raises the
problem of the analysis of a set of objects − the enterprises which are
parties to the trade market and indicators of competitiveness according
to level of development. To this end, proposed clustering of domestic
enterprises. Priorities for search of ways of increase of competitiveness
of industries is the effective interaction between producers, consumers,
financial and credit system, local authorities and infrastructure elements
with a view to taking the managerial decisions that would best meet the
economic interests of all actors. Proven to be an effective form of
security for such cooperation are clusters. The implementation of the
cluster approach gives the opportunity to identify and assess the critical
factors of influence on formation of competitiveness of the industry.
The principles of the developed technique of diagnostics of the
competitiveness of enterprises can be used for decision-making with
comprehensive market research and selection of the most promising
enterprises in the development of measures to improve the
competitiveness of products, elaboration of proposals towards the
298
development capabilities of the enterprise and the development of
activities aimed at creating competitive advantages. Thus, on the basis
of the proposed method are determined by changes in competitiveness
and its components that becomes an information support of scientific-
analytical substantiation of administrative decisions on the development
and organization of a set of actions aimed at supporting factors in the
functioning of the enterprise in the market. Bases of management of
regional clusters originate from initiatives for their formation, which can
offer groups private sector of the economy, the structural unit of the
public sector, other institutions, primarily in order to increase the
competitiveness of economic entities in a particular geographic region.
Often these initiatives come from the underdeveloped (depressive)
regions. At the same time, the Ukrainian experience shows that these
initiatives are limited to one administrative region – region and beyond
its limits, at least for three reasons:
– the lack of macroeconomic policy (state), and therefore local
interest in the formation of clusters;
– low availability of external funding, in particular the lack of
budgetary support from Central and local;
– the inability to implement effective governance model inter-
regional cluster.
The last reason is particularly relevant for Ukraine, despite the
existence of different phases of cluster development, which requires
appropriate strategies to improve first of all the business processes,
including through innovation, foreign direct investment.
This implies that, in addition to market mechanisms, the system of
cluster management should include coordination mechanisms that can
be implemented formally or informally, organizational through the main
or through a specialized firm.
Coordination may cover individual functions, and the design,
production, logistics, marketing, training, and their complex. Described
allows, firstly, to assert the relevance of a clear promotional policy of
the state regarding the establishment and development of clusters in
Ukraine. Second, despite the current low availability of financial
resources to implement the objectives of the cluster, its development is
not provided in the Central and local budgets for direct financial support
of clusters, a real source of financial support for the development of
clusters are foreign direct investment. However, the very existence of
the cluster can attract attention from investors, but the priority in terms
of investment attractiveness are the national factors stable financial,
299
legal, fiscal and administrative policies, as FDI always exist in two
dimensions: risk and return. In addition to stability, investment
attractiveness of regions should consider the presence of special
economic zones. Thirdly, as to create and develop clusters on a
voluntary basis on their own initiative and without loss of legal
personality by its participants, the major factor is the maturity of the
intangible conditions for the functioning of the region, the sign of which
is the social capital that cannot be bought or borrowed, but you can
create and develop. According to the World Bank definition social
capital is social norms and relationships that provide coordination of
people and achieve the desired goals. Without going into a scientific
debate regarding definitions of social capital, let us take the paradigm
that social capital arises in the triangle “government–enterprise–society”
and has a structural dimension-dimension relationships and the cognitive
dimension [7].
Observations of the author allow us to state in Ukraine, the lack of
traditions of entrepreneurship and institutional support, which is an
important factor in the poor state of clustering of the regional economy.
The result is therefore a low level of use of labour resources and the
chance for international integration and globalization. In General, social
capital can be interpreted as the source of the creation and development
of long-term forms of cooperation in the region, which are clusters, and
with the help of four blocks:
• relationship and participation;
• trust and understanding;
• education and knowledge;
• culture and behavior.
A high level of achievement in these blocks has a positive effect on
the economy of the region, however, a moderate level leads to a
decrease in welfare, the growth of transactional costs of formation of
group conflicts, growing income inequality and the like.
In General, we can say that the weakest links of public capital in
Ukraine is:
a) unwillingness to cooperate (due to low confidence);
b) unwillingness to risk;
с) low creativity.
And, actually, this is a significant obstacle for the creation of
regional clusters along with the absence of reasonable belief of potential
cluster members regarding the possibility of obtaining significant korista
from cooperation in terms of cluster.
300
One of the effective tools of persuasion can be considered a pattern
of good practice for the operation of the cluster and systems
management. So, there are many barriers or “bottlenecks” in
implementing the idea of cluster creation in Ukraine. For lack of
entrepreneurs with the appropriate level of entrepreneurial culture and
experience of cooperation with contractors on the principles of
cooperation, the key role is public policy promoting the development of
clusters [6].
Theoretical generalizations of beneficial effects of integration of the
enterprises in the cluster were given the opportunity to determine their
structure, defining the potential of competitiveness of enterprises:
• economic effect: the effect of the system (increase in production,
lower unit fixed costs, reducing the specific transaction costs, improve
market position, increase the value of firms);
effect of restructuring (concentration on core competencies,
outsourcing optimization);
– the effect of diversification (increasing the elasticity relative to
market conditions, the weakening of the influence of seasonality,
stabilization of the financial condition, risk reduction);
in effect, due to legal conditions (tax benefits);
• socio-economic effect: increasing the level of skills of workers;
– wage growth;
– the improvement of working conditions;
– better service;
– improvement in the quality of products, which are consumed in the
market;
• environmental and economic effect, which occurs due to more
rational use of natural resources: reducing the negative impact on the
environment (use of non-waste technologies, use of energy saving
technologies, implementation of international standards for
environmental management – ISO 14001).
The deepening of the level of detail the components of the cluster
effect makes it possible, firstly, to increase the level of validity of
decisions on the formation of a cluster, and secondly, to create a suitable
methodology for forecasting expected results, and thirdly, to avoid
repeated calculation of the relevant components of the effect and a
General disregard of other essential components, in fourth, makes it
possible to identify the strategic effect of the cluster taking into account
its impact on the local market and the natural environment for the
public, including human capital.
301
Characteristics of the model the success of a cluster in a structured
way will allow us to formalize the procedure for calculating the
expected economic performance of the cluster, in particular, and the
impact on the competitiveness of its participants. The prospects of
further researches are seen in the deepening of the study of applied
aspects of the creation and implementation of clusters in the economy of
Ukraine.
In economic research the most widely used concept of the
mechanism of management competitiveness of the enterprise as a set of
means and methods by which the impact on the whole of the available
internal capacity of the enterprise in the external environment, taking
into account tendencies of development of the market situation with the
aim of obtaining the desired level of competitiveness [1].
Dividing the overall methodological approach relative to the given
definition of the category of mechanism of management the
competitiveness, we consider it necessary to focus on some
controversial provisions.
First of all, the basic elements of the management system are: define
mission, goals, motives, activities, and management methods,
development of optimum organizational structure of management, the
formation of a system of indicators of enterprise activity, diagnostics of
internal and external factors that affect competitiveness, the
development of competitive strategy and rationale of ways and methods
of increase of competitiveness.
All these elements are used in the full interaction. With this in mind,
the more meaningful is the concept of the mechanism of
competitiveness management of the enterprise as a complex of actions
for definition of the strategic prospects, analysis of factors influencing
competitiveness, and risk assessment of the level of competitiveness and
development prospects.
Agreeing with the above definition of the mechanism of management
competitiveness of the enterprise, there are basic conditions and
organizational and economic measures to ensure and enhance the
competitiveness of enterprises:
– the application of scientific approaches to strategic management;
– the choice of strategic prospects of development;
– ensuring the unity of development of technics, technology,
Economics, management;
– application of modern methods of research and development;
– ensuring the priority of products;
302
– identification and use of price factors to improve competitiveness
of products;
– influence directly to the consumer by providing monetary or
commodity credit;
– studying the activities of competitors to improve similar products;
– organization of informational support of managerial processes.
The system-oriented approach is the base on which are formed the
future direction and carried out concrete actions in the field of
competitiveness [8].
In our opinion, cluster competition – a special form olgopolsky
competition that determines the market fighting for the minimization of
costs and maximization of income between horizontally and vertically
integrated structures.
The cluster theory of economic development, N. Porter suggests that
one or several firms, reaching competitiveness in the world market,
extending its positive impact on the immediate environment: suppliers,
consumers and competitors. And the success of the environment, in turn,
affects the further growth of competitiveness of the company [4].
The result is a cluster community of firms, closely related branches,
which are mutually promoting growth of competitiveness of each other.
For the whole of the state economy clusters carry out a role of points of
growth of the domestic market. After the first formation of new clusters
and international competitiveness of the country as a whole increases.
She keeps on strong positions of separate clusters, whereas outside
them, even the most developed economy can only give mediocre results.
In the cluster benefit applies in all areas of relationships:
– new manufacturers coming from other industries, accelerate its
development by promoting research and providing the necessary
resources for the implementation of new strategies;
– there is a free exchange of information and the rapid spread of
innovations along the channels of suppliers or the consumers having
contacts with numerous competitors;
– the relationship inside the cluster, often absolutely unexpected,
lead to new ways of competition and generate all other possibilities;
– human resources and ideas form new combinations. The main
thesis of M. porter [4] is that the prospective competitive advantages are
not created externally and on the domestic markets.
In General, there are three broad definitions of clusters, each of
which emphasizes the main feature of its functioning [3]:
– is limited forms of regional economic activity within related
303
sectors, usually linked to the other scientific institutions;
– do the vertical industrial chain, narrowly-defined sectors in which
adjacent stages of the production process form the core of the cluster
(“supplier-manufacturer-marketed money-client”). In the same category
there are networks emerging in major firms;
– is industries defined at a high aggregation level or set of sectors at
an even higher level of this process.
Besides, allocate cluster strategies that complement each other is the
strategy aimed at improving the use of knowledge in existing clusters
Over time, effective clusters cause large investment and close
attention of the government, i.e. the cluster becomes greater than the
sum of its individual parts. The concentration of competitors, their
customers and investors facilitates efficient specialization of production.
The cluster provides employment to many small firms and small
businesses. Besides, the cluster form of organization leads to a special
form of innovation – “aggregate innovative product”. Join a cluster
based on vertical integration forms not spontaneous concentration of
various scientific and technological inventions, and certain system of
distribution of new knowledge and technologies. The most important
condition for the effective transformation of inventions into innovations,
and innovations into competitive advantages is the formation of a
network of sustainable relationships between all members of the cluster.
Thus, cooperation is becoming more necessary, but it also carries with it
known risks – the possibility of loss of autonomy (ability to self-conduct
in the market for independent development of new products, new
technologies, etc.). That’s why in some countries in recent decades has
assumed such importance of an efficient “cluster strategies” that are
based on the centres of business activity that has proven its strength and
competitiveness in the global market. The government concentrated
efforts on supporting the existing clusters and creating new networks of
companies previously not exposed between them. The state thus not
only contributes to the formation of clusters, but itself becomes a
participant in the networks.
With accumulated experience specialists described seven key
characteristics of clusters, a combination which is based on a particular
choice of cluster strategy [2]:
– geographical: the construction of spatial clusters of economic
activity, ranging from purely local to global;
– horizontal: some industries/sectors can enter into a larger cluster;
– vertical: in clusters may be present adjacent stages of the

304
production process. It is important which of the network participants is
the initiator and the final executor of innovation within the cluster;
– lateral: in the cluster together different sectors, which can provide
savings due to economies of scale, which leads to new combinations;
– technology: a set of sectors that use the same technology;
– focus: cluster of companies, concentrated around a single center –
enterprise, research Institute or educational institution;
– quality: is important here is not only the question of whether firms
collaborate, but how they do it. The network is not always automatically
stimulate innovation. Sometimes, in networking, by contrast, suppressed
innovation processes and promotes protective behaviours. Relationships
with suppliers can stimulate innovation processes, but they also can be
used for shifting costs for partners and infringement of their financially.
In the latter case, networks are neither stable nor stimulating.
An important feature of cluster is its innovative orientation. The most
successful clusters form where there is ongoing or anticipated
“breakthrough” in the field of engineering and production technology
with the following entry into new “market niches”. In this regard, is
actively used by the “cluster approach” in the formation and regulation
of national innovative programs. Particular attention is paid to the
definition and support for those innovations that provide long-term
business development.
Therefore, we believe that the cluster approach used in studies of
competitiveness, it is necessary to apply for the solution of such tasks
as:
– analysis of competitiveness (state, region, industry);
– development of programs of regional development;
– the basis of stimulation of innovative activity of enterprises.
Analysis of tendencies of development of industry of Ukraine
demonstrates the need for identifying positive and negative factors of
influence on competitiveness of companies in the industry and finding
ways of improving its level. Providing conditions conducive to
establishment of desired level of competitiveness of the sector, raises the
problem of the analysis of a set of objects−the enterprises which are
parties to the trade market and indicators of competitiveness according
to level of development. To this end, proposed clustering of domestic
enterprises. Priorities for search of ways of increase of competitiveness
of the industry is the effective interaction between producers,
consumers, financial and credit system, local authorities and
infrastructure elements with a view to taking the managerial decisions
305
that would best satisfy the economic interests of all the entities in the
relationship. Proven to be an effective form of security for such
cooperation are clusters. The implementation of the cluster approach
gives the opportunity to identify and assess the critical factors of
influence on formation of competitiveness of the industry.
Implementation of theoretical provisions and practical
recommendations for the development and implementation of
organizational-economic mechanism of management the
competitiveness of the industry will contribute to its effective
functioning and development.
References: 1. Ilchuk, V.P., Khomenko, I.A., Lysenko, I.V. (2013). Klasterna stratehiia
ekonomichnoho rozvytku rehionu, Chernihiv, Chernihiv State
technological University (in Ukrainian).
2. Kontseptsiia stvorennia klasteriv v Ukraini, Retrieved from:
http://biznes.od.ua/index.php?option=com_content&task=view&id=49
9&Itemid=33
3. Proekt rozporiazhennia Kabineta Ministrov “Ob odobrenii kontseptsii
Natsionalnoi strategii formirovaniia i razvitiia transgranichnykh
klasterov”, Retrieved from: http://ved.odessa.gov.ua/Main.aspx?sect=
Page&IDPage=23566&ID=1150.
4. Porter, M. E. (1980) Competitive Strategy: Techniques for Analyzing
Industries and Competitors, Retrieved from:
http://www.management.com.ua/books/view-books.php?id=247
5. Guide to cluster development. Ukraine: SME Support Services in
Priority Regions. EuropeAid/121495/C/SV/UA. Retrieved from:
http://economymk.gov.ua/download/books/ClusterHandbookUkr.pdf.
6. Khomenko, I.O. (2015). Metodolohichni osnovy klasteryzatsii
transportnoi haluzi, Kyiv: Condor-vydavnytstvo (in Ukrainian).
7. Khomenko, I.A. (2012). Orhanizatsiyno-ekonomichnyy mekhanizm
transportnykh klasteriv, Visnyk Chernihivskoho derzhavnoho
tekhnolohichnoho universytetu. Seriia “Economichni nauky”, no. 3
(60), pp. 143–149 (in Ukrainian).
8. Shkarlet, S.M., Ilchuk, V.P., Khomenko, I.A. (2014). Derzhavno-
pryvatne partnerstvo yak odyn z mekhanizmiv efektyvnoho
finansuvannia priorytetnykh proektiv dorozhnoi haluzi, Ekonomichnyi
prostir – Economic space, no. 89, pp. 93–103 (in Ukrainian).

306
CONCLUSION
In the context of global change one of which is the COVID-19
pandemic, the most important factor in ensuring the sustainable
functioning of economic entities is the introduction of new models of
economic systems management. Achieving sustainable functioning of
economic entities largely depends on the available resource potential,
its preservation and maintenance of value, expanded reproduction and
innovation ensure. Due to the changes in the market environment
caused by the pandemic, the theoretical foundations and methodology
of economic systems management need to be improved and
substantially supplemented. The problem is partly solved by the
introduction of modern information technology in the economic
systems management and the transition of individual economic entities
online, which have such an opportunity. For other economic entities,
digitalization has become an effective instrument for growth and
expanse of volumes of activity, which has formed a new model of
economic systems management.
The results of the author’s research in the collective monograph are
devoted to solving the problems of formation and implementation of
new models of economic systems management and mechanisms of
their implementation in modern global challenges based on strategic
management and making management decisions.
An important component of the collective monograph is the
developing of new models of innovation management, financial-credit
and investment ensuring, approaches to modeling socio-demographic
processes, directions of rationalization of marketing ensure for
economic systems management.
The results of the research presented in the collective monograph
reflect the theoretical and practical aspects of the implementation of
economic systems management mechanisms that ensure the
preservation of resource potential of economic entities in the current
perspective and the possibility of developing scenarios for its
development in the future, including in various sectors of the
economy.
It is established that ensuring the efficiency of economic systems
management in the current global challenges is based on improving the
management process of innovative economic entities.
307
Overcoming the crisis provoked by the COVID-19 pandemic and
creating conditions for preserving the resource potential of economic
entities require the developing and implementation of a balanced
economic policy aimed at economic systems managing in the country,
ensuring optimal use of resources on this basis. In a complex set of
priority changes one of the important places belongs to the rational
ratio of self-regulated and regulated levers functioning of economic
systems, the formation of a balance of interaction of market self-
regulation and the role of the state in ensuring favorable economic
conditions.
The current global scientific-technological, information, cyber and
environmental revolution require appropriate changes in the models of
economic systems management. Each economic entities, based on
available resources and capabilities, market conditions, should
developing its own model of economic activity management, which,
based on the latest global challenges and opportunities, would ensure
the preservation, efficient function and development in the future.
That is why we believe that the innovative model of economic
systems management in accordance with the current state of economic
entities and global challenges has no alternative among other models
of economic functioning (such as the model of traditional
development, the model of catching up, etc.). And only the transition
of economic systems to the model of conservation and progressive
development, in which the main source of economic growth will be
scientific knowledge, technological innovation and information, can
ensure the effective functioning of economic entities, create conditions
for solving socio-economic problems and challenges caused by the
COVID-19 pandemic.
The results of the study of world experience show that recent
history knows no example of the formation of a highly developed,
flexible, efficient functioning economy without a market, or a highly
efficient socially oriented market economy without a leading
regulatory role of the state. Therefore, the state should make efforts to
maximize the preservation of economic entities by providing
appropriate financial assistance, various social transfers and develop
public-private partnerships in the most attractive areas and directions
of economic activity. Such measures will promote the formation of
parity of state regulation of the economy and market self-regulation,
which will ultimately ensure effective management of economic
systems.
308
Effective management of economic systems requires financial-
credit support for the creation of new technologies, first of all, the
emergence of social innovations, the development of online
technologies and digitalization. In the context of globalization
challenges, dynamism of external and internal processes there is a
need for a fundamental understanding of the theory of management of
economic systems in the transition to the principles of conservation of
resource potential, formation of ecological systems and development
of theoretical-methodological provisions and methods of making
flexible management decisions.
The impact of the pandemic and the dynamism of the market
environment require the introduction of organizational-economic
measures by economic entities aimed at maintaining stability,
adaptability and flexibility of functioning. However, maintaining an
appropriate level of functioning of economic entities necessitates their
sustainable development, which can be defined as balanced
quantitative, structural and qualitative changes that meet the objectives
and take into account the constraints imposed by the external
environment and resource potential. Ensuring the effective functioning
of economic entities is possible only through the formation of an
appropriate management mechanism, which should be understood as
an integrated system of organically linked economic, organizational,
social, financial and other forms and methods of management, ways,
tools and levers of influence on the processes of functioning that meet
the parameters of the internal and external environment, restrictions
and conditions of economic activity. The creation of such a
mechanism should be based on the principles and methods of
developing and implementation of management decisions, certain
objects and subjects of development management, clearly defined
management functions, selected structural elements of the mechanism
and the peculiarities of their use.
The process of implementing economic systems management
models taking into account the available resource potential,
innovations and processes of transformation of economic entities
should be planned and managed in advance, which is possible to create
an optimal program of change. Its development should be based on the
parameters of changes in economic activity, certain options for
implementing the developed program and approaches to the
transformation, the proposed method of optimal use of resources for
the development program and taking into account the presented system

309
of constraints.
In general, the authors of the collective monograph are convinced
that in modern conditions the innovation and knowledge should be the
main factor in stabilizing the socio-economic state of economic
entities. Ensuring the sustainable functioning of economic systems will
help to form an appropriate science-innovation policy in accordance
with the strategy of preserving, maintaining and increasing the
resource potential of economic entities, which will gradually restore
business activity and normalize the economic situation in the pre-
pandemic period.

310

311
312
New trends in the economic systems
management in the context
of modern global challenges
Collective monograph
scientific edited by M. Bezpartochnyi
Format 60x84/16
Circulation: 200 copies
16,86 p.s.
VUZF Publishing House “St. Grigorii Bogoslov”
Sofia, 2020
ISBN 978-954-8590-85-3