Liverpool Superport Economic Trends Study - Knowsley Council
80
The Mersey Partnership: Liverpool Superport Economic Trends Study FINAL REPORT by MDS Transmodal Limited & Roger Tym & Partners Date: August 2009 Ref: 209006R2 final v2
-
Upload
khangminh22 -
Category
Documents
-
view
1 -
download
0
Transcript of Liverpool Superport Economic Trends Study - Knowsley Council

The Mersey Partnership:
Liverpool Superport Economic Trends
Study
FINAL REPORT
by
MDS Transmodal Limited & Roger Tym & Partners
Date: August 2009 Ref: 209006R2 final v2

Printed on 01/09/09 12:40 Our Ref: 209006r2 final v2-1
CONTENTS 1 INTRODUCTION Page 1 2 LIVERPOOL SUPERPORT Page 3 3 EVIDENCE BASE Page 8 4 STRATEGIC DEVELOPMENT
– S.W.O.T. ANALYSIS Page 41
5 SUPERPORT ACTION PLAN AND OUTCOMES Page 44 APPENDICES Page 64

The Mersey Partnership – Liverpool Superport Economic Trends Study Page 1
Printed on 01/09/09 12:40 Our Ref: 209006r2 final v2-1
1 INTRODUCTION 1.1 STUDY OBJECTIVES
MDS Transmodal (MDST) and Roger Tym and Partners (RTP) were commissioned by The Mersey Partnership (TMP) to complete a study with the following objectives:
• To collate the economic impacts of existing and planned key SuperPort infrastructure in a standardised form;
• To establish/strengthen the business case for proposed linkages into the ports and airport;
• To assess the infrastructure needed to support SuperPort growth; • To assess the interaction and relationship between SuperPort and key growth sectors
and regional priorities; • To define and quantify the key issues that could restrain SuperPort growth.
1.2 STUDY SCOPE
In terms of its geographic scope the study encompasses the ports, freight facilities and the airport located within the six local authorities in the Liverpool City Region, plus the port facilities at the entrance to the Manchester Ship Canal. However, this study also considers the potential impact of the Liverpool SuperPort concept on the rest of the North West, as well as the rest of the UK. The Liverpool SuperPort sits within two strategies with a wider geographic scope:
• The Ocean Gateway, which is Peel Holdings’ private sector-led long-term investment strategy for the North West along the River Mersey and Manchester Ship Canal corridor between Liverpool and Manchester;
• The Atlantic Gateway, which is an NWDA-led initiative that encompasses the development projects included in the Ocean Gateway, but includes other facilities and development sites within the same corridor.
The main emphasis in this study is on freight, given the international and national role of the Port of Liverpool and the amount of logistics activity that is generated in the sub-region. However, air passenger traffic through Liverpool John Lennon Airport (LJLA) and cruise and Irish Sea RoRo passenger traffic are also considered. The time horizon for the study is 2030.

The Mersey Partnership – Liverpool Superport Economic Trends Study Page 2
Printed on 01/09/09 12:40 Our Ref: 209006r2 final v2-1
1.3 STUDY STRUCTURE
Chapter 2 Liverpool SuperPort describes the SuperPort, the existing economic contribution it makes to the City Region and the potential contribution that the full development of the SuperPort could make to the Liverpool City Region and the North West region. Chapter 3 Evidence Base provides detailed support for the summary of the impacts included in Chapter 2. Chapter 4 Strategic Development – S.W.O.T. Analysis provides an assessment of the key opportunities and threats facing the shipping, aviation and logistics industries across the Liverpool City Region and how they relate to existing strengths and weaknesses. Chapter 5 SuperPort Action Plan sets out the nine action areas that partners and stakeholders should focus on to ensure delivery of the SuperPort.

The Mersey Partnership – Liverpool Superport Economic Trends Study Page 3
Printed on 01/09/09 12:40 Our Ref: 209006r2 final v2-1
2 LIVERPOOL SUPERPORT 2.1 DEFINITION OF THE SUPERPORT 2.1.1 The vision
A vision for the Liverpool SuperPort was originally set out in the Liverpool SuperPort prospectus, published in June 2008: “To bring together and integrate the strengths of the Ports, Airports and Freight Community to create a ‘SuperPort’ for freight and passenger operations within the Liverpool City Region that will become a key driver of its economy. It will create the most effective and cost efficient environment for freight cargo logistics and passenger transit in the UK. “ Liverpool SuperPort aims therefore to be a step change in City Region competitiveness. The focus of the Liverpool SuperPort is on the potential for high quality port, airport and intermodal freight facilities within the Liverpool City Region. It encompasses the ports, freight facilities and the airport located within the six local authorities in the Liverpool City Region, plus the port facilities at the mouth of the Manchester Ship Canal. However, this study also considers the potential impact of the Liverpool SuperPort concept on the rest of the North West, as well as the rest of the UK. The vision is market-driven – providing high quality facilities and services to generate additional traffic volumes, which help to justify additional private sector investment in the City Region. However, the public sector stakeholders involved in the Liverpool SuperPort have the objective of achieving wider public benefits – principally greater employment and prosperity in the City Region, allied with (wherever possible) reduced environmental impacts from the economic activity that is generated.
2.1.2 Markets and customers
The Liverpool SuperPort is focused on providing high quality, cost-effective services in two main markets:
• The freight market – for logistics companies, shipping lines, freight forwarders and shippers/receivers of freight located in or serving the Liverpool City Region, with cargo origins and destinations around the world.
• The passenger market – aviation, cruise and ferry services for overseas visitors to the City Region and its businesses and residents.

The Mersey Partnership – Liverpool Superport Economic Trends Study Page 4
Printed on 01/09/09 12:40 Our Ref: 209006r2 final v2-1
Although the main focus of the SuperPort may be on unitload/high value freight, the conventional/bulk freight market remains important, as the port facilities that handle these cargoes are key links in the transport chain between sources of raw materials and manufacturers located in the Liverpool City Region and the rest of the North West; in addition, the conventional/bulk traffics help to diversify the port facilities’ traffic portfolio. The existing facilities, as well as the planned facilities that will further develop the Liverpool SuperPort, are shown on the following map. Planned facilities are highlighted in green.

The Mersey Partnership – Liverpool Superport Economic Trends Study Page 5
Printed on 01/09/09 12:40 Our Ref: 209006r2 final v2-1
2.1.3 SuperPort facilities The Liverpool SuperPort is, in physical terms, a multi-modal transport network of facilities that uses common inland transport links (road, rail and inland waterway). This network can be summarised as follows: Summary of the Liverpool SuperPort multi-modal network of facilities Facility Relevant modes Role Traffic statistics Ownership Bromborough Maritime, with road
connections Short sea bulk port Included in Port of
Liverpool Victoria Group
Freightliner Liverpool Rail, with road connections
Regional intermodal rail freight terminal
Not published Freightliner Ltd.
Knowsley Rail Freight Terminal
Rail, with road connections
Regional intermodal rail freight terminal, with warehousing
Not published Potter Group
Liverpool John Lennon Airport (LJLA)
Air, with road connections
International airport 5.4m passengers & 3.6k tonnes of freight (2008)
Peel Airports
Manchester Ship Canal
Inland waterway, with rail & road connections
Inland waterway, with a range of docks and wharves for (mainly) short sea traffic
8.1m tonnes of freight (2007)
Mainly Peel Ports, but some port facilities are owned by other companies
Mersey Multimodal Gateway (3MG)
Rail, with road connections
Regional intermodal rail freight terminal, with warehousing
1.2 million tonnes of freight (2008)
Stobart Group
Port of Garston Maritime, with road connections
Short sea bulk port 0.5m tonnes of freight (2007)
Associated British Ports
Port of Liverpool (including port facilities in Birkenhead)
Maritime, with rail & road connections
Multi-purpose deep sea, short sea & Irish Sea ferry port
32.3m tonnes of freight; 173k ferry passengers (2007)
Peel Ports
Stock of large warehouses (>10,000m2)
Road & rail National & regional distribution centres
0.7 million m2 (3% of total stock in England & Wales)
Various
There is a significant degree of complementarity between these facilities in that collectively they generate the critical mass of traffic that allows the development of additional freight and passenger services for the SuperPort as a whole. However they also compete with each other and the degree of competition between the facilities in the Liverpool City Region is a key strength of the Liverpool SuperPort because it helps to maintain cost competitiveness and service quality, as well as foster innovation within the City Region for the SuperPort’s customers.
2.1.4 The strategic network links
The Liverpool SuperPort facilities are linked by common rail and road infrastructure within the Liverpool City Region, but much of the traffic to and from the SuperPort facilities is strategic in nature and is therefore reliant on the following national infrastructure:
• The West Coast Mainline (WCML), which is the main British rail freight artery, providing access for intermodal rail freight services with a generous loading gauge to the Midlands and London and to Scotland.

The Mersey Partnership – Liverpool Superport Economic Trends Study Page 6
Printed on 01/09/09 12:40 Our Ref: 209006r2 final v2-1
• The M6, which is the main north-south motorway route for freight in Great Britain; • The M62, which provides motorway access to the Yorkshire and East of England
markets across the Pennines. • The M53/M56 and the M57/M58 that provide access from the Wirral and North
Liverpool to the M6; • The Manchester Ship Canal, providing inland waterway access from the Mersey to
Greater Manchester.
2.2 THE EXISTING CONTRIBUTION OF THE SUPERPORT AND ITS GOALS Liverpool City Region already has a strong array of ports, airport and freight infrastructure that will provide the foundation for future SuperPort developments. As a whole, it is estimated that these assets currently contribute over 34,000 jobs and £1.1billion of GVA per annum to the City Region economy. The Liverpool SuperPort has five main goals:
• To increase productivity/economies of scale; • Market creation and development; • To stimulate new investment; • To enhance existing stakeholder engagement; • To promote innovation and the environmental agenda.
2.3 POTENTIAL FUTURE CONTRIBUTION
Without SuperPort the Liverpool City Region should be able to continue to operate successful port and airport facilities. However, when SuperPort comes to fruition the transformational impact on the economy will be highly significant:
• Up to an additional 28,000 jobs for the local and regional economy; • Additional GVA of up to £0.9 billion per annum; • An additional 73 million tonnes of traffic per annum handled by facilities in the
Liverpool City Region, most of which would otherwise have been handled in other UK regions;
• An additional 1.24 million tonnes of rail freight traffic per annum through the Port of Liverpool;
• An additional 9 million tonnes per annum of rail freight through rail and waterborne-linked distribution parks.

The Mersey Partnership – Liverpool Superport Economic Trends Study Page 7
Printed on 01/09/09 12:40 Our Ref: 209006r2 final v2-1
2.4 SUPERPORT PIPELINE PROJECTS
There are a number of projects that have the potential to position the Liverpool City Region as the most competitive logistics and passenger transport cluster in the UK, including the following: Estimated Additional Jobs Estimated Additional GVA p.a. Post-Panamax container terminal 3,000 £100M Extension to 3MG (Halton) 1,145 £38M Parkside Rail-connected Distribution Park 10,702 £360M Extension to Liverpool John Lennon Airport 6,360 £211M Port Weston 480 £16M Mersey Gateway 4,640 £155M Port Wirral 1,600 £53M Langton Riverside RoRo Terminal 208 £7M

The Mersey Partnership – Liverpool Superport Economic Trends Study Page 8
Printed on 01/09/09 12:40 Our Ref: 209006r2 final v2-1
3 EVIDENCE BASE 3.1 INTRODUCTION
This chapter provides detailed support for the summary of the impacts included in Chapter 2 and provides the detailed analysis of the existing economic contribution of the SuperPort and its position in key markets.
3.2 ECONOMIC IMPACTS 3.2.1 Planning & economic development policy
Table 3.1a-e provide a summary of planning and economic development policy at a regional level (Table 3.1a), at a sub-regional level (Table 3.1b) and at a local level (Tables 3.1 c-e), setting out their relevance to the development of the Liverpool SuperPort.
Table 3.1a: Planning and economic development policy – regional policy Policy document Key issues Relevance to SuperPort Regional Strategy RS2010 Principles and Issues Paper
Integrating the North West into the European and wider world economy.
The ability of the region to compete in world markets is heavily dependent on the competitiveness of its infrastructure.
North West Regional Economic Strategy 2006 (“The RES”)
Support for the development of airports and ports to aid sustainable growth. Action points 28, and 72-76 relate specifically to the development of ports and airports and the thrust of these action points is to assist their development.
The Port of Liverpool is identified as a key strength of the region, and is highlighted as a growth opportunity. Action point 73 states: “Grow the Port of Liverpool (including Birkenhead). In support, deliver deep-water facilities, related development and transport links… Liverpool Port provides a global gateway for the regional and national economy and is well placed to benefit from the expansion of world trade, reducing reliance on congested southern ports.”
North West Regional Spatial Strategy 2008
Supports development of the port, rail and airport infrastructure.
Policy RT5 Airports states that plans and strategies should support the economic activity generated and sustained by the region’s airports, including LJLA as a key economic driver for the Liverpool City Region. Policy RT6 recommends optimising the use of ports and assets for trade and leisure, in particular the Port of Liverpool and the Manchester Ship Canal. Policy RT7 supports promotion of the Regional Freight Strategy, including the promotion of a shift from road-based transport. Policy RT8 supports the promotion of shift from road to rail and water based transport and identifying inter-modal freight terminals.

The Mersey Partnership – Liverpool Superport Economic Trends Study Page 9
Printed on 01/09/09 12:40 Our Ref: 209006r2 final v2-1
Table 3.1b: Planning and economic development policy – City Region Policy document Key issues Relevance to SuperPort Liverpool City Region Multi Area Agreement (MAA)
The MAA contains four ‘transformational ideas,’ which are activities under development with an intention to develop the policies. The SuperPort forms one of these transformational ideas.
The SuperPort can “become a leading example of technical and service innovation, harnessing the potential of its supply chains”, aiming to become a global destination, transhipment hub of choice and pioneer of sustainability. The SuperPort is highlighted as a key driver for inward investment. It is acknowledged that a joint vision, utilisation of a wider set of assets, alignment of private sector investment and channelling of public sector investment will be required for delivering the SuperPort.
Table 3.1c: Planning and economic development policy – Liverpool & Sefton Policy document Key issues Relevance to SuperPort Liverpool 2024 A Thriving International City, 2008
John Lennon Airport and some port facilities are located within the Liverpool City boundary.
Developing a well-connected and competitive city region has been identified as a strategic priority for the city.
Liverpool Unitary Development Plan, 2003, and Saved Policies, 2007
Supports both the continuing revival in the fortunes of the Port and major expansion of operations at the Airport, provided that concerns in respect of heritage and environmental protection, nature conservation and surface transportation/traffic impact, can be satisfactorily resolved.
Policy E3 “The City Council will support the continued growth and development of both the Port of Liverpool and Garston Port…” and Policy E4 “Airport Development expansion and development supported.”
Sefton Community Strategy: A Vision for Sefton, 2006-2011
Most of Liverpool Docks are within the southwest area of Sefton. Emphasis on the importance of the docks as a current and future employer. Possible negative impacts of high volumes of port activity currently dependent on limited infrastructure.
Suggests work is required to reduce the negative impact of further freight traffic between the motorway network and the Liverpool Docks, which could hinder the further development of the Port. Identifies need to strengthen and improve transport links especially to Liverpool Docks, the south and west access routes to Southport and public transport links to rural areas.
Sefton Unitary Development Plan, Written Statement, 2006
Contains a number of entries relating directly to the port and movement of freight. In particular there is an emphasis on rail and support for future development:
Policy EDT9: “Development generating large movements of freight should wherever practicable be served by a direct rail link”; and …“The docks have high-capacity rail freight facilities and enjoy good access to the strategic highway network. This gives them unique locational advantages on which future development should capitalise.”

The Mersey Partnership – Liverpool Superport Economic Trends Study Page 10
Printed on 01/09/09 12:40 Our Ref: 209006r2 final v2-1
Table 3.1d: Planning and economic development policy – Wirral & Halton Policy document Key issues Relevance to SuperPort Wirral MBC Core Strategy Development Plan Sustainability Appraisal
Birkenhead Docks on the Wirral side of the Mersey form a significant proportion of the existing SuperPort infrastructure and the docks are recognised as key employment assets.
The development of the port and freight handling are both recognised as important drivers of growth.
Wirral’s Future – Open to All: An Investment Strategy for Wirral
Emphasises the importance of the maritime sector as a whole.
The Birkenhead Docks and transport infrastructure and the Wirral Docklands and Woodside are identified as priority projects.
Wirral Employment and Enterprise Investment Framework
Priority two of the District’s Investment Framework is to “Create the Right Environment and Infrastructure for Business to Thrive”, including the sub point to “Deliver the designated Strategic Regional Sites as regional investment sites, knowledge nuclei or intermodal freight terminals.”
Halton Unitary Development Plan (Adopted 2005)
In addition to hosting dock facilities at the mouth of the Mersey, the Halton boundary is next to LJLA and, most significantly, includes 3MG. The district’s planning and economic development documents highlight the importance of these facilities in contributing to the success of the local economy. 3MG has an on-site intermodal rail freight terminal and distribution centres and is undergoing the first phase of expansion of its Widnes site. The distribution facilities are being expanded and it is anticipated that these will be a substantial source of employment for Halton.
Supports new development at employment areas or development sites which use the facilities for transportation of goods (Policy TP13) and surface access improvements to Liverpool Airport (Policy TP20). Support for the development of the new Mersey Crossing (Policy S14).
Halton BC’s Emerging Core Strategy Documents 1 and 2, Issues and Options, 2006
Preference for development to be located so as not to present undue risks to the potential occupants or impact on the safe operation of Liverpool John Lennon Airport. However, the document also mentions LJLA’s proximity to green belt land. The Masterplan for the Airport states “Such land would only be released from its Green Belt designation in the development plan in exceptional circumstances or planning permission granted on it for inappropriate development, including airport related development, in very special circumstances.” Halton Borough Council are not planning to review their Green Belt boundaries until the Merseyside-wide review scheduled for 2011.

The Mersey Partnership – Liverpool Superport Economic Trends Study Page 11
Printed on 01/09/09 12:40 Our Ref: 209006r2 final v2-1
Table 3.1e: Planning and economic development policy – Wirral & Halton Policy document Key issues Relevance to SuperPort Mersey Gateway Regeneration Strategy, 2008
Recognises the Mersey Gateway as the “next phase of regeneration activity for Halton - combining the requirements for a major infrastructure project with the physical and socio-economic regeneration of those areas directly affected.”
Focuses in part on the importance of being well connected. “The strategic aim to be ‘well connected’ seeks to maximise the benefits of the common ownership of the Port and John Lennon Airport, and the supply chain hinterland, serving the North of England”.
Knowsley Replacement Development Plan, Adopted 2006 Eastern access road transport corridor
Knowsley borders Liverpool City to the east, and although neither the docks nor airport are within the Authority, the area is host to logistics centres serving both facilities and includes the Knowsley Rail Freight Terminal and the eastern access road to LJLA.
Projects in support of the airport are welcomed (Policy T1), and Policy T12 states: “Any development that would or could adversely affect the operational integrity or safety of Liverpool John Lennon Airport will not be permitted.”
Knowsley Development Guide, 2005
Liverpool John Lennon Airport is listed as a key Asset (1 of 4), and strengthening links to South Liverpool and John Lennon Airport is a development priority.
St. Helens City Growth Strategy, 2008-2016
The SuperPort concept offers an opportunity to improve the strength of the wider Liverpool economy of which St. Helens is a part. Being geographically further from the docks and airport, the district will host less of the physical infrastructure directly linked to the SuperPort.
Parkside rail-connected distribution park is listed as a Key Project.
3.2.2 The SuperPort as a cluster 3.2.2.1 Benefits of clustering
Companies choose to cluster in a particular location as they can benefit from having a dense, geographically close network of suppliers and customers. Such benefits can include labour market pooling, supplier specialisation, knowledge spillovers, entrepreneurship, developing local demand, locking-in investment to a location and development of cultural relationships1. Clustering can occur between linked industries, distribution channels and customers, companies related by skills or technologies and/or related institutions such as research organisations and/or universities.
3.2.2.2 Clustering and the Liverpool SuperPort
Clustering already takes place in the Liverpool City Region where, because of a strong tradition as a mercantile maritime city, companies in the four key maritime sub-sectors of shipping/ports, maritime services, marine engineering and distribution/logistics are co-located and/or their activity is interdependent. This, in turn, has encouraged inward investment of major maritime companies, including shipping lines, which now have their HQ or UK HQ based in Liverpool.
1 Cortright, J (2006) Making Sense of Clusters: Regional Competitiveness and Economic Development. Brookings Institution Metropolitan Policy Program.

The Mersey Partnership – Liverpool Superport Economic Trends Study Page 12
Printed on 01/09/09 12:40 Our Ref: 209006r2 final v2-1
Maritime cluster activity in Liverpool was recognised in 2003 with the formation of Mersey Maritime, which helps to promote, develop and support the 1,700 maritime companies in the City Region that employ 28,000 staff2 with an annual turnover of £2.5 billion. Mersey Maritime acts as an umbrella organisation for its members and stakeholders, delivering key actions around four themes: business development, communications, infrastructure and skills.
The SuperPort has the potential to encourage certain types of firms to locate in the City Region. Such firms include those in the freight supply chain, such as freight forwarding, cargo and warehousing companies, logistics companies, as well as those in ‘back office’ operations, such as shipping agencies, insurance and maritime law. Several consultees mentioned the potential for the Liverpool SuperPort to bring clustering benefits to the City Region. These benefits include an increase in the number of businesses that would be developed in or attracted to the area by the development of the post-panamax terminal, such as handlers, contractors and businesses in the supply chain. Other consultees mentioned the possibility of the development of a logistics cluster resulting through the development of SuperPort infrastructure. Singapore was mentioned by some consultees and was included in the Liverpool SuperPort prospectus as an example of a successful cluster development. Singapore’s maritime industry cluster contributes to around 7% of Singapore’s GDP, employing over 96,000 people in more than 5,000 establishments. This includes shipping and port related sectors, offshore, shipbuilding and repair and services such as finance, insurance and legal services3. The Maritime and Port Authority of Singapore aims to develop its maritime cluster by: attracting a critical mass of key industry players through investment in R&D; developing Singapore as a centre of learning by establishing new R&D facilities; and promoting Singapore through Singapore Maritime Week (attracting over 13,000 participants in 2009)4.
3.2.3 Baseline economic impact 3.2.3.1 Introduction
In this section we estimate the impact of development of the Liverpool City Region transport assets on the regional economy. However to establish the context of these impacts we firstly provide a baseline profile of the sub region’s transport assets, focusing on the number of jobs they support and the GVA.
3.2.3.2 Local economic profile
According to the latest available government statistics, across the Liverpool City Region authorities there are approximately 593,100 jobs and approximately 40% of these jobs are in the City of Liverpool. In terms of sector split, the data shows that across the Liverpool City Region authorities, Distribution, Retail, Hotels and Restaurants and Public Administration,
2 The Mersey Partnership Evaluation Report (Spring 2009) 3 Source: www.maritimecareers.com.sg, building on The Maritime and Port Authority of Singapore 4 Source: Singapore is prepared to ride out the storm, The Business Times, 20 May 2009

The Mersey Partnership – Liverpool Superport Economic Trends Study Page 13
Printed on 01/09/09 12:40 Our Ref: 209006r2 final v2-1
Education and Health are the largest sectors and on average account for between a quarter and a third of all jobs. Transport and Communication across the districts accounts for 6% of all jobs, and this proportion is higher in both Halton (12%) and St Helens (11%).
Figure 3.1: Broad sector employment, Liverpool City Region, 2007 Source: Annual Business Inquiry
Looking in more detail at the transport related and other supporting activities, Table 3.2 overleaf shows the number of jobs and the location quotient (LQ)5 for each of these sectors across the Liverpool City Region authorities.
5 The LQ measures how well represented a sector is in an area compared to the national economy. It equals the sector’s share of the area’s total employment divided by the sector’s share of Great Britain’s employment. An LQ equal to 1 indicates that the sector’s representation in the area is average. If the LQ is above 1, the sector has a higher than average representation in the area; if it is lower than 1, the sector has a lower than average representation in the area.
0%
10%
20%
30%
40%
50%
60%
70%
80%
90%
100%
% t
otal
em
ploy
men
t
Halton
Knowsle
y
Liverp
ool
Sefton
St Helen
sWirra
l
Mersey
side
NW GB
Agriculture & fishing Energy & waterManufacturing Construction Distribution, retail, hotels & restaurants Transport & commsFBS Public admin,education & health Other services

The Mersey Partnership – Liverpool Superport Economic Trends Study Page 14
Printed on 01/09/09 12:40 Our Ref: 209006r2 final v2-1
Table 3.2 shows that within the Liverpool City Region there is a higher than average representation in five of the 10 transport and other supporting sectors: Freight by Road, Inland Water Transport, Storage and Warehousing, Other Supporting Land Transport Activities and Activities of Other Transport Agencies. Looking at the individual districts, Halton and St Helens have a high number of jobs and have higher than average representation in warehousing and distribution activities. Liverpool, likewise, has a relatively higher number of jobs and has higher than average representation in Other Supporting Land Transport Activities and Activities of Other Transport Agencies – which includes freight forwarder agencies.
Table 3.2: LQ and Jobs in Transport and other supporting sectors, Liverpool City Region, 2007 Halton Knowsley Liverpool Sefton St Helens Wirral Merseyside
SIC Code (2003) No LQ No LQ No LQ No LQ No LQ No LQ No LQ
6024 : Freight transport by road 2,738 5.0 1,118 2.0 617 0.3 486 0.5 3,050 4.8 299 0.3 8,308 1.4 6110 : Sea and coastal water transport 5 0.2 2 0.1 226 1.8 33 0.6 2 0.1 0 0.0 268 0.8 6120 : Inland water transport 7 2.3 0 0.0 3 0.2 1 0.2 0 0.0 93 17.0 104 3.1 6210 : Scheduled air transport 0 0.0 0 0.0 486 0.8 0 0.0 0 0.0 1 0.0 487 0.3 6220 : Non-scheduled air transport 1 0.0 0 0.0 128 0.8 0 0.0 0 0.0 1 0.0 130 0.3 6311 : Cargo handling 19 1.2 7 0.4 54 0.8 12 0.4 0 0.0 3 0.1 95 0.5 6312 : Storage and warehousing 433 1.6 407 1.4 477 0.4 219 0.5 1,736 5.4 309 0.6 3,581 1.2 6321 : Other supporting land transport activities 23 0.2 4 0.0 2,095 3.3 36 0.1 149 0.9 144 0.5 2,451 1.5 6340 : Activities of other transport agencies 55 0.4 116 0.9 1,317 2.6 230 1.1 147 1.0 97 0.4 1,962 1.5 6720 : Activities auxiliary to insurance and pension funding 230 0.8 112 0.4 1,426 1.2 470 0.9 63 0.2 263 0.5 2,564 0.8 Total Transport 3,511 2.2 1,766 1.1 6,829 1.0 1,487 0.5 5,147 2.8 1,210 0.4 19,950 1.1
3.2.3.3 Review of information relating to the impact of SuperPort facilities
In order to analyse the importance of the various transport schemes in terms of jobs generated within the current economic structure of the Liverpool City Region, we draw upon existing documents to ascertain their economic value to the sub regional economy. However, for some of the transport schemes existing economic impact studies are not available so we have applied “ready reckoner” multipliers, as set out in English Partnerships’ ‘Additionality Guidance,’ to ascertain the number of indirect and induced jobs each transport scheme supports.
For all existing facilities and pipeline projects, we estimate jobs created by sector and occupations. As well as jobs, we have also calculated the Gross Value Added (GVA) for each facility or pipeline project. This is the value of each facility or scheme as it reflects profits, salaries and investment. It is the net value of revenue after allowing for supply inputs. Based on GVA values in the 2006 UK Blue Book, grossed up to 2008, we have assumed each service sector job generates some £33,000 in GVA. The job-creation estimates are very broad-brush estimates of economic impacts. Firstly, there is no estimate included for leakage, which is an estimate of the proportion of outputs

The Mersey Partnership – Liverpool Superport Economic Trends Study Page 15
Printed on 01/09/09 12:40 Our Ref: 209006r2 final v2-1
(jobs) benefiting those outside the intervention’s target area. However, given the target area for the impacts is at least at a regional level, we estimate leakage to be minimal and do not include any calculations to estimate leakage effects. Secondly, there is no estimate included for displacement. Displacement is an estimate of the impact of the intervention taking market share from other existing local firms or organisations. Again, as we are considering the impacts at the regional level, the degree of displacement is unlikely to be significant. Thirdly, when the total impact of the schemes is considered, there is no account taken of the potential overlap between different infrastructure schemes in considering the jobs created through the multiplier. For example, off-site impacts of the airport (such as related cargo, freight forwarding and logistics jobs) will be counted as on-site impacts at 3MG. This is not accounted for in our figures, again resulting in an over-estimate of the impacts. It is therefore important that the figures set out below are not used out of context. They provide a good estimate of direct job impacts from the individual development schemes and for each individual project they are a reasonable estimate of impacts through the multiplier. However, it may be misleading to quote the total figures when including the total jobs, as leakage and displacement factors have not been applied and there will be some element of double-counting across the region.
3.2.3.4 Maritime Sector in the Liverpool City Region
A recent study by Fisher Associates analysed the contribution of the maritime sector to the Liverpool City Region economy. The study took a broad definition of port related activities and based its methodology on questionnaires and interviews with businesses located in the Liverpool City Region that are involved in maritime activities. In terms of total impact, this study concluded that the maritime sector generated an estimated £913 m for the Liverpool City Region economy in 2004/05. £710 m is direct GVA – wealth created due to firms directly involved in this sector – and £203m is indirect or induced – wealth generated due to an initial investment injection into the maritime sector. Based on this GVA, the study estimated the maritime sector accounts for around 5%-5.5% of the City Region’s GVA, which makes the sector as important as construction. In terms of jobs, the maritime sector generates a total of 26,440 FTE jobs, 20,540 of which are directly related to the port and 5,900 jobs are indirect/induced jobs. The study provides a sector breakdown of these total jobs and most are in the transport and communications sector with very few jobs in other sectors. However given the scale of the maritime sector in the Liverpool City Region we would expect it to provide a greater number of jobs across the various sectors. Consequently we have derived our own version of the sector breakdown of these jobs by firstly converting these FTE jobs into total jobs and then applying sector specific input output multipliers (Table 3.3).

The Mersey Partnership – Liverpool Superport Economic Trends Study Page 16
Printed on 01/09/09 12:40 Our Ref: 209006r2 final v2-1
Table 3.3: Sector breakdown of maritime jobs
Jobs %
Agriculture 51 0%
Mining and quarrying 73 0%
Manufacturing 1,125 4%
Electricity, gas and water supply 163 1%
Construction 166 1%
Wholesale & retail trade 417 1%
Transport and communications 25,023 85%
Financial intermediation 2,129 7%
Public administration 24 0%
Education, health and social work 95 0%
Other services 114 0%
Total Jobs 29,379 100%
Table 3.3 shows that 85% of total jobs are in transport and communications. Of the other sectors 2,130 jobs are in financial intermediation, 1,130 jobs are in manufacturing and the other sectors account for less than 200 jobs each. Table 3.4 shows that maritime jobs require workers with a diverse range of skills, as employment opportunities are across the various occupation groups. Just under half of all jobs are in the low skilled categories of process, plant and machine operatives and elementary occupations. The next largest occupation category is managers and senior officials, which accounts for close to a fifth of all jobs.
Table 3.4: Occupation breakdown of maritime jobs
Jobs %
Managers and Senior Officials 5,046 17%
Professional Occupations 1,164 4%
Associate Prof & Tech Occupations 2,650 9%
Administrative and Secretarial Occupations 3,833 13%
Skilled Trades Occupations 1,280 4%
Personal Service Occupations 1,048 4%
Sales and Customer Service Occupations 1,945 7%
Process, Plant and Machine Operatives 5,872 20%
Elementary occupations 6,542 22%
Totals 29,379 100%
3.2.3.5 Liverpool John Lennon Airport
Liverpool John Lennon Airport (LJLA) is one of the fastest growing airports with a throughput of about 5 million passengers per annum. The Liverpool John Lennon Airport Master Plan sets in context the airport’s current role in the local and regional economy and outlines its

The Mersey Partnership – Liverpool Superport Economic Trends Study Page 17
Printed on 01/09/09 12:40 Our Ref: 209006r2 final v2-1
plans for growth to 2030, incorporating the expansion of both passenger and cargo facilities and an extension to the runway. Based on the airport’s recent employment survey, there are approximately 2,150 direct on- site jobs and an additional 200 direct off-site jobs. The Master Plan estimates an indirect and induced multiplier factor for the Liverpool City Region of 0.3, thereby producing an additional 700 jobs. Thus in total the survey estimates the total impact of the airport in employment terms is approximately 3,050 jobs. Translating these jobs into broad sectors, we estimate most of the jobs – approximately 2,590 jobs - are in transport and communications. The next largest is financial intermediation and manufacturing, accounting for 230 jobs and 120 jobs respectively. In each of the other sectors employment is less than 50 jobs.
Table 3.5: Sector split of direct, indirect and induced jobs at LJLA
Jobs %
Agriculture 5 0%
Mining and quarrying 8 0%
Manufacturing 120 4%
Electricity, gas and water supply 17 1%
Construction 18 1%
Wholesale & retail trade 45 1%
Transport and communication 2,585 85%
Financial intermediation 227 7%
Public administration 3 0%
Education, health and social work 10 0%
Other services 12 0% Total Jobs 3,050 100%
Apportioning these sector jobs into the various occupational categories, we estimate the airport provides employment across all occupational categories. Around a half of the airports jobs are in the low skilled occupations, a third of all jobs are in the medium skill occupation categories and the remaining 20% are in high skilled occupation groups.

The Mersey Partnership – Liverpool Superport Economic Trends Study Page 18
Printed on 01/09/09 12:40 Our Ref: 209006r2 final v2-1
Table 3.6 Occupational breakdown of LJLA jobs Jobs %
Managers and Senior Officials 366 12%
Professional Occupations 165 5%
Associate Prof & Tech Occupations 161 5%
Administrative and Secretarial Occupations 363 12%
Skilled Trades Occupations 282 9%
Personal Service Occupations 79 3%
Sales and Customer Service Occupations 271 9%
Process, Plant and Machine Operatives 904 30%
Elementary occupations 461 15%
Totals 3,050 100%
To estimate the GVA we apply an average GVA per job of £33,300; this produces a total GVA impact of £101.6m.
3.2.3.6 Mersey Multi Modal Gateway (3MG)
This is a major rail freight distribution park in Widnes, which provides rail-connected distribution centres and an on-site intermodal rail freight terminal. The terminal handles approximately 60,000 containers per annum between road and rail and currently there are 750,000 sq ft of existing distribution sheds, with outline consent for a total of 1.8m sq ft of new buildings, rising eventually to 3.5m sq ft. No economic impact studies have been undertaken for this development, so to estimate the number of direct jobs the facility supports we have applied standard floor space/worker ratios6. As the terminal accommodates large strategic warehouses we have used a ratio of 90 sq m per worker. Applying this ratio we have calculated that the terminal supports approximately 770 direct jobs. Applying a GVA of £33,300 per worker, we estimate the distribution park generates GVA for the economy of approximately of £25.8m.
To calculate the indirect and induced impact of the terminal we apply EP’s “ready reckoner” multipliers for B2/B8 projects to the direct number of jobs. This produces a further 340 jobs for the region. Applying a GVA of £33,300 we estimate the indirect and induced impact is £11.34m regionally.
6 These densities and plot ratio are taken from a 1997 study by Roger Tym & Partners for SERPLAN (Roger Tym & Partners for SERPLAN, The Use of Business Space: Employment Densities and Working Practices in South East England, 1997). The government’s recent Guidance Note on Employment Land Reviews commends these figures, noting that the RTP study ‘remains one of the most comprehensive data sources for London and the South East’. There are no such studies for other regions.

The Mersey Partnership – Liverpool Superport Economic Trends Study Page 19
Printed on 01/09/09 12:40 Our Ref: 209006r2 final v2-1
Table 3.7 below shows the sector split of all jobs, direct, indirect and induced. As expected, 8 out of 10 jobs generated from the terminal - approximately 890 jobs - are in Transport and Communications. However we estimate the terminal also supports around 110 financial intermediation jobs and approximately 60 manufacturing jobs.
Table 3.7: Sector split of total jobs at 3MG
Total Jobs %
Agriculture 3 0%
Mining and quarrying 4 0%
Manufacturing 58 5%
Electricity, gas and water supply 8 1%
Construction 9 1%
Wholesale & retail trade 22 2%
Transport and communication 888 80%
Financial intermediation 111 10%
Public administration 1 0%
Education, health and social work 5 0%
Other services 6 1%
Total Jobs 1,115 100%
We have separated these sector jobs into occupational categories, based on the regional averages for industrial and occupational breakdowns. Table 3.8 shows 40% of the total jobs are in the two low skilled occupations. Of the remaining jobs, 190 jobs are in high skilled managers and senior official, 150 jobs are in administrative and secretarial and the other occupation categories are small as they account for less than 110 jobs.
Table 3.8: Occupational breakdown of 3MG jobs
Jobs %
Managers and Senior Officials 188 17%
Professional Occupations 52 5%
Associate Prof & Tech Occupations 105 9%
Administrative and Secretarial Occupations 146 13%
Skilled Trades Occupations 54 5%
Personal Service Occupations 42 4%
Sales and Customer Service Occupations 76 7%
Process, Plant and Machine Operatives 214 19%
Elementary occupations 237 21%
Totals 1,115 100%

The Mersey Partnership – Liverpool Superport Economic Trends Study Page 20
Printed on 01/09/09 12:40 Our Ref: 209006r2 final v2-1
3.2.3.7 Knowsley Rail Freight Terminal The Potter Group’s Knowsley Rail Freight Terminal provides 15,500 sq m of insulated warehouse space as well as an on-site intermodal rail freight terminal. No economic assessment studies have been undertaken so, based on the size of the distribution centre and using floorspace to worker density as specified above, we estimate the current direct number of jobs at the terminal is approximately 170 jobs. The indirect and induced impact is approximately 80 jobs regionally, producing a total impact of 250 jobs for the region. Translating these to GVA, based on our estimate of £33,300 per job, this equates to a direct impact of £5.74 m and an indirect and induced impact of £2.52m regionally.
Table 3.9 below provides a sector breakdown of these freight terminal jobs. Transport and Communication is the largest sector, accounting for 8 out 10 jobs. Of the remaining sectors, employment in each of these is small, at less than 30 jobs. Table 3.9: Sector split of jobs from Knowsley Rail Freight Terminal
Jobs %
Agriculture 1 0%
Mining and quarrying 1 0%
Manufacturing 13 5%
Electricity, gas and water supply 2 1%
Construction 2 1%
Wholesale & retail trade 5 2%
Transport and communication 198 80%
Financial intermediation 25 10%
Public administration 0 0%
Education, health and social work 1 0%
Other services 1 1%
Total Jobs 248 100%
Separating these sector jobs into occupational categories, Table 3.10 shows 4 out of 10 jobs are in the low skilled occupations. Of the remaining jobs, these are evenly split between the high and medium skilled occupations categories.

The Mersey Partnership – Liverpool Superport Economic Trends Study Page 21
Printed on 01/09/09 12:40 Our Ref: 209006r2 final v2-1
Table 3.10 Occupation breakdown of jobs from Knowsley Rail Freight Terminal Jobs %
Managers and Senior Officials 42 17%
Professional Occupations 12 5%
Associate Prof & Tech Occupations 23 9%
Administrative and Secretarial Occupations 32 13%
Skilled Trades Occupations 12 5%
Personal Service Occupations 9 4%
Sales and Customer Service Occupations 17 7%
Process, Plant and Machine Operatives 48 19%
Elementary occupations 53 21%
Totals 248 100%
3.2.3.8 Freightliner Garston
Freightliner’s Terminal at Garston is an intermodal rail freight terminal that receives and dispatches maritime container trains to and from major deep sea container ports such as Felixstowe and Southampton. Containers are loaded and unloaded at the terminal, sometimes stored for a short period of time and then transported by road to/from their origin/destination in the Liverpool City Region.
Unfortunately no economic impact studies have been undertaken and based on industry sources, we estimate that the number of jobs supported is about 100 direct jobs. Applying EP multipliers we estimate the indirect and induced jobs provided by the scheme is approximately 44 jobs. Therefore the total impact of the scheme is that the terminal supports 144 jobs regionally, which equates to a GVA of £4.80 m. Apportioning these jobs by sector and occupation, we estimate that 115 of the jobs are in Transport and Communication. All other sectors are small and no single sector accounts for more than 14 jobs.

The Mersey Partnership – Liverpool Superport Economic Trends Study Page 22
Printed on 01/09/09 12:40 Our Ref: 209006r2 final v2-1
Table 3.11: Sector split of jobs from Freightliner Garston Jobs %
Agriculture 0 0%
Mining and quarrying 0 0%
Manufacturing 8 5%
Electricity, gas and water supply 1 1%
Construction 1 1%
Wholesale & retail trade 3 2%
Transport and communication 115 80%
Financial intermediation 14 10%
Public administration 0 0%
Education, health and social work 1 0%
Other services 1 1% Total Jobs 144 100%
Apportioning these sector jobs by occupations, we estimate about 60 jobs will be in the two low skilled categories and around 45 jobs each will be in the mid and high skilled occupations. . Table 3.12: Occupation split of jobs from Freightliner Garston
Jobs %
Managers and Senior Officials 24 17%
Professional Occupations 7 5%
Associate Prof & Tech Occupations 14 9%
Administrative and Secretarial Occupations 19 13%
Skilled Trades Occupations 7 5%
Personal Service Occupations 5 4%
Sales and Customer Service Occupations 10 7%
Process, Plant and Machine Operatives 28 19%
Elementary occupations 31 21%
Total 144 100%

The Mersey Partnership – Liverpool Superport Economic Trends Study Page 23
Printed on 01/09/09 12:40 Our Ref: 209006r2 final v2-1
3.2.3.9 Summary of impacts of existing SuperPort facilities
Below we summarise the total impacts of each of the facilities across the region. Table 3.13: Summary of Impact Jobs and GVA
Existing Impact Schemes Jobs GVA, £
Maritime 29,379 978,320,700
LJLA 3,050 101,565,000
3MG 1,115 37,122,840
Knowlsey Freight Terminal 248 8,258,400
Garston Freight Terminal 144 8,795,200
Total 33,936 1,130,062,140
As Table 3.13 above shows7, our estimate of the economic value of the existing transport schemes for the North West region is that they support approximately 34,000 jobs and generates a GVA regionally of £1.13 bn. In terms of a sector breakdown, based on the input output method Table 3.14 shows that of jobs supported by the various transport schemes support, 28,808 jobs are in the transport and communications sector. Of the remaining sectors most notable is financial intermediation, which provides 2,506 jobs, and manufacturing, which provides 1,325. Table 3.14: Sector breakdown of transport scheme jobs
Jobs %
Agriculture 60 0%
Mining and quarrying 86 0%
Manufacturing 1,325 4%
Electricity, gas and water supply 192 1%
Construction 195 1%
Wholesale & retail trade 491 1%
Transport and communication 28,808 85%
Financial intermediation 2,506 7%
Public administration 28 0%
Education, health and social work 112 0%
Other services 134 0%
Total Jobs 33,936 100%
7 To calculate GVA for the maritime sector we applied our GVA per employ figure of £33,300. This is slightly different from the figure shown in the Mersey Maritime Economic Impact study, which assumes FTE jobs supported is 26,441 and GVA is £34,600

The Mersey Partnership – Liverpool Superport Economic Trends Study Page 24
Printed on 01/09/09 12:40 Our Ref: 209006r2 final v2-1
Table 3.15 apportions these sector jobs into occupational categories.
Table 3.15: Occupational breakdown of transport scheme jobs Jobs %
Managers and Senior Officials 5,665 17%
Professional Occupations 1,400 2%
Associate Prof & Tech Occupations 2,935 9%
Administrative and Secretarial Occupations 4,392 13%
Skilled Trades Occupations 1,635 5%
Personal Service Occupations 1,184 3%
Sales and Customer Service Occupations 2,318 7%
Process, Plant and Machine Operatives 7,065 21%
Elementary occupations 7,323 224%
Total Jobs 33,936 100%
Marrying the occupational categories to skill levels8, Table 3.15 shows employment across the various occupational categories is evenly split, emphasising that the existing facilities provide employment for residents of all skill levels. Looking at the existing skills set of residents in the Liverpool City Region and comparing these with jobs that the various facilities support across the region, Figure 3.2 shows that in the City Region, approximately 55% of residents are qualified to NVQ level 2 – equivalent to 5 GCSE’s A-C level - slightly above the regional and national average of 49% and 45% respectively. Conversely 22% of residents have an NVQ level 4/5 – at least one degree – which is less than the regional and national averages of 25% and 28% respectively.
8 Managers and senior officials, professional and associate and technical occupations are classified as ‘high skilled occupations’ and process, plant and machine operatives and elementary occupations are classified as ‘low skilled occupations’.

The Mersey Partnership – Liverpool Superport Economic Trends Study Page 25
Printed on 01/09/09 12:40 Our Ref: 209006r2 final v2-1
Figure 3.2: Skill levels, Liverpool City Region, 2007
This broadly implies that residents of the Liverpool City Region are well qualified to fill many of the new jobs created, although there may be some in-commuting required.
0%
10%
20%
30%
40%
50%
60%
70%
80%
90%
100%
% o
f W
orki
ng a
ge p
opul
atio
n
Liverpool City Region North West England & Wales
No Quals NVQ 1 NVQ 2 NVQ 3 NVQ4/5

The Mersey Partnership – Liverpool Superport Economic Trends Study Page 26
Printed on 01/09/09 12:40 Our Ref: 209006r2 final v2-1
3.3 MARKET POSITION OF LIVERPOOL SUPERPORT 3.3.1 Summary of transport policy
Table 3.16 provides a summary of transport policy at national, regional and local levels, setting out their relevance to the development of the Liverpool SuperPort.
Table 3.16: Transport policy documents relevant to the Liverpool SuperPort Policy document Key issues Relevance to SuperPort Ports Policy Interim Report (DfT, 2007)
Government should not determine where new port capacity is developed, subject to planning regime Support for development of Port Master Plans.
Support for the development of additional port facilities by the private sector, subject to the planning regime Support for the development of a Mersey Ports Master Plan.
Ports National Policy Statement (forthcoming)
Will provide statutory guidance on planning for future major port developments and their hinterland infrastructure.
Direct impact on planning for SuperPort pipeline projects.
DfT Seaforth post-panamax container terminal decision letter (2007)
DfT provided scheme proposal with the relevant permissions, based on “demonstrable need for the scheme…” and on the potential for the terminal to provide benefits for the local and regional economies.
Planning support for key SuperPort project.
DaSTS (DfT, 2008) Port of Liverpool recognised as being one of 10 international gateways for the UK. Transport funding up to 2014 to be focused on most congested routes around the biggest conurbations & on links to international gateways.
The Port of Liverpool recognised as being a key gateway for the UK Resources will be targeted on links to and from the Liverpool City Region, such as the M62, the M6, and access to the Port of Liverpool.
NW Regional Spatial Strategy (2008)
Ports recognised as having an economic development role. Supports development of landside surface access plans. Encourages transfer of freight from road to more sustainable modes. Promotes use of existing infrastructure & the development of good road, rail and inland waterway connections to ports.
Generally supportive of features of SuperPort, particularly where there is a focus on sustainable distribution.
Liverpool LTP2 Mersey Ports & LJLA bring economic benefits to the City Region. Sustainable access to these should be promoted, including rail access to the Port of Liverpool.
Supports economic development & sustainable distribution roles of the SuperPort.
Halton LTP2 Recognises economic and transport benefits of LJLA & Mersey Gateway.
Strong support for Mersey Gateway and supports improve surface access to LJLA.
3.3.2 Freight activity in the Liverpool City Region
This section of the report sizes the total freight market in the Liverpool City Region in terms of HGV equivalents of freight that is loaded or unloaded in the City Region. The freight market is split by direction (inwards and outwards) and between international and domestic traffic. International traffic is freight that has an origin or a destination in the City Region, but enters or leaves Greater Britain through a port in the North West.

The Mersey Partnership – Liverpool Superport Economic Trends Study Page 27
Printed on 01/09/09 12:40 Our Ref: 209006r2 final v2-1
3.3.2.1 Freight market size: traffic with an origin in the Liverpool City Region
Total estimated freight, in terms of HGV equivalents transported from the Liverpool City Region to the rest of GB, is shown in Table 3.17 below.
Table 3.17: Freight traffic from the Liverpool City Region to the rest of GB, 2007 Thousand HGV equivalents Traffic HGV equivalents Share Domestic road 8,555 84% Domestic rail 325 3% Total domestic 8,879 87% International road 1,291 13% International rail 39 - Total international 1,330 13% Grand total 10,209 100% Source: MDS Transmodal GB Freight Model An estimated 10.2 million HGV equivalents of freight has an origin in the Liverpool City Region. About 75% of this freight has a destination in the North West region, with 49% of freight moving to another location within the City Region itself (Figure 3.3).
An estimated 1.3 million HGV equivalents of freight with an origin in the Liverpool City Region is international traffic, representing 13% of total freight traffic, which has passed through a port in the City Region; of this total, some 4% is transported inland by rail rather than by road. Compared to total freight moved from the Liverpool City Region, the sphere of influence for international freight from the City Region is much wider, with only 35% of international freight lifted having a destination in the North West region as a whole, while 24% is transported to the Midlands, 17% to London/South East and 15% across the Pennines to Yorkshire and the Humber (Figure 3.4).
Figure 3.3: Liverpool City Region Destination of total freight, 2007
Source: MDST GBFM
Cheshire
Cumbria
Greater Manchester
Lancashire
Liverpool City Region
East Midlands
East of England
Greater London
North East
Scotland
South East
South West
Wales
West Midlands
Yorks&Humb

The Mersey Partnership – Liverpool Superport Economic Trends Study Page 28
Printed on 01/09/09 12:40 Our Ref: 209006r2 final v2-1
Domestic traffic is, on average, travelling over relatively short distances that are more suitable to road freight transport, given the economics of this mode of transport. However, international traffic from the Port of Liverpool provides more scope for the use of rail because the port is rail-connected (so that there is no fixed cost involved in road collection) and it travels on average over longer distances.
3.3.2.2 Freight market size: traffic with a destination in the Liverpool City Region
Total estimated freight movements in terms of HGV equivalents to the Liverpool City Region from the rest of GB is shown in Table 3.18 below.
Table 3.18: Freight traffic to the Liverpool City Region from the rest of GB, 2007 Thousand HGV equivalents Traffic HGV equivalents Share Domestic road 9,287 85% Domestic rail 52 - Total domestic 9,339 86% International road 1,471 14% International rail 75 1% Total international 1,546 15% Grand total 10,885 100% Source: MDS Transmodal GB Freight Model An estimated 10.9 million HGV equivalents of freight have a destination in the City Region; of this total international freight some 1% is transported to the City Region by rail rather than by road. The international freight comes from South Coast ferry ports (particularly via Dover and the Eurotunnel Shuttle), from the Humber ports and from the deep sea container ports such as Felixstowe and Southampton. The deep sea container ports in the Greater South East are in competition with the Liverpool deep sea container terminal in that the door-to-door competitiveness of the Greater South East ports is assisted by the existence of rail freight services to and from intermodal rail freight terminals and rail-connected distribution parks in the North West region, such as the
Figure 3.4: Liverpool City Region Destination of international freight, 2007
Source: MDST GBFM
CheshireCumbria
Greater ManchesterLancashire
Liverpool City RegionEast Midlands
East of EnglandGreater London
North EastScotland
South EastSouth West
WalesWest Midlands
Yorks&Humb

The Mersey Partnership – Liverpool Superport Economic Trends Study Page 29
Printed on 01/09/09 12:40 Our Ref: 209006r2 final v2-1
Garston and Trafford Park terminals operated by Freightliner, 3MG and the Knowsley Rail Freight Terminal. However, these rail freight facilities, which form an important element of the Liverpool SuperPort, provide the means for shippers and receivers of deep sea containerised freight to receive their cargo cost effectively, given the distances involved from Felixstowe and Southampton (c.400 km). Where the rail freight terminals have on-site warehousing (for example, at 3MG or Knowsley), the economics of rail freight are further improved because containers can be loaded at the port (without a road haul), railed to the City Region and then taken directly to an on-site distribution building without the cost of using a public road.
3.3.2.3 Warehousing in the City Region
The following map shows the distribution of warehouses over 10,000 square metres in the North West.
Location of warehousing over 10,000 m2 in the North West, 2009 Source: MDS Transmodal NB: PCD = Post Code District Apart from the East and West Midlands, the North West has the greatest amount of large warehouse space in England and Wales with some 4.4 million m2 and has 217 large warehouses, more than any other region except the West Midlands. The Liverpool City Region has 21% of the North West region’s warehousing (Table 3.19). This demonstrates the importance of the North West region and the Liverpool City Region for the GB logistics industry.

The Mersey Partnership – Liverpool Superport Economic Trends Study Page 30
Printed on 01/09/09 12:40 Our Ref: 209006r2 final v2-1
Table 3.19: Large warehouse space in the North West (>10,000 m2), 2009
Sub-region Space (Thousand m2)
No. of warehouses % Space in NW % Warehouses in NW
Liverpool City Region 928 46 21% 21% Cheshire 890 43 20% 20% Cumbria 92 5 2% 2% Greater Manchester 1,714 83 39% 38% Lancashire 765 40 17% 18% Total 4,389 217 100% 100% Source: MDS Transmodal
Distribution centres are essential to the Liverpool SuperPort because they are the locations where freight is unloaded, stored, value is added and then goods are re-loaded; these are all activities which require skilled labour. They also attract high-volume shippers and receivers, whose traffic volume provides the critical mass of traffic required for the development of rail and waterborne services and provide opportunities for other facilities that are not directly adjacent to the distribution centres. For example, the Port of Liverpool can attract additional traffic because shippers and receivers that occupy sites on a rail freight distribution park in the City Region have another option for deep sea container shipping and short sea shipping to Ireland and the Atlantic Arc.
3.3.3 Port traffic 3.3.3.1 The ports & their traffics
The “Port of Liverpool” is ranked 7th in the UK in terms of total tonnage with total traffic of 32.3 million tonnes in 2007, just behind the Forth and Milford Haven, whose traffic is dominated by oil-related traffic. The port facilities include the dock system in Liverpool itself, Birkenhead Docks, Tranmere Oil Terminal and the Bromborough riverside berth, the latter owned by the Victoria Group rather than Peel. It is a major unitised port, with high value and historically high growth LoLo and RoRo traffic accounting for 37% of its total traffic in tonnes, as compared with 28% for ports nationally. With its central location and deep water the Port of Liverpool has a good balance between deep sea traffic (28%), short sea traffic (48%) and coastal traffic (28%), serving a wide variety of overseas markets and handling a variety of commodity types. Along with the other deep water ports that are reasonably close to the major GB conurbations (i.e. London, Grimsby/Immingham and Southampton) Liverpool has a diverse but balanced portfolio of commodity types, which should assist the port to maintain its traffic volumes during the economic recession better than some other ports that are focused on handling only a few traffic types.

The Mersey Partnership – Liverpool Superport Economic Trends Study Page 31
Printed on 01/09/09 12:40 Our Ref: 209006r2 final v2-1
The Manchester Ship Canal is ranked 19th in the UK in terms of traffic volumes, handling 8.1 million tonnes of cargo in 2007. It is almost exclusively a short sea port and provides inland waterway access for short sea and coastal vessels towards Manchester. The Port of Garston handled some 0.5 million tonnes of cargo in 2007 and handles a variety of short sea and coastal bulk cargoes.
3.3.3.2 Port hinterlands
Uniquely in the North of England, the Port of Liverpool serves a national hinterland for unitload traffics in both the Irish Sea RoRo market and the deep sea LoLo market. While 70% of LoLo traffic through Liverpool is distributed to Northern Britain (the three northern English regions and Scotland), 23% is for Central Britain (Wales, the East and West Midlands and the East of England) and 6% for Southern Britain (Greater London, the South East and the South West).
Figure 3.5: Top 10 UK ports by traffic volume: balance between port area of loading & unloading, 2007
Source: DfT Maritime Statistics
0%10%20%30%40%50%60%70%80%90%
100%Li
verp
ool
Grim
sby
& Im
min
gham
Lond
on
Tees
& H
artle
pool
Sout
ham
pton
Forth
Milfo
rd H
aven
Felix
stow
e
Dov
er
Sullo
m V
oe
Deep sea
Short sea
Domestic
Figure 3.6: Top 10 UK ports: balance of commodity types, 2007Source: DfT Maritime Statistics
0%
20%
40%
60%
80%
100%
Live
rpoo
l
Grim
sby
& Im
min
gham
Lond
on
Tees
& H
artle
pool
Sout
ham
pton
Forth
Milfo
rd H
aven
Felix
stow
e
Dov
er
Sullo
m V
oe
Unaccomp RoRo
Accomp RoRo
Containers
Gen. Cargo
Steel
Forestry prods.
Other dry bulk
Agric. Prods.
Ores
Coal
Other liquid bulk
Oil prods.
Crude oil
Liquefied gas

The Mersey Partnership – Liverpool Superport Economic Trends Study Page 32
Printed on 01/09/09 12:40 Our Ref: 209006r2 final v2-1
In the case of Irish Sea RoRo truck and trailer traffic, about 28% of Liverpool’s accompanied RoRo traffic is distributed to and from Southern Britain and 43% to and from Central Britain.
Bulk traffics handled through the Mersey Ports are usually for regional and super-regional hinterlands, although Liverpool has a national role for some bulk traffics such as steel scrap.
Figure 3.7: Port of Liverpool: LoLo hinterland by regionSource: MDS Transmodal
East Midlands
East of England
Great er London
Nort h East
Nort h West
Scot land
Sout h East
Sout h West
Wales
West Midlands
Yorks&Humb
Figure 3.8: Port of Liverpool: Accomp. RoRo hinterland by region
Source: MDS Transmodal
East M idlands
East of England
Greater London
North East
North West
Scotland
South East
South West
Wales
West M idlands
Yorks&Humb
Figure 3.9: Port of Liverpool: Unaccomp. RoRo hinterland, by region
Source: MDS Transmodal
East M idlands
East of England
Greater London
North East
North West
Scotland
South East
South West
Wales
West M idlands
Yorks&Humb

The Mersey Partnership – Liverpool Superport Economic Trends Study Page 33
Printed on 01/09/09 12:40 Our Ref: 209006r2 final v2-1
The hinterland data for LoLo and RoRo traffic reflect the fact that the North West has a deep sea container port that serves the whole of Britain and RoRo ports that act as gateways for Britain’s RoRo traffic to and from Ireland. There is an important distinction between the role played by the Port of Liverpool and ports in the North East and Yorkshire and the Humber: east coast ports play a very important ‘super-regional’ role in providing access for general cargo for all of Northern England and parts of the Midlands to the Northern Continent, Scandinavia and the Baltic and also serve a number of heavy industrial plants. By contrast, the Port of Liverpool plays a national role for unitised freight for the North American and Irish forelands.
3.3.4 Port markets: containers 3.3.4.1 Container port traffic
Total GB container port traffic grew during the period 2002-07 by 24% from 4.2 million units to some 5.2 million units. In 2007 Liverpool was the fourth largest GB container port with 8.4% of the market and its traffic growth since 2002 has been above the national trend at 35% - faster than the Greater South East deep sea container ports collectively and GB ports as a whole (see Table 3.20).
Table 3.20: GB Container Port Traffic, 2002-07 Thousand containers 2002 2003 2004 2005 2006 2007 % Growth 2002-07-
Liverpool 309 356 378 383 385 418 +35%
Felixstowe 1,715 1,585 1,711 1,728 1,880 2,063 +20%
Southampton 791 846 880 838 903 1,110 +40%
Thamesport 325 314 377 413 354 307 -6%
London 374 397 506 451 446 493 +32%
Sub-total Greater SE deep sea 3,205 3,142 3,474 3,430 3,583 3,973 +24%
Other GB container ports 648 686 780 760 732 783 +21%
Total GB container ports 4,162 4,184 4,632 4,573 4,700 5,174 +24%
Source: DfT Maritime Statistics
The growth in container traffic through GB ports during the period 2002-07 was due to the expansion of imports of consumer and semi-manufactured goods from deep sea locations, as manufacturing capacity shifted towards the Far East and, in particular, China. For this reason the Far East-Europe and trans-Pacific trade routes have become the most important in the world in terms of volumes; these key arterial routes for world trade have attracted very significant investment in a new generation of very large post-panamax vessels. In 2007 the Greater South East deep sea container ports (Felixstowe, Southampton, Tilbury, and Thamesport) handled 77% of the GB container market. This reflects the continuing preference for many deep sea shipping lines, deploying very large post-panamax sized ships of

The Mersey Partnership – Liverpool Superport Economic Trends Study Page 34
Printed on 01/09/09 12:40 Our Ref: 209006r2 final v2-1
over 12,000 TEU capacity, to minimise maritime diversion costs by serving GB with a single call at a port in the Greater South East en route between Gibraltar and Rotterdam.
3.3.4.2 Prospects for the Port of Liverpool
The Europe-North America route, which is of particular importance to the Port of Liverpool, was shielded from the need to cater for very large containerships because of the importance of the US east coast market and the limited draft available in East Coast North American ports. However, ports such as New York have now been dredged to accommodate 14.5m draft vessels over wide tidal windows and this provides the opportunity for the world’s largest ships to trade between the Far East and the East Coast of North America via the Mediterranean and NW Europe. The Panama Canal will be widened by 2014 and this will facilitate the use of post-panamax vessels on round the world services. Based on inland road and rail costs alone (i.e. not taking into account shipping costs) and based on a GB national distribution of traffic, we have estimated that for the inland distribution of deep sea containers Liverpool provides the most competitive location of any of the GB deep sea container ports because of its central location for the major GB markets.
Liverpool offers the lowest average inland cost by some margin: it is 8% more cost effective than Bristol, which is not an established deep sea container port, and 13% more cost effective than Felixstowe. When shipping costs are included, the Port of Liverpool may be a less competitive location for those shipping lines that are serving an “average” distribution of customers in GB and are deploying post-panamax ships on the “traditional” direct route between Gibraltar and Rotterdam; this is because, under these circumstances, there is a cost involved in diverting the ships from the direct route from Gibraltar to Rotterdam to a west coast port. However, an alternative strategy for some shipping lines could be to serve the GB market by making a call at a GB west coast port, such as Liverpool, deploying post-panamax ships on
Figure 3.10: Average cost for inland distribution per container via GB deep sea ports, 2009
Source: MDS Transmodal
240
250
260
270
280
290
300
310
Liverpool Bristol Felixstow e Tilbury/LondonGatew ay
Southampton
Cost/container

The Mersey Partnership – Liverpool Superport Economic Trends Study Page 35
Printed on 01/09/09 12:40 Our Ref: 209006r2 final v2-1
services between Gibraltar and North America. In these circumstances, Liverpool would be able to provide a cost saving over any other GB port for both shipping and inland distribution costs, due to its west coast location and its central location for inland distribution. Against this background of increasing deep sea container trade, the deployment by shipping lines of larger vessels that could not be accommodated at the existing facilities at Liverpool and new market opportunities for west coast deep sea container ports, Peel sought and obtained the necessary permissions for a new post-panamax riverside container terminal at Seaforth.
3.3.5 RoRo freight market 3.3.5.1 The facilities
The Port of Liverpool has three RoRo terminals, operated by P&O European Ferries in Gladstone Dock (Liverpool), Seatruck Ferries in Langton Dock (Liverpool) and Norfolkline at the Twelve Quays RoRo Terminal (Birkenhead). There are also proposals, which have already all received the relevant permissions, for a fourth RoRo terminal on the river outside Langton Dock. In 2007 Liverpool handled some 0.53 million RoRo units.
3.3.5.2 The RoRo traffic
The operators from these facilities provide services, mainly for unaccompanied trailers, between Liverpool and Dublin, Belfast and Warrenpoint; in 2007 unaccompanied trailers accounted for 68% of total RoRo units handled through the port, the remainder being driver accompanied HGVs. The facilities therefore accommodate relatively sustainable RoRo services in environmental terms, in that the cargo is transported on longer distance ferry services, which require shorter road hauls between inland origins and destinations. Holyhead (North Wales) and Cairnryan and Stranraer (the Loch Ryan ports in South West Scotland) generally cater for accompanied RoRo traffic, which is faster moving but involves longer road hauls.
3.3.5.3 The market and Liverpool’s share
Figure 3.11: Irish Sea RoRo Market, 2003 & 2007Source: DfT Maritime Statistics
0200
400600800
1000
120014001600
18002000
2003 2007
Thou
sand
uni
ts SW Wales
Loch Ryan
Holyhead
Other NW
Liverpool

The Mersey Partnership – Liverpool Superport Economic Trends Study Page 36
Printed on 01/09/09 12:40 Our Ref: 209006r2 final v2-1
The Irish Sea RoRo market grew rapidly up to 2007, driven particularly by strong economic growth in the Republic of Ireland, the “peace dividend” in Northern Ireland and greater integration of the EU economy. Between 2003 and 2007 alone, the market grew by some 19%. During this period, the Port of Liverpool grew its RoRo volumes by some 35% and increased its market share from 26% to 30%. This increasing competitiveness has been due to the Twelve Quays facility being able to offer a faster door-to-door transit time to hauliers with its riverside location (i.e. the ships do not need to negotiate locks) and faster vessels being deployed to provide overnight deliveries from North West Regional Distribution Centres to Dublin, allied with strong competition between the RoRo operators at Liverpool. In the short-term, the prospects for the Irish Sea RoRo freight market are less positive as the market slowed in 2008 and may decline in 2009 as both the Irish and UK economies are in recession. The reduction in general economic activity in the Republic of Ireland, particularly in the retail and construction sectors, has led to a reduction in consumer demand, which has a direct impact on the volume of unitised freight moving across the Irish Sea.
3.3.6 Ship repair
Among the ancillary services provided to the shipping industry in the Liverpool City Region ship repair and conversion is prominent because of the opportunity cost for local shipping lines involved in taking ships out of service for routine repairs and refits if there is no local ship repair facility. The City Region is fortunate in having the Cammell Laird facilities on Birkenhead, which provide some of the best ship repair and shipbuilding facilities in North West Europe.
In addition, the ship repair and maintenance industry in the City Region supports a large number of highly skilled jobs; the ship repair, maintenance and ship building industries in the Liverpool City Region was estimated to support about 1,400 jobs in 2004/059. Since 2005 Cammell Laird Shiprepairers and Shipbuilders Ltd (formerly Northwest Shiprepairers Ltd) has taken over operation of all the high quality facilities at the Cammell Laird site on Birkenhead and has rapidly expanded its activities. The commercial ship repair and conversion market remains highly competitive, but the company has successfully secured a long term contract with the Ministry of Defence to refit eleven of the Royal Navy’s 16 Royal Fleet Auxiliary vessels so that it has a stable base load of business upon which to market the company’s services in the international market. The company also plans to be able to re-start shipbuilding in the City Region, using the Cammell Laird site’s building hall, and has secured preferred bidder status to construct the central blocks of the Royal Navy’s two new aircraft carriers.
9 Merseyside Maritime Economic Impact Study (Fisher Associates, January 2007)

The Mersey Partnership – Liverpool Superport Economic Trends Study Page 37
Printed on 01/09/09 12:40 Our Ref: 209006r2 final v2-1
3.3.7 Airfreight Due to the high costs of transport per tonne, airfreight services are only used for very high value, lightweight and urgent consignments such as parcels and small parts for just-in-time manufacturing processes. There is likely to be little physical exchange of cargo between the Port of Liverpool and the airport because they are catering for quite distinct sectors of the freight transport market; however, both facilities are likely to serve the same freight forwarders and logistics providers. Most airfreight by volume (60% in 2008) is transported as belly-hold cargo by wide-bodied passenger aircraft from major international airports such as the London Airports and Manchester Airport. Larger consignments are transported in specialised cargo aircraft. In 2008 LJLA handled some 3,700 tonnes of airfreight, mainly in cargo aircraft. Traffic has declined significantly since 2003 due to the loss of key contracts with customers such as the Post Office (Chart 3.12). Manchester Airport, with its status as the North of England’s major international airport and its long haul services, handled some 143,000 tonnes of airfreight in 2008 (Chart 3.13); about 55% of this traffic was handled in wide-bodied passenger aircraft.
Figure 3.12: LJLA freight traffic volumes (tonnes) 2003-08
Source: Civil Aviation Authority
0
5,000
10,000
15,000
20,000
25,000
30,000
2003 2004 2005 2006 2007 2008
Passenger Aircraft Cargo Aircraft Post
Figure 3.13: Manchester Airport freight traffic volumes (Tonnes) - 2003-2008
0
20,000
40,000
60,000
80,000
100,000
120,000
140,000
160,000
180,000
2003 2004 2005 2006 2007 2008
Passenger Aircraft Cargo Aircraft Post

The Mersey Partnership – Liverpool Superport Economic Trends Study Page 38
Printed on 01/09/09 12:40 Our Ref: 209006r2 final v2-1
LJLA plans to extend the runway so that inter-continental services can operate, which would provide the potential for handling larger air freighters. The development of the airfreight market at LJLA will be facilitated by the development of the proposed Oglet World Cargo Centre and the Eastern Access Transport Corridor to the airport.
3.3.8 Passenger market
This section of the report focuses on the passenger market to and from the Liverpool City Region by air, ferry and cruise ship.
3.3.8.1 Aviation
Handling much lower volumes of traffic than the much more established Manchester Airport, LJLA has been highly successful in growing its volumes during the period 2003-08 and now handles more passengers for low cost airlines than any airport outside the South of England. During this period it has increased its volumes by 71% to reach 5.4 million passengers in 2008, while Manchester Airport increased its passengers by only 10% over the same period to reach 21.1 million.
LJLA has played a key role in providing low cost aviation for residents of the City Region and the rest of the North West and low cost airline services have radically changed the travel and tourism industry over the last ten years. The airport is also likely to have assisted Liverpool to develop as a destination for overseas visitors by providing low cost access from many European countries. The range of services provides low cost access to customers for business people and, via a new KLM service to Schipol, LJLA also provides access to destinations worldwide via a major European hub airport. The economic recession is likely to lead to a reduction in passenger volumes in 2009, but the fall in the value of sterling against the euro should provide a boost to inbound tourism. LJLA
Figure: 3.14 LJLA Passenger Volumes 2003-08
0
1000
2000
3000
4000
5000
6000
2003 2004 2005 2006 2007 2008
Thou
sand
pas
seng
ers
Domestic
Intermational

The Mersey Partnership – Liverpool Superport Economic Trends Study Page 39
Printed on 01/09/09 12:40 Our Ref: 209006r2 final v2-1
is likely to be a major generator of employment for the City Region and the availability of an international airport with low cost flights, and providing access to worldwide destinations via Schipol, is likely to be an important factor for inward investment decisions.
3.3.8.2 RoRo passengers
The Irish Sea ferry services between the Port of Liverpool and Ireland are focused on handling freight traffic, but some of the services also carry passengers, mainly travelling with their cars. Traffic volumes have fallen in recent years due to competition from low cost airlines and from ferry services via Holyhead, the latter offering a shorter and faster crossing to the Dublin Bay area.
In 2007 the Port of Liverpool handled some 0.65 million passengers and 160,000 cars; the wider economic benefits from these passengers may be minimal because most are likely to be only transiting the port terminals.
Table 3.21: Port of Liverpool - Ferry passengers 2002-07 Thousand passengers 2002 2007 Growth 2002-07 Passenger cars 148 160 +8% Passengers to ROI 291 173 -41% Passengers to N Ireland 137 187 +36% Passengers to Isle of Man 314 290 -7% Total passengers 742 650 -12% Source: DfT Maritime Statistics Ryanair tends to dominate the GB-ROI passenger market, while easyJet dominates the GB-Northern Ireland market. Both these airlines operate services from LJLA and so, to some extent, the airport is in competition with the ferry services from the Port of Liverpool. The following chart shows trends in the GB-Ireland passenger market between 2002 and 2008 and shows how the market as a whole is dominated by air services; services through Liverpool are included in the Central Corridor. Chart 3.15 shows that the GB-Ireland passenger market has stagnated in recent years and then declined by about 7% in 2007-08 as the deep recession in the ROI and in the UK has reduced the propensity to travel.
Figure 3.15: GB-Ireland Passenger Market 2002-2008Source: MDS Transmodal, based on PSA/CAA data
0
5,000
10,000
15,000
20,000
25,000
2002 2003 2004 2005 2006 2007 2008
Thou
sand
pas
seng
ers
Ferry - Southern Corridor
Ferry - Central Corridor
Ferry - Northern Corridor
Air - GB-ROI
Air - GB-Northern Ireland

The Mersey Partnership – Liverpool Superport Economic Trends Study Page 40
Printed on 01/09/09 12:40 Our Ref: 209006r2 final v2-1
3.3.8.3 Cruise passengers The UK cruise market is the largest in Europe and has been growing rapidly in the last few years, due to increasing disposable income and the industry’s success in attracting younger passengers to the cruise experience. Ports receive one or both of two types of call by cruise vessels:
• Turnaround calls, where passengers begin or end their cruises; • Way-calls where cruise vessels berth at a port for a day so that passengers can
disembark to visit on-shore attractions. Cruise port calls of either kind are regarded as providing significant wider economic benefits through cruise tourist expenditure in hotels and restaurants, at tourist attractions and on souvenirs etc. From a commercial point of view, however, many UK port operators are not prepared to develop new specialised facilities for cruise ships because only a few calls can be attracted each year and the season only lasts between May and October. Chart 3.16 shows the total number of passengers starting and/or ending their cruises at a UK port during the period 2002-07, which shows that the market has grown by almost 100% in five years.
There are two cruise port facilities at Liverpool – the Liverpool Cruise Terminal at Pier Head (operated and marketed by Liverpool City Council) and an in-dock facility in Langton Dock run by Peel Ports. In the North of England, the Port of Liverpool is alone in attracting some home port calls and the Liverpool Cruise Terminal has been successful in attracting way-calls from cruise vessels that are cruising around the British Isles, on itineraries that include Ireland and Scotland as well as the North West. The Liverpool Cruise Terminal, which opened in September 2007, attracted 15 cruise ships in 2008 and 14 ships are booked for the 2009 season.
Figure 3.16: Passengers starting/ending cruises at UK ports 2002-07
Source: DfT Maritime Statistics
0
200
400
600
800
1000
1200
2002 2003 2004 2005 2006 2007
Thou
sand
pas
seng
ers
Pax starting/endingcruises at UK ports

The Mersey Partnership – Liverpool Superport Economic Trends Study Page 41
Printed on 01/09/09 12:40 Our Ref: 209006r2 final v2-1
4 STRATEGIC DEVELOPMENT – S.W.O.T. ANALYSIS
As a foundation for developing a future strategy for SuperPort an assessment of the key opportunities and threats facing the shipping, aviation and logistics industries across the Liverpool City Region, and how they relate to existing strengths and weaknesses, is provided below.
STRENGTHS
Competition & investment: • Strong competition between facilities within the SuperPort, which fosters innovation and
competitiveness within the logistics sector as a whole. • Large private sector companies, such as Peel, Stobart, ProLogis and Associated British
Ports that have the ability to invest in the physical facilities required for the future development of the SuperPort.
• Common ownership of the Port of Liverpool, LJLA and the Manchester Ship Canal, which facilitates the integrated implementation of the SuperPort up to 2030.
“Natural” advantages: • Geographic advantages: deepwater plus a central location in GB, providing shorter
distances between Liverpool and a national hinterland; offers the shortest maritime route to North America for deep sea services and provides the direct maritime route between Dublin and the GB motorway network.
• Rich sub-regional and regional hinterland, with a large population and a significant manufacturing sector that imports raw materials.
• The Port of Liverpool provides the most cost-effective location from which to distribute deep sea containers to a national hinterland (not taking into account shipping costs);
• Diversified and balanced traffic portfolio in terms of commodities, hinterlands and overseas markets; both freight and passengers included within the concept.
• Availability of labour for the wider logistics sector.
Physical assets: • Strong portfolio of sustainable distribution assets:
o Rail freight distribution parks providing rail access for general freight, with on-site distribution centres;
o Rail freight links to the Port of Liverpool and to facilities on the Manchester Ship Canal;
o Short sea ports on the Mersey and facilities along the Manchester Ship Canal; o Inland waterway access through Liverpool docks to the Mersey; o Existing short sea shipping links between Liverpool and the Atlantic Arc (i.e.
Scotland, Ireland, Western France and Iberia). • The Bootle Branch Line cleared to W10 to allow the Port of Liverpool to distribute high
cube boxes by rail to its hinterland.

The Mersey Partnership – Liverpool Superport Economic Trends Study Page 42
Printed on 01/09/09 12:40 Our Ref: 209006r2 final v2-1
• Liverpool Cruise Terminal, which provides deepwater berthing for cruise ships in the historic city centre.
• Strategic motorway network and the WCML, linking the Liverpool SuperPort to its national hinterland.
Planning & policy: • Existing planning permissions available for development of new deep sea LoLo and Irish
Sea RoRo facilities on the Mersey. • Strong public sector support for the concept at all levels of Government within the region; • Strong brand recognition for the SuperPort; • Strong maritime cluster organisation in Mersey Maritime.
WEAKNESSES
• Geographic weaknesses:
o West coast location, while the UK mainly trades with its Continental mainland neighbours;
o Significant maritime diversion required from the direct route for deep sea shipping services serving the whole NW European market en route between Gibraltar and the Continental mainland.
• Road and rail network capacity constraints between the region and the rest of GB, specifically related to a lack of capacity on the M6 between the North West and the West Midlands and a lack of rail capacity on the WCML south of Crewe.
• Lack of land availability in strategic locations for the development of the Port of Liverpool.
OPPORTUNITIES
Cost competitiveness: • Greater cost competitiveness compared to other port regions, based on the existing
geographic advantages, the development of sustainable distribution services and the availability of distribution facilities in competitive locations.
Development of sustainable distribution sites:
• Development of port-centric distribution at the Port of Liverpool, combining deep sea container, Irish Sea RoRo and national and regional distribution to provide a prime location for shippers and their logistics providers with access to deep water, road, rail and inland waterway linkages.
• Development of additional rail freight distribution parks and tri-modal distribution parks to create employment and ensure that new distribution buildings are located where sustainable distribution services can be developed.

The Mersey Partnership – Liverpool Superport Economic Trends Study Page 43
Printed on 01/09/09 12:40 Our Ref: 209006r2 final v2-1
Development of maritime infrastructure & services at the Port of Liverpool: • Development of the post-panamax berth at the Port of Liverpool to maintain deep sea
container services to/from North America and to provide the potential for services to/from the Far East.
• Greater development of short sea and coastal (“Motorways of the Sea”) services between the Mersey and the rest of the Atlantic Arc.
Planning & policy: • Port Master Plan for the Mersey Ports to integrate the market-based aspirations of the
private sector with the sustainability/wealth creation aspirations of the public sector and to reach consensus on partnership working to address hinterland access, within the wider development potential provided by Peel’s vision for Ocean Gateway vision and the NWDA’s vision for the Atlantic Gateway.
• Government policy to support the growth of rail freight, with funding available for network improvements up to 2014/15 and beyond.
• Integrated and consistent support for the development of the Liverpool SuperPort through strategies and planning policies at a local and regional level, such as the Multi-Area Agreement, Regional Strategy 2010, the Ocean Gateway and the Atlantic Gateway;
• Planning policies to support the development of sustainable distribution services by rail and inland waterway between the SuperPort and its hinterland, as a means to reduce environmental and congestion impacts within the SuperPort and beyond.
THREATS
• Competition from other port regions (e.g. the Humber, Harwich Haven) and other regions
with concentrations of distribution activity (e.g. the East and West Midlands). • The success of the Liverpool SuperPort will lead to additional road freight on local road
networks, which may not be acceptable to residents and politicians at a local level. • Reductions in future public sector budgets may lead to a requirement for very strong
business cases for public sector funding for projects (i.e. providing very good value for money for taxpayers).
• The Irish economy has been particularly badly affected by the credit crunch and the economy is in a deep recession; this will have an impact on the growth of RoRo traffic through Liverpool in the short-term.
• The short to medium term economic climate may reduce the level of investment available from the private sector.

The Mersey Partnership – Liverpool Superport Economic Trends Study Page 44
Printed on 01/09/09 12:40 Our Ref: 209006r2 final v2-1
5 SUPERPORT ACTION PLAN AND OUTCOMES 5.1 ACTION PLAN
To ensure delivery of its long-term objectives partners and stakeholders involved in the development of Liverpool SuperPort need to focus on nine action areas around Governance and Government Lobbying, Infrastructure Investment, Strategic Development and Market Development.
Outline business cases for each of the pipeline projects (“Investment in Facilities” and “Investment in Hinterland Access”) is included in Appendix 2.
a) Governance and government lobbying
The Liverpool City Region Multi-Area Agreement (MAA) was published in June 2009 and included the Liverpool SuperPort as one of the key initiatives that can have a transformational impact on the City Region’s competitiveness. ACTION 1 LIVERPOOL SUPERPORT GOVERNANCE ARRANGEMENTS Action Formalised arrangement between key SuperPort public and private sector
stakeholders supporting the Multi Area Agreement Economy Platform. Key actors All relevant bodies in the City Region. Public sector bodies in the City Region could play a role in lobbying central government and pushing forward the City Region and the SuperPort at a national level, particularly in the light of the forthcoming National Ports Policy Statement. This will be particularly important to ensure that hinterland access projects receive the relevant central government support in the planning process and in terms of funding priority. ACTION 2 LOBBYING CENTRAL GOVERNMENT Action Co-ordinated lobbying of central government to ensure that SuperPort hinterland
access pipeline projects are supported through the planning process and are then funded.
Key actors The Mersey Partnership & Mersey Maritime. Support from Private sector infrastructure developers & NWDA.

The Mersey Partnership – Liverpool Superport Economic Trends Study Page 45
Printed on 01/09/09 12:40 Our Ref: 209006r2 final v2-1
b) Infrastructure investment
Action 3 relates to the pipeline projects within the SuperPort that require investment in port and airport facilities and distribution parks that are connected to the rail network and have waterborne freight access. ACTION 3 INVESTMENT IN SUPERPORT PIPELINE FACILITIES Action Investment is required by the private sector in the following facilities:
• Port-centric distribution at the Port of Liverpool • Liverpool Post-Panamax Container Terminal • 3MG • Langton Riverside RoRo Terminal • Parkside • Extension of the runway at LJLA & World Cargo Centre • Port Wirral • Port Weston
Key actors Peel, Pro Logis & Stobart Group Support from Planning support from local authorities & lobbying support from other public sector
bodies at a City Region and regional level. Action 4 relates to investment by the public sector for hinterland access infrastructure both within the SuperPort itself and also at a more strategic level, given the importance of the M6/WCML Corridor for distribution of freight to and from the Superport. ACTION 4 INVESTMENT IN HINTERLAND ACCESS Action Investment is required by the public sector in the following hinterland access
infrastructure to ensure that freight and passengers can move as efficiently as possible between the SuperPort and its hinterland:
• Mersey Gateway • Road access to Port of Liverpool • Rail access schemes (capacity and loading gauge) to existing and future
SuperPort facilities (e.g. Halton Curve, Canada Dock and Birkenhead Docks)
• Rail freight capacity on the WCML south of Crewe • Widening of the M6 between the North West & Birmingham • Eastern Access Transport Corridor to LJLA
Key actors Highways Agency, Network Rail & Halton BC Support from Planning support from local authorities in Liverpool & lobbying support from other
public sector bodies at a City Region and regional level.

The Mersey Partnership – Liverpool Superport Economic Trends Study Page 46
Printed on 01/09/09 12:40 Our Ref: 209006r2 final v2-1
c) Strategic development
It will be important for the Liverpool SuperPort to have a prominent position within the North West Regional Strategy (2010 - Northwest Development Agency), the Principles and Issues Paper for which has been out to consultation. Local Authorities, the Mersey Partnership and the private sector infrastructure developers will need to work with the NWDA and respond positively in the consultation process to ensure the SuperPort has a high profile within this document. This key document could provide specific support for the pipeline projects and could also include planning policies to make it more likely that distribution buildings will be developed on sites with high quality rail and water access. ACTION 5 NORTH WEST REGIONAL STRATEGY Action Partnership working to ensure that the SuperPort, its vision, objectives and
pipeline projects are fully reflected in the North West Regional Strategy. The document could also include planning policies to encourage new distribution buildings to be developed on sites with high quality rail and water access.
Key actors NWDA, local authorities, The Mersey Partnership, Mersey Maritime and private sector infrastructure developers, 4NW.
A Master Plan for the Mersey Ports would help to communicate the plans of the port operators on the Mersey and along the Manchester Ship Canal and would develop consensus on how to develop the SuperPort up to 2030. The LJLA Master Plan will also be reviewed in about 2012 and may be need to be up-dated. ACTION 6 MASTER PLANS Action Develop Master Plan for the Mersey Ports and review and, if necessary, up-date
the Airport Master Plan to communicate plans for future ports and airport development and develop consensus; these Master Plans will need to be aligned with the Superport strategy.
Key actors Peel Ports & Airports, Stobart, Victoria Group & Associated British Ports. Support from NWDA, The Mersey Partnership, Merseyside LTP Team & local authorities.
A strategy for short sea and coastal shipping and the European Union’s concept of “Motorways of the Sea” should be developed to maximise the potential of the maritime mode for the transport of high value and other freight between the Mersey and the rest of GB and between the Mersey and the rest of the Atlantic Arc (Ireland, Western France, Spain, Portugal and North Africa).

The Mersey Partnership – Liverpool Superport Economic Trends Study Page 47
Printed on 01/09/09 12:40 Our Ref: 209006r2 final v2-1
ACTION 7 WATERBORNE SUSTAINABLE DISTRIBUTION Action Develop a strategy to maximise the potential for sustainable distribution from short
sea and coastal shipping and “Motorways of the Sea” to and from the Port of Liverpool and other facilities on the Mersey and the Manchester Ship Canal.
Key actors The Mersey Partnership, Peel, Stobart Group & other port operators Support from NWDA & local authorities
There appears to be a lack of an evidence-base matching the proposed employee requirements of the new SuperPort infrastructure developments with existing residents. It would be beneficial to carry out an in-depth study looking at the existing and estimated future skills of residents compared to the estimated skills required by new employment from SuperPort developments. This would show clearly the match between supply and demand for the required skills and set out clearly what training provision would be required. ACTION 8 SKILLS & TRAINING STUDY & STRATEGY Action Complete skills and training study for the SuperPort to ensure there is a sound
evidence based upon which a skills and training started can be developed. This initial study would then need to be followed up with a long-term SuperPort skills and training strategy to ensure that the employment opportunities could be taken up by residents in the City Region.
Key actors The Mersey Partnership, Mersey Maritime and the Learning & Skills Council. Support from Private sector developers, local authorities & universities & other local education
providers.
d) Market development
There was a feeling among some stakeholders that clear and concise marketing communications are needed for the freight and logistics sector to communicate the benefits of locating in the City Region to potential customers throughout the world. This may need some initial work on developing a marketing strategy. ACTION 9 SUPERPORT FREIGHT & LOGISTICS MARKETING Action Development and implementation of a SuperPort freight and logistics marketing
strategy to ensure that the “product” is defined in clear and concise terms, target customers have been identified and marketing activities have been defined. This could include consideration of whether the SuperPort needs a high profile “champion” (possibly a celebrity or politician) to act as an advocate outside the City Region. This strategy should be followed up by the development of clear and concise promotional material that can be used to market and sell the Superport.
Key actors The Mersey Partnership, Mersey Maritime & private sector operators.

The Mersey Partnership – Liverpool Superport Economic Trends Study Page 48
Printed on 01/09/09 12:40 Our Ref: 209006r2 final v2-1
5.2 OUTCOMES: ECONOMIC IMPACT OF THE SUPERPORT 5.2.1 Introduction
In this section we assess the potential impact in terms of jobs and GVA generated locally and regionally from proposed transport pipeline projects in the SuperPort. As with the existing facilities analysed in Section 3.3 above, we have drawn, wherever possible, on existing evidence to ascertain the economic impact. For transport schemes where no studies have been undertaken, we have used the proposed floor space of the new developments (where available) to determine the direct jobs accommodated at the new developments and used English Partnerships’ multipliers to establish indirect and induced impacts. Furthermore, as in Section 3.3 above, we estimate sector and occupational breakdown of the jobs created from each transport scheme.
5.2.2 Post Panamax Terminal
This is a development of a deep sea post-panamax container terminal outside the lock gates at Seaforth which would virtually double capacity at the Port of Liverpool, costing in excess of £100m. Based on existing evidence available, the Seaforth River Terminal Harbour Revision Order established the overall addition to local employment would be expected to be in the order of 3,000 jobs10. Of these total jobs the direct jobs are estimated to be 180 FTE jobs, which equate to 200 total direct jobs, with the remaining 2,800 jobs being indirect and multiplier jobs created from the scheme.
In terms of the jobs created regionally, we estimate approximately 1,140 jobs will be created in the transport and communication sector. But the new terminal will also create jobs in other sectors – 910 jobs in financial intermediation and 480 jobs in manufacturing.
10 See http://www.dft.gov.uk/pgr/shippingports/ports/ir/seaforthriver, para 4.51

The Mersey Partnership – Liverpool Superport Economic Trends Study Page 49
Printed on 01/09/09 12:40 Our Ref: 209006r2 final v2-1
Table 5.1 provides a detailed sector breakdown.
Table 5.1: Sector split of post-panamax terminal jobs
Jobs %
Agriculture 22 1%
Mining and quarrying 31 1%
Manufacturing 481 16%
Electricity, gas and water supply 70 2%
Construction 71 2%
Wholesale & retail trade 178 6%
Transport and communication 1,139 38%
Financial intermediation 909 30%
Public administration 10 0%
Education, health and social work 41 1%
Other services 49 2%
Total Jobs 3,000 100%
Apportioning these jobs into occupations (Table 5.2), we estimate that 1,100 jobs will be in both the high and mid-skilled occupation categories, with the remaining 800 jobs in the low skilled occupation categories. Table 5.2: Summary of occupational breakdown for post-panamax terminal jobs
Jobs %
Managers and Senior Officials 436 15%
Professional Occupations 306 10%
Associate Prof & Tech Occupations 368 12%
Administrative and Secretarial Occupations 396 13%
Skilled Trades Occupations 260 9%
Personal Service Occupations 161 5%
Sales and Customer Service Occupations 258 9%
Process, Plant and Machine Operatives 407 14%
Elementary occupations 407 14%
Totals 3,000 100%
Translating these job estimates to GVA we apply an average GVA per job of £33,300, giving an estimated total impact of the development for the regional economy of £99.9m.
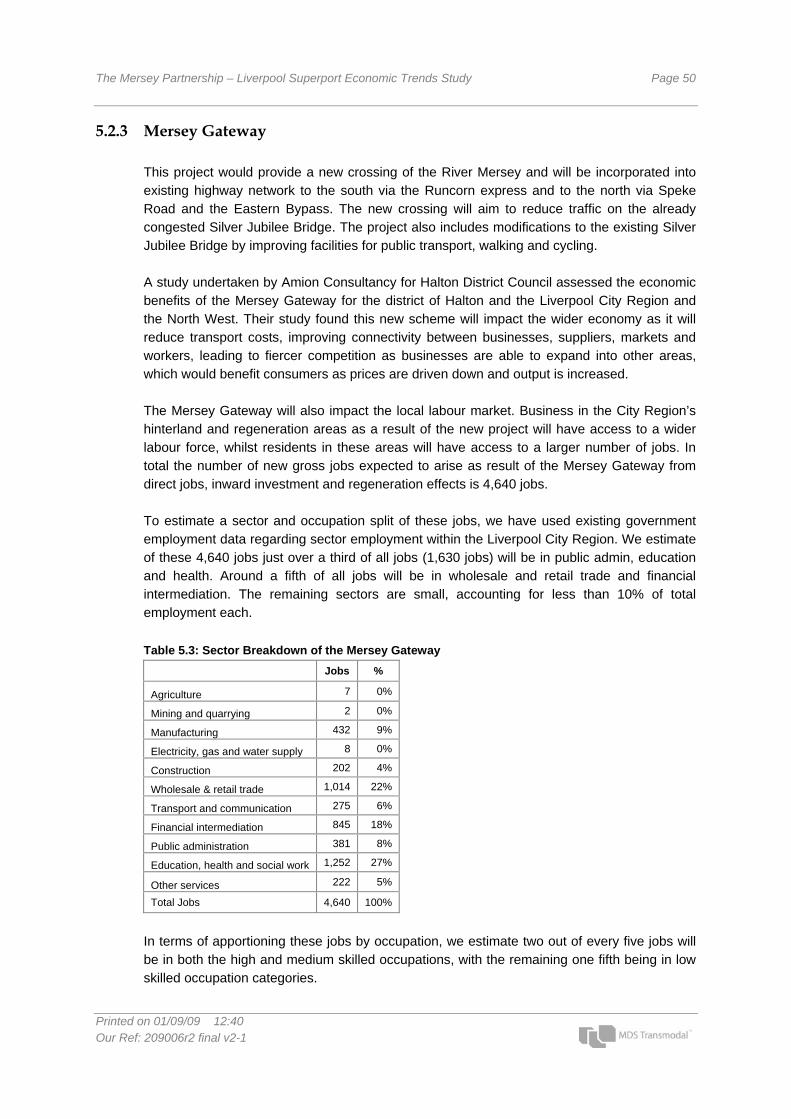
The Mersey Partnership – Liverpool Superport Economic Trends Study Page 50
Printed on 01/09/09 12:40 Our Ref: 209006r2 final v2-1
5.2.3 Mersey Gateway
This project would provide a new crossing of the River Mersey and will be incorporated into existing highway network to the south via the Runcorn express and to the north via Speke Road and the Eastern Bypass. The new crossing will aim to reduce traffic on the already congested Silver Jubilee Bridge. The project also includes modifications to the existing Silver Jubilee Bridge by improving facilities for public transport, walking and cycling. A study undertaken by Amion Consultancy for Halton District Council assessed the economic benefits of the Mersey Gateway for the district of Halton and the Liverpool City Region and the North West. Their study found this new scheme will impact the wider economy as it will reduce transport costs, improving connectivity between businesses, suppliers, markets and workers, leading to fiercer competition as businesses are able to expand into other areas, which would benefit consumers as prices are driven down and output is increased. The Mersey Gateway will also impact the local labour market. Business in the City Region’s hinterland and regeneration areas as a result of the new project will have access to a wider labour force, whilst residents in these areas will have access to a larger number of jobs. In total the number of new gross jobs expected to arise as result of the Mersey Gateway from direct jobs, inward investment and regeneration effects is 4,640 jobs. To estimate a sector and occupation split of these jobs, we have used existing government employment data regarding sector employment within the Liverpool City Region. We estimate of these 4,640 jobs just over a third of all jobs (1,630 jobs) will be in public admin, education and health. Around a fifth of all jobs will be in wholesale and retail trade and financial intermediation. The remaining sectors are small, accounting for less than 10% of total employment each.
Table 5.3: Sector Breakdown of the Mersey Gateway
Jobs %
Agriculture 7 0%
Mining and quarrying 2 0%
Manufacturing 432 9%
Electricity, gas and water supply 8 0%
Construction 202 4%
Wholesale & retail trade 1,014 22%
Transport and communication 275 6%
Financial intermediation 845 18%
Public administration 381 8%
Education, health and social work 1,252 27%
Other services 222 5%
Total Jobs 4,640 100%
In terms of apportioning these jobs by occupation, we estimate two out of every five jobs will be in both the high and medium skilled occupations, with the remaining one fifth being in low skilled occupation categories.

The Mersey Partnership – Liverpool Superport Economic Trends Study Page 51
Printed on 01/09/09 12:40 Our Ref: 209006r2 final v2-1
Table 5.4: Occupational split of Mersey Gateway jobs Jobs %
Managers and Senior Officials 628 14%
Professional Occupations 579 12%
Associate Prof & Tech Occupations 646 14%
Administrative and Secretarial Occupations 632 14%
Skilled Trades Occupations 408 9%
Personal Service Occupations 423 9%
Sales and Customer Service Occupations 411 9%
Process, Plant and Machine Operatives 335 7%
Elementary occupations 578 12%
Totals 4,640 100%
Translating these jobs into GVA, we apply an average of £33,300 per worker producing a GVA of £154.5m for the scheme.
5.2.4 3MG Expansion
3MG is currently undergoing the first phase of expansion of its Widnes site, which it is anticipated will offer 3.5m sq ft of space for logistics and create in the region of 5,000 new jobs. Two new distribution centres of 570,000 sq ft and 200,000 sq ft were given planning permission in November 2008. Based on the size of these distribution centres and using a density of 90 sq m per worker we estimate these two new centres will directly create an additional 800 jobs. Applying EP “ready reckoners”, we forecast regionally the induced and indirect jobs created will be an additional 350 jobs. Apportioning these job estimates – direct, indirect, induced – into sectors and then occupations, we anticipate 910 jobs from the 3MG expansion will be in transport and communication, 110 jobs will be created in financial intermediation services and around a 60 additional jobs will be in manufacturing.

The Mersey Partnership – Liverpool Superport Economic Trends Study Page 52
Printed on 01/09/09 12:40 Our Ref: 209006r2 final v2-1
Table 5.5: Sector split from 3MG expansion
Jobs %
Agriculture 3 0%
Mining and quarrying 4 0%
Manufacturing 60 5%
Electricity, gas and water supply 9 1%
Construction 9 1%
Wholesale & retail trade 22 2%
Transport and communication 912 80%
Financial intermediation 114 10%
Public administration 1 0%
Education, health and social work 5 0%
Other services 6 1%
Total Jobs 1,145 100%
In terms of the occupational breakdown (Table 5.6), we expect approximately 460 jobs will be in the two low skilled occupational categories of process, plant and machine operatives and elementary occupations. We also anticipate 190 jobs will be in the high skilled category of managers and senior official, 150 jobs will be in administrative and secretarial and the remaining categories account for around 100 jobs or less respectively. Table 5.6: Occupational breakdown of 3MG future jobs
Jobs %
Managers and Senior Officials 193 17%
Professional Occupations 54 5%
Associate Prof & Tech Occupations 108 9%
Administrative and Secretarial Occupations 150 13%
Skilled Trades Occupations 56 5%
Personal Service Occupations 43 4%
Sales and Customer Service Occupations 78 7%
Process, Plant and Machine Operatives 220 19%
Elementary occupations 243 21%
Total Jobs 1,145 100%
In terms of the GVA of the scheme we estimate this to be £38.1 m, assuming a GVA of £33,300 per worker.
5.2.5 Port Weston
Port Weston is planned to provide a “Train Road Water” distribution park, with waterborne access via the Manchester Ship Canal, a rail connection and road access to the Runcorn Expressway. It is planned to provide some 30,000 sq m of warehouse space, as well as a new bulk liquid tank farm.

The Mersey Partnership – Liverpool Superport Economic Trends Study Page 53
Printed on 01/09/09 12:40 Our Ref: 209006r2 final v2-1
As no studies have been conducted which specifically analyse the economic benefits of this new development, we have used the size of the floor space available at the port to provide an estimate of the number of new jobs created. Applying a floor space/worker ratio of 90 sq m per worker, the direct employment would be some 330 jobs. Applying EP’s “ready reckoner” multipliers we estimate the indirect and induced impact will create an additional 150 jobs for the region. Therefore the total impact of the scheme 480 jobs regionally, which equates to a GVA of £15.98 m.
Table 5.7 provides a sector split for these jobs and we anticipate that 380 jobs will be created in the transport and communications sector. Of the remaining sectors, 50 jobs will be created in financial intermediation, 30 jobs in manufacturing and less than 10 jobs in each of the other sectors.
Table 5.7: Sector split from the Port Weston
Jobs %
Agriculture 1 0%
Mining and quarrying 2 0%
Manufacturing 25 5%
Electricity, gas and water supply 4 1%
Construction 4 1%
Wholesale & retail trade 9 2%
Transport and communication 383 80%
Financial intermediation 48 10%
Public administration 1 0%
Education, health and social work 2 0%
Other services 3 1% Total Jobs 480 100%
In terms of occupational breakdown, we forecast the two largest categories, accounting for around 200 jobs, will be in the low skilled groups of process, plant and machine operatives and elementary occupations (Table 5.8). 80 jobs will be managers and senior officials, 60 jobs will be created in administrative and secretarial occupations, while the other occupations groups are small accounting for less than 50 jobs.

The Mersey Partnership – Liverpool Superport Economic Trends Study Page 54
Printed on 01/09/09 12:40 Our Ref: 209006r2 final v2-1
Table 5.8: Occupational breakdown of the Port Weston
Jobs %
Managers and Senior Officials 81 17%
Professional Occupations 23 5%
Associate Prof & Tech Occupations 45 9%
Administrative and Secretarial Occupations 63 13%
Skilled Trades Occupations 23 5%
Personal Service Occupations 18 4%
Sales and Customer Service Occupations 33 7%
Process, Plant and Machine Operatives 92 19%
Elementary occupations 102 21%
Totals 480 100%
5.2.6 Runway extension, passenger growth and Cargo Centre development at
Liverpool John Lennon Airport
The Liverpool John Lennon Master Plan indicates that the proposed extension of the runway at Liverpool airport, along with other proposed developments such as enhancement of the passenger terminal and a cargo centre would greatly improve the appeal of the airport. The extension of the runway would enable long haul flights to China, US and India, thereby improving the appeal of Liverpool to investors in major economies. Improved accessibility would attract more air intensive sectors, such as Banking and Finance, Research and Development (all of which are classified as high value sectors), which would greatly improve skills and employment opportunities in the region. The Master Plan forecasts that passenger growth to 8.3 million passengers per annum and the development of the cargo terminal by 2015 will lead to an additional 4,170 direct on-site and off-site jobs 1,050 indirect off-site and a total employment impact of 5,220 additional jobs compared to the existing jobs at the airport. By 2030 the total direct on and off site jobs will be an additional 4,550 jobs and 1,310 indirect jobs, creating a total job increase of 6,360 jobs over the 2006-2030 period. This equates to an additional GVA of £211.8m. Apportioning these jobs by sector, we estimate many of the new jobs, 5,490 jobs will be in transport and communications. In addition, 430 jobs will be created in financial intermediation and 230 jobs in manufacturing.

The Mersey Partnership – Liverpool Superport Economic Trends Study Page 55
Printed on 01/09/09 12:40 Our Ref: 209006r2 final v2-1
Table 5.9: Sector split of LJLA jobs
Jobs %
Agriculture 10 0%
Mining and quarrying 15 0%
Manufacturing 225 4%
Electricity, gas and water supply 33 1%
Construction 33 1%
Wholesale & retail trade 83 1%
Transport and communication 5,489 86%
Financial intermediation 426 7%
Public administration 5 0%
Education, health and social work 19 0%
Other services 23 0%
Total Jobs 6,360 100%
Translating these sector jobs into occupation categories (Table 5.10) we anticipate the airport will create number of new jobs across all occupational categories. But many of these new jobs, around a half, will be in the two low skilled occupational groups of plant, process and machinery and elementary occupations.
Table 5.10: Occupational breakdown of LJLA development
Jobs %
Managers and Senior Officials 758 12%
Professional Occupations 333 5%
Associate Prof & Tech Occupations 321 5%
Administrative and Secretarial Occupations 754 12%
Skilled Trades Occupations 589 9%
Personal Service Occupations 158 2%
Sales and Customer Service Occupations 564 9%
Process, Plant and Machine Operatives 1,917 30%
Elementary occupations 965 15%
Totals 6,360 100%
5.2.7 Parkside
Parkside will, subject to planning, be a large rail freight distribution park in St Helens, with large distribution centres and an on-site intermodal terminal. The site is capable of accommodating very large distribution buildings – seven buildings of approximately 0.6 million sq ft or more and three buildings of 1 m sq ft. The site would have good access to the M6 and the site would have access to the WCML, with rail services to the Channel Tunnel, the Greater South East deep sea container ports and other regions of GB. Applying a floorspace to worker density of 90 sq m per job we estimate the number of direct jobs created will be 7,430 jobs. To calculate the indirect and induced impact we apply EP’s

The Mersey Partnership – Liverpool Superport Economic Trends Study Page 56
Printed on 01/09/09 12:40 Our Ref: 209006r2 final v2-1
“ready reckoner” multiplier to the direct jobs; this produces a further 3,270 jobs. Therefore based on the assumptions above, Parkside will create approximately 10,700 jobs across the region which based on a GVA of £33,300 per job equates to £356.38m Apportioning the total jobs across the broad sectors (Table 5.11), most of these new jobs, approximately 8 out 10, will be in Transport and Communications. Of the remaining sectors, 1,060 jobs will be created in Financial Intermediation and an additional 560 jobs in manufacturing.
Table 5.11: Sector split for Parkside
Jobs %
Agriculture 25 0%
Mining and quarrying 36 0%
Manufacturing 562 5%
Electricity, gas and water supply 81 1%
Construction 83 1%
Wholesale & retail trade 208 2%
Transport and communication 8,528 80%
Financial intermediation 1,062 10%
Public administration 12 0%
Education, health and social work 47 0%
Other services 57 1%
Total Jobs 10,702 100%
Apportioning these jobs by occupations (Table 5.12) we estimate that of the new jobs created, 20% (4,500 jobs) will be in the two low skilled occupation categories plant, process machine operatives and elementary occupations. The next largest sector will be managers and senior officials, with 1,800, jobs followed by administrative and secretarial occupations with 1,400 jobs. Table 5.12: Occupational breakdown for Parkside
Jobs %
Managers and Senior Officials 1,805 17%
Professional Occupations 502 5%
Associate Prof & Tech Occupations 1,006 9%
Administrative and Secretarial Occupations 1,398 13%
Skilled Trades Occupations 520 5%
Personal Service Occupations 404 4%
Sales and Customer Service Occupations 733 7%
Process, Plant and Machine Operatives 2,059 19%
Elementary occupations 2,275 21%
Totals 10,702 100%

The Mersey Partnership – Liverpool Superport Economic Trends Study Page 57
Printed on 01/09/09 12:40 Our Ref: 209006r2 final v2-1
5.2.8 Port Wirral This port would, subject to planning, transfer port activity from others in the City Region. This development is likely to have an intermodal freight terminal so that goods can be received by rail and road and there would also be warehousing space, which could act as Regional Distribution Centres serving the North West Region. Based on an assumption that 100,000 square metres of warehousing space would be available and applying a floorspace density of 90 sq m to the warehousing area, we calculate the direct jobs will be 1,100 jobs. To estimate the indirect and induced jobs we apply EP’s ‘ready reckoner’ multipliers to the direct jobs; this produces an additional 490 jobs regionally. Hence the total impact of the scheme is 1,600 jobs regionally and a GVA of £53.28m Apportioning these jobs across the broad sectors, Table 5.13 below shows the largest employment sector by some distance is transport and communications creating 1,280 jobs. 160 jobs will be created in financial intermediation, 80 jobs in manufacturing and all other sectors will account for less than 30 jobs each. Table 5.13 Sector split for Port Wirral
Total Jobs %
Agriculture 4 0%
Mining and quarrying 5 0%
Manufacturing 84 5%
Electricity, gas and water supply 12 1%
Construction 12 1%
Wholesale & retail trade 31 2%
Transport and communication 1,275 80%
Financial intermediation 159 10%
Public administration 2 0%
Education, health and social work 7 0%
Other services 8 1%
Total Jobs 1,600 100%
The port will provide employment across the broad range of occupational categories. Approximately 40% of jobs created at the port will be in low skilled occupation categories. Of the remaining jobs, 270 will be in the high skilled group of managers and officials and a further 210 jobs will be in the medium skilled occupation category of administration and secretarial. All other occupation categories will provide less than 150 jobs.

The Mersey Partnership – Liverpool Superport Economic Trends Study Page 58
Printed on 01/09/09 12:40 Our Ref: 209006r2 final v2-1
Table 5.14: Occupational split for Port Wirral
Jobs %
Managers and Senior Officials 270 17%
Professional Occupations 75 5%
Associate Prof & Tech Occupations 150 9%
Administrative and Secretarial Occupations 209 13%
Skilled Trades Occupations 78 5%
Personal Service Occupations 60 4%
Sales and Customer Service Occupations 110 7%
Process, Plant and Machine Operatives 308 19%
Elementary occupations 340 21%
Totals 1,600 100%
5.2.9 Langton Riverside RoRo Terminal
This development would provide riverside berths for ferries, probably mainly for services across the Irish Sea, with terminal space for the storage of road trailers. Based on industry sources we have assumed that some 100 direct jobs and the additional indirect and multiplier jobs using EP multipliers will be 44 jobs regionally. Thus the total number of jobs created regionally will be 144 jobs which equates to a GVA of £4.80m Apportioning these total jobs across the broad sectors, Table 5.15 below shows virtually all jobs, 170 jobs will be in transport and communications sector, as all other sectors accounts for 20 jobs or less. Table 5.15: Sector split for Langdon Riverside RoRo Terminal
Jobs %
Agriculture 0 0%
Mining and quarrying 0 0%
Manufacturing 8 5%
Electricity, gas and water supply 1 1%
Construction 1 1%
Wholesale & retail trade 3 2%
Transport and communication 115 80%
Financial intermediation 14 10%
Public administration 0 0%
Education, health and social work 1 0%
Other services 1 1%
Total Jobs 144 100%
In terms of the occupation breakdown of these jobs, Table 5.16 shows around 40% of jobs will be in the two low skilled occupation categories. Of the remaining 85 jobs these are evenly split between the high and medium skilled occupation categories.

The Mersey Partnership – Liverpool Superport Economic Trends Study Page 59
Printed on 01/09/09 12:40 Our Ref: 209006r2 final v2-1
Table 5.16: Occupation split of Langdon Riverside RoRo Terminal
Jobs %
Managers and Senior Officials 24 17%
Professional Occupations 7 5%
Associate Prof & Tech Occupations 14 9%
Administrative and Secretarial Occupations 19 13%
Skilled Trades Occupations 7 5%
Personal Service Occupations 5 4%
Sales and Customer Service Occupations 10 7%
Process, Plant and Machine Operatives 28 19%
Elementary occupations 31 21%
Totals 144 100%
5.2.10 Summary economic impact of pipeline projects
In Table 5.17 we have summarised each of the impacts of the above SuperPort pipeline projects across the region. Table 5.17: Summary impacts on jobs and GVA
Proposed Scheme Jobs GVA (£m)
Post Panamax Terminal 3,000 99.9
Mersey Gateway 4,640 154.5
Port of Weston 480 16.0
LJLA Expansion 6,360 211.8
Parkside 10,702 356.4
3MG Expansion 1,145 38.1
Port of Wirral 1,600 53.3
Langdon RoRo 144 4.80
Total 28.071 934.8
Table 5.17 above shows the proposed development of each of the transport schemes is estimated to create 28,100 jobs. In terms of GVA, we have applied a GVA per worker of £33,300, which suggests that the total benefits for the region are anticipated to be £935 million. In terms of the sector breakdown (Table 5.18), of the new jobs created by the various transport schemes virtually all will be in transport and communications, 18,120 jobs, followed by 3,570 new jobs created in financial intermediation. Manufacturing, education, health and social work and wholesale and retail will also account for around 7% of all new jobs created.

The Mersey Partnership – Liverpool Superport Economic Trends Study Page 60
Printed on 01/09/09 12:40 Our Ref: 209006r2 final v2-1
Table 5.18: Sector split of proposed transport schemes
Jobs %
Agriculture 72 0%
Mining and quarrying 95 0%
Manufacturing 1,876 7%
Electricity, gas and water supply 217 1%
Construction 415 1%
Wholesale & retail trade 1,549 6%
Transport and communication 18,115 65%
Financial intermediation 3,576 13%
Public administration 412 1%
Education, health and social work 1,374 5%
Other services 368 1%
Total Jobs 28,071 100%
The occupational breakdown of these jobs shows the largest occupational categories will be process, plant and machine operatives, elementary occupations, managers and senior officials and administrative and secretarial. These four categories will account for 18,120 of the new jobs. Table 5.19 below provides a more detailed occupational breakdown.
Table 5.19: Occupational breakdown of proposed transport schemes
Jobs %
Managers and Senior Officials 4,196 15%
Professional Occupations 1,879 7%
Associate Prof & Tech Occupations 2,658 9%
Administrative and Secretarial Occupations 3,620 13%
Skilled Trades Occupations 1,940 7%
Personal Service Occupations 1,274 5%
Sales and Customer Service Occupations 2,197 8%
Process, Plant and Machine Operatives 5,366 19%
Elementary occupations 4,941 18%
Total Jobs 28,071 100%

The Mersey Partnership – Liverpool Superport Economic Trends Study Page 61
Printed on 01/09/09 12:40 Our Ref: 209006r2 final v2-1
5.3 OUTCOMES: FREIGHT TRANSPORT IMPACTS OF THE LIVERPOOL SUPERPORT
We have modelled a scenario using its GB Freight Model (GBFM) of the potential net freight transport impacts of the Liverpool SuperPort in terms of additional freight tonnes handled, user benefits and reduced environmental impacts. GBFM has been developed by MDS Transmodal since 1996 and is an integrated software/database system linking domestic and international GB freight data with simple economic models to explain freight demand in GB. It includes trade and traffic forecasts and allows scenario based forecasting by changing the economics of freight. The model was developed independently by MDS Transmodal, but has been expanded in partnership with various organisations including the UK Department for Transport, Leeds University Institute for Transport Studies, the Strategic Rail Authority and HM Revenue and Customs. The model has been fully audited for the Department for Transport and has been used to develop freight forecasts within the UK National Transport Model, to develop UK national port traffic forecasts for the UK Government, cross-channel forecasts for the French Government and UK national rail freight forecasts for the Rail Freight Group and the Freight Transport Association. The model has been used to estimate the potential impact of the development of the majority of the SuperPort freight facilities by 2030 in terms of traffic volumes loaded and unloaded in the SuperPort and quantified environmental benefits. The scenarios relate to the movement of relatively high value general freight (fast-moving consumer goods) in units, rather than considering bulks or very high value airfreight.
Apart from the 2007 Base Case, two scenarios were modelled to allow a comparison to be made between a 2030 scenario where all the SuperPort pipeline projects are developed (the 2030 SuperPort Scenario) and one where none of them were developed (the Without SuperPort Scenario). The latter scenario assumes that distribution facilities will be available elsewhere in the North West and in Great Britain to handle the freight. The SuperPort pipeline projects that were considered related to the following freight facilities:
• Port of Liverpool Post-Panamax Container Terminal; • Port-centric Distribution at Port of Liverpool; • Mersey Gateway Port; • Extension to 3MG; • Parkside; • Port Wirral; • Langton Riverside RoRo Terminal.
The GBFM includes detailed data on inland movements of containerised imports and exports through all GB ports, including the Port of Liverpool and the Greater South East deep sea container terminals. It also includes detailed data on the inland distribution of RoRo freight passing through Irish Sea (and Channel/East Coast) ferry ports. It does not, however, include

The Mersey Partnership – Liverpool Superport Economic Trends Study Page 62
Printed on 01/09/09 12:40 Our Ref: 209006r2 final v2-1
detailed data on airfreight movements. The results, in terms of freight tonnage lifted, are shown in Table 5.20. Table 5.20: Estimated SuperPort Impact in 2030 – Freight Tonnes Lifted Million tonnes 2007 Base
Case 2030 With SuperPort
2030 Without SuperPort
Impact of SuperPort in 2030
Port of Liverpool LoLo 5.08 9.82 5.74 +4.08 Langton Riverside RoRo - 2.74 - +2.74 Other SuperPort Pipeline Projects: new distribution park capacity
- 58.32 - +58.32
Existing NW Distribution Parks 195.51 176.51 195.43 -18.92 Total NW 200.58 247.37 201.17 +46.20 Rest of GB 1345.30 1616.63 1657.47 -40.84 Source: MDS Transmodal GB Freight Model The results of the modelling suggest that the development of the SuperPort could have the effect by 2030 of increasing container traffic through the Port of Liverpool by some 71% compared to the 2030 Without SuperPort Scenario. The Langton Riverside RoRo terminal secures some 2.74 million tonnes of cargo in the 2030 With SuperPort Scenario, compared to the 2030 Without SuperPort Scenario. In the 2030 Without SuperPort Scenario, the Port of Liverpool only increases its traffic by 3% during the period 2007-30, which implies that if the post-panamax berth is not developed, but other ports expand their capacity, the Port would lose market share to ports in the Greater South East. The results of the modelling also suggest that the SuperPort’s rail and/or waterborne distribution parks could generate an additional 68 million tonnes in 2030 compared to the 2030 Without Superport Scenario. Some of the traffic handled at the SuperPort’s additional distribution park capacity would otherwise have been handled by other warehousing in the North West, but the SuperPort has the effect of generating an additional 46 million tonnes of freight for the North West that would otherwise have been handled by warehouses in other regions. Table 5.21 shows the amount of forecast rail freight generated as a result of the development of the SuperPort freight facilities.
Table 5.21: Estimated SuperPort Impact in 2030 – additional rail traffic Million tonnes per annum 2007 Base
Case 2030 With SuperPort
2030 Without SuperPort
Impact of SuperPort in 2030
Port of Liverpool LoLo 0.13 2.32 1.08 +1.24 New distribution park capacity
- 8.11 - +8.11
Existing NW distribution parks
4.50 10.26 11.95 -1.69
Total NW 4.63 20.67 13.03 +7.64 Rest of GB 24.86 125.74 122.30 +3.44 Source: MDS Transmodal GB Freight Model The results of the modelling suggest that the development of the SuperPort could have the effect by 2030 of increasing rail freight traffic through the Port of Liverpool by 1.24 million

The Mersey Partnership – Liverpool Superport Economic Trends Study Page 63
Printed on 01/09/09 12:40 Our Ref: 209006r2 final v2-1
tonnes per annum compared to the Without SuperPort Scenario. The results also suggest that the SuperPort’s new rail and/or waterborne distribution parks could generate an additional 7.64 million tonnes of rail freight per annum by 2030 compared to the 2030 Without Superport Scenario. Table 5.22 provides a summary of the environmental impacts of the development of the SuperPort freight facilities in terms of HGV tonne kilometres (tkm) and £ Sensitive Lorry Miles (SLM). HGV tkm provides a measure of the estimated amount of freight on the road network and Table 4.20 provides the analysis for both the North West and for the whole of GB. The £SLM measure is used by the DfT to quantify all the net external costs of road freight compared to more environmentally sustainable modes of freight transport to take account of environmental emissions, congestion costs and the cost of road accidents etc. Table 5.22: Estimated SuperPort Impact in 2030 – environmental impacts Billion 2007 Base
Case 2030 With SuperPort
2030 Without SuperPort
Impact of SuperPort in 2030 (% change)
Road tkm in GB
185.6 238.3 238.1 +0.1%
Road tkm in NW
23.6 29.9 28.8 +3.7%
£SLM in GB £3.34 £4.18 £4.16 +0.5% £ SLM in NW £0.37 £0.46 £0.43 +7.4% Source: MDS Transmodal GB Freight Model
The results from the GBFM suggest that the development of the additional SuperPort freight facilities would have an essentially neutral impact on the total amount of road freight at a GB level. The increase in road tonne kilometres and £SLM in the North West is a reflection of the additional traffic volumes that are being handled in the region. However, the Liverpool SuperPort increases the rail modal split in the North West region from 2.3% in 2007 to 8.4% in 2030, so that a significant proportion of the additional freight activity in 2030 is transported by rail rather than road.

The Mersey Partnership – Liverpool Superport Economic Trends Study Page 64
Printed on 01/09/09 12:40 Our Ref: 209006r2 final v2-1
APPENDIX 1: SUMMARY OF RESULTS OF STAKEHOLDER CONSULTATION EXERCISE 1 Introduction RTP and MDST carried out consultation interviews in April to July 2009 with the following organisations as part of the process of developing an evidence base and producing a strategy for the further development of the Liverpool SuperPort. We are very grateful for the contribution made by all these organisations. 4NW Freightliner Halton Borough Council Highways Agency Hill Dickinson Knowsley Metropolitan Borough Council Learning and Skills Council Liverpool Chamber of Commerce Liverpool City Council Liverpool John Lennon Airport Liverpool John Moores University Liverpool Vision Lombard Shipping Mersey Gateway Mersey Maritime Merseyside LTP Team Merseytravel Network Rail North West Development Agency Peel Ports Potter Group Pro Logis St. Helens Metropolitan Borough Council Sefton Metropolitan Borough Council Stobart Group The Mersey Partnership University of Liverpool Warrington Borough Council Wirral Metropolitan Borough Council The results of the consultation exercise have been presented separately for:
• Local authorities, The Mersey Partnership, Mersey Maritime, universities in the City Region, other agencies focusing on skills and economic development in the City Region and professional services;
• Private sector transport operators and public sector agencies focussing on transport issues. The results summarised below reflect the views and perceptions of the organisations consulted.

The Mersey Partnership – Liverpool Superport Economic Trends Study Page 65
Printed on 01/09/09 12:40 Our Ref: 209006r2 final v2-1
2 Stakeholder Consultation: Economic Development, Planning, Education/Skills & Professional Services RTP and MDST carried out stakeholder interviews in April-June 2009 with local authorities, The Mersey Partnership, Mersey Maritime, universities in the City Region and other agencies focusing on skills and economic development in the City Region in April and May 2009. Knowledge of the SuperPort In general, stakeholders were well aware of the SuperPort and its constituent infrastructure assets and developments. Many felt it was a useful branding or marketing tool to bring together disparate infrastructure assets and pipeline developments, which is likely to help bring about economic development of the Liverpool City Region. However, many stakeholders were unclear of exactly what the benefits of the SuperPort were supposed to be and would welcome further information. In particular, it was felt that synergy and linkages between the different aspects of the SuperPort needed to be clarified. There was a wide range of understanding of the meaning of the SuperPort to the Liverpool City Region and its constituent Authorities. Considering the SuperPort as a whole, stakeholders suggested it was a useful framework to help Local Authorities plan their investment priorities. It was also suggested to be a useful tool for raising the profile of Liverpool and the City Region. Local Authorities recognised in particular the importance of the individual infrastructure projects in the pipeline in their area; some stakeholders felt these developments would go ahead anyway, whether the SuperPort concept existed or not. It was regarded by one consultee as mainly a commercial opportunity for the private sector, requiring support from the public sector for lobbying Government and assisting with marketing. There was a feeling among some consultees that there was a need to make the concept more tangible. Liverpool SuperPort is a brand, but a brand needs to have some substance behind it. Impacts of the SuperPort development Stakeholders identified many impacts of the SuperPort. These are split into sections below: Job Creation: It was anticipated by all stakeholders that development of the individual infrastructure projects would help to generate jobs in the Liverpool City Region. This would result from:
• An increased number of businesses using the Post-Panamax terminal. This will directly increase the number of people required at the port (e.g. stevedores, fork lift truck drivers, process packers etc), as well as people in the supply chain (logistics, freight forwarders, warehousing staff etc). Stakeholders also identified potential for the development of economic benefits in the Liverpool City Centre, such as the creation of “back office” operation jobs e.g. shipping agencies, insurance and maritime law.
• Employment sites being opened up for development following development of the Mersey Gateway Bridge.
• Productivity improvements through time-savings to existing businesses in the locale of the Mersey Gateway Bridge.

The Mersey Partnership – Liverpool Superport Economic Trends Study Page 66
Printed on 01/09/09 12:40 Our Ref: 209006r2 final v2-1
• Inward investing companies attracted to the Halton area following development of the Mersey Gateway Bridge.
• Inward investment to Liverpool City Region resulting from improved marketing of the City Region using the SuperPort concept and from larger operations in the North West encouraging larger companies to locate in the City Region, possibly developing headquarter facilities (building on companies already in the area e.g. Maersk).
• Possible attraction of manufacturing companies to the City Region to generate employment in ‘part construction’ of goods, following importing partly constructed goods through the Port, airport etc. Some stakeholders felt the Free Trade Zone would be beneficial in helping bring these types of jobs.
• Supporting current jobs and possibly increasing future jobs in ship-building. • Jobs supported through increased tourism of greater tourist numbers travelling through the
airport and through Liverpool Port on cruise liners. • Jobs created in the construction phase of all the infrastructure developments. • However, some stakeholders noted that development in the Liverpool City Region would be
displacement of jobs from elsewhere e.g. other regions of the UK or from the Continent. Impacts on Worklessness: Stakeholders generally felt there was potential to impact on worklessness through increasing the range and number of jobs available in the City Region, provided that the relevant courses and training were available to give people the opportunity to develop the necessary skills. Environmental Impacts: A number of stakeholders suggested there would be environmental impacts resulting from the SuperPort. Whilst not going into great detail, impacts identified included:
• Positive environmental impacts of transferring freight from road to rail, and through increasing the number of vessels through Liverpool rather than other ports, cutting down inland travel distances.
• Negative environmental impacts of increasing flights at Liverpool John Lennon Airport, and potential noise and pollution impacts on residents living underneath flight paths. One consultee argued that the mitigation measures that would be implemented by Peel could be communicated better to stakeholders.
Stakeholders recognised the potential opportunities resulting from the infrastructure developments comprising the SuperPort. For example, they saw the potential to bring forward sites for logistics development as goods would be transported through the Local Authorities. Other stakeholders recognised the potential for building up their business parks and less directly-related job opportunities through the increased profile of the City Region bringing in inward investors. Relative Importance to Regeneration Aspirations The relative importance of the SuperPort to the regeneration aspirations of the local areas varied. Obviously, each of the Local Authorities has developments within their own area and these tend to be of importance to the regeneration aspirations of the individual areas. However, the SuperPort concept was of less importance to some local areas, which viewed the developments within their areas as almost independent of whether the SuperPort concept existed or not. Relative Importance of Infrastructure Developments

The Mersey Partnership – Liverpool Superport Economic Trends Study Page 67
Printed on 01/09/09 12:40 Our Ref: 209006r2 final v2-1
Views varied on the relative importance of different infrastructure developments that make up the SuperPort. However, there was reasonable agreement amongst the stakeholders that the development of the Post-Panamax facility was of great importance in developing the Port, which would have knock-on implications and benefits for the wider City Region. The Mersey Gateway Bridge was also noted as of importance, as it should provide a network alternative by road, to help keep vehicles on the roads moving around the City Region. Some stakeholders suggested development of the airport was also important as it is currently insufficiently equipped to deal with large freight planes, and that air was an important aspect of the holistic offer for freight required by the SuperPort concept. There was a general lack of understanding about whether there were links between the Ports and Liverpool John Lennon Airport, and if there were, how important these were and what the potential was for development. Impacts if the SuperPort does not proceed In considering the potential impacts of the SuperPort not going ahead, there was a great divergence of views. Firstly, stakeholders tended to split between the SuperPort branding concept not going ahead and the actual infrastructure developments not going ahead. In general, the non-development of the concept was considered to have less impact than the non-development of the infrastructure. In the absence of the Post-Panamax development, some stakeholders felt that Liverpool Port would begin to decline, as the larger ships (which are becoming increasingly prevalent in cargo movement) would not be able to dock at Liverpool and would choose to dock elsewhere (e.g. Ports in the South East). Liverpool would therefore not only lose out on potential future increases in cargo, but might also start to lose the vessels it currently has. However, other people felt the impacts would not be so significant and that the Port would just continue in the status quo. Some stakeholders, who felt the SuperPort was of less importance to their local area, felt there would less impact on their local area of the Post-Panamax development not going ahead, as their local developments were likely to go ahead in any case. Some stakeholders felt that should the Mersey Gateway not go ahead, there would be increasing problems on the City Region’s road infrastructure, with increasing unreliability of journey times, potential problems with the integrity of the existing Silver Jubilee Bridge, and an inability to claim that the City Region is well-connected by road. Actions to Maximise the Economic Potential Stakeholders identified a large number of actions that could be carried out to help maximise the potential economic benefits of the SuperPort:
• Local Authorities could help as intermediaries in transferring the benefits into jobs i.e. working with local education providers, as well as the Learning and Skills Council, Mersey Maritime etc to ensure the local people have the right skills to take advantage of potential job opportunities.
• Local Authorities could help to bring forward the ‘right’ transport infrastructure required for the SuperPort to work as a whole i.e. if the Ports are developed but the road infrastructure is insufficient, benefits will be lost as vessels will not want to dock where there are inadequate road or rail infrastructure to move freight onwards. Local Authorities can help to achieve this through including these transport proposals in local planning documents, mediating between developers, the Highways Agency etc, as well as ensuring planning permissions are granted (where appropriate).

The Mersey Partnership – Liverpool Superport Economic Trends Study Page 68
Printed on 01/09/09 12:40 Our Ref: 209006r2 final v2-1
• Local Authorities could play a role in lobbying National Government and pushing forward the City Region and SuperPort concept to advance the concept at a national level. In particular, it was felt that Liverpool needed to be higher in the Government’s priorities on Ports; current policy supports development in the South East and East of England.
• It was also felt to be important to lobby for the concept to be included in the North West Regional Strategy (2010 – North West Development Agency), which is currently out to consultation.
• Some stakeholders suggested the Multi Area Agreement (MAA) needed to be more strongly worded to ensure that National Government is aware of the potential benefits of the SuperPort, state exactly what is needed from Government and what would be generated in return.
• Local Authorities could work as brokers between Peel Holdings and local stakeholders to help build support for the SuperPort. Local Authorities have good contacts with relevant constituents and could provide an important brokering role.
• Local Authorities could help to promote the SuperPort concept more widely. It was generally felt that a charismatic and strong ‘champion’ was needed to help promote the SuperPort outside of the City Region, possibly a politician or celebrity.
• Some stakeholders felt there was potential for Local Authorities to work together more positively to avoid duplication of effort and pool funding arrangements. However, it was conceded that this could be difficult politically.
• Some stakeholders felt there needed to be stronger links between the Port and other infrastructure developers to set out what is needed from the Local Authorities for successful development.
3 Stakeholder Consultation: Private sector transport operators and public sector
transport agencies Knowledge and definition of the SuperPort All consultees had a high level of awareness of the Liverpool SuperPort, reflecting the close involvement of many of the consultees in its development. The SuperPort was regarded as mainly being a “concept” or a “marketing brand” rather than something more practical and tangible. It was also described as a “vision” and an “aspiration” and a “collection of assets.” Several private sector consultees regarded the Liverpool SuperPort as a marketing tool to help commercial operators in the City Region to secure future deals. One suggested that the Liverpool SuperPort could better be described as a “gateway”. There was a view that the Liverpool SuperPort needed a clear definition, with some simple messages that can be communicated easily to the outside world – particularly to potential customers. The Liverpool SuperPort synergies The commercial operators believe the synergies come from serving key shippers (e.g. retailers) that occupy large warehouses in the City Region and which need deep sea container services, air freight services, rail freight services, as well as road freight distribution etc. This provides the critical mass

The Mersey Partnership – Liverpool Superport Economic Trends Study Page 69
Printed on 01/09/09 12:40 Our Ref: 209006r2 final v2-1
for large distribution centres and more efficient vehicle utilisation, as well as greater use of rail and waterborne transport. Measuring success or failure Commercial operators mentioned:
• Attracting “big name” retailers to occupy warehousing; • Reducing lorry miles; • Developing a consistent message; • Throughput in terms of freight tonnes and passengers; • Numbers of jobs created and additional GVA generated; • Cost savings for business from location.
Success or failure can probably only be measured over the longer term i.e. 2020 or 2030. Impacts of the SuperPort development These were generally considered to be the potential to secure inward investment and job creation. It was regarded as having the potential to be a major economic driver in the future, with a potential snowball effect from clustering of logistics businesses in the City Region. Major pipeline projects The prioritisation of the projects depended to a great extent on the commercial interests of the private sector operators, but in general terms, the following were emphasised by the private and public sector consultees:
• Post-panamax berth at Seaforth; • Access to Seaforth Docks (both road access and the Halton Curve to double rail freight
capacity into and out of the ports); • Development of multimodal terminals in the Liverpool SuperPort (3MG, Port Salford,
Parkside, Port Weston etc.) • Expansion of Liverpool Airport and development of the World Cargo Centre; • Planning permission for extension of LIFT.
Potential issues with Liverpool SuperPort Some doubts were expressed about the scope of the Liverpool SuperPort: Should its geographic scope extend as far as Manchester? Should it include residential development, which is not relate to transport and should it include airports, given that they are environmentally less sustainable. A concern was expressed about the available marketing material on the Liverpool SuperPort, which is unlikely to be clear and concise enough to communicate the key selling points to potential (commercial) customers. A key issue in this respect is the confusion over the geographic scope of the SuperPort. A 1-2 page leaflet should be developed setting out a few simple messages, with some case studies setting out the benefits of the Liverpool SuperPort.

The Mersey Partnership – Liverpool Superport Economic Trends Study Page 70
Printed on 01/09/09 12:40 Our Ref: 209006r2 final v2-1
Access to the Port of Liverpool Access between Seaforth Docks and Switch Island, particularly given the potential development of the post-panamax container terminal, is considered by public sector transport agencies to be a major political issue. These consultees expressed the view that the use of rail freight for inland distribution should be maximised, but recognised that potential demand related to the economics of rail freight compared to road freight. Strategic access for the Liverpool SuperPort There are fears that the M6 will in the future be the subject of only active traffic management rather than more significant up-grades, with crawler lanes for trucks, hard shoulder running and a few major junction improvements. The role of the public sector in the Liverpool SuperPort The private sector operators felt that the public sector agencies at a City Region and regional level should be acting as ambassadors for the Liverpool SuperPort to help market to potential inward investors and to demonstrate a unity of purpose between the private and public sectors. Some consultees felt that there was sometimes a lack of consistent commitment to the Liverpool SuperPort from all elements of the public sector in the City Region. A more supportive, responsive and consistent planning regime would assist the future development of the required facilities in the Liverpool SuperPort. While the private sector would provide entrepreneurial initiative to develop the SuperPort, the public sector needed to provide lobbying and marketing support to facilitate the development of the required investment. Public sector grants were also mentioned as being helpful. Potential constraints to the development of the Liverpool SuperPort Issues that were highlighted include:
• Lack of availability of land around the Port of Liverpool • Lack of existing depth of water for deep sea container vessels at the Port of Liverpool • Lack of a tangible message about the Liverpool SuperPort to communicate to the outside
world • Lack of political support in some quarters, particularly for road access to the Port of Liverpool • Possible lack of related office-based skills in the Liverpool City Region • Lack of private sector finance for major developments • Private sector will seek to protect their own assets rather than share common goals • Home port calls for cruise vessels (as well as way calls) not being made at Pier Head, as it
provides deep water in a high profile location. • The quality of strategic access to the Liverpool SuperPort via the M6 south to Birmingham
and on the WCML south of Crewe.

The Mersey Partnership – Liverpool Superport Economic Trends Study Page 71
Printed on 01/09/09 12:40 Our Ref: 209006r2 final v2-1
APPENDIX 2: OUTLINE BUSINESS CASES FOR SUPERPORT PIPELINE PROJECTS
Investment in facilities PIPELINE PROJECT 1:
LIVERPOOL POST-PANAMAX CONTAINER TERMINAL
Description The proposed terminal would offer 820 metres of deep water berth plus 500 metres of feeder berth, both located on a newly created peninsula immediately downstream of Gladstone lock. Overall, the Port would then offer around 2,500 metre of container quay. Some 17 hectares of new container storage area would also be created to supplement the existing 48 hectares at the existing Seaforth Container Terminal. For the first time the Port of Liverpool would be able to accommodate post-panamax deep sea container ships. An existing intermodal rail terminal would allow container trains to distribute containers inland by intermodal services using the restored Olive Mount chord and load gauge upgrade to the West Coast Main Line so that high cube containers can despatched directly on standard metre high wagons to elsewhere in GB. Containers could also be distributed up the Manchester Ship Canal by feeder vessel.
Project status All required permissions in place. Costs • In excess of £100 million development cost
• Additional HGVs on road access route to motorway network (A5036) Benefits • Opportunity to attract significant additional traffic volumes to the Port of Liverpool through
maintaining its position in its existing core transatlantic market and the potential calls from Far East-N America services; modelling suggests the additional traffic volumes could be 4 million tonnes p.a. by 2030.
• Employment: 3,000 jobs (direct, indirect & induced); • GVA: +£100 million • Likely to lead to reduced transport costs for shippers/receivers in the NW.
Synergies for SuperPort
Direct links with Port-centric Distribution at the Port of Liverpool, allowing shippers to minimise transport costs for imported goods; increased competitiveness for the Liverpool SuperPort because it provides access to post-panamax deep sea container services for shippers and receivers located in the SuperPort.
Lead Peel Ports

The Mersey Partnership – Liverpool Superport Economic Trends Study Page 72
Printed on 01/09/09 12:40 Our Ref: 209006r2 final v2-1
PIPELINE PROJECT 2:
PORT-CENTRIC DISTRIBUTION AT THE PORT OF LIVERPOOL
Description The development of large distribution centres on land within the port estate and close to the deep sea container port and intermodal rail terminal at Seaforth Docks would provide occupiers with the option to import and export goods via the deep sea container port, but also to store goods for the Irish market and domestic freight for the Liverpool City Region and the North West. Inland distribution could be by rail and barge, as well as by road. The creation of sites for large distribution centres is likely to require the reorganisation of the port estate in the first instance and could then involve the expansion of the port estate beyond its existing boundaries.
Project status Concept stage. Costs • Development costs would be funded by the private sector developer
• Additional HGVs on local road network Benefits • Opportunity to attract significant additional container traffic volumes to the Port of Liverpool, as well
as Irish Sea RoRo traffic. • Employment: likely to generate significant direct employment in the distribution centres; • Likely to lead to reduced transport costs for shippers and receivers because Liverpool provides the
lowest inland distribution costs for a GB-wide distribution of traffic, involving, on average, shorter road hauls and rail and waterborne inland distribution than from other GB deep sea container ports.
Synergies for SuperPort
Direct link with Liverpool Post-Panamax Container Terminal; increased competitiveness for the SuperPort because it helps to provide the critical mass of freight traffic for additional logistics activity, which will also use other facilities in the SuperPort.
Lead Peel Ports
PIPELINE PROJECT 3:
PARKSIDE
Description The development of a rail freight distribution park in St Helens, with large distribution centres and an on-site intermodal terminal. The site is capable of accommodating very large distribution buildings – seven buildings of approximately 0.6 million sq ft or more and three buildings of 1 m sq ft. The site would have good access to the M6 and the site would have access to the WCML, with rail services to the Channel Tunnel, the Greater South East deep sea container ports and other regions of GB.
Project status Seeking planning permission. Costs • Development costs funded by the private sector developer
• Additional HGVs on local roads Benefits • Employment: 10,700-12,800 jobs (direct, indirect & induced);
• GVA: +£356-428 million; • The rail freight services provide lower cost distribution than by road and so help to reduce the
peripherality of the Liverpool City Region; • Reduced environmental impacts from the availability of rail freight services.
Synergies for SuperPort
Increased competitiveness for the SuperPort because it helps to provide the critical mass of freight traffic for additional logistics activity, which will also use other facilities in the SuperPort.
Lead Pro Logis

The Mersey Partnership – Liverpool Superport Economic Trends Study Page 73
Printed on 01/09/09 12:40 Our Ref: 209006r2 final v2-1
PIPELINE PROJECT 4:
PORT WESTON
Description Port Weston is a short sea port with on-site storage that Stobart Group is planning to develop as a Train Road Water distribution site.
Project status Project planning stage. Costs • Development costs funded by the private sector developer
• Additional HGVs on local roads Benefits • Employment: 500-600 jobs (direct, indirect & induced);
• GVA: +£16-19 m; • The rail freight services provide lower cost distribution than by road and so help to reduce the
peripherality of the Liverpool City Region; • Reduced environmental impacts from the availability of rail freight services.
Synergies for SuperPort
Increased competitiveness for the SuperPort because it helps to provide the critical mass of freight traffic for additional logistics activity, which will also use other facilities in the SuperPort.
Lead Stobart Group
PIPELINE PROJECT 5:
3MG EXPANSION
Description The expansion of the existing 3MG rail freight distribution park in Widnes, with additional large distribution centres. 3MG is currently undergoing the first phase of expansion of its site, which it is anticipated will offer 3.5m sq ft of space for logistics activity. Two new distribution centres of 570,000 sq ft and 200,000 sq ft were given planning permission in November 2008.
Project status Obtained planning permission. Costs • Development costs funded by the private sector developer
• Additional HGVs on local roads Benefits • Employment: likely to generate 1,100-1,400 jobs (direct, indirect & induced).
• GVA: +£38-46 million; • The rail freight services provide lower cost distribution than by road and so help to reduce the
peripherality of the Liverpool City Region; • Reduced environmental impacts from the availability of rail freight services.
Synergies for SuperPort
Increased competitiveness for the SuperPort because it helps to provide the critical mass of freight traffic for additional logistics activity, which will also use other facilities in the SuperPort.
Action Develop terminal Lead Stobart Group
PIPELINE PROJECT 6:
PORT WIRRAL
Description The development of a new port facility at the entrance to the Manchester Ship Canal to handle a wide range of port traffics and with on-site distribution buildings and a rail connection.
Project status Project planning stage. Costs • Development costs funded by the private sector developer
• Additional HGVs on local roads Benefits • Employment: could generate 1,600 jobs (direct, indirect & induced);
• GVA: +£53 per annum • The rail freight services provide lower cost distribution than by road and so help to reduce the
peripherality of the Liverpool City Region; • Reduced environmental impacts from the availability of rail freight and shipping services.
Synergies for SuperPort
Increased competitiveness for the SuperPort because it helps to provide the critical mass of freight traffic for additional logistics activity, which will also use other facilities in the SuperPort.
Lead Peel

The Mersey Partnership – Liverpool Superport Economic Trends Study Page 74
Printed on 01/09/09 12:40 Our Ref: 209006r2 final v2-1
PIPELINE PROJECT 7:
DEVELOPMENT OF LIVERPOOL JOHN LENNON AIRPORT
Description The Liverpool John Lennon Master Plan indicates that the proposed extension of the runway at Liverpool airport, along with other proposed developments such as enhancement of the passenger terminal and a cargo centre would enable long haul flights to China, US and India, thereby improving the appeal of Liverpool to investors in major economies.
Project status Project planning stage. Costs • Development costs funded by the private sector developer
• Additional cars and HGVs on local roads Benefits • Employment: 9,400 (direct, indirect & induced);
• GVA: +£313 million. Synergies for SuperPort
Increased competitiveness for the SuperPort because it allows logistics providers based in the Superport to offer their customers air freight services. Improved accessibility for passengers is likely to lead to greater numbers of tourists and increases the attractiveness of the City Region as a location for business.
Lead Peel
PIPELINE PROJECT 8:
LANGTON RIVERSIDE RORO TERMINAL
Description RoRo terminal providing direct access to the River Mersey, with all required planning permissions. Project status All required permissions in place. Costs • Development costs funded by the private sector developer
• Additional HGVs on local roads Benefits • Employment: c.200 (direct, indirect & induced);
• GVA: +£7m. Synergies for SuperPort
Increased competitiveness for the SuperPort because it helps to provide the critical mass of freight traffic for additional logistics activity, which will also use other facilities in the SuperPort.
Lead Peel Ports
Investment in hinterland access PIPELINE PROJECT 9:
MERSEY GATEWAY
Description Provides an additional new crossing of the River Mersey and will be incorporated into the existing highway network to the south via the Runcorn Central Expressway and to the north via Speke Road and the Eastern Bypass. The project also includes modifications to the existing Silver Jubilee Bridge by improving facilities for public transport, walking and cycling.
Project status Planning permission being sought. Cost £431 million Benefits • The new crossing will reduce general congestion across the existing Silver Jubilee Bridge and so
reduce journey times and increase journey time reliability for cars and freight. • Employment: additional 190 net FTE jobs in the local area & 470 net jobs in the North West;
greater accessibility to job opportunities for labour force (source: Amion Consultancy). • Additional wealth: £373 million additional GVA due to wider economic benefits such as reduced
transport costs, greater access to market for businesses etc. (source: Amion Consultancy). Synergies for SuperPort
Improved accessibility from the south of the Mersey to LJLA; direct impact on the operational efficiency and competitiveness of both 3MG and Port Weston.
Action Secure planning permission & build the Mersey Gateway Lead Halton BC

The Mersey Partnership – Liverpool Superport Economic Trends Study Page 75
Printed on 01/09/09 12:40 Our Ref: 209006r2 final v2-1
PIPELINE PROJECT 10:
ROAD ACCESS TO THE PORT OF LIVERPOOL
Description Would provide improved road access between Seaforth Docks and its container terminal and associated distribution activity and the core motorway network (M57/M58). The Highways Agency’s favoured scheme is a new road, although other options may be available. The costs and benefits described below are based on this scheme.
Project status Pre-option stage Costs • Estimated cost £165 million.
Benefits • The enhanced road access to Seaforth Docks should reduce general congestion on the existing
A5036 and so reduce journey times and increase journey time reliability for HGVs from the port. • Reduced impact on residents living adjacent to A5036.
Synergies for SuperPort
Improved accessibility from Seaforth Docks, including the Liverpool Post-panamax Container Terminal, to the M57/58 and M6; direct impact on the long-term operational efficiency and competitiveness of the Port of Liverpool and the SuperPort as a whole.
Action Select appropriate scheme, secure planning permission & implement. Lead Highways Agency
PIPELINE PROJECT 11:
RAIL ACCESS TO PORT FACILTIES
Description Would re-introduce or increase the existing capacity of rail access to port facilities such as Seaforth Docks, Canada Dock and Birkenhead Docks
Project status Pre-feasibility. Costs Not known. Benefits • Potential for modal shift for some traffic that is currently on the road, thereby reducing
congestion and other environmental impacts. • May also provide the potential for new passenger services in the City Region.
Synergies for SuperPort
Improved accessibility by rail, with modal shift impacts and the potential to have a positive impact on the long-term operational efficiency and competitiveness of the SuperPort as a whole.
Action Establish economic and technical feasibility of individual schemes and, subject to viability of proposals, implement in line with Network Rail guidelines.
Lead Peel & Network Rail

The Mersey Partnership – Liverpool Superport Economic Trends Study Page 76
Printed on 01/09/09 12:40 Our Ref: 209006r2 final v2-1
GLOSSARY OF TERMS Additionality The extent to which an activity is undertaken within a given geographical area as a result of the project or initiative. Thus, an impact arising from a project is additional if it would not have occurred in the absence of the project.11 Baseline A description of conditions existing at a point in time against which subsequent changes can be detected through monitoring. A baseline study is also required in order to establish what the conditions would be if development were not to take place. Conditions may not be stable as even in the absence of development; there may be decline, improvement or cyclic conditions. 12 Coastal shipping The movement of cargo by sea between two ports of the same country; this means that traffic between the North West and Northern Ireland (part of the UK, but not included within GB) is treated as coastal shipping. Container Standard units made of steel, usually with end doors. Standard sizes are used so that they are easily stackable on land and easily stowed on a vessel; can also be carried on trucks and by rail. Deep sea shipping The movement of cargo by sea between UK ports and ports situated outside Europe and the Mediterranean. Direct Impact First order impacts required for the undertaking of the project or initiative being studied. Displacement The proportion of project outputs accounted for by reduced outputs elsewhere in the target area.13 For example, a new retail development might invite existing local retailers to move from their old location within the study area, leaving the old location vacant. The activity of the local retailers is not additional for the local area, the activity has only moved within the area, so the impact is considered to be displaced. Draft The standard measure of a vessel’s depth below the water line, usually stated in metres. FTE Full-Time-Equivalent jobs are a way to measure a worker's involvement in a project. An FTE of 1.0 means that the person is equivalent to a full-time worker; while an FTE of 0.5 signals that the worker is only half-time. GB Freight Model (GBFM) is freight demand model that was developed by MDS Transmodal and is used by the DfT as its freight module within the National transport Model. GDP Gross domestic product is a measure of economic activity in a country. It is calculated by adding the total value of a country's annual output of goods and services. GDP = private consumption + investment + public spending + the change in inventories + (exports - imports). It is usually valued at market prices.14
11 EP Additionality Guide 2008 12 EP Additionality Guide 2008 13 EP Additionality Guide 2008 14 http://www.economist.com/research/economics/alphabetic.cfm?letter=G

The Mersey Partnership – Liverpool Superport Economic Trends Study Page 77
Printed on 01/09/09 12:40 Our Ref: 209006r2 final v2-1
Greater South East The three government regions of London, the South East and the East of England. GVA Gross value added is the difference between output and intermediate consumption for any given sector/industry. That is the difference between the value of goods and services produced and the cost of raw materials and other inputs which are used up in production. 15 Hinterland Where traffic goes to and comes from within the country where the port is located. Indirect/Induced Impact Second order impacts, or Multiplier Effects generated by an initiative. A project generating economic activity typically also generates demand for additional goods and services not associated directly with the project. Satisfying this demand provides additional activity, often not on site. For example building a bridge may require steel. Purchasing steel provides activity for steel producers. The additional activity in steel production is an indirect impact caused by the initiative. Input-output tables: These tables provide estimates of supply linkages between sectors and are used to estimate the supply linkage or indirect multiplier effects. Intermodal freight The movement of goods in one and the same loading unit or a vehicle by successive modes of transport without handling of the goods themselves when changing modes. Leakage The proportion of outputs that benefit those outside of the project’s target area or group.16 Lift-on Lift-off (LoLo) Where containers are transferred between the quay and the ship using cranes i.e. the containers are lifted on and off the ship. Logistics providers Companies that carry out transport and warehousing operations on an integrated basis for their customers. LQ Location quotient – a measure of concentration. The quotient indicates the geographical concentration of a particular activity in a particular area as a function of the expected concentration based on national average. The formula can be presented as: LQ=% total workforce in a defined area working in industry X % total national workforce working in industry X So if an area has 15% of its workforce in agriculture when only 5% of the national workforce is employed in agriculture, the LQ=15/5=3.17 Market Prices Market or purchasers prices are the prices actually paid by the purchaser for goods and services, including transport costs, trade margins and taxes.18 15 ONS http://www.statistics.gov.uk/about/glossary/economic_terms.asp 16 EP Additionality Guide 2008 17 http://www.tuition.com.hk/geography/g.htm

The Mersey Partnership – Liverpool Superport Economic Trends Study Page 78
Printed on 01/09/09 12:40 Our Ref: 209006r2 final v2-1
Multiplier Effects Further economic activity (jobs, expenditure or income) associated with additional local income, local supplier purchases and longer term effects.19 These can be split into: supply linkage multipliers (or indirect multipliers), due to purchases made as a result of the intervention and further purchases with firms linked along the supply chain; and income multipliers (induced multipliers) associated with local expenditure as a result of those deriving income from direct and supply linkage impacts of the intervention. A ready-reckoner or composite multiplier accounts for both supply linkage and income multipliers. Outcomes Intended results from a project in terms of its key or ultimate objectives. 20 Outputs Impacts immediately resulting from an intervention.21 PCD Post Code District Post-panamax container ship A ship carrying containers that has physical dimensions that mean it cannot pass through the Panama Canal. Roll-on Roll-off (RoRo) Where commercial vehicles, passenger cars and trade cars are wheeled on and off ferries, using ramps between the ships and the quay. Short sea shipping The movement of cargo and passengers by sea between ports situated in geographical Europe or between those ports and ports situated in non-European countries with a coastline on the enclosed seas bordering Europe. Substitution Where a firm substitutes one activity for a similar activity (such as recruiting a different job applicant) to take advantage of public sector assistance. 22 TEU Twenty feet equivalent unit; standard measure of the volume of containers handled at a port and by a shipping line; a forty feet long container is therefore two TEU.
18 ONS http://www.statistics.gov.uk/about/glossary/economic_terms.asp 19 EP Additionality Guide 2008 20 EP Additionality Guide 2008 21 EP Additionality Guide 2008 22 EP Additionality Guide 2008