kauffman skein algebra of the torus - The University of Liverpool
Upload
khangminh22Category
view
0download
0
Molecular, biochemical and
pharmacological characterisation of
Mycobacterium tuberculosis cytochrome bd-
I oxidase: a putative therapeutic target
Taghreed Abdulaziz Hafiz
Ph.D. 2013

Molecular, biochemical and pharmacological
characterisation of Mycobacterium tuberculosis
cytochrome bd-I oxidase: a putative therapeutic target
Thesis is submitted in accordance with the requirements of the
University of Liverpool for the degree of Doctor of Philosophy
By
Taghreed Abdulaziz Hafiz
M.Sc (University of Liverpool)
June 2013

Declaration
This thesis is the result of my own work. The material contained in the thesis has not
been presented, nor is currently being presented, either wholly or as a part, for any
other degree or other qualification.
The research work was carried out in the Liverpool School of Tropical Medicine,
University of Liverpool, United Kingdom.
………………………………………..
Taghreed Abdulaziz Hafiz (2013)

I
Dedication
First and foremost, I would like to dedicate this work to my lovely parents, my husband and to my son Adel and my daughter Danah

II
Acknowledgements
I am profoundly indebted to the grace of Allah for giving me the ability, insights,
ideas and strength to make this thesis possible. Thank you Allah for your blessing on
my family and me.
I would like to acknowledge my supervisor Dr Giancarlo Biagini for his support,
encouragement, stimulating suggestions and constructive criticism throughout the
time of research and writing of this thesis. I also wish to thank my co-supervisor
Professor Steve Ward for his helpful suggestions and comments on my work.
I would like to express my gratitude and appreciation to Dr Ashley Warman for all
of the guidance and support in helping me with various aspects of my work; your
advice was immeasurable and I am extremely thankful. Additionally, special thanks
go to Dr Nicholas Fisher for all of his advice and help on my work.
The Steve Ward group, especially Mrs Alison Ardrey, Dr Gavin Laing, Dr Darren
Moss, Dr Gemma Nixon, Dr Alison Shone, Angela Travis and Mary Creegan, are all
acknowledged for their support, help and ability to make the working environment
very comfortable and conducive to research.
I am equally grateful to my colleagues, Dr Roslaini Abd Majid, Dr Teresa Ratio and
Dr Thomas Antoine for their support and help. You have all been wonderful and it
was great getting to know you and working with you.
My deepest gratitude to my lovely mother Rajaa Obaid and to my father Abdulaziz
Hafiz; you are simply the best parents in the whole world. Without your prayers to
Allah, resolute encouragement, patience and help with taking care of my kids and
myself, this thesis would not have been possible. A special big thank you goes to my
lovely sisters, Kholoud, Nehad, Hanan, Tahani and Deema, and to my beloved
brother Mohammed for all of your prayers and support. Thank you for making my
adored daughter Danah laugh and helping her to enjoy her time with you and for
committing to sending me pictures of her every day. I love you all very much.
My sincerest love and apology go to my son Adel (2 years and 5 months) and to my
baby daughter Danah (1 year) for being busy and away from you. I am sorry. Thank
you for your patience with me. I adore you. Thank you Danah for being my pretty
princess; every night away from you was a big challenge and burden to bear.
Finally, I wish to express my heart-felt thankfulness to my dear husband Murad
Mubaraki for his love, support and help throughout my lab work and during my
pregnancies of Adel and Danah. Thank you for teaching me the techniques used in
my metabolomics work. Thank you for lifting the burden off my shoulders
throughout my PhD and thank you for being so supportive during the hardest nights,
when I had to leave Danah back in Saudi Arabia. I love you.

III
Publications and presentations
Work in this thesis is in preparation for publication and has been presented at
meetings in the following forms:
Publication in preparation:
Mycobacterium tuberculosis cytochrome bd oxidase; Initial characterisation of a
putative therapeutic target*
Taghreed A. Hafiz1*
, Ashley J. Warman1*
, Nicholas E. Fisher1, Gemma L. Nixon
1,
Neil G. Berry2, Paul M. O’Neill
2, Stephen A. Ward
1, and Giancarlo A. Biagini
1
*Running title: Characterisation of Mtb cytochrome bd oxidase
* Joint first author
Presentations:
Mycobacterium tuberculosis cytochrome bd oxidase: a terminal solution?
Taghreed A. Hafiz1, Ashley J. Warman
1, Nicholas E. Fisher
1, Gemma L. Nixon
1,
Neil G. Berry2, Paul M. O’Neill
2, Stephen A. Ward
1, and Giancarlo A. Biagini
1
Has been presented at the Tuberculosis 2012 Conference held, September 11-15,
2012 at the Institut Pasteur, Paris, France.

IV
Table of content
Dedication .................................................................................................................... I
Acknowledgements ..................................................................................................... II
Publications and presentations ................................................................................... III
Table of content.......................................................................................................... IV
List of Figures ............................................................................................................ XI
List of Tables............................................................................................................ XV
List of appendices ................................................................................................... XVI
Abbreviations ........................................................................................................ XVII
Abstract ................................................................................................................. XXII
Chapter I ....................................................................................................................... 1
General introduction..................................................................................................... 1
1.1. Overview ....................................................................................................... 2
1.2. The global burden of tuberculosis in the world ............................................. 3
1.3. Mycobacterium tuberculosis (Mtb): .............................................................. 4
1.3.1. The pathogen of tuberculosis: biology and virulence factors ................ 4
1.3.2. Pathogenesis of tuberculosis .................................................................. 6
1.3.2.1. Life cycle of Mtb ...................................................................................... 6
1.3.2.2. Granuloma ................................................................................................ 8
1.3.2.3. Latency of Mtb ......................................................................................... 9
1.3.2.3.1. Replication state of dormant Mtb .......................................................... 9
1.3.2.3.2. Latency models ................................................................................... 10
1.3.2.4. Persister cells.......................................................................................... 12
1.3.2.5. Yin-Yang model ..................................................................................... 13
1.4. Tuberculosis drugs: ..................................................................................... 15
1.4.1. First-line tuberculosis drugs: ................................................................ 16
1.4.1.1. Isoniazid ................................................................................................. 16
1.4.1.2. Rifampicin .............................................................................................. 19
1.4.1.3. Ethambutol ............................................................................................. 20
1.4.1.4. Pyrazinamide .......................................................................................... 21
1.4.2. Second-line tuberculosis drugs ............................................................ 22
1.4.2.1. Streptomycin .......................................................................................... 23

V
1.4.3. Metronidazole, a drug against anaerobic bacteria ................................ 23
1.4.4. Resistant tuberculosis phenotypes........................................................ 24
1.5. Mycobacterium tuberculosis and a vision for the future ............................. 29
1.5.1. The Genomic era in the study of Mtb .................................................. 29
1.5.2. Mycobacterium tuberculosis metabolism ............................................ 30
1.5.2.1. Carbohydrate, TCA cycle....................................................................... 31
1.5.2.2. Fatty acids metabolism, Glyoxylate shunt ............................................. 32
1.5.2.3. Amino acids metabolism ........................................................................ 34
1.5.3. Electron transport and respiration in Mycobacterium tuberculosis ..... 37
1.5.3.1. Electron donors ...................................................................................... 37
1.5.3.2. Quinones in Mycobacterium tuberculosis .............................................. 38
1.5.3.3. Electron Acceptors ................................................................................. 39
1.5.4. Cytochrome bd-I oxidase ..................................................................... 42
1.5.4.1. Definition ............................................................................................... 42
1.5.4.2. Subclasses .............................................................................................. 42
1.5.4.3. Physiological functions .......................................................................... 43
1.5.4.4. Cytochrome bd expression conditions ................................................... 43
1.5.4.5. Genetics .................................................................................................. 44
1.5.4.5.1. Genes of Mycobacterium tuberculosis encoding the protein subunits
and assembly factors of the cytochrome bd-I oxidase ........................................... 44
1.5.4.5.2. Regulation of cydAB operon expression ............................................. 44
1.5.4.6. Cofactors and substrates ......................................................................... 45
1.5.4.7. Proposed catalytic mechanism ............................................................... 46
1.5.4.8. Inhibitors of cytochrome bd-I ................................................................ 46
1.5.4.9. The importance of bd-I and latency ....................................................... 46
1.5.5. Transcriptional changes in respiratory chain components of
Mycobacterium tuberculosis among various growth models ............................. 47
1.6. Potential future anti-TB drugs ..................................................................... 49
1.6.1. TB drugs global alliance ...................................................................... 49
1.6.2. Important drugs that target Mtb ETC ................................................... 49
1.6.3. Other future drugs candidates .............................................................. 50
1.7. Objectives .................................................................................................... 51
Chapter II ................................................................................................................... 52

VI
Generation and characterisation of a heterologous expression system for
Mycobacterium tuberculosis cytochrome bd-I oxidase in an E. coli respiratory
knockout (bo3/bd-I) mutant strain. ............................................................................. 52
2.1. Introduction ................................................................................................. 53
2.2. Material and methods .................................................................................. 58
2.2.1. Amplification of Mycobacterium tuberculosis cydABDC operon ....... 58
2.2.1.1. Primer design ......................................................................................... 58
2.2.1.2. Polymerase chain reaction of cydABDC operon .................................... 60
2.2.1.3. Purification of PCR products ................................................................. 61
2.2.1.4. Agarose gel electrophoresis ................................................................... 61
2.2.2. TA cloning ........................................................................................... 62
2.2.3. Preparation of media: ........................................................................... 63
2.2.3.1. LB Broth (Luria-Bertani medium) ......................................................... 63
2.2.3.2. LB agar plate media ............................................................................... 63
2.2.4. Transformation of One Shot® TOP10 chemically competent E. coli .. 63
2.2.5. Glycerol Bacterial Stock ...................................................................... 64
2.2.6. Mini preps ............................................................................................ 64
2.2.7. Screening of positive clones pTM3 by restriction enzyme analysis .... 65
2.2.8. Analysis by automated sequencing ...................................................... 65
2.2.9. Maxi prep ............................................................................................. 65
2.2.10. Sub-cloning of pTM3 into pUC19 expression vector .......................... 66
2.2.11. Transformation of ligated expression vector into One Shot®
TOP10
chemically competent E. coli .............................................................................. 67
2.2.12. Selection of recombinants .................................................................... 68
2.2.13. Preparation of competent ML16 E. coli cells....................................... 68
2.2.14. Transformation of pTMA into ML16 competent cells ........................ 69
2.2.15. Large-scale culture ............................................................................... 70
2.2.16. Preparation of 50 mM KPi, 2 mM EDTA, pH 7.5 buffer .................... 71
2.2.17. Membrane preparations ........................................................................ 71
2.2.18. Determination of protein concentration ............................................... 72
2.2.19. Initial spectroscopic study of Mtb cytochrome bd-I oxidase ............... 72
2.2.20. Growth curves ...................................................................................... 73
2.2.21. SDS-PAGE ........................................................................................... 73
2.2.22. Sample Preparation for SDS-PAGE..................................................... 74

VII
2.3. Results ......................................................................................................... 75
2.3.1. Amplification of the Mycobacterium tuberculosis H37Rv cydABDC
operon 75
2.3.2. Screening of positive clones of pTM3 in TOP 10 E. coli host ............ 76
2.3.3. Sub-cloning of pTM3 into the pUC19 expression vector .................... 78
2.3.4. The effect of recombinant Mycobacterium tuberculosis cytochrome bd-
I on cell pigmentation ......................................................................................... 80
2.3.5. Expression studies of cydABDC operon in the ML16 host .................. 81
2.3.6. Initial spectroscopic study of the Mycobacterium tuberculosis
cytochrome bd-I .................................................................................................. 82
2.3.6.1. Wild–type E. coli (BL21(DE3)pLysS) strain ......................................... 83
2.3.6.2. Double-knockout E. coli (ML16) strain ................................................. 84
2.3.6.3. Transformed double-knockout E. coli (TML16) strain .......................... 85
2.3.7. Assessment of growth phenotypes ....................................................... 86
2.3.7.1. Wild–type E. coli BL21(DE3) pLysS strain .......................................... 87
2.3.7.2. Double-knockout E. coli (ML16) strain ................................................. 88
2.3.7.3. Transformed double-knockout E. coli (TML16) strain .......................... 89
2.4. Discussion ................................................................................................... 90
Chapter III .................................................................................................................. 97
Biochemical and pharmacological characterization of Mycobacterium tuberculosis
cytochrome bd-I oxidase ............................................................................................ 97
3.1. Introduction ................................................................................................. 98
3.2. Material and methods ................................................................................ 103
3.2.1. Membrane preparations ...................................................................... 103
3.2.2. Preparation of 50 mM KPi, 2 mM EDTA, pH 7.5 buffer .................. 103
3.2.3. Preparation of decylubiquinol (dQH2) and ubiquinol-2 (Q2H2) ......... 103
3.2.4. Preparation of ubiquinol-1 (Q1H2) ..................................................... 104
3.2.5. Steady state kinetic assays ................................................................. 104
3.2.6. pH assay ............................................................................................. 105
3.2.7. Detergent assays ................................................................................. 105
3.2.8. Chemoinformatics compound selection ............................................. 106
3.2.8.1. Preparation of inhibitor stock solutions ............................................... 106
3.2.8.2. Enzyme inhibition assays ..................................................................... 108
3.2.8.3. Competition assays, Lineweaver-Burk and Eadie-Hofstee Plots ......... 108

VIII
3.2.9. Culture of Mycobacterium tuberculosis ............................................. 109
3.2.9.1. Preparation of media: ........................................................................... 109
3.2.9.1.1. Middlebrook 7H9 broth .................................................................... 109
3.2.9.1.2. Middlebrook 7H11 agar plate medium ............................................. 109
3.2.9.2. General considerations regarding Mtb culturing .................................. 109
3.2.9.2.1. Mtb strain and growth media ............................................................ 110
3.2.9.2.2. Culturing Mtb from frozen stocks ..................................................... 110
3.2.9.2.3. Mtb aerobic cultures .......................................................................... 110
3.2.9.2.4. Hypoxia model of growth: cultures grown in limited oxygen condition
110
3.2.9.2.5. Mtb growth curves ............................................................................ 111
3.2.10. Mycobacterium tuberculosis drug sensitivity assays ......................... 111
3.2.11. Time-kill studies ................................................................................ 113
3.2.12. Statistical analysis .............................................................................. 113
3.3. Results ....................................................................................................... 114
3.3.1. Detergent assay .................................................................................. 114
3.3.2. pH assay ............................................................................................. 115
3.3.3. Kinetic characterization of Mtb bd-I .................................................. 116
3.3.3.1. Decylubiquinol (dQH2) ........................................................................ 117
3.3.3.2. Ubiquinol-1 (Q1H2) .............................................................................. 118
3.3.3.3. Ubiquinol-2 (Q2H2) .............................................................................. 118
3.3.4. Drug sensitivity assays ....................................................................... 119
3.3.4.1. Growth inhibition studies ..................................................................... 119
3.3.4.2. Enzyme and growth inhibition studies, quinolone-type compounds ... 120
3.3.5. Correlation Study ............................................................................... 128
3.3.6. Time-kill studies ................................................................................ 128
3.3.7. The mechanism of inhibition of Mtb bd-I activity by quinolone-type
inhibitors ........................................................................................................... 130
3.3.7.1. Inhibition mechanism of Mtb bd-I by CK-2-63 ................................... 133
3.3.7.2. Inhibition mechanism of Mtb bd-I by SCR-8-12 ................................. 134
3.3.7.3. Inhibition mechanism of Mtb bd-I by MTD-403 ................................. 135
3.3.7.4. Inhibition mechanism of Mtb bd-I by SL-2-25 .................................... 136
3.3.7.5. Inhibition mechanism of Mtb bd-I by PG-203 ..................................... 137
3.4. Discussion ................................................................................................. 138

IX
Chapter IV ................................................................................................................ 148
Generation and characterisation of a heterologous expression system for
Mycobacterium tuberculosis cytochrome bd-I oxidase in an E. coli respiratory
knockout (bo3/bd-I/bd-II) mutant strain ................................................................... 148
4.1. Introduction ............................................................................................... 149
4.2. Materials and methods ............................................................................... 151
4.2.1. Preparation of competent cells ........................................................... 151
4.2.2. Transformation of pTMA into MB44 competent cells ...................... 151
4.2.3. Optimization of Mtb bd-I expression conditions ............................... 152
4.2.4. Large-scale culture of TMB44, AnMB44 and BL21(DE3)pLysS strains
153
4.2.5. Membrane preparations ...................................................................... 154
4.2.6. Determination of protein concentration ............................................. 154
4.2.7. Initial spectroscopic study of Mtb cydABDC operon ......................... 154
4.2.8. Growth curves .................................................................................... 154
4.2.9. Preparation of dQH2, Q1H2 and Q2H2 ................................................ 155
4.2.10. Steady-state kinetic assays ................................................................. 155
4.2.11. Enzyme inhibition assay .................................................................... 155
4.3. Results ....................................................................................................... 156
4.3.1. The effect of recombinant Mtb cytochrome bd-I on cell pigmentation
156
4.3.2. Initial spectroscopic study of the Mtb cydABDC operon ................... 157
4.3.2.1. Wild–type E. coli BL21(DE3) pLysS strain ........................................ 157
4.3.2.2. Triple-knockout E. coli (MB44) strain ................................................. 158
4.3.2.3. Transformed triple-knockout E. coli (TMB44) strain .......................... 159
4.3.3. Assessment of growth phenotypes ..................................................... 159
4.3.3.1. Wild–type E. coli BL21(DE3) pLysS strain ........................................ 160
4.3.3.2. Triple-knockout E. coli (MB44) strain ................................................. 161
4.3.3.3. Transformed triple-knockout E. coli (TMB44) strain .......................... 162
4.3.4. Kinetic analysis of the recombinant Mtb cytochrome bd-I oxidase .. 163
4.3.5. Drug sensitivity assays ....................................................................... 165
4.4. Discussion ................................................................................................. 166
Chapter V ................................................................................................................. 171
Pharmaco-metabolomics of Mycobacterium tuberculosis ....................................... 171

X
5.1. Introduction ............................................................................................... 172
5.2. Material and methods ................................................................................ 176
5.2.1. Preparation of targeted metabolomics solutions ................................ 176
5.2.1.1. Solvents and Chemicals ....................................................................... 176
5.2.1.2. Quenching solution .............................................................................. 176
5.2.1.3. Extraction solution ............................................................................... 176
5.2.1.4. Mobile phase solvents .......................................................................... 176
5.2.2. Preparation of inhibitor stock solutions ............................................. 177
5.2.3. Culture of Mycobacterium tuberculosis ............................................. 177
5.2.4. Protocol for sampling metabolites from Mtb H37Rv culture ............ 177
5.2.4.1. Experiment set-up ................................................................................ 178
5.2.4.2. Metabolites extraction .......................................................................... 179
5.2.5. LC-MS/MS samples preparation ....................................................... 179
5.2.6. Preparation of standards stock for calibration curve standards .......... 180
5.2.7. Analysis using LC-MS/MS ................................................................ 182
5.2.8. Data treatment and analysis ............................................................... 183
5.3. Results ....................................................................................................... 185
5.3.1. PCA and PLS-DA .............................................................................. 186
5.3.2. Heat map profile of the Mtb metabolome .......................................... 189
5.3.3. Biochemical time–dependent of metabolite profiles in Mtb H37Rv. 190
5.4. Discussion ................................................................................................. 213
Chapter VI ................................................................................................................ 220
General discussion ................................................................................................... 220
Appendixes ............................................................................................................... 228
References ................................................................................................................ 256

XI
List of Figures
Chapter 1:
Figure 1.1: Worldwide distribution of new TB cases per 100,000 people in 2011 (3) 4
Figure 1.2: Schematic representation of the cell wall of Mycobacterium tuberculosis
...................................................................................................................................... 5
Figure 1.3: The life-cycle of Mycobacterium tuberculosis: from infection to host
defence ......................................................................................................................... 7
Figure 1.4: Yin and yang of persisters and replicating bacteria and their
interconversions (24, 45). ........................................................................................... 14
Figure 1.5: Yin and yang of latent infection and overt disease and their
interconversions (24, 45). ........................................................................................... 14
Figure 1.6: Structure of isoniazid, C6H7N3O ............................................................. 17
Figure 1.7: Structure of rifampicin, C43H58N4O12 ...................................................... 19
Figure 1.8: Structure of ethambutol, C10H24N2O2 ...................................................... 20
Figure 1.9: Structure of pyrazinamide, C5H5N3O ...................................................... 21
Figure 1.10: Structure of streptomycin, C21H39N7O12 ................................................ 23
Figure 1.11: Structure of metronidazole, C6H9N3O3 .................................................. 24
Figure 1.12: Distribution of Notified MDR-TB (population rate per 100,000) – 2010
(143) ........................................................................................................................... 25
Figure 1.13: Worldwide distribution of countries reporting at least one case of XDR-
TB (in red), according to WHO report, 2010 (144). .................................................. 26
Figure 1.14: Central metabolic pathways of Mycobacterium tuberculosis (192-194)
.................................................................................................................................... 36
Figure 1.15: Structures of (a) Ubiquinone and (b) Menaquinone .............................. 39
Figure 1.16: Components of the electron transport chain in Mycobacterium
tuberculosis (209) ...................................................................................................... 41
Chapter 2:
Figure 2.1: The position of the cydAB genes in the context of the Mycobacterium
tuberculosis genome................................................................................................... 53
Figure 2.2: The electron transport chain of Mycobacterium tuberculosis and of E.
coli .............................................................................................................................. 55
Figure 2.3: Components of the electron transport chain of ML16, an E. coli mutant
strain ........................................................................................................................... 56
Figure 2.4: Amplification of Mycobacterium tuberculosis H37Rv cydABDC operon
.................................................................................................................................... 75
Figure 2.5: Restriction enzyme digestion analysis of a transformed colony of the
pTM3 construct .......................................................................................................... 77

XII
Figure 2.6: Plasmid map of pCR®
II-TOPO® bearing the Mycobacterium tuberculosis
cydABDC operon ........................................................................................................ 78
Figure 2.7: Restriction enzyme digestion analysis of transformed colonies of pTMA
constructs ................................................................................................................... 79
Figure 2.8: Plasmid map of the pUC19 expression vector bearing the Mycobacterium
tuberculosis cydABDC operon ................................................................................... 80
Figure 2.9: Effect of Mtb bd-I on cell pigmentation .................................................. 81
Figure 2.10: SDS-PAGE analysis of the recombinant Mtb cytochrome bd-I oxidase
.................................................................................................................................... 82
Figure 2.11: Reduced minus oxidized spectra of wild-type E. coli BL21 (DE3) LysS
strain ........................................................................................................................... 83
Figure 2.12: Reduced minus oxidized spectra of ML16 ............................................ 84
Figure 2.13: Reduced minus oxidized spectra of TML16.......................................... 85
Figure 2.14: Structures of resazurin in various oxidation states ................................ 86
Figure 2.15: Growth of BL21 (DE3) pLysS (wild-type E. coli) supplemented with a
redox indicator (resazurin) ......................................................................................... 87
Figure 2.16: Growth of ML16 supplemented with a redox indicator (resazurin) ...... 88
Figure 2.17: Growth of TML16 supplemented with a redox indicator (resazurin) ... 89
Chapter 3:
Figure 3.1: Structures of decylubiquinone, ubiquinone-1 and ubiquinone-2 and their
reduced quinol counterparts ....................................................................................... 98
Figure 3.2: Proposed cytochrome bd-I model adapted from (211) .......................... 100
Figure 3. 3: A) aurachin C structure. B) aurachin D structure ................................. 102
Figure 3.4: A) HDQ structure. B) The quinolone core ............................................ 102
Figure 3.5: The effect of detergents on Mtb bd-I activity in 50 mM KPi, 2 mM
EDTA, pH 7.5 buffer ............................................................................................... 114
Figure 3.6: pH dependence of Mtb bd-I activity. ..................................................... 115
Figure 3.7: Steady-state decylubiquinol:Mtb bd-I activity ...................................... 117
Figure 3.8: Steady-state ubiquinol-1:Mtb bd-I activity ........................................... 118
Figure 3.9: Steady-state ubiquinol-2: Mtb bd-I activity........................................... 118
Figure 3.10: IC50 determination of isoniazid concentrations against Mtb aerobic
growth ...................................................................................................................... 120
Figure 3.11: The quinolone-type compounds flow chart of potency against Mtb bd-I
and Mycobacterium tuberculosis H37R ................................................................... 121
Figure 3.12: Determination of the IC50s for CK-2-63 and MTD-403 against Mtb bd-I
activity ...................................................................................................................... 126
Figure 3.13: Scatter plot of the IC50s of quinolone-type compounds against Mtb bd-I
and aerobically cultured Mycobacterium tuberculosis H37Rv ................................ 128
Figure 3.14: Time-kill curves for untreated and drug-treated Mtb H37Rv.............. 129
Figure 3.15: Substrate titration of steady state velocity for Mtb bd-I in the presence
of the CK-2-63 inhibitor........................................................................................... 133

XIII
Figure 3.16: Substrate titration of steady state velocity for Mtb bd-I in the presence
of the SCR-8-12 inhibitor......................................................................................... 134
Figure 3.17: Substrate titration of steady state velocity for Mtb bd-I in the presence
of the MTD-403 inhibitor......................................................................................... 135
Figure 3.18: Substrate titration of steady state velocity for Mtb bd-I in the presence
of the SL-2-25 inhibitor ........................................................................................... 136
Figure 3.19: Substrate titration of steady state velocity for Mtb bd-I in the presence
of the PG-203 inhibitor ............................................................................................ 137
Chapter 4:
Figure 4.1: Components of the electron transport chain of MB44, an E. coli mutant
strain ......................................................................................................................... 149
Figure 4.2: Effect of recombinant Mtb cytochrome bd-I expression on cell
pigmentation ............................................................................................................. 156
Figure 4.3: Reduced minus oxidized spectrum of wild-type E.coli BL21(DE3) pLysS
strain ......................................................................................................................... 157
Figure 4.4: Reduced minus oxidized spectra of MB44 ............................................ 158
Figure 4.5: Reduced minus oxidized spectrum of TMB44 ...................................... 159
Figure 4.6: Growth of BL21(DE3) pLysS (wild-type E. coli) in vitro supplemented
with resazurin. .......................................................................................................... 160
Figure 4.7: Growth of MB44 in vitro supplemented with resazurin ........................ 161
Figure 4.8: Growth of TMB44 in vitro supplemented with resazurin ..................... 162
Figure 4.9: Steady-state decylubiquinol/ubiquinol-1: Mtb bd-I activity ................. 164
Figure 4.10: Determination of the IC50 for MTD-403 against Mtb bd-I activity ..... 165
Chapter 5:
Figure 5.1: Schematic diagram of the proposed mode of action of DOTS and Mtb
respiratory inhibitors ................................................................................................ 173
Figure 5.2: LC-MS/MS chromatogram of AMP ...................................................... 183
Figure 5.3: Standard calibration curve of AMP ....................................................... 184
Figure 5.4: 2-D and 3-D PCA score plots for Mtb H37Rv upon exposure to different
drugs and inhibitors .................................................................................................. 187
Figure 5.5: 2-D and 3-D PLS-DA scores for Mtb H37Rv upon exposure to different
drugs and inhibitors. ................................................................................................. 188
Figure 5. 6: Heat map profile of drug-treated and untreated Mtb H37Rv metabolome
.................................................................................................................................. 189
Figure 5.7: Time-dependent changes of Mtb H37Rv metabolites in INH-treated and
untreated control cells .............................................................................................. 192
Figure 5.8: Time-dependent change of Mtb H37Rv metabolites in INH-treated and
untreated control cells .............................................................................................. 193

XIV
Figure 5.9: Time-dependent changes of Mtb H37Rv metabolites in INH-treated and
untreated control cells .............................................................................................. 194
Figure 5.10: Time-dependent changes of Mtb H37Rv metabolites in EMB-treated
and untreated control cells ....................................................................................... 195
Figure 5.11: Time-dependent changes of Mtb H37Rv metabolites in EMB-treated
and untreated control cells ....................................................................................... 196
Figure 5.12: Time-dependent changes of Mtb H37Rv metabolites in EMB-treated
and untreated control cells ....................................................................................... 197
Figure 5.13: Time-dependent changes of Mtb H37Rv metabolites in RIF-treated and
untreated control cells .............................................................................................. 198
Figure 5.14: Time-dependent changes of Mtb H37Rv metabolites in RIF-treated and
untreated control cells .............................................................................................. 199
Figure 5.15: Time-dependent changes of Mtb H37Rv metabolites in RIF-treated and
untreated control cells .............................................................................................. 200
Figure 5.16: Time-dependent changes of Mtb H37Rv metabolites in STR-treated and
untreated control cells .............................................................................................. 201
Figure 5.17: Time-dependent changes of Mtb H37Rv metabolites in STR-treated and
untreated control cells .............................................................................................. 202
Figure 5.18: Time-dependent changes of Mtb H37Rv metabolites in STR-treated and
untreated control cells .............................................................................................. 203
Figure 5.19: Time-dependent changes of Mtb H37Rv metabolites in TPZ-treated and
untreated control cells .............................................................................................. 204
Figure 5.20: Time-dependent changes of Mtb H37Rv metabolites in TPZ-treated and
untreated control cells .............................................................................................. 205
Figure 5.21: Time-dependent changes of Mtb H37Rv metabolites in TPZ-treated and
untreated control cells .............................................................................................. 206
Figure 5.22: Time-dependent changes of Mtb H37Rv metabolites in CK-2-63-treated
and untreated control cells ....................................................................................... 207
Figure 5.23: Time-dependent changes of Mtb H37Rv metabolites in CK-2-63-treated
and untreated control cells ....................................................................................... 208
Figure 5.24: Time-dependent of changes Mtb H37Rv metabolites in CK-2-63-treated
and untreated control cells ....................................................................................... 209
Figure 5.25: Time-dependent changes of Mtb H37Rv metabolites in RKA-307-
treated and untreated control cells............................................................................ 210
Figure 5.26: Time-dependent changes of Mtb H37Rv metabolites in RKA-307-
treated and untreated control cells............................................................................ 211
Figure 5.27: Time-dependent changes of Mtb H37Rv metabolites in RKA-307-
treated and untreated control cells............................................................................ 212
Figure 5.28: Degradation of amino acids to one of seven common metabolic
intermediates (194)................................................................................................... 215

XV
List of Tables
Chapter 1:
Table 1.1: Summary of drugs currently used against TB and their mechanisms of
resistance (67, 138, 140). ........................................................................................... 28
Chapter 2:
Table 2.1: The oligonucleotide primers for amplifying the cydABDC genes from
Mycobacterium tuberculosis H37Rv ......................................................................... 58
Table 2.2: The oligonucleotide primers used for sequencing of the cydABDC genes
.................................................................................................................................... 59
Chapter 3:
Table 3.1: List of the inhibitors used in inhibition studies for phenotypic profiling of
H37Rv strain of Mtb ................................................................................................ 107
Table 3.2: Kinetic parameters of Mtb bd-I activity.................................................. 116
Table 3.3: Bactericidal IC50s and IC90s values of inhibitor compounds tested against
Mycobacterium tuberculosis .................................................................................... 119
Table 3.4: The physical characteristics of the quinolone-type compounds used in this
study ......................................................................................................................... 122
Table 3.5: IC50s values from growth inhibitory assays of quinolone-type compounds
.................................................................................................................................. 125
Table 3.6: The IC50s determination of KCN and HDQ against Mtb bd-I activity ... 127
Table 3.7: Diagnostic signatures and binding features of reversible inhibition
modalities (335, 345, 352, 353) ............................................................................... 131
Table 3.8: Mechanism of inhibition of Mtb bd-I by quinolone-type inhibitors in
presence of varying concentrations of dQH2 substrate ............................................ 132
Chapter 4:
Table 4.1: Kinetic parameters of Mtb bd-I activity.................................................. 163
Chapter 5:
Table 5.1: Metabolite primary stocks concentration for calibration curve standards
.................................................................................................................................. 180
Table 5.2: Metabolites showing notable fold change following drug exposure
(Summarised from Figs. 5.7 – 5.27) ........................................................................ 214

XVI
List of appendixes
Appendix I: Growth curve of Mtb H37Rv ............................................................... 229
Appendix II: Metabolomic technique tables ............................................................ 234
Appendix III: Metabolites calibration curves .......................................................... 237

XVII
Abbreviations ACDP Advisory Committee on Dangerous Pathogens
ADP Adenosine diphosphate
AIDS Acquired immune deficiency syndrome
Ala Alanine
AMB44 Aerobically grown MB44 competent cells
AML16 Aerobically grown ML16 competent cells
AMP Adenosine monophosphate
AnMB44 O2-limited grown MB44 competent cells
AnML16 O2-limited grown ML16 competent cells
AOX Alternative oxidase
APS Ammonium persulphate
Arg Arginine
ARV Antiretroviral
Asn Asparagine
Asp Aspartic acid
ATMB44 Transformed cells grown in aerobic growth condition
ATP Adenosine triphosphate
BCG Bacillus Calmette-Guérin
BN-PAGE Blue-Native polyacrylamide gel electrophoresis
Bp Base pair
BSA bovine serum albumin
CCM Central carbon metabolic
CcO aa3-type cytochrome c oxidase
CFU Colony forming unit
cfu.ml-1
CFU per millilitre
CHAPS 3-[(3-cholamidopropyl)dimethylammonio]-1-propanesulfonate
CID Collision induced dissociation
CIO Cyanide insensitive oxygen reductases
CPZ Chlorpromazine
CTP Cytidine triphosphate
Cys Cysteine
DDM n-dodecyl-β-D-maltopyranoside
DEPC Diethylpyrocarbonate
dH2O Distilled water
DHAP Dihydroxyacetone phosphate
DMPK Drug metabolism and pharmacokinetics
DMSO Dimethyl sulfoxide
DNA Deoxyribonucleic acid
DOTS Directly observed treatment, short-course
dQH2 Decylubiquinol
DTT Dithiothreitol
E Enzyme

XVIII
EDTA Ethylenediaminetetraacetic acid
EI Enzyme-Inhibitor complex
EMB Ethambutol
ES Enzyme-Substrate complex
ESI Electrospray ionization
ETC Electron transport chain
F Fluorine
FAD Flavin adenine dinucleotide
FADH2 reduced flavin adenine dinucleotide
FAS-I type I fatty acid synthases
FAS-II type II fatty acid synthases
FRD Fumarate reductase
G-3-P Glycerol-3-phosphate
G3PDH Glycerol-3-phosphate dehydrogenase
GABA γ-Aminobutyric acid
GC-MS Gas chromatography-mass spectrometry
Gln Glutamine
Glu Glutamic acid
Gly Glycine
GS Gramicidin S
GSH Glutathione
GSSG Glutathione disulfide
GTP Guanosine triphosphate
H2O Water
H2O2 Hydrogen peroxide
HDQ 1-hydroxy-2-dodecyl-4(1H) quinolone
HEPES 4-(2-hydroxyethyl)-1-piperazineethanesulfonic acid
HILIC Hydrophilic interaction liquid chromatography
His Histidine
HIV Human immunodeficiency virus
HTS High-throughput screening
I Inhibitor
IC50 Half-maximal inhibitory concentration
IC90 90% inhibitory concentration
ICLs Isocitrate lyases
Ile Isoleucine
INH Isoniazid
IPTG Isopropyl-β-D-thiogalactoside
K2HPi dipotassium hydrogen phosphate trihydrate
KatG Catalase-peroxidase
KCN Potassium cyanide
KDa Kilodaltons
KDH α-ketoglutarate dehydrogenase

XIX
KGD α-ketoglutarate decarboxylase
KH2Pi Potassium dihydrogen orthophphosphate potassium
Km Michaelis constant, half-maximal velocity
KOR α-ketoglutarate:ferredoxin oxidoreductase
LB Luria-Bertani
LC-MS Liquid chromatography-mass spectrometry
LC-MS/MS Liquid chromatography-tandem mass spectrometry
LDH L-lactate dehydrogenase
Leu Leucine
LM Lipomannan
LOD Limit of detection
LTBI Latent Tuberculosis infection
Lys Lysine
m/z Mass-to-charge ratio
MABA Microplate alamar blue assay
ManLAM Mannose capped lipoarabinomannans
MCC Methylcitrate cycle
MCL 2-methylisocitrate lyase
MCS Multiple cloning sites
MDH Malate dehydrogenase
MDR-TB Multidrug-resistant tuberculosis
MeOH Methanol
MES 2-(N-morpholino)ethanesulfonic acid
Met Methionine
mg.ml-1
Milligram per millilitre
ML16 Untransformed AnML16 competent cells
MLS Malate synthase
mM Millimolar
MoA Mode of action
MQ Menaquinone
MQ-8 Menaquinone-8
MQ-9 Menaquinone-9
MQH2 Menaquinol
MSI Metabolomics standard initiative
Mtb Mycobacterium tuberculosis
Mtb bd-I M. tuberculosis cytochrome bd-I oxidase
MTZ Metronidazole
MW Molecular weight
NA Not applicable
NA Nicotinic acid
NAD nicotinamide adenine dinucleotide
NADH Reduced nicotinamide adenine dinucleotide
NADP Nicotinamide adenine dinucleotide phosphate
NADPH Reduced Nicotinamide adenine dinucleotide phosphate

XX
ND Not determined
NDH NADH dehydrogenases
NDH-1 Type I NADH dehydrogenase
NDH-2 Type II NADH dehydrogenase
NDH-2A Type IIA NADH dehydrogenase
NIAID National Institute for Allergy and Infectious Diseases
nM Nanomolar
nm Nanometers
NO Nitric oxide
NOS Reactive nitrogen species
NRP Non-replicating persistence
NRP-1 NRP phase 1
NRP-2 NRP phase 2
NRs Nitrate reductases
OADC Oleic Albumin Dextrose Catalase
OCF3 trifluoromethoxy
OD Optical density
PAS p-aminosalicylic acid
PBS Phosphate buffer saline
PCA Principal component analysis
PCR Polymerase chain reaction
PDH Proline dehydrogenase
PEP Phosphoenolpyruvate
Pfu Pyrococcus furiosus
Phe Phenylalanine
PIM Phosphatidylinositol mannoside
PLS-DA Partial least squares-discriminant analysis
PMF Proton motive force
POA Pyrazinoic acid
PPP Pentose phosphate pathway
Pro Proline
PTFE-coated Polytetrafluoroethylene-coated
pTM3 pCR®
II, TA/cydABDC construct
pTMA pUC19/cydABDC construct
PZA Pyrazinamide
Q1H2 Ubiquinol-1
Q2H2 Ubiquinol-2
QH2 Quinol
QSAR models Quantitative structure–activity relationship models
R2 The linearity
Raz Resazurin
RIF Rifampicin
RNS Reactive nitrogen species
XXI
ROS Reactive oxygen species
Rru Resorufin
RT Retention time
S Substrate
SAR Structure-activity relationship
SDH Succinate dehydrogenase
SDS-PAGE Sodium dodecyl sulfate polyacrylamide gel electrophoresis
SEM Standard error of the mean
Ser Serine
SRM Single reaction monitoring
SSA Succinic semialdehyde
SSRs Simple sequence repeats
STR Streptomycin
TAPS N-Tris(hydroxymethyl)methyl-3-aminopropanesulfonic acid
TB Tuberculosis
TCA Tricarboxylic acid
TDR-TB Totally-drug-resistant tuberculosis
TEMED N,N,N\N'-tetramethylethylenediamine
Thr Threonine
TMB44 Transformed cells grown in O2-limited growth condition
TML16 Transformed AnML16 competent cells
TMPD N,N,N′,N′-tetramethyl-p-phenylenediamine
TPZ Trifluoperazine
Trp Tryptophan
TRZ Thioridazine
TST Tuberculin skin testing
TTP Thymidine triphosphate
Tyr Tyrosine
UDP Uracil diphosphate
UMP Uridine monophosphate
UQH2 Ubiquinol
UTP Uridine triphosphate
v/v Volume per volume
Val Valine
VIP Variable Influence on Projection
Vmax Maximum reaction velocity
w/v Weight per volume
WHO World Health Organization
X-gal 5-bromo-4-chloro-3-indolyl β-D-galactopyranoside
XDR-TB Extensively drug-resistant TB
XXDR-TB Very extensively-drug-resistant TB
μM Micromolar

XXII
Abstract
Tuberculosis (TB) remains one of the most devastating diseases in humans.
Nowadays, tuberculosis therapy is not sufficient to control the TB epidemic and only
lasts for 6 months to cure patients and prevent relapse; therefore, the treatment of
Mycobacterium tuberculosis (Mtb) is particularly challenging (1). New antibiotics,
mainly those that are derived from new chemical classes, are more likely to be more
effective against resistant strains. Moreover, expanding the knowledge of the mode
of action of drugs has important implications in tackling TB. Only empirical
approaches can be adopted in the journey of discovering new anti-tubercular drugs
until a clear picture of latency and persister cells’ physiology is achieved. Mtb has
the extraordinary ability to survive under hypoxia, suggesting a high degree of
metabolic plasticity. The flexibility conferred by a modular respiratory system is
critical to the survival of Mtb, thereby also making it a promising area of research for
new drug targets. This thesis aimed towards the characterisation of cytochrome bd-I
quinol oxidase (bd-I), a respiratory component that is believed to operate during both
the replicative and “dormant” Mtb phenotypes. The essential nature of Mtb bd-I,
which has no human homologue, has been confirmed in a recent deep sequencing
study of genes required for Mtb growth by Griffin et al. (2), further confirming its
potential as a novel target. Recombinant Mtb bd-I was successfully expressed under
the control of the pUC19 lac promoter in the Escherichia coli ML16 bo3/bd-I and
MB44 bo3/bd-I/bd-II knockout strains, allowing “noise-free” measurement of the
enzyme. Initial steady-state kinetics of the enzyme was presented using a range of
quinol substrates, revealing a substrate preference for dQH2 over Q1H2 and Q2H2. A
number of bd-I inhibitors were identified and their pharmacodynamic profiles
against Mtb H37Rv were determined. In addition, a pharmaco-metabolomics
platform was initiated to explore the cellular response of Mtb to current first-line TB
drugs as well as in house bd-I and type II NADH inhibitors. The initial findings are
discussed in the context of the known mode of action of the drugs and future
research needs in drug discovery of this devastating disease.

1
Chapter I
General introduction

2
1.1. Overview
Tuberculosis (TB) is an infectious disease caused by the bacillus Mycobacterium
tuberculosis (Mtb), that most often affect the lungs. Despite the availability of highly
efficacious treatment for decades, TB remains a major global health problem. TB is
second only to HIV as the leading infectious killer worldwide (3).
Although active, drug-sensitive TB disease is curable and preventable, although the
prolonged and demanding current TB drugs regimen leads to the emergence of drug
resistant strains, which are difficult, complicated, and expensive to treat. Further,
sub-populations of slow-growing and persistent Mtb are not targeted by the present
TB drugs regimen. Moreover, the deadly synergy of TB and HIV diseases demands
first-line treatments that can be fully harmonized as the current TB drugs regimen is
not compatible with certain common antiretroviral (ARV) therapies used to treat the
human immunodeficiency virus (HIV)/AIDS.
Nearly 50 years passed with no new TB drugs have been developed, despite the
flaws with and growing resistance to current TB treatments. Therefore, a shorter,
faster, simpler and affordable cure for TB could improve treatment compliance, stop
the spread of the disease, save millions of lives and have tremendous global benefits.
The new anti-TB treatments should also tackle drug-resistant strains of Mtb,
including the organisms in the latent state and it should be compatible with the
current drugs.
Targeting respiration and the electron transport chain of Mtb is framed in the context
of exciting new developments in tuberculosis drug discovery due to its importance to
the survival of Mtb. Currently, The drugs diarylquinolines and phenothiazines have
in common the fact that both target oxidative phosphorylation in mycobacteria (4),
and that the diarylquinoline TMC207 is involved in a clinical phase II trial and in a
novel multi-drug regimen in late-stage clinical trials (1).

3
1.2. The global burden of tuberculosis in the world
TB is a global pandemic, killing someone approximately every 25 seconds. TB
remains a major cause of morbidity and mortality worldwide. According to the
WHO, an estimate 8.8 million incident cases of TB globally occurred in 2010, of
which 1.1 million deaths were among HIV-negative cases of TB and an additional
0.35 million deaths among people who were HIV-positive (3).
Challenges and burden of TB are arising due to the occurrence of the twin
pandemics, TB and HIV/AIDS, as well as the emergence of drug resistant strains of
Mtb. Those challenges in conjunction with poor control programs are leading to the
resurgence of the disease. An estimated 15% of the population infected with TB (1.4
million people) are co-infected with HIV (3). Further, there were an estimated 0.5
million cases of multidrug-resistant TB (MDR-TB) in 2008 (5), where patient with
MDR-TB shows resistance to the two most effective first-line anti-TB drugs,
rifampicin and isoniazid (6). Unfortunately, MDR-TB is present in almost all
countries surveyed (3).
Latent TB, a state when Mtb remain dormant without developing or transmitting the
disease, poses a massive challenge in controlling TB with estimates of about one-
third of the world's population has latent TB, of which between 5% and 15% will
develop active disease during the course of their lifetime (3). Additional factors that
are related to the high TB burden include homelessness, poverty, increasing number
of refugees and the lack of governmental support in prevention and treatment
programs in developing countries. The lack of better preventive measures that block
Mtb transmission or prevent establishment of Mtb infection contributed in increasing
the burden of TB. The only available vaccine against TB is one-century-old Bacillus
Calmette-Guérin (BCG) vaccine with incomplete protective efficacy against
pulmonary TB in adults (3, 7). However, light of hope exists with 11 vaccine
candidates (in clinical trials) that could offer an excellent protective efficacy (8).
The majority of the estimated TB cases in 2010 happened in Asia (59%) and Africa
(26%) while smaller proportions of cases were found in the Eastern Mediterranean
Region (7%), the European Region (5%) and the Region of the Americas (3%) (3).

4
The worldwide distribution of new TB cases per 100,000 individuals is depicted in
the following Figure (1.1).
Figure 1.1: Worldwide distribution of new TB cases per 100,000 people in 2011 (3)
All this illustrates the tremendous burden that a single disease has globally.
Therefore, advances in TB research are urgently needed to explore the mysteries of
Mtb pathogenesis and potential drug targets that could help in eliminating the
disease.
1.3. Mycobacterium tuberculosis (Mtb):
1.3.1. The pathogen of tuberculosis: biology and virulence factors
Tuberculosis is caused by Mtb, a slow growing aerobic-to-facultative anaerobe
intracellular pathogen that parasitizes macrophages. Mtb belongs to the
Mycobacterium genus, Mycobacteriaceae family, Corynebacterineae suborder,
Actinomycetales order, Actinobacteria phylum in the Bacteria kingdom. Mtb are
gram positive non-motile and rod-shaped bacteria. The cell wall is a major virulence
factor of Mtb that relates to Mtb intrinsic drug resistance. The Mtb cell wall is built
of a fascinating diversity of lipids layers, which includes a hydrophilic
arabinogalactan layer linked to hydrophobic mycolic acids. This arabinogalactan/

5
mycolic acid layer, which lies on the top of the peptidoglycan layer, is further
covered with a layer of polypeptides and mycolic acids consisting of free lipid,
glycolipids, and peptidoglycolipids (Figure 1.2). The cell wall of mycobacterium is
unique by the dominance of mycolic acids. Other important glycolipids including
mannose capped lipoarabinomannans (ManLAM), lipomannan (LM), and
phosphatidylinositol mannoside (PIM) (9). These layers constitute a barrier for both
hydrophobic and hydrophilic compounds rendering the outer surface of Mtb
extremely hydrophobic (10, 11).
Importantly, the capacity of Mtb to escape the host immune system and remain alive
and in a dormant state is considered one of the main Mtb virulence factors. This
phenomenon is called latency where Mtb remain alive in the human host, in an
asymptomatic non-transmissible state and with the ability to reactivate and cause
active disease, having their virulence mechanisms intact.
Figure 1.2: Schematic representation of the cell wall of Mycobacterium tuberculosis

6
1.3.2. Pathogenesis of tuberculosis
1.3.2.1. Life cycle of Mtb
To develop new efficient drugs, it is important to understand the disease process.
The disease is spread through an aerosol route when people who are sick with active
pulmonary TB expel bacteria, for instance by coughing or sneezing. Tuberculosis
commonly affects the lungs (pulmonary TB) and causes symptoms that can include
coughing up blood, chest pains, fever, and fatigue. However, Mtb can disseminate to
other parts of the body (extrapulmonary TB) including the central nervous system,
lymphatic system, bones and joints. Pulmonary TB is by far the most common form
of tuberculosis, accounting for 86% of all new and relapsed cases worldwide (3).
Mtb usually enters the body by airborne droplet nuclei, which are inhaled and lodge
in the alveoli in the distal airways. Mtb is then taken up by alveolar macrophages,
initiating a cascade of events where either successful containment of the infection in
granulomas or progression to active disease takes place. The notorious success of
Mtb adaptation inside its human host refers to its ability to impair the normal
maturation of the phagosome (reprogramming of macrophages after phagocytosis to
prevent its own degradation). Ideally, Mtb bacteria are internalised inside
macrophages in a membrane-bound organelle called the phagosome. The phagosome
undergoes a maturation process along the endocytic pathway leading to fusion with
late endosomes and finally lysosomes, forming the phagolysosome where some of
the ingested bacilli are degraded (12). However, bacilli phagocytosed by alveolar
macrophages can subsequently invade the subtending epithelial layer leading to
induction of a localized inflammatory response and consequently recruitment of
mononuclear cells from neighboring blood vessels. This recruitment provides fresh
host cells for the bacterial population.
In immunocompetent individuals the propensity of Mtb to survive in a pathogen-
friendly phagosome (granuloma) and to establish asymptomatic latent infection is a
continued threat of TB infection. This is because the immune system is capable of
effectively containing Mtb regardless of the fact that the infectious microorganism
may not always be fully eliminated (13). The risk of active disease, disease
reactivation or death exists in an immune-compromised host (e.g. HIV positive

7
individuals) or patients with chronic diseases such as diabetes/obesity (14). During
active TB or disease reactivation, damage in lung tissue occurs and an active
granuloma displays extensive pathology that eventually ruptures and releases
thousands of viable, infectious bacilli into the airways. This point of the highly
infectious form of the disease allows the cycle to resume. Interestingly, it is
impossible to predict who will fully eradicate Mtb and who will contain latent TB
infection and remain healthy due to the variance of immune system response from
person to person (Figure 1.3) (15, 16).
Figure 1.3: The life-cycle of Mycobacterium tuberculosis: from infection to host defence
Primary infection can progress toward active disease or can be contained as latent infection.
Active TB can: be cured (eradication of Mtb by host’s immune system); be contained as
latent infection and remain healthy; or lead to death. Latent infection can: develop to active
disease (reactivation); or be cured.

8
1.3.2.2. Granuloma
The granuloma is the characteristic feature of human latent pulmonary TB as well as
an important key factor responsible for immune evasion and reactivation.
Pathologists have described the lung granuloma as the hallmark of pulmonary TB.
Granuloma formation is a sign of protective immunity and known to occur in the
early stages of an infection episode to ensure pathogen containment. However, the
features of the granuloma are still largely unknown, regardless of the efforts on in
vitro granuloma models and on in vivo dissections to mimic the human granuloma
environment (17, 18).
The granuloma is defined as a central core of necrotic tissue surrounded by dense
layers of immune system cells, like macrophages and lymphocytes, large
multinucleated cells (Langhans giant cells), dendritic cells and specialised leukocytes
as well as epithelioid cells and fibroblasts. Development of the tuberculous
granuloma restrains pathogen dissemination throughout the host and focuses the
immune response to the site of mycobacterial persistence. This development is
controlled by cytokines and chemokines produced by leukocytes and local tissue
cells (17-19). Within granulomas, mycobacteria in activated macrophages adapt to a
metabolic life-style that makes preferential use of fatty acids, functions under severe
oxidative and nitrosative stress, increases cell-wall thickness and halts active
replication (13, 20). Moreover, the highly pathogenic mycobacteria stimulate the
formation of granuloma-specific foamy macrophages which have a high lipid content
that constitute a nutrient-rich reservoir for long-term persistence (21).
Various animal models (e.g. guinea pigs, rabbits and nonhuman primates caseous)
have been used to study granulomas using pimonidazole, an imaging agent that
indicates hypoxic conditions, and metronidazole, a drug only effective against
anaerobic bacteria (22). Puissegur et al (2004) replicated an in vitro model of
granulomas using mononuclear cells, isolated from a BCG-vaccinated non-infected
individual human blood sample and exposed to mycobacterial antigen-coated beads,
or live-mycobacteria. This process lead to the production of a cellular aggregation
response, similar to the granuloma (23).

9
1.3.2.3. Latency of Mtb
Latency, persistence, and dormancy are terms that are sometimes used
interchangeably in describing Mtb and TB pathogenesis. Latency is defined as the
presence of any tuberculous lesion which fails to produce symptoms of active TB.
Persistence stand for actual or potential bacterial survival in the face of any stress
from the host immune system (24). Dormancy has been used to describe both TB
disease as well as the metabolic state of the tubercle bacillus where dormancy
involves a reversible metabolic shutdown. Latent infection may be attributable to
dormant bacteria as well as to bacilli with similar phenotypes as persister cells,
which will be described shortly (24-26).
This dormant or latent infection presents a vast reservoir of potential reactivation and
transmission of the disease, making eradication of TB a major challenge. Impairment
of the immune system either by age, chronic illness or HIV/AIDS cause reactivation
of these dormant bacilli that can occur at any time, even decades after the primary
infection took place (27).
The existence of latent TB in an infected individual could be detected by a visible
calcified granulomatous tissue under X-ray. Further, the infected individual will have
a strong immune response against Mtb antigens which is detected through tuberculin
skin testing (TST) (13). Unfortunately TST gives a high rate of false positives that
makes it inadequate to distinguish if the immunological reaction is due to BCG
vaccination or previous exposure to pathogenic Mtb. Similarly, it is difficult to
distinguish if an active TB infection occurred as result of latent TB reactivation or as
a new incident of infection (11, 28).
1.3.2.3.1. Replication state of dormant Mtb
The issue of defining the replication state of dormant Mtb is still controversial.
However, there are two acceptable hypotheses. The first one defends a non-
replication or very slow replication state, a near-static state of Mtb that permits an
escape from the host immune system and a resistance against antibiotics (13). The
second hypothesis proposes a dynamic state of constant replication of Mtb, enclosed
by the immune system. In both states, Mtb developed an elaborate survival

10
mechanism in humans where the immune system in immunocompetent individuals
engages a lifelong battle against latent TB infection, either eradicating the
pathogenic Mtb or limiting its replication, creating a long-standing reservoir of
future disease and contagion (13, 25, 28).
Yang et al (2011) conducted a genomics and molecular epidemiology study that
support the first hypothesis, a non-replication state of Mtb during latency. However,
this hypothesis is not conclusive as the study was limited by the small number of
case studies and by the fact that the mutation rates of the mononucleotide simple
sequence repeats (SSRs or microsatellites) in Mtb genome are unknown (29).
Other studies in the defence of the second hypothesis were that Mtb bacilli in
continuous replication during latency are counted by the presence of metabolic
activity within the Mtb bacilli (28, 30). Moreover, one of the strongest arguments for
Mtb replication during latency comes from the fact that isoniazid, active against only
replicating mycobacteria, is able to completely sterilize the host from bacteria, which
suggests that at least part of the Mtb latent population is replicating (13). Gill et al’s
(2009) study favoured the second hypothesis as well, where transformed Mtb with
the unstable plasmid pBP10 were used during mice infection. This study showed loss
of plasmid during chronic infection which implied a replication state of Mtb during
this period (31).
1.3.2.3.2. Latency models
The acknowledegment of the consequence of the latency phenomenon in TB
pathogenicity drives the research toward latency abrogation. This requires a better
understanding of the physiological events that lead to latency, thus efforts to
replicate this state in vitro were made. The Wayne model of hypoxia and the Cornell
mouse model, the most utilised models, are two examples of modulating some
conditions that are known to reduce Mtb metabolism and create a state that would
mimic one or more features of the latency condition.
The Wayne model of hypoxia is one of the best characterized models, where the Mtb
bacilli are submitted to a slow shift from aerobic to anaerobic conditions by growing

11
bacteria in a constantly stirred liquid medium with no disturbance on the surface of
the liquid and with a defined proportion between air and liquid in sealed tubes. This
specific set up leads to a gradual depletion of oxygen from the bottom to the top of
the tube in a constant manner, which in turn results in a successful adaptation of the
bacilli to hypoxic conditions. As the latency state is established, the Mtb bacilli enter
a 2-phase state called non-replicating persistence (NRP), NRP phase 1 (NRP-1) and
NRP phase 2 (NRP-2) (20, 32, 33). During NRP-1, the oxygen saturation is about
1% and the number of viable bacteria reaches stationary, although cell enlargement
leads to a minute increase in the turbidity of the culture (34). Eventually, during the
next phase NRP-2, the culture transfers to complete anaerobic conditions where the
oxygen saturation is 0.06% and a significant reduction of metabolism with no
morphological changes of bacteria take place (33, 34).
With regards to drug susceptibility, although dormant bacilli display increased
tolerance, they are still susceptible to rifampicin and isoniazid once bacilli resume
growth. Further, the bacilli are sensitive to metronidazole since metronidazole is
only active against anaerobic or microaerophilic bacteria. This susceptibility is
considered as an evidence for hypoxia in the phenomenon of latency (33, 35).
The Cornell mouse model, a drug induced model, is an alternative dormancy model
where Mtb infected mice are treated with isoniazid and pyrazinamide for only 12
weeks, resulting in disappearance of active TB disease and rendering uncultivatable
Mtb bacilli from mouse spleens (36). Consequently, one third of the mice show a
reappearance of active and drug-sensitive Mtb. Therefore, the latent period of the
disease is considered to be the 12 weeks between disappearance and then
reappearance of the infection (37, 38).
A variety of other models have been established to mimic the latency state of Mtb as
present in the macrophage, phagosome or granuloma environment. For example, the
nutrition starvation model is based on evidence that indicated the presence of severe
nutrient limitations in TB lesions (39, 40). The phosphate depletion model is another
model that represents the macrophage restricted environment (41). Moreover, the
prolonged stationary-phase model has been developed since similarities between
persistence and the bacteria that exist in stationary phase, the non-replicating

12
phenomenon, has been proposed (42, 43). Recently, a novel multiple-stress model
for inducing dormancy in Mtb has been suggested where the bacteria are submitted
to a combination of stresses which are low oxygen, high CO2, low nutrients and an
acidic environment. The multiple-stress model can be used in high-throughput
screening for drugs targeting the persistent bacteria, since it most likely resembles
the latency environment in the human host (44).
1.3.2.4. Persister cells
Tubercle bacilli produce heterogeneous bacterial populations, including persisters,
dormant and growing bacteria. This is due the fact that Mtb are able to reside in
various microenvironmental statuses that are oxygen-rich (in cavities) or oxygen-
limited (in host macrophages or in granulomatous lesions) conditions, or in other
stressful conditions (e.g. nutrient starvation, oxidative stress, and acidic pH) (45).
Persisters can inhabit intracellular and extracellular locations as well as different cell
types, e.g. adipose tissue and sputum (24, 46, 47).
There is overlap with the bacterial dormancy (persistence) phenomenon and
persisters where dormant Mtb are applicable to some but not all described
persistence phenomena (26, 48). The term “persister” donates a well-defined sub-
population of bacteria that survive antibiotic exposure, while “persistence” as
mentioned earlier points to the bacterial survival in the face of any stress from the
host immune system (24).
Although mycobacterial persisters are genetically identical to drug susceptible
bacteria and have non-inheritable phenotypic resistance or tolerance to antibiotics,
they are still capable of surviving the cidal action of antibiotics (24, 49). Persisters
necessitate lengthy TB therapy, posing a major challenge for controlling TB.
Persisters appear to be non-replicating or slowly replicating bacilli where their
propagation depends on the age of the culture, the antibiotic exposure duration, and
the type and concentration of antibiotics used in the culture (45, 50, 51).
The mechanisms of persister cell development are complex and may be related to
those required for persistence (dormancy) in chronic infection. Single-gene mutation

13
studies identify several genes or pathways that might engage in Mtb persister
formation or maintenance, such as energy-related pathways genes. In INH-treated
mice, disruption of cydDC genes accelerated Mtb elimination, which entailed
reduction of antibiotic resistant cells (persisters) (24, 52). CydDC, encoding an ABC
transporter, is implicated in cytochrome bd-I assembly, an essential enzyme during
hypoxia and for Mtb viability (2, 53).
1.3.2.5. Yin-Yang model
There is sparse information defining the subpopulations of Mtb. A yin-yang model,
applicable to both patients and experimental systems, has been proposed to
emphasize the heterogeneity, dynamic nature, and interconversion of the diverse Mtb
subpopulations present. The hypothesis of yin-yang models is that the bacterial
population consists of growing, slow-growing, and non-growing subpopulations that
have different metabolic statuses which can interconvert at the level of the bacteria
(24). This model also provides a possible justification of latent infection (yin) and
active disease (yang) abilities to interconvert at the level of the host and behave as a
continuum. Further, the rationale behind the current two-phase TB regime and the
reasons of using isoniazid as chemoprophylaxis or for treatment of latent TB
infection (LTBI) could be explained through the yin-yang model as well (24).
There are two yin-yang models. The first one is the yin and yang of persisters and
replicating bacteria and their interconversions (Figure 1.4). This model suggests that
the subpopulation of growing bacteria (yang) has a small proportion of non-growing
or slowly growing persisters (yin). This proportion increases upon entry of the
bacteria into the stationary phase. Furthermore, this model shows that after a 2-
month intensive-phase treatment with isoniazid (INH), rifampin (RIF), pyrazinamide
(PZA), and ethambutol (EMB), the remaining persister tubercle bacilli can revert to
growing form that can be eliminated by INH/RIF combination in the succeeding 4-
month continuance phase of treatment. This model also demonstrates the possibility
of Mtb to revert from a non-growing form during LTBI to a growing form, that is
INH susceptible. This in turn explains using INH as prophylactic treatment of LTBI.
Moreover, this model shows the possibility of phenotypic resistance persister

14
tubercle bacilli to convert into genetic resistance growing bacteria and vice versa
(24).
Figure 1.4: Yin and yang of persisters and replicating bacteria and their
interconversions (24, 45).
The second yin-yang model is the yin and yang of latent infection and overt or active
disease and their interconversions (Figure 1.5). During overt disease (yang), the
growing bacterial population is the majority while non-growing bacteria or persisters
are the minority and vice versa with respect to LTBI (yin). These proportions of
growing and non-growing bacteria vary according to the host immune system and
antibiotic treatment effectiveness (24).
Figure 1.5: Yin and yang of latent infection and overt disease and their
interconversions (24, 45).

15
1.4. Tuberculosis drugs:
The current TB chemotherapy evolved from numerous experimental and clinical
studies where the introduction of the current front-line anti-tuberculosis drugs started
in 1952 with the discovery of isoniazid (54, 55), which was then followed by
pyrazinamide (1952) (56-58), ethambutol (1961) (58) and rifampicin (1967) (59-62).
Recently, a variety of other second-line drugs were introduced such as kanamycin,
amikacin, capreomycin, cycloserine, ethionamide and thiacetazone.
The current first-line recommended standard TB chemotherapy, called DOTS
(directly observed treatment, short-course), involves a direct monitoring of the
patient by trained health professionals of the patient being treated. DOTS is a six
month therapy consisting of an initial two-month phase of treatment with four drugs,
INH, RIF, PZA, and EMB, followed by a continuation phase of treatment with INH
and RIF for another four months. The DOTS regimen is recommended by the WHO
and has a cure rate of up to 85% with drug-susceptible forms of TB (63-65).
The rationale behind using the combination of drugs regimen is due to the
synergistic reaction of these drugs as well as the presence of physiologically
heterogeneous population of the tubercle bacilli. Moreover, this combination serves
as an attempt to avoid the risk of emergence of drug-resistant strains under
monotherapy and reduces anti-TB therapy from 18 months to 6 months (33, 66, 67).
However, long treatment duration could be attributed to the possibility of existence
of phenotypically tolerant tubercle bacilli after a 2-month intensive-phase treatment
that can be killed by INH and RIF in the subsequent 4-month continuation phase of
treatment (24, 68).
With regards to DOTS regimen strengths; within 2 months of treatment initiation,
99% of tubercular bacilli could be killed by the INH and RIF combination, the two
most potent anti-TB drugs. Thereafter, RIF and INH are crucial for successful 6-
month treatment regimens as RIF kills low or non-replicating bacilli that are not
affected by any other anti-TB agents (67).

16
Regarding DOTS limitations, DOTS is an extremely prolonged, demanding and
complex regimen results in patient non-compliance that leads to the development of
deadlier heritable drug-resistant strains (69). Further, another massive challenge is to
control the twin epidemics, TB and HIV/AIDS, which arises from the
incompatibility of current TB therapy with certain common ARV drugs that are used
to treat HIV/AIDS (70). Moreover, DOTS is ineffective in controlling MDR-TB in
high MDR-TB incidence areas (71). Therefore, first-line treatments that can be fully
harmonized and overcome the current TB drugs flaws are urgently needed. A
detailed description of the drugs of the DOTS regimen is given below.
With respect to LTBI, the current recommended treatment of LTBI to prevent
endogenous reactivation consists of 6–12 months of isoniazid. However, this regime
is limited by the long duration of therapy and potential for hepatic toxicity.
Therefore, shorter and more intermittent rifamycin-containing regimens have been
investigated where rifampicin for 4 months is an alternative in the USA and Canada
whereas in the UK, a 3-month regimen of rifampicin plus isoniazid is used with
success (72-75). Remarkably, Lin et al (2012) showed that MTZ given for 2 months
is almost as effective as using an INH/RIF combination in order to prevent
reactivation of LTBI (76).
1.4.1. First-line tuberculosis drugs:
1.4.1.1. Isoniazid
Isoniazid (Figure 1.6), a pyridine derivative of nictoinamide, is the most widely
prescribed first-line drug for the treatment of TB. Isoniazid (INH, isonicotinic acid
hydrozide) is a highly bactericidal drug against actively growing bacilli and
bacteriostatic for non-dividing Mtb. INH is a small hydrophilic compound that is
thought to enter Mtb through porins in the mycobacterial cell wall (77). The
accumulation of isoniazid has been also attributed to the role of an active efflux (78-
80).

17
Figure 1.6: Structure of isoniazid, C6H7N3O
INH is a pro-drug activated by the mycobacterial enzyme catalase-peroxidase
(KatG), a hemoprotein possessing catalase-peroxidase, Mn2+
-dependent peroxidase,
cytochrome P450-like oxygenase, and peroxynitritase activities (81, 82). A number
of stable KatG mediated isoniazid metabolites have been identified which include
isonicotinic acid, isonicotinamide and pyridine-4-carboxyaldehyde (83). However,
none of these stable metabolite themselves are bactericidal and it is likely that
bactericidal activity is attributed to reactive intermediate species, isonicotinic acyl
radicals and anions (84).
Our knowledge of the mechanism of action of INH is limited despite numerous
studies that have been done. Isoniazid is particularly effective at inhibiting the
synthesis of mycolic acid needed for the Mtb cell wall (85). The synthesis of mycolic
acid in Mtb is attributed to a number of proteins including an enoyl-acyl carrier
protein reductase (InhA), an acyl carrier protein (AcpM) and a β-ketoacyl-ACP
synthase (KasA). These proteins (InhA, AcpM and KasA) are hypothesised as
targets for the isoniazid active metabolites as mutation in these proteins show a low
level of INH resistance (86).
One of the proposed mechanisms by which INH is able to inhibit InhA and therefore
mycolic acid synthesis is that Mtb KatG oxidizes isoniazid, a prodrug, to an
isonicotinic acyl radical, which then couples to reduced nicotinamide adenine
dinucleotide (NADH) (84, 87). In this theory, isonicotinic acyl radicals covalently
bind to NAD• radicals to form isonicotinic acyl NADH that is thought to be a potent
inhibitor of InhA. Inhibition of InhA by the INH-NADH adduct probably results in a
weakened mycobacterial cell wall and, eventually, death of the pathogen (84).
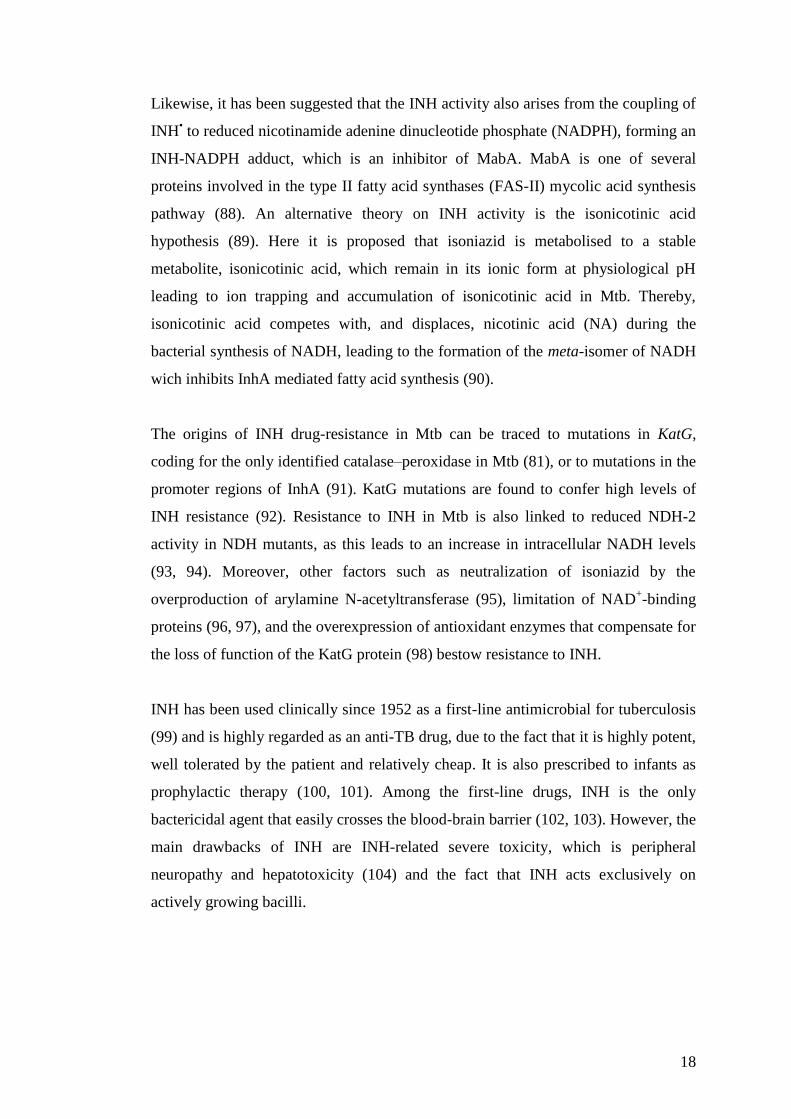
18
Likewise, it has been suggested that the INH activity also arises from the coupling of
INH• to reduced nicotinamide adenine dinucleotide phosphate (NADPH), forming an
INH-NADPH adduct, which is an inhibitor of MabA. MabA is one of several
proteins involved in the type II fatty acid synthases (FAS-II) mycolic acid synthesis
pathway (88). An alternative theory on INH activity is the isonicotinic acid
hypothesis (89). Here it is proposed that isoniazid is metabolised to a stable
metabolite, isonicotinic acid, which remain in its ionic form at physiological pH
leading to ion trapping and accumulation of isonicotinic acid in Mtb. Thereby,
isonicotinic acid competes with, and displaces, nicotinic acid (NA) during the
bacterial synthesis of NADH, leading to the formation of the meta-isomer of NADH
wich inhibits InhA mediated fatty acid synthesis (90).
The origins of INH drug-resistance in Mtb can be traced to mutations in KatG,
coding for the only identified catalase–peroxidase in Mtb (81), or to mutations in the
promoter regions of InhA (91). KatG mutations are found to confer high levels of
INH resistance (92). Resistance to INH in Mtb is also linked to reduced NDH-2
activity in NDH mutants, as this leads to an increase in intracellular NADH levels
(93, 94). Moreover, other factors such as neutralization of isoniazid by the
overproduction of arylamine N-acetyltransferase (95), limitation of NAD+-binding
proteins (96, 97), and the overexpression of antioxidant enzymes that compensate for
the loss of function of the KatG protein (98) bestow resistance to INH.
INH has been used clinically since 1952 as a first-line antimicrobial for tuberculosis
(99) and is highly regarded as an anti-TB drug, due to the fact that it is highly potent,
well tolerated by the patient and relatively cheap. It is also prescribed to infants as
prophylactic therapy (100, 101). Among the first-line drugs, INH is the only
bactericidal agent that easily crosses the blood-brain barrier (102, 103). However, the
main drawbacks of INH are INH-related severe toxicity, which is peripheral
neuropathy and hepatotoxicity (104) and the fact that INH acts exclusively on
actively growing bacilli.

19
1.4.1.2. Rifampicin
Rifampicin (RIF) (Figure 1.7) is a large lipophilic semi-synthetic derivative of the
natural product rifamycin, obtained from culture filtrates of Streptomyces
mediterranei. RIF uptake is mediated by diffusion through the cell wall, in a process
that is influenced by the cell wall arabinogalactan content (77).
Figure 1.7: Structure of rifampicin, C43H58N4O12
RIF is a broad-spectrum antibiotic with potent bactericidal activity against both
active and dormant tubercle bacilli. It inhibits RNA synthesis by binding to the
central region of the β-subunit (81 bp) of RNA polymerase (encoded by the rpoB
gene), which effectively blocks transcription (105-107). Therefore, RIF continues to
exhibit some bactericidal action, even after O2 depletion occurs (33).
Resistance to RIF is the main reason of treatment failure and fatality as it is one of
the essential drugs in modern chemotherapy (108). Mutations in the 81 bp region of
rpoB are the most common mutations associated with rifampicin resistance
(approximately 96%) (105).
Importantly, simultaneous use of rifampicin and antiretroviral drugs is
complicated by drug–drug interactions (DDI). This DDI is caused by the
potent induction by rifampicin of a number of drug-metabolising enzymes
involved in antiretroviral drugs metabolism and transport (109). Moreover,
rifampicin is not highly toxic on its own, however some studies showed that the
incidence of hepatotoxic effects associated with rifampicin monotherapy is around

20
2%, but rarely associated with fulminant hepatitis (110, 111). Otherwise, rifampicin
toxicity is mostly idiosyncratic, and only a small percentage is attributable to an
allergic, hypersensitivity type reaction which leads to symptoms including fever,
rash, flu-like syndrome, acute renal failure, haemolytic anaemia, thrombocytopenia,
and anaphylactic events (112).
1.4.1.3. Ethambutol
Ethambutol (EMB) is a bacteriostatic agent that has activity against growing bacilli
but has no effect against non-replicating bacilli (Figure 1.8). EMB is a small,
hydrophilic agent that is thought to cross the mycobacterial wall via the porin
channels, although some evidence of active uptake exists (77).
Figure 1.8: Structure of ethambutol, C10H24N2O2
The specific mode of action of EMB is still uncertain. EMB exerts its activity by
interfering with the synthesis and assembly of arabinogalactan (113), with secondary
effects upon lipoarabinogalactan (114) and mycolic acids (115), essential lipids in
the Mtb cell wall. EMB is assumed to act via inhibition of three arabinosyl
transferases: EmbA, EmbB, and EmbC. These arabinosyl transferases are essential in
Mtb, where EmbA and EmbB are required for the synthesis of arabinogalactan, and
EmbC is involved in the synthesis of LAM (116-119). EmbB has been proposed as
the target of EMB in Mtb (120) although Goude et al (2009) found that EmbB is not
the only target and that EmbC is one of the cellular targets of EMB action (119).
The genetic basis of resistance to EMB in mycobacteria has been referred to
mutations in EmbCAB operon, especially EmbB. High levels of resistance were
attributed to a combination of mutations in EmbB codon 306 and EmbC codon 270
(119, 121). The most frequent adverse effects associated with EMB are ocular
toxicity, manifested by optic or retrobulbar neuritis, and hepatotoxicity (122, 123).

21
1.4.1.4. Pyrazinamide
Pyrazinamide (PZA) (Figure 1.9), a structural analogue of nicotinamide, is a
paradoxical drug, showing good activity against tubercle bacilli at acid pH (124) and
being more effective against old cultures than young cultures (125), and also more
active at low oxygen or anaerobic conditions (126). PZA is a prodrug of active agent
pyrazinoic acid (POA). PZA introduction allowed TB therapy to be shortened from 1
year to 6 months.
Figure 1.9: Structure of pyrazinamide, C5H5N3O
However, it shows no activity against Mtb grown in standard culture conditions in
vitro (127), unless acidic conditions are introduced (128) which probably facilitate
the accumulation of POA inside the bacilli (129, 130). The acidic environment in
vivo is thought to be generated by either a small decrease in phagosome pH which
occurs due to binding of the early endosomes, or by early inflammation following
Mtb infection (131).
Zhang and colleagues (129, 130) have reported that, PZA enters Mtb through porins
and is converted to POA by the PZase/nicotinamidase enzyme. POA in turn leaves
Mtb via a weak efflux pump or by passive diffusion. The presence of Mtb in acidic
environment allows the POA, which is uncharged and protonated, to enter Mtb and
accumulate as the rate of POA influx is greater than the efflux. Accumulation of
pyrazinoic acid is thought to be vital in mediating PZA antimicrobial activity (124).
There are a number of postulated mechanisms of action of POA. The first postulated
hypothesis is that the accumulation of protonated POA brings protons into the
bacilli, leading to acidification of the cytosol which eventually causes disruption of
the Mtb membrane energetic by collapsing the membrane potential and affecting

22
membrane transport. The PZA effectiveness against dormant Mtb is attributed to the
reduction of its ability to maintain membrane potential (132). The second proposed
hypothesis is that PZA and POA inhibit fatty acid synthesis in Mtb through type I
fatty acid synthases (FAS-I) inhibition at pH 6 (acidic condition) but not at pH 6.8
(133).
The mycobacterial enzyme PZase, encoded by the pncA gene of Mtb, is essential for
converting PZA to POA. A mutation in the gene pncA, which encodes PZase, is the
major mechanisms of PZA resistance (134). The non-uptake of the pro-drug is an
additional mechanism of resistance to the PZA that is known to exist but has not
been fully investigated. It has been demonstrated that the accumulation of both PZA
and nicotinamide, but not isoniazid, in mycobacteria is partially dependent on an
uptake process, which could be an active transport or facilitated transport with
subsequent ATP dependent metabolism (134).
In terms of tuberculosis treatment PZA is relatively non-toxic. The toxicity of PZA
is dose-related (110, 135) and has the frequently described adverse events (AE) of
arthralgia and hepatotoxicity (110, 136).
1.4.2. Second-line tuberculosis drugs
The emergence of strains resistant to DOTS drugs causes a major concern for TB
treatment. Therefore, alternative TB drugs, known as the second-line TB drugs, are
available to be used (Table 1.1). These second-line drugs include fluoroquinolones,
such as ciprofloxacin, ofloxacin, levofloxacin and moxifloxacin as well as
aminoglycosides, injectable agents, such as streptomycin, amikacin, kanamycin and
capreomycin. Further, they include bacteriostatic second-line drugs, cycloserine,
ethionamide and para-aminosalicylic acid (73). Quinolone drugs were shown to have
high activity against Mtb and have been used as second-line drugs for the treatment
of drug-resistant TB since the late 1980s (124).

23
1.4.2.1. Streptomycin
Streptomycin (STR), an aminoglycoside antibiotic, was the first effective drug
against Mtb, representing the beginning of modern Mtb chemotherapy (Figure 1.10).
Figure 1.10: Structure of streptomycin, C21H39N7O12
Primarily, the STR mode of action is associated with interfering with protein
synthesis by inhibiting initiation of mRNA translation, that in turn results in
misreading of the genetic code and damaging of the cell membrane. Specifically,
STR binds tightly to the conserved A site of 16S rRNA in the 30S ribosomal subunit.
STR has an effect only on replicating tubercle bacilli. However, the intracellular
location of the bacilli could render STR inactive (67, 123, 124).
Streptomycin remains an important drug for treating diseases caused by Mtb, but it is
no longer first-line. This could be referred to number of factors, including rapid
development of resistance to this drug, and since the combination of INH and STR
had little overall effect and must be given by injections. STR resistance is linked to
mutations in rpsL (S12 ribosomal protein) and rrs (16S rRNA) genes that encode
small ribosomal subunit (67, 123, 124, 137).
1.4.3. Metronidazole, a drug against anaerobic bacteria
Metronidazole (MTZ) (Figure 1.11) is classified as a nitroimidazole and as
antitubercular which kills only dormant and persister Mtb under hypoxic/anaerobic
conditions. Metronidazole acts on damaging the pathogen deoxyribonucleic acid
(DNA) but has poor activity against replicating tubercle bacilli. Recently, Zhang
(2012) and Lin et al (2012) found that MTZ alone can prevent reactivation of LTBI

24
to active disease (35, 76). Metronidazole serves as a control in the anaerobic TB
studies (138, 139). A Phase II clinical trial in South Korea sponsored by the National
Institute for Allergy and Infectious Diseases (NIAID) (www.niaid.nih.gov), is
currently studying the effect of adding MTZ to the treatment against MDR-TB (138).
Figure 1.11: Structure of metronidazole, C6H9N3O3
1.4.4. Resistant tuberculosis phenotypes
The sporadic appearance of drug resistant Mycobacterium tuberculosis strains is an
inevitable consequence of using anti-TB antibiotics. There are factors that accelerate
the emergence of these resistance strains, including the aforementioned DOTS
limitations, inadequate chemotherapy prescriptions, poor management of drug
supplies, the use of drugs of unproved bioavailability and poor direct observation of
TB patients throughout the treatment course. There are two types of resistance, TB
primary resistance occurs when the person is infected with an already Mtb drug-
resistant strain and TB secondary resistance (acquired resistance) occurs when TB
patients who are infected with Mtb drug susceptible strains develop resistance (6,
138).
MDR-TB and extensively drug-resistant TB (XDR-TB), resistant phenotypes, are
acquired by a sequence of cumulative mutations in the genes involved in individual
drug resistance (140). MDR-TB is defined as TB caused by strains of
Mycobacterium tuberculosis that are resistant to at least isoniazid and rifampicin, the
backbone of any successful TB treatment programme. In the other hand, XDR-TB is
a form of TB caused by bacteria that are resistant to isoniazid and rifampicin (i.e.
MDR-TB) as well as to any of the second-line drugs, namely aminoglycosides, and
fluoroquinolones (73). Recently, a high level of challenge in TB management has
been appeared by the emergence of totally-drug-resistant tuberculosis (TDR-TB) or

25
very extensively-drug-resistant tuberculosis (XXDR-TB). This type of TB resistant
strain, reported in Italy and Iran, is resistant to all first- and second-line drugs (141,
142).
The highest proportions of MDR-TB ever documented in a subnational area where
MDR-TB has reached 0.5 million cases per year and in some countries accounts for
up to 28% of new TB cases (Figure 1.12). XDR-TB was found in 5.4% of MDR-TB
cases and eight countries reported XDR-TB in more than 10% of MDR-TB cases (5).
A map showing the worldwide distribution of XDR-TB cases is displayed in Figure
(1.13) where large parts of Africa do not have reported XDR-TB cases as result of
laboratory limitations in diagnosis (WHO 2010).
Figure 1.12: Distribution of Notified MDR-TB (population rate per 100,000) – 2010
(143)

26
Figure 1.13: Worldwide distribution of countries reporting at least one case of XDR-
TB (in red), according to WHO report, 2010 (144).
Patients with MDR TB can be cured with appropriate management based on second-
line TB drugs although they are inherently more toxic and less effective than first-
line drugs. Therefore, a reliable assessment of drug resistance (drug susceptibility
testing, DST) is an essential prerequisite to support clinical decision making and
helps to prevent the emergence of further drug resistance in patients with MDR TB.
This strategy is called the DOTS-Plus strategy (145, 146) or individualized regimen.
A regimen of at least four drugs should be implemented: injectable anti-tuberculosis
drugs, kanamycin, amikacin or capreomycin, a fluoroquinolone, an oral
bacteriostatic second-line drug and pyrazinamide. The duration of the MDR-TB
treatment can last from 8 to 20 months, which could be modified according to the
patient’s response to therapy, with increased risks of adverse reactions after 12
months. However, this individualized regimen is difficult to apply in low income
areas and thus a standardized approach has the advantages of making it easier to
estimate drug needs and to train personnel in the treatment of MDR-TB patients.
27
The standardized approach should include at least pyrazinamide, a fluoroquinolone,
a parenteral agent, ethionamide (or prothionamide), and either cycloserine or p-
aminosalicylic acid (PAS) if cycloserine cannot be used. Unfortunately the current
recommendations do not necessarily apply to XDR-TB patients as there is lack of
evidence for the best drug regimens for treating these patients. XDR-TB patients can
be cured although the probability of success with the current drugs available is much
lower than in patients with ordinary TB or even MDR-TB. Effective treatment of
XDR-TB depends on the speed and the accuracy of the diagnosis as well as on a
good selection of the second-line drugs that are available to clinicians (147). A
summary of the mechanisms of resistance involved with each of the first- and
second-line drugs is displayed in Table (1.1).

28
Table 1.1: Summary of drugs currently used against TB and their mechanisms of resistance (67, 138, 140).
Drug Effect on Mechanism of action Target
Mutations associated with resistance
Fir
st-l
ine
Ag
ents
Isoniazid Replicating bacilli Inhibits mycolic acid
synthesis InhA, KasA and AcpM
katG (Catalase-peroxidase)
inhA (Enoyl ACP reductase)
Rifampicin Replicating and
dormant bacilli Inhibits RNA synthesis RNA polymerase β-subunit rpoB (β-subunit of RNA polymerase)
Ethambutol Replicating bacilli Inhibits arabinogalactan
synthesis EmbB and EmbC
EmbB and EmbC (Arabinosyl
transferase)
Pyrazinamide Dormant bacilli Depletes membrane
energy
Unknown (possibly inhibits FAS-I
or alters membrane energetics) pncA (Nicotinamidase/pyrazinamidase)
Streptomycin Replicating bacilli Inhibits protein synthesis A site of 16S rRNA in the 30S
ribosomal subunit
rpsL (S12 ribosomal protein)
rrs (16S rRNA)
Ba
cter
ioci
da
l
seco
nd
-lin
e d
ru
gs Amikacin/Kanamycin Replicating bacilli Inhibits protein synthesis Ribosomes rrs (16S rRNA)
Capreomycin No conclusive data Inhibits protein synthesis Methylated nucleotides in
ribosomal subunits
tlyA (2'-O-methyltransferase)
rrs (16S rRNA)
Fluoroquinolones No conclusive data Inhibit DNA gyrase DNA gyrase gyrA-gyrB (DNA gyrase subunit A/B)
Ba
cter
iost
ati
c
seco
nd
-lin
e d
ru
gs
Ethionamide Replicating bacilli Inhibits mycolic acid
synthesis InhA
ethA (Flavin monooxygenase)
inhA ( Enoyl ACP reductase)
Para-aminosalicylic acid No conclusive data Inhibits folate metabolism Possibly Dihydropteroate synthase inhA (Enoyl ACP reductase)
thyA (Thymidylate synthase)
Cycloserine No conclusive data Inhibits peptidoglycan
synthesis
Alanine racemase
D-alanine-D-alanine ligase
alr (Alanine racemase)
ddl (D-alanyl-alanine synthetase A)

29
1.5. Mycobacterium tuberculosis and a vision for the future
1.5.1. The Genomic era in the study of Mtb
The publication of the complete annotated genome of the Mtb laboratory strain
H37Rv in 1998 was the beginning of the genomic era of Mtb (148). Since then, the
Mtb clinical strain CDC1551 and six related mycobacteria, M. leprae, M. ulcerans,
M. avium, M. avium paratuberculosis, M. smegmatis, and M. bovis have been fully
sequenced (149). The annotation of Mtb genomes is an on-going process where more
information is being added constantly to the annotation platform.
Sequencing the Mtb genome is considered an important milestone in modern history
of TB study. Currently, the complete genome of Mtb H37Rv is available in NCBI.
This culminates in a composite sequence of 4,411,532 base pairs (bp), with a G + C
content of 65.6% (http://www.ncbi.nlm.nih.gov/genome/166). This G + C rich
genome is a characteristic of Gram positive Actinobacteria and confers high stability
of the DNA. The Mtb genome represents the second-largest bacterial genome
sequence currently available after that of Escherichia coli (E. coli) (150) with 90%
of a total 4047 genes identified as functional of which 3988 are protein coding genes
(148, 151, 152). Another striking feature of the Mtb genome is the abundance of
genes coding for enzymes involved in fatty acid metabolism (more than 250 genes)
compared with only 50 genes in E. coli (148). Mtb also has the amazing potential to
produce over 100 enzymes implicated in the β-oxidation of fatty acids and it contains
both the FAS I and FAS II fatty acid synthase systems (153).
Regarding the post-genomic era, relating the annotated genome sequence to the
physiological functions of a cell is considered the main goal of this era. Therefore,
comparative and functional genomics has advanced since the publication of the
complete genome sequence, notably through the study of the transcriptome, the
proteome and the biogenesis of Mtb. The full transcriptome of Mtb has been studied
using different TB experimental models, activated and naive mice macrophages
(154-156). Moreover, Cappelli et al (2006) were the first to describe Mtb gene
expression in human macrophages (157) while Rachman et al (2006) conducted the
study on human lung tissue (surgical specimens) directly (158). Application of
comparative proteomic analysis explored the critical proteins involved in Mtb

30
pathogenicity (159). Metabolomic-based methods offer integrated readouts of the
genome and the proteome on a physiologically global scale. Specifically,
metabolomics is the study of metabolite profiles, the end products of biological cell
or organism processes. This approach provides the benefit of identifying and
analysing metabolites in response to various physiological conditions (160, 161), for
instance, studying a drug’s effect upon the metabolitc level, a topic that will be
discussed later (Chapter V).
Studying gene essentiality in bacteria employs familiar genome-scale methods,
which are a microarray hybridization or conventional sequencing. These methods
allowed mapping the sites of transposon insertions in large libraries of random
mutants and identifying the regions of the genome that were unable to sustain
mutation, which probably indicate the essentiality of these genes for the survival of
the organism (116, 162-165). However, these methods suffer from significant
drawbacks, resulting in uncertainty of an essential region location. Griffin et al
(2011) used highly parallel Illumina sequencing to characterize transposon libraries
achieving a precise identification of essential open reading frames (2). Recently,
Zhang et al (2012) coupled high-density mutagenesis with deep sequencing and
found a high level of agreement with Mtb essential genes data that were reported by
Griffin et al (2011) (2, 166).
1.5.2. Mycobacterium tuberculosis metabolism
The metabolic machinery of any bacteria is made up of two tightly linked
biochemical networks: the carbon metabolic pathways (carbohydrates, fatty acids
and amino acids metabolism), the tricarboxylic acid (TCA) cycle and the membrane-
embedded electron transport chain (ETC). The carbon metabolism provides the
respiratory chain with electrons (mostly as NADH and reduced flavin adenine
dinucleotide (FADH2)). The ETC components allow the cell flexibility in the H+/e
-
ratio (the number of protons delivered to the periplasmic side of the membrane per
electron) and rapid responsiveness in the rate of ATP synthesis in response to O2 and
carbon availability (167, 168).
Adaptation of Mtb to the host environment is a defining feature of its pathogenicity.
The key of this adaptation is the metabolic reprogramming of Mtb during acute and

31
chronic (latent) phases of TB disease. However, biochemical knowledge of Mtb
metabolic networks remains scarce.
1.5.2.1. Carbohydrate, TCA cycle
During aerobic in vitro growth of Mtb, various carbon sources feed into central
carbon metabolic (CCM) pathways such as D-glucose (dextrose), glycerol and
acetate, where each carbon source is widely catabolized into intermediates of
glycolysis/gluconeogenesis, the pentose phosphate pathway (PPP) and the TCA
cycle (160, 168). de Carvalho et al (2010) concluded that Mtb did not exhibit diauxic
growth (consuming individual carbon substrates in a preferred sequence) but Mtb
can catabolize multiple carbon sources simultaneously, leading to enhanced
monophasic growth. For instance, while co-catabolizing glucose and glycerol, Mtb
preferentially metabolized glucose into intermediates of glycolysis and PPP, and
glycerol for TCA cycle intermediates. However, concurrently, Mtb also incorporated
low levels of glycerol into glycolytic/gluconeogenic and pentose phosphate
intermediates (160). In the absence of exogenous sugars, glycolytic intermediates are
precursors for biosynthetic pathways as well which are generated by
gluconeogenesis (154).
The TCA cycle is the major energy-generating pathway in aerobic organisms as it
plays essential roles in cell metabolism, providing reduced equivalents for energy
generation and biosynthetic reactions as well as yielding precursors for lipids, amino
acids and heme synthesis. Mtb is considered an aerobic-to-facultative anaerobe
bacillus and has functional genes coding for all enzymes of the standard TCA cycle
regardless of its ability to survive for long periods in a hypoxic environment (33,
148). In fact, it is intriguing that the TCA cycle in Mtb is unusual in that α-
ketoglutarate dehydrogenase (KDH) is replaced by α-ketoglutarate decarboxylase
(KGD), which is absent in mammalian cells, and a succinic semialdehyde
dehydrogenase (169, 170). In the γ-Aminobutyric acid (GABA) shunt, an alternative
pathway from α-ketoglutarate to succinate via succinic semialdehyde (SSA) was
proposed which replaces the succinyl-CoA in Mtb TCA cycle (169). Although this
pathway supports growth on carbohydrates when the glyoxylate shunt is inoperable,
Mtb still requires production of succinyl-CoA by an alternate enzyme, anaerobic-like

32
α-ketoglutarate:ferredoxin oxidoreductase (KOR) (171). Importantly, the presence of
a functional glyoxylate shunt and KOR could bypass the requirement for KDH
activity. These observations show that, unlike most organisms, Mtb employes two
different pathways from α-ketoglutarate, one that functions simultaneously with β-
oxidation, KOR-dependent, and one that functions in the absence of β-oxidation,
KGD-dependent (171, 172).
1.5.2.2. Fatty acids metabolism, Glyoxylate shunt
During infection, Mtb switches its carbon sources of glycerol and glucose to fatty
acids, where upregulation of Mtb genes involved in fatty acid catabolism has been
observed in vivo from the lungs of mice and humans (173-175). A transcriptional
profiling study of Mtb recovered from macrophages in vitro showed induction of
genes involved in the β-oxidation of fatty acids upon converting the microbe from
aerobic to anaerobic respiration (154). Mtb possesses more than 250 enzymes
involved in lipid metabolism, which includes enzymes for lipid biosynthesis as well
as degradation, where host cell lipids degradation is crucial for the intracellular life
of the organism (148, 176).
Two pathways are required for fatty acid utilization by bacteria: the β-oxidation
cycle and the glyoxylate shunt. The β-oxidation cycle is the dominant route for
oxidative degradation of fatty acids in bacteria and eukaryotes, yielding acetyl-CoA
and propionyl-CoA. Acetyl-CoA molecules are generated from the β-oxidation of
both odd- and even-chain-length fatty acids, while propionyl-CoA comes from odd-
chain-length fatty acids degradation, and can also be generated by catabolism of
cholesterol, methyl-branched fatty acids and branched-chain amino acids (168, 177,
178).
The importance of the glyoxylate shunt, which has no mammalian counterpart, was
demonstrated by McKinney et al (2000), who showed that the persistence of Mtb in
macrophages and mice requires the glyoxylate shunt enzymes, isocitrate lyases (ICL
1 and 2) (172). Similarly, it has been proposed that glyoxylate cycle enzymes are
activated during adaptation to the low oxygen environment of the granuloma. Upon
using fatty acids as the principal carbon source, replenishment of TCA cycle

33
intermediates (anaplerosis) occurs via the glyoxylate cycle that converts acetyl-CoA
into oxaloacetate. In the glyoxylate shunt, ICL 1 and 2 catalyse the cleavage of
isocitrate into glyoxylate and succinate while malate synthase (MLS) mediates the
condensation of glyoxylate and acetyl-CoA into malate (168, 175). Isocitrate lyases
(ICLs) play two main roles during infection, bypassing carbon loss under limited
nutrient availability by using the glyoxylate shunt and preventing accumulation of
toxic propionyl-CoA (16). ICLs are jointly required for fatty acid catabolism, in vivo
growth in the macrophage and mice, and for virulence in Mtb, as mutant bacteria
lacking icl1 and icl2 cannot grow in mice and are rapidly eliminated (179). Beste et
al (2011) demonstrated a role for ICLs and the glyoxylate shunt during slow growth
rate of Mtb on glycerol suggesting that they operate under more general conditions
(180).
The methylcitrate cycle in Mtb is operational with ICL 1 and 2 serving dual roles as
ICLs in the glyoxylate shunt and as a 2-methylisocitrate lyase (MCL) in the
methylcitrate cycle (175, 181). Propionyl-CoA is assimilated via the methylcitrate
cycle which oxidizes propionyl-CoA to pyruvate (182). Mtb uses the
methylmalonyl-CoA pathway to metabolize propionyl-CoA for cell wall synthesis
(175). Moreover, ICLs control propionate levels when the bacterium uses specific
carbon sources, such as cholesterol, fulfilling a detoxification function (177, 183).
Pandey and Sassetti (2008) showed that Mtb utilizes cholesterol, a major component
of host cell membranes, during Mtb persistance in the lungs of chronically infected
animals as well as during the growth of Mtb within IFN-γ-activated macrophages
that predominate at this stage of infection (183). During cholesterol catabolism
metabolic modification is centered on propionyl-CoA and pyruvate pools that
necessitate the stimulation of the propionyl-CoA-assimilating methylcitrate cycle
(MCC) enzymes (184). It is becoming apparent that fatty acid metabolism is pivotal
during infection and that the glyoxylate shunt could be a good target for drug
development. However, the possibility of a parallel uptake of additional carbon
sources such as sugars, fatty acids and amino acids from the human host during
infection cannot be excluded, as been observed in cholesterol uptake mutants that
grow normally in resting macrophages of infected mice (183, 184).

34
Although it has been suggested that mycobacteria in vivo-growth is lipolytic rather
than lipogenic, fatty acid biosynthesis still plays an important role (148). Mycolic
acids, representing essential components of the mycobacterial cell wall, are very
long-chain β-hydroxy fatty acids with a long α-alkyl side chain (185). The
biosynthetic pathway of mycolates involves two types of fatty acid-synthesizing
systems, FAS-I and FAS-II (148). The multifunctional FAS-I polypeptide contains
all the functional domains required for de novo fatty acid synthesis (186).
Mycobacterial FAS-II elongates acyl-CoA primers generated by FAS-I to a mixture
of homologous fatty acids of longer chain lengths (meromycolic acids) (187).
Redox couples in Mtb are NAD+/NADH, NADP
+/NADPH and FAD/FADH2, all of
which are vital for both anabolic and catabolic reactions. NAD+, an efficient electron
sink, is used as a cofactor in several oxidising reactions. A constant level of NADH
is maintained during various phases of growth in vitro, while the concentration of
NAD+, a major contributor to a change in NADH/NAD
+ ratio, is variable. A higher
ratio of Mtb NADH/NAD+ is generated during the transition from aerobic to
anaerobic growth phase (188, 189). β-oxidation of fatty acids consumes NAD+ and
FADH in every cycle of fatty acid oxidation, therefore type II NADH dehydrogenase
(NDH-2) induction signals the need of NAD+ regeneration to maintain the NAD
+
pool (154). Concurrently, the β-oxidation of fatty acids yields one NADH and one
FADH2 molecule for every acetyl-CoA generated. Consequently, NADH and
FADH2 channel the electrons to the ETC, which consecutively oxidises and reduces
multiple redox centres before generating ATP (188).
1.5.2.3. Amino acids metabolism
The existing knowledge about amino acid metabolism in mycobacteria is limited.
Generally, L-asparagine is the preferred source of nitrogen for the growth of
mycobacteria but can be replaced by L-alanine, L-glutamine or L-glutamic acid. In
glycerol-enriched media, glutamate becomes the preferred source of nitrogen (190).
One of the most important precursors for gluconeogenesis are free amino acids
which might increase when amino acids are not utilized for protein anabolism but are
oxidized by impairment of protein synthesis (191). The Mtb genome revealed a
statistically significant preference for the amino acids alanine, glycine, proline,

35
arginine and tryptophan all of which are encoded by G + C rich codons, and a
comparative reduction in the use of asparagine, isoleucine, lysine, phenylalanine and
tyrosine amino acids, encoded by A + T rich codons (148).
During infection, due to the high demand for amino acids as substrates for energy
production, many amino acids significantly increased in the lung, spleen, liver, and
serum of Mtb-infected mice. Moreover, Shin et al (2011) found that intermediates of
pyrimidine metabolism, uracil, uridine, and UDP-glucose, and intermediates of
purine metabolism ATP, AMP, inosine, allantoin, and xanthine were high in Mtb-
infected mice (191).
Central carbon metabolic pathways of Mtb are depicted in the following Figure
(1.14), including the major catabolic intermediates and amino acids. Importantly,
these metabolic pathways are found to be critical for the virulence of Mtb during
infection.

36
Figure 1.14: Central metabolic pathways of Mycobacterium tuberculosis (192-194)
Central carbon metabolic pathways depicting a bioinformatic inventory of Mtb’s CCM
pathways, inculding the anabolic monomers (amino acids; purple boxes) and the major
catabolic intermediates from which they derive (dashed grey arrows) are shown. Major
carbon substrates are shown in green boxes. The CCM pathways are colour-coded as present
in the key panel. KOR, α-ketoglutarate:ferredoxin oxidoreductase and KGD, α-ketoglutarate
decarboxylase. His, Histidine; Arg, Arginine; Asn, Asparagine; Asp, Aspartic acid; Ala,
Alanine; Cys, Cysteine; Gln, Glutamine; Glu, Glutamic acid; Gly, Glycine; Ile, Isoleucine;
Leu, Leucine; Lys, Lysine; Pro, Proline; Ser, Serine; Thr, Threonine; Trp, Tryptophan; Tyr,
Tyrosine; Val, Valine; Phe, Phenaylalanine; Met, Methionine.

37
1.5.3. Electron transport and respiration in Mycobacterium tuberculosis
The importance of the flexibility, conferred by a modular respiratory system, in the
survival of Mtb has led to the targeting of the ETC components in the context of
developing new anti-TB drugs.
Mtb oxidizes a variety of electron donors including succinate, NADH, lactate,
malate, proline and glycerol using different aerobic, microaerophilic and anaerobic
respiratory systems. Consequently, the generated electrons are transported to any
terminal electron acceptors that include oxygen, nitrate, nitrite and fumarate. ETC
contains electron carriers in heme molecules, copper atoms or flavin prosthetic
groups forms. Generally, dehydrogenases transfer electrons from cytoplasmic
electron donors into the quinone pool, in the centre of the ETC, resulting in reducing
menaquinone to menaquinol. Subsequently, the menaquinol is oxidized back to
menaquinone by the cytochrome bc1 complex. Successively, bc1 complex passes
electrons to a terminal oxidase, cytochrome bd-I oxidase. In anaerobic respiration,
terminal reductases comprising nitrate reductases and fumarate reductase replace the
terminal oxidase. Finally, electrons are transferred to the terminal electron acceptor.
A proton motive force (PMF) forms as a result of simultaneous action between
electron migration across the chain and proton passage from the cytoplasmic side
into the periplasmic side of the membrane. Production of ATP is a result of gradient
dissipation by movement of the protons through a membrane-associated ATP
synthase back into the cytoplasm (195). The composition of the respiratory system of
Mtb is shown in Figure (1.16). The biochemical properties and physiological roles of
the specific respiratory system components of Mtb are described in more detail.
1.5.3.1. Electron donors
NADH:menaquinone oxidoreductases, also known as NADH dehydrogenases
(NDH), are one of the main electron donors of the Mtb respiratory system. NDH
play an essential role in transferring electrons from NADH to the quinone pool and
in NAD+ recycling. Mtb has three different NDH: a type I NDH (NDH-1) and two
type II NDH (NDH-2 and NDH-2A). The redox activity in NDH-1 is coupled to
proton translocation while in NDH-2 and NDH-2A is not. NDH-2 and NDH-2A are

38
single-subunit dehydrogenases that catalyse electron transferring from NAD(P)H to
the quinone pool without proton translocation across the membrane (195). Studies
have suggested that NDH-1 and NDH-2A are dispensable for Mtb growth in vitro,
while NDH-2 is required for optimal Mtb growth in vitro (116). Further, NDH-2A
was shown to have no role in the virulence of Mtb in SCID mice (2, 196). Weinstein
et al (2005) found that the classic inhibitors of NDH-1 (rotenone, piericidin A, and
pyridaben) did not inhibit overall oxidoreductase activity (197). Thus, NDH-2 is
suggested to function as the main NDH of the Mtb respiratory chain (198).
Succinate dehydrogenase (SDH) is known as complex II of the ETC and catalyses
the oxidation of succinate to fumarate and the reduction of the quinone. SDH is an
essential part of the TCA cycle and has a role in aerobic respiration (195, 199, 200).
The Mtb respiratory chain has other dehydrogenases, L-lactate (LDH), Glycerol-3-
phosphate (G3PDH), malate (MDH) and proline dehydrogenase (PDH), for
oxidizing the other electron donors but without identified function (195).
1.5.3.2. Quinones in Mycobacterium tuberculosis
Quinones are lipid-soluble molecules that have a critical role in the ETC as a
reversible redox component, carrying electrons between electron donors and
acceptors (201). In bacteria, quinones present in different forms, which are
ubiquinone, menaquinone, and/or demethylmenaquinones, of which menaquinone is
known as the sole quinone in Gram-positive bacteria (Figure 1.15). Mycobacteria
have only menaquinone according to the genomic data of Mtb (148). The variant of
menaquinone in Mtb contains nine isoprene units (MQ-9) (202). MQ-9 synthesized
by a series of enzymes encoded by menABCDEH (203). Menaquinone has a lower
redox potential than ubiquinone that confers less tendency to accept electrons and
being reduced (195). The quinone structure consists of a hydrophobic isoprenoid unit
rendering quinone soluble in the interior of the membranes (204).

39
Figure 1.15: Structures of (a) Ubiquinone and (b) Menaquinone
1.5.3.3. Electron Acceptors
The cytochrome bc1 reductase-cytochrome c oxidase super-complex comprises
cytochrome bc1 reductase (bc1 complex) which catalyzes the oxidation of
menaquinol (MQH2) and the aa3-type cytochrome c oxidase (CcO). Electrons from
the bc1 complex are passed through an iron-sulphur cluster and cytochrome c to the
CuA atom in the CcO where the reduction of O2 to water takes place. This catalysis is
coupled with proton translocation across the membrane, resulting in greater energy
conversion (195).
Cytochrome bd-I oxidase is a terminal oxidase that oxidizes menaquinol and reduces
O2 to water (195). Cytochrome bd-I oxidase has the ability to generate a PMF by
trans-membrane charge separation, unlike heme-copper terminal oxidases, with a
“proton pump” mechanism (205). Generation of PMF by trans-membrane charge
separation is conducted by virtue of the fact that protons resulting from the oxidation
of ubiquinol are released into the positive (periplasmic) side of the membrane, while
the protons used to convert O2 to H2O are taken from the negative (cytoplasmic) side
(205, 206).
Amongst the mycobacteria, Mtb is the most competent reducer of nitrate, containing
two homologues of nitrate reductases (NRs) encoded by narGHJI and narX. NR
catalyses the reduction of nitrate to nitrite, granting Mtb with the ability to persist

40
under O2 depletion (anaerobic condition) and/or nitrate abundance conditions (195,
207).
Fumarate reductase (FRD) is more efficient at catalyzing the reduction of fumarate
to succinate and the oxidation of quinol (QH2), the reverse reaction of SDH. FRD
accepts electrons from QH2 and acts as terminal electron acceptor under anaerobic
conditions. FRD is suggested to be involved in the mechanism of Mtb persistence
(195, 199, 200).
In Mtb there are genes that encode a cytoplasmic NirBD nitrite reductase and
sulphite/nitrite reductase, NirA. Through the action of anaerobic nitrite reductases,
the nitrite resulting from degradation of reactive nitrogen intermediates or nitrate
respiration can be reduced to ammonia (195).
F0F1 ATP synthase, encoded by the atpBEFHAGDC operon, is a multisubunit
complex consisting of a membrane-embedded proton-pumping F0 part and a
cytoplasmic, catalytic and non-catalytic nucleotide binding domain, F1. During
aerobic respiration, the enzyme is responsible for the production of ATP by
oxidative phosphorylation whereas in anaerobic respiration, it works as ATPase,
pumping protons through the membrane. The F0F1 ATP synthase can utilize the PMF
across the bacterial cytoplasmic membrane for the synthesis of ATP (195, 208).

41
Figure 1.16: Components of the electron transport chain in Mycobacterium tuberculosis (209)
The chain electron donor components are Ndh/NdhA-type II NADH: (mena)quinone oxidoreductase (two isoforms), SDH-succinate dehydrogenase, G3PDH-
glycerol-3-phosphate dehydrogenase, LDH-L-lactate dehydrogenase, MDH-malate dehydrogenase, PDH-proline dehydrogenase and nuo-type I NADH
(complex I). Electron acceptors are cytochrome bc1-aa3 super complex-the cytochrome bc1 reductase-cytochrome c oxidase super-complex and an alternative
terminal oxidase pathway which comprises cytochrome bd oxidase (quinol oxidase), FRD-fumarate reductase and NR-nitrate reductase. Chain components
also include F0F1 ATP synthase (complex V), MK-9-menaquinone-9 and MKH2-menaquinol. P and n correspond to the positive and negative sides of the
respiratory membrane with respect to proton translocation. Proton movements are indicative only and do not represent H+/e
- ratios for the respective
complexes. The orientation and topology of the subunits are indicative only.

42
1.5.4. Cytochrome bd-I oxidase
1.5.4.1. Definition
Cytochrome bd-I oxidase is a respiratory quinol: O2 oxidoreductase found in many
prokaryotes, including strictly anaerobic bacteria such as Desulfovibrio vulgaris
Hildenborough (DvH) (210). Respiratory oxygen terminal oxidases are a class of
enzymes at the end of the respiratory chain of organisms that couple the oxidation of
a respiratory substrate, cytochrome c or QH2, to the reduction of O2 to water. This
type of reaction leads to the bioenergetic function of cytochrome bd-I oxidase
through the production of a PMF by a vectorial charge transfer of protons (211).
1.5.4.2. Subclasses
Oxygen reductases (terminal oxidases) are classified into three distinct families
which are the heme-copper family, the alternative oxidase (AOX) family and the
cytochrome bd family. The cytochrome bd family are quinol oxidases with no
homology to any subunit of the heme-copper family or the AOX family. The
cytochrome bd family does not have copper or non-heme iron (53, 211-214).
Moreover, based on structural and spectroscopic observations, the cytochrome bd
family is sub-classified into the A-subfamily (long Q-loop), B-subfamily (short Q-
loop) and the cyanide insensitive oxygen reductases (CIO) (211). The Q-loop is a
hydrophilic domain of subunit I of cytochrome bd-I oxidase and has been implicated
as part of the quinol binding site. The long Q-loop bd-family members have an insert
in the C-terminal portion of the Q-loop, while the short Q-loop bd-members do not
have this insert (211, 215). At the gene sequence level, CIO has no differentiating
characteristic that could distinguish CIO from other members of cytochrome bd
family. However, CIO has been characterized by low heme d content and resistance
to cyanide (211, 216).
Interestingly, although many aerobic prokaryotes do not contain any member of the
bd family, some prokaryotes have more than one bd family member, for instance,
two: E. coli (217, 218); three: Vibrio cholerae (219); and as many as six bd-type
oxidoreductase: some Acidithiobacillus strains (211). In Mtb, there is only one bd

43
family member, the cydAB-encoded cytochrome bd-I oxidase (148) that serves as an
alternative terminal oxidase pathway under oxygen-limited conditions (195, 209).
1.5.4.3. Physiological functions
The cellular bioenergetic function of cytochrome bd-I is the production of a PMF via
liberation of protons upon quinol oxidation (218, 220). Cytochrome bd-I grants
bacteria with a number of vital physiological functions. Cytochrome bd-I permits
colonization of O2-poor environments (221, 222), by working as an O2 scavenger in
order to prevent degradation of O2-sensitive enzymes such as nitrogenase (223). This
enzyme was found to support anaerobic photosynthetic growth as well (224).
Moreover, it is of interest to note the positive correlation between the level of
cytochrome bd-I expression and microbial pathogen virulence which was observed
in tuberculosis, pneumonia, life-threatening sepsis and meningitis (211, 221, 225).
Further physiological functions of cytochrome bd-I oxidase are in improving
bacterial tolerance to nitrosative stress (211, 226, 227), contributing in detoxification
of hydrogen peroxide in E. coli (228), suppressing extracellular superoxide
production in Enterococcus faecalis (229), and involvement in the degradation of
aromatic compounds in Geobacter metallireducens (230). Under conditions of nitric
oxide (NO) stress, cytochrome bd-I was overexpressed, granting nitric oxide
resistance to E. coli (231). It has been suggested that Mtb cytochrome bd-I oxidase
may thus serve to maintain an energized membrane during the persistent stages of
infection, NRP stage 1 and 2 (20), and forms a part of the Mtb defence system
against immune-mediated oxidative damage (232). Shi et al (2008) wrote that
cytochrome bd-I oxidase is a potential enzyme candidate that may defend against
reactive oxygen and nitrogen species (ROS and RNS) produced by the host adaptive
immunity during tuberculosis infection (233).
1.5.4.4. Cytochrome bd expression conditions
There are many stressful conditions that influence the expression of cytochrome bd
family in E. coli. For instance, low O2 tension (234), alkalinization of the medium
(235), high temperature (236), the presence of poisons in the environment (for

44
example, cyanide) (237), uncouplers-protonophores (235, 238) and high hydrostatic
pressure, observed in Shewanella violacea DSS12 (239). In Mtb, a high level of
cytochrome bd-I expression was recorded during NRP stages 1 and 2 growth
conditions, categorized by low O2 tension and metabolic slowdown (20). In M.
smegmatis, although the threshold pO2 for cyd induction is at 1% air saturation,
cyanide induces cydAB gene expression at 21% air saturation (Kana et al., 2001).
Further, DNA microarray analyses showed an up-regulation of Mtb H37Rv cydA
(2.7-fold) during Mg2+
starvation (240). CydAB gene expression in Mtb was up-
regulated by inhibitors of CcO and during adaptation to hypoxia (241) which is
probably a response to the disruption of the bc1-aa3 pathway (242). Similarly in M.
smegmatis, up-regulation of cytochrome bd-I oxidase occurred in response to
disruption of the bc1-aa3 respiratory pathway as well (242). However, Mtb cydAB
gene expression showed no up-regulation during hydrogen peroxide (H2O2) or
menadione treatment (241).
1.5.4.5. Genetics
1.5.4.5.1. Genes of Mycobacterium tuberculosis encoding the protein subunits
and assembly factors of the cytochrome bd-I oxidase
The genes involved in the expression of the cytochrome bd-I oxidase are the cydA
and cydB genes, encoding subunits I and II of the cytochrome bd-I oxidase,
respectively. The cydDC genes, located immediately downstream of the cydA and
cydB genes, encode an ABC-type transporter which is implicated in the assembly of
functional bd-type oxidase (195, 232, 243-247) and in maintaining redox
homeostasis in the periplasm (53, 248, 249).
1.5.4.5.2. Regulation of cydAB operon expression
Two global transcriptional regulators, Arc and Fnr control the expression of the
cydAB operon (250). Arc is a two-component regulatory system, ArcA and ArcB, of
which ArcA responds to the oxidation state of the quinone pool, sensed by ArcB
(251). Under microaerophilic conditions (O2 tension of 2-15% of air saturation), a

45
high level of phosphorylated ArcA activates the cydAB operon in E. coli (252). The
Fnr regulator is active only during anaerobic growth and it serves as redox sensor.
During the transition to anaerobic conditions (O2 tension of less than 2% of air
saturation), the active Fnr regulator inhibits cytochrome bd-I (250). However, the
induction of cyd expression differs between organisms. For example, the threshold of
O2 tension for cyd induction in M. smegmatis (253) and Mtb (221) is suggested to be
at 1% air saturation while in E. coli it is found to be at 10% air saturation (254).
1.5.4.6. Cofactors and substrates
The oxidation of quinols by cytochrome bd-I enzyme as an electron acceptor is
species-specific. For example, in E. coli the cytochrome bd-I enzyme can oxidize
both ubiquinol (UQH2) and menaquinol (MQH2) whereas in B. stearothermophilus,
the substrate of cytochrome bd-I is MQH2 and in Azotobacter vinelandii is UQH2
(255, 256). MQH2 is the substrate in Mtb as mentioned previously (195).
Cytochrome bd-I oxidase has a three-heme enzyme comprising two protoheme IX
groups (hemes b558 and b595) and a chlorin (heme d). The low-spin hexacoordinate
heme b558 accepts electrons from a quinol (257) whereas the high-spin heme d is
recognized as the O2 binding site and it catalyses the reduction of O2 to water.
Construction of cydA and cydB mutants in E. coli located heme b558 on subunit I and
hemes b595 and d on subunit II of cytochrome bd oxidase (258, 259). Using mutant
strains defective in cydB, Green et al (1986) managed to express, purify and retain
only heme b558 (cydA–encoded) (260). The location of heme b558 heme b595 and heme
d is predicted to be near the periplasmic surface (215, 261). The α-band of the
reduced heme d in the absolute absorption spectrum of E. coli cytochrome bd-I
showed a peak at 628–632 nm. The α-bands of the reduced heme b558 and heme b595
at room temperature reveal maxima at 560–562 nm and at 594–595 nm respectively,
in the difference absorption spectrum (262, 263).

46
1.5.4.7. Proposed catalytic mechanism
Cytochrome bd-I oxidases in E. coli are known to have a relatively high affinity for
O2 (Km = 0.3 µM) and the ability to generate PMF by trans-membrane charge
separation, unlike heme-copper terminal oxidases which operate with a “proton
pump” mechanism (205, 213, 231). The electron transfer sequence in cytochrome
bd-I is thought to be QH2 → heme b558 → [heme b595 → heme d] → O2. This process
will be explained in detail in Chapter (III).
1.5.4.8. Inhibitors of cytochrome bd-I
Quinol oxidase inhibitors are classified into two main groups: inhibitors that operate
at the Q-binding site (Q-like compounds) and inhibitors that act at the O2
binding/reducing site (heme ligands) such as cyanide, azide or nitrite. Importantly,
inhibitors acting at the oxygen reduction site tend to be moderately weak (53, 211,
213). Therefore, investigations for specific inhibitors of the bd-I type oxygen
reductases, which could be used in clinical practice, took place where aurachins C
and D and their alkyl-substituted derivatives were found to be potent inhibitors
against quinol oxidases (264). Gramicidin S (GS), a cationic cyclic decapeptide, was
found to be a potent inhibitor against E. coli bd-I (IC50 5.3 μM) as well. However,
the membrane lipid bilayer was found to be the main target of GS rather than bd-I
(265).
1.5.4.9. The importance of bd-I and latency
Tackling latent TB is a main goal in the new era of TB drug discovery, providing a
promising approach for shortening the duration of current TB therapy, as seen for
PZA (126), RIF (266), TMC207, a novel diarylquinoline (267) and MTZ (35).
Latency is a condition that displays the ability of Mtb bacilli to adapt under any
stress from the host immune system. The importance of cytochrome bd-I oxidase in
dormant Mtb bacilli or in persister cells of Mtb during latency was proposed by
different studies. Initially at the genome level, cydAB-encoded cytochrome bd-I
oxidase was defined to be essential for Mtb survival (2). The critical role of the
cytochrome bd-I oxidase was further defined in the context of Mtb bacilli adaptation
to stress conditions. Transcriptional studies confirmed the significance of this

47
enzyme both in vivo and in vitro where the level of Mtb bd-I expression was higher
under hypoxic conditions (20, 212, 221). Boshoff et al (2004) found that the
cydABDC operon was up-regulated in response to the respiratory inhibitors such as
the phenothiazines (e.g. thioridazine, TRZ), the CcO-specific inhibitors (cyanide and
azide) and redox cycling agents (menadione and clofazimine). Moreover, the study
found that isoniazid- and pyrazinamide-treated Mtb showed up-regulation of the
cydABDC operon (241). Interestingly, the F1-ATPase-defective E. coli and
Corynebacterium glutamicum mutants were found to have specific up-regulation of
less efficient PMF generation components, such as NDH-II and cytochrome bd-I, to
avoid generating excess PMF (268, 269). This observation emphasises the
importance of cytochrome bd-I during restricted conditions such as latency where
ATP synthase was found to be down regulated. Importantly, single-gene mutation
studies suggested that cydDC, encoding an ABC transporter and implicated in
cytochrome bd-I assembly, might engage in Mtb persister formation or maintenance
(24, 52).
1.5.5. Transcriptional changes in respiratory chain components of
Mycobacterium tuberculosis among various growth models
The fact that there is a high degree of microenviromental diversity encountered by
the tubercle bacillus during infection in humans originates from different extents of
cavitary disease (Tuberculosis) within a single patient, and since within a lesion
several immunological microenvironments exist to exert different effects on bacterial
subpopulations (15, 20). As the science behind these microenvironments remains
unknown, in vitro models have been developed to mimic the environments that are
thought to be encountered by Mtb in vivo. Models in which the tubercle bacilli enter
into a state of NRP include, but are not restricted to, carbon starvation (Loebel
model) (270), O2 depletion in vitro (Wayne model) (33) and the chronic stage of
infection in mice (195).
Oxygen limitation is believed to be a crucial factor affecting the metabolism of Mtb
during pathogenesis, since the granuloma would have such hypoxic environments
(20, 25, 271). Numerous studies analysed the transcriptome of Mtb in a hypoxic
model and suggested that the NRP state was associated with O2 depletion and nitrate

48
reduction (221, 241, 271, 272). Bacon et al (2004) recorded a strong induction of the
narX and narK2-encoded NR and nitrate/nitrite transporter respectively, during
growing Mtb in a chemostat at 1% air saturation, signalling a shift to nitrate
metabolism. In the Wayne model, a gradual O2 depletion resulted in the initial
establishment of the NRP-1 state (1% air saturation), followed by NRP-2 (0.06% air
saturation), a state acknowledged by a widespread of metabolic cessation.
Simultaneously, the following genes: cydA, cydB, cydC, and cydD were induced to
3.1-, 2.9-, 1.6- and 2.6-fold, respectively, while the expression level of the bc1–aa3
super complex remained unchanged (33, 34, 43, 221). Concomitant with these
changes was the down-regulation of the intracellular ATP level of oxygen-starved
bacilli (Wayne bacilli) by 5-fold compared to that of exponentially growing bacilli
(273, 274).
The carbon starvation model, accompanied by O2-limiting conditions resulted in
down-regulation of 47% of aerobic respiration genes, among which were
cytochrome bd-I oxidase, SDH and ATP synthase, and the up-regulation of genes
encoding FRD and NR (195, 270). The hallmark of Mtb growth in resting bone-
marrow-derived macrophages model was the reduction of aerobic respiratory
components, NDH-1 and CcO, concurrently with the down-regulation of ATP
synthase coding genes. These observation were indicative of low energy necessities
during intracellular growth (154). Simultaneously, an induction of nitrate/nitrite
transport, NR and FRD in activated macrophages were indicative of their availability
as alternate electron acceptor in the intracellular environment of Mtb (275).
Regarding the transcriptional profiling of Mtb respiratory chain components using in
vivo models, there are three distinct respiratory states defined during Mtb
colonization of mouse lungs (murine model). The first respiratory state occurs during
the acute phase and is characterized by a bioenergetically efficient state, as
evidenced by up-regulation of genes encoding ATP synthase, NDH-1 and CcO
subunits (221). The second respiratory state appears as result of NO production, a
central component of the host immune response. This state is characterized by the
down-regulation of bioenergetically efficient respiratory components and ATP
synthase and concurrent up-regulation of microaerophilic respiration genes,

49
cytochrome bd-I oxidase and nitrate reduction and transport (221). Moreover, NO
marks the appearance of the third respiratory state, characterized by the down-
regulation of cytochrome bd-I oxidase and strong up-regulation of NRs (221).
However, challenging Mtb with NO drove the organism to nitrate reduction and led
to up-regulation of cytochrome bd-I oxidase and NDH-2 (195, 271, 276, 277).
The respiratory states of Mtb in human disease are not well characterized.
Nonetheless, it is worth noting that some studies detected the expression of NR,
together with FRD genes in the granulomatous region that is found in the pericavity
and in the distal lung (158, 278).
1.6. Potential future anti-TB drugs
1.6.1. TB drugs global alliance
The current TB treatment regime has many challenges, which include complex
dosing schedules, long treatment times, and growing rates of drug resistance. The
Stop TB partnership set a goal for adequately controlling TB and to ultimately
eradicate it by 2050, and for this to be a reality, new drugs, diagnostics and vaccines
will be required (http://www.stoptb.org/). Generally, the Target Product Profiles of
new TB drugs state that drugs need to be effective against resistant strains as well as
able to treat latent infection, compatible with anti-retroviral therapy, suitable for
paediatric populations and shorting and simplifing the duration of treatment (279).
1.6.2. Important drugs that target Mtb ETC
A new anti-tubercular drugs, targeting the ETC component of Mtb, is currently in
clinical development and known as TMC207 (R207910, Bedaquiline). TMC207 is a
novel diarylquinoline that demonstrates a potent anti-TB activity both in vitro and in
vivo with the same target specificity on both replicating and dormant bacilli (280).
TMC207 acts by specifically targeting the subunit c, encoded by the gene atpE of the
F1F0-ATP synthase, causing a pronounced bactericidal effect (267). TMC207 is
currently in Phase IIb clinical trials for the treatment of patients with MDR-TB (274,
281).

50
Phenothiazines are old drugs that re-emerged recently as potential anti-TB agents.
Phenothiazines target the Mtb ETC through inhibiting type II NADH: menaquinone
oxidoreductase. Warman et al (2012) showed that phenothiazine activity against Mtb
NDH-2 is directly correlated to antitubercular activity against Mtb under both
aerobic and anaerobic growth conditions. However, the potential and known
toxicities of the phenothiazine class still exist. Therefore, phenothiazines could be
used as potential templates on which to base future anti-TB drugs that overcome the
current drawbacks (282).
1.6.3. Other future drugs candidates
Owing to the fact that each of anti-TB drugs has potential as a starting point for the
discovery of a new clinical candidate, new chemical entities have progressed in
clinical development based on chemical tailoring of existing drugs or drug classes.
Two approved fluoroquinolones (moxifloxacin and gatifloxacin), DNA gyrase
inhibitors, have shown promising results for treating resistant TB strains and
shortening the duration of treatment. The parent scaffold of moxifloxacin and
gatifloxacin is nalidixic acid and they are currently in phase III clinical trials where
the efficacy of these drugs in replacing either INH or ethambutol in first-line therapy
is being tested (138, 279, 283, 284). Furthermore, cell wall synthesis inhibitors, PA-
824 and OPC-67683 (nitroimidazole family), with a remarkable antitubercular
activity are in phase II clinical trials, and they are remodelling of Metronidazole.
PNU-100480 is a protein synthesis inhibitor, developed from Linezolid
(oxazolidinone family), and is in phase II clinical trials as well (279). Moreover,
SQ109 (diamine derivative) is a new cell wall synthesis inhibitor, and targets a
mycolic acid transporter (MmpL3). SQ109 is in Phase II clinical trials and shows
synergistic effects with the antitubercular drugs isoniazid and rifampicin (138, 281,
285, 286).

51
1.7. Objectives
This thesis sets out to expand the current knowledge of the ETC of Mtb.
Specifically, the thesis has focused on an important, but hitherto little studied
component, the cytochrome bd-I quinol oxidase. A basic characterisation of this bd-
I quinol oxidase has been undertaken as well as an initial study to determine its
pharmacological potential as a drug target. As an extension to this work, an initial
pharmacometabolomics study was undertaken to determine the cellular
consequences of targeting this component. The specific objectives include;
Cloning and expression of Mtb cytochrome bd-I oxidase (Mtb bd-I),
using two different heterologous expression systems (ML16 (bo3/bd-I)
and MB44 (bo3/bd-I/bd-II)).
Steady state characterisation of Mtb bd-I in the two expression models.
Pharmacological profiling of Mtb bd-I in the two expression models and
chemical validation of the target.
Set up of a pharmacometabolomics platform to assess the cellular
consequence of perturbation on Mtb metabolism by known drugs and
selective ETC inhibitors.

52
Chapter II
Generation and characterisation of a heterologous
expression system for Mycobacterium tuberculosis
cytochrome bd-I oxidase in an E. coli respiratory
knockout (bo3/bd-I) mutant strain.

53
2.1. Introduction
The aim of this study was to explore the features of the Mtb cytochrome bd-I oxidase
(Mtb bd-I) through initially cloning the enzyme, followed by characterizing the
expression, growth conditions and the spectroscopic signature of this enzyme.
Kana et al (2001) previously demonstrated the ability of recombinant Mtb
cytochrome bd-I oxidase to restore bd-I activity in a M. smegmatis mutant strain
(253). However, detailed studies of Mtb cytochrome bd-I in terms of functionality
and inhibitor profiling have not yet been performed.
The Mtb genome encodes approximately 4,000 genes contained within 4,411,529
base pairs (148, 287, 288). The Rv1623c, Rv1622c, Rv1621c and Rv1620c genes,
encoding the cydABDC operon (5,967 bp), are found between 1,819,963 and
1,825,887 base pairs of the Mtb genome (Figure 2.1).
Figure 2.1: The position of the cydAB genes in the context of the Mycobacterium
tuberculosis genome
The cytochrome bd-encoding genes (cydA and cydB) are found adjacent to genes (cydD and
cydC) encoding an ABC-type transporter.
(http://genome.tbdb.org/annotation/genome/tbdb/GeneDetails).
An Escherichia coli bo3/bd-I knockout strain was used to develop a heterologous
expression system for Mtb bd-I. A brief description of Mtb and E. coli quinol
terminal oxidases will be presented.

54
As stated previously, Mtb has two terminal oxidases, the cytochrome bc1 reductase-
cytochrome c oxidase super-complex and the cytochrome bd-I oxidase (195) (Figure
2.2, A). Cytochrome bd-I oxidase contains two structural subunits, subunits I and II,
encoded by cydA and cydB respectively. CydDC of the cydABDC operon, encoding
an ABC-type transporter, are implicated in the assembly of a functional bd-type
oxidase and in maintaining redox homeostasis in the periplasm through exporting
cysteine (53, 232, 247, 248). Cytochrome bd-I oxidase is an enzyme that couples the
oxidation of a respiratory substrate quinol (two-electron donor) to the four-electron
reduction of O2 to water. The high-affinity cytochrome bd-I oxidase is able to
scavenge oxygen under microaerophilic conditions. Upregulation of this enzyme in
vitro and in vivo has been observed at the transition to chronic infection, providing
initial evidence for the importance of cytochrome bd-I oxidase in the adaptation of
Mtb to host immunity (221, 253, 289).
E. coli possesses three terminal quinol oxidases; cytochrome bo3, cytochrome bd-I
and cytochrome bd-II, encoded by the cyoABCDE, cydAB and appBC operons,
respectively (218, 290) (Figure 2.2, B). Cytochrome bo3 is from the heme-copper
family of terminal oxidases while cytochrome bd-I and cytochrome bd-II are
members of the cytochrome bd-family (211). Dassa et al (1991) demonstrated the
homology between cytochrome bd-II subunits (encoded by appC and appB) and
cytochrome bd-I subunits (encoded by cydA and cydB) with 60% and 57%
homology of amino acid sequences, respectively (291). Thus, the spectral features of
cytochrome bd-II closely resembles those of cytochrome bd-I, rendering them
spectrophotometrically undistinguishable (217). The well-studied E. coli cytochrome
bd-I oxidase has a three-heme form, which includes heme b558, heme b595 and heme
d, with signature peaks at 560 nm, 596 nm and 629 nm, respectively. Similarly, the
difference spectrum of E. coli cytochrome bd-II showed the presence of heme d (626
nm), heme b595 (589 nm), and heme b558 (559 nm) (212, 217).

55
A)
B)
Figure 2.2: The electron transport chain of Mycobacterium tuberculosis and of E. coli
A) Components of the electron transport chain in Mtb of which cytochrome bd-I oxidase
(quinol oxidase) is an alternative terminal oxidase. Figure adapted from Fisher et al (2009)
(209). B) Components of the electron transport chain in E.coli. The chain electron donor
components are Ndh/NdhA-type II NADH: (mena)quinone oxidoreductase (two isoforms),
SDH-succinate dehydrogenase, G3PDH-glycerol-3-phosphate dehydrogenase, LDH-L-
lactate dehydrogenase, FDH-formate dehydrogenase, H2DH-H2 dehydrogenase, and nuo-
type I NADH (complex I). Electron acceptors are the cytochrome bo3 oxidase and an
alternative terminal oxidase pathway which is cytochrome bd-I oxidase, cytochrome bd-II
oxidase, FRD-fumarate reductase, TMAORD-TMAO reductase and NR-nitrate reductase.
Chain components also include the F0F1 ATP synthase (complex V), MQ-8-menaquinone-8
and MQH2-menaquinol. P and n correspond to the positive (periplasmic) and negative
(cytoplasmic) sides of the respiratory membrane with respect to proton translocation. Proton
movements are indicative only and do not represent H+/e
- ratios for the respective
complexes. The orientation and topology of the subunits are indicative only.

56
Here we describe the use of the ML16, an Escherichia coli bo3/bd-I knockout strain
to express Mtb cytochrome bd-I terminal oxidase (Chapter II and III); the use of an
E. coli bo3/bd-I/bd-II triple-knockout strain for the heterologous expression of Mtb
cytochrome bd-I is described in Chapter IV. As mentioned previously in Chapter
1.5.4.4, different cytochrome bd members have distinctive expression features. For
example, the expression of cytochrome bd-I in E. coli and Mtb is recorded during
both aerobic and microaerophilic growth conditions (20, 212), while induction of
cytochrome bd-II in E. coli is associated with a shift to anaerobic growth or
stationary phase, as well as with phosphate, carbon or glucose starvation (217, 218,
290, 292). Therefore, cytochrome bd-II in E. coli is likely to function under even
more O2-limiting conditions than cytochrome bd-I (293).
Figure 2.3: Components of the electron transport chain of ML16, an E. coli mutant
strain
The ML16 respiratory chain has all the electron donor components of wild-type E. coli but
only cytochrome bd-II oxidase, FRD-fumarate reductase, TMAORD-TMAO reductase and
NR-nitrate reductase as electron acceptors. Chain components also include F0F1 ATP
synthase (complex V) and MQH2-menaquinol. P and n correspond to the positive
(periplasmic) and negative (cytoplasmic) sides of the respiratory membrane with respect to
proton translocation. Proton movements are indicative only and do not represent H+/e
- ratios
for the respective complexes. The orientation and topology of the subunits are indicative
only.

57
Growth cycles were monitored for wild-type E. coli, ML16 and transformed strains
with a view to studying the effect of the recombinant Mtb cytochrome bd-I on the
transformed cells. The standard systematic growth cycle of any bacteria should
include four main phases; lag phase, exponential phase, stationary phase and decline
phase. Following inoculation of cells into a synthetic medium, the time which
elapses before cell growth accelerates is known as the lag phase. The exponential
phase is when the culture grows at a constant rate, and the growth rate is proportional
to the culture density. The stationary phase refers to a culture that shows no further
increase in the number of cells (i.e. non-replicating cells or the rate of death equal to
the rate of growth). Entry into the stationary phase is a transition period for the cells
in which cells exit from the cell cycle, maintain viability during starvation, and
resume growth when starvation is relieved. During the stationary phase studies show
the importance of the proteins made and the regulation of their synthesis and their
essentiality for the survival of the cell, which will be discussed later (294-296).
Importantly, the stationary-phase model of Mtb latency is based on studying the
persistence phenomena of Mtb during this phase (42, 43). The last phase of the
‘standard’ bacterial life cycle is the decline phase, which is characterized by toxic
waste accumulations, food depletion and bacterial death (294-296).

58
2.2. Material and methods
2.2.1. Amplification of Mycobacterium tuberculosis cydABDC operon
2.2.1.1. Primer design
Each primer described herein was designed from the published genome sequence of
the Mycobacterium tuberculosis cydABDC operon from the TB data base
(http://www.tbdb.org/). Primers were custom synthesised by Invitrogen, UK. Pairs of
oligonucleotide primers (Table 2.1) for PCR reactions were designed to be
complementary to the cydABDC operon to be replicated, with one primer designed to
bind the sense strand and another for antisense strand.
Table 2.1: The oligonucleotide primers for amplifying the cydABDC genes from
Mycobacterium tuberculosis H37Rv
cydABDC PCR primers Primer sequence (5' → 3')
Forward Primer CCG GAG ATG ACA GAT GAA TGT CGT CG
Reverse Primer GGC GTT ACG TGC TGA TAT CGA TGA CTC AGG
.
The forward and reverse primers were designed to incorporate both the initiation and
termination operon.
An additional 18 internal oligonucleotide primers were designed to provide
sequencing coverage of the entire 5,967 bp gene sequence. The entire operon was
checked for frameshift, silent and other mutations which could affect the expression
of cytochrome bd-I oxidase protein. The primers used for sequencing are
summarised in the following table (Table 2.2).

59
Table 2.2: The oligonucleotide primers used for sequencing of the cydABDC genes
cydABDC sequencing primers Primer sequence (5' → 3')
Forward Primer 15 CGA TCT GCA GCA GGA ATA CC
Forward Primer 16 GGT TCG GTG TCA TCG CAG CG
Forward Primer 17 GCT CAA CGC CTA CAC CCT GC
Forward Primer 18 GGA CGT ATT GGG TTT TCC GG
Forward Primer 19 CCA TTG TGG TGA TCA CAC TGC
Forward Primer 20 CCA GTT TCA TGC CGC AGC TGA CG
Forward Primer 21 GCT GTA CTA GAC GAG TTG CCC
Forward Primer 22 CCC TTA TCT ATC ACC GGC TGG
Forward Primer 23 GCA ACG TCA TCG CCG ACT CAC AAC G
Reverse Primer 4 GGC CGG TAG TCG TTT GGT CC
Reverse Primer 5 CGC CCA TAC CGA CAT GAG CG
Reverse Primer 6 GGT TTT CAA AGC GAT GAA CAC CGC
Reverse Primer 7 GGT GGA GGT ATC CGT TCA GC
Reverse Primer 8 CCA TGA AGA TCG GTA TCA GG
Reverse Primer 9 CGG TGA GAT CAT ACG GTG CG
Reverse Primer 10 CAC GTG TTG TTC GGT GCG GG
Reverse Primer 11 GCA TGT TGG CCA GTT CGT CGA CG
Reverse Primer 12 GGC AAC AAC ATC AGG ATG GC
The primers were designed against the published cydABDC sequence (http://www.tbdb.org/)
to bind at intervals along the inserted cydABDC operon.

60
2.2.1.2. Polymerase chain reaction of cydABDC operon
The cydABDC-encoding genes were amplified from Mtb genomic DNA prepared
from a culture of Mtb H37Rv supplied by Dr. Amanda Brown (Queen
Mary, University of London).
Polymerase chain reaction (PCR) reactions were carried out in a 50 µl volume,
containing 2 µl (about 20 µmol) of each primer (Table 2.1), 1 µl of the DNA to be
amplified (typically 10 ng), 25 µl 2x Phusion® Master Mix (New England BioLabs,
UK), 1.5 µl dimethyl sulfoxide (DMSO) and 18.5 µl of sterile dH2O. The PCR
reaction for amplifing the cydABDC sequence was performed using a Bio-RAD PCR
thermal cycler (Bio-RAD, UK). The PCR reaction involved an initial denaturation
step of 98 °C for 2 min, followed by 35 cycles of (a) denaturation at 98 °C for 10 s,
(b) annealing at 64 °C for 40 s and (c) polymerisation at 72 °C for 4 min, followed
by a final polymerisation step of 72 °C for 7 min. PCR product was run on an
ethidium bromide-containg 1% agarose gel alongside a 1 kb DNA ladder
(Invitrogen, UK) to check the size of the PCR product (297). The resulting DNA
bands were visualized by exposure to UV light briefly in order to avoid damaging
the DNA.
It is worth mentioning that Pyrococcus furiosus (Pfu) DNA Polymerase (Fermantas,
UK) and CrimsonTM
Taq DNA polymerase (New England BioLab, UK) were used at
different annealing temperatures (55-65) °C with the purpose of amplifying the
cydABDC operon, but both enzymes gave unsuccessful results. Therefore, Phusion®
Master Mix (New England BioLabs, UK), a high-fidelity PCR Master Mix, was used
for amplification of the cydABDC operon, owing to fusion of a novel Pyrococcus-
like enzyme with a processivity-enhancing domain. Phusion®
Master Mix is capable
of amplifying long DNA templates (7.5 Kb-20 Kb) with high accuracy and fidelity
(50X greater than Taq polymerase) (298, 299). Phusion®
Master Mix has a
processivity that is 10-fold greater than Pfu DNA polymerase and 20-fold greater
than that of Taq DNA polymerase.

61
2.2.1.3. Purification of PCR products
Purification of PCR product was conducted following confirmation that the PCR
product was the expected size (5,967 bp) of the cydABDC operon. This method is
important in order to remove agarose and other contaminants away from the PCR
product that may inhibit further cloning steps. The DNA fragment was purified using
a QIAquick Gel Extraction Kit (Qiagen, Germany). The ~ 6000 bp cydABDC DNA
band was excised from the agarose gel with a sterile scalpel. The gel slice was
weighed before 3 volumes of buffer QG were added to 1 volume of the gel slice. The
mixture was incubated at 50 °C for 10 min before being vortexed intermittently until
completely dissolved gel fragments was achieved. The sample was transferred into
QIAquick spin column in a 2 ml collection tube and centrifuged at high speed
(13,000 g) for 1 min. The flowthrough was discarded and the Qiaquick column was
returned to the same collection tube. In order to remove all the residual of agarose,
0.5 ml of buffer QG was added to QIAquick column and centrifuged for 1 min at
13,000 g. The flow through was discarded and the QIAquick column was
centrifuged for a further 1 min at 13,000 g. For the elution step, the QIAquick
column was transferred into a clean 1.5 ml microcentrifuge tube and 50 µl
diethylpyrocarbonate (DEPC)-treated water (Ambion, UK) was added before
centrifugation at maximum speed (13,000 g) for 1 min. A NanoDrop 1000 U 3.7.1
(Thermo scientific, UK) was used in order to check the purity and the concentration
of the PCR product, which was then stored at -20 °C until required.
2.2.1.4. Agarose gel electrophoresis
Agarose gels were used to separate the DNA fragments in the PCR products or from
the restriction enzyme digestions. In this study 1% agarose gels (Sigma Aldrich, UK)
were prepared in 1 x Tris-Acetate-EDTA (TAE) consisting of 40 mM Tris, 20 mM
acetic acid and 1 mM EDTA, pH 8.0 (Sigma Aldrich, UK). The mixture was heated
for 2 min in a microwave oven and cooled at room temperature. Subsequently,
ethidium bromide (0.25 μg.ml-1
) (Sigma Aldrich, UK) was added before pouring the
gel solution into a gel cast on flat surface. DNA samples were mixed with 6 x
loading dye (Invitrogen, UK) and loaded before being electrophoresed for 30 - 40
min at a constant current of 90 volts. Once completed, the gel was visualised by UV

62
illuminator (Syngene Bioimaging, UK) and analysed using Genetools analysis
software (Syngene Synoptics Ltd. Cambridge, UK). The DNA fragments were
compared with DNA molecular weight marker (Invitrogen, UK).
2.2.2. TA cloning
A-tailing of the PCR product was applied to add cohesive ends to the cloned DNA
fragment, thus facilitating its insertion into the pCR®
II, TA cloning vector
(Invitrogen, UK). This reaction was achieved by incubating 7 µl (~50 ng) of the
isolated fragment with 1 µl of 1 mM dATP, 1 µl of Taq polymerase and 1 µl x10
Taq polymerase buffer (New England BioLab, UK) in a total reaction volume of 10
µl at 70 °C for 20 min. The pCR®
II, TA cloning vector was selected due its
following advantages, eliminating any enzymatic modifications of the PCR product;
allowing transcription from either direction into the insert; and not demanding PCR
primers that contain restriction sites. Moreover, the pCR®
II, TA cloning vector
enhanced screening chances, as it possesses genes that confers ampicillin and
kanamycin resistance, either one could be used for propagation. It has the lacZ gene
as well that can be used for blue/white screening as uninterrupted lacZ expresses β-
galactosidase, an enzyme which converts 5-bromo-4-chloro-3-indolyl β-D-
galactopyranoside (X-gal) to a blue derivative in the presence of isopropyl-β-D-
thiogalactoside (IPTG, which is a stable mimic of lactose and induces expression of
lacZ). Functional β-galactosidase will not be expressed once the insertion at the
multiple cloning sites (MCS) occurs, and thus no formation of coloured product
occurs, resulting in white colonies, which should contain plasmid with the desired
gene cloned.
Subsequently, attempts were made to ligate the A-tailed fragment into the pCR®
II,
TA cloning vector (Invitrogen, UK). All ligations were carried out in a 10 µl reaction
volume with any shortfall of volume being made up with dH2O. The ligation
reaction contained 3 µl of A-tailed PCR product, 2 µl of pCR®
II, 1 µl of each
provided T4 DNA ligase and x10 buffer and 3 µl of dH2O. The reaction was
submitted for an overnight incubation at 14 °C before the ligation reactions being

63
transformed into TOP10 competent cells. The ligation mixture of pCR®
II-TOPO and
cydABDC operon created the pCR®
II, TA/cydABDC construct, designated as pTM3.
2.2.3. Preparation of media:
2.2.3.1. LB Broth (Luria-Bertani medium)
All growth of cells was carried out in sterilised LB medium (Sigma Aldrich, UK).
Required antibiotics were added to the LB solution when the medium had cooled
below 50 °C, but prior to use.
2.2.3.2. LB agar plate media
Sterile agar plates were prepared using LB agar medium (Sigma Aldrich, UK) and
required antibiotics were added to the LB solution when the medium had cooled
below 50 °C, but prior to setting.
2.2.4. Transformation of One Shot® TOP10 chemically competent E. coli
Transformation was performed following the standard methods of Sambrook and
Russell (2001) (297). The ligation mixture pTM3 was transformed into One Shot®
TOP10 chemically competent E. coli (Invitrogen, UK) by the heat shock method.
This method involved incubating a standard volume (14 µl) of Top 10 competent
cells with 2 µl of recombinant plasmid DNA (pTM3) on ice for 30 min. Cells were
then heat shocked at 42 °C for 1 min before being returned to ice for 2 min. About
180 µl of pre-warmed S.O.C medium (Invitrogen, UK) was added to the cells, which
were then incubated at 37 °C in a shaking incubator at 200 rpm for 1 h. In order to
have blue/white screen colonies for successfully ligated plasmid, 20 µl of X-Gal
substrate was added to the cells. Subsequently, 150 µl of the cells were then plated to
LB agar containing appropriate antibiotics (100 µg.ml-1
ampicillin) and incubated
overnight at 37 °C. The following day, white colonies were picked from the plates
and grown in 5 ml LB medium containing 100 µg.ml-1
of ampicillin at 37 °C in a
shaking incubator at 200 rpm. Glycerol stocks of the plasmid-containing cells were

64
made from these cultures. Thereafter ampicillin was used in order to sustain plasmid
transformant growth and for selectivity.
2.2.5. Glycerol Bacterial Stock
Glycerol stocks were prepared using 100 μl of 50% (v/v) sterile glycerol and 500 μl
of bacterial suspension in LB medium. The bacterial suspension was kept at -80 °C
for future use.
2.2.6. Mini preps
Mini preps were carried out using QiaAmp (Qiagen, UK). A white colony (plasmid-
containing cell) from a fresh LB agar plate was used to inoculate 10 ml LB medium
containing appropriate antibiotic (100 µg.ml-1
ampicillin) and incubated overnight at
37 °C in a shaking incubator at 200 rpm. Subsequently, the culture was centrifuged
for 5 min at 10,000 g. The supernatant was poured off and the pelleted cells were
resuspended in 250 µl of cell resuspension solution (P1) before being transferred to a
microcentrifuge tube. The addition of 250 µl of buffer P2 was followed by inverting
the tubes 4-6 times until the cell suspension turned blue signifying lysis of the cells.
The mixture was neutralized by the addition of 350 µl Buffer N3 neutralisation
solution and immediately mixed thoroughly by inverting the tube before being
centrifuged at 13,000 g for 10 min at room temperature. The cleared lysate was
transferred into a QIAprep spin column and was centrifuged at 13,000 g for 1 min
and the flowthrough was discarded. The column was washed twice, first with 500 µl
of buffer PB and then with 750 µl of buffer PE solution and after each wash the
column was centrifuged for 1 min at 13,000 g at room temperature. The flowthrough
was discarded and followed by an additional 1 min centrifuge step to remove
remaining wash buffer. Finally, the plasmid DNA was eluted in 50 µl of buffer EB
by centrifugation at 13,000 g for 1 min at room temperature. The DNA concentration
was measured using a NanoDrop 1000 U 3.7.1 (Thermo scientific, UK) and stored at
-20 °C until required.

65
2.2.7. Screening of positive clones pTM3 by restriction enzyme analysis
Screening of the positives clones was conducted in order to validate successful
cloning and subcloning of the inserted gene into the vectors, and successful
transformation of the ligated gene into the E. coli host. The reaction mixture for
pTM3 digestion was in a total reaction volume of 30 µl that contained 2.5 µl of
pTM3, 2 µl of 10x fast digest buffer, 1 µl of EcoRI restriction endonuclease
(Fermentas, UK) and 24.5 µl of dH2O. The reaction was incubated at 37 °C for 15
min then inactivated at 80 °C for 5 min. Following digestion, 10 µl of digested
plasmid with 2 µl of 6 x loading dye were loaded to a 1% agarose gel, containing
ethidium promide (0.25 µg.ml-1
), run alongside 1 kb DNA ladder (Invitrogen, UK).
Electrophoresis was conducted in 1 x TBE running buffer at 90 volts for 30 min and
the gel was visualised under UV light.
2.2.8. Analysis by automated sequencing
pTM3 (200 ng) produced positive results by PCR and restriction enzyme analysis,
and was sequenced using automated DNA sequencing (Cogenics, UK), and the 18
internal primers (Table 2.2) which were designed for the sequencing reaction.
2.2.9. Maxi prep
A maxi prep was used to obtain good yields of recombinant plasmid DNA to be used
for sub-cloning of pTM3 into the pUC19 expression vector. A single colony of
TOP10 competent cells containing pTM3 was inoculated into 5 ml LB broth,
containing 100 µg.ml-1
ampicillin before being overnight incubated at 37 °C with
vigorous shaking at 200 rpm. 500 μl of this culture was added into 100 ml LB/100
µg.ml-1
ampicillin broth and submitted for overnight incubation at 37 °C with
vigorous shaking at 200 rpm. The culture was harvested by centrifugation at 13,000
g at 4 °C. The supernatant was discarded, and the bacterial pellet was resuspended
completely in 1 ml of buffer P1 followed by 1 ml Buffer P2. The tube was mixed by
inverting several times until the cell suspension turned blue indicating lysis of the
cells. The mixture was neutralized by the addition of 1.4 ml Buffer N3 neutralisation
solution and immediately mixed thoroughly by inverting the tube. The bacterial

66
lysate was subjected to centrifugation at 13,000 g for 20 min at room temperature.
The cleared lysate was transferred into QIAprep spin column and centrifuged at
13,000 g for 1 min and then the flowthrough was discarded. The column was washed
twice, firstly with 500 µl of buffer PB and then with 750 µl of buffer PE solution and
following each wash the column was centrifuged for 1 min at 13,000 g at room
temperature. The flowthrough was discarded and the column was further centrifuged
for 1 min at 13,000 g to remove remaining wash buffer. Finally, the plasmid DNA
was eluted in 50 µl of buffer EB by centrifugation at 13,000 g for 1 min at room
temperature. The DNA concentration was measured using a NanoDrop 1000 U 3.7.1
(Thermo scientific, UK) and stored at -20 °C until required.
2.2.10. Sub-cloning of pTM3 into pUC19 expression vector
The pUC19 vector was selected for protein production as it possesses an ampicillin
resistance gene that enables screening for plasmid-containing cells and helps to
prevent contamination of the cell cultures. Moreover, it has a MCS in the lacZ gene
to give flexibility in selecting the restriction enzyme or the enzymes used for
cloning.
In order to express Mtb cytochrome bd-I oxidase protein, the cloned gene was
excised from pTM3 using the restriction site EcoRI present in both pTM3 and
pUC19 expression vectors. The digests were analysed by visualisation on a 1%
agarose gel and the gene fragments gel purified (Qiagen, Germany).
The sub-cloning reactions were as follows: The first reaction was for pTM3
digestion which involved a total reaction volume of 30 µl that contained 2.5 µl
plasmid DNA (pTM3), 2 µl of 10x fast digest buffer, 1 µl of EcoRI restriction
endonuclease (Fermentas, UK) and 24.5 µl of dH2O. The reaction was incubated at
37 °C for 15 min then inactivated at 80 °C for 5 min. Following digestion, the
reaction product was run alongside 1 kb DNA ladder (Invitrogen) on a 1% Aquapor
LE gel (Invitrogen, UK) containing ethidium promide (0.25 µg.ml-1
). The desired
fragment (the operon of interest) was excised from the gel and purified using
QIAquick Gel Extraction Kit (Qiagen, Germany) (Chapter 2.2.1.3) in order to

67
remove undesirable products that may hinder later stages of the cloning processes.
The concentration of DNA yield was measured using a NanoDrop 1000 U 3.7.1
(Thermo scientific, UK).
The second reaction was for pUC19 digestion which involve a total reaction volume
of 30 µl that contained 5 µl pUC19 vector, 2 µl of 10x fast digest buffer, 1 µl of
EcoRI restriction endonuclease (Fermentas, UK) and 22 µl of dH2O. The reaction
was incubated at 37 °C for 15 min then inactivated at 80 °C for 5 min. Afterwards,
dephosphorylation was carried out to prevent the re-ligation of the double-digested
expression vector pUC19 which involved adding 2 µl of Antractic phosphatase
buffer and 2 µl of Antractic phosphatase enzyme to the reaction. The reaction went
through consequent incubation at 37 °C for 10 min and 65 °C for 10 min,
respectively. Following digestion, the reaction product was run alongside 1 kb DNA
ladder (Invitrogen) on a 1% Aquapor LE gel (Invitrogen, UK) containing ethidium
promide (0.25 µg.ml-1
). The desired fragment was excised from the gel and purified
using QIAquick Gel Extraction Kit (Qiagen, Germany) (Chapter 2.2.1.3) in order to
remove other undesirable products that may hinder later stages of the cloning
processes. The concentration of DNA yield was measured using a NanoDrop 1000 U
3.7.1 (Thermo scientific, UK).
The vector and insert were ligated in 10 µl reaction volumes, containing 1 µl of
digested pUC19, 7 µl of digested pTM3, 1 µl of 10x T4 ligase buffer and 1 µl of T4
Ligase. The reaction was incubated overnight at 16 °C to create the
pUC19/cydABDC construct (designated as pTMA).
2.2.11. Transformation of ligated expression vector into One Shot®
TOP10
chemically competent E. coli
The ligated expression vectors (pTMA) were transformed into TOP10 E. coli cells
following the above mentioned protocol (Chapter 2.2.4). The ligation mixture was
transformed using heat-shock transformation into TOP10 chemically competent E.
coli cells and plated on LB agar containing 100 µg.ml-1
ampicillin.

68
2.2.12. Selection of recombinants
Viable colonies from the transformation were cultured in ampicillin-enriched LB
medium and the plasmid extracted by Miniprep (Qiagen, UK) (as described in
section 2.2.6). In order to confirm the success of the cloning step, restriction enzyme
digests were performed and visualised on 1% agarose gels, containing ethidium
promide (0.25 µg.ml-1
). pTMA was analyzed using PstI (NEB, UK) and EcoRI
(Fermentas, UK) restriction enzymes.
The first reaction was for digestion of pTMA in a 30 µl reaction volume, containing
3 µl of plasmid DNA (pTMA), 2 µl of 10x fast digest buffer, 1 µl of EcoRI
restriction endonuclease (Fermantas, UK) and 24 µl of dH2O. The reaction was
incubated at 37 °C for 15 min. The second digestion reaction of pTMA was
conducted using PstI (NEB, UK) in a 30 µl reaction volume, containing 2 µl of
plasmid DNA (pTMA), 2 µl of BSA buffer, 3 µl of buffer 3, 1 µl of PstI restriction
endonuclease (NEB, UK) and 22 µl of dH2O. The reaction was incubated at 37 °C
for 1 h and 50 min. Following digestion, the reactions products were run alongside 1
kb DNA ladder (Invitrogen, UK) on a 1% Aquapor LE gel (Invitrogen, UK)
containing ethidium promide (0.25 µg.ml-1
).
2.2.13. Preparation of competent ML16 E. coli cells
In order to express Mtb cytochrome bd-I protein, specific competent cells were
required to incorporate and replicate the plasmid conveying the Mtb cydABDC
operon. Competent cells were constructed using ML16, an E.coli bo3/bd-I knockout
strain, donated by Professor Robert B. Gennis, Illinois. The ML16 (ΔrecA, ΔcydAB,
ΔcyoABCDE::Cmr) strain lacks two types of quinol:oxygen oxidoreductase
(cytochrome bo3 and cytochrome bd-I terminal oxidases) but has only one type of
quinol:oxygen oxidoreductase (cytochrome bd-II terminal oxidase). ML16 has a
chloramphenicol resistance cassette as it was constructed following the protocol of
Datsenko and Wanner (2000) that based on using phage-based E. coli homologous
recombination system (300). ML16 is a derivative of E. coli C43 (DE3) (genotype F-
ompT gal hsdSB (rB-mB
-) dcm lon λDE3) (301, 302).

69
Competent ML16 cells were produced by the magnesium chloride/calcium chloride
method. This involved overnight aerobic and O2-limited cultures. The aerobic culture
condition was as follow: 200 ml LB medium (in a 500 ml flask) enriched with 2.5
µg.ml-1
chloramphenicol incubated at 37 °C in a shaking incubator at 200 rpm. The
O2-limited culture involved inoculation of an overnight aerobic ML16 culture into
375 ml LB medium enriched with 2.5 µg.ml-1
chloramphenicol (in a 500 ml flask),
sealed with a rubber plug with a head-space ratio of 0.5 and incubated at 37 °C in a
shaking incubator at 200 rpm.
Competent cells preparations were performed according to the standard protocols of
Sambrook and Russell (2001) (297). 100 ml of the cultures were centrifuged (4000
g) for 10 min at 4 °C once an OD600= 0.44 was reached. The optical density was
determined using a Thermo Spectronic instrument (Genesys, UK). Then, the cells
were resuspended in 30 ml ice-cold 80 mM magnesium chloride/ 20 mM calcium
chloride per 100 ml of culture volume. The cells were centrifuged as before,
resuspended in 4 ml of ice-cold 100 mM calcium chloride solution with the addition
of 200 µl of 50% (v/v) glycerol. The cells were then aliquoted (200 µl) into cold
Eppendorf tubes and stored at -80 °C until required. The competent cells were
designated as AnML16 (O2-limited grown ML16) and AML16 (aerobically grown
ML16).
2.2.14. Transformation of pTMA into ML16 competent cells
A 200 µl volume of each AnML16 and AML16 competent cells were transformed
with the pTMA (10 µl) by firstly co-incubating on ice for 30 min followed by heat
shock at 42 °C for 90 s, before returning samples to ice for 2 min. 300 µl of pre-
warmed S.O.C medium (Invitrogen, UK) was added to the cells, which were then
incubated at 37 °C in a shaking incubator for 1 h at 200 rpm. 150 µl of the cells were
then plated to agar plates containing appropriate antibiotic, which was a combination
of both 100 µg.ml-1
ampicillin and 2.5 µg.ml-1
chloramphenicol to sustain plasmid
transformant growth, and incubated at 37 °C aerobically and anaerobically.
AnaeroGen sachet (Thermo Scientific, UK) was used to generate an anaerobic
atmosphere. After 2 days of incubation, colonies were picked from the plates and
grown in 5 ml LB medium containing an appropriate concentrations of antibiotic at

70
37 °C in a shaking incubator at 200 rpm. These cultures were then used for making
glycerol stocks of the plasmid-containing cells and for larger scale cultures and
plasmid preparation.
Of note, transformants of pTMA into aerobic ML16 competent cells (AML16) took
3 days to grow on agar plates and 2-3 days in 5 ml LB broth over both growth
conditions (aerobic and anaerobic). In contrast, transformants of pTMA into O2-
limited ML16 competent cells (AnML16) was successful for both growth conditions
(aerobic and anaerobic).
2.2.15. Large-scale culture
The successful transformant colonies were grown in selective O2-limited conditions,
375 ml of LB (in a 500 ml flask), containing 100 µg.ml-1
ampicillin and 2.5 µg.ml-1
chloramphenicol, sealed with a rubber plug with a head-space ratio of 0.5. An
negative control (untransformed AnML16 competent cells) was grown in the same
selective O2-limited condition, but without ampicillin. The inoculum size was 0.2%
of 375 ml LB broth. For clarification, the two strains that were used throughout
experiments were untransformed AnML16 competent cells (henceforth ML16) and
transformed AnML16 competent cells (henceforth TML16).
In addition, the same successful transformant colonies were grown in aerobic
conditions, 200 ml of LB (in a 500 ml flask) containing 100 µg.ml-1
ampicillin and
2.5 µg.ml-1
chloramphenicol. An negative control (untransformed AnML16
competent cells) was grown in the same aerobic conditions but without ampicillin.
The inoculum size was 0.2% of 200 ml LB broth.
In similar manner, BL21(DE3) pLysS, (F –ompT hsdSB (rB
–mB
–) gal dcm (DE3)
pLysS (CmR)), was also cultured as a wild-type E. coli strain in both aerobic and O2-
limited growth conditions, supplemented with 34 µg.ml-1
chloramphenicol. BL21
(DE3) bears pLysS, a compatible chloramphenicol-resistance plasmid, that produces
T7 lysozyme, a natural inhibitor of T7 RNA polymerase (303).

71
During both aerobic and O2-limited growth condition, IPTG was added at the
beginning of the culture (i.e. along with inocula) to 1 mM final concentration
(personal communication with Dr. Ashley Warman and Dr. Nick Fisher). Cultures
were incubated at 37 °C in a shaking incubator at 200 rpm for 19 h.
It is worth commenting that selecting the above mentioned growth parameters, the
addition of IPTG at the beginning of the culture and incubating cells for 19 h, was
reliant on ML16 growth monitoring, which showed reduction of OD600 after 19 h of
O2-limited incubation (described later, Figure 2.3.7.2).
2.2.16. Preparation of 50 mM KPi, 2 mM EDTA, pH 7.5 buffer
For kinetic assays 50 mM KPi, 2 mM EDTA, pH 7.5 buffer was used throughout
experiments, unless otherwise stated. This buffer was prepared as follow: a 50 mM
K2HPi (dipotassium hydrogen phosphate trihydrate) + 2 mM EDTA
(ethylenediaminetetraacetic acid), pH 10 solution and a 50 mM KH2Pi (potassium
dihydrogen orthophphosphate) + 2 mM EDTA, pH 5.8 solution were prepared.
Subsequently, these two solutions were mixed to produce a 50 mM KPi + 2 mM
EDTA buffer at pH 7.5.
2.2.17. Membrane preparations
Membrane preparations were carried out following the protocol of Fisher et al
(2009) (209). TML16, ML16 and BL21(DE3) pLysS from both aerobic and O2-
limited large-scale cultures (grown in defined conditions as described above (section
2.2.15) were harvested by centrifugation at 4000 g for 10 min using a Beckman
centrifuge (Beckman Coulter, UK). Following supernatant removal, the cell pellets
were resuspended in buffer (50 mM KPi, 2 mM EDTA, pH 7.5) and incubated on ice
with hen egg lysozyme to a final concentration 200 μg.ml-1
for 10 min. The cells
were broken by two passes through a standard laboratory cell disruptor (Constant
Systems, UK) operating at 20,000 psi and then the debris pelleted by centrifugation
at 12,000 g at 4 °C for 20 min. The supernatant was collected and centrifuged by
ultracentrifuge at 100,000 g at 4 °C for 1 h, depositing the membranes as a highly

72
viscous pellet. This was collected and resuspended with the aid of a Potter
homogenizer (Sigma Aldrich, UK) in 2 ml of 50 mM KPi, 2 mM EDTA buffer (pH
7.5) per litre of original culture volume. Glycerol was added to a final concentration
of 10% (v/v) and the membrane suspension stored in 50 μl aliquots at -80 °C until
required. The total protein concentration of the membrane suspension was measured
by Bradford assay (Chapter 2.2.18). To maintain enzyme activity, aliquots were not
repeatedly freeze-thawed, and were stable for at least 6 months when stored at -80
°C.
2.2.18. Determination of protein concentration
The Bradford assay (304) was carried out in order to determine the protein
concentration used for spectral analysis and to quantify the specific enzyme activity
from membrane preparations. The Bio-Rad Reagent (Bio-Rad, UK) was diluted with
distilled water in 1:4 ratio. A known concentration of bovine serum albumin (BSA)
(2 mg.ml-1
) was used in order to obtain a standard curve. A standard curve was
generated using BSA (Sigma Aldrich, UK) at concentrations ranging from 0.2-0.9
mg.ml-1
. The protein samples were prepared in a serial dilution ranging from 1 in 2.5
to 1 in 35. Subsequently, 2 μl of each samples was plated in triplicate into a 96 well
plate. The automated dispenser Varioskan (VarioskanTM
, Thermal Corporation) was
used to dispense 200 μl of Bradford Reagent into each well. The plate was incubated
in the dark for 5 min at room temperature before determining the protein
concentration using Skant® Software (Varioscan™ , Thermo Corporation) reading
the absorbance at 595 nm.
2.2.19. Initial spectroscopic study of Mtb cytochrome bd-I oxidase
Initial UV-visible spectroscopic analysis of freshly prepared membranes was carried
out on a Cary 300 Bio UV/visible spectrophotometer (Varian, UK). Assays of total
volume 700 μl were performed with 200 μl of the crude recombinant membrane
suspended in 500 μl of (50 mM KPi, 2 mM EDTA, pH 7.5) buffer. Spectra over a
wavelength range of 500 – 700 nm were recorded for the oxidised membrane alone
in the presence of potassium hexacyanoferrate (III), as well as in the presence of

73
reductants sodium dithionite. A difference spectrum was generated by subtracting
the oxidised spectrum from the reduced spectrum.
2.2.20. Growth curves
Growth was monitored by measuring the optical density (OD) at 600 nm using a
Thermo Spectronic instrument (Genesys, UK) over a time course (hours) and under
the same aerobic and O2-limited growth conditions (section 2.2.15). A redox
indicator (resazurin), a rapid qualitative test, was used in order to monitor the
respiratory state of the cells during growth. Resazurin was added to the media to
final concentration of 0.0002% (w/v) according to the protocol of Karakashev et al
(2003) (305). Aerobic cultures exceeded the 19 h of incubation to monitor the
stationary phase of the cells. Pictures were taken to record the colour change of
resazurin in the medium.
2.2.21. SDS-PAGE
Sodium dodecyl sulfate polyacrylamide gel electrophoresis (SDS-PAGE) was used
to separate protein samples according to their molecular weight. The percentage of
resolving gel used was 10%. The monomer solution of the resolving gel consisted of
acrylamide/bis-acrylamide solution, (30% w/v) (Bio-RAD, UK) distilled H2O, 1.5 M
Tris-HCl (pH 8.8) (Sigma Aldrich, UK), 10% (w/v) SDS (Sigma Aldrich, UK), 20%
ammonium persulphate (APS) (Sigma Aldrich, UK) and 10 μl N,N,N\N'-
tetramethylethylenediamine (TEMED) (Fluka, UK) per 10 ml gel mix. The monomer
solution was mixed gently and poured into glass plates assembled by instructions
from the Mini-Protean III Electrophoresis Manual (Bio-RAD, UK). The gel was
covered with water-saturated ethanol to ensure an even surface and to reduce
polymerisation. After the gel had polymerised, the ethanol was removed by capillary
action using a paper towel. The stacking gel, a 4% monomer solution, was prepared
using the following materials: 530 µl 30% (w/v) arylamide/bis (Bio-Rad, UK), 2.39
ml H2O, 1 ml 0.5 M Tris-HCl (pH 6.8), 40 µl 10% (w/v) SDS, 40 µl of 20% APS
and 6 µl TEMED. This mixture was poured over the resolving gel with the comb
fitted and allowed to polymerise for 30 min at room temperature.

74
2.2.22. Sample Preparation for SDS-PAGE
Different protein sample dilutions (1:10, 1:25 and 1:50) were prepared using assay
buffer (50 mM KPi, 2 mM EDTA, pH. 7.5). For each sample, 10 µl of the protein
sample was mixed with an equal volume of DTT (dithiothreitol). Prior to gel
loading, samples were boiled for 5 min at 90 °C. The proteins were separated on
SDS-PAGE using 1 X SDS-running buffer (0.196 M glycine, 48 mM Tris-base,
0.04% (w/v) SDS, pH 8.3) at a constant current of 60 milliamps for 60 min.
Afterwards, the gel was stained with Expedion instant blue (a Comassie Blue based
staining solution) (Expedion, UK). Staining was carried out for 30 min with slow
agitation before being destained in distilled water. The prestained, broad range
protein marker SpectraTM Multicolor Broad Range Protein Ladder (Fermentas, UK)
was used to estimate the resulting protein band sizes.

75
2.3. Results
2.3.1. Amplification of the Mycobacterium tuberculosis H37Rv cydABDC operon
Using specific primers (Chapter 2.2.1.1), genomic DNA of Mtb strain H37Rv was
subjected to amplification by PCR. The primers (Table 2.1) were designed to
facilitate amplification of the whole cydABDC operon, yielding a single amplicon of
5,967 bp (Figure 2.4). This figure indicates that the PCR conditions have been
optimised and primers are specific for the targeted gene. This amplicon is predicted
to encode proteins of 1934 amino acids using the TB data base
(http://www.tbdb.org/).
Figure 2.4: Amplification of Mycobacterium tuberculosis H37Rv cydABDC operon
The cydABDC operon predicted to be 5,967 bp was amplified from Mtb H37Rv genomic
DNA. Lane M contains 1 kb DNA Ladder (Invitrogen), lane 1 shows the PCR products of
the cydABDC operon that shows a single band of size ~ 6 kb. The PCR products were
visualised on a 1% agarose gel containing 0.25 µg.ml-1
ethidium bromide (Sigma Aldrich,
UK).

76
2.3.2. Screening of positive clones of pTM3 in TOP 10 E. coli host
The amplicons of the cydABDC operon were initially cloned to the pCR®II-TOPO
®
vector using the TOPO-TA cloning kit (Invitrogen, UK). TOPO-TA cloning
provides fast and efficient cloning strategies for direct cloning of the PCR products
into a high copy number plasmid vector. The cloning of PCR products into the
TOPO vector created the 9,578 bp pCR®
II-TOPO®
/cydABDC construct (pTM3).
The success of the pTM3 cloning was validated using restriction enzyme analysis
(described in Chapter 2.2.7). White colonies from each transformation were picked
and cultured overnight in LB medium containing 100 µg.ml-1
ampicillin. The
following day, plasmid DNA was isolated using a Qiagen Miniprep kit before being
subjected to restriction digest analysis. Figure 2.5 shows the results from digesting
plasmid isolate with EcoRI. The positive clone produced two bands corresponding to
the predicted digest fragments (3,599 and 5,979 bp). The recombinant plasmids
were designated as pTM3 (Figure 2.6). In order to check pTM3 for errors, the
plasmid was submitted for automated sequencing by Cogenics (UK) using 18
internal primers (Table 2.2) designed against the published cydABDC sequence
(http://genome.tbdb.org). These oligonucleotides were designed to provide
sequencing coverage of the entire 5,967 bp operon. The automated DNA sequencing,
using the BLAST programme (http://blast.ncbi.nlm.nih.gov), revealed that the pTM3
is 100% identical with the published sequence and is free from errors, and that the
gene could now be transferred to plasmids suited for the expression of the encoded
proteins.

77
Figure 2.5: Restriction enzyme digestion analysis of a transformed colony of the pTM3
construct
The EcoRI restriction digest of the pTM3 plasmid was run alongside 1 Kb DNA ladder (lane
M) (Invitrogen), resulting in two expected bands of 5,979 bp and 3,955 bp (lane 1)
confirming that the pTM3 construct has been correctly created. Digestion was visualised by
exposure to UV light following electrophoresis on 1% agarose gels containing 0.25 µg.ml-1
ethidium bromide.

78
Figure 2.6: Plasmid map of pCR®II-TOPO
® bearing the Mycobacterium tuberculosis
cydABDC operon
pCR®II-TOPO
® (Invitrogen, UK) was used to construct the recombinant cydABDC directly
from a PCR reaction. The pCR®II-TOPO
® Invitrogen vector is a 4.0 kb linearised vector.
The pCR®II-TOPO
® vector contains a lac promoter to allow the expression of the lacZ gene
which encodes the first 146 amino acid of β-galactosidase. Interruption of lacZ by the
insertion of PCR product may give rise to white colonies. The presence of both the
kanamycin and ampicillin resistance genes in the vector allows for selection and
maintenance in E. coli. The vector contains a pUC origin which allows replication,
maintenance and high copy number in E. coli. The vector has f1 origin which allows rescue
of the sense strand for mutagenesis and single-strand sequenancing. The plasmid map was
generated using BVTech Plasmid (BVTech Plasmid.5.1 software).
2.3.3. Sub-cloning of pTM3 into the pUC19 expression vector
The plasmid pTM3 was sub-cloned into the pUC19 expression vector. This was
carried out by digestion of the plasmid to excise the cydABDC insert from the TOPO
vector and subsequent ligation to the pUC19 vector. pTM3 and the pUC19 vector
were first digested using EcoRI and the appropriate fragments subsequently ligated
as described in (section 2.2.10) before being transformed to TOP10 E. coli cells
(section 2.2.11). Colonies were picked, and subjected to overnight liquid culture
followed by miniprep DNA isolation. An EcoRI digest (Figure 2.7, A), cutting the
plasmid twice in the insert region to give 5,981 bp and 2,686 bp fragments, verified
the clone as correct. These data were backed up using a PstI digest (Figure 2.7, B),
cutting twice in the insert region to give 5,047 bp and 3,620 bp fragments. The
digests confirmed the successful production of the positive recombinant plasmid,
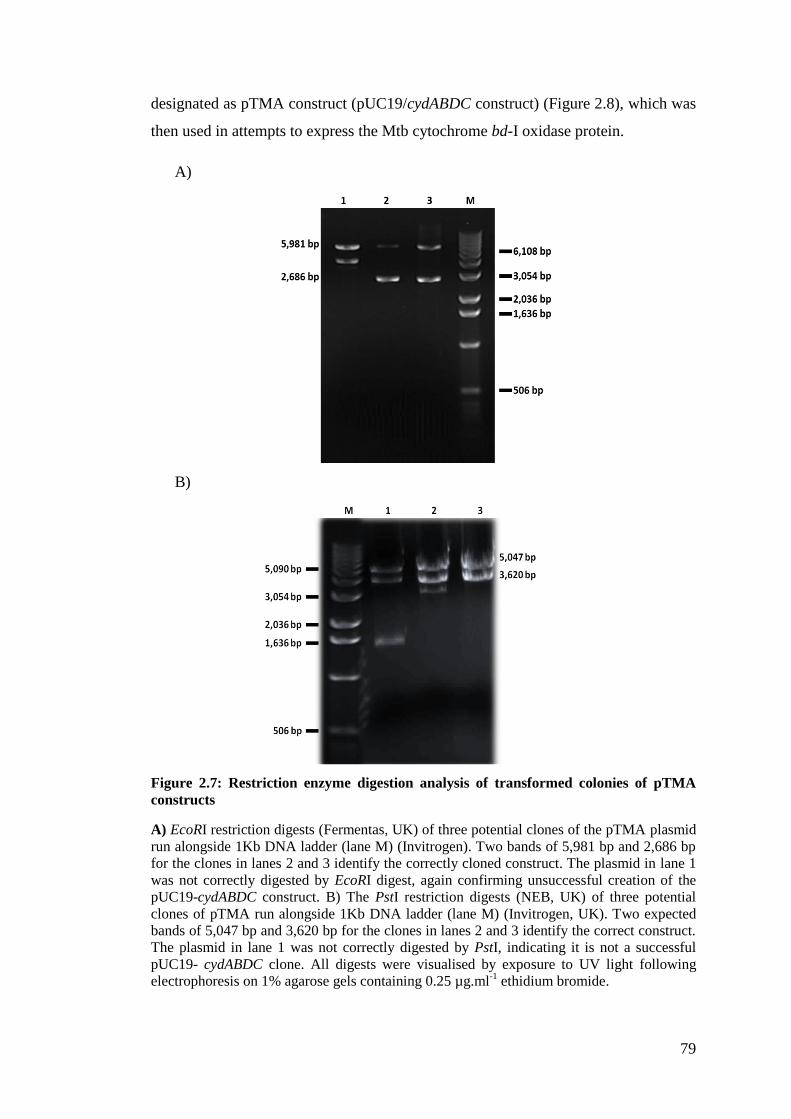
79
designated as pTMA construct (pUC19/cydABDC construct) (Figure 2.8), which was
then used in attempts to express the Mtb cytochrome bd-I oxidase protein.
A)
B)
Figure 2.7: Restriction enzyme digestion analysis of transformed colonies of pTMA
constructs
A) EcoRI restriction digests (Fermentas, UK) of three potential clones of the pTMA plasmid
run alongside 1Kb DNA ladder (lane M) (Invitrogen). Two bands of 5,981 bp and 2,686 bp
for the clones in lanes 2 and 3 identify the correctly cloned construct. The plasmid in lane 1
was not correctly digested by EcoRI digest, again confirming unsuccessful creation of the
pUC19-cydABDC construct. B) The PstI restriction digests (NEB, UK) of three potential
clones of pTMA run alongside 1Kb DNA ladder (lane M) (Invitrogen, UK). Two expected
bands of 5,047 bp and 3,620 bp for the clones in lanes 2 and 3 identify the correct construct.
The plasmid in lane 1 was not correctly digested by PstI, indicating it is not a successful
pUC19- cydABDC clone. All digests were visualised by exposure to UV light following
electrophoresis on 1% agarose gels containing 0.25 µg.ml-1
ethidium bromide.

80
Figure 2.8: Plasmid map of the pUC19 expression vector bearing the Mycobacterium
tuberculosis cydABDC operon
The pUC19 plasmid contains a lacZ gene which has similar features to pCR®II-TOPO
®
vector. The presence of the lacZ gene allows recombinants to be selected by blue/white
screening. pUC19 also possesses the ampicillin resistance gene that enables selection. The
plasmid construction was carried out by excising the cydABDC from pCR®II-TOPO
® vector
and ligating into the pUC19 multiple cloning sites (between EcoRI restriction sites). The
plasmid map was generated using BVTech Plasmid (BVTech Plasmid.5.1 software).
2.3.4. The effect of recombinant Mycobacterium tuberculosis cytochrome bd-I on
cell pigmentation
The colour of harvested cells during membrane preparation process was assessed
with a view to examining the effect of recombinant Mtb cytochrome bd-I oxidase
(Mtb bd-I) on cell pigmentation. The transformed double-knockout cells
(TML16) showed a colour change to a red/brown pigmentation following
harvesting both aerobic and O2-limited cultures. In contrast, the untransformed
double-knockout cells (ML16) had a light yellow pigmentation following
harvesting aerobic and O2-limited cultures (Figure 2.9).
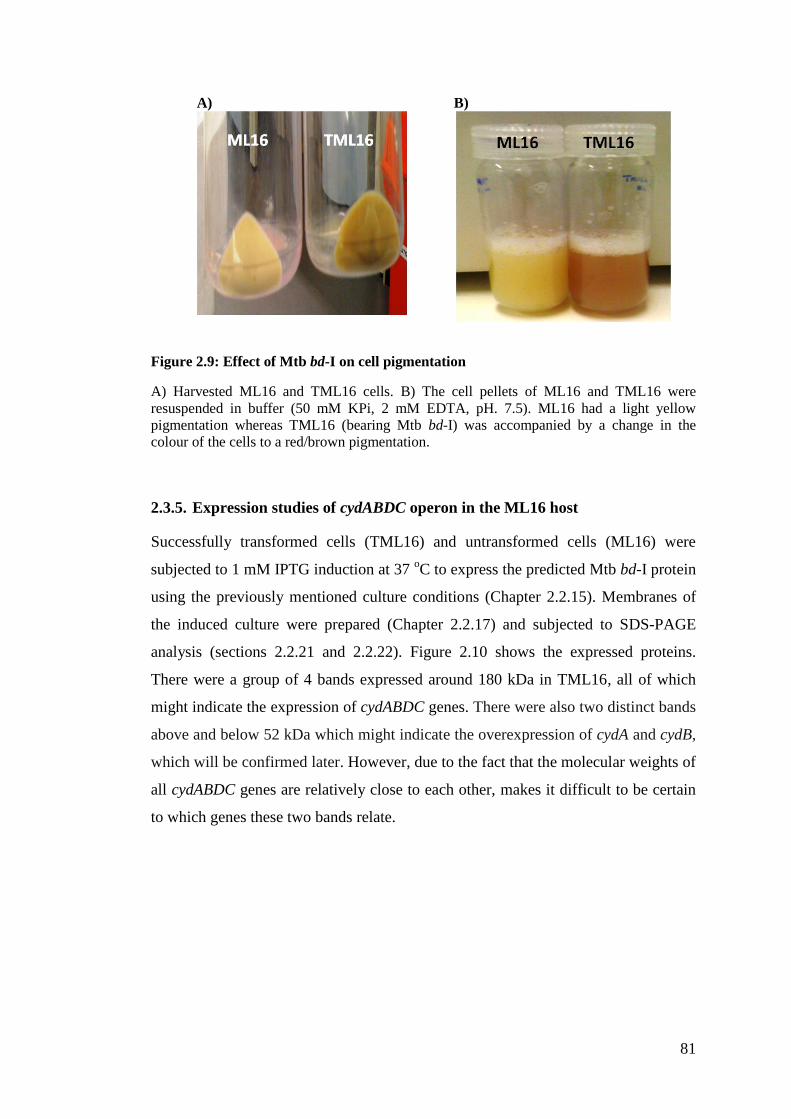
81
A) B)
Figure 2.9: Effect of Mtb bd-I on cell pigmentation
A) Harvested ML16 and TML16 cells. B) The cell pellets of ML16 and TML16 were
resuspended in buffer (50 mM KPi, 2 mM EDTA, pH. 7.5). ML16 had a light yellow
pigmentation whereas TML16 (bearing Mtb bd-I) was accompanied by a change in the
colour of the cells to a red/brown pigmentation.
2.3.5. Expression studies of cydABDC operon in the ML16 host
Successfully transformed cells (TML16) and untransformed cells (ML16) were
subjected to 1 mM IPTG induction at 37 oC to express the predicted Mtb bd-I protein
using the previously mentioned culture conditions (Chapter 2.2.15). Membranes of
the induced culture were prepared (Chapter 2.2.17) and subjected to SDS-PAGE
analysis (sections 2.2.21 and 2.2.22). Figure 2.10 shows the expressed proteins.
There were a group of 4 bands expressed around 180 kDa in TML16, all of which
might indicate the expression of cydABDC genes. There were also two distinct bands
above and below 52 kDa which might indicate the overexpression of cydA and cydB,
which will be confirmed later. However, due to the fact that the molecular weights of
all cydABDC genes are relatively close to each other, makes it difficult to be certain
to which genes these two bands relate.
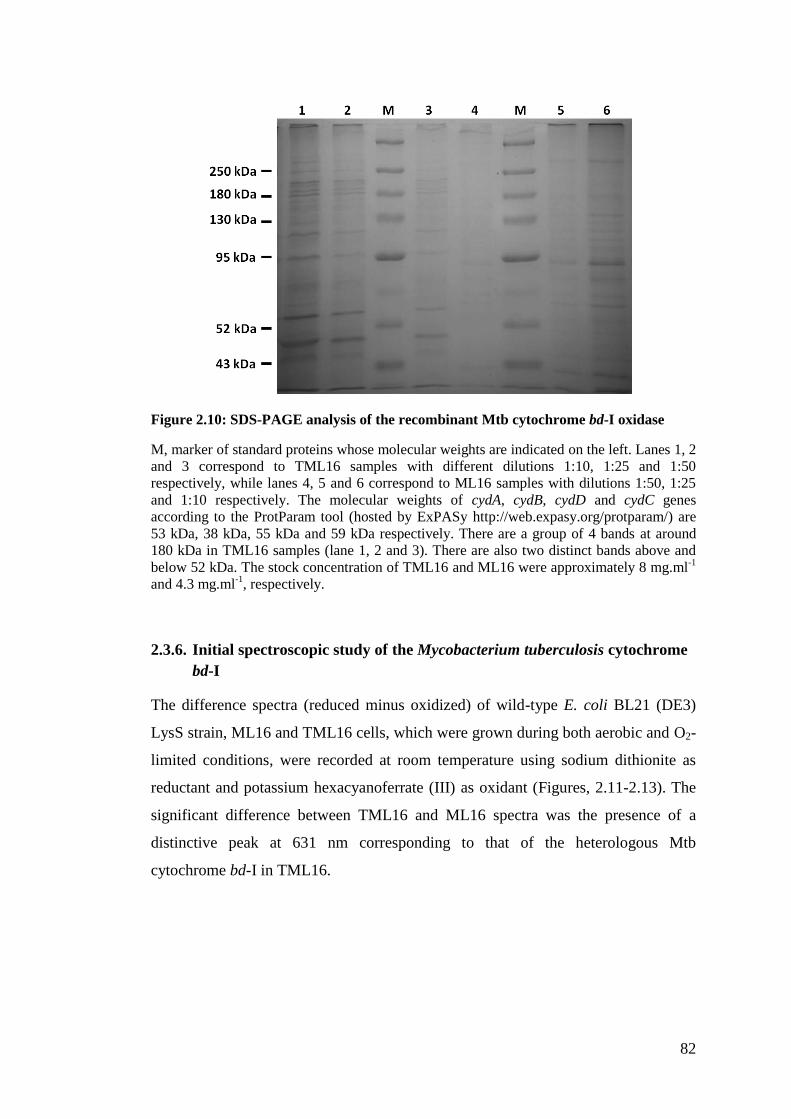
82
Figure 2.10: SDS-PAGE analysis of the recombinant Mtb cytochrome bd-I oxidase
M, marker of standard proteins whose molecular weights are indicated on the left. Lanes 1, 2
and 3 correspond to TML16 samples with different dilutions 1:10, 1:25 and 1:50
respectively, while lanes 4, 5 and 6 correspond to ML16 samples with dilutions 1:50, 1:25
and 1:10 respectively. The molecular weights of cydA, cydB, cydD and cydC genes
according to the ProtParam tool (hosted by ExPASy http://web.expasy.org/protparam/) are
53 kDa, 38 kDa, 55 kDa and 59 kDa respectively. There are a group of 4 bands at around
180 kDa in TML16 samples (lane 1, 2 and 3). There are also two distinct bands above and
below 52 kDa. The stock concentration of TML16 and ML16 were approximately 8 mg.ml-1
and 4.3 mg.ml-1
, respectively.
2.3.6. Initial spectroscopic study of the Mycobacterium tuberculosis cytochrome
bd-I
The difference spectra (reduced minus oxidized) of wild-type E. coli BL21 (DE3)
LysS strain, ML16 and TML16 cells, which were grown during both aerobic and O2-
limited conditions, were recorded at room temperature using sodium dithionite as
reductant and potassium hexacyanoferrate (III) as oxidant (Figures, 2.11-2.13). The
significant difference between TML16 and ML16 spectra was the presence of a
distinctive peak at 631 nm corresponding to that of the heterologous Mtb
cytochrome bd-I in TML16.

83
2.3.6.1. Wild–type E. coli (BL21(DE3)pLysS) strain
A)
480 500 520 540 560 580 600 620 640 660
-0.4
0.0
0.4
0.8
1.2
A
bsorb
ance
Wavelength (nm)
629 nm
596 nm
560 nm
531 nm
B)
480 500 520 540 560 580 600 620 640 660
-0.8
-0.4
0.0
0.4
0.8
1.2
629 nm
A
bso
rban
ce
Wavelength (nm)
596 nm
560 nm
531 nm
Figure 2.11: Reduced minus oxidized spectra of wild-type E. coli BL21 (DE3) LysS
strain
The difference spectra (reduced minus oxidized) of wild-type E. coli BL21 (DE3) LysS
strain were recorded at room temperature using sodium dithionite as reductant and
potassium hexacyanoferrate (III) as oxidant. There are three distinct features spectra
recorded in A) O2-limited and B) Aerobic E. coli cultures, which are cytochrome b at 560
nm, cytochrome a1 at 596 nm and cytochrome d at 629 nm. The cells were grown in O2-
limited condition using closed shaken flasks with a head-space ratio of 0.5 and induced at
time = 0 h with 1 mM IPTG. The ratios of heme d (629 nm) with respect to heme b560 as a
reference peak are 0.51 in O2-limited condition and 0.3 in aerobic condition. These peaks
have been normalized according to the following equation (Value-min/max-min). The final
protein concentration of O2-limited membranes was approximately 5.7 mg.ml-1
and for
aerobic membranes was approximately 4 mg.ml-1

84
2.3.6.2. Double-knockout E. coli (ML16) strain
A)
480 500 520 540 560 580 600 620 640 660
-0.1
0.0
0.1
0.2
Wavelength (nm)
A
bsorb
ance
602 nm
557 nm
528 nm
B)
480 500 520 540 560 580 600 620 640 660
-0.2
0.0
0.2
0.4
0.6
A
bsorb
ance
Wavelength (nm)
557 nm
528 nm
602 nm
Figure 2.12: Reduced minus oxidized spectra of ML16
The difference spectra (reduced minus oxidized) of ML16 were recorded at room
temperature using sodium dithionite as reductant and potassium hexacyanoferrate (III) as
oxidant. There is a distinct feature in the spectra recorded in both A) O2-limited and B)
Aerobic ML16 cultures, showing peak at 602 nm. The cells were grown in O2-limited
condition using closed shaken flasks with a head-space ratio of 0.5 and induced at time = 0 h
with 1 mM IPTG. The ratios of heme (602 nm) with respect to heme b557 as a reference peak
are 0.85 in O2-limited conditions and 0.44 in aerobic conditions. These peaks have been
normalized according to the following equation (Value-min/max-min). The final protein
concentration of O2-limited membranes was approximately 1.2 mg.ml-1
and for aerobic
membranes was approximately 2.2 mg.ml-1

85
2.3.6.3. Transformed double-knockout E. coli (TML16) strain
A)
480 500 520 540 560 580 600 620 640 660
-0.3
-0.2
-0.1
0.0
0.1
0.2
0.3
0.4
A
bso
rban
ce
Wavelength (nm)
631 nm
595 nm
558 nm
530 nm
B)
480 500 520 540 560 580 600 620 640 660
-0.2
-0.1
0.0
0.1
0.2
0.3
A
bsorb
ance
Wavelength (nm)
631 nm595 nm
558 nm
530 nm
Figure 2.13: Reduced minus oxidized spectra of TML16
The difference spectra (reduced minus oxidized) of TML16 were recorded at room
temperature using sodium dithionite as reductant and potassium hexacyanoferrate (III) as
oxidant. Cytochrome d at 631 nm is a distinct feature of recombinant Mtb cytochrome bd-I
in both A) O2-limited and B) aerobic TML16-10 cultures. The cells were grown in O2-
limited conditions using closed shaken flasks with a head-space ratio of 0.5 and induced at
time = 0 h with 1 mM IPTG. The ratios of heme d (631nm) with respect to heme b558 as a
reference peak are 0.3 in O2-limited conditions and 0.13 in aerobic conditions. These peaks
have been normalized according to the following equation (Value-min/max-min). The final
protein concentration of O2-limited membranes was approximately 2.8 mg.ml-1
and for
aerobic membranes was approximately 4.3 mg.ml-1
.

86
2.3.7. Assessment of growth phenotypes
To qualitatively evaluate the contribution of cytochrome bd-I to respiration,
monitoring the growth of E. coli BL21 (DE3) LysS strain, AnML16 and TML16
cells was conducted to identify the differences between wild-type, mutant and
transformed cells respectively. Resazurin (Raz), a redox indicator, shows a
qualitative result for the bacterial respiratory state. In appropriate reducing
conditions, Raz (blue in colour) irreversibly loses an oxygen ion to become resorufin
(Rru) (Figure 2.14). Rru (orange/pink in colour) can undergo a further reduction to
colourless dihydroresorufin, which is a reversible reaction by atmospheric oxygen
and is mainly favoured upon total consumption of Raz (306). Raz is able to
differentiate strict anaerobes (blue in colour) from microaerophiles (orange/pink in
colour) and other strict aerobes (colourless) (305). Owing to the fact that Raz has a
dark blue colour which is the starting colour of any culture medium, the dark blue
colour in this study, therefore, did not represent a strict anaerobic bacteria respiratory
state, but represents no metabolic activity or O2 consumption.
Figure 2.14: Structures of resazurin in various oxidation states

87
2.3.7.1. Wild–type E. coli BL21(DE3) pLysS strain
The growth of BL21(DE3) pLysS (wild-type E. coli) was monitored through both
aerobic and O2-limited growth conditions (Figure 2.15). During the O2-limited
growth, after 6 h incubation, the colour of Raz was reduced to dark orange/pink
(Rru) during the exponential phase at OD600 ~ 0.38. Cells achieved highest density
after 12 h of incubation (OD600 ~ 0.44) and maintained a stationary plateau for about
10 h. Similarly, during aerobic growth, the colour of Raz after 6 h of incubation was
reduced to dark orange/pink but with a slow growth rate at the beginning of
exponential phase. Wild-type E. coli attained maximal density (OD600 ~ 1.5) after 42
h of aerobic incubation and maintained a stationary plateau for about 15 h before
starting to decline.
Figure 2.15: Growth of BL21 (DE3) pLysS (wild-type E. coli) supplemented with a
redox indicator (resazurin)
Growth was monitored by recording optical density (OD600) values of aerobic, shaken
cultures (blue) and O2-limited, closed, shaken flasks with a head-space ratio of 0.5 (red). The
colours of the medium during the growth curve correspond to the colour of the resazurin in
the medium (resazurin indicative colour chart). Wild-type E. coli began reducing resazurin
after 6 h of aerobic incubation and achieved maximal density (OD600 ~ 1.5) after 42 h of
aerobic incubation. During O2-limited growth, wild-type E. coli also began reducing
resazurin after 6 h of incubation but reached highest density (OD600 ~ 0.44) after 12 h of
incubation. Error bars represent ± SEM of each point.
Aerobic culture
O2-limited culture
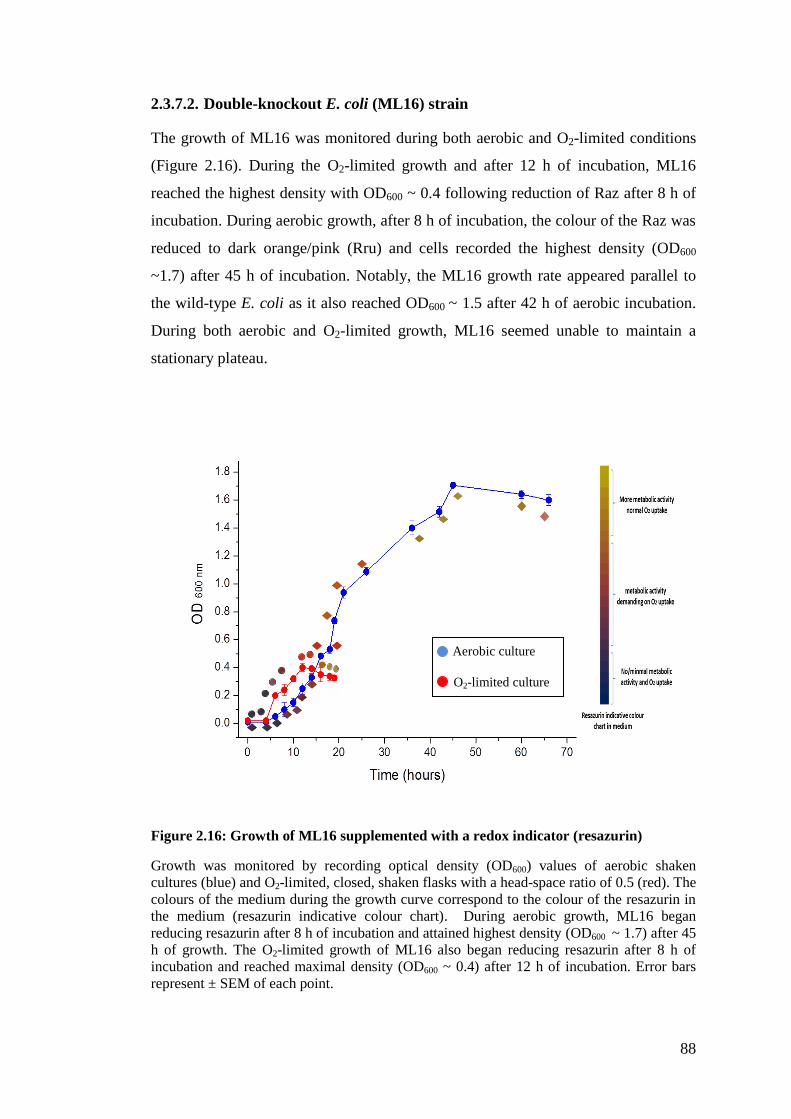
88
2.3.7.2. Double-knockout E. coli (ML16) strain
The growth of ML16 was monitored during both aerobic and O2-limited conditions
(Figure 2.16). During the O2-limited growth and after 12 h of incubation, ML16
reached the highest density with OD600 ~ 0.4 following reduction of Raz after 8 h of
incubation. During aerobic growth, after 8 h of incubation, the colour of the Raz was
reduced to dark orange/pink (Rru) and cells recorded the highest density (OD600
~1.7) after 45 h of incubation. Notably, the ML16 growth rate appeared parallel to
the wild-type E. coli as it also reached OD600 ~ 1.5 after 42 h of aerobic incubation.
During both aerobic and O2-limited growth, ML16 seemed unable to maintain a
stationary plateau.
Figure 2.16: Growth of ML16 supplemented with a redox indicator (resazurin)
Growth was monitored by recording optical density (OD600) values of aerobic shaken
cultures (blue) and O2-limited, closed, shaken flasks with a head-space ratio of 0.5 (red). The
colours of the medium during the growth curve correspond to the colour of the resazurin in
the medium (resazurin indicative colour chart). During aerobic growth, ML16 began
reducing resazurin after 8 h of incubation and attained highest density (OD600 ~ 1.7) after 45
h of growth. The O2-limited growth of ML16 also began reducing resazurin after 8 h of
incubation and reached maximal density (OD600 ~ 0.4) after 12 h of incubation. Error bars
represent ± SEM of each point.
Aerobic culture
O2-limited culture

89
2.3.7.3. Transformed double-knockout E. coli (TML16) strain
The growth of TML16 was monitored throughout aerobic and O2-limited growth
conditions (Figure 2.17). During O2-limited growth, after 12 h of incubation, the
colour of Raz was reduced to dark orange/pink (Rru) and TML16 attained the
highest density after 16 h of incubation (OD600 ~ 0.22). TML16 was able to maintain
a stationary plateau. During aerobic growth, reduction of Raz was observed after 12
h of incubation. TML16 achieved its highest density (OD600 ~ 1.2) after 45 h of
aerobic incubation and maintained a stationary plateau for about 15 h before starting
to decline.
Figure 2.17: Growth of TML16 supplemented with a redox indicator (resazurin)
Growth was monitored by recording optical density (OD600) values of aerobic, shaken
cultures (blue) and O2-limited, closed, shaken flasks with a head-space ratio of 0.5 (red). The
colours of the medium during the growth curve correspond to the colour of the resazurin in
the medium (resazurin indicative colour chart). During both aerobic and O2-limited growth
of TML16, resazurin reduction began after 12 h of incubation. TML16 attained maximal
density (OD600 ~ 1.2) after 45 h of aerobic incubation but reached highest density (OD600 ~
0.22) after 16 h of O2-limited incubation. Error bars represent ± SEM of each point.
Aerobic culture
O2-limited culture

90
2.4. Discussion
The genes involved in the expression of the cytochrome bd-I oxidase are cydA and
cydB, encoding subunits I and II of cytochrome bd-I oxidase. Nevertheless, cloning
the whole operon cydABDC was a necessity due to the fact that the cydDC genes,
located immediately downstream of cydAB genes, are implicated in the assembly of
a functional bd-type oxidase (195, 243-247). This suggested a functional association
between cytochrome bd-I oxidase and the ABC transporter owing to the adjacent
location of Mtb cydAB and cydDC genes (221). The cydABDC organization in Mtb
(148) is parallel to that observed in M. smegmatis (253) and Bacillus subtilis (215,
307). However, Kana et al (2001) wrote that the cydDC genes in M. smegmatis may
be expressed independently from cydAB owing to the intergenic space between
cydAB and cydDC (253). Moreover, Green et al (1984) was able to express
cytochrome bd-I oxidase in E. coli through cloning merely cydAB genes (308). In
Geobacillus thermodenitrificans, a low GC Gram-positive bacterium, coexistance of
the cytochrome bd-I and ABC transporter genes in the same plasmid was also not
necessary (309). On the contrary, an aspect regarding the necessity of cydDC genes
has been further emphasised recently in a study of Corynebacterium glutamicum, a
high GC Gram-positive bacterium, that showed the importance of involving cydDC
genes in the expression plasmid for cydAB overexpression (310).
Essentially, using highly parallel Illumina sequencing, Griffin et al (2011) precisely
identified essential genes (151 genes) for Mtb viability. This study showed that all
cyd-operon genes, cydABDC, are essential for Mtb viability (2). This contradicted a
previous study which deemed only 81 genes to be essential through the use of
microarrays, and which suggested that only cydB is essential for Mtb (116).
Remarkably, Zhang et al (2012) who coupled high-density insertion libraries with
deep sequencing showed a 97.1% level of agreement with the data of Griffin et al
(2011) regarding essential Mtb genes (2, 166).
With regards to the expression conditions, appropriate signalling of the regulatory
components may lead to levels of cytochrome bd-I or bd-II, under specific growth
conditions, that are significant to the cells. As previousely mentioned, in E. coli
cytochrome bd-I has different expression conditions to that of cytochrome bd-II. The

91
expression of cytochrome bd-I both in E. coli and Mtb was recorded during both
aerobic and microaerophilic growth conditions (20, 212) whereas cytochrome bd-II
was expressed under anaerobic or starvation conditions (217, 218, 290, 292). Herein,
expression studies of the recombinant Mtb cytochrome bd-I oxidase (Mtb bd-I) in an
E. coli mutant used the low O2 tension as a stressful condition. The spectra data
showed that Mtb bd-I was expressed moderately in aerobic conditions and
excessively under oxygen-limiting conditions. The ratio of cytochrome d peak to the
reference peak in TML16 was higher in O2-limited (0.3) condition than in aerobic
conditions (0.13). These findings are in accordance with previous observations of
cytochrome bd-I expression conditions in E. coli (234, 311), in M. smegmatis (253)
and in this study of the wild-type E. coli strain.
The induction of cytochrome bd-I oxidase was suggested to be at 1% air saturation in
M. smegmatis (253), at 7% air saturation in E. coli (246) and during transition to
anaerobiosis state in B. subtilis (312). However, the present data suggest that the
induction of Mtb bd-I is observed during both oxygen-rich and oxygen-limited
conditions (i.e. aerobic and O2-limited). These results further contradict the
suggestion of Shi et al (2005) that Mtb cytochrome bd-I is only induced at 1% air
saturation (221).
SDS-PAGE analysis of Mtb bd-I showed expression of two bands, which have
protein mass of around 52 kDa. However, these bands were indistinguishable in
terms of gene identity on SDS-PAGE since the molecular weights of all cydABDC
genes are relatively close to each other. The protein masses of Mtb cydA, cydB, cydD
and cydC subunits are 53.83 kDa, 37.63 kDa, 54.8 kDa and 59.5 kDa, respectively.
Cytochrome bd-I in E. coli, a transmembrane heterodimer protein, has one copy of
each subunit with molecular weight of 58 kDa for subunit I and 43 kDa for subunit II
(212). Therefore, according to the spectral analysis data that confirmed the
expression of Mtb bd-I, we can suggest that the two expressed bands could represent
Mtb bd-I subunits I and II. According to the transformed double-knockout (TML16)
protein concentration, the proteins seemed to be overexpressed as even in a highly
diluted sample, the proteins bands were clearly visible. This in turn confirmed the

92
aforementioned Kabashima et al (2009) finding that cydDC was necessary for cydAB
over expression (310).
Spectral properties showed different heme peaks and ratios according to growth
conditions or strain differences. Reduced minus oxidized difference spectra recorded
at room temperature were used to analyze the cytochrome content of wild-type E.
coli BL21(DE3) pLysS. During both aerobic and O2-limited growth conditions,
major absorbance peaks that were observed at 560, 596, and 629 nm were
characteristic of b-, a1-, and d-type cytochromes, respectively that represent a
‘normal’ E. coli spectrum (313, 314).
Importantly, the spectra of ML16 mutant strain lacked the heme-d features but
showed absorbance peaks at 528, 557, and a discrete peak at 602 nm, a finding
consistent with specific disruption of cytochrome bd-I. The discrete peak at 602 nm
was reported as cytochrome aa3 in other bacteria such as the Thiobacillus novellus
(315), Rhizobium leguminosarum (316) and Bradyrhizobium japonicum (317).
However, cytochrome aa3 in B. subtilis (318) and in M. smegmatis (253) has a peak
at 600 nm rather than 602 nm. Essentially, wild-type E. coli BL21(DE3) did not
possess the genes that code for cytochrome aa3 oxidase, qoxABCD. Siegel et al
(1973) recorded similar peak at 602 nm during a study of NADPH-sulfite reductase
of E. coli. However, it had not been designated to a specific cytochrome component
(319). Accordingly, given that macromolecular reorganization of prosthetic groups
and terminal oxidase subunits could give rise to alternate oxidases, terminal
components of the respiratory chain cannot be inferred only from the genome
sequence (253). Likewise, the bb’-type terminal oxidase in B. subtilis, which
appeared to be bd-type (encoded by the cydAB genes), had the heme-d substituted by
high spin heme-b (320). This might be the case for the present ML16 spectrum as
despite the presence of endogenous cytochrome bd-II genes, the heme-d absorbance
peak that was expected to be present at about 628 nm - 632 nm was not recorded
(217, 218, 290, 292).

93
The ML16 strain was transformed with a plasmid carrying the entire Mtb cydABDC
genes that led to restoration of heme-d631 absorbance peak, confirming that the Mtb
cydABDC operon was able to functionally complement the cytochrome bd-I defect in
the E. coli mutant (ML16) strain. Interestingly, Kana et al (2001) confirmed that the
presence of a plasmid carrying Mtb cydABDC operon restored heme-d631 in a
cytochrome bd-I defective M. smegmatis mutant strain (253). The heme-d
absorbance peak (about 628 nm - 632 nm) is a characteristic of the cytochrome bd-I
oxidase in E. coli (263) and B. subtilis (Winstedt et al., 1998). The signals at 558 nm
and at 595 nm were presumably due to the low-spin heme b558 and the high-spin
cytochrome b595 component of the cytochrome bd-type oxidase complex, as were
reported in the well-studied E. coli (313) and A. vinelandii (321) oxidases.
A novel, but unexplained, observation is the red/brown pigmentation observed in
TML16 cultures (aerobic and O2-limited). This could be explained by the
overexpression of heme-containing cytochromes and porphyrins, which was
supported by the expression studies of TML16 showing an over expression of
functional recombinant Mtb cytochrome bd-I oxidase. Ratledge (1999) suggested
that the presence of porphyrins was the main reason behind the red colour in
mycobacteria (322). Significantly, a hypoxic culture of M. smegmatis, with 0.6%
oxygen saturation, was accompanied by a change in the coloration of the cells from a
light yellow pigmentation to a red pigmentation. In turn, this infers the induction of
the cytochrome bd-I oxidase and the machinery needed for its assembly and
synthesis (i.e. porphyrin/heme and cysteine biosynthesis) (289).
Regarding the growth rate of the cells, during aerobic conditions, ML16 showed a
higher growth rate, reaching its highest density (OD600 ~ 1.7) after 45 h compared to
the BL21 (DE3) pLysS (reference strain) (OD600 ~ 1.5) after 42 h of incubation, and
to the transformed strain TML16 that which hardly exceeded OD600 ~ 1.2 after 45 h
of incubation. Nevertheless, the ML16 growth rate seemed more similar to the
reference strain as it also reached OD600 ~1.5 after 42 h of incubation. Kana et al
(2001) wrote that inactivation of M. smegmatis cydA and/or cydB genes had no
discernible effect on the growth rate during exponential phase, when bacteria were
grown aerobically at 21 or 5% air saturation. However, Kana et al (2001) observed a

94
significantly lower growth rate of M. smegmatis cydA mutant than that of wild-type,
when bacteria were grown at 0.5 and 1% air saturation (253). Moreover, Cohen
(2011) suggested that the reduction in the growth rate could be attributed to exposing
the cells to oxygen limiting conditions (294). In contrast, data showed that during
O2-limited conditions, Ml16 demonstrated a similar growth rate to the reference
strain reaching an OD600 of ~ 0.4 after 12 h of incubation. Therefore, results
suggested that the air saturation inside the flasks during O2-limited condition could
be more than 1%. In turn, TML16 cells under oxygen-limiting condition exhibited a
low growth rate in comparison with both mutant and reference strains, as it reached
the highest density (OD600 ~ 0.22) after 16 h of incubation. The slow growth rate of
TML16 during both oxygen-rich and oxygen-limited conditions might be due to the
adaptation of the cells to synthesize a functional recombinant Mtb cytochrome bd-I
oxidase alongside growing under oxygen limited condition.
To qualitatively evaluate the contribution of cytochrome bd-I to respiration in
aerobic and O2-limited conditions, resazurin was used as a visual indicator of the
oxygen depletion in cultures (305) and as an indicator of the respiratory function.
Raz reacts in the presence of oxygen, acids and functional dehydrogenases and
oxidoreductases of viable organisms. Raz could be reduced by strict aerobes,
facultative anaerobes such as E. coli, aerotolerant and microaerophile organisms, but
not by strict anaerobes (305, 323, 324).
ML16 and the wild-type strain cultures were shown to reduce resazurin earlier than
TML16. During both aerobic and O2-limited growth conditions, the reduction of Raz
was detected respectively after 8 h and 6 h post-inoculation for ML16 and the
reference strain. TML16 cell cultures were observed to reduce Raz slower, taking 12
h of incubation to reduce during both O2-limited and aerobic growth conditions. The
oxygen depletion in TML16 culture was delayed due to the fact that the host cells
needed longer time to express functional cytochrome bd-I. Geckil et al (2001) noted
that oxygen uptake might be particularly strict when recombinant cells are involved.
This is due to the fact that the presence of the plasmid is considered a burden
because of the cellular resources required for maintaining and expressing plasmid
genes. In addition, the plasmid may cause perturbations in cellular metabolism (325).

95
However, the presence of a plasmid (pLysS) in the reference strain did not hold it
back from reducing Raz during earlier time of growth rate. This could be attributed
to the fact that pLysS has no noticeable effect on growth rate (303). Expectedly,
ML16 reduced Raz later than the wild-type due to the lack of cytochromes bo3 and
bd-I in ML16 cells. Notably, although ML16 did not show a heme-d absorbance
peak of cytochrome bd-II, it demonstrated normal oxygen utilization with a
colourless Raz in the medium observed, which might indicate aerobic respiration.
Significantly, the demand for oxygen uptake was sustained in TML16, resembling
that of the reference strain. However, ML16 showed a short period of oxygen uptake
demand before it reached the regular oxygen uptake phase. The ability of the Mtb
bd-I to restore the reference strain phenotype (oxygen consumption) is attributed to
its high affinity for oxygen. Bekker et al (2009) showed that cytochrome bd-I has a
10- and 20-fold-higher affinity for oxygen than cytochrome bd-II and cytochrome
bo3, respectively (290). Moreover, the high demand for O2 by both TML16 and the
reference strain could also be attributed to a potential factor related to its harbouring
a plasmid construct (325). In accordance with the present data, Khosravi et al (1990)
wrote that recombinant cells require more oxygen than plasmid-free cells (326).
There are other factors that could affect the oxygen depletion in cultures, and in turn
the resazurin status. For instance, the mode and vigour of agitation (33) were found
to have an effect on the Raz status as well as the intense light (i.e. bright sunlight),
which could lead to rapid photochemical decay of resazurin (327). However, these
factors could be ruled out as they were fixed throughout this study experiments and
intense light exposure was avoided.
Regarding the stationary phase (non-replicating phase) viability, unlike the reference
strain, both aerobically and O2-limited grown ML16 seemed to exhibit a stationary-
phase viability defect as observed in cyd mutant strains of E. coli (295) and of A.
vinelandi (328). Remarkably, TML16 cells did display a restoration of the loss of
stationary phase viability, emphasising the significance of cytochrome bd-I during
stationary phase. The ability of Mtb bd-I to restore cells viability during stationary
phase was further confirmed in different heterologous expression system, the
TMB44 system (Chapter IV). In addition, the mycobacterial bd-I oxidase was

96
required specifically for growth under extreme microaerophilia (253). Interestingly,
this observation might indicate the involvement of Mtb bd-I in persister cell
viability. Persister cells are non-replicating subpopulation of microbes that exist
during the stationary phase and have the ability to survive exposure to bactericidal
antibiotics (4). Nevertheless, significant expression of Mtb bd-I during aerobic
conditions could indicate the ability of this enzyme to compensate the loss of other
terminal oxidases.
In summary, the spectroscopic evidence provided herein confirms the presence of
Mtb heme-d-containing cytochrome in the E. coli mutant strain, ML16. In this and
other respects, the high affinity cydAB-encoded cytochrome bd-I oxidase of Mtb
displayed spectral features analogous to the well-characterized E. coli cytochrome
bd-I (213). In addition, cytochrome bd-I oxidase demonstrated its role as an essential
oxygen scavenger and as an important respiratory component of Mtb with respect to
maintaining cell viability during stationary phase. Stationary phase could include
slowly-replicating, non-replicating and/or persister cells. This is in agreement with
the Griffin et al (2011) sequencing study that confirmed Mtb cytochrome bd-I
oxidase essentiality (2) for Mtb viability, and with Dhar and McKinney (2010) who
identified cydDC essentiality for persister cells (24, 52).
Regarding limitation and recommendations of this chapter, monitoring oxygen
consumption in the cultures was limited to visual qualitative assessment using Raz.
Ideally, measuring the O2 saturation of the cultures using an O2 electrode sensor or
rotometer would be recommended. Moreover, growing cells in a chemostat could act
as an alternative way of culturing TML16 whereby all the parameters in the system
could be monitored, including the dissolved O2 tension (253). Initial
characterizations of the recombinant Mtb cytochrome bd-I oxidase including steady
state kinetic and drug susceptibility studies are described in the following chapter.

97
Chapter III
Biochemical and pharmacological characterization
of Mycobacterium tuberculosis cytochrome bd-I
oxidase

98
3.1. Introduction
The purpose of this study was to explore the kinetic properties of recombinant
Mycobacterium tuberculosis cytochrome bd-I oxidase (Mtb bd-I) and to highlight
the potential of this enzyme as a novel drug target, thus, optimistically, fuelling the
drug discovery pipeline.
The respiratory chain of Mtb can function with a variety of different membrane-
bound NADH dehydrogenases, including NDH-1, NDH-2, NDH-2A, and SDH as
well as LDH, G3PDH, MDH and PDH dehydrogenases, on the electron input side.
In contrast, the electron accepting components of the respiratory chain include two
terminal oxidases (cytochrome bc1-aa3 super complex and cytochrome bd-I oxidase)
as well as reductases (NRs and FRD). The link between the electron donating and
the electron accepting enzymes are the membrane mobile quinones. Donor:quinone
oxidoreductases (i.e. NADH:quinone oxidoreductase) and quinol:acceptor
oxidoreductase, such as quinol:oxygen oxidoreductase for bd, are coupled together to
generate simple electron transport chains, producing a PMF. Quinones are small
membrane-entrapped lipophilic molecules that are freely diffusible, which can carry
two electrons and two protons in the fully reduced state (quinol) (329).
Decylubiquinol (dQH2), ubiquinol-1 (Q1H2) and ubiquinol-2 (Q2H2) are examples of
synthetic quinols that are frequently utilised in enzymological studies (Figure 3.1).
Figure 3.1: Structures of decylubiquinone, ubiquinone-1 and ubiquinone-2 and their
reduced quinol counterparts

99
It is well known that utilization of quinol as an electron donor by cytochrome bd-I
oxidase (bd-I) is species-specific. For example, bd-I can only oxidize menaquinol
(MQH2) in B. stearothermophilus and ubiquinol (UQH2) in A. vinelandii. In contrast,
E. coli bd-I can oxidize both UQH2 and MQH2 (255, 256), as upon changes from
aerobic to anaerobic growth conditions, bd-I replaces UQH2 by MQH2 (330).
Menaquinone (MQ) is the substrate in Mtb, consisting of nine isoprene units (MQ-9)
while in E. coli it contains 8 units (MQ-8) (195, 202, 331). In vitro, beside the
physiological substrates, short chain ubiquinols such as dQH2, Q1H2 and Q2H2 as
well as artificial electron donors, N,N,N′,N′-tetramethyl-p-phenylenediamine
(TMPD) can be oxidized by bd-I (53, 212, 213).
Viewing the reaction pathway or catalytic cycle of an enzyme helps in understanding
the enzyme catalysis and thus in planning the best inhibition mechanism of the
enzyme. Cytochrome bd-I oxidase is an integral membrane protein with exposed
surfaces to cytoplasmic and periplasmic compartments. Cytochrome bd-I oxidase is
a terminal oxidase that oxidizes quinol/menaquinol and reduces O2 to water. Three
hemes (heme b558, heme b595 and heme d) form the enzyme. Heme b558 is associated
with subunit I of bd-I and is involved in QH2 oxidation. Heme d is the site for
capturing and, subsequently, reducing O2 to H2O and is predicted to be located in the
second subunit (subunit II) of bd-I, near the periplasmic surface (195, 257, 332).
Both heme b595 and heme d are located close to each other forming a di-heme active
site and potentially can bind ligands; heme d has a higher affinity for ligands than
heme b595, resulting in binding of ligands to heme d (211, 333). The chemistry
catalyzed by the enzyme is simple:
The electron transfer sequence in cytochrome bd-I is thought to be QH2 → heme b558
→ [heme b595 → heme d] → O2. Four protons per O2 are taken up from the
cytoplasmic side and four are released to the periplasmic side, thus the H+/e
- ratio is
1. Simultaneously, reduction of O2 to water and oxidation of quinol to quinone,
performed along with the transfer of four electrons through heme b558 and b595 to the
O2 reducing site, result in the generation of a PMF by trans-membrane charge
separation, which subsequently may drive ATP synthesis by the ATP synthetase
(332). Generation of a PMF by trans-membrane charge separation is a consequence

100
of releasing protons, generated from the quinol oxidation, into the positive
(periplasmic) side of the membrane, and taking protons, used to convert O2 to H2O,
from the negative (cytoplasmic) side (205, 206). The proposed model of cytochrome
bd-I oxidase catalytic mechanism is depicted in the following figure (Figure 3.2).
Figure 3.2: Proposed cytochrome bd-I model adapted from (211)
Enzyme reactions can be studied under steady state conditions. Steady state kinetics
refers to a balance situation between the rate of Enzyme-Substrate (ES) formation
and the rate of ES complex disappearance. During the initial phase of an enzyme
reaction, the initial velocity, a slope of the product (or substrate) concentration
versus time plot, typically lasts until about 10 to 15% of the initial substrate
concentration has been converted into product; afterwards the velocity slows down.
Enzymes can catalyse monosubstrate, bisubstrate and multiple substrate reactions.
Monosubstrate reaction, the most simple enzyme reaction, involves converting a
single substrate to a single product. A bisubstrate reaction involves two substrates,
utilized to form one or more products. A multiple substrate reaction includes more
than two substrates combining to form products (334, 335).
Under physiological conditions cytochrome bd-I activity varies; the detergent nature
in which the purified enzyme is solubilised has an influence on its activity. For
instance, solubilising E. coli bd-I in octylglucoside detergent rendered the enzyme
inactive. However, E. coli bd-I shows high activity in Tween-20 (211, 336).

101
Concerning the importance of the pH profile, pH is known to affect the charges on
the amino acids residues within the active site, resulting in structural changes of the
catalytic side. Subsequently, the substrate may no longer fit into enzyme active site.
Moreover, changes in pH could break the ionic bonds that stabilize the functional
structure of the enzyme (194, 335). The conserved amino acids residues in the bd-
family are His19, His186 and Met393, Arg448, and Glu99, Glu107, Ser140, Lys252
and Glu257, of which the latter two residues are involved in QH2 binding (211, 337).
The conserved amino acids residues in the bd-family could participate in critical
proton transfer reactions and in stabilizing charges during the transition state (334).
Inhibiting the electron transport chain components of Mtb is an attractive
chemotherapeutic goal as demonstrated by the diarylquinoline: TMC207 drug,
targeting the mycobacterial ATP synthase complex (4, 274, 338, 339). The fact that
Mtb bd-I, has no counterparts in mammalian mitochondria, and that it is essential for
Mtb viability renders this component attractive as a drug target (Chapter 2.4) (2,
211).
Different classes of inhibitors were found to be potent against quinol oxidases, such
as the natural antibiotic gramicidin S and the quinolone-type inhibitors, aurachins C
and D (Figure 3.3). Derivatives of aurachin compounds showed that the critical core
of the compounds is the ring structure. The compounds’ effectiveness is maintained
upon replacing the natural polyisoprenyl side chain with a simpler saturated aliphatic
side chain; as the chain length of the R group increased, little systematic variations
of inhibitor potency were observed (264, 265). A relatively similar scenario was
adopted in a drug discovery programme with the objective of identifying hit
compounds against Plasmodium falciparum NADH:ubiquinone oxidoreductase
(PfNDH2) (340, 341). Based on structure-activity relationship (SAR) development,
this program succeeded in identifying a novel quinolone-type inhibitor against
PfNDH2. A further programme (MtbNDH2 programme) ensued with the objective
of identifying selective inhibitors against NDH-2: NADH dehydrogenase, a novel
enzyme target within the Mtb bacilli, adopting the same strategy as the PfNDH2
programme.

102
Figure 3. 3: A) aurachin C structure. B) aurachin D structure
1-hydroxy-2-dodecyl-4(1H) quinolone (HDQ) is a known inhibitor of PfNDH2 and
was the core for initiating the chemoinformatics approach with the purpose of
selecting compounds for high-throughput screening (HTS) (342). Therefore,
quinolone-type compounds (from in house libraries) were examined against Mtb bd-I
and Mtb H37Rv. The quinolone core (Figure 3.4) of these compounds has been the
key target for SAR development investigating, the relationship between the chemical
structure of a compound and its biological or pharmacological activity. SAR can be
considered by viewing a series of molecules, each with a slightly different structure,
and then observing the biological activity with each structural variation.
Figure 3.4: A) HDQ structure. B) The quinolone core
Eliminating the pathogenic organism is the ultimate clinical outcome of any drug
designed for this purpose. Therefore, studying the pharmacokinetic and the
pharmacodynamics of inhibitors as well as the kinetics of inhibitor interaction with
the enzyme provides a meaningful prediction of drug efficacy in vivo. In this work,
basic kinetic parameters of the Mtb cytochrome bd-I catalytic reaction were
measured and compared to cytochrome bd-I from previously studied bacteria.
Moreover, the IC50s of quinolone-type inhibitors against Mtb bd-I and the inhibitor-
enzyme interaction were studied.
A) B)
A) B)
A B

103
3.2. Material and methods
3.2.1. Membrane preparations
Following the protocol of Fisher et al (2009), membrane preparations were carried
out as detailed in Chapter (2.2.17) (209). It is worth mentioning that all assays were
carried out using the membranes of the TML16 strain, grown under O2-limited
conditions, as it has the highest catalytic activity. The Mtb bd-I of the TML16 strain,
grown under aerobic condition, was also examined for steady-state kinetics with
dQH2 to evaluate Mtb bd-I under both growth conditions (Figure 3.6, B).
3.2.2. Preparation of 50 mM KPi, 2 mM EDTA, pH 7.5 buffer
For kinetic assays 50 mM KPi, 2 mM EDTA, pH 7.5 buffer was used throughout
experiments, unless otherwise stated. This buffer was prepared following the
previously described protocol (section 2.2.16).
3.2.3. Preparation of decylubiquinol (dQH2) and ubiquinol-2 (Q2H2)
Preparation of both dQH2 and Q2H2 were performed according to the protocol of
Fisher et al (2004) (343). Briefly, 10 mg of 2,3-dimethoxy-5-methyl-n-decyl-1,4-
benzoquinone (decylubiquinone) or 10 mg of 2,3-dimethoxy-5-methyl-6-geranyl-
1,4-benzoquinone (ubiquinone-2) (Sigma Aldrich, UK), were dissolved in 400 µl of
nitrogen-saturated hexane. An equal volume of aqueous 1.15 M sodium dithionite
was added, and the mixture shaken vigorously until colourless. The upper, organic
phase was collected, the dQH2 or Q2H2 were extracted off hexane and the solvent
was evaporated under N2. Subsequently, dQH2 or Q2H2 were dissolved in 100 µl of
96% ethanol (acidified with 10 mM HCl). Concentrations of dQH2 or Q2H2 were
determined spectrophotometrically on a Cary 300 Bio UV/visible spectrophotometer
(Varian, UK) from absolute spectra, using = 4.14 mM-1
.cm-1
. Both dQH2
and Q2H2 were stored at -80 oC and used within two weeks.

104
3.2.4. Preparation of ubiquinol-1 (Q1H2)
Preparation of Q1H2 was based on the protocol of Kihira et al (2012) (344) with
modification where 1 ml of 40 mM ubiquinone-1 (Sigma Aldrich, UK) solubilised in
DMSO was diluted 3-fold with 100 mM potassium phosphate buffer (KPi, pH 7.5).
Sodium dithionite powder was added to this solution to reduce ubiquinone-1 until
the yellow colour disappeared. The Q1H2 formed was extracted with hexane and the
solvent was evaporated under N2. Q1H2 was dissolved in 100 µl of 96% ethanol
(acidified with 10 mM HCl). The concentration of Q1H2 was calculated
spectrophotometrically on a Cary 300 Bio UV/visible spectrophotometer (Varian,
UK) from absolute spectra, using = 4.14 mM-1
.cm-1
. Q1H2 was stored at -80
oC and used within two weeks.
3.2.5. Steady state kinetic assays
Oxidation of quinols (dQH2, Q1H2 and Q2H2) by Mtb bd-I was measured
spectrophotometrically at 283 nm on a Cary 300 Bio UV/visible spectrophotometer
(Varian, UK). Total reaction volume in a 1 cm pathlength quartz cuvette was 700 µl,
containing 698 µl of (50 mM KPi, 2 mM EDTA, pH 7.5) buffer and 2 µl of the crude
recombinant membrane to a final concentration of 3 μg.ml-1
. Following thorough
agitation of the cuvette contents and recording the absorption spectrum, quinol was
added (to a final concentration of 5 - 98 µM) and kinetic data collected for 4 min.
Initial rates (computer-fitted as zero-order kinetics) were measured as a function of
quinone concentration, using = 8.1 mM-1
cm-1
. Plots of initial velocity as a
function of substrate concentration were fitted using the Michaelis-Menten equation
(dQH2 and Q1H2):
However, for Q2H2 oxidation, a modified ping-pong bi-bi mechanism was used for
Mtb bd-I as per Matsumoto et al (2006) (345). The formula was established by Dr.
Nick Fisher.
( S )
2 S ( (
) ) S

105
Data were analysed using a Michaelis-Menten hyperbola and a modified ping-pong
bi-bi mechanism equation in order to determine Km and Vmax values using Origin 8.5
(OriginLab Corp., USA). The mathematical term Vmax refers to the maximal velocity
obtained at infinite substrate concentration whereas Km (commonly stated to as the
Michaelis constant) refers to the substrate concentration that leads to half saturation
of the enzyme active sites under steady state conditions (334, 335).
3.2.6. pH assay
To investigate the role of acid base catalysis in Mtb bd-I oxidase-catalyzed reactions,
the pH dependence of kinetic parameters was determined by measurement of dQH2
oxidation rates across the pH range of 5.5 - 8.5, employing a mixed buffer system
containing 2-(N-morpholino)ethanesulfonic acid (MES), 4-(2-hydroxyethyl)-1-
piperazineethanesulfonic acid (HEPES), and N-Tris(hydroxymethyl)methyl-3-
aminopropanesulfonic acid (TAPS). UV-visible spectroscopic analysis of freshly
prepared membranes was carried out on a Cary 300 Bio UV/visible
spectrophotometer (Varian, UK). Total reaction volume in a 1 cm pathlength quartz
cuvette was 700 µl, which contained 2 µl of membrane (final concentration 3 μg.ml-
1)
suspended in 698 µl of different pH (40mM HEPES/MES/TAPS) buffer.
Following thorough agitation of the cuvette contents, a UV-visible absorption
spectrum was recorded at 283 nm, to which a fixed concentration of 50 μM dQH2
was added to initiate the reaction. Specific catalytic activity (μmol.min-1
.mg-1
) was
calculated using = 8.1 mM-1
.cm-1
.
3.2.7. Detergent assays
The effect of detergents on Mtb bd-I oxidation rates of dQH2 were measured
spectrophotometrically using a Cary 300 Bio UV/visible spectrophotometer (Varian,
UK) and a quartz cuvette of pathlength 1 cm. Assays of total reaction volume 700 µl
containing 698 µl of (50 mM KPi, 2 mM EDTA, pH 7.5) buffer, 2 µl of the
membranes (final protein concentration of 11.3 μg.ml-1
) and 0.01% (v/v) of 3-[(3-
cholamidopropyl)dimethylammonio]-1-propanesulfonate (CHAPS), n-dodecyl-β-D-
maltopyranoside (DDM), cholate, deoxycholate, Triton X-100 or Tween-80
detergents. Following thorough agitation of the cuvette contents and recording of a
UV-visible absorption spectrum at 283 nm, 2.3 µl of 15 mM dQH2 (final

106
concentration of 50 μM dQH2) was added to the cuvette to initiate the reaction.
Specific catalytic activity (μmol.min-1
.mg-1
) was calculated using = 8.1 mM-
1.cm
-1.
3.2.8. Chemoinformatics compound selection
The best 18 compounds against PfNDH2 of the mitochondrial ETC of Plasmodium
falciparum (340) were tested against Mtb bd-I and Mtb H37Rv. Subsequently, 5
more compounds were chosen arbitrarily from a program established to identify hits
against NDH2 complex of Mycobacterium tuberculosis, which were RKA-259,
SCR-8-12, RKA-307, RKA-310 and MTD-403.
3.2.8.1. Preparation of inhibitor stock solutions
10 mM inhibitor stocks were prepared according to their solvent solubility (Table
3.1). Inhibitor stocks were prepared and kept at -20 oC for no longer than 1 month.
Final dilutions were made with culture medium (7H9 MiddleBrook) or with DMSO
and freshly prepared prior to studies being carried out. Final concentration of DMSO
was maintained below 1% throughout experiments unless otherwise stated.

107
Table 3.1: List of the inhibitors used in inhibition studies for phenotypic profiling of
H37Rv strain of Mtb
Compound Molecular weight
(g.mol-1
) Solvent Source
Isoniazid 137.14 DMSO Sigma Aldrich, UK
Rifampicin 822.94 DMSO Sigma Aldrich, UK
Ethambutol 277.23 DMSO Sigma Aldrich, UK
Streptomycin 728.69 H2O Sigma Aldrich, UK
Metronidazole 171.15 DMSO Sigma Aldrich, UK
CK-2-63 411.37 DMSO
In house synthesis in collaboration
with Prof Paul O’Neill, Department
of Chemistry, Uni. of Liverpool)
CK-3-22 412.36 DMSO In house synthesis
CK-2-88 325.40 DMSO In house synthesis
CK-3-23 339.43 DMSO In house synthesis
CK-3-14 346.35 DMSO In house synthesis
RKA-307 318.41 DMSO In house synthesis
RKA-310 348.44 DMSO In house synthesis
RKA-259 442.39 DMSO In house synthesis
RKA-41 602.72 DMSO In house synthesis
RKA-70 395.37 DMSO In house synthesis
RKA-73 411.37 DMSO In house synthesis
SCR-8-12 361.32 DMSO In house synthesis
LT-9 343.39 DMSO In house synthesis
SL-2-25 396.36 DMSO In house synthesis
WDH-1U-10 403.86 DMSO In house synthesis
WDH-1W-5 385.34 DMSO In house synthesis
WDH-2A-9 399.37 DMSO In house synthesis
GN-171 467.44 DMSO In house synthesis
OB-231 428.41 DMSO In house synthesis
OB-258 444.41 DMSO In house synthesis
PG-128 381.35 DMSO In house synthesis
PG-203 411.37 DMSO In house synthesis
1-hydroxy-2-dodecyl-
4(1H) quinolone 329.48 Methanol In house synthesis
Potassium cyanide 65.12 Methanol Sigma Aldrich, UK

108
3.2.8.2. Enzyme inhibition assays
Determination of IC50s values for the inhibitors against Mtb bd-I were performed
using a Cary 300 Bio UV/visible spectrophotometer (Varian, UK), and a quartz
cuvette of pathlength 1 cm. Assays, of total volume 700 μl, were carried out at room
temperature containing assay buffer (50 mM KPi, 2 mM EDTA, pH 7.5) and fixed
concentration of membranes (3 μg.ml-1
) and inhibitors, which were added prior to
reaction initiation with 50 μM dQH2. IC50 values were calculated from plots of log
dose vs oxidation rate using a four parameter logistic function (y = m1+(m2-
m1)/(1+(m0/m3)^m4); m1=0.1; m2=150; m3=1; m4=1), using Origin 8.5 software
(OriginLab Corp., USA) and initial rates were measured as a function of quinone
concentration, using = 8.1 mM-1
cm-1
.
3.2.8.3. Competition assays, Lineweaver-Burk and Eadie-Hofstee Plots
Determination of Km and Vmax values of Mtb bd-I in the presence of two different
inhibitor concentrations were performed using the aforementioned steady-state
kinetic assays (section 3.2.5) with and without the addition of fixed concentration of
inhibitors prior to reaction initiation. In order to examine the type of some inhibitors,
i.e. whether they were competitive, non-competitive or uncompetitive inhibitors,
Lineweaver-Burk and Eadie-Hofstee plots were generated. The Lineweaver-Burk
plot is generated by plotting the reciprocal velocity (1/v) against the reciprocal
substrate concentration (1/S) at two or more values of inhibitor concentrations. In
contrast, the Eadie-Hofstee plot is generated by plotting the initial velocity (v)
against the value of initial velocity over substrate concentration (v/[S]) at two or
more values of inhibitor concentrations. Both Lineweaver-Burk and Eadie-Hofstee
plots linearize the Michaelis–Menten equation and are considered useful means to
present data graphically and thus identify the type of inhibition. However, the Eadie-
Hofstee plot, unlike the Lineweaver-Burk plot, distributes points evenly by giving
equal weight to data points in any range of substrate concentration or reaction
velocity (194, 335).

109
3.2.9. Culture of Mycobacterium tuberculosis
3.2.9.1. Preparation of media:
3.2.9.1.1. Middlebrook 7H9 broth
Middlebrook 7H9 Broth (BD Diagnostic, UK) was enriched with 0.2% (v/v)
glycerol, 0.05% (v/v) Tween® 80 and 10% (v/v) ADC (Albumin Dextrose Catalase)
before being filtered through a sterile bottle top filter unit with a 0.22 μm membrane
(Fisher Scientific, UK). ADC is an enrichment supplement composed of albumin,
dextrose and catalase, constituents essential for mycobacterial growth.
3.2.9.1.2. Middlebrook 7H11 agar plate medium
Middlebrook 7H11 Agar (BD Diagnostic, UK) plates were supplemented with 0.2%
(v/v) glycerol. 10% (v/v) OADC (Oleic Albumin Dextrose Catalase) was added
when the medium had cooled below 50 °C, but prior to setting. OADC is an
enrichment supplement composed of oleic acid, albumin, dextrose and catalase,
constituents essential for mycobacterial growth.
3.2.9.2. General considerations regarding Mtb culturing
The Advisory Committee on Dangerous Pathogens (ACDP) has categorized
Mycobacterium tuberculosis as hazard group 3. Within a containment Level 3
laboratory, a Nuaire Labguard Class II biological safety cabinet (Nuaire, USA) was
for all work involving viable Mtb.
Mtb cultures were safely contained inside a Bio TransportTM
Carrier box (Nalgene®,
USA) inside the incubator and during moving the cultures from the incubator to the
safety cabinet and vice versa. All waste generated was immersed in a solution of 5%
(v/v) of Surfanios before being autoclaved. Surfanios (Anios lab, France) was used
as disinfectant due to its superior ability to sterilise mycobacteria.
110
3.2.9.2.1. Mtb strain and growth media
Mtb strain H37Rv (ATCC#25618) was maintained in Middlebrook 7H9 Broth or
Löwenstein-Jensen slopes (BD Diagnostic, UK) at 37 °C in a 5% CO2 HERACell
150 CO2 incubator (Thermo Scientific, UK). The continuous sub-culture of Mtb in
solid or liquid medium was avoided as in vitro culture mutations might occur
frequently due to prolonged incubation (346).
3.2.9.2.2. Culturing Mtb from frozen stocks
Mtb was retrieved from -20 °C and allowed to defrost at room temperature. 50 μl of
Mtb stock was inoculated directly into 10 ml of Middlebrook 7H9 broth.
Simultaneously, a pre-warmed Löwenstein-Jensen slope was inoculated using a 10
μl disposable loop (NUNC, UK) as a cell reservoir and to eliminate the presence of
any contamination. Mtb cultures were incubated at 37 °C in a 5% CO2 HERACell
150 CO2 incubator (Thermo Scientific, UK). Following 2-3 weeks growth, an
isolated Mtb colony was transferred from the slope into a 50 ml Falcon tube
containing 10 ml of Middlebrook 7H9 both. The culture was vortexed and
subsequently incubated for a minimum of 2 weeks before being used. The remaining
Mtb in the defrosted vial were discarded in 5% (v/v) Surfanios.
3.2.9.2.3. Mtb aerobic cultures
Mtb inoculum (100 μl) was transferred to a 50 ml Falcon tube containing 10 ml of
Middlebrook 7H9 broth. The culture was vortexed and incubated for a minimum of 2
weeks at 37 °C in a 5% CO2 incubator before being used. The aerobic culture was
discarded after 8 weeks of incubation.
3.2.9.2.4. Hypoxia model of growth: cultures grown in limited oxygen condition
The Wayne model of growth was adapted for Mtb growth in oxygen limited
conditions (347). The creation of a microaerophilic environment (limited aeration)
was attained through reducing the head-space ratio to 0.5, and 375 μl of the log-
exponential phase Mtb were cultured in 50 ml Falcon tubes containing 37.5 ml of

111
Middlebrook 7H9 Broth. Each tube contained an autoclaved Polytetrafluoroethylene-
coated (PTFE-coated) magnetic stirring bar (VWR International) with 8 × 5 mm
dimensions. Subsequently, tube was closed tightly and sealed with Parafilm®
(Pechiney Plastic Packaging Company, USA). Cultures were incubated in a 5% CO2
incubator at 37 °C, stirring at 120 rpm on a Biostir 4 magnetic stirrer (Wheaton
Industries Inc, USA) (282).
3.2.9.2.5. Mtb growth curves
In order to plot growth curves for aerobic Mtb cultures (Chapter 3.2.9.2.3), the
culture turbidity was monitored twice a week at 600 nm using a WPA CO 8000
Biowave cell density meter (Biochrom, UK). The generation time, defined as the
time for Mtb cells to double in number, was assessed by plotting a curve of time
versus the OD600 values of the culture.
With the purpose of monitoring the growth of Mtb hypoxic cultures, a set of 19
cultures were made following the aforementioned method (section 3.2.9.2.4) and
used to monitor the growth of the hypoxic culture. At selected times, one tube was
opened and an aliquot of culture was collected before checking the turbidity at OD600
using the portable WPA CO 8000 Biowave cell density meter (Biochrom, UK).
Once the culture was opened and used, it was discarded.
Assuring the same provenance of bacteria, a 2 week culture of Mtb at OD600 ~ 0.9
was selected and used throughout all experiments. The generated growth curves
(Appendix I, Figures A - D) were used as additional information about the growth
rate of aerobic and hypoxic Mtb cultures that were used in this thesis.
3.2.10. Mycobacterium tuberculosis drug sensitivity assays
Mtb drug sensitivities were determined using Mtb drug sensitivity assay, microplate
alamar blue assay (MABA assay) as per Hartkoorn et al (2007) and Warman et al
(2012) (282, 348) with modification. All compounds were initially prepared in 400
μM in DMSO. Serial dilutions of each compound were made in DMSO, of which 2.5
μl were plated in triplicate to wells of a 96-well microplate (NUNC, UK) containing

112
47.5 μl growth medium. Compounds were plated alongside drug-free controls
containing growth medium with 2.5% DMSO and positive controls containing supra-
IC90 concentrations of isoniazid. Outer wells of assay plates contained sterile H2O
with the purpose of reducing the evaporation over the course of the experiment.
Subsequently, Mtb culture (aerobic or hypoxic) was diluted to the turbidity of a
McFarland Standard number 1 (Pro-Lab Diagnostics, UK) (OD600 = 0.3),
corresponding to a bacterial concentration of 3×10⁸ colony forming units per ml
(cfu.ml-1
), which was further diluted to obtain a final concentration of 1×10⁷ cfu.ml
-
1. All dilutions were made using Middlebrook 7H9 Broth. Mid-log phase Mtb diluted
to 1x10⁷ cfu.ml
-1 (50 μl) were plated in all wells, except the wells that contained
sterile H2O. Plates were incubated for 7 days at 37 °C in a CO2 incubator.
Afterwards, 20 μl 2:1 alamarBlue®:Tween 80 was added to the plates and further
incubated for 24 hours. AlamarBlue® solution (ABD Serotec, USA) was used as
indicator of Mtb growth as growth can be observed as a change in the colouration of
the alamarBlue®
solution. Afterwards, 10% paraformaldehyde (Sigma Aldrich, UK)
was freshly prepared and filtered through a 0.22 μm pore filter before being added to
each well of sterilise plates. It is important to filter 10% paraformaldehyde solution
in order to eliminate particles that could affect the photometric reading of the plate.
Following two hours of plate incubation with 10% paraformaldehyde, plates were
wiped thoroughly with 5% (v/v) Surfanios and assay results were determined by
measurement of well absorbance at 570 nm and 600 nm using an Opsys MRTM
Microplate Reader (Dynex Technologies, USA). Using these data and drug-free
wells data, the half-maximal inhibitory concentration (IC50) for each compound was
calculated. The IC50 represents the concentration of a drug which causes 50% of
growth inhibition. The IC90 (90% inhibitory concentration) refers to the
concentration of drug which causes 90% of growth inhibition. IC50 values were
calculated from plots of log dose vs. percentage of growth fitted with a four
parameter logistic function (Origin 8.5 software).
For anaerobic cultures, plates were prepared as described for aerobically grown Mtb
and subsequently were sealed within GasPak EZ pouches (BD, UK) containing an
indicator to confirm the maintaining of anaerobic conditions over the course of the

113
experiment. Afterwards, plates were incubated anaerobically at 37 °C in a CO2
incubator for 7 days and subsequently were moved to an aerobic environment and
incubated for a further 7 days. Plates were assayed (addition of alamarBlue®
and
10% paraformaldehyde) as previously described for aerobic cultures. In addition to
isoniazid controls, metronidazole controls were included to confirm anaerobic
conditions had been achieved (139). IC50 values of anaerobic cultures were
calculated in the same manner as for aerobic cultures.
3.2.11. Time-kill studies
Time-kill studies were carried out using the method of Warman et al (2012) (282). A
mid-log phase aerobic Mtb H37Rv culture (Chapter 3.2.9.2.3) was diluted to approx.
1x10⁷ cfu.ml
-1 and subsequently added to equal volumes of drug-containing growth
medium in the wells of a 24-well plate. Drugs were present at a final concentration
of 5x IC90 (90% inhibitory concentration), as determined from modified MABA
assays (Tables 3.3 and 3.5). A drug-free control was included in order to monitor
normal culture growth. After 1, 2, 4, and 7 days, aliquots of the cultures were
withdrawn and centrifuged at 10,000 g for 10 min. Pelleted materials were
resuspended in drug free Middlebrook 7H9 media (lacking Tween-80 and ADC).
Subsequently, serial dilution (1:10 - 1:106) were made before plating to solid growth
medium (Middlebrook 7H11 agar plates) (Becton Dickinson UK Ltd, Cowley,
Oxford, UK) supplemented with 10% OADC, 0.2% (v/v) glycerol, and 0.05% (v/v)
Tween-80). An aliquot of day 0 drug-free inoculum was similarly processed to
determine the initial bacterial load of all wells. After 14 days of incubation at 37 °C
in a CO2 incubator, cfu.ml-1
values were determined by colony counting.
3.2.12. Statistical analysis
To study the significance of the presence of different detergents on Mtb bd-I activity,
Mann-Whitney U test was applied whereas spearman’s correlation function was
applied to study the association between aerobically cultured Mtb H37Rv and
enzyme IC50 data using GraphPad 5 Software (USA).

114
3.3. Results
3.3.1. Detergent assay
The activity of Mtb bd-I was examined in the presence of different detergent types.
There was an increase in Mtb bd-I activity in the presence of 0.01% of cholate,
deoxycholate, CHAPS and DDM whilst the presence of Triton X-100 and Tween-80
led to noticeable decreases in activity (Figure 3.5). The effects of these detergents
were assessed for the double-knockout E. coli strain (ML16) as well and showed that
detergents did not have any effect on dQH2 oxidation activity, confirming the
expression of Mtb bd-I in the transformed double-knockout E. coli strain (TML16).
Detergent free Cholate Deoxycholate CHAPS DDM Triton X-100 Tween 800.0
0.5
1.0
1.5
2.0
2.5
3.0
Sp
eci
fic c
ata
lytic
act
ivity
(
mol.m
in-1.m
g-1)
0.01% Detergent
Figure 3.5: The effect of detergents on Mtb bd-I activity in 50 mM KPi, 2 mM EDTA,
pH 7.5 buffer
The transformed double-knockout E. coli strain, TML16 (dark grey bars), showed increases
of Mtb bd-I activity in the presence of 0.01% cholate, deoxycholate, CHAPS or DDM but a
notable decrease in the presence of Triton X-100 and Tween-80. The effect of detergents
was also examined on the double-knockout E. coli strain, ML16 (light grey bars). The values
are the average of experimental triplicates ± SEM. The data showed no significant effect
between the presence and the absence of detergent (P > 0.05) (GraphPad 5 Software, USA).

115
3.3.2. pH assay
To determine the most favourable conditions for kinetic studies of Mtb bd-I, the
optimum pH was examined (Figure 3.6). The pH dependence of the dQH2 Mtb bd-I
oxidase activity showed a bell-shaped curve from which the greatest Mtb bd-I
activity was at pH 7.5, but low activity values were recorded at more acidic and
alkaline pH values.
5.5 6.0 6.5 7.0 7.5 8.0 8.5
2
3
4
5
6
7
8
9
Specific
cata
lytic a
ctivity (
mol.m
in-1.m
g-1)
pH
Figure 3.6: pH dependence of Mtb bd-I activity.
The rate of dQH2 oxidation by Mtb bd-I was determined in a mixed buffer system containing
40 mM HEPES/MES/TAPS. The optimal activity of Mtb bd-I was observed at pH 7.5 but it
decreased at more acidic and alkaline pH. The values were obtained by calculating an
average of two independent replicate experiments ± SEM (Origin 8.5 software).

116
3.3.3. Kinetic characterization of Mtb bd-I
Initial kinetic characterisation of crude Mtb bd-I membranes revealed a typical
biphasic activity with a fast linear phase followed by a second slower phase in
presence of dQH2 and Q1H2 substrates (Figures 3.7, A and 3.8 respectively). In
contrast, Mtb cytochrome bd-I showed sigmoidal behaviour with low concentrations
of Q2H2 (Figure 3.9), in agreement with previous studies (345, 349).
Mtb bd-I demonstrated a preference for dQH2. Apparent Km data for substrate
analogues were determined spectrophotometrically (Figures 3.7 – 3.9) identifying a
rank order preference for dQH2 > Q1H2 > Q2H2 with Km values of 19.25 ± 1.3, 51.55
± 8.9, and 65.21 ± 15.31 µM respectively. Examining Mtb bd-I membranes of
TML16 strain, grown in aerobic conditions revealed similar Km data (21.52 ± 3.57
µM) to that from O2-limited condition (19.25 ± 1.3 µM). The specific catalytic
activity values of Mtb bd-I during O2-limited condition was 9.01 ± 0.23 μmol.min-
1.mg
-1 and during aerobic condition was 5.1 ± 0.29 μmol.min
-1.mg
-1 (Table 3.2).
Given the fact that the assay was performed in an oxygen-rich environment, for ‘air-
oxidized’ cytochrome bd-I (i.e. the oxygen reduction rate almost constant) the
oxidation rate of quinols was not affected. Therefore, the data gave a monophasic
shape although bd-I was expected to exhibit a bisubstrate catalytic reaction. The
Michaelis-Menten equation for dQH2 and Q1H2 oxidation was applied. However,
under oxygen-limiting growth conditions, enzyme kinetics may be affected as the
oxidation of quinols would be tightly coupled to dioxygen reduction rate (345).
Table 3.2: Kinetic parameters of Mtb bd-I activity
Km ± SEM (μM)
specific catalytic activity ± SEM
(μmol.min-1
.mg-1
)
dQH2 (O2-limited) 19.25 ± 1.3 9.01 ± 0.23
dQH2 (aerobic) 21.52 ± 3.57 5.1 ± 0.29
Q1H
2
51.55 ± 8.9 5.26 ± 0.52
Q2H
2
65.21 ± 15.31 8.65 ± 2.5

117
3.3.3.1. Decylubiquinol (dQH2)
A)
0 25 50 75 100
0
2
4
6
8
10
Sp
ecific
ca
taly
tic a
ctivity (m
ol.m
in-1.m
g-1)
[dQH2] M
B)
0 25 50 75 100
0
1
2
3
4
Sp
ecific
ca
taly
tic a
ctivity (m
ol.m
in-1.m
g-1)
[dQH2] M
Figure 3.7: Steady-state decylubiquinol:Mtb bd-I activity
Steady-state kinetics of Mtb bd-I were measured spectrophotometrically at 283 nm. The
oxidation of decylubiquinol (dQH2) by the Mtb bd-I (closed circles) was analysed using the
Michaelis-Menten equation. The apparent Km (µM) and specific catalytic activity (µmol.min-
1.mg
-1) values were calculated to be respectively A) 19.25 ± 1.3 and 9.01 ± 0.23, during O2-
limited growth condition and B) 21.52 ± 3.57 and 5.1 ± 0.29 during aerobic growth
condition. ML16 (open circles) was tested as a negative background. The reactions were
initiated by the addition of dQH2 (5 - 98 µM). The points are the mean initial rates of
experimental duplicate obtained at each dQH2 concentration indicated. Data were fitted
using the Michaelis-Menten function using rectangular hyperbola (Origin 8.5 software).

118
3.3.3.2. Ubiquinol-1 (Q1H2)
0 25 50 75 100
0
1
2
3
4
5
Sp
ecific
ca
taly
tic a
ctivity (m
ol.m
in-1.m
g-1)
[Q1H
2] M
Figure 3.8: Steady-state ubiquinol-1:Mtb bd-I activity
Steady-state kinetics of Mtb bd-I were measured spectrophotometrically at 283 nm. The
oxidation of ubiquinol-1 (Q1H2) by the Mtb bd-I (closed circles) was analysed using the
Michaelis-Menten equation. The apparent Km (µM) and specific catalytic activity (µmol.min-
1.mg
-1) values were calculated to be 51.55 ± 8.9 and 5.26 ± 0.52 respectively. ML16 (open
circles) was tested as a negative background. The reactions were initiated by the addition of
Q1H2 (5 - 98 µM). The points are the mean initial rates of experimental duplicates obtained
at each Q1H2 concentration indicated. Data were fitted using the Michaelis-Menten function
(Origin 8.5 software).
3.3.3.3. Ubiquinol-2 (Q2H2)
0 25 50 75 100
0
2
4
6
8
10
12
Specific
Cata
lytic A
ctivity (m
ol.m
in-1.m
g-1)
[Q2H
2] M
Figure 3.9: Steady-state ubiquinol-2: Mtb bd-I activity
Steady-state kinetics of Mtb bd-I were measured spectrophotometrically at 283 nm. The
oxidation of ubiquinol-2 (Q2H2) by Mtb bd-I (closed circles) was analysed using the
modified ping-pong bi-bi mechanism for cytochrome bd-I. The apparent Km (µM) and
specific catalytic activity (µmol.min-1
.mg-1
) values were calculated to be 65.21 ± 15.31 and
8.65 ± 2.5 respectively. ML16 (open circles) was tested as a negative background. The
reactions were initiated by the addition of Q2H2 (5 - 98 µM). The points are the mean initial
rates of experimental duplicates obtained at each Q1H2 concentration indicated. Data were
fitted using a modified ping-pong bi-bi function (Origin 8.5 software).
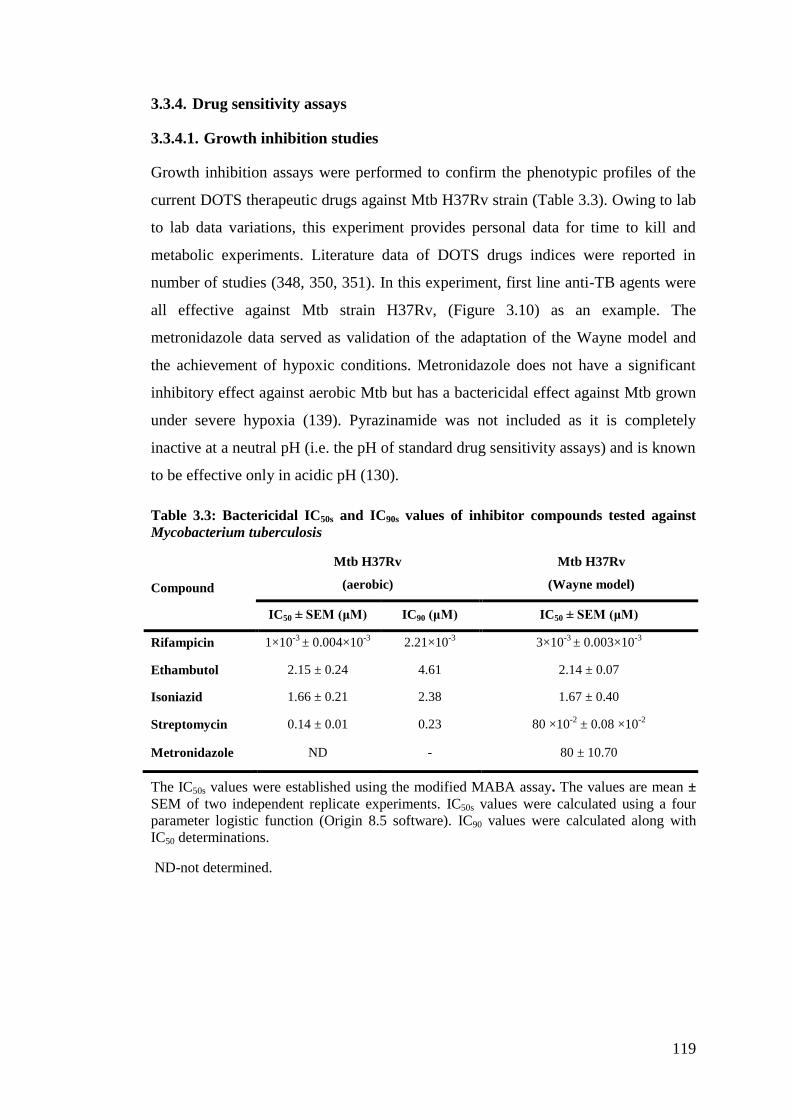
119
3.3.4. Drug sensitivity assays
3.3.4.1. Growth inhibition studies
Growth inhibition assays were performed to confirm the phenotypic profiles of the
current DOTS therapeutic drugs against Mtb H37Rv strain (Table 3.3). Owing to lab
to lab data variations, this experiment provides personal data for time to kill and
metabolic experiments. Literature data of DOTS drugs indices were reported in
number of studies (348, 350, 351). In this experiment, first line anti-TB agents were
all effective against Mtb strain H37Rv, (Figure 3.10) as an example. The
metronidazole data served as validation of the adaptation of the Wayne model and
the achievement of hypoxic conditions. Metronidazole does not have a significant
inhibitory effect against aerobic Mtb but has a bactericidal effect against Mtb grown
under severe hypoxia (139). Pyrazinamide was not included as it is completely
inactive at a neutral pH (i.e. the pH of standard drug sensitivity assays) and is known
to be effective only in acidic pH (130).
Table 3.3: Bactericidal IC50s and IC90s values of inhibitor compounds tested against
Mycobacterium tuberculosis
The IC50s values were established using the modified MABA assay. The values are mean ±
SEM of two independent replicate experiments. IC50s values were calculated using a four
parameter logistic function (Origin 8.5 software). IC90 values were calculated along with
IC50 determinations.
ND-not determined.
Compound
Mtb H37Rv
(aerobic)
Mtb H37Rv
(Wayne model)
IC50 ± SEM (μM) IC90 (μM) IC50 ± SEM (μM)
Rifampicin 1×10⁻³
± 0.004×10⁻³
2.21×10⁻³
3×10⁻³
± 0.003×10⁻³
Ethambutol 2.15 ± 0.24 4.61 2.14 ± 0.07
Isoniazid 1.66 ± 0.21 2.38 1.67 ± 0.40
Streptomycin 0.14 ± 0.01 0.23 80 ×10-2
± 0.08 ×10⁻²
Metronidazole ND - 80 ± 10.70

120
0.1 1 10 100
0
50
100
% o
f co
ntr
ol g
row
th[Isoniazid] M
Figure 3.10: IC50 determination of isoniazid concentrations against Mtb aerobic growth
The percentages of growth were calculated, utilizing control wells to represent 100 %
growth. The IC50 for isoniazid was calculated as 1.66 ± 0.21 μM using a four parameter
logistic function (Origin 8.5 software). The values are mean ± SEM of two independent
replicate experiments.
3.3.4.2. Enzyme and growth inhibition studies, quinolone-type compounds
As a step towards identifying and validating a novel Mtb bd-I inhibitor, a collection
of quinolone-type inhibitors (in house compounds) were tested against Mtb bd-I. The
flow of Mtb bd-I and Mtb H37Rv inhibition studies is depicted in Figure 3.11 that
shows the rank order of compound potency against Mtb bd-I and Mtb H37Rv,
ranging from the least potent to the most potent. Inhibition studies with these
inhibitors showed significant attenuations of quinol oxidation activity in a
concentration-dependent manner (as an example see Figure 3.12). The IC50s values
were determined for 23 compounds with each compound screened at 8
concentrations (with 3-fold dilution steps between points), all of which were
replicated. Generally, IC50 values ranged between approximately 3 x 10⁻³
and 70 μM
(Table 3.4). In order to examine SAR of these compounds, the inhibitors were
classified into groups according to their structures. Hundreds of compounds were
screened through a single point inhibition screening assay. In this screening, all
compounds were examined at final concentration of 5 μM and processed normally
using the MABA assay (Mtb) in aerobic condition. Consequently, those compounds
that showed 50% or more inhibition processed to a full IC50 modified MABA assay
(Mtb). The in house labratory data of single point screening assay at 5 μM
concentration of quinolone-type compounds using the modified MABA assay (Mtb)
is shown in Table (3.4). ClogP values of all quinolone-type inhibitors were

121
calculated; ClogP is a well-established measure of the compound's hydrophilicity
from which high ClogP value indicates low hydrophilicity and thus poor absorption
or penetration (Table 3.4).
Figure 3.11: The quinolone-type compounds flow chart of potency against Mtb bd-I
and Mycobacterium tuberculosis H37R
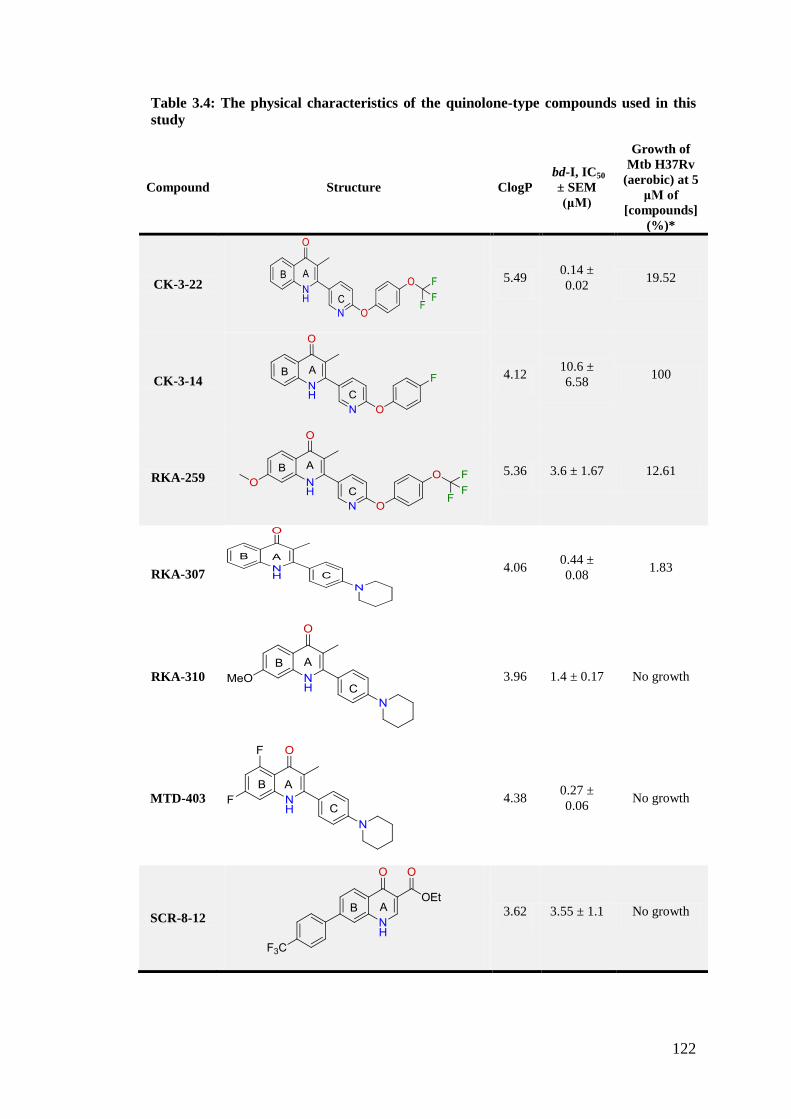
122
Table 3.4: The physical characteristics of the quinolone-type compounds used in this
study
Compound Structure ClogP
bd-I, IC50
± SEM
(μM)
Growth of
Mtb H37Rv
(aerobic) at 5
μM of
[compounds]
(%)*
CK-3-22
5.49 0.14 ±
0.02 19.52
CK-3-14
4.12 10.6 ±
6.58 100
RKA-259
5.36 3.6 ± 1.67 12.61
RKA-307
4.06 0.44 ±
0.08 1.83
RKA-310
3.96 1.4 ± 0.17 No growth
MTD-403
4.38 0.27 ±
0.06 No growth
SCR-8-12
3.62 3.55 ± 1.1 No growth

123
Table 3.4: (continued)
CK-2-88
5.14 0.02 ±
0.01 90.51
CK-3-23
6.67 3.6 ± 0.57 6.62
CK-2-63
6.11 3 x 10
-3 ± 1
x 10-4
37.81
PG-203
5.23 0.07 ±
0.02 100
RKA-70
6.32 0.75 ±
0.36 100
RKA-73
6.18 0.31 ±
0.06 100
LT-9
5.30 0.1 ± 0.02 34.74
RKA-41
3.68 70.3 ±
29.98 ND
SL-2-25
5.33 0.29 ±
0.07 88.91

124
Table 3.4: (continued)
WDH-1U-
10
4.95 0.012 ± 1
x 10-3
82.22
WDH-1W-
5
4.29 15.8 ±
1.23 61.31
WDH-2A-
9
4.64 6.5 ± 2.26 97.42
GN-171
6.34 0.25 ±
0.09 100
OB-231
4.55 7.8 ± 1.64 93.42
OB-258
4.42 8.8 ± 2.87 94.81
PG-128
3.82 4.47 ±
0.86 95.63
The quinolone-type compounds were grouped according to their chemical structures along
with their code, ClogP values and the mean of IC50s values against Mtb bd-I ± SEM of
experimental duplicates. Values were determined spectrophotometrically (Mtb bd-I). IC50s
values were calculated using a four parameter logistic function (Origin 8.5 software).
* In house laboratory data of a single point screening assay at 5 μM concentration of
quinolone-type compounds using the modified MABA assay (Mtb H37Rv).

125
The in house laboratory data of the quinolone-type inhibitors were used in this study
to show the full phenotypic profiles of these compounds. Growth inhibition assays
were determined against Mtb H37Rv, using the modified MABA assay, under
aerobic and anaerobic growth conditions for the quinolone-type inhibitors. Out of 23
compounds tested against Mtb bd-I and screened through single point screening
assay, 9 compounds showed ≤ 50% of growth at 5 μM concentration, all of which
were examined through a full IC50 modified MABA assay (Mtb) (Table 3.5).
Table 3.5: IC50s values from growth inhibitory assays of quinolone-type compounds
Values were calculated spectrophotometrically (Mtb bd-I) or using the modified MABA assay (Mtb).
The values are the mean of at least two replicates. IC50s values were calculated using a four parameter
logistic function (Origin 8.5 software).
* In house laboratory data. ND-not determined. NA-not applicable as aerobic IC50 was > 10 μM.
Compound Mtb bd-I Mtb H37Rv (aerobic)
Mtb H37Rv
(Wayne model)
IC50 ± SEM (μM) IC50 ± SEM (μM)* IC90 (μM) IC50 (μM)*
LT-9 0.1 ± 0.02 >10 ND NA
CK-3-22 0.14 ± 0.02 1.97 ± 0.05 4.95 >10
SCR-8-12 3.55 ± 1.12 3.45 ± 0.15 4.55 6.41
CK-3-23 3.6 ± 0.57 2.89 ± 0.11 6.53 1.63
CK-2-63 3 x 10⁻³
± 0.1 x 10⁻³
3.7 ± 0.19 6.73 1.61
RKA-259 3.6 ± 1.67 1.03 ± 0.03 2.08 1.42
RKA-307 0.44 ± 0.08 1.57 ± 0.03 3.11 3.92
RKA-310 1.4 ± 0.17 0.81 ± 0.04 1.96 0.61
MTD403 0.27 ± 0.06 0.27 ± 0.01 0.85 0.41

126
The following graphs (Figure 3.12) show examples of the inhibitory effects of two
quinolone-type compounds tested against Mtb bd-I.
A)
1E-4 1E-3 0.01 0.1 1
0.04
0.06
0.08
0.10
0.12
0.14
A
bs.m
in-1 (
28
3 n
m)
[CK-2-63] M
B)
1E-3 0.01 0.1 1 10
0.08
0.10
0.12
0.14
bs.m
in-1
(28
3n
m)
[MTD-403] M
Figure 3.12: Determination of the IC50s for CK-2-63 and MTD-403 against Mtb bd-I
activity
The IC50s values for A) CK-2-63 and B) MTD-403 in the decylubiquinol:Mtb bd-I assay
were determined spectrophotometrically at 283 nm. The IC50s values are 3 x 10⁻³
± 0.1 x 10⁻³
μM and 0.27 ± 0.06 μM for CK-2-63 and MTD-403, respectively. The values are the
average of experimental duplicates ± SEM at each point. The data were fitted using a four
parameter logistic function (Origin 8.5 software).

127
The following Table (3.6) shows other compounds used for characterization of Mtb
bd-I. Heme ligands (e.g., cyanide, azide or nitric oxide) are known to act at the O2
binding/reducing site of the cytochrome bd-I oxidase (211). Thus, the IC50 of
potassium cyanide (KCN) was calculated to be 429.11 ± 126.85 μM against Mtb bd-
I. In addition, the IC50 of HDQ, a quinolone-like inhibitor that has high affinity for
alternative NADH dehydrogenases, was calculated to be 231.93 ± 116.4 μM.
Table 3.6: The IC50s determination of KCN and HDQ against Mtb bd-I activity
Compound Structure ClogP Mtb bd-I, IC50 ± SEM (μM)
KCN
ND 429.11 ± 126.85
HDQ
6.52 231.93 ± 116.43
The IC50s values for KCN and HDQ in the decylubiquinol:Mtb bd-I assay were determined
spectrophotometrically at 283 nm. IC50s values are the mean ± SEM of experimental
duplicates. IC50s values were calculated using a four parameter logistic function (Origin 8.5
software).

128
3.3.5. Correlation Study
Scatter trends in activity for the compounds were observed with regards to
aerobically cultured Mtb H37Rv and enzyme IC50 data. This is most clearly
demonstrated by a plot of Mtb bd-I IC50 against aerobically cultured Mtb H37Rv
IC50 (Figure 3.13) in which no significant correlation was apparent (Table 3.5).
However, excluding LT-9, CK-3-22, CK-2-63 and RKA-259 resulted in a two star
(**) significant correlation (P value < 0.01).
Recombinant Mtb bd-I IC50 (M)
M. t
ub
ercu
losi
s IC
50
(M
)
0 1 2 3 40
2
4
6
8
10
Figure 3.13: Scatter plot of the IC50s of quinolone-type compounds against Mtb bd-I
and aerobically cultured Mycobacterium tuberculosis H37Rv
The IC50s of MTD-403 (closed circle), RKA-307 (closed square), CK-3-22 (open square),
RKA-310 (open diamond), CK-3-23 (closed diamond), SCR-8-12 (open circle), CK-2-63
(closed inverted triangle), LT-9 (open inverted triangle), and RKA-259 (cross) compounds
against Mtb bd-I and aerobically cultured Mtb H37Rv were plotted using a correlation
function in GraphPad Prism (GraphPad 5 Software, USA). The data showed no significant
correlation between enzyme inhibition and in vitro antitubercular activity (P > 0.05). The
values are the IC50s of the compounds are detailed in Table 3.5.
3.3.6. Time-kill studies
According to the in vitro definition, bacteriostatic agents inhibit bacterial growth
whereas bactericidal agents kill bacteria. The bactericidal/static nature of 8
quinolone-type inhibitors was determined by time-dependent kill kinetic studies
(Figure 3.14, compounds were presented at 5 x IC90). Whilst untreated Mtb showed
significant growth over 7 days, all quinolone-type compounds showed bacteriostatic

129
activities with the exception of SCR-8-12, CK-3-22 and CK-3-23. SCR-8-12
revealed a significant reduction in viable counts (cfu.ml-1
) of Mtb within the first 4
days and by day 7 no viable organisms remained. SCR-8-12 activity is similar to the
bactericidal activity of streptomycin (STR). In particular, CK-3-22 and CK-3-23 did
not exhibit any significant reduction in viable counts over 7 days while RKA-310
displayed lower viable counts than control over 7 days but without any significant
decline. LT-9, RKA-307 and MTD-403 demonstrated nearly the same bacteriostatic
nature where viable counts of bacteria started to decline by day 7. This phenomenon
is more obvious in CK-2-63 activity, which showed reduction of Mtb viable count
by day 7. Ethambutol (EMB) reduced the viable counts significantly over 7 days but
it failed to completely attenuate growth. The bactericidal/static nature of RKA-259
was not determined due to time limitation.
Figure 3.14: Time-kill curves for untreated and drug-treated Mtb H37Rv
Time-kill curves for untreated cells, ethambutol, streptomycin, CK-2-63, CK-3-22, CK-3-23,
LT-9, MTD-403, SCR-8-12, RKA-310, and RKA-307. Compounds were present at 5 x IC90
(established from MABA assays) and cfu.ml-1
were determined at the appropriate time points.
Points are the mean of experimental duplicates. Error bars represent ± SEM of each point.

130
3.3.7. The mechanism of inhibition of Mtb bd-I activity by quinolone-type
inhibitors
To study the mechanism of inhibition and to distinguish the interaction between Mtb
bd-I and the substrate, dQH2 and quinolone-type inhibitors, the steady state kinetics
of Mtb bd-I were studied with respect to the substrate and inhibitors. The main
division of inhibitors are irreversible and reversible inhibitors. The enzyme catalytic
activity is completely destroyed by irreversible inhibitors but completely restored
following reversible inhibitors removal. Most drugs bind to their enzyme target
through reversible interactions. The enzymatic reaction begins with the reversible
binding of substrate (S) to the free enzyme (E) to form the enzyme-substrate (ES)
complex. Inhibitors (I) can bind directly to the free form of the enzyme, to an ES
complex, or to both. To describe S binding to the enzyme-inhibitor (EI) complex, a
constant α must be used. The constant α defines the degree to which inhibitor
binding affects the affinity of the E for S. According to the inhibitors influence on
enzyme kinetic behaviour and parameters, inhibitors were divided into three types,
competitive, non-competitive and uncompetitive inhibitors (335, 352). Matsumoto et
al (2006) described that competitive inhibition is characterised by no alteration of the
maximum velocity (Vmax) while non- and un-competitive inhibition cause attenuation
of Vmax (345). Reversible modes of inhibitor interactions with enzymes and their
effect on the S binding affinity and consequently on kinetic parameters are depicted
in Table 3.7.

131
Table 3.7: Diagnostic signatures and binding features of reversible inhibition modalities (335, 345, 352, 353)
Inhibition
modality
Diagnostic signature in
Lineweaver-Burk plot
Diagnostic signature in
Eadie-Hofstee plot Enzyme-Inhibitor binding Affinity of EI complex to S
Effect on parameters
Km Vmax
Competitive, α =
∞
Intersecting lines that
converge at the y-axis
lines intersecting the y-
axis at Vmax
Inhibitor binds exclusively
to the free enzyme
EI complex excludes further S
binding Increase No effect
Non-competitive,
α > 1
Intersecting lines that
converge to the left of the y-
axis and above x-axis
Par
alle
l li
nes
Inhibitor binds to the free
enzyme
EI complex decreases affinity of
S binding Increase Decrease
Non-competitive,
α = 1
Intersecting lines that
converge to the left of the y-
axis and on the x-axis
Inhibitor binds to the free
enzyme and ES complex
equally
EI complex has no change in
affinity of S binding No effect Decrease
Non-competitive,
α < 1
Intersecting lines that
converge to the left of the y-
axis and below the x-axis
Inhibitor binds with greater
affinity to the ES complex
EI complex augments affinity of
S binding Decrease Decrease
Uncompetitive, α Parallel lines lines intersecting the x-
axis at Vmax/ Km
Inhibitor binds exclusively
to the ES complex
Inhibitor requires the prior
formation of the ES complex for
binding and inhibition
Decrease Decrease

132
In order to uncover the mechanism of inhibition of Mtb bd-I by CK-2-63, SL-2-25,
MTD-403, PG-203 and SCR-8-12, the data were first fitted using the Michaelis-
Menten function to calculate Km and Vmax (converted to specific catalytic activity)
parameters. Then data were transformed to Lineweaver-Burk plot and Eadie-Hofstee
plots with view to examine the properties as depicted in Table 3.7. The mode of
quinolone-type compound inhibition is summarized in the following Table 3.8 and
the data for each inhibitor are depicted in Figures 3.15 - 3.19. The 5 quinolone-type
compounds were selected arbitrarily.
Table 3.8: Mechanism of inhibition of Mtb bd-I by quinolone-type inhibitors in
presence of varying concentrations of dQH2 substrate
Inhibitor Km ± SEM
(μM)
Specific catalytic activity
± SEM (μmol.min-1
.mg-1
) Mechanism of inhibition
CK-2-63 4 nM 25.8 ± 3.5 6.95 ± 0.42 Non-competitive, α > 1
Or mixed-type of inhibition 12 nM 28.3 ± 5.2 5.93 ± 0.55
SCR-8-12 3 μM 12.3 ± 1.1 8.85 ± 0.23
Competitive 9 μM 10.2 ± 1.3 8.62 ± 0.27
MTD-403 110 nM 8.5 ± 0.9 8.45 ± 0.22
Competitive 330 nM 7.9 ± 0.7 8.5 ± 0.18
SL-2-25 110 nM 7.4 ± 3.4 6.0 ± 0.46
Uncompetitive 330 nM 7.7 ± 0.7 4.45 ± 0.91
PG-203 110 nM 7.7 ± 1.5 4.1 ± 0.17
Uncompetitive 330 nM 8.7 ± 1.6 2.88 ± 0.13
Steady-state kinetics of treated Mtb bd-I were measured spectrophotometrically at 283 nm.
The oxidation of dQH2 by Mtb bd-I in the presence of inhibitors was analysed using the
Michaelis-Menten equation. The apparent Km (µM) and specific catalytic activity (µmol.min-
1.mg
-1) values were calculated. The reactions were initiated by the addition of gradient
concentration of dQH2 (5 - 98 µM). The values are the mean initial velocity of experimental
duplicates obtained at each point. The data were fitted using the Michaelis-Menten function
(Origin 8.5 software). The Km and specific catalytic activity parameters were compared to
untreated Mtb bd-I parameters of dQH2 substrate oxidation (Km = 19.25 ± 1.3 µM, specific
catalytic activity = 9.01 ± 0.23 µmol.min-1
.mg-1
).

133
3.3.7.1. Inhibition mechanism of Mtb bd-I by CK-2-63
A)
B) C)
Figure 3.15: Substrate titration of steady state velocity for Mtb bd-I in the presence of
the CK-2-63 inhibitor
A) Steady-state kinetics of Mtb bd-I at varying dQH2 (5-98 µM) concentration with no
inhibitor (closed circle), with 4 nM CK-2-63 (open diamond) and with 12 nM CK-2-63
(closed diamond) were fitted using the Michaelis-Menten function (Origin 8.5 software). B)
Data as in (A) were fitted using the double reciprocal Lineweaver Burk plot. CK-2-63 shows
a non-competitive (α > 1) mode of inhibition with intersecting lines that converge to the left
of the y-axis and above x-axis. C) Data as in (A) were fitted using the Michaelis-Menten
function Eadie-Hofstee plot. CK-2-63 shows a mixed mode of inhibition; the lines are not
parallel neither intersecting at Vmax values. The points are the mean initial velocity of
experimental duplicates obtained at each dQH2 concentration indicated. The data were fitted
using Kalidagraph (Synergy software).

134
3.3.7.2. Inhibition mechanism of Mtb bd-I by SCR-8-12
A)
B) C)
Figure 3.16: Substrate titration of steady state velocity for Mtb bd-I in the presence of
the SCR-8-12 inhibitor
A) Steady-state kinetics of Mtb bd-I at varying dQH2 (5-98 µM) concentration with no
inhibitor (closed circle), with 9 μM SCR-8-12 (closed diamond) and with 3 μM SCR-8-12
(open diamond) were were fitted using the Michaelis-Menten function (Origin 8.5 software).
B) Data as in (A) were fitted using the double reciprocal Lineweaver Burk plot. SCR-8-12
shows a competitive mode of inhibition with intersecting lines that converge at the y-axis. C)
Data as in (A) were fitted using the Eadie-Hofstee plot. SCR-8-12 shows a competitive
mode of inhibition with intersecting lines at Vmax values. The points are the mean initial
velocity of experimental duplicates obtained at each dQH2 concentration indicated. The data
were fitted using Kalidagraph (Synergy software).
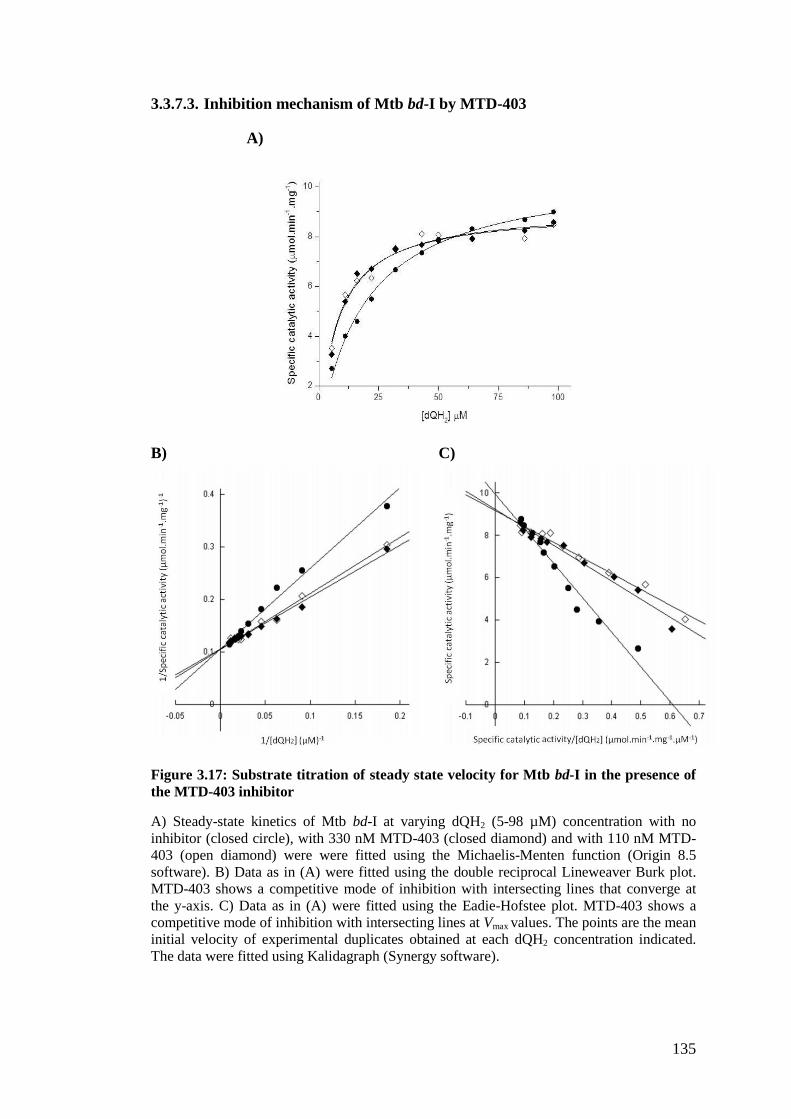
135
3.3.7.3. Inhibition mechanism of Mtb bd-I by MTD-403
A)
B) C)
Figure 3.17: Substrate titration of steady state velocity for Mtb bd-I in the presence of
the MTD-403 inhibitor
A) Steady-state kinetics of Mtb bd-I at varying dQH2 (5-98 µM) concentration with no
inhibitor (closed circle), with 330 nM MTD-403 (closed diamond) and with 110 nM MTD-
403 (open diamond) were were fitted using the Michaelis-Menten function (Origin 8.5
software). B) Data as in (A) were fitted using the double reciprocal Lineweaver Burk plot.
MTD-403 shows a competitive mode of inhibition with intersecting lines that converge at
the y-axis. C) Data as in (A) were fitted using the Eadie-Hofstee plot. MTD-403 shows a
competitive mode of inhibition with intersecting lines at Vmax values. The points are the mean
initial velocity of experimental duplicates obtained at each dQH2 concentration indicated.
The data were fitted using Kalidagraph (Synergy software).

136
3.3.7.4. Inhibition mechanism of Mtb bd-I by SL-2-25
A)
B) C)
Figure 3.18: Substrate titration of steady state velocity for Mtb bd-I in the presence of
the SL-2-25 inhibitor
A) Steady-state kinetics of Mtb bd-I at varying dQH2 (5-98 µM) concentration with no
inhibitor (closed circle), with 330 nM SL-2-25 (closed diamond) and with 110 nM SL-2-25
(open diamond) were fitted using the Michaelis-Menten function (Origin 8.5 software). B)
Data as in (A) were fitted using the double reciprocal Lineweaver Burk plots. SL-2-5 shows
an uncompetitive mode of inhibition with parallel lines. C) Data as in (A) were fitted using
the Eadie-Hofstee plot. SL-2-5 shows an uncompetitive mode of inhibition with intersecting
lines at Vmax /Km values. The points are the mean initial velocity of experimental duplicates
obtained at each dQH2 concentration indicated. The data were fitted using Kalidagraph
(Synergy software).

137
3.3.7.5. Inhibition mechanism of Mtb bd-I by PG-203
A)
B) C)
Figure 3.19: Substrate titration of steady state velocity for Mtb bd-I in the presence of
the PG-203 inhibitor
A) Steady-state kinetics of Mtb bd-I at varying dQH2 (5-98 µM) concentration with no
inhibitor (closed circle), with 330 nM PG-203 (closed diamond) and with 110 nM PG-203
(open diamond) were fitted using the Michaelis-Menten function (Origin 8.5 software). B)
Data as in (A) were fitted using the double reciprocal Lineweaver Burk plot. PG-203 shows
an uncompetitive mode of inhibition with parrallel lines. C) Data as in (A) were fitted using
the Eadie-Hofstee plot. PG-203 shows an uncompetitive mode of inhibition with intersecting
lines at Vmax /Km values. The points are the mean initial velocity of experimental duplicates
obtained at each dQH2 concentration indicated. The data were fitted using Kalidagraph
(Synergy software).

138
3.4. Discussion
A detailed understanding of the drug target and the mechanism of drug-target
binding helps immensely in developing a lead. An initial characterization of
recombinant Mtb cytochrome bd-I oxidase (Mtb bd-I) will be discussed in this
chapter. There are several aspects of enzymes characterizations that merit
consideration, some of which will be discussed here. The pH and detergent
influences on Mtb bd-I activity were considered. In addition, substrate preference,
catalytic behaviour and potential of Mtb bd-I as a drug target were studied.
A heterologous expression system (TML16) for Mtb bd-I characterization was
developed using an Escherichia coli bo3/bd-I knockout strain (ML16; recA, cydAB,
cyoABCDE::Cmr). Steady-state kinetics of Mtb bd-I for dQH2 oxidation were
performed using crude recombinant membrane of TML16 strain that was grown
aerobically and under O2-limited condition. The apparent Km (µM) and specific
catalytic activity (µmol. min-1
.mg-1
) values were calculated to be respectively 19.25
± 1.3 and 9.01 ± 0.23, during O2-limited growth condition and 21.52 ± 3.57 and 5.1
± 0.29 during aerobic growth condition. The Km values of Mtb bd-I from both
growth conditions were similar, but not the specific catalytic activity values. This
was justified through the fact that Km is a characteristic of an enzyme for its substrate
and is independent of the enzyme concentration used in the experiment. However,
catalytic activity value varies with the amount of enzyme used and hence it has no
absolute value (335). Therefore, all the experimental assays in this chapter were
performed using crude recombinant membranes from O2-limited grown TML16 as it
had the highest catalytic activity.
Steady-state kinetics of Mtb bd-I oxidase revealed a substrate preference for dQH2
over Q1H2 and Q2H2 (Km = 19.25 μM, 51.5 μM and 65.2 μM). The reported Km value
of dQH2 oxidation in E. coli (85 µM) (290) is much higher than that of Mtb bd-I,
indicating the high affinity of dQH2 for Mtb bd-I. Q1H2 is the preferred substrate for
studying cytochrome bd-I in various organisms, recording a broad range of Km
values. The apparent Km values estimated for cytochrome bd-I Q1H2 oxidation by E.
coli, Azotobacter vinelandii, Klebsiella pneumonia, Cyanobacterium synechocystis
and Photobacterium phosphoreum range from 40 µM to 280 µM. The initial steady-
state kinetics of Mtb bd-I were consistent with previous studies whereby Mtb bd-I

139
conclusively catalyses the conversion of quinol to quinone with concomitant O2
reduction. Importantly, the catalytic behaviours of Mtb bd-I in oxidation of dQH2
and Q1H2 were similiar to its counterparts in other bacteria, following a
monosubstrate reaction (described by the Michaelis-Menten equation) (212, 213,
321, 336, 345, 349, 354-357).
Regarding the enzyme kinetics of Q2H2 oxidation, different Km values were reported
for the E. coli cytochrome bd-I, 50 µM (356), 60 µM (358) and 42 µM (345).
Cyanobacterium synechocystis cytochrome bd-I had a Km value of 8 µM for Q2H2
oxidation (349). Although Mtb bd-I showed comparable kinetic to E. coli bd-I, it
seemed to have the lowest affinity for the Q2H2 substrate. Notably, kinetic analysis
with a wide range of substrate concentrations revealed that the oxidase activity of
Mtb cytochrome bd-I showed sigmoidal concentration dependence at low
concentrations of Q2H2, and marked substrate inhibition at high concentrations of
Q2H2. In a structure-function study on the ubiquinol-2 analogs, the substrate
inhibition of E. coli bd-I oxidase was related to the 6-diprenyl group and to the 3-
methoxy group on the quinone ring (345). The peculiar kinetics were considered as a
unique feature of bd-type quinol oxidase since in a similar Q2H2 concentration range,
the alternative E. coli terminal oxidase, the cytochrome bo3 heme-copper quinol
oxidase, never exhibits such sigmoidality or substrate inhibition (358, 359). Vladimir
(2003) noted that the substrate inhibition is often observed in the nonphysiological
reaction and at high substrate concentrations where the substrates usually act as
uncompetitive inhibitors and forming a dead-end complex (335, 352). In agreement
with the Matsumoto et al (2006) study, the kinetic mechanism of Q2H2 oxidation by
Mtb bd-I can be explained by a modified Ping-Pong bi-bi mechanism (following a
bisubstrate reaction) (345).
The reaction of ‘air-oxidized’ Mtb bd-I with dQH2 and Q1H2 substrates generated a
monophasic kinetic plot, whereas with Q2H2 a biphasic kinetic plot was observed.
Mtb cytochrome bd-I oxidase kinetic beheviour is in agreement with previously
recorded kinetic behaviour in E. coli (211, 290, 345). However, there is discord
between the orders of substrate preference (dQH2 > Q1H2 > Q2H2, this study, and
Q2H2 > Q1H2 > dQH2, (345)). Importantly, the discrepancies in the kinetic parameter
values and the substrate preference are referred to species-specificity and to the type

140
of protein used (recombinant or purified protein). Morover, further differences
according to the degrees of the protein purification were recorded as well (345, 358).
Steady-state kinitics of Mtb bd-I signified the uniqueness of cytochrome bd-I
mechanism for the substrate oxidation and dioxygen reduction in accordance with
previous studies.
Studying optimum conditions for enzyme activity and determination of those in
which Mtb cytochrome bd-I oxidase was highly active was essential for future
biophysical characterization. Regarding the pH significance, Wilson (2010) wrote
that the enzyme activity is pH dependent. Therefore, the pH dependence of Mtb bd-I
dQH2 oxidase activity was studied, showing the highest activity of the enzyme
(optimum pH of Mtb bd-I) at pH 7.5, with lower activity was observed at more
acidic and alkaline pH values. Similarly, Lorence et al (1984) found that ubiquinol-1
oxidase activity of E. coli cytochrome bd-I oxidase had a broad optimum pH at and
above pH 7.5 but low enzyme activity at acidic pH 6.5 - 5.5 (336). These effects of
pH could be results of a combination of factors, the ionization state of amino acids
residues of the catalytic side, the binding of substrate to enzyme, the ionization of
substrate and the alteration of protein structure (particularly at extremes of pH) (194,
335).
Furthermore, the specific activity of Mtb bd-I was affected differently by detergents.
High ubiquinol oxidase activity was observed in the presence of cholate, or
deoxycholate, CHAPS, or DDM. However, in the presence of Triton X-100 or
Tween-80, the decylubiquinol oxidase activity was notably reduced. In contrast,
there was high ubiquinol-1 oxidase activity of E. coli cytochrome bd-I oxidase in the
presence of γ-palmitoyl-L-α-alysophosphatidylcholine, or Tween-20, but it was
totally inactive in presence of octylglucoside, cholate, or high concentrations of
Triton X-100 (336). It is noteworthy that CHAPS, cholate and deoxycholate are
ionic detergents while Tween-80, Triton X-100 and DDM are non-ionic detergents.
Importantly, substrate binding, product formation and release can be critically
affected by the ionization of different groups on the enzyme (334).
The cytochrome bd-family, as mentioned before (section 1.5.4.2), is subdivided into
the A-subfamily with a long Q-loop, such as E. coli bd-I, and the B-subfamily with a

141
short Q-loop, such as Bacillus stearothermophilus and Mtb (215, 360). However, the
functional role of different sizes of the Q-loop is not clear yet (211). Importantly,
some of the short Q-loop cytochrome bd-I oxidase are cyanide insensitive oxygen
reductases (CIO) such as Pseudomonas aeruginosa bd-I, which is distinguished by
low heme d content (216). Herein, recombinant Mtb cytochrome bd-I was found to
be a cyanide sensitive oxidase with an IC50 of 429.11 μM. These data are in
comparable with the short Q-loop B. stearothermophilus enzyme that showed a
similar IC50 value (~500 μM) against the duroquinol oxidase activity of the purified
cytochrome bd-I (360). The long Q-loop purified E. coli bd-I was shown to be
cyanide sensitive with an IC50 of 2 mM (213).
It worth mentioning that cyanide is a known bacterial cytochrome bd-I inhibitor,
likely to act at the site of oxygen reduction. However, it does not have a potent
inhibition activity (211, 213). Therefore, identifying a novel inhibitor that acts on the
quinol oxidation site was the main focus of the current research.
HDQ, the core of quinolone-type inhibitors, is a known cytochrome bd-I inhibitor as
seen in Desulfovibrio vulgaris Hildenborough (DvH) (210). Correspondingly, the
HDQ data showed an inhibition effect of Mtb bd-I activity with an IC50 of 231 μM.
Therefore, a total of 23 quinolone-type inhibitors were examined against both Mtb
bd-I and the Mtb H37Rv strain (single-point screening at 5 μM of inhibitor
concentration), from which the potency screen produced 9 compounds with an IC50 <
4 μM against Mtb bd-I.
Medicinal chemistry manipulation of the core template was the basis of inhibitor
development with a view to maximize solubility and activity. The best 18 hits in the
PfNDH2 programme were tested against Mtb bd-I, in addition to 5 more compounds,
which were chosen arbitrarily from the MtbNDH2 programme. Some of these
compounds are structurally related. The first structurally related group is the CK-3-
22 (the primary template), RKA-259 and CK-3-14 group. CK-3-22 (ClogP = 5.49)
has a nitrogen in ring C to improve solubility, which showed an IC50 of 140 nM
against Mtb bd-I and good inhibition of Mtb H37Rv growth at 5 μM single-point
screening. Furthermore, CK-3-22 has the trifluoromethoxy (OCF3) group,
acknowledged to improve the stability and lipophilicity of biologically active

142
molecules and hence improve in vivo uptake and transport (361, 362). Regarding
RKA-259, although adding 7-methoxy into the CK-3-22 template enhanced inhibitor
potency against Mtb H37Rv, it reduced RKA-259 effectiveness against Mtb bd-I
with IC50 of 3.6 μM. In CK-3-14, replacing the OCF3 group with fluorine (F)
decreased the ClogP value (4.12). Fluorine is probably the next most favourite
hetero-atom after nitrogen for incorporation into small molecules. However,
inhibitor potency against both Mtb bd-I (IC50 = 10.6 μM) and Mtb H37Rv was
reduced. In contrast, in the RKA-307, MTD-403 and RKA-310 group, adding 5,7-
difluoro into RKA-307 (the primary template, ClogP = 4.06), which had a good
activity against both Mtb bd-I (440 nM) and Mtb H37Rv, led to increased inhibitor
potency in the MTD-403 compound without marked changes in the ClogP value.
MTD-403 had a potent activity against both Mtb bd-I (IC50 = 270 nM) and Mtb
H37Rv. This highlights the fact that fluorine as a substituent in active ingredients
plays a significant role (361). Notably, although adding 7-methoxy into the RKA-
307 template enhanced RKA-310 potency against Mtb H37Rv, it decreased RKA-
310 activity against Mtb bd-I with an IC50 of 1.4 μM.
CK-2-88 is a primary template for 6 other compounds, which are CK-2-63, CK-3-23,
RKA-70, RKA-73, PG-203 and LT-9. Although CK-2-88 (ClogP = 5.14) exhibited a
potent activity against Mtb bd-I (IC50 of 20 nM), a weak inhibition effect against
Mtb H37Rv was observed. Addition of OCF3 into CK-2-88, as seen in previous
compounds, conferred a potent CK-2-63 compound with IC50 of 3 nM against Mtb
bd-I and a good inhibition profile against Mtb H37Rv. However, the solubility of
CK-2-63 was decreased slightly as demonstrated in its ClogP value (ClogP = 6.11).
On the other hand, swapping the substitution pattern in CK-2-63 at the 2 and 3
positions resulted in a more soluble PG-203 compound (ClogP = 5.23) with less
potency against Mtb bd-I (IC50 of 70 nM) and with no inhibition activity against Mtb
H37Rv. CK-3-23 (ClogP = 6.67) is CK-2-88 with the addition of 4-methoxy group,
the compound was active but less potent and less soluble than CK-2-63. To improve
the activity of CK-2-63, the replacement of O with CH2 and H at the 3-position with
CH3 gave RKA-70 (ClogP = 6.32) with low effectiveness against both Mtb bd-I and
H37Rv. Moreover, addition of N-hydroxy into the RKA-70 template to give RKA-73
did not show any significant improvement. LT-9 is CK-2-88 with F in the side chain
143
that showed better activity against Mtb H37Rv. However, this addition did not result
in any significant improvement against Mtb bd-I from that of CK-2-88.
SCR-8-12 was developed as a bc1 inhibitor against malaria and it showed good
inhibition activity against both Mtb bd-I and H37Rv. Fluoroquinolone type
compounds are used for the treatment of TB and currently constitute the second line
of anti-TB therapy as they play a key part in the treatment of MDR-TB (147).
However, RKA-41, a fluoroquinolone type compound, did not reveal good inhibitory
activities against Mtb bd-I. SL-2-25 has an OCF3 group and nitrogen as well to
improve solubility. It showed a good activity against Mtb bd-I with an IC50 of 290
nM but was not active against Mtb H37Rv. WDH-1W-5 has a pyrazole in the side
chain and gave poor activity against both Mtb bd-I and H37Rv. WDH-2A-9 is
WDH-1W-5 with an addition of methyl at the 3-position to improve solubility. This
addition improved WDH-2A-9 activity against Mtb bd-I with an IC50 of 6.5 μM, but
retained poor inhibition activity against Mtb H37Rv. WDH-1U-10 has an ester group
at the 3-position and Cl in the side chain, which confered potent activity against Mtb
bd-I with an IC50 of 12 nM, but poor activity against Mtb H37Rv. GN-171 has an
OCF3 group instead of a Cl, this showed good activity with an IC50 of 250 nM
against Mtb bd-I, but poor activity against Mtb H37Rv. Although PG-128 has an
extra nitrogen in its side chain to improve solubility, it did not exhibit good activity
against H37Rv and had an IC50 of 4.47 μM against Mtb bd-I. OB-231 has an
extended side chain and its analogue OB-258 has a N-hydroxy group to look at its
effect on activity. Both compounds showed poor activity against Mtb bd-I and
H37Rv with IC50 values of 7.8 μM and 8.8 μM respectively, against Mtb bd-I.
From the quinolone-type inhibitors, a total of 9 inhibitors discussed above showed
generally an acceptable inhibition profile with IC50 < 4 μM against Mtb bd-I and
with 50% or more inhibition against Mtb H37Rv (single-point screening at 5 μM
inhibitor concentration). These inhibitors were submitted for full IC50 evaluation
during both aerobic (replicating Mtb H37Rv) and anaerobic, Wayne model, (non-
replicating Mtb H37Rv) conditions. Some of these compounds showed a poor
activity against replicating Mtb H37Rv, such as LT-9 although it had good activity
against Mtb bd-I. Further, CK-3-22 showed good activity against both Mtb bd-I and
replicating Mtb H37Rv, but not against non-replicating Mtb H37Rv. SCR-8-12
showed a similar IC50 (~ 3.5 μM) against both Mtb bd-I and replicating Mtb H37Rv,

144
but it was less potent against non-replicating Mtb H37Rv. Although CK-2-63 was
more potent than CK-3-23 against Mtb bd-I, both inhibitors exhibited largely similar
inhibition profiles with regard to replicating/non-replicating Mtb H37Rv. The
similarity of growth inhibition assays might be due to the fact that both CK-2-63 and
CK-3-23 were developed from the same template (CK-2-88). The potency of RKA-
259 against replicating/non-replicating Mtb H37Rv was significantly better than that
of RKA-307, although the latter was more potent than RKA-259 against Mtb bd-I.
The phenotypic profile of RKA-310 against replicating/non-replicating Mtb H37Rv
was even better than the previous compounds. RKA-310, following chemistry
refinement, was replaced by an optimised version of the quinolone-type inhibitor,
MTD-403. MTD-403 showed a potent inhibition profile against both Mtb bd-I and
Mtb H37Rv. It should be noted that there was no significant correlation between Mtb
bd-I and Mtb H37Rv growth inhibition assays. This might be due to the fact that the
solubility and permeability characteristics of these inhibitors against bacteria would
have an impact on how inhibitors behave (341); in addition to the possibility that
these compounds may have multiple targets which would also confound a direct
correlation with Mtb kill.
Interestingly, although there was no significant correlation between Mtb bd-I and
Mtb H37Rv growth inhibition assays, excluding LT-9, CK-3-22, CK-2-63 and RKA-
259 resulted in a highly significant correlation (P value < 0.01) with the remaining
compounds. The significant correlation might suggest that Mtb bd-I (an ETC
component) is a potential target for the tested quinolone-type inhibitors. This
suggestion is further enforced by HepG2 data for mitochondrial toxicity assessment
where CK-3-22, CK-3-23, CK-2-63, RKA-259, RKA-307, RKA-310 and MTD-403
showed much lower IC50s in HepG2 cells cultured in galactose-containing media
than that cultured in glucose-containing media (personal communication with Dr.
Gemma Nixon). Therefore, HepG2 assays proved that inhibitors targeting the ETC.
Briefly, IC50s values of quinolone-type inhibitors were determined using HepG2 cells
that were cultured in the presence of glucose or galactose. If the inhibitors target a
mitochondrial component, HepG2 cultured in glucose-containing media will
continue growing as they adapt to produce ATP through glycolysis while cells
growing in the presence of galactose will be attenuated as ATP production will be
through oxidative phosphorylation (363). Interestingly, SCR-8-12 did not show any

145
difference of IC50 values during both assays (with glucose or galactose), suggesting
that SCR-8-12 had a different mode of action than other inhibitors, as also
demonstrated by the time-kill data.
Bactericidal inhibitors are superior to bacteriostatic ones in reducing resistance
development and in shortening the treatment period. However, the clinical
importance of in vitro bactericidal inhibitors is rarely observed (364). The
bactericidal/static nature of inhibitors on extra-cellular Mtb (Mtb grown in liquid
culture) could be affected by various factors such as time scale of incubation, the
metabolic state of Mtb (replicating or non-replicating Mtb), and the physiological
conditions of the experiment (364-366). Evaluating the bactericidal/static nature of
the quinolone-type inhibitors showed no bactericidal activity over 7 days with the
exception of SCR-8-12. CK-3-22 and CK-3-23 treated Mtb exhibited almost
identical behaviour to untreated Mtb over 7 days. In contrast, RKA-310 treated Mtb
showed a low number of viable bacteria compared to that of untreated Mtb but
without significant decline of viable count over 7 days of incubation. The
bacteriostatic activities of LT-9, RKA-307, CK-2-63 and MTD-403 showed
reduction of viable counts by day 7. These quinolone-type inhibitors, in addition to
RKA-310, might display similar bactericidal/bacteriostatic activities, as
demonstrated by the diarylquinoline TMC207, a selective inhibitor of mycobacterial
ATP synthase. It is worth mentioning that the bactericidal nature of the TMC207 is
characterized by a bacteriostatic phase in the first 7 days followed by a dose-related
bactericidal phase (365). Therefore, the bactericidal/static nature of CK-3-22 and
CK-3-23 might be apparent if the time scale of drug incubation exceeded 14 days.
Significantly, SCR-8-12 showed a bactericidal activity that is similar to the standard
drugs, streptomycin and isoniazid (366-369). SCR-8-12 seemed to operate by a
different mode of action than other quinolone-type inhibitors, as supported by the
aforementioned HepG2 data. Noticeably, de Steenwinkel et al (2010) found that
isoniazid displayed a concentration-dependent killing manner while rifampicin was
revealed to be a strongly time-dependent killing agent (366). Dhillon et al (2010)
wrote that the bactericidal activity of TMC207 on extra-cellular Mtb was time but
not dose-dependent for at least the first 12 days of drug incubation. Moreover,
TMC207 killing was observed to be faster in tuberculous lesions than in aerobic
culture, and it increased as treatment continued (365).

146
Examining the classification and mechanism of enzyme inhibition is of importance
in terms of studying the mechanism by which an enzyme promotes its catalytic
activity and revising how the inhibitor structures might be modified to increase their
potency (335). The double reciprocal Lineweaver Burk data revealed that CK-2-63 is
a non-competitive inhibitor implying that CK-2-63 might bind to the free enzyme
that consequently might result in reducing substrate affinity binding. However, the
Eadie-Hofstee plot of CK-2-63 was not conclusive, suggesting that CK-2-63 may
exhibit a mixed-type of inhibition. SCR-8-12 and MTD-403 appeared to be
competitive inhibitors. Competitive inhibitors are known to bind exclusively to the
free enzyme, which subsequently leads to exclusion of any further substrate binding.
Competitive inhibition is usually reflected by affecting the apparent value of Km but
not the value of Vmax (353). However, SCR-8-12 and MTD-403 showed a decrease
in the Km value rather than an increase which means that the affinity of Mtb bd-I for
the substrate increased; hence inhibitors seemed not to be binding to the quinol
oxidation site. Copeland (2005) wrote that inhibitors that displayed the kinetic
signatures of competitive inhibitors are not necessarily bound to the enzyme active
site (353). SL-2-25 and PG-203 (CK-2-63 substitute) are reported to be
uncompetitive inhibitors. This, in turn, suggests that as uncompetitive inhibitor they
may exclusively bind to the enzyme substrate complex (353).
Identifying and developing potential Mtb bd-I and Mtb H37Rv quinolone-type
inhibitors as novel therapeutic agents is conceivable. To this end, MTD-403 has been
found to be the optimum compound. MTD-403 displayed an excellent therapeutic
index (no toxicity) and permeability (well absorbed in gut). However, it was found to
be metabolized very quickly. Hence, further optimisation work to improve the drug
metabolism and pharmacokinetics (DMPK) properties of the template is ongoing
(personal communication with Dr. Gemma Nixon). Moreover, further medicinal
chemistry quantitative structure–activity relationship models (QSAR models) are
needed to improve MTD-403.
Studying the enzyme active site in terms of the binding of a substrate(s) to the
enzyme catalytic site and the subsequent conversion of the substrate(s) to product(s)
is critical to gain a complete understanding of the way enzymes work. To gain such
understanding, a wide range of strategies could be adopted in future, such as X-ray

147
crystallographic studies, irreversible inhibitor with radioisotope studies and kinetic
studies. In addition to the kinetics studies of Mtb bd-I that were carried out in this
study, measuring the oxygen affinity of Mtb bd-I is considered one of the basic
kinetic characterizations of this enzyme. Unfortunately, lack of laboratory facilities
hindered this investigation (231, 370-372).
Regarding the limitations of this study, although time-kill data were informative,
increasing the time scale from 7 days to at least 14 days is recommended. Moreover,
as carried out by Dhillon et al (2010) using various concentration of inhibitors is
advised to examine the dose effect on eliminating Mtb (365).

148
Chapter IV
Generation and characterisation of a heterologous
expression system for Mycobacterium tuberculosis
cytochrome bd-I oxidase in an E. coli respiratory
knockout (bo3/bd-I/bd-II) mutant strain

149
4.1. Introduction
The aim of this chapter was to construct an additional expression system for
Mycobacterium tuberculosis cytochrome bd-I terminal oxidase (Mtb bd-I)
characterization. This system was used as a validation tool for the main Mtb bd-I
biochemical features, obtained through using the ML16 strain.
Mtb bd-I characterization was accomplished using ML16, an E. coli bo3/bd-I
knockout (Chapter II and III). Owing to the challenges of expressing Mtb bd-I, an E.
coli bo3/bd-I/bd-II knockout strain (MB44) was used in order to have an additional
possibility of successful expression of Mtb bd-I (Figure 4.1). However, although
successful expression of Mtb bd-I using the MB44 strain was achieved,
characterization studies of Mtb bd-I were carried out using the ML16 strain since the
MB44 strain was too weak and difficult to grow to form the foundation of robust
Mtb bd-I characterization studies.
Figure 4.1: Components of the electron transport chain of MB44, an E. coli mutant
strain
The chain has the entire electron donors found in wild type E. coli and only FRD-fumarate
reductase, TMAORD-TMAO reductase and NR-nitrate reductase as electron acceptors.
Chain components also include the F0F1 ATP synthase (complex V), MQ-8-menaquinone-8
and MQH2-menaquinol. P and n correspond to the positive (periplasmic) and negative
(cytoplasmic) sides of the respiratory membrane with respect to proton translocation. Proton
movements are indicative only and do not represent H+/e
- ratios for the respective
complexes. The orientation and topology of the subunits are indicative only.

150
MB44 is a mutant E. coli BW25113 strain (∆cydB::Kanr ∆cyoB ∆appB ∆nuoB)
lacking all three E. coli terminal quinol oxidases, cytochrome bo3, cytochrome bd-I
and cytochrome bd-II, encoded by the cyoABCDE, cydAB and appBC operons,
respectively. Cytochrome bd-I and cytochrome bd-II are under the cytochrome bd-
family in E. coli and have similar spectral signatures. However, as discussed earlier
(Chapter 2.4), they have different expression conditions. Moreover, Bekker et al
(2009) recorded different Km values of quinol oxidation by cytochrome bd-I and
cytochrome bd-II, which were 85 μM and 250 μM respectively (211, 290).
Bekker et al (2009) constructed MB44 with a kanamycin marker for selectivity.
MB44 has phenotypic characteristics which require growth in LB medium enriched
with 50 mM glucose and 50 µg.ml-1
kanamycin. Moreover, MB44 has no significant
respiratory activity; but in aerobic conditions, it catabolises glucose as an energy
source by full homolactic fermentation into lactate. In contrast, it exhibits mixed acid
fermentation in oxygen-limited conditions, producing lactate, acetate and succinate
(194, 290).

151
4.2. Materials and methods
4.2.1. Preparation of competent cells
Competent cells were constructed using MB44, an E. coli bo3/bd-I/bd-II knockout
strain, donated by Dr. Martijn Bekker, University of Amsterdam, Nieuwe. The
MB44 strain lacked all forms of quinol:oxygen oxidoreductase (i.e. cytochrome bo3,
cytchrome bd-I and cytchrome bd-II terminal oxidases). Following the protocol of
Datsenko and Wanner (2000), MB44 was constructed to contain a kanamycin
resistance cassette (300). Dr. Martijn Bekker informed me that MB44, a derivative of
E. coli K-12 strain MG1655, grew in the presence of 50 µg.ml-1
kanamycin and 50
mM glucose (290).
Competent MB44 cells were produced by the magnesium chloride/calcium chloride
method. The aerobic culture condition was as follows: inoculation of overnight
MB44 culture into 200 ml LB medium (in a 500 ml flask) enriched with 50 mM
glucose and 50 µg.ml-1
kanamycin, and incubated at 37 °C in a shaking incubator at
200 rpm. Generation of the O2-limited culture involved inoculation of an overnight
MB44 culture into 375 ml LB medium enriched with 50 mM glucose and 50 µg.ml-1
kanamycin (in a 500 ml flask), sealed with a rubber plug with a head-space ratio of
0.5 and incubated at 37 °C in a shaking incubator at 200 rpm.
Competent cell preparations were performed according to the standard protocols of
Sambrook and Russell (297). 100 ml of the cultures were centrifuged at 4000 g for
10 min at 4 °C once cell density reached OD600 ~ 0.25. Subsequently, cells were
processed as described earlier in section 2.2.13. The competent cells were designated
as AnMB44 (Anaerobic growth MB44) and AMB44 (Aerobic growth MB44).
4.2.2. Transformation of pTMA into MB44 competent cells
A volume of 200 µl of AnMB44 and AMB44 competent cells were transformed with
the pTMA (10 µl) and processed as described previously (Chapter 2.2.14), with the
exception of plating the cells to LB agar plates enriched with 50 mM glucose, 100
µg.ml-1
ampicilin and 50 µg.ml-1
kanamycin. Antibiotics were added to sustain
plasmid transformant growth. Plates were incubated overnight at 37 °C aerobically

152
and anaerobically. After 3 days of incubation, colonies were picked from the plates
and grown in 5 ml LB medium containing an appropriate concentration of antibiotic
at 37 °C in a shaking incubator at 200 rpm. These cultures were then used for
making glycerol stocks of the plasmid-containing cells and for larger scale cultures
and plasmid preparation. The positive transformed cells were designated as TMB44
(O2-limited growth TMB44) and ATMB44 (Aerobic growth TMB44).
Importantly, as experienced earlier with ML16 transformation (2.2.14),
transformation of pTMA to AMB44 gave a strain that was less effecient to continue
with; it took 3-4 days to grow on agar plates and about 3 days to grow in 5 ml LB
medium over both growth conditions (aerobic and anaerobic). Importantly,
transformation of pTMA to AnMB44 was successful for both growth conditions
(aerobic and anaerobic).
4.2.3. Optimization of Mtb bd-I expression conditions
The general growth conditions were as follow: aerobic growth involved 200 ml of
LB (in a 500 ml flask), containing 100 µg.ml-1
ampicilin and 50 µg.ml-1
kanamycin.
The selective O2-limited condition involved 375 ml of LB (in a 500 ml flask),
containing 100 µg.ml-1
ampicilin and 50 µg.ml-1
kanamycin, sealed with a rubber
plug with a head-space ratio of 0.5. Cultures were incubated at 37 °C in a shaking
incubator at 200 rpm.
At first, the growth condition of TML16 that led to successful expression of Mtb bd-
I (Chapter 2.2.15) was applied to TMB44 cells with a difference in medium
supplementation (i.e. addition of 50 mM glucose). This growth condition included an
addition of 1 mM IPTG along with inoculum and a total incubation time of 19 h.
However, these parameters did not lead to successful expression of Mtb bd-I.
Therefore, increasing the incubation time to 48 h was applied because the MB44
growth curve showed a continuation of growth up to 48 h (Figure 4.7), which will be
discussed later. Simultaneously, the time of induction using IPTG was changed
(induction after 24 h of incubation) due to the length of the incubation period, as
extended IPTG inductions may result in protein degradation (personal

153
communication with Dr. Ashley Warman). Nevertheless, no successful expression of
Mtb bd-I was detected. Optimization of the glucose concentration was the next step.
Different glucose concentrations were used; 25 mM, 10 mM, 5 mM and 1 mM. The
successful expression of Mtb bd-I was observed at 1 mM glucose. The final growth
parameters were incubating for 48 h, addition of IPTG after 24 h of incubation and
supplementation of the medium with 1 mM glucose.
It worth mentioning that after optimizing the glucose concentration and having
successful expression of Mtb bd-I, TMB44 cells were grown in 1 mM glucose for 19
h and with addition of IPTG at the beginning along with inoculum, resembling the
TML16 expression condition. However, no successful expression of Mtb bd-I was
detected.
4.2.4. Large-scale culture of TMB44, AnMB44 and BL21(DE3)pLysS strains
The successful transformation colonies (TMB44) were grown in selective O2-limited
conditions, 375 ml of LB enriched with 1 mM glucose (in a 500 ml flask), containing
100 µg.ml-1
ampicilin and 50 µg.ml-1
kanamycin, sealed with a rubber plug with a
head-space ratio of 0.5. IPTG was added after 24 h of incubation to 1 mM final
concentration. Cultures were incubated at 37 °C in a shaking incubator at 200 rpm
for 48 h. A negative control (untransformed MB44 competent cells) was grown in
the same selective O2-limited condition but without the addition of ampicilin. The
inoculum size was 0.2% of 375 ml LB broth. Hereafter, the positive transformed
cells were designated as TMB44 whereas the negative untransformed cells were
designated as MB44.
Also, the same successful transformation colonies were grown in aerobic conditions,
using 200 ml of LB enriched with 1 mM glucose (in a 500 ml flask) containing 100
µg.ml-1
ampicilin and 50 µg.ml-1
kanamycin. IPTG was added after 24 h of
incubation to 1 mM final concentration. Cultures were incubated at 37 °C in a
shaking incubator at 200 rpm for 48 h. A negative control (untransformed MB44
competent cells) was grown in the same selective O2-limited condition, but without
the addition of ampicilin. The inoculum size was 0.2% of 375 ml LB broth.

154
BL21(DE3) pLysS was cultured as wild-type E.coli strain following similar
aforementioned aerobic and O2-limited growth conditions, supplemented with only
34 µg.ml-1
chloramphenicol.
4.2.5. Membrane preparations
Membrane preparations were carried out following the protocol of Fisher et al
(2009) which was described previously in detail (section 2.2.17) (209).
4.2.6. Determination of protein concentration
The Bradford assay (304) was carried out as described in detail previously (section
2.2.18).
4.2.7. Initial spectroscopic study of Mtb cydABDC operon
Initial UV-visible spectroscopic analysis of freshly prepared membranes was carried
out on a Cary 300 Bio UV/visible spectrophotometer (Varian, UK) following a
previously described methodology (Chapter 2.2.19). Reduced minus oxidized spectra
of the wild-type E. coli BL21 (DE3) LysS strain, MB44 and TMB44 cells were
recorded over only O2-limited conditions. Difficulties with having a decent volume
of crude membrane from aerobically grown MB44 and TMB44 cells hampered the
process of obtaining spectra.
4.2.8. Growth curves
Growth was monitored by measuring the optical density at 600 nm using a Thermo
Spectronic instrument (Genesys, UK) over a time course (hours) under the above
mentioned aerobic and O2-limited growth conditions (section 4.2.4). A redox
indicator (resazurin) was used following the previously explained protocol (section
2.2.20).

155
4.2.9. Preparation of dQH2, Q1H2 and Q2H2
Preparation of both dQH2 and Q2H2 were performed according to the protocol of
Fisher et al (2004) (343). Preparation of Q1H2 was based on the protocol of Kihira et
al (2012) (344) with modification. Detailed methods were previously presented
(section 3.2.3. and 3.2.4).
4.2.10. Steady-state kinetic assays
Quinol oxidation (dQH2 and Q1H2) by Mtb bd-I was measured
spectrophotometrically at 283 nm on a Cary 300 Bio UV/visible spectrophotometer
(Varian, UK). The method was described previously (section 3.2.5).
4.2.11. Enzyme inhibition assay
Determination of an IC50 value for MTD-403 against Mtb bd-I was performed using
a Cary 300 Bio UV/visible spectrophotometer (Varian, UK) following the previously
described protocol (section 3.2.8.2).
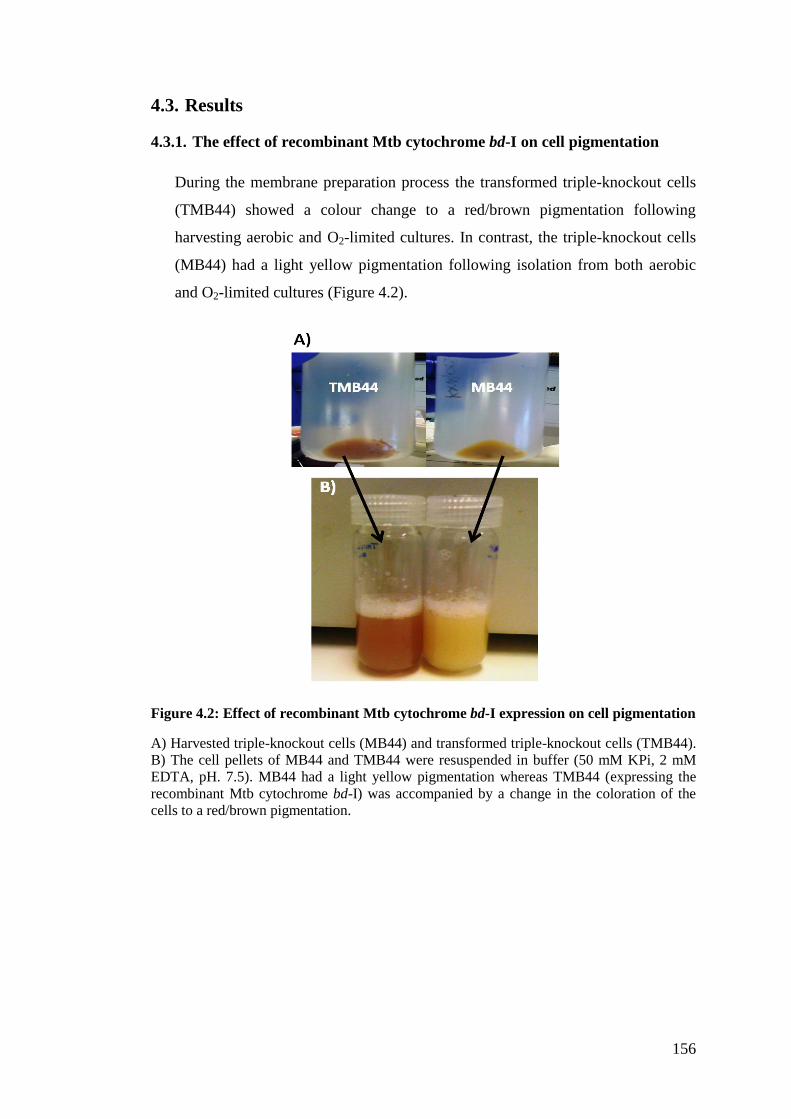
156
4.3. Results
4.3.1. The effect of recombinant Mtb cytochrome bd-I on cell pigmentation
During the membrane preparation process the transformed triple-knockout cells
(TMB44) showed a colour change to a red/brown pigmentation following
harvesting aerobic and O2-limited cultures. In contrast, the triple-knockout cells
(MB44) had a light yellow pigmentation following isolation from both aerobic
and O2-limited cultures (Figure 4.2).
Figure 4.2: Effect of recombinant Mtb cytochrome bd-I expression on cell pigmentation
A) Harvested triple-knockout cells (MB44) and transformed triple-knockout cells (TMB44).
B) The cell pellets of MB44 and TMB44 were resuspended in buffer (50 mM KPi, 2 mM
EDTA, pH. 7.5). MB44 had a light yellow pigmentation whereas TMB44 (expressing the
recombinant Mtb cytochrome bd-I) was accompanied by a change in the coloration of the
cells to a red/brown pigmentation.

157
4.3.2. Initial spectroscopic study of the Mtb cydABDC operon
Reduced minus oxidized spectra of the wild-type E. coli BL21 (DE3) LysS strain,
MB44 and TMB44 cells, growing at O2-limited condition, were recorded at room
temperature using sodium dithionite as reductant and potassium hexacyanoferrate
(III) as oxidant (Figures 4.3 - 4.5). The presence of a distinctive peak at 631 nm was
the significant difference between TMB44 and MB44 spectra which corresponded to
that of the heterologous Mtb cytochrome bd-I in TMB44.
4.3.2.1. Wild–type E. coli BL21(DE3) pLysS strain
480 500 520 540 560 580 600 620 640 660
-0.4
0.0
0.4
0.8
629 nm
596 nm
560 nm
531 nm
Wavelength (nm)
bsorb
ance
Figure 4.3: Reduced minus oxidized spectrum of wild-type E.coli BL21(DE3) pLysS
strain
Reduced minus oxidized spectra of the wild-type E. coli BL21 (DE3) LysS strain was
recorded at room temperature using sodium dithionite as reductant and potassium
hexacyanoferrate (III) as oxidant. There are three distinct features spectra recorded in O2-
limited grown E. coli, which are cytochrome b at 561 nm, cytochrome a1 at 596 nm and
cytochrome d at 629 nm. The cells were grown for 48 h using closed shaken flasks with a
head-space ratio of 0.5 and induced with 1 mM IPTG after 24 h of incubation. The ratio of
heme d (629 nm) with respect to heme b560 as a reference peak is 0.71 in O2-limited
conditions. These peaks have been normalized according to the following equation (Value-
min/max-min). The final protein concentration of the membranes was approximately 6.3
mg.ml-1

158
4.3.2.2. Triple-knockout E. coli (MB44) strain
A)
480 500 520 540 560 580 600 620 640 660
0.0
0.1
0.2
bsorb
ance
Wavelength (nm)
593 nm
560 nm
528 nm
B)
480 500 520 540 560 580 600 620 640 660
-0.1
0.0
0.1
0.2
0.3
605 nm
560 nm
528 nm
Wavelength (nm)
bsorb
ance
C)
480 500 520 540 560 580 600 620 640 660
-0.4
0.0
0.4
0.8
1.2
Wavelength (nm)
560 nm
528 nm
bsorb
ance
Figure 4.4: Reduced minus oxidized spectra of MB44
Reduced minus oxidized spectra of MB44 were recorded at room temperature using sodium
dithionite as reductant and potassium hexacyanoferrate (III) as oxidant. The cells were
grown in O2-limited condition for 48 h using closed shaken flasks with a head-space ratio of
0.5 and induced with 1 mM IPTG after 24 h of incubation. A), B) and C) are spectra of
MB44 crude membranes from different cultures batches. There are consistent peaks at ~ 528
nm and 560 nm in all membranes. A) and B) show a broad peak at ~600 nm that is not
present in C) crude membranes. The final protein concentrations of A, B and C membranes
were approximately 1, 1.3 and 2 mg.ml-1

159
4.3.2.3. Transformed triple-knockout E. coli (TMB44) strain
480 500 520 540 560 580 600 620 640 660
-0.2
0.0
0.2
0.4
Wavelength (nm)
530 nm
558 nm
595 nm
631 nm
bsorb
ance
Figure 4.5: Reduced minus oxidized spectrum of TMB44
A reduced minus oxidized spectrum of TMB44 was recorded at room temperature using
sodium dithionite as reductant and potassium hexacyanoferrate (III) as oxidant. Cytochrome
d at 631 nm is recorded as distinct feature of recombinant Mtb cytochrome bd-I. The cells
were grown in O2-limited conditions for 48 h using closed shaken flasks with a head-space
ratio of 0.5 and induced with 1 mM IPTG after 24 h of incubation. The ratio of heme d (631
nm) with respect to heme b558 as a reference peak is 0.34 in O2-limited condition. These
peaks have been normalized according to the following equation (Value-min/max-min). The
final protein concentration of membrane was approximately 3 mg.ml-1
4.3.3. Assessment of growth phenotypes
To qualitatively assess the contribution of Mtb cytochrome bd-I to respiration,
monitoring the growth of wild-type, mutant and transformed cells was performed to
identify the differences between E. coli BL21 (DE3) LysS, MB44 and TMB44
strains, respectively. Resazurin (Raz), a redox indicator, showed a qualitative result
for the bacterial respiratory state, as discussed previously (2.3.7).

160
4.3.3.1. Wild–type E. coli BL21(DE3) pLysS strain
The growth of BL21(DE3) pLysS (wild-type E. coli) was monitored through both
aerobic and O2-limited growth conditions (Figure 4.6). During O2-limited growth,
the colour of the Raz was changed to dark orange/pink (Rru) after 6 h of incubation,
during the exponential phase. Cells achieved highest density after 48 h incubation
(OD600 ~ 0.5) and maintained a stationary plateau for about 12 h. Similarly, during
the aerobic growth, the colour of Raz was changed to dark orange/pink after 6 h of
incubation. Wild-type E. coli reached its highest density (OD600 ~1.6) after 48 h of
aerobic incubation and maintained a stationary plateau for 12 h before starting to
decline.
Figure 4.6: Growth of BL21(DE3) pLysS (wild-type E. coli) in vitro supplemented with
resazurin.
Growth was monitored by recording optical density (OD600) values of aerobic, shaken
cultures (blue) and O2-limited, closed, shaken cultures with a head-space ratio of 0.5 (red).
The colours of the medium during the growth curve correspond to the colour of the resazurin
in the medium (resazurin indicative colour chart). During both aerobic and O2-limited
growth, wild-type E. coli began reducing resazurin after 6 h of incubation and achieved
maximal density after 48 h with OD600 ~ 1.6 and OD600 ~ 0.5 for aerobic and O2-limited
incubation, respectively.
Aerobic culture
O2-limited culture

161
4.3.3.2. Triple-knockout E. coli (MB44) strain
The growth of MB44 was assessed during aerobic and O2-limited growth conditions
(Figure 4.7). During both growth conditions, MB44 reached highest density after 48
h incubation with OD600 ~ 0.26 and started reducing Raz, after 10 h incubation.
MB44 did not maintain a stationary plateau during both growth conditions and
started to decline just after reaching its highest density.
Figure 4.7: Growth of MB44 in vitro supplemented with resazurin
Growth was monitored by recording optical density (OD600) values of aerobic, shaken
cultures (blue) and O2-limited, closed, shaken flasks with a head-space ratio of 0.5 (red). The
colours of the medium during the growth curve correspond to the colour of the resazurin in
the medium (resazurin indicative colour chart). During both aerobic and O2-limited growth
conditions, MB44 began reducing resazurin after 10 h incubation and attained highest cell
density (OD600 ~ 0.26) after 48 h of growth.
Aerobic culture
O2-limited culture

162
4.3.3.3. Transformed triple-knockout E. coli (TMB44) strain
The growth of TMB44 was observed all through aerobic and O2-limited growth
conditions (Figure 4.8). Similar behaviours were observed during both growth
conditions, the colour of the Raz was changed after 8 h incubation. TMB44 achieved
highest density after 44 h incubation (OD600 ~ 0.53) and succeeded in maintaining a
stationary plateau for about 14 h.
Figure 4.8: Growth of TMB44 in vitro supplemented with resazurin
Growth was monitored by recording optical density (OD600) values of aerobic, shaken
cultures (blue) and O2-limited, closed, shaken flasks with a head-space ratio of 0.5 (red). The
colours of the medium during the growth curve correspond to the colour of the resazurin in
the medium (resazurin indicative colour chart). During both aerobic and O2-limited growth
conditions, resazurin reduction began after 8 h incubation and cells attained highest density
(OD600 ~ 0.53) after 44 h incubation.
Aerobic culture
O2-limited culture

163
4.3.4. Kinetic analysis of the recombinant Mtb cytochrome bd-I oxidase
Initial kinetic characterisation of crude TMB44 membranes was performed as per
TML16 in order to compare the Mtb bd-I data from two different expression
systems. Examining Mtb bd-I in TMB44 membranes revealed similar Km data to that
of TML16 (section 3.3.3). Apparent Km data for substrate analogues were
determined spectrophotometrically (Figure 4.9) identifying a rank order preference
for dQH2 > Q1H2 with Km values of 22.57 ± 2.1 µM and 51.83 ± 6.1 µM
respectively. The specific catalytic activity values of Mtb bd-I for dQH2 oxidation
was 6.21 ± 0.51 µmol.min-1
.mg-1
and for Q1H2 was 1.74 ± 0.26 µmol.min-1
.mg-1
(Table 4.1). The kinetic parameters of Q2H2 oxidation were not determined due to
limited quantities of the membrane preparations and time restrictions. However,
preliminary data for Q2H2 showed that TMB44 demonstrated similar kinetics to
TML16 (section 3.3.3.3), i.e. substrate inhibition at high Q2H2 concentrations. Due to
limited quantities of MB44 membrane preparations and time restrictions, full
kinetics studies were not performed. However, MB44 did not show any quinol
oxidation activity at 50 µM dQH2 or Q1H2.
Table 4.1: Kinetic parameters of Mtb bd-I activity
Km ± SEM (μM)
Specific catalytic activity ± SEM
(μmol.min-1
.mg-1
)
dQH2 TML16 19.25 ± 1.3 9.01 ± 0.23
dQH2 TMB44 22.57 ± 2.1 6.21 ± 0.51
Q1H
2 TML16 51.55 ± 8.9 6.27 ± 0.53
Q1H
2 TMB44 51.83 ± 6.1 1.74 ± 0.26
The kinetic parameters of Mtb bd-I in both expression systems, TML16 and TMB44, are
presented.

164
A)
0 25 50 75 100
0
2
4
6
Sp
ecific
Ca
taly
tic A
ctivity (m
ol.m
in-1.m
g-1)
[dQH2] M
B)
0 25 50 75 100
0.0
0.5
1.0
1.5
Sp
ecific
Ca
taly
tic A
ctivity (m
ol.m
in-1.m
g-1)
[Q1H
2] M
Figure 4.9: Steady-state decylubiquinol/ubiquinol-1: Mtb bd-I activity
Steady-state kinetics of Mtb bd-I were measured spectrophotometrically at 283 nm. A) The
oxidation of dQH2 was analysed and the apparent Km (µM) and specific catalytic activity
(µmol.min-1
.mg-1
) values were calculated to be 22.57 ± 2.1 and 6.21 ± 0.51 respectively. B)
The oxidation of Q1H2 was analysed and the apparent Km (µM) and specific catalytic
activity (µmol.min-1
.mg-1
) values were calculated to be 51.83 ± 6.1 and 1.74 ± 0.26
respectively. The reactions were initiated by the addition of different concentrations of dQH2
/Q1H2 (5 - 98 µM). The points are the mean initial rates of experimental duplicate obtained
at each dQH2/Q1H2 concentration indicated. Data were fitted using the Michaelis-Menten
function using rectangular hyperbola (Origin 8.5 software).

165
4.3.5. Drug sensitivity assays
Inhibition studies of quinolone-type inhibitors against the recombinant Mtb
cytochrome bd-I oxidase revealed a number of potent compounds against both Mtb
bd-I and Mtb H37Rv. Herein, the most potent compound so far (MTD-403) was
tested against Mtb bd-I from the TMB44 expression system (Figure 4.10). MTD-403
gave a similar IC50 value (330 ± 160 nM) to that obtained from the TML16
expression system (270 ± 60 nM) against Mtb bd-I (Chapter 3.3.4.2).
1E-3 0.01 0.1 1 10
0.08
0.10
0.12
0.14
0.16
0.18
bs.m
in-1
(283
nm
)
[MTD-403] M
Figure 4.10: Determination of the IC50 for MTD-403 against Mtb bd-I activity
The IC50 value for MTD-403 in the decylubiquinol:Mtb bd-I assay was determined
spectrophotometrically at 283 nm. The IC50 value is 0.33 ± 0.16
μM. The value is derived
using averages of experimental duplicates ± SEM at each point. The data were fitted using a
four parameter logistic function (Origin 8.5 software).

166
4.4. Discussion
The aforementioned phenotypic features of the MB44 strain were observed during
expression studies of Mtb bd-I. MB44 was able to grow only in the presence of
glucose and although the medium was enriched with a high concentration of glucose
(50 mM), this mutant could only attain a low cell density (OD600 ~ 0.26) during the
process of competent cells preparations. In accordance with these observations,
Dassa et al (1991) showed that a triple E. coli mutant strain, SBS2019
(∆cyo∆cyd∆appB::TnphoA), was not able to grow without the presence of a
fermentative carbon source (glucose) and displayed drastic growth inhibition in the
presence of oxygen. This growth inhibition was attributed to the accumulation of
ROS in the cells. Moreover, SBS2019 was observed to form micro-colonies after
prolonged incubation (291). Furthermore, it has been reported that ECOM3
(MG1655, ∆(cydAB appBC cyoABCD)::FRT-kan-FRT) is another triple E. coli
mutant strain which was only capable of growth in the presence of glucose (373).
These observations confirm that MB44 exhibited similar phenotypes to its
counterparts of triple-knockout strains.
Regarding the expression conditions of Mtb bd-I, appropriate signalling of the
regulatory components of cytochrome bd-I was discussed previously (section 2.4).
Although appropriate expression conditions of Mtb bd-I were achieved in the
double-knockout E. coli (ML16) strain, applying similar conditions to transformed
MB44 (TMB44) was not successful in expressing Mtb bd-I. This observation was
attributed to the strain phenotype differences. As mentioned above, MB44
demonstrates weak growth which leads to the extended incubation time of 48 h and
induction of cells after 24 h of incubation, but these changes were not sufficient to
express Mtb bd-I. Therefore, enlightened by the observation of Bekker et al (2009),
enhancing the expression of cytochrome bd-II in E. coli in glucose-limited condition,
limiting glucose supplementation in the medium was applied (290). Remarkably,
Mtb bd-I was successfully expressed in MB44 cells under glucose limited conditions
(1 mM glucose) and induction after 24 h of the 48 h incubation time. Since MB44
cells were slow growing cells, leaving MB44 to grow for the first 24 h without the
stress of induction was the reason behind addition of IPTG after 24 h of incubation,

167
besides avoiding protein degradation as a result of long IPTG exposure (personal
communication with Dr. Ashley Warman).
According to growth conditions or strains phenotypes, spectral analysis revealed
different heme peaks. Reduced minus oxidized difference spectra recorded at room
temperature were used to analyze the cytochrome content of MB44, TMB44 and
wild-type E. coli BL21 (DE3) pLysS (reference strain). Difficulties in generating
good yields of membrane severely limited the scope of further studies. Although
there were differences in growth conditions, the reference strain which was induced
after 24 h of incubation (reference strain-2) showed similar absorbance peaks of b-,
a1- and d-type cytochromes (at 560, 596, and 629 nm) to that studied previously, the
reference strain that was induced at the beginning of incubation (reference strain-1)
(section 2.4). These data were also comparable to the literature for “normal” wild-
type E. coli BL21 spectra (313, 314).
Regarding MB44 spectra, although this mutant was harvested from relatively large
cultures (27 L), the absorbance peaks were not always discernable due to poor
membrane yields; a consequence of low cell density. However, there were two
consistent peaks at 528 and 560 nm, which are characteristic peaks of E. coli b-type
cytochromes (313, 314). Some of the MB44 membranes demonstrated peaks at 593
and 605 nm. MB44 does not have endogenous cytochromes (unlike ML16 which has
cytochrome bd-II). Therefore, these unexpected peaks in MB44 could be attributed
to the background noise of the spectra. Significantly, TMB44 spectra revealed
similar spectral signatures to that of TML16 (Chapter 2.4), confirming the Mtb bd-I
expression. The heme-d absorbance peak (approx. 628 - 632 nm) is a characteristic
feature of the cytochrome bd-I oxidase in M. smegmatis, in E. coli and in B. subtilis
(253, 263, 307).
TMB44 cultures displayed red/brown pigmentation as observed with TML16 cells
(Chapter 2.4). This observation was attributed to the increased expression of heme-
containing cytochromes; hence confirming the expression of cytochrome bd-I
oxidase (289).

168
With regards to the growth rate, the reference strain-2 showed a relatively slow
growth rate during O2-limited conditions, compared to reference strain-1 (Chapter
2.4). Reference strain-2 reached its highest density (OD600 ~ 0.5) after 48 h
incubation whereas reference strain-1 recorded the maximum at 12 h incubation with
OD600 ~ 0.44. The growth delay in reference strain-2 induction could be attributed to
a combination of factors, oxygen limitation and delayed IPTG induction. During
aerobic conditions there were no significant differences between reference strain-1
and -2.
As expected, MB44 growth rate was too weak and slow during both growth
conditions (aerobic and O2-limited) in comparison with reference strain-2 and the
ML16 strain (Chapter 2.4). MB44 hardly reached an OD600 ~ 0.26 while ML16
exceeded an OD600 ~ 1.7 and OD600 ~ 0.4 during aerobic and O2-limited growth,
respectively. MB44 data were in agreement with the findings of previous studies in
which quinol oxidase mutant strains were reported to have weak and slow growth
phenotypes, which in turn could be explained by the toxic effect of oxygen-derived
compounds accumulating in the cells (290, 291, 373).
Significantly, TMB44 exhibited a more “healthy” growth rate than MB44 cells and
restored the reference strain-2 growth rate during O2-limited growth condition.
During aerobic growth, although TMB44 showed a higher growth rate (maximal
OD600 ~ 0.5) than MB44 (maximal OD600 ~ 0.26), expression of Mtb bd-I did not
restore reference strain-2 growth rate (maximal OD600 ~ 1.6). This might be due to
the adaption of the cells to synthesize a functional recombinant Mtb cytochrome bd-I
oxidase, i.e. TMB44 cells under additional pressure of harnessing cellular resources
to maintain and express plasmid genes. In addition, the plasmid may cause
disruption in cellular metabolism which might hold back cell growth (325).
Moreover, the time of IPTG induction might have an influence on cell growth.
To evaluate the contribution of cytochrome bd-I to respiration during growth,
resazurin was used as a visual qualitative indicator of oxygen depletion in cultures
and respiratory function (305). Reference strain-2 showed a similar initial resazurin
reduction to the previously discussed reference strain-1 (Chapter 2.4). However, as

169
reference strain-2 was induced after 24 h of incubation unlike reference strain-1
(induction was at the beginning of the incubation), reference strain-2 showed a
normal O2 uptake state during O2-limited growth conditions. The absence of IPTG
pressure during the first 24 h of cell replication could be a justification for this
observation. Remarkably, during aerobic and O2-limited growth conditions, TMB44
started reducing resazurin (after 8 h of incubation) earlier than TML16 (12 h during
O2-limited and aerobic incubation). However, TMB44 showed similar resazurin
colouration to that of TML16, which indicates a high demand on O2 consumption
(Chapter 2.4). During both growth conditions, the reduction of resazurin by MB44
was noticed after 10 h of incubation. The colour of resazurin during MB44 cultures
was not a representation of O2 uptake, but of the presence of acids (305, 323, 324).
As mentioned earlier, MB44 during aerobic conditions operates full homolactic
fermentation, producing lactate, and during oxygen-limited conditions it has a mixed
acid fermentation that could explain the reduction of resazurin (218, 290).
With regards to the stationary phase (non-replicating phase) viability, the MB44
strain exhibited a stationary-phase viability defect. However, TMB44 during both
aerobic and O2-limited conditions was able to restore the loss of viability in the
stationary phase similar to reference strain-2 and to the TML16 strain. The defect of
MB44 in maintaining a stationary phase was in accordance with cyd mutant strains
ML16 (this study, section 2.4) in E. coli (295) and an A. vinelandi cydAB mutant
(328). These findings again confirm the importance of cytochrome bd-I during the
non-replicating stage and the ability of Mtb bd-I to compensate for the loss of other
terminal oxidases.
Importantly, steady-state kinetics of Mtb bd-I oxidase from TMB44 showed similar
kinetic parameters (Km values) for dQH2 and Q1H2 and substrate preference (dQH2 >
Q1H2) to that of TML16 (section 2.4). These data confirm Mtb bd-I oxidase
characteristics for dQH2 and Q1H2 substrates. As discussed before, the variance in
Vmax values was due to the differences in the amount of enzyme used (335).
Moreover, MTD-403, the optimum quinolone-type inhibitor against Mtb to date, was
tested against Mtb bd-I oxidase from the TMB44 membrane preparation in order to

170
further confirm Mtb bd-I characterization. The IC50 of MTD-403 was similar to that
obtained using the TML16 strain.
In summary, Mtb bd-I was successfully heterologously expressed in an E. coli triple-
knockout system. The steady state kinetic features and inhibitory profile were
consistent with those previously observed using the double-knockout system
(TML16), supporting the validity of the latter. The slow growth rate and poor yields
derived from the TMB44 and MB44 lines, however, make these systems unsuitable
for large scale use, as is required for drug discovery or protein purification.

171
Chapter V
Pharmaco-metabolomics of Mycobacterium
tuberculosis

172
5.1. Introduction
The objective of this chapter was to begin to study the pharmaco-metabolomics of
Mtb first line and developing drugs. The broader objective is to generate a
metabolomics fingerprint for drugs with validated modes of action (MoA) and to
determine whether the fingerprints are consistent with proposed MoA of new drugs.
Metabolomics is a systematic study that quantitatively and/or qualitatively profiles
the living system metabolome. The metabolome gives a holistic view of the living
system when combined with other ‘‘omics’’ approaches, transcriptomics and
proteomic (374, 375). Considering the global increasing rates of MDR-and XDR-TB
(143, 144), expanding the knowledge of the drug MoA will allow more rational
development of new drugs to bypass resistance to current TB therapy. Knowledge of
the Mtb response at the transcriptomic, proteomic or metabolomic level to novel
compounds, as well as to the clinically used drugs, usually offers a credible proof of
the affected metabolome pathways and thus understanding their MoA. Moreover,
important secondary effects of antimicrobial drug action would be revealed, which in
turn allows for the development of co-drugs that target such secondary responses as
a new direction of antimicrobial therapy (376).
Metabolic changes signal the organism response to a drug’s perturbation and the
ability of the organism to adapt to the disruption. However, envisaging targets that
would have a cidal effect on replicating and non-replicating Mtb is hampered by
incomplete understanding of such metabolic responses to target disruption by new
drugs and by the current anti-TB therapies (241). Moreover, this process is also
limited by a lack of complete understanding of drugs MoA. Most of the studies on
anti-TB drugs MoA have centred on the primary target and its associated mutations
that count for emerging resistant strains. The MoAs of current TB drugs (DOTS) on
the Mtb metabolome are not well characterized. Studying the perturbations of the
Mtb metabolome by DOTS are limited to transcriptional and proteomic studies (241,
376).
In this chapter, the front line anti-TB drugs (isoniazid (INH), rifampicin (RIF),
ethambutol (EMB) and streptomycin (STR) were examined along with two of the

173
previously tested Mtb bd-I in house quinolone-type inhibitors, CK-2-63 and RKA-
307, and trifluoperazine (TPZ), a phenothiazine-based compound, targeting type II
NADH:quinone oxidoreductase, to understand various metabolic alterations of Mtb
bacilli upon exposure to these drugs. The mode of action of these inhibitors was
previously described (Chapter 1.4.1) and is depicted in Figure (5.1). The central
carbon metabolites were included in this study owing to their critical roles during TB
infection (Chapter 1.5.2, Figure 1.14). Moreover, redox couples, bioenergetic
couples and some of the amino acid metabolites were also included. As the Mtb rely
on lipids in vivo (172-175), some key metabolites that link fatty acids metabolism
with TCA cycle and glyoxylate shunt were included such as acetyl-CoA, propionyl-
CoA, succinyl-CoA and methylmalonyl-CoA (16). However, other metabolites of
fatty acid metabolism were not incorporated due to method limitation, which will be
discussed later in this chapter.
Figure 5.1: Schematic diagram of the proposed mode of action of DOTS and Mtb
respiratory inhibitors

174
Recently, high-resolution mass spectrometers have emerged in the field of microbial
metabolomics, driving the research towards obtaining profiles of a large number of
low-molecular-weight compounds (metabolites) in highly complex biological
samples. Metabolites, the intermediates of biochemical reactions, have a critical role
in linking different operating metabolic pathways within the living cells that generate
a tight controlled metabolic network. Liquid chromatography-mass spectrometry
(LC-MS)-based metabolomics experiments have different approaches, targeted
analysis or non-targeted profiling. Targeted analysis aims at measuring a predefined
set of known metabolites whereas non-targeted profiling is based on identification
and quantitation of unknown metabolites (374, 377).
The metabolome of living cells has a large variety of metabolites that differ in
chemical structures and properties. The metabolome complexity is a result of wide-
ranging chemical compounds that range from hydrophilic carbohydrates, volatile
alcohols and ketones, amino and non-amino organic acids, hydrophobic lipids, and
complex natural products to ionic inorganic species which makes identifying the
complete metabolome at the same time virtually unfeasible (378).
Studying the metabolome is a multiple-step process which typically includes cell
growth, metabolism quenching, metabolome extraction, and sample concentration,
metabolites detection by LC-MS or another advanced method and finally data
analysis (378). The quenching step is based on arrest of all metabolic activities that
exist in living cells and typically accomplished through quick alteration in
temperature or pH (379). There are different approaches for quenching the
metabolism of cells grown in liquid culture (the common physiological condition of
most microbes) that have been reviewed in details by Rabinowitz (2007), of which
the quench the harvest method was applied in this study (380). Here, quenching and
extraction are combined as a 40:40:20 acetonitrile:methanol:water solution results in
extraction of the intracellular metabolites because of disruption of the cell wall, as
well as metabolism quenching. Importantly, at the metabolome quenching step,
isotopic internal standards can be added to the quenching solvents in order to obatin
precise quantitaive data (377).

175
Regarding the extraction step, an ideal extraction aims to extract all or most of the
metabolites in their original state (i.e., the extraction solvent should stop any further
physical and chemical alterations of the metabolites) and in a quantitative manner.
More than one solvent is usually used as one mixture during the extraction procedure
in order to be compatible with all types of metabolites. For instance, polar solvents
like methanol or methanol–water mixtures are used to extract polar metabolites,
whereas non-polar solvents like chloroform or hexane are used for lipophilic
compounds extraction (377, 381).
Prior to sample analysis, a concentration step is required to remove all the solvent(s)
from the samples due to high sample dilutions that result in lower concentration of
metabolites, although risking of metabolome alterations is expected. Therefore,
removing solvents is needed to enhance metabolite signals at the detection phase and
to avoid any interference of these solvents with the subsequent analysis. There are
different methods of metabolite concentration, of which the most efficient and
common one is through using a nitrogen gas stream to evaporate solvent (378).
In terms of metabolites detection and analysis, a highly sensitive and selective
technique, liquid chromatography-tandem mass spectrometry (LC-MS/MS), was
applied. LC-MS/MS is an analytical chemistry technique that combines physical
separation, ionization and characterization of one or more compounds using tandem
mass spectrometry. LC-MS includes three essential steps which are liquid
chromatography separation, ionization, and separation and quantitation of the ions by
mass spectrometry. This method is able to profile over a hundred cellular metabolites
in a single chromatographic separation. The mass spectrometry spectrum presents
masses of the ionized molecule and its fragments which are the total of the
component atoms masses. Specificity arises from two orthogonal dimensions of
separation: chromatographic retention time (RT) and mass-to-charge ratio (m/z), and
in modern instruments the specificity is further increased by multiple rounds of MS
(‘‘tandem mass spectrometry’’ or ‘‘MS/MS’’) (377, 382).

176
5.2. Material and methods
5.2.1. Preparation of targeted metabolomics solutions
5.2.1.1. Solvents and Chemicals
Water (H2O; VWR International Ltd, UK), acetonitrile (CH3CN; Fisher Scientific,
UK) and methanol (CH3OH; Fisher Scientific, UK) were all HPLC grade.
Ammonium acetate (C2H3O2NH4) was purchased from VWR International Ltd (UK).
Mass spectroscopy grade formic acid (CH2O2, ≥ 98%) and ammonium hydroxide
(NH4OH) were obtained from Sigma Aldrich (UK).
5.2.1.2. Quenching solution
The quenching solution consisted of 40:40:20 acetonitrile (ACN): Methanol
(MeOH): water (H2O) + 0.1 M formic acid and was spiked with 200 μM of internal
standards, β-alanine and DL-arabinose for positive and negative modes, respectively.
Solutions were prepared and stored at -20 °C (383).
5.2.1.3. Extraction solution
The extraction solution consisted of only 40:40:20 ACN:MeOH:H2O and was
prepared in a similar manner to the quenching solution (section 5.2.1.1).
5.2.1.4. Mobile phase solvents
The mobile phase solvent consisted of two main solvents, solvent A [20 mM
ammonium acetate + 20 mM ammonium hydroxide in 95:5 water: acetonitrile (pH
9.45)] and solvent B (acetonitrile, ACN). Before use, the mobile phase was filtered
through a sterile bottle top filter unit with a 0.22 μm membrane (Fisher Scientific,
UK), sonicated and degassed using a sonicator (Fisher Scientific, UK) for 15 min.
This mobile phase was used due to its compatibility with the luna aminopropyl
column used in this study, as tested by Rabinowitz’s lab (384, 385).

177
5.2.2. Preparation of inhibitor stock solutions
10 mM inhibitor stocks were prepared according to their solvent solubility as
detailed before in section 3.2.8.1. 10 mM stock solutions were prepared and kept at -
20oC for no longer than 1 month. Final dilutions were made with culture medium
(7H9 MiddleBrook) and freshly prepared prior to studies being carried out (Table
4.1). The effect of DOTS drugs, isoniazid, ethambutol, rifampicin and streptomycin,
on Mtb H37Rv metabolites were examined along with quinolone-type inhibitors,
CK-2-63 and RKA-307.
5.2.3. Culture of Mycobacterium tuberculosis
Cultures of Mycobacterium tuberculosis H37Rv were carried out as described
previously (section 3.2.9). Briefly, aerobic cultures of Mtb H37Rv were grown to
mid-log phase at 37 °C in 10 ml growth medium (Middlebrook 7H9 broth)
supplemented with 10% (v/v) ADC, 0.2% (v/v) glycerol, and 0.05% (v/v) Tween®
80.
5.2.4. Protocol for sampling metabolites from Mtb H37Rv culture
Currently, the protocol for microbial metabolomics analysis is still in the proof-of-
concept stage, thus protocols are typically developed for a specific study (379).
There are several protocols used to extract metabolites from bacteria. The most
common used are filter-based cell culture, batch liquid culture and chemostats.
Filter-based cell culture and chemostats were excluded due to CTL3 facilities
limitation. The metabolite extraction processes involve two main steps, metabolism
quenching and metabolites extraction. Quenching metabolism was accomplished
using a cold quenching solution, 40:40:20 ACN:MeOH:H2O. This mixture was
found to be effective in quenching metabolism and in extracting nucleotide
triphosphates from E. coli. Metabolite extraction was attained by centrifugation (380,
382).
Following the protocol of Rabinowitz (2007), metabolite sampling from Mtb H37Rv
liquid culture was applied with modification (380). The quenching solution 40:40:20

178
ACN:MeOH:H2O was acidified with 0.1 M formic acid and spiked with 200 μM of
internal standards, β-alanine and DL-arabinose. The addition of formic acid in the
quenching solution helps protecting nucleotide triphosphates against degradation.
This quenching solution was used to simultaneously quench metabolism and initiate
the extraction process. Moreover, it is worth mentioning that 40:40:20
ACN:MeOH:H2O solution was used for Mtb H37Rv metabolite extraction because it
was verified to kill all viable Mtb H37Rv where it has been used in previous Mtb
studies (160, 241). To further confirm this before commencing the experiment, the
following ratios 1:6, 1:8 and 1:10 of Mtb H37Rv culture: 40:40:20 ACN:MeOH:H2O
solution were cultured grown on 7H11 agar plates and incubated at 37 °C in a 5%
CO2 HERACell 150 CO2 incubator (Thermo Scientific, UK). After 5 weeks of
incubation, no colony growth was recorded at all ratios. Therefore, 1:8 (Mtb H37Rv
culture: quenching solution) ratio was used for quenching process in this study.
Importantly, the 40:40:20 ACN:MeOH:H2O mixture at cold temperature is
considered a general efficient quenching and appropriate solvent for metabolite
extraction due to its compatibility to hydrophilic interaction liquid chromatography
(HILIC) compounds which cover most of the polar and some of the non-polar
metabolites (241, 378, 383, 384).
5.2.4.1. Experiment set-up
Drug-containing growth medium was placed in the wells of 24-well plates. Drugs
were present at a final concentration of IC90 (90% inhibitory concentration), as
determined from modified MABA assays (section 4.3.4, Tables 4.3 and 4.5). The
IC90 value of TPZ (36.02 µM) was obtained from the Warman et al (2012) study
(282). With a view to capture the primary effects of the drugs/inhibitors on Mtb
metabolic, IC90 was chosen as the final concentration rather than using IC50 through
consulting previously published studies (241, 386). A drug-free control (vehicle
control) was included in order to monitor normal culture growth. Exponentially
growing Mtb H37Rv cells were harvested at an OD600 of ~1 by centrifugation at 0
°C, using an Eppendorf 5804R refrigerated centrifuge (Eppendorf, UK), at 5000 g
for 10 min. Pelleted materials were resuspended in a cold drug free Middlebrook
7H9 Broth (lacking glycerol, Tween® 80 and ADC). Subsequently, the culture was

179
added to equal volumes of drug-containing growth medium (final concentration of
culture corresponded to OD600 of 0.5, 1 x 10⁸ cfu.ml
-1) in the wells of 24-well plates.
The final concentration of culture was chosen following the protocol of Griffin et al
(2012) (184). The 24-well plate was incubated at 37 °C in a 5% CO2 HERACell 150
CO2 incubator (Thermo Scientific, UK). ampho
5.2.4.2. Metabolites extraction
Following pre-determined incubations of 0, 1, 2, 3, 6 and 7 days, aliquots of the
cultures were withdrawn and the extraction step initiated. The Mtb H37Rv culture
was quenched using cold quenching solution in ratio 1:8 (culture: quenching
solution). Subsequently, samples were vortexed for 30 s before centrifugation at
5000 g for 15 min at 0 °C using an Eppendorf 5804R refrigerated centrifuge
(Eppendorf, UK). Afterward, supernatants were collected in a sterilized tube and the
remaining pelleted materials were resuspended in a cold extraction solution
(40:40:20 ACN:MeOH:H2O). In similar manner, samples were vortexed, centrifuged
and supernatants were pooled with the preceding supernatant. Pooled supernatant
was filtered using a 0.22 μM Millex® filter unit (Millipore, UK). The samples were
transferred to the LC-MS/MS lab and stored at -80 °C to be processed through LC-
MS/MS no later than a week from sampling.
5.2.5. LC-MS/MS samples preparation
According to the protocol of Biagini et al (2012), samples were transferred to glass
vials and dried under a stream of nitrogen. Mobile phase solvent A (pH 9.45) was
used to resuspend the dried samples. Afterwards, samples were vortexed, filtered
using a 0.22 μM filter unit (Phenomenex-RC, UK) and transferred to Chromacol LC-
MS/MS glass vials (Chromacol, Thermo Fisher Scientific Inc., UK) (387).

180
5.2.6. Preparation of standards stock for calibration curve standards
Following the protocol of Biagini et al (2012) that was established by PhD student
Murad Mubaraki, standards stocks were prepared according to their solvent
solubility at specific concentrations for each metabolite (Sigma Aldrich, UK) (Table
5.1). Consequently, 100 μl of each metabolite was merged in one standard mixture
before the preparation of 16 serial dilutions of the standard mixture, which was
carried out using HPLC grade water. These 16 standard levels were processed
through the extraction step and prepared for LC-MS/MS analysis in a similar manner
to that described earlier (section 5.2.4.2 and 5.2.5). These standard levels were
analysed through LC-MS/MS (section 5.2.7) before generating the calibration curves
by plotting the area ratio of the metabolite standard (The area under the curve (AUC)
of metabolite divided by AUC of internal standard) against its concentration. The
linearity for each metabolite was evaluated by using linear regression.
Table 5.1: Metabolite primary stocks concentration for calibration curve standards
Metabolites MW (g.mol-1
) Primary Stock
Concentration (mM) Solvent
Glucose 180.16 11.10 H2O
Fumarate 116.07 17.23 H2O
Succinate 118.09 16.93 H2O
Malate 134.09 14.91 H2O
α-ketoglutarate 146.11 13.68 MeOH
(Iso)-Citrate 192.12 10.41 MeOH
PEP, Phosphoenolpyruvate 168.04 11.90 H2O
G-3-P, Glycerol-3-phosphate 170.05 11.62 H2O
Hypoxanthine 136.12 14.70 DMSO
Lactate 90.08 44.40 H2O
DHAP, Dihydroxyacetone
phosphate 170.06 23.52 H2O
Oxaloacetate 132.07 151.43 H2O
Acetyl-CoA 809.57 12.35 MeOH
Succinyl-CoA 867.60 5.76 H2O
Propionyl-CoA 823.60 6.07 H2O
Methylmalonyl-CoA 867.61 2.31 H2O
Alanine 89.09 22.44 H2O
Asparagine 132.12 15.13 H2O
Aspartate 133.1 15.02 H2O
Glutamine 146.14 13.68 H2O
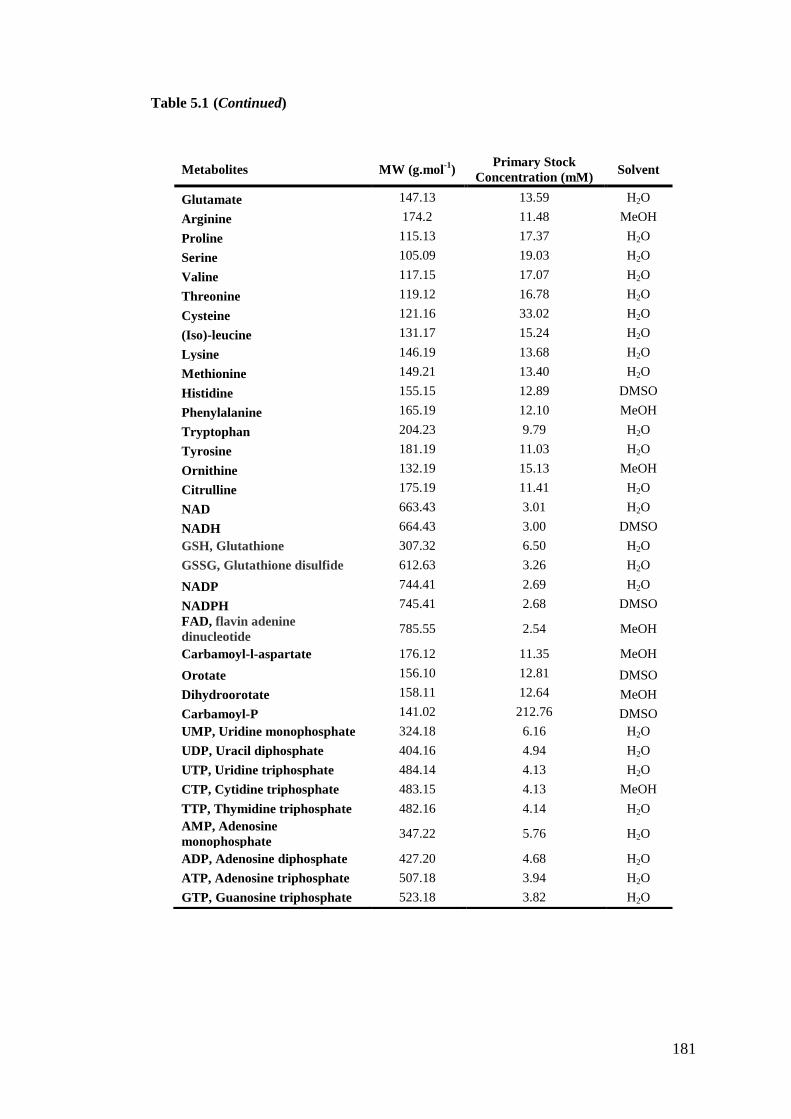
181
Table 5.1 (Continued)
Metabolites MW (g.mol-1
) Primary Stock
Concentration (mM) Solvent
Glutamate 147.13 13.59 H2O
Arginine 174.2 11.48 MeOH
Proline 115.13 17.37 H2O
Serine 105.09 19.03 H2O
Valine 117.15 17.07 H2O
Threonine 119.12 16.78 H2O
Cysteine 121.16 33.02 H2O
(Iso)-leucine 131.17 15.24 H2O
Lysine 146.19 13.68 H2O
Methionine 149.21 13.40 H2O
Histidine 155.15 12.89 DMSO
Phenylalanine 165.19 12.10 MeOH
Tryptophan 204.23 9.79 H2O
Tyrosine 181.19 11.03 H2O
Ornithine 132.19 15.13 MeOH
Citrulline 175.19 11.41 H2O
NAD 663.43 3.01 H2O
NADH 664.43 3.00 DMSO
GSH, Glutathione 307.32 6.50 H2O
GSSG, Glutathione disulfide 612.63 3.26 H2O
NADP 744.41 2.69 H2O
NADPH 745.41 2.68 DMSO
FAD, flavin adenine
dinucleotide 785.55 2.54 MeOH
Carbamoyl-l-aspartate 176.12 11.35 MeOH
Orotate 156.10 12.81 DMSO
Dihydroorotate 158.11 12.64 MeOH
Carbamoyl-P 141.02 212.76 DMSO
UMP, Uridine monophosphate 324.18 6.16 H2O
UDP, Uracil diphosphate 404.16 4.94 H2O
UTP, Uridine triphosphate 484.14 4.13 H2O
CTP, Cytidine triphosphate 483.15 4.13 MeOH
TTP, Thymidine triphosphate 482.16 4.14 H2O
AMP, Adenosine
monophosphate 347.22 5.76 H2O
ADP, Adenosine diphosphate 427.20 4.68 H2O
ATP, Adenosine triphosphate 507.18 3.94 H2O
GTP, Guanosine triphosphate 523.18 3.82 H2O

182
5.2.7. Analysis using LC-MS/MS
Following the protocol of Biagini et al (2012) an Accela Autosampler HPLC system
(Thermo Fisher Scientific) was used with modification for the metabolites separation
using an Luna aminopropyl column (250 × 2 mm with a 5-μm particle size)
(Phenomenex, USA) (387). The mobile phase consisted of solvent A [20 mM
ammonium acetate + 20 mM ammonium hydroxide in 95:5 water:acetonitrile (pH
9.45)], prepared as described before and solvent B (acetonitrile). The
chromatographic gradients were as follows: t = 0, 15% A; t = 15 min, 100% A; t =
33 min, 100% A; t = 35 min, 15% A; t = 45 min, 15% A. Injection volume, flow
rate, column temperature, and autosampler temperature were set at 20 μl, 150 μl.min-
1, 15 °C, and 15 °C, respectively.
For metabolite detection, a TSQ Quantum Access Triple-Stage Quadrupole mass
spectrometer (Thermo Electron Corporation) was used. Electrospray ionization (ESI)
was employed for the metabolite detection and analysis of metabolites. ESI spray
voltage was 4000 V and 5500 V for positive and negative modes, respectively.
Nitrogen was used as sheath gas at 30 psi and as the auxiliary gas at 10 psi. Argon
was used as the collision gas at 1.5 mTorr. The capillary temperature was 320 °C and
270 °C for positive and negative modes, respectively. Scan time for each single
reaction monitoring (SRM) event transition was 0.1 s with a scan width of 1 m/z.
Xcalibar (Thermoscientific) software was applied to conduct the instrument control,
data acquisition, and data analysis. LC-MS/MS parameters including retention time
(RT), product and precursor mass, and collision induced dissociation (CID) are
presented in Appendix II (Tables 1 and 2). The linearity (R2), linearity range and
limit of detection (LOD) are presented in Appendix II (Table 3).

183
5.2.8. Data treatment and analysis
Using known concentrations of standards for each of the 56 SRMs, calibration
curves were generated and thus metabolite concentrations levels were quantified.
AUC of the integrated peak represented the signal for each metabolite. Figure 5.2
shows an example of a LC-MS/MS chromatogram of the AMP metabolite. An
example of calibration curve of AMP is shown in Figure 5.3. Calibration curves of
all metabolites are presented in Appendex III (Figures 1-19). Each metabolite signal
was normalized to the signal of the internal standard DL-arabinose (negative mode)
or β-alanine (positive mode) in the same sample.
Principal component analysis (PCA), partial least squares-discriminant analysis
(PLS-DA) and heat maps were generated through the MetaboAnalyst web server
(http://www.metaboanalyst.ca/MetaboAnalyst/faces/Home.jsp) (388). Afterwards,
data were plotted using GraphPad prism 5 Software Inc. for each metabolite in order
to determine the important results.
Figure 5.2: LC-MS/MS chromatogram of AMP
A) Chromatographic separation of AMP peak shows retention time (RT) at ~22.8 min. B)
SRM scan of ionized AMP shows the detection of its product ion at a mass-to-charge (m/z)
of 136.
c:\murad\...\2012\oct\11th\pos\std1 12/10/2012 05:12:18 STD1
RT: 0.00 - 45.03 SM: 3G
0 2 4 6 8 10 12 14 16 18 20 22 24 26 28 30 32 34 36 38 40 42 44
Time (min)
0
20
40
60
80
100
Re
lative
Ab
un
da
nce
RT: 22.81
23.54 24.19 27.30 32.50 41.10 44.5042.0428.093.01 13.788.07 36.339.81 20.575.690.99 10.74 38.2130.77 34.1619.3518.2615.883.88
NL:
5.37E5
TIC F: + c ESI
SRM ms2
348.000@cid21.
00
[135.500-
136.500] MS
std1
std1 #12940 RT: 22.81 AV: 1 NL: 5.44E5
F: + c ESI SRM ms2 [email protected] [135.500-136.500]
135.5 135.6 135.7 135.8 135.9 136.0 136.1 136.2 136.3 136.4 136.5
m/z
0
20
40
60
80
100
Re
lative
Ab
un
da
nce
136.02
A)
B)

184
Figure 5.3: Standard calibration curve of AMP
The line of best fit for the calibration curve was generated using equal weighted linear
regression as the mathematical model of best fit, showing R2
> 0.99. AMP concentration in
experimental samples was calculated from the resulting area ratio and the regression
equation of the calibration curve.
AMPY = 0.0999809*X R^2 = 0.9941 W: Equal
0 20 40 60 80 100
uM
0
1
2
3
4
5
6
7
8
9
10
11
Are
a R
atio

185
5.3. Results
Generated data were initially processed using the MetaboAnalyst web server (388)
where multivariate statistical analysis using PCA and PLS-DA was performed on the
ratio of log2 transformed datasets. All data were expressed as the normalized levels
of metabolites to the number of Mtb cells in untreated and drug-treated samples.
Afterwards, datasets were analyzed through hierarchical cluster analysis generating a
heatmap. Finally, the importance of drug-treated metabolite versus untreated
metabolites (vehicle control) was examined for each metabolite individually
(GraphPad prism 5 Software Inc.). Out of 56 metabolites examined by LC-MS/MS,
only 25 metabolites were analysed by the MetaboAnalyst web server. All redox
couples, bioenergetics metabolites and some of amino acid metabolites: asparagine,
arginine, serine and cysteine were not detected by LC-MS/MS as they were below
LOD. Moreover, 7 CCM metabolites: PEP, DHAP, lactate, acetyl-CoA, succinyl-
CoA, methylmalonyl-CoA and propionyl-CoA were not detected (below LOD,
Appendix II, Table 2).

186
5.3.1. PCA and PLS-DA
Comparative analyses of metabolomics data are greatly facilitated by using PCA and
PLS-DA. PCA converts high dimensional data into lower-dimensional plots without
loss of information through developing a small number of artificial variables
(principal components). PCA is a commonly used unsupervised technique, as it
requires no a priori knowledge of class of the sample. PCA is usually presented in
terms of component scores that account for most of the variance in the observed
variables of the data. Similarly, PLS-DA uses a supervised technique to determine
pattern on the original data. PLS-DA classifies the data into two blocks, one between
class variation and the other within class. Thus, PLS-DA separates the more
meaningful data from the less meaningful (388, 389). 2-D PCA showed that RKA-
307-treated Mtb H37Rv clusters away from the untreated Mtb H37Rv and other
drugs/inhibitors treated clusters (Figure 5.4, A), which is also observed with the 3-D
PCA. The TPZ-treated Mtb H37Rv cluster was more defined with the 3-D PCA
(Figure 5.4, B). PLS-DA was applied to further improve and refine the clustering and
positioning of the variables and to assess the significance of class discrimination. 2-
D PLS-DA (Figure 5.5, A) displayed discrimination of clusters for the CK-2-63-,
TPZ- and RKA-307-treated Mtb H37Rv. Moreover, INH-, EMB-, RIF- and STR-
treated Mtb clusters overlapped with untreated Mtb H37Rv as displayed by 2-D
PLS-DA. Interestingly, 3-D PLS-DA (Figure 5.5, B) showed even better clustering
of the data from which TPZ-, CK-2-63- and RKA-307-treated Mtb H37Rv were
found to be in the same side but with different directions. In contrast, RIF-treated
Mtb showed a defined cluster while INH- and STR-treated Mtb H37Rv
demonstrated quite close distance clusters. EMB-treated Mtb H37Rv cluster was
close to the untreated Mtb H37Rv cluster.

187
Figure 5.4: 2-D and 3-D PCA score plots for Mtb H37Rv upon exposure to different drugs and inhibitors
The samples (the time course points) on both plots are colour coded as following: untreated Mtb H37Rv samples (light blue), Mtb H37Rv samples treated
with isoniazid (INH, grey), ethambutol (EMB, orange), rifampicin (RIF, black), streptomycin (STR, pink), trifluoperazine (TPZ, green), CK-2-63 (red) and
RKA-307 (dark blue). A) 2-D PCA score plot shows two distinct clusters with different directions. The first cluster includes untreated Mtb H37Rv samples
and drug-treated samples with INH, EMB, RIF, STR, TPZ and CK-2-63 whereas the second cluster includes only RKA-307-treated Mtb. B) 3-D PCA score
plot displays no clear cluster except for that of RKA-307- and TPZ-treated Mtb. Each time-point for each metabolite represents the normalized average of two
independent replicates which were divided by the corresponding average values derived from Mtb harvested at time 0 day (arrow indicted) to generate the
corresponding ratios. Ratios were log2 transformed and plotted using the metaboanalyst web server (388).
A) B)
Time = 0 day Time = 0 day

188
Figure 5.5: 2-D and 3-D PLS-DA scores for Mtb H37Rv upon exposure to different drugs and inhibitors.
The samples (the time course points) on both plots are colour coded as following: untreated Mtb H37Rv samples (light blue), Mtb H37Rv samples treated
with isoniazid (INH, grey), ethambutol (EMB, orange), rifampicin (RIF, black), streptomycin (STR, pink), trifluoperazine (TPZ, green), CK-2-63 (red) and
RKA-307 (dark blue). A) 2-D PLS-DA score plot shows four distinct clusters with different directions which are TPZ-, RKA-307-, CK-2-63- and RIF-treated
Mtb whereas untreated Mtb H37Rv, INH-, EMB- and STR-treated Mtb clusters are overlapped. B) 3-D PLS-DA score plot displays TPZ-, CK-2-63- and
RKA-307- treated Mtb in the same side but different directions. INH- and STR-treated Mtb display approximately close distance clusters whereas RIF-treated
Mtb cluster shows a separate cluster. EMB-treated Mtb cluster is close to untreated Mtb cluster. Each time-point for each metabolite represents the
normalized average of two independent replicates which were divided by the corresponding average values derived from Mtb harvested at time 0 day (arrow
indicted) to generate the corresponding ratios. Ratios were log2 transformed and plotted using the metaboanalyst web server (388).
A) B)
Time = 0 day
Time = 0 day

189
5.3.2. Heat map profile of the Mtb metabolome
The heat map is presented here as a visual aid for the similarity measures between
the samples through expressing the relative difference of the dynamic changes in a
scale of red and green colour (Figure 5.6). In comparison with untreated Mtb, RKA-
307-treated Mtb had the most visual differences of the dynamic changes, which
included most of the CCM metabolites and some of amino acid metabolites. In
contrast, Mtb treated with other drugs showed less visual differences of the dynamic
changes in comparison with untreated Mtb. Individual analysis of each metabolite
will be presented in the following section (Chapter 5.3.4).
Figure 5. 6: Heat map profile of drug-treated and untreated Mtb H37Rv metabolome
The heat map shows the dynamic changes of 25 metabolites in Mtb H37Rv treated with the
following drugs/inhibitors: isoniazid (INH), ethambutol (EMB), rifampicin (RIF),
streptomycin (STR), trifluoperazine (TPZ), CK-2-63 and RKA-307 and in untreated Mtb
H37Rv (vehicle control). Each time-point for each metabolite represents the normalized
average of two independent replicates which were divided by the corresponding average
values derived from Mtb harvested at time 0 day to generate the corresponding ratios. Ratios
were log2 transformed and plotted on a colour dynamic range scale using the metaboanalyst
web server (388). Rows correspond to metabolites measured by LC-MS/MS. Columns
correspond to the time course from day 0 to day 7 for each of treated and untreated Mtb
H37Rv. Green and red colours represent decreases and increases of metabolites ratio,
respectively. Black colour indicates the baseline. G-3-P, glycerol-3-phosphate.

190
5.3.3. Biochemical time–dependent of metabolite profiles in Mtb H37Rv.
Following examination of the clusters and the dynamic change of the samples, time-
dependent graphs of untreated Mtb H37Rv and Mtb H37Rv treated with the
following drugs/inhibitors: INH, EMB, RIF, STR, TPZ, CK-2-63 and RKA-307 for
25 metabolites were plotted (GraphPad prism 5 Software Inc.).
INH-treated Mtb showed a notable increase in the level of glycerol-3-phosphate (G-
3-P), α-ketoglutarate, valine, alanine and lysine. In addition, the levels of malate and
hypoxanthine increased by day 7. Glutamate and ornithine utilization and threonine
production were considerably low, compared to the drug-free control Mtb (Figures
5.7-5.9). Regarding EMB-treated Mtb (Figures 5.10-5.12), the level of fumarate
production was remarkably low whereas, the level of (iso)-citrate was notably
reduced, compared to the drug-free control Mtb. Moreover, the level of alanine,
proline and histidine was notably decreased in EMB-treated Mtb
Compared to the untreated control Mtb, RIF-treated Mtb showed the following
effects: the level of fumarate and (iso)-citrate was found to be notably decreased
whereas the level of ornithine was shown to be considerably less utilized and
threonine drastically less produced than that of untreated Mtb. Moreover, RIF-treated
Mtb showed an important increase in (iso)-leucine and valine levels (Figures 5.13-
5.15). Concerning STR-treated Mtb, succinate, oxaloacetate and ornithine level
displayed substantial accumulation whereas (iso)-citrate and proline levels were
notably decreased. Furthermore, the histidine level was found to be lower compared
to the drug-free control Mtb (Figures 5.16-5.18).
TPZ-treated Mtb was found to have a remarkable reduction of (iso)-citrate, valine
and malate levels and low production of hypoxanthine and threonine. Moreover, a
considerable accumulation of ornithine and α-ketoglutarate levels and low utilization
of glutamate were observed, compared to the drug-free control Mtb (Figures 5.19-
5.21).
CK-2-63-treated Mtb (in comparison with untreated control Mtb) showed a notably
low production level of alanine, valine, proline, (iso)-leucine, succinate and
191
hypoxanthine. Moreover, (iso)-citrate found to be considerably decreased while
aspartate was remarkably increased in CK-2-63-treated Mtb. A complete inhibition
of methionine consumption was also observed following CK-2-63-treatment
(Figures 5.22-5.24).
With regards to RKA-307-treated Mtb, most of the TCA cycle metabolites (Figure
1.13, Chapter 1.6.2), which were succinate, malate and oxaloacetate were shown to
have low production levels. Moreover, fumarate, (iso)-citrate and α-ketoglutarate
revealed remarkable levels of reduction compared to the drug-free control Mtb. The
following amino acids: citrulline, glutamine, valine, threonine, proline and histidine
were found to be drastically decreased, in comparison with the untreated control Mtb
(Figures 5.25-5.27).

192
Figure 5.7: Time-dependent changes of Mtb H37Rv metabolites in INH-treated and untreated control cells
The following metabolites levels in untreated (closed circle) and INH-treated (open circle) cells were determined by LC-MS/MS, A) Glucose, B) Glycerol-3-
phosphate (G-3-P), C) Succinate, D) Fumarate, E) Malate, F) Oxaloacetate, G) (iso)-citrate and H) α-Ketoglutarate. The final concentration of Isoniazid
(INH) was at IC90 (2.38 µM). The points represent the mean ± SEM of duplicate independent experiments. In INH-treated Mtb H37Rv, G-3-P, malate and α-
Ketoglutarate show a substantial increase (GraphPad prism 5 Software Inc.).
Time (Days)
Fold
cha
nge
ratio
0 1 2 3 6 70.0
0.5
1.0
1.5
Time (Days)
Fold
cha
nge
ratio
0 1 2 3 6 70
100
200
300
400
Time (Days)
Fold
cha
nge
ratio
0 1 2 3 6 70
20
40
60
Time (Days)
Fold
cha
nge
ratio
0 1 2 3 6 70.0
0.5
1.0
1.5
2.0
2.5
Time (Days)
Fold
cha
nge
ratio
0 1 2 3 6 70
50
100
150
200
250
Time (Days)
Fold
cha
nge
ratio
0 1 2 3 6 70
1
2
3
4
Time (Days)
Fold
cha
nge
ratio
0 1 2 3 6 70
1
2
3
4
5
Time (Days)
Fold
cha
nge
ratio
0 1 2 3 6 70
5
10
15
20
* P < 0.05
* P < 0.05
A
D
B
E
G
H
F
C

193
Figure 5.8: Time-dependent change of Mtb H37Rv metabolites in INH-treated and untreated control cells
The following metabolites levels in untreated (closed circle) and INH-treated (open circle) cells were determined by LC-MS/MS, A) Alanine, B) Aspartate,
C) Glutamate, D) Citrulline E) Ornithine, F) Glutamine, G) Proline, H) Hypoxanthine and I) Histidine. The final concentration of Isoniazid (INH) was at IC90
(2.38 µM). The points represent the mean ± SEM of duplicate independent experiments. In INH-treated Mtb H37Rv, glutamate and ornithine show notably
low levels whereas alanine and hypoxanthine show obvious increase (GraphPad prism 5 Software Inc.).
Time (Days)
Fold
cha
nge
ratio
0 1 2 3 6 70
100
200
300
400
Time (Days)
Fold
cha
nge
ratio
0 1 2 3 6 70
200
400
600
800
1000
Time (Days)
Fold
cha
nge
ratio
0 1 2 3 6 70
5
10
15
Time (Days)
Fold
cha
nge
ratio
0 1 2 3 6 70.4
0.6
0.8
1.0
1.2
Time (Days)
Fold
cha
nge
ratio
0 1 2 3 6 70
20
40
60
Time (Days)
Fold
cha
nge
ratio
0 1 2 3 6 70.0
0.5
1.0
1.5
2.0
Time (Days)
Fold
cha
nge
ratio
0 1 2 3 6 70
2
4
6
8
Time (Days)
Fold
cha
nge
ratio
0 1 2 3 6 70
200
400
600
800
Time (Days)
Fold
cha
nge
ratio
0 1 2 3 6 70
10
20
30
40
* P < 0.05
* P < 0.05
A
D
B
E
G
H
F
C
I

194
Figure 5.9: Time-dependent changes of Mtb H37Rv metabolites in INH-treated and untreated control cells
The following metabolites levels in untreated (closed circle) and INH-treated (open circle) cells were determined by LC-MS/MS, A) Valine, B) (iso)-leucine,
C) Phenylalanine, D) Tryptophan E) Tyrosine, F) Lysine, G) Threonine and H) Methionine. The final concentration of Isoniazid (INH) was at IC90 (2.38 µM).
The points represent the mean ± SEM of duplicate independent experiments. In INH-treated Mtb H37Rv, valine and lysine show notable increase; threonine
shows a clearly low level (GraphPad prism 5 Software Inc.)
Time (Days)
Fold
cha
nge
ratio
0 1 2 3 6 70
100
200
300
Time (Days)
Fold
cha
nge
ratio
0 1 2 3 6 70
10
20
30
40
50
Time (Days)
Fold
cha
nge
ratio
0 1 2 3 6 70
20
40
60
Time (Days)
Fold
cha
nge
ratio
0 1 2 3 6 70
10
20
30
Time (Days)
Fold
cha
nge
ratio
0 1 2 3 6 70
10
20
30
40
Time (Days)
Fold
cha
nge
ratio
0 1 2 3 6 70
2
4
6
8
10
Time (Days)
Fold
cha
nge
ratio
0 1 2 3 6 70
20
40
60
80
100
Time (Days)
Fold
cha
nge
ratio
0 1 2 3 6 70.0
0.5
1.0
1.5
2.0
2.5
* P < 0.05
* P < 0.05
* P < 0.05
A
D
B
E
G
H
F
C

195
Figure 5.10: Time-dependent changes of Mtb H37Rv metabolites in EMB-treated and untreated control cells
The following metabolite levels in untreated (closed circle) and EMB-treated (open circle) cells were determined by LC-MS/MS, A) Glucose, B) Glycerol-3-
phosphate (G-3-P), C) Succinate, D) Fumarate, E) Malate, F) Oxaloacetate, G) (iso)-citrate and H) α-Ketoglutarate. The final concentration of Ethambutol
(EMB) was at IC90 (4.61 µM). The points represent the mean ± SEM of duplicate independent experiments. In EMB-treated Mtb H37Rv, fumarate and (iso)-
citrate show noticeable decreases (GraphPad prism 5 Software Inc.).
Time (Days)
Fold
cha
nge
ratio
0 1 2 3 6 70.0
0.5
1.0
1.5
Time (Days)
Fold
cha
nge
ratio
0 1 2 3 6 70
50
100
150
Time (Days)
Fold
cha
nge
ratio
0 1 2 3 6 70
20
40
60
80
100
Time (Days)
Fold
cha
nge
ratio
0 1 2 3 6 70.0
0.5
1.0
1.5
2.0
Time (Days)
Fold
cha
nge
ratio
0 1 2 3 6 70
20
40
60
80
Time (Days)
Fold
cha
nge
ratio
0 1 2 3 6 70
1
2
3
Time (Days)
Fold
cha
nge
ratio
0 1 2 3 6 70.0
0.5
1.0
1.5
2.0
Time (Days)
Fold
cha
nge
ratio
0 1 2 3 6 70.0
0.5
1.0
1.5
2.0
2.5
* P < 0.05
** P < 0.01
A
D
B
E
G
H
F
C

196
Figure 5.11: Time-dependent changes of Mtb H37Rv metabolites in EMB-treated and untreated control cells
The following metabolite levels in untreated (closed circle) and EMB-treated (open circle) cells were determined by LC-MS/MS, A) Alanine, B) Aspartate,
C) Glutamate, D) Citrulline E) Ornithine, F) Glutamine, G) Proline, H) Hypoxanthine and I) Histidine. The final concentration of Ethambutol (EMB) was at
IC90 (4.61 µM). The points represent the mean ± SEM of duplicate independent experiments. In EMB-treated Mtb H37Rv, alanine, proline and histidine show
notable decrease (GraphPad prism 5 Software Inc.).
Time (Days)
Fold
cha
nge
ratio
0 1 2 3 6 70
100
200
300
400
500
Time (Days)
Fold
cha
nge
ratio
0 1 2 3 6 70
5
10
15
Time (Days)
Fold
cha
nge
ratio
0 1 2 3 6 70.5
0.6
0.7
0.8
0.9
1.0
1.1
Time (Days)
Fold
cha
nge
ratio
0 1 2 3 6 70
20
40
60
Time (Days)
Fold
cha
nge
ratio
0 1 2 3 6 70.0
0.5
1.0
1.5
Time (Days)
Fold
cha
nge
ratio
0 1 2 3 6 70
2
4
6
8
Time (Days)
Fold
cha
nge
ratio
0 1 2 3 6 70
200
400
600
Time (Days)
Fold
cha
nge
ratio
0 1 2 3 6 70
20
40
60
80
100
Time (Days)
Fold
cha
nge
ratio
0 1 2 3 6 70
5
10
15
20
A
D
B
E
G
H
F
C
I

197
Figure 5.12: Time-dependent changes of Mtb H37Rv metabolites in EMB-treated and untreated control cells
The following metabolite levels in untreated (closed circle) and EMB-treated (open circle) cells were determined by LC-MS/MS, A) Valine, B) (iso)-leucine,
C) Phenylalanine, D) Tryptophan E) Tyrosine, F) Lysine, G) Threonine and H) Methionine. The final concentration of Ethambutol (EMB) was at IC90 (4.61
µM). The points represent the mean ± SEM of duplicate independent experiments. There are no noticeable changes among metabolites (GraphPad prism 5
Software Inc.).
Time (Days)
Fold
cha
nge
ratio
0 1 2 3 6 70
50
100
150
Time (Days)
Fold
cha
nge
ratio
0 1 2 3 6 70
10
20
30
Time (Days)
Fold
cha
nge
ratio
0 1 2 3 6 70
10
20
30
40
Time (Days)
Fold
cha
nge
ratio
0 1 2 3 6 70
5
10
15
20
Time (Days)
Fold
cha
nge
ratio
0 1 2 3 6 70
10
20
30
40
Time (Days)
Fold
cha
nge
ratio
0 1 2 3 6 70
2
4
6
8
Time (Days)
Fold
cha
nge
ratio
0 1 2 3 6 70
20
40
60
80
100
Time (Days)
Fold
cha
nge
ratio
0 1 2 3 6 70.0
0.5
1.0
1.5
2.0
2.5
A
D
B
E
G
H
F
C

198
Figure 5.13: Time-dependent changes of Mtb H37Rv metabolites in RIF-treated and untreated control cells
The following metabolite levels in untreated (closed circle) and RIF-treated (open circle) cells were determined by LC-MS/MS, A) Glucose, B) Glycerol-3-
phosphate (G-3-P), C) Succinate, D) Fumarate, E) Malate, F) Oxaloacetate, G) (iso)-citrate and H) α-Ketoglutarate. The final concentration of Rifampicin
(RIF) was at IC90 (2.21x10⁻³
µM). The points represent the mean ± SEM of duplicate independent experiments. In RIF-treated Mtb H37Rv, fumarate and
(iso)-citrate show remarkable decreases (GraphPad prism 5 Software Inc.).
Time (Days)
Fold
cha
nge
ratio
0 1 2 3 6 70.0
0.5
1.0
1.5
Time (Days)
Fold
cha
nge
ratio
0 1 2 3 6 70
50
100
150
Time (Days)
Fold
cha
nge
ratio
0 1 2 3 6 70
20
40
60
80
Time (Days)
Fold
cha
nge
ratio
0 1 2 3 6 70.0
0.5
1.0
1.5
2.0
Time (Days)
Fold
cha
nge
ratio
0 1 2 3 6 70
50
100
150
Time (Days)
Fold
cha
nge
ratio
0 1 2 3 6 70
1
2
3
Time (Days)
Fold
cha
nge
ratio
0 1 2 3 6 70.0
0.5
1.0
1.5
2.0
Time (Days)
Fold
cha
nge
ratio
0 1 2 3 6 70
2
4
6
** P < 0.01
** P < 0.01
A
D
B
E
G
H
F
C

199
Figure 5.14: Time-dependent changes of Mtb H37Rv metabolites in RIF-treated and untreated control cells
The following metabolite levels in untreated (closed circle) and RIF-treated (open circle) cells were determined by LC-MS/MS, A) Alanine, B) Aspartate, C)
Glutamate, D) Citrulline E) Ornithine, F) Glutamine, G) Proline, H) Hypoxanthine and I) Histidine. The final concentration of Rifampicin (RIF) was at IC90
(2.21x10⁻³
µM). The points represent the mean ± SEM of duplicate independent experiments. In RIF-treated Mtb H37Rv, ornithine shows low levels
(GraphPad prism 5 Software Inc.).
Time (Days)
Fold
cha
nge
ratio
0 1 2 3 6 70
200
400
600
800
1000
Time (Days)
Fold
cha
nge
ratio
0 1 2 3 6 70
2
4
6
8
Time (Days)
Fold
cha
nge
ratio
0 1 2 3 6 70.5
0.6
0.7
0.8
0.9
1.0
1.1
Time (Days)
Fold
cha
nge
ratio
0 1 2 3 6 70
20
40
60
80
Time (Days)
Fold
cha
nge
ratio
0 1 2 3 6 70.0
0.5
1.0
1.5
Time (Days)
Fold
cha
nge
ratio
0 1 2 3 6 70
5
10
15
Time (Days)
Fold
cha
nge
ratio
0 1 2 3 6 70
200
400
600
Time (Days)
Fold
cha
nge
ratio
0 1 2 3 6 70
20
40
60
80
100
Time (Days)
Fold
cha
nge
ratio
0 1 2 3 6 70
5
10
15
20
* P < 0.05
A
D
B
E
G
H
F
C
I
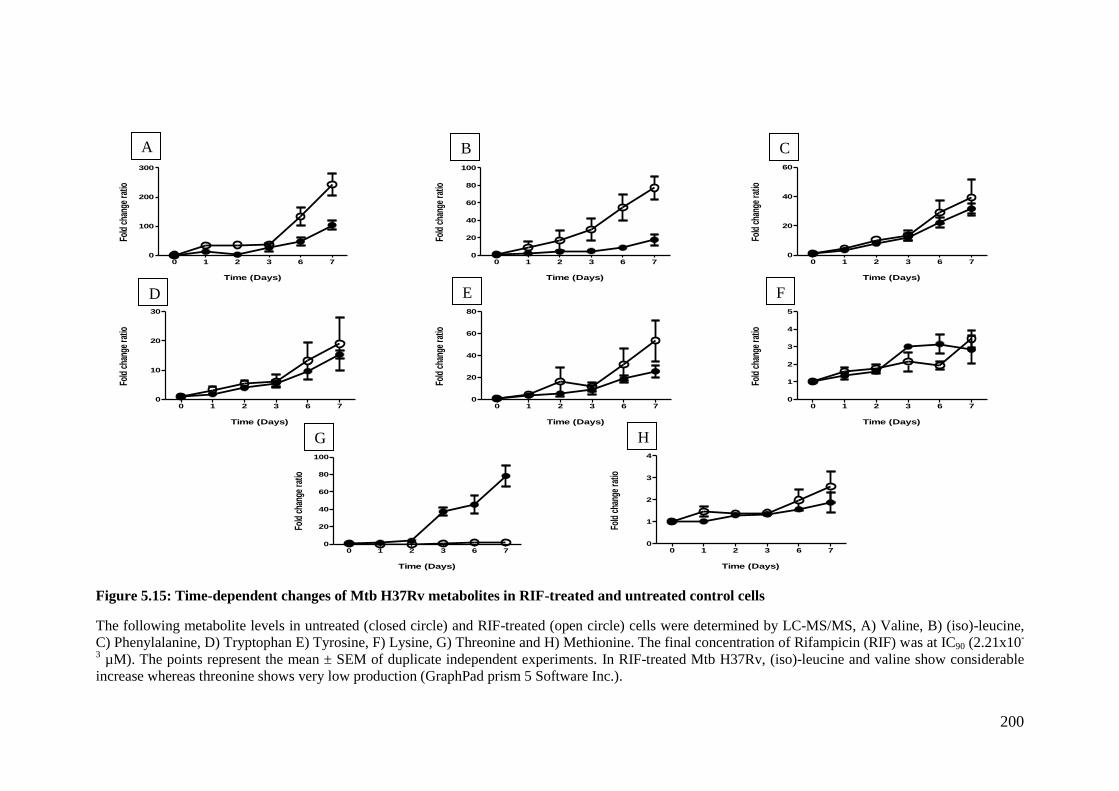
200
Figure 5.15: Time-dependent changes of Mtb H37Rv metabolites in RIF-treated and untreated control cells
The following metabolite levels in untreated (closed circle) and RIF-treated (open circle) cells were determined by LC-MS/MS, A) Valine, B) (iso)-leucine,
C) Phenylalanine, D) Tryptophan E) Tyrosine, F) Lysine, G) Threonine and H) Methionine. The final concentration of Rifampicin (RIF) was at IC90 (2.21x10-
3 µM). The points represent the mean ± SEM of duplicate independent experiments. In RIF-treated Mtb H37Rv, (iso)-leucine and valine show considerable
increase whereas threonine shows very low production (GraphPad prism 5 Software Inc.).
Time (Days)
Fold
cha
nge
ratio
0 1 2 3 6 70
100
200
300
Time (Days)
Fold
cha
nge
ratio
0 1 2 3 6 70
20
40
60
80
100
Time (Days)
Fold
cha
nge
ratio
0 1 2 3 6 70
20
40
60
Time (Days)
Fold
cha
nge
ratio
0 1 2 3 6 70
10
20
30
Time (Days)
Fold
cha
nge
ratio
0 1 2 3 6 70
20
40
60
80
Time (Days)
Fold
cha
nge
ratio
0 1 2 3 6 70
1
2
3
4
5
Time (Days)
Fold
cha
nge
ratio
0 1 2 3 6 70
20
40
60
80
100
Time (Days)
Fold
cha
nge
ratio
0 1 2 3 6 70
1
2
3
4
* P < 0.05
* P < 0.05A
D
B
E
G
H
F
C

201
Figure 5.16: Time-dependent changes of Mtb H37Rv metabolites in STR-treated and untreated control cells
The following metabolites levels in untreated (closed circle) and STR-treated (open circle) cells were determined by LC-MS/MS, A) Glucose, B) Glycerol-3-
phosphate (G-3-P), C) Succinate, D) Fumarate, E) Malate, F) Oxaloacetate, G) (iso)-citrate and H) α-Ketoglutarate. The final concentration of Streptomycin
(STR) was at IC90 (0.23 µM). The points represent the mean ± SEM of duplicate independent experiments. In STR-treated Mtb H37Rv, succinate and
oxaloacetate show a clear increase whereas (iso)-citrate shows a remarkable decrease (GraphPad prism 5 Software Inc.).
Time (Days)
Fold
cha
nge
ratio
0 1 2 3 6 70.0
0.5
1.0
1.5
Time (Days)
Fold
cha
nge
ratio
0 1 2 3 6 70
20
40
60
80
100
Time (Days)
Fold
cha
nge
ratio
0 1 2 3 6 70
50
100
150
200
Time (Days)
Fold
cha
nge
ratio
0 1 2 3 6 70.0
0.5
1.0
1.5
2.0
2.5
Time (Days)
Fold
cha
nge
ratio
0 1 2 3 6 70
20
40
60
80
Time (Days)
Fold
cha
nge
ratio
0 1 2 3 6 70
5
10
15
Time (Days)
Fold
cha
nge
ratio
0 1 2 3 6 70.0
0.5
1.0
1.5
2.0
Time (Days)
Fold
cha
nge
ratio
0 1 2 3 6 70
5
10
15
* P < 0.05
** P < 0.01
A
D
B
E
G
H
F
C

202
Figure 5.17: Time-dependent changes of Mtb H37Rv metabolites in STR-treated and untreated control cells
The following metabolite levels in untreated (closed circle) and STR-treated (open circle) cells were determined by LC-MS/MS, A) Alanine, B) Aspartate, C)
Glutamate, D) Citrulline E) Ornithine, F) Glutamine, G) Proline, H) Hypoxanthine and I) Histidine. The final concentration of Streptomycin (STR) was at
IC90 (0.23 µM). The points represent the mean ± SEM of duplicate independent experiments. In STR-treated Mtb H37Rv, ornithine shows considerable
increase whereas histidine and proline are present at low level (GraphPad prism 5 Software Inc.).
Time (Days)
Fold
cha
nge
ratio
0 1 2 3 6 70
100
200
300
400
500
Time (Days)
Fold
cha
nge
ratio
0 1 2 3 6 70
1
2
3
4
Time (Days)
Fold
cha
nge
ratio
0 1 2 3 6 70.5
0.6
0.7
0.8
0.9
1.0
1.1
Time (Days)
Fold
cha
nge
ratio
0 1 2 3 6 70
10
20
30
40
50
Time (Days)
Fold
cha
nge
ratio
0 1 2 3 6 70
1
2
3
4
Time (Days)
Fold
cha
nge
ratio
0 1 2 3 6 70
2
4
6
Time (Days)
Fold
cha
nge
ratio
0 1 2 3 6 70
200
400
600
Time (Days)
Fold
cha
nge
ratio
0 1 2 3 6 70
50
100
150
Time (Days)
Fold
cha
nge
ratio
0 1 2 3 6 70
5
10
15
20
** P < 0.01
* P < 0.05G
H
I
A
D
B
E
F
C

203
Figure 5.18: Time-dependent changes of Mtb H37Rv metabolites in STR-treated and untreated control cells
The following metabolite levels in untreated (closed circle) and STR-treated (open circle) cells were determined by LC-MS/MS, A) Valine, B) (iso)-leucine,
C) Phenylalanine, D) Tryptophan E) Tyrosine, F) Lysine, G) Threonine and H) Methionine. The final concentration of Streptomycin (STR) was at IC90 (0.23
µM). The points represent the mean ± SEM of duplicate independent experiments. There are no noticeable changes among metabolites (GraphPad prism 5
Software Inc.).
Time (Days)
Fold
cha
nge
ratio
0 1 2 3 6 70
50
100
150
Time (Days)
Fold
cha
nge
ratio
0 1 2 3 6 70
10
20
30
Time (Days)
Fold
cha
nge
ratio
0 1 2 3 6 70
10
20
30
40
Time (Days)
Fold
cha
nge
ratio
0 1 2 3 6 70
5
10
15
20
Time (Days)
Fold
cha
nge
ratio
0 1 2 3 6 70
10
20
30
40
Time (Days)
Fold
cha
nge
ratio
0 1 2 3 6 70
2
4
6
Time (Days)
Fold
cha
nge
ratio
0 1 2 3 6 70
20
40
60
80
100
Time (Days)
Fold
cha
nge
ratio
0 1 2 3 6 70.0
0.5
1.0
1.5
2.0
2.5
A
D
B
E
G
H
F
C

204
Figure 5.19: Time-dependent changes of Mtb H37Rv metabolites in TPZ-treated and untreated control cells
The following metabolite levels in untreated (closed circle) and TPZ-treated (open circle) cells were determined by LC-MS/MS, A) Glucose, B) Glycerol-3-
phosphate (G-3-P), C) Succinate, D) Fumarate, E) Malate, F) Oxaloacetate, G) (iso)-citrate and H) α-Ketoglutarate. The final concentration of Trifluoperazine
(TPZ) was at IC90 (36.02 µM). The points represent the mean ± SEM of duplicate independent experiments. In TPZ-treated Mtb H37Rv, malate and (iso)-
citrate show a notable decrease while α-Ketoglutarate shows a clear increase (GraphPad prism 5 Software Inc.).
Time (Days)
Fold
cha
nge
ratio
0 1 2 3 6 70.0
0.5
1.0
1.5
Time (Days)
Fold
cha
nge
ratio
0 1 2 3 6 70
20
40
60
80
Time (Days)
Fold
cha
nge
ratio
0 1 2 3 6 70
20
40
60
Time (Days)
Fold
cha
nge
ratio
0 1 2 3 6 70.0
0.5
1.0
1.5
2.0
Time (Days)
Fold
cha
nge
ratio
0 1 2 3 6 70
20
40
60
80
Time (Days)
Fold
cha
nge
ratio
0 1 2 3 6 70
1
2
3
4
Time (Days)
Fold
cha
nge
ratio
0 1 2 3 6 70.0
0.5
1.0
1.5
2.0
Time (Days)
Fold
cha
nge
ratio
0 1 2 3 6 70
5
10
15** P < 0.01
A
D
B
E
G
H
F
C

205
Figure 5.20: Time-dependent changes of Mtb H37Rv metabolites in TPZ-treated and untreated control cells
The following metabolite levels in untreated (closed circle) and TPZ-treated (open circle) cells were determined by LC-MS/MS, A) Alanine, B) Aspartate, C)
Glutamate, D) Citrulline E) Ornithine, F) Glutamine, G) Proline, H) Hypoxanthine and I) Histidine. The final concentration of Trifluoperazine (TPZ) was at
IC90 (36.02 µM). The points represent the mean ± SEM of duplicate independent experiments. In TPZ-treated Mtb H37Rv, glutamate shows low utilization;
ornithine is notably increased and hypoxanthine is present at low levels (GraphPad prism 5 Software Inc.).
Time (Days)
Fold
cha
nge
ratio
0 1 2 3 6 70
200
400
600
Time (Days)
Fold
cha
nge
ratio
0 1 2 3 6 70
2
4
6
Time (Days)
Fold
cha
nge
ratio
0 1 2 3 6 70.0
0.5
1.0
1.5
Time (Days)
Fold
cha
nge
ratio
0 1 2 3 6 70
20
40
60
Time (Days)
Fold
cha
nge
ratio
0 1 2 3 6 70.0
0.5
1.0
1.5
2.0
2.5
Time (Days)
Fold
cha
nge
ratio
0 1 2 3 6 70
2
4
6
8
10
Time (Days)
Fold
cha
nge
ratio
0 1 2 3 6 70
200
400
600
800
Time (Days)
Fold
cha
nge
ratio
0 1 2 3 6 70
20
40
60
80
100
Time (Days)
Fold
cha
nge
ratio
0 1 2 3 6 70
10
20
30
** P < 0.01
** P < 0.01
* P < 0.05
A
D
B
E
G
H
F
C
I

206
Figure 5.21: Time-dependent changes of Mtb H37Rv metabolites in TPZ-treated and untreated control cells
The following metabolite levels in untreated (closed circle) and TPZ-treated (open circle) cells were determined by LC-MS/MS, A) Valine, B) (iso)-leucine,
C) Phenylalanine, D) Tryptophan E) Tyrosine, F) Lysine, G) Threonine and H) Methionine. The final concentration of Trifluoperazine (TPZ) was at IC90
(36.02 µM). The points represent the mean ± SEM of duplicate independent experiments. In TPZ-treated Mtb H37Rv, threonine and valine are present at very
low levels (GraphPad prism 5 Software Inc.).
Time (Days)
Fold
cha
nge
ratio
0 1 2 3 6 70
50
100
150
Time (Days)
Fold
cha
nge
ratio
0 1 2 3 6 70
10
20
30
40
Time (Days)
Fold
cha
nge
ratio
0 1 2 3 6 70
10
20
30
40
Time (Days)
Fold
cha
nge
ratio
0 1 2 3 6 70
5
10
15
20
Time (Days)
Fold
cha
nge
ratio
0 1 2 3 6 70
10
20
30
40
Time (Days)
Fold
cha
nge
ratio
0 1 2 3 6 70
2
4
6
8
10
Time (Days)
Fold
cha
nge
ratio
0 1 2 3 6 70
20
40
60
80
100
Time (Days)
Fold
cha
nge
ratio
0 1 2 3 6 70.0
0.5
1.0
1.5
2.0
2.5* P < 0.05
A
D
B
E
G
H
F
C

207
Figure 5.22: Time-dependent changes of Mtb H37Rv metabolites in CK-2-63-treated and untreated control cells
The following metabolite levels in untreated (closed circle) and CK-2-63-treated (open circle) cells were determined by LC-MS/MS, A) Glucose, B)
Glycerol-3-phosphate (G-3-P), C) Succinate, D) Fumarate, E) Malate, F) Oxaloacetate, G) (iso)-citrate and H) α-Ketoglutarate. The final concentration of
CK-2-63 was at IC90 (6.73 µM). The points represent the mean ± SEM of duplicate independent experiments. In CK-2-63-treated Mtb H37Rv, succinate is at
low levels and (iso)-citrate is also considerably decreased (GraphPad prism 5 Software Inc.).
Time (Days)
Fold
cha
nge
ratio
0 1 2 3 6 70.0
0.5
1.0
1.5
Time (Days)
Fold
cha
nge
ratio
0 1 2 3 6 70
50
100
150
Time (Days)
Fold
cha
nge
ratio
0 1 2 3 6 70
20
40
60
Time (Days)
Fold
cha
nge
ratio
0 1 2 3 6 70.0
0.5
1.0
1.5
2.0
2.5
Time (Days)
Fold
cha
nge
ratio
0 1 2 3 6 70
20
40
60
80
Time (Days)
Fold
cha
nge
ratio
0 1 2 3 6 70
1
2
3
Time (Days)
Fold
cha
nge
ratio
0 1 2 3 6 70.0
0.5
1.0
1.5
2.0
Time (Days)
Fold
cha
nge
ratio
0 1 2 3 6 70
1
2
3** P < 0.01
* P < 0.05A
D
B
E
G
H
F
C

208
Figure 5.23: Time-dependent changes of Mtb H37Rv metabolites in CK-2-63-treated and untreated control cells
The following metabolite levels in untreated (closed circle) and CK-2-63-treated (open circle) cells were determined by LC-MS/MS, A) Alanine, B)
Aspartate, C) Glutamate, D) Citrulline E) Ornithine, F) Glutamine, G) Proline, H) Hypoxanthine and I) Histidine. The final concentration of CK-2-63 was at
IC90 (6.73 µM). The points represent the mean ± SEM of duplicate independent experiments. In CK-2-63-treated Mtb H37Rv, aspartate is noticeably
increased while alanine, proline and hypoxanthine are at very low levels produced (GraphPad prism 5 Software Inc.).
Time (Days)
Fold
cha
nge
ratio
0 1 2 3 6 70
100
200
300
400
500
Time (Days)
Fold
cha
nge
ratio
0 1 2 3 6 70
10
20
30
40
Time (Days)
Fold
cha
nge
ratio
0 1 2 3 6 70.4
0.6
0.8
1.0
1.2
Time (Days)
Fold
cha
nge
ratio
0 1 2 3 6 70
10
20
30
Time (Days)
Fold
cha
nge
ratio
0 1 2 3 6 70.0
0.5
1.0
1.5
Time (Days)
Fold
cha
nge
ratio
0 1 2 3 6 70
2
4
6
Time (Days)
Fold
cha
nge
ratio
0 1 2 3 6 70
200
400
600
Time (Days)
Fold
cha
nge
ratio
0 1 2 3 6 70
20
40
60
80
100
Time (Days)
Fold
cha
nge
ratio
0 1 2 3 6 70
5
10
15
20
* P < 0.05
* P < 0.05
* P < 0.05A
D
B
E
G
H
F
C
I

209
Figure 5.24: Time-dependent of changes Mtb H37Rv metabolites in CK-2-63-treated and untreated control cells
The following metabolite levels in untreated (closed circle) and CK-2-63-treated (open circle) cells were determined by LC-MS/MS, A) Valine, B) (iso)-
leucine, C) Phenylalanine, D) Tryptophan E) Tyrosine, F) Lysine, G) Threonine and H) Methionine. The final concentration of CK-2-63 was at IC90 (6.73
µM). The points represent the mean ± SEM of duplicate independent experiments. In CK-2-63-treated Mtb H37Rv, (iso)-leucine, valine and methionine are
produced at low levels (GraphPad prism 5 Software Inc.).
Time (Days)
Fold
cha
nge
ratio
0 1 2 3 6 70
50
100
150
Time (Days)
Fold
cha
nge
ratio
0 1 2 3 6 70
10
20
30
Time (Days)
Fold
cha
nge
ratio
0 1 2 3 6 70
10
20
30
40
Time (Days)
Fold
cha
nge
ratio
0 1 2 3 6 70
5
10
15
20
Time (Days)
Fold
cha
nge
ratio
0 1 2 3 6 70
10
20
30
40
Time (Days)
Fold
cha
nge
ratio
0 1 2 3 6 70
1
2
3
4
Time (Days)
Fold
cha
nge
ratio
0 1 2 3 6 70
50
100
150
Time (Days)
Fold
cha
nge
ratio
0 1 2 3 6 70.0
0.5
1.0
1.5
2.0
2.5
* P < 0.05
* P < 0.05
A
D
B
E
G
H
F
C

210
Figure 5.25: Time-dependent changes of Mtb H37Rv metabolites in RKA-307-treated and untreated control cells
The following metabolite levels in untreated (closed circle) and RKA-307-treated (open circle) cells were determined by LC-MS/MS, A) Glucose, B)
Glycerol-3-phosphate (G-3-P), C) Succinate, D) Fumarate, E) Malate, F) Oxaloacetate, G) (iso)-Citrate and H) α-Ketoglutarate. The final concentration of
RKA-307 was at IC90 (3.11 µM). The points represent the mean ± SEM of duplicate independent experiments. In RKA-307-treated Mtb H37Rv, succinate,
malate, oxaloacetate are produced at low levels; fumarate, (iso)-citrate and α-Ketoglutarate levels are remarkably reduced (GraphPad prism 5 Software Inc.).
Time (Days)
Fold
cha
nge
ratio
0 1 2 3 6 70.0
0.5
1.0
1.5
Time (Days)
Fold
cha
nge
ratio
0 1 2 3 6 70
20
40
60
80
Time (Days)
Fold
cha
nge
ratio
0 1 2 3 6 70
20
40
60
Time (Days)
Fold
cha
nge
ratio
0 1 2 3 6 70.0
0.5
1.0
1.5
2.0
Time (Days)
Fold
cha
nge
ratio
0 1 2 3 6 70
20
40
60
80
Time (Days)
Fold
cha
nge
ratio
0 1 2 3 6 70
1
2
3
Time (Days)
Fold
cha
nge
ratio
0 1 2 3 6 70.0
0.5
1.0
1.5
2.0
Time (Days)
Fold
cha
nge
ratio
0 1 2 3 6 70.0
0.5
1.0
1.5
2.0
2.5
** P < 0.01 ** P < 0.01
** P < 0.01 ** P < 0.01
* P < 0.05
* P < 0.05
A
D
B
E
G
H
F
C

211
Figure 5.26: Time-dependent changes of Mtb H37Rv metabolites in RKA-307-treated and untreated control cells
The following metabolite levels in untreated (closed circle) and RKA-307-treated (open circle) cells were determined by LC-MS/MS, A) Alanine, B)
Aspartate, C) Glutamate, D) Citrulline E) Ornithine, F) Glutamine, G) Proline, H) Hypoxanthine and I) Histidine. The final concentration of RKA-307 was at
IC90 (3.11 µM). The points represent the mean ± SEM of duplicate independent experiments. In RKA-307-treated Mtb H37Rv, citrulline, histidine, proline
and glutamine are produced at low levels (GraphPad prism 5 Software Inc.).
Time (Days)
Fold
cha
nge
ratio
0 1 2 3 6 70
100
200
300
400
500
Time (Days)
Fold
cha
nge
ratio
0 1 2 3 6 70
1
2
3
4
Time (Days)
Fold
cha
nge
ratio
0 1 2 3 6 70.5
0.6
0.7
0.8
0.9
1.0
1.1
Time (Days)
Fold
cha
nge
ratio
0 1 2 3 6 70
10
20
30
Time (Days)
Fold
cha
nge
ratio
0 1 2 3 6 70.0
0.5
1.0
1.5
Time (Days)
Fold
cha
nge
ratio
0 1 2 3 6 70
2
4
6
Time (Days)
Fold
cha
nge
ratio
0 1 2 3 6 70
200
400
600
Time (Days)
Fold
cha
nge
ratio
0 1 2 3 6 70
50
100
150
200
250
Time (Days)
Fold
cha
nge
ratio
0 1 2 3 6 70
5
10
15
20
* P < 0.05 ** P < 0.01
* P < 0.05
A
D
B
E
G
H
F
C
I

212
Figure 5.27: Time-dependent changes of Mtb H37Rv metabolites in RKA-307-treated and untreated control cells
The following metabolite levels in untreated (closed circle) and RKA-307-treated (open circle) cells were determined by LC-MS/MS, A) Valine, B) (iso)-
Leucine, C) Phenylalanine, D) Tryptophan E) Tyrosine, F) Lysine, G) Threonine and H) Methionine. The final concentration of RKA-307 was at IC90 (3.11
µM). The points represent the mean ± SEM of duplicate independent experiments. In RKA-307-treated Mtb H37Rv, valine and threonine are at very low
levels (GraphPad prism 5 Software Inc.).
Time (Days)
Fold
cha
nge
ratio
0 1 2 3 6 70
50
100
150
Time (Days)
Fold
cha
nge
ratio
0 1 2 3 6 70
10
20
30
Time (Days)
Fold
cha
nge
ratio
0 1 2 3 6 70
10
20
30
40
Time (Days)
Fold
cha
nge
ratio
0 1 2 3 6 70
5
10
15
20
Time (Days)
Fold
cha
nge
ratio
0 1 2 3 6 70
10
20
30
40
Time (Days)
Fold
cha
nge
ratio
0 1 2 3 6 70
1
2
3
4
Time (Days)
Fold
cha
nge
ratio
0 1 2 3 6 70
20
40
60
80
100
Time (Days)
Fold
cha
nge
ratio
0 1 2 3 6 70.0
0.5
1.0
1.5
2.0
2.5
* P < 0.05
* P < 0.05
A
D
B
E
G
H
F
C

213
5.4. Discussion
The greatest obstacles towards significant advances in TB drug development that
target both replicating and non-replicating Mtb arise from the lack of the knowledge
of mycobacterial physiology and the mechanisms associated with drug sensitivity.
Pharmaco-genomics, -transcriptomics and -proteomics have been applied in
Mycobacterium tuberculosis studies (241, 386, 390, 391). However, so far
pharmaco-metabolomic studies of Mtb were limited to the Chakraborty et al (2013)
study which explored the MoA of the antifolate para-aminosalicylic acid (PAS)
(392).
Studies of the MoA of quinolone-type compounds used against Mtb bd-I and of
current TB drugs were carried out to assess the potential of pharmaco-metabolomics
to explore and/or validate the MoA of existing and new TB drugs. In this regard, the
first-line TB drugs, INH-, EMB-, RIF- and STR-treated Mtb along with electron
transport chain inhibitors, TPZ- and CK-2-63-treated Mtb were initially clustered in
a 2-D PCA plot along with untreated Mtb H37Rv. Interestingly, however, RKA-307-
treated Mtb had a distinct cluster. When PLS-DA analysis was applied. 2-D PLS-DA
confirmed the discrete clustering of RKA-307-treated Mtb and furthermore, TPZ and
CK-2-63-treated Mtb were observed to be closely associated with this cluster,
consistent with overlapping MoA of respiratory chain inhibitors. In contrast, the
first-line TB drugs-treated Mtb were clustered in close distance to the untreated Mtb
H37Rv cluster. These observations could be credited to the general effect of the first-
line TB drugs on the amino acids and common metabolic intermediates from which
these amino acids are synthesized (Figure 1.14, Chapter I) or break down to (Figure
5.29). In contrast, ETC inhibitors, RKA-307-, TPZ- and CK-2-63-treated Mtb
showed quite different effects of which RKA-307-treated Mtb revealed noticeable
down-regulation effect on the most of TCA cycle intermediates and some of their
related amino acids. Table 5.2 summarizes the metabolites that showed noticeable
effects among treated Mtb H37Rv in comparison with that of untreated Mtb H37Rv.
TPZ- and CK-2-63-treated Mtb displayed an additional effect which is a clear down-
regulation of hypoxanthine, a purine synthesis intermediate (393). It is worth
mentioning that although CK-2-63 and RKA-307 are Mtb bd-I inhibitors of the same
class (quinolone-type compounds) and were found to cluster on the same side of

214
PLS-DA plots, they did exhibit different clustering directions. This might be
explained by the structure variation between these compounds that, interestingly,
also confirms the differences in the pharmacodynamics profiles that were found
earlier (Chapter III).
Table 5.2: Metabolites showing notable fold change following drug exposure
(Summarised from Figs. 5.7 – 5.27)
Drugs/inhibitors Metabolites showed notable effect upon drug exposure
INH-treated Mtb G-3-P, α-Ketoglutarate, malate, glutamate, ornithine, valine, alanine,
hypoxanthine, lysine and threonine
EMB-treated Mtb Fumarate, (iso)-citrate, alanine, proline and histidine
RIF-treated Mtb Fumarate, (iso)-citrate, ornithine, (iso)-leucine, valine and threonine
STR-treated Mtb Oxaloacetate, succinate, (iso)-citrate, ornithine, proline and histidine
TPZ-treated Mtb (iso)-citrate, α-Ketoglutarate, malate, glutamate, ornithine, threonine, valine
and hypoxanthine
CK-2-63-treated Mtb Succinate, (iso)-citrate, alanine, aspartate, hypoxanthine, (iso)-leucine,
proline, valine and methionine
RKA-307-treated Mtb Succinate, fumarate, malate, oxaloacetate, (iso)-citrate, α-Ketoglutarate,
Citrulline, glutamine, histidine, valine, proline and threonine

215
Figure 5.28: Degradation of amino acids to one of seven common metabolic
intermediates (194)
Central carbon metabolic (CCM) pathways of Mtb, including the anabolic monomers (amino
acids; green boxes) and the major catabolic intermediates that they breakdown to (dashed
grey arrows) are shown. Arg, Arginine; Asn, Asparagine; Asp, Aspartic acid; Ala, Alanine;
Cys, Cysteine; Gln, Glutamine; Glu, Glutamic acid; Gly, Glycine; Ile, Isoleucine; Leu,
Leucine; Lys, Lysine; Pro, Proline; Ser, Serine; Thr, Threonine; Trp, Tryptophan; Tyr,
Tyrosine; Val, Valine; Phe, Phenaylalanine; Met, Methionine.
The discrimination between the first-line TB drugs was further improved in the 3-D
PLS-DA plot where INH- and STR-treated Mtb displayed closely related distance
clusters, whereas the EMB-treated Mtb cluster was close to that of the untreated Mtb
cluster. Moreover, RIF-treated Mtb was shown to have a distinctive cluster. This
discrimination implied that each of the first-line TB drugs had different MoA
although sharing a general effect on amino acids and common metabolic
intermediates. Therefore, observations from other omics studies on the MoA of the
first-line TB drugs will be highlighted in the following section in order to point out
the expected effect of these drugs on Mtb metabolism and thus indirectly explain the
clustering pattern of the first-line TB drugs.
216
INH-treated cells revealed substantial increases in G-3-P, α-Ketoglutarate, valine,
alanine and lysine levels. Moreover, the level of malate and hypoxanthine notably
increased by day 7. Glutamate and ornithine of INH-treated Mtb were found to be at
very low levels. Threonine was also present in low amounts. Importantly, INH is
known as a cell wall synthesis inhibitor. Pharmaco-proteomic studies on
Mycobacterium bovis BCG (394) and on Mycobacterium smegmatis (395) along
with a pharmaco-genomic study (396) and pharmaco-transcriptomic studies on Mtb
(241, 386, 390) showed that INH-treated Mtb had a significant up-regulation in the
FAS-II system. FAS-II is involved in the synthesis of mycolic acids, the primary
target of INH. Upon exposure of Mtb to INH, Takayama et al (1972) found
inhibition of mycolic acid synthesis components using thin-layer chromatography
(85). Moreover, Argyrou et al (2006) detected nucleic acid biosynthesis suppression
in proteomic profiling of INH-treated Mtb (397) and earlier biochemical analysis of
INH-treated Mtb found depletion of NADH and NADPH pools (398). A
pharmacoproteomic study of INH-treated Mtb showed up-regulation of proteins
involved in cell wall processes such as the ESAT-6 family proteins, and down-
regulation of 13 proteins including ATP-dependent DNA/RNA helicase (391).
Unfortunately, FAS-II precursors such as acetyl-CoA, methylmalonyl-CoA and
redox couples were below limits of detection in this study. Interestingly, an
important perturbation of amino acid metabolism was observed in INH-treated Mtb.
However, a previous study found that the total protein synthesis of Mtb treated with
INH for 12 h remained unaffected using the Lowry et al (1951) conventional method
for protein determination. These discrepancies might be because of the short drug
incubation time in the study by Gangadharam et al (1963) (399, 400).
Regarding EMB that primarily targets arabinogalactan in the Mtb cell wall, EMB-
treated Mtb showed a notable decrease in (iso)-citrate levels and low production of
fumarate. Furthermore, the level of alanine, proline and histidine was notably
decreased in EMB-treated Mtb. A pharmaco-proteomic study of EMB-treated
Mycobacterium smegmatis found an up-regulation of FAS-II proteins (395).
Similarly, Boshoff et al (2004) observed that the genes of FAS-II pathways were
significantly affected, similarly to what has been seen with INH-treated Mtb, upon
treating Mtb with EMB (241). Unfortunately in this study, for the EMB-treated Mtb
group, the FAS-II precursors such as acetyl-CoA and methylmalonyl-CoA were not

217
determined (below LOD) as observed with INH-treated Mtb. Moreover, Jia et al
(2005) found that Mtb treated with EMB had a similar effect to that of INH-treated
Mtb in terms of up-regulating ESAT-6 family proteins. However, unlike INH-treated
Mtb, up-regulation of ATP-dependent DNA/RNA helicase was also observed (391).
It is worth mentioning that these differences between INH- and EMB-treated Mtb
further explained the dissimilarities of those drugs in terms of 3D PLS-DA
clustering, although both are cell wall synthesis inhibitiors.
RIF is a RNA synthesis inhibitor that acts by binding to RNA polymerase. Mtb
treated with RIF revealed reduced levels of (iso)-citrate and fumarate and low
production of and low utilization of threonine and ornithine, respectively. Moreover,
RIF-treated Mtb showed a considerably increased level of (iso)-leucine and valine
compared with drug-free control Mtb. A transcriptional study on Haemophilus
influenzae protein synthesis patterns conducted by Evers et al (2001) found that RIF-
treated H. influenza displayed up-regulation of RNA polymerase subunits and
ribosomal protein along with the complete shutdown of RNA synthesis (401).
Unfortunately, pyrimidine metabolism precursors such as carbamoyl-l-aspartate,
orotate and dihydroorotate were below LOD. However, the obtained results of
disruptions of some amino acids metabolism and TCA cycle metabolites could be
regarded as a secondary effect of RIF on Mtb metabolome.
STR is a protein synthesis inhibitor that binds to a ribosomal subunit. STR-treated
Mtb showed reduced levels of (iso)-citrate and low production of histidine, but
substantial increases in ornithine, suucinate and oxaloacetate levels. Unlike RIF-
treated H. influenzae, STR-treated H. influenzae exhibited no significant changes in
RNA polymerase subunits, ribosomal protein and RNA synthesis (401). This
observation supports 3-D PLS-DA data that showed a different pattern between RIF-
and STR-treated Mtb. Moreover, Qiu et al (2005) wrote that the transcriptional study
of STR-treated Yersinia pestis revealed a general repression of energy metabolism
genes and retardation of metabolic process and RNA synthesis, but up-regulation of
genes that relate to membrane proteins, lipoproteins and porins (402). Boshoff et al
(2004) stated that RIF- and STR-treated Mtb resulted in global down-regulation of
Mtb genes (241). Notably, these findings may explain this thesis finding of STR-
treated Mtb.
218
TPZ-treated Mtb showed drastically decreased levels of (iso)-citrate, valine and
malate but a noticeable increase in the levels of α-Ketoglutarate and ornithine. In
addition, there was little or no utilization of glutamate and a low production of
threonine and hypoxanthine. Boshoff et al (2004) found that the main effects of
chlorpromazine (CPZ) and thioridazine (TRZ), phenothiazine-based compounds,
were a reduction in ATP levels and a decreased intracellular NADH/NAD+ ratio
(241). Unfortunately, bioenergetic couples such as ATP and redox couples NADH
and NAD were below LOD. However, the perturbations of amino acids metabolism
and hypoxanthine could be related to the remote effect of TPZ on Mtb metabolome.
Concerning Mtb treated with RKA-307, a quinolone-type inhibitor, drastic
reductions in levels of most TCA cycle intermediates were observed including
succinate, malate, (iso)-citrate, fumarate, α-Ketoglutarate and oxaloacetate
(compared with drug-free Mtb). RKA-307-treated Mtb also showed remarkable
decreases in valine, threonine, citrulline, glutamine, proline and histidine levels. In
contrast, CK-2-63, a compound of similar class to RKA-307, exhibited notable
reduction in the level of succinate, (iso)-citrate, (iso)-leucine, hypoxanthine, alanine,
valine, proline and methionine and a visible increase in aspartate level. RKA-307
and CK-2-63, as discussed earlier (Chapter 3.4), showed an inhibition effect against
Mtb cytochrome bd-I oxidase. However, the difference between RKA-307 and CK-
2-63 pharmaco-metabolomic profiling could be attributed to the differences in the
compounds’ structures, as discussed earlier (Chapter 3.4). The TCA cycle fluxes of a
Bacillus subtilis mutant strain that lacked cytochrome aa3 oxidase were
quantitatively assessed using gas chromatography-mass spectrometry (GC-MS) and
revealed a severe reduction of TCA cycle fluxes (403). Importantly, the reduction of
some TCA cycle metabolites in RKA-307-treated Mtb might imply the concept of
multiple targets (i.e it could show an inhibition effect on different respiratory
components besides cytochrome bd-I oxidase).
Inside the cell, the level of metabolites is determined by complex regulatory
processes, transcription and translation regulation, protein-protein interactions and
enzymes-metabolites interactions (374, 377). The compensation of some metabolites
by other pathways of a complex high connectivity metabolism network could explain

219
the absence of significant changes of drug/inhibitor-treated Mtb metabolites. Bhat et
al (2010), who studied the metabolic adjustments in Mtb upon exposure to INH,
wrote that, with regard to the disturbed metabolic pathways, the metabolic
adjustment could be described as a distant effect within the metabolic network. This
metabolic adjusment involves some important metabolites that are produced through
alternate pathways to keep the biological reactions operational (404). For instance,
although INH- and EMB-treated Mtb showed important changes that are involved in
CCM metabolites but not in fatty acid or cell wall synthesis, they may still offer
valuable information about the secondary effect of these drugs MoA.
This is the first study to investigate the metabolomic profiling of Mtb in response to
first-line TB drugs as well as ETC inhibitors. Although no conclusive results
regarding the MoA were generated, this study opens the door for future promising
research towards the understanding not only of the specific responses of anti-TB
drugs (primary MoA) but also the important secondary effects on Mtb metabolic
network. In turn, new directions of anti-TB therapy development would consider
developing co-drugs that target secondary responses on the Mtb metabolic network
(376). The sensitivity of the LC-MS/MS used in this method showed some
limitations, since metabolites of bioenergetic and redox couples such as ATP and
NADH were below the limit of detection. Thus, using more sensitive analysis
instrumentation (e.g. Orbitrap MS) and improved sample preparation methods would
be advised for future studies. Moreover, for future work it is worth using different
concentrations of drugs/inhibitors since drugs were found to induce gene expression
only within a certain window of concentration (376, 405). This might be applied at
the metabolic level as well, where low concentrations of drugs/inhibitors might not
be adequate for affecting metabolite levels, whereas a high concentration might show
death-related effects.

220
Chapter VI
General discussion
221
Mycobacterium tuberculosis, an organism discovered 130 years ago, remains a major
health threat, claiming nearly 2 million individuals annually. After almost a century
without the introduction of new vaccines, 11 candidates are currently in clinical trials
(8). Likewise, after decades (nearly 50 years) with the current yet inadequate TB
treatment and without novel classes of drugs to tackle today's TB pandemic, several
candidates are currently in late development clinical phases (www.tballiance.org)
(Chapter 1.7). On-going searches for new drug targets against Mtb are required in
order to find the best multi-drug regimen that would overcome the current first- and
second-line treatment drawbacks (Chapter 1.4). However, it is inevitable that the
organism will develop resistance, even to new drugs. Therefore, a detailed
understanding of the pathogenesis of Mtb (cross-talk with a human host) and the
pathogen’s response to drugs is vital. Mainly, there are three strategies that
contribute in the enormous success of Mtb pathogenesis: first, macrophage
reprogramming to impair organism degradation; second, formation of well-
structured granulomas, creating a confined environment for the host-pathogen
interfacing; and third, transition into a dormancy stage, rendering Mtb extremely
resistant to host defence and drug action, which is characterised by slowing down of
the metabolic machinery of Mtb, the carbon metabolic pathways and the membrane-
embedded respiratory components (3, 16, 406).
Mtb has a heterogeneous, dynamic nature, and inter-conversion of diverse Mtb
subpopulations does occur. This phenomenon, demonstrated through the Yin-Yang
model (24) (Chapter 1.3.2.5), forms the basis of the current difficulties to eradicate
Mtb, regardless of using the INH/RIF combination in the 4-month continuance phase
of treatment to eliminate the possibility of dormant and/or persistent tubercle bacilli
reverting. Therefore, the urgent medical need for new TB drugs will continuously
present until efficient first-line and second-line regimens that have a bactericidal
effect on active, latent and resistant forms of Mtb are established. Energy
metabolism, including metabolic pathways and the ETC, have emerged as new
target-pathways for the development of new anti-tubercular drugs, owing to the fact
that active or dormant tubercle bacilli will need energy to keep them alive regardless
of the level of this energy (i.e. high or low). Here, a review of this thesis is presented,
conclusions are drawn and gaps in the work are highlighted so that they can be
addressed in future research.

222
A key objective of the thesis (Chapter II) was the generation of a heterologous
expression system for Mtb cytochrome bd-I oxidase in E. coli respiratory knockout
mutant strains. A double-knockout ML16 strain, lacking two types of quinol:oxygen
oxidoreductase (cytochrome bo3 and cytochrome bd-I), and a triple-knockout MB44
strain, lacking all types of quinol:oxygen oxidoreductase (cytochrome bo3,
cytochrome bd-I and cytochrome bd-II), were used. Successfully, a heterologous
expression system for Mtb cytochrome bd-I oxidase was established in both strains.
However, some limitations of the triple-knockout strain were found, which will be
discussed shortly. First of all, the generation and validation of a heterologous
expression system for Mtb cytochrome bd-I oxidase in the ML16 strain (named as
TML16) was successful in terms of biochemical characterisation by spectral analyses
of TML16 strain and of microbiological characterisation by assessment of growth
phenotypes and oxygen depletion in cultures during both aerobic and O2-limited
growth conditions. The spectral analyses of the TML16 stain confirmed the
expression of recombinant Mtb cytochrome bd-I oxidase (Mtb bd-I) by restoration of
its spectral signature, a peak at 631 nm. Importantly, an additional critical validation
is that although the ML16 strain still harboured endogenous cytochrome bd-II genes,
the haem-d absorbance peak that was expected to be present at about 628-632 nm
(217, 218, 290, 292) was not recorded. Moreover, it was possible to correlate the
spectrum profile with growth conditions. The ratios of the cytochrome d peak to the
reference peak in TML16 and wild-type strains were higher in O2-limited than in
aerobic conditions. The microbiological assessment of TML16 growth phenotypes
revealed the ability of Mtb bd-I to restore some of the important wild-type growth
phenotypes, maintaining cell viability during the stationary phase, unlike the ML16
strain (4, 295) (Chapter 2.4).
Multidisciplinary approaches towards the characterisation of Mtb bd-I were
implemented in Chapter III, revealing original and conclusive data of Mtb bd-I
kinetics. Optimum conditions for enzyme activity were examined, revealing a pH of
7.5 to be for the highest Mtb bd-I activity. Moreover, for future biophysical
characterisation, the effect of detergents on Mtb bd-I activity was assessed. Mtb
cytochrome bd-I oxidase showed a substrate preference for dQH2 over Q1H2 and
Q2H2 (Km = 19.25 μM, 51.5 μM and 65.2 μM). However, the physiological substrate
of Mtb bd-I, MQH2, could not be examined in this study due to solubility issues.
223
Importantly, Mtb bd-I was confirmed to conclusively catalyse the oxidation of
quinol simultaneously with O2 reduction resulting in a monophasic kinetic plot with
dQH2 and Q1H2 substrates. However, this reaction showed a biphasic kinetic plot
with the substrate Q2H2, which acted as a non-competitive inhibitor at high substrate
concentrations. The steady-state kinetics of Mtb bd-I were within the range of bd-I
kinetics of previously studied organisms (211-213, 290, 321, 336, 345, 349, 354-
357).
Targeting ETC components, as demonstrated by the discovery of TMC207, is one of
the most promising areas toward the discovery of new anti-tubercular drugs (267).
Therefore, characterising Mtb bd-I oxidase facilitated the study of its competency as
a novel target for new TB chemotherapeutics. The goal was identifying a novel
inhibitor that acts on the quinol oxidation site. Therefore, quinolone-type compounds
(from in house libraries) were screened against Mtb bd-I and Mtb H37Rv, and the
quinolone core of these compounds was found to be the key target for SAR
development. A total of 23 quinolone-type inhibitors were examined, of which 9
inhibitors showed an acceptable inhibition profile with IC50 <4 μM against Mtb bd-I
and with 50% or more inhibition against Mtb H37Rv (single-point screening at 5 μM
inhibitor concentration). Interestingly, 5 compounds, RKA-307, RKA-310, MTD-
403, SCR-8-12 and CK-3-23, showed significant correlation (P value < 0.01)
between Mtb bd-I and Mtb H37Rv growth inhibition assays, suggesting that Mtb bd-
I is a potential target for the quinolone-type inhibitors tested. This suggestion has
been further confirmed by HepG2 assay, which showed that these compounds target
the ETC. However, SCR-8-12 was shown to have a different mode of action, as it
did not exhibit any differences between glucose and galactose HepG2 assays. This
observation has been supported by time-kill kinetics, where SCR-8-12 was shown to
have bactericidal activity, unlike the remaining quinolone-type compounds. Closer
examination of the structure of SCR-8-12 (Dr G Nixon, Medicinal Chemists)
indicates that this compound has a similar pharmacophore to fluoro-quinolones
which may account for its distinct pharmacodynamic profile compared to other
members of the series. The bacteriostatic activity of LT-9, RKA-307, RKA-310, CK-
2-63 and MTD-403 showed a visible reduction by day 7. Importantly, TMC207
showed quite similar time-kill kinetics (365); thus, this observation strongly
promotes increasing the drug incubation time for the quinolone-type compounds up

224
to at least 14 days in order to evaluate the full time-kill kinetics. Up to this point,
MTD-403 was found to be the optimum compound against Mtb bd-I, although
further improvements of the inhibitor DMPK are needed.
Although the generation and validation of a heterologous expression system for Mtb
cytochrome bd-I oxidase in the ML16 strain (named as TML16) was successful and
robust in all aspects, Chapter IV demonstrated the generation and validation of
another heterologous expression system for Mtb cytochrome bd-I oxidase, but in a
triple-knockout MB44 strain (named as TMB44). The reason for generating this
system at the beginning was due to the absence of endogenous cytochrome bd-II,
since the role of cytochrome bd-II in the ML16 strain was unknown. Therefore, we
needed a backup plan for the study, due to the challenges faced during Mtb bd-I
expression trials, which were countless in terms of obtaining a successful
transformation, finding the ideal growth condition and preparing crude membranes.
As demonstrated in chapter IV, this system represented an additional support system
for TML16 data, which confirmed the basic Mtb bd-I kinetics that were obtained
using the TML16 strain. However, TMB44 cannot replace TML16 because of the
weakness of the MB44 strain and difficulties in preparing crude membranes.
Chapter V provided an introduction for future promising pharmaco-metabolomics
works in Mtb. With the objective of contributing towards developing new
therapeutics and obtaining a better picture of their MoA, two quinolone-type
inhibitors that showed activity against Mtb bd-I were examined. Remarkably, RKA-
307-treated Mtb revealed significant effects of the inhibitor on TCA cycle
intermediates and some amino acid metabolites. Moreover, this study initially
highlights the differences between two inhibitors of similar classes (i.e. RKA-307
and CK-2-63). The first-line TB drugs showed different significant fingerprints on
Mtb metabolome; nevertheless, they were not conclusive. However, it confirmed the
variation of MoA between these drugs and highlighted areas that require further
detailed studies, such as the perturbation of amino acid metabolism.

225
With regards to the limitations of this study, qualitatively measuring O2 saturation in
the culture was one of the study limitations. Thus, growing cells in a chemostat
model (253) was advised. Moreover, measuring the oxygen affinity of Mtb bd-I (a
limitation of this study) which could be carried out following the protocol of D'mello
et al. (1994) is needed for further enzyme characterisation (372).
Although MTD-403 was found to be the optimum inhibitor of Mtb bd-I and Mtb
H37Rv, improving DMPK properties was necessary. Furthermore, extending the
quinolone-type inhibitors incubation time in the time-kill assay was recommended in
order to provide a conclusive view of the bactericidal/bacteriostatic nature of these
inhibitors. This was owing to the TMC207 time-kill kinetic that showed a slow static
effect in the first 7 days and a bactericidal action by 14 days (365).
For advanced studies of Mtb bd-I, enzyme purification would be the next step;
however, unfortunately, Mtb bd-I was not His-tagged and thus different purification
methods were required. Blue-Native polyacrylamide gel electrophoresis (BN-PAGE)
was successfully used for isolating various respiratory components from mammalian
and yeast mitochondria (407, 408). BN-PAGE is known to reduce the tendency of
protein aggregation during analysis and to eliminate the need for using detergents,
which in turn reduces the risk of detergent-sensitive protein denaturation (409).
Applying this technique for Mtb bd-I purification is recommended since Mtb bd-I
was found to be over-expressed.
The large diversity and complexity of the metabolites that exist in a living cell means
that using only one method is unlikely to provide enough sensitivity to detect all
metabolites. However, this is a predicted outcome, since many central metabolites
are biosynthetic intermediates that are usually found at levels more than 10,000-fold
lower than other metabolites (378, 410). Thus, due to the fact that such trace
metabolites remain a challenge to measure, an instrument with increased sensitivity,
such as the exactive Orbitrap MS is recommended (411). Moreover, this method is
generic, as the column used in this method, Luna aminopropyl, detects most of the
polar and few of the non-polar compounds. Therefore, fatty acid synthesis
metabolites could not be included in this study. A variety of measurement tools exist
226
to obtain these diverse metabolites and using a single method makes it impossible to
acquire them all (412). For instance, Kamphorst et al. (2011) successfully analysed
fatty acid metabolism using a Luna C8 reversed-phase column (a column that is
suitable for fatty acids metabolites) along with the exactive Orbitrap MS (413).
It is worth mentioning that the metabolome processing steps (cell growth,
metabolism quenching, metabolite extraction, concentration and detection by LC-MS
and data analysis) would be expected to have a major impact on the obtained results
(378). Therefore, the experiment was applied following the metabolomics standard
initiative (MSI) (http://msi-workgroups.sourceforge.net/). Some extraction methods
could convey more or equivalent drawbacks when compared to others. For example,
using centrifugation for harvesting cells carries the possibility of metabolites loss.
Thus, using the filter culture method entails minimal risk of metabolome loss. This
method is based on transferring a filter (cells grown on filter) from an agarose plate
into a cold quenching solvent (380, 414). However, using the filter culture method
for Mtb experiments bears high category 3 hazards and requires special advanced
category 3 laboratory facilities that would not be found in standard category 3 Mtb
laboratories.
Future work
Expressing Mtb bd-I allows the initial characterisation of the enzyme and would
expedite future advanced characterisation, such as X-ray crystallographic studies and
docking studies. The cutting-edge method used in this thesis and the findings
necessitate the further application of metabolomics and exploration of the secrets of
Mtb pathogenesis. The metabolic capability of an organism to adapt to diverse
environments is considered a hallmark of microbial pathogenesis (378). Therefore,
using the powerful technique of metabolomics to study Mtb opens doors for a wide
range of applications and for global readouts of all ‘omic’ data. Revealing the mode
of action of either current or future potential drugs and their relevance to the
proposed primary target and on the secondary subsequent actions of these drugs
would create a better strategy to improve and/or develop TB therapy (376).
Furthermore, metabolomics would facilitate the study of the diverse dynamic nature
of the Mtb subpopulations by using different latency models, from the simple in

227
vitro model (Wayne model) to the advanced in vivo model (Cornell model) in mice
(20, 32, 33, 36). Watanabe et al. (2011) studied the metabolism of Mtb in response
to hypoxia using a chemostat model. This study found a significant difference
between Mtb aerobic and hypoxic cultures, in which succinate was found to be
accumulated in the extracellular part of hypoxic cultures. Watanabe et al. (2011)
concluded that Mtb sustained an energised membrane by coupling the secretion of
succinate to the reductive branch of the TCA cycle (415). Moreover, targeted
knockout techniques could be applied in order to reveal the function of Mtb bd-I and
to assess its role during various stressful conditions, as well as during macrophage
infection. Imaging techniques could be applied to examine the effect of Mtb bd-I
absence on Mtb pathogenesis. This hypothesis is based on the high NO dissociation
rate of cytochrome bd-I in E. coli, providing a strategy to evade the NO-mediated
host immune attack (231, 416, 417). Remarkably, Jones et al. (2007) found that the
E. coli mutant strain lacking bd-I failed to colonise the mouse intestine, which was in
contrast to the E. coli mutant strain lacking cytochrome bo3 (222). This finding
emphasises the importance of cytochrome bd-I in organism pathogenicity. Such
multidisciplinary approaches applied to expand our knowledge of Mtb would
pinpoint the potential targets that could contribute to developing better interventions
to tackle the problem of TB.

228
Appendixes

229
Appendix I: Growth curve of Mtb H37Rv
Figure A: Growth curve of aerobic culture of Mtb
0
0.2
0.4
0.6
0.8
1
1.2
1.4
1.6
0 10 20 30 40 50 60
OD
60
0
Time (Days)

230
Appendix I: (Continued)
Figure B: Fluorescence microscopy images of Mtb H37Rv bacilli
Mtb H37Rv bacilli grown in aerobic culture was stained using Auramine Phenol. At the
following OD values, 0.02, 0.22, 0.54, 0.75, 1.14, 1.47 and 1.5 which correspond to days of
Mtb H37Rv culture that was shown in Figure A, Mtb H37Rv bacilli were stained and
visualised under fluorescence microscopy. The images were viewed using 100 x
amplification and the scale was at 2 µm.

231
Appendix I: (Continued)
Figure C: Growth curve of anaerobic culture of Mtb (Wayne model)
There was a gradual depletion of oxygen from the Mtb culture, grown anaerobically. Mtb
presents a distinct four-stage of growth, an initial exponential growth phase followed by
non-replicating persistence (NRP) phase 1 (NRP-1) where a small increase in the optical
densities presents. Subsequently, a phase of OD decreasing is shown which may represent
the death of some cells that did not stand the stress of oxygen limitation. NRP-2
demonstrates the stabilisation of the numbers of the bacteria.
0
0.1
0.2
0.3
0.4
0.5
0 10 20 30 40 50
OD
60
0
Time (Days)
NRP-2
NRP-1
Exponential
phase
OD declining

232
Appendix I: (Continued)
Figure D: Fluorescence microscopy images of Mtb H37Rv bacilli
Mtb H37Rv bacilli grown in anaerobic culture was stained using an Auramine Phenol staining. At the
following OD values, 0.09, 0.29, 0.4, 0.45, 0.46, 0.41, 0.38, 0.3 and 0.24 which correspond days of Mtb
H37Rv culture that was showed in Figure C, Mtb H37Rv bacilli were stained and visualised under
fluorescence microscopy. Mtb H37Rv bacilli show visible increasing in length by OD = 0.45 (starts of
NRP-1). The images were viewed using 100 x amplification and the scale was at 5 µm.

233
Appendix I: (Continued)
Auramine phenol staining method of Mtb
Auramine phenol and potassium permanganate (Pro-Lab Diagnostics, USA) were
diluted 1 in 10 in dH2O and stored at room temperature in the dark. Differentiator
solution consisted of 1% (v/v) hydrochloric acid and 75% (v/v) absolute ethanol in
dH2O.
A Mtb H37Rv culture was transferred to a 15 ml Falcon tube before being
centrifuged at 3000 g for 10 min. Pelleted materials were resuspended in sterile
phosphate buffer saline (PBS). A thin, uniform smear in a glass slide was prepared
using 10 µl of suspension before being heat fixed on a heat block placed inside the
safety cabinet for 5-10 min. Slides were flooded with the Auramine phenol stain, left
to stand for 10 min and then rinsed with dH2O. Slides were then flooded with
differentiator solution (1% hydrochloric acid: ethanol: dH2O) for 10 min, rinsed a
second time with ddH2O, flooded with 0.1% (w/v) potassium permanganate for 45-
60 s and finally rinsed again with ddH2O before being air dried. Subsequently, slides
were mounted in 100μl of sterile PBS, a coverslip was placed on top of the smears
and the slides sealed using nail polish. Slides were kept in darkness and examined
immediately by fluorescence oil immersion microscopy using a wide blue (> 525
nm) long-pass filter at a magnification of 100x. Images were captured using a
camera fitted to the fluorescence microscope.

234
Appendix II: Metabolomic technique tables
Table 1: LC-MS/MS parameters for metabolites detected in positive ESI mode
(protonation, Molecule + H+) Abbreviations: MW, Molecular Weight; CID, Collision
Induced Dissociation; RT, retention time.
Metabolite MW (g.mol-1
) Precursor mass CID Product mass RT (min)
Alanine 89.09 90.1 14 44.1 12.8
B-alanine 89.09 90.3 5 71.8 12.5
Serine 105.09 106 10 60 13.1
Proline 115.13 116 11 70 12.4
Valine 117.15 118 11 55 12.1
Threonine 119.12 120 11 74 13.3
Cysteine 121.16 122 21 59 26.1
(iso)-leucine 131.17 132 11 86 11.4
Asparagine 132.12 133 17 74 13.4
Ornithine 132.19 133 15 70 14.4
Aspartate 133.1 134 15 74 16.4
Glutamine 146.14 147 15 84 13.1
Lysine 146.19 147 16 84 14.4
Glutamate 147.13 148 15 84 16.5
Methionine 149.21 150 10 133 12
Histidine 155.15 156 12 110 13.6
Phenylalanine 165.19 166 28 103 11.6
Arginine 174.2 175 14 60 13.7
Citrulline 175.19 176 12 159 12.9
Carbamoyl-l-aspartate 176.12 177 17 74 21.5
Tyrosine 181.19 182 26 77 13
Tryptophan 204.23 205 16 146 11.9
GSH 307.32 308 19 162 19.7
UMP 324.18 325 12 97 22.3
AMP 347.22 348 21 136 22.8
UDP 404.16 405 19 97 23.1
ADP 427.20 428 31 136 23.5
TTP 482.16 483 25 81 27.3
CTP 483.15 484 21 112 25.1
UTP 484.14 485 30 97 27.7
ATP 507.18 508 37 136 25.5
GTP 523.18 524 37 152 27.8
GSSG 612.63 613 33 231 22
NAD 663.43 664 30 428 16.5
NADH 664.43 666 26 514 27.1
NADP 744.41 744 48 136 22.9
NADPH 745.41 746 16 729 31.9
FAD 785.55 786 24 348 22.9
Acetyl-CoA 809.57 810 28 303 24
Propionyl-CoA 823.60 824 33 317 24.2
Succinyl-CoA 867.60 868 38 361 25

235
Appendix II: (Continued)
Table 2: LC-MS/MS parameter for metabolites detected in negative ESI mode
(deprotonation, Molecule – H+) Abbreviations: MW, Molecular Weight; CID, Collision
Induced Dissociation; RT, retention time.
Metabolite MW (g.mol-1
) Precursor mass CID Product mass RT (min)
Lactate 90.08 89 11 43 14
Fumarate 116.07 115 11 71 25.5
Succinate 118.09 117 16 73 21.5
Oxaloacetate 132.07 131 12 87 24.2
Malate 134.09 133 12 115 21.6
Hypoxanthine 136.12 135 16 92 13.4
Methylmalonyl-CoA 867.61 866 20 821 25.0
Carbamyl phosphate 141.02 140 38 79 25.7
2-Oxoglutarate 146.11 145 11 101 26.6
DL-arabinose 150.13 149.1 7 130.6 10.8
Orotate 156.10 155 13 111 15.3
Dihydroorotate 158.11 157 14 113 14.1
PEP 168.04 167 20 79 23.3
DHAP 170.06 169 43 79 29
G-3-P 172.07 171 13 79 21.8
Glucose 180.16 179 18 59 11.7
(iso)-citrate 192.12 191 18 111 23.3

236
Appendix II: (Continued)
Table 3: Regression coefficients R2, linearity range and limit of detection (LOD) for
metabolites targeted in LC-MS/MS method
Metabolite R² Linear Range
(uM)
LOD
(nM) Metabolite R²
Linear Range
(uM)
LOD
(nM)
Propionyl-CoA 0.99 0.003 – 108.41 3 AMP 0.99 0.025 – 102.86 25
Tryptophan 0.98 0.005 – 174.87 5 NAD 0.99 0.026 – 53.83 26
Phenylalanine 0.99 0.006 – 216.2 6 UMP 0.98 0.026 – 110.17 26
Glucose 0.99 0.006 – 198.25 6 GSH 0.98 0.028 – 116.21 28
Citrulline 0.99 0.006 – 203.86 6 GSSG 0.98 0.028 – 58.3 28
Tyrosine 0.99 0.006 – 197.11 6 2-Oxoglutarate 0.99 0.029 – 244.45 29
G-3-P 0.99 0.006 – 207.55 6 Valine 0.99 0.037 – 304.86 37
(iso)-citrate 0.99 0.006 – 93 6 UDP 0.99 0.042 – 88.37 42
Methionine 0.99 0.007 – 239.36 7 NADP 0.99 0.047 – 48.04 47
Histidine 0.98 0.007 – 230.19 7 Succinyl-CoA 0.98 0.049 – 102.91 49
Dihydroorotate 0.99 0.007 – 56.47 7 Hypoxanthine 0.99 0.063 – 262.61 63
Lysine 0.99 0.007 – 244.3 7 GTP 0.99 0.066 – 68.26 66
Orotate 0.98 0.007 – 57.2 7 CTP 0.99 0.072 – 73.92 72
Glutamate 0.99 0.007 – 242.74 7 UTP 0.98 0.072 – 73.77 72
Acetyl-CoA 0.99 0.007 – 220.58 7 Proline 0.99 0.074 – 310.21 74
Ornithine 0.99 0.008 – 270.24 8 Alanine 0.99 0.096 – 400.87 96
Aspartate 0.99 0.008 – 268.32 8 NADPH 0.99 0.096 – 47.9 96
Malate 0.99 0.008 – 266.35 8 Carbamoyl-l-
aspartate 0.99 0.097 – 202.78 97
Succinate 0.99 0.009 – 302.44 9 NADH 0.99 0.107 – 53.67 107
FAD 0.99 0.011 – 45.46 11 PEP 0.99 0.206 – 212.53 206
Glutamine 0.99 0.015 – 244.38 15 TTP 0.99 0.578 – 74.07 578
(iso)-leucine 0.98 0.016 – 272.27 16 Fumarate 0.98 0.615 – 307.69 615
Asparagine 0.98 0.016 – 270.32 16 Serine 0.99 0.68 – 339.84 680
ATP 0.98 0.017 – 70.42 17 DHAP 0.99 0.84 – 420.17 840
Threonine 0.99 0.018 – 299.82 18 Cysteine 0.98 1.179 – 589.73 1179
ADP 0.99 0.020 – 83.6 20 Oxaloacetate 0.98 5.4 – 2704.14 5400
Lactate 0.99 0.024 – 793.03 24 Carbamoyl
phosphate 0.98 7.59 – 3799.39 7590
Arginine 0.99 0.025 – 205.02 25 Methylmalonyl-
CoA 0.98 4.38 – 68.96 4380
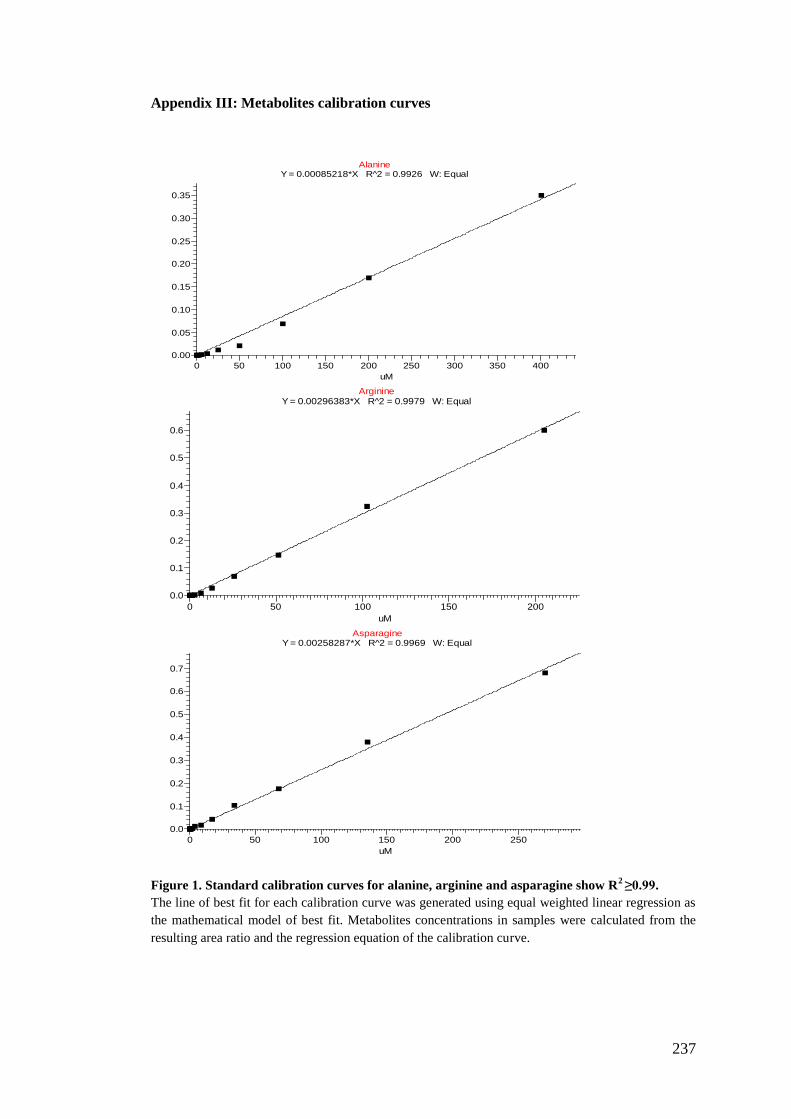
237
Appendix III: Metabolites calibration curves
Figure 1. Standard calibration curves for alanine, arginine and asparagine show R2 ≥0.99.
The line of best fit for each calibration curve was generated using equal weighted linear regression as
the mathematical model of best fit. Metabolites concentrations in samples were calculated from the
resulting area ratio and the regression equation of the calibration curve.
AlanineY = 0.00085218*X R^2 = 0.9926 W: Equal
0 50 100 150 200 250 300 350 400
uM
0.00
0.05
0.10
0.15
0.20
0.25
0.30
0.35
Are
a R
atio
ArginineY = 0.00296383*X R^2 = 0.9979 W: Equal
0 50 100 150 200
uM
0.0
0.1
0.2
0.3
0.4
0.5
0.6
Are
a R
atio
AsparagineY = 0.00258287*X R^2 = 0.9969 W: Equal
0 50 100 150 200 250
uM
0.0
0.1
0.2
0.3
0.4
0.5
0.6
0.7
Are
a R
atio
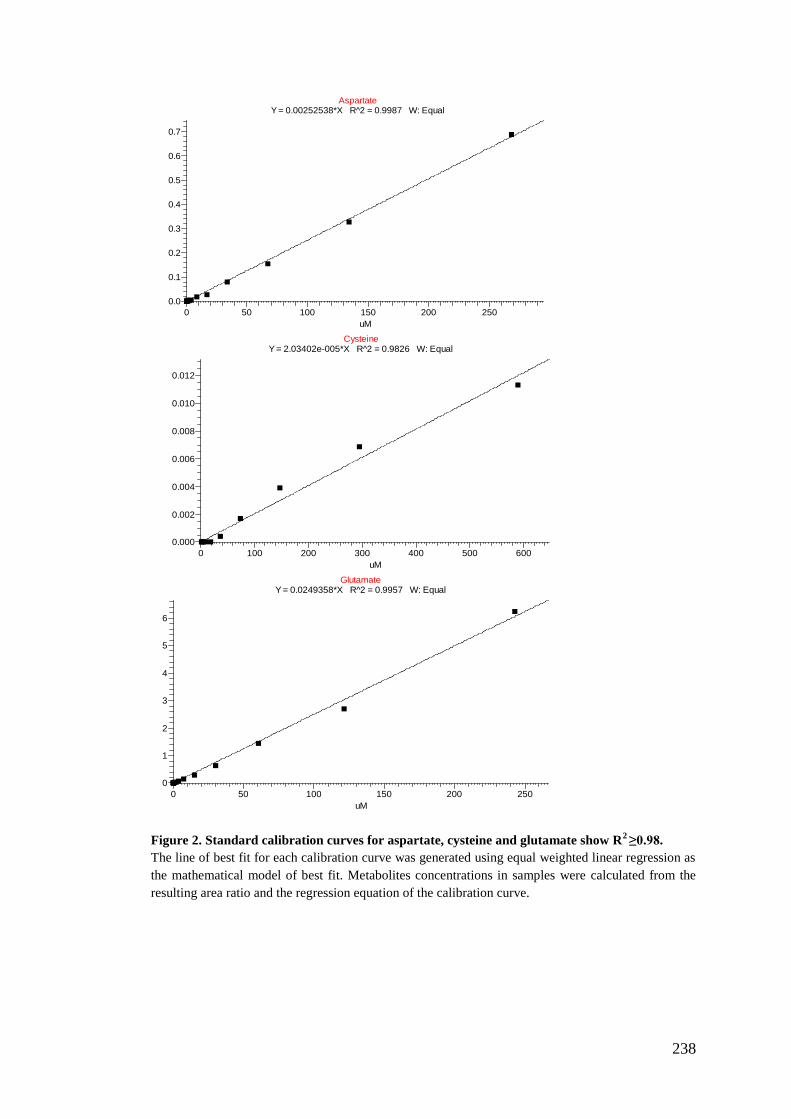
238
Figure 2. Standard calibration curves for aspartate, cysteine and glutamate show R2 ≥0.98.
The line of best fit for each calibration curve was generated using equal weighted linear regression as
the mathematical model of best fit. Metabolites concentrations in samples were calculated from the
resulting area ratio and the regression equation of the calibration curve.
AspartateY = 0.00252538*X R^2 = 0.9987 W: Equal
0 50 100 150 200 250
uM
0.0
0.1
0.2
0.3
0.4
0.5
0.6
0.7
Are
a R
atio
CysteineY = 2.03402e-005*X R^2 = 0.9826 W: Equal
0 100 200 300 400 500 600
uM
0.000
0.002
0.004
0.006
0.008
0.010
0.012
Are
a R
atio
GlutamateY = 0.0249358*X R^2 = 0.9957 W: Equal
0 50 100 150 200 250
uM
0
1
2
3
4
5
6
Are
a R
atio

239
Figure 3. Standard calibration curves for (iso)-leucine, lysine and methionine show R2 ≥0.99.
The line of best fit for each calibration curve was generated using equal weighted linear regression as
the mathematical model of best fit. Metabolites concentrations in samples were calculated from the
resulting area ratio and the regression equation of the calibration curve.
(Iso)LeucineY = 0.0682853*X R^2 = 0.9908 W: Equal
0 50 100 150 200 250
uM
0
5
10
15
20
Are
a R
atio
LysineY = 0.00278251*X R^2 = 0.9973 W: Equal
0 50 100 150 200 250
uM
0.0
0.1
0.2
0.3
0.4
0.5
0.6
0.7
Are
a R
atio
MethionineY = 0.0991284*X R^2 = 0.9997 W: Equal
0 50 100 150 200 250
uM
0
5
10
15
20
25
Are
a R
atio

240
Figure 4. Standard calibration curves for proline, tryptophan and phenyalanine show R2 ≥0.99.
The line of best fit for each calibration curve was generated using equal weighted linear regression as
the mathematical model of best fit. Metabolites concentrations in samples were calculated from the
resulting area ratio and the regression equation of the calibration curve.
ProlineY = 0.00723535*X R^2 = 0.9938 W: Equal
0 50 100 150 200 250 300
uM
0.0
0.5
1.0
1.5
2.0
Are
a R
atio
TryptophanY = 0.317796*X R^2 = 0.9995 W: Equal
0 50 100 150
uM
0
10
20
30
40
50
60
Are
a R
atio
PhenylalanineY = 0.137957*X R^2 = 0.9992 W: Equal
0 50 100 150 200
uM
0
5
10
15
20
25
30
Are
a R
atio

241
Figure 5. Standard calibration curves for tyrosine, valine and threonine show R2 ≥0.99.
The line of best fit for each calibration curve was generated using equal weighted linear regression as
the mathematical model of best fit. Metabolites concentrations in samples were calculated from the
resulting area ratio and the regression equation of the calibration curve.
TyrosineY = 0.00265792*X R^2 = 0.9908 W: Equal
0 50 100 150 200
uM
0.00
0.05
0.10
0.15
0.20
0.25
0.30
0.35
0.40
0.45
0.50
0.55
Are
a R
atio
ValineY = 0.000670002*X R^2 = 0.9990 W: Equal
0 50 100 150 200 250 300
uM
0.00
0.02
0.04
0.06
0.08
0.10
0.12
0.14
0.16
0.18
0.20
0.22
Are
a R
atio
ThreonineY = 0.00270466*X R^2 = 0.9986 W: Equal
0 50 100 150 200 250 300
uM
0.0
0.1
0.2
0.3
0.4
0.5
0.6
0.7
0.8
Are
a R
atio

242
Figure 6. Standard calibration curves for serine, ornithine and citrulline show R2 ≥0.98.
The line of best fit for each calibration curve was generated using equal weighted linear regression as
the mathematical model of best fit. Metabolites concentrations in samples were calculated from the
resulting area ratio and the regression equation of the calibration curve.
SerineY = 8.38819e-005*X R^2 = 0.9890 W: Equal
0 50 100 150 200 250 300 350
uM
0.000
0.005
0.010
0.015
0.020
0.025
0.030
Are
a R
atio
OrnithineY = 0.0090944*X R^2 = 0.9988 W: Equal
0 50 100 150 200 250
uM
0.0
0.5
1.0
1.5
2.0
2.5
Are
a R
atio
CitrullineY = 0.0659563*X R^2 = 0.9983 W: Equal
0 50 100 150 200
uM
0
5
10
Are
a R
atio

243
Figure 7. Standard calibration curves for hypoxanthine, methylmalonyl CoA and DHAP show
R2 ≥0.98.
The line of best fit for each calibration curve was generated using equal weighted linear regression as
the mathematical model of best fit. Metabolites concentrations in samples were calculated from the
resulting area ratio and the regression equation of the calibration curve.
HypoxanthineY = 0.126161*X R^2 = 0.9958 W: Equal
0 50 100 150 200 250
uM
0
5
10
15
20
25
30
35A
rea
Ra
tio
Methylmalonyl_CoAY = 0.00199664*X R^2 = 0.9822 W: Equal
0 10 20 30 40 50 60 70
uM
0.00
0.02
0.04
0.06
0.08
0.10
0.12
0.14
Are
a R
atio
DHAPY = 0.000108554*X R^2 = 0.9845 W: Equal
0 50 100 150 200 250 300 350 400 450
uM
0.000
0.005
0.010
0.015
0.020
0.025
0.030
0.035
0.040
0.045
0.050
Are
a R
atio

244
Figure 8. Standard calibration curves for glycerol-3-phosphate, 2-oxoglutarate and malate show
R2 ≥0.99.
The line of best fit for each calibration curve was generated using equal weighted linear regression as
the mathematical model of best fit. Metabolites concentrations in samples were calculated from the
resulting area ratio and the regression equation of the calibration curve.
.
Glycerol-3-PhosphateY = 0.0305518*X R^2 = 0.9936 W: Equal
0 50 100 150 200
uM
0
1
2
3
4
5
6
Are
a R
atio
a-ketoglutarateY = 0.11473*X R^2 = 0.9931 W: Equal
0 50 100 150 200 250
uM
0
5
10
15
20
25
30
Are
a R
atio
MalateY = 0.645991*X R^2 = 0.9991 W: Equal
0 50 100 150 200 250
uM
0
20
40
60
80
100
120
140
160
180
Are
a R
atio
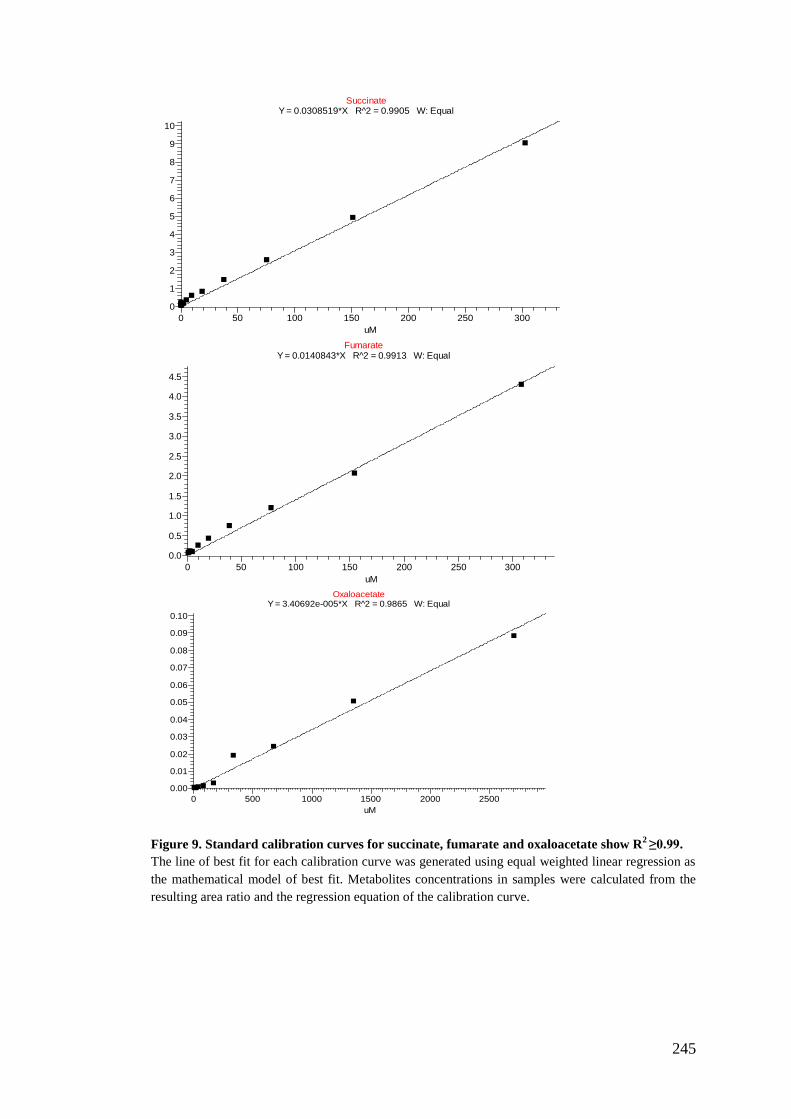
245
Figure 9. Standard calibration curves for succinate, fumarate and oxaloacetate show R2 ≥0.99.
The line of best fit for each calibration curve was generated using equal weighted linear regression as
the mathematical model of best fit. Metabolites concentrations in samples were calculated from the
resulting area ratio and the regression equation of the calibration curve.
SuccinateY = 0.0308519*X R^2 = 0.9905 W: Equal
0 50 100 150 200 250 300
uM
0
1
2
3
4
5
6
7
8
9
10
Are
a R
atio
FumarateY = 0.0140843*X R^2 = 0.9913 W: Equal
0 50 100 150 200 250 300
uM
0.0
0.5
1.0
1.5
2.0
2.5
3.0
3.5
4.0
4.5
Are
a R
atio
OxaloacetateY = 3.40692e-005*X R^2 = 0.9865 W: Equal
0 500 1000 1500 2000 2500
uM
0.00
0.01
0.02
0.03
0.04
0.05
0.06
0.07
0.08
0.09
0.10
Are
a R
atio

246
Figure 10. Standard calibration curves for (iso)-citrate, acetyl-CoA and succinyl-CoA show R2
≥0.99.
The line of best fit for each calibration curve was generated using equal weighted linear regression as
the mathematical model of best fit. Metabolites concentrations in samples were calculated from the
resulting area ratio and the regression equation of the calibration curve.
(Iso)_CitrateY = 0.121448*X R^2 = 0.9904 W: Equal
0 20 40 60 80 100 120 140 160 180 200
uM
0
5
10
15
20
Are
a R
atio
Acetyl-CoAY = 0.0709522*X R^2 = 0.9908 W: Equal
0 50 100 150 200
uM
0
2
4
6
8
10
12
14
16
Are
a R
atio
Succinyl-CoAY = 0.00357221*X R^2 = 0.9895 W: Equal
0 20 40 60 80 100
uM
0.00
0.05
0.10
0.15
0.20
0.25
0.30
0.35
0.40
Are
a R
atio

247
Figure 11. Standard calibration curves for AMP, ADP and ATP show R2 ≥0.99 .
The line of best fit for each calibration curve was generated using equal weighted linear regression as
the mathematical model of best fit. Metabolites concentrations in samples were calculated from the
resulting area ratio and the regression equation of the calibration curve.
.
AMPY = 0.0999809*X R^2 = 0.9941 W: Equal
0 20 40 60 80 100
uM
0
1
2
3
4
5
6
7
8
9
10
11
Are
a R
atio
ADPY = 0.0444041*X R^2 = 0.9966 W: Equal
0 10 20 30 40 50 60 70 80 90
uM
0.0
0.5
1.0
1.5
2.0
2.5
3.0
3.5
4.0
Are
a R
atio
ATPY = 0.0259697*X R^2 = 0.9915 W: Equal
0 10 20 30 40 50 60 70
uM
0.0
0.2
0.4
0.6
0.8
1.0
1.2
1.4
1.6
1.8
2.0
Are
a R
atio

248
Figure 12. Standard calibration curves for CTP, UMP and UDP show R2 ≥0.99 .
The line of best fit for each calibration curve was generated using equal weighted linear regression as
the mathematical model of best fit. Metabolites concentrations in samples were calculated from the
resulting area ratio and the regression equation of the calibration curve.
CTPY = 0.0141641*X R^2 = 0.9917 W: Equal
0 10 20 30 40 50 60 70 80
uM
0.0
0.1
0.2
0.3
0.4
0.5
0.6
0.7
0.8
0.9
1.0
1.1
Are
a R
atio
UMPY = 0.00682175*X R^2 = 0.9932 W: Equal
0 20 40 60 80 100 120
uM
0.0
0.1
0.2
0.3
0.4
0.5
0.6
0.7
0.8
Are
a R
atio
UDPY = 0.00187434*X R^2 = 0.9914 W: Equal
0 10 20 30 40 50 60 70 80 90
uM
0.00
0.02
0.04
0.06
0.08
0.10
0.12
0.14
0.16
0.18
Are
a R
atio

249
Figure 13. Standard calibration curves for UTP, TTP and GTP show R2 ≥0.98 .
The line of best fit for each calibration curve was generated using equal weighted linear regression as
the mathematical model of best fit. Metabolites concentrations in samples were calculated from the
resulting area ratio and the regression equation of the calibration curve.
UTPY = 0.0014978*X R^2 = 0.9925 W: Equal
0 10 20 30 40 50 60 70 80
uM
0.00
0.01
0.02
0.03
0.04
0.05
0.06
0.07
0.08
0.09
0.10
0.11
0.12
Are
a R
atio
TTPY = 0.00153233*X R^2 = 0.9893 W: Equal
0 10 20 30 40 50 60 70 80
uM
0.00
0.02
0.04
0.06
0.08
0.10
0.12
Are
a R
atio
GTPY = 0.0204543*X R^2 = 0.9857 W: Equal
0 10 20 30 40 50 60 70
uM
0.0
0.2
0.4
0.6
0.8
1.0
1.2
1.4
Are
a R
atio

250
Figure 14. Standard calibration curves for FAD, GSH and GSSG show R2 ≥0.98 .
The line of best fit for each calibration curve was generated using equal weighted linear regression as
the mathematical model of best fit. Metabolites concentrations in samples were calculated from the
resulting area ratio and the regression equation of the calibration curve.
FADY = 0.0885915*X R^2 = 0.9937 W: Equal
0 5 10 15 20 25 30 35 40 45 50
uM
0.0
0.5
1.0
1.5
2.0
2.5
3.0
3.5
4.0
Are
a R
atio
GSHY = 0.00333705*X R^2 = 0.9858 W: Equal
0 20 40 60 80 100 120
uM
0.00
0.05
0.10
0.15
0.20
0.25
0.30
0.35
0.40
Are
a R
atio
GSSGY = 0.00397739+0.00816149*X R^2 = 0.9827 W: Equal
0 10 20 30 40 50 60
uM
0.00
0.05
0.10
0.15
0.20
0.25
0.30
0.35
0.40
0.45
0.50
Are
a R
atio
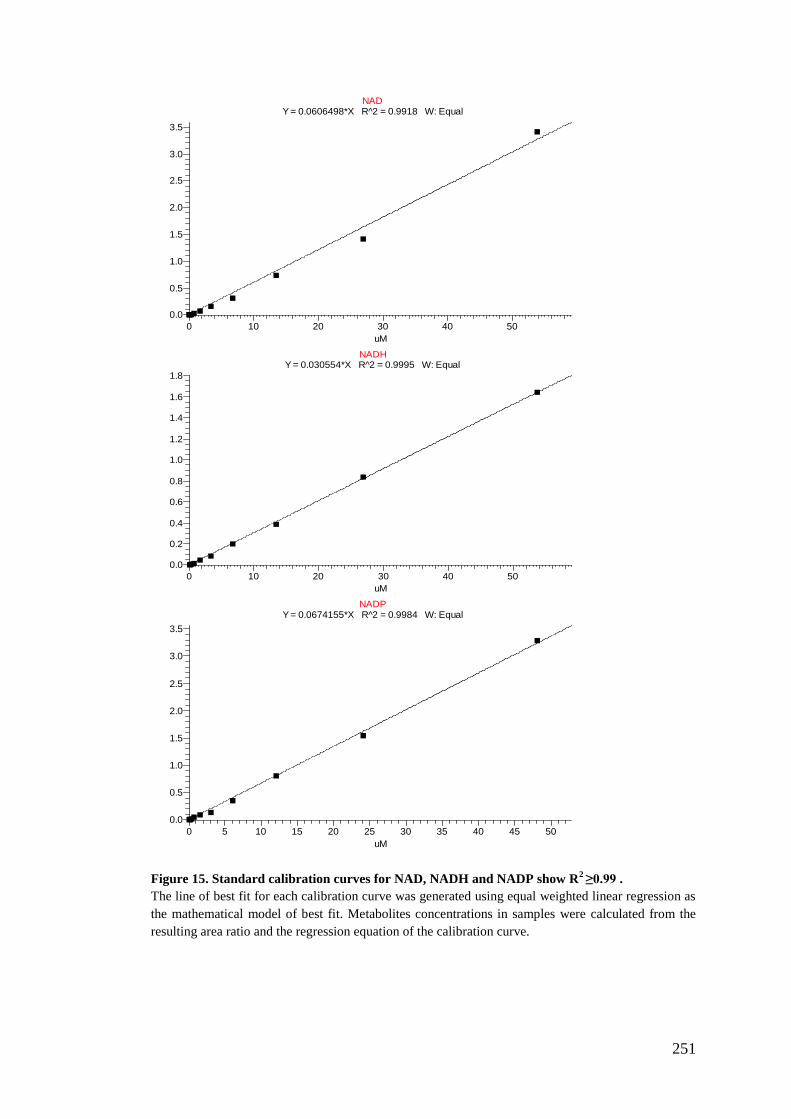
251
Figure 15. Standard calibration curves for NAD, NADH and NADP show R2 ≥0.99 .
The line of best fit for each calibration curve was generated using equal weighted linear regression as
the mathematical model of best fit. Metabolites concentrations in samples were calculated from the
resulting area ratio and the regression equation of the calibration curve.
NADY = 0.0606498*X R^2 = 0.9918 W: Equal
0 10 20 30 40 50
uM
0.0
0.5
1.0
1.5
2.0
2.5
3.0
3.5
Are
a R
atio
NADHY = 0.030554*X R^2 = 0.9995 W: Equal
0 10 20 30 40 50
uM
0.0
0.2
0.4
0.6
0.8
1.0
1.2
1.4
1.6
1.8
Are
a R
atio
NADPY = 0.0674155*X R^2 = 0.9984 W: Equal
0 5 10 15 20 25 30 35 40 45 50
uM
0.0
0.5
1.0
1.5
2.0
2.5
3.0
3.5
Are
a R
atio

252
Figure 16. Standard calibration curves for NADPH, glucose and lactate show R2 ≥0.99 .
The line of best fit for each calibration curve was generated using equal weighted linear regression as
the mathematical model of best fit. Metabolites concentrations in samples were calculated from the
resulting area ratio and the regression equation of the calibration curve.
NADPHY = 0.04503*X R^2 = 0.9928 W: Equal
0 5 10 15 20 25 30 35 40 45 50
uM
0.0
0.2
0.4
0.6
0.8
1.0
1.2
1.4
1.6
1.8
2.0
2.2
Are
a R
atio
GlucoseY = 0.0343342*X R^2 = 0.9948 W: Equal
0 50 100 150 200
uM
0
1
2
3
4
5
6
7
Are
a R
atio
LactateY = 0.0066705*X R^2 = 0.9923 W: Equal
0 100 200 300 400 500 600 700 800
uM
0.0
0.5
1.0
1.5
2.0
2.5
3.0
3.5
4.0
4.5
5.0
5.5
Are
a R
atio

253
Figure 17. Standard calibration curves for dihydroorotate, orotate and carbamoyl-phosphate
show R2 ≥0.98 .
The line of best fit for each calibration curve was generated using equal weighted linear regression as
the mathematical model of best fit. Metabolites concentrations in samples were calculated from the
resulting area ratio and the regression equation of the calibration curve.
DihydroorotateY = 0.685089*X R^2 = 0.9901 W: Equal
0 50 100 150 200
uM
0
20
40
60
80
100
120
140
160
Are
a R
atio
OrotateY = 9.1245*X R^2 = 0.9802 W: Equal
0 50 100 150 200 250
uM
0
200
400
600
800
1000
1200
1400
1600
1800
2000
2200
Are
a R
atio
Carbamyl_phosphateY = 0.00148284*X R^2 = 0.9837 W: Equal
0 500 1000 1500 2000 2500 3000 3500 4000
uM
0
1
2
3
4
5
6
Are
a R
atio

254
Figure 18. Standard calibration curves for carbamoyl-l-aspartate, propionyl-CoA and PEP
show R2 ≥0.99.
The line of best fit for each calibration curve was generated using equal weighted linear regression as
the mathematical model of best fit. Metabolites concentrations in samples were calculated from the
resulting area ratio and the regression equation of the calibration curve.
Carbamoyl-L-aspartateY = -0.00575732+0.00192897*X R^2 = 0.9924 W: Equal
0 50 100 150 200
uM
0.00
0.05
0.10
0.15
0.20
0.25
0.30
0.35
0.40
Are
a R
atio
Propionyl-CoAY = 0.484487*X R^2 = 0.9917 W: Equal
0 20 40 60 80 100
uM
0
5
10
15
20
25
30
35
40
45
50
55
Are
a R
atio
PEPY = 0.0385364*X R^2 = 0.9926 W: Equal
0 50 100 150 200
uM
0
1
2
3
4
5
6
7
8
9
Are
a R
atio
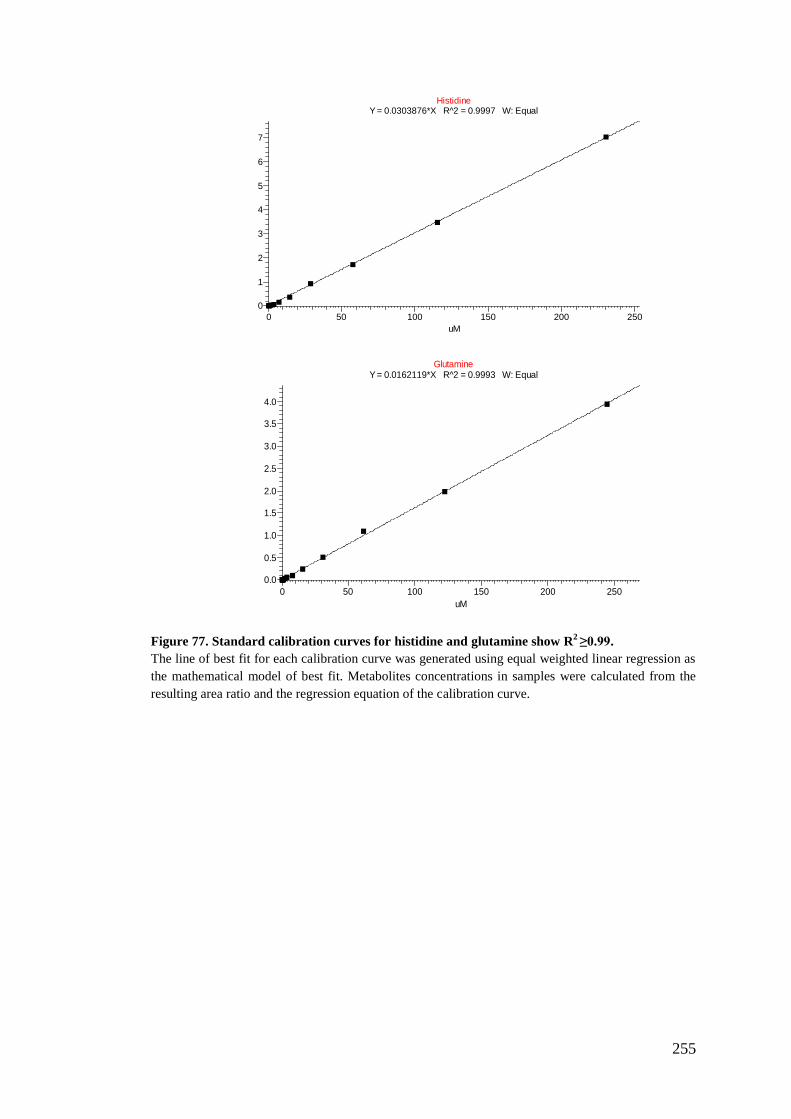
255
Figure 77. Standard calibration curves for histidine and glutamine show R2 ≥0.99.
The line of best fit for each calibration curve was generated using equal weighted linear regression as
the mathematical model of best fit. Metabolites concentrations in samples were calculated from the
resulting area ratio and the regression equation of the calibration curve.
HistidineY = 0.0303876*X R^2 = 0.9997 W: Equal
0 50 100 150 200 250
uM
0
1
2
3
4
5
6
7
Are
a R
atio
GlutamineY = 0.0162119*X R^2 = 0.9993 W: Equal
0 50 100 150 200 250
uM
0.0
0.5
1.0
1.5
2.0
2.5
3.0
3.5
4.0
Are
a R
atio

256
References
1. TB-Alliance. 2012. Global Alliance for TB Drug Development-TB Alliance Pipeline.
http://www.tballiance.org/downloads/Pipeline/TBA-Pipeline-May-2012.pdf. 2. Griffin JE, Gawronski JD, DeJesus MA, Ioerger TR, Akerley BJ, Sassetti CM. 2011.
High-Resolution Phenotypic Profiling Defines Genes Essential for Mycobacterial Growth and Cholesterol Catabolism. Plos Pathogens 7.
3. WHO. 2011. Global tuberculosis control: WHO report 2011.
http://www.who.int/tb/publications/global_report/2011/en/index.html. 4. Hurdle JG, O'Neill AJ, Chopra I, Lee RE. 2011. Targeting bacterial membrane
function: an underexploited mechanism for treating persistent infections. Nature Reviews Microbiology 9:62-75.
5. WHO. 2010. Multidrug and extensively drug-resistant TB (M/XDR-TB): 2010 global report on surveillance and response.
http://whqlibdoc.who.int/publications/2010/9789241599191_eng.pdf. 6. Sharma SK, Mohan A. 2006. Multidrug-resistant tuberculosis - A menace that
threatens to destabilize tuberculosis control. Chest 130:261-272. 7. Ottenhoff THM, Kaufmann SHE. 2012. Vaccines against Tuberculosis: Where Are We
and Where Do We Need to Go? Plos Pathogens 8. 8. Kaufmann SHE. 2011. Fact and fiction in tuberculosis vaccine research: 10 years
later. Lancet Infectious Diseases 11:633-640. 9. Chatterjee D, Khoo KH. 1998. Mycobacterial lipoarabinomannan: an extraordinary
lipoheteroglycan with profound physiological effects. Glycobiology 8:113-120. 10. Niederweis M, Danilchanka O, Huff J, Hoffmann C, Engelhardt H. 2010.
Mycobacterial outer membranes: in search of proteins. Trends in Microbiology 18:109-116.
11. Glickman MS, Jacobs WR. 2001. Microbial pathogenesis of Mycobacterium tuberculosis: Dawn of a discipline. Cell 104:477-485.
12. Vergne I, Chua J, Singh SB, Deretic V. 2004. Cell biology of Mycobacterium tuberculosis phagosome. Annual Review of Cell and Developmental Biology 20:367-394.
13. Ehlers S. 2009. Lazy, Dynamic or Minimally Recrudescent? On the Elusive Nature and Location of the Mycobacterium Responsible for Latent Tuberculosis. Infection 37:87-95.
14. Barry CE, Boshoff HI, Dartois V, Dick T, Ehrt S, Flynn J, Schnappinger D, Wilkinson RJ, Young D. 2009. The spectrum of latent tuberculosis: rethinking the biology and intervention strategies. Nature Reviews Microbiology 7:845-855.
15. Kaplan G, Post FA, Moreira AL, Wainwright H, Kreiswirth BN, Tanverdi M, Mathema B, Ramaswamy SV, Walther G, Steyn LM, Barry CE, III, Bekker L-G. 2003. Mycobacterium tuberculosis growth at the cavity surface: A microenvironment with failed immunity. Infection and Immunity 71:7099-7108.
16. Gengenbacher M, Kaufmann SHE. 2012. Mycobacterium tuberculosis: success through dormancy. Fems Microbiology Reviews 36:514-532.
17. Ulrichs T, Kaufmann SHE. 2006. New insights into the function of granulomas in human tuberculosis. J. Pathol. 208:261-269.
18. Gupta A, Kaul A, Tsolaki AG, Kishore U, Bhakta S. 2012. Mycobacterium tuberculosis: Immune evasion, latency and reactivation. Immunobiology 217:363-374.
19. Tufariello JM, Chan J, Flynn JL. 2003. Latent tuberculosis: mechanisms of host and bacillus that contribute to persistent infection. Lancet Infectious Diseases 3:578-590.

257
20. Boshoff HIM, Barry CE. 2005. Tuberculosis - Metabolism and respiration in the absence of growth. Nature Reviews Microbiology 3:70-80.
21. Peyron P, Vaubourgeix J, Poquet Y, Levillain F, Botanch C, Bardou F, Daffe M, Emile J-F, Marchou B, Cardona P-J, de Chastellier C, Altare F. 2008. Foamy Macrophages from Tuberculous Patients' Granulomas Constitute a Nutrient-Rich Reservoir for M-tuberculosis Persistence. Plos Pathogens 4.
22. Via LE, Lin L, Ray SM, Carrillo J, Allen SS, Eum SY, Taylor K, Klein E, Manjunatha U, Gonzales J, Lee EG, Park SK, Raleigh JA, Cho SN, McMurray DN, Flynn JL, Barry CE. 2008. Tuberculous granulomas are hypoxic in guinea pigs, rabbits, and nonhuman primates. Infection and Immunity 76:2333-2340.
23. Puissegur MP, Botanch C, Duteyrat JL, Delsol G, Caratero C, Altare F. 2004. An in vitro dual model of mycobacterial granulomas to investigate the molecular interactions between mycobacteria and human host cells. Cellular Microbiology 6:423-433.
24. Zhang Y, Yew WW, Barer MR. 2012. Targeting Persisters for Tuberculosis Control. Antimicrobial Agents and Chemotherapy 56:2223-2230.
25. Gomez JE, McKinney JD. 2004. M-tuberculosis persistence, latency, and drug tolerance. Tuberculosis 84:29-44.
26. Barer MR. 1997. Viable but non-culturable and dormant bacteria: Time to resolve an oxymoron and a misnomer? Journal of Medical Microbiology 46:629-631.
27. Leung AN. 1999. Pulmonary tuberculosis: The essentials. Radiology 210:307-322. 28. Zumla A, Atun R, Maeurer M, Mwaba P, Ma Z, O'Grady J, Bates M, Dheda K,
Hoelscher M, Grange J. 2011. Viewpoint: Scientific dogmas, paradoxes and mysteries of latent Mycobacterium tuberculosis infection. Tropical Medicine & International Health 16:79-83.
29. Yang Z, Rosenthal M, Rosenberg NA, Talarico S, Zhang L, Marrs C, Thomsen VO, Lillebaek T, Andersen AB. 2011. How dormant is Mycobacterium tuberculosis during latency? A study integrating genomics and molecular epidemiology. Infection Genetics and Evolution 11:1164-1167.
30. Henderson B, Lund PA, Coates ARM. 2010. Multiple moonlighting functions of mycobacterial molecular chaperones. Tuberculosis 90:119-124.
31. Gill WP, Harik NS, Whiddon MR, Liao RP, Mittler JE, Sherman DR. 2009. A replication clock for Mycobacterium tuberculosis. Nature Medicine 15:211-214.
32. Wayne LG. 1994. DORMANCY OF MYCOBACTERIUM-TUBERCULOSIS AND LATENCY OF DISEASE. European Journal of Clinical Microbiology & Infectious Diseases 13:908-914.
33. Wayne LG, Hayes LG. 1996. An in vitro model for sequential study of shiftdown of Mycobacterium tuberculosis through two stages of nonreplicating persistence. Infection and Immunity 64:2062-2069.
34. Wayne LG, Sohaskey CD. 2001. Nonreplicating persistence of Mycobacterium tuberculosis. Annual Review of Microbiology 55:139-163.
35. Zhang Y. 2012. Metronidazole validates drugs targeting hypoxic bacteria for improved treatment of tuberculosis. Proceedings of the National Academy of Sciences of the United States of America 109.
36. McCune RM, Tompsett R, McDermott W. 1956. THE FATE OF MYCOBACTERIUM TUBERCULOSIS IN MOUSE TISSUES AS DETERMINED BY THE MICROBIAL ENUMERATION TECHNIQUE .2. THE CONVERSION OF TUBERCULOUS INFECTION TO THE LATENT STATE BY THE ADMINISTRATION OF PYRAZINAMIDE AND A COMPANION DRUG. Journal of Experimental Medicine 104:763-802.
37. McCune RM, Tompsett R. 1956. FATE OF MYCOBACTERIUM TUBERCULOSIS IN MOUSE TISSUES AS DETERMINED BY THE MICROBIAL ENUMERATION TECHNIQUE .1.

258
THE PERSISTENCE OF DRUG-SUSCEPTIBLE TUBERCLE BACILLI IN THE TISSUES DESPITE PROLONGED ANTIMICROBIAL THERAPY. Journal of Experimental Medicine 104:737-&.
38. Parrish NM, Dick JD, Bishai WR. 1998. Mechanisms of latency in Mycobacterium tuberculosis. Trends in Microbiology 6:107-112.
39. Loebel RO, Shorr E, Richardson HB. 1933. The influence of foodstuffs upon the respiratory metabolism and growth of human tubercle bacilli. Journal of Bacteriology 26:139-166.
40. Gengenbacher M, Rao SPS, Pethe K, Dick T. 2010. Nutrient-starved, non-replicating Mycobacterium tuberculosis requires respiration, ATP synthase and isocitrate lyase for maintenance of ATP homeostasis and viability. Microbiology-Sgm 156:81-87.
41. Rifat D, Bishai WR, Karakousis PC. 2009. Phosphate Depletion: A Novel Trigger for Mycobacterium tuberculosis Persistence. Journal of Infectious Diseases 200:1126-1135.
42. Hampshire T, Soneji S, Bacon J, James BW, Hinds J, Laing K, Stabler RA, Marsh PD, Butcher PD. 2004. Stationary phase gene expression of Mycobacterium tuberculosis following a progressive nutrient depletion: a model for persistent organisms? Tuberculosis 84:228-238.
43. Voskuil MI, Visconti KC, Schoolnik GK. 2004. Mycobacterium tuberculosis gene expression during adaptation to stationary phase and low-oxygen dormancy. Tuberculosis 84:218-227.
44. Deb C, Lee CM, Dubey VS, Daniel J, Abomoelak B, Sirakova TD, Pawar S, Rogers L, Kolattukudy PE. 2009. A Novel In Vitro Multiple-Stress Dormancy Model for Mycobacterium tuberculosis Generates a Lipid-Loaded, Drug-Tolerant, Dormant Pathogen. Plos One 4.
45. Zhang Y. 2007. Advances in the treatment of tuberculosis. Clinical Pharmacology & Therapeutics 82:595-600.
46. Neyrolles O, Hernandez-Pando R, Pietri-Rouxel F, Fornes P, Tailleux L, Barrios Payan JA, Pivert E, Bordat Y, Aguilar D, Prevost M-C, Petit C, Gicquel B. 2006. Is Adipose Tissue a Place for Mycobacterium tuberculosis Persistence? Plos One 1.
47. Garton NJ, Waddell SJ, Sherratt AL, Lee SM, Smith RJ, Senner C, Hinds J, Rajakumar K, Adegbola RA, Besra GS, Butcher PD, Barer MR. 2008. Cytological and transcript analyses reveal fat and lazy persister-like bacilli in tuberculous sputum. Plos Medicine 5:634-645.
48. Zhang Y. 2004. Persistent and dormant tubercle bacilli and latent tuberculosis. Frontiers in Bioscience 9:1136-1156.
49. Bigger JW. 1944. Treatment of staphylococcal infections with penicillin - By intermittent sterilisation. Lancet 2:497-500.
50. Li Y, Zhang Y. 2007. PhoU is a persistence switch involved in persister formation and tolerance to multiple antibiotics and stresses in Escherichia coli. Antimicrobial Agents and Chemotherapy 51:2092-2099.
51. Ma C, Sim S, Shi W, Du L, Xing D, Zhang Y. 2010. Energy production genes sucB and ubiF are involved in persister survival and tolerance to multiple antibiotics and stresses in Escherichia coli. Fems Microbiology Letters 303:33-40.
52. Dhar N, McKinney JD. 2010. Mycobacterium tuberculosis persistence mutants identified by screening in isoniazid-treated mice. Proceedings of the National Academy of Sciences of the United States of America 107:12275-12280.
53. Junemann S. 1997. Cytochrome bd terminal oxidase. Biochimica Et Biophysica Acta-Bioenergetics 1321:107-127.

259
54. Bernstein J, Lott WA, Steinberg BA, Yale HL. 1952. CHEMOTHERAPY OF EXPERIMENTAL TUBERCULOSIS .5. ISONICOTINIC ACID HYDRAZIDE (NYDRAZID) AND RELATED COMPOUNDS. American Review of Tuberculosis 65:357-364.
55. Fox HH. 1952. THE CHEMICAL APPROACH TO THE CONTROL OF TUBERCULOSIS. Science 116:129-134.
56. Solotorovsky M, Gregory FJ, Ironson EJ, Bugie EJ, Oneill RC, Pfister K. 1952. PYRAZINOIC ACID AMIDE - AN AGENT ACTIVE AGAINST EXPERIMENTAL MURINE TUBERCULOSIS. Proceedings of the Society for Experimental Biology and Medicine 79:563-565.
57. Yeager RL, Munroe WGC, Dessau FI. 1952. PYRAZINAMIDE (ALDINAMIDE) IN THE TREATMENT OF PULMONARY TUBERCULOSIS. American Review of Tuberculosis 65:523-546.
58. Thomas JP, Baughn CO, Shepherd RG, Wilkinson RG. 1961. A NEW SYNTHETIC COMPOUND WITH ANTITUBERCULOUS ACTIVITY IN MICE - ETHAMBUTOL (DEXTRO-2,2'-(ETHYLENEDIIMINO)-DI-1-BUTANOL). American Review of Respiratory Disease 83:891-&.
59. Clark J, Wallace A. 1967. The susceptibility of mycobacteria to rifamide and rifampicin. Tubercle 48:144-148.
60. Grumbach F, Rist N. 1967. Experimental antitubercular activity of rifampicin, a derivative of rifamycin SV. Rev Tuberc Pneumol (Paris) 31:749-762.
61. Nitti V, Catena E, Ninni A, Difilipp.A. 1967. ACTIVITY OF RIFAMPICIN IN EXPERIMENTAL TUBERCULOSIS OF GUINEA PIG. Chemotherapy 12:369-&.
62. Pallanza R, Arioli V, Furesz S, Bolzoni G. 1967. RIFAMPICIN - A NEW RIFAMYCIN .2. LABORATORY STUDIES ON ANTITUBERCULOUS ACTIVITY AND PRELIMINARY CLINICAL OBSERVATIONS. Arzneimittel-Forschung 17:529-&.
63. WHO. 2011. THE GLOBAL PLAN TO STOP TB 2011–2015.
http://www.stoptb.org/assets/documents/global/plan/TB_GlobalPlanToStopTB
2011-2015.pdf. 64. WHO. 2009. Treatment of tuberculosis: guidelines – 4th ed.
http://whqlibdoc.who.int/publications/2010/9789241547833_eng.pdf. 65. Lienhardt C, Glaziou P, Uplekar M, Loennroth K, Getahun H, Raviglione M. 2012.
Global tuberculosis control: lessons learnt and future prospects. Nature Reviews Microbiology 10:407-416.
66. Michel J-B, Yeh PJ, Chait R, Moellering RC, Jr., Kishony R. 2008. Drug interactions modulate the potential for evolution of resistance. Proceedings of the National Academy of Sciences of the United States of America 105:14918-14923.
67. du Toit LC, Pillay V, Danckwerts MP. 2006. Tuberculosis chemotherapy: current drug delivery approaches. Respiratory Research 7.
68. Mitchison DA, Coates ARM. 2004. Predictive in vitro models of the sterilizing activity of anti-tuberculosis drugs. Current Pharmaceutical Design 10:3285-3295.
69. Johnson R, Streicher EM, Louw GE, Warren RM, van Helden PD, Victor TC. 2006. Drug resistance in Mycobacterium tuberculosis. Current Issues in Molecular Biology 8:97-111.
70. De Cock KM, Chaisson RE. 1999. Will DOTS do it? A reappraisal of tuberculosis control in countries with high rates of HIV infection. International Journal of Tuberculosis and Lung Disease 3:457-465.
71. Kimerling ME, Kluge H, Vezhnina N, Iacovazzi T, Demeulenaere T, Portaels F, Matthys F. 1999. Inadequacy of the current WHO re-treatment regimen in a central Siberian prison: treatment failure and MDR-TB. International Journal of Tuberculosis and Lung Disease 3.

260
72. Long R. 2007. The Canadian lung Association/Canadian Thoracic Society and tuberculosis prevention and control. Canadian Respiratory Journal 14.
73. Nuermberger EL, Spigelman MK, Yew WW. 2010. Current development and future prospects in chemotherapy of tuberculosis. Respirology 15:764-778.
74. Holland DP, Sanders GD, Hamilton CD, Stout JE. 2009. Costs and Cost-effectiveness of Four Treatment Regimens for Latent Tuberculosis Infection. American Journal of Respiratory and Critical Care Medicine 179:1055-1060.
75. Spyridis NP, Spyridis PG, Gelesme A, Sypsa V, Valianatou M, Metsou F, Gourgiotis D, Tsolia MN. 2007. The effectiveness of a 9-month regimen of isoniazid alone versus 3-and 4-month regimens of isoniazid plus rifampin for treatment of latent tuberculosis infection in children: Results of an 11-year Randomized study. Clinical Infectious Diseases 45:715-722.
76. Lin PL, Dartois V, Johnston PJ, Janssen C, Via L, Goodwin MB, Klein E, Barry CE, III, Flynn JL. 2012. Metronidazole prevents reactivation of latent Mycobacterium tuberculosis infection in macaques. Proceedings of the National Academy of Sciences of the United States of America 109.
77. Lambert PA. 2002. Cellular impermeability and uptake of biocides and antibiotics in Gram-positive bacteria and mycobacteria. Journal of Applied Microbiology 92:46S-54S.
78. Viveiros M, Portugal I, Bettencourt R, Victor TC, Jordaan AM, Leandro C, Ordway D, Amaral L. 2002. Isoniazid-induced transient high-level resistance in Mycobacterium tuberculosis. Antimicrobial Agents and Chemotherapy 46:2804-2810.
79. De Rossi E, Ainsa JA, Riccardi G. 2006. Role of mycobacterial efflux transporters in drug resistance: an unresolved question. Fems Microbiology Reviews 30:36-52.
80. Choudhuri BS, Sen S, Chakrabarti P. 1999. Isoniazid accumulation in Mycobacterium smegmatis is modulated by proton motive force-driven and ATP-dependent extrusion systems. Biochemical and Biophysical Research Communications 256:682-684.
81. Zhang Y, Heym B, Allen B, Young D, Cole S. 1992. THE CATALASE PEROXIDASE GENE AND ISONIAZID RESISTANCE OF MYCOBACTERIUM-TUBERCULOSIS. Nature 358:591-593.
82. Wengenack NL, Lopes H, Kennedy MJ, Tavares P, Pereira AS, Moura I, Moura JJG, Rusnak F. 2000. Redox potential measurements of the Mycobacterium tuberculosis heme protein KatG and the isoniazid-resistant enzyme KatG(S315T): Insights into isoniazid activation. Biochemistry 39:11508-11513.
83. Johnsson K, Schultz PG. 1994. MECHANISTIC STUDIES OF THE OXIDATION OF ISONIAZID BY THE CATALASE PEROXIDASE FROM MYCOBACTERIUM-TUBERCULOSIS. Journal of the American Chemical Society 116:7425-7426.
84. Rozwarski DA, Grant GA, Barton DHR, Jacobs WR, Sacchettini JC. 1998. Modification of the NADH of the isoniazid target (InhA) from Mycobacterium tuberculosis. Science 279:98-102.
85. Takayama K, Wang L, David HL. 1972. EFFECT ON ISONIAZID ON IN-VIVO MYCOLIC ACID SYNTHESIS, CELL-GROWTH, AND VIABILITY OF MYCOBACTERIUM-TUBERCULOSIS. Antimicrobial Agents and Chemotherapy 2:29-&.
86. Zhang Y, Amzel LM. 2002. Tuberculosis drug targets. Current Drug Targets 3:131-154.
87. Nguyen M, Claparols C, Bernadou J, Meunier B. 2001. A fast and efficient metal-mediated oxidation of isoniazid and identification of isoniazid - NAD(H) adducts. Chembiochem 2:877-883.
88. Ducasse-Cabanot S, Cohen-Gonsaud M, Marrakchi H, Nguyen M, Zerbib D, Bernadou J, Daffe M, Labesse G, Quemard A. 2004. In vitro inhibition of the

261
Mycobacterium tuberculosis beta-ketoacyl-acyl carrier protein reductase MabA by isoniazid. Antimicrobial Agents and Chemotherapy 48:242-249.
89. Thiemer-Kruger E. 1958. Isonicotinic acid hypothesis of the antituberculous action of isoniazid. Am Rev Tuberc 77:364-367.
90. Scior T, Meneses Morales I, Garces Eisele SJ, Domeyer D, Laufer S. 2002. Antitubercular isoniazid and drug resistance of Mycobacterium tuberculosis: A review. Archiv der Pharmazie (Weinheim) 335:511-525.
91. Banerjee A, Dubnau E, Quemard A, Balasubramanian V, Um KS, Wilson T, Collins D, Delisle G, Jacobs WR. 1994. INHA, A GENE ENCODING A TARGET FOR ISONIAZID AND ETHIONAMIDE IN MYCOBACTERIUM-TUBERCULOSIS. Science 263:227-230.
92. Wade MM, Zhang Y. 2004. Mechanisms of drug resistance in mycobacterium tuberculosis. Frontiers in Bioscience 9:975-994.
93. Vilcheze C, Weisbrod TR, Chen B, Kremer L, Hazbon MH, Wang F, Alland D, Sacchettini JC, Jacobs WR, Jr. 2005. Altered NADH/NAD(+) ratio mediates coresistance to isoniazid and ethionamide in mycobacteria. Antimicrobial Agents and Chemotherapy 49:708-720.
94. Miesel L, Weisbrod TR, Marcinkeviciene JA, Bittman R, Jacobs WR, Jr. 1998. NADH dehydrogenase defects confer isoniazid resistance and conditional lethality in Mycobacterium smegmatis. Journal of Bacteriology 180:2459-2467.
95. Payton M, Auty R, Delgoda R, Everett M, Sim E. 1999. Cloning and characterization of arylamine N-acetyltransferase genes from Mycobacterium smegmatis and Mycobacterium tuberculosis: Increased expression results in isoniazid resistance. Journal of Bacteriology 181:1343-1347.
96. Chen P, Bishai WR. 1998. Novel selection for isoniazid (INH) resistance genes supports a role for NAD(+)-binding proteins in mycobacterial INH resistance. Infection and Immunity 66:5099-5106.
97. Lee ASG, Teo ASM, Wong SY. 2001. Novel mutations in ndh in isoniazid-resistant Mycobacterium tuberculosis isolates. Antimicrobial Agents and Chemotherapy 45:2157-2159.
98. Hillas PJ, del Alba FS, Oyarzabal J, Wilks A, de Montellano PRO. 2000. The AhpC and AhpD antioxidant defense system of Mycobacterium tuberculosis. Journal of Biological Chemistry 275:18801-18809.
99. Sarich TC, Zhou T, Adams SP, Bain AI, Wall RA, Wright JM. 1995. A MODEL OF ISONIAZID-INDUCED HEPATOTOXICITY IN RABBITS. J. Pharmacol. Toxicol. Methods 34:109-116.
100. Singh N, Golani A, Patel Z, Maitra A. 2008. Transfer of isoniazid from circulation to breast milk in lactating women on chronic therapy for tuberculosis. British Journal of Clinical Pharmacology 65:418-422.
101. Obrien RJ, Long MW, Cross FS, Lyle MA, Snider DE. 1983. HEPATOTOXICITY FROM ISONIAZID AND RIFAMPIN AMONG CHILDREN TREATED FOR TUBERCULOSIS. Pediatrics 72:491-499.
102. Ellard GA, Humphries MJ, Allen BW. 1993. CEREBROSPINAL-FLUID DRUG CONCENTRATIONS AND THE TREATMENT OF TUBERCULOUS MENINGITIS. American Review of Respiratory Disease 148:650-655.
103. Vinnard C, Winston CA, Wileyto EP, MacGregor RR, Bisson GP. 2010. Isoniazid resistance and death in patients with tuberculous meningitis: retrospective cohort study. British Medical Journal 341.
104. Blumberg HM, Leonard MK, Jasmer RM. 2005. Update on the treatment of tuberculosis and latent tuberculosis infection (vol 293, pg 2776, 2005). Jama-Journal of the American Medical Association 294:182-182.

262
105. Somoskovi A, Parsons LM, Salfinger M. 2001. The molecular basis of resistance to isoniazid, rifampin, and pyrazinamide in Mycobacterium tuberculosis. Respiratory Research 2:164-168.
106. Telenti A, Imboden P, Marchesi F, Lowrie D, Cole S, Colston MJ, Matter L, Schopfer K, Bodmer T. 1993. DETECTION OF RIFAMPICIN-RESISTANCE MUTATIONS IN MYCOBACTERIUM-TUBERCULOSIS. Lancet 341:647-650.
107. Levin ME, Hatfull GF. 1993. MYCOBACTERIUM-SMEGMATIS RNA-POLYMERASE - DNA SUPERCOILING, ACTION OF RIFAMPICIN AND MECHANISM OF RIFAMPICIN RESISTANCE. Molecular Microbiology 8:277-285.
108. Mitchison DA, Nunn AJ. 1986. INFLUENCE OF INITIAL-DRUG RESISTANCE ON THE RESPONSE TO SHORT-COURSE CHEMOTHERAPY OF PULMONARY TUBERCULOSIS. American Review of Respiratory Disease 133:423-430.
109. Niemi M, Backman JT, Fromm MF, Neuvonen PJ, Kivisto KT. 2003. Pharmacokinetic interactions with rifampicin - Clinical relevance. Clinical Pharmacokinetics 42:819-850.
110. Girling DJ. 1978. HEPATIC TOXICITY OF ANTI-TUBERCULOSIS REGIMENS CONTAINING ISONIAZID, RIFAMPICIN AND PYRAZINAMIDE. Tubercle 59:13-32.
111. Villarino ME, Ridzon R, Weismuller PC, Elcock M, Maxwell RM, Meador J, Smith PJ, Carson ML, Geiter LJ. 1997. Rifampin preventive therapy for tuberculosis infection - Experience with 157 adolescents. American Journal of Respiratory and Critical Care Medicine 155:1735-1738.
112. Martinez E, Collazos J, Mayo J. 1999. Hypersensitivity reactions to rifampin - Pathogenetic mechanisms, clinical manifestations, management strategies, and review of the anaphylactic-like reactions. Medicine 78:361-369.
113. Takayama K, Kilburn JO. 1989. INHIBITION OF SYNTHESIS OF ARABINOGALACTAN BY ETHAMBUTOL IN MYCOBACTERIUM-SMEGMATIS. Antimicrobial Agents and Chemotherapy 33:1493-1499.
114. Deng LY, Mikusova K, Robuck KG, Scherman M, Brennan PJ, McNeil MR. 1995. RECOGNITION OF MULTIPLE EFFECTS OF ETHAMBUTOL ON METABOLISM OF MYCOBACTERIAL CELL-ENVELOPE. Antimicrobial Agents and Chemotherapy 39:694-701.
115. Mikusova K, Slayden RA, Besra GS, Brennan PJ. 1995. BIOGENESIS OF THE MYCOBACTERIAL CELL-WALL AND THE SITE OF ACTION OF ETHAMBUTOL. Antimicrobial Agents and Chemotherapy 39:2484-2489.
116. Sassetti CM, Boyd DH, Rubin EJ. 2003. Genes required for mycobacterial growth defined by high density mutagenesis. Molecular Microbiology 48:77-84.
117. Amin AG, Goude R, Shi L, Zhang J, Chatterjee D, Parish T. 2008. EmbA is an essential arabinosyltransferase in Mycobacterium tuberculosis. Microbiology-Sgm 154:240-248.
118. Goude R, Amin AG, Chatterjee D, Parish T. 2008. The critical role of embC in Mycobacterium tuberculosis. Journal of Bacteriology 190:4335-4341.
119. Goude R, Amin AG, Chatterjee D, Parish T. 2009. The Arabinosyltransferase EmbC Is Inhibited by Ethambutol in Mycobacterium tuberculosis. Antimicrobial Agents and Chemotherapy 53:4138-4146.
120. Telenti A, Philipp WJ, Sreevatsan S, Bernasconi C, Stockbauer KE, Wieles B, Musser JM, Jacobs WR. 1997. The emb operon, a gene cluster of Mycobacterium tuberculosis involved in resistance to ethambutol. Nature Medicine 3:567-570.
121. Jadaun GPS, Das R, Upadhyay P, Chauhan DS, Sharma VD, Katoch VM. 2009. Role of embCAB gene mutations in ethambutol resistance in Mycobacterium tuberculosis isolates from India. International Journal of Antimicrobial Agents 33:483-486.

263
122. Griffith DE, Brown-Elliott BA, Shepherd S, McLarty J, Griffith L, Wallace RJ. 2005. Ethambutol ocular toxicity in treatment regimens for Mycobacterium avium complex lung disease. American Journal of Respiratory and Critical Care Medicine 172:250-253.
123. Handbook-of-anti-tuberculosis-agents. 2008. Handbook of anti-tuberculosis agents. Tuberculosis 88:85-169.
124. Zhang Y. 2005. The magic bullets and tuberculosis drug targets. Annual review of pharmacology and toxicology 45:529-564.
125. Zhang Y, Permar S, Sun ZH. 2002. Conditions that may affect the results of susceptibility testing of Mycobacterium tuberculosis to pyrazinamide. Journal of Medical Microbiology 51:42-49.
126. Wade MM, Zhang Y. 2004. Anaerobic incubation conditions enhance pyrazinamide activity against Mycobacterium tuberculosis. Journal of Medical Microbiology 53:769-773.
127. Tarshis MS, Weed WA. 1953. LACK OF SIGNIFICANT INVITRO SENSITIVITY OF MYCOBACTERIUM TUBERCULOSIS TO PYRAZINAMIDE ON 3 DIFFERENT SOLID MEDIA. American Review of Tuberculosis 67:391-395.
128. McDermott W, Tompsett R. 1954. ACTIVATION OF PYRAZINAMIDE AND NICOTINAMIDE IN ACIDIC ENVIRONMENTS INVITRO. American Review of Tuberculosis 70:748-754.
129. Zhang Y, Scorpio A, Nikaido H, Sun ZH. 1999. Role of acid pH and deficient efflux of pyrazinoic acid in unique susceptibility of Mycobacterium tuberculosis to pyrazinamide. Journal of Bacteriology 181:2044-2049.
130. Zhang Y, Mitchison D. 2003. The curious characteristics of pyrazinamide: a review. International Journal of Tuberculosis and Lung Disease 7:6-21.
131. Heifets L, Higgins M, Simon B. 2000. Pyrazinamide is not active against Mycobacterium tuberculosis residing in cultured human monocyte-derived macrophages. International Journal of Tuberculosis and Lung Disease 4:491-495.
132. Zhang Y, Wade MM, Scorpio A, Zhang H, Sun ZH. 2003. Mode of action of pyrazinamide: disruption of Mycobacterium tuberculosis membrane transport and energetics by pyrazinoic acid. Journal of Antimicrobial Chemotherapy 52:790-795.
133. Zimhony O, Cox JS, Welch JT, Vilcheze C, Jacobs WR. 2000. Pyrazinamide inhibits the eukaryotic-like fatty acid synthetase I (FASI) of Mycobacterium tuberculosis. Nature Medicine 6:1043-1047.
134. Raynaud C, Laneelle MA, Senaratne RH, Draper P, Laneelle G, Daffe M. 1999. Mechanisms of pyrazinamide resistance in mycobacteria: importance of lack of uptake in addition to lack of pyrazinamidase activity. Microbiology-Sgm 145:1359-1367.
135. Corbella X, Vadillo M, Cabellos C, Fernandezviladrich P, Rufi G. 1995. HYPERSENSITIVITY HEPATITIS DUE TO PYRAZINAMIDE. Scandinavian Journal of Infectious Diseases 27:93-94.
136. Blumberg HM, Burman WJ, Chaisson RE, Daley CL, Etkind SC, Friedman LN, Fujiwara P, Grzemska M, Hopewell PC, Iseman MD, Jasmer RM, Koppaka V, Menzies RI, O'Brien RJ, Reves RR, Reichman LB, Simone PM, Starke JR, Vernon AA. 2003. American Thoracic Society/Centers for Disease Control and Prevention/Infectious Diseases Society of America: treatment of tuberculosis. Am J Respir Crit Care Med 167:603-662.
137. Peloquin CA, Berning SE, Nitta AT, Simone PM, Goble M, Huitt GA, Iseman MD, Cook JL, Curran-Everett D. 2004. Aminoglycoside toxicity: Daily versus thrice-weekly dosing for treatment of mycobacterial diseases. Clinical Infectious Diseases 38:1538-1544.

264
138. Sacchettini JC, Rubin EJ, Freundlich JS. 2008. Drugs versus bugs: in pursuit of the persistent predator Mycobacterium tuberculosis. Nature Reviews Microbiology 6:41-52.
139. Wayne LG, Sramek HA. 1994. METRONIDAZOLE IS BACTERICIDAL TO DORMANT CELLS OF MYCOBACTERIUM-TUBERCULOSIS. Antimicrobial Agents and Chemotherapy 38:2054-2058.
140. Zhang Y, Yew WW. 2009. Mechanisms of drug resistance in Mycobacterium tuberculosis. International Journal of Tuberculosis and Lung Disease 13:1320-1330.
141. Migliori GB, De Iaco G, Besozzi G, Centis R, Cirillo DM. 2007. First tuberculosis cases in Italy resistant to all tested drugs. Euro surveillance : bulletin europeen sur les maladies transmissibles = European communicable disease bulletin 12:E070517.070511.
142. Velayati AA, Masjedi MR, Farnia P, Tabarsi P, Ghanavi J, ZiaZarifi AH, Hoffner SE. 2009. Emergence of New Forms of Totally Drug-Resistant Tuberculosis BacilliSuper Extensively Drug-Resistant Tuberculosis or Totally Drug-Resistant Strains in Iran. CHEST Journal 136:420-425.
143. WHO. 2010. Indicators of diagnosis, notification and treatment of multidrug-
resistant TB, by country and year. http://www.who.int/tb/challenges/mdr/en/. 144. WHO. 2010. Multidrug and extensively drug-resistant TB (M/XDR-TB): 2010 global
report on surveillance and response, Geneva, Switzerland. 145. WHO. 2001. GUIDELINES FOR DRUG SUSCEPTIBILITY TESTING FOR SECOND-LINE
ANTI-TUBERCULOSIS DRUGS FOR DOTS-PLUS.
http://www.who.int/docstore/gtb/publications/mdrtb/tb_2001_288/guidelines.p
df. 146. Park SK, Kim CT, Song SD. 1998. Outcome of chemotherapy in 107 patients with
pulmonary tuberculosis resistant to isoniazid and rifampin. International Journal of Tuberculosis and Lung Disease 2:877-884.
147. WHO. 2011. Guidelines for the programmatic management of drug-resistant tuberculosis.
http://whqlibdoc.who.int/publications/2011/9789241501583_eng.pdf. 148. Cole ST, Brosch R, Parkhill J, Garnier T, Churcher C, Harris D, Gordon SV, Eiglmeier
K, Gas S, Barry CE, Tekaia F, Badcock K, Basham D, Brown D, Chillingworth T, Connor R, Davies R, Devlin K, Feltwell T, Gentles S, Hamlin N, Holroyd S, Hornby T, Jagels K, Krogh A, McLean J, Moule S, Murphy L, Oliver K, Osborne J, Quail MA, Rajandream MA, Rogers J, Rutter S, Seeger K, Skelton J, Squares R, Squares S, Sulston JE, Taylor K, Whitehead S, Barrell BG. 1998. Deciphering the biology of Mycobacterium tuberculosis from the complete genome sequence. Nature 393:537-+.
149. Mathema B, Kurepina NE, Bifani PJ, Kreiswirth BN. 2006. Molecular epidemiology of tuberculosis: Current insights. Clinical Microbiology Reviews 19:658-+.
150. Blattner FR, Plunkett G, Bloch CA, Perna NT, Burland V, Riley M, ColladoVides J, Glasner JD, Rode CK, Mayhew GF, Gregor J, Davis NW, Kirkpatrick HA, Goeden MA, Rose DJ, Mau B, Shao Y. 1997. The complete genome sequence of Escherichia coli K-12. Science 277:1453-&.
151. Anand P, Sankaran S, Mukherjee S, Yeturu K, Laskowski R, Bhardwaj A, Bhagavat R, Brahmachari SK, Chandra N, Consortium O. 2011. Structural Annotation of Mycobacterium tuberculosis Proteome. Plos One 6.
152. Camus JC, Pryor MJ, Medigue C, Cole ST. 2002. Re-annotation of the genome sequence of Mycobacterium tuberculosis H37Rv. Microbiology-Sgm 148:2967-2973.
153. Domenech P, Barry CE, Cole ST. 2001. Mycobacterium tuberculosis in the post-genomic age. Current Opinion in Microbiology 4.

265
154. Schnappinger D, Ehrt S, Voskuil MI, Liu Y, Mangan JA, Monahan IM, Dolganov G, Efron B, Butcher PD, Nathan C, Schoolnik GK. 2003. Transcriptional adaptation of Mycobacterium tuberculosis within macrophages: Insights into the phagosomal environment. Journal of Experimental Medicine 198:693-704.
155. Rachman H, Strong M, Schaible U, Schuchhardt J, Hagens K, Mollenkopf H, Eisenberg D, Kaufmann SHE. 2006. Mycobacterium tuberculosis gene expression profiling within the context of protein networks. Microbes and Infection 8:747-757.
156. Rohde KH, Abramovitch RB, Russell DG. 2007. Mycobacterium tuberculosis invasion of macrophages: Linking bacterial gene expression to environmental cues. Cell Host & Microbe 2:352-364.
157. Cappelli G, Volpe E, Grassi M, Liseo B, Colizzi V, Mariani F. 2006. Profiling of Mycobacterium tuberculosis gene expression during human macrophage infection: Upregulation of the alternative sigma factor G, a group of transcriptional regulators, and proteins with unknown function. Research in Microbiology 157.
158. Rachman H, Strong M, Ulrichs T, Grode L, Schuchhardt J, Mollenkopf H, Kosmiadi GA, Eisenberg D, Kaufmann SHE. 2006. Unique transcriptome signature of Mycobacterium tuberculosis in pulmonary tuberculosis. Infection and Immunity 74:1233-1242.
159. Starck J, Kallenius G, Marklund BI, Andersson DI, Akerlund T. 2004. Comparative proteome analysis of Mycobacterium tuberculosis grown under aerobic and anaerobic conditions. Microbiology-Sgm 150.
160. de Carvalho LPS, Fischer SM, Marrero J, Nathan C, Ehrt S, Rhee KY. 2010. Metabolomics of Mycobacterium tuberculosis Reveals Compartmentalized Co-Catabolism of Carbon Substrates. Chemistry & Biology 17.
161. Somashekar BS, Amin AG, Rithner CD, Troudt J, Basaraba R, Izzo A, Crick DC, Chatterjee D. 2011. Metabolic Profiling of Lung Granuloma in Mycobacterium tuberculosis Infected Guinea Pigs: Ex vivo (1)H Magic Angle Spinning NMR Studies. Journal of Proteome Research 10:4186-4195.
162. Lamichhane G, Zignol M, Blades NJ, Geiman DE, Dougherty A, Grosset J, Broman KW, Bishai WR. 2003. A postgenomic method for predicting essential genes at subsaturation levels of mutagenesis: Application to Mycobacterium tuberculosis. Proceedings of the National Academy of Sciences of the United States of America 100:7213-7218.
163. Hutchison CA, Peterson SN, Gill SR, Cline RT, White O, Fraser CM, Smith HO, Venter JC. 1999. Global transposon mutagenesis and a minimal mycoplasma genome. Science 286:2165-2169.
164. Jacobs MA, Alwood A, Thaipisuttikul I, Spencer D, Haugen E, Ernst S, Will O, Kaul R, Raymond C, Levy R, Liu CR, Guenthner D, Bovee D, Olson MV, Manoil C. 2003. Comprehensive transposon mutant library of Pseudomonas aeruginosa. Proceedings of the National Academy of Sciences of the United States of America 100:14339-14344.
165. Sassetti CM, Boyd DH, Rubin EJ. 2001. Comprehensive identification of conditionally essential genes in mycobacteria. Proceedings of the National Academy of Sciences of the United States of America 98:12712-12717.
166. Zhang YJ, Ioerger TR, Huttenhower C, Long JE, Sassetti CM, Sacchettini JC, Rubin EJ. 2012. Global Assessment of Genomic Regions Required for Growth in Mycobacterium tuberculosis. Plos Pathogens 8.
167. Sharma P, Hellingwerf KJ, de Mattos MJT, Bekker M. 2012. Uncoupling of Substrate-Level Phosphorylation in Escherichia coli during Glucose-Limited Growth. Applied and Environmental Microbiology 78.

266
168. Munoz-Elias EJ, McKinney JD. 2006. Carbon metabolism of intracellular bacteria. Cellular Microbiology 8:10-22.
169. Tian J, Bryk R, Itoh M, Suematsu M, Nathan C. 2005. Variant tricarboxylic acid cycle in Mycobacterium tuberculosis: Identification of alpha-ketoglutarate decarboxylase. Proceedings of the National Academy of Sciences of the United States of America 102:10670-10675.
170. Wagner T, Bellinzoni M, Wehenkel A, O'Hare HM, Alzari PM. 2011. Functional Plasticity and Allosteric Regulation of alpha-Ketoglutarate Decarboxylase in Central Mycobacterial Metabolism. Chemistry & Biology 18.
171. Baughn AD, Garforth SJ, Vilcheze C, Jacobs WR. 2009. An Anaerobic-Type alpha-Ketoglutarate Ferredoxin Oxidoreductase Completes the Oxidative Tricarboxylic Acid Cycle of Mycobacterium tuberculosis. Plos Pathogens 5.
172. McKinney JD, zu Bentrup KH, Munoz-Elias EJ, Miczak A, Chen B, Chan WT, Swenson D, Sacchettini JC, Jacobs WR, Russell DG. 2000. Persistence of Mycobacterium tuberculosis in macrophages and mice requires the glyoxylate shunt enzyme isocitrate lyase. Nature 406:735-738.
173. Talaat AM, Lyons R, Howard ST, Johnston SA. 2004. The temporal expression profile of Mycobacterium tuberculosis infection in mice. Proceedings of the National Academy of Sciences of the United States of America 101:4602-4607.
174. Timm J, Post FA, Bekker LG, Walther GB, Wainwright HC, Manganelli R, Chan WT, Tsenova L, Gold B, Smith I, Kaplan G, McKinney JD. 2003. Differential expression of iron-, carbon-, and oxygen-responsive mycobacterial genes in the lungs of chronically infected mice and tuberculosis patients. Proceedings of the National Academy of Sciences of the United States of America 100.
175. Munoz-Elias EJ, Upton AM, Cherian J, McKinney JD. 2006. Role of the methylcitrate cycle in Mycobacterium tuberculosis metabolism, intracellular growth, and virulence. Molecular Microbiology 60:1109-1122.
176. Anishetty S, Pulimi M, Pennathur G. 2005. Potential drug targets in Mycobacterium tuberculosis through metabolic pathway analysis. Computational Biology and Chemistry 29.
177. Yang XX, Nesbitt NM, Dubnau E, Smith I, Sampson NS. 2009. Cholesterol Metabolism Increases the Metabolic Pool of Propionate in Mycobacterium tuberculosis. Biochemistry 48:3819-3821.
178. Savvi S, Warner DF, Kana BD, McKinney JD, Mizrahi V, Dawes SS. 2008. Functional characterization of a vitamin B(12)-dependent methylmalonyl pathway in Mycobacterium tuberculosis: Implications for propionate metabolism during growth on fatty acids. Journal of Bacteriology 190:3886-3895.
179. Munoz-Elias EJ, McKinney JD. 2005. Mycobacterium tuberculosis isocitrate lyases 1 and 2 are jointly required for in vivo growth and virulence. Nature Medicine 11:638-644.
180. Beste DJV, Bonde B, Hawkins N, Ward JL, Beale MH, Noack S, Noeh K, Kruger NJ, Ratcliffe RG, McFadden J. 2011. C-13 Metabolic Flux Analysis Identifies an Unusual Route for Pyruvate Dissimilation in Mycobacteria which Requires Isocitrate Lyase and Carbon Dioxide Fixation. Plos Pathogens 7.
181. Gould TA, de Langemheen HV, Munoz-Elias EJ, McKinney JD, Sacchettini JC. 2006. Dual role of isocitrate lyase 1 in the glyoxylate and methylcitrate cycles in Mycobacterium tuberculosis. Molecular Microbiology 61:940-947.
182. Textor S, Wendisch VF, DeGraaf A, Muller U, Linder MI, Linder D, Buckel W. 1997. Propionate oxidation in Escherichia coli: evidence for operation of a methylcitrate cycle in bacteria. Archives of Microbiology 168.

267
183. Pandey AK, Sassetti CM. 2008. Mycobacterial persistance requires the utilization of host cholesterol. Proceedings of the National Academy of Sciences of the United States of America 105.
184. Griffin JE, Pandey AK, Gilmore SA, Mizrahi V, McKinney JD, Bertozzi CR, Sassetti CM. 2012. Cholesterol Catabolism by Mycobacterium tuberculosis Requires Transcriptional and Metabolic Adaptations. Chemistry & Biology 19.
185. Asselineau J, Lederer E. 1950. STRUCTURE OF THE MYCOLIC ACIDS OF MYCOBACTERIA. Nature 166.
186. Smith S, Witkowski A, Joshi AK. 2003. Structural and functional organization of the animal fatty acid synthase. Progress in Lipid Research 42.
187. Bhatt A, Molle V, Besra GS, Jacobs WR, Jr., Kremer L. 2007. The Mycobacterium tuberculosis FAS-II condensing enzymes: their role in mycolic acid biosynthesis, acid-fastness, pathogenesis and in future drug development. Molecular Microbiology 64.
188. Kumar A, Farhana A, Guidry L, Saini V, Hondalus M, Steyn AJC. 2011. Redox homeostasis in mycobacteria: the key to tuberculosis control? Expert Reviews in Molecular Medicine 13.
189. Farhana A, Guidry L, Srivastava A, Singh A, Hondalus MK, Steyn AJC. 2010. Reductive Stress in Microbes: Implications for Understanding Mycobacterium tuberculosis Disease and Persistence, p. 43-117. In Poole RK (ed.), Advances in Microbial Physiology, Vol 57, vol. 57.
190. Masood R, Sharma YK, Venkitasubramanian TA. 1985. METABOLISM OF MYCOBACTERIA. Journal of Biosciences 7.
191. Shin J-H, Yang J-Y, Jeon B-Y, Yoon YJ, Cho S-N, Kang Y-H, Ryu DH, Hwang G-S. 2011. H-1 NMR-based Metabolomic Profiling in Mice Infected with Mycobacterium tuberculosis. Journal of Proteome Research 10:2238-2247.
192. Eisenreich W, Dandekar T, Heesemann J, Goebel W. 2010. Carbon metabolism of intracellular bacterial pathogens and possible links to virulence. Nature Reviews Microbiology 8.
193. Rhee KY, de Carvalho LPS, Bryk R, Ehrt S, Marrero J, Park SW, Schnappinger D, Venugopal A, Nathan C. 2011. Central carbon metabolism in Mycobacterium tuberculosis: an unexpected frontier. Trends in Microbiology 19:307-314.
194. Voet DJ, Voet JG, Pratt CW. 2008. Principles of Biochemistry, 3rd ed. John Wiley & Sons, Inc., Hoboken.
195. Kana BD, Machowski EE, Schechter N, Teh J-S, Rubin H, Mizrahi V. 2009. Electron Transport and Respiration in Mycobacteria. Mycobacterium: Genomics and Molecular Biology:35-64.
196. McAdam RA, Quan S, Smith DA, Bardarov S, Betts JC, Cook FC, Hooker EU, Lewis AP, Woollard P, Everett MJ, Lukey PT, Bancroft GJ, Jacobs WR, Duncan K. 2002. Characterization of a Mycobacterium tuberculosis H37Rv transposon library reveals insertions in 351 ORFs and mutants with altered virulence. Microbiology-Sgm 148:2975-2986.
197. Weinstein EA, Yano T, Li LS, Avarbock D, Avarbock A, Helm D, McColm AA, Duncan K, Lonsdale JT, Rubin H. 2005. Inhibitors of type IINADH :-menaquinone oxidoreductase represent a class of antitubercular drugs. Proceedings of the National Academy of Sciences of the United States of America 102:4548-4553.
198. Velmurugan K, Chen B, Miller JL, Azogue S, Gurses S, Hsu T, Glickman M, Jacobs WR, Jr., Porcelli SA, Briken V. 2007. Mycobacterium tuberculosis nuoG is a virulence gene that inhibits apoptosis of infected host cells. Plos Pathogens 3:972-980.
199. Cecchini G, Maklashina E, Yankovskaya V, Iverson TM, Iwata S. 2003. Variation in proton donor/acceptor pathways in succinate:quinone oxidoreductases. FEBS Letters 545:31-38.

268
200. Van Hellemond JJ, Tielens AGM. 1994. Expression and functional properties of fumarate reductase. Biochemical Journal 304:321-331.
201. Farrand SK, Taber HW. 1974. CHANGES IN MENAQUINONE CONCENTRATION DURING GROWTH AND EARLY SPORULATION IN BACILLUS-SUBTILIS. Journal of Bacteriology 117:324-326.
202. Collins MD, Goodfellow M, Minnikin DE, Alderson G. 1985. MENAQUINONE COMPOSITION OF MYCOLIC-ACID-CONTAINING ACTINOMYCETES AND SOME SPOROACTINOMYCETES. Journal of Applied Bacteriology 58:77-86.
203. Teh JS, Yano T, Rubin H. 2007. Type IINADM : menaquinone oxidoreductase of Mycobacterium tuberculosis. Infectious Disorders - Drug Targets 7:169-181.
204. Roehm K-H. 2001. Electron carriers: proteins and cofactors in oxidative phosphorylation. . Encyclopedia of Life Sciences. .
205. Jasaitis A, Borisov VB, Belevich NP, Morgan JE, Konstantinov AA, Verkhovsky MI. 2000. Electrogenic reactions of cytochrome bd. Biochemistry 39:13800-13809.
206. Belevich I, Borisov VB, Zhang J, Yang K, Konstantinov AA, Gennis RB, Verkhovsky MI. 2005. Time-resolved electrometric and optical studies on cytochrome bd suggest a mechanism of electron-proton coupling in the di-heme active site. Proceedings of the National Academy of Sciences of the United States of America 102:3657-3662.
207. Lenaerts AJ, Hoff D, Aly S, Ehlers S, Andries K, Cantarero L, Orme IM, Basaraba RJ. 2007. Location of persisting mycobacteria in a guinea pig model of tuberculosis revealed by R207910. Antimicrobial Agents and Chemotherapy 51:3338-3345.
208. Haagsma AC, Driessen NN, Hahn M-M, Lill H, Bald D. 2010. ATP synthase in slow- and fast-growing mycobacteria is active in ATP synthesis and blocked in ATP hydrolysis direction. Fems Microbiology Letters 313:68-74.
209. Fisher N, Warman AJ, Ward SA, Biagini GA. 2009. TYPE II NADH: QUINONE OXIDOREDUCTASES OF PLASMODIUM FALCIPARUM AND MYCOBACTERIUM TUBERCULOSIS: KINETIC AND HIGH-THROUGHPUT ASSAYS. Methods in Enzymology, Vol 456: Mitochondrial Function, Part a: Mitochondrial Electron Transport Complexes and Reactive Oxygen Species 456:303-320.
210. Lamrabet O, Pieulle L, Aubert C, Mouhamar F, Stocker P, Dolla A, Brasseur G. 2011. Oxygen reduction in the strict anaerobe Desulfovibrio vulgaris Hildenborough: characterization of two membrane-bound oxygen reductases. Microbiology-Sgm 157.
211. Borisov VB, Gennis RB, Hemp J, Verkhovsky MI. 2011. The cytochrome bd respiratory oxygen reductases. Biochimica Et Biophysica Acta-Bioenergetics 1807:1398-1413.
212. Miller MJ, Gennis RB. 1983. THE PURIFICATION AND CHARACTERIZATION OF THE CYTOCHROME-D TERMINAL OXIDASE COMPLEX OF THE ESCHERICHIA-COLI AEROBIC RESPIRATORY-CHAIN. Journal of Biological Chemistry 258:9159-9165.
213. Kita K, Konishi K, Anraku Y. 1984. TERMINAL OXIDASES OF ESCHERICHIA-COLI AEROBIC RESPIRATORY-CHAIN .2. PURIFICATION AND PROPERTIES OF CYTOCHROME-B558-D COMPLEX FROM CELLS GROWN WITH LIMITED OXYGEN AND EVIDENCE OF BRANCHED ELECTRON-CARRYING SYSTEMS. Journal of Biological Chemistry 259:3375-3381.
214. Green GN, Fang H, Lin RJ, Newton G, Mather M, Georgiou CD, Gennis RB. 1988. THE NUCLEOTIDE-SEQUENCE OF THE CYD LOCUS ENCODING THE 2 SUBUNITS OF THE CYTOCHROME-D TERMINAL OXIDASE COMPLEX OF ESCHERICHIA-COLI. Journal of Biological Chemistry 263:13138-13143.
215. Osborne JP, Gennis RB. 1999. Sequence analysis of cytochrome bd oxidase suggests a revised topology for subunit I. Biochimica Et Biophysica Acta-Bioenergetics 1410:32-50.

269
216. Cunningham L, Williams HD. 1995. ISOLATION AND CHARACTERIZATION OF MUTANTS DEFECTIVE IN THE CYANIDE-INSENSITIVE RESPIRATORY PATHWAY OF PSEUDOMONAS-AERUGINOSA. Journal of Bacteriology 177:432-438.
217. Sturr MG, Krulwich TA, Hicks DB. 1996. Purification of a cytochrome bd terminal oxidase encoded by the Escherichia coli app locus from a Delta cyo Delta cyd strain complemented by genes from Bacillus firmus OF4. Journal of Bacteriology 178:1742-1749.
218. Shepherd M, Sanguinetti G, Cook GM, Poole RK. 2010. Compensations for Diminished Terminal Oxidase Activity in Escherichia coli CYTOCHROME bd-II-MEDIATED RESPIRATION AND GLUTAMATE METABOLISM. Journal of Biological Chemistry 285:18464-18472.
219. Heidelberg JF, Eisen JA, Nelson WC, Clayton RA, Gwinn ML, Dodson RJ, Haft DH, Hickey EK, Peterson JD, Umayam L, Gill SR, Nelson KE, Read TD, Tettelin H, Richardson D, Ermolaeva MD, Vamathevan J, Bass S, Qin HY, Dragoi I, Sellers P, McDonald L, Utterback T, Fleishmann RD, Nierman WC, White O, Salzberg SL, Smith HO, Colwell RR, Mekalanos JJ, Venter JC, Fraser CM. 2000. DNA sequence of both chromosomes of the cholera pathogen Vibrio cholerae. Nature 406:477-483.
220. Trumpower BL, Gennis RB. 1994. ENERGY TRANSDUCTION BY CYTOCHROME COMPLEXES IN MITOCHONDRIAL AND BACTERIAL RESPIRATION - THE ENZYMOLOGY OF COUPLING ELECTRON-TRANSFER REACTIONS TO TRANSMEMBRANE PROTON TRANSLOCATION. Annual Review of Biochemistry 63:675-716.
221. Shi LB, Sohaskey CD, Kana BD, Dawes S, North RJ, Mizrahi V, Gennaro ML. 2005. Changes in energy metabolism of Mycobacterium tuberculosis in mouse lung and under in vitro conditions affecting aerobic respiration. Proceedings of the National Academy of Sciences of the United States of America 102:15629-15634.
222. Jones SA, Chowdhury FZ, Fabich AJ, Anderson A, Schreiner DM, House AL, Autieri SM, Leatham MP, Lins JJ, Jorgensen M, Cohen PS, Conway T. 2007. Respiration of Escherichia coli in the mouse intestine. Infection and Immunity 75:4891-4899.
223. Dincturk HB, Demir V, Aykanat T. 2011. Bd oxidase homologue of photosynthetic purple sulfur bacterium Allochromatium vinosum is co-transcribed with a nitrogen fixation related gene. Antonie Van Leeuwenhoek 99:211-220.
224. Hassani BK, Steunou AS, Liotenberg S, Reiss-Husson F, Astier C, Ouchane S. 2010. Adaptation to Oxygen ROLE OF TERMINAL OXIDASES IN PHOTOSYNTHESIS INITIATION IN THE PURPLE PHOTOSYNTHETIC BACTERIUM, RUBRIVIVAX GELATINOSUS. Journal of Biological Chemistry 285:19891-19899.
225. Yamamoto Y, Poyart C, Trieu-Cuot P, Lamberet G, Gruss A, Gaudu P. 2005. Respiration metabolism of Group B Streptococcus is activated by environmental haem and quinone and contributes to virulence. Molecular Microbiology 56:525-534.
226. Borisov VB, Forte E, Giuffre A, Konstantinov A, Sarti P. 2009. Reaction of nitric oxide with the oxidized di-heme and heme-copper oxygen-reducing centers of terminal oxidases: Different reaction pathways and end-products. J. Inorg. Biochem. 103:1185-1187.
227. Forte E, Borisov VB, Konstantinov AA, Brunori M, Giuffre A, Sarti P. 2007. Cytochrome bd, a key oxidase in bacterial survival and tolerance to nitrosative stress. Ital J Biochem 56:265-269.
228. Borisov VB, Davletshin AI, Konstantinov AA. 2010. Peroxidase activity of cytochrome bd from Escherichia coli. Biochemistry-Moscow 75:428-436.
229. Huycke MM, Moore D, Joyce W, Wise P, Shepard L, Kotake Y, Gilmore MS. 2001. Extracellular superoxide production by Enterococcus faecalis requires

270
demethylmenaquinone and is attenuated by functional terminal quinol oxidases. Molecular Microbiology 42:729-740.
230. Heintz D, Gallien S, Wischgoll S, Ullmann AK, Schaeffer C, Kretzschmar AK, van Dorsselaer A, Boll M. 2009. Differential Membrane Proteome Analysis Reveals Novel Proteins Involved in the Degradation of Aromatic Compounds in Geobacter metallireducens. Mol. Cell. Proteomics 8:2159-2169.
231. Mason MG, Shepherd M, Nicholls P, Dobbin PS, Dodsworth KS, Poole RK, Cooper CE. 2009. Cytochrome bd confers nitric oxide resistance to Escherichia coli. Nature Chemical Biology 5:94-96.
232. Parish T, Brown A. 2009. Mycobacterium: Genomics and Molecular Biology. Mycobacterium: Genomics and Molecular Biology.
233. Shi L, Sohaskey CD, North RJ, Gennaro ML. 2008. Transcriptional characterization of the antioxidant response of Mycobacterium tuberculosis in vivo and during adaptation to hypoxia in vitro. Tuberculosis 88:1-6.
234. Fu HA, Iuchi S, Lin ECC. 1991. THE REQUIREMENT OF ARCA AND FNR FOR PEAK EXPRESSION OF THE CYD OPERON IN ESCHERICHIA-COLI UNDER MICROAEROBIC CONDITIONS. Molecular & General Genetics 226:209-213.
235. Avetisyan AV, Bogachev AV, Murtasina RA, Skulachev VP. 1992. INVOLVEMENT OF A D-TYPE OXIDASE IN THE NA+-MOTIVE RESPIRATORY-CHAIN OF ESCHERICHIA-COLI GROWING UNDER LOW DELTA(MU)BARH+ CONDITIONS. Febs Letters 306:199-202.
236. Wall D, Delaney JM, Fayet O, Lipinska B, Yamamoto T, Georgopoulos C. 1992. ARC-DEPENDENT THERMAL REGULATION AND EXTRAGENIC SUPPRESSION OF THE ESCHERICHIA-COLI CYTOCHROME-D OPERON. Journal of Bacteriology 174:6554-6562.
237. Ashcroft JR, Haddock BA. 1975. SYNTHESIS OF ALTERNATIVE MEMBRANE-BOUND REDOX CARRIERS DURING AEROBIC GROWTH OF ESCHERICHIA-COLI IN PRESENCE OF POTASSIUM CYANIDE. Biochemical Journal 148:349-352.
238. Bogachev AV, Murtazina RA, Shestopalov AI, Skulachev VP. 1995. INDUCTION OF THE ESCHERICHIA-COLI CYTOCHROME-D BY LOW DELTA(MU)OVER-BAR(H+) AND BY SODIUM-IONS. Eur. J. Biochem. 232:304-308.
239. Tamegai H, Kawano H, Ishii A, Chikuma S, Nakasone K, Kato C. 2005. Pressure-regulated biosynthesis of cytochrome bd in piezo- and psychrophilic deep-sea bacterium Shewanella violacea DSS12. Extremophiles 9:247-253.
240. Walters SB, Dubnau E, Kolesnikova I, Laval F, Daffe M, Smith I. 2006. The Mycobacterium tuberculosis PhoPR two-component system regulates genes essential for virulence and complex lipid biosynthesis. Molecular Microbiology 60:312-330.
241. Boshoff HIM, Myers TG, Copp BR, McNeil MR, Wilson MA, Barry CE. 2004. The transcriptional responses of Mycobacterium tuberculosis to inhibitors of metabolism - Novel insights into drug mechanisms of action. Journal of Biological Chemistry 279:40174-40184.
242. Matsoso LG, Kana BD, Crellin PK, Lea-Smith DJ, Pelosi A, Powell D, Dawes SS, Rubin H, Coppel RL, Mizrahi V. 2005. Function of the cytochrome bc(1)-aa(3) branch of the respiratory network in mycobacteria and network adaptation occurring in response to its disruption. Journal of Bacteriology 187:6300-6308.
243. Siegele DA, Imlay KR, Imlay JA. 1996. The stationary-phase-exit defect of cydC (surB) mutants is due to the lack of a functional terminal cytochrome oxidase. Journal of Bacteriology 178:6091-6096.
244. Poole RK, Hatch L, Cleeter MWJ, Gibson F, Cox GB, Wu GH. 1993. CYTOCHROME BD BIOSYNTHESIS IN ESCHERICHIA-COLI - THE SEQUENCES OF THE CYDC AND CYDD
271
GENES SUGGEST THAT THEY ENCODE THE COMPONENTS OF AN ABC MEMBRANE TRANSPORTER. Molecular Microbiology 10:421-430.
245. Poole RK, Gibson F, Wu GH. 1994. THE CYDD GENE-PRODUCT, COMPONENT OF A HETERODIMERIC ABC TRANSPORTER, IS REQUIRED FOR ASSEMBLY OF PERIPLASMIC CYTOCHROME-C AND OF CYTOCHROME-BD IN ESCHERICHIA-COLI. Fems Microbiology Letters 117:217-224.
246. Tseng CP, Albrecht J, Gunsalus RP. 1996. Effect of microaerophilic cell growth conditions on expression of the aerobic (cyoABCDE and cydAB) and anaerobic (narGHJI, frdABCD, and dmsABC) respiratory pathway genes in Escherichia coli. Journal of Bacteriology 178:1094-1098.
247. Braibant M, Gilot P, Content J. 2000. The ATP binding cassette (ABC) transport systems of Mycobacterium tuberculosis. Fems Microbiology Reviews 24:449-467.
248. Pittman MS, Corker H, Wu GH, Binet MB, Moir AJG, Poole RK. 2002. Cysteine is exported from the Escherichia coli cytoplasm by CydDC, an ATP-binding cassette-type transporter required for cytochrome assembly. Journal of Biological Chemistry 277:49841-49849.
249. Pittman MS, Robinson HC, Poole RK. 2005. A bacterial glutathione transporter (Escherichia coli CydDC) exports reductant to the periplasm. Journal of Biological Chemistry 280:32254-32261.
250. Cotter PA, Melville SB, Albrecht JA, Gunsalus RP. 1997. Aerobic regulation of cytochrome d oxidase (cydAB) operon expression in Escherichia coli: Roles of Fnr and ArcA in repression and activation. Molecular Microbiology 25:605-615.
251. Georgellis D, Kwon O, Lin ECC. 2001. Quinones as the redox signal for the Arc two-component system of bacteria. Science 292:2314-2316.
252. Alexeeva S, Hellingwerf KJ, de Mattos MJT. 2003. Requirement of ArcA for redox regulation in Escherichia coli under microaerobic but not anaerobic or aerobic conditions. Journal of Bacteriology 185:204-209.
253. Kana BD, Weinstein EA, Avarbock D, Dawes SS, Rubin H, Mizrahi V. 2001. Characterization of the cydAB-encoded cytochrome bd oxidase from Mycobacterium smegmatis. Journal of Bacteriology 183:7076-7086.
254. Becker S, Vlad D, Schuster S, Pfeiffer P, Unden G. 1997. Regulatory O-2 tensions for the synthesis of fermentation products in Escherichia coli and relation to aerobic respiration. Archives of Microbiology 168:290-296.
255. Zhang J, Oettmeier W, Gennis RB, Hellwig P. 2002. FTIR spectroscopic evidence for the involvement of an acidic residue in quinone binding in cytochrome bd from Escherichia coli. Biochemistry 41:4612-4617.
256. Yang K, Zhang J, Vakkasoglu AS, Hielscher R, Osborne JP, Hemp J, Miyoshi H, Hellwig P, Gennis RB. 2007. Glutamate 107 in subunit I of the cytochrome bd quinol oxidase from Escherichia coli is protonated and near the heme d/heme b(595) binuclear center. Biochemistry 46:3270-3278.
257. Spinner F, Cheesman MR, Thomson AJ, Kaysser T, Gennis RB, Peng QY, Peterson J. 1995. THE HEME B(558) COMPONENT OF THE CYTOCHROME BD QUINOL OXIDASE COMPLEX FROM ESCHERICHIA-COLI HAS HISTIDINE METHIONINE AXIAL LIGATION. Biochemical Journal 308:641-644.
258. Kranz RG, Barassi CA, Miller MJ, Green GN, Gennis RB. 1983. IMMUNOLOGICAL CHARACTERIZATION OF AN ESCHERICHIA-COLI STRAIN WHICH IS LACKING CYTOCHROME-D. Journal of Bacteriology 156:115-121.
259. Newton G, Gennis RB. 1991. INVIVO ASSEMBLY OF THE CYTOCHROME-D TERMINAL OXIDASE COMPLEX OF ESCHERICHIA-COLI FROM GENES ENCODING THE 2 SUBUNITS EXPRESSED ON SEPARATE PLASMIDS. Biochimica Et Biophysica Acta 1089:8-12.

272
260. Green GN, Lorence RM, Gennis RB. 1986. SPECIFIC OVERPRODUCTION AND PURIFICATION OF THE CYTOCHROME-B558 COMPONENT OF THE CYTOCHROME-D COMPLEX FROM ESCHERICHIA-COLI. Biochemistry 25:2309-2314.
261. Zhang J, Barquera B, Gennis RB. 2004. Gene fusions with beta-lactamase show that subunit I of the cytochrome bd quinol oxidase from E-coli has nine transmembrane helices with the O-2 reactive site near the periplasmic surface. Febs Letters 561:58-62.
262. Bloch DA, Borisov VB, Mogi T, Verkhovsky MI. 2009. Heme/heme redox interaction and resolution of individual optical absorption spectra of the hemes in cytochrome bd from Escherichia coli. Biochimica Et Biophysica Acta-Bioenergetics 1787:1246-1253.
263. Lorence RM, Koland JG, Gennis RB. 1986. COULOMETRIC AND SPECTROSCOPIC ANALYSIS OF THE PURIFIED CYTOCHROME-D COMPLEX OF ESCHERICHIA-COLI - EVIDENCE FOR THE IDENTIFICATION OF CYTOCHROME-A1 AS CYTOCHROME-B595. Biochemistry 25:2314-2321.
264. Meunier B, Madgwick SA, Reil E, Oettmeier W, Rich PR. 1995. NEW INHIBITORS OF THE QUINOL OXIDATION SITES OF BACTERIAL CYTOCHROMES BO AND BD. Biochemistry 34:1076-1083.
265. Mogi T, Ui H, Shiomi K, Omura S, Kita K. 2008. Gramicidin S identified as a potent inhibitor for cytochrome bd-type quinol oxidase. Febs Letters 582:2299-2302.
266. Cho SH, Warit S, Wan BJ, Hwang CH, Pauli GF, Franzblau SG. 2007. Low-oxygen-recovery assay for high-throughput screening of compounds against nonreplicating Mycobacterium tuberculosis. Antimicrobial Agents and Chemotherapy 51:1380-1385.
267. Koul A, Dendouga N, Vergauwen K, Molenberghs B, Vranckx L, Willebrords R, Ristic Z, Lill H, Dorange I, Guillemont J, Bald D, Andries K. 2007. Diarylquinolines target subunit c of mycobacterial ATP synthase. Nature Chemical Biology 3.
268. Sawada K, Kato Y, Imai K, Li L, Wada M, Matsushita K, Yokota A. 2012. Mechanism of increased respiration in an H+-ATPase-defective mutant of Corynebacterium glutamicum. Journal of Bioscience and Bioengineering 113:467-473.
269. Noda S, Takezawa Y, Mizutani T, Asakura T, Nishiumi E, Onoe K, Wada M, Tomita F, Matsushita K, Yokota A. 2006. Alterations of cellular physiology in Escherichia coli in response to oxidative phosphorylation impaired by defective F-1-ATPase. Journal of Bacteriology 188:6869-6876.
270. Betts JC, Lukey PT, Robb LC, McAdam RA, Duncan K. 2002. Evaluation of a nutrient starvation model of Mycobacterium tuberculosis persistence by gene and protein expression profiling. Molecular Microbiology 43:717-731.
271. Voskuil MI, Schnappinger D, Visconti KC, Harrell MI, Dolganov GM, Sherman DR, Schoolnik GK. 2003. Inhibition of respiration by nitric oxide induces a Mycobacterium tuberculosis dormancy program. Journal of Experimental Medicine 198:705-713.
272. Bacon J, James BW, Wernisch L, Williams A, Morley KA, Hatch GJ, Mangan JA, Hinds J, Stoker NG, Butcher PD, Marsh PD. 2004. The influence of reduced oxygen availability on pathogenicity and gene expression in Mycobacterium tuberculosis. Tuberculosis (Amsterdam) 84:205-217.
273. Rao SPS, Alonso S, Rand L, Dick T, Pethe K. 2008. The protonmotive force is required for maintaining ATP homeostasis and viability of hypoxic, nonreplicating Mycobacterium tuberculosis. Proceedings of the National Academy of Sciences of the United States of America 105:11945-11950.
274. Koul A, Vranckx L, Dendouga N, Balemans W, Van den Wyngaert I, Vergauwen K, Goehlmann HWH, Willebrords R, Poncelet A, Guillemont J, Bald D, Andries K. 2008.

273
Diarylquinolines are bactericidal for dormant mycobacteria as a result of disturbed ATP homeostasis. Journal of Biological Chemistry 283:25273-25280.
275. Rengarajan J, Bloom BR, Rubin EJ. 2005. Genome-wide requirements for Mycobacterium tuberculosis adaptation and survival in macrophages. Proceedings of the National Academy of Sciences of the United States of America 102:8327-8332.
276. Brown GC. 2001. Regulation of mitochondrial respiration by nitric oxide inhibition of cytochrome c oxidase. Biochimica Et Biophysica Acta-Bioenergetics 1504:46-57.
277. Brunori M, Giuffre A, Forte E, Mastronicola D, Barone MC, Sarti P. 2004. Control of cytochrorne c oxidase activity by nitric oxide. Biochimica Et Biophysica Acta-Bioenergetics 1655:365-371.
278. Fenhalls G, Stevens L, Moses L, Bezuidenhout J, Betts JC, van Helden P, Lukey PT, Duncan K. 2002. In situ detection of Mycobacterium tuberculosis transcripts in human lung granulomas reveals differential gene expression in necrotic lesions. Infection and Immunity 70:6330-6338.
279. Koul A, Arnoult E, Lounis N, Guillemont J, Andries K. 2011. The challenge of new drug discovery for tuberculosis. Nature 469:483-490.
280. Andries K, Verhasselt P, Guillemont J, Gohlmann HWH, Neefs JM, Winkler H, Van Gestel J, Timmerman P, Zhu M, Lee E, Williams P, de Chaffoy D, Huitric E, Hoffner S, Cambau E, Truffot-Pernot C, Lounis N, Jarlier V. 2005. A diarylquinoline drug active on the ATP synthase of Mycobacterium tuberculosis. Science 307:223-227.
281. Villemagne B, Crauste C, Flipo M, Baulard AR, Deprez B, Willand N. 2012. Tuberculosis: The drug development pipeline at a glance. European Journal of Medicinal Chemistry 51.
282. Warman AJ, Rito TS, Fisher NE, Moss DM, Berry NG, O'Neill PM, Ward SA, Biagini GA. 2012. Antitubercular pharmacodynamics of phenothiazines. Journal of Antimicrobial Chemotherapy.
283. Cynamon M, Sklaney MR, Shoen C. 2007. Gatiffoxacin in combination with rifampicin in a murine tuberculosis model. Journal of Antimicrobial Chemotherapy 60.
284. Spigelman MK. 2007. New tuberculosis therapeutics: A growing pipeline. Journal of Infectious Diseases 196.
285. Chen P, Gearhart J, Protopopova M, Einck L, Nacy CA. 2006. Synergistic interactions of SQ109, a new ethylene diamine, with front-line antitubercular drugs in vitro. Journal of Antimicrobial Chemotherapy 58.
286. Sacksteder KA, Protopopova M, Barry CE, Andries K, Nacy CA. 2012. Discovery and development of SQ109: a new antitubercular drug with a novel mechanism of action. Future Microbiology 7.
287. Cole ST. 1999. Learning from the genome sequence of Mycobacterium tuberculosis H37Rv. Febs Letters 452:7-10.
288. Reddy TBK, Riley R, Wymore F, Montgomery P, DeCaprio D, Engels R, Gellesch M, Hubble J, Jen D, Jin H, Koehrsen M, Larson L, Mao M, Nitzberg M, Sisk P, Stolte C, Weiner B, White J, Zachariah ZK, Sherlock G, Galagan JE, Ball CA, Schoolnik GK. 2009. TB database: an integrated platform for tuberculosis research. Nucleic Acids Research 37:D499-D508.
289. Berney M, Cook GM. 2010. Unique Flexibility in Energy Metabolism Allows Mycobacteria to Combat Starvation and Hypoxia. Plos One 5.
290. Bekker M, de Vries S, Ter Beek A, Hellingwerf KJ, de Mattos MJT. 2009. Respiration of Escherichia coli Can Be Fully Uncoupled via the Nonelectrogenic Terminal Cytochrome bd-II Oxidase. Journal of Bacteriology 191:5510-5517.
291. Dassa J, Fsihi H, Marck C, Dion M, Kiefferbontemps M, Boquet PL. 1991. A NEW OXYGEN-REGULATED OPERON IN ESCHERICHIA-COLI COMPRISES THE GENES FOR A

274
PUTATIVE 3RD CYTOCHROME-OXIDASE AND FOR PH 2.5 ACID-PHOSPHATASE (APPA). Molecular & General Genetics 229:341-352.
292. Atlung T, Knudsen K, Heerfordt L, Brondsted L. 1997. Effects of sigma(S) and the transcriptional activator AppY on induction of the Escherichia coli hya and cbdAB-appA operons in response to carbon and phosphate starvation. Journal of Bacteriology 179:2141-2146.
293. Brondsted L, Atlung T. 1996. Effect of growth conditions on expression of the acid phosphatase (cyx-appA) operon and the appY gene, which encodes a transcriptional activator of Escherichia coli. Journal of Bacteriology 178:1556-1564.
294. Cohen GN. 2011. Bacterial Growth. 295. Siegele DA, Kolter R. 1993. ISOLATION AND CHARACTERIZATION OF AN
ESCHERICHIA-COLI MUTANT DEFECTIVE IN RESUMING GROWTH AFTER STARVATION. Genes & Development 7:2629-2640.
296. Kolter R, Siegele DA, Tormo A. 1993. THE STATIONARY-PHASE OF THE BACTERIAL LIFE-CYCLE. Annual Review of Microbiology 47.
297. Sambrook J, Russell DW. 2001. Molecular cloning: A laboratory manual. Molecular cloning: A laboratory manual.
298. Frey B, Suppmann B. 1995. Biochemica 2:34-35. 299. NEB. 2011. NEB UK Expressions.
http://www.neb.uk.com/latest/documents/neb_uk_expressions_oct11.pdf. 300. Datsenko KA, Wanner BL. 2000. One-step inactivation of chromosomal genes in
Escherichia coli K-12 using PCR products. Proceedings of the National Academy of Sciences of the United States of America 97:6640-6645.
301. Miroux B, Walker JE. 1996. Over-production of proteins in Escherichia coli: Mutant hosts that allow synthesis of some membrane proteins and globular proteins at high levels. Journal of Molecular Biology 260:289-298.
302. Wagner S, Klepsch MM, Schlegel S, Appel A, Draheim R, Tarry M, Hogbom M, van Wijk KJ, Slotboom DJ, Persson JO, de Gier J-W. 2008. Tuning Escherichia coli for membrane protein overexpression. Proceedings of the National Academy of Sciences of the United States of America 105:14371-14376.
303. Novagen®. 2003. pET system manual, p. 68. In Novagen® aboEB (ed.), the pET Manual, 10 ed.
304. Bradford MM. 1976. RAPID AND SENSITIVE METHOD FOR QUANTITATION OF MICROGRAM QUANTITIES OF PROTEIN UTILIZING PRINCIPLE OF PROTEIN-DYE BINDING. Analytical Biochemistry 72.
305. Karakashev D, Galabova D, Simeonov I. 2003. A simple and rapid test for differentiation of aerobic from anaerobic bacteria. World Journal of Microbiology & Biotechnology 19:233-238.
306. O'Brien J, Wilson I, Orton T, Pognan F. 2000. Investigation of the Alamar Blue (resazurin) fluorescent dye for the assessment of mammalian cell cytotoxicity. European Journal of Biochemistry 267.
307. Winstedt L, Yoshida KI, Fujita Y, von Wachenfeldt C. 1998. Cytochrome bd biosynthesis in Bacillus subtilis: Characterization of the cydABCD operon. Journal of Bacteriology 180:6571-6580.
308. Green GN, Kranz JE, Gennis RB. 1984. CLONING THE CYD GENE LOCUS CODING FOR THE CYTOCHROME-D COMPLEX OF ESCHERICHIA-COLI. Gene 32:99-106.
309. Arutyunyan AM, Sakamoto J, Inadome M, Kabashima Y, Borisov VB. 2012. Optical and magneto-optical activity of cytochrome bd from Geobacillus thermodenitrificans. Biochimica Et Biophysica Acta-Bioenergetics 1817.

275
310. Kabashima Y, Kishikawa J, Kurokawa T, Sakamoto J. 2009. Correlation Between Proton Translocation and Growth: Genetic Analysis of the Respiratory Chain of Corynebacterium glutamicum. Journal of Biochemistry 146:845-855.
311. Cotter PA, Chepuri V, Gennis RB, Gunsalus RP. 1990. CYTOCHROME-O (CYOABCDE) AND D (CYDAB) OXIDASE GENE-EXPRESSION IN ESCHERICHIA-COLI IS REGULATED BY OXYGEN, PH, AND THE FNR GENE-PRODUCT. Journal of Bacteriology 172:6333-6338.
312. Ye RW, Tao W, Bedzyk L, Young T, Chen M, Li L. 2000. Global gene expression profiles of Bacillus subtilis grown under anaerobic conditions. Journal of Bacteriology 182:4458-4465.
313. Ingledew WJ, Poole RK. 1984. THE RESPIRATORY CHAINS OF ESCHERICHIA-COLI. Microbiological Reviews 48:222-271.
314. Green GN, Kranz RG, Lorence RM, Gennis RB. 1984. IDENTIFICATION OF SUBUNIT-I AS THE CYTOCHROME-B558 COMPONENT OF THE CYTOCHROME-D TERMINAL OXIDASE COMPLEX OF ESCHERICHIA-COLI. Journal of Biological Chemistry 259:7994-7997.
315. Yamanaka T, Fujii K. 1980. CYTOCHROME A-TYPE TERMINAL OXIDASE DERIVED FROM THIOBACILLUS-NOVELLUS - MOLECULAR AND ENZYMATIC-PROPERTIES. Biochimica Et Biophysica Acta 591:53-62.
316. Delgado MJ, Yeoman KH, Wu GH, Vargas C, Davies AE, Poole RK, Johnston AWB, Downie JA. 1995. CHARACTERIZATION OF THE CYCHJKL GENES INVOLVED IN CYTOCHROME-C BIOGENESIS AND SYMBIOTIC NITROGEN-FIXATION IN RHIZOBIUM-LEGUMINOSARUM. Journal of Bacteriology 177:4927-4934.
317. Obrian MR, Kirshbom PM, Maier RJ. 1987. TN5-INDUCED CYTOCHROME MUTANTS OF BRADYRHIZOBIUM-JAPONICUM - EFFECTS OF THE MUTATIONS ON CELLS GROWN SYMBIOTICALLY AND IN CULTURE. Journal of Bacteriology 169:1089-1094.
318. Santana M, Kunst F, Hullo MF, Rapoport G, Danchin A, Glaser P. 1992. MOLECULAR-CLONING, SEQUENCING, AND PHYSIOLOGICAL CHARACTERIZATION OF THE QOX OPERON FROM BACILLUS-SUBTILIS ENCODING THE AA3-600 QUINOL OXIDASE. Journal of Biological Chemistry 267:10225-10231.
319. Siegel LM, Murphy MJ, Kamin H. 1973. REDUCED NICOTINAMIDE ADENINE-DINUCLEOTIDE PHOSPHATE-SULFITE REDUCTASE OF ENTEROBACTERIA .1. ESCHERICHIA-COLI HEMOFLAVOPROTEIN - MOLECULAR PARAMETERS AND PROSTHETIC GROUPS. Journal of Biological Chemistry 248:251-264.
320. Azarkina N, Siletsky S, Borisov V, von Wachenfeldt C, Hederstedt L, Konstantinov AA. 1999. A cytochrome bb '-type quinol oxidase in Bacillus subtilis strain 168. Journal of Biological Chemistry 274:32810-32817.
321. Kolonay JF, Moshiri F, Gennis RB, Kaysser TM, Maier RJ. 1994. PURIFICATION AND CHARACTERIZATION OF THE CYTOCHROME BD COMPLEX FROM AZOTOBACTER-VINELANDII - COMPARISON TO THE COMPLEX FROM ESCHERICHIA-COLI. Journal of Bacteriology 176:4177-4181.
322. Ratledge C. 1999. Iron metabolism, p. 260-286 pp. In Ratledge C, Dale, J.W., (ed.), Mycobacteria: Molecular Biology and Virulence, 1st ed. Wiley-Blackwell, Oxford.
323. Gonzalez-Pinzon R, Haggerty R, Myrold DD. 2012. Measuring aerobic respiration in stream ecosystems using the resazurin-resorufin system. Journal of Geophysical Research-Biogeosciences 117.
324. Zhang HX, Du GH, Zhang JT. 2004. Assay of mitochondrial functions by resazurin in vitro. Acta Pharmacologica Sinica 25.
325. Geckil H, Stark BC, Webster DA. 2001. Cell growth and oxygen uptake of Escherichia coli and Pseudomonas aeruginosa are differently effected by the genetically engineered Vitreoscilla hemoglobin gene. Journal of Biotechnology 85:57-66.

276
326. Khosravi M, Ryan W, Webster DA, Stark BC. 1990. VARIATION OF OXYGEN REQUIREMENT WITH PLASMID SIZE IN RECOMBINANT ESCHERICHIA-COLI. Plasmid 23.
327. Haggerty R, Argerich A, Marti E. 2008. Development of a ''smart'' tracer for the assessment of microbiological activity and sediment-water interaction in natural waters: The resazurin-resorufin system. Water Resources Research 44:10.
328. Edwards SE, Loder CS, Wu GH, Corker H, Bainbridge BW, Hill S, Poole RK. 2000. Mutation of cytochrome bd quinol oxidase results in reduced stationary phase survival, iron deprivation, metal toxicity and oxidative stress in Azotobacter vinelandii. Fems Microbiology Letters 185:71-77.
329. Simon J, van Spanning RJM, Richardson DJ. 2008. The organisation of proton motive and non-proton motive redox loops in prokaryotic respiratory systems. Biochimica Et Biophysica Acta-Bioenergetics 1777:1480-1490.
330. Unden G, Bongaerts J. 1997. Alternative respiratory pathways of Escherichia coli: Energetics and transcriptional regulation in response to electron acceptors. Biochimica Et Biophysica Acta-Bioenergetics 1320:217-234.
331. Hastings SF, Kaysser TM, Jiang FS, Salerno JC, Gennis RB, Ingledew WJ. 1998. Identification of a stable semiquinone intermediate in the purified and membrane bound ubiquinol oxidase cytochrome bd from Escherichia coli. European Journal of Biochemistry 255.
332. Gennis RB. 1998. How does cytochrome oxidase pump protons? Proceedings of the National Academy of Sciences of the United States of America 95.
333. Borisov VB. 2008. Interaction of bd-type quinol oxidase from Escherichia coli and carbon monoxide: Heme d binds CO with high affinity. Biochemistry-Moscow 73:14-22.
334. Copeland R. 2005. Evaluation of enzyme inhibitors in drug discovery: a guide Medicinal Chemists and Pharmacologists. John Wiley & Sons, Inc., Hoboken, NJ, USA.
335. Wilson K. 2010. Enzymes. In Wilson KaW, John. (ed.), Principle and Techniques of Biochemistry and Molecular Biology, vol. seven. Cambridge University Press, Cambridge.
336. Lorence RM, Miller MJ, Borochov A, Faimanweinberg R, Gennis RB. 1984. EFFECTS OF PH AND DETERGENT ON THE KINETIC AND ELECTROCHEMICAL PROPERTIES OF THE PURIFIED CYTOCHROME-D TERMINAL OXIDASE COMPLEX OF ESCHERICHIA-COLI. Biochimica Et Biophysica Acta 790:148-153.
337. Mogi T, Akimoto S, Endou S, Watanabe-Nakayama T, Mizuochi-Asai E, Miyoshi H. 2006. Probing the ubiquinol-binding site in cytochrome bd by site-directed mutagenesis. Biochemistry 45:7924-7930.
338. Diacon AH, Pym A, Grobusch M, Patientia R, Rustomjee R, Page-Shipp L, Pistorius C, Krause R, Bogoshi M, Churchyard G, Venter A, Allen J, Palomino JC, De Marez T, van Heeswijk RPG, Lounis N, Meyvisch P, Verbeeck J, Parys W, de Beule K, Andries K, Mc Neeley DF. 2009. The Diarylquinoline TMC207 for Multidrug-Resistant Tuberculosis. New England Journal of Medicine 360:2397-2405.
339. Haagsma AC, Podasca I, Koul A, Andries K, Guillemont J, Lill H, Bald D. 2011. Probing the Interaction of the Diarylquinoline TMC207 with Its Target Mycobacterial ATP Synthase. Plos One 6.
340. Pidathala C, Amewu R, Pacorel B, Nixon GL, Gibbons P, Hong WD, Leung SC, Berry NG, Sharma R, Stocks PA, Srivastava A, Shone AE, Charoensutthivarakul S, Taylor L, Berger O, Mbekeani A, Hill A, Fisher NE, Warman AJ, Biagini GA, Ward SA, O'Neill PM. 2012. Identification, Design and Biological Evaluation of Bisaryl Quinolones Targeting Plasmodium falciparum Type II NADH:Quinone Oxidoreductase (PfNDH2). Journal of Medicinal Chemistry 55:1831-1843.

277
341. Leung SC, Gibbons P, Amewu R, Nixon GL, Pidathala C, Hong WD, Pacorel B, Berry NG, Sharma R, Stocks PA, Srivastava A, Shone AE, Charoensutthivarakul S, Taylor L, Berger O, Mbekeani A, Hill A, Fisher NE, Warman AJ, Biagini GA, Ward SA, O'Neill PM. 2012. Identification, Design and Biological Evaluation of Heterocyclic Quinolones Targeting Plasmodium falciparum Type II NADH:Quinone Oxidoreductase (PfNDH2). Journal of Medicinal Chemistry 55:1844-1857.
342. Sharma R, Lawrenson AS, Fisher NE, Warman AJ, Shone AE, Hill A, Mbekeani A, Pidathala C, Amewu RK, Leung S, Gibbons P, Hong DW, Stocks P, Nixon GL, Chadwick J, Shearer J, Gowers I, Cronk D, Parel SP, O'Neill PM, Ward SA, Biagini GA, Berry NG. 2012. Identification of Novel Antimalarial Chemotypes via Chemoinformatic Compound Selection Methods for a High-Throughput Screening Program against the Novel Malarial Target, PfNDH2: Increasing Hit Rate via Virtual Screening Methods. Journal of Medicinal Chemistry 55:3144-3154.
343. Fisher N, Castleden CK, Bourges I, Brasseur G, Dujardin G, Meunier B. 2004. Human disease-related mutations in cytochrome b studied in yeast. Journal of Biological Chemistry 279:12951-12958.
344. Kihira C, Hayashi Y, Azuma N, Noda S, Maeda S, Fukiya S, Wada M, Matsushita K, Yokota A. 2012. Alterations of glucose metabolism in Escherichia coli mutants defective in respiratory-chain enzymes. Journal of Biotechnology 158:215-223.
345. Matsumoto Y, Muneyuki E, Fujita D, Sakamoto K, Miyoshi H, Yoshida M, Mogi T. 2006. Kinetic mechanism of quinol oxidation by cytochrome bd studied with ubiquinone-2 analogs. Journal of Biochemistry 139:779-788.
346. David HL. 1970. Probability distribution of drug-resistant mutants in unselected populations of Mycobacterium tuberculosis. Applied Microbiology 20:810-814.
347. Wayne LG, Hayes LG. 1996. An in vitro model for sequential study of shiftdown of Mycobacterium tuberculosis through two stages of nonreplicating persistence. Infection and Immunity 64:2062-2069.
348. Hartkoorn RC, Chandler B, Owen A, Ward SA, Squire SB, Back DJ, Khoo SH. 2007. Differential drug susceptibility of intracellular and extracellular tuberculosis, and the impact of P-glycoprotein. Tuberculosis 87:248-255.
349. Mogi T, Miyoshi H. 2009. Properties of Cytochrome bd Plastoquinol Oxidase from the Cyanobacterium Synechocystis sp PCC 6803. Journal of Biochemistry 145:395-401.
350. Collins LA, Franzblau SG. 1997. Microplate Alamar blue assay versus BACTEC 460 system for high-throughput screening of compounds against Mycobacterium tuberculosis and Mycobacterium avium. Antimicrobial Agents and Chemotherapy 41.
351. Torres E, Moreno E, Ancizu S, Barea C, Galiano S, Aldana I, Monge A, Perez-Silanes S. 2011. New 1,4-di-N-oxide-quinoxaline-2-ylmethylene isonicotinic acid hydrazide derivatives as anti-Mycobacterium tuberculosis agents. Bioorganic & Medicinal Chemistry Letters 21.
352. Vladimir L. 2003. comprehensive enzyme kinetics. Plenum publishers, New York. 353. Copeland R. 2005. Chapter 3: Reversible mode of inhibitor interactions with
enzymes, Evaluation of enzyme inhibitors in drug discovery: a guide Medicinal Chemists and Pharmacologists. John Wiley & Sons, Inc., Hoboken, NJ, USA.
354. Junemann S, Butterworth PJ, Wrigglesworth JM. 1995. A SUGGESTED MECHANISM FOR THE CATALYTIC CYCLE OF CYTOCHROME BD TERMINAL OXIDASE BASED ON KINETIC-ANALYSIS. Biochemistry 34:14861-14867.
355. Konishi K, Ouchi M, Kita K, Horikoshi I. 1986. PURIFICATION AND PROPERTIES OF A CYTOCHROME B560-D COMPLEX, A TERMINAL OXIDASE OF THE AEROBIC
278
RESPIRATORY-CHAIN OF PHOTOBACTERIUM-PHOSPHOREUM. Journal of Biochemistry 99:1227-1236.
356. Yang FD, Yu L, Yu CA, Lorence RM, Gennis RB. 1986. USE OF AN AZIDO-UBIQUINONE DERIVATIVE TO IDENTIFY SUBUNIT-I AS THE UBIQUINOL BINDING-SITE OF THE CYTOCHROME-D TERMINAL OXIDASE COMPLEX OF ESCHERICHIA-COLI. Journal of Biological Chemistry 261:4987-4990.
357. Smith A, Hill S, Anthony C. 1990. THE PURIFICATION, CHARACTERIZATION AND ROLE OF THE D-TYPE CYTOCHROME-OXIDASE OF KLEBSIELLA-PNEUMONIAE DURING NITROGEN-FIXATION. Journal of General Microbiology 136:171-180.
358. Sakamoto K, Miyoshi H, Takegami K, Mogi T, Anraku Y, Iwamura H. 1996. Probing substrate binding site of the Escherichia coli quinol oxidases using synthetic ubiquinol analogues. Journal of Biological Chemistry 271.
359. Sakamoto K, Miyoshi H, Ohshima M, Kuwabara K, Kano K, Akagi T, Mogi T, Iwamura H. 1998. Role of the isoprenyl tail of ubiquinone in reaction with respiratory enzymes: Studies with bovine heart mitochondrial complex I and Escherichia coli bo-type ubiquinol oxidase. Biochemistry 37:15106-15113.
360. Sakamoto J, Koga E, Mizuta T, Sato C, Noguchi S, Sone N. 1999. Gene structure and quinol oxidase activity of a cytochrome bd-type oxidase from Bacillus stearothermophilus. Biochimica Et Biophysica Acta-Bioenergetics 1411:147-158.
361. Leroux FR, Manteau B, Vors J-P, Pazenok S. 2008. Trifluoromethyl ethers - synthesis and properties of an unusual substituent. Beilstein Journal of Organic Chemistry 4.
362. Jeschke P, Baston E, Leroux FR. 2007. alpha-fluorinated ethers as "exotic" entity in medicinal chemistry. Mini-Reviews in Medicinal Chemistry 7.
363. Swiss R, Will Y. 2011. Assessment of mitochondrial toxicity in HepG2 cells cultured in high-glucose- or galactose-containing media. Current protocols in toxicology / editorial board, Mahin D. Maines (editor-in-chief) ... [et al.] Chapter 2.
364. Pankey GA, Sabath LD. 2004. Clinical relevance of bacteriostatic versus bactericidal mechanisms of action in the treatment of gram-positive bacterial infections. Clinical Infectious Diseases 38.
365. Dhillon J, Andries K, Phillips PPJ, Mitchison DA. 2010. Bactericidal activity of the diarylquinoline TMC207 against Mycobacterium tuberculosis outside and within cells. Tuberculosis 90.
366. de Steenwinkel JEM, de Knegt GJ, ten Kate MT, van Belkum A, Verbrugh HA, Kremer K, van Soolingen D, Bakker-Woudenberg I. 2010. Time-kill kinetics of anti-tuberculosis drugs, and emergence of resistance, in relation to metabolic activity of Mycobacterium tuberculosis. Journal of Antimicrobial Chemotherapy 65:2582-2589.
367. Donald PR, Diacon AH. 2008. The early bactericidal activity of anti-tuberculosis drugs: a literature review. Tuberculosis 88.
368. Jindani A, Aber VR, Edwards EA, Mitchison DA. 1980. THE EARLY BACTERICIDAL ACTIVITY OF DRUGS IN PATIENTS WITH PULMONARY TUBERCULOSIS. American Review of Respiratory Disease 121.
369. Jindani A, Dore CJ, Mitchison DA. 2003. Bactericidal and sterilizing activities of antituberculosis drugs during the first 14 days. American Journal of Respiratory and Critical Care Medicine 167:1348-1354.
370. Dmello R, Hill S, Poole RK. 1996. The cytochrome bd quinol oxidase in Escherichia coli has an extremely high oxygen affinity and two oxygen-binding haems: Implications for regulation of activity in vivo by oxygen inhibition. Microbiology-Uk 142:755-763.
371. Belevich I, Borisov VB, Konstantinov AA, Verkhovsky MI. 2005. Oxygenated complex of cytochrome bd from Escherichia coli: Stability and photolability. Febs Letters 579:4567-4570.

279
372. Dmello R, Hill S, Poole RK. 1994. DETERMINATION OF THE OXYGEN AFFINITIES OF TERMINAL OXIDASES IN AZOTOBACTER-VINELANDII USING THE DEOXYGENATION OF OXYLEGHEMOGLOBIN AND OXYMYOGLOBIN - CYTOCHROME BD IS A LOW-AFFINITY OXIDASE. Microbiology-Uk 140:1395-1402.
373. Portnoy VA, Herrgard MJ, Palsson BO. 2008. Aerobic Fermentation of D-Glucose by an Evolved Cytochrome Oxidase-Deficient Escherichia coli Strain. Applied and Environmental Microbiology 74:7561-7569.
374. Bajad S, Shulaev V. 2011. LC-MS-based metabolomics. In Metz TO (ed.), Metabolic Profiling Methods In Molecular Biology, vol. 708. Humana Press Inc., Totowa, NJ.
375. Goodacre R, Vaidyanathan S, Dunn WB, Harrigan GG, Kell DB. 2004. Metabolomics by numbers: acquiring and understanding global metabolite data. Trends in Biotechnology 22:245-252.
376. Wecke T, Mascher T. 2011. Antibiotic research in the age of omics: from expression profiles to interspecies communication. Journal of Antimicrobial Chemotherapy 66:2689-2704.
377. Villas-Boas SG, Mas S, Akesson M, Smedsgaard J, Nielsen J. 2005. Mass spectrometry in metabolome analysis. Mass Spectrometry Reviews 24:613-646.
378. Reaves ML, Rabinowitz JD. 2011. Metabolomics in systems microbiology. Current Opinion in Biotechnology 22:17-25.
379. Merlo ME, Jankevics A, Takano E, Breitling R. 2011. Exploring the metabolic state of microorganisms using metabolomics. Bioanalysis 3.
380. Rabinowitz JD. 2007. Cellular metabolomics of Escherchia coli. Expert Review of Proteomics 4:187-198.
381. Maharjan RP, Ferenci T. 2003. Global metabolite analysis: the influence of extraction methodology on metabolome profiles of Escherichia coli. Analytical Biochemistry 313:145-154.
382. Crutchfield CA, Lu WY, Melamud E, Rabinowitz JD. 2010. MASS SPECTROMETRY-BASED METABOLOMICS OF YEAST, p. 393-426, Methods in Enzymology, Vol 470: Guide to Yeast Genetics:, vol. 470.
383. Rabinowitz JD, Kimball E. 2007. Acidic acetonitrile for cellular metabolome extraction from Escherichia coli. Analytical Chemistry 79:6167-6173.
384. Bajad SU, Lu W, Kimball EH, Yuan J, Peterson C, Rabinowitz JD. 2006. Separation and quantitation of water soluble cellular metabolites by hydrophilic interaction chromatography-tandem mass spectrometry. Journal of Chromatography A 1125:76-88.
385. Kimball E, Rabinowitz JD. 2006. Identifying decomposition products in extracts of cellular metabolites. Analytical Biochemistry 358:273-280.
386. Wilson M, DeRisi J, Kristensen H-H, Imboden P, Rane S, Brown PO, Schoolnik GK. 1999. Exploring drug-induced alterations in gene expression in Mycobacterium tuberculosis by microarray hybridization. Proceedings of the National Academy of Sciences of the United States of America 96:12833-12838.
387. Biagini GA, Fisher N, Shone AE, Mubaraki MA, Srivastava A, Hill A, Antoine T, Warman AJ, Davies J, Pidathala C, Amewu RK, Leung SC, Sharma R, Gibbons P, Hong DW, Pacorel B, Lawrenson AS, Charoensutthivarakul S, Taylor L, Berger O, Mbekeani A, Stocks PA, Nixon GL, Chadwick J, Hemingway J, Delves MJ, Sinden RE, Zeeman A-M, Kocken CHM, Berry NG, O’Neill PM, Ward SA. 2012. Generation of quinolone antimalarials targeting the Plasmodium falciparum mitochondrial respiratory chain for the treatment and prophylaxis of malaria. Proceedings of the National Academy of Sciences 109:8298-8303.
388. Xia J, Mandal R, Sinelnikov IV, Broadhurst D, Wishart DS. 2012. MetaboAnalyst 2.0—a comprehensive server for metabolomic data analysis. Nucleic Acids Research.

280
389. Jolliffe IT. 2002. Principal Component Analysis. Springer, Secaucus, NJ, USA. 390. Betts JC, McLaren A, Lennon MG, Kelly FM, Lukey PT, Blakemore SJ, Duncan K.
2003. Signature gene expression profiles discriminate between isoniazid-, thiolactomycin-, and triclosan-treated Mycobacterium tuberculosis. Antimicrobial Agents and Chemotherapy 47:2903-2913.
391. Jia L, Coward L, Gorman GS, Noker PE, Tomaszewski JE. 2005. Pharmacoproteomic effects of isoniazid, ethambutol, and N-geranyl-N '-(2-adamantyl)ethane-1,2-diamine (SQ109) on Mycobacterium tuberculosis H37Rv. Journal of Pharmacology and Experimental Therapeutics 315:905-911.
392. Chakraborty S, Gruber T, Barry CE, III, Boshoff HI, Rhee KY. 2013. Para-Aminosalicylic Acid Acts as an Alternative Substrate of Folate Metabolism in Mycobacterium tuberculosis. Science 339:88-91.
393. Biazus G, Schneider CZ, Palma MS, Basso LA, Santos DS. 2009. Hypoxanthine-guanine phosphoribosyltransferase from Mycobacterium tuberculosis H37Rv: Cloning, expression, and biochemical characterization. Protein Expression and Purification 66:185-190.
394. Hughes MA, Silva JC, Geromanos SJ, Townsend CA. 2006. Quantitative proteomic analysis of drug-induced changes in mycobacteria. Journal of Proteome Research 5:54-63.
395. Wang R, Marcotte EM. 2008. The proteomic response of Mycobacterium smegmatis to anti-tuberculosis drugs suggests targeted pathways. Journal of Proteome Research 7:855-865.
396. Fu LM. 2006. Exploring drug action on Mycobacterium tuberculosis using affymetrix oligonucleotide genechips. Tuberculosis 86:134-143.
397. Argyrou A, Jin L, Siconilfi-Baez L, Angeletti RH, Blanchard JS. 2006. Proteome-wide profiling of isoniazid targets in mycobacterium tuberculosis. Biochemistry 45:13947-13953.
398. Awaness AM, Mitchison DA. 1973. CUMULATIVE EFFECTS OF PULSED EXPOSURES OF MYCOBACTERIUM-TUBERCULOSIS TO ISONIAZID. Tubercle 54:153-158.
399. Gangadharam PRJ, Schaefer WB, Harold FM. 1963. SELECTIVE INHIBITION OF NUCLEIC ACID SYNTHESIS IN MYCOBACTERIUM TUBERCULOSIS BY ISONIAZID. Nature 198:712-&.
400. Lowry OH, Rosebrough NJ, Farr AL, Randall RJ. 1951. PROTEIN MEASUREMENT WITH THE FOLIN PHENOL REAGENT. Journal of Biological Chemistry 193:265-275.
401. Evers S, Di Padova K, Meyer M, Langen H, Fountoulakis M, Keck W, Gray CP. 2001. Mechanism-related changes in the gene transcription and protein synthesis patterns of Haemophilus influenzae after treatment with transcriptional and translational inhibitors. Proteomics 1:522-544.
402. Qiu JF, Zhou DS, Han YP, Zhang L, Tong ZZ, Song YJ, Dai EH, Li B, Wang J, Guo ZB, Zhai JH, Du ZM, Wang XY, Yang RF. 2005. Global gene expression profile of Yersinia pestis induced by streptomycin. Fems Microbiology Letters 243:489-496.
403. Zamboni N, Sauer U. 2003. Knockout of the high-coupling cytochrome aa(3) oxidase reduces TCA cycle fluxes in Bacillus subtilis. Fems Microbiology Letters 226:121-126.
404. Bhat AG, Vashisht R, Chandra N. 2010. Modeling metabolic adjustment in Mycobacterium tuberculosis upon treatment with isoniazid. Systems and synthetic biology 4:299-309.
405. Urban A, Eckermann S, Fast B, Metzger S, Gehling M, Ziegelbauer K, Ruebsamen-Waigmann H, Freiberg C. 2007. Novel whole-cell antibiotic biosensors for compound discovery. Applied and Environmental Microbiology 73:6436-6443.
406. Zumla A, Raviglione M, Hafner R, von Reyn CF. 2013. CURRENT CONCEPTS Tuberculosis. New England Journal of Medicine 368:745-755.

281
407. Schagger H, Pfeiffer K. 2000. Supercomplexes in the respiratory chains of yeast and mammalian mitochondria. Embo Journal 19:1777-1783.
408. Arnold I, Pfeiffer K, Neupert W, Stuart RA, Schagger H. 1998. Yeast mitochondrial F1F0-ATP synthase exists as a dimer: identification of three dimer-specific subunits. Embo Journal 17:7170-7178.
409. Schagger H. 2001. Blue-Native gel to isolate protein cpmplexes from mitochondria, p. 231-244. In Pon L, Schon, EA., (ed.), Mitochondria. Academic press, California, USA.
410. Bennett BD, Kimball EH, Gao M, Osterhout R, Van Dien SJ, Rabinowitz JD. 2009. Absolute metabolite concentrations and implied enzyme active site occupancy in Escherichia coli. Nature Chemical Biology 5:593-599.
411. Lu W, Clasquin MF, Melamud E, Amador-Noguez D, Caudy AA, Rabinowitz JD. 2010. Metabolomic Analysis via Reversed-Phase Ion-Pairing Liquid Chromatography Coupled to a Stand Alone Orbitrap Mass Spectrometer. Analytical Chemistry 82:3212-3221.
412. Azizan KA, Baharum SN, Ressom HW, Noor NM. 2012. GC-MS Analysis and PLS-DA Validation of the Trimethyl Silyl-Derivatization Techniques. American Journal of Applied Sciences 9:1124-1136.
413. Kamphorst JJ, Fan J, Lu W, White E, Rabinowitz JD. 2011. Liquid Chromatography-High Resolution Mass Spectrometry Analysis of Fatty Acid Metabolism. Analytical Chemistry 83:9114-9122.
414. Brauer MJ, Yuan J, Bennett BD, Lu W, Kimball E, Botstein D, Rabinowitz JD. 2006. Conservation of the metabolomic response to starvation across two divergent microbes. Proceedings of the National Academy of Sciences of the United States of America 103:19302-19307.
415. Watanabe S, Zimmermann M, Goodwin MB, Sauer U, Barry CE, III, Boshoff HI. 2011. Fumarate Reductase Activity Maintains an Energized Membrane in Anaerobic Mycobacterium tuberculosis. Plos Pathogens 7.
416. Borisov VB, Forte E, Sarti P, Brunori M, Konstantinov AA, Giuffre A. 2007. Redox control of fast ligand dissociation from Escherichia coli cytochrome bd. Biochemical and Biophysical Research Communications 355:97-102.
417. Giuffrè A, Borisov VB, Mastronicola D, Sarti P, Forte E. 2012. Cytochrome bd oxidase and nitric oxide: From reaction mechanisms to bacterial physiology. FEBS Letters 586:622-629.
Copyright © 2022 FDOKUMEN


![33rd year - Deeper Life Bible Church [Liverpool]](https://static.fdokumen.com/doc/165x107/6336f6eed63e7c790105970d/33rd-year-deeper-life-bible-church-liverpool.jpg)