New sonographic measures of peripheral nerves: a tool for the diagnosis of peripheral nerve...
6
257 online | memorias.ioc.fiocruz.br Mem Inst Oswaldo Cruz, Rio de Janeiro, Vol. 108(3): 257-262, May 2013 Leprosy is a chronic granulomatous disease caused by Mycobacterium leprae that predominantly affects the skin and peripheral nerves (Britton & Lockwood 2004, Lasry-Levy et al. 2011). Leprosy is the leading infectious cause of disability (Rodrigues & Lockwood 2011). Al- though the prevalence of leprosy has declined substan- tially over the past 50 years (Merle et al. 2010), transmis- sion of the disease continues and it remains a relevant public health problem worldwide (WHO 2008). Many new leprosy cases are detected worldwide each year. A total of 228,474 cases of leprosy were reported in 2010, 95% of which were found in 17 countries that reported more than 1,000 new cases each that year, in- cluding India, Brazil and Indonesia (WHO 2011). In con- trast to the decreasing overall leprosy prevalence rates in Brazil, the new case detection rates remain high (34,984 new cases detected in 2010) (Rodrigues & Lockwood 2011, WHO 2011). These data indicate the continuing transmission of leprosy. Although making a clinical diagnosis of leprosy is fre- quently straightforward, there is not a good point-of-care test to confirm the diagnosis. A delay in diagnosis may re- sult in important negative outcomes, such as an increased risk of nerve damage (Rodrigues & Lockwood 2011). Var- ious factors contribute to a delay in diagnosis, but stigma is an important factor in many cultures (Senior 2009). The mechanisms involved in nerve damage are not clearly understood. There is no specific test to measure the extent of nerve damage or to show evidence of recov- ery during the treatment of leprosy with multiple drugs (Rodrigues & Lockwood 2011). Although nerve damage in leprosy can be consis- tently demonstrated by electromyography, which may reveal a pattern that is highly suggestive of leprosy, a definite diagnosis is dependent on nerve biopsy find- ings. Recently, sonography has been described as a use- ful tool in the diagnosis of leprosy neuropathy. A highly correlated finding is a fusiform thickening of the periph- eral nerves that are generally compromised in leprosy patients (LPs), including the ulnar, median (M) and pos- terior tibial nerves, which can be measured by the cor- responding cross-sectional areas (CSAs) of the affected regions (Martinoli et al. 2000, Elias Jr et al. 2009). In this study, we evaluated the distribution pattern of peripheral nerve damage in LPs by sonography, examin- ing the CSAs of the ulnar [cubital tunnel (T) and pre- tunnel (PT)], M and common fibular (CF) nerves and comparing them with those of healthy volunteers (HVs). Financial support: FINEP (01.05.0948.0), FAEPA-CNDSHCFMRP-USP + Corresponding author: [email protected] Received 22 August 2012 Accepted 6 February 2013 New sonographic measures of peripheral nerves: a tool for the diagnosis of peripheral nerve involvement in leprosy Marco Andrey Cipriani Frade/ + , Marcello Henrique Nogueira-Barbosa, Helena Barbosa Lugão, Renata Bazan Furini, Wilson Marques Júnior, Norma Tiraboschi Foss Divisão de Dermatologia, Divisão de Radiologia, Departamento de Neurologia, Faculdade de Medicina de Ribeirão Preto, Universidade de São Paulo, Ribeirão Preto, SP, Brasil To evaluate ultrasonographic (US) cross-sectional areas (CSAs) of peripheral nerves, indexes of the differences between CSAs at the same point (∆CSAs) and between tunnel (T) and pre-tunnel (PT) ulnar CSAs (∆TPTs) in leprosy patients (LPs) and healthy volunteers (HVs). Seventy-seven LPs and 49 HVs underwent bilateral US at PT and T ulnar points, as well as along the median (M) and common fibular (CF) nerves, to calculate the CSAs, ∆CSAs and ∆TPTs. The CSA values in HVs were lower than those in LPs (p < 0.0001) at the PT (5.67/9.78 mm²) and T (6.50/10.94 mm²) points, as well as at the M (5.85/8.48 mm²) and CF (8.17/14.14 mm²) nerves. The optimum CSA- receiver operat- ing characteristic (ROC) points and sensitivities/specificities were, respectively, 6.85 mm² and 68-85% for the PT point, 7.35 mm² and 71-78% for the T point, 6.75 mm² and 62-75% for the M nerve and 9.55 mm² and 81-72% for the CF nerve. The ∆CSAs of the LPs were greater than those of the HVs at the PT point (4.02/0.85; p = 0.007), T point (3.71/0.98; p = 0.0005) and CF nerve (2.93/1.14; p = 0.015), with no difference found for the M nerve (1.41/0.95; p = 0.17). The optimum ∆CSA-ROC points, sensitivities, specificities and p-values were, respectively, 1.35, 49%, 80% and 0.003 at the PT point, 1.55, 55-85% and 0.0006 at the T point, 0.70, 58-50% and 0.73 for the M nerve and 1.25, 54-67% and 0.022 for the CF nerve. The ∆TPT in the LPs was greater than that in the HVs (4.43/1.44; p <0.0001). The optimum ∆TPT-ROC point was 2.65 (90% sensitivity/41% specificity, p < 0.0001). The ROC analysis of CSAs showed the highest specificity and sensitivity at the PT point and CF nerve, respectively. The PT and T ∆CSAs had high spec- ificities (> 80%) and ∆TPT had the highest specificity (> 90%). New sonographic peripheral nerve measurements (∆CSAs and ∆TPT) provide an important methodological improvement in the detection of leprosy neuropathy. Key words: leprosy - peripheral nerves - neuropathy - ultrasonography
Transcript of New sonographic measures of peripheral nerves: a tool for the diagnosis of peripheral nerve...

257
online | memorias.ioc.fiocruz.br
Mem Inst Oswaldo Cruz, Rio de Janeiro, Vol. 108(3): 257-262, May 2013
Leprosy is a chronic granulomatous disease caused by Mycobacterium leprae that predominantly affects the skin and peripheral nerves (Britton & Lockwood 2004, Lasry-Levy et al. 2011). Leprosy is the leading infectious cause of disability (Rodrigues & Lockwood 2011). Al-though the prevalence of leprosy has declined substan-tially over the past 50 years (Merle et al. 2010), transmis-sion of the disease continues and it remains a relevant public health problem worldwide (WHO 2008).
Many new leprosy cases are detected worldwide each year. A total of 228,474 cases of leprosy were reported in 2010, 95% of which were found in 17 countries that reported more than 1,000 new cases each that year, in-cluding India, Brazil and Indonesia (WHO 2011). In con-trast to the decreasing overall leprosy prevalence rates in Brazil, the new case detection rates remain high (34,984 new cases detected in 2010) (Rodrigues & Lockwood 2011, WHO 2011). These data indicate the continuing transmission of leprosy.
Although making a clinical diagnosis of leprosy is fre-quently straightforward, there is not a good point-of-care test to confirm the diagnosis. A delay in diagnosis may re-sult in important negative outcomes, such as an increased risk of nerve damage (Rodrigues & Lockwood 2011). Var-ious factors contribute to a delay in diagnosis, but stigma is an important factor in many cultures (Senior 2009).
The mechanisms involved in nerve damage are not clearly understood. There is no specific test to measure the extent of nerve damage or to show evidence of recov-ery during the treatment of leprosy with multiple drugs (Rodrigues & Lockwood 2011).
Although nerve damage in leprosy can be consis-tently demonstrated by electromyography, which may reveal a pattern that is highly suggestive of leprosy, a definite diagnosis is dependent on nerve biopsy find-ings. Recently, sonography has been described as a use-ful tool in the diagnosis of leprosy neuropathy. A highly correlated finding is a fusiform thickening of the periph-eral nerves that are generally compromised in leprosy patients (LPs), including the ulnar, median (M) and pos-terior tibial nerves, which can be measured by the cor-responding cross-sectional areas (CSAs) of the affected regions (Martinoli et al. 2000, Elias Jr et al. 2009).
In this study, we evaluated the distribution pattern of peripheral nerve damage in LPs by sonography, examin-ing the CSAs of the ulnar [cubital tunnel (T) and pre-tunnel (PT)], M and common fibular (CF) nerves and comparing them with those of healthy volunteers (HVs).
Financial support: FINEP (01.05.0948.0), FAEPA-CNDSHCFMRP-USP+ Corresponding author: [email protected] 22 August 2012Accepted 6 February 2013
New sonographic measures of peripheral nerves: a tool for the diagnosis of peripheral nerve involvement in leprosy
Marco Andrey Cipriani Frade/+, Marcello Henrique Nogueira-Barbosa, Helena Barbosa Lugão, Renata Bazan Furini, Wilson Marques Júnior, Norma Tiraboschi Foss
Divisão de Dermatologia, Divisão de Radiologia, Departamento de Neurologia, Faculdade de Medicina de Ribeirão Preto, Universidade de São Paulo, Ribeirão Preto, SP, Brasil
To evaluate ultrasonographic (US) cross-sectional areas (CSAs) of peripheral nerves, indexes of the differences between CSAs at the same point (∆CSAs) and between tunnel (T) and pre-tunnel (PT) ulnar CSAs (∆TPTs) in leprosy patients (LPs) and healthy volunteers (HVs). Seventy-seven LPs and 49 HVs underwent bilateral US at PT and T ulnar points, as well as along the median (M) and common fibular (CF) nerves, to calculate the CSAs, ∆CSAs and ∆TPTs. The CSA values in HVs were lower than those in LPs (p < 0.0001) at the PT (5.67/9.78 mm²) and T (6.50/10.94 mm²) points, as well as at the M (5.85/8.48 mm²) and CF (8.17/14.14 mm²) nerves. The optimum CSA- receiver operat-ing characteristic (ROC) points and sensitivities/specificities were, respectively, 6.85 mm² and 68-85% for the PT point, 7.35 mm² and 71-78% for the T point, 6.75 mm² and 62-75% for the M nerve and 9.55 mm² and 81-72% for the CF nerve. The ∆CSAs of the LPs were greater than those of the HVs at the PT point (4.02/0.85; p = 0.007), T point (3.71/0.98; p = 0.0005) and CF nerve (2.93/1.14; p = 0.015), with no difference found for the M nerve (1.41/0.95; p = 0.17). The optimum ∆CSA-ROC points, sensitivities, specificities and p-values were, respectively, 1.35, 49%, 80% and 0.003 at the PT point, 1.55, 55-85% and 0.0006 at the T point, 0.70, 58-50% and 0.73 for the M nerve and 1.25, 54-67% and 0.022 for the CF nerve. The ∆TPT in the LPs was greater than that in the HVs (4.43/1.44; p <0.0001). The optimum ∆TPT-ROC point was 2.65 (90% sensitivity/41% specificity, p < 0.0001). The ROC analysis of CSAs showed the highest specificity and sensitivity at the PT point and CF nerve, respectively. The PT and T ∆CSAs had high spec-ificities (> 80%) and ∆TPT had the highest specificity (> 90%). New sonographic peripheral nerve measurements (∆CSAs and ∆TPT) provide an important methodological improvement in the detection of leprosy neuropathy.
Key words: leprosy - peripheral nerves - neuropathy - ultrasonography

New sonographic nerve tools in leprosy • Marco Andrey Cipriani Frade et al.258
PATIENTS, MATERIALS AND METHODS
Patients - A total of 126 patients and HVs were included and assigned to one of two groups: LPs (n = 77) and HVs (n = 49). All LPs were selected from the Leprosy Outpatient Clinic of the Sanitary Dermato-logical National Reference Centre, Clinical Hospital, Medical School of Ribeirão Preto, University of São Paulo (HCFMRP-USP). The diagnosis of leprosy was established based on clinical signs and symptoms, skin smears and skin biopsy. The patients were classified as multibacillary or paucibacillary according to the Ridley and Jopling (1966) criteria and the operational classifi-cation (WHO 1998). Sonography was performed before the start of multidrug therapy.
The control group was comprised of randomly chosen HVs. They were selected after ruling out diabetes, hy-pothyroidism, human immunodeficiency virus infection, trauma-related peripheral nerve disease and alcoholism.
Sonography and image analysis - All sonographic examinations were performed by the same specialised radiologist (MHN-B) with a 12-MHz linear transducer, model HDI-11 (Philips Medical Systems, Bothell, Wash-ington, USA). All individuals were examined in a seated position with a 45º flexed elbow as described by Gelber-man et al. (1998) and Marques et al. (2003). The ulnar nerves were scanned from the axilla to the hand along the transverse and longitudinal axes. The greatest CSAs of the ulnar nerve were measured above the medial epi-condyle between the triceps brachii and biceps brachii muscles (PT area) and at the cubital T (T area). The M nerve was analysed in the forearm and wrist and the CSAs were measured approximately 5 cm proximal to the flexor retinaculum. The CF nerve was analysed at the fibula head with the patient seated and the leg flexed at 90º. The sonographic evaluation was performed dur-ing a single examination period and included the bilat-eral nerves of the upper and lower extremities.
The CSA of the nerve was obtained by freehand de-limitation at the inner borders of the echogenic rim of the nerve. The measurements were performed using the elec-tronic cursor at the time of examination and the CSAs were assessed at the level of maximum nerve enlargement.
Nerve assessment - A total of 924 nerve points were examined, including 234 PT and 240 T points along the ulnar nerve, 224 points along the M nerve and 226 points along the CF nerve. The measurements of the right and left standard CSAs of the previously selected PT and T points of the ulnar nerve, the distal third of the forearms for the M nerve and the lateral fibular heads for the CF nerve were performed in the same manner for each vol-unteer and each LP.
The CSA measurements were used to calculate the fol-lowing indexes: (i) differential CSA index (∆CSAs), cal-culated by the difference between the largest and smallest CSA measurements for each nerve point independent of the side and (ii) differential T-PT index (∆TPT) of the ul-nar nerves, calculated on the same side as the difference between the largest and smallest CSA measurements of PT and T points along the ulnar nerves.
Statistical analysis - The GraphPad Prism software, version 5.01, San Diego, CA, USA, was used to perform paired t tests to analyse the differences in nerve measure-ments between sides and unpaired t tests were performed to compare the results between groups. The sensitivities and specificities of each parameter were calculated and re-ceiver operating characteristic (ROC) curve analyses were conducted. The best point of the ROC curve was consid-ered as the greatest value obtained of the product between sensitivity and specificity (Hanley & McNeil 1982).
Ethics - The study protocol was approved by the Eth-ical Committee of the HCFMRP-USP (3114/2010) and all subjects provided written informed consent. The pro-cedures followed were in accordance with the Helsinki Declaration of 1975, as revised in 1983.
RESULTS
All 126 subjects underwent sonographic evaluation. The clinical data and leprosy classifications, according to the Ridley and Jopling (1966) criteria and the opera-tional classification (WHO 1998), and slit skin smear results are shown in Table I.
The number of nerves, means and standard devia-tions of the CSAs, ∆CSAs and ∆TPTs in the HVs and LPs, as well as the respective p-values, are shown in Table II. The means of the ulnar, M and CF CSA mea-surements in the HVs were lower than those in the LPs (p < 0.0001).
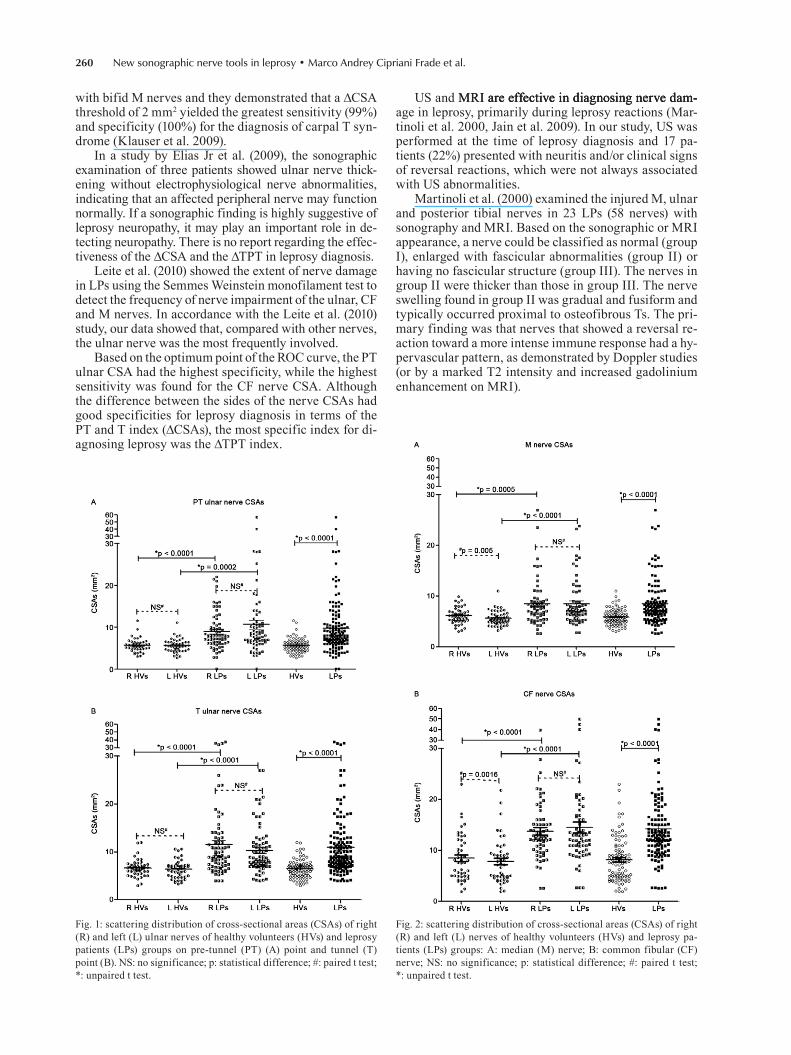
The distributions of the measurements of each stud-ied nerve are shown in Figs 1, 2. Among the HVs, the CSAs of the right M and CF nerves were greater than those of the left-sided nerves (p < 0.005 and p < 0.0016, respectively) (Fig. 2A, B). No other significant differ-ence was found between the two sides.
TABLE IClinical data of the leprosy patients (LPs)
and healthy volunteers (HVs)
Variables
LPs n = 77 n (%)
HVs n = 49 n (%)
Gender Male Female
48 (62.3)27 (37.7)
19 (38.8)29 (61.2)
Age Mean (range) 46.1 (17-81) 33.1 (12-67)Clinical classification Indeterminate Tuberculoid Borderline-tuberculoid Borderline-borderline Borderline-lepromatous Lepromatous
3 (3.9)8 (10.4)31 (40.3)19 (24.7)9 (11.7)
7 (9)
------
Operational classification Paucibacillary Multibacillary
11 (14.3)66 (85.7)
--

259Mem Inst Oswaldo Cruz, Rio de Janeiro, Vol. 108(3), May 2013
The LPs had greater ∆CSAs than the HVs at the PT and T points of the ulnar nerve and for the CF nerve (Fig. 3A, Table II). No significant difference was detected for the M nerve.
The mean ± standard deviation of the T CSAs (6.7 ± 2.2 mm2) was greater than that of the PT CSAs in the HVs (5.88 ± 1.8 mm2; p < 0.0001) and no significant dif-ference was found in LPs between the T-CSAs (10.94 ± 6.35 mm2) and PT-CSAs (9.78 ± 6.99 mm2). The ∆TPT values were greater in the LPs than in the HVs. There was no difference in the ∆TPT between the right and left nerves in both groups, as shown in Fig. 3B.
The optimum ROC points of the CSAs, ∆CSAs and ∆TPTs in the HVs and LPs, the respective sensitivities and specificities and the area under the ROC curves (ar-eas, standard errors and p-values) are shown in Table III.
The greatest CSA sensitivity was found for the CF nerve (81%) and the greatest specificity was found for the PT area of the ulnar nerve (85%), with areas under the ROC curve of approximately 0.80 (p < 0.0001). Re-garding the optimum points of the ∆CSAs, the ulnar nerve measurements had the best specificity for the PT (80%) and T (85%) points, with areas under the ROC curve greater than 0.66 and p-values lower than 0.003. The ∆TPT had the lowest sensitivity and the highest specificity (90%) among all the variables.
DISCUSSION
Leprosy neuropathy is responsible for many of the feared consequences of an M. leprae infection, which may progress to severe impairment followed by disabilities and deformities if diagnosis and treatment are delayed. Con-sidering the polymorphic aspect of leprosy neuropathy, diagnosis may be difficult even in countries with high in-cidence rates. Clinical findings, electrophysiological tests and nerve sonographic characteristics of leprosy neuropa-
thy have been described previously (Grimaud et al. 2000, Martinoli et al. 2000, Marques et al. 2003, Arruda et al. 2004, Elias Jr et al. 2009, Bathala et al. 2012).
Ultrasonography (US) is non-invasive, useful for studying changes at nerve sites and more cost-effective than other imaging procedures, such as magnetic reso-nance imaging (MRI). Current technological develop-ments leading to improved image quality, reduced US device sizes and reductions in price will make it possible for US to become a tool that can be used in countries in which leprosy is endemic (Jain et al. 2009).
The higher mean CSA values in the T region in LPs compared with HVs (Fig. 3B) suggest that sonographic evaluation of the T region can be a useful tool for detect-ing neural involvement in leprosy. According to Elias Jr et al. (2009), the best sonographic discriminator for the ulnar nerve in LPs is the CSA of the ulnar nerve measured in the elbow region and not only at the cubital T. Consistent with this suggestion, the T-CSAs in this study had sig-nificantly higher values than the PT-CSAs (p < 0.0001) in HVs, while these measurements were similar in LPs.
Considering the fact that a given nerve on one side of the body is thicker than the same nerve on the op-posite side of the body due to the dominance of one side, we proposed to assess the ∆CSA. The ∆CSA val-ues were significantly lower in HVs compared with LPs. This study sought to evaluate peripheral nerves in the arms and lower limbs to minimise the influence of the dominance of one side or occupational activities in nerve thickness, which is predominantly detectable in the up-per extremities. The results confirmed higher ∆CSAs in LPs even in the lower limbs (CF nerves).
Concerning the use of such parameters in other diseases, Klauser et al. (2011) described the use of the ∆CSA parameter as improving the diagnostic accuracy of US for the presence of carpal T syndrome in patients
TABLE IINumber of nerves, means and standard deviation (SD) of cross-sectional areas (CSAs), differential CSA index (∆CSAs)
and differential tunnel (T)-pre-tunnel (PT) index (∆TPT) in healthy volunteers (HVs) and leprosy patients (LPs) with respective p values
Nerves Variable
Groups
p
HVs LPs
n Mean ± SD n Mean ± SD
Ulnar (PT) CSAs (mm2)
92 5.9 ± 1.8 142 9.8 ± 7.0 < 0.0001Ulnar (T) 92 6.7 ± 2.2 148 10.9 ± 6.4 < 0.0001Median 96 5.9 ± 1.5 128 8.5 ± 4.4 < 0.0001Common fibular 96 8.2 ± 4.4 130 14.1 ± 7.3 <0.0001
Ulnar (PT) ∆CSAs(mm2)
46 0.9 ± 0.7 71 4.0 ± 7.8 0.0067Ulnar (T) 46 1.0 ± 0.7 74 3.7 ± 5.1 0.0005Median 48 1.0 ± 0.8 64 1.4 ± 2.2 0.17Common fibular 48 1.1 ± 1.1 65 2.9 ± 5.0 0.0154
Ulnar (T and PT) ∆TPT(mm2)
98 1.4 ± 1.6 146 4.4 ± 6.7 < 0.0001
New sonographic nerve tools in leprosy • Marco Andrey Cipriani Frade et al.260
with bifid M nerves and they demonstrated that a ∆CSA threshold of 2 mm2 yielded the greatest sensitivity (99%) and specificity (100%) for the diagnosis of carpal T syn-drome (Klauser et al. 2009).
In a study by Elias Jr et al. (2009), the sonographic examination of three patients showed ulnar nerve thick-ening without electrophysiological nerve abnormalities, indicating that an affected peripheral nerve may function normally. If a sonographic finding is highly suggestive of leprosy neuropathy, it may play an important role in de-tecting neuropathy. There is no report regarding the effec-tiveness of the ∆CSA and the ∆TPT in leprosy diagnosis.
Leite et al. (2010) showed the extent of nerve damage in LPs using the Semmes Weinstein monofilament test to detect the frequency of nerve impairment of the ulnar, CF and M nerves. In accordance with the Leite et al. (2010) study, our data showed that, compared with other nerves, the ulnar nerve was the most frequently involved.
Based on the optimum point of the ROC curve, the PT ulnar CSA had the highest specificity, while the highest sensitivity was found for the CF nerve CSA. Although the difference between the sides of the nerve CSAs had good specificities for leprosy diagnosis in terms of the PT and T index (∆CSAs), the most specific index for di-agnosing leprosy was the ∆TPT index.
US and MRI are effective in diagnosing nerve dam-MRI are effective in diagnosing nerve dam- are effective in diagnosing nerve dam-age in leprosy, primarily during leprosy reactions (Mar-tinoli et al. 2000, Jain et al. 2009). In our study, US was performed at the time of leprosy diagnosis and 17 pa-tients (22%) presented with neuritis and/or clinical signs of reversal reactions, which were not always associated with US abnormalities.
Martinoli et al. (2000) examined the injured M, ulnar and posterior tibial nerves in 23 LPs (58 nerves) with sonography and MRI. Based on the sonographic or MRI appearance, a nerve could be classified as normal (group I), enlarged with fascicular abnormalities (group II) or having no fascicular structure (group III). The nerves in group II were thicker than those in group III. The nerve swelling found in group II was gradual and fusiform and typically occurred proximal to osteofibrous Ts. The pri-mary finding was that nerves that showed a reversal re-action toward a more intense immune response had a hy-pervascular pattern, as demonstrated by Doppler studies (or by a marked T2 intensity and increased gadolinium enhancement on MRI).
Fig. 2: scattering distribution of cross-sectional areas (CSAs) of right (R) and left (L) nerves of healthy volunteers (HVs) and leprosy pa-tients (LPs) groups: A: median (M) nerve; B: common fibular (CF) nerve; NS: no significance; p: statistical difference; #: paired t test; *: unpaired t test.
Fig. 1: scattering distribution of cross-sectional areas (CSAs) of right (R) and left (L) ulnar nerves of healthy volunteers (HVs) and leprosy patients (LPs) groups on pre-tunnel (PT) (A) point and tunnel (T) point (B). NS: no significance; p: statistical difference; #: paired t test; *: unpaired t test.

261Mem Inst Oswaldo Cruz, Rio de Janeiro, Vol. 108(3), May 2013
Jain et al. (2009), using high-resolution sonography, clearly showed that the kappa value between clinical pal-pation and the assessment of nerve size by sonography is low. They concluded that clinical examination of enlarged nerves is subjective and inaccurate, whereas sonography provides an objective measure of the nerve dimensions and reveals structural changes over a longer length of the
nerve. Our patients and HVs were systematically exam-ined using a linear array US transducer, with the predom-inant aim of calculating the CSAs of the nerves.
The results showed that the use of sonography, a non-invasive method, to calculate the CSAs of peripheral nerves is an important tool with which to detect large ar-eas of nerve damage in LPs. The ROC analysis of CSAs showed the best specificity and sensitivity at the PT point of the ulnar and CF nerves, respectively. Among the new measurements of peripheral nerves, the ∆CSAs of the PT and T points of the ulnar nerve showed high specificity (> 80%) and the ∆TPTs showed the highest specificity (> 90%).
Sonographic evaluation yields sonographic meas-urements of peripheral nerves (the CSAs of the PT and T ulnar points as well as of the M and CF nerves) and can be used to obtain indexes of the differences between ∆CSAs and between ∆TPT. These new sonographic measures (∆CSA and ∆TPT) provide an important meth-odological improvement in diagnosing neuropathy and may be useful tools for the detection of the peripheral nerve enlargement in LPs.
REFERENCES
Arruda AP, Marques Jr W, Foss NT, Garbino JA, Virmond M, Bar-reira AA 2004. Near nerve potential of sural nerve in leprosy. Arq Neuropsiquiatr 62: 571-574.
Bathala L, Kumar K, Pathapati R, Jain S, Visser LH 2012. Ulnar neu-ropathy in Hansen disease: clinical, high-resolution ultrasound and electrophysiologic correlations. J Clin Neurophysiol 29: 190-193.
Britton WJ, Lockwood DN 2004. Leprosy. Lancet 363: 1209-1219.
Elias Jr J, Nogueira-Barbosa MH, Feltrin LT, Furini RB, Foss NT, Marques Jr W, dos Santos AC 2009. Role of ulnar nerve sonog-raphy in leprosy neuropathy with electrophysiologic correlation. J Ultrasound Med 28: 1201-1209.
TABLE IIIReceiver operating characteristic (ROC) optimum point of cross-sectional areas (CSAs), differential CSA index (∆CSAs)
and differential tunnel (T)-pre-tunnel (PT) index (∆TPT) in healthy volunteers (HVs) and leprosy patients (LPs), respective sensitivity and specificity and analysis of area under the ROC curve
Nerves VariableHVs (n)
LPs (n)
ROC optimum point(mm2)
Sensitivity(%)
Specificity(%)
Area under the ROC curve
Area SE p
Ulnar (PT) CSAs 92 142 6.85 68 85 0.79 0.03 < 0.0001Ulnar (T) 92 148 7.35 71 78 0.80 0.03 < 0.0001Median 96 128 6.75 62 75 0.73 0.03 < 0.0001Common fibular 96 130 9.55 81 72 0.80 0.03 <0.0001
Ulnar (PT) ∆CSAs 46 71 1.35 49 80 0.66 0.05 0.003Ulnar (T) 46 74 1.55 55 85 0.69 0.05 0.0006Median 48 64 0.70 58 50 0.52 0.06 0.73Common fibular 48 65 1.25 54 67 0.63 0.05 0.022
Ulnar (T and PT) ∆TPT 98 146 2.65 41 90 0.66 0.04 < 0.0001
SE: standard error.
Fig. 3: scattering distribution of cross-sectional areas index (∆CSAs) of neural points (A) and tunnel (T)-pre-tunnel (PT) index (∆TPT) (B) in healthy volunteers (HVs) and leprosy patients (LPs) groups. CF: common fibular nerve; L: left nerve; M: median nerve; p: statistical difference; R: right nerve; #: paired t test; *: unpaired t test.

New sonographic nerve tools in leprosy • Marco Andrey Cipriani Frade et al.262
Gelberman RH, Yamaguchi K, Hollstien SB, Winn SS, Heidenreich Jr FP, Bindra RR, Hsieh P, Silva MJ 1998. Changes in interstitial pressure and cross-sectional area of the cubital tunnel and of the ulnar nerve with flexion of the elbow. An experimental study in human cadavera. J Bone Joint Surg Am 80: 492-501.
Grimaud J, Verchot B, Blum L, Chapuis F, Millan J 2000. Clinical screening for ulnar nerve damage in leprosy patients. J Neurol 247: 966-967.
Hanley JA, McNeil BJ 1982. The meaning and use of the area under a re-ceiver operating characteristic (ROC) curve. Radiology 143: 29-36.
Jain S, Visser LH, Praveen TL, Rao PN, Surekha T, Ellanti R, Abhishek TL, Nath I 2009. High-resolution sonography: a new technique to detect nerve damage in leprosy. PLoS Negl Trop Dis 3: e498.
Klauser AS, Halpern EJ, de Zordo T, Feuchtner GM, Arora R, Gruber J, Martinoli C, Löscher WN 2009. Carpal tunnel syndrome as-sessment with US: value of additional cross-sectional area mea-surements of the median nerve in patients versus healthy volun-teers. Radiology 250: 171-177.
Klauser AS, Halpern EJ, Faschingbauer R, Guerra F, Martinoli C, Gabl MF, Arora R, Bauer T, Sojer M, Löscher WN, Jaschke WR 2011. Bifid median nerve in carpal tunnel syndrome: assessment with US cross-sectional area measurement. Radiology 259: 808-815.
Lasry-Levy E, Hietaharju A, Pai V, Ganapati R, Rice AS, Haanpää M, Lockwood DN 2011. Neuropathic pain and psychological morbidity in patients with treated leprosy: a cross-sectional prev-alence study in Mumbai. PLoS Negl Trop Dis 5: e981.
Leite SN, Barros ARSB, Fonseca MCR, Andrade TAMA, Foss NT, Frade MAC 2010. Effectiveness of semmes-weinstein monofila-
ments in leprosy neuropathy in physiotherapy tertiary service. Hansen Int 35: 9-16.
Marques Jr W, Foss NT, Arruda AP, Barreira AA 2003. Near-nerve potential in lepromatous leprosy. Muscle Nerve 28: 460-463.
Martinoli C, Derchi LE, Bertolotto M, Gandolfo N, Bianchi S, Fiallo P, Nunzi E 2000. US and MR imaging of peripheral nerves in leprosy. Skeletal Radiol 29: 142-150.
Merle CS, Cunha SS, Rodrigues LC 2010. BCG vaccination and lep-rosy protection: review of current evidence and status of BCG in leprosy control. Expert Rev Vaccines 9: 209-222.
Ridley DS, Jopling WH 1966. Classification of leprosy according to immunity. A five-group system. Int J Lepr Other Mycobact Dis 34: 255-273.
Rodrigues LC, Lockwood DNJ 2011. Leprosy now: epidemiology, prog-ress, challenges and research gap. Lancet Infect Dis 11: 464-470.
Senior K 2009. Stigma, chemoprophylaxis and leprosy control. Lan-cet Infect Dis 9: 10.
WHO - World Health Organization 1998. Model prescribing informa-tion. Drugs used in leprosy. Available from: archives.who.int/tbs/rational/h2988e.pdf.
WHO - World Health Organization 2008. Enhanced global strategy for further reducing the disease burden due to leprosy (plan pe-riod: 2011-2015). Available from: searo.who.int/LinkFiles/GLP_SEA-GLP-2009_3.pdf.
WHO - World Health Organization 2011. Relevé épidémiologique hebdomadaire. Wkly Epidemiol Rec 86: 389-400.