Variations of Thoracic Splanchnic Nerves and its Clinical Implications

Electrical stimulation of peripheral nerves induces opticalresponses via skeletal muscle kinematics
M. Kelley Erba, Debbie K. Chenb, Angelo Sassarolib, Sergio Fantinib, and Peter R.Bergethona
aBoston University School of Medicine, Boston MA, USA 02118bTufts University, Medford MA, USA 02155
AbstractWe have previously reported an optical response in human subjects occurring at 100 ms followingelectrical stimulation of peripheral nerves. In the present study, an animal model has been createdto directly investigate the myogenic components of the signal. In addition, experiments have beenperformed in human subjects to investigate the signal’s neuroanatomical specificity, sensitivity tomuscle motion, and spatial and spectral features. The results of this work suggest that the observedoptical signal derives from stimulus-induced motion associated with muscle contraction and likelycontains myological information of clinical value.
KeywordsNear-infrared spectroscopy; peripheral nervous system; skeletal muscle; nerve stimulation; musclecontraction
1. INTRODUCTIONWe have previously reported the existence of an evoked optical response to electricalstimulation of the peripheral nerve measured non-invasively in human subjects1. Thisresponse constituted a change in the tissue diffuse reflectance of 690 and 830 nm light, witha peak latency between 60 and 160 ms and an amplitude on the order of 0.1%. Initialinvestigations revealed that signals were wavelength and stimulus-intensity dependent, co-localized to the site of stimulation-induced nerve electrophysiology, and delayed in patientswith diabetic neuropathy2–4. The timescale of the signals and their wavelength dependencesuggested that changes in absorption, rather than scattering, associated with tissuehemodynamic events were likely to underlie those changes. In the present work, we reportfurther studies on the spatial and spectral dependence of these signals, as well as thecontribution of stimulus-induced motion and the effect of vascular occlusion, the results ofwhich have been recently published5, 6. We also discuss ongoing work aimed atunderstanding the usefulness of these signals for non-invasively assessing the health of bothnerve and muscle.
The current study was designed using both human subjects and an animal model. In humansubjects, we have investigated the spatial dependence by measuring the optical signals attwelve locations around a fixed optical collection point during stimulation of the sural nerve.
© 2011 SPIECorrespondence to: M. Kelley Erb.
NIH Public AccessAuthor ManuscriptProc Soc Photo Opt Instrum Eng. Author manuscript; available in PMC 2011 May 12.
Published in final edited form as:Proc Soc Photo Opt Instrum Eng. 2011 January 23; 7896(1): . doi:10.1117/12.875145.
NIH
-PA Author Manuscript
NIH
-PA Author Manuscript
NIH
-PA Author Manuscript

To study the spectral dependence of both optical coupling changes as well as the stimulatedresponse, broadband spectroscopy (650–900 nm) was performed in the wrist using themedian nerve. To study the effect of vascular occlusion, a pressure cuff was placed aroundthe upper arm and inflated above venous pressure to achieve venous occlusion, or abovesystolic arterial pressure to achieve arterial occlusion. To determine the effect of stimulus-induced motion on these optical signals, we compared responses from stimulation of mixedsensory/motor nerves to that of pure sensory nerves, in which the nerve activation could notinduce muscle tensioning. Finally, in the animal model, built using the exposed sciatic nerveof a Sprague-Dawley rat, we more directly assessed the contribution of motion by bothpharmacologically and surgically disconnecting the nerve from its muscle.
Our measurements show repeatable, spatially dependent optical signals with spectralfeatures that are unaffected by vascular occlusions and are consistent with those ofhemoglobin. Moreover, data from both the animal model and human subjects suggest akinematic origin for these signals. In the animal model, signals were dramatically reduced orcompletely eliminated following functional disconnection of the nerve from its muscle. Inhuman subjects, pure sensory nerve stimulation failed to elicit a signal, whereas the directinduction of motion via stimulation of mixed nerves generates a large optical response. Thetemporal characteristics of the current data, as well as those collected previously, areconsistent with that of force-velocity measurements made using classical muscle physiologytechniques. Together with data from ongoing human and animal studies, these data suggestthat diffuse optical imaging could be used as a non-invasive tool for investigating musclekinematics in a variety of clinical scenarios.
2. METHODS2.1 Stimulation and data acquisition
For both human and animal studies, a clinical nerve conduction velocity / electromyography(EMG) monitor (Carefusion Healthcare, San Diego CA or Cadwell Laboratories, Inc.,Kennewick, WA) was used to measure sensory nerve action potentials (SNAPs) andcompound muscle action potentials (CMAPs). For the spatial dependence, spectraldependence, and vascular occlusion protocols, recording electrodes were placed in the samearea as the optical probe shown in Figs. 1 and 2 to measure the SNAP. Then, the recordingelectrodes were removed and replaced by the optical probe. The EMG system provided theelectrical stimulation at current levels set by the operator. An electrical pulse of 0.1 msduration, at a repetition rate of 1.5 Hz, was used at the highest level of current below thethreshold of any visible skin motion to avoid potential motion artifacts and minimizecontributions to the optical data from changes in optical coupling between skin andillumination/collection optical fibers. Stimulation current levels ranged from 5–15 mA. Forall animal studies and for the human studies investigating the contribution of motion,SNAPs and CMAPs were recorded continuously during the acquisition of the optical data.
Broadband spectral measurements were made using a xenon arc lamp (Model 6258, OrielInstruments, Stratford, CT), which was band-pass filtered over the wavelength band 400–1000 nm. Two 2 mm diameter optical fibers served as illumination and collection fibers,respectively, delivering light from the arc lamp to the tissue and collecting light from thetissue to a spectrograph (ModelSP-150, Acton Research Corp., Acton, MA) with a 300 g/mm grating and 700 nm blaze wavelength. We detected spectrally dispersed light with acharged coupled device (CCD) camera (Model DU420A-BR-DD, Andor Technology, SouthWindsor, CT). The distance between illumination and collector fiber on the tissue was set to2 cm [Fig. 2(c)]. A LabView program controlled the CCD collection and synchronized thespectral acquisition with the electrical stimulation to collect 30 consecutive spectrafollowing each stimulation pulse, at an acquisition time per spectrum of 18.3 ms.
Erb et al. Page 2
Proc Soc Photo Opt Instrum Eng. Author manuscript; available in PMC 2011 May 12.
NIH
-PA Author Manuscript
NIH
-PA Author Manuscript
NIH
-PA Author Manuscript
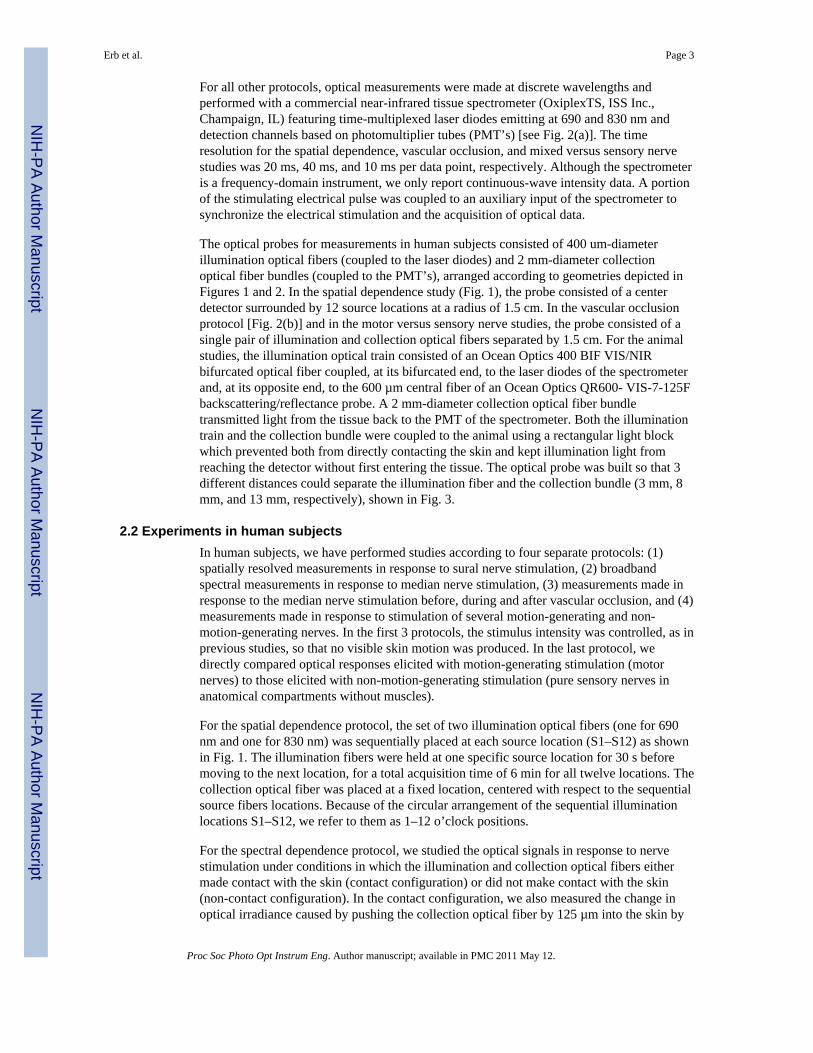
For all other protocols, optical measurements were made at discrete wavelengths andperformed with a commercial near-infrared tissue spectrometer (OxiplexTS, ISS Inc.,Champaign, IL) featuring time-multiplexed laser diodes emitting at 690 and 830 nm anddetection channels based on photomultiplier tubes (PMT’s) [see Fig. 2(a)]. The timeresolution for the spatial dependence, vascular occlusion, and mixed versus sensory nervestudies was 20 ms, 40 ms, and 10 ms per data point, respectively. Although the spectrometeris a frequency-domain instrument, we only report continuous-wave intensity data. A portionof the stimulating electrical pulse was coupled to an auxiliary input of the spectrometer tosynchronize the electrical stimulation and the acquisition of optical data.
The optical probes for measurements in human subjects consisted of 400 um-diameterillumination optical fibers (coupled to the laser diodes) and 2 mm-diameter collectionoptical fiber bundles (coupled to the PMT’s), arranged according to geometries depicted inFigures 1 and 2. In the spatial dependence study (Fig. 1), the probe consisted of a centerdetector surrounded by 12 source locations at a radius of 1.5 cm. In the vascular occlusionprotocol [Fig. 2(b)] and in the motor versus sensory nerve studies, the probe consisted of asingle pair of illumination and collection optical fibers separated by 1.5 cm. For the animalstudies, the illumination optical train consisted of an Ocean Optics 400 BIF VIS/NIRbifurcated optical fiber coupled, at its bifurcated end, to the laser diodes of the spectrometerand, at its opposite end, to the 600 µm central fiber of an Ocean Optics QR600- VIS-7-125Fbackscattering/reflectance probe. A 2 mm-diameter collection optical fiber bundletransmitted light from the tissue back to the PMT of the spectrometer. Both the illuminationtrain and the collection bundle were coupled to the animal using a rectangular light blockwhich prevented both from directly contacting the skin and kept illumination light fromreaching the detector without first entering the tissue. The optical probe was built so that 3different distances could separate the illumination fiber and the collection bundle (3 mm, 8mm, and 13 mm, respectively), shown in Fig. 3.
2.2 Experiments in human subjectsIn human subjects, we have performed studies according to four separate protocols: (1)spatially resolved measurements in response to sural nerve stimulation, (2) broadbandspectral measurements in response to median nerve stimulation, (3) measurements made inresponse to the median nerve stimulation before, during and after vascular occlusion, and (4)measurements made in response to stimulation of several motion-generating and non-motion-generating nerves. In the first 3 protocols, the stimulus intensity was controlled, as inprevious studies, so that no visible skin motion was produced. In the last protocol, wedirectly compared optical responses elicited with motion-generating stimulation (motornerves) to those elicited with non-motion-generating stimulation (pure sensory nerves inanatomical compartments without muscles).
For the spatial dependence protocol, the set of two illumination optical fibers (one for 690nm and one for 830 nm) was sequentially placed at each source location (S1–S12) as shownin Fig. 1. The illumination fibers were held at one specific source location for 30 s beforemoving to the next location, for a total acquisition time of 6 min for all twelve locations. Thecollection optical fiber was placed at a fixed location, centered with respect to the sequentialsource fibers locations. Because of the circular arrangement of the sequential illuminationlocations S1–S12, we refer to them as 1–12 o’clock positions.
For the spectral dependence protocol, we studied the optical signals in response to nervestimulation under conditions in which the illumination and collection optical fibers eithermade contact with the skin (contact configuration) or did not make contact with the skin(non-contact configuration). In the contact configuration, we also measured the change inoptical irradiance caused by pushing the collection optical fiber by 125 µm into the skin by
Erb et al. Page 3
Proc Soc Photo Opt Instrum Eng. Author manuscript; available in PMC 2011 May 12.
NIH
-PA Author Manuscript
NIH
-PA Author Manuscript
NIH
-PA Author Manuscript

means of a finely controlled linear stage. Data were also collected on a tissue-like phantommade of silicon, featuring optical properties similar to those of tissue (µa~0.15 cm−1, µs'~5cm−1) in the wavelength band considered in this study (650–900 nm).
The vascular occlusion protocols consisted of 4 phases: 2 minutes with neither nervestimulation nor vascular occlusion (phase 1), 2 minutes of nerve stimulation but no vascularocclusion (phase 2), 5 minutes of nerve stimulation and vascular occlusion (phase 3), and 5min of nerve stimulation after the release of vascular occlusion (phase 4).
To study the effect of motion-generating nerve stimulation, CMAPs were acquired in theabductor pollics brevis (APB) muscle and the abductor digiti minimi (ADM) duringstimulation of the median nerve, ulnar nerve, and the recurrent branch of the median nerve.To study the effect of non-motion-generating sensory nerve stimulation, antidromic SNAPswere acquired in the medial antebrachial cutaneous nerve (medAC) and the lateralantebrachial cutaneous nerve (latAC) of 4 subjects while measuring the optical responsenear the recording electrode. Additionally, in the median nerve, orthodromic SNAPs wereacquired at the wrist proximal to the carpal tunnel during stimulation of the proper digitalbranch of the median nerve in the second digit.
2.3 Experiements in the animal modelThe animal model was created using the sciatic nerve of the Sprague-Dawley rat. Duringproximal stimulation of the exposed nerve, optical responses were measured in non-contactmode along its distal course before and after both pharmacological and surgical denervationof lower limb muscles.
All surgical procedures were approved by Boston University School of Medicine’s animalcare and use committee. Eight animals were anesthetized using 5% isoflurane and thenplaced in the prone position on a heated surgical bed and maintained anesthetized with 3%isoflurane. The left hind quarter was shaved using an electric trimmer and a chemicaldepilator (Nair, Church and Dwight Co., Inc., Princeton, NJ) was used to remove theremaining fur. Once prepared for surgery, isoflurane was discontinued and the animal wasgiven an intraperitoneal injection of Ketamine + Xylazine (90 mg/kg and 4 mg/kg,respectively). The animal was then intubated with a 14-gage intravenous catheter and placedon a TOPO Small Animal Ventilator (Kent Scientific, Torrington, CT) in constant pressuremode with the following parameters: respiratory rate; 50 breaths/min, time ratio ofinspiratory phase/total respiratory cycle; 30%, peak inspiratory pressure; 13.5 cmH2O.Blood pressure (BP) and heart rate (HR) were continuously monitored using a commoncarotid artery catheter and a transducer flushed with heparinized saline. BP and HR datawere amplified with multi-purpose transducer amplifier (Harvard Apparatus, Holliston, MA)and then sampled and displayed using a voltage analog input module controlled by auniversity serial bus (USB) data acquisition system (National Instruments, cDAQ 9172) andLabView software. Once the animal had stabilized on the ventilator and was non-responsiveto foot pinch, a skin incision was made just distal to the sciatic notch, where the anteriorhead of biceps femoris could be blunt dissected from the caudal margin of gluteus maximus,thus exposing the proximal course of the sciatic nerve. The resulting surgical window washeld open using an ophthalmologic speculum.
Optical data were acquired from each source-detector distance during approximately 60nerve stimulations. Before each trial, the optical probe was positioned with amicromanipulator so that the source and detector were equidistant and perpendicular to thecourse of the nerve. After 1 trial at each source detector distance, a 0.2 mg/kg dose of aclinically used neuromuscular blocking agent, Nimbex (Cisatracurium Besylate), wasdelivered in a 300 µl bolus via the left common carotid artery catheter. CMAPs were then
Erb et al. Page 4
Proc Soc Photo Opt Instrum Eng. Author manuscript; available in PMC 2011 May 12.
NIH
-PA Author Manuscript
NIH
-PA Author Manuscript
NIH
-PA Author Manuscript

monitored periodically over the next several minutes to track the action of the drug. Oncethe CMAP was abolished, another set of optical measurements were made at each source-detector separation. Nimbex belongs to the nondepolarizing class of neuromuscular blockingagents and acts as a competitive antagonist of post-synaptic acetylcholine receptors at theneuromuscular junction. This class of drug has been shown to exhibit affects on theautonomic nervous system7. While Nimbex was chosen for its hemodynamic stability8, acontrol experiment was necessary to confirm that changes in the signal on delivery of thedrug were related to neuromuscular action and not changes in hemodynamic parameters. Inan additional set of animals, a second surgical window was made in the popliteal fossa,distal to both the site of stimulation and the placement of the optical probe. Before the startof the experiment, the tibial and common peroneal nerves were mobilized taking care not todamage major vessels in the space. Following the acquisition of data at each source-detectordistance, both nerves were cut distal to their blood supply and a second set of data wereacquired at each source detector distance.
2.4 Data AnalysisA detailed description of the data processing has been described elsewhere5, 6. Briefly, theaverage change in optical irradiance over N nerve stimulations is written as <δIstim(t)/I(t0)>.For spectral measurements of effect of optical coupling, the relative change in irradiancefollowing a change in optical coupling is indicated as ΔIcoupling/I0. For the study of theoptical response to nerve stimulation in the vascular occlusion protocol, we report themaximum optical response (with sign) for each individual stimulation, <δIstim(tmax)/I(t0)>,as well as the change in optical irradiance, ΔIoccl(t)/I0, where I0 is the average irradianceover the two-minute baseline period (phase 1) and I(t0) is the measured irradiance at theonset of stimulation. This last value reflects the changes in tissue hemoglobin concentrationand saturation over the optically probed volume. In section 3.7 we present the results ofsimultaneous optical and isotonic transducer recordings from isolated muscles in the animalmodel. Measurements from the isotonic transducer are of changes in muscle length during atwitch and are written as: δxi(t)/x(t0i).
3. RESULTS3.1 Summary
The results are summarized in table 1 and detailed in sections 3.2 – 3.7 and elsewhere5, 6. Inthe animal model, optical signals were completely eliminated following bothpharmacological and surgical separation of the nerve from the muscles it innervates. Inhumans, when the stimulation was of purely sensory nerves, no optical signals could beelicited, even when the electrical stimulation was strong enough to recruit the entire nerve.These three results together suggest that nerve activation alone was insufficient and thatmotion caused by muscle contraction is necessary to generate an intermediate optical signal.The broadband spectral measurements, made in the distal forearm of human subjects,indicated that at the time of peak amplitude, the signal had the spectral characteristics ofhemoglobin. Moreover, during venous and arterial occlusion, the signals respondeddifferently than the background tissue optical properties. For example, during arterialocclusion, the background tissue irradiance of 830 nm light increased while that of 690 nmlight decreased, indicating hemoglobin desaturation in tissue capillary beds. The amplitudeof both 690 nm and 830 nm nerve-stimulation induced signals, however, remained identical.These two results suggest that while blood containing structures likely underlie thesesignals, they are most likely due to large vessels rather than small capillary beds. Finally, wesought to determine the nature of the motion causing these signals. The spatially resolvedmeasurements indicated that displacements of these vessels are more likely than rapiddilation or constriction. This is because the polarity and amplitude were found to vary
Erb et al. Page 5
Proc Soc Photo Opt Instrum Eng. Author manuscript; available in PMC 2011 May 12.
NIH
-PA Author Manuscript
NIH
-PA Author Manuscript
NIH
-PA Author Manuscript

smoothly over space, with positive-going signals observed in some locations and negative-going signals in others. Rapid vascular dilations and constrictions would not have this effect.They would have the same polarity in all locations.
3.2 Spatial dependenceFigure 4 shows both the probe geometry as well as a representative result from subject 1 forthe spatial dependence protocol. Across all 5 subjects the direction of the optical responsewas positive at locations in the upper right quadrant (i.e. S1–S3) and flat or negative in theother 3 quadrants. This result is consistent with the displacement of a blood vessel within theoptically probed region. It is not consistent with the hypothesis that vessels are either rapidlydilating or constricting, in which case the signal would always be either positive or negative,respectively. These findings are also consistent with the anatomy of this region. The suralnerve travels obliquely beneath the lateral malleolus as it enters the dorsal aspect of the footfrom the lower leg. Nutrient vascular supply to peripheral nerves includes branches fromadjacent epineurial, fasciocutaneous, or muscular arteries, all of which anastomose to form acontinuous longitudinal plexus that travels with the nerve.
3.3 Spectral dependenceWe studied the spectral dependence of optical coupling effects by acquiring broadbandspectra before and after lowering the optical probe into contact with the subject using afinely tuned linear stage. Changing the optical coupling induced optical irradiance changeswith a flat spectral dependence and an average value of 0.42 ± 0.09% in the tissue phantomcase [flat dashed line in Fig. 5(a)] and 2.78 ± 0.06% in the in vivo case [flat dashed line inFig. 5(b)]. In addition, the lower panels of figure 5 show that the optical response to mediannerve stimulation, as a function of wavelength, reflects the spectral signature of hemoglobinin the case where the fibers were not in contact with the skin [c.f. Fig. 5(d)].
3.4 Effect of vascular occlusionThe results of vascular occlusion are shown in figure 6. The experiment consisted of 4phases for both venous and arterial occlusion. Phase 1 is a baseline control period where thepressure cuff was deflated and no stimulation took place. During phase 2, when stimulationbegan but the pressure cuff remained deflated, the background tissue irradiance wasunaffected (figure 6, upper traces). Negative going optical responses, however, wereobserved in both experiments (figure 6, lower traces) and had an amplitude ranging from−0.2% to −0.5%. During phase 3, when the cuff was inflated, the background tissueirradiance changed depending on the type of occlusion. For venous occlusion, the irradianceof both wavelengths decreased, consistent with an increase in total blood volumecorresponding to increases in both [Hb] and [Hbo2]. During Arterial occlusion, theirradiance of 690 nm light decreased and that of 830 nm light increased, consistent with thedeoxygenation of hemoglobin associated with an increase in [Hb] a decrease in [Hbo2]. Thestimulated responses during this phase, however, did not follow the changes observed in thebackground tissue. The response amplitude for both wavelengths during venous occlusiondecreased (i.e. is less negative or dampened). During the arterial occlusion, however, theresponse amplitude of both wavelengths increased slightly (i.e. became more negative).During phase 4, both the background irradiance and the stimulated response returned to pre-occlusion baseline levels for both arterial and venous occlusion.
The most striking result of these experiments is that arterial occlusion had opposite effectson the background tissue irradiance of the different wavelengths but the same effect on theirmaximum response during stimulation. This suggests that the optical response to nervestimulation does not derive from capillary hemoblobin, which provides the dominantcontribution to ΔIoccl(t)/I0.
Erb et al. Page 6
Proc Soc Photo Opt Instrum Eng. Author manuscript; available in PMC 2011 May 12.
NIH
-PA Author Manuscript
NIH
-PA Author Manuscript
NIH
-PA Author Manuscript

3.5 Mixed nerve stimulation versus sensory nerve stimulationFigure 7(a), top panel, shows a supramaximal electrophysiological response measured in theAPB and demonstrates that the entire muscle was recruited, which produced large amplitudemotion of the thumb. The amplitude (~10%) of the corresponding optical response is 2orders of magnitude larger than that of signals described previously1, though the temporaland spectral features are comparable, suggesting a similar biological origin. Similar resultswere obtained during stimulation of both the ulnar nerve and the median nerve at the elbow(Figure 7(a)). While the median nerve does travel in the optically probed region, the ulnarnerve does not. However, both of these nerves do innervate muscles whose tendons arelocated in the distal forearm beneath the optical probe. In all subjects, stimulation undereach of these three conditions resulted in large amplitude signals demonstrating that opticalmeasurements at the wrist are sensitive to motion induced by nerves which are both withinand outside the region of optical interrogation.
Figure 7(b) shows the results from subject 2 during sensory nerve activation of the mediannerve, medial antebrachial cutaneous nerve, and lateral antebrachial cutaneous nerve. Ineach case, despite the presence of a robust electrical signal in the optically probed region, nooptical response was detected. In all other subjects, no optical response was observed in anyof the sensory stimulation conditions.
3.6 Animal model: effect of neuromuscular block and surgical denervationFigure 8 shows a typical plantar muscle action potential and the corresponding optical time-trace obtained from the middle source-detector separation in the animal model. In general,optical signals obtained from the rodent hind limb are faster than those obtained from thehuman forearm, reaching peak amplitude between 30 and 40 ms post-stimulus. Theamplitude of the signal was on the order of 1–5% and this was not affected by changing thesource-detector separation distance.
The direction of the signal (positive vs. negative irradiance changes) varied, both within asingle animal (at different source-detector separations) or between animals. This finding isin agreement with signals generated in human subjects both in this and previous work 6. Inall 5 animals, a 0.2 mg/kg intra-arterial dose of Cisatracurium Besylate dramaticallyreduced, or completely eliminated the stimulation-induced signals, Fig. 9 (b).
In 3 animals, optical responses were reduced by an order of magnitude though none-the-lessremained statistically significant at several source-detector separations. Animals given anintravenous bolus of Cisatracurium at doses between 1.5 and 6 ED95 have been shown tobegin spontaneously recovering after as little as 20 minutes 9. In this study, boluses werebeing delivered intra-arterially; a route that could speed the clearance of the drug. Indeed, inone animal, following an approximately 15 minute washout period, the return of the plantarmuscle CMAPs was associated with a dramatic return of the optical signal (Figure 9 (c)).This apparent dose-response relationship was later confirmed in a 6th animal in whichsignals were present following a 0.100 mg/kg dose but eliminated following a 0.6 mg/kgdose. This result suggests, though does not confirm, a correlation between the amplitude ofthe optical response and the percentage of recruited muscle fibers.
In an additional set of animals, the two divisions of the sciatic nerve (tibial and commonperoneal) were surgically transected in the popliteal fossa. This manipulation produces thesame functional disconnection of nerve from muscle while avoiding potential hemodynamicside affects associated with acetylcholine receptor blockade. In agreement with thepharmacological results, surgical disconnection of the nerve from the muscle eliminatednerve-stimulation induced optical responses at each source-detector separation.
Erb et al. Page 7
Proc Soc Photo Opt Instrum Eng. Author manuscript; available in PMC 2011 May 12.
NIH
-PA Author Manuscript
NIH
-PA Author Manuscript
NIH
-PA Author Manuscript

3.7 Animal model: Isolated muscles, preliminary resultsWe have recently begun to investigate the potential of these diffuse optical measurements todirectly measure muscle contractile physiology. Figure 10 shows the results from oneSprague-Dawley rat in which the surgical methods described above were extended toinclude isolating the gastrocnemius muscle and the soleus muscle from their surroundingtissues, with the nerve and blood supply left intact. The distal tendons were separated fromthe foot and attached to an isotonic transducer, which was secured from the oppositedirection by a spring. The nerve was then stimulated at frequencies below and above thefusion frequency for tetanus while measuring optically directly from the surface of themuscle (4, 6, and 15 hz, in panels a, b, and c, respectively). The upper traces are recordsfrom the isotonic transducer for both muscles and the lower traces are the opticalmeasurements. Interestingly, even in this preliminary set of data, the two muscles can bedistinguished on the basis of their optical responses. Using both this animal model and avariety of human clinical populations, we are continuing to investigate the sensitivity andspecificity of this tool for detecting changes muscle contractile physiology that may evolvein healthy and diseased muscle.
4. DISCUSSIONThe optical signals reported here were generated by peripheral nerve stimulation anddetected in anatomical regions that fall into two categories, 1) those containing mostlymuscle tissue (the upper leg in the animal model), and 2) those containing few or no muscles(the human distal forearm and lateral ankle). In the compartments that do not containmuscles, the results of the spatially and spectrally resolved measurements strongly suggestthat motion of blood-containing structures account for these signals. In the lateral aspect ofthe ankle, the major blood containing structures include the small saphenous vein and thefibular artery, which travel with the continuation of the sural nerve. The sural nerve itself isalso well supplied with vessels. These three structures are mechanically linked by theirinvesting fascia. Thus, any mechanical tensioning that acts on the nerve will also put thesevessels into motion, and this likely explains the signals generated in this region. In the distalforearm, however, the principle blood containing structures are the ulnar and radial arteries,which do not travel with the median nerve. The median nerve, however, like the sural nerve,has a rich epineurial and endoneurial vascular network. Blood in this network, therefore,likely constitutes the imaging contrast agent and therefore changes to median nerve bloodsupply might be reflected in changes to these optical signals. In diabetes, for instance,microangiopathies are considered to play a role in the pathogenesis of diabeticpolyneuropathy10. These signals may prove a useful non-invasive assessment tool for thevascular health of peripheral nerves.
We have also generated robust signals in optically probed regions that are comprisedprimarily of muscle tissue. These signals have a time course that is highly consistent withthe time course of muscle contraction. Preliminary results obtained from isolated muscles inour animal model demonstrate that these signals can distinguish muscles of differentcontraction times and suggest that this tool could be used to follow changes in theircontractile properties.
In our initial investigations, great care was taken to control the level of stimulation so thatthe investigator could not detect visible skin motion. The signal amplitudes under theseconditions were small (~0.2% – 0.5%) but none-the-less robust and repeatable. This highsensitivity suggests that diffuse optical imaging might be capable of detecting thecontraction events of single motor units, which would make it valuable for studyingneuromuscular changes that accompany aging and disease11, especially in locationsinaccessible to force transducers.
Erb et al. Page 8
Proc Soc Photo Opt Instrum Eng. Author manuscript; available in PMC 2011 May 12.
NIH
-PA Author Manuscript
NIH
-PA Author Manuscript
NIH
-PA Author Manuscript

AcknowledgmentsThis work is supported by National Institutes of Health (NIH) Grants R01-NS059933, National Institute on Aging(NIA) T32-001, T32-AG00277, and by CIMIT/U.S. Army Medical Acquisition Activity (USAMRAA) fundingunder cooperative agreement no. W81XWH-07-2-0011
REFERENCES1. Tong Y, Martin JM, Sassaroli A, et al. Fast optical signals in the peripheral nervous system. J
Biomed Opt. 2006; 11(4):044014. [PubMed: 16965171]2. Chen DK, Tong Y, Sassaroli A, et al. Fast optical response to electrical activation in peripheral
nerves - art. no. 643104. Multimodal Biomedical Imaging II. 2007; 6431:43104–43104. 43100.3. Fantini S, Chen DK, Martin JM, et al. Near-infrared signals associated with electrical stimulation of
peripheral nerves. Proc SPIE. 2009; 71744. Fantini S, Chen DK, Martin JM, et al. Optical characterization of near-infrared signals associated
with electrical stimulation of peripheral nerves. Proc SPIE. 2009; 7174:717401.5. Erb MK, Chen DK, Sassaroli A, et al. Diffuse optical signals in response to peripheral nerve
stimulation reflect skeletal muscle kinematics. Biomedical Optics Express. 2010; 1(3):943–954.[PubMed: 21258520]
6. Chen DK, Erb MK, Tong Y, et al. Spectral and spatial dependence of diffuse optical signals inresponse to peripheral nerve stimulation. Biomedical Optics Express. 2010; 1(3):923–942.[PubMed: 21258519]
7. Virmani S, Tempe DK, Datt V, et al. Effect of muscle relaxants on heart rate, arterial pressure,intubation conditions and onset of neuromuscular block in patients undergoing valve surgery. AnnCard Anaesth. 2006; 9(1):37–43. [PubMed: 17699906]
8. Esmaoglu A, Akin A, Mizrak A, et al. Addition of cisatracurium to lidocaine for intravenousregional anesthesia. J Clin Anesth. 2006; 18(3):194–197. [PubMed: 16731321]
9. Chen C, Yamaguchi N, Varin F. Dose-dependency of pharmacokinetic/pharmacodynamicparameters after intravenous bolus doses of cisatracurium. Br J Anaesth. 2008; 101(6):788–797.[PubMed: 18974056]
10. Theriault M, Dort J, Sutherland G, et al. Local human sural nerve blood flow in diabetic and otherpolyneuropathies. Brain. 1997; 120(Pt 7):1131–1138. [PubMed: 9236626]
11. Chan KM, Doherty TJ, Brown WF. Contractile properties of human motor units in health, aging,and disease. Muscle & Nerve. 2001; 24(9):1113–1133. [PubMed: 11494264]
Erb et al. Page 9
Proc Soc Photo Opt Instrum Eng. Author manuscript; available in PMC 2011 May 12.
NIH
-PA Author Manuscript
NIH
-PA Author Manuscript
NIH
-PA Author Manuscript

Figure 1.Experimental setup for spatial dependence protocol. A single detection fiber bundle wassurrounded by 12 illumination fiber pairs, labeled S1–S12. Sural nerve stimulation wasproximal to the site of the optical measurements. The sources were held at each location for30 seconds.
Erb et al. Page 10
Proc Soc Photo Opt Instrum Eng. Author manuscript; available in PMC 2011 May 12.
NIH
-PA Author Manuscript
NIH
-PA Author Manuscript
NIH
-PA Author Manuscript
Figure 2.Experimental setup for the human studies. (a) Configuration of the Ag/AgCl electrodes andoptical probe while making CMAP measurements of APB during stimulation of the mediannerve at the elbow. The anatomical cross section illustrates the location of the median andulnar nerves in the region of optical interrogation. (b) Probe geometry used for the vascularocclusion protocol. (c) Probe geometry for the spectral dependence protocol.
Erb et al. Page 11
Proc Soc Photo Opt Instrum Eng. Author manuscript; available in PMC 2011 May 12.
NIH
-PA Author Manuscript
NIH
-PA Author Manuscript
NIH
-PA Author Manuscript

Figure 3.Experimental setup for the animal model. A surgical window was created over the proximalcourse of the left sciatic nerve in Sprague-Dawley rats. A non-invasive optical probedelivering 690 and 830 nm light at 3 different source-detector separation distances wascoupled to the PMT of a frequency-domain spectrometer and oriented perpendicularly to thecourse of the nerve. 60 × 600 ms epochs, each synchronized to the delivery of a 0.1 mscurrent stimulus to the exposed nerve (1), were averaged to generate an optical response.Simultaneously, electrophysiological responses to the stimulus were recorded from theplantar muscles of the left foot. (2) ground electrode, (3) active recording electrode, (4)reference electrode.
Erb et al. Page 12
Proc Soc Photo Opt Instrum Eng. Author manuscript; available in PMC 2011 May 12.
NIH
-PA Author Manuscript
NIH
-PA Author Manuscript
NIH
-PA Author Manuscript

Figure 4.(a) Schematic diagram of the optical probe for spatially resolved measurements; (b) Opticalresponses to right sural nerve stimulation for the twelve source-detector pairs measured onsubject 1.
Erb et al. Page 13
Proc Soc Photo Opt Instrum Eng. Author manuscript; available in PMC 2011 May 12.
NIH
-PA Author Manuscript
NIH
-PA Author Manuscript
NIH
-PA Author Manuscript

Figure 5.Broadband spectra of optical signals measured (a) on a tissue-like phantom as a result ofpushing the detector fiber by 250 µm into the phantom in a contact configuration, and onsubject 6 (b) as a result of pushing the detector fiber by 125 µm into the skin in a contactconfiguration. Broadband spectra are also shown at the point of maximal optical response tomedian nerve stimulation under conditions of (c) fiber-skin contact and no visible handmotion, and (d) no contact between optical fiber and skin, and visible stimulation-inducedhand motion.
Erb et al. Page 14
Proc Soc Photo Opt Instrum Eng. Author manuscript; available in PMC 2011 May 12.
NIH
-PA Author Manuscript
NIH
-PA Author Manuscript
NIH
-PA Author Manuscript

Figure 6.(a) results obtained from subject 6 during venous occlusion. (b) results obtained fromsubject 6 during arterial occlusion. The numbers above each panel correspond to therespective phases of the experiment (see text).
Erb et al. Page 15
Proc Soc Photo Opt Instrum Eng. Author manuscript; available in PMC 2011 May 12.
NIH
-PA Author Manuscript
NIH
-PA Author Manuscript
NIH
-PA Author Manuscript

Figure 7.Optical responses at the wrist during stimulation of mixed nerves in subject 2. (a, top panel)CMAP generated in APB (left) and the corresponding optical response (right) duringstimulation of the median nerve at the elbow. (a, middle panel) CMAP and correspondingoptical trace during stimulation of the recurrent branch of the median nerve in the palm. (a,bottom panel) CMAP and corresponding optical response during stimulation of the ulnarnerve at the elbow. Differences in the latency-to-onset of the electrophysiological responsebetween stimulation at the elbow and at the recurrent branch of the median nerve reflect theincreased distance (~20 cm) over which the nerve impulse must travel before depolarizingthe muscle. (b) Optical data during sensory nerve stimulation in subject 2. (top panel)Median nerve SNAP measured at the wrist during stimulation of the 2nd digit and thecorresponding optical data. (middle panel) Medial antebrachial cutaneous SNAP andcorresponding optical data. (bottom panel) Lateral antebrachial cutaneous SNAP andcorresponding optical data
Erb et al. Page 16
Proc Soc Photo Opt Instrum Eng. Author manuscript; available in PMC 2011 May 12.
NIH
-PA Author Manuscript
NIH
-PA Author Manuscript
NIH
-PA Author Manuscript

Figure 8.Typical results from middle source-detector separation in the animal model. (a) A plantarmuscle action potential. (b) Signals generated in the lower limb of the Sprague-Dawley ratare faster than signals generated in human subjects.
Erb et al. Page 17
Proc Soc Photo Opt Instrum Eng. Author manuscript; available in PMC 2011 May 12.
NIH
-PA Author Manuscript
NIH
-PA Author Manuscript
NIH
-PA Author Manuscript

Figure 9.The effect of Cisatracurium Besylate on signals generated in the rat. (a) Signals from themiddle source-detector separation in one of the rats prior to delivery of the drug. (b) Opticaltraces from the same rat following drug delivery. (c) Following a 15 minute washout period,both the electrophysiological and optical response returned.
Erb et al. Page 18
Proc Soc Photo Opt Instrum Eng. Author manuscript; available in PMC 2011 May 12.
NIH
-PA Author Manuscript
NIH
-PA Author Manuscript
NIH
-PA Author Manuscript

Figure 10.NIRS optical signals map time course of whole muscle force and length during 4, 6, and 15Hz stimulation. The upper graph of each panel shows relative change in muscle lengthrecorded by the isotonic transducer and the lower graphs each are optical data recorded atboth 690 nm and 830 nm. Panels (a) and (b) both Soleus (slow twitch) and Gastrocnemius(fast twitch) for 4 Hz and 6 Hz, respectively. Panel (c) Soleus only, demonstrating the effectof fused tetanus (15 Hz).
Erb et al. Page 19
Proc Soc Photo Opt Instrum Eng. Author manuscript; available in PMC 2011 May 12.
NIH
-PA Author Manuscript
NIH
-PA Author Manuscript
NIH
-PA Author Manuscript

NIH
-PA Author Manuscript
NIH
-PA Author Manuscript
NIH
-PA Author Manuscript
Erb et al. Page 20
Table 1
A summary of the results and their implications for the biological origin of the optical signal
RESULTS
Question Protocol Results Conclusion
Contribution of Motion Neuromuscular Block(animal model)
Signals are lost following block andreturn with washout of the drug
Contractile motion induced by nervestimulation is necessary and sufficient togenerate an intermediate signal
Surgical Denervation(animal model)
Nerve transection also eliminates theoptical signal
Sensory vs. Mixed Nerves Sensory Nerves: No SignalMixed Nerves: Large Signal
Structures involved Spectral Dependence At the time of peak signal amplitude,the spectral nature of the signal reflectsthat of hemoglobin
Motion of blood-containing structuresdominate the signal
Vascular Occlusion During occlusion, changes to theSignal are not the same as changes tothe background tissue opticalproperties
Signal is not derived from tissue capillarybeds, which determine backgroundoptical properties
Dilation or Displacement Spatial Dependence Signals are positive-going in somelocations and negative-going in others
Displacement of a large vessel couldaccount for the signal, but not dilation,which would cause signals to be eitheralways positive or always negative
Proc Soc Photo Opt Instrum Eng. Author manuscript; available in PMC 2011 May 12.
Copyright © 2022 FDOKUMEN