New insights on technological evolution - e-Archivo
103
1 Universidad Carlos III de Madrid TESIS DOCTORAL New Insights on Technological Evolution Autor: Mariano Mastrogiorgio Directores: Andrea Fosfuri Marco Giarratana Departamento de Economía de la Empresa Getafe, Abril de 2014
-
Upload
khangminh22 -
Category
Documents
-
view
3 -
download
0
Transcript of New insights on technological evolution - e-Archivo
1
Universidad Carlos III de Madrid
TESIS DOCTORAL
New Insights on Technological Evolution
Autor: Mariano Mastrogiorgio
Directores: Andrea Fosfuri
Marco Giarratana
Departamento de Economía de la Empresa
Getafe, Abril de 2014
2
Universidad Carlos III de Madrid
TESIS DOCTORAL
New Insights on Technological Evolution
Autor: Mariano Mastrogiorgio
Directores: Andrea Fosfuri
Marco Giarratana
Firma del Tribunal Calificador:
Nombre y Apellido Firma
Calificación:
Getafe, de de
Presidente:
Vocal:
Secretario:
Suplente:

3
“ zà cant e zà son”
“se la canta e se la suona”
(Italian proverb)
4
Index
o Acknowledgments p. 5
o Introduction p. 6
o Chapter 1 p. 12
o Introduction p. 14
o Background and Hypotheses p. 15
o Data p. 22
o Empirical Framework p. 22
o Results p. 33
o Discussion p. 36
o References p. 39
o Tables, Figures, Appendices p. 46
o Chapter 2 p. 59
o Introduction p. 61
o Background and Hypotheses p. 63
o Data p. 71
o Empirical Framework p. 73
o Results p. 82
o Discussion p. 85
o References p. 88
o Tables, Figures, Appendices p. 97
o Chapter 3 p. 105
o Introduction p. 107
o Theoretical Background p. 109
o Methods p. 115
o Main Developments p. 119
o Discussion p. 130
o References p. 132
o Tables, Figures, Appendices p. 138
* Por razones de confidencialidad no se da publicidad al capítulo 3 = Chapter 3contains confidencial data which can not be disclosed.

5
______Acknowledgments
_______________________________________
I would like to express my gratitude to my advisors, Andrea Fosfuri and Marco Giarratana, for their
guidance, their continuous support, and their advices about academic life. I would like to express my
gratitude to Gino Cattani for sponsoring my visit to NYU Stern School of Business. I would like to
express my gratitude to Ayfer Ali for giving me the access to her database. I would like to express my
gratitude to Pierpaolo Andriani, with whom I started to collaborate recently. I would like to express my
gratitude to Victor Gilsing and the ACED Centre at the University of Antwerp for the incoming job
opportunity. Also, I would like to thank the Spanish Ministry of Competitiveness for providing the
funding, the internal PhD committee for their comments on my dissertation, and the entire Department
of Business Administration at Universidad Carlos III for allowing me to undertake this dissertation. I am
very grateful to my father and my mother for their patience during these years. I am very grateful to my
brother for the fruitful discussions on cutting-edge issues. Last but not least, I am very grateful to all my
colleagues and friends, for the amazing moments of friendship and love we spent together in this
beautiful city of Madrid, which I will always carry in my heart.
6
______ Introduction
_______________________________________
Many studies in the innovation literature have borrowed from evolutionary theories, because “the
nature of invention…is an evolution, rather than a series of creations, and much resembles a biologic process” (Gilfillan,
pag. 275). Levinthal (1998), for example, has built on the “punctuated equilibrium” framework in order
to illustrate the idea that technological innovation processes are characterized by long periods of
equilibrium, then punctuated by short periods of radical change. Ziman (2000) provides a very good
summary on the evolutionary debate, a debate that spans several fields, ranging from economics (David
1985) to history of science and technology (Merton 2004; Mokyr 1996), to cultural anthropology (Cavalli
Sforza and Feldman 1981), to engineering (Basalla 1988; Vincenti 1994) as well as to evolutionary biology
and physics (Casals et al. 2012; Kauffman 2000).
This dissertation contains three essays. Borrowing from evolutionary theories, these essays help
to provide new insights into the innovation literature by analyzing the processes that lead to the
emergence of new technologies and inventions, as well as the main implications in terms of technological
uncertainty. The dissertation can be divided into two parts. The first part focuses on technological uncertainty.
In particular, it focuses on the role played by technological uncertainty for the functioning of markets for
technology. The second part, corresponding to the last two essays, focuses on the underlying processes
of technological evolution that lead to the emergence of new technologies and that represent, in a certain
way, the “roots” of technological uncertainty. The second part of the dissertation contributes to our
understanding of the common processes through which technologies that are originally developed for
specific functions and uses may turn out to have unanticipated and serendipitous applications in different
fields. For example, Gutenberg’s printing press was developed from a wine press (Johnson 2010). Similar
7
examples are very common in several industries. New evolutionary theories, such as the theories of
exaptation, are adopted in order to study these processes.
The first essay explores the role played by technological uncertainty for the functioning of a small
market for technology. The main hypothesis is that technological uncertainty, making problematic the
valuation of patent assets, may decrease the incentive of firms to participate in markets for technology.
In order to test the main hypothesis, I explore a small market for technology whose main actors are: 1)
the technology licensing office (TLO) of a large US academic medical center; 2) the firms who showed
interest in TLO’s patents by signing confidentiality, options or licensing agreements for those patents. I
adopt a novel approach in order to measure technological uncertainty of a patent. This approach is based
on connectivity analysis, which is a methodology originating from network analysis that has been recently
applied in innovation studies. The evidence suggests that lower levels of technological uncertainty are
correlated with an increase in the hazard of licensing.
The second essay contributes to the understanding of the processes through which technologies,
originally developed for specific functions and uses, may turn out to have unanticipated and serendipitous
applications in different fields. The concept of exaptation from evolutionary biology is introduced, in order
to shed light on an alternative mechanism that leads to the genesis of new technologies. This mechanism
consists in the discovery of “latent” functions of existing technologies, which were designed and
developed for other purposes. The essay explores the role played by technological complexity, defined in
terms of interdependence among technological subparts and modules, for the emergence of new
functions. The main hypothesis is that intermediate levels of technological complexity increase the
emergence of new functions of a technology. In order to test the main hypotheses, I identify technologies
with patents, using a random cross-section of US patent granted in 1991. In order to measure the
emergence of new functions, I adopt a novel approach based on the proportion of forward citations
coming from patents that belong to different technological classes. The evidence suggests that high levels
of technological complexity increase cross-class forward citations with decreased acceleration.
8
Unlike the second essay which focuses on “technological” determinants of exaptation, this essays
focuses on the factors that fall into the “socio-cognitive” domain. A longitudinal case study design is
adopted, in order focus on a specific technology. This essay explores how the interaction of contingent
factors and prior knowledge determined the transposition of a key technology -furlers, originally developed
to produce bobbins of paper- from the paper manufacturing sector to the sailing industry, where they
started to be used in order to “wind and unwind” the ropes of large sailing yachts. This essays focuses
on two Italian companies, “Fabio Perini S.p.A.” and “Perini Navi S.p.A.”, both established by the same
inventor and entrepreneur. The essay combines the analysis of archival records, such as patents and other
documents provided by the firms, with several interviews.
This dissertation is interdisciplinary. It lies at the intersection of novel evolutionary theories of
innovation, of the entrepreneurship literature, as well as of the research on markets for technology and
patent valuation. Likewise, it is based on a combination of novel quantitative approaches with qualitative
approaches.

9
______ Introducción
_______________________________________
Muchos estudios en el campo de la innovación han adoptado analogías evolucionistas porque “la
naturaleza de la invención…se parece mucho a un proceso biológico” (Gilfillan, pag. 275). Levinthal, por ejemplo,
ha utilizado el concepto de “equilibrio puntuado” para ilustrar la idea de que los procesos de innovación
tecnológica son caracterizados por un largo periodo estático interrumpido por eventos de cambio radical.
Ziman (2000) contiene un resumen interesante del debate evolucionista sobre la innovación tecnológica,
un debate que abarca la economía (David 1985), la historia de la ciencia y tecnología (Merton 2004; Mokyr
1996), la antropología cultural (Cavalli Sforza and Feldman 1981), la ingeniería (Basalla 1988; Vincenti
1994), como también la biología evolucionista y la física (Casals et al. 2012; Kauffman 2000).
Esta tesis contiene tres ensayos. Los tres ensayos tratan de aportar nuevo conocimiento sobre la
literatura de innovación que ha adoptado analogías evolucionistas para arrojar luz sobre los procesos que
conducen a la aparición de nuevas tecnologías, como así también sobre las implicaciones en términos de
incertidumbre tecnológica. La tesis está dividida en dos partes. La primera parte, correspondiente al
primer ensayo, se focaliza sobre el papel jugado por la incertidumbre tecnológica en el funcionamiento
de los mercados de tecnología. La segunda parte, la correspondiente a los últimos dos ensayos, analiza
los procesos de evolución tecnológica que conducen a la aparición de nuevas tecnologías y que
representan, en cierto modo, las “raíces” de la incertidumbre tecnológica. Concretamente, la segunda
parte de la tesis ayuda a comprender los procesos a través de los cuales la tecnología, de forma
impredecible, puede mutar sus funciones y usos más allá de aquellos para los cuales fue originalmente
diseñada y desarrollada. La antigua prensa de Gutenberg, por ejemplo, fue desarrollada basándose en el
diseño de las tecnologías utilizadas por la producción de vino (Johnson 2010). La historia de la tecnología

10
está llena de ejemplos similares. En esta tesis se adoptan nuevas teorías evolucionistas, como las teorías
de exaptation, para arrojar luz sobre estos procesos, dada la atención creciente que están recibiendo en los
estudios de innovación.
El primer ensayo diserta sobre el papel jugado por la incertidumbre tecnológica en el funcionamiento
de los mercados de tecnología. La hipótesis principal es que la incertidumbre tecnológica disminuye el
incentivo de las empresas para participar en estos mercados. Para probar las hipótesis principales analizo
un pequeño mercado de licencias tecnológicas en el cual los actores principales son las oficinas de
licencias tecnológicas de un hospital estadounidense y las empresas interesadas en sus patentes. Para
medir la incertidumbre tecnológica de una patente, utilizo una nueva metodología basada en el análisis
de redes. Los resultados principales sugieren que niveles más bajos de incertidumbre tecnológica se
correlacionan con un funcionamiento más rápido del mercado.
El segundo ensayo busca explicar los procesos por los cuales tecnologías originalmente
desarrolladas para usos y funciones específicas impredeciblemente pueden ser utilizadas de otros modos.
Se introduce el concepto evolucionista de exaptation para arrojar luz sobre un mecanismo alternativo que
conduce a la aparición de nuevas tecnologías. Éste consiste en el descubrimiento de funciones “latentes”
de tecnologías existentes que fueron originalmente desarrolladas para usos y funciones diferentes.
Además se explora el papel jugado por la complejidad tecnológica, definida en términos de interdependencia
entre las componentes físicas de una tecnología. La hipótesis principal es que niveles intermedios de
complejidad tecnológica están correlacionados con un aumento en la emergencia de nuevas funciones
tecnológicas. Para probar las hipótesis principales, utilizo una muestra aleatoria de todas las patentes
norteamericanas concedidas durante los primeros seis meses de 1991. Para medir la emergencia de nuevas
funciones tecnológicas, utilizo una nueva metodología que se basa en la proporción de citas de patentes
que pertenecen a clases tecnológicas distintas. Los resultados apoyan las hipótesis principales.
A diferencia del segundo ensayo, que se focaliza en los determinantes “tecnológicos” de la
exaptation, éste ensayo se centra en los factores que pertenecen al dominio “socio-cognitivo”. Además,
este ensayo se basa sobre un estudio de caso sobre una tecnología específica. El ensayo explora como la
11
interacción de factores contingentes y conocimiento previo determinaron la transposición de una tecnología
especifica -los enrolladores, desarrollados originalmente en la industria del papel-, al sector de los yates
de lujo, donde empezaron a ser utilizados como “retractores” de cuerdas y velas. El ensayo analiza la
historia de dos empresas italianas fundadas por el mismo inventor y empresario, la “Fabio Perini S.p.A.”
y la “Perini Navi S.p.A.”, y se basa en el análisis de documentos de archivo, como patentes y notas
originales, proporcionados por las empresas.
Esta tesis es interdisciplinar, y se sitúa en la intersección de las nuevas teorías evolucionistas, de
la literatura de innovación y emprendimiento, como también de la investigación sobre el funcionamiento
de los mercados de tecnología. Además, esta tesis se basa en una combinación de enfoques cualitativos y
cuantitativos.

12
______
Chapter 1
Technological Uncertainty in Markets for Technology
______________________________________________________________________________________
Co-Authored with Ayfer Ali1
_______________________________________
ABSTRACT
This essay explores the role played by technological uncertainty for the functioning of a small market
for technology. The main hypothesis is that technological uncertainty, making problematic the valuation
of patent assets, may decrease the incentive of firms to participate in markets for technology. In order to
test the main hypothesis, I explore a small market for technology whose main actors are: 1) the technology
licensing office (TLO) of a large US academic medical center; 2) the firms who showed interest in TLO’s
patents by signing confidentiality, options or licensing agreements for those patents. I adopt a novel
approach in order to measure technological uncertainty of a patent. This approach is based on
connectivity analysis, which is a methodology originating from network analysis that has been recently
applied in innovation studies. The evidence suggests that lower levels of technological uncertainty are
correlated with an increase in the hazard of licensing.
Keywords: uncertainty, markets for technology, patents, connectivity analysis
1 Assistant professor, Department of Business Administration, Universidad Carlos III de Madrid
E-mail: [email protected]
13
Index
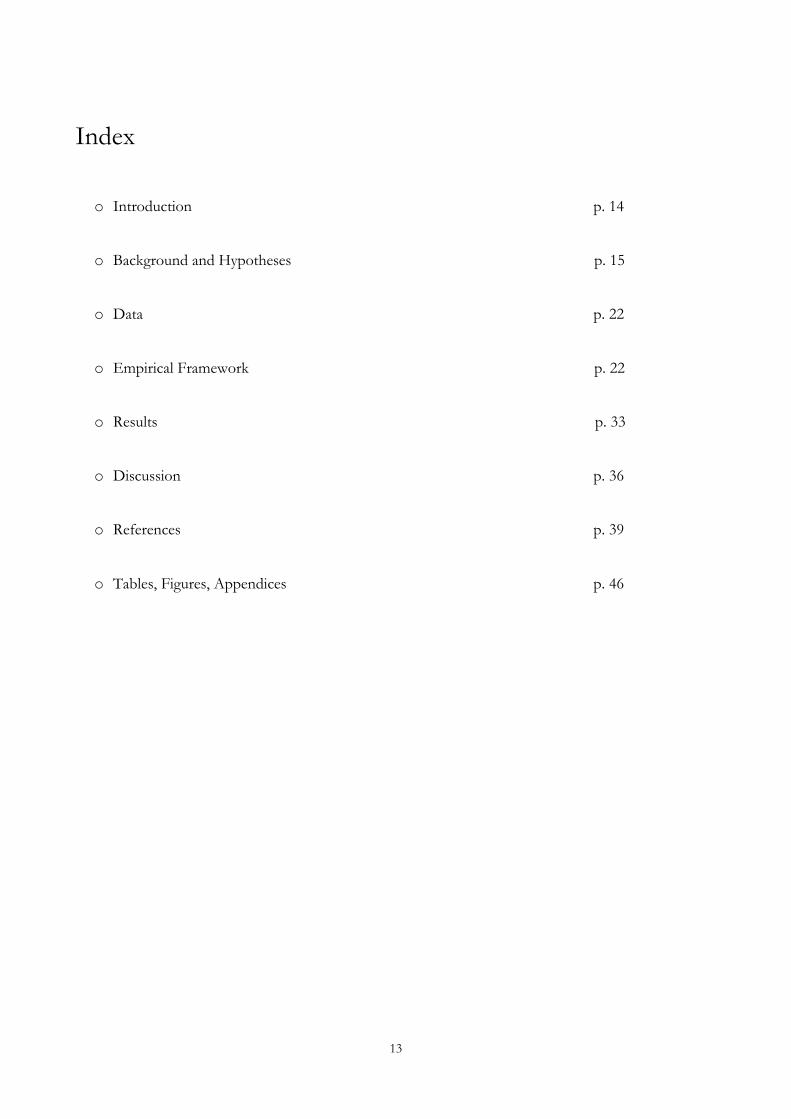
o Introduction p. 14
o Background and Hypotheses p. 15
o Data p. 22
o Empirical Framework p. 22
o Results p. 33
o Discussion p. 36
o References p. 39
o Tables, Figures, Appendices p. 46
14
Introduction
Recent literature on markets for technology has explored the efficiency of these markets from a
perspective that merges the “market design” literature and the markets for technology literature (Gans
and Stern 2010). The market design literature (Myerson 2008; Roth 2002, 2008) has highlighted three
conditions for efficient market operations: market thickness, lack of congestion and market safety (Roth
2007). The markets for technology literature, on the other hand, has focused on the qualities that make
technology and ideas different from more traditional goods: need for complementary ideas, value rivalry,
and ease of reproducibility (Gans and Stern 2010). The issue of market thickness is central in the debate
and the lack of complementary ideas is likely “the most significant” of the issues that prevent thick market
functioning (Gans and Stern 2010). Similarly, Ali and Cockburn (2012) have suggested that lack of
demand in markets for technology is partly due to the necessity of complementary technologies in the
licensing firm. This suggests that participation in markets for technology depends on whether these
markets can help aggregate in one entity all the required complementary patent inputs, in other words
on the ability of these markets to avoid strategic hold-up and to aggregate across a package of patents
(Gans and Stern 2010). However, as suggested by Gans and Stern (2010), lack of participation in these
markets may also be due to a lack of complementarity that unfolds over the time dimension. In fact, the
value of a technological innovation to a firm may depend on the emergence of complementary
technological innovations whose precise form and timing may be serendipitous and difficult to anticipate
(Gans and Stern 2010). Similarly, it may depend on the emergence of complementary technological
innovations that may not yet exist (Rosenberg 1996). This suggests that technological uncertainty can
prevent markets for technology from functioning smoothly.
The aim of this paper is to analyze the role played by technological uncertainty in the functioning of
markets for technology. A stylized framework is proposed, borrowed from Denrell et al. (2003), in order
to shed light on a possible mechanism that may underlie the relationship between technological
uncertainty and markets for technology: we argue that, because of market incompleteness, which
characterizes markets for technology in a significant way, technological uncertainty can make problematic
15
the valuation of technological assets. Disagreements on valuation may then lead to fewer deals. Therefore,
our framework indirectly suggests that, in the presence of technological uncertainty, the achievement of
completeness can improve market functioning. In order to understand the role played by technological
uncertainty, we explore a small market for technology whose actors are the technology licensing office
(TLO) of a large academic medical center and the firms who showed interest by signing confidentiality
agreements, options or licensing agreements for the TLO’s patents. In order to measure the technological
uncertainty of a patent, we adopt a novel aproach based on connectivity analysis, a methodology originating
from the field of network analysis and graph theory, which has found recent application in several studies
on patent networks (Barberà-Tomas et al. 2011; Martinelli 2012). The evidence suggests that lower levels
of technological uncertainty are correlated with an increase in the hazard of licensing.
This paper contributes to the literature on markets for technology, answering a call to explore
the role played by uncertainty in their efficient functioning (Arora and Gambardella, 2010). It has been
argued that the growth of these markets is hindered by uncertainty about the value of patents (Arora and
Gambardella 2010). The aim of this paper is to disentangle the problem of valuation, exploring the role
played by technological uncertainty. To our knowledge, previous research has not explored the linkage
between markets for technology and technological uncertainty adopting this kind of perspective.
Moreover, we introduce a novel methodology for the measurement of technological uncertainty. The rest
of the paper is organized as follows. The next section develops the theoretical framework and formulates
testable hypotheses. The third section describes the data. The fourth section describes the empirical
setting. The fifth section presents the results. The last section discusses and concludes.
Background and Hypotheses
Markets for technology and uncertainty about patent valuation
The rate of transactions in markets for technology has been increasing. However, it is still
uncommon for technologies to be traded in organized marketplaces (Gans and Stern 2010). As suggested
by Fosfuri and Giarratana (2010), while most markets function “nicely and easily”, markets for
16
technology are characterized by “maladies” that lead to their failure. Transaction costs have been
explicitly recognized as a limit to their development (Arora and Gambardella 2010; Teece 1998).
However, research is still needed on the role played by transaction costs and their influence on these
markets (Arora and Gambardella 2010). Many researchers have stressed the problem of information
asymmetry, accentuated by opportunistic behavior (Williamson 1973). However, they have neglected the
other pillar of transaction cost theory: the problem of uncertainty in the transactional environment, the
negative consequences of which are heightened by the presence of bounded rationality (Arora and
Gambardella, 2010). A few researchers, noticing this gap, have started to emphasize that “symmetric
uncertainties” are significant obstacles to the functioning of these markets (Arora and Gambardella,
2010). For example, it has been argued that the growth of markets for technology is hindered by
fundamental uncertainty about the value of patents (Arora and Gambardella 2010): in other words, the
value of patents is “skewed” for all firms (Scherer and Harhoff 2000) and, while they may know the shape
of the value distribution, they may not know if the patent is in the “right tail” (Arora and Gambardella
2010). The main consequence is that the returns from buying a technology are also skewed and, therefore,
firms may choose to not participate in markets for technology (Arora and Gambardella 2010). The
existing evidence seems to confirm this hypothesis: using a sample of 229 US and Canadian licensors,
Razgaitis (2004)’s survey has shown that, for a total of 100 licensable technologies, for only 25 of them a
potential licensee is eventually found, negotiations are started in only 6 to 7 cases, and deals are eventually
concluded in only 3 to 4 cases (Arora and Gambardella 2010). Survey respondents indicated that the main
reason for deal failure was uncertainty over patent value.
Disentangling the uncertainty about patent valuation: the role of technological uncertainty
A fundamental prerequisite to understanding uncertainty about the value of patents is to provide
a clear definition of the object of valuation: a patent, which includes the legal rights provided by the
patent as well as an underlying technology (Pitkethly 2007). On the basis of this definition, we can
distinguish between the value of the legal rights provided by the patent and the value of the underlying
technology (Munari and Oriani, 2011). Therefore, we can distinguish between two fundamental levels of
17
uncertainty about the value of patents: 1) legal uncertainty, and 2) uncertainty about the underlying
technology (Munari and Oriani, 2011). Before a patent is granted, legal uncertainty has two sources:
uncertainty about whether the patent will be granted and, if granted, uncertainty about the scope of the
claims (Lemley and Shapiro 2005). After a patent is granted, there is still uncertainty on patent challenge
and enforcement (Lemley and Shapiro 2005). While not the main topic of this paper, an example of the
magnitude of legal uncertainty can be helpful: when the U.S. Court of Appeals decided to invalidate, two
years before expiry, a patent on Prozac in 2000, the company´s stock price dropped 31 percent in one
day (Lemley and Shapiro 2005). Uncertainty about the underlying technology can be decomposed into
market uncertainty and technological uncertainty (Oriani and Sobrero, 2008). Rosenberg (1996) identified
several sources of technological uncertainty: uncertainty about the development of complementary
technologies and of technological systems, uncertainty about which technology will end up dominating
an industry, as well as uncertainty about technological uses. Uncertainty about technological uses occupies
a special position if we consider that, very often, technological uses cannot be predicted in advance
(Rosenberg, 1996). In fact, as noticed by Rosenberg (1996), the history of technology is characterized by
the fact that many technologies, originally developed for narrowly defined uses, turned out to have
significant and unanticipated applications in very different fields. An example is provided by the laser:
despite the significant impact of the laser on telecommunications, initially patent lawyers were even
skeptical about applying for a patent, because according to them this invention had no relevance to that
industry (Rosenberg 1996). Therefore, technological uncertainty about uses has an “ontological”
dimension, because it does not relate to just “whether” specific technological developments will happen.
It also relates to “what” they will be, since they have never been seen before (Lane and Maxfield 2005).
Unlike the factors belonging to the legal domain, the channels through which technological factors may
affect valuation is not straightforward. Therefore, as noticed by Rosenberg (1996), the relationship
between technological uncertainty and valuation is far more complicated than any superficial claim may
suggest. In the next section a stylized theoretical framework, borrowed from Denrell et al. (2003), is
illustrated, in order to shed light on the relationship between technological uncertainty and valuation.
18
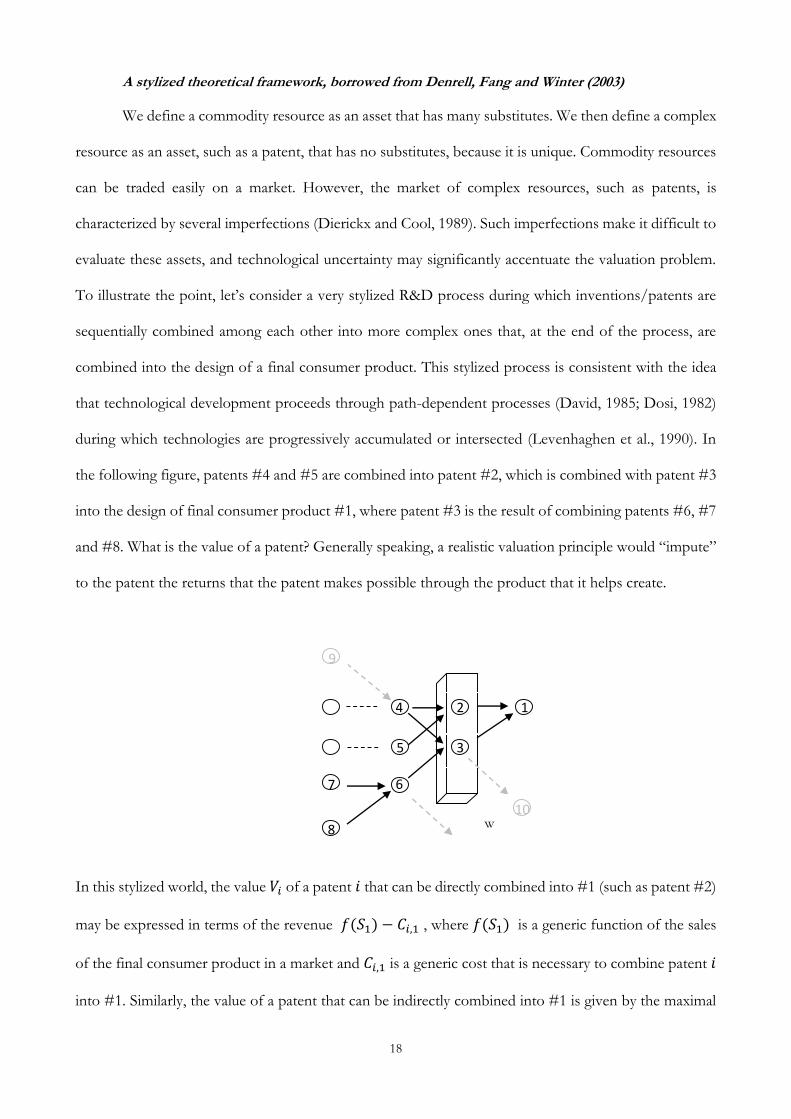
A stylized theoretical framework, borrowed from Denrell, Fang and Winter (2003)
We define a commodity resource as an asset that has many substitutes. We then define a complex
resource as an asset, such as a patent, that has no substitutes, because it is unique. Commodity resources
can be traded easily on a market. However, the market of complex resources, such as patents, is
characterized by several imperfections (Dierickx and Cool, 1989). Such imperfections make it difficult to
evaluate these assets, and technological uncertainty may significantly accentuate the valuation problem.
To illustrate the point, let’s consider a very stylized R&D process during which inventions/patents are
sequentially combined among each other into more complex ones that, at the end of the process, are
combined into the design of a final consumer product. This stylized process is consistent with the idea
that technological development proceeds through path-dependent processes (David, 1985; Dosi, 1982)
during which technologies are progressively accumulated or intersected (Levenhaghen et al., 1990). In
the following figure, patents #4 and #5 are combined into patent #2, which is combined with patent #3
into the design of final consumer product #1, where patent #3 is the result of combining patents #6, #7
and #8. What is the value of a patent? Generally speaking, a realistic valuation principle would “impute”
to the patent the returns that the patent makes possible through the product that it helps create.
In this stylized world, the value 𝑉𝑖 of a patent 𝑖 that can be directly combined into #1 (such as patent #2)
may be expressed in terms of the revenue 𝑓(𝑆1) − 𝐶𝑖,1 , where 𝑓(𝑆1) is a generic function of the sales
of the final consumer product in a market and 𝐶𝑖,1 is a generic cost that is necessary to combine patent 𝑖
into #1. Similarly, the value of a patent that can be indirectly combined into #1 is given by the maximal
w
4
5
2
3
1
6 7
8
10
9
19
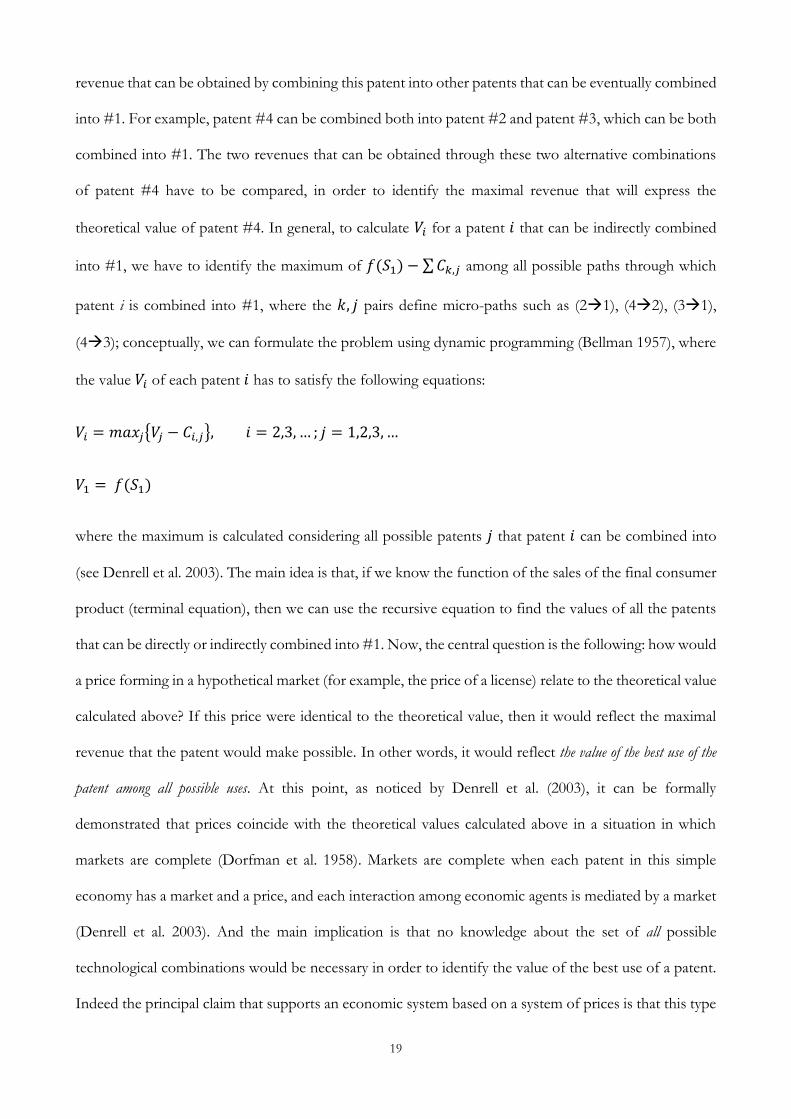
revenue that can be obtained by combining this patent into other patents that can be eventually combined
into #1. For example, patent #4 can be combined both into patent #2 and patent #3, which can be both
combined into #1. The two revenues that can be obtained through these two alternative combinations
of patent #4 have to be compared, in order to identify the maximal revenue that will express the
theoretical value of patent #4. In general, to calculate 𝑉𝑖 for a patent 𝑖 that can be indirectly combined
into #1, we have to identify the maximum of 𝑓(𝑆1) − ∑ 𝐶𝑘,𝑗 among all possible paths through which
patent i is combined into #1, where the 𝑘, 𝑗 pairs define micro-paths such as (21), (42), (31),
(43); conceptually, we can formulate the problem using dynamic programming (Bellman 1957), where
the value 𝑉𝑖 of each patent 𝑖 has to satisfy the following equations:
𝑉𝑖 = 𝑚𝑎𝑥𝑗{𝑉𝑗 − 𝐶𝑖,𝑗}, 𝑖 = 2,3, … ; 𝑗 = 1,2,3, …
𝑉1 = 𝑓(𝑆1)
where the maximum is calculated considering all possible patents 𝑗 that patent 𝑖 can be combined into
(see Denrell et al. 2003). The main idea is that, if we know the function of the sales of the final consumer
product (terminal equation), then we can use the recursive equation to find the values of all the patents
that can be directly or indirectly combined into #1. Now, the central question is the following: how would
a price forming in a hypothetical market (for example, the price of a license) relate to the theoretical value
calculated above? If this price were identical to the theoretical value, then it would reflect the maximal
revenue that the patent would make possible. In other words, it would reflect the value of the best use of the
patent among all possible uses. At this point, as noticed by Denrell et al. (2003), it can be formally
demonstrated that prices coincide with the theoretical values calculated above in a situation in which
markets are complete (Dorfman et al. 1958). Markets are complete when each patent in this simple
economy has a market and a price, and each interaction among economic agents is mediated by a market
(Denrell et al. 2003). And the main implication is that no knowledge about the set of all possible
technological combinations would be necessary in order to identify the value of the best use of a patent.
Indeed the principal claim that supports an economic system based on a system of prices is that this type
20
of knowledge is not necessary (Denrell et al. 2003), as noticed by Hayek (1945). Rather, a patent owner
would simply have to compare the values of 𝑉𝑗 − 𝐶𝑖,𝑗 for all possible patents 𝑗 into which 𝑖 can be directly
combined, in order to identify the value of the best use of the patent: in other words, local comparisons
of possible revenues would be sufficient in order to identify the value of the best use of a patent
(Koopmans 1957; Denrell et al. 2003). However, markets for technology are characterized by significant
levels of incompleteness, and “when markets are incomplete, prices may not correspond to the values computed in the
above way” (Denrell et al. 2003, p. 983). For example, if patents #2 and #3 are not traded and therefore
their prices cannot be observed, then the price of patent #4 cannot reflect the maximal revenue of
combining patent #4 via #2 or #3 into #1, unless economic agents know the possibility of these combinations. In
other words, “valuation in incomplete markets depends crucially on the knowledge economic agents have about alternative
transformations” (Denrell et al. 2003, p. 983). However, in uncertain technological domains, economic agents may
lack this kind of knowledge. Knowledge of technological transformations (and, in general, knowledge of
technological uses) is limited by the fact that technological transformations and uses are often unknown,
and cannot be pre-specified ex-ante (Bonaccorsi 2011). As noticed by Basalla (1988), inventions offer an
unlimited range of possibilities, but only few of them will be explored. We argue that, in the case of
markets for technology, characterized by pervasive levels of incompleteness, technological uncertainty
may lead to valuation problems and cause their malfunctioning. If patents #2 and #3 are not traded and
their prices cannot be observed, then the price of patent #4 cannot reflect the maximal revenue of
combining patent #4 via #2 or #3 into #1, unless economic agents “know” the possibility of these
combinations. However, if economic agents lack this kind of knowledge, they cannot see “through the
wall” (w) of uncertainty. Facing fundamental problems about the valuation of patent #4, they may choose
not to invest in #4 until uncertainty is resolved2. Therefore:
h1. Technological uncertainty, making valuation problematic, hinders the functioning of markets for technology.
2 The linkage between technological uncertainty and markets for technology can be analyzed under a real options lens. As noticed by Conti et al. (2013), when there is exogenous uncertainty and firms’ actions cannot reduce it, a dominant strategy is to wait until this uncertainty is resolved, buying an “option to defer”, whose cost is the “foregone benefit that the firm would realize had it invested immediately” (Conti et al. 2013, pag. 45).
21
In a recent review on markets for technology, Conti et al. (2013) have made a distinction between
the various determinants of the demand in markets for technology. They distinguish between institutional
factors, such as intellectual property rights, and organizational factors, such as firm size and capabilities.
Firm capabilities, in particular, have received increasing attention: building on the concept of absorptive
capacity (Cohen and Levinthal 1989), Arora and Gambardella (1994b) have introduced the distinction
between the “ability to evaluate” and the “ability to utilize” an external technology (to be eventually
acquired through a license). The ability to evaluate is the ability of a firm to “predict” the value of an
external technology, usually on the basis of scientific capabilities. The ability to utilize is the ability of a
firm to “extract” value from an external technology, usually on the basis of the downstream capabilities
it owns, such as manufacturing and marketing capabilities (Conti et al. 2013). We expect to observe that
both the ability to evaluate and to utilize an external technology play a negative moderating role in the
relationship between technological uncertainty and the functioning of markets for technology. For
example, the ability of a firm to evaluate an external technology may consist in a better ability to learn
about potential technological applications, as new information progressively emerges. Therefore:
h2. The higher is the ability of a firm to evaluate an external technology, the lower is the impact of technological uncertainty
on the functioning of markets for technology.
h3. The higher is the ability of a firm to utilize an external technology, the lower is the impact of technological uncertainty
on the functioning of markets for technology.
The relationship between technological uncertainty and the functioning of markets for
technology may also vary across technological characteristics, depending on the level of technological
maturity and on the extent to which a technology builds on early stage research (Narin et al. 1997;
Ziedonis 2007). We expect to observe that technological maturity weakens the relationship between technological
uncertainty and the functioning of markets for technology. As noticed by Ziedonis (2007), mature technologies are
characterized by lower uncertainty regarding the market potential, and this may positively affect the
decision to sign agreements. Similarly, the extent to which a technology builds on early-stage research strengthens the
relationship between technological uncertainty and market functioning. In other words, technologies based on early-
22
stage research are characterized by higher uncertainty regarding the market potential, and this may
negatively affect the decision to sign agreements.
Data
To test our hypotheses, we explore a small market for technology. The market actors are the
technology licensing office (TLO) of a large academic medical center and the firms who signed
confidentiality, option or licensing agreements for the TLO’s patents. Our dataset consists of all TLO’s
patents filed and granted from 1980 to 2008, and the agreements signed from 1980 to 2011. While a
confidentiality agreement gives a firm the right to “look” at a confidential description of the patent, an
option (upon the payment of a fee) gives a firm the right to license the patent within a pre-specified
period. Otherwise a firm can directly sign a license (for more details, see Ali and Cockburn 2012). Our
objective is to estimate the relationship between technological uncertainty, measured at the patent level,
and the timing of licensing. For this purpose, we build on event history analysis, in order to estimate the
hazard rate of the time during which the first license occurs. Building on event history analysis, as in
Gans et al. (2008), our “failure” event is represented by the first instance of licensing. After excluding the
patents that were licensed before filing, our final dataset consists of 278 patents and 2448 patent-year
observations. We use patent data obtained from the USPTO, NBER (Hall et al. 2001), and Patent
Network Dataverse databases (Lai et al. 2011).
Empirical Framework
Econometric specification
Our objective is to disentangle the impact of technological uncertainty from other factors, such
as sources of legal uncertainty. We divided, for each TLO’s patent, the data into yearly observations
starting from the earliest filing date3. We defined 𝑙𝑖𝑐𝑒𝑛𝑠𝑒𝑖𝑡 to be equal to 0 until the year in which the
3 The “earliest filing date” is the filing date of the “parent” application, if the patent in question is a continuation or divisional application of an earlier US parent application.
23
first licensing event occurs for patent i, at which point a unique failure event sets licenseit equal to 1.
We also defined post − grantit, a time-varying control equal to 0 in the years that follow the earliest
filing date and precede the grant date, and equal to 1 in the years that follow the grant date. This regressor
allows us to distinguish between a pre-patent and a post-patent period for each patent. (Moreover,
according to Gans et al. (2008), it could be interpreted as the treatment of patent grant on the timing of
licensing). We also introduced a grant-lag control, defined as the time distance between the grant date
and the earliest filing date. (According to Gans et al. (2008), this regressor could directly control for
unobserved technology-specific factors that may result in a spurious correlation between the grant lag
and the licensing lag)4. We then introduced 𝑥𝑖𝑡, a time-varying regressor defined in the next section, which
expresses the technological uncertainty of patent i. As in Gans et al. (2008), we employed a Cox
Proportional Hazard Model, which includes a non-parametric baseline hazard rate, and a multiplicative
term allows time-varying and time-invarying regressors to have, relative to the baseline, a proportional
impact (Lancaster 1990):
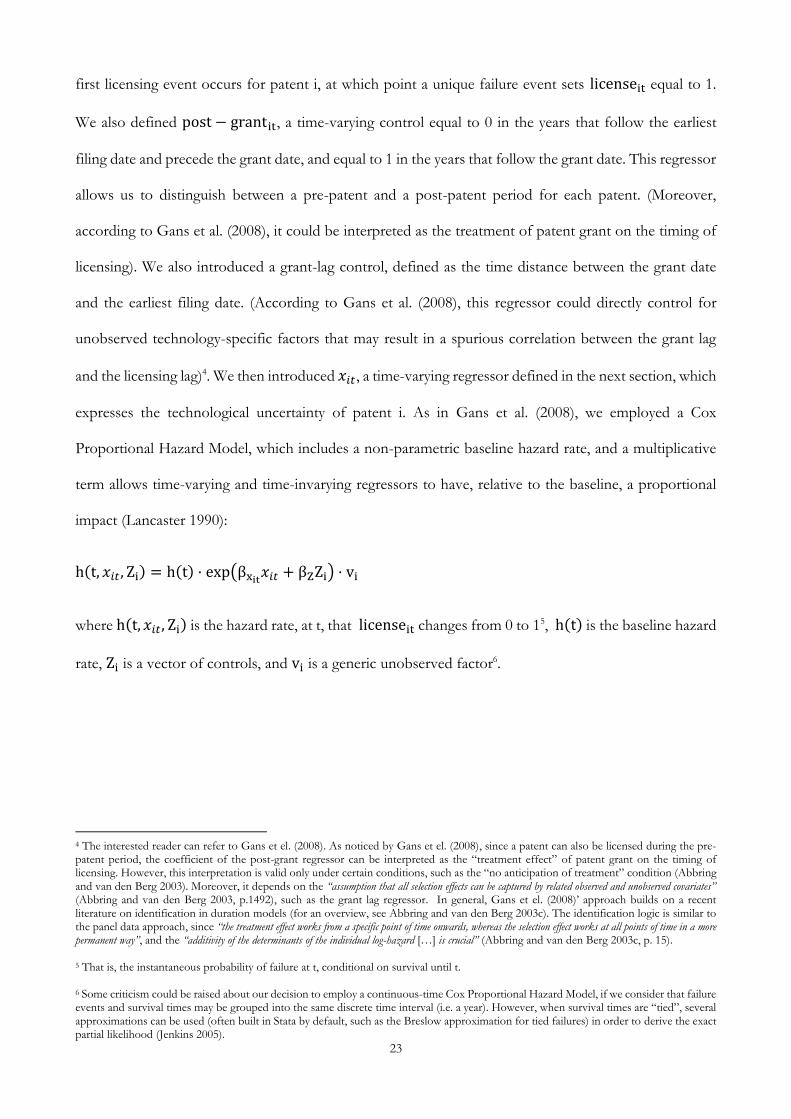
h(t, 𝑥𝑖𝑡, Zi) = h(t) · exp(βxit𝑥𝑖𝑡 + βZZi) · vi
where h(t, 𝑥𝑖𝑡, Zi) is the hazard rate, at t, that licenseit changes from 0 to 15, h(t) is the baseline hazard
rate, Zi is a vector of controls, and vi is a generic unobserved factor6.
4 The interested reader can refer to Gans et el. (2008). As noticed by Gans et el. (2008), since a patent can also be licensed during the pre-patent period, the coefficient of the post-grant regressor can be interpreted as the “treatment effect” of patent grant on the timing of licensing. However, this interpretation is valid only under certain conditions, such as the “no anticipation of treatment” condition (Abbring and van den Berg 2003). Moreover, it depends on the “assumption that all selection effects can be captured by related observed and unobserved covariates” (Abbring and van den Berg 2003, p.1492), such as the grant lag regressor. In general, Gans et el. (2008)’ approach builds on a recent literature on identification in duration models (for an overview, see Abbring and van den Berg 2003c). The identification logic is similar to the panel data approach, since “the treatment effect works from a specific point of time onwards, whereas the selection effect works at all points of time in a more permanent way”, and the “additivity of the determinants of the individual log-hazard […] is crucial” (Abbring and van den Berg 2003c, p. 15). 5 That is, the instantaneous probability of failure at t, conditional on survival until t. 6 Some criticism could be raised about our decision to employ a continuous-time Cox Proportional Hazard Model, if we consider that failure events and survival times may be grouped into the same discrete time interval (i.e. a year). However, when survival times are “tied”, several approximations can be used (often built in Stata by default, such as the Breslow approximation for tied failures) in order to derive the exact partial likelihood (Jenkins 2005).
24
Measures: technological uncertainty
In order to measure technological uncertainty, we adopted a novel methodology based on an
algorithm that counts the number of citation paths (defined as “patent connectivity”) passing through
the patent. We assumed that patent connectivity is a proxy of the “technological intensity” of the
trajectory to which the patent belongs, and of low uncertainty. We built on connectivity analysis, a
methodology originating from the field of network analysis and graph theory, which has found recent
application in innovation studies (Barberà-Tomas and Consoli 2012; Barberà-Tomas et al. 2011;
Martinelli 2012). For example, Martinelli (2012) has analyzed how technological trajectories evolve in the
telecommunications industry, using a novel methodology that identifies the main trajectory of a patent
citation network and tracks its changes as the patent citation network evolves. The disappearance of a
patent from the technological trajectory is an indicator of “uncertainty” (Martinelli 2012)7. Barberà-
Tomas and Consoli (2012) have adopted a similar approach, in in order to analyze strategic responses to
persistent uncertainty in medical innovation. In this paper, we proposed an extension of their approach,
and we directly considered the connectivity of a patent, rather than its disappearance from the main
trajectory, as an indicator of uncertainty. We assumed that the higher the connectivity, the higher is the
probability that the patent will remain stable on the main trajectory, the lower is the uncertainty. To
calculate patent connectivity, we adopted a SPC (Search Path Count) approach, which is based on an
efficient algorithm that counts how many times a patent lies on “all” the paths between “all” patents of
the citation network constituted by “all” US patents belonging to the relevant technological classes (for
technical details, see De Nooy et al. 2011). When we look at patent citations, we are typically confronted
with a network whose nodes and arcs are respectively constituted by patents and citations among patents,
and in which the “forward citations” received by a patent correspond to an in-degree centrality index that
measures the “local” importance of the patent in the network (Valverde et al. 2006; Wartburg et al 2005).
While the use of forward citations may be intuitive, “one may also suggest that this exercise ought to be integrated
with a study of the whole ‘connectivity structure’ of the network in question”, as suggested by Fontana et al. (2008,
7 See Martinelli (2012), pag. 427.
25
p.7). In other words, it is possible to characterize the network position of a patent by taking into account
not only direct citations, but also indirect ones. In this paper, we adopted this approach. As noticed by
Wartburg et al. (2005), in the case of social networks indirect links are less valuable than direct links.
However, in the case of patent networks, we can hypothesize that the technological and “knowledge”
foundations of patents encompass not only the very recent developments that are cited directly, but also
the developments of earlier patents8. When we give a look to patent citations, we are typically confronted
with a network whose nodes and links are respectively constituted by patents and citations among patents.
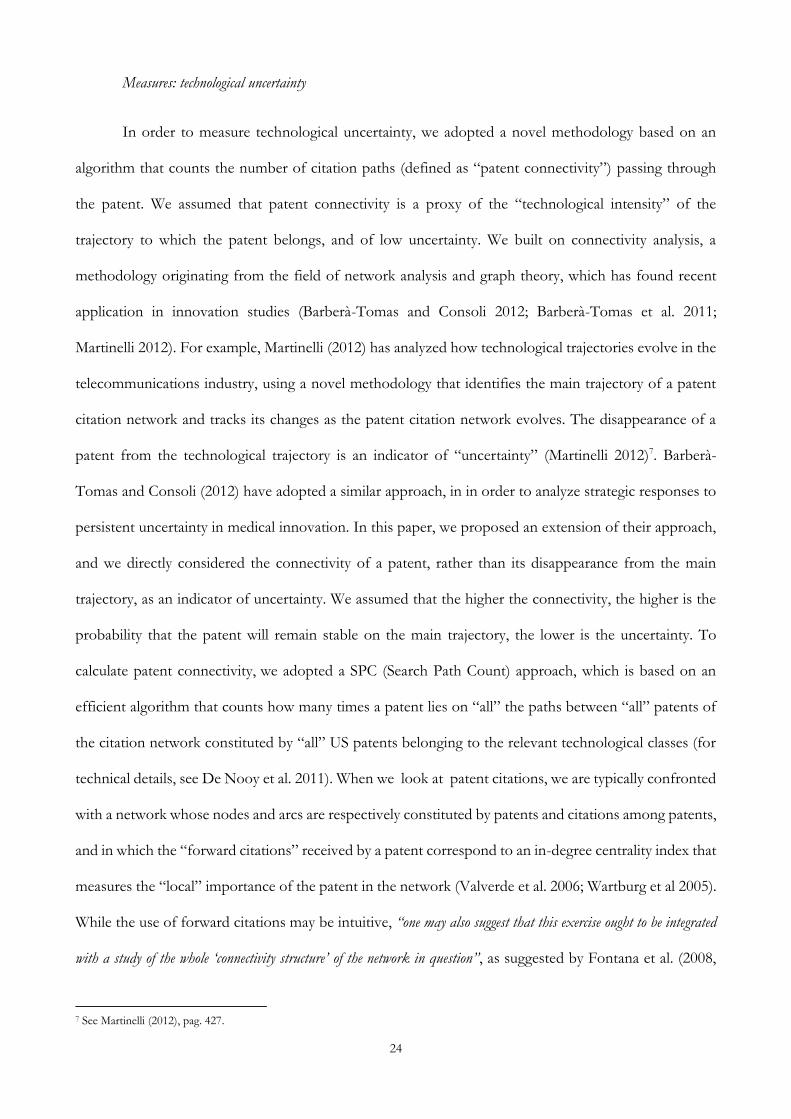
First, the network is directed: citations among patents have a direction, which is opposite to the direction
of the knowledge flow among them. In the illustration below, patent #2 cites patents #4 and #5. We
then assume the existence
of a knowledge flow going from patents #4 and #5 to patent #2. The fact that citations are placed by
patent examiners, rather than inventors, may call into question the use of citations as maps of “knowledge
flows”, as noticed by Alcacer and Gittelman (2006). However, the issue of knowledge flow as conceived
by Alcacer and Gittelman (2006) does not matter in our case, since we are interested in the “technical
link” among patents and not in weather the inventor was aware of the previous inventions (Martinelli
2010)9. Second, the network is binary, since the presence of a citation can be associated to a 1 and its
8 This is consistent with recent studies that have described the “evolution of technology” as a process characterized by “travels in time” that resurrect early, or even extinct, technologies: after having classified a collection of cornet bells (some of them produced in 1825), Temkin and Eldredge (2007) showed that the evolution of cornet bells, and the evolution of technology in general, can be represented in terms of a “spreading, recursive network of pathways that often double back to ‘dead’ ends” (Kelly 2010, p. 50). 9 As noticed by Verspagen (2007), the use of patent citations as a tool for mapping trajectories is justified by the fact that “a reference to a previous patent indicates that the knowledge in the latter patent was in some way useful for developing the new knowledge described in the citing patent” (p. 6).
4
5
2
3
1
6 7
8
9
10

26
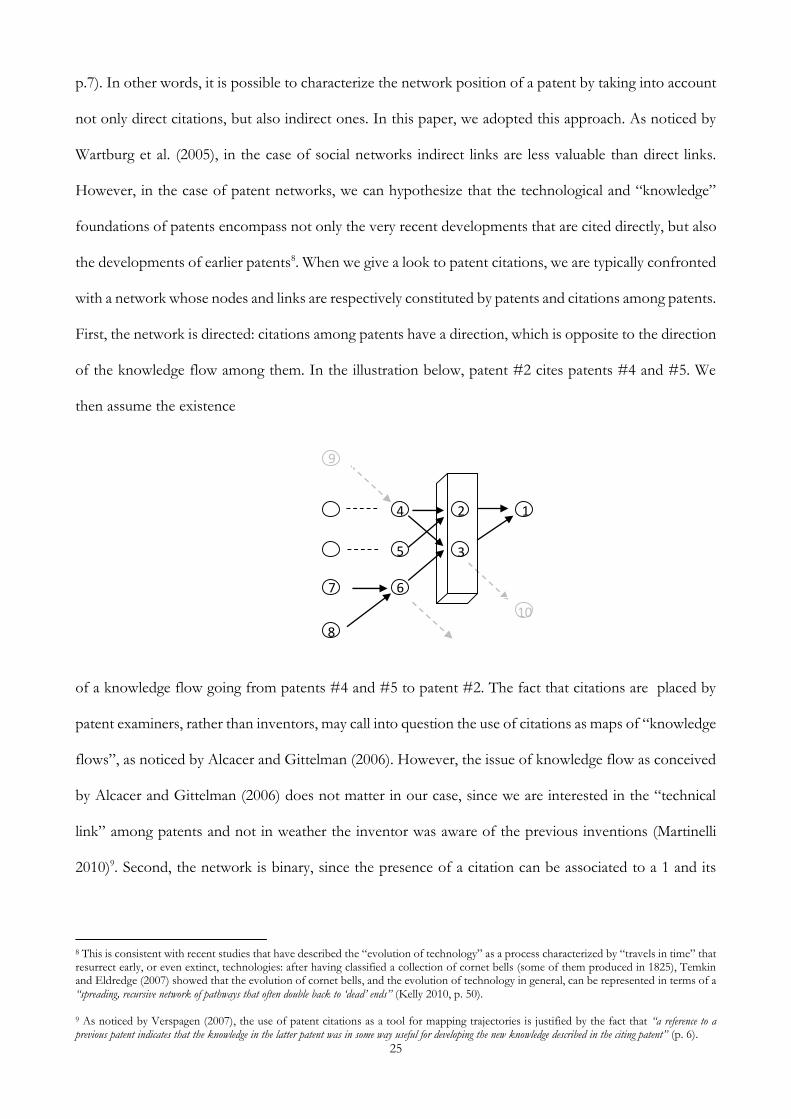
absence to a 0, and therefore no numerical weights besides 1 or 0 are associated to citations so far. Third,
the network is not characterized by cycles. This property is intuitive, since patents can only cite previous
patents. In the example, patent #2 (issued in 1990) cites patents #4 and #5 (issued in 1985 and 1975
respectively). The presence of a cycle is excluded by the fact that patents #4 and #5 cannot cite a “future”
patent, such as #2. Fourth, as noticed by Martinelli (2012), we can distinguish among three kinds of
patents: a) startpoints, with in-degree equal to 0, in which no arc is ending, such as #7, #8 and #9; b)
endpoints, with out-degree equal to 0, in which no arc is starting, such as #1 and #10; c) intermediates,
with in-degree and out-degree different from 0, such as #3, #4, #5 and #6. We described the main
properties of a patent citation network. The following steps explain the procedure used to calculate
technological uncertainty.
1. Identification of technological classes. For each of the 28 different technological classes of TLO’s
patents, eventual overlapping technological classes were identified and added to the set, on the
basis of the classification information provided by the USPTO. The rationale is that several
technological classes of the US patent system overlap. For example, class 514 is considered to be
an integral part of class 424, retaining the same definitions. Therefore, a set of almost 50 different
technological classes was identified.
2. Extraction of the citation network. The citation network of the patents that belonged to this set of
classes was extracted from the patent citation database provided by the USPTO, containing
several millions of records of all citations among all US patents issued from the beginning of 1975
to the end of 2009. The time evolution of the citation network was extracted: we firstly extracted
the citation network of patents issued in 1975; we then added, year by year until 2009, the patents
issued in that year. In others words, 35 different “snapshots” of the patent citation network were
extracted: the first includes citations among patents issued in 1975, the second includes citations
among patents issued from the beginning of 1975 to the end of 1976, the third includes citations
among patents issued from the beginning of 1975 to the end of 1977, and so on until 2009.
3. Inversion of the citation network. Each snapshot was then inverted, since citations among patents have
a direction that is the opposite of the direction of the technical knowledge flow among them.
27
4. Transformation of the inverted binary citation network in a weighted citation network. Afterwards, each
citation was assigned a numerical weight. The numerical weight was calculated by a SPC (Search
Path Count) algorithm in Pajek. The SPC algorithm firstly identified, for each startpoint, all paths
in the network between the startpoint and all the reachable endpoints. Then it counted, for each
citation in the network and for each patent to which the citation is incident, the number of paths
passing through it. Going back to the illustration, the SPC algorithm firstly identified all paths
between startpoints #5, #7, #8 and #9 end endpoints #1 and #10: that is 9-4-2-1, 9-4-3-1, 9-4-
3-10, 5-2-1, 7-6-3-1, 7-6-3-10, 8-6-3-1, 8-6-3-10. It then counted the number of paths passing
through each patent. For example, 6 paths pass through patent 3 (for technical details, see De
Nooy et al. 2011). The SPC method is based on a breadth-first-search efficient algorithm that,
after the topological sort of the network, computes the weights fast and exactly, without any kind
of approximation (see Batagelj, 2003).
5. Re-scaling of patent metrics. The connectivity of each patent was re-scaled by the median connectivity
of all patents issued in the same year and belonging to the same technological class. The re-scaling
was performed in order to remove systematic sources of variation of connectivity values across
technological classes, or taking place during time as the size of the network increases, as well as
to purge the data of effects due to truncation10. We therefore followed the “fixed-effects
approach” proposed by Hall et al. (2001) for forward citations, assuming that all sources of
systematic variation have to be removed before comparing patents belonging to different
technological classes and to different cohorts. The rationale of the decision to re-scale by the
median, rather than the average, is explained by the fact that the distribution of connectivity
values is right skewed, and therefore very large values may easily distort averages (Herraiz et al.,
2011). Moreover, to correct for skewness, we considered the logarithm of scaled connectivity.
Therefore, we defined the scaled connectivity of patent i at time interval t as follows:
10 The issue of truncation is not relevant in our case, since connectivity values were calculated in such a way that “fixed-window” comparisons are made possible (Hall et al. 2001).
28
scit = ln (cit/Mc(year,cl) t)
where cit is the connectivity of patent i at time t, and Mc(year,cl) t is the median connectivity at time t of
all patents issued in the same year and belonging to the same technological class. We then defined xit, a
time-varying regressor which expresses the technological uncertainty of patent i at time t in terms of
decreasing levels of scaled connectivity.
Measures: ability to evaluate and ability to utilize
To measure a firm’s ability to evaluate an external technology, we calculated how central is the
technological class of the licensed patent, and the knowledge element associated to it, in the network of
technological classes of the firm’s patent portfolio. Therefore, we assumed that technological classes are
the elements of the firm’s knowledge base (Fleming and Sorenson 2001) and that the network of
technological classes is the structure of the firm’s knowledge base (Yayavaram and Ahuja 2008). In order
to calculate the measure, we first built the network of technological classes, as in Yayavaram and Ahuja
(2008). For each instance of licensing, we considered the firm associated to it. We then obtained the
patent portfolio of the firm, consisting of all the patents accumulated by the firm during the three years
that precede the licensing date.11 We then matched each patent to the multiple technological class
assignments made by the USPTO, obtained from the Patent Network Dataverse database (Lai et al.
2011). We then built the coupling matrix of the firm’s knowledge base, a weighted network whose nodes
are the technological classes and the strength of coupling between them is given by the number of patents
in which they co-occur. As noticed by Yayavaram and Ahuja (2008), this measure may approximate the
“cognitive” structure that allows a firm to evaluate an external technology, and to learn about new
technological applications as new information progressively emerges. Figure 2 provides an illustration of
a knowledge base structure, for a single firm. The following steps consisted in the calculation of
technological class centrality (class of the licensed patent) in the firm’s knowledge network. We adopted
11 Since firm names are not standardized in USPTO databases, they were manually disambiguated in order to eliminate common misspellings (Ali and Cockburn 2012).
29
the measure of degree centrality for weighted networks proposed by Opsahl et al. (2010). The measure
can be formalized as follows:
dci = ki1−α ∗ (
si
ki)
α
where ki = ∑ xijNj and si = ∑ wij
Nj , i is the technological class of the licensed patent, j indexes all other
technological classes, N is the total number of technological classes, and x is an adjacency matrix in which
the cell xij is 1 if technological class i is connected to j, and 0 otherwise. Similarly, w is a weighted
adjacency matrix in which the value of the cell wij, if greater than 0, is the weight of the connection
between technological class i and technological class j, given by the number of patents in which they co-
occur. Finally, 𝛼 is a weighting parameter, set to 0.512. To correct for the fact that the size of knowledge
networks may vary across firms, we scaled the measure by the average weighted degree centrality of the
other classes. In order to measure a firm’s ability to utilize an external technology, we calculated the number
of patents in the firm’s patent portfolio. Since patents are an output of R&D expenditures, we assumed
that their number is a proxy of firm’s financial resources and, indirectly, of their manufacturing and
marketing capabilities.
Measures: control variables
Alternative sources of uncertainty about the underlying technological innovation. We controlled for alternative
sources of technological uncertainty, in order to rule out other factors that may be correlated to our
measure of technological uncertainty and, at the same time, to licensing outcomes. We also controlled
for sources of uncertainty about the market potential of the technology. As noticed by Ziedonis (2007),
we could ideally measure the technological uncertainty of a technology, as well as the uncertainty about
its market potential, by determining the development’s phase of the invention (and therefore its
“maturity”) at the time of disclosure. However, such information is not available. Therefore, building on
Lanjouw and Shankerman (2001) and Ziedonis (2007), we used the number of backward citations. It is likely
12 The weighting parameter determines the relative importance of the number of node’s ties compared to their strength.

30
that, in technological areas with more prior art to cite, there is less technological uncertainty, and less
uncertainty about market potential of the technology (Ziedonis 2007). We also controlled for the aging
of backward patent citations. We calculated youth of backward patent citations, as the average difference
between the issue year of each backward patent citation and the issue year of the patent. Similarly, we
calculate the youth of oldest backward patent citation, as the difference between the issue year of the oldest
backward patent citation and the issue year of the patent. Issue years were extracted algorithmically from
the USPTO web-page of each patent, since USPTO databases only provide backward citations dating
back to 1975 at most. We also controlled for sources of uncertainty that may be captured by the extent
to which the patent builds on scientific research. We introduced the number of non-patent references, such
as references to scientific journals, to control for the extent to which the patent builds on scientific
research. The extent to which a patent builds on scientific research may determine the success of complex
and uncertain inventive processes (Fleming and Sorenson 2004). Indeed, as noticed by Hegde (2011), the
number of non-patent references can be used as a proxy of closeness to commercial applications. In fact,
as noticed by Narin et al. (1997), patents that have more scientific references tend to protect early-stage
inventions. We also controlled for the youth of non-patent references, calculating the average difference
between the year of each non-patent reference and the issue year of the patent. We also controlled for
the youth of oldest non-patent reference, calculating the difference between the year of the oldest non-patent
reference and the issue year of the patent. Non-patent references and their years were extracted manually
from the USPTO web-page of each patent. Finally, in order to control for alternative sources of
technological uncertainty, we introduced growth rate of class, a control for the growth rate of the number
of patents issued in the same technological class of the patent between the two years that precede the
earliest filing date.
Sources of legal uncertainty. Before a patent has been granted, there is uncertainty about whether the patent
will be granted and, if granted, uncertainty about the scope of the claims (Lemley and Shapiro 2005).
31
After a patent has been granted, these sources of uncertainty disappear (Gans et al. 2008)13, even though
other sources remain, especially those related to ultimate patent scope, and those related to patent
challenge and enforcement (Lemley and Shapiro 2005). To control for legal uncertainty, we introduced a
post-grant time-varying regressor, equal to 0 in the years after the earliest filing date and before the patent
grant date, and 1 after patent issue (see Gans et al. 2008). Moreover, as in Gans et al. (2008), we introduced
a grant lag regressor that counts the number of years between the earliest filing date and the issue date14.
Patent characteristics. We also controlled for several patent characteristics. As noticed by Gambardella and
Giarratana (2013), the capability of a firm to manufacture general-purpose technologies (Bresnahan and
Trajtenberg 1995) represents an important determinant of licensing. In order to measure the generality
of a patent, we counted the number of technological classes according to the international patent classification
(IPC). When counting the number of IPC classes, we used the first four digits only, as in Lerner (1994).
Therefore, we counted a patent assigned to IPC classes C12P 21/02, C12N 1/21, C12N 5/10, C07H
21/04 as falling into three classes, C12P, C12N and C07H respectively (Lerner 1994). We also controlled
for the number of claims. Claims have been used as an alternative proxy of generality (Gambardella and
Giarratana 2013), building on the idea that “the number of claims is […] an indication that an innovation is
broader” (Lanjouw and Schankerman 2004, p. 448). At the same time, more claims are an indication of
higher scope of legal protection (Lanjouw and Schankerman 2004), which may affect licensing outcomes.
As noticed by Merges and Nelson (1990), claims define the boundaries of legal protection, forming a
protective line around the patent that lets others know when they are infringing on their rights15. We also
controlled for the “importance” of a patent. As noticed by Trajtenberg (1990), forward citations
13 According to Gans et al. (2008), the key moment when grant and scope uncertainty are resolved is when the “notice of allowance” is received by the inventor, rather than the patent grant date (which, on average, follows the allowance date after 5-7 months). Nevertheless, the results of their analysis did not change when they tried to use the grant date as the key timing measure. 14 According to Gans et al. (2008), the coefficient of post-grant could be interpreted as the “treatment effect” of patent grant on the timing of licensing. However, this interpretation is valid only under certain conditions, such as the “no anticipation of treatment” condition (Abbring and van den Berg 2003). Moreover, it depends on the “assumption that all selection effects can be captured by related observed and unobserved covariates” (Abbring and van den Berg 2003, p.1492). Gans et al. (2008) introduced an allowance lag regressor, in order to directly control for the fact that post-grant may be correlated to an increase in the licensing hazard because of a spurious correlation between the grant lag and the licensing lag (the licensing lag is the distance, in years, between the earliest filing date and the date of the first license). 15 The scope of legal protection can be abstractly defined in terms of a set of multiple “embodiments” (i.e. claims) of the technology that, analogous to the “metes and bounds” of a real property, distinguishes inventors’ intellectual property from the surrounding terrain (Merges and Nelson 1990).
32
determine the importance of a patent, and are correlated to the value of the underlying invention.
Therefore, they may also affect licensing outcomes. However, the use of forward citations as a control
may present some difficulties (see Mehta et al. 2009). To address them we introduced forward metric, a
measure that scales the number of forward citations received until the year that precedes the first license,
by the average number of forward citations received (until the same year) by patents belonging to the
same technological class and cohort (Ziedonis 2007). We also tried to rule out the factors that may be
correlated to licensing outcomes, and that may be influenced by the experience of inventors. As noticed
by Fleming (2007), the distribution of inventive outcomes is highly skewed. Against the traditional belief
that the outliers of this distribution (innovative breakthroughs) arise from the effort of lone inventors,
Singh and Fleming (2010) have demonstrated that inventors’ collaboration increases the probability of
breakthroughs, because of greater opportunities of recombination during the process of creative search.
We controlled for the number of inventors of the patent, and for the number of inventors’ patents as observed
before the first license. Inventors’ careers were extracted from the Patent Network Dataverse database
(Lai et al. 2011). In order to identify inventors’ careers, we relied on the upper-bound disambiguation
(Lai et al. 2011)16.
Other controls. We introduced a looked before dummy, equal to 1 if the patent was “looked at” before the
first license.17 We also controlled for the number of times a patent was looked at before the first license: this
control may capture the level of competition by other firms. In fact, in a very similar setting, Ziedonis
(2007) introduced the variable “competitors”, based on the number of firms that signed secrecy
agreements for the licensed patent.
16 The lack of a consistent and unique identification of inventors at the USPTO results in name ambiguity on patent records. In order to remove ambiguity, a disambiguation algorithm has been proposed by Lai et al. (2011): a lower-bound disambiguation, which attempts to capture the careers of inventors in their entirety, at the cost of lumping together, occasionally, different inventors; an upper-bound disambiguation, “which attempts to ensure that each cluster corresponds to a distinct inventor at the cost of occasionally splitting a single inventor over multiple clusters” (Lai et al. 2011, p. 19). 17 That is, a confidentiality or an option agreement was signed.
33
Patent issue year fixed effects. We introduced a dummy for the issue year of the patent, in order to remove
systematic sources of variation taking place during time and that, eventually, may not be captured by the
rescaling of the connectivity metric.
Results
Table 1 presents descriptive statistics. The following tables present the results of our Cox hazard
regression models, in terms of hazard ratios (which should be read relative to one). Appendix 1 describes
the statistical properties of the patent citation network and of our measure: patent connectivity. Table 3
presents the results of Cox hazard regression models for the first hypothesis. The first model in Table 3
only includes controls for alternative sources of technological uncertainty, as well as patent issue year
fixed effects. The second specification adds controls for legal uncertainty. The third specification adds
controls for patent characteristics. The fourth specification adds the remaining controls. The fifth
specification contains the full model. The sixth specification contains the full model with interaction
effects for technological maturity. In the fifth specification, the coefficient of scaled connectivity is significant
at the 5% level and is correlated to a more than 11% increase in the hazard of licensing, in support of
our first hypothesis. The coefficient of post-grant is not significant, while the coefficient of grant lag is
positive and significant. This seems to suggest that, in our setting, the linkage between the grant of a
patent and the functioning of markets for technology is not clear. This result is consistent with the
conclusions made by Gans et al. (2008), who have noticed that this linkage cannot be generalized, because
it may vary significantly across sectors18. Moreover, unobserved factors, captured by the grant lag
regressor, seem to be important (Gans et al. 2008). The coefficient of looked before is positive and
significant, and its size relevant. This suggests that the previous signing of a confidentiality or option
agreement may act as a signal of patent “quality” that increases the hazard of licensing. The coefficient
of number of technological classes is positive and significant. This suggests that patent generality may be
positively associated to licensing, and to the functioning of markets for ideas (Gambardella and
18 We also run a model with monthly observations, as in Gans et al. (2008). We did not find substantial differences in the main results.
34
Giarratana 2013, Gans et al. 2008). The coefficient of number of claims is positive and significant, although
its size is not relevant. The coefficient of backward patent citations is positive and significant, although its
size is not relevant. The coefficient of number of inventors’ patents is significant but, strangely, is negatively
correlated to licensing. Finally, the coefficient of forward metric is negative and significant, and its size is
relevant. This last result is puzzling, and it may be due to the fact that this measure is in part endogenous
(Gans at al. 2008), since late censoring may induce higher a number of forward citations. In the sixth
specification, which contains the full model with interaction effects for technological maturity, the main
results do not change substantially. The coefficient of scaled connectivity is significant at the 10% level and
is correlated to a more than 9% increase in the hazard of licensing, in support of our first hypothesis.
The coefficient of number of times looked before becomes significant, with a negative sign. This suggests that,
if a patent has been the object of several confidentiality or option agreements not followed by licensing,
this may be a signal of technological risk rather than “quality”19. The coefficient of youth of backward patent
citations becomes negative and significant. This suggests that lower technological maturity is negatively
correlated to licensing, contrary to the finding of Gans et al. (2008). The coefficient of youth of oldest
backward patent citation becomes positive and significant. This suggests that a decrease in the age of the
oldest prior art (and, therefore, in “excessive” maturity) is positively correlated to licensing. The
interaction effect of scaled connectivity with youth of backward patent citations is negative and significant, but
not relevant in size terms. Similarly, the interaction effect of scaled connectivity with youth of oldest backward
patent citation is positive and significant, but not relevant in size terms. In Tables 5 and 6, additional
specifications explore the robustness of the main results. In the first column of Table 5, we allow for
shared frailty among patents with the same technological class20. In the second column, we experiment
with a Weibull functional form for the hazard rate. In the fourth model specification, we estimate a Cox
proportional hazard model with clustered standard errors for technological class, excluding all the patents
19 It is important to notice that an option agreement, upon the payment of a fee, gives the licensee the right to license the patent within a pre-specified period, and therefore to wait until technological risk factors are resolved. 20 In other words, we suppose that the distribution of vi has a Gamma distributed functional form which can be summarized by few frailty
parameters (Jenkins 2005) at the technological class level. If we define u = log (v), then the logarithm of the hazard rate with shared frailty
is given by log[h(t, xit, Zi)] = log[h(t)] + βxitxit + βZZi + u. As noticed by Jenkins (2005), we can think of this as a random effects model,
which assumes that the data consist of a hierarchal structure of different sub-populations whose differences relate to that hierarchy.
35
that were licensed before grant. As we can notice, the main results for scaled connectivity do not change
substantially, in terms of statistical and economic significance. In the third column, we introduce an
alternative measure of technological uncertainty: we measure uncertainty in terms of the standard
deviation of scaled connectivity values, measured before the first instance of licensing. As we can notice,
while an increase in the levels of scaled connectivity is positively correlated to licensing, an increase in
the standard deviation of scaled connectivity is negatively correlated to licensing. In Table 6, we estimate
Cox proportional hazard model with shared frailty for technological class, excluding all the patents that
were licensed before grant. In Model 2, we exclude the grant lag regressor. In Models 3 and 4, we also
exclude backward citations and forward metric. As we can notice, scaled connectivity remains positive and
significant, in support of the validity of our measure and of our first hypothesis.
Table 4 presents the results of Cox hazard regression models for the second and third hypothesis.
The dataset now only consists of 81 patents and 439 patent-year observations, since we were not able to
measure the ability to evaluate / utilize an external technology for all the firms in the original sample21. The
fifth specification in Table 4 contains the full model. The sixth specification contains the full model with
interaction effects. As we can notice, scaled connectivity plays a mutated role in this setting. Once we control
for the ability of a firm to evaluate/utilize an external technology, the coefficient of scaled connectivity
is significant and negatively correlated to licensing. The ability to evaluate an external technology is not
significant. The ability to utilize is significant and negatively correlated to licensing, but not relevant in size
terms. The interaction effects, when significant, do not support our second and third hypotheses. These
results are puzzling, and should be interpreted cautiously. A possible interpretation is that, since our
sample only consists of those patents licensed by big firms, those firms may “strategically” choose to not
invest in external technologies, regardless of the fact that exogenous technological uncertainty has been
reduced. Although in contradiction with some literature on “intensive strategies for technology
evaluation” (see Conti et al. 2013), these results represent a starting point for further research and
improvements.
21 That is, for those firms without patent portfolio.

36
For several reasons, our results should be interpreted cautiously. First, the sample is very small.
Second, as in Gans et al. (2008), several measures are correlated with each other. Third, our measure of
uncertainty differs from previous studies (Barberà-Tomas and Consoli 2012; Barberà-Tomas et al. 2011;
Martinelli 2012): we consider the number of citation paths as a direct indicator of uncertainty, rather than
the disappearance of a patent from the main trajectory. This choice is based on the assumption that, the
higher is connectivity, the higher is the probability that the patent will remain stable on the main
trajectory. Future research should definitely embark on a large-scale statistical analysis of this assumption,
in order to confirm the validity of our methodological extension.
Discussion
This essay explored the role played by technological uncertainty for the functioning of a small market
for technology. The main hypothesis is that technological uncertainty, making problematic the valuation
of patent assets, may decrease the incentive of firms to participate in markets for technology. Moreover,
the negative effect of technological uncertainty can be even stronger in situations characterized by market
incompleteness.
The main policy implication is that the design of market configurations characterized by
completeness can improve market functioning. The last developments in the IP industry -such as the
birth of the IPXI, the first centralized financial exchange for patent licenses22- are going in that direction.
A market for patents is complete if each patent has a market. The business model of the IPXI is based
on the basic intuition that a market cannot form around a patent until that asset is “commoditised”.
Therefore the IPXI has split each patent in a package of non-exclusive “unit licenses”, the so-called URL
contracts, which will be traded on a centralized market that will be open to a significant number of buyers
and sellers (McClure 2011). Thanks to its focus on commoditization the IPXI will offer a new “paradigm”
for the IP industry (McClure 2011). Indeed the traditional IP market was based on the exchange of a
22 The IPXI has been established by Ocean Tomo, a Chicago-based firm specializing in intellectual property. Its supporting partners include the Chicago Board Options Exchange. On May 4th 2012 the IPXI published a first version of the rulebook that governs how the exchange will function, and it will probably open during the fall of 2014.
37
generic patent asset (such as a patent license) “as a whole” on a bilateral “blind market” (Lemley and
Myhrvold 2008). Patents were exchanged as “singularites” (Troy 2012) characterized by uniqueness,
incomparability, and uncommonness (Karpic 2010). As legal constructs, patents are singularities since
they are novel and non-obvious and therefore unique by definition (Troy 2012). By splitting each patent
into a package of non-exclusive unit licenses, the URL contracts, the IPXI has “fractioned” the singularity
of the legal construct. However, patents are also singularities as containers of technological knowledge,
which is very often anchored to a specific firm-context and is “costly if not impossible to use elsewhere” (Troy
2012, p. 49) unless the access to complementary knowledge is facilitated. This suggests that, in order to
foster market participation, the IPXI also has to facilitate the access to all complementary assets.
However, lack of participation to the market may be also due to a lack of complementarity that unfolds
over the time dimension. In other words, the value of a technology to a firm and the willingness of the
firm to participate to the market may depend on the emergence of complementary innovations whose
precise form and timing may difficult to anticipate (Gans and Stern 2010). More importantly, it may
depend on the emergence of complementary innovations that may not yet exist (Rosenberg 1996).
This suggests that, despite the improvements induced by commoditization, technological
uncertainty may still play a problematic role for the functioning of markets for technology. In the
hypothetical situation in which each patent has a market, and a price can be observed for it, this price
may never correspond to the theoretical value calculated before (see pag. 18). Such correspondence would
require perfect knowledge of the “direct” technological uses of each patent, which may be limited by the
simple fact that technologies bring with themselves an infinite set of uses that cannot known or pre-
specified ex-ante (Bonaccorsi 2011). Indeed the mapping between the physical configuration of a
technology and the set of all possible uses lacks order and predictability. In other words, “knowledge about
physical structures can enumerate exhaustively only all mappings [with functions] that are not feasible, but never those
that are” (Bonaccorsi 2011, p. 308). While technological uncertainty can have a negative impact on the
functioning of markets for technology, at the same time it may represent a unique opportunity for those
firms that are able to cope with uncertainty. Thanks to their “ability to evaluate” an external technology
(Arora and Gambardella 2010b) and to “foresee” new uses in advance, those firms may be able to set up

38
profitable arbitrage strategies. In fact, as noticed by Barney (1989), firms with better expectations can
obtain above normal economic performances when strategic factors markets are characterized by
imperfections.
39
References
Abbring, J.H., & van den Berg, G.J. 2003. The nonparametric identification of treatment effects in
duration models. Econometrica, 71: 1491-1518.
Abbring, J.H., & van den Berg, G.J. 2003b. A simple procedure for the evaluation of treatment
effects on duration models. Working paper.
Abbring, J.H., & van den Berg, G.J. 2003b. Analyzing the effect of dynamically assigned treatments
using duration models, binary treatment models, and panel data models. Working paper.
Alcacèr, J., & Gittelman, M. 2006 Patent citations as a measure of knowledge flows: The influence of
examiner citations. The Review of Economics and Statistics, 88(4): 774-779
Ali, A., & Cockburn, I. 2012. Buyer behavior in markets for technology: Technology proximity
between firm portfolio and in-licensed patents. Working paper.
Arora, A., & Gambardella, A. 1994b. Evaluating technological information and utilizing it: Scientific
knowledge, technological capability, and external linkages in biotechnology. Journal of Economic
Behavior & Organization, 24(1): 91-114.
Arora, A., Fosfuri, A. & Gambardella, A. 2001. Markets for technology: The economics of
innovation and corporate strategy. MIT Press.
Arora, A., & Gambardella, A. 2010. Ideas for rent: An overview of markets for technology. Industrial
and Corporate Change, 19(3): 775-803.
Arora, A., & Gambardella, A. 2010b. The market for technology. In Hall, B., & Rosenberg, N. 2010.
Handbooks of Economics of Innovation. Elsevier.
Barberà-Tomàs, D., & Consoli, D. 2012. Whatever works: Uncertainty and technological hybrids in
medical innovation. Technological Forecasting and Social Change, 79: 932-948.
Barberà-Tomàs, D., Jimenez-Saez, F., & Castellò-Molina, I. 2011. Mapping the importance of the real
world: The validity of connectivity analysis of patent citations networks. Research Policy, 40: 473-
486.
40
Barney, J.B. 1986. Strategic factor markets: Expectations, luck, and business strategy. Management
Science, 32(10): 1231-1241.
Batagelj, V. 2003. Efficient algorithms for citation network analysis. Working Paper.
Basalla, G. 1988. The evolution of technology. Cambridge University Press.
Bellman, R. 1957. Dynamic programming. Princeton University Press.
Bonaccorsi, A. 2011. A functional theory of technology and technological change. In Antonelli, C. 2011.
Handbook on the Economic Complexity of Technological Change. Edward Elgar.
Bresnahan, T.F., & Trajtenberg, M. 1995. General purpose technologies, engines of growth. Journal of
Econometrics, 65(1): 83-108.
Clauset, A., Shalizi, C.R., & Newman, M.E.J. 2009. Power law distributions in empirical data. SIAM
Review, 51(4): 661-703.
Cohen, W.M., & Levinthal, D.A. 1990. Absorptive capacity: A new perspective on learning and
innovation. Administrative Science Quarterly, 35(1): 128-152.
Conti, R., Gambardella, A., & Novelli, E. 2013. Research on markets for inventions and implications for
R&D allocation strategies. The Academy of Management Annals, 7(1): 717-774.
David, P. 1985. Clio and the economics of QWERTY. American Economic Review, 75(2): 332-337.
De Nooy, W., Mrvar, A., & Batagelj, V. 2011. Exploratory social network analysis with Pajek:
Revised and expanded second edition. Cambridge University Press.
Denrell, J., Fang, C., & Winter, S.G. 2003. The economics of strategic opportunity. Strategic
Management Journal, 24: 977-990.
Dierickx, I., & Cool, K.O. 1989. Asset stock accumulation and sustainability of competitive advantage.
Management Science, 35: 1504-1511.
Dorfman, R., Samuelson, P.A., & Solow R.M. 1958. Linear programming and economic analysis.
McGraw Hill.
41
Dosi, G. 1982. Technological paradigms and technological trajectories. Research Policy, 11(3): 147-162.
Fleming, L, & Sorenson, O. 2004. Science as a map in technological search. Strategic Management
Journal, 25: 909-928.
Fleming, L. 2007. Breakthroughs and the “long tail” of innovation. MIT Sloan Management Review,
49(1): 69-74.
Fleming, L., & Sorenson, O. 2001. Technology as a complex adaptive system: Evidence from patent data.
Research Policy, 30: 1019-1039.
Fontana, R., Nuvolari, A., & Verspagen, B. 2008. Mapping technological trajectories as patent
citation networks. An application to data communication standards. Working paper.
Fosfuri, A., & Giarratana, M. 2010. Trading under the buttonwood: A foreword to the markets for
technology and ideas. Industrial and Corporate Change, 9(3): 767-773.
Gambardella, A., & Giarratana, M. 2013. General technological capabilities, product market
fragmentation, and markets for technology. Research Policy, 42: 315-325.
Gans, J.S., David, H.H., & Stern, S. 2008. The impact of uncertain intellectual property rights on the
market for ideas: Evidence from patent grant delays. Management Science, 54(5): 982-997.
Gans, J.S., & Stern, S. 2010. Is there a market for ideas? Industrial and Corporate Change, 3: 805-837.
Gray, C. 2008. A new era in IP licensing: The Unit License Right program. The Licensing Journal,
November/December.
Hall, B.H., Jaffe, A.B., & Trajtenberg, M. 2001. The NBER patent citations data file: Lessons,
insights and methodological tools. Working Paper.
Hayek, F.A.V. 1945. The use of knowledge in society. American Economic Review, 35: 519-530.
Hegde, D. 2011. Asymmetric information and contracts in the market for ideas: Evidence from
the licensing of biomedical inventions. Working paper.
42
Herraiz, I., German, D.M., & Hassan, A.E. On the distribution of source code file sizes. Working
paper.
Jenkins, S.P. 2005. Survival analysis. Working paper.
Karpic, L. 2010. Valuing the unique: The economics of singularities. Princeton University Press.
Kelly, K. 2011. What technology wants. The Penguin Group.
Koopmans, T.C. 1957. Three essays on the state of economic science. McGraw Hill.
Lai, R., D’Amour, A., Yu, A., & Fleming, L. 2010. Disambiguation and co-authorships networks of
the US Patent Inventor database (1975-2010). Working paper.
Lancaster, T. 1990. The econometric analysis of transition data. Cambridge University Press.
Lane, D.A. & Maxfield, R.R. 2005. Ontological uncertainty and innovation. Journal of Evolutionary
Economics, 15: 3-50.
Lanjouw, J.O., & Schankerman, M. 2001. Characteristics of patent litigation: A window on competition.
Rand Journal of Economics, 32 (1): 129-151.
Lanjouw, J.O., & Schankerman, M. 2004. Patent quality and research productivity: Measuring innovation
with multiple indicators. The Economic Journal, 114(495): 441-465.
Lemley, M.A., & Shapiro, C. 2005. Probabilistic patents. Journal of Economic Perspectives, 19(2): 75-
98.
Lemley, M.A., & Myhrvold, N. 2007. How to make a patent market. Hofstra Law Review, 36: 257.
Lerner, J. 1994. The importance of patent scope. Rand Journal of Economics, 25(2): 319-333.
Levenhagen, M., Thomas, H., & Porac, J.F. 1990. A model of market formation. Working paper.
Mansfield, E. 1995. Academic research underlying industrial innovation: Sources, characteristics and
financing. Review of Economics and Statistics, 77: 55-65.
Martinelli, A. 2010. The dynamics of technological discontinuities: A patent citation network
analysis of telecommunication switches. PhD thesis.
43
Martinelli, A. 2012. An emerging paradigm or just another trajectory? Understanding the nature of
technological changes using engineering heuristics in the telecommunications switching industry.
Research Policy, 41: 414-429.
McClure, I. 2011. The value of IP as a commodity. Intellectual Asset Management, May/June.
Mehta, A., Rysman, M., & Simcoe, T. 2010. Identifying the age profile of patent citations: New estimates
of knowledge diffusion. Journal of Applied Econometrics, 25: 1179-1204.
Merges, R.P., & Nelson, R.R. 1990. On the complex economics of patent scope. Columbia Law
Review, 90: 839-916.
Myerson, R. 2008. Perspectives on mechanism design in economic theory. American Economic
Review, 98: 586-603.
Munari, F., & Oriani, R. 2011. The economic valuation of patents: Methods and applications.
Edward Elgar Publishing.
Narin, F., Hamilton, K.S., & Olivastro, D. 1997. The increasing linkage between US technology and
public science. Research Policy, 26: 317-330.
Newman, M.E.J. 2003. The structure and function of complex networks. Working paper.
Opsahl, T., Agneessens, F., & Skvoretz, J. 2010. Node centrality in weighted networks: Generalizing
degree and shortest paths. Social Networks, 32: 245-251.
Oriani, R., & Sobrero, M. 2008. Uncertainty and the market valuation of R&D within a real options logic.
Strategic Management Journal, 29: 343-361.
Pitkethly, R. 2006. Patent valuation and real options. In Bosworth, D. & Webster, E. 2006. The
Management of intellectual property. Edward Elgar Publishing.
Razgaitis, R. 2004. US/Canadian licensing in 2003: Survey results. Journal of the Licensing Executive
Society, 34(4): 139-151.
44
Rosenberg, N. 1996. Uncertainty and technological change. In Landau, R., Taylor, T. & Wright, G. 1996.
The mosaic of economic growth. Stanford University Press.
Roth, A.E. 2002. The economist as engineer: Game theory, experimentation, and computation as tools
for design economics. Econometrica, 70: 1341-1378.
Roth, A.E. 2007. The art of designing markets. Harvard Business Review, 85: 118-126.
Roth, A.E. 2008. What have we learned from market design? Economic Journal, 118: 285-310.
Scherer, F. & Harhoff, D. 2000. Policy implications for a world of skew-distributed outcomes. Research
Policy, 29: 559-566.
Singh, J., & Fleming, L. 2010. Lone inventors as sources of breakthroughs: Myth or reality? Management
Science, 56(1): 41-56.
Teece, D.J. 1998. Capturing value from knowledge assets: The new economy, markets for know-how,
and intangible assets. California Management Review, 40(3): 55-79.
Temkin, I., & Eldredge, N. 2007. Phylogenetics and material cultural evolution. Current Anthropology,
48(1): 146-153.
Trajtenberg, M. 1990. A penny for your quotes: Patent citations and the value of innovations. The Rand
Journal of Economics, 21(1): 172-187.
Troy, I. 2012. Patent transactions and markets for patents. PhD thesis.
Valverde, S., Solè, R.V., Bedau, M.A., Packard, N. 2006. Topology and evolution of technology
innovation networks. Physical Review, 76.
Verspagen, B. 2007. Mapping technological trajectories as patent citation networks: A study on the
history of fuel cell research. Advances in Complex Systems, 10(1): 93-115.
Wartburg, I.V., Teichert, T., & Rost, K. 2005. Inventive progress measured by multi-stage patent citation
analysis. Research Policy, 34(10): 1591-1607.
Williamson, O.E. 1973. Markets and hierarchies: Some elementary considerations. American Economic
Review, 63(2): 316-325.

45
Yayavaram, S., & Ahuja, G. 2008. Decomposability in knowledge structures and its impact on the
usefulness of inventions and knowledge-base malleability. Administrative Science Quarterly, 53(2):
333-362.
Ziedonis, A.A. 2007. Real options in technology licensing. Management Science, 53(10): 1618-1633.
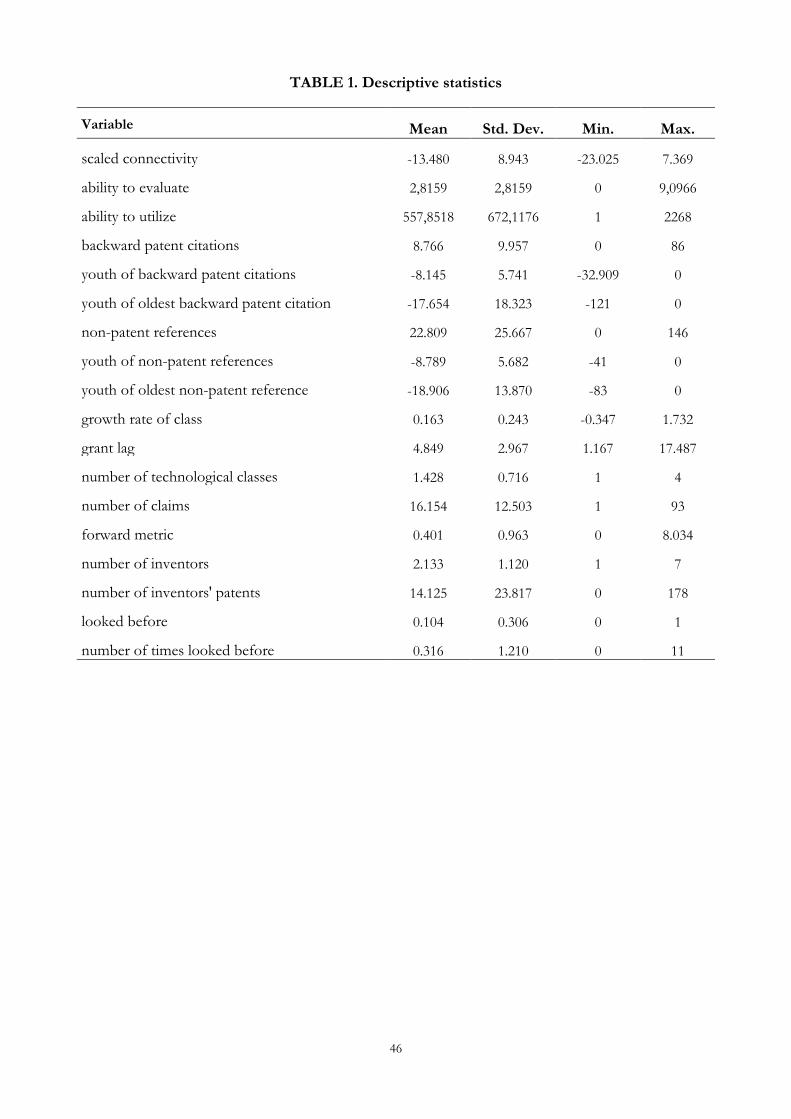
46
TABLE 1. Descriptive statistics
Variable Mean Std. Dev. Min. Max.
scaled connectivity -13.480 8.943 -23.025 7.369
ability to evaluate 2,8159 2,8159 0 9,0966
ability to utilize 557,8518 672,1176 1 2268
backward patent citations 8.766 9.957 0 86
youth of backward patent citations -8.145 5.741 -32.909 0
youth of oldest backward patent citation -17.654 18.323 -121 0
non-patent references 22.809 25.667 0 146
youth of non-patent references -8.789 5.682 -41 0
youth of oldest non-patent reference -18.906 13.870 -83 0
growth rate of class 0.163 0.243 -0.347 1.732
grant lag 4.849 2.967 1.167 17.487
number of technological classes 1.428 0.716 1 4
number of claims 16.154 12.503 1 93
forward metric 0.401 0.963 0 8.034
number of inventors 2.133 1.120 1 7
number of inventors' patents 14.125 23.817 0 178
looked before 0.104 0.306 0 1
number of times looked before 0.316 1.210 0 11

47
TABLE 3. Cox Hazards with clustered standard errors for technological class (H1)
Variable Model 1 Model 2 Model 3 Model 4 Model 5 Model 6
a. scaled connectivity 1.1148 1.0947 (0.0541)** (0.0572)*
b. backward citations 1.0210 1.0176 1.0301 1.0274 1.0196 1.0392 (0.0133) (0.0145) (0.0090)*** (0.0126)** (0.0106)* (0.0184)**
c. youth backward citations 0.9611 0.9897 0.9749 0.9821 0.9992 0.9070 (0.0337) (0.0419) (0.0268) (0.0227) (0.0223) (0.0360)**
d. youth oldest backward citation 1.0081 1.0005 1.0079 1.0063 1.0025 1.0282 (0.0148) (0.0160) (0.0104) (0.0082) (0.0074) (0.0121)**
e. non-patent references 1.0058 1.0028 0.9986 0.9985 0.9989 0.9900 (0.0056) (0.0052) (0.0049) (0.0050) (0.0059) (0.0079)
f. youth non-patent references 0.9852 0.9940 1.0022 1.0049 0.9988 0.9763 (0.0227) (0.0244) (0.0340) (0.0330) (0.0309) (0.0262)
g. youth oldest non-patent reference 0.9977 0.9961 1.0072 1.0049 1.0117 1.0176 (0.0143) (0.0151) (0.0148) (0.0142) (0.0147) (0.0185)
h. growth rate of class 1.2283 1.0950 1.5664 1.3714 1.6214 0.8310 (0.4551) (0.3946) (0.6130) (0.6069) (0.7498) (0.7225)
post-grant 1.2296 1.5661 1.6066 0.1412 0.1115 (0.2620) (0.3891)* (0.3664)** (0.1754) (0.1462)*
grant lag 1.0919 1.0813 1.1114 1.1253 1.1290 (0.0395)** (0.0283)*** (0.0307)*** (0.0289)*** (0.0329)***
interaction a*b 1.0012 (0.0008)
interaction a*c 0.9932 (0.0022)***
interaction a*d 1.0017 (0.0006)***
interaction a*e 0.9995 (0.0003)*
interaction a*f 0.9975 (0.0016)
interaction a*g 1.0010 (0.0008)
interaction a*h 0.9619 (0.0392)
number of technological classes 1.2740 1.2135 1.2528 1.2576 (0.1271)** (0.1324)* (0.1450)* (0.1559)*
number of claims 1.0134 1.0119 1.0100 1.0101 (0.0042)*** (0.0047)** (0.0052)* (0.0054)*
forward metric 0.0584 0.0636 0.0464 0.0447 (0.0269)*** (0.0278)*** (0.0206)*** (0.0250)***
number of inventors 0.9649 0.8952 0.9157 0.8872 (0.0601) (0.0596)* (0.0636) (0.0773)
number of inventors’ patents 0.9875 0.9824 0.9818 0.9821 (0.0068)* (0.0081)** (0.0083)** (0.0083)**
looked before 7.0188 7.8134 9.1249 (3.2177)*** (3.8198)*** (4.7601)***
number of times looked before 0.7339 0.7514 0.7391 (0.1237)* (0.1310) (0.1252)*
log pseudolikelihood -740.57826 -737.96645 -685.4574 -675.68802 -666.44679 -659.00323
* p<0.1; ** p<0.05; *** p<0.01.
Number of patents=278. Number of patent-year observations=2448. Breslow method for tied failures.
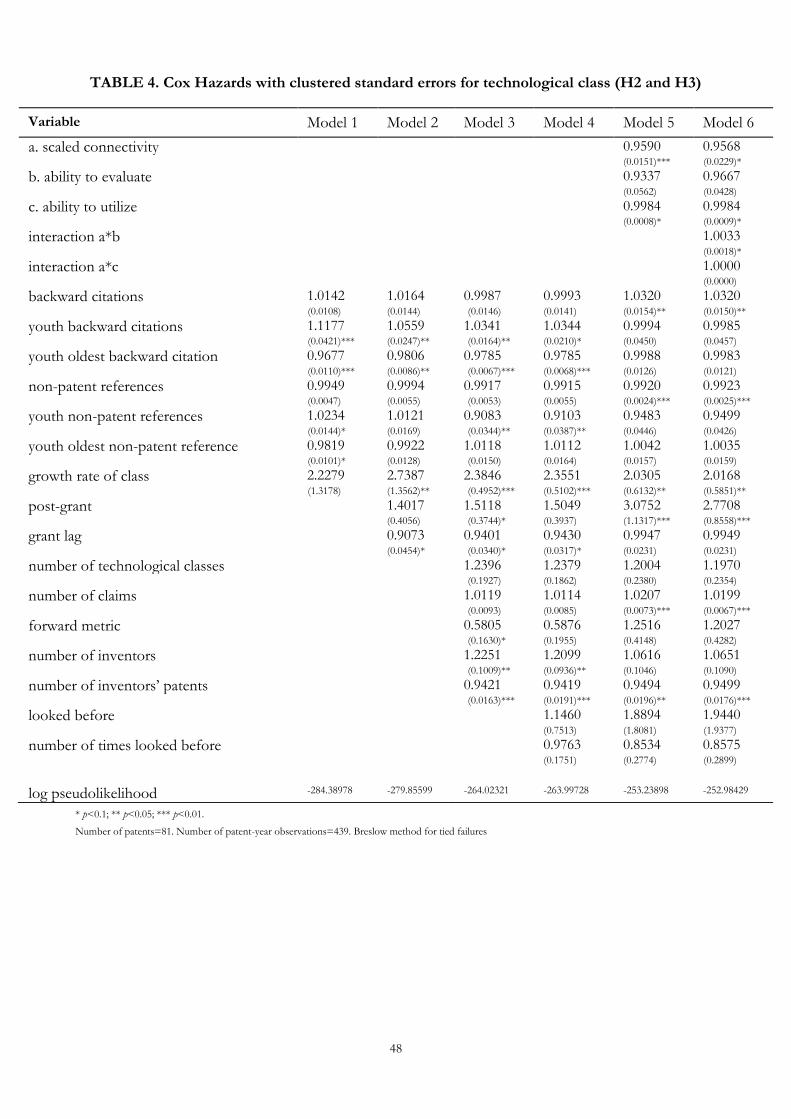
48
TABLE 4. Cox Hazards with clustered standard errors for technological class (H2 and H3)
Variable Model 1 Model 2 Model 3 Model 4 Model 5 Model 6
a. scaled connectivity 0.9590 0.9568 (0.0151)*** (0.0229)*
b. ability to evaluate 0.9337 0.9667 (0.0562) (0.0428)
c. ability to utilize 0.9984 0.9984 (0.0008)* (0.0009)*
interaction a*b 1.0033 (0.0018)*
interaction a*c 1.0000 (0.0000)
backward citations 1.0142 1.0164 0.9987 0.9993 1.0320 1.0320 (0.0108) (0.0144) (0.0146) (0.0141) (0.0154)** (0.0150)**
youth backward citations 1.1177 1.0559 1.0341 1.0344 0.9994 0.9985 (0.0421)*** (0.0247)** (0.0164)** (0.0210)* (0.0450) (0.0457)
youth oldest backward citation 0.9677 0.9806 0.9785 0.9785 0.9988 0.9983 (0.0110)*** (0.0086)** (0.0067)*** (0.0068)*** (0.0126) (0.0121)
non-patent references 0.9949 0.9994 0.9917 0.9915 0.9920 0.9923 (0.0047) (0.0055) (0.0053) (0.0055) (0.0024)*** (0.0025)***
youth non-patent references 1.0234 1.0121 0.9083 0.9103 0.9483 0.9499 (0.0144)* (0.0169) (0.0344)** (0.0387)** (0.0446) (0.0426)
youth oldest non-patent reference 0.9819 0.9922 1.0118 1.0112 1.0042 1.0035 (0.0101)* (0.0128) (0.0150) (0.0164) (0.0157) (0.0159)
growth rate of class 2.2279 2.7387 2.3846 2.3551 2.0305 2.0168 (1.3178) (1.3562)** (0.4952)*** (0.5102)*** (0.6132)** (0.5851)**
post-grant 1.4017 1.5118 1.5049 3.0752 2.7708 (0.4056) (0.3744)* (0.3937) (1.1317)*** (0.8558)***
grant lag 0.9073 0.9401 0.9430 0.9947 0.9949 (0.0454)* (0.0340)* (0.0317)* (0.0231) (0.0231)
number of technological classes 1.2396 1.2379 1.2004 1.1970 (0.1927) (0.1862) (0.2380) (0.2354)
number of claims 1.0119 1.0114 1.0207 1.0199 (0.0093) (0.0085) (0.0073)*** (0.0067)***
forward metric 0.5805 0.5876 1.2516 1.2027 (0.1630)* (0.1955) (0.4148) (0.4282)
number of inventors 1.2251 1.2099 1.0616 1.0651 (0.1009)** (0.0936)** (0.1046) (0.1090)
number of inventors’ patents 0.9421 0.9419 0.9494 0.9499 (0.0163)*** (0.0191)*** (0.0196)** (0.0176)***
looked before 1.1460 1.8894 1.9440 (0.7513) (1.8081) (1.9377)
number of times looked before 0.9763 0.8534 0.8575 (0.1751) (0.2774) (0.2899)
log pseudolikelihood -284.38978 -279.85599 -264.02321 -263.99728 -253.23898 -252.98429
* p<0.1; ** p<0.05; *** p<0.01.
Number of patents=81. Number of patent-year observations=439. Breslow method for tied failures
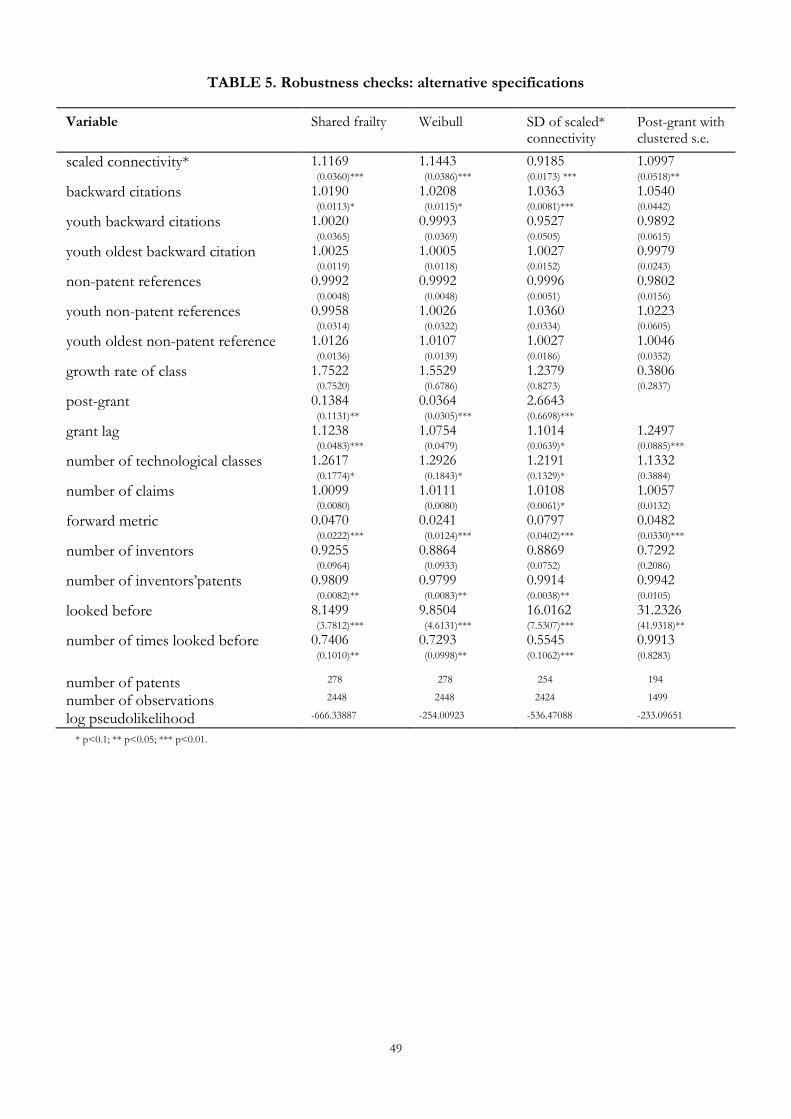
49
TABLE 5. Robustness checks: alternative specifications
Variable Shared frailty Weibull SD of scaled* connectivity
Post-grant with clustered s.e.
scaled connectivity* 1.1169 1.1443 0.9185 1.0997 (0.0360)*** (0.0386)*** (0.0173) *** (0.0518)**
backward citations 1.0190 1.0208 1.0363 1.0540 (0.0113)* (0.0115)* (0.0081)*** (0.0442)
youth backward citations 1.0020 0.9993 0.9527 0.9892 (0.0365) (0.0369) (0.0505) (0.0615)
youth oldest backward citation 1.0025 1.0005 1.0027 0.9979 (0.0119) (0.0118) (0.0152) (0.0243)
non-patent references 0.9992 0.9992 0.9996 0.9802 (0.0048) (0.0048) (0.0051) (0.0156)
youth non-patent references 0.9958 1.0026 1.0360 1.0223 (0.0314) (0.0322) (0.0334) (0.0605)
youth oldest non-patent reference 1.0126 1.0107 1.0027 1.0046 (0.0136) (0.0139) (0.0186) (0.0352)
growth rate of class 1.7522 1.5529 1.2379 0.3806 (0.7520) (0.6786) (0.8273) (0.2837)
post-grant 0.1384 0.0364 2.6643 (0.1131)** (0.0305)*** (0.6698)***
grant lag 1.1238 1.0754 1.1014 1.2497 (0.0483)*** (0.0479) (0.0639)* (0.0885)***
number of technological classes 1.2617 1.2926 1.2191 1.1332 (0.1774)* (0.1843)* (0.1329)* (0.3884)
number of claims 1.0099 1.0111 1.0108 1.0057 (0.0080) (0.0080) (0.0061)* (0.0132)
forward metric 0.0470 0.0241 0.0797 0.0482 (0.0222)*** (0.0124)*** (0.0402)*** (0.0330)***
number of inventors 0.9255 0.8864 0.8869 0.7292 (0.0964) (0.0933) (0.0752) (0.2086)
number of inventors’patents 0.9809 0.9799 0.9914 0.9942 (0.0082)** (0.0083)** (0.0038)** (0.0105)
looked before 8.1499 9.8504 16.0162 31.2326 (3.7812)*** (4.6131)*** (7.5307)*** (41.9318)**
number of times looked before 0.7406 0.7293 0.5545 0.9913 (0.1010)** (0.0998)** (0.1062)*** (0.8283)
number of patents 278 278 254 194
number of observations 2448 2448 2424 1499
log pseudolikelihood -666.33887 -254.00923 -536.47088 -233.09651
* p<0.1; ** p<0.05; *** p<0.01.
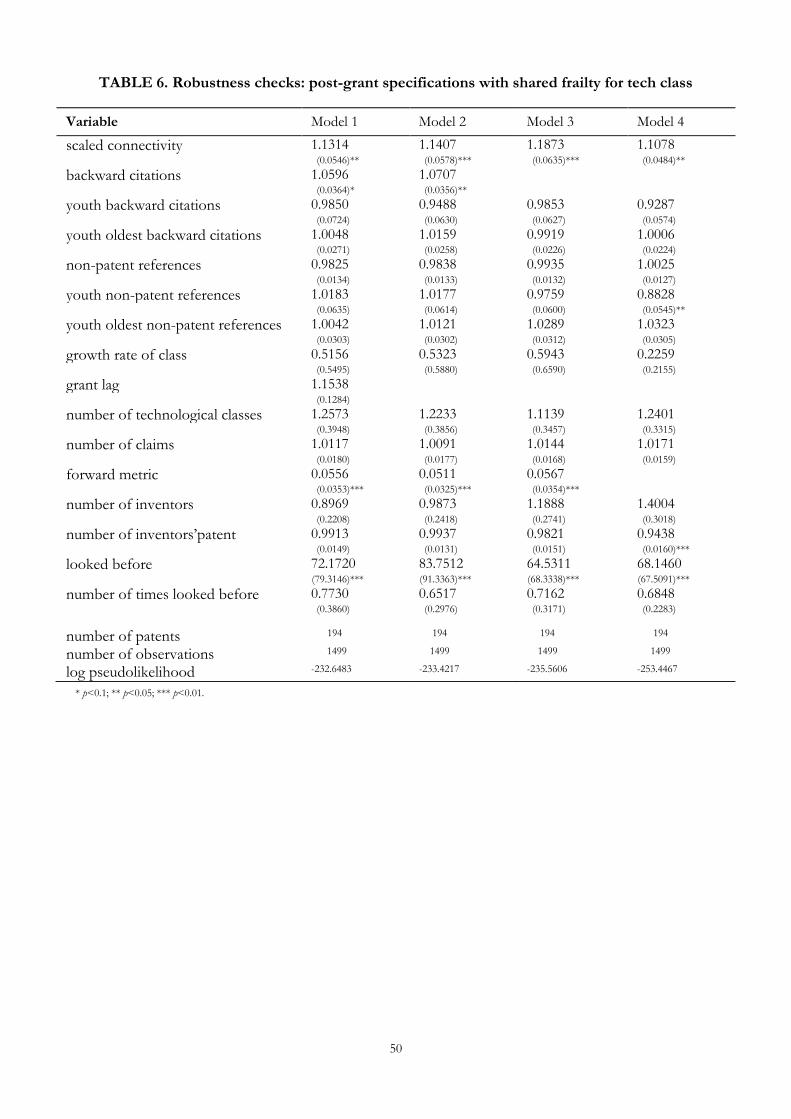
50
TABLE 6. Robustness checks: post-grant specifications with shared frailty for tech class
Variable Model 1 Model 2 Model 3 Model 4
scaled connectivity 1.1314 1.1407 1.1873 1.1078 (0.0546)** (0.0578)*** (0.0635)*** (0.0484)**
backward citations 1.0596 1.0707 (0.0364)* (0.0356)**
youth backward citations 0.9850 0.9488 0.9853 0.9287 (0.0724) (0.0630) (0.0627) (0.0574)
youth oldest backward citations 1.0048 1.0159 0.9919 1.0006 (0.0271) (0.0258) (0.0226) (0.0224)
non-patent references 0.9825 0.9838 0.9935 1.0025 (0.0134) (0.0133) (0.0132) (0.0127)
youth non-patent references 1.0183 1.0177 0.9759 0.8828 (0.0635) (0.0614) (0.0600) (0.0545)**
youth oldest non-patent references 1.0042 1.0121 1.0289 1.0323 (0.0303) (0.0302) (0.0312) (0.0305)
growth rate of class 0.5156 0.5323 0.5943 0.2259 (0.5495) (0.5880) (0.6590) (0.2155)
grant lag 1.1538 (0.1284)
number of technological classes 1.2573 1.2233 1.1139 1.2401 (0.3948) (0.3856) (0.3457) (0.3315)
number of claims 1.0117 1.0091 1.0144 1.0171 (0.0180) (0.0177) (0.0168) (0.0159)
forward metric 0.0556 0.0511 0.0567 (0.0353)*** (0.0325)*** (0.0354)***
number of inventors 0.8969 0.9873 1.1888 1.4004 (0.2208) (0.2418) (0.2741) (0.3018)
number of inventors’patent 0.9913 0.9937 0.9821 0.9438 (0.0149) (0.0131) (0.0151) (0.0160)***
looked before 72.1720 83.7512 64.5311 68.1460 (79.3146)*** (91.3363)*** (68.3338)*** (67.5091)***
number of times looked before 0.7730 0.6517 0.7162 0.6848 (0.3860) (0.2976) (0.3171) (0.2283)
number of patents 194 194 194 194
number of observations 1499 1499 1499 1499
log pseudolikelihood -232.6483 -233.4217 -235.5606 -253.4467
* p<0.1; ** p<0.05; *** p<0.01.
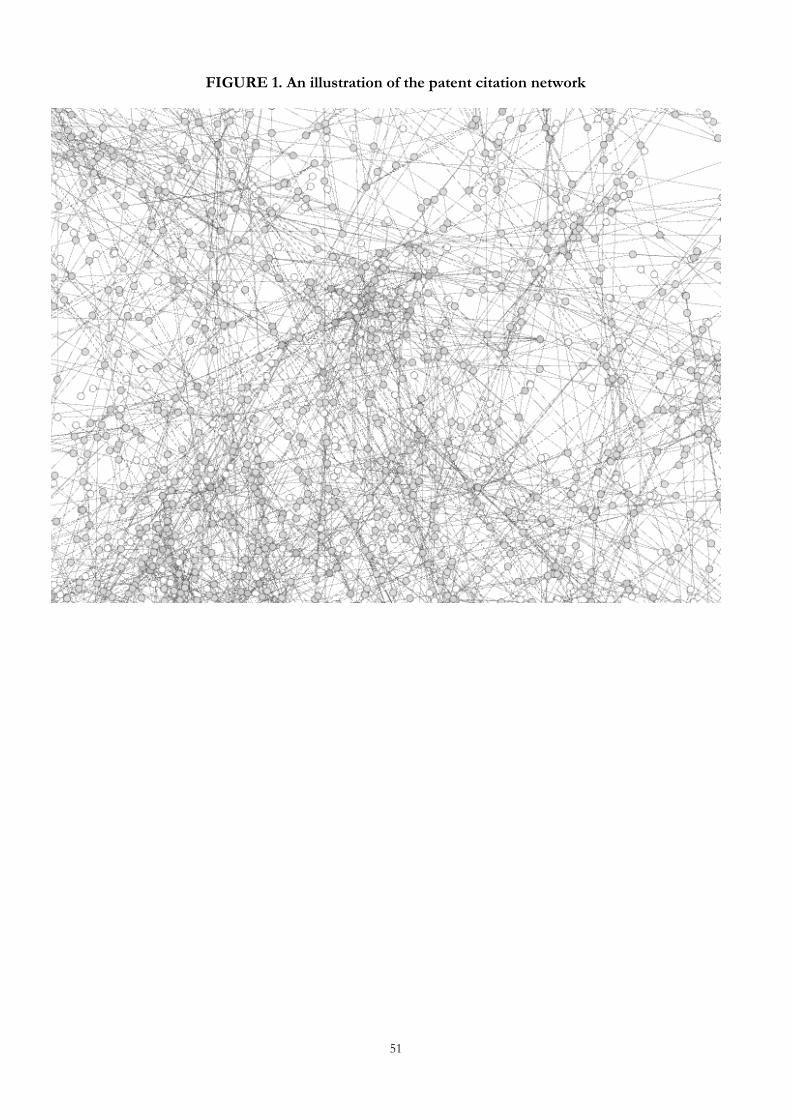
51
FIGURE 1. An illustration of the patent citation network
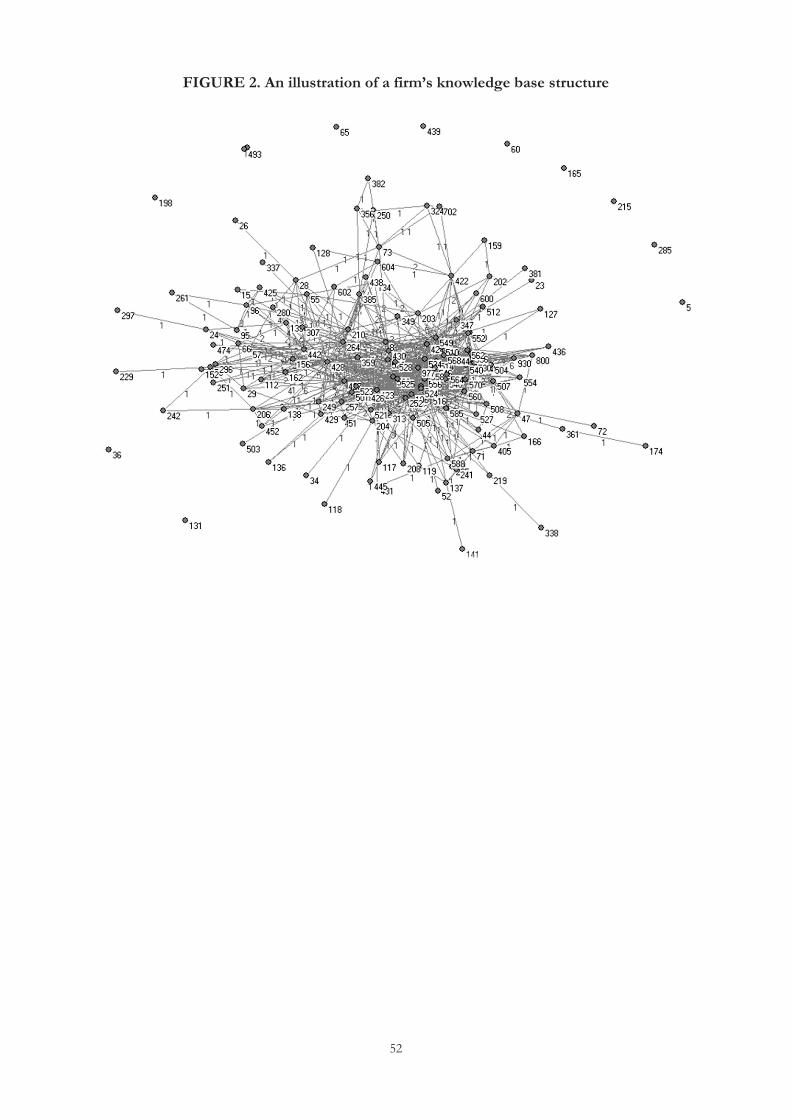
52
FIGURE 2. An illustration of a firm’s knowledge base structure
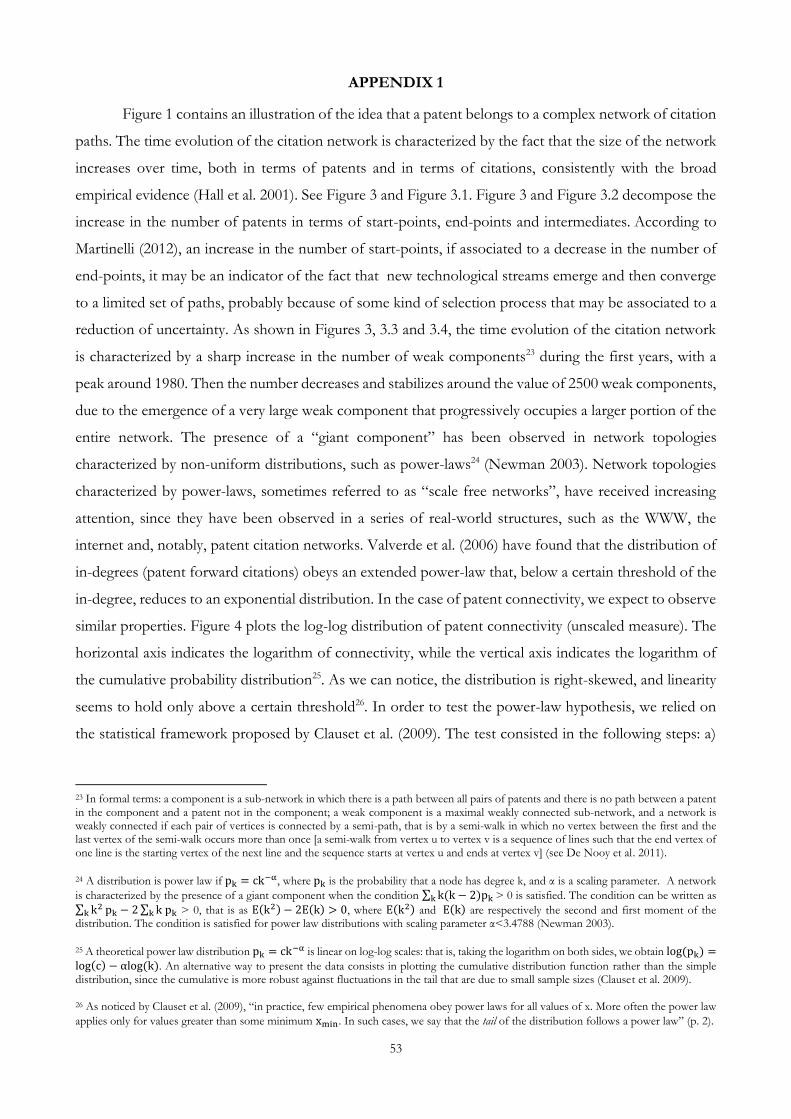
53
APPENDIX 1
Figure 1 contains an illustration of the idea that a patent belongs to a complex network of citation
paths. The time evolution of the citation network is characterized by the fact that the size of the network
increases over time, both in terms of patents and in terms of citations, consistently with the broad
empirical evidence (Hall et al. 2001). See Figure 3 and Figure 3.1. Figure 3 and Figure 3.2 decompose the
increase in the number of patents in terms of start-points, end-points and intermediates. According to
Martinelli (2012), an increase in the number of start-points, if associated to a decrease in the number of
end-points, it may be an indicator of the fact that new technological streams emerge and then converge
to a limited set of paths, probably because of some kind of selection process that may be associated to a
reduction of uncertainty. As shown in Figures 3, 3.3 and 3.4, the time evolution of the citation network
is characterized by a sharp increase in the number of weak components23 during the first years, with a
peak around 1980. Then the number decreases and stabilizes around the value of 2500 weak components,
due to the emergence of a very large weak component that progressively occupies a larger portion of the
entire network. The presence of a “giant component” has been observed in network topologies
characterized by non-uniform distributions, such as power-laws24 (Newman 2003). Network topologies
characterized by power-laws, sometimes referred to as “scale free networks”, have received increasing
attention, since they have been observed in a series of real-world structures, such as the WWW, the
internet and, notably, patent citation networks. Valverde et al. (2006) have found that the distribution of
in-degrees (patent forward citations) obeys an extended power-law that, below a certain threshold of the
in-degree, reduces to an exponential distribution. In the case of patent connectivity, we expect to observe
similar properties. Figure 4 plots the log-log distribution of patent connectivity (unscaled measure). The
horizontal axis indicates the logarithm of connectivity, while the vertical axis indicates the logarithm of
the cumulative probability distribution25. As we can notice, the distribution is right-skewed, and linearity
seems to hold only above a certain threshold26. In order to test the power-law hypothesis, we relied on
the statistical framework proposed by Clauset et al. (2009). The test consisted in the following steps: a)
23 In formal terms: a component is a sub-network in which there is a path between all pairs of patents and there is no path between a patent in the component and a patent not in the component; a weak component is a maximal weakly connected sub-network, and a network is weakly connected if each pair of vertices is connected by a semi-path, that is by a semi-walk in which no vertex between the first and the last vertex of the semi-walk occurs more than once [a semi-walk from vertex u to vertex v is a sequence of lines such that the end vertex of one line is the starting vertex of the next line and the sequence starts at vertex u and ends at vertex v] (see De Nooy et al. 2011). 24 A distribution is power law if pk = ck−α, where pk is the probability that a node has degree k, and α is a scaling parameter. A network
is characterized by the presence of a giant component when the condition ∑ k(k − 2)pkk > 0 is satisfied. The condition can be written as
∑ k2k pk − 2 ∑ k pkk > 0, that is as E(k2) − 2E(k) > 0, where E(k2) and E(k) are respectively the second and first moment of the
distribution. The condition is satisfied for power law distributions with scaling parameter α<3.4788 (Newman 2003). 25 A theoretical power law distribution pk = ck−α is linear on log-log scales: that is, taking the logarithm on both sides, we obtain log (pk) =log(c) − αlog (k). An alternative way to present the data consists in plotting the cumulative distribution function rather than the simple distribution, since the cumulative is more robust against fluctuations in the tail that are due to small sample sizes (Clauset et al. 2009). 26 As noticed by Clauset et al. (2009), “in practice, few empirical phenomena obey power laws for all values of x. More often the power law
applies only for values greater than some minimum xmin. In such cases, we say that the tail of the distribution follows a power law” (p. 2).
54
estimation of the threshold value and of the scaling parameter α; b) calculation of a Kolmogorov-Smirnov
distance between the probability distribution of the data and the theoretical distribution defined by the
parameters estimated in a (empirical distance); such distance was then compared to the distances between
probability distributions generated by synthetic data and the theoretical distribution (synthetic distances),
in order to determine a p-value that consists in the proportion of synthetic distances that are larger than
the empirical distance, and therefore in a measure of the plausibility of the “power-law hypothesis” for
the empirical data (for more details, see Clauset et al. (2009)). The test generates a p-value of 0.65. This
suggests that, above a certain threshold, the power law hypothesis cannot be ruled out27.
27 The test has been realized using the vector of connectivity values calculated for the 1975-1985 snapshot. The fitting procedure has been repeated 100 times. The value obtained for α is 2.63.
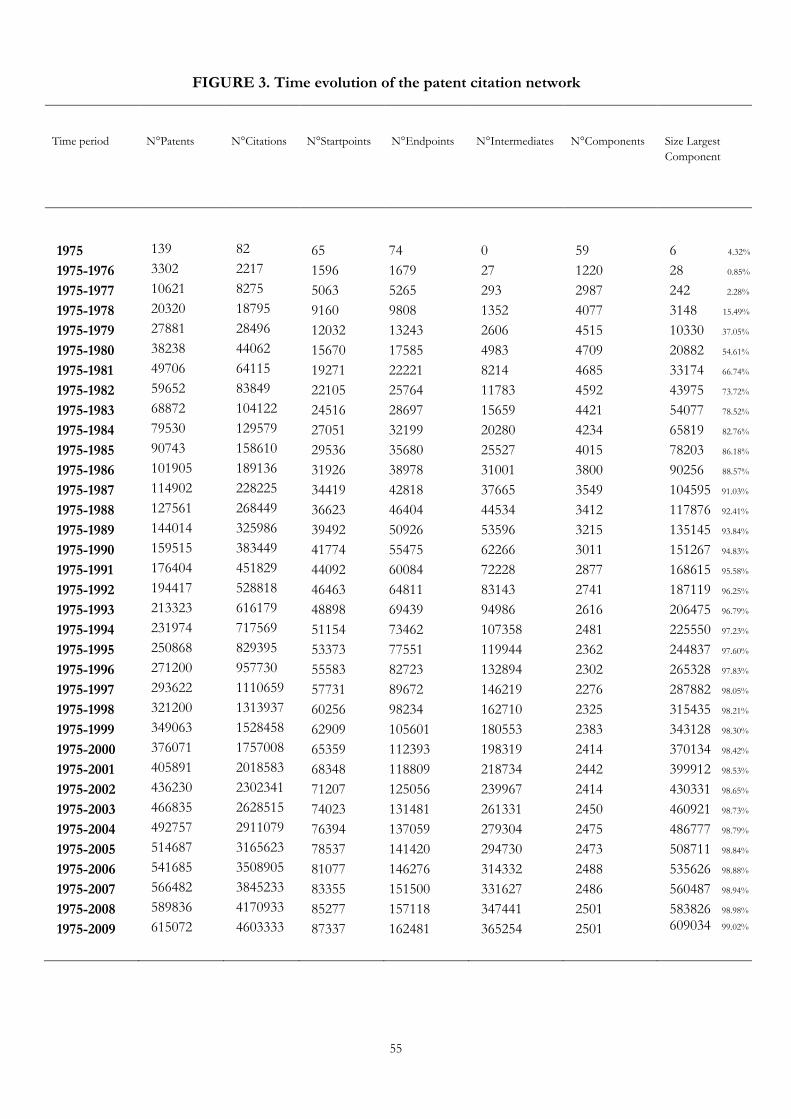
55
FIGURE 3. Time evolution of the patent citation network
Time period
N°Patents
N°Citations
N°Startpoints
N°Endpoints
N°Intermediates
N°Components
Size Largest
Component
1975
1975-1976
1975-1977
1975-1978
1975-1979
1975-1980
1975-1981
1975-1982
1975-1983
1975-1984
1975-1985
1975-1986
1975-1987
1975-1988
1975-1989
1975-1990
1975-1991
1975-1992
1975-1993
1975-1994
1975-1995
1975-1996
1975-1997
1975-1998
1975-1999
1975-2000
1975-2001
1975-2002
1975-2003
1975-2004
1975-2005
1975-2006
1975-2007
1975-2008
1975-2009
139
3302
10621
20320
27881
38238
49706
59652
68872
79530
90743
101905
114902
127561
144014
159515
176404
194417
213323
231974
250868
271200
293622
321200
349063
376071
405891
436230
466835
492757
514687
541685
566482
589836
615072
82
2217
8275
18795
28496
44062
64115
83849
104122
129579
158610
189136
228225
268449
325986
383449
451829
528818
616179
717569
829395
957730
1110659
1313937
1528458
1757008
2018583
2302341
2628515
2911079
3165623
3508905
3845233
4170933
4603333
65
1596
5063
9160
12032
15670
19271
22105
24516
27051
29536
31926
34419
36623
39492
41774
44092
46463
48898
51154
53373
55583
57731
60256
62909
65359
68348
71207
74023
76394
78537
81077
83355
85277
87337
74
1679
5265
9808
13243
17585
22221
25764
28697
32199
35680
38978
42818
46404
50926
55475
60084
64811
69439
73462
77551
82723
89672
98234
105601
112393
118809
125056
131481
137059
141420
146276
151500
157118
162481
0
27
293
1352
2606
4983
8214
11783
15659
20280
25527
31001
37665
44534
53596
62266
72228
83143
94986
107358
119944
132894
146219
162710
180553
198319
218734
239967
261331
279304
294730
314332
331627
347441
365254
59
1220
2987
4077
4515
4709
4685
4592
4421
4234
4015
3800
3549
3412
3215
3011
2877
2741
2616
2481
2362
2302
2276
2325
2383
2414
2442
2414
2450
2475
2473
2488
2486
2501
2501
6 4.32%
28 0.85%
242 2.28%
3148 15.49%
10330 37.05%
20882 54.61%
33174 66.74%
43975 73.72%
54077 78.52%
65819 82.76%
78203 86.18%
90256 88.57%
104595 91.03%
117876 92.41%
135145 93.84%
151267 94.83%
168615 95.58%
187119 96.25%
206475 96.79%
225550 97.23%
244837 97.60%
265328 97.83%
287882 98.05%
315435 98.21%
343128 98.30%
370134 98.42%
399912 98.53%
430331 98.65%
460921 98.73%
486777 98.79%
508711 98.84%
535626 98.88%
560487 98.94%
583826 98.98% 609034 99.02%
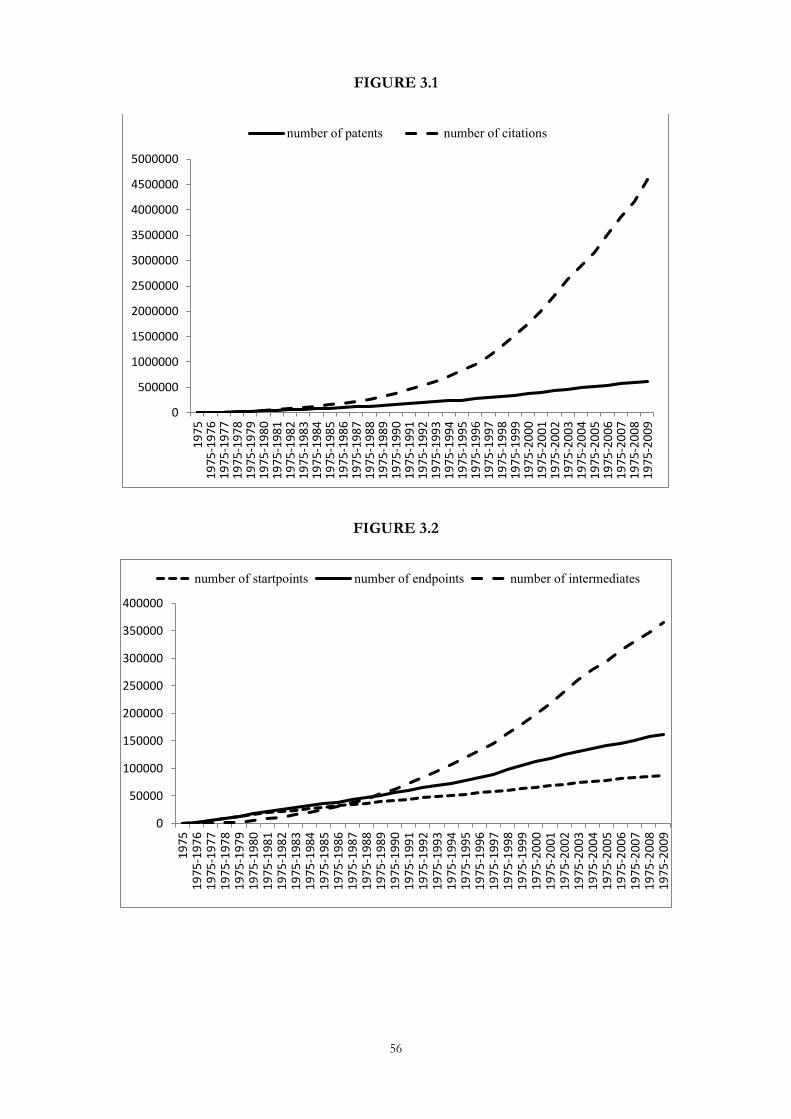
56
FIGURE 3.1
FIGURE 3.2
0
500000
1000000
1500000
2000000
2500000
3000000
3500000
4000000
4500000
5000000
19
75
19
75
-19
76
19
75
-19
77
19
75
-19
78
19
75
-19
79
19
75
-19
80
19
75
-19
81
19
75
-19
82
19
75
-19
83
19
75
-19
84
19
75
-19
85
19
75
-19
86
19
75
-19
87
19
75
-19
88
19
75
-19
89
19
75
-19
90
19
75
-19
91
19
75
-19
92
19
75
-19
93
19
75
-19
94
19
75
-19
95
19
75
-19
96
19
75
-19
97
19
75
-19
98
19
75
-19
99
19
75
-20
00
19
75
-20
01
19
75
-20
02
19
75
-20
03
19
75
-20
04
19
75
-20
05
19
75
-20
06
19
75
-20
07
19
75
-20
08
19
75
-20
09
number of patents number of citations
0
50000
100000
150000
200000
250000
300000
350000
400000
19
75
19
75
-19
76
19
75
-19
77
19
75
-19
78
19
75
-19
79
19
75
-19
80
19
75
-19
81
19
75
-19
82
19
75
-19
83
19
75
-19
84
19
75
-19
85
19
75
-19
86
19
75
-19
87
19
75
-19
88
19
75
-19
89
19
75
-19
90
19
75
-19
91
19
75
-19
92
19
75
-19
93
19
75
-19
94
19
75
-19
95
19
75
-19
96
19
75
-19
97
19
75
-19
98
19
75
-19
99
19
75
-20
00
19
75
-20
01
19
75
-20
02
19
75
-20
03
19
75
-20
04
19
75
-20
05
19
75
-20
06
19
75
-20
07
19
75
-20
08
19
75
-20
09
number of startpoints number of endpoints number of intermediates
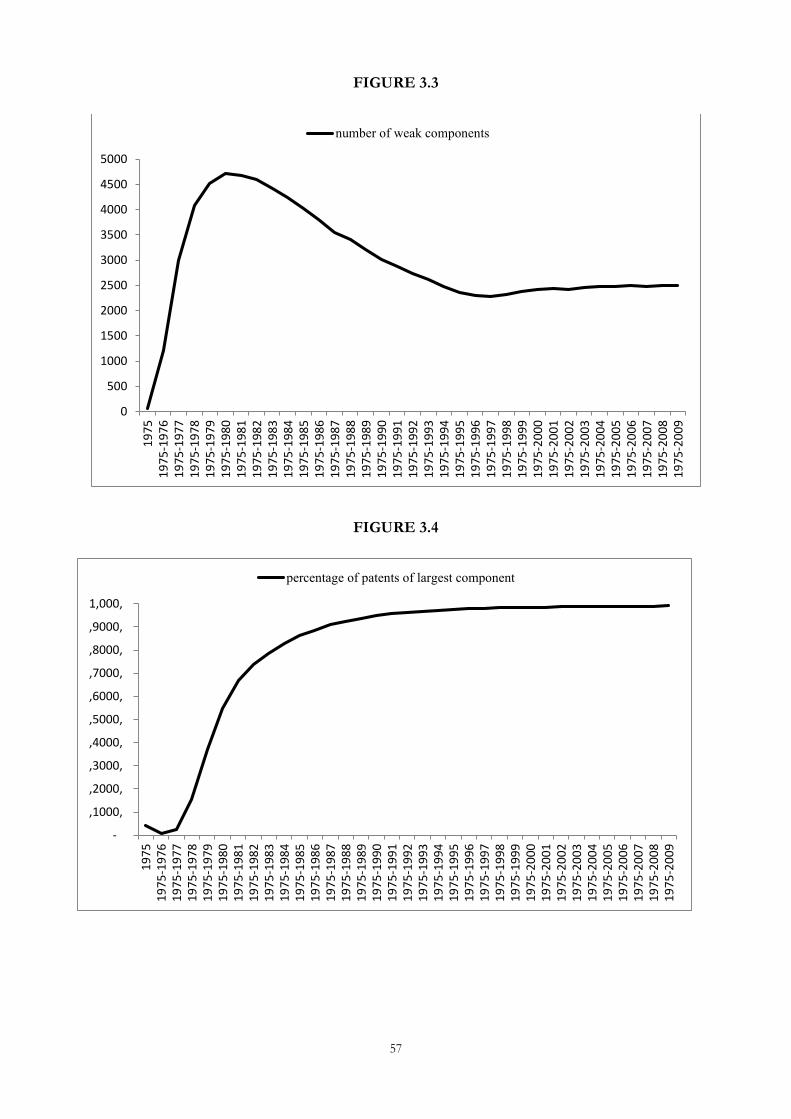
57
FIGURE 3.3
FIGURE 3.4
0
500
1000
1500
2000
2500
3000
3500
4000
4500
50001
97
51
97
5-1
97
61
97
5-1
97
71
97
5-1
97
81
97
5-1
97
91
97
5-1
98
01
97
5-1
98
11
97
5-1
98
21
97
5-1
98
31
97
5-1
98
41
97
5-1
98
51
97
5-1
98
61
97
5-1
98
71
97
5-1
98
81
97
5-1
98
91
97
5-1
99
01
97
5-1
99
11
97
5-1
99
21
97
5-1
99
31
97
5-1
99
41
97
5-1
99
51
97
5-1
99
61
97
5-1
99
71
97
5-1
99
81
97
5-1
99
91
97
5-2
00
01
97
5-2
00
11
97
5-2
00
21
97
5-2
00
31
97
5-2
00
41
97
5-2
00
51
97
5-2
00
61
97
5-2
00
71
97
5-2
00
81
97
5-2
00
9
number of weak components
-
,1000,
,2000,
,3000,
,4000,
,5000,
,6000,
,7000,
,8000,
,9000,
1,000,
19
75
19
75
-19
76
19
75
-19
77
19
75
-19
78
19
75
-19
79
19
75
-19
80
19
75
-19
81
19
75
-19
82
19
75
-19
83
19
75
-19
84
19
75
-19
85
19
75
-19
86
19
75
-19
87
19
75
-19
88
19
75
-19
89
19
75
-19
90
19
75
-19
91
19
75
-19
92
19
75
-19
93
19
75
-19
94
19
75
-19
95
19
75
-19
96
19
75
-19
97
19
75
-19
98
19
75
-19
99
19
75
-20
00
19
75
-20
01
19
75
-20
02
19
75
-20
03
19
75
-20
04
19
75
-20
05
19
75
-20
06
19
75
-20
07
19
75
-20
08
19
75
-20
09
percentage of patents of largest component
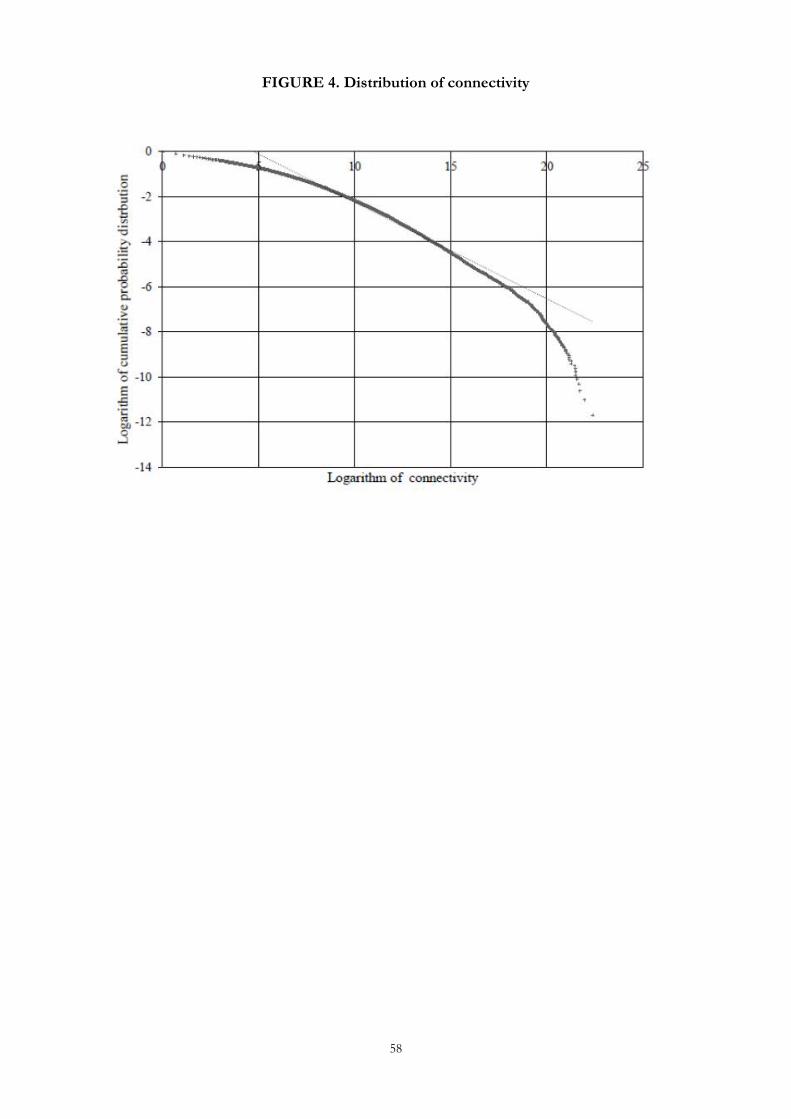
58
FIGURE 4. Distribution of connectivity
o e:
.~ '"; -2
~ "O ,q -4
:0 -8 .... -6 Q.
.~
.!§ -8 :: E a 'o -10 E
-= ·¡: ~ -12 .3
-14
. ~ 1~
1¡5
"" ....... ~ .
Logaritbm of cotmectivity
~ o :s
, . .... ... ,
\ 1 . . , .
59
______
Chapter 2
Technology as a Complex Exaptive System
_____________________
Co-Authored with Victor Gilsing28
____________________________________________
ABSTRACT
This essay contributes to the understanding of the processes through which technologies, originally
developed for specific functions and uses, may turn out to have unanticipated and serendipitous
applications in different fields. The concept of exaptation from evolutionary biology is introduced, in order
to shed light on an alternative mechanism that leads to the genesis of new technologies. This mechanism
consists in the discovery of “latent” functions of existing technologies, which were designed and
developed for other purposes. The essay explores the role played by technological complexity, defined in
terms of interdependence among technological subparts and modules, for the emergence of new
functions. The main hypothesis is that intermediate levels of technological complexity increase the
emergence of new functions of a technology. In order to test the main hypotheses, I identify technologies
with patents, using a random cross-section of US patent granted in 1991. In order to measure the
emergence of new functions, I adopt a novel approach based on the proportion of forward citations
coming from patents that belong to different technological classes. The evidence suggests that high levels
of technological complexity increase cross-class forward citations with decreased acceleration.
Keywords: technological evolution, exaptation, patents
28 Full professor, Department of Management (ACED), University of Antwerp E-mail: [email protected]

60
Index
o Introduction p. 61
o Background and Hypotheses p. 63
o Data p. 71
o Empirical Framework p. 73
o Results p. 82
o Discussion p. 85
o References p. 88
o Tables, Figures, Appendices p. 97
61
Introduction
The literature on innovation and technical change has tried to go beyond the analysis of the
economic and organizational impact of “exogenous” technological innovations (Fleming and Sorenson
2001; Rogers 1983; Rosenberg 1982; Tushman and Anderson 1986), trying to describe the processes of
invention that lead to these innovations (Fleming and Sorenson 2001). Several studies have borrowed
evolutionary analogies, building on the idea that “...invention…much resembles a biologic process” (Gilfillan
1935, pag. 275; Fleming and Sorenson 2001). However, they have adopted a neo-Darwinian view
according to which invention (and, in general, technological evolution) is characterized by a process of
variation (through recombination) and selective retention, as in the case of biological entities (Ziman
2000). For example Fleming and Sorenson (2001), building on the NK fitness landscape model proposed
by Kauffman (1993) in evolutionary biology, have proposed an adaptive theory that views invention as a
process of “search” among different technological configurations that implement some “pre-specified”
function, and where the success of this search process varies according to the the underlying complexity
of the technological architecture (in terms of interdependence among the technological subparts). These
studies have contributed significantly to our theoretical understanding of technological innovation.
However, the history of technology has shown that alternative mechanisms may also play a role
during the process of invention. The introduction of new evolutionary analogies may be necessary in
order to shed light on these alternative mechanisms. Engineers and scientists cannot deny that the (often
serendipitous) discovery of “latent” functions of existing technologies is a pervasive phenomenon in
innovation and science (Dew 2009; Merton 2004; Mokyr 1990)29, and that the discovery of a new function
does not necessarily require the invention of a new technological configuration from scratch. The
example of Gutenberg’s printing press is illustrating: it basically consisted in the discovery of a new
function of a mature technology that belonged to a different field, such as the machinery of the wine
press (Johnson 2010). In order to describe these alternative mechanisms, the concept of exaptation,
29 For example, the birth of the modern pharmaceutical industry was the result of a complex chain of serendipitous events and “functional shifts” that led to the discovery of several well known drugs (Meyers 2007).

62
introduced in evolutionary biology to complement the neo-Darwinian concept of adaptation, has been
recently introduced in management studies (Andriani and Cohen 2007; Cattani 2005, 2006; Dew et al.
2004; Furnari 2011; Lane et. Al 2007; Mokyr 1997). While the concept of adaptation refers to technologies
that are fit for their current role because they were designed and developed for it, the concept of
exaptation refers to technologies that are fit for their current role because of features present for other
reasons, and therefore it refers to technologies designed for old usages and later co-opted for their current
one (Gould and Vrba 1982).
The aim of this paper is to explore the emergence of new technological functions under the lenses
of a theory of technological exaptation, and to explore how the emergence of new functions varies
according to the level of complexity of a technological architecture (in terms of interdependence among its
technological subparts). In this paper, we use patent citation models and the measure of complexity
recently introduced by Fleming and Sorenson (2001). Building on the empirical setting proposed by
Fleming and Sorenson in their paper “Technology as a Complex Adaptive System” (Research Policy, vol. 30
2001), the aim of this paper is to explore a complementary theory based on exaptive mechanisms. We
expect to observe that intermediate levels of technological complexity are correlated to a higher
proportion of forward citations coming from different technological classes. Our results seem to confirm
our main hypothesis, according to which high complexity is correlated to a slower path of the emergence
of new technological functions. To our knowledge, previous research on technological exaptation has
mainly relied on case studies or simulation approaches, and few empirical contributions have only focused
on the organizational-level conditions that lead to technological exaptation. The aim of this paper is to
explore the issue of exaptation at a fine-grained level, that of the technological artefact, adopting an
empirical approach.
The rest of the paper is organized as follows. In the next section the literature is reviewed; then
the theoretical framework is developed and the research hypotheses are formulated. The third section
describes the data. The fourth section describes the empirical setting. The fifth section presents the
results. The last section discusses and concludes.
63
Background and Hypotheses
Evolution of technology
Several studies in the innovation and management literature have borrowed evolutionary
analogies. As noticed by Gilfillan (1935) (quoted in Fleming and Sorenson (2001)), “The nature of
invention…is an evolution, rather than a series of creations, and much resembles a biologic process” (pag. 275). Recently,
Levinthal (1998) has built on the “punctuated equilibrium” framework to illustrate the idea that
technological evolution is characterized by long periods of stasis and equilibrium, then punctuated by
short periods of speciation of new technologies. The idea that technological innovation resembles an
evolutionary process has also exceeded the boundaries of the academic community, receiving increasing
attention in the mass literature (see Johnson 2010; Kelly 2010). The recent book “Technological Innovation
as an Evolutionary Process”, edited by Ziman (2000), contributes the most to the debate, a debate that spans
several fields, ranging from economics (David 1985) to history of science and technology (Merton 2004;
Mokyr 1996), cultural anthropology (Cavalli Sforza and Feldman 1981), engineering (Basalla 1988;
Vincenti 1994) as well as evolutionary biology and physics (Casals et al. 2012; Kauffman 2000). As
noticed by Ziman (2000), the idea of technological evolution may be presented as one of the main aspects
of the general principle of “evolutionary epistemology” (Campbell 1974), a principle according to which
the whole human (and technological) development is a continuation of biological evolution. However, it
is also important to point out that there are important “disanalogies” between technological evolution
and biological evolution, since technological evolution is characterized by the presence of Lamarckian
mechanisms and purposeful design rather than blind variation, and by the absence of a clear mapping
between “genotypes” and “phenotypes”, because of the lack of a “gene” equivalent in the technological
world (Ziman 2000)30. This last issue is central because it suggests that, when compared to biological
systems, technologies (and their internal modules) are characterized by higher degrees of autonomy and
30 The concept of “meme”, popularized by Dawkins (1976) as the equivalent of a gene in the evolution of human artefacts, seems to be a metaphorical abstraction of the gene rather than a concept that refers to an “operationally equivalent” feature (Ziman 2000).
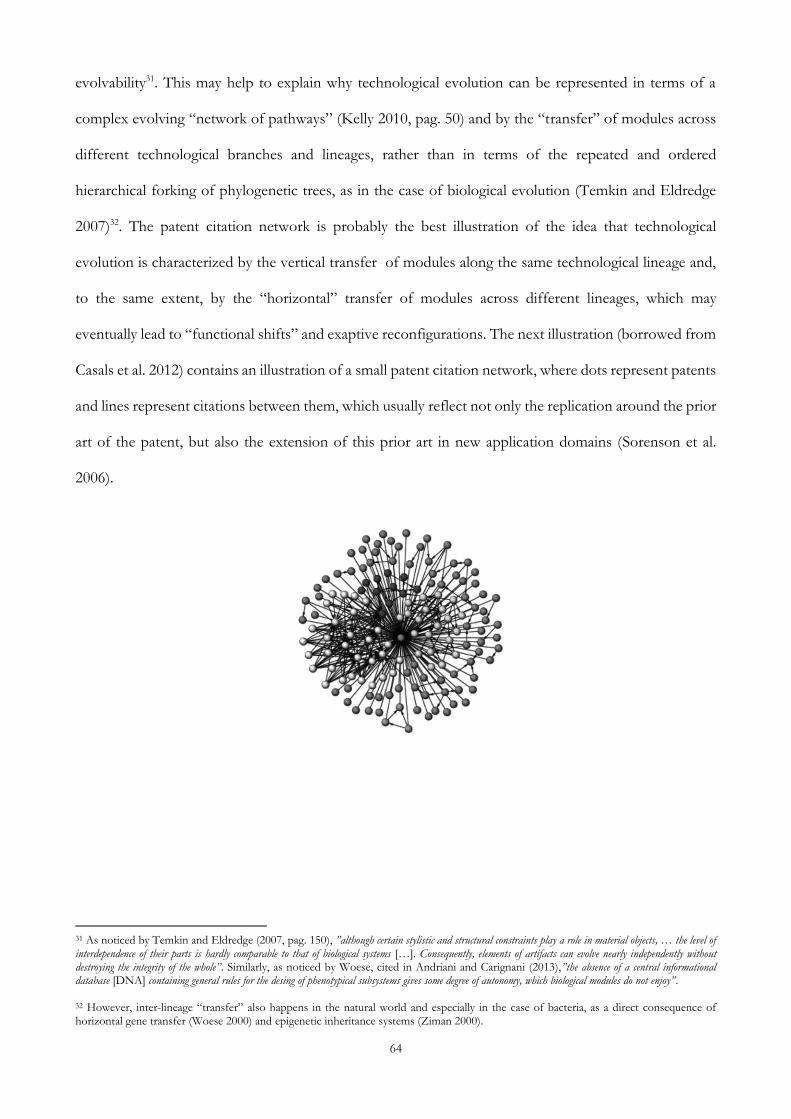
64
evolvability31. This may help to explain why technological evolution can be represented in terms of a
complex evolving “network of pathways” (Kelly 2010, pag. 50) and by the “transfer” of modules across
different technological branches and lineages, rather than in terms of the repeated and ordered
hierarchical forking of phylogenetic trees, as in the case of biological evolution (Temkin and Eldredge
2007)32. The patent citation network is probably the best illustration of the idea that technological
evolution is characterized by the vertical transfer of modules along the same technological lineage and,
to the same extent, by the “horizontal” transfer of modules across different lineages, which may
eventually lead to “functional shifts” and exaptive reconfigurations. The next illustration (borrowed from
Casals et al. 2012) contains an illustration of a small patent citation network, where dots represent patents
and lines represent citations between them, which usually reflect not only the replication around the prior
art of the patent, but also the extension of this prior art in new application domains (Sorenson et al.
2006).
31 As noticed by Temkin and Eldredge (2007, pag. 150), ”although certain stylistic and structural constraints play a role in material objects, … the level of interdependence of their parts is hardly comparable to that of biological systems […]. Consequently, elements of artifacts can evolve nearly independently without destroying the integrity of the whole”. Similarly, as noticed by Woese, cited in Andriani and Carignani (2013),”the absence of a central informational database [DNA] containing general rules for the desing of phenotypical subsystems gives some degree of autonomy, which biological modules do not enjoy”. 32 However, inter-lineage “transfer” also happens in the natural world and especially in the case of bacteria, as a direct consequence of horizontal gene transfer (Woese 2000) and epigenetic inheritance systems (Ziman 2000).
65
Technological exaptation
The concept of exaptation was introduced in evolutionary studies by Gould and Vrba (1982). It
refers to biological “characters evolved for other usages (or for no function at all) and later ‘coopted’ for their current role”
(pag. 6)33. For example, it has been advanced the hypothesis that links birds’ wings to one or more pre-
flight movements that served different ancestral functions, such as climbing trees or capturing preys
(Gatesy and Baier 2005). The concept of exaptation has been recently introduced in innovation studies
(Andriani and Cohen 2007; Cattani 2005, 2006; Dew et al. 2004; Furnari 2011; Lane et. al 2007; Mokyr
1997)34 in order to shed light on an alternative mechanism, with respect to purposeful design, that leads
to the genesis of new technologies, and that consists in the discovery of “latent” functions of technologies
that were designed and developed for other purposes. The existence of latent functions, in turn, is a
corollary of a property according to which a physical structure has an unbounded set of functions mapped
to it, a subset of which are the functions responsible for the main use of the technology, while other
functions remain latent (see Bonaccorsi (2011) and the emerging engineering literature on functional
representations)35. Mechanisms such as exaptation have played a crucial role in several industries. For
instance, the microwave oven was originally developed from a radar magnetron (Osepchuk 1984), the
jukebox was exapted from Edison’s phonograph (Dew et al. 2004), and the first amplifier was exapted
from a device originally designed for radio detection (Nebeker 2009). Similarly, Gutenberg’s printing
press was exapted from a wine press (Johnson 2010). As noticed by Johnson (2010), Gutenberg literally
borrowed “a machine designed to get people drunk and turned it into an engine for mass communication” (pag. 153).
Generally speaking, exaptation has played a significant role in the history of technology. As emphasized
by the historian of technology Mokyr: “one might venture that, in the history of technology, exaptation is probably
more common than in natural history” (Ziman 2000, pag. 57). The increasing attention on the concept of
33 As noticed by Gould and Vrba (1982): “We suggest that such characters, evolved for other usages (or for no function at all), and later ‘coopted’ for their current role, be called exaptations. [...] They are fit for their current role, hence aptus, but they were not designed for it, and are therefore not ad aptus, or pushed towards fitness. They owe their fitness to features present for other reasons, and are therefore fit (aptus) by reason of (ex) their form, or ex aptus” (pag. 6).
34 The increasing attention on the concept has been accompanied by a heated debate on the appropriate terminology. We refer to the critique of Cattani’s (2006) article by Dew (2007) (followed by a reply in 2008), who suggested that the term “exaptation” should replace Cattani’s “pre-adaptation”. However, with minor differences, the two terms refer to the same concept. 35 According to Bonaccorsi (2011), the “malleability” of the mapping between structural spaces and functional spaces and the possibility to discover of latent functions are both a direct consequence of the fact that functions have an “abstract” nature.
66
exaptation in the innovation literature can be explained by several factors. Firstly, the concept of
exaptation points out a very simple idea: the functions for which a technology has been designed and
developed are only a subset of the set of possible functions that the technology in question can generate
(Dew et al. 2004). The set of possible functions can be very large and practically unbounded (Dew et al.
2004). This pattern of activation also lacks any kind of “pre-stateability” (Kauffman 2000)36, since it is
the result of a complex and contingent interaction between the technology and the context, which in turn
is influenced by the actions of the users, as well as by the activity of entrepreneurs that try to combine
the existing technology with new domains of use, markets and industries (Dew et al. 2004; Levinthal
1998). At this point, it is worth considering that while the innovation literature has focused on firms’
innovation within an existing industry (see, for example, Ahuja and Lampert 2001), less attention has
been given to firms’ innovation within an industry that differs from the core industry in which they
compete (Cattani 2006). An exception is Levinthal (1998), who has examined the process of “speciation”
of new technologies which occurs when firms re-use their knowledge base in a different industry. Another
exception are the studies by Cattani (2005, 2006), who has examined the case in which this knowledge
base is not created in anticipation of the new technologies, but it is rather “pre-adapted”, that is
accumulated in the past for very different applications. Secondly, the concept of exaptation changes the
perspective on innovation, suggesting us to look at the implicit potential of “existing” technologies rather
than developing “new” technologies (Grandori 2007). Moreover, the concept of exaptation changes the
perspective on innovation because it contributes to characterize the innovation process in more detail,
particularly in terms of an “adaptation-exaptation-adaptation cycle” that starts with basic R&D, and with
the development and adaptation of a technology for a given domain of use. This phase is then followed
by an exaptation phase, during which the technology is linked to a new domain of use. The final phase
consists in the adaptation of the technology to the requirements of the new domain of use (Dew et al.
2004; Levinthal 1998). In a well-known study on the development of the technology for wireless
communication, Levinthal (1998) has indirectly pointed to this adaptation-exaptation-adaptation cycle
36 According to Rosenberg (1996): the “listing of failures to anticipate future uses and larger markets for new technologies could be expanded almost without limit” (pag. 95).

67
and to the fact that the market-defining phase of exaptation does not necessarily require significant
technological shifts37. Despite the increasing attention on the concept of exaptation in the innovation
literature, previous studies are mainly based on theoretical reviews (Andriani and Cohen 2007; Dew et al.
2004) computer simulations (Lane et. al 2007) or case studies (Cattani 2006; Furnari 2011). Previous
empirical studies on the topic have only focused on the environmental and organizational-level
conditions that lead to exaptation (Cattani 2005; Levinthal 1998). The aim of this paper is to shed light
on the technology-level conditions, answering to the call of Cattani (2006) of identifying more precisely
the micro-determinants of the processes of invention that lead to exaptation. Therefore, building on
patent citation models, we explore how the emergence of exaptation varies according to the level of
complexity of a technological architecture, which is defined in terms of interdependence among its
technological subparts. We expect to observe that intermediate levels of complexity, relaxing the technical
constraints faced by inventors, augment the set of the design options that can be reached from a given
technology (Baldwin and Clark 2000).
Intermediate complexity and design options
Based on Vincenti (1994) and Whitney (2005)’s work, we define a technology as a complex system
that is composed of a hierarchy of subparts. We define technological complexity in terms of the level of
interdependence / coupling among them (Fleming and Sorenson 2001, Kauffman 1993; Ulrich 1995).
This definition resembles the concept of modularity, which is referred to the degree to which a technology
is composed of modules that are relatively weakly connected among each other (Baldwin and Clark
2000)38. When a technology is complex, the decision to modify a subpart is constrained by the interactions
with other subparts of the system, whether they are placed at the same or at different hierarchical levels,
or by other technical specifications and requirements. The idea that constraints matter for design is well
established in engineering studies. According to Phillips (2007), “there is a struggle between the creative ideas of
37 For example, it only took few weeks and few thousand dollars to develop a broadcast radio from a wireless telegraph (Dew et al. 2004). 38 However, we should consider that the literature has defined modularity in several ways (Fleming and Sorenson 2000).
68
machine designers and their recalcitrant, real machinery” (pag. 4). Similarly, Vincenti (1991) notices that, when
these constraints are low, engineers have more degrees of freedom and they can arrive more easily to a
solution to the design problem. Moreover, in order to analyse these constraints, scientific and visual
approaches have been adopted in the engineering practice. Among the scientific approaches, we can
mention “kinematics” as an example, whose principles are adopted for the design of modern technologies
in the robotics, automobiles, aircrafts, satellites, consumer electronics and biomechanical prostheses
sectors, and whose main issue of concern is the level of constraint of a technological architecture
(interested readers can refer to Eckhardt (1998) and Phillips (2007) for more information)39. Among the
visual approaches, we can mention design structure matrices (DSM) (Eppinger 1991, 1997; Steward
1981a, 1981b), defined as n x n matrices where M = (Mij) with Mij ≠ 0 if subparts i and j interact
among each other (Casals et al. 2012). These matrices give a visual representation of all internal
constraints of a technological architecture. Despite the attention given to technological complexity and
its role played during the achievement of solutions to given design problems, less attention has been
given to the issue of how technological complexity influences the exaptive potential of a technology, and
the emergence of new functions. Fleming and Sorenson (2001) developed a theory of invention as a
process of search on technology landscapes. They found that intermediate levels of complexity enhance
the solution to given design problems and the possibility to adapt a technology for a given function. They
build on the NK framework (Kauffman 1993) as well as and on the modularity literature (Baldwin and
Clark 2000), which has defined a set of modular operators such as splitting, substituting, inverting,
porting, excluding and augmenting. This is in order to classify all the possible actions taken for a
technological architecture, when technological complexity is not too high (Baldwin and Clark 2000).
However, while operators such as “substituting”, consisting of the substitution of a module/subpart for
a better one, may enhance the possibility to adapt a technology for a given function, operators such as
“augmenting”, which consists of adding a new module/subpart, may lead to exaptive reconfigurations
39 The level of constraint of a technological architecture can be expressed in terms of the Kutzbach’s criterion: F=αn(β-6)+6(n-1), where F
is the number of degrees of freedom of the technological architecture. α=e/n is the ratio of the number of links among subparts by the
number of subparts, and it expresses the level of interdependence among subparts. We can notice that, unless β>6, increasing levels of α
make F negative, generating over-constraint (Whitney, 2005).

69
that give the technology “some new type of functionality” (Baldwin and Clark 2000, pag. 136). This suggests
that intermediate levels of complexity also multiply the design options of a technology (Baldwin and
Clark 2000), and enhance the possibility to adapt it for a given function “as well as” to exapt it for new
ones (Andriani and Carignani 2013; Dew et al. 2004)40. Indeed, as suggested by Farmer et al. (2012, pag.
7), “a system in which combination is easy to happen will rapidly explore the adjacent possible” (Kauffman 2000). The
history of early computer designs illustrates this point very well, if we consider that modular computer
designs of the 90s started to include new modules and subparts with no counterpart in older designs,
many of which were “never-before-imagined” software applications that significantly changed the entire
sector (Baldwin and Clark 2000; Langlois and Robertson 1992). We expect to observe is that intermediate
levels of technological complexity increase the exaptive opportunities of a technology, while excessively
low or excessively high values decrease those opportunities. As noticed by Fleming and Sorenson (2001),
low values of technological complexity, implying low interdependence among technological subparts,
allow inventors and designers to eliminate cycling traps and loops in the design process and to change
configurations easily (Baldwin and Clark 2000). However, low values of technological complexity are
achieved through the imposition of “design rules” that, taking certain parameters out of the design choice,
reduce the ability of inventors and designers to explore potentially novel and fruitful areas of the design
space (Baldwin and Clark 2000; Fleming and Sorenson 2001)41. On the other hand, high values of
technological complexity, implying high interdependence among technological subparts, expose
inventors and designers to a “complexity catastrophe” (Kauffmann 1993), since they have to devote their
time and abilities to the processing of complex interdependencies and interactions (Fleming and Sorenson
2001), rather than to the exploration of multiple design options and exaptive reconfigurations. Therefore:
h1. The exaptive potential of a technology increases for intermediate levels of technological complexity.
40 Andriani and Carignani (2013) have started to develop a framework for exaptation and modularity, taking into account the level at which exaptation takes place within a modular architecture. They distinguish between “radical”, “internal” and “external” exaptation, and they provide real examples. An exaptation is radical when an internal module is exapted and an entirely new technological architecture, with a new function, arises around the module. An exaptation is internal when an internal module is exapted within an existing technological architecture, whose function does not change. An exaptation is external when the entire technological architecture is exapted for a new function. 41 Quoting Baldwin and Clark (2000): “Converting an ordinary design parameter into a design rule entails […] costs. […] designers will lose the ability to explore some parts of the space of designs –in effect, the architects will restrict the search, declaring some parts of the design space to be out of bounds” (pag. 69).
70
We also want to understand how the scope of legal protection of a technology moderates the
relationship between complexity and exaptive potential, building on the idea that the scope of legal
protection of a technology is also an important factor shaping successive developments (Kitch 1977;
Merges and Nelson 1990)42 . According to Bonaccorsi (2011), the higher the scope of legal protection,
the stronger the monopoly power granted to the owner of the technology against the incentives of other
firms to develop a new invention that infringes some claims of the old technology. Indeed Klemperer
(1990), as well as Gilbert and Shapiro (1990), have illustrated that “patent scope” is a positive input of
the profit function of an innovator. According to Reitzig (2003), patent scope is a “value driver”. In a
similar vein, Lerner (1994) has found that the value of biotech firms increases as the scope of the patents
owned by them increases. Despite its positive role in the profit function of a patent owner, the prevailing
view among the economists is to limit patent scope, to avoid social losses that derive from monopoly as
well as to avoid the blocking of successive imitative developments (Gallini 1992; Machlup 1958; Scherer
1980; Turner 1969)43 44. Avoiding the blocking of successive development may be even more important
in the case of technologies in the “fluid” phase of their life-cycle, a phase that may be characterized by
the exploration of exaptive reconfigurations and diversification (Andriani and Carignani 2013). We expect
to observe that, as the scope of legal protection of a technology increases, the negative effect of high
complexity on the exaptive potential of the technology becomes stronger. Moreover, we expect this
overall effect to be stronger when the firms that are building on the technology differ from the firm that
owns the technology. The scope of legal protection of a technology is here defined in terms of the
different possible “embodiments” envisioned by the inventors, that can be likened to the fence of a real
estate property since they distinguish the intellectual property of the inventors from the surrounding
42 The issue of scope is central in the technological evolution debate. Indeed, as noticed by Merges and Nelson (1990), scope plays a very important role in the case of complex technologies, whose developments can proceed on different technological trajectories at the same time. 43 Successive developments may be “imitative”, especially when conditions of low interdependence allow that. In fact, as noticed by Rivkin (2000), while systems (technologies in our case) characterized by low internal interdependence are less inert and more “fluid” (Levinthal 1997; Sorenson 1997), at the same time they can be imitated more easily. That’s why firms, in absence of the possibility to use interdependence and “causal ambiguities” (Reed and DeFilippi 1990) in order to deter imitation, they rely on intellectual property rights which “formally” impede imitation (Peteraf 1993; Rumelt 1984). 44 The view according to which patent scope limits successive developments, well accepted in the patent literature, has been recently criticized by Katznelson and Howells (2012).
71
“terrain” of technological possibilities (Merges and Nelson, 1990)45. When the inventors of a technology
apply for legal protection, they may choose to include a great number of embodiments with the clear
purpose of obtaining maximal protection against future potentially profitable developments of their
technological invention (Fromer, 2009). However, this can be detrimental to the explorative efforts of
other inventors and firms. Therefore:
h2. When technological complexity is high, and when the firms that build on the technology differ from the firm that owns the technology,
the exaptive potential of a technology declines most rapidly when the scope of legal protection is high.
Data
To test our hypotheses, we relied on an empirical setting based on patent data. Our objective is
to study exaptation at the technology-level. We therefore identified a technology with a patent, and we
considered a random cross-section of US patents granted between the beginning of January and the end
of June of 1991. Patents are characterized by several limitations, and they may constitute imperfect
measures of innovation: it is very likely that inventors, as well as firms, apply for patents only to protect
their best inventions. Not all ideas are therefore equally represented in a patent database. Similarly, there
is a significant amount of variation in patenting across sectors (Fleming and Sorenson 2001). On the
other hand, the use of patent data is very common in innovation studies. We believe that patent data are
very useful in our setting because they allow us to exploit the information contained in citations. Citations
are the result of an interaction between inventors and patent examiners at the USPTO (Alcacer and
Gittelman 2006). They reflect both the replication around the “prior art” as well as the extension of prior
art in new combinations and application domains (Sorenson et al. 2006). The fact that citations also
reflect an extension into new application domains is demonstrated by the fact that a relevant amount of
citations is among patents that belong to different technological classes. Moreover, around half of these
45 This definition is only valid in patent-law systems known as “peripheral” (US, UK and Japan), where the entire set of embodiments defines exactly the “fence” of protection (Fromer, 1999). In patent-law systems known as “central” (Germany and continental Europe), legal protection is provided only by few central embodiments that are used to determine whether future items (such as the claims of an infringing patent) are similar enough to fall within the intellectual property.
72
cross-class citations do not even share the same broad industrial category (Ghiglino and Kuschy, 2010).
According to a definition provided by the US Patent Classification System (USPTO 2012), a technological
class distinguishes the function of one technology from another. If we rely on such definition, then we
can consider the proportion of cross-class forward citations as a proxy for the potential of a technology
being subjected to functional shifts and exaptive “re-uses”. In this regard, we can model how the exaptive
potential of a technology, measured at the patent level, varies according to the level of technological
complexity, where complexity is measured using subclass information, as in Fleming and Sorenson
(2001)’s work, where subclasses reflect physical subparts and structural features (USPTO 2012). At this
point we would like to emphasize that we are measuring “potential” exaptations rather real exaptations
since a correct assessment of real exaptations would require an in-depth case study for each patent of the
database. This goes well beyond our study. Moreover, we would like to emphasize that our use of patent
citations does not raise issues such as those pointed out by Alcacer and Gittelman (2006)46, since we
consider citations as maps of “technical links” among inventions (Martinelli 2010) rather than maps of
“knowledge flows” among inventors. As mentioned in the introduction, our empirical setting builds on
Fleming and Sorenson (2001)’s work (see also: Fleming, 2001; Singh and Fleming, 2010; Sorenson, Rivkin
& Fleming, 2006). To our knowledge, their measure of technological complexity is the first attempt in
the innovation literature, where the issue of interdependence has been dealt mainly through the use of
simulations, such as the NK model. Patent data were obtained from the USPTO, NBER (Hall et al.
2001), and Patent Network Dataverse databases(Lai et al. 2011). Our estimation sample is 20.332 patents
for the first hypothesis, and 4.836 for the second hypothesis.
46 They found that almost 40% of citations are added by examiners, rather than by inventors. This fact begs the issue of whether it is reasonable to assume that citations among patents reflect an exchange of knowledge among inventors.
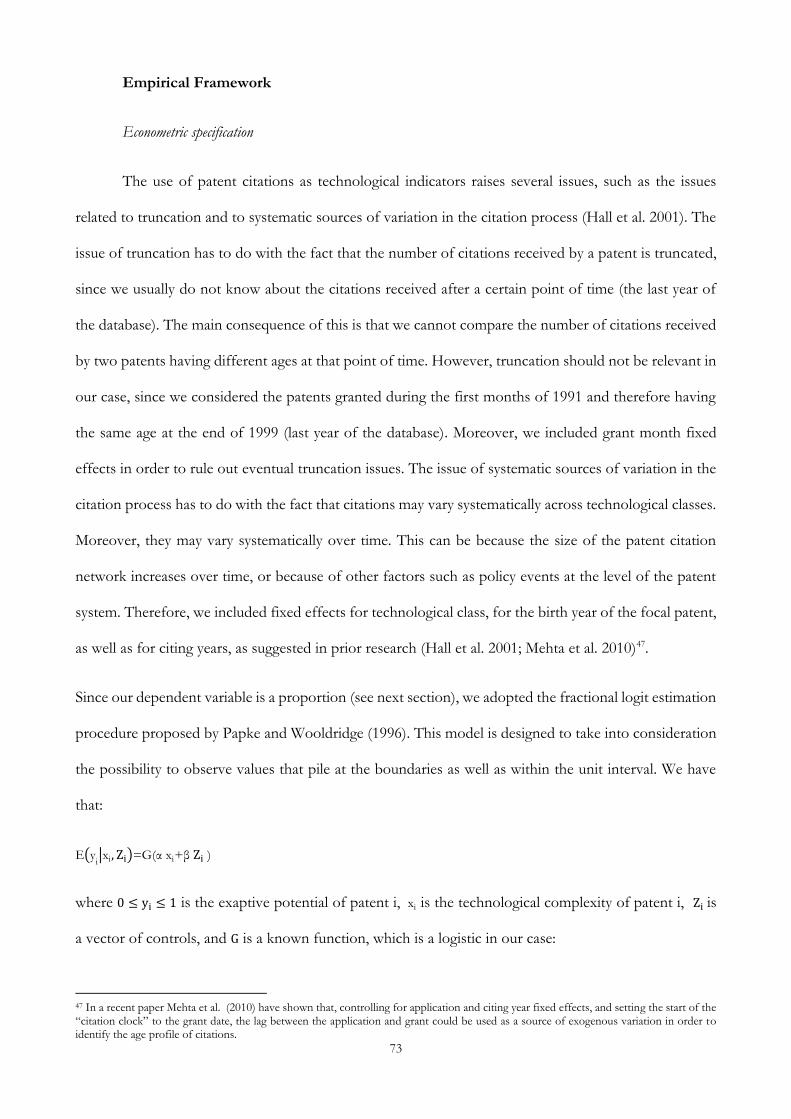
73
Empirical Framework
Econometric specification
The use of patent citations as technological indicators raises several issues, such as the issues
related to truncation and to systematic sources of variation in the citation process (Hall et al. 2001). The
issue of truncation has to do with the fact that the number of citations received by a patent is truncated,
since we usually do not know about the citations received after a certain point of time (the last year of
the database). The main consequence of this is that we cannot compare the number of citations received
by two patents having different ages at that point of time. However, truncation should not be relevant in
our case, since we considered the patents granted during the first months of 1991 and therefore having
the same age at the end of 1999 (last year of the database). Moreover, we included grant month fixed
effects in order to rule out eventual truncation issues. The issue of systematic sources of variation in the
citation process has to do with the fact that citations may vary systematically across technological classes.
Moreover, they may vary systematically over time. This can be because the size of the patent citation
network increases over time, or because of other factors such as policy events at the level of the patent
system. Therefore, we included fixed effects for technological class, for the birth year of the focal patent,
as well as for citing years, as suggested in prior research (Hall et al. 2001; Mehta et al. 2010)47.
Since our dependent variable is a proportion (see next section), we adopted the fractional logit estimation
procedure proposed by Papke and Wooldridge (1996). This model is designed to take into consideration
the possibility to observe values that pile at the boundaries as well as within the unit interval. We have
that:
E(yi|xi, Zi)=G(α xi+β Zi )
where 0 ≤ yi ≤ 1 is the exaptive potential of patent i, xi is the technological complexity of patent i, Zi is
a vector of controls, and G is a known function, which is a logistic in our case:
47 In a recent paper Mehta et al. (2010) have shown that, controlling for application and citing year fixed effects, and setting the start of the “citation clock” to the grant date, the lag between the application and grant could be used as a source of exogenous variation in order to identify the age profile of citations.
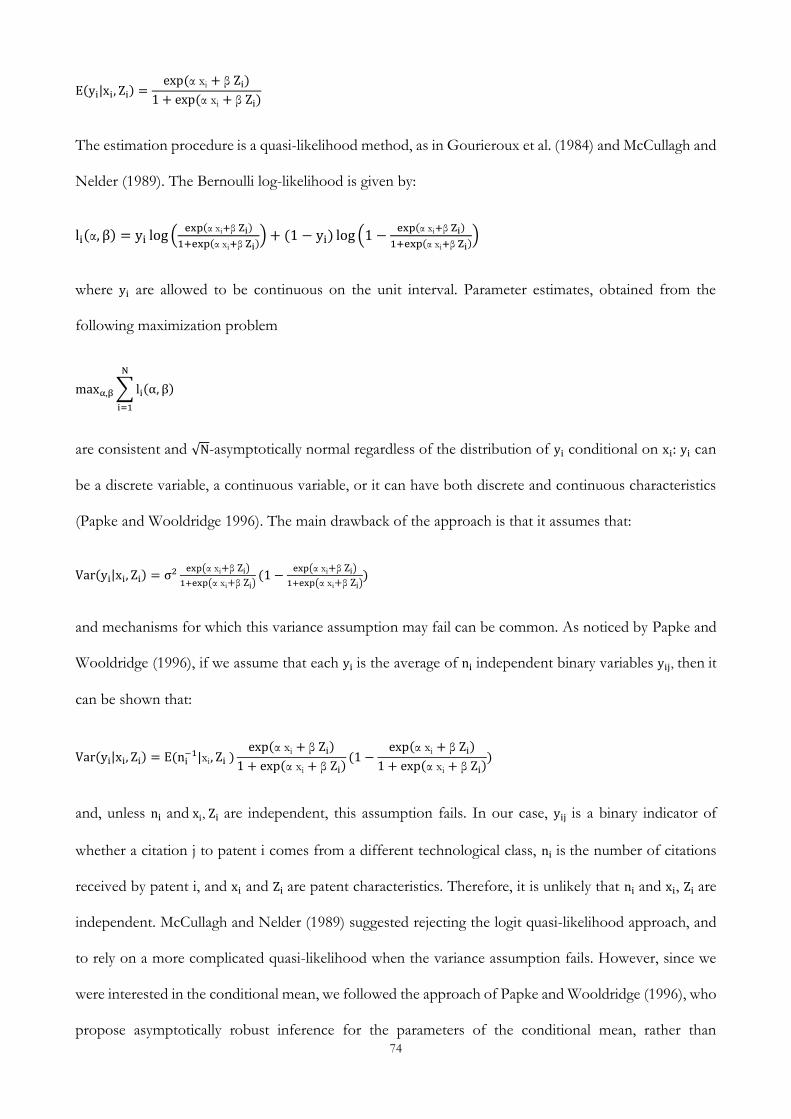
74
E(yi|xi, Zi) =exp (α xi + β Zi)
1 + exp (α xi + β Zi)
The estimation procedure is a quasi-likelihood method, as in Gourieroux et al. (1984) and McCullagh and
Nelder (1989). The Bernoulli log-likelihood is given by:
li(α, β) = yi log (exp(α xi+β Zi)
1+exp(α xi+β Zi)) + (1 − yi) log (1 −
exp(α xi+β Zi)
1+exp(α xi+β Zi))
where yi are allowed to be continuous on the unit interval. Parameter estimates, obtained from the
following maximization problem
maxα,β ∑ li(α, β)
N
i=1
are consistent and √N-asymptotically normal regardless of the distribution of yi conditional on xi: yi can
be a discrete variable, a continuous variable, or it can have both discrete and continuous characteristics
(Papke and Wooldridge 1996). The main drawback of the approach is that it assumes that:
Var(yi|xi, Zi) = σ2 exp(α xi+β Zi)
1+exp(α xi+β Zi)(1 −
exp(α xi+β Zi)
1+exp(α xi+β Zi))
and mechanisms for which this variance assumption may fail can be common. As noticed by Papke and
Wooldridge (1996), if we assume that each yi is the average of ni independent binary variables yij, then it
can be shown that:
Var(yi|xi, Zi) = E(ni−1|xi, Zi )
exp(α xi + β Zi)
1 + exp(α xi + β Zi)(1 −
exp(α xi + β Zi)
1 + exp(α xi + β Zi))
and, unless ni and xi, Zi are independent, this assumption fails. In our case, yij is a binary indicator of
whether a citation j to patent i comes from a different technological class, ni is the number of citations
received by patent i, and xi and Zi are patent characteristics. Therefore, it is unlikely that ni and xi, Zi are
independent. McCullagh and Nelder (1989) suggested rejecting the logit quasi-likelihood approach, and
to rely on a more complicated quasi-likelihood when the variance assumption fails. However, since we
were interested in the conditional mean, we followed the approach of Papke and Wooldridge (1996), who
propose asymptotically robust inference for the parameters of the conditional mean, rather than

75
abandoning the Bernoulli quasi-likelihood approach because the variance assumption may fail. We thus
used robust standard errors, as in Papke and Wooldridge (1996)48.
Measures: exaptive potential
In order to measure the exaptive potential of a patent, we built on the fact that forward citations
not only reflect the replication around the prior art of the patent, but also the extension of this prior art
in new application domains, as noticed by Sorenson et al. (2006). We assumed that cross-class forward
citations reflect the extension of the prior art in new application domains, and we introduced a novel
measure of exaptive potential based on the proportion of cross-class forward citations. We assumed that
a technological class identifies the function of a technology, and distinguishes the function of this
technology from the function of other technologies. Our assumption is consistent with the bases of
classification developed by the USPTO, which uses the “fundamental, direct or necessary function as the principal
basis of classification”, where function is the result achieved by “similar processes or structures […] by the application
of similar natural laws to similar substances” (USPTO 2012b, pag. 3). The USPTO classifies a patent by
assigning an original classification (OR classification) which usually reflects the most comprehensive
claim (the so called “controlling claim”), and a set of other classifications (XR classifications) which may
reflect non-inventor information. Usually they are non-mandatory, unless the controlling claim spans
different classifications. In such case, the XR classifications are mandatory49 (USPTO 2012b). In order
to measure the exaptive potential of a patent, we considered the proportion of cross-class forward
citations. We considered a forward citation to be cross-class if the OR class of the citing patent differs
from the OR class, as well as from the XR classes, of the focal patent. In this way, we tried to capture
the extent to which the main function of the focal patent, as well as other functions and uses eventually
envisioned at the time of the grant, differed from the main function of the citing patents. Therefore, we
measured the exaptive potential of a patent i as follows:
48 Stata’s glm command could not handle Papke and Wooldridge (1996)’s model when their seminal article was published. Few years ago, the command has been enhanced to do so. Moreover, a new stata code for fractional response models has been developed by Ramalho (see http://evunix.uevora.pt/~jsr/FRM.htm). 49 This situation is common for Markush Type claims, in the case of chemical compounds (USPTO 2012b).

76
yi = ∑dj
N
Nj=1
where N is the number of forward citations received until the end of 199950, and dj is a dummy equal to
1 if the OR class of the citing patent differs from the OR and XR classes of patent i, and 0 otherwise. We
also measured the extent to which functional shifts and exaptive “re-uses” happen in remote
technological areas. We introduced two alternative variables that make use of the NBER aggregation of
technological classes in broader industrial categories (Hall et al. 2001). For a similar measure, that tries to
capture serendipitous discoveries occurring in remote technological areas, see Trajtenberg et al. (1997).
Firstly, we measured exaptive potential as the proportion of cross-class citations coming from different
industrial sub-categories. We then measured exaptive potential in terms of cross-class citations coming
from different industrial categories.
In order to test the second hypothesis, we measured the exaptive potential of a patent by looking at how
much the follow-up technical advances based on the patent and owned by other firms (“cross-firm”
forward citations), spread across different technological classes. Therefore, we measured the “external”
exaptive potential of patent i as follows:
y i,ext. = ∑dj
Next.
Next.j=1
where Next. is the number of cross-firm forward citations, and dj is defined as above. In order to uniquely
identify firms, we used the PDPCO identifier obtained from the NBER patent data project. The PDPCO
identifier is the result of several algorithmic procedures that, starting from the organizations to which the
patent was assigned at issue (assignees), were designed to provide a match of patent data to Compustat
data51. Patent ownership may change over time because patent owners may change over time. Dynamic
50 Therefore, we made maximal use of the NBER database, which in our case ended in December 1999. The fact that the patents of our sample were granted in 1991 allowed us to capture the bulk of forward citations, which tend to peak during the 3-5 years that follow the grant date (Jaffe and Trajtenberg, 1995). 51 See: “NBER PDP Project User Documentation: Matching Patent Data to Compustat Firms”.
77
matches are therefore recorded in the PDPCO database. However, for our purposes, we only considered
the first owners, since they were more likely to be involved in the original inventive process52.
Measures: technological complexity
In order to quantify the technological complexity of a patent, we adopted the measure of
interdependence proposed by Fleming and Sorenson (2001) (see also Sorenson et al. 2006), which is
based on the observation of the historical difficulty of combining the subclasses of which the patent is
composed with different subclasses. The underlying assumption is that patent subclasses are proxies of
underlying components, which can be physical components, or pieces of technical knowledge only
indirectly connected to physical configurations (Sorenson et al. 2006). The idea behind the measure is the
following: if the patent is composed of subclasses that, in the past, could not be combined easily with
other subclasses, this may be an indication of the fact that the components of the patent are characterized
by sensitive interdependencies, and of the fact that the actual configuration of components belongs to a
small set of possible alternative configurations. This kind of patent will receive a high value of
technological complexity. Conversely, if the patent is composed of subclasses that, in the past, could be
combined easily with many other subclasses, this may be an indication of the fact that the components
of the patent are not characterized by sensitive interdependencies, and of the fact that components can
be mixed and matched independently. In other words, the set of possible configurations to which the
actual configuration belongs to is large. This kind of patent will receive a low value of technological
complexity. We thus measured the technological complexity of patent i as follows:
x i =csi
∑ erjcsij=1
where csi is the number of subclasses of patent i, and erj is the “ease of recombination score” of each
subclass j belonging to patent i. Therefore, we measured the technological complexity of patent i as the
52 Instead of the PDPCO identifiers, we could have used assignees identifiers directly. However, as noticed by Hall et al. (2001), very often assignees are not/do not belong to firms. More importantly, assignees are not “consolidated”, and the same firm may appear with different assignee identifiers in different patents (Hall et al., 2001).
78
inverse of the average ease of recombination of subclasses. The ease of recombination of a generic
subclass j is given by:
erj =Nsc,j
Npat,j
where Nsc,j is the number of subclasses which co-appeared with subclass j in Npat,j previous patents. The
ease of recombination score of a generic subclass j is the result of an intensive calculation that uses a 15-
year window of historical data that precedes the estimation sample, which consists of all the patents
granted from the beginning of 1975 until the end of 1990. Figure 1, borrowed from Sorenson et al. (2006),
illustrates the calculation of the measure for a digital technology patent53.
Measures: control variables
In order to rule out the factors that may be correlated to technological complexity and, at the
same time, to our measure of exaptive potential, we introduced several controls, as in Fleming and
Sorenson (2001), Fleming (2001), Singh and Fleming (2010), and Sorenson et al. (2006).
Number of claims. We expect to observe that the scope of legal protection moderates the relationship
between technological complexity and exaptive potential. We introduced the number of patent claims as
a proxy of the scope of legal protection. As noticed by Lanjouw and Shankerman (2000), patent claims
should reflect the scope of legal protection that can be claimed for a technology. In fact, as noticed by
Merges and Nelson (1990), patent claims form a protective line around the patent that delimits the
intellectual property of the inventors.
Combination familiarity. A patent may be less exaptive not because of higher complexity, but because the
inventors that build on the patent, having excessive familiarity with its particular combination of
components, may remain trapped in local search (March 1991) and be less inclined to explore exaptive
reconfigurations. In order to measure the familiarity with the combination of components of patent i, we
53 The measure has been validated externally by Fleming and Sorenson (2004) through a survey. They basically asked inventors how coupled were the components of their patent. They then compared the results of the survey to the calculation of interdependence for the corresponding patent, and they found a strong correlation.
79
measured the average proximity in time of patent i to previous patents having an identical combination
of patent subclasses. Previous patents belong to a 15-year window of historical data that precedes the
estimation sample. As in Fleming (2001), we measured the combination familiarity of patent i as follows:
cfi =1
n∑ e−
ad. i−ad. j
knj=1 , where n is the number of previous patents with an identical combination of patent
subclasses, ad. i − ad. j is the distance between the application date of patent i and the application date
of patent j, and k is a parameter of knowledge loss54.
Number of subclasses. A patent may be less exaptive not because of higher complexity, but because the
inventors that build on the patent have to deal with an excessive number of components. This may
constitute a cognitive bound. As in Fleming (2001), we used the number of patent subclasses as a proxy
of the number of components.
Single subclass dummy. Several patents in our sample only have one subclass55. As in Fleming and Sorenson
(2001), we controlled for them since the measure of complexity is not able to capture interdependencies
for these patents.
Experience diversity. A patent may be less exaptive not because of higher complexity, but because the
inventors that build on the patent have less experience with different fields and technological areas. As
in Singh and Fleming (2010), we used the number of different technological classes in which the inventors
of patent i have patented in the past as a proxy of experience diversity. Again, we considered a 15-year
window of historical data that precedes the estimation sample.
Technology control. In order to remove systematic sources of variation in the citation process that may affect
our dependent variable, we controlled for the average number of citations received by a patent in the
same technological class of patent i, as in Fleming and Sorenson (2001). Moreover, if patent i falls in
different technological classes, we also included these classes in the calculation. For example, if patent i
falls in one class 2 and three classes 16, and if a patent of class 2 and 16 respectively receives 2 and 4
54 We set k to 18%, as in Fleming (2001), although Argote et al. (1990) have estimated a higher value for this parameter. 55 As in Fleming and Sorenson (2001), around 7% of the patents of our sample have only one subclass.
80
citations on average, then the citation count for patent i is given by (1/4)*2.0+(3/4)*4.0=3.5 (Fleming
and Sorenson, 2001). In order to calculate the average number of citations, we considered all the patents
granted in 1985 and the citations received until December 1990 (the month that precedes our estimation
sample).
Number of prior art citations. A patent may be less exaptive not because of higher complexity, but because
it is characterized by higher technological maturity, which may limit the exploration of exaptive
reconfigurations. As in Lanjouw and Shankerman (2001) and Ziedonis (2007), we used the number of
backward citations as a proxy of technological maturity.
Number of classes. We included this variable because a patent that falls in a broad range of technological
classes is more likely to be cited by future patents, and this may affect the denominator of our dependent
variable (Fleming and Sorenson 2001). Similarly, a patent that falls in a broad range of technological
classes is more likely to be cited by patents that also fall in different technological classes. This may also
affect the numerator of our dependent variable.
Scientific references. A patent may be less exaptive not because of higher complexity, but because it is
characterized by lower levels of generality. We used the number of non-patent references, such as
references to scientific journals, as a proxy of generality. Moreover, as noticed by Hegde (2011) and Narin
et el. (1997), non-patent references can also be used as a proxy of technological maturity, since patents
with more scientific references tend to protect early-stage inventions.
Diversity of patent portfolio. In order to test the second hypothesis, we measured the “external” exaptive
potential of a patent belonging to a generic firm. We looked at how much “cross-firm” forward citations
spread across different technological classes. We wanted to rule out the factors that may be correlated to
our dependent variable, and that may depend on the propensity of firms’ patent portfolios to cite patents
belonging to different technological classes. We therefore used pre-sample information in order to
measure permanent firm characteristics. According to Blundell et al. (1995), this means including
variables that approximate the build-up of firm technological knowledge before the point of entry in the

81
sample. This may constitute an approximation of unobservable factors. In order to measure this
propensity, for each forward citation received by the focal patent i, we calculated the technological
diversity of the patent portfolio that belongs to the firm that is associated to the citing patent. We then
calculated the average technological diversity across all forward citations, and introduced it as a control.
In order to calculate the technological diversity of a patent portfolio, we computed the dispersion of
patents among different technological classes, adopting a Herfindahl index of dispersion. We also
controlled for the technological diversity of the patent portfolio belonging to the firm associated to the
focal patent i. In order to calculate these measures, we considered a 10-year pre-sample window56.
Size of patent portfolio. In s a similar way, we controlled for the average size of the patent portfolio belonging
to citing firms. We also controlled for the size of the patent portfolio belonging to the firm that is
associated to the focal patent i.
Technological class fixed effects. We introduced technological class fixed effects, in order to remove systematic
sources of variation in the citation process that may take place across technological classes and that the
technology control may miss.
Application year and citing year fixed effects. In order to remove systematic sources of variation in the citing
process that may take place over time, we controlled for the application year of the focal patent and for
the application years of the first and last citing patent.
Grant month fixed effects. We introduced grant month fixed effects, in order to rule out eventual truncation
issues due to the fact that a patent granted in January 1991 will systematically receive more citations than
a patent granted in June 1991.
56 We considered the 1980-1990 window.
82
Results
Table 1 presents descriptive statistics. The main values are consistent with previous studies
(Fleming and Sorenson 2001; Fleming 2001). The correlations are presented in Table 2. As we can see,
except for the number of classes and the number of subclasses, correlation values are relatively low.
Estimation results are reported in Tables 3 to 6. Estimation results for the first hypothesis are reported
in Table 3. Model 1 shows the baseline model with control variables. Model 2 adds technological
complexity. Model 3 adds a square term for technological complexity. Model 4 demonstrates that the
main results are insensitive to the inclusion of controls. Estimation results are reported in terms of
exponentiated coefficients, and they should be read relative to one. As we can notice in Model 3, the
coefficient of technological complexity is positive and significant. The square term is significant with a
negative sign. However, several doubts could be raised about its economic significance and the fact that
we may force technological complexity to take a quadratic relationship, while technological complexity
may actually increase cross-class forward citations with decreased acceleration (a point that has been
already pointed out by Fleming and Sorenson (2001)). Although for several reasons these results should
be interpreted cautiously, they seem to confirm our initial hypothesis that technological complexity plays
a central role not only for technological adaptation (in line with Fleming and Sorenson’s “Technology as a
Complex Adaptive System”, Research Policy, vol. 30 2001), but also for exaptive mechanisms. As we can
notice, when technological complexity increases by one unit and we hold all the other variables constant,
the predicted odds of exaptive potential (in terms of cross-class forward citations) increase by a
multiplicative factor of 1.1239 and the effect becomes weaker due to the effect of the squared term57.
Moreover, several controls are significant with the expected sign, except for the control for the number
of classes. Table 4 presents the results of the main hypothesis, based on two alternative measures that
make use of the NBER aggregation of technological classes in broader industrial categories. Models 1-3
present the results for the measure of exaptive potential based on industrial sub-categories. Models 4-6
57 See Jaccard (2001) for an interpretation of exponentiated coefficients in logistic regression. As noticed by Jaccard (2001), the exponentiated coefficient of a continuous predictor is the multiplicative factor by which the predicted odds of the dependent variable change, given a unit increase in the predictor, holding constant all other variables (see also Hosmer and Lemeshow 2000).

83
present the results for the measure of exaptive potential based on industrial categories. As we can notice,
the main results for technological complexity and its square term remain significant and with the expected
sign. However, the differences between Models 2 and 5 in the magnitude of the coefficients do not seem
to be very informative for our understanding of how functional shifts in distant technological areas vary
according to different levels of complexity.
Table 5 reports estimation results for the second hypothesis. In this case, the estimation sample
is smaller. This is due the fact that many patent assignees are not firms, and a unique PDPCO key does
not exist for several patents of the extended sample. Again, Model 1 shows the baseline model with
control variables. Model 2 adds technological complexity and its square term. Model 3 adds the
interaction effect of technological complexity with the number of patent claims. Model 4 excludes the
main controls. As we can notice in Model 3, the coefficient of technological complexity is positive and
significant. When it increases by one unit and we hold all the other variables constant, the predicted odds
of the external exaptive potential (in terms of cross class-cross firm forward citations) increase by a
multiplicative factor of 1.5105. The square term is also significant, with a negative sign, and its magnitude
is now more pronounced, in line with our first hypothesis. Patent claims are significant in all models, but
the interaction with complexity is not significant in Model 3. Moreover, patent claims have a different
sign from than from what is expected. This suggests that, although patent claims form a protective line
around the focal patent and delimit the intellectual property of a firm (Merges and Nelson 1990), they
may not act as a limit that blocks successive technological developments carried out by other firms, but
rather as a signal of quality that fosters them. In some extent, this interpretation is consistent with a recent
study of Katznelson and Howells (2012), which contradicts a widespread view in the innovation literature,
according to which patent scope blocks downstream (see Merges and Nelson 1990). However, these
results do not seem to confirm our second hypothesis, according to which, when technological
complexity is high, and when the firms that build on the technology differ from the firm that owns the
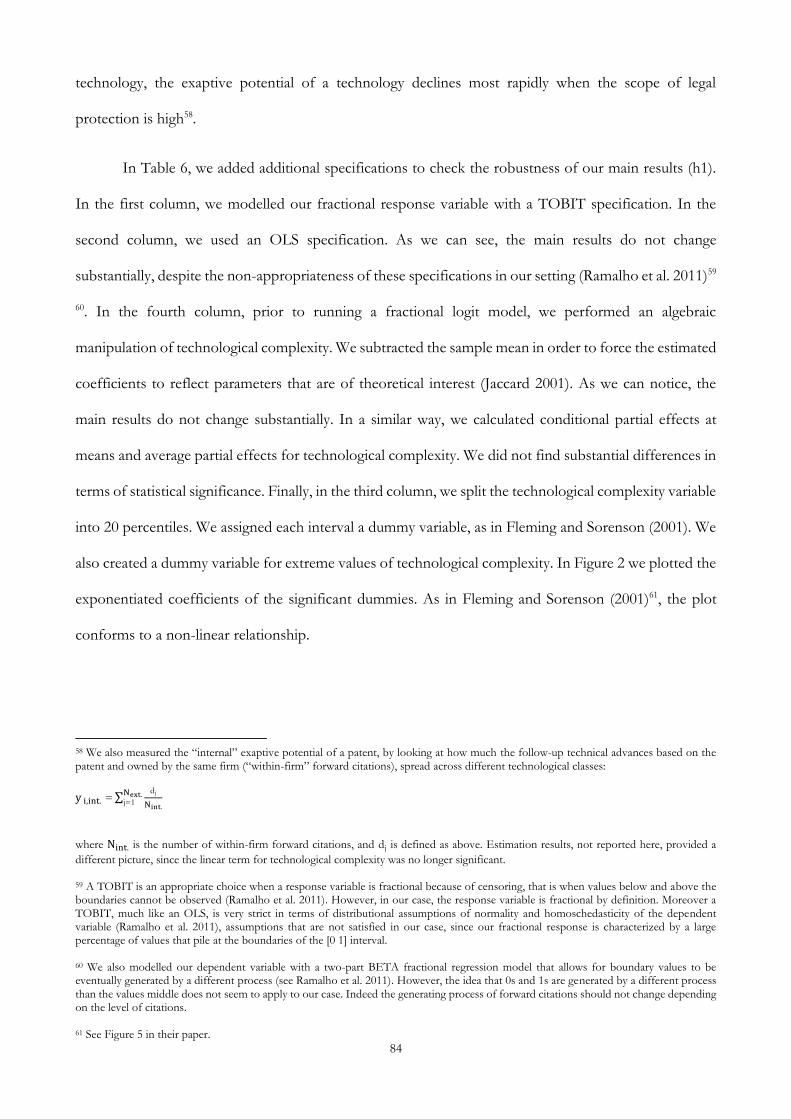
84
technology, the exaptive potential of a technology declines most rapidly when the scope of legal
protection is high58.
In Table 6, we added additional specifications to check the robustness of our main results (h1).
In the first column, we modelled our fractional response variable with a TOBIT specification. In the
second column, we used an OLS specification. As we can see, the main results do not change
substantially, despite the non-appropriateness of these specifications in our setting (Ramalho et al. 2011)59
60. In the fourth column, prior to running a fractional logit model, we performed an algebraic
manipulation of technological complexity. We subtracted the sample mean in order to force the estimated
coefficients to reflect parameters that are of theoretical interest (Jaccard 2001). As we can notice, the
main results do not change substantially. In a similar way, we calculated conditional partial effects at
means and average partial effects for technological complexity. We did not find substantial differences in
terms of statistical significance. Finally, in the third column, we split the technological complexity variable
into 20 percentiles. We assigned each interval a dummy variable, as in Fleming and Sorenson (2001). We
also created a dummy variable for extreme values of technological complexity. In Figure 2 we plotted the
exponentiated coefficients of the significant dummies. As in Fleming and Sorenson (2001)61, the plot
conforms to a non-linear relationship.
58 We also measured the “internal” exaptive potential of a patent, by looking at how much the follow-up technical advances based on the patent and owned by the same firm (“within-firm” forward citations), spread across different technological classes:
y i,int. = ∑dj
Nint.
Next.j=1
where Nint. is the number of within-firm forward citations, and dj is defined as above. Estimation results, not reported here, provided a
different picture, since the linear term for technological complexity was no longer significant.
59 A TOBIT is an appropriate choice when a response variable is fractional because of censoring, that is when values below and above the boundaries cannot be observed (Ramalho et al. 2011). However, in our case, the response variable is fractional by definition. Moreover a TOBIT, much like an OLS, is very strict in terms of distributional assumptions of normality and homoschedasticity of the dependent variable (Ramalho et al. 2011), assumptions that are not satisfied in our case, since our fractional response is characterized by a large percentage of values that pile at the boundaries of the [0 1] interval.
60 We also modelled our dependent variable with a two-part BETA fractional regression model that allows for boundary values to be eventually generated by a different process (see Ramalho et al. 2011). However, the idea that 0s and 1s are generated by a different process than the values middle does not seem to apply to our case. Indeed the generating process of forward citations should not change depending on the level of citations. 61 See Figure 5 in their paper.
85
These results should be interpreted cautiously for several reasons. Firstly, the cross-sectional
nature of our empirical setting gives no guarantee against the presence of eventual confounding factors,
although our models control for several differences in patent characteristics. The identification strategy
proposed by Mehta et al. (2010), that makes use of the lag between application date and grant date as a
source of exogenous variation, may represent a starting point for future studies that adopt a similar
setting. Secondly, the accuracy of the measure of technological complexity may vary across technologies.
As noticed by Fleming and Sorenson (2001), patent subclasses may not always correspond closely to
technological components. Thirdly, our dependent variable captures potential exaptations rather than
real exaptations. Real exaptations are characterized by functional shifts induced by technologically
conservative choices, in the sense that they draw on the reuse of already present technological features
(Dew et al. 2004). Moreover, functional shifts are the result of non-anticipated discoveries rather than
purposeful search. Although, to a certain extent, our dependent variable may be able to capture non-
anticipation, the measurement of technological conservativeness goes well beyond this study. Fourthly,
our main results seem to suggest that technological complexity increases cross-class forward citations
with decreased acceleration, rather than in terms of a quadratic relationship. Although these results do
not invalidate our theoretical apparatus, they suggest us to focus the attention on extreme levels of
technological complexity, rather than intermediate levels.
Discussion
This essay contributed to the understanding of the processes through which technologies,
originally developed for specific functions and uses, may turn out to have unanticipated and serendipitous
applications in different fields. The concept of exaptation from evolutionary biology was introduced, in
order to shed light on an alternative mechanism that leads to the genesis of new technologies. This
mechanism consists in the discovery of “latent” functions of existing technologies, which were designed
and developed for other purposes. The essay explored the role played by technological complexity, defined in
terms of interdependence among technological subparts and modules, for the emergence of new

86
functions. The main hypothesis is that intermediate levels of technological complexity increase the
emergence of new functions of a technology.
The concept of exaptation should occupy a more central position in the innovation debate. Firstly,
because it helps to shed light on a relevant phenomenon that characterizes the evolution of technology.
Secondly, because it offers a novel perspective on the management on innovation. This novel perspective
suggests looking at the implicit potential of “existing” technologies rather than developing “new” ones
(Grandori 2007). Exaptation also provides a strong rationale for the management of serendipity (Merton
2004). Moreover, the concept of exaptation contributes to characterize the innovation process in terms
of an “adaptation-exaptation-adaptation cycle”. The cycle starts with basic R&D and with the
development and adaptation of a technology for a given domain of use. This stage may be then followed
by an exaptation phase, during which the technology is linked to a new domain of use. The final phase
consists of adapting the technology to the requirements of the new domain of use (Dew et al. 2004;
Levinthal 1998). Therefore, as noticed by Dew et al. (2004), both exaptation and adaptation occupy a
central position in the innovation debate. Indeed both the refinements of existing technologies and the
introduction of new ones are central notions in the innovation debate (Henderson and Clark 1990). As
noticed by Henderson and Clark (1990), the development of a technological innovation is characterized
by periods of novel experimentation during which there is little or no agreement among
engineers/designers on the main components of the technological innovation, and how they should be
combined together (Clark 1985; Henderson and Clark 1990)62. This experimentation phase, which may
be characterized by the discovery of new technological functions and exaptive reconfigurations, is usually
followed by a phase of design stability. This is when a “dominant design” emerges, which defines the
integration of the components in a technological architecture that, once established, becomes stable.
62 Quoting Henderson and Clark (1990): “For example, in the early days of the automobile industry, cars were built with gasoline, electric, or steam engines, with steering wheels or tillers, and with wooden or metal bodies” (pag. 14). See also Abernathy (1978).
87
From then on, the progress of the technology consists in the improvement of the components
(Abernathy and Utterback 1978; Clark 1985; Henderson and Clark 1990; Sahal 1986).
In this essay we suggested that intermediate levels of technological complexity play a central role
during the entire adaptation-exaptation-adaptation cycle, not only because they make the adaptation
phase more effective (Fleming and Sorenson 2001), but also because they multiply the design options of
a technology (Baldwin and Clark 2000). In general, we suggested to consider technological complexity
and variables of “physical” nature as important factors that shape the overall innovation process, aside
from the economic variables (Sahal 1986). These variables may also have important implications in terms
of competitive advantage, if we take into account the view according to which complexity and economic
rents are closely linked (Denrell, Fang & Winter 2003; Schoemaker 1990; Yao 1988). In fact, the effort
to lower technological interdependencies in order to make the innovation cycle more flexible comes with
the cost of increasing imitation. As noticed by Rivkin (2000), while technologies that are characterized
by low internal interdependence are more evolvable and less inert (Levinthal 1997; Sorenson 1997), at
the same time they can be attacked easily by imitators. This situation may push firms to strengthen
intellectual property rights and patent scope in order to formally impede imitation and block successive
developments (Peteraf 1993; Rumelt 1984). Therefore, this begs the issue of a proper balance between a
strategy that lowers technological interdependence in order to foster technological “evolvability”, and a
strategy that strengthens patent scope in order to deter imitation and the external exploitation of
technological evolvability.

88
References
Abernathy, W.J. 1978. The productivity dilemma: Roadblock to innovation in the automobile
industry. John Hopkins University Press.
Abernathy, W.J., & Utterback, J. 1978. Patterns of industrial innovation. Technology Review, June-July:
40-47.
Ahuja, G., & Lampert, C.M. 2001. Entrepreneurship in the large corporation: A longitudinal study of
how established firms create breakthrough inventions. Strategic Management Journal, 22: 521-543.
Alcacer, J., & Gittelman, M. 2006. Patent citations as a measure of knowledge flows: The influence of
examiner citations. The Review of Economics and Statistics, 88(4): 774-779.
Andriani, P., & Cohen, J. 2007. Innovation in biology and technology: Exaptation precedes
adaptation. Presented at the conference “exaptation 2009 international workshop”, Gargnano del
Garda (Italy).
Andriani, P., & Carignani, G. 2013. The emergence of new functions in modular systems: The
impact of exaptation on technological change. Working paper.
Argote, L., Beckman, S., & Epple, D. 1990. The persistence and transfer of learning in industrial settings.
Management Science, 36(2): 140-154.
Baldwin, C.Y., & Clark., K.B. 2000. Design rules: The power of modularity. MIT Press.
Basalla, G. 1988. The evolution of technology. Cambridge University Press.
Blundell, R., Griffith, R., & Van Reenen, J. Dynamic count data models of technological innovation. The
Economic Journal, 105: 333-344.
Bonaccorsi, A. 2011. A functional theory of technology and technological change. In Antonelli, C. 2011.
Handbook on the economic complexity of technological change. Edward Elgar.
89
Campbell, D.T. 1974. Evolutionary epistemology. In Schilpp, P.A. The philosophy of Karl Popper.
Open Court.
Casals, M.R., Farmer, D., Kauffman, S., Solè, R.V., & Valverde, S. 2012. The evolutionary ecology of
technological innovations. Working paper, Santa Fe Institute.
Cattani, G. 2005. Preadaptation, firm heterogeneity, and technological performance: A study on the
evolution of fiber optics, 1970-1995. Organization Science, 16: 563-580.
Cattani, G. 2006. Technological pre-adaptation, speciation, and emergence of new technologies: How
Corning invented and developed fiber optics. Industrial and Corporate Change, 15(2): 285-318.
Cattani, G. 2008. Reply to Dew’s (2007) commentary: “Pre-adaptation, exaptation and technology
speciation: A comment on Cattani (2006)”. Industrial and Corporate Change, 17: 585-596.
Cavalli-Sforza, L.L., & Feldman, M.W. 1981. Cultural transmission and evolution: A quantitative
approach. Princeton University Press.
Clark, K.B. 1985. The interaction of design hierarchies and market concepts in technological evolution.
Research Policy, 14: 235-251.
David, P.A. 1985. Clio and the economics of QWERTY. The American Economic Review, 75(2):
332-337.
Dawkins, R. 1976. The selfish gene. Oxford University Press.
Denrell, J., Fang, C., & Winter, S.G. 2003. The economics of strategic opportunity. Strategic
Management Journal, 24: 977-990.
Dew, N., Sarasvathy, S.D., & Venkataraman, S. 2004. The economic implications of exaptation. Journal
of Evolutionary Economics, 14: 69-84.
Dew, N. 2007. Pre-adaptation, exaptation and technology speciation: A comment on Cattani (2006).
Industrial and Corporate Change, 16(1): 155-160.
90
Dew, N. 2009. Serendipity in entrepreneurship. Organization Studies, 30(7): 735-753.
Eckhardt, H.D. 1998. Kinematic design of machines and mechanisms. McGraw-Hill.
Fleming, L., & Sorenson, O. 2001. Technology as a complex adaptive system: Evidence from patent data.
Research Policy, 30: 1019-1039.
Fleming, L. 2001. Recombinant uncertainty in technological search. Management Science, 47: 117-132.
Fleming, L., & Sorenson, O. 2004. Science as a map in technological search. Strategic Management
Journal, 25:909-928.
Fromer, J.C. 2009. Claiming intellectual property. University of Chicago Law Rewiew, 76: 719-796.
Furnari, S. 2011. Exaptation and innovation in architecture: The case of Chicago’s Millennium Park. In
Grandori, A., & Gaillard Giordani, L. Organizing Entrepreneurship. Routledge.
Gallini, N.T. 1992. Patent policy and costly imitation. The Rand Journal of Economics, 23(1): 52-63.
Gatesy, S.M., & Baier, D.B. 2005. The origin of the avian flight stroke: A kinematic and kinetic
perspective. Paleobiology, 31(3): 382-399.
Gilbert, R., & Shapiro, C. 1990. Optimal patent length and breadth. RAND Journal of Economics,
21(1): 106-112.
Gilfillan, S. 1935. Inventing the ship. Follett Publishing Co.
Ghiglino, C., & Kuschy, N. 2010. Patent citation patterns without preferential attachment. Working
paper.
Gould, S.J., & Vrba, E. 1982. Exaptation: A missing term in the science of form. Paleobiology, 8(1): 4-
15.
Gourieroux, C., Monfort, A., & Trognon, A. 1984. Pseudo-maximum likelihood methods: Theory.
Econometrica, 52: 681 -700.
91
Grandori, A. 2007. Discovery in natural selection and knowledge processes: A commentary on ‘an agent-
based model of exaptive processes’. European Management Review, 4: 153-156.
Hall, B.H., Jaffe, A.B., & Trajtenberg, M. 2001. The NBER patent citations data file: Lessons,
insights and methodological tools. Working Paper, NBER.
Hegde, D. 2011. Asymmetric information and contracts in the market for ideas: Evidence from
the licensing of biomedical inventions. Working paper.
Henderson, R.M., & Clark, K.B. 1990. Architectural innovation: The reconfiguration of existing products
technologies and the failure of established firms. Administrative Science Quarterly, 35: 9-30.
Hosmer, D.W., & Lemeshow, S. 2000. Applied logistic regression. Wiley Series in Probability and
Statistics.
Jaccard, J. 2001. Interaction effects in logistic regression. Sage Publications.
Jaffe, A., & Trajtenberg, M. 1995. Flows of knowledge from universities and federal labs: Modelling
the flow of patent citations over time and across institutional and geographic boundaries.
Colloquium on science, technology and the economy, National Academy of Sciences.
Johnson, S. 2010. Where good ideas come from: The natural history of innovation. The Penguin
Group.
Katznelson, R.D., & Howells, J. 2012. Inventing-around Edison’s incandescent lamp patent:
Evidence of patents’ role in stimulating downstream development. Presented at the fifth annual
conference on entrepreneurship and innovation, Searle Center on Law, Regulation, and Economic
Growth (Northwestern University).
Kauffmann, S.A. 1993. The origins of order. Oxford University Press.
Kauffman, S. 2000. Investigations. Oxford University Press.
Kelly, K. 2010. What technology wants. The Penguin Group.
92
Kitch, E.W. 1977. The nature and function of the patent system. Journal of Law and Economics, 20
(2): 265-290.
Klemperer, P. 1990. How broad should the scope of patent protection be? RAND Journal of
Economics, 21(1): 113-130.
Lai, R., D’Amour, A., & Fleming, L. 2011. The careers and co-authorship networks of US patent-
holders, since 1975. Working paper, Harvard Business School Institute for Quantitative Social
Science.
Lane, D., Villani, M., Bonacini, S., Ferrari, D., & Serra, R. 2007. An agent-based model of exaptive
processes. European Management Review, 4: 141-151.
Langlois, R.N., & Robertson, P.L. 1992. Networks and innovation in a modular system: Lessons from
the microcomputer and stereo component industries. Research Policy, 21: 297-313.
Lanjouw, J.O., & Schankerman, M. 2001. Characteristics of patent litigation: A window on competition.
The Rand Journal of Economics, 32(1): 129-151.
Lanjouw, J.O., & Schankerman, M. 2004. Patent suits: Do they distort research incentives? Working
paper, CEPR.
Lerner, J. 1994. The importance of patent scope: An empirical analysis. RAND Journal of Economics,
25(2): 319-333.
Levinthal, D. 1997. Adaptation on rugged landscapes. Management Science, 43: 934-950.
Levinthal, D.A. 1998. The slow pace of rapid technological change: Gradualism and punctuation in
technological change. Industrial and Corporate Change, 7(2): 217-247.
Machlup, F. 1958. An economic review of the patent system. Study of the subcommittee on patents,
trade-marks, and copyrights of the committee on judiciary, United States Senate.
93
March, J. 1991. Exploration and exploitation in organizational learning. Organization Science, 2: 71-
87.
McCullagh, P., & Nelder, J.A. 1989. Generalized linear models. Chapman and Hall.
Mehta, A., Rysman, M., & Simcoe, T. 2010. Identifying the age profile of patent citations: New estimates
of knowledge diffusion. Journal of Applied Econometrics, 25: 1179:1204.
Merges, R.P., & Nelson, R.R. 1990. On the complex economics of patent scope. Columbia Law
Review, 90: 839-916.
Merton, R.K. 2004. The travels and adventures of serendipity: A study in sociological semantics
and the sociology of science. Princeton University Press.
Meyers, M.A. 2007. Happy accidents: Serendipity in major medical breakthroughs in the
twentieth century. Arcade.
Mokyr, J. 1990. The lever of riches. Technological creativity and economic progress. Oxford
University Press.
Mokyr, J. 1996. Evolution and technological change: A new metaphor for economic history? In Fox, R.
Technological change. Harwood Publishers.
Mokyr, J. 1997. Innovation and selection in evolutionary models of technology: Some definitional
issues. Paper presented at the conference on evolutionary models in economics, Oxford (UK).
Narin, F., Hamilton, K.S., & Olivastro, D. 1997. The increasing linkage between US technology and
public science. Research Policy, 26: 317-330.
Nebeker, F. 2009. Dawn of the electronic age: Electrical technologies in the shaping of the
modern world, 1914 to 1945. John Wiley.
Nelson, R., & Winter, S. 1982. An evolutionary theory of economic change. Harvard University Press.
94
Osepchuk, J.M. 1984. A history of microwave heating applications. Microwave Theory and
Techniques, IEEE Transactions 32(9): 1200-1224.
Papke, L.E., & Wooldridge, J.M. 1996. Econometric methods for fractional response variables with an
application to 401(K) plan participation rates. Journal of Applied Econometrics, 11: 619-632.
Peteraf, M.A. 1993. The cornerstones of competitive advantage: A resource based view. Strategic
Management Journal, 14: 179-191.
Phillips, J. 2007. Freedom in machinery. Cambridge University Press.
Ramalho, E.A., & Ramalho, J.J.S. 2011. Alternative estimating and testing empirical strategies for
fractional regression models. Journal of Economic Surveys, 25(1): 19-68.
Rang, H.P. 2009. Drug discovery and development: Technology in transition. Churchill Livingstone
Elsevier.
Reed, R., & DeFilippi, R.J. 1990. Causal ambiguity, barriers to imitation, and sustainable competitive
advantage. Academy of Management Review, 15: 88-102.
Reitzig, M. 2003. What determines patent value? Insights from the semiconductor industry. Research
Policy, 32: 13-26.
Rivkin, J.W. 2000. Imitation of complex strategies. Management Science, 46: 824-844.
Rogers, E. 1983. The diffusion of innovations. Free Press.
Rosenberg, N. 1982. Inside the black box: Technology and economic change. Cambridge University
Press.
Rosenberg, N. 1996. Uncertainty and technological change. In Landau, R., Taylor, T., & Wright, G. The
mosaic of economic growth. Stanford University Press.

95
Rumelt, R.P. 1984. Toward a strategic theory of the firm. In Lamb, R. Competitive Strategic
Management. Prentice Hall.
Sahal, D. 1986. Technological guideposts and innovation avenues. Research Policy, 14: 61-82.
Scherer, F.M. 1980. Industrial market structure and economic performance. Rand McNally College
Pub. Co.
Schoemaker, P.J.H. 1990. Strategy, complexity and economic rent. Management Science, 36: 1178-
1192.
Simon, H.A. 1962. The architecture of complexity. Proceedings of the American Philosophical
Association, 106: 467-482.
Singh, J., & Fleming, L. 2010. Lone inventors as sources of breakthroughs: Myth or reality? Management
Science, 56(1): 41-56.
Sorenson, O.J. 1997. The complexity catastrophe in the computer industry: Interdependence and
adaptability in organizational evolution. Unpublished PhD dissertation, Stanford University.
Sorenson, O., Rivkin, J.W., & Fleming L. 2006. Complexity, networks and knowledge flow. Research
Policy, 35: 994-1017.
Temkin, I., & Eldredge, N. 2007. Phylogenetics and material cultural evolution. Current Anthropology,
48(1): 146-153.
Trajtenberg, M., Henderson, R., & Jaffe, A. 1997. University versus corporate patents: A window on the
basicness of invention. Economics of Innovation and New Technology, 5: 19-50.
Turner, D.F. 1969. Patent system and competitive policy. New York University Law Review, 44(3):
450-476.
Tushman, M., & Anderson, P. 1986. Technological discontinuities and organizational environments.
Administrative Science Quarterly, 31: 439-465.
96
Ulrich, K. 1995. The role of product architecture in the manufacturing firm. Research Policy, 24:419-
440.
USPTO 2012. Overview of the US patent classification system.
USPTO 2012b. Handbook of Classification.
Vincenti, W.G. 1991. The scope of social impact in engineering outcomes: A diagrammatic aid to analysis.
Social Studies of Science, 21: 761-767.
Vincenti, W.G. 1994. The retractable airplane landing gear and the Northrop “anomaly”: Variation-
selection and the shaping of technology. Technology and Culture, 35: 1-33.
Whitney, D.E. 2005. Degree correlations and motifs in technological networks. Engineering
Systems Division Working Paper Series, MIT.
Woese, C.R. 2000. Interpreting the universal phylogenetic tree. Proceedings of the National Academy
of Sciences, 97:8392-8396.
Yao, D.A. 1988. Beyond the reach of the invisible hand: Impediments to economic activity, market
failures, and profitability. Strategic Management Journal, 9: 59-70.
Ziedonis, A.A. 2007. Real options in technology licensing. Management Science, 53 (10): 1618-1633.
Ziman, J. 2000. Technological innovation as an evolutionary process. Cambridge University Press.
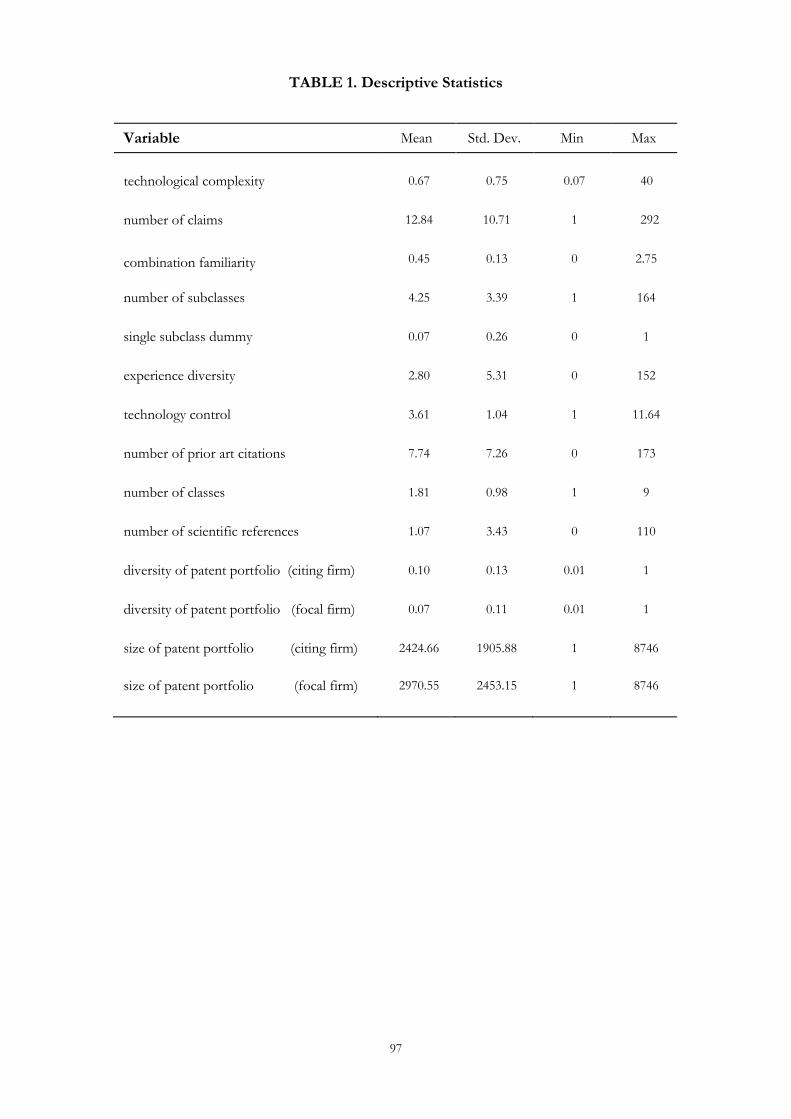
97
TABLE 1. Descriptive Statistics
Variable Mean Std. Dev. Min Max
technological complexity 0.67 0.75 0.07 40
number of claims 12.84 10.71 1 292
combination familiarity 0.45 0.13 0 2.75
number of subclasses 4.25 3.39 1 164
single subclass dummy 0.07 0.26 0 1
experience diversity 2.80 5.31 0 152
technology control 3.61 1.04 1 11.64
number of prior art citations 7.74 7.26 0 173
number of classes 1.81 0.98 1 9
number of scientific references 1.07 3.43 0 110
diversity of patent portfolio (citing firm) 0.10 0.13 0.01 1
diversity of patent portfolio (focal firm) 0.07 0.11 0.01 1
size of patent portfolio (citing firm) 2424.66 1905.88 1 8746
size of patent portfolio (focal firm) 2970.55 2453.15 1 8746
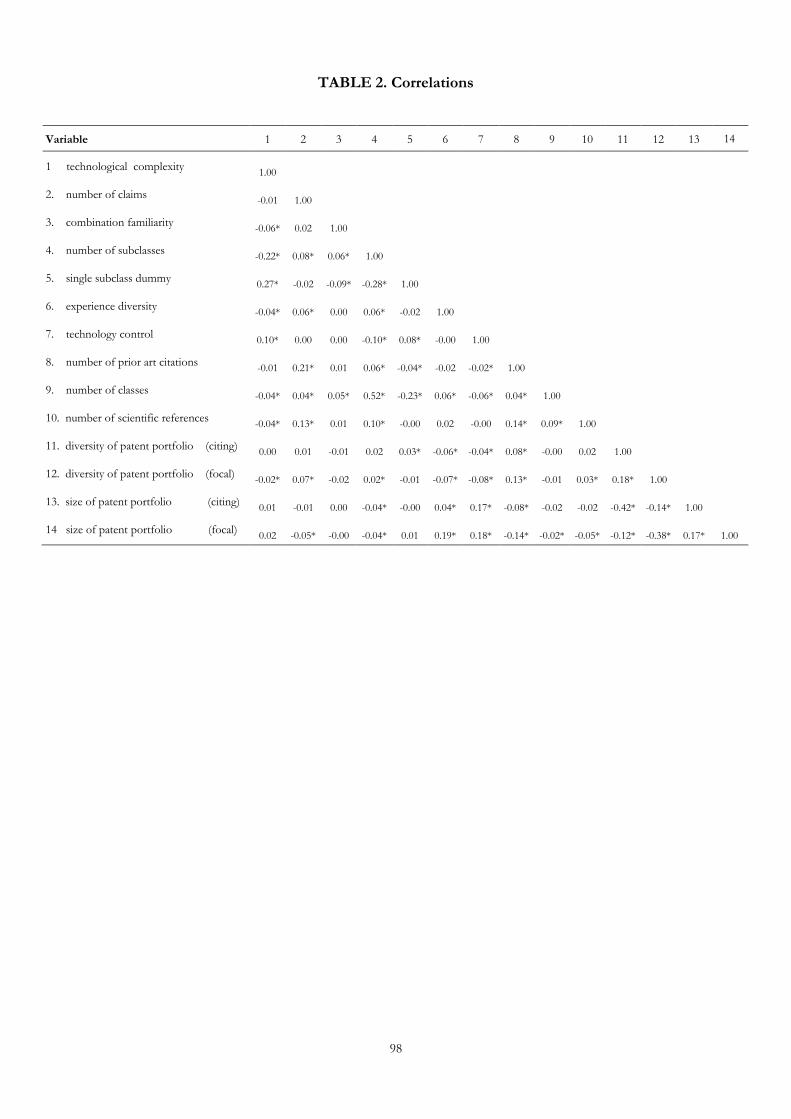
98
TABLE 2. Correlations
Variable 1 2 3 4 5 6 7 8 9 10 11 12 13
14
1 technological complexity
1.00
2. number of claims
-0.01
1.00
3. combination familiarity
-0.06*
0.02
1.00
4. number of subclasses
-0.22*
0.08*
0.06*
1.00
5. single subclass dummy
0.27*
-0.02
-0.09*
-0.28*
1.00
6. experience diversity
-0.04*
0.06*
0.00
0.06*
-0.02
1.00
7. technology control
0.10*
0.00
0.00
-0.10*
0.08*
-0.00
1.00
8. number of prior art citations
-0.01
0.21*
0.01
0.06*
-0.04*
-0.02
-0.02*
1.00
9. number of classes
-0.04*
0.04*
0.05*
0.52*
-0.23*
0.06*
-0.06*
0.04*
1.00
10. number of scientific references
-0.04*
0.13*
0.01
0.10*
-0.00
0.02
-0.00
0.14*
0.09*
1.00
11. diversity of patent portfolio (citing)
0.00
0.01
-0.01
0.02
0.03*
-0.06*
-0.04*
0.08*
-0.00
0.02
1.00
12. diversity of patent portfolio (focal)
-0.02*
0.07*
-0.02
0.02*
-0.01
-0.07*
-0.08*
0.13*
-0.01
0.03*
0.18*
1.00
13. size of patent portfolio (citing)
0.01
-0.01
0.00
-0.04*
-0.00
0.04*
0.17*
-0.08*
-0.02
-0.02
-0.42*
-0.14*
1.00
14 size of patent portfolio (focal)
0.02
-0.05*
-0.00
-0.04*
0.01
0.19*
0.18*
-0.14*
-0.02*
-0.05*
-0.12*
-0.38*
0.17*
1.00
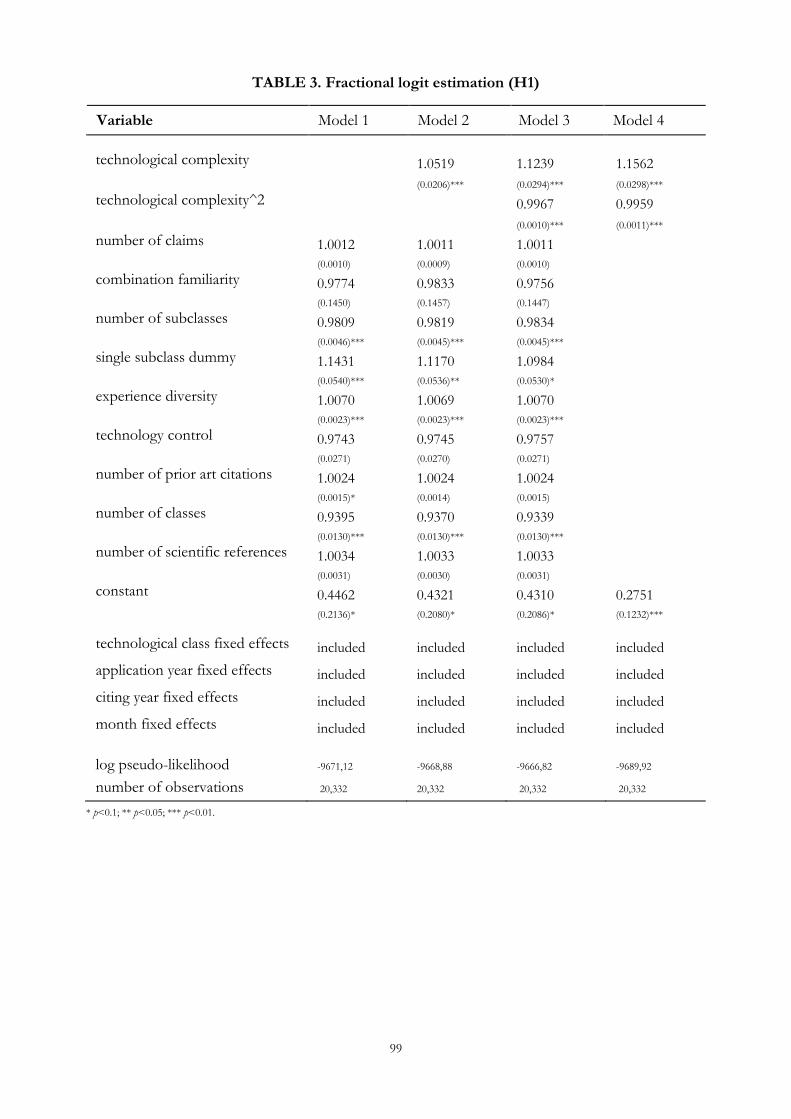
99
TABLE 3. Fractional logit estimation (H1)
Variable Model 1 Model 2 Model 3 Model 4
technological complexity 1.0519 1.1239 1.1562
(0.0206)*** (0.0294)*** (0.0298)***
technological complexity^2 0.9967 0.9959
(0.0010)*** (0.0011)***
number of claims 1.0012 1.0011 1.0011
(0.0010) (0.0009) (0.0010)
combination familiarity 0.9774 0.9833 0.9756
(0.1450) (0.1457) (0.1447)
number of subclasses 0.9809 0.9819 0.9834
(0.0046)*** (0.0045)*** (0.0045)***
single subclass dummy 1.1431 1.1170 1.0984
(0.0540)*** (0.0536)** (0.0530)*
experience diversity 1.0070 1.0069 1.0070
(0.0023)*** (0.0023)*** (0.0023)***
technology control 0.9743 0.9745 0.9757
(0.0271) (0.0270) (0.0271)
number of prior art citations 1.0024 1.0024 1.0024
(0.0015)* (0.0014) (0.0015)
number of classes 0.9395 0.9370 0.9339
(0.0130)*** (0.0130)*** (0.0130)***
number of scientific references 1.0034 1.0033 1.0033
(0.0031) (0.0030) (0.0031)
constant 0.4462 0.4321 0.4310 0.2751
(0.2136)* (0.2080)* (0.2086)* (0.1232)***
technological class fixed effects included included included included
application year fixed effects included included included included
citing year fixed effects included included included included
month fixed effects included included included included
log pseudo-likelihood -9671,12 -9668,88 -9666,82 -9689,92
number of observations 20,332 20,332 20,332 20,332
* p<0.1; ** p<0.05; *** p<0.01.
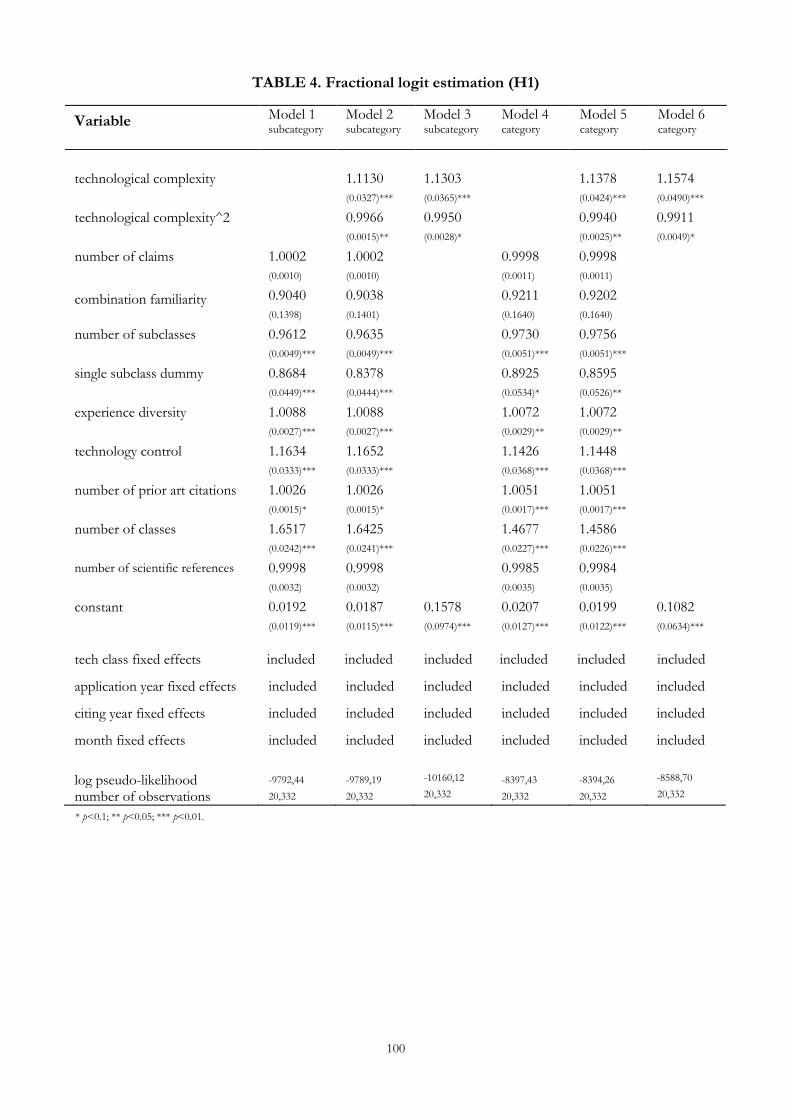
100
TABLE 4. Fractional logit estimation (H1)
Variable Model 1 subcategory
Model 2 subcategory
Model 3 subcategory
Model 4 category
Model 5 category
Model 6 category
technological complexity 1.1130 1.1303 1.1378 1.1574
(0.0327)*** (0.0365)*** (0.0424)*** (0.0490)***
technological complexity^2 0.9966 0.9950 0.9940 0.9911
(0.0015)** (0.0028)* (0.0025)** (0.0049)*
number of claims 1.0002 1.0002 0.9998 0.9998
(0.0010) (0.0010) (0.0011) (0.0011)
combination familiarity 0.9040 0.9038 0.9211 0.9202
(0.1398) (0.1401) (0.1640) (0.1640)
number of subclasses 0.9612 0.9635 0.9730 0.9756
(0.0049)*** (0.0049)*** (0.0051)*** (0.0051)***
single subclass dummy 0.8684 0.8378 0.8925 0.8595
(0.0449)*** (0.0444)*** (0.0534)* (0.0526)**
experience diversity 1.0088 1.0088 1.0072 1.0072
(0.0027)*** (0.0027)*** (0.0029)** (0.0029)**
technology control 1.1634 1.1652 1.1426 1.1448
(0.0333)*** (0.0333)*** (0.0368)*** (0.0368)***
number of prior art citations 1.0026 1.0026 1.0051 1.0051
(0.0015)* (0.0015)* (0.0017)*** (0.0017)***
number of classes 1.6517 1.6425 1.4677 1.4586
(0.0242)*** (0.0241)*** (0.0227)*** (0.0226)***
number of scientific references 0.9998 0.9998 0.9985 0.9984
(0.0032) (0.0032) (0.0035) (0.0035)
constant 0.0192 0.0187 0.1578 0.0207 0.0199 0.1082
(0.0119)*** (0.0115)*** (0.0974)*** (0.0127)*** (0.0122)*** (0.0634)***
tech class fixed effects included included included included included included
application year fixed effects included included included included included included
citing year fixed effects included included included included included included
month fixed effects included included included included included included
log pseudo-likelihood -9792,44 -9789,19 -10160,12 -8397,43 -8394,26 -8588,70
number of observations 20,332 20,332 20,332 20,332 20,332 20,332
* p<0.1; ** p<0.05; *** p<0.01.

101
TABLE 5. Fractional logit estimation (H2)
Variable Model 1 Model 2 Model 3 Model 4
tech complexity 1.4386 1.5105 1.4076 (0.1968)*** (0.2334)*** (0.1808)***
tech complexity^2 0.9579 0.9572 0.9596
(0.0222)* (0.0215)* (0.0176)**
tech complexity*number of claims 0.9969 1.0051
(0.0046) (0.0023)**
number of claims 1.0075 1.0073 1.0093
(0.0022)*** (0.0022)*** (0.0038)**
combination familiarity 2.2174 2.1499 2.1412
(0.8039)** (0.7742)** (0.7704)**
number of subclasses 1.0011 1.0066 1.0063
(0.0106) (0.0106) (0.0106)
single subclass dummy 1.5396 1.4262 1.4236
(0.1740)*** (0.1661)*** (0.1657)***
experience diversity 1.0101 1.0103 1.0104
(0.0068) (0.0068) (0.0068)
technology control 0.9350 0.9339 0.9331
(0.0592) (0.0588) (0.0588)
number of prior art citations 0.9966 0.9967 0.9966
(0.0042) (0.0042) (0.0042)
number of classes 0.8384 0.8270 0.8270
(0.0307)*** (0.0307)*** (0.0307)***
number of scientific references 1.0069 1.0071 1.0069
(0.0098) (0.0098) (0.0098)
diversity pat portfolio (focal) 0.9830 0.9915 0.9938
(0.2599) (0.2619) (0.2621)
diversity pat portfolio (citing) 1.1576 1.1589 1.1622
(0.2788) (0.2782) (0.2791)
size pat portfolio (focal) 0.9999 0.9999 0.9999
(0.0000) (0.0000) (0.0000)
size pat portfolio (citing) 0.9999 0.9999 0.9999
(0.0000) (0.0000) (0.0000)
constant 0.6142 0.5554 0.5419 0.4382
(0.3654) (0.3311) (0.3239) (0.2311)
technological class fixed effects included included included included
application year fixed effects included included included included
citing year fixed effects included included included included
month fixed effects included included included included
log pseudo-likelihood -2356,91 -2354,11 -2353,95 -2373,35
number of observations 4,836 4,836 4,836 4,836
* p<0.1; ** p<0.05; *** p<0.01.
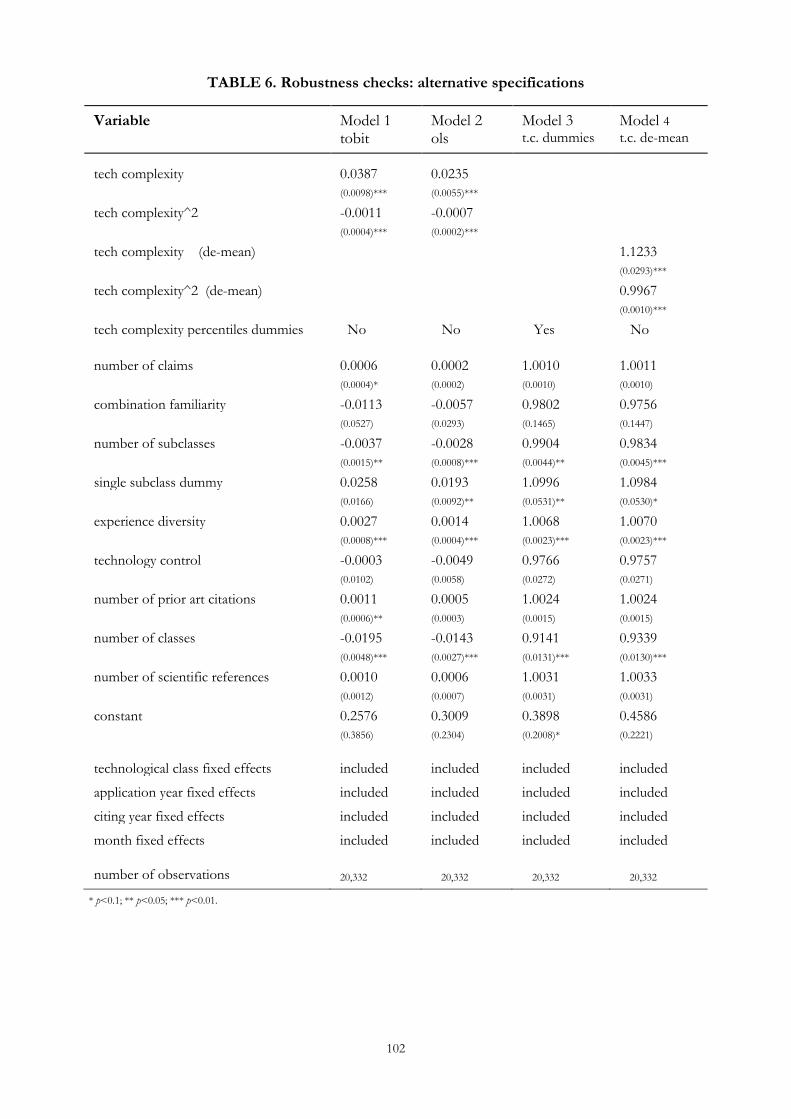
102
TABLE 6. Robustness checks: alternative specifications
Variable Model 1 tobit
Model 2 ols
Model 3 t.c. dummies
Model 4
t.c. de-mean
tech complexity 0.0387 0.0235 (0.0098)*** (0.0055)***
tech complexity^2 -0.0011 -0.0007 (0.0004)*** (0.0002)***
tech complexity (de-mean) 1.1233 (0.0293)***
tech complexity^2 (de-mean) 0.9967 (0.0010)***
tech complexity percentiles dummies No No Yes No
number of claims 0.0006 0.0002 1.0010 1.0011 (0.0004)* (0.0002) (0.0010) (0.0010)
combination familiarity -0.0113 -0.0057 0.9802 0.9756 (0.0527) (0.0293) (0.1465) (0.1447)
number of subclasses -0.0037 -0.0028 0.9904 0.9834 (0.0015)** (0.0008)*** (0.0044)** (0.0045)***
single subclass dummy 0.0258 0.0193 1.0996 1.0984 (0.0166) (0.0092)** (0.0531)** (0.0530)*
experience diversity 0.0027 0.0014 1.0068 1.0070 (0.0008)*** (0.0004)*** (0.0023)*** (0.0023)***
technology control -0.0003 -0.0049 0.9766 0.9757 (0.0102) (0.0058) (0.0272) (0.0271)
number of prior art citations 0.0011 0.0005 1.0024 1.0024 (0.0006)** (0.0003) (0.0015) (0.0015)
number of classes -0.0195 -0.0143 0.9141 0.9339 (0.0048)*** (0.0027)*** (0.0131)*** (0.0130)***
number of scientific references 0.0010 0.0006 1.0031 1.0033 (0.0012) (0.0007) (0.0031) (0.0031)
constant 0.2576 0.3009 0.3898 0.4586 (0.3856) (0.2304) (0.2008)* (0.2221)
technological class fixed effects included included included included
application year fixed effects included included included included
citing year fixed effects included included included included
month fixed effects included included included included
number of observations 20,332 20,332 20,332 20,332
* p<0.1; ** p<0.05; *** p<0.01.
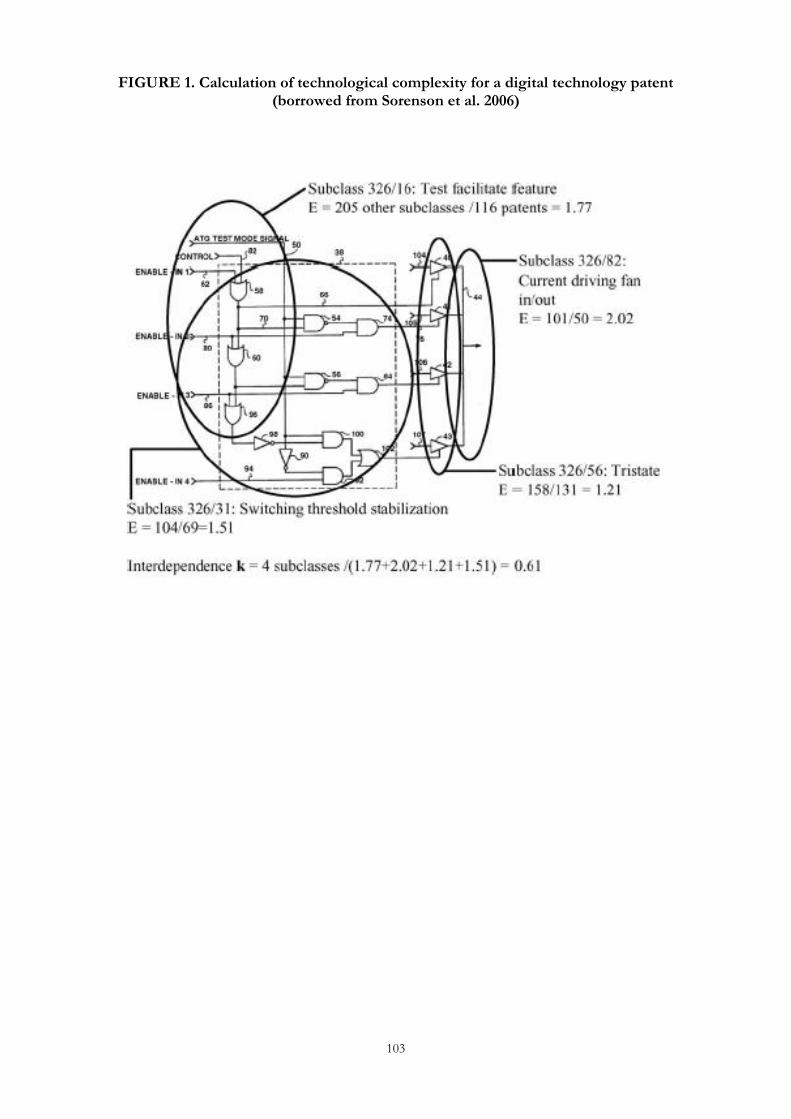
103
FIGURE 1. Calculation of technological complexity for a digital technology patent (borrowed from Sorenson et al. 2006)