New insights into activation and substrate recognition of polyhydroxyalkanoate synthase from...
8
BIOTECHNOLOGICALLY RELEVANT ENZYMES AND PROTEINS New insights into activation and substrate recognition of polyhydroxyalkanoate synthase from Ralstonia eutropha Kazunori Ushimaru & Smith Sangiambut & Nicholas Thomson & Easan Sivaniah & Takeharu Tsuge Received: 8 March 2012 / Revised: 3 April 2012 / Accepted: 4 April 2012 / Published online: 29 April 2012 # Springer-Verlag 2012 Abstract The polyhydroxyalkanoate synthase of Ralstonia eutropha (PhaC Re ) shows a lag time for the start of its polymerization reaction, which complicates kinetic analysis of PhaC Re . In this study, we found that the lag can be virtually eliminated by addition of 50 mg/L TritonX-100 detergent into the reaction mixture, as well as addition of 2.5 g/L Hecameg detergent as previously reported by Gerngross and Martin (Proc Natl Sci USA 92: 6279–6283, 1995). TritonX-100 is an effective lag eliminator working at much lower concentration than Hecameg. Kinetic analysis of PhaC Re was conducted in the presence of TritonX-100, and PhaC Re obeyed Michaelis–Menten kinetics for (R)-3- hydroxybutyryl-CoA substrate. In inhibitory assays using various compounds such as adenosine derivatives and CoA derivatives, CoA free acid showed competitive inhibi- tion but other compounds including 3′-dephospho CoA had no inhibitory effect. Furthermore, PhaC Re showed a consid- erably reduced reaction rate for 3′-dephospho (R)-3-hydrox- ybutyryl CoA substrate and did not follow typical Michaelis– Menten kinetics. These results suggest that the 3′-phosphate group of CoA plays a critical role in substrate recognition by PhaC Re . Keywords Polyhydroxyalkanoate . PHA synthase . Kinetic analysis . Lag eliminator . TritonX-100 Introduction Polyhydroxyalkanoates (PHAs) are aliphatic polyesters pro- duced by a variety of microorganisms as intracellular re- serve materials for carbon and energy (Rehm 2003; Sudesh et al. 2000). PHAs have various mechanical and thermal properties depending on their monomer compositions and are expected to be used as renewable plastic because PHAs can be produced from biomass such as sugars, fatty acids, and plant oils (Rehm 2003; Sudesh et al. 2000). PHA polymerization reaction is catalyzed by PHA synthase (PhaC). The substrate of PhaC is (R)-3-hydroxyacyl coen- zyme A and the resulting polyesters are accumulated in microorganisms as insoluble granules. The polymeriza- tion reaction by PhaC proceeds in aqueous solution at ambient temperature without using a template, organic solvents, or metal cofactor. Additionally, even under such conditions, which favor hydrolysis, PhaC is capable of poly- merizing very high-molecular weight PHA (Gerngross and Martin 1995). To date, a number of PHA synthases have been isolated and characterized (Rehm 2003; Sudesh et al. 2000). Of these, the most characterized PhaC is from Ralstonia eutro- pha (PhaC Re ), which prefers to polymerize 3HA monomers with acyl chain length of C3–C5 (Rehm 2003; Sudesh et al. 2000). The subunit size of PhaC Re is 64 kDa (589 amino acids; Peoples and Sinskey 1989) and it is presumed that two subunits must dimerise to form an active enzyme (Gerngross et al. 1994; Zhang et al. 2000). PhaC Re was isolated as a soluble form from the original organism R. eutropha but the recovery in PhaC Re activity was very low (Haywood et al. 1989). Subsequently, Gerngross et al. demonstrated that soluble PhaC Re was efficiently produced by employing recombinant Escherichia coli and used for in vitro PHA synthesis (Gerngross et al. 1994). In addition, they K. Ushimaru : T. Tsuge (*) Department of Innovative and Engineered Materials, Tokyo Institute of Technology, 4259 Nagatsuta, Midori-ku, Yokohama 226-8502, Japan e-mail: [email protected] S. Sangiambut : N. Thomson : E. Sivaniah Cavendish Laboratory, University of Cambridge, JJ Thomson Avenue, Cambridge CB3 0HE, UK Appl Microbiol Biotechnol (2013) 97:1175–1182 DOI 10.1007/s00253-012-4089-x
Transcript of New insights into activation and substrate recognition of polyhydroxyalkanoate synthase from...
BIOTECHNOLOGICALLY RELEVANT ENZYMES AND PROTEINS
New insights into activation and substrate recognition
of polyhydroxyalkanoate synthase from Ralstonia eutropha
Kazunori Ushimaru & Smith Sangiambut &
Nicholas Thomson & Easan Sivaniah & Takeharu Tsuge
Received: 8 March 2012 /Revised: 3 April 2012 /Accepted: 4 April 2012 /Published online: 29 April 2012# Springer-Verlag 2012
Abstract The polyhydroxyalkanoate synthase of Ralstoniaeutropha (PhaCRe) shows a lag time for the start of itspolymerization reaction, which complicates kinetic analysisof PhaCRe. In this study, we found that the lag can bevirtually eliminated by addition of 50 mg/L TritonX-100detergent into the reaction mixture, as well as addition of2.5 g/L Hecameg detergent as previously reported byGerngross and Martin (Proc Natl Sci USA 92: 6279–6283,1995). TritonX-100 is an effective lag eliminator working atmuch lower concentration than Hecameg. Kinetic analysisof PhaCRe was conducted in the presence of TritonX-100,and PhaCRe obeyed Michaelis–Menten kinetics for (R)-3-hydroxybutyryl-CoA substrate. In inhibitory assays usingvarious compounds such as adenosine derivatives andCoA derivatives, CoA free acid showed competitive inhibi-tion but other compounds including 3′-dephospho CoA hadno inhibitory effect. Furthermore, PhaCRe showed a consid-erably reduced reaction rate for 3′-dephospho (R)-3-hydrox-ybutyryl CoA substrate and did not follow typical Michaelis–Menten kinetics. These results suggest that the 3′-phosphategroup of CoA plays a critical role in substrate recognition byPhaCRe.
Keywords Polyhydroxyalkanoate . PHA synthase . Kineticanalysis . Lag eliminator . TritonX-100
Introduction
Polyhydroxyalkanoates (PHAs) are aliphatic polyesters pro-duced by a variety of microorganisms as intracellular re-serve materials for carbon and energy (Rehm 2003; Sudeshet al. 2000). PHAs have various mechanical and thermalproperties depending on their monomer compositions andare expected to be used as renewable plastic because PHAscan be produced from biomass such as sugars, fatty acids,and plant oils (Rehm 2003; Sudesh et al. 2000). PHApolymerization reaction is catalyzed by PHA synthase(PhaC). The substrate of PhaC is (R)-3-hydroxyacyl coen-zyme A and the resulting polyesters are accumulated inmicroorganisms as insoluble granules. The polymeriza-tion reaction by PhaC proceeds in aqueous solution atambient temperature without using a template, organicsolvents, or metal cofactor. Additionally, even under suchconditions, which favor hydrolysis, PhaC is capable of poly-merizing very high-molecular weight PHA (Gerngross andMartin 1995).
To date, a number of PHA synthases have been isolatedand characterized (Rehm 2003; Sudesh et al. 2000). Ofthese, the most characterized PhaC is from Ralstonia eutro-pha (PhaCRe), which prefers to polymerize 3HA monomerswith acyl chain length of C3–C5 (Rehm 2003; Sudesh et al.2000). The subunit size of PhaCRe is 64 kDa (589 aminoacids; Peoples and Sinskey 1989) and it is presumed thattwo subunits must dimerise to form an active enzyme(Gerngross et al. 1994; Zhang et al. 2000).
PhaCRe was isolated as a soluble form from the originalorganism R. eutropha but the recovery in PhaCRe activity wasvery low (Haywood et al. 1989). Subsequently, Gerngross etal. demonstrated that soluble PhaCRe was efficiently producedby employing recombinant Escherichia coli and used for invitro PHA synthesis (Gerngross et al. 1994). In addition, they
K. Ushimaru : T. Tsuge (*)Department of Innovative and Engineered Materials,Tokyo Institute of Technology,4259 Nagatsuta,Midori-ku, Yokohama 226-8502, Japane-mail: [email protected]
S. Sangiambut :N. Thomson : E. SivaniahCavendish Laboratory, University of Cambridge,JJ Thomson Avenue,Cambridge CB3 0HE, UK
Appl Microbiol Biotechnol (2013) 97:1175–1182DOI 10.1007/s00253-012-4089-x
revealed that soluble PhaCRe shows a lag time at the start ofthe polymerization reaction. This lag time is considered to becaused by dimerization of PhaCRe subunits to create the activeform of the enzyme (Gerngross et al. 1994). Owing to this lagtime, it was difficult to determine the basic kinetic parametersof PhaCRe. Zhang et al. found that multihydroxyl compoundssuch as fructose and glycerol effectively eliminate the lag timeof the PhaCRe-catalyzed polymerization reaction and thisfinding enabled the first kinetic study of PhaCRe (Lenz et al.1999; Song et al. 2000; Zhang et al. 2000). Additionally, theirreport demonstrated the competitive inhibition of the poly-merization reaction by free coenzyme A acid (CoASH; Lenzet al. 1999; Song et al. 2000; Zhang et al. 2000), suggestingthat PhaCRe recognizes not only the hydroxyacyl moiety butalso CoA. Furthermore, an importance of the adenyl moiety ofCoA in substrate recognition by PhaCRe was shown by theresult of very weak polymerization activity toward substratewith the adenyl moiety removed (Gerngross and Martin 1995;Yuan et al. 2001). However, it is unknown how PhaCRe
recognizes the adenyl moiety and whether adenyl compoundswork as competitive inhibitors during the polymerizationreaction.
In this study, we conducted a kinetic study of PhaCRe toexamine whether adenyl compounds work as the inhibitorsof the polymerization reaction. Following previous studies(Song et al. 2000; Zhang et al. 2000), we first evaluated theability of fructose as a lag eliminator for the polymerizationreaction by PhaCRe. However, fructose did not effectivelyeliminate the lag time in our study; therefore, we sought tofind other lag eliminators among some detergents and opti-mized the assay conditions. Employing the established con-ditions, inhibitory effects of several adenosine derivativesand CoA derivatives were investigated. Furthermore, on thebasis of the results, the mechanism by which PhaCRe recog-nizes substrates was discussed. This study demonstrates forthe first time that the 3′-phosphate group of the adenylmoiety in substrates plays an important role in substraterecognition by PhaCRe.
Materials and methods
Chemicals
CoASH was purchased from Wako Pure ChemicalIndustries (Osaka, Japan). Ellman’s reagent, 5,5′-dithiobis(2-nitrobenzoic acid) (DTNB), was purchased from KantoChemicals (Tokyo, Japan). (R)-3-Hydroxybutyric acid [(R)-3HB], (RS)-3-hydroxybutyryl-CoA (racemic 3HBCoA), 3′-dephosphocoenzyme A (3′-dp-CoASH), adenosine 5′-diphosphate sodium salt (5′-ADP), adenosine 3′-monophos-phate sodium salt (3′-AMP), and adenosine 3′,5′-diphos-phate sodium salt (3′-P-5′-P-ADP), were purchased from
Sigma (St. Louis, MO, USA). The detergents TritonX-100(ICN Biomedicals and MP Biomedicals), Tween20 (KantoChemical), Tween80 (Kanto Chemical), BRIJ35 (MPBiomedicals), and Hecameg [6-O-(N-heptylcarbamoyl)methyl α-D-glucopyranoside, AppliChem] were purchasedfrom commercial suppliers as indicated. These chemicalswere used as received.
Preparation of PhaCRe
Histidine-tagged PhaCRe was expressed in recombinant E.coli BL21(DE3) strain (Novagen, CA, USA), as describedpreviously (Normi et al. 2005). The cells were resuspendedin binding buffer (20 mM sodium phosphate, 500 mMNaCl, 20 mM imidazole, 5 vol% glycerol and 0.05 wt%Hecameg, pH 7.4) and lysed by sonification. The lysedsolution was centrifuged at 27,000×g for 30 min. The su-pernatant solution was passed into a HisTrap HP column(GE healthcare) equilibrated in binding buffer and waswashed with 50 ml binding buffer at a flow rate of 1 ml/min. After washing, histidine-tagged PhaCRe was eluted bya linear gradient of elution buffer (20 mM sodium phos-phate, 500 mM NaCl, 500 mM imidazole, 5 vol% glyceroland 0.05 wt% Hecameg, pH 7.4) from 0 to 100 %. All stepswere carried out at 4 °C. Aliquots of purified enzyme werefrozen in liquid nitrogen and stored at −80 °C. The concen-tration of PhaCRe was determined using a Quant-iT ProteinAssay Kit (Invitrogen).
Preparation of 3HBCoA
(R)-3-Hydroxybutyryl-CoA (3HBCoA) was synthesizedfrom (R)-3HB and CoA by the mixed-anhydride method(Goldman and Vagelos 1961; Waterson and Hill 1972).The product was purified by high-performance liquid chro-matography (HPLC; Shimadzu 10A LC-VP system andSPD-20A UV–vis detector) with reversed phase column(μBondapak C18 19/300 mm, Waters) using 20 % (v/v) meth-anol aqueous solution isocratically. After purification, metha-nol was evaporated and the aqueous solution was condensedby lyophilization. The concentration of 3HBCoA was quan-tified by HPLC relative to a standard curve of purchasedracemic 3HBCoA. The quantitative analysis was performedas below: The analytical HPLC system was composed of aShimadzu 10A LC-VP system and SPD-M10A PDA.Samples (50 μL) were injected into the HPLC equippedwith Shodex C18M 4E reversed phase column (ShowaDenko) at 40 °C equilibrated with 50 mM sodium phos-phate buffer (pH 5.0) containing 5 % of acetonitrile.Injected samples were eluted by a gradient of acetonitrile(0–5 min, 5 % acetonitrile; 5–35 min, 5–70 % lineargradient of acetonitrile; 35–40 min, 70 % acetonitrile) and
1176 Appl Microbiol Biotechnol (2013) 97:1175–1182

detected by UV absorption at 254 nm derived from theadenyl moiety of the CoA structure.
Preparation of 3′-dephospho 3HBCoA
3′-Dephospho-(R)-3-hydroxybutyryl-CoA (3′-dp-3HBCoA)was prepared by dephosphorylation of 3′-phosphategroup in 3HBCoA using shrimp alkaline phosphatase(Wadler and Cronan 2007). The dephosphorylation re-action was performed by incubating 10 mM 3HBCoAwith 20 μl shrimp alkaline phosphatase (Sigma) in50 mM Tris–HCl (pH 8.5) containing 5 mM MgCl2 at37 °C for 3 h. After dephosphorylation, the product waspurified by HPLC in the same manner as 3HBCoA. Thestructure of the product was verified by 500 MHz 1HNMR and 202.35 MHz 31P NMR in D2O solvent. Theconcentration of 3′-dp-3HBCoA was quantified relative to aHPLC standard curve of purchased racemic 3HBCoA.
Activity assay based on absorbance at 236 nm
PhaCRe activities were mainly assayed by measuringdecreases in absorbance at 236 nm due to the cleavageof the thioester bond in 3HBCoA (Fukui et al. 1976).The assays were carried out at 30 °C in 50 mM sodiumphosphate buffer (pH 7.0) containing 100 μM 3HBCoAwith or without varying the chemistry and concentrationof detergents. After pre-incubation, the purified PhaCRe
(13.2 μg/ml in final volume) was added into the reactionmixture, followed by monitoring the change in absorbance at236 nm using a 1 cm light path length cuvette. Reaction rateswere determined from the change in absorbance over the first10 s. The molar extinction coefficient ε23604500 M−1 cm−1
was used to calculate the activity (Fukui et al. 1976). When the
initial absorbance was high (abs236>1.5), due to high3HBCoA concentration, a cuvette with 3 or 5 mm light pathlength was used.
Activity assay using DTNB
The amount of CoASH released during the early stagesof the reaction was measured by DTNB assay (Valentinand Steinbüchel 1994) with some modifications as fol-lows: the reaction was initiated by adding PhaCRe
(18.5 μg/ml in final volume). After incubation for10 s (3HBCoA) or 150 s (3′-dp-3HBCoA), the reactionwas stopped by adding trichloroacetic acid (2.5 % (v/v)final concentration). A portion of the reaction mixtureswere diluted with DTNB solution (500 mM potassiumphosphate buffer containing DTNB, pH 8.0) to give1 mM DTNB, followed by measuring the absorbanceat 412 nm. The molar absorbance coefficient ε412013,600 M−1 cm−1 was used to determine the concentra-tion of –SH group. Unlike the absorbance assay at236 nm, the DTNB assay is a discontinuous methodbut applicable to higher substrate concentration. Unlessotherwise noted, the assay conditions were the same asthe absorbance assay at 236 nm.
Kinetic analysis and inhibition study
Kinetic parameters of PhaCRe were determined fromthe assay data collected in the presence of 50 mg/LTritonX-100. For the inhibitory study, CoASH, 3′-dp-CoASH, 5′-ADP, 3′-AMP, and 3′-P-5′-P-ADP (Fig. 1)were examined at concentrations of 50 or 100 μM, in thepresence of 50 μM 3HBCoA as the substrate. For 3HBCoAsubstrate, the Michaelis–Menten equation (Eq. 1) was
3’-P-5’-P-ADP
5’-ADP
3’-AMP
3’-dp-CoASHCoASH
3HBCoA 3’-dp-3HBCoA
Fig. 1 Chemical structures of CoASH, 3HBCoA, 3′-dp-CoASH, 3′-dp-3HBCoA, 3′-AMP, 5′-ADP, and 3′-P-5′-P-ADP
Appl Microbiol Biotechnol (2013) 97:1175–1182 1177
used for determination of kinetic parameters. The for-mula is given by
v ¼ kcat ½E�½S�Km þ ½S� ð1Þ
where v is reaction rate, [E] is the catalytic site con-centration, [S] is the concentration of a substrate, Km isthe Michaelis constant, and kcat is turnover number.Calculation of kcat was based on one catalytic site in adimerized PhaCRe. Kinetic inhibition analysis was performedusing the following formula (Eq. 2):
v ¼ kcat½E�½S�ð1 þ ½I�=KiÞKm þ ½S� ð2Þ
where [I] is inhibitor concentration, and Ki is apparent disso-ciation constant between enzyme and inhibitor. For 3′-dp-3HBCoA substrate, the Hill equation (Eq. 3) wasused for determination of kinetic parameters. The formula isgiven by
v ¼ kcat ½E�½S�n
ðK0:5Þn þ ½S�n ð3Þ
where K0.5 is [S] at which half of the enzyme are bound, and nis Hill coefficient.
Results
Lag elimination in PhaCRe-catalyzed polymerizationreaction
It has been reported that soluble PhaCRe shows a lag time atthe start of polymerization (Gerngross et al. 1994; Zhang etal. 2000). Because the lag time complicates the kineticanalysis, it is better to be eliminated. In previous studies(Song et al. 2000; Zhang et al. 2000), fructose was proposedto be an effective lag eliminator. Thus, we conducted akinetic study of PhaCRe using fructose as a lag eliminator.However, our assays with fructose showed no effect on lagelimination (data not shown). The lag eliminaton effect offructose was also refuted by another study (Stubbe and Tian2003). We sought to find other lag eliminators for kinetic
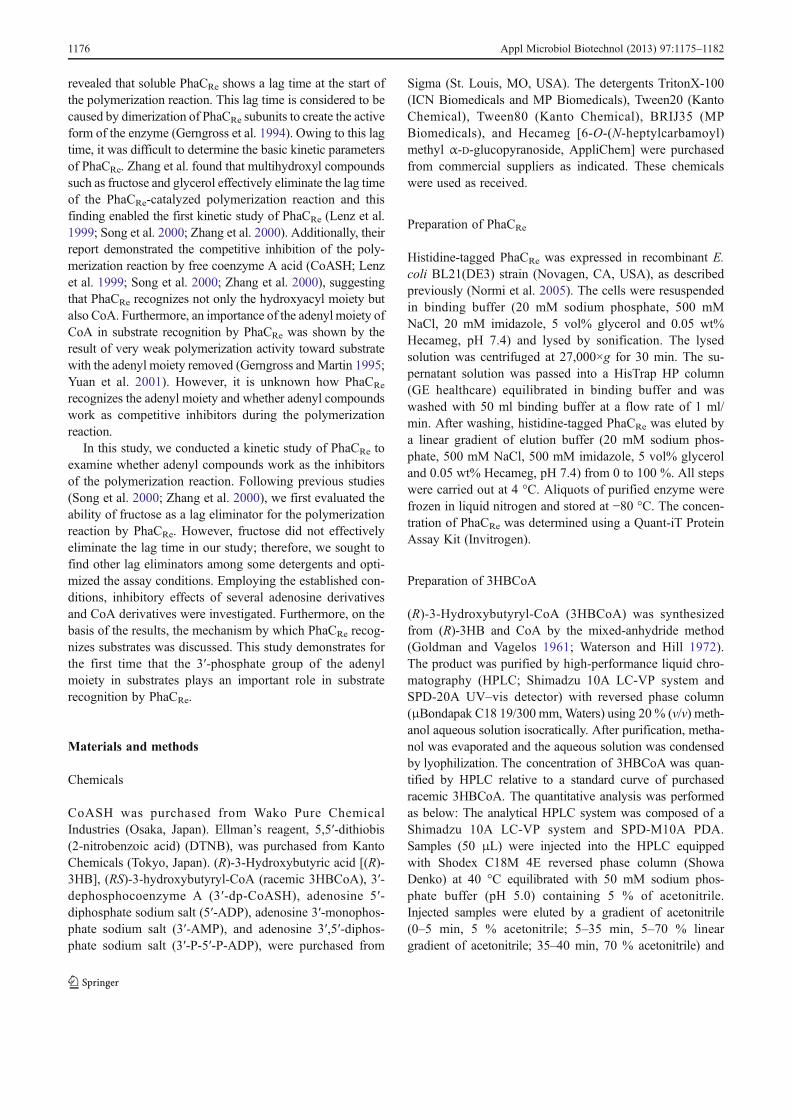
study of PhaCRe. As possible lag eliminators, five nonionicdetergents as listed in Table 1 were examined at 0.4 timestheir critical micelle concentration (CMC). This concentra-tion was adopted from a previous study which demonstratedthat Hecameg at 0.4 CMC can virtually eliminate the lag timeof PhaCRe-catalyzed polymerization reaction (Gerngross andMartin 1995). Figure 2 shows the 3HBCoA consumptionduring activity assay in the presence of each detergent at aconcentration of 0.4 CMC. It was clearly shown that TritonX-100 and Hecameg effectively eliminated the lag time whereasTween20 and Tween80 showed moderate efficacy. BRIJ35seriously inhibited the PhaCRe activity. The effect of detergentconcentration was examined for each detergent except BRIJ35,and the results are shown in Fig. 3. The optimum sub-CMCconcentrations of each detergent for PhaCRe activity weredetermined. Interestingly, there was a large difference inamounts of TritonX-100 and Hecameg needed to maximizethe PhaCRe activity. These concentrations were 50 mg/L
Table 1 The critical micelle concentration (CMC) of detergents
Detergent CMC (mM) CMC (g/L) Reference
TritonX-100 0.3 0.188 Makino et al. (1973)Hecameg 19.5 6.54 The supplier’s dataBRIJ35 0.09 0.110 The supplier’s dataTween20 0.06 0.0736 Lemaire et al. (2000)Tween80 0.012 0.0157 Lemaire et al. (2000)
-0.25
-0.2
-0.15
-0.1
-0.05
0
0 20 40 60 80 100Time (sec)
Control
Tr iton
Hecameg
Brij
Tween20
Tween80
None
Tr itonX-100
Hecameg
BRIJ35
Tween20
Tween80
Δ Abs
236
Fig. 2 Effects of nonionic detergents on PhaCRe reaction rate for3HBCoA substrate. The assay was carried out by monitoring thechange in absorbance at 236 nm with the reaction mixtures containing0.4 CMC of detergent
0
5
10
15
20
25
0 0.1 0.2 0.3 0.4 0.5 0.6 0.7
Tr itonHecamegTween20Tween80
TritonX-100
Hecameg
Tween20
Tween80
Rel
ativ
e act
ivity
Detergent concentration(Relative to CMC)
Fig. 3 Relative activities of PhaCRe reaction rate for 3HBCoA sub-strate at different detergent concentrations. Relative activities weredetermined from the change in absorbance at 236 nm at first 10 s
1178 Appl Microbiol Biotechnol (2013) 97:1175–1182
(80 μmol/L) and 2.3 g/L (6.8 mmol/L), respectively.Furthermore, the maximum relative activity of PhaCRe withTritonX-100 was higher than that with Hecameg. From theseresults, TritonX-100 is capable of working as the lag eliminatormore effectively than Hecameg. Therefore, TritonX-100 wasused for PhaCRe activity assay at a concentration of 50 mg/L(0.25 CMC) for further experiments.
Kinetic parameters of PhaCRe for 3HBCoA
PhaCRe exhibited normal Michaelis–Menten kinetics inthe presence of 50 mg/L TritonX-100 and the kineticparameters are listed in Table 2. By the absorbanceassay at 236 nm, the Km and kcat values for 3HBCoA(40 μM to 1 mM) were 0.381 mM and 1.18×10⁴ min−1,respectively. However, this method was not applicablefor high substrate concentrations because the initial ab-sorbance increased with increasing substrate concentra-tion. Our DTNB assay is an end-point assay to measurereleased CoASH during the polymerization reaction and
enables the test to be conducted at high substrate con-centration. Therefore, the DTNB assay was also usedfor the kinetic study and the Km and kcat values for3HBCoA (50 μM to 3 mM) were determined to be0.321 mM and 1.13×10⁴ min−1, respectively. These valueswere consistent with those obtained by the absorbance assayat 236 nm, at lower substrate concentrations.
Inhibition study
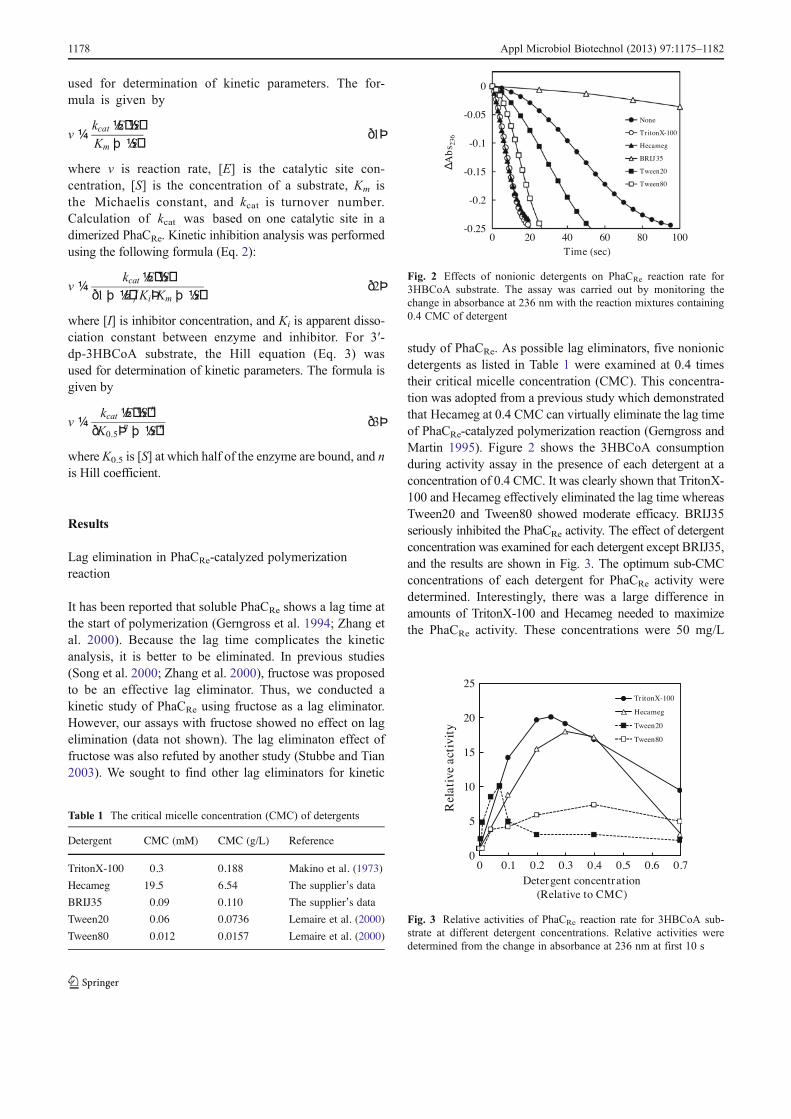
Five compounds, CoASH, 3′-dp-CoASH, 5′-ADP, 3′-AMP,and 3′-P-5′-P-ADP (see Fig. 1) were evaluated for theirinhibitory effects on PhaCRe-catalyzed polymerization.As representative examples, plots of 3HBCoA consump-tion by PhaCRe in the presence of CoASH, 3′-dp-CoASH, or3′-P-5′-P-ADP are shown in Fig. 4. Among the compoundstested, only CoASH showed a significant inhibitory ef-fect. The mode of inhibition by CoASH was investigatedbased on the absorbance assay at 236 nm. As shown in Fig 5,the Lineweaver–Burk plot indicates a competitive inhibi-tion with an inhibition constant (Ki) of 0.107 mM−1 forCoASH.
Table 2 Kinetic parameters of PhaCRe for 3HBCoA substrate
Assay method Km (mM) kcat (min−1) kcat/Km (mM−1 min−1) Ki [CoASH] (mM) Additives Reference
Abs236a 0.381 1.18×10⁴ 3.10×10⁴ 0.107 TritonX-100 (50 mg/L) This study
DTNBb 0.321 1.13×10⁴ 3.51×10⁴ – TritonX-100 (50 mg/L) This studyAbs236 0.232 3.0×10³ 1.29×10⁴ 0.370 Glycerol Lenz et al. (1999)Abs236 0.103 2.03×10⁴ 1.97×10⁵ 0.108 Fructose Zhang et al. (2000a)Abs236 0.19 2.64×10³ 1.38×10⁴ – 0.05 % Hecameg, 5 %
Glycerol, FructoseNormi et al. (2005)
a The cleavage of the thioester bond in 3HBCoA was measured by monitoring the change in absorbance at 236 nmb The amount of released CoASH was measured by using DTNB reagent
-0.14
-0.12
-0.1
-0.08
-0.06
-0.04
-0.02
0
0.02
0 5 10 15 20 25
ControlCoASH (50 μM) CoASH (100 μM) 3’-dp-CoASH (50 μM) 3’-dp-CoASH (100 μM) 3’-P-5’-P-ADP (50 μM)
ΔAbs
236
Time (sec)
Fig. 4 Reaction assay curves of PhaCRe with 50 μM 3HBCoA assubstrate and CoASH derivatives as potential inhibitors, measured bychange in absorbance at 236 nm
0
2
4
6
8
10
12
14
16
0 10 20 30
3HBCoA3HBCoA + 50 mM CoASH
y = 0.848 + 0.323xR = 0.997y = 0.817 + 0.456xR = 0.995
1/v(
min
mM
-1)
1/3HBCoA (mM-1)
Fig. 5 Lineweaver-Burk analysis of the inhibition effect of CoASH(50 μM) on PhaCRe reaction rate for 3HBCoA substrate. The assay wascarried out by monitoring the change in absorbance at 236 nm
Appl Microbiol Biotechnol (2013) 97:1175–1182 1179
Kinetic parameters of PhaCRe for 3′-dp-3HBCoA
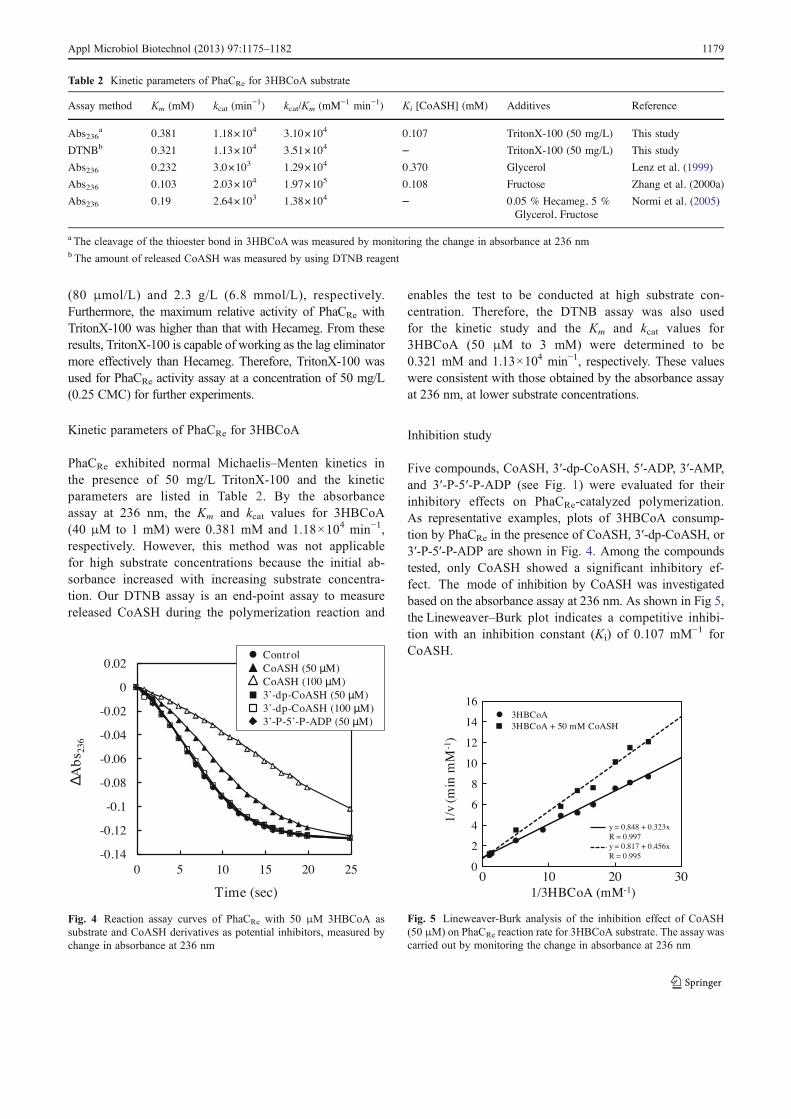
3′-Dephospho-3HBCoA (3′-dp-3HBCoA) was prepared byenzymatic dephosphorylation of 3HBCoA using shrimpalkaline phosphatase (Wadler and Cronan 2007). The 3′-dp-3HBCoA was purified by HPLC and the structure wasconfirmed by 1H and 31P NMR prior to use. The 31P NMRspectra of 3HBCoA and 3′-dp-3HBCoA are shown in Fig. 6.Only 5′-diphosphate signals are observed in the spectrum of3′-dp-3HBCoA. Chemical shifts of each signal are as follows:3HBCoA: δ00.49 (s, 1P), −10.19 (d, 1P), −10.79 (d, 1P); 3′-dp-3HBCoA: δ0−10.30 (d, 1P), −10.85 (d, 1P).
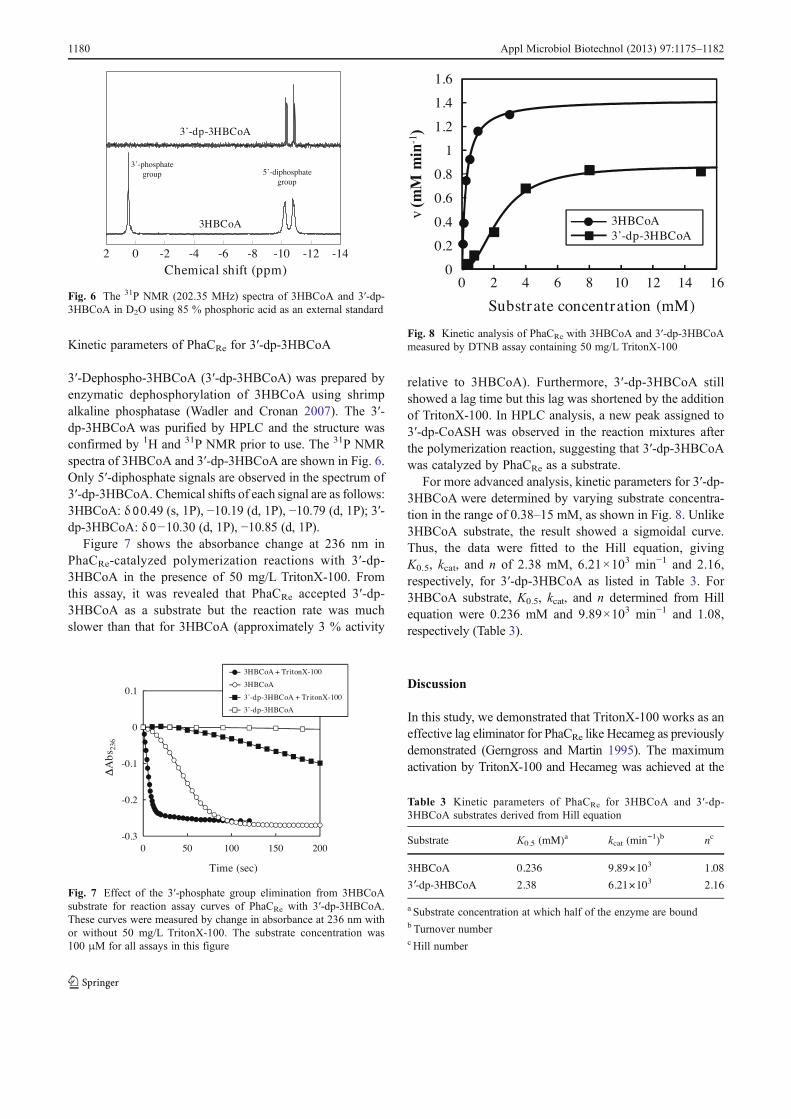
Figure 7 shows the absorbance change at 236 nm inPhaCRe-catalyzed polymerization reactions with 3′-dp-3HBCoA in the presence of 50 mg/L TritonX-100. Fromthis assay, it was revealed that PhaCRe accepted 3′-dp-3HBCoA as a substrate but the reaction rate was muchslower than that for 3HBCoA (approximately 3 % activity
relative to 3HBCoA). Furthermore, 3′-dp-3HBCoA stillshowed a lag time but this lag was shortened by the additionof TritonX-100. In HPLC analysis, a new peak assigned to3′-dp-CoASH was observed in the reaction mixtures afterthe polymerization reaction, suggesting that 3′-dp-3HBCoAwas catalyzed by PhaCRe as a substrate.
For more advanced analysis, kinetic parameters for 3′-dp-3HBCoA were determined by varying substrate concentra-tion in the range of 0.38–15 mM, as shown in Fig. 8. Unlike3HBCoA substrate, the result showed a sigmoidal curve.Thus, the data were fitted to the Hill equation, givingK0.5, kcat, and n of 2.38 mM, 6.21×10³ min−1 and 2.16,respectively, for 3′-dp-3HBCoA as listed in Table 3. For3HBCoA substrate, K0.5, kcat, and n determined from Hillequation were 0.236 mM and 9.89×10³ min−1 and 1.08,respectively (Table 3).
Discussion
In this study, we demonstrated that TritonX-100 works as aneffective lag eliminator for PhaCRe like Hecameg as previouslydemonstrated (Gerngross and Martin 1995). The maximumactivation by TritonX-100 and Hecameg was achieved at the
-14-12-10-8-6-4-202
3’-dp-3HBCoA
3HBCoA
3’-phosphategroup 5’-diphosphate
group
Chemical shift (ppm)
Fig. 6 The 31P NMR (202.35 MHz) spectra of 3HBCoA and 3′-dp-3HBCoA in D2O using 85 % phosphoric acid as an external standard
-0.3
-0.2
-0.1
0
0.1
0 50 100 150 200
3HBCoA + Tr iton3HBCoA3'-dp-3HBCoA + Tr iton3'-dp-3HBCoA
Abs
236
Time (sec)
3HBCoA + Tr itonX-1003HBCoA3’-dp-3HBCoA + Tr itonX-1003’-dp-3HBCoA
Fig. 7 Effect of the 3′-phosphate group elimination from 3HBCoAsubstrate for reaction assay curves of PhaCRe with 3′-dp-3HBCoA.These curves were measured by change in absorbance at 236 nm withor without 50 mg/L TritonX-100. The substrate concentration was100 μM for all assays in this figure
00.20.40.60.8
11.21.41.6
0 2 4 6 8 10 12 14 16
v-1
Substrate concentration (mM)
3HBCoA3’-dp-3HBCoA
Fig. 8 Kinetic analysis of PhaCRe with 3HBCoA and 3′-dp-3HBCoAmeasured by DTNB assay containing 50 mg/L TritonX-100
Table 3 Kinetic parameters of PhaCRe for 3HBCoA and 3′-dp-3HBCoA substrates derived from Hill equation
Substrate K0.5 (mM)a kcat (min−1)b nc
3HBCoA 0.236 9.89×10³ 1.083′-dp-3HBCoA 2.38 6.21×10³ 2.16
a Substrate concentration at which half of the enzyme are boundb Turnover numberc Hill number
1180 Appl Microbiol Biotechnol (2013) 97:1175–1182
concentration of 0.2–0.4 CMC. Because the CMC of TritonX-100 is much lower than that of Hecameg (Table 1), TritonX-100 showed the activation effect at as low as 50 mg/L. It shouldbe noted that Tween80 and Tween20 have a moderate activa-tion effect on PhaCRe and their CMC are lower than that ofTritonX-100. Thus there is concern that the contamination withthese detergents even at a small concentrationmay significantlyaffect the results of PhaCRe activity assays. Early studiesreported the different effects of additives on PhaCRe activation(Lenz et al. 1999; Song et al. 2000; Zhang et al. 2000). Thismight be due to the unexpected activation of PhaCRe by con-taminating detergents. A similar activation effect by nonionicdetergents has been reported for lipases, with which PhaCshares significant structural similarity (Mogensen et al. 2005).The maximum activation for lipase was also observed at aconcentration lower than CMC. PHA synthases and lipasesare members of the α/β-hydrolase fold family (Jia et al.2000; Jia et al. 2001); thus the molecular mechanism underly-ing the activation of these enzymesmight be commonly shared.
Free CoASH shows competitive inhibition of PhaCRe-3HBCoA binding, as demonstrated in this study and others(Lenz et al. 1999; Song et al. 2000; Zhang et al. 2000).Interestingly however, 3′-dp-CoASH did not show inhibito-ry effect even though its structure is very similar to that ofCoASH. This result highlights the importance of the 3′-phospate group in CoA to be recognized as a substrate byPhaCRe. It is presumed that an ionic interaction betweenPhaCRe and the 3′-phospate group of CoA is involved inthe highly specific recognition elements. Nevertheless,adenyl compounds having the 3′-phosphate group, such as3′-AMP and 3′-P-5′-P-ADP, did not show any inhibitoryeffect. This suggests that PhaCRe likely recognizes wholeCoA structure together with the 3′-phosphate group.
We conducted a kinetic analysis of PhaCRe for 3′-dp-3HBCoA (Table 3). The v-[S] curve was sigmoidal (asshown in Fig. 8) and its Hill number n was 2.16 despitethe kinetic analysis of PhaCRe for 3HBCoA showingMichaelis–Menten behavior (n≈1). It is unclear whyPhaCRe showed the allosteric effect on 3′-dp-3HBCoA con-centration and why the lag time still remained. However,significant reduction of K0.5 was observed when the 3′-phosphate group was eliminated, suggesting a weakenedenzyme–substrate affinity. The kinetic data also supportthe hypothesis that ionic interaction between PhaCRe andthe 3′-phosphate group plays an important role in the sub-strate recognition. Previous studies demonstrated an activityreduction of PhaCRe under strong ionic strength or by chang-ing pH (Zhang et al. 2000), which might be derived fromweakening of this ionic interaction.
As listed in Table 2, the Km value determined in thisstudy is higher than those reported in the literature (Lenzet al. 1999; Normi et al. 2005; Zhang et al. 2000). This wasprobably due to the high concentration (50 mM) of phosphate
buffer used in this study instead of 20mM buffer used in thesereports, because high ionic strength increases the Km ofPhaCRe (Zhang et al. 2000). In addition to this, differentdetergents might also influence Km because each detergentshowed different lag elimination effects (see Fig. 2).
In conclusion, this study provides new insights into acti-vation of PhaCRe that should be useful for kinetic analysis ofPhaCRe. Additionally, we performed kinetic analysis ofPhaCRe using TritonX-100 as a new lag eliminator andinvestigated the CoA recognition mechanism. It was dem-onstrated for the first time that the 3′-phosphate group inCoA structure plays a critical role in substrate recognitionby PhaCRe. The findings reported here would be helpful inunderstanding the molecular nature of PHA synthases.
Acknowledgments This work was supported by Grant-in-Aid forScientific Research (KAKENHI 23310060).
References
Fukui T, Yoshimoto A, Matsumoto M, Hosokawa S, Saito T,Nishikawa H, Tomita K (1976) Enzymatic synthesis of poly-β-hydroxybutyrate in Zoogloea ramigera. ArchMicrobiol 110:149–156
Gerngross TU, Snell KD, Peoples OP, Sinskey AJ (1994) Overexpressionand purification of the soluble polyhydroxyalkanoate synthase fromAlcaligenes eutrophus: evidence for a required posttranslationalmodification for catalytic activity. Biochemistry 33:9311–9320
Gerngross TU, Martin DP (1995) Enzyme-catalyzed synthesis of poly[(R)-(−)-3-hydroxybutyrate]: formation of macroscopic granulesin vitro. Proc Natl Sci USA 92:6279–6283
Goldman P, Vagelos PR (1961) The specificity of triglyceride synthesisfrom diglycerides in chicken adipose tissue. J Biol Chem236:2620–2623
Haywood GW, Anderson AJ, Dawes EA (1989) The importance ofPHB-synthase substrate specificity in polyhydroxyalkanoate syn-thesis by Alcaligenes eutrophus. FEMS Microbiol Lett 57:1–6
Jia Y, Kappock TJ, Frick T, Sinskey AJ, Stubbe J (2000) Lipases providea newmechanisticmodel for polyhydroxybutyrate (PHB) synthases:characterization of the functional residue in Chromatium vinosumPHB synthase. Biochemistry 39:3927–3936
Jia Y, Yuan W, Wodzinska J, Park C, Sinskey AJ, Stubbe J (2001)Mechanistic studies on class I polyhydroxybutyrate (PHB) syn-thase from Ralstonia eutropha: class I and III synthases share asimilar catalytic mechanism. Biochemistry 40:1011–1019
Lemaire M, Champeil P, Møller JV (2000) Interaction of membraneproteins and lipids with solubilizing detergents. Biochim BiophysActa 1508:86–111
Lenz RW, Farcet C, Dijkstra PJ, Goodwin S, Zhang S (1999)Extracellular polymerization of 3-hydroxyalkanoate monomerswith the polymerase of Alcaligenes eutrophus. Int J BiolMacromol 25(1–3):55–60
Makino S, Reynolds JA, Tanford C (1973) The binding of deoxycho-late and triton X-100 to proteins. J Biol Chem 248:4926–4932
Mogensen JE, Sehgal P, Otzen DE (2005) Activation, inhibition, anddestabilization of Thermomyces lanuginosus lipase by detergents.Biochemistry 44:1719–1730
Normi YM, Hiraishi T, Taguchi S, Abe H, Sudesh K, Najimudin N,Doi Y (2005) Characterization and properties of G4X mutants ofRalstonia eutropha PHA synthase for poly(3-hydroxybutyrate)biosynthesis in Escherichia coli. Macromol Biosci 5:197–206
Appl Microbiol Biotechnol (2013) 97:1175–1182 1181
Peoples OP, Sinskey AJ (1989) Poly-beta-hydroxybutyrate (PHB) bio-synthesis in Alcaligenes eutrophus H16. Identification and char-acterization of the PHB polymerase gene (phbC). J Biol Chem264:15298–15303
Rehm BHA (2003) Polyester synthases: natural catalysts for plastics.Biochem J 376:15–33
Song JJ, Zhang SM, Lenz RW,Goodwin S (2000) In vitro polymerizationand copolymerization of 3-hydroxypropionyl-CoA with the PHBsynthase from Ralstonia eutropha. Biomacromolecules 1:433–439
Stubbe J, Tian J (2003) Polyhydroxyalkanoate (PHA) homeostasis: therole of PHA synthase. Nat Prod Rep 20:445–457
Sudesh K, Abe H, Doi Y (2000) Synthesis, structure and properties ofpolyhydroxyalkanoates: biological polyesters. Prog Polym Sci25:1503–1555
Valentin HE, Steinbüchel A (1994) Application of enzymatically syn-thesized short-chain-length hydroxy fatty acid coenzyme A
thioesters for assay of polyhydroxyalkanoic acid synthases.Appl Microbiol Biotechnol 40:699–709
Wadler C, Cronan JE (2007) Dephospho-CoA kinase provides a rapidand sensitive radiochemical assay for coenzyme A and its thio-ester. Anal Biochem 368:17–23
Waterson RM, Hill RL (1972) Enoyl coenzymeA hydratase (Crotonase) –catalytic properties of crotonase and its possible regulatory role infatty-acid oxidation. J Biol Chem 247:5258–5265
Yuan W, Jia Y, Tian J, Snell KD, Müh U, Sinskey AJ, Lambalot RH,Walsh CT, Stubbe J (2001) Class I and III polyhydroxyalkanoatesynthases from Ralstonia eutropha and Allochromatium vinosum:characterization and substrate specificity studies. Arch BiochemBiophys 394:87–98
Zhang SM, Yasuo T, Lenz RW, Goodwin S (2000) Kinetic and mech-anistic characterization of the polyhydroxybutyrate synthase fromRalstonia eutropha. Biomacromolecules 1:244–251
1182 Appl Microbiol Biotechnol (2013) 97:1175–1182