New Findings in Long-Wave Research - Free
346
-
Upload
khangminh22 -
Category
Documents
-
view
2 -
download
0
Transcript of New Findings in Long-Wave Research - Free


New Findings in Long-Wave Research
Edited by
Alfred Kleinknecht Senior Economist University of Amsterdam
Ernest Mandel Professor Emeritlls Free University of Brussels (Flemish Section)
and
Immanuel Wallerstein Director of the Fernand Braudel Center State Unil'ersity of New York, Binghamton
M St. Martin's Press

Contents Preface vii Notes on the Contributors ix
1 Long-Wave Research: New Results, New Departures-An Introduction Alfred Kleinknecht 1
PART I: EMPIRICAL TESTS OF LONG WAVES
2 Between Trends and Trade Cycles: Kondratieft' Long Waves Revisited Jan P. G. Reijnders 15
3 Filter Design in the Frequency Domain Rainer Metz and Winfried Stier 45
4 A Re-examination of Long Waves in Aggregate Production Series Rainer Metz 80
5 Testing Long Waves in Price and Volume Series from Sixteen Countries Hans J. Gerster 120
PART II: LONG-RUN PROFIT RATES
6 Long Waves in Profit Rates in Four Countries Andrey V. Poletayev 151
Comment Angelo Reati 168
7 The Falling Rate of Profit as the Cause of Long Waves: Theory and Empirical Evidence Anwar Shaikh 174 Comment Boe Thio 195
v

VI Contents
A rejoinder Anwar Shaikh 199
8 Rate of Profit and its Determining Factors from a 'Regulationist' Point of View Louis Fontvieille 203 Comment Gerard Roland 225
PART III: ACCUMULATION, LONG WAVES AND SOCIAL CHANGE
9 The Long Wave as an Endogenous Mechanism Stanislav Menshikov 233
10 Great Depressions as Transitional Phases within the Capitalist Mode of Production Thomas Kuczynski 257 Comment Bart Verspagen 275
11 Class Struggle and Kondratieff Waves, 1870 to the Present Beverly Silver 279 Comment Peter Scholliers and Alain Meynen 296
12 Long Waves and the Dialectic of Innovations and Conflicts Pierre Dockes and Bernard Rosier 301
13 The International Debate on Long Waves of Capitalist Development: An Intermediary Balance Sheet Ernest Mandel 316
14 A Brief Agenda for the Future of Long-Wave Research Immanuel Wallerstein 339
Index 343

Preface The papers in this book have been selected from a conference held at the Free University of Brussels in January 1989. We are indebted to the Belgian National Fund for Scientific Research (NFWO) , the Ministry for the Flemish Community, the Belgian Ministry of Econ-omic Affairs, the Belgian ASLK Bank and National Bank, as well as the Free University of Brussels, the Maison des Sciences de l'Homme in Paris, the Fernand Braudel Center at the State University of New York at Binghamton, and the University of Amsterdam (The Netherlands) for their co-operation and financial assistance for the conference.
The conference showed that, on the one hand, there are still substantial differences in views on the long-wave process, and even on the mere existence of 45-60-year long waves. On the other hand, a fruitful convergence of ideas seems to emerge. Both are documented in this book. We are indebted to a number of fellows who are not contributing to this volume but to whose oral contributions at the conference we owe a lot. Among them are Giovanni Arrighi, Andre Gunder Frank, Dirk Frantzen, Allan and Christopher Freeman, Giorgio Gattei, Joshua Goldstein, David M. Gordon, Arnulf Griibler, Nebojsa Nakicenovic, George F. Ray, Annemieke Roobeek and Solomos Solomou.
vii
ALFRED KLEINKNECHT ERNEST MANDEL
IMMANUEL WALLERSTEIN

Notes on the Contributors Pierre Dockes is Professor of Economics at Lyon University, France. He was educated at the same university. He is the Director of the Centre Walras, which publishes the complete works of Leon Walras. He has published works on economic history; theory of growth and crisis; and the relationship between conflicts, modes of regulation and innovation, in particular, his book (with Bernard Rosier), L'His-loire ambigue (Paris, 1988).
Louis Fontvieille is Director of Research at the French National Centre of Scientific Research (CNRS). He was educated at the University of Paris I where he gained the title of Doctor in National Accounts and Planning in 1976. He works in Montpellier University's Faculty of Law and Economics since 1984. He has published exten-sively on quantitative history and long-cycles theory.
Hans J. Gerster is a scientific officer at the Federal Ministry for Research and Technology, Bonn, Germany. After apprenticeship and work in the machine-building industry, he became a student at the University of Siegen and at the Technical University of Aachen, studying mechanical and chemical engineering and economics. He completed his studies to become a graduate engineer and economist-engineer. He was a research fellow at the Institute of Economics at the Technical University, Aachen, and obtained his doctorate there as Doctor of Political Science. He then became a confidential clerk with a public company for business promotion at Paderborn. He has published works on administered prices and price-inflexibility; ap-plied time-series analysis; and long-term business cycles.
Alfred Kleinknecht is a senior economist of SE~, Foundation for Economic Research of the University of Amsterdam, The Nether-lands. He graduated at the Free University of West Berlin in 1977 and in 1984 he received his PhD in economics at the Free University of Amsterdam. He was a research fellow at the International Institute of Management at the Berlin Wissenschaftszentrum (1977-80) and at the Free University of Amsterdam (1980-84). From 1984-88 he was lecturer in economics at the University of Limburg at Maastricht. He was responsible for two national postal surveys on industrial innova-
ix

x Notes on the Contributors
tion in The Netherlands, and has published extensively on long waves and industrial innovation.
Thomas Kuczynski is Director of the Institute for Economic History, Berlin, Germany (formerly the Academy of Sciences of the GDR). He was educated at the Economic University of Berlin/GDR, where he obtained his doctorate. He headed the research group on 'Math-ematical Methods' at the Institute of Economic History, Berlin. He has published extensively on quantitative history; German economic history; methodology of economics; and historical sciences.
Ernest Mandel was educated at the Ecole Pratique des Hautes Etudes (Sorbonne), and the Free University of Berlin, where he gained his PhD. He recently retired from his chair as a professor at the Free University of Brussels (Flemish Section), Belgium. He has published many books on economic theory, with particular emphasis on Marxist economics.
Stanislav Menshikov is currently an international management con-sultant in Moscow, New York and Prague. He has been a Professor of Moscow and Novosibirsk Universities from 1965 to 1974; Director of Projections and Perspective Studies, United Nations, from 1974 to 1980; adviser, Central Committee, Communist Party, Moscow, 1980-86; consultant, World Marxist Review, Prague, 1986-90. Author of books on international economics; business cycles; long waves; Soviet economic crisis and other subjects.
Rainer Metz works at the Central Archive for Empirical Social Research at the University of Cologne, Germany, since 1988. After studying economics at the University of Tiibingen he worked from 1980 to 1985 on a research project, 'History of Money and Currency in Europe' at the University of Trier, where he also got his PhD. From 1985 to 1987 he worked at the Center for Data Processing at the University of Tiibingen in a research project on 'Scientific Text Data Processing'. He has published on programs for text processing; on money and prices in pre-industrial Europe; on the statistical evidence of long waves and Kuznets cycles; and on methods of time-series analysis for historians.
Alain Meynen is a research assistant at the Free University of Brussels (Flemish Section), Belgium. He studied contemporary history at the

Notes on the Contributors xi
same university. He has published on the history of the labour movement and economic development after 1945.
Andrey V. Poletayev is head of the 'Evolution of Market Economies' section in the Institute of World Economy and International Rela-tions (USSR Academy of Sciences) in Moscow, USSR. Since 1989 he has also been a professor in the Economic College of Moscow State University. He graduated from the Economic College of Moscow State University in 1974, obtained his PhD in 1980, and in 1989 became a Doctor of Economic Sciences.
Angelo Reati is Principal Administrator at the Commission of the European Communities. He was educated in Italy (at the Catholic University of Milan), in England (Loughborough University of Tech-nology) and in Belgium (Universite Catholique de Louvain-Ia-Neuve), where he obtained his PhD. He has published empirical and theoretical work on the long-term development of capitalist econ-omies and on the labour theory of value.
Jan P. G. Reijnders is Reader in Economics at Utrecht University, The Netherlands. He was educated in The Netherlands at the Uni-versity of Brabant and at Groningen University, where he obtained his PhD. His main scientific interest is business-cycle theory, time-series analysis and public stabilisation policy.
Gerard Roland teaches economics at the Free University of Brussels (French Section), Belgium, where he received his PhD. in econ-omics. Besides his interest in long waves and growth, he has pub-lished different articles and a book on Soviet-type economics and the transition from plan to market.
Bernard Rosier was educated as an agricultural engineer. He was a former scholar of the 'Institut National Agronomique de Paris' (National Agricultural Institute of Paris) and of the Faculty of Econ-omics of the University of Grenoble. As a Professor of Political Economy at the University of Aix-Marseille he collaborated closely with Pierre Dockes. He died in 1991 at the age of 58.
Peter Scholliers is Senior Research Assistant with the Belgian Fund for Scientific Research. He studied contemporary history at the Uni-versity of Brussels, where he obtained his PhD. His publications have been on the development of wages, prices, and the standard of living.

xii Notes on the Contributors
Anwar Shaikh is Professor of Economics at the Graduate Faculty of the New School for Social Research in New York. He was educated at Princeton University (BSc) and Columbia University (from which he received his PhD). His research and publications cover Marxian economics; international trade theory; nonlinear macrodynamics; national income accounts; the welfare state and the social wage; and long-term growth and technical change.
Beverly Silver is a research associate at the Fernand Braudel Center, State University of New York at Binghamton, USA. She has pub-lished several articles on labour unrest in the world economy and in particular countries. She is currently completing a long-term, large-scale analysis of the world labour movement.
Winfried Stier is Professor of Statistics and Methods of Empirical Research at the University of St Gallen, Switzerland. He was edu-cated at the Universities of Tiibingen and Bochum. He has published extensively on statistical methods, especially on time-series analysis.
Boe Thio lectures in macroeconomics at the University of Amster-dam. His main research activities are in business-cycle theory and macroeconomic policy.
Bart Verspagen is a PhD student at the Maastricht Economic Re-search Institute on Innovation and Technology (MERIT), The Netherlands. He has published works on the economics of tech-nological change.
Immanuel Wallerstein is Director of the Fernand Braudel Center of the State University of New York at Binghamton, USA. He was educated at Columbia University. He is the author of a number of books on economics and social science.

1 Long-Wave Research: New Results, New Departures An Introduction ALFRED KLEINKNECHT
The alleged 45 to 60-year-Iong waves in economic growth are gener-ally referred to as 'Kondratieff long waves', because of the prominent paper about them by Nikolai Kondratieff in 1926. Analytically more far-reaching contributions on long waves had been published earlier in the Netherlands, but these had only limited circulation owing to the language barrier. It would, in fact, be more appropriate to speak about 'Van Gelderen-De Wolff long waves' (see the survey in Kleinknecht, 1987a). However, in order to avoid confusion, we shall continue to use the well-established term 'Kondratieff long waves'.
Theorising about Kondratieff long waves itself seems to move in a long wave rhythm. Following a huge amount of literature during the inter-war period, very little was published during the rapid growth period of the 1950s and 1960s. This book is part of the renaissance of long-wave research that has followed the period of weaker growth of the world economy since the mid-1970s.
Parts I and II deal intensively with two aspects that received only sparse attention on earlier occasions. First, do these odd long waves exist at all? Second, are there long waves in profit rates that corre-spond with the ups and downs in general economic activity? While the first question is important for almost every student of long-run growth, the second is of central importance to Marxists and other (modern) supply-siders. A third point: what the interaction is be-tween economic growth, profit rates, innovation, and social change in a long-wave context, is addressed in Part III, partly by model builders (Thomas Kuczynski and Stanislav Menshikov), and partly empiri-cally (Beverly Silver).
I shall start my introduction to this book with the question of whether long waves actually exist, and then turn to the empirical
1

2 Long-Wave Research: Introduction
contributions on long-run profit rates. Finally, I shall outline a possible synthesis of various 'competing' theoretical explanations of Kondratieff long waves.
LONG WAVES: FACT OR ARTEFACT?
The first pioneering contributions on long waves by Jan van Gelderen (1913), Sam De Wolff (1915 and 1921) and later on by Nikolai Kondratieff (1926), showed that long waves in price indices and interest rates are almost visible in the raw data. In any case, their existence has been little disputed. There has been considerable concern, however, about whether such price fluctuations are corre-lated to 'real' variables such as output, investment or employment. In other words: can long waves be identified in indicators of general economic activity? Do they affect economic life at large?
G. Garvy (1943), in his review of Kondratieff's work of 1926, and Simon Kuznets (1940), reviewing Joseph A. Schumpeter's (1939) Business Cycles, raised serious doubts about this, and so did U. Weinstock in his 1964 survey. Recent long-wave research ended with further scepticism (see, for example, van Ewijk, 1981 and 1982; van der Zwan, 1980; or Solomou, 1986 and 1987).
Over a long period, and for a number of reasons, the arguments raised by the sceptics have not been dealt with adequately. First, only a few long-wave researchers have paid any real attention to the matter. Indeed, many seemed to behave like Christian believers who simply accept that Christ exists. Second, some economists tend to believe that something exists if it can be produced by some model (for example, the Forrester school: see Sterman, 1985a and 1985b). Third, and perhaps most important, econometrics have not provided us with techniques that can be used in a straightforward way for the analysis of long waves.
The authors in Part I emphasise the technical problems involved in separating the alleged long waves from other components in econ-omic time series. But they also demonstrate that progress can be made. Rainer Metz analyses the same time series that had earlier been investigated, using quite a different method, by Hans Bieshaar and myself (Bieshaar and Kleinknecht 1984 and 1986). Bieshaar and I only partially rehabilitated the long-wave hypothesis, arguing that the hypothesis holds from the 1890s onwards. For preceding periods, the evidence remained ambiguous. While the series from Sweden,

Alfred Kleinknecht 3
Italy, Belgium or Denmark! showed evidence of long waves even before the 1890s, series from important countries such as Great Britain, France or Germany did not.
A weak point of the Bieshaar and Kleinknecht test was that the turning points of the long waves had to be determined a priori, judging from evidence in the literature (the latter being largely derived from price fluctuations). Metz's filter technique (outlined in a separate chapter by Rainer Metz and Winfried Stier) allows the turning points to be derived directly from the time series. It now appears that the cases in which Bieshaar and Kleinknecht found evidence of long waves are those in which they assumed turning points similar to those found by Metz. In a number of cases, notably during the nineteenth century (and most strikingly in the case of France), Metz's turning points are different, which is probably why the Bieshaar and Kleinknecht test failed to detect long waves. In the nineteenth century in particular, the degree of international coher-ence of national growth patterns is less than assumed in our test.
A close international synchronisation of business fluctuations in national and regional markets obviously requires an exchange be-tween such markets of considerable quantities of goods and infor-mation at low cost and high speed. Horses and sailing ships could not achieve this. It is only since the emergence of a modern transporta-tion and communication infrastructure, such as railways and the electric telegraph, that such synchronisation has become increasingly possible.
While Metz detects notable differences in the dating of turning points among countries during the nineteenth century, there are few differences from the 1890s onwards. The only major problem arises from the treatment of the two world wars. When values for the war years are interpolated (omitting outliers due to war shocks), the Kondratieff wave is fully rehabilitated, both for the nineteenth and twentieth centuries (with the exception of Great Britain). However, if war values are left in the series (Metz's 'version II'), the Kondra-tieff wave persists during the nineteenth century, but during the twentieth century shorter fluctuations frequently emerge, which re-semble the Kuznets swing. The same holds for many of Hans Gerster's series.
Gerster's estimates are comparable with Metz's 'version II' esti-mates, as he does not interpolate for the world war values. While Metz uses aggregate series and Gerster takes series of individual products or product groups, both reach essentially the same result when not correcting for the world war disturbances: evidence of
4 Long-Wave Research: Introduction
Kondratieff long waves during the nineteenth century and a 'Kuznets' pattern during the twentieth century.
In my view, it is doubtful whether results derived from series without interpolation for the world war outliers are reliable. First, given the severity of the world wars, it is much easier to defend an interpolation of war values in a series than to argue that these should be left in the series as they are. Second, by leaving the war values in the series, Gerster and Metz several times achieve results that seem implausible. For example, in several cases, the early 1950s show a 'Kuznets depression', whereas this period is generally conceived of as a period of economic recovery (enhanced by reconstruction and catching-up effects). In my interpretation, this 'Kuznets depression' is a statistical artefact. It is caused by production dropping from abnormally high war levels (biasing the trend estimates upwards) to historically 'normal' levels. Third, a theoretical explanation of a Kuznets swing pattern in the twentieth century is still missing. There is weak evidence of twentieth-century migration waves which were so strong as to unleash ensuing waves in population-sensitive capital investment and macroeconomic growth. Not surprisingly, the 'Kuz-nets cycle' has been considered a typical nineteenth-century cycle (see Rostow's (1975) survey).
If war year outliers are omitted, a Kondratieff long-wave pattern emerges in almost all series, in spite of some national peculiarities. The most encouraging outcome for long-wave adherents is Metz's result of a long-wave pattern in the world production series. Once adequately analysed, such a world series can serve as a kind of reference cycle for numerous other variables such as profit rates or 'soft' indicators.
Metz and Gerster may not share Jan Reijnders' emphasis on the problem of 'perspectivistic distortion' which, if rigorously formu-lated, appears logically impossible to solve. One may wonder whether Reijnders' 'standardisation' of time series, using the Phelps Brown price index, is an adequate solution to the problem. This standardisation (which has never been done before) seems to be of crucial importance as it leads Reijnders to conclude that Kondratieff long waves exist in the British series - a finding that contradicts many earlier investigations.
On the other hand, his results are consistent with those of Gerster and Metz in so far as they suggest that there is still a place for Kuznets swings in nineteenth-century Great Britain. However, in his thorough examination of the work by Casper van Ewijk and SOIOlllOS

Alfred Kleinknecht 5
Solomou, Jan Reijnders argues that their 'Kuznets swings' may be statistical artefacts, that is, their anaiysis is likely to be flawed because of problematic filtering effects resulting from the use of first differences for detrending economic time series (see also Reijnders, 1988, 1990). Here we feel the Schumpeterian spirit of 'creative destruction', which invites new research on Kuznets cycles.
Summarising the above, we can conclude:
1. Metz and Reijnders convincingly criticise the evidence provided against Kondratieff waves in earlier studies (van Ewijk, Solomou and others).
2. When omitting outliers during the two world wars, Metz fully rehabilitates the Kondratieff long wave hypothesis for the nine-teenth and twentieth centuries.
3. If world war outliers are left in the series, there is evidence for Kondratieff waves during the nineteenth century in the work of Gerster and Metz. During the twentieth century, however, some-what shorter waves emerge whose length is sometimes within the Kuznets range (18-25 years) and sometimes in between the Kuz-nets and the Kondratieff range. These waves are likely not to be 'true' Kuznets swings, but artefacts resulting from war shocks.
4. While at least part of the Kuznets waves as detected by van Ewijk and Solomou are likely to be artefacts (also resulting from the use of growth rates for trend elimination), there is evidence both in Reijnders' and in Metz's work of a Kuznets swing pattern in nineteenth-century Great Britain.
These results are favourable for 'believers' in Kondratieff long waves. Nevertheless, an important reservation needs to be made: the proof that Kondratieff-type fluctuations have actually occurred in the history of modern economic growth does not yet allow us to speak of Kondratieff cycles. Sceptics may argue that the few such fluctuations may have been due to some unique historical circumstances, and that (also because of tremendous structural change) there is no reason to expect such fluctuations to be repeated in the future. The question of whether or not such fluctuations are true cycles depends on whether theoretical explanations can convincingly demonstrate their en-dogenous character. This requirement, which is far from trivial (see, for example, Rosenberg and Frischtak, 1984), brings us to the other parts of this book.
6 Long-Wave Research: Introduction
WHY DO SUCH FLUcrUATIONS OCCUR?
As Massimo Di Matteo et al. (1989) rightly point out in their intro-duction, present long-wave research is dominated by two main directions: a '(neo)-Schumpeterian' and a 'social structure of accumulation' paradigm. The latter is advocated by David Gordon and his various co-authors and has links with the French 'regulation' school. The former has emerged from the Schumpeter renaissance that has taken place since the late 1970s. One point of concern within that Schumpeter renaissance is whether major innovations come about in clusters, such that their subsequent diffusion would be a major determinant for a long-wave upswing (see Kleinknecht, 1987, 1990; and Dockes and Rosier in this volume).
It seemed for some time that these two approaches were compet-ing, but it is now becoming increasingly clear that at least one connnon link makes them rather complementary: the emphasis on the role of profit rates in the long-wave process. Authors such as Gordon emphasise the importance of the 'social structure of ac-cumulation' as a determinant of profit rates, while Schumpeterians focus on the interplay between innovation and profits. Both agree that rates of profit are a central determinant of the accumulation process. If they are right and if economic growth follows a long-wave path, then a long-wave pattern should be found in various profit rate indicators.
This is empirically investigated in Part II. Andrey Poletayev esti-mates rates of profit for four countries: the USA, Germany, Japan and Great Britain. Anwar Shaikh restricts himself to US profit rates, focusing on the distinction between short-run fluctuations and long-run tendencies of profit rates, that is, between profit rates as far as they are determined by short-run fluctuations in effective demand, and the long-run Marxian profit rate which essentially depends on the organic composition of capital and the rate of surplus value. Whereas Poletayev and Shaikh use aggregate data, Louis Fontvieille reports profit rates from the French coal industry, interpreted from the viewpoint of the French Regulation School. Although from different angles, all three argue that profit rates show a long-wave pattern. The commentators of Part II (Angelo Reati, Boe Thio and Gerard Roland) make clear that there is still ample room for debates about the most appropriate indicators. However, in spite of differences in detail, even Reati's results on post-war profit rates are consistent with the long-wave hypothesis (Reati, 1990).

Alfred Kleinknecht 7
Marxists have long been concerned about whether long-run profit rates show a 'secular' decline. Independently of whether such a secular decline exists, it becomes obvious from the papers in Part II that a considerable part of the variance in long-run profit rates is to be explained by the long-wave concept. The contributions in Part II are original and important in that they provide empirical support to a re-interpretation of the famous Marxian 'law' in a long-wave context.
It would now be desirable to extend the investigation of long-run profit rates and their determinants to other countries. Moreover, Schumpeterian theory suggests that the rise and decline of industrial sectors should have an equivalent in systematic differences in profit rates among industries. This implies that the investigation of long-run profit rates at the level of individual industries might be a promising line of research.
In an analysis of thirty West German manufacturing branches I demonstrated that systematic differences in rates of return on capital exist between modern, highly-innovative, and traditional industries. While the latter show declining rates of return (and a declining capital productivity) from the 1950s up to the 1970s, the former have rising rates of return (and a rising capital productivity) during the 1950s and part of the 1960s. Thereafter, they also show declining rates of return and declining capital productivities (Kleinknecht, 1987b). This suggests that the high rate of product and process improvement in new industries temporarily counteracts the Marxian 'law' of the falling profit rate. It would be desirable for such disaggre-gated profit-rate research to be carried out for other countries and periods and, if possible, at a finer level of disaggregation. This may lead us to a reformulation of Marxian profit-rate theory that will integrate modern Schumpeterian insights. It may also help to over-come the somewhat unfortunate dichotomy between rates of inno-vation and profit rates which underlies Ernest Mandel's (1980) exogenous explanation of the lower turning point of long waves (see also his contribution to this book).
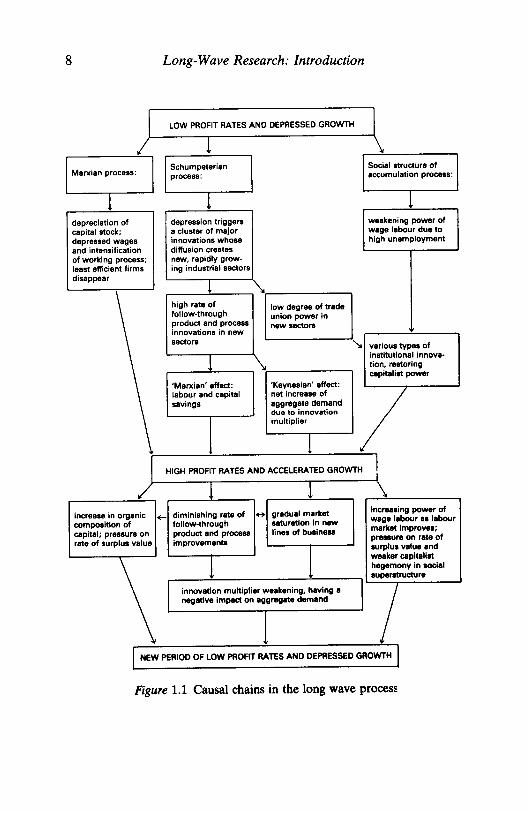
In Figure 1.1 I draw some basic causal chains, trying to integrate Schumpeterian insights with Marxian profit-rate analysis and the social structure of accumulation approach. Thomas Kuczynski and Stanislav Menshikov try to integrate part of these causal chains in their models. My research on long-run clusters of major innovations, on subsequent 'follow-through' innovations, and on their links to sectoral growth patterns (Kleinknecht, 1987, 1990), substantiates parts of the Schumpeterian process as hypothesised in Figure 1.1. Of
8 Long-Wave Research: Introduction
LOW PROFIT RATES AND DEPRESSED GROWTH I I ! \
Marxian process: Schumpeterian Social structure of process: accumulation process:
1 1 depreciation of depression triggers weakening power of capital stock; a cluster of major wage labour due to depressed wages innovations whose high unemployment and intensification diffusion creates of working process; new, rapidly grow-least efficient firms ing induatrial sectors dissppear
1 high rate of low degree of trada follow-through union power in product and process new sectors innovations in new sectors ~ various typea of
institutional innova-tion, restoring capitalist power
'Marxian' effect: 'Keynesian' effect: labour and capital nat increase of savings aggregata demand
due to innovation multiplier
L HIGH PROFIT RATES AND ACCELERATED GROWTH J
,/ ! ! \ increase in organic +- diminishing rate of 4+ gradual marlcet incr888ing power of composition of follow-through ssturetion In new waga labour as labour capital; pressure on product and process lines of busin_ markat Improves; rete of surplus value improvements pressure on rata of
1 surplus value and weaker capitalist hegemony In _Ial superatructure
Innovation multiplier weakening, having a I I negative impact on eggregate demand
I NEW PERIOD OF LOW PROFIT RATES AND DEPRESSED GROWTH I Figure 1.1 Causal chains in the long wave process

Alfred Kleinknecht 9
course, further efforts towards the build-up of data bases that will allow for independent scrutiny are desirable.
It should be added that links exist between this Schumpeterian theme and Keynesian demand analysis via the concept of innovation multipliers. The realisation of an innovation usually requires invest-ment in R&D, in know-how, in manpower training, in design, in production facilities, in troubleshooting, and sometimes even in the social infrastructure (take the example of automobiles, aircraft, or the telephone). The expansionary effects on demand of such invest-ments can be described in analogy with the standard Keynesian income multiplier model. The size of the expansionary multiplier effects would, of course, depend on how revolutionary were the underlying innovations, the rate of subsequent (major and/or minor) innovations, and their degree of diffusion.
If I am right that radical innovations are not randomly distributed over time but come about in waves (being 'triggered' by long-wave depressions), it becomes conceivable that the innovation multiplier causes waves of expansion and contraction in demand that can be felt in aggregate figures. Hence, borrowing from the Keynesian and Schumpeterian paradigms, the concept of the innovation multiplier contributes to the explanation of the ups and downs of Kondratieff long waves.
The Schumpeterian idea of a regular discontinuity in innovation and the corresponding rise and decline of industries might also have an impact on the long-run development of the labour movement. In a refinement of the type of analysis presented by Beverly Silver in this volume, one could examine the hypothesis that the Schumpeterian process implies regular set-backs for organised labour for two reasons. First, because of an initially weak trade union power in newly-emerging industries, as these industries employ scarce special-ists whose wages are high (inertia in the educational system may enhance their temporary scarcity); that is, these people do not need to join trade unions. Second, because declining old sectors are usually strongholds of the labour movement. Their (relative) decline implies a loss of trade-union power. Investigations of this hypothesis might establish a link between the Schumpeterian model and the social structure of accumulation process as referred to in Figure 1.1.
Among the three approaches sketched in Figure 1.1, the Marxian and the Schumpeterian approaches have as yet the best backing by empirical research, although further work is certainly required. The social structure of accumulation approach has for the first time been

10 Long-Wave Research: Introduction
tested by Gordon for the US economy in the post-war period (see Gordon (1989) and the references given there). It is a crucial weak-ness of Gordon's exercise that a lack of adequate data forced him to restrict his investigation to a single long-wave upswing (notably missing what happened in the downswing period between the two world wars). I fully agree with Immanuel Wallerstein's view in this volume that further progress can only be achieved if more people will undertake creative efforts (comparable to that by Gordon or Silver in this volume) in order to construct new data bases covering the long-run development of 'soft' indicators.
In conclusion, this present book documents considerable progress, notably in testing the existence of long waves in indicators of aggre-gate growth and in long-run profit rates. Together with the evidence established earlier on long-run innovation waves, these results have led us to a number of new research hypotheses, and we are now moving towards a fruitful synthesis of the various approaches. More-over, the contributions by Menshikov and Kuczynski show that (besides data collection and the testing of partial hypotheses) useful work can (and should still) be done in checking the consistency of the various hypotheses by means of simulation models. Long-wave re-search promises to remain a fascinating topic.
NOTE
1. For an independent confirmation of the long-wave hypothesis in Danish data, using a methodology quite different from that of Bieshaar and Kleinknecht, see Rasmussen and Mosekilde (1989).
REFERENCES
Bieshaar, H. and A. Kleinknecht (1984) 'Kondratieff long waves in aggre-gate output? An econometric test', Konjunkturpolitik, vol. 30, no. 5, pp. 279-303.
-- (1986) 'Reply to S. Solomou', Konjunkturpolitik, vol. 32, no. 3, pp. 185-94.
De Wolff, S. (1915) 'Accumulatie en crisis', De Nieuwe Tijd, vol. 20, pp. Iff., 353ff. and 469ff.
-- (1921): 'Prosperiteits - en depressieperioden', De Socialistische (lids, vol. 6, no. 1, (January).

Alfred Kleinknecht 11
Di Matteo, M., R. Goodwin and A. Vercelli (eds) (1989) Technological and social factors in long term fluctuations, (Berlin, Heidelberg, New York: Springer).
Ewijk, C. van (1981) 'The long wave - a real phenomenon?', De Economist, vol. 129, pp. 324-72.
-- (1982) 'A spectral analysis ofthe Kondratieff-cycle', Kyklos, vol 35, No. 3, pp. 468-99.
Garvy, G. (1943) 'Kondratieff's theory of long cycles', Review of Economics and Statistics, vol. 25, pp. 203-23.
Gelderen, J. van (alias J. Fedder) (1913) 'Springvloed, Beschouwingen over industriele ontwikkeling en prijsbeweging' (three parts), De Nieuwe Tijd, vol. 18, pp. 253ff., 269ff. and 445ff.
Gordon, D. M. (1989) 'What makes epochs? A comparative analysis of technological and social explanations of long economic swings', in M. Di Matteo et al. (eds), Technological and social factors in long term fluctu-ations, pp. 267-304.
Kleinknecht, A. (1987a) Innovation patterns in crisis and prosperity. Schum-peter's long cycle re-considered (London: Macmillan; New York: St Mar-tin's Press).
-- (1987b) 'Rates of innovations and profits in the long wave' in T. Vasko (ed.), The Long Wave Debate (Berlin, Heidelberg, New York: Springer) pp.216-38.
-- (1990) 'Are there Schumpeterian waves of innovations?', Cambridge Journal of Economics, vol. 14, no. 1 (March) pp. 81-92.
Kondratieff, N. D. (1926) 'Die langen Wellen der Konjunktur', Archiv fur Sozialwissenschaft und Sozialpolitik, vol. 56, no. 3, pp. 573-609.
Kuznets, S. (1940) 'Schumpeter's Business Cycles', American Economic Review, vol. 30 (June) pp. 257-7l.
Mandel, E. (1980) Long Waves of Capitalist Development (Cambridge Uni-versity Press).
Rasmussen, S. and E. Mosekilde (1989) 'Empirical indication of economic long waves in aggregate production', European Journal of Operational Research, vol. 42, pp. 279-93.
Reati, A. (1990) Taux de profit et accumulation du capital dans l'onde longue de l'apres-guerre (Brussels: Editions de l'Universite Libre de Bruxelles).
Reijnders, J. P. G. (1988) The enigma of long waves (Ph.D. thesis, Faculty of Economics, University of Groningen, The Netherlands); also published as Long waves in economic development (Aldershot: E. Elgar, 1990).
Rosenberg, N. and C. Frischtak (1984) 'Technological innovation and long waves', Cambridge Journal of Economics, vol. 8 (March) pp. 7-24.
Rostow, W. W. (1975) 'Kondratieff, Schumpeter, Kuznets: Trend periods revisited', Journal of Economic History, vol. 35, pp. 719ff.
Schumpeter, J. A. (1939) Business cycles: A theoretical, historical and statisti-cal analysis of the capitalist process, 2 vols (New York: McGraw-Hill).
Solomou, S. (1986) 'Kondratieff long waves in aggregate output? A com-ment', Konjunkturpolitik, vol. 32, no. 3, pp. 179-84.
-- (1987) Phases of economic growth 1850-1973: Kondratieff waves and Kuznets swings (Cambridge University Press).

12 Long-Wave Research: Introduction
Sterman J. D. (1985a) 'An Integrated Theory of the Economic Long Wave', Futures, Vol. 17 (April) pp. 104-31.
-- (1985b) 'A Behavioral Model of the Economic Long Wave', Journal of Economic Behavior and Organization, vol. 6, pp. 17-53.
Vasko, T. (ed.) (1987) The Long Wave Debate (Berlin, Heidelberg, New York: Springer).
Weinstock, U. (1964) Dos Problem der Kondratieff Zyklen (Berlin-Miinchen: Duncker & Humblot).
Zwan, A. van der (1980) 'On the assessment of the Kondratieff cycle and related issues', in S. K. Kuipers and G. J. Lanjouw (eds), Prospects of economic growth (Amsterdam: North Holland) pp. 183ff.

Part I Empirical Tests of Long Waves

2 Between Trends and Trade Cycles: Kondratieff Long Waves Revisited JAN P. G. REIJNDERS
INTRODUCTION
At the Colloquium on Research on Long Waves in Paris in 1983, I presented a paper which delineated the broad outlines of a long-run approach to the problem of long waves. The paper was published in Social Science Information in 1984 but did not arouse much interest. The subject kept fascinating me, however, and in subsequent years I elaborated the principles and put them on paper in my thesis of 1988 and in a book (Reijnders, 1990). This chapter summarises the princi-pal findings.
PERSPECTIVISTIC DISTORTION
The (re )introduction of a long-run approach to the problem of long waves was found necessary because the short-run approach, which originated from Schumpeter's work in this field, proved incapable of establishing the existence of Kondratieff-type long waves. Charac-teristic of the long-run approach, which closely corresponds to Kon-dratieff's tradition, is that its analysis starts with the elimination of the trend. The problem is that trend elimination procedures are considered very tricky because the selection of the basic trend func-tion has a direct impact on the resulting cycles. A strong case against the use of direct trend elimination procedures was presented by E. Fricky, who demonstrated that the application of different trend-fitting procedures to the same data leads to different 'cycles' whose apparent length varies from 45 years down to 3.3 years (Fricky, 1942, p. 46). Fricky suggested that the variation in results mainly derives
15

16 Between Trends and Trade Cycles
from the selection of trend functions. However, scrutiny of his summary tables reveals that it is not so much the variation in trend specifications but rather the variation in the length of the time series considered which explains the variation in results.
The impact of the length of the interval for which a given time series is defined may be explained by analogy as follows. Economic history as it is represented by economic time series is not analysed in its totality but in discrete intervals, in fractions as if one were looking at history through a window. What is observed through this window depends upon its location and its size. The location of the window determines which part of the historical sequence is observed (for instance, the era of the so-called Industrial Revolution, the Great Depression of the nineteenth century, or the period after the Second World War). The image observed changes in accordance with the special characteristics of these parts. The size of the window not only determines the length of the stretch of history that is covered by the observation but also the perspective of the observer, that is, the impression he gets with regard to the structure of the data series. A small window, for example, hampers the vision of long-run move-ments which extend over intervals that exceed the size of the window. Such a window therefore tends to accentuate short-run movements. A large window, by contrast, will bring the long-run movements into more relief and will probably draw attention away from short-run movements. If the size of the window and its location are changed simultaneously it might be possible to create a great number of different images of economic history which allow for a large number of differing inferences about the nature and composition of economic development.
On the basis of the foregoing one might argue that there is a direct correspondence between the interval length and the duration of the cycle which is observed. A small window would bring out clearly the shorter cycles, a medium-sized window the cycles of medium dur-ation, and a large window the cycles of a long duration. The window would then be assumed to operate like a radio scanner which picks the strongest signal out of the frequency band to which it is switched. Although Fricky's results may be interpreted as an indication of the coexistence of several cycle types, it seems to be rather naive to suppose that every single resulting 'cycle' in Fricky's table indicates a real periodic component of the series. One must be aware of the fact that the mentioned effect is the outcome of a rather complicated process where, given the specification of the trend, the length and the

Jan P. G. Reijnders 17
location of the interval interact with the actual composition of the time series in such a way that it is uncertain whether the result is a reality, an illusion or a combination of the two. It is certainly conceivable that such an interaction generates an image which is so distorted that it does not even resemble the pattern from which it derives. On an earlier occasion I noted this effect, where the image observed depends upo~ the viewing angle and the position of the observer relative to his object, as 'perspectivistic distortion' (Reijn-ders, 1984). Such an effect occurs whenever the duration of a periodic movement exceeds the size of the window, that is, the length of the interval that is analysed.
The mechanism of perspectivistic distortion may be explained by the following example. Suppose that an interval covering k years of a time series is analysed. The analysis consists of fitting a linear trend to this interval which is then eliminated in order to represent the resulting 'cycle' as clearly as possible. Now let the series be a strictly periodic function of time (say a sine or cosine function) with a period of 23t. Provided that the period of the cycle exceeds the length of the interval, that is, k < 2Jt, the apparent duration of the resulting 'cycle' depends upon the length of the interval and upon the location of this interval relative to the time series. Figure 2.1 illustrates two out of many possible cases.
On the left-hand side of Figure 2.1 a situation is displayed where the midpoint of the interval coincides with a maximum or minimum point of the time series. Because the sine function is symmetrical around the maxima and minima, the least squares interval 'trend' will be a horizontal line running parallel to the axis of time. The apparent 'duration' of the resulting 'cycle' is equal to the length of the interval. Changes in the length of the interval consequently result in pro-portional changes in the apparent 'duration' of the cycle. It is signi-ficant to note that not only the apparent 'duration' of the 'cycle' is affected but also its apparent 'amplitude'. The smaller the interval the smaller the difference between the highest and the lowest function value, thus the smaller the apparent 'amplitude' of the 'cycle'.
On the right-hand side of Figure 2.1 a situation is displayed where the midpoint of the interval coincides with one of the points of inflection of the time series. In this case also the apparent 'duration' as well as the apparent 'amplitude' of the resulting 'cycle' are affected, but in a quite different way. If the midpoint of the interval coincides with a point of inflection, the least squares interval 'trend' will intersect the curve in three points. This is a consequence of the

18 Between Trends and Trade Cycles
fact that the curve is S-shaped around the point of inflection (that is, the first derivative increases up to the point of inflection and de-creases thereafter). If the 'trend' is eliminated, the points which correspond to the points of intersection with the curve appear like points of inflection of a (low amplitude) 'periodic' movement which completes more than one 'cycle' within the given interval. Similar to the former case, the apparent 'duration' of the cycle varies in pro-portion to the length of the interval, with the difference however that in this case the apparent 'duration' equals approximately three-quarters of the interval length. What happens to the apparent 'ampli-tude' of the resulting cycle is quite interesting. It is reduced to the extent that it is smaller than a third of the amplitude of the actual cycle, whereas in the former case the apparent 'amplitude' was only reduced to three-quarters of it. The power of the original cycle is absorbed by the interval 'trend'. The higher the inclination of the interval 'trend', the stronger the absorption of power. Therefore, a reduction in the interval length, which will cause the interval 'trend' to rotate counter-clockwise, will make the apparent 'amplitude' of the resulting 'cycle' decrease very quickly.
The differences between the results on the left-hand side and on the right-hand side of Figure 2.1 indicate that it is not only the length of the interval which determines the shape of the resulting cycle: apart from the 'interval effect', the 'location effect' is as important. Even if the length of the interval is constant, a change in location will completely change the shape of the resulting 'cycle' and the incli-nation of the interval 'trend'. If the window on the left-hand side of Figure 2.1 is slowly shifted to the right, several changes will take place. The inclination of the interval 'trend' becomes negative and the apparent 'amplitude' of the resulting 'cycle' diminishes relative to the original situation. From the moment that the interval 'trend' intersects the curve three times the apparent 'duration' of the result-ing 'cycle' will also diminish. Beyond a certain point (that is, the situation where the midpoint of the interval coincides with the in-flection point of the downward phase of the sine function) the apparent 'amplitude' and apparent 'duration' start increasing again, up to the point where the interval is centred around the lower turning point of the sine function. If the shifting of the interval continues, the inclination of the interval 'trend' becomes positive and the sequence of changes in the apparent 'amplitude' and in the apparent 'duration' start all over again.
Jan P. G. Reijnders
\
, \ / . , \ / .
. . '-.. ... ; ./
,-...... ./ , , , . . , \
-, ~,-~,----.---.~L-r---.---~~~r---~ --"-2
. 2 Time
Wave Trend 1 ------- Residual 1 -----Trend 2 --- Residual 2 -----
Figure 2.1 Illustration of perspectivistic distortion
19
The dependence of the apparent 'amplitude' of the resulting 'cycle' upon length and location of the interval is not only important for its own sake, it is also important in view of the possibility to distinguish between different types of cycle. If one imagines that a short cycle is superimposed upon the longer cycle of Figure 2.1 it is easy to understand that it is only possible to discern the longer 'cycle' if the remaining apparent 'amplitude' is sufficiently large relative to the amplitude of the short cycle. Therefore there will be an alternating image according to differing locations of the interval. If the interval is centred around an extremal point of the sine function, and the amplitude of the sine function is large enough, the longer resulting 'cycle' will have a chance to reveal itself. The apparent 'duration' of the dominant long cycle upon which the short cycle is superimposed will then be mainly governed by the interval length, provided that the latter is not so small that the amplitude of the resulting 'cycle' fades away. If, however, the interval is centred around a point of inflection the resulting 'amplitude' will be reduced to such an extent that the shorter cycle will in any case dominate the image so that the length of

20 Between Trends and Trade Cycles
the interval does not matter very much unless the interval is signifi-cantly larger than Jt (that is, half the period of the sine function). Therefore, one may expect alternating images in the sense of a long cycle dominance followed by a short cycle dominance if the interval is shifted along the time axis to successive extremal points and points of inflection.
From this example it ought to be obvious that even in the simplest case, of only one strictly periodic function, one may find a number of 'cycles', of which the apparent 'duration' and shape depend upon length and location of the interval chosen. In reality the problem of perspectivistic distortion is even more complex because several per-iodic movements may be involved. Several combinations of cyclical illusions, 'quid pro quo's' and real cycles, which do not only depend on the length and location of the interval but also on the relative phase and amplitude of the periodic components, may be tied together into an inextricable Gordian knot.
Unfortunately, the principal problem of perspectivistic distortion cannot be solved completely. The exact solution would require perfect knowledge of the whole of economic history from an un-known date in the remote past to an unknown date in the distant future. Otherwise one cannot exclude the possibility that there are periodic phenomena that distort the image and frustrate the analysis of the time series in question. In the face of eternity even secular trends may be reversed. Consequently, one faces a problem that resembles the difficulty in statistics, of having to state the character-istics of a population on the basis of a limited sample of which neither its relation to the populMion nor its degree of representativeness is known.
As long as the principal solution is lacking one may well have to restrict oneself to a practical solution by hypothesis. Because per-spectivistic distortion is caused by the presence of low frequency components, the probability of distortion is smaller whenever the interval is larger. If one accepts the hypothesis that the degree of distortion is an inverse function of the length of the interval or, alternatively, that the degree of reliability of the results increases with the prolongation of the interval, the core of a practical solution to the problem of perspectivistic distortion is given. If it is possible to find a series which covers an interval of time which is so large that it may be assumed to exceed even the length of the longest periodic component contained in the process of economic development, one may study the long-run characteristics of economic development in
Jan P. G. Reijnders 21
their proper, undistorted shape. If economic development shapes the basic characteristics of all economic indicators in a similar fashion, one may assume that economic time series all have in common that they are particular expressions of this process. In this case the information yielded by an analysis of the longest possible time series! may be used to assess the degree to which shorter series are affected by perspectivistic distortion. One would then be able to provide a basis for a technique to compensate for this effect.
Before attempting to find an approximate solution to the problems caused by perspectivistic distortion, it is first of all necessary to assess whether the mentioned effect has any relevance with respect to Kondratieff waves.
SYSTEMATIC LONG-RUN MOVEMENTS
So far, the principle of perspectivistic distortion has been advanced as a particular explanation of the results obtained by Fricky and as an illustration of the degree to which the analysis of time series is sensitive to optical illusions. The occurrence of the mentioned effect is plausible in Fricky's case because the time interval covered by his analysis is relatively short (from 45 down to 3.3 years). Therefore the existence of long waves of the Kondratieff type, or in some cases of the major business cycle, is a sufficient condition for the occurrence of perspectivistic distortion in every item listed in Fricky's summary table.
In view of the nature of the problem, the occurrence of perspec-tivistic distortion only endangers long-wave analysis if there is scope for the expectation that systematic movements exist of which the average period exceeds the length of the time interval that is usually covered by long-wave analysis. Apart from my own contribution (Reijnders, 1984), perspectivistic distortion has not been subjected to a separate analysis and has not been recognised as a special problem in long-wave analysis.2 The literature on long waves and some related studies in quantitative economic history, however, do contain direct or indirect references to systematic movements in the very long run. These movements, which are usually assumed to extend over periods of 250 years and more, are referred to as 'logistics', 'life cycles of economic development' or 'hegemonical life cycles' (Simiand, 1932; Cameron, 1973; N. B. Forrester, 1973; J. W. Forrester, 1977; Waller-stein, 1980; van Duijn, 1983; Kleinknecht, 1987; and so on). It is

22 Between Trends and Trade Cycles
difficult to judge the value of these references because in most cases the existence of such movements is postulated without reference to empirical studies which might support such a position. 3
There are, however, some indications of the existence of 'logistics' or whatever one likes to call them. Figures 2.2a--e represent the relative deviations from trends fitted to an index of the wholesale price level; industrial production (excluding building); imports; ex-ports; and population of the United Kingdom 1700-1985. In all cases the trend is an exponential function of the form (legt, which is fitted by a naive procedure (that is, a straight line is fitted to the logarithms of the series without further qualifications). The deviations from the log linear trend can be interpreted as relative deviations from an exponential trend.
Figure 2.2b suggests that the familiar Kondratieff waves in the price series are superimposed on a systematic long-run fluctuation. The other series are different. These series are clearly dominated by a systematic long-run fluctuation, the relative amplitude of which is so strong that it pushes the Kondratieff waves (if they are at all present) into the background.
Visual inspection suggests that the dominant characteristic of all series (though less pronounced in the price series) is a systematic long-run movemenL In the case of the volume series, it declines until 1780, rises until 1875, declines until 1925, and rises until the end of the interval, where it starts declining again. The long-run movements in the monetary series exhibit a pattern that seems to run in roughly the opposite direction to the pattern of the volume series.4
It is interesting to note that because the systematic deviations are defined as relative deviations from the exponential 'standard trend', the 'full trend' of the volume series for the period 1780-1940 will be S-shaped. For this reason the visual appearance of the long-run movement seems to be at least partially consistent with the impli-cations of the 'logistic' or 'life cycle of economic development'. One should, however, be very careful when interpreting the long-run movement in this way. An interval covering 285 years may seem sufficiently long but this does not exclude the possibility that the actual process of long-term development takes an even longer time to unfold. In this case the visual impression from the graphs would not indicate the actual pattern of economic development in the long run but only a distorted image of it. Consequently it is better to avoid the rather pretentious terminology of 'logistics' or 'life cycles of econ-omic development' and to designate the observed pattern simply as the 'systematic long-run movement' instead.

JanP. G. Reijnders 23
(a) Industrial production .8
.8
..
. 2
0.0
-.2
-.' -.8
'700 17" '796 , ... '892 '!MIl
(b) Prices (d) Imports 2.S .8
2.0 .. '.S
0.0
'.0 -A
.5
-.8 0.0
-.S -1.2
-1.0 -1.8
1700 1757 181. 1871 '928 '985 '700 1757 18'. '871 '928 '985
(c) Exports (e) Population '.0 30.
. 8 20 .
'0 . . 2
O.
-.2 -10.
-.8 -20.
-1.0 -30. x 10-2
'700 17" 1796 , ... '882 ,!MIl '700 '751 '8'4 1871 '928 ,985
Figure 2.2 Deviations from a log linear trend. Miscellaneous series 1700-1985

24 Between Trends and Trade Cycles
The characteristics of the long-run movement need not be scruti-nised now. For our present purposes it is sufficient to draw the following conclusions:
• The systematic long-run movement (be it a proper or distorted representation of the real long-run dynamics) suggests that there are fluctuations or cycles whose length considerably exceeds the period of the Kondratieff wave;
• The apparent amplitude of the systematic long-run movement is larger than the apparent amplitude of shorter cycles. This is par-ticularly so for the volume series but it is also true for the price series. The amplitude of the long-run movement, relative to the shorter cycles, is so large that the latter are pushed into the background. In order to be able to analyse the Kondratieff waves in the volume series it will therefore be necessary to eliminate the impact of the systematic long-run movement, which must be inter-preted as a component which belongs to the domain of the trend;
• To be able to remove the long-run movement from the series one must have some basic understanding of the nature and actual shape of the real long-run pattern. Consequently the so-called 'logistic' or 'life cycle of economic development' must be analysed within its proper perspective. The study of this phenomenon is a necessity, not only because of the information it yields with respect to the process of economic development in the long run, but also because knowledge of its proper shape is a prerequisite for the study of the dynamics within the domain of the Kondratieff wave.
The observation that there is a long-run systematic movement which extends over time intervals that are as long as, or even longer than, the earlier considered interval of 285 years, implies that any interval which is shorter than this is, in one way or another, affected by perspectivistic distortion. This sheds an interesting light on the validity of the results obtained by the application of the conventional methods of long-wave analysis.
Consider, for example, the 'split halves' or 'binary split' method (see Reijnders, 1990, pp. 80-119). Its basic characteristic is that the total interval covered by a given time series is split up into sub-intervals to which a 'conformity test' or 'concordance test' is applied. The definition of sub-intervals is derived from a predefined periodis-ation of 'long wave' turning points. As a consequence the average length of the sub-intervals varies between, say, 40 and 60 years.

Jan P. G. Reijnders 25
Because the duration of the systematic long-run movement exceeds considerably the length of the sub-intervals considered, the occur-rence of perspectivistic distortion is certain. In fact the 'binary split' method is a perfect illustration of the harmful effects of perspectivis-tic distortion in the case of long-wave analysis. Its application implies the analysis of a series of consecutive 'snapshots' of the process of economic development, each of which has a different location rela-tive to the axis of time. Therefore every 'snapshot' highlights a different aspect of the systematic long-run movement. Because the amplitude of the systematic long-run movement in the volume series is relatively large compared with the other components, the former will dominate the shape of the series in most of the sub-intervals. For this reason the 'binary split' method does not, as it is supposed to do, really measure the differences of growth rates which correspond to alternating phases of the 'long wave'. It mainly measures differences in growth rates that correspond to distorted images of the systematic long-run movement which appear in each sub-interval. Therefore a quid pro quo is involved.
It is not only the result of the 'binary split' method which should be interpreted with utmost care. Outside the realm of the 'binary split' method there are also various examples of attempts to establish the existence of long waves on the basis of time intervals which are too short not to be decisively affected by perspectivistic distortion. It is significant that, with the notable exception of Kondratieff himself, none of the authors in question seems to have been capable of dealing with the problem of perspectivistic distortion in a satisfactory manner (see, for example, Broersma, 1978; van Paridon, 1979).
The existence of the systematic long-run movement and the conse-quent danger of perspectivistic distortion does not only present a problem for certain variants of long-wave methodology alone: it also affects long-wave analysis at large. If one attempts to establish the existence of long waves it is not sufficient to demonstrate their presence in only one or in a limited number of time series from one single country. It is necessary to show traces of long waves in several series from several countries. In this context the practical difficulty arises that the available statistical material, that is, time series of different categories of economic indicators for different countries, relates to a wide variety of time intervals.5 This practical difficulty is turned into a major problem if it is assumed that the systematic long-run movement is characteristic of the main economic time series of the advanced countries. This follows from the fact that the length

26 Between Trends and Trade Cycles
of various time series which relate to different countries may vary considerably. Moreover, because the systematic long-run movements for different countries do not necessarily develop in step, one has to face the fact that series apply not only to intervals of unequal length but also of unequal location in relation to the long-run movements. Since, by hypothesis, the degree of perspectivistic distortion depends upon the length and the location of the interval, one must assume that the degree of distortion is different for different series. Hence these series, as well as the results obtained from their analyses, are not really comparable. However, comparison is necessary to demon-strate Kondratieff waves. For this reason the usual methods run into serious difficulties. One might go so far as to say that this incompar-ability invalidates the results obtained by the customary methods. I do not venture so far, but I do suggest that such incomparability is an additional reason why the short-run approach has, to date, not been very successful.
To make progress one will have to cope with this problem. If the series as such are not comparable they will have to made comparable. Different series must be standardised, that is, be uniformly corrected for the influence of perspectivistic distortion.
STANDARDISATION
Something approximating a solution of the problem of perspectivistic distortion may be achieved by generalising the characteristics of series with the lowest degree of distortion (that is, the longest series) and by imposing this generalisation upon the series of a higher degree of distortion. Roughly, the procedure would be as follows. The characteristics of the longest series are isolated by means of a statisti-cal model that is fitted to the series. The next step is the construction of a model which contains the information about the periodic struc-ture of the long series and to fit it to the shorter series. After this the patterns which are explained by the model are removed from all series. Thus, by eliminating similar information, the remaining re-siduals have been subjected to similar transformations. They will be comparable although they stem from differing intervals. One cannot, however, directly generalise about the patterns found in the longer series because one can neither assume that the long-run movements are synchronised throughout all series nor that the amplitudes are identical. One has to take some complicating factors into account:

Jan P. G. Reijnders 27
• From the observation that the long-run movement of the price series lags behind the long-run movement of the volume series it may be concluded that considerable time-lags between the system-atic long-run movements of different series are involved;
• If systematic long-run movements do exist they will exhibit them-selves in the economic development of a national or regional entity. As the pattern of economic development of national or regional entities is as a rule unequally distributed, a relative accel-eration of the pace of growth of one entity will be accompanied by relative deceleration of the pace of growth of another. Consider-able time-lags or even exact counterphases between the long-run patterns of different countries must therefore be expected.
These complications prevent direct generalisations. They do not, however, prevent generalisation altogether. They only impose special demands upon the model that is used to approximate the systematic long-run movement. The model must be suitable for retaining the periodic structure of the longer series while at the same time allowing for differing amplitudes and phases when adapted to shorter series. The model which can accomplish the isolation of components that belong to the domain of the trend, must meet the following requirements:
1. The first requirement is, as a matter of course, that the model must give a reasonable fit to the data in question.
2. The second requirement, which is somewhat in contradiction with the first, is that the impact of the model must be restricted to the components that belong to the domain of the trend. It must only affect periodicities of over, say, 70 or 80 years, and leave the shorter ones unaffected.
3. The third requirement stems from the need to generalise about the results. On the one hand the model must have a certain degree of rigidity to retain the periodical structure of the systematic long-run movement. On the other hand it must be flexible enough to allow for differences in amplitude and phases of the long-run move-ments of various series.
Subsequently these requirements will be referred to as the 'reason-able fit', the 'domain selectivity' and the 'generalisability' require-ment. To solve the problem of the trend in a way which satisfies these conditions, the 'full trend' is defined as consisting of two parts:

28 Between Trends and Trade Cycles
• one which represents the steady and continuous element of economic development. This part is designated the 'standard trend';
• one which represents the element of economic development that is not continuous but which none the less logically belongs to the domain of the trend. This part is designated the 'systematic devi-ations from the standard trend'.
The standard trend is assumed to have the shape of an exponential function. With a view to the necessity to generalise the shape of the trend to series of differing definition intervals, the 'systematic devi-ations from the standard trend' are assumed to take the shape of a summation of two sinusoids of which the duration exceeds the dur-ation of the Kondratieff wave. The estimation problem then be-comes:
n n (M.1) min L In[Et12 = L [In(yt)-ln(c)-tln(l+g)
i=1 i=1
m L {ukcos(23t(H'tk)ldk)} y k=l
where:
t time Et = residual in t Yt = value of the time series in t c = intercept of the 'standard trend' g = growth rate of the 'standard trend' Uk = amplitude of component k 'tk = phase of component k dk = duration of component k (in units of time)6 m = number of periodical components = 2 n = series length
The application of model M.1 to the earlier mentioned series cover-ing a 285-year interval without further qualification yields a great variety in estimates of periodicity (Reijnders, 1990, p. 185). The different series seem to lack uniformity. The question is whether this apparent lack of uniformity is a property of the series as such or whether it is simply a trick of the eye. The latter can develop when even the 285-year interval is affected by the occurrence of perspecti-

Jan P. G. Reijnders 29
vistic distortion. In this case every single series provides its own distorted image of what may be a basically identical characteristic. Then it appears as if every difference in the degree of distortion is a distinct 'characteristic' of the series in question.
To establish that it is indeed perspectivistic distortion which is responsible for the apparent lack of uniformity and to lay a foun-dation for further analysis it is essential to refer to a time series which is significantly longer than the already mentioned interval of 285 years. For this purpose the Phelps Brown and Hopkins price of consumables series is selected. It covers an interval of 690 years and envelops periodicities which exceed the 285-year limit. If the analysis of this particular series indicates the presence of periodicities that exceed the 285-year limit, account must be taken of the possibility that perspectivistic distortion does play a part in an interval of this length. The application of model M.l to this Phelps Brown and Hopkins series yields as estimates of periodicity:
d1 = 376.26 (t = 69.37) and d2 = 242.05 (t = 81.39)
The duration of the first component exceeds the length of the 285-year interval. Consequently series which only cover such an interval are unreliable guides to the estimates of duration because they are affected by perspectivistic distortion. The next question then is: does perspectivistic distortion explain the apparent lack of uni-formity between the series covering the 285-year interval? The an-swer can be found by checking whether the insertion of the duration estimates which derive from the Phelps Brown and Hopkins index in model M.l leads to estimates of amplitude and phase which consti-tute essentially similar patterns.
The meaning of the expression 'similarity' in this context is prob-ably best illustrated by the elaboration of the extreme case which will be designated: strict uniformity. By analogy to the definition of similar triangles in planimetry, strict uniformity of patterns might be defined as a situation in which one pattern can be reconstructed on the basis of a simple linear transformation of another. The com-posite: ~lsin23t(t + 't21)ldl + ~sin23t(t + 't22)ld2 can be reconstructed from the composite un sin23t(t + 'tn)ldl + u12sin23t(t + 't12)/~ by a multiplicative transformation of amplitude and an additive trans-formation of phase provided that the proportion between amplitudes and the difference between phases of the constituent parts is equal for every composite, that is, if:

30 Between Trends and Trade Cycles
6at (= U12/Un ) = 6a2 (= u2iu2t)
and
On the basis of such a definition, the critical test with regard to strict uniformity of patterns involves the comparison of amplitude pro-portions (6at and 6a2) and phase differences (6d and 6'2) of the periodic components of various series.
In the present context the definition of strict uniformity is too restrictive. It is not necessary that different patterns are exact linear transformations of each other. It is sufficient to establish a certain family likeness between them. The difficulty is, of course, how the existence of family ties can be demonstrated. In view of the fact that the Phelps Brown and Hopkins index is used to define the basic periodicities on which all estimates of the systematic long-run move-ment are based, one might consider this particular series as the progenitor of the family. Other series might then be considered to be descendants provided it can be demonstrated that they have at least one characteristic in common with their alleged progenitor. In anal-ogy with the earlier definition of strict uniformity one might thus define approximate uniformity or family likeness as a situation where the joint confidence region of the 6ai and the 6ti of an alleged 'descendant' series overlaps the joint confidence region of the 600 and the 6ti of the 'ancestor', the Phelps Brown and Hopkins series. It is not necessary that a given series is indeed a linear transformation of the 'ancestor'. In fact, it is only necessary to show that there is a slight chance that this is so. Consequently it is adequate to consider 99.9 per cent confidence limits.
It can be demonstrated (Reijnders, 1990, p. 199) that, with the notable exception of the population index, the joint confidence regions of the 600 and the 6ti of all series overlap. Consequently all economic indicators from the 285-year interval can be regarded as being descendants of the Phelps Brown series. In other words, the systematic long-run movements of these indicators follow a uniform pattern. The estimates of duration which derive from the Phelps Brown and Hopkins index are the key to uniformity, which makes the systematic long-run movements of all items that relate to the econ-omic process fit together like pieces in a giant jigsaw puzzle.
It is significant that only one relatively simple specification of a trend function is capable of representing the main characteristics of a

Jan P. G. Reijnders 31
l PHELPS BROWN Jr------.. 1 HI UNIFORMITY I
INDUSTRIAL . . PRODUCTION I r .I L PRICES --"
I~IXED PERIODSI/ • IMPORTS r~~ EXPORTS POPULATION
FIXED PERIODS FIXED AMPLITUDE
PROPORTIONS FIXED PHASE DIFFERENCES
CONSUMER EXPENDITURE PUBLIC EXPENDITURE CAPITAL FORMATION GROSS NATIONAL PRODUCT AGRICULTURAL PRODUCTION
La. INDUSTRIAL PRODUCTION ,--.-- TRANSPORT 81 COMMUNICATION
DISTRIBUTION 81 OTHER SERVICES GROSS DOMESTIC PRODUCT WORKING POPULATION EMPLOYMENT CIVIL EMPLOYMENT UNEMPLOYMENT
Figure 2.3 'Anatomy' of the standardisation procedure
variety of economic time series covering different time intervals and remaining well within the limits set by conventional statistical pro-cedure. It is also significant that this trend specification leads to estimates of amplitude and phase characteristics which support the view that the principal long-run movements of several economic indicators fit into a uniform framework. One can make use of this empirical property by fixing the amplitude proportions as well as the phase differences of the periodic components in addition to the already fixed durations. This introduces a new element of rigidity, which again enhances the possibility of 'transplanting' the observed characteristics of the 690- and 285-year series to the shorter ones.
The connections between consecutive steps in this methodological 'cascade' which lead to the standardisation procedure7 are displayed in Figure 2.3. By fixing the parameters which relate to amplitude proportions and to phase differences the model is made sufficiently rigid to preserve uniformity. But because timing and amplitude of the overall movement are left variable, the model is flexible enough to adjust to the peculiarities of individual series. In its final form the model gives an approximation of the trend which is multi-functional in the sense that it not only provides an instrument for detrending data but also for standardising them, that is, for making uniform corrections for the effect of perspectivistic distortion.

32 Between Trends and Trade Cycles
The estimation problem now becomes:
(M.2) min ~ln[ EtY = ~[ln(Yt) - In(c) - t X In(l + g) -
a 1 cos (2Jt(t + 't1)«I>I) + a 1 Oaf cos (2Jt(t + 't1 +
O'f)«I>ZW
where
amplitude of component 1 phase of component 1 fixed amplitude proportion between component 1 and component 2 fixed phase difference between component 1 and component 2
The fixed coefficients of the model are the periodicity and phase difference parameters. They are fixed at the average values which were obtained from the analysis of the Phelps Brown and Hopkins index. Consequently «1>1 = 376, «1>2 = 242, Oaf = 0.65 and o.r = 81. There remain 4 more parameters to be estimated simultaneously: In(c), In(l + g), a 1 and'tl'
The fixed periodicities model with fixed-phase relatives provides an instrument which fulfils the requirements which were formulated earlier, namely the 'reasonable fit', 'domain selectivity' and 'general-isability' criteria. On the one hand it is flexible enough to adapt itself to individual characteristics of time series because it allows for differences in 'temperament' (amplitude) and phase. On the other hand it is sufficiently rigid to create the possibility of retaining the periodic'll structure of the long-interval series, which can then be 'transplanted' to series which cover a shorter interval.
SPECTRAL ANALYSIS
The elimination of the 'full trend' is obtained by simply subtracting the log transformed 'full trend' from the log transformed data series. The residual which is left can be -interpreted as the sum of all cyclical patterns, fluctuations and erratic movements of the time series which do not belong to the domain of the trend. Because the composition of

Jan P. G. Reijnders 33
the 'full trend' is uniform for every single time series regardless of its length, the residual can be rated as a 'standardised' series.
Having standardised series at our disposal, the stage is set for testing whether or not there are traces of a Kondratieff wave in the residual series. The standardised series all conform to the weak stationarity condition (Reijnders, 1990, p. 222). Consequently the minimum requirements for the application of spectral analysis are fulfilled.
The power spectrum is approximated by a smoothed version of the 'periodogram'. Smoothing is obtained by applying a data window (or taper) and Fourier transform the tapered series, after padding it with zeros on either side (Bloomfield, 1976, p. 164). Subsequently a 'spectral window' is applied to obtain the required degree of smooth-ness. This approach prevents data being lost. Since the padding of series is necessary in any case, one may append the original series up to a highly composite number to obtain the highest calculation speed. Another advantage of the padding of series is that it becomes possi-ble to measure the spectra of series over a finer grid of periodicities which enhances the 'resolution' of the spectra. Finally, another advantage of padding is that series from different intervals may be padded up to the same number, which implies that all spectra are measured over the same range of frequencies despite the fact that they may be based on series of different lengths.
The results of the spectral analysis for the various series from different intervals are summarised in Tables 2.1 to 2.4. In order not to bother the reader with endless listings of spectrum estimates, a summary only is presented here. The principle of the summary is as follows. The power spectrum is essentially a decomposition of the total variance of a series into contributions of individual frequencies. A peak in the spectrum at a certain frequency indicates that this particular frequency has a higher 'power', or a higher explanatory value, than the frequencies which directly surround it. From this it seems to follow that it is sufficient to establish the existence of Kondratieff waves by demonstrating that there is a peak in one of the frequencies which belong to the Kondratieff domain. This is inad-equate. Especially in the case where a narrow spectral window is applied, the power spectrum has a rather ragged appearance, which implies that there are many local peaks. If the presence of a spectral peak is seen as the only precondition for establishing a certain type of cycle, one must be aware of the fact that a ragged spectrum implies
34 Between Trends and Trade Cycles
Table 2.1 Distribution of peaks in the spectra of miscellaneous series 1700-198S12
Narrow EBW = 0.0199, Medium EBW = 0.0434, Wide EBW = 0.0775
Grid = 512 Trend Kondratieff Buffer Kuznets
Industrial pro- N 1 (S) 2 (10) 3 (29) duction (excl. M 1 (S) 2 (29) construction) W 1 (6) 2 (29)
N 1 ( 9) 2 (14) Wholesale prices M 1 (10) 3 (33)
W 1 (10)
N 1 (S) 2 (IS) Imports M 1 (S) 2 (IS)
W 1 (S) 2 (IS)
N 2 (S) 1 (10) 3 (22) Exports M 2 (S) 1 (10) 3 (22)
W 1 ( 9) 2 (22)
N 1 (6) 2 (13) 3 (30) Population M 1 (6) 2 (29)
W 1 (6) 2 (29)
Table 2.2 Distribution of peaks in the spectra of the main categories of expenditure and gross national product with periods of war replaced
by linear interpolations13
Narrow EBW = 0.0199, Medium EBW = 0.0434, Wide EBW = 0.0775
Grid = 512 Trend Kondratieff Buffer Kuznets
Consumers' N 2 ( 8) 1 (15) 3 (31) expenditure M 2 ( 8) 1 (16) 3 (31)
W 1 (15) 2 (32)
Public expenditure N 1 (11) 2 (26) on goods and M 1 (11) 2 (28) services W 1 (13) 2 (26)
Gross fixed N 3 ( 9) 1 (16) 2 (24) capital M 3 ( 8) 1 (16) 2 (24) formation W 1 (17)
Gross national N 1 ( 8) 2 (15) product M 1 ( 9)
W 1 ( 9)

Jan P. G. Reijnders 35
Table 2.3 Distribution of peaks in the spectra of the output of various sectors and gross domestic product
Narrow EBW = 0.0199, Medium EBW = 0.0434, Wide EBW = 0.0775
Grid = 512 Trend Kondratieff Buffer Kuznets
Agriculture, N 2 ( 9) 1 (26) forestry and M 2 (11) 1 (26) fishing W 2 (11) 1 (26)
Industrial pro- N 1 (7) ± 2 (17) duction (incl. M 1 (7) ± 2 (17) construction) W 1 (7) ±
Transport and N 1 ( 8) 3 (25) Communication M 1 ( 8) 2 (25)
W 1 ( 9) 2 (25)
Distribution N 1 ( 8) 2 (18) and other M 2 ( 8) 1 (17) services W 2 ( 8) 1 (17)
Gross domestic N 1 ( 8) 2 (17) product M 1 ( 8) 2 (17)
W 1 ( 8)
that one has to recognise a great number of distinct 'cycles'. 8 It is not sufficient just to check whether there is a peak in the relevant interval or not, it is also necessary to assess the relative importance of a particular peak by comparing its altitude to the altitudes of other peaks in the spectrum. Therefore the requirement is that a peak in the Kondratieff domain is not merely a small ripple, but that it is prominent in the sense that it ranks amongst the three highest peaks in the spectrum at large. To give an impression of the relative performance of the Kondratieff domain, its ranking is contrasted with the ranking of the neighbouring domains, namely the domain of the trend and of the 'Kuznets' wave. It is important to keep an eye on the trend domain because there is always a possibility that the normalis-ation procedure might not eradicate all traces of the systematic long-run movement. Such a residue in the trend domain introduces a certain bias, which affects the spectral estimates as such and which may create a difficulty in distinguishing the power of the Kondratieff domain, because the powers of the two adjacent domains tend to merge together into a single broad peak located On or close to the borderline. It is interesting to consider the other neighbour of the

36 Between Trends and Trade Cycles
Table 2.4 Distribution of peaks in the spectra of the working population, employment and unemployment
Narrow EBW = 0.0199, Medium EBW = 0.0434, Wide EBW = 0.0775
Grid = 512 Trend Kondratieff Buffer Kuznets
Working N 1 (13) 2 (22) population M ± 1 (14) 2 (21)
W 1 (15)
Total N 1 (11) 2 (22) employment M 1 (11) 2 (22)
W 1 (11) 2 (21)
Total civil N 1 ( 9) employment M 1 ( 9)
W 1 ( 9)
N 1 (12) 2 (21) Unemployment M 1 (12) 2 (21)
W 1 (11)
Percentage N 1 (12) 2 (21) unemployed M 1 (12) 2 (21)
W 1 (11)
Kondratieff domain as well. The Kuznets domain is worth consider-ing because it may be interpreted as a competing hypothesis which also strives for the hegemony in the field of long-wave analysis. 9 It is interesting to contrast their respective powers in order to see whether one is indeed more prominent than the other, or whether the ad-herents of either hypothesis should finally seek ways of peaceful coexistence.
The various domains are delimited as follows. The duration of the Kondratieff wave is estimated at some 40-60 years. This range is enveloped by the frequencies 8 to 13, which vary from 39.4 to 64 years. lO This is the Kondratieff domain. The lower frequencies, that is, frequency 1 up to and including frequency 7, envelop the trend domain. The Kuznets wave is pitched at a duration of 15-25 years. 11
This range is covered by frequency 20 (= 25.6 years) up to and including frequency 34 (= 15.1 years). Frequencies 35 and higher are subsequently allocated to the Juglar cycle, the Kitchin cycle, and so on. It is important to notice that the Kondratieff and Kuznets do-mains are not adjacent. There is a kind of no man's land between
Jan P. G. Reijnders 37
them, which covers frequencies 14-19, ranging from 36.6 years down to 26.9. Since it is best not to depart too much from conventional classifications of cycle lengths, the no man's land will be considered as a kind of buffer zone between the two rival domains.
Let us now turn to the results. Tables 2.1 to 2.4 contain a survey of how the three highest peaks in the respective spectra are distributed over domains. The rank of a peak is recorded in the column of the corresponding domain. The bracketed numbers refer to the precise frequency where the peak occurs. Peaks which rank lower than three are not considered here. In such cases, or in the case that the domain in question does not contain a peak at all, a minus sign is put in the corresponding column. There are cases where a broad peak occurs which is situated right at the border of two domains and where the summit touches the borderline. Under the circumstances a very small change in assumption, for instance the choice of the width of the spectral window, may make the summit flip over to the other side. It is then doubtful which of the two domains should get the credit for the peak. In such a case the domain which actually contains the summit is credited for a peak and the runner-up is marked with a ± sign to indicate that one may grant it the benefit of the doubt. A perusal of the results represented in Tables 2.1 to 2.4 shows that Kondratieff's long wave is a prominent feature in most spectra, particularly so in the spectra of indicators of aggregate activity such as Gross Domestic Product (GDP), Gross National Product (GNP), and Employment. Similarly, it shows that the Kuznets cycle will probably also survive as a member of the long-wave family. It seems as though the Kuznets cycle particularly comes into its own where indicators of a lower level of aggregation are concerned. The results demonstrate that long-wave analysis cannot be considered a sub-species of the art of chasing red herrings. On the contrary. It indi-cates that the long-wave hypothesis is well worth considering.
Under the present circumstances, Kondratieff's hypothesis sur-vives the spectral analysis test. This accords in a broad sense with the results obtained with some other applications of spectral analysis in this field (Haustein and Neuwirth, 1982; Morsink, 1987). They are, however, diametrically opposed to the results of van Ewijk's spectral analytic test (van Ewijk, 1982). He concludes that there is weak but stable indication of Kondratieff waves in price series but that no trace of them can be found in the volume series (ibid., p. 494). In the final analysis, the disagreement with van Ewijk regarding the validity of Kondratieff's hypothesis hinges upon the contrast in the method of

38 Between Trends and Trade Cycles
trend elimination; van Ewijk's results must be rejected because his growth rate transformation obviously eliminates the long wave be-fore he even starts looking for it (see Reijnders, 1990, pp. 236-9 and 246-52).
The procedure mentioned for detrending and standardising data provides an adequate solution to the problem of the trend. Its application leads to standardised residuals which fulfil the stationarity conditions required for spectral analysis. Unlike 'local methods', spectral analysis does not try to extract the influence of one cyclical component from the others in isolation. Neither does it try to estab-lish individual turning points. It evaluates the contribution of all periodic components simultaneously and gives an aggregate measure of the explanatory powers of various groups of periodic functions.
Spectral analysis of the standardised series indicates that the ex-planatory power of the Kondratieff domain is relatively high, es-pecially with respect to indicators of aggregate activity. Therefore the Kondratieff wave cannot be regarded as an illusion. There is substan-tial evidence to the contrary which demonstrates that long waves of the Kondratieff type do exist. However, the positive conclusions with regard to Kondratieff's hypothesis are conditional. The following qualifications have to be made:
• The present results only apply to one single national entity and this context is too limited for drawing far-reaching conclusions. It will be necessary to replicate this analysis for a greater number of countries in order to see whether the British case is an exception or not and it will be necessary to demonstrate that the patterns of interaction between nations are such that the Kondratieff move-ment is propagated internationally;
• As far as Kondratieff waves are concerned, the present results have only an empirical status and as such only provide an alibi for a preoccupation with long-wave analysis. They can, however, indi-rectly contribute to what will ultimately be the principal part of the validation of Kondratieff's finding: its explanation on a theoretical level;
• The scope of the present results is not limited to Kondratieff waves alone. Ultimately the findings depend upon prior application of a detrending and standardising procedure. This procedure contains the implicit assumption that periodicity is not the exclusive at-tribute of the Kondratieff domain. If one decides to accept the Kondratieff wave on the basis of the present results, one will also

Jan P. G. Reijnders 39
have to accept that this particular movement is embedded in a rather complicated structure which contains a multitude of wave-like movements, not only of shorter but also of considerably longer duration than the Kondratieff wave itself. Therefore one can not claim a separate raison d' etre for the Kondratieff wave because it is an integral part of this multi-cycle structure and does not have a life of its own.
The first two qualifications are the consequence of the fact that in as complicated a field as long-wave research it is impossible to give all the answers at once. Probably they are only temporary qualifications. They stress the need for further research in this area and in the near future their importance may therefore diminish.
The third qualification is of a different kind. It states that to a certain extent the results obtained are the product of the method which was applied. Unlike the earlier mentioned qualifications its importance will not diminish in the course of time. It derives from a fundamental postulate with regard to the structure of economic time series. It is based on the assumption that this structure is character-ised by the presence of one part which represents the steady and continuous element of economic development and another part which largely consists of cycles. According to their average duration these cycles can be grouped into 'domains'. In the history of busi-ness-cycle theory several domains were claimed for different types of cycles: as previously noted, we have Kitchin, Juglar, Kuznets and Kondratieff domains. There is, however, no reason to assume that this list of past claims is a limiting enumeration of possible domains. There may be more and in principle any of those mentioned could be enveloped by other cycles. Any method which is designed to isolate a certain type of cycle must explicitly take account of this possibility. The definition of the 'environment' thus determines the set of rules with which the method must accord. 14 The method of standardisation and trend elimination which was developed here, as well as spectral analysis, accord with these rules. 15 In this sense they are the logical consequences of the definition of the 'environment' of the Kondra-tieff wave.
If one accepts Kondratieff's limited multi-cycle interpretation, one will also have to accept its logical extension which is proposed here. If the extended multi-cycle interpretation is accepted one will also have to accept the methods that fit within the framework of rules which logically derive from this. Finally, if these methods are accepted one

40 Between Trends and Trade Cycles
will also have to accept the results to which their application leads. If the structure of economic time series is conceived as a structure which is characterised by the simultaneous existence of several types of cycle, one will have to accept that the Kondratieff cycle is a part of it.
Kondratieff's hypothesis is valid if one of the ideas, of which Kondratieff must at least have had an intuitive understanding, is taken to its logical conclusions. This idea is that a long wave can only be discerned in a time series if its trend is effectively removed. The elimination of trends is, however, a rather tricky enterprise. Kondra-tieff's own analysis went astray at this point. My objective was to demonstrate that Kondratieff's approach is fruitful and that his strategy is feasible (without making the mistakes for which he has been fiercely criticised). Following the long-run approach there is a host of difficulties to overcome. But there is a way around them. The problem of the trend can be solved in such a way that the results are immune to the kind of criticism that Kondratieff had to face. The results indicate that Kondratieff's original hypothesis holds.
NOTES
1. The effort to provide a solution to the problem of perspectivistic distortion requires reference to very long data series. This poses the question of data reliability: the further back in time we move, the greater are the sources of data error. However, the implied solution to the problem of perspectivistic distortion only requires the analysis of broad long-term trends in the data. Therefore it is not sensitive to the kind of 'local' data errors which seem to bother economic historians who are concerned with the identification and timing of the so-called 'Industrial Revolution' (See, for example, Harley, 1982; Crafts, 1983, 1985).
2. There are some instances where the influence of the 'time period considered' is referred to (Fricky, 1942, p. 46; Pesek, 1961, p. 296; Melnyk, 1969, p. 18; van Duijn, 1983, p. 148). However, these references have the character of mere parenthetical remarks and cannot be considered proper descriptions of the nature of the problem.
3. A remarkable example is N. Forrester. He devotes a complete book to the 'life cycle of economic development', which does not contain one single reference to empirical studies which might substantiate his speculation (N. B. Forrester, 1973).
4. There seems to be a time lag. Production leads by approximately thirty years. It is essential to add the expression 'it seems', because in view of the possible presence of perspective distortion one cannot trust one's own eyes.
5. In the case of Great Britain a limited number of time series cover

Jan P. G. Reijnders 41
(parts of) the eighteenth century. For other 'core' countries compar-able statistics are only available for the periods after ± 1800 (France), ± 1860 (USA) or ± 1870 (Germany). A more complete coverage of the set of economic indicators is only available for the second half or, in most cases, the last quarter of the nineteenth century.
6. Generally, it is more convenient to define the frequency of a compo-nent, which is the inverse of the duration. The frequency expresses the number of cycles within the interval considered. Defining the interval length as 2:n:, the frequency (in radians per time unit) is 2:n:/dk •
7. It is essential to be aware of the status of subsequent steps in the standardisation procedure. As such, the Phelps Brown and Hopkins series is only used to provide estimates of periodicity. Subsequently these estimates are used as a catalyst to isolate the common character-istics of the 'prices of consumables', 'industrial production', 'wholesale prices', 'imports', and 'exports' series. The common characteristics which have been established on the basis of approximate uniformity test form the true basis for the generalisation.
8. This principle is applied, for example, by Haustein and Neuwirth (1982). Consequently they 'discover' a very high number of distinct 'cycles', which appears a rather absurd inference.
9. It must be pointed out that the animosity between the two interpreta-tions does not come from the originator of the alternative hypothesis, but rather from his devotees. Originally, Kuznets himself was very sympathetic about Kondratieff and his forerunners (Kuznets, 1967, pp. 259ff.). He was, however, very critical of Schumpeter (Kuznets, 1940). The animosity amongst present-day followers is illustrated by the discussion between Solomou (1986) and Bieshaar and Kleinknecht (1986), where Solomou tried to destroy Bieshaar's and Kleinknecht's results with a view to claiming the prevalence of the Kuznets cycle. Subsequently Bieshaar and Kleinknecht hit back by claiming that the Kuznets cycle is no more than a 'bastard' cycle according to my earlier given definition (Reijnders, 1984, pp. 425-6).
10. The spectrum is estimated over a grid of 512. The duration of a periodic function which corresponds to a certain frequency can be determined by dividing 512 by the number of the frequency. For example, frequency number ten corresponds to a duration of 512110 = 51.2 years.
11. This is according to the estimate of Abramovitz (1965, p. 520). There is considerable confusion as to the delimitation of the time-span which the Kuznets wave covers. The confusion is probably due to Kuznets himself, whose frequency tables of cycle phases cover 3-5 years up to 33-35 years (Kuznets, 1967, pp. 204-6). Since one phase is half a cycle, Kuznets' tables cover cyclical phenomena between 6 and 70 years. Such 'imperialism' is, of course, inadmissible in the present context. Therefore it is best to stick to Abramovitz' definition.
12. Sources: Prices of consumables 1264-1954 (Phelps Brown and Hop-kins, 1956, appendix B, pp. 311-14). Volume Index of industrial production (excl. construction) 1700-1985 (Hoffman, 1965, table 54, appendix). Revised following Harley (1982) and Crafts (1983), Lomax

42 Between Trends and Trade Cycles
(1959, table 2, p. 196), Mitchell and Jones (1971, pp. 125-7), Annual Abstract of Statistics. Index of Wholesale Prices 1700-1985: Schumpe-ter (1938), Gayer, Rostow and Schwartz (1953, vol. I, pp. 468-70), Sauerbeck-Statistics in Mitchell (1962, pp. 474-5), 18th Abstract of Labour Statistics in Mitchell (1962, p. 476), Board of Trade Journal in Mitchell (1962, p. 477), Annual Abstract of Statistics. Volume index of Imports and Exports (inc/. re-exports) 1700-1985: Schlote (1938, table 7, pp. 133-4), Imlah (1958, table 8, pp. 94-8; appendix table 1, pp. 205-7), Feinstein (1972b, table 7, pp. T21-T23), Annual Abstract of Statistics. Population 1700-1985: Wrigley and Schofield (1981, pp. 531-5), Flinn (ed.) (1977, p. 58), Maddison (1985, p. 20), Mitchell (1962, p. 20), Feinstein (1972b), Mitchell and Jones (1971), Annual Abstract of Statistics. Main categories of expenditure (at constant market prices) and Gross National Product (at constant factor cost) 1830-1985: Deane (1968, pp. 106-7), Feinstein (1972b: T21-T23), Annual Abstract of Statistics. Output of various sectors and Gross Domestic Product at constant factor cost 1855-1985: Feinstein (1972b: T24-T25), Annual Abstract of Statistics. [The compromise estimate of Greasley (1986) has not been used because of the rather devastating criticism contained in Feinstein (1989)]. Working Population, Employment and Unemploy-ment 1855-1985: Feinstein (1972b: T125-T127), Annual Abstract of Statistics. For more details on sources see Reijnders (1990, pp. 265-9).
13. Expenditure proves to be extremely sensitive of a 'war pulse effect' (Reijnders, 1990, pp. 230! ff.). Therefore the war periods are inter-polated.
14. '[ .. statistical methods .. ] must grow out of the theory of the patterns to which they are to apply' (Schumpeter, 1939, p. 199).
15. This is not to say that these are the only methods which accord to the rules. The digital filtering method which is applied in the contributions of Metz, Stier and Gerster to the present volume is probably also acceptable provided that a correction for perspectivistic distortion is incorporated.
REFERENCES
Abramovitz, M. (1965) 'The Nature and Significance of Kuznets Cycles', in L. A. Gordon and L. R. Klein (eds), Readings in Business Cycles.
Ark, B. van, H. J. Brinkman, J. W. Drukker, A. Maddison, C. van der Meer, H. van der Meulen and B. Slot (1985) Economic Growth in North-western Europe: The Last 400 Years (Research Memorandum no. 214) (Groningen: Institute of Economic Research).
Bloomfield, P. (1976) Fourier Analysis of Time Series. An Introduction (New York: John Wiley).
Bieshaar, H. and A. Kleinknecht (1986) 'Kondratieff Long Waves? Reply to Solomou', Konjunkturpolitik, no. 32, pp. 185--94.
Broersma, Tj. J. (1978) De Lang~ Golf in het Economische Leven. Empi-rische en Theoretische Onderzoekingen (Groningen: VRB).
Cameron, R. (1973) 'The Logistics of European Economic Growth: A Note

Jan P. G. Reijnders 43
on Historical Periodization', Journal of European Economic History, no. 2, pp. 145-8.
Crafts, N. F. R. (1983) 'British Economic Growth, 1700-1831: A Review of the Evidence', Economic History Review, no. 36, pp. 177-99.
-- (1985) British Economic Growth during the Industrial Revolution (Ox-ford: Clarendon Press).
Deane, P. (1968) 'New Estimates of Gross National Product for the United Kingdom 1830-1940', Review of Income and Wealth, no. 14, pp. 95-112.
Duijn, J. van (1983) The Long-Wave of Economic Life (London: George Allen & Unwin).
Ewijk, C. van (1982) 'A Spectral Analysis of the Kondratieff-Cycle', Kyklos, no. 35, pp. 468-99. '
Feinstein, C. H. (1972a) National Income, Expenditure and Output of the United Kingdom 1855-1965 (Cambridge: NIEO).
-- (1972b) Statistical Tables of National Income, Expenditure and Output of the U.K. 1855-1965 (Cambridge University Press).
-- (1989) 'Wages and the Paradox of the 1880s', Explorations in Economic History, no. 26, pp. 237-47.
Flinn, M. (ed.) (1977) Scottish Population History from the 17th Century to the 1930s (Cambridge University Press).
Forrester, J. W. (1977) 'Growth Cycles', De Economist, no. 125, pp. 525-43. Forrester, N. B. (1973) The Life Cycle of Economic Development (Cam-
bridge, Mass.: Wright Allen Press). Fricky, E. (1942) Economic Fluctuations in the United States (Cambridge,
Mass.: Harvard University Press). Gayer, W., W. Rostow and A. Schwartz (1953) The Growth and Fluctuation
of the British Economy 1790-1850 (Oxford: Clarendon Press). Gordon, L. A. and L. R. Klein (1965) Readings in Business Cycles (London:
George Allen & Unwin). Greasley, D. (1986) 'British Economic Growth: The Paradox of the 1880s
and the Timing of the Climacteric', Explorations in Economic History, no. 23, pp. 416-44.
Harley, C. K. (1982) 'British Industrialization before 1841: Evidence of Slower Growth during the Industrial Revolution', Journal of Economic History, no. 42, pp. 267-89.
Hoffman, W. G. (1965) British Industry, 1700-1950 (Oxford: Basil Black-well).
Haustein, H. and E. Neuwirth (1982) 'Long Waves in World Industrial Production, Energy Consumption, Innovations, Inventions', Technologi-cal Forecasting and Social Change, no. 22, pp. 53-89.
Imlah, I. H. (1958) Economic Elements of the Pax Brittanica (Cambridge, Mass.: Harvard University Press).
Kleinknecht, A. (1987) Innovation Patterns in Crisis and Prosperity: Schum-peter's Long Cycle Reconsidered (London: Macmillan).
Kuznets, S. (1940) 'Schumpeter's Business Cycles', American Economic ReView, no. 30, pp. 257-71.
-- (1967) Secular Movements in Production and Prices (Reprint of Kuznets (1930» (New York: Kelly).
Lomax, K. S. (1959) 'Production and Productivity in the United Kingdom since 1900', Journal of the Royal Statistical Society, no. 122, pp. 185-210.
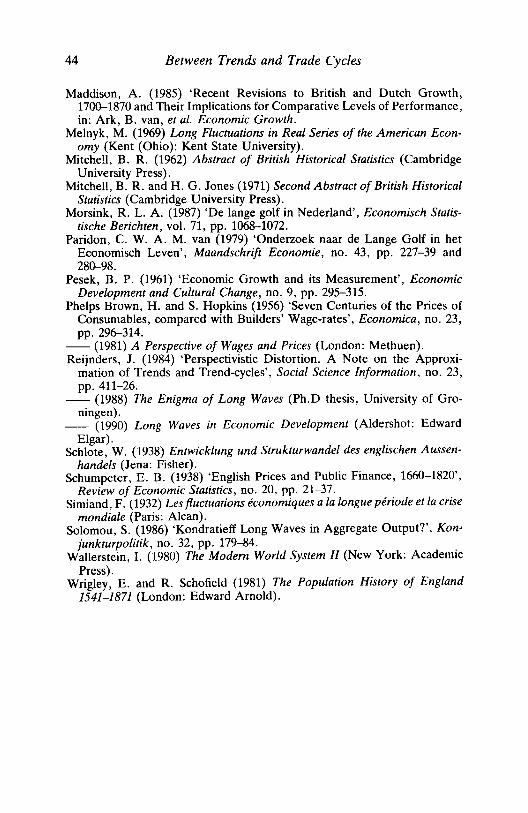
44 Between Trends and Trade Cycles
Maddison, A. (1985) 'Recent Revisions to British and Dutch Growth, 1700-1870 and Their Implications for Comparative Levels of Performance, in: Ark, B. van, et al. Economic Growth.
Melnyk, M. (1969) Long Fluctuations in Real Series of the American Econ-omy (Kent (Ohio): Kent State University).
Mitchell, B. R. (1962) Abstract of British Historical Statistics (Cambridge University Press).
Mitchell, B. R. and H. G. Jones (1971) Second Abstract of British Historical Statistics (Cambridge University Press).
Morsink, R. L. A. (1987) 'De lange golf in Nederland', Economisch Statis-tische Berichten, vol. 71, pp. 106&-1072.
Paridon, C. W. A. M. van (1979) 'Onderzoek naar de Lange Golf in het Economisch Leven', Maandschrift Economie, no. 43, pp. 227-39 and 28~98.
Pesek, B. P. (1961) 'Economic Growth and its Measurement', Economic Development and Cultural Change, no. 9, pp. 295-315.
Phelps Brown, H. and S. Hopkins (1956) 'Seven Centuries of the Prices of Consumables, compared with Builders' Wage-rates', Economica, no. 23, pp. 296-314.
-- (1981) A Perspective of Wages and Prices (London: Methuen). Reijnders, J. (1984) 'Perspectivistic Distortion. A Note on the Approxi-
mation of Trends and Trend-cycles', Social Science Information, no. 23, pp.411-26.
-- (1988) The Enigma of Long Waves (Ph.D thesis, University of Gro-ningen).
-- (1990) Long Waves in Economic Development (Aldershot: Edward Elgar).
Schlote, W. (1938) Entwicklung und Strukturwandel des englischen Aussen-handels (Jena: Fisher).
Schumpeter, E. B. (1938) 'English Prices and Public Finance, 1660-1820', Review of Economic Statistics, no. 20, pp. 21-37.
Simiand, F. (1932) Les fluctuations economiques a la longue periode et la crise mondiale (Paris: Alcan).
Solomou, S. (1986) 'Kondratieff Long Waves in Aggregate Output?', Kon-junkturpolitik, no. 32, pp. 179-84.
Wallerstein, 1. (1980) The Modern World System II (New York: Academic Press).
Wrigley, E. and R. Schofield (1981) The Population History of England 1541-1871 (London: Edward Arnold).
3 Filter Design in the Frequency Domain * RAINERMETZ WINFRIED STIER
Within economic and social research, time series play an important role in many respects. They are taken as indicators for the economic and social processes which are investigated. Since time series are sets of time-ordered observations, we can conceive them as signals or as a sum of such signals. A lot of questions dealing with time series, that is, with signals, can be formalised and transformed into algorithms by using the theory of linear time-invariant systems. As a system S we define every rule which transforms a signal S(a) into a signal S(b).
Within this context two fundamental questions arise:
• If one considers two time series and the first is the input for second, one can try to identify the system which transforms the input into the output. This is a problem of 'system identification' .
• If one considers only a single time series and tries to identify a system which transforms this time series according to specified criteria, a problem of 'system-design' is defined.
In the following we discuss only the second problem, system design. The essential point is the fact that we can conceive a time series as a sum of signals. In most cases, of course, the analyst is interested in only one or two of these signals (signals may be con-ceived of as being 'components' of the series). In so far as the properties of signals can be formalised, the problem of signal detec-tion is a problem of system design. System design in this sense is identical to the transformation of an input signal into an output signal with regard to special conditions. Such transformations can be characterised as filters.
It is important to note that the system-design approach differs fundamentally from all approaches in which specific parameters are estimated. System design is not a problem of estimating model
45

46 Filter Design in the Frequency Domain
parameters based on a theory of statistical inference but of con-structing linear time-invariant filters (systems) which meet pre-specified criteria. Considerations about estimation and testing or about the stochastic or deterministic nature of the process are of no relevance in this approach. It is also important to note that the model- and filter-design approach do not exclude each other in empirical research. Quite the contrary: a combination of both instru-ments seems to be an interesting and fruitful field for future research.
In the following, filters are defined as algorithms which transform given time series. Analysing time series using a filter-theoretical approach requires:
• a formal description of the signal(s) we are interested in; and • a method to extract (isolate) this/these signal(s).
To meet the latter requirement a special system transfer function has to be designed. If one describes a time series in the frequency domain, the system transfer function shows whether the amplitudes of the different signals corresponding to specific frequency bands of the series are preserved, amplified, reduced or eliminated. Therefore one of the tasks of filter theory is the design of filters in such a way that they meet pre-specified criteria: that means, for instance, that they realise desired amplitude functions.
The performance of a filter is given by its transfer function (or frequency response function). In general, this is a complex function with the period 2 Jt and can therefore be written as
Where IT(e")I:=A(e") is the amplitude function and <I>(e") is the phase function of the filter, which will be dealt with in detail below. The amplitude function of a filter shows how the power of a signal -corresponding to different frequencies - is modified by the filter, that is, if it is reduced, eliminated or amplified. An essential point in modern filter theory is the fact that no ad hoc solutions (such as moving averages) are accepted, but filters are designed in such a way that they accomplish pre-specified amplitude functions. Frequency bands in which the value of amplitude function is equal to 1 (0) are called passbands (stopbands). Typical examples of desired ampli-tudes are low-, high- and bandpass filters (see Figure 3.1).
Not only the amplitude function but also the phase function of a

Rainer Metz and Winfried Stier 47
lowpass Highpass Bandpass
Figure 3.1 Lowpass, highpass and bandpass filters
filter is of great importance in filter design. The phase function of a filter indicates by how many time-units the filter output lags behind the filter input. As such phase shifts can be very crucial, especially in economic and social research, the phase function of a filter ought to be identically zero for all frequencies. The realisation of this require-ment is not trivial. For practical purposes it is sufficient that the phase shift in passbands is smaller than one time unit (year, month, and so on).
Finally, we must discuss another desirable filter characteristic, which is, however, no obvious property of the frequency response function: the stability of the filter output at the boundary when the series is updated. It can be shown that a filter for which its output depends only on former filter outputs, and on the present and former filter inputs, has this kind of output stability. Such filters are called 'causal' or IIR (infinite impulse/response) filters.
In practical research this stability is of great importance because conclusions drawn upon data available up to now do not have to be changed in the light of new data. According to the above consider-ations, the following desiderata can be formulated for an appropriate filter design:
1. Exact amplitude function for pre-specified frequency bands; 2. Zero phase characteristics in passbands; and 3. Perfect stability of the filter output at the boundary of a series in the
case of updating the time series (for the most recent data points).
It can be shown that these conditions cannot be met simultaneously. For example, with IIR filters, almost exact amplitude characteristics are obtainable, which are completely sufficient in practice. But unfor-tunately, these filters can have poor phase characteristics which result in considerable time-delays between filter input and filter output, with the consequence that the most recent values of a series cannot be analysed.

48 Filter Design in the Frequency Domain
Zero-phase characteristics can easily be achieved with FIR (finite impulse response), but not with IIR filters. In general, FIR filters show poor amplitude characteristics, unless a sufficiently lengthy filter is chosen. However, for sharp amplitude functions, the length of an FIR filter easily embraces a hundred or more data points. Since practical time series are often relatively short, the FIR approach is not an efficient way of filter design if one is interested in sharp amplitudes. The two desirable characteristics - exact amplitude and zero phase -cannot practically be met simultaneously with FIR filters.
The implications of the third condition mentioned above, namely the stability of the filtered values at the boundary of a series, can be demonstrated in the context of seasonal adjustment. If, for example, a monthly series is seasonally adjusted and the adjusted series is used for diagnostic purposes, then the diagnosis is mainly based on the most recent adjusted values, say the last four or five values. Now, if the original series is updated (one observation is added) and season-ally adjusted again, then it might happen that these four or five adjusted values change dramatically with the consequence that the diagnosis made in the last month has to be revised. Such revisions may be very uncomfortable for official agencies. Therefore, it seems to be preferable to use filters producing stable outputs in the sense indicated. From a practical point of view, absolute and relative stability have to be differentiated. Relative stability means that the modifications of the filter output are only 'minor'. IIR filters are absolutely stable, that is, the output does not change any more after updating, since they are causal. Their non-linear phase functions, however, can restrict their practicability.
FILTERS WITH EXACf AMPLITUDE AND ZERO-PHASE CHARACfERISTICS
Designing filters in the frequency domain and filtering in the time domain (where the filter equations used are derived from the de-signed transfer function) is a relatively complicated matter. In par-ticular, the first two desiderata mentioned above cannot be realised simultaneously. Therefore the question arises whether there are different design approaches, which are easier to handle. This is indeed the case.
The essential point of the approach to be described below is the fact that the complete filtering process (filter design as well as filtering

Rainer Metz and Win fried Stier 49
series) is done in the frequency domain. No filter equation is used in the time domain. Since the data are always given in the time domain, they have to be transformed into the frequency domain. This can be done with the help of the Discrete Fourier Transform (DFT): Letting x(t), t = 0, 1 ... T-1, a given signal of length T, its DFT is defined by:
T-l
X(eiA): = L x(t) e-iAt , I.. £[0, 23t]. t=O
X(e") represents the complete frequency content of the given signal x(t). However, the DFT of x(t) is defined at an infinite number of frequencies, so a direct evaluation seems to be impossible. More-over, this fact seems to prevent a restoration of the original signal by an inverse transformation. Fortunately, it can be shown, that X( e") is needed only at T frequencies. This means that,
T-l
X(e") = X(k) = L x(t) e-i(2)tIT)t\ k = 0, 1 ... , T-1, t=O
suffices to restore exactly the given signal by the Inverse Discrete Fourier Transform (IDFT) (See, for example, Schwartz and Shaw (1975) p. 58):
T-l
x(t) = L X(k)e i(2>tIT)kt, t = 0, 1 , .. , T-1 k=o
This result means that there is a one-to-one correspondence between a signal and its DFT. No frequency information contained in the signal is lost this way.
In practice, a refinement of the above-mentioned DFT is necess-ary, especially for short time series, that is, small T. The frequency resolution might be too coarse in these cases. Therefore, an L-point sequence x(t), L > T, can be defined by
lX(t), t = 0, 1, ... , T-1 x(t): = ° ,T:!f:.t:!f:.L-1
with the L-point DFT _ L-l
X(k) = L x(t)e-i (2>tIL)t\ k = 0, 1 ... L-1 t=O
evalua~d at the set offrequencies I..k = (2rr.lL) k, k = 0,1, ... ,L-1. Since X(t) = 0, t ~ T, we can write

50 Filter Design in the Frequency Domain T-l
X(k) = ~ x(t) e-i(2)<IL)Ik, k = 0, 1, ... , L-l. 1=0
This technique of augmenting a finite duration signal by adding 'zeros' allows arbitrary resolution in computing the DFT of the series on a set of uniformly spaced points around the unit circle (see, for example, Rabiner and Gold (1975) pp. 50). In practice, the technique of Fast Fourier Transform (FFT) is to be preferred for the evaluation of the D FT of a signal.
The filtering procedures seem to be straightforward now: the DFT of a time series can easily be modified by multiplication with the desired amplitude characteristic. The filtered series results from the IDFT.
For example, a lowpass filter can be produced by mUltiplying the DFT of a series in the passband by one and in the stopband by zero. In order to avoid the so-called Gibb's phenomenon (high-frequency oscillations in the filter output resulting from discontinuities in the amplitude function), a transition band has to be placed between the passband and the stopband. Since a very short transition band is sufficient to avoid this phenomenon, the amplitude function of this lowpass shows practically an ideal shape.
The filtered series in the time domain is given by the IDFT. Of great importance is the fact that the phase function of this filter is identical to zero in the whole frequency domain. Other filters, such as highpass or bandpass filters, for example, can be designed in a similar way. Figure 3.2 shows the output of a lowpass using this technique for the index of Belgian industrial production from 1831-1913. Obvi-ously, the filter output shows somewhat strange behaviour at the beginning and at the end of the series. This requires a consideration of the filter errors.
ERROR-CONSIDERATION IN FILTER DESIGN
For the evaluation of different design procedures it is useful to consider not only the amplitude and phase characteristics of the generated filters, but also the errors involved with finite duration signals. If we consider two signals, the first one of infinite duration -x(t), . . . -1, 0, 1 . . . . - and the second one of finite duration - x(t), t = 1, ... , T - then we can write for the filter output of these signals in the time domain:
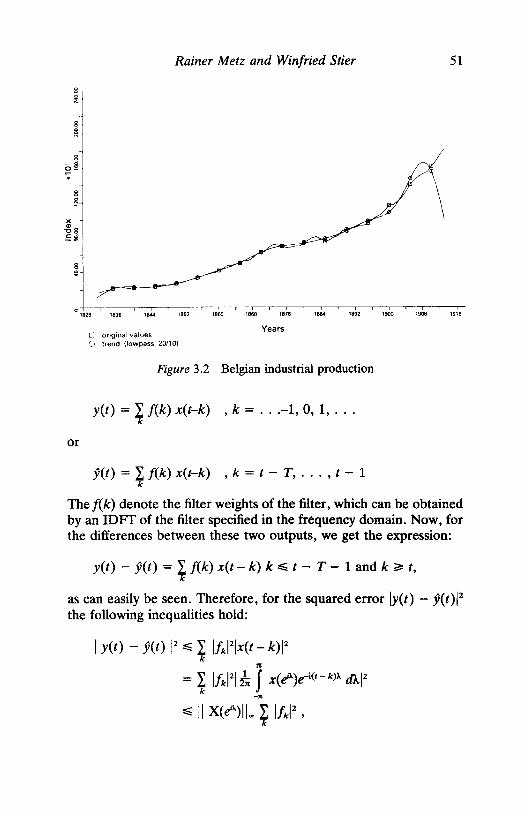
8 - iii ~-. )(
-88 .!:i!
Rainer Metz and Winfried Stier
:1 ~-----, I I I 1860
I 1884
I 1892 1828 1836 1844 1852
o original values Years
o trend lIowpass 20110)
Figure 3.2 Belgian industrial production
y(t) = I f(k) x(t-k) ,k = ... -1, 0, 1, ... k
or
j(t) = I f(k) x(t-k) ,k = t - T, ... , t - 1 k
I 1900
I 1908
51
I 1916
The f(k) denote the filter weights of the filter, which can be obtained by an IDFT of the filter specified in the frequency domain. Now, for the differences between these two outputs, we get the expression:
y(t) - j(t) = t f(k) x(t - k) k ~ t - T - 1 and k ~ t,
as can easily be seen. Therefore, for the squared error Iy(t) - j(t)12 the following inequalities hold:
I y(t) - j(t) 12 ~ t IA121x(t - kW :It
= ~ Ifkl21 in f x(eU-)e-i(t-k»' tD.12 ..."
~ II X(eU-)II .. t IAI2 ,

52 Filter Design in the Frequency Domain
where II X(ei')I1~ is the supremum of the Fourier spectrum of x(t). Notice that here the IDFf of X(e'A) , by which x(t) is represented, is given by an integral and not by a finite sum, because the signal in the above expression is of infinite duration.
The last inequality shows that the squared error consists of two components. The first one is due to the signal and the second one to the filter. For the second component, the genuine filter error, FE, we can write:
From this expression it follows that for causal filters, as for IIR filters, FE(t, T) decreases monotonically because fk = 0, k < 0, so that the minimum of filter error is taken at the right boundary of the time series. In contrast, however, noncausal filters, like zero phase filters, take the maximum of FE(t, T) at the boundaries of the signal. For these filters, the filter error has a V-shape and the minimum is taken in the middle of the filtered signal.
REDUCTION OF THE FILTER ERROR
In view of the above formula for the filter error, there seem to be two possible ways leading to a reduction of the error for a zero-phase filter. The first one amounts to specifying a filter in such a way that the filter-weights A decline rapidly in absolute size. However, this would only be possible if the amplitude characteristic of the filter showed a non-exact shape; that means it does not take the values of one in passbands or zero in stopbands.
To achieve such an effect, it is possible to smooth the amplitude function in the transition band, by giving a non-zero value to the amplitude function at the beginning of the stopband. The shape of the amplitude function in the transition band is then determined by a spline function. But since we are striving for filters with exact transfer functions, this 'weakening' of the requirements as formulated above, is ruled out in general. Therefore, the only way out of this problem is to try to decrease the supremum of the Fourier spectrum of the given signal. This can be done in a relatively easy manner. For instance, if we design a low-pass filter, then we estimate the Fourier spectrum of the time series and determine the frequency where it takes the supremum. If, for example, this frequency is located in the passband,
Rainer Metz and Win/ried Stier 53
we eliminate the harmonic component corresponding to this fre-quency, filter the series and add this component again to the filtered series. This can be done several times, thus successively decreasing the suprema of the Fourier spectrum. By this procedure, the filter error can be reduced repeatedly and be made arbitrarily small. If the frequency is located in the stopband, the corresponding harmonic component is no longer added, because it would be multiplied by zero in any case.
As the practical results clearly show, the filter error resulting from filters with exact amplitude and zero-phase characteristics can be reduced 'arbitrarily' with the aid of this procedure. By using the filter-design approach as represented here, time series can be decom-posed in an exact manner and in a way which seems to be adapted to the needs of the practically-orientated time series analyst.
SIMULATION EXPERIMENTS
Before presenting filter outputs of simulated time series, let us summarise some requirements which should be met by an 'ideal' filtering approach:
1. A filter should be able to reproduce those signals exactly which correspond to passband frequencies. Moreover, for these signals, no time-shifts should occur.
2. A filter should not generate signals which are not contained in a time series (for example like the well-known Slutzky effect).
The first simulated series of length T = 200 is additively composed of three signals (or components) which are generated by the equations:
X t = Tt + L t + Ct , t = 1, ..., 200
Tt : = 5 + O.7t (trend signal)
L t : = 5 sin (2nI60·t) (long-cycle signal)
Ct : = 5 sin (2n/8·t) (business-cycle signal)
By design, these signals follow very simple paths in time in order to be able to study the efficiency of a filter in clear-cut situations and to keep the signals separate so as to avoid mixture effects. The three

54
8 1!.
8 'ii
8
Filter Design in the Frequency Domain
1~~~~~--~~~~~~--~~~~~~--~~'-~-r-'-1790 1810 1830
o trend o long wave 6 business cycle o composed series
1850 1870 18 .. 1910
Years 1930
Figure 3.3 Simulated series
1950 1970 1990 2010
components and the series are shown in Figure 3.3. The problem now is to design filters which are able to extract these signals. Let us begin with the trend.
The first problem which has to be solved before it makes sense to specify an amplitude function of a filter at all, is the problem of the definition of the signal which is supposed to be extracted. Since in real time series, components reflect real phenomena like growth, business cycle and so on, signal definitions should be derived by using subject matter considerations. Unfortunately, most theories in the social sciences do not supply definitions which are operable. This means that the statistician himself has to provide 'adequate' definitions.
Now, in the case of 'trend', all oscillations with an infinite length of duration can be called 'trend'. Since all time series in reality are finite, a modified definition seems to be appropriate. For a series of length T, a cycle of length T is the longest cycle which can be observed (if this movement can be called a 'cycle' at all). Therefore, all oscillations of frequency smaller than liT are called 'trend', since they do not repeat themselves within the observed time-span of the given series. This definition implies that the passband of the trend is the interval (0, liT). Since rectangular amplitude functions lead to the Gibb's phenomenon, a transition band has to be specified. For

8 ii!.
8 ~.
8 g-
Rainer Metz and Winfried Stier
1790 1810
Years o trend (theoretical result) o filtered trend without optimisation
Figure 3.4 Simulated series (lowpass)
55
, 2010
this we choose the interval (liT, 2fT). The stopband therefore consists of all frequencies in the interval (2fT, 0.5).
The filter output together with the theoretical trend is shown in Figure 3.4. Obviously, the deviations between the theoretical and the extracted signal are maximal at the right boundary of the series. All in all, the filtering result is by no means satisfying. As discussed above, the program calculates a quadratic error for all time points. This error is partly due to the filter and partly due to the spectral properties of the series. Here, the first part amounts to 0.338E-4 and the second to 0.229E+9. In the present version of the program the error due to the series is not standardised. Therefore it depends on the series to be filtered. Since in our case we know the signal to be extracted, we can use a different procedure to measure the efficiency of the designed filter. We calculate the sum of squared deviations
where Xi denotes the filter-output and Xi the theoretical signal. This sum is equal to 71744. The development of the filter error and this sum when the number of iterations is increased is shown in Table 3.1.
In this case the number of iterations (i) and the number of

56
i = s
o 1 2 3 4 5
Filter Design in the Frequency Domain
Table 3.1
FE
7757 8.5 7.8 0.24 0.6IE-03 0.37E-04
frequency points (s) is increased simultaneously.
SEQ
71744 150 98 43 4
29
Whereas the filter error drops monotonically, this is not the case for the sum of squared deviations, which contradicts the theoretical derivation of the filter error. At present, the reasons for this phenom-enon are not clear. Ignoring a possible 'bug' in the program, one reason might be an incorrect implementation of the Brendt algorithm by which the local extrema of the spectrum are determined. Another possibility might be that the different components of the series interfere in the spectrum in a way which cannot be disentangled sufficiently, with the consequence that the filtering process is dis-turbed. However, when the theoretical trend alone is used as filter input, the phenomenon remains the same in principle, though the filter results are improved. So it is likely that the phenomenon is due to interference only, if at all, to a minor degree. Of course, one must keep in mind that the supremum of the spectrum cannot be decreased beyond a certain limit with real time series. This would only be possible with the trivial input x(t) = 0, where it would, of course, be zero. So a certain divergence between the theoretical and the practi-cal filter output must always be expected. Figure 3.5 shows the output in the case of ten iterations and four frequencies. Practically, this is a 'perfect' agreement between the theoretical signal and the filter-output.
The problems discussed above and their practical relevance are demonstrated in Figure 3.6. The trend filtered out by using ten iterations and ten frequencies differs more at the boundaries of the series than the resulting trend using four iterations and four fre-quencies. Obviously, this has to do with the boundary problem, as indicated in Figure 3.7. Here, the deviations ofthe two filter outputs from the theoretical signal are shown. They are higher in the case of more iterations. At the end of this chapter it will be shown that a

8 l!
8 2
Rainer Metz and Winfried Stier 57
o ,,.. 1 "10
I --~-.,r-~--~,--~
I8JO lbO 1810 I -r-r - ,- r, -~-'Ir-~--~I--~--r, --~-.,-
ll9Q 1910 1930 1!)5(1 1910 1990 2010
8
~ I
8 j
Years [: .rend (lheoreucal resull )
fil tered trend wllh op1lmlsaiJon hter·l0. freQ·41
Figure 3.5 Simulated series (lowpass)
........
l ..- - , f 1 ,- I
1810 'lila ,~ .... 1890 l!tlo 1930
Years o Irenrl Uheore\ical fesul1 }
Ilite reorilf-.'!nd w~ l h opl1mtSat,on II ler. 10. freQ-l01 A Idlercod !rend with optlml$ation I lIeHt heQ·4.
,-~--r, -
I~ 1'110
Figure 3.6 Simulated series (lowpass)
' .... , 701.

58
~ o ,
8 ,
Filter Design in the Frequency Domain
~+-4--.-.-.--.-r-'--.-r-.-''-.-'--r·-r-'I-'--,'-'-'I--'-~1 - ~ - ~ ~ ~ ~ - - ~ ~ ~ Years
o deviations by Iiltering with lowpa.. Iiter-4, Iraq-4) o deviation. by Iiltering with lowp ... Iit.r·'O,lraq·'O)
Figure 3.7 Deviations between filtered and theoretical trends
greater number of iterations and frequencies lead only to better results if the number of FFf frequencies is increased also.
As mentioned previously, the filter design used here allows the implementation of any filter-type. While a trend is extracted by a lowpass filter, a highpass filter is needed for trend elimination. Such a filter reproduces the high-frequency content of a series. In our example, the filter is supposed to extract the cyclical component of the series, which in fact consists of two cycles. If we define the highpass in 'symmetry' to the lowpass used in trend extraction, then all components with a period length greater than 200 time-units are eliminated. The interval (11200, 212(0) is used as the transition band. The following amplitude function is used:
T(f) = 0, f E (0, liN)
0< T(f) < 1, f E (liN, 21N)
T(f) = 1, f E (2IN, 112)
Here, the theoretical signal and the filter output are practically identical after four iterations, as can be seen from Figure 3.8. The deviations are only margin, so that the two series cannot be dis-tinguished visually.
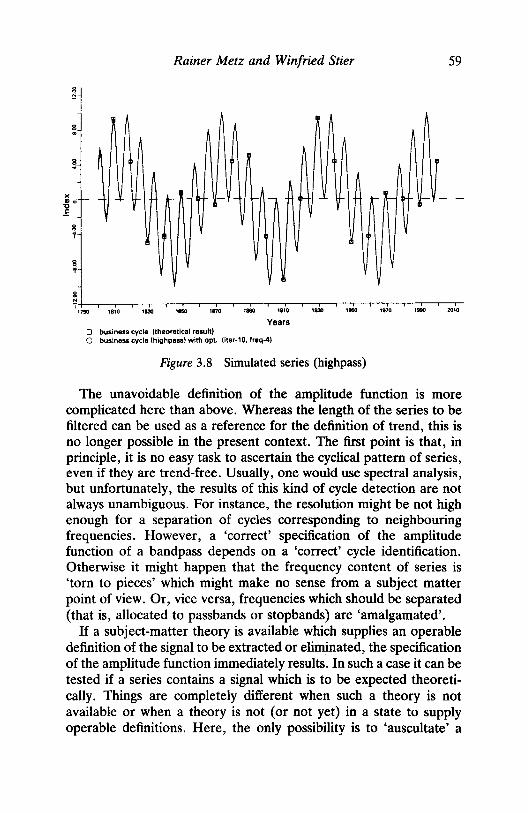
8 1
Rainer Metz and Win/ried Stier
Year$ o business cycle (theoretical result) o bu.ine .. cycle (highp ••• ) with opt. (iter-l0. froq-4)
Figure 3.8 Simulated series (highpass)
59
The unavoidable definition of the amplitude function is more complicated here than above. Whereas the length of the series to be filtered can be used as a reference for the definition of trend, this is no longer possible in the present context. The first point is that, in principle, it is no easy task to ascertain the cyclical pattern of series, even if they are trend-free. Usually, one would use spectral analysis, but unfortunately, the results of this kind of cycle detection are not always unambiguous. For instance, the resolution might be not high enough for a separation of cycles corresponding to neighbouring frequencies. However, a 'correct' specification of the amplitude function of a bandpass depends on a 'correct' cycle identification. Otherwise it might happen that the frequency content of series is 'tom to pieces' which might make no sense from a subject matter point of view. Or, vice versa, frequencies which should be separated (that is, allocated to passbands or stopbands) are 'amalgamated'.
If a subject-matter theory is available which supplies an operable definition of the signal to be extracted or eliminated, the specification of the amplitude function immediately results. In such a case it can be tested if a series contains a signal which is to be expected theoreti-cally. Things are completely different when such a theory is not available or when a theory is not (or not yet) in a state to supply operable definitions. Here, the only possibility is to 'auscultate' a
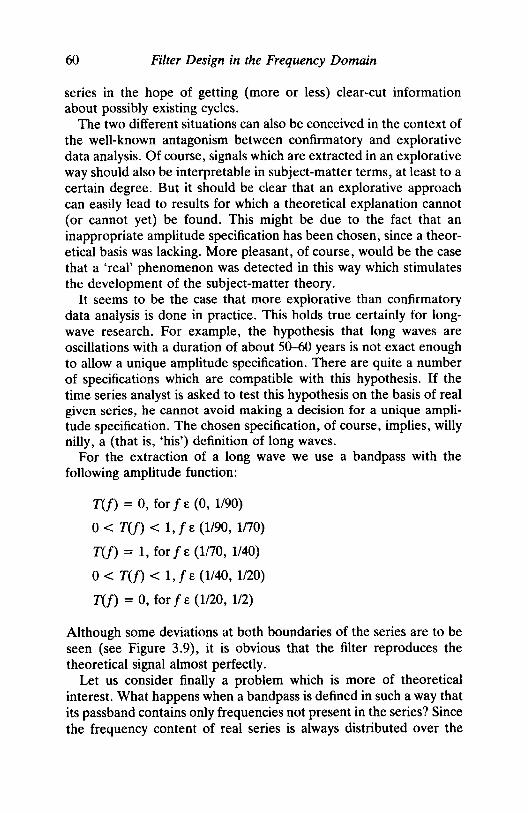
60 Filter Design in the Frequency Domain
series in the hope of getting (more or less) clear-cut information about possibly existing cycles.
The two different situations can also be conceived in the context of the well-known antagonism between confirmatory and explorative data analysis. Of course, signals which are extracted in an explorative way should also be interpretable in subject-matter terms, at least to a certain degree. But it should be clear that an explorative approach can easily lead to results for which a theoretical explanation cannot (or cannot yet) be found. This might be due to the fact that an inappropriate amplitude specification has been chosen, since a theor-etical basis was lacking. More pleasant, of course, would be the case that a 'real' phenomenon was detected in this way which stimulates the development of the subject-matter theory.
It seems to be the case that more explorative than confirmatory data analysis is done in practice. This holds true certainly for long-wave research. For example, the hypothesis that long waves are oscillations with a duration of about 50-60 years is not exact enough to allow a unique amplitude specification. There are quite a number of specifications which are compatible with this hypothesis. If the time series analyst is asked to test this hypothesis on the basis of real given series, he cannot avoid making a decision for a unique ampli-tude specification. The chosen specification, of course, implies, willy nilly, a (that is, 'his') definition of long waves.
For the extraction of a long wave we use a bandpass with the following amplitude function:
T(f) = 0, for f E (0, 1190)
0< T(f) < 1, f E (1/90, 1nO)
T(f) = 1, for f E (1170, 1140)
0< T(f) < 1, f E (1140, 1120)
T(f) = 0, for f E (1120, 1/2)
Although some deviations at both boundaries of the series are to be seen (see Figure 3.9), it is obvious that the filter reproduces the theoretical signal almost perfectly.
Let us consider finally a problem which is more of theoretical interest. What happens when a bandpass is defined in such a way that its passband contains only frequencies not present in the series? Since the frequency content of real series is always distributed over the

8 .. 8 .
8 ,
8 r
Rainer Metz and Winfried Stier 61
Years o long wave (theoretical r •• ult) o long wave (bandpall) with opt. lit.r·l0. Iroq-4)
Figure 3.9 Simulated series (bandpass)
whole frequency range (0, 3t), this is more of an academic question. However, experiments like this might give us information on the quality (that is, resolution capabilities) of filters.
The bandpass used for analysing this question has the following amplitude function:
T(f) = 0, f E (0, 1150)
o < T(f) < 1, f t (1150, 1140)
T(f) = 1, f E (1140, 1125)
0< T(f) < 1, f E (1125, 1120)
T(f) = 0, f E (1120, 112)
The filter output and the filtered series are shown in Figure 3.10. Obviously, the filter output seems to be identical to zero. Thus, the filter does not generate signals which are not contained in the input series. A closer look at the numerical values of the filter output reveals that the output is not exactly zero, but only very close to zero. The greatest value is 0.055 which is 0.3 per cent of the trend value of that time-pOint. This result shows again that an absolutely perfect extraction of a signal is not possible with series of finite length.

62 Filter Design in the Frequency Domain
e e e e e e e e e e e e • e e • e • • e
8 ~+-.-.-.-.--r-r-r~~-.-'r-~.-.-.-.-'-.-.--r-r-'-
1710 1810 '830 ,,.. '''0 1180 '110 1130 11&0 1170 '18O 2010
Years o composed seriel o bandpass with opt. (iter-l0. freq-4)
Figure 3.10 Simulated series (bandpass)
THE IMPACT OF A NOISE COMPONENT
The series analysed so far did not contain a noise component. Real series usually show movements which can be characterised as disturb-ances for which noise models are indicated. The simplest of them is white noise. A white noise process with zero mean and unit variance was generated and added to the signals used in the simulations above. In the following we discuss results and problems arising by adding noise. We restrict ourselves to the lowpass and the bandpass. The series to be filtered is shown in Figure 3.11. For the trend extraction we find almost identical results as for the series without noise (see Figure 3.12). For the bandpass, the deviations between the two filtered series are slightly greater (see Figure 3.13.)
Again, if one looks more closely at the numerical values of the filter outputs, one finds that the results with noise-free series are better. The impact of white noise on the filter output can be seen clearly in Figure 3.14. Moreover, the deviations between filter output and theoretical signal are greater for the, bandpass than for the lowpass (see Figure 3.15).
It is not surprising that the results were more perfect with noise~ free series. The spectral power of white noise is distributed uniform-

o composed seri •• a whitanoise
Rainer Metz and Winfried Stier
Years
Figure 3.11 Simulated series containing white noise
1'10 'UI) , ... '"70 ,. 1'10 , ... , ... '970 Years
o trend (lowpa •• on serie. without white noi .. ) o trend !lowpalS on .. riel with white noise)
Figure 3.12 Simulated series containing white noise
63
, ... 20'.

64
8 . 8 "
Filter Design in the Frequency Domain
~+-~--~~~--~~--~-r~~~~--~-r~~'-~--~-r--r-~~--~ 1790 1810 '030 '160 '810
,. "'0 Years
o long wIve tbandp ••• on seriel without white nGiM) o long wave (bandpass on seri •• with white noil.)
'030 "'1iO 1870
Figure 3.13 Simulated series containing white noise
'100 %0'0
;~~--~~--~-T--~-T--~-r--r--r--r--r--r--r--r--.--r--.--r--r--r-~ ~ ~ - ~ - ~ - - - -
o deviations (filtering series without white noise) a deviations (filtering series with white noise)
Years
Figure 3.14 Deviations between filtered and theoretical long waves
20'0

Rainer Metz and Win/ried Stier 65
Ii o
Years o deviations (filtering series without white noise) o deviations (filtering series with white noise)
Figure 3.15 Deviations between filtered and theoretical trends
ally over the whole frequency range (0, 3t). Both low- and bandpass partly preserve this power. Since the spectral power of the noise and the signals overlap, their perfect separation is not possible with a filter. This is a general rule when the power of signals overlap. (This is also true for a filter approach where filtering is done in the time domain.) The oscillations of the white-noise component which are due to the frequency band of the long wave are shown in Figure 3.16.
Let us now do some trend studies. The main point of these studies is to demonstrate that for the extraction of a trend by filtering, no a priori assumption about a special trend function has to be made. This is in sharp contrast to procedures traditionally based upon the so-called 'classical' time-series model, which is (for economic series) in general composed of four components: trend, cycle, seasonality and noise. This approach requires the specification of a trend function whose unknown parameters are usually estimated by some 'least-squares' procedure.
The following trend functions are used most commonly:
(a) Exponential function: T = a . bt
(b) Logistic function: Tt = ~ at 1 + -

66 Filter Design in the Frequency Domain
~I
g ~
I
~ I )( ," 0
-0 E
8
~
8 ~ , , "' r ,-., I -, .- I ' ... ,.,,, '660 1100 040 1110 1'70 1160 ,..",
Years whIte no.so bandpass (wI th oPlimrsation Iter· IS. freq~ 15)
Figure 3.16 Filtering white noise
(c) Log-linear trend: In Tt = aj + bj • t
, ,.., , "100
r ,.,"
(d) Polynomials of different degree: Tt = a + b . t + c' t 2 ••• m . t n
In the context of the 'classical' time-series model, the researcher decides on one of these functions, usually after a visual inspection of a series. The filter approach only requires the frequency band which is supposed to define the trend.
To demonstrate this point, we again use a simulated series which is additively composed of the trend and the cycle with a length of 400 time-units:
X t = Tt + Ct , t = 1, . . ., 400
with:
Tt := 6000
+200 1 + 18e-o.02 . t + 3
Ct := 13.3 sin (2Jt/60) + 6.67 sin (2Jt/25)
+ 10 sin (2Jt/8).

Rainer Metz and Winfried Stier 67
Here, the trend is supposed to follow a logistic function and the cycle involves three periodic functions of a duration of 60, 25 and 8 time-units, corresponding to the usually assumed length of a Kondratieff- a Kuznets- and a Juglar-cycle respectively. If trend and cycle are simply added as above, then the weight of the cycle decreases more and more in the course of time. This seems to be somewhat unrealistic. For many series it is to be observed that the short-term variations become more intensive with increasing trend, that is, the variance of the cyclical component is not time-invariant. In order to simulate such an effect properly, the cyclical component is multiplied by the term M(t):
where T(t) denotes the trend at time t and T(1) the trend value at t == 1; M(t) is a monotonically increasing function of t. This guarantees a positive correlation between the variance of the cyclical component and the evolution of the trend values. The components and the composed series are shown in Figure 3.17.
$ ~ ---r-.--'-T,-,-.,r-r-.,-.-.,--,-"-.-.,-..-r,-.-.,-.r-,, -.-.-, ~ ~ - ~ ~ ~ ~ - - ~ - ~
Years o composed series o logistic trend t:. cycl ••
Figure 3.17 Simulated series with logistic trend

68
. ...,
Filter Design in the Frequency Domain
. .,,. r I '--T- r '1 1 )ti60 1100 lItO 1)80
Irend Uheoletrcal resulU !rend ClowpaS$ with opl1mlsahons ,tel -S. 'req.SI
. .. ,.. Years
. "M"
. ""'"
Figure 3.18 Logistic trend (lowpass)
. ., .. . ""10
It has to be emphasised again that for the extraction of the trend of this series it is not necessary to assume a specific trend function. We choose the same amplitude function as in the examples above which implies that we consider the trend as being defined by all frequencies in the interval (0, 11200), with the transition band (11200, 11100). This specification will simply be abbreviated to 200/100.
The trend extracted by this filter and the theoretical trend are shown in figure 3.18. A deviation between the extracted and the theoretical trend can be observed at the boundary of the series. The question remains, if this result could be improved by modifying the amplitude-function, that is, by using a different trend definition. We will not enter now into a discussion of an 'adequate' trend definition; this will be done later. We only mention that a modifica-tion of the lowpass from 200/100 to 140/70 yields a slightly improved result. (Note that the transition band in the second case is much smaller than in the first. If we had chosen an equal width for this band, the result would have improved much more, of course). A comparison of the deviations of the two filtered trends from their theoretical counterparts is given in figure 3.19.
Once again it has to be emphasised that filter theory cannot supply a solution to the problem of how a trend should be defined properly.
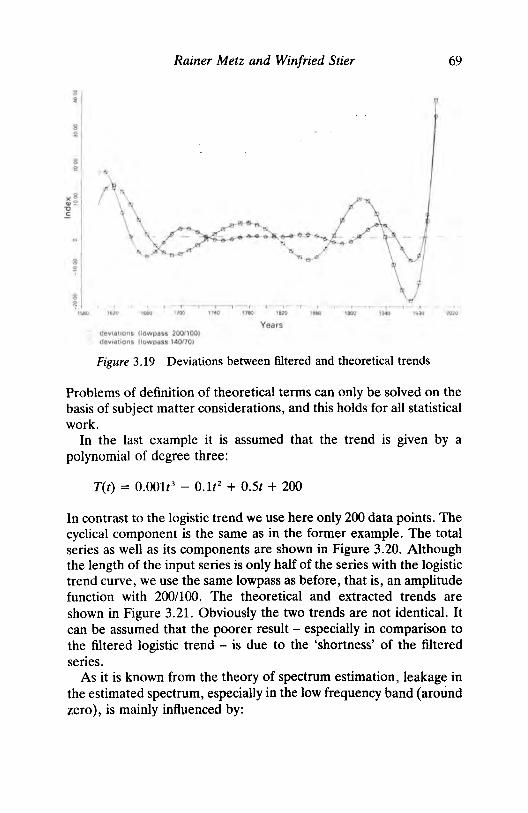
8 ~
8 g
8 2
x 8 Q) j?
"0 .:
8
8 ~ ,,..
Rainer Metz and Winfried Stier 69
r"
, I I .....,..... 1 I f T -, r 1-' , 1 I.,. 1660 , 100 1140 ,
II ... ,
111010 1860 1100 1940 I!.)Q 2O~
devlauons Uowpass 20011001 devlaltons Howpass 1401701
Years
Figure 3.19 Deviations between filtered and theoretical trends
Problems of definition of theoretical terms can only be solved on the basis of subject matter considerations, and this holds for all statistical work.
In the last example it is assumed that the trend is given by a polynomial of degree three:
T(t) = 0.001t3 - 0.lt 2 + 0.5t + 200
In contrast to the logistic trend we use here only 200 data points. The cyclical component is the same as in the former example. The total series as well as its components are shown in Figure 3.20. Although the length of the input series is only half of the series with the logistic trend curve, we use the same lowpass as before, that is, an amplitude function with 200/100. The theoretical and extracted trends are shown in Figure 3.21. Obviously the two trends are not identical. It can be assumed that the poorer result - especially in comparison to the filtered logistic trend - is due to the 'shortness' of the filtered series.
As it is known from the theory of spectrum estimation, leakage in the estimated spectrum, especially in the low frequency band (around 1:ero), is mainly influenced by:
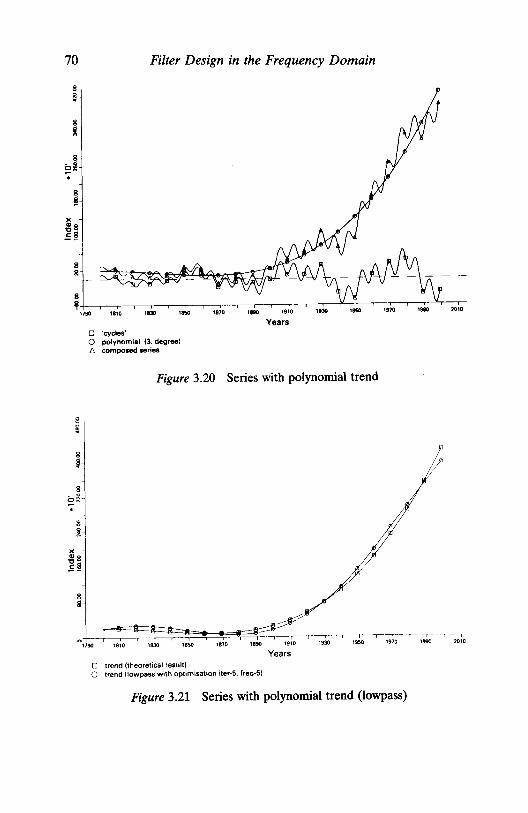
70 Filter Design in the Frequency Domain
; I " ~!! •
" ! .. "'8 ~~
8 II
; "10 1'10 '830 '860 1870 ,. 1910
Years '830 , ...
8 i
8 §
8 ~~-.
8 ~ .
.. ~" E~
8 iii
o 'cycles' o polynomial (3. degree) tJ. compoaad aeries
Figure 3.20 Series with polynomial trend
'170 ,. 20'0
.;
/ J-:=~~=~~=~~=~~==~~::::~'---::::,-.. , ------,-- -,---r---r---T- --,----,- ---r--,-'790 1810 '830 '860 '810 '810 1910 1930 1950 1970 1990 2010
Years o trend (theoretical resull) o trend (lowpass with optimisation iter~S, freq-5)
Figure 3.21 Series with polynomial trend (lowpass)

Rainer Metz and Winfried Stier
(i) the variance structure of the time series; and (ii) the length of the time series.
71
That means that leakage increases with increasing instability of the variance and is reduced with increasing length of the time series. That the poorer results are mainly due to this leakage effect in the Fourier spectrum can be shown by looking at the results of a modified amplitude function of the lowpass. If we choose an amplitude func-tion with 50/40, the theoretical and extracted trends are practically identical. As far as the leakage effect is concerned, it seems that the lowpass with 200/100 is 'too narrow' for this spectrum, with the consequence that its frequency content is erroneously allocated, partly to the stopband and filtered out, that is, 'torn in pieces' as stated above. An exact analysis of to what extent the observed differences might be due to leakage effects could possibly be done by using tapers in estimating the spectrum. How, and if, tapering affects the filter output, especially at the boundaries, is as yet unknown. Modifying the amplitude function (enlarging the passband) might not be possible in practical research, because subject matter considera-tions might require specific definitions and thus specific amplitude functions. Therefore some other possibilities for improving the filter result will be discussed shortly.
As already mentioned in the theoretical considerations above, it is possible to sample the frequency axis at more than T points. The program allows a maximum number of frequency points of the FFT of 216. To demonstrate the effect of an increasing number of FFT frequencies, we have made alternative calculations with the same amplitude function. The results are illustrated in Table 3.2. The second column of the table shows the results if the number of FFT frequencies increase, and the number of iterations remain constant. Surprisingly, the squared errors increase also. A theoretical explana-tion of this phenomenon can probably be seen in the fact that leakage effects in FFT increase also when the number of frequencies used in computing it increase. (See, for example Bloomfield (1976) p. 73).
An improvement of the filtered series can only be achieved by increasing not only the number of FFT frequencies but also the number of iterations and frequencies used for minimising the input Fourier spectrum. This is interesting, especially with regard to our above-mentioned example of filtering a linear trend curve (see Table 3.1 on page 56).

72
Number of freq. points (FFf)
4096 8192
16384 32768 65536
Filter Design in the Frequency Domain
Table 3.2 Lowpass 200/100
i = 4, s = 4 squared errors
1.605.449 1.655.203 1.791.979 1.852.059 1.878.066
To demonstrate this effect, we have calculated the FFT for 215
frequency points and minimised the input Fourier spectrum using 20 iterations and 20 frequencies. In this case the sum of squared errors drops to 435.808. A further improvement can be achieved by further increasing the number of iterations. For 40 iterations, 30 frequencies and 216 FFT-frequency points, the sum of squared error drops to 352.162. The trend filtered according to this constellation is shown in Figure 3.22. This graph shows how close filtered and theoretical trend are. For the calculation of this trend the computer (IBM 4361) needed more than 10.000 CPU-seconds, which might be too much for
-I-.=~~, ~,~~, ~::-.~--,---,,--,--~, ,--,---,---,---1790 1810 1830 1850 1870 1950 1970 1990 2010
Years o trend (theoretical result) o trend (lowpass with optimum iter·40. freq·20, fft·2 111 )
Figure 3.22 Series with polynomial trend (lowpass)

Rainer Metz and Winfried Stier 73
~=-~-6----_ _ __
D-- ---T'---=---,-;----.~~~~~~-,-=--~-~, =,,;:, ~~~~~,.:::-~,__,_____,-,_, ----,----,-, - ,_____,,-,--,' _____,-,--, 1790 1810 1830 1850 1870 1890 1910 1930 1950 1970 1990 2010
Years LJ trend (theoretical result) (I trend (lowpass with optim. A. log. transf. iter·5, freq-5) /\ trend (Iowpass with optim. iter-5, freq-5)
Figure 3.23 Series with polynomial trend (lowpass)
practical consideration, especially when using a Pc. Therefore some further possibilities for improving the filter output will be checked.
Basically, the quality of the estimated Fourier spectrum of a given time series is highly influenced by the variance of this series. In most cases, the generally-assumed time-independent variance does not hold. On the contrary, for most economic or social time series, the variance is time-dependent, that is, such time series are not stationary.
Therefore various types of transformations are used to make such time series stationary. One possibility is to take the logarithms instead of the original values. Since this transformation is not a linear one, its transfer characteristics cannot be studied by means of linear filter theory. Because of this 'black box' characteristic, the effect of a logarithm transformation can be studied only in simulations.
As a first example, we take the logarithms of the simulated series and filter with a lowpass, which has the same amplitude function as before (200/100) and 4 iterations and 4 frequencies. As can be seen from Figure 3.23, especially by a comparison with the trend filtered out using the original values, the result is considerably improved at the left boundary of the series, that is, especially for the small-sized values of the time series. This is because the impact of the great values on the spectrum is strongly reduced by taking the logarithms.

74 Filter Design in the Frequency Domain
8
g
g
8 ,
g <if'" - -- .- - -,- ----,--------,--.....,---,-, ----,-,,-,-,-, ----'-1 '~T~"""--'--'-' ----,,-,-----,-, ---,----,,--,---,--
1790 1810 1830 1850 1870 1890 1910 1930 1950 1970 1990 2010
Years r:: trend (filtered with log. transform.) () trend (filtered without log. transform.)
Figure 3.24 Percentage deviations between filtered and theoretical trends
This improvement at the left boundary is accompanied by a worsen-ing at the right boundary. Obviously, the strong exponential develop-ment is underestimated by the logarithm transformation. A closer look at the differences between the theoretical and practical results show that the logarithm transformation leads to a specific reduction of the relative deviations. These are defined as percentage deviations of the filtered series from the theoretical trend. Figure 3.24 demon-strates that these deviations are reduced by taking the logarithms in comparison to the filtered original series, especially at the left bound-ary. The result at the right boundary is slightly better for the original values.
A last example may illustrate the influence on the filter output of a high FFT resolution, a high number of iterations and a logarithm transformation. The filtering is done with a lowpass 200/100 at 215
frequency points, 20 iterations and 20 frequencies, both with and without logarithmic transformation. Both trends are shown in Figure 3.25. It is obvious that in this case logarithmic transformation does not result in an improvement of the filtered trend. At the right boundary the trend of the logarithmic values is worse than at the other one. This is expressed also in the sum of squared error which amounts to 5.781.976 in the case of the logarithmic transformation and to only 435.808 in the other case. The amount and shape of these

8 o~
*
Rainer Metz and Winfried Stier 75
., -'--~i ~~i ~~i ~~i ~~i ~·-'-r--T---'----'--'----'-----'----'--~i 1790 1810 1830 1850 1870 1890 2010
Years o trend (theoretical result) o trend (filtered with optim. fft_2 15 )
l':. trend (filtered with optim. A. log. transf. fft-2'~)
Figure 3.25 Series with polynomial trend (lowpass)
deviations are shown in Figure 3.26, where the deviations are ex-pressed again in percentage values of the theoretical trend. This example illustrates very clearly that a logarithm transformation im-proves the result only within the range of small-sized values. At the Same time it leads to an underestimation of values growing exponen-tially. Thus a logarithm transformation has negative as well as posi-tive effects.
Perhaps a trade-off between these effects can be achieved, if a general Box and Cox transformation is performed. An 'optimal' parameter of this transformation Can be found, for example, in a simple way by 'trial and error': from a grid of values (say -1, -0.8, ... 0, 0.2, 1) the One is taken which gives the 'best' filter output. A more complicated procedure would be the estimation of an ARIMA model of the series and choosing the Box and Cox par-ameter in a way that the residual sum of squares is minimised. However, using software which allows automatic modelling (such as AUTOBOXPLUS, for instance), this Can be done quickly and easily. The usefulness of these possibilities has yet to be checked though.
For historical time series, however, the advantages of a logarithm transformation are appreciably greater than the possible disadvan-tages. As a final example, this will be illustrated by filtering a

76 Filter Design in the Frequency Domain
8
8
,.
8 ~ ~.-,-, --,-~,,--,---.,=-,.-,-, --,--".--,---.,--,----,-, -,--, -,--,.----,--------,-----1-,-
1190 1810 1830 1850 1870 1890 "'0 1930 1950 1910 1990 2010
Years o trend (filtered without log. transform.) o trend (filtered with log. transform.)
Figure 3.26 Percentage deviations between filtered and theoretical trends
historical series. For demonstration, we use the coal production figures for the UK (170~1950) which were compiled by Walter G. Hoffmann (1940). This series is an extreme example for variance instability of economic time series. Filtering the original series with a lowpass, we can observe the same effects as in the case of the polynomial trend (with 200 values). The trend shows a kind of oscillation in the first half of the series where the variance is small (see Figure 3.27). The filtered trend even shows negative values at the beginning of the series.
An essential improvement can be achieved by increasing the num-ber of frequencies in the FFT (215 frequency points were calculated) and increasing the number of iterations and frequency points in minimising the input Fourier spectrum. A comparison of the two trends demonstrates the reduction of the filter error (see Figure 3.28). A satisfactory trend estimation for the time periods with relatively small variance is not obtainable in this way, however. But this is possible by using a logarithm transformation. A comparison of the different trend curves for the period from 17~ 1848 shows the reduction of the 'oscillation effect'. Figure 3.29 shows the trend for the period 17~ 1848 calculated on the basis of the original series as explained above (see Figure 3.28; the trends are always calculated for the whole period 17~1950), and the trend calculated for the logar-

Rainer Metz and Winfried Stier 77
8
-~
8 ~
)(8 .,51 ." .E
~
~
8 ~
1700 1720 17.., 17 .. 17" '000 '120 '840 '800 '800 '900 '920
Years o original values o trend (lowpa .. iter-4.lraq-4)
Figure 3.27 Coal production in the UK 1700-1920
1720 17.., 17" 17 .. 1100 1120 '840 '800 '800 '100 '920 Years
o original values o trend (lowpass iter-4. Ireq-4) 6. trend (lowp ••• iter-20. Iraq-20. fft·2")
Figure 3.28 Coal production in the UK 1700-1920
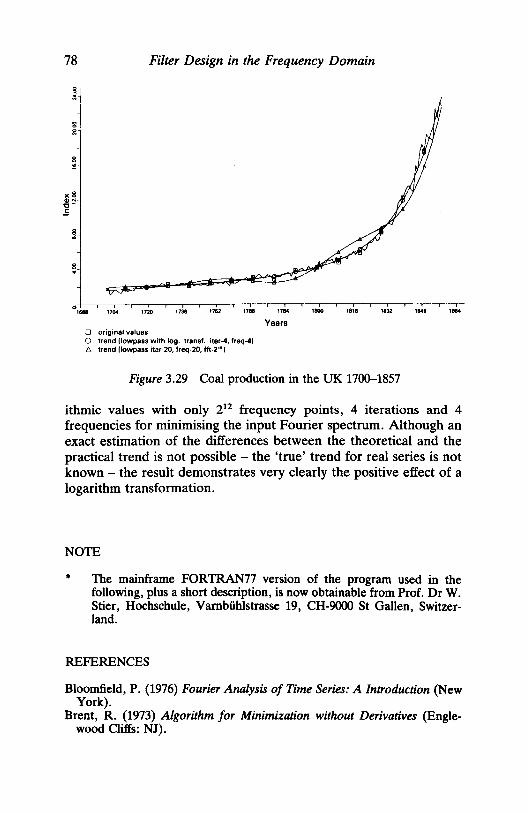
78
)(8 CD f'io ,,-o!:
Filter Design in the Frequency Domain
d+-~-.-.--.-,--.-.-.'-.-'--.-.--r--T'-''-T'-'--''-'--''-'--~' 1688 1704 1720 1736 1152 1788 1784 1800 1818 1832 1848 1864
o original values o trend (lowpass with log. transf. iter-4, freq-4) ~ trend (lowpass itar-20. fraq-20, fft_2 15 )
Years
Figure 3.29 Coal production in the UK 1700-1857
ithmic values with only 212 frequency points, 4 iterations and 4 frequencies for minimising the input Fourier spectrum. Although an exact estimation of the differences between the theoretical and the practical trend is not possible - the 'true' trend for real series is not known - the result demonstrates very clearly the positive effect of a logarithm transformation.
NOTE
* The mainframe FORTRAN77 version of the program used in the following, plus a short description, is now obtainable from Prof. Dr W. Stier, Hochschule, Vambiihlstrasse 19, CH-9000 St Gallen, Switzer-land.
REFERENCES
Bloomfield, P. (1976) Fourier Analysis of Time Series: A Introduction (New York).
Brent, R. (1973) Algorithm for Minimization without Derivatives (Engle-wood Cliffs: NJ).

Rainer Metz and Win/ried Stier 79
Hoffmann, W. G. (1940) Wachstum und Wachstumsformen der englischen-Industriewirtschaft von 1700 bis zur Gegenwart (Jena).
Rabiner, L. R. and B. Gold (1975) Theory and Application of Digital Signal Processing (Englewood Cliffs: NJ).
Schmidt, R. (1984) Konstruktion von Digitalfiltern und ihre Verwendung bei der Analyse 6konomischer Zeitreihen (Bochum).
Schwartz, M. and L. Shaw (1975) Signal Processing (New York). Stier, W. (1990) Methoden der Zeitreihenanalyse (Berlin/HeidelberglNew
York: Springer).

4 A Re-examination of Long Waves in Aggregate Production Series RAINERMETZ
INTRODUCfION
The adherents of Kondratieff's long-wave theory assume the exist-ence of fluctuations in long-term economic growth with an approxi-mate duration of 40--60 years. However, not only the mere existence of long waves is controversial but also - if their existence is accepted-their precise timing. Despite improvements in statistical methods and the availability of richer data, different authors still achieve different and controversial results.
Solomou (1987, p. 164), for example, investigating growth rates for specific time periods, concludes that the 'evidence presented in this study rejects a Kondratieff wave phasing of post-1850 economic growth' , and that alternating phases of economic growth are rather in the form of Kuznets swings. He adds that 'Kuznets swings are found to be more generalised than has previously been recognised'(ibid., p. 170). But he also qualifies his findings, saying that 'The swings are best viewed as episodic events rather than cycles of growth and they are a pattern of growth limited to specific historical eras' (ibid.).
Solomou denies the existence of Kondratieff cycles for price series as well as for real series. This brings him into conflict with other investigations, which confirmed the existence of Kondratieff cycles in price series and denied their existence in 'real' series (see, for example, van Ewijk, 1982, p. 494). Opposed to van Ewijk, Reijnders - who also works with spectral analysis - has meanwhile confirmed the Kondratieff hypothesis, using a special kind of trend estimation to avoid what he calls 'perspectivistic distortion' (Reijnders, 1988, p. 291; see also Chapter 2 in this volume).
In contrast to the negative conclusions of Solomou and van Ewijk,
80

Rainer Metz 81
Bieshaar and Kleinknecht (1984) arrived at more positive results. They used statistical methods which are completely different from those of Solomou and van Ewijk. In their test - Rejinders called it the binary split approach - the turning points of the long waves are determined a priori according to evidence from the literature. Among others they chose the Mandelian scheme for testing. From their investigation of eleven aggregate production series, Bieshaar and Kleinknecht concluded that, with the exception of the British series, and roughly during the last hundred years, a pattern consistent with the long-wave hypothesis can be found (ibid., p. 293). However, they consider the empirical evidence of Kondratieff cycles for the pre-1890 period as uncertain. According to their test, only the series of Belgium, Italy and Sweden show a Kondratieff wave pattern during the pre-1890 period (ibid., p. 293).
The most painstaking empirical investigation has been made by Gerster (1988), using the Stier filter. On the basis of fifty-three price-and-volume series for sixteen Western economies he obtained evidence of long waves ranging from 20 to 60 years. 1 However, he adds that by far the majority of the long waves (with a mean cycle length of approximately 35-40 years) are shorter than the Kondratieff cycles and are therefore clearly in the Kuznets range (ibid., p. 98, see also Chapter 5 in this volume). Gerster's results are confirmed by Jim Taylor (1988) who uses polynomials of different degrees. The poly-nomials are fitted to the series successively and their selection de-pends on their statistically significant share in the variance. Although the waves he found do not exactly fit Kondratieff's scheme, Taylor is convinced that 'In five nations clear statistical significance for a "long wave" was found' (ibid., p. 384). Taylor agrees with Gerster that the long waves are shorter than the typical Kondratieff cycle (ibid., p. 388). Besides, Taylor emphasises that 'Kondratieff reported true periodicity - enough to allow prediction: the waves reported here are a-periodic' (ibid.). The results of the various empirical investigations lead us to a crucial point in present long-wave research: are long waves in economic growth a quasi-periodic phenomenon which oc-curs regularly and therefore in a predictable way? The discussion of this problem cannot be restricted to statistical procedures. It has to be done within the framework of theoretical models and explana-tions. The statistician can only deliver empirical results concerning the postulated theoretical terms.
The crucial point in present long-wave research is the attempt to establish long waves within a theory of long-term economic develop-

82 Long Waves in Aggregate Production Series
ment. Long waves are conceived of as the numeric expression of a mechanism of self-generating processes which repeat themselves periodically. Economic growth, then, can be characterised as phases of high growth generation followed by phases of low growth, and vice versa. This is the fascinating idea of an endogenous mechanism which generates regularity.
Verifying this thesis statistically is difficult, because economic growth as a whole shows no self-repeating patterns of regularity. The statistical analysis of economic growth with regard to regular patterns requires the concept of cycle analysis. The analysis of cycles requires, on the other hand, the elimination of the non-cyclical or so-called irreversible component of time series, that is, the trend. Long-wave research focuses on specific forms of economic growth, whereas the theoretical conceptualisation of the phenomenon, as well as the empirical analysis, is based on the cycle concept. This conceptual contradiction may be characterised as the 'long wave dichotomy'.
The importance of this dichotomy becomes clear, if the results of cycle analysis are taken as basis for growth and development analysis. It is also evident that the interdependence between growth and long-term cycles is not considered at present to be within the frame-work of statistical cycle analysis. The necessity of linking both com-ponents - growth and long-term cycles - empirically as well as theoretically should be seen as an important topic in future research of long-term economic growth and cycles.
The method explained and used in this chapter deals exclusively with the problem of trend and cycle detection in economic time series. This detection does not only mean an identification of possibly existing trends and cycles but also their extraction from given time series and their representation in the time domain. In this approach we conceive of long waves as quasi-periodic oscillations with a duration of about 35-60 years. Moreover, these cycles ought to be not only a long-term phenomenon in single series, but also a world market phenomenon. Therefore long waves should occur with high synchronity in many time series across nations. As long waves in real volume series have been much more controversial than long waves in price series, I shall concentrate on the former rather than on the latter.
A difficulty in testing long waves in real series has to do with the strong exponential growth during long periods. This exponential growth possibly superimposes upon existing cycles to such a degree that they cannot be detected in the series directly (as is the case, for
Rainer Metz 83
example, in price series). I shall deal with this problem in the next section.
The time series I have investigated are nearly the same as those used by Bieshaar and Kleinknecht (1984). For a more detailed description and critical judgement of the series I refer to Bieshaar and Kleinknecht and the literature mentioned there. Additionally I used the series of GDP for France and Denmark published by Angus Maddison (1982). I used Maddison's figures for France instead of the French series examined by Bieshaar and Kleinknecht because the former covers the period from 1820 to 1979 and is therefore much longer. 2
METHODOLOGICAL APPROACH
A suitable statistical procedure must be able to extract possibly existing cycles from time series. As already shown in Metz and Stier (Chapter 3 in this volume), this task can be characterised as a problem of signal detection. A time series is conceived of as a sum of signals plus a noise component:
TIME SERIES = SIGNALl + SIGNAL2 + ... + SIGNALN + NOISE
or
X(t) = S1(t) + Sit) + ... + SN(t) + N(t)
In order to extract possibly existing long waves one has to eliminate the other signals as well as the noise component. This requires (i) an exact definition of the signals which are to be eliminated and (ii) a method which eliminates the different signals. The crucial point in this context has always been and remains the trend estimation and elimination. As the notion of 'trend' is quite untidy, it is difficult to transfer it into algorithms. More exact trend definitions cannot be operated with the traditional methods of time series analysis. So it comes as no surprise by now that it is commonly recognised that the way of handling the trend largely determines whether or not one finds long waves. As already shown in Metz and Stier, the filter design approach offers opportunities for signal detection and extraction which are not feasible with traditional methods of time series analysis.

84 Long Waves in Aggregate Production Series
1.,0 1830 ,8&0 '870 '100 1910 '!130 1960 1970 1990
Years o original series o trend
Figure 4.1 World (I) industrial production 1780-1979
According to our definition of long waves as a cyclical process, a corresponding trend definition and trend elimination is first required. Here we define trend as oscillations with a duration longer than the long waves we are looking for. For the extraction of those oscilla-tions, a lowpass filter is required for which an amplitude function has to be specified. As the maximum duration of long waves is generally assumed to be about 60 years, all oscillations ranging from infinity to 65 years are conceived as trend. Consequently the oscillations rang-ing from less than 65 to 2 years are defined as cyclical components. For the representation of a so-defined trend a lowpass filter is required, for which the amplitude function is defined as (0, 90/65).3
The filter reproduces exactly those oscillations of the time series whose frequencies correspond to the passband of the lowpass filter. The resulting trend for the series World I is shown in Figure 4.1. It is clear that the filtered trend changes according to our trend definition (that is, according to the amplitude function specified). If the pass-band of the lowpass filter is chosen more narrowly, the trend be-comes smoother and 'inflexible'. On the other hand, the trend becomes more flexible if the passband of the filter is made broader.
However, it has to be kept in mind that this does not guarantee that the results can be interpreted meaningfully from an historical point of view. To what extent the resulting trends agree with our
Rainer Metz 85
ideas about long-term economic development and how the filtered trend can be interpreted substantively cannot be answered by means of filter theory. Because the filter design approach offers the oppor-tunity to realise countless definitions of trends or other components, the question remains whether there is a measure to judge the ex-tracted components in terms of their statistical significance. For this purpose, the explained variance is a completely useless measure, because the explained variance grows as if the passband of the filter has been enlarged. To the best of my knowledge there is no statistical criterion for solving this problem.
Just as the trend can be filtered, so can the trend-free series, using a highpass filter for which the amplitude function is given with (90/65,2).4
The result of such a bighpass filter is the trend free (World I) series shown in Figure 4.2. Let me repeat: the filter guarantees that possibly existing cycles with a maximum duration of 65 years are not part of the trend. That means they are not filtered out with the trend. This also guarantees that cycles with a duration of 2-65 years are trans-ferred completely unchanged (with regard to phase and amplitude) into the filtered series. This trend free series is the basis for examin-ing the existence of long waves, which can be done with a filter that
'830 , ... 1870 1890 1910 1130 1150 1970 1990
Years o detrended series
Figure 4.2 World (I) industrial production 1780-1979

86 Long Waves in Aggregate Production Series
><8 -8" .E
~+-'-~-r-r~~-'~~r-r-~.-'-~-.-r-r~~-'-.~~ ~ ~ ~ - - ~ - ~ - -Years
o detrended series o smoothed componenlliong waves'
1970 ,.
Figure 4.3 World (I) industrial production 1780-1979
eliminates short-term fluctuations. If one defines the possible dura-tion of Kondratieff cycles with 35-65 years the filter has to eliminate all oscillations ranging from 2-<35 years. For this purpose a band-pass filter is used whose amplitude function is defined as (90/65, 35/30}.5
The result is a smoothed component which represents exactly those oscillations corresponding to the passband of the defined amplitude function, that is, it represents all oscillations with a duration of 35-65 years (see Figure 4.3). The smoothed component shows the long waves of 35-65 years we are looking for. It also allows us to deter-mine directly the peaks and troughs of the long waves.
It is obvious that the explanatory power of such long waves is reduced to the extent that they are defined exclusively as very long-term oscillations. Therefore many investigations assume a broader possible duration for such cycles. For example, Gerster defined a cycle duration of 12-60 years (1988, p. 38). Metz assumed a possible cyclicity of 20-60 years (1984, p. 281). As was the case in trend estimation, it is also evident for cycle analysis that the specified definition (statistically, the amplitude function) determines the his-torical shape and thus the dating of the cycles. To demonstrate the problem involved, I will test alternative cycle definitions for the series World I, which are graphically presented in Figures 4.4 and 4.5. For

Rainer Metz 87
!;: 7+--,--,--,--,--,--,--,--.--.--.--.--,--.--.--.--.--.--.--.--.--.--.-
1770 1790 1810 ,.'" 1800 1870 ,_ '9'0 1930 1950 1970 1100
Years
o long waves (65-45 years duration) o long waves (65-25 years duration)
Figure 4.4 World (I) industrial production 1780-1979
><8 ~.
,-
lnO 1790 '.,0 1830 1800 1870 ,_ "'0 '930 '800 '970 '880 Years
o long wavesl6!>-35 years duration) o long waves 16!>-15 year. duration)
Figure 4.5 World (I) industrial production 1780-1979

88 Long Waves in Aggregate Production Series
this purpose I will define four amplitude functions for filtering the detrended series:
Tl = (45/40, 0); 1'2 = (35/30, 0); T3 = (25/20, 0); T4 = (15/12, 0).
These amplitude functions define 4 different types of cyclicity. For example, according to Tl, the duration of the cycles can range between 65 and 40 years, whereas according to T4 it can vary between 65 and 12 years.
The smaller the passband of the filter, the higher the smoothing effect of the lowpass filter. It is obvious that with an increasing smoothing effect, the long-term cycles become more and more 'inde-pendent' from the real historical events, which are represented in the trend-free values. This smoothing effect can be extended to such a degree that the smoothed component finally runs without any rela-tion to the real historical events (that is, in the form of a linear component). The smoothed components shown in Figures 4.4 and 4.5 show very clearly that the relevance of short-term variations for the long cycles is higher in the case of T4 than in the case of Tl. The period from 1780 to about 1820 shows one cycle according to T1, T2 and T3, but two cycles according to T4. Similar results can be obtained for the period from 1820 to 1890.
This demonstrates very clearly that a decision for or against a specific cycle definition cannot be made without further assumptions. To analyse the question of whether a specific cycle exists or not cannot be answered exclusively on the basis of different filter results. Therefore Taylor's question 'what is meant when we say that a "cycle" exists in time series data' (1988, p. 375) is also of decisive importance within the filter design approach. Since purely statistical criteria for solving this problem are not available at present (the explained variance does not work), I made a spectral analysis for all trend-free series. The spectral analysis should inform us about the underlying cyclical structure of the series. Despite the well-known weaknesses of spectral analysis, the results allow at least preliminary insights.
Although the fluctuations in the series are sometimes quite differ-ent, the spectral analysis confirms for almost all of the series a dominance of long waves with a duration of about 30-60 years. It is interesting to note that the spectral density functions of the series can be classified into two types. One type reveals a clear dominance of
Rainer Metz 89
very long waves without notable influences of other fluctuations. The second type also reveals a wave but at the same time shows other fluctuations. Two examples of this are the spectral density functions of the GDP of Italy (Figure 4.6) and the industrial production of the UK (Figure 4.7). This indicates not only an abstract statistical subtle-ty but also a different structure of the underlying cyclical processes. How far this dissimilarity can be explained by economic arguments referring to pecularities of the national economies remains open.
Despite the observed differences, the cycle definition of T2 is the most plausible. According to this definition (the passband ends at (35/30)), possibly existing cycles with a duration of less than 30 years (Kuznets cycles) are excluded. We have a problem here with the disturbing influences of the two world wars. In many series the wars lead to an abnormal and erratic course of the values. It is open to dispute whether these shocks should be part of the model or whether they have to be excluded as exogenous shocks. There are some good reasons for both opinions, therefore I made my calculations twofold. In a first version (referred to in the following as VI) I eliminated the existing world war values by linear interpolation, regarding the war years as statistical outliers.6 In the case of VI, the smoothed compo-nent (that is, the long wave) is filtered according to the lowpass definition of T2.
In the second version (V2) the values for the world wars are not interpolated. As the oscillations which are due to the world wars show a shorter duration it is more appropriate to use the lowpass definition of T3 for filtering the smoothed component. This also gives the so-called Kuznets swings a better chance to show up. As a consequence of these considerations, I filtered each of the series twice (versions VI and V2). Because of the extreme distortions due to the world war values, the results according to V2 are likely to be less reliable. My dating of long waves is therefore in principal based on the results according to VI.
Regarding these peculiarities - defining an appropriate cyclicity and handling the world war values - it has to be kept in mind critically that the results depend mainly on our definitions and that these definitions primarily have an explorative character. Differences be-tween my results and those of Gerster can therefore be explained to a great extent by different definitions. As Gerster used the same filter technique as I did, we have not had to discuss methodological differences and can concentrate on the discussion of the definitions underlying the research process. The situation is completely different

90 Long Waves in Aggregate Production Series
ci+-~~~r-~~-.~~~~~~~~~~~~~~ o 16 24 32 40 48 58 M 72 80 88
Lag o estimated spectrum
Figure 4.6 Spectrum of the detrended series of Italian GDP
Lag o estimated spectrum
Figure 4.7 Spectrum of the de trended series of UK industrial production

Rainer Metz 91
in a comparison of my results with those of Taylor. As the stepwise polynomial regression used by Taylor are not linear (that is, time-invariant) filters, it is not possible to check the amplitude or phase characteristics of the polynomials. Differences in the results can not only be explained by different definitions but also by the use of uncomparable methods.
RESULTS
In the following, for each series, the trend and the long waves are represented in Figures 4.8a-19b. In principal the trend is shown only for the interpolated series (VI). The long waves are shown for both versions. It should be remembered that in version VI the world war values are interpolated (both for trend and long-wave filtering), and in the second the available world war values are included unchanged. The turning points, according to VI, are summarised in Table 4.1. Also the lengths of the cycles are given both from peak to peak (figures in round brackets) and from trough to trough (figures in square brackets). Moreover, for each up- and downswing, the mean growth rates, calculated from the original series, are presented.
Belgium: industrial production 1831-1981
Jean Gadiseur's Belgian industrial production series reveals a marked cycle with a trough 1844/49, a peak 1867/69 and a trough 1892/94 (see Figures 4.8a and 4.8b). (In the following all figures behind the slash denote the year identified according to version V2.) In the following period we have again a dominant cycle from 1892 (T = trough) to 1920 (P = peak) to 1947 (T) according to VI, but two shorter cycles if we look at the results according to V2. The upswing after the Second World War is stable for both versions and has its break off (upper turning point) in 1970/71. This series clearly confirms the 2nd (bourgeois) Kondratieff and the upswing of the 4th (neoclassical) Kondratieff. According to VI, the 3rd Kondratieff also exists, although the period 1890-1945 is obviously influenced by shorter oscillations due to the two world wars.
These results confirm the findings of Bieshaar and Kleinknecht, who concluded that Belgian industrial production reveals a long-wave pattern which is consistent with the 'orthodox' chronology of

92 Long Waves in Aggregate Production Series
Table 4.1 Dating of long waves
1st Kondratieff 2nd Kondratieff 3rd Kondratieff 4th Kondratieff Trough Peak Trough Peak Trough Peak Trough Peak
Mandel's periodization: 1790 1826 1847 1873 1893 1913 1939/48 1966
My findings: Belgium (a)
(b) (c)
I>enmark (a)
France industrial
(b) (c)
production (a) (b) (c)
France GI>P (a) (b) (c)
Germany NNP (a) (b) (c)
Italy GI>P (a) (b) (c)
Sweden GI>P (a) (b) (c)
UK GI>P (a) (b) (c)
USA GNP (a) (b) (c)
World I (a) (b) (c)
World II (a)
Notes: (a) turning points
(b) (c)
(b) average growth rates (c) average wave lengths • from 1959-1979 '" 3.3% •• from 1889-1911 = 4.4%
1844 1867 1892 1920 1947 1970 3.7% 2.2% 1.5% 2.1% 4.1%
(48) [53] (55) [50] 1839 1862 1885 1928 1952 1976
2.3% 2.1% 2.9% 2.4% 4.1% (48) [68] (67) [57]
1827 1853 1880 1924 1947 1970 2.3% 1.3% 2.2% -0.6% 6.6%
(53) [71] (67) [46] 1832 1863 1886 1927 1952 1977
1.8% 1.1% 1.5% 1.6% 4.9% (54) [64] (64) [50]
1880 1912 1942 1970 3.3% 1.1 % 5.0%
(62) [58] 1890 1921 1948 1970
1.7% 1.4% 5.7% (58) [49]
1867 1890 1913 1936 1959 2.8% 3.7% 2.4% 4.3%
[46] (46) [46] 1869 1889 1909 1930 1966
2.2% 1.8% 0.9% 2.3% [40] (41) [57]
1911 1937 1967 4.40/0 2.3% 4.0% **
[56] 1798 1820 1860 1885 1912 1943 1972
3.0% 4.2% 3.0% 4.4% 2.1% 5.5% [62] (65) [52] (58) [60]
18P,3 1923 1947 1974 2.2% 1.8% 4.5%
(49) [51]
The bold percentage figures indicate an anomaly in so far as the upswing/downswing reveals a lower/higher growth rate than the preceding or following downswing/upswing.

Rainer Metz 93
8 O! .
O~'8-'.-'--'8;"==~='~~~~'8M~~--, .. .--.--.--.--.--.--.--.--.--.--.--.--r--r--,~T',-
8 .,.
D original series o trend
Years
Figure 4.8a Belgium: Industrial production 1831-1981
8 ~'+--'--.--'--.--'--.--'--.--'--.--'--.--.--.--.--.--.--.--r'-r,--r--r,-
1816 1832 1848 1864 ,., 1886 1912 1928 ,"" 19(10 1976 1992
Years o long wavas (version V2) o long waves (version Vll
Figure 4.8b Belgium: Industrial production 1831-1981

94 Long Waves in Aggregate Production Series
Kondratieff cycles. It is interesting to note that Gerster's (1988, p. 174) dating of the same series is identical with my result from V2. This is not surprising, because his cycle definition allows for Kuznets cycles as well, and he also did not interpolate the values for the two world wars. According to Gerster, a mean cycle length of 27 years can be ascertained, whereas it is 51 years according to Vl.
Denmark: GDP 1820-1979
For this series two-and-a-half significant long-term cycles can be ascertained according to V1. A first long wave can be dated from 1838/36 (T) to 1862/56 (P) to 1885/90 (T) (see Figures 4.9a and 4.9b). Obviously this long wave confirms very well the 2nd Kondratieff and it remains relatively stable according to both versions (V1 and V2). Disregarding the world wars, we get a second long wave for the period 1885 (T) to 1928 (P) to 1952 (T). Figure 4.9b shows how the world wars influenced growth for this period (version V2).
Without interpolation for the world wars, we find two shorter waves. The latter can be dated from 1890(T) to 1905(P) to 1917(T), and 1917(T) to 1930(P) to 1947(T). According to V1, the upswing of the 4th Kondratieff does not begin earlier than 1952, whereas ac-cording to V2 it had already started in 1947. The calculations for this series demonstrate nicely how trend curves, and thus the trend-free series, are influenced by the way the world wars are treated.
France: industrial production 1815-1981
In contrast to the results of Bieshaar and Kleinknecht, this series reveals for both versions a distinct long wave from 1827/23(T) to 1853(P) to 1880/81(T) (see Figures 4. lOa and 4.10b). The subsequent period until the end of the Second World War is less uniform. Including the world war values (version V2), the upswing ends in 1909 and the following downswing in 1918, and the subsequent wave from 1918 to 1929 to 1944 is again more in the Kuznets range. A different picture occurs according to V1 when the world war values are interpolated. Here we get a 44-year upswing from 1880 to 1924 and a 23-year downswing until 1947. In both versions the post-war peak (1970/71) is quite similar.
Obviously, these results contradict Solomou's and van Ewijk's findings. The differences are primarily due to the different methods of trend elimination. Similarly to van Ewijk, Solomou (1987, p. 44)

8 '\'
1824 '840 "56 1872
o original series o trend
Rainer Metz
'888 '904 Years
1920 1936
Figure 4.9a Denmark: GDP 1820-1979
'824 '840 , ... o long waves (version V1) o long waves (version V21
1872 '888 '904
Years 1120 '936
Figure 4.9b Denmark: GDP 1820-1979
95
1952 '968 '984
, .. , '888 , ...

96 Long Waves in Aggregate Production Series
j .. III
'808 1824 I
'840 1856 1872 1888 1904
8 g
8 o
Years o original series o trend
Figure 4.10a France: Industrial production 1815-1979
1824 '840 '856 1872 1888 1904 '9,. 19,. '95' Years
o long waves (version Vl) o long waves (version V2)
Figure 4.10b France: Industrial production 1815-1979
I '968
'968
I '984
'984

Rainer Metz 97
argues that in the period 1850--1913 a Kuznets pattern dominates, whereas our results clearly demonstrate the empirical evidence of Kondratieff cycles in the nineteenth century.
While the 'orthodox' dating (as applied by Bieshaar and Klein-knecht) assumes a Kondratieff cycle for 1826(P) to 1847(T) to 1873(P), according to my calculations French industrial production shows an upswing from 1823 to 1853 and a downswing from 1853 to 1881. This explains why Bieshaar and Kleinknecht did not find statistically significant differences in average growth rates between upswings and downswings according to their 'orthodox' dating. Whereas my dating for the nineteenth century is consistent with Gerster's dating, my results for the twentieth century are not. This is again due to his different handling of the world wars and the different definitions of possible cyclicity.
France: GDP 1820-1979
For this series too, the method of handling the world wars influences the shape of the trend and thus the trend-free series, especially for the period from 1930 to 1979. Therefore, the dating of the upswing of the 4th Kondratieff is different for both versions. Despite these peculiarities, two distinct phases of long-term fluctuation emerge. The first is the period from about 1830 to 1890 and the second from about 1890 to 1950. If we look at the results of version VI, two long-term cycles can be detected. The first from 1832(T) to 1863(P) to 1886(T), and the second from 1886(T) to 1927(P) to 1952(T) (see Figures 4.11a and 4.11b). Whereas the first cycle remains stable also for version V2 (in this case it can be dated from 1828(T) to 1862(P) to 1892(T)) the second mentioned phase reveals two shorter cycles, again due to the world wars. The first cycle runs from 1892(T) to 1906(P) to 1916(T), and the second from 1916(T) to 1930(P) to 1945(T). If we interpolate the world war values (version VI), the post-war boom starts in 1952 and breaks off in 1977. According to version V2, the lower turning point is in 1945 and the upper in 1974.
For this series also we have to modify the results of Bieshaar and Kleinknecht, as the long wave we found for the nineteenth century does not fit the 'orthodox' dating (used by Bieshaar and Kleinknecht) of the 2nd Kondratieff. Bieshaar and Kleinknecht did not find signifi-cantly different growth rates because they tested the period 1826 to 1847 to 1873 whereas, according to my findings, the period 1830 to 1886 is appropriate. Taylor's results correspond with mine from 1928

98
8 xg ~M 1:
Long Waves in Aggregate Production Series
o,+--.--.--.--r-.--.--,--.--.--.--.-.--.--.--.--.--.-.--,--.--r--r-
8 :!
x~ .,-,,' 1:
1808 1824 1840
o original series o trend
1856 1872 1888 1904 1920 1936 1952 1968 1984
Years
Figure 4.11a France: GDP 1820-1979
~'+--.--.--.--r-.--.--'--.--r--.-.r-'--.--.--r--.-.r-'--.--.--.--r,. 1124 1140 '" 117. 1_ 1" 1120 1031 1112 ,. '" Years o long WIVH (v.raion V1) o long wive. (veraion V2)
Figure 4.11b France: GDP 1820-1979

Rainer Metz 99
onwards, but not before that date. This difference can only partly be explained by Taylor's use of different series, and has primarily to do with differences in methodology. In this context it is interesting to note the curious shape of Taylor's series up to 1908, which indicates a strong bias of the used polynomials (Taylor, 1988, fig. 2, p. 382).
Germany: NNP 1850-1979
For this series again, the world war values affect the results strongly. Interpolating the values of the Second World War (version V1), a distinct long wave is discernible from 1880 to 1912 to 1942. The post-Second World War boom breaks off in 1972. According to V2, we can discern a less distinct cycle from 1860 to 1872 to 1884, and a more dominant intermediate cycle from 1928 to 1939 to 1950, whereas the fluctuations between 1880 and 1930 are almost identical according to both versions (see Figures 4.12a and 4.12b). Obviously, the waves measured according to V2 are shorter than a Kondratieff. Also, the post-war boom breaks off earlier than expected, in 1965. According to V2 (that is, without interpolation of the war values) the Kuznets' swings are more dominant in the German series than, for example, in Italy or Sweden. This may be due to the much greater influence of the world wars in the German case. If we restrict our view to V2 it seems that the Kuznets swings dominate the periods before 1884 and from 1920 to 1950. This would at least partly confirm the results of Solomou. However, considering that the trend-free values of the Kuznets swings are for a considerable part below the trend values (that is, they do not really oscillate around the trend) one can call into question the dominance of Kuznets' swings.
Solomou's comparison (1987, p. 42) of his findings with the results of Metz and Spree (1981) is problematic for two reasons. First, Reinhard Spree and I intended to investigate the shorter Kuznets swings, so the Kondratieff long waves were filtered out with the trend. Second, the notch-filter we used has a remarkable phase shift, especially for lower frequencies. Therefore Solomou's conclusion (referring to Metz and Spree) 'that Kuznets swings are a relevant growth variation for the pre-1913 period' (1987, p. 42) is irrelevant, as Kondratieff long waves were filtered out beforehand.

100 Long Waves in Aggregate Production Series
11.40 '856 1872 '888 1904 1920 1936 19" '968 '984 Years
o original series o trend
Figure 4.12a Germany: NNP 1850-1979
8
8 ~ •. ~ ~~~--~~--~~r-~--r-~~r-~~r-~--r-~~--'--'--~-'--'--'-
1824 '840 '856 1872
o long waves (version Vl) o long waves (version V2)
'888 '904 1920
Years 1936 '!IS,
Figure 4.12b Germany: NNP 1850-1979
'968 '984 '000
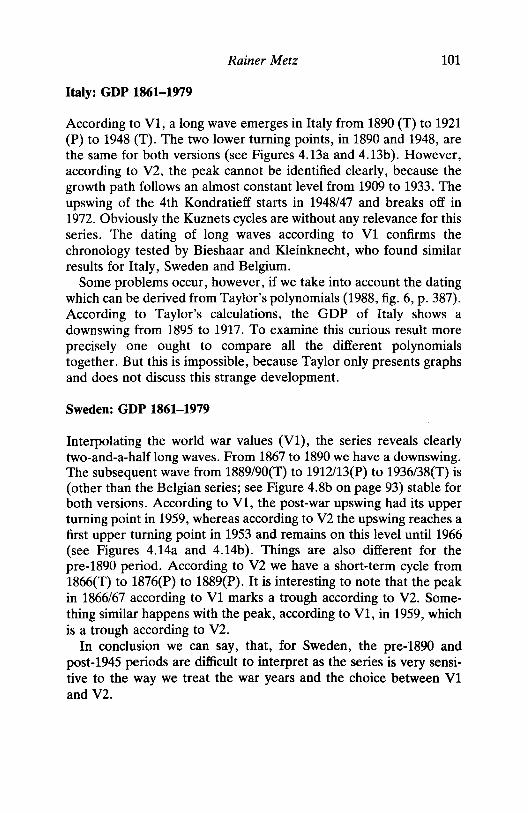
Rainer Metz 101
Italy: GDP 1861-1979
According to VI, a long wave emerges in Italy from 1890 (T) to 1921 (P) to 1948 (T). The two lower turning points, in 1890 and 1948, are the same for both versions (see Figures 4.13a and 4.13b). However, according to V2, the peak cannot be identified clearly, because the growth path follows an almost constantIevel from 1909 to 1933. The upswing of the 4th Kondratieff starts in 1948/47 and breaks off in 1972. Obviously the Kuznets cycles are without any relevance for this series. The dating of long waves according to VI confirms the chronology tested by Bieshaar and Kleinknecht, who found similar results for Italy, Sweden and Belgium.
Some problems occur, however, if we take into account the dating which can be derived from Taylor's polynomials (1988, fig. 6, p. 387). According to Taylor's calculations, the GDP of Italy shows a downswing from 1895 to 1917. To examine this curious result more precisely one ought to compare all the different polynomials together. But this is impossible, because Taylor only presents graphs and does not discuss this strange development.
Sweden: GDP 1861-1979
Interpolating the world war values (VI), the series reveals clearly two-and-a-half long waves. From 1867 to 1890 we have a downswing. The subsequent wave from 1889/90(T) to 1912/13(P) to 1936/38(T) is (other than the Belgian series; see Figure 4.8b on page 93) stable for both versions. According to VI, the post-war upswing had its upper turning point in 1959, whereas according to V2 the upswing reaches a first upper turning point in 1953 and remains on this level until 1966 (see Figures 4.14a and 4.14b). Things are also different for the pre-1890 period. According to V2 we have a short-term cycle from 1866(T) to 1876(P) to 1889(P). It is interesting to note that the peak in 1866/67 according to VI marks a trough according to V2. Some-thing similar happens with the peak, according to VI, in 1959, which is a trough according to V2.
In conclusion we can say, that, for Sweden, the pre-1890 and post-1945 periods are difficult to interpret as the series is very sensi-tive to the way we treat the war years and the choice between VI and V2.
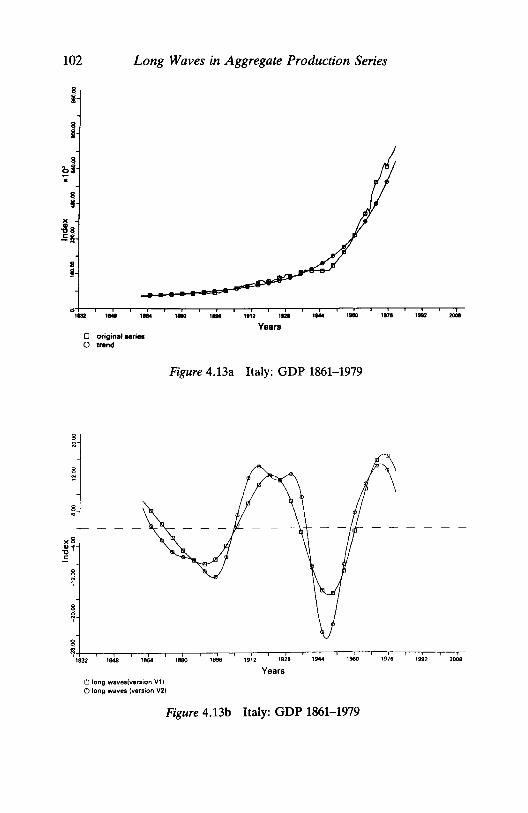
102 Long Waves in Aggregate Production Series
8 iii
o original lerie. o trend
8 .. - - -
x 8 ~'f E
8 ~
8 7
:;: ~
1832 1848 1864
~ long waves(version V11 C) long waves (version V2)
Years
Figure 4.13a Italy: GDP 1861-1979
188. 1896 1912 1928 , .... 1960
Years
Figure 4.13b Italy: GDP 1861-1979
1976 1992 2008

g ~-
8 g
8 '"
)( 0>0
"C E
'''' ~ original series e> trend
18 ..
Rainer Metz 103
1880 1896 1912 1928 '''' 1960 1976 1992 2008
Years
Figure 4.14a Sweden: GDP 1861-1979
,+--.---.--r--r--r--.--,--.---.--r--r--,--.--,--,r--r--r--.--,--,r--r--r-1832 1848 1864 1880 1896 1912 1928 1944 1960 1976 1992 2008
~ long wave. (version Vl) ~ long waves (version V2)
Years
Figure 4.14b Sweden: GDP 1861-1979
104 Long Waves in Aggregate Production Series
UK: industrial production 1801-1981
The trend-free series shows no strong dominance of the Kondratieff cycles. The results for both versions are difficult to interpret. A first wave can be dated from 1817/22(T) to 1831/36(P) to 1846/51(T). The subsequent period until about 1880 shows no long waves at all. For the period 1882/87(T) to 1902l04(P) to 1921/25(T) a long wave again shows up (see Figures 4.15a and 4.15b).
Disregarding the world wars (version VI), a long upswing from 1925 to 1958 becomes evident, whereas the results according to V2 reveal one cycle from 1921(T) to 1935(P) to 1946(T) and a sub-sequent upswing period from 1946 to 1964. Obviously the Kuznets swing pattern for this series is determined by the world wars. In general, it is difficult to see a long-wave pattern which runs through the whole period of observation. In the case of the UK, fluctuations are very different from those of Belgium, Sweden and Italy. These results confirm the sceptical conclusion of Bieshaar and Kleinknecht, who find only 'very weak evidence for the existence of long waves from the [two] British series' (1984, p. 292). The question of whether the United Kingdom has an exceptional position within Europe due to a 'hegemonial' life-cycle, which is also discussed by Bieshaar and Kleinknecht, has to remain open as it cannot be answered within the statistical framework given here.
UK: GDP 1830-1979
For the whole period, three phases can be distinguished: 1830 to 1888, 1889 to 1928, and 1928 to 1966. These phases indicate at the same time periods for which, according to VI, long waves can be detected. Although this relatively homogeneous picture disappears, when the results of version V2 are investigated, several years can be identified as identical turning points for both: VI and V2: 1869/75(P); 1888/89(T); 1909/13(P); 1928/30(T); 1966(P) (see Figures 4.16a and 4.16b).
Comparing the results of VI and V2 it becomes obvious that for the period from 1830 to 1888 Kuznets swings affect the series to a high degree. The same is true for the period 1928 to 1941 to 1954 if we include the two world wars (version V2). According to VI, the series reveals a weak Kondratieff cycle. These results confirm, on the one hand, Reijnders' conclusion that 'the elimination of the disturb-ing influence of war pulses completely rehabilitates the Kondratieff'

Rainer Metz 105
l==1C=~~=!~~==~-T--'--'--'--'--T--'--'--'--'--'--'--'-~i~'-~i~ °'801 1817 1833 1849 1~S '~, utfn 1913 1929 1945 1961 1977
8 'f
8 'I'
8 N
tJ original series C) trend
Years
Figure 4.15a UK: Industrial Production 1801-1981
i'801 '117 '133 , ... '1M 1.1 1.7 1813 '928 , ... ~ long _ lvenion VII o long w .... I .. roion V21
Years
Figure 4.15b UK: Industrial production 1801-1981
,., '177

106
8 ..
Long Waves in Aggregate Production Series
1832
~ original serial o trend
1848 1864 1880 1896 1912 1928 1944 1960 Years
Figure 4.16a UK: GDP 1830-1979
1916 1992
~ '1~8-'8-'--1832'--'-1-848r-'--1864'--'--1880'--'-1-.. r-'--1.'1-2-'--1.r~--r-'-944r-'--1'960~'--1.rn--r-'-99r-2
~ long wav .. (version V1) " long wav .. (version V2)
Years
Figure 4.16b UK: GDP 1830-1979

Rainer Metz 107
(1988, p. 286). On the other hand, they confirm Solomou's findings of Kuznets cycles during the pre-1913 period in Great Britain. More-over, Kuznets swings also seem to show up during the post-1913 period, although for this period they might be largely due to the disturbing influence of the world wars.
USA: GNP 1889-1979
Both versions confirm a marked upswing until 1908/1911 and a subsequent downswing until 1935/37, fitting the Kondratieff scheme very well (see Figures 4.17a and 4.17b). Thereafter, the results depend greatly on the version used. According to VI (that is, without the Second World War) a marked upswing from 1935 to 1967/69 becomes evident. Including the Second World War values, shorter waves occur, which are mainly influenced by the Korean boom. The latter can be dated to the years 1935(T) to 1948(P) to 1957(T) and are therefore clearly in the Kuznets range. It is obvious that the Second World War and the Korean War 'disturbed' the Kondratieff long-wave pattern and led to a Kuznets swing pattern.
World (I) industrial production, excluding mining: 1780-1979
According to VI, Figure 4.18b shows evidence of Kondratieff long waves. The downswing of the first wave can be dated from 1798 to 1820, the second from 1820(T) to 1860(P) to 1885(T), the third from 1885(T) to 1912(P) to 1943(T), and the last upswing from 1943 to 1972 (see Figures 4.18a and 4.18b). Independently of whether we use VI or V2, the following turning points emerge: 1793/98(P) , 1818/20(T), 1856/60(P), 1884/85(T), 1909/12(P) and 1971/72(P). With the exception of the Second World War period, the results of both versions are highly uniform. The results of version Vl- excluding the wars - reveal fluctuations of which the mean length is consistent with the Kondratieff cycle. Therefore the results of Bieshaar and Klein-knecht have to be modified as they conclude that the series gives no support for long-term fluctuations during the pre-1890 period. Ac-cording to my results, there is evidence of long waves even before the 1890s. Bieshaar and Kleinknecht arrive at their conclusion because the dating of long waves differs from the 'orthodox' Kondratieff scheme which they used. This again demonstrates the ambiguity of the binary split approach.

108 Long Waves in Aggregate Production Series
1897
~ originalserie. o trend
190. 1913 '921 1929 1937
Years 194. 1953
Figure 4.17a USA: GNP 188~1979
~'889 1897 1905 1113 1921 1929 1837 1945 1953
Years o long __ (version VI) o long WIY .. (version V2)
Figure 4.17b USA: GNP 188~1979
1961
, .. ,
1968 1977
1889 1977

8 &i
Rainer Metz 109
o~~~ __ ~-F~~~~~~~~~ 1770 1790 1810 1830 1850 1870 1890 1910 1930 1950 1970 1990
g'
g
g
t:J original series () trend
Years
Figure 4.18a World (I) industrial production 1780-1979
~ t--.----'--,-----,-------,--r---r----.--,----,---,--'o-.--.-.---'r--,---,or--,---,o-,.----,-1770 1790 1810 1830 1850 1870 1890 1910 1930 1950 1970 1990
[!J long waves !version Vl) o long waves (verSion V2)
Years
Figure 4.18b World (1) industrial production 178{}-1979

110 Long Waves in Aggregate Production Series
World (II) total industrial production, including mining: 1850--1976
This series is shorter than the World (I) series, which may be a reason why fluctuations are not as clear as in World (I). When filtering according to V1, a weak downswing phase can be detected until 1898. This phase is followed by an upswing from 1898 to 1923 and a subsequent downswing until 1947, followed by a post-war boom until 1974 (see Figures 4.19a and 4.19b). Including the world wars (version V2) we again arrive at shorter waves which resemble the Kuznets swings.
SUMMARISING THE EMPIRICAL RESULTS
From a statistical point of view most of the world war values can be regarded as outliers which disturb the 'normal' structure of the time series. The following conclusions are therefore drawn exclusively from the results obtained by version V1.
The twelve time series investigated contain 1754 annual values. Counting from peak to peak, nineteen long waves can be identified (fifteen if one dates from trough to trough).7 The average wave length amounts to 54 years (for nineteen peak-to-peak waves) or to 56 years (for fifteen trough-to-trough waves). This is remarkable, as it contradicts several of the former investigations (for example, Gerster 1988, Metz 1984, Taylor 1988), which concluded that the average wave length is shorter than is typically assumed for the Kondratieff cycle. Nevertheless, the above findings show several deviations from the 'orthodox' dating of Kondratieff waves. Notably the dating of the 2nd (bourgeois) Kondratieff is not very uniform. In the series of World (I), in French industrial production, and in French GDP upswings start much earlier than 1847, as is indicated by the 'orthodox' dating.
Long waves during the second half of the nineteenth century, however, reveal much more uniformity. Only French industrial pro-duction is an exception as the upswing of the third Kondratieff starts in 1853. The downswing from 1860/69 to 1880/92 and the following upswing until the First World War can be ascertained for almost all series investigated here. This seems to indicate a high international synchronity during the phase of developed capitalism. It is remark-able, however, that the third Kondratieff upswing does not break off internationally uniform with the beginning of, or during the First

8 _ 0
0::: .
8 iil
Rainer Metz 111
o+-~--~~--~-.--~-.--~-,--~-,--.--.--.-~--,--,--,--.--,--.--,-
8 ..
)( 4>0 "0 E
8 "f
8 "i
8
1824 1840 1856 1872 1888 1904 1920 1936 1952 1968 1984 2000
:: original series ,~! trend
Years
Figure 4.19a World (II) industrial production 1850-1976
"~1.-24-'--lSW"--'t~--1'8;-2-'--1'8~--'--"9~--'--'9';-O-'--19'k--'--1~TI-2-T--,~TI--'--,~TI--'--2000"-
~ long waves (version V1) C) long waves (version V21
Years
Figure 4.19b World (II) industrial production 1850-1976

112 Long Waves in Aggregate Production Series
8 '1
8 ~+-.-'-,,-.-.-.-.-.~r-r-r-.-'-'-'-"-'-'-'-'-'--~ 1824 1840 1856 1872 ,_ 191M '920 1936 1952 1988 1984 2000
Years C!J long WIVes World I " long waves Germany NOP h. long waves USA GNP
Figure 4.20 Long waves for different series 18SG-1979
World War. In the series World (I), France, Belgium, Italy and Denmark, the upswing continues until the 1920s. A similarly high synchronity can be found during the upswing after the Second World War, although its starting point cannot be dated easily because of the disturbing effect of this war. The upswing starts in the various series between 1936 and 1952; and it breaks off between 1967 (USA) and 1975 (France).8
Despite such periods of high synchrortity, a variable time and nation dependent lead-lag structure becomes evident when compar-ing the cycle of each series with the series World (I). I chose the cycle of World (I) as a reference cycle for two reasons: (i) it is long enough; and (ii) it can be assumed that peculiarities of series from individual nations may cancel each other out.
In Figures 4.20-4.25 the various series are plotted together with that of World (I). As can be seen from Figure 4.20, Germany completely coincides with World (I). A high synchronity can be found also between the US and World (I). From 1937 onwards there is a 7-year lead by the US against World (I). Belgium and Italy lag about 5-7 years behind World (I), and subsequently the long waves of Belgium and Italy develop in complete synchronity (see Figure

x
8 ..
Rainer Metz 113
{lo E
8 "I
~~'-~~-.-.~-.-.-.-'r-.-r-.-.-.-~-.-.-.-.-.-'~ ~ ~ - ~ ~ ~ - ~ ~ ~ ~ ~
Years ~ long waves World I " long waves Belgium industrial production 6 Italy GOP
Figure 4.21 Long waves for different series 1831-1981
4.21). The same is true for the long waves in French and Danish GDP (see Figure 4.22).
A high degree of synchronity can be detected also for World (I), Germany, the US and Sweden between 1850 and 1940 (see Figure 4.23). The beginning of the upswing for Germany can be dated to 1880, followed by World (I) in 1885 and Sweden in 1890. In the nineteenth century, Belgium lagged behind World (I). This is difficult to interpret because we know that Belgian industry had a lead during the first industrialisation period. While the lead of 6 years by the US against World (I) since 1937 is not surprising, the lag of the USA against Sweden of 2-6 years is difficult to explain.
Finally, a comparison of the long waves for World (I) and World (II) does not reveal - as may have been expected - an identical pattern (see Figure 4.24). Especially for the period from 1850 to 1910/20, it is uncertain whether the differences can be explained exclusively by the absence of the mining industry in World (I). We also find a remarkable lead-lag structure in the two British series (see Figure 4.25).
The same holds for the two French series too (see Figure 4.26, together with World (I». In the latter case the amplitudes of the GDP

114
x
8 .. -80 .E
Long Waves in Aggregate Production Series
~'~'B08---r--r-~--'--'---r--r--'--~-'--'--'r--r--r--.--'--'--'---r--r--'---'-1824 1840 1856 1872 1888 1904 1920 1936 1952' 1968 1984
Years CJ long waves Denmark GOP (182G-1979) e:> long waves France GOP (18~'979)
Figure 4.22 Long waves for different series 1820-1979
8 ..
1872 '888 1904 1920 1936 '95' , ... '984 '000 Years
r.tJ long waves World I C) long waves Germanv NNP !::. long waves USA GOP o long waves Sweden GOP
Figure 4.23 Long waves for different series 1850-1979

8
8
8
8
8 ,
Rainer Metz 115
'840 '856 1812 , ... 1904 1920 1936 '''2 , ... , ... Years
[j. long waves World I C) long waves world \I
Figure 4.24 Long waves for different series 1850-1976
~ "~~--'--'-8,r.--r--,~T2--'--,~.---r-,-... r--r--,~To--'--'8'~--'--'-9,r2--r--'9r28--'--,~'--'--,-~r--r--'9T76-
~ long waves o long waves 6 long waves
World I UK industrial production UK GOP
Years
Figure 4.25 Long waves for different series 1801-1979

116 Long Waves in Aggregate Production Series
8 ~+-.--.-.~--,-.--.~-.~~,-~,-~-,~~~~-.~-,---~ 1'808 1824 1840 1856 1872 1888 1904 1920 1936 1952 1968 1984
Years
['] long waves World I 6 long waves France industrial production ll.long waves France GOP
Figure 4.26 Long waves for different series 1815-1979
series are dampened more than those of industrial production (which is not the case for the UK series). Some problems occur in comparing the French NDP series, analysed by Bieshaar and Kleinknecht, with the French GDP series published by Maddison (see Figure 4.27). To a certain degree, the differences between the two may demonstrate the influence of the differing length of the time series.
These very few comments illustrate, I think, that the analysis of the lead-lag structure - which can be done very easily with the help of adequate filters - offers a very promising research field for the future.
CONCLUDING COMMENTS
From the beginning of the nineteenth century up to the present time, most of the trend-free series show long waves with a mean length that is typical for Kondratieff waves. As the series investigated here are indicators of general economic activity, the interpretation of Kondra-tieff waves as mere price waves (see, for example, van Ewijk, 1982) can be refuted. Moreover, in opposition to Bieshaar and Kleinknecht I find strong evidence of long waves also during the pre-1890 period. Furthermore, other than Gerster (1988), Taylor (1988) and Solomou

" ",0 "C E
8 .,.
Rainer Metz 117
~+-.-,,-.-.-.-''-.-.-.-,,-.-.-.-.--'-r-.-,,-.-.-.-.-1896 1904 1912 1920 1928 1936 1944 1952 1960 1968 1976 1984
Years ~ long waves France NDP (1900-1979) e:> long waves France GOP (1820-1979)
Figure 4.27 Long waves for different series 1900-1979
(1987), I find a mean cycle length that confirms Kondratieff's hypoth-esis. One reason for this homogeneity in the mean cycle length is due to my handling of the two world wars and the cycle definition I made for filter analysis (version VI).
The final question we should discuss is that of the existence of the Kondratieff cycle as a 'true cycle'. This problem involves not only the assumed long-wave scheme, as postulated, for example, by Mandel, but also a high international synchronity of growth fluctuations. Comparing the 'orthodox' dating of the cycles - as, for example, handled by Mandel, and Bieshaar and Kleinknecht - some remark-able confirmations as well as significant discrepancies can be ascer-tained. Some series, notably the French, deviate from this general scheme. On the other hand, many series do reveal a high synchronity and also, for some periods, a marked lead-lag structure, indicating a reasonably close international interdependence of long waves.
In conclusion, the question 'Is there any evidence of Kondratieff long waves in important indicators of general economic activity?' has to be answered with an unrestrained 'YES!' The central question, however, of whether these cycles can be considered as 'true cycles' can be answered only in a theoretical framework, considering en-dogenous variables as well as exogenous shocks.

118 Long Waves in Aggregate Production Series
In other words, the long waves that have been detected by means of my filter method should now be explained by a theoretical model. Such a model can be accepted as realistic if it allows one to predict 'the past' as well as the future. A Kondratieff wave could be regarded as a true cycle if its model which is, for example, specified for the period 1820-1913, allows us to predict the long cycles of the twentieth century. Then (and only then) we would be allowed to speak about 'true cycles' (in contrast to unique epoques or singular historical events). Future research will have to tell us whether long waves are 'true cycles'.
NOTES
1. This restriction is in general confirmed by Metz (1984, p. 286) who wrote: 'The results confirm partly the dating of long wave which is commonly accepted in the literature. Of course, over the whole time span, the historical evidence of the cycles changes widely in form and intensity.'
2. It is interesting to note that the results of both series are not identical. For our handling of the figures concerning the two world wars, compare the explanation of the different methods, called VI and V2, below.
3. This notation indicates that the passband extends from 0 to 65. 90/65 denotes the transition band in which the amplitude function of the lowpass drops monotonically from 1 to O.
4. This notation indicates that the frequency band 1/90-1/2 denotes the passband of the filter. The transition band extents from 90 to 65.
5. This notation denotes the frequencies 1/65 to 1/30 as passband and 1/90 to 1/65 and 1/35 to 1/30 as transition band of the filter. Because of the bias effect mentioned above we filter the trend-free series with a lowpass filter (35/30, 0), which is equivalent to a bandpass filter for the original series.
6. The following years have been interpolated: France (industrial produc-tion) 1939-45; France (GDP) 1940-47; Germany (NNP) 1914-24, 1937-41; United Kingdom (GDP) 1939-45; USA (GNP) 1939-45; Italy (GDP) 1939-46; World I (industrial production) 1939-45; World II (total industrial production) 1939-45; Denmark (GDP) 1914-18 and 1940-45.
7. The cycles detected for UK industrial production are not included in these figures.
8. Sweden takes an exceptional position, because the upswing starts in 1926 and breaks off in 1959.
Rainer Metz 119
REFERENCES
Bieshaar, H. and A. Kleinknecht (1984) 'Kondratieff long waves in aggre-gate output? An econometric test', Konjunkturpolitik, vol. 30, pp. 279-303.
Ewijk, C. van (1982) 'A Spectral Analysis of the Kondratieff-Cycle', Kyklos vol. 35, pp. 468--99.
Gerster, H. J. (1988) 'Lange Wellen wirtschaftlicher Entwicklung' (Frank-furt: Peter Lang).
Kleinknecht, A. (1987) Innovation Patterns in Crisis and Prosperity. Schum-peter's Long Cycle Reconsidered (London: Macmillan; New York: St Martin's Press).
Maddison, A. (1982) Phases of Capitalist Development (Oxford University Press).
Metz, R. (1984) 'Zur empirischen Evidenz "langer Wellen''', Kyklos, vol. 37, pp. 266-90.
Metz, R. and R. Spree (1981) 'Kuznets-Zyklen im Wachstum der deutschen Wirtschaft wiihrend des 19. und fruhen 20. Jahrhunderts' in D. Petzina and G. Van Roon (eds), Konjunktur, Krise, Gesellschaft. Wirtschaftliche Wechsellagen und soziale Entwicklung im 19. und 20. lahrhundert (Stutt-gart: Klett-Cotta) pp. 343--76.
Reijnders, J. (1988) The Enigma of Long Waves (Ph.D. thesis, University of Groningen).
Solomou, S. (1987) Phases of Economic Growth 1850-1973, (Cambridge University Press).
Spree, R. (1980) 'Was kommt nach den "langen Wellen" der Konjunktur?' in W. H. Schroder and R. Spree (eds), Historische Konjunkturforschung (Historisch Sozialwissenschaftliche Forschungen, vol. 11) (Stuttgart: Klett-Cotta) pp. 304-15.
Taylor, J. B. (1988) 'Long Waves in Six Nations: Results and Speculations from a New Methodology', Review, vol. XI, no. 3, pp. 373--92.

5 Testing Long Waves in Price and Volume Series from Sixteen Countries HANS J. GERSTER
INTRODUcnON
In the wake of the economic problems of Western countries which have persisted since the mid-1970s, the long-wave hypothesis has regained increasing significance as an interpretation of long-run economic development. During the 1950s and 1960s long cyclical movements in capitalist economies played only a minor role in economics. Yet, when the growth trend broke in the 1970s, and phases of negative growth followed, the confidence with which the economists had explained growth cycles as a new form of business fluctuations had gone. The (old) business cycle was back. After more than twenty years of more-or-Iess sustained growth during the 1950s and 1960s, and a prolonged phase of relative stagnation, it is neces-sary to extend our research perspective beyond the time frame of the business cycle.
Besides the secular stagnation hypothesis and the recently ad-vanced reconstruction hypothesis as interpretations of long-term economic development, the persistence of the current crisis helped the theory of long waves in particular to gain increasing attention as an interpretation of the current crisis. However, both the possible causes of the long waves and the question of whether there is any evidence of long waves at all continue to be the subject of con-troversy. From the beginning, the hypothesis of long waves has been met with criticism, because of inadequate statistical methods (see, for example, Slutzky, 1937). The improvement of analytical methods since the mid-1960s, however, seemed to make possible a reliable investigation of long waves. The instrument of spectral analysis, long proven by the natural sciences, promised to allow an adequate examination of the long-swing hypothesis. The basic works on the analysis of economic time series by N. R. Goodman (1961), C. W. J.
120

Hans 1. Gerster 121
Granger and M. Hatanaka (1964), G. M. Jenkins and D. G. Watts (1968) and others were followed by a wealth of verification and falsification attempts concerning the assumed phenomenon of long waves (see, for example, Adelman, 1965; Hatanaka and Howrey, 1969; van Ewijk, 1982).
When, after the newly developed methods had rekindled the discussion of long waves, the mid-1970s brought an additional interest - for practical purposes - in explaining the persisting world economic crisis, Schumpeter's (1939) cyclical model regained topical significance. The question now asked was: is it correct to say (in analogy to Schumpeter's (1939) three-cycle model) that the econ-omy, since about the end of the 1960s, has been undergoing not only a downswing phase of the Juglar and Kitchin cycles, but at the same time a downswing phase according to Kondratieff, which will last about 25 years (see, for example, Stolper, 1982; Rostow 1975)?
Using similar arguments but not suggesting a rigid pattern of economic phases to recur in the future, Leon H. Dupriez (1963) suggested as a working hypothesis that the (Kondratieff) upswing since 1945 would, in the foreseeable future, be followed by a turning point and that growth could therefore not be expected to continue.
On the basis of time series of economic development since the eighteenth century established by B. R. Mitchell, Walter G. Hoff-mann and the Bureau of Labour Statistics in the US Department of Labor (BLS), hypotheses concerning the phenomenon of long waves have been empirically tested, frequently with differing methods, in particular in the wake of the works published by Nikolai Kondratieff (1926, 1928) and Joseph A. Schumpeter (1939). The authors arrived at contradictory results, ranging from strict refutal on one side, to support for the long-wave hypothesis at the other. These verification and falsification attempts show that, despite the (presumably) more adequate method of spectral analysis, the results strongly depended on whether certain conditions were fulfilled. 1
In view of the rather contradictory results of the efforts to test the existence of long waves and to establish their cycle length, this chapter will begin by taking a critical look at the statistical methods used. It will be argued that the principal problem lies in an adequate trend elimination and that traditional instruments of time series analysis and spectral analysis do not lend themselves readily to testing long waves on a methodically 'clean and comparable' basis.
Finally, this paper presents graphically some fifty-three time series from 1800 to 1980 using theoretically better-founded methods which

122 Testing Long Waves in Price and Volume Series
stem from recent filter theory. Our time series include both price index series and real variables relating to the most important industri-alised countries as well as to some (raw-materials-supplying) peri-pheral countries. Some series are documented by way of examples in the Annex in graphic form (Figures 5.AI-5.A6 on pages 138-43), which are uniform and therefore comparable over time, as well as in an.exact phase-dating table (Table 5.Al on pages 144-5).
METHODICAL PROBLEMS INVOL YED IN THE VERIFICATION OR FALSIFICATION OF THE LONG-SWING HYPOTHESIS
Component methods and the calculation of moving averages
The component method in traditional time-series analysis starts from the assumption that, provided the trend component is known, the cyclical component can be explained separately. This raises the question of what would be an adequate method of trend elimination. Kondratieff, in his empirical studies, started from the assumption that the trend component can be represented as a polynomial whose parameters can be determined by means of a least square estimate (KQ estimating method) in such a way that there is a minimal deviation between the trend and the original series.
Apart from the multiplicative model of the CENSUS-X-II method (Xt = gt . St . Zt), the Berliner method is probably one of the best-known methods for the· (cyclical) analysis of economic time series (see Stier, 1980). While, according to Stier, the Berliner procedure is 'agreeably' clearly formulated and also reproducible, in contrast to the CENSUS-II procedure, this very clarity, which is inherent in the linear regression model, is at the same time accom-panied by the characteristic weaknesses of regression models. These weaknesses consist of specification problems involved in determining the polynomial degrees p and q for the smooth component gt and the seasonal component St as well as the determination of the lengths of the supporting reaches and support points of the trend and seasonal estimates. Thus, as in the case of the application of spectral analysis (see page 124), the procedure must be preceded by theoretical argu-ments which, inter alia, must answer the question of which form has the trend of a time series. As far as the classical component model is

Hans 1. Gerster 123
concerned, however, it must be said that the implied assumption (that it is an economic model) is by no means correct.
All that is done, in fact, is to give economic labels to the individual components; but at the same time no deduction is made, for instance, from the growth and cyclical theories that the trajectory u of the smooth component is, for example, a polynomial of the third order. According to Stier (1980), these fundamental, shape-related hypoth-eses of the component model are at any rate more than doubtful from the point of view of scientific theory, since they can never be verified empirically.
The polynomial degrees from 1 to 3, which are often chosen because they involve less calculating work, tend to obscure the dubiousness of such a procedure; for a successive raising of the polynomial degree leads to increasing congruence between the orig-inal series and the trend polynomial. This shows just how strongly the chosen polynomial degree influences the form of the trend, and, in particular, the values of the derived residual series. Since, in addi-tion, it is not possible to determine, on theoretical grounds, the polynomial degree to be assumed, the results will never be free from arbitrariness (Stier, 1976).
In elementary time-series analysis, one frequently encounters un-weighted moving averages for determining the smooth component or trend component of a time series. The functioning and mathematical properties of this filtering technique can be understood more easily if the frequency response function T(A.) for this filtering process is ascertained. For the simple N-parametric moving average with N = 2q + 1, the frequency response function reads as follows:
T(A.) = sin (NAJ2) N* sin (1J2)
On the basis of this frequency response function, Schulte (1978) was able to show quite clearly that, inter-alia, a twenty-parametric and a ten-parametric moving average, applied three times, are completely unsuitable for studying 6O-year cycles.
In addition to the disadvantage of major boundary value losses with increasing supporting width (at least 60 values), these filtering processes entail the danger of artificially-generated cycles. This is the so-called Slutzky-Yule effect (see Slutzky, 1937), according to which the smoothing procedures used distort real developments and

124 Testing Long Waves in Price and Volume Series
perhaps even generate cycles which are not contained in the original series.
Spectral analysis
When applying spectral analysis, time series are considered as an implementation of a stationary process; it is assumed that the individ-ual components of the process, because of their stationarity, influ-ence each other only to the extent to which they are dependent exclusively on their distance, that is, on the time difference 't and not on the value of the time index.2
For a fairly exact isolation of the components of a time series, both in terms of their relative significance and in terms of the duration of the period, one uses therefore, together with the spectrum, a depic-tion of the process in the frequency domain. By means of a Fourier transformation of the correlogram, the analysis of the cyclical behav-iour in the frequency domain becomes possible by means of the spectral density function. The spectral density describes the contribu-tion of each frequency component to the total variance of the process (time series), thus representing the distribution of the total variance over the individual frequencies.
In contrast to the methods mentioned in the previous section, spectral analysis, which offered itself as a modern and (seemingly) adequate testing tool for the long-swing hypothesis, thus avoids an 'a-priori-component analysis' (Stier, 1976) and, in principle, confines the analysis to the frequency domain, that is to say, a time series can be decomposed without previously eliminating certain components of the series.
Spectral analysis is, however, tied to the decisive condition of 'weak stationarity' of the underlying stochastic process, which means that the time series must not show any evolutionary movement, that is, it must show no trend over time. Since, however, economic series usually do have a clear trend, this leads to a large spectral mass in the neighbourhood of ro = O. In the case of the simultaneous existence of so-called side windows (leakage effect), this trend influences spectral estimations, of small frequencies in particular, to such a degree that often statements about cycles of great wave length can no longer be derived from the spectrum. This very low resolving power of the spectral window, in particular in the low frequency domain, which is of interest here, leaves the spectral estimation of such series hardly informative with regard to the existence oflow-frequency movements

Hans J. Gerster 125
such as long waves. Thus, we are again confronted with the problem of adequate trend elimination.
Summary: reasons for the method chosen in this study
In the previous section it was argued that the verification of the long-swing hypothesis with the help of various methods of traditional time series analysis was inadequate in so far as the basic problem of the analysis of long waves, namely the determination of the trend, could not be solved neutrally.
To sum up, the requirements to be met by a technique for the analysis and presentation of long waves will be described once more to make the choice of the Stier filtering method more intelligible. For the various above-mentioned techniques of analysis, those require-ments which are not fulfilled, or only insufficiently so, can be sum-marised as follows:
Requirement A Implementation of a theoretically-founded trend definition for the isolation of the secular trend component. Condition of weak stationarity (that is, elimination of all movement compo-nents of a time series with a period duration, for example, of above 60 years).
Requirement B Implementation of a theoretically determined isola-tion of high-frequency segments of the time series (which means that movement components, for example, of a period duration of more than 12 years have to be eliminated).
Requirement C Exact fade-out characteristics of the filter used so that neither amplification nor attenuation effects occur as a result of the filtering process (for example, avoidance of the Slutzky-Yule effect). The transfer characteristics of the filter have to be verified by means of the transfer function and/or the filter has to be designed in accordance with a transfer function.
Requirement D An exact zero-phase relationship between filter input and filter output has to be achieved.
Requirement E Exact analysis up to the boundaries of the time series, that is to say, no boundary value losses.

126 Testing Long Waves in Price and Volume Series
Requirement F Graphical depiction of the long waves over the complete period studied for comparing the dating of individual economic phases and for determining the amplitude characteristics.
Requirement G Since this study intends to present fifty-three long time series in an international comparison, the reasons for the selec-tion of coefficients and parameters used for the analysis must be uniform and as scientifically founded as possible. The stability and precision of the measurements and the uniformity of measuring conditions have to be ensured (reliability).
(a) Component method
• only requirement F is fulfilled; • requirements A, Band G are not fulfilled because of the specifica-
tion problems involved in the determination - based on an econ-omic theory - of the polynomial degrees, length of the supporting reaches and supporting points; and
• unacceptable inability to meet requirements C and D depending on coefficient selection cannot be excluded.
(b) Simple symmetrical moving averages
• A and B are not satisfiable, even with skilful multiple application of such filters;
• requirement C is not fulfilled since the Slutzky-Yule effect and 'filter leakage' occur; and
• requirement E cannot be met since major boundary value losses occur with increasing supporting width.
(c) Spectral analysis
• a prerequisite for applying this method is that requirement A be fulfilled because spectral analysis itself cannot do so;
• requirement F is not satisfied since representation of the changing cycle pattern over the whole period of time studied cannot be combined with statements on amplitude characteristics; and
• G is not satisfiable since no uniform reasons can be provided for criteria of significance, selectio.n of window functions and optimum lag length for all series under study with differing numbers of observations.

Hans 1. Gerster
Trend determination and isolation of long waves with a digital filtering method according to Stier
127
Stier and his coworkers developed a new filtering method which possesses the properties required for the analysis of long waves in an exact and verifiable manner (Cf. Stier, 1981; Metz, 1984; and Ger-ster, 1988; see also chapter 3 by Metz and Stier in this volume).
With this filtering method it is possible to represent the desired movement components which are given by definition, directly in the time domain, for example as a long wave. Only with regard to fulfilment of the above-mentioned requirement E, application of the Stier filter can, in some cases, meet difficulties. The properties of the filter ensure that no cycles are generated by the smoothing process (Slutzky effect) and that the components which are filtered out correspond exactly to those of the original series, both in terms of shape (amplitude) and in terms of position (phase). Using the Stier filter program, the following filter types can be applied with any degree of exactness desired:
Highpass filter: supplies, for example, a trend-adjusted series Lowpass filter: carries out, for example, a trend isolation Bandpass filter: ascertains, for example, a trend and high frequency-free series.
At the same time, band stop filters, multiple band stop filters and multiple notch filters can be applied.
For studying cycles with a 12-60-year duration, I shall choose a bandpass filter because it eliminates not only all high-frequency movements from 1 to 12 years but also all low-frequency elements of the original period from 60 years upwards. This implies that all frequency components contained in the original series of the fre-quency domain 0,0833 ~ f ~ 0, 01667 (time domain 12 ~ t ~ 60 years) remain as a filter output and can be depicted directly as long waves. For the time series thus analysed, the upper and lower turning points, the points-in-time of the trend-passages and the duration of the upswing and downswing phases can then be determined directly.

128 Testing Long Waves in Price and Volume Series
RESULTS
The price index series
The nineteen price series analysed in this chapter do not initially seem to corrobate Kondratieff's hypothesis of a mean cycle length of 4~0 years. With 31 to 56 years the mean wave length is consider-ably shorter. Seven of the seventeen long waves alone are in the range of 31-26 years, another eight in the range 41-45 years. It is, however, remarkable that in the case of almost all series under review a cycle lengthening up to the turn of the century is followed by a marked cycle shortening since the first decade of this century. The accelerating effect of the two world wars on long-term price cycles (effective for the first time in Kondratieff's analysis up to 1924) has consistently been continued in the relatively quick succession of the Second World War. Only with the beginning of the 1950s is an increasing wave length again recognisable.
The peaks of the long price waves obviously reflect post-war inflation in the wake of national and worldwide wars - for the United States, for example, the Second War of Independence 1812-14; the Secession Wars up to 1865; the First and Second World Wars - and, since 1970, the same effect can to some extent be noted as a result of the Vietnam War.
There are some indications of a relationship between the wave length and type of commodity. For example, the raw materials price waves have the shortest mean cycle length and the finished products price waves have the longest, with semi-finished products price waves somewhere in between the two. An international comparison reveals a remarkable parallel of wholesale price waves of the same mean cycle length of 41-44 years between the developed industrialized nations and the peripheral country Spain. The hypothesis of an autonomous development of the periphery (see Broder, 1981) can therefore not be corrobated. A comparison of long price waves for various refined metals reveals both partially parallel lead relation-ships in the nineteenth century (copper) and a direct parallel which becomes increasingly evident since about 1900-1920 for all price waves found. The mean cycle length is in the range of 33-42 years, a duration which might be typical for semi-finished products.

Hans 1. Gerster 129
The time series of real quantities
In general, the empirical evidence of long waves in price indices has been little disputed. Criticism of the long-wave hypothesis was in particular directed against the evidence of long waves in 'real' quanti-ties, such as industrial production, national product, investments and other quantity indicators. However, as can easily be gathered from the graphs and tables in the Annex (see pages 138-45), the long waves found there all along clearly contradict the critics' doubts (see, for example, Van Ewijk, 1982); for all (real) time series depicted and documented clearly reveal long-term upswing and downswing phases, some of which vary in length.
The long waves, which, in general, are very heterogeneous, are shorter than the mean period length of 45-60 years postulated by Kondratieff. By far the greater number of real series have a cycle length of 27-35 years. More than in the case of the long waves in price indices, this shorter mean cycle length is due to their steadily decreasing length, at least up to and during the 1950s. In the case of some series, cycle length increases again a little up to 1980. However, since this countertrend has been going on for such a short period, it is not possible to decide whether or not this increase is significant.
The output and production series with their average cycle length seem to indicate a correlation between type of commodity and length of the cycle. My detailed study (Gerster, 1988) shows that the mean cycle length differs significantly according to the degree of finishing. Accordingly, mining and agricultural products, being raw products, have the shortest wave length, with 20-31 years, followed by semi-finished products with 32-41 years. Two finished products (wheat flour and refined sugar) even show longer wave lengths, with 39-55 years. Of course, this is only a preliminary confirmation of the hypothesis that an increasing degree of goods finishing corresponds to an increasing length of the goods cycle. Further research is cer-tainly desirable.
A CLOSER LOOK AT MEAN CYCLE LENGTHS AND TURNING POINTS
I also made an analysis of the mean wave lengths of the 129 time series examined in my 1988 book. From an application of the

130 Testing Long Waves in Price and Volume Series
n,
9
8
7
10 15 20 25 30 35 45 50 55 60 65 70
I Kuznets I Kondratieff I Mean cycle length (years)
Figure 5.1 The frequency distribution of mean cycle lengths
Kolmogoroff-Smirnov test of accommodation it followed that the frequency distribution of the mean cycle lengths correlates closely (significance level: a = 0.01) with a normal distribution. The sample mean is I! = 36.8 years. For the probabilities 95 per cent and 99 per cent, the random scatter for x with normal distribution N(I!; a) = N(36.82; 10.4) reads as follows:
(a) for P = 95%: 35.03 ~ x ~ 38.62
(b) for P = 99%: 34.46 ~ x ~ 39.18.
In the case of (b) this means that the mean cycle length of the unknown aggregate with 99 per cent probability is in the range between 34.46 and 39.18 years. This is slightly less than the 'classical' length of a Kondratieff cycle (45-60 years), although it is still con-siderably longer than a Kuznets swing (15-25 years). The frequency distribution of mean cycle lengths is given in Figure 5.1.
In view of this result, it is now interesting to examine whether the turning points of the waves in the individual series are in some way concentrated in certain periods and, if so, whether the time distribu-tion of turning points is consistent with the classical dating of Kondra-tieff long waves. Figure 5.2 lists the turning points - grouped

Hans J. Gerster 131
Year
n, 14
12 Troughs
(rn. ' 410)
1800 10 20 30 40 50 60 70 80 90 1900 10 20 30 40 50 60 70 80 Year
Figure 5.2 Turning-points distribution (116 series)
according to peaks and troughs - in the form of a discrete distribution for 116 series from 1800 to 1980. The peaks and troughs concentrate as follows:
Peaks Troughs
1803-09 1812-18
1824-30 1835-39
1843-47 (1863-67) intermediate trough
1866-73 1891-97
(1915-23) intermediate trough 1917-22
1933-45 1948-57
1964-71

132 Testing Long Waves in Price and Volume Series
Excluding the two intermediate troughs of 1863-67 and 1915-23, the corresponding alternation between the frequency of peaks and troughs is very interesting:
No. of peaks No. of troughs
1812-18: 11 0 1824-30: 1 17 1835-39: 8 4 1843-47: 0 13 1866-73: 39 8 1891-97: 6 47 1917-22: 53 13 1933-45: 40 75 1948-57: 46 32
From the above it follows that there are indeed alternations between periods with frequently-occuring peaks and rarely-occuring troughs, and vice versa. It is interesting to compare these periods with the 'classical' dating of turning points by Kondratieff (1926, p. 590):
Upper turning points: 1810-17 1870-75 1914-20 Lower turning points: 1844-51 1890-96
It seems that in the period before the 1840s, the results shown in Figure 5.2 are ambiguous: on the one hand, the peaks around 1812-18 are consistent with Kondratieff's periodisation. On the other hand, the peaks around 1835-39 and the troughs around 1824-30 do not fit with Kondratieff's scheme. However, from the 1840s onwards, all peaks and troughs in Figure 5.2 are reasonably close to Kondra-tieff's turning phases, that is, my 1843-47 troughs come close to Kondratieff's above-quoted dating of the lower turning point from 1844-51, and my peaks in the end 1860s deviate only a little from his 1870-75 turning phase. Also, his 1890-96 trough and his 1914-20 peak periods are well supported by Figure 5.2. In interpreting the series around the two world wars, one should, of course, be cautious, since the various series may, to a different degree, have been in-fluenced by these wars. None the less, it is tempting to continue Kondratieff's above-quoted dating of long waves to the present. In this case, Figure 5.2 suggests that we should take the period around the Second World War as another trough period, the 1950s as a peak

Hans J. Gerster 133
period, and the early 1970s as another trough period. From the above we can conclude that it remains doubtful from my
analysis whether the Kondratieff long wave-scheme indeed holds for the period of early industrialisation. However, for Kuznets' period of 'modern economic growth' from the mid-nineteenth century on-wards, our analysis seems to support Kondratieff's scheme.
The above conclusions could be criticized because Figure 5.2 covers price as well as volume series. Therefore in Figures 5.3 and 5.4 we consider the distribution of price and volume series separately. These figures show significant cumulations of peaks and troughs for both types of series. The price series in Figure 5.4 show stronger peak and trough cumulations than do the real volume series in Figure 5.3. This may have to do with the greater homogeneity of the price series as opposed to the volume series: about 82 per cent of the price series from (only) five nations are UK and USA series, whereas the share of British and United States series in the real quantity series (from sixteen nations) is only 42 per cent. Figure 5.5 lists the frequencies of peaks and troughs from the eight British and eighteen United States
n,
Peaks 12
10
1800 10 20 30 40 50 60 70 60 90 1900 10 20 30 40 50 60 70 60 Year n,
14
12
10 Troughs
1800 W ~ ~ 40 50 60 ro 60 90 1900 W ~ ~ 40 50 60 ro 60 Year
Figure 5.3 Turning-points distribution (57 series): real quantities

134 Testing Long Waves in Price and Volume Series
n,
12
10
i 8
I 8
! J 4
2
14
12
Peaks
V •• r
Troughs
1800 10 20 30 40 50 50 70 80 90 1800 10 20 30 40 50 80 70 80 Veo'
Figure 5.4 Turning-points distribution (59 series): price series
real volume series separately. Twenty-four series only may not be representative. None the less, in Figure 5.5 clear cumulations of peaks and troughs can be discerned.
Comparison of the peaks and troughs of the price and real quantity series shows the following remarkable lead-lag structure:
• peak phases of price series show a lead towards the peak phases of real volume series of 3 to 7 years;
• trough phases of price series, however, show a lag behind the trough phases of real volume series of 3 to 9 years.
This suggests that not only in short-term business cycles (see Gerster, 1984) but also in long waves, the behaviour of prices is countercycli-cal. That is, price inflation seems not to occur - as one would expect theoretically - in phases of (over-heated) booms, but in periods of stagnation. A more detailed examination of this hypothesis would require a pairwise comparison of price and volume series of individ-ual goods. Unfortunately, my data set does not allow that to be done.
In Figure 5.3, the real quantity series show more cumulations of

Hans J. Gerster 135
n,
Peaks 12
10
1800 10 20 30 40 SO 60 10 80 90 1900 10 20 30 40 50 60 70 80 Year n,
14 Troughs
12
10
1800 10 20 30 40 50 60 10 80 90 1900 10 20 30 40 50 60 10 80 Year
Figure 5.5 Turning-points distribution (24 series): real quantities (18 US and 6 UK series)
peaks (around 1870 and 1910) and troughs (around 189011900 and 1920 and 1930/35) which are consistent with the Kondratieff long-wave scheme. However, during the inter-war period and thereafter, the cumulations of peaks and troughs follow in a 15-18 year rhythm, which, at first glance, seems to resemble a Kuznets-swing pattern.
As the fifty-eight real volume series are of quite different product types and national origins, I also investigated whether specific prod-uct series from certain nations were dominant in certain cumulation periods. However, no plausible and consistent result emerged. This also implies that I did not find specific groups of products from certain nations which seemed to be strongly influenced by pre-war armament booms, by the war, or by a post-war reconstruction boom.
However, the combined analysis of product groups by certain groups of countries revealed the following result (compare Figure 5.3):
• the (weak) trough of 1845-50: the European series on coal, iron ore, raw steel and semi-finished steel products are very dominant;
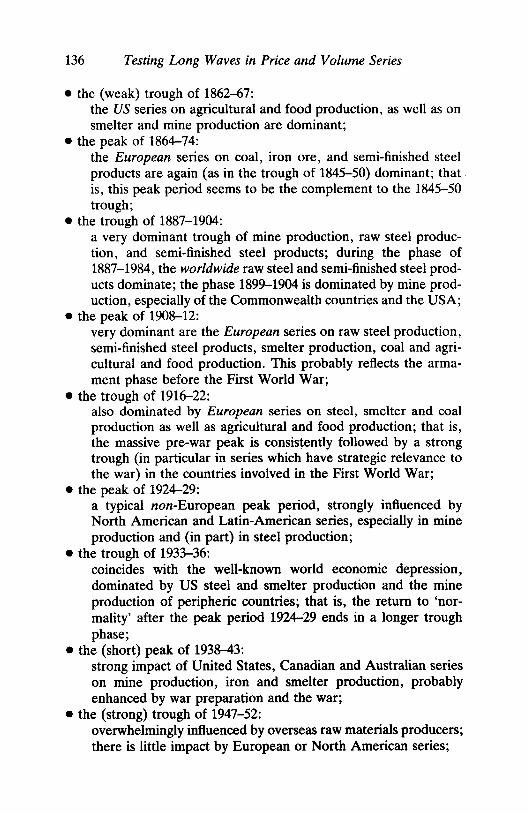
136 Testing Long Waves in Price and Volume Series
• the (weak) trough of 1862-67: the US series on agricultural and food production, as well as on smelter and mine production are dominant;
• the peak of 1864-74: the European series on coal, iron ore, and semi-finished steel products are again (as in the trough of 1845-50) dominant; that is, this peak period seems to be the complement to the 1845-50 trough;
• the trough of 1887-1904: a very dominant trough of mine production, raw steel produc-tion, and semi-finished steel products; during the phase of 1887-1984, the worldwide raw steel and semi-finished steel prod-ucts dominate; the phase 1899-1904 is dominated by mine prod-uction, especially of the Commonwealth countries and the USA;
• the peak of 1908-12: very dominant are the European series on raw steel production, semi-finished steel products, smelter production, coal and agri-cultural and food production. This probably reflects the arma-ment phase before the First World War;
• the trough of 1916-22: also dominated by European series on steel, smelter and coal production as well as agricultural and food production; that is, the massive pre-war peak is consistently followed by a strong trough (in particular in series which have strategic relevance to the war) in the countries involved in the First World War;
• the peak of 1924-29: a typical non-European peak period, strongly influenced by North American and Latin-American series, especially in mine production and (in part) in steel production;
• the trough of 1933-36: coincides with the well-known world economic depression, dominated by US steel and smelter production and the mine production of peripheric countries; that is, the return to 'nor-mality' after the peak period 1924-29 ends in a longer trough phase;
• the (short) peak of 1938-43: strong impact of United States, Canadian and Australian series on mine production, iron and smelter production, probably enhanced by war preparation and the war;
• the (strong) trough of 1947-52: overwhelmingly influenced by overseas raw materials producers; there is little impact by European or North American series;

Hans J. Gerster 137
• the (strong) peak of 1954-59: truly dominant are European series (Belgium, United Kingdom, France and Sweden), especially in coal, smelter, agricultural and steel production. United States series participate below average. This peak period seems to have been the climax of the European reconstruction period after the Second World War;
• the (weak) trough of 1960-64: 92 per cent of all trough series during this period stem from the USA, UK and Australia, especially series on mine, smelter and steel production;
• the (strong) peak of 1966-71: dominated by North American series on steel, smelter and mine production. The above list can be summarised as follows:
European series Peaks: 1864-70 190~12 1954-59 Troughs: 1845-50 1887-94 1916-22 Cycle lengths: 43, 41, 29 and 47 years (mean: 40 years)
US and (in part) Commonwealth series: Peaks: 1875-80 1924-29 193~3 1966-71 Troughs: 1862-67 1899--1904 1933-36 1960-64 Cycle lengths: 37,49,33, 14,28 and 28 years (mean: 32 years).
CONCLUSION
It seems that from the turn of the century up to the Second World War, waves became shorter, and, thereafter, again became longer. In the European series, a Kondratieff pattern appears to be dominant, whereas the series for the USA and the Commonwealth countries may follow in part a Kondratieff and in part a Kuznets swing pattern. The latter may also account for some important phase differences between Europe on the one hand and the USA and the Common-wealth on the other.
However, some of the peak and trough periods during the twen-tieth century may also be due to the world wars. It still needs to be clarified whether those waves which are shorter than the classical Kondratieff periodicity can indeed be ascribed to the mechanism which accounts for the Kuznets swing. An alternative interpretation would be that these Kuznets-type fluctuations are just artefacts, due to disturbances caused by the world wars.

138 Testing Long Waves in Price and Volume Series
102 Series
0.4
0.2
0.0 (40)
-{l.2
1.0
0.5
0.0 (19)
-{l.5
0.4
0.0 (21)
-{l.4 1.0
0.5
0.0 (23)
-{l.5
1.0
0.0 (22)
-1.0 Fuel and lighting
0.2 0.4 0.6 0.8 1.0 1.2 1.4 1.6
Years
Figure S.Al US wholesale price index 1800-1980

Hans J. Gerster 139
102 Series 1.00
0.75
0.50 Spain 1812-1969
0.25
0.00 (37)
--{l.25
--{l.50
--{l.75
0.8
0.4
0.0 (38)
--{l.4
--{l.8
0.4 UK 1801-1969
0.0 (39)
--{l.4
0.4
0.2
0.0 (40)
--{l.2
--{l.4
0.2 0.4 0.6 0.8 1.0 1.2 1.4 1.6
Years
Figure 5.A2 Wholesale price index (1913 = 1(0)

140 Testing Long Waves in Price and Volume Series
10' Series
0.50 Belgium 1830-1969
0.25
0.00 ~---~-----:;~,,-,L...---t---t--t-r--t-I
-0.25
-0.50
0.8
0.4
0.0
-0.4
-0.8
-1.2
-1.6
0.2
0.1
0.0
-0.1
-0.2
-0.3
-0.4
France 1825-1969
... . Sweden (75) 1859-1969
-UK (76) 1850-1969
0.2 0.4 0.6 0.8 1.0 1.2 1.4 1.6
Years
Figure 5.A3 Output of coal (1000 tons)
(73)
(74)
1.6
1.2
0.8 ~ 0.4
0.0 • : -0.4
-0.8 t -1.2
-1.6
-2.0
102

Hans J. Gerster 141
Series
1.5 - Belgium (110) 106 Tons 12
1.0 1830-1969 ! 8
0.5 4
0.0 ........... ~ 0.0
-0.5 --4
-1.0 .... Russia (112) 106 Tons ,
-8
-1.5 1801-1969 -12
3
~---. ....... -_c...---==~----4--lr-1f---+--+---~ (111)
1.1l
1.2
4 0.8
0.4
.. 0.0
: -0.4
'-0.8
-1.2
1.2 1.4 1.6
Years
Figure 5.A4 Output of pig iron

142 Testing Long Waves in Price and Volume Series
Series 102~ __________________________ ~ ________ ,
0.75
0.50
0.25
France (net national) 1885-1979
0.00 J.-------------::~---_;:__--_t_.
~.25
0.2
0.1 Italy (GOP)
1860-1979 0.0 I---------I~--\---+--+_--+__f
~.1
0.75
0.50
0.25 Sweden (GOP)
1860-1979 0.00 I----------lt----:;f---+--=--t---"'I
~.25
~.50
~.75
0.2
(117)
(118)
(119)
0.0 +----r---.f-. ---':';--+:A:Art-t-+H~-H-""'H· 0.0 ~ . \ ...... '-..
~.2 :~.1
~.4 .... UK (GNP) 1830-1979 j
~.2
~.6
0.2 0.4 0.6 0.8 1.0 1.2 1.4 1.6
Years
Figure S.A5 National/domestic product (real, in constant prices, 1970)

Hans J. Gerster 143
101 I 102
3.0
1.2 2.0
- Belgium (121) 0.8 1840-1979
1.0 0.4
0.0 ! 0.0
-1.0 .... USA (67)
1860-1970 -0.8 -2.0
0.3
4 : .... '\ 0.2
2 - France (122) 1814-1969 ,
0.1
: . • 0.0 0.0
-2 : -0.1
.... UK (125) 1802-1969 ,
-0.2 -4
-0.3 -6
, 0,
" 0.15
0.8 0.50
.. 0.4 0.25
- Sweden (124) 1861-1969
0.00 • 0.0
-0.25 · • ...0.4 · -0.50 · · · -0.8 -0.15 .... Italy (123) 1861-1969 · 0 .... 0
-1.00
0.2 0.4 0.6 0.8 1.0 1.2 1.4 1.6
Years 102
Figure 5.A6 Index (1913 = 1(0) industrial production

......
.j:.
.j
:.
Tabl
e 5.
Al
Ups
win
gs a
nd d
owns
win
gs o
f the
'lon
g w
aves
'
Ave
r.·
Begi
nnin
g of
: Se
ries
cycl
e ",
y.
pro.
re
c. de
p.
",y.
pr
o.
ree.
dep.
",
y.
pro.
re
e. de
p.
",y.
pr
o.
Tee.
de
p.
",y.
pr
o.
rec.
dep.
",
y.
pro.
re
e.
Who
lesa
le p
rice
inde
x 19
U
SA:
Che
mic
als
45
1818
18
23
1855
18
66
1876
18
93
1912
19
19
1931
19
40 1
945
1949
19
55
1969
19
75
21
USA
: Fa
rm p
rodu
cts
33
1808
18
10
1816
182
1 18
27
1834
183
6 18
38
1844
18
57
1867
18
75
1895
19
11
1920
19
29
1937
19
43
1949
19
56
1967
19
73
22
USA
: Fu
el+l
ight
ing
43
1804
18
09
1814
181
8 18
25
1849
18
68
1879
18
95
1914
192
2 19
30
1938
194
1 19
48
1951
19
70
1975
23
U
SA:
Met
als
56
1808
18
13
1820
18
54 1
859
1867
18
75
1894
19
10
1920
19
35
1969
197
4 37
Sp
ain
41
1818
18
24 1
832
1838
18
47
1855
18
61
1883
18
90
1909
191
5 19
23
1934
19
44
1953
19
65
38
Swed
en
43
1863
18
82
1895
19
12
1919
19
26
1933
19
48
1955
39
U
K
44
1803
18
07
1813
18
19
1824
183
6 18
40 1
844
1849
18
54 1
873
1880
18
94 1
912
1920
19
27
1941
19
49
1954
19
70
40
USA
43
18
05
1808
181
5 18
21
1827
185
8 18
67
1876
18
95
1912
19
21
1930
19
39 1
946
1950
19
55
1969
19
74
Who
1esa
le p
rice
(USA
) 26
W
heat
32
18
07
1815
18
21
1826
18
33
1836
183
9 18
45
1851
18
68
1976
18
93
1910
19
19
1927
19
37
1944
19
50
1958
19
66
1973
19
79
28
Suga
r 49
18
04
1808
18
16 1
824
1842
18
59
1866
18
75
1892
191
0 19
20
1929
19
41
1968
32
C
oal a
nthr
acite
31
18
34
1843
18
59
1866
187
4 18
76
1879
188
4 18
89
1913
19
18
1926
19
33
1940
19
51
1957
19
64
1969
Pr
ices
of r
efin
ed m
etal
s 41
U
K:
Cop
per
42
1802
18
07
1817
18
29
1849
185
7 18
64
1893
19
08
1919
19
35
1943
19
49
1952
19
55
1962
19
68
1974
42
U
SA:
Cop
per
41
1865
18
74
1890
19
02
1918
19
29
1943
19
51
1954
19
57
1964
19
69
43
UK: L
ead
35
1811
18
31
1838
18
41
1844
18
47
1849
18
57
1878
18
87
1905
19
20
1928
19
40
1945
19
51
1957
19
64
1971
44
U
SA:
Lead
33
18
20
1826
18
29 1
834
1836
183
8 18
45
1852
18
69
1976
18
95
1902
19
22
1929
19
39
1945
19
51
1958
19
64
1971
45
U
K:
Silv
er
36
1838
18
51
1867
18
84 1
893
1909
19
15
1921
19
29
1937
19
41
1948
19
52
1967
19
72
46
USA
: Si
lver
33
18
62
1897
19
12
1920
19
31
1938
19
42
1949
19
51
1965
19
72
Out
put o
f coa
ls
73
Belg
ium
28
18
35
1850
186
6 18
70 1
875
1878
18
82 1
906
1911
19
17
1925
19
35
1940
19
44
1948
19
54
1961
19
69
74
Fran
ce
27
1828
183
3 18
49
1885
18
90
1907
19
12
1918
192
4 19
29
1936
19
43
1950
19
57
1964
75
Sw
eden
23
18
73 1
885
1904
19
09
1915
19
17
1920
19
30
1936
19
43
1951
19
52
1954
19
59
1963
76
U
K
52
1853
18
61
1869
18
78
1893
19
02
1910
19
18
1944
194
9 19
56
1965
M
ine
prod
uctio
n co
pper
77
A
ustra
lia
31
1844
18
49 1
864
1869
18
85
1893
19
03
1912
19
19
1924
193
2 19
40
1945
19
50
1956
19
62
1967
19
71
1975
78
C
anad
a 29
18
82
1893
19
09
1910
19
12
1924
193
0 19
39
1945
19
51
1968
19
75
79
Chi
le
33
1847
18
65
1880
18
95
1916
19
21
1926
19
31
1933
19
35
1942
19
48
1953
19
72
80
Sout
h A
fric
a 60
18
76
1903
19
10
1929
19
49
1961
19
69
81
USA
30
18
70
1890
19
06
1913
19
29
1934
194
0 19
43
1947
19
52
1967
19
72

Min
e pr
oduc
tion
silv
er
91
Aus
ttalia
18
18
84 1
889
1894
189
9 19
02 1
905
1909
191
4 19
19 1
932
1939
194
4 19
48 1
953
1956
196
0 19
62 1
964
1968
19
70
1975
92
Bo
livia
50
li1
78 1
895
1902
19
16 1
927
1940
195
6 19
71
93
Can
ada
27
1901
19
05 1
912
1921
19
22 1
924
1928
193
4 19
47
1965
19
71
94
Chi
le
29
1852
185
7 18
77 1
883
1894
190
1 19
08 1
917
1924
193
1 19
33 1
935
1940
19
45
1950
197
0 95
M
eXico
33
18
84 1
889
1905
190
9 19
15 1
921
1926
194
4 19
50 1
963
1970
197
4 96
Pe
ru
21
1876
188
0 18
84
1889
190
7 19
09 1
912
1915
191
8 19
25 1
932
1934
193
6 19
39
1941
19
49 1
956
1965
97
U
SA
18
1864
187
1 18
76 1
881
1883
188
6 18
93 1
898
1904
191
1 19
21
1925
19
31
1935
19
40 1
945
1954
19
56 1
958
1961
19
64 1
968
1971
0u1p
Ul o
f pig
iron
11
0 B
elgi
um
34
1831
183
4 18
41 1
857
1869
188
5 19
00 1
905
1909
191
2 19
18 1
922
1929
193
7 19
44 1
963
111
Fran
ce··
35
18
25 1
828
1830
18
36 1
852
1864
188
1 18
99 1
904
1909
191
3 19
18 1
922
1928
193
6 19
45
1954
196
7 11
2 R
ussi
a 41
18
22 1
840
1859
186
9 18
87 1
899
1912
192
2 19
26 1
929
1936
194
0 19
48 1
960
113
Swed
en
34
1838
18
45 1
860
1869
188
6 19
03 1
908
1914
192
1 19
26 1
932
1939
194
4 19
51
1961
196
7 11
4 U
K
32
1838
18
45 1
853
1870
188
5 18
92 1
902
1912
192
0 19
28 1
935
1938
194
3 19
47
1951
19
58 1
966
NaI
ioIIa
IIdom
estic
pro
duct
11
7 Fr
ance
(ne
t nat
iona
l)
57
1902
193
1 19
39
1945
19
69 1
978
118
Ital
y (G
DP)
45
18
62 1
872
1884
189
3 19
02 1
918
1935
194
1 19
48 1
966
1975
11
9 Sw
eden
(GD
P)
56
1863
187
9 18
91
1907
191
5 19
35
1942
196
4 19
71
1978
12
0 U
SA (G
NP)
28
18
95
1900
192
0 19
25 1
929
1935
193
9 19
45 1
951
1958
196
8 19
77
51
UK
(GN
P)
37
1832
18
36 1
853
1873
188
1 18
91
1907
191
4 19
20
1929
193
5 19
41
1947
19
52 1
965
1972
198
0 In
dusir
ial p
rodu
ctio
n. in
dex
1913
= 1
00
121
Bel
gium
27
18
40 1
865
1874
188
3 18
88 1
902
1908
191
1 19
17 1
923
1929
193
8 19
44 1
952
1954
195
6 19
61
1965
19
71
197R
12
2 Fr
IlllC
e 38
18
14
1830
183
9 18
51
1860
18
72 1
879
1894
190
0 19
18 1
922
1930
193
8 19
43 1
961
123
Italy
70
18
66 1
904
1932
193
9 19
48 1
962
124
Swed
en
30
1877
18
90 1
902
1911
19
18
1922
192
6 19
34 1
940
1958
196
3 l2
S
UK
42
18
13 1
823
1833
185
4 18
72 1
881
1889
189
5 19
07 1
912
1918
193
1 19
39 1
945
1960
196
5 67
U
SA
34
1864
186
9 18
86
1899
190
8 19
25 1
929
1934
194
0 19
44 1
950
1958
19
64
Gro
os in
vest
men
t 12
6 It
aly
28
1862
186
5 18
83 1
890
1898
190
4 19
08 1
912
1917
192
2 19
29 1
940
1947
195
6 19
67 1
975
127
Swed
en
52
1867
188
0 18
91 1
904
1926
193
6 19
46 1
960
1969
197
7 12
8 U
K
33
1830
18
37 1
855
1875
188
2 18
90 1
897
1903
190
8 19
14 1
921
1933
193
9 19
45 1
962
1969
197
5 12
9 U
SA
30
1897
190
3 19
24 1
930
1939
194
9 19
52 1
955
1959
19
63 1
969
Not
a:
• av
enge
c:yd
e 1e
ngtb
in y
eats
••
inc
ludi
ng A
lsa<:
e-Lo
rraio
e rv
y.-
ery
pr
o. p
rosp
erity
n:
c. re
cess
ion
I-'
cIep
. dep
ress
ion
~
VI

146 Testing Long Waves in Price and Volume Series
NOTES
1. The following problems must be mentioned in this context: the condi-tion of stationarity of a time series, the choice of the spectral window and of the truncation point (lag parameter) combined with the resolving power of the spectrum and the identification of significant peaks in the spectrum.
2. The expression 'weakly stationary process' is used when the moments of first and second order are independent of time, that is, when E{X(t)} = !let) = !l and the variance cr(t) = cr of the process variables are time-independent constants !l and 0 2 , while the covariance of two variables X(t) and X(t + t) is only a function of the time difference t = t2 - tl • Cf. Fishman (1969) pp. 9ff.; and Granger and Hatanaka (1964) pp. 26ff.
REFERENCES
Adelman, I. (1965) 'Long Cycles - Fact or Artifact?', American Economic Review, vol. 60, pp. 444-63.
Broder, A. (1981) 'Okonomische Zyklen in Uindern der Europaischen Peripherie: Die iberische Halbinsel 1820-1923' in F. Frobel, J. Heinrich and O. Kreye (eds), Krisen in der kapitalistischen Weltokonomie (Reinbek: Rowohlt) pp. 153-167.
Dupriez, L. H. (1963) 'Der "Kondratieff' in der Konjunkturentwicklung seit 1945', Weltwirtschaftliches Archiv, vol. 93, pp. 262-77.
Ewijk, C. van (1982) 'A Spectral Analysis of the Kondratieff-Cycle', Kyklos, vol. 35, pp. 468-99.
Fishman, G. S. (1969) Spectral Methods in Econometrics (Cambridge Uni-versity Press).
Gerster, H. J. (1984) Flexibilitat und Rigiditat in der Preisbewegung. Empiri-sche Untersuchung zum pro- und kontrazyklischen Preisverhalten fur die Bundesrepublik Deutschland im Zeitraum 1949-1978 an Hand der Grund-stottpreise, Erzeugerpreise, Grof3handels- und Einzelhandelspreise (Frank-furt-am-Main, Bern, New York: Peter Lang).
-- (1988) Lange Wellen wirtschaftlicher Entwicklung. Empirische Analyse langfristiger Zyklen fur die USA, Grof3britannien und weitere 14 Indus-triellinder von 1800-1980 (Frankfurt-am-Main, Bern, New York, Paris: Peter Lang).
Goodman, N. R. (1961) 'Some Comments on Spectral Analysis of Time Series', Technometrics, vol. 3, pp. 221-8.
Granger, C. W. J. and M. Hatanaka (1964) Spectral Analysis of Economic Time Series (Princeton, NJ: Princeton University Press).
Hatanaka, M. and E. P. Howrey (1969) 'Low Frequency Variation in Economic Time Series', Kyklos, vol. 29, pp. 752-66.
Jenkins G. M. and D. G. Watts (1968) Spectral Analysis and its Applications (San Francisco).
Kondratieff, N. D. (1926) 'Die langen Wellen der Konjunktur', Archiv fur Sozialwissenschaft und SozialpoUtik, vol. 56, pp. 573-609.
Hans I. Gerster 147
Kondratieff, N. D. (1928) 'Die Preisdynamik der industriellen und land-wirtschaftlichen Waren (zum Problem der relativen Dynamik der Kon-junktur), in Archiv fiir Sozialwissenschaft und Sozialpolitik, vol. 60 (Tn-bingen, 1928).
Metz, R. (1984) 'Zur empirischen Evidenz "langer Wellen"', Kyklos, vol. 37, no. 2, pp. 266-90.
Rostow, W. W. (1975) 'Kondratieff, Schumpeter and Kuznets: Trend Periods Revisited', Journal of Economic History, vol. 35, pp. 719ff.
Schulte, H. (1978) Statistisch-methodische Untersuchungen zum Problem langer Wellen (Dissertation, Ph.D. thesis, University of Bochum).
Schumpeter, J. A. (1939) Business Cycles (New York: McGraw-Hill). Slutzky, E. (1937) 'The Summation of Random Causes as the Source of
Cyclical Processes', Econometrica, vol. 5, pp. 105-46. Stier, W. (1976), 'Die langen Wellen der Konjunktur', Wirtschaftsdienst vol.
12, pp. 637-9. -- (1980) Verfahren zur Analyse saisonaler Schwankungen in okonomi-
schen Zeitreihen (Berlin Heidelberg New York: Springer). -- (1981) 'Saisonschwankungen', Handworterbuch der Wirtschaftswissen-
schaften, vol. 6 (Stuttgart, New York), pp. 535 ff. Stolper, W. F. (1982) 'Schumpeters Theorie der Innovation', Ifo Studien, pp.
261 ff.

Part II Long-Run Profit Rates

6 Long Waves in Profit Rates in Four Countries ANDREY v. POLETAYEV*
PROFIT AND THEORETICAL CONCEPTS OF LONG WAVES
At the present moment we have many different concepts of long waves, and the diversities among them seem to be very substantial. Some authors view these different concepts and theories as compet-ing ones. Others believe (and I share this opinion) that existing concepts are more complementary than competitive and, further-more, that we can find common elements among the main ap-proaches. For example, according to Kleinknecht (1987, p. 206), one such element is the innovation process.
However, in my opinion, there exists an even more important element which links together the main existing theories of long waves. This is the mechanism of profit, which plays a very important, if not the major role, in different concepts. To illustrate this state-ment, let us have a brief look at several well-known groups of theories. Relevant classifications can be found, for example, in Kleinknecht (1987, pp. 20&-8), Goldstein (1988, pp. 21-63), and so on.
First of all, the theories must be mentioned in which the occur-rence of long waves is directly connected with the movements of profits, which in turn are said to depend on the movement of wages, labour costs or distribution of income. In this case, the role of profit is obvious. These concepts are closely related to the theories in which long waves are analysed in connection with fluctuations in social conflicts and with changes within the social, political and institutional characteristics of the society. The distribution of national income between profits and labour compensation is one of the main issues in economic class conflicts, the last being the prime moving force for change in the social and political structures of the society.
The second important group of theories connects long waves with the overaccumulation of capital. The proponents of this approach
151

152 Long Waves in Profit Rates in Four Countries
also recognise (directly or implicitly) the fact that the profit motive is the main cause of the overaccumulation of capital, that is, again the main element of the long-wave mechanism.
Profit also plays a major role in innovation theories, a point I wish to underline especially. This is important in the light of a critique of these theories by Nathan Rosenberg and Claudio Frischtak (1984), who pointed to the absence of an endogenous mechanism in the innovation concepts of long waves. I can respond to their critique by reminding them that the maximisation of profit is the basic motive of entrepreneurial activity. The inability under current market condi-tions, given technologies and products, to earn sufficient profits becomes a stimulus for innovation of products and technologies, which offer the prospect of additional profits to the innovator. In spite of the fact that aspirations for maximum (or additional) profit exist at all times, the impulse for radical innovations occurs only when the rate of profit becomes relatively low, and the risk of going out of business becomes greater than the risk of innovation.
Finally, we may note that profit also plays a key role in Walt W. Rostow's concept of long waves or trend periods. In spite of the fact that the profit variable is not included directly in his model of long waves, it is included in it indirectly as the difference between prices of finished goods and costs of production (Rostow and Kennedy, 1979). It is obvious that a search for maximum profit is the main motive and moving force for developing new sources of mineral and agricultural products, and thus has a very strong influence on the movement of relative prices in the different groups of commodities.
Even this brief review of the major theoretical approaches to the problem of long waves provides us with a basis for a certain opti-mism. These approaches seem to be closely connected through the mechanism of profit, and there are reasons to hope that a majority of existing concepts can be united into a single theory of long waves which will incorporate explanations of the different sides of the long-wave process, the profit motive serving as its prime moving force.
However, at the current stage of research on long waves, we have a serious problem connected with long-term movements of rate of return, that is, the confirmation of the existence of long waves in profit rate. As we have seen, the existence of long-term fluctuations of the rate of return appears to be a crucial element in the majority of long-wave theories. Consequently, the existence of long-term fluctu-ations of the rate of return would be the best proof of the existence of

Andrey V. Poletayev 153
long waves as a whole, and the absence of such fluctuations will put under question the very idea of long waves.
That is why the analysis of long-term dynamics of the rate of profit can be seen as one of the most important tasks of research work in the field of long waves, and the results of this analysis may become crucial to the fate of this theory.
EMPIRICAL RESULTS
Until now the number of empirical estimates of the long-term dy-namics of profit rates remains relatively small. Leaving aside esti-mates for individual years, which are inherently difficult to use in the context of long-wave analysis, we can say that the first works, containing consistent estimates of the rate of return for relatively long periods, were published only in the 1960s. Those are the works of George Stigler (1963), who estimated the rate of return in US manufacturing for 1926-58; Hoffmann (1965), who calculated the rate of return of joint-stock companies in Germany for 1926-38 and in the Federal Republic of Germany for 1950-59; and P. E. Hart et al. (1968), who gave figures for the rate of return for manufacturing in Great Britain for 1920-38 and 1948-62. Those estimates were summarised by E. H. Phelps Brown and M. H. Browne (1968), who also made an attempt (not very impressive, however) to construct some proxies of the rate of return for longer periods of time, using data on national income and capital stock, made by Hoffmann for Germany and Charles Feinstein for Great Britain.
An article by William Nordhaus (1974) stimulated publication in the 1970s and 1980s of a large number of works containing alternative estimates of the profit rate in the post-1945 US economy. These publications in turn served as an impetus to construct estimates of the rate of return in European countries and Japan (Hill, 1979; Chan-Lee and Sutch, 1985). As a result, profit-rate estimates became part of the official Organisation for Economic Co-operation and Development (OECD) statistics. In addition I can mention estimates for four countries made by Reati (1980, 1981, 1986a, 1986b, 1986c), and for nine countries provided by an international group of researchers (Holland (ed.), 1984).
However, a tiny portion of the large number of papers published in recent years deal with really long periods of time. The majority of the authors, even those who analyse profit movement in the long-wave

154 Long Waves in Profit Rates in Four Countries
context, limit themselves to the post-1945 period (Reati, 1986b; Kleinknecht, 1986). Among the few exceptions are estimates made for the US by Stanislav Menshikov and Larissa Klimenko (1985), G. Dumenil and D. Levy (1988) and Anwar Shaikh (chapter 7, this volume), and for France by Fontvieille (1987).
While constructing my estimates, I tried to follow several method-ological principles. First, in the nominator of the rate of return I included profit taxes and interest payments of the profit-producing business units. Second, as a base for my estimates I tried to choose a sector of the economy which on the one hand is sufficiently broad, and on the other is characterised by developed market relations, that is, the use of wage labour and existence of the profit motive. The most obvious examples of such sectors are the corporate sector and the private business non-farm sector. I tried to exclude sectors with a high portion of self-employed persons (agriculture); the government sector (excluding public corporations with a profit motive); and per-sonal services.
The main sources for my estimates were:
• for the UK: Feinstein (1972) and his revised estimates of the capital stock in 1855-80 (d. Matthews et al., 1982; Feinstein and Pollard, 1988);
• for Germany: Hoffmann (1965) and some estimates given in Kuz-nets (1930);
• for the USA: Goldsmith (1955), and Kuznets (1941); • for Japan: Ohkawa and Rosowsky (1973), and Ohkawa and Shino-
hara (eds) (1979). • for most recent decades, we used national official statistical data
and estimates published by the OEeD.
One of the problems of constructing rate of profit estimates is connected with data on capital stock. In most cases statistics give us data only on the stock of fixed capital, which is only a part of the total advanced capital. Using these data, researchers implicitly presume that the proportion of fixed capital in total capital is relatively constant. But in Marxian theory, the movement of the profit rate is closely connected with changes in this proportion. To avoid this contradiction between theory and empirical data I used the following procedure to estimate the rate of profit.
From the Marxian formula of the rate of return,
m p' =---c + v
(1)

Andrey V. Poletayev
it follows, that
m v + m pi = ______ _
c v --+--v+m v+m
since v = (v + m) - m, therefore:
m v + m pi = ________ _
+ (1-~) v + m
c v + m
155
(2)
(3)
In practice, m may be viewed as profits; c as fixed capital plus inventory stock (data on inventories are not always available, but this is not so substantial, because in the long run the ratio of inventory stock to fixed capital is relatively constant); and v + m can be interpreted as national income produced in the relevant sector. Using formula (3) we estimated rates of return for the UK, Germany/FRG, and Japan. For the US there are no direct data on national income in the nineteenth century and beginning of the twentieth. Therefore I calculated the rate of return on tangible assets in the nonfinancial corporate sector and compared my calculations with estimates of rate of return on total assets for given years (see details in Entov and Poletayev, 1987). I must mention, that I used estimates of the year averages of fixed capital stock at replacement costs. Choice of gross or net stock depended upon the existing data on profits - gross or net respectively. Data on profits are mainly coherent with national ac-counts. Details of the methods of estimation of capital and profits can be found in relevant sources. The results of my estimations are presented in Figures 6.1a-6.1d.
The main differences of my estimates from previous ones are as follows. First, I was operating with relatively homogeneous sectors of the economy, which allowed me to avoid biases connected with the decline of the role of the agricultural sector, the decline in the number of self-employed persons, and the growth of compensation paid in the government sector. At the same time I was dealing with broad enough sectors and my estimates are not limited to manufac-turing, which in spite of its importance constitutes only a part of the economy.

(a)
UK
(no
n-fa
rm,
non-
mili
tary
bus
ines
s se
ctor
, grO
$5 r
ate
of p
rofit
J
'850
~.
1815
'9
00
with
out s
tock
app
reci
atio
n in
clud
ing
stoc
k ap
prec
iatio
n
Ie)
Ger
man
ylFR
G (
net
rate
of p
rofit
)
1925
'9
50
1915
'·'1-
----
----
----
----
----
----
----
----
----
----
--,
,. ,. '2
'0
~
o I'll
II -2
-4
-6
-6
-10
-12
+1
----
---,
----
----
--,-
----
-,--
----
---,
----
--,-
----
' 18
50
1875
'9
00
1925
19
50
'Gew
erbe
' sec
tor
(indu
stry
, tra
de, t
rans
port
atio
n, b
anki
ng)
join
t st
ock
com
pani
es
III
busi
ness
non
-far
m s
ecto
r
1975
(b)
US
A (
non-
finan
cial
cor
pora
tions
, ne
t ra
te o
f pro
fit)
1.,,-
------
------
------
------
------
------
------
, 17
U
,. N
U
12
11
10 9
I~ I~
II
/tvv~
I V~A
Vii 'Y
~1 V
U~
1875
19
00
1925
19
50
1975
(d)
Japa
n (p
ri'va
te n
on-fa
rm s
ecto
r. gr
oss
rate
of p
rofit
) in
per
cent
ages
,. ,. '3
12
11 '0
j II Ii I! I\t
l\ I V
' r
""v
I 18~
18'75
19
00
Hh5
19
'50
19'75
Figu
re 6
.1
Rat
es o
f pro
fit i
n fo
ur c
ount
ries,
in p
erce
ntag
es
-U\ 0\

Andrey V. Poletayev 157
Secondly, my estimates for the UK in 1855-80 are based on Fein-stein's revised data on capital stock. The revisions were very substan-tial, which becomes obvious, for example, in the dynamics of the capital/output ratio. According to the initial data, this ratio fell sharply in this period, but according to the revised data, it was relatively stable.
Thirdly, I considered estimates based on Hoffmann's data for the nineteenth century and beginning of the twentieth century as unreli-able. According to this data, the rate of return demonstrated an incredible stability during this period: for more than 60 years, it was equal to 7 per cent plus or minus 0.5 of a percentage point! That is why I used another set of data, which gives a more realistic picture: the data on the rate of return of German joint-stock companies in 1870-1900. These estimates are based on data given in Kuznets (1930, pp. 212-13), and were calculated as unweighted averages of the rates of return in the coal, iron, and machine-building industries.
It is important to mention, that my estimates are not very sensitive to estimation procedures. If I calculate the rate of return in a more traditional way (as the ratio of profits to fixed capital) the dynamics appears almost the same (there are only slight changes in the ampli-tude). The only parameter which has an influence on the estimates in a substantial way is inventory valuation adjustment (stock apprecia-tion in the UK) and capital consumption adjustment. For example, estimates for the UK which include stock appreciation show a long-term trough of the rate of return during the recession of 1929-33, otherwise the trough appears to be in the recesion of 1920-21.
As is shown in many works, inclusion of inventory valuation adjustment is very important, especially in periods of high inflation. So I tried to include it in my estimates where possible, but unfortu-nately such data are available only after the First World War (or even later).
Lastly, I have to compare my estimates with those published by other authors. Speaking generally, my results coincide with other estimates on the US for the whole period (Menshikov and Klimenko, 1985; Shaikh, chapter 7, this volume) and with the majority of estimates for the post-1945 period for other countries. My estimates also correspond with (or are even based on) data published by Stigler (1963), Hart et al. (1968) and Hoffmann (1965) for the post-I920 period.
I have to mention that my results, being in principle similar to those of Dumenil and Levy (1988), have another dating of global

158 Long Waves in Profit Rates in Four Countries
turning points of the rate of return movement. Their calculations show a peak at the beginning of the 1880s, a trough in the mid-1890s and the next peak in the late 1910s (see Dumenil and Levy, 1988, fig. 19). The divergences from my dating may be explained by the differences in selection of basic data and in the statistical procedures employed.
So, my estimates allow me to conclude that there exist long-wave movements of the rate of return with tentative peaks in the beginning of the 1870s, the beginning of the twentieth century, and in the 1950s (1960s for Japan); and troughs in the 1880s, 1930s and 1970s. Because of the very intensive short-term cyclical fluctuations, exact dating of the long waves in the profit rate remains very tentative. It might be better to speak about the periods of high levels of the rate of return (in the 1860s, 1900s and 1950s) and periods of low levels (1880s, 1920s/beginning of the 1930s, and 1970s/beginning of the 1980s) with periods of transition from low to high level (and vice versa) in between. But in spite of some vagueness connected with the dating of the turning points, we can state that there do exist long-term fluctua-tions of the profit rate with a period of approximately fifty years.
MODELS OF THE FORMATION OF THE RATE OF PROFIT
It is quite obvious that for the analysis of long waves in the profit rate it is insufficient to find wave-type fluctuations of this parameter. It is no less important to investigate the mechanisms modulating these fluctuations. In this context, we can point to several models, which can help us to analyse factors influencing the long-term dynamics of the rate of profit.
Marx's model
This model was proposed by Karl Marx in the context of his analysis of the 'tendency of the rate of profit to fall'. The model is based on equation (1) (see page 154) and can be written as:
MIV p' = CIV + 1 (4)
In this model, movements of the rate of return are determined by the relative changes in the rate of surplus value (MIV) and the organic

Andrey V. Poletayev 159
composition of capital (CIV). One of the basic ideas underlying this model is the presumption of the growth of the productivity of labour. This growth becomes the moving force of the mechanism which leads to both decline and rise in the profit rate.
Let us look first at the denominator, that is, the organic composi-tion of capital. It changes under the influence of the technical and value composition of capital, which are relatively independent:
C Qc c -=--*-V Qv v
(5)
where Qc and Qv are quantities, c and v are values of the units of constant and variable capital.
Due to the growth of labour productivity, the technical composi-tion of capital (QcIQv) increases. But at the same time, productivity growth leads to devaluation of constant capital, to a decrease of its value relative to the value of variable capital, and as a result, to the decline in the value composition (clv) of capital.
The same dual influence of labour productivity growth is reflected in the movements of the numerator, the rate of surplus value. Increase in the technical composition of capital, on the one hand, leads to a relative decrease of the amount of labour used, and on the other offers additional possibilities for a rise in the rate of exploita-tion, mainly through an increase in the intensity of the labour process and growth of relative surplus value, to use Marx's terminology.
The resulting influence of labour productivity growth on the profit rate movement is indeterminate. The latter may rise or fall depend-ing on the specific characteristics of each historical period. But, according to Marx, both rising and falling trends of the profit rate stimulate development of the inner contradictions of the reproduc-tion process. Thus, the decline of the profit rate slows the appearance of new capitals, leads to the formation of excess capital as well as excess labour, overaccumulation of capital, and economic recessions. In turn, prolonged rise of the profit rate inevitably goes along with the growth of exploitation of the working class, makes more serious the problem of realisation, and deepens the break between the mass of produced value and money demand of the working class.
Hence, Marx's model first demonstrates the possibility of both rise and decline in the rate of profit. Secondly, it shows that neither of these two tendencies can develop constantly, precisely because of the contradictions that accompany both of them. Thus, the profit rate

160 Long Waves in Profit Rates in Four Countries
movement must take the form of the alternation of periods of rise and fall, that is, the form of fluctuations. These fluctuations appear both as business cycles and as cycles of more prolonged periods of time.
Macroeconomic model
In this model, factors influencing the rate of profit may be described thus:
(6)
The rate of profit here is a dependent variable of the share of profits in the national income (P / Y) and the output/capital ratio in current prices (Y/ K).
This expression is widely used in the theory of distribution, but there it is analysed in the reverse form: share of profits in national income is viewed as a result of the movements of the rate of profit and capital/output ratio (compare, for example, Feinstein, 1968, pp. 129ff). From our point of view, equation (6) gives a more correct impression of the causal links between the three parameters under consideration.
In Figures 6.2a-6.2d I present my estimates of the rate of return, the share of profits in national income, and the product/capital ratio. These estimates allow me to arrive at the tentative conclusion that the movements of all three variables are synchronous. It means that long waves of the profit rate can be viewed as a result of the long waves in the profit share and output/capital ratio. This makes clear the interrelation of the different concepts of long waves (particularly the distributional concept and the capital overaccumulation concept).
But the proposition of the synchronous movement of all three variables cannot be considered to be proven. Such synchronisation is not observed in all countries and time periods. It can be seen most distinctly in the UK; in other countries this synchronisation only appeared to start from the 1920s, that is, in the last long wave. We may also note that long-wave fluctuations are more obvious in the movement of profit shares than in the output/capital ratio. However, this fact may be connected not with economic factors, but with relative unreliability of the capital estimates for the nineteenth cen-tury and the beginning of the twentieth. We cannot exclude the possibility of finding more distinct long wave fluctuations in the output/capital ratio after constructing more precise capital data. The
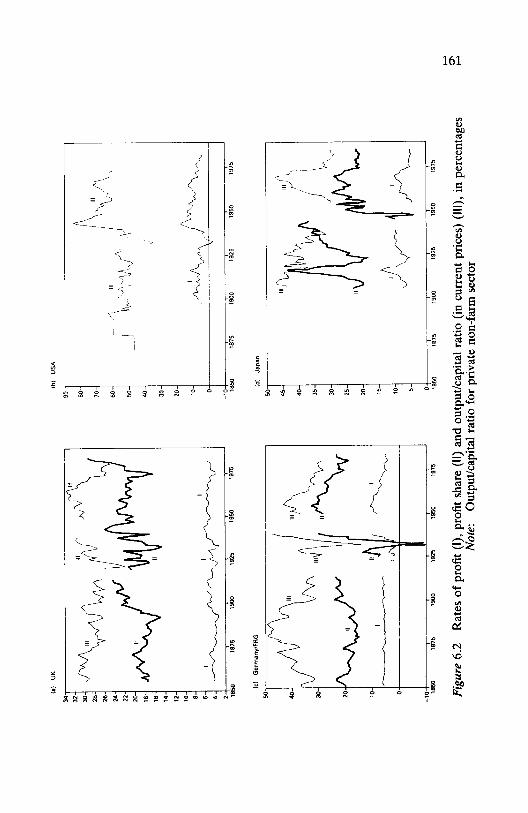
(a)
UK
34r-~=:~~~----~--------~----------~~-----
321 :
JVv'\
. "' A
(\
;V"
,rVI "
' ~
~V ~
~~
24 ::~, V
16 I.
12
10 8
, "
~"~
2 Iii iii
1850
18
75
1"90
0 19
25
1950
19
75
(e)
Ger
man
y/FR
G
~ . /'
J~,,~
. 3
0'V
Y
V ~
10
~
"'!\
"~
~
181;
1 19
00
-1~J
50
._L_
._ ... ~
__ In
l'
J _
1925
19
50
1975
(b)
US
A
90j 80
70
J\
;~\"' '"
1 II!
,~}
\
~\,"'\ ~
V A
J
-'"
o "o
J 1\
' 60
r __ -
.J 50
40
30
20
10
-10 18
50
1875
(d)
Japa
n
50
45
40
35
30
25
20
15
10 :L
18
50
1875
, ."
",-"
, f~~~
1900
19
25
1950
19
75
"' (\ f
Jv~
.--
I T
1900
19
25
1950
19
75
Figu
re 6
.2
Rat
es o
f pro
fit (
I), p
rofit
sha
re (I
I) an
d ou
tput
/cap
ital r
atio
(in
cur
rent
pric
es)
(III),
in
perc
enta
ges
Note:
O
utpu
t/cap
ital r
atio
for
priv
ate
non-
farm
sec
tor
..... 0"- .....

162 Long Waves in Profit Rates in Four Countries
revision of Feinstein's initial capital data for the UK serves as an example for such a possibility.
A microeconomic model
In this model, rate of profit movement is determined by the equation:
(7)
where P f S is the share of profits in sales (or share of profit in price); and Sf K is the rate of velocity, or capital turnover. This model is most close to real business practice and to the movements of costs and prices, and reflects changes in market conditions.
The parameters of this model can be verified only with statistical data for the US. In other countries there are no data on the volume of sales for sufficiently long periods of time.
Figures 6.3a and 6.3b present my estimates of the share of profits in sales in US manufacturing and the non-financial corporate sector. Because of the lack of data we cannot link these estimates directly with capital turnover in these sectors, but the existence of long waves in profits per dollar of sales seems quite obvious. We can assume that in this case long-wave fluctuations of the rate of return are again formed due to the existence of long waves in the movement of the influencing factors.
SEVERAL QUESTIONS FOR FUTURE RESEARCH
The existence of long waves in profit rates give strong support to the idea of long-term fluctuations in the economy as a whole. At the same time, the movement of profit rate raises several questions connected with a theory of long waves. In this section I will briefly discuss some of these questions, in order to stimulate debate in this field.
Rate of profit and interest rate
Some researchers of long waves believe that in the long run, profit rates move synchronously with interest rates (see, for example, Man-del, 1980, pp. 11ff.). My estimates do not confirm this hypothesis (see Figures 6.4a and 6.4b). Rates of profit and interest rates move in

.I'~
I-=M
:.n=
~:==
"=rl
=~~ __
____
____
____
____
____
____
____
____
, ;~
T 11
to
9 8 7 6 S 4 3 2 1 ~'~I--------------------~II--------------1
-2
-3
-41 18
50
1S/b
19
00
1925
19
50
1975
I w
ithou
t adj
ustm
ents
II
with
inve
ntor
y va
luat
ion
and
capi
tal c
onsu
mpt
ion
adju
stm
ents
(b)
Non
-fin
anci
al c
orpo
ratio
ns
12TI
----
----
----
----
----
----
----
----
----
----
----
--,
11
10
4 3 1850
18
75
I w
ithou
t ad
just
men
ts
1900
19
25
II w
ith in
vent
ory
valu
atio
n an
d ca
pita
l con
sum
ptio
n ad
just
men
ts
1950
19
75
Figu
re 6
.3
Prof
its p
er d
olla
r of
sale
s in
the
US
econ
omy,
in p
erce
ntag
es
Ie)
UK
1S,
K
14
13 12 11
10 21
i i
1850
18
75
1900
I
rate
of
prof
it II
yiel
d on
gov
ernm
ent c
onso
ls
1925
19
50
1975
18~:
b~I~
US~A
~---
----
----
----
----
---~
----
----
----
~ 17
16
15
14
13
12 11
10 9 8 7 6 5 4 3 2 :,
II
-1
-2 ·-3+' ----,----:r-:-----:::'::---;;s:----~-
1850
18
75
1950
19
75
1900
19
25
I ra
te o
f pr
ofit
II yi
eld
on h
igh-
grad
e m
unic
ipal
bon
ds
Figu
re 6
.4
Rat
es o
f pro
fit a
nd in
tere
st r
ate,
in p
erce
ntag
es
.......
0\
\H

164 Long Waves in Profit Rates in Four Countries
counterphase with a relatively small (by historical standards) shift of several years.
Let us remember that my estimates of profit rates include interest payments in the numerator. Hence the difference between the dy-namics of profit and interest rates cannot be explained merely by changes in distribution of the surplus value between profit and interest.
It is worth mentioning that relative movements of profit rates and interest rates in the long run largely resemble the picture of their movements in business cycles. In the latter case, they move in counterphase with a shift of several months. The minimum interest rate is usually observed in the middle of the business cycle upswing, and maximum profit rate in the last third of the upswing phase. Consequently, the maximum interest rate is reached at the beginning of the recession phase, and the minimum profit rate at the end of the same phase.
The problem of the relations between profit and interest rate movements once again raises the question of differences and similari-ties between business cycles and long waves. Another interesting question is the relation of both profit rates and nominal interest rates to the movement of rt:al interest rate.
The rate of profit as a regulator of economic activity
Traditionally it is presumed that one of the main roles of the profit rate in the long-wave mechanism is connected with its influence on the investment and innovation processes. But these relationships appear to be rather tricky.
For example, according to common sense the maximum of innova-tion activity ought to be observed in periods of high profit rates, which indicate good prospects for economic growth and good finan-cial opportunities for introducing new techniques and technologies, and producing new products. During the recession periods the low rate of profit ought to depress innovative activity as its prospects and opportunities of realisation are very questionable.
But in practice we meet with the opposite situation. A low rate of profit stimulates innovations and a high rate of profit depresses them. This fact can be explained, first of all, by the differences in innova-tions structure. We can assume that basic innovationS", which are connected with radical changes in the production process, are very risky and under 'normal' conditions are avoided by entrepreneurs.

Andrey V. Poletayev 165
Only when the profit rate reaches a very low level and the risk of going out of business becomes greater than the risk of introducing basic (radical) innovation, the need for the latter becomes obvious.
But a 'strange' relationship between profit rates and innovation activity can be also explained by the difference between realised and expected profits.
The same situation is true of the long-term changes of investment activity. From one side, the massive new investments, which take place in the periods of low profit rates (as at the end of 1970s/ beginning of the 1980s) can be explained by changes in the structure of investment (growth of the proportion of net investment in its gross volume). From another side, here we meet again the difference between realised and expected profits. This difference appears to be very important not only in theory, but also in practice.
The problem of endogeneity
In the literature on long waves there exist two different positions on the problem of endogeneity of long waves in profit rates. The first one is represented by Mandel (1980), who believes that only the transition from an upward to a downward movement is caused by endogenous (economic) factors, and, in the trough of long waves, the rate of profit begins to rise only as a result of exogenous (non-economic) forces. The second position is represented, for example, by Menshikov (1987, and Chapter 9 in this VOlume), who believes that fluctuations of profit rate are generated endogenously during the entire long wave.
Our previous discussion of the different models of the rate of profit formation supports the second point of view. Long-wave fluctuations of the profit rate (including the switch from a downward to an upward movement) are caused by processes endogenous to the economic system.
A special role in this mechanism is played by economic recessions. It is well known that in the course of business cycles a recession gives an impulse to a period of cyclical growth of the profit rate. The same is true in the long run: periods of prolonged growth of the rate of profit start after the most severe and destructive economic recessions ('great depressions') which can be called 'trans-cyclical'. An econ-omic crisis solves current contradictions of the reproduction process and establishes a stimulus for the restructuring of the economy. Thus, in so far as we believe that economic crises are caused by endogenous

166 Long Waves in Profit Rates in Four Countries
factors, we have to conclude that the long-term rise of the profit rate is also caused by endogenous forces.
Until now I was speaking only about the economic system. But I believe that the mechanism of long waves includes changes not only in economic, but also in social and political structures, all of which are closely interrelated. In this sense, even factors which are exogen-ous to the economic system may be viewed as endogenous par-ameters of the whole socioeconomic system. That is why I support approaches orientated to the analysis of interrelations between differ-ent sub-systems of society (see, for example, Gordon et al., 1982, Goldstein, 1988).
As I mentioned at the beginning of the Chapter, long waves of profit rates can serve as a basis for integration of different economic concepts of long waves. I consider such an integration in general (including not only purely economic concepts, but also social and political ones) to be one of the most promising lines of future research on long waves.
NOTE
* I would like to thank Charles Feinstein for his useful remarks on an earlier draft of this chapter.
REFERENCES
Chan-Lee, J. H. and H. Sutch (1985) 'Profits and Rates of Return in O.E.C.D. Countries', OECD Working Paper no. 20 (Paris: OECD).
Dumenil, G. and D. Levy (1988) 'Theory and Facts. What Can We Learn From a Century of History of the U.S. Economy?' (paper presented at the International Conference on Regulation Theory, Barcelona, Spain).
Entov, R. M. and A. V. Poletayev (1987) 'On the Long-Term Dynamics of the Rate of Return' in T. Vasko (ed.), The Long-Wave Debate (Berlin: Springer Verlag).
Feinstein, C. H. (1968) 'Changes in the Distribution of the National Income in the United Kingdom Since 1860' in 1. Marchal and B. Ducros (eds), The Distribution of National Income (London: Macmillan).
-- (1972) National Income, Expenditure, and Output of the United King-dom, 1855-1965 (Cambridge University Press).
Feinstein, C. H. and S. Pollard (eds) (1988) Studies in Capital Formation in the United Kingdom, 1750-1920 (Oxford: Clarendon).
Fontvieille, L. (1987) 'The Labor Force in Long-Term Fluctuations', Review, vol. X, no. 3, pp. 535-55.

Andrey V. Poletayev 167
Goldsmith, R. W. (1955) A Study of Saving in the United States, 3 vols (Princeton, NJ: Princeton University Press).
Goldstein, J. S. (1988) Long Cycles: Prosperity and War in the Modern Age (New Haven, Conn.: Yale University Press).
Gordon, D. M., R. Edwards and M. Reich (1982) Segmented Work, Divided Workers: The Historical Transformation of Labor in the United States (Cambridge University Press).
Hart, P. E. et al. (1968) Studies in Profit, Business Saving and Investment in the United Kingdom, 1920-1962, vol. II (London: George Allen & Unwin).
Hill, T. P. (1979) Profits and Rates of Return (Paris: OECD). Hoffmann, W. G. (1965) Das Wachstum der deutschen WirtschaJt seit der
. Mitte des 19. Jarhunderts (Berlin: Springer Verlag). Holland, D. M. (ed.), (1984) Measuring Profitability and Capital Costs: An
International Study (Lexington, Mass.: Lexington Books). Kendrick, J. W. (1961) Productivity Trends in the United States (Princeton,
NJ: Princeton University Press). Kleinknecht, A. (1980) 'Oberlegungen zur Renaissance der Langen Wellen
der Konjunktur ("Kondratieff-Zyklen")' in W. H. SchrOder and R. Spree, (eds), Historische Konjunkturforschung (Stuttgart: Klett-Cotta) pp. 316-38.
Kleinknecht, A. (1986) 'Long waves, depression and innovation' in De Economist, vol. 134, pp. 84-108.
-- (1987) Innovation Patterns in Crisis and Prosperity: Schum peter's Long Cycle Reconsidered (London: Macmillan).
Kuznets, S. S. (1930) Secular Movements in Production and Prices (Boston: Houghton Mifflin).
-- (1941) National Income and Its Composition, 2 vols (New York: NBER).
Mandel, E. (1980) Long Waves of Capitalist Development: The Marxist Interpretation (Cambridge University Press).
Matthews, R. C. 0., C. H. Feinstein and J. F. Odling-Smee (1982) British Economic Growth, 1856-1973 (Stanford, Cal.: Stanford University Press).
Menshikov, S. M. (1987) 'Structural Crisis as a Phase in Long-Term Econ-omic Fluctuations' in T. Vasko (ed.), The Long-Wave Debate (Berlin: Springer Verlag).
Menshikov, S. M. and L. I. Klimenko (1985) 'On Long Waves in the Economy' in G. BIanchi, G. Bruckman, and T. Vasko, (eds) , Long Waves, Depression, and Innovation: Implications for National and Re-gional Economic Policy. (Laxenburg, Austria: IIASA).
Nordhaus, W. D. (1974) 'The Falling Share of Profits', Brookings Papers on Economic Activity, no. l.
Phelps Brown, E. H. and M. H. Browne (1968) A Century of Pay: The Course of Pay and Production in France, Germany, Sweden, the UK and the USA, 1860-1960 (London: Macmillan).
Ohkawa, K. and H. Rosowsky (1973) Japanese Economic Growth: Trend Acceleration in the Twentieth Century (Stanford, Cal.: Stanford University Press).
Ohkawa, K. and M. Shinohara (eds) (1979) Patterns of Japanese Economic Development: A Quantitative Appraisal. (New Haven, Conn.: Yale Uni-versity Press).

168 Long Waves in Profit Rates in Four Countries
Reati, A. (1980 and 1981) 'A propos de la baisse tendancielle du taux de profit: analyse desagregee de l'industrie italienne, 1951-1971', Cahiers economiques de Bruxelles, no. 88 (1980), pp. 507-45; (Part One) and no. 89 (1981), pp. 75-108 (Part Two).
-- (1986a) 'The Rate of Profit and the Organic Composition of Capital in the Post-1945 Long Wave: The Case of British Industry from 1959 to 1981', Review, vol. IX, no. 4, pp. 515-7l.
-- (1986b) 'The Rate of Profit and the Organic Composition of Capital in West German Industry from 1960 to 1981', Review of Radical Political Economy, vol. XVIII, nos 1 & 2, pp. 56-86.
-- (1986c) 'Le taux de profit et la composition organique du capital dans Ie cycle long d'apres-guerre: Ie cas de l'industrie francaise de 1959 a 1981', Recherches economiques de Louvain, vol. LV, no. 2, pp. 129-72.
Rosenberg, N. and C. R. Frischtak, (1984) 'Technological Innovation and Long Waves', Cambridge Journal of Economics, vol. VIII, pp. 7-24.
Rostow, W. W. and M. Kennedy (1979) 'A Simple Model of the Kondratieff Cycle', in P. Uselding (ed.), Research in Economic History, vol. IV (Greenwich, Conn.: JAI Press).
Stigler, G. J. (1963) Capital and Rates of Return in Manufacturing Industries (Princeton, NJ: Princeton University Press).
COMMENT
Angelo Reati
Introduction
Andrey Poletayev has considered an interesting and important aspect of the mechanism of long waves, a subject which is controversial and on which there is still sparse empirical evidence; his effort is, thus, particularly welcome.
I have two kinds of observations. The first refers to some short-comings of Poletayev's analysis; the second is methodological, and concerns his computing of the rate of profit.
The analysis
I shall first comment on Poletayev's statement that the rate of profit is the unifying element of the existing (and apparently contradictory) long-wave theories and that 'the existence of long-term fluctuations of the rate of return would be the best proof of the existence of long waves as a whole' (see pages 152-3).
Of course, if we consider the question from such a general point of

Angelo Reati 169
view, all economic theories are unified by the profit motive. A meaningful reference to profits should be precise and help us in a straightforward way to understand the mechanism of long waves. Poletayev is perhaps right in saying that a long-wave pattern in the rate of profit is a proof of the existence of long waves in production. However, I miss a substantiation of this statement. The question to be answered concerns the role of the rate of profit in long-wave movements: are the level and the evolution of profitability the cause or the effect of the long expansion and stagnation? If, for the upper turning point, we can easily accept that the decline in the rate of profit is one of the main causes of the transition to stagnation, then things are much less clear for the lower point.
There are two opposite interpretations. According to Mandel (1980), for a new phase of long-term growth to start it is necessary to have an exceptional and stable increase of profitability, which can result only from some exogenous factors, that is, the lower turning point is exogenously determined.
For the adherents of an endogenous explanation of the lower turning point of the long wave, the rate of profit is the cause of the technological revolution and of the ensuing upswing, but in an opposite sense to that of Mandel. It is not because the rate of profit is high that firms innovate massively, but because it is extremely low and depression is at its deepest point. In this situation, capitalists must choose: either they innovate (and thereby increase profitability) or perish. In this sense the upswing is endogenous (see Gerhard Mensch, 1979; Jaap van Duijn, 1983; Alfred Kleinknecht, 1987; Stanislav Menshikov, Chapter 9 in this volume).
Poletayev seems to ignore the complexity of this question. He does not refer explicitly to Gerhard Mensch's (1979) contribution, al-though he seems to accept it implicitly; he quotes Alfred Kleinknecht (1987), but he does not consider Kleinknecht's discussion of Mensch's theory. He thinks to have demonstrated that long-wave patterns in profitability are generated endogenously on the unsub-stantiated argument that, as in the (short-term) business cycle 'a recession gives an impulse to a period of cyclical growth of the profit rate, the same is true in the long run' (see page 165; my emphasis added). Poletayev confuses here the 'curative' effects of the business cycle with the mechanism of long waves in which, as was shown by Mandel, an exceptional increase in the rate of profit can only be produced by some exceptional (and in this sense 'exogenous') factors.

170 Comment
(See, however, for a different view, the discussion between Mandel and the adherents of an endogenous explanation of long waves, Chapter 13 in this volume).
On pages 158-62, Poletayev presents three models of the forma-tion of the rate of profit. I shall briefly comment here on the first two.
Marx's 'law' of the tendential fall of the rate of profit is presented in a curious way. As we know, for Marx, the increase in the organic composition of capital is a necessary movement and, therefore, the ensuing fall in the rate of profit is of the same nature: a necessity and not just a possibility. Ignoring all the controversies (summarised in van Parijs, 1980), Poletayev says that 'Marx's model first demon-strates the possibility of both rise and decline in the rate of profit. Secondly, it shows that neither of these two tendencies can develop constantly. . . Thus the profit rate movement must take the form. . . of fluctuations' (see pages 159-60). If this is a rejection of the 'law' of the tendential fall of the rate of profit, I agree. But it cannot be presented as Marx's theory!
In the same section there is an error. Poletayev writes that 'due to the growth of labour productivity, the technical composition of capi-tal ... increases' (see page 159). This is the wrong causation: the material basis of productivity increases is technical change, which is reflected in an increase of the technical composition of capital.
Concerning the second model (the 'macroeconomic' one), Pole-tayev says (on page 160) that equation (6) gives a 'correct impression of the causal links between the three parameters under considera-tion'. I note that it is inappropriate to speak of causality in this case. Formula (6) is, in fact, no more than splitting an identity (p = PIK), and this cannot indicate any causal link between the variables, because the same identity could be split in many other ways.
The methodology
The formula of the profit rate Poletayev uses (formulae (1) and (3)) is wrong. In my view, the correct formula for the rate of profit of capital advanced, (that is, the stock of fixed capital and the stock of circulat-ing capital) is the following, in which all magnitudes are at current prices:
p= ----= s s (I)
K+IV K+(W~II)

Angelo Reati
where:
S = net profits = VA - D - W VA = gross value added D = depreciation, at current replacement costs W = wages and salaries II = intermediate inputs K = stock of net fixed capital at current replacement costs,
average of the year.
171
W = yearly average of stocks of raw materials, finished goods, and goods and work in progress
r W+II
= rate of turnover of circulating capital = W
(II)
Fixed and circulating capital deserve some comments. Concerning the first, I notice that gross capital stock is not suitable for calculating the rate of profit, because the gross measure is not capital advanced. Indeed, the fraction of fixed capital already accounted for as capital consumption, if it still exists in its physical form, is no longer part of the immobilised funds, as the firm has already incorporated it back into its costs and recovered it within its prices. However, data on net capital stock are not always available. In that case, the evolution of profitability of net capital stock can be proxied by computing the gross rate of profit on (gross) capital stock, as Poletayev does for the UK and for Japan.
Circulating capital requires a more detailed study. (In what follows I draw from Bertrand and Fauqueur, 1978). The stock of circulating capital is formed by the funds which are permanently immobilised in the firm to finance payment of the labour force employed during a period of production, and the means of production other than fixed capital. It differs from the latter because it is entirely recovered at the end of the production and realisation cycle, to be reinvested in it once more. The amount of circulating capital advanced thus depends on technical aspects (length of the production cycle) as well as on market conditions. This happens when short-run fluctuations in sales make inventories larger than usual, so lengthening the realisation period. The stock of circulating capital must therefore not be confused, for example, with the demands for funds which are simply due to the fact that wages are paid weekly or monthly.
Circulating capital can be considered either at the technical level
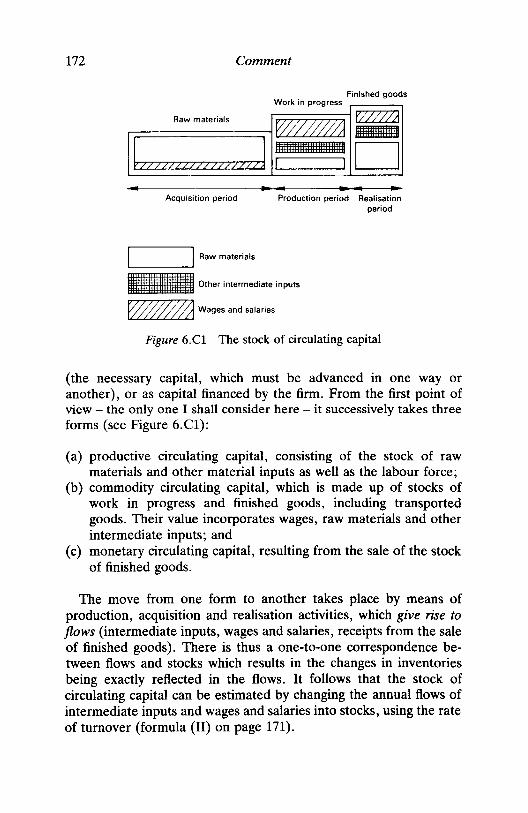
172 Comment
Finished goods Work in progress
Raw materials r.;:::;:;;:;:;::;::;:;::;;:;;i fTl/ffi ,,==============::::::;--1 W /:0" m lliiilililiiiiiiii llllllllllllllllll]
- Acquisition period
iiiiiiiiiliililiiiliiiiliii D ..... .....~
Production period Realisation period
I Raw materials !!!!! Other intermediate inputs
~ Wages and salaries
Figure 6.Cl The stock of circulating capital
(the necessary capital, which must be advanced in one way or another), or as capital financed by the firm. From the first point of view - the only one I shall consider here - it successively takes three forms (see Figure 6.Cl):
(a) productive circulating capital, conslstmg of the stock of raw materials and other material inputs as well as the labour force;
(b) commodity circulating capital, which is made up of stocks of work in progress and finished goods, including transported goods. Their value incorporates wages, raw materials and other intermediate inputs; and
(c) monetary circulating capital, resulting from the sale of the stock of finished goods.
The move from one form to another takes place by means of production, acquisition and realisation activities, which give rise to flows (intermediate inputs, wages and salaries, receipts from the sale of finished goods). There is thus a one-to-one correspondence be-tween flows and stocks which results in the changes in inventories being exactly reflected in the flows. It follows that the stock of circulating capital can be estimated by changing the annual flows of intermediate inputs and wages and salaries into stocks, using the rate of turnover (formula (II) on page 171).

Angelo Reati 173
Let us now compare my formula (I) with Poletayev's formula (1). His term c is correctly defined, and is equivalent to my K + IV. However, deciding to take full consideration of capital advanced (and just not fixed capital) Poletayev adds, in the denominator of his formula 1, the flow of wages. This wrong formula implies that the level of the rate of profit is reduced and its fluctuations are amplified. This does not mean that, had Poletayev used the right formula, the long-wave movement in profitability would have disappeared. His evidence is only slightly biased. However, I regret that the well-known uncertainties surrounding statistical data (especially long-term series) are here increased by a conceptual insufficiency.
I also note, in passing, that what Poletayev says on pages 154 and 155 about circulating capital is contradictory. In fact, after having stated, on page 154, that 'in Marxian theory, the movement of the profit rate is closely connected with changes in [the] proportion' of fixed capital in total capital, on page 155 he adds that 'in the long run the ratio of inventory stock to fixed capital is relatively constant'.
There is also a confusion on page 162, where Poletayev calls 'the rate of velocity, or capital turnover' the ratio of sales to the stock of fixed capital. I do not understand the meaning of this notion which, of course, has nothing to do with the rate of turnover of circulating capital. If we had to define a rate of turnover of fixed capital, we should take gross capital stock with respect to depreciation.
References
Bertrand, H. and A. Fauqueur (1978) 'Rotation du capital circulant et rentabilite', Revue economique, no. 2, pp. 291-331.
Duijn, J. J. van (1983) The Long Wave in Economic Life (London: George Allen & Unwin).
Kleinknecht, A. (1987) Innovation Pattems in Crisis and Prosperity: Schum-peter's Long Cycle reconsidered (London: Macmillan).
Mandel, E. (1980) Long Waves of Capitalist Development. The Marxist Interpretation (Cambridge University Press and Paris: Ed. de la Maison des Sciences de I'Homme).
Mensch, G. (1979) Stalemate in Technology. Innovations Overcome De-pression (Cambridge, Mass.: Ballinger).
Parijs, Ph. Van (1980) 'The Falling-Rate-of-Profit-Theory-of-Crisis: a Rational Reconstruction by Way of Obituary', Review of Radical Political Economics, vol. 12, no. 1, pp. 1-16.

7 The Falling Rate of Profit as the Cause of Long Waves: Theory and Empirical Evidence ANWAR SHAIKH
INTRODUCTION
Capitalist accumulation is a turbulent dynamic process. It has power-ful built-in rhythms which conjunctural factors and specific historical events only serve to modulate, as long as they remain within the capitalist rules of the game. Any analysis of the concrete history of capitalist accumulation must therefore distinguish between the in-trinsic patterns of capitalist accumulation, and their particular histori-cal expression.
Business cycles are the most visible elements of capitalist dy-namics. A fast (3 to 5-year inventory) cycle arises from the perpetual oscillations of aggregate supply and demand, and a medium (7 to lO-year fixed capital) cycle from the slower fluctuations of aggregate capacity and supply (Shaikh, 1989a, 1989b). Underlying these busi-ness cycles is a much slower rhythm consisting of alternating long phases of accelerating and decelerating accumulation which form the 'basic curve of capitalist development'. The various business cycles are articulated into this basic curve, and are modified by it (Mandel, 1975, pp. 126-7). Conjunctural influences and historical events feed into these intrinsic patterns. The stage upon which capitalist history is played out is always on the move.
Marx recognised that the analysis of the rate of profit is crucial because capitalist accumulation is driven by profitability. In recent times, Ernest Mandel has pioneered a return to Marx's emphasis on the laws of motion of capitalist accumulation, and on the centrality of the rate of profit (Mandel, 1975, 1978, 1980). In particular, he has argued that what we perceive as 'long waves' in various economic variables are the expressions of alternating long phases of accelerated
174

Anwar Shaikh 175
and decelerated accumulation which are tied directly to correspond-ing fluctuations in the rate of profit (Mandel, 1980, ch. 1). In the throes of a long depression, some positive combination of 'exogen-ous extraeconomic factors' triggers a sudden rise in the rate of profit, and this sets off an accelerated phase in accumulation (Man-del, 1980, p. 24). During this phase, two things happen: the organic composition of capital rises as capitalists invest in new and more capital-intensive technology; and the rate of surplus value rises as productivity growth generally outstrips the growth in real wages. The growth in the rate of surplus value initially outpaces the growth in the organic composition, so that the rate of profit continues to rise. But eventually national reserve armies begin to dry up, real wage growth accelerates, and the rate of surplus value begins to slow down and perhaps even stagnate. Now the effect of a rising organic composition of capital becomes dominant, the rate of profit falls, and the economy enters a long decelerated phase of accumulation (Mandel, 1980). On the whole, 'long waves of accelerated and decelerated accumulation' are direct expressions of corresponding 'long waves in the rise and decline of the rate of profit' (Mandel, 1980, p. 15).
My argument is similar to Mandel's, with one crucial difference. Mandel's is a long-wave theory based on up-and-down movements in the rate of profit. In contrast to this, I have long argued that Marx's theory of a secularly falling rate of profit provides a natural founda-tion for a theory of long waves (Shaikh, 1978, 1984; 1987a, 1987b). In what follows, I will first briefly outline the steps in this thesis, and then develop and analyse data on the long-run tendency of the rate of profit in the USA from 1899 to 1984. My aim is to identify the strong forces generated by capitalist accumulation, so as to provide an adequate foundation for subsequent analyses of its economic history.
LONG WAVES AND THE THEORY OF THE FALLING RATE OF PROFIT
The basic elements of the theory of the falling rate of profit can only be sketched here, due to limitations of space. Details are in the various references provided at the end of the chapter.
As noted earlier, capitalist accumulation is characterised by cycli-cal fluctuation around a long-term curve. Conjunctural factors and particular historical events then modify both cycle and trend. The overall movement of the rate of profit reflects all of these influences.

176 The Falling Rate of Profit as the Cause of Long Waves
The present discussion concerns the forces which determine the underlying trend, the 'basic curve', of capitalist accumulation. This requires us to distinguish between the basic rate of profit r* corre-sponding to this underlying trend, and the actual rate of profit r which is the synthesis of the trend and all other factors. The basic rate may be defined as the rate of profit which obtains at some standard rate of capacity utilisation. Oscillations and other variations in the balances between aggregate demand, supply, and capacity, as well as changing trends in shift work, will then show up as fairly large movements in capacity utilisation which cause the actual rate of profit r to fluctuate around the slowly changing basic rate r*. Capacity utilisation thus plays a central role in medium- and short-term movements (Marris, 1984).
Karl Marx, like Adam Smith and David Ricardo before him, believed that the basic rate of profit tended to fall over time. His analysis of this tendency begins from the observation that the desire for profits is unlimited. This desire drives each capital to struggle against labour and against other capitals. The struggle of labour manifests itself in the mechanisation of production, in which workers are replaced by machines in order to raise the productivity of labour. But this increased productivity of labour can only be realised in the struggle against other capitals if it is expressed as a lower unit cost of production.
As a general rule, such lower unit costs of production are achieved at the expense of greater fixed capital tied up per unit output (and hence the capitalisation of production). To put it in the language of microeconomics, capitalist production displays an inherent tendency towards lower average variable and average total costs, at the ex-pense of higher average fixed costs.
Individual capitalists take advantage of the lower unit costs af-forded by a new method of production by lowering their prices and expanding their market share. To quote Marx: 'The battle of com-petition is fought by the cheapening of commodities' (Marx, 1867, vol. I, ch. 25, p. 626), in which 'one capitalist can drive another from the field and capture his capital only by selling more cheaply' . And 'in order to be able to sell more cheaply without ruining himself, he must ... raise the productive power of labor as much as possible', which in turn is achieved 'above all, by a greater division oflabor, by a more universal introduction and continual improvement of machin-ery' (Marx, 1867, p. 89). Aggressive price-setting and price-cutting behaviour is therefore inherent in capitalist competition. This simple

Anwar Shaikh 177
fact can be shown to completely invalidate the so-called Okishio Theorem.!
The mechanisation and capitalisation of production lead to rising technical, organic, value (CIV), and materialised (C/(v + s» com-positions of capital. Very briefly, the rising capitalisation of produc-tion implies a greater amount of fixed capital tied up per unit output (a rising capital/net output ratio Kly), which in turn implies a rising materialised composition C/(v + s) (Shaikh, 1987a).
A rising materialised composition produces a downward drift in the general rate of profit, even when the rate of surplus value slv is rising faster than the materialised composition of capital C/(v + s). This latter result is quite remarkable. Rosdolsky has shown that Marx's discussion in the Grundrisse already contains the core of this result (Rosdolsky, 1977, chs 16, 17,26, and the appendix to part V). Let s = surplus value, C = total (fixed and circulating constant capital), v = variable capital, and I = v + s = living labour. Then we can write the basic rate of profit as
* s sis I slv I r =-=-.-=---.-= C C v + sCI + slv C
Marx argues that the rate of surplus value tends to rise over time, because real wages will not generally rise as fast as productivity (firms which are forced to hand all the productivity gains of technical change over to workers' wages will not last long as capitalist enter-prises). It is evident from the above expression for the basic rate of profit that even when s/v rises without limit, the ratio (slv)/(J + slv) rises at an ever decreasing rate, since in the limit it approaches 1. Thus, no matter how fast slv rises, the rate of profit eventually falls at a rate asymptotic to the fall of IIC (which in turn is the rate at which the materialised composition of capital CII rises). For any combina-tions of rates of rise of slv and CIl, one can easily show that the basic rate of profit will inevitably fall. To see this, let us assume that both slv and CIl are positive functions of time such that slv = f(t) , f' > 0, f" ~ 0, and CII = F(t), F' > 0, F" ~ 0. Then
slv 1 1 r* = ---- . - = ------- = -------1 + slv C (1 +_1_) (Cll) (1 +_1_) F(t)
slv f(t)

178 The Falling Rate of Profit as the Cause of Long Waves
It is clear from the above expression for the basic rate of profit that asf(t) rises over time, lIf(t) gets smaller and smaller, so that the trend of r* is eventually dominated by the trend of the materialised com-position Cil = F(t). Further analysis is in Shaikh (1984).
A secularly falling rate of profit necessarily produces a 'long wave' in the basic mass of profit, which first accelerates, then decelerates, stagnates, and even falls. Consider the following simple representa-tion (more detail is available in Shaikh, 1987b). The basic mass of profit P* = r* . K, where K = the stock of capital advanced. Assume that the basic rate of profit falls at some given rate a, so that r* = ro *e-at• Then the rate of growth gpo of the mass of profit is
gpo = gr" + gK
where gr" and gK are the growth rates of r* and K, respectively. But from the expression for r*, gr" = -a. Morever, if in general the
rate of capital accumulation is proportional to the rate of profit, so that gK = Se • r, where Se = the capitalists' propensity to save (Ricardo-Marx-Kalecki-Kaldor, and so on), then we may write
gpo = -a + Se • r*
A long upturn comes about precisely when profitability has been restored to the point where the basic mass of profit begins to grow. Thus in the beginning of the long boom, gpo > O. Now, as the rate of profit declines during the long boom (for the reasons elucidated above), and hence gK declines until at some critical level of the basic rate of profit r* * = al se, gpo = O. At this point, the basic mass of profit has become stagnant.
To complete the argument, this analysis of the long wave in the basic mass of profit must be complemented by a corresponding analysis of the path of the actual mass of profit. The difference between depressions and normal accumulation becomes crucial here. In normal accumulation, the actual level of capacity utilisation tends to gravitate around some normal level. But in a depression, accumu-lation is stagnant and capacity utilisation can be below normal for long intervals. Thus the beginning of a long upturn will be attended by a rise in capacity utilisation, until such time as the normal mech-anisms of accumulation cause the rate of capacity utilisation to once again gravitate to around the normal level. The actual rate of profit

Anwar Shaikh
o r = actual rate of profit r* = basic rate of profit
t**
Figure 7.1 Rate of profit
Time 0 P = actual mass of profit p* = basic mass of profit
t**,.
Figure 7.2 Mass of profit
179
Time
may therefore initially rise even when the basic rate may be falling. Moreover, since the actual rate of accumulation is roughly propor-tional to the actual rate of profit, gK too may rise initially. Both the rise in the actual rate of profit and the acceleration in accumulation will serve initially to raise the actual mass of profit faster than the basic mass of profit. Figures 7.1 and 7.2 illustrate this intrinsic dynamic, upon which historical factors then operate. The basic mass and rate of profit are depicted as dotted lines, and the actual mass and rate as solid lines. Note that the basic rate of profit is depicted as rising at the beginning of the long upturn, but then falling throughout the subsequent portion of the long boom into the long downturn. This emphasises the fact that in Marx's theory of the falling rate of profit the transition between long-wave phases is correlated with the movements of mass of profit2 and not with that of the rate of profit (as in Mandel). It also makes it clear that Marx's argument does not exclude secular or conjunctural departures from the dominant ten-dency of the rate of profit to fall.
Marx calls the point of transition from normal accumulation to the crisis phase the 'point of absolute overaccumulation of capital'. It marks a phase change in all the major patterns of accumulation. The exact patterns in the long downturn phase depend on more concrete

180 The Falling Rate of Profit as the Cause of Long Waves
and conjunctural factors involving the credit system, on the role of the state vis-a-vis workers, businesses, and the banks, and on the strength of the class struggle.
The basic trends implied by Marx's argument are summarised below:
• Rising ratios of fixed capital to output and to wages. In Marxian terms, these ratios represent the money-forms of rising material-ised and value compositions of capital, respectively.
• Productivity rising faster than real wages (in Marxian terms, a rising rate of exploitation).
• A falling rate of profit even in the boom years (as opposed to a rising rate throughout the boom, as in Mandel).
• The falling rate of profit leading to an eventual stagnation in the basic mass of profit.
• A stagnation of profit of enterprise signalling the beginning of the crisis phase, in which there is a qualitative change from stability to instability (Shaikh, 1989a).
As we shall see, these are exactly the patterns one finds over two successive long waves in the US.
LONG WAVES AND PROFITS IN THE UNITED STATES, 1899-1984
The preceding analysis requires us to distipguish the basic underlying rate of profit from the actual rate. A secularly falling basic rate gives rise to the 'curve' in accumulation which we perceive as a long wave. This curve will also be reflected in the actual rate, but only as a long-term trend hidden under turbulent and erratic fluctuations due to fast and slow cycles, historical events, and the ever-present anar-chy of capitalist production. Since all this turbulence will be picked up in the rate of capacity utilisation, a good empirical measure of this rate becomes crucial. 3 Such a measure must pick up not only the large fluctuations associated with the cataclysmic events such as de-pressions and world wars and the fairly large ones associated with the fast (3 to 5-year inventory) cycle, but also the more subtle ones associated with the slow (7 to lO-year fixed capital) cycle and with long-term trends in normal shift work.
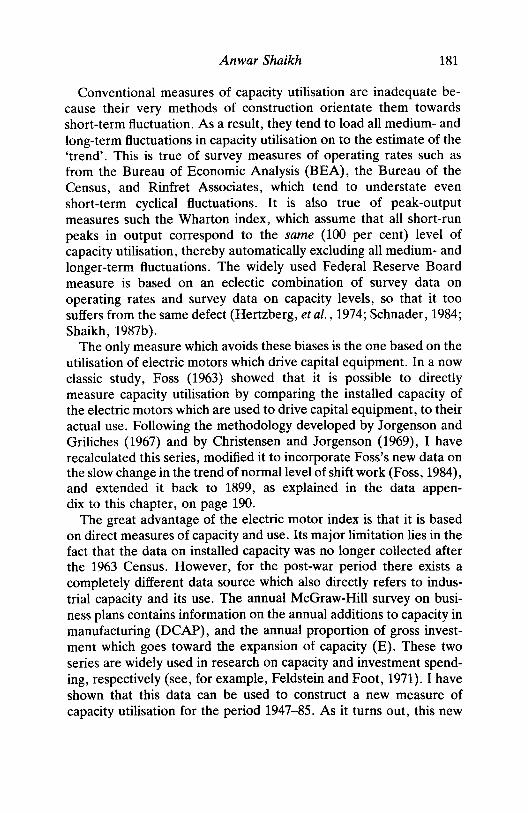
Anwar Shaikh 181
Conventional measures of capacity utilisation are inadequate be-cause their very methods of construction orientate them towards short-term fluctuation. As a result, they tend to load all medium- and long-term fluctuations in capacity utilisation on to the estimate of the 'trend'. This is true of survey measures of operating rates such as from the Bureau of Economic Analysis (BEA), the Bureau of the Census, and Rinfret Associates, which tend to understate even short-term cyclical fluctuations. It is also true of peak-output measures such the Wharton index, which assume that all short-run peaks in output correspond to the same (100 per cent) level of capacity utilisation, thereby automatically excluding all medium- and longer-term fluctuations. The widely used Federal Reserve Board measure is based on an eclectic combination of survey data on operating rates and survey data on capacity levels, so that it too suffers from the same defect (Hertzberg, et al., 1974; Schnader, 1984; Shaikh, 1987b).
The only measure which avoids these biases is the one based on the utilisation of electric motors which drive capital equipment. In a now classic study, Foss (1963) showed that it is possible to directly measure capacity utilisation by comparing the installed capacity of the electric motors which are used to drive capital equipment, to their actual use. Following the methodology developed by Jorgenson and Griliches (1967) and by Christensen and Jorgenson (1969), I have recalculated this series, modified it to incorporate Foss's new data on the slow change in the trend of normal level of shift work (Foss, 1984), and extended it back to 1899, as explained in the data appen-dix to this chapter, on page 190.
The great advantage of the electric motor index is that it is based on direct measures of capacity and use. Its major limitation lies in the fact that the data on installed capacity was no longer collected after the 1963 Census. However, for the post-war period there exists a completely different data source which also directly refers to indus-trial capacity and its use. The annual McGraw-Hill survey on busi-ness plans contains information on the annual additions to capacity in manufacturing (DCAP), and the annual proportion of gross invest-ment which goes toward the expansion of capacity (E). These two series are widely used in research on capacity and investment spend-ing, respectively (see, for example, Feldstein and Foot, 1971). I have shown that this data can be used to construct a new measure of capacity utilisation for the period 1947-85. As it turns out, this new

182 The Falling Rate of Profit as the Cause of Long Waves
1.1 -,----,-..,----,----,----y--.---~-_r____r-__,._-_r____.-__r_'l
0.9
~ is 0.8
:~ ~ 0.7 .~
B 0.6 " ~
0.5
0.4
1899 1905 1911 1917 1923 1929 1935 1941 1947 1953 1959 1965 1971 1977 1983 Year
Figure 7.3 Capacity utilisation (electric motor and indexes chained)
measure corresponds closely to the electric motor measure of ca-pacity utilisation over the 1947-63 period in which the two overlap (Shaikh, 1987b). This allows us to chain the two measures together, adjust for trends in the normal level of shift work (Foss, 1984), and end up with a new long-term measure of capacity utilisation for 1899-1984. Details of this and all other calculations are provided in the data appendix to this chapter (see page 189).
Figure 7.3 presents the long-term measure of capacity utilisation. As explained in the data appendix on page 192, this is a measure of actual production relative to normal economic capacity. The latter is defined as the capacity corresponding to normal levels of shift work. It subsumes normal reserves of capacity. The resulting measure of capacity utilisation therefore only reflects cyclical and conjunctural fluctuations, as is theoretically desired. Depressions and wars typi-cally induce large fluctuations in capacity utilisation, but in less turbulent years the trend hovers around 80--90 per cent.
The existence of a good, long-term measure of capacity utilisation allows us to address the theoretical arguments outlined earlier. The theory of the falling rate of profit locates the basic trend at the level of the general rate of profit (the ratio of surplus value to normal capital advanced), not merely at the level of the normal business rate

Anwar Shaikh 183
of return. The profit rate measure shown here is therefore con-structed to be as general as possible, with profit defined as the excess over costs of production, so that costs of sales and financial activities (realisation costs), as well as all taxes, are included in profit. This is, in fact, the general measure which business accountants call 'profit on sales' (profit minus costs of production), as opposed to the narrower measure called 'net income' (profit on sales minus taxes and adminis-trative, sales, and financial expenses) (Meyer, 1964, pp. 49-51). Since realisation costs have generally risen faster than production costs over the long run, the business rate of profit is likely to fall relative to the general rate. But without some notion of the trend of the former, we would be unable to distinguish between primary and secondary influences on the trend of the latter (whose derivation and analysis is part of the continuation of this work).
In order to distinguish structural trends from short- and medium-turn cyclical and conjunctural fluctuations, we must adjust variables such as the capital-output ratio and the rate of profit for fluctuations in capacity utilisation. In this chapter, I make this adjustment in the simplest possible way, by deflating flow variables such as output and profit by the capacity utilisation rate in order to get normal capacity (that is, potential output and profit. More sophisticated techniques will be explored in subsequent work. 4
The 95-year interval from 1899-1984 encompasses almost two whole long waves: one beginning in the mid-1890s and culminating in the Great Depression of 1929-33, and another beginning in the 1930s and continuing into the present. From the point of view of the theory of the falling rate of profit, it is of great importance to analyse the two associated phases of so-called normal accumulation, running from 1899-1929 and 1947-84, respectively. Figures 7.4-7.6 compare the adjusted and unadjusted measures for capital/production-worker wages, capital/output, and rate of profit, with trend lines superim-posed on the adjusted measures. 5 It is evident in each case that even our simple adjustment for capacity utilisation captures a substantial portion (but not all) of the short- and medium-run fluctuations in the unadjusted variables, thereby helping bring out the secular trend. This is most striking in the Depression years after 1929, in which the levels of the adjusted variables are essentially stable, while those of the unadjusted ones fluctuate wildly. In Figure 7.6, for instance, the normal rate of profit r* is more or less constant over the Depression, while the actual rate of profit first plunges sharply as accumulation collapses from 1929-33, and then rises sharply as accumulation

184 The Falling Rate of Profit as the Cause of Long Waves
6 ;---;---;---.---.---'---.---.---~--.---.---r---r---.---n
': ~ 4.5
2.5
1.5
1899 1905 191 I 1911 1923 1929 1935 1941 1947 1953 1959 1965 1971 1977 1983 W.o • Prod Wkr Wages WiD- - WplU U - CaplHl1 UtiHutlon rate Year
-/(JWp
;.. ~ ,.-i2
+ K/Wp'
Figure 7.4 Capital/wages in manufacturing
1.6 -l 1.5
1.4
1.3
1.2
1.1
K y>
0.8
0.7
0.6
0.5
0.4
1899 1905 1911 1917 1923 1929 1935 1941 1947 1953 1959 1965 1971 1977 1983 Y ... actual aUlpol y • • Ylu - normal capacity output
-K/Y + K/Y'
Figure 7.5 Capital/output in manufacturing
Year

1.8
1.7 -
1.6
1.5
1.4
1.3
1.2
1.1
0.8
0.7
0.6
0.5
0.4
Anwar Shaikh 185
-
+
!
0.3 -+rrTT'T"I-n-.-rrf,rT'T'TrtnrT'T'Tl-rn"'T'T'T'l..-t..-I'T'TT+rnn-rlTTT"l.,f,-T"T'1"T+n-r-rrt"",rrJ,TTT1-trrTT'T'/-1 1899 1905 1911 1917 1923 1929 1935 1941 1947 1953 1959 1965 1971 1977 1983 , = actual profit rate ,.. = rlu = normal capacity rate
-r + ,..
Figure 7.6 Rates of profit in manufacturing
Year
recovers. As Figure 7.3 makes clear, the latter two effects are primarily due to fluctuations in capacity utilisation. Such fluctuations are theoretically expected, as was noted in the previous section.
Similarly, over the post-war period the normal rate of profit dis-plays a clear downward trend. But this is masked by a 17 -year wave in capacity utilisation, which rises sharply from 1958--66 and then de-clines just as sharply from 1966-75. The actual rate of profit thus rises in the upturn phase of the post-war long wave, and then falls in the downturn phase. Mandel would interpret this as evidence of a rise-and-fall in the actual rate of profit causing the long upturn and downturn (Mandel, 1980, ch. 1). I would interpret it as an effect of a secularly falling normal rate of profit, in which this falling profitability eventually chokes off the long upturn and reverses the rising level of capacity utilisation beginning in 1958 (see the earlier discussion around Figures 7.1 and 7.2 on page 179).
Figure 7.7 looks at the ratios of gross profits to gross value added PlY and of gross profits to the wage bill of production workers PIWp. Since these are ratios of two flows, they are not adjusted by u. They are essentially constant in the first period, but rise considerably in the

186 The Falling Rate of Profit as the Cause of Long Waves
3.4
1.2
r v V ~
~ h ~ ~ ,-I V ~ ( '" f-"" -\;
3.2
2.8
2.6
2.4
2.2
1.8
1.6
1.4
0.8
0.6 ,.,. .J.H+u ~
i..<+"
0.4 1899 1905 1911 1917 1923 1929 1935 1941 1947 1953 1959 1965 1971 1977 1983
Year
_ PI Wp == profit-wage ratio + PlY = profit-share
Figure 7.7 Profit/wages and profit/output
second. Figure 7.8 depicts a crucial linkage in the theory of the falling rate of profit. The top curve represents the normal maximum rate of profit R*, which is simply the reciprocal of the normal capital-output ratio KIY*. The bottom curve shows the normal rate of profit r*. As we can see, the two move in very similar ways in the pre-Depression period, and in fairly similar ways in the post-war period. The differ-ence in the relative movements in the two periods is explained by the differences in the trends of the profit share PlY in the two periods, as indicated in Figure 7.7 earlier. None the less, one can see that in both periods the long-term trend of the normal rate of profit is dominated by the trend of the capital-output ratio. We have already shown in the previous section that this dominance is a necessary consequence of a rising capital-output ratio.
Profit rates in manufacturing are good proxies for the social rate because profit rates tend to equalise across broad sectoral groupings. But the mass of profit depends also on the rate of growth of the sector, and here there need be no tendential equality across sectors. In this case, the weight of the sector in total social capital is import-ant. For the pre-Depression period, manufacturing dominates total
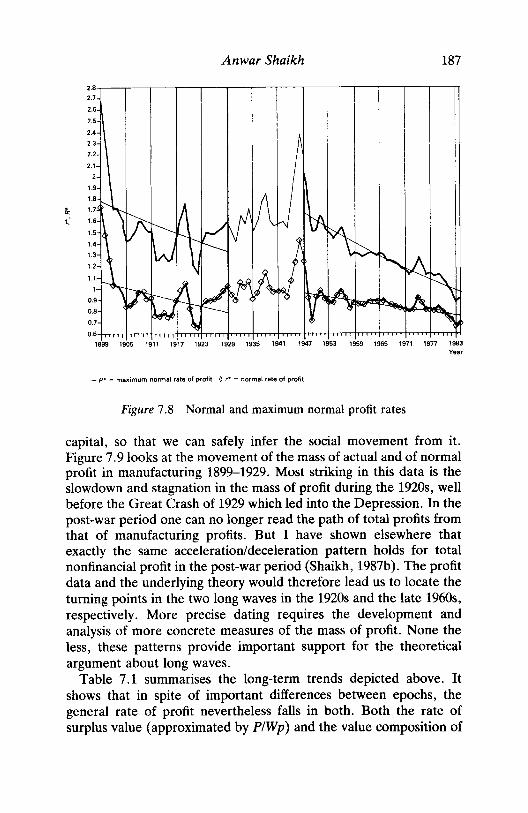
&: t:"
2.8 2.1
2.6
2.5
2.4 2.3 2.2
2.1
1.9 1.8 1.7
1.6
1.5
1.4 1.3
1.2
1.1
0.9 0.8
0.7
Anwar Shaikh 187
0.6-t-norrf-rrror+n "-rt.""';+rrrT"T"lfnorrhCTTTrh-1rrrr......,,CT.,f--rrnrr-h-rrr+nTTTl-n-..,.-rt-,..,.,.,.-r+/ 1899 1905 1911 1911 1923 1929 1935 1941 1947 1953 1959 1965 1971 1911 1983
Year
_ R· = maximum normal rate of profit 0 r* = normal rate of profit
Figure 7.8 Normal and maximum normal profit rates
capital, so that we can safely infer the social movement from it. Figure 7.9 looks at the movement of the mass of actual and of normal profit in manufacturing 1899-1929. Most striking in this data is the slowdown and stagnation in the mass of profit during the 1920s, well before the Great Crash of 1929 which led into the Depression. In the post-war period one can no longer read the path of total profits from that of manufacturing profits. But I have shown elsewhere that exactly the same acceleration/deceleration pattern holds for total nonfinancial profit in the post-war period (Shaikh, 1987b). The profit data and the underlying theory would therefore lead us to locate the turning points in the two long waves in the 1920s and the late 1960s, respectively. More precise dating requires the development and analysis of more concrete measures of the mass of profit. None the less, these patterns provide important support for the theoretical argument about long waves.
Table 7.1 summarises the long-term trends depicted above. It shows that in spite of important differences between epochs, the general rate of profit nevertheless falls in both. Both the rate of surplus value (approximated by PIWp) and the value composition of

188 The Falling Rate of Profit as the Cause of Long Waves
28
26
24
22
20
18
'" i3 16 ... I
14 :;: :,; 12
10
1899 1904 1909 1914 1919 1924 1929 1934
o P "" actual profit + p. = adjusted profit = PIU
Figure 7.9 Mass of profit in manufacturing, 1899-1934
Table 7.1 Annual trend rates, in percentages
1899-1929 1947-84
KIWp* +0.9 +3.1 KIY* +1.0 +1.5 PIWp +0.1 +2.4 PlY +0.0 +0.8 R* -1.0 -1.5 r* -1.0 -0.7
capital (approximated by KIWp) appear to rise much more rapidly in the second period than in the first. None the less, the latter effect is dominant in both periods, so that the general rate of profit falls in both (albeit at a slower rate in the second).
SUMMARY AND CONCLUSIONS
I have tried to outline a theory of long waves based on Marx's theory of secularly falling rate of profit. The rate of profit falls because a

Anwar Shaikh 189
nsmg materialised composition of capital necessarily overwhelms even a rising rate of surplus value. The falling tendency in the rate of profit chokes off the initial acceleration in the mass of profit, which then decelerates and eventually stagnates. The point of stagnation in the mass of profit, which Marx called the 'point of absolute overaccu-mulation', signals the turning point in the long wave. It ushers in a phase change from stable and healthy accumulation to unstable and depressed accumulation. The empirical examination of the above thesis required adjusting the rate of profit for variations in the rate of capacity utilisation, so as to bring out the basic structural patterns and compare them to the above thesis. In this regard, the theoretical argument fares tolerably well.
There are several issues which need to be developed further. The general measure of profit used in this chapter needs to be linked to more concrete measures, so that we can move from the general rate of profit in the sense of Marx to the rate of return which businesses perceive. This would allow us to address the impact of circulation and realisation costs, and of taxes, on the final profitability of capital. Furthermore, the method of adjusting variables for variations in capacity utilisation needs to be refined. Lastly, it should be men-tioned that all studies of profitability suffer from the fact that conven-tional measures of the capital stock (including our own) suffer from major deficiencies in their construction (R. A. Gordon, 1971; R. J. Gordon, 1969, 1970, 1971; Perla, 1968). This too is an area which needs further work, for it is quite likely that the defects in the capital stock measures produce a bias in measure of the rate of profit. Attempts to correct for these defects are under way.
DATA APPENDIX
Some of the data series used below were not available for every year in the interval 1899-1984. Where possible, the missing values have been filled in, taking their ratio to some correlated variable and interpolating this between available points.
1. Manufacturing capital stock, value added, wages and profits
The capital stock measure used is the gross current-dollar stock of plant and equipment in manufacturing, 1889-1985. This is an unpub-lished backward extension of the series on input~utput industry
190 The Falling Rate of Profit as the Cause of Long Waves
capital stocks, published by the Bureau of Industrial Economics (BIE). I thank Ken Rogers of the Bureau for making it available to me. It is the only consistent series current-dollar and constant-dollar series which goes back to 1889. Like most other such series, it suffers from the defect of being calculated on the assumption that the useful life of plant and equipment is independent of economic fluctuations, even when they are as cataclysmic as the Great Depression.
The basic data for gross value added and production worker wages comes from the Census of Manufactures, 1982, Table 1, supple-mented by subsequent Censuses for 1983-85 data. Gross profit was calculated as gross value added minus production-worker wages, as an approximation of surplus value realised in manufacturing. This makes it inclusive of nonproduction worker wages, corporate officer salaries, and depreciation charges. All such data is available annually 1949-1986, once in 1947, in two-year intervals from 1919-39, and in five-year intervals from 1899-1919. The missing years in our series from 1899-1949 were interpolated between available benchmarks using a series for current-dollar aggregate national product. This GNP series is available for 1929-87 in the National Income and Product Accounts of the United States, 1929-82 (NIPA, 1929-82) and in subsequent Surveys of Current Business (SCBs), for 1909-28 it is available in Romer's re-estimates (Romer, 1987, Table 7, Appendix), and for 1899-1908 from Historical Statistics of the US (HS, 1975), series Fl. The interpolations were made according to the general procedure described above. This technique was also applied to esti-mate production-worker wages in the same missing years.
2. Capacity utilisation
The electric motor utilisation index for 1899-1963
I adopted the basic procedures developed by Christensen and Jorgen-son (1969), Jorgenson and Griliches (1967), and Foss (1963), and used them in conjunction with the Rogers/BIE capital stock estimates for real gross stock in manufacturing equipment (KREQ) , census benchmark data on installed capacity of electric motors (HPBNCH) from the Census of Manufactures, and annual data on electricity consumed by these motors (ELCONS) from the Survey of Manufac-tures and from my own estimates. The details are as follows.
HP Benchmark year estimates (HPBNCH) of the capacity horse-power of electric motors used to drive manufacturing equipment

Anwar Shaikh 191
were taken from Historical Statistics of the U.S. (HS, 1975), Series P70, for the years 1899, 1904, 1909, 1914, 1919, 1925, 1927, 1929, 1939, 1954, 1962 (the last available year), converted to billions of Kw-hrs as in Foss (1963) and interpolated between benchmark years using an unpublished BIE series on real equipment stocks in manu-facturing (KREQ) from 1889-1984.
EMOTORS The electric power consumed (ELCONS) by manufac-turing is available in various manufacturing censuses from 1939--62. Data for this interval was taken from HS (1975) as total consumption of electric power (Series S124) minus power consumed for nuclear energy (Series S125). This same source also lists data in earlier years, even though Census data for 1929 is incomplete and no Census data was gathered for the years prior to 1929 (1954 Census of Manufac-tures, pp. 208-20). The Historical Statistics of the U.S. (1975) series does not list any documentation for its sources or methods for the years prior to 1939. Calls to them revealed that no further informa-tion was available. In the light of this, I felt it prudent to re-estimate this series for the years prior to 1939. Foss (1963) estimates the 1929 value by assuming that motors driven by generated electricity were utilised at the same rate as those driven by purchased electricity, as is roughly true in the previously available benchmark year of 1939. But 1939 was a severe recession year, whereas 1929 was a near peak year. In the other near peak benchmark years of 1954 and 1962, the proportions in the two utilisation rates were systematically different from 1939. I therefore used the 1954--62 average proportions instead. Data between 1929 and 1939 benchmarks was interpolated using an index for the portion of manufacturing output which comes from plants using electric motors to drive machinery (QMAN*). This latter series was created by splicing together the estimates for total manufacturing output 1899-1938 in Long Term Economic Growth 1860-1970, Series A19, with corresponding estimates for 1939--1985 in The Economic Report of the President 1987, Table B45, Total Manufacturing, and multiplying the result by the proportion of electric motor hp in relation to total mechanical hp (Schurr and Netschert, 1960, Table 62, p. 187 for benchmark years from 1889-1954; HS, 1975, Series P701P68, p. 681, for 1962; and linearly interpolated for years in between benchmarks). The resulting series for ELCONS from 1929--62 was extended backwards to 1899 using QMAN* and the trend of ELCONS/QMAN* between 1929--39. The final step was to multiply the electric power consumed in manufac-turing ELCONS by estimates of the proportion of manufacturing

192 The Falling Rate of Profit as the Cause of Long Waves
electricity consumption which goes to run electric motors (EMPROP), to create the estimated electricity consumption of equipment motors in manufacturing (EMOTORS = ELCONS X EMPROP). The pro-portion EMPROP is available for 1929,1939,1954 (Foss, 1963, p. 11) and 1962 (Christensen and Jorgenson, 1969), Since it varies only slightly, the proportion in the intervening years was estimated by linear interpolation between benchmarks, and the trend between 1929-39 was used to extrapolate back to 1899.
VE The relative utilisation of manufacturing equipment (UE) was then calculated as the ratio of electric power consumed by equipment motors (EMOTORS) to the normal capacity horsepower of these motors (HPN) corresponding to the normal level of shiftwork. In his original study, Foss (1963) calculates a standard (40-hour) weekly shift measure of capacity hp by multiplying the installed capacity hp (which corresponds to the peak mechanical capacity) by the ratio of one shift (40 hours) to continuous weekly operation (168 hours). But later, Foss estimates (Foss, 1984) that the normal level of shiftwork rose between 1929 and 1976, which means that normal available capacity itself also rose. Normal capacity was therefore calculated by multiplying standard one shift capacity by the shiftwork index (Foss, 1984, Table 1, pp. 8-9 for 1929-76; the 1976 value was used for 1977-84, since this is a period of relative stagnation; the 1929-39 trend was extrapolated back to 1919 since the 1919-29 period was one of growth; and the 1919 value used for 1899-1918, for lack of better alternatives) .
For 1947-86, McGraw-Hill survey data on capacity additions and on the proportion of gross investment devoted to expansion invest-ment was utilised to create a completely different capacity utilisation index. Evidence indicates that this survey data refers to gross ad-ditions to capacity (Rost, 1980), so that the annual net addition to capacity can be estimated by multiplying the gross additions by the expansion investment/gross investment proportions in each year. The net additions can then be cumulated to get an index of capacity, and this divided into the Federal Reserve Board index of industrial production to create an index of capacity utilisation. The resulting index behaves very much like the electric motor utilisation index over the period 1947-62, in which they overlap. The procedure is described in more detail in Shaikh (1987b) Appendix B.
The final step was to splice together the previous two series on capacity utilisation so as to create one overall series from 1899-1985.
Anwar Shaikh 193
The resulting series represents a considerable improvement over all previous capacity utilisation series, and is the only one to cover so long a period.
NOTES
1. In the neoclassical notion of perfect competition, upon which most neo-Ricardian and neo-Marxian writers base their representations of competition, capitals are assumed to be passive 'price-takers' who expect prices to be constant even in the face of technical change. In this case, profit-rate maximising behaviour necessarily leads to a rising general rate of profit for any given wage (Okishio, 1961). On the other hand, if it is assumed that prices are expected to fall with technical change in the face of price-cutting behaviour, then the same profit-rate maximising behaviour will favour techniques which have lower unit costs (Nakatani, 1979). Now it is the Okishio theorem which is invalid-ated. The movements of the general rate of profit then turn out to depend precisely on the factors analysed by Marx (organic composition of capital, rate of surplus value, and so on).
2. At a more concrete level, this argument applies to what Marx calls the mass of profit-of-enterprise, that is to profit over and above the equiv-alent of interest, because it is this profit of enterprise which is the characteristic element of industrial investment (as opposed to the mere financial investment and speculation).
3. Adjustment via capacity utilisation is the theoretically appropriate technique for identifying the basic rate of profit. Filtering methods generally require economic data to first be 'detrended', which pre-supposes knowledge of the very trend we seek to identify (for example, Rainer Metz in Chapter 4, this volume).
4. The general problem may be approached as one of unobserved com-ponents. Let r = r* . re, where re = the cyclical and conjunctural component of the rate of profit r, and r* = the structural (trend) component. Since the capacity utilisation rate u is our index of the cyclical and conjunctural influences, we may suppose that re = f(u). Then r* = rlf(u) , and our problem becomes one of determining an appropriate f(u). My procedure in this paper amounts to assuming f(u) = u.
5. Trends were calculated as log-linear regressions of the variable against time. The anti-log of the resulting predicted value was then super-imposed on the original variable.
REFERENCES
Christensen, L. R. and D. W. Jorgenson (1969) 'The Measurement of US Real Capital Input, 1929-1967', Review of Income and Wealth, vol. 15, no. 4.

194 The Falling Rate of Profit as the Cause of Long Waves
Feldstein, M. and D. K. Foot (1971) 'The Other Half of Gross Investment: Replacement and Modernization Expenditures Review of Economics and Statistics, vol. 53.
Foss, M. F. (1963) 'The Utilization of Capital Equipment: Postwar Com-pared with Prewar', Survey of Current Business, vol. 43, pp. 8-16.
-- (1984) Changing Utilization of Fixed Capital: An Element in Long-Term Growth (Washington DC: American Enterprise Institute).
Gordon, R. A. (1971) 'Looking Forward After Fifty Years', Survey of Current Business, 50th anniversary issue, vol. 5l.
Gordon, R. J. (1969) '$45 Billion of US Private Investment Has been Mislaid,' American Economic Review, vol. 59.
-- (1970) '$45 Billion of US Private Investment Has Been Mislaid: Reply', American Economic Review, vol. 60.
-- (1971) 'A Rare Event', Survey of Current Business, vol. 5l. Hertzberg, M. R., A. I. Jacobs and J. E. Trevathan (1974) 'The Utilization
of Manufacturing Capacity, 1965-73', Survey of Current Business. Jorgenson, D. W., and Z. Griliches (1967) 'The Explanation of Productivity
Change', Review of Economic Studies, vol. 34. Mandel, E. (1975) Late Capitalism (London: New Left Books). -- (1978) The Second Slump (London: New Left Books). -- (1980) Long Waves in Capitalist Development (Cambridge University
Press). Marris, R. (1984) The Economics of Capital Utilization: A Report on
Multiple-Shift Work (Cambridge University Press). Marx, K. (1867) Wage Labour and Capital, in Marx-Engels Selected Works
in One Volume (New York: International Publishers, 1970). -- (1867) Capital vol. I (New York: International Publishers, 1967). Meyer, G. (1964) Understanding Financial Statements (New York: New
American Library) pp. 49-5l. Nakatani, T. (1979) 'Price Competition and Technical Change', Kobe Uni-
versity Economic Review. Okishio, N. (1961) 'Technical Change and the Rate of Profit', Kobe Univer-
sity Economic Review. Perlo, V. (1968) 'Capital-Output Ratios in Manufacturing', Quarterly Re-
view of Economics and Business, pp. 29-42. Romer, C. (1986) 'The Prewar Cycle Reconsidered', National Bureau of
Economic Research Working Paper No. 1969. -- (1987) 'Gross National Product, 1909-1928: Existing Estimates, New
Estimates, and New Interpretations of World War I and its Aftermath', National Bureau of Economic Research Working Paper No. 2187.
Rosdolsky, R. (1977) The Making of Marx's Capital (London: Pluto Press). Rost, R. F. (1980) 'New Federal Reserve Measures of Capacity and Capacity
Utilization', Federal Reserve Bulletin. Schnader, M. H. (1984) 'Capacity Utilization' in Frank J. Fabozzi and Harry
I. Greenfield The Handbook of Economic and Financial Measures (Illi-nois: Dow-Jones Irwin).
Schurr, S. S. and B. C. Netschert (1960) Energy in the American Economy, 1850-1975 (Baltimore: Johns Hopkins Press).

Anwar Shaikh 195
Shaikh, A. (1978) 'An Introduction to the History of Crisis Theories' in U.S. Capitalism in Crisis (New York: URPE).
-- (1984) 'Dynamics of the Falling Rate of Profit', unpublished manu-script.
-- (1987a) 'Organic Composition of Capital' in J. Eatwell, M. Milgate, and P. Newman (eds) The New Palgrave: A Dictionary of Economic Theory and Doctrine, (London: Macmillan).
-- (1987b) 'The Current Economic Crisis: Causes and Implications' in The Imperiled Economy Book 1 (New York: URPE).
-- (1989a) 'Accumulation, Finance and Effective Demand in Marx, Key-nes and Kalecki' in W. Semmler (ed.), Financial Dynamics and Business Cycles: New Perspectives, (New York: M. E. Sharpe).
-- (1989b) A Dynamic Approach to the Theory of Effective Demand, working paper no. 19 (Jerome Levy Economics Institute of Bard College).
US Bureau of Census (1966) Long Term Economic Growth, 1860-1965 (Washington, DC: US Government Printing Office).
-- (1967) Annual Survey of Manufactures. Book Value of Fixed Assets and Rental Payments for Buildings and Equipment, M64 (AS)-6 (Washington DC: US Government Printing Office).
-- (1975) Historical Statistics of the United States: Colonial Times to 1970 (Washington DC: US Government Printing Office).
US Department of Commerce (1986) The National Income and Product Accounts of the United States, 1929-82. (Washington DC: US Government Printing Office).
US Bureau of Labor Statistics (1979) Capital Stock Estimates for Input-Out-put Industries: Methods and Data, Bulletin 2034 (Washington: US Govern-ment Printing Office).
US Dept. of Commerce (1987) Economic Report of the President.
COMMENT
Boe Thio
The theoretical exposition in Shaikh's paper desires to establish the hypothesis of a falling 'basic' rate of profit. Since the figures on actual rates of profit do not show such a tendency (see also Shaikh's Figure 7.6 on page 185), the factors explaining discrepancies between actual and basic rate are important to establish a trend in the rate of profit. The empirical part of the paper does three things:
1. It presents new data on capital stock and capacity utilisation for the US manufacturing sector. 2. It draws attention to the influence of capacity utilisation on profitability.

196 Comment
3. It attempts to substantiate empirically a long-run decline in the rate of profit for the US economy.
As to the first point, it is difficult to comment on the quality of the data on capital stock and capacity utilisation because they are not fully presented. Therefore, my comment will concentrate mainly on the application of the data and the plausibility of the results. As to the second point, I agree with Shaikh that the influence of capacity utilisa-tion on profitability may be important. The relevant definitions are:
r = (Y - Wp) I K = PI K = (P I Y) I (K I Y)
and
K I Y = (K I Y*) I (Y I Y*).
If we define
ps = PlY; u = Y I Y*
k = K I Y; k* = K I Y*
it follows that k = k* I u and the (observed) rate of profit equals
r = ps I k = u.ps I k*.
In Shaikh's definition the normal capacity rate of profit equals
r* = ps I k* (= rlu).
This 'normal rate of profit', which has a central place in Shaikh's study, attempts to measure the rate of profit that would obtain if a normal rate of capacity utilisation prevailed. With higher effective demand and output, other things being equal, a higher observed rate of profit would be realised. It is implied, then, that the normal rate of profit would not be affected by a change in effective demand. We run the risk, however, of confusing pure definition and causation, be-cause the profit share will never be unaffected by changes in effective demand.
Introduction of the utilisation rate u enables us to distinguish by

Boe Thio 197
definition a change in the observed capital output ratio k into a change of the capital coefficient k* and a change of the utilisation rate u. When we look for the influence of u on the rate of profit, we have two effects: a higher utilisation rate means a lower observed capital output ratio (by definition) and thus a higher rate of profit r. At the same time a higher u may coincide with a higher profit share; this, however, is expressed in the observed profit share. One should therefore be cautious when presenting the 'normal profit rate' as defined above as the profit rate prevailing at normal capacity utilis-ation; r* equals actual profit share divided by normal (or 'technical') capital output ratio. So r*, though 'corrected' by dividing through the utilisation rate, is not causally independent of u, because it affects the observed profit share. Only if the profit share ps is insensitive to changes in the utilisation rate, the normal rate of profit r* as defined here indicates the rate of profit obtainable at full capacity. For the measurement or construction of the rate of profit from observed variables, the rate of capacity utilisation is, however, dispensable. The measurement of the actual profit rate is in no way affected by the rate of capacity utilisation.
We may observe that the utilisation rate can deviate from an 'average' level for a longer period of time and through more than one business cycle. The economy m~y alternate longer periods of 'near full employment' with periods of low demand pressure. It may be true that variation of the rate of capacity utilisation is under-estimated, as Shaikh asserts, due to overestimation of changes in capacity and capital stock. If we accept that, observed fluctuations in the rate of profit would represent an underestimation.
Shaikh states that we can extend this argument to the long run. On this point I have some comments. His construction of the capacity utilisation figures is heavily dependent on the long-run trend in shift work. Without correction for this, the measured rate of capacity utilisation would rise substantially during the observed period, so it is doubtful whether such a measure is valid.
As to the construction of the utilisation index by Shaikh, one should observe that it is based on an indirect measure of the ratio of the use of electricity for electric motors and the energy use of these motors at full capacity. Even if such a measure could be completely correct, there may be reasons why it shows a long-run trend quite apart from changes in the utilisation rate, such as gradual develop-ment of techniques to apply machines of appropriate size, or learning on the basis of experience how to integrate electrical machinery in
198 Comment
the production process. There is no need to interpret an observed trend in the actual use of electric motor capacity as a trend in the utilisation rate. Therefore I find the construction of this utilisation index and its application not sufficiently founded.
As to the third point - the author's view on the development of the rate of profit in the long run - his main thesis is that there is a clear downward tendency in the rate of profit during the period 1899-1929, and 1945 up to the present. This tendency is explained mainly by an increase of the normal capital output ratio k* (see above). This thesis challenges most other publications in this field. See, for example, the chapter by A. V. Poletayev in this volume (Chapter 6), Weisskopf (1979), Dumenil, Glick and Rangel (1987). A systematic decline of the rate of profit is not commonly found, and the idea that a falling rate of profit in the long run could be substantiated by a steady increase of the capital output ratio does not find support in other statistical sources. If one takes Maddison's (1982) indices of gross capital stock and GNP figures for the USA in order to obtain an index of the macroeconomic capital output ratio, one would find (with 1950 = 1) 1900 = 1.20, 1913 = 1.30, 1929 = 1.28, 1950 = 1, 1960 = 1.03, 1975 = 1.10. So one finds substantial fluctuations, but no systematic increase. Feinstein's (1972) figures for the UK show a pattern of increasing capital output ratio until the end of the 1920s, a decline till the early 1940s and some increase thereafter. It appears that technological development is able to increase the efficiency of capital goods with respect to output. It should be remembered, however, that the concept of profit in the present chapter differs considerably from the concept of profit in the national accounting sense. It is rather a global measure of surplus value: value-added minus the wage bill of production workers. Therefore we get a systematic increase in the share of profits in this sense. Whereas the share of all wages and salaries is rising over time.
Shaikh argues that although the rate of surplus value in this sense is rising, the rise of the (normal) capital output ratio even dominates this effect so as to produce a downward tendency of the (normal) rate of profit over the whole of the twentieth century. Clearly, Figure 7.6 displays no particular trend in the actual rate of profit, and the same is true for the actual capital output ratio in Figure 7.5 - except for the first five years, which could very well be a statistical artifact. At the same time we do observe long movements of the profit rate around a more-or-Iess constant level. It is not clear how movements in the

Boe Thio 199
utilisation rate in the long run could be helpful in explaining the rate of profit.
To summarise, Shaikh's attempt to give a new and more precise measurement of the rate of capacity utilisation for the USA is subject to doubt. His idea that the rate of capacity utilisation could be relevant to the analysis of fluctuations in the profit rate may be applicable in the short- and medium-term, but does not add to an understanding of long-run movements of the rate of profit.
References
Dumenil, G., M. Glick, J. Rangel (1987) 'The rate of profit in the United States', Cambridge Journal of Economics, no. 11, pp. 331-59.
Feinstein, C. H. (1972) Statistical Tables of National Income, Expenditure and Output of the U.K. 1855-1965 (Cambridge University Press).
Maddison, A. (1982) Phases of Capitalist Development (Oxford University Press).
Poletayev, A. Y., 'Long Waves in Profit Rates in Four Countries', this volume.
Weisskopf, T. E. (1979) 'Marxian crisis theory and the rate of profit in the postwar U.S. economy', Cambridge Journal of Economics, no. 3, pp. 341-378.
REJOINDER
Anwar Shaikh
I thank Boe Thio for his thoughtful and insightful comments on my chapter. We agree on some points, but disagree on others. As is usually the case, basic differences about the theory of capitalist accumulation play a crucial role.
Let me first note the areas of theoretical agreement. Thio agrees that capacity utilisation u is an important factor to consider when trying to explain the movements of the observed rate of profit r = (Ply) I (KIY). He goes on to note that my procedure for identifying the influence of u on r is not entirely adequate since I only adjust the denominator but not the numerator for variations in u. There are really two issues at stake here: the precise statistical manner in which one identifies the influence on u; and the question of whether one operates on r as a whole, or separately on each of its constituent

200 Rejoinder
components, such as PlY and KIY. My statistical procedure was to adjust KIY for u because KIY is a stock-flow ratio which necessarily varies with u, but not to adjust PlY because this is a flow-flow ratio which need not vary with u, though it may, of course, do so. An alternative way to view my adjustment procedure is to see it as a simple form of an unobserved components model in which the adjust-ment is done on r as a whole through the functionf(u) = u (see my Note 4, page 193). In any case, it is not hard to see from my Figure 7.7 that the profit-share PlY is quite stable when compared to the (unadjusted) capital-output ratio KIYin Figure 7.5. Thus while Thio is right to point to the theoretical possibility of an influence of u on PlY, this is not particularly important at an empirical level.
A second point on which we completely agree is the need to distinguish between the most abstract form of profit, which is the surplus over the costs of production, and its more concrete forms such as business net income (production profit minus sales and administrative expenses) and even business net income after taxes. I made the same point myself (see pages 183 and 189). The most abstract definition corresponds roughly to the mass of surplus value realised in manufacturing, whereas the more concrete forms corre-spond to those portions of surplus value which capitalist enterprises retain as profits. Since Marx's argument for a falling rate of profit is located at the most general level, and not at the level of increasing administrative costs, sales costs, or taxes, it was important to assess the empirical evidence at the theoretically appropriate level. Only in this way is it possible to distinguish between the proposition that in creased costs of circulation merely exacerbate the downward trend of the basic rate of profit, from the proposition that they are the cause of a falling (concrete) rate of profit. I hold to the former, and Thio implicitly espouses the latter. 1
There are two areas of disagreement, also rooted in theoretical considerations. My capacity utilisation measure is the ratio of actual production to normal economic capacity, the latter being defined by the normal length and intensity of the working week (measured by the normal number of weekly shifts). The normal length of the working week is a social and historical variable which varies over time, as Marx long ago emphasised. It changes slowly, and perhaps discontinuously, as new norms are established. Foss (1984) finds it rises between pre- and post-second World War periods by about 25 per cent, probably because an increasing capital-intensity of pro-duction is itself an incentive for higher levels of shift work (Winston

Anwar Shaikh 201
1974, p. 1307). In any case, the effective economic capacity so defined acts as the centre of gravity for actual output over the fixed capital cycle, other things (such as depressions and wars) being equal. Thus, only when economic capacity is properly defined would one expect the measure of capacity utilisation to be devoid of a long-run trend -as it in fact is, in my Figure 7.3. Yet this is precisely what Thio objects to. He wishes to remove the adjustment for normal levels of shift work, and then, finding that the remaining index would 'rise substan-tially during the observed period' , rejects my measure completely. In effect, Thio wishes to substitute an engineering measure of capacity (one-shift capacity, or perhaps 24-hour capacity) for an economic measure of it. But this is simply an error. While engineering capacity might be useful as an historical benchmark, it is not the capacity around which production and investment decisions are geared. Only an economic measure of capacity will suffice for an analysis of the economics of accumulation.2
Thio also argues that my analysis of the long-run trend in the rate of profit and the capital-output ratio does not conform to the results of others such as Poletayev in this volume, or Weisskopf (1979), Dumenil, Glick, and Rangel (1987), and Maddison (1982) (see Thio, page 198). This is a most curious argument. Having himself empha-sised the importance of capacity utilisation in the analysis of the rate of profit, and having conceded that conventional capacity utilisation measures may be biased, he then falls back on empirical studies which either use these same conventional capacity utilisation measures to adjust the profit rate (Weisskopf) or which/ail to adjust it at all (Maddison, Poletayev, and Dumenil et al.). Since these defects are the very ones which I criticise, I can hardly be blamed for failing to 'live up' to them.
Again and again, Thio returns to the point that the observed rate of profit does not fall over the long run. But he is a bit hasty here. Even a cursory glance at Figure 7.6 indicates that in the pre-Depression period from 1899--1929, the actual rate of profit r has precisely as strong a downward trend as normal rate of profit r*. But in the ensuing debacles of the Great Depression, of the Second World War, of the subsequent sharp recession as the war ended, and of the quick succession of first the Korean War and then the Vietnam War, any trend in the US rate of profit was bound to be buried under the virtually continuous turbulence. It is not until the mid-1960s that the shocks from these events died out. Is it then any wonder that only after 1965 can one 'read' the trend of the normal rate of profit from
202 Rejoinder
that of the observed rate? Is that a deficiency in the theory? I would argue not. On the contrary, it is only by distinguishing between major conjunctural events and the basic underlying 'curve of capitalist development' that we can hope to make sense of capitalist history. To the extent that Thio and I disagree on this, the difference is essen-tially theoretical and methodological, not empirical.
Notes
1. My data shows that the share of production-worker wages is falling, as evidenced by a rising production profit share in Figure 7.7. Thio argues that the share of all wages and salaries, which additionally include the wages of sales and administrative personnel, is rising. This implies that the share of the residual, that is, of net business income, is falling, solely because of a rising share of circulation and administrative costs. Else-where, he argues that the capital-output ratio shows no trend. Thus the concrete rate of profit falls because of a rising share of nonproduction costs. So he implicitly espouses the argument first advanced by Joseph Gillman (1958).
2. Thio also suggests that the rise in the capacity utilisation measure unadjusted for shift work (that is, in the utilisation of engineering capacity) might be explained by the fact that electrically-driven equip-ment is utilised better as more experience is gained in using it. But this simply does not fit the facts. As shown in Schurr and Netschert (1960, Table 62, p. 187), electrically-driven equipment was dominant by the 1920s (comprising 82 per cent of total installed hp in manufacturing by 1929). Yet capacity utilisation unadjusted for shift work is essentially stable up to 1939, only jumping to a new stable level after the Second World War. And this jump-pattern corresponds precisely to the pre-war/post-war jump in shift work found by Foss (1984).
References
Gillman, J. (1958) The Falling Rate of Profit, Marx's Law and Its Significance to Twentieth Century Capitalism (New York: Cameron Associates).
Winston, G. (1974) 'The Theory of Capital Utilization and Idleness', Journal of Economic Literature, vol. 12, no. 4 (December 1974) pp. 1301-20.

8 Rate of Profit and its Determining Factors from a 'Regulationist' Point of View LOUIS FONTVIEILLE
The question of profit has a central position in ideological, political and scientific discussions. Some consider that profit is responsible for all the sins under the sun and is the result of the exploitation of labour and the cause of the misery of the people; it is a synonym for parasitism. Others, however, think that it confirms quality, dyna-mism and success and is therefore the key to development.
It is a fact that the economic policies put into practice since the late 1970s lean more towards the second proposal than the first. Improv-ing the situation would involve an effort to re-establish profits, and greater profits would lead to the recovery of investment and relaunch growth. However, the expected results have not materialised. In-creased profits have not led to increased investment, but in contrast to more unemployment and less growth.
It is clear that profit does not play the same role during periods of prosperity and periods of depression. Economic laws do not seem to have the stability that textbooks claim for them. They form part of an historical process that must be taken into account in order to under-stand the apparent incoherence of the system.
The important point here is not the law which governs phenomena in their immobile form or in the relations that can be observed for a given period of time, but the law governing their change, that is to say the law governing their movement from one form to another, from one order of linkage to another (Marx, 1873).
Based on the theory of historical materialism and on his final research on capital, the Marxist theory of regulationl (Boccara, 1973) provides an answer to this question. This theory was used as a guide in my research on long-term cycles. Indeed, in 1976, I connected fluctuations of the state over a long period to regulation of the
203
204 Rate of Profit and its Determining Factors
economic system as a whole (Fontvieille, 1976). The rate of profit played a major role in the analysis. This is why its evolution and that of its determinant factors are examined here from a 'regulationist' point of view.
THE FUNCTION OF PROFIT IN THE REGULATION OF THE CAPITALIST MODE OF PRODUCTION
The theory of regulation, developed in 1971, extends the contri-bution of the overaccumulation-devalorization theory to the move-ment of contradiction between the ratio of production to productive forces:
The overaccumulation-capital devalorization theory makes it possible to analyse the spontaneous regulation of capitalism which takes place as in a natural, biological organism. It shows how this regulation takes place on the basis of capitalist relations of pro-duction, movement, distribution and consumption, i.e. the eco-nomic structure of capitalist society. Regulation concerns the inciting of progress in material productive forces (and in labour productivity) and the fighting of obstacles to such progress. It also involves re-establishing the normal coherence of the system after the development of the lack of harmony and formal disorder that this progress inevitably causes. Re-establishment takes place through the crises and transformations that it causes, including structural transformations of the economic body which go as far as calling into question the existence of capitalism itself. (Boccara, 1973)
Based on a systems type of approach, the theory of regulation considers the whole formed by the forces of production, the social relations in production and the superstructures associated with them as a developing system in which all parts are interdependent. The coherence of the system during development is provided by regu-lators at the nodes between the different components. In primitive societies, the regulators are situated essentially between the com-ponents of the forces of production themselves, between nature and man and between men and their production (famines and epidemics, for example). As human development proceeds, the regulators shift progressively to the points of intersection between productive forces

Louis Fontvieille 205
and social relations in production, but remain as a whole independent of the consciousness and will of men. The capitalist mode of pro-duction forms the final stage of this evolution and prepares a fresh shift of the regulators to superstructure level. In this new stage their action is increasingly subjected to the will of men who take free decisions with regard to their own development.
The capitalist mode of production is essentially contradictory. It opposes the productive forces of living labour, which belong to the workers, and the material productive forces that they have produced which, owing to production relations, are the property of capital. The counterpart of this opposition, which lies at the very heart of the productive forces, lies in the production relation which determines the distribution of the new value produced between variable capital and surplus value.
The aim of capital is its own development. It is therefore pushed by its nature to develop material productive forces without taking into account the development of the productive forces of living labour. All our research on long-term cycles in based on the hypothesis that the functioning of the capitalist mode of production - that is, its production relations - leads to periodic blockage of the productive forces because its very nature makes it favour the development of material productive forces. Since the latter are put into operation by the productive force of living labour - which also produce them -their development cannot be independent of the productive forces of living labour.
Thus the priority given to accumulation probably leads periodically to a decrease in the efficiency of the system and to a blockage. The resulting aggravation of class struggles then leads to a transformation of production relations, that is, their adaptation to the level of development reached by material productive forces. This structural transformation would then make capital take a new step towards the end of its history and give productive forces fresh efficiency, thus opening the way to a new accumulation cycle.
Development of the capitalist mode of production is based on the accumulation of capital which is based in turn on the production of surplus value. The ratio of surplus value produced to accumulated capital - the rate of profit - plays a thoroughly central role here. It both validates or sanctions the activity of the capitalist and deter-mines his anticipations. From this point of view it is the criterion of the basic management of capital.
On a social scale, an increasing medium rate of profit encourages

206 Rate of Profit and its Determining Factors
increased accumulation of capital, whereas a falling rate makes anticipation uncertain and restrains growth. However, the rate of profit does not only have an effect on the quantitative dimension of accumulation but also affects the qualitative aspects. An increasing rate of profit encourages extensive accumulation whereas a falling rate encourages intensive accumulation. In the first case the im-portant point is to accumulate, and the more the capitalist accumu-lates the more profit he receives. In contrast, in the second case, the lack of certainty with regard to the result encourages the economising of capital and stimulates innovation. The rate of profit thus plays the role of regulator of material accumulation.
DETERMINANT FACTORS OF THE RATE OF PROFIT AND THEIR EVOLUTION
In terms of value, the rate of profit is the ratio of the surplus value produced (su) to the total capital outlay for its production (constant capital c and variable capital v):
su r =--
c+v
or, divided by v,
sulv r =
1 + c/v
The rate of profit thus relates the rate of surplus value to the composition of capital by value. As the latter leads to the organic composition of capital, c/(v + su), it can be seen immediately that the rate of profit is found at the node between production relations and productive forces at the same time as at the heart of the basic contradiction of capitalist production relations. Indeed, the rate of surplus value expresses the opposition of capital and the labour force in the sharing of the new value produced by labour, whereas the organic composition of capital is a result of the opposition between the material productive forces, that is, the labour which has become the property of capital, and the productive forces of living labour which the workers exchange for wages. Study of these two relations

Louis Fontvieille 207
should thus enable us to approach the evolution of the rate of profit closely linked with analysis of the contradictions which develop within the system between production relations and productive forces. This problematic was at the heart of a case study started in 1980 on the coal industry; a few results are given here.
The surplus value rate and its evolution
We aim here at determining how the relative position of the labour force evolves in the sharing of its output. We are, of course, aware of the difficulty of the task. In the absence of national accounting in terms of working time, no measuring instrument can be considered as being totally independent of the phenomenon that we would like to measure. For this reason I propose an approach using several com-plementary indicators.
The first approach consists of considering the evolution of wages. Fran~is Simi and (1931) showed that, on the basis of a batch of hourly wages, the nominal wages increased during the prosperity phase of the long cycle ('phase A' in his terminology) and, in contrast, real wages increased during the depression phase. Curi-ously, this observation has never been taken up or checked in subsequent work on the long cycle.
I established batches of nominal wages in the coal industry and batches of the corresponding purchasing power (see Figures 8.la and 8.lb). Like Simiand, I observed a long inverse fluctuation of real wages (increase during phase B) but, in contrast with his findings, my series of nominal wages was also inverse, although much less obvi-ously so. The two observations are not necessarily incompatible. Simiand used hourly wages of strictly defined categories of worker whereas our results were based on the total wages bill and number of workers. The difference between the two types of observations may therefore be a result of the transformation of the wage-earning population during the depression phase with, for example, a decrease in the employment of women or children, or perhaps a relative decrease in low-skill jobs. This hypothesis of an increase in the level of qualifications is confirmed by a study of transport at the bottom of mines (Prigent and Fontvieille, 1987) which shows that the introduc-tion of new techniques during depression periods led to a relative decrease in the number of carriers or 'trammers' in relation to the number of hewers.
The movement of purchasing power gives only very approximate

208
8.00
7.80
7.60
7.40
7.20
7.00
6.80
6.60
6.40
6.20
6.00
5.80
5.60
Rate of Profit and its Determining Factors
(a) Purchasing power of average wages
1810 1830 1850 Cl, C2 Companie d'Anzin C3 all of France
1870 1890 1910 1930 1950 1970
(b) Purchasing power of average wage, trend deviation 0.30,----------'---"---------------,
0.20
0.10
0.00 +--+--+-t-f-----tt+_--m-+-T~'---"....---__jr___++__;_--+-__;
-0.10
-0.20
-0.30 -
-0.40
-0.50 -fnn'mmTmmT'1""'mmTmmTl"'""mmT"'"'f ................. '""T"""'"''"''"'''"I'''''''''''''''''''''''f''''' ............ .,....., ....... .......j 1810 1830 1850
Cl Companie d'Anzin 82 all of France
1870 1890 1910 1930
Figure 8.1 Purchasing power of average wage
1950 1970

Louis Fontvieille 209
information on the rate of surplus value. If purchasing power stag-nates or decreases, it can certainly be concluded that the rate of surplus value is increasing. In contrast, an increase in purchasing power does not necessarily mean that the rate of surplus value is falling, if, for example, productivity is increasing at least as fast as real wages. In this case, output increases more rapidly than consump-tion by the labour force.
Thus, another indicator of the evolution of the rate of surplus value is obtained by relating the purchasing power of the average wage to the productivity of the corresponding work. Of course, labour pro-ductivity does not necessarily evolve in the same way as overall productivity and there is a distinct risk of distortion, particularly at the level of a single branch of industry. My batch is an example of this. With the 1873 coal crisis2 (Escudier, 1988), the period 1870-97 was one of an increase in mechanisation which was so strong that the increase in labour productivity almost totally compensated that of purchasing power. If this period is left out (see Figure 8.2), purchas-ing power generally increased faster than productivity during de-pression phases and more slowly during phases of prosperity. With
12.00
11.00
10.00
9.00
8.00
7.00
6.00
5.00
4.00
3.00 1810 1830 1850 1870 1890 1910 1830 1950 1970
- Cl Companie d'Anzin - B2 all of France
Figure 8,2 Purchasing power/productivity

210 Rate of Profit and its Determining Factors
the exception of a few details, this evolution was confirmed by the evolution in manufacturing industries in the USA (Fontvieille, 1988) and even in the US economy as a whole (Dumenil and Levy, 1988). There is also an illustration from Argentina in a study by Frederico Foders and Hans H. Glismann (1987).
Another approach to surplus value rate consists of comparing the wages cost with the value of the product. The latter comprises wages, surplus value, depreciation of fixed capital and intermediate con-sumption. If it is assumed that the last two items are stable, which is not absurd in a primary industry, the share of wages in the value of the product gives an inverse picture of the rate of surplus value. In the multi-author work on the movement of profit edited by Jean Bouvier (1965), Michel Gillet calculated this relationship but did not notice the long-term fluctuation characteristic of its evolution. As can be seen in Figure 8.3a and 8.3b, the share of wages in the value of the product increases during depression phases and stagnates or even decreases during periods of prosperity.
This evolution is confirmed for the period 181~97, for which I calculated the ratio of net surplus value to wages, or that of the net surplus value minus wages over wages, which comes down to the same thing. This removes interference resulting from long-term movements concerning depreciation or intermediate consumption. The long-term fluctuation of the ratio calculated in this way appears even more distinctly (see Figure 8.4).
All the indicators thus show that there is a long-term fluctuation in the rate of surplus value in the form of increase during prosperous periods and decrease during the depression phase. The fall in the rate of surplus value during the depression phase, that is, the improve-ment of the relative situation of the labour force, is obviously a surprise to common sense and deserves some explanation. It is true that the long phases of depression are a source of great difficulties for workers. The number of unemployed increases and reaches consider-able proportions, particularly when it is related to the wage-earning population rather than to the total working population. In addition, wage-earners whose qualifications have become unsuitable because of technological changes are condemned to accepting jobs which are devalorized in comparison to their previous qualifications. Practically all families of workers are affected by these difficulties at one time or another.
However, it would be a mistake not to notice the new growth which emerges from the decomposition of old forms. What is born is,

Louis Fontvieille 211
(a) Wages in the production value
0.90...,.---------------------------.,
0.80
0.70
0.60
0.50
0.40
0.30
1810 1830 1850 1870 1890 1910 1930 1950 1970 -- Cl Companie d'Anzin -- B2 ali of France
(b) Wages in the production value, trend deviation 0.40...,.--"-----'---------------------,
0.30
0.20
1810 1830 1850 Cl Companie d'Anzin B2 ali of France
1870 1890 1910 1930
Figure 8.3 Wages in the production value
1950 1970

212 Rate of Profit and its Determining Factors 1.90 1.80 1.10 1.60 1.50 1.40 1.30 1.20 1.10 1.00 0.90 0.80
~ 0.70 0.60 0.50 0.40 0.30 0.20 0.10 0.00
-0.10 1810 1830 1850 1870 1890
Figure 8.4 Surplus value ratio, Companie d'Anzin
in contrast, a more developed, stronger labour force with increased knowledge and responsibilities. It is a new production relation in which the labour force climbs by its own efforts to the level of the material productive forces that it has engendered.
This process is, of course, neither mechanical nor linear. It results from the creative action of the men who build it up while building themselves up. Transformations take place in successive thrusts, often followed by backward movement. There is generally a thrust at the beginning of the depression phase. It marks the limits reached by the over-exploitation of the labour force and the increase in the rate of surplus value. One or two intermediate thrusts, which are often weaker, occur during the depression period. A final thrust at the end of the phase completes the structural transformation which opens the door to a new phase of prosperity. These successive thrusts - showing as a compromise the state of the respective forces - should be compared with the thrusts observed by Giovanni Arrighi and Beverly Silver (1988) in labour movements. 3
In fact, a new development of the labour force, reflected in the decrease in the rate of surplus value, comes into operation through the reduction of value and of employment. For this I have used the concept of the revalorisation of the labour force, in term-by-term

Louis Fontvieille 213
contrast with that of the devalorisation of capital. I consider that this double process brings about the structural transformation of pro-duction relations, which makes it possible to overcome the contradic-tions of the system. Marx (1894) certainly felt this when, discussing the issue of the contradiction between the development of productive forces and that of production relations, he wrote that 'The methods by which it [capitalist production] accomplishes this include the fall of the rate of profit, depreciation of existing capital, and the development of the productive forces of labour at the expense of already created productive forces.'
The organic composition of capital and its movement
Evaluation of the organic composition of capital poses extremely complex and technical theoretical problems which are not discussed here, and the interested reader should refer to various articles in which these questions are approached to different degrees (see Font-vieille 1981, 1986 and 1987). It is simply stated that one of the most important questions is that of the evaluation of the value (in the sense of labour value), in particular for capital, which consists of successive strata. Depending on the batch used (market value, real terms or physical indicators) the secular trends may be in opposite directions, leading to debate on a possible fall in the composition of capital. None of the batches produced can be considered as being truly representative. In contrast, they provide valuable and generally concordant information on long-term fluctuations. This is why I chose an approach based on several indicators, giving complemen-tary pictures of the same phenomenon.
A preliminary batch of approaches consisted of relating evalu-ations of capital to the product. Three indicators of this type are shown in Figures 8.Sa, 8.Sb, 8.6 and 8.7. The first relates fixed productive capital to the number of tonnes mined and covers the period 1740-1897. If the period 1790-1830 - deeply marked by the troubles of the French Revolution - is set aside, delayed long-term fluctuation is observed in which there is a rise in the capital-product ratio from approximately half (or two-thirds) of the way through the prosperity phase until the middle of the depression phase.
The second indicator relates the stock of fixed capital to the net surplus value. Both are evaluated in present-day francs, that is, in gold value for the period in question. The same type of fluctuation is

214 Rate of Profit and its Determining Factors
5.20 ...;(.::81~T..:o.:...n • .:..::.;by:.-c:.:u::.rr..:e_nt::.F_r • .:...n..:c.:... ________________ --,--____ ~
5.00
4.80
4.60
4.40
4.20
4.00
3.80
3.60
3.40
3.20
3.00
2.80
1740 1760 1780 1800 1820 1840 1860 1880 1900
-- Cl Compania d'Anzin
(b) Trend deviation 0.60 ~~--------------------------------------~ 0.40
0.30
0.20
0.10
0.00 -+-4---.S------II--+-I-JI~---__._I_~IM_ll\+_~,L_-___I,,*__++.__r_l
-0.10
-0.20
-0.30
-0.40
-0.60
-0.60
-0.70
-'0.80
-0.90
-1.00
-1. 1 0 ~'"'"'"'""'"1' ...... """"""'1"""""'""'''"T"""''' ....... mnTl''"'"''"'''"'''l''' ............. '''"T ....... ''"''''"'''1''""''"'"'''....j 1740 1760 1780 1800 1820 1840 1860 1880 1900
Cl Compenia d' Anzin
Figure 8.5 Capital productivity

Louis Fontvieille 215
3.80 .,.--;----------------------- ------r 3.60
3.40
320 I, 3.00
2.80
2.60
2.40
2.20
2.00
1.80
1.60
1.40
1.20
1.00
0.80
0.60
'~ 0.40 -f.-,,.,..,.,.,......,,,...,.,..,..,..,,...,,.T""'"',,.....,......,,,.....,..,..,..,,....,.,..,..,..,,,......,.,..,.,,,.....,..,..,.., ....... ,..;.,.,,,.....,..,..,..,"TT,..,..,.., ........ ,..,..,..,.........I
1810 1830 1850 1870 1890
Figure 8.6 Fixed capital/net value added, Companie d'Anzin
0.50 -,--------------------------, 0.48 0.46 0.44
0.42 0.40 0.38 0.36 0.34 0.32 0.30 0.28 0.26 0.24 0.22 0.20
I
AI I I
O. 18 -fr,,,....,...,.,..,,..,..,..,,.,.....""'l,..,..,..,,,...,.,.,.,...,,..,..,.., .......... ,.,............, ......... TTn......,,....,. ......... .,..,.,.,~,....,,,.,..... ........ .,.,...,.......I 1810 1830 1850 1870 1890
Figure 8.7 Intermediate consumption/net value added, Companie d'Anzin

216 Rate of Profit and its Determining Factors
observed: a slight fall 1810-31; a very steep fall from 1831 to 1856-66; an upward trend 1866-83 and a new fall after 1883.
The third indicator relates intermediate consumption (circulating capital) to net surplus value. Like the preceding indicator, it shows a long-term, delayed fluctuation.
Evaluation of the capital/product ratio forms part of most national accounting systems today. Almost everybody agrees on 1964-65 as the date when the trend in the evolution of this ratio became in-verted, which comes down to the same as the productivity of capital. However, we know practically nothing of what happened before, since with the exception of the work of Kuznets, there was no evaluation of the stock of capital before the Second World War. The ratio of gross national product to the stock of fixed capital calculated from American batches (Dumenil and Levy, 1988) verifies this hypothesis except for the period 1885-1905 when the composition of capital increased distinctly less than during the preceding years, but more than between 1905 and 1933.
Another, more original, approach consists of taking into consider-ation movements of the productivity of labour and of capital. The advantage of this method is that it relates the evolution of the composition of capital to the type of development of overall labour productivity. Increasing productivity means producing with less work. This result is attained in the production process either by economising living labour or by economising past labour contained in the fixed capital and in intermediate consumption, or obviously to economise on both. If stress is laid on economising living labour (even going as far as expending a little more past labour to do this), the organic composition of capital tends to increase. In contrast, if stress is laid on economising the material means (even at the cost of expending a little more intelligence), the organic composition of the capital decreases.
The first indicator (the capital/product ratio described above) is strictly the inverse of the productivity of capital. As it is based on the movement of this first ratio (see Figure 8.5), the productivity of capital thus probably increases from the middle of the depression phase until the middle of the prosperity phase and then falls from the middle of the prosperity phase until the middle of the depression.
Figures 8.8a and 8.8b show the evolution of labour productivity expressed as tonnes per job. Long-term fluctuation can be seen until the First World War, with growth from the middle of the prosperity phase until the middle of the depression phase. If it is considered that

Louis Fontvieille 217
(al Tons by year by job 6.00~------~--~~--------------------------------~ 5.90 5.80 5.70 5.60 5.50 5.40 5.30
~ 5.20
~ C!l 9
5.10 5.00 4.90 4.80 4.70 4.60 4.50 4.40 4.30 4.20 4.10 --j.m"'""""""""'""""""""''''''''''''"'"'""""'''"'""''''''''"''I''''''''''''"'""'Tmnn""",'""'1"'''''''''"""""'''''''''"'"".....ni
1810 1830 1850 1870 1890 1910 1930 1950 1970
-- C1 Companie d'Anzin -- 82 all of France
(bl Trend deviation 0.50,----------------------------------------------,
0.40
0.30
0.20
0.10
0.00 -AA-+-----+--l---II--++-----.-+ft--+-+-----+-~~----~.,.._--_.l_--__I
-0.10
-0.20
-0.30
-0.40
-0.50
-(1.60
-(I. 70 -l-'"""'"""'T""''"''"'"''"T''''""""'"''''' ........ ~"'"1''mnmmnm'"'l'"mnm""'""'''''"nmn ........ 'T'''''mTm.......j 1810 1830 1850 1870 1890 1910 1930 1950 1970
-- C1 Companie d'Anzin --- 82 all of France
Figure 8.8 Productivity
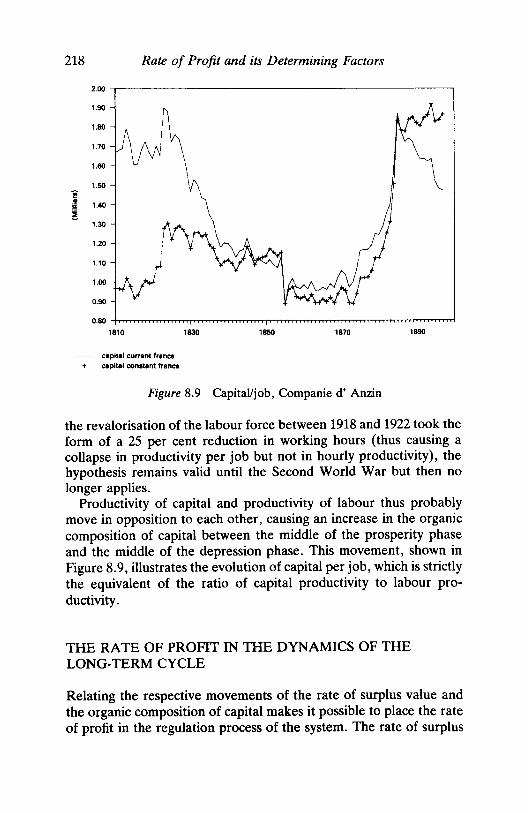
218 Rate of Profit and its Determining Factors
2.00
1.90
1.80
1.70
1.60
1.50 f ~ 1.40 ~
1.30
1.20
1.10
1.00
0.90
0.80 1810 1830 1850 1870 1890
capital current franca + capital constant franca
Figure 8.9 CapitaUjob, Companie d' Anzin
the revalorisation of the labour force between 1918 and 1922 took the form of a 25 per cent reduction in working hours (thus causing a collapse in productivity per job but not in hourly productivity), the hypothesis remains valid until the Second World War but then no longer applies.
Productivity of capital and productivity of labour thus probably move in opposition to each other, causing an increase in the organic composition of capital between the middle of the prosperity phase and the middle of the depression phase. This movement, shown in Figure 8.9, illustrates the evolution of capital per job, which is strictly the equivalent of the ratio of capital productivity to labour pro-ductivity.
THE RATE OF PROFIT IN THE DYNAMICS OF THE LONG-TERM CYCLE
Relating the respective movements of the rate of surplus value and the organic composition of capital makes it possible to place the rate of profit in the regulation process of the system. The rate of surplus

Louis Fontvieille 219
value rises at the start of the prosperity phase, whereas the compo-sition of capital falls. The rate of profit is thus orientated upwards and conditions are favourable for accumulation. The resulting rapid growth in investment leads in turn to growth in employment. The new production ratio at the end of the depression phase enables considerable revalorisation of the labour force. On this new basis, the absorption of unemployment causes rapid growth in consump-tion. Demand is thus stimulated in two ways - by consumption and by investment. Market tensions favour price rises. The positive price movement in relation to value tends to strengthen rates of profit. A virtuous circle thus develops which encourages growth.
The absorption of unemployment obviously creates conditions which are more favourable for social struggles, but the growth of overall productivity, which is a result of the new dynamics of the system, enables capital to achieve a compromise that combines maintaining or even increasing purchasing power and increasing the rate of surplus value.
Since it is not very selective, a rising rate of profit encourages accumulation and a type of development of productivity which favours the economising of living labour since expending past labour is perceived as a source of profit. Nevertheless, during the first half of the prosperity phase this natural trend of capital is amply compen-sated by the process of diffusion of the innovations which have appeared during the depression phase. Seen as a whole, these inno-vations constitute a new technological system whose efficiency is based on the economising of past labour. As the new system spreads, gains in productivity by economising past labour become more and more difficult, and finally economy of living labour - a gain in the apparent productivity of labour - becomes dominant. This evolution leads to a return to growth in capital composition.
Growth in the organic composition of capital in the second half of the prosperity phase creates conditions in which it becomes more difficult to increase the rate of profit. Indeed, this requires acceler-ation of the increase of surplus value, which in turn aggravates labour disputes. Since it is not possible to adjust wages, a solution is sought in accelerating the apparent productivity of labour, thus creating a vicious circle in which capital expends more and more past labour to economise an increasing amount of living labour.
This type of development of productivity necessarily approaches a limit. This is reached when the expenditure in past labour wholly compensates economy of living labour and the overall productivity of

220 Rate of Profit and its Determining Factors
the system ceases to progress. The resulting evolution of productive forces leads to overdevelopment of the material means used, re-duction in living labour and increased unemployment. The shrinking of the basis of production of surplus value leads to seeking ways to increase the rate and to overexploitation of the labour force. The increase in consumption tends to weaken, which in turn weakens investment.
At this stage, the economic structure - that is, production relations - is incapable of developing productive forces. It has led the system to a general crisis in efficiency which stems from a deep-seated imbalance of the productive forces that it has developed. This resides in the overdevelopment of the material means of production and the underdevelopment of the productive forces of living labour. In other words, the crisis appears as a structural overaccumulation of capital in relation to the surplus value that the productive forces of labour are capable of producing.
It is not a question of a simple excess of goods as in a conjunctural crisis, which a temporary lowering of prices or a few bankruptcies may remedy. The crisis lies in the imbalance of the productive forces which renders them inefficient and in the production relations which repeat and aggravate this imbalance.
Solving the problem thus requires a transformation of the pro-duction relations in such a way as to correct the imbalance, that is, both the over-accumulation of capital and the under-development of the labour forces. Since this implies questioning the existing state of affairs, an outcome can only be reached by struggles. The forms taken by the new production relations, the institutions which are created during the process and the more-or-Iess radical nature of the changes will finally depend on the relative strength acquired by the men and classes concerned. The cyclic nature of the the development of the capitalist mode of production does not involve a mechanism here.
I obviously agree on this point with the questions of Mandel concerning the endogenous or exogenous nature of the transition from depression to prosperity (Mandel, 1980). In my conception of regulation, as a transformation factor the class struggle is necessarily endogenous. I consider that regulation is an historical process of reproduction and transformation of a system.
Social struggles mark the limits of overexploitation at the end of the prosperity phase or at the beginning of a depression. After the effect of the revival of consumption resulting from the victories

Louis Fontvieille 221
obtained, they result in a fall in the rate of surplus value, whereas the composition of capital continues to increase. A collapse of the rate of profit obviously results. Under the pressure of the struggles, capital begins to seek positive results in solving the most flagrant contradic-tions and in particular those which affect the efficiency of the system: the beginnings of efforts to develop the education system, to reduce working hours, to take family requirements into account without raising all wages, and so on. However, these measures remain limited in scope since they are part of the constraint of valorization of capital and the consequent need to raise the rate of surplus value.
At the same time, the fall in the rate of profit is favourable for the emerging of a new type of development of productivity. As soon as the profitability of material investments becomes increasingly un-certain, capital begins to seek productive combinations which are more economical as regards material means. The efforts made to overcome contradictions thus stimulate the innovation process.
We agree on this point with neo-Schumpeterian analyses which showed that innovations increased during depression phases (Kleink-necht, 1987). However, innovations require more intelligence, more responsibility and the knowledge of more complex processes. They require a more highly qualified, more developed and hence more expensive labour force.
This type of development of productivity is thus in contradiction with the dominant logic of the system. Indeed, it encourages the economising of past labour (and hence of capital) and the develop-ment of living labour. Even if it contains the solution to the crisis of overall productivity of labour in which the system has become bogged down, it can only concern a minor proportion of capital.
Capital mainly uses old recipes in its attempts to clear up the difficulties with which it is faced; it attempts to raise even further the apparent productivity of labour or tries to recover all or part of the positions won by the labour force. The devalorization which results from the fall in the rate of profit leads naturally in this direction. Insolvency first hits companies using labour, and which are hit by the increase in the wages bill. However, instead of clearing up the situation, these bankruptcies result in an increase in the organic composition of the remaining capital. They result in massive re-duction of the labour force which produced the surplus value. The increase in unemployment that they cause weighs on consumption and counterweighs most of the positive effects on demand that the new advantages won by the working labour force would have pro-

222 Rate of Profit and its Determining Factors
cured. The only result of the process of devalorization-destruction of capital is that of making the system contract, increasing its in-efficiency and wasting material and human productive forces.
The worsening difficulties resulting from attempts to find a solution lead to aggravation of social and political struggles, through which a new compromise is imposed. While purchasing power increases, the educational system develops strongly. In addition, new institutional forms emerge to meet new requirements and new co-operative themes are born of the productive forces. Friendly societies and savings banks developed in the period 1830--50, pension funds were set up in 1880--95 and sickness benefit schemes in the 1930s. The 1970s and 1980s have seen the development of in-service training and an unprecedented expansion of the 'association' system, in particular in the domains of leisure activities, sport and culture.
In parallel, continued difficulties and a fall in the rate of profit encourage capital to concentrate more and more on the search for innovatory solutions. The innovation process is thus reinforced and the new type of development of productivity tends to become domi-nant during the second half of the depression phase. This new type of development leads to an increase in the productivity of capital and a fall in its organic composition.
Nevertheless, the fall in organic composition is not enough to compensate the fall in the rate of surplus value. Indeed, the reduction of the productive sphere means that most investment is covered by depreciation and that most accumulation develops in the non-productive sphere (for example, increase in public debts), or even in speculation. The fall in the organic composition of capital does not have an effect on this part of capital. In addition, within the frame-work of capitalist production, the innovation process is continuously perverted and used to attempt to increase the apparent productivity of labour, or used by a labour force that is desired to be as cheap as possible. Capital thus loses a fair proportion of the potential for new efficiency contained in the innovations.
This contradictory manner of seeking a solution inevitably leads to further decreases in the rate of profit, fresh reduction in employment and the worsening of difficulties. This situation, which is dominant at the end of the depression phase, is accompanied by social tensions, and revolutionary tendencies. A new social compromise acquires its final shape during these struggles. Conditions ripen throughout the depression phase. Indeed, through technological mutations, a fraction of the capital progressively acquires mastery of the productive forces.

Louis Fontvieille 223
It requires a more developed labour force capable of using the new technology that it now masters and the requirements of this labour force must be taken into consideration. Capital knows that a com-promise on the rate of surplus value is required for this.
Since it dominates the dynamic productive forces, it can make the other fractions of capital accept a compromise, which ensures that it has a larger share of the surplus value produced and leaves only the wage of submission to the others. In practice, this compromise results in a transformation of the relations of ownership which institutional-ise the structural devalorization of capital in excess in relation to the surplus value available under the conditions of the new wages com-promise.
The dynamic fraction of capital thus recovers a high rate of profit which enables accumulation to be carried out on a larger scale. Simultaneously, the new wages compromise creates conditions that are suitable for an increase in consumption, thus leading to new fields for the profitable use of capital.
NOTES
1. We use here the term Marxist theory of regulation to indicate its coherence with Marxist concepts of thought as a whole and of which it is a development; this distinguishes it from the theory of regulation generally known as the 'French School of Regulation' which integrates more or less exogenous elements, and in particular elements of Keyne-sian thinking and institutionalist theories (see, for example, Gordon, Bowles, and so on.).
2. Like the 1973 oil crisis, the 1873 coal crisis led to a price boom which took seven or eight years to settle, thus encouraging over-investment.
3. See also the chapter by Beverly Silver in this volume.
REFERENCES
Arrighi, G. and B. J. Silver (1988) 'Global Patterns of Labor Movements', Conference: 'Processus de salarisation dans l'economie mondiale', Paris: Maison des Sciences de I'Homme 9-10 June.
Boccara, P. (1973) Etudes sur Ie capitalisme monopoliste d'Etat, sa crise et son issue (Paris: Editions Sociales) (republication of three articles pub-lished in Economie et Politique between May and September 1971) (a) pp. 293-389, (b) pp. 354-5.
Bouvier, J., F. Furet and M. Gillet (1965) Le Mouvement du profit en France au XIXe siecle (Paris, The Hague: Mouton).
224 Rate of Profit and its Determining Factors
Dumenil, G. and D. Levy (1988) 'Theory and Facts: What can we learn from a century of history of the United States economy? A preliminary draft', CEPREMAP, International Conference on 'The Theory of Regulation', Barcelona, 16-18 June (see fig.12).
Escudier, J. L. (1988) 'Crises mondiales de l'energie et mutations du systeme productif au XIXe siecle et au XXe siecle: la crise charbonniere de 1873 et la crise petroliere de 1973', Revue Economique, vol. 39, no. 2, pp. 369-88.
Foders, F., and H. H. Glismann (1987) 'Long Waves in Argentine Economic Development', in: T. Vasko, (ed.) The Long Wave Debate (Berlin, Heidelberg, New York: Springer) pp. 12-27.
Fontvieille, L. (1976) 'Evolutions et croissance de l'Etat fram;ais: 1815-1969' Economie et Societes, vol. X, nos. 9, 10, 11 and 12 (September-December) pp.494ft.
-- (1981) 'Contribution a l'etude des fluctuations longues: Ie cadre, les sources et les methodes de l'enquete sur l'exploitation du charbon dans Ie Nord-Pas-de-Calais de 1815 a 1914', Cahiers Recherches et Travaux de l'Institut d'Histoire Economique et Sociale de I'Universite de Paris I.
-- (1986) 'Fluctuations longues et rapports de production', Issues, no. 25, pp.43-94.
-- (1987) 'The Labor Force in Long Term Fluctuations', Review, vol. X no. 3, pp. 535-85.
-- (1988) 'Innovations, developpement de la force de travail et productivite', Conference on 'Regularities of Scientific Technical Progress and Long Term Tendencies of Economic Development', Novosibirsk, 14-19 March.
Kleinknecht, A. (1987) Innovation Patterns in Crisis and Prosperity: Schum-peter's Long Cycle Reconsidered (London: Macmillan).
Mandel, E. (1980) Long Waves of Capitalist Development: the Marxist Interpretation (Cambridge University Press) p. 48.
Marx, K. (1873) Afterword to the second German edition of Capital, Capital, vol. 1 (New York: International Publishers, 1%7).
-- (1894) (posthumous) Capital, vol. 3 (New York: International Pub-lishers, 1967) p. 249.
Mensch, G. (1979) Stalemate in Technology: Innovations Overcome the De-pression (New York: Ballinger) (First published in German in 1975).
Prigent, A. and L. Fontvieille (1990) 'La technique et Ie travail dans les fluctuations de longue periode: l'evolution des transports au fond des mines', Technologies Ideologies Pratiques, vol. IX, no. 2, pp. 169-83.
Simiand, F. (1931) Le salaire, revolution sociale et la monnaie (Paris: Alcan).

Gerard Roland 225
COMMENT
Gerard Roland
I am hesitant as to whether I should comment on the empirical or the theoretical part of Louis Fontvieille's chapter. It is not always easy to make the link between these two parts.
On the one hand, most of the empirical material provided relates (a) to nineteenth century data and (b) to Anzin Companies. Long waves are first of all a macroeconomic phenomenon, best studied at that level and not at the enterprise level. Only four of the nine figures in the paper contain data for France as a whole, and only four of the nine figures display times series going beyond the nineteenth century. So it would perhaps be rather bold to make sweeping generalisations or draw firm empirical conclusions on the basis of the data presented.
On the other hand, I found that there are in the paper many general theoretical assertions deserving of discussion, but many of these are not firmly backed by empirical findings. However, this need not be a problem if one considers that this is a theoretical paper. So my position is decided: my comments will concentrate on the theor-etical content of the chapter.
I feel that this is largely what Fontvieille would prefer. He is the main representative of the Marxist theory of regulation, which is less well-known than what is commonly called the French School of Regulation, with the works of Michel Aglietta (1976), Robert Boyer (1986), Alain Lipietz (1979) and others. Being less well-known than these authors, his theory has received fewer comments. Taking the view that healthy criticism is preferable to silence. I am glad to make these comments. This is all the more true since I am personally very sympathetic to a synthesis between long-wave theory and regulation theory.1 So I will analyse Fontvieille's paper from what he would call the 'non-Marxist', regulationist approach.
This leads me to my first comment: as Louis Fontvieille is present-ing an alternative to regulation theory, it would have been interesting to know what the differences are between the two approaches in order to justify his own approach. After all, in the title of the paper he speaks of a '''regulationist'' point of view'. We do not learn much about the differences between the two approaches except for the fact that his theory is 'Marxist' and that the other is 'non-Marxist'. What is the criterion for 'Marxist' versus 'non-Marxist'? In Note 1 on page 223, we learn that it is non-Marxist to integrate elements of Keyne-

226 Comment
sianism and institutionalism with Marxian thought. Fontvieille prob-ably equates 'Marxist' and 'non-Marxist' with some version of 'right' and 'wrong'. I cannot see what is methodologically wrong with integrating modern economic analysis with a Marxian perspective, unless a logical or empirical refutation of that particular theory is employed. I have always felt that science is cumulative, building on the accumulation of accepted knowledge and the rejection of refuted theories or hypotheses.
There is a reference to regulation in the chapter, with the long citation from Paul Boccara on page 204. Unfortunately, I failed to see in this citation either a definition of regulation or any causal explana-tion between economic variables.
A little further on (pages 204-5) there is an interesting develop-ment on regulators, explaining that there is a historical evolution towards more conscious regulators. If this is true, the idea is very encouraging for those of us who are dedicated to the cause of social-ism. Unfortunately, there is no definition of 'regulator' and the idea, potentially very rich, is hardly developed.
Now we come to what I understood to be the main building block of Fontvieille's theoretical framework and it is on this that I shall concentrate the rest of my comments. It is the idea that capital by its nature, overdevelops the material forces of production, but under-develops the labour force of production. This idea seems to me axiomatic in the chapter and is crucial for Fontvieille's explanation of long waves.
According to Fontvieille, even at the beginning of a phase of prosperity, the rising profit rate favours a labour-saving productivity increase (see pages 219-20) compensated by the innovations of a new technological system, which are capital-saving. However, once the new technological system is generalised, capital's inherent bias for labour-saving productivity increases, dominates and induces a rise of the capital-output ratio, which leads capital, in order to prevent a falling profit rate, to further increase labour-saving innovations. This leads eventually to a falling profit rate, which triggers a new techno-logical revolution based on capital-saving processes. The reasoning is, of course, developed at greater length, but this is, in a nutshell, how I understood it.
Well, the question one asks oneself is: why should capital, by nature, be biased towards more capital-intensive processes? If we regard the profit-maximising behaviour of capitalists at the micro-level as axiomatic, then why should capitalists opt for more capital-

Gerard Roland 227
intensive technology if more labour-intensive technology yields higher profit? One should remember here Okishio's (1961) results extended by Roemer (1981): technical change in itself cannot bring forth a fall in the rate of profit. Rising capital-labour intensity associated with a falling rate of profit is generally a reaction to labour-market tensions or expectations of such tensions. This type of capital-labour substitution is actually profit-increasing compared to unchanged technology and new labour-market tensions. Very often, the fall in the rate of profit is erroneously explained by this substitu-tion effect, whereas it is the result of an income effect due to labour-market tensions caused by overaccumulation.
There are indeed two different types of overaccumulation explana-tions. The theory of over-accumulation-devalorization, as I under-stand it, seems to emphasise rather metaphysically that capital by nature tends towards exaggeratedly high capital-labour intensity. Whereas overaccumulation theory, as in Marx (1969, Ch. 25), or in profit-squeeze crisis theory,2 emphasises that profit-maximising be-haviour of individual capitalists leads to an accumulation rate exceed-ing what growth theory calls the natural rate, thereby leading to a balance of power favourable to labour, and allowing a profit squeeze through wage increases. I have mentioned labour-market tensions, but the reasoning can be extended to natural resources if the price elasticity of supply is rather low.
By excluding these market imbalances, Fontvieille's explanation of long waves appears, in many respects, logically unconvincing. Let us take just a few examples.
First, the reversal of the organic composition of capital is explained by capital's bias for labour-saving technology (see page 219), an ex-planation which, as seen above, is inconsistent with profit-maximising behaviour. Then, to avoid the falling rate of profit, this rising organic composition of capital would induce, it is asserted, a rise in the rate of the surplus value that can only be made possible by a further increase in labour-saving productivity. But again, why especially this bias? If capital were devalorizing at a certain constant rate (of stationary equilibrium), there would be no need for a rise in capital intensity.
Next, it is asserted that rising capital-intensity leads to a decrease in employment. But this is not necessarily true and depends on the rate of growth in the economy. Even if employment does decrease, along with wages and consumption, this still does not imply a fall in investment because, if in parallel to the rising capital-labour inten-sity, the share of sector 1 is growing in output then investment can

228 Comment
continue to rise, while consumption remains stagnant, and so the profit-wage ratio can also continue to rise.
Further, whereas Fontvieille states that the crisis will be provoked by underconsumption later it is stated that it will be by class struggle. Now class struggle here seems to be a positive function of the ex-ploitation rate: if the rate of surplus value increases, then class struggle becomes more intense. This is plainly not true, since 'non-Marxist' regulation theory has shown that increases in relative surplus value, accompanied by balanced growth between the two sectors allows for increased labour consumption and a 'Fordist' compromise, real wage being planned not to exceed productivity growth.
When explaining that the fall of the profit rate induces capital-saving innovations, Fontvieille states that this is contradictory to the general 'logic' of the capitalist system. But in that case, why do such innovations happen at all? On the other hand, if profit is the real driving force, then there is no contradiction at all with the logic of the system.
To conclude, to have a theory of long waves, one must have at least one common explanation for the downturn, where rhythm of inno-vation and profit rate are key variables. Personally, I would rather opt for some kind of overaccumulation explanation combined with other mutually-reinforcing causes. To have a theory of this sort, the inevitable step is to have a model containing these features. In that regard, some of the models presented in this volume, such as that by Stanislav Menshikov in Chapter 9, are encouraging steps forward. At this stage of research, theoretical model building and econometric testing alone can bring clarity to the theoretical controversy.
Notes
1. See, for example A. Reati and G. Roland (1987 and 1988). 2. See, for example J. Glombowski and M. Kruger (1987 and 1988).
References
Aglietta, M. (1976) Regulation et crises du capitalisme (Paris: Calmann-Levy).
Boyer, R. (1986) La theorie de la regulation: une analyse critique (Paris: Decouverte).

Gerard Roland 229
Glombowski, J. and M. Kruger (1987) Generalizations of Goodwin's growth cycle model in D. Batten, J. Casti and B. Johansson (eds), Economic evolution and structural adjustment (Berlin: Springer Verlag) pp. 260-90.
-- (1988) 'A Short-period growth cycle model', Recherches Economiques de Louvain, no. 4, pp. 123--38.
Lipietz, A. (1979) Crise et Inflation Pourquoi? (Paris: Maspero). Marx, K. (1969) Le Capital volume 1 (Paris: Gamier-Flamrnarion). Okishio, N. (1961) 'Technical Changes and the Rate of profit', Kobe Univer-
sity Review, no. 7, pp. 85-99. Reati, A. and G. Roland (1987) 'Onde lunghe e "regolazione": torie antago-
nistiche 0 complementari? II caso tedesco dell' ultimo dopoguerra', Note Economiche, no. 3, pp. 141-65.
-- (1988) 'Ondes longues et regulation: Ie cas allemand', Cahiers econ-omiques de Bruxelles, no. 117, pp. 107-50.
Roemer, J. (1981) Analytical foundations of Marxian economic theory (Cam-bridge University Press).
Part III Accumulation, Long Waves and Social Change

9 The Long Wave as an Endogenous Mechanism STANISLAV MENSHIKOV
One of the main points in the current long-wave controversy is whether this wave has an internal economic mechanism or is mainly caused by external shocks and influences. Since the roots of this controversy go back to the 1920s, namely to the criticism by Leon Trotsky of Kondratieff's long-cycle hypothesis, it is perhaps useful to start with a short description of how Kondratieff's theory related to Marx's earlier writings, and then present a more formal approach to the analysis of the endogenous economic mechanism underlying this phenomenon.
KONDRATIEFF AND MARX
Explaining the basic mechanism of the long wave, Kondratieff stated that there was not just one, but a number of cyclical fluctuations in the capitalist economy, and each of them was a specific way of achieving a certain order of macroeconomic equilibrium. This pro-position is fully consistent with Karl Marx's important passage in his Theories of Surplus Value on the different ways of overcoming the contradictions of reproduction: short-lived and relatively weak re-cessions; cyclical and deeper-running crises; and finally, long-lived crisis processes taking several cycles to resolve.
Kondratieff wrote about three different orders or levels of macro-economic equilibrium which are achieved (or contradictions resol-ved) within different time frames. The first and shortest is the usual market equilibrium (or imbaJance) between supply and demand. The short-term inventory cycle of 3-4 years duration is the result of this movement.
The second order of contradictions works itself through the mech-anism of equalising the market value and production prices through the movement of capital between the various industries, described in Volume 3 of Marx's Capital. This is the basic medium-term business
233

234 The Long Wave as an Endogenous Mechanism
cycle of 7-10 years, which tends to restore equilibrium between the stock of business equipment and the conditions of surplus value realisation in the various industries.
Finally, at the third and highest level, equilibrium is sought for changes in the stock of principal capital goods, that is, the basic and largest production structures; capital invested in land reclamation and transportation infrastructure; and education of cadres of quali-fied labour. Kondratieff considered the reproduction of principal capital goods, which takes a long time and involves great expenditure to install, and whose economic lifetime is equally long, as the ma-terial basis of the long cycle.
Recent statistical studies have shown that this part of fixed capital is not as small as some authors claim. The share of business structures in total gross stock of fixed capital in the USA is about 50 per cent (at current prices), and their average economic life, as measured by the depreciation rate, averages 32-35 years in this century (see Historical Statistics of the US). At least half of this has an average lifetime of 45-50 years. Thus the claim that the share of such capital is 'infinite-simal' and therefore there is no material base for the long wave, is absurd (see Poletayev and Saveljeva (1988, p. 78)).
Although Kondratieff followed Marx in terms of the material basis of fluctuations, he failed to accept the same lead when coming to the concrete mechanism of the long wave. He correctly pointed out that the upward phase of the long cycle was caused by the renovation and growth of the stock of principal capital goods, as well as by the radical changes in and the redistribution of the principal productive forces of society. According to Kondratieff (1926), the long depression phase, stimulated the search for ways of reducing costs of production by means of technical innovations. To his critics who claimed that technical progress was external and exogenous to the economic process he rightly replied that changes of technology are not a chance or exogenous phenomenon, they are caused by economic necessity and interwoven with the rhythm of the long wave. But that was all. Kondratieff did not attempt to explain the actual mechanism of interrelating technical progress with the long wave.
Every new business cycle of medium duration represents yet another stage of technological progress and development of pro-ductive forces. But it is not an even and uniform movement, mono-tonously repeating itself from one business cycle to another. Marx distinguished intensive technical progress 'involving more efficient means of production' and extensive progress which meant 'nothing

Stanislav Menshikov 235
beyond expanding the field of production' upon the technological base already installed.
Some cycles of medium duration are dominated by minor modifi-cations and modernisation of existing machinery and technology, with new models of machines replacing old ones. Other cycles in-volve deeper change - one generation of technology replacing another. Finally, still other cycles see a large-scale introduction of basically new types of machinery and technology, laying the ground-work for technological revolutions. Such revolutions, like chain reactions, spread from one sector and branch of the economy to others, finally embracing the whole sphere of social reproduction and fundamentally revamping its technological base.
Technical revolutions witness a fundamental replacement of fixed capital invested in the 'general conditions of reproduction' , that is, in durable industrial structures; transport and communication facilities; economic infrastructure in general; the production of basic structural materials and energy and power resources; and the deep change in the labour force and in the methods and forms of organisation of work and production.
The slowdown of technological progress creates a wide range of contradictions which cannot be resolved except through accelerated technological progress and another technological revolution. Tech-nological revolutions bring to life new sectors and industries and speed up the overall pace of accumulation and reproduction. But as new sectors and industries gain momentum, technological modifi-cations become less notable and more ordinary. That leads, once again, to a slowdown of reproduction and to sustained periods of crisis and depression. At this point, technological progress concen-trates on labour-saving devices. The 'high pressure' of overaccumula-tion of capital and mass unemployment thus created causes the technological base to be revolutionised again; and that closes the circuit.
Another point that Kondratieff failed to note and appreciate was the long-term oscillation in the rate of profit. He indicated that for the long upturn to materialise, large free reserves of capital were needed in both natural and money forms. But for some reason he further concentrated exclusively on money capital, citing its over-accumulation in the spheres of credit and the stock exchange and the cheapness of money, that is, the low interest rate.
Again, when explaining the upper turning point, he indicated as one of the main causes high interest rates and the expensiveness of

236 The Long Wave as an Endogenous Mechanism
capital. The lower turning point is, on the contrary, approached when interest rates fall. Thus, he concludes, the dynamics of the long cycle have an endogenous mechanism that causes them.
There can be no objection to this conclusion, as such. But one wonders why Kondratieff missed the profit rate as one of the basic motivation mechanisms under capitalism while stressing exclusively interest rates. The latter do apply to borrowed money capital but not directly to invested productive capital, where the overall profit rate in the economy and the expected individual rates are more direct and powerful factors. Perhaps this was the influence of Michail Tugan-Baranovski, who put an emphasis on money capital and interest rates in explaining the medium-term cycle. In any case, the profit rate was absent from the Kondratieff analysis, but was very relevant to what Marx had to say.
It is also important for another and very substantial reason. The profit rate in Marx's analysis is very much associated both with technical progress and with overaccumulation of capital. Kondratieff appreciated the importance of both technical progress and capital accumulation, but failed to tie them to the long wave in any consist-ent way. One of the most important links in this interconnection is that long-term fluctuations of technological progress are reflected in the structure of capital. Marx considered the changing organic com-position of capital as a trend that operated not monotonously, but through fluctuations.
Periods of technological evolution are associated with an increas-ing organic composition of capital, and those of technological revol-ution with a falling organic composition. When new industries and factories are created and new infrastructure built, there is always an enormous increase in fixed capital and the stock of circulating capital, which exceeds the rise in variable capital (or total wage bill). It is only when the phase of the new technological revolution is reached and inventions are introduced intensively that the qualitative leap occurs, both in labour productivity and the efficiency of new technology, that is, productivity rises faster than the cost of capital employed per unit of labour. In other words, the law operates, but through fluctuations and pauses.
This, of course, has broad implications for the operation of the capitalist economy because the organic composition of capital di-rectly affects the overall rate of profit. A rising organic composition of capital means a falling rate of profit and vice versa. Marx indicated that the secular trend in his time was for the organic composition of

Stanislav Menshikov 237
capital to rise and for the profit rate to fall. But he also made a special point of discussing 'transient fluctuations' in the operation of the trend. Owing to a set of counteracting factors, he wrote, this trend 'is really manifest only under certain circumstances and within lasting periods of time' (vol. 25, Pt 1, pp. 239,262 in Marx, Capital, vol. 3 English edition). This was the mechanism that explained the influ-ence of technical progress on the overall profit rate.
Now for the opposite effect - the influence of the rate of profit on technological progress. Long-term fluctuations of the rate of profit are reflected in general rates of expanded reproduction and capital accumulation. With a rising rate of profit, growth of output accel-erates, while a sustained decline of the rate of profit tends to slow accumulation and economic growth, but within certain limits. An excessive rise of the profit rate discourages capitalists from introduc-ing technical innovations, and, conversely, a fall of the profit rate below a certain minimum compels entrepreneurs to resort to new technology as the way to solve their problems.
Whenever the general rate of profit is low, the old technical base of production morally wears out and an opportunity for fundamental innovation presents itself. But in this case, too, capitalists act with caution: a new technological revolution begins with the installation of machinery which enables individual production costs to be reduced, above all at the expense of living labour and economising on the cost of fixed and circulating capital. Only in the second place, with overall conditions of realisation improved, are new types of goods launched, giving rise to new sectors and industries, and to a 'quantitative expansion of factories'.
In the opening stages of the technological revolution, while indi-vidual capitalists are still using inventions which are not yet in general use, the overall rate of profit rises. But subsequently, once an innovation has become a common asset, the additional surplus value disappears, while the profit derived from secondary modification and partial modernisation of new machinery is substantially lower than it is when this machinery is installed for the first time. Consequently, at a certain stage of the technological revolution, the general rate of profit must fall again.
Kondratieff put strong emphasis on money capital, but did not draw on Marx's analysis of overaccumulation of capital in its broader sense. Over accumulation of capital inevitably occurs after the 'quan-titative expansion' of factories, signifying the evolutionary phase of the technological revolution is over. Suddenly there is an overabundance

238 The Long Wave as an Endogenous Mechanism
of productive as well as money capital. At this point the profit rate starts to fall, not only because of changes in the structure of capital, but also because of its quantitative excess. This is important in explaining the upper turning point of the long wave.
There are two ways in which excessive productive capital can be disposed of: by its physical destruction (including the closure of plants and factories) and by reducing its value, that is, capital devalu-ation. The second process occurs in different forms: falling prices for elements of fixed and circulating capital; writing-off machinery and equipment which, though physically able to operate, has exceeded its actual (rather than expected) economic lifetime; or selling old plant and equipment to new owners at cut-rate prices. In all cases the result is a drastic reduction in the overall value of productive capital which helps restore equilibrium between the supply of and demand for principal capital goods.
To summarise, Kondratieff's analysis of the long-wave mechanism was to a large extent based on Marx, but it missed quite a number of aspects which could have made his case much stronger. Had he done so, would it have convinced his critics or his gaolers, endearing him to Schumpeter and other non-Marxist authors? It is very doubtful that it would. But history is not a simple and straightforward story.
STATISTICAL EVIDENCE
Any serious scholar is aware that the statistical identification of the long wave is not a trivial problem and needs refined mathematical methods. The following time series were studied (see Menshikov and Klimenko, 1985): gross domestic product (GOP) for the USA (1889-82), industrial production (IP) for the USA (1864-1982), the FRG (1860-1982), and Japan (1900-82); IP and agricultural pro-duction (AP) for the UK (1700-1982). In every case, except the UK, it was possible to discern a quasi-periodicity of about 50 years in deviations from the trend.
It is called quasi-periodicity because:
1. The relative shortness of most of the series (90-120 years) makes it possible to identify no more than 1.5-2 complete oscillations; 2. In the opening parts of the series the movement is practically indistinguishable from the deceleration of the secular trend; and
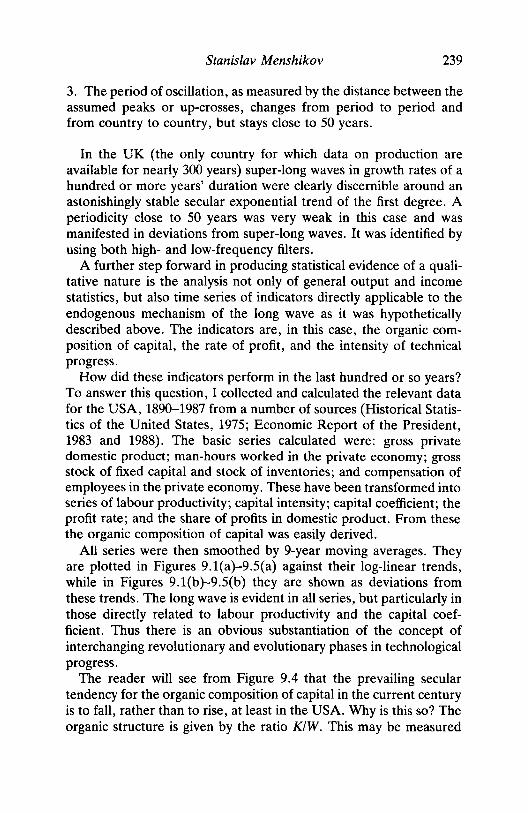
Stanislav Menshikov 239
3. The period of oscillation, as measured by the distance between the assumed peaks or up-crosses, changes from period to period and from country to country, but stays close to 50 years.
In the UK (the only country for which data on production are available for nearly 300 years) super-long waves in growth rates of a hundred or more years' duration were clearly discernible around an astonishingly stable secular exponential trend of the first degree. A periodicity close to 50 years was very weak in this case and was manifested in deviations from super-long waves. It was identified by using both high- and low-frequency filters.
A further step forward in producing statistical evidence of a quali-tative nature is the analysis not only of general output and income statistics, but also time series of indicators directly applicable to the endogenous mechanism of the long wave as it was hypothetically described above. The indicators are, in this case, the organic com-position of capital, the rate of profit, and the intensity of technical progress.
How did these indicators perform in the last hundred or so years? To answer this question, I collected and calculated the relevant data for the USA, 1890-1987 from a number of sources (Historical Statis-tics of the United States, 1975; Economic Report of the President, 1983 and 1988). The basic series calculated were: gross private domestic product; man-hours worked in the private economy; gross stock of fixed capital and stock of inventories; and compensation of employees in the private economy. These have been transformed into series of labour productivity; capital intensity; capital coefficient; the profit rate; and the share of profits in domestic product. From these the organic composition of capital was easily derived.
All series were then smoothed by 9-year moving averages. They are plotted in Figures 9.1(a)-9.5(a) against their log-linear trends, while in Figures 9.1(b)-9.5(b) they are shown as deviations from these trends. The long wave is evident in all series, but particularly in those directly related to labour productivity and the capital coef-ficient. Thus there is an obvious substantiation of the concept of interchanging revolutionary and evolutionary phases in technological progress.
The reader will see from Figure 9.4 that the prevailing secular tendency for the organic composition of capital in the current century is to fall, rather than to rise, at least in the USA. Why is this so? The organic structure is given by the ratio KIW. This may be measured

240 The Long Wave as an Endogenous Mechanism
1894 1984
Figure 9.1(a) Labour productivity, moving average
1894 1984
Figure 9.1 (b ) Labour productivity, deviation from trend
either in current, or constant, prices. In the former case the ratio depends both on the technical structure KIL and on the relation between prices of capital goods and the nominal wage rate. In the latter case it depends on capital intensity and real wages. This is given by the formula:
KIW = KIL: WIL
where WIL is the wage rate. In our calculations we use variables in constant prices. It follows that the organic structure will increase if real wages rise more slowly than capital intensity, or not at all.
When Marx first introduced this concept, the prevailing tendency

Stanislav Menshikov 241
1894 1984
Figure 9.2(a) Capital intensity, moving average
1894 1984
Figure 9.2(b) Capital intensity, deviation from trend
was stagnant or slowly-rising wages, and he concluded from this that the organic structure was rising. However, this changed in the USA around the turn of the twentieth century. Consider Table 9.1. Though real wages did not rise over the whole period as fast as labour productivity, they increased much faster than capital intensity. Therefore the organic structure fell by more than 40 per cent and the capital coefficient by nearly 50 per cent.
A turn in capital productivity and the profit rate tends to take place long before serious changes occur in the overall growth of the economy. In 1898-1907, gross product was in its upturn phase, while capital productivity was already falling. The downturn phase in gross product (1907-28) started only after capital productivity passed its
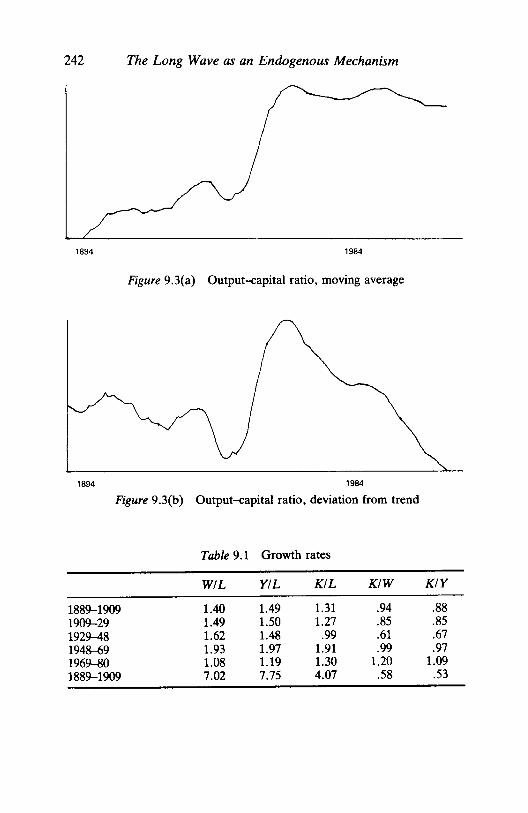
242 The Long Wave as an Endogenous Mechanism
1894 1984
Figure 9.3(a) Output~apital ratio, moving average
1894 1984
Figure 9.3(b) Output~apital ratio, deviation from trend
Table 9.1 Growth rates
WIL YIL KIL KIW KIY 1889-1909 1.40 1.49 1.31 .94 .88 1909-29 1.49 1.50 1.27 .85 .85 1929-48 1.62 1.48 .99 .61 .67 1948--69 1.93 1.97 1.91 .99 .97 1969-80 1.08 1.19 1.30 1.20 1.09 1889-1909 7.02 7.75 4.07 .58 .53
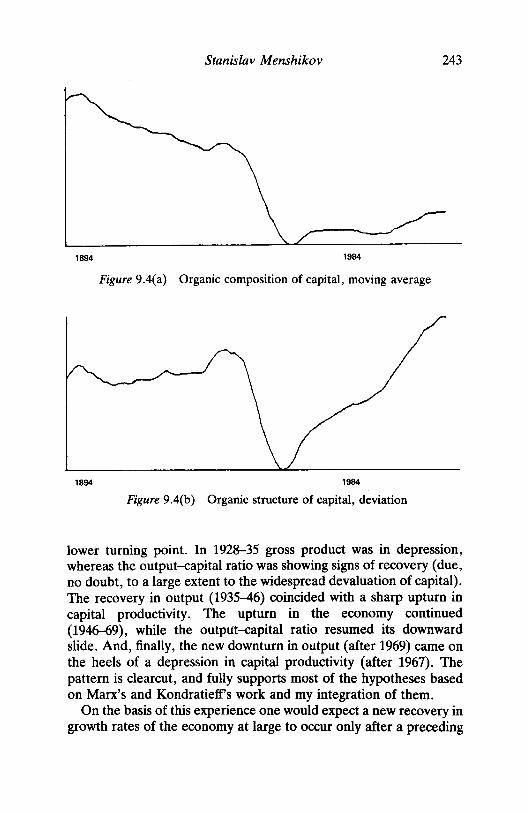
Stanislav Menshikov 243
1894 1984
Figure 9.4(a) Organic composition of capital, moving average
1894 1984
Figure 9.4(b) Organic structure of capital, deviation
lower turning point. In 1928-35 gross product was in depression, whereas the output-capital ratio was showing signs of recovery (due, no doubt, to a large extent to the widespread devaluation of capital). The recovery in output (1935-46) coincided with a sharp upturn in capital productivity. The upturn in the economy continued (1946--69), while the output-capital ratio resumed its downward slide. And, finally, the new downturn in output (after 1969) came on the heels of a depression in capital productivity (after 1967). The pattern is clearcut, and fully supports most of the hypotheses based on Marx's and Kondratieff's work and my integration of them.
On the basis of this experience one would expect a new recovery in growth rates of the economy at large to occur only after a preceding

244 The Long Wave as an Endogenous Mechanism
1894 1984
Figure 9.5(a) Profit rate, moving average
1894 1984
Figure 9.5(b) Profit rate, deviation from trend
recovery in the output-(;apital ratio had occurred. This, then, is the basic leading indicator to watch in the coming years.
THE STRUCTURAL CRISIS AS A PHASE IN THE LONG WAVE
Historically, the downswing phase of the long wave has been associ-ated with structural crises of the economy. Such a crisis indicates that further overall economic expansion at or above the average secular growth rates is impossible without a fundamental change in the sectoral output structure; the system of inter-industry ties and tech-nological relationships; the international division of labour; major

Stanislav Menshikov 245
forms of industrial organisation; and existing methods of market and government control.
Basically, the crisis occurs when the old economic structure comes into conflict with the demands of new technology, but is not yet ready for change. The inertia of the existing structure serves to delay readjustment and transition to new conditions, making it painful and slow to develop. While the old structure prevails, growth rates stagnate, and there is disruption in markets and the monetary sphere, so that business conditions are generally unfavourable. The structural crisis is overcome when the old economic structure finally begins to recede and new branches and sectors, new forms of organisation and regulation develop. Fundamental changes in the economic structure cannot be accomplished within a short time-scale. Common to all manifestations of the structural crisis is that they transcend the limits of one business cycle, that is, 7-10 years. Naturally, the time needed to overcome and resolve particular crises may vary; some drag on for two cycles and more, others for even longer.
During its history, capitalism has experienced several structural economic crises, each involving a far-reaching change in structure consistent with a certain level achieved in the development of pro-ductive forces. The change-over from manufactory to factory (in the late eighteenth century); the spread of corporate property (from the 1820s); the onset of the monopoly stage (starting with the 1870s); the rise of state monopoly control and regulation of the economy (1920s and after); and the appearance of transnational corporations as a leading force in capitalist development (from the 1970s) have all been brought about by the objective need to overcome successive struc-tural crises. In other words, structural crises are an outcome and a form of resolution within the framework of capitalism of its basic contradiction - between the social character of production and the private form of appropriation.
As we have seen, the long wave is directly associated with techno-logical revolutions, that is, with widespread qualitative changes in production technology encompassing the whole economy. The prin-cipal driving force behind every long upturn is the opening up of new directions in technology, not just new generations of existing direc-tions, and not just new models and variations of an existing gener-ation. In the course of such revolutions new sectors and industries are created and old sectors and industries undergo drastic technological change. What starts as the sporadic introduction of new technologies in a limited number of plants in selected industries, continues as the
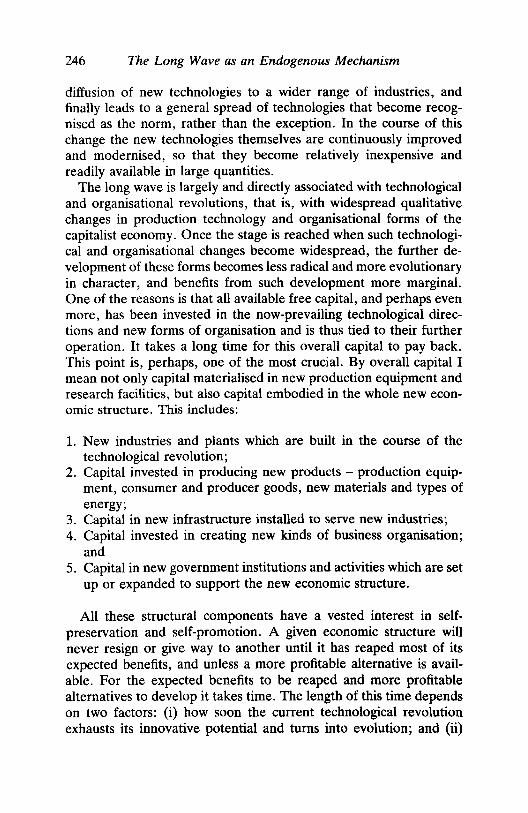
246 The Long Wave as an Endogenous Mechanism
diffusion of new technologies to a wider range of industries, and finally leads to a general spread of technologies that become recog-nised as the norm, rather than the exception. In the course of this change the new technologies themselves are continuously improved and modernised, so that they become relatively inexpensive and readily available in large quantities.
The long wave is largely and directly associated with technological and organisational revolutions, that is, with widespread qualitative changes in production technology and organisational forms of the capitalist economy. Once the stage is reached when such technologi-cal and organisational changes become widespread, the further de-velopment of these forms becomes less radical and more evolutionary in character, and benefits from such development more marginal. One of the reasons is that all available free capital, and perhaps even more, has been invested in the now-prevailing technological direc-tions and new forms of organisation and is thus tied to their further operation. It takes a long time for this overall capital to pay back. This point is, perhaps, one of the most crucial. By overall capital I mean not only capital materialised in new production equipment and research facilities, but also capital embodied in the whole new econ-OInic structure. This includes:
1. New industries and plants which are built in the course of the technological revolution;
2. Capital invested in producing new products - production equip-ment, consumer and producer goods, new materials and types of energy;
3. Capital in new infrastructure installed to serve new industries; 4. Capital invested in creating new kinds of business organisation;
and 5. Capital in new government institutions and activities which are set
up or expanded to support the new economic structure.
All these structural components have a vested interest in self-preservation and self-promotion. A given economic structure will never resign or give way to another until it has reaped most of its expected benefits, and unless a more profitable alternative is avail-able. For the expected benefits to be reaped and more profitable alternatives to develop it takes time. The length of this time depends on two factors: (i) how soon the current technological revolution exhausts its innovative potential and turns into evolution; and (ii)
Stanislav Menshikov 247
how fast even newer technological directions present themselves as more profitable business opportunities. The same is true of forms of business, and labour or government organisations. The change from qualitative technological and organisational change to evolution is sufficient to start a downturn in the long wave. But the availability of profitable new technology and organisation is necessary to trigger developments that make obsolete the prevalent technology and or-ganisational forms, and consequently the existing economic struc-ture.
However, the long downturn leading to a crisis starts even before the following technological and organisational revolution is ready to take off. When a given economic structure is being created there is a lot of business activity, which continues for a long time, but is temporary in nature. This includes investment activity which directly generates high demand for construction, equipment and other capital goods, and indirectly creates additional demand for intermediate goods, labour and consumer goods. This activity serves to extend the long upturn phase in total output. But once the economic structure has been created, or even when its creation has passed its peak, this investment activity is substantially reduced, adversely affecting ag-gregate demand. Excess capacity and high unemployment become lasting features of the economy. One result is long stagnation in businesses that were once growth industries, and even served as locomotives of growth in the preceding upturn. Among them are some industries producing final-use goods, such as machine-building, consumer durables or construction. But also and inevitably they include industries producing basic materials and energy. The other important result is the emergence of excess capacity, or the overaccu-mulation and overproduction of productive capital.
This is an important point in the analysis. It is essential to see how two different forces are combined to drive the economy down at the crest of the long upswing. First, the way in which technological progress affects the overall profit rate. When the spread of new technology is followed by less important modifications, changes and improvements, capital productivity ceases to rise and starts sliding down. This leads, as we have shown, to the long fall in the profit rate. The stage is set a long downturn in the economy. But this is acceler-ated by the second force - the emergence of excess capacity and overaccumulation of capital. Not only does the profit rate (and capital productivity) fall faster because of this additional influence, but general business conditions begin to deteriorate also.

248 The Long Wave as an Endogenous Mechanism
Fluctuations in capital or capacity utilisation accentuate fluctu-ations caused by technological changes. The profit rate is positively correlated with capital utilisation. Since both movements (capital productivity and capacity utilisation) have approximately the same timing (the first, perhaps, slightly leading the latter), they tend to superpose and support each other.
Another important conclusion is that structural change in the economy is not only affected l:>y technological change: it is itself a major factor determining technological change. Once the overcapac-ity situation develops and many basic industries are in stagnation, the need for modernisation, and technological and organisational change become imperative. The system is forced to change due to the lasting, and generally unfavourable, business conditions.
The most important point is the relative profitability of business alternatives and the relative risks involved. The general and prevail-ing profit rate serves as a gauge against which potential profit and risk associated with new undertakings are measured. The higher the prevailing profit rate the more investment would be expected to pour into existing technology, which has proved to be profitable, and into relatively minor improvements. This in itself serves to slow down the growth of profits and eventually to stop it completely.
The comparison is always between the general rate of profit, which may be considered the current overall assessment of the pro-fitability of the established and predominant economic structure, and the individual profit and risk expected by the corporation or entrepreneur, indicating their assessment of the potential return from innovations. When the general profit rate is high it is difficult for the individual rate to be even higher, and so there is little stimulus to attempt major innovations. It is true that when the prevailing profit rates are high and financial possibilities ample, basic research could be expected to be more easily financed. But the time-lag between such research and actual resulting innovations makes it more probable that the latter will appear as realistic busi-ness opportunities during the downswing, rather than otherwise.
Not only the level, but also the direction of change in the prevailing profit rate is important. While profits are rising, prospects for risk-taking and adventure investment are still encouraging, but once the profit rate starts falling, even though it remains high, the signal is given for more caution, with fewer adventures and less risk-taking. This inevitably occurs at the crest of the boom period, particularly

Stanislav Menshikov 249
after the let-down in investment activity. Therefore technological revolutions are doomed to evolution and routine soon after the peak in profitability is reached. The upper turning point in the long wave is thus established.
Let us now consider the lower turning point. When the prevailing profit rate is falling in the downswing, there is little incentive to invest in new technology, which has not yet proved to be more profitable. However, the profit rate eventually reaches such low levels that the range of business alternatives, which are seductive due to the potentially much higher individual profitability, becomes sufficiently large. Risk-taking may be the only alternative when the general profit rate is very low and when current profits may indeed be nonexistent.
It is true that at this point in the downswing financial possibilities are limited for large investments in new technologies. However, once some innovation investment takes off, even in relatively small amounts, it helps slow down and finally halt the downward trend in general turnaround. The overall profit rate may still be low, but once it starts to recover, the impulse is given to more modernisation in both production technology and new goods. By the time the prevail-ing profit rate reaches its long-term average, and this is due also to improving general business conditions, new technology establishes itself as a rule, and its spread throughout the economy and the concomitant change in economic structure is assured.
Traditionally, total capital investment has been statistically dis-aggregated by industry, functional use (plant or equipment), and reproduction role (replacement or expansion). To my knowledge there have been no statistical series which differentiate between investment used to expand existing technologies and products, and investment going into new technologies and new products. An in-direct way of disaggregating investment according to this criteria involves the estimation of latent variables. The technique used for these purposes is described elsewhere (see Menshikov and Klimenko, 1988). This has made it possible to disaggregate statistical series into components which are not to be found in statistical publications.
For my purposes I have used this technique to break down net capital investment in the USA 1899-1987 into three parts:
1. Extensive investment - used to increase the stock of existing technologies;

250 The Long Wave as an Endogenous Mechanism
2. Intensive investment, type 1, or productivity investment - used to introduce new technologies which increase factor productivity in existing plants; and
3. Intensive investment, type 2, or new products investment - used to create new products and shares of production.
All three types of investment serve to bring about structural change, albeit in a different way. The most direct result is produced by intensive investment, type 2, which serves to create new products and industries. The role of intensive investment, type 1, is first and foremost to accelerate factor productivity growth and to implement new technologies which promote a general upswing in the economy. Its eventual result is the spread of new technology across the board and the creation of a new structure in the economy as a whole. Extensive investment serves to expand existing technology, and in this way to support the further development of a new economic structure, once it has been initiated. The most active and revolution-ary part is intensive investment of both types, while extensive invest-ment is more conservative and evolutionary in nature.
Time series calculated by us show that, on the average, extensive investment leading to quantitative growth in existing technologies accounts for two-thirds of total net investment, while the share of productivity investment is 12 per cent, and new products investment 21 per cent. But there are significant oscillations throughout the period in question.
The pattern of the two types of intensive investment is quite different. It is the share of productivity investment (not new products investment) that reached a maximum in 1934. During the whole period from 1903 to 1934, except for a temporary decline in 1917-23, there was a sharp upturn in productivity investment associated with the advent of new factor-saving technology (the assembly-line, Tay-lorism, Fordism). Productivity investment continued to rise (in re-lative terms) straight into the long depression, which added to the mass unemployment of those years. In the late 1930s and during the war years the reintroduction of relatively cheap and abundant labour reduced the importance of labour-saving technology. It regained importance in the post-war years when the new production tech-nology, which had been developed earlier, spread across the board. The pause in the 1960s and early 1970s occurred at a later stage of the upswing and did not yet reflect the new automation based on the microprocessor and robotics. As to the frequency of oscillations in

Stanislav Menshikov 251
productivity investment, there was a 42-year interval between the major troughs of 1903 and 1945 and, similarly, a 40-year distance between the two principal peaks of 1933 and 1973. Thus, productivity investment brings us closer to the long-term Kondratieff wave. One can single out productivity investment as the most active and leading investment component of structural change in the long wave.
A LONG-WAVE MODEL
The theoretical discussion in the preceding paragraphs provides the basic elements for a formal model of the long wave. Consider a simplified version of our mathematical 'Siena model' of the wave, presented in Menshikov and Klimenko (1985):
dy/dt = -a(y - bk);
dk/dt = -c(k - gp);
p = y - k;
where:
y = growth of rate of labour productivity;
(1)
(2)
(3)
k = growth rate of capital intensity (capital stock per manhour of labour);
p = growth rate of the profit rate; and a, b, c, g = structural coefficients.
Labour productivity adjusts to capital intensity, and the latter to the profit rate. To simplify matters it is assumed that the share of profit in national product is constant, so that p is approximately equal to y - k.
The dynamic properties of this model are determined by the characteristic equation:
r + [a + c(1 + g)]x + ac(1 + g - bg) = 0; (4)
or, if b = 1 (which is approximately true in the long run),
x2 + [a + c(1 + g)]x + ac = 0 (5)
Regular cycles in growth rates are generated when g = -2, and a = c.

252 The Long Wave as an Endogenous Mechanism
Given these conditions, long waves of 50-60 years' duration appear if speeds of adjustment are in the range of 0.11-0.12, 20-year cycles, when a = c = .34; a 7-year cycles when they are both = 1, and a 3.5-year cycle, when a = c = 2.
Let me now explain in more detail the logic of the model and the calculations underlying it. First, on the choice of variables. The reader will see that they have been chosen from the list that was described above, that is, labour productivity, capital intensity, the profit rate. Obviously, underlying the operation of the model is the movement of the capital coefficient, which, as shown, is close to the movement of the organic composition of capital.
Second, growth rates rather than absolute values are used in the model, mainly for substantive reasons. All variables show secular growth over the observed historical period. Thus equations of the model describe deviations from long-term stability conditions which are not actually satisfied at any given moment, but appear as hypo-thetical trends, showing the potential growth rate of the economy in the long run. The model thus combines growth trends and fluctu-ations.
Equation (1) is derived from the general production function, which postulates that output is determined by a particular combi-nation of means of production (stock of productive capital) and living labour. If both sides of this generally-known expression are divided by the quantity of labour, labour productivity becomes a function of capital intensity. In neoclassical economics this relation is basically stable at the long-term equilibrium. But not so in real life. As seen in my statistical data, labour productivity follows capital intensity but in such a way as to rise alternately faster and slower than the latter.
The most important coefficient in this equation, from the point of view of producing the long wave, is a: when estimated over the whole observed period its value varied between 0.033 and 0.048. This indicates a very low speed of adjustment and therefore a prolonged period of fluctuation of productivity around capital intensity.
Equation (2) is a derivation of the investment function, where capital investment is determined by the rate of profit. It is normally assumed that investment is positively dependent on profitability. As we have seen, this applies only to extensive and new product invest-ment, but not to productivity investment which is driven by the difference between the individual and general profit rate. When the latter is low the need for new technology with higher factor pro-ductivity becomes a top priority. Therefore, not surprisingly, the sign

Stanislav Menshikov 253
of coefficient g in this equation was found to be negative (-0.62). The negative influence of the general profit rate on capital intensity
also has other substantive reasons. In a long depression, when a negative p is driving down the profit rate, there is both an involuntary accumulation of fixed capital and inventories, and a strong drive to save at the expense of labour - with or without investing in labour-saving equipment. These influences keep capital intensity rising. In a recovery, more labour is needed to fill up unutilised capacity, and k may fall while p rises. When the profit rate is higher than average, there is less compulsion to save labour, and labour-intensive tech-nologies are used more readily.
While Equation (1) is important in determining the overall slow speed of reaction in the system (as far as technological progress and the interchange of its forms are concerned), Equation (2) serves as the driving force of the long wave because it is crucial in explaining the basic turning points of the wave: both the upper and lower points.
When solved theoretically as a differential system, the model yielded damped fluctuations with a period of 53.7 years. When simulated as a difference approximation, the model produced per-iodic waves of 60 years' duration (for a more detailed analysis see Menshikov and Klimenko (1985). A much larger model is presented in Menshikov and Klimenko (1988). First, oscillations in the rate of surplus value were specifically taken care of by introducing:
dzldt = -e(z - fy) (6)
where z is the growth rate of profit per unit of labour. The equation is a simple derivation of the relation between surplus
value and national product. In the long-term, total profit rises some-what faster than product, which is indicated by the estimated coef-ficient f = 1.05. The speed of adjustment is moderate (e = 0.124). But the basic enlargement of the model was connected with the disaggregation of investment into its structural components. Thus, instead of Equation (2) there appeared three other equations de-scribing the relationships associated with extensive, and two types of intensive, investment:
dxldt = -q(x - hv)
drldt = -1 (r - my)
dwldt == -i (w - jp)
(2a)
(2b)
(2c)

254 The Long Wave as an Endogenous Mechanism
where:
x = growth rate of extensive investment; v = growth rate of gross private domestic product; r = growth rate of productivity investment; and w = growth rate of new products investment.
Extensive investment is determined by the need to adjust the actual stock of extensive capital to its desired level determined by incre-ments in output. Production investment is determined by changes in labour productivity and new products investment by changes in the general profit rate.
I shall not go through the estimated values of all the coefficients. However, one point is important in this respect. The speed of reaction of new product investment is the lowest of all three types: i = .022. This is 4.5 times lower than that for extensive investment (q = .094) and 2.5 times lower than for factor saving (productivity) investment (r = .059). With such different speeds of adjustment (and thus different life-cycles in fixed capital structural components) one would expect the model to generate a spectrum of oscillations.
To close the system, three additional identities and one production function were necessary:
KS =X + R + W (6)
k =KS - s (7)
s =v-y (8)
v = n1 * KS(t - 1) + n2 * s (9)
where:
KS = growth rate of total investment; X, R, W = ratios of the three types of investment to total capital stock in the previous period; and s = growth rate of labour.
The full model, now containing ten equations, was simulated for the period 1889-1987, both with and without stochastic shocks. The non-shocked simulation is closest to a visual description of the cycles generated by the model. Fluctuations in product showed theoretical

Stanislav Menshikov 255
troughs occurring in 1903, 1923, 1941, 1965, pointing to the existence of a 20-year cycle. Movement in total capital stock pointed to a wave close to 60 years. Oscillations of the capital-output ratio had the periodicity of about 40 years. And oscillations in the profit rate were closer to the 20-year pattern.
How do these different fluctuations relate to the various types of investment? The movement of the share of extensive investment had a periodicity of 20 years; new product investment, close to 30 years; and productivity investment, 40 years. This is at some variance with speeds of reaction, as shown in the coefficients of Equations (2a)-(2c). But it only confirms the important conclusion that although the life cycle of a particular capital good is the underlying material base for the existence in the economy of a periodic fluctu-ation, the latter is also affected by the whole mechanism of the economy, including the operation of the rate of profit, which has to do not only with technological changes, but also with general busi-ness conditions - the extent to which capital and labour are utilised.
The dynamic properties of the model were also analysed by ob-taining the characteristic roots of the system of differential equations. Three cycles were found to exist: of 32, 38 and 48 years' duration. Obviously, both the Kondratieff wave of 50 years and a shorter structural interchange of 30-40 years were evident. When the exten-sive investment equation was eliminated from the system, the 30-year cycle disappeared, while 41 and 49-year periodicities remained: another confirmation of the close association of extensive investment with shorter-term fluctuations. When the new product investment equation was eliminated only fluctuations of 46-61 years remained. And when productivity investment disappeared from the system, no long wave of any length remained. The conclusion that productivity investment is the basic factor driving the long wave was thus sup-ported.
REFERENCES
Giuliano Bianchi, Gerhard Bruckmann, Jos Delbeke, Tibor Vasko (eds) (1985) Long Waves, Depression and Innovation, Proceedings of the Siena! Florence Meeting, 26-30 October 1983, published as Collaborative Paper CP-85-9 of the International Institute for Applied Systems Analysis (IIASA) (Laxenburg, Austria) March.
Klimenko, L. and S. Menshikov (1987) Catastrophe Theory Applied to the

256 The Long Wave as an Endogenous Mechanism
Analysis of Long Waves, in T. Vasko, editor Long-Wave Debate, Berlin, Heidelberg, New York: Springer 1987, p. 345-358.
Kondratieff, N. O. (1926): 'Die langen Wellen der Konjunktur' in: Archiv fur Sozialwissenschaft und Sozialpolitik, Vol. 58, p. 573-610.
Kondratieff, N. D. and D. Oparin (1928): Great Cycles in Business Con-ditions (Moscow) (in Russian).
Marx, K. Capital, vols. 1 and 3. -- Theories of Surplus Value. Krelle, W. (ed.) (1988) The Future of the World Economy (Berlin, Heidel-
berg, New York: Springer Verlag). Menshikov, S. (1984) 'The Structural Crisis in the Capitalist Economy',
Kommunist (Moscow) no. 4, (in Russian). English translation in Political Affairs (New York, 1984) no. 4.
Menshikov, S. and L. Klimenko (1985) 'On Long Waves in the Economy' in G. Bianchi et al., Long Waves, Depression and Innovation.
Menshikov, S. and L. Klimenko (1988) 'Long Waves in Economic Struc-ture', Krelle (ed.), 1988.
Menshikov, S. (1987) 'The Structural Crisis as a Phase in the Long Cycle' in T. Vasko (ed.), The Long Wave Debate.
Poletayev, A. (1988) and Savelieva, J. 'Long Waves in the Development of Capitalism' in MEMO (Moscow), no. 5 (in Russian).
Statistical Sources (1975) Historical Statistics of the United States, Washing-ton, Part 2; Economic Report of the President (Washington DC: 1984, 1989).
Vasko, T. (ed.) (1987) The Long Wave Debate (Berlin, Heidelberg, New York: Springer).

10 Great Depressions as Transitional Phases within the Capitalist Mode of Production THOMAS KUCZYNSKI
Twenty years ago, the Polish economist, Oskar Lange, had this to say on the problem of long waves: 'Even though historical facts cited above [the consecutive historical phases of capitalist production since 1825] are not subject to any serious reservations, they are not sufficient proof of the existence of long-range cycles. To prove this theory it would be necessary to show that there exists a causal relation between two consecutive phases of the cycle and nobody has succeeded in showing this.' (Lange, 1969, pp. 76-7). Although, even today, there are enough researchers who doubt the historical exist-ence of long waves (see, for example, Goldberg, 1985; Priewe, 1985; Solomou, 1987), I intend to take the view referred to by Lange and assume long waves to be an historically-verified fact. Starting out from this position, let me turn to the problem formulated by Lange, which consists in showing that there exists a causal relation between two consecutive phases of the cycle. Here we can build upon a wealth of groundwork carried out by other authors who have studied various aspects of the problem in detail: without, however, in my opinion, arriving at an integrated theory of long waves.
GROWTH CYCLES VERSUS ESCALA nON PHASES
The main pitfall on the way to an integrated theory of long waves is the idea to consider one factor as the moving factor of the cycle, which, in the end, could be nothing else than Aristotles' (1921, § 1071b) prime mover, itself immovable. I myself do not believe that there is any immovable prime mover in that sense or that there are parameters 'that produce evolution but are not evolution themselves'
257
258 Great Depressions as Transitional Phases
(Luhmann, 1971, p. 362), which have been sought in recent systems-theory-orientated social theories. If, for example, we conceive in-novations or, more generally, technological progress, as the prime mover of long waves, the question will remain unsolved as to why the prime mover works so discontinuously. If we conceive - to take a second example - the falling tendency of the rate of profit as a prime mover, the question will remain unanswered as to why the effects of this prime mover appear with such discontinuity. Resorting to the prime mover we can - perhaps - demonstrate a uniform basic tend-ency in the development, but we cannot explain the periodic ups and downs in the development. The latter, however, is obviously the very type of problem that Lange formulated.
Should we intend to tackle it by adding to the uniform basic tendency a component responsible for the ups and downs, this component would clearly be something different from the basic tendency. Its workings would not be dependent on the basic tendency and thus not on any account be something derived from the basic tendency. But it appears to be unworkable and wrong to try to explain periodically recurring events in history in a way that leaves the basic tendency of the historical process unconsidered. The period-icity will have to be accounted for by the basic tendency itself; in other words, periodicity is an element inherent in the basic tendency, and not one added to it.
Incidentally, it follows from this approach that all the statistical procedures for verifying long waves that are based on isolating the waves from the basic tendency are inadequate for the object under examination. They mayor may not contribute to a graphic and visual clarification of the phenomenon, but they do not provide a theoreti-cal framework for the explanation of the phenomenon. Some sixty years ago Oskar Anderson (1928; 1962, p. 176) was able to show that the shape of long waves depends on the type of trend chosen and that, ideally, mirror-image results may be achieved by choosing a different type of trend: periods of upswing change into periods of stagnation and vice versa. This does not only apply to the results achieved by Kondratieff in his investigations, but also to all the others that have been achieved by applying spectral analysis and filter design. The recurring criticism of the various forms of trend elimin-ation (see the recent example of Gerster, 1988, p. 98) overlooks the point that matters, since it assumes the existence of such a trend supposed to be separable from long waves. Contrary to this we could demonstrate that, especially with long-run analyses, the presupposi-tion of a secular trend implies absurd conclusions under a theoretical

Thomas Kuczynski 259
and historical aspect (Kuczynski, 1986, 1987a). Thus statistical analysis, too, will have to be based on the statement that long waves and the basic tendency of development must not be separated; that trend and cycle form an indivisible whole (see Bogdanov, 1928; Eventov, 1929). It follows that any trend elimination is inadequate: not that the answers to the question of how to eliminate the trend are wrong, it is rather that the question itself is put the wrong way.
Schumpeter (1939) was the first to suggest the idea that the period-icity should be taken as an element inherent in the basic tendency, but he proposed it in a methodologically inadequate way: the trend underlying, say, a cycle of nth order is itself a cycle of (n + l)th order. If carried out strictly, the concept shows the complete reversi-bility of the process: after the cycle of the highest order has been passed through, the initial state is re-established. Obviously, no development in the proper sense of the word can occur within the framework of such a model, for it excludes history as a process of development. Once started, the process runs to infinity - this is, according to Hegel (1812/1971, p. 225), 'bad infinity' - and it will also repeat itself in its bad infinity.
But if we look at the graph of a growth process composed of a long cycle and a trend (see Figure 10.1), we can also decompose it in a different way (see Figure 10.2). Such decomposition reveals an essentially different growth process - although the (re )composed graphs are almost identical. What is taken as a basis is no longer the anhistorical uniformity of trend and cycle, but a sequence of logistic functions. It is only for clarification purposes that we have complied with the anhistorical uniformity in a particular way. Starting from a simple logistic function,
(1)
with
Q = 90; a = 3; ~ = 0.1 as parameters and tw = a/~ = 30; Yw = Q/2 = 45; as inflection point
we have increased a to 9,15, ... in the sense of a 6O-year cycle and thus produced almost strict cyclicity. We get the simple basic model of an escalating function with m as degree of escalation:
m y = ~ Q/(l + ea(2i+l)-Ilt). (2)
i = 0
Instead of demanding that a new logistic function should start at

260 Great Depressions as Transitional Phases
Figure 10.1 Linear trend plus trigonometric function
exactly the inflection point of the one preceding it and that it should, furthermore, have the same saturation level Q and the same growth rate ~, we could vary all these parameters. By introducing the parameter y we get the generalised logistic function
(3)
with the shifted inflection point
tw = (a + log y)/~; Yw = [yQ/(l + y)]Y.
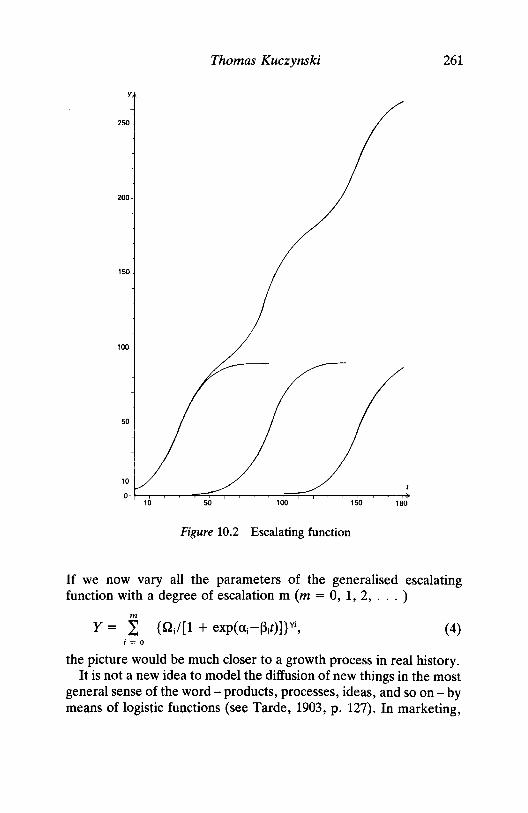
Thomas Kuczynski
y
250
200 ~
150
100
50
10
O~~r-r-~~~~--~~=T~~~~~-r~ 10 50 100 150 180
Figure 10.2 Escalating function
261
If we now vary all the parameters of the generalised escalating function with a degree of escalation m (m = 0, 1, 2, ... )
m Y = L {Q;I[l + exp(ac~l)]}Y\ (4)
i = 0
the picture would be much closer to a growth process in real history. It is not a new idea to model the diffusion of new things in the most
general sense of the word - products, processes, ideas, and so on - by means of logistic functions (see Tarde, 1903, p. 127). In marketing,
262 Great Depressions as Transitional Phases
the concept has successfully established itself in the sense of the product life-cycle (see Levitt, 1965), but in analysing long waves it has been applied largely without success (see van Duijn, 1983, pp. 26ff.). If we interpret the parameters from an economic point of view, it becomes clear why this has been the case.
THE LOGISTIC GROWTH OF STOCKS AND ITS CONSEQUENCES FOR THE GROWTH OF PRODUCTION
The parameter QY indicates the saturation level of the process. It is a matter of course that the phenomena in economic reality can only grow to a certain magnitude, which can be determined more or less exactly, and this will surprise only those who have fallen victim to the fictitious secular trend. There is the popular as well as the philos-opher's formulation. 'All that exists has a measure' (Hegel, 1971, p. 343). The length of a country's railway network cannot grow beyond a certain dimension. For most industrial countries a satura-tion level may be (ex post) prognosticated from the development up to 1890, that is, a long time before the advent of the automobile as a serious competitor within the transport system. There was also logis-tic growth in the number of registered cars, though in two stages: in general, the inflection point of the first wave was before the Great Crash of 1929, that of the second in the 19608, that is, before what has been called the oil shock. We could add to this list almost at will.
But first and foremost the list would contain the sizes of stocks (similarly, the logistic function was first applied to model the growth of biological populations). But it is manufacturing data in addition to prices and interest rates that is above all investigated in analysing long waves. There is, however, an inevitable difference between the development of production and that of stocks. In order to have logistic growth in the stock of cars, for example, those cars must be included that are newly-manufactured but which are taken out of the stock for reasons of physical wear, technological obsolence, fashion, and so on.
So the growth function of production is not simply the derivative of the growth function of the stock. If we assume that the stock grows in a simple logistic manner (see Equation 1) then the growth function of production in its simplest case (constant retirement rate) is
z = y' + ILY (Sa)

Thomas Kuczynski 263
with 11 as retirement rate, and therefore
z = Y(1l + ~(1 - yIQ». (5b)
If the retirement rate is small enough, namely, 11 < ~, this function even has a maximum. At the moment tmax = [a + 10g«~+Il)/(~-Il»]I~ the function reaches the value of Zmax = Q(~+11)2/4~. We notice that a fall in the growth function of production may be wholly prevented by increasing the retirement rate. But in this case, too, it has one inflection point, the time co-ordinate of which we get from the solution of the quadratic equation
(6)
There is another problem: all the elements of an escalating func-tion are assumed to have started an infinitely long time ago with infinitely small values. But in reality they started with finitely small values and at a moment that can be determined more or less exactly. They cannot fall below certain minimum values, as we very well know from reality. They are also historically determined, such as, for example, minimum capital. If there is only one logistic function, we can settle that this real minimum (J) equals the value Yo = [Q/(1 + eU)]Y reached at the moment to=O. It is obviously not possible to do this when we analyse a sequence of logistic functions. Here the real minimum of the 'ith' function is not reached before the moment
(7)
(provided the difference in dimension between (J) and Q is large enough).
The third problem is that the start of a new escalation is often connected with substitution processes, so that logistic functions that have started earlier are at the least damped in their growth and mostly diminish below the level already reached, perhaps even suf-fering a sharp drop. If there are sufficiently long time series for each individual product (and the different manufacturing processes applied to its production) this process can be analysed. But most products and processes as well as the industries manufacturing or applying them generally pass through one long upswing period only, so that no comprehensive causal analysis can be made, although a rise and fall may be demonstrated. With highly aggregate (macroeconomic) data,

264 Great Depressions as Transitional Phases
however, the multitude of different parameters can no longer be estimated.
If we assumed that a new logistic function started each year, the aggregate would grow almost continuously. It is only when the new logistic functions start in batches that the more-or-Iess marked pic-ture of a periodic escalation process arises. It becomes visible in the aggregate data with particular clarity if we decompose the time series into the individual classical cycles (Juglar cycles) and analyse growth from one peak to another. However, what becomes visible in such kinds of decomposition first and foremost is not the upward move-ment of the newly-begun logistic functions - their weight is much too small for this in the initial phase - but the saturation of those branches and groups of products of which the logistic growth had already started. Hence the stagnation phase is the starting point of a new long wave - just as in the classical cycle the crisis is, according to Marx (1884/1977, pp. 188ff.), the starting point for the new cycle.
THE RATE OF PROFIT AND THE INPUT-OUTPUT RATIO
Therefore the question is not so much why growth slows down - all that exists has a measure - but rather why a new upswing starts. If we assumed the new upswing to be conditioned by exogenous factors (as, for example, in Mandel, 1980) we would logically imply that long waves are not a phenomenon that can be derived from the intrinsic mechanism of capitalist economy but that they are due to more-or-less accidental events. But if we apply the escalation model outlined above to the development of the rate of profit, this intrinsic mechan-ism becomes quite clear; in my opinion it is not by chance that Marx touched on some aspects of long-wave development precisely in connection with the development of the rate of profit (see supporting evidence in Kuczynski, 1987b) and therefore was by no means of the opinion that the rate of profit was bound to fall from the very beginning and in a permanent manner.
Let us look at the formula for the rate of profit, although not in its conventional form ofp' = sl(c + v), because hardly anything can be discovered from this . We rather start from a base stock of fixed capital Ct. During its period of turnover (several years) a value of product P is created. Apart from Ct the circulating capital used during this time in both its constant Cz and variable v parts must be deducted from this value of product. The turnover period of the fixed

Thomas Kuczynski 265
capital covers several production cycles, during which the circulating capital, too, has been turned over several times. Therefore we cannot simply add the total consumption of Cz and v to the advanced capital. If we assume its turnover figures during the time that Cf is productive to be Uz and U y , respectively, then only c)uz and vluy , respectively, are included in the advanced capital - the rest of these expenses are already paid out of the proceeds from the sale of goods and are therefore not advanced. Then the following will apply:
s = P - (Cf + Cz + v),
pi = P - (Cf + Cz + v) Cf + czluz + vluy
(8a)
(9a)
The value of the advanced circulating capital is small compared with that of the fixed capital and it becomes almost irrelevant with high turnover figures. Therefore we simplify the formula into
pi = PICf - (cz + v)/Cf - 1. (9b)
The value of product may be split up. It consists of certain goods produced in certain quantities qi, each having a value per piece of w(q i), and therefore
(lOa)
By analogy we have
(10b-d)
Let us assume that B people have been employed (as v turns over several times, one person working during the whole production time of Cf is, of course, not counted as one person, but as Uv employed people), then the average value of the commodity labour power is
(11)
If we use
(12a-c)

266 Great Depressions as Transitional Phases
as expressions for the relative values of q i, /; and Zi, and
(13a-c)
for the relative values of total production, the total stock of fixed capital and the total consumption of circulating constant capital, the rate of profit is
(9c)
If finally we use
q* = q lB· f* = f, lB· z* = z IB r T'T r'T r (l4a-c)
as expressions for the corresponding per capita quantities - per capita production q:, per capita stock t: and per capita consumption z: (each in relative values) - the rate of profit is
P' = q*I£* - z*J-F* - 1/£* - 1 rJr rJr Jr . (9d)
I do not intend to analyse this formula in full details but it is evident that
1. If the value of labour power falls, the rate of profit rises; 2. If the relative values of circulating capital (raw materials, and so
on) increase faster than those of fixed capital, the rate of profit goes down; and
3. If per capita production increases faster than the per capita stock of fixed capital, the rate of profit rises (provided that the changes in the relative values of q and f are equal).
But the most important component in these equations for the analysis of long waves in the development of the rate of profit should be seen in the relationship of production and the stock of capital. For this main element of the rate of profit we use the expression
k = qJfr = 1 + p' + (B + zr)/fr. (lSa)
Starting from the formulation developed before it was discovered in a first approximation that the growth of the stock of capital follows the function

Thomas Kuczynski 267
(16a)
with
<Pf = QA1 + exp(uf - ~ft)]. (16b)
whereas the growth of production follows the function
(17a)
with
(17b)
It follows for the output-input ratio
(lSb)
The point in question is whether and under which conditions k reaches a maximum. If we form the first derivation dk/dt and equate it to zero, we get, after some rearrangements,
!!y~tC1-<Pf/Qf) + f~i1-<piQq)*[y~tC1-<Pf/Qf) + ~q<piQq] = f~i1-<piQq)*[!! + f~q(l-<piQq)] (18)
It is only in a few special cases that this equation has an explicit solution for the moment when k reaches its maximum; generally an iteration process will be necessary for this. But apart from this inconvenience the equation normally has precisely one solution for the range of (real-valued) time. We characterise as abnormal the particular case when k falls right from the start because the stock of producing (fixed) capital grows faster than the stock of produced commodities; this happens in accordance with the model when ~f > ~q or (at least) when Y~f > f~q. Therefore we can take it for granted that k as a specific output-input ratio will increase up to a certain moment and then begin to go down, and that due to the dominating position of k within the rate of profit, the rate of profit, too, will increase up to about that moment. This corresponds to the reality of capitalist business life in so far as a rate of profit which falls

268 Great Depressions as Transitional Phases
right from the start and keeps falling permanently will induce nobody to engage in any kind of economic activity whatsoever.
Let me add here that my model is very simple and contains no feedback. Normally, the growth in the stock of capital and pro-duction itself depends on the movement of the rate of profit. It follows from this that the movement of q, f and k had to be expressed in a system of nonlinear differential equations with delayed argu-ment. But also the differences in the development of individual branches will have to be taken into account, as will be seen later. I have not yet found a solution of this highly complex system of nonlinear differential equations and I have in particular not managed to achieve the necessary determination of the lag parameters, not even on a level of mere plausibility. Therefore I have confined myself to this very simple model.
THE ROLE OF THE AVERAGE RATE OF PROFIT
Various means may be used to prevent the rate of profit from falling. The main means to halt the falling tendency of the rate of profit is technological progress. Technological progress may manifest itself in an increase of per capita production, a lowering of per piece con-sumption of raw materials or, as mentioned before, an increase in the output-input ratio k. But any technical and/or technological system can only be improved within its own limits, and the more it is improved the smaller are both the possibilities for, and the economic effects of, further improvement. There is a similar situation as far as improvements in the organisation of production and the economies of scale are concerned. Inevitably the time will come when a certain industry experiences an actual fall of the rate of profit.
If the rate of profit falls in a certain branch, a redistribution of capital takes place - according to the law of average profit. But as fixed capital has a certain material composition and is only disposable within certain limits, this redistribution applies to the additional capital, that is, net investments. The effects of this reorientation of net investments are twofold. For the short term there is a relief of the strain on the branch in question, the growth rate of production decreases a little, as does the stock of capital (even this cannot be represented in the present approach to a model because it is re-stricted to one branch), but on the whole the situation within the
Thomas Kuczynski 269
branch is stabilised; although net investments have been reduced, at least the fixed capital that is wearing out will continue to be replaced, so replacement investments will scarcely be reduced. For the long term, however, the reorientation of net investments will produce the very situation in the other branches which seemed to have been overcome in the single branch. It should be taken into consideration that overaccumulation caused by the redistribution of net invest-ments also spreads to those branches which, concerning their tech-nological basis, have not yet reached the limits for their growth: it is temporary overaccumulation of the kind that occurs in any classical crisis. But as parts of the technological basis reach their saturation level, there is no longer a possibility of short-term reductions of overaccumulation.
There can be no short-term change in the situation. It presupposes the establishment of new industries. This is done first and foremost by introducing fundamentally new technologies, by effecting what we call basic innovations that form the basis of new industries as, for instance, the mechanised textile industry, the railways, the electrical industry, the car industry, the electronics industry, and so on. This is the techno-economic basis of the clustering of so-called basic innova-tions (Kleinknecht, 1987). But the introduction of technologies which in the end - whether originally intended or not - result in the establishment of a whole new industry, the introduction of such basically new technologies is a risky affair, because very few people know anything about their profitability, possible market behaviour, the technologically and economically induced follow-up investments, and so on. In addition to this, established enterprises will be unlikely to be interested in installing them as long as the rate of profit can be secured at its former level with traditional technology or with slight improvement to it, for the introduction of a new technology holds a double risk: not only concerning its own profitability but also con-cerning its effects on the profitability of technologies that are (still) profitable at the time. If it is introduced, whole complexes of plant may not only become obsolete but also even unprofitable.
Therefore its profitability is not a sufficient, although a necessary, requirement for the widespread introduction of new technology. Not before the old technologies have reached a point where the fall of the rate of profit cannot be stopped any longer will the new ones take their place. However, they will only do so if they yield surplus profit for the longer term, so that it is not only a matter of carrying out net investments out of the surplus value but also of the reorientating the

270 Great Depressions as Transitional Phases
replacement investments and of reproducing old industries on a narrowed scale only. But for the moment the higher profitability of the new industries causes a further deterioration of the general situation, for the law of average profit causes a fall of the rate of profit in other enterprises, especially in those still applying old technology. Therefore these enterprises are doubly forced to intro-duce new technology: the pressure of new technology on their rate of profit is added to that of the old.
On the accumulation side, too, it becomes apparent that the situation is Janus-faced: there has been overaccumulation on the one hand, but on the other hand accumulation has not gone far enough, namely in the enterprises applying the new technology. Enough surplus profit has to have accumulated with the latter before can it be used productively in the form of new investments. At the same time the other enterprises that have hitherto applied old technology -provided that they have survived competition - will no longer orien-tate their replacement investments towards the old but also towards the new technology.
But the economic effect of new technology is by no means re-stricted to the industry applying it or the one newly established by it. The goods produced by it enter the reproduction process of capital, whether in the form of machines and plant, or as raw materials, or semi-finished products, or as consumer goods for the workers; the cuts in the prices of these goods cause medium-range improvements in the conditions of capital utilisation and consequently an increase of the rate of profit also in branches not applying the new technology directly. Even industries in decline may be given a fresh impetus for renewed growth in one way or another.
It is obvious that all these processes will not develop from one day to the next, for they require the restructuring of whole spheres of capital. It is this economic effect of what we call basic innovations that makes up their real importance beyond technology and an individ-ual industry, which makes them fundamentally different from innova-tions with a smaller economic scope. Whereas the latter induce larger or smaller oscillations of the rate of profit which balance out in the relatively short term, the basic innovations establishing new indus-tries are among those which 'very gradually assert themselves and are recognised as a change in the conditions' (Marx, 1863/1972, p. 518).
As soon as the new technology is generally applied, the surplus profit gained with it before dwindles away and the average rate of profit is re-established at a new level: the 'cycle' starts again.
Thomas Kuczynski 271
It may even be left open whether the new average rate of profit is lower or higher than the previous one, and whether the tendency for the rate of profit to fall is a real fall. The tendential element is not anything added to Marx's law of the tendency of general rate of profit to fall - in the sense that all laws have only a tendency to assert themselves - but it is inherent in the law, for the law itself will bring forth the tendencies counteracting it; contrary to the deviations from, for example, the law of value, which can only be explained by effects at work under conditions which are factors outside the law, the deviations in this case result from the law itself.
WORLD-ECONOMY AND NATIONAL ECONOMIES
If we want to go over to the statistical verification of this process, we are confronted with considerable difficulties. Firstly, there are, of course, no statistics of investments for any country which would enable us to analyse over decades the net and replacement invest-ments in a classification according to industries. We also lack the branch-specific rates of profit (the actual rates of profit of the par-ticular spheres of production). We can only analyse over a sufficiently long period, that is, more than a century, the effects on the growth of production in the individual branches. If we do this for the individual countries, we arrive at extremely inconsistent results, for we can see at first sight that it is not only the individual industries that behave differently - which is in full accord with the hypotheses presented here - but also the single national economies. In fact, the whole process takes place on a world- economic basis. Each national econ-omy may react in a different manner - according to its historical position in this world economy.
Let us take as an example the Great Depression of 1873-93 and the following prolonged upswing until the outbreak of the First World War. Both phases can be distinguished rather precisely on the basis of the statistics of world industrial production, but for the national economies of the core countries this is only possible in part. If we analyse pure statistics of production we see that in the USA the Great Depression, and in France and England the prolonged upswing, fail to take place almost completely; it is only in Germany that we can distinguish both phases rather distinctly. This can be explained con-sistently from a world-economic angle: the USA was the most im-portant immigration country of the time and kept on strengthening
272 Great Depressions as Transitional Phases
this position due to the worsening economic situation in Europe. Here we must analyse the per capita production and in this case the results look quite different, although, of course, the accelerator effect connected with immigration is not fully compensated by this pro-cedure. England and France at first found a way out into their colonial empires, which either existed or were to be established then, and they changed the regional structure of their foreign trade and resorted to capital export. All this - which proved later to be mere palliatives - was not available to Germany. Instead of looking for 'new markets for old products' it had to look for 'new products for old markets'. This uncomfortable position served as a solid basis for the new industries arising during the Great Depression (the chemical, electrical and modern steel industries), industries that became the 'leaders' of the following upswing. It is small wonder, then, that this upswing was delayed and much weaker in England and France. In this respect the long-wave mechanism is at work on a world-economic basis only: it is a global principle. (Global principle in a similar sense as in physics: there is a distinction between the weak global principles applying only to the system as a whole and the strong local principles applying to each individual element of the overall system.)
PHASES OF CAPITALIST DEVELOPMENT
In addition to this, historical analysis shows that technological prog-ress giving rise to new industries takes place on a socio-economic basis that is of an inconsistent nature. On the one hand it is first and foremost introduced· by small entrepreneurs, some of whom are successful in this way. (This is, by the way, the most vital point of Schumpeter's thesis concerning the 'innovative powers of the private entrepreneur' .) This results from the simple fact that at first new technology is much less capital-intensive than old technologies -examples may be found in large numbers, from the spinning jenny to the microcomputer. Therefore new technology at first mainly favours the small entrepreneur (which is, incidentally, the real basis of the recurring thesis of the up-and-coming middle classes). But things may look quite different as innovations become increasingly mature. The big entrepreneur then takes the small innovative entrepreneur's place. The production and application of the cheap electric motor gave rise to the higly capital-intensive electrical industry, with the

Thomas Kuczynski 273
same thing happening in the chemical industry, and a similar course of events to be assumed for the microcomputer (which can be bought so cheaply now) and the electronics industry. Moreover, we have to state that in the stagnation phases of the old industries we can not only notice the establishment of new ones but at the same time also the development of new forms of organising and regulating pro-duction, above all in the new industries, but also in at least some of the old ones, too. It was obviously not possible to tackle the crisis of the old industries with the old system of organisation and regulation, and the new industries, once emerged from their initial stages (the pioneer era of beginning commercialisation), also required different forms of organisation and regulation.
It would go beyond the scope of this chapter to demonstrate in detail the relationship between the technological basis of a specific mode of production and its organisation and regulation, but in my mind it is not by chance that, as a result of the Great Depression, the transition to monopoly capitalism took place; that the efforts made to overcome the world economic crisis and the 'depression of a special kind' (Varga, 1934), which W. A. Lewis (1978) called 'the Greatest Depression', inevitably led to the transition towards state-monopoly capitalism; that today we are in a phase of transition towards supra-national state-monopoly capitalism which finds expression in, for example, efforts made to create a 'European internal market'.
That is why I think we should view and analyse the great depressions as transitional phases within the capitalist mode of production. The capitalist economic system was in a deep crisis involving the whole mode of production in each of these transitional phases.
It was by no means agreed from the beginning that it (the crisis) should be overcome in the sense of developing the capitalist mode of production further and going over to a new specific mode of pro-duction. As we know from systems theory, systems are particularly sensitive to ( exogenous) interferences if they are still very young or already very old, and highly prone to interference for this reason. It is no accident that wars and revolutions have occurred in the last stages of the upswing and during the transitional phases, and that new trends in the development of the working-class movement also gained ground at these times. But these are all political events, therefore exogenous factors relative to the long-wave development in econ-omic life. They may contribute to maintaining the capitalist mode of production. (Sweezy (1970, p. 25), for example, said that the Second World War saved American capitalism), they may also counteract it,

274 Great Depressions as Transitional Phases
as, for example, the October Revolution of 1917 in Russia and the building of socialism.
That is why I do not think (as, for example, Mandel, 1980) that the further existence of the capitalist mode of production is due to exogenous factors. I rather think that hitherto the influence of exogenous factors has not been strong enough to put an end to the endogenous mechanism of the long-wave development of the capi-talist mode of production on a world scale. The way in which this might happen, what possibilities for such an end has history har-boured in the past and is harbouring now, is a different question going beyond the scope of my contribution.
REFERENCES
Anderson, O. (1929) Zur Problematik der empirisch-statistischen Konjunk-turforschung (Bonn: Kurt Schroeder).
-- (1962), Probleme der statistischen Methodenlehre in den Sozialwissen-schaften (Wiirzburg: Physica-Verlag).
Aristotle: (ed. Rolfes) (1921) Metaphysik (Leipzig: Meiner). Bogdanov, V. (1928) 'K voprosu 0 zakonomernosti istoricheskogo rasvitija
kapitalizma', in: Pod znamenem marksizma, no. 6, pp. 8Off. Duijn, J. J. van (1983) The Long Wave in Economic Life (London: George
Allen & Unwin). Eventov, L. (1929) '0 prirode dlitelnykh kolebanij kapitalisticheskoj dina-
mike', in: Problemy ekonomiki, no. I, pp. 54ff.; no. 2, pp. 47ff. Freeman, C., J. Clark and L. Soete (1982) Unemployment and Technical
Innovation (London: Frances Pinter). Gerster, H. J. (1988) Lange Wellen wirtschaftlicher Entwicklung (Frankfurt:
Peter Lang). Goldberg, J. (1985) 'Das Konzept der "langen Wellen der Konjunktur"', in:
Grof3e Krisen des Kapitalismus - Lange Wellen der Konjunktur? (Frank-furt: IMSF) pp. 51-96.
Hegel, G. W. F. (1971) Wissenschaft der Logik, Vol. 1, (Berlin: Akademie-Verlag).
Hufbauer, G. (1966) Synthetic Materials and the Theory of International Trade (Cambridge, Mass.: Harvard University Press).
Kleinknecht, A. (1987) Innovation Patterns in Crisis and Prosperity (Lon-don: Macmillan).
Kuczynski, T. (1978) 'Spectral Analysis and Cluster Analysis as mathemat-ical methods for the Periodization of Historical Processes' , Proceedings of the 7th International Economic History Congress, Edinburg mimeo.
-- (1986) The Impact of the Depression of the 1930's and its Relevance for the Contemporary World, (Paper for session A5 of the 9th International Economic History Congress), (Bern/Budapest).
-- (1987a) 'Die Entwicklung des AuBenhandels wahrend der "GroBten Depression''', in: lahrbuchfiir Wirtschaftsgeschichte, Pt. I, pp. 79ff.

Thomas Kuczynski 275
-- (1987b) in T. Vasko (ed.) The Long Wave Debate (New York, Heidel-berg, Berlin: Springer) pp. 59ff.
Lange, O. (1969) The Theory of Reproduction and Accumulation (Warsaw: Akademie-Verlag).
Levitt, T. (1965) Harvard Business Review, no. 6, pp. 81ff. Lewis, W. A. (1978) Growth and Fluctuations 1870-1913 (London, Boston,
Sydney: George Allen & Unwin). Luhmann, N. (1971) in N. Luhmann and Habermas, Theorie der Gesellschaft
oder Sozialtechnologie - was leistet die Systemforschung? (Frankfurt: Suhr-kamp).
Mandel, E. (1980) Long Waves of Capitalist Development (Cambridge, Paris).
Marx, K. (1972) Theories of Surplus Value, Vol. III, (London). - (1977) Capital, Vol. II (Moscow) Mensch, G. (1975): Das technologische Patt. (Frankfurt: Umschau Verlag). Priewe, J. (1985) 'Die drei gro6en Krisen des deutschen Kapitalismus', in: J.
Goldberg, Grope Krisen des Kapitalismus (Frankfurt: IMSF) pp. 9-50. Schumpeter, J. A. (1939): Business Cycles, (New York: McGraw-Hill). Solomou, S. (1987) Phases of Economic Growth, 1850-1973 (Cambridge
University Press). Sweezy, P. (1970) Die ZUkunft des Kapitalismus (Frankfurt: Suhrkamp). Tarde, G. (1903) The Laws of Imitation (London: Henry Holt). Varga, E. (1934) Die Grope Krise und ihre politischen Folgen (Moscow,
Leningrad) .
COMMENT
Bart Verspagen
Thomas Kuczynski's chapter is aimed at formulating an integrated theory explaining the existence of long waves in economic variables. In essence, his effort comes down to combining two explanations that are usually presented separately: innovation and the profit rate.
Kuczynski's analysis is enlightening in that it puts these two expla-nations together explicitly and I can subscribe to much of his analysis. I think that his idea of not separating trend and cycle in the theoreti-cal analysis of economic history is a major improvement in long-wave theory. In my opinion, the application of this idea would be a major innovation in empirical work on long waves.
Kuczynski is quite clear with respect to the question of whether previous writers on the subject have been able to formulate an integrated theory of economic long waves. He states that 'other authors . . . studied various aspects of the problem in detail: without, however ... arriving at an integrated theory of long waves' (see page 257). I would probably be a little more modest in this respect.

276 Comment
I think Schumpeter had a clear notion of the interaction between profit and innovation in the various stages of long waves, although he certainly did not present this in such a clear and integrated way as Kuczynski does. And since it is a well-known fact that Schumpeter took a lot of his arguments from Marx's work, we are likely to find some useful insights in the latter too. In fact, Marx had a clear theory on the innovation-profit rate relation, although he did not present it in a long-wave context. Rather, his 'unit of analysis' was the business cycle. The chapter by Menshikov in this volume (Chapter 9) provides some references to Marx's work on the relation between profit and innovation. 1 Moreover, that chapter shows that even Kondratieff had some notion of this relation.
By all this I do not wish to suggest that everything that Kuczynski has written, has been done before in exactly the same way. I merely want to emphasise that there already exist at least elements of an integrated explanation with innovation and the profit rate as driving forces behind long waves. A detailed review of the work by Schum-peter, Marx and others would have been a good starting point for Kuczynski's paper.
I will now discuss a few specific points about the model. The first point I want to make concerns its cyclical character. Several authors have pointed to the fact that we should rather speak of 'waves' than of 'cycles'. This is done to point to the non-fixed periodicity character of the Kondratieff movement. As has been argued by Carlotta Perez,2 a wave 'running' on steel or electricity is likely to be quite different from one 'running' on microcomputers. The length of the phases, but also the steepness of up- and downswings is likely to vary in, and between, separate waves. I think that the nature of Kuczyn-ski's 'combined endogenous prime mover' is also one of non-fixed-periodicity.
But how can the model in this chapter deal with this (empirical) feature? When estimating the model, I could imagine that one would try to vary the value of coefficients through time. This could be done by estimating the model for different time-spans separately, and apply the Chow F-test on structural change between these periods. This would, however, require a lot of data, which is a major problem. Another obvious problem with this approach is that it is an arbitrary decision to pick the exact moments when structural change is to occur. Although it would certainly be possible to give some theoreti-cal plausibility for the choice of such a point, one would ideally like the model to determine it.

Bart Verspagen 277
The second point I would like to make is that the model is clearly a macroeconomic one, using aggregate variables. The reasoning underlying it, that is, the idea of the product life-cycle, seems to be a concept that is applicable rather to the sector or product level. I can imagine the production and profits of an individual sector or product following the logistic curves used by Kuczynski, but why then would such a pattern turn up in the aggregate data?
To make the model generate an aggregate long wave, one obvi-ously needs some assumption on how the different sectoral (logistic) patterns interact. Thus, one can simply assume that the sectoral logistic curves synchronise in time. If they start and reach saturation level at approximately the same point in time, .an aggregate long-wave pattern would clearly result by simply adding up the sectoral data.
But why would this synchronisation take place? Why would these sectoral movements start at the same time, and why would the length of the logistic curves be equal? To give a counter-example, one could even imagine that sectoral movements are ordered in such a very particular way as to form a smooth aggregate growth path, expansion phases of one curve offsetting saturation phases of others.
Kuczynski does not really seem to go into this aggregation-issue. He touches on the subject very briefly in his treatment of the average profit rate and the rise of new industries. A falling average profit rate provides an incentive to invest in new, fast-growing industries. Thus, investment is directed towards the fast-growing industries, and away from the stagnating sectors. This is, in fact, an argument that can be found in neo-classical Walrasian general equilibrium models.
Two comments can be made with regard to this 'average profit rate' explanation of synchronisation. First, as we can learn from Walrasian general eqUilibrium models, the regulationist power of average profit rates crucially depends on the possibilities of free entry in all sectors. If it is possible that no (or little) investment from outside a sector takes place, due to (technological) barriers of entry, that sector can experience above-average profit rates for a sustained period of time. This means that the synchronisation of sectoral trends will not take place. The second point is that the simple average profit rate model neglects the explicit interrelations between industries, such as input-output relations. I think these should be taken into account explicitly. What Christopher Freema\1 and Carlotta Perez have called 'key factors in techno-economic paradigms', have very strong relations to all other sectors and thereby are the driving force

278 Comment
behind the upswing phase. In conclusion, I think that Kuczynski's model is a little too swift in taking the step from microeconomics to macroeconomics.
I think that an ultimate model of an aggregate long-wave move-ment should take these points into account. In my opinion, the non-cyclical character of the model and the inter-sectoral relations are very close to each other, the latter being an important determi-nant of the exact shape of the wave. However, the model as it is presented at this stage cannot deal with this complex aspect of reality.
But Kuczynski should be credited with building a model in which these elaborations can lead to a realistic model of long waves. I think he has succeeded in picking the two most important phenomena behind long waves, and bringing them together in a way that does not make the artificial distinction between trend and cycle.
The question remains of how one could incorporate the above points in a model. I think that the use of simulation techniques would be very useful in this respect. Contrary to empirical work, one can manipulate variables and coefficients in such an exercise. It is, of course, clear that a simulation model can never give any formal proof of whether the underlying theory is true. But it does offer the opportunity of setting out the theoretical arguments very clearly, and enables one to test the implications of the assumptions made. Thus, a simulation model could illustrate under which assumptions on sec-toral interaction the logistic product-cycle curves would add up to an aggregate long-wave pattern.
Notes
1. Another outstanding review of Marx's work on the business cycle, and especially on the interaction between innovation and the profit rate, can be found in Gourvitch, A., (1940) Survey of Economic Theory on Technological Change and Employment (New York: Augusta M. Kel-ley) pp. 73-9.
2. Perez, C. (1983) 'Structural Change and the Assimilation of New Technologies in the Economic and Social System', Futures, vol. 15, no. 4, pp. 357-75.

11 Class Struggle and Kondratieff Waves, 1870 to the Present BEVERLY SILVER
The resurgence of class conflict in Western Europe in the late 1960s, and the more-or-Iess simultaneous end of the long post-war boom prompted a revival of interest in both Kondratieff waves and in labour-capital conflict, and, not surprisingly, the emergence of some theories which postulate a causal link between these two processes. Ernest Mandel (1980), James E. Cronin (1980) and Ernesto Scre-panti (1984) have elaborated theories which (more-or-less tightly) tie together a long wave in capital accumulation with a long wave in the class struggle. While these theories are intriguing, they have been subjected to little empirical verification. Furthermore, what has been attempted (for example, Screpanti, 1987; Goldstein, 1988) has been flawed by the use of insufficient or inappropriate empirical measures of 'the class struggle'.
The problem is two-pronged and not easily resolved. First there is the problem of finding an empirical measure that captures the con-cept of 'class struggle'. Second is the problem of finding data (with sufficient historical and geographical coverage) to construct the ap-propriate empirical measures. Screpanti (1987) used strike indices as a measure of the intensity of class struggle. Screpanti's claim is that 'any changes occurring in the "qualitative" nature of class struggle should also manifest themselves in the intensity of strike waves.' While this argument is not entirely unconvincing, there are neverthe-less several major difficulties involved in relying solely on strike statistics in a long-waves study.
First of all, a large volume of strikes is not necessarily an indication of a high level of class struggle. For example, there was a very high level of strike activity in the USA in the 1950s and 1960s but most observers would attribute this to the institutionalisation of labour-capital conflict after the Second World War, and the acceptance of the official strike as a normal bargaining tool in contract negotiations,
279

280 Class Struggle and Kondratieff Waves
where the settlements are limited within specified parameters and rules of the game.
The same problem appears from the opposite angle as follows: there may be very intense class conflict which manifests itself primar-ily in non-strike forms of struggle, for example, riots, sabotage, factory occupations, slowdowns, armed revolts and proletarian insur-rections. The presence or absence of these other forms of conflict, in conjunction with the same volume of official strikes, indicates very different levels of intensity of class conflict. The assumption that strike statistics will always reflect escalations in the forms of conflict beyond the strike seems unwarranted. This concern is further amplified when one takes into account the fact that many of the official strike series exclude strikes which are deemed to be 'politica1'.
The second problem lies in the insufficient temporal and geographi-cal coverage of existing strike series. Even the longest official strike series do not cover two full long-wave cycles, with systematic data collection begining only since the 1880s. Furthermore, with the ex-ception of the UK, all countries' series contain major gaps (for example, during the period of Fascism and world war for Germany, France and Italy; or during a period in the early twentieth century when the US government decided simply to discontinue strike data collection). Needless to say, strike series for countries outside of the core of the world-economy are either non-existent or cover even shorter periods.
This latter problem is especially important: long-wave theorists beginning with Kondratieff have emphasised the importance of inter-national synchrony in defining the existence of long waves (Golds-tein, 1988, p. 181). There has been some ambiguity as to whether this international synchrony is limited to the core. In fact, Screpanti argues that since 'it is recognized that the world engine of long cycles is constituted by the most advanced capitalist countries' , he can safely limit his analysis to five such countries (the USA, France, Germany, Italy and the UK). His claim is that 'any macroscopic event affecting simultaneously the economic and social evolution of these countries will most probably be a common phenomenon of all the core capital-ist countries and will be capable of reverberating at a world-wide leve1' (Screpanti, 1987, p. 101).
Again, this claim is not totally unconvincing. It may very well be that the investment decisions of core capitalists are the key invest-ment decisions in determining long waves of capital accumulation -both because of the weight of core capitalists among all capitalists and
Beverly Silver 281
because their investments span the globe (whether through direct investment, or indirectly as finance and merchant capital). However, it assumes that the only struggles relevant to core capitalists' invest-ment decisions are those by workers located in the core. Can we eliminate the Russian, Chinese and Cuban revolutions from an assessment of world-scale labor-capital conflict and its interrelation-ship with long waves of capital accumulation? Is the wave of strikes in the periphery throughout the 1950s and early 1960s associated with the decolonisation struggles irrelevant to the investment decisions of capitalists? Or the wave of strikes in the semiperiphery in the late 1970s and 1980s (from South Africa and Brazil to Spain, South Korea and Poland)?
Finally, as Screpanti recognises, if we limit the analysis to a single national case we might mistake what is nationally-specific for a more general phenomenon. It follows, however, that if we limit the analysis to core countries, we might mistake what is core-specific for a more general phenomenon. Moreover, we will have no hope of uncovering any world-level links among economic and social waves in the core, periphery and semiperiphery of the world-economy.
As I mentioned earlier, these problems are not easily resolved. With all these difficulties in mind, the World Labor Research Work-ing Group at the Fernand Braudel Center! set out to create a database on labour-capital conflict from which indices of class struggle could be constructed, which would avoid the pitfalls inherent in strike indices as described above. The initial phase of this major project has involved reading through the Index of The Times (Lon-don) and The New York Times from 1870 to the present, and recording any act of labour unrest anywhere in the world reported by these papers and so noted in their Indexes. 2 Incidents of labour unrest recorded in our database include not only strikes, but also general strikes, demonstrations, riots, factory occupations, sabotage, unofficial slowdowns, revolts, insurrections, and any other actions indicative of labour unrest. The choice of these two newspapers rested on several considerations, but primarily on the fact that they are the major newspapers of the two world hegemonic powers of the twentieth century. Thus, we expected the geographical scope of their reporting to be world-scale - reflecting their country of origin's world-scale political and economic interests.
In the second section of this paper I will use indices constructed from this database in order to assess the plausibility of the theoretical claims put forward by Screpanti, Mandel and Cronin on the interre-

282 Class Struggle and Kondratieff Waves
lationship between long waves of capital accumulation and class struggle. The indices constructed include one of acuteness (the num-ber of reports of labour unrest per year); of extensiveness (the number of countries in which labour unrest is reported per year); and of intensity (acuteness and extensiveness combined). To be appropri-ate for the task at hand, our database and derived indices must measure what Screpanti, Mandel and Cronin have variously called 'the intensity of class struggle', 'worker militancy', and in particular identify its peaks (Cronin's 'explosions of working class activism', Screpanti's 'major proletarian insurgencies').
Screpanti (1984, p. 517) enumerates several common character-istics which define his major proletarian insurgencies: First, they were
'proletarian; i.e., the working class played a dominating role in them both in terms of quantitative participation and in terms of political hegemony over the movement; (2) they were general; i.e., they flared up simultaneously in all parts of the center of the world capitalist system; (3) they were autonomous; they were spon-taneous movements of the working class that broke its normal dependence and subordination to the economic, political and social dynamics of the capitalist system; (4) they were radical; i.e., they aimed at striking the capitalist system at its roots . . . The outbursts of class movements of this nature had . . . a lasting frightening effect on the "animal spirits" of the dominating classes, shattering their state of confidence and discouraging investment activity, while fostering reactionary and restrictive choices in econ-omic policy.'
Screpanti (1984, p. 524) notes that a good measure would ordinally scale different types of struggle, giving lower weight to official strikes and high weight to such actions as factory occupations and riots. Cronin (1980, p. 104) emphasises the innovative character of the major outbursts of working-class activism (that is, new forms of struggle, demands, participants); and that they often 'explode upon the scene taking both left and right by surprise'.
Our database seems to meet these criteria surprisingly well. First, it includes only reports of events in which the newspapers' Indexes specifically mention wage workers as the actors. Second, its coverage is world-scale. Third, events which are considered routine, normal, not news, would not make it into the newspaper, and thus would be

Beverly Silver 283
excluded from our database. The more radical an event (the higher it ranks on the ordinal scale of militancy), the more likely it is to make it into the newspapers, and hence into our database. Finally, if 'capitalists' animal spirits' is a key factor underlying the timing of long waves, massive reporting of widespread class struggles by these major newspapers may both reflect and affect the willingness of capitalists to invest. The degree of space which the newspapers of the hegemonic power devote to labour unrest can be seen as an indica-tion of just how frightened they are by workers' struggles.
A brief report on the reliability of the World Labor Group data-base is provided in the Appendix to this chapter (see pages 293-4). A full report on the database (including data collection methods and extensive reliability studies) will be published in a special issue of Review in 1992.
While their theoretical reasoning about the causal mechanisms are quite different, Mandel, Screpanti and Cronin all have broadly simi-lar expectations about the cotrajectories of capital accumulation and class struggle. Starting from relatively low levels, class struggle is expected to rise during the A phase, and escalate sharply at the end of this phase. (Cronin and Screpanti are the most explicit in their prediction that major explosions of labour militancy occur at the transition from the A to the B phase). During the B phase, levels of class struggle may remain quite high, and repeated outbursts of unrest may occur. For Mandel (1980, p. 48), in particular, 'intensified class struggle . . . generally characterizes most of the depressive long wave'. Nevertheless, the overall trend in the B phase should be downward, and the transition to the new A phase should be charac-terised by an atmosphere of relatively low levels of unrest.
In order to assess the plausibility of the above picture, three main empirical methods are used:
1. Comparison of the growth rates (mean standardised slopes) of each A and B phase for our index of intensity;
2. Comparison of mean levels of intensity for each A and B phase and for the transitional periods (T phases); and
3. Identification of years in which major explosions of worker mili-tancy occur.

284 Class Struggle and Kondratieff Waves
The first two methods (comparing mean standardised slopes and mean levels from phase to phase) are used by Goldstein (1988, pp. 187, 193).3 The third method is derived from Shorter and Tilly's (1974) study of strikes in France. The index of intensity used here is analagous to Screpanti's (1987) strike intensity index. For this chap-ter, an index of acuteness (the number of reports of labour unrest per year) is multiplied by an index of extension (the number of countries in which labour unrest is reported per year). The product is a single index of intensity which simultaneously captures the level and geo-graphical extent of worker militancy. Finally, the dating for A and B phases used in these calculations is Goldstein's (1988, p. 67) 'base dating scheme' , for which he claims the existence of 'a strong consen-sus' among long-wave scholars. And the dating for the T phases is taken from Screpanti (1984, p. 521).
Table 11.1 shows the results of the calculations for growth rates (mean standardised slopes) and mean levels of intensity. Based on the above-discussed theories we would expect to find rising growth rates in A phases and declining growth rates in B phases (Cronin, Mandel, Screpanti). Furthermore, we would expect the levels of intensity in T phases (from A to B) to be higher than either the preceding A phase or the following B phase (Cronin, Screpanti); and the level of intensity in T phases (from B to A) to be lower than either the preceding B phase or the following A phase (Cronin, Mandel, Screpanti).
The growth rates of 'class struggle' in Table 11.1 do reveal a procyclical correlation with Kondratieff phases - with one major exception. There is a strong positive growth rate in the late-nineteenth-century B phase. Another anomaly appears after World War II when the rate of growth is zero for core countries.4 While this rate of growth is higher than the negative growth rates exhibited in the preceding and following B phases, we would still expect to see some positive overall growth. Finally, in the B phase currently in progress, the strong positive growth rate in 'non-core countries' stands out.
If we now tum to the comparison between levels of class-struggle intensity in A, Band T phases, we find that only two of our five T phases behave as predicted by the theories. These are the 1914-20 transition to the inter-war B phase, where the intensity of the class struggle is far higher than the average for either the preceding A phase or the following B phase; and the 1939-45 transition to the
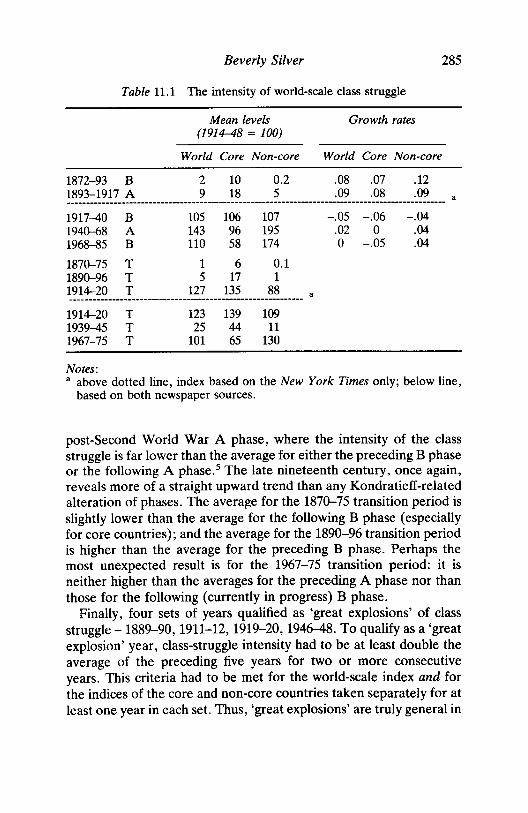
Beverly Silver 285
Table 11.1 The intensity of world-scale class struggle
Mean levels Growth rates (1914-48 = 100)
World Core Non-core World Core Non-core
1872-93 B 2 10 0.2 .08 .07 .12 1893-1917 A 9 18 5 .09 .08 .09 a
1917-40 B 105 106 107 -.05 -.06 -.04 1940-68 A 143 96 195 .02 0 .04 1968-85 B 110 58 174 0 -.05 .04 1870-75 T 1 6 0.1 1890-96 T 5 17 1 1914--20 T 127 135 88 a ..... _--------------------------------_ .. _----------------------1914--20 T 123 139 109 1939-45 T 25 44 11 1967-75 T 101 65 130
Notes: a above dotted line, index based on the New York Times only; below line,
based on both newspaper sources.
post-Second World War A phase, where the intensity of the class struggle is far lower than the average for either the preceding B phase or the following A phase.s The late nineteenth century, once again, reveals more of a straight upward trend than any Kondratieff-related alteration of phases. The average for the 187~75 transition period is slightly lower than the average for the following B phase (especially for core countries); and the average for the 1890-96 transition period is higher than the average for the preceding B phase. Perhaps the most unexpected result is for the 1967-75 transition period: it is neither higher than the averages for the preceding A phase nor than those for the following (currently in progress) B phase.
Finally, four sets of years qualified as 'great explosions' of class struggle -1889-90,1911-12,1919-20,1946-48. To qualify as a 'great explosion' year, class-struggle intensity had to be at least double the average of the preceding five years for two or more consecutive years. This criteria had to be met for the world-scale index and for the indices of the core and non-core countries taken separately for at least one year in each set. Thus, 'great explosions' are truly general in

286 Class Struggle and Kondratieff Waves
6
Unbroken line: Index of acuteness (3-year moving average); 1870-1914: New York Times; 1906-74: New York Times and The Times (London).
Broken line: Mandel's drawing of the European class struggle, (1980) p. 50.
Figure 11.1 The European class struggle
geographic terms and not core-specific or non-core-specific phenomena. One 'great explosion' was, as expected, in a transition period from an A to a B phase (1919-20) and one was in the latter part of the immediately-preceding A phase (1911-12). One, however, was at the beginning of an A phase (1946--48). Finally, one was at the very end of that anomalous late-nineteenth-century B phase (1889-90).
The anomaly of the late nineteenth century is not surprising, as it has also been found in other long-wave studies. Screpanti's analysis based on strike indices finds this same upward trend in the late-nineteenth-century B phase. He writes: ' ... with the exception of 1876-95 the average of the two indices of [strike] intensity are positive in upswings and negative in downswings'. (1987, p. 107) Likewise, when looking at the duration of strike waves, he concludes: 'with the exception of what happened in 1885-91, the only inter-national strike waves showing a duration longer than two years are those occurring in the three downturns of the long cycle' (ibid.). Mandel also sees a long upward trend in the 'European Class Struggle' beginning in the early 1880s (in the middle of the B phase) and continuing through the post-First World War strike wave. Figure 11.1 shows our index for the acuteness of class struggle in Europe co-plotted with Mandel's 'guesstimate' of the same (see Mandel, 1980, p. 50).
Data gaps in official strike series, combined with attention to only a

Beverly Silver 287
small number of countries, has strongly prejudiced perceptions of the post-Second World War explosion of class struggle. This explosion was world-scale: our index of extension (the number of countries in which labour unrest is reported) shows a sharp surge after the Second World War (see Figure 11.4). And our database reveals acute waves of class struggle in a long list of countries ranging from Italy, Greece, France and the United States to India, Iran, Japan, Argentina and South Africa. Furthermore, even if we focus only on the five coun-tries in Screpanti's sample, data gaps in the official strike series can cause serious underestimation of this 'great explosion'. There are no official strike statistics for Italy and Germany for the three years we identified as a major post-war explosion (1946-48). For these years/ countries Screpanti (1987, p. 118) entered zeros into his index cal-culations. Not surprisingly, then, he found no class struggle peak after the Second World War. However, these years were not only a major explosion for our world-level index, but also for the five countries in Screpanti's sample - and especially for Italy (see Appen-dix to this chapter, on pages 293-4). The exclusion of political strikes from several of the official indices has undoubtedly led to a further underestimation of this major wave of class struggle.
Our results for the post-Second World War A phase, and especially the 1967-75 transition period, are slightly more perplexing. This period is widely perceived as one of intense class struggle. Screpanti's (1987) empirical study locates class struggle peaks in the late 196Os. I
4 ······· 1····;· ·· · 3 ' .. ,' .. :" '.. .. .. , ..... : I ~' ":'; '~~ :":": ":":' :
. ..... ' .... , It ':' : . : .. : ,11,,1\\ :! :In\ ,' .: . :~: : . : : .¥ I fJ\ ~ \tit. : : :
.. " \ ." I, 'I , I{ \ ' . I'll . , ... ,. , ,. '.'. : ' .,'. ", ... ',' 1''1,[" .: ,1, :" ,', . : ' · :V~j~ :l " • ' . . · 11 ' • • • • • •
2 ",., . . ,
• . ( : . . : \ : ): : : ' : : :
o 70 76 82' 88 94' 0 6 12 18 24 30 36 42 48 54 60 66 72 78 84
1870-1920: New York Times; 1906-85: New York Times and The Times (London); 1914-48 = 1
Figure 11.2 Index of intensity for world-scale class struggle

288 Class Struggle and Kondratieff Waves
1870-1920: New York Times; 1906-85: New York Times and The Times (London); 1914-48 = 1
Figure 11.3 Index of acuteness for world-scale class struggle
2.0
1.5
.5
0.0 io' 7S' 82' 88 94 0 S 12 18 24 30 3S' 42' 48 54' SO 66 72 78' 84
1870-1920: New York Times; 1906-85: New York Times and The Times (London); 1914-48 = 1
Figure 11.4 Index of extension for world-scale class struggle
think three factors may help account for the divergence between this perception and our results. First, Screpanti's results may be a func-tion of the particular group of countries in his sample. In fact, when I tested for 'great explosions' on a series which is limited to the five countries aggregated by Screpanti (that is, France, Germany, Italy, the UK and the US), our data also revealed a 'great explosion' from 1968--70. However, there is no such great explosion for our world-scale index or for our index of all core countries.
Secondly, in most of the core countries which experienced a major

Beverly Silver 289
resurgence of conflict in the late 1960s, the main locus of unrest (and the innovative part of the unrest) was not with wage workers as such, but with students, women, minorities, and so on. While one might argue that these are the 'new proletarians' (for example, with the feminisation of the labour force), in these struggles they neither presented themselves nor were perceived by our hegemonic news-papers as such. Finally, the routinisation of the strike as part of normal industrial labour relations since the Second World War, has meant an increase in strike activity (and an upward trend in most core strike series), but a decline in the percentage of total strikes which our newspaper sources would consider 'news', and which we should consider to be 'class struggle'.
In sum, while it remains plausible that there is some causal inter-relationship between waves of class struggle and of capital accumula-tion, the evidence does not provide support for the proposition that this connection is either close or unmediated by other processes. In the final section of this chapter I will suggest what one of these other mediating processes might be.
If we look at our indices of world-scale class struggle graphed over time (see Figures 11.2, 11.3 and 11.4 on pages 287-8), we see that the two most prominent peaks correspond to the waves of class struggle following each of the world wars. Furthermore, all our 'great ex-plosions' occurred between 1890 and 1948: decades corresponding to the intensifying crisis and breakdown of world hegemony. Likewise, growth rates of class-struggle intensity decelerate and world-scale 'great explosions' of class struggle disappear in the decades corre-sponding to the establishment of a new world hegemony. These observations suggest that a strong counter-cyclical relationship exists between world-scale class struggle and cycles of hegemony - rising levels of class conflict in periods of crisis/breakdown of hegemony and declining levels of class contlict with the establishment of new periods of hegemony. Or to put it more cautiously, it suggests that such an interrelationship is worth investigating.
While it goes beyond the scope of this chapter to offer a full-blown analysis of the interrelationship between A and B phases, class struggle, and cycles of hegemony, the remainder of this contribution will argue that this is a fruitful direction for future research. To this end, the various anomalies in the trajectory of the class struggle

290 Class Struggle and Kondratieff Waves
(discussed in on pages 284-9) will be traced to the world hegemonic conjuncture into which each A and B phase falls. 6
Unfortunately, to actually compare hegemonic cycles we would need even longer time series than the minimum required to begin looking at Kondratieff waves. Our data only cover slightly more than one hegemonic cycle: from the beginnings of the crisis of British hegemony to the beginnings of the crisis of United States hegemony. Thus, we cannot compare equivalent phases across different cycles of hegemony. Nevertheless, by taking into account the phase in the hegemonic cycle, we can see that long waves develop in markedly different world political-economic contexts (Arrighi, 1989), and that these latter contexts may be as important as the alternation of A and B phases in determining the course of world-scale class conflict.
The A and B phases covered in this paper fall into four different hegemonic phases. The first NB phase (until 1914) coincided with the crisis of British hegemony. The second B phase (and the transi-tion periods to and from it) overlap with the period of open struggle for hegemony (no hegemony). US hegemony is established at the end of the Second World War, and lasts for the rest of the A phase. Finally, the transition years to the current B phase also mark the transition to a crisis of US hegemony.
The first anomaly - the rapid growth of class struggle throughout the late nineteenth century (including the B phase) and the 'ex-plosion' of labour militancy at the end of the B phase - can be traced to the crisis of British hegemony. A first sign of this crisis was the mounting intercapitalist competition unleashed as Germany, the US and others caught up with 'the workshop of the world', the United Kingdom. This competition, in turn, drove capitalists to seek ways to lower costs and reduce competition. The strategies pursued consti-tuted direct and indirect attacks on the wages and working conditions of the world's workers. The latter, in turn, responded with growing and explosive militancy.
Mergers, cartels and protectionism turned the deflationary squeeze on profits into an inflationary squeeze on wages. Efforts to reduce unit costs through deepening the division of labour and mechanisa-tion, constituted a direct attack on the working conditions, economic security and life-styles of craftworkers. And imperialist expansion intensified inflationary pressures on core workers while also leading to the creation of new working classes in the periphery - often via the forced separation of the peasantry from the means of production and subsistence.

Beverly Silver 291
All these attacks on the living and working conditions of the world's workers elicited an increasingly organised, militant and pol-iticised response. The combination of workers became the necessary corollary to the combination of capital, if real wages were to be protected. The attack on craftworkers provoked especially strong resistance - the latter 'formed the front line of the industrial class battle' (Hobsbawm, 1984, p. 169). And resistance to forced prolet-arianisation provoked bloody struggles in the periphery. Thus, both the late-nineteenth-century B phase and the early-twentieth-century A phase were characterised by rising levels and growing explosive-ness of world-scale class struggle.
These same tensions continued to provoke intense class struggle in the inter-war period. However, class struggle was made more ex-plosive by the world wars. Two of the four 'great explosions' of labour militancy identified on pages 285-6 occurred in the years immediately following the world wars (1919-20 and 1946-48). Class conflict was delegitimised in the first years of each war - leading to a downturn - but the economic and political hardships of war culmi-nated in world-scale explosions of worker militancy as well as major revolutions (in Russia and China) towards the end of each.
The third anomaly - the zero growth rate of labour-capital conflict in the core in the postwar A phase - can be traced to the establish-ment of US hegemony. On an obvious level, it brought an end to the cycle of world wars and the attendant economic and political dislocations, thus eliminating one of the main sources of the explos-iveness of world-scale class conflict. However, the de-escalation in labour-capital conflict was also brought about by concessions to the core working classes - concessions which were embedded in the social-economic policies of the new hegemonic power. The exercise of Keynesianism on a world scale, the globalisation of the New Deal, the spread of Fordist mass consumption norms - these interrelated policies took into account what Polanyi (1957) has called 'the fic-titious nature of the commodity labor'. Under British hegemony, labour had been treated essentially like any other commodity -whether its services were bought and at what price were determined by 'the self-regulating market'. As we saw above, however, when 'the self-regulating market' determined that real wages should plummet, unemployment should skyrocket, or people's customary living and working conditions be drastically reorganised, labour did not respond as an inanimate object or passive commodity. Rather, worker protest escalated. In contrast, the new post-war hegemonic order offered a

292 Class Struggle and Kondratieff Waves
New Deal to the core working classes - rising consumption levels and a social welfare floor in exchange for acceptance/co-operation in the total restructuring of production along the lines laid out by the most advanced sectors of US corporate capital. This new model of social relations was exported from the hegemonic power to the rest of the core via the Marshall Plan and US multinational corporations.
This new model provided a solution to the impasse in labour-capi-tal relations which had plagued core countries since the late nine-teenth century: with the new methods of production the militant, politicised craftworkers were increasingly marginalised from produc-tion, and newly-proletarianised workers such as peasants and immi-grants were drawn into the expanding semi-skilled positions in modern industry. Marginalisation of the craftworker contributed to the de-escalation of the class struggle in the core. Over time the semi-skilled workers who replaced the craftworker were also able (and willing) to conduct intensive and effective strike waves - es-pecially as the unprecedented post-war boom dried up the reserves of unemployed and non-waged labour in core countries. However, these strike waves did not cumulate and escalate as they had during the earlier crisis and rivalry period. For one of the strengths of world-scale capitalism under US hegemony has been corporate capi-tal's ability (organisationally and technically) to plan and execute production on a global scale. Thus, each time reserves of cheap labour dried up in a given region, corporate capital responded by reorientating investments to new areas which still had large reserves of non-wage labour. This process had the effect of containing the labour movement in the region from which capital emigrated, but strengthening the movement in the areas to which capital migrated. The result - under US hegemony - has been waves of labour unrest that counterbalance each other, rather than cumulate on a world scale. The result has also been to progressively decrease labour-capi-tal conflict in the core, while progressively increasing labour-capital conflict outside the core (see Silver, 1991; Arrighi and Silver, 1984).
These processes produced the above-mentioned anomalies of the post-war A and B phases: a declining rate of labour militancy in the core and a rising rate of labour militancy in the non-core areas of the world-economy. It also explains our final anomaly: why the late 1960s do not appear as a world-scale wave of class conflict. As the move-ment was brought under control in Western Europe, it was strength-ened elsewhere (for example, Brazil, South Africa, South Korea and
Beverly Silver 293
Poland) leaving a flat trend in world-scale labour-capital conflict from 1968 to the present.
APPENDIX
There is an ongoing effort to assess and improve the reliability of the World Labor Group database. A full report will be published in a special issue of Review in 1992. Preliminary reliability checks provide us with enough con-fidence in our database to justify its use in exploratory studies of this kind. Space limitations of this chapter allow me to provide only initial indications of the database's reliability.
Below I offer an indication of how our database· series compare with official statistics for four countries for which official strike statistics exist (France, Germany, Italy and South Africa) and how they compare with the peaks identified in the secondary literature for one country for which no official strike statistics are available (Poland). Our series include many types of actions besides strikes (and some types of strikes usually excluded from the official statistics). Nevertheless, we would expect some positive correla-tion between the two. Such results have, in fact, emerged.
France
The top ten years of labour unrest (that is, years with the most reports of labour unrest) in France from 1914-85 in our database are 1919-20, 1936-38, 1947-48, 1950, 1953 and 1968. Eight out of ten of these rank among the top ten in the official statistics for strikes, strikers or working days lost. The exceptions are 1937-38, years of the Popular Front and its aftermath, a period of intense class conflict, and years for which no official statistics for working days lost were collected.
Germany
The top ten years of labour unrest in Germany from 1906-85 in our database are 1910, 1917-20, 1922-24, 1928 and 1955. Nine out of ten of these rank among the top ten in the official statistics for strikes, strikers or working days lost. The exception is 1955, which ranks eleventh in the number of strikers.
Italy
The top ten years of labour unrest in Italy from 1906-85 in our database (excluding years in which there are no official statistics) are 1919-20, 1949-50, 1962, 1964, 1969-72. Eight out of ten of these rank among the top ten in the official statistics for strikes, strikers, or working days lost. The exceptions are 1949-50, the tail end of the post-Second World War wave of class conflict - underestimated in the official statistics because of the ex-

294 Class Struggle and Kondratieff Waves
clusion of political strikes, and perhaps because strike statistics were only collected again in 1949 after a 25-year gap. The gap itself includes two years which show up on our top ten list: 1947-48. Thus, our database captures a major post-Second World War wave of class conflict in Italy which is often missed or undervalued due to missing official data and underestimation due to the exclusion of political strikes.
South Africa
The years which were in the top ten list for reports of labour unrest in South Africa from 1910-84 by our newspaper sources were: 1913-14, 1919, 1922, 1947, 1957, 1960, 1973, 1976, 1980. Seven out of ten of these years ranked among the top ten years in the official statistics for strike, strikers or working days lost (Republic of South Africa, 1986). The year 1914 ranked eleventh in working days lost; and the 1913-14 period was a known period of major white working-class revolt on the Rand (where the strike was only one of a wide range of protest tools used). The year 1960 did not rank high in the official statistics, but we maintain that our ranking is a mote accurate reflection of the intensity of class struggle; 1960 is the year of Sharpeville, and our database records widespread political protest strikes and other unrest which is not reflected in the official statistics.
Poland
The ten years in our database with the highest number of reports of labour unrest in Poland in the post-Second World War period are 1956, 197~71, 1976-77, 198~83 and 1985. These correspond exactly with the years of working-class uprisings identified by Touraine et al. (1983, pp. 13-34) -working class uprisings in Poznan in 1956, Baltic and Lodz strikes in 197~71, an uprising which began at the Ursus tractor plant in Warsaw in 1976, and, of course, the emergence of Solidarity and the 'outbreak of the most wide-spread and the longest lived popular uprising yet to challenge communist rule' in August 1980. Of course, there are no strike statistics series for Poland. Our database,however, allows one to be constructed which has a very close correspondance with the patterning identified in the secondary literature.
While the above results are encouraging, some cautionary notes on interpret-ing the results presented in this chapter are still in order. In particular, the period from 1870 to 1905 needs to be interpreted with caution. It is based solely on reporting from The New York Times (since the official Index of The Times of London does not begin until 1906). While the years since 1906 are based on two sources, this double-check is not yet available for the earlier years. Furthermore, the USA - a major site of class struggle in the period - is excluded from The New York Times database, and thus excluded from the 187~1905 period indices, with possible distorting effects on the aggregate constructed indices of class struggle in these earlier years.

Beverly Silver 295
NOTES
1. The members of the World Labor Research Working Group are Gio-vanni Arrighi, Mark Beittel, John Casparis, Jamie Faricellia Dangler, Melvyn Dubofsky, Roberto Patricio Korzeniewicz, Donald Quatert, Mark Selden and Beverly Silver. I would like to thank the participants and discussants at the Conference, and Ernesto Screpanti for helpful comments and criticisms on an earlier version of this chapter.
2. Because of the totally disproportionate criteria for reporting on dom-estic news, incidents of labour unrest in the US and the UK were not recorded from The New York Times and The Times, respectively.
3. The procedure used by Goldstein (1988, p. 187) for estimating growth rates is as follows: the best-fitting slope is estimated by linear regression for each A and B phase (defined by his 'base dating scheme'). These slopes are converted into growth rates by dividing each slope by the mean of the series during that period.
4. The states defined as 'core' in this chapter are: north-western Europe (except Ireland), North America, Australia and New Zealand.
5. The result for the 1939-45 T phase is, however, somewhat misleading. The T phase overlaps almost entirely with the years of the world war, and it immediately precedes a major outburst of world-scale class struggle in the second half of the 1940s.
6. For a fuller discussion of the linkages between the evolution of world-scale labour-capital conflict and world hegemony, see Silver (1991).
REFERENCES
Arrighi, G. (1989) 'Custom and Innovation: Long Waves and Stages of Capitalist Development' in Massimo DiMatteo, Richard Goodwin and A. Vercelli (eds), Technological Change and Social Factors in Long Fluctuations (Berlin: Springer Verlag).
Arrighi, G. and B. Silver (1984) 'Labor Movements and Capital Migration: The United States and Western Europe in World-Historical Perspective' in C. Bergquist (ed.), Labor in the Capitalist World-Economy (Beverly Hills, Cal.: Sage Publications).
Cronin, J. E. (1980) 'Stages, Cycles and Insurgencies: The Economics of Unrest' in T. K. Hopkins and I. Wallerstein (eds) , Processes of the World-System (Beverly Hills, Cal.: Sage Publications).
Goldstein, J. S. (1988) Long Cycles: Prosperity and War in the Modern Age. (New Haven, Conn.: Yale University Press).
Hobsbawm, E. (1984) Workers: Worlds of Labor (New York: Pantheon). Mandel, E. (1980) Long Waves of Capitalist Development: The Marxist
Interpretation (Cambridge University Press). Polanyi, K. (1957) The Great Transformation: The Political and Economic
Origins of Our Time. (Boston, Mass.: Beacon Press). Republic of South Africa, National Manpower Commission (1986) Certain
Aspects of Strikes in the Republic of South Africa, RP113/1986 (Pretoria: Government Printer).

296 Class Struggle and Kondratieff Waves
Screpanti, E. (1984) 'Long Cycles and Recurring Proletarian Insurgencies', Review, vol. 7, no. 2, pp. 509-48.
-- (1987) 'Long Cycles in Strike Activity: An Empirical Investigation', British Journal of Industrial Relations, vol. 25, no. 1, pp. 99-124.
Shorter, E. and C. Tilly, (1974) Strikes in France: 1830-1968 (Cambridge University Press).
Silver, B. (1991) 'World-Scale Patterns of Labor-Capital Conflict' in I. Brandell (ed.), Workers in Third-World Industrialization (London: Mac-millan).
Touraine, A. et al. (1983) Solidarity. The Analysis of a Social Movement: Poland 1980-1981 (Cambridge University Press).
COMMENT
Alain Meynen and Peter Scholliers
It should be clear that the relationship between long waves, or economic cycles in general, and class struggle is not to be understood as 'exogenous': class struggle would then only be the aftermath of an independent economic level. On the contrary, class struggle takes place in the heart of the economic space, in relations of production, that is, relations of extortion of surplus labour and exploitation, within which the productive forces develop. This means also that the history of the capitalist economy, far from being dominated by completely autonomous, purely 'economic' laws, is to be understood in terms of a continuously developing relationship of forces between antagonist classes. In short, class struggle cycles cannot be considered as 'exogenous' to the 'economy', nor can the cyclical movement typical for a capitalist economy be separated from class struggle: on the contrary, just this movement should be understood as the specific form in which the class struggle emerges.
These general methodological remarks are not superfluous. It is striking that the main current of actual long-wave studies is still highly marked by economistic-technologistic conceptions consider-ing the economy as spontaneously self-reproducing. 'Economy' and 'class struggle' are separated into principally independent units. Furthermore, this 'economistic' way of thinking is accentuated by the ruling academic division of labour organising the long-wave studies. In the 'economic aspects' of these studies, class struggle - or labour struggle - cycles are, wherever they are mentioned, generally looked at in a scheme drawing a mechanistic, quasi-topological distinction

Alain Meynen and Peter Scholliers 297
between the 'immanent laws' of capital (represented as 'endogenous' factors) and class struggle developments (represented as 'exogenous' factors). In its turn, the study of the link between technological progress and long waves - a main subject in the long-wave debate -tends to consider productive forces as the only driving force of history, to abstract them from class strategical aspects of technologi-cal interventions (in the production process) and to consider the development of class struggle as a fatal consequence of economic and technological development. On the other hand, the long-wave analysis of class or labour struggle - or the evolution of 'social conflicts' - is often based on an alleged (in fact, non existent) consen-sus about the definition of economic cycles, specifically long waves. It takes the various economic movements as a starting point (and not as a subject for analysis) and omits a more accurate explanation about their further meaning. The same holds good for Beverly Silver. Her approach does not consider the theoretical problems raised by the long-wave concept. It is a kind of flight forward: she immediately steps to the 'cycles of hegemony', that is, how the long wave-class struggle correlation is 'mediated' through the cycles of building the world hegemony. This is why Silver's discourse is too descriptive, too formalistic and not sufficiently explicit. Moreover, the empirical 'argumentation' regarding the link between class struggle and the cycles of hegemony is not really convincing: her 'alternative' measure of class struggle can be put into question at many points.
Let us examine the problems involved in Silver's approach.
1. Silver's attempt to put class struggle into a world perspective is doubtlessly legitimate. The 'world system' as such is an abstract subject, whereas the periodisation of class struggle has to be situated in the concrete shape taken by this 'world system', that is, in social formations. Class struggle can only be analysed in terms of social formations. After all, social formations cannot be considered as 'external' to the 'world system'. On the contrary, they are the knots of uneven development in the capitalist 'world system' and therefore they are related to the constituting mode of reproduction of this system. In Silver'S approach, this uneven development eclipses and is considered as a sort of 'by-product'. Thus Silver comes close to the idea of considering concrete class struggle developments within an abstract (world) model existing before these developments. 2. The study of the long-wave class struggle relationship should therefore start simultaneously from the totality of the capitalist world

298 Comment
as well as from the unevenness of the process of capitalist develop-ment and from the development of resistance in the different national social formations. In short, just as class struggle at the level of the capitalist world economy cannot be seen as a sum of completely independent 'disturbances' in the various links (the particular social formations) of the imperialistic chain, one cannot sum up these 'disturbances' into one figure. According to Silver, class struggle at a world level is simply the sum of the developments in the struggle in different parts of the 'world economy'. This explicit, empiricist per-ception reinforces the abstract and formalist character of her ap-proach. She completely leaves aside the difference between the resistance in the capitalist and the non-capitalist worlds (that is, the bureaucratic workers' states), as well as the differences in content and forms of the struggle in the imperialistic core and peripheral countries (conflIcts between proletariat and bourgeoisie in developed capitalist countries; anti-imperialism and resistance against national bourgeoisie in colonial or semi-colonial countries). Finally she com-pletely disregards the specific national differences in the development of resistance. 3. Another controversial point is Silver's characterisation of the 'hegemony cycles'. Her analysis suggests a decrease in resistance intensity in the actual (late-capitalist) phase of imperialism (begin-ning at the end of the Second World War). All 'great explosions' distinguished by Silver (1889--90, 1911-12, 1919--20, 1946-48) coin-cide with the transition from the 'liberal' capitalist stage to the imperialistic stage (from the end of the nineteenth century to the interbellum) and the consolidation of the imperialistic period (begin-ning between the two world wars, after 1930). According to Silver's perception of 'hegemony cycles', this would mean that, especially in imperialistic Europe, the settlement and the expansion of American hegemony (in the post-Second World War period) implied a some-what declining trend of class struggle. This interpretation is similar to the 'ultra-imperialistic' conception which identifies American he-gemony with European 'pacification' under this hegemony. At the same time it is a further confirmation of the mythical image about the Western working class integrated in the 'welfare society', grown from the post-war New Deal model. Several indices (strikes, factory occu-pations, different kinds of latent labour revolts and so on), however, oppose this ideological image. It is undeniably true that, from a class strategical point of view, the long post-war boom (1940/45-66) corre-sponded with a long period within which capital had the initiative.

Alain Meynen and Peter Scholliers 299
The European labour struggle followed the pattern of wage increases linked to productivity development. But as soon as the growth resulted in a progressive shrinking of unemployment, the relationship of forces on the labour market turned to the advantage of the working class. The struggle over surplus value blazed up and labour resistance broke away from the grip of integration mechanisms of the capitalist planning state. At first, under the form of a latent resistance against alienating working circumstances (increasing absenteeism, removal of materials, sabotage, and so on), later in the form of (mostly spontaneous) strikes, factory occupations, specific forms of direct working control, from about 1966 onwards, the Fordist worker managed to bring the struggle back into the factories in nearly all highly-developed countries. This was a sign of resurgence of resist-ance in the whole of society. 4. Silver's interpretation of the link between long waves-hegemony cycles and class struggle relies on the alternative database she put forward. She rightly stressed that an analysis of class struggle devel-opments cannot be limited to strike analysis. We also share her criticism on 'official' (strike) figures. On the other hand, we are very sceptical about her 'alternative' measure. Silver uses the indexes of two major newspapers, namely The Times (London) and The New York Times. This could lead to confusion: Silver pretends to globalise class struggle development but in fact she reproduces a kind of ideological perception of class struggle. This perception is doubtless useful to some extent: it allows an understanding of how the bourgeois ideological apparatuses record class struggle. But it is not permissible to pre-structure the study of real class struggle develop-ments by identifying the facts relevant to class struggle evolution with the 'facts' mentioned in class struggle reports by the bourgeoisie. From The Times and The New York Times failure to report on strike outbursts in the late 1960s and early 1970s, Silver wrongly concludes that these strikes were not really penetrating and that they were a 'normal' part of post-war 'industrial relations'. Here, a key-question is: would it not be more correct to conclude that the development of inner-factory frictions in the late 1960s, in and about the labour process, was not perceived by an important part of the bourgeois ideological apparatus? 5. Finally, it should be said that Silver gives a poor answer to her initial question, namely the relationship of long waves and class struggle. One of the major effects of her procedure is that she does not first relate the long wave-class struggle correlation to the internal

300 Comment
dynamics and contradictions in the capitalist mode of production (which finally rely upon class opposition), but to the shifts, con-sidered as 'external' factors, in the competitive struggle between imperialist superpowers. For instance, she suggests that in the imme-diate post-war period, the New Deal model, one of the generating factors of the long-lasting post-war boom, was simply 'exported' from the USA to Europe. Here, she does not pay attention to the 'internal' factors (class relations within the European countries) which allowed an induced reproduction of 'Americanism'. She also disregards the changes in shape of world production relations generating the shifts in the 'superstructure' of the 'world system'.
In short: cycles of hegemony cannot be studied independently of the various phases of the imperialist period which, in their turn, correspond to well-defined forms of capital accumulation: forms under which exploitation and the struggle around it take place.

12 Long Waves and the Dialectic of Innovations and Conflicts PIERRE DOCKES BERNARD ROSIER
Schumpeter (1912) argued that economic innovation is at the heart of capitalist development, being inseparable from the accumulation process, and the entrepreneur-innovator plays a decisive role in the process. The object of this chapter is to indicate how this logic should be generalised to other kinds of innovations and prompt us to ask basic questions about their origin. This leads us to view innovations as we are defining them in their relation to social conflicts in the multiple ways in which they structure social relations and social practices. Hence emerges the dialectic of innovations and conflicts.
In consequence, long waves are not considered as cyclical move-ments of specific aggregates, but rather as an alternation between periods more-or-Iess governed by a set of rules and periods of transformation.
THE DIALECTIC OF INNOVATION AND CONFLICT
By posing a series of questions stimulated by theories of innovation, we are led to rethink the theories of conflict.
Interrogations about theories of innovation
Schumpeter took innovation to be intrinsic to 'development', which was radically distinguished from a hypothetical 'circular flow' of simple reproduction operating within a static framework of pure competition. Therefore, the model of general equilibrium fun-damental to neoclassical economics was inherently inappropriate for the analysis of innovation and of the realities of imperfectly competi-tive dynamic economies.
301

302 Long Waves: the Dialectic of Innovations and Conflicts
At the same time that the economy is reproducing its fundamental structures, the economy (and in tum the whole of society) is chang-ing. Indeed, society must change in order to reproduce itself. Conse-quently, the eruption of innovation in the economic system and the disruptions that it causes cannot be appreciated theoretically unless, from the outset, it is taken to be a constituent element of the system. Before Schumpeter, this was true of Marx, many of whose analyses still stand up well.
But if innovation is perceived as a structural necessity, therefore as a permanent (if discontinuous) process, which renders any equilib-rium model irrelevant, we must none the less distinguish between minor innovations which do not challenge the modus operandi of the system ('normal technical progress', see Dosi (1982), and quite a different category of innovations, the major innovations of which, precisely because they do challenge the very foundations of the economic system themselves, constitute radical 'technical progress' .
The latter type of innovation, which develops or diffuses in clus-ters, gives rise to 'technological revolutions' and is linked by Schumpeter to long waves in the economy. This historical altemance of periods of innovation (Simiand's A phases) and periods of de-pression (B phases) is discussed by Christopher Freeman (1979) and Giovanni Dosi (1982) for the field of technology by applying Thomas Kuhn's analysis in the field of science. The long phase of expansion based on new technological devices corresponds for Dosi to the period of a new 'technological paradigm', or 'techno-economic para-digm', in the terminology of Perez (1983), in the sense of being a new way of conceiving techniques. Dosi (1982) argues that 'economic forces . . . together with institutional and social factors operate as a selective device (the 'focusing device' of Rosenberg (1982» within a large set of possibilities of directions of development notionally allowed by science in the slow process of elaborating a new paradigm in the B period. Understood in this way,
1. There is not a single selection, but a process subject to various social conjunctures and the pressures of alliances that are formed; 2. The processes of propagation/diffusion of the innovation reacts back on the process of selection; and 3. The process of selection affects the range of possibilities.
There is an irreversibility of choices: once a given orientation is taken, other 'possibilities' are thereby eliminated.

Pierre Dockes and Bernard Rosier 303
In other words, to answer the query, 'What is the source of major technological progress?' we have to open the 'black box' (Rosenberg, 1982) in which these interrelations are located: how, on what basis, in terms of what logic and with what rhythms do these processes operate? Schumpeter's answer to the why of this fundamental ques-tion is a theory of exceptional individuals; and to the how, largely the system of credit. There are in addition some other suggested prelimi-nary answers. On the one hand, the group of Schumpeterian evolu-tionists (Nelson and Winter, 1982; Dosi et at., 1988) emphasise the impact of the dynamics of interfirm competition whose 'genotypes' (their diverse 'routines') are variously adapted to the struggle for survival (especially via innovation). But the specific features of social development and technical change make biological evolution only a useful analogy (Freeman, 1991). On the other hand, a certain num-ber of 'radical' authors (namely Marglin, 1974; Bettelheim, 1970; Coriat, 1976) have stressed the role of the relation of production in the particular forms of development of the forces of production which can no longer be conceived as generically 'neutral' (in the sense of reflecting the presumed universal character of their develop-ment, their persistent thrust no matter what the real social structure). The importance of social context, institutional environment, interac-tive systems or networks in the selection and deployment of innova-tions is increasingly recognised by historians of technology and science (namely, Hughes, 1983; CalIon, 1989; Bijker et at., 1987) following Marc Bloch (1938) and by economists and 'regulationnistes' (namely, Freeman and Perez, 1986; Dosi et at., 1988; Boyer, 1986, 1988). Studying technological change, we have refused (Dockes and Rosier, 1977, 1983) the assumption that one can separate:
1. Cause and effect, the effects being largely contained in the very process of elaboration; 2. The technological ( or economic) domain and the whole social context.
Technological change itself is the consequence of the two relations whose articulation forms the 'matrix' of productive capitalism: rela-tions among capitalists (role of dynamic competition in technological change) and relations between capital and wage-labour. We have been emphasising (1988) the relations between various kinds of innovation - not only technological and economic but also social,

304 Long Waves: the Dialectic of Innovations and Conflicts
political and cultural- and the social shaping of technologies, looking then at how these clusters of innovations, seen as part of a new socia-economic paradigm (Dockes, 1990) affect various aspects of the social system. A socio economic paradigm is a way of conceptualising the social, economic and technical organisation of production which is articulated not around a key factor (as in Freeman and Perez, 1986) but around a particular form of a social relation of production and a specific labour organisation in firms.
The necessary integration of the conDict factor
Sociological theories of conflict support and inform our analysis. In these theories, conflict is taken to be a constituent element of social interaction. In addition to the quite fundamental Marxian notion of the class struggle it is useful to look at the theories of 'conflict sociology' from G. Simmel (1908) to Max Weber (1964) and Kenneth Boulding (1962). Whereas the Marxian school stresses the inevitable character of class struggle within capitalism, 'conflict sociology' con-siders conflict to be a positive aspect of any process of socialisation and calls on us to recognise the existence of some common rules governing group relations. 'Conflict belongs to the sphere of social relations' (Freund, 1983). Far from neglecting co-operation, this approach allows us to appreciate the socially-constitutive relation between conflict and communication (Habermas, 1981). As for com-promise - one of humanity's great inventions according to Simmel (1908) - it permits, groups (or persons) with different, even oppos-ing, interests to cohabit. Thereby, it is the basis of all exchanges and all culture. But compromise is by definition innovation, and vice versa: it permits the temporary setting aside of conflicts, in particular by the establishment of rules.
If sociological conflict theories seldom discuss economic innova-tions, the economists who talk exclusively about competition make only marginal reference to conflict. On the contrary, it seems essen-tial to consider all kinds of conflict: conflicts in the creation of scientific knowledge (Thomas Kuhn again); those inevitably asso-ciated with social stratification both at macro- and micro-levels; political conflicts (and especially those which result in wars); and cultural or ideological conflicts. If we use the term, 'polyconflictu-ality', we refer thereby not merely to the variety of fields of conflict but also to their interrelations.
We suggest the following hypotheses:
Pierre Dockes and Bernard Rosier 305
• Innovation - its complexity, its origins, its spread - cannot be fully understood except as part of the social structure as a whole; it is the 'social diagram' in the sense in which Foucault (1975) uses this phrase that is responsible for innovation.
• In any society that is 'not undivided' (Clast res , 1974), the social arena is defined by the multiple conflicts within it and which reflect deeply divergent interests.
• Given that the societies with which we are concerned are fraught with conflicts inherent in their modes of social interaction and repeatedly revived as a result of innovation, can one study the one (innovation) separately from the other (conflict)?
Conflicts and innovations: establishing the theoretical links
On the basis of some studies in the 'historical economy' (Dockes, 1979, Dockes and Rosier, 1988) of epochs of significant change -social, political and cultural transformations as well as technological and economic ones - we cannot only respond negatively to the question just posed, but also conclude that there is a dialectical relationship between conflicts and major innovations. Not only are conflicts at the heart of the origin of innovations, but innovations, especially major innovations, engender conflicts or displace them. Thus it is more than the rhythms of innovations and the speed with which they penetrate the social tissue that is at issue; it is their very content.
For major innovations which emerge as the object and the locus of the many conflicts that traverse society appear equally to be one of the outcomes of these struggles. Therefore, they will necessarily be deeply affected by the struggles. We designate this process as the 'social imprint' on technologies (production technologies, technolo-gies of social control, of consumption, of housing and the organis-ation of space, and so on). Fordism, with its parcellisation of the labour process and its corresponding specific factory organisation of machinery that is said to justify the parcellisation, is one of the most striking instances of this phenomenon.
It is crucial to note that the conflicts that lead to innovations do not necessarily occur in the field in which the innovations arises: one of the most remarkable characteristics of 'Western' development has been its ability to transform social conflict into technical innovations. In short, it is the whole web of conflictual relations and their network or system we have to take into account. The creation of a new

306 Long Waves: the Dialectic of Innovations and Conflicts
socio-economic paradigm can thus be seen as a major global innova-tion emerging within conflictual conjunctures by the convergence of a series of innovations (technical, social, political and cultural). It is thus a process of social production of innovations from several points of view.
(a) In the first place, it is a question of the nature of the process of producing a major innovation by and through conflictual conjunc-tures with the progressive rise of a 'social need for innovation' (which is not to be confused with a demand - an economic demand - for innovations), and its emergence as part ofthe multiple ways in which the various opposing forms relate to each other: as a means in the effort of each rival to dominate the other in the development of the conflict, as a form of 'technical dialogue', compromise or resolution of the conflict via negotiation often institualised ('communicative' innovations) and finally in the setting aside (depassement) of the conflict (especially one caused by an innovation that leads to a rupture). (b) In the second place, it is a question of the ways in which innovation is structured by a social process that gives it its social imprint and determines the paths it will take. The selective device orientates not only research but also scientific policies and R&D processes on behalf of certain interest groups. The role of the dominant groups which hold economic power is a determinant here. To say that innovation has a social imprint is to assert that the new 'object' is defined and specified by the social configuration either in its nature or its material base (for example, the particular system of machines required by Fordist organisation) and/or in the way it is used (namely the steam-engine, see Dockes and Rosier, 1988). Tech-nical 'progress' is neither univocal nor universal, but specific to a given economic system and a given social conjuncture. It has itself a social imprint; it is one of the many possible paths of innovation. (c) Finally, it is a way of regulating conflicts. All conflicts do not automatically lead to innovations, and certainly not to the same kinds of innovations! For a conflict to lead to a certain kind of innovation, certain conditions must be fulfilled and certain institutions have to exist, which brings us once again to the ways in which societies function. In particular, it is necessary that the conflict be expressed and develop into innovations via rules of the social game that are either institutionalised or tacit. This is not possible in some societies. The modalities of regulating conflicts playa decisive role here both on
Pierre Dockes and Bernard Rosier 307
the strength of innovative tendencies and on the types of innovation. And the social regulation of innovation is part of the search for 'social equilibrium', or at least part of a situation in which conflicts are socially tolerated.
Hence, depending on the nature of the society, on the social conjunctures, there are various possible outcomes:
• Stifling of conflicts (the case of absolutist regimes) with the appearance of 'innovations of resistance' (as in the case of 'parallel economies');
• Prevention of major innovations by a social compromise whose object is to maintain the status quo that the innovation might upset (in the case of some medieval societies, or of conjunctures of 'orderly expansion', see page 308); and
• Changing the course of the conflict or circumventing it entirely by a sufficient orientation of the innovation (for example, 'technical progress') away from the locus of the conflict (in social relations).
Needless to say, these various solutions do not exclude one other; however, one or the other of these modes predominates. It is possible to fail, to not solve the conflict and enter a war, which can both destroy and produce innovations. Conversely, one might, quite to the contrary, witness a triumph of communication through a dynamic democratic solution, that of a 'concrete utopia'. Our problematic thus may lead us precisely to develop an explanatory schema of long waves which is based on a fundamental shift in perspective.
THE PRODUCTIVE ORDER AND CRISES OF TRANSFORMATION: AN ANALYSIS OF LONG WAVES
Given the dialectic of innovation and conflict, our approach to long waves suggests a shift in perspective. It does not start by observing long waves but by observing transformations of capitalism, in the course of which we encounter long waves. We may discern, in fact, a series of long, relatively orderly periods (which we refer to by the concept 'productive order') and, on the other hand, periods of 'disorder' and of deep changes in the operating forms of the econ-omic system (the 'crisis of transformation'). The succession of these two phases is the basis of what is observed as long movements of

308 Long Waves: the Dialectic of Innovations and Conflicts
large economic aggregates exhibiting cycles of 'orderly' expansion and depression.
The concept of a productive order
Bya 'productive order' we mean a coherent set of (temporary) forms of basic relations which define capitalism as an economic system to the degree that these forms can allow a long period of expansion to occur. In this case we speak of a 'form or stage' of capitalism. Such a period is only possible in so far as the principal contradictions of the system are overcome for a time. A productive order is the oper-ational expression of a socioeconomic paradigm. This underlines the requirement that there be a relatively coherent global order so that the production of economic surplus and capital accumulation may take place efficiently during what will, therefore, be a period of long 'orderly' expansion.
The basic relations that define industrial capitalism as an economic system are, on the one hand, wage-labour and the capital-labour relation and, on the other, competition or the relations among capital. These relations operate within a national framework only if (a) their forms determine a certain type of economic development or 'development of productive forces' based on a specific technical infrastructure that evolves in a dependent rhythm ('technological revolutions'); and (b) they are located within a system (also orderly), of international relations. Hence the central role of modes of regu-lation, which ensure the necessary stability during the long A period of the operant forms of social relations. Let us briefly spell out these questions.
Since capitalism is by nature conflictual, the way in which the labour force is employed, must repeatedly be adapted so as to maintain effective social control, which is an important determinant of labour productivity growth (we can interpret thus the introduction of Taylorism). The adjustments of the wage relation (see Bowles, Gordon and Weisskopf, 1983) can be thOUght of as part of 'disciplin-ary cycles' (Gaudemar, 1978) occurring in correlation with the long waves. The theories of long waves and innovations emphasise changes in productive techniques and more generally economic fac-tors. Social factors tend to play at most a secondary role. In our schema, social phenomena (including cultural and political phenomena) are seen as strategic. It is not enough simply to argue the necessity of social change in order that technical change occurs, as do Gerhard
Pierre Dockes and Bernard Rosier 309
Mensch (1975) or Christopher Freeman (1979). Rather, social changes are the very core of the process oftransformation; hence the dialectic of innovation and conflict plays a key role.
As capital accumulation becomes more intensive, capital tends to become more concentrated, and the relative power of capital vis-a-vis labour (see Chapter 10 by Beverly Silver in this volume) is changing. All this is occurring while the forms of competition, and therefore the industrial and financial structures, evolve. This is the history of contemporary capitalism. The 'passage' from a relatively competitive capitalism to one that is often called 'monopolistic' took place essen-tially during the 'Great Depression' at the end of the nineteenth century for reasons that were not only economic (economies of scale, market power) but even more social (the centralisation of capital is also the centralisation of labour, a process intended to heighten the possibility of social control given the rise of trade unionism). 'Mon-opoly' capitalism is thus the product of a stressful long-wave down-turn, in which economic conflicts criss-cross with social and political conflicts, and as a result of which a new socio-economic paradigm is put in place. And it was this downswing which generated the oppos-ing innovations of trade unionism and concentration of firms, which in turn displaced the conflicts and transfigured them.
The forms of the two principal relations of capitalism and their articulation (the problem of coherence) are relevant only in terms of their efficiency in the double process that forms and reproduces capitalism: the production and sale of commodities, and the extrac-tion and accumulation of economic surplus. But, in turn, these processes can be perpetuated and enlarged (in new forms via the long depressions) only by changing their technical base, that is, the con-tent of the 'productive forces' utilised and more generally the types of economic growth (types of production, consumption and sociability). During a depression, the interplay of conflicts and social relations produces the major technical changes which can be put into effect by laying on them a certain 'social imprint'. The depressions thus appear to be periods of innovation preparing the way for 'technological revolutions' that bring about, in great historical waves, new techno-logical systems within the framework of new 'socioeconomic para-digms'. What seems to be typical of depressions is, on the one hand, the articulation of several major innovations, and on the other, the early stage of development of clusters of innovations around each radical innovation. The existence of new 'social conditions' there-upon permits the generalisation of the new technical system in the
310 Long Waves: the Dialectic of Innovations and Conflicts
course of the period of orderly expansion. If the social need for transformation causes the depression with its characteristic traits (especially unemployment), the latter in turn make possible these transformations (especially by weakening opposing forces).
Given the role of the world market, a productive order cannot achieve its ends within a national economy unless it contains appro-priate mechanisms to organise international exchanges. Given the strong tendency to globalise capitalist economies, the relative import-ance of the world-level division of labour has expanded to the point that the very notion of a national productive order is today question-able. The world-level division of labour may be characterised by the mode and degree of opening of the national systems to the world system and by the forms of domination at this level. In fact, we see a relationship with long waves: increase in various forms of free trade during periods of expansion; the rise of imperialism and various kinds of protectionispI during depressions.
Finally, to ensure its relative operationality, every productive order has to have specific modes of regulation. By that we mean, in fact, the whole set of procedures which together allow the repro-duction, over a long period, of the relations of production and exchange, and therefore the functioning of the economic system as well as the behaviour and mentalities which ensure that it operates. In other words, to be operational, these procedures must make it possible to overcome for a while the contradictions of a system with opposing interest groups expressing their demands in multiple con-flicts. This means that regulation is primarily social and political.
Two great modes of regulation, each typical of a stage in the evolution of the economic system (thus corresponding to specific productive orders), followed each other historically. The first, in the nineteenth century, was the 'merchant' mode (although its operation presumed the existence of repressive state machineries). Following the Great Depression and the danger it represented for the repro-duction of the social system (class and power structure) and in response to this situation of social and economic conflict, little by little a complex mode of regulation emerged that was largely insti-tuted in liaison with the transformation in the mode of accumulation. This mode of regulation was monopolistic ('Fordism', stable oligop-olies) and implied government intervention (Keynesian economic policies, social policies). The new mode of regulation tended to substitute social control for external coercion (legal violence) forms of discipline. It was based on value-systems internalised by the

Pierre Dockes and Bernard Rosier 311
workers themselves such as, for example, the cult of 'progress'; acceptance of the hierarchical system, by seeing it as the outcome of individual competence and of science (take, for example, the notion of the 'scientific' organisation of work), access to consumer goods, and so on. The reproduction of capitalism through periods of social conflict involves the creation of new mentalities, of new cultural forms that lead to accepting the economic system as the only possible one. The elaboration of new regulation processes is thus innovating in order to supersede contradictions and conflicts.
From orderly expansion to the crisis of mutation
In so far as a 'productive order' is in place, the efficient process of the creation, realisation and accumulation of economic surplus produces an 'orderly expansion'. During these periods, conflict remains strong, but this can easily result in gains for some that are not losses for others. The positive-sum game of economic growth permits social compromises that are all the more effective in view of the fact that the social need for innovation is small since the system is functioning relatively well. Indeed, a major innovation might risk undoing social 'equilibrium', whether institutionalised or not. One specific form of regulation of conflicts and of innovations in this case is the prevention of major innovations susceptible of calling this 'equilibrium', that is, this global compromise, into question.
Historically, the period of 'orderly expansion' leads to a period of long depression. The existence of an order permitting the long expansion does not at all mean, in fact, the disappearance of the underlying contradictions of the economic system. These are merely temporarily set aside. Indeed, it is the very success of this effort that allows new contradictions to erupt to the point that the operationality of the system is broken, its mode of regulation becoming impotent. The result is a fall in the rate of profit; hence the interest to study its evolution (see the chapters by Shaikh, Poletayev and Fontvieille in this volume). These contradictions are specific to each productive order and thereby give specific characteristics to the depression. Thus the long expansion of the 1950s and 1960s ended with the occurrence of two contradictions. First, the contradiction between an economy which, in order to grow and through its growth, had transnationalised itself and the forms of regulation that had remained strictly national; and second, the contradiction between the rising power of labour, resulting from a long period of full employment, and the needs of

312 Long Waves: the Dialectic of Innovations and Conflicts
capital to achieve high rates of return. This pair of contradictions resulted in the need for a period of mutation, a period of bank-ruptcies and decline in the rates of expansion of the leading sectors, massive layoffs, and unemployment, which are all typical features of a depression. In putting it this way, we are shifting the perspective. It is not the depression that produces innovations and change, but rather the rise of contradictions that creates the 'need' for major innovations; thus mutation, given the breakdown of a certain pro-ductive order, creates the depression.
The Kondratieff B phases are first and foremost 'crises of mutation' of the productive order which characterised the previous expansion (that is, it is a 'crisis of regulation'). The B phases in which the genesis of new forms of capitalism take place are periods of disorder and instability. They are, at the same time, periods of morphogen-esis, that is, the production of new forms - of major innovations of various kinds which are to be organised in a new productive order. The depressive aspect of the period is only, therefore, an intermedi-ate factor which hides the fact that several active modules of enter-prises and economic sectors are in full expansion. These are going to become the core of future industrial systems. If we are sceptical about an exclusively macroeconomic approach to long waves, we emphasise, by a rather different way, the classical view - that the long depression carries the seed ofits antithesis (that is, expansion), each phase producing its successor.
Innovation is 'prevented' to a considerable degree during orderly expansion within the framework of a certain social equilibrium tied to a productive order, an equilibrium that is quite difficult and costly to challenge. As a result, expansion is essentially the time of normal technical change. But, once the efficiency of the productive order of expansion is broken, innovations are on the agenda. Major inno-vations are now not only possible (because of the breakdown of social equilibrium) but must even expand in all domains (because of the rise of the social 'need' for major innovations). The cluster of major innovations does not only include technical or economic innovations but also social, political, cultural, and 'communicational' innovations also. The latter open the way for the former and, in return, the former permit the extension of the latter. The system can survive only by this metamorphosis.
On this basis, it becomes possible to overcome the debate between those who, like Kondratieff, explain innovation by the long wave

Pierre Dockes and Bernard Rosier 313
(inherent in capitalism) and those who, like Schumpeter, explain the long wave by waves of major innovations.
The depression, a time of transformation, functions as a 'social laboratory'. However, this does not imply that a positive outcome for the economic system - a new productive order - is a structural necessity. The transition from one productive order to another in the spasms of a long period of gestation always constitutes a critical moment, one that is unavoidable. Productive capitalism cannot, in fact, develop by remaining wedded to the articulation of the wage and commodity relation, generally considered to be its unchanging feature, but only by transforming itself. However, it is never certain that it will succeed.
If the crisis of mutation is a period of disorder, it is also the time of radical innovation. Innovation becomes the object, the stake, and the outcome of the many conflicts pervading the social arena. The crisis of mutation consequently verifies the correctness of approaching economic and social change by the 'dialectic of innovation and conflict'. This allows us to realise what is truly at stake in a long depression, that is, the unchanging feature of the process of trans-formation of capitalism. The long wave is thus truly that of the alternating operationality of certain forms, the calling into question of old forms and the creation of new ones. In other words, economic fluctuations, the morphogenesis of capitalism and the periodisation of its history are three interrelated processes which are the cause of each other through the complex relationship between conflict and innovation.
REFERENCES
Bettelheim, Ch. (1970), Calcul economique et formes de propriete (Paris: Maspero).
Bijker, W., T. Hughes and T. Pinch (1987) The Social Construction of Technological Systems (Cambridge University Press).
Bloch, M. (1938) 'Technique et evolution sociale, reflexions d'un historien', Europe, vol. 47, no. 185, re-edited in M. Bloch (1963) Melanges histori-ques (Paris: SEVPEN) pp. 832-8.
Boulding, K. (1962) Conflict and Defense, a General Theory (New York: Harper and Row).
Bowles, S., D. Gordon and T. Weisskopf (1983) Beyond the Waste Land, a Democratic Alternative to Economic Decline (New York: Doubleday).

314 Long Waves: the Dialectic of Innovations and Conflicts
Boyer, R. (1986) La Theorie de la regulation, une analyse critique (Paris: La Decouverte) .
-- (1988) 'Technical Change and the Theory of Regulation', in G. Dosi, et at., Technical Change and Economic Theory.
CalIon, M. (ed.) (1989) La Science et ses reseaux (Paris: La Decouverte). CalIon, M., I. Law and A. Rip (eds) (1986) Mapping the Dynamics of Science
and Technology (London: Macmillan). Clastres, P. (1974) La Societe contre l' Etat (Paris: Minuit). Coriat, B. (1976) Science, technique et capital (Paris: Le Seuil). Dockes, P. (1979) La Liberation medievale (Paris: Flammarion); English
translation (1982) Medieval Slavery and Liberation (Chicago: The Uni-versity of Chicago Press).
-- (1990) 'Formation et transferts des paradigmes socio-techniques', Re-vue franr;aise d'economie, vol. 5, no. 4 (December).
Dockes, P. and B. Rosier (1977) Questions aux historiens (Lyon: Presses universitaires de Lyon).
-- (1983) Rythmes economiques (Paris: La Decouverte). -- (1988) L'Histoire ambigue: croissance et developpement en question,
(Paris: Presses universitaires de France). Dosi, G. (1982) 'Technological Paradigms and Technological Trajectories' in
Research Policy, vol. 11, no. 3, (June); and in C. Freeman (ed.) (1983) Long Waves in the World Economy (London: Butterworths).
Dosi, G., C. Freeman, R. Nelson, G. Silverberg and L. Soete (1988) Technical Change and Economic Theory (London: Pinter).
Foucault, M. (1975) Surveiller et punir (Paris: Gallimard). Freeman, C. (1979) 'The Determinants of Innovation', Futures, vol. 11
(June). -- (1991) 'Innovation, Changes of Techno-Economic Paradigm and Biolo-
gical Analogies in Economics', Revue economique, special edition on 'Economie et Histoire'.
Freeman, C. and C. Perez (1986) The Diffusion of Technical Innovations and Changes in Techno-economic Paradigm (University of Sussex: SPRU) mimeo.
Freund, J. (1983) Sociologie du con flit (Paris: Presses universitaires de France).
Gaudemar, J. P. de (1978) 'La crise comme laboratoire social: l'exemple des disciplines industrielles' in L'Occident en desarroi: ruptures d'un systeme economique, (Paris: Dunod).
Gorz, A. (ed.) (1973) Critique de la division du travail (Paris: Le Seuil). Habermas, J. (1981) Theorie des kommunikativen Handelns (Frankfurt-am-
Main: Suhrkamp). Hughes, T. P. (1983) Networks of Power: Electrification in Western Society,
1880-1930, (Baltimore: Johns Hopkins University Press). Kleinknecht, A. (1987) Innovation Patterns in Crisis and Prosperity. Schum-
peter's Long Cycle Reconsidered (London: Macmillan). Kondratieff, N. D. (1935) 'The Long Waves in Economic Life', The Review
of Economic Statistics, vol. 17, no. 6 (November); re-edited in Review, vol. 2, no. 4, (Spring 1979).
Marglin, S. (1974) 'What do bosses do? The Origins and Functions of

Pierre Dockes and Bernard Rosier 315
Hierarchy in Capitalist Production', The Review of Radical Political Econ-omy, vol. 6, no. 2 (Summer).
Mensch, G. (1975) Des technologische Patt: Innovationen aberwinden die Depression, (Frankfurt: Umschau); English edition (1979) Stalemate in Technology: Innovations Overcome the Depression, (Cambridge, Mass.: Ballinger) .
Nelson, R. R. and S. G. Winter (1982) An Evolutionary Theory of Economic Change (Cambridge, Mass.: Harvard University Press).
Perez, C. (1983) 'Structural Change and the Assimilation of New Technolo-gies in the Economic and Social System', Futures, vol. 15, no. 5.
Rosenberg, N. (1982) Inside the Black Box: Technology and Economics (Cambridge University Press).
Rosenberg, N. and C. R. Frischtak (1984) 'Technological Innovation and Long Waves', Cambridge Journal of Economics, vol. 8, no. 1 (March).
Rosier, B. (1987) Les Theories des crises economiques (Paris: La Decouverte) (2nd edn 1988).
Schumpeter, J. A. (1912) Theorie der wirtschaftlichen Entwicklung (Leipzig: Duncker und Humblot); English translation (1934) The Theory of Econ-omic Development, (Cambridge, Mass.: Harvard University Press).
Simmel, G. (1908) Soziologie, Untersuchungen aber die Formen der Ver-gesellschaftung (Leipzig: Duncker und Humblot) (5th publication 1968).
Wallerstein, I. (1989) 'La Crise comme transition', in S. Amin, et al., La Crise, queUe crise? (Paris: Maspero).
Weber, M. (1964) Wirtschaft und Gesellschaft, Grundriss der verstehenden Sociologie (Studienausgabe, Koln: Kiepenheuer und Witsch); English translation (1968) Economy and Society, an Outline of Interpretive Soci-ology (New York: Bedminster Press).
13 The International Debate on Long Waves of Capitalist Development: An Intermediary Balance Sheet ERNEST MANDEL
The Brussels colloquium of January 1989 has produced a number of papers and discussion contributions of a high standard which faith-fully reflect the present state of the international scientific debate about long waves of capitalist development. In that sense, I consider that it was a real scientific success, but also because there was lively pluralistic controversy. I leave purposely aside all questions of politi-cal implications or perspectives to be drawn from the debates, which constitute a different problem, although, of course, not unconnected with the purely theoretical one. But our duty as scientists is to judge historically verifiable phenomena by strictly scientific criteria, re-gardless of their political implications.
The international debate on the 'long waves' centres essentially on seven issues:
1. A temporal/spatial framework problem: can long waves be statis-tically verified and in what time-frame, regarding what geographi-cally significant areas, and with what key indices? 2. What is the basic dynamic of capitalist growth? Is it inherent in the capitalist system itself, or does it in the last analysis depend upon the ups and downs of innovative individuals (the Marxists versus the Schumpeterians controversy)? Closely related to that question is the debate about the prime movers of long waves. Are oscillations in the average rate of profit the basic causes of variations in the rate of
316

Ernest Mandel 317
growth (of capital accumulation), or are they rather the result of these variations? 3. What is the precise correlation between the ups and downs of scientific technological innovation, and the long-term movements of capitalist growth? 4. What is the extent of regularity, verifiable in long-term capitalist development? (The 'long cycles' versus 'long waves', or Kondratieff versus Trotsky controversy.) 5. The controversy about the 'exogenous' versus the 'endogenous' determination of long waves of capitalist development (the Mandel versus the 'regulation school' controversy). 6. The correlated controversy about the monocausal or pluricausal nature of capital's social control over wage labour. 7. The controversy about forces determining basic changes in gen-eral conditions of capital accumulation, and the correlated questions about the ups and downs of hegemonic states in the world market.
ARE LONG WAVES STATISTICALLY VERIFIABLE?
Are long waves statistically verifiable and verified? There now exists a great deal of material on that issue especially related to the curves of world trade and world output. I believe that the empirical evidence overwhelmingly - although obviously not 100 per cent - points in the direction of a confirmation of the existence of long waves.
But an important methodological question is closely related to that of empirical verification: long waves of exactly what? I stick to the definition which I presented in the early 1960s: long waves of capital-ist development, which means long waves of output, employment, income, investment, capital accumulation, and long waves of rates of profit. From this it follows that one cannot integrate into a 'long-wave' theory of capitalist development time series concerning essen-tially food prices extending over 500 years. I do not, a priori, deny that some long waves in agricultural output and international trade, both of staple goods and luxury goods, could be discerned. However, this is a distinct problem, that we could call the Wallerstein-Gunter Frank hypothesis.
It is important to stress that it is a different problem from the one of long waves discernible in the capitalist economy. A capitalist economy is not simply an economy based on exchange, trade and

318 The International Debate on Long Waves
money capital accumulation. It is an economy based upon production by wage labour, which capital hires in order to realise profits, which permit more capital to accumulate, leading to more investment in production, larger output, larger profits, and so on. That growth dynamic is quite different from anything which occurs in pre-capitalist societies, even when money capital and international trade are already widely developed. And it is the variations in these growth rates which justify the concept of 'long waves of capitalist develop-ment'. Of course, one could object that this is a subjective parti pris in defining the object of study. I would not deny this: if one formu-lates a different problem one can, of course, come up with a different answer. But this is not a valuable objection to a theory of long waves of capitalist development, as many authors formulate it. The only valuable objection would be: this theory is irrelevant for understand-ing what has been going on in the real world for the last 200 years. I have not heard a single argument convincingly advanced along these lines. What has been said is that other questions are relevant too. This might very well be the case. But they only lead to the con-clusion: so what?
One should not forget that the problem of the long waves of capitalist development has historically arisen out of the business cycle theory, which, in turn, is a product of business cycle reality. It has been an analytical tool to understand and explain successive ups and downs of investment, output, employment and income. Nobody can seriously argue that these problems are irrelevant to the understand-ing of what has been going on in the economy and society of many countries throughout the world for the last 160-200 years, first in Britain, Western Europe and the USA, and then in the rest of the world. The fact that other problems can also be posed does not suppress the necessity of examining these precise kinds of problems.
THE RELEVANT GEOGRAPHICAL FRAMEWORK CONTROVERSY
An additional difficulty has been raised: where should we look for empirical verification or falsification of the long-wave theory? In the national economies? In those of the leading capitalist nations? In the world economy taken as a whole? Again we have to notice the implicit theoretical assumptions underlying the statistical material. If the time series of a great number of capitalist countries, not to say of

Ernest Mandel 319
all of them, are juxtaposed to look for evidence of long waves, a basic synchronisation, if not identity, of all these economies is assumed. This seems a serious methodological error.
Non-industrial countries, or countries in the 'take-off' phase of industrial production, will not have a growth pattern identical with that of already-industrialised countries. Dependent countries will not have the same growth pattern as independent metropolitan-centre countries. Certain countries such as Switzerland occupy a clearly counter-cyclical position: when things go badly in the world econ-omy, capital flows into that refuge country. Neutral Sweden, again, occupies a special place, at least in twentieth-century economic development.
So one could concentrate either on some key capitalist economies or on world output and world trade taken in their totality, and consider any national deviation from that general trend as a specific problem to be specifically explained and not as 'proof' that the long waves are not empirically verifiable to a satisfying degree.
THE MOVING FORCES OF CAPITALIST GROWTH, OR MARXISTS VERSUS SCHUMPETERIANS
Closely related to the question of what are we really talking about is the question: what is the basic logic of capitalist expansion? I agree fully with the 'rate of profit/rate of capital accumulation' mechanism as a key answer to that problem. As a matter of fact, I have already advanced that position in 1964. Inasmuch as material is presented to clarify or throw doubt on the studies, I believe it to be stimulating further discussion, but not of such a magnitude that it undermines the credibility of the basic working hypothesis itself.
A number of different debates are subsumed in the controversy about the basic reason for growth under capitalism. First and fore-most is the question of whether there is a basic growth dynamic inherent in the capitalist mode of production, or whether this de-pends in the final analysis on the autonomous role of innovative personalities, unleashing processes of radical and cumulative techno-logical change.
I fully agree with all those participants in the discussion who stress the growth dynamic inherent in the capitalist mode of production, who consider this growth dynamic (or, what is strictly the same in Marxist terms, the dynamic of capital accumulation) 'systemimmanent',

320 The International Debate on Long Waves
to use the German term. This growth dynamic is unleashed by two basic characteristics of capitalism:
1. Competition, that is, private property in the economic sense of the word (fragmentation of decision-taking by firms independent of each other) - the private character of labour embodied in commodities, which is only post festum recognised as social labour to the degree that their exchange value is realised on the market. 2. The class struggle between capital and labour, that is, the separ-ation of the direct producers from their means of production and livelihood, and the economic compulsion thus imposed upon them to sell their labour power to the owners of the means of production.
These two basic characteristics of capitalism oblige the capitalists (the capitalist firms) to accumulate more and more capital in order to lower production costs through the purchase of more and more sophisticated equipment and cheaper and cheaper raw materials. Otherwise they will be beaten by competitors.
These characteristics also impose upon the capitalists the obli-gation to substitute machinery (dead labour) for living labour, to avoid scarcities of labour, which drive wages up. Both trends towards technical progress immanent in the system are trends towards labour-saving technical progress. In certain phases of long waves, they will be compensated, sometimes even overcompensated, by the trend towards capital-saving (more correctly: constant capital saving) technological progress. But the long-term end result of the interaction of both is definitely one of basically labour-saving techni-cal progress.
This trend is, of course, obscured or even buried in statistics about total wage labour, or 'total wage bill' statistics, which do not make the distinction between productive and unproductive labour. The law of motion indicated here concerns productive labour under capital-ism, that is, labour producing surplus value. But this is again not a dogmatic parti pris, but a distinction quite relevant for understanding what has been going on in economic history since the Industrial Revolution. How could one otherwise accept or even explain the reality of the trend towards growing mechanisation, semi-automation, automation and robotism, which has been visible since the Industrial Revolution?
Second is the debate about the prime mover of this growth dy-namic inherent in the system. In my opinion, it is definitely the

Ernest Mandel 321
pressure towards growing real capital accumulation, that is, the combination of surplus-value production, surplus-value realisation and surplus-value division (between productively and unproductively spent surplus-value). The distinction between ex ante and ex post profit calculations, between what levels of expected profits either stimulate current investment decisions or put a brake on them, and what levels of realised profits stimulate or restrict capital accumu-lation and thereby investment decisions in the next cycle of repro-duction, allows us to separate two problems. One is that of the relation of microeconomic choices and macroeconomic outcomes which is never guaranteed under a system of private property and competition; and the other that of the time-lag between private decision-taking moments and periods in which the social outcome of these decisions becomes apparent and in turn determines new private decisions.
The average rate of profit is definitely a social result of private decisions, and a social result which becomes apparent only after a given time-lag. The oscillations of the rate of profit, which in the last analysis determine the long term differences in the rate of growth, again lead to an important time-lag, for they become obvious to capitalist firms in the form of higher or lower profit expectations only after some real experiences and verifications. So the time sequence seems to me to be the following one: expected rates of profits induce higher or lower investment decisions, which induce higher or lower rates of growth which, combined with variations in the rates of surplus-value, variations in the organic composition of capital, vari-ations in the degree of expansion or contraction of the market, lead to variations in the realized rates of profit. These in turn determine the volume of real capital accumulation and new profit expectations, which themselves in turn co-determine investment decisions for the next cycle.
An important new contribution to the international debate has been the one by Anwar Shaikh around the relevance of the fluctu-ations of productive capacity utilisation as a co-determinant of profit-rate fluctuations and investment decisions. We should separate the question of the empirical data, which remain open to correction through new methods of investigation or new collected data, from the question of the inner coherence of the argument. From the latter point of view, Anwar Shaikh's contribution seems unassailable.
If one looks at the reasons for lower average rates of growth in long depressive waves, the existence of long-term overcapacity in important

322 The International Debate on Long Waves
branches of output appears prima facie as one of the key reasons for a significantly lower rate of productive capital accumulation (of ex-panded reproduction). Especially in the present long depression, it leads simultaneously to an important momentary 'rupture' between money capital accumulation and productive capital investment, that is, to great excesses of speculation. But as only productive capital produces surplus-value, such a break will always be temporary. So much for the prediction of long-term 'de-industrialisation' in the broader sense of the word (of course, many service industries are just that: service industries, that is, fields of productive capital invest-ment), which will go the way of all flesh.
Third is the relation between the abstract, general growth dynamic of capitalism and the concrete, specific forms it takes. Again because of the very nature of capitalist production as a generalised market economy (generalised commodity production), capitalist growth is always uneven, that is disproportionate, growth. Some countries, regions, branches of industry or firms grow quicker than others. This not only stems from the fragmented character of decision-making, first of all in the field of past and current investment. It also results from the differences in the initial capital profile of each country, region, branch of industry or firm. It likewise reflects the different organic composition of these 'many capitals' - the only form in which capital can exist with a growth dynamic, as Marx explicitly stated. And it likewise reflects the important role of specific-use values produced by each country, region, branch of industry or firm. For demand, purchasing power on the market is always demand for a specific use value and not abstract 'aggregate demand', which is only a final sum, an epiphenomenon. Here the question of product inno-vation as a problem separate from that of technological innovation, fully comes into its own.
Now we are at the very heart of the theory of the 'long waves of capitalist development'. The whole problem only arises because unevenness of growth is a fact of life. The way the problem of the growth dynamic of capitalism is related to the problem of long waves can be restated in the following terms: is there an immanent logic under capitalism which implies that the combination of all the factors which determine capitalist growth leads to disproportions which have long-term cumulative results, and leads to periods where they result in an average rate of capital accumulation which is substantially lower (or even non-existent), compared to that of other long periods? One could, of course, theoretically deny that this is the case, and only

Ernest Mandel 323
recognise random oscillations. But I believe that the empirical evi-dence nicely dovetails with the theoretical analysis. Given the rela-tively 2.utonomous and disproportionate, uneven, dynamics of the organic composition of capital, of the rate of surplus-value and of the world market (to name just the three most important ones), such varying long-term cumulative effects seem the most likely outcome of long-term uneven development.
TECHNOLOGICAL INNOVATIONS AND LONG WAVES OF CAPITALIST DEVELOPMENT
The assumption that uneven, differentiated, discontinuous growth is immanent in the capitalist mode of production, by no means down-plays or marginalises the role of technological innovation, and es-pecially the role of technological revolution, in the long waves of capitalist development. Quite the contrary. I have already stressed that capitalist growth is always accompanied by technical progress. What Marxists, following Marx himself, would assume is that such innovations inevitably result from the very operation of the system, that they are not dependent upon the biological accident of a sudden appearance of 'innovative personalities', that they constantly stimu-late such appearance through material rewards, social (ideological) pressure and specific institutions such as transformation of the system of higher education; systematic organisation of scientific research; development of the so-called applied sciences; increasing autonomi-sation and profitability of research activities, and so on. It is in that sense, and in that sense only, that Marxists would criticise Schumpeter.
The question of the discontinuous, diachronic character of that growth implies that cumulative results of technical change are also discontinuous and diachronic. This means that at least three aspects of technical change have to be distinguished: invention (scientific discovery); initial so-called experimental technological innovation; and diffusion.
The first aspect has up to now been little investigated in the framework of the long-waves theory. We have to rely for the time being mainly on the conclusions drawn from the history of science (or scientific discoveries) itself. The evidence seems to point in the direction of an increasingly continuous and cumulative character of scientific discoveries, with, however, particular specific leaps forward in particular fields and in the function of specific social pressures.! I
324 The International Debate on Long Waves
will leave this field of enquiry to current and future further research. It is important to stress from the outset that there is no automatic
correlation between scientific discoveries and technological inno-vation. Under capitalism, and in any form of market economy, scientific discoveries and technological innovations will always be at least partially mediated through material rewards (under capitalism: profit expectation and realisation) of independent firms. When these stimulants decline technological innovation will decline, regardless of whether new inventions are available or not. When the expected financial rewards start to rise, technological innovation will expand.
In order to relate this elementary causality to the mechanism of long waves, we have to answer further questions. Can it be empiri-cally verified that technological innovations appear in bunches, either during long 'expansive waves' or during long 'depressive waves'? If the answer is yes, then why? If not, are they more-or-Iess equally distributed throughout time? And if their 'bunching' has been proven, what are its results regarding the growth dynamic; what are its effects upon the rhythm of capital accumulation?
The first question has led to the Mensch versus Freeman/ Kleinknecht controversy. I have to make a self-criticism here: in my book entitled Long Waves of Capitalist Development (Cambridge University Press, 1980). I hastily and wrongly assumed that Mensch's data were correct. Today, the evidence points in the direction of Freeman and Kleinknecht being right. I stand chastised.
But it does not follow from this that the rhythm of technological innovation is irrelevant to the long-waves problematic. In order to reintegrate the Freeman/Kleinknecht data into an understanding of the logic and the operation of the succession of long depressions and long expansions, two distinctions which I made in the above-mentioned book remain fully operative.
First, it seems logical to note that a long depression stimulates technological research, that technological innovations are a source of surplus profits (technological rents), and that when the rate of profit is depressed, the search for such rents would become frantic. But it is likewise logical to assume that under conditions of relative st~gnation of the market, and of high levels of excess capacity, the overall macroeconomic weight of innovative activity will not tend to be very high. A larger part of capital investment will be in the nature of perfecting existing technology. Only a minor part will take the form of fundamental technological innovation of an incremental nature.
Towards the end of the 'long depressive wave' this begins to

Ernest Mandel 325
change. This is why several colleagues see in this very change the cause of the upturn (which then becomes essentially 'endogenous'). But I believe that such a view underestimates the decisive role of profit expectations and profit realisation in the operation of capitalism.
Only if and when the economic climate is already one of greater and greater profit expectations, and of actually realised increases in the average rate of profit, will innovative activity jump from being essentially experimental and incremental into becoming all-pervasive and generalised through mass production. Only then will we witness a real technological revolution, that is, a real change in the technology of all leading branches of output (including services). It is not the technological revolution which triggers off a new expansive long wave. It is the long-term increase in the rate of profit which triggers off a new expansion, which then becomes cumulative, that is, a long-term expansion through the technological revolution. What have been called 'new technological systems', 'pervasive technologi-cal changes' and 'combinations of incremental and radical innova-tions' represent just that technological revolution.
Again we see the actual time sequence as follows: a general initial increase in the average rate of profit triggers a general increase in capital accumulation, which stimulates the financing of generalised radical technological change, which generates an overall technologi-cal revolution, which by cost-cutting and initially increasing techno-logical rents makes an increase of the average rate of profit (or at least its staying at an unusually high level over a long period, through several successive business cycles) possible.
In a parallel way, in the latter half of the 'expansive long wave', the very generalisation of the new technology erodes the technological rents, creates increasing market saturation for those products mainly embodying the new technological revolution, creates increasing ex-cess capacity in the 'new' sectors of output, impedes reductions in the organic composition of capital and, through an interplay of all these factors, makes for a long-term tendential decline of the average rate of profit.
As for an empirical investigation of the quantitative aspects of technological revolutions in relation to the organic composition of capital, I would advise the following paths of study: the relative weight of new branches of output in overall production; the fluctu-ations in the life-cycle of equipment; and the fluctuation of raw materials and energy costs as part of total production costs of finished products.

326 The International Debate on Long Waves
LONG CYCLES OR LONG WA YES
Is the long-term movement of output, employment and income endowed with the same kind of regularity as the business cycle? Is it basically more irregular? In the first case, it would be correct to speak about long cycles of capitalist development; but in the second case, it would be more appropriate to call the long-term movement an addition of long waves. In the light of the history of economic ideas, this controversy could be called the Kondratieff versus Trotsky debate.
There are two approaches to this debate which we must dis-tinguish. The first one is semantic, a question of definition, which has to be empirically verified or discounted. The second one is analyticaVcausal. The semantic problem turns on the definition of regularity. How regular should a movement be in order to be called 'regular'? The average duration of the business cycle over the last 200 years has been 7.5 years. But this average, as Marx noticed a century ago, is a statistical long-term average. The real duration of the business cycle has varied between 5 and 10 years.
If one supposes that the average duration of a long wave is 25 years, but that this average results from a real movement varying between 20 and 30 years, one does not encounter a basic difference between the regularity of the business cycle and the regularity of the Kondratieff cycle. But the cumulative character of the variations could make quite a difference. In the history of business cycles we do not encounter three or four successive cycles of 10 years' duration, followed by three or four successive cycles of 5 years. So, the 7.5-year average duration of the business cycle is more than a purely statistical average: it corresponds to the common duration of the real move-ment, the extremes of variation being exceptions and not the rule.
On the other hand, there is a cumulative effect of a succession of long-term movements of a duration other than 25 years. The latest expansive long wave in the USA is not a 'post-Second World War boom' as in Western Europe and Japan; it lasted from 1940 until the early 1970s, that is, for 33 years. Likewise, the 'the long depressive wave' which started around 1973, has already lasted almost 20 years, and I am convinced that it will last for a great number of years more. So even if one takes again a 30-35-year duration, this would make for two successive Kondratieff waves lasting together at least 63 years, if not 68-70 years or more, which is substantially above a 50-year double cycle.

Ernest Mandel 327
If one adds to this the fact that the previous 'expansive long wave' lasted only 20 years (1893-1913) followed by a 'depressive long wave' of 25 years for the USA (for Europe and Japan, it is nearly imposs-ible to come to a conclusion of how to integrate the years of the Second World War into the picture), one finds a cumulative differ-ence of 50 per cent in duration of the long-term movement: 45 years as against 68--70 years, if not more.
The picture remains substantially the same if one considers the previous Kondratieff 'long expansive wave' of 25 years (1848--73) which was followed by a long depression of 20 years (1873-93): again 45 years as against 68 years or more. The irregularity seems rather higher than that of the business cycle. The first Kondratieff wave of industrial capitalism would confirm this conclusion: an expansive wave of 27 years (1798--1825) followed by a depressive long wave of 23 years (1825-48), that is, a duration of 50 years quite different from the above-mentioned 45- and 68--70-year periods. Likewise, the different duration of the 'expansive' and of the 'depressive' waves is also evident in every Kondratieff wave. Therefore, irregularity seems to be stronger than regularity, the concept of 'long waves' seems to corre-spond more to the historical evidence than the concept of 'long cycles'.
But more important than the semantic and empirical aspect of the question is the analytical, causal, explanatory one. The very nature of a cyclical movement lies in the automaticity of the reversal, of the turning point. Whatever happens in other realms of society, whatever occurs in international relations, in the class struggle, in the field of ideology or regarding specific forms of government, a crisis of overproductionloveraccumulation of capital, is inevitably succeeded by a revival of investment, output, employment and income. This results from the very nature of capitalist production dominated by fragmentation of decision-making between competing firms. These decisions lead to the phenomenon of overshooting, that is, too much production for a given 'effective demand' of final consumers, fol-lowed by too little production even for a reduced effective demand; too much capital for a given mass of surplus-value produced and profits realised, followed by much less capital productively invested for the given (even reduced) mass of surplus-value and realised profit. Hence an increase in the average rate of profit. Hence the take-off of a new cycle of expanded reproduction, that is, expanded investment, output, employment and income. The very forces which drive business into crisis drive it into expansion after a given interval, independently of all interferences.

328 The International Debate on Long Waves
It is my contention that a similar mechanism does not operate in the framework of the 'long waves of capitalist development'. Here, a basic asymmetry between the reversal from a 'long expansive wave' into a 'long depressive wave' on the one hand, and the reversal from a 'long depressive wave' into a 'long expansive wave' on the other, has to be noticed. The first is more or less automatic; the second is definitely not. The reasons for this asymmetry are again linked to the very nature of the capitalist mode of production. The cumulative effects of profit expectations determining investment decisions of individual capitalist firms, and the profit realisations by these very same firms, determine the average rate of profit, independent of anyone's plans, intentions or previsions. They create a long-term momentum in which a cumulative decline of the rate of profit be-comes unavoidable throughout a certain number of successive busi-ness cycles. Whether it needs two, three or four business cycles is of secondary importance and can vary from one 'long expansive wave' to another. In other words, the economic forces which operate in favour of long-term expansion have to spend themselves progress-ively, more or less in the same way as the forces which create a capitalist 'boom' have to erode within the normal business cycle.
But the same is not true for the conditions transforming a 'long depressive wave' into a 'long expansive wave'. While we have to stress that the 'normal' business cycle continues to operate within every long-wave expansion, the 'long wave' has a dampening effect on each of them. Crises (recessions) which occur in a long expansion tend to be milder and shorter. Booms which occur in a long depression likewise tend to be milder and weaker.
So the real problem is how, under these conditions, there could come about a combination of circumstances which suddenly trans-form these mild and short booms into a long-lasting rapid expansion. The automatic mechanisms of the business cycle (unemployment driving the rate of surplus-value up; the cheapening of raw materials making for a decline in the organic composition of capital; techno-logical innovations in the production of equipment having the same result) seem insufficient to produce such a tum-round, all other conditions remaining equal.
Historical evidence points strongly in the direction of exogenous system shocks being necessary to bring about a basic reversal of an historical trend. The basic historical trend of the capitalist mode of production is indeed one of decline and not one of impetuous upsurge in the average rate of profit. But three times in history we

Ernest Mandel 329
have witnessed such an impetuous upsurge: after 1848; after 1893; and around 1940 in the US (1948-49 in Western Europe and Japan). Each time, extra-economic system shocks seem to have played a key role. They led in each case to a sudden expansion of the world market and a sudden basic change in the general conditions of capital accumulation favouring such accumulation. The factors stimulating a long-term upsurge of the rate of profit were the liberal or bourgeois revolution of 1848 and the discovery of the California gold-fields around the same time; the radical increase in capital investment in the colonial world (imperialism) and the discovery of the South African Rand gold-fields after 1893; the cumulative long-term results of Fascism (counter-revolution) and war around 1940 and afterwards.
THE 'ENDOGENOUS' VERSUS 'EXOGENOUS' MOVEMENT CONTROVERSY
The hypothesis of a basic asymmetry between the upward and the downward turnround of the 'long wave', and the decisive role of system shocks in triggering off the upward turn, lead to the con-troversy about the 'endogenous' versus the 'exogenous' character of the passage from a long depression into a long expansion. Again, we have to distinguish the semantic aspect of the problem from the analytical one.
When we speak about 'system shocks' and about the 'exogenous' determination of the upward turning point, we mean system shocks with regard to the basic economic mechanisms of the capitalist mode of production. We do not consider that an extension of the world market as realised by the 1848 revolution, or by the discovery of the California gold-fields, is an automatic, unavoidable result of the long-term economic depression of 1825-48.
Of course, a long depression favours the search for new gold-fields. It likewise creates forces operating in the direction of revolution, but accompanied also by forces favouring counter-revolution. However, the end-result of these trends is in no way predetermined. To take one present example: for years, a frantic search for new gold-fields has been going on especially in Brazil and New Guinea. But can anyone predict that this will definitely lead to the discovery of new gold-fields of the amplitude and weight in the world economy com-parable to those of the Californian gold-fields after 1848 and the Rand gold-fields after 1893?

330 The International Debate on Long Waves
Inasmuch as I can base myself upon empirically verifiable and refutable data, they overwhelmingly tend to confirm my hypothesis of system shocks exogenous to the economic laws of capitalism, properly speaking. I have not seen any empirical evidence proving the economic endogeneity of these 'system shocks'. And I continue to challenge all those colleagues who support the hypothesis of an 'endogenously produced long-term upward movement' to show solid empirical evidence in support of their contention, and not to limit themselves to purely 'logical' (I would prefer to say paralogical) reasoning.
Of course, if the framework of reference of the terms 'endogeneity' and 'exogeneity' is changed, then quite different conclusions become possible. If one takes the terms 'exogenous' and 'endogenous' as referring to bourgeois society in its totality, then it is obvious that revolutions, counter-revolutions, wars, gold-fields and so on, are not 'exogenous' to bourgeois society. In that case, the colleagues who defend the 'endogenous character' of the upward turning point are, of course, correct. But theirs is then a purely Pyrrhic victory. For they are only indulging in tautology, which has no analytical value whatsoever. Everything which occurs inside bourgeois society is by definition endogenous to that society. By making this rather trite point, my colleagues have not proved in any way that revolution, counter-revolution, wars and the discovery of giant new gold-fields (basic changes in the money/commodity relation) are the unavoid-able result of a long-term economic depression. And that's what the 'exogenous' versus 'endogenous' controversy is all about.
THE LIMITS OF CAPITALISM'S LONG-TERM SELF-REGULATORY POTENTIAL
So the 'exogenous' versus 'endogenous' explanation of the upward turning point in the long-term movement of capitalist development throws us back to another controversy: what are the forces determin-ing basic changes in the general conditions of capitalist accumu-lation? Are they purely economic, that is, do long-term depressions create not only necessary but also sufficient preconditions for all those social and political changes on which more favourable general conditions of capitalist accumulation depend? Or is there a relative autonomy of social and political forces which could (I do not say do) counteract, brake or even reverse the results of the economic forces

Ernest Mandel 331
operating during long-term depressions? In other words, is there an unavoidable long-term self-regulation of capitalism, independent of what social forces, different fractions of the capitalist class and of the working class, actually achieve in real life, independent of their concrete correlation of forces, and of the outcome of their real struggles?
To bring the controversy to its vital implication: is the class-struggle cycle mechanically determined by economic forces resulting essentially from levels of employment? Do long-term depressions make working classes' crushing defeats unavoidable? Was Adolf Hitler's victory in 1933 inevitable? Or should one rather say that there is indeed a relative autonomy of long-term class-struggle results, a relative desynchronisation of the class struggle and the ups and downs of investment, output, employment and income? Can the subjective factor in history - in this case the divisions of the bour-geoisie between its 'liberal' and its 'aggressively reactionary' wings; the concrete policies (strategies and tactics) of the reformist social-democracy and the Stalinist CP (Komintern) - make a decisive difference between victory and defeat of, for example, Fascism?
The question of the long-term results of the class struggle is basic to the question of the possibility of a long-term expansion of capitalism, of a long-term rise of the average rate of profit, through the me-diation of the long-term fluctuation of wages, which are one of the determinants (not the only one, of course) of the rate of surplus value.2 It is undeniable in the light of empirical evidence that long-term fluctuations of real wages are not a straight function of the ups and downs of the unemployment ratio, but a function of a whole series of variables, which I have attempted to analyse elsewhere.3
There is an interesting philosophical debate underlying this con-troversy. Two varieties of determinism are confronted here: mech-anical-economic (economistic) rectilinear determinism on the one hand; dialectical, parametrical socioeconomic determinism on the other hand. I contend that the second version of determinism, which sees two or three possible outcomes for each specific historical crisis -not innumerable ones for sure, nor ones unrelated to the basic motive forces of a given mode of production, but definitely several, corre-sponds both to Marx's theory, and to Marx's analytical practice. But this is, of course, neither here nor there regarding the controversy we are dealing with. The question is, in what direction do the actual empirical data point?
Here I must state that the international debate has produced a
332 The International Debate on Long Waves
wealth of new evidence, some of which has been presented to the Brussels colloquium, confirming my hypothesis of the relative auton-omy of the long-term class struggle movement, and the long-term militarisation/war trends from the long waves of economic develop-ment, properly speaking. Both masses of evidence have implications for a realistic judgement of what is going on during the present long-term depression, and the likelihood that it will lead to a new 'Kondratieff expansion' .
THE CONDITIONS FOR EFFICIENT SOCIAL CONTROL OF CAPITALISM OVER LABOUR
If one assumes that capitalism's long-term self-regulation is more-or-less unavoidable, then it follows that the present long depression will indeed lead to a 'soft landing'. A new 'expansive long wave' will then occur in the foreseeable future, no matter whether it is after the next recession or the one after that.
If one assumes, however, that such an assured long-term regu-lation is uncertain, that there are no economic mechanisms which automatically produce a long-term expansion, then the likelihood or not of a 'soft landing' after the present depression remains at the very least an open question, not yet decided by history. Then everything depends upon the outcome of the struggle between specific social and political forces in a series of key countries throughout the world. And then one basic difference between the present long depression and the previous one is immediately noticeable, immediately leaps to the eye. No working-class or Third-World liberation movement in a key country of the world, with the exception of Indonesia, has suffered a decisive defeat comparable to those successively inflicted in Italy, China, Indo-China, Indonesia, Japan, Germany, Spain, Brazil and France in the 1920s and 1930s.
Indeed, in all key countries today the partial retreats and partial defeats suffered by the labour movement and the liberation move-ment after 1974-75 leave their fighting potential largely intact and make a new upsurge of class struggle not only possible but likely. This has already occurred in Brazil, South Africa, South Korea, France, Poland, Spain and Italy. It is starting to occur in the USSR and China as well and will probably spread to more and more important countries. Again, linked to the controversy about the limits of capitalist long-term self-regulation is an important theoreti-

Ernest Mandel 333
cal problem. Given the very nature of the capitalist mode of pro-duction in which the free wage labourer (and not the slave) is the producer of wealth and of the social surplus product, purely econ-omic mechanisms cannot in and of themselves produce 100 per cent automatic resignation, passivity and subordination of wage labour under capital. Specific forms of social control over labour, inside the factory as well as in society in its totality,4 are an indispensable complement of purely economic mechanisms which, through the fluctuations of the reserve army of labour, assure a degree of sub-mission but do not guarantee it permanently, or automatically, or fully.
History has confirmed Marx's analysis in that respect too. Wage labour can be organised or unorganised. It can organise militant unions or unions more or less subordinated to the employer's econ-omic objectives. It can fight back or remain passive in the light of attacks on a given average level of real wages. It can be content with historically established living standards, or accept their substantial lowering, or it can fight to integrate the satisfaction of new needs into that socially recognised average price of the commodity 'labour power', that is, fight for substantial increases in real wages. It can accept changes imposed at its expense in the labour organisation at the point of production (for example, speed-ups; reductions of free time; declining recognition of acquired skills; night work for women; work during weekends, and so on). It can likewise fight back and impose forms of control and limitation on these changes by its own representatives.
All these different variations in the forms and efficiency of control of capital over wage labour have occurred throughout history in numerous countries. They all have in common that, while they are obviously influenced by economic changes and the basic dynamics of the capitalist mode of production, they depend in the last analysis on a dialectic between these economic mechanisms and what Marx called the relationship of forces between the combatants. This re-lationship of forces is in turn 'overdetermined' by the cumulative results of long-term trends bearing upon the strength of the labour movement and the militancy of the working class.
To illustrate these historical determinants of the degree of social control which capital can in real life impose upon labour: the degree of resistance of the working class to a radical deterioration of its real wages and labour conditions in countries such as France, Italy, Germany, Belgium, Denmark and even the UK, depends to a large

334 The International Debate on Long Waves
degree not only (and not even in the first place) upon the extent of unemployment since 1974 or 1984, the fear of unemployment, the extent of new government anti-labour legislation, the pressure or the efficiency of new employer's production, and labour control tech-niques inside the factories and offices, all forces which obviously exercise a powerful pressure in the direction of greater control of capital over labour.
That degree of resistance also depends to a large, and I would say decisive, extent upon the strength of working-class militancy ac-cumulated throughout the previous historical period, as a result of the economic forces operating in the past,S especially full employment and the effects of the 'welfare state', and the way in which the working class translated them into a militant potential through momentous struggles. The degree of social control capital can effec-tively impose upon labour therefore depends on the results of the past cycle of class struggles as much as, if not more than it does upon the effects of the present economic 'long wave' on labour's relative strength and/or weakness.
THE WEIGHT OF FLUCTUATIONS OF HEGEMONIC STATES IN THE DETERMINATION OF LONG WAVES OF CAPITALIST DEVELOPMENT
Finally, we have to integrate into the factors determining basic changes in the general conditions of capitalist accumulation, the relative importance of the ups and downs of single capitalist states' hegemony in the world market. In the past the following rule has been roughly formulated: long expansive waves are characterised by the consolidation of a single capitalist power's hegemony in the world market: 'free enterprise' Great Britain in the 1848-73 period; British imperialism in the 1893-1913 period (although to a smaller degree than Britain's hegemony in 1848-73); US imperialism's hegemony in the 194O(1948}-1968(1973) period.
In the same way, a long depression is generally accompanied by the absence of one single hegemonic power. The UK did not yet enjoy such a monopoly of a high level of average industrial productivity of labour in the 1825-48 period as it established afterwards. The 1873-93 long depression had not yet seen the consolidation of the British Empire, which occurred later. The 1913-39 period had not yet seen the emergence of the 'American century' which occurred as a

Ernest Mandel 335
result of the Second World War, although the tremendous industrial and financial superiority of the USA in the struggle for world domi-nation was already clear in 1940. And the present long depression is obviously characterised by a rapid decline of US hegemony in the world market.
It is important to stress the structural links between the weight of these ups and downs of single countries' hegemony on the world market on the one hand, and the basic nature of the capitalist mode of production on the other. Because capitalism is basically private production and competition, a purely private monetary system is inoperative and contrary to the needs of the system taken as a whole. The very nature of money as a means to bridge the contradiction between private and socially-recognised labour in a market economy cannot be realised through private money. So capitalist paper money has to be state controlled, in order for its 'value' (more correctly, the amount of gold it represents) to be potentially recognised by all capitalists. This, in turn, means that the relative industrial power, competitive superiority and financial stability of each capitalist state determines the relative degree to which the paper currency it emits will play the role of a 'general equivalent' on the world market.
The implacable laws of competition lead to the foreseeable result that competitive superiority and financial stability are never acquired once and for all, or even for very long periods. It is an object of the law of uneven and combined development. Capitalist powers devel-oping later than others can overtake the first ones in the field of average productivity of labour and industrial competitivity. Cur-rencies which once were 'as good as gold' can suddenly become weakened as a result of lasting deficits of a given country's balance of payments.
The controversy which arises around this problem (which inciden-tally also illustrates that the question of the total volume of gold production, that is, the question of the discovery of new great gold-fields, is in no way marginal but central to the general conditions of capital accumulation)6 can be summarised in the following way.
Is there a long-term independent cycle of power hegemony (for example, overdetermined by military/political strength) which deter-mines the long waves of economic development? Or is it rather the outcome of economic mechanisms and international competition which determines the ups and downs of single power hegemony? This is an interesting and paradoxical variation of the controversy around the 'exogenous' versus 'endogenous' determination of long waves.

336 The International Debate on Long Waves
We tend to be more cautious in respect of that controversy than in respect to the relative autonomy of the long-term class struggle cycles and real wages fluctuations. A certain degree of autonomy of states' hegemony from the long-term results of international competition and relative competitiveness in the world market is undeniable. British imperialism maintained a clear superiority in the realm of naval power long after its industrial superiority was eroded. It even reconquered temporarily a relative technical superiority in the field of air power in 1939-40, which played a decisive role in preventing Germany from winning the war against the United Kingdom in 1940.
The USA today maintain a strong military-political preponderance in the capitalist part of the world, disproportionate to the relative decline of its industrial and financial power. But such discrepancies are generally limited in time. Industrial power and technological advance make rapid rearmament possible. This happened with Germany in the mid-1930s. It could happen any time with Japan today.
The exacerbation of inter-capitalist rivalries, the eruption of trade wars and of increased protectionism, or the appearance of semi-autarchic trade blocs, are closely correlated with periods of long depression. It seems a moot point to determine whether they are causes of such depressions, consequences of them, or consequences which tend in turn to make the depressions longer and deeper. I tend to agree with the third position but it doesn't seem to make a big difference in any case.
What is important is rather the fact that the decline of a given power's hegemony, and subsequently the impossibility for its cur-rency to be any longer accepted as 'world paper money', as a real substitute for gold,? is not followed rapidly by the emergence of another hegemonic power substituting itself for the former. Neither the yen nor the Deutschemark have taken the place of the dollar. 8
Whether the ecu could is still an open question. So the conclusion is that such a substitution can occur only at the
outcome of a long inter-imperialist struggle for world hegemony, and that struggle does not necessarily have to lead to world wars, as it did in 1914 and in 1939. It does lead to an increasing weight of arms production and exports, but these can be partially 'absorbed' through 'local' wars (there have been eighty of them since 1945!). So while I would not accept the concept of 'long war waves' or even less of 'long war cycles', I would accept that there are long waves of inter-capitalist rivalry correlated with long expansions and long de-
Ernest Mandel 337
pressions. Rivalry, whether in the form of trade wars or military conflicts, tends to grow in long depressions, and it tends to be less explosive in long expansions.
All these long-term movements, some of them in parallel, some of them contradictory to each other, are synthetised in the fluctuations of the average rate of profit. We are again back to basics. Under capitalism, the rate of profit is the result of the operation of all mechanisms proper to the system. No monocausal explanation of that mode of production, nor of the crises, nor of the business cycle, nor of the long waves of development, is possible. All are products of the interplay of all the basic contradictions, in plural, of the system. This was explicitly stated by Marx. I fully concur with him, not because ipse dixit, but because 200 years of historical evidence confirm the correctness of that diagnosis.
NOTES
1. For example: the pressure of war economy which led to a leap forward of discoveries in blockaded Germany during the First World War; the giant research effort spurred on by the US decision to manufacture the A-bomb during the Second World War; and the powerful impulse given to research by the upsurge of ecological consciousness in the last 25 years, and so on.
2. The explanation of crises by a 'profit squeeze' as a result of rising wages is quite different from its explanation through a decline in the rate of profit. An increase in real wages does not necessarily lead to a decline in the rate of profit. It can be neutralised or even overcompensated by an increase in the rate of surplus value (a strong rise in the productivity of labour in the wage goods industry), by a decline in the organic compo-sition of capital through a cheapening of raw materials and equipment, or a combination of both these trends.
3. See my essay: 'Historical and institutional determinants of long-term variations of real wages' in Peter Scholliers (ed.), Real Wages in 19th and 20th century Europe (New York: Berg, 1989).
4. Recently, interesting supplementary points have been made in the international debate: institutional rigidities are obstacles to radical changes in the system of management. New technological sociopolitical paradigms call for new social-political institutions. It seems to me that these are but paraphrases of the thesis that new (and higher) degrees of social control of capital over labour are needed, for all the advantages of a technological revolution in the field of increasing the rate of surplus value to be reaped by capital.
5. In the same way, the divisions of the bourgeoisie between more 'liberal' and more 'reactionary conservative' wings have historical roots, in the

338 The International Debate on Long Waves
way in which the bourgeoisie conquered power: through a radical revolution (USA; France); through a revolution ending in a more moderate compromise (England); through a 'revolution from above' which maintained the aristocracy's hold over important parts of the state apparatus, especially in the army and the diplomacy (Germany; Italy; Japan).
6. See my essay 'Gold, Money and the Transformation Problem' in Ernest Mandel and Alan Freeman (eds) , Ricardo, Marx, Sraffa (London: Verso Books, 1984).
7. The disintegration of the 'gold-exchange (dollar)-standard' expresses itself in the dual movement of 'dedollarisation' of the imperialist countries' and of world trade on the one hand, and of 'dollarisation' of most of the Third-World countries on the other.
8. We should distinguish the problem of the use of certain currencies as reserve currencies of other countries' central banks, and the use of currencies as means of credit and private investments (for example, through international bonds). The yen and Deutschemark play an insignificant role in the first field, but a much larger one in the second.

14 A Brief Agenda for the Future of Long-Wave Research IMMANUEL WALLERSTEIN
The resistance to acknowledging the existence of 'long waves', is, when all is said and done, astonishing. All modern science presumes the normality of patterned fluctuations. No doubt there is more to reality than patterned fluctuations, but there seem to be no real phenomena that do not fluctuate in ways that can eventually be summarised empirically as patterns. Even hidebound opponents of long-wave theory acknowledge the reality of short waves, the so-called 'business cycle'. Why the capitalist economy has short-term cycles but cannot have long-term ones is so mysterious that one can only consider such allegations as mystical or, more to the point, ideological. I suggest that we waste no more time proving that the Earth revolves around the Sun. Let those who assert the contrary play in their own garden.
What have we accomplished since the early pioneers of long-wave research, such as Kondratieff and Schumpeter, first wrote about these waves? We have, of course, collectively elaborated and specified what they suggested. This is particularly true of the now vast literature on innovations. But what have we added?
We have begun to develop a plausible technology for measuring long waves. This has been the principal weapon of our hostile critics, and I believe we are beginning to meet them on their own technical ground. The contributions to this book are strong evidence of this advance. In particular, I believe that Jan Reijnder's concept of 'perspectivistic distortion' offers us a major epistemological opening for serious work. We have also begun to move beyond the narrowly economic variables.
It is virtually self-evident that if various economic indicators show cyclical patterns it is unthinkable that so-called 'political' and 'social' indicators would not also do so, and that all would not be in some complicated way correlated. This is an immense domain, and we
339

340 A Brief Agenda for the Future of Long-Wave Research
have only just begun to work on it. Yet I am quite optimistic that such research will not only flourish but may begin to overwhelm (quantitatively) the kind of 'economic' cyclical research that has hitherto dominated the field.
Thirdly, we have begun to emphasise what seems to me, as I said in 1983 at the Paris meeting on long waves, l was the fil conducteur of the cyclical rhythms of the capitalist world-economy, profit rates. For the first time, the Brussels meeting of 1989 devoted a large part of its discussion to profit rates.
Having noted these achievements, which are considerable, I feel somewhat frustrated by the resistance of most people currently involved in long-wave research to move significantly in three particu-lar directions, which seem to me essential, if we are to get at what is behind long waves - which are, after all, merely an indicator of an underlying process. What seems to me important to take away from the 1989 discussion is the agenda of three items that have still had no serious research carried out on them:
1. There are no world data. Virtually every study of long waves is based on state-level data. Most of the data are restricted to a few countries, generally speaking the OEeD countries. Some studies compare several countries. Many are still single-country studies.
We find, of course, that patterns are not identical, state to state. We say some of these countries are 'ahead of or 'behind' the cycle. But this, of course, implies a norm. The only norm to which we can possibly be referring is that of the world-economy as a whole: but we have almost no data about the cycles of the world-economy as a whole. Take profit rates. A multinational corporation presumably invests in many countries. Its policies are supposedly affected not merely by the overall profit level of given industries and of given countries, but also of the world-economy as a whole. All our theories tell us this. Should not long-wave researchers look for data which are implicitly or explicitly being used by policy-makers of corporations? 2. There is no systematic comparison of the differential effect of long waves on core and periphery (and the semiperiphery). There is no reason to assume that state-level patterns would all be parallel with world-level patterns. Quite the contrary. We might well think the various state-level patterns are completely opposite, or perhaps complementary. Yet most of our state-level analyses do, in fact, assume parallelism. And, of course, our opponents 'disprove' cyclical patterns by 'proving' counter-cyclical state-level occurrences.
Immanuel Wallerstein 341
In addition to geographical variation, there may well be sectorial variation (new leading industries versus 'old' industries, the counter-cyclical pattern of gold production, and so on). Furthermore, there may be variations in the core (the hegemonic power versus the others); in the semiperiphery (rising versus falling zones); and in the periphery (favoured versus marginalised zones). None of this will we be able to know about until we gather not only world data but also (for it is not the same) world-wide data. 3. There is no systematic comparison over time. Our 'classic' dates are those of Kondratieff, extended slightly forward: 1792-1920s (or 1980s). There are three time zones that these classic dates ignore. There are those who argue that, even if Kondratieff was basically right for 1792-1920s, the world has changed and the cycles are no longer occurring, or no longer occurring in the same way.
There are those who collect data on long waves for the years 1500-1800, and they are generally hermetically sealed off from those who collect data about the nineteenth and twentieth centuries. Finally, there are some who have found these cyclical patterns in the European Middle Ages (for example, Guy Bois). Now, of course, many say that these various sets of cycles are not comparable, that they reflect different structural patterns, and so on. But these are ex cathedra statements, and I personally find them extremely suspect. We will not be able to speak intelligently about these matters until we do the empirical comparisons.
Therefore, I am calling for a massive reorientation of long-wave research: (i) towards collection of data at the level of the world-economy; (ii) towards world-economy-wide comparisons; and (iii) towards very long temporality.
There are, of course, two major barriers to this appeal. One is the availability of data. The second is the availability of theory. The first is a tiresome obstacle but not an intellectually serious one. Of course, it is difficult to get 'hard' data. So what? There are thousands of scientific issues for which it is difficult to get hard data. It only means we have to work harder and more ingeniously, and be satisfied initially with less convincing results. But it is simply not true that no serious data exist, or that no more can be discovered and/or invented.
The real obstacle is theory. Most long-wave analysts work with a model that says the Industrial Revolution, circa 1780-1840, marked an historic rupture, and therefore it is not really seriously credible that patterns 'before' and 'after' resemble each other. I challenge this.

342 A Brief Agenda for the Future of Long-Wave Research
Many long-wave analysts work with a model that, unless a country is 'industrialized', with a large, wage-earning proletariat, there can be no real cycles. I challenge this.
And many analysts do not really accept the functioning importance of a world-economy. For many, the world-economy is merely an epiphenomenal international economy, the consequence of economic activities in a few major states. I challenge this.
Until we begin to resolve some of the theoretical issues that divide long-wave analysts, we shall not collect truly useful data. And until we begin to collect the kind of data for which I have been calling, we shall not persuade the rest of the intellectual world that long waves are an intrinsic element in the social functioning of all historical systems, and in particular of the capitalist world-economy.
NOTE
1. 'Long Waves as a Capitalist Process', Review, vol. VII, no. 4 (Spring 1984) pp. 559-75.