TRANSATLANTIC TRENDS KEY FINDINGS 2014
62
TRANSATLANTIC TRENDS KEY FINDINGS 2014
-
Upload
sciencespo-lyon -
Category
Documents
-
view
0 -
download
0
Transcript of TRANSATLANTIC TRENDS KEY FINDINGS 2014

TRANSATLANTIC TRENDSKEY FINDINGS 2014

Transatlantic Trends 2014 Partners

TRANSATLANTIC TRENDS 2014
Foreword . . . . . . . . . . . . . . . . . . . . . . . . . . . . . . . . . . . . . . 1
Executive Summary . . . . . . . . . . . . . . . . . . . . . . . . . . . . . . . 3
Methodology . . . . . . . . . . . . . . . . . . . . . . . . . . . . . . . . . . 11
1 . The Transatlantic Relationship . . . . . . . . . . . . . . . . . . . . . . . 13
2 . The Economy, the EU, and Immigration . . . . . . . . . . . . . . . . . . 25
The Economic Impact of the Crisis . . . . . . . . . . . . . . . . . . . . . 25
The Future of the European Project . . . . . . . . . . . . . . . . . . . . 26
Mobility, Migration, and Integration . . . . . . . . . . . . . . . . . . . . 32
3 . Transatlantic Security Cooperation . . . . . . . . . . . . . . . . . . . . . 42
Regional Cooperation . . . . . . . . . . . . . . . . . . . . . . . . . . . . 42
NATO . . . . . . . . . . . . . . . . . . . . . . . . . . . . . . . . . . . . . 44
Iran . . . . . . . . . . . . . . . . . . . . . . . . . . . . . . . . . . . . . . 48
Europe’s Eastern Neighborhood . . . . . . . . . . . . . . . . . . . . . . 49
4 . Russia . . . . . . . . . . . . . . . . . . . . . . . . . . . . . . . . . . . . . 53
Russian Opinions on Economy and Immigration . . . . . . . . . . . . . 53
Russian Opinions on International Cooperation . . . . . . . . . . . . . 53
Russia and Europe’s Eastern Neighborhood . . . . . . . . . . . . . . . 55

Transatlantic Trends 2014 1
This is the 13th Transatlantic Trends survey; it began in 2002 as World Views. Over more than a decade, Transatlantic Trends has become the preeminent source of United States and European public opinion on a host of transatlantic issues, including foreign policy
challenges, support for NATO, the economy, and the rise of other world powers. The data provided by the survey have become an invaluable tool for policymakers, the media, think tanks, and academics. In addition to producing original research, the survey’s goal is also to foster debate on the strategic policy goals, objectives, and values of the United States and Europe as members of the transatlantic community.
The 13 years reflected by our polls have been tumultuous for both Europe and the United States, shaped for a long time by a marked divide about the United States intervention in Iraq, the alliance’s role in Afghanistan, and the global economic crisis. Increasingly, the poll also shows a deepening north-south divide within Europe — at a time when publics on both sides of the Atlantic appear to be drawing closer together again. This year’s survey continues to include data on mobility, migration, and integration, based on a previous survey, Transatlantic Trends: Immigration.
Greece and Russia have been added to the Transatlantic Trends survey this year, and as you will see in the data, they make compelling additions to the sections on foreign, security, and economic policy. They add depth and diversity to the survey during a time of heightened interest in transatlantic relations in a globalized world.
Karen Donfried President, German Marshall Fund of the United States
Foreword

Transatlantic Trends 2014 3
Executive Summary
Over the past year, policymakers on both sides of the Atlantic have been confronted with increasingly grave foreign policy challenges, even as the global economic crisis appeared to retreat somewhat: bloody wars and civil strife in the Middle East and
a worsening conflict in Ukraine — all before a backdrop of partisan political divisions and domestic concerns that limit citizens’ appetite for international engagement. Under the circumstances, politicians and publics alike face difficult questions about burden-sharing in the context of transatlantic cooperation, the future of NATO and the European project, negotiations on Iran’s nuclear program, the impact of mobility and migration on foreign and security policy, and the West’s relations with Russia.
Transatlantic Trends 2014 paints a picture of a complex relationship between the United States and Europe, and their responses to these challenges.
This year’s survey uncovered some significant findings. Seven stand out particularly:
• Americans and Europeans disagreed on the future of the transatlantic relationship, with a majority of Europeans (especially in Germany) preferring a more independent approach.
• A majority of Americans disapproved of President Barack Obama’s international policies for the first time.
• A north-south divide continued to trouble Europe, and three-in-four Europeans said the EU was not doing enough to combat the economic crisis.
• Majorities in Europe wanted to accommodate the United Kingdom’s concerns rather than see it leave the EU — with the exception of France.
• Transatlantic majorities wanted to continue economic and political support for Ukraine, even if that meant a risk of continued conflict with Russia; a majority of Americans polled were willing to give NATO membership to Ukraine, while a majority of Europeans were willing to offer it EU membership. Two-thirds were willing to support stronger sanctions against Russia.
• A majority of Russians polled said their country should act to maintain its influence over Ukraine, even if there was a risk of conflict with the EU.
• A plurality of Americans felt that illegal immigrants should be given the opportunity to legalize their status — with an overwhelming majority in that group saying this should include a path to citizenship.
Transatlantic Relations: As in previous years, majorities on both sides of the Atlantic continued to hold positive views of each other, and felt positively about strong U.S. and Euro-pean leadership in global affairs. They also agreed that neither Russian nor Chinese leadership was desirable — although a large minority of Americans wanted to see a stronger Russian role. Still, a majority of Europeans said that they would like to see their country take a more inde-pendent approach in the relationship.
United States: Three-in-four Americans continued to feel affected by the economic crisis. U.S. respondents were divided about the transatlantic relationship; when broken down by party

The German Marshall Fund of the United States4
affiliation, Democrats tended to want a closer relationship, while Republicans wanted a more independent approach. Americans were also keen on a stronger global role from the EU.
European Union: Growing majorities on both sides of the Atlantic wanted strong global leadership from the EU. Within the EU, majorities agreed that EU membership had been good for their country, primarily because the EU is a community of democracies that should act together. Belief that the euro had been bad for member states’ economies and hostility toward increased EU budgetary authority were on the wane.
Southern Europe: A north-south divide between successful and troubled economies remained very much apparent in Europe. While economic conditions in the north improved — the percent saying they were personally affected by the economic crisis dropped 14 points in Germany, 7 points in the Netherlands, 7 points in Sweden, and 7 points in the United Kingdom — southern countries have yet to recover in earnest, with 95% in Greece, 91% in Portugal, 81% in Spain, and 72% in Italy still saying they were affected. These were also the countries (along with the U.K.) most likely to say that EU membership was a bad thing.
Leaders’ approval: A majority of U.S. respondents disapproved of President Barack Obama’s foreign policy for the first time; and while European majorities continued to approve, there was a downward trend, most notably in Germany, where approval rates dropped 20 percentage points. European approval rates of their own governments’ international policies remained stable and positive in most countries.
Economic policy: On both sides of the Atlantic, publics were overwhelmingly concerned with economic issues.
Immigration: Transatlantic majorities disapproved of their own governments’ handling of immigration (except in Sweden, Poland, and Russia). Respondents in the United States expressed mixed feelings about the number of immigrants in their country, but relaxed their views when told the actual numbers. On the whole, Europeans were less concerned about mobility within the EU than about immigration from outside the EU — and about emigration from Europe. A plurality of U.S. respondents wanted to see illegal immigrants given the ability to obtain legal status in the United States.
Security policy: NATO continued to be seen as essential on both sides of the Atlantic (except in Greece), with a sharp increase in Poland. Majorities in the United States and Europe agreed that NATO should be engaged in territorial defense, but disagreed about out-of-area opera-tions and providing arms and training to other countries. Americans and Europeans had mixed feelings, however, about regional security cooperation with regard to the Middle East or China.
Ukraine: Transatlantic majorities wanted to continue economic and political support for Ukraine, even if that meant a risk of continued conflict with Russia; a majority of Americans polled were willing to give NATO membership to Ukraine, while a majority of Europeans were willing to offer it EU membership. Two-thirds were willing to support stronger sanctions

Transatlantic Trends 2014 5
against Russia, but similar numbers were opposed to sending military supplies to Ukraine (except Poland).
Russia: Opinion of Russia and Russian global leadership continued to decline on both sides of the Atlantic. Russians felt similarly about the United States and Europe, with a plurality wanting a more independent relationship between NATO and Russia. Four-in five Russians said they approved of their own country’s international polices, and a majority of Russians polled said their country should act to maintain its influence over Ukraine, even if there was a risk of conflict with the EU.
Iran and Afghanistan: Sanctions remained the tool of choice for majorities on both sides of the Atlantic when dealing with the Iranian nuclear program. Likewise, majorities in the United States and Europe agreed that NATO should continue to attempt establishing stability in places like Afghanistan.
China: Americans and Europeans largely shared the view that Chinese global leadership was undesirable as well as having a negative opinion of China itself; but a majority of Americans wanted to work with China bilaterally, while Europeans were split between engaging China bilaterally and working together within the EU.
Germany: Respondents in Germany, where the revelations about U.S. National Security Agency spying have been the source of a great deal of tension in the relationship with the United States, remained positive on the United States, but appear to have cooled off on future cooperation. For the first time, a majority of Germans said they would prefer a more indepen-dent approach from the United States, up 17 percentage points since 2013.
Poland: Polish respondents warmed to the United States again; they were also particularly cool toward Russia. Poles also felt more strongly than other Europeans that Ukraine should be given membership in the EU and NATO, and were the only ones to say that the West should send Ukraine military supplies.
Sweden: Swedes remained very favorably disposed toward international engagement, and were among the least pessimistic about their economy. A majority of Swedes polled said their country should not join NATO, but that number has been declining slowly since 2012.
Turkey: Turkish respondents, who have been less engaged in the transatlantic relationship over the past several years, appeared to be more willing to re-engage with the EU and NATO on a number of fronts. For the first time since 2006, a majority of Turks thought that EU membership would be good for their country.
Key Findings of the Survey
The Transatlantic Relationship• On both sides of the Atlantic, pluralities named economic concerns as the most important
issue facing their country — with Americans saying simply “the economy” and Europeans split between “the economy” and “unemployment.”

The German Marshall Fund of the United States6
• More than half of EU respondents (56%) said it was desirable that the United States exert strong leadership in world affairs, almost unchanged from 2013. Favorable opinion of the United States dropped three percentage points in Europe from 2013, but 67% of Europeans continued to hold favorable views of the United States.
• On the other hand, favorability of the United States in Germany dropped from 68% in 2013 to 58%.
• Growing majorities on both sides of the Atlantic expressed the desire for strong leadership from the European Union. Nearly three in four Americans — 70%, up 13 percentage points since 2013 — said it was desirable, as did 73% of European respondents.
• Favorable opinion of the EU rose seven percentage points in the United States, reaching 57%, while in Europe 65% of respondents expressed a favorable view. Forty-five percent of Turks described their opinion of the EU as favorable (a ten percentage point increase since 2013), and 31% (a five percentage point increase since 2013) said that EU leadership is desirable.
• Asked about the role of Russia, 68% of respondents in Europe felt a leadership role for that country was undesirable. Fifty-three percent of respondents in the United States viewed Russian global leadership as undesirable, while 39% supported a strong role.
• In Europe, 65% of respondents described Chinese leadership as undesirable, as did 55% of Americans (an increase of eight percentage points since 2013) and 70% of Turks. In the United States, 34% of respondents reported a favorable view of China, with 35% of Euro-peans agreeing.
• Forty-three percent of Americans said they approved of Obama’s handling of international policies, while 53%, a nine percentage point increase, disapproved. In Europe, approval of Obama’s handling of international policies dropped five percentage points since 2013 (64%, from 69%).
• In Germany, approval of Obama’s handling of international policy dropped from 76% in 2013 to 56%, while the number of respondents who disapprove rose 19 percentage points since 2013 to 38%.
• Asked whether the partnership between the United States and the European Union should become closer, a division emerged on both sides of the Atlantic. In the United States, 34% of respondents said they would like the relationship to become closer (a five percentage point increase), and 27% said it should remain about the same. Thirty-three percent would like the United States to take a more independent approach. In Europe, however, 50% (an eight percentage point increase from 2013) said they would like to see their country take a more independent approach. This change was especially apparent in Germany: 57% of Germans (a 17 percentage point increase from 2013) felt that their country should become more independent.

Transatlantic Trends 2014 7
The Economy, the EU, and Immigration• Americans continue to feel affected by the economic crisis (73%), while the number in
Europe decreased seven percentage points from 2013 to 58%.
• While stable majorities in Greece (95%), Portugal (91%), and Spain (81%) reported that they had been personally affected by the crisis, the numbers in the U.K., Poland, Nether-lands, Sweden, and Germany declined.
• A majority of European respondents (73%) said the EU was not doing enough to combat the crisis. The EU countries most affected tended to be particularly disappointed: large majorities in Spain (88%) and Italy (87%) said the EU was not doing enough, while Germans were the most likely in Europe to say that it was (34%, compared to 60% who said it was not). A majority of Europeans (66%) felt that the countries most severely affected by the crisis were also not doing enough to repair their own economies.
• A majority of EU respondents (65%) considered membership in the EU to have been beneficial to their countries. The lowest approval rate was seen in Turkey (53%), where respondents were asked if membership would be good.
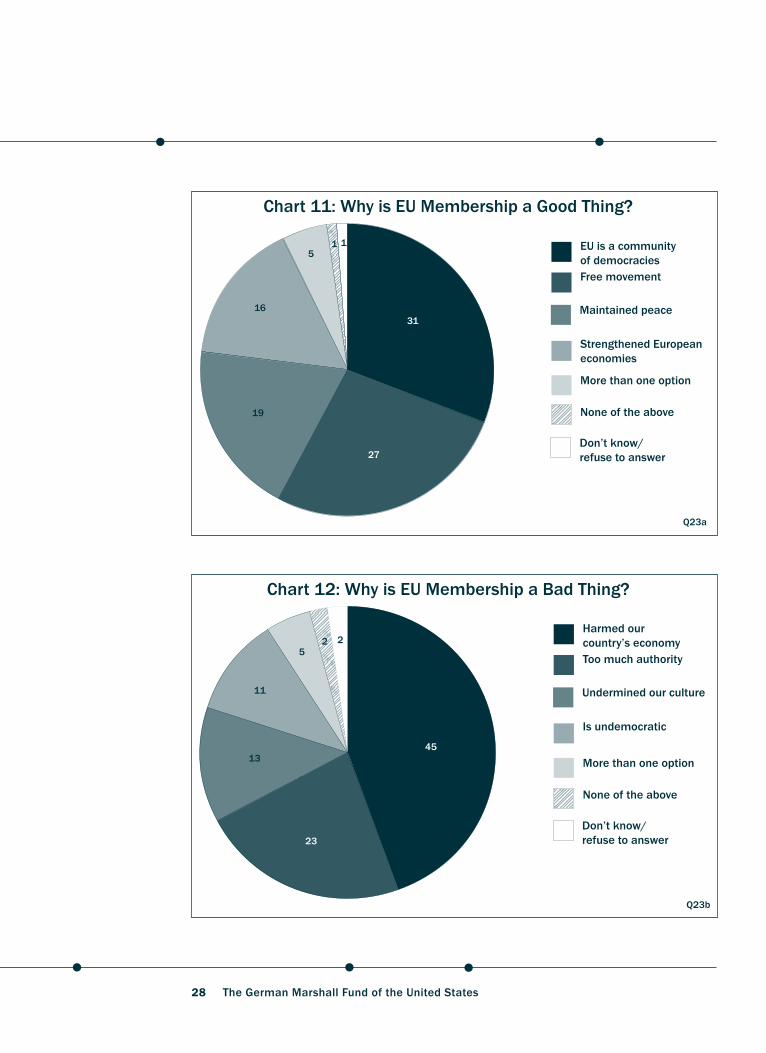
• Among those who said that EU membership was good for their country, a plurality (31%) said it was because “the EU is a community of democracies that should act together.” Twenty-seven percent said that the European Union is beneficial because it guarantees freedom of travel, work, and study within its borders.
• Among those who said that membership in the European Union was bad for their country, 45% of respondents said it was because the EU has harmed the national economy of their country. This response was particularly common in Italy (66%) and in Portugal (56%).
• Majorities in almost every country polled said that the euro had been (or, in non-member countries, would be) bad for their economy, for an EU-wide average of 56%. However, the number of respondents saying the euro had been bad for their economy dropped from 2013 levels in every country but Italy and Spain — in France, for example, there was a 13 percentage point decrease to 51%. Thirty-seven percent of European respondents said the euro had been good for their economy, including a 60% majority in Germany and a plurality of Dutch respondents (47%).
• Majorities in every country surveyed but France agreed with the statement that the other EU member states should do more to accommodate British concerns rather than let the United Kingdom leave the EU, for an EU average of 51% versus 38%.
• On both side of the Atlantic respondents disapproved of their own government’s handling of immigration from other countries (Americans: 71%; Europeans: 60%). Spanish respon-dents expressed the strongest disapproval (77%), while in Sweden the majority approved of the government’s handling with immigration (60%).
• Asked why immigrants come to their countries, “to work” was mentioned by 61% of European respondents and 70% of U.S. respondents, and “to seek social benefits” was

The German Marshall Fund of the United States8
mentioned by 41% in Europe and 45% in the United States. Turks felt that the most impor-tant reason for immigration to Turkey was to seek asylum (77%).
• When respondents were asked if there were too many immigrants, Americans were divided (38% said there were too many, while 36% said there were a lot but not too many), while a plurality of Europeans (44%) said there were a lot but not too many.
• However, if respondents were given statistics on the actual number of immigrants in their country first, as half were, these numbers changed considerably: the percentage of respon-dents saying there were too many dropped in the United States by 17 percentage points to 21%, and in Europe by 11 percentage points to 21%.
• A plurality (40%) in Europe felt the country’s policies toward refugees should be more restrictive, while 38% of respondents in the United States agreed and 34% said that the policies are “about right now.” Only minorities on both sides of the Atlantic wished for less restrictive policies (Europe 21%; the United States 20%).
• Forty-five percent of Americans said illegal immigrants should be able to obtain legal status in the United States, while 27% feel that they should be required to return to their home countries.
• A majority in Europe were not concerned about immigration from inside the EU (55%, compared to 43% who were), while 56% of respondents said that they were worried about immigration from outside the EU. Portuguese respondents were the most likely to express concern about immigration from inside the EU (62%), while respondents in Greece (84%) were most likely to say that they were concerned by immigration from outside the EU.
• Fifty-one percent of respondents in the United States felt that first-generation immigrants were integrating well, while European respondents were split: 48% said they are not inte-grating well, and 46% reported that they are integrating well.
• Emigration is considered a problem in Europe (58%), while the majority of respondents in the United States said it is not a problem (66%). Responses in Europe varied, though: 95% of respondents in Greece, 93% in Portugal, and 87% in Spain agreed that emigration is a problem, while few in the Netherlands (13%) and Sweden (15%) agreed.
Transatlantic Security Cooperation• Asked whom to work with when managing relations with China, Europeans were split.
Forty-two percent preferred to work together with other EU countries, while 44% want their country to work with China bilaterally. Only 9% of European respondents would prefer to work with the United States when managing relations with China.
• Respondents in Europe were also split on addressing the Middle East together or sepa-rately: 44% prefer to work with other EU countries, while 41% said they want to manage the relationship independently. In Turkey, a plurality preferred taking an independent approach toward the Middle East (46%).

Transatlantic Trends 2014 9
• In the United States, a majority (53%) wants to work with China bilaterally. A plurality of Americans would like to work independently when managing relations in the Middle East (48%, compared to 45% who would prefer to work with the EU).
• While a plurality of Turks still want their country to act alone (33%), the number of respondents who wanted to cooperate with the EU increased by seven percentage points from 2013 to 28%.
• NATO was seen as “still essential” by 61% of EU respondents and 58% of Americans. Respondents in the Netherlands (81%) were most likely to describe NATO as essential, while the greatest increase in support was a 15 percentage point jump in Poland. Greece was the only country in the European Union in which a majority described NATO as “no longer essential” (52%).
• When asked which kind of missions NATO should be engaged in, majorities on both sides of the Atlantic said it should be engaged in the territorial defense of Europe (59% of Americans and 73% of Europeans). However, respondents in the EU and in the United States disagreed on whether NATO should conduct military operations outside of the United States and Europe, with a plurality of respondents in the United States for (49%) and a European majority (51%) against. While a majority of respondents in the United States (53%) supported the idea that NATO provide arms and training to other countries, Europeans disagreed (52%).
• Majorities of Americans (53%) and Europeans (57%) and a plurality of Turks (43%) agreed that NATO should attempt to establish stability in places like Afghanistan.
• Transatlantic opinion about how best to prevent Iran from acquiring nuclear weapons remained stable: 32% of respondents in the United States and the EU preferred economic sanctions. While the second-most popular option for U.S. respondents was computer sabo-tage (17%), Europeans preferred to offer economic incentives (21%). When asked about the use of military force, 6% of Europeans and 12% of Americans said they would use it as a first option.
• Regarding the situation in Ukraine, respondents on both sides of the Atlantic said that the European Union should continue to provide economic and political support to Ukraine, even if there was a risk of continued conflict with Russia — 57% in the United States and 58% in the EU. Greece was the only country surveyed in which a plurality of respondents disapproved (49%).
• Asked whether Ukraine should become a member of NATO, a majority in the United States approved (68%) while Europeans were evenly split (46% said it should, 47% said it should not). Fifty-two percent of Europeans said that the EU should offer membership to Ukraine, while 43% of respondents were opposed. Majorities in the United States (58%) and Europe (68%) think that their governments should increase economic assistance to Ukraine. When asked about sending military supplies to Ukraine, however, 71% of Europeans and 52%

The German Marshall Fund of the United States10
of Americans were opposed. Poland is the only country surveyed in which a majority of respondents approved of sending military supplies (52%).
• Two-thirds of respondents in the United States (64%) and Europe (61%) agreed there should be stronger economic sanctions against Russia because of its actions in Ukraine.
Russia• Sixty-eight percent of Europeans polled said they considered Russian leadership undesir-
able, as did 53% of Americans. Thirty-nine percent of Americans found it desirable.
• Seventy-one percent of Americans said their opinion of Russia was unfavorable and 68% of Europeans agreed.
• Eighty-one percent of Russian respondents consider U.S. global leadership undesirable; 49% describe it as very undesirable. Sixty-two percent describe European leadership as undesirable as well.
• Eighty-six percent of Russians disapprove of President Barack Obama’s handling of interna-tional policies; 87% said they disapproved of Obama’s management of relations with Russia. Eighty-three percent said they approved of their own government’s handling of interna-tional policies.
• Seventy-two percent of Russians viewed the United States with disfavor; 52% said they felt the same about the EU.
• Forty-seven percent of Russian respondents said the relationship between Russia and NATO should become more independent; 31% said it should stay about the same.
• When asked with whom Russia should operate internationally, 36% of all respondents in Russia said that Russia should work with emerging powers, 29% argued that Russia should work with the nations of the Commonwealth of Independent States, 14% said Russia should work with EU member states, and 10% said it should work alone. Only 2% answered that Russia should work above all with the United States.
• Two-thirds of all Russian respondents (64%) reported that they held unfavorable views of Ukraine.
• Thirty-six percent of the Russians polled said their country should work on the future of Europe’s eastern neighborhood alone, while 22% preferred to work with the EU and the United States.
• Fifty-three percent of Russian respondents agreed that Russia should act to maintain its influence over Ukraine even if there was a risk of conflict with the European Union; 29% disagreed.

Transatlantic Trends 2014 11
TNS Opinion was commissioned to conduct the survey using Computer Assisted Tele-phone Interviews in all countries except Poland, Russia, and Turkey, where lower tele-phone penetration necessitated the use of face-to-face interviews.
In all countries but Russia, a random sample of approximately 1,000 men and women, 18 years of age and older, was interviewed; in Russia the sample size was 1,500. Interviews were conducted primarily between June 2 and June 25, 2014.
For results based on the national samples in each of the 13 countries surveyed, one can say with 95% confidence that the maximum margin of error attributable to sampling and other random effects is plus or minus three percentage points. For results based on the total European sample, the margin of error is plus or minus one percentage point. In addition to sampling error, question wording and practical difficulties in conducting surveys can also introduce error or bias into the findings of public opinion polls.
For trended questions first asked before 2010, averages were weighted on the basis of the size of the adult population in each country to maintain consistency with previous years’ reports. For questions that started in 2010 or later, the results were also weighted so that the sample matches certain population characteristics, including age, gender, education, and region.
When processing is complete, data from the survey are deposited with the Inter-University Consortium for Political and Social Research at the University of Michigan (ICPSR), the Roper Center for Public Opinion Research at the University of Connecticut, and the GESIS-Leibniz Institute for the Social Sciences and are available to scholars and other interested parties.
For more detailed methodology and topline data, please visit www.transatlantictrends.org.
Note on European AveragesOver time, additional European countries have been added to the survey. While the addition of new countries has affected the Europe-wide average, the impact has usually not been statistically significant. Therefore, for ease of presentation, we have treated several different averages as if they were part of one average. When the EU average is reported for previous years, this is based on the EU-7 average from 2002-03, the EU-8 average from 2004-10, the EU-9 average from 2011-13, and the EU-10 average for 2014.
European Averages ReportedEU7 2002-03 U.K., France, Germany, the Netherlands, Italy, Poland, and Portugal
EU8 2004-10 EU7 countries plus Spain
EU9 2011-13 EU8 countries plus Sweden
EU10 2014 EU9 countries plus Greece
Methodology
The German Marshall Fund of the United States12
Total Coverage
YEAR TOTAL COVERAGE EUROPEAN COVERAGE
2002 U.S. + E6 France, Germany, Italy, the Netherlands, Poland, U.K.
2003 U.S. + E7 France, Germany, Italy, the Netherlands, Poland, U.K., Portugal
2004- 05 U.S. + E10 France, Germany, Italy, the Netherlands, Poland, U.K., Portugal, Turkey, Slovakia, Spain
2006-10 U.S. + E12 France, Germany, Italy, the Netherlands, Poland, U.K., Portugal, Turkey, Slovakia, Spain, Bulgaria, Romania
2011 U.S. + E13 France, Germany, Italy, the Netherlands, Poland, U.K., Portugal, Turkey, Slovakia, Spain, Bulgaria, Romania, Sweden
2012 U.S. + E13 + Russia France, Germany, Italy, the Netherlands, Poland, U.K., Portugal, Turkey, Slovakia, Spain, Bulgaria, Romania, Sweden
2013 U.S. + E12 France, Germany, Italy, the Netherlands, Poland, U.K., Portugal, Turkey, Slovakia, Spain, Romania, Sweden
2014 U.S. + E11 + Russia France, Germany, Greece, Italy, the Netherlands, Poland, U.K., Portugal, Turkey, Spain, Sweden

Transatlantic Trends 2014 13
Over the past year, the economic crisis that has gripped policymakers and publics on both sides of the Atlantic since late 2008 has receded somewhat, as have concerns about the United States’ and Europe’s relationships with emerging powers. Meanwhile,
traditional issues have surged to the forefront of public attention within the transatlantic relationship including debates about allies’ commitment to the security of the European conti-nent, relations with Russia, and questions of mutual trust raised by the U.S. National Security Agency allegations. Public opinion, however, appears divided between issues of domestic concern, such as the health of national economies and unemployment, on one hand, and international concerns and crises on the other.
Under these circumstances, Americans and Europeans alike continue to appreciate the need for Western leadership in dealing with demanding global policy problems, and remain wary of non-Western powers like Russia and China. Yet many of U.S. President Barack Obama’s policies remain controversial in Europe. Many Americans question the EU’s ability to heal the divisions created by the global financial crisis, and worry that it may not be able to take the lead in protecting the security of its member states and neighbors against external aggression.
Questions asked in this chapter concerned opinions on leadership, countries, governments’ international policies in general, and the future of the transatlantic relationship. Sections on opinion in Germany, Poland, and partisan divides on both sides of the Atlantic illustrate key underlying trends.
Domestic Concerns Weigh More Heavily than Foreign PolicyWhen asked about the most important issue facing their country, pluralities on both sides of the Atlantic named economic concerns. However, while U.S. respondents were most likely to cite the economy itself (28%), Europeans were equally likely to focus on unemployment (27%) and the economy (26%).1
There was also significant variation within Europe: while French and Greek respondents were most likely to respond that the economy was the most important issue facing their country (43% and 49%, respectively), German respondents were most likely to say education (20%), British respondents were most likely to say immigration (25%), and Dutch respondents were most likely to say the economy or healthcare (both 29%). Polish, Spanish, and Italian respon-dents were the most likely to choose unemployment (44%, 43%, and 40%, respectively).
Among the concerns cited, “international instability” was named most by Russian respondents (22%). Turkish respondents were most likely to say terrorism (24%).
Few respondents anywhere mentioned crime, and the only country where a meaningful number of respondents cited the environment was Sweden (17%).
European Support for U .S . Leadership Strong, but Uneven European support for U.S. leadership remained largely stable — 56% of Europeans said that it was desirable that the United States exert strong leadership in world affairs, up one percentage point from 2013. Sixty percent of Germans, down three percentage points since 1 Question 0: What do you think is the most important issue facing our country at the moment?
1 The Transatlantic Relationship

The German Marshall Fund of the United States14
2013, described strong U.S. leadership as desirable, as did 62% of Swedish respondents, 65% of British respondents (both unchanged from 2013), and 68% of Dutch respondents (up four percentage points since 2013). Sixty-one percent of Polish respondents described U.S. leader-ship as desirable, representing an 11 percentage point increase since 2013 and a more or less steady trend upwards from 39% in 2006.2
Greece and Spain were less enthusiastic. Only 31% of Greek respondents described strong U.S. leadership as desirable, as did 39% of Spanish respondents, though the latter represents a nine percentage point gain since 2013 and a 21 percentage point gain from an 18% low point in 2008. France, Italy, and Portugal also expressed mixed feelings: 51% of respondents in France, 55% in Italy, and 53% in Portugal described strong U.S. leadership as desirable, while 48%, 42%, and 37%, respectively, described it as undesirable.
Twenty percent of Turkish respondents described U.S. leadership as desirable, virtually unchanged from 2013 (21%) and up from a low of 7% in 2007. Seventy-one percent of Turkish respondents described strong U.S. leadership as undesirable.
Increasing Support for Strong EU LeadershipMeanwhile, respondents in nearly every country polled expressed more enthusiasm for European Union leadership than in 2013, with the exception of those countries where over-whelming majorities supporting the EU’s role already existed. Seventy-three percent of European respondents overall described a strong EU role in international affairs as desirable, up two percentage points since 2013. Results in a few countries were particularly noteworthy: 65% of Spanish respondents, up nine percentage points since 2013, described strong EU lead-ership as desirable, a near-return to 2012 levels (67%); 73% of Polish respondents described strong EU leadership as desirable, the highest level of support measured since 2007 (76%); and 62% of British respondents said the same, notable in the current political climate for the absence of any real shift from 2013 (60%). Forty-one percent of Italians, the most in Europe, described strong EU leadership as “very desirable.”3
Greek respondents were the least likely in Europe to describe a strong European role as desir-able (59%) and the most likely to describe it as undesirable (38%).
Thirty-one percent of Turkish respondents, up from 26% in 2013 and a high point since 2006 (35%), described a strong European role as desirable, while 59%, down from 63% in 2013, disagreed.
Perhaps most notable was the U.S. response. Seventy percent of U.S. respondents, up 13 percentage points since 2013, described strong European leadership as desirable, while only 21%, down 8 percentage points since 2013, said the opposite. Even more significantly, the increase was among those who described strong EU leadership as “very desirable” — 32% in 2014, up 11 percentage points since 2013.
2 Question 1a: How desirable is it that the United States exert strong leadership in world affairs?3 Question 1b: How desirable is it that the European Union exert strong leadership in world affairs?

Transatlantic Trends 2014 15
Europeans and Americans Remain Wary of Russia …Support for strong Russian leadership was weak on both sides of the Atlantic. Thirty-nine percent of U.S. respondents said that Russian leadership was desirable, compared to 40% in 2013; 53%, up seven percentage points since 2013, said it was undesirable. On average, 27% of European respondents described Russian leadership as desirable, unchanged since 2013, while 68% described it as undesirable, up three percentage points since 2013.4
Polish and Spanish respondents were particularly likely to describe Russian leadership as undesirable (81% and 84%, respectively), but the sentiment was expressed by overwhelming majorities in a number of countries, including Sweden (77%, up 8 percentage points since 2013), France (72%, up eight percentage points since 2013), and Portugal (69%, up 15 percentage points since 2013). In Germany, however, fewer respondents described Russian leadership as undesirable than in 2013 (59%, down 10 percentage points since 2013), while more described it as desirable (38%, up 11 percentage points since 2013).
Only in Greece did a majority support Russian leadership, with 52% describing it as desirable while 40% described it as undesirable.
Fourteen percent of Turkish respondents described Russian leadership as desirable, while 71% described it as undesirable.
4 Question 1c: How desirable is it that Russia exert strong leadership in world affairs?
0
20
40
60
80
100
201420132012201120102009200820072006
U.S. desire for EU leadership EU desire for U.S. leadership
Chart 1: U.S. vs. EU Leadership
Perc
ent
72
54
37
7268
52
Q1a, 1b
3636
7673
55 56 57
69
55
63
56
70

The German Marshall Fund of the United States16
… And Feel Similarly about ChinaRespondents in both Europe and the United States expressed similar opposition when asked about Chinese leadership. Thirty-eight percent of U.S. respondents, down four percentage points since 2013, described strong Chinese leadership as desirable, while 55%, up eight percentage points since 2013, described it as undesirable; in Europe, 28% described Chinese leadership as desirable, up two percentage points since 2013, while 65% described it as unde-sirable, unchanged from 2013.5
Greeks were, again, the most likely in Europe to describe Chinese leadership as desirable (53%), and the least likely to describe it as undesirable (39%). Dutch and British respondents were also relatively positive (45% and 41%, respectively, described strong Chinese leadership as desirable). Respondents in Poland and Spain were particularly unfriendly toward China; only 13% in the former and 16% in the latter described strong Chinese leadership as desirable, while 69% in the former and 80% in the latter described it as undesirable.
Sixteen percent of Turkish respondents, up one percentage point since 2013, described Chinese leadership as desirable, while 70%, down two percentage points since 2013, described it as undesirable.
5 Question 1d: How desirable is it that China exert strong leadership in world affairs?
0
20
40
60
80
100
In TurkeyIn the EUIn the United States
China
USA
EU
Russia
Perc
ent
70
Chart 2: Desirability of Leadership in World Affairs
83
14
56
2831
27
39 38
Q1a-d
73
2016

Transatlantic Trends 2014 17
Approval of Obama’s Foreign Policy Continues to Ebb …Approval of President Obama’s handling of international relations continued to slide from its post-election high in 2009 in both the United States and Europe. Forty-three percent of Americans said that they approved of his handling of international policies, a decline of seven percentage points from 2013, while 53% disapproved — a nine percentage point increase from 2013, and the first time that this has become U.S. majority opinion in Transatlantic Trends.6
In Europe, 64% approved of Obama’s handling of international policies, a five percentage point decrease from 2013 and a 21 percentage point decrease from 2009. In some countries he fared even worse: only 33% of Greek respondents approved of Obama’s handling of international policies, while 60% disapproved, as did 34% of Spanish respondents (55% approved). The most notable shift, however, was in Germany, where 56% of respondents — a 20 percentage point drop from 2013 — retained a positive opinion of his international policies, while 38%, a 19 percentage point increase from 2013, disagreed.
Sixty-eight percent of respondents in Portugal, a seven percentage point decrease from 2013, said that they approved of Obama’s international policies. In Poland, his popularity continued its recovery from its 2012 low of 49%, hitting 68% this year. Italian and Dutch respondents were the most likely to hold a favorable impression, with 74% of respondents in both countries expressing their approval.6 Question 2.1: Do you approve or disapprove of the way the president of the United States, Barack Obama, is handling international policies?
Opinion of Transatlantic Relationship Divided Along Party LinesAmericans surveyed in 2014 were divided, with some preferring a closer transatlantic relation-ship (34%), some opting for one that remains as it is now (27%), and some expressing a desire for the United States to take a more independent approach (33%) — and that division became more pronounced when respondents were broken down by party affiliation. Forty percent of those respon-dents identifying themselves as Democrats or leaning toward the Democratic party wanted a closer transatlantic relationship, compared to 27% who identified as Republicans or leaned toward the Republican party. Conversely, 43% of Republicans wanted a more independent transatlantic relation-ship, while 24% of Democrats agreed.1
This is by no means a new development, though the division varies in intensity. In 2013, 42% of Republicans wanted a more independent relationship, a sentiment with which 22% of Democrats agreed; 30% of Republicans and 38% of Democrats wanted a closer relationship. In 2010, 38% of Republicans and 60% of Democrats wanted a closer relationship, while 34% of Republicans and only 16% of Democrats wanted more independence.
This is, however, a trend that is apparent in Europe as well — albeit in reverse. In Germany, within the Christian Democratic Union (CDU) — the center right coalition partner — 27% want a closer relation-ship; among the Social Democratic Party (SPD), the center left coalition partner, only 17% want a closer relationship. At the same time, 47% of CDU members and 54% of SPD members want more independence. In France, the center right Union for a Popular Movement is evenly split, with 42% preferring a closer relationship and 44% preferring independence. Within the Socialist Party, on the other hand, 56% would prefer more independence, while 29% want a closer relationship.
1 These numbers were calculated by cross-tabulating responses to Question 5 with party political identifications.

The German Marshall Fund of the United States18
Thirty-four percent of Turkish respondents, down one percentage point since 2013, said that they approved of Obama’s international policies, while 57%, up four percentage points since 2013, disapproved.
…While Citizens’ Approval of their Own Government’s Foreign Policy Remains StableMeanwhile, respondents’ views of their own governments’ handling of international poli-cies remained largely unchanged. Fifty-two percent of Europeans said they approved of their government’s international policy, up two percentage points since 2013; 42% disapproved, down three percentage points since 2013.7
However, there was variation within Europe. In Poland, 52% approved of their government’s handling of international policies, a 14 percentage point increase from 2013. Governments also gained ground in Italy and the U.K., with 51% expressing approval in the former (a six percentage point increase from 2013) and 51% in the latter (a seven percentage point increase). In Spain, there was a six percentage point increase in approval from 2013 — but that only brought it to 33%.
In Germany, 68% of respondents said that they approved of their government’s handling of international policies, down nine percentage points since 2013. And in Greece, only 28% approved of their government’s handling of international policies, while 66% disapproved.
7 Question 3.1: Do you approve or disapprove of the way [COUNTRY’S] government is handling international policies?
0
20
40
60
80
100
*Russia
Greece
Turke
yU.S.
Spain
GermanyU.K.
*SwedenEU
Portuga
l
Poland
France
Netherl
andsIta
ly
20142009
Perc
ent
Chart 3: Approval of President Obama
74
85
90
56
63
88
64
9091
55
6974
55
6868
Q2.1
82
75
92
85
57
50
26
43
34
7
64
33
*Sweden data from 2011, Russia data from 2012

Transatlantic Trends 2014 19
Turkish respondents were split: 47% approved of their government’s handling of international policies, down four percentage points from 2013, while 47% disapproved.
United States and EU Still Seen Favorably; China and Turkey Much Less SoEven as approval of Obama’s international policies continued to ebb in Europe, the United States itself remained generally popular: 67% of Europeans, down three percentage points from 2013, said that they had a favorable impression of the United States, while 29%, up from 26% in 2013, said that their impression was unfavorable.8
Polish, Dutch, and French respondents regarded the United States particularly well — 78%, 75%, and 73%, respectively, said their opinion was favorable. But only 40% of Greek respon-dents agreed, and 55% described their opinion as unfavorable. In Germany, U.S. favorability dropped ten percentage points from 2013, reaching 58%, while 40%, ten percentage points higher than in 2013, said their opinion of the United States was unfavorable.
Thirty-one percent of Turks said their opinion of the United States was favorable, down one percentage point since 2013.
Opinion of the European Union remained largely unchanged: 57% of U.S. respondents, up seven percentage points since 2013, described their opinion as favorable, as did 65% of Europeans, down one percentage point since 2013. It was generally stable within individual
8 Questions 4.1-3, 5: Please tell me if you have a very favorable, somewhat favorable, somewhat unfavorable, or very unfa-vorable opinion of the United States/Europe/China/Turkey?
0
20
40
60
80
100
Greece
SpainU.S.
Portuga
l
Turke
y
FranceIta
lyU.K.
PolandEU
Netherl
ands
Germany
Sweden
Russia
Disapprove
Approve
Perc
ent
Chart 4: Approval of Own Government
19 4338
25 42
51
47
83
Q3.1
47
52
4233
3335
444747
515252
60
68
74
12 58 62 66
28

The German Marshall Fund of the United States20
0
20
40
60
80
100
Poland
U.S.
Turke
y
SwedenU.K.
Netherl
andsEU
France
Portug
al
Germany
Spain
Italy
Greece
Remain the same
Become closer
More independent approach
Perc
ent
Chart 6: Future of U.S.-EU Partnership
32 2633
36
2819
50
26
69
Q5
192019
333435
4247
5155575858
18
18
34 37
22
27
3236
353220
14
21
9
8
24
12
0
20
40
60
80
100
In TurkeyIn the EUIn the United States
China
U.S.
EU
Russia
Perc
ent 57
Chart 5: Favorable Opinions of World Powers
81
20
67
35
45
2520
34
Q4.1-4.4
65
31
20

Transatlantic Trends 2014 21
European countries as well, with a five percentage point increase in favorability in Spain — for a total of 64% — representing the most significant shift. Polish and German respondents were the most likely to describe their opinions of the EU as favorable (76% and 75%, respectively), while Greek and British respondents were the most likely in Europe to describe their opinions as unfavorable, with a majority in Greece (51%) and a large minority in the U.K. (43%).
Only in Turkey did opinion change noticeably. Forty-five percent of Turks, a ten percentage point increase from 2013, described their opinion of the EU as favorable, while 51%, a nine percentage point drop, described it as unfavorable.
When asked about China, Americans and Europeans were more wary; 34% of Americans said their opinion was favorable, up two percentage points since 2013, while 35% of Europeans said the same, up four percentage points since 2013. Within Europe, the Greeks were most likely to express a favorable opinion of China (62%), followed by the Dutch (45%); Italians were the most likely to express an unfavorable opinion (67%), followed by Germans (62%). Turkish respondents were particularly hostile, with 68% describing their opinion as unfavorable.
Transatlantic Relationship Is Healthy in PolandPoles seem more enthusiastic about working with the United States — and with their neighbors. There was a slight increase in the number of Polish respondents who wanted a closer transat-lantic relationship (37%, a five percentage point increase from 2013 and the strongest response in Europe), but a strong increase in support for NATO: 62% of respondents, an increase of 15 percentage points from 2013, said that the alliance remains essential for national security, more than in any year since 2002 (64%). Polish respondents also found U.S. leadership more desirable than last year (61%, an 11 percentage point increase since 2013), and expressed renewed approval of their own government’s handling of international policies (52%, a 14 percentage point increase since 2013).1
It is not difficult to see why Poles may be more interested in the strength of their alliances than they were in 2013: approval of Russia dropped by 11 percentage points, reaching 19% — the second lowest level in Europe behind Sweden’s (14%) — while 81% of Polish respondents described Russian leadership as undesirable. Polish respondents seem to be shaken by events in Ukraine, with 56% describing their impression of Ukraine as favorable (the highest in Europe) and 67% saying the European Union should continue to provide support to Ukraine even if it causes conflict with Russia (again, second only to Sweden’s 73%).
Polish respondents were also particularly adamant about their preferred tactics to deal with the crisis. Sixty-three percent, more than anywhere save the United States, wanted to offer Ukraine NATO membership, and 69%, the highest response in the survey for this question, wanted to offer EU membership. The Poles were also the respondents most in favor of offering Ukraine economic assistance (78%) and levying stronger sanctions against Russia (77%), and the only country where a majority supported sending military supplies and equipment to Ukraine (52%).
1 This box references Questions 5, 10 (Some people say that NATO is still essential to our country’s security. Others say it is no longer essential. Which of these views is closer to your own?), 1 a, 3.1, 4.4, 1c, 4.6 (favorability of Ukraine), 16a (Should the European Union continue to provide economic and political support to Ukraine, even if there is a risk of increasing conflict with Russia?), and 16b.1-5 (There have been a number of proposals for how (the EU/USA) should react to Russian actions in Ukraine. For each of the following, please tell me if you agree or disagree with the proposed action: offer NATO membership to Ukraine/offer EU membership to Ukraine/increase economic assistance to Ukraine/send military supplies and equipment to Ukraine/impose stronger economic sanctions on Russia).

The German Marshall Fund of the United States22
Finally, opinion of Turkey declined in 2014. Thirty-six percent of Americans expressed a favorable opinion, down from 43% in 2013, and 31% of Europeans, down from 42% in 2013, agreed. The drop was particularly notable in Germany, with the percent of respondents describing their opinion as favorable dropping 24 percentage points to 23%. Turks themselves seemed to lose some faith in their own country: 73% described their opinion of Turkey as favorable, down 12 percentage points since 2013.
Transatlantic Relationship Cools Noticeably on European Side A division emerged between European and U.S. respondents when they were asked by Trans-atlantic Trends what future they would prefer for the transatlantic security and diplomatic partnership. Fifty percent of Europeans said that they would prefer to see their country taking a more independent approach from the United States, an eight percentage point increase from 2013. A 34% plurality in the United States would like the relationship to become closer, a five percentage point increase from 2013, while 27% would like the relationship to stay about the same; 33% would like the United States to take a more independent approach. Fewer Euro-peans than in 2013 would like the relationship to become closer (26%, versus 29%) or remain the same (21% versus 25%).9
In Greece, polled for the first time this year, 69% of respondents wanted more independence. Further, within Europe a number of countries saw dramatic increases in the number of respondents expressing a desire for greater independence: in Italy there was a nine percentage point increase from 2013 in those saying their country should take a more independent approach, and a six percentage point increase from 2013 in Spain. There were already majori-ties or pluralities in favor of more national independence from the United States in the U.K. (42%), Portugal (55%), the Netherlands (47%), and France (51%).
Most notable was Germany’s response. Fifty-seven percent of Germans, a 17 percentage point increase from 2013, said that they would prefer their country to become more independent, while 19%, a six percentage point decrease from 2013, wanted a closer transatlantic relation-ship, and 24%, a nine percentage point decrease from 2013, wanted the transatlantic relation-ship to remain about the same.
9 Question 5: Do you think that the partnership in security and diplomatic affairs between the United States and the European Union should become closer, should remain about the same, or should (the partners) take a more independent approach?

Transatlantic Trends 2014 23
Germany and the United States: Signs of CoolingThe past year has been a difficult one for the German-U.S. relationship. The National Security Agency’s wiretapping activities in Germany, publicized by Edward Snowden in the middle of 2013’s Transatlantic Trends field work period, appear to have driven a wedge between the two allies, one that grows wider with each new revelation of the program’s extent.1
This tension is reflected in this year’s poll numbers. Germans remain positive about the role of the United States in international affairs — 60% say that the United States should exert strong leader-ship, compared to 63% in 2013 and 65% at the start of Obama’s presidency in 2009 — but seem to have soured on the methods the United States chooses to use. Fifty-six percent of Germans approve of Obama’s handling of international policies, a 20 percentage point drop from 2013 — and a 36 percentage point drop from 2009 — while 38% disapprove, a 19 percentage point increase. A large portion of that drop has come from his most ardent supporters: only 8% said they “approved very much,” compared to 40% in 2009. Germans also expressed a less favorable opinion of the United States as a whole, with 58% saying their opinion was generally favorable (down ten percentage points since 2013) and 40% saying their opinion was unfavorable (up ten percentage points since 2013).
1 This box references Questions 1a, 2.1, 4.1, and 5.
-20
0
20
Germany
Portuga
lU.S.EU
France
Netherl
andsSpain
Italy
Turke
yU.K.
Sweden
Poland
Perc
ent
Chart 7: Change in Approval of President Obama from 2013 to 2014
8
-3-4
-20 -11
-2
Q2.1
-7 -7
-20
-5

The German Marshall Fund of the United States24
Perhaps most troubling is Germans’ response when asked about their preferred future for the trans-atlantic relationship: fewer said they would like it to become closer (19%, down six percentage points since 2013) or remain the same (24%, down nine percentage points since 2013), while for the first time a majority said they would like a more independent approach (57%, up 17 percentage points since 2013). Germans may still want U.S. leadership, but they seem to prefer a United States that leads somewhere else.
0
20
40
60
20142013201220112010200920082007200620052004
U.S. Germany
Chart 8: More Independent Approach to Transatlantic RelationshipPe
rcen
t
53
30
20
34
56
33
Q5
30
26
51
57
2927
4239
34
41
33
57
40
33
Question not asked in 2007, no data.

Transatlantic Trends 2014 25
In 2014, there were growing signs that the economic crisis that had troubled the United States and Europe for more than half a decade was beginning to abate, and that growth was returning on both sides of the Atlantic.
Questions asked in this section of the survey concerned the impact of the economic crisis on people’s personal lives, opinions of crisis management by the EU and by the countries most affected by the crisis, attitudes to membership in the EU, the euro, and EU budgetary authority, as well as the price of keeping the United Kingdom from leaving the EU. The section ends with a battery of questions on immigration.
Sections on the north-south divide in Europe, on Turkish attitudes to the EU, and U.S. views on illegal immigrants illustrate three important sub-stories of this year’s survey.
THE ECONOMIC IMPACT OF THE CRISIS
Despite some signs of economic improvement in Europe, it is by no means clear that the crisis is over, and it is already apparent that it has created deep new social, economic, and political cleavages in Europe. Spain, Portugal, Italy and Greece, in particular, remain mired in economic difficulties; and France, too, appears to be struggling with economic reform.
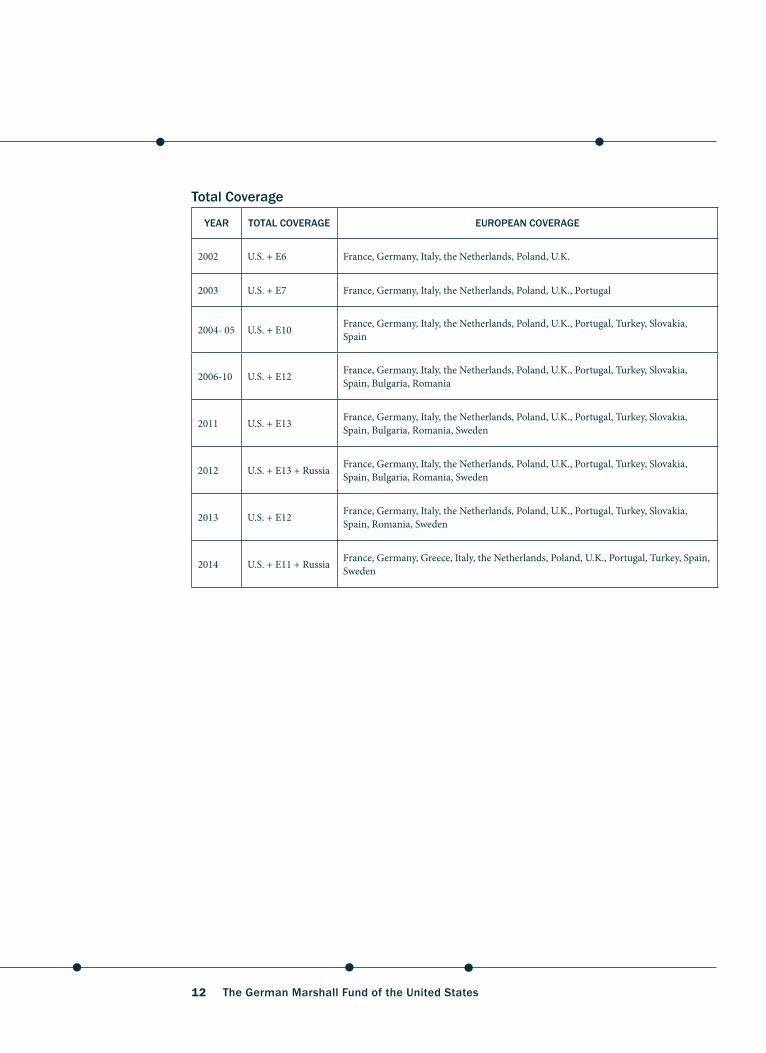
Majorities Affected by Crisis: Stable in the United States, Shrinking in EuropeWhen asked about the impact of the economic crisis, Europeans and Americans continued to report that they had been personally affected. Seventy-three percent in the United States — down two percentage points from 2013, but almost unchanged since 2009 (74%) — said that they or their families had been greatly or somewhat affected. However, only 58% in Europe (down seven percentage points from 2013) responded similarly.10
The highest rate of respondents reporting that they had been personally affected was in Greece (95%). Responses in the troubled southern periphery of Europe in general remained virtu-ally unchanged: 91% reported having been affected in Portugal, up one percentage point from 2013; 81% had been affected in Spain, down one percentage point from 2013. Seventy-two percent said the same in Italy, down four percentage points from the previous year. In France, 64% of respondents agreed (down one percentage point).
In other EU countries, however, majorities of those saying they had been personally affected by the crisis dropped, in some cases significantly including in the United Kingdom (62%, down seven percentage points since 2013), Poland (52%, down eight percentage points since 2013), and the Netherlands (47%, down seven percentage points since 2013).
In Germany and Sweden, where majorities had earlier reported that they had not been person-ally affected, the numbers continued to drop (30%, down 14 percentage points since 2013, and 22%, down 7 percentage points since 2013, respectively).
10 Question 18: And regarding the extent to which you or your family has been personally affected by the current economic crisis, would you say that your family’s financial situation has been greatly affected/somewhat affected/not really affected/not affected at all?
2 The Economy, the EU, and Immigration
The German Marshall Fund of the United States26
Seventy-six percent of Turkish respondents, up 14 percentage points from 2013, reported having been greatly or somewhat affected, while 21% of respondents, down 12 percentage points since 2013, said they had not been affected.
THE FUTURE OF THE EUROPEAN PROJECT
The crisis in Europe has raised fundamental questions about the future of the European project — and about the will of some states, like the United Kingdom, to remain members. So Transatlantic Trends asked for the first time why respondents in different countries think EU membership has been good for their countries — or not.
Belief that EU Membership Has Been Beneficial Strong In EuropeSixty-five percent of European respondents — majorities in all countries surveyed — said that EU membership had generally been good for their country. German, Polish, and French respondents (76%, 73%, and 71%, respectively) were the most likely to say it has been good. The lowest approval rates for EU membership were registered in Turkey (where 53% of respondents said that EU membership would be a good thing), Greece (53%), and the United Kingdom (51%).11
Overall, 28% said that EU membership had been bad. These numbers were highest in Greece (42%), the United Kingdom (40%), Italy (36%), and Portugal (36%).11 Question 22: Generally speaking, do you think that [COUNTRY’S] membership in the European Union [EU COUN-TRIES: has been/TURKEY: would be] a good thing or a bad thing for [COUNTRY]?
0
20
40
60
80
100
*Sweden
Germany
Netherl
ands
*Russia
PolandEU
U.K.
FranceIta
lyU.S.
Turke
ySpain
Portuga
l
Greece
20142009
Perc
ent
Chart 9: Affected by Economic Crisis
95
60
74
586264 64
4750
81
91
7873
76
Q18
62
42
5458
20
56
31
47
30
22
72
52
46
*Russia data from 2012; Sweden data from 2011.

Transatlantic Trends 2014 27
Why is Membership in the EU Good? Most Say it’s a Community of DemocraciesFor the first time, this year’s Transatlantic Trends asked those who said that membership in the European Union was good for their country about the reasoning behind this belief. Given a list of possible choices, 31 percent of respondents chose “the EU is a community of democra-cies that should act together.” This response was most common in Italy (41%), Sweden (39%), France (35%), Germany, and Spain (both 32%). Twenty-seven percent of respondents said that “the European Union allows freedom of travel, work, and study within its borders”; this response was most common in Poland (43%), Portugal (42%), and Greece (34%). Nineteen percent of respondents said that “the European Union has maintained peace in Europe”; this was most common in France, Germany (both 28%), and Turkey (20%). Sixteen percent of respondents said “the European Union has strengthened European economies”; this was most common in Turkey (29%), the Netherlands, Poland (both 24%), and the United Kingdom (20%).12
Why is Membership in the EU Bad? Most Say it has Harmed their Economy Also for the first time, this year’s Transatlantic Trends asked those who said that membership in the European Union was bad for their country about their motives for this belief. Given a list of possible choices, 45 percent of respondents said that “the European Union has harmed our country’s economy”; this response was most common in Italy (66%), Portugal (56%), Spain (53%), Germany (47%), France (46%), and Greece (44%). Twenty-three percent of respon-12 Question 23 a: What is the most important reason why membership is [TURKEY: would be] a good thing?
0
20
40
60
80
100
U.K.
Greece
Turke
y
Portuga
lIta
lySpain
Sweden
Netherl
andsEU
France
Poland
Germany
Disagree
Agree
Perc
ent
Chart 10: EU Membership has been Beneficial
132626
24 28
63
36
76
Q22
29
3633
51535355566163
65
7173
21 4240
The German Marshall Fund of the United States28
More than one option
Strengthened European economies
Maintained peace
EU is a community of democraciesFree movement
Don’t know/refuse to answer
None of the above
Chart 11: Why is EU Membership a Good Thing?
Q23a
31
5
27
19
16
11
More than one option
Is undemocratic
Undermined our culture
Harmed our country’s economyToo much authority
Don’t know/refuse to answer
None of the above
Chart 12: Why is EU Membership a Bad Thing?
Q23b
45
5
23
13
11
2 2

Transatlantic Trends 2014 29
dents said “there is too much authority in the European Union”; this was most common in Sweden (55%) and the Netherlands (40%). Thirteen percent of respondents said that the European Union had “undermined” their country’s culture; this was most common in Turkey (42%), the United Kingdom (25%), and France (17%). Only 11% of respondents said that “the European Union is undemocratic”; this was most common in Turkey (21%), Greece (16%), and Poland (15%).13
Belief in the Damaging Impact of Euro is on the Wane…Majorities in nearly every country surveyed responded that the use of the euro has been bad (or, in non-eurozone countries, would be bad) for their economy, but there are signs of a trend reversal. Fifty-six percent of European respondents (down four percentage points since 2013, and one since 2010), said that use of the euro has been bad, compared to 37% who said it has been good (up four percentage points since 2013, and stable since 2010). Among those who said the euro has been bad, numbers dropped in all countries surveyed, most notably in France (51%, down 13 percentage points since 2013, and 9 since 2010); disapproval remained stable only in Italy (58%) and Spain (62%). Greek disapproval stood out at 69%.14
Sweden and the United Kingdom remained firmly opposed to the euro, with 75% in the former and 83% in the latter saying it would be bad for their national economy.
13 Question 23 b: What is the most important reason why membership is [TURKEY: would be] a bad thing?14 Question 24: Generally speaking, do you think that using the euro in [COUNTRY] [WITHIN THE EUROZONE] has been/[OUTSIDE THE EUROZONE] WOULD BE a good thing for the [COUNTRY] economy?
Turkey Turns Toward EuropeTurkish respondents have been lukewarm for the past few years on the European Union, with only pluralities (45% in 2013, up one percentage point since 2012) saying that membership would be a good thing and large minorities (36% in 2013, down one percentage point since 2012) saying it would be bad. In 2014, however, a clear majority of Turks (53%) said that accession would benefit the country, while a diminished minority (29%) disagreed.1
Further, more Turks said that their opinion of the EU was favorable (45%, up ten percentage points since 2013) and that EU leadership in world affairs was desirable (31%, up five percentage points since 2013). Turkey was also slightly less likely than in the past to prefer unilateralism: 33% of Turkish respondents said that Turkey should act alone on international matters (down five percentage points since 2013) while 28% said that Turkey should work with the European Union (up seven percentage points since 2013).
Turks were also more positive on NATO, with 49% saying it remained essential to their security — a ten percentage point increase from 2013 and the highest level of support measured since 2005. When asked what NATO should be doing, Turks were divided. Fifty-seven percent supported its role in the territorial defense of Europe, a 42% plurality opposed its operating out of area, a 47% plurality opposed its providing arms and training to other countries (41% if Ukraine was mentioned specifi-cally), and a 43% plurality supported its work attempting to establish stability in places like Afghani-stan.
1 Question 22: Generally speaking, do you think that [COUNTRY’S] membership in the European Union [EU COUNTRIES: has been]/[TURKEY: would be] a good thing or a bad thing for [COUNTRY]?

The German Marshall Fund of the United States30
North-South Divide Widens in EuropeResponses from this year’s survey seem to indicate that the tide of the economic crisis is receding, but unevenly, as the underlying terrain may have changed fundamentally. In Germany, 30% of respondents said they felt personally affected by the economic crisis, a 14 percentage point drop from 2013; in the Netherlands, 47% said that they were personally affected, a seven percentage point drop from 2013; and in Sweden, 22% said that they were personally affected, another seven percentage point drop from 2013.1
On the other hand, responses in Europe’s south have hardly shifted at all: 91% of Portuguese respon-dents (compared to 90% in 2013 and 89% in 2012) said that they had been affected, as did 81% of respondents in Spain (compared to 82% in 2013 and 80% in 2012) and 72% in Italy (compared to 76% in 2013 and 75% in 2012). In Greece, surveyed for the first time this year, 95% said that they had been affected — and 73% of respondents said that they had been greatly affected. Even France failed to gain ground this year: 64% of French respondents, compared to 65% in 2013, said that they had been affected.
Those countries that remain deeply affected were more likely to say the European Union is still not doing enough to combat the crisis, a sentiment expressed by 88% of respondents in Spain, 87% in Italy, 85% in Greece, and 83% in France. In Germany, on the other hand, 60% said the European Union wasn’t doing enough while 72% said the countries affected were not doing enough them-selves, a statement with which 67% in Sweden — along with 74% in Spain and Italy — agreed.
1 Questions 18, 19 (Is the European Union doing enough to combat the economic crisis in Europe?), and 20 (Do you think the countries most severely affected by the economic crisis are doing enough to combat the crisis themselves?).
0 20 40 60 80 100
Germany
Sweden
Netherlands
EU
U.K.
Poland
Portugal
France
Greece
Italy
Spain
EU not doing enough
Countries affected not doing enough
Both not doing enough
Percent
Chart 13: Handling of the Economic Crisis
16
16
11
22
20
10
5
3
Q19,20
35
11
14
18
5
10
22
10
6
4
4
15
9
14
45
40
43
47
47
54
53
53
71
68
61

Transatlantic Trends 2014 31
Among the countries that said the euro has been good, a two-in-three majority of German respondents (60%, up eight percentage points since 2013) stood out. A plurality of Dutch respondents (47%, up five percentage points since 2013) agreed.
…As is Disapproval of EU Control over National Economic PolicyMajorities in the European Union believe that the EU should not have more authority over member states’ budgetary and economic policy — yet here too there were slight signs of a change in the trend. Sixty-four percent (down four percentage points since 2013; but up nine since 2011) said that each member state should retain this authority for itself. This feeling was particularly strong in Greece (79%). Yet in all EU states surveyed, the numbers of respondents who wanted member states to retain control over budgets dropped, sometimes significantly, including in the Netherlands (67%, down 8 percentage points since 2013, but up 12 since 2011), Portugal, (59%, down eight percentage points since 2013, but up 3 since 2011), Spain (61%, down 14 percentage points since 2013, but up 8 since 2011), and Sweden (73%, down 8 percentage points since 2013, and 2 since 2011). Only in Germany did this sentiment remain stable at 60% (but up 16 percentage points since 2011).15
German and French respondents were the most likely to say that the EU should exercise control over national economic policy. This was a minority view in both countries (both 37%), and represented a 17 percentage point drop from 2011 in Germany, when a majority (54%)
15 Question 21: Some people say that because of recent economic difficulties, the EU should have more authority over member states’ economic and budgetary policies. Other people say that each member state should retain this authority for itself. Which view is closer to your own?
Most Populist Voters just Dissatisfied with other Parties — Except in NetherlandsThe European Parliamentary elections held in May seemed to communicate a worrisome message to supporters of the European project: populist Eurosceptic parties opposed to the European Union itself gained ground in many member states, casting doubt on the future of European integration at a time when it may be more essential than ever before.1
However, supporters of deeper European integration can take some solace in the knowledge that many of these votes were cast more to protest the other options than to express actual support for populist projects. This year’s survey asked respondents who identified as populist party voters — or who leaned toward populist parties — whether they liked the policies of the populist party itself or simply felt the other parties were not doing a good job. In Germany, among respondents who voted for Alternative für Deutschland (Alternative for Germany), 58% said that other parties were not doing a good job. Among Italians who voted for the Movimento 5 Stelle (Five Star Movement) 50% said the same (compared to 43% who supported the party’s policies), as did 66% of Front National voters in France and 60% of U.K. Independence Party voters in the United Kingdom.
The one exception was the Netherlands, where 58% of respondents who voted for Geert Wilders’ Partij voor de Vrijheid (Party for Freedom) said that they liked his party’s policies. Only 28% said that they were dissatisfied with the other parties.
1 It should be noted that the sample sizes for this question were quite small, owing to the small number of self-identified populist voters: percentages here are out of 52 respondents in Germany, 117 in Italy, 139 in France, 71 in the Netherlands, and 205 in the United Kingdom. These results should thus be seen more as a gauge of general sentiment than as exact tallies.Question D7a: A lot of people abstained in the European Parliament elections of May this year, while others voted. Did you vote?

The German Marshall Fund of the United States32
held that opinion, but an eight percentage point increase from 2013 in France. In all other countries, the percentage of those who wanted to see more budgetary authority for the EU actually increased, sometimes substantially — climbing 10 percentage points from 2013 in Sweden (to 22%) and 14 percentage points in Spain (35%).
Many Want to Accommodate the United Kingdom, Rather than See it Leave the EUWhen Transatlantic Trends asked for the first time about recent discussions about the United Kingdom leaving the European Union, a majority of the respondents (51%) in the EU member states polled said other EU member states should do more to accommodate British concerns. Top among these was the United Kingdom itself (57%), followed by majorities in Sweden (56%), Greece, Poland (both 55%), Portugal, Italy (both 52%), Germany and Spain (both 50%), and a plurality in the Netherlands (45%).16
An average of 38% agreed with the statement that it would be better if the United Kingdom left the European Union. Only in France was this view held by a majority (52%) of respondents.
16 Question 25: As you may know, the U.K. has raised concerns about the terms of its membership in the European Union, and there has been some discussion of the U.K. leaving the European Union. Do you think the other EU member states should do more to accommodate the concerns of the U.K., or would it be better if the U.K. leaves the EU?
0
20
40
60
80
100
France
Netherl
andsSpain
GermanyEU
Portuga
lIta
ly
Poland
Greece
SwedenU.K.
U.K. should leave the EU
EU should accommodate concerns of the U.K.
Perc
ent
Chart 14: Should the EU Accommodate the U.K.?
26 30
36
23
52
41
57
Q25
373831
4245
50505152555556
35
40
52

Transatlantic Trends 2014 33
MOBILITY, MIGRATION, AND INTEGRATION
On both sides of the Atlantic, issues of mobility, migration, and integration connect with foreign, security, economic, and social policy.17 Conflicts in Syria and other parts of the world continue to force people to flee to safer neighboring countries, while asylum and refugee matters carry a great deal of weight within the European Union, with an increase of border crossings in the Mediterranean Sea pushing Southern European countries to ask for more support and burden sharing among EU member states. At the same time, economic pressures also remain a main driver of mobility within the European Union, intensifying discussions on integration and access to benefits in countries that receive migration and the impacts of emigration on the countries from which migrants are relocating.
In the United States, the debate about immigration reform and how to proceed with the 11-12 million unauthorized immigrants remains difficult for policymakers. The last two years have also seen an unprecedented rise of unaccompanied minors from Central America, adding to the pressure to act on migration policy.
Most Europeans and Americans Have Immigrant FriendsMajorities in both the United States (69%) and Europe (58%) said that they had at least a few friends who were born in other countries; 30% of Americans and 41% of Europeans said that they did not. Swedes were the most likely to say that “many” of their friends were born abroad (21%), and also the most likely to say “a few” were (63%); German (66%), Spanish (64%), French (63%), Greek (59%), and British (58%) respondents were also particularly likely to count immigrants among their friends. Poland was the only country in the EU where a majority of respondents said that they did not have friends born abroad (70%).18
In Turkey, 68% said that none of their friends were born abroad, while 21% said a few were.
Large Majorities in the United States and EU Disapprove of their Governments’ Handling of ImmigrationTransatlantic Trends asked respondents whether they approved of their own government’s handling of immigration from other countries. Sixty percent of Europeans said they disap-proved; 71% of Americans polled disapproved as well. Disapproval in Europe was most pronounced in Spain (77%), Greece (75%), the United Kingdom (73%), Italy, and France (both 64%). In Turkey, 67% disapproved. Majorities approved in Sweden (60%) and Poland (50%).19
These results are similar to those obtained in 2013 when respondents were asked if their governments were “doing a good job” managing immigration policy: 58% of Europeans said no, as did 68% of Americans. Seventy-four percent of Spanish respondents said their govern-ment was not doing a good job, as did 72% of British respondents.
17 The 2008-11 data reported in this section was collected in a separate survey, Transatlantic Trends: Immigration (TTI). Some TTI trend questions were used in this section. Comparability of the 2014 and 2013 data with those previous data sets is limited, however, because of a potential framing effect due to the fact that immigration questions were here preceded by questions about foreign, security, and economic policy.18 Question D 15: Do you have any friends who were born in another country who now live in [COUNTRY]?19 Question 3.3: Do you approve or disapprove of the way [COUNTRY’S] government is handling immigration from other countries?

The German Marshall Fund of the United States34
Sixty-four percent of Swedish respondents said the government was doing a poor job, rendering this year’s result a significant reversal; the same could be said of Poland, where 49% said their government was doing a poor job in 2013.
In Germany, 46% of respondents approved of the government’s handling of immigration in 2014, a near-return to 2011 levels (38%) after a jump to 54% in 2013. Fifty-one percent of respondents disapproved of the government’s handling of immigration.
Large Transatlantic Majorities Agree Most Immigrants Come to their Countries to WorkIn a new question, Transatlantic Trends asked respondents to name what they thought were the two most common reasons for immigrants to come to their country. Answers varied widely from one country to another.20
“To work” was selected as either the first or second most common reason by nearly two-in-three respondents in Europe (61%), and by three-in-four in the United States (70%). This reason was most often named in Spain (74%), followed by Greece (72%) and Poland (67%).
“To seek social benefits” was the next most frequent cited reason, by 41% in Europe, and by 45% in the United States. This motivation was most often named in the Netherlands (56%)
20 Question 26a+b: In your opinion, what do you think is the most common reason for immigrants (from other countries) to come to [COUNTRY]? And what is the second most common reason? Country percentages for this question add up to 200%, because the question allowed two responses.
0
20
40
60
80
100
Russia
Poland
Sweden
Portuga
l
Germany
Netherl
andsEUIta
ly
France
Turke
yU.S.
U.K.
Greece
Spain
Approve
Disapprove
Perc
ent
Chart 15: Government’s Handling of Immigration
22 34332527
64
46
77
Q3.3
44403623
3638
4851
5760
6467
717375
20 60
50
67
26

Transatlantic Trends 2014 35
Turkey Russia
U.S.EU
United with family members
Seek asylum
Seek social benefits
Work None of the above
Don’t know/refuse to answer
Study
Chart 16: Why Immigrants Come to Country
Q26a
13
3
2
52
24
2
17
4046
26
43
5
47
36
1
60
2
22
4
18
2
7
16
29
Results represent the primary response given.

The German Marshall Fund of the United States36
and France (54%). In the United Kingdom, 55% of respondents said “access to social benefits,” a slightly different wording drafted to better address the discussion there.
“To seek asylum” was the third most frequent motivation attributed to immigrants in Europe (40%), but only 18% of Americans agreed. This reason was most often named in Sweden (68%), followed by Germany and the Netherlands (both 47%), as well as Italy (46%).
“To be united with family members” was quoted fourth, with 22% in Europe and 30% in the United States. It was most often referenced in Sweden (46%) followed by France (31%).
“To study” was quoted in fourth place by Americans (23%), and in fifth or last place by the Europeans (18%); it was named most frequently in Portugal (34%), the United Kingdom (32%), and Poland (27%).
In Turkey, an overwhelming majority (77%) felt immigrants came most often to seek asylum; 47% thought immigrants came to seek social benefits, and 35% said they came to work.
Opinion Divided on Policies Toward Refugees Transatlantic Trends asked for the first time about the policies toward refugees in respondents’ countries. In Europe, a plurality (40%) said their country’s policy should be more restric-tive, whereas only 34% said policies were “about right now.” Results in the United States were similar; a plurality (34%) agreed with the proposition that current policies are “about right now,” while 38% felt they should be more restrictive. Minorities in Europe (21%) and the United States (20%) felt their countries’ treatment of refugees should be less restrictive.21
Among the respondents most in favor of more restrictive refugee policies, Italy (57%) and Greece (56%) stood out, followed by the United Kingdom (48%). Respondents in Poland (42%), France, and Sweden (both 40%) were most likely to agree that their own country’s policy was about right. The highest percentage of respondents willing to have less restrictive refugee policies was found in Germany (31%), followed by the Netherlands (26%), Poland, and Spain (both 24%).
Two-in-three Turks (66%) favored more restrictive refugee policies; 21% thought they should be less restrictive, and only 10% thought they were about right. Seventy-seven percent of Turkish respondents said they were worried about refugees; 20% said they were not worried.
Europeans more Worried about Immigration from Outside the EU than about Mobility Within the EUTransatlantic Trends asked for the first time whether Europeans were worried about immigra-tion from within or from outside the EU. Fifty-five percent of European respondents said they were not worried about immigration from within the EU, while 43% were; 56%, however, said they were worried about immigration from outside the EU, while 42% were not.22
21 Question 28: And how about refugees? Do you think that [COUNTRY’S] policies toward refugees should be more restrictive/should be less restrictive/are about right now?Question 29.5 (only in Turkey): Can you tell me if you are worried or not worried about refugees?22 Question 29.3, 4: Can you tell me if you are worried or not worried about immigration from within/from outside the EU?

Transatlantic Trends 2014 37
Respondents in Sweden (82%) were most likely to say they were not concerned by immigra-tion within the EU, followed by Poland (72%), and Germany (65%). Those most worried about immigration within the EU were respondents in Portugal (62%), followed by Spain (53%), Italy, and the United Kingdom (both 51%).
Respondents in Greece (84%) were most likely to say that they were concerned by immigra-tion from outside the EU, followed by Italy (76%) and France (59%). The leader in the group that was least concerned by immigration from outside the EU was Sweden (69%), followed by Poland (57%).
Majority in United States Says First-Generation Immigrants are Integrating Well, But Europe is Divided Publics in Europe and the United States were mostly optimistic about the integration of immigrants, particularly about the second generation. A majority of respondents in the United States (51%, down ten percentage points from 2013) stated that they felt that first-generation immigrants were integrating well into U.S. society. Europe was split, with 46% saying first-generation immigrants were integrating well, and 48% saying they were not. Majorities saw first-generation immigrants as integrating well in Portugal (83%), followed by Spain (59%), Poland (54%), and the United Kingdom (46%).23
However, majorities in Greece (70%), Sweden (65%, up 4 percentage points since 2013), France (56%, up 3 percentage points since 2013), Italy (52%, up 17 percentage points since 2013), and Germany (51%, up 3 percentage points since 2013) disagreed, as did half of respondents in the United Kingdom and Netherlands (both 50%), saying immigrants were integrating poorly.
In Turkey, 66% of respondents (down eight percentage points since 2013) stated that first-generation immigrants were integrating poorly. Thirty-two percent disagreed, up 19 percentage points since 2013.
Transatlantic Majorities Say Children of Immigrants are Integrating WellWhen respondents were asked about second-generation immigrants, answers were much more positive. Sixty-nine percent (up one percentage point since 2013) of Americans thought they were integrating well, with 61% (up two percentage points since 2013) of Europeans concurring. Approval was highest in Portugal (86%, up four percentage points since 2013), Greece (70%), Spain (69%, down four percentage points from 2013), the Netherlands (66%, up five percentage points since 2013), as well as in Germany, Italy, and the United Kingdom (all 63%).24
Among those who said that immigrants’ children are integrating poorly, disapproval stood out in France (48%, down seven percentage points since 2013), and Sweden (41%, down two percentage points since 2013).
23 Question 32a: Generally speaking, how well do you think that immigrants are integrating into NATIONALITY society?24 Question 32b: Generally speaking, how well do you think that the children of immigrants are integrating into NATION-ALITY society?

The German Marshall Fund of the United States38
Information Changes Perceptions of ImmigrationIn 2014, Transatlantic Trends repeated an experiment from TTI 2010 in order to see how respon-dents’ perceptions of the number of immigrants differ if they are made aware of actual immigra-tion statistics. For this question, one-half of each national sample received official Organization for Economic Cooperation and Development (OECD) estimates of immigrants as a percentage of a country’s population, and the other half did not.1
The results support the outcome of 2010: information does change perceptions about the number of immigrants. Those who heard an official estimate before answering the question were less likely, especially in Greece and the United Kingdom, to say there were “too many” immigrants in their country: without information 58% of Greek respondents said there were too many immigrants in the country, while only 27% of those who received information said the same. In the U.K., the percentage dropped from 54% down to 31%; in Italy it dropped from 44% to 22%, while the number of those saying “not many” increased from 15% to 34%.
Overall, in both Europe and the United States more than one-third of those who did not receive the official statistics thought there were too many immigrants in their country (Europe 32%, United States 38%). These numbers are in stark contrast to those who did receive the statistics beforehand: only one-in-five in Europe and the United States (both 21%) thought there were “too many,” repre-senting an 11 percentage point decrease in the former and a 17 percentage point decrease in the latter.
1 Question 27 b: Generally speaking, how do you feel about the number of people living in [COUNTRY] who were not born in [COUNTRY]?; Question 27a: As you may know, according to official estimates, around [XX]% of the [COUNTRY] population was born in another country. In your opinion, is this too many, a lot but not too many, or not many?
0
20
40
60
80
Poland
Sweden
German
y
Franc
e
Russia
Netherl
andsEU
SpainU.S.
Portug
alIta
lyU.K.
Greece
Not given percent of immigrants
Given percent of immigrants
Perc
ent
Chart 17: Too Many Immigrants in Our Country
58
31
22
293132
27
44
54
29
3839
Q27a-b
24
29
17
9
34
15
21
28
212119 19
9
17

Transatlantic Trends 2014 39
Fifty-four percent (down two percentage points since 2013) of Turkish respondents thought that second-generation immigrants were integrating poorly; 42% (up nine percentage points since 2013) thought they were doing well.
Americans Say Emigration is not a Problem; Europeans Disagree, Some Strongly Asked whether emigration was a problem for their country, more than two-in-three U.S. respondents (66%, compared to 69% in 2013) said it was not, whereas 58% of Europeans said it was (57% in 2013). The highest agreement levels in Europe were found in Greece (95%), Portugal (93%, up five percentage points from 2013), Spain (87%, up seven percentage points from 2013), Italy (84%, up two percentage points from 2013) and Poland (83%, up one percentage point from 2013). Respondents in the Netherlands (13%) and Sweden (15%) were least likely to say that emigration was a problem for their country.25
In Turkey, there was a marked upswing in the number of respondents who saw emigration as a problem (75%, up 29 percentage points from 2013); 21% disagreed (down 24 percentage points since 2013).
25 Question 33: Do you think that emigration in [COUNTRY], that is, the number of [NATIONALITY] who are leaving to live in other countries, is a very serious problem, a somewhat serious problem, not a serious problem, or not a problem at all for [COUNTRY]? Question D18a,b: Have you ever thought about moving away from your home country for a year or more or even permanently?/ In view of the economic crisis, have you ever thought about moving away from your home country for a year or more or even permanently?
0
20
40
60
80
100
Sweden
Poland
GermanyU.K.
Spain
Portuga
l
Netherl
andsEU
FranceIta
ly
Greece
From outside the EU
From within the EU
Perc
ent
Chart 18: Concern about Immigration
84
51
44
545456
48
59
76
56
Q29.3-4
5351
40
27
56
34
49
62
43
51
24
16

The German Marshall Fund of the United States40
When asked if they would ever consider personally moving abroad, 68% of Americans said they had never thought about it, as did 51% of Europeans. Portuguese, Greek, and British respondents were the most likely to say they had done it or considered it (58%, 55%, and 55%, respectively); within Europe, Polish respondents were the most likely to want to stay put (59%). Seventy-two percent of Turks said that they had never thought about it.
When asked if they would emigrate in the context of the economic crisis, 68% of Americans and 63% of Europeans said they had never considered it.
0
20
40
60
80
100
Netherl
ands
SwedenU.S.
GermanyU.K.
FranceEU
Russia
Turke
y
Poland
Italy
Spain
Portuga
l
Greece
Perc
ent
Chart 19: Emigration is a Problem
75
8387
9395
84
Q33
585956
3733
1513
31

Transatlantic Trends 2014 41
Americans Worry about Illegal Immigrants, but Most Would Like to See Them Get Legal Status In the United States, a fierce debate about immigration reform continues, centering now on how to proceed with the 11-12 million people who came to the country without legal documentation. The primary question is whether to legalize them or not, and whether to offer a pathway to citizenship if they are legalized.1
When asked about illegal immigrants, 60% (compared to 61% in 2013) said they were worried; 38% (compared to 37% in 2013) said they were not worried. Seventy-eight percent (up five percentage points since 2013) of U.S. respondents said they were not worried about legal immigrants; 21% (down four percentage points since 2013) were worried.
Transatlantic Trends also asked Americans whether illegal immigrants should be required to return to their country of origin or should be given the opportunity to obtain legal status that allows them to stay in the United States. A plurality (45%) said illegal immigrants should be able to obtain legal status in the United States; 27% felt they should be required to return. Twenty-six percent said it depended on the circumstances. Of those Americans who support legal-ization, 86% agreed that the legal status should include a path to U.S. citizen-ship. Only 11% of those disagreed.
1 Question 29.1, 2: Can you tell me if you are worried or not worried about legal/illegal immigration?; Question 30: Thinking now about immigrants who are currently living in [COUNTRY] ILLEGALLY, should they be required to return to their country of origin, or should they be given the opportunity to obtain legal status that allows them to stay here?; and FILTERED Question 31: You said that you would prefer for immigrants in the country illegally to have the opportunity to obtain legal status. In your opinion, should this legal status include a path to U.S. citizenship or should it not include a path to U.S. citizenship?
0
20
40
60
Depends on circumstanceRepatriatePath to gain legal status
Don’t know/refuse to answer
Should not include a path to U.S. citizenship
Should include a pathto U.S. citizenship
Perc
ent
Chart 20: Future of Illegal Immigrants
27
Q30,31
26
45
Legal Status for Immigrants
86
311

The German Marshall Fund of the United States42
3 Transatlantic Security Cooperation
In the past year, threats to global security multiplied, from tensions in the South China Seas to the Middle East, with civil war raging unchecked in Iraq and Syria, violent unrest in Libya, and conflict erupting once more in the Palestinian territory of Gaza.26 Yet in 2014,
conflict also came closer to Europe’s borders than it has ever been since the Balkan wars of the 1990s: in the former Soviet Republic of Ukraine, now a member of the EU’s “Eastern Partner-ship,” and seeking a close association with Europe.
Questions asked in this section of the survey cover the transatlantic security partnership, options for cooperation, NATO, negotiations on Iran’s nuclear program, and the conflict in Europe’s eastern neighborhood. A section on attitudes of Swedish voters highlights a group of respondents whose willingness for their country to engage in international affairs is consis-tently above the European average.
REGIONAL COOPERATION
Just as about half of Europeans expressed a general desire for more independence from the United States, they also said that they would prefer more independence — or more coopera-tion within the EU — when managing specific regional relationships and concerns. Transat-lantic Trends asked Americans and Europeans for the first time in 2014 how they would prefer to manage key regional relationships and concerns.
Europeans Split on Dealing with China Together Or Separately; Turks Prefer Independent Approach When managing their relationship with China, 42% of Europeans said they would prefer to work closely with other members of the European Union, while 44% wanted their country to take an independent approach toward China. A majority of respondents in France (51%), and pluralities in the Netherlands (48%), Spain (47%), and Sweden (45%) were the most likely to want to work closely with other members of the European Union. Greek, Portuguese, and British respondents were the most likely to want to work with China bilaterally (62%, 55%, and 49%, respectively).27
Poland was the only country in Europe where a significant number of respondents — 19% — wanted to work closely with the United States; 11% of British and Italian respondents said the same.
A 44% plurality of Turkish respondents wanted to work with China independently, while 21% wanted to work with the United States. Nineteen percent wanted to work closely with the countries of the European Union.
26 The conflict between Israel and Hamas in Gaza, and the fighting in Libya, both still ongoing as Transatlantic Trends 2014 went to press, erupted after the fieldwork for this year’s survey had been completed.27 Question 6a.2: And how about managing our relationship with China, should [COUNTRY] work closely with other members of the European Union/work closely with the United States/take an independent approach?

Transatlantic Trends 2014 43
42
44
9
6
With the United States
Take an independent approach
With EU countries
Don’t know/refuse to answer
x
Chart 21: Who Should the EU Work with on China?
Q6a.2
44
41
10
5
With the United States
Take an independent approach
With EU countries
Don’t know/refuse to answer
x
Chart 22: Who Should the EU Work with on the Middle East?
Q6a.3
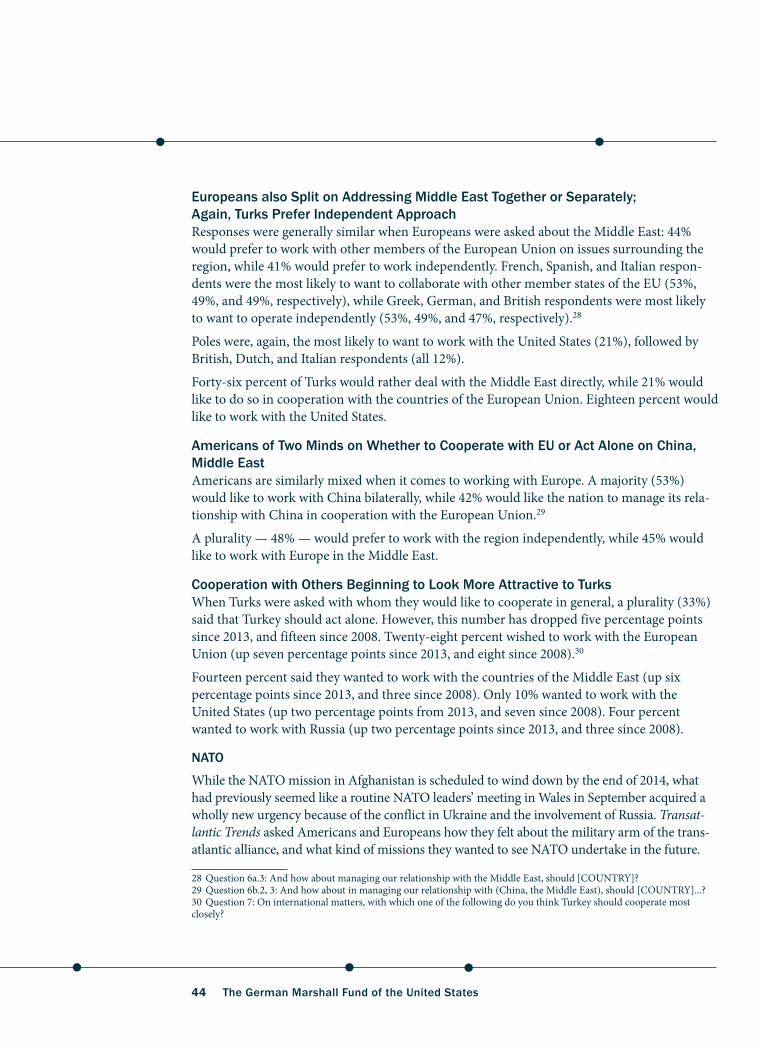
The German Marshall Fund of the United States44
Europeans also Split on Addressing Middle East Together or Separately; Again, Turks Prefer Independent Approach Responses were generally similar when Europeans were asked about the Middle East: 44% would prefer to work with other members of the European Union on issues surrounding the region, while 41% would prefer to work independently. French, Spanish, and Italian respon-dents were the most likely to want to collaborate with other member states of the EU (53%, 49%, and 49%, respectively), while Greek, German, and British respondents were most likely to want to operate independently (53%, 49%, and 47%, respectively).28
Poles were, again, the most likely to want to work with the United States (21%), followed by British, Dutch, and Italian respondents (all 12%).
Forty-six percent of Turks would rather deal with the Middle East directly, while 21% would like to do so in cooperation with the countries of the European Union. Eighteen percent would like to work with the United States.
Americans of Two Minds on Whether to Cooperate with EU or Act Alone on China, Middle EastAmericans are similarly mixed when it comes to working with Europe. A majority (53%) would like to work with China bilaterally, while 42% would like the nation to manage its rela-tionship with China in cooperation with the European Union.29
A plurality — 48% — would prefer to work with the region independently, while 45% would like to work with Europe in the Middle East.
Cooperation with Others Beginning to Look More Attractive to TurksWhen Turks were asked with whom they would like to cooperate in general, a plurality (33%) said that Turkey should act alone. However, this number has dropped five percentage points since 2013, and fifteen since 2008. Twenty-eight percent wished to work with the European Union (up seven percentage points since 2013, and eight since 2008).30
Fourteen percent said they wanted to work with the countries of the Middle East (up six percentage points since 2013, and three since 2008). Only 10% wanted to work with the United States (up two percentage points from 2013, and seven since 2008). Four percent wanted to work with Russia (up two percentage points since 2013, and three since 2008).
NATO
While the NATO mission in Afghanistan is scheduled to wind down by the end of 2014, what had previously seemed like a routine NATO leaders’ meeting in Wales in September acquired a wholly new urgency because of the conflict in Ukraine and the involvement of Russia. Transat-lantic Trends asked Americans and Europeans how they felt about the military arm of the trans-atlantic alliance, and what kind of missions they wanted to see NATO undertake in the future.
28 Question 6a.3: And how about managing our relationship with the Middle East, should [COUNTRY]?29 Question 6b.2, 3: And how about in managing our relationship with (China, the Middle East), should [COUNTRY]...?30 Question 7: On international matters, with which one of the following do you think Turkey should cooperate most closely?
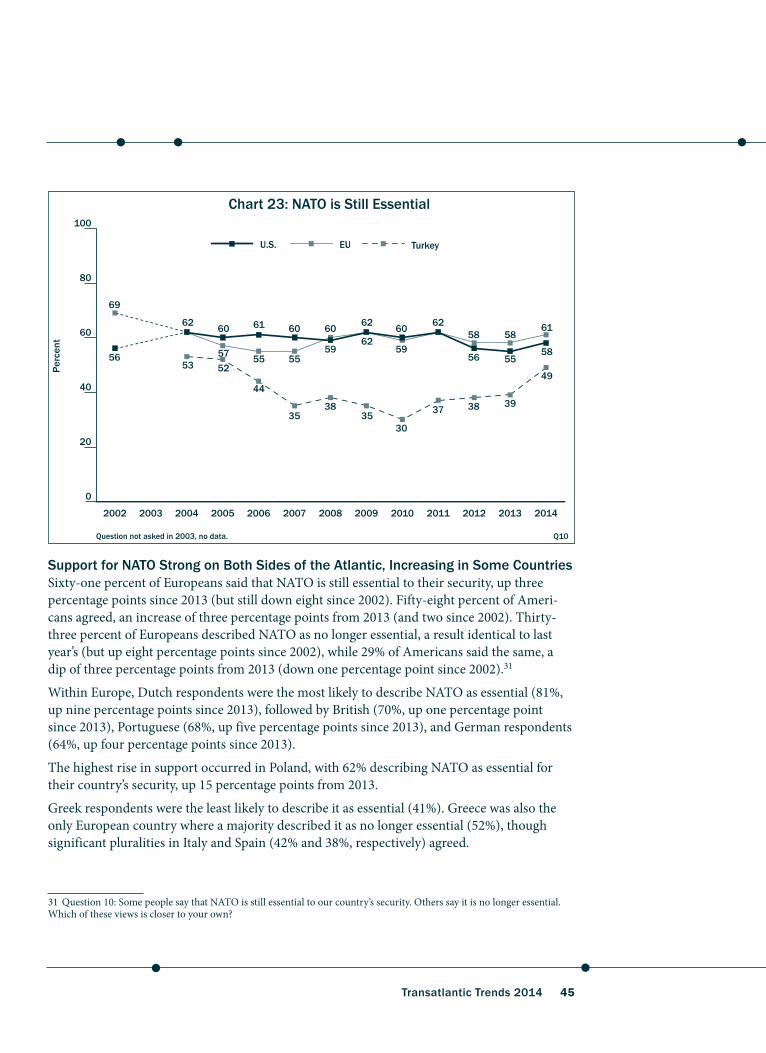
Transatlantic Trends 2014 45
Support for NATO Strong on Both Sides of the Atlantic, Increasing in Some CountriesSixty-one percent of Europeans said that NATO is still essential to their security, up three percentage points since 2013 (but still down eight since 2002). Fifty-eight percent of Ameri-cans agreed, an increase of three percentage points from 2013 (and two since 2002). Thirty-three percent of Europeans described NATO as no longer essential, a result identical to last year’s (but up eight percentage points since 2002), while 29% of Americans said the same, a dip of three percentage points from 2013 (down one percentage point since 2002).31
Within Europe, Dutch respondents were the most likely to describe NATO as essential (81%, up nine percentage points since 2013), followed by British (70%, up one percentage point since 2013), Portuguese (68%, up five percentage points since 2013), and German respondents (64%, up four percentage points since 2013).
The highest rise in support occurred in Poland, with 62% describing NATO as essential for their country’s security, up 15 percentage points from 2013.
Greek respondents were the least likely to describe it as essential (41%). Greece was also the only European country where a majority described it as no longer essential (52%), though significant pluralities in Italy and Spain (42% and 38%, respectively) agreed.
31 Question 10: Some people say that NATO is still essential to our country’s security. Others say it is no longer essential. Which of these views is closer to your own?
0
20
40
60
80
100
2014201320122011201020092008200720062005200420032002
TurkeyEUU.S.
Chart 23: NATO is Still Essential
Perc
ent
60
55
62
69
57
61
555356
Q10Question not asked in 2003, no data.
35
44
52
60
59
6062
38
62
59
35
60 62
30
56
3837
58
55
39
58
58
49
61

The German Marshall Fund of the United States46
In Turkey, 49% of respondents described NATO as essential, a ten percentage point increase from 2013 and the highest result obtained since 2004 (53%); 33% described it as no longer essential (down six percentage points since 2013, but up seven since 2004).
Transatlantic Majorities Want to See NATO Engaged in Territorial DefenseThis year, Transatlantic Trends asked respondents for the first time which kinds of missions NATO should be engaged in. Fifty-nine percent of Americans and 73% of Europeans said it should be engaged in the territorial defense of Europe; 30% of Americans and 23% of Euro-peans said it should not. Dutch, Polish, and Portuguese respondents were particularly likely to agree (83%, 82%, and 80%, respectively); Greek, French, and Italian respondents were the most likely to disagree (46%, 28%, and 28%, respectively).32
A majority of Turkish respondents agreed with the transatlantic consensus: 57% said that NATO should be engaged in the territorial defense of Europe, while 26% said that it should not.
Americans and Europeans Disagree on Out-Of-Area Missions for NATO…A majority of Europeans (51%) said that NATO should not conduct military operations outside of the United States and Europe; a plurality of Americans (49%) said that it should. Majorities in Portugal, the Netherlands, and France said that NATO should act outside of the United States and Europe (65%, 58%, and 55%, respectively). Large majorities in Greece, Germany, and Italy disagreed (69%, 63%, and 59%, respectively).33
32 Question 11.1: And should NATO be engaged in the following missions? 1. The territorial defense of Europe.33 Question 11.2: Conducting military operations outside of the United States and Europe.
0
20
40
60
80
TurkeyEUU.S.
Providing arms or training to countries like Ukraine
Territorial defense of Europe
Military operations outside of the United States and Europe
Providing arms or training
Stability in Afghanistan
Perc
ent
Chart 24: What Should NATO be Engaged In?
5357
55
43
59
49
73
Q11.1-5
53
4138
36
4343 41
57

Transatlantic Trends 2014 47
Turks were split evenly: 41% said NATO should operate outside of Europe and the United States; 42% said it should not.
…And on Providing Arms or Training to Help Other Countries Defend ThemselvesA majority of Americans (53%) said that NATO should provide arms or training to other countries to help them defend themselves; a majority of Europeans (52%) disagreed. Polish, Portuguese, British, and Dutch respondents were more likely to deviate from the European consensus — 58%, 55%, 50%, and 50%, respectively, said that NATO should provide arms or training to other countries. Italy, Spain, and France were particularly adamant in their opposi-tion (70%, 61%, and 56%, respectively).34
34 Question 11.3: Providing arms or training to help other countries defend themselves.
Sweden, NATO, and International EngagementIn recent years, Sweden has stood out in Europe for its willingness to participate in military interven-tions, especially when sanctioned by the United Nations or NATO. In 2014, 54% of Swedes supported participating in military operations carried out by NATO, compared to 47% in 2013 — and that number jumps to 60% if the operation is sanctioned by the United Nations. Thirty-nine percent of Swedes supported Sweden joining NATO outright, continuing a slow upwards trend; 36% supported Sweden joining NATO in 2013, and 24% did in 2012. A majority of 54% continued to say Sweden should not join NATO, but that number decreased by two percentage points since 2013, and by fifteen since 2012, the first time the question was asked in Transatlantic Trends.1
These attitudes appear to be part of a pattern of strong preferences for international engagement. Swedish respondents strongly favor U.S. and European global leadership (62% and 76%, respec-tively), and are strongly against Russian leadership (77%, matched by an unfavorable view of Russia, 78%); they also tend to approve strongly of their own government’s international policies (74%, but less so of its relations with Russia, 56%). They also have a marked preference for sanctions against Iran (38%). And despite mixed feelings about Ukraine (favorable: 35%; unfavorable: 45%), three-in-four (73%) are willing to support it even at the risk of conflict with Russia. This includes a willing-ness to offer it EU membership (56%, but a plurality of 49% is against offering NATO membership), economic assistance (72%, but 54% do not want to send military supplies), and economic sanctions against Russia (68%)
In 2013, Swedes were more likely than any other respondents save Italians to say that democracy was preferable to stability in the Middle East (both 73%), and the second-most likely to want to inter-vene in Syria behind the French (though majorities in both nations were opposed to intervention — 61% in Sweden and 65% in France). Sixty-three percent of Swedes approved of keeping some troops in Afghanistan to train the army and police, compared to a European average of 53%.
In 2012, 56% of Swedes said that intervening in Iraq was the right thing to do (38% of European respondents agreed), 62% said the same of Afghanistan (42% of Europeans agreed), and an over-whelming 68% approved of intervening in Libya (48% of Europeans agreed). Swedish respondents were also the most likely to want to maintain troop levels in Afghanistan (45%), and among the least likely to want to withdraw all troops (26%).
1 Question 12a: Thinking about the future, do you support or oppose the participation of Sweden in military operations carried out by NATO with the support of the United Nations? Question 12b: Do you support or oppose the participation of Sweden in military operations carried out by NATO? Question 13: Some people say that Sweden should become a member of the NATO alliance. Other people say that Sweden should not join NATO. Which view is closer to your own?

The German Marshall Fund of the United States48
Forty-seven percent of Turkish respondents were opposed to NATO providing arms and training to other countries, while 38% said that it should.
The current crisis in Ukraine appeared to have done little to change respondents’ minds: when half the sample was asked if NATO should provide arms and training to countries like Ukraine, 53% of Europeans said no (one percentage point higher than without mention of Ukraine), while 55% of Americans said yes (two percentage points higher than otherwise). The opinions of German and Portuguese respondents were particularly likely to differ when Ukraine was mentioned: 54% of Germans said NATO should not provide arms and training to countries like Ukraine, compared to 49% when the question was asked abstractly, while 44% of Portu-guese respondents said yes, compared to 55% when the question was asked abstractly.35
…But Agree that NATO Should Work Toward Stability in Places Like AfghanistanFinally, majorities in the United States (53%) and Europe (57%) agreed that NATO should attempt to establish stability in places like Afghanistan. Portuguese, Spanish, and Dutch respondents were particularly likely to say yes (69%, 67%, and 62%, respectively). In Greece, a plurality (49%) disagreed, followed by 45% of the German respondents and 41% of the French respondents.36
Turks were less certain: a 43% plurality said that NATO should be engaged in places like Afghanistan, while 37% said that it should not; 20% did not know or refused to answer.
IRAN
Transatlantic discussions about the use of force against Iran’s nuclear program have been put on hold pending negotiations in Vienna between the United States, Britain, France, Germany, China, and Russia on one hand, and Teheran on the other. A mid-July deadline for an accord was extended by four more months in order to help bridge fundamental disagreements about whether Iran would have to dismantle part of its program.
Sanctions Still Transatlantic Community’s Tool of Choice in IranWhen given a number of options to deal with the threat posed by Iran’s nuclear program — specifically, economic incentives, economic sanctions, support for the opponents of the Iranian government, computer sabotage, and military action — pluralities on both sides of the Atlantic (32% in the United States and 32% in the EU) preferred economic sanctions, just as they did in 2013. The second-most popular option in the United States was computer sabotage (17%, up four percentage points since 2013), while 21% of Europeans would prefer to offer economic incentives (up three percentage points since 2013).37
The highest approval for the sanctions option was found in Sweden and Spain (both 38%), as well as the Netherlands (36%), Italy, and France (both 34%). The strongest preference
35 Question 11.4: Providing arms or training to help other countries like Ukraine defend themselves.36 Question 11.5: Attempting to establish stability in places like Afghanistan.37 Question 14: As you may know, efforts to prevent Iran from acquiring nuclear weapons are under way. Which of the following do you think is the best option? Offer economic incentives/impose economic sanctions/provide support to op-ponents of the government/use computer technology to sabotage nuclear installations/take military action/accept that Iran could acquire nuclear weapons.

Transatlantic Trends 2014 49
for economic incentive was found in Germany (33%, up six percentage points since 2013), followed by Greece (31%).
As in previous years, only 9% of European and 6% of U.S. respondents were willing to consider providing support for the Iranian opposition. However, only 6% of Europeans and 4% of Americans were willing to accept that Iran could acquire nuclear weapons as long as other options were on the table.
Turkish respondents resembled Europeans in their priorities: 20% would prefer to impose economic sanctions against Iran, 13% would like to offer Iran economic incentives to give up its nuclear capabilities, 13% would rather use computer sabotage, and 12% would accept Iran’s possession of a nuclear weapon.
Force Against Iran if Nothing Else Works?Only 12% of Americans (down six percentage points since 2013) and 6% of Europeans (up one percentage point since 2013) would prefer to use military force first, and only 4% in the United States and 6% in Europe were willing from the outset to accept an Iran with nuclear weapons. When all those who responded otherwise were asked if they would prefer to take military action against Iran if all other options were exhausted, 60% of Americans (down four percentage points since 2013) said that they would, while 27% would rather accept that Iran could acquire a nuclear weapon. Fifty percent of those Europeans (up two percentage points since 2013) who had not selected military force or acceptance of a nuclear Iran initially said that they would change their mind if all other options were exhausted; 35% said they would not.38
Under these circumstances, the military option met with the highest approval in France (70%), Portugal (67%), and Spain (59%). The option of accepting a nuclear Iran if military action was the only available alternative met with the most support in Germany (51%), the United Kingdom (47%), the Netherlands, and Greece (both 41%).
Turks were divided. Six percent of Turkish respondents would support taking military action against Iran as long as all other options were on the table. Thirty-eight percent of those who would not (up from 23% in 2013) said that they would change their minds if all other options were exhausted — but a plurality of 43% (down five percentage points since 2013) said they preferred to accept a nuclear Iran.
EUROPE’S EASTERN NEIGHBORHOOD
2014 saw mounting challenges for Europe and the United States in the European Union’s Eastern neighborhood, the region between the EU’s eastern borders and Russia’s western borders. At the beginning of the year, three of the region’s countries — Ukraine, Georgia, and Moldova — were negotiating association agreements with the EU. When Ukraine’s then-Pres-ident Viktor Yanukovych, ceding to pressure from Moscow, cancelled his country’s negotia-tions and announced Ukraine would join the Russia-led Eurasian Union instead, demonstra-
38 Question 15: And now imagine that all of these non-military options have been tried and the only option left to prevent Iran from acquiring nuclear weapons is the use of military force. In that case, should the [European Union/United States/Turkey/Russia] take military action against Iran, or should [it/they] simply accept that Iran could acquire nuclear weapons?
The German Marshall Fund of the United States50
tions erupted across Ukraine. Yanukovych ultimately fled, and a transitional government was installed, which held national elections in May.
President Petro Poroshenko’s Ukraine continues to seek closer links to the EU. But the annexa-tion of the Ukrainian peninsula of Crimea by Russia, and battles between Ukrainian and separatist forces in Eastern Ukraine make the future of Ukraine’s democratic transformation uncertain and are endangering the security of the entire region.
Views on Ukraine Moderately Favorable in the United States, Mixed in Europe, Negative in TurkeyWithin the series of questions that asked respondents how favorably they felt about certain countries, this year’s Transatlantic Trends survey asked for the first time how favorably Ameri-cans and Europeans felt about Ukraine. In the United States, a plurality (44%) said they held a favorable opinion of Ukraine; 32% said their opinion was unfavorable, while 24% said they did not know or refused to answer.39
European respondents were split, with 43% saying they held a favorable opinion, and 42% saying they disagreed. The most strongly favorable view of Ukraine in Europe was held by Polish respondents (56%), followed by respondents in France (50%), Germany, and the United Kingdom (both 43%). Within the EU, unfavorable opinion of Ukraine was strongest in Italy and the Netherlands (both 50%), followed by Greece and Sweden (both 45%). German respon-dents were split roughly equally (favorable: 43%; unfavorable: 45%).
The highest unfavorable ratings for Ukraine were found in Turkey (57%).
Transatlantic Majorities Want to Provide Economic and Political Support for Ukraine; Greece DisagreesIn a question that was asked for the first time in 2014, respondents were asked whether the European Union (Americans were asked the United States) should continue to provide economic and political support to Ukraine, even if there was a risk of increasing conflict with Russia. A majority of Americans (57%) and Europeans (58%) agreed, but there was some vari-ation within Europe. Majorities everywhere in Europe approved; only in Greece did a plurality of respondents disapprove of continued support (49%). The highest approval rates were registered in Sweden (73%), Poland (67%), Germany (65%), Portugal (64%), and the United Kingdom (59%). The lowest approval rate was found in Turkey, where a plurality of 42% said they approved; however, Turkey also registered a high do not know/refusal rate of 24%.40
Americans, Europeans Disagree on NATO Membership for UkraineIn another new question, respondents were asked their opinion of various other proposals for reaction to Russian actions in Ukraine. Asked whether NATO membership should be offered to Ukraine, two-thirds of Americans agreed (68%), while Europeans were split (for: 46%; against: 47%). The highest approval for this proposal was found in Poland (63%), Portugal 39 Question 4.6: Please tell me if you have a very favorable, somewhat favorable, somewhat unfavorable, or very unfavorable opinion of Ukraine?40 Question 16a: Should the European Union [in the United States: The United States] continue to provide economic and political support to Ukraine, even if there is a risk of increasing conflict with Russia?

Transatlantic Trends 2014 51
(61%), Spain (57%), and Turkey (52%). The highest disapproval rates were registered in Germany (67%) and France (53%).41
Europeans Disagree Among Themselves on EU Membership for UkraineA majority of Europeans agreed (52%) that the EU should offer membership to Ukraine; 43% disagreed. Polish respondents were even more in favor of this than of NATO member-ship (69%), followed by Portugal (64%), Spain (62%), Greece (61%), Italy (58%), and Sweden (56%). The highest disapproval rates were found in Germany (63%), the Netherlands (57%), and France (52%). Fifty-four percent of Turkish respondents agreed that Ukraine should be offered membership in the EU.
Transatlantic Majorities Want to Increase Economic Assistance to UkraineTwo-thirds of European respondents (68%) agreed that the EU should increase its economic assistance to Ukraine; 58% of Americans agreed that the United States should increase its assis-tance; however, 37% of Americans disagreed. Within Europe, the highest approval rates were found in Poland (78%), closely followed by Germany (77%), Sweden (72%), and Portugal (71%).
41 Question 16b: There have been a number of proposals for how [the EU/the United States] should react to Russian ac-tions in Ukraine: offer NATO membership to Ukraine/offer EU membership to Ukraine/increase economic assistance to Ukraine/send military supplies and equipment to Ukraine/impose stronger economic sanctions on Russia? …
0
20
40
60
80
100
Turke
y
Greece
SpainIta
ly
Netherl
andsU.S.
FranceEU
U.K.
Portuga
l
Germany
Poland
Sweden
No
Yes
Perc
ent
Chart 25: Provide Economic and Political Support to Ukraine Even if it Causes Conflict with Russia
2438
3532
33
58
73
Q16.a
39393628
4448
5253575859
646567
20 43 49
34
42

The German Marshall Fund of the United States52
Transatlantic Majorities Disapprove of Sending Military Supplies to Ukraine, Except in PolandNearly three-fourths of the Europeans polled (71%) said they disapproved of proposals to send military supplies and equipment to Ukraine in response to Russia’s actions; a small majority of Americans (52%) also disapproved, while 43% would like to send military supplies or equipment. Only in Poland did a majority of respondents (52%) endorse this option. In Europe, the highest disapproval rates for this suggestion were found in Germany (85%), France (81%), and Italy (80%).
Americans and Europeans Approve of Stronger Economic Sanctions against RussiaNearly two-thirds of Americans and Europeans (64% and 61%, respectively) agreed that stronger economic sanctions against Russia were warranted because of its actions in Ukraine. Poles were most likely to approve of this option (77%), followed by the Spanish (71%) and the Swedes (68%). The highest disapproval rate was registered in Greece (61%). The Germans polled were evenly split, with 49% agreeing and 50% disagreeing.
0
20
40
60
80
100
PolandEUU.S.
Economic aid
Offer NATO membership
Provide military supplies and equipment
Sanctions against Russia
Offer EU membership
Perc
ent
64
Chart 26: Response to Russia Action in Ukraine
58
52
77
63
25
68
43
78
68
46
61
Q16b.1-5
69
52
Transatlantic Trends 2014 53
In 2014, Transatlantic Trends polled in Russia for the second time (the first was in 2012) amidst a raging controversy over the conflict in Ukraine and Russia’s role in it. By the end of July, it appeared that what had begun as a regional conflict over Ukraine’s relationship with Europe
and Russia might well become a major political conflict between Russia and the West itself.
RUSSIAN OPINIONS ON ECONOMY AND IMMIGRATION
Asked what they saw as the most important issue facing their country at the moment, a plurality (29%) of Russian respondents named the economy; the second-most named concern was “inter-national instability” (22%), while “corruption” was the third-most cited concern (11%).42
Fifty percent of the Russian respondents, down eight percentage points from 2012, reported having been greatly or somewhat affected by the economic crisis. Forty-six percent, up eight percentage points since 2012, said they had not been affected.
Russians Do Not Think their Country Has Too Many Immigrants, but are Worried About Immigration from CIS StatesSixty-seven percent of Russian respondents, when asked for the first time about their own government’s handling of immigration, said they approved; 26% disapproved. An over-whelming majority of Russian respondents (76%) thought immigrants came to their country to work; 42% said they came to seek asylum, and 40% felt they came to seek social benefits.
Further, a plurality of respondents (40%) said there were “a lot but not too many,” while 29% said there were “too many” immigrants in their country. Twenty-two percent said there were “not many.” When told the exact percentage of immigrants living in their country, Russian respon-dents were divided between saying “a lot, but not too many” (37%), and “not many” (38%); only 19% thought there were “too many.” When asked if they were worried about immigrants from former Soviet states, respondents were almost evenly split, with 48% saying they were and 44% saying they were not worried. When Russians were asked about immigration from outside the Soviet Union, 38% said they were worried, whereas 52% said they were not worried.
Forty-three percent of Russians favored more restrictive refugee policies; 14% thought they should be less restrictive, and 36% thought they were about right.
Fifty-five percent of respondents stated that first-generation immigrants were integrating well. Thirty-four percent disagreed, saying they were integrating poorly. Sixty-three percent, however, said that the second generation was integrating well, with only 23% disagreeing.
Asked whether emigration was a problem for their country, 59% of Russians said that it was, while 36% said it was not.
RUSSIAN OPINIONS ON INTERNATIONAL COOPERATION
Russians Do Not Want Western Global Leadership — or Chinese LeadershipAsked about the desirability of U.S. leadership in the world, 10% of Russians (down 9 percentage points from 2012) said they considered it desirable; 81% (up 17 percentage points
42 Questions 0, 3.3, 26a, 26b, 27b, 27a, 29.6,7, 28, 32a, b, 33.
4 Russia

The German Marshall Fund of the United States54
from 2012) disagreed, with 49% describing strong U.S. leadership as “very undesirable,” up twenty-eight percentage points since 2012. Asked about the desirability of European Union leadership in the world, only 25% of Russians (down 12 percentage points from 2012) said they considered it desirable; 62% (up 18 percentage points from 2012) disagreed. Russian respondents hardly felt more positive about Chinese leadership: less than one-third of the Russians polled (28%) said they considered it desirable; 53% said that it was not.43
Asked about the desirability of Russian leadership in the world, however, more than two-thirds of Russians (72%, up 3 percentage points from 2012) said they considered it desirable; 21% (up 1 percentage point from 2012) disagreed.
Russians Disapprove of Obama’s Foreign Policy, but Back the Kremlin’sRussian approval of President Barack Obama’s handling of international policies fell 19 percentage points to 7% from 2012; at the same time, disapproval rose 38 percentage points to 86% from 2012. Russians also expressed near-universal disapproval of President Barack Obama’s management of relations with Russia — 87% disapproved, while 7%, a 31 percentage point drop from 2012, approved.44
Russians’ approval of their own government’s handling of international policies rose to an overwhelming 83%, up 12 percentage points from 2012; 12% disapproved, down nine percentage points from 2012.
Russian Views of the United States and Europe Decline Sharply; China and Turkey Remain PopularRussians’ views of the United States deteriorated sharply between 2012 and this year: only 23% (down 27 percentage points from 2012) said they held a favorable opinion of the United States; 72% (up 31 percentage points from 2012) said they held an unfavorable view. Their opinion of the European Union was little better, although it did not drop as far: 41% (down 23 percentage points from 2012) said they held a favorable opinion of the EU; 52% (up 28 percentage points from 2012) said they held an unfavorable view.45
Russians’ views of China, in contrast, have become even more favorable than two years ago, with 77% (up 14 percentage points from 2012) saying they held a favorable opinion of China; only 17% (down 13 percentage points from 2012) said they held an unfavorable view.
Russians’ views of Turkey remain favorable, if slightly less so than in 2012: 54% (down 7 percentage points from 2012) said they held a favorable opinion of Turkey; 28% (up 2 percentage points from 2012) said they held an unfavorable view.
Most Russians Want the Russia-NATO Relationship to be More Independent, but Want to Cooperate with Rising PowersTransatlantic Trends asked Europeans and Americans whether the partnership in security and diplomatic affairs between the United States and the European Union should become closer,
43 Questions 1a, b, c, d.44 Questions 2.1-2, 3.1.45 Questions 4.1-3.

Transatlantic Trends 2014 55
remain about the same, or take a more independent approach. In Russia, respondents were asked the same of the relationship between Russia and NATO.46
A plurality of Russians (47%, up 11 percentage points from 2012) said that Russia should take a more independent approach. The number of those who said it should stay about the same remained stable at one-in-three (31%, compared to 30% in 2012). Only 15% of respondents (down six percentage points from 2012) said the relationship should become closer.
Further, when Russians were asked if they should cooperate most closely with countries of the EU, the United States, emerging powers such as China or India, the countries of the Common-wealth of Independent States (CIS), or act alone, 36% of all Russian respondents said that their country should work with emerging powers; 29% said that Russia should work with the CIS states. Fourteen percent said Russia should work with EU states; and 10% said it should work alone. Only 2% answered that Russia should work above all with the United States.
In Russia, 63% of respondents wanted to work with China independently; 19% wanted to work with the countries of the European Union, while only 6% wanted to work with the United States. Fifty-eight percent of Russians would like to operate in the Middle East independently, while 21% would like to do so in collaboration with the European Union and seven percent with the United States.
However, Russians were more open to cooperating with the West on a few key issues. Regarding stability in Syria, 30% said Russia should work alone, while 28% thought it should work with the EU and the United States together. Fifteen percent wanted Russia to work only with the EU, and only 2% wanted it to work alone with the United States. In the case of the ongoing negotiations with Iran regarding its nuclear program, 29% wanted Russia to work alone, while 30% felt it should work with the EU and the United States. Thirteen percent said Russia should work only with the EU, and 3% said the same for the United States.47
Russians preferred to offer Iran economic incentives (23%) to cease work on its nuclear program; 17% would impose sanctions, while 11% would endorse the use of computer tech-nology to sabotage Iranian installations. Four percent would support military action. Only 13% of those who did not support military action said they would change their mind if other options were exhausted, while 55% would accept Iran’s possession of nuclear weapons.
RUSSIA AND EUROPE’S EASTERN NEIGHBORHOOD
Russians Feel Favorably Toward Moldova, Belarus — but Not Georgia or UkraineRussians held mixed views of their neighborhood. Fifty-six percent of respondents said they held favorable views of Moldova; 28% said their views were unfavorable. An even higher
46 Question 5: Do you think that the partnership in security and diplomatic affairs between Russia and NATO should become closer, should remain about the same, or should (the partners) take a more independent approach? Question 8: On international matters, with which one of the following do you think Russia should cooperate most closely? The countries of the European Union/the United States/emerging powers such as India and China/CIS states/Russia should act alone. Ques-tions 6a.2-3.47 Question 9.1, 2: On the following issues, do you think it would be better for Russia to work together with the EU, the United States, both or should Russia work alone? Stability in Syria/negotiations with Iran regarding its nuclear program?

The German Marshall Fund of the United States56
number — 80%, (up sixteen percentage points from 2012) — said they held favorable views of Belarus, with only 14% disagreeing (down 13 percentage points from 2012).48
However, Russian feelings about Georgia were mixed, with 42% (up 15 percentage points from 2012) saying they held favorable opinions, and 46% (down 14 percentage points from 2012) saying they held unfavorable views.
On Ukraine, two-thirds of all Russian respondents (64%) reported that they held unfavorable views, with only 30% saying their views were favorable.
This is, however, an area in which Russians expressed a clear preference for autonomy. When asked about the future of Europe’s eastern neighborhood, 36% of the Russians polled said their country should work on this issue alone, while 22% preferred it to work with the EU and the United States. Nineteen percent stated that they would like to see Russia working with the EU alone on this issue; only 2% were willing to say the same about working with the United States alone.49
Finally, Russians were asked whether Russia should act to maintain its influence over Ukraine even if there was a risk of conflict with the European Union. Fifty-three percent replied in the affirmative, 29% in the negative. Eighteen percent either said they did not know or refused to answer.
48 Questions 4.7-9. 49 Question 9.3: On the following issues, do you think it would be better for Russia to work together with the EU, the United States, both or should Russia work alone? The future of Europe’s eastern neighborhood? Question 17: Do you think Russia should act to maintain its influence over Ukraine, even if there is a risk that that could cause conflict with the EU?
0
20
40
60
80
100
UkraineGeorgiaMoldovaBelarus
Unfavorable
Favorable
Perc
ent
Chart 27: Russian Favorability of Eastern Neighborhood
56
Q4.6-9
42
4628
14
80
30
64

Transatlantic Trends 2014 57
European and U .S . Views on Russia Russian Global Leadership Seen as Undesirable by Europeans; United States Is SplitAsked about the desirability of Russian leadership in the world, more than two-thirds of Europeans (68%, up three percentage points from 2013) said they considered it undesirable. A majority of Amer-icans agreed, with 53% (up seven percentage points from 2013) saying they found Russian leader-ship undesirable, and 39% saying that they felt it was desirable (compared to 40% in 2013).1
In Europe, the view that Russian leadership was undesirable was held most strongly in Spain (84%, up three percentage points from 2013), Poland (81%, up six percentage points since 2013), Sweden (77%, up eight percentage points since 2013), France (72%, also up eight percentage points since 2013), and Turkey (71%, up four percentage points since 2013).
Greece was the only EU country where a majority said they found Russian leadership in the world desirable (52%); 40% disagreed.
In Germany, a majority of 59% said they found Russian leadership undesirable — but it was the only country in the survey where disapproval rates fell, by ten percentage points from 69% in 2013. Approval rates in Germany rose by 11 percentage points from 2013, to 38%.
Opinion of Russia Remains on Decline on Both Sides of the Atlantic Opinion of Russia continued to deteriorate, with 71% of Americans, up 12 percentage points since 2013 and 23 since 2012, saying their opinion was unfavorable; 68% of Europeans, up six percentage points since 2013 and thirteen since 2012, agreed. Swedes were particularly negative, with 78% describing their opinion as unfavorable, as were the Dutch, (73%). Greeks were moreover the only respondents with a positive impression of Russia — 65% described their opinion as favor-able. Sixty-eight percent of Turks described their opinion as unfavorable, while 20% described their opinion as favorable.2
Barack Obama’s Handling of Russia Meets with Approval in Europe, while United States Is SplitA majority of Europeans (52%) said they approved of President Barack Obama’s management of relations with Russia; however, the number of those who said they disapproved rose by 9 percentage points from 2013 to 35%. U.S. respondents were split, with 41% (down 12 percentage points from 2013) saying they approved, and 49% (up 15 percentage points from 2013) saying they disapproved. Approval rates were highest in the Netherlands (65%), Italy, and Sweden (both 62%). Disapproval rates were highest in Greece (62%) and Turkey (61%).3
Some of the highest changes in approval of President Obama’s Russia policy were seen in Turkey, where disapproval rates rose by 17 points from 2013, and Germany, where approval rates fell 10 percentage points from 2013 to 49%, and the number of those who said they disapproved rose 15 percentage points from 2013 to 43%. However, approval rates in Sweden rose by eight percentage points from 2013.
Europeans Split about their own Government’s Handling of RussiaTransatlantic Trends asked respondents for the first time whether they approved of their own govern-ment’s management of relations with Russia. Europeans were split, with 46% responding that they approved of their government’s policy, and 42% responding that they disapproved. Approval rates were highest in Germany and Sweden (both 56%), as well as the Netherlands (49%) and France and the United Kingdom (both 48%). Disapproval ran highest in Poland (55%), Turkey (54%), and Spain 1 Question 1c: How desirable is it that Russia exert strong leadership in world affairs?2 Question 4.4 Please tell me if you have a very favorable, somewhat favorable, somewhat unfavorable or very unfavorable opinion of Russia?3 Question 2.2: Do you approve or disapprove of the way the president of the United States, Barack Obama, is…? Managing rela-tions with Russia.

The German Marshall Fund of the United States58
(52%). Twenty-eight percent of Portuguese respondents and 21% of Spanish respondents did not know or refused to answer.4
Few Europeans Would Prefer to Work with the United States on Russia; Americans Split on Transatlantic CooperationTransatlantic Trends asked respondents for the first time whether their country, in managing its relationship with Russia, should work more closely with other members of the European Union, work closely with the United States, or take an independent approach. Europeans on average were split between working with their peers in the EU (45%), or charting a more independent course (41%). Only 9% said they wanted to work closely with the United States.5
France was the only country where a majority wanted to work closely with other EU member states (55%). Pluralities in Italy (49%), the Netherlands, Spain (both 48%), and Sweden (47%) agreed. In Germany, respondents were equally split between closer EU cooperation and independence (both 45%). Majorities or pluralities said they preferred a more independent course in Greece (60%), the United Kingdom (44%), Portugal (43%), Turkey (40%), and Poland (35%).
The highest approval ratings for working closely with the United States were found in Turkey (27%) and Poland (22%). All other approval rates for working with the United States ranged between 2% and 10%.
Meanwhile, U.S. respondents were split almost equally on this question. Forty-six percent said they wanted to work closely with the EU, while 48% preferred an independent approach.
4 Question 3.2: Do you approve or disapprove of the way [COUNTRY’S] government is...? Managing relations with Russia.5 Question 6a/b.1: And how about managing our relationship with Russia, should [COUNTRY]...?
0
20
40
60
80
Russia
Greece
Turke
yU.S.
Poland
Spain
GermanyEU
U.K.
France
Portuga
l
SwedenIta
ly
Netherl
ands
Own government
President Obama
Perc
ent
Chart 28: Approval of Relations with Russia
49
5356
27
56
46
65
33
56
47
59
48
40
Q2.2, 3.2
49
39
48
26
35
7
25
4141
45
52
6262

T ransatlantic Trends is a comprehensive annual survey of U.S. and European public opinion. Polling was conducted by TNS Opinion from June
2-26, 2014, in the United States, Turkey, Russia, and ten European Union member states: France, Germany, Greece, Italy, the Netherlands, Poland, Portugal, Spain, Sweden, and the United Kingdom. The survey is a project of the German Marshall Fund of the United States (GMF) and the Compagnia di San Paolo, with additional support from the Barrow Cadbury Trust, the Fundación BBVA, and the Swedish Ministry for Foreign Affairs.
The advisory committee for the survey included Pierangelo Isernia, professor of political science, University of Siena (Italy); Richard Eichenberg, associate professor of political science, Tufts University (United States), and Nicoló Russo Perez, program manager, Compagnia di San Paolo (Italy). For the immigration data, the advisers were Susan Martin, executive director, Institute for the Study of International
Migration, Georgetown University (United States); Claudia Diehl, professor of microsociology, University of Konstanz (Germany); and Ayesha Saran, programme manager, and Debbie Pippard, head of programmes, from the Barrow Cadbury Trust (United Kingdom).
The authors of the Key Findings Report were Constanze Stelzenmüller, senior transatlantic fellow and project lead for Transatlantic Trends; and Josh Raisher, program coor-dinator for Transatlantic Trends. Astrid Ziebarth, director, Migration and Society Program, and Tanja Wunderlich, senior transatlantic fellow, shaped the immigration section of the Key Findings report, and made important con-tributions to the overall analysis of the data. We wish to acknowledge the invaluable help of Linda Basile, postdoc-toral researcher at the University of Siena. Daniela Braun and Bridget Parker played a major role in creating the accompanying charts and provided other essential help dur-ing the preparation of this report.
Transatlantic Trends Program Note

A project of the German Marshall Fund of the United States and the Compagnia di San Paolo, with additional support from the Swedish Ministry for Foreign Affairs, the Barrow Cadbury Trust,
and the BBVA Foundation.
www.transatlantictrends.org