New drop weight analysis for surface tension determination of liquids
9
Colloids and Surfaces A: Physicochem. Eng. Aspects 332 (2009) 112–120 Contents lists available at ScienceDirect Colloids and Surfaces A: Physicochemical and Engineering Aspects journal homepage: www.elsevier.com/locate/colsurfa New drop weight analysis for surface tension determination of liquids Boon-Beng Lee, Pogaku Ravindra, Eng-Seng Chan ∗ Centre of Materials and Minerals, School of Engineering and Information Technology, Universiti Malaysia Sabah, 88999 Kota Kinabalu, Sabah, Malaysia article info Article history: Received 28 May 2008 Received in revised form 21 August 2008 Accepted 1 September 2008 Available online 9 September 2008 Keywords: Drop weight method Correction factors Bond number correlation Surface tension Viscosity LCP coefficient method abstract The validity of the existing drop weight analyses for determining surface tension could be influenced by the liquid properties. This study aimed to verify the validity of the Harkins–Brown correction factors and the Bond number correlation, as well as to develop a new drop weight analysis that is insensitive to liquid properties. The liquid samples of known surface tension and viscosity were chosen and classified into six different groups. Validation was done by comparing the data compiled in this study with the existing correlations as well as by dimensionless analysis. Results show that the existing drop weight analyses are valid for most liquid groups provided that the surface tension number (N ) exceeds 10 −1 or the Ohnersorge number (Oh) is below 10 2 . This, however, confirms the influence of liquid properties on the validity of the analyses. The LCP coefficient method was developed to eliminate this problem by using the drop weight results generated from multiple tips of different sizes. The surface tension could then be calculated by using a semi-empirical linear correlation. Error analysis shows that the LCP coefficient method gives the best reliability and accuracy among various drop weight analyses. © 2008 Elsevier B.V. All rights reserved. 1. Introduction Surface tension is a phenomenon caused by the cohesive forces between liquid molecules. It is an effect within the surface film of a liquid that causes the film to behave like an elastic sheet [1,2]. Commonly it is measured in mN/m or mJ/m 2 depending on how it is defined [3]. The knowledge of surface tension is useful for many applications and processes as the surface tension governs the chem- ical and physical behavior of liquids. It can be used to determine the quality of numerous industrial products such as paints, ink jet prod- ucts, detergents, cosmetics, pharmaceuticals, lubricants, pesticides and food products. Also, it has profound effect on some steps in industrial processes such as adsorption, distillation and extraction [4,5]. Many methods have been established to measure the surface tension of liquids such as the capillary rise method, drop weight method, du Nouy ring method, Wilhelmy plate method, spinning drop method, pendant drop method and sessile drop method. The choice of the method depends on the nature and stability of the liquid being measured, the measurement conditions, precision, reliability and the instrumentation cost. Among these methods, drop weight could be considered as one of the oldest and it is still widely used. This method is popular because it is inexpensive and the set-up is simple [6–8]. A typical drop weight apparatus consists ∗ Corresponding author. Tel.: +60 88 320 000; fax: +60 88 320 348. E-mail addresses: [email protected], [email protected] (E.-S. Chan). of a single dripping tip of known diameter, a liquid delivery system and a weighing balance. The principle of drop weight method is based on Tate’s law which approximates the balance between the gravitational force pulling the drop down (or the drop weight) and the surface ten- sion force holding the drop pendant to the tip at the instant of drop detachment [9]. In this method liquid is allowed to drip slowly from a dripping tip of known radius and the weight of the collected liq- uid droplets is measured. Surface tension could then be calculated from force balance as shown in Eq. (1): = mg 2r (1) where is the surface tension of the droplet–air interface, m is the mass of the falling droplet, g is the gravitational acceleration and r is the radius of dripping tip. In reality, it is well known that only a portion of a pendant drop that is grown from a dripping tip breaks away from it while a smaller fraction of the pendant drop remains undetached from the tip [9–18]. This inevitably results in smaller detached drop, or less weight, thus leading to an underestimation of the liquid sur- face tension. Over many decades, this problem has been usually rectified by multiplying the calculated surface tension value with a factor that can be determined from an experimental curve devel- oped by Harkins and Brown (HB) [11]. The curve is a plot of the fraction of the ideal drop volume, (r/V 1/3 )= V/V Ideal , as a function of the dimensionless tip radius, r/V 1/3 . Once the actual drop vol- ume, V (and hence r/V 1/3 ), is known, the correction factor (r/V 1/3 ) 0927-7757/$ – see front matter © 2008 Elsevier B.V. All rights reserved. doi:10.1016/j.colsurfa.2008.09.003
Transcript of New drop weight analysis for surface tension determination of liquids
Colloids and Surfaces A: Physicochem. Eng. Aspects 332 (2009) 112–120
Contents lists available at ScienceDirect
Colloids and Surfaces A: Physicochemical andEngineering Aspects
journa l homepage: www.e lsev ier .com/ locate /co lsur fa
New drop weight analysis for surface tension determination of liquids
Boon-Beng Lee, Pogaku Ravindra, Eng-Seng Chan ∗
Centre of Materials and Minerals, School of Engineering and Information Technology, Universiti Malaysia Sabah, 88999 Kota Kinabalu, Sabah, Malaysia
a r t i c l e i n f o
Article history:Received 28 May 2008Received in revised form 21 August 2008Accepted 1 September 2008Available online 9 September 2008
Keywords:Drop weight methodCorrection factors
a b s t r a c t
The validity of the existing drop weight analyses for determining surface tension could be influenced bythe liquid properties. This study aimed to verify the validity of the Harkins–Brown correction factors andthe Bond number correlation, as well as to develop a new drop weight analysis that is insensitive to liquidproperties. The liquid samples of known surface tension and viscosity were chosen and classified intosix different groups. Validation was done by comparing the data compiled in this study with the existingcorrelations as well as by dimensionless analysis. Results show that the existing drop weight analyses arevalid for most liquid groups provided that the surface tension number (N� ) exceeds 10−1 or the Ohnersorgenumber (Oh) is below 102. This, however, confirms the influence of liquid properties on the validity of theanalyses. The LCP coefficient method was developed to eliminate this problem by using the drop weight
Bond number correlationSurface tensionViscosityL
results generated from multiple tips of different sizes. The surface tension could then be calculated byusing a semi-empirical linear correlation. Error analysis shows that the LCP coefficient method gives the
cy am
1
baCiaiquai[
tmdclrdwt
oa
wpsdauf
�
wmi
dat
0d
CP coefficient method best reliability and accura
. Introduction
Surface tension is a phenomenon caused by the cohesive forcesetween liquid molecules. It is an effect within the surface film ofliquid that causes the film to behave like an elastic sheet [1,2].ommonly it is measured in mN/m or mJ/m2 depending on how it
s defined [3]. The knowledge of surface tension is useful for manypplications and processes as the surface tension governs the chem-cal and physical behavior of liquids. It can be used to determine theuality of numerous industrial products such as paints, ink jet prod-cts, detergents, cosmetics, pharmaceuticals, lubricants, pesticidesnd food products. Also, it has profound effect on some steps inndustrial processes such as adsorption, distillation and extraction4,5].
Many methods have been established to measure the surfaceension of liquids such as the capillary rise method, drop weight
ethod, du Nouy ring method, Wilhelmy plate method, spinningrop method, pendant drop method and sessile drop method. Thehoice of the method depends on the nature and stability of theiquid being measured, the measurement conditions, precision,
eliability and the instrumentation cost. Among these methods,rop weight could be considered as one of the oldest and it is stillidely used. This method is popular because it is inexpensive andhe set-up is simple [6–8]. A typical drop weight apparatus consists
∗ Corresponding author. Tel.: +60 88 320 000; fax: +60 88 320 348.E-mail addresses: [email protected], [email protected] (E.-S. Chan).
lfraofou
927-7757/$ – see front matter © 2008 Elsevier B.V. All rights reserved.oi:10.1016/j.colsurfa.2008.09.003
ong various drop weight analyses.© 2008 Elsevier B.V. All rights reserved.
f a single dripping tip of known diameter, a liquid delivery systemnd a weighing balance.
The principle of drop weight method is based on Tate’s lawhich approximates the balance between the gravitational forceulling the drop down (or the drop weight) and the surface ten-ion force holding the drop pendant to the tip at the instant of dropetachment [9]. In this method liquid is allowed to drip slowly fromdripping tip of known radius and the weight of the collected liq-id droplets is measured. Surface tension could then be calculatedrom force balance as shown in Eq. (1):
= mg
2�r(1)
here � is the surface tension of the droplet–air interface, m is theass of the falling droplet, g is the gravitational acceleration and r
s the radius of dripping tip.In reality, it is well known that only a portion of a pendant
rop that is grown from a dripping tip breaks away from it whilesmaller fraction of the pendant drop remains undetached from
he tip [9–18]. This inevitably results in smaller detached drop, oress weight, thus leading to an underestimation of the liquid sur-ace tension. Over many decades, this problem has been usuallyectified by multiplying the calculated surface tension value with
factor that can be determined from an experimental curve devel-ped by Harkins and Brown (HB) [11]. The curve is a plot of theraction of the ideal drop volume, � (r/V1/3) = V/VIdeal, as a functionf the dimensionless tip radius, r/V1/3. Once the actual drop vol-me, V (and hence r/V1/3), is known, the correction factor� (r/V1/3)
B.-B. Lee et al. / Colloids and Surfaces A: Physico
Nomenclature
a capillary constant, a =(2�/(��g)1/2)BO Bond number, BO = r2�g/�C1, C2 coefficients of quadratic equation between drop
weight and dripping tip radiusg gravitational force, 981 cm/s2
m mass of falling drop (g)N� surface tension number, N� = r�/�2
Oh Ohnesorge number, Oh =�/(�r�)1/2
r radius of dripping tip (cm)V volume of a detached drop (cm3)VIdeal ideal drop volume–volume of detached drop that
obey Tate’s lawWe Weber number, We =�Q2/�2r3�
Greek letters� surface tension (mN/m)� viscosity (cP)� kinematic viscosity (mm2/s)� density (g/ml)
cc
�
te�hwwBaram
fit[sr(iddd
i
�
w
c[
tados((dW
B
f
�
dtoisdcdsldddrca
2
2
TorfoeCvliquid viscosity according to the standard procedures. In this study,
� (r/V/1/3) drop weight correction factor in function of(r/V1/3)
an be determined from the curve. The surface tension can then bealculated by using Eq. (2):
= mg
2�r (r/V1/3)(2)
Harkins and Brown’s [11] work included r/V1/3 range from 0.31o 1.225 and � (r/V1/3) from 0.535 to 0.721. The range was laterxpanded by other investigators with r/V1/3 from 0.0638 to 4.45 and(r/V1/3) from 0.19 to 0.94 [6,12,17]. Various mathematical models
ave been developed for determination of the correction factorsithout referring to the experimental curve. In general, the modelsere developed based on the experimental data from Harkins andrown [11] and/or Wilkinson [6]. They are usually in the form ofpolynomial equation [6,12,13,19]. An accurate model with a wide
ange of r/V1/3 (from 0 to 1.20) has been proposed recently by theuthors [12]. The model is known as the Lee–Chan–Pogaku (LCP)odel and it is described by Eq. (3).
(r
V1/3
)= 1.000 − 0.9121
(r
V1/3
)− 2.109
(r
V1/3
)2
+13.38(
r
V1/3
)3− 27.29
(r
V1/3
)4+ 27.53
(r
V1/3
)5
−13.58(
r
V1/3
)6+ 2.593
(r
V1/3
)7(3)
In the past, the issue on the applicability of the HB correctionactors for various liquids has been of much interest. Many stud-es have reported that the correction factors could be affected byhe liquid properties such as density, viscosity and surface tension14,15,18,20–22]. Some studies have suggested that the surface ten-ion number (N� =�r�/�2 where � is the liquid viscosity) mustemain much larger than unity [23] or the Ohnersorge numberOh =�/(�r�)1/2) must be smaller than unity [10] in order to elim-
nate the influence of liquid rheological behavior when using therop weight method. Furthermore, an empirical equation has beeneveloped to correct Eq. (2) by offsetting the viscosity effect inetermining the surface tension of viscous liquid (up to 30 cP) andtt1l
chem. Eng. Aspects 332 (2009) 112–120 113
t is shown in Eq. (4) [24]:
=(
mg
2�r (r/V1/3)
)
×(
1 − [(0.028r + 0.0145) ln(�) + (0.0134r + 0.0096)]t
)(4)
here � is the kinematic viscosity and t is the drop formation time.On the contrary, another study has shown that the liquid vis-
osity of up to 10,000 cP had no effect on the HB correction factors25].
In the recent years, a new correlation has been developedhrough the computations of the dynamics of drop formation fromcapillary by solving numerically the one-dimensional (1d) slen-er jet equations [10]. The work improved the theoretical basisf the drop weight method by showing a functional relation-hip between the parameter r/V1/3, the gravitational Bond numberBO = r2�g/�), the Ohnesorge number (Oh) and the Weber numberWe =�Q2/�2r3� where Q is the volumetric flow rate). A simpleimensionless correlation has been deduced within the limits of theeber number and Ohnersorge number and it is shown as follows:
O = 3.60(
3V1/3
)2.81(5)
Rearrangement of Eq. (5) allows calculation of surface tensionrom Eq. (6):
= r2�g
[3.60(r/V1/3)2.81](6)
This aim of this study was to verify the validity of the existingrop weight analyses, namely the Harkins–Brown correction fac-ors and Bond number correlation, in determining surface tensionf various liquids and to develop a new drop weight analysis thats independent of liquid properties. The sample liquids of knownurface tension and viscosity were chosen and classified into sixifferent groups. Validation was performed by comparing the dataompiled in this study with the existing correlations as well as byimensionless analysis. Surface tension number (N� ) and Ohner-orge number (Oh) was used to determine the relative effect ofiquid viscosity and surface tension and hence, the limits for therop weight analyses to remain valid could be found. Finally, a newrop weight analysis (the LCP coefficient method) that is indepen-ent of liquid properties was developed by using the drop weightesults generated from multiple tips. Statistical error analysis wasonducted to compare the accuracy and reliability of all drop weightnalyses for determination of surface tension values.
. Materials and methods
.1. Classification of liquids
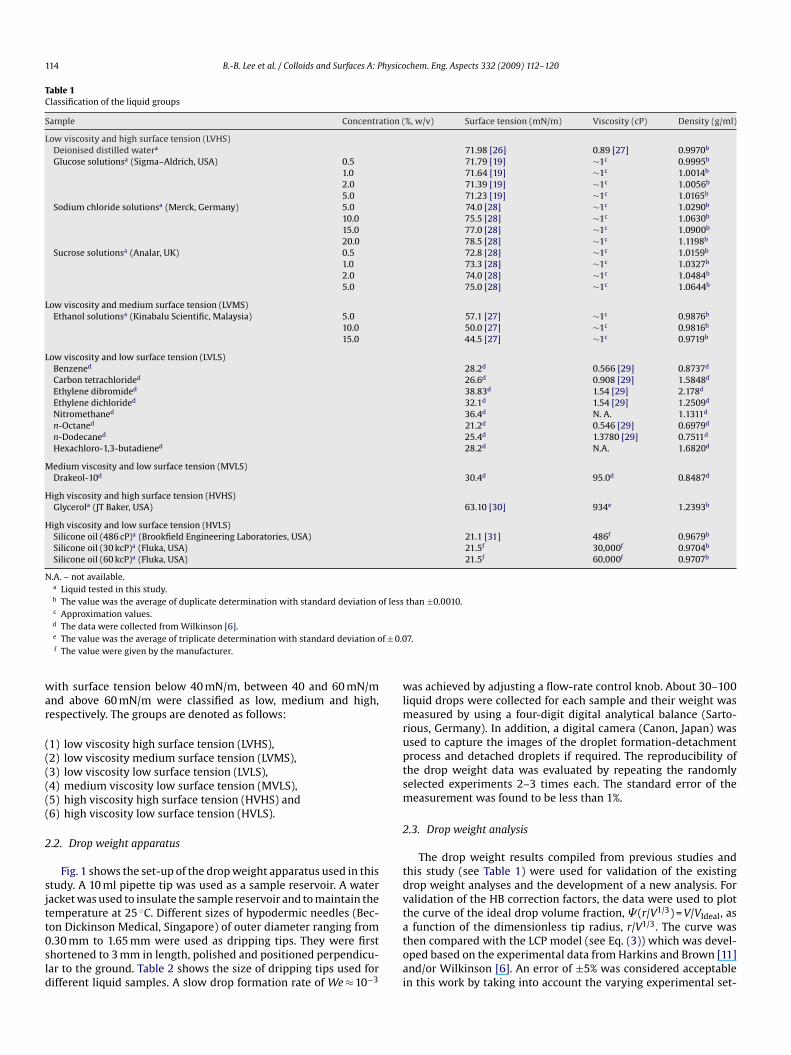
Table 1 compiles the liquids which were examined in this study.he liquids of known surface tension value from previous studiesr manufacturer were chosen so that the value could be used aseferences. Experiments were also conducted to validate the sur-ace tension of some liquids. The liquid viscosity and density werebtained from previous studies or manufacturers if available. Oth-rwise, a digital density meter (Kyoto Electronics Manufacturingo. Ltd., Japan) was used to measure liquid density at 25 ◦C and aiscometer (Brookfield Engineering, USA) was used to measure the
he liquids were classified into six different groups according toheir viscosity and surface tension. The liquids with viscosity below0 cP, between 10 and 100 cP and above 1000 cP were referred asow, medium and high, respectively. On the other hand, the liquids
114 B.-B. Lee et al. / Colloids and Surfaces A: Physicochem. Eng. Aspects 332 (2009) 112–120
Table 1Classification of the liquid groups
Sample Concentration (%, w/v) Surface tension (mN/m) Viscosity (cP) Density (g/ml)
Low viscosity and high surface tension (LVHS)Deionised distilled watera 71.98 [26] 0.89 [27] 0.9970b
Glucose solutionsa (Sigma–Aldrich, USA) 0.5 71.79 [19] ∼1c 0.9995b
1.0 71.64 [19] ∼1c 1.0014b
2.0 71.39 [19] ∼1c 1.0056b
5.0 71.23 [19] ∼1c 1.0165b
Sodium chloride solutionsa (Merck, Germany) 5.0 74.0 [28] ∼1c 1.0290b
10.0 75.5 [28] ∼1c 1.0630b
15.0 77.0 [28] ∼1c 1.0900b
20.0 78.5 [28] ∼1c 1.1198b
Sucrose solutionsa (Analar, UK) 0.5 72.8 [28] ∼1c 1.0159b
1.0 73.3 [28] ∼1c 1.0327b
2.0 74.0 [28] ∼1c 1.0484b
5.0 75.0 [28] ∼1c 1.0644b
Low viscosity and medium surface tension (LVMS)Ethanol solutionsa (Kinabalu Scientific, Malaysia) 5.0 57.1 [27] ∼1c 0.9876b
10.0 50.0 [27] ∼1c 0.9816b
15.0 44.5 [27] ∼1c 0.9719b
Low viscosity and low surface tension (LVLS)Benzened 28.2d 0.566 [29] 0.8737d
Carbon tetrachlorided 26.6d 0.908 [29] 1.5848d
Ethylene dibromided 38.83d 1.54 [29] 2.178d
Ethylene dichlorided 32.1d 1.54 [29] 1.2509d
Nitromethaned 36.4d N. A. 1.1311d
n-Octaned 21.2d 0.546 [29] 0.6979d
n-Dodecaned 25.4d 1.3780 [29] 0.7511d
Hexachloro-1,3-butadiened 28.2d N.A. 1.6820d
Medium viscosity and low surface tension (MVLS)Drakeol-10d 30.4d 95.0d 0.8487d
High viscosity and high surface tension (HVHS)Glycerola (JT Baker, USA) 63.10 [30] 934e 1.2393b
High viscosity and low surface tension (HVLS)Silicone oil (486 cP)a (Brookfield Engineering Laboratories, USA) 21.1 [31] 486f 0.9679b
Silicone oil (30 kcP)a (Fluka, USA) 21.5f 30,000f 0.9704b
Silicone oil (60 kcP)a (Fluka, USA) 21.5f 60,000f 0.9707b
N.A. – not available.a Liquid tested in this study.b The value was the average of duplicate determination with standard deviation of less than ±0.0010.c Approximation values.
f ± 0.0
war
((((((
2
sjtt0sld
wlmruptsm
2
tdvt
d The data were collected from Wilkinson [6].e The value was the average of triplicate determination with standard deviation of The value were given by the manufacturer.
ith surface tension below 40 mN/m, between 40 and 60 mN/mnd above 60 mN/m were classified as low, medium and high,espectively. The groups are denoted as follows:
1) low viscosity high surface tension (LVHS),2) low viscosity medium surface tension (LVMS),3) low viscosity low surface tension (LVLS),4) medium viscosity low surface tension (MVLS),5) high viscosity high surface tension (HVHS) and6) high viscosity low surface tension (HVLS).
.2. Drop weight apparatus
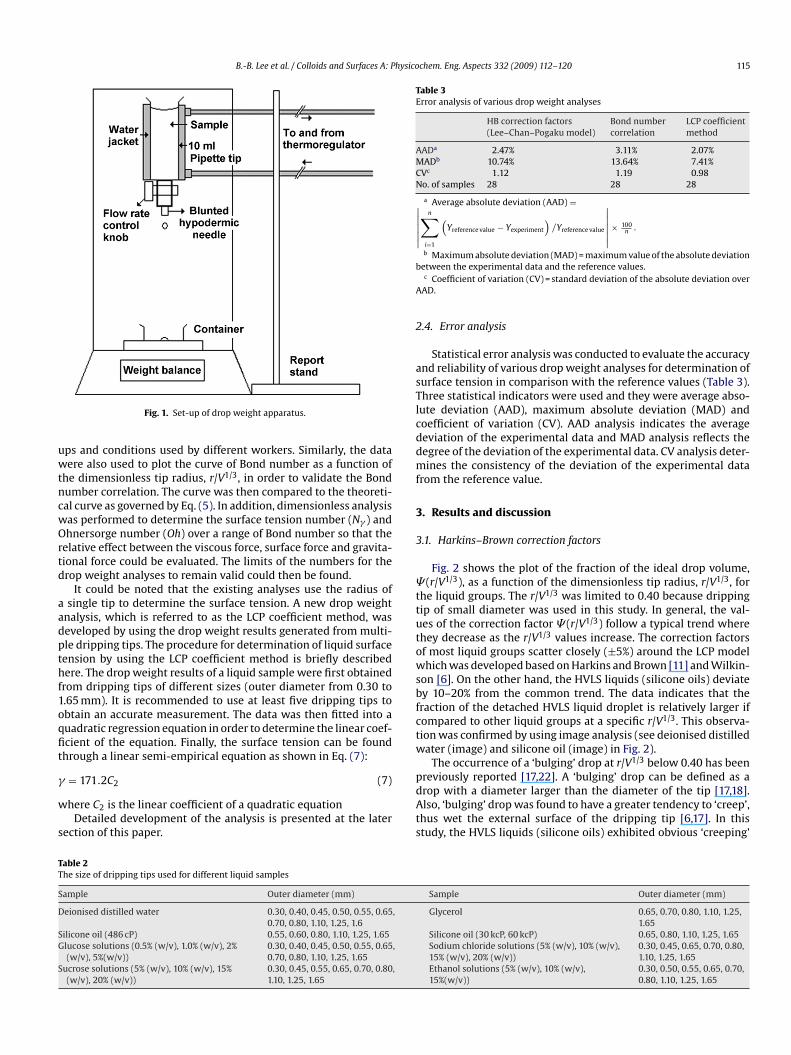
Fig. 1 shows the set-up of the drop weight apparatus used in thistudy. A 10 ml pipette tip was used as a sample reservoir. A wateracket was used to insulate the sample reservoir and to maintain theemperature at 25 ◦C. Different sizes of hypodermic needles (Bec-
on Dickinson Medical, Singapore) of outer diameter ranging from.30 mm to 1.65 mm were used as dripping tips. They were firsthortened to 3 mm in length, polished and positioned perpendicu-ar to the ground. Table 2 shows the size of dripping tips used forifferent liquid samples. A slow drop formation rate of We ≈ 10−3atoai
7.
as achieved by adjusting a flow-rate control knob. About 30–100iquid drops were collected for each sample and their weight was
easured by using a four-digit digital analytical balance (Sarto-ious, Germany). In addition, a digital camera (Canon, Japan) wassed to capture the images of the droplet formation-detachmentrocess and detached droplets if required. The reproducibility ofhe drop weight data was evaluated by repeating the randomlyelected experiments 2–3 times each. The standard error of theeasurement was found to be less than 1%.
.3. Drop weight analysis
The drop weight results compiled from previous studies andhis study (see Table 1) were used for validation of the existingrop weight analyses and the development of a new analysis. Foralidation of the HB correction factors, the data were used to plothe curve of the ideal drop volume fraction, � (r/V1/3) = V/VIdeal, as
function of the dimensionless tip radius, r/V1/3. The curve washen compared with the LCP model (see Eq. (3)) which was devel-ped based on the experimental data from Harkins and Brown [11]nd/or Wilkinson [6]. An error of ±5% was considered acceptablen this work by taking into account the varying experimental set-
B.-B. Lee et al. / Colloids and Surfaces A: Physicochem. Eng. Aspects 332 (2009) 112–120 115
uwtncwOrtd
aadpthf1oqfit
�
w
s
Table 3Error analysis of various drop weight analyses
HB correction factors(Lee–Chan–Pogaku model)
Bond numbercorrelation
LCP coefficientmethod
AADa 2.47% 3.11% 2.07%MADb 10.74% 13.64% 7.41%CVc 1.12 1.19 0.98No. of samples 28 28 28
a Average absolute deviation (AAD) =∣∣∣∣∣n∑i=1
(Yreference value − Yexperiment
)/Yreference value
∣∣∣∣∣ × 100n .
b Maximum absolute deviation (MAD) = maximum value of the absolute deviationb
A
2
asTlcddmf
3
3
�ttutowsbfctw
TT
S
D
SG
S
Fig. 1. Set-up of drop weight apparatus.
ps and conditions used by different workers. Similarly, the dataere also used to plot the curve of Bond number as a function of
he dimensionless tip radius, r/V1/3, in order to validate the Bondumber correlation. The curve was then compared to the theoreti-al curve as governed by Eq. (5). In addition, dimensionless analysisas performed to determine the surface tension number (N� ) andhnersorge number (Oh) over a range of Bond number so that the
elative effect between the viscous force, surface force and gravita-ional force could be evaluated. The limits of the numbers for therop weight analyses to remain valid could then be found.
It could be noted that the existing analyses use the radius ofsingle tip to determine the surface tension. A new drop weight
nalysis, which is referred to as the LCP coefficient method, waseveloped by using the drop weight results generated from multi-le dripping tips. The procedure for determination of liquid surfaceension by using the LCP coefficient method is briefly describedere. The drop weight results of a liquid sample were first obtained
rom dripping tips of different sizes (outer diameter from 0.30 to.65 mm). It is recommended to use at least five dripping tips tobtain an accurate measurement. The data was then fitted into auadratic regression equation in order to determine the linear coef-cient of the equation. Finally, the surface tension can be foundhrough a linear semi-empirical equation as shown in Eq. (7):
= 171.2C2 (7)
here C2 is the linear coefficient of a quadratic equationDetailed development of the analysis is presented at the later
ection of this paper.
pdAts
able 2he size of dripping tips used for different liquid samples
ample Outer diameter (mm)
eionised distilled water 0.30, 0.40, 0.45, 0.50, 0.55, 0.65,0.70, 0.80, 1.10, 1.25, 1.6
ilicone oil (486 cP) 0.55, 0.60, 0.80, 1.10, 1.25, 1.65lucose solutions (0.5% (w/v), 1.0% (w/v), 2%(w/v), 5%(w/v))
0.30, 0.40, 0.45, 0.50, 0.55, 0.65,0.70, 0.80, 1.10, 1.25, 1.65
ucrose solutions (5% (w/v), 10% (w/v), 15%(w/v), 20% (w/v))
0.30, 0.45, 0.55, 0.65, 0.70, 0.80,1.10, 1.25, 1.65
etween the experimental data and the reference values.c Coefficient of variation (CV) = standard deviation of the absolute deviation over
AD.
.4. Error analysis
Statistical error analysis was conducted to evaluate the accuracynd reliability of various drop weight analyses for determination ofurface tension in comparison with the reference values (Table 3).hree statistical indicators were used and they were average abso-ute deviation (AAD), maximum absolute deviation (MAD) andoefficient of variation (CV). AAD analysis indicates the averageeviation of the experimental data and MAD analysis reflects theegree of the deviation of the experimental data. CV analysis deter-ines the consistency of the deviation of the experimental data
rom the reference value.
. Results and discussion
.1. Harkins–Brown correction factors
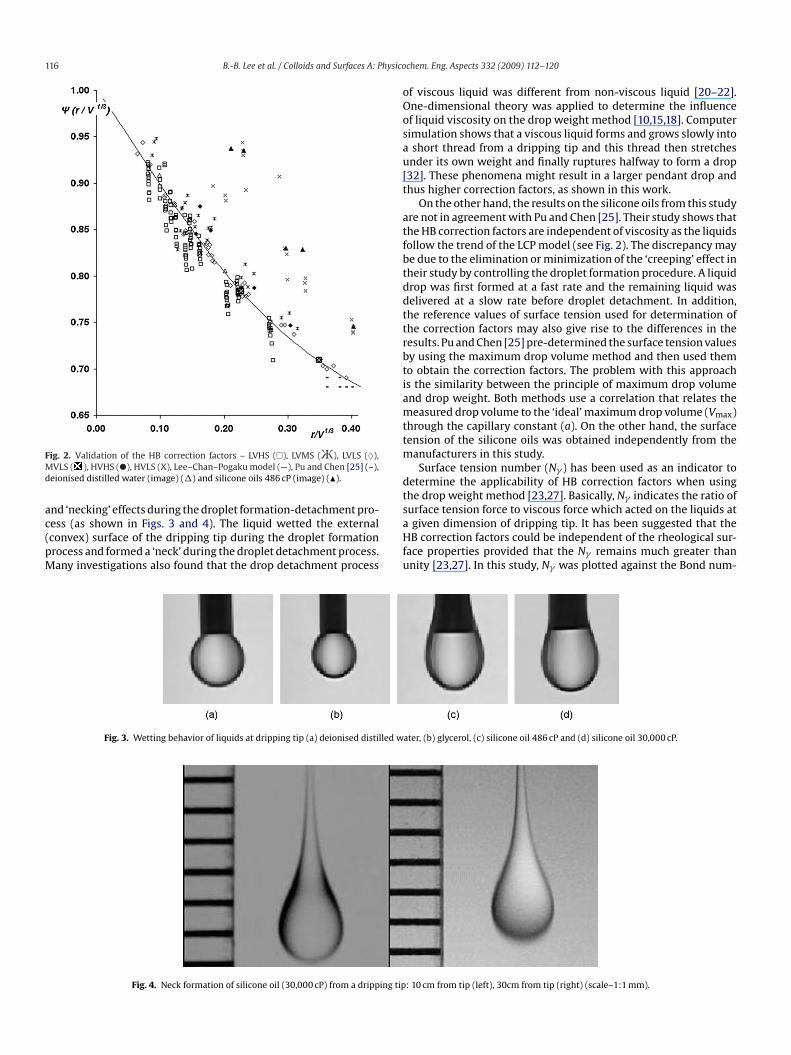
Fig. 2 shows the plot of the fraction of the ideal drop volume,(r/V1/3), as a function of the dimensionless tip radius, r/V1/3, for
he liquid groups. The r/V1/3 was limited to 0.40 because drippingip of small diameter was used in this study. In general, the val-es of the correction factor � (r/V1/3) follow a typical trend wherehey decrease as the r/V1/3 values increase. The correction factorsf most liquid groups scatter closely (±5%) around the LCP modelhich was developed based on Harkins and Brown [11] and Wilkin-
on [6]. On the other hand, the HVLS liquids (silicone oils) deviatey 10–20% from the common trend. The data indicates that theraction of the detached HVLS liquid droplet is relatively larger ifompared to other liquid groups at a specific r/V1/3. This observa-ion was confirmed by using image analysis (see deionised distilledater (image) and silicone oil (image) in Fig. 2).
The occurrence of a ‘bulging’ drop at r/V1/3 below 0.40 has beenreviously reported [17,22]. A ‘bulging’ drop can be defined as a
rop with a diameter larger than the diameter of the tip [17,18].lso, ‘bulging’ drop was found to have a greater tendency to ‘creep’,hus wet the external surface of the dripping tip [6,17]. In thistudy, the HVLS liquids (silicone oils) exhibited obvious ‘creeping’
Sample Outer diameter (mm)
Glycerol 0.65, 0.70, 0.80, 1.10, 1.25,1.65
Silicone oil (30 kcP, 60 kcP) 0.65, 0.80, 1.10, 1.25, 1.65Sodium chloride solutions (5% (w/v), 10% (w/v),15% (w/v), 20% (w/v))
0.30, 0.45, 0.65, 0.70, 0.80,1.10, 1.25, 1.65
Ethanol solutions (5% (w/v), 10% (w/v),15%(w/v))
0.30, 0.50, 0.55, 0.65, 0.70,0.80, 1.10, 1.25, 1.65
116 B.-B. Lee et al. / Colloids and Surfaces A: Physico
FMd
ac(pM
oOosau[t
atfbtddttrbtiamttm
dt
ig. 2. Validation of the HB correction factors – LVHS (�), LVMS (Ж), LVLS (♦),VLS ( ), HVHS (�), HVLS (X), Lee–Chan–Pogaku model (—), Pu and Chen [25] (–),
eionised distilled water (image) (�) and silicone oils 486 cP (image) (�).
nd ‘necking’ effects during the droplet formation-detachment pro-ess (as shown in Figs. 3 and 4). The liquid wetted the externalconvex) surface of the dripping tip during the droplet formationrocess and formed a ‘neck’ during the droplet detachment process.any investigations also found that the drop detachment process
saHfu
Fig. 3. Wetting behavior of liquids at dripping tip (a) deionised distilled w
Fig. 4. Neck formation of silicone oil (30,000 cP) from a dripping tip
chem. Eng. Aspects 332 (2009) 112–120
f viscous liquid was different from non-viscous liquid [20–22].ne-dimensional theory was applied to determine the influencef liquid viscosity on the drop weight method [10,15,18]. Computerimulation shows that a viscous liquid forms and grows slowly intoshort thread from a dripping tip and this thread then stretchesnder its own weight and finally ruptures halfway to form a drop32]. These phenomena might result in a larger pendant drop andhus higher correction factors, as shown in this work.
On the other hand, the results on the silicone oils from this studyre not in agreement with Pu and Chen [25]. Their study shows thathe HB correction factors are independent of viscosity as the liquidsollow the trend of the LCP model (see Fig. 2). The discrepancy maye due to the elimination or minimization of the ‘creeping’ effect inheir study by controlling the droplet formation procedure. A liquidrop was first formed at a fast rate and the remaining liquid waselivered at a slow rate before droplet detachment. In addition,he reference values of surface tension used for determination ofhe correction factors may also give rise to the differences in theesults. Pu and Chen [25] pre-determined the surface tension valuesy using the maximum drop volume method and then used themo obtain the correction factors. The problem with this approachs the similarity between the principle of maximum drop volumend drop weight. Both methods use a correlation that relates theeasured drop volume to the ‘ideal’ maximum drop volume (Vmax)
hrough the capillary constant (a). On the other hand, the surfaceension of the silicone oils was obtained independently from the
anufacturers in this study.Surface tension number (N� ) has been used as an indicator to
etermine the applicability of HB correction factors when usinghe drop weight method [23,27]. Basically, N� indicates the ratio of
urface tension force to viscous force which acted on the liquids atgiven dimension of dripping tip. It has been suggested that theB correction factors could be independent of the rheological sur-ace properties provided that the N� remains much greater thannity [23,27]. In this study, N� was plotted against the Bond num-
ater, (b) glycerol, (c) silicone oil 486 cP and (d) silicone oil 30,000 cP.
: 10 cm from tip (left), 30cm from tip (right) (scale–1:1 mm).
B.-B. Lee et al. / Colloids and Surfaces A: Physicochem. Eng. Aspects 332 (2009) 112–120 117
F(
bdBsaBsn[
ttNrf1ssaasem
F(
ttt3
fs‘wr
3
sgatsEfrom the Bond number correlation incurred more than 10% error
TS
A
RHMBL
T
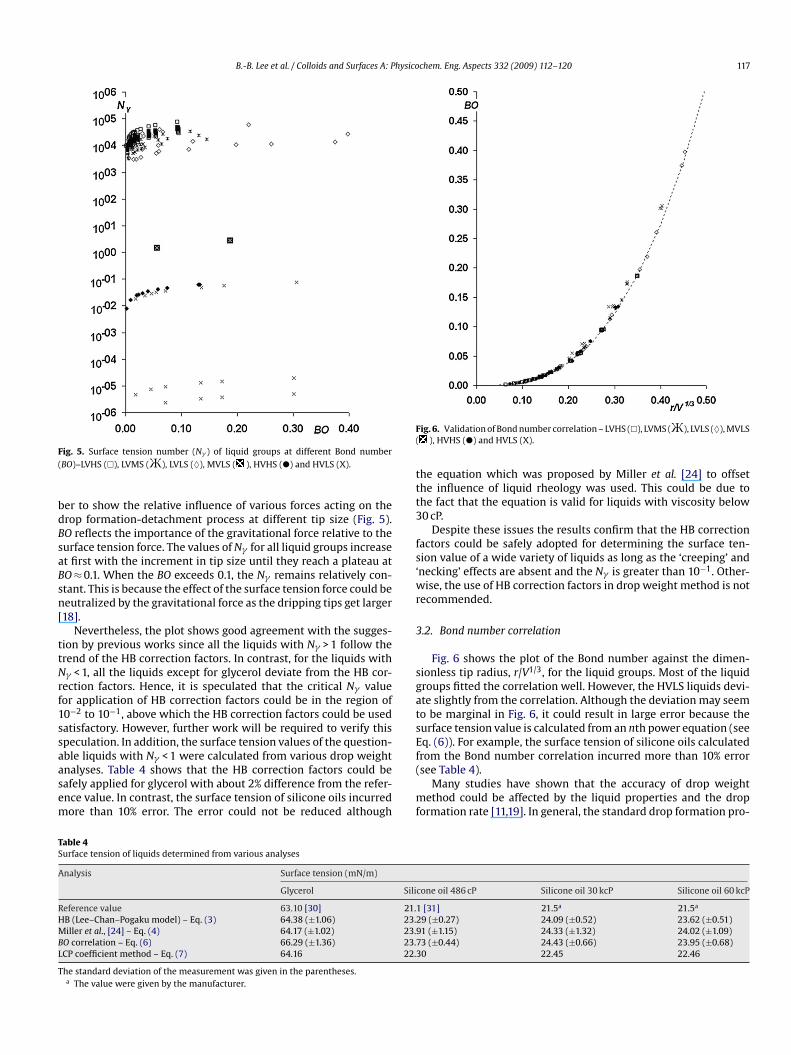
ig. 5. Surface tension number (N� ) of liquid groups at different Bond numberBO)–LVHS (�), LVMS (Ж), LVLS (♦), MVLS ( ), HVHS (�) and HVLS (X).
er to show the relative influence of various forces acting on therop formation-detachment process at different tip size (Fig. 5).O reflects the importance of the gravitational force relative to theurface tension force. The values of N� for all liquid groups increaset first with the increment in tip size until they reach a plateau atO ≈ 0.1. When the BO exceeds 0.1, the N� remains relatively con-tant. This is because the effect of the surface tension force could beeutralized by the gravitational force as the dripping tips get larger18].
Nevertheless, the plot shows good agreement with the sugges-ion by previous works since all the liquids with N� > 1 follow therend of the HB correction factors. In contrast, for the liquids with� < 1, all the liquids except for glycerol deviate from the HB cor-
ection factors. Hence, it is speculated that the critical N� valueor application of HB correction factors could be in the region of0−2 to 10−1, above which the HB correction factors could be usedatisfactory. However, further work will be required to verify thispeculation. In addition, the surface tension values of the question-ble liquids with N� < 1 were calculated from various drop weight
nalyses. Table 4 shows that the HB correction factors could beafely applied for glycerol with about 2% difference from the refer-nce value. In contrast, the surface tension of silicone oils incurredore than 10% error. The error could not be reduced although(
mf
able 4urface tension of liquids determined from various analyses
nalysis Surface tension (mN/m)
Glycerol Sili
eference value 63.10 [30] 21.1B (Lee–Chan–Pogaku model) – Eq. (3) 64.38 (±1.06) 23.2iller et al., [24] – Eq. (4) 64.17 (±1.02) 23.9
O correlation – Eq. (6) 66.29 (±1.36) 23.7CP coefficient method – Eq. (7) 64.16 22.3
he standard deviation of the measurement was given in the parentheses.a The value were given by the manufacturer.
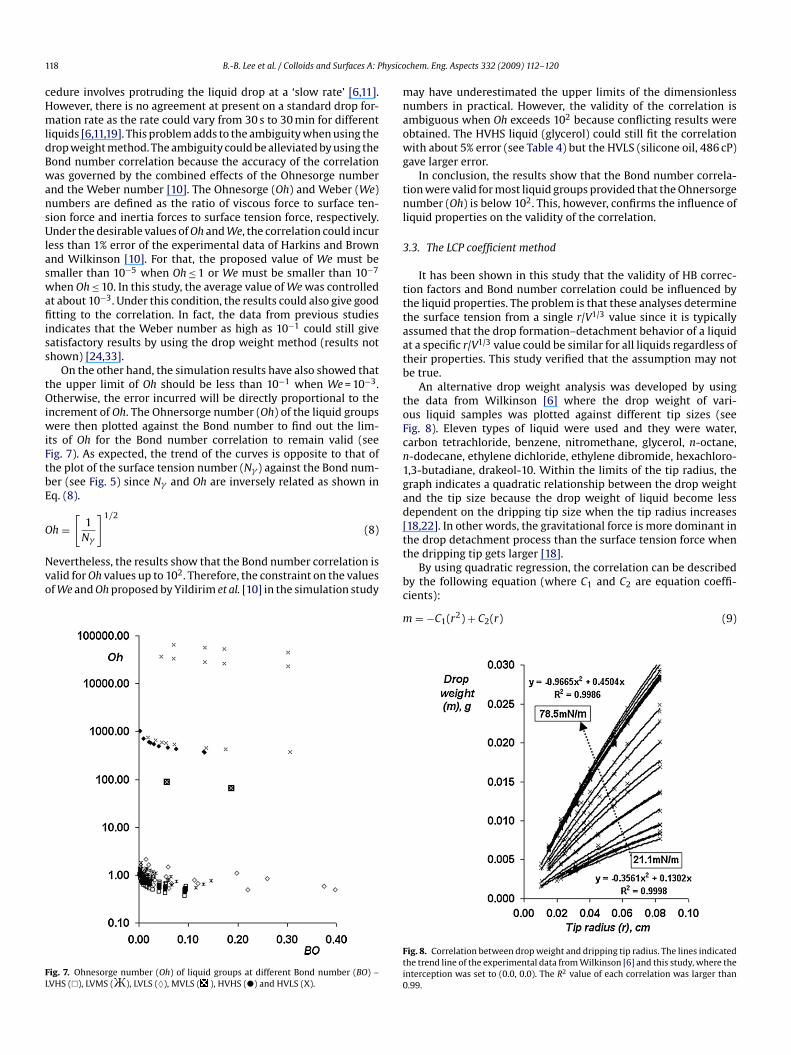
ig. 6. Validation of Bond number correlation – LVHS (�), LVMS (Ж), LVLS (♦), MVLS), HVHS (�) and HVLS (X).
he equation which was proposed by Miller et al. [24] to offsethe influence of liquid rheology was used. This could be due tohe fact that the equation is valid for liquids with viscosity below0 cP.
Despite these issues the results confirm that the HB correctionactors could be safely adopted for determining the surface ten-ion value of a wide variety of liquids as long as the ‘creeping’ andnecking’ effects are absent and the N� is greater than 10−1. Other-
ise, the use of HB correction factors in drop weight method is notecommended.
.2. Bond number correlation
Fig. 6 shows the plot of the Bond number against the dimen-ionless tip radius, r/V1/3, for the liquid groups. Most of the liquidroups fitted the correlation well. However, the HVLS liquids devi-te slightly from the correlation. Although the deviation may seemo be marginal in Fig. 6, it could result in large error because theurface tension value is calculated from an nth power equation (seeq. (6)). For example, the surface tension of silicone oils calculated
see Table 4).Many studies have shown that the accuracy of drop weight
ethod could be affected by the liquid properties and the dropormation rate [11,19]. In general, the standard drop formation pro-
cone oil 486 cP Silicone oil 30 kcP Silicone oil 60 kcP
[31] 21.5a 21.5a
9 (±0.27) 24.09 (±0.52) 23.62 (±0.51)1 (±1.15) 24.33 (±1.32) 24.02 (±1.09)3 (±0.44) 24.43 (±0.66) 23.95 (±0.68)0 22.45 22.46
1 hysico
cHmldBwansUlaswafiiss
tOiwiFtbE
O
Nvo
FL
mnaowg
tnl
3
tttaatb
toFcn1gad[
18 B.-B. Lee et al. / Colloids and Surfaces A: P
edure involves protruding the liquid drop at a ‘slow rate’ [6,11].owever, there is no agreement at present on a standard drop for-ation rate as the rate could vary from 30 s to 30 min for different
iquids [6,11,19]. This problem adds to the ambiguity when using therop weight method. The ambiguity could be alleviated by using theond number correlation because the accuracy of the correlationas governed by the combined effects of the Ohnesorge number
nd the Weber number [10]. The Ohnesorge (Oh) and Weber (We)umbers are defined as the ratio of viscous force to surface ten-ion force and inertia forces to surface tension force, respectively.nder the desirable values of Oh and We, the correlation could incur
ess than 1% error of the experimental data of Harkins and Brownnd Wilkinson [10]. For that, the proposed value of We must bemaller than 10−5 when Oh ≤ 1 or We must be smaller than 10−7
hen Oh ≤ 10. In this study, the average value of We was controlledt about 10−3. Under this condition, the results could also give goodtting to the correlation. In fact, the data from previous studies
ndicates that the Weber number as high as 10−1 could still giveatisfactory results by using the drop weight method (results nothown) [24,33].
On the other hand, the simulation results have also showed thathe upper limit of Oh should be less than 10−1 when We = 10−3.therwise, the error incurred will be directly proportional to the
ncrement of Oh. The Ohnersorge number (Oh) of the liquid groupsere then plotted against the Bond number to find out the lim-
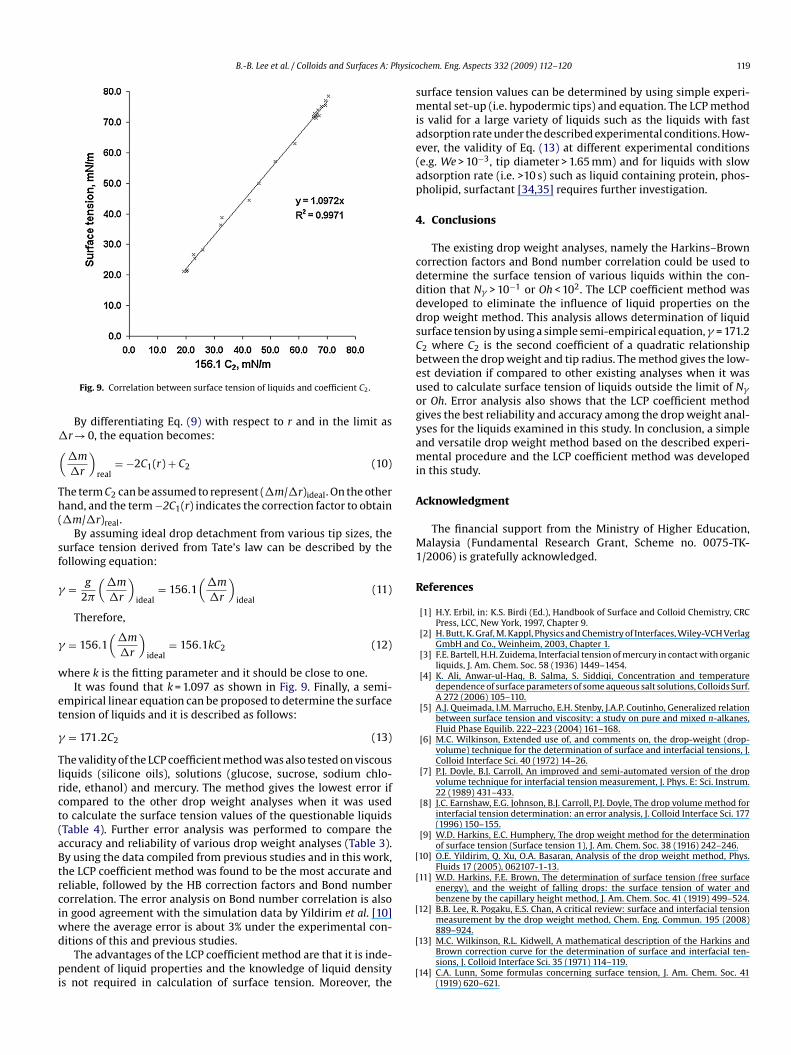
ts of Oh for the Bond number correlation to remain valid (seeig. 7). As expected, the trend of the curves is opposite to that ofhe plot of the surface tension number (N� ) against the Bond num-er (see Fig. 5) since N� and Oh are inversely related as shown inq. (8).
h =[
1]1/2
(8)
N�evertheless, the results show that the Bond number correlation isalid for Oh values up to 102. Therefore, the constraint on the valuesf We and Oh proposed by Yildirim et al. [10] in the simulation study
ig. 7. Ohnesorge number (Oh) of liquid groups at different Bond number (BO) –VHS (�), LVMS (Ж), LVLS (♦), MVLS ( ), HVHS (�) and HVLS (X).
tt
bc
m
Fti0
chem. Eng. Aspects 332 (2009) 112–120
ay have underestimated the upper limits of the dimensionlessumbers in practical. However, the validity of the correlation ismbiguous when Oh exceeds 102 because conflicting results werebtained. The HVHS liquid (glycerol) could still fit the correlationith about 5% error (see Table 4) but the HVLS (silicone oil, 486 cP)
ave larger error.In conclusion, the results show that the Bond number correla-
ion were valid for most liquid groups provided that the Ohnersorgeumber (Oh) is below 102. This, however, confirms the influence of
iquid properties on the validity of the correlation.
.3. The LCP coefficient method
It has been shown in this study that the validity of HB correc-ion factors and Bond number correlation could be influenced byhe liquid properties. The problem is that these analyses determinehe surface tension from a single r/V1/3 value since it is typicallyssumed that the drop formation–detachment behavior of a liquidt a specific r/V1/3 value could be similar for all liquids regardless ofheir properties. This study verified that the assumption may note true.
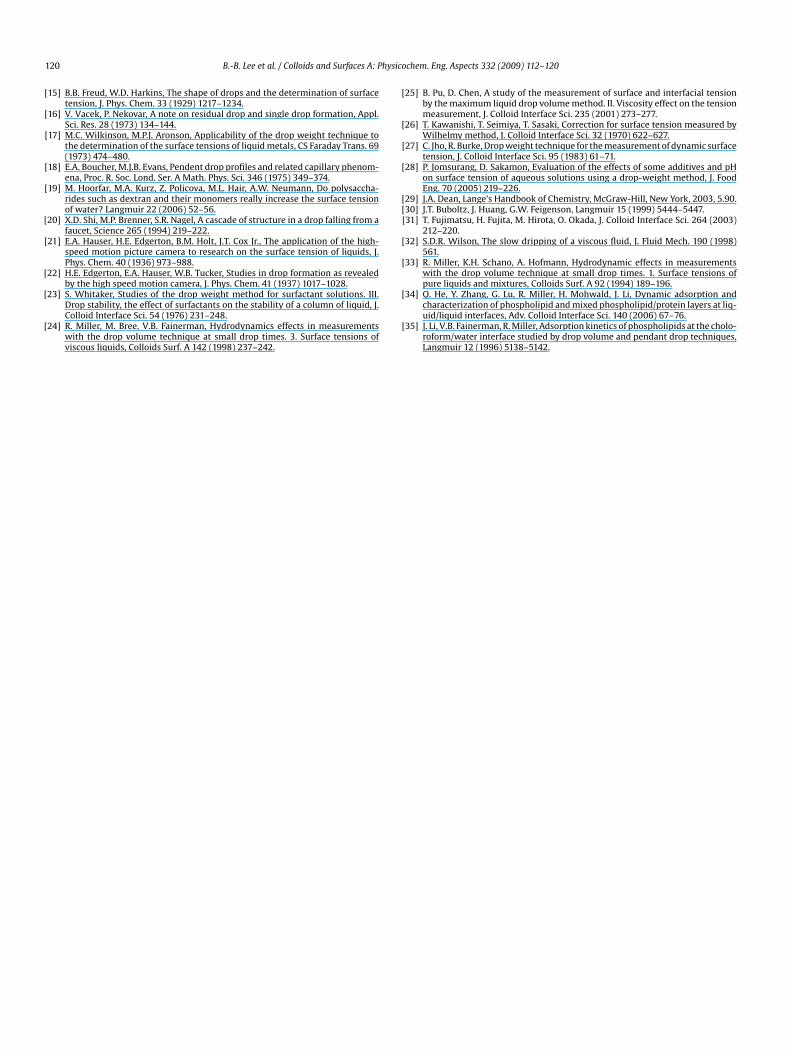
An alternative drop weight analysis was developed by usinghe data from Wilkinson [6] where the drop weight of vari-us liquid samples was plotted against different tip sizes (seeig. 8). Eleven types of liquid were used and they were water,arbon tetrachloride, benzene, nitromethane, glycerol, n-octane,-dodecane, ethylene dichloride, ethylene dibromide, hexachloro-,3-butadiane, drakeol-10. Within the limits of the tip radius, theraph indicates a quadratic relationship between the drop weightnd the tip size because the drop weight of liquid become lessependent on the dripping tip size when the tip radius increases18,22]. In other words, the gravitational force is more dominant inhe drop detachment process than the surface tension force whenhe dripping tip gets larger [18].
By using quadratic regression, the correlation can be describedy the following equation (where C1 and C2 are equation coeffi-ients):
= −C1(r2) + C2(r) (9)
ig. 8. Correlation between drop weight and dripping tip radius. The lines indicatedhe trend line of the experimental data from Wilkinson [6] and this study, where thenterception was set to (0.0, 0.0). The R2 value of each correlation was larger than.99.
B.-B. Lee et al. / Colloids and Surfaces A: Physico
�(
Th(
sf
�
�
w
et
�
Tlrct(aBtrciwd
pi
smiae(ap
4
cddddsCbeuogyami
A
M1
R
[
[
[
Fig. 9. Correlation between surface tension of liquids and coefficient C2.
By differentiating Eq. (9) with respect to r and in the limit asr → 0, the equation becomes:
�m
�r
)real
= −2C1(r) + C2 (10)
he term C2 can be assumed to represent (�m/�r)ideal. On the otherand, and the term −2C1(r) indicates the correction factor to obtain�m/�r)real.
By assuming ideal drop detachment from various tip sizes, theurface tension derived from Tate’s law can be described by theollowing equation:
= g
2�
(�m
�r
)ideal
= 156.1(�m
�r
)ideal
(11)
Therefore,
= 156.1(�m
�r
)ideal
= 156.1kC2 (12)
here k is the fitting parameter and it should be close to one.It was found that k = 1.097 as shown in Fig. 9. Finally, a semi-
mpirical linear equation can be proposed to determine the surfaceension of liquids and it is described as follows:
= 171.2C2 (13)
he validity of the LCP coefficient method was also tested on viscousiquids (silicone oils), solutions (glucose, sucrose, sodium chlo-ide, ethanol) and mercury. The method gives the lowest error ifompared to the other drop weight analyses when it was usedo calculate the surface tension values of the questionable liquidsTable 4). Further error analysis was performed to compare theccuracy and reliability of various drop weight analyses (Table 3).y using the data compiled from previous studies and in this work,he LCP coefficient method was found to be the most accurate andeliable, followed by the HB correction factors and Bond numberorrelation. The error analysis on Bond number correlation is alson good agreement with the simulation data by Yildirim et al. [10]
here the average error is about 3% under the experimental con-itions of this and previous studies.
The advantages of the LCP coefficient method are that it is inde-endent of liquid properties and the knowledge of liquid density
s not required in calculation of surface tension. Moreover, the
[
[
chem. Eng. Aspects 332 (2009) 112–120 119
urface tension values can be determined by using simple experi-ental set-up (i.e. hypodermic tips) and equation. The LCP method
s valid for a large variety of liquids such as the liquids with fastdsorption rate under the described experimental conditions. How-ver, the validity of Eq. (13) at different experimental conditionse.g. We > 10−3, tip diameter > 1.65 mm) and for liquids with slowdsorption rate (i.e. >10 s) such as liquid containing protein, phos-holipid, surfactant [34,35] requires further investigation.
. Conclusions
The existing drop weight analyses, namely the Harkins–Brownorrection factors and Bond number correlation could be used toetermine the surface tension of various liquids within the con-ition that N� > 10−1 or Oh < 102. The LCP coefficient method waseveloped to eliminate the influence of liquid properties on therop weight method. This analysis allows determination of liquidurface tension by using a simple semi-empirical equation,� = 171.22 where C2 is the second coefficient of a quadratic relationshipetween the drop weight and tip radius. The method gives the low-st deviation if compared to other existing analyses when it wassed to calculate surface tension of liquids outside the limit of N�r Oh. Error analysis also shows that the LCP coefficient methodives the best reliability and accuracy among the drop weight anal-ses for the liquids examined in this study. In conclusion, a simplend versatile drop weight method based on the described experi-ental procedure and the LCP coefficient method was developed
n this study.
cknowledgment
The financial support from the Ministry of Higher Education,alaysia (Fundamental Research Grant, Scheme no. 0075-TK-
/2006) is gratefully acknowledged.
eferences
[1] H.Y. Erbil, in: K.S. Birdi (Ed.), Handbook of Surface and Colloid Chemistry, CRCPress, LCC, New York, 1997, Chapter 9.
[2] H. Butt, K. Graf, M. Kappl, Physics and Chemistry of Interfaces, Wiley-VCH VerlagGmbH and Co., Weinheim, 2003, Chapter 1.
[3] F.E. Bartell, H.H. Zuidema, Interfacial tension of mercury in contact with organicliquids, J. Am. Chem. Soc. 58 (1936) 1449–1454.
[4] K. Ali, Anwar-ul-Haq, B. Salma, S. Siddiqi, Concentration and temperaturedependence of surface parameters of some aqueous salt solutions, Colloids Surf.A 272 (2006) 105–110.
[5] A.J. Queimada, I.M. Marrucho, E.H. Stenby, J.A.P. Coutinho, Generalized relationbetween surface tension and viscosity: a study on pure and mixed n-alkanes,Fluid Phase Equilib. 222–223 (2004) 161–168.
[6] M.C. Wilkinson, Extended use of, and comments on, the drop-weight (drop-volume) technique for the determination of surface and interfacial tensions, J.Colloid Interface Sci. 40 (1972) 14–26.
[7] P.J. Doyle, B.J. Carroll, An improved and semi-automated version of the dropvolume technique for interfacial tension measurement, J. Phys. E: Sci. Instrum.22 (1989) 431–433.
[8] J.C. Earnshaw, E.G. Johnson, B.J. Carroll, P.J. Doyle, The drop volume method forinterfacial tension determination: an error analysis, J. Colloid Interface Sci. 177(1996) 150–155.
[9] W.D. Harkins, E.C. Humphery, The drop weight method for the determinationof surface tension (Surface tension 1), J. Am. Chem. Soc. 38 (1916) 242–246.
10] O.E. Yildirim, Q. Xu, O.A. Basaran, Analysis of the drop weight method, Phys.Fluids 17 (2005), 062107-1-13.
11] W.D. Harkins, F.E. Brown, The determination of surface tension (free surfaceenergy), and the weight of falling drops: the surface tension of water andbenzene by the capillary height method, J. Am. Chem. Soc. 41 (1919) 499–524.
12] B.B. Lee, R. Pogaku, E.S. Chan, A critical review: surface and interfacial tensionmeasurement by the drop weight method, Chem. Eng. Commun. 195 (2008)
889–924.13] M.C. Wilkinson, R.L. Kidwell, A mathematical description of the Harkins andBrown correction curve for the determination of surface and interfacial ten-sions, J. Colloid Interface Sci. 35 (1971) 114–119.
14] C.A. Lunn, Some formulas concerning surface tension, J. Am. Chem. Soc. 41(1919) 620–621.
1 hysico
[
[
[
[
[
[
[
[
[
[
[
[
[
[
[[[
[
[
20 B.-B. Lee et al. / Colloids and Surfaces A: P
15] B.B. Freud, W.D. Harkins, The shape of drops and the determination of surfacetension, J. Phys. Chem. 33 (1929) 1217–1234.
16] V. Vacek, P. Nekovar, A note on residual drop and single drop formation, Appl.Sci. Res. 28 (1973) 134–144.
17] M.C. Wilkinson, M.P.J. Aronson, Applicability of the drop weight technique tothe determination of the surface tensions of liquid metals, CS Faraday Trans. 69(1973) 474–480.
18] E.A. Boucher, M.J.B. Evans, Pendent drop profiles and related capillary phenom-ena, Proc. R. Soc. Lond. Ser. A Math. Phys. Sci. 346 (1975) 349–374.
19] M. Hoorfar, M.A. Kurz, Z. Policova, M.L. Hair, A.W. Neumann, Do polysaccha-rides such as dextran and their monomers really increase the surface tensionof water? Langmuir 22 (2006) 52–56.
20] X.D. Shi, M.P. Brenner, S.R. Nagel, A cascade of structure in a drop falling from afaucet, Science 265 (1994) 219–222.
21] E.A. Hauser, H.E. Edgerton, B.M. Holt, J.T. Cox Jr., The application of the high-speed motion picture camera to research on the surface tension of liquids, J.Phys. Chem. 40 (1936) 973–988.
22] H.E. Edgerton, E.A. Hauser, W.B. Tucker, Studies in drop formation as revealedby the high speed motion camera, J. Phys. Chem. 41 (1937) 1017–1028.
23] S. Whitaker, Studies of the drop weight method for surfactant solutions. III.Drop stability, the effect of surfactants on the stability of a column of liquid, J.Colloid Interface Sci. 54 (1976) 231–248.
24] R. Miller, M. Bree, V.B. Fainerman, Hydrodynamics effects in measurementswith the drop volume technique at small drop times. 3. Surface tensions ofviscous liquids, Colloids Surf. A 142 (1998) 237–242.
[
[
chem. Eng. Aspects 332 (2009) 112–120
25] B. Pu, D. Chen, A study of the measurement of surface and interfacial tensionby the maximum liquid drop volume method. II. Viscosity effect on the tensionmeasurement, J. Colloid Interface Sci. 235 (2001) 273–277.
26] T. Kawanishi, T. Seimiya, T. Sasaki, Correction for surface tension measured byWilhelmy method, J. Colloid Interface Sci. 32 (1970) 622–627.
27] C. Jho, R. Burke, Drop weight technique for the measurement of dynamic surfacetension, J. Colloid Interface Sci. 95 (1983) 61–71.
28] P. Jomsurang, D. Sakamon, Evaluation of the effects of some additives and pHon surface tension of aqueous solutions using a drop-weight method, J. FoodEng. 70 (2005) 219–226.
29] J.A. Dean, Lange’s Handbook of Chemistry, McGraw-Hill, New York, 2003, 5.90.30] J.T. Buboltz, J. Huang, G.W. Feigenson, Langmuir 15 (1999) 5444–5447.31] T. Fujimatsu, H. Fujita, M. Hirota, O. Okada, J. Colloid Interface Sci. 264 (2003)
212–220.32] S.D.R. Wilson, The slow dripping of a viscous fluid, J. Fluid Mech. 190 (1998)
561.33] R. Miller, K.H. Schano, A. Hofmann, Hydrodynamic effects in measurements
with the drop volume technique at small drop times. 1. Surface tensions ofpure liquids and mixtures, Colloids Surf. A 92 (1994) 189–196.
34] Q. He, Y. Zhang, G. Lu, R. Miller, H. Mohwald, J. Li, Dynamic adsorption andcharacterization of phospholipid and mixed phospholipid/protein layers at liq-uid/liquid interfaces, Adv. Colloid Interface Sci. 140 (2006) 67–76.
35] J. Li, V.B. Fainerman, R. Miller, Adsorption kinetics of phospholipids at the cholo-roform/water interface studied by drop volume and pendant drop techniques,Langmuir 12 (1996) 5138–5142.