Clinical factors associated with postoperative hydronephrosis ...
Upload
independentCategory
view
1download
0
Neutrophil-Related Gene Expression And Low-Density Granulocytes Associated with
Disease Activity and Response to Treatment in ANCA-Associated Vasculitis
Peter C. Grayson, MD, MSc1, Carmelo Carmona-Rivera, PhD1, Lijing Xu, PhD2, Noha
Lim, PhD2, Zhong Gao, PhD2, Adam L. Asare, PhD2, Ulrich Specks, MD3, John H. Stone,
MD, MPH4, Philip Seo, MD5, Robert F. Spiera, MD6, Carol A. Langford, MD, MHS7, Gary
S. Hoffman, MD7, Cees G.M. Kallenberg MD, PhD8, E. William St. Clair, MD9, Nadia K.
Tchao, MD2, Steven R. Ytterberg, MD3, Deborah J. Phippard, PhD2, Peter A. Merkel,
MD, MPH10, Mariana J. Kaplan, MD1, and Paul A. Monach, MD, PhD11 for the RAVE-ITN
Research Group
1 National Institutes of Health, NIAMS, Bethesda, MD, USA 2 Immune Tolerance Network, Bethesda, MD, USA 3 Mayo Clinic Foundation, Rochester, MN, USA 4 Rheumatology Unit, Massachusetts General Hospital, Boston, MA, USA 5 Johns Hopkins University, Baltimore, MD, USA 6 Hospital for Special Surgery, New York City, NY, USA 7 Cleveland Clinic Foundation, Cleveland, OH, USA 8 University of Groningen, Groningen, the Netherlands 9 Duke University Medical Center, Durham, NC, USA 10 Division of Rheumatology, University of Pennsylvania, Philadelphia, PA, USA 11 Section of Rheumatology, Boston University School of Medicine, Boston, MA, USA
Financial supports of conflicts disclosure: This research was performed as a project of the Immune Tolerance Network (NIH contract N01-AI-15416; protocol number ITN-21AI). This research was also supported through the Intramural Research Program at the National Institute of Arthritis and Musculoskeletal and Skin Diseases (NIAMS) and was supported by the National Center for Advancing Translational Sciences, NIH, through BU-CTSI Grant Number KL2 TR000158. Dr. Grayson received support from a Rheumatology Scientist Development Award from the Research and Education Foundation of the American College of Rheumatology.
Corresponding Author and Reprint Requests: Peter C. Grayson, MD, MSc National Institutes of Health / NIAMS 10 Center Drive, Building 10, Rm 216G Bethesda, MD 20892 Email: [email protected]; Phone: 301-827-9187: Fax: 301-480-0676
Running Head: LDGs in AAV
Keywords: vasculitis, antineutrophil cytoplasmic antibody (ANCA), proteinase 3,
myeloperoxidase, biomarkers, low-density granulocyte (LDG), neutrophil extracellular traps (NETs), granulomatosis with polyangiitis (GPA, Wegener’s), microscopic polyangiitis (MPA)
Full Length Arthritis & RheumatologyDOI 10.1002/art.39153
This article has been accepted for publication and undergone full peer review but has not beenthrough the copyediting, typesetting, pagination and proofreading process which may lead todifferences between this version and the Version of Record. Please cite this article as an‘Accepted Article’, doi: 10.1002/art.39153© 2015 American College of RheumatologyReceived: Oct 21, 2014; Revised: Jan 21, 2015; Accepted: Apr 07, 2015
This article is protected by copyright. All rights reserved.

2
ABSTRACT (248 words)
Objectives: To discover biomarkers involved in the pathophysiology of ANCA-
associated vasculitis (AAV) and determine if low-density granulocytes (LDGs)
contribute to gene expression signatures in AAV.
Methods: The source of clinical data and linked biospecimens was a randomized
controlled treatment trial in AAV. RNA-sequencing of whole blood from patients
with AAV was performed during active disease at the baseline visit (BL) and
during remission 6 months later (6M). Gene expression was compared between
patients who met versus did not meet the primary trial outcome of clinical
remission at 6M (responders vs. nonresponders). Measurement of neutrophil-
related gene expression was confirmed in PBMCs to validate findings in whole
blood. A negative selection strategy isolated LDGs from PBMC fractions.
Results: Differential expression between responders (n=77) and nonresponders
(n=35) was detected in 2,346 transcripts at BL visit (p<0.05). Unsupervised
hierarchical clustering demonstrated a cluster of granulocyte-related genes,
including myeloperoxidase (MPO) and proteinase 3 (PR3). A granulocyte multi-
gene composite score was significantly higher in nonresponders than responders
(p<0.01) and during active disease compared to remission (p<0.01). This
signature strongly overlapped an LDG signature identified previously in lupus
(FDRGSEA<0.01). Transcription of PR3 measured in PBMCs was associated with
active disease and treatment response (p<0.01). LDGs isolated from patients
with AAV spontaneously formed neutrophil extracellular traps containing PR3
and MPO.
Page 3 of 51
John Wiley & Sons
Arthritis & Rheumatology
This article is protected by copyright. All rights reserved.

3
Conclusions: In AAV an increased expression of a granulocyte gene signature
is associated with disease activity and decreased response to treatment. The
source of this signature is likely LDGs, a potentially pathogenic cell type in AAV.
Page 4 of 51
John Wiley & Sons
Arthritis & Rheumatology
This article is protected by copyright. All rights reserved.

4
Granulomatosis with polyangiitis (GPA, Wegener’s) and microscopic
polyangiitis (MPA) are two forms of anti-neutrophil cytoplasmic antibody (ANCA)
- associated vasculitis[1]. Advances in therapy have transformed ANCA-
associated vasculitis (AAV) from a frequently fatal disease into a chronic illness;
however, a proportion of patients with AAV do not achieve remission after an
initial course of therapy and even fewer achieve sustained remission over long-
term follow up[2]. The Rituximab in ANCA-Associated Vasculitis (RAVE) trial
expanded standard of care treatment options for patients with AAV by
demonstrating that rituximab was not inferior to cyclophosphamide as effective
remission-induction therapy[3]. Despite the success of the trial, only 115 of 197
(58%) study patients in both treatment groups achieved the primary trial outcome
defined as complete remission off glucocorticoids at the month 6 study visit, and
only 71 patients (36%) remained in stable remission throughout 18 months of
follow-up[4].
There are currently few clinical and serologic markers that predict clinical
outcomes in AAV, and none of these markers have been shown to reliably guide
treatment decisions[5-8]. While ANCA has an undisputed diagnostic role in
AAV[9], the value of serial ANCA measurement to predict clinical outcomes is
controversial[10]. Identification of novel therapeutic targets and biomarkers that
predict clinical outcomes to guide patient-specific therapeutic decisions is a high
priority in AAV.
Page 5 of 51
John Wiley & Sons
Arthritis & Rheumatology
This article is protected by copyright. All rights reserved.

5
Neutrophils have an important role in the pathogenesis of AAV[11].
Patients with AAV typically have antibodies directed against proteinase 3 (PR3)
or myeloperoxidase (MPO), which are neutrophil granular proteins. In vitro
studies have shown an activating effect of ANCA on cytokine-primed
neutrophils[12], and the pathogenic potential of ANCA has been established in
animal models[13, 14]. The understanding of the potential roles of neutrophils in
AAV has been expanded with the discovery of neutrophil extracellular traps
(NETs)[15]. NETs are a meshwork of chromatin fibers that contain granule-
derived peptides and enzymes and are extruded by neutrophils following various
sources of stimulation[16]. NETs play a role in host defense against pathogens;
however, evidence also implicates NETs in the pathogenesis of many
autoimmune diseases, including AAV[17, 18]. Upon binding to the surface
membrane of neutrophils, ANCA can directly stimulate extrusion of NETs
(NETosis) in vitro[19-21]. NETs can be seen at sites of active glomerulonephritis
and within disease-associated thrombi in AAV[20, 22].
Low-density granulocytes (LDGs) are a distinct subset of neutrophils that
co-localize with peripheral blood mononuclear cells (PBMCs) in density gradient
preparations[23]. Circulating LDGs are not detected in healthy controls;
however, LDGs are abundant in the blood of patients with systemic lupus
erythematosus (SLE) where they have been characterized as pro-inflammatory,
are capable of synthesizing type I interferons, and are cytotoxic to endothelial
cells[24-26]. In contrast to normal-density neutrophils, which typically undergo
NETosis in ex-vivo analyses only upon exposure to pro-inflammatory stimulants,
Page 6 of 51
John Wiley & Sons
Arthritis & Rheumatology
This article is protected by copyright. All rights reserved.

6
LDGs undergo spontaneous NETosis without stimulation[24]. To date, LDGs
have not been described in the blood of patients with AAV; however, two whole-
genome gene expression profiling studies in AAV have identified granulocyte
signatures in PBMC fractions isolated by density gradient preparations, implying
that LDGs may be the source cell of these expression signatures[27, 28].
The objectives of this study were to identify potential clinical biomarkers in
AAV through whole-genome gene expression profiling and to determine if LDGs
are present in AAV and contribute to gene expression signatures derived from
blood.
Page 7 of 51
John Wiley & Sons
Arthritis & Rheumatology
This article is protected by copyright. All rights reserved.

7
METHODS
Patient selection and characterization:
Patients were selected from the RAVE trial. Study design details of this
trial have been reported[3]. For this study, a subset of patients in the RAVE trial
was selected based upon clinical outcome data at month 6. Patients in either
treatment assignment group who met the primary outcome in the RAVE trial of
disease remission off glucocorticoids at month 6 were classified as responders.
Patients who did not meet the primary outcome in the RAVE trial were termed
nonresponders.
Sample collection, storage, and processing:
Peripheral venipuncture was used to collect 3mL blood samples directly into
Tempus blood RNA tubesTM at the baseline visit (prior to treatment with rituximab or
cyclophosphamide) and at month 6. RNA was isolated in two separate batches
using Applied Biosystems RNA chemistry. A complete blood cell count (CBC) with
differential was measured concurrently with collection of each RNA sample. Serum
samples were tested for ANCA by means of direct and capture enzyme-linked
immunosorbent assays (ELISA). PBMCs were isolated by Ficoll/Hypaque density
gradient preparations at each study center and stored in liquid nitrogen until further
use.
Deep sequencing, alignment, and quantification of large RNA:
Page 8 of 51
John Wiley & Sons
Arthritis & Rheumatology
This article is protected by copyright. All rights reserved.

8
Deep sequencing of large RNA (RNA-Seq) was performed by Expression
Analysis Inc (Durham, NC) using an Illumina Genome Analyzer IIX as outlined in
the Illuimina TruSeqTM RNA Sample Preparation Guide. Globin reduction was
performed to reduce the proportion of large RNA in whole blood from globin
genes which can interfere with the detection of less abundant gene
transcripts[30]. cDNA libraries were built for single-read and paired-end
sequencing using standard procedures. Starting with 500ng of total RNA, mRNA
was purified by polyA selection, chemically fragmented, and reverse transcribed
using oligo-DT primers. Following second strand synthesis, adapters were
ligated to the 3’ end. Polymerase chain reaction (PCR) was performed to amplify
and enrich the ligated material to create the final cDNA library.
Sequencing reads were aligned to the human genome using Bowtie2
software[31]. Local alignment was applied without overlap, treating overlapping
mates as discordant. Discordant or unpaired alignment was not allowed. Bam
files were imported into Partek Genomic Suites for RNA quantification analysis.
Ensembl transcripts (release 64) were used for the annotation source.
Transcript-level raw data without normalization was used for differential
expression analyses.
Quantitative reverse transcription-polymerase chain reaction (qRT-PCR)
analysis:
RNA was isolated from PBMCs using DNA-Free RNA kit (Zymo Research,
Irvine, CA). Total RNA (500 ng) was reverse transcribed using iScript RT single
Page 9 of 51
John Wiley & Sons
Arthritis & Rheumatology
This article is protected by copyright. All rights reserved.

9
strand cDNA (Bio-Rad). qPCR was performed using TaqMan Gene Expression
Master Mix (Applied Biosystem, Foster City, CA), human GAPDH primers
(Hs99999905_m1) as internal control, and sequence-specific primers for MPO
(Hs00924296_m1), PR3 (Hs01597752_m1), Cathelicidin (Hs00189038_m1), and
Calprotectin S100A8 (Hs00374264_g1). Samples were run in duplicate using a
CFX96 C1000 Touch Real Touch Thermal Cycler (Bio-Rad). Data was analyzed
using Bio-Rad CFX Manager software.
Isolation of LDGs:
LDGs were isolated from fresh peripheral blood samples obtained in an
independent group of five patients with AAV sequentially evaluated at the
National Institutes of Health (NIH). None of these patients were participants in
the RAVE trial. All of the patients fulfilled the modified 1990 American College of
Rheumatology (ACR) Classification Criteria for Wegener’s granulomatosis[29,
32] and were evaluated at random points in the course of disease. Healthy
controls were recruited through an NIH healthy volunteer program. AVV-LDGs
were isolated from the PBMC layer as previously described[24]. Briefly, “buffy
coat” was incubated in sodium chloride solutions to eliminate red blood cells.
PBMCs were incubated with a cocktail of biotinylated antibodies for 30 minutes
on ice. Cells were then incubated with magnetic beads for 15 minutes on ice and
passed through a MACS column (Miltenyi Biotec) per the manufacturer’s
instructions. LDG purity was assessed by flow cytometry as described[24].
Page 10 of 51
John Wiley & Sons
Arthritis & Rheumatology
This article is protected by copyright. All rights reserved.

10
Control and AVV normal-density neutrophils were isolated from the red-blood cell
layer by dextran sedimentation.
Immunofluorescence analysis
Cells were seeded on coverslips and stimulated with 40 nM of PMA.
Neutrophils and LDGs were incubated with 5% CO2 at 37°C for 60 min. Cells
were fixed with 4% paraformaldehyde in PBS overnight at 4°C. After washing,
cells were blocked with 0.2% porcine skin gelatin (Sigma) in PBS for 30 min and
incubated for 1 h at 37°C with anti-human elastase (Abcam), anti-MPO (DAKO)
or anti-PR3 (Santa Cruz) antibodies diluted in blocking buffer. After 3 washes
with PBS for 5 min at room temperature, cells were incubated for 30 min at 37°C
with either Alexa-555-conjugated anti-rabbit IgG or Alexa-488-conjugated anti-
mouse IgG secondary antibody. Nuclei were co-stained with 1:1000
fluorescence dye Hoechst 33342. Coverslips were washed with PBS 3 times for
5 min at room temperature and were mounted on a glass slide using Prolong-
gold. Images were acquired on a Zeiss LSM780 confocal laser-scanning
microscope and quantification performed as previously described[25].
Statistical analysis:
The Bioconductor package edgeR (release 2.14) was used for differential
expression analyses of read counts[33]. Generalized linear models (GLMs) were
applied to the non-normally distributed read counts data. Since RNA was
isolated in two separate batches for these experiments, adjustments for batch
Page 11 of 51
John Wiley & Sons
Arthritis & Rheumatology
This article is protected by copyright. All rights reserved.

11
effect differences were made using an additive model within edgeR. Different
cut-offs to define statistical significance for differential gene expression analyses
were explored. A multi-gene composite score was created by calculating z-
scores on a per gene per sample basis. Mean granulocyte composite score was
compared between responders and nonresponders and between active disease
and remission using the Wilcoxon rank sum and Wilcoxon signed rank tests.
Linear regression models were used to determine the association between
the granulocyte gene composite score (dependent variable) and the following
independent variables derived from the baseline study visit: age, ANCA titer by
direct or capture ELISA, Birmingham Vasculitis Activity Score modified for
Wegener’s granulomatosis (BVAS/WG), mean dose of glucocorticoids over 14
days prior to baseline visit blood sample collection, absolute neutrophil count,
absolute lymphocyte count, hemoglobin level, B cell count, platelet count,
erythrocyte sedimentation rate (ESR) and C-reactive protein (CRP). A p value of
< 0.1 was used to define the threshold for incorporation of a variable in the
multivariable linear regression models and a p value of < 0.05 was used to define
statistical significance in the regression models. Logistic regression was used to
determine the association between clinical outcome status (nonresponders vs
responders) and the granulocyte gene composite score.
Enrichment of relevant gene set signatures was tested using Gene Set
Enrichment Analysis (GSEA v2.1.0)[34]. GSEA is a computational method that
can be used to determine if a specific set of genes shows concordant differences
between two phenotypes (i.e. nonresponders vs responders). Gene sets with an
Page 12 of 51
John Wiley & Sons
Arthritis & Rheumatology
This article is protected by copyright. All rights reserved.

12
estimated false discovery rate (FDR) of < 0.05 were considered significant, per
GSEA guidelines. Data were analyzed through the use of QIAGEN’s Ingenuity
Pathway Analysis (IPA, QIAGEN Redwood City, www.qiagen.com/ingenuity).
In the RAVE trial, PBMCs were collected concurrently with whole blood
RNA at some study visits. A subset of 5 nonresponders and 5 responders was
selected for gene expression analyses using PBMCs instead of whole blood as
the sample source. Nonresponders and responders were matched on age,
gender, ANCA specificity (PR3 vs MPO), disease subtype (GPA vs MPA), and
treatment assignment (cyclophosphamide vs rituximab). Expression of the
following neutrophil-related genes was studied in the PBMC fraction: PR3, MPO,
CAMP, and calprotectin (S100A8). Differential expression of mRNA as
measured by qPCR in the PBMC samples was compared using one-way
analysis of variance (ANOVA).
Ethics and Informed Consent:
All patients enrolled in the RAVE trial or evaluated at the NIH provided
written informed consent for collection and future use of samples and data.
Participating ethics boards approved the research.
Page 13 of 51
John Wiley & Sons
Arthritis & Rheumatology
This article is protected by copyright. All rights reserved.
13
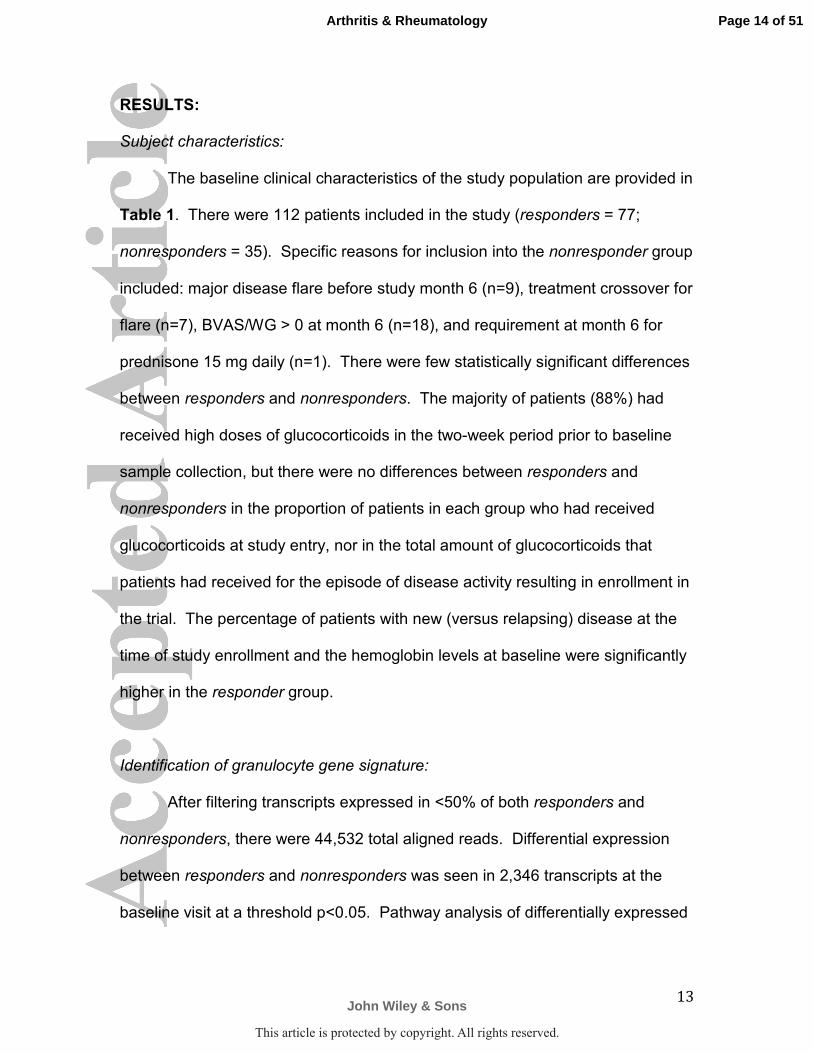
RESULTS:
Subject characteristics:
The baseline clinical characteristics of the study population are provided in
Table 1. There were 112 patients included in the study (responders = 77;
nonresponders = 35). Specific reasons for inclusion into the nonresponder group
included: major disease flare before study month 6 (n=9), treatment crossover for
flare (n=7), BVAS/WG > 0 at month 6 (n=18), and requirement at month 6 for
prednisone 15 mg daily (n=1). There were few statistically significant differences
between responders and nonresponders. The majority of patients (88%) had
received high doses of glucocorticoids in the two-week period prior to baseline
sample collection, but there were no differences between responders and
nonresponders in the proportion of patients in each group who had received
glucocorticoids at study entry, nor in the total amount of glucocorticoids that
patients had received for the episode of disease activity resulting in enrollment in
the trial. The percentage of patients with new (versus relapsing) disease at the
time of study enrollment and the hemoglobin levels at baseline were significantly
higher in the responder group.
Identification of granulocyte gene signature:
After filtering transcripts expressed in <50% of both responders and
nonresponders, there were 44,532 total aligned reads. Differential expression
between responders and nonresponders was seen in 2,346 transcripts at the
baseline visit at a threshold p<0.05. Pathway analysis of differentially expressed
Page 14 of 51
John Wiley & Sons
Arthritis & Rheumatology
This article is protected by copyright. All rights reserved.

14
genes revealed upregulation of pathways related to bacterial defense, myeloid
differentiation, and neutrophil activation in nonresponders (Supplemental Figure
1 and Supplementary Table 1).
Unsupervised hierarchical clustering of differentially expressed genes
demonstrated a distinct cluster of 179 genes that predominantly included
granulocyte-related genes and included MPO and PR3, the major auto-antigens
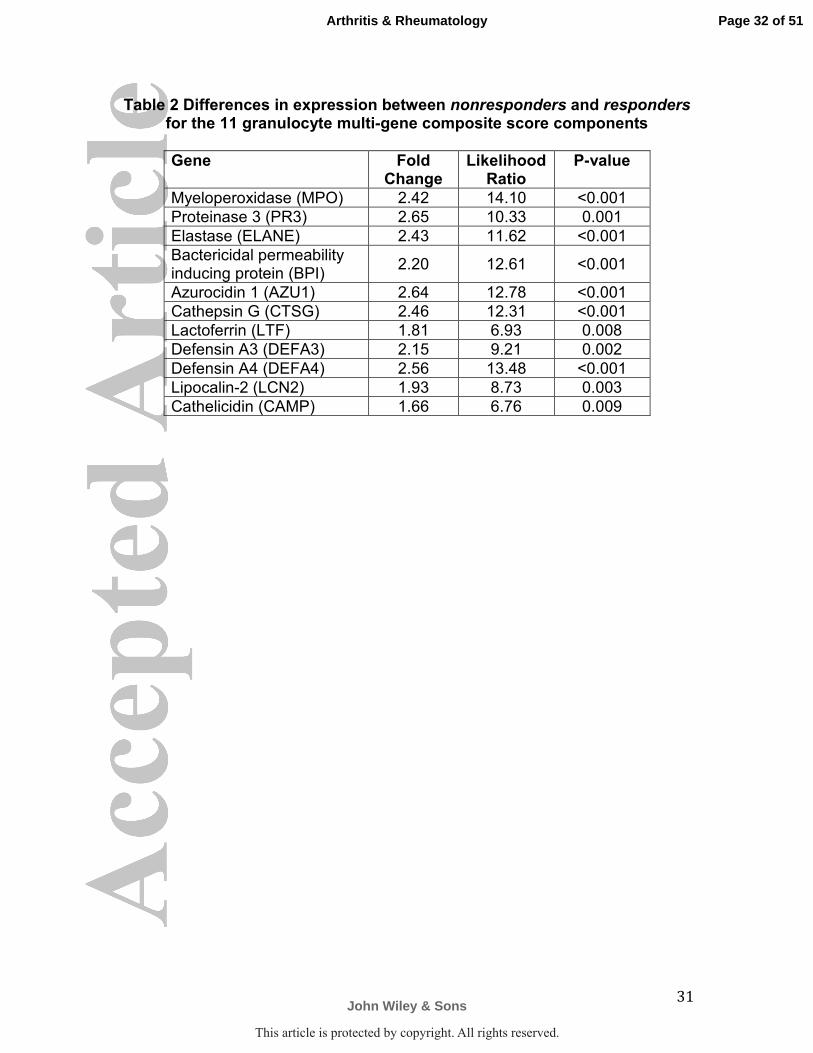
in AAV (see Supplemental Table 2 for the complete list of genes). A multi-gene
composite score was made using expression data from 11 granulocyte genes
purposefully selected within the cluster of differentially-expressed granulocyte
genes to represent a spectrum of neutrophil granular proteins. A list of the 11
genes and the differential expression values between nonresponders and
responders is provided in Table 2.
The mean granulocyte multi-gene composite score was higher in
nonresponders [0.11; range -0.43 to 7.59] than responders [-0.27; range -0.46 to
3.70] (p=0.02). Nine of 26 nonresponders (26%) and 4 of 73 responders (5%)
had granulocyte composite scores of > 1.2 (p<0.01 by Fisher’s exact test).
Clinical and demographic characteristics of patients with a baseline granulocyte
composite scores >1.2 did not differ significantly from patients with lower
granulocyte composite scores (data not shown).
Whole blood RNA from the month 6 study visit was available only in the
responder group. At this time point, all of these patients were in clinical
remission off glucocorticoids. The median month 6 granulocyte multi-gene
composite score for responders was higher at the baseline visit during active
Page 15 of 51
John Wiley & Sons
Arthritis & Rheumatology
This article is protected by copyright. All rights reserved.

15
disease [-0.17; range -0.46 to 3.70] compared to the month 6 visit during clinical
remission [-0.39; range -0.47 to 0.53] (p<0.01).
Association of granulocyte multi-gene composite score with clinical outcomes:
Linear regression models were used to determine the association between
the granulocyte gene composite score (dependent variable) and several clinical
variables. Age, BVAS/WG, absolute neutrophil count (ANC), and platelet count
were significantly associated with the granulocyte gene composite score in
univariable analyses, and only ANC remained significantly associated in a
multivariable regression model (Table 3).
Logistic regression was used to determine the association between clinical
outcome status (nonresponders vs responders) and the granulocyte gene
composite score. In univariable models, clinical outcome status was only
significantly associated with the granulocyte gene composite score and
hemoglobin level. A 1-unit increase in the granulocyte gene composite score at
baseline was significantly associated with a 1.77 times increased odds for not
meeting the primary outcome in the RAVE trial (OR=1.77; 95%CI=1.15 – 2.73;
p=0.01); this association remained significant after adjustment for age,
BVAS/WG, absolute neutrophil count, hemoglobin level, and glucocorticoid use
(OR=2.13; 95%CI 1.16 – 3.90, p=0.01). Logistic regression analysis using
granulocyte composite score as a dichotomous outcome variable (> 1.2 versus
≤1.2) showed no significant associations with any of the clinical, demographic, or
laboratory variables including ANCA subtype and absolute neutrophil count (data
Page 16 of 51
John Wiley & Sons
Arthritis & Rheumatology
This article is protected by copyright. All rights reserved.

16
not shown). These analyses demonstrate that the multi-gene granulocyte
composite score was significantly associated with treatment response status in
the RAVE trial even after adjustments for potential confounding variables.
Enrichment of low-density granulocyte signature:
Given the presence of a granulocyte gene signature detected in whole
blood in patients with AAV in the RAVE trial, GSEA was used to identify potential
cell populations as sources of the signature. Differential expression of
granulocyte genes measured in the PMBC fraction from patients with AAV
compared to healthy controls has been reported in two independent whole-
genome microarray studies [27, 28]. The list of differentially expressed
granulocyte gene sets from both of these prior studies was significantly enriched
in the nonresponder group in RAVE (enrichment scores for both studies = 0.86,
FDRGSEA < 0.001). A gene signature derived by comparing differential whole-
genome gene expression from isolated LDGs versus autologous normal-density
neutrophils in patients with SLE has been reported[25]. Forty-one of the 281
genes that defined an LDG signature in the lupus cohort overlapped with
differential gene expression in the RAVE nonresponders, including 9 of the 11
granulocyte composite score genes (enrichment score = 0.79, GSEAFDR <0.001).
There was substantial overlap in differentially expressed genes between the
present study, the two published studies of PBMCs in AAV, and the study of
LDGs in SLE (FIGURE 1). Nine genes were present in all 4 datasets: BPI,
Page 17 of 51
John Wiley & Sons
Arthritis & Rheumatology
This article is protected by copyright. All rights reserved.

17
CAMP, CEACAM6, DEFA4, HP, MS4A3, PGLYRP1, RETN, and TCN1. See
Supplementary Figure 2 for further information regarding enrichment analyses.
Validation of granulocyte gene signature in PBMCs:
To determine if the granulocyte gene signature identified in whole blood
originated from LDGs, neutrophil-related gene expression was measured in the
PBMC fraction in a subset of responders and nonresponders. Significant
differential transcription of PR3 was observed between responders and
nonresponders. Expression of PR3 was 17-fold upregulated in 4 of 5
nonresponders compared to responders (p<0.01). There was non-statistically
significant increased expression for S100A8 in nonresponders (p=0.18). No
significant differences were observed for MPO or CAMP (FIGURE 2A).
PBMCs were available for paired sample analyses in 4 responders from
both baseline (active disease) and month 6 (remission) study visits.
Transcription of PR3 was significantly increased in all 4 patients during active
disease versus remission (p<0.01). Differences in S100A8 expression were
observed in 3 of 4 patients. There were no differences for MPO or CAMP
(FIGURE 2B). These experiments validate the findings in whole blood and
provide additional evidence that LDGs are the source of the whole blood
granulocyte signature.
Direct isolation of low-density granulocytes in independent cohort:
Page 18 of 51
John Wiley & Sons
Arthritis & Rheumatology
This article is protected by copyright. All rights reserved.

18
To confirm whether LDGs are present in patients with AAV and to account
for the neutrophil signature observed in PBMCs, normal-density neutrophils and
LDGs were isolated in 60 ml of blood from 5 patients with AAV. Three of these
patients were evaluated at 2 separate study visits 6-month apart. The clinical
characteristics of these patients are provided (Supplementary Table 3). LDGs
were identified and quantified in all 5 patients with AAV at every study visit
(Supplementary Table 3). Spontaneous NETosis was observed in LDGs for all
5 patients at every visit (FIGURE 3A). Unstimulated normal-density neutrophils
and LDGs from patients with AAV underwent significantly more NET formation
compared to unstimulated normal-density neutrophils from healthy controls
(FIGURE 3B). NETs derived from LDGs in patients with AAV, irrespective of
ANCA subtype, externalized both PR3 and MPO (FIGURE 3C).
Page 19 of 51
John Wiley & Sons
Arthritis & Rheumatology
This article is protected by copyright. All rights reserved.

19
DISCUSSION
Transcriptomic analysis of whole blood from patients with AAV revealed a
granulocyte gene expression signature associated with disease activity and
treatment response. In the RAVE trial, patients with high levels of granulocyte
gene expression during the baseline study visit were less likely to meet the trial’s
primary outcome of complete remission at the month 6 study visit. In contrast,
clinical features of disease, standard laboratory assessments including ANCA,
and disease-specific activity indices did not predict treatment response in these
patients. Differential gene expression of granulocyte-related genes in the PBMC
fraction validates the granulocyte signature observed in whole blood and
localizes the signature to a recently-described subset of neutrophils known as
LDGs. In particular, expression of PR3 in the PBMC fraction was 17-fold higher
in patients who did not meet the primary outcome in RAVE compared to
treatment responders. LDGs were directly isolated from peripheral blood in all
patients with AAV in an independent cohort of patients, marking the first time
these cells have been reported in AAV. LDGs from patients with AAV readily
underwent NETosis in the absence of added stimulation and produced NETs
containing both PR3 and MPO, the major antigenic targets of ANCA.
The source of a granulocyte signature identified in whole blood could be
normal-density neutrophils, LDGs, or both. Comparisons with other
transcriptomic studies strongly suggest that LDGs and not normal-density
neutrophils are the source of the granulocyte signature identified in this study.
Two prior studies examined whole-genome gene expression in sorted normal-
Page 20 of 51
John Wiley & Sons
Arthritis & Rheumatology
This article is protected by copyright. All rights reserved.

20
density neutrophils versus PBMCs. In a study by Lyons et al, granulocyte-related
gene expression was detected in the PBMC fraction of blood from patients with
lupus and AAV compared to healthy controls and correlated with the number of
quantity of granulocytes identified in PBMCs by flow cytometry[28]. In a study by
Cheadle et al, transcription of granulocyte genes in the PBMC fraction, including
PR3 and MPO, differentiated patients with AAV from healthy controls[27]. In
both studies, granulocyte expression signatures identified in PBMCs, not in
normal-density neutrophils, strongly overlapped the granulocyte gene signature
identified in whole blood in our study. These data suggest that LDGs, which by
definition are neutrophils that co-localize in the PBMC fraction, are the source of
granulocyte gene expression signatures in AAV. A gene expression signature
derived directly from isolated LDGs in patients with SLE[25] also strongly
overlaps the granulocyte signatures identified in AAV in each of these studies,
providing additional evidence that LDGs are the specific cellular source of these
signatures. Although enrichment of degranulated neutrophils could contribute to
gene expression signatures identified in this study, electron microscopy studies
demonstrate that LDGs are not simply degranulated neutrophils[23].
Spontaneous NET formation observed in LDGs isolated from patients with AAV
requires the presence of neutrophil granular proteins, which are abundantly
transcribed in LDGs.
Increased transcription of PR3, and to a lesser extent calprotectin, in
PBMCs was associated with disease activity and treatment response. Similar
associations were not observed for MPO or CAMP, despite the fact that these
Page 21 of 51
John Wiley & Sons
Arthritis & Rheumatology
This article is protected by copyright. All rights reserved.

21
genes were components of the granulocyte expression signature identified in
whole blood. Other studies have found differences between PR3 and MPO as
potential biomarkers in AAV. Independent of ANCA specificity, transcription of
PR3 but not MPO and presence of neutrophil surface membrane PR3 but not
surface membrane MPO differentiates AAV from healthy blood donors and
disease controls[35, 36]. Additionally, increased transcription of PR3 in the
PBMC fraction has been previously shown to correlate with disease activity in
AAV[27]. Whether PR3 expression could be a useful surrogate marker for LDGs
needs to be assessed in prospective studies.
A major strength of this study is the use of samples collected within a
large clinical trial in AAV linked to systematically-recorded clinical and laboratory
data. Regression models were used to assess the associations between the
granulocyte signature and clinical/laboratory data. The granulocyte signature was
weakly associated with baseline BVAS/WG score and platelet count, suggesting
that the signature captures elements of baseline disease activity. Historically,
baseline disease activity scores in AAV do not predict treatment response[5]. In
keeping with this observation, granulocyte gene expression, but not the baseline
BVAS/WG score, was significantly associated with treatment response.
Glucocorticoids are a potential confounder of granulocyte gene
expression. Glucocorticoids promote demargination of circulating neutrophils
and enhance release of immature neutrophils from bone marrow[37]. The
majority of patients in this study were receiving high doses of glucocorticoids at
the time of the baseline sample collection. However, cumulative glucocorticoid
Page 22 of 51
John Wiley & Sons
Arthritis & Rheumatology
This article is protected by copyright. All rights reserved.

22
use in the 2 weeks prior to the baseline visit was not directly associated with the
granulocyte multi-gene composite score, and no differences in glucocorticoid use
were observed between treatment responders and nonresponders, lessening
concerns for potential confounding by glucocorticoids of the association between
the granulocyte expression signature and treatment response.
Use of whole blood as a tissue source for gene expression is potentially a
study limitation. Blood is comprised of many cell populations, and it can be
challenging to differentiate changes in transcript abundance in blood caused by
regulation of gene transcriptional activity from changes secondary to relative
abundance of cell populations expressing transcripts at constant levels.
However, in this study absolute neutrophil and lymphocyte counts at baseline did
not differ between treatment responders and nonresponders. Although
hemoglobin levels were significantly higher in nonresponders, the association
between treatment response and the granulocyte signature score remained
significant in multivariable models that adjusted for differences in hemoglobin
levels. Heterogeneity of cell populations in whole blood can also reduce the
power of transcriptomic studies to identify significant differential gene expression
across phenotypes. In this study, a lenient p value of <0.05 was used to define
significant differential expression, increasing the potential for false discovery.
However, validation of differential granulocyte gene expression in a different
tissue source (PBMCs), consistency in findings across different transcriptomic
datasets in AAV, and functional studies of LDGs lessen the concern for false
discovery. The associations between granulocyte gene expression derived from
Page 23 of 51
John Wiley & Sons
Arthritis & Rheumatology
This article is protected by copyright. All rights reserved.

23
whole blood and clinical outcomes, while statistically significant, were only
observed in a minority of treatment nonresponders (26%). The high doses of
glucocorticoids at baseline may have reduced some of the significant differences
in gene expression between the responder and non-responder groups. More
specific measures of LDGs, rather than indirect measures in whole blood, may
be required to accurately predict clinical outcomes for individual patients with
AAV. LDGs were not isolated directly in fresh samples collected within the RAVE
trial, and these cells could not be isolated from frozen PBMC because they do
not survive freeze-thaw cycles.
In conclusion, granulocyte-related gene expression was associated with
disease activity and relatively poor response to treatment in AAV. LDGs are the
likely source of granulocyte gene expression in this study and previous
transcriptomic studies that have identified similar gene expression signatures in
AAV. LDGs may play an important role in disease pathogenesis in AAV by
promoting direct toxicity to endothelial cells and, potentially, by direct involvement
in the causal pathway for the generation of ANCAs through autoantigen
externalization due to enhanced NET formation. Future efforts to further
characterize the function of LDGs and to explore their potential as biomarkers in
AAV are warranted.
Page 24 of 51
John Wiley & Sons
Arthritis & Rheumatology
This article is protected by copyright. All rights reserved.

24
REFERENCES
1. Jennette JC, Falk RJ, Bacon PA, Basu N, Cid MC, Ferrario F, et al. 2012
revised International Chapel Hill Consensus Conference Nomenclature of
Vasculitides. Arthritis and rheumatism. 2013;65(1):1-11.
2. Hoffman GS, Leavitt RY, Fleisher TA, Minor JR, Fauci AS. Treatment of
Wegener's granulomatosis with intermittent high-dose intravenous
cyclophosphamide. The American journal of medicine. 1990;89(4):403-10.
3. Stone JH, Merkel PA, Spiera R, Seo P, Langford CA, Hoffman GS, et al.
Rituximab versus cyclophosphamide for ANCA-associated vasculitis. The
New England journal of medicine. 2010;363(3):221-32.
4. Specks U, Merkel PA, Seo P, Spiera R, Langford CA, Hoffman GS, et al.
Efficacy of remission-induction regimens for ANCA-associated vasculitis.
The New England journal of medicine. 2013;369(5):417-27.
5. Hogan SL, Falk RJ, Chin H, Cai J, Jennette CE, Jennette JC, et al.
Predictors of relapse and treatment resistance in antineutrophil
cytoplasmic antibody-associated small-vessel vasculitis. Annals of internal
medicine. 2005;143(9):621-31.
6. McKinney EF, Lyons PA, Carr EJ, Hollis JL, Jayne DR, Willcocks LC, et al.
A CD8+ T cell transcription signature predicts prognosis in autoimmune
disease. Nature medicine. 2010;16(5):586-91, 1p following 91.
7. Li ZY, Chang DY, Zhao MH, Chen M. Predictors of treatment resistance and
relapse in antineutrophil cytoplasmic antibody-associated vasculitis: a
Page 25 of 51
John Wiley & Sons
Arthritis & Rheumatology
This article is protected by copyright. All rights reserved.

25
study of 439 cases in a single Chinese center. Arthritis & rheumatology.
2014;66(7):1920-6.
8. Pagnoux C, Hogan SL, Chin H, Jennette JC, Falk RJ, Guillevin L, et al.
Predictors of treatment resistance and relapse in antineutrophil
cytoplasmic antibody-associated small-vessel vasculitis: comparison of
two independent cohorts. Arthritis and rheumatism. 2008;58(9):2908-18.
9. Hagen EC, Daha MR, Hermans J, Andrassy K, Csernok E, Gaskin G, et al.
Diagnostic value of standardized assays for anti-neutrophil cytoplasmic
antibodies in idiopathic systemic vasculitis. EC/BCR Project for ANCA
Assay Standardization. Kidney international. 1998;53(3):743-53.
10. Tomasson G, Grayson PC, Mahr AD, Lavalley M, Merkel PA. Value of
ANCA measurements during remission to predict a relapse of ANCA-
associated vasculitis--a meta-analysis. Rheumatology. 2012;51(1):100-9.
11. Falk RJ, Jennette JC. ANCA disease: where is this field heading? Journal of
the American Society of Nephrology : JASN. 2010;21(5):745-52.
12. Falk RJ, Terrell RS, Charles LA, Jennette JC. Anti-neutrophil cytoplasmic
autoantibodies induce neutrophils to degranulate and produce oxygen
radicals in vitro. Proceedings of the National Academy of Sciences of the
United States of America. 1990;87(11):4115-9.
13. Xiao H, Heeringa P, Liu Z, Huugen D, Hu P, Maeda N, et al. The role of
neutrophils in the induction of glomerulonephritis by anti-myeloperoxidase
antibodies. The American journal of pathology. 2005;167(1):39-45.
Page 26 of 51
John Wiley & Sons
Arthritis & Rheumatology
This article is protected by copyright. All rights reserved.

26
14. Xiao H, Heeringa P, Hu P, Liu Z, Zhao M, Aratani Y, et al. Antineutrophil
cytoplasmic autoantibodies specific for myeloperoxidase cause
glomerulonephritis and vasculitis in mice. The Journal of clinical
investigation. 2002;110(7):955-63.
15. Brinkmann V, Reichard U, Goosmann C, Fauler B, Uhlemann Y, Weiss DS,
et al. Neutrophil extracellular traps kill bacteria. Science.
2004;303(5663):1532-5.
16. Remijsen Q, Kuijpers TW, Wirawan E, Lippens S, Vandenabeele P, Vanden
Berghe T. Dying for a cause: NETosis, mechanisms behind an
antimicrobial cell death modality. Cell death and differentiation.
2011;18(4):581-8.
17. Kaplan MJ, Radic M. Neutrophil extracellular traps: double-edged swords of
innate immunity. Journal of immunology. 2012;189(6):2689-95.
18. Brinkmann V, Zychlinsky A. Neutrophil extracellular traps: is immunity the
second function of chromatin? The Journal of cell biology.
2012;198(5):773-83.
19. Nakazawa D, Shida H, Tomaru U, Yoshida M, Nishio S, Atsumi T, et al.
Enhanced formation and disordered regulation of NETs in
myeloperoxidase-ANCA-associated microscopic polyangiitis. Journal of
the American Society of Nephrology : JASN. 2014;25(5):990-7.
20. Kessenbrock K, Krumbholz M, Schonermarck U, Back W, Gross WL, Werb
Z, et al. Netting neutrophils in autoimmune small-vessel vasculitis. Nature
medicine. 2009;15(6):623-5.
Page 27 of 51
John Wiley & Sons
Arthritis & Rheumatology
This article is protected by copyright. All rights reserved.

27
21. Kelley JM, Monach PA, Ji C, Zhou Y, Wu J, Tanaka S, et al. IgA and IgG
antineutrophil cytoplasmic antibody engagement of Fc receptor genetic
variants influences granulomatosis with polyangiitis. Proceedings of the
National Academy of Sciences of the United States of America.
2011;108(51):20736-41.
22. Nakazawa D, Tomaru U, Yamamoto C, Jodo S, Ishizu A. Abundant
neutrophil extracellular traps in thrombus of patient with microscopic
polyangiitis. Frontiers in immunology. 2012;3:333.
23. Carmona-Rivera C, Kaplan MJ. Low-density granulocytes: a distinct class of
neutrophils in systemic autoimmunity. Seminars in immunopathology.
2013;35(4):455-63.
24. Denny MF, Yalavarthi S, Zhao W, Thacker SG, Anderson M, Sandy AR, et
al. A distinct subset of proinflammatory neutrophils isolated from patients
with systemic lupus erythematosus induces vascular damage and
synthesizes type I IFNs. Journal of immunology. 2010;184(6):3284-97.
25. Villanueva E, Yalavarthi S, Berthier CC, Hodgin JB, Khandpur R, Lin AM, et
al. Netting neutrophils induce endothelial damage, infiltrate tissues, and
expose immunostimulatory molecules in systemic lupus erythematosus.
Journal of immunology. 2011;187(1):538-52.
26. Carmona-Rivera C, Zhao W, Yalavarthi S, Kaplan MJ. Neutrophil
extracellular traps induce endothelial dysfunction in systemic lupus
erythematosus through the activation of matrix metalloproteinase-2.
Annals of the rheumatic diseases. 2014.
Page 28 of 51
John Wiley & Sons
Arthritis & Rheumatology
This article is protected by copyright. All rights reserved.

28
27. Cheadle C, Berger AE, Andrade F, James R, Johnson K, Watkins T, et al.
Transcription of proteinase 3 and related myelopoiesis genes in peripheral
blood mononuclear cells of patients with active Wegener's granulomatosis.
Arthritis and rheumatism. 2010;62(6):1744-54.
28. Lyons PA, McKinney EF, Rayner TF, Hatton A, Woffendin HB, Koukoulaki
M, et al. Novel expression signatures identified by transcriptional analysis
of separated leucocyte subsets in systemic lupus erythematosus and
vasculitis. Annals of the rheumatic diseases. 2010;69(6):1208-13.
29. Group WR. Design of the Wegener's Granulomatosis Etanercept Trial
(WGET). Controlled clinical trials. 2002;23(4):450-68.
30. Vartanian K, Slottke R, Johnstone T, Casale A, Planck SR, Choi D, et al.
Gene expression profiling of whole blood: comparison of target
preparation methods for accurate and reproducible microarray analysis.
BMC genomics. 2009;10:2.
31. Langmead B, Trapnell C, Pop M, Salzberg SL. Ultrafast and memory-
efficient alignment of short DNA sequences to the human genome.
Genome biology. 2009;10(3):R25.
32. Leavitt RY, Fauci AS, Bloch DA, Michel BA, Hunder GG, Arend WP, et al.
The American College of Rheumatology 1990 criteria for the classification
of Wegener's granulomatosis. Arthritis and rheumatism. 1990;33(8):1101-
7.
Page 29 of 51
John Wiley & Sons
Arthritis & Rheumatology
This article is protected by copyright. All rights reserved.

29
33. Gentleman RC, Carey VJ, Bates DM, Bolstad B, Dettling M, Dudoit S, et al.
Bioconductor: open software development for computational biology and
bioinformatics. Genome biology. 2004;5(10):R80.
34. Subramanian A, Tamayo P, Mootha VK, Mukherjee S, Ebert BL, Gillette
MA, et al. Gene set enrichment analysis: a knowledge-based approach for
interpreting genome-wide expression profiles. Proceedings of the National
Academy of Sciences of the United States of America.
2005;102(43):15545-50.
35. Ohlsson S, Hellmark T, Pieters K, Sturfelt G, Wieslander J, Segelmark M.
Increased monocyte transcription of the proteinase 3 gene in small vessel
vasculitis. Clinical and experimental immunology. 2005;141(1):174-82.
36. Muller Kobold AC, Kallenberg CG, Tervaert JW. Leucocyte membrane
expression of proteinase 3 correlates with disease activity in patients with
Wegener's granulomatosis. British journal of rheumatology.
1998;37(8):901-7.
37. Nakagawa M, Terashima T, D'Yachkova Y, Bondy GP, Hogg JC, van Eeden
SF. Glucocorticoid-induced granulocytosis: contribution of marrow release
and demargination of intravascular granulocytes. Circulation.
1998;98(21):2307-13.
Page 30 of 51
John Wiley & Sons
Arthritis & Rheumatology
This article is protected by copyright. All rights reserved.

30
Table 1 Baseline Subject Characteristics Nonresponders
N=35 Responders
N=77 P-value
Age (years ± standard deviation)
51 ± 14.8 52 ± 17.9 0.78
Gender (%) Female Male
46 54
56 44
0.43
Race (White %) 91 96 0.37
Treatment arm (%) Cyclophosphamide/azathioprine Rituximab
66 34
47 53
0.10
ANCA subtype (%) MPO PR3
20 80
35 65
0.17
Disease type (%) MPA GPA
14 86
26 74
0.26
New diagnosis (%) 31 57 0.02
Organ system involvement (%) - Constitutional - Cutaneous - Mucous membranes, eyes - Ear, nose, throat - Cardiovascular - Gastrointestinal - Pulmonary - Renal - Nervous
60 17 23 57 3 3 63 54 17
53 18 19 56 1 3
57 65 22
0.64 >.99 0.87 >.99 0.53 >.99 0.72 0.39 0.73
Received glucocorticoids prior to baseline visit (%)
89 87 >.99
Mean cumulative dose of glucocorticoids from 14 days before baseline sample collection - Prednisone (mg) - Methylprednisolone (g)
290 ± 228.9 0.7 ± 1.11
332 ± 322.5 1.0 ± 1.32
0.47 0.28
Total white blood cell count 12 ± 5.4 12 ± 4.5 0.69
Absolute neutrophil count 9 ± 5.4 10 ± 4.7 0.84
Hemoglobin 12 ± 1.5 11 ± 1.8 0.01
Platelet 356 ± 129.9 379 ± 133.3 0.42
Lymphocyte count 1.3 ± 1.0 1.3 ± 1.0 0.96
BVAS/WG score 7.3 ± 2.8 8.3 ± 3.5 0.19
ANCA titer 221 ± 145.8 189 ± 122.0 0.26
Erythrocyte sedimentation rate (mm/hr)
38 44 0.34
C-reactive protein (mg/dL) 2.2 7.4 0.12
Key: ANCA = antineutrophil cytoplasmic antibody, MPO = myeloperoxidase, PR3 = proteinase 3, BVAS/WG = Birmingham Vasculitis Activity Score for Wegener’s granulomatosis.
Page 31 of 51
John Wiley & Sons
Arthritis & Rheumatology
This article is protected by copyright. All rights reserved.
31
Table 2 Differences in expression between nonresponders and responders for the 11 granulocyte multi-gene composite score components
Gene Fold Change
Likelihood Ratio
P-value
Myeloperoxidase (MPO) 2.42 14.10 <0.001
Proteinase 3 (PR3) 2.65 10.33 0.001
Elastase (ELANE) 2.43 11.62 <0.001
Bactericidal permeability inducing protein (BPI)
2.20 12.61 <0.001
Azurocidin 1 (AZU1) 2.64 12.78 <0.001
Cathepsin G (CTSG) 2.46 12.31 <0.001
Lactoferrin (LTF) 1.81 6.93 0.008
Defensin A3 (DEFA3) 2.15 9.21 0.002
Defensin A4 (DEFA4) 2.56 13.48 <0.001
Lipocalin-2 (LCN2) 1.93 8.73 0.003
Cathelicidin (CAMP) 1.66 6.76 0.009
Page 32 of 51
John Wiley & Sons
Arthritis & Rheumatology
This article is protected by copyright. All rights reserved.

32
Table 3 Linear Regression Models showing the associations between the Granulocyte Multi-Gene Composite Score and Clinical/Laboratory Data
Univariable Model Multivariable Model
Predictor Variable Parameter Estimate
Standard Error
P-value
Parameter Estimate
Standard Error
P-value
Absolute neutrophil count
0.04 0.01 <0.01 0.03 <0.01 0.01
Platelet count <0.01 <0.01 <0.01 <0.01 <0.01 0.14
BVAS/WG Score 0.04 0.02 0.01 0.03 0.02 0.05
Age 0.01 <0.01 0.07 0.01 <0.01 0.09
Hemoglobin -0.05 0.03 0.12
These variables were not included in the multivariable models due to
lack of significant association (p>0.1) in the univariable models.
Absolute lymphocyte count
0.11 0.08 0.15
Erythrocyte sedimentation rate
<0.01 0.10 0.36
Cumulative glucocorticoid use
<0.01 <0.01 0.46
B cell count <0.01 <0.01 0.49
ANCA titer <0.01 <0.01 0.76
C-reactive protein <0.01 0.06 0.80
Page 33 of 51
John Wiley & Sons
Arthritis & Rheumatology
This article is protected by copyright. All rights reserved.

33
FIGURE LEGENDS
Figure 1. Gene Set Enrichment Analyses: Venn diagram illustrates overlap in the number of differentially expressed genes identified in four independent datasets. The RAVE dataset compared whole blood gene expression between treatment responders and nonresponders in ANCA-associated vasculitis (AAV). The Cheadle and Lyons studies compared expression in PBMCs between patients with AAV and healthy controls(33,34). The Villanueva et al study compared expression between LDGs and autologous normal-density neutrophils in patients with SLE(25). Overlapping ovals indicates the number of common genes shared between datasets. Figure 2. Differential Expression of Neutrophil Related mRNA in the PBMC Fraction: Expression of proteinase 3 (PR3) and calprotectin (S100A8) but not myeloperoxidase (MPO) or cathelicidin (CAMP) are differentially upregulated in PBMCs in treatment nonresponders compared to responders in the RAVE trial (Figure 2A). PBMCs expression of PR3 and S100A8 is differentially upregulated within the same patients with AAV during active disease compared to remission (Figure 2B). Figure 3. Demonstration of LDGs in Patients with AAV: Immunofluorescence microphotographs of normal-density neutrophils from a healthy control, normal-density neutrophils and LDGs from a patient with AAV (Figure 3A). The top row depicts unstimulated neutrophils and the bottom row depicts neutrophils stimulated with PMA. NET formation (long strands) in the absence of PMA stimulation is observed in in both neutrophils and LDGs in AAV but not in control neutrophils, and is enhanced by PMA stimulation. Blue = DAPI stain (DNA); red = anti-myeloperoxidase stain. Unstimulated normal-density neutrophils (Vas-Neu) and LDGs (Vas-LDG) from patients with AAV undergo significantly more ex vivo NET formation than neutrophils from healthy controls (Ctrl-Neu) (p<0.01) and LDGs from patients with AAV undergo significantly more NET formation than autologous normal-density neutrophils (p<0.05) (Figure 3B). LDGs isolated from a patient with AAV demonstrate spontaneous NET formation and both PR3 and MPO co-localize within NETs (Figure 3C).
Page 34 of 51
John Wiley & Sons
Arthritis & Rheumatology
This article is protected by copyright. All rights reserved.

Figure 1
254x190mm (300 x 300 DPI)
Page 35 of 51
John Wiley & Sons
Arthritis & Rheumatology
This article is protected by copyright. All rights reserved.

Figure 2
254x190mm (300 x 300 DPI)
Page 36 of 51
John Wiley & Sons
Arthritis & Rheumatology
This article is protected by copyright. All rights reserved.

Figure 3
254x190mm (300 x 300 DPI)
Page 37 of 51
John Wiley & Sons
Arthritis & Rheumatology
This article is protected by copyright. All rights reserved.
Copyright © 2022 FDOKUMEN