Brazilian psychiatric brain bank: a new contribution tool to network studies
Upload
khangminh22Category
view
2download
0
FACULTY OF PSYCHOLOGY AND EDUCATIONAL SCIENCES
Neurophysiological Assessment of
Brain Network Activity Involved in
Cognitive Processing in Animal
Models of Alzheimer’s Disease
Sofia Jacob
Doctoral thesis offered to obtain the degree of Doctor in Philosophy (Ph.D.)
Department of Brain and Cognition
Supervisor (s): Prof. Dr. Detlef Balschun Prof. Dr. Wilhelmus H.I.M. (Pim) Drinkenburg
2020


Neurophysiological Assessment of Brain
Network Activity Involved in Cognitive
Processing in Animal Models of Alzheimer’s
Disease
Sofia Jacob
Promoter (s):
Prof. Dr. Detlef Balschun
Prof. Dr. Wilhelmus H.I.M. Drinkenburg
Jury Members:
Dr. Per Nilsson
Prof. Dr. Jos Prickaerts
Prof. Dr. Cees Van Leeuwen
Prof. Dr. Andreas Van Leupoldt
Leuven, 3rd April 2020
Thesis submitted in partial fulfillment of the requirements for the degree of Doctor in Philosophy
at KU Leuven, Belgium
Department of Brain and Cognition
Faculty of Psychology & Educational Sciences
Katholieke Universiteit Leuven


“In god we trust, all others must bring data”
W. Edwards Deming


P a g e 1 | 128
Summary
The pathophysiological processes of Alzheimer’s disease (AD) are thought to start 20 years before
cognitive symptoms are observed for the first time. During the initial stage, known as the pre-
symptomatic phase of AD, also depicted as the preclinical phase, small alterations in the brain,
unnoticeable to the affected individual, start to occur. With disease progression, these small
changes advance into irreversible brain damage. It is believed that the best chance of therapeutic
success in AD will be early intervention. Biomarker research has become one of the main
investigational areas of AD as they could play an instrumental role in unequivocally identifying
the initial phase of AD.
Accumulating evidence suggests that neuronal oscillations play an important role in driving
brain network communications. Furthermore, oscillatory alterations are commonly observed in
patients with AD. It is still unclear whether they are early driving mechanisms of cognitive
dysfunction. If these neuronal network alterations can be identified at the preclinical phase of AD,
they could be implemented as a disease diagnostic tool.
Numerous animal models recapitulating the hallmarks of AD pathogenesis have been
created to facilitate the understanding of the molecular mechanisms underlying the disease process.
Among the most common models are transgenic animals that produce amyloid-β (Aβ) pathology
due to the artificial overexpression of the human amyloid precursor protein (APP) with mutations
linked to familial AD. More recent models include the App knock-in mice that produce robust Aβ
amyloidosis with physiological App expression levels.
The primary goal of this study was to investigate electrophysiological readouts in
combination with cognitive tasks to characterize electrophysiological functional alterations at ages
relevant for the preclinical AD phase. Two animal models were used, one that overexpresses
mutated human APP (the McGill-R-Thy1-APP rat) and another one that expresses mutated
humanized App at physiological levels (AppNL-G-F mice). We hypothesized that in these models, at
an age that mimics the preclinical stage of AD, Aβ amyloidosis causes aberrant network activity,
which reflects the early development of cognitive disturbances. Our results from the AppNL-G-F
characterization study do not support the hypothesis of early alterations in cognition relevant
oscillations due to Aβ amyloidosis. This study also indicated that APP overexpression, and not Aβ
overproduction, might be responsible for the abnormal network activity in the McGill-R-Thy1-
APP rat model. More in general, the experimental approach presented in this thesis provides a

P a g e 2 | 128
versatile methodology for assessment of complex neuronal network dynamics in models of AD as
well as in models of other neurodegenerative diseases.

P a g e 3 | 128
Samenvatting
Het begin van de pathofysiologische processen die aanleiding geven tot de ziekte van Alzheimer
wordt aangenomen zich te situeren 20 jaar voordat cognitieve symptomen voor het eerst worden
waargenomen. Tijdens de initiële fase van de ziekte, bekend als de presymptomatische ofwel
preklinische fase, manifesteren zich kleine veranderingen in de hersenen, onmerkbaar voor het
getroffen individu. Naarmate de ziekte vordert, evolueren deze kleine veranderingen tot
onomkeerbare hersenschade. Men neemt aan dat vroege interventie de grootste kans op
therapeutisch succes zal hebben. Zodoende is het onderzoek naar biomerkers één van de
belangrijkste onderzoeksgebieden van ziekte van Alzheimer, aangezien deze een instrumentele rol
kunnen spelen bij het accuraat identificeren van de preklinische fase.
Er is steeds meer bewijs dat gesynchroniseerde electrische activiteit van hersencellen, de
zogenaamde neuronale oscillaties, een belangrijke rol spelen in de communicatie van neuronale
netwerken in het brein. Bovendien worden afwijkingen in bepaalde oscillaties vaak waargenomen
bij Alzheimerpatiënten. Het is nog onduidelijk of dit vroege mechanismen zijn, die gerelateerd
zijn aan cognitieve disfunctie. Als dergelijke neuronale netwerkveranderingen in de preklinische
fase van de ziekte van Alzheimer kunnen worden geïdentificeerd, dan kunnen ze worden
geïmplementeerd als diagnostisch hulpmiddel.
Talrijke diermodellen die de hoofdkenmerken van de Alzheimer pathogenese recapituleren
werden gecreëerd om inzichten te genereren in de moleculaire mechanismen, die ten grondslag
liggen aan het ziekteproces. De meest voorkomende modellen zijn transgene dieren die amyloïd-
β (Aβ) pathologie produceren als gevolg van de kunstmatige overexpressie van het menselijke
amyloïde precursor eiwit (Engelse afkorting: APP), met mutaties gelinkt aan familiale vormen van
de ziekte van Alzheimer. Meer recente modellen omvatten de App knock-in muizen, die robuuste
Aβ amyloïdose vertonen, maar fysiologische App expressieniveaus hebben.
Het primaire doel van deze studies was om Alzheimer diermodellen te karakteriseren op
leeftijden die overeenkomen met de preklinische fase van Alzheimer. Dit werd uitgevoerd aan de
hand van technieken, die de elektrofysiologische functie meten in combinatie met cognitieve
taken. Twee diermodellen werden gebruikt, één die gemuteerd menselijk APP tot overexpressie
brengt (de McGill-R-Thy1-APP rat), en een andere die gemuteerd gehumaniseerd App op
fysiologische niveaus tot expressie brengt (de AppNL-G-F muizen). Onze hypothese was dat in deze
modellen, op een leeftijd die het preklinische stadium van de ziekte van Alzheimer simuleert, Aβ

P a g e 4 | 128
amyloïdose afwijkende netwerkactiviteit veroorzaakt, welke de vroege ontwikkeling van
cognitieve stoornissen representeert. Onze resultaten in de AppNL-G-F muizen ondersteunen de
hypothese van vroege veranderingen in voor cognitie relevante oscillaties als gevolg van Aβ
amyloïdose niet. Deze studie gaf verder aan dat APP overexpressie, en niet Aβ overproductie,
mogelijk verantwoordelijk is voor de abnormale netwerkactiviteit in het McGill-R-Thy1-APP rat
model. Meer in het algemeen biedt de experimentele benadering in dit proefschrift een veelzijdige
methodologie voor onderzoek van de complexe neuronale netwerkdynamiek in diermodellen van
de ziekte van Alzheimer, alsook diermodellen van andere neurodegeneratieve ziekten.

List of abbreviations
P a g e 5 | 128
List of abbreviations
A/T/N Amyloid deposition [A], neurofibrillary tangle [T] and neuronal injury [N]
AAALAC Accreditation of laboratory animal care international
AB Amyloid beta
ABCA7 ATP-binding cassette transporter A7
AD Alzheimer's disease
AICD amyloid precursor protein intracellular domain
ANOVA Analysis of variance
AP Anterior-posterior
APP Amyloid precursor protein
Cg Cingulate cortex
CLU Clusterin
CR1 complement receptor 1
CSF cerebrospinal fluid
CT Correction trial
CTF C-terminal fragment
dCA1 dorsal CA1 region of the hippocampus
ddPCR Droplet digital PCR
DMS dorsal medial striatum
DNA Deoxyribonucleic acid
DV dorsal-ventral
EEG Electroencephalography
ELISA enzyme-linked immunosorbent assay
fAD familial AD
FDR False discovery rate
Frt Ass Ctx frontal associated cortex
GABABR Amino aminobutyric acid type B receptor
GuHCl Guanidin-hydrochloride
HET Heterozygous
HFO high frequency oscillation
HFP high frequency oscillations

List of abbreviations
P a g e 6 | 128
HG High gamma
HO homozygous
ITI Inter-trial-interval
IWG International Working Group
KI Knock-in
Lat Ctx Lateral cortex
LFP Local field potentials
LG Low gamma
L-M1/M2 Ctx left M1/M2 cortex
LTP long term potentiation
M mean
MAPT microtubule-associated protein tau
MI Modulation index
ML Medial-lateral
mPFC medial prefrontal cortex
NFTs neurofibrillary tangles
NIA/AA National Institute on Aging/Alzheimer Association
PAC phase-amplitude coupling
PBS Phosphate-buffered saline
PCR Polymerase chain reaction
PDGF factor B-chain
PET positron emission tomography
PrP prior protein
PS Presenilin
PSD Power Spectral Density
PSEN1 presenilin 1
PSEN2 presenilin 2
R-M1/M2 Ctx right M1/M2 cortex
ROI Regions-of-interest
RSC retrosplenial cortex
s Soluble

List of abbreviations
P a g e 7 | 128
S- Unconditioned stimulus
S+ Conditioned stimulus
sAD sporadic AD
SD Standard deviation
Thy-1 thymocyte differentiation antigen 1
TREM2 triggering receptor expressed on myeloid cells 2
TUNL Trial-unique delayed non-matching-to-location
V1 Ctx Left V1 cortex
VD Visual Discrimination
WT Wildtype

P a g e 8 | 128

Table of Contents
P a g e 9 | 128
Table of Contents
General Introduction .................................................................................................................. 13
1.1. Introduction to Alzheimer’s Disease ................................................................................................ 13
1.2. Etiology of Alzheimer’s Disease ...................................................................................................... 13
Familial Alzheimer’s Disease .............................................................................................................. 14
Sporadic Alzheimer’s Disease ............................................................................................................. 14
1.3. Pathological Hallmarks ..................................................................................................................... 14
APP Processing and the Role of Aβ Pathology ................................................................................... 16
Neurofibrillary Tangles ....................................................................................................................... 18
Synaptic and Neuronal Loss ................................................................................................................ 18
1.4. Alzheimer’s Disease Progression ..................................................................................................... 19
1.5. Oscillations ....................................................................................................................................... 20
Oscillations in Pathological Conditions............................................................................................... 21
1.6. Animals Models of Alzheimer’s Disease Pathology ........................................................................ 22
Objectives ................................................................................................................................... 27
2.1. General Objective of the Project ....................................................................................................... 27
2.2. Specific Objectives ........................................................................................................................... 27
Objective 1: .......................................................................................................................................... 27
Objective 2: .......................................................................................................................................... 27
Objective 3: .......................................................................................................................................... 27
Material and Methods ................................................................................................................ 29
3.1. Animals ............................................................................................................................................. 29
McGill-R-Thy1-APP Rats ................................................................................................................... 29
AppNL-G-F Mice ..................................................................................................................................... 29
3.2. Surgery .............................................................................................................................................. 30
3.3. Behavioral Task ................................................................................................................................ 31
Trial-unique delayed Non-matching-to-location Task ........................................................................ 31
Apparatus ......................................................................................................................................... 32
Touchscreen Pre-training Stages ..................................................................................................... 33
TUNL Task Acquisition .................................................................................................................. 33
TUNL Task Delay Test ................................................................................................................... 34
Visual Discrimination Task ................................................................................................................. 35
Apparatus ......................................................................................................................................... 36
Touchscreen Pre-training Stages ..................................................................................................... 36
VD Task Tests ................................................................................................................................. 37
Table of Contents
P a g e 10 | 128
3.4. Electrophysiological Measurements ................................................................................................. 39
Recordings ........................................................................................................................................... 39
Home-cage Exploration: .................................................................................................................. 39
TUNL Task: ..................................................................................................................................... 40
VD Task: .......................................................................................................................................... 40
Relative and Absolute Power Spectral Density Analysis .................................................................... 40
Phase-amplitude Coupling Analysis .................................................................................................... 40
3.5. Brain Aβ1-42 Enzyme-linked Immunoassay (ELISA)..................................................................... 41
3.6. Immunohistochemistry ..................................................................................................................... 42
3.7. McSA1 Antibody Specificity ........................................................................................................... 43
3.8. Genotyping ....................................................................................................................................... 44
Droplet Digital PCR (ddPCR) ............................................................................................................. 44
3.9. Statistical Analysis............................................................................................................................ 44
Behavioral, Electrophysiological and Histopathological Characterization of McGill-R-Thy1-
APP Rats ...................................................................................................................................................... 47
4.1. Introduction....................................................................................................................................... 47
4.2. Results............................................................................................................................................... 48
Performance during TUNL Task ......................................................................................................... 48
Pre-training: ..................................................................................................................................... 48
TUNL Task Acquisition: ................................................................................................................. 49
TUNL Task Delay Test ................................................................................................................... 50
Brain Oscillations Analysis During TUNL Task ................................................................................. 52
Power Spectral Density .................................................................................................................... 52
Phase-amplitude Coupling ............................................................................................................... 57
Brain Oscillation Analysis During Home-Cage Environment Exploration......................................... 61
Power Spectral Density .................................................................................................................... 61
Phase-Amplitude Coupling .............................................................................................................. 62
Pathology ............................................................................................................................................. 63
Immunohistochemistry .................................................................................................................... 63
McSA1 Antibody Specificity Analysis ........................................................................................... 67
Genotyping – ddPCR ........................................................................................................................... 68
4.3. Conclusion ........................................................................................................................................ 68
Behavioral, Electrophysiological and Histopathological Characterization of AppNL-G-F Mice .. 71
5.1. Introduction....................................................................................................................................... 71
5.2. Results............................................................................................................................................... 73
Performance during VD Task .............................................................................................................. 73
Pre-training: ..................................................................................................................................... 73

Table of Contents
P a g e 11 | 128
Visual Discrimination Task: ............................................................................................................ 73
Brain Oscillations Analysis During VD Task ..................................................................................... 75
Relative Power Spectral Density: .................................................................................................... 75
Phase-Amplitude Coupling:............................................................................................................. 77
Brain Oscillations Analysis During Home-cage Environment Exploration ........................................ 83
Relative Power Spectral Density: .................................................................................................... 83
Phase-amplitude Coupling: .............................................................................................................. 84
Pathology ............................................................................................................................................. 85
5.3. Conclusion ........................................................................................................................................ 87
General Discussion .................................................................................................................... 89
References .................................................................................................................................................... 95
Scientific Contributions ............................................................................................................................. 111
Curriculum Vitae ....................................................................................................................................... 113
Acknowledgements .................................................................................................................................... 117

P a g e 12 | 128

P a g e 13 | 128
General Introduction
1.1. Introduction to Alzheimer’s Disease
Alzheimer’s disease (AD) is the most common cause of progressive neurodegenerative dementia
(Scheltens et al., 2016). The characteristic symptoms are impairments in memory, language,
problem-solving and other cognitive skills. In the more advanced stages, people with AD need
around-the-clock care, making it a devastating disease, not only for the patients, but also for their
caregivers. Considering that the main risk factor of the disease is age (Querfurth & LaFerla, 2011)
and that average life-expectancy increases, the associated personal, social and socio-economic
burden will intensify, if we do not find an effective treatment. The major pathological hallmarks
of AD are the formation and deposition of amyloid beta (Aβ) senile plaques and neurofibrillary
tangles (NFTs) (Scheltens et al., 2016). These pathological changes are accompanied by
neuroinflammation, aberrant synaptic and neuronal network activities (Başar et al., 2016;
Friedman, Honig, & Scarmeas, 2013; Nimmrich, Draguhn, & Axmacher, 2015), and eventually
dramatic brain shrinkage due to neuronal damage (Scheltens et al., 2016).
Despite the advances in AD research, much is still to be discovered about the etiology of
the disease and how it can be prevented, slowed or stopped. Current treatments are purely
symptomatic with no disease modifying effects, providing only temporary improvements. There
is an urgent need for early diagnosis to avoid irreversible brain damage and to allow timely
intervention of potential disease modifying drugs.
1.2. Etiology of Alzheimer’s Disease
In the majority of AD patients, the etiology of the disease is unknown and it develops as a result
of multiple factors. This condition is described as sporadic AD (sAD). In no more than 1 percent
of cases, the disease is caused by autosomal dominant inherited mutations and are defined as
familial AD (fAD). The majority of patients develop AD at age 65 or older. These cases are called
late-onset AD and the etiology is always sporadic. Early-onset develops before age 65 and it can
be either sAD or fAD (Scheltens et al., 2016).

P a g e 14 | 128
Familial Alzheimer’s Disease
Mutations in amyloid precursor protein (APP), presenilin 1 (PSEN1), presenilin 2 (PSEN2) genes
are the only three associated with fAD. People inhering APP or PSEN1 mutations are guaranteed
to develop AD, while those who inherited a PSEN2 mutation have a 95 percent chance to develop
the disease (Bekris, Yu, Bird, & Tsuang, 2010). Some mutations in these three genes affect APP
cleavage and Aβ production. Importantly, despite the low incidence of fAD, multiple transgenic
animal models carrying mutations in these genes have been created to further understand the
molecular mechanisms implicated in the pathogenesis of the disease (see section –Animals Models
of Alzheimer’s Disease Pathology).
Sporadic Alzheimer’s Disease
Most AD cases develop as a result of multiple environmental and genetic factors rather than a
single cause, but unfortunately little is known about the interplay between them (Alzheimer’s
Association, 2019; Livingston et al., 2017). From the environmental risk factors, age is the
greatest. Modifiable risk factors include cardiovascular disease risk factors, such as smoking, and
diabetes, lower education, lack of exercise, and traumatic brain injury (Alzheimer’s Association,
2019). Genome-wide association studies have identified single nucleotide polymorphisms in
several genes that are associated with an increased risk factor, the most influential being the APOE
ε4 allele. APOE plays an important role in cholesterol transport and Aβ clearance. There are three
common alleles in the APOE gene (ε2, ε3, and ε4). Having the ε4 form increases the risk of getting
sAD compared to the ε3 form, and having the ε2 form may decrease the risk compared with having
ε3 form (Alzheimer’s Association, 2019; Spinney, 2014). Other single nucleotide polymorphisms
have been identified, for example, in Clusterin (CLU), ATP-binding cassette transporter A7
(ABCA7), triggering receptor expressed on myeloid cells 2 (TREM2), complement receptor 1
(CR1), and CD33 genes as genetic risk factors of sAD (Karch & Goate, 2015).
1.3. Pathological Hallmarks
In 1907 Alois Alzheimer identified the two main pathological hallmarks of AD: Extracellular
amyloid plaques and intracellular NFTs (Stelzmann, Norman Schnitzlein, & Reed Murtagh, 1995).
Eighty years after this discovery, the molecular compositions of these pathological hallmarks were

P a g e 15 | 128
described (Glenner & Wong, 1984; Grundke-Iqbal et al., 1986). NFTs are composed of aggregated
hyper-phosphorylated forms of the microtubule-associated protein Tau (Grundke-Iqbal et al.,
1986), while plaques are mainly composed of insoluble Aβ aggregates (Glenner & Wong, 1984).
Macroscopically, AD is characterized by general cortical mass reduction, enlargement of
ventricles, and hippocampal and cerebral cortex atrophy (Apostolova, 2013). See Figure 1.
Figure 1. Pathological hallmarks of Alzheimer’s disease (AD). A) atrophy of the brain. Depicts a
section of a hemibrain from an AD patient (left) and a healthy aged brain (right). The brain from
the AD patient shows marked atrophy, dilation of the lateral ventricle, and a small hippocampus.
B) Neuritic plaques [P] and neurofibrillary tangles [N] in the hippocampus, as seen with the
modified Bielschowshy silver impregnation. C) Immunostaining of a frontal cortex section with
an anti-amyloid-β antibody (10D5) revealing a diffuse amyloid plaque [D], a dense cored plaque
[C] and cerebral amyloid angiopathy [A]. D) immunodetection of neurofibrillary tangles (N) and
neuritic plaques [P] in frontal lobe. Figure adapted from (Wippold, Cairns, Vo, Holtzman, &
Morris, 2008).

P a g e 16 | 128
APP Processing and the Role of Aβ Pathology
Aβ peptides are generated by sequential proteolytic cleavage of APP. Depending on the secretases
that cleave APP, it can undergo amyloidogenic and non-amyloidogenic processing. In the non-
amyloidogenic pathway, APP is first cleaved by α secretase in the middle of the Aβ sequence to
generate the soluble APPα (sAPPα) fragment and APP-CTF-α. The subsequent cleavage of APP-
CTF-α by γ-secretase yields the P3 peptide and the amyloid precursor protein intracellular domain
(AICD). In the amyloidogenic pathway, APP is cleaved by β-secretase to produce sAPPβ and a C-
terminal fragment (APP-CTF-β) which contains the Aβ peptide. In turn, APP-CTF-β is cleaved by
γ-secretase at multiple sites in the plasma membrane yielding Aβ peptides of different lengths and
AICD (see Figure 2, right panel) (Citron, 2004; Maya & Bassem, 2014). Aβ protein fragments can
accumulate and build up into plaques. These plaques can exhibit different sizes and degree of
compactness. For instance, diffuse Aβ plaques are mostly present in nondemented elderly people,
while neuritic Aβ plaques are commonly found in AD patients. From the different Aβ peptides,
the Aβ1-42 is considered the main constituent of the amyloid plaques (Serrano-Pozo, Frosch,
Masliah, & Hyman, 2011). Although cleavage of APP into Aβ had been extensively studied in
relation to AD, the relationship of physiological α-secretase to β-secretase processing is not fully
understood.
The amyloid cascade hypothesis proposes Aβ accumulation and amyloid plaque deposition
as the first initiators of AD pathogenesis (Hardy & Higgins, 1992). The hypothesis was postulated
in the early 90’ and proposed a linear cascade where the deposition of Aβ is the initial pathological
event in AD, leading to amyloid plaques, NFTs, neuronal loss and ultimately to dementia (Hardy
& Higgins, 1992; Karran, Mercken, & De Strooper, 2011).
Several pieces of evidence made this hypothesis the leading one in the field guiding
academic and pharmaceutical research in the last two decades. First, all currently known mutations
associated with fAD affect Aβ production or aggregation. Mutations in APP, PSEN1, and PSEN2
(catalytic subunit of γ-secretase) affect APP cleavage and Aβ production, favouring the release of
longer and less soluble Aβ peptides (Bekris et al., 2010). Second, individuals with Down’s
syndrome are at increased risk of developing AD. Most of these patients have three copies of the
APP gene, leading to elevated APP expression and increased Aβ deposition (Lott, 2012). Third, a
coding mutation in the APP gene (A673T) has been showed to reduce the risk for AD (TCW &
Goate, 2017). In October 2019, Biogen announced the 2020 application for Food and Drug

P a g e 17 | 128
Administration approval for aducanumab, a human monoclonal antibody against Aβ developed.
The results of the phase 3 clinical study are the first ones to demonstrate that clearance of Aβ
aggregates can reduce clinical decline in patients with early AD
(https://www.alzforum.org/news/research-news/reports-my-death-are-greatly-exaggerated-
signed-aducanumab). If this drug works and it is approved, it will become the first treatment for
AD.
Despite the above supporting evidence, the linearity of the amyloid hypothesis remains one
of the most highly debated topics in the field. Some of the scepticism on this hypothesis comes
from the lack of consistent relation between the extent of amyloid pathology and the severity of
dementia (Terry et al., 1991). The rate of cognitive impairment in AD correlates best with the
burden of NFT (Bierer et al., 1995; Pontecorvo et al., 2017). Furthermore, with the new
understanding of the preclinical AD phase (see section Alzheimer’s Disease Progression), a more
holistic approach where other cell populations such as microglia and astrocytes also play a role in
the progression of the diseases has been suggested (De Strooper & Karran, 2016).
Figure 2. The proteolytic processing of amyloid precursor protein (APP). APP can be cleaved by
α-, β- and γ-secretases; the cleavage sites of these proteases are indicated in the full-length APP
shown in the center of the figure. APP can undergo amyloidogenic (right) or non-amyloidogenic
(left) processing. In the amyloidogenic pathway, cleavage by β-secretase results in the formation
of soluble APPβ (sAPPβ) and APP-CTF-β. The subsequent action of γ-secretase on APP-CTF-β
releases Aβ from the amyloid precursor protein intracellular domain (AICD). In the non-
amyloidogenic pathway, cleavage by α-secretase prevents the formation of Aβ; α-secretase cleaves
within the Aβ sequence, giving rise to sAPPα and the membrane-tethered APP-CT-α, which in

P a g e 18 | 128
turn is cleaved by γ-secretase resulting in release of the P3 peptide and AICD. Figure adapted from
(Maya & Bassem, 2014).
Neurofibrillary Tangles
Tau, the main component of NFTs is a microtubule-associated protein, essential for axonal
microtubule assembly and stability (Lindwall & Cole, 1984). When hyper-phosphorylated, tau
loses affinity for microtubules becoming highly prone to aggregation, and filament formation
(Abraha et al., 2000). NFTs pathology in AD develops in a highly distinct spatial manner. The first
tau depositions are observed in the trans-entorhinal region, followed by the hippocampal
formation, and finally the rest of the neocortex (Braak & Braak, 1991).
It is important to notice that NFTs are common in many neurodegenerative diseases
without Aβ plaques, such as frontotemporal dementia and Pick’s disease. Together, these diseases,
are known as tauopathies (Spillantini & Goedert, 2013). In the context of AD, a substantial amount
of evidence suggests an interplay between Aβ and tau (Ittner & Götz, 2011).
Synaptic and Neuronal Loss
A major pathological characteristic found in AD patients is synaptic degeneration (Selkoe, 2002).
Importantly, the degree of cognitive decline in patients with AD has been more robustly correlated
to synaptic loss than with the number of NFTs and Aβ plaques (DeKosky & Scheff, 1990; Terry
et al., 1991). Furthermore, synaptic loss in areas associated with memory, such as the
hippocampus, has been reported in the early stages of AD (Scheff, Price, Schmitt, & Mufson,
2006).
The interaction between Aβ and tau and their role on the cascades that lead to synaptic
dysfunction remains a controversial issue and a topic of active investigation. For instance, it has
been suggested that Aβ modulates synaptic transmission (Parihar & Brewer, 2010). The Aβ
oligomer hypothesis places these soluble Aβ aggregates as the key neurotoxic agents that cause
synaptic failure (Karran & De Strooper, 2016). Tau aggregation may play a role in synaptic
dysfunction by causing axonal transport deficits (Mandelkow, Stamer, Vogel, & Thies, 2003).
While new evidence suggest that intermediate forms of tau, prior to NFT formation, are the toxic
species (Shafiei, Guerrero-Muñoz, & Castillo-Carranza, 2017). Furthermore, microglial activation
and neuroinflammation can affect synaptic activity (Karran & De Strooper, 2016).
P a g e 19 | 128
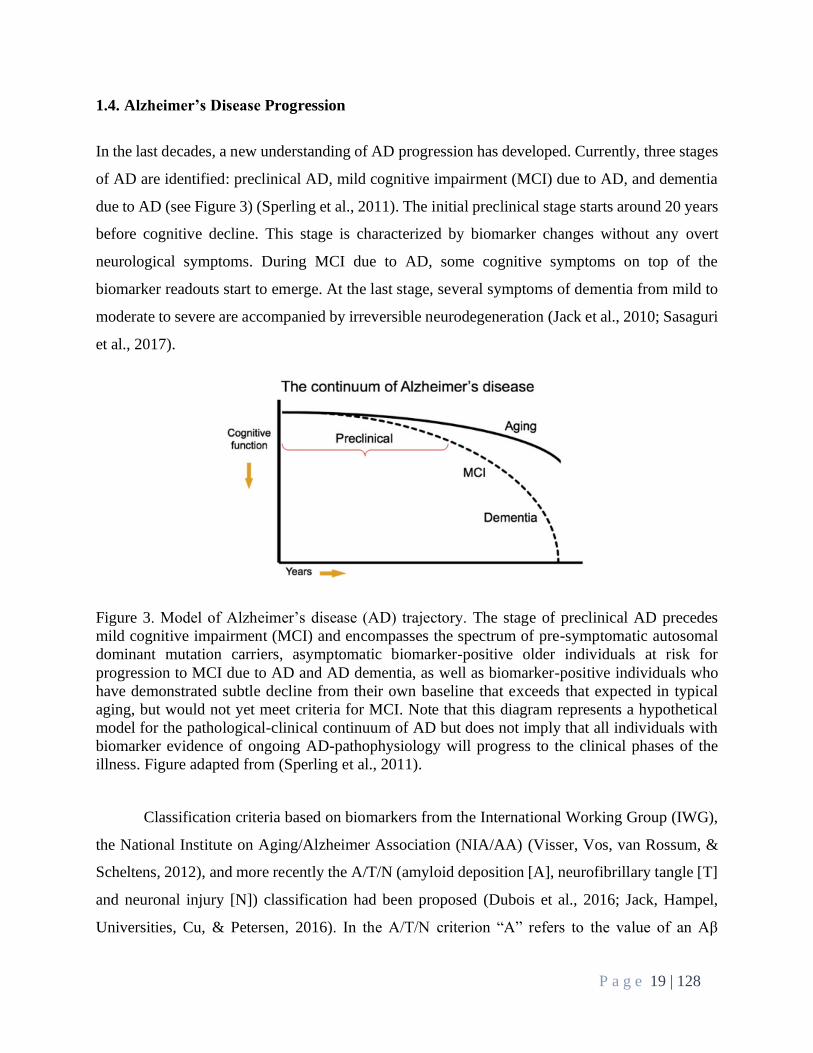
1.4. Alzheimer’s Disease Progression
In the last decades, a new understanding of AD progression has developed. Currently, three stages
of AD are identified: preclinical AD, mild cognitive impairment (MCI) due to AD, and dementia
due to AD (see Figure 3) (Sperling et al., 2011). The initial preclinical stage starts around 20 years
before cognitive decline. This stage is characterized by biomarker changes without any overt
neurological symptoms. During MCI due to AD, some cognitive symptoms on top of the
biomarker readouts start to emerge. At the last stage, several symptoms of dementia from mild to
moderate to severe are accompanied by irreversible neurodegeneration (Jack et al., 2010; Sasaguri
et al., 2017).
Figure 3. Model of Alzheimer’s disease (AD) trajectory. The stage of preclinical AD precedes
mild cognitive impairment (MCI) and encompasses the spectrum of pre-symptomatic autosomal
dominant mutation carriers, asymptomatic biomarker-positive older individuals at risk for
progression to MCI due to AD and AD dementia, as well as biomarker-positive individuals who
have demonstrated subtle decline from their own baseline that exceeds that expected in typical
aging, but would not yet meet criteria for MCI. Note that this diagram represents a hypothetical
model for the pathological-clinical continuum of AD but does not imply that all individuals with
biomarker evidence of ongoing AD-pathophysiology will progress to the clinical phases of the
illness. Figure adapted from (Sperling et al., 2011).
Classification criteria based on biomarkers from the International Working Group (IWG),
the National Institute on Aging/Alzheimer Association (NIA/AA) (Visser, Vos, van Rossum, &
Scheltens, 2012), and more recently the A/T/N (amyloid deposition [A], neurofibrillary tangle [T]
and neuronal injury [N]) classification had been proposed (Dubois et al., 2016; Jack, Hampel,
Universities, Cu, & Petersen, 2016). In the A/T/N criterion “A” refers to the value of an Aβ

P a g e 20 | 128
biomarker (amyloid positron emission tomography [PET] or cerebrospinal fluid [CSF] Aβ42); “T”
refers to the value of a tau biomarker (CSF phosphor tau, or tau PET), and “N” biomarkers of
neurodegeneration or neuronal injury ([(18)F]-fluorodeoxyglucose-PET, structural MRI, or CSF
total tau). Each biomarker category is rated as positive or negative. An individual score might
appear as A+/T+/N-, or A+/T-/N-, etc. Importantly, these criteria do not specify disease labels and
thus do not represent a diagnostics classification system (Jack et al., 2016).
Biomarkers, such as PET scans and CSF tests, have tremendously advanced AD research
by providing relevant AD-related pathophysiology in living persons (Dubois et al., 2016; Jack et
al., 2016; Visser et al., 2012). It is believed that earlier interventions at the preclinical stage of AD
may offer the best chance of therapeutic success and biomarkers play an instrumental role in
correctly identifying the initial stage of AD. Biomarkers are not only being used as part of
diagnostic tools, but they also facilitate clinical trials targeting early stages of the disease, help to
monitor treatment responses, and can advance our knowledge on preclinical AD.
The search and investigation of more reliable, affordable, specific, sensitive, and less
invasive novel biomarkers to complement and replace the currently used markers, which are
expensive and invasive, is one of the main research areas in AD in these days, as targeted by
initiatives like the Alzheimer’s Drug Discovery Foundation Diagnostics Accelerator Initiative
(https://www.alzdiscovery.org).
1.5. Oscillations
Cognitive processes are based on the coordinated interaction of populations of neurons that are
distributed within and across different brain areas. Neuronal oscillations, transient and rhythmic
variation in neuronal activity, are usually assessed at frequencies from <0.1 to 300 Hz and
classified in frequency bands (delta, theta, alpha, beta, gamma, and high frequency oscillation
[HFO]). These bands are created based on correlations with response to cognitive processes,
vigilance state, pharmacology, and sensory and motor events, as different frequencies provide
distinct temporal windows for processing (Buzsáki & Draguhn, 2004; Jobert et al., 2012).
Accumulating evidence suggests that neuronal oscillations play a substantial role in driving the
communication in brain networks, not only in humans but also in rats (Fries, 2015; Hasselmo &
Stern, 2014; Herrmann, Strüber, Helfrich, & Engel, 2016).

P a g e 21 | 128
Oscillation in the theta (4 -12 Hz) and gamma (30 - 100 Hz) band are commonly related to
cognitive processes and the changes in these oscillatory activities are correlated with specific task
demands (M. X. Cohen, 2014). Complex interactions between oscillations have also been
implicated in driving brain network’s communication. In particular, phase-amplitude coupling
(PAC) between the phase of theta and the amplitude of gamma has been suggested to be a potential
mechanism to regulate neuronal communication in multiple brain regions (Axmacher et al., 2010;
Lisman & Jensen, 2013; Tort et al., 2008). For instance, Tort and colleagues, using an item-context
association learning paradigm, investigated theta-gamma PAC in the CA3 region of the
hippocampus while rats learned the task. They observed that an increase in theta-gamma PAC was
correlated with an increase in accuracy during learning. Furthermore, the increased PAC was
maintained during over-trained sessions (Tort, Komorowski, Manns, Kopell, & Eichenbaum,
2009). Similarly, in humans, using transcranial alternating current stimulation in the medial
prefrontal cortex (mPFC) during a working memory task, Alekseichuk and coworkers
demonstrated that increased performance coincided with gamma bursts being phase-locked to the
peak of the theta oscillation (Alekseichuk, Turi, Amador de Lara, Antal, & Paulus, 2016).
Oscillations in Pathological Conditions
A better understanding of neuronal network interactions and circuit dynamics is crucial for our
comprehension of brain disorders. Electroencephalography (EEG) is a particularly attractive tool
to study alterations in circuit dynamics in AD and other neurodegenerative disorders due to its low
cost and easy implementation (Babiloni et al., 2020; Walsh, Drinkenburg, & Ahnaou, 2017).
In AD patients, changes in EEG spectral power or synchronization have been commonly
reported (Coben, Danziger, & Storandt, 1985; Engels et al., 2015; Nimmrich et al., 2015;
Voevodskaya et al., 2018). These oscillatory alterations are probably related to multiple direct and
indirect effects of Aβ and tau pathology leading to synaptic dysfunctions that impact local network
activity (Babiloni et al., 2020). A shift in power from fast to slow waves is typically reported in
EEG recordings with progressing AD pathology (Başar et al., 2016). For instance, decrease of
alpha power is commonly observed in the EEG of patients with dementia due to AD. Engels et al.
investigated functional connectivity in relation to disease severity. They divided AD patients in
mild, moderate and severe groups based on the Mini Mental State Examination and recorded EEG
to then perform functional connectivity analysis. Their results indicate a decrease in functional

P a g e 22 | 128
connectivity in the lower alpha band as the disease progresses (Engels et al., 2015). PAC has also
been shown to be affected in patients with AD (Poza et al., 2017) and MCI (Dimitriadis, Laskaris,
Bitzidou, Tarnanas, & Tsolaki, 2015). These disruptions are also present in animal models of
pathology (Busche & Konnerth, 2015; Palop et al., 2007; Palop & Mucke, 2010). Bazzigaluppi
and colleagues, recently demonstrated reduced PAC in the hippocampus and mPFC in a transgenic
rat model of AD at early stages of pathology (Bazzigaluppi et al., 2018).
Although some of the studies investigating oscillatory changes in patients used new
guidelines for diagnosis and investigated preclinical and clinical AD, the reliability of the AD
diagnosis in other studies must be considered with caution, given the lack of available biomarkers
at the time of the studies. For instance, it has been indicated a clinical misdiagnosis of about 20%
(Fischer et al., 2017).
Importantly, neuronal network changes are also seen in other pathologies such as
schizophrenia, bipolar disorders, and other neurodegenerative disorders. For instance, a disruption
of gamma oscillations, which in turn is associated with the cognitive deficits, has been observed
in these diseases (Nimmrich et al., 2015). Furthermore, it is still unclear whether neuronal
alterations occur rather at a late stage of the disease as a consequence of neurodegeneration, or at
an early stage as a primary mechanism contributing to cognitive dysfunction. If the second
conjecture is correct, the potential value of having a reliable electrophysiological biomarker of
preclinical and early stages of the AD could have a major impact on the disease diagnostics. Our
knowledge about the pathophysiology of neural networks in AD is limited and more research is
urgently needed.
1.6. Animals Models of Alzheimer’s Disease Pathology
Animal models have played a major role in AD research. To date, there are approximately 200
different transgenic rodent models (see https://www.alzforum.org/research-models). The most
common of them are transgenic mouse models overexpressing human APP, presenilin (PS), and/or
tau mutations. Even though none of the transgenic models replicates all aspects of AD, they have
provided important insights into the pathophysiology of the disease.
Transgenic mouse models overexpressing human APP were the first created models
(Games et al., 1995) and are still the most commonly used. These models overexpress APP with

P a g e 23 | 128
one or multiple fAD mutations. Some of the most commonly used mutations are K670N/M671L
(Swedish) with increased total Aβ, V717F (Indiana), and V717I (London) with both having
increased Aβ42/ Aβ40 ratios (Goate et al., 1991; Karch & Goate, 2015; Murrell, Farlow, Ghetti,
& Benson, 1991). The APP is expressed from numerous promoters, such as factor B-chain
(PDGF), thymocyte differentiation antigen 1 (Thy-1), and prior protein (PrP) genes (Sasaguri et
al., 2017). Among the most frequently used rodent models are PSAPP, Tg2576, APP23, and J20.
These models are characterized by Aβ deposits, cognitive dysfunction, even before Aβ plaques,
and synaptic damages (Games et al., 1995; Hsiao et al., 1996; Mucke et al., 2000; Palop et al.,
2007; Sasaguri et al., 2017; Sturchler-Pierrat et al., 1997). At the brain network level, it has been
reported by numerous studies that these mouse models demonstrate various alterations (Busche &
Konnerth, 2015; Palop et al., 2007; Palop & Mucke, 2010), even before Aβ accumulation
(Goutagny, Gu, Cavanagh, Jackson, & Chabot, 2013). Although these results show some
phenotypical similarities with AD (Nimmrich et al., 2015; Palop & Mucke, 2009; Poza et al.,
2017), it is not clear what are the underlying mechanisms that cause the aberrant neuronal activity
observed in these models.
Other commonly used mouse models are double transgenics where APP mutant mice are
crossed with PSEN1 mutant mice. The most commonly used models carrying both mutant genes
are the APP/PS1 and 5xFAD (Holcomb et al., 1998; Oakley et al., 2006). These models are
characterized by rapid Aβ deposition, behavioral impairments, and neuronal loss. Single transgenic
mutant PSEN1 mice are not used as the overexpression of mutant PS1 alone does not induce AD
pathology or cognitive deficits (Hall & Roberson, 2012; Sasaguri et al., 2017). These models, as
well as the mutant APP models, fail to replicate two major pathologies of AD: NFT and substantial
neurodegeneration.
Several mutant tau transgenic mouse models presenting NFTs and neurodegeneration are
also available (Drummond & Wisniewski, 2017; Hall & Roberson, 2012; Kiyota, 2014). These
models express human tau with mutations that cause frontotemporal dementia with parkinsonism
linked to chromosome 17 (Yoshiyama, Lee, & Trojanowski, 2001). To investigate AD, better-
considered models are the ones combining tau transgenic models with APP models, such as the
APP-V717I x Tau-P301L mice (Terwel et al., 2008). These models exhibit both Aβ accumulation
and NFTs, making them more complete than other models and allowing to investigate interactions
between tau and Aβ pathology. However, the tau mutations used in these models are not directly

P a g e 24 | 128
linked to AD. Furthermore, the overexpression of APP and tau can have artificial phenotypes
(Born et al., 2014; Nilsson, Saito, & Saido, 2014).
Although most of the transgenic models are in mice, in the last decade, transgenic rat
models have also been created (Cohen et al., 2013; Leon et al., 2010). One of the main reasons for
this gap was related to the limited number of tools to alter the rat genome (Do Carmo & Cuello,
2013; Ellenbroek & Youn, 2016). However, rats have a rich and complex behavioral repertoire
and are physiologically, genetically, and morphologically closer to humans than mice (Do Carmo
& Cuello, 2013; Ellenbroek & Youn, 2016). Therefore, it is important to consider if this species is
a more relevant model to study AD pathology. One of the most characterized transgenic rat models
is the McGill-R-Thy1-APP, overexpressing human APP carrying both Swedish and the Indiana
mutations under the control of the murine Thy1.2 promoter (Leon et al., 2010). This model, similar
to the APP-overexpressing mouse models, develops Aβ deposits, cognitive impairments, as well
as synaptic and network decline (Parent et al., 2017; Qi et al., 2014).
All the above-mentioned transgenic rodent models have several important limitations.
First, these models use exogenous promoters to overexpress the different genes, which triggers an
abnormal expression of the proteins (Höfling et al., 2016). Second, the lack of standardization on
the use of different promoters makes it difficult to compare the models. Third, in the case of APP
overexpression models, various APP fragments, besides Aβ, are being produced (see Figure 2).
Therefore, while these models are useful to investigate Aβ production and deposition (Sasaguri et
al., 2017), the overexpression of these proteins makes it difficult to distinguish between the
phenotypes produced by Aβ pathology and other APP fragments unrelated to AD pathology.
In 2014, Saito and colleagues developed a new generation of App knock-in (KI) mice that
produce robust Aβ amyloidosis with physiological App protein levels (Saito et al., 2014). These
mice express humanized Aβ with either one (Swedish, AppNL), two (Swedish and
Beyreuther/Iberian, AppNL-F), or three (Swedish, Beyreuther/Iberian, and Artic, AppNL-G-F) fAD
mutations. The AppNL-F and AppNL-G-F models present Aβ plaques depositions and cognitive
alterations, while the AppNL do not develop plaques or have cognitive deficits (Masuda et al., 2016;
Saito et al., 2014a). More recently, Saito and colleagues developed another KI mouse model, in
this case with humanized microtubule-associated protein tau (MAPT) and crossed it with the App
KI models to investigate App-Tau interactions (Saito et al., 2019). Although, these models avoid
potential artifacts associated with the strong overexpression of AD-related genes, the development

P a g e 25 | 128
of pathology relies on several mutations linked to fAD and frontotemporal dementia and may not
accurately recreate the pathological processes in sAD.
Importantly, no existing model recapitulates all features of AD. Therefore, different models
may be most appropriate for addressing different questions and comparisons between different
models should always be done in the context of a specific scientific question rather than
considering just one particular model to be reliably mimicking AD (Jankowsky & Zheng, 2017).

P a g e 26 | 128

Objectives
P a g e 27 | 128
Objectives
2.1. General Objective of the Project
The general objective of this thesis was to characterize the dynamics in neural circuitry during
cognitive behavior in preclinical experimental rodent models of AD. We hypothesized that Aβ
amyloidosis causes aberrant network activity at the preclinical stage of the disease, which reflects
the early development of cognitive disturbances observed in models of AD pathology.
2.2. Specific Objectives
To evaluate this hypothesis, we have pursued the following major objectives:
Objective 1:
Study neuronal oscillations during cognitive process in a rat model of AD pathology at an age that
represents the preclinical phase of AD. For this purpose, we characterized the McGill-R-Thy1-
APP rat model at a behavioral, electrophysiological and histopathological level (chapter 4).
Objective 2:
Study neuronal oscillations during cognitive process in a mouse model of AD pathology at an age
that represents the preclinical phase of AD. For this purpose, we characterized the AppNL-G-F mouse
model at a behavioral, electrophysiological and histopathological level (chapter 5).
Objective 3:
Assess PAC as a sensitive functional readout of AD pathology. To this end, we investigated PAC
in relation to cognitive processes in the two AD models mentioned in objectives 1 and 2 (chapters
4 and 5).

Objectives
P a g e 28 | 128
To achieve the above-mentioned objectives the following techniques had to be established by
the candidate:
• Selection, assessment, and optimization of the trial-unique delayed non-matching-to-
location (TUNL) and visual discrimination (VD) tasks.
• Implementation, optimization, and validation of the wireless recording of local field
potentials (LFPs) during the behavioral task.
• Selection of electrophysiological readouts of interest.
• Implementation, optimization, and validation of surgical implantation of head-stages for
the recording of LFPs in rats and mice.
• Implementation, optimization, and validation of the synchronization between the video
system and the wireless electrophysiological recording to investigate oscillatory activity
during home-cage environment exploration.
• Detection and removal of artifacts from electrophysiological signal.
Overall, the approach presented in this thesis aimed at creating a versatile tool for further
assessment of the complex interplay between different frequency bands of oscillations of LFPs
and their relationship with behavior. Such a combination of techniques could open new avenues
for the investigation of cognition-related network perturbations in relevant animal models of AD
pathology, eventually determining their translational validity and potential use as
electrophysiological readouts in drug discovery and development. In this thesis we used this tool
in two transgenic model (objectives 1 and 2) and focus the oscillatory analysis in PAC (objective
3).

Material and Methods
P a g e 29 | 128
Material and Methods
3.1. Animals
All experiments were performed in strict accordance with the guidelines of the Association for
Assessment and Accreditation of Laboratory Animal Care International (AAALAC) and with the
European Council Directive of 24 November 1986 (86/609/EEC) and European Ethics Committee
directive (2010/63/EU) for the protection of laboratory animals. In line with Belgian governmental
directives, all protocols were approved by the Animal Care and Use Committee of Janssen
Pharmaceutica NV. After weaning animals were singly housed (to prevent damage to chronically
instrumented head-stages by cage-mates) in individually ventilated cages under a reversed 12-12
light cycle (lights off 07:00-19:00; light intensity ~100 lux) under controlled environmental
conditions throughout the study (22 ± 2°C ambient temperature and relative humidity at 60%).
Home-cages were equipped with corn cob bedding, tissue for nesting material, a tinted
polycarbonate shelter for the mice and ad libitum water. Throughout pre-training and cognitive
testing, rodents were provided with a restricted diet (SAFE A05) to maintain them at 80% free-fed
weight to ensure consistent motivation towards reward pellets. All behavioral testing was
conducted during the dark phase to obtain optimal engagement in the behavioral task as this is the
active phase of the circadian cycle in mice and rats.
McGill-R-Thy1-APP Rats
In vivo data were obtained from 6 homozygous (HO), 6 heterozygous (HET), and 16 wildtype
(WT) male McGill-R-Thy1-APP rats (generated by Cuello and colleagues (Leon et al., 2010) and
obtained from the Janssen transgenic rodent facility, Belgium). A separate, satellite group of 6 HO
of 7 months of age were used for immunohistochemical studies.
AppNL-G-F Mice
In vivo data were obtained from 8 HO males AppNL-G-F mice (generated by Saito and colleagues
(Saito et al., 2014a) and obtained from the Janssen transgenic rodent facility, Belgium) and 10 age-

Material and Methods
P a g e 30 | 128
matched non-litter mates WT C57BL/6J male mice (Charles River, France). A separate, satellite
group of 36 AppNL-G-F male mice were group-housed in individually ventilated cages for
biochemical and immunohistochemical studies.
3.2. Surgery
Surgeries were carried out when animals were 3 months old. The surgeon was blinded to animal
genotype before carrying out the procedure. Anesthesia was induced by an isoflurane inhalation
(O2, N2O and 5% isoflurane) for 2 minutes and animals inserted into a stereotactic frame
(StereoDrive, Neurostar, Germany). During the surgical procedure, anesthesia was maintained
using a continuous flow of gas (O2, N2O and 2% isoflurane) delivered via an inhalation mask. A
homeothermic blanket system was used to sustain a stable 37-38°C body temperature. To minimize
pain during surgery, a subcutaneous injection of analgesic Piritramide (dipidolor, 0.025mg/kg)
was administered to mice and Metacam (0.1 ml/kg) to rats. As a further precaution to minimize
pain from the surgery, a local spray analgesic (Xylocaine, 10%) was applied at the surgery site.
An incision was made along the sagittal plane to expose the skull, and the scalp held open using
suture thread tied to the stereotactic frame. The skull was cleaned using saline solution and dried
using swabs and cotton buds. Holes were drilled for the placement of recording electrodes; all
coordinates relative to bregma, anterior-posterior (AP), medial-lateral (ML), dorsal-ventral (DV).
Two stainless steel screws were fixed over the left frontal and right occipital lobes to secure the
implant. Depth electrodes consisted of a single fomvar-insulated tungsten wire (100μm diameter
with a blunt-tipped, Peira, Belgium) and surface electrodes were 500μm diameter gold-plated pins,
impedance= 150. Electrodes were placed in different brain structures (Franklin & Paxinos, 1997;
Paxinos & Watson, 1998, for rats and mice, respectively) (see Table 1 for rats and Table 2 for
mice). All electrodes were referenced to the same ground electrode placed on the midline above
the cerebellum (-1.5mm AP, 0.5mm ML) and grounded by a pin positioned on the midline above
the occipital lobe (-5.0mm AP, 0.0mm ML). After placing all electrodes, a multichannel connector
(Nano strip connector, Omnetics, Minneapolis, USA) was affixed using dental cement to the
cranium and the wound sutured around the implant. Animals’ recovery and well-being were
closely monitored for approximately 10 days until they were fully recovered.

Material and Methods
P a g e 31 | 128
Brain Structure AP (mm) ML (mm) DV (mm)
frontal associated cortex (Frt Ass Ctx) 5.5 -1.5 0
Left M1/M2 cortex (L-M1/M2 Ctx) 2 -2 0
Right M1/M2 cortex (R-M1/M2 Ctx) 2 2 0
Cingulate cortex (Cg) 1 0 0
Left lateral cortex (Lat Ctx) -3.5 -4 0
Left V1 cortex (V1 Ctx) -7.2 -4 0
Medial prefrontal cortex (mPFC) 3.0 0.7 -3.6
Retrosplenial cortex (RSC) -3.5 0 0
Table 1. Coordinates of surgical implanted electrodes in different brain areas for rats. AP: anterior-
posterior, ML: medial-lateral, DV: dorsal-ventral (according to Paxinos & Watson 1998)
Brain Structure AP (mm) ML (mm) DV (mm)
Dorsal medial striatum (DMS) 1.4 -1.0 -2.5
dorsal CA1 region of the hippocampus
(dCA1)
-1.7 -1.5 -1.7
Cingulate cortex (Cg) -0.5 0.0 0.0
Retrosplenial cortex (RSC) -1.8 0.0 0.0
Table 2. Coordinates of surgical implanted electrodes in different brain areas for mice. AP:
anterior-posterior, ML: medial-lateral, DV: dorsal-ventral (according to Franklin & Paxinos, 1997)
3.3. Behavioral Task
Trial-unique delayed Non-matching-to-location Task
The TUNL task was used for the study conducted with the McGill-R-Thy1-APP rats (see chapter
4). TUNL is a touchscreen task used to assess working memory and spatial pattern separations in
rats (Oomen et al., 2013; Talpos, McTighe, Dias, Saksida, & Bussey, 2010).

Material and Methods
P a g e 32 | 128
Apparatus
Rats were trained in operant boxes (modified from Med Associates Inc. Fairfax, Vermont): 2 sides
of the box were constructed of clear acrylic glass. One of the other 2 sides was equipped with a
pellet receptacle containing a light and an infrared nose-poke detector, a tone generator, and a
house light. The remaining side of the box was equipped with a touch-sensitive, flat-screen, LCD
computer monitor (26.5 cm x 40 cm). The monitor was then covered with a “mask”, a piece of
black acrylic glass with 66 small apertures dividing the touchscreen into multiple response fields
in which stimuli were presented. Nose-poking on the screen was detected with an infrared touch
detection system. Boxes were placed in sound attenuated chambers fitted with a small ventilation
fan. The floor of the chamber consisted of aluminum bars spaced approximately 1 cm apart. Each
operant box was controlled by K-limbic software, version 1.20.2 (Conclusive Solutions,
Sawbridgeworth, UK). For the description of the operant box see Figure 4.
Figure 4. Image of the rat touchscreen operant box (modified from Med Associates Inc. Fairfax,
Vermont). One wall of the operant box was equipped with a flat-screen monitor and touchscreen
infrared detection system. The monitor was covered with a black acrylic glass mask. The opposite
side of the box was equipped with a pellet receptacle containing a light and an infrared nose-poke
detector. The other 2 sides of the box were constructed of clear acrylic glass. In the image, a rat is
shown with the head-stage to wirelessly record electrophysiological brain activity during the task.

Material and Methods
P a g e 33 | 128
Touchscreen Pre-training Stages
Habituation. Rats were exposed once for 30 minutes to the operant boxes to habituate to the
environment. During this time, the touchscreen was not activated, and food pellets were available
inside the food magazine.
Tone-training. Rats were first trained to make an association between a tone and the delivery of a
food pellet. This association was created by delivering a pellet after the activation of a 0.5 s tone.
To ensure the formation of an association, pellets were not delivered until the previous pellet had
been collected. Once the reward was retrieved, the next trial was automatically initiated. To
advance to the next phase of training, rats had to complete 60 trials within 60 minutes (1
session/day).
Screen-touch training. The next phase of training consisted of building associative strength
between nose-poking the screen and receiving a food pellet. During this phase, nose-poking any
area of the screen was followed by the 0.5 s tone and the delivery of a pellet (all-locations). Rats
were trained in this way until they successfully completed 60 trials in 45 minutes. The second and
last phase of the screen-touch training consisted in a smaller area of the screen being randomly
illuminated where the rats were required to nose-poke to only this location to earn a pellet (one-
location). This process was conducted until rats successfully completed 60 trials in 45 minutes. As
with the tone-training, a new trial would not be started until the previous pellet had been collected.
After this step rats were ready to be advanced to TUNL task training.
TUNL Task Acquisition
Briefly, rats were trained up to 84 trials within a 60 minutes daily session with an inter-trial-interval
(ITI) of 20 seconds on the TUNL task as follows: A session began with the delivery of a food
pellet. Collection of the pellet activated the sample stage where the touchscreen displayed a white
square on the screen, referred as the sample stimulus, where the rat needed to nose-poke. A reward
pellet was delivered in 1 out of 3 trials to maintain robust sample stage initiation. After a variable
delay, the rat activated the choice stage by nose-poking in the food magazine. During this phase,
the rat was presented with two stimuli on the screen: the sample stimulus, and a new one in a novel
location, referred to as the choice stimulus. To obtain a reward, the rat had to select the choice
(novel) stimulus. By manipulating the delay between the sample and choice stage the rat’s ability
Material and Methods
P a g e 34 | 128
to remember the sample stimulus to select the novel stimulus during the choice stage was
investigated. During this stage rats were fitted with head-stages used for the LFPs recordings on
alternating test days to acclimatize them to wearing the head-stage. After the acquisition of the
task was achieved (80% correct during variable delays for 2 consecutive days), rats moved into
the delay test.
TUNL Task Delay Test
During this phase, rats were exposed to 2- and 8-second delays in the TUNL task while
electrophysiological recordings were being performed. Initially, rats were trained in the 2 seconds
delay until they completed the task with 80% accuracy for 2 consecutive sessions. Once this was
achieved, rats completed the TUNL task with 2 seconds delay simultaneously with the
electrophysiological recording. Thereafter, the delay was increased to 8 seconds and
electrophysiological measurements were also performed. During the TUNL task, the following
parameters were recorded using the K-limbic software: % correct responses [(correct responses /
(correct + incorrect)) *100]; latency to initiate the sample stage; latency to respond to the sample
stimulus; latency to initiate the choice stage; latency to respond to the choice stimulus, and to
collect the reward. Furthermore, the rats had limited time to perform each stage of the task and if
they exceeded this time the trial ended, and it was considered an omission. For instance, rats had
to respond to the sample stimulus within 30s, to activate the choice stage within 10s, and to respond
to the choice stimulus within 10s, otherwise the trial was finished. Incorrect trials and omissions
were followed by a correction trial (CT). During all CTs the stimulus presentation was in the same
location as the preceding trial, and the trail repeated unit the rats responded to the correct window.
Outcomes during CTs were not included in trial count or any analyzes. For an illustration of the
TUNL task see Figure 5.

Material and Methods
P a g e 35 | 128
Figure 5. Trial-Unique Non-match to Location (TUNL) task. A session began with the delivery of
a food pellet in a food magazine opposite to the touchscreen. Collection of the pellet initiated the
trial and activated the sample stage where the sample stimulus appeared on the screen. After nose-
poking on the stimulus, the delay was activated. After a delay (2 seconds in this illustration), the
rat could activate the choice stage by nose-poking in the food magazine. During this phase, the rat
was presented with two stimuli on the screen, the sample stimulus, and a new one in a novel
location, referred to as the choice stimulus. Rats were reinforced with a food pellet when selecting
the choice stimulus and the action was registered as a correct response. If the sample stimulus was
selected, the rat did not receive a reward, the light of the operant chamber went off for 5 seconds,
the response was registered as incorrect, and a CT was initiated. Grey area represents local field
potentials (LFPs) analysis. Epochs of 1.0 seconds immediately preceding activation of the
touchscreen for sample and choice stages during correct responses were selected for
electrophysiological analysis of LFP recordings.
Visual Discrimination Task
The VD task was used for the study conducted with the AppNL-G-F mice (see chapter 5). The VD
task is a relatively simple task where mice learn to consistently respond to one of two visual
stimuli. Learning this type of discrimination is essential for decision making and adaptive
behavior.
Material and Methods
P a g e 36 | 128
Apparatus
Similar to the apparatus used for the TUNL task with rats, mice were trained in operant boxes,
however with appropriately smaller dimensions (modified from Med Associates Inc. Fairfax,
Vermont). In this case, the LCD computer monitor was 11.5cm x 19cm. The monitor was then
covered with a mask with two aperture plates dividing the touchscreen into two response fields
(75mm x 75 mm) in which visual stimuli were presented.
Touchscreen Pre-training Stages
The mice were shaped to use touch screens for responding to stimulus images during five pre-
training stages (Horner et al., 2013). All mice began pre-training at 3.5 months of age and
progressed from each stage on an individual basis based on their performance (i.e. reaching a pre-
set performance criterion).
Habituation. The first stage aimed to familiarize the mice with the operant chambers and extractor
fan noise. Mice were placed in the boxes with lights off for 30 minutes and received ten reward
pellets (TestDiet, USA). Mice had to consume all reward pellets during the session in order to
progress to the next stage.
Tone Association. In this stage, mice established an association between a tone and reward
delivery. A reward was delivered with a tone to begin the session. The food magazine light
remained on from reward delivery until collection. The next reward and tone were delivered after
a 30 seconds ITI when the mouse entered the food magazine. Mice were required to complete 60
trials within 60 minutes for 2 consecutive days to advance to the next stage.
Touch Association. Here, mice were encouraged to touch the screen to receive the reward. During
trials, a white square was presented in one of the two response windows for 30 seconds. The
location of the stimulus presentation was pseudo-random between trials. If mice touched the square
during this time a food reward was delivered with a tone and a 10 second ITI initiated. Otherwise,
the stimulus was removed, and the house light switched on for 10 seconds followed by a 10 seconds
ITI. There was no penalty for touching the other response window. Mice were required to complete
a minimum of 35 trials in 45 minutes to advance to the next stage.
Must Touch. During this stage the association between screen touches and rewards was reinforced.
The procedure and success criterion were the same as in the Touch Association stage, however
new trials did not begin automatically after 30 seconds – animals were required to touch the
Material and Methods
P a g e 37 | 128
illuminated square before the next trial could begin. Animals were required to complete a
minimum of 35 trials in 45 minutes to advance to the next stage.
Punish Incorrect. The final stage of pre-training introduced a penalty for indiscriminate screen
touches. The trials proceeded as in the Must Touch stage but touches to the non-illuminated
response window triggered a 5 second timeout with the house light on, followed by a 10 seconds
ITI. These trials were recorded as incorrect and followed by a CT. During all CTs the stimulus
presentation was in the same location as the preceding trial, and the trail repeated until the mice
responded to the correct window. Outcomes during CTs were not included in trial count or any
analyzes. Mice progressed from this stage once they could achieve ≥75% correct responses over a
minimum of 30 trials for 2 consecutive days. The number of trials was capped at 80. During this
stage of the pre-training regime mice were fitted with head-stages used for the LFPs recordings on
alternating test days to acclimatize them to wearing the head-stage. After this step mice were ready
to advance to the VD task testing.
VD Task Tests
VD testing began when mice were at an age of 4.5 months. In VD sessions, a pair of images
previously validated (Horner et al., 2013) (Figure 6 a) were presented on screen. Based on a
subject’s counterbalanced group assignment, each image was designated as either the conditioned
stimulus (S+) or the unconditioned stimulus (S-) and the reward-contingency of the image was
kept constant for each mouse across the experiment. Responses to S+ were rewarded with a food
pellet, while responses to S- were recorded as incorrect and resulted in a 5s timeout with the house
light on. As in the Punish Incorrect pre-training stage, incorrect trials were followed by CTs in
which stimulus locations were kept the same. Stimulus presentations occurred in a pseudo-random
location in each trial, never appearing in the same window in more than 3 consecutive trials
(excluding CTs) and total presentations counterbalanced between the two locations. Mice
completed one 45-minute session (max 80 trials) of VD testing daily until they achieved an
acquisition criterion set as 2 consecutive sessions at ≥80% correct responses over a minimum of
30 trials. For an illustration of the VD task see Figure 6, b.
Material and Methods
P a g e 38 | 128
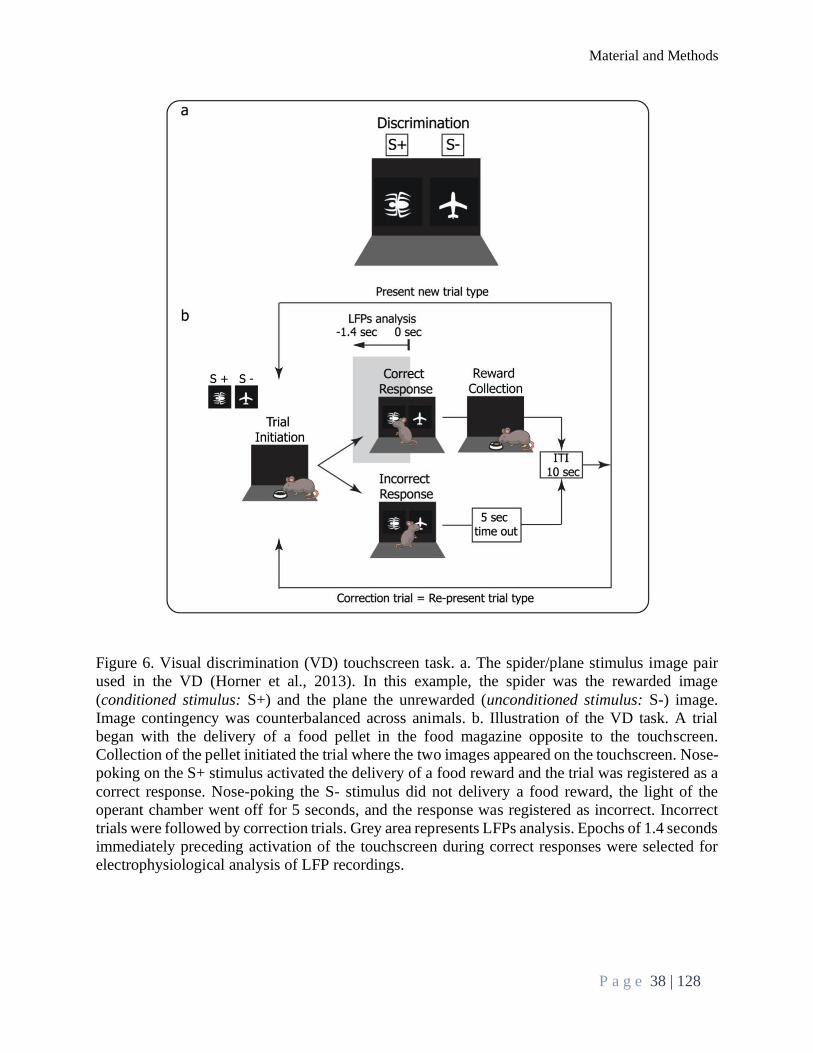
Figure 6. Visual discrimination (VD) touchscreen task. a. The spider/plane stimulus image pair
used in the VD (Horner et al., 2013). In this example, the spider was the rewarded image
(conditioned stimulus: S+) and the plane the unrewarded (unconditioned stimulus: S-) image.
Image contingency was counterbalanced across animals. b. Illustration of the VD task. A trial
began with the delivery of a food pellet in the food magazine opposite to the touchscreen.
Collection of the pellet initiated the trial where the two images appeared on the touchscreen. Nose-
poking on the S+ stimulus activated the delivery of a food reward and the trial was registered as a
correct response. Nose-poking the S- stimulus did not delivery a food reward, the light of the
operant chamber went off for 5 seconds, and the response was registered as incorrect. Incorrect
trials were followed by correction trials. Grey area represents LFPs analysis. Epochs of 1.4 seconds
immediately preceding activation of the touchscreen during correct responses were selected for
electrophysiological analysis of LFP recordings.

Material and Methods
P a g e 39 | 128
3.4. Electrophysiological Measurements
Recordings
LFPs were sampled with a frequency of 1000 Hz, referenced to the ground electrode placed
midline above the cerebellum, and high-pass filtered above 1 Hz using small-size W4-HS (mice)
and W16-HS (rats) wireless head-stages, connected to a W2100 system (Multichannel systems,
Germany). All analyzes were done with built-in and custom-written routines in Matlab
(MathWorks, 2014a). Detection of artifacts and wrongly placed electrodes was carried out in three
steps. Firstly, data were visually inspected and electrodes with noise were excluded for further
analysis. Secondly, epochs were excluded during the Matlab analysis using an amplitude method
(i.e. artifact rejection) with a SD cut-off of 10. Finally, at the end of the experiment, animals were
deeply anesthetized and electrolytical lesions were produced at the selected recording sites using
a current generator apparatus (500µA for 30 seconds, MC Stimulus II, Multichannel systems,
Germany), then animals were euthanized, and their brain tissue was frozen in dry-ice cooled
methylbutane. Coronal sections of frozen brains were obtained using a cryostat and counterstained
for histological verification of sub-cortical electrode placements.
LFPs were recorded and analyzed in three conditions:
Home-cage Exploration:
Mice at 5 and 8 months and rats at 3.5 months of age were placed for 1 hour in their home-cage
environment with a camera (UI-3140CP-C-HQ Rev.2, IDS Imaging, Germany) above the cage.
The activity recoded with the camera was synchronized with the recorded LFPs. Home-cages were
placed in sound attenuated chambers fitted with a small ventilation fan that also provided a mild
masking background noise. Behavioral activity was scored using Smart software v3.0 (Panlab,
Barcelona) and categorized into different activity levels based on speed. Speed and epoch length
were selected to match behavioral task conditions: only segments where the speed was between 2
and 30 cm/sec for mice and 9 and 50 cm/sec for rats were considered for the analysis. Using a
sliding window approach, we selected LFPs data at 1.4 seconds epochs for mice and 1.0 seconds
for rats for further analysis.

Material and Methods
P a g e 40 | 128
TUNL Task:
Neuronal and behavioral data were synchronized with a precision of 10 milliseconds using a
transistor-transistor logic output signal generated by the food magazine light of the operant box.
Recordings of sessions with 2- and 8-seconds delay of the TUNL task were included in the study.
Response latencies were used to select an epoch for analysis within each trial of 1.0 second prior
to correct sample and choice touchscreen responses (Figure 2). This value was used to maximize
the length of the window that contained brain activity related to choose-making immediately prior
to screen-touch while avoiding inclusion of activity related to trial initiation.
VD Task:
Neuronal and behavioral data were synchronized with a precision of 10 milliseconds using a
transistor-transistor logic output signal generated by the food magazine light of the operant box.
Recordings of the first (Task_Start) and last (Task_End) session of the VD task were included in
the study. Response and collection latency data were used to select an epoch for analysis within
each trial of 1.4 seconds prior to a correct touchscreen response (Figure 6, b). This value was used
to maximize the length of the window containing brain activity related to choose-making
immediately prior to screen-touch while avoiding inclusion of activity related to trial initiation.
Relative and Absolute Power Spectral Density Analysis
Welch’s PSD was estimated and analyzed for frequencies ranging from 4 to 200 Hz for each epoch
and condition. For each subject, PSD values were averaged for each examined brain region in 1
Hz frequency bins per session across trials and power was expressed as relative power to the total
power over 4 to 200 Hz. For statistical analysis, relative and absolute PSD data were averaged
across theta (4-12Hz), gamma (30-100 Hz) and HFO (101-200 Hz) (Buzsáki & Draguhn, 2004).
Phase-amplitude Coupling Analysis
The signal was convoluted with complex Morlet wavelets to extract estimates of time-varying
frequency band-specific amplitude and phase from the LFPs data. Theta-gamma PAC was
calculated using an algorithm described previously (Tort et al., 2008). The MI was used to quantify
the modulation of the high frequency amplitude signal (30-200 Hz, estimated in 5Hz steps) by a

Material and Methods
P a g e 41 | 128
low frequency phase of the same signal (4-12 Hz, estimated in 0.5 Hz steps). While a MI value
close to zero indicates no relationship between low frequency phase and high frequency amplitude,
a higher value results from stronger phase-to-amplitude modulation. Due to the short duration of
the analysis window (1.0 or 1.4 seconds), within each epoch a lengthiest segment with integer
number of cycles for the considered low frequency phase was extracted, and values of analytical
signals for all the segments within a session were aggregated (over time) in a complex phase space
prior to MI estimations for each animal and electrode. For statistical analysis MI were averaged
across the amplitude frequency low gamma (LG, 30-60 Hz), high gamma (HG, 61-100 Hz) and
HFO (101-200Hz). This gamma sub-banding was done as it has been suggested that different
frequency bands act as different channels for communication. For instance, in the CA1 region of
the hippocampus gamma oscillations split in two different components indicating different origins.
LG arises from interactions with the CA3 region of the hippocampus, where HG is thought to
arises from interactions with the entorhinal cortex (Colgin et al., 2009).
3.5. Brain Aβ1-42 Enzyme-linked Immunoassay (ELISA)
AppNL-G-F mice were euthanized by decapitation after which brains were excised. Olfactory lobes
and hindbrain were removed from tissue processed for biochemistry. Brain hemispheres were
weighed, immediately frozen on dry-ice and stored at -80°C prior to biochemical (right
hemisphere) analysis. For the preparation of brain homogenates, tissue was thawed on ice in pre-
cooled GuHCl extraction buffer (5M Guanidin-hydrochloride, 50 mM Tris-HCl, pH 8.0, 1
mL/100mg tissue). Homogenization was done utilizing 4.5 mL TallPrep tubes (MP Biomedicals)
containing Lysing matrix D (1.4 mm ceramic beads) and FastPrep-24 5G homogenizer (MP
Biomedicals). Subsequently, homogenates were shaken for 3 hours at room temperature and stored
at -80 °C until further use.
Aβ1-42 in AppNL-G-F brain extracts were quantified in a one-step direct sandwich ELISA
with capture antibody JRF/cAβ42/26 that specifically recognizes Aβ ending at amino acid 42, and
detection with SULFOTAG™-labelled 3D6 antibody that recognizes Aβ starting with amino acid
1. Equal volumes of brain homogenates of different mice belonging to the same age group (4 to 6
mice per time point) were pooled and then further diluted 1:10 in casein buffer (0.1% casein in
PBS). Next, samples were spun for 20 minutes at 20.00 g (4 °C) and supernatants were collected

Material and Methods
P a g e 42 | 128
to be further diluted in 0.5M GuHCl buffer to optimal dilutions for use in the assay. Human Aβ1–
42 standard peptide (Anaspec, San Jose, CA, USA) was dissolved in DMSO at 0.1 mg/mL and
stored at -80°C. For use in ELISA, a number of standards were diluted in 0.5M GuHCl buffer from
20.00 pg/mL down to 0 pg/mL.
Capture antibody was diluted in PBS (1.5 µg/mL), coated onto Multi-array 96-well
SECTOR plates (Meso Scale Discovery, L15XA, 30 µL/well) and incubated overnight at 4°C.
After five washes with PBS containing 0.5% Tween20 (wash buffer), the plates were blocked in
0.1% casein buffer (2 hours at room temperature while shaking) and washed again with wash
buffer (5x). Prior to their addition to the plates, samples and standards were mixed in an equal
volume of SULFOTAG™-labelled detection antibody (diluted in 0.1% casein buffer) and were
subsequently incubated on the plates overnight at 4°C. The next day, plates were washed five times
with wash buffer, 2 × MSD Read Buffer T was added to the wells and plates were immediately
read with the MESO SECTOR S 600 plate reader. Using Meso Scale software, raw signals were
normalized against the standard curve.
3.6. Immunohistochemistry
Mice and rats were sacrificed by decapitation; brains were removed from the skull, and the left
hemisphere was post-fixed overnight in a formalin-based fixative, embedded in paraffin and sliced
(5 µm) with a microtome. Following deparaffinization and rehydration of the sections, antigen
retrieval was performed (10 minutes incubation in 70% formic acid or heat-induced epitope
retrieval in EDTA buffer) and endogenous peroxidase activity was blocked with 3% hydrogen
peroxide. Samples were incubated overnight at room temperature or 30 minutes at 37°C with
biotinylated primary antibodies (Table 3, Table 4), diluted in antibody diluent with background
reducing components (DAKO, Glostrup, Denmark). After extensive washing, secondary
biotinylated antibody was applied for 30 minutes, followed by streptavidin-HRP (Vector Labs,
Burlingame, CA, USA) and chromogenic labelling with 3,3-diaminobenzidine (DAB, DAKO).
Slides were counterstained with hematoxylin, dehydrated and permanently mounted (Vectamount,
Vector Labs). Imaging was performed with a NanoZoomer slide scanner (Hamamatsu Photonics,
Shizuoka, Japan). For the experiment carried out using the AppNL-G-F, slides were analyzed with
Matlab using Phaedra (Cornelissen, Cik, & Gustin, 2012). Regions-of-interest (ROIs) were

Material and Methods
P a g e 43 | 128
manually delineated in accordance with a stereotaxic atlas (Franklin & Paxinos, 1997) and for each
ROI the percentage of DAB-labelled area per total area was calculated.
Primary Ab Company Concentration Secondary Ab Company Concentration
JRD/sAPP/32 In-house 0.3 µg/ml
Monoclonal
rabbit Anti-
mouse/rat IgG1
+ IgG2a + IgG3
Abcam
ab133469 1/500
JRF/cAβ42/26 In-house 1 µg/ml
JRF/AβN/25 In-house 2 µg/ml
McSA1 Abnova 0.5µg/ml
4G8-
biotinylated
Biolegend 1 µg/ml
Table 3. Primary and secondary antibodies for McGill-R-Thy1-APP experiments.
Primary Ab Company Concentration Secondary Ab Company Concentration
JRF/cAβ42/26 In-house 2 µg/ml Anti-mouse/rat
IgG2a Abcam
1/500
JRF/AβN/25 In-house 1 µg/ml 1/250
Table 4. Primary and secondary antibodies for AppNL-G-F experiments.
3.7. McSA1 Antibody Specificity
The commercial antibody McSA1 (Abnova; cat# MAB5669) is commonly used in literature
investigating pathology the McGill-R-Thy1-APP rats (Iulita et al., 2014, 2017; Leon et al., 2010;
Wilson et al., 2016). Although this antibody is reported to specifically bind Aβ with amino acid
epitope 1-12, it is neither clear from publications nor from the vendors website if this antibody is
a neo-epitope antibody (specific for the cleaved Aβ). If it is not, it would cross-react with human
APP or cleaving products containing Aβ1-12 epitope, like sAPPα. Therefore, to investigate the
specificity of McSA1 antibody, a direct coating ELISA was performed with 500ng/ml coating with
recombinant human sAPPα, Aβ1-42, and Aβ 11-42. Control antibodies can be seen in Table 5.
15nM concentration was coated for each protein/peptide.

Material and Methods
P a g e 44 | 128
Antibody Epitope Reactivity
sAPPα Aβ1-42 Aβ11-42
JRD/sAPP/32 APP yes no no
JRF/AbN/25 Aβ1-x no yes no
4G8 Aβ 17-24 no yes yes
JRF/Abtot/17 Aβ 1-16 yes yes no
J&JPRD/hAb11/1 Aβ11-x no no yes
JRF/cAb42/26 Aβx-42 no yes yes
Table 5. Control antibodies used to investigate McSA1 antibody specificity.
3.8. Genotyping
Genotyping of McGill-R-Thy1-APP and AppNL-G-F animals was conducted at Charles River (Lyon,
France) using protocols previously described (Leon et al., 2010; Saito et al., 2014a).
Droplet Digital PCR (ddPCR)
To confirm the genotype of the McGill-R-Thy1-APP rats in-house, tails were obtained at the end
of the experiments and genomic DNA was extracted using DNeasy Blood & Tissue kit (Catalog
Number: QIAG69506, QIAGET) according to the manufacturer’s instructions. The QX200
ddPCR system (Bio-Rad) was used to provide absolute measurements on genomic DNA copy
number with high accuracy, precision, resolution and sensitivity.
3.9. Statistical Analysis
Statistical analyzes for in vivo data were conducted using JMP®, version 12 (SAS Institute Inc,
NC, US). For statistical inference on behavioral data, the distributions of dependent variables
were assessed for meeting the assumption of normality required in parametric statistical tests.
Group comparisons were made using a two-tailed two-sample t-test. If the data did not meet the
normality assumptions, Wilcoxon rank-sum test (statistics are reported as Z) was used. A mixed-
effect model for repeated measures with genotype, and session as fixed effects and subject as a
Material and Methods
P a g e 45 | 128
random effect was used to investigate percentage of correct responses during the VD task in the
AppNL-G-F experiment. Residuals of models were inspected for normality and an alpha level of 0.05
was used to determine significance in all statistical tests. For statistical inference on
electrophysiological data, most data were non-normally distributed and nonparametric tests were
applied. For within-subject analysis the delta value between the two conditions (start and end of
the VD task) was calculated and compared to zero. Significance was tested using the Wilcoxon
rank-sum test. Correction for multiple comparison was performed using the Benjamini-Hochberg
procedure with a false discovery rate (FDR) threshold of q = 0.05 (Benjamini & Hochberg, 1995;
Glickman, Rao, & Schultz, 2014). For clear representation, descriptive statistics, such as mean,
median, standard deviation (SD), and ranges, together with p values and thresholds are presented
in tables and box plots with individual points for each subject, rather than commonly reported bars
graphs (Weissgerber, Milic, Winham, & Garovic, 2015). Box plots represent the interquartile
range; the solid line inside the box indicates the median, the box represents 50% of data points
between the first and third quartile, and the upper and lower whiskers represent scores outside the
middle 50%.
Statistical analyzes for biochemical and immunohistochemical data were conducted using
GraphPad Prism, version 8 (GraphPad Software, Inc.). Using the Shapiro-Wilk test, the
distributions of dependent variables were assessed for meeting the assumption of normality
required in parametric statistical tests. Multiple group comparisons were made using the Brown-
Forsythe and Welch’s Analysis of variance (ANOVA) with Dunnett’s T3 multiple comparisons
test. Data were considered significant when p < 0.05 (1 symbol p < 0.05, 2 symbols, p < 0.01, 3
symbols p < 0.001, 4 symbols p < 0.0001).

P a g e 46 | 128

McGill-R-Thy1-APP Rats Characterization
P a g e 47 | 128
Behavioral, Electrophysiological and Histopathological Characterization of
McGill-R-Thy1-APP Rats
4.1. Introduction
The primary goal of this part of the thesis was to investigate electrophysiological readouts in
combination with a cognitive task to illuminate functional differences between McGill-R-Thy1-
APP (HET and HO) and WT littermate controls. The McGill-R-Thy1-APP model is a transgenic
rat model overexpressing the human APP carrying both the Swedish double mutation (K670N,
M671L) and the Indiana mutation (V717F). Pathologically, these rats were reported to show
already at 1 week of age intraneuronal Aβ accumulation in different cortical and hippocampal
areas. Extracellular Aβ deposits in the subiculum and entorhinal cortex start to become appearing
after 6 months in HO rats. By 13 months, plaque pathology spreads across the hippocampus and
cortical regions (Leon et al., 2010). At the level of cognition, the McGill-R-Thy1-APP rat starts to
show cognitive impairment in spatial memory and VD at around 3 months of age (Galeano et al.,
2014; Leon et al., 2010; Wilson et al., 2016). Furthermore, at the electrophysiological level, this
transgenic rat shows resistance to long term potentiation (LTP) induction in vivo and in vitro in
the dorsal hippocampus during the pre-plaque stage at approximately 3.5 months of age (Qi et al.,
2014). At the network level, the McGill- R-Thy1-APP rat was described to show a progressive
functional decline (Parent et al., 2017). As with the previous mentioned measurements, the
abnormalities at the connectivity level appear before Aβ plaques, suggesting that human Aβ
oligomeric peptides and aggregates exert toxic effects before the formation of plaques.
Rats had to perform in the TUNL task with a 2- and 8- seconds delay at 3.5 months of age
while LFPs in different cortical and sub-cortical brain areas were recorded using a wireless
neurophysiological signal acquisition system. In parallel with these recordings, we measured LFPs
at the same age during home-cage exploration, without the behavioral task to investigate neuronal
network changes exclusively associated with pathology. The electrophysiological analysis focused
on PAC between theta (4 – 12 Hz) and gamma (30 – 100 Hz) activity during three distinct
recording conditions related to different cognitive load: the sample and the choice stages of the
TUNL task, and exploration of the home-cage environment. The age of 3.5 months of was selected
because it matches the preclinical AD phase according to the available data. Immunohistochemical

McGill-R-Thy1-APP Rats Characterization
P a g e 48 | 128
analysis was conducted to correlate Aβ plaques deposition with the electrophysiological and
behavioral results.
4.2. Results
Performance during TUNL Task
Pre-training:
During the pre-training stage there were no genotype differences in the number of sessions required
to learn the tone association (WT: M = 1, SD = 0, n = 16; HET: M =1, SD = 0, n = 6; HO: M = 1,
SD = 0, n = 6, Figure 7, left panel), the all-locations (WT: M =2.38, SD = 0.50, n = 16; HET: M =
2.00, SD = 0.00, n = 6; HO: M = 2.33, SD = 0.52, n = 6, Figure 7, middle panel), and the one-
location (WT: M = 1.13, SD = 0.34, n = 16; HET: M = 1.00, SD = 0.00, n = 6; HO: M = 1.67, SD
= 0.82, n = 6, Figure 7, right panel) stages of touchscreen pre-training.
Figure 7. Pre-training of the Trial-unique Non-match to Location (TUNL) task in WT, HET, and
HO McGill-R-Thy1-APP rats. Number of days to acquire the tone-training (left panel), all-
locations (middle panel), and one-location (right panel) of the screen-touch training are shown.
Performance during the different pre-training stages did not differ between genotypes. Data are
represented in box plots with individual points for each subject. Statistically significance level at
p < 0.05. ns: non-significant.

McGill-R-Thy1-APP Rats Characterization
P a g e 49 | 128
TUNL Task Acquisition:
McGill-R-Thy1-APP HO failed to acquire the TUNL task as they had a high level of omissions
(HO: M = 96.51%, SD = 5.45, n = 6, Figure 8). We compared body weight between genotypes to
assess if the lack of performance on the HO rats was associated with food reward motivation, but
no differences were observed (Figure 9). Furthermore, HO performed similarly to the WT and
HET during the pre-training phase of the task, demonstrating motivation to respond in the operant
box. Due to the low number of trials, HO rats were not included in further behavioral and
electrophysiological analyzes during the task.
Figure 8. Percentage of omissions during acquisition of the Trial-unique Non-match to Location
(TUNL) task in WT, HET, and HO McGill-R-Thy1-APP rats. HO rats had a significantly higher
number of omissions that WT and HET rats. Data are represented in box plots with individual
points for each subject. Statistically significance level at p < 0.05. ns: non-significant.
Figure 9. Mean body weight (g) during experiments in WT, HET, and HO McGill-R-Thy1-APP
rats. No differences were observed between genotypes. Data are represented in box plots with
individual points for each subject. Statistically significance level at p < 0.05. ns: non-significant.

McGill-R-Thy1-APP Rats Characterization
P a g e 50 | 128
TUNL Task Delay Test
From the original sample size, 7 WT and 1 HET rats were excluded from the analysis due to
insufficient electrophysiological signal quality or problems with the implant. An extra WT rat had
surgical complications before the 8 seconds delay and was removed from the further studies.
Finally, 2 WT and 1 HET did not reach behavioral performance criterion to be included in the
delay test. For the rats included on the analysis, there were no differences in performance during
the 2- and 8- seconds delay between WT and HET rats.
2 seconds delay. Both genotypes performed well above change levels and they did not
differ during sessions with LFPs recordings (WT: M = 86.30, SD = 5.45, n = 7; HET: M = 83.49,
SD = 6.94, n = 4; Z = -0.66, p = 0.51 Figure 10, a). Analysis of percentage of CTs (WT: M =14.20,
SD = 8.34, n = 7; HET: M = 17.04, SD = 6.34, n = 4; Z = 0.47, p = 0.64 Figure 10, b), and percentage
of omissions (WT: M = 10.64, SD = 11.74, n = 7; HET: M = 5.21, SD = 5.69, n = 4; Z = -0.094, p
= 0.925 Figure 10, c) did not identify a significant difference between genotypes. Furthermore, no
differences were found between WT and HET rats for sample response (WT: M = 4.50, SD = 2.47,
n = 7; HET: M = 2.93, SD = 0.38, n = 4; Z = -0.28, p = 0.78 Figure 10, d, first panel), choice
initiation (WT: M = 2.09, SD = 0.86, n = 7; HET: M = 3.01, SD = 0.40, n = 4; Z = 1.42, p = 0.16
Figure 10, d, seconds panel), choice response (WT: M = 3.29, SD = 0.63, n = 7; HET: M = 2.70,
SD = 0.34, n = 4; Z = -1.60, p = 0.11 Figure 10, d, third panel), and reward collection (WT: M =
1.47, SD = 0.57, n = 7; HET: M = 1.34, SD = 0.18, n =; Z = 0.09, p = 0.92 Figure 10, d, fourth
panel) latencies.
8 seconds delay. As with the 2 seconds delay, no differences were found between WT and
HET rats. Analysis of percentage of correct responses (WT: M = 77.99, SD = 10.63, n = 6; HET:
M = 70.33, SD = 3.07, n = 4; Z = -1.18, p = 0.24, Figure 11, a), CTs (WT: M = 22.62, SD = 9.55,
n = 6; HET: M = 28.57, SD = 4.86, n = 4; Z = 0.97, p = 0.33, Figure 11, b), and omissions (WT:
M = 4.52, SD = 5.25, n = 6; HET: M = 1.23, SD = 0.82, n = 4; Z = -1.07, p = 0.28, Figure 11, c)
did not identify a significant difference between the two groups. Latency to sample response (WT:
M = 4.30, SD = 0.53, n = 6; HET: M = 4.14, SD = 1.27, n = 4; Z = 0.32, p = 0.75, Figure 11, d,
first panel), choice initiation (WT: M = 1.13, SD = 0.23, n = 6; HET: M = 1.22, SD = 0.26, n = 4;
Z = 0.32, p = 0.75, Figure 11, d, second panel), choice response (WT: M = 3.83, SD = 0.51, n = 6;
HET: M = 3.68, SD = 0.68, n = 4; Z = -0.11, p = 0.91, Figure 11, d, third panel), and reward
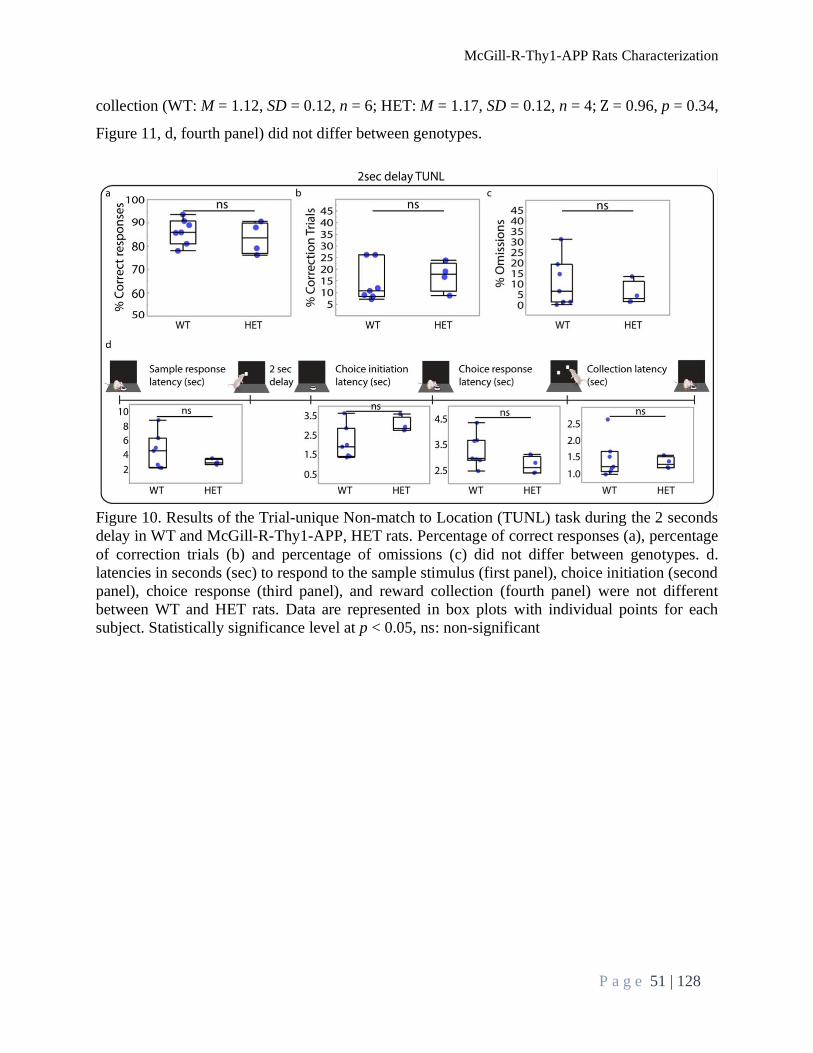
McGill-R-Thy1-APP Rats Characterization
P a g e 51 | 128
collection (WT: M = 1.12, SD = 0.12, n = 6; HET: M = 1.17, SD = 0.12, n = 4; Z = 0.96, p = 0.34,
Figure 11, d, fourth panel) did not differ between genotypes.
Figure 10. Results of the Trial-unique Non-match to Location (TUNL) task during the 2 seconds
delay in WT and McGill-R-Thy1-APP, HET rats. Percentage of correct responses (a), percentage
of correction trials (b) and percentage of omissions (c) did not differ between genotypes. d.
latencies in seconds (sec) to respond to the sample stimulus (first panel), choice initiation (second
panel), choice response (third panel), and reward collection (fourth panel) were not different
between WT and HET rats. Data are represented in box plots with individual points for each
subject. Statistically significance level at p < 0.05, ns: non-significant
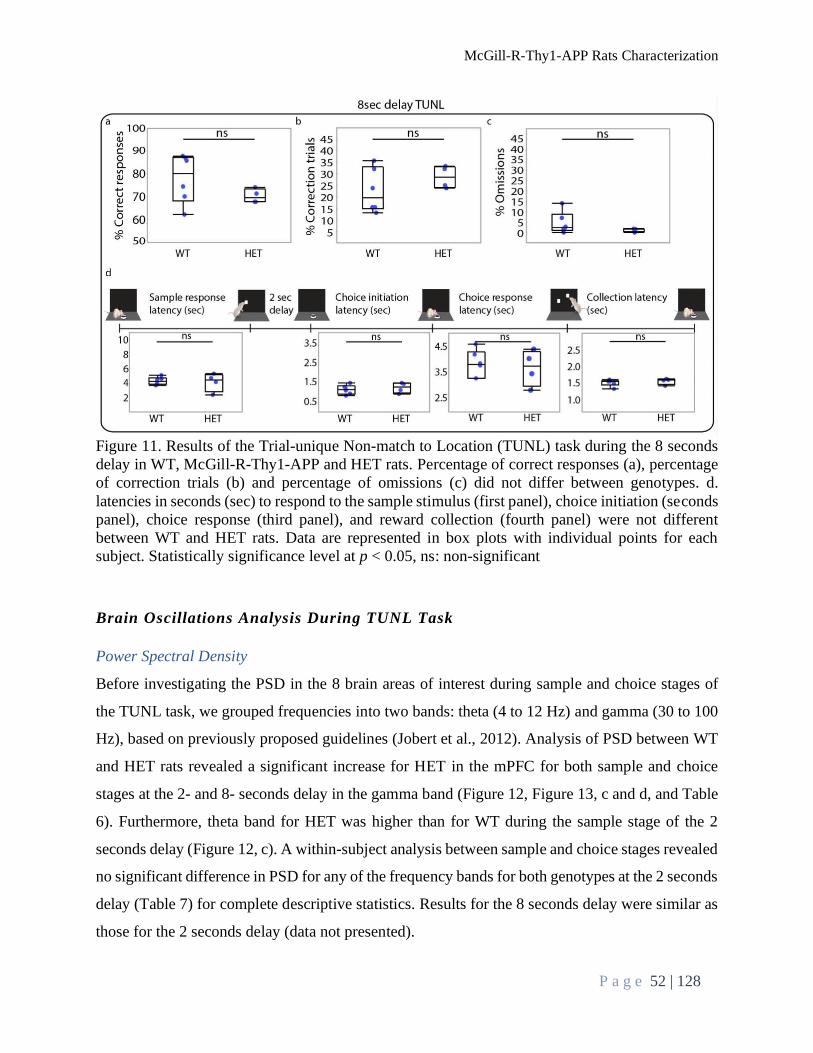
McGill-R-Thy1-APP Rats Characterization
P a g e 52 | 128
Figure 11. Results of the Trial-unique Non-match to Location (TUNL) task during the 8 seconds
delay in WT, McGill-R-Thy1-APP and HET rats. Percentage of correct responses (a), percentage
of correction trials (b) and percentage of omissions (c) did not differ between genotypes. d.
latencies in seconds (sec) to respond to the sample stimulus (first panel), choice initiation (seconds
panel), choice response (third panel), and reward collection (fourth panel) were not different
between WT and HET rats. Data are represented in box plots with individual points for each
subject. Statistically significance level at p < 0.05, ns: non-significant
Brain Oscillations Analysis During TUNL Task
Power Spectral Density
Before investigating the PSD in the 8 brain areas of interest during sample and choice stages of
the TUNL task, we grouped frequencies into two bands: theta (4 to 12 Hz) and gamma (30 to 100
Hz), based on previously proposed guidelines (Jobert et al., 2012). Analysis of PSD between WT
and HET rats revealed a significant increase for HET in the mPFC for both sample and choice
stages at the 2- and 8- seconds delay in the gamma band (Figure 12, Figure 13, c and d, and Table
6). Furthermore, theta band for HET was higher than for WT during the sample stage of the 2
seconds delay (Figure 12, c). A within-subject analysis between sample and choice stages revealed
no significant difference in PSD for any of the frequency bands for both genotypes at the 2 seconds
delay (Table 7) for complete descriptive statistics. Results for the 8 seconds delay were similar as
those for the 2 seconds delay (data not presented).
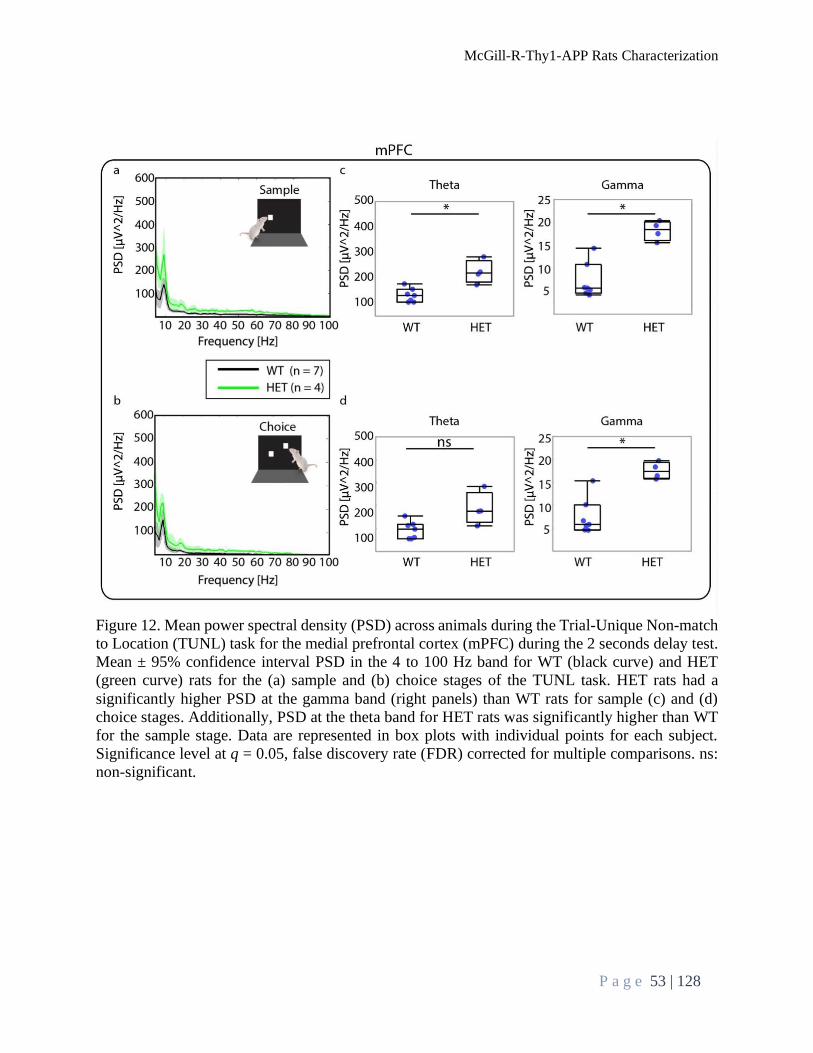
McGill-R-Thy1-APP Rats Characterization
P a g e 53 | 128
Figure 12. Mean power spectral density (PSD) across animals during the Trial-Unique Non-match
to Location (TUNL) task for the medial prefrontal cortex (mPFC) during the 2 seconds delay test.
Mean ± 95% confidence interval PSD in the 4 to 100 Hz band for WT (black curve) and HET
(green curve) rats for the (a) sample and (b) choice stages of the TUNL task. HET rats had a
significantly higher PSD at the gamma band (right panels) than WT rats for sample (c) and (d)
choice stages. Additionally, PSD at the theta band for HET rats was significantly higher than WT
for the sample stage. Data are represented in box plots with individual points for each subject.
Significance level at q = 0.05, false discovery rate (FDR) corrected for multiple comparisons. ns:
non-significant.

McGill-R-Thy1-APP Rats Characterization
P a g e 54 | 128
Figure 13. Mean power spectral density (PSD) across animals during the Trial-Unique Non-match
to Location (TUNL) task for the medial prefrontal cortex (mPFC) during the 8 seconds delay test.
Mean ± 95% confidence interval PSD in the 4 to 100 Hz band for WT (black curve) and HET
(green curve) rats for the (a) sample and (b) choice stages of the TUNL task. HET rats had a
significantly higher PSD at the gamma band (right panels) than WT rats for sample (c) and (d)
choice stages. Data are represented in box plots with individual points for each subject.
Significance level at q = 0.05, false discovery rate (FDR) corrected for multiple comparisons. ns:
non-significant.

McGill-R-Thy1-APP Rats Characterization
P a g e 55 | 128
Table 6. Between-subject analysis of power spectral density (PSD) during the Trial-unique Non-
match to Location (TUNL) during the 2 seconds delay test.
Conditions: Sample Stage, Choice Stage.
Brain areas: Cingulate Cortex (Cg), frontal associated cortex (Frt Ass Ctx), V1 cortex (V1 Ctx),
lateral cortex (Lat Ctx), left and right M1/M2 cortex (L-M1/M2 Ctx, R-M1/M2 Ctx), retrosplenial
cortex (RSC), medial prefrontal cortex (mPFC).
Frequencies: theta and gamma.
Z: Wilcoxon rank-sum test.
Significance level at q = 0.05, false discovery rate (FDR) corrected for multiple comparisons.
Condition Brain Area Freq Z Prob > [Z] p value rank FDR threshold
Theta 0,472 0,637 1,000 0,008
Gamma 0,283 0,777 3,000 0,025
Theta 0,000 1,000 3,000 0,025
Gamma 0,094 0,925 2,000 0,017
Theta -1,417 0,156 2,000 0,017
Gamma -0,661 0,508 4,000 0,033
Theta -0,850 0,395 1,000 0,008
Gamma -0,472 0,637 2,000 0,017
Theta 0,283 0,777 2,000 0,017
Gamma 0,472 0,637 1,000 0,008
Theta -0,283 0,777 2,000 0,017
Gamma 0,000 1,000 4,000 0,033
Theta 0,094 0,925 4,000 0,033
Gamma 1,417 0,156 2,000 0,017
Theta 2,362 0,018 3,000 0,025
Gamma 2,551 0,011 2,000 0,017
Theta 0,094 0,925 4,000 0,033
Gamma 0,283 0,777 2,000 0,017
Theta 0,094 0,825 1,000 0,008
Gamma 0,000 1,000 4,000 0,033
Theta -1,417 0,156 1,000 0,013
Gamma -1,039 0,299 3,000 0,025
Theta -0,283 0,777 3,000 0,025
Gamma -0,094 0,925 4,000 0,033
Theta 0,000 1,000 4,000 0,033
Gamma 0,283 0,777 3,000 0,025
Theta -0,283 0,777 1,000 0,008
Gamma -0,094 0,925 3,000 0,025
Theta 0,472 0,637 3,000 0,025
Gamma 1,417 0,156 1,000 0,008
Theta 1,984 0,047 4,000 0,033
Gamma 2,551 0,011 1,000 0,013
R-M1/M2 Ctx
RSC
mPFC
R-M1/M2 Ctx
RSC
mPFC
Sample Stage
Choice Stage
Cg
L-Frt Ass Ctx
V1 Ctx
Lat Ctx
L-M1/M2 Ctx
Cg
L-Frt Ass Ctx
V1 Ctx
Lat Ctx
L-M1/M2 Ctx

McGill-R-Thy1-APP Rats Characterization
P a g e 56 | 128
Genotype Brain Area Freq Condition Mean SD Median Rangle
Theta 69.43 53.12 47.93 210.77
Gamma 5.47 3.15 4.70 29.71
Theta 75.53 62.22 49.88 221.77
Gamma 5.57 3.82 4.58 48.84
Theta 92.53 65.74 86.04 309.31
Gamma 5.88 3.29 5.29 17.06
Theta 88.43 72.10 65.45 294.53
Gamma 5.89 3.45 5.10 20.68
Theta 65.72 56.53 52.36 321.18
Gamma 4.70 2.6 4.22 35.98
Theta 84.72 143.94 47.63 985.37
Gamma 4.89 3.22 4.13 43.50
Theta 68.11 41.96 58.37 204.04
Gamma 4.96 2.49 4.51 17.80
Theta 66.50 39.78 56.19 173.91
Gamma 5.24 3.44 4.25 25.86
Theta 48.87 39.63 43.67 213.76
Gamma 3.41 2.67 2.45 18.98
Theta 46.62 36.73 40.793 200.04
Gamma 34.58 3.36 2.59 33.79
Theta 30.60 26.16 25.53 135.17
Gamma 2.66 1.67 2.15 10.22
Theta 27.46 21.84 24.92 100.53
Gamma 2.72 1.99 2.08 10.51
Theta 71.83 66.65 49.48 267.26
Gamma 5.26 3.62 4.29 24.21
Theta 67.05 63.79 46.99 261.78
Gamma 5.13 4.13 3.87 44.09
Theta 66.89 57.15 49.83 285.41
Gamma 5.15 3.60 3.84 19.15
Theta 65.15 58.11 44.70 258.82
Gamma 4.97 3.89 3.77 21.79
Theta 50.43 33.05 42.74 131.68
Gamma 5.83 2.98 5.22 25
Theta 52.90 37.31 42.06 131.53
Gamma 6.00 3.44 5.33 36.10
Theta 57.84 32.64 51.62 162.67
Gamma 6.53 2.89 6.00 15.06
Theta 57.53 34.70 47.43 151.06
Gamma 6.61 3.02 6.22 19.25
Theta 58.07 40.16 48.19 190.57
Gamma 6.27 3.47 5.57 24.38
Theta 61.85 47.55 47.84 186.76
Gamma 6.45 4.09 5.52 41.12
Theta 67.70 52.77 54.14 236.57
Gamma 6.06 2.069 5.63 13.39
Theta 66.98 57.78 40.80 231.39
Gamma 6.13 2.88 5.79 16.71
Theta 85.65 86.89 42.68 341.35
Gamma 5.08 3.66 3.95 27.79
Theta 90.65 90.71 42.39 334.64
Gamma 5.23 4.26 3.81 26.62
Theta 99.86 93.02 53.69 345.49
Gamma 6.73 3.55 5.75 17.19
Theta 99.05 106.23 48.00 370.35
Gamma 6.96 4.18 5.62 24.24
Theta 90.83 58.05 73.08 254.70
Gamma 7.26 5.31 5.75 33.11
Theta 93.71 64.62 70.02 252.55
Gamma 7.52 5.78 5.85 41.40
Theta 192.93 103.14 181.48 399.23
Gamma 18.27 10.26 18.25 62.91
Theta 186.92 113.93 159.89 555.89
Gamma 17.58 10.38 16.87 76.34
WT
McGill-R-Thy1-APP
(HET)
WT
McGill-R-Thy1-APP
(HET)
WT
McGill-R-Thy1-APP
(HET)
WT
McGill-R-Thy1-APP
(HET)
mPFC
WT
McGill-R-Thy1-APP
(HET)
WT
McGill-R-Thy1-APP
(HET)
WT
McGill-R-Thy1-APP
(HET)
WT
McGill-R-Thy1-APP
(HET)
L-M1/M2 Ctx
L-Frt Ass Ctx
V1 Ctx
Lat Ctx
R-M1/M2 Ctx
RSC
Sample Stage
Choice Stage
Sample Stage
Choice Stage
Sample Stage
Choice Stage
Sample Stage
Choice Stage
Sample Stage
Choice Stage
Sample Stage
Choice Stage
Sample Stage
Choice Stage
Sample Stage
Choice Stage
Sample Stage
Choice Stage
Sample Stage
Choice Stage
Sample Stage
Choice Stage
Sample Stage
Choice Stage
Sample Stage
Choice Stage
Sample Stage
Choice Stage
Cg
Sample Stage
Choice Stage
Sample Stage
Choice Stage
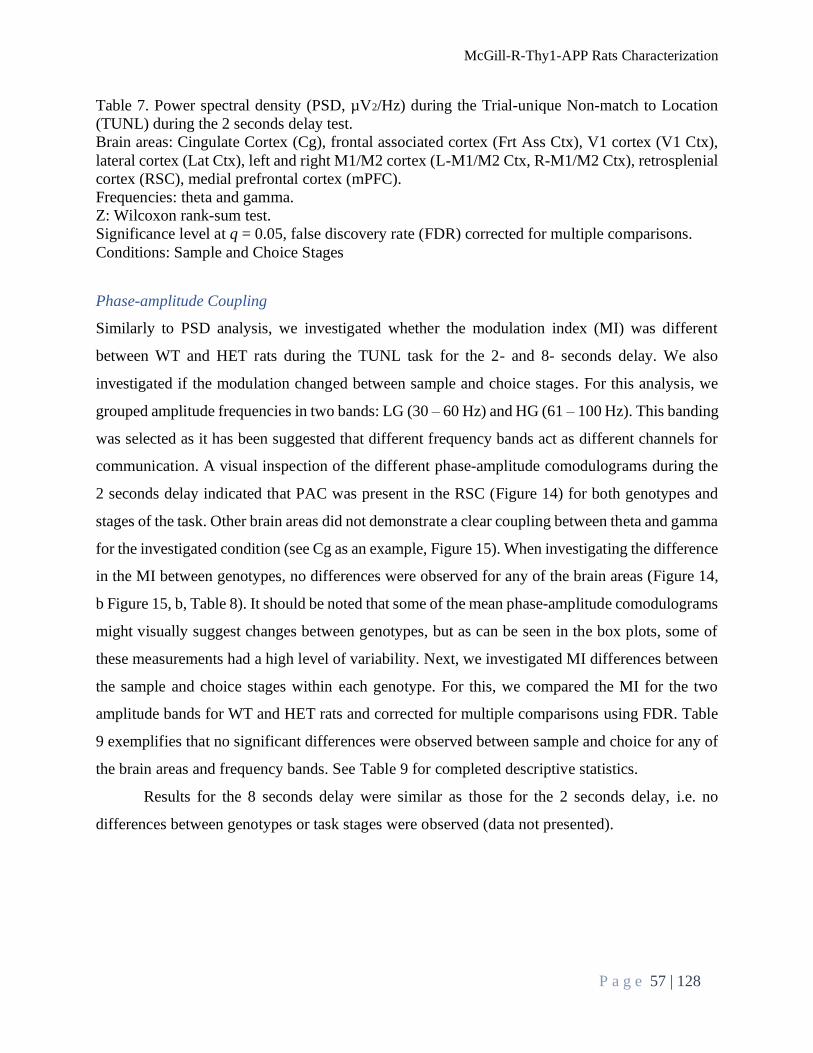
McGill-R-Thy1-APP Rats Characterization
P a g e 57 | 128
Table 7. Power spectral density (PSD, µV2/Hz) during the Trial-unique Non-match to Location
(TUNL) during the 2 seconds delay test.
Brain areas: Cingulate Cortex (Cg), frontal associated cortex (Frt Ass Ctx), V1 cortex (V1 Ctx),
lateral cortex (Lat Ctx), left and right M1/M2 cortex (L-M1/M2 Ctx, R-M1/M2 Ctx), retrosplenial
cortex (RSC), medial prefrontal cortex (mPFC).
Frequencies: theta and gamma.
Z: Wilcoxon rank-sum test.
Significance level at q = 0.05, false discovery rate (FDR) corrected for multiple comparisons.
Conditions: Sample and Choice Stages
Phase-amplitude Coupling
Similarly to PSD analysis, we investigated whether the modulation index (MI) was different
between WT and HET rats during the TUNL task for the 2- and 8- seconds delay. We also
investigated if the modulation changed between sample and choice stages. For this analysis, we
grouped amplitude frequencies in two bands: LG (30 – 60 Hz) and HG (61 – 100 Hz). This banding
was selected as it has been suggested that different frequency bands act as different channels for
communication. A visual inspection of the different phase-amplitude comodulograms during the
2 seconds delay indicated that PAC was present in the RSC (Figure 14) for both genotypes and
stages of the task. Other brain areas did not demonstrate a clear coupling between theta and gamma
for the investigated condition (see Cg as an example, Figure 15). When investigating the difference
in the MI between genotypes, no differences were observed for any of the brain areas (Figure 14,
b Figure 15, b, Table 8). It should be noted that some of the mean phase-amplitude comodulograms
might visually suggest changes between genotypes, but as can be seen in the box plots, some of
these measurements had a high level of variability. Next, we investigated MI differences between
the sample and choice stages within each genotype. For this, we compared the MI for the two
amplitude bands for WT and HET rats and corrected for multiple comparisons using FDR. Table
9 exemplifies that no significant differences were observed between sample and choice for any of
the brain areas and frequency bands. See Table 9 for completed descriptive statistics.
Results for the 8 seconds delay were similar as those for the 2 seconds delay, i.e. no
differences between genotypes or task stages were observed (data not presented).
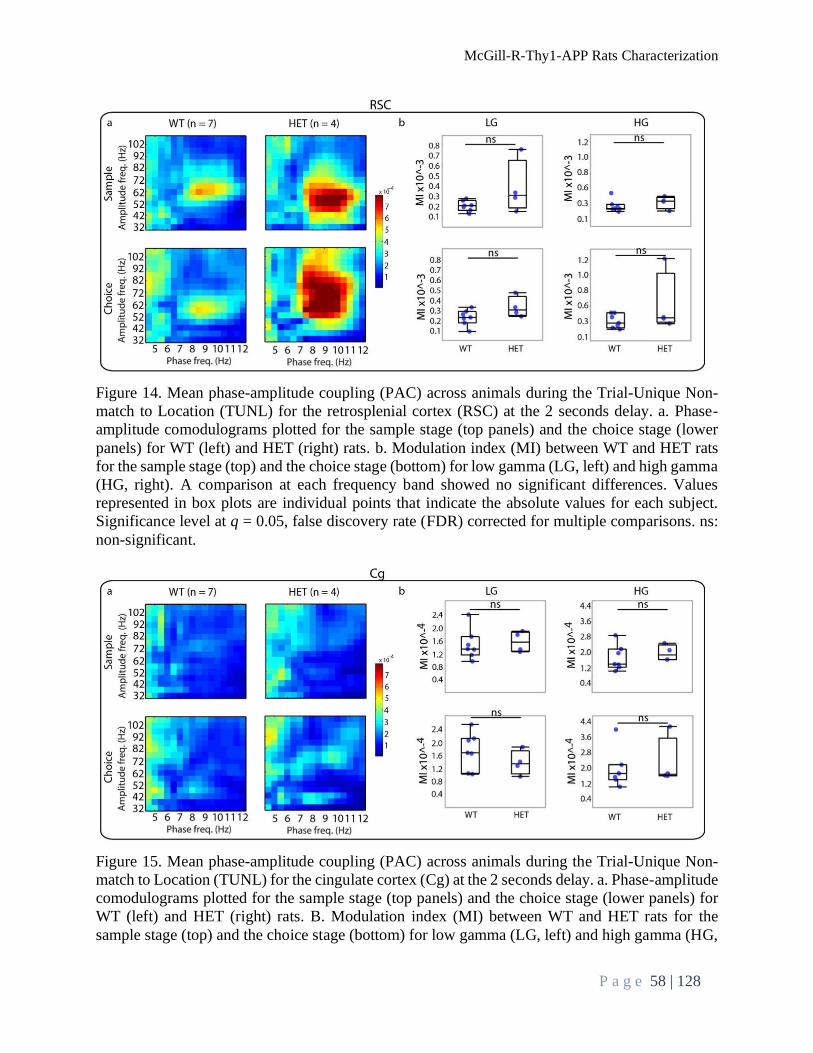
McGill-R-Thy1-APP Rats Characterization
P a g e 58 | 128
Figure 14. Mean phase-amplitude coupling (PAC) across animals during the Trial-Unique Non-
match to Location (TUNL) for the retrosplenial cortex (RSC) at the 2 seconds delay. a. Phase-
amplitude comodulograms plotted for the sample stage (top panels) and the choice stage (lower
panels) for WT (left) and HET (right) rats. b. Modulation index (MI) between WT and HET rats
for the sample stage (top) and the choice stage (bottom) for low gamma (LG, left) and high gamma
(HG, right). A comparison at each frequency band showed no significant differences. Values
represented in box plots are individual points that indicate the absolute values for each subject.
Significance level at q = 0.05, false discovery rate (FDR) corrected for multiple comparisons. ns:
non-significant.
Figure 15. Mean phase-amplitude coupling (PAC) across animals during the Trial-Unique Non-
match to Location (TUNL) for the cingulate cortex (Cg) at the 2 seconds delay. a. Phase-amplitude
comodulograms plotted for the sample stage (top panels) and the choice stage (lower panels) for
WT (left) and HET (right) rats. B. Modulation index (MI) between WT and HET rats for the
sample stage (top) and the choice stage (bottom) for low gamma (LG, left) and high gamma (HG,

McGill-R-Thy1-APP Rats Characterization
P a g e 59 | 128
right). A comparison at each frequency band showed no significant differences. Values are
represented in box plots were individual points indicate absolute values for each subject.
Significance level at q = 0.05, false discovery rate (FDR) corrected for multiple comparisons. ns:
non-significant.
Table 8. Between-subject analysis of phase-amplitude coupling (PAC) during the Trial-unique
Non-match to Location (TUNL) during the 2 seconds delay test.
Conditions: Sample Stage, Choice Stage.
Brain areas: Cingulate Cortex (Cg), frontal associated cortex (Frt Ass Ctx), V1 cortex (V1 Ctx),
lateral cortex (Lat Ctx), left and right M1/M2 cortex (L-M1/M2 Ctx, R-M1/M2 Ctx), retrosplenial
cortex (RSC), medial prefrontal cortex (mPFC).
Frequencies: theta and gamma.
Z: Wilcoxon rank-sum test.
Significance level at q = 0.05, false discovery rate (FDR) corrected for multiple comparisons.
Condition Brain Area Freq Z Prob > [Z] p value rank FDR threshold
LG 0,4724 0,6366 2 0,025
HG 0,85042 0,3951 4 0,05
LG 1,2283 0,2193 1 0,0125
HG 0,2847 0,7768 3 0,0375
LG -1,0394 0,2986 1 0,0125
HG 0,09449 0,9247 2 0,025
LG 0,28347 0,7768 3 0,0375
HG 0,47246 0,6366 2 0,025
LG 1,41737 0,1564 1 0,0125
HG -0,66144 0,5083 4 0,05
LG 0,28347 0,7768 3 0,0375
HG -1,2283 0,2193 1 0,0125
LG 1,41737 0,1564 1 0,0125
HG 0,85042 0,3951 3 0,0375
LG -0,09449 0,9247 3 0,0375
HG -1,98431 0,0472 1 0,0125
LG -1,0394 0,298 1 0,0125
HG 0,47246 0,6366 3 0,0375
LG 0,28347 0,7768 4 0,05
HG 0,47246 0,6366 2 0,025
LG 0 1 4 0,05
HG 0,094 0,9247 3 0,0375
LG 0 1 4 0,05
HG 1,0394 0,29886 1 0,0125
LG -0,85 0,3951 3 0,0375
HG 1,0394 0,2568 2 0,025
LG -0,85042 0,3951 2 0,025
HG 0 1 4 0,05
LG 1,417 0,1564 2 0,025
HG 0,66144 0,5083 4 0,05
LG -1,7953 0,0588 2 0,025
HG -0,09449 0,9247 4 0,05
RSC
mPFC
Cg
L-Frt Ass Ctx
V1 Ctx
Lat Ctx
L-M1/M2 Ctx
R-M1/M2 Cx
Sample Stage
Choice Stage
Cg
L-Frt Ass Ctx
V1 Ctx
Lat Ctx
L-M1/M2 Ctx
R-M1/M2 Ctx
RSC
mPFC

McGill-R-Thy1-APP Rats Characterization
P a g e 60 | 128
Table 9. Phase-amplitude coupling (PAC) during the Trial-unique Non-match to Location (TUNL)
during the 2 seconds delay test.
Brain areas: Cingulate Cortex (Cg), frontal associated cortex (Frt Ass Ctx), V1 cortex (V1 Ctx),
lateral cortex (Lat Ctx), left and right M1/M2 cortex (L-M1/M2 Ctx, R-M1/M2 Ctx), retrosplenial
cortex (RSC), medial prefrontal cortex (mPFC).
Frequencies: theta and gamma.
Z: Wilcoxon rank-sum test.
Significance level at q = 0.05, false discovery rate (FDR) corrected for multiple comparisons.

McGill-R-Thy1-APP Rats Characterization
P a g e 61 | 128
Brain Oscillation Analysis During Home-Cage Environment Exploration
Power Spectral Density
Our next analysis was conducted to determine if we could observe differences between genotypes
in brain oscillatory activity when rats were exploring the home-cage environment at an age of 3.5
months. In this analysis not only WT and HET rats were included, but also HO rats, as the analysis
was independent of task performance. Contrary to PSD results obtained during the TUNL task, we
did not observed differences between genotypes for any of the frequency bands (Figure 16, Table
10) for the mPFC. Furthermore, as with the PSD during the TUNL task, we did not observe
differences for any of the other brain regions of interest (Table 10).
Figure 16. Mean power spectral density (PSD) across animals during the home-cage exploration
for the medial prefrontal cortex (mPFC). a. Mean ± 95% confidence interval PSD in the 4 to 100
Hz band for WT (black curve), HET (green curve), HO (blue curve) rats at 3.5 months of age
during the home-cage exploration. b. Box plots for theta (left panel) and gamma (right panel),
where individual points indicate PSD for each subject. Significance level at q = 0.05, false
discovery rate (FDR) corrected for multiple comparisons. ns: non-significant.
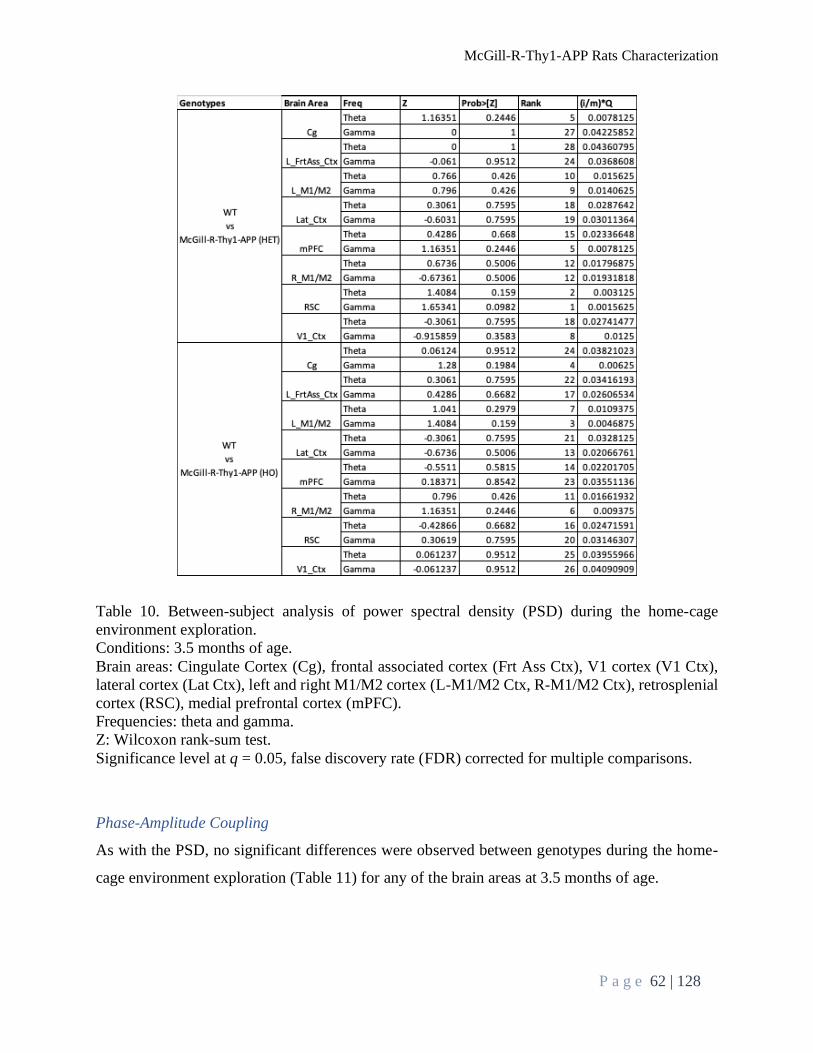
McGill-R-Thy1-APP Rats Characterization
P a g e 62 | 128
Table 10. Between-subject analysis of power spectral density (PSD) during the home-cage
environment exploration.
Conditions: 3.5 months of age.
Brain areas: Cingulate Cortex (Cg), frontal associated cortex (Frt Ass Ctx), V1 cortex (V1 Ctx),
lateral cortex (Lat Ctx), left and right M1/M2 cortex (L-M1/M2 Ctx, R-M1/M2 Ctx), retrosplenial
cortex (RSC), medial prefrontal cortex (mPFC).
Frequencies: theta and gamma.
Z: Wilcoxon rank-sum test.
Significance level at q = 0.05, false discovery rate (FDR) corrected for multiple comparisons.
Phase-Amplitude Coupling
As with the PSD, no significant differences were observed between genotypes during the home-
cage environment exploration (Table 11) for any of the brain areas at 3.5 months of age.

McGill-R-Thy1-APP Rats Characterization
P a g e 63 | 128
Table 11. Between-subject analysis of phase-amplitude coupling (PAC) during the home-cage
environment exploration.
Conditions: 3.5 months of age.
Brain areas: Cingulate Cortex (Cg), frontal associated cortex (Frt Ass Ctx), V1 cortex (V1 Ctx),
lateral cortex (Lat Ctx), left and right M1/M2 cortex (L-M1/M2 Ctx, R-M1/M2 Ctx), retrosplenial
cortex (RSC), medial prefrontal cortex (mPFC).
Frequencies: theta and gamma.
Z: Wilcoxon rank-sum test.
Significance level at q = 0.05, false discovery rate (FDR) corrected for multiple comparisons.
Pathology
Immunohistochemistry
Aβ accumulation was studied by immunohistochemical evaluation of McGill-R-Thy1-APP
forebrain tissue with multiple antibodies. In-house antibodies (JRF/AβN/25, Figure 17 and
JRF/cAβ42/26, Figure 18) indicated that HO McGill-R-Thy1-APP rats had no Aβ pathology at 7
months of age (panels e and f), while the 2 positive controls (panels b and c) had dense plaque

McGill-R-Thy1-APP Rats Characterization
P a g e 64 | 128
depositions. These results were confirmed with commercial antibody, 4G8 (Figure 19). As these
results were in contradiction with previous reports(Iulita et al., 2014, 2017; Leon et al., 2010;
Wilson et al., 2016), we evaluated the same forebrain tissue samples with the antibody used in
these publications (McSA1, Figure 20). Immunohistochemical results with the McSA1 suggested
limited intracellular Aβ in pyramidal neurons (Figure 17, e and f). Finally, we assessed the samples
with an in-house antibody specific for human and rodent App, JRD/sAPP/32 (Figure 18). As
expected, negative and positive controls, as well as HO McGill-R-Thy1-APP showed positive
staining for App. Altogether, our data indicate that at 7 months of age the HO McGill-R-Thy1-
APP rats do not have Aβ accumulation. Furthermore, our data questions the previously reported
(Grant, Ducatenzeiler, Szyf, & Cuello, 2000) specificity of McSA1 for human Aβ.
Figure 17. Immunohistochemical analysis of Aβ accumulation using an N-terminal antibody
(JRF/AβN/25). a. forebrain tissue of a WT (C57BL/6) mouse at 14 months of age as a negative
control. b and c. forebrain tissue of two transgenic mouse models overexpressing human APP at
14 and 15 months of age, respectively, as positive controls. d. WT McGill-R-Thy-APP at 7 months
of age as a negative control. e and f. two HO McGill-R-Thy-APP at 7 months of age. Scale bars
in the photographs are 2.5 mm and 50 µm (hippocampus inset).

McGill-R-Thy1-APP Rats Characterization
P a g e 65 | 128
Figure 18. Immunohistochemical analysis of Aβ accumulation using a C-terminal antibody
(JRF/cAβ42/26). a. forebrain tissue of a WT (C57BL/6) mouse at 14 months of age as a negative
control. b and c. forebrain tissue of two transgenic mouse models overexpressing human APP at
14 and 15 months of age respectively as positive controls. d. WT McGill-R-Thy-APP at 7 months
of age as a negative control. e and f. two HO McGill-R-Thy-APP at 7 months of age. Scale bars
in the photographs are 2.5 mm and 50 µm (hippocampus inset).
Figure 19. Immunohistochemical analysis of Aβ accumulation using the anti-Aβ, 17-24, 4G8
antibody. a. forebrain tissue of a WT (C57BL/6) mouse at 14 months of age as a negative control.
b and c. forebrain tissue of two transgenic mouse models overexpressing human APP at 14 and 15
months of age respectively as positive controls. d. WT McGill-R-Thy-APP at 7 months of age as
a negative control. e and f. two HO McGill-R-Thy-APP at 7 months of age. Scale bars in the
photographs are 2.5 mm and 50 µm (hippocampus inset).

McGill-R-Thy1-APP Rats Characterization
P a g e 66 | 128
Figure 20. Immunohistochemical analysis of Aβ accumulation using the McSA1 antibody. a.
forebrain tissue of a WT (C57BL/6) mouse at 14 months of age as a negative control. b and c.
forebrain tissue of two transgenic mouse models overexpressing human APP at 14 and 15 months
of age respectively as positive controls. d. WT McGill-R-Thy-APP at 7 months of age as a negative
control. e and f. two HO McGill-R-Thy-APP at 7 months of age. Scale bars in the photographs are
2.5 mm and 50 µm (hippocampus inset).
Figure 21. Immunohistochemical analysis of Aβ accumulation using an anti-APP antibody
(JRD/sAPP/32). a. forebrain tissue of a WT (C57BL/6) mouse at 14 months of age as a negative
control. b and c. forebrain tissue of two transgenic mouse models overexpressing human APP at
14 and 15 months of age respectively as positive controls. d. WT McGill-R-Thy-APP at 7 months
of age as a negative control. e and f. two HO McGill-R-Thy-APP at 7 months of age. Scale bars
in the photographs are 2.5 mm and 50 µm (hippocampus inset).

McGill-R-Thy1-APP Rats Characterization
P a g e 67 | 128
McSA1 Antibody Specificity Analysis
To further evaluate the specificity of McSA1 for human Aβ, a direct coating ELISA was performed
with a 15 nM concentration coating with recombinant human sAPPα, Aβ1-42, and Aβ 11-42.
Although all control antibodies reacted with the expected coated protein/peptide (Figure 19
b,c,d,e,f, and g), McSA1 antibody reacted not only with Aβ1-42 but also with sAPPα, implying
this antibody is not a neo-epitope antibody (Figure 19,a). Furthermore, the lack of reactivity with
Aβ11-42 indicates its epitope locates in the first 11 amino acids.
Figure 22. Direct coating ELISA with 15nM concentration coating with recombinant human
sAPPα, Aβ1-42, and Aβ 11-42. a. Evaluation of the specificity of McSA1 for human Aβ. McSA1
antibody reacted not only with Aβ1-42, but also with sAPPα, implying this antibody is not a neo-
epitope antibody (specific for the cleaved Aβ). b. Control antibody JRD/sAPP/32 binds to epitope
in sAPPα but not Aβ, therefore it only reacted with sAPPα. c. Control antibody JRF/AbN/25 is a
McGill-R-Thy1-APP Rats Characterization
P a g e 68 | 128
neo-epitope antibody for Aβ 1-x and thus should react with Aβ 1-42, but not with sAPPα nor with
Aβ 11-42. Results indicated binding to Aβ 1-42, but also partial binding to sAPPα. d. Control
antibody JRF/Abtot/17 binds with Aβ epitope 1-12, therefore reacted with sAPPα, and Aβ 1-42.
e. Control antibody 4G8 binds with epitope 17-24, thus reacted with Aβ 1-42 and Aβ 11-42. f.
J&JPRD/hAb11/1 negative control. g. Control antibody JRF/cAb42/26 is a neo-epitope antibody
for Aβ x-42, thus reacted with both Aβ 1-42 and Aβ 11-42, but not with sAPPα.
Genotyping – ddPCR
It is important to notice that the original study design was planned to only include WT and HO
rats, as it has been reported that HET McGill-R-Thy1-APP rats have a low level of pathology
(Leon et al., 2010). After observing that approximately half of the HO rats were not performing in
the TUNL task, while the other half was learning the task, we re-genotyped the rats at the end of
the study using a technology that produces accurate and precise digital PCR: the ddPCR.
Unexpectedly, results indicated that 50% of the HO rats, were actually HET. The re-assigned
genotypes matched clearly with the bimodal performance distribution, as HO rats failed to acquire
the TUNL task, while HET rats performed similarly to WT rats.
4.3. Conclusion
The purpose of this part of the thesis was to characterize the McGill-R-Thy1-APP rats by
performing a behavioral, electrophysiological, and pathological investigation at 3.5 months of age.
In has been suggested that Aβ amyloidosis causes altered neuronal oscillatory activity (Busche &
Konnerth, 2015; Palop & Mucke, 2016). In this chapter, we tested the hypothesis that Aβ
amyloidosis causes aberrant network activity at the preclinical stage of the disease and underlies
the early cognitive disturbances observed in models of AD pathology using the McGill-R-Thy1-
APP rat.
The McGill-R-Thy1-APP HO rats showed a strong impairment in the acquisition of the
TUNL task, as they had a high level of omissions. We excluded demotivation as the main reason
for this impairment, as HO rats performed equally well as the WT and HET during the pre-training
stage of the task. Furthermore, no bodyweight differences were observed between genotypes.
Importantly, a previous study of the HO McGill-R-Thy1-APP rats in the operant touchscreen
apparatus, using a different task than the one here, reported that these rats took over 10 seconds to

McGill-R-Thy1-APP Rats Characterization
P a g e 69 | 128
make touchscreen responses (Wilson et al., 2016). In our experimental designed rats had 30
seconds to respond to sample stimulus, and 10 seconds to activate the choice stage or respond to
the choice stimulus. Therefore, a plausible explanation for the impairment observed in our
experiment is that rats did not have sufficient time to make a choice during the acquisition. We
consider that this hypothesis should be further investigated. To do so, first, the TUNL task with
longer response intervals should be properly validated in WT rats, as such a modification can affect
the rats’ performance. Allowing for longer response intervals might confound working memory
results. Differently to the HO rats, HET rats were able to acquire the TUNL task at a similar rate
than the WT rat. Additionally, the behavioral results during the sessions with LFPs recordings in
the 2- and 8-seconds delays indicated that WT and HET rats were able to perform above chance
in the TUNL task.
Neuronal functioning was assessed by PSD and PAC. Our electrophysiological analysis
was centered on the TUNL task. One of the relevant characteristics of the TUNL task is the
possibility to compare the electrophysiological readouts during the sample and the choice stages.
Motorically, the rats are performing similar actions, but cognitively, they are executing distinct
processes, which allows investigating working memory processes without motoric confounders.
Our results indicate an increase in power for HET rats compared to WT, especially for the gamma
band at the mPFC without behavioral impairment. Previous research using the TgF344-AD rat
model also found power impairments in the mPFC, but rather than an increase in the power, an
attenuation of the gamma power was observed (Bazzigaluppi et al., 2018). It remains to be tested
if the PSD in the mPFC in the McGill-R-Thy1-APP rats decreases ones Aβ plaques are present.
Importantly, in the Bazzigalupi and colleagues study (Bazzigaluppi et al., 2018),
electrophysiological recordings were obtained while rats were under anesthesia. In our study, rats
were performing a behavioral task, which it is known to require the contribution of the mPFC for
successful working memory functioning (Benchenane, Tiesinga, & Battaglia, 2011). Contrary to
what was expected, we did not observe PAC differences between WT and HET rats for any of the
investigated brain areas at the tested age. It remains to be investigated if other brain areas or later
time points might reveal changes in PAC. Furthermore, we did not observe PSD and PAC changes
between the two stages of the task (sample and choice). The TUNL task allows the use of variable
delays, manipulating task complexity. Giving that the number of incorrect responses was very low
in our experiment, we only analyzed LFPs during correct responses. Longer delays could allow

McGill-R-Thy1-APP Rats Characterization
P a g e 70 | 128
investigating differences in electrophysiological readouts between correct and incorrect responses,
or between sample and choice stages. Unfortunately, the low number of correct trials for the HO
rats did not allow us to record LFPs during the TUNL task. A second electrophysiological analysis
was conducted during home-cage environment exploration. In this part of the experiment, HO rats
were also included, as their performance in the TUNL task was not relevant for the analysis. Our
results indicated no difference in either power or coupling between the genotypes for any of the
recorded brain areas.
The selection of the 3.5 months of age aimed to investigate the early stage of Aβ pathology
without clear cognitive symptoms, and to match what is considered the preclinical phase of AD
(Sasaguri et al., 2017). It has been previously reported that McGill-R-Thy1-APP rats have
intracellular Aβ as early as 1 week of age and that this pathology is strongly established by 2 to 3
months of age in both HO and HET rats (Iulita et al., 2014, 2017; Leon et al., 2010; Wilson et al.,
2016). Importantly, our biochemical data indicate that the antibody, McSA1, used in the mentioned
studies (Iulita et al., 2014, 2017; Leon et al., 2010; Wilson et al., 2016) to identify Aβ pathology
in the McGill-R-Thy1-APP model, reacts to both sAPPα and Aβ 1-42. This implies that positive
immunohistochemical staining by this antibody is not clearly attributable to Aβ pathology but may
be caused by APP overexpression. Overall, contrary to current literature, our
immunohistochemical results with multiple antibodies indicate that the McGill-R-Thy1-APP rats
do not have intracellular Aβ pathology at the age investigated in this study. This leads us to the
conclude that any behavioral and electrophysiological deficits observed in our experiments are
likely associated with the overexpression of APP, rather than with Aβ amyloidosis.
AppNL-G-F Mice Characterization
P a g e 71 | 128
Behavioral, Electrophysiological and Histopathological Characterization of
AppNL-G-F Mice
Part of this chapter has been published in:
Jacob, S., Davies, G., De Bock, M., Hermans, B., Wintmolders, C., Bottelbergs, A., Borgers, M.,
Theunis, C., Van Broeck B., Manyakov, N. V., Balschun, D., Drinkenburg W.H.I.M. (2019).
Neural oscillations during cognitive processes in an App knock-in mouse model of Alzheimer’s
disease pathology. Scientific reports, 9 (1), 1-19.
5.1. Introduction
Numerous animal models mirroring some features of AD pathogenesis have been created
to facilitate the understanding of the molecular mechanisms of the disease (Jankowsky & Zheng,
2017). Among the most common models are transgenic mouse models overexpressing the human
APP with mutations linked to familial AD in APP or/and PSEN1/2 (Sasaguri et al., 2017).
Although these animals have been instrumental in understanding some basic aspects of AD
(Sasaguri et al., 2017), the overexpression of these proteins might lead to artificial phenotypes
(Born et al., 2014; Nilsson et al., 2014). At the brain network level, it has been reported by
numerous studies that these mouse models demonstrate various alterations (Busche & Konnerth,
2015; Palop et al., 2007; Palop & Mucke, 2010), even before Aβ accumulation (Goutagny et al.,
2013). Although these results show some phenotypical similarities with AD (Nimmrich et al.,
2015; Palop & Mucke, 2009; Poza et al., 2017), it is not clear what are the underlying mechanisms
that cause the aberrant neuronal activity observed in these models. Some evidence suggests that
APP overexpression, and not Aβ overproduction might be responsible for the abnormal network
activity in APP-overexpressing mouse models (Born et al., 2014). Further evidence supporting this
hypothesis, comes from studies investigating the physiological role of APP or its processed
fragments in non-pathological conditions (Maya & Bassem, 2014; Rice et al., 2019). For instance,
it has been demonstrated that sAPP plays a role in the modulation of synaptic transmission (Rice
et al., 2019).
The new generation of App KI mice produce robust Aβ amyloidosis with physiological
App levels (Nilsson et al., 2014; Saito et al., 2014a). While Aβ plaque deposition starts at 6 months

AppNL-G-F Mice Characterization
P a g e 72 | 128
in AppNL-F mice (Saito et al., 2014a), its onset in AppNL-G-F mice is already at 2 months and saturates
around 7 months (Saito et al., 2014a; Sakakibara, Sekiya, Saito, Saido, & Iijima, 2018). In contrast,
AppNL mice do not develop any Aβ plaques, even at late ages (Saito et al., 2014a; Sakakibara et
al., 2018). Behaviorally, AppNL-G-F mice demonstrate impairments in multiple cognitive domains,
including declined spatial reversal learning and attention control, loss of avoidance memory, and
enhanced impulsivity and compulsivity, starting at 8 months of age (Masuda et al., 2016). Studies
investigating early time points show more inconclusive results. For instance, while in the original
report, deficits in the Y-maze were indicated (Saito et al., 2014a), a later study did not find deficits
in working memory using the Y-maze at 6 months of age (Whyte et al., 2018). Another study
testing AppNL-G-F mice at 3, 6, and 10 months demonstrated largely unaffected behavioral readouts,
with only mildly changes in social and anxiety-related test performance (Latif-Hernandez et al.,
2019). Brown et al., investigated network hyperexcitability in two mouse models: AppNL-F and J20
(APP overexpression). Although they were able to replicate the previously reported effect on
network hyperexcitability in the J20 mice, the effect was absent in 𝐴𝑃𝑃𝑁𝐿−𝐹/𝑁𝐿−𝐹 mice (Brown
et al., 2018).
The App KI models have not yet been fully characterized with respect to neuronal network
activity. Therefore, the primary goal of this part of the thesis was to investigate
electrophysiological readouts in combination with a cognitive task to illuminate functional
differences between AppNL-G-F and C57BL/6J WT controls. Mice had to perform a VD task using
touchscreen operant boxes, starting at 4.5 months of age while LFPs in the DMS, Cg, RSC, and
dCA1 region of the hippocampus were recorded using a wireless neurophysiological signal
acquisition system. In parallel with these recordings, we measured LFPs at two time points during
home-cage exploration, without the behavioral task to investigate neuronal network changes
exclusively associated with pathology progression. The ages to perform the in vivo experiments
were selected with the objective to match the preclinical AD phase. Biochemical and
immunohistochemical analyses were conducted to correlate Aβ plaque deposition with the
electrophysiological and behavioral results at the different time points. The electrophysiological
analysis focused on PAC between theta (4 – 12 Hz), gamma (30 – 100 Hz), and HFO (100 – 200
Hz) activity during three distinct recording conditions related to different cognitive load, the start
and the end of the VD task, and exploration of the home environment.

AppNL-G-F Mice Characterization
P a g e 73 | 128
5.2. Results
Performance during VD Task
Pre-training:
During the pre-training stage there were no genotype effects on the number of sessions required in
the tone association (WT: M = 3.9, SD = 0.7, n = 10; AppNL-G-F: M = 4.5, SD = 0.5, n = 8, Z = 3.74,
p = 0.05), touch association (WT: M = 1.2, SD = 0.6, n = 10; AppNL-G-F: M = 1.0, SD = 0.0, n = 8,
Z = 0.8, p = 0.37), must touch (WT: M = 1.4, SD = 0.8, n = 10; AppNL-G-F: M = 1.4, SD = 1.1, n =
8, Z = 0.07, p = 0.78) and Punish Incorrect (WT: M = 3.9, SD = 1.4, n = 10; AppNL-G-F: M = 4.3,
SD = 1.4, n = 7, Z = 0.31, p = 0.57) stages of touchscreen pre-training. One AppNL-G-F mouse did
not complete all pre-training stages within 30 days and did not progress onto the VD task.
Visual Discrimination Task:
The individual learning curves of mice during acquisition of the VD task are shown in Figure 23,
a. As expected, percentage of correct responses on the first day of the discrimination task was
around chance level (WT: M = 49.17%, SD = 12.46, n = 10; AppNL-G-F: M = 52.97%, SD = 10.61,
n = 7) and no difference was found between genotypes t (15) = 0.656, p = 0.52. To compare
learning rates, a mixed linear model was used to fit of the percentage of correct responses data
(𝑅2= 0.715). There was a significant effect of session F (1, 139.6) = 252.3, p < 0.0001, and a
significant interaction session and genotype F (1, 139.6) = 29.07, p < 0.0001. The main genotype
effect did not reach significance F (1, 14.7) = 2.375, p = 0.1445. One mouse in the AppNL-G-F group
needed 24 sessions to reach the VD criterion, twice that of the slowest learner in the WT group.
Excluding this extreme value from the model fit resulted in a non-significant interaction term
between genotype and session F (1, 115.5) = 3.668, p = 0.0580. Analysis of the number of sessions
required to reach the learning criterion of two consecutive sessions of 80% correct responses or
higher did not identify a significant difference between groups (WT: M = 7.4%, SD = 2.91, n = 10;
AppNL-G-F: M = 11.43%, SD = 5.94, n = 7, Z= 2.95, p = 0.08, Figure 23, b). Similarly, a comparison
of the percentage of CTs did not indicate a genotype difference (WT: M = 32.24%, SD = 5.24, n =
10; AppNL-G-F: M = 33.54%, SD = 6.08, n = 7, Z = 0.15, p = 0.69, Figure 23, c). Analysis of latencies
to initiate trials (WT: M = 4.54%, SD = 1.86, n = 10; AppNL-G-F: M = 5.51%, SD = 2.9, n = 7, Z =
0.61, p =0.43, Figure 23, d), response to the stimulus (WT: M = 5.07%, SD =0.87, n = 10; AppNL-

AppNL-G-F Mice Characterization
P a g e 74 | 128
G-F: M = 7.69%, SD = 6.07, n = 7, Z = 0.95, p = 0.33, Figure 23, e), and to collect the food reward
(WT: M = 2.04%, SD = 0.34, n = 10; AppNL-G-F: M = 2.28%, SD = 0.89, n = 7, Z = 0.15, p = 0.69,
Figure 23, f) indicated no alterations in any response latencies for the AppNL-G-F mice. Together
these results suggest that the ability to discriminate visual stimuli and to form stimulus-reward
associations was largely unaffected in the AppNL-G-F mice.
Figure 23. Acquisition of the visual discrimination (VD) touchscreen task in AppNL-G-F and WT
mice. a. learning curves of mice during discrimination learning for WT (left panel) and AppNL-G-F
(right panel). Percentage of correct responses is plotted by sessions where each colored line
represents an individual mouse. b. number of sessions to achieve learning criterion of two
consecutive sessions of 80% correct or higher responses did not differ between WT and AppNL-G-F
mice. c. percentage of correction trials did not differ between genotypes. Latencies to initiate trial
(d), response to the stimulus (e), and collect the reward (f) did not differ between genotypes. In
figures b, c, d, e, f data are represented in box plots with individual points for each subject.
Statistically significance level at p < 0.05. ns: non-significant.

AppNL-G-F Mice Characterization
P a g e 75 | 128
Brain Oscillations Analysis During VD Task
Relative Power Spectral Density:
Before investigating the relative PSD in the 4 brain areas of interest during the start and end of the
VD task, we grouped frequencies on three bands: theta (4 to 12 Hz), gamma (30 to 100 Hz) and
HFO (101 to 200 Hz), based on previous proposed guidelines(Jobert et al., 2012). A within-subject
analysis between the end and start of the VD task revealed no significant difference in relative
PSD for any of the frequency bands for both genotypes (see Figure 24 with Cg brain area as an
example and Table 12 for all descriptive statistics and statistical tests). We also investigated
relative PSD between WT and AppNL-G-F, but no significant differences were found for any of the
brain areas and frequency bands.
Figure 24. Mean relative power spectral density (PSD) across animals during the visual
discrimination (VD) task for the cingulate cortex (Cg). Mean relative PSD in the 4 to 200 Hz band
during start of the VD task (Task_Start, black and blue curves) and end of the VD task (Task_End,
green and red curves) for (a) WT and (c) AppNL-G-F mice. Delta between Task_End and Task_Start
is represented in box plots were individual points indicate delta values for each subject for (b) WT
and (d) AppNL-G-F mice. No significant difference was observed between the end and the start of
the task for the two genotypes at the three different frequency bands. Significance level at q = 0.05,
false discovery rate (FDR) corrected for multiple comparisons. ns: non-significant.

AppNL-G-F Mice Characterization
P a g e 76 | 128
Table 12. Relative power spectral density (PSD, µV2/Hz) during the visual discrimination (VD)
task.
Brain areas: Cingulate Cortex (Cg), dorsal CA1 region of the hippocampus (dCA1), dorsal medial
striatum (DMS), and retrosplenial cortex (RSC).
Frequencies: theta, gamma and high frequency oscillations (HFO).
Conditions: Task_Start = start of the VD task, Task_End = end of the VD task.
Descriptive statistics for PSD (µV2/Hz), N: sample size, Z: Wilcoxon rank-sum test.
Significance level at q = 0.05, false discovery rate (FDR) corrected for multiple comparisons.
Genotype Brain Area Freq Condition Mean SD Median Range N Z Prob > [Z]
p value
rank
FDR
threshold
Task_Start 0,03879 0,01048 0,04082 0,03418
Task_End 0,03639 0,00094 0,03746 0,02788
Task_Start 0,00540 0,00110 0,00510 0,00360
Task_End 0,00560 0,00100 0,00550 0,00300
Task_Start 0,00120 0,00034 0,00120 0,00078
Task_End 0,00130 0,00036 0,00120 0,00082
Task_Start 0,04875 0,00666 0,04702 0,01918
Task_End 0,04600 0,00860 0,04278 0,02300
Task_Start 0,00450 0,00077 0,00460 0,00220
Task_End 0,00480 0,00083 0,00530 0,00220
Task_Start 0,00093 0,00020 0,00100 0,00049
Task_End 0,00099 0,00022 0,00100 0,00059
Task_Start 0,04992 0,01000 0,05291 0,03031
Task_End 0,04901 0,00896 0,05110 0,02459
Task_Start 0,00420 0,00062 0,00440 0,00200
Task_End 0,00440 0,00068 0,00430 0,00190
Task_Start 0,00019 0,00006 0,00020 0,00017
Task_End 0,00025 0,00013 0,00023 0,00049
Task_Start 0,05863 0,00790 0,06198 0,01952
Task_End 0,05361 0,00862 0,05439 0,02604
Task_Start 0,00360 0,00100 0,00330 0,00300
Task_End 0,00410 0,00120 0,00380 0,00380
Task_Start 0,00026 0,00011 0,00026 0,00031
Task_End 0,00031 0,00013 0,00032 0,00038
Task_Start 0,06310 0,00684 0,06254 0,02294
Task_End 0,06634 0,00559 0,06502 0,01872
Task_Start 0,00320 0,00076 0,00300 0,00250
Task_End 0,00330 0,00064 0,00340 0,00220
Task_Start 0,00042 0,00013 0,00037 0,00043
Task_End 0,00041 0,00012 0,00039 0,00037
Task_Start 0,06536 0,00494 0,06540 0,01470
Task_End 0,06330 0,01026 0,06251 0,02893
Task_Start 0,00320 0,00069 0,00310 0,00210
Task_End 0,00360 0,00098 0,00320 0,00250
Task_Start 0,00040 0,00014 0,00039 0,00041
Task_End 0,00041 0,00014 0,00036 0,00041
Task_Start 0,04116 0,00835 0,03904 0,02734
Task_End 0,03915 0,00799 0,03650 0,02338
Task_Start 0,00480 0,00088 0,00490 0,00300
Task_End 0,00510 0,00091 0,00510 0,00280
Task_Start 0,00119 0,00033 0,00125 0,00093
Task_End 0,00132 0,00031 0,00148 0,00071
Task_Start 0,04553 0,01188 0,04353 0,03560
Task_End 0,04530 0,01254 0,04611 0,03356
Task_Start 0,00460 0,00120 0,00460 0,00370
Task_End 0,00470 0,00120 0,00480 0,00330
Task_Start 0,00109 0,00027 0,00098 0,00073
Task_End 0,00103 0,00028 0,00110 0,00078
Gamma
HFO
Cg
dCA1
DMS
RSC
WT
App NL-G-F
WT
App NL-G-F
WT
App NL-G-F
WT
App NL-G-F
HFO
HFO
Theta
0,00833
6
7 12 0,0469 4
Theta
Gamma
HFO
Theta
Gamma
HFO
Theta
Gamma
HFO
Theta
Gamma
10 0,1953 16 0,03333
10
8
0,04375
9 0,1563 14 0,02917
7
7
24 0,05000
0,01042
7 0,01458
4,5 0,6953 22 0,04583
0,2969 18 0,03750
Theta
Gamma
HFO
Theta
Gamma
HFO
Theta
Gamma
9,5
0,03125
8 13 0,0781 9
0,01250
7 7 0,2969 17 0,03542
11 0,0781 8 0,01667
6 9,5 0,0625 6
7
7
8
9
0,0625
0,1484 13
8
5 0,5469
0,0156
8 -11
9 0,1563 15
5
3 0,6875 21
0,02708
0,01875
10 25,5 0,0059 1 0,00208
20 0,04167
15,5 0,0742
9 -13,5 0,1289 12
0,04792
8 17
7 -1 0,9375
2 0,00417
10 -1,5 0,9219 23
0,006259 19,5 0,0195
0,02500
7 -10 0,1094 11 0,02292
3
-7 0,3828 19 0,03958
0,02083
7 -7
6 -8,5 0,0938 10

AppNL-G-F Mice Characterization
P a g e 77 | 128
Phase-Amplitude Coupling:
Similarly to relative PSD analysis, we investigated whether the MI changed as the animals
progressed on the VD task and if this modulation was different for the AppNL-G-F compared to the
WT mice. For this analysis, we grouped amplitude frequencies in three bands: LG (30 - 60Hz),
HG (61 - 100 Hz), and HFO (101 - 200 Hz). This banding was selected as it has been suggested
that different frequency bands act as different channels for communication. For instance, in the
CA1 region of the hippocampus, gamma oscillations split into two different components indicating
different origins. LG arises from interactions with the CA3 region of the hippocampus, while HG
is thought to arise from interactions with the entorhinal cortex (Colgin et al., 2009). A visual
inspection of the phase-amplitude comodulograms of the different brain areas indicates that PAC
occurs in different frequency bandings. For instance, Cg (Figure 25, a) and RSC (Figure 26, a)
show coupling between HFO and higher theta, while the DMS (Figure 27, a) and dCA1 (Figure
28, a) show coupling between HG and high theta. When investigating the changes in the MI
between the end and the start of the VD task the most prominent effect was observed in the Cg
(Figure 25, b) and RSC (Figure 26, b) for WT mice where the MI decreased by the end of the VD.
WT mice also demonstrated a similar effect in HFO for the DMS (Figure 27, b) and dCA1 (Figure
28, b). Importantly, during the start of the task, the coupling seems to be associated with more
frequency bands, suggesting that as the mice learned the task, the coupling became more localized.
These differences were not clearly observed for the AppNL-G-F mice, where they only demonstrated
a decreased coupling for HG in the Cg (Figure 25, b). See Table 13, for completed descriptive
statistics and results of statistical analysis. Next, we investigated genotype differences within each
condition (task-start and task-end). For this, we compared the MI for the three different amplitude
bands at the start and the end of the task and corrected for multiple comparisons using a FDR, as
done with all previous comparisons (see 3.9 Statistical Analysis). Table 14 shows that no
significant differences were observed between AppNL-G-F and WT mice for any of the brain areas
and frequency bands. Note that for simplicity, panel c of figures: Figure 25, Figure 26, Figure 27,
and Figure 28 shows box plots of the full amplitude range, but the statistical analysis was done for
each separate frequency band. It should be noted that some of the mean phase-amplitude
comodulograms might visually suggest changes between genotypes, but as it can be seen in the
box plots, some of these measurements had a high level of variability. The different results

AppNL-G-F Mice Characterization
P a g e 78 | 128
obtained for the within and between-subject analysis might reflect difference in the experimental
design. Importantly, these designs are addressing different questions, therefore, they may provide
different patterns of results (Keren, 2014).
Figure 25. Mean phase-amplitude coupling (PAC) during the visual discrimination (VD) task for
the cingulate cortex (Cg). a. Phase-amplitude comodulograms plotted for WT mice (top panels)
and AppNL-G-F mice (lower panels) for the start of the VD task (Task_Start, left) and the end of the
VD task (Task_End, right). b. Modulation index (MI) delta between Task_End and Task_Start for
low gamma (LG, left), high gamma (HG, middle) and high frequency oscillations (HFO, right) for
WT mice (top panels) and AppNL-G-F mice (lower panels). Comparison at each frequency band
showed a significant difference for WT mice, but only at HG for AppNL-G-F mice. c. MI between
WT and AppNL-G-F mice for Task_Start (left) and Task_End (right). Comparison at each frequency
band showed no significant difference. Values are represented in box plots were individual points
indicate (b) delta or (c) absolute values for each subject. Significance level at q = 0.05, false
discovery rate (FDR) corrected for multiple comparisons. ns: non-significant.

AppNL-G-F Mice Characterization
P a g e 79 | 128
Figure 26. Mean phase-amplitude coupling (PAC) during the visual discrimination (VD) task for
the retrosplenial cortex (RSC). a. Phase-amplitude comodulograms plotted for WT mice (top
panels) and AppNL-G-F mice (lower panels) for the start of the VD task (Task_Start, left) and the
end of the VD task (Task_End, right). b. Modulation index (MI) delta between Task_End and
Task_Start for low gamma (LG, left), high gamma (HG, middle) and high frequency oscillations
(HFO, right) for WT mice (top panels) and AppNL-G-F mice (lower panels). Comparison at each
frequency band showed a significant difference for WT mice at LG and HG, but no significant
difference for AppNL-G-F mice. c. MI between WT and AppNL-G-F mice for Task_Start (left) and
Task_End (right). Comparison at each frequency band showed no significant difference. Values
are represented in box plots were individual points indicate (b) delta or (c) absolute values for each
subject. Significance level at q = 0.05, false discovery rate (FDR) corrected for multiple
comparisons. ns: non-significant.

AppNL-G-F Mice Characterization
P a g e 80 | 128
Figure 27. Mean phase-amplitude coupling (PAC) during the visual discrimination (VD) task for
the dorsal medial striatum (DMS). a. Phase-amplitude comodulograms plotted for WT mice (top
panels) and AppNL-G-F mice (lower panels) for the start of the VD task (Task_Start, left) and the
end of the VD task (Task_End, right). b. Modulation index (MI) delta between Task_End and
Task_Start for low gamma (LG, left), high gamma (HG, middle) and high frequency oscillations
(HFO, right) for WT mice (top panels) and AppNL-G-F mice (lower panels). Comparison at each
frequency band showed a significant difference for WT mice at HFO, but no significant difference
for AppNL-G-F mice. c. MI between WT and AppNL-G-F mice for Task_Start (left) and Task_End
(right). Comparison at each frequency band showed no significant difference. Values are
represented in box plots were individual points indicate (b) delta or (c) absolute values for each
subject. Significance level at q = 0.05, false discovery rate (FDR) corrected for multiple
comparisons. ns: non-significant.
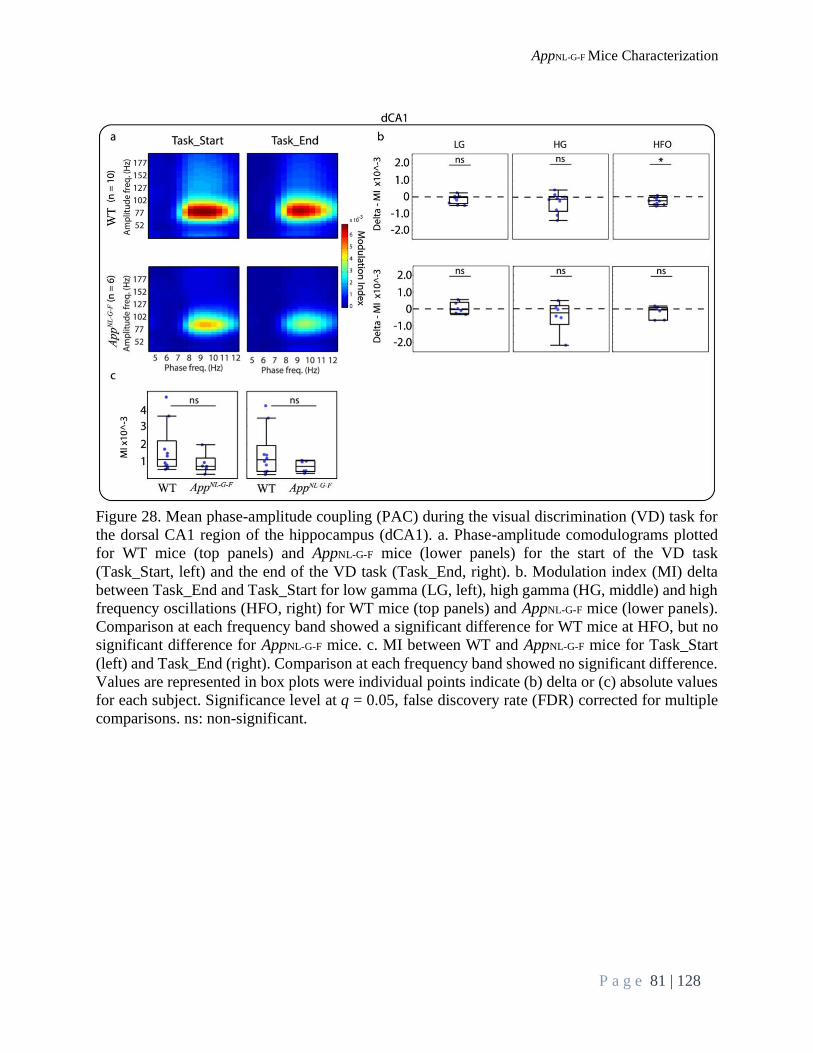
AppNL-G-F Mice Characterization
P a g e 81 | 128
Figure 28. Mean phase-amplitude coupling (PAC) during the visual discrimination (VD) task for
the dorsal CA1 region of the hippocampus (dCA1). a. Phase-amplitude comodulograms plotted
for WT mice (top panels) and AppNL-G-F mice (lower panels) for the start of the VD task
(Task_Start, left) and the end of the VD task (Task_End, right). b. Modulation index (MI) delta
between Task_End and Task_Start for low gamma (LG, left), high gamma (HG, middle) and high
frequency oscillations (HFO, right) for WT mice (top panels) and AppNL-G-F mice (lower panels).
Comparison at each frequency band showed a significant difference for WT mice at HFO, but no
significant difference for AppNL-G-F mice. c. MI between WT and AppNL-G-F mice for Task_Start
(left) and Task_End (right). Comparison at each frequency band showed no significant difference.
Values are represented in box plots were individual points indicate (b) delta or (c) absolute values
for each subject. Significance level at q = 0.05, false discovery rate (FDR) corrected for multiple
comparisons. ns: non-significant.

AppNL-G-F Mice Characterization
P a g e 82 | 128
Table 13. Phase-amplitude coupling (PAC) during the visual discrimination (VD) task.
Brain areas: Cingulate Cortex (Cg), dorsal CA1 region of the hippocampus (dCA1), dorsal medial
striatum (DMS), and retrosplenial cortex (RSC).
Frequencies: theta, gamma and high frequency oscillations (HFO).
Conditions: Task_Start = start of the VD task, Task_End = end of the VD task.
Descriptive statistics for Modulation Index (MI), N: sample size, Z: Wilcoxon rank-sum test.
Significance level at q = 0.05, false discovery rate (FDR) corrected for multiple comparisons.
Grey cells indicated significance values. P value ranks lower than 8 are statistically significant
different between the two conditions.
Genotype Brain Area Freq Condition Mean SD Median Range N Z Prob > [Z]
p value
rank
FDR
threshold
Task_Start 0,000136 0,000054 0,000133 0,000150
Task_End 0,000060 0,000020 0,000066 0,000048
Task_Start 0,000167 0,000056 0,000164 0,000201
Task_End 0,000072 0,000034 0,000065 0,000094
Task_Start 0,000271 0,000060 0,000283 0,000193
Task_End 0,000138 0,000051 0,000143 0,000172
Task_Start 0,000119 0,000074 0,000124 0,000214
Task_End 0,000073 0,000035 0,000085 0,000084
Task_Start 0,000219 0,000173 0,000181 0,000506
Task_End 0,000099 0,000040 0,000098 0,000120
Task_Start 0,000247 0,000090 0,000229 0,000249
Task_End 0,000135 0,000065 0,000099 0,000174
Task_Start 0,000852 0,000477 0,000713 0,001435
Task_End 0,000719 0,000499 0,000732 0,001614
Task_Start 0,003142 0,003040 0,001842 0,002389
Task_End 0,002817 0,003087 0,001674 0,008305
Task_Start 0,001266 0,001129 0,000807 0,003486
Task_End 0,001019 0,001000 0,000786 0,003212
Task_Start 0,000332 0,000204 0,000310 0,000581
Task_End 0,000371 0,000320 0,000257 0,000816
Task_Start 0,001877 0,001494 0,001523 0,004300
Task_End 0,001438 0,008713 0,001322 0,002162
Task_Start 0,000597 0,000397 0,000438 0,001036
Task_End 0,000398 0,000182 0,000377 0,000465
Task_Start 0,000176 0,000071 0,000156 0,000201
Task_End 0,000115 0,000036 0,000119 0,000092
Task_Start 0,000434 0,000149 0,000443 0,000412
Task_End 0,000322 0,000130 0,000318 0,000340
Task_Start 0,000434 0,000112 0,000433 0,000326
Task_End 0,000276 0,000121 0,000296 0,000390
Task_Start 0,000190 0,000074 0,000205 0,000205
Task_End 0,000136 0,000047 0,000158 0,000120
Task_Start 0,000703 0,000571 0,000494 0,001642
Task_End 0,000535 0,000505 0,000267 0,001350
Task_Start 0,000350 0,000098 0,000360 0,000246
Task_End 0,000230 0,000154 0,000188 0,000480
Task_Start 0,000147 0,000071 0,000119 0,000218
Task_End 0,000075 0,000023 0,000075 0,000067
Task_Start 0,000177 0,000053 0,000181 0,000189
Task_End 0,000091 0,000034 0,000087 0,000095
Task_Start 0,000309 0,000097 0,000326 0,000332
Task_End 0,000196 0,000068 0,000182 0,000178
Task_Start 0,000130 0,000091 0,000089 0,000268
Task_End 0,000084 0,000043 0,000084 0,000129
Task_Start 0,000202 0,000118 0,000188 0,000336
Task_End 0,000098 0,000044 0,000089 0,000120
Task_Start 0,000272 0,000089 0,000302 0,000225
Task_End 0,000166 0,000096 0,000155 0,0002890,0229167
0,0354167
0,0291667
0,0270833
0,01875
0,00625
0,0145833
0,0125
0,0020833
0,0416667
0,03125
3
2
21
16
0,0479167
0,0458333
0,025
0,0208333
0,0104167
0,0166667
0,0395833
0,0375
0,0083333
0,05
0,0041667
0,04375
0,0333333
11
5
17
14
13
9
0,1094
0,0313
7
6
1
20
15
8
19
18
4
24
23
22
12
10
0,0781
0,0195
0,0078
0,0078
0,375
0,0391
0,0234
0,0156
0,1563
0,0781
-21,5
-6
-17
-17
-18
-8
-11
-10
-13
0,0156
0,0156
0,0078
0,2188
0,0781
0,0156
0,1934
0,1602
0,0098
0,8438
0,5625
0,4375
-9
-11
-11
-19,5
-21,5
8
7
9
7
HFO
LG
HG
HFO
-14
-13,5
-14,5
-24,5
1,5
-3,5
-4,5
-15
-16
-17
8
7
10
LG
HG
HFO
LG
HG
HG
HFO
LG
HG
HFO
HFO
LG
HG
HFO
LG
LG
HG
HFO
LG
HG
6
WT
RSC
App NL-G-F
WT
Cg
App NL-G-F
WT
dCA1
App NL-G-F
WT
DMS
App NL-G-F
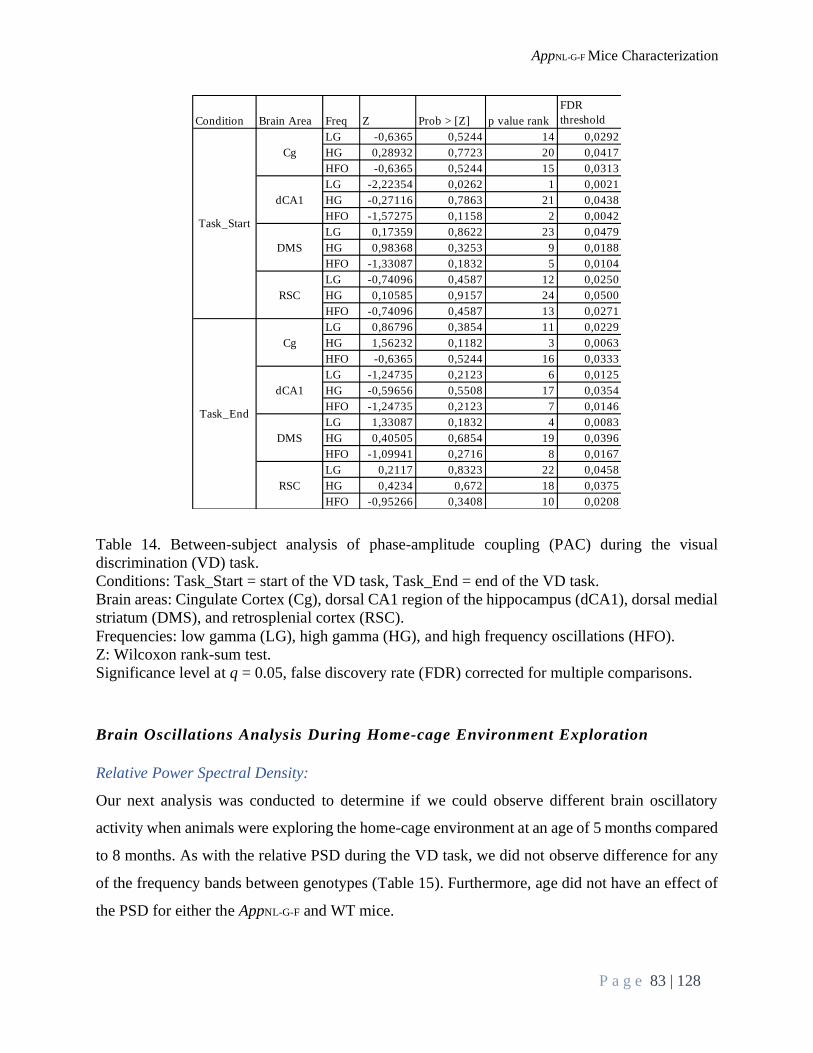
AppNL-G-F Mice Characterization
P a g e 83 | 128
Table 14. Between-subject analysis of phase-amplitude coupling (PAC) during the visual
discrimination (VD) task.
Conditions: Task_Start = start of the VD task, Task_End = end of the VD task.
Brain areas: Cingulate Cortex (Cg), dorsal CA1 region of the hippocampus (dCA1), dorsal medial
striatum (DMS), and retrosplenial cortex (RSC).
Frequencies: low gamma (LG), high gamma (HG), and high frequency oscillations (HFO).
Z: Wilcoxon rank-sum test.
Significance level at q = 0.05, false discovery rate (FDR) corrected for multiple comparisons.
Brain Oscillations Analysis During Home-cage Environment Exploration
Relative Power Spectral Density:
Our next analysis was conducted to determine if we could observe different brain oscillatory
activity when animals were exploring the home-cage environment at an age of 5 months compared
to 8 months. As with the relative PSD during the VD task, we did not observe difference for any
of the frequency bands between genotypes (Table 15). Furthermore, age did not have an effect of
the PSD for either the AppNL-G-F and WT mice.
Condition Brain Area Freq Z Prob > [Z] p value rank
FDR
threshold
LG -0,6365 0,5244 14 0,0292
HG 0,28932 0,7723 20 0,0417
HFO -0,6365 0,5244 15 0,0313
LG -2,22354 0,0262 1 0,0021
HG -0,27116 0,7863 21 0,0438
HFO -1,57275 0,1158 2 0,0042
LG 0,17359 0,8622 23 0,0479
HG 0,98368 0,3253 9 0,0188
HFO -1,33087 0,1832 5 0,0104
LG -0,74096 0,4587 12 0,0250
HG 0,10585 0,9157 24 0,0500
HFO -0,74096 0,4587 13 0,0271
LG 0,86796 0,3854 11 0,0229
HG 1,56232 0,1182 3 0,0063
HFO -0,6365 0,5244 16 0,0333
LG -1,24735 0,2123 6 0,0125
HG -0,59656 0,5508 17 0,0354
HFO -1,24735 0,2123 7 0,0146
LG 1,33087 0,1832 4 0,0083
HG 0,40505 0,6854 19 0,0396
HFO -1,09941 0,2716 8 0,0167
LG 0,2117 0,8323 22 0,0458
HG 0,4234 0,672 18 0,0375
HFO -0,95266 0,3408 10 0,0208
Task_Start
Task_End
Cg
dCA1
DMS
RSC
Cg
dCA1
DMS
RSC

AppNL-G-F Mice Characterization
P a g e 84 | 128
Table 15. Between-subject analysis of relative power spectral density (PSD) during the no-task
condition. Conditions: 5 and 8 months of age.
Brain areas: Cingulate Cortex (Cg), dorsal CA1 region of the hippocampus (dCA1), dorsal medial
striatum (DMS), and retrosplenial cortex (RSC).
Frequencies: theta, gamma, and high frequency oscillations (HFO).
Z: Wilcoxon rank-sum test.
Significance level at q = 0.05, false discovery rate (FDR) corrected for multiple comparisons.
Phase-amplitude Coupling:
As a with the relative PSD, no significant differences were observed between genotypes during
the home-cage environment exploration (Table 16) for any of the brain areas. Furthermore, we did
not observe an effect on age for either the WT or AppNL-G-F mice. Taken together, these results
suggest that the AppNL-G-F mice demonstrate up to 8 months of age normal PAC in a freely moving
condition without task performance (investigation of further age points were beyond the scope of
this study).
Condition Brain Area Freq Z Prob > [Z] p value rank
FDR
threshold
Theta 0,6365 0,5244 14 0,0291667
Gamma -0,05786 0,9539 24 0,05
HFO -0,40505 0,6854 19 0,0395833
Theta 0,88388 0,3768 9 0,01875
Gamma 0,29463 0,7683 20 0,0416667
HFO 0,76603 0,4437 11 0,0229167
Theta 0,63888 0,5229 13 0,0270833
Gamma -0,5111 0,6093 17 0,0354167
HFO -0,7665 0,4433 10 0,0208333
Theta 0,28932 0,7723 21 0,04375
Gamma -0,40505 0,6854 18 0,0375
HFO -0,52077 0,6025 16 0,0333333
Theta -0,96825 0,3329 7 0,0145833
Gamma 0,71005 0,4777 12 0,025
HFO 1,74284 0,0814 2 0,0041667
Theta -0,13333 0,8415 23 0,0479167
Gamma 0,26667 0,7897 22 0,0458333
HFO 1,2 0,2301 5 0,0104167
Theta -1,5 0,1336 3 0,00625
Gamma 2,07143 0,0383 1 0,0020833
HFO 0,92857 0,3531 8 0,0166667
Theta 1,09735 0,2725 6 0,0125
Gamma -0,58095 0,5613 15 0,03125
HFO -1,22644 0,22 4 0,0083333
5_Months
8_Months
Cg
dCA1
DMS
RSC
Cg
dCA1
DMS
RSC

AppNL-G-F Mice Characterization
P a g e 85 | 128
Table 16. Between-subject analysis of phase-amplitude coupling (PAC) during the no-task
condition.
Conditions: 5 and 8 months of age.
Brain areas: Cingulate Cortex (Cg), dorsal CA1 region of the hippocampus (dCA1), dorsal medial
striatum (DMS), and retrosplenial cortex (RSC).
Frequencies: low gamma (LG), high gamma (HG), and high frequency oscillations (HFO).
Z: Wilcoxon rank-sum test.
Significance level at q = 0.05, false discovery rate (FDR) corrected for multiple comparisons.
Pathology
Biochemical analysis of AppNL-G-F forebrain tissue revealed that Aβ1-42 increased in an age-
dependent manner (Figure 29, a) and was accompanied by progressive Aβ plaque pathology as
seen by immunohistochemistry (Figure 29, b-c). Aβ1-42 levels in the brain seemed to be minor at
2 months of age, but progressively increased starting from 4 months of age up to 12-15 months.
This can also be deduced from the immunohistochemical evaluation of cortical and hippocampal
pathology (% Aβ plaque area as detected by antibodies JRF/cAβ42/26 and JRF/AβN/25) that
showed a limited number of Aβ deposits at 2 months of age in cortex, further progressing up to 8-
Condition Brain Area Freq Z Prob > [Z] p value rankFDR
threshold
LG -0,68264 0,4948 12 0,02609
HG 1,31276 0,1893 6 0,01304
HFO -0,26255 0,7929 22 0,04783
LG -1,37607 0,1688 3 0,00652
HG -0,52926 0,5966 14 0,03043
HFO -0,31755 0,7508 19 0,04130
LG 1,44659 0,148 1 0,00217
HG 0,52077 0,6025 15 0,03261
HFO 0,28932 0,7723 21 0,04565
LG 0,36757 0,7132 18 0,03913
HG 1,20774 0,2271 7 0,01522
HFO -0,15753 0,8748 24 0,05217
LG -0,40505 0,6854 16 0,03478
HG -0,40505 0,6854 17 0,03696
HFO 1,33087 0,1832 5 0,01087
LG -1,35529 0,1753 4 0,00870
HG -0,88388 0,3768 10 0,02174
HFO -0,53033 0,5959 13 0,02826
LG 0,7665 0,4433 11 0,02391
HG 1,14998 0,2502 8 0,01739
HFO 0,89443 0,3711 9 0,01957
LG -0,28932 0,7723 20 0,04348
HG -0,17359 0,8622 23 0,05000
HFO 1,44659 0,148 2 0,00435
5_Months
Cg
dCA1
DMS
RSC
8_Months
Cg
dCA1
DMS
RSC

AppNL-G-F Mice Characterization
P a g e 86 | 128
15 months as observed by others (Masuda et al., 2016; Saito et al., 2014a). Altogether, our data
indicate that between 4 and 8 months of age, the period where mice were used for the in vivo
behavioral and neurophysiological characterization, increased Aβ1-42 levels and Aβ plaques were
present in both cortex and hippocampus.
Figure 29. Amyloid β pathology in AppNL-G-F mice. a. Biochemical quantification of Aβ1-42 in
AppNL-G-F forebrains (GuHCl fraction) measured by sandwich ELISA. Standard curves for
calibration were generated using synthetic human Aβ1–42 peptide. Data represent the mean of 2
to 4 independent measurements of pooled samples with each pool consisting of equal volumes of
extracts from 4 to 6 mice (n = 5, 6, 5, 4, 4, 6, 6 per indicated time point respectively). Star symbols
indicate significance compared to 2 mo (months of age). b and c. Example images and
immunohistochemical analysis of the plaque occupancy area in cortex (inset) and hippocampus
using a C-terminal antibody (JRF/cAβ42/26, b) or N-terminal antibody (JRF/AβN/25, c). Scale
bars in the photographs are 2.5 mm and 50 µm (inset). In the summarizing plots, mean and SD are
presented in a bar chart in which each superimposed dot representing a single animal. Star symbols
indicate significance compared to 2 mo.

AppNL-G-F Mice Characterization
P a g e 87 | 128
5.3. Conclusion
The purpose of this part of the thesis was to characterize the onset and progression of AD-mediated
deficits in brain network functions in AppNL-G-F mice, a second-generation mouse model of Aβ
amyloidosis(Saito et al., 2014a), by behavioral, electrophysiological, and pathological
investigations in an age-dependent manner. Previous research using human APP-overexpressing
models has led to the hypothesis that aberrant network and altered oscillatory rhythmic activity
caused by Aβ amyloidosis reflect and underlie the early cognitive disturbances observed in AD
(Busche & Konnerth, 2015; Palop & Mucke, 2009, 2016). In our study, we tested this hypothesis
using a more relevant model of AD pathology, as the AppNL-G-F mice produce robust Aβ
amyloidosis, like the first-generation models (LaFerla & Green, 2012) and AD patients (Scheltens
et al., 2016), but without potential undesirable side effects caused by the overexpression of APP
(Born et al., 2014; Nilsson et al., 2014).
Behaviorally, the AppNL-G-F mice did not show strong associative learning impairments in
the VD task. Overall AppNL-G-F mice demonstrated a higher variability than the controls in learning
the task. Mice were 4.5 months old at the start of the VD task, which correlates with early plaque
deposition. Previous studies characterizing the new generation of AD mouse models have
identified some minimal behavioral changes at young ages (Latif-Hernandez et al., 2019), though
impaired performance on cognitive tests has only been reported from the age of 6 months onwards
(Masuda et al., 2016; Saito et al., 2014a; Whyte et al., 2018). Our study, using a different
behavioral task than those already investigated in this model, contributes to an increasing body of
evidence indicating that the AppNL-G-F mice do not show severe cognitive impairments at early
plaque stages.
To investigate the electrophysiological correlates, we used advanced techniques to explore
the effects of AD-related pathology on neural oscillations in different brain areas during cognition.
Our analysis was centered on comparing the start and end of the VD task. At the end of the task,
the relationship between decision making and coupling could be easily assessed, as mice were at
80% or higher accuracy. For the start of the task, the interpretation was more difficult, as mice
were responding at chance level. Therefore, some of the correct trial response analysis could
include brain activity that may or may not pertain to decision making. We believe that some of the
non-specific coupling observed at the start of the task could be associated with this mentioned
AppNL-G-F Mice Characterization
P a g e 88 | 128
variability within correct responses. Our results indicate a decrease in coupling for the WT mice
as they learned the task, especially for the Cg and RSC. This result is in accordance with previous
research indicating that PAC increases with task difficulty (Axmacher et al., 2010; Tamura,
Spellman, Rosen, Gogos, & Gordon, 2017). For the AppNL-G-F mice, this decrease was less
pronounced, only reaching statistical significance for HG in the Cg. Importantly, between-subject
comparisons for PAC and PSD did not reveal significant differences between the two genotypes.
Altogether our results indicate very subtle changes in coupling, suggesting PAC might not be
affected in the preclinical phase of AD based on amyloidosis pathology only. It remains to be
tested if other brain areas or the interaction between them might reveal changes in PAC at these
early stages. Furthermore, other complex functional connectivity analysis that has been explored
in patients (Engels et al., 2015), should be investigated in this and other animal models of AD
pathology.
Our main motivation for this study was to investigate PAC, for which a role in neuronal
information processing was reported (Lega, Burke, Jacobs, & Kahana, 2016), in a second-
generation mouse model while animals performed the task. In addition, we were also interested in
investigating PAC without any influence that the VD task could have on this readout. To this end,
we measured LFPs when mice were exploring their home-cage environment at 5 and 8 months of
age. Despite seeing an age-dependent increase in Aβ pathology between these time points, we did
not observe changes in PAC for any of the brain regions examined. Importantly, the ages for
recording were selected based on previous reports of pathology (Saito et al., 2014a). Our objective
was to obtain two measurements: one at a relatively early plaque stage and a second one at a later
time point where amyloid pathology is at an advanced state. Our findings indicate an age-
dependent increase in Aβ1-42 levels and plaque deposition that are consistent with previous
research (Masuda et al., 2016; Mehla et al., 2019; Saito et al., 2014a).
Altogether, our results from this study do not support the hypothesis of early alterations in
oscillations and functional neuronal activity (Busche & Konnerth, 2015; Goutagny et al., 2013;
Palop & Mucke, 2016) postulated using the first-generation models. We believe that by allowing
researchers to dissociate the effects of APP overexpression from the pathophysiological changes
in AD, the second-generation models will facilitate a deeper understanding of the neurobiology of
the disease.

General Discussion
P a g e 89 | 128
General Discussion
In this thesis, we characterized the neural circuitry dynamics during cognitive processes in two
experimental rodent models of AD pathology, the AppNL-G-F mouse model and the McGill-R-Thy1-
APP rat model. Evidence suggests that the pathological processes underlying AD start decades
prior to the manifestation of cognitive symptoms (Dubois et al., 2016). We hypothesized that Aβ
amyloidosis causes aberrant network activity at the preclinical stage of the disease, which reflects
the early cognitive disturbances observed in models of AD pathology.
As an initial step in this project, we were able to successfully implement state-of-the-art
neurophysiological imaging techniques during cognitive processes, combining operant
touchscreen apparatus with wireless LFP recordings. This approach was selected because of
multiple advantages: firstly, the use of a wireless system allowed the rodents to move freely in the
operant box. Secondly, the touchscreen platform permitted standardization and lowered the
motoric demands on the rodents (Horner et al., 2013). Finally, the synchronization of LFPs with
different behavioral parameters enabled a precise quantification of electrophysiological changes
related to behavioral performance; thus, making optimal use of the high temporal resolution of
LFPs recording techniques. We also implemented, optimized, and validated surgical implantation
of electrodes for the LFP recordings.
Electrode placement was motivated by two factors. The first factor was based on
topographic distribution of amyloid plaques in AD patients (Serrano-Pozo et al., 2011) and animal
models with Aβ pathology (Sasaguri et al., 2017). Following the Braak and Braak
neuropathological staging of AD-related changes, amyloid deposits are first observed in the
neocortex and gradually extend to the hippocampal formation at the latest stages of the disease
(Braak & Braak, 1991). Importantly, the distribution of amyloid deposits exhibits considerable
inter-individual variability (Braak & Braak, 1991). Of note, in carriers of the Arctic mutation, sub-
cortical pathology is observed (Kalimo et al., 2013). Aβ pathology distribution varies among the
different animal models. The AppNL-G-F mice have been reported to show cortical amyloidosis
starting at 2 months of age extending to sub-cortical areas by 4 months, recapitulating patients
carrying the Arctic mutation (Saito et al., 2014b). These results have been confirmed by our
immunohistochemical studies. The McGill-R-Thy1-APP rats have been reported to have abundant
intraneuronal accumulation of Aβ in the cortex and hippocampus by 3 months of age. As will

General Discussion
P a g e 90 | 128
further be discussed in this discussion, this result was not confirmed in this thesis. The second
factor to motivate our electrode placement was based on the functional role of these areas on
cognitive processes associated with the two behavioral tasks (Benchenane et al., 2011; Thorn,
Atallah, Howe, & Graybiel, 2010). Highly relevant areas that are associated with the used tasks
are the DMS and the mPFC because they play a role in establishing action-reward associations in
the VD task (Thorn et al., 2010), and working memory function in the TUNL task respectively
(Benchenane et al., 2011).
Part of our objectives was to study and characterize oscillations during cognitive processes
in models of AD pathology at an age that matches the preclinical phase of AD. To this end, we
characterized of the McGill-R-Thy1-APP rat model at a behavioral, electrophysiological and
histopathological level. We observed behavioral impairments in the HO rats, as these animals
failed to acquire the TUNL task. At the electrophysiological level, we observed an increase in PSD
in HET rats compared to WT during the task. Importantly and in contrast to what was expected
based on existing literature (Leon et al., 2010), we did not observe any Aβ pathology in both HO
and HET rats at the age investigated in this study. This suggests that the observed changes in our
experiments are likely associated with the artificial overexpression of APP. The second rodent
model used in this thesis was the AppNL-G-F mouse model. As with the rats, we characterized these
mice at behavioral, electrophysiological and histopathological level. Our findings confirmed an
age-dependent increase in Aβ1-42 levels and plaque deposition in these mice. This had no
consequences on cognitive performance in the VD task, which was largely unaffected in the AppNL-
G-F mice at the ages tested. At electrophysiological level, we observed subtle changes in PAC in
the WT mice during the VD task that were not present in the AppNL-G-F mice. Furthermore, we did
not detect age-dependent changes in PSD and PAC for both the WT and the AppNL-G-F mice. Our
results obtained in this mouse model with physiological App expression levels and high plaque
load do not provide support for the hypothesis that aberrant network activity, caused by Aβ
amyloidosis, could be used as a potential readout to detect any functional or cognitive alterations
in early AD pathology.
Although validating transgenic models was not part of the initial scope of this thesis,
our results highlight the importance of selecting and validating relevant animal models to obtain
meaningful results. Numerous publications using the McGill-R-Thy1-APP rat model have
suggested the existence of intraneuronal Aβ species. The observation of functional impairments

General Discussion
P a g e 91 | 128
prior to the formation of any extracellular plaques led to the hypothesis that intraneuronal
accumulation of Aβ is a toxic event driving AD (Iulita et al., 2014; Leon et al., 2010; Qi et al.,
2014; Wilson et al., 2016). The presence of intraneuronal accumulations of Aβ was based on
immunohistochemistry using the McSA1 monoclonal antibody to human Aβ. To prove the
specificity of McSA1 for Aβ peptides over human full-length APP, these studies used antibody
preabsorption (Leon et al., 2010) and colocalization (Iulita et al., 2014) techniques. Following our
ELISA evaluations, our findings challenge this view and indicate that the observed effects in this
study are independent of intracellular Aβ accumulation, and seem merely a consequence of the
overexpression of APP. Although more studies should be conducted to confirm these findings, we
believe our ELISA results are compelling evidence that the McSA1 antibody cannot distinguish
Aβ peptides from the same Aβ epitopes within APP. This calls for a careful re-evaluation of any
reported findings in this animal model. Special attention should be paid to studies claiming
functional consequences of intracellular Aβ accumulation (Parent et al., 2017; Qi et al., 2014).
Similarly, reports evaluating intraneuronal Aβ in other APP overexpression animal models should
carefully determine antibody selectivity (Goutagny et al., 2013; Palop & Mucke, 2010).
Among the most commonly used models are transgenic rodent overexpressing human
APP with mutations linked to familial AD resulting in amyloidosis. Importantly, the normal
physiological function of APP is not completely understood. Evidence suggest that sAPP is a
modulator of synaptic transmission (Mockett, Richter, Abraham, & Müller, 2017). In a recent
study, Rice and colleagues, identified the ɣ-aminobutyric acid type B receptor (GABABR), as
the candidate receptor for sAPP mediating synaptic activity (Rice et al., 2019). In 2014, Born et
al., disseminated the effects of APP overexpression, Aβ overproduction, and plaque formation on
network activity. Their results indicate that APP overexpression, and not Aβ pathology, is
responsible for neuronal network alterations observed in APP-overexpressing mouse models (Born
et al., 2014). Taken together, the mentioned publications suggest that the reported network
alterations in overexpressing models (Busche & Konnerth, 2015; Palop et al., 2007; Palop &
Mucke, 2010) might be due to overexpression of APP, rather than Aβ. Furthermore, we consider
that any results obtained with any overexpressing model on network dysfunction should be
evaluated against the new insights obtained by using the App KI models. It has been suggested that
more than 3000 publications using APP and APP/PS overexpressing models should be re-
evaluated (Saito et al., 2014a; Saito, Matsuba, Yamazaki, Hashimoto, & Saido, 2016). We believe

General Discussion
P a g e 92 | 128
the use of relevant controls, such as rodents overexpressing WT human proteins with WT protein
levels at the same level as the mutant protein should be implemented when using APP and APP/PS
overexpressing models. Furthermore, models such as the App KI mice are a good alternative to
investigate the effects of Aβ without overexpression artifacts. Although the App KI mice have been
extensively used since they became available, the combination of several familial mutations
remains artificial, and it could cause effects that are not present in sAD. For any model, it is
important to remind ourselves of its limitations to correctly interpret results.
Another objective of this thesis was to assess PAC as a sensitive functional readout of Aβ
pathology in the preclinical phase of AD in the two mentioned models. We focused our analysis
on PAC, as this measurement has been suggested to be associated with normal cognitive
functioning in humans (Axmacher et al., 2010; Canolty et al., 2006; Lega et al., 2016) and rodents
(Amemiya & Redish, 2018; Belluscio, Mizuseki, Schmidt, Kempter, & Buzsáki, 2012; Tort et al.,
2009, 2008), and to be disrupted in patients with AD and MCI (Dimitriadis et al., 2015; Poza et
al., 2017). Furthermore, it has been shown that injections of tau aggregated in the hippocampus
causes early PAC deficits in the P301L tau mouse model of AD pathology (Ahnaou et al., 2017).
Contrary to what we expected, our results indicate no changes in PAC at this early stage of
pathology. Although the studies carried out by Poza et al., and Dimitriadis et al., provide valuable
insights to better understand coupling changes associated with the disease in patients, both studies
reported PAC alterations after the preclinical phase. Based on previous literature (Tort et al., 2009,
2008), we expected to see PAC changes in a task-related manner. Opposite to this, for the TUNL
task, we did not observe differential theta-gamma coupling between the sample and choice stages
on the studied brain areas. A plausible explanation is that the selected brain areas are equally
involved in the two aspects of the task (sample and choice); therefore, we did not detect a
difference. Another explanation is related to the high accuracy level observed during the TUNL
task. For instance, Tort et al., (2009), demonstrated an increase in theta-gamma PAC in the
hippocampus as the rats learned an item-context association task, but once the performance was
high and stable, the strength in the coupling was maintained. Similarly, we only observed subtle
changes in PAC for WT mice during the VD task. Overall, it might be that the selected tasks in
this thesis are not sensitive to detect PAC changes. Research of other functional connectivity
analyzes investigated in patients (Engels et al., 2017) were outside the scope of this thesis, but we
believe they should be further explored in the different animal models used in the field.

General Discussion
P a g e 93 | 128
Altogether, our results do not support the hypothesis of early alterations in oscillations due
to Aβ amyloidosis. Future studies should focus on the investigation of electrophysiological
readouts using relevant models, like the App KI model. We believed the App KI and the MAPT KI
models could help to gain insights and outline a timeline on network changes associated with AD
pathology. In AD patients changes in power spectral or synchronization have been commonly
reported (Coben et al., 1985; Engels et al., 2015; Nimmrich et al., 2015; Voevodskaya et al., 2018).
Although some of these studies used new guidelines for diagnosis and investigated preclinical and
clinical AD, the reliability of the AD diagnosis and early detection in other studies must be
considered with caution, given the lack of available biomarkers at the time of the studies.
Electrophysiological readouts provide high temporal measurements of neuronal network
functioning that can be implemented in experimental models, but also in patients (Babiloni et al.,
2020). A key aspect to evaluate the potential value of electrophysiological readouts as biomarkers
is to understand when neuronal network alterations appear. If these alterations are present early on
during the preclinical AD phase, these readouts could have a major impact on disease diagnostics.

P a g e 94 | 128
References
P a g e 95 | 128
References
Abraha, A., Ghoshal, N., Gamblin, T. C., Cryns, V., Berry, R. W., Kuret, J., & Binder, L. I.
(2000). C-terminal inhibition of tau assembly in vitro and in Alzheimer’s disease. Journal
of Cell Science, 113(21), 3737–3745.
Ahnaou, A., Moechars, D., Raeymaekers, L., Biermans, R., Manyakov, N. V, Bottelbergs, A., …
Drinkenburg, W. H. (2017). Emergence of early alterations in network oscillations and
functional connectivity in a tau seeding mouse model of Alzheimer’s disease pathology.
Scientific Reports, 7(1), 1–14. https://doi.org/10.1038/s41598-017-13839-6
Alekseichuk, I., Turi, Z., Amador de Lara, G., Antal, A., & Paulus, W. (2016). Spatial Working
Memory in Humans Depends on Theta and High Gamma Synchronization in the Prefrontal
Cortex. Current Biology, 26(12), 1513–1521. https://doi.org/10.1016/j.cub.2016.04.035
Alzheimer’s Association, 2019. (2019). Alzheimer’s Disease Facts and Figures. Alzheimers
Dement 2019; 15 (3):321-87, 87. Retrieved from
https://www.alz.org/media/Documents/alzheimers-facts-and-figures-2019-r.pdf
Amemiya, S., & Redish, A. D. (2018). Hippocampal Theta-Gamma Coupling Reflects State-
Dependent Information Processing in Decision Making. Cell Reports, 22(12), 3328–3338.
https://doi.org/10.1016/j.celrep.2018.02.091
Apostolova. (2013). Hippocampal atrophy and ventricular enlargement in normal aging, 26(1),
17–27. https://doi.org/10.1097/WAD.0b013e3182163b62.Hippocampal
Axmacher, N., Henseler, M. M., Jensen, O., Weinreich, I., Elger, C. E., & Fell, J. (2010). Cross-
frequency coupling supports multi-item working memory in the human hippocampus.
Proceedings of the National Academy of Sciences, 107(7), 3228–3233.
https://doi.org/10.1073/pnas.0911531107
Babiloni, C., Blinowska, K., Bonanni, L., Cichocki, A., De Haan, W., Del Percio, C., … Randall,
F. (2020). What electrophysiology tells us about Alzheimer’s disease: a window into the
synchronization and connectivity of brain neurons. Neurobiology of Aging, 85, 58–73.
https://doi.org/10.1016/j.neurobiolaging.2019.09.008

References
P a g e 96 | 128
Başar, E., Schmiedt-Fehr, C., Mathes, B., Femir, B., Emek-Savaş, D. D., Tülay, E., … Başar-
Eroğlu, C. (2016). What does the broken brain say to the neuroscientist? Oscillations and
connectivity in schizophrenia, Alzheimer’s disease, and bipolar disorder. International
Journal of Psychophysiology, 103, 135–148. https://doi.org/10.1016/j.ijpsycho.2015.02.004
Bazzigaluppi, P., Beckett, T. L., Koletar, M. M., Lai, A. Y., Joo, I. L., Brown, M. E., …
Stefanovic, B. (2018). Early‐stage attenuation of phase‐amplitude coupling in the
hippocampus and medial prefrontal cortex in a transgenic rat model of Alzheimer’s disease.
Journal of Neurochemistry, 144(5), 669–679.
Bekris, L. M., Yu, C. E., Bird, T. D., & Tsuang, D. W. (2010, December). Review article:
Genetics of Alzheimer disease. Journal of Geriatric Psychiatry and Neurology. SAGE
PublicationsSage CA: Los Angeles, CA. https://doi.org/10.1177/0891988710383571
Belluscio, M. A., Mizuseki, K., Schmidt, R., Kempter, R., & Buzsáki, G. (2012). Cross-
frequency phase-phase coupling between θ and γ oscillations in the hippocampus. The
Journal of Neuroscience : The Official Journal of the Society for Neuroscience, 32(2), 423–
435. https://doi.org/10.1523/JNEUROSCI.4122-11.2012
Benchenane, K., Tiesinga, P. H., & Battaglia, F. P. (2011). Oscillations in the prefrontal cortex:
A gateway to memory and attention. Current Opinion in Neurobiology. Elsevier Ltd.
https://doi.org/10.1016/j.conb.2011.01.004
Benjamini, Y., & Hochberg, Y. (1995). Controlling the False Discovery Rate: A Practical and
Powerful Approach to Multiple Testing. Journal of the Royal Statistical Society. Series B
(Methodological), 289–300.
Bierer, L. M., Hof, P. R., Purohit, D. P., Carlin, L., Schmeidler, J., Davis, K. L., & Perl, D. P.
(1995). Neocortical Neurofibrillary Tangles Correlate With Dementia Severity in
Alzheimer’s Disease. Archives of Neurology, 52(1), 81–88.
https://doi.org/10.1001/archneur.1995.00540250089017
Born, H. A., Kim, J.-Y., Savjani, R. R., Das, P., Dabaghian, Y. A., Guo, Q., … Jankowsky, J. L.
(2014). Genetic Suppression of Transgenic APP Rescues Hypersynchronous Network
Activity in a Mouse Model of Alzeimer’s Disease. Journal of Neuroscience, 34(11), 3826–

References
P a g e 97 | 128
3840. https://doi.org/10.1523/jneurosci.5171-13.2014
Braak, H., & Braak, E. (1991). Neuropathological stageing of Alzheimer-related changes. Acta
Neuropathologica, 82(4), 239–259. https://doi.org/10.1007/BF00308809
Brown, R., Lam, A. D., Gonzalez-Sulser, A., Ying, A., Jones, M., Chou, R. C., … Oren, I.
(2018). Circadian and Brain State Modulation of Network Hyperexcitability in Alzheimer’s
Disease. Eneuro, 5(2), ENEURO.0426-17.2018. https://doi.org/10.1523/ENEURO.0426-
17.2018
Busche, M. A., & Konnerth, A. (2015). Neuronal hyperactivity - A key defect in Alzeimer’s
disease? Bioessays Journal, 37, 624–632. https://doi.org/10.1002/bies.201500004
Buzsáki, G., & Draguhn, A. (2004). Neuronal oscillations in cortical networks. Science (New
York, N.Y.), 304(5679), 1926–1929. https://doi.org/10.1126/science.1099745
Canolty, R. T., Edwards, E., Dalal, S. S., Soltani, M., Nagarajan, S. S., Kirsch, H. E., … Knight,
R. T. (2006). High Gamma Power Is Phase-Locked to Theta Oscillations in Human
Neocortex. Science, 313(5793), 1626–1628. https://doi.org/10.1126/science.1128115
Citron, M. (2004). Strategies for disease modification in Alzheimer’s disease. Nature Reviews
Neuroscience, 5(9), 677–685. https://doi.org/10.1038/nrn1495
Coben, L. A., Danziger, W., & Storandt, M. (1985). A longitudinal EEG study of mild senile
dementia of Alzheimer type: changes at 1 year and at 2.5 years. Electroencephalography
and Clinical Neurophysiology, 61(2), 101–112. https://doi.org/10.1016/0013-
4694(85)91048-X
Cohen, M. X. (2014). A neural microcircuit for cognitive conflict detection and signaling. Trends
in Neurosciences, 37(9), 480–490. https://doi.org/10.1016/j.tins.2014.06.004
Cohen, R., Rezai-Zadeh, K., Weitz, T. M., Rentsendorj, A., Gate, D., Spivak, I., … Town, T.
(2013). A Transgenic Alzheimer Rat with Plaques, Tau Pathology, Behavioral Impairment,
Oligomeric A , and Frank Neuronal Loss. Journal of Neuroscience, 33(15), 6245–6256.
https://doi.org/10.1523/JNEUROSCI.3672-12.2013
Colgin, L. L., Denninger, T., Fyhn, M., Hafting, T., Bonnevie, T., Jensen, O., … Moser, E. I.

References
P a g e 98 | 128
(2009). Frequency of gamma oscillations routes flow of information in the hippocampus.
Nature, 462, 353. Retrieved from https://doi.org/10.1038/nature08573
Cornelissen, F., Cik, M., & Gustin, E. (2012). Phaedra, a Protocol-Driven System for Analysis
and Validation of High-Content Imaging and Flow Cytometry. Journal of Biomolecular
Screening, 17(4), 496–506. https://doi.org/10.1177/1087057111432885
De Strooper, B., & Karran, E. (2016). The Cellular Phase of Alzheimer’s Disease. Cell, 164(4),
603–615. https://doi.org/10.1016/j.cell.2015.12.056
DeKosky, S. T., & Scheff, S. W. (1990). Synapse loss in frontal cortex biopsies in Alzheimer’s
disease: Correlation with cognitive severity. Annals of Neurology, 27(5), 457–464.
https://doi.org/10.1002/ana.410270502
Dimitriadis, S. I., Laskaris, N. A., Bitzidou, M. P., Tarnanas, I., & Tsolaki, M. N. (2015). A
novel biomarker of amnestic MCI based on dynamic cross-frequency coupling patterns
during cognitive brain responses. Frontiers in Neuroscience, 9(OCT), 1–17.
https://doi.org/10.3389/fnins.2015.00350
Do Carmo, S., & Cuello, A. (2013). Modeling Alzheimer’s disease in transgenic rats. Molecular
Neurodegeneration, 8(1), 37. https://doi.org/10.1186/1750-1326-8-37
Drummond, E., & Wisniewski, T. (2017). Alzheimer’s disease: experimental models and reality.
Acta Neuropathologica. https://doi.org/10.1007/s00401-016-1662-x
Dubois, B., Hampel, H., Feldman, H. H., Scheltens, P., Aisen, P., Andrieu, S., … Jack, C. R.
(2016). Preclinical Alzheimer’s disease: Definition, natural history, and diagnostic criteria.
Alzheimer’s & Dementia, 12(3), 292–323. https://doi.org/10.1016/j.jalz.2016.02.002
Ellenbroek, B., & Youn, J. (2016). Rodent models in neuroscience research: is it a rat race?
Disease Models & Mechanisms, 9(10), 1079–1087. https://doi.org/10.1242/dmm.026120
Engels, M. M. A., Stam, C. J., Van der Flier, W. M., Scheltens, P., De Waal, H., & Van Straaten,
E. C. (2015). Declining functional connectivity and changing hub locations in Alzheimer’s
disease: an EEG study. BMC Neurology, 15(1), 145. https://doi.org/10.1186/s12883-015-
0400-7

References
P a g e 99 | 128
Engels, M. M. A., van der Flier, W. M., Stam, C. J., Hillebrand, A., Scheltens, P., & van
Straaten, E. C. W. (2017). Alzheimer’s disease: The state of the art in resting-state
magnetoencephalography. Clinical Neurophysiology, 128(8), 1426–1437.
https://doi.org/10.1016/j.clinph.2017.05.012
Fischer, C. E., Qian, W., Schweizer, T. A., Ismail, Z., Smith, E. E., Millikin, C. P., & Munoz, D.
G. (2017). Determining the impact of psychosis on rates of false-positive and false-negative
diagnosis in Alzheimer’s disease. In Alzheimer’s and Dementia: Translational Research
and Clinical Interventions (Vol. 3, pp. 385–392). Elsevier Inc.
https://doi.org/10.1016/j.trci.2017.06.001
Franklin, K. B., & Paxinos, G. (1997). The mouse brain in stereotaxic coordinates. Waltham:
Academic press.
Friedman, D., Honig, L. S., & Scarmeas, N. (2013). Seizures and Epilepsy in Alzheimer’s
Disease. CNS Neurosci Ther., 18(4), 285–294. https://doi.org/10.1111/j.1755-
5949.2011.00251.x.Seizures
Fries, P. (2015). Rhythms for Cognition: Communication through Coherence. Neuron, 88(1),
220–235. https://doi.org/10.1016/j.neuron.2015.09.034
Galeano, P., Martino Adami, P. V., Do Carmo, S., Blanco, E., Rotondaro, C., Capani, F., …
Morelli, L. (2014). Longitudinal analysis of the behavioral phenotype in a novel transgenic
rat model of early stages of Alzheimer’s disease. Frontiers in Behavioral Neuroscience,
8(September), 1–15. https://doi.org/10.3389/fnbeh.2014.00321
Games, D., Adams, D., Alessandrini, R., Barbour, R., Borthelette, P., Blackwell, C., … Zhao, J.
(1995). Alzheimer-type neuropathology in transgenic mice overexpressing V717F β-
amyloid precursor protein. Nature, 373(6514), 523–527. https://doi.org/10.1038/373523a0
Glenner, G. G., & Wong, C. W. (1984). Alzheimer’s disease: Initial report of the purification and
characterization of a novel cerebrovascular amyloid protein. Biochemical and Biophysical
Research Communications, 120(3), 885–890. https://doi.org/10.1016/S0006-
291X(84)80190-4
Glickman, M. E., Rao, S. R., & Schultz, M. R. (2014). False discovery rate control is a

References
P a g e 100 | 128
recommended alternative to Bonferroni-type adjustments in health studies. Journal of
Clinical Epidemiology. Elsevier Inc. https://doi.org/10.1016/j.jclinepi.2014.03.012
Goate, A., Chartier-Harlin, M.-C., Mullan, M., Brown, J., Crawford, F., Fidani, L., … Hardy, J.
(1991). Segregation of a missense mutation in the amyloid precursor protein gene with
familial Alzheimer’s disease. Nature, 349(6311), 704–706.
https://doi.org/10.1038/349704a0
Goutagny, R., Gu, N., Cavanagh, C., Jackson, J., & Chabot, J. (2013). Alterations in
hippocampal network oscillations and theta – gamma coupling arise before A b
overproduction in a mouse model of Alzheimer ’ s disease, 37(March), 1896–1902.
https://doi.org/10.1111/ejn.12233
Grant, S. M., Ducatenzeiler, A., Szyf, M., & Cuello, A. C. (2000). Aß Immunoreactive Material
Is Present in Several Intracellular Compartments in Transfected, Neuronally Differentiated,
P19 Cells Expressing the Human Amyloid ß-Protein Precursor. Journal of Alzheimer’s
Disease, 2(3–4), 207–222. https://doi.org/10.3233/JAD-2000-23-403
Grundke-Iqbal, I., Iqbal, K., Tung, Y. C., Quinlan, M., Wisniewski, H. M., & Binder, L. I.
(1986). Abnormal phosphorylation of the microtubule-associated protein tau (tau) in
Alzheimer cytoskeletal pathology. Proceedings of the National Academy of Sciences,
83(13), 4913–4917. https://doi.org/10.1073/pnas.83.13.4913
Hall, A. M., & Roberson, E. D. (2012). Mouse models of Alzheimer’s disease. Brain Research
Bulletin, 88(1), 3–12. https://doi.org/10.1016/j.brainresbull.2011.11.017
Hardy, J., & Higgins, G. (1992). Alzheimer’s disease: the amyloid cascade hypothesis. Science,
256(5054), 184–185. https://doi.org/10.1126/science.1566067
Hasselmo, M. E., & Stern, C. E. (2014). Theta rhythm and the encoding and retrieval of space
and time. NeuroImage, 85, 656–666. https://doi.org/10.1016/j.neuroimage.2013.06.022
Herrmann, C. S., Strüber, D., Helfrich, R. F., & Engel, A. K. (2016). EEG oscillations: From
correlation to causality. International Journal of Psychophysiology, 103, 12–21.
https://doi.org/10.1016/j.ijpsycho.2015.02.003
Höfling, C., Morawski, M., Zeitschel, U., Zanier, E. R., Moschke, K., Serdaroglu, A., … Kuhn,

References
P a g e 101 | 128
P.-H. (2016). Differential transgene expression patterns in Alzheimer mouse models
revealed by novel human amyloid precursor protein-specific antibodies. Aging Cell, 15(5),
953–963. https://doi.org/10.1111/acel.12508
Holcomb, L., Gordon, M. N., McGowan, E., Yu, X., Benkovic, S., Jantzen, P., … Duff, K.
(1998). Accelerated Alzheimer-type phenotype in transgenic mice carrying both mutant
amyloid precursor protein and presenilin 1 transgenes. Nature Medicine, 4(1), 97–100.
https://doi.org/10.1038/nm0198-097
Horner, A. E., Heath, C. J., Hvoslef-Eide, M., Kent, B. A., Kim, C. H., Nilsson, S. R. O., …
Bussey, T. J. (2013). The touchscreen operant platform for testing learning and memory in
rats and mice. Nature Protocols, 8(10), 1961–1984. https://doi.org/10.1038/nprot.2013.122
Hsiao, K., Chapman, P., Nilsen, S., Eckman, C., Harigaya, Y., Younkin, S., … Cole, G. (1996).
Correlative Memory Deficits, A Elevation, and Amyloid Plaques in Transgenic Mice.
Science, 274(5284), 99–103. https://doi.org/10.1126/science.274.5284.99
Ittner, L. M., & Götz, J. (2011). Amyloid-β and tau — a toxic pas de deux in Alzheimer’s
disease. Nature Reviews Neuroscience, 12(2), 67–72. https://doi.org/10.1038/nrn2967
Iulita, M. F., Allard, S., Richter, L., Munter, L.-M., Ducatenzeiler, A., Weise, C., … Cuello, A.
C. (2014). Intracellular Aβ pathology and early cognitive impairments in a transgenic rat
overexpressing human amyloid precursor protein: a multidimensional study. Acta
Neuropathologica Communications, 2(1), 61. https://doi.org/10.1186/2051-5960-2-61
Iulita, M. F., Bistué Millón, M. B., Pentz, R., Aguilar, L. F., Do Carmo, S., Allard, S., … Cuello,
A. C. (2017). Differential deregulation of NGF and BDNF neurotrophins in a transgenic rat
model of Alzheimer’s disease. Neurobiology of Disease, 108(February), 307–323.
https://doi.org/10.1016/j.nbd.2017.08.019
Jack, C. R., Hampel, H. J., Universities, S., Cu, M., & Petersen, R. C. (2016). A new
classification system for AD , independent of cognition A / T / N : An unbiased descriptive
classification scheme for Alzheimer disease biomarkers. Neurology, 0(July), 1–10.
Jack, C. R., Knopman, D. S., Jagust, W. J., Shaw, L. M., Aisen, P. S., Weiner, M. W., …
Trojanowski, J. Q. (2010). Hypothetical model of dynamic biomarkers of the Alzheimer’s

References
P a g e 102 | 128
pathological cascade. The Lancet Neurology, 9(1), 119–128. https://doi.org/10.1016/S1474-
4422(09)70299-6
Jankowsky, J. L., & Zheng, H. (2017). Practical considerations for choosing a mouse model of
Alzheimer’s disease. Molecular Neurodegeneration, 1–22. https://doi.org/10.1186/s13024-
017-0231-7
Jobert, M., Wilson, F. J., Ruigt, G. S. F., Brunovsky, M., Prichep, L. S., & Drinkenburg, W. H. I.
M. (2012). Guidelines for the Recording and Evaluation of Pharmaco-EEG Data in Man:
The International Pharmaco-EEG Society (IPEG). Neuropsychobiology, 66(4), 201–220.
https://doi.org/10.1159/000343478
Kalimo, H., Lalowski, M., Bogdanovic, N., Philipson, O., Bird, T. D., Nochlin, D., … Ingelsson,
M. (2013). The Arctic AβPP mutation leads to Alzheimer’s disease pathology with highly
variable topographic deposition of differentially truncated Aβ. Acta Neuropathologica
Communications, 1(1), 60. https://doi.org/10.1186/2051-5960-1-60
Karch, C. M., & Goate, A. M. (2015). Alzheimer’s Disease Risk Genes and Mechanisms of
Disease Pathogenesis. Biological Psychiatry, 77(1), 43–51.
https://doi.org/10.1016/j.biopsych.2014.05.006
Karran, E., & De Strooper, B. (2016). The amyloid cascade hypothesis: are we poised for
success or failure? Journal of Neurochemistry, 139, 237–252.
https://doi.org/10.1111/jnc.13632
Karran, E., Mercken, M., & De Strooper, B. (2011). The amyloid cascade hypothesis for
Alzheimer’s disease: an appraisal for the development of therapeutics. Nature Reviews
Drug Discovery, 10(9), 698–712. https://doi.org/10.1038/nrd3505
Keren, G. (2014). Between-or within-subjects design: A methodological dilemma. A Handbook
for Data Analysis in the Behaviorial Sciences.
Kiyota, T. (2014). Animal Models of Alzheimer’s Disease. In H. Xiong & H. E. Gendelman
(Eds.) (pp. 527–540). New York, NY: Springer New York. https://doi.org/10.1007/978-1-
4614-8794-4_35
LaFerla, F. M., & Green, K. N. (2012). Animal models of Alzheimer disease. Cold Spring Harb

References
P a g e 103 | 128
Perspect Med, 2(11), 1–13. https://doi.org/10.1101/cshperspect.a006320
Latif-Hernandez, A., Shah, D., Craessaerts, K., Saido, T., Saito, T., De Strooper, B., …
D’Hooge, R. (2019). Subtle behavioral changes and increased prefrontal-hippocampal
network synchronicity in APP NL−G−F mice before prominent plaque deposition.
Behavioural Brain Research, 364(November 2017), 431–441.
https://doi.org/10.1016/j.bbr.2017.11.017
Lega, B., Burke, J., Jacobs, J., & Kahana, M. J. (2016). Slow-Theta-to-Gamma Phase-Amplitude
Coupling in Human Hippocampus Supports the Formation of New Episodic Memories.
Cerebral Cortex, 26(1), 268–278. https://doi.org/10.1093/cercor/bhu232
Leon, W. C., Canneva, F., Partridge, V., Allard, S., Ferretti, M. T., Dewilde, A., … Cuello, A. C.
(2010). A novel transgenic rat model with a full alzheimer’s - Like amyloid pathology
displays pre - Plaque intracellular amyloid -beta- Associated cognitive impairment. Journal
of Alzheimer’s Disease, 20(1), 113–126. https://doi.org/10.3233/JAD-2010-1349
Lindwall, G., & Cole, R. D. (1984). Phosphorylation affects the ability of tau protein to promote
microtubule assembly. Journal of Biological Chemistry, 259(8), 5301–5305.
Lisman, J. E., & Jensen, O. (2013). The Theta-Gamma Neural Code. Neuron. Elsevier Inc.
https://doi.org/10.1016/j.neuron.2013.03.007
Livingston, G., Sommerlad, A., Orgeta, V., Costafreda, S. G., Huntley, J., Ames, D., …
Mukadam, N. (2017). Dementia prevention, intervention, and care. Lancet (London,
England), 390(10113), 2673–2734. https://doi.org/10.1016/S0140-6736(17)31363-6
Lott, I. T. (2012). Neurological phenotypes for Down syndrome across the life span (pp. 101–
121). https://doi.org/10.1016/B978-0-444-54299-1.00006-6
Mandelkow, E., Stamer, K., Vogel, E., & Thies, E. (2003). Clogging of axons by tau, inhibition
of axonal traffic and starvation of synapses. Neurobiology of Aging, 24(8), 1079–1085.
https://doi.org/10.1016/j.neurobiolaging.2003.04.007
Masuda, A., Kobayashi, Y., Kogo, N., Saito, T., Saido, T. C., & Itohara, S. (2016). Cognitive
deficits in single App knock-in mouse models. Neurobiology of Learning and Memory, 135,
73–82. https://doi.org/10.1016/j.nlm.2016.07.001

References
P a g e 104 | 128
Maya, N., & Bassem, H. A. (2014). Amyloid precursor protein and neural development.
Development, 141(13), 2543–2548. https://doi.org/10.1242/dev.108712
Mehla, J., Lacoursiere, S. G., Lapointe, V., Mcnaughton, B. L., Sutherland, R. J., Mcdonald, R.
J., & Mohajerani, M. H. (2019). Age-dependent behavioral and biochemical
characterization of single APP knock-in mouse ( APP NL-G-F / NL-G-F ) model of
Alzheimer ’ s disease. Neurobiology of Aging, 75, 25–37.
https://doi.org/10.1016/j.neurobiolaging.2018.10.026
Mockett, B. G., Richter, M., Abraham, W. C., & Müller, U. C. (2017). Therapeutic Potential of
Secreted Amyloid Precursor Protein APPsα. Frontiers in Molecular Neuroscience, 10.
https://doi.org/10.3389/fnmol.2017.00030
Mucke, L., Masliah, E., Yu, G.-Q., Mallory, M., Rockenstein, E. M., Tatsuno, G., …
McConlogue, L. (2000). High-Level Neuronal Expression of Aβ 1–42 in Wild-Type Human
Amyloid Protein Precursor Transgenic Mice: Synaptotoxicity without Plaque Formation.
The Journal of Neuroscience, 20(11), 4050–4058. https://doi.org/10.1523/JNEUROSCI.20-
11-04050.2000
Murrell, J., Farlow, M., Ghetti, B., & Benson, M. (1991). A mutation in the amyloid precursor
protein associated with hereditary Alzheimer’s disease. Science, 254(5028), 97–99.
https://doi.org/10.1126/science.1925564
Nilsson, P., Saito, T., & Saido, T. C. (2014). New Mouse Model of Alzheimer’s. ACS Chemical
Neuroscience, 5(7), 499–502. https://doi.org/10.1021/cn500105p
Nimmrich, V., Draguhn, A., & Axmacher, N. (2015). Neuronal Network Oscillations in
Neurodegenerative Diseases. NeuroMolecular Medicine, 17(3), 270–284.
https://doi.org/10.1007/s12017-015-8355-9
Oakley, H., Cole, S. L., Logan, S., Maus, E., Shao, P., Craft, J., … Vassar, R. (2006).
Intraneuronal beta-Amyloid Aggregates, Neurodegeneration, and Neuron Loss in
Transgenic Mice with Five Familial Alzheimer’s Disease Mutations: Potential Factors in
Amyloid Plaque Formation. Journal of Neuroscience, 26(40), 10129–10140.
https://doi.org/10.1523/JNEUROSCI.1202-06.2006

References
P a g e 105 | 128
Oomen, C. A., Hvoslef-Eide, M., Heath, C. J., Mar, A. C., Horner, A. E., Bussey, T. J., &
Saksida, L. M. (2013). The touchscreen operant platform for testing working memory and
pattern separation in rats and mice. Nature Protocols, 8(10), 2006–2021.
https://doi.org/10.1038/nprot.2013.124
Palop, J. J., Chin, J., Roberson, E. D., Wang, J., Thwin, M. T., Bien-Ly, N., … Mucke, L.
(2007). Aberrant Excitatory Neuronal Activity and Compensatory Remodeling of Inhibitory
Hippocampal Circuits in Mouse Models of Alzheimer’s Disease. Neuron, 55(5), 697–711.
https://doi.org/10.1016/j.neuron.2007.07.025
Palop, J. J., & Mucke, L. (2009). Epilepsy and Cognitive Impairments in Alzheimer Disease.
Arch Neurol., 66(4). https://doi.org/10.1001/archeneurol.2009.15.
Palop, J. J., & Mucke, L. (2010). Amyloid-Β-induced neuronal dysfunction in Alzheimer’s
disease: From synapses toward neural networks. Nature Neuroscience, 13(7), 812–818.
https://doi.org/10.1038/nn.2583
Palop, J. J., & Mucke, L. (2016). Network abnormalities and interneuron dysfunction in
Alzheimer disease. Nature Reviews Neuroscience, 17(12), 777–792.
https://doi.org/10.1038/nrn.2016.141
Parent, M. J., Zimmer, E. R., Shin, M., Kang, M. S., Fonov, V. S., Mathieu, A., … Rosa-Neto, P.
(2017). Multimodal imaging in rat model recapitulates Alzheimer’s Disease biomarkers
abnormalities. The Journal of Neuroscience : The Official Journal of the Society for
Neuroscience. https://doi.org/10.1523/JNEUROSCI.1346-17.2017
Parihar, M. S., & Brewer, G. J. (2010). Amyloid-β as a Modulator of Synaptic Plasticity. Journal
of Alzheimer’s Disease, 22(3), 741–763. https://doi.org/10.3233/JAD-2010-101020
Paxinos, G., & Watson, C. (1998). The Rat Brain in Stereotaxic Coordinates (4th editio).
Pontecorvo, M. J., Devous, M. D., Navitsky, M., Lu, M., Salloway, S., Schaerf, F. W., …
Mintun, M. A. (2017). Relationships between flortaucipir PET tau binding and amyloid
burden, clinical diagnosis, age and cognition. Brain, aww334.
https://doi.org/10.1093/brain/aww334
Poza, J., Bachiller, A., Gómez, C., García, M., Nunez, P., Gomez-Pilar, J., … Roberto, H.

References
P a g e 106 | 128
(2017). Phase-Amplitude Coupling Analysis of Spontaneous EEG Activity in Alzheimer’s
Disease. IEEE, 2259–2262. https://doi.org/10.1109/EMBC.2017.8037305
Qi, Y., Klyubin, I., Harney, S. C., Hu, N., Cullen, W. K., Grant, M. K., … Rowan, M. J. (2014).
Longitudinal testing of hippocampal plasticity reveals the onset and maintenance of
endogenous human Aß-induced synaptic dysfunction in individual freely behaving pre-
plaque transgenic rats: rapid reversal by anti-Aß agents. Acta Neuropathologica
Communications, 2(1), 175. https://doi.org/10.1186/s40478-014-0175-x
Querfurth, H. M., & LaFerla, F. M. (2011). Mechanisms of Disease Alzheimer’s. The New Engl
and Journal of Medicine, 56(3), 687–696. https://doi.org/10.1056/NEJMra0909142
Rice, H. C., De Malmazet, D., Schreurs, A., Frere, S., Van Molle, I., Volkov, A. N., … De Wit,
J. (2019). Secreted amyloid-b precursor protein functions as a GABA B R1a ligand to
modulate synaptic transmission. Science, 363(6423).
https://doi.org/10.1126/science.aao4827
Saito, T., Matsuba, Y., Mihira, N., Takano, J., Nilsson, P., Itohara, S., … Saido, T. C. (2014a).
Single App knock-in mouse models of Alzheimer’s disease. Nature Neuroscience, 17(5),
661–663. https://doi.org/10.1038/nn.3697
Saito, T., Matsuba, Y., Mihira, N., Takano, J., Nilsson, P., Itohara, S., … Saido, T. C. (2014b).
Single App knock-in mouse models of Alzheimer’s disease. Nature Neuroscience, 17(5),
661–663. https://doi.org/10.1038/nn.3697
Saito, T., Matsuba, Y., Yamazaki, N., Hashimoto, S., & Saido, T. C. (2016). Calpain Activation
in Alzheimer’s Model Mice Is an Artifact of APP and Presenilin Overexpression. Journal of
Neuroscience, 36(38), 9933–9936. https://doi.org/10.1523/jneurosci.1907-16.2016
Saito, T., Mihira, N., Matsuba, Y., Sasaguri, H., Hashimoto, S., Narasimhan, S., … Saido, T. C.
(2019). Humanization of the entire murine Mapt gene provides a murine model of
pathological human tau propagation . Journal of Biological Chemistry, 294(34), 12754–
12765. https://doi.org/10.1074/jbc.ra119.009487
Sakakibara, Y., Sekiya, M., Saito, T., Saido, T. C., & Iijima, K. M. (2018). Cognitive and
emotional alterations in App knock-in mouse models of Aβ amyloidosis. BMC

References
P a g e 107 | 128
Neuroscience, 19(1), 1–17. https://doi.org/10.1186/s12868-018-0446-8
Sasaguri, H., Nilsson, P., Hashimoto, S., Nagata, K., Saito, T., De Strooper, B., … Saido, T. C.
(2017). APP mouse models for Alzheimer’s disease preclinical studies. The EMBO Journal,
36(17), e201797397. https://doi.org/10.15252/embj.201797397
Scheff, S. W., Price, D. A., Schmitt, F. A., & Mufson, E. J. (2006). Hippocampal synaptic loss in
early Alzheimer’s disease and mild cognitive impairment. Neurobiology of Aging, 27(10),
1372–1384. https://doi.org/10.1016/j.neurobiolaging.2005.09.012
Scheltens, P., Blennow, K., Breteler, M. M. B., De Strooper, B., Frisoni, G. B., Salloway, S., &
Van der Flier, W. M. (2016). Alzheimer’s disease. The Lancet, 388(10043), 505–517.
https://doi.org/10.1016/S0140-6736(15)01124-1
Selkoe, D. J. (2002). Alzheimer’s Disease Is a Synaptic Failure. Science, 298(5594), 789–791.
https://doi.org/10.1126/science.1074069
Serrano-Pozo, A., Frosch, M. P., Masliah, E., & Hyman, B. T. (2011). Neuropathological
alterations in Alzheimer disease. Cold Spring Harbor Perspectives in Medicine, 1(1), 1–23.
https://doi.org/10.1101/cshperspect.a006189
Shafiei, S. S., Guerrero-Muñoz, M. J., & Castillo-Carranza, D. L. (2017). Tau Oligomers:
Cytotoxicity, Propagation, and Mitochondrial Damage. Frontiers in Aging Neuroscience, 9.
https://doi.org/10.3389/fnagi.2017.00083
Sperling, R. A., Aisen, P. S., Beckett, L. A., Bennett, D. A., Craft, S., Fagan, A. M., … Phelps,
C. H. (2011). Toward defining the preclinical stages of Alzheimer’s disease:
Recommendations from the National Institute on Aging-Alzheimer’s Association
workgroups on diagnostic guidelines for Alzheimer’s disease. Alzheimer’s and Dementia,
7(3), 280–292. https://doi.org/10.1016/j.jalz.2011.03.003
Spillantini, M. G., & Goedert, M. (2013). Tau pathology and neurodegeneration. The Lancet
Neurology, 12(6), 609–622. https://doi.org/10.1016/S1474-4422(13)70090-5
Spinney, L. (2014). Alzheimer’s disease: The forgetting gene. Nature, 510(7503), 26–28.
https://doi.org/10.1038/510026a
References
P a g e 108 | 128
Stelzmann, R. A., Norman Schnitzlein, H., & Reed Murtagh, F. (1995). An english translation of
alzheimer’s 1907 paper, “über eine eigenartige erkankung der hirnrinde.” Clinical Anatomy,
8(6), 429–431. https://doi.org/10.1002/ca.980080612
Sturchler-Pierrat, C., Abramowski, D., Duke, M., Wiederhold, K.-H., Mistl, C., Rothacher, S., …
Sommer, B. (1997). Two amyloid precursor protein transgenic mouse models with
Alzheimer disease-like pathology. Proceedings of the National Academy of Sciences,
94(24), 13287–13292. https://doi.org/10.1073/pnas.94.24.13287
Talpos, J. C., McTighe, S. M., Dias, R., Saksida, L. M., & Bussey, T. J. (2010). Trial-unique,
delayed nonmatching-to-location (TUNL): A novel, highly hippocampus-dependent
automated touchscreen test of location memory and pattern separation. Neurobiology of
Learning and Memory, 94(3), 341–352. https://doi.org/10.1016/j.nlm.2010.07.006
Tamura, M., Spellman, T. J., Rosen, A. M., Gogos, J. A., & Gordon, J. A. (2017). Hippocampal-
prefrontal theta-gamma coupling during performance of a spatial working memory task.
Nature Communications, 8(1), 2182. https://doi.org/10.1038/s41467-017-02108-9
TCW, J., & Goate, A. M. (2017). Genetics of β-Amyloid Precursor Protein in Alzheimer’s
Disease. Cold Spring Harbor Perspectives in Medicine, 7(6), a024539.
https://doi.org/10.1101/cshperspect.a024539
Terry, R. D., Masliah, E., Salmon, D. P., Butters, N., DeTeresa, R., Hill, R., … Katzman, R.
(1991). Physical basis of cognitive alterations in alzheimer’s disease: Synapse loss is the
major correlate of cognitive impairment. Annals of Neurology, 30(4), 572–580.
https://doi.org/10.1002/ana.410300410
Terwel, D., Muyllaert, D., Dewachter, I., Borghgraef, P., Croes, S., Devijver, H., & Van Leuven,
F. (2008). Amyloid Activates GSK-3β to Aggravate Neuronal Tauopathy in Bigenic Mice.
The American Journal of Pathology, 172(3), 786–798.
https://doi.org/10.2353/ajpath.2008.070904
Thorn, C. A., Atallah, H., Howe, M., & Graybiel, A. M. (2010). Differential dynamics of activity
changes in dorsolateral and dorsomedial striatal loops during learning. Neuron, 66(5), 781–
795. https://doi.org/10.1016/j.neuron.2010.04.036

References
P a g e 109 | 128
Tort, A. B. L., Komorowski, R. W., Manns, J. R., Kopell, N. J., & Eichenbaum, H. (2009).
Theta-gamma coupling increases during the learning of item-context associations.
Proceedings of the National Academy of Sciences, 106(49), 20942–20947.
https://doi.org/10.1073/pnas.0911331106
Tort, A. B. L., Kramer, M. A., Thorn, C., Gibson, D. J., Kubota, Y., Graybiel, A. M., & Kopell,
N. J. (2008). Dynamic cross-frequency couplings of local field potential oscillations in rat
striatum and hippocampus during performance of a T-maze task. Proceedings of the
National Academy of Sciences, 105(51), 20517–20522.
https://doi.org/10.1073/pnas.0810524105
Visser, P. J., Vos, S., van Rossum, I., & Scheltens, P. (2012). Comparison of International
Working Group criteria and National Institute on Aging–Alzheimer’s Association criteria
for Alzheimer’s disease. Alzheimer’s & Dementia, 8(6), 560–563.
https://doi.org/10.1016/j.jalz.2011.10.008
Voevodskaya, O., Pereira, J. B., Volpe, G., Lindberg, O., Stomrud, E., van Westen, D., …
Hansson, O. (2018). Altered structural network organization in cognitively normal
individuals with amyloid pathology. Neurobiology of Aging, 64, 15–24.
https://doi.org/10.1016/j.neurobiolaging.2017.11.014
Walsh, C., Drinkenburg, W. H. I. M., & Ahnaou, A. (2017). Neurophysiological assessment of
neural network plasticity and connectivity: Progress towards early functional biomarkers for
disease interception therapies in Alzheimer’s disease. Neuroscience and Biobehavioral
Reviews, 73, 340–358. https://doi.org/10.1016/j.neubiorev.2016.12.020
Weissgerber, T. L., Milic, N. M., Winham, S. J., & Garovic, V. D. (2015). Beyond bar and line
graphs: time for a new data presentation paradigm. PLoS Biology, 13(4), e1002128.
https://doi.org/10.1371/journal.pbio.1002128
Whyte, L. S., Hemsley, K. M., Lau, A. A., Hassiotis, S., Saito, T., Saido, T. C., … Sargeant, T. J.
(2018). Reduction in open field activity in the absence of memory deficits in the
AppNL−G−F knock-in mouse model of Alzheimer’s disease. Behavioural Brain Research,
336(August 2017), 177–181. https://doi.org/10.1016/j.bbr.2017.09.006

References
P a g e 110 | 128
Wilson, E. N., Abela, A. R., Do Carmo, S., Allard, S., Marks, A. R., Welikovitch, L. A., …
Cuello, A. C. (2016). Intraneuronal Amyloid Beta Accumulation Disrupts Hippocampal
CRTC1-Dependent Gene Expression and Cognitive Function in a Rat Model of Alzheimer
Disease. Cerebral Cortex, bhv332. https://doi.org/10.1093/cercor/bhv332
Wippold, F. J., Cairns, N., Vo, K., Holtzman, D. M., & Morris, J. C. (2008). Neuropathology for
the neuroradiologist: Plaques and tangles. American Journal of Neuroradiology, 29(1), 18–
22. https://doi.org/10.3174/ajnr.A0781
Yoshiyama, Y., Lee, V. M.-Y., & Trojanowski, J. Q. (2001). Frontotemporal dementia and
tauopathy. Current Neurology and Neuroscience Reports, 1(5), 413–421.
https://doi.org/10.1007/s11910-001-0100-0

Scientific Contributions
P a g e 111 | 128
Scientific Contributions
Scientific Acknowledgements and Personal Contribution
• The candidate, Sofia Jacob, designed, organized and performed all in vivo experiments.
• The Matlab toolbox for the electrophysiological analysis was created by Nikolay Manyakov.
• Immunohistochemical staining of the McGill-R-Thy1-APP rats were carried out by Kristel Buyens
and Astrid Bottelbergs.
• McSA1 antibody specificity experiment was carried out by Marianne Borgers.
• Genotyping of McGill-R-Thy1-APP rats using ddPCR was designed and performed by Louis De
Muynck.
• Brain Aβ1-42 ELISA and immunohistochemical experiments for the AppNL-G-F mice were designed
and performed by Marijke De Bock, Bart Hermans, Cindy Wintmolders, Astrid Bottelbergs,
Marianne Borgers, Clara Theunis, and Bianca Van Broeck.
Conflict of Interest
No competing interests to declare.

P a g e 112 | 128

Curriculum Vitae
P a g e 113 | 128
Curriculum Vitae
Sofia Jacob
Current Position:
Present – September 2019 – Modis, Belgium
Project Manager Life Sciences
Education:
Present – 2015 – PhD Student, Janssen Pharmaceutica, KU Leuven, Belgium
PhD Thesis submitted: “Neurophysiological Assessment of Brain Network Activity
Involved in Cognitive Processing in Animal Models of Alzheimer’s Disease”.
Promoters: Prof. Dr. Detlef Balschun and Prof. Dr. Wilhelmus H.I.M. (Pim) Drinkenburg
2015 – 2013 – Master in Neuroscience. Erasmus Mundus, Université de Bordeaux, France
Double diploma from Université de Bordeaux and Charité Universitätsmedizin, Berlin,
with a semester abroad at Vrije Universiteit, Amsterdam.
Master thesis in industry at Janssen Pharmaceutica, Belgium
Final grade: A = magna cum laude
2013 – 2009 – Bachelor of Science, Honors in Psychology, Behavioral Neuroscience. Concordia
University, Montreal, Canada
Degree conferred with distinction (final grade: A = magna cum laude)
Publications:
• Jacob, S., Davies, G., De Bock, M. Hermans, B., Wintmolders, C., Bottelbergs, A.,
Borgers, M., Theunis, C., Van Broeck, B., Manyakov N. V., Balschun, B., & Drinkenburg
W.H.I.M. (2019). Neural oscillations during cognitive processes in an App knock-in mouse
Curriculum Vitae
P a g e 114 | 128
model of Alzheimer’s disease pathology. Sci Rep 9, 16363 doi:10.1038/s41598-019-
51928-w
• Gervais, N. J., Jacob, S., Brake, W.G., & Mumby, D. G., (2014). Modulatory effect of 17-
β estradiol on performance of ovariectomized rats on the Shock-Probe test. Physiology and
Behaviour. doi: 10.1016/j.physbeh.2014.04.030
• Gervais, N. J., Jacob, S., Brake, W.G., & Mumby, D. G., (2013). Systemic and intra-rhinal-
cortical 17-β estradiol administration modulate object-recognition memory in
ovariectomized female rats. Hormones and Behaviour, 64, 4 doi:
10.1016/j.yhbeh.2013.08.010
Talks:
• Jacob, S., Ahnaou A., Drinkenburg, WH., (2017, September). Neurophysiological
Assessment of Network Plasticity and Connectivity in a Tau Preclinical Mouse Model of
Alzheimer’s disease. International Conference on Basic and Clinical Multimodal Imaging.
Bern, Switzerland
• Jacob, S., (2016, October) Advanced EEG imaging of neuronal network interactions
during spatial working memory performance in rats: Paving the road for pharmacological
assessments. 19th International Pharmaco-EEG society meeting, Nijmegen, The
Netherlands.
Relevant Posters:
• Jacob, S., Davies. G., Manyakov. N., Drinkenburg, WH., (2018, October).
Characterization of neural oscillations during cognitive processes in an APP knock-in
mouse model of Alzheimer’s disease pathology. Poster submitted to the 1st annual meeting
of the Janssen Benelux Postdoc/ PhD student community, Beerse, Belgium.
• Tahon, K., Jackson, DA., Jacob, S., Drinkenburg, WH., (2016, November). Hippocampal
sharp-wave ripple characteristics during delay periods in the rodent automated search task.

Curriculum Vitae
P a g e 115 | 128
Poster submitted to the 46th annual meeting of the Society for Neuroscience, San Diego,
California, United States.
• Tahon, K., Jackson, DA., Jacob, S., Drinkenburg, WH., (2016, October).
Neurophysiological substrates of memory process. 19th International Pharmaco-EEG
society meeting, Nijmegen, The Netherlands.
• Jacob, S., Tahon, K., Steckler, T., Drinkenburg, P., (2016, March). Glutamatergic
manipulation in spatial search processes: advanced cognitive neurophysiological analysis
in rats. Poster submitted to the ECNP workshop for junior scientists in Europe, Nice,
France.
• Jacob, S., Tahon, K., Drinkenburg, P., (2015, July). Effects of MK-801 and Memantine on
learning and memory in rats: Advanced electroencephalography and behavioral analysis
suing an automated spatial search task. Poster submitted to the Neurasmus annual meeting,
Amsterdam, The Netherlands.
Relevant Conferences and Courses:
• 1st Annual Meeting of the Janssen Benelux Post-Doc/ PhD Student Community, Beerse,
Belgium (2018, October).
• Advanced course on Circuit Dynamic and Cognition. Neuroscience school of advanced
studies. Coordinator: Gyorgy Buzsaki (2018, June).
• Advanced course on Learning and Memory: Cellular and Molecular Mechanisms.
Neuroscience school of advanced studies. Coordinators: Susumu Tonegawa & Alcino J.
Silva (2017, June).
• 13h International Conference on Alzheimer’s & Parkinson’s Diseases, Vienna, Austria
(2017, March)
• 46th Annual Meeting of the Society for Neuroscience, San Diego, California, United States
(2016, November)
• 19th International Pharmaco-EEG society meeting, Nijmegen, The Netherlands (2016,
October)

Curriculum Vitae
P a g e 116 | 128
• European College of Neuropsychopharmacology workshop for junior scientists in Europe,
Nice, France (2016, March)
• FELASA B - Laboratory animal science (2013, July)
Scholarships:
• IWT Baekeland Mandate (2019 – 2015)
• Erasmus Mundus Student Scholarship – Category A (2015 – 2013)
• Certificate of Academic Excellence – Canadian Psychology Association (2013, June)

Acknowledgements
Acknowledgements
Here I am, writing the last words of my thesis. Looking back, I find myself full of emotions.
Without a doubt, I have grown scientifically and personally during this journey, and I owe this
growth to many people to whom I would like to express my appreciation.
First, I would like to voice my sincere gratitude to my supervisors Prof. Dr. Pim
Drinkenburg and Prof. Dr. Detlef Balschun for giving me the opportunity to conduct my Ph.D. at
the KU Leuven and Janssen Pharmaceutica. Pim, thank you for the unconditional support you have
offered me during these years. I think we both remember very well our first telephone conversation
where I told you I was not sure if electrophysiology was for me…if I only knew that 6 months
later, we were going to be writing a project proposal to start a Ph.D. in that topic. Detlef, thank
you for sharing your knowledge in the field of Alzheimer’s disease and providing me with
insightful directions. Both of you have given me a lot of freedom to grow as a scientist, allowing
me to design my experiments and making my own decisions. Of course, this came with the cost of
bumping my head against the wall multiple times, but in the end, I grew stronger.
Next to my supervisors, I would like to thank Dr. Nikolay (Kolya) V. Manyakov. Kolya,
you did not only help me with the development of the Matlab toolbox and its numerous
modifications, but your scientific input has a great impact on the way I think. I learned to appreciate
the “rawness” of your communication, challenging what I was doing. Thank you for all your
support!
Probably I would have never started this adventure if it was not for Dr. Koen Tahon. Koen,
thank you for believing in me and for teaching me so much in such a short period of time. You
have become a good friend. I truly missed you in the lab during the second half of my Ph.D.
I am also very grateful to my thesis committee members, Prof. Dr. Cees Van Leeuwen,
Prof. Dr. Andreas Van Leupoldt, I appreciate your input and suggestion during the many
interactions we had during my Ph.D., as well as for correcting this manuscript. Dr. Per Nilsson,
Prof. Dr. Jos Prickaerts, thank you for taking the time to travel to Belgium to be part of the jury of
my thesis and reviewing this manuscript.
Janssen colleagues, thank you for the great time! To all my in vivo colleagues: you made
the many hours working in the dark very bright. Thank you to the LAM team for helping us to
provide the best care for the animals. Willy, dank je wel voor de Nederlandse oefeningen and the

Acknowledgements
nice chats! Thank you to all members of Pim’s team, Abdel, Koen, Marjolein, Sean, Ria, Sofie,
Heidi, Christ, Leen, and Annemie, for all your support and encouragement. Heidi, thank you for
introducing me to the Janssen running team, for always being there for me (in the lab, but
especially at a personal level), and for being so real. I truly admire your endurance and strength
and I am very happy you are part of my life. Sean, my office mate, thank you for the great scientific
discussions! To the Neuroscience in vitro department, I would like to take this opportunity to thank
Bianca, Clara, Marianne, Astrid, Bart and Louis for helping and teaching me in vitro techniques.
During my project I believe I re-did my analysis 100 times, thank you, Tom, for providing advice
on statistical analysis. During my Ph.D. I have the chance to supervise three master students. I
enjoyed this experience tremendously. Julia, Natalie and Gethin, I hope you enjoyed working
together as much as I did. Thank you to my lunch group who provided a great distraction to the
long days in the lab. Many of you have become great friends!
I am proud to be one of the founding members of the Benelux Janssen Postdoc and Ph.D.
student community. Thank you to all the members who are part of it, but especially to Eric, Sarah,
Suzy, and all the steering committee members. I had a lot of fun organizing conferences, work in
progress sessions and the JTalks event. I am looking forward to seeing the community grow.
To the Ephys group, it was great to join in many of your lab meetings and events. I know
the distance did not allow us to interact as much as I would have liked, but I hold great memories
of our lab retreat in Barcelona. Thank you for your valuable feedback and interesting
conversations. Marta, thank you for helping me with the in vivo electrophysiology, for hosting me
in your house (even without knowing me), so I did not have to travel so much. I am very happy to
count you as a friend and thank you for introducing me to the Spanish clan!
This is the right time to express my gratitude to all my friends who encouraged and
supported me during these years. When it comes to friends there is an enormous number of people
I would like to thank and I know the chance of accidentally forget someone is rather high. So, let
me start by saying “thank you!” to everyone who in one way or another has been part of my life
in the last 4 years. Steph, you do not have an idea of how much I would like not to have an ocean
between us. I know we do not call each other as much as we should, but every time we do, it feels
like the time has not passed. Steve, Hannes, and Constance thank you for our great annual trips.
Let’s make it to Scotland next year! Thilo & Claartje, thank you for all our weekends and dinners
together. The Spanish group in Leuven, thank you for the amazing dinners que te hacen explotar,

Acknowledgements
and the numerous times I stayed at your apartments. Jime y Marta se han convertido en dos
personas muy importantes en mi vida. Jeroen, I truly enjoy our conversations (especially when we
are drinking one of your amazing beers). Thank you for introducing me to one of the most genuine
people I know, Julie. Thank you to the Tousensemble group for fun weekends together. To the
BMW group for welcoming me into the family with open arms. Stijn and Natascha, I hold great
memories of our trip to Sardinia, I hope we can repeat soon! Constantin and Annelies thank you
for the nice dinners together (where we always talk too much about work) and trusting us with
your kids.
This thank you is one of the most difficult ones because I cannot find the words to express
my gratitude. Louis, you complete me in a way that is inexplicable. Thank you for always listening,
for helping me in the lab, and for giving me scientific advice. We both know how difficult the last
year has been for me. Thank you for being by my side, for always supporting me, for encouraging
me, and for believing in me. I look forward to having many new adventures together. Te amo!
Louis, I also have to thank you for giving me such an amazing “family in law”. Thank you
all for welcoming me into the De Muynck family. Now that I am closing the Ph.D. chapter, I
promise to put more effort into learning Dutch, but I cannot promise I will be able to learn West-
Vlaams…I think this takes a lifetime.
Gracias a mi familia en Argentina, mis hermanos, sobrinos, tías (las de toda la vida y las
mas recientes), primos y primas. Me hubiese gustado que estén aquí, pero entiendo que los 11.279
km no lo permiten. Gracias papa y mama por dejarme volar…mama se que esta orgullosa de mi.
¡Te extraño!
Sofia Jacob


FACULTY OF PSYCHOLOGY & EDUCATIONAL SCIENCES
DEPARTMENT OF BRAIN AND COGNITION
LABORATORY OF BIOLOGICAL PSYCHOLOGY
TIENSESTRAAT 102
3000 LEUVEN, BELGIUM
Neurophysiological Assessment of Brain Network Activity Involved in Cognitive Processing in Animal Models of Alzheimer’s Disease
Sofia Jacob
Copyright © 2022 FDOKUMEN