Using the electrocorticographic speech network to control a brain–computer interface in humans
12
Using the electrocorticographic speech network to control a brain–computer interface in humans This article has been downloaded from IOPscience. Please scroll down to see the full text article. 2011 J. Neural Eng. 8 036004 (http://iopscience.iop.org/1741-2552/8/3/036004) Download details: IP Address: 161.116.100.64 The article was downloaded on 13/04/2011 at 15:28 Please note that terms and conditions apply. View the table of contents for this issue, or go to the journal homepage for more Home Search Collections Journals About Contact us My IOPscience
-
Upload
independent -
Category
Documents
-
view
0 -
download
0
Transcript of Using the electrocorticographic speech network to control a brain–computer interface in humans

Using the electrocorticographic speech network to control a brain–computer interface in
humans
This article has been downloaded from IOPscience. Please scroll down to see the full text article.
2011 J. Neural Eng. 8 036004
(http://iopscience.iop.org/1741-2552/8/3/036004)
Download details:
IP Address: 161.116.100.64
The article was downloaded on 13/04/2011 at 15:28
Please note that terms and conditions apply.
View the table of contents for this issue, or go to the journal homepage for more
Home Search Collections Journals About Contact us My IOPscience
IOP PUBLISHING JOURNAL OF NEURAL ENGINEERING
J. Neural Eng. 8 (2011) 036004 (11pp) doi:10.1088/1741-2560/8/3/036004
Using the electrocorticographic speechnetwork to control a brain–computerinterface in humansEric C Leuthardt1,2,8, Charles Gaona1, Mohit Sharma1,Nicholas Szrama1,2, Jarod Roland2, Zac Freudenberg3, Jamie Solis2,Jonathan Breshears2 and Gerwin Schalk2,4,5,6,7
1 Department of Biomedical Engineering, Washington University in St. Louis, Campus Box 8057,660 South Euclid, St Louis, MO 63130, USA2 Department of Neurological Surgery, Washington University in St. Louis, School of Medicine,Campus Box 8057, 660 South Euclid, St Louis, MO 63130, USA3 Department of Computer Science, Washington University in St. Louis, Campus Box 8057,660 South Euclid, St Louis, MO 63130, USA4 Brain–Computer Interface R&D Program, Wadsworth Center, New York State Department of Health,Albany, NY, USA5 Department of Neurology, Albany Medical College, Albany, NY, USA6 Department of Biomedical Engineering, Rensselaer Polytechnic Institute, Troy, NY, USA7 Department of Biomedical Sciences, State University of New York, Albany, NY, USA
E-mail: [email protected]
Received 23 November 2010Accepted for publication 22 February 2011Published 7 April 2011Online at stacks.iop.org/JNE/8/036004
AbstractElectrocorticography (ECoG) has emerged as a new signal platform for brain–computerinterface (BCI) systems. Classically, the cortical physiology that has been commonlyinvestigated and utilized for device control in humans has been brain signals from thesensorimotor cortex. Hence, it was unknown whether other neurophysiological substrates,such as the speech network, could be used to further improve on or complement existingmotor-based control paradigms. We demonstrate here for the first time that ECoG signalsassociated with different overt and imagined phoneme articulation can enable invasivelymonitored human patients to control a one-dimensional computer cursor rapidly andaccurately. This phonetic content was distinguishable within higher gamma frequencyoscillations and enabled users to achieve final target accuracies between 68% and 91% within15 min. Additionally, one of the patients achieved robust control using recordings from amicroarray consisting of 1 mm spaced microwires. These findings suggest that the corticalnetwork associated with speech could provide an additional cognitive and physiologicsubstrate for BCI operation and that these signals can be acquired from a cortical array that issmall and minimally invasive.
S Online supplementary data available from stacks.iop.org/JNE/8/036004/mmedia
1. Introduction
The use of electrocorticographic (ECoG) signals has recentlygained substantial interest as a practical and robust platform
8 Author to whom any correspondence should be addressed.
for basic and translational neuroscience research. This interestis based in part on ECoG’s robustness, but also on its tradeoffof signal fidelity and invasiveness. Compared with scalp-recorded electroencephalographic (EEG) signals, ECoG hasmuch larger signal magnitude, increased spatial resolution
1741-2560/11/036004+11$33.00 1 © 2011 IOP Publishing Ltd Printed in the UK
J. Neural Eng. 8 (2011) 036004 E C Leuthardt et al
(0.1 versus 5.0 cm for EEG), and higher frequency bandwidth(0–500 versus 0–40 Hz for EEG) (Ball et al 2009, Freeman et al2003, Boulton et al 1990, Slutzky et al 2010). Of particularnote, amplitudes in frequencies higher than 40 Hz carryinformation that appears to be particularly amenable to BCIoperation. These signals, which are challenging to detect withEEG, are thought to be produced by smaller cortical assembliesand show stronger correlations with neuronal action potentialfirings than classic lower frequency rhythms (Ray et al 2008,Heldman et al 2006). Furthermore, these high-frequencychanges have also been associated with numerous aspects ofspeech and motor function in humans (Crone et al 1998, 2001a,2001b, Leuthardt et al 2004, Schalk et al 2007b, Wisneskiet al 2008, Pei et al 2011). Because ECoG electrodes do notpenetrate the brain, they have been shown to have superiorlong-term stability in different animal models (Bullara et al1979, Loeb et al 1977, Yuen et al 1987, Margalit et al 2003,Chao et al 2010). In addition to its superior long-term stability,a study recently showed that the neural substrate that encodesmovements is also stable over many months (Chao et al 2010).In summary, there is substantial evidence that ECoG shouldhave critical advantages for brain–computer interface (BCI)operation.
Up to now, ECoG signals have been used to achieverapid acquisition of control in one- and two-dimensionalcursor tasks in humans using actual and imagined motormovements (Leuthardt et al 2004, Schalk et al 2008a). Itwas unknown whether other neurophysiological substrates,such as the speech network, could be used to furtherimprove on or complement existing motor-based controlparadigms. Human speech has been extensively studiedusing different types of neuroimaging (i.e. positron emissionspectroscopy (PET) or functional magnetic resonanceimaging (fMRI)), neurophysiological functional mapping (i.e.magnetoencephalography (MEG) or ECoG), lesional models,or behavioral studies (Price et al 1996, Fiez and Petersen1998, Towle et al 2008, Sinai et al 2005, Crone et al 2001a,Pulvermuller et al 2006, Dronkers et al 2004). These andother studies have shown that speech processing involves awidely distributed network of cortical areas that are locatedpredominantly in the temporal perisylvian regions (Spechtand Reul 2003, Scott and Johnsrude 2003). In particular,these regions include Wernicke’s area, which is located in theposterior–superior temporal lobe, and Broca’s area located inthe posterior–inferior frontal gyrus (Fiez and Petersen 1998,Towle et al 2008, Billingsley-Marshall et al 2007). Otherfindings have suggested that the left premotor cortex alsoplays a major role in language tasks, in particular for theplanning of articulation and speech production (Duffau et al2003, Heim et al 2002). Given the numerous cortical networksassociated with speech and the intuitive nature by which peopleregularly imagine speech, the separable physiology and thedifferent cognitive task of utilizing speech may provide thebasis for BCI control that can be used independently or as anadjunct to motor-derived control. Some recent studies havebegun to explore the value of these language networks for thepurpose of neuroprosthetic applications. Wilson et al (2006)demonstrated that the auditory cortex can be used for real-time
Table 1. Demographic and clinical information for the four patients.
Age atCognitive Speech seizure Seizure Seizure
Patient Age Sex capacity capacity onset type focus
1 48 F Normal Normal 1.5 CP L temporal2 45 F Normal Normal 14 CP L temporal
parietal region3 49 M Normal Normal 45 CP L temporal4 36 F Normal Normal 0.5 CP L frontal lobe
CP—complex partial; M—male; F—female; L—left.
control of a cursor. More recent studies have shown initialevidence that some phonemes and words are separable duringactual speech with ECoG (Blakely et al 2008, Kellis et al 2010,Schalk et al 2007a), but concrete evidence that BCI controlcan be achieved using the speech network has been absent.
In this study, we examined the possibility that differentelements of speech, in particular real and imagined articulationof phonemic sounds, can be used to achieve ECoG-baseddevice control. We demonstrate for the first time that theelectrocorticographic signals associated with speech can beeffectively used to select from one of the two choices withminimal training. These findings further extend the cognitiveand cortical signal repertoire that may be used to functionallyaugment patients with severe disabilities.
2. Patients and methods
2.1. Patients
This study included four patients (ages 36–48) with intractableepilepsy undergoing temporary placement of a subduralelectrode array (four left hemispheric 8 × 8 grids) for clinicalmonitoring to identify and resect their epileptic foci. The studywas approved by the Human Research Protection Organizationof the Washington University Medical Center. Prior toinclusion in the study, patients gave their written informedconsent. A craniotomy was performed to place the electrodearray according to clinical criteria (figure 1). Patients werethen moved to a 24 h video monitoring unit for a period ofapproximately one week, during which time the data for thisstudy were collected. Patients had no prior training on a BCIsystem. Demographic and clinical information for each of thefour study participants is shown in table 1.
2.2. Signal acquisition
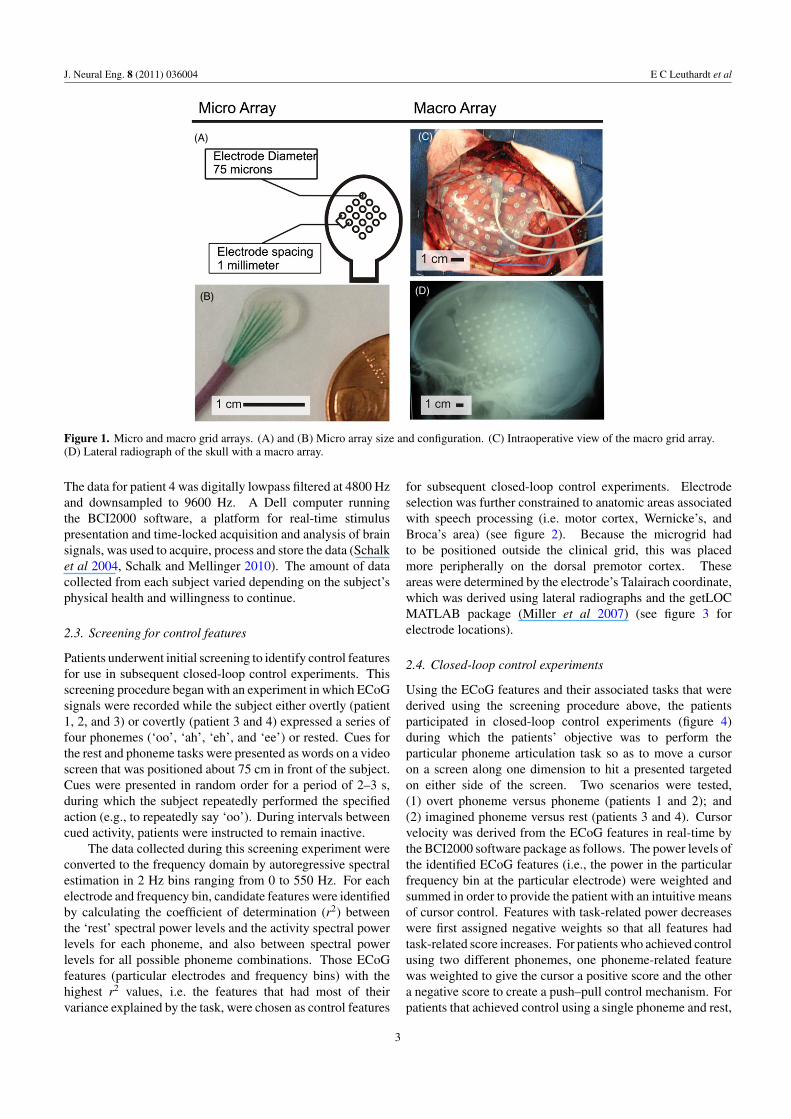
Electrode arrays (AdTech, Racine, WI) consisted of 64electrodes (8 × 8) spaced 10 mm apart, with a 2.3 mmdiameter exposed surface. Additionally, subject 2 had anexperimental microarray placed. This array consisted of16 microwires, 75 μm in diameter, that were spaced 1 mmapart (figure 1). Electrocortical signals were acquired usingg.tec biosignal amplifiers (Graz, Austria). All signals wereinternally sampled at 38.4 kHz with a 6.6 kHz low pass filter.For patients 1–3, the signals were then digitally bandpassfiltered within the amplifiers between 0.1 and 500 Hz, andsubsequently downsampled to a 1200 Hz output sampling rate.
2
J. Neural Eng. 8 (2011) 036004 E C Leuthardt et al
(A)
(B) (D)
(C)
Figure 1. Micro and macro grid arrays. (A) and (B) Micro array size and configuration. (C) Intraoperative view of the macro grid array.(D) Lateral radiograph of the skull with a macro array.
The data for patient 4 was digitally lowpass filtered at 4800 Hzand downsampled to 9600 Hz. A Dell computer runningthe BCI2000 software, a platform for real-time stimuluspresentation and time-locked acquisition and analysis of brainsignals, was used to acquire, process and store the data (Schalket al 2004, Schalk and Mellinger 2010). The amount of datacollected from each subject varied depending on the subject’sphysical health and willingness to continue.
2.3. Screening for control features
Patients underwent initial screening to identify control featuresfor use in subsequent closed-loop control experiments. Thisscreening procedure began with an experiment in which ECoGsignals were recorded while the subject either overtly (patient1, 2, and 3) or covertly (patient 3 and 4) expressed a series offour phonemes (‘oo’, ‘ah’, ‘eh’, and ‘ee’) or rested. Cues forthe rest and phoneme tasks were presented as words on a videoscreen that was positioned about 75 cm in front of the subject.Cues were presented in random order for a period of 2–3 s,during which the subject repeatedly performed the specifiedaction (e.g., to repeatedly say ‘oo’). During intervals betweencued activity, patients were instructed to remain inactive.
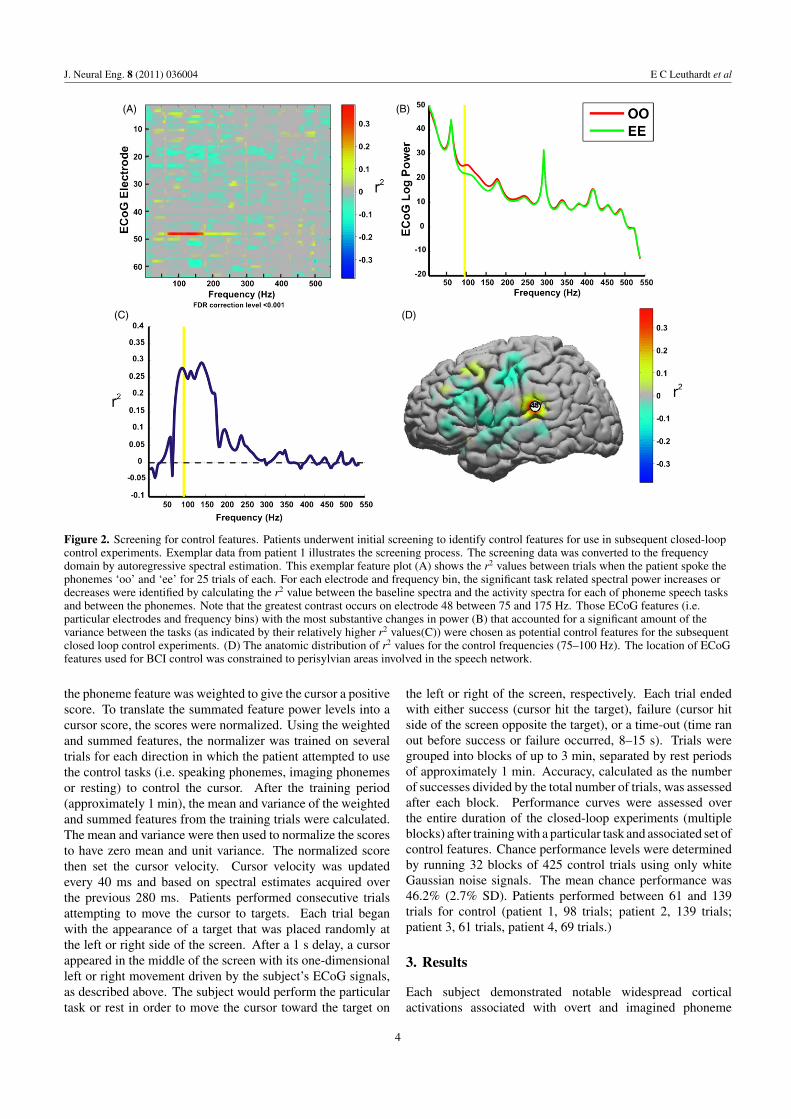
The data collected during this screening experiment wereconverted to the frequency domain by autoregressive spectralestimation in 2 Hz bins ranging from 0 to 550 Hz. For eachelectrode and frequency bin, candidate features were identifiedby calculating the coefficient of determination (r2) betweenthe ‘rest’ spectral power levels and the activity spectral powerlevels for each phoneme, and also between spectral powerlevels for all possible phoneme combinations. Those ECoGfeatures (particular electrodes and frequency bins) with thehighest r2 values, i.e. the features that had most of theirvariance explained by the task, were chosen as control features
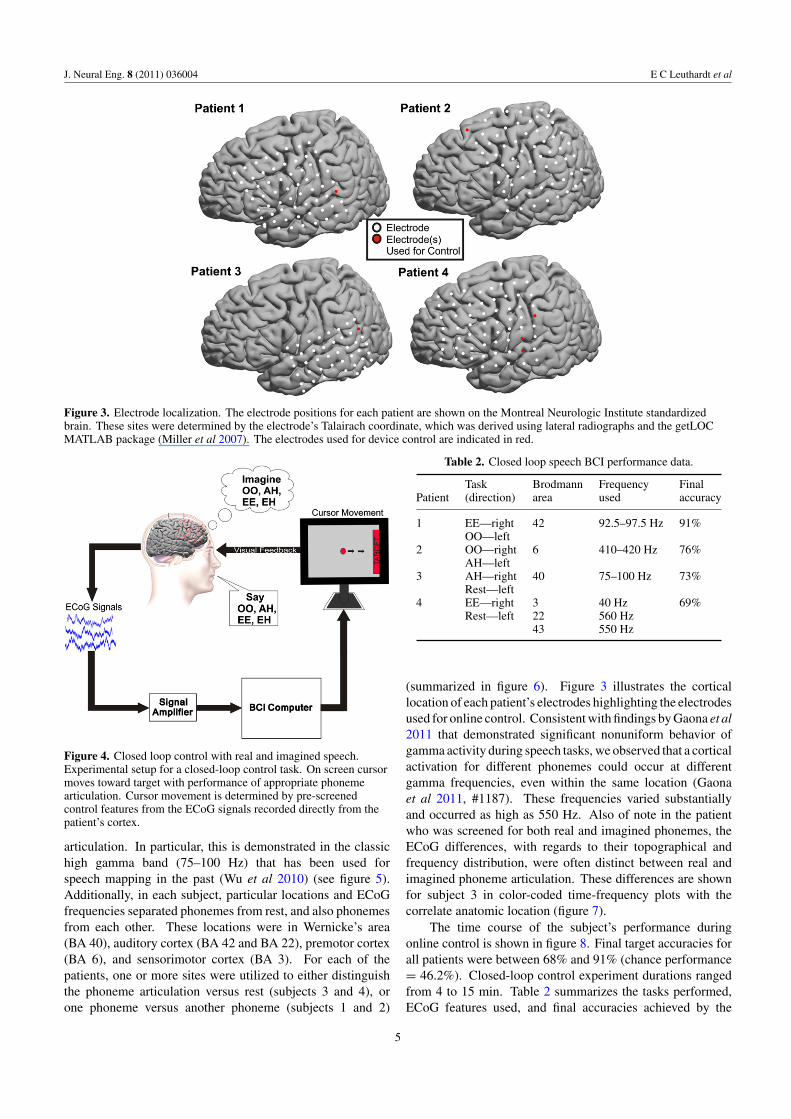
for subsequent closed-loop control experiments. Electrodeselection was further constrained to anatomic areas associatedwith speech processing (i.e. motor cortex, Wernicke’s, andBroca’s area) (see figure 2). Because the microgrid hadto be positioned outside the clinical grid, this was placedmore peripherally on the dorsal premotor cortex. Theseareas were determined by the electrode’s Talairach coordinate,which was derived using lateral radiographs and the getLOCMATLAB package (Miller et al 2007) (see figure 3 forelectrode locations).
2.4. Closed-loop control experiments
Using the ECoG features and their associated tasks that werederived using the screening procedure above, the patientsparticipated in closed-loop control experiments (figure 4)during which the patients’ objective was to perform theparticular phoneme articulation task so as to move a cursoron a screen along one dimension to hit a presented targetedon either side of the screen. Two scenarios were tested,(1) overt phoneme versus phoneme (patients 1 and 2); and(2) imagined phoneme versus rest (patients 3 and 4). Cursorvelocity was derived from the ECoG features in real-time bythe BCI2000 software package as follows. The power levels ofthe identified ECoG features (i.e., the power in the particularfrequency bin at the particular electrode) were weighted andsummed in order to provide the patient with an intuitive meansof cursor control. Features with task-related power decreaseswere first assigned negative weights so that all features hadtask-related score increases. For patients who achieved controlusing two different phonemes, one phoneme-related featurewas weighted to give the cursor a positive score and the othera negative score to create a push–pull control mechanism. Forpatients that achieved control using a single phoneme and rest,
3
J. Neural Eng. 8 (2011) 036004 E C Leuthardt et al
(A) (B)
(C) (D)
Figure 2. Screening for control features. Patients underwent initial screening to identify control features for use in subsequent closed-loopcontrol experiments. Exemplar data from patient 1 illustrates the screening process. The screening data was converted to the frequencydomain by autoregressive spectral estimation. This exemplar feature plot (A) shows the r2 values between trials when the patient spoke thephonemes ‘oo’ and ‘ee’ for 25 trials of each. For each electrode and frequency bin, the significant task related spectral power increases ordecreases were identified by calculating the r2 value between the baseline spectra and the activity spectra for each of phoneme speech tasksand between the phonemes. Note that the greatest contrast occurs on electrode 48 between 75 and 175 Hz. Those ECoG features (i.e.particular electrodes and frequency bins) with the most substantive changes in power (B) that accounted for a significant amount of thevariance between the tasks (as indicated by their relatively higher r2 values(C)) were chosen as potential control features for the subsequentclosed loop control experiments. (D) The anatomic distribution of r2 values for the control frequencies (75–100 Hz). The location of ECoGfeatures used for BCI control was constrained to perisylvian areas involved in the speech network.
the phoneme feature was weighted to give the cursor a positivescore. To translate the summated feature power levels into acursor score, the scores were normalized. Using the weightedand summed features, the normalizer was trained on severaltrials for each direction in which the patient attempted to usethe control tasks (i.e. speaking phonemes, imaging phonemesor resting) to control the cursor. After the training period(approximately 1 min), the mean and variance of the weightedand summed features from the training trials were calculated.The mean and variance were then used to normalize the scoresto have zero mean and unit variance. The normalized scorethen set the cursor velocity. Cursor velocity was updatedevery 40 ms and based on spectral estimates acquired overthe previous 280 ms. Patients performed consecutive trialsattempting to move the cursor to targets. Each trial beganwith the appearance of a target that was placed randomly atthe left or right side of the screen. After a 1 s delay, a cursorappeared in the middle of the screen with its one-dimensionalleft or right movement driven by the subject’s ECoG signals,as described above. The subject would perform the particulartask or rest in order to move the cursor toward the target on
the left or right of the screen, respectively. Each trial endedwith either success (cursor hit the target), failure (cursor hitside of the screen opposite the target), or a time-out (time ranout before success or failure occurred, 8–15 s). Trials weregrouped into blocks of up to 3 min, separated by rest periodsof approximately 1 min. Accuracy, calculated as the numberof successes divided by the total number of trials, was assessedafter each block. Performance curves were assessed overthe entire duration of the closed-loop experiments (multipleblocks) after training with a particular task and associated set ofcontrol features. Chance performance levels were determinedby running 32 blocks of 425 control trials using only whiteGaussian noise signals. The mean chance performance was46.2% (2.7% SD). Patients performed between 61 and 139trials for control (patient 1, 98 trials; patient 2, 139 trials;patient 3, 61 trials, patient 4, 69 trials.)
3. Results
Each subject demonstrated notable widespread corticalactivations associated with overt and imagined phoneme
4
J. Neural Eng. 8 (2011) 036004 E C Leuthardt et al
Figure 3. Electrode localization. The electrode positions for each patient are shown on the Montreal Neurologic Institute standardizedbrain. These sites were determined by the electrode’s Talairach coordinate, which was derived using lateral radiographs and the getLOCMATLAB package (Miller et al 2007). The electrodes used for device control are indicated in red.
Figure 4. Closed loop control with real and imagined speech.Experimental setup for a closed-loop control task. On screen cursormoves toward target with performance of appropriate phonemearticulation. Cursor movement is determined by pre-screenedcontrol features from the ECoG signals recorded directly from thepatient’s cortex.
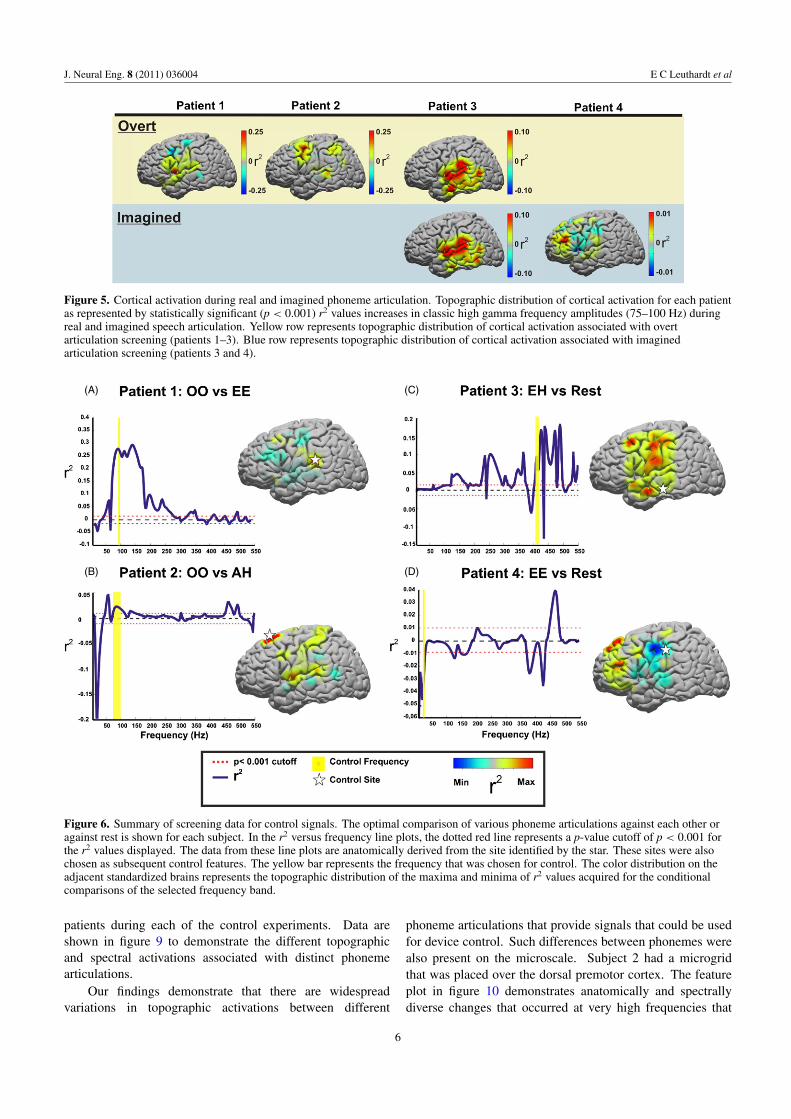
articulation. In particular, this is demonstrated in the classichigh gamma band (75–100 Hz) that has been used forspeech mapping in the past (Wu et al 2010) (see figure 5).Additionally, in each subject, particular locations and ECoGfrequencies separated phonemes from rest, and also phonemesfrom each other. These locations were in Wernicke’s area(BA 40), auditory cortex (BA 42 and BA 22), premotor cortex(BA 6), and sensorimotor cortex (BA 3). For each of thepatients, one or more sites were utilized to either distinguishthe phoneme articulation versus rest (subjects 3 and 4), orone phoneme versus another phoneme (subjects 1 and 2)
Table 2. Closed loop speech BCI performance data.
Task Brodmann Frequency FinalPatient (direction) area used accuracy
1 EE—right 42 92.5–97.5 Hz 91%OO—left
2 OO—right 6 410–420 Hz 76%AH—left
3 AH—right 40 75–100 Hz 73%Rest—left
4 EE—right 3 40 Hz 69%Rest—left 22 560 Hz
43 550 Hz
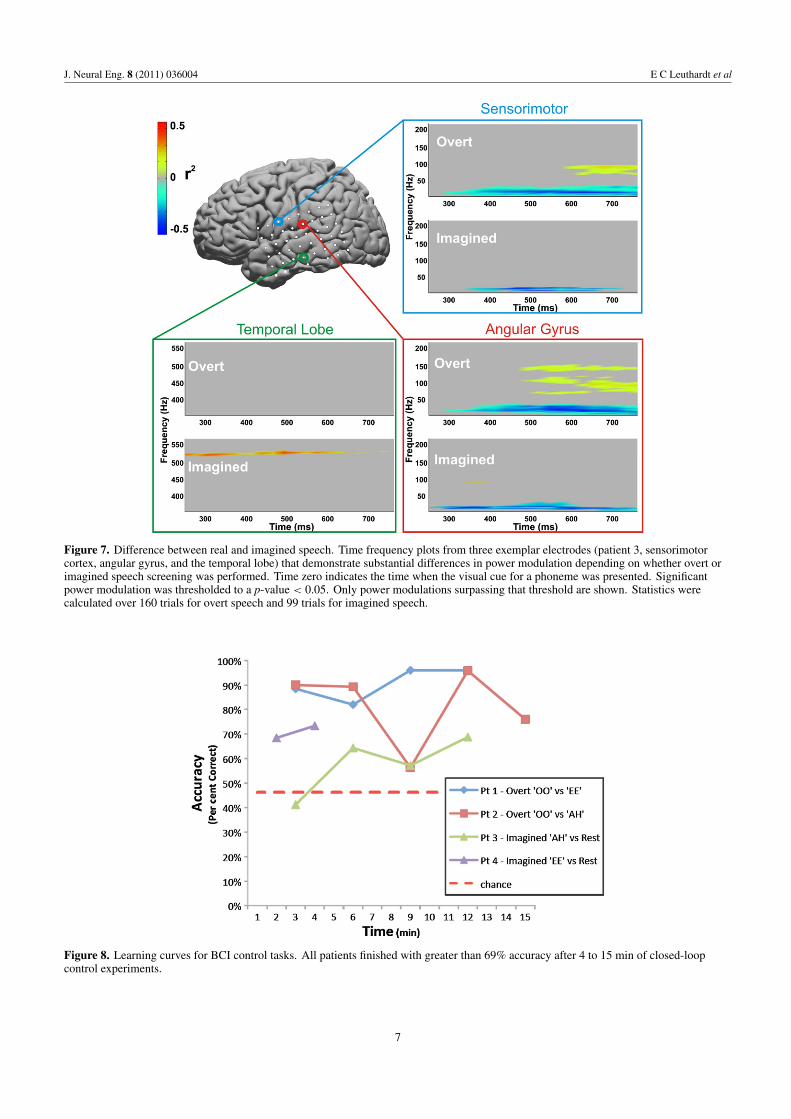
(summarized in figure 6). Figure 3 illustrates the corticallocation of each patient’s electrodes highlighting the electrodesused for online control. Consistent with findings by Gaona et al2011 that demonstrated significant nonuniform behavior ofgamma activity during speech tasks, we observed that a corticalactivation for different phonemes could occur at differentgamma frequencies, even within the same location (Gaonaet al 2011, #1187). These frequencies varied substantiallyand occurred as high as 550 Hz. Also of note in the patientwho was screened for both real and imagined phonemes, theECoG differences, with regards to their topographical andfrequency distribution, were often distinct between real andimagined phoneme articulation. These differences are shownfor subject 3 in color-coded time-frequency plots with thecorrelate anatomic location (figure 7).
The time course of the subject’s performance duringonline control is shown in figure 8. Final target accuracies forall patients were between 68% and 91% (chance performance= 46.2%). Closed-loop control experiment durations rangedfrom 4 to 15 min. Table 2 summarizes the tasks performed,ECoG features used, and final accuracies achieved by the
5
J. Neural Eng. 8 (2011) 036004 E C Leuthardt et al
Figure 5. Cortical activation during real and imagined phoneme articulation. Topographic distribution of cortical activation for each patientas represented by statistically significant (p < 0.001) r2 values increases in classic high gamma frequency amplitudes (75–100 Hz) duringreal and imagined speech articulation. Yellow row represents topographic distribution of cortical activation associated with overtarticulation screening (patients 1–3). Blue row represents topographic distribution of cortical activation associated with imaginedarticulation screening (patients 3 and 4).
(A) (C)
(B) (D)
Figure 6. Summary of screening data for control signals. The optimal comparison of various phoneme articulations against each other oragainst rest is shown for each subject. In the r2 versus frequency line plots, the dotted red line represents a p-value cutoff of p < 0.001 forthe r2 values displayed. The data from these line plots are anatomically derived from the site identified by the star. These sites were alsochosen as subsequent control features. The yellow bar represents the frequency that was chosen for control. The color distribution on theadjacent standardized brains represents the topographic distribution of the maxima and minima of r2 values acquired for the conditionalcomparisons of the selected frequency band.
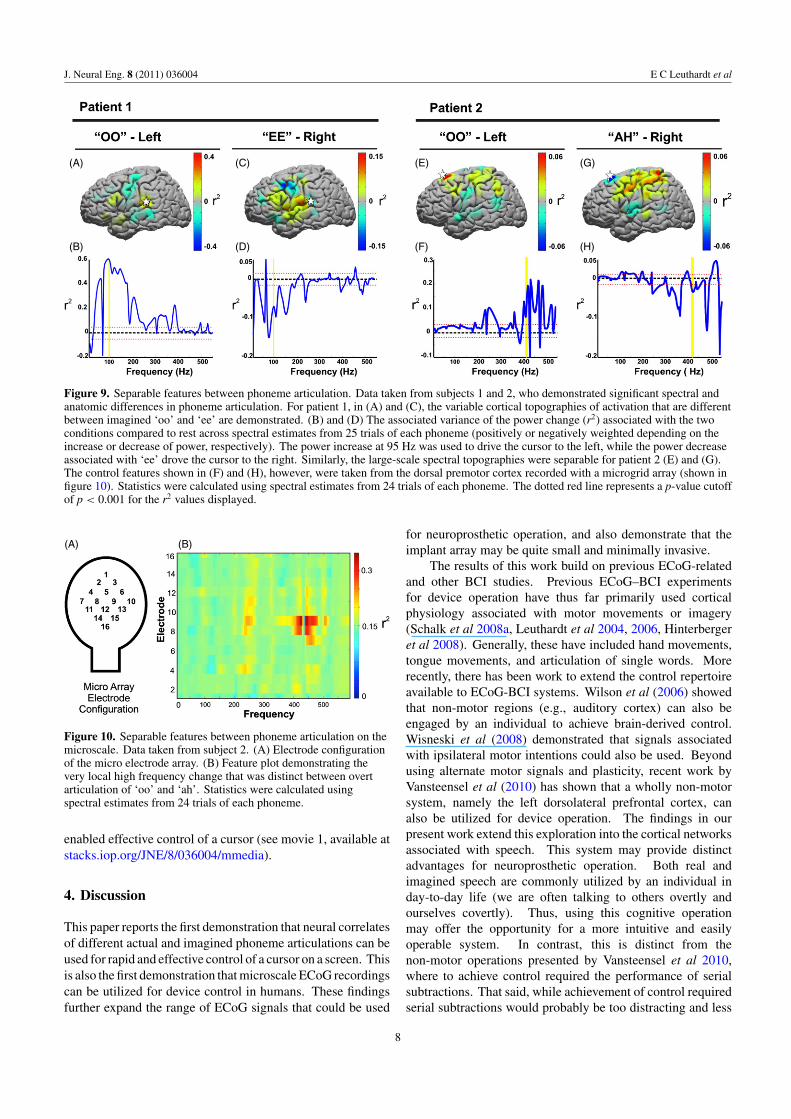
patients during each of the control experiments. Data areshown in figure 9 to demonstrate the different topographicand spectral activations associated with distinct phonemearticulations.
Our findings demonstrate that there are widespreadvariations in topographic activations between different
phoneme articulations that provide signals that could be usedfor device control. Such differences between phonemes werealso present on the microscale. Subject 2 had a microgridthat was placed over the dorsal premotor cortex. The featureplot in figure 10 demonstrates anatomically and spectrallydiverse changes that occurred at very high frequencies that
6
J. Neural Eng. 8 (2011) 036004 E C Leuthardt et al
Figure 7. Difference between real and imagined speech. Time frequency plots from three exemplar electrodes (patient 3, sensorimotorcortex, angular gyrus, and the temporal lobe) that demonstrate substantial differences in power modulation depending on whether overt orimagined speech screening was performed. Time zero indicates the time when the visual cue for a phoneme was presented. Significantpower modulation was thresholded to a p-value < 0.05. Only power modulations surpassing that threshold are shown. Statistics werecalculated over 160 trials for overt speech and 99 trials for imagined speech.
Figure 8. Learning curves for BCI control tasks. All patients finished with greater than 69% accuracy after 4 to 15 min of closed-loopcontrol experiments.
7
J. Neural Eng. 8 (2011) 036004 E C Leuthardt et al
(A)
(B)
(C)
(D)
(E)
(F)
(G)
(H)
Figure 9. Separable features between phoneme articulation. Data taken from subjects 1 and 2, who demonstrated significant spectral andanatomic differences in phoneme articulation. For patient 1, in (A) and (C), the variable cortical topographies of activation that are differentbetween imagined ‘oo’ and ‘ee’ are demonstrated. (B) and (D) The associated variance of the power change (r2) associated with the twoconditions compared to rest across spectral estimates from 25 trials of each phoneme (positively or negatively weighted depending on theincrease or decrease of power, respectively). The power increase at 95 Hz was used to drive the cursor to the left, while the power decreaseassociated with ‘ee’ drove the cursor to the right. Similarly, the large-scale spectral topographies were separable for patient 2 (E) and (G).The control features shown in (F) and (H), however, were taken from the dorsal premotor cortex recorded with a microgrid array (shown infigure 10). Statistics were calculated using spectral estimates from 24 trials of each phoneme. The dotted red line represents a p-value cutoffof p < 0.001 for the r2 values displayed.
(A) (B)
Figure 10. Separable features between phoneme articulation on themicroscale. Data taken from subject 2. (A) Electrode configurationof the micro electrode array. (B) Feature plot demonstrating thevery local high frequency change that was distinct between overtarticulation of ‘oo’ and ‘ah’. Statistics were calculated usingspectral estimates from 24 trials of each phoneme.
enabled effective control of a cursor (see movie 1, available atstacks.iop.org/JNE/8/036004/mmedia).
4. Discussion
This paper reports the first demonstration that neural correlatesof different actual and imagined phoneme articulations can beused for rapid and effective control of a cursor on a screen. Thisis also the first demonstration that microscale ECoG recordingscan be utilized for device control in humans. These findingsfurther expand the range of ECoG signals that could be used
for neuroprosthetic operation, and also demonstrate that theimplant array may be quite small and minimally invasive.
The results of this work build on previous ECoG-relatedand other BCI studies. Previous ECoG–BCI experimentsfor device operation have thus far primarily used corticalphysiology associated with motor movements or imagery(Schalk et al 2008a, Leuthardt et al 2004, 2006, Hinterbergeret al 2008). Generally, these have included hand movements,tongue movements, and articulation of single words. Morerecently, there has been work to extend the control repertoireavailable to ECoG-BCI systems. Wilson et al (2006) showedthat non-motor regions (e.g., auditory cortex) can also beengaged by an individual to achieve brain-derived control.Wisneski et al (2008) demonstrated that signals associatedwith ipsilateral motor intentions could also be used. Beyondusing alternate motor signals and plasticity, recent work byVansteensel et al (2010) has shown that a wholly non-motorsystem, namely the left dorsolateral prefrontal cortex, canalso be utilized for device operation. The findings in ourpresent work extend this exploration into the cortical networksassociated with speech. This system may provide distinctadvantages for neuroprosthetic operation. Both real andimagined speech are commonly utilized by an individual inday-to-day life (we are often talking to others overtly andourselves covertly). Thus, using this cognitive operationmay offer the opportunity for a more intuitive and easilyoperable system. In contrast, this is distinct from thenon-motor operations presented by Vansteensel et al 2010,where to achieve control required the performance of serialsubtractions. That said, while achievement of control requiredserial subtractions would probably be too distracting and less
8
J. Neural Eng. 8 (2011) 036004 E C Leuthardt et al
practical in a real-world setting, with training patients maybe able to produce the necessary control. On this topic,it is encouraging that two of our four patients immediatelyhad greater than 90% accuracy without any prior training.Moreover, all patients achieved high levels of control withinminutes, similar to results achieved previously only for ECoG-based BCIs based on actual/imagined motor tasks (Leuthardtet al 2004, 2006, Schalk et al 2008a).
Although performance of control with speech-relatedphysiology was comparable to motor physiology-derived BCIoperation, there are some notable distinctions that should behighlighted between these two systems. Motor signals usedfor BCI operation tend to be much more focal within theprimary motor cortex. Speech signals, however, engage broadregions of the brain, focused primarily around the perisylviancortex (Specht and Reul 2003, Scott and Johnsrude 2003).Consistent with this broad network, we found that there werenumerous motor and non-motor areas that could be used forcontrol. Given that there are multiple levels by which speechis processed (i.e. auditory, phonological, semantic, motorpreparation/execution), this would explain why different areasare able to enable one to distinguish phonemes at numerousdifferent sites. Namely, that they may represent differentelements of processing along the language hierarchy (Binder2000, Binder et al 1994, 1997, 2000, 2003). This broadnetwork is attractive from an implant standpoint. The notionthat the entire perisylvian region could be used would makea speech-derived BCI potentially more flexible in where itwould need to placed. Another key difference from the motorBCI experience is the differences between actual and imaginedperformance of the task. These findings are consistent withother fMRI and ECoG studies that have also noted differencesin overt and covert speech (Palmer et al 2001, Pei et al 2011).The substantial difference between actual and imagined speechis in marked contrast to results from EEG and ECoG-basedstudies that demonstrated that motor movements and motorimagery have similar neural signatures (McFarland et al 2000,Miller et al 2010). This is an important consideration foroptimally screening signals that will be subsequently used forBCI control.
There has been growing interest in microscale ECoGrecordings. Recent studies have shown that a substantialquantity of motor and speech information can be derivedfrom closely spaced and small electrodes on the order ofmillimeters (Leuthardt et al 2009a, Kellis et al 2010, Blakelyet al 2008, Wang et al 2009). In this study, the microgridwas located over the dorsal premotor cortex. Although theventral premotor cortex is putatively thought to be associatedwith Broca’s region and language expression, recent studieshave demonstrated that the dorsal premotor cortex plays arole in the dorsal stream of language processing in whichsublexical acoustic information is transformed into motoricarticulation (Hickok and Poeppel 2007, Saur et al 2008).This study is the first to use this differential informationfor BCI device control. Additionally, the small scale atwhich speech information was acquired and used in thisstudy has important surgical implications for future brain–computer interface applications. To date, ECoG recordings
have primarily been conducted using electrode arrays that weremade specifically for epilepsy monitoring. The role of thesegrid electrodes is to achieve broad cortical coverage for thelocalization of a seizure focus. As a result, they require a fairlylarge craniotomy for their placement. The demonstration thatseparable speech intentions can be acquired from a site in thepremotor cortex that is less than a centimeter indicates thatthe practical array for neuroprosthetic applications may onlyrequire a relatively small burr hole. This would significantlyreduce the risk of the surgical procedure for placement of theBCI construct. Furthermore, previous studies have shown thatan epidurally acquired ECoG signal can be utilized for brain-derived device control (Leuthardt et al 2006) and that whencompared to subdural signals in rats and humans appear to besimilar (Slutzky et al 2010). If the quality of these microscalesignals is preserved above and below the dura, a construct thatrequires a burr hole and an epidural array could be even lessrisky. At the same time, it is important to note that signalcharacteristics in open-loop situations may not generalize toclosed-loop situations. Thus, the practical influence on BCIperformance of different recording techniques (e.g., epiduralversus subdural) needs to be empirically tested in onlineexperiments. The significant risk reduction could improve therisk-benefit consideration for implantation in either medicallyfragile patients (e.g., amyotrophic lateral sclerosis) or inpatients for whom the construct would be placed over normalbrain (e.g., spinal cord injury and unaffected hemisphere inunilateral stroke). This ultimately could hasten the adoptionof the BCI technology across a wider patient population.
Although we report an exciting initial demonstration ofwhat may be possible using speech networks in humansand microscale signals, there are some important limitationsand future considerations that merit attention. This studyutilized different phonemes as the cognitive task for deviceoperation. This was done intentionally to cover the vowelarticulation space. These phonemes, however, probablydo not access higher-order lexical processing. Thus, inthis work, lower-order phonetic processing can indeed beused for BCI operation, but whether higher-order semanticencoding can be used remains unknown. Fortunately, thereis preliminary evidence from several groups that consonants,vowels, and whole words are distinguishable using macroand microscale ECoG (Kellis et al 2010, Schalk et al 2007a,2008b). Their utility for BCI operation will need to be studiedfurther. Ideally, these speech-related signals would provideadditive control features to those provided by more establishedmotor paradigms. The question of whether a multimodalBCI incorporating different cognitive operations will provideadded operational benefit will also require explicit validation(Leuthardt et al 2009b).
In summary, these results push forward the broad potentialof the ECoG signal platform for neuroprosthetic application.The study shows that speech operations can be exploitedfor control signals from small regions of a cortex withina broad perisylvian network. Additionally, that separablecontrol signals are accessible on the microscale (1 mm) furthersupports the notion that ECoG neuroprosthetics could beminimally invasive.
9
J. Neural Eng. 8 (2011) 036004 E C Leuthardt et al
References
Ball T, Kern M, Mutschler I, Aertsen A and Schulze-Bonhage A2009 Signal quality of simultaneously recorded invasive andnon-invasive EEG Neuroimage 46 708–16
Billingsley-Marshall R L, Clear T, Mencl W E, Simos P G,Swank P R, Men D, Sarkari S, Castillo E M and PapanicolaouA C 2007 A comparison of functional MRI andmagnetoencephalography for receptive language mappingJ. Neurosci. Methods 161 306–13
Binder J 2000 The new neuroanatomy of speech perception Brain123 Pt 12 2371–2
Binder J R, Frost J A, Hammeke T A, Bellgowan P S, Springer J A,Kaufman J N and Possing E T 2000 Human temporal lobeactivation by speech and nonspeech sounds Cereb. Cortex10 512–28
Binder J R, Frost J A, Hammeke T A, Cox R W, Rao S M andPrieto T 1997 Human brain language areas identified byfunctional magnetic resonance imaging J. Neurosci.17 353–62
Binder J R, McKiernan K A, Parsons M E, Westbury C F,Possing E T, Kaufman J N and Buchanan L 2003 Neuralcorrelates of lexical access during visual word recognitionJ. Cogn. Neurosci. 15 372–93
Binder J R et al 1994 Functional magnetic resonance imaging ofhuman auditory cortex Ann. Neurol. 35 662–72
Blakely T, Miller K J, Rao R P, Holmes M D and Ojemann J G2008 Localization and classification of phonemes using highspatial resolution electrocorticography (ECoG) grids Conf.Proc. IEEE Eng. Med. Biol. Soc. 2008 4964–7
Boulton A A, Baker G B and Vanderwolf C H 1990Neurophysiological Techniques: II. Applications to NeuralSystems (Chfton, NJ: Humana Press)http://www.springerprotocols.com/BookToc/doi/10.1385/0896031853
Bullara L A, Agnew W F, Yuen T G, Jacques S and Pudenz R H1979 Evaluation of electrode array material for neuralprostheses Neurosurgery 5 681–6
Chao Z C, Nagasaka Y and Fujii N 2010 Long-term asynchronousdecoding of arm motion using electrocorticographic signals inmonkeys Front Neuroeng. 3 3
Crone N E, Boatman D, Gordon B and Hao L 2001a Inducedelectrocorticographic gamma activity during auditoryperception. Brazier Award-winning article, 2001 Clin.Neurophysiol. 112 565–82
Crone N E, Hao L, Hart J Jr, Boatman D, Lesser R P, Irizarry Rand Gordon B 2001b Electrocorticographic gamma activityduring word production in spoken and sign languageNeurology 57 2045–53
Crone N E, Miglioretti D L, Gordon B and Lesser R P 1998Functional mapping of human sensorimotor cortex withelectrocorticographic spectral analysis: II. Event-relatedsynchronization in the gamma band Brain 121 Pt 12 2301–15
Dronkers N F, Wilkins D P, Van Valin R D Jr, Redfern B Band Jaeger J J 2004 Lesion analysis of the brain areas involvedin language comprehension Cognition 92 145–77
Duffau H, Capelle L, Denvil D, Gatignol P, Sichez N, Lopes M,Sichez J P and Van Effenterre R 2003 The role of dominantpremotor cortex in language: a study using intraoperativefunctional mapping in awake patients Neuroimage20 1903–14
Fiez J A and Petersen S E 1998 Neuroimaging studies of wordreading Proc. Natl Acad. Sci. USA 95 914–21
Freeman W J, Holmes M D, Burke B C and Vanhatalo S 2003Spatial spectra of scalp EEG and EMG from awake humansClin. Neurophysiol. 114 1053–68
Gaona C M, Sharma M, Freudenburg Z V, Breshears J D,Bundy D T, Roland J, Barbour D L, Schalk G andLeuthardt E C 2011 Nonuniform high-gamma (60–500 Hz)
power changes dissociate cognitive task and anatomy in humancortex J. Neurosci. 31 2091–100
Heim S, Opitz B and Friederici A D 2002 Broca’s area in the humanbrain is involved in the selection of grammatical gender forlanguage production: evidence from event-related functionalmagnetic resonance imaging Neurosci. Lett. 328 101–4
Heldman D A, Wang W, Chan S S and Moran D W 2006 Local fieldpotential spectral tuning in motor cortex during reaching IEEETrans. Neural Syst. Rehabil. Eng. 14 180–3
Hickok G and Poeppel D 2007 The cortical organization of speechprocessing Nat. Rev. Neurosci. 8 393–402
Hinterberger T, Widman G, Lal T N, Hill J, Tangermann M,Rosenstiel W, Scholkopf B, Elger C and Birbaumer N 2008Voluntary brain regulation and communication withelectrocorticogram signals Epilepsy Behav. 13 300–6
Kellis S, Miller K, Thomson K, Brown R, House P and Greger B2010 Decoding spoken words using local field potentialsrecorded from the cortical surface J. Neural Eng. 7 056007
Leuthardt E C, Freudenberg Z, Bundy D and Roland J 2009aMicroscale recording from human motor cortex: implicationsfor minimally invasive electrocorticographic brain-computerinterfaces Neurosurg. Focus 27 E10
Leuthardt E C, Miller K J, Schalk G, Rao R P and Ojemann J G2006 Electrocorticography-based brain computerinterface—the Seattle experience IEEE Trans. Neural Syst.Rehabil. Eng. 14 194–8
Leuthardt E C, Schalk G, Roland J, Rouse A andMoran D W 2009b Evolution of brain-computer interfaces:going beyond classic motor physiology Neurosurg. Focus 27 E4
Leuthardt E C, Schalk G, Wolpaw J R, Ojemann J G and Moran DW 2004 A brain-computer interface usingelectrocorticographic signals in humans J. Neural Eng. 1 63–71
Loeb G E, Walker A E, Uematsu S and Konigsmark B W 1977Histological reaction to various conductive and dielectric filmschronically implanted in the subdural space J. Biomed. Mater.Res. 11 195–210
Margalit E et al 2003 Visual and electrical evoked responserecorded from subdural electrodes implanted above the visualcortex in normal dogs under two methods of anesthesiaJ. Neurosci. Methods 123 129–37
McFarland D J, Miner L A, Vaughan T M and Wolpaw J R 2000 Muand beta rhythm topographies during motor imagery and actualmovements Brain Topogr. 12 177–86
Miller K J, Makeig S, Hebb A O, Rao R P, denNijs M andOjemann J G 2007 Cortical electrode localization from x-raysand simple mapping for electrocorticographic research: the‘Location on Cortex’ (LOC) package for MATLAB J.Neurosci. Methods 162 303–8
Miller K J, Schalk G, Fetz E E, den Nijs M, Ojemann J G and Rao RP N 2010 Cortical activity during motor execution, motorimagery, and imagery-based online feedback Proc. Natl Acad.Sci. USA 107 4430–5
Palmer E D, Rosen H J, Ojemann J G, Buckner R L, Kelley W Mand Petersen S E 2001 An event-related fMRI study of overtand covert word stem completion Neuroimage 14 182–93
Pei X, Leuthardt E C, Gaona C M, Brunner P, Wolpaw J Rand Schalk G 2011 Spatiotemporal dynamics ofelectrocorticographic high gamma activity during overt andcovert word repetition Neuroimage 54 2960–72
Price C J, Wise R J, Warburton E A, Moore C J, Howard D,Patterson K, Frackowiak R S and Friston K J 1996 Hearing andsaying. The functional neuro-anatomy of auditory wordprocessing Brain 119 Pt 3 919–31
Pulvermuller F, Shtyrov Y, Ilmoniemi R J and Marslen-Wilson W D2006 Tracking speech comprehension in space and timeNeuroimage 31 1297–305
Ray S, Crone N E, Niebur E, Franaszczuk P J and Hsiao S S 2008Neural correlates of high-gamma oscillations (60–200 Hz) inmacaque local field potentials and their potential implicationsin electrocorticography J. Neurosci. 28 11526–36
10

J. Neural Eng. 8 (2011) 036004 E C Leuthardt et al
Saur D et al 2008 Ventral and dorsal pathways for language Proc.Natl Acad. Sci. USA 105 18035–40
Schalk G, Anderson N, Wisneski K, Kim W, Smyth M D,Wolpaw J R, Barbour D L and Leuthardt E C 2007a Towardbrain–computer interfacing using phonemes decoded fromelectrocorticography activity (ECoG) in humans Society forNeuroscience Annual Meeting (Washington, DC)http://www.sfn.org/am2007/skins/main/pdf/pressbook2sectionb_final.pdf
Schalk G, Kubanek J, Miller K J, Anderson N R, Leuthardt E C,Ojemann J G, Limbrick D, Moran D, Gerhardt L A andWolpaw J R 2007b Decoding two-dimensional movementtrajectories using electrocorticographic signals in humansJ. Neural Eng. 4 264–75
Schalk G, McFarland D J, Hinterberger T, Birbaumer N and WolpawJ R 2004 BCI2000: a general-purpose brain-computer interface(BCI) system IEEE Trans. Biomed. Eng. 51 1034–43
Schalk G and Mellinger J 2010 A Practical Guide toBrain–Computer Interfacing with BCI2000 (New York:Springer) http://www.springer.com/computer/hci/book/978-1-84996-091-5
Schalk G, Miller K J, Anderson N R, Wilson J A, Smyth M D,Ojemann J G, Moran D W, Wolpaw J R and Leuthardt E C2008a Two-dimensional movement control usingelectrocorticographic signals in humans J. Neural Eng.5 75–84
Schalk G, Pei X, Anderson N R, Wisneski K, Smyth M D, BarbourD L, Wolpaw J R and Leuthardt E C 2008b Decoding spokenand imagined phonemes using electrocorticographic signals inhumans Society for Neuroscience Annu. Meetinghttp://www.abstractsonline.com/Plan/ViewAbstract.aspx?sKey=fa317e68-3331-4f94-b0d9-6fa70986f1e4&cKey=bf311a55-8676-4aa7-92ad-51adb48eac6f&mKey=%7bAFEA068D-D012-4520-8E42-10E4D1AF7944%7d
Scott S K and Johnsrude I S 2003 The neuroanatomical andfunctional organization of speech perception Trends Neurosci.26 100–7
Sinai A, Bowers C W, Crainiceanu C M, Boatman D, Gordon B,Lesser R P, Lenz F A and Crone N E 2005
Electrocorticographic high gamma activity versus electricalcortical stimulation mapping of naming Brain 128 1556–70
Slutzky M W, Jordan L R, Krieg T, Chen M, Mogul D J andMiller L E 2010 Optimal spacing of surface electrode arraysfor brain-machine interface applications J. Neural Eng. 7 26004
Specht K and Reul J 2003 Functional segregation of the temporallobes into highly differentiated subsystems for auditoryperception: an auditory rapid event-related fMRI-taskNeuroimage 20 1944–54
Towle V L, Yoon H A, Castelle M, Edgar J C, Biassou N M,Frim D M, Spire J P and Kohrman M H 2008 ECoG gammaactivity during a language task: differentiating expressive andreceptive speech areas Brain 131 2013–27
Vansteensel M J, Hermes D, Aarnoutse E J, Bleichner M G,Schalk G, van Rijen P C, Leijten F S and Ramsey N F 2010Brain–computer interfacing based on cognitive control Ann.Neurol. 67 809–16
Wang W, Degenhart A D, Collinger J L, Vinjamuri R, Sudre G P,Adelson P D, Holder D L, Leuthardt E C, Moran D W,Boninger M L, Schwartz A B, Crammond D J,Tyler-Kabara E C and Weber D J 2009 Human motor corticalactivity recorded with Micro-ECoG electrodes, duringindividual finger movements Conf. Proc. IEEE Eng. Med. Biol.Soc. 2009 586–9
Wilson J A, Felton E A, Garell P C, Schalk G and Williams J C2006 ECoG factors underlying multimodal control of abrain-computer interface IEEE Trans. Neural Syst. Rehabil.Eng. 14 246–50
Wisneski K J, Anderson N, Schalk G, Smyth M, Moran Dand Leuthardt E C 2008 Unique cortical physiology associatedwith ipsilateral hand movements and neuroprostheticimplications Stroke 39 3351–9
Wu M, Wisneski K, Schalk G, Sharma M, Roland J, Breshears J,Gaona C and Leuthardt E C 2010 Electrocorticographicfrequency alteration mapping for extraoperative localization ofspeech cortex Neurosurgery 66 E407–9
Yuen T G, Agnew W F and Bullara L A 1987 Tissue response topotential neuroprosthetic materials implanted subdurallyBiomaterials 8 138–41
11