Speech motor control in fluent and dysfluent speech production of an individual with apraxia of...
69
Running Head: SPEECH MOTOR CONTROL IN APRAXIA OF SPEECH Speech motor control in fluent and dysfluent speech production of an individual with apraxia of speech and Broca’s aphasia Pascal H.H.M. van Lieshout, Arpita Bose, Paula A. Square, & Catriona M. Steele University of Toronto, Graduate department of Speech-Language Pathology Oral Dynamics Laboratory, Canada First author address: Pascal van Lieshout, Ph.D. University of Toronto Graduate Department of Speech-Language Pathology, Oral Dynamics Lab Rehabilitation Sciences Building 160-500 University Avenue Toronto, Ontario M5G 1V7 Canada
Transcript of Speech motor control in fluent and dysfluent speech production of an individual with apraxia of...

Running Head: SPEECH MOTOR CONTROL IN APRAXIA OF SPEECH
Speech motor control in fluent and dysfluent speech production of an individual with apraxia of
speech and Broca’s aphasia
Pascal H.H.M. van Lieshout, Arpita Bose, Paula A. Square, & Catriona M. Steele
University of Toronto, Graduate department of Speech-Language Pathology
Oral Dynamics Laboratory, Canada
First author address:
Pascal van Lieshout, Ph.D.
University of Toronto
Graduate Department of Speech-Language Pathology, Oral Dynamics Lab
Rehabilitation Sciences Building
160-500 University Avenue
Toronto, Ontario M5G 1V7
Canada

Speech Motor Control in Apraxia of Speech
Abstract
In this study, movement data from lips, jaw and tongue were acquired using the AG-100 EMMA
system from a relatively young individual with apraxia of speech (AOS) and Broca’s aphasia.
Two different analyses were performed. In the first analysis, kinematic and coordination data
from error-free fluent speech samples were compared to the same type of data from a group of
six age-matched control speakers (males & females). In the second analysis, selected movement
data from the subject’s fluent speech were compared to her dysfluent speech samples to gain
more insight into potential underlying speech motor control mechanisms. Overall, the findings
indicated that the subject with AOS and Broca’s aphasia was very similar to her age matched
controls with respect to fluent speech kinematics. However, in comparing different utterances,
specific differences in movement characteristics were identified, especially for upper lip
movements and lip coordination. Comparing these results from the fluent speech samples with
the changes in gestural motion and coordination for dysfluent speech, the fluent speech
characteristics suggest the use of compensatory motor control strategies. In particular, the
findings highlight the potential role of movement amplitude as a (de)stabilizing factor in speech
motor coordination.
2

Speech Motor Control in Apraxia of Speech
Movement characteristics and coordination in the fluent and dysfluent speech production of an
individual with apraxia of speech and Broca’s aphasia
Apraxia of Speech (AOS) is typically described as a motor-speech disorder,
demonstrating a limited ability to translate a presumably correct linguistic code into appropriate
motor events (McNeil, Robin, & Schmidt, 1997; McNeil, Pratt, & Fosset, 2004). AOS is
characterized by apparent disruptions in movement transitions within and between speech
segments, leading to prolonged durations of individual speech sounds and of the transitions
between sounds, syllables or words. These distortions are often perceived as sound substitutions
and prosodic abnormalities (McNeil et al., 1997). Although the focus in the literature is on
temporal characteristics (timing, sequencing), it has been argued that AOS also includes
problems in spatial aspects of movement control, such as reaching specific spatial targets in the
vocal tract for specific sound productions (Square, Roy, & Martin, 1997).
Most current theories regarding AOS propose that its core problem must reside at a stage
of speech motor production during which an abstract linguistic code is transformed into a
command that can be implemented by the speech motor execution system (e.g., McNeil et al.,
1997; Aichert & Ziegler, 2004; and McNeil et al., 2004 for a review). There is little concrete
information about this hypothetical stage, but it has been suggested that it utilizes a repository of
abstract motor templates (Levelt & Wheeldon, 1994; Roelofs, 1997; Levelt, Roelofs, & Meyer,
1999). Based on this notion, some researchers claim that people with AOS have a problem in
accessing this motor lexicon and are therefore forced to build motor “plans” from scratch each
time they engage in speech production (Whiteside & Varley, 1998; Varley & Whiteside,
2001),which would correspond to the laborious and time consuming nature of their speech. This
3

Speech Motor Control in Apraxia of Speech
theory has been criticized for various reasons (Ballard, Barlow, & Robin, 2001; Ziegler, 2001).
Although there is some recent support for the existence of a syllable based motor lexicon
(Cholin, Schiller, & Levelt, 2004, cf. Meyer, 1997), claims about ‘motor lexicon’ issues in AOS
have found little support (Aichert et al., 2004).
Many accounts of the nature of motor problems in AOS focus on the planning of
individual articulator movements. In a recent study, Clark and Robin (1998) suggested that a
given individual with AOS might have limitations in either the abstract planning or the specific
muscle command specification (but not both) of non-verbal oral motor tasks. Clark and Robin
based the explanation of their findings on Schmidt’s Schema Theory (Schmidt, 1988), which
draws a distinction between abstract generalized motor plans (i.e., not related to a specific
effector system) and concrete motor programming (specifying force and temporal aspects of
muscle activation) in limb control. A similar distinction has been proposed for speech production
(e.g., Sternberg, Knoll, Monsell, & Wright, 1988; van Lieshout, 1995; Van der Merwe, 1997). In
a recent review paper, McNeil (McNeil et al., 2004) endorsed this “planning and programming”
model to explain the origin of speech motor problems in AOS. Although such an approach may
provide some useful descriptors for differences in individual movement characteristics between
speakers with AOS and controls, it is limited in its ability to address a very basic feature of AOS,
namely the apparent problem in coordinating articulators with respect to a common task goal
(e.g., McNeil et al., 1997; Square et al., 1997; Blumstein, 1998).
Unfortunately, experimental evidence for coordination problems in AOS is based on a
limited number of studies, and among these only a few have looked at the behaviors of multiple
articulators simultaneously (e.g., Itoh, Sasanuma, Hirose, Yoshioka, & Ushijima, 1980; Ziegler
& von Cramon, 1986). The majority of studies in this area have focused on single articulator
4

Speech Motor Control in Apraxia of Speech
data, for example, movements of the velum (Itoh, Sasanuma, & Ushijima, 1979), lower lip
(McNeil, Caligiuri, & Rosenbek, 1989; McNeil & Adams, 1991), vocal folds (Hoole, Schröter-
Morasch, & Ziegler, 1997), or tongue (Hardcastle, 1987; Katz, Bharadwaj, & Carstens, 1999).
Other studies have analyzed acoustic events associated with the coordination of lip motion and
phonation onset commonly referred to as voice onset time (e.g., Freeman, Sands, & Harris, 1978;
Itoh et al., 1982; van der Merwe A., Uys, Loots, Grimbeek, & Jansen, 1989; Baum & Ryan,
1993). Overall, these findings suggest that coordination in people with AOS is more variable
compared to normal speakers and that movement sequences are more segregated (i.e., showing
reduced temporal cohesion). However, since most speakers with AOS also speak at a slower rate,
it remains unclear if coordination is indeed a problem in itself, or if the observed variability and
movement segregation is an epiphenomenon of the slower movement rate instead (see also
McNeil et al., 1989; Adams, Weismer, & Kent, 1993).
To address this issue appropriately, one has to realize that coordination is more than just a
simple summation of individual movements in time and space. This was emphasized and
demonstrated many years ago by the Russian scientist Bernstein (1967), who argued that it is
essential to create a functional dependency relationship (or synergy) between the individual
components of a complex system (e.g., speech) that are involved in the execution of a specific
task, in order to reduce the various control degrees of freedom (see also Turvey, 1990; Kelso,
1995). Coordination thus provides efficiency and compensatory flexibility to a complex control
system, so that even when a single component structure is damaged, task goals can still be
accomplished by compensatory coupling of the damaged structure to other structures that remain
functional (see e.g., van Lieshout, Rutjens, & Spauwen, 2002). Therefore, in order to understand
the nature of speech production problems in AOS, we need to gain a better understanding of the
5

Speech Motor Control in Apraxia of Speech
potential limitations that exist in speech motor coordination, in addition to and beyond the
presence of ‘abnormal’ individual movement characteristics.
To address this issue, we favour a theoretical perspective which focuses on coordination
as a phenomenon on its own, instead of treating it as a derived characteristic of individual
movements combined in time and space. This perspective is elegantly represented in the speech
production models of Articulatory Phonology (Browman & Goldstein, 1992) and Task Dynamics
(Saltzman & Kelso, 1987), which we will jointly refer to as “Articulatory Dynamics Theory” or
ADT. For the reader who is less familiar with these models, we will briefly summarize the basic
concepts of this model in relation to coordination at the different levels of speech production,
because it has informed the way we have analyzed the kinematic data in this study.
In ADT the basic unit of speech production is the gesture, which is defined as a task-
specific neural activation pattern in control of a flexible assembly of individual articulators to
create a local constriction inside the vocal tract (Browman & Goldstein, 1990). Figure 1 shows a
simplified diagram of the different levels of coordination defined in ADT, using time-aligned
real movement data for the production of a bilabial stop to illustrate the degree of abstraction at
each level.
[Insert figure 1 about here]
At the highest (i.e., most abstract) level we find the gestural representation, in this case a single
task specification for bilabial closure. At this level, neural activation patterns govern the overall
degree and location of vocal tract constrictions. The trajectory shown does not depict actual
activation levels, but rather an abstract representation of the gestural involvement for this type of
task, with a predominant closing component (downward trace). At the next level are the
dimension-specific task implementations, which are referred to as tract variables in ADT
6
Speech Motor Control in Apraxia of Speech
terminology. They are separate representations for lip aperture (vertical dimension) and
protrusion (horizontal dimension) components. Finally, at the lowest (i.e., most direct
observable) level, each tract variable specification is mapped onto a specific articulator, which
requires a downward movement for the upper lip, and (distinctly different) upward movements
for lower lip and mandible in this example for lip aperture. The nature of the coupling or
coordination between the individual movements of the lips and jaw is constrained within the task
specification of the original gesture. This low level type of coordination will be referred to as
intra-gestural coordination (cf. Saltzman, Löfqvist, Kay, Kinsella-Shaw, & Rubin, 1998). The
main influence on this type of coordination can be assumed to have a more peripheral
(physiological/ biomechanical) origin (cf. Saltzman & Munhall, 1989; Fowler, 1995) as for
example, induced by changes in movement rate and/or force.
The production of linguistic units such as words and/or syllables involves more than a
single gesture. For example, even a simple VCV sequence like /api/ requires the coupling of two
different gestures involved in tongue body constriction (tongue body + jaw) and bilabial closure
in order to produce the proper acoustic events. This type of coordination is specified at the
gestural level (top level box in figure 1) and will be referred to as inter-gestural coordination.
Although physiological/biomechanical constraints may play a role through the influence of
individual articulators (see below), it is at this level of coordination that linguistic (and other
higher order) constraints are incorporated in the form of specific speech task requirements
(Fowler, 1995). Such influences are traceable through for example, word stress and syllable
structure manipulations (e.g., van Lieshout, Hijl, & Hulstijn, 1999).
Based on this approach, intra- and inter-gestural coordination measures tap into different
levels of speech motor control. This is a highly relevant distinction for individuals with AOS,
7

Speech Motor Control in Apraxia of Speech
because recent publications suggest that AOS involves differential deficits for tasks involving
abstract versus more concrete (muscle specific) stages of motor preparation (Van der Merwe,
1997; McNeil et al., 2004).
Although ADT provides a very useful theoretical framework in which to explore different
levels of coordination, it has been less explicit about some of the fundamental principles
underlying the nature and stability of interaction between coupled articulators. These principles
have received more attention in a related theoretical framework called Coordination Dynamics
(Kelso, 1995; Kelso, 2000). Space does not permit a detailed account of this theory, but
interested readers are referred to two recent papers in which the basic concepts of Coordination
Dynamics are explained in the context of speech research (van Lieshout et al., 2002; van
Lieshout, 2004). For this study, it is important to know that Coordination Dynamics theory
proposes that specific intrinsic properties of the articulators exert a strong influence on the nature
and stability of a task-specific coupling (Kelso, 1995). In particular, frequency and amplitude
changes in the primary motions of articulators are claimed to (de)stabilize existing coordinative
patterns (Buchanan, Kelso, deGuzman, & Ding, 1997; Fink, Foo, Jirsa, & Kelso, 2000; van
Lieshout et al., 2002) when certain critical thresholds are exceeded. This type of nonlinear
relationship between kinematic properties and coupling stability (coordination) is important to
explore in the context of a speech disorder like AOS in order to understand potential sources of
interruptions in the fluency of speech production (see also Bose, van Lieshout, & Square, 2003
for a similar approach with aphasic subjects). It is also important to investigate whether different
levels of coordination (intra- and inter-gestural) are equally influenced by such kinematic
properties. One would expect that lower levels of coordination might be more susceptible to
8

Speech Motor Control in Apraxia of Speech
dynamics properties of individual movements, but as recently shown, low level dynamics do
influence higher order (inter-gestural) coordination patterns (Saltzman et al., 1998).
The Present Study
In the present study, we recorded the movements of upper lip, lower lip, tongue tip,
tongue body and jaw for a young adult female speaker with AOS and Broca’s aphasia. This
subject was a fairly unique case, as she was at an age (30 years) where cerebrovascular accidents
are infrequent (Nightingale & Farmer, 2004; Petitti, Sidney, Quesenberry, & Bernstein, 1997).
Her clinical profile has been defined in great detail in a different manuscript documenting the
effects of a specific speech motor therapy (Bose, Square, Schlosser, & van Lieshout, 2001).
Given her relatively young age, we were able to study speech motor behaviors unaffected by the
age related changes that are inevitably part of the speech presentation of older populations of
patients with AOS, such as those used in the majority of (speech) movement studies in this area
(e.g., see Sosnoff, Vaillancourt, & Newell, 2004 for the effects of aging on the adaptability to
coordinate multiple neural oscillators in rhythmical force production). As appropriate reference
data for this age category are lacking for the type of measures used in this study, it was deemed
necessary to compare our subject’s fluent speech motor characteristics to a group of age matched
male and female control speakers to incorporate gender-specific variations in speech motor
parameters (Simpson, 2001). In performing these tests, the main purpose is to establish whether
these movement variables can differentiate fluent speech samples of our subject with AOS and
Broca’s aphasia from similar data collected from normal speakers and thus provide a potential
window on basic speech motor control issues in this population. Similar strategies have been
used in other populations with speech problems, for example in people who stutter (van
Lieshout, Hulstijn, & Peters, 1996).
9

Speech Motor Control in Apraxia of Speech
In the second part of our analysis, we compared specific kinematic and coordination
measures acquired during fluent speech production of our subject with the same measures
gathered from samples containing dysfluent speech. This allowed us to speculate about
underlying speech motor control mechanisms, especially with regard to the presence of
compensatory strategies in the control of fluent speech (van Lieshout, Hulstijn, & Peters, 2004).
To our knowledge, such an explicit and detailed comparison has not been performed thus far and
may shed some light on the sometimes conflicting results on kinematic characteristics of AOS as
presented in the literature. In addition, as set out in the previous sections, it can be used to
evaluate some of the earlier claims on the appropriateness of using the ADT model for studying
speech motor behaviors in AOS (Kelso & Tuller, 1981), in particular with respect to a potential
disruption of the coupling between articulators and/or gestures as the basic source of error in this
population (see also Ziegler et al., 1986).
Methods
Subjects
The experimental subject was a 30-year-old right-handed female, highly educated and a
native speaker of Canadian English (AS). She suffered a left-hemisphere cerebrovascular
accident (CVA) secondary to hemorrhage from the rupture of a congenital arteriovenous
malformation. A large lesion occupying the left frontoparietal occipital region was evident on CT
scans one month after the incident. At that time, she was characterized as having severe non-
fluent Broca’s aphasia with pronounced oral and verbal apraxia and a right hemiparesis.
At the time of this study, she was 13 months post-onset. A summary of a detailed speech
and language assessment, which included both standardized and non-standardized measures,
appears in table 1 (for more details see Bose et al., 2001).
10

Speech Motor Control in Apraxia of Speech
[Insert table 1 about here]
Spontaneous language samples were characterized by short phrases and grammatically
simple constructions marked by agrammatic errors. In general, speech was slow and labored,
showing initiation difficulties, articulatory groping, visible and audible searching, self-rehearsals,
phonemic errors and distortions, difficulty in sequencing movements with increased utterance
length, and varied off-target attempts at words. Naming tasks revealed word-finding difficulties,
including circumlocutory responses, and both semantic and phonemic paraphasias. Repetition
was impaired for phrases greater than seven syllables in length. AS exhibited less difficulty
producing automatic versus volitional speech. Apart from her mild right facial hemiparesis, a
detailed motor speech examination revealed no significant abnormalities in muscle tone or
strength, and no classifiable dysarthria as defined by Duffy (Duffy, 1995). Prior to participating
in this study, she had completed a year of in-patient and outpatient rehabilitation, which included
general speech and language treatment, physical and occupational therapy. However, she did not
receive any specific speech motor based interventions. Based on her clinical profile our subject
fits the necessary and sufficient criteria for the differential diagnosis of AOS as proposed by
McNeil et al. (2004).
The reference group of normal speaking subjects (NS) consisted of 6 young adults (4
females and 2 males) of comparable age to our subject with AOS (mean age = 27.7 years, SD =
4.3 years, range = 23-35 years) and with comparable educational experience. They all used
English as their first language and had no reported history of speech, language, or hearing
problems.
11

Speech Motor Control in Apraxia of Speech
Experimental Tasks
All subjects repeated one of three different non-word1 tasks ([���], [���], & [�������) in a
single trial for about 12 seconds in a preferred rate. We refrained from imposing a specific
speech rate on our subjects, given potential limitations in controlling speech at different rates for
patients with AOS2 (Ziegler, 2002) and also because we wanted to assess speech motor control
under normal rate circumstances, as fast and/or slow rates show atypical signal characteristics
(Westbury & Dembowski, 1993; van Lieshout & Moussa, 2000) and potentially also differ in
terms of neural control (Wildgruber, Ackermann, & Grodd, 2001).
The bi- and tri-syllabic stimuli were selected in order to allow the study of both intra
(between single articulator movements) and inter (between consonant and vowel gestures)
gestural levels of coordination within a single task. We used these non-words to focus our
attention on processes at or below the level of phonology, as this is where speech problems for
people with AOS are believed to have their origin (see introduction). These specific tasks have
been shown to differ in ease of articulation (van Lieshout et al., 2000; van Lieshout, Hulstijn,
Alfonso, & Peters, 1997). Our approach follows a common practice of using non-words either
embedded in a stereotypical short sentence frame or simply being reiterated to detect limitations
in speech motor control (e.g., Ackermann, Hertrich, & Hehr, 1995), even though certain problem
areas in AOS may be underestimated when compared to more natural speech production
(Ziegler, 2002).
The three tasks will be referred to as API, IPA and PTK. Each task involved a bilabial
closure gesture for a voiceless stop [p] and tongue body constriction gestures for vowel
1 The term non-word is defined here as a pronounceable meaningless string of letters with a well-defined syllabic structure.2 Our original instruction to the subject with AOS was to change rate while reiterating the stimuli, but she was notable to do so and we allowed her to repeat all tasks at her own preferred rate.
12
Speech Motor Control in Apraxia of Speech
alternations. We will refer to each reiterated speech task as a trial-set. Trial-sets for the three
tasks used in this study were embedded in a larger block of trial-sets with other stimuli (not
reported here). For all speakers, the target trial-sets were extracted from 2 sessions conducted on
different days to allow for normal day-to-day variation in kinematic parameters (Alfonso & van
Lieshout, 1997). For AS who participated in a speech motor therapy as part of a different study
mentioned above (Bose et al., 2001), only baseline data were used to avoid any potential therapy
based influences.
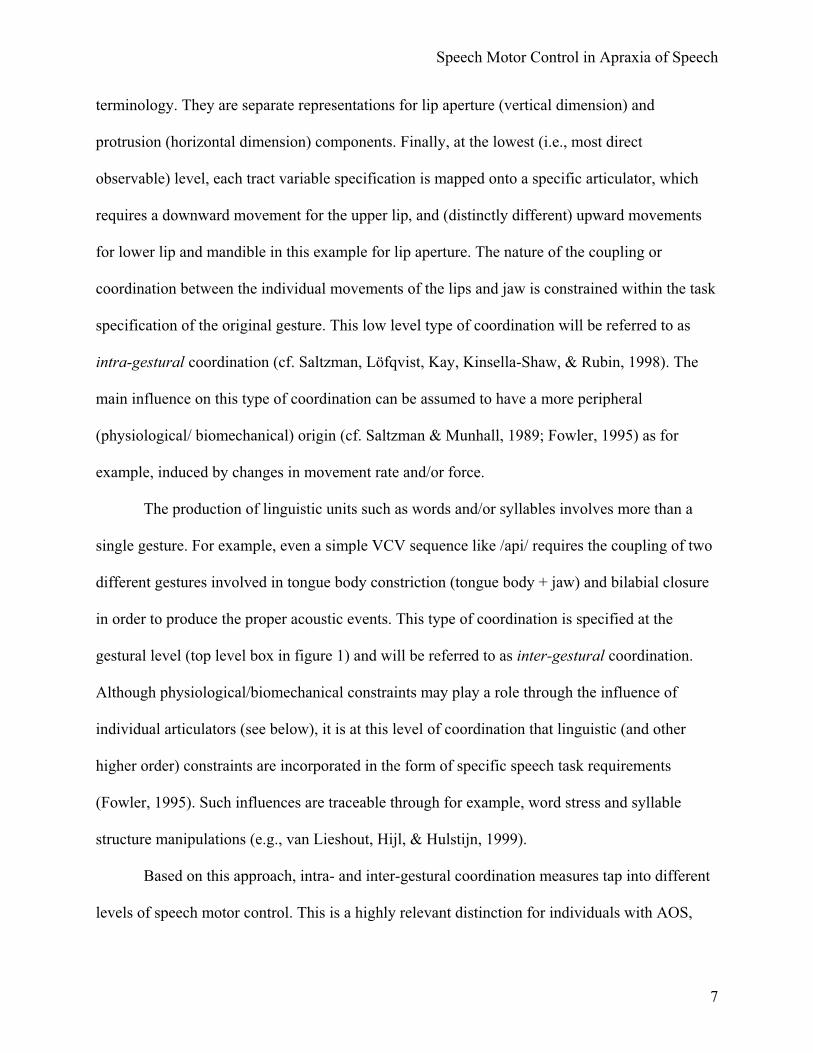
Instrumentation
All data were collected using time-aligned audio and Electro-Magnetic Midsagittal
Articulography (EMMA) position signals from the AG100 system (Carstens Medizinelektronik,
GmbH, Germany) with a large helmet size (62 cm diameter) and automated calibration. All
position data were sampled at 400 Hz, while acoustic data were acquired at 16 kHz. Further
details about this equipment are described elsewhere (van Lieshout et al., 2000).
Procedures
Transducer coils were attached to the midline positions of the vermilion border of upper
and lower lip, the posterior surface of a thin thermo-plastic custom made mould covering the
lower incisors, the tongue blade (1 cm behind tongue tip), the tongue body (3 cm behind tongue
blade coil), and tongue back (approximately 2 cm behind tongue body coil). Two additional coils
were attached to the gums of the upper incisors and the bridge of the nose to detect (and correct
for) head movements. All coils were attached with surgical methacrylate resin (Cyanodent,
Ellman International Mfg.).
Following coil attachment, we measured the occlusal bite plane, using a plastic device
with two coils attached in the midline at a fixed distance of 3 centimeter. Subjects held the
13

Speech Motor Control in Apraxia of Speech
device in their mouth using their teeth for about 3 seconds. The upper incisors touched the device
just behind the posterior transducer coil (cf. Löfqvist, 1991; van Lieshout et al., 2000). For
speech data collection, a computer monitor was positioned at a distance of 1.5 meters in front of
the chair in which subjects were seated. An acoustic and visual warning signal indicated the
upcoming presentation of a stimulus on the screen. Each stimulus was presented on the center of
the screen in a large font for about 4 seconds. During this preparation interval, the subject also
received a warning to take a deep breath to allow him/her to repeat the stimulus for 12 seconds in
a single breath (if possible). After the preparation interval, another acoustic and visual signal
indicated to the subject to begin repeating the stimulus according to the specified rate
instructions (see above). The stimulus remained in sight throughout as a reminder. After 12
seconds the stimulus would disappear from the screen and an acoustic signal indicated the end of
a trial-set. Subsequent trial-sets were initiated when the subject indicated that he/she was ready.
Data processing
Movement data were smoothed using an 11-point triangular filter (effective low pass
frequency 27.5 Hz) prior to processing. Subject-specific occlusal plane data were rotated to align
them with the EMMA horizontal axis. Thus, a uniform coordinate reference frame was
established for all subjects (Westbury, 1994). For the individual articulator data, movement
signals were band-pass filtered with a 7th-order Hamming windowed Butterworth filter using 6.0
Hz and 0.1 Hz as the high and low cut-off points. This procedure removes DC drift and higher-
frequency noise components but preserves the main motion components (van Lieshout et al.,
2000). For the kinematic measurements, lower lip signals were corrected for jaw movements
using an estimate of jaw rotation based on the principal component of the mandible coil
trajectory (Westbury, Lindstrom, & McClean, 2002). Compared to a simple subtraction method,
14

Speech Motor Control in Apraxia of Speech
which ignores jaw rotation, this method reduces positional and speed errors by approximately
65-70% (Westbury, 1988; Westbury, Lindstrom, & McClean, 2002).
To study inter-gestural coordination, we calculated a gestural measure of bilabial closure
(BC) as the two-dimensional Euclidean distance between the upper lip and the lower lip plus
mandible. Similarly, the gestural position of the tongue tip/blade (TT) and tongue body (TB)
coils was calculated as the two-dimensional Euclidean distance from the nasal reference coil. By
convention, gestural measures will be labeled using uppercase letters. Similar procedures for
incorporating both vertical and horizontal displacement to reflect the abstract task dependent
nature of gestures (see figure 1) have been reported previously in the speech literature (Saltzman,
Byrd, Saltzman, & Byrd, 2000; Byrd & Saltzman, 1998). Figure 2 shows an example of a PTK
trial-set for a control subject, with position information for the three gestures TB, TT, and BC, as
well as for the vertical (up/down) dimension of the upper lip (uly), lower lip (lly), and jaw (jwy)
motion (see below for more information on these variables). Notice that for the gestural data,
downward displacement of the waveform indicates a smaller combined XY distance relative to
the nose coil (i.e., effectively a movement towards the palate or a high degree of constriction).
The rectangular shape defines the virtual boundaries (between successive bilabial closures) for a
single PTK utterance. The upper two panels show the spectrogram and acoustic waveform
respectively. For orientation purposes only, the approximate “target” positions for [p], [t], and
[k] are labeled.
[Insert figure 2 about here]
Dependent variables
Following the data processing procedures described above, kinematic parameters were
derived from the movement data. Details about these procedures can be found elsewhere (van
15

Speech Motor Control in Apraxia of Speech
Lieshout et al., 2002; van Lieshout et al., 2000). For this study, we focused on three traditional
kinematic measures, namely movement duration (DUR in ms), peak velocity (PV in mm/s) and
amplitude (AMP in mm; i.e., movement range from valley to peak and vice versa) and three
derived parameters: kinematic stiffness (STIF = peak velocity/amplitude in 1/s), velocity profile
parameter (VPP in a.u., in the literature also referred to as constant C = stiffness * duration, e.g.,
Munhall, Ostry, & Parush, 1985), and velocity profile symmetry index (VPS in %, in the
literature also referred to as % time to peak velocity, e.g., Adams et al., 1993). These parameters
are based on a frictionless mass-spring model of single axis motions (e.g., Perkell, Zandipour,
Matthies, & Lane, 2002). According to this model, stiffness acts as the control parameter for
frequency of oscillation (or resistance to change in motion) and it has been suggested that it can
be an important parameter for describing motor control differences in populations with speech
disorders (e.g., Ackermann, Hertrich, & SCHARF, 1995). VPP is an index for the shape of the
velocity profile (e.g., 1.7 indicates a single-peaked shaped profile), and VPS is an index of the
relative time spent on acceleration during opening and closing movements (with a value of 50%
indicating a perfectly symmetrical velocity profile with equal time allotted to acceleration and
deceleration). These mass-spring model based measures have been discussed at length in the
literature on normal speakers (e.g., see Adams et al., 1993; van Lieshout et al., 2000; Perkell et
al., 2002; Munhall et al., 1985; Shaiman, Adams, & Kimelman, 1997) and to some extent, they
have also been used in studies for speakers with AOS (e.g., McNeil et al., 1991). Specific
changes in these parameters are assumed to reflect differences in motor control strategies (see
also Perkell et al., 2002 for a discussion of this topic), that is, these parameters may be sensitive
to motor control differences between normal speakers and AOS that are not detectable in the
more traditional measures of movement amplitude, peak velocity and duration (see also
16

Speech Motor Control in Apraxia of Speech
Ackermann et al., 1995). Earlier studies (e.g., Forrest, Adams, McNeil, & Southwood, 1991)
have shown for lower lip that differences between normal speakers and speakers with AOS were
most prominent for closing movements. Thus, we restricted our analysis of individual
articulators to closing movements, which were labeled as follows: upper lip (uly), lower lip (lly),
tongue body3 (tby), and jaw (jwy).
In a recent review, McNeil suggested that higher coefficients of variation (CV) values for
peak velocity might be a distinctive feature of AOS (McNeil et al., 2004). CV’s indicate how
consistently a speaker is able to achieve the same values for a given movement target during the
repetition of a task. To test this assumption for our subject, we included CV’s for the peak
velocities of the articulators of interest mentioned above.
In addition to these individual kinematic parameters, we also calculated a cyclic spatio-
temporal index (cSTI) (van Lieshout et al., 2002) based on the STI measure described by Smith
and colleagues (Smith & Goffman, 1998; Smith, Goffman, Zelaznik, Ying, & McGillem, 1995).
CSTI values reflect pattern variability across individual movement cycles and thus can be used to
identify (short-term) changes in the stability of speech motor execution. In order to calculate
cSTI, individual orientation-specific movement cycles, defined by the peaks and valleys in the
signal, are amplitude- and time-normalized and aligned with each other. Separate standard
deviations for the overlapping segments are then computed at 2% intervals in relative time. CSTI
is defined as the sum of these standard deviations within a plane of movement (vertical or
horizontal). Figure 3 shows an example of a cSTI analysis for the same upper lip and lower lip
data depicted in figure 2 (PTK task) with the original and filtered signals (as used for the
analysis), and the segmented individual cycles (raw, amplitude & time normalized). As shown,
both lip movements were highly stable (= consistent) in this example.
3 Tongue blade movements were only used to obtain information on inter-gestural coordination in the PTK task.
17

Speech Motor Control in Apraxia of Speech
[Insert figure 3 about here]
To measure coordination between individual articulators and between gestures, we
employed a new approach compared to that used in previous studies (e.g., van Lieshout et al.,
2002). First, we applied a cross-spectral coherence analysis (e.g., Aoyagi, Ohashi, Tomono, &
Yamamoto, 2000; Boose, Spieker, Jentgens, & Dichgans, 1996; Kay, 1988). With this technique
we can measure the correlation between individual spectral bins of Fourier transformed position
signals with a resolution of 0.1 Hz (van Lieshout, 2001). A high correlation ratio for a given
spectral component indicates a strong entrainment between the two signals at that particular
frequency. Figure 4 shows an example of a cross-spectral analysis for TB and BC signals for the
same trial-set as depicted in figure 2 (PTK task). The graph shows strong and highly correlated
peaks at 2.8 Hz in both signals. We refer to these spectral components as motion primitives (van
Lieshout, 2001) in line with recent models of motor control where movement signals are treated
as combined influences of neural pattern generators (Bizzi & Mussa-Ivaldi, 1998; Woch &
Plamondon, 2004). The dominant motion primitive for each trial-set (at the frequency showing
the highest power and/or the highest spectral correlation across the two signals) was selected as
the input for the subsequent relative phase analysis, because it provides a clean estimate of the
main control influence on the motion pattern across time.
[Insert figure 4 about here]
Relative phase provides a time and amplitude normalized index of relative timing
between two articulators or two gestures (Kelso, Saltzman, & Tuller, 1986; van Lieshout et al.,
2002). To this end, point-differentiation was used to obtain velocity versus time functions from
the position signals. The position and velocity signals were then band-pass filtered using the
dominant peak (identified in the cross-spectral analysis procedure described above) as the center
18

Speech Motor Control in Apraxia of Speech
frequency (± 0.2 Hz). These signals were processed in a standard way (e.g., van Lieshout et al.,
2002) to obtain continuous estimates of relative phase. For intra-gestural coordination we
calculated relative phase signals for upper lip and lower lip motions, whereas for inter-gestural
coordination we calculated relative phase signals for BC vs. TB in API and IPA tasks. For PTK,
we made two comparisons in order to differentiate between phase coupling for tongue and lip
movements related to bilabial and alveolar sound productions (/p/ vs. /t/: TT vs. BC) and for
tongue movements related to alveolar and velar sound productions (/t/ vs. /k/: TB vs. TT). All
relative phase variables are expressed in degrees.
To measure the stability of coordination, we used the within-trial-set (circular) standard
deviation of relative phase (van Lieshout et al., 2002; van Lieshout, 2004; Kelso, 1995). Figure 5
displays an example of a relative phase signal for the same tongue body constriction (TB) and
bilabial closure (BC) gestures shown in figure 4 at 2.8 Hz. In this example, the coupling is very
stable (SD = 6.03 deg) at 271 deg, a typical value found for this type of task (van Lieshout,
2001).
[Insert figure 5 about here]
For the present study, the following dominant motion primitive values were derived for
intra- and intergestural coordination calculations. For AS the average (across trials) and standard
deviation (SD) values for the dominant motion primitives were 1.8 (0.25) Hz, 1.7 (0.19) Hz and
2.3 (0.36) Hz for API, IPA and PTK respectively. For our group of control speakers the average
(across trials and subjects) and SD values for API, IPA and PTK were 1.9 (0.39) Hz, 2.0 (0.41)
Hz, and 2.0 (0.59) Hz. Differences are small, but do notice that whereas controls show virtual no
task related changes, AS had higher values for PTK compared to API and IPA. All values are
well within normal limits for rate variations in speech production.
19

Speech Motor Control in Apraxia of Speech
Speech sample selection
All trial-sets from our subject with AOS were screened for errors in performance and/or
the presence of disfluencies. Only portions that were spoken in a perceptually correct and fluent
way, and for which the kinematic data revealed no obvious errors or deviations (e.g.,
interruptions of ongoing movements) were selected for the first part of the results section of this
study. For the control speakers we also selected only error-free speech samples. In this we
followed procedures developed over the years for extracting fluent speech samples from
physiological data in people who stutter (e.g., van Lieshout et al., 1996).
For the second part of the results section of this study, we only used data from AS. We
coded samples of her kinematic data as either error free (i.e., as defined for part 1) or containing
errors of several different types: initiation difficulties, articulatory groping, visible and audible
searching, self-rehearsals, phonemic errors and distortions, difficulty in sequencing movements,
and off-target attempts at tasks. Errors related to technical difficulties or pauses related to
inhalation before the end of a trial-set was reached were not included in these samples. Given the
inherent difficulty in making accurate decisions on the exact nature of these speech problems,
and the fact that there would not be sufficient occurrences of each of these categories, we did not
further attempt to classify the errors. Instead, we simply labeled stretches of speech containing
such errors as dysfluent speech. In addition, we separately coded the 1-second intervals
preceding the onset of each dysfluent speech interval to determine if specific kinematic changes
occurred prior to the onset of overt dysfluent speech behaviors. This could provide useful
preliminary information regarding mechanisms that potentially give rise to interruptions of fluent
speech (van Lieshout et al., 2004). Figure 6 shows a typical example of a coded trial-set, with ‘1’
indicating intervals of normal fluent speech, ‘2’ indicating 1-second intervals immediately
20

Speech Motor Control in Apraxia of Speech
preceding sections of dysfluent speech, and ‘3’ indicating intervals of overt dysfluent speech.
[Insert figure 6 about here]
Statistical analysis
For part 1 of the analysis, the data that are shown for each dependent variable are
averaged across the extracted error-free speech samples for each task separately. Comparing a
single individual to a group of subjects has its challenges, but it is a fairly common procedure in
cognitive neuropsychology case studies. From this literature, recent papers discussed and
promoted the use of a statistical approach as opposed to a less rigorous comparison with only
descriptive statistics (Mitchell, Mycroft, & Kay, 2004; Crawford, Garthwaite, Howell, & Gray,
2004; Mycroft, Mitchell, & Kay, 2002). We applied the F-test (repeated measures ANOVA)
proposed by Mycroft and colleagues (Mycroft et al., 2002). In order to correct for possible
differences in the population variance between normal speakers and patients with AOS, it is
required to adjust the F-criteria for these tests. There are no reliable kinematic reference data to
estimate such a potential difference, but for comparing fluent speech samples we adopted a
cautious 1.5:1 ratio, which at the 0.05 level would require us to accept a difference as significant
when the F-ratio is 10 or higher. This is a rather conservative approach (Crawford et al., 2004),
which is why we did not use further (Bonferroni) corrections to account for the fact that we are
testing multiple dependent variables. With these modified F-criteria, a significant finding would
indicate a true difference in the mean score of AS when compared to the scores of NS.
Differences which were not found to be significant under the stringent criteria applied here, but
showed a trend as defined by a more relaxed p-value (< .1), with an uncorrected F-value at df
(1,5) = 4.06 as a lower limit, will be highlighted as well. As mentioned in the introduction, in
performing these tests, the main purpose was to establish whether and how these movement
21

Speech Motor Control in Apraxia of Speech
variables differentiated fluent speech samples of AS from normal speakers and would warrant
further scrutiny in future studies. To this end, we also needed to demonstrate that our tasks did
challenge AS in terms of producing fluent speech. A useable estimate for this is the average
length of time of fluent speech per trial set for each task; smaller values basically mean more
speech errors for a given task. In our analysis, we used AS versus NS as our “GROUP” factor
(between-subjects) and TASK (API, IPA, & PTK) as our within-subject factor. Separate analyses
were performed for individual articulator closing movement parameters (upper lip, lower lip,
tongue body, & jaw) and coordination data (intra- and inter-gestural). Main effects for TASK
were further explored using Tukey-Kramer post-hoc tests to identify individual task differences.
For part 2 of the analysis, we averaged the data within the coded sections (CODE) for
each task. For this analysis, we selected movement range (AVAMP), peak velocity (AVPV) and
duration (AVDUR) for the bilabial closure (BC) and tongue body constriction (TB) gestures in
API and IPA and for tongue body constriction (TB) and tongue tip/blade (TT) constriction
gestures for PTK. This focus was mostly for practical reasons, but it is also at this higher level of
motor coordination that the current literature suggests AOS might be expected to express itself
most clearly (e.g., McNeil et al., 2004). In addition to these individual gesture data, inter-gestural
relative phase mean and within-trial-set variability values (for the dominant motion primitive)
were included in this analysis. We performed a within-subject ANOVA with GESTURE (TB and
BC in API/IPA, and TT and TB in PTK) and CODE (intervals #1, #2 or #3) as independent
variables for the kinematic data, and an analysis on TASK (API, IPA, & PTK) and CODE for
inter-gestural coordination (TB with BC for API & IPA, TB with TT for PTK), with the alpha
level set at p < .05. Tukey-Kramer post-hoc tests were used where appropriate. All statistical
tests were performed with Number Cruncher Statistical Software (NCSS) 2000 (Hintze, 1998).
22

Speech Motor Control in Apraxia of Speech
Results
Before presenting the kinematic and coordination data, we will report the test results for
the average duration (in seconds) of the error free speech intervals per trial set for each task. The
data are shown in figure 7. Overall, AS had shorter stretches of fluent speech (within a trial set)
compared to NS, but the difference is especially clear for the IPA and PTK tasks. NS showed
virtually no difference across tasks. Although the main GROUP difference failed to reach
significance [F(1,7) = 3.72, p = 0.95], but the main trends for TASK [F(2,14) = 8.43, p = .004]
and the GROUP x TASK interaction [F(2,14) = 5.85, p = 0.014] confirmed the task specific
reduction in fluent speech for AS. Thus, our tasks, in particular IPA and PTK were challenging
to AS. This was also our impression while listening to her speech during the experiment. The
difference between API and IPA confirms the findings from earlier studies on normal speakers,
where it was found that IPA proved to be more difficult to articulate at higher speeds than API
(van Lieshout et al., 2000; van Lieshout et al., 1997).
[Insert figure 7 about here]
Part 1
Table 2 presents the means and standard deviations (SD) for all kinematic data, shown separately
by task and articulator. The repeated measures ANOVA test results are summarized in table 3.
From these tests results it is clear that none of the kinematic variables indicated a significant
difference between fluent speech samples from AS and NS. In fact, based on the distributional
characteristics of the NS data, we estimated that in order to find a significant difference4, AS
should have shown means that would be minimally 2.2 times the SD of the control speakers
(across tasks). We calculated the appropriate lower and upper limits of this distribution, rescaled
it to a 100% range and plotted AS’ values (across tasks) in this range to indicate how her data
23

Speech Motor Control in Apraxia of Speech
fitted this distribution. To clarify, statistical significance would only be obtained for values
falling above or below this range (figure 8).
[Insert tables 2 & 3 and figure 8 about here]
Clearly, most variables fell in the 30-70% midrange, and only three upper lip variables (AMP,
PV, and VPP) reached a position above the 70% mark of the distribution. For uly AMP and PV,
this is confirmed by a trend towards a GROUP difference (table 3).
Some variables showed a significant effect or trend for a GROUP x TASK interaction
(table 3). Significant interaction effects were obtained for tby duration and tby VPP contrasts
(figure 9). Both variables show similar patterns for AS; higher values for API and IPA, lower
values for PTK compared to NS. In fact, for duration, NS showed hardly any task differences
whereas for VPP, their data showed an almost linear increase from API to PTK. Trends were
found for jwy AMP, uly PV, lly PV, jwy PV, uly DUR, and tby cSTI (see tables 2 + 3). The
trend for jwy AMP and PV indicated that AS showed clearly higher values for API, smaller
differences for IPA and no difference for PTK when compared to NS. For uly PV, PTK showed
a much stronger increase in peak velocity for AS when compared to NS. For uly duration, the
difference was similar to what was found for tby duration, viz. NS showed no task difference,
but AS showed a marked decrease in duration for PTK (in fact, this was seen for all duration
measures). Finally, tby cSTI echoed the change in duration, with small differences between API
and IPA and a sharper increase in cSTI for PTK when comparing AS with NS.
[Insert figure 9 about here]
Main TASK effects were prominent for amplitude and peak velocity variables in all
articulators. Upper lip showed the opposite pattern of the other articulators, with smaller values
for API and IPA compared to PTK (see table 2). For other variables, task effects were limited to
4 Based on one-tailed t-test appropriate for this type of comparison Crawford et al., 2004.
24

Speech Motor Control in Apraxia of Speech
a specific articulator (tby and jwy duration; lly and jwy stiffness; jwy VPS; jwy cSTI; jwy CV-
PV) or completely absent (VPP). The shorter movement duration for PTK was mirrored in
higher stiffness and variability values in these articulators.
Regarding intra- and inter-gestural coordination (see table 4), as with the kinematic data,
none of the GROUP differences reached significance. However, for intra-gestural coordination
we did find a trend for lower values across the three tasks in AS [F(1,7) = 5.42, p = 0.053]. There
was also a significant TASK effect [F(2,14) = 22.33, p < .001] and a trend for an interaction
[F(2,14) = 4.08, p = 0.04]. The TASK effect showed a significantly higher value for IPA
compared to API and PTK. Basically, this means that for IPA the lower lip leads on average (>
180 deg), whereas for the other two tasks, the upper lip leads (< 180 deg). The interaction trend
reflects the greater AS vs. NS difference in relative phase for lip coordination in PTK compared
to the other two tasks.
A significant TASK effect was also found for inter-gestural coordination [F(3,21) =
297.13, p < .001], but no effect or trend of GROUP [F(1,7) = 2.1, p = .191] or GROUP x TASK
interaction [F(3,21) = 1.75, p = 0.188]. The TASK effect for inter-gestural coordination reflected
systematic differences between values in three distinct phase regions which were roughly
bounded by the 90 deg, 180 deg, and 270 deg marks. Coordination data are shown in figure 10.
[Insert table 4 and figure 10 about here]
With respect to relative phase variability (see table 4), there were no effects or trends for
GROUP [intra: F(1,7) = 0.19, p = 0.672; inter: F(1,7) = 0.02, p = 0.886], TASK [intra: F(2.14) =
0.7, p = 0.511; inter: F(3,21) = 3.2, p = 0.044] or interaction [intra: F(2,14) = 1.29, p = 0.305;
inter: F(3,21) = 2.26, p = 0.111]. In other words, both intra- and inter-gestural coupling was
stable for all three tasks in the fluent speech of AS and NS alike.
25

Speech Motor Control in Apraxia of Speech
Part 2
Using the coding system explained in the methods section (CODE: 1 = intervals of
normal fluent speech, 2 = 1-second intervals immediately preceding sections of dysfluent speech,
and 3 = intervals of overt dysfluent speech; see figure 6), we calculated the average values for
amplitude (AVAMP), peak velocity (AVPV) and duration (AVDUR) estimates of gestural
movements (GESTURE = BC, TB, or TT; i.e., changes in these parameters relate to Euclidian
distance estimates) and their coupling (relative phase and within-trial-set standard deviation of
relative phase). The kinematic data are shown in figure 11. Following is a description of the
ANOVA test results.
[Insert figure 11 about here]
For AVAMP, we found a significant effect for CODE [F(2,99) = 4.06, p = .02]. There was
a significant GESTURE effect [F(2,99) = 17.93, p < .001], but no CODE X GESTURE
interaction [F(4,99) = 0.86, p = 0.491]. Amplitudes showed a clear reduction during dysfluent
speech production, compared to fluent speech, except for TT. This reduction in amplitude is
already visible before the actual onset of disfluencies (as shown for #2 samples).
For AVPV, we again found a significant effect for CODE [F(2,99) = 6.59, p = .002] and a
main effect for GESTURE [F(2,99) = 16.57, p < .001]. The interaction did not reach the required
levels for significance or trend [F(4,99) = 0.98, p =.422]. As shown in figure 11, similar to
amplitude, there was a clear downsizing of peak velocities from error-free speech to dysfluent
samples for TB and BC, with #2 samples in between. Unlike amplitude values, even TT showed
a similar trend. Overall, as with amplitude, PV values for TT were smaller compared to BC and
TB.
26

Speech Motor Control in Apraxia of Speech
For AVDUR, we found significant main effects for CODE [F(2,99) = 3.16, p = .046] and
GESTURE [F(2,99) = 7.17, p = .001], but no interaction [F(4,99) = 0.09, p = .986]. Post-hoc
tests revealed a significant difference between the #2 samples (smaller values) compared to the
dysfluent samples (#3). In terms of average duration, as with the other variables, TT data showed
smaller values compared to the other gestures (figure 11).
[Insert figure 12 about here]
Gestural coordination data are shown in figure 12. In terms of relative phase or PHI, we
did not find a main effect or trend for CODE [F(2,43) = 1.17, p = .31]. We did find a significant
TASK effect [F(2,43) = 256.80, p < .001] and a significant CODE x TASK interaction [F(4,43) =
2.90, p = .033]. As shown in figure 12, phase values are quite stable across the different speech
samples for each task, but dysfluent speech does induce some changes to inter-gestural coupling,
be it in different ways for API (higher values) compared to IPA and PTK (lower values). Overall,
phase values remained within or close to their original boundaries as discussed in part 1. This
means that the basic nature of the coupling (i.e., its specific phase lag) was not strongly
influenced by the fact that speech was dysfluent.
For the within-trial-set standard deviation of relative phase or SDPHI, we found a
significant CODE effect [F(2,43) = 4.57, p = .016]. There was no main effect for TASK [F(2,43)
= 0.01, p = .985], nor an interaction with CODE [F(4,43) = 0.48, p = .153]. Post-hoc tests
showed higher values for #3 samples compared to #1 and #2 (fluent speech) samples (figure 12).
In other words, dysfluent speech was characterized by higher variability in gestural coordination.
Discussion
The first part of this study was set up to establish whether movement variables could
differentiate fluent speech samples of a young female speaker with AOS and Broca’s aphasia
27

Speech Motor Control in Apraxia of Speech
from similar data collected from normal speakers and would warrant further scrutiny in future
studies. In the second part of our analysis, we compared specific kinematic and coordination
measures acquired during fluent speech production with the same measures gathered from
samples containing dysfluent speech. This allowed us to speculate about underlying speech
motor control mechanisms in our subject, especially with regard to the presence of compensatory
strategies in the control of fluent speech (van Lieshout et al., 2004). We performed a detailed
analysis of individual movement characteristics (closing movements) and two levels of
coordination (intra- and inter-gestural) in movement data from upper lip, lower lip, tongue body,
tongue tip/blade, and mandible, acquired during reiterated non-word utterances (API, IPA, &
PTK). These tasks were found to be sufficiently challenging to our subject (especially IPA &
PTK) to generate a fair amount of dysfluent speech samples.
The findings of Part 1 revealed that in applying strict statistical criteria for comparing an
individual’s performance to a group of controls (Mycroft et al., 2002), kinematic characteristics
for AS were well within normal limits during fluent speech production. Only for upper lip
amplitude and peak velocity, we found a general trend for higher values for AS compared to NS.
However, it was also quite apparent that the three tasks showed different profiles for most
kinematic variables. In general, the PTK task was very different from the two bisyllabic tasks
API and IPA, showing smaller, faster and more variable closing movements. These task related
differences played a role in comparing AS with NS, as indicated by several statistically notable
(significant or trend) interactions.
First, our subject AS in general executed error-free speech movements with larger
amplitudes, peak velocities and durations while reiterating bisyllabic tasks (especially API), but
this was not true for PTK, except for upper lip amplitude and peak velocity. When task-related
28

Speech Motor Control in Apraxia of Speech
changes occurred in higher-order derived kinematic variables (stiffness, VPP and VPS), these
were consistent with the main differences seen in amplitude and/or duration. It should also be
noticed that in fluent speech AS did not show a consistent pattern of higher variability in cyclic
movement patterns. VPS and CV-PV were the only variables that revealed no (general or task-
related) differences between AS and NS during fluent speech. Obviously, this does not mean that
they cannot change during dysfluent speech, which may account for group differences found for
these variables in other studies (Adams et al., 1993; McNeil et al., 2004).
In terms of coordination, AS showed a trend towards overall lower values for intra-
gestural coordination but not for inter-gestural coordination. Despite this difference in the type of
coupling, the variability of both coordination measures was not significantly different compared
to controls during the production of fluent speech. For lip coordination, API and PTK induced an
overall dominant upper lip lead, whereas for IPA lower lip lead was the preferred pattern. For
inter-gestural coordination, we found three clearly distinct regions of phase coupling for the four
gestural configurations across all subjects (TB-BC in API & IPA; TT-BC and TT-TB for PTK)
with no inherent differences in stability. The latter finding supports claims from ADT on the
specific nature and relative stability of couplings in gestural phasing (Saltzman et al., 2000).
Part 2, which involved a direct comparison between error-free and dysfluent speech
samples produced by AS, showed a significant downsizing of amplitude and peak velocity values
for speech immediately preceding and during the production of dysfluent speech. These changes
in kinematics were associated with changes in the stability of inter-gestural coupling (lower for
dysfluent speech), but not in the nature of the coupling.
Comparing the kinematic findings of the present study with data reported in the literature
on people with AOS (with or without aphasia), the longer duration found for bisyllabic tasks is in
29

Speech Motor Control in Apraxia of Speech
agreement with (the few) other kinematic studies for this population (see McNeil et al., 1997, for
a review). These increased movement durations can (to some extent) be assumed to underlie the
longer durations within and between segments reported in acoustic and perceptual studies, as
discussed in the introduction to this paper. Interestingly, the longer durations were not found for
PTK, which calls into question the general nature of this phenomenon. More about this further
down.
With respect to larger movement amplitudes and peak velocities found for bisyllabic
tasks, the correspondence with previous literature is less clear. One study reported larger
amplitudes but normal peak velocities for subjects with AOS (McNeil et al., 1989). Another
study reported lower peak velocities (Itoh et al., 1980), but most studies have not found evidence
of systematic differences in amplitude and/or peak velocity (Itoh & Sasanuma, 1987; McNeil et
al., 1991; Robin, Bean, & Folkins, 1989). In part, these discrepancies may be attributable to
differences in the procedures used to select data (error-free vs. dysfluent speech samples or a
mixture of both), or to differences between individual subjects and their clinical profile (see
McNeil et al., 2004 for an extensive discussion of the latter topic). Our subject was also younger
than the subjects used in previous kinematic studies, which may add to the observed differences.
Also, it is important to keep in mind that discrete kinematic parameters may show variation
within a subject across time (Alfonso et al., 1997), a reason why we (unlike other studies)
collected data over two different sessions, spread in time.
However, the interpretation of kinematic findings is not a simple matter and needs to be
discussed in a broader perspective. One way to do this is to take a theoretical approach, based on
assumptions derived from the mass-spring model (e.g., see Munhall et al., 1985; Ostry &
Munhall, 1985; Perkell et al., 2002). If we explore this model a bit further, we can make specific
30

Speech Motor Control in Apraxia of Speech
predictions about the nature of changes in the different variables as a function of motor demands.
This is shown in figure 13.
[Insert figure 13 about here]
The graph depicts amplitude, peak velocity and durational changes within the constraints
of a single-peak velocity profile, typically found in (quasi) sinusoidal movement patterns (an
example of which is shown in the upper right-hand corner of the graph). Different configurations
pertaining to changes in individual kinematic parameters are numbered 1 to 4. The legend below
the graph indicates the expected changes in the dependent variables if a subject changed either
amplitude (e.g., 1 vs. 2), or duration (1 vs. 3), or both (1 vs. 4) as part of the speech task
requirements. Since all tasks have to be executed under single-peak velocity constraints, VPP
and VPS values remain the same (1.57 and 50% respectively). If a subject simply makes smaller
movements for one task compared to another, both amplitude and peak velocity will scale down,
but duration and stiffness values will stay (roughly) the same. Figure 14 shows the amplitude and
duration data (with velocity indicated as slopes) for NS and AS as measured for API and PTK,
separately for upper lip and lower lip closing movements.
[Insert figure 14 about here]
For upper lip, NS showed a clear increase in amplitude for PTK, but no change in duration; thus,
peak velocity also increased (steeper slope). Clearly, a pattern fitting the amplitude scaling
strategy depicted in 2 vs. 1 of figure 13. AS showed a slightly different change in movement
parameters. First, the increase in amplitude was much stronger, but second, movement duration
also decreased. Combined this led to a strong increase in upper lip peak velocity, something that
was confirmed in the GROUP trends we found for these variables. Clearly, this pattern does not
fit any of the strategies depicted in figure 13. Also notice that for upper lip, duration is longer for
31

Speech Motor Control in Apraxia of Speech
API, but shorter for PTK compared to NS. However, amplitude is consistently higher for AS
compared to NS in both tasks.
For lower lip data, NS showed a clear decrease in amplitude and a small decrease in
duration for PTK, compared to API (this pattern is similar to the data for jaw and tongue body;
see table 2). AS showed a similar trend, but stronger, and contrary to upper lip movements, the
amplitude and duration values were only larger for AS compared to NS in the production of API.
So, both NS and AS showed the type of control strategy depicted in the 1 vs. 4 contrast of figure
13.
A few conclusions can be drawn from this mass-spring model inspired comparison. First,
control strategies for fluent speech in AS seem to more different from controls in her upper lip
data, compared to the other articulators. Second, what is noticeable about AS’s upper lip strategy
is not an attempt to prolong movement duration, but to keep its amplitude relatively large across
the two tasks (and this also applies to IPA; see table 2).
Why would this be relevant? To answer that question we need to turn to the lip
coordination data. Here it was found that AS showed a trend for lower relative phase values in
lip coupling across the three tasks. Data from a recent study suggest that lip coordination patterns
are more stable when there is a greater lag between upper and lower lip movements (van
Lieshout et al., 1999). Similar findings have been reported for people who stutter, based on
larger and consistent time lags between successive moments of peak velocities for lips and jaw
(van Lieshout, Alfonso, Hulstijn, & Peters, 1994). Relative phase values reflect stable solutions
(or attractors) in the control network of articulators (Kelso, 1995; van Lieshout, 2004; Saltzman
et al., 1989). Interestingly, the only kinematic variables that showed a consistent difference
between AS and NS across all three tasks were upper lip amplitude and especially peak velocity,
32

Speech Motor Control in Apraxia of Speech
both of which were higher for AS. It is possible that these higher amplitudes are associated with
the stable lip coordination patterns found in AS’s fluent speech data. This would certainly fit one
assumption from Coordination Dynamics theory where it is stated that coupling stability can be
influenced by critical thresholds in movement amplitude (and/or peak velocity), in addition to
other factors (Peper & Beek, 1998). Recent data for speech provided some preliminary support
for this claim (van Lieshout et al., 2002; Goozee, Lapointe, & Murdoch, 2002). More support
can be gained from the data presented in part 2 of the current study. There it was shown that
dysfluent speech samples are characterized by smaller gestural amplitudes and higher coupling
variability. The decrease in amplitude could already be seen in the 1-second fluent speech
samples before the onset of errors, but at that time coordination was still stable, indicating that in
line with Coordination Dynamics, a switch to instability requires certain critical thresholds, not
just a linear downscaling (e.g., Williamson, 1998; Beek, Peper, & Daffertshofer, 2002; Kelso et
al., 1998; van Lieshout, 2004). In other words, amplitude/peak velocity changes may provide a
(non-linear) window into the stability of coordination (van Lieshout, 2004).
We were somewhat surprised that AS in fluent speech showed little evidence for making
adaptations to inter-gestural coordination, as opposed to intra-gestural coordination. This could
be due to restrictions on allowable phase couplings at this level as evidenced by apparently
distinct phase regions for inter-gestural coordination (see also Saltzman & Byrd, 2000). If true,
this could mean that strategies to effectively control coordination stability are more easily
implemented at the lower levels of coordination (intra-gestural), which in turn could benefit
higher levels of coordination as well. As the data of part 2 indicated, AS’ fluent and dysfluent
speech do show clear differences in coupling stability for inter-gestural coupling, consistent with
the coordination problems described in the literature (see introduction). This also demonstrates
33

Speech Motor Control in Apraxia of Speech
that a clear separation between fluent and error-based speech samples (as described in this study)
is necessary to tease out the source of kinematic and coordination changes (see also van Lieshout
et al., 2004 for a similar discussion on stuttering).
Conclusions
In this investigation of the speech of a single subject with AOS and Broca’s aphasia, we
found that overall, her fluent speech was quite comparable to that of age-matched control
speakers. However, when task constraints are taken into account, consistent kinematic
differences appeared, together with differences in (intra-gestural) coordination. These differences
seem reflective of a motor control strategy designed to maintain stability in movement
coordination. The role of movement amplitude in this process was highlighted, including the
apparent associative relationship between gestural amplitudes and coordination instability in
comparing fluent and dysfluent speech samples. If these speculations about movement control
strategies can be verified in future studies, this would provide a potential paradigm for treatment
protocols that could benefit clinical populations, where changes in coupling dynamics can be
experimentally induced by varying kinematic parameters like amplitude and/or peak velocities.
Acknowledgements
This study was supported by a grant from the Natural Sciences and Engineering Research
Council of Canada (NSERC), awarded to the first author. The authors wish to thank Dr. Wolfram
Ziegler for his valuable comments on an earlier version of this manuscript.
34
Speech Motor Control in Apraxia of Speech
References
Ackermann, H., Hertrich, I., & Hehr, T. (1995). Oral diadochokinesis in neurological
dysarthrias. Folia phoniatrica et logopaedica, 47, 15-23.
Ackermann, H., Hertrich, I., & SCHARF, G. (1995). Kinematic analysis of lower lip
movements in ataxic dysarthria. Journal of Speech and Hearing Research, 38, 1252-1259.
Adams, S. G., Weismer, G., & Kent, R. D. (1993). Speaking rate and speech movement
velocity profiles. Journal of Speech and Hearing Research, 36, 41-54.
Aichert, I. & Ziegler, W. (2004). Syllable frequency and syllable structure in apraxia of
speech. Brain and Language, 88, 148-159.
Alfonso, P. J. & van Lieshout, P. (1997). Spatial and temporal variability in obstruent
gestural specification by stutterers and controls: Comparisons across sessions. In W.Hulstijn, H.
F. Peters, & P. H. H. M. van Lieshout (Eds.), Speech production: Motor control, brain research
and fluency disorders (pp. 151-160). Amsterdam: Elsevier Publishers.
Aoyagi, N., Ohashi, K., Tomono, S., & Yamamoto, Y. (2000). Temporal contribution of
body movement to very long-term heart rate variability in humans. American Journal of
Physiology-Heart and Circulatory Physiology, 278, H1035-H1041.
Ballard, K. J., Barlow, J. A., & Robin, D. A. (2001). The underlying nature of apraxia of
speech: A critical evaluation of Varley and Whiteside's dual route speech encoding hypothesis.
Aphasiology, 15, 50-58.
Baum, S. R. & Ryan, L. (1993). Rate of speech effects in aphasia: voice onset time. Brain
35
Speech Motor Control in Apraxia of Speech
and Language, 44, 431-445.
Beek, P. J., Peper, C. E., & Daffertshofer, A. (2002). Modeling rhythmic interlimb
coordination: beyond the haken-kelso-bunz model. Brain and Cognition, 48, 149-165.
Bernstein, N. (1967). The co-ordination and regulation of movements. Oxford: Pergamon
Press.
Bizzi, E. & Mussa-Ivaldi, F. A. (1998). Neural basis of motor control and its cognitive
implications. Trends in Cognitive Sciences, 2, 97-102.
Blumstein, S. E. (1998). Phonological aspects of aphasia. In M.T.Sarno (Ed.), Acquired
Aphasia (pp. 157-185). New York: Academic Press.
Boose, A., Spieker, S., Jentgens, C., & Dichgans, J. (1996). Wrist tremor: Investigation
of agonist-antagonist interaction by means of long-term EMG recording and cross-spectral
analysis. Electromyography and Motor Control-Electroencephalography and Clinical
Neurophysiology, 101, 355-363.
Bose, A., Square, P. A., Schlosser, R., & van Lieshout, P. (2001). Effects of PROMPT
therapy on speech motor function in a person with aphasia and apraxia of speech. Aphasiology,
15, 767-785.
Bose, A., van Lieshout, P., & Square, P. A. (2003). Speech coordination in individuals
with aphasia and normal speakers. Brain and Language, 87, 158-159.
Browman, C. P. & Goldstein, L. (1990). Gestural specification using dynamically-
defined articulatory structures. Journal of Phonetics, 18, 299-320.
36

Speech Motor Control in Apraxia of Speech
Browman, C. P. & Goldstein, L. (1992). Articulatory phonology: an overview.
Phonetica., 49, 155-180.
Buchanan, J. J., Kelso, J. A. S., deGuzman, G. C., & Ding, M. (1997). The spontaneous
recruitment and suppression of degrees of freedom in rhythmic hand movements. Human
Movement Science, 16, 1-32.
Byrd, D. & Saltzman, E. (1998). Intragestural dynamics of multiple prosodic boundaries.
Journal of Phonetics, 26, 173-199.
Cholin, J., Schiller, N. O., & Levelt, W. J. M. (2004). The preparation of syllables in
speech production. Journal of Memory and Language, 50, 47-61.
Clark, H. M. & Robin, D. A. (1998). Generalized motor programme and parameterization
accuracy in apraxia of speech and conduction aphasia. Aphasiology, 12, 699-713.
Crawford, J. R., Garthwaite, P. H., Howell, D. C., & Gray, C. D. (2004). Inferential
methods for comparing a single case with a control sample: modified t-tests versus Mycroft et
al.'s (2002) modified ANOVA. Cognitive Neuropsychology, 21, 750-755.
Dabul, B. L. (1979). Apraxia battery for adults Austin, TX: Pro-Ed.
Duffy, J. R. (1995). Motor speech disorders - Substrates, differential diagnosis, and
management. St. Louis, MO: Mosby-Year Book, Inc.
Fink, P. W., Foo, P., Jirsa, V. K., & Kelso, J. A. (2000). Local and global stabilization of
coordination by sensory information. Experimental Brain Research, 134, 9-20.
Forrest, K., Adams, S., McNeil, M. R., & Southwood, H. (1991). Kinematic,
37

Speech Motor Control in Apraxia of Speech
electromyographic, and perceptual evaluation of speech apraxia, conduction aphasia, ataxic
dysarthria and normal speech production. In C.A.Moore, K. M. Yorkston, & D. R. Beukelman
(Eds.), Dysarthria and apraxia of speech: Perspectives on management (pp. 147-171).
Baltimore: Paul H. Brookes.
Fowler, C. A. (1995). Speech production. In J.L.Miller & P. D. Eimas (Eds.), Speech,
Language, and Communication (pp. 29-61). San Diego: Academic Press.
Freeman, F. J., Sands, E. S., & Harris, K. S. (1978). Temporal coordination of phonation
and articulation in a case of verbal apraxia: a voice onset time study. Brain and Language, 6,
106-111.
Goozee, J. V., Lapointe, L. L., & Murdoch, B. E. (2002). Kinematic analysis of lingual
fatigue in myasthenia gravis. Journal of Medical Speech-Language Pathology, 10, 249-255.
Hardcastle, W. J. (1987). Electropalatographic study of articulation disorders in verbal
dyspraxia. In J.H.Ryalls (Ed.), Phonetic approaches to speech production in aphasia and related
disorders (pp. 113-136). Boston: College-Hill Press.
Hayden, D. A. & Square, P. A. (1999). The verbal motor production assessment for
children San Antonio, TX: Psychological Corporation.
Hintze, J. L. (1998). NCSS 2000 [Computer software]. Kaysville, Utah: NCSS.
Hoole, P., Schröter-Morasch, H., & Ziegler, W. (1997). Patterns of laryngeal apraxia in
two patients with Broca's Aphasia. Clinical Linguistics & Phonetics, 11, 429-442.
Itoh, M. & Sasanuma, S. (1987). Articulatory movements in apraxia of speech. In
38

Speech Motor Control in Apraxia of Speech
J.H.Ryalls (Ed.), Phonetic approaches to speech production in aphasia and related disorders
(pp. 137-162). Boston, MA: College-Hill Press.
Itoh, M., Sasanuma, S., Hirose, H., Yoshioka, H., & Ushijima, T. (1980). Abnormal
articulatory dynamics in a patient with apraxia of speech: x- ray microbeam observation. Brain
and Language, 11, 66-75.
Itoh, M., Sasanuma, S., Tatsumi, I. F., Murakami, S., Fukusako, Y., & Suzuki, T. (1982).
Voice onset time characteristics in apraxia of speech. Brain and Language, 17, 193-210.
Itoh, M., Sasanuma, S., & Ushijima, T. (1979). Velar movements during speech in a
patient with apraxia of speech. Brain and Language, 7, 227-239.
Kaplan, E., Goodglass, H., & Weintraub, S. (1983). The Boston Naming test
Philadelphia: Lea and Febiger.
Katz, W. F., Bharadwaj, S. V., & Carstens, B. (1999). Electromagnetic articulography
treatment for an adult with Broca's aphasia and apraxia of speech. Journal of Speech Language
and Hearing Research, 42, 1355-1366.
Kay, S. M. (1988). Modern Spectral Estimation. Englewood Cliffs, NJ: Prentice-Hall.
Kelso, J. A., Fuchs, A., Lancaster, R., Holroyd, T., Cheyne, D., & Weinberg, H. (1998).
Dynamic cortical activity in the human brain reveals motor equivalence. Nature, 392, 814-818.
Kelso, J. A., Saltzman, E. L., & Tuller, B. (1986). The dynamical perspective on speech
production: Data and theory. Journal of Phonetics, 14,1, 29-59.
Kelso, J. A. & Tuller, B. (1981). Toward a theory of apractic syndromes. Brain and
39
Speech Motor Control in Apraxia of Speech
Language, 12, 224-245.
Kelso, J. A. S. (2000). Principles of dynamic pattern formation and change for a science
of human behavior. In L.Bergman, R. Cairns, L. Nilsson, & L. Nystedt (Eds.), Developmental
Science and the Holistic Approach (pp. 63-84). Mahway, NJ: Erlbaum.
Kelso, J. A. S. (1995). Dynamic patterns. The self-organization of brain and behavior.
Cambridge, MA: A Bradford Book (MIT Press).
Kertesz, A. (1982). Western Aphasia Battery. New York: Grune & Stratton.
Levelt, W. J., Roelofs, A., & Meyer, A. S. (1999). A theory of lexical access in speech
production. Behavioral and Brain Sciences, 22, 1-38.
Levelt, W. J. & Wheeldon, L. (1994). Do speakers have access to a mental syllabary?
Cognition, 50, 239-269.
Lofqvist, A. (1991). Proportional Timing in Speech Motor Control. Journal of Phonetics,
19, 343-350.
McNeil, M. R. & Adams, S. G. (1991). A comparison of speech kinematics among
apraxic, conduction aphasic, ataxic dysarthric, and normal geriatric speakers. Clinical
Aphasiology, 19, 279-294.
McNeil, M. R., Caligiuri, M., & Rosenbek, J. (1989). A comparison of labiomandibular
kinematic durations, displacements, velocities, and dysmetrias in apraxic and normal adults.
Clinical Aphasiology, 17, 173-189.
McNeil, M. R., Pratt, S. R., & Fosset, T. R. D. (2004). The differential diagnosis of
40

Speech Motor Control in Apraxia of Speech
apraxia of speech. In B.Maassen, R. Kent, H. Peters, P. van Lieshout, & W. Hulstijn (Eds.),
Speech Motor Control in Normal and Disordered Speech (pp. 389-414). Oxford: Oxford
University Press.
McNeil, M. R., Robin, D. A., & Schmidt, R. A. (1997). Apraxia of speech: Definition,
differentiation, and treatment. In M.R.McNeil (Ed.), Clinical Management of Sensorimotor
speech disorders (pp. 311-344). New York, USA: Thieme.
Meyer, A. S. (1997). Word form generation in language production. In W.Hulstijn, H. F.
M. Peters, & P. H. H. M. van Lieshout (Eds.), Speech production: Motor control, brain research
and fluency disorders (pp. 73-88). Amsterdam: Elsevier.
Mitchell, D. C., Mycroft, R. H., & Kay, J. (2004). Comparing a single case to a control
sample: Differences in distribution versus differences in means. Cognitive Neuropsychology, 21,
756-760.
Munhall, K. G., Ostry, D. J., & Parush, A. (1985). Characteristics of velocity profiles of
speech movements. Journal of Experimental Psychology: Human Perception and Performance,
11, 457-474.
Mycroft, R. H., Mitchell, D. C., & Kay, J. (2002). An evaluation of statistical procedures
for comparing an individual's performance with that of a group of controls. Cognitive
Neuropsychology, 19, 291-299.
Nightingale, A. L. & Farmer, R. D. T. (2004). Ischemic stroke in young women: A nested
case-control study using the UK general practice research database. Stroke, 35, 1574-1578.
41

Speech Motor Control in Apraxia of Speech
Ostry, D. J. & Munhall, K. G. (1985). Control of rate and duration of speech movements.
Journal of the Acoustical Society of America, 77, 640-648.
Peper, C. E. & Beek, P. J. (1998). Distinguishing between the effects of frequency and
amplitude on interlimb coupling in tapping a 2:3 polyrhythm. Experimental Brain Research, 118,
78-92.
Perkell, J. S., Zandipour, M., Matthies, M. L., & Lane, H. (2002). Economy of effort in
different speaking conditions. I. A preliminary study of intersubject differences and modeling
issues. Journal of the Acoustical Society Of America, 112, 1627-1641.
Petitti, D. B., Sidney, S., Quesenberry, J., & Bernstein, A. (1997). Incidence of stroke and
myocardial infarction in women of reproductive age. Stroke, 28, 280-283.
Robin, D. A., Bean, C., & Folkins, J. W. (1989). Lip movement in apraxia of speech.
Journal of Speech and Hearing Research, 32, 512-523.
Roelofs, A. (1997). The WEAVER model of word-form encoding in speech production.
Cognition, 64, 249-284.
Roy, E. A., Square-Storer, P. A., Adams, S., & Friesen, H. (1985). Error/movement
notation systems in apraxia. Recherches Semiotiques/Semiotic Inquiry, 5, 402-412.
Saltzman, E. & Byrd, D. (2000). Task-dynamics of gestural timing: Phase windows and
multifrequency rhythms. Human Movement Science, 19, 499-526.
Saltzman, E. & Kelso, J. A. (1987). Skilled actions: a task-dynamic approach.
Psychological Review, 94, 84-106.
42

Speech Motor Control in Apraxia of Speech
Saltzman, E., Löfqvist, A., Kay, B., Kinsella-Shaw, J., & Rubin, P. (1998). Dynamics of
intergestural timing: a perturbation study of lip-larynx coordination. Experimental Brain
Research, 123, 412-424.
Saltzman, E. L. & Munhall, K. (1989). A dynamical approach to gestural patterning in
speech production`. Ecological Psychology, 1, 333-382.
Schmidt, R. A. (1988). Motor control and learning: A behavioral emphasis. Champaign,
IL: Human Kinetics.
Shaiman, S., Adams, S. G., & Kimelman, M. D. Z. (1997). Velocity profiler of lip
protrusion across changes in speaking rate. Journal of Speech Language and Hearing Research,
40, 144-158.
Simpson, A. P. (2001). Dynamic consequences of differences in male and female vocal
tract dimensions. Journal of the Acoustical Society of America, 109, 2153-2164.
Smith, A. & Goffman, L. (1998). Stability and patterning of speech movement sequences
in children and adults. Journal of Speech Language and Hearing Research, 41, 18-30.
Smith, A., Goffman, L., Zelaznik, H. N., Ying, G. S., & McGillem, C. (1995).
Spatiotemporal stability and patterning of speech movement sequences. Experimental Brain
Research, 104, 493-501.
Sosnoff, J. J., Vaillancourt, D. E., & Newell, K. M. (2004). Aging and rhythmical force
output: loss of adaptive control of multiple neural oscillators. Journal of Neurophysiology, 91,
172-181.
43

Speech Motor Control in Apraxia of Speech
Square, P. A., Roy, E. A., & Martin, R. E. (1997). Apraxia of speech: Another form of
praxis disruption. In L.J.G.Rothi & K. M. Heilman (Eds.), Apraxia: The neuropsychology of
action (pp. 173-206). London, UK: Lawrence Erlbaum.
Sternberg, S., Knoll, R. L., Monsell, S., & Wright, C. E. (1988). Motor Programs and
Hierarchical Organization in the Control of Rapid Speech. Phonetica, 45, 175-197.
Turvey, M. T. (1990). Coordination. American Psychologist, 45, 938-953.
van der Merwe A., Uys, I. C., Loots, J. M., Grimbeek, R. J., & Jansen, L. P. (1989). The
influence of certain contextual factors on voice onset time, vowel duration and utterance duration
in verbal apraxia. South African Journal of Communication Disorders, 36, 29-41.
Van der Merwe, A. (1997). A theoretical framework for the characterization of
pathological speech sensorimotor control. In M.R.McNeil (Ed.), Clinical management of
sensorimotor speech disorders (pp. 1-25). New York: Thieme.
van Lieshout, P., Alfonso, P. J., Hulstijn, W., & Peters, H. F. (1994). Electromagnetic
Midsagittal Articulography (EMMA). In F.J.Maarse, A. E. Akkerman, A. N. Brand, L. J. M.
Mulder, & M. J. Van der Stelt (Eds.), Computers in Psychology: Applications, Methods, and
Instrumentation (pp. 62-76). Lisse: Swets & ?Zeitlinger.
van Lieshout, P., Hulstijn, W., Alfonso, P. J., & Peters, H. F. (1997). Higher and lower
order influences on the stability of the dynamic coupling between articulators. In W.Hulstijn, H.
F. Peters, & P. van Lieshout (Eds.), Speech production: Motor control, brain research and
fluency disorders (pp. 161-170). Amsterdam: Elsevier Science Publishers.
44
Speech Motor Control in Apraxia of Speech
van Lieshout, P. & Moussa, W. (2000). The assessment of speech motor behaviors using
electromagnetic articulography. The Phonetician, 81, 9-22.
van Lieshout, P. H. H. M. (1995). Motor planning and articulation in fluent speech of
stutterers and nonstutterers. University of Nijmegen, The Netherlands.
van Lieshout, P. H. H. M. (2001). Coupling dynamics of motion primitives in speech
movements and its potential relevance for fluency. Society for Chaos Theory in Psychology &
Life Sciences Newsletter 8[4], 18.
van Lieshout, P. H. H. M. (2004). Dynamical systems theory and its application in
speech. In B.Maassen, R. Kent, H. Peters, P. van Lieshout, & W. Hulstijn (Eds.), Speech Motor
Control in Normal and Disordered Speech (pp. 51-82). Oxford, UK: Oxford University Press.
van Lieshout, P. H. H. M., Hijl, M., & Hulstijn, W. (1999). Flexibility and stability in
bilabial gestures: 2) Evidence from continuous syllable production. In J.J.Ohala, J. J. Hasegawa,
M. Ohala, D. Granville, & A. C. Bailey (Eds.), Proceedings XIVth International Congress of
Phonetic Sciences (pp. 45-48). San Francisco: American Institute of Physics.
van Lieshout, P. H. H. M., Hulstijn, W., & Peters, H. F. M. (2004). Searching for the
weak link in the speech production chain of people who stutter: A motor skill approach. In
B.Maassen, R. Kent, H. Peters, P. van Lieshout, & W. Hulstijn (Eds.), Speech Motor Control in
Normal and Disordered Speech (pp. 313-356). Oxford: Oxford University Press.
van Lieshout, P. H. H. M., Hulstijn, W., & Peters, H. F. M. (1996). Speech production in
people who stutter: Testing the motor plan assembly hypothesis. Journal of Speech and Hearing
Research, 39, 76-92.
45

Speech Motor Control in Apraxia of Speech
van Lieshout, P. H. H. M., Rutjens, C. A. W., & Spauwen, P. H. M. (2002). The
dynamics of interlip coupling in speakers with a repaired unilateral cleft-lip history. Journal Of
Speech Language And Hearing Research, 45, 5-19.
Varley, R. & Whiteside, S. P. (2001). What is the underlying impairment in acquired
apraxia of speech? Aphasiology, 15, 39-49.
Westbury, J. R. (1988). Mandible and Hyoid Bone Movements During Speech. Journal
of Speech and Hearing Research, 31, 405-416.
Westbury, J. R. (1994). On Coordinate Systems and the Representation of Articulatory
Movements. Journal of the Acoustical Society of America, 95, 2271-2273.
Westbury, J. R. & Dembowski, J. (1993). Articulatory kinematics of normal
diadochokinetic performance. Annual Bulletin of the Research Institute of Logopedics and
Phoniatrics, 27, 13-36.
Westbury, J. R., Lindstrom, M. J., & McClean, M. D. (2002). Tongues and lips without
jaws: A comparison of methods for decoupling speech movements. Journal of Speech Language
and Hearing Research, 45, 651-662.
Whiteside, S. P. & Varley, R. A. (1998). A reconceptualisation of apraxia of speech: A
synthesis of evidence. Cortex, 34, 221-231.
Wildgruber, D., Ackermann, H., & Grodd, W. (2001). Differential contributions of motor
cortex, basal ganglia, and cerebellum to speech motor control: Effects of syllable repetition rate
evaluated by fMRI. Neuroimage, 13, 101-109.
46

Speech Motor Control in Apraxia of Speech
Williamson, M. M. (1998). Neural control of rhythmic arm movements. Neural
Networks, 11, 1379-1394.
Woch, A. & Plamondon, R. (2004). Using the framework of the kinematic theory for the
definition of a movement primitive. Motor Control, 8, 547-557.
Ziegler, W. (2001). Apraxia of speech is not a lexical disorder. Aphasiology, 15, 74-77.
Ziegler, W. (2002). Task-related factors in oral motor control: Speech and oral
diadochokinesis in dysarthria and apraxia of speech. Brain and Language, 80, 556-575.
Ziegler, W. & von Cramon, D. (1986). Timing deficits in apraxia of speech. European
Archives of Psychiatry and Neurological Sciences, 236, 44-49.
47

Speech Motor Control in Apraxia of Speech
Figure Captions
Figure 1. Simplified diagram of the general layout of the Articulatory Dynamics Theory (ADT)
model, showing hierarchical layered levels of coordination (gestural score, tract variable, &
articulators). The signals show kinematic manifestations of these levels, based on real data. See
text for more details.
Figure 2. Example of a typical PTK trial-set for one control subject, with position information
for the three gestures tongue body (TB), tongue blade/tip (TT), and bilabial closure (BC), as well
as for the vertical dimension of the upper lip (uly), lower lip (lly; corrected for jaw), and Jaw
(jwy). The rectangular shape depicts the virtual gestural boundaries (based on BC) for a single
repetition of the task. Approximate “target” locations for individual sounds are also labelled (see
text for more details).
Figure 3. Example of a cSTI analysis for the same upper lip and lower lip data as used in figure
2, showing both the original and filtered signals (as used for the analysis) in the top panel, and
the individual cycle specific information (original, amplitude & time normalized). See text for
more details.
Figure 4. Example of a cross-spectral analysis for TB and BC signals for the same trial-set as
used for figure 2. The graph shows a strong frequency entrainment (correlation of 1) in the cross-
spectrum panel for the dominant spectral peak at 2.8 Hz. See text for more details.
Figure 5. Example of a relative phase signal for the same tongue body constriction (TB) and
bilabial closure (BC) gestures as shown in figure 2 at the dominant frequency of 2.8 Hz, depicted
in figure 4. For this example, the coupling is very stable (SD = 6.03 deg) at 271 deg. See text for
more details.
Figure 6. Example of a coded AS trial-set for IPA, with ‘1’ indicating normal fluent parts, ‘2’
48

Speech Motor Control in Apraxia of Speech
parts immediately preceding sections with dysfluent speech samples, and ‘3’ parts containing
dysfluent speech samples (as determined both acoustically and perceptually). The grey arrows
identify gestural events associated with vowel position for /i/ and /a/, and bilabial closure for /p/.
Figure 7. Mean and standard deviations for the average length (in seconds) of within-trial set
fluent speech parts for AS and NS, separate for task. See text for more details.
Figure 8. Normalized distribution identifying upper (+2.2 SD NS) and lower (- 2.2 SD NS)
limits, outside which a main comparison between AS and NS would have led to a significant
main GROUP effect. Individual mean values of AS are plotted appropriately within this range to
assess how they fit the variation in the control group (NS). See text for more details.
Figure 9. Means and standard deviations for tongue body (tby) duration (DUR) and VPP values,
separately for TASK and GROUP. See text for more details.
Figure 10. Means and standard deviations for intra- and inter-gestural coordination data (relative
phase or PHI), separately for TASK and GROUP. See text for more details.
Figure 11. Mean and standard deviations for amplitude, peak velocity and duration of gestural
movements (BC, TB, TT), separately for the different speech sample selections, with ‘1’
indicating normal fluent parts, ‘2’ parts immediately preceding sections with dysfluent speech
samples, and ‘3’ parts containing dysfluent speech samples. See text for more details.
Figure 12. Mean and standard deviations for relative phase and SD relative phase for gestural
coupling, separately for TASK and fluency code (‘1’ indicating normal fluent parts, ‘2’ parts
immediately preceding sections with dysfluent speech samples, and ‘3’ parts containing
dysfluent speech samples). See text for more details.
Figure 13. Mass-spring model diagram and predicted movement control strategies according to
changes in amplitude (1 vs. 2), duration (1 vs. 3), or both (1 vs. 4). See text for more details.
49

Speech Motor Control in Apraxia of Speech
Figure 14. Mass-spring model representation of changes in amplitude, duration and peak velocity
for AS and NS in upper lip and lower lip closing movements, comparing API with PTK. See text
for more details.
50
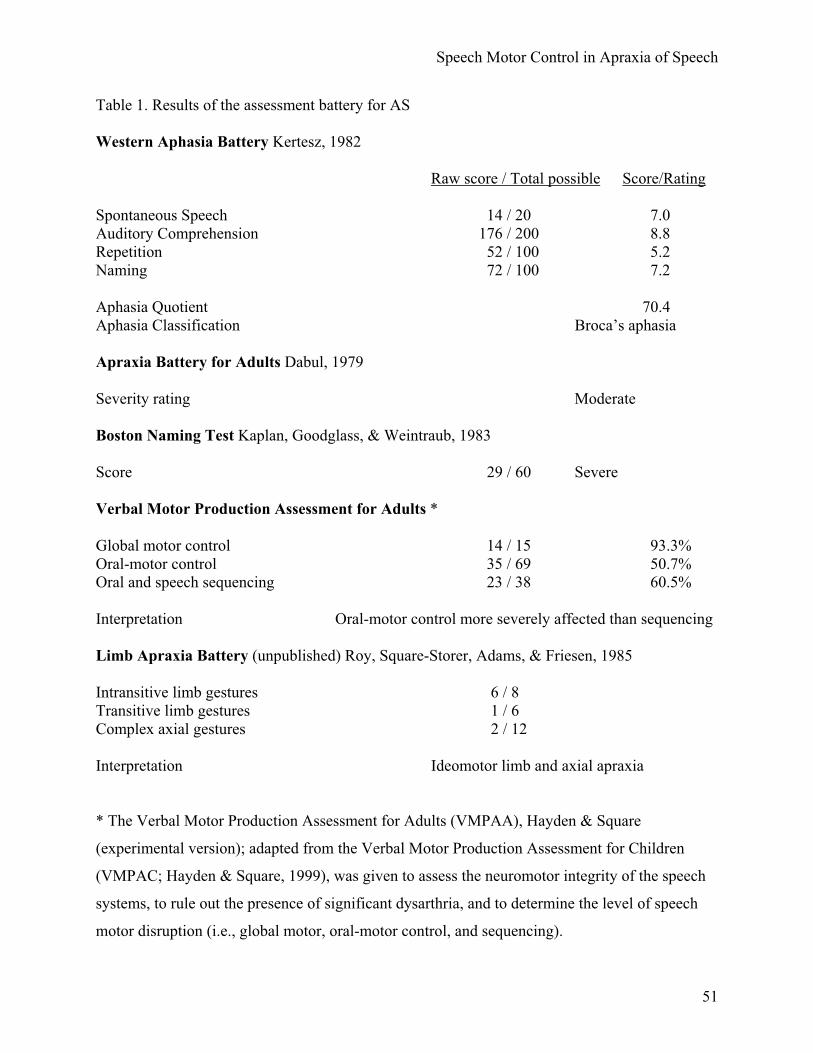
Speech Motor Control in Apraxia of Speech
Table 1. Results of the assessment battery for AS
Western Aphasia Battery Kertesz, 1982
Raw score / Total possible Score/Rating
Spontaneous Speech 14 / 20 7.0 Auditory Comprehension 176 / 200 8.8 Repetition 52 / 100 5.2 Naming 72 / 100 7.2
Aphasia Quotient 70.4Aphasia Classification Broca’s aphasia
Apraxia Battery for Adults Dabul, 1979
Severity rating Moderate
Boston Naming Test Kaplan, Goodglass, & Weintraub, 1983
Score 29 / 60 Severe
Verbal Motor Production Assessment for Adults *
Global motor control 14 / 15 93.3% Oral-motor control 35 / 69 50.7% Oral and speech sequencing 23 / 38 60.5%
Interpretation Oral-motor control more severely affected than sequencing
Limb Apraxia Battery (unpublished) Roy, Square-Storer, Adams, & Friesen, 1985
Intransitive limb gestures 6 / 8 Transitive limb gestures 1 / 6 Complex axial gestures 2 / 12
Interpretation Ideomotor limb and axial apraxia
* The Verbal Motor Production Assessment for Adults (VMPAA), Hayden & Square
(experimental version); adapted from the Verbal Motor Production Assessment for Children
(VMPAC; Hayden & Square, 1999), was given to assess the neuromotor integrity of the speech
systems, to rule out the presence of significant dysarthria, and to determine the level of speech
motor disruption (i.e., global motor, oral-motor control, and sequencing).
51

Speech Motor Control in Apraxia of Speech
Table 2. Means (upper row) and standard deviations (lower row) for kinematic variables,
separate for task and articulator; see text for more details.
AS NSAPI IPA PTK API IPA PTK
AMP uly 3.69 4.15 5.61 2.79 2.84 3.541.25 1.02 0.77 1.01 1.14 1.33
lly 16.29 12.78 7.49 12.70 10.05 8.673.33 3.08 2.46 5.28 3.00 2.16
tby 17.94 15.02 11.06 14.39 13.06 8.641.76 2.70 0.95 3.74 2.97 3.18
jwy 11.39 7.32 3.43 7.18 5.07 3.812.13 2.16 2.21 3.84 1.67 2.55
PV uly 32.01 34.27 51.57 24.29 24.28 30.5912.32 8.36 7.69 9.14 9.98 12.85
lly 110.12 106.47 69.91 105.65 89.51 90.3419.76 24.68 19.97 23.11 19.34 21.56
tby 130.03 110.78 91.70 105.48 104.41 70.7711.64 22.27 9.39 25.88 26.34 22.49
jwy 83.18 52.11 34.16 51.59 41.41 34.6411.97 13.90 18.50 21.58 12.35 19.80
DUR uly 551.53 587.77 432.15 483.89 481.57 498.0265.78 55.27 60.77 140.55 146.08 144.96
lly 577.08 616.09 432.07 514.55 492.71 464.5180.54 73.74 70.20 141.96 135.82 105.95
tby 560.52 602.71 431.04 511.47 494.54 494.5979.30 82.71 72.44 143.22 139.95 153.47
jwy 580.91 580.98 386.48 526.17 495.79 448.5080.63 58.79 111.84 137.71 134.42 151.83
STIF uly 8.63 8.27 9.19 9.10 8.80 8.960.96 0.43 0.26 1.72 1.77 1.52
lly 6.84 8.43 9.44 8.83 9.16 10.610.64 0.71 0.49 1.62 1.25 0.85
tby 7.77 7.39 8.37 7.48 8.06 8.841.48 0.52 1.01 0.93 1.16 1.65
jwy 7.41 7.47 11.21 7.73 8.43 10.280.69 0.88 2.15 0.95 1.07 2.06
VPP uly 2.26 2.39 1.97 1.99 1.94 2.020.19 0.19 0.24 0.19 0.32 0.23
lly 1.81 2.50 1.88 2.06 2.11 2.330.12 0.17 0.28 0.27 0.32 0.56
tby 2.02 2.18 1.75 1.82 1.90 2.020.18 0.17 0.18 0.24 0.26 0.47
jwy 2.09 1.92 1.97 1.83 1.89 2.020.18 0.16 0.29 0.25 0.23 0.46
VPS uly 46.27 41.94 52.79 47.99 47.27 49.249.09 4.76 2.83 5.96 7.11 6.71
lly 52.74 59.00 53.73 50.14 58.58 54.366.61 5.32 10.47 11.32 5.71 9.23
52

Speech Motor Control in Apraxia of Speech
tby 44.14 49.28 45.87 47.33 47.89 44.245.47 6.30 1.34 5.26 5.63 7.33
jwy 56.56 45.56 44.95 52.84 49.70 48.925.20 8.98 5.24 6.87 8.11 3.60
CSTI uly 5.58 4.41 6.08 10.73 11.02 8.781.24 0.83 2.16 7.12 7.48 5.97
lly 6.18 6.06 9.94 6.04 6.67 8.441.31 2.20 2.42 1.82 2.06 3.51
tby 6.51 4.82 6.85 6.14 6.13 11.823.97 2.06 6.05 2.45 2.35 5.91
jwy 10.34 10.36 19.12 9.07 9.36 17.714.07 6.50 6.89 5.03 3.15 6.30
CV-PV uly 0.17 0.11 0.08 0.21 0.21 0.190.08 0.04 0.01 0.14 0.12 0.09
lly 0.11 0.12 0.16 0.12 0.13 0.160.02 0.04 0.03 0.04 0.04 0.08
tby 0.13 0.09 0.14 0.10 0.10 0.180.09 0.02 0.04 0.04 0.04 0.12
jwy 0.13 0.20 0.33 0.15 0.19 0.270.04 0.14 0.14 0.05 0.05 0.07
53

Speech Motor Control in Apraxia of Speech
Table 3. Results repeated measures ANOVA for kinematic variables, separate for task and
articulator; see text for more details.
GROUP(A)
TASK (B) A X B
df (1,7) df (2,14) df (2,14)F p F p F p
AMP uly 5.1 0.058 18.91 0.001 3.278 0.068lly 0.8 0.401 12.71 0.001 1.98 0.175tby 1.59 0.247 193.36 0.001 2.18 0.15jwy 1.86 0.215 27.91 0.001 4.56 0.03
PV uly 4.63 0.07 20.82 0.001 5.07 0.022lly 0 0.974 9.81 0.002 4.77 0.026tby 1.3 0.291 28.75 0.001 2.23 0.144jwy 2.39 0.166 21.48 0.001 5.14 0.021
DUR uly 0.24 0.642 3.99 0.042 6.16 0.012lly 0.57 0.475 3.61 0.055 1.68 0.221tby 0.12 0.741 15.17 0.001 13.89 0.001jwy 0.13 0.725 7.72 0.005 2.17 0.151
STIF uly 0.22 0.657 1.59 0.238 0.85 0.447lly 3.45 0.105 22.63 0.001 1.27 0.313tby 0.22 0.655 4.17 0.038 1.04 0.379jwy 0.04 0.845 24.81 0.001 2.03 0.168
VPP uly 3.42 0.107 2.72 0.1 5.2 0.021lly 0.47 0.517 2.73 0.1 3.72 0.051tby 0.14 0.717 3.42 0.062 9.99 0.002jwy 0.53 0.489 0.43 0.657 1.13 0.35
VPS uly 0.39 0.554 3.05 0.08 1.46 0.265lly 0.05 0.831 2.96 0.085 0.13 0.883tby 2.89 0.982 1.89 0.188 0.93 0.419jwy 0.51 0.45 7.51 0.006 2.09 0.161
CSTI uly 1.67 0.237 0.12 0.889 0.91 0.427lly 0.18 0.688 4.52 0.031 0.47 0.634tby 2.47 0.16 9.42 0.003 4.1 0.04jwy 1.52 0.257 13.02 0.001 0.01 0.994
CV-PV uly 1.95 0.205 1.96 0.178 0.96 0.406lly 0.01 0.917 1.77 0.206 0.06 0.945tby 0.28 0.614 4.14 0.039 0.91 0.425jwy 1.19 0.312 32.24 0.001 2.12 0.157
54

Speech Motor Control in Apraxia of Speech
Table 4. Means (upper row) and standard deviations (lower row) for coordination data (intra- and
inter-gestural); see text for more details.
AS NSAPI IPA PTK API IPA PTK
PHI-INTRA 145.51 193.13 121.87 165.87 209.70 183.4912.22 15.89 12.64 33.83 18.00 27.49
SDPHI-INTRA 4.92 5.96 7.68 6.68 7.72 6.322.46 3.07 5.84 3.59 4.86 4.00
AS NSAPI IPA PTK API IPA PTK
TB-TT TT-BC TB-TT TT-BCPHI-INTER 42.98 260.08 49.53 153.93 71.13 290.98 55.33 150.36
9.43 13.06 16.72 21.84 16.03 13.89 24.38 36.52SDPHI-INTER 8.30 13.55 10.08 7.47 10.09 11.01 8.15 10.69
5.80 5.81 3.95 3.98 2.95 3.83 3.40 4.23
55

Figure 1
Coordination Levels
up
downMandibleLower lipUpper lip
Gestural taskspecification
Dimension-specific taskimplemention
Bilabial closure
Lip aperture Lip protrusion
close
open
smaller
largerback
front
Articulatory actions

Figure 2

Figure 3

Figure 4

Figure 5

Figure 6

Figure 7
0.0
2.0
4.0
6.0
8.0
api ipa ptk
Task
Flue
nt s
peec
h / t
rial s
et (s
) ASNS

Figure 8
0
10
20
30
40
50
60
70
80
90
100AM
P_U
Ly
AMP_
LLy
AMP_
TBy
AMP_
JWy
PV_U
Ly
PV_L
Ly
PV_T
By
PV_J
Wy
DU
R_U
Ly
DU
R_L
Ly
DU
R_T
By
DU
R_J
Wy
STIF
_ULy
STIF
_LLy
STIF
_TBy
STIF
_JW
y
VPP_
ULy
VPP_
LLy
VPP_
TBy
VPP_
JWy
VPS_
ULy
VPS_
LLy
VPS_
TBy
VPS_
JWy
cSTI
_ULy
cSTI
_LLy
cSTI
_TBy
cSTI
_JW
y
PHI-I
NTR
A
SDPH
I-IN
TRA
PVC
V_U
Ly
PVC
V_LL
y
PVC
V_TB
y
PVC
V_JW
y
Variables
%
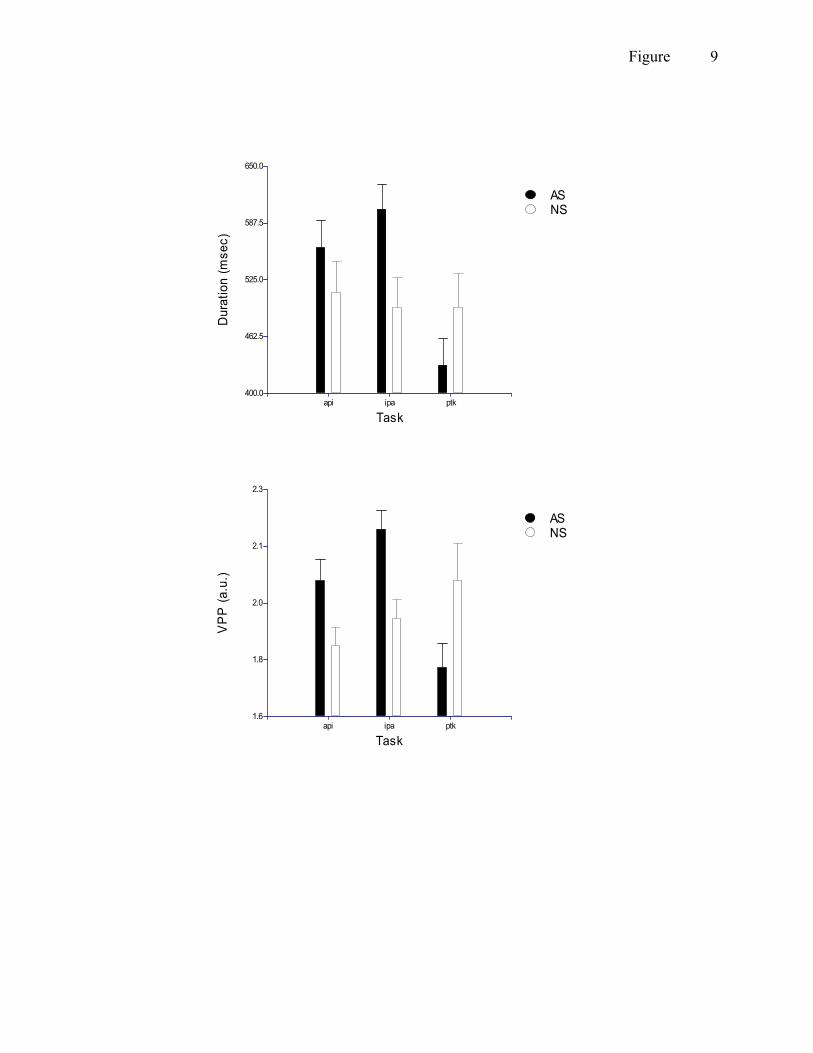
Figure 9
400.0
462.5
525.0
587.5
650.0
api ipa ptk
Task
Dur
atio
n (m
sec)
ASNS
1.6
1.8
2.0
2.1
2.3
api ipa ptk
Task
VP
P (a
.u.)
ASNS

Figure 10
100.0
135.0
170.0
205.0
240.0
api ipa ptk
Task
Rel
ativ
e ph
ase
(deg
)ASNS
Intra-gestural
0.0
87.5
175.0
262.5
350.0
api ipa ptk-tbtt ptk-ttbc
Task
Rel
ativ
e ph
ase
(deg
)
ASNS
Inter-gestural

Figure 11
0.0
3.0
6.0
9.0
12.0
BC TB TT
Am
plitu
de (m
m)
Fluency code123
10.0
22.5
35.0
47.5
60.0
BC TB TT
Pea
k ve
loci
ty (m
m/s
)
Fluency code123
Fluency code
350.0
450.0
550.0
650.0
750.0
BC TB TT
Gesture
Dur
atio
n (m
s)
123

Figure 12
0.0
75.0
150.0
225.0
300.0
api ipa ptk
Rel
ativ
e ph
ase
(deg
)
Fluency code123
0.0
12.5
25.0
37.5
50.0
api ipa ptk
Task
SD
Rel
ativ
eph
ase
(deg
)
Fluency code123

Figure 13
Vertical = AmplitudeHorizontal = Duration
1 -> 2 1 -> 3 1 -> 4AMP < = <PV < > =DUR = < <STIF = > >VPP 1.57 1.57 1.57VPS 50% 50% 50%
1
2
3
4

Figure 14
NS-APINS-PTKAS-APIAS-PTK
Upper lip
Lower lip