MDMA intoxication and verbal memory performance: a placebo-controlled pharmaco-MRI study
Upload
khangminh22Category
view
0download
0
1
NEUROPHYSIOLOGICAL CORRELATES OF ECSTASY/MDMA USE ON EXECUTIVE
FUNCTIONING
Carl Alexander Roberts
A thesis submitted in partial fulfilment of the requirements of Liverpool John Moores
University for the degree Doctor of Philosophy.
November 2013
2
Acknowledgements
I would like to thank the School of Natural Sciences and Psychology at Liverpool
John Moores University for their support and funding over the last three years. I would like to
thank all of the members of my supervisory team; Professor Stephen Fairclough, Professor
Francis McGlone and in particular Dr. Cathy Montgomery. Dr. Montgomery has provided
invaluable help and mentoring over the course of this PhD, her suggestions on drafts of
papers and this thesis have been highly valued at every point during the last three years. I
would also like to thank my Mum and Dad, as well as Laura, Julian and Evan Neale for their
emotional support.

3
Abstract
The purpose of this thesis was to assess the integrity of the serotonin system, by
measuring the neurophysiological response to tasks that measure executive functions, and
neuroendocrine function in ecstasy users and non-users. Each of the proposed executive
functions outlined in Miyake et al.’s (2000) conceptual framework (inhibition, switching and
updating) as well as the addition of access to semantic/long term memory made by Fisk and
Sharp (2004), was assessed using behavioural tasks in combination with EEG and fNIRS.
Behavioural performance between ecstasy users and various controls (polydrug and
drug naïve) was equivalent throughout the thesis. However ERP analysis revealed ecstasy-
related atypicalities in cognitive processing during inhibitory control, switching and access.
Ecstasy users displayed increases in P2 and N2 components during these tasks that reflect
recruitment of additional resources. A diminished P3 response during the switching task was
evident for ecstasy users and polydrug users relative to controls. Regression analyses suggest
that lifetime cannabis use may be an important factor for this function. Results from fNIRS
suggest that ecstasy users show an increased haemodynamic response during all four
executive functions relative to non-users, which suggests that ecstasy users are engaged in
more effortful cognition than controls. Increases in neuronal activation whilst performing at a
similar level behaviourally are understood as recruitment of additional resources. Again
during switching cannabis use may have been an important factor.
Another aim of this thesis was to assess neuroendocrine function. Ecstasy users
displayed elevated basal cortisol levels relative to polydrug controls and drug naïve controls.
The results suggest that ecstasy is detrimental to the integrity of the HPA-axis.
This thesis provides support for ecstasy-related damage to the serotonergic system
and should be used in educating prospective ecstasy users of relative harms.

4
Index
Page
Chapter 1: Overview of thesis 9
Chapter 2: Working memory and the central executive 11
Chapter 3: Review of cognitive deficits in ecstasy users 16
3.1 Intelligence 17
3.2 Executive functioning 20
3.2.1 Mental set switching 20
3.2.2 Inhibitory control 27
3.2.3 Working memory and updating 33
3.2.4 Access to semantic/long term memory 42
Chapter 4: Neurophysiology and neuroimaging as indicators of cognition 57
4.1 Principles of EEG 57
4.2 Principles of fNIRS 62
Chapter 5: Review of Neuroimaging studies in ecstasy users 68
5.1 Single-Photon Emission Computed Tomography (SPECT) 68
5.2 Electroencephalography (EEG) 74
5.3 Magnetic Resonance Imaging (MRI) 81
5.4 Magnetic Resonance Spectroscopy (MRS) 84
5.5 Functional Magnetic Resonance Imaging (fMRI) 87
5.6 Diffusion Tensor Imaging (DTI) 94
5.7 Positron Emission Tomography (PET) 96
Chapter 6: Electrophysiological indices of executive functioning
6.1 Chapter overview 115
6.2 Introduction 116
6.3 Method 125
6.4 Results 142
6.5 Discussion and summary 176
5
Chapter 7: fNIRS and updating
7.1 Chapter overview 179
7.2 Introduction 179
7.3 Method 183
7.4 Results 187
7.5 Discussion and summary 200
Chapter 8: fNIRS response to switching, inhibition and access
8.1 Chapter overview 202
8.2 Introduction 202
8.3 Method 206
8.4 Results 209
8.5 Discussion and summary 229
Chapter 9: fNIRS, multitasking and neuroendocrine response
9.1 Chapter overview 232
9.2 Introduction 232
9.3 Method 236
9.4 Results 240
9.5 Discussion and summary 249
Chapter 10: General discussion 251
References:
A-F 284-292
G-N 292-304
O-Z 304-314
Appendices
Appendix 1: Table of regressions on RLG fNIRS Chapter 8 316
Appendix 2: Table of regressions on CWFT fNIRS Chapter 8 324
Appendix 3: Peer reviewed publication on EEG and inhibitory control 329-339
Appendix 4: Peer reviewed publication on EEG and access 340-355
Appendix 5: Peer reviewed publication on EEG and switching 356-365
6
List of tables by chapter
Chapter 3
Table 3.1: Summary of studies involving behavioural assessment of executive 49
function in ecstasy users
Chapter 5
Table 5.1: Summary of studies assessing objective measures of neurotoxicity 104
in ecstasy users.
Chapter 6
Table 6.1: Indices of sleep quality, fluid intelligence and socio-demographic 142
variables.
Table 6.2: Indices of other drug use. 143
Table 6.3: Amounts of various drug metabolites found in urine samples (mg/L). 145
Table 6.4: Performance data (means and SDs of error count and reaction times) 148
for all participants in both conditions of the semantic association task.
Table 6.5: Performance data (means and SDs of error count and reaction times) 150
on the n-back task.
Table 6.6: Mean amplitudes (µvolts) across components, for each electrode 151
measured (Go/NoGo).
Table 6.7: Mean amplitudes (µvolts) across components, for each electrode 156
measured during the number letter task.
Table 6.8: Mean amplitudes (µvolts) across components, for each electrode 165
measured for the semantic association task.
Table 6.9: Mean amplitudes (µvolts) at each electrode measured for the P3 173
component (n-back task)
Table 6.10: Mean amplitudes (µvolts) for each electrode measured for the 174
N2 component (n-back task).
Table 6.11: Mean amplitudes (µvolts) for each electrode measured for the 175
P2 component (n-back task).
Chapter 7
Table 7.1: Indices sleep quality, fluid intelligence and socio-demographic 188
variables.
7
Table 7.2: Indices of other drug and alcohol use. 189
Table 7.3: Means and SDs of performance on the letter updating task. 192
Table 7.4: Means and SDs of performance on the spatial updating task. 192
Table 7.5: Mean oxy-Hb and deoxy-Hb changes from baseline (µmolar) 193
for letter updating.
Table 7.6: Mean oxy-Hb and deoxy-Hb changes from baseline (µmolar) 198
for spatial updating.
Chapter 8
Table 8.1: Indices sleep quality, fluid intelligence and socio-demographic 210
variables.
Table 8.2: Indices of Drug use. 211
Table 8.3: Means and SDs for behavioural measures for ecstasy users 213
and non-users.
Table 8.4: Mean changes in oxy-Hb and deoxy-Hb (µmolar) from baseline, 214
for ecstasy users and non-user controls during the random letter generation task.
Table 8.5: Mean changes in oxy-Hb and deoxy-Hb (µmolar) from baseline, 220
for ecstasy users and non-user controls on the switching blocks of the
number/letter task.
Table 8.6: Mean changes in oxy-Hb and deoxy-Hb (µmolar) from baseline, 223
for ecstasy users and non-users for the CWFT.
Chapter 9
Table 9.1: Indices sleep quality, fluid intelligence and socio-demographic 240
variables.
Table 9.2: Indices of drug use. 241
Table 9.3: Performance data (means and SDs of total scores) multitasking 244
components.
Table 9.4: Oxy-Hb and deoxy-Hb changes from baseline (µmolar) for 246
each group during the multitasking test.
8
List of figures by chapter
Chapter 4
Figure 4.1: Voxel placement for fNIRS 65
Chapter 6
Figure 6.1: Topographies at midpoints for each component (P2, N2 and P3) 135
for the Go/NoGo task.
Figure 6.2: Number-letter task topographies at midpoints for each component 136
(P2, N2 and P3).
Figure 6.3: Semantic association task topographies at midpoints for each 138
component (P2, N2 and P3) in the high association condition.
Figure 6.4: Semantic association topographies at midpoints for each 139
component (P2, N2 and P3) in the low association condition.
Figure 6.5: N-back topographies at midpoints for each component 140
(P2, N2 and P3) in the n=2 condition.
Figure 6.6: Grand average waveforms for the 3 groups across electrodes: 153
FCz and Fz.(correct trials on Go/NoGo task)
Figure 6.7: Grand average waveforms for the 3 groups across electrodes: 158
O1, Oz, POz and PO4 (correct switches)
Figure 6.8: Grand average waveforms for the 3 groups across electrodes: 162
Fz, FCz and Cz (P2 correct switches)
Figure 6.9: Grand average waveforms for the three groups across electrode 168
PO3 on the high association condition of the semantic association task.
Figure 6.10: Grand average waveforms for the three groups across electrodes 169
O2 and PO8 on the low association condition of the semantic association task.
Chapter 9
Figure 9.1: Diurnal cortisol profile for each group over the two-day protocol 248
9
Chapter 1: Overview of thesis
Chapter 1 provides a brief overview of each chapter that this thesis comprises.
Chapter 2 provides a brief introduction to the study of working memory and the fractionation
of the central executive. It is these theoretical models of executive functioning that form the
basis for behavioural assessment in this thesis. This chapter briefly introduces the reader to
the study of ecstasy use and executive function and provides a rationale for studying each
function separately.
Chapter 3 reviews studies into cognition in ecstasy users, briefly starting with
intelligence and then focusing more in depth on each of the executive functions that are later
investigated. This chapter reviews the current understanding of how ecstasy affects executive
functioning and provides a rationale for further clarification in this research area.
Chapter 4 defines the theoretical background of the neuroimaging techniques that are
used in this thesis, including how they work, what the data that they generate may tell us and
advantages and limitations of each technique. Furthermore this chapter provides a rationale
for using the two techniques employed in this thesis in a complimentary fashion.
Ecstasy is proposed to damage the serotonergic system and is a proposed neurotoxin.
It is understood that damage to the serotonin system may underlie any observed cognitive
deficits. As such Chapter 5 reviews the literature on objective measures of serotonergic
neurotoxicity in human ecstasy users from various functional and structural neuroimaging
methods.
Chapters 6, 7, 8 and 9 are the empirical chapters of this thesis. The first of these
assesses each of the four executive functions (using function specific tasks) and their
electrophysiological correlates from ERPs in ecstasy users, polydrug controls and drug naïve

10
controls. Chapter 7 assesses the haemodynamic response to memory updating using fNIRS
and two updating tasks (letter updating and spatial updating) in ecstasy users, polydrug
controls and drug naïve controls. Chapter 8 assesses the haemodynamic response to inhibition
(using a random letter generation task), switching (using the number-letter task) and access to
semantic memory (using the Chicago Word Fluency Task) in ecstasy users and controls.
The results from these three chapters indicate that ecstasy users perform at a similar
level to controls in the executive functioning tasks employed in each chapter. However they
show neurophysiological responses that reflect compensatory mechanisms/recruitment of
additional resources to enable equivalent performance.
Chapter 9 investigates the haemodynamic response to multitasking in ecstasy users,
polydrug controls and drug naïve controls. Importantly, this chapter also investigates the
integrity of the HPA-axis and the neuroendocrine response to stress, through salivary cortisol
sampling.
Finally Chapter 10 provides a general discussion of the results and places them in the
context of the existing literature on ecstasy use, executive function and serotonin system
degradation. This chapter discusses these results in terms of implications for drug users and
suggestions for future research.
11
Chapter 2: Working memory and the central executive
2.1 Chapter overview
This chapter briefly describes Baddeley’s working memory model and more recent
work that has built upon this model exploring the central executive, executive processing and
the fractionation of the central executive. This gives the theoretical basis for further
exploration of executive functions that are discussed in Chapter 3.
Theory of working memory, executive functioning and ecstasy use.
Baddeley’s (1986) multi-component model of working memory is a key construct in
cognitive psychology. Initially proposed as a three component model, this comprises a
modality free control system, called the central executive, with limited storage capacity that
is subserved by two “slave” storage systems. The two slave systems are: the phonological
loop, which is involved in processing sound and language, and the visuospatial sketchpad,
which processes visuospatial information. A fourth component- the episodic buffer was later
added (Baddeley, 2000) to bridge the gap between the limited capacity of the initial three
components and long term memory. This was added after observing an amnestic patient with
severe damage to long term memory who was able to recall passages of prose that were
beyond the capacity of the phonological loop or the visuospatial sketch pad. The episodic
buffer is regarded as the storage component of the central executive (Baddely, 2003), and is
thought to be involved in transfer of episodic information to and from long term memory
stores.
The central executive is an integral component of working memory and is responsible
for coordinating the processing of information from the subsidiary components. Initially
understood to operate as a single unit, studies on individual differences (Miyake et al., 2000)
and patients with frontal lobe damage (Shallice & Burgess, 1991) started to suggest that

12
perhaps the central executive was not a unified construct. Lehto (1996) explored the
relationship between working memory capacity and a variety of executive functioning tasks
in a normal 15-16 year old student population. It was observed that performance on complex
span measures (working memory) had high inter-correlations with memory updating.
However, although performance on the Wisconsin Card Sorting Task (WCST) correlated
with working memory measures, performance on two further executive measures (Tower of
Hanoi and Global Search Test) did not. Perhaps more interesting, is that none of the
executive measures correlated significantly with one another, which led Lehto to conclude
that the central executive was not unified.
Miyake et al. (2000) explored the separability of executive functions further, by
examining three possible discrete executive functions: mental set shifting (“shifting”),
information updating and monitoring (“updating”) and inhibition of prepotent responses
(“inhibition”) and their contributions to the complex neuropsychological tasks used to assess
executive function. In this study, performance on three tasks, each proposed to target a
proposed executive function (WCST, Tower of Hanoi –ToH, and random number generation
- RNG), as well as two other commonly used executive tasks (operation span and dual
tasking) were correlated. It was observed, from confirmatory factor analysis, that the three
target executive functions were moderately correlated with one another, but were distinctly
separable. Furthermore structural equation modelling revealed that each function contributed
separately to each task, with performance on the WCST relating to the executive function of
shifting, ToH pertaining to inhibition, operation span to updating and RNG loaded on both
inhibition and updating.
Fisk and Sharp (2004) investigated the separability of executive functions in their
research on age related cognitive impairment and observed findings largely consistent with
13
Miyake et al.’s fractionated components of the central executive. However an additional
component termed “access” that involves access to long term memory was proposed. This
addition was proposed due to word fluency tasks often being used as a measure of executive
function, and apparent impairment of word fluency after damage to frontal brain regions
(Stuss et al., 1998). Word fluency involves temporary access of long term memory stores and
does not seem to fit as well with the three initial proposed components of executive function.
Furthermore Baddeley (1996) postulated that temporary activation of long term memory was
a key executive process. In this study a battery of executive tests were administered to an
elderly cohort, including the WCST, Random Letter Generation (RLG), Brooks spatial
sequences, reading and computation span, word fluency and a measure of dual task
performance. All of the tasks loaded on at least one of Miyake’s executive processes apart
from word fluency and the redundancy measure of RLG (the extent to which a letter is
produced with the same overall frequency), which loaded on their proposed fourth executive
function of access.
The study of executive functions is complicated by task impurity, for example the
WCST, a commonly used task to assess mental set shifting, requires sorting cards based on a
particular theme (e.g. colour, shape, number) then switching to another theme at the
experimenter’s request. This not only involves shifting of the mental set, but also perceptual
and motor cognitive abilities necessary for sorting cards and monitoring verbal feedback
(Friedman et al., 2008). As such purer tasks of executive function are required. Further work
into the separability of executive functions has been conducted by Friedman et al. (2006)
who suggest that the three executive functions identified in Miyake’s model are differentially
related to intelligence, with updating showing close relations with crystallised and fluid
intelligence, but shifting and inhibition showing no such relationship. Furthermore Friedman
et al. (2008) also suggest that the executive functions are correlated by hereditary factors that
14
go beyond speed of processing or intelligence, but are separable due to other genetic factors
unique to each function.
This fractionation of the central executive into four discrete components has helped
the progression of research into the effects of ecstasy/MDMA on cognition. Many earlier
studies into ecstasy use and working memory refer to the central executive as a single entity,
and have yielded equivocal results, whereby users show deficits in some tasks but not others.
For example Halpern et al. (2004) administered a large battery of neuropsychological tests to
a relatively pure MDMA user group and found that heavy users were impaired on
performance of a Stroop task (supposed to be related to inhibition), but did not find
significant performance deficits on many other tasks (including the WCST, Controlled Oral
Word Association, WAIS-R digit span subtest, WAIS-R digit symbol subtest, the Rey-
Osterrieth complex figure text and the California verbal word learning test). Fox et al. (2001)
also observed ecstasy users to be unimpaired on the WCST, supposedly pertaining to the
executive function of shifting, whereas Fox et al. (2002) show evidence of ecstasy-related
impairment in shifting as well as verbal fluency, and spatial working memory. Morgan et al.
(2002) conversely report little performance deficits in the Stroop task or word fluency. Due to
equivocal findings there was no definitive consensus on whether executive functions were
impaired in ecstasy users or not. As such, Montgomery, Fisk, Newcombe and Murphy (2005),
applied Miyake et al.’s (2000) and Fisk & Sharp’s (2004) framework to the research on
ecstasy users, suggesting that ecstasy users display differential impairments in executive
function. It is argued that a systematic approach is necessary, using “pure” tasks that tap one
function only, to observe how MDMA affects each component of the central executive.
Ecstasy-related impairments were observed in the updating and access components of
executive function, but not in the switching and inhibition components.

15
In light of these findings, this thesis focuses on the separable executive functions and
uses function-specific tasks to assess each component of executive function in ecstasy users.
Furthermore neurophysiological measures such as electroencephalography (EEG) and
functional Near Infrared Spectroscopy (fNIRS) are employed as more sensitive measures of
cognitive impairment. The literature on the research pertaining to ecstasy-related deficits on
executive function briefly touched upon here will be reviewed in greater detail in Chapter 3
whereby each component of the central executive will be reviewed separately.

16
Chapter 3: Review of the literature on cognitive deficits in ecstasy users
The recreational drug ecstasy/MDMA (3,4-methylenedioxymethamphetamine) is a
potent indirect monoaminergic agonist, that is structurally similar to amphetamine and
mescaline (Morgan, 2000). The acute psychological and physiological effects include
feelings of euphoria and empathy, increased energy, dilated pupils and tight jaw (trismus)
(Davison & Parrott, 1997) and are thought to result primarily from serotonin and dopamine
agonsim (McDowell & Kleber, 1994). However ecstasy has been classed under the novel
pharmacological category of entactogens (from Greek and Latin roots, meaning to produce a
“touching within” Nichols, 1986) owing to its unique psychoactive profile that can be
differentiated from classic hallucinogens and stimulants (Morgan, 2000). MDMA increases
emotional sensitivity and empathy, but does not produce hallucinations, as such it cannot be
classified as an hallucinogen or psychostimulant (Cole & Sumnall, 2003). Working memory
deficits, and those particularly associated with higher level executive functioning tasks appear
to be most prominent. This is particularly salient given the continued prevalence of
ecstasy/MDMA use; for example the British Crime Survey (2012) states that 3.3% of 16-24
year olds report use of MDMA in the last year, and the negative psychological consequences
could have real world functional significance (Montgomery et al., 2010). MDMA related
changes in cognition are believed to be related to the drug’s effects on the serotonin system
(Gouzoulis-Mayfrank et al., 2000) and have been shown to be long lasting (Gerra et al.,
2000). Specifically serotonin, understood to be implicated in supporting working memory
processes, is densely innervated in the prefrontal cortex (Pazos et al., 1987), and as such it is
integral in executive processing.
There have been a number of investigations into working memory deficits in human
ecstasy users compared to drug naïve controls. This chapter reviews the literature of several
17
aspects of cognition that have been investigated including intelligence, and the four executive
functions outlined in Chapter 2: shifting, inhibition, updating and access. Although many
publications cover several executive functions, this chapter has been subdivided into sections
for each component of the central executive, and thus papers may have been cited multiple
times.
3.1 Intelligence:
As mentioned in Chapter 2, the executive functions are differentially correlated with
intelligence so this thesis controls for intelligence throughout. Studies on ecstasy and
cognition do attempt to control for intelligence, often using Raven’s Standard Progressive
Matrices (SPM), the Weschler Abbreviated Scale of Intelligence (WASI) or a test of
crystallised intelligence (e.g. The National Adult Reading Test - NART).
Gouzoulis-Mayfrank et al. (2000) measured both crystallised and fluid intelligence in
ecstasy users, cannabis users and non-drug users. Fluid intelligence was assessed using a
German version of the Weschler Adult Intelligence Scale – Revised (WAIS-R), Mosaic test,
in which, participants must reproduce complex visual patterns using cubes (this task assesses
visuomotor performance, planning and problem solving) and the LPS-4 (a problem solving
test assessing abstract thinking). Crystallised intelligence was assessed with the German
WAIS-R general knowledge test. Ecstasy users performed significantly worse than both non-
users and cannabis users on all three intelligence measures. Due to the ecstasy user group
having lower IQ measures, the researchers had to control for intelligence in their subsequent
analyses. Gouzoulis-Mayfrank et al. (2003) also observed deficits in crystallised intelligence
in heavy ecstasy users compared to moderate users and non-users, using the WAIS-R General
Knowledge test.
18
However, not all studies find differences in intelligence. For example using the NART,
which involves participants reading 50 words of decreasing fluency in the English language,
with atypical phonology, so that words should not be guessed correctly using standard
grammatical pronunciation (a measure of crystallised intelligence), Fox et al. (2002)
observed no significant differences between ecstasy users and non-users. Furthermore
Morgan et al. (2006) used the NART to assess premorbid intelligence in ecstasy polydrug
users, non-ecstasy polydrug users and drug naïve controls and observed no significant
between group differences in their estimated IQ (ecstasy users: 111.8, polydrug controls :
112.1, drug naïve controls: 111.2). Similarly, using a Dutch variant of the NART (the DART)
Renememan et al. (2006) transformed the number of correctly read words into an estimate of
verbal IQ and observed that former ecstasy users (male: 105.9, female: 102.0), heavy current
users (male: 106.0, female: 104.5), moderate users (male: 111.2, female: 112.2) and non-
ecstasy polydrug users (male: 104.7, female: 106.9) had comparable premorbid IQ regardless
of gender. Moreover Dafters et al. (1999) observed that level use of ecstasy was not
correlated with performance on the NART.
Montgomery, Fisk and Newcombe (2005) used the NART in ecstasy polydrug users
compared to drug naïve controls and observed no significant between group differences in
this measure. The same study also found no significant differences between users and non-
users on Raven’s SPM, whereby participants are required to study a series of problems
presented as a symbolic sequence and select an appropriate response to complete the
sequence from a choice of 6/8 options. Montgomery and Fisk (2008) again observed no
differences between ecstasy users and controls on the NART and Raven’s SPM. Raven’s
SPM has been used frequently in the literature to assess fluid intelligence, and has repeatedly
yielded no observable significant differences between ecstasy users and non-users (Fisk et al.,
2004; Montgomery, Fisk & Newcombe, 2005). However, Montgomery et al. (2010) found
19
ecstasy users to score significantly lower than non-users on this measure. Furthermore
Halpern et al. (2011) found performance on Raven’s SPM and WAIS-R digit symbol subtest
to be significantly reduced in moderate users, but not heavy users in comparison to drug
naïve controls. However in an earlier study by the same research group (Halpern et al., 2004)
on a similarly pure ecstasy using cohort, no such differences were observed.
Verbal intelligence (using the WAIS III vocabulary subtest) and performance
intelligence (using the WAIS III block design subtest) in ecstasy users was explored in a
longitudinal study by Zakzanis and Young (2001) to observe whether these measures were
robust to continuing ecstasy use over time. The tests were administered twice, one year apart,
with continued ecstasy use in between testing dates. It was observed that there were no
significant differences in WAIS vocabulary score between the first testing session (mean =
53.0) and the one year follow up score (mean = 52.1), nor was there significant decline in
performance in WAIS block design performance between time one (mean = 49.0) and time
two (mean= 48.4). However there was a significant correlation between frequency of MDMA
use and performance change (time one – time two score) on the vocabulary subtest,
suggesting that verbal intelligence is adversely affected by frequency of ecstasy use.
Thomasius et al. (2003) also explored premorbid intelligence using the German multiple
choice test of vocabulary knowledge (Mehrfachwahl-Wortschatztest – MWT-B), in their
initial study (Thomasius et al., 2003) they report that ecstasy users (IQ score – 102.5), former
ecstasy users (IQ – 106.48), polydrug controls (IQ -104.28) and drug naïve controls (IQ -
104.97) showed no significant differences in IQ, and this remained non-significant in their
follow up study (Thomasius et al., 2006) (ecstasy users – 101.36, former users – 106.48,
polydrug controls – 107.91, drug naïve controls – 105.20). Currently abstinent ecstasy users
were assessed on verbal intelligence using the WAIS-III vocabulary subtest and the NART in
a study by McCann et al. (2007) and again it was observed that differences between abstinent

20
ecstasy users and drug naïve controls on their estimated baseline intelligence were non-
significant (WAIS- III; MDMA users 44.44, controls 40.39, NART; MDMA users 102.74,
controls 99.38); it was suggested that these tests provide estimates of verbal intelligence that
are insensitive to MDMA related neurotoxicity.
In summary, it would appear that most studies in this area attempt to control for IQ
differences, and in the majority of cases there is little difference in IQ between ecstasy using
populations and controls. In studies that do show between group differences in IQ measures,
IQ is used as a covariate and statistically controlled for in subsequent analysis. Although one
longitudinal study (Zakzanis & Young, 2001) observed a negative correlation between
frequency of ecstasy use and performance on verbal intelligence measures, suggesting that
ecstasy use could affect intelligence over time, other longitudinal studies have found little
effect of use on measures of intelligence (Thomasius et al., 2006). However in line with most
other research in this area, the studies presented in this thesis all have at least one control
intelligence measure.
3.2.1 Mental set switching
Mental set “switching” or “shifting” is the ability to switch attention between task
types, whereby a switch between tasks is associated with a performance cost, either in
accuracy or time, compared to completing two tasks in succession (Jersild, 1927). Switching
reflects cognitive flexibility and is one of the core executive functions outlined in Miyake et
al.’s (2000) framework. Several tasks have been used in the literature to assess this function
in ecstasy users, including the WCST, the number-letter task, plus-minus task, and a
switching variant of the Stroop task. Findings of performance of this executive function in
ecstasy users are equivocal.

21
Fox et al. (2001) used a computerised version of the WCST whereby participants
have to learn a rule in order to sort a pack of 128 cards, along three possible ‘dimensions’
(colour, shape or number). After 10 consecutive successful card placements, the rule by
which the cards were being sorted was changed (switch). There were six switch trials, where
the rule changed (from colour to shape to number then repeated). In this task participants are
scored for number of correctly completed trials, number of trials to complete the first
category, percentages of perseverative (the amount by which they fixated on a rule after it
had changed) and non-perseverative errors and failure to maintain set. No significant
performance differences on the task were reported between controls and ‘problem’ or ‘non-
problem users’ (defined as problems attributed to use of ecstasy), furthermore lifetime dose
of ecstasy (low = < 100 tablets, medium = 100-500 tablets, high = > 500 tablets) had no
significant effect on performance. The WCST was administered in a neurocognitive test
battery to current ecstasy users [15 male, mean age = 24.5, mean lifetime dose (MLD) for
males = 1033.77, females = 600.42 tablets], former users (16 male, mean age = 24.13, MLD
for males = 987.31, females = 533.80 tablets), polydrug controls (15 male, mean age = 24.41)
and drug naïve controls (15 male, mean age = 23.13) by Thomasius et al. (2003), planned
comparisons revealed that the polydrug user group produced a significantly higher amount of
perseverative errors than both ecstasy using groups. Reneman et al. (2006) compared 15
moderate MDMA users (9 male, mean age = male 25.6, female 22.7, MLD = male 29.5,
female, 27.3), 23 heavy MDMA users (12 male, mean age = male 27.1, female 25.0, MLD =
male 831.8, female 200.9 tablets ), 16 former users (8 male, mean age = male 26.4, female
24.1, MLD = male 126.9, female 409.3 tablets) and 13 ecstasy naïve, but drug taking controls
(7 male, mean age = male 29.3, female 23.3) on performance on the WCST and observed
little difference on any of the performance measures of the task. Similarly Back-Madruga et
al. (2003) observed no differences in performance on the WCST between recreational ecstasy

22
users (n=22, 14 male, mean age = 37.0, mean lifetime occasions = 74.6) and controls (n=28,
23 male, mean age = 39.9). Halpern et al. (2004) also observed no significant differences in
performance on the WCST between 23 MDMA users with minimal exposure to other drugs
(8 male, median age = 20, median lifetime MDMA episodes = 60) and 16 ecstasy naïve
comparison individuals involved in rave subculture (9 male, median age = 22). However,
when the ecstasy user group was further subdivided into light (less than 50 occasions of use)
and heavy (more than 50 occasions of use) users, heavy users performed worse compared to
non-users after adjusting for age, sex and family of origin on the “total categories” score of
the task. However this score does not relate to the executive function of switching in the same
way as total perseverations does and may not reflect switching deficits. In a follow up study
(Halpern et al., 2011) with similarly ecstasy pure participants (n=52, 30 male, median age =
22, median lifetime episodes of MDMA use = 43.5) versus rave subculture matched controls
(n=59, 38 male, median age = 24) it was again observed that there were no significant
between group differences in performance on the WCST. However this changed when the
ecstasy user group was subdivided into heavy and moderate users. This time WCST total
category score was significantly reduced among moderate, but not heavy users. Results from
studies administering the WCST as a measure of switching seem to suggest that this function
is relatively robust to ecstasy use. However as discussed in Chapter 2, this task has been
criticised for not necessarily being a pure measure of mental set switching. Therefore, it is
important to consider other tasks that have assessed this function.
Fox et al. (2002) compared 20 ecstasy polydrug users (10 male, mean age = 27.3,
MLD = 172.0 tablets) and 20 ecstasy naïve polydrug users (8 male, mean age = 27.5) on their
ability to effectively “switch” attention using the 3D IDED (intra-dimensional/extra
dimensional) attention shift task as well as a switching version of the Go/NoGo task. Based
on a task in the CANTAB neuropsychological battery, the 3D IDED comprised of eight

23
stages related to forming, maintaining and shifting attentional set. Participants are required to
learn two alternative forced choice discriminations and their reversals. The stimuli used,
varied on three possible dimensions (one dimension is relevant and the other two are not). In
the first and simplest stage (visual discrimination) two stimuli are presented and these vary on
one of the three dimensions (e.g. colour) and in the reversal stage the previously incorrect
item becomes the correct item. Following this, there is the compound visual stage in which
the two stimuli are different on all three possible dimensions. In the intra dimensional shift
stage, the “relevant” dimension (e.g. colour) remained the same despite the introduction of
two novel stimuli. Finally in the extra-dimensional shift stage participants are required to
shift their response set to a previously irrelevant dimension (e.g. shape). Each stage has a
reversal stage and participants progress to the next stage by achieving six successive
discriminations. Although increases in errors and reaction time were observed within groups
as difficulty increased, there were no significant between group differences in performance at
any stage on non-reversal trials. However on reversal trials the difficulty by group interaction
was approaching significance, with ecstasy users making more errors on simple and
compound reversal trials but fewer errors on the extra dimensional reversal condition than
controls. Furthermore ecstasy users were significantly slower than controls at all levels of
reversal, indicating performance deficits. In the same study, switching was also assessed with
a switching variant of the Go/NoGo task with 10 blocks, each containing 18 symbols
appearing rapidly on the centre of a screen. Half of the symbols were “targets” and half were
“non-targets” comprising of letters (from A-G) and numbers (2-9). Participants had to press
the space bar when a target appeared on the screen and were to withhold a response to non-
targets. The targets (either letters or numbers) switched every two blocks. Mean errors were
calculated (failure to press space bar) as well as mean distractors (pressing space bar when it

24
should not have been pressed) and mean reaction time for correct responses. No between
group differences were observed on any of the measures analysed on the task.
The number-letter task is considered to load on the executive function of switching
only, and was used by Montgomery, Fisk, Newcombe and Murphy (2005), to assess
switching performance in 51 ecstasy polydrug users (27 male, mean age 21.96, MLD =
345.96 tablets) compared to 42 non-user controls (8 male, mean age 20.83). In this task
(adapted from Rogers & Monsell, 1995), participants are presented with a number-letter pair
(e.g. “D4”) in one of four quadrants on a computer screen. If the number-letter pair appears in
one of the top two quadrants of the screen, participants must indicate whether the letter is a
vowel or a consonant. If the pair appears on the bottom half of the screen participants should
indicate whether the number is odd or even. In the main three blocks of the task, number-
letter pairs appear 64 times, in the first block they alternate between the two quadrants on the
top half of the screen. In block two, pairs alternate between the bottom two quadrants.
However on the third block the pairs rotate clockwise around all four quadrants of the screen.
As such every second trial in block three requires a switch in categorisation. A switch cost is
calculated by subtracting the average time taken to complete trials on the first two blocks
(where no switching is required) from the mean trial reaction time in block three. There were
no differences between users and non-users in this task, and groups had equivalent age,
premorbid intelligence, fluid intelligence and years in education. In the same study, the plus-
minus task also measured set switching, and involves three blocks of mental arithmetic; in
block one participants are given a list of 30 two-digit numbers (10-99) and are required to add
three to each number, in block two participants are given another 30 two-digit number list
and are required to subtract three from each. In the final block participants are given a third
30 two-digit list and participants are to alternate between adding three and subtracting three
from each number on the list. This final block involves a shift/switch and the switch cost is
25
calculated by subtracting mean completion times for lists one and two from the time taken to
complete list three. No between-group differences were observed on this task, and the main
effect of ecstasy use on switching was non-significant.
Using a modified version of the Stroop task, to assess inhibition and task switching,
Dafters (2006) compared performance of 18 ecstasy users (12 male, mean age = 23.24, MLD
= 522.33), 15 ecstasy users who did the task in reversed order (9 male, mean age = 22.93,
MLD = 475.87), 17 cannabis users (13 male, mean age = 23.19) and 18 controls (10 male,
mean age = 22.67) whom had never used either drug. The switching component came in the
fourth phase of the task whereby colour words appeared on a screen and participants were
required to name the ink colour rather than read the word. On half of the trials the word was
underlined in black and participants were required to select the colour name rather than the
ink colour, hence a switch in rule. Reaction times were analysed for the switch trials and it
was reported that ecstasy users performed worse than both cannabis users and non-drug user
groups on the switching component of the task, after covarying for other drug use. However,
the mapping of tasks onto individual executive functions is difficult, and as this task is
usually implemented to assess inhibition, perhaps this manipulation does not necessarily tap
switching exclusively. It could be that these results still reflect inhibition deficits (Murphy et
al., 2009). Dafters et al. (1999) had previously observed dose related impairment in switching
using a derivative of the WCST called the Behavioural Assessment of the Dysexecutive
Syndrome (BADS) rule shift cards test, whereby MDMA use was negatively correlated with
performance on the task. There was, however, no control group in this experiment, and when
heavy ecstasy (at least 50 MDMA tablets over lifetime)/ cannabis (1680.7 mean lifetime
joints) users, were compared to light ecstasy (below 50 tablets)/cannabis users (1252.9 mean
lifetime joints), cannabis only users (1023.1 lifetime mean lifetime joints) and non-drug
26
controls, this task yielded no significant differences between groups after covarying for
alcohol, amphetamine cocaine and LSD (Dafters et al., 2004).
von Geusau et al. (2004) assessed cognitive flexibility in 26 ecstasy using first year
university students (17 male, mean age = 21.4 MLD = 53.82 tablets, 9 female, mean age =
21.7, MLD = 38.78) and 33 non-user controls (12 male, mean age = 22.0, 21 female, mean
age = 21.4) using the Dots-Triangles task and the Local-Global task. In the Dots-Triangles
task participants are presented with a 4x4 grid on a computer screen in which varying
numbers of dots or triangles appear. When dots appear, participants have to decide whether
there are more dots in the left half of the screen or the right half, and when triangles appear a
decision has to be made as to whether there are more triangles in the top half of the screen or
the bottom half. In blocks one and two, all trials are dots or triangles (randomised), whereas
in block three it alternates between dots and triangles being presented every four trials. The
Local-Global task involves participants responding to rectangles and squares. Larger (global)
rectangles or squares consist of smaller (local) rectangles or squares. Participants respond to
either the local or global figures only, in the first two blocks of the task. In the third block, the
rule alternates between local and global every fourth trial, initiating a switch. Male users
displayed a significantly higher switch cost reaction time than non-users in the dots triangles
task, although they were also shown to be significantly more accurate. Female users and non-
users were equivalent in performance on this task. Moreover on the Local-Global task male
users were significantly slower than controls and had a higher switch cost. However there
was no significant difference in accuracy on this task.
In summary, it appears from the literature that the majority of studies suggest that this
executive function is relatively stable after ecstasy use, although there may be issues with the
purity of some of the tasks. However there is some evidence to suggest that this executive

27
function warrants further investigation. Although von Geusau et al. (2004) suggests that this
function is more affected in males, this could be an effect of dose, as the males in this sample
had a higher mean lifetime dose than females and the range was much larger for males. This
is interesting to consider given that Dafters et al. (1999) showed evidence of a relationship
between dose and performance on set switching. Halpern et al.’s (2004) study also showed an
effect in heavy users compared to light users. However this was contradicted in a follow up
study (Halpern et al., 2011) with moderate users performing worse than heavy users.
Furthermore Dafters’ 2006 study showed evidence for deficits in this area. Perhaps the
addition of neuroimaging techniques in combination with performance on these tasks can
help to address equivocal findings. As such the effect of ecstasy use on mental set switching
will be investigated in this thesis both behaviourally and with EEG and fNIRS, using the
number-letter task in Chapters 6 and 8.
3.2.2 Inhibitory control
Inhibitory control, or response inhibition is one of the executive processes outlined in
Miyake et al.’s (2000) framework and involves the inhibition of prepotent, or dominant
responses when they are not necessary. This function has been assessed in ecstasy using
populations with several tasks, including: the traditional Stroop task, RLG, RNG, ToH, Stop
Signal and Go/NoGo tasks.
The most frequently used task to assess this function in the literature is the Stroop task
(Stroop, 1935). Conventional Stroop measures involve comparing reaction times of
participants to name the ink colour of a colour named word (e.g. the word “yellow” written in
red ink), to naming the ink colour when the stimulus and colour match (e.g. “red” written in
red ink) or the stimulus is not a word (e.g. an asterisk) (Murphy et al., 2009). Morgan et al.
(2002) examined performance on the Stroop task in 18 current heavy ecstasy users (9 male,
28
mean age = 23.4, MLD = males 513 tablets, females 93 tablets), 15 former heavy ecstasy
users (4 male, mean age = 24.7, MLD = males 336 tablets, females 577 tablets, abstinent for
at least 6 months), 16 ecstasy naïve polydrug controls (8 male, mean age = 22.1) and 15 drug
naïve controls (6 male, mean age = 22.4). No significant between group differences were
observed for number of errors made or reaction time. Dafters (2006) used a modified version
of the Stroop task, in which standard colour-word interference trials were interspersed with
trials where the target colour was the same as the distractor word from the previous trial.
Performance was compared between ecstasy users, cannabis users and controls (as described
in Chapter 3.2.1). After covarying for cocaine, amphetamines, alcohol and tobacco, ANOVA
revealed no significant between group differences on the magnitude of Stroop interference
reaction times (pre potent response inhibition). However a difference was observed on the
magnitude of negative priming, whereby ecstasy users showed a reduced priming effect
(reduced short term residual inhibition) compared to both other groups. It was suggested that
these two inhibition types are regulated by separable processes and future work should
investigate the microstructure of cognitive subcomponents. Back-Madruga et al. (2003) failed
to observe behavioural differences in the Stroop task between ecstasy users and controls
matched for age, IQ and education (described in Chapter 3.2.1). Similarly Gouzoulis-
Mayfrank et al. (2000) observed no significant differences on Stroop performance between
ecstasy users, cannabis users and non-drug users. However Halpern et al. (2004) did observe
ecstasy-related performance deficits on the Stroop task, after subdividing the ecstasy using
population into heavy and light users (as described in chapter 3.2.1). Heavy users showed
significantly longer reaction times and more Stroop errors on interference trials. However,
these findings were not replicated in a follow up study (Halpern et al., 2011). A longitudinal
test on 149 new ecstasy users (<5 MDMA use occasions before participating in the study)
was conducted by Wagner et al. (2012) to examine whether abnormalities in executive

29
function existed prior to drug using. This was followed up one year later with 109 remaining
participants; Of these, 43 did not use illicit substances other than cannabis over the 1 year
(classed as non-users for analysis) and 23 took more than 10 MDMA tablets over the one
year period (mean = 33.6). The remaining participants used MDMA more than once, but had
taken less than 10 tablets, and so were excluded from follow up analysis. Using a German
variant of the Stroop task, no significant differences were found in performance between
groups, or between baseline and follow up sessions. This suggests that performance on this
task does not decline following continued use in new users over a one year period.
Wareing et al. (2000) assessed performance of 10 ecstasy users (mean age = 22.2,
mean duration of use = 4.1 years), 10 former users (mean age = 22.6, mean duration of use =
3.9 years, abstinence of at least 6 months) and 10 non-users (mean age = 22.6) on RLG.
Participants were instructed to speak aloud consonants in random order and to avoid
repeating letter sequences, producing alphabetical sequences and to try and produce each
letter with the same overall frequency. Participants were required to produce three sets of 100
letters, at a different rate (every 4 seconds, 2 seconds or 1 second – presentation randomised).
This task yields three performance measures; redundancy - the extent to which each letter
appears with the same overall frequency, number of letters produced at each rate (often due to
more accelerated rates participants will lapse and produce fewer letters) and number of vowel
intrusions. A low score on redundancy and vowel intrusions is desirable for good
performance on this task, whereas a high score on the number of letters produced is indicative
of good performance. Ecstasy users (both groups) performed worse on the task compared to
controls, with more vowel intrusions at all three rates, and higher redundancy and lower
number of letters produced relative to controls at the 1s rate. It is suggested that this function
is impaired in ecstasy users and this persists after six months, furthermore ecstasy users
perform worse when greater demand is placed on them. However the sample size here is

30
relatively small and these results were not replicated in a follow up study with a larger sample
(Fisk et al., 2004) where it was observed that ecstasy users (n=44, mean age = 21.52, MLD =
343.38 tablets) were unimpaired on all measures of RLG performance relative to controls
(n=59, mean age = 21.37). Moreover, Montgomery, Fisk, Newcombe and Murphy (2005)
observed ecstasy users (described in Chapter 3.2.1) to perform better at RLG than non-users
with users producing significantly more letters than controls. Other measures (alphabetic
sequences, repeat letters and redundancy) were non-significant.
RLG was also administered to 15 ecstasy users (3 male, 1 transsexual, mean age =
24.5, MLD = 364.8 tablets), 12 cannabis only users (6 male, mean age = 21.9) and controls (6
male, mean age = 19.6) who had never used either drug in a study by Murphy et al. (2011).
No between group differences were observed in measures of alphabetic sequences or repeat
sequences (measures of impulsivity) and ecstasy use did not predict performance on these
measures. However there were between group differences in ‘redundancy’ which the authors
suggest pertains more to access to long term memory and as such will be discussed in
Chapter 3.2.4.
More recently, Clark et al. (2009), suggested that disrupted ‘reflection’ impulsivity
may be more related to cannabis use than MDMA use. In this study 46 current ecstasy users
(33 male, mean age = 24.2, MLD = 609.1 tablets), 14 former ecstasy users (6 male, mean age
= 27.9, MLD = 1000.8 tablets, abstinence of at least 1 year), 15 cannabis users (5 male, mean
age = 22.3) and 19 drug naïve controls (12 male, mean age = 24.0) were compared on
performance of a novel information sampling task (IST). The IST comprised of two
conditions; the fixed reward (FR) condition and the reward conflict (RC) condition.
Participants had to make judgements on which colour (out of a choice of two) was most
frequently contained inside 25 boxes. Participants could open as many boxes as they desired
31
before making the judgement. In the FR condition participants were awarded 100 points for a
correct response regardless of how many boxes were opened before reaching the decision. In
the RC condition 250 points were available to win at the start of the trial, which decreased by
10 points with every box that was opened, creating conflict between reward and certainty
level. Moreover, 100 points were deducted for incorrect responses. Performance was indexed
by average number of boxes opened, as well as calculating the probability of a correct
response at the point of decision [P(correct)]. Post-hoc analysis revealed that cannabis users
opened significantly less boxes than current ecstasy users, and this difference was
approaching significance with former users and drug naïve controls. There was also a group
by gender interaction, and subsequent analysis revealed that male cannabis users had
significantly reduced information sampling compared to males in all three other groups. This
difference was not the case in females, despite equivalent cannabis use in males and females.
However, the results from this study are difficult to interpret given the higher use of cannabis
(although not statistically significant) in both ecstasy groups compared to cannabis users. The
authors suggest this study shows evidence against a simplistic pathway from ecstasy
consumption to elevated impulsivity via serotonin neurotoxicity.
The Go/NoGo task, is believed to have specificity for the executive function of
response inhibition. The literature suggests that ecstasy users are relatively unimpaired on
this task also. Gouzoulis-Mayfrank et al. (2003) used this response inhibition task in which
participants are presented with two visual stimuli (e.g. an X and an O) independently, one of
these is defined as the critical target and every time this stimulus appears on the screen
participants are to respond to it. Whereas the other stimulus is a non-critical target and
responses are to be inhibited. Performance is measured by the amount of responses to the
non-critical target (errors). In this study no significant differences in performance on the task
were observed between 30 heavy ecstasy users (21 male, mean age = 21.5, MLD = 503.2

32
tablets), 30 moderate users (21 male, mean age = 24, MLD = 39.5 tablets) and non-drug
controls (21 male, mean age = 25.37). Similarly Roberts & Garavan (2010) assessed 20
ecstasy users (10 male, mean age = 22.4, MLD = 406.5 tablets) and 20 drug naïve controls
(10 male, mean age = 22.5) on the Go/NoGo task in an fMRI study. No significant between
group differences were observed on any of the performance measures (% of successful
response inhibitions, error of commission reaction times and GO reaction times). However
between group differences were observed on neurophysiological data which will be discussed
further in Chapter 5.5. Hanson and Luciana (2010) also observed no MDMA related
performance deficits in a Go/NoGo task. On the contrary Hoshi et al. (2007) observed
impaired response inhibition on a Go/NoGo task in current ecstasy users (n=25, mean age =
28.64, mean lifetime uses = 288.00) compared to former users (n=28, mean age = 29.50,
mean lifetime uses = 264.86) and drug naïve controls (n=27, mean age = 32.04). However,
polydrug controls (n=29, mean age = 31.93) were also impaired in this task compared to
former users and drug naïve controls. The authors concluded that recency of use may play a
role in response inhibition given that former users do not appear impaired on this function.
Moreover recent use of cannabis and cocaine may also play a role in inhibition given that
polydrug controls showed impairments compared to former users and drug naïve controls.
The majority of published studies investigating this function using the Stroop task
have yielded no ecstasy-related effects in terms of performance. Although Halpern et al.
(2004) did observe differences with this task after subdividing their ecstasy user group to
heavy and light users. This was, however, not replicated in a follow up study, using similarly
pure ecstasy users. As such the initial findings should be treated with caution. Wareing et al.
(2000) observed deficits in ecstasy users (both current and former) compared to non-users
with RLG, however again this was not replicated. Of the Go/NoGo tasks reviewed, only one
showed drug related deficits behaviourally, and recent cannabis and cocaine use were
33
implicated here; as such it would appear that this function is relatively robust to MDMA use.
Nevertheless this thesis intends to provide a complete analysis of MDMA’s effects on
executive functioning. Therefore performance in this function will be assessed with the
addition of neuroimaging to provide a more complete understanding of the mechanisms that
subserve this function. This function will be investigated using the Go/NoGo task and the
RLG task using EEG and fNIRS in chapters 6 and 8 respectively.
3.2.3 Updating
The updating function of working memory involves the monitoring and coding of
incoming information for task relevance, and updating the items held in working memory by
replacing irrelevant information with new incoming relevant information (Miyake et al.
2000), and appears to be more consistently affected by MDMA use.
Montgomery, Fisk, Newcombe and Murphy (2005) assessed this function in 27
ecstasy users (14 male, mean age 21.70, MLD = 345.96 tablets) versus 34 non-user controls
(10 male, mean age 21.59) using a letter updating task and a computation span task. In the
letter updating task participants are presented with a random sequence of between six and 12
consonants. There are 24 trials and participants are unaware of the list length each time.
Participants complete six trials at each list length (6, 8, 10 and 12) and in each case need to
recall the last six consonants. A composite score for updating can then be calculated. In this
study a second measure of updating was also completed (computation span). Participants are
given a number of arithmetic problems to solve (e.g. 4 + 7 = ?) and have to circle the correct
answer from a choice of three possible answers, as well as simultaneously remembering the
second digit of each presented problem. Following each set of problems, the second digits are
to be recalled in the order they were presented. The number of arithmetic problems, to be
solved whilst remembering second digits, increases as the task progresses. For the first three
34
trials, one problem is presented, increasing to two for the next three trials and then increased
by one every three trials until the participant gives two incorrect answers in a set.
Computation span is defined as the maximum number of second digits in serial order
correctly remembered, accompanied by correct arithmetic responses. In this study the authors
observed no between group differences in background variables such as age, premorbid
intelligence, number of hours slept per evening, years of education or fluid intelligence (as
measured by Raven’s SPM) – although this was approaching significance. Ecstasy users did
however score significantly higher than non-users for subjective daytime sleepiness (as
measured by the Epworth Sleepiness Scale). It was observed that ecstasy users performed
significantly worse than non-users on both the letter updating and computation span task
measures. Letter updating was subsequently investigated again by Montgomery and Fisk
(2008), with 73 ecstasy users (39 male, mean age = 21.77, MLD = 309.86 tablets) and 73
non-ecstasy user controls (16 male, mean age = 20.73). Separate analyses were conducted
according to span length (span = 4, 5 or 6), and it was observed that ecstasy users with simple
spans of five and six performed worse than non-users. Those with a span of four were not
significantly different. It is suggested that this may be due to small numbers of participants
with this span length, thus reducing the statistical power of the analysis. Correlational
analysis revealed that higher levels of ecstasy use were associated with poorer performance
on the task, whereas indicators of cocaine and cannabis use were not correlated with updating
performance.
Fisk et al. (2004) had previously observed deficits in updating, using the computation
span task, in ecstasy users (described in Chapter 3.2.2) compared to non-users. Performance
on this task was significantly worse in the ecstasy using cohort after covarying for cannabis,
amphetamine and cocaine use, as well as cigarettes smoked per day and units of alcohol
consumed per week. Similarly Wareing et al. (2004) observed deficits in both current ecstasy
35
users (n=42, 22 male, mean age = 24.69, MLD = 553 tablets) and former users (n=17, 9 male,
mean age = 26.06, abstinent for at least 6 months, MLD = 385 tablets) compared to non-user
controls (n=31, 12 male, mean age = 23.39) in computation span. This remained significant
after statistically controlling for cannabis and other drugs and is suggestive of long lasting
impairments as the deficits persist after six months abstinence.
Wareing et al. (2005) measured computation span in 36 current users (mean age =
21.81, MLD = 591.33 tablets), 12 former users (mean age = 26.83, MLD = 433.36) and 31
controls (mean age = 23.39). The updating component of spatial working memory was also
investigated with a maintenance plus type visuo-spatial working memory task. This task
involved participants being presented with a 4x4 matrix on a computer screen, in which five
cells would be highlighted for three seconds. The task commenced with one matrix being
presented three times. On the next three trials two matrices were presented sequentially and
this kept on increasing by one matrix every three trials up until a maximum of six matrices
per trial. In each matrix, one of the highlighted cells was filled with 0’s and participants had
to remember the position of this cell, whist simultaneously indicating whether there were
more highlighted cells at the top or the bottom of the matrix. After all of the matrices for each
trial had been presented, participants had to indicate on a blank grid all of the 0 labelled cells
that had appeared in the trial, in the order that they had appeared. This had to be correctly
achieved on two out of three trials at each level for acceptance of performance at that level.
This task is analogous to computation span, as it requires concurrent processing and storage
of incoming information but without the phonological component. It was observed that
ecstasy users and former users both performed significantly worse in the computation span
task. Moreover both groups of ecstasy users performed significantly worse than non-users in
the spatial working memory task. These differences remained after controlling for spatial
span and age. Spatial updating was investigated by Montgomery and Fisk (2008) using a task
36
that is analogous to the letter updating task, in which participants are presented with blocks in
a Corsi type arrangement and a random sequence of spatial locations are highlighted.
Twenty-four trials (6 at span sequence length, 6 at span+2, 6 at span+4 and 6 at span+6) are
undertaken whereby the participant is unaware of the number of locations to be highlighted.
The participant is to indicate the last X amount of blocks highlighted in the order they were
presented (where X is the participant’s span that had been calculated prior to undertaking the
updating task). Seventy-three ecstasy users were compared to 73 non-users on task
performance (as described above) and separate analyses were conducted for each span length.
It was observed that for those participants with a spatial span of five, ecstasy users performed
significantly worse than controls. Furthermore heavy ecstasy use was correlated with poorer
performance. Spatial span and spatial working memory was assessed in 52 polydrug users
(MDMA use 0-150 tablets) and non-drug controls (< 10 occasions of cannabis use and no use
of other drugs) by Hanson and Luciana (2010). The Spatial Delayed Response Task (SDRT)
was used in which participants had to correctly recall a spatial location that had been
highlighted on the screen after various delay intervals (500ms, 4000ms or 8000ms). Polydrug
users had poorer spatial memory spans, and were more negatively impacted by increasing
delay intervals than controls (as measured by the SDRT). However the polydrug user group
was a mixture of ecstasy polydrug users and ecstasy naïve polydrug users. Exploratory
correlations showed that the spatial working memory summary score was negatively
correlated with average number of ecstasy tablets consumed per session, as well as maximum
number of tablets ever taken in one session. Total lifetime dose (tablets) was not correlated
with performance suggesting that impairment is associated with the size of an
average/maximal dose.
Backward digit span is another measure of updating that has been employed in the
research on ecstasy use. Participants are required to repeat sequences of digits in the opposite

37
order (backwards) to which they were presented. Sequence lengths increase with successful
performance and points are gained for sequences that are correctly repeated in order. Reay et
al. (2006) compared performance in this task between 15 ecstasy polydrug users (9 male,
mean age = 25, mean ecstasy use = 11.5 tablets per month for the last 4.3 years) and 15 non-
ecstasy polydrug users (7 male, mean age = 21.3, defined as having never used ecstasy); it
was observed that performance was not significantly different between the two groups after
controlling for cannabis, cocaine, alcohol and tobacco. Similarly, Gouzoulis-Mayfrank et al.
(2003) observed no performance differences on this task between heavy ecstasy users,
moderate users and non-users (as described in Chapter 2.3.2). However in a previous study
by the same group (Gouzoulis-Mayfrank et al. 2000), it was reported that ecstasy users (at
least two tablets per month over the previous two years/at least 25 occasions; no heavy
alcohol use/no other illicit drug use except cannabis) performed significantly worse than non-
drug users and cannabis matched controls, and this remained significant after covarying for
general knowledge. Backward digit span (and forwards digit span) was also administered to
11 MDMA users (4 male, mean age = 22.9, MLD = 32.5 tablets), 13 polydrug users (4 male,
mean age = 23.2) and 13 non-users (4 male, mean age = 23.2), in an EEG study by Nulsen et
al. (2011), who observed no main effect of group on performance. Moreover, MDMA
variables did not predict performance in their regression analyses. Croft et al. (2001) also
used backward and forward digit span as a measure of updating performance to assess the
relative contributions of ecstasy and cannabis to cognitive impairment (31 drug naïve controls,
11 MDMA/cannabis users and 18 cannabis users). It was observed from ANCOVA that there
were no differences between MDMA/cannabis users and cannabis only users on these
measures. However there were significant differences between drug naïve controls and a
combined (both MDMA/cannabis users and cannabis only users) drug user group. It was
suggested that cannabis use was more closely related to performance deficits, as both drug

38
user groups had used cannabis and did not differ on performance. Moreover, covarying for
MDMA consumption had little effect on results. This highlights the complication of
concomitant use of other drugs in this research area, and suggests that cognitive deficits
observed in ecstasy users may be related to cannabis use.
Halpern et al. (2011) measured backwards digit span in ecstasy users, who report little
use of other drugs, and non-users (as described in Chapter 3.2.1). Modest differences between
users and non-users were observed, with ecstasy users scoring lower for correct repeated
sequences. However it was concluded that differences were sufficiently limited to reject a
large effect of ecstasy. As such residual cognitive deficits in ecstasy users were not assumed.
However in a reinterpretation of results, Parrott (2011) suggested that the initial interpretation
was incorrect and that, these results were in-line with other studies suggesting serotonergic
neurotoxicity and cognitive impairment in ecstasy users. It was argued that the participants in
Halpern et al.’s (2011) study were careful drug users, with lifetime rates that were not
particularly high (especially for the heavy user group) and that usage was not intense. The
bioenergetic stress model (Parrott, 2006) suggests MDMA damage is greater when taken
intensely and cumulatively. Parrott (2011) suggests that even under the neuroprotective
circumstances that users in this sample experienced, cognitive damage is still apparent.
Bedi and Redman (2008) assessed backwards digit span in 45 ecstasy polydrug users
(ecstasy and cannabis use ≥ 10 times), 48 cannabis polydrug users (cannabis use ≥ 10 times,
with variable other drug use) and 40 legal drug users (namely alcohol, > 5 times cannabis
use). No differences were observed here on a group level, however hierarchical regression
suggested that weak negative semi-partial correlations were apparent with lifetime ecstasy
dose and LSD dose with attention/working memory scores (digit span forward and digit span
backwards). Other studies that report no ecstasy-related deficits on backwards digit span
39
include Thomasius et al. (2003) and Bhattachary and Powell (2001). Suggesting this task has
produced more varying results than other tasks that assess updating. Nevertheless a meta-
analysis by Rogers et al. (2009) suggested that generally ecstasy users performed worse than
controls on common measures of digit span.
The N-back task has been used to assess updating in ecstasy users, often in
association with neuroimaging methods (which will be reviewed in a separate chapter). In
this task, participants are usually presented with strings of digits (or letters) sequentially, and
upon instruction are required to recall the “nth” character back in the sequence (where n=0 is
the last character to be displayed in the sequence). This task can be varied for difficulty
depending on how far back in the sequence the participant is required to recall. Gouzoulis-
Mayfrank et al. (2003) observed heavy users, moderate users and non-users (as described in
Chapter 2.3.2) performance on a 2-back task (whereby participants must respond to a
stimulus if it is the same as one presented two trials earlier), no significant between group
differences were observed on measures of performance on this task. Daumann, Fimm et al.
(2003) subjected 11 heavy ecstasy users (8 male, mean age = 27, MLD = 258.18 tablets), 11
moderate ecstasy users (8 male, mean age = 23.27, MLD = 27.36 tablets) and 11 healthy non-
user controls (8 male, mean age = 25.64) to three n-back tasks consisting of sequential
presentation of single letters. In the 0-back condition, participants had to respond when a
stimulus in the sequence matched a target stimulus. In the 1-back condition, participants were
to respond to stimuli that matched the stimuli immediately preceding it, and in the 2-back
condition participants had to respond if the stimuli matched a stimulus presented 2 letters
earlier. Analysis of behavioural data revealed that although there was a main effect of
difficulty, there were no between group differences in performance on the task. In an 18
month longitudinal study (Daumann, Fischermann, Heekeren et al., 2004), 30 ecstasy users
(at time 1, whom had consumed ecstasy regularly twice a month over a six month period, or
40
at least 20 occasions, excluded if they regularly use legal or illegal psychotropic drugs such
as opiates and benzodiazepines, or regular heavy use of alcohol), which due to various
exclusion reasons reduced to 21 users (16 male, mean age = 24.93) at time 2, completed three
n-back tasks (0,1 and 2 back) at time 1 and 2, to observe whether performance deteriorates
over time with continued/discontinued use. The 21 returning participants were subdivided
into those who had not consumed any MDMA or amphetamine in the 18 month period (n=8)
and those who reported continued ecstasy and amphetamine use of at least 20 tablets (n=9).
The remaining four participants were excluded from analysis due to sporadic MDMA and
amphetamine use between time 1 and 2. The two groups did not differ in performance at
baseline or follow up. However both groups tended to respond quicker at time 2 (significantly
at 2 back for abstinent users and 0-back for continuing users). The results suggest task
performance was not correlated with drug use patterns.
In summary it appears that ecstasy use has a more consistent effect on memory
updating. Of the studies reviewed here, ecstasy users performed consistently worse than non-
drug controls on letter updating (Montgomery & Fisk, 2008; Montgomery, Fisk, Newcombe
& Murphy, 2005). Although there was no polydrug control group employed in either study,
greater use of MDMA was associated with poorer performance. The findings are however,
more diverse for backwards digit span. No differences between ecstasy users and controls are
observed in several of the studies reviewed (Bedi & Redman, 2008; Bhattachary & Powell,
2001; Croft et al., 2001; Gouzoulis-Mayfrank et al., 2003; Nulsen et al., 2011; Reay et al.,
2006; Thomasius et al., 2006). However one of these (Nulsen, et al., 2011) was an EEG study
with low n numbers, which may have lacked the statistical power to detect behavioural
differences (this study did show between group differences in electrophysiological measures
will be discussed in Chapter 5). Another (Reay et al., 2006) failed to detect differences
between ecstasy users and cannabis users. However, as discussed by Croft et al. (2001),

41
cannabis may play a role in ecstasy-related impairments. Conversely Gouzoulis-Mayfrank et
al. (2000) showed deficits in ecstasy users compared to cannabis matched controls, so this
warrants further exploration. Halpern et al.’s (2011) study could be useful in deciphering the
ecstasy/cannabis contribution to this task due to this ecstasy using population being relatively
pure. However there is debate about the interpretation of the findings, with Parrott (2011)
suggesting that the results here show evidence that intensity of dose is related to cognitive
impairment. Finally Bedi and Redman (2008) observed an MDMA related effect on
performance on this task with regression analysis, and meta-analysis on this task suggests that
overall ecstasy use is associated with poor performance.
Spatial working memory performance was shown to be associated with intensity of
MDMA dose (Hanson & Luciana, 2010), and MDMA use was correlated with poor
performance in this measure by Montgomery and Fisk (2008). Current and former users were
observed to be worse than non-users (Montgomery & Fisk, 2008), suggesting that this deficit
is persistent after cessation of use. Moreover the control group here were not drug naïve and
these results remained after controlling for other drug use. As such it is unlikely that the
deficit is due to continued cannabis use. Computation span regularly yields observable
deficits in ecstasy users relative to controls after covarying for other drug use (Fisk et al.,
2004; Wareing et al., 2004) and this has also been observed to be persistent after cessation of
use (Wareing et al., 2004; Wareing et al., 2005). The N-back task in this review appears to
have yielded few ecstasy-related deficits. However this may in part be due these
neuroimaging studies recruiting low numbers of participants (Daumann, Fischermann,
Heekeren et al., 2004). Moreover, in these studies, the n-back task has not gone beyond a 3-
back difficulty; perhaps deficits may become more apparent with increasing difficulty.
Further to this, many of these studies have found differences in their neurophysiological

42
response (Daumann Fimm et al., 2003; Daumann, Fischermann, Heekeren et al., 2004) and
will be discussed further in Chapter 5.
Chapters 6 and 7 will investigate ecstasy-related differences in memory updating
using neuroimaging techniques (EEG and fNIRS). Pure memory tasks that tap this function
will be used in combination with the neuroimaging measures. For example computation span
relies heavily on ability to conduct mental arithmetic, which should be avoided. As such the
n-back task will be used in combination with EEG. Furthermore the difficulty of the task will
be increased beyond the level that has been used previously in the research. Letter updating
and spatial updating tasks will be used in combination with fNIRS in Chapter 7, due to these
tasks consistently yielding behavioural differences. Using these tasks in combination with
fNIRS will allow the neurophysiological mechanisms underlying performance to be observed.
3.2.4 Access to semantic/long term memory
The fourth component of the central executive - access to semantic/long term memory
(referred to as ‘access’ from this point on) was added by Fisk and Sharp (2004). This function
involves word fluency and efficiency of lexical access. Retrieval of words and semantics
involves the ability to access the long term memory store. The efficiency with which this can
occur is dependent on areas of the DLPFC (Stuss et al., 1998), amongst other subcortical
networks. Tasks that have classically been used to study this function in the ecstasy literature
include RLG and the Chicago Word Fluency Task (CWFT). RLG is understood to load on
two executive processes, with alphabetic sequences and letter repeats loading on inhibition
and redundancy loading on access.
Murphy et al. (2011) observed that ecstasy users (described in Chapter 3.2.2)
performed significantly worse than drug naïve controls, but not compared to cannabis only
users on the redundancy measure of RLG, which is suggested to load on access. The cannabis
43
only group did not have a significantly lower redundancy score compared to drug naïve
controls. However regression analysis yielded a significant relationship between cannabis use
and redundancy, whereas MDMA use did not. Furthermore members of the ecstasy user
group had very high cannabis consumption totals that perhaps contributed to the significant
divergence from drug naïve controls in the analysis. Wareing et al. (2000) observed that
current and former ecstasy users performed worse than controls on the redundancy measure
of RLG, however this result was not replicated with a larger sample by Fisk et al. (2004) or
by Montgomery, Fisk, Newcombe and Murphy (2005).
The CWFT is a measure of word fluency that requires access to semantic long term
memory. In this pencil and paper task, there are usually two blocks that increase in difficulty.
In the first block participants are required to write down as many words beginning with the
letter S, as possible in five minutes. The following block requires participants to write down
words beginning with C, with the added restriction that they must only use four letter words.
Furthermore in block two the time in which participants are given to produce words is
reduced to four minutes. Participants are instructed to avoid place names, people’s names and
plurals. This task is usually coupled with a semantic fluency task which requires participants
to name as many animals (including breeds within species) as possible in a four minute
period. The number of appropriate words is given as the total score for each fluency measure.
Using these fluency measures Montgomery, Fisk, Newcombe and Murphy (2005) observed a
main effect of ecstasy use on word fluency. Ecstasy users produced significantly less S letter
and C letter words than non-user controls. This difference was greatest in the C letter
category, which places more constraints upon participants and is therefore more demanding.
Group differences on the semantic fluency measure were not significant. Due to the small
amounts of illicit drug use in the non-user sample in this study, correlations of performance
with different measures of ecstasy, amphetamine, cocaine and cannabis use were performed

44
to investigate the influence of other drug use on word fluency. Although measures of ecstasy
were correlated with word fluency performance, measures of cocaine use were similarly
correlated and as such it is difficult to attribute the observed effects solely to MDMA use in
this study. Montgomery et al. (2007) again observed significant performance deficits in
ecstasy users compared to non-users on a composite measure of word fluency (letter fluency
– C letter words and S letter words combined) after covarying for semantic fluency and
controlling for sleep. However, this study was an analysis of participants from several studies
from this research lab, and so included the data from the 2005 study. Heffernan et al. (2001)
measured word fluency/semantic fluency in a similar task with 30 ecstasy users (17 male,
mean age 23.9, mean use = 5.6 tablets per month) and 37 non-user controls (10 male, mean
age 25.5). In this study, verbal fluency was measured by participants writing down as many C
letter words as possible in one minute. Semantic fluency was measured by naming as many
animals as possible in a one minute time frame, and a combined verbal/semantic fluency
measure was obtained whereby participants had to recall as many household objects
beginning with T as possible in one minute. Amounts of cannabis, cocaine and alcohol use
were incorporated into an Analysis of Covariance and it was observed that the ecstasy user
group performed significantly worse on verbal fluency, semantic fluency and verbal/semantic
fluency. Fisk and Montgomery (2009) compared performance on the CWFT (S letter words
and 4 letter C words) in ecstasy users (n=117, 64 male, mean age = 21.68, MLD = 328.55
tablets), cannabis only users (n=53, 17 male, mean age = 20.96) and non-users of illicit drugs
(57, 14 male, mean age = 20.91) and observed that after controlling for sleep measures,
ecstasy users still showed deficits in performance on the CWFT.
An oral variant of the CWFT is also frequently used as a measure of word fluency,
known as the Controlled Oral Word Association task (COWA) or the FAS task, this usually
involves participants orally producing words beginning with F, followed by words beginning
45
with A and then S in one minute periods. Results using this variant of the task have provided
less consistent findings. Halpern et al. (2004) observed no performance differences on this
task between heavy users, moderate users and nonusers (sample described in Chapter 3.2.1).
Bedi and Redman (2008) found no differences at the group level (45 ecstasy users, 48
cannabis only users, 40 legal drug users described in Chapter 3.2.3) for COWA, and MDMA
use variables did not predict word fluency performance in a regression analysis. Morgan et al.
(2002) used the COWA task with 18 current heavy ecstasy users who also used other illicit
drugs, 15 abstinent (at least 6 months) heavy ecstasy users, who continued to use other illicit
drugs, 16 polydrug controls who had never taken ecstasy but had similar pattern of other drug
use and 15 drug naïve controls (sample described in Chapter 3.2.2). Statistical analysis
revealed no significant between group differences on this measure of verbal fluency, although
there was a trend for ecstasy user groups to perform worse on a category fluency task
whereby participants had 90 seconds to name as many fruits as possible followed by 90
seconds to name as many vegetables as possible.
Bhattachary and Powell (2001) observed ecstasy-related deficits in word fluency
using the COWA. In this sample, participants were divided into groups of nonusers (n = 20,
mean age = 22.1), novice users (n = 18, mean age = 23.6, 1-5 lifetime doses) regular users (n
= 26, mean age = 23.8, modal lifetime doses ≥ 51) and currently abstinent users (n = 16,
mean age = 24.6, modal lifetime doses ≥ 51). All three MDMA user groups performed
significantly worse than non-users on this task. Hanson and Luciana (2004) also compared
ecstasy users (n=26, 14 male, mean age = 21.3, mean occasions of use = 64.3) and
individuals with no history of MDMA use (n=26, 14 male, mean age = 20.7); Although users
and non-users had equivalent performance in number of words generated, it was observed
that ecstasy users produced more rule-breaking errors. Furthermore in an exploratory analysis
of MDMA users with MDMA abuse/dependence (as described by the DSM-IV) verses non-
46
problem MDMA users, it was observed that those with a clinical diagnosis produced
significantly fewer words than those without. Hanson and Luciana (2010) again assessed this
function using the COWA in polydrug users and controls observing no between group
differences on verbal working memory. Due to the polydrug user group in this study also
containing participants who had never used ecstasy, regression analyses were conducted to
observe contributions of individual drugs on the neuropsychological measures. It was
concluded that MDMA did not correlate with performance on verbal working memory. Croft
et al. (2001) assessed COWA along with word fluency of ‘animals’ in their study on 31 drug
naïve controls (mean age = 23.5), 11 ecstasy/cannabis users (mean age = 25.7, MLD = 41.9
tablets) and 18 cannabis only users (mean age = 26.6). No differences were observed between
drug user groups on this task, however when drug user groups were combined and compared
to nonusers it was observed that controls performed better on the ‘animals’ component of
word fluency. After covarying for total cannabis use, total MDMA use, frequency of cannabis
use and frequency of MDMA use the authors concluded that the effects observed may be
more related to cannabis use than MDMA use.
More recently Raj et al. (2010) assessed 16 polysubstance users (10 male, mean age =
23.6, 12 with a history of MDMA use, mean episodes of use = 43.33) on a task that probed
semantic verbal memory in a preliminary fMRI study. This task consisted of a word and
pseudo-word encoding period and a word and pseudo-word recognition period. During each
encoding phase participants were required to memorise a group of five English words and or
a group of five pronounceable pseudo-words. After this they were presented with homophone
pairs (e.g. prey/pray), one of which was novel, the other of which would have appeared in the
encoding period. Participants had to identify which of the homophones was previously
presented. Pseudo-words were Dutch words, and pseudo-word homophone counterparts were
synthesised English words based on pronunciation. English words in the encoding phase

47
should have a greater semantic association for participants and as such the difference between
words and pseudo-words should isolate semantic memory. Correlations between drug use and
performance on task measures (correct responses, omission errors, commission errors and
reaction time for correct responses) revealed that MDMA was not associated with recognition
task measures. However total lifetime cannabis joints was significantly negatively correlated
with accuracy (number of commission errors) on the pseudo word part of the task. Moreover,
lifetime exposure to cannabis (both episodes and total joints) was significantly negatively
correlated with reaction time on the word part of the task. However due to the nature of this
preliminary study and the small sample used, the results need to be treated with caution. The
results from fMRI will be discussed in Chapter 5.
In summary it appears that there is evidence for ecstasy-related deficits in word
fluency using the written variant of the CWFT. However one of these studies (Montgomery
et al. 2007) includes data from their 2005 study that observed deficits in this task. The results
are less consistent when the task takes on an oral format. However using the FAS one minute
version, does not provide a variant of difficulty like the CWFT does, and as was observed by
Montgomery, Fisk, Newcombe and Murphy (2005), ecstasy users tend to perform worse in
more difficult circumstances when greater load is placed on the central executive. Further to
this, it may be that over a short period of time (1 minute) ecstasy users perform
comparatively to controls. Perhaps longer periods (such as 4 or 5 minutes in the CWFT) of
sustained load, on the central executive, may uncover effects of difficulty and load. Using the
short variant COWA, Hanson and Luciana (2004) observed performance deficits in ecstasy
users. However this was only with number of rule-breaking errors rather than performance on
fluency measures. This may reflect ecstasy users’ difficulty in following instructions rather
than deficits in access. Furthermore these results were not replicated in a follow up study
(Hanson & Luciana, 2010). The RLG studies reviewed show mixed results, with two
48
suggesting performance deficits in ecstasy users (Murphy et al., 2011; Wareing et al., 2000)
and others suggesting no such observable differences (Fisk et al., 2004; Montgomery, Fisk,
Newcombe & Murphy, 2005). Moreover, Murphy et al. (2011) suggest that performance is
more correlated with cannabis use. Cannabis use was also put forward as a greater predictor
of performance on the COWA by Croft et al. (2001) and in a novel semantic task by Raj et al.
(2011), so it would seem that the relationship between this function, MDMA and cannabis
use needs further exploration.
This thesis will fully investigate the role of ecstasy in access to semantic long term
memory. The addition of neuroimaging techniques may provide valuable insight into the
nature of processing mechanisms involved in this executive function and untangle the
inconsistent evidence in the neuropsychological literature. This function is assessed
behaviourally and with EEG in Chapter 6 and with fNIRS in Chapter 8.
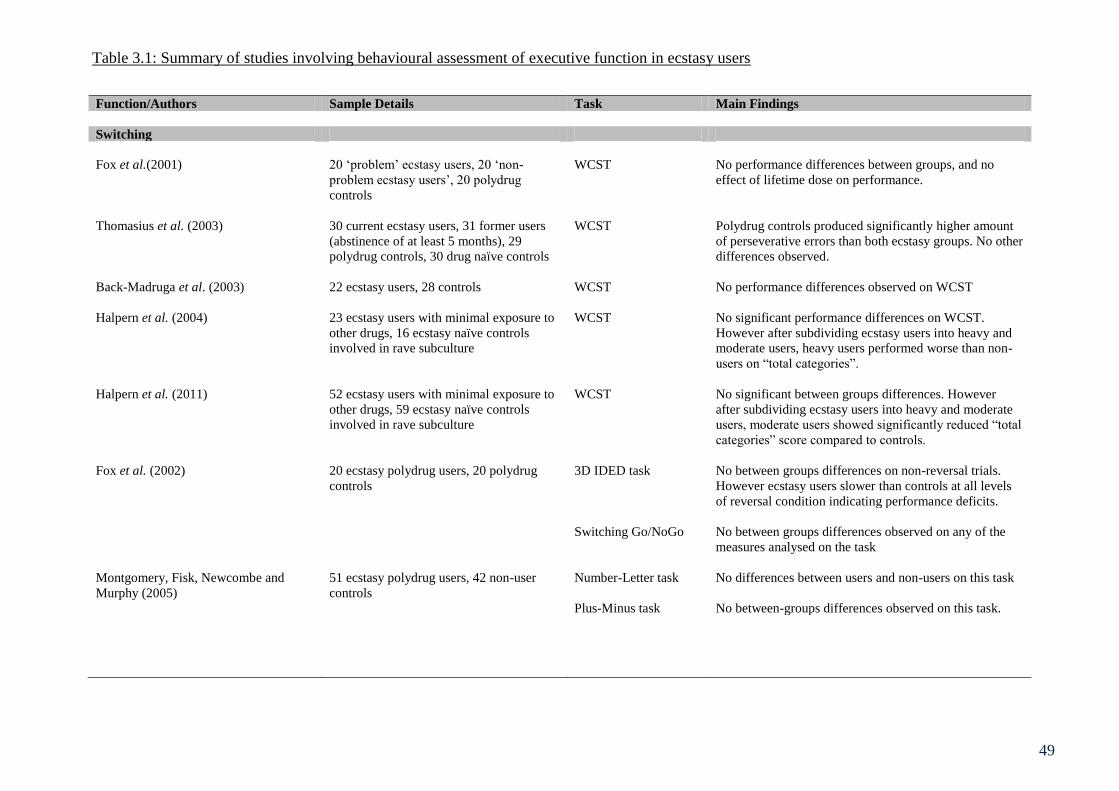
49
Function/Authors Sample Details Task Main Findings
Switching
Fox et al.(2001) 20 ‘problem’ ecstasy users, 20 ‘non-
problem ecstasy users’, 20 polydrug
controls
WCST No performance differences between groups, and no
effect of lifetime dose on performance.
Thomasius et al. (2003) 30 current ecstasy users, 31 former users
(abstinence of at least 5 months), 29
polydrug controls, 30 drug naïve controls
WCST Polydrug controls produced significantly higher amount
of perseverative errors than both ecstasy groups. No other
differences observed.
Back-Madruga et al. (2003) 22 ecstasy users, 28 controls WCST No performance differences observed on WCST
Halpern et al. (2004) 23 ecstasy users with minimal exposure to
other drugs, 16 ecstasy naïve controls
involved in rave subculture
WCST No significant performance differences on WCST.
However after subdividing ecstasy users into heavy and
moderate users, heavy users performed worse than non-
users on “total categories”.
Halpern et al. (2011) 52 ecstasy users with minimal exposure to
other drugs, 59 ecstasy naïve controls
involved in rave subculture
WCST No significant between groups differences. However
after subdividing ecstasy users into heavy and moderate
users, moderate users showed significantly reduced “total
categories” score compared to controls.
Fox et al. (2002) 20 ecstasy polydrug users, 20 polydrug
controls
3D IDED task No between groups differences on non-reversal trials.
However ecstasy users slower than controls at all levels
of reversal condition indicating performance deficits.
Switching Go/NoGo No between groups differences observed on any of the
measures analysed on the task
Montgomery, Fisk, Newcombe and
Murphy (2005)
51 ecstasy polydrug users, 42 non-user
controls
Number-Letter task No differences between users and non-users on this task
Plus-Minus task No between-groups differences observed on this task.
Table 3.1: Summary of studies involving behavioural assessment of executive function in ecstasy users

50
Dafters (2006) 18 ecstasy users, 15 ecstasy users who
completed task in reverse order, 17
cannabis only users, 18 drug naïve
controls.
Stroop task Ecstasy users performed worse than both cannabis users
and non-drug user groups on the switching component of
the task, after covarying for other drug use
Dafters et al. (1999) 24 recreational drug users BADS rule shift cards
test
MDMA use was negatively correlated with performance
on the task
Dafters et al. (2004) 16 heavy ecstasy (+50 tablets) and
cannabis users, 19 light ecstasy (-50
tablets) and cannabis users, 15 cannabis
only users, 19 drug naïve controls.
BADS rule shift cards
test
No significant differences between groups after
covarying for alcohol, amphetamine cocaine and LSD
Von Geusau et al. (2004) 26 ecstasy users, 33 non-user controls Dots-Triangles and
Local-Global tasks
Male users significantly higher switch cost reaction time
than non-users in the dots triangles task, although
significantly more accurate. On the Local-Global task
male users were significantly slower than controls and
had a higher switch cost. However there was no
significant difference in accuracy on this task.
Inhibitory Control
Morgan et al. (2002) 18 current ecstasy users, 15 former ecstasy
users (abstinent for at least 6 months), 16
polydrug controls, 15 drug naïve controls.
Stroop task No between groups differences (error or reaction time).
Dafters (2006) 18 ecstasy users, 15 ecstasy users who
completed task in reverse order, 17
cannabis only users, 18 drug naïve
controls.
Modified Stroop task No significant between groups differences on the
magnitude of Stroop interference reaction times (pre
potent response inhibition). However ecstasy users
showed a reduced priming effect (reduced short term
residual inhibition) compared to both other groups.
Back-Madruga et al. (2003) 22 ecstasy users, 28 controls (not
specified)
Stroop task No between groups differences observed.
Gouzoulis-Mayfrank et al. (2000) 28 ecstasy users, 28 cannabis users, 28
drug naïve controls
Stroop task No between groups differences observed.
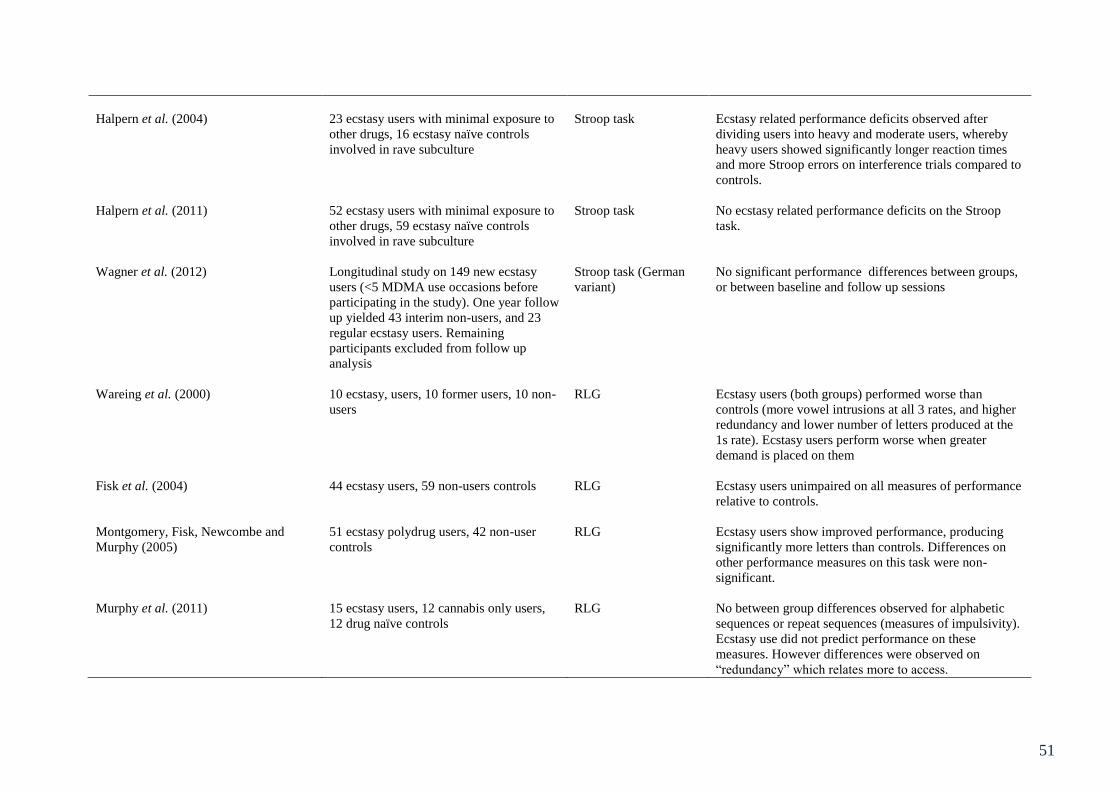
51
Halpern et al. (2004) 23 ecstasy users with minimal exposure to
other drugs, 16 ecstasy naïve controls
involved in rave subculture
Stroop task Ecstasy related performance deficits observed after
dividing users into heavy and moderate users, whereby
heavy users showed significantly longer reaction times
and more Stroop errors on interference trials compared to
controls.
Halpern et al. (2011) 52 ecstasy users with minimal exposure to
other drugs, 59 ecstasy naïve controls
involved in rave subculture
Stroop task No ecstasy related performance deficits on the Stroop
task.
Wagner et al. (2012)
Longitudinal study on 149 new ecstasy
users (<5 MDMA use occasions before
participating in the study). One year follow
up yielded 43 interim non-users, and 23
regular ecstasy users. Remaining
participants excluded from follow up
analysis
Stroop task (German
variant)
No significant performance differences between groups,
or between baseline and follow up sessions
Wareing et al. (2000) 10 ecstasy, users, 10 former users, 10 non-
users
RLG Ecstasy users (both groups) performed worse than
controls (more vowel intrusions at all 3 rates, and higher
redundancy and lower number of letters produced at the
1s rate). Ecstasy users perform worse when greater
demand is placed on them
Fisk et al. (2004) 44 ecstasy users, 59 non-users controls RLG Ecstasy users unimpaired on all measures of performance
relative to controls.
Montgomery, Fisk, Newcombe and
Murphy (2005)
51 ecstasy polydrug users, 42 non-user
controls
RLG Ecstasy users show improved performance, producing
significantly more letters than controls. Differences on
other performance measures on this task were non-
significant.
Murphy et al. (2011) 15 ecstasy users, 12 cannabis only users,
12 drug naïve controls
RLG No between group differences observed for alphabetic
sequences or repeat sequences (measures of impulsivity).
Ecstasy use did not predict performance on these
measures. However differences were observed on
“redundancy” which relates more to access.
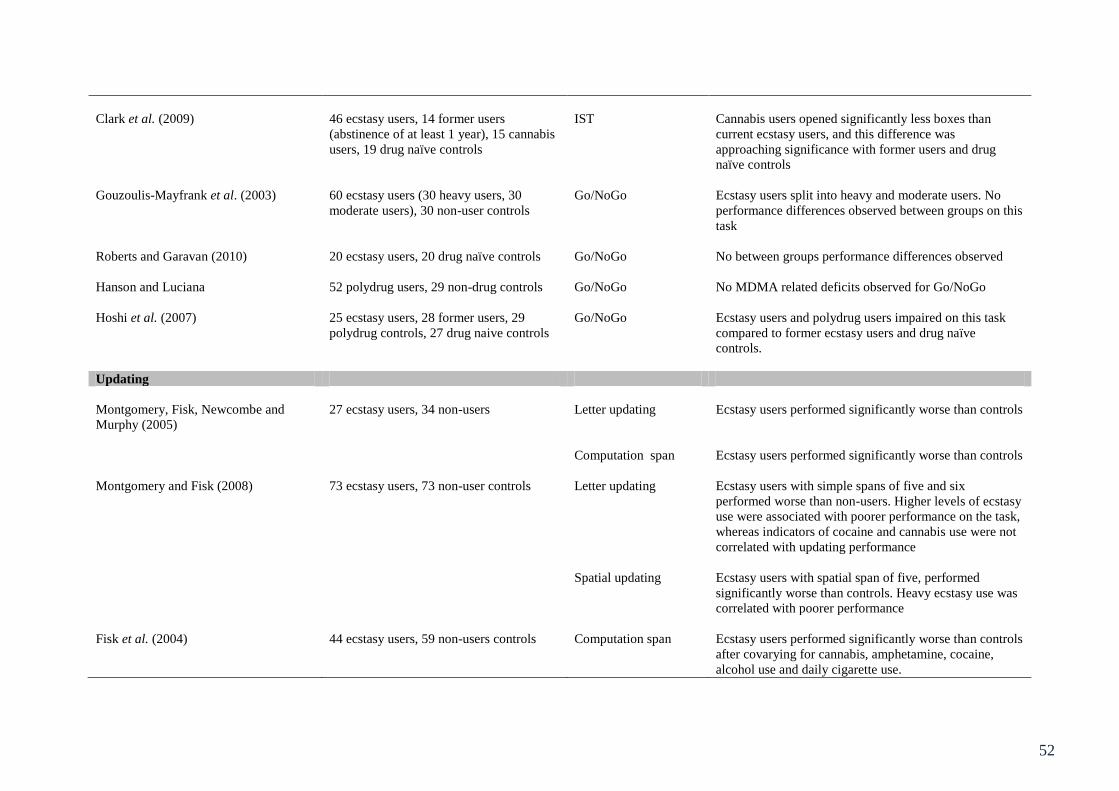
52
Clark et al. (2009) 46 ecstasy users, 14 former users
(abstinence of at least 1 year), 15 cannabis
users, 19 drug naïve controls
IST Cannabis users opened significantly less boxes than
current ecstasy users, and this difference was
approaching significance with former users and drug
naïve controls
Gouzoulis-Mayfrank et al. (2003) 60 ecstasy users (30 heavy users, 30
moderate users), 30 non-user controls
Go/NoGo Ecstasy users split into heavy and moderate users. No
performance differences observed between groups on this
task
Roberts and Garavan (2010) 20 ecstasy users, 20 drug naïve controls Go/NoGo No between groups performance differences observed
Hanson and Luciana 52 polydrug users, 29 non-drug controls Go/NoGo No MDMA related deficits observed for Go/NoGo
Hoshi et al. (2007) 25 ecstasy users, 28 former users, 29
polydrug controls, 27 drug naive controls
Go/NoGo Ecstasy users and polydrug users impaired on this task
compared to former ecstasy users and drug naïve
controls.
Updating
Montgomery, Fisk, Newcombe and
Murphy (2005)
27 ecstasy users, 34 non-users Letter updating Ecstasy users performed significantly worse than controls
Computation span Ecstasy users performed significantly worse than controls
Montgomery and Fisk (2008) 73 ecstasy users, 73 non-user controls Letter updating Ecstasy users with simple spans of five and six
performed worse than non-users. Higher levels of ecstasy
use were associated with poorer performance on the task,
whereas indicators of cocaine and cannabis use were not
correlated with updating performance
Spatial updating Ecstasy users with spatial span of five, performed
significantly worse than controls. Heavy ecstasy use was
correlated with poorer performance
Fisk et al. (2004) 44 ecstasy users, 59 non-users controls Computation span Ecstasy users performed significantly worse than controls
after covarying for cannabis, amphetamine, cocaine,
alcohol use and daily cigarette use.
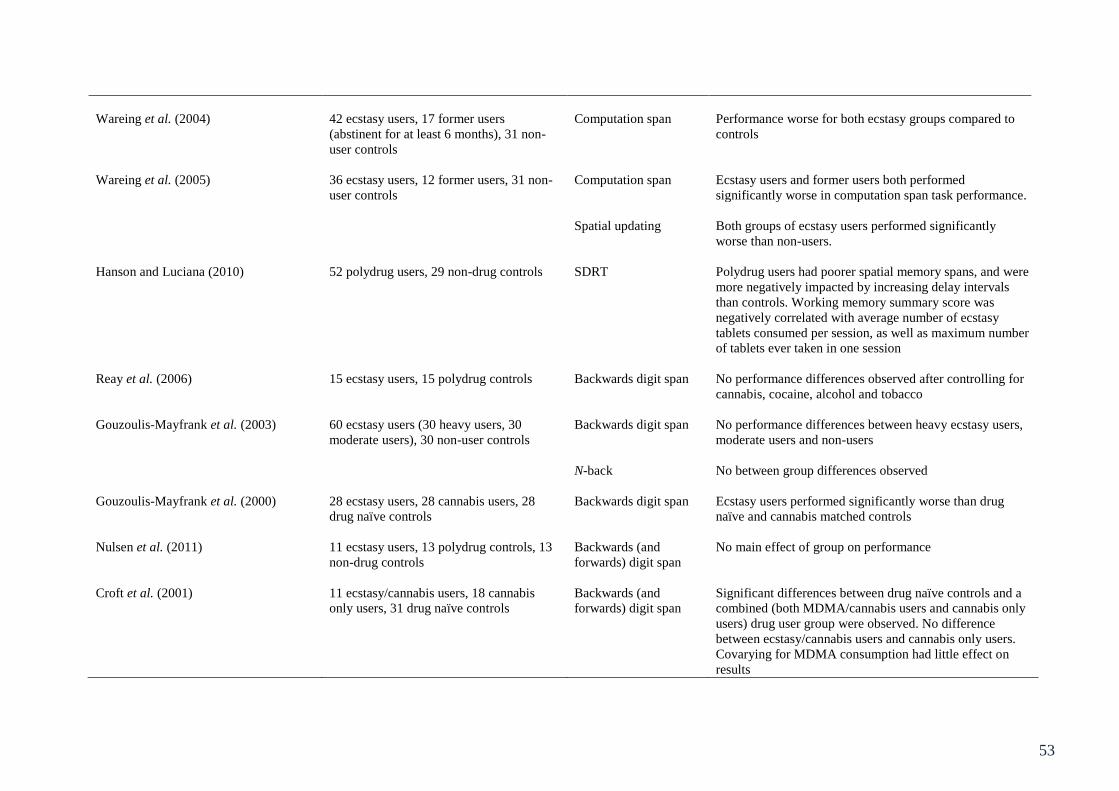
53
Wareing et al. (2004) 42 ecstasy users, 17 former users
(abstinent for at least 6 months), 31 non-
user controls
Computation span Performance worse for both ecstasy groups compared to
controls
Wareing et al. (2005) 36 ecstasy users, 12 former users, 31 non-
user controls
Computation span Ecstasy users and former users both performed
significantly worse in computation span task performance.
Spatial updating Both groups of ecstasy users performed significantly
worse than non-users.
Hanson and Luciana (2010) 52 polydrug users, 29 non-drug controls SDRT Polydrug users had poorer spatial memory spans, and were
more negatively impacted by increasing delay intervals
than controls. Working memory summary score was
negatively correlated with average number of ecstasy
tablets consumed per session, as well as maximum number
of tablets ever taken in one session
Reay et al. (2006) 15 ecstasy users, 15 polydrug controls Backwards digit span No performance differences observed after controlling for
cannabis, cocaine, alcohol and tobacco
Gouzoulis-Mayfrank et al. (2003) 60 ecstasy users (30 heavy users, 30
moderate users), 30 non-user controls
Backwards digit span No performance differences between heavy ecstasy users,
moderate users and non-users
N-back No between group differences observed
Gouzoulis-Mayfrank et al. (2000) 28 ecstasy users, 28 cannabis users, 28
drug naïve controls
Backwards digit span Ecstasy users performed significantly worse than drug
naïve and cannabis matched controls
Nulsen et al. (2011) 11 ecstasy users, 13 polydrug controls, 13
non-drug controls
Backwards (and
forwards) digit span
No main effect of group on performance
Croft et al. (2001) 11 ecstasy/cannabis users, 18 cannabis
only users, 31 drug naïve controls
Backwards (and
forwards) digit span
Significant differences between drug naïve controls and a
combined (both MDMA/cannabis users and cannabis only
users) drug user group were observed. No difference
between ecstasy/cannabis users and cannabis only users.
Covarying for MDMA consumption had little effect on
results

54
Halpern et al. (2011) 52 ecstasy users with minimal exposure to
other drugs, 59 ecstasy naïve controls
involved in rave subculture
Backwards digit span Ecstasy users showed modest performance deficits,
scoring lower for correct repeated sequences.
Bedi and Redman (2008) 45 ecstasy users, 48 cannabis users, 40
legal drug use controls
Backwards digit span No between groups differences observed. Lifetime ecstasy
use showed weak negative semi-partial correlation with
performance
Thomasius et al. (2003) 30 current ecstasy users, 31 former users
(abstinence of at least 5 months), 29
polydrug controls, 30 drug naïve controls
Backwards digit span No ecstasy related performance deficits
Bhattacharay and Powell (2001) 26 regular ecstasy users, 18 novice ecstasy
users, 16 currently abstinent ecstasy users
(abstinence of at least 30 days) and 20
non-user controls
Backwards digit span No between groups performance differences
Daumann, Fimm et al. (2003) 11 heavy ecstasy users, 11 moderate
ecstasy users, 11 non-user controls
n-back No between groups performance differences
Daumann, Fischermann, Heekeren et al.
(2003)
18 month longitudinal study with 30
ecstasy users at time 1, which reduced to
21 users at time 2. These were subdivided
into those who had not consumed MDMA
or amphetamine in the 18 month period
(n=8) and those who continued to use
ecstasy and amphetamine (n=9). The
remaining four participants were excluded
from analysis due to sporadic MDMA and
amphetamine use between time 1 and 2
n-back No performance differences between groups at baseline or
follow up.
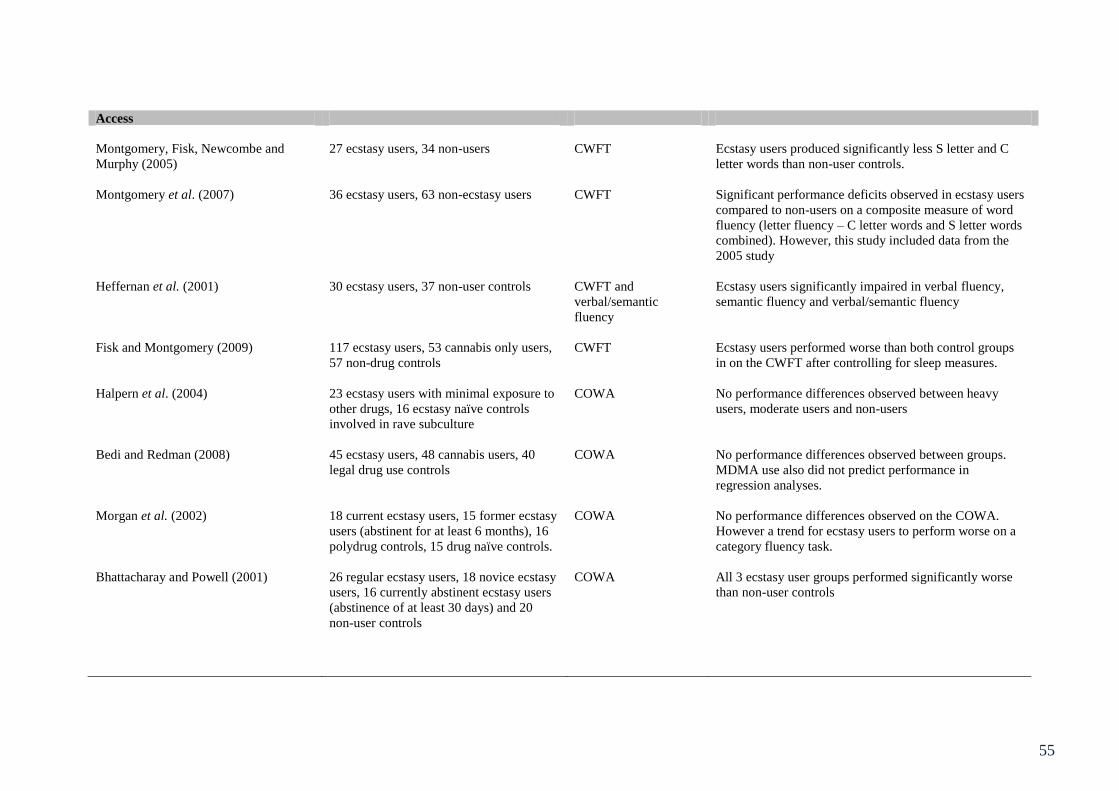
55
Access
Montgomery, Fisk, Newcombe and
Murphy (2005)
27 ecstasy users, 34 non-users CWFT Ecstasy users produced significantly less S letter and C
letter words than non-user controls.
Montgomery et al. (2007) 36 ecstasy users, 63 non-ecstasy users CWFT Significant performance deficits observed in ecstasy users
compared to non-users on a composite measure of word
fluency (letter fluency – C letter words and S letter words
combined). However, this study included data from the
2005 study
Heffernan et al. (2001) 30 ecstasy users, 37 non-user controls CWFT and
verbal/semantic
fluency
Ecstasy users significantly impaired in verbal fluency,
semantic fluency and verbal/semantic fluency
Fisk and Montgomery (2009) 117 ecstasy users, 53 cannabis only users,
57 non-drug controls
CWFT Ecstasy users performed worse than both control groups
in on the CWFT after controlling for sleep measures.
Halpern et al. (2004) 23 ecstasy users with minimal exposure to
other drugs, 16 ecstasy naïve controls
involved in rave subculture
COWA No performance differences observed between heavy
users, moderate users and non-users
Bedi and Redman (2008) 45 ecstasy users, 48 cannabis users, 40
legal drug use controls
COWA No performance differences observed between groups.
MDMA use also did not predict performance in
regression analyses.
Morgan et al. (2002) 18 current ecstasy users, 15 former ecstasy
users (abstinent for at least 6 months), 16
polydrug controls, 15 drug naïve controls.
COWA No performance differences observed on the COWA.
However a trend for ecstasy users to perform worse on a
category fluency task.
Bhattacharay and Powell (2001) 26 regular ecstasy users, 18 novice ecstasy
users, 16 currently abstinent ecstasy users
(abstinence of at least 30 days) and 20
non-user controls
COWA All 3 ecstasy user groups performed significantly worse
than non-user controls
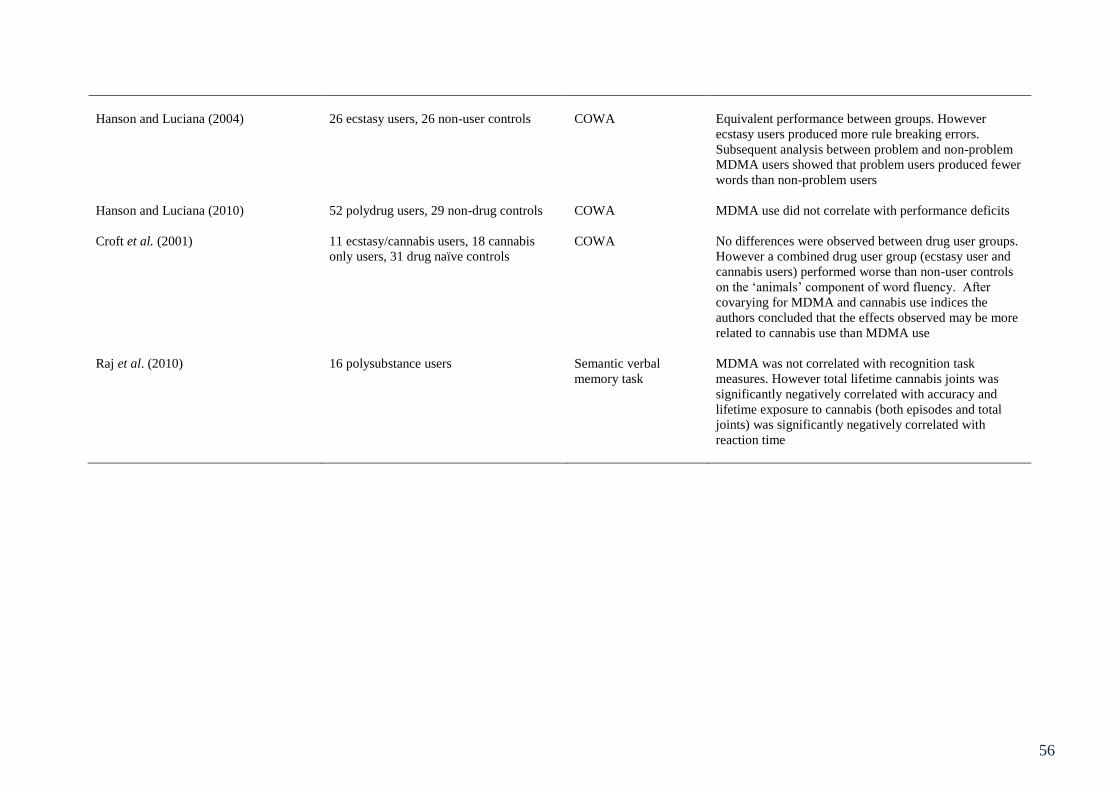
56
Hanson and Luciana (2004) 26 ecstasy users, 26 non-user controls COWA Equivalent performance between groups. However
ecstasy users produced more rule breaking errors.
Subsequent analysis between problem and non-problem
MDMA users showed that problem users produced fewer
words than non-problem users
Hanson and Luciana (2010) 52 polydrug users, 29 non-drug controls COWA MDMA use did not correlate with performance deficits
Croft et al. (2001) 11 ecstasy/cannabis users, 18 cannabis
only users, 31 drug naïve controls
COWA No differences were observed between drug user groups.
However a combined drug user group (ecstasy user and
cannabis users) performed worse than non-user controls
on the ‘animals’ component of word fluency. After
covarying for MDMA and cannabis use indices the
authors concluded that the effects observed may be more
related to cannabis use than MDMA use
Raj et al. (2010) 16 polysubstance users Semantic verbal
memory task
MDMA was not correlated with recognition task
measures. However total lifetime cannabis joints was
significantly negatively correlated with accuracy and
lifetime exposure to cannabis (both episodes and total
joints) was significantly negatively correlated with
reaction time
57
Chapter 4: Neurophysiology and neuroimaging as indicators of cognition.
4.1 EEG
Physiological Basis of the EEG Signal
Neurons communicate via action potentials which are discrete voltage spikes
generated in the cell body that travel down the axon to axon terminals where
neurotransmitters are then released. Theoretically, two neurons with action potentials that are
sent simultaneously via parallel axons that end in simultaneous firing would summate for a
voltage recording at an electrode. However, this rarely happens. Instead, slight differences (at
the microsecond level) in neuronal firing typically cancel out action potentials in different
axons and are therefore not detectable from electrodes at the scalp. As such the potentials
usually observed with an EEG reflect post synaptic potentials (Luck, 2005).
Post synaptic potentials are voltages that occur either after an action potential has
travelled along the axon fibre to an excitatory synapse causing and excitatory postsynaptic
potential, or an action potential travels along a fibre ending in an inhibitory synapse where
hyperpolarization occurs, culminating in an inhibitory post synaptic potential (Speckman &
Elger, 2005). Neurotransmitters bind to the membrane on the post synaptic cell which causes
the opening or closing of an ion channel, resulting in a change in potential at the cell
membrane (Luck, 2005). Unlike action potentials, whose durations are only milliseconds in
length, postsynaptic potentials are longer, potentially lasting hundreds of milliseconds. If
there is coherence between neurons (i.e. many receiving excitatory neurotransmitter and in a
similar orientation), then post synaptic potentials may summate and their voltages will be
measurable at the scalp (Schaul, 1998).

58
EEG recording and processing
EEG recording involves the measurement, amplification and recording of differences
between fluctuating electrical field potentials over time (Kamp et al., 2005). EEG recordings
should adequately represent the spatial distribution of potentials over the scalp. As such,
recording from several electrodes simultaneously is imperative. It is routine for a large
number of electrodes to be placed over the scalp of a participant.
During a conventional EEG recording session an electrode cap is fitted to a
participant’s head and electrodes are placed into standardised positions in the electrode cap.
A suitable conducting gel is used to form an electrolyte bridge between the participants head
and each electrode. The placement of the electrodes usually corresponds to the Standardised
International 10-20 system. This system is based upon internationally recognised anatomical
landmarks on the skull and allows for consistency of electrode names and locations across
research laboratories. The electrodes themselves have an input amplifier and measurement of
electrical field potentials occurs here. The necessity of input amplification is due to relatively
low signal voltage amplitudes at the scalp. Once the electrodes have acquired the EEG signal
and it has been amplified it is necessary to convert the signal from a continuous analogue
voltage to a discrete digital one that is compatible with a computer for display, analysis and
storage of data (Luck, 2005).
As voltage is the potential for a current to move between two points, the signal at an
electrode represents the difference between the voltage at an electrode site and a predefined
reference electrode site (Luck, 2005). There are several ways in which a reference can be
provided, including a common average reference representing the mean of all scalp
electrodes, linked earlobes or mastoids or the vertex (Hagemann et al., 2001), and Laplacian
59
calculations based on differences between an electrode and it’s ‘nearest neighbour’ electrodes
(Nunez et al., 1997).
Event Related Potentials and components
If EEG as a general method is used to investigate brain reactions to a variety of
stimuli, then Event Related Potentials (ERPs) can be globally understood as EEG changes
that are time-locked to a stimulus (Lopes da Silva, 2005). They are defined in the time
domain as electrical activity from the brain that is caused by a particular event or stimulus.
As such ERPs are used to quantify the neurophysiological response to a stimulus and
differences between groups and conditions can be observed (Duncan et al., 2009).
ERPs have distinct advantages over measurements of speed and accuracy of motor
responses, the first being that they provide a continuous measure of cognitive processing
giving rise to the possibility of determining the stage at which processing is affected by
experimental manipulation (Luck, 2005). The second is that they can provide a measure of
processing of stimuli in cases where no behavioural response is required. For example
attended versus ignored stimuli (Luck, 2005) such as that used in a Go/NoGo task. A
disadvantage however is that functional significance of an ERP is not as clear as that of a
behavioural response, which is perhaps why it is necessary to observe both.
Due to ERPs being small, a relatively large number of trials are necessary to measure
them adequately. However due to the fact that ERPs are time-locked to an event, single ERP
waveforms can be averaged together to create a grand average (mean) waveform. It is these
grand-averaged waveforms that are usually presented in research papers, and they reflect
more clearly defined positive and negative deflections that are understood as components
(Luck, 2005).

60
ERP components are usually labelled in such a way that refers to their polarity (P =
positive, N= negative) and their position in the waveform or time (for example P1 would
refer to the first positive component). Some of these components have been described by
Luck (2005) for example P1 is a very early positive going component, typically largest at
lateral occipital electrodes, that usually peaks between 100 and 130ms; this appears sensitive
to spatial attention and arousal and is not considered to be affected by top down processes.
The N1 component follows the P1 wave and has two posterior components that peak usually
around 150-200ms and again reflect spatial attention, although there is suggestion that this
component is involved in discriminative processing. The second positive component P2
follows the N1 at anterior and central electrodes. This component is usually larger in trials
that contain target features which are fairly simple, so this is an early processing stage. The
P2 wave can be observed at anterior and central sites, and elicits a larger response to simple
target features that are relatively infrequent (Luck & Hillyard, 1994). This component
precedes the N2 and is suggested to be involved in the initial inhibition from further
processing in target stimuli (Hansen & Hillyard, 1988).
The N2 and P3 components are more widely studied and as such will be described in
more detail here. The N2 family has several studied components; a basic N2 can be observed
with a repetitive non-target stimulus. However if other deviant stimuli are presented within a
repetitive sequence then a larger amplitude of this basic N2 is observed. Task relevant
deviants evoke a later N2 effect (sometimes referred to as N2b) which appears largest over
central (for auditory stimuli) and parietal (for visual stimuli) sites; this component is assumed
to reflect stimulus categorisation processes (Luck, 2005). The N2 component is observed to
be involved in inhibition as this component has been suggested to reflect stimulus
discrimination (Ritter et al., 1982) and is therefore an important measure of response
inhibition. Kok et al. (2004) suggest the N2 component shows greater amplitude in trials
61
where inhibition of response is required (NoGo) than no inhibition (Go) trials. Moreover
amplitude of N2 is more prominent in unsuccessful inhibition trials. The N2 component is
associated with errors (i.e. “error negativity” or Ne), and is sensitive to monitoring errors.
This has been suggested to be a product of activity in medial frontal regions such as the
anterior cingulate (Bekker et al., 2005).
The P3 wave follows the N2 wave, and can be subdivided into a frontally maximum
P3a component that will increase with unexpected task irrelevant stimuli and P3b component
that is largest over parietal sites. Usually when studies refer to the P3 component, it is
actually the P3b that they are referring to. Typically cognitive impairment is associated with
alterations to the P3 amplitude or latency due to the P3 being involved in higher level
processing of stimuli. This component encompasses frontal-parieto network activation
(Gaspar et al., 2011) and in normal populations decreases in the amplitude potential reflects
increased cognitive load, and diminished P3 reflects cognitive dysfunction. Longer latencies
and smaller amplitude of the P3 response are indicative of cognitive impairment. The P3
component is also understood to be associated with the allocation of attentional resources
necessary for information processing and also memory function (de Sola et al., 2008).
Strengths and Limitations of EEG
Due to EEG employing a high sampling rate (usually 512Hz) it has excellent temporal
resolution that allows tracking of neurophysiological processes at the neuronal rate
(milliseconds) (Liu & He, 2010). As described earlier this affords a continuous measure of
cognitive processing and direct understanding of how stimuli are processed and which stages
of processing are affected by experimental manipulation. Furthermore the EEG signal is
directly coupled to neuronal electrical activity (Debener et al., 2006), as opposed to inferred
indirect measurements of neuronal activity in neuroimaging methods that rely on
62
haemodynamic responses such as fMRI and fNIRS. EEG is considered to be much less
expensive than other techniques (for example fMRI) and is non-invasive (Luck, 2005).
Furthermore systems such as the one used for data collection in this thesis (Biosemi Ag-AgCl
active-two electrode system - Biosemi B.V, Amsterdam, Netherlands) contain their own
preamplifier, minimising electrode impedance, and this system is also portable and does not
require electrical shielding.
A major limitation of EEG is that it has poor spatial resolution in comparison to
haemodynamic measurement counterparts. This is due to the electrodes being separated from
the source of the activity in the brain by cerebrospinal fluid, the skull and scalp (Nunez,
1981). The ambiguity of the location of active neurons is known as the inverse problem
(Michel et al., 2004). Many complex mathematical algorithms have been developed to
attempt to solve the so called inverse problem, however many of these are constrained by a
priori assumptions on the generation of EEG signals (Michel et al., 2004). It is suggested that
the measurements contain inadequate information about the generators of the activity and as
such a perfect localization tomography does not exist (Pascual-Marqui, 1999).
4.2 Functional Near-Infrared Spectroscopy (fNIRS).
Introduction and Physiological Basis of the Technique
fNIRS is a novel non-invasive optical neuroimaging technique, that is portable and is
used to measure the haemodynamic response to brain activation (Leff et al., 2011). This is an
indirect neuroimaging measurement based on the assumption that neuronal activity and
cerebral blood flow are tightly coupled (Holper et al, 2009; Villringer & Dirnagl, 1995).
More specifically fNIRS can be used to measure oxygenation changes to oxygenated
haemoglobin (oxy-Hb) and deoxygenated haemoglobin (deoxy-Hb) (Jobsis, 1977), by
shining light in the near infrared range (700 – 900nm) directly onto the tissue of a
63
participant’s forehead. Oxygenated and deoxygenated haemoglobin have characteristic
optical properties in this light range (Izzetoglu et al., 2004) and chromophores can change in
concentration with oxy and deoxygenated haemoglobin. Thus, light reflected back to a
detector will be attenuated by an increase in chromophores. The differences in light
attenuation can be attributed to the oxygenation changes in the haemoglobin. Typically this
type of neuroimaging will penetrate to structures around 2-3 mm of the cortex underlying the
skull (Firbank et al., 1998). Therefore forebrain structures such as the dorsolateral prefrontal
cortex (DLPFC) can be easily accessed and observed. Due to the DLPFC being prominent in
higher level processing, and due to these structures being easy to access with this type of
imaging, it has been used in several studies observing motor control and learning (Leff et al.,
2011), as well as more complex tasks that involve working memory and category
discrimination (Izzetoglu et al., 2004).
The Modified Beer-Lambert Law
fNIRS raw signals are measurements of light intensity (Ayaz et al., 2011) and optical
density is measured at two wavelengths (one for oxy-Hb and one for deoxy-Hb). These are
chosen (within the 700-900nm range) based on intensities whereby oxy-Hb and deoxy-Hb are
the dominant chromophores (absorb the majority of light) compared to other tissue
chromophores (Ayaz et al., 2011). The isosbestic point (around 805nm) is the point at which
oxy-Hb and deoxy-Hb absorption spectrums cross. Hence a wavelength above this is used to
assess oxy-Hb changes (850nm in this case) and a wavelength below the isosbestic point is
used to maximally assess deoxy-Hb changes (730nm). The Modified Beer-Lambert Law is
used to calculate relative changes in oxy-Hb and deoxy-Hb from baseline. It is worth noting
that levels of oxy-Hb and deoxy-Hb (given as µmolar) are calculations that are relative to
baseline only, and it is not possible to derive absolute values of concentration with fNIRS.
64
Optical density at a specific wavelength is calculated using the following formula
(Modified Beer-Lambert Law):
(from Ayaz et al., 2011).
Whereby wavelength (λ) is equal to the logarithmic ratio of input light intensity (Iin)
and output (detected) light intensity (Iout). This (optical density – OD) is also related to the
concentration (c) and extinction coefficient (e) of chromophores, as well as the corrected
distance between light source and detector (d) and a constant attenuation factor (G) (Ayaz et
al., 2011).
Changes in chromophore concentration lead to changes in optical density, thus by
calculating optical density changes at two wavelengths (850 and 730nm), and by applying
known extinction coefficients of oxy-Hb and deoxy-Hb at each of those wavelengths,
concentration changes in oxy-Hb and deoxy-Hb can be determined (Boas et al., 2001).
Data Collection and Sensor Placement:
Conventional fNIRS recording requires a fNIRS headband that has several light
emitting diodes and sensors embedded in it. This is placed over the participant’s forehead,
ensuring that the sensors make contact with the skin (any hair preventing contact between
sensor and skin should be moved) and that there is no ambient light leakage (to this end a
further headband may be placed over the fNIRS headband to limit light leakage). The
locations of sensors (voxels) can be observed in Figure 4.1.
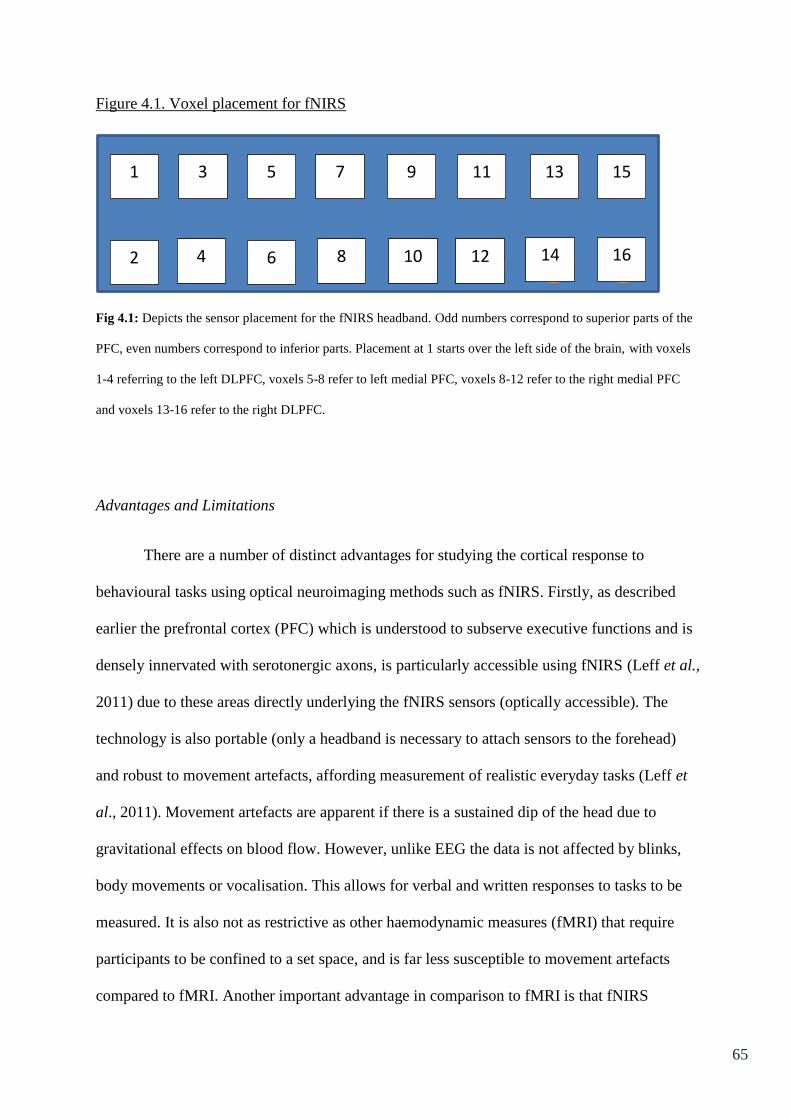
65
Figure 4.1. Voxel placement for fNIRS
Fig 4.1: Depicts the sensor placement for the fNIRS headband. Odd numbers correspond to superior parts of the
PFC, even numbers correspond to inferior parts. Placement at 1 starts over the left side of the brain, with voxels
1-4 referring to the left DLPFC, voxels 5-8 refer to left medial PFC, voxels 8-12 refer to the right medial PFC
and voxels 13-16 refer to the right DLPFC.
Advantages and Limitations
There are a number of distinct advantages for studying the cortical response to
behavioural tasks using optical neuroimaging methods such as fNIRS. Firstly, as described
earlier the prefrontal cortex (PFC) which is understood to subserve executive functions and is
densely innervated with serotonergic axons, is particularly accessible using fNIRS (Leff et al.,
2011) due to these areas directly underlying the fNIRS sensors (optically accessible). The
technology is also portable (only a headband is necessary to attach sensors to the forehead)
and robust to movement artefacts, affording measurement of realistic everyday tasks (Leff et
al., 2011). Movement artefacts are apparent if there is a sustained dip of the head due to
gravitational effects on blood flow. However, unlike EEG the data is not affected by blinks,
body movements or vocalisation. This allows for verbal and written responses to tasks to be
measured. It is also not as restrictive as other haemodynamic measures (fMRI) that require
participants to be confined to a set space, and is far less susceptible to movement artefacts
compared to fMRI. Another important advantage in comparison to fMRI is that fNIRS
1
2
3
4
5
7
9
11
13
15
6
8
10
12
14
16

66
obtains information about oxygenated haemoglobin as well as deoxygenated haemoglobin, as
opposed to just deoxy-Hb, as is the case with fMRI (Schecklemann et al., 2010). Although
deoxy-Hb is more closely linked to the BOLD response, oxy-Hb is understood to be the best
indicator of activation in fNIRS. Furthermore total haemoglobin (Hbt) can be calculated and
as such fNIRS gives a multi-dynamic haemoglobin response (Leff et al., 2011). A further
advantage of fNIRS is that it is relatively low cost, flexible, portable and user friendly
(Holper et al., 2009).
fNIRS does also have several disadvantages, primarily that in comparison to fMRI it
has relatively poor spatial resolution. Although placement is usually in line with the
standardised 10-20 system of anatomical landmarks, it measures cortical activation but does
not provide anatomical information about the brain like fMRI (Leff et al., 2011). Furthermore
the measurements are confined to relatively superficial cortical areas, as such positioning of
the device determines the regions that are examined (Ehlis et al., 2008). Moreover fNIRS has
relatively poor temporal resolution in comparison to EEG (Ehlis et al., 2008).
Summary
In summary, EEG and fNIRS can provide robust data which details neural and
haemodynamic responses to activation. Each method has considerable strengths which are
important for the current investigation. The excellent temporal resolution and direct
measurement of neuronal activity that EEG affords provides much needed information about
the stages of processing that may be affected. Moreover, haemodynamic response to cortical
activation in areas of the PFC (which is hypothesised to be damaged with ecstasy use) can be
explored with fNIRS. Taken together, these techniques will provide a wealth of information
about how cognitive processing may be affected by use of ecstasy. EEG and fNIRS data are
implemented in this thesis to investigate functional atypicalities of cognitive processes in

67
ecstasy users relative to controls. ERP analysis is relatively underused for assessing executive
function in ecstasy users, and as such is implemented to achieve a holistic understanding of
the contribution of processing deficits in each executive function. fNIRS, to the author’s
knowledge, has not been used to assess cognitive deficits in ecstasy users, as such this is a
novel approach to the investigation of executive functions in ecstasy users as well as the
haemodynamic response to multi-tasking.
68
Chapter 5: Review of Neuroimaging Studies in Ecstasy Users
Executive function and other cognitive deficits were reviewed in Chapter 3. Given the
dense innervation of serotonin neurons in prefrontal areas, it is understood that such deficits
may be mediated by MDMA related damage to the serotonin system. It is believed that
repeated use of MDMA will lead to serotonergic neurotoxicity, or down-regulation of
serotonin receptors. Indeed, in the animal literature MDMA has been observed to be toxic to
serotonin neurons (see Ricaurte et al., 2000 for a review). In humans direct investigation of
serotonergic neurotoxicity is difficult. However, various neuroimaging methodologies have
been employed to investigate the integrity of the serotonin system. This chapter reviews the
literature from neuroimaging studies in ecstasy users. It is important for this thesis to better
understand how MDMA use may affect neuronal activity, as atypicalities in neuronal
function are a more sensitive indicator of potential MDMA related neurotoxicity than residual
cognitive performance indicators. Each indicator of neuronal activity will be described at the
outset of each subchapter and the relationship between MDMA use and neuronal integrity
will be discussed.
5.1 Single-Photon Emission Computed Tomography (SPECT)
Single-Photon Emission Computed Tomography (SPECT) is a neuroimaging method
that utilises radioligands for the labelling of serotonin transporters (SERT) in the brain, so
that they can be tracked and densities of these receptors can be assessed. Owing to the 5-HT
transporter being understood as a structural element of the 5-HT neuron, it is a putative
reliable marker of the integrity of 5-HT neurons (Reneman, Booij, Majoie et al., 2001).
Moreover, lower densities of 5-HT receptors observed with SPECT may reflect damage to
the serotonin system, via MDMA use.
69
The effect of MDMA use on cortical 5-HT2A receptor densities was assessed using
SPECT by Reneman, Habraken et al. (2000). In this preliminary study, the radioligand
[123I]R91150 was administered intravenously to 10 MDMA users (7 male, mean age = 27,
MLD = 139 tablets, abstinent for at least 2 months), 5 former users (4 male, mean age = 24,
MLD = 218 tablets), and 10 healthy drug naive control subjects (4 male, mean age = 23).
Mean cortical 5-HT2A receptor binding ratios were calculated (average of left and right frontal,
parietal and occipital binding of [123I]R91150) and it was observed that the current MDMA
user group had significantly lower binding ratios than controls and former users. The
observed low cortical 5-HT2A receptor densities in the current user group are suggested to be
due to downregulation of receptors owing to MDMA induced 5-HT release. However the
increase in cortical 5-HT2A receptor densities (approaching significance) in the former user
group compared to controls is suggested to be due to upregulation of post synaptic 5-HT2A
receptors as a result of low synaptic 5-HT caused by MDMA induced serotonergic
neurotoxicity.
The same research group (Reneman, Booij et al., 2000) investigated whether MDMA
use produced alterations to post-synaptic 5-HT2A receptors and memory function, by
administering the same radioligand [123I]R91150, as well as a verbal memory test (Rey
Auditory Verbal Learning Test – RAVLT) to 5 MDMA users (4 male, mean age = 23.6,
MLD = 218, mean time since last dose = 4.6 months) and 9 age and education matched
healthy controls (4 male, mean age = 22.8). SPECT imaging results revealed that overall
binding ratios were higher in the MDMA user group. However this only approached
significance in the occipital cortex. Again it is suggested that the higher density of 5-HT2A
receptors, reflects upregulation of postsynaptic 5-HT2A receptors as a result of 5-HT depletion.
Furthermore, performance on the memory task was significantly reduced in MDMA users
relative to controls and this was correlated with 5-HT2A receptor binding in the MDMA group.

70
The authors suggest that these results reflect memory deficits that are attributable to MDMA
induced 5-HT deficits.
Serotonin transporter densities were examined in 22 current MDMA users (11 male,
mean age = 26.2, MLD = 485 tablets, mean time since last use = 2.4 months), 13 former users
(8 male, mean age = 25.3, MLD = 268 tablets, mean time since last use = 29 months) and 13
controls (7 male, mean age = 25) by Reneman, Lavalaye et al., (2001). This study used the
radioligand: iodine 123-labeled 2β-carbomethoxy-3β-(4-iodophenyl) tropane (123
Iβ-CIT).
SERT and memory function (using the RAVLT) were assessed to observe if there were
correlations between the two and whether prolonged abstinence could lead to recovery of any
observed deficits. Current MDMA users displayed lower cortical 123
Iβ-CIT binding than
controls, however no significant differences in binding were observed between former users
and controls. Immediate and delayed recall performance on the RAVLT was poorer for both
ecstasy user groups relative to controls. However this was not correlated with 123
Iβ-CIT
binding. It was concluded that the lower SERT densities in current MDMA users reflects
neurotoxic effects, which may be reversible after cessation of use, whereas the effects on
memory function may be long lasting. The same research group (Reneman, Booij, de Bruin et
al., 2001) used the same radioligand in a SPECT study to investigate the effects of sex, dose
and long term abstention from use of MDMA on serotonin neurons. Fifteen moderate ecstasy
users (9 male, mean age = males 25.6, females 22.7, MLD = 28.6 tablets, mean time since
last use = 3.6 months), 23 heavy users (12 male, mean age = males 27.1, females 25, MLD =
530 tablets, mean time since last use = 2.3months), 16 former users (8 male, mean age =
males 26.4, females 24.1, MLD = 268.1, mean time since last use = 29 months) and 15
controls (7 male, mean age = males 29.3, females 23.3) participated in this study. There were
no between group differences in age, verbal intelligence or use of alcohol, tobacco and
cannabis, although MDMA users reported more use of amphetamines and cocaine than
71
controls. 123
Iβ-CIT binding ratios were significantly lower in female, but not male heavy
MDMA users compared to controls and this was true for all brain regions analysed. The
moderate user group showed equivalent binding ratios for males and females compared to
controls. Females showed significantly lower binding ratios than males in the former user
group, though this did not differ significantly to controls. Overall SERT binding and log
transformed previous MDMA use were significantly correlated in females but not in males.
These results suggest that MDMA use can lead to reductions in serotonin transporters that are
dependent on gender, and level of use. The study also suggests that MDMA induced
reductions in SERTs may be reversible after abstention in females.
Reneman, Booij et al. (2002) investigated the densities of nigrostriatal dopamine neurons in
29 ecstasy users (15 male, mean age = 26.1, MLD = 324 tablets), 9 ecstasy and amphetamine
users (6 male, mean age = 22.1, MLD = 358 tablets) and 15 non-user controls (7 male, mean
age = 26.1) using the radioligand 123
Iβ-CIT. It is understood that MDMA may affect the
dopaminergic system, and tablets sold as ecstasy may also contain known compounds that
cause dopaminergic neurotoxicity, such as (meth) amphetamine. Between group comparisons
revealed that 123
Iβ-CIT binding ratios were significantly higher in the ecstasy user group
compared to controls, whereas 123
Iβ-CIT binding ratios were significantly reduced in the
ecstasy + amphetamine group relative to ecstasy only users (but not compared to controls).
Level use of ecstasy and amphetamine did not correlate with 123
Iβ-CIT binding ratios. The
authors suggest combined use of MDMA and amphetamine may lead to reduced dopamine
transporter densities. However this is most likely to result from the amphetamine use, given
that ecstasy alone does not appear to have an effect on dopamine neurons, whereas
amphetamine has been observed to be neurotoxic to dopamine neurons in animal studies (e.g.
Ricaurte et al., 1984).
72
Chang et al. (2000) used SPECT to assess cerebral blood flow (CBF) in 21 ecstasy
users (17 male, mean age = 43.4, MLD = 211 tablets) and 21 age, gender and
socioeconomically matched controls (17 male, mean age = 43.7). MDMA users showed only
slightly lowered global CBF (2.3%) and mild but not significant reductions in regional CBF.
Differences in individual regions were not significantly different, and drug use variables
(frequency, duration or recency) did not correlate significantly with global or regional CBF.
This study also investigated acute effects of MDMA administration. Eight participants were
administered MDMA on two separate occasions within one week and were scanned again 2-3
weeks later. Global and regional CBF SPECT scans post MDMA administration showed
decreases in CBF in most brain regions compared to baseline and to controls. Decreased
regional CBF was greatest in the caudate and superior parietal cortices, and right DLPFC.
These decreases were more pronounced in participants who received larger doses of MDMA
and most recently. However the data suggest that these effects may be transient.
More recently Klomp et al. (2012) suggested that age of first exposure may affect
serotonin transporter densities. SPECT analysis of 123
Iβ-CIT was conducted in 33 ecstasy
users stratified for early exposed users (first use at between 14 and 18 years) and later
exposed users (first exposure between 18 and 36 years). ANOVA revealed a significant effect
of age at first use in midbrain 123
Iβ-CIT binding ratios (age at scan, gender, duration of use
and lifetime dose had no effect). There was also a strong significant negative correlation
between age of first use and midbrain 123
Iβ-CIT binding ratios in the early exposed group,
but not the late exposed group. These findings suggest that MDMA affects the developing
brain differently to the mature brain and MDMA’s neurotoxic effect is dependent on the
developmental stage of SERT and maturity of serotonin transmitter function.

73
The sustained effect of MDMA on SERT densities in novel ecstasy users was
assessed by de Win et al. (2008a), using the radioligand 123
Iβ-CIT. In this prospective
study 188 ecstasy naïve participants with a high probability of ecstasy use were recruited,
based on participants indicating intention to use in the near future. Participants underwent
SPECT imaging at baseline and again in a follow up imaging session 12-36 months after
baseline. By the follow up testing sessions, 59 participants that were still engaged with the
study had started to use ecstasy. This incidental ecstasy user group had a mean lifetime dose
of six tablets (range of 0.5-80) with a mean time since last use of 18.7 weeks. From the initial
cohort of participants, 56 that were still ecstasy naïve were selected as controls, matched with
the ecstasy group for gender, age and cannabis use. At baseline the two groups did not differ
significantly in their age, gender, verbal IQ, SERT polymorphism, smoking, alcohol use, or
use of cannabis, cocaine and amphetamines. However at follow up the novel ecstasy users
showed significantly increased consumption of alcohol, cannabis, cocaine and amphetamine
compared to the persistent ecstasy naïve control group. No significant effects of MDMA on
123
Iβ-CIT binding were observed, with no between group differences at baseline, or follow
up, and no significant dose response effects of cumulative doses of MDMA on follow up
outcomes.
In summary, the majority of the literature of SPECT imaging in ecstasy users suggests
changes in SERT binding ratios. The evidence suggests that heavy users are likely to develop
reductions in subcortical serotonin transporter densities (Reneman, Lavalaye et al., 2001) and
that there appears to be dose dependent transient reductions in SERT whereby females are
more vulnerable than males (Reneman, Booij, de Bruin et al., 2001). Reneman, Booij et al.
(2000) suggest increases in [123I]R91150 binding in ecstasy users, however this study was
conducted in a small sample of users (n=5) and the results only approached significance in
one area. Recency of last dose may also be of significance given that Reneman, Habraken et
74
al. (2000), observed lower [123I]R91150 binding ratios in recent ecstasy users compared to
former users and controls. Moreover, in the subacute effects observed by Chang et al. (2000)
decreases in CBF after ecstasy use were more pronounced in larger and more recent doses.
Klomp et al.’s (2012) study suggests that age at first exposure may play a key role in the
extent of serotonin transporter density reduction and Reneman, Booij et al.’s (2002) results
suggest that MDMA may be a selective serotonin neurotoxin (with amphetamine more likely
to be culpable for striatal dopamine receptor reduction). The majority of studies show
reduced serotonin transporter densities following ecstasy use, which is a putative marker of 5-
HT neurotoxicity. The only study that observed no alteration in SERT binding between
ecstasy users and non-users (de Win, Jager et al., 2008a) was conducted on novel ecstasy
users who had received relatively low doses of MDMA in comparison to other studies.
Evidence from SPECT studies suggests a reduction in SERT densities as a result of
serotonergic neurotoxicity. If this is the case and neurotoxicity has occurred in the present
sample, differences in behavioural performance as well as changes in processing and
haemodynamic response to task may be observable in this thesis.
5.2 Electroencephalography (EEG)
EEG involves the measurement of electrical activity at the scalp, using electrodes that
are placed all over a participant’s head. Using this technique several methods can be used to
investigate various neuronal responses. For example Event Related Potentials (ERPs) are an
aggregate of post synaptic action potentials that are time locked to an event, whereas Event
Related Synchronisation (ERS) or Event Related Desynchronisation (ERD) reflect increases
or decreases in amplitudes of specific frequency bands in relation to an event.
Dafters et al. (1999) investigated the relationship between EEG variables (spectral
power and coherence) and cognitive/mood variables with level of MDMA use with a 128

75
electrode EEG apparatus on 23 recreational MDMA users (mean age = 24 years). In this
study, six resting (eyes closed) epochs of 60 seconds were recorded from each participant
(with 20s re-arousal periods between each recording) for spectral and coherence analysis.
Spectral analysis was conducted on one relatively artefact free 60s epoch after visual
inspection. The results from spectral analysis revealed that level of MDMA use is positively
correlated with an increase in alpha power across left frontal, left posterior and right posterior
areas of the brain. Use is also positively correlated with beta power in the left posterior region
and is negatively correlated with relative delta power over the whole scalp. Coherence
analysis revealed weak but significant negative correlations between MDMA use and sites
located over visual tracts (O1-T3, O2-T4). The authors suggest that these results (the
desynchronisation of EEG activity – increased high frequency bands alpha and beta coupled
with decrease in low frequency band delta) in MDMA users mimic results observed in ageing
populations.
Gamma, et al. (2005) assessed the ERP P3 component in response to an inhibition
task in 16 ecstasy polydrug users (8 male, mean age = 22.6, MLD = 270.2 tablets) and 17
controls (10 males, mean age = 26.0, less extensive drug use). ERPs were evoked by a
Continuous Performance Test (CPT A-X), this is analogous to a Go/NoGo task whereby a
participant in shown letters sequentially on a screen (A, B, C,D, E, F, G, H, J, L, X), and if an
‘A’ appears followed directly by an ‘X’ participants are to respond (“Go”). The presentation
of ‘A’ acts as a cue inducing preparation of a motor response. However the response is to be
inhibited if any letter other than ‘X’ follows. ERPs to the letter following ‘A’ were used for
analysis and the size of the P3 response was calculated as the mean amplitude between 250
and 450ms. Midline electrodes Fz, Cz and Pz were used for analysis, as these had been
shown previously to produce maximal P3 amplitude. The averaged P3 amplitude for the 4
quadrants of scalp potential field were also compared (using electrodes Fp1, F3, F7, FC5 and
76
FT9 for the anterior left quadrant, the corresponding electrodes on the right side of the scalp
were used for anterior right quadrant, P3, O1, T5, CP5, TP9 and PO9 were used for the
posterior left quadrant and the corresponding electrodes on the right side were used for the
anterior right quadrant). The results showed that ecstasy users displayed a significantly
reduced P3 in relation to NoGo trials at midline electrodes Fz and Cz. However after
controlling for age, education and cannabis use, Fz became non-significant (p=.08). Quadrant
analysis revealed one significant difference; in the posterior right quadrant ecstasy users
displayed greater P3 positivity than controls – however this again became non-significant
after controlling for confounders. There were no between group differences in latencies of P3.
Moreover lifetime use of MDMA and cannabis did not correlate with ERP characteristics or
performance on the task. Task performance was also equivalent between groups. The authors
suggest that although lower P3 amplitudes in ecstasy users are consistent with higher levels
of neuronal disinhibition, other results do not reflect disturbed inhibitory brain mechanisms.
Cognitive processing of ecstasy users was investigated using EEG by Mejias et al.
(2005) using a visual oddball task. In this particular “oddball” paradigm, faces (2 women, 2
men) were presented to participants. These were either, neutral or emotional (happy or
fearful). The neutral faces were the frequent stimuli (presented 84 times in a block of 100
trials), and the emotional faces were the infrequent/”oddball” stimuli that were presented 16
times in a block of 100 trials (8 x fearful, 8 x happy). This enables separation of attentional
(preparation to process) and response related (preparation to respond) components of an ERP.
Thus the N2 component (peaking around 250ms at occipital electrodes) indicates a switch of
attention (to prepare) and the P3(b) component (occurring around 450ms at parietal sites)
relates functionally to later stages of processing that are conscious, such as decision making
and premotor responses. ERPs were recorded from 14 MDMA users (mean age = 24.64,
MLD = 143.07 tablets) and 14 controls (mean age = 25.57, matched for scores for depression
77
and anxiety and cannabis use), whilst performing 16 blocks of the visual oddball task.
MDMA users were slower than controls to respond to rare stimuli. Furthermore ecstasy users
who had consumed upwards of 100 tablets were significantly slower to respond to rare
stimuli than those who had consumed fewer than 100 tablets. A mixed ANOVA revealed that
ecstasy users showed a greater latency of the P3b component compared to controls for rare
stimuli. There were no differences in latency in the N2 or P3a components, or amplitudes at
any measured component. When ERPs for happy vs. fearful faces were compared, there were
no between group differences (amplitudes or latencies) for happy faces, whereas ecstasy
users showed a greater P3b latency for fearful faces compared to controls. The authors
suggest that these results reflect serotonergic neurotoxicity in MDMA users which manifests
in attentional deficits. These are indexed neurophysiologically by a postponement of
information processing at the attentional level to the decision level (P3b) in MDMA users.
Casco et al. (2005) investigated Visually Evoked Potentials (VEPs) to a simple
discrimination task in eight heavy MDMA users (7 male, mean age = 28, MLD = 1054
tablets), eight moderate MDMA users (7 male, mean age = 25, MLD = 52.4 years) and 18
drug free controls (limited drug use, split into 2 sub-groups of 19-23 years n=9, 3 male and
24-32 years n=9, 5 male). This two-alternative forced-choice task comprised of digits being
presented on a screen randomly (either 1 or 2); when the sequence is interrupted participants
indicate whether the last digit that appeared on the screen was a 1 or a 2. There were no
between group differences on performance on the task, although pairwise comparisons
showed that heavy MDMA users made significantly more errors compared to drug free
controls. Amplitudes and latencies of the following components; P100, N150, P200, N250,
P300 and N400 were measured at electrodes Oz and Fz. Heavy MDMA users showed
significantly reduced P200 and P300 amplitudes at Oz compared to controls. Moderate users
also showed significantly reduced P300 amplitude relative to controls. No such differences
78
were found in latencies at this site. At Fz the P300 was significantly reduced in both heavy
and moderate users compared to controls. Moreover the N250 component was significantly
reduced in heavy users relative to controls (this was also approaching significance in
moderate users). Latency was not significantly different at any component for this electrode.
Since the groups do not differ in latencies of components it is suggested that processing speed
is not affected in these ecstasy users. However reductions in amplitude at middle (exogenous)
and late (endogenous) stages of processing are suggested to be evidence of altered cortical
activity associated with low level cognitive processing. It was concluded that recreational use
of MDMA is sufficient to cause neurotoxicity that is associated with subtle low-level
cognitive deficits in humans.
Auditory ERPs and cognitive performance were assessed in a longitudinal study by de
Sola et al. (2008). Fourteen ecstasy polydrug users (6 male, mean age = 25.2, mean total
lifetime use = 207.4 at baseline) 13 cannabis users (5 male, mean age = 25.1, daily cannabis
use or at least 25 times in lifetime) and 22 drug naïve controls (7 male, mean age = 24.3)
were recruited. Three ecstasy users, four cannabis users and one drug naïve control had
dropped out by the follow up experiment. ERPs were evoked by an auditory oddball
paradigm and participants were required to count the infrequent stimuli. Grand averaged P3
amplitudes and P3 latencies were obtained at time 1 and 12 months later at time 2. There
were no significant between group differences for P3 amplitude or P3 latency at time 1 or
time 2. Correlations between MDMA use and P3 response were not significant at time 1 or
time 2. However a significant correlation was observed between lifetime cannabis use and P3
latency at time 1, which was approaching significance at time 2 whereby greater cannabis use
improved neuronal processing speed. Conversely a marginally significant correlation between
cannabis use and P3 amplitude suggested increased lifetime dose is associated with lower P3
amplitude. Although reduced P3 amplitude and increased P3 latency in ecstasy users
79
compared to controls was consistent across time 1 and time 2, the results were marginal and
non-significant and fail to provide evidence for neurotoxicity associated with MDMA use,
though it is suggested that executive functioning tasks are more likely to be impaired at the
cognitive level than simple attentional orientation tasks.
More recently Burgess et al. (2011) investigated verbal episodic memory ERPs in 15
ecstasy polydrug users (7 male, mean age = 24.1 mean lifetime MDMA uses = 138), 14
cannabis users (7 male, mean age = 21.9) and 13 non-illicit drug users (6 male, mean age =
22.3). Participants undertook two recognition memory tasks, which were identical apart from
the type of stimuli; words (verbal) and faces (non-verbal). Over 90 trials participants had to
indicate whether the presented stimulus was new (presented first time in the sequence) or old
(had been repeated). The tests consisted of 40 stimuli that were repeated and 10 items that
were shown only once. No between groups differences were observed on performance on the
task. However for the word recognition memory task, Partial Least Squares (PLS) analysis on
the ERP data identified a single latent variable that discriminated between correct new
responses and correct old responses. A significant repetition effect was observed, with a more
positive-going ERP for repeated words centred on the left parietal area maximal in the 500-
700ms interval. There was a significant difference between groups in latent variable scores
with ecstasy/polydrug users showing significantly reduced amplitude compared to non-drug
controls, and this difference was approaching significance with the cannabis user group. This
latent variable consisted of two ERP components that were extracted using singular value
decomposition. These were identified as a left parietal recollection effect and a midline
frontal familiarity effect. Component scores were compared between groups, the recollection
component revealed a significantly reduced late positive ERP over left parietal sites in
ecstasy users compared to both other groups. No between group differences were observed
for the familiarity component. Latent component analysis on the face recognition task did not
80
provide any between group differences. It is suggested that ecstasy/polydrug users showed an
attenuation of a neuronal response that is associated with the ‘pure’ cognitive process of
verbal recollection.
Nulsen et al. (2011), observed differences in EEG activity in a cohort of 11 MDMA
users (4 male, mean age = 22.9, MLD = 32.5 tablets), 13 polydrug users (4 male, mean age =
23.2) and non-users (4 male, mean age = 23.2), whereby during forward and backwards digit
span tasks (described in Chapter 3.2.3), both control groups displayed a significantly reduced
P3b in the digit backwards task (more difficult aspect of the task) than the digit forwards task.
However the MDMA user group did not show this difference, yet this group displayed the
greatest discrepancy between digit backward span and digit forward span. These results
suggest that the ecstasy user group found this part of the task more demanding. The authors
suggest that ecstasy users’ performance was suppressed more by concurrent processing
demands of the working memory task than controls, and the ERP data reflect this, showing a
reduction in the cognitive resources allocated to processing.
On the whole, the majority of the studies reviewed reflect differences in
electrophysiological data that are suggestive of alterations to cognitive processing associated
with MDMA use. However there are several studies that fail to show ecstasy-related ERP
atypicalities (de Sola et al., 2008; Gamma et al., 2005). Some studies have observed
differences in latencies of a P3 component (Mejias et al., 2005). Others have observed
reductions in P3 amplitude associated with ecstasy use, despite equivalent behavioural
performance (Casco et al., 2005). Conversely, Nulsen et al. (2011) failed to observe
reductions in P3 amplitude despite observing performance deficits. Other studies have shown
alterations to late ERP components reflective of altered cognitive processing (Burgess et al.,
2011). The full extent of MDMA’s effect on electrophysiological indices requires
81
clarification and there is a paucity of EEG data relating specifically to executive processes.
As such this thesis aims to observe differences between MDMA users, polydrug controls and
drug naïve controls on each executive function, on three well defined components of an ERP;
the P2, N2 and the P3(b).
5.3 Magnetic Resonance Imaging (MRI)
Magnetic Resonance Imaging (MRI) is a non-invasive neuroimaging method that
relies on a large cylindrical magnet to create a magnetic field around a subject’s head. When
a magnetic field is created, protons (mainly from H+ hydrogen ions that are abundant in
living tissue) align with the same direction as this field (Weishaupt et al., 2008). Radio
frequency pulses are then sent to target nuclei (H+ ions) causing them to fall out of alignment
(resonance). Following this, protons immediately begin to realign with the magnetic field.
The realignment causes a radio frequency which can be received by the scanner. These are
known as T1 scans and parameters can be adapted to obtain a high contrast between grey and
white matter. As such these scans can provide valuable structural information. MRI is unable
to measure neuronal activity, however functional MRI (fMRI) involves parameter
manipulation to allow for brain function to be imaged whilst an action is being performed
(Kennedy et al., 2002) (this will be discussed in more detail in chapter 5.5).
Chang et al. (1999) conducted MRI scans in a 1.5 T scanner on 21 subjects with a
history of MDMA use (15 male, median age = 43, mean duration since last use = 4 months,
average lifetime dose of 13.1 g) and 37 ‘normal’ controls (22 men, median age = 38), and
observed all images for MDMA users and controls to be normal with no significant brain
atrophy or white matter lesions. Similarly Chang et al. (2000) observed normal MRI scans for
21 MDMA using subjects and 21 controls (as described 5.1) in a 1.5 T scanner.
82
Structural MRI scans of 31 MDMA polydrug users (5+ uses of MDMA and abstinent
for at least 3 weeks) and 29 non-MDMA users (age and sex matched that had used a variety
of drugs but not MDMA) were compared using voxel based morphometry (VBM) in a study
by Cowan et al. (2003) to investigate regional brain grey and white matter concentration. It
was hypothesised that ecstasy users may show reduced neocortical grey matter as a result of
loss of serotonergic trophic effects on cortical cells. Using a 1.5 T scanner T1 weighted scans
revealed multiple areas of reduced grey matter concentration in MDMA users relative to
controls. The neocortical regions displaying significantly reduced grey matter concentrations
included bilateral Brodmann Area (BA) 18 in the occipital lobe, BA 21 in the temporal lobe,
and left BA 45 in the frontal lobe, as well as a midline region of the brain stem and bilateral
areas of the cerebellum. These findings are interesting to observe if we consider the proposed
functionality of these areas. Both BA 45 and BA21 in the neocortex are suggested to play an
important role in semantic memory retrieval. This therefore has direct relevance to the current
thesis, as this function will be examined with further neuroimaging techniques.
Reneman, Majoie et al. (2001) assessed eight ecstasy users (7 male, mean age = 27.6,
MLD = 154 tablets, mean duration since last use = 14.6 weeks) and six non-users (3 male,
mean age = 22.3 years) on conventional T1 and T2 weighted scans as well as diffusion and
perfusion imaging (the results from which will be discussed in chapter 5.6). Perfusion MRI is
conducted to assess the vasculature of the brain by calculation of cerebral blood volume
(rCBV). Intravenous bolus injections of gadopentetate dimeglumine were administered to
participants prior to T2 weighted echo planar scans to provide an endogenous tracer of
arterial blood entering the brain (Keston et al., 2003). No oedematous changes in the brains
of ecstasy users compared to controls were observed. However the perfusion MRI data
provide more interesting results, with ecstasy users having overall higher mean rCBV values
than controls. This difference approached statistical significance in the globus pallidus. The
83
rCBV ratio in the globus pallidus also correlated significantly with extent of previous drug
use, and did not correlate with age, sex or IQ values. The authors suggest that increased
rCBV in the globus pallidus is a result of vasodilation that occurs in the absence of serotonin
controlled vasoconstriction due to serotonergic depletion.
Schouw et al. (2012) conducted Pharmacological MRI to assess 5-HT dysfunction in
ecstasy users (10 male; 50+ lifetime tablets; 7 healthy controls) by examining the
haemodynamic response to injection of a selective serotonin reuptake inhibitor (SSRI –
citalopram). MRI was conducted using a 3.0T scanner with pre-infusion anatomical 3DT1
weighted scans conducted for registration with pharmacologically labelled (post infusion)
scans. Subtraction of post infusion/citalopram labelled arterial spin labelling (ASL) images
from pre infusion/control ASL images yielded whole brain perfusion weighted images.
MDMA users displayed a significant cerebral blood flow reduction in response to the 5-HT
challenge, most prominent in the left thalamus. A significant decrease in CBF was also
observed in the right occipital cortex and the right frontal cortex. Significant CBF increases
were observed in the left globus pallidus and left frontal cortex. Controls showed minimal
differences between the two scans. Mean whole brain CBF was significantly increased in
ecstasy users compared to controls, and CBF was significantly decreased in the left thalamus
and bilateral occipital lobe compared to controls after citalopram infusion. It is suggested that
ecstasy users showed citalopram evoked haemodynamic changes in cortical regions and
subcortical grey matter areas that contain high densities of serotonin receptors in normal
populations, as a result of possible neurotoxicity.
Overall it appears that structural MRI scans have yielded little evidence for MDMA
related changes to white matter areas (Chang et al., 1999; Chang et al., 2000; Cowan et al.,
2003) perhaps suggesting that this measure is not sensitive enough to observe a physical
84
alteration to brain composition after MDMA use. However, reductions in neocortical grey
matter have been observed in ecstasy users compared to controls in structural scans, typically
in areas that are important for semantic retrieval (BA 21 and 45). Perfusion MRI was
successful in identifying increases in cerebral blood volume in the globus pallidus in ecstasy
users (Reneman, Majoie et al., 2001). This is a substructure of the basal ganglia, which has
been highlighted for its role in access to semantic memory (Copeland, 2003). Furthermore
alterations of cerebral blood flow were also observed in this area in ecstasy users from
pharmacological MRI (Schouw et al., 2012), as well as CBF reductions in cortical regions
and subcortical grey matter areas.
5.4 Magnetic Resonance Spectroscopy (MRS)
Proton Magnetic Resonance Spectroscopy (1H MRS) is another non-invasive
technique, that is similar to MRI in that it measures signals from hydrogen protons. However
rather than structural information, MRS provides information about relative concentrations of
CNS metabolites associated with structural brain integrity (Cowan et al., 2007). These
include the neuronal marker N-acetylaspartate (NAA) and the putative glial marker
myoinositol (MI).
Chang et al. (1999) used MRS to evaluate neurochemical abnormalities in 21 MDMA
users and 37 controls (as described in Chapter 5.3). Using a 1.5 T scanner, MRS was
performed in mid-occipital (grey matter), mid frontal (grey matter) and right parietal (white
matter) brain regions. The results showed that metabolite concentrations of NAA, creatine
(CR) and choline compounds (CHO) were comparable in all three brain areas measured
between ecstasy users and non-users. However ecstasy users showed elevated MI and MI to
CR ratios in parietal white matter as well as MI and MI/CR in parietal white matter.
Furthermore occipital grey matter positively correlated with MDMA use. The authors suggest
85
that the lack of NAA change (which is a marker considered sensitive to death or damage to
neurons) could reflect down regulation of 5-HT neurons rather than damage, or potentially
neuronal recovery. Similarly Liu et al. (2011) observed no significant increases in NAA
between MDMA users (n = 25, 20 male, mean age = 25.04, MLD = 158.12 tablets) and drug
naïve controls (n = 27, 17 male, mean age = 27.04) in the basal ganglia, whereas MDMA
users displayed increases in MI concentrations. Correlations between CR concentration and
MDMA dose were observed in the right basal ganglia.
Reneman, Majoie et al. (2002) investigated NAA/Cr, NAA/CHO and MI/Cr ratios in
midfrontal grey matter, mid occipital grey matter and right parietal matter using (1H MRS) in
15 male MDMA users (MLD = 723 tablets, mean time since last use – 12 weeks) and 12 age
matched controls. Ecstasy users showed significantly reduced NAA/Cr and NAA/CHO ratios
in frontal grey matter compared to controls. Frontal grey matter binding ratios were
negatively correlated with MDMA use. No differences were observed in mid occipital grey
matter or right parietal white matter between the two groups. These findings are difficult to
reconcile with those reported by Chang et al. (1999) and suggest that reduced NAA/Cr and
NAA/CHO ratios in the frontal cortex reflect neuronal abnormality. As the ecstasy users in
Reneman, Majoie et al., (2002) had a higher lifetime dose than Chang et al., (1999), this
could be an effect of dosage.
Obergreisser et al. (2001) investigated MDMA use on the hippocampus using (1H
MRS) in 6 ecstasy users (having at least 100 doses from 3-6 years, range = 120-350) and 5
age matched (26.6 years) controls. It was observed that there were no differences in
hippocampal NAA or choline compounds between ecstasy users and non-users, consistent
with Chang et al.’s (1999) findings. Daumann, Fischermann, Pilatus et al. (2004) conducted
1H MRS in the left hippocampus, midfrontal and midoccipital cortex of 13 regular ecstasy

86
users (10 male, MLD = 324.54 tablets, mean time elapsed since last use = 47.38 days) and a
non-MDMA control group (n=13, 10 male) that were matched for age, sex, level of education
and cannabis use. No significant between group differences were observed in NAA/Cr ratios
in any brain region observed. Furthermore there were no meaningful correlations between
NAA/Cr ratios and drug use, or memory performance. It was concluded that 1H MRS was a
less sensitive measure of neurotoxicity in ecstasy users than cognitive measures. Similarly, de
Win et al. (2008a) observed no significant effects of MDMA on brain metabolites (cohort
and experiment explained in more detail in Chapter 5.1) in a longitudinal study, nor in a
prospective cohort study on sustained effects of low dose ecstasy use on the brain in new
ecstasy users (de Win et al., 2007) (this study will be described in more depth in chapter 5.6)
Cowan et al. (2007) investigated absolute concentrations of NAA and MI in the
occipital lobe in 9 MDMA users (at least 5 occasions of use, aged 18-35) and 7 non-MDMA
controls matched for age and sex and had used a variety of other drugs. In this study a higher
field proton strength MRS of 4T was used in an attempt to gain a more sensitive measure of
neuronal disturbance. There were no statistical differences in absolute NAA or absolute MI
levels in the occipital cortex between MDMA users and non-users. The authors concluded
that these findings are not supportive of MDMA induced alterations to neurons or glia in the
occipital cortex of this small sample of moderate MDMA users.
In summary, MRS studies suggest MDMA has little effect on NAA, which is an
indirect measure of neuronal damage. However the samples in these studies are relatively
small, furthermore the one study which did yield ecstasy-related differences had a cohort of
MDMA users with far greater MDMA exposure than the other studies (Reneman, Majoie et
al., 2002). MRS has also been criticised for perhaps not being sensitive enough to detect
small changes in NAA that are associated with low level recreational doses of MDMA, or
87
detect changes to 5-HT terminals only (Chang et al., 1999). Although increasing the field
power made little difference in the study by Cowan et al. (2007) perhaps more work is
necessary with larger samples of heavier MDMA users.
5.5 Functional Magnetic Resonance Imaging (fMRI)
Similar to MRI this functional technique relies on magnetic fields being created
around a participant’s head. However rather than T1 weighted scans (that have a high spatial
resolution to give clear structural information) this technique relies on T2 weighted scans at a
lower resolution to assess Blood Oxygen Level Dependent (BOLD) signal changes (Kennedy
et al., 2002). In basic terms radio frequencies that are delivered to cause transverse
magnetisation (falling out of alignment of protons) also cause the spin axes of nuclei to tilt
(precess) in phase. When the pulse is stopped, this phase precess will relax, and the time
taken for all ions to fall out of phase is called T2. Increases in duration of time to repeat (time
between radio frequency pulses and T2) and time to echo (time between radio frequency
pulses and signal reception) give T2 weighted scans. T2 weighted scans favour imaging of
water, as such by using paramagnetic contrast agents in the blood (deoxy-haemoglobin)
blood flow and blood volume changes can be assessed (Huettel et al., 2004).
Daumann, Fimm et al. (2003) investigated the cerebral activation during a working
memory task using fMRI with 11 moderate ecstasy users (8 male, MLD = 27.3 tablets, mean
time since last dose =330.09 days), 11 heavy users (8 male, MLD = 258.18 tablets, mean time
since last use = 89.27 days) and 11 healthy controls, all matched for age, sex and level of
education. Participants conducted an n-back task (behavioural results discussed in Chapter
3.2.3) in combination with fMRI. The fMRI results showed that all three groups showed
significant and localised haemodynamic changes in prefrontal, parietal, occipital and
cingulate brain regions. However there were no group differences in activation at any level of

88
the task at a conservative significance level (p<0.05 corrected). Whereas using a more liberal
significance level (p<0.01, and p<0.001 uncorrected) heavy users showed weaker BOLD
responses in left frontal and temporal regions on the most difficult level of the task (2-back)
relative to the other two groups. Also, both user groups showed increased activation in the
right parietal cortex with 1 and 2 back tasks. However extent of previous drug use did not
correlate with BOLD signal changes. It is suggested that these results may reflect subtle brain
functioning alterations associated with MDMA use, but to treat these results with caution. In
a similar fMRI/n-back study, Daumann, Schnitker et al. (2003) studied BOLD activation in 8
pure ecstasy users (no regular use of any other drugs, mean age 25.30, MLD = 74.50 tablets),
8 polyvalent ecstasy users (concomitant use of ecstasy and amphetamines and cannabis, mean
age = 26.41, MLD = 56.25 tablets) and 8 healthy controls (mean age = 25.55) in an attempt to
control for concomitant use of other drugs. Performance on the n-back task was equivalent
between the three groups and all groups showed typical cortical activation patterns during the
task. However pure MDMA users showed reduced BOLD activation in the temporal gyrus
and angular gyrus in the 1-back task compared to controls (polyvalent users did not differ
significantly from controls). Moreover pure MDMA users had lower signal changes
compared to polyvalent users in the striate cortex and higher BOLD response in the premotor
cortex. At the more difficult 2-back level of the task, pure MDMA users showed lower
activation than both other groups in the angular gyrus. It is concluded from these results that
MDMA is associated with neuronal alterations that may reflect MDMA-induced
neurotoxicity and that altered fMRI patterns are not associated with concomitant use of other
drugs.
The same research group (Daumann, Fischermann, Heekeren et al., 2004) conducted
an 18 month longitudinal fMRI study, again using the n-back task in 30 ecstasy users (at time
1, this reduced to 21 users by time two). This ecstasy using cohort was then subdivided into
89
two groups based on their drug use in the interval between testing at time 1 and time 2; a
group that were abstinent during the interval period (n=8, 6 male, mean age =24.50 MLD =
31.50 tablets, mean time since last dose = 487.5 days) and a group that continued to use
ecstasy during the interval period (n=9, 5 male, mean age = 25.67, MLD = 149.44 tablets,
mean time since last dose = 15.67 days). The results of the fMRI scan at time 1 suggest no
differences in cortical activation between the two groups. At time 2 cortical activation
patterns did not alter significantly for any level of the n-back task from baseline in the interim
abstention group, whereas the continuing users showed increased activation from baseline in
two clusters in the parietal cortex during the most difficult level of the task (2-back).
Furthermore correlational analysis revealed that the increase in haemodynamic activation
between time 1 and time 2 in the two clusters in the parietal cortex for the continuing users
was associated with higher one night dose of MDMA. These results suggest that higher
nightly doses may result in higher risk of neuronal damage. The authors also offer that
neuronal damage in ecstasy users is long lasting, as the interim abstinent group did not differ
(or improve) in their activation at time 2 compared to time 1, assuming that activation at time
1 was atypical.
Moeller et al. (2004) used fMRI to study activation during a working memory task in
15 MDMA users (12 male, mean age = 24.7, mean lifetime uses = 193.5, mean time since
last use = 37 days) and 19 controls (11 male, mean age = 25.4). Participants undertook an
fMRI scan whilst completing an immediate and delayed memory task. SPM99 random effects
analysis showed that ecstasy users displayed significantly greater BOLD activation in three
clusters of brain regions compared to controls in the delayed memory task. These clusters
were; 1- left medial and superior frontal gyri with extending activation to the right medial
superior frontal gyri, bilateral anterior cingulate gyri, and right middle frontal gyrus. 2- left
thalamus extending to left caudate and putamen, left parahippocampal gyrus, left

90
hippocampus and left insula. 3- right hippocampal gyrus extending to the right hippocampus,
right thalamus, right lentiform nucleus, right putamen, right insula, and right temporal cortex.
Most of these effects remained after controlling for other drugs. However after controlling for
cannabis, the effect was no longer significant in the prefrontal cortex. The authors suggest
that the observed increase in activation of the BOLD signal could be due to MDMA users
being less “efficient” at the working memory task, resulting in an increase in neuronal
activity to perform at a similar level as controls. They also argue that increased BOLD fMRI
activation in the hippocampus may be MDMA specific. Valdes et al. (2006) used the same
subjects as those used by Moeller et al. (2004) and compared fMRI data with scores on the
Barrat Impulsivity Scale. There was a significant correlation between activation in two
clusters of the DLPFC and scores on the BIS. However there was no group by BIS interaction
with DLPFC activation, suggesting that this activation is related to impulsivity independently
of MDMA use. In line with Moeller et al. (2004), hippocampal dysfunction was observed in
adolescent MDMA users, in an fMRI study by Jacobsen et al. (2004). Selective and divided
attention and verbal working memory was assessed concurrently with fMRI in 6 adolescent
MDMA users (average of 10 episodes of MDMA use, mean age at first use = 15.8, little use
of other drugs other than cannabis and alcohol, mean age = 17.3) and 6 adolescents with no
history of MDMA use (matched for age and gender). The two groups did not differ with
regards to consumption of cigarettes, cannabis, years of education, estimated intelligence or
self-reported depression or anxiety. Performance on tasks was equivalent, although MDMA
users had significantly longer reaction times. MDMA users displayed significantly lowered
hippocampal activity relative to controls during the working memory task. Correlational
analysis revealed that time since last use was negatively correlated with left hippocampal
activity. The authors suggest that abnormal hippocampal function in ecstasy users could be
the result of damage to serotonin neurons that normally modulate inhibitory circuits.
91
Moreover the negative relationship between hippocampal activity and time since last use
suggests that function of inhibitory circuits in the hippocampus may recover after long
periods of abstinence.
Jager et al. (2008) assessed the concomitant use of other drugs in 71 participants
recruited on the basis of variations in the amount and type of drugs that they used. Thirty-
three heavy MDMA users (MLD = 322 tablets) and 38 non users (both groups showing
considerable variation in the type and amounts of drugs they were using) completed tasks of
working memory, attention and associative memory tasks in association with fMRI
procedures. Analysis of fMRI revealed no significant effects of ecstasy or any other drugs on
brain activity relating to working memory (modified Sternberg task) and attention (SAT task).
However in the associative learning task ecstasy use predicted lower activity in the left
DLPFC and higher activation in the right middle occipital gyrus. Moreover these effects
appeared to be independent of cannabis and alcohol use, as well as amphetamine cocaine and
tobacco use. The authors suggest these results reflect sustained – possibly even long term
adaptation or compensatory reorganisation of a fronto-visual network.
Cowan et al. (2006) investigated the BOLD fMRI response to visual cortex activation
in ecstasy users. In this study 20 MDMA users (who reported MDMA use on at least 4
occasions, mean age = 20.8, 8 male) and 23 non-users (13 male, mean age = 25.3) were
administered photic stimulation using specially constructed fibre optic goggles, whilst an
fMRI scan was undertaken. MDMA users had reported significantly greater lifetime use of
alcohol, amphetamine, cannabis, cocaine, hallucinogens, opiates, sedatives and phencyclidine
than non-users. However there were no differences in visual cortical activation between the
two groups. Nevertheless a within subjects analysis in the MDMA user group revealed that
degree of prior MDMA exposure was correlated with number of activated pixels for photic
92
stimulation. Conversely MDMA exposure was not correlated with BOLD signal change,
whereas lifetime alcohol, hallucinogens, sedatives and cannabis were all inversely correlated
with % BOLD signal change, but not with number of activated pixels. As such the results are
inconclusive with regard to the neurophysiological response to visual cortex activation in
ecstasy users.
More recently Raj et al. (2010) observed reduced BOLD signal change during a
semantic recognition task in ecstasy polydrug users. In a cohort and task described in Chapter
3.2.4 it was observed that there were statistically significant correlations of MDMA use and
BOLD signal change in left BA 9, 18 and 21/22, but not BA 45 during a semantic recognition
task. Lifetime episodes of MDMA use and lifetime dose were both inversely correlated
with %BOLD signal change at BA 9. Lifetime episodes of use was inversely correlated with
BOLD signal change in BA 18 and 21/22, though no such correlations were observed for the
encoding phase of the task, suggesting that MDMA affects verbal recognition but not
encoding. These results were complicated by inverse correlations between lifetime cocaine
use and BOLD signal activation in left BA 9 and 18 as well as a statistically significant
inverse correlation between cannabis use and activation in left BA 9. Nonetheless, after
controlling for lifetime cocaine and cannabis use, the association between MDMA use and
BA 9 activation remained statistically significant. The findings in this study are consistent
with findings of other neuroimaging and behavioural studies suggesting that access to
semantic memory may be adversely affected by MDMA use.
Neurophysiological correlates of impulse inhibition were explored in 20 ecstasy users
and 20 drug naïve controls (as described in Chapter 3.2.2) by Roberts and Garavan (2010).
fMRI data showed that ecstasy users displayed greater activity in right middle and inferior
frontal gyri, right middle frontal gyrus and right inferior parietal lobule, during successful
93
response inhibitions (STOPS) on a Go/NoGo task, compared to controls. Ecstasy users also
displayed greater error activation in the right middle and inferior temporal gyri. Deactivation
in the left medial frontal gyrus and left posterior cingulate was significantly greater for
controls on error trials. It is suggested that the increased activation displayed by ecstasy users
despite behaviourally silent differences in performance, shows increased neuronal
recruitment to inhibit in this group. Recruitment of additional resources to maintain
performance, suggests a subtle functional impairment that would have not been exposed with
behavioural measures alone.
The results from fMRI warrant further exploration, although it appears that ecstasy
use is generally associated with reductions in the BOLD response in frontal and temporal
regions (Daumann, Fimm et al., 2003; Daumann, Schnitker et al., 2003) the DLPFC (Jager et
al., 2008), hippocampus (Jacobsen et al., 2004) and BA 9 (Raj et al., 2010). These reductions
may reflect neuronal loss or damage. Increases in BOLD have also been observed in several
areas including the thalamus and hippocampus (Moeller et al., 2004) and right middle
occipital gyrus (Jager et al., 2008). However, the authors of these studies suggest that this
may reflect compensatory mechanisms due to task inefficiency. Furthermore some increases
in BOLD have been observed in MDMA users in the parietal cortex and are also correlated
with higher nightly doses. These effects may be more pronounced in younger users who have
yet to complete neurodevelopment upon initiation of use (Jacobsen et al., 2004). There is also
evidence to suggest that ecstasy-related alteration of neuronal activity is long lasting
(Daumann, Fischermann, Heekeren et al., 2004). However further exploration of use on
executive function is warranted.
94
5.6 Diffusion Tensor Imaging (DTI)
Diffusion Tensor Imaging (DTI) is an MRI technique that enables diffusional motion
of water molecules to be assessed (de Win et al., 2007), and allows imaging of tissue
structures at the microscopic level, providing information about neural tissues and changes
associated with damage and acute brain ischemia (Le Bihan, 2003). Diffusion in the brain
white matter is anisotropic, and motion is restricted by cellular structures (for example axons)
(de Win et al., 2007). Damage to axons may cause cytotoxic oedema, causing the cells to
swell and hence restrict diffusion motion further, resulting in decreased apparent diffusion
coefficient (ADC). Conversely, chronic damage to axons, may lead to increases in
extracellular water concentrations, subsequently leading to decreases in fractional anisotropy
(FA) and therefore increased ADC (de Win et al., 2007). This neuroimaging technique is
used to visualise anatomical functional connectivity between different areas of the brain by
mapping the orientation of white matter tracts (Le Bihan, 2003).
In a prospective study (de Win et al., 2007), DTI scans were performed on 188
ecstasy naïve participants who were selected on the basis that there was a high probability of
them using ecstasy in the near future. Thirty participants (12 males, mean age 22.5 years,
cumulative dose of ecstasy was 1.8 tablets, with an average of 7.7 weeks since last use) were
scanned soon after their first ecstasy use. These scans revealed a 0.9% significant increase in
FA of white matter in the centrum semiovale as well as a significant decrease (3.4%) of ADC
in the thalamus post ecstasy use. However after correction for multiple comparisons and
exclusion of participants with continued cocaine use, the increase in FA was no longer
significant. The authors suggest that this does not provide evidence of structural neuronal
damage. However the sustained decreases in ADC may indicate prolonged vasoconstriction
in certain areas even after low doses of ecstasy, although it is not known whether these

95
effects are permanent. This study was followed up by the same research group (de Win et al.,
2008a), using the same initial sample. At the time of this study a total 59 participants had
used ecstasy (MLD = 6 tablets). These were compared against 56 controls matched for age,
gender and IQ, although the ecstasy users had now used significantly more cannabis,
amphetamine, cocaine and alcohol than controls. Ecstasy users showed a significant decrease
in FA in the thalamus and fronto-parietal white matter. They also showed an increase in FA
in the globus pallidus and ADC in the thalamus relative to controls. It is suggested that
decreased FA and increased ADC in the thalamus reflects axonal damage, given that axonal
cells are understood to be the main cause for restriction of water diffusion and axonal damage
leads to the observed changes in FA and ADC.
The globus pallidus was also indicated as an area of interest in a diffusion MRI study
by Reneman, Majoie et al. (2001). In this preliminary study 8 MDMA users (described in
Chapter 5.3) and 6 non-ecstasy controls undertook diffusion MRI scans. It was observed that
ecstasy users displayed a significant increase in ADC in the globus pallidus relative to
controls. However, no significant correlations were observed between extent of previous
ecstasy use and ADC values. This increase in ADC is attributed to possible axonal injury or
loss and not due to an increase in water content in the extracellular space, as local brain
oedema was not detected on T2 weighted scans.
Moeller et al. (2007) compared FA, mean diffusivity (Dₐᵥ), and longitudinal (diffusion
along the direction of fibres) and transverse (perpendicular to the fibre tract axis) diffusivities
between 12 MDMA users (10 male, mean age = 27.3, 181 mean occasions of use) and 20
healthy controls (13 male, mean age = 25.5), in six regions of the corpus callosum (Genu,
Rostral body, Anterior Midbody, Posterior Midbody, Isthmus and Splenium). Results from
DTI showed that MDMA users had significantly reduced longitudinal diffusivities in the
96
rostral body of the corpus callosum relative to controls, consistent with axonal damage in
MDMA users. No significant differences in FA, Dₐᵥ or transverse diffusivity were observed.
Conversely to de Win et al. (2008a), Liu et al. (2011) observed significant increases
in FA in the bilateral thalami in 25 ecstasy users relative to 27 drug naïve controls (as
described in Chapter 5.4). In this whole brain DTI study; MDMA users showed clusters with
significantly increased FA in posterior parts of bilateral thalami and the retrolenticular parts
of internal capsules. Decreased FA was observed in MDMA users in the genu of the corpus
callosum which is consistent with findings from Moeller et al. (2007). Furthermore MDMA
users showed significant decreases in ADCs in the bilateral thalami, posterior internal capsule
and corona radiata along the bilateral corticospinal tracts, as well as significantly increased
ADC in the bilateral anterior internal capsule, the bilateral superior longitudinal fasiculus and
the splenium and genu of the corpus callosum. Decreased ADCs in bilateral thalami and
increased FA is consistent with de Win et al.’s (2007) initial findings suggesting that integrity
of axons in the basal ganglia-thalamocortical circuit may be compromised by MDMA use.
Neurotoxic effects of ecstasy on the thalamus were explored further using DTI by de
Win et al. (2008b) using a sample of 71 polydrug users (33 of which were defined as heavy
MDMA users, MLD = 322 tablets) correlations were conducted between drug use variables
and DTI values. Extent of MDMA use was significantly correlated with decreased FA in the
thalamus although no significant effect of MDMA on ADC in the basal ganglia was observed.
5.7 Positron Emission Tomography (PET)
Positron Emission Tomography (PET) is another haemodynamic functional
neuroimaging technique that involves participants receiving injections of a radioactive tracer
(radioligand). PET scanners are then able to monitor the distribution of the tracer in the brain,

97
which indexes cerebral blood flow, and thus is an indirect measure of neural activity (Cabeza
& Nyberg, 1997).
PET may also be used to measure SERT densities, similar to SPECT by using radio
ligands that selectively label the 5-HT transporter. McCann et al. (1998) used the radioligand
carbon-11-labelled McN-5652 to observe differences in SERT binding between 14 MDMA
users (9 male, mean age = 26.6, mean use = 228 occasions, mean usual dose = 386mg, mean
duration since last use = 19 weeks) and 15 controls (9 male, mean age = 28.3). The
distribution volumes ratios (DVR) for binding of the radioligand were significantly globally
decreased in MDMA users relative to controls, suggesting that users had lower densities of
SERT sites than controls. Moreover, decreases in SERT binding correlated significantly with
extent of previous drug use, suggesting MDMA exposure may lead to loss of 5-HT terminals.
The same radioligand was used in a much larger sample by Buchert et al. (2003).
Thirty current ecstasy users (15 male, mean age = 24.5, MLD = 831 tablets, mean duration
since last use = 25 days), 29 former users (15 male, mean age = 24.4, MLD = 793 tablets,
mean duration since last use = 520 days), 29 ecstasy naïve drug users (15 male, mean age =
24.4) and 29 drug naïve controls (14 male, mean age = 23.2) were compared for SERT
availability in SERT rich areas of the brain including: mesencephalon, putamen, caudate and
thalamus. The results showed that ecstasy users had significantly lower DVR in the
mesencephalon than all other groups. Ecstasy users had significantly reduced DVRs in the
caudate relative to polydrug users and in the thalamus, ecstasy users’ DVRs were
significantly reduced compared to polydrug users and drug naïve controls. The mean DVRs
over all areas were lowest in current users. However, DVRs for former users and drug naïve
controls were similar across all areas, suggesting possible recovery. There were no
differences between groups in DVRs in the white matter, where there are no SERTs,
suggesting that the effects are serotonin specific.
98
Using the same sample, Buchert et al., (2004) observed that current MDMA users had
significantly reduced DVRs in the posterior cingulate gyrus, left caudate, thalamus, occipital
cortex, medial temporal lobes including the hippocampus and parahippocampal regions and
brainstem with mesencephalon and pons compared to all three control groups. These
differences were more pronounced in females than males, suggesting that females may be
more susceptible to MDMA related serotonergic changes. Interestingly, there were no
significant differences in SERT availability between former users and the two other control
groups, suggesting that these effects may be reversible after long periods of abstention. This
is also supported by the finding that DVRs and MDMA abstention periods were positively
correlated in the brainstem with mesencephalon and pons and the basal forebrain. SERT
appeared to normalise in this follow up study, with no significant differences between groups
in the mesencephalon. The authors suggest that there were reductions in ecstasy use, which
may account for normalising SERT levels. These findings coupled with normal SERT levels
in former users suggest that ecstasy-related effects of SERT availability may be reversible.
The effects of MDMA use on cortical serotonin function in females was explored
further in a PET study by Di lorio et al. (2012) using the 5-HT2A receptor specific radioligand
[18
F]setoperone. Fourteen female MDMA users (mean age = 21.64, mean lifetime MDMA
consumption = 14000mg) were compared with 10 female controls (mean age = 21.60).
MDMA users had significantly increased 5-HT2A receptor binding in occipital-parietal,
temporal, occipito-temporal-parietal, frontal and fronto-parietal regions. Lifetime use was
also significantly correlated with binding increases in fronto-parietal, occipito-temporal,
fronto-limbic, and frontal regions. There were no significant effects of duration of abstinence
on binding here, suggesting chronic 5-HT neurotoxicity in females.
Thomasius et al. (2003) used [11
C]McN5652 to assess serotonin transporter density in
30 current ecstasy users (15 male, mean age = 24.5, MLD = 1033.77 tablets, time since last
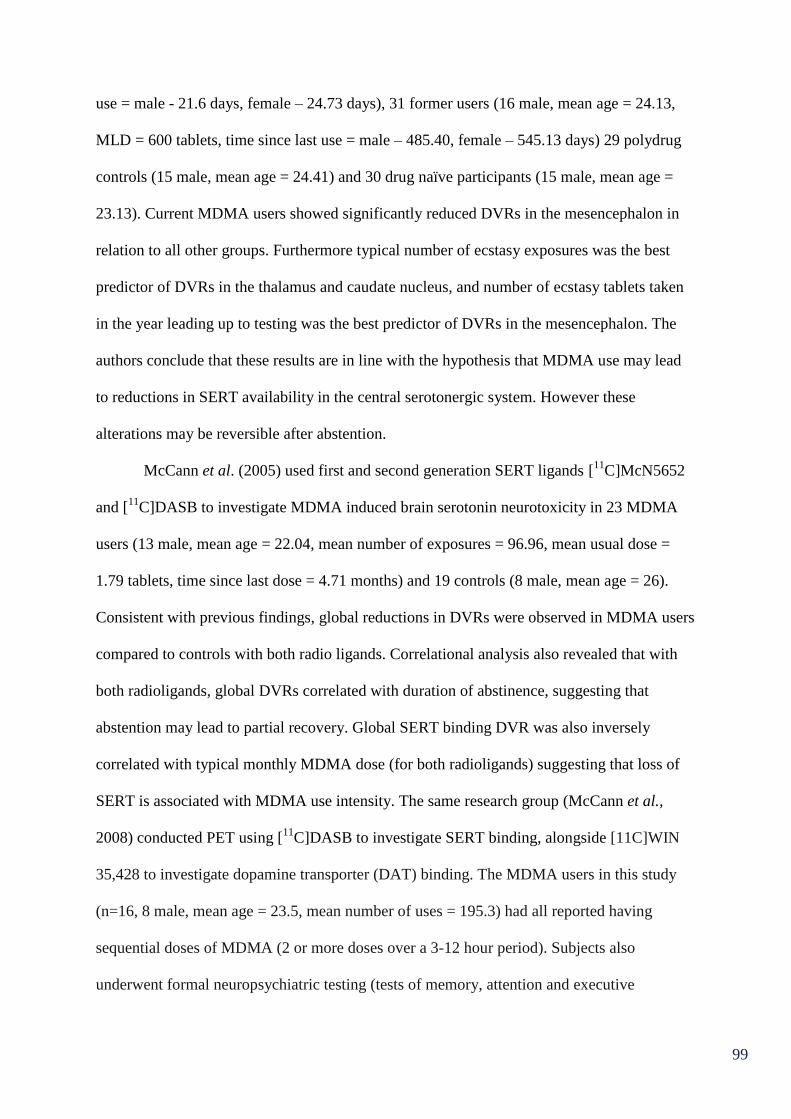
99
use = male - 21.6 days, female – 24.73 days), 31 former users (16 male, mean age = 24.13,
MLD = 600 tablets, time since last use = male – 485.40, female – 545.13 days) 29 polydrug
controls (15 male, mean age = 24.41) and 30 drug naïve participants (15 male, mean age =
23.13). Current MDMA users showed significantly reduced DVRs in the mesencephalon in
relation to all other groups. Furthermore typical number of ecstasy exposures was the best
predictor of DVRs in the thalamus and caudate nucleus, and number of ecstasy tablets taken
in the year leading up to testing was the best predictor of DVRs in the mesencephalon. The
authors conclude that these results are in line with the hypothesis that MDMA use may lead
to reductions in SERT availability in the central serotonergic system. However these
alterations may be reversible after abstention.
McCann et al. (2005) used first and second generation SERT ligands [11C]McN5652
and [11
C]DASB to investigate MDMA induced brain serotonin neurotoxicity in 23 MDMA
users (13 male, mean age = 22.04, mean number of exposures = 96.96, mean usual dose =
1.79 tablets, time since last dose = 4.71 months) and 19 controls (8 male, mean age = 26).
Consistent with previous findings, global reductions in DVRs were observed in MDMA users
compared to controls with both radio ligands. Correlational analysis also revealed that with
both radioligands, global DVRs correlated with duration of abstinence, suggesting that
abstention may lead to partial recovery. Global SERT binding DVR was also inversely
correlated with typical monthly MDMA dose (for both radioligands) suggesting that loss of
SERT is associated with MDMA use intensity. The same research group (McCann et al.,
2008) conducted PET using [11
C]DASB to investigate SERT binding, alongside [11C]WIN
35,428 to investigate dopamine transporter (DAT) binding. The MDMA users in this study
(n=16, 8 male, mean age = 23.5, mean number of uses = 195.3) had all reported having
sequential doses of MDMA (2 or more doses over a 3-12 hour period). Subjects also
underwent formal neuropsychiatric testing (tests of memory, attention and executive

100
function). The results indicated that SERT binding was significantly reduced in multiple
brain regions for MDMA users relative to controls (occipital cortex, parietal cortex, temporal
cortex, anterior cingulate cortex, posterior cingulate cortex, DLPFC and hippocampus). The
reductions were greatest in cortical regions (especially the occipital cortex) and there were no
significant differences in SERT binding in subcortical regions. However, no differences were
observed between users and controls in DAT binding in the caudate or putamen, and no
relationship was found between measures of MDMA use and DAT binding. There was,
however, a significant negative correlation between SERT availability in the hippocampus
and duration of MDMA use. These results reflect the specificity of MDMA as a selective
serotonin neurotoxin and suggest that sequential dosing is associated with lasting decreases in
SERT. Memory performance was also correlated with SERT binding in the DLPFC,
orbitofrontal cortex and parietal cortex, across groups. However this was not significant in
MDMA users alone, suggesting that MDMA use disrupts this relationship.
More recently Sudhakar et al. (2009) investigated SERT binding using [11
C]DASB in
12 former MDMA users (all male, mean age = 28.2, mean lifetime occasions = 243.75,
typical session dose = 2.75, time since last use = 2.74 years), 9 polydrug user controls (all
male, mean age = 35.6) and 19 drug naïve controls (mean age = 30.5). No significant
differences were observed in cerebellar DVR between the three groups and there were no
correlations between variables of MDMA use and SERT binding suggesting no long lasting
serotonin neuron damage in recreational users.
Presynaptic (5-HT transporter, SERT) and postsynaptic (5-HT2A receptor) markers of
serotonin transmission in neocortical areas were investigated in a PET study using the SERT
ligand [11
C]DASB and the 5-HT2A receptor ligand [11
C]MDL by Urban et al. (2012). Thirteen
current users (8 male, mean age = 30.8, 5.7 weeks mean abstinence, 142 mean MDMA
sessions) and 13 matched healthy controls were compared. Presynaptic SERT availability

101
was reduced overall in ecstasy users compared to controls for cortical but not subcortical
regions. The most pronounced differences were observed in the medial prefrontal cortex,
occipital cortex and temporal cortex. As predicted, decreased SERT was regionally
associated with upregulated 5- HT2A receptor binding. It is suggested that these results reflect
MDMA induced damage to 5-HT neuron terminals innervating the cortex. Kish et al., (2010)
observed SERT binding of [11
C]DASB in cortical and subcortical areas using voxel based
analysis with 49 chronic MDMA users (28 male, mean age = 25.9, range of cumulative
lifetime tablets = 2 – 922, variable use of other drugs) and 50 controls (25 male, mean age =
26, low use of other drugs). ANOVA revealed highly regional-specific decreases in
[11
C]DASB binding in ecstasy users compared to controls that was restricted to the entire
cerebral cortices and hippocampus with the most marked reduction (-46%) in the occipital
cortex. No changes were observed in the SERT rich striatum (Caudate, putamen and ventral
striatum), thalamus, global pallidus or midbrain. These findings suggest that SERT binding
reduction is regionally specific and is unlikely to be explained by recent use of other
stimulant drugs, hormonal levels, SERT promoter gene polymorphisms or structural brain
changes (as observed from regression analysis).
[H2 15
O]-PET was used to assess cerebral blood flow after a single dose of MDMA
(1.7mg/kg) or placebo in 16 MDMA naïve participants by Gamma et al. (2000). It was
observed that MDMA produced acute increases in regional cerebral blood flow in the
ventromedial, frontal and occipital cortex, inferior temporal lobe and cerebellum, as well as
decreases in the motor and somatosensory cortices, left amygdala, insula, cingulate cortex
and thalamus.
To sum up, the literature on SERT binding in MDMA users as assessed by PET seems
to consistently suggest that use is associated with lower SERT availability (McCann et al.,
1998; McCann et al., 2005) globally. However this is usually more pronounced in SERT rich

102
areas such as the mesencephalon, caudate and thalamus (Buchert et al., 2003; Buchert et al.,
2004; Thomasius et al., 2003). Findings of decreased DVRs in SERT rich areas coupled with
no such differences in white matter (Buchert et al., 2003) reflect that potential neural damage
is serotonin specific. This is also reflected by lack of observed differences in dopamine
transporter binding between MDMA users and non-users (McCann et al., 2008). There is
evidence to suggest that MDMA’s effects on serotonin terminals are more pronounced in
female users (Buchert et al., 2004; Di lorio et al., 2012). Furthermore the majority of studies
reviewed suggest that the effects observed may be reversible. Sudhakar et al. (2009) observed
no differences in SERT between former users and controls and other studies have shown
correlations between period of abstention and SERT availability (Buchert et al., 2004;
McCann et al., 2005).
Chapter Summary
The evidence from neuroimaging studies suggests that ecstasy does adversely affect
the serotonin system. Although it is clear that some methods are not as sensitive as others at
detecting perhaps mild cognitive aberrations (MRI, MRS) associated with low recreational
doses. Other methods (SPECT, PET, fMRI) consistently show alterations to neuronal
activation/ SERT binding that reflect degradation of the serotonin system that is associated
with MDMA use. Abstention also appears to play an important role with regards neuronal
changes, as many studies suggest that SERT availability returns to normal levels after periods
of abstention. However, some of the behavioural deficits noted in chapter 3 have been shown
to be long lasting. All participants in this thesis will be required to be abstinent from MDMA
use for at least 7 days prior to testing, to observe long lasting effects of drug rather than an
acute residual intoxication effect. Other neuroimaging studies that have been coupled with
behavioural tasks have observed differences in their neurophysiological performance despite
having undetectable behavioural deficits, suggesting neuroimaging techniques are more

103
sensitive to cognitive impairment than behavioural measures alone. As such all of the studies
in this thesis will combine behavioural assessments with assessments of neurophysiological
indices. Furthermore after conducting a literature search for fNIRS studies with MDMA users,
it has been concluded that this neuroimaging technique has never been used for assessment of
cognitive performance in MDMA users previously. As such the application of this technique
to this research area is novel, and will provide valuable information about haemodynamics in
the PFC of MDMA users.

104
Measure/Authors Methodology Findings
SPECT
Reneman, Habraken et al. (2 000) Structural analysis, using radioligand [123I]R91150 to
assess cortical 5-HT2A receptor binding in 10 MDMA
users, 5 former users and 10 drug naïve controls
Current MDMA users had significantly lower binding
ratios than controls and former users over an average of
left and right frontal, parietal and occipital areas.
Reneman, Booij et al. (2000) Structural analysis using radioligand [123I]R91150 to
assess post-synaptic 5-HT2A receptor binding in 5
MDMA users and 9 non-user controls
Overall binding ratios higher for MDMA users. However
this only approached significance in the occipital cortex.
Reneman, Lavalaye et al. (2001) Structural analysis using radioligand 123
Iβ-CIT to
assess cortical SERT binding in 22 current MDMA
users, 13 former users and 13 controls
Current MDMA users displayed lower cortical SERT
binding than controls. No significant differences in
binding observed between former users and controls.
Reneman, Booij, de Bruin et al. (2001) Structural analysis using radioligand 123
Iβ-CIT to
assess cortical SERT binding in 15 moderate ecstasy
users, 23 heavy users, 16 former users and 15 controls
Binding ratios significantly lower in female heavy users
compared to controls for all brain regions analysed.
Overall SERT binding and log transformed previous
MDMA use were significantly correlated in females but
not in males.
Reneman, Booij et al. (2002) Structural analysis using radioligand 123
Iβ-CIT to
assess nigrostriatal dopamine neuron densities in 29
ecstasy users, 9 ecstasy and amphetamine users and 15
controls.
123 Iβ-CIT binding ratios significantly higher in the
ecstasy user group compared to controls. 123
Iβ-CIT
binding ratios significantly reduced in the ecstasy +
amphetamine group relative to ecstasy only users.
Chang et al. (2000) Functional analysis, assessing cerebral blood flow in 21
ecstasy users and 21 controls
Ecstasy users showed slightly lowered global CBF
(2.3%) and mild but not significant reductions in regional
CBF compared to controls.
Klomp et al. (2012) Structural analysis using radioligand 123
Iβ-CIT to
assess SERT binding ratios in 33 ecstasy users stratified
for early (14-18 years) and late (18-36 years) exposure
Significant effect of age at first use in midbrain 123
Iβ-
CIT binding ratios. Also a strong significant negative
correlation between age of first use and midbrain 123
Iβ-
CIT binding ratios in the early exposed group, but not the
late exposed group.
Table 5.1: Summary of studies assessing objective measures of neurotoxicity in ecstasy users

105
de Win et al. (2008a) Structural analysis using radioligand 123
Iβ-CIT to
assess SERT binding ratios in prospective ecstasy users
in a longitudinal study: 188 ecstasy naïve participants
scanned at time 1, with 59 participants subsequently
using ecstasy by time 2 (12-36 months follow up). 59
incidental ecstasy users compared to 56 still drug naïve
controls
No significant ecstasy related effects on 123
Iβ-CIT
binding observed.
EEG
Dafters et al. (1999) Functional analysis. Spectral and coherence analysis of
60s resting (eyes closed) epochs and cognitive/mood
variables in 23 ecstasy users.
Level of MDMA use positively correlated with an
increase in alpha power across left frontal, left posterior
and right posterior areas. Use also positively correlated
with beta power in the left posterior region and
negatively correlated with relative delta power over the
whole scalp. Coherence analysis revealed weak but
significant negative correlations between MDMA use
and sites located over visual tracts (O1-T3, O2-T4).
Gamma et al. (2005) Functional analysis. ERP P3 assessed whilst conducting
inhibition task (CPT A-X) in 16 ecstasy users and 17
controls
Ecstasy users show significantly reduced P3 in relation to
NoGo trials at midline electrodes Fz and Cz. After
controlling for age, education and cannabis use, Fz
became non-significant. No between group differences in
P3 latencies. No correlation between P3 amplitude or
latency and lifetime MDMA use.
Mejias et al. (2005) Functional analysis. ERP components assessed while
conducting visual oddball task: 14 ecstasy users, 14
controls.
Ecstasy users showed a greater latency of the P3b
component compared to controls for rare stimuli.
Casco et al. (2005) Functional analysis. ERP components of VEPs assessed
during a simple discrimination task: 8 heavy ecstasy
users, 8 moderate users and 18 drug free controls
Heavy users showed significantly reduced P2 and P3
amplitudes at Oz compared to controls. Moderate users
showed significantly reduced P3 amplitude relative to
controls. P3 was significantly reduced in both heavy and
moderate users compared to controls at Fz. N250
significantly reduced in heavy users relative to controls.

106
de Sola et al. (2008) Functional analysis. ERP components assessed in
relation to an auditory oddball paradigm in 14 ecstasy
users, 13 cannabis users and 22 drug naïve controls.
Longitudinal study.
No significant between group differences for P3
amplitude or latency at time 1 or time 2. Correlations
between MDMA use and P3 response not significant at
time 1 or time 2. However lifetime cannabis use and P3
latency significantly correlated at time 1, with greater
cannabis use associated with increased neuronal
processing speed.
Burgess et al. (2011) Functional analysis. ERPs analysed during two
recognition memory tasks in 15 ecstasy users, 14
cannabis users and 13non-drug users
Significantly reduced late positive ERP over left parietal
sites in ecstasy users compared to both other groups for
the recollection component of the task.
Nulsen et al. (2011) Functional analysis. ERPs analysed during forward and
backwards digit span task: 11 ecstasy users, 13
polydrug controls, 13 non-drug controls
Both control groups show significantly reduced P3 in the
digit backwards task than the digit forwards task. This
difference is not evident in ecstasy users, despite
showing greatest discrepancy in performance between
the two tasks.
MRI
Chang et al. (1999) Structural analysis: 21 ecstasy users, 37 non-users Ecstasy users and controls showed normal scans with no
significant brain atrophy or white matter lesions.
Chang et al. (2000) Structural analysis: 21 ecstasy users, 21 non-users Normal MRI scans for ecstasy users and controls.
Cowan et al. (2003) Structural analysis: 31 ecstasy users, 29 non-users Ecstasy users showed reduced grey matter concentrations
relative to controls in bilateral BA 18 in the occipital
lobe, BA 21 in the temporal lobe, and left BA 45 in the
frontal lobe, as well as a midline region of the brain stem
and bilateral areas of the cerebellum.
Reneman, Majoie et al. (2001) Structural analysis with conventional T1 weighted
scans as well as diffusion and perfusion MRI
(Intravenous bolus injections of gadopentetate
dimeglumine administered prior to T2 weighted echo
planar scans) in 8 ecstasy users and 6 non-user controls
Perfusion MRI showed ecstasy users had overall higher
mean rCBV values than controls. This approached
significance in the globus pallidus. The rCBV ratio in the
globus pallidus also correlated significantly with extent
of previous drug use. No differences were observed on
other MRI measures.

107
Schouw et al. (2012) Structural analysis. Pharmacological MRI, 3.0T T1
weighted scans performed pre and post infusion with
SSRI Citalopram. Haemodynamic response to SSRI
investigated in 10 male ecstasy users and 7 non-user
controls
Ecstasy users displayed a significant cerebral blood flow
reduction in response to 5-HT challenge, most prominent
in the left thalamus.
MRS
Chang et al. (1999) Structural analysis from relative concentrations of CNS
metabolites associated with structural brain integrity: 21
ecstasy users, 37 non-user controls
Concentrations of NAA, CR and CHO comparable in all
3 brain areas measured (mid occipital, mid frontal and
mid parietal brain regions) between ecstasy users and
non-users. However ecstasy users showed elevated MI
and MI to CR ratios in parietal white matter as well as
MI and MI/CR in parietal white matter. Occipital grey
matter positively correlated with MDMA use.
Liu et al. (2011) Structural analysis from relative concentrations of CNS
metabolites associated with structural brain integrity: 25
ecstasy users, 27 drug naïve controls
No significant differences in NAA between groups in the
basal ganglia. However ecstasy users displayed increases
in MI concentrations. Correlations between CR
concentration and MDMA dose observed in the right
basal ganglia.
Reneman, Majoie et al. (2002) Structural analysis from relative concentrations of CNS
metabolites associated with structural brain integrity: 15
male ecstasy users, 12 non-user controls
Ecstasy users show significantly reduced NAA/Cr and
NAA/CHO ratios in frontal grey matter compared to
controls. Frontal grey matter binding ratios were
negatively correlated with MDMA use. No differences
observed in mid occipital grey matter or right parietal
white matter between groups.
Obergreisser et al. (2001) Structural analysis from relative concentrations of CNS
metabolites associated with structural brain integrity.
Assessment of MDMAs effects on the hippocampus in
6 ecstasy users and 5 non-user controls.
No differences in hippocampal NAA or choline
compounds between ecstasy users and non-users.
Daumann, Fischermann, Pilatus et al. (2004) Structural analysis. 1H MRS in the left hippocampus,
midfrontal and midoccipital cortex of 13 ecstasy users
and 13 non-user controls
No significant between group differences in NAA/Cr
ratios in any brain region observed. No meaningful
correlations between NAA/Cr ratios and drug use.

108
de Win et al. (2008a) Structural analysis from relative concentrations of CNS
metabolites associated with structural brain integrity:
188 ecstasy naïve participants scanned at time 1, with
59 participants subsequently using ecstasy by time 2
(12-36 months follow up). 59 incidental ecstasy users
compared to 56 still drug naïve controls
No significant effects of MDMA on brain metabolites.
Cowan et al. (2007) Structural analysis, MRS 4T was used to investigate
absolute concentrations of NAA and MI in the occipital
lobe in 9 ecstasy users and 7 non-user controls
No statistical differences in absolute NAA or absolute
MI levels in the occipital cortex between MDMA users
and non-users.
fMRI
Daumann, Fimm et al. (2003) Functional analysis during n-back task: 11 heavy
ecstasy users, 11 moderate ecstasy users, 11 non-user
controls
Heavy users showed weaker BOLD responses in left
frontal and temporal regions on the most difficult level of
the task (2-back) relative to the other two groups (at
liberal significance level p<0.01, and p<0.001
uncorrected). Both user groups showed increased
activation in the right parietal cortex with 1 and 2 back
tasks. Extent of previous drug use did not correlate with
BOLD signal changes.
Daumann, Schnitker et al. (2003) Functional analysis during n-back task: 8 pure ecstasy
users, 8 polyvalent ecstasy users, 8 non-user controls
Pure MDMA users showed reduced BOLD activation in
the temporal gyrus and angular gyrus in the 1-back task
compared to controls. Pure MDMA users had lower
signal changes compared to polyvalent users in the striate
cortex and higher BOLD response in the premotor
cortex. Pure MDMA users showed lower activation than
both other groups in the angular gyrus during 2-back
(more difficult) level of the task.
Daumann, Fischermann, Heekeren et al. (2004) Functional analysis during n-back task, in an 18 month
longitudinal study: 30 ecstasy users (at time 1, reducing
to 21 users by time two)
Continuing users showed increased activation from
baseline in two clusters in the parietal cortex during the
most difficult level of the task (2-back) at time 2
compared to time 1. Increase in haemodynamic
activation between time 1 and time 2 associated with
higher one night dose of MDMA.
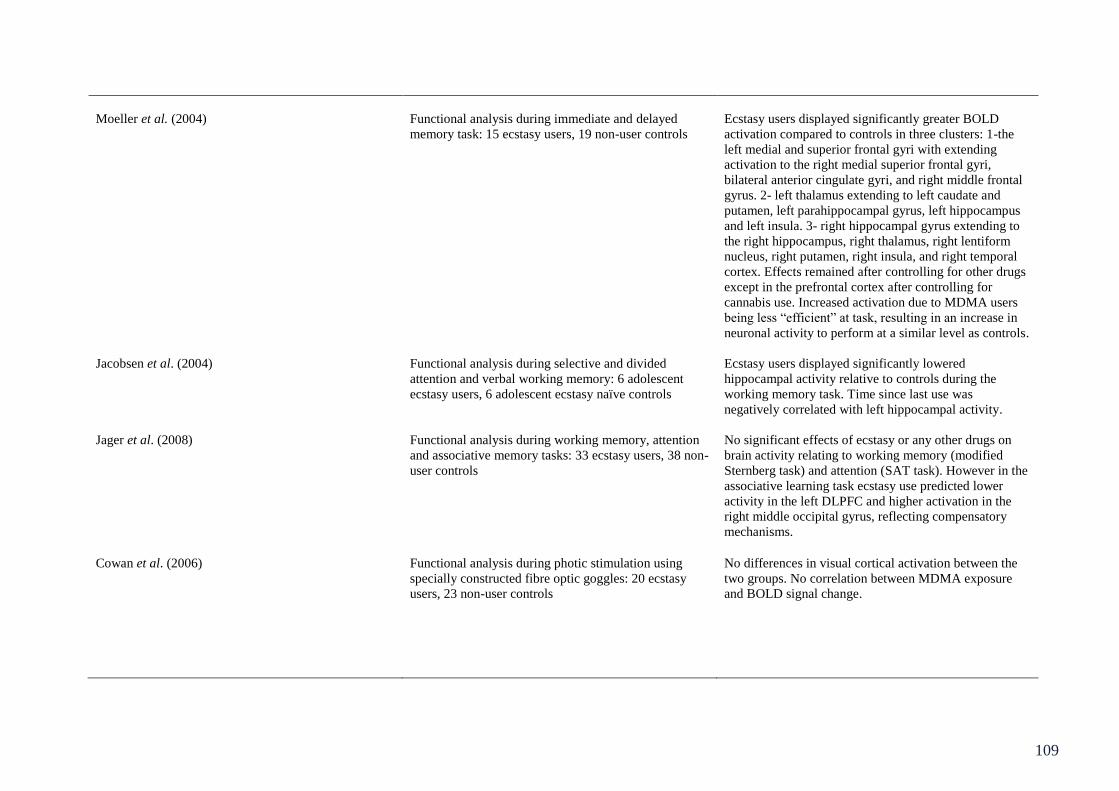
109
Moeller et al. (2004) Functional analysis during immediate and delayed
memory task: 15 ecstasy users, 19 non-user controls
Ecstasy users displayed significantly greater BOLD
activation compared to controls in three clusters: 1-the
left medial and superior frontal gyri with extending
activation to the right medial superior frontal gyri,
bilateral anterior cingulate gyri, and right middle frontal
gyrus. 2- left thalamus extending to left caudate and
putamen, left parahippocampal gyrus, left hippocampus
and left insula. 3- right hippocampal gyrus extending to
the right hippocampus, right thalamus, right lentiform
nucleus, right putamen, right insula, and right temporal
cortex. Effects remained after controlling for other drugs
except in the prefrontal cortex after controlling for
cannabis use. Increased activation due to MDMA users
being less “efficient” at task, resulting in an increase in
neuronal activity to perform at a similar level as controls.
Jacobsen et al. (2004) Functional analysis during selective and divided
attention and verbal working memory: 6 adolescent
ecstasy users, 6 adolescent ecstasy naïve controls
Ecstasy users displayed significantly lowered
hippocampal activity relative to controls during the
working memory task. Time since last use was
negatively correlated with left hippocampal activity.
Jager et al. (2008) Functional analysis during working memory, attention
and associative memory tasks: 33 ecstasy users, 38 non-
user controls
No significant effects of ecstasy or any other drugs on
brain activity relating to working memory (modified
Sternberg task) and attention (SAT task). However in the
associative learning task ecstasy use predicted lower
activity in the left DLPFC and higher activation in the
right middle occipital gyrus, reflecting compensatory
mechanisms.
Cowan et al. (2006) Functional analysis during photic stimulation using
specially constructed fibre optic goggles: 20 ecstasy
users, 23 non-user controls
No differences in visual cortical activation between the
two groups. No correlation between MDMA exposure
and BOLD signal change.

110
Raj et al. (2010) Functional analysis during a semantic recognition task
in 16 ecstasy polydrug users
During semantic recognition, but not encoding- lifetime
episodes of MDMA use and lifetime dose were both
inversely correlated with %BOLD signal change at BA 9.
Lifetime episodes of use was inversely correlated with
BOLD signal change in BA 18 and 21/22. After
controlling for other drugs the correlation at BA 9
remained significant.
Roberts and Garavan (2010) Functional analysis during Go/NoGo task in 20 ecstasy
users and 20 drug naïve controls.
Ecstasy users displayed greater activity in right middle
and inferior frontal gyri, right middle frontal gyrus and
right inferior parietal lobule, during successful response
inhibitions, compared to controls. Ecstasy users also
displayed greater error activation in the right middle and
inferior temporal gyri. It is suggested that increased
activation despite equivalent performance, shows
increased neuronal recruitment to inhibit in ecstasy users.
DTI
de Win et al. (2007) Structural analysis: 30 participants scanned before
ecstasy use and soon after first reported ecstasy use
0.9% significant increase in FA of white matter in the
centrum semiovale as well as a significant decrease
(3.4%) of ADC in the thalamus observed post ecstasy
use. However increases in FA did not remain after
correction for multiple comparisons and exclusion of
participants with continued cocaine use.
de Win et al. (2008a) Structural analysis: 59 novice MDMA users, 56 non-
user controls
Ecstasy users showed a significant decrease in FA in the
thalamus and fronto-parietal white matter. Ecstasy users
also showed an increase in FA in the globus pallidus and
ADC in the thalamus relative to controls.
Reneman, Majoie et al. (2001) Structural analysis: 8 ecstasy users, 6 non-user controls Ecstasy users displayed a significant increase in ADC in
the globus pallidus relative to controls. No significant
correlations were observed between extent of previous
ecstasy use and ADC values.
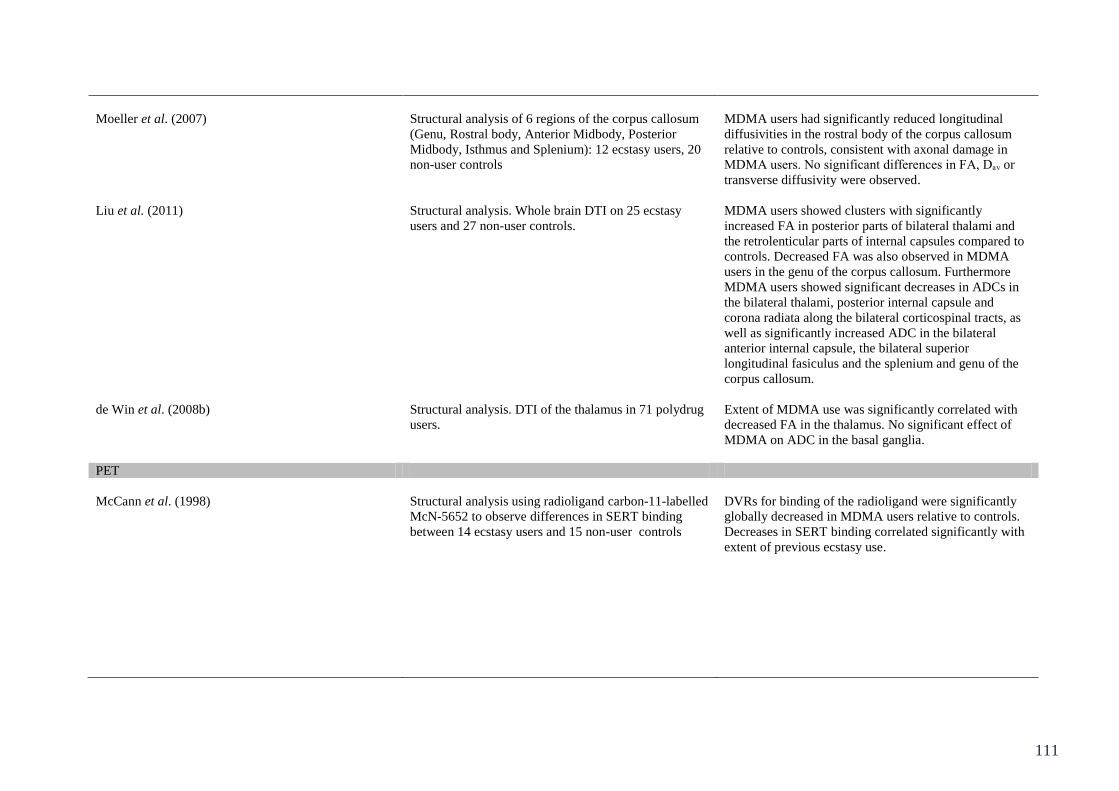
111
Moeller et al. (2007) Structural analysis of 6 regions of the corpus callosum
(Genu, Rostral body, Anterior Midbody, Posterior
Midbody, Isthmus and Splenium): 12 ecstasy users, 20
non-user controls
MDMA users had significantly reduced longitudinal
diffusivities in the rostral body of the corpus callosum
relative to controls, consistent with axonal damage in
MDMA users. No significant differences in FA, Dₐᵥ or
transverse diffusivity were observed.
Liu et al. (2011) Structural analysis. Whole brain DTI on 25 ecstasy
users and 27 non-user controls.
MDMA users showed clusters with significantly
increased FA in posterior parts of bilateral thalami and
the retrolenticular parts of internal capsules compared to
controls. Decreased FA was also observed in MDMA
users in the genu of the corpus callosum. Furthermore
MDMA users showed significant decreases in ADCs in
the bilateral thalami, posterior internal capsule and
corona radiata along the bilateral corticospinal tracts, as
well as significantly increased ADC in the bilateral
anterior internal capsule, the bilateral superior
longitudinal fasiculus and the splenium and genu of the
corpus callosum.
de Win et al. (2008b) Structural analysis. DTI of the thalamus in 71 polydrug
users.
Extent of MDMA use was significantly correlated with
decreased FA in the thalamus. No significant effect of
MDMA on ADC in the basal ganglia.
PET
McCann et al. (1998) Structural analysis using radioligand carbon-11-labelled
McN-5652 to observe differences in SERT binding
between 14 ecstasy users and 15 non-user controls
DVRs for binding of the radioligand were significantly
globally decreased in MDMA users relative to controls.
Decreases in SERT binding correlated significantly with
extent of previous ecstasy use.
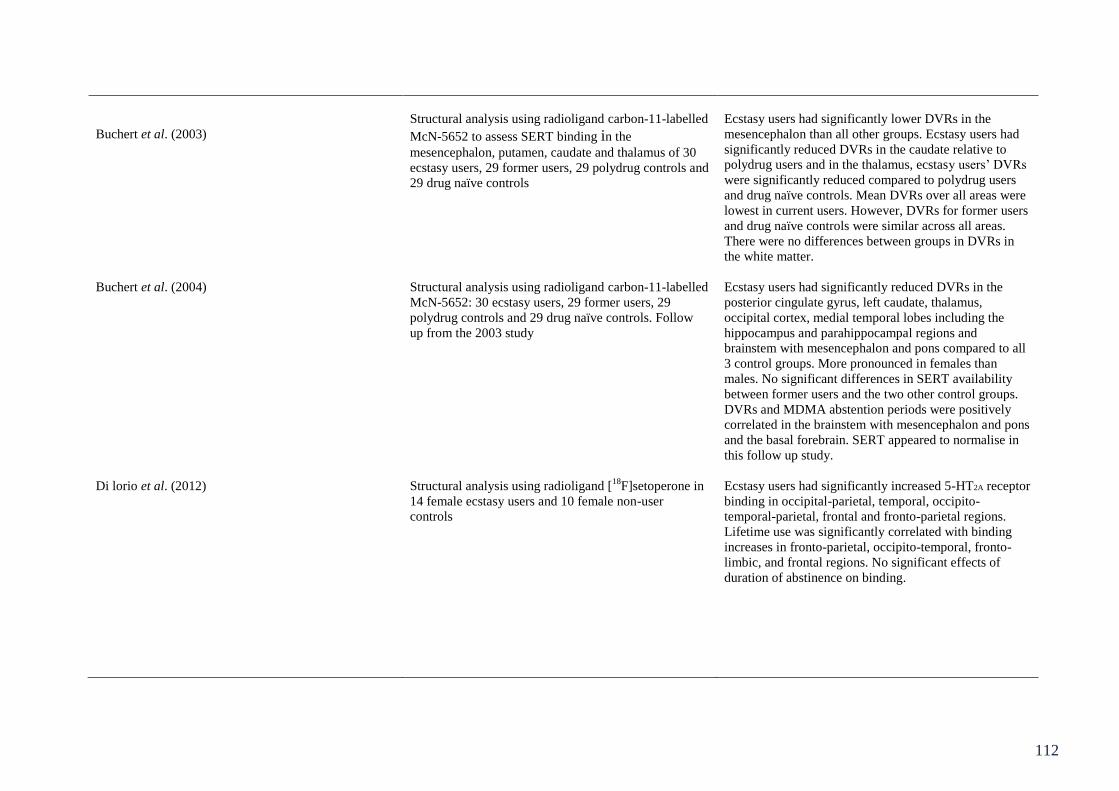
112
Buchert et al. (2003)
Structural analysis using radioligand carbon-11-labelled
McN-5652 to assess SERT binding in the
mesencephalon, putamen, caudate and thalamus of 30
ecstasy users, 29 former users, 29 polydrug controls and
29 drug naïve controls
Ecstasy users had significantly lower DVRs in the
mesencephalon than all other groups. Ecstasy users had
significantly reduced DVRs in the caudate relative to
polydrug users and in the thalamus, ecstasy users’ DVRs
were significantly reduced compared to polydrug users
and drug naïve controls. Mean DVRs over all areas were
lowest in current users. However, DVRs for former users
and drug naïve controls were similar across all areas.
There were no differences between groups in DVRs in
the white matter.
Buchert et al. (2004) Structural analysis using radioligand carbon-11-labelled
McN-5652: 30 ecstasy users, 29 former users, 29
polydrug controls and 29 drug naïve controls. Follow
up from the 2003 study
Ecstasy users had significantly reduced DVRs in the
posterior cingulate gyrus, left caudate, thalamus,
occipital cortex, medial temporal lobes including the
hippocampus and parahippocampal regions and
brainstem with mesencephalon and pons compared to all
3 control groups. More pronounced in females than
males. No significant differences in SERT availability
between former users and the two other control groups.
DVRs and MDMA abstention periods were positively
correlated in the brainstem with mesencephalon and pons
and the basal forebrain. SERT appeared to normalise in
this follow up study.
Di lorio et al. (2012) Structural analysis using radioligand [18
F]setoperone in
14 female ecstasy users and 10 female non-user
controls
Ecstasy users had significantly increased 5-HT2A receptor
binding in occipital-parietal, temporal, occipito-
temporal-parietal, frontal and fronto-parietal regions.
Lifetime use was significantly correlated with binding
increases in fronto-parietal, occipito-temporal, fronto-
limbic, and frontal regions. No significant effects of
duration of abstinence on binding.
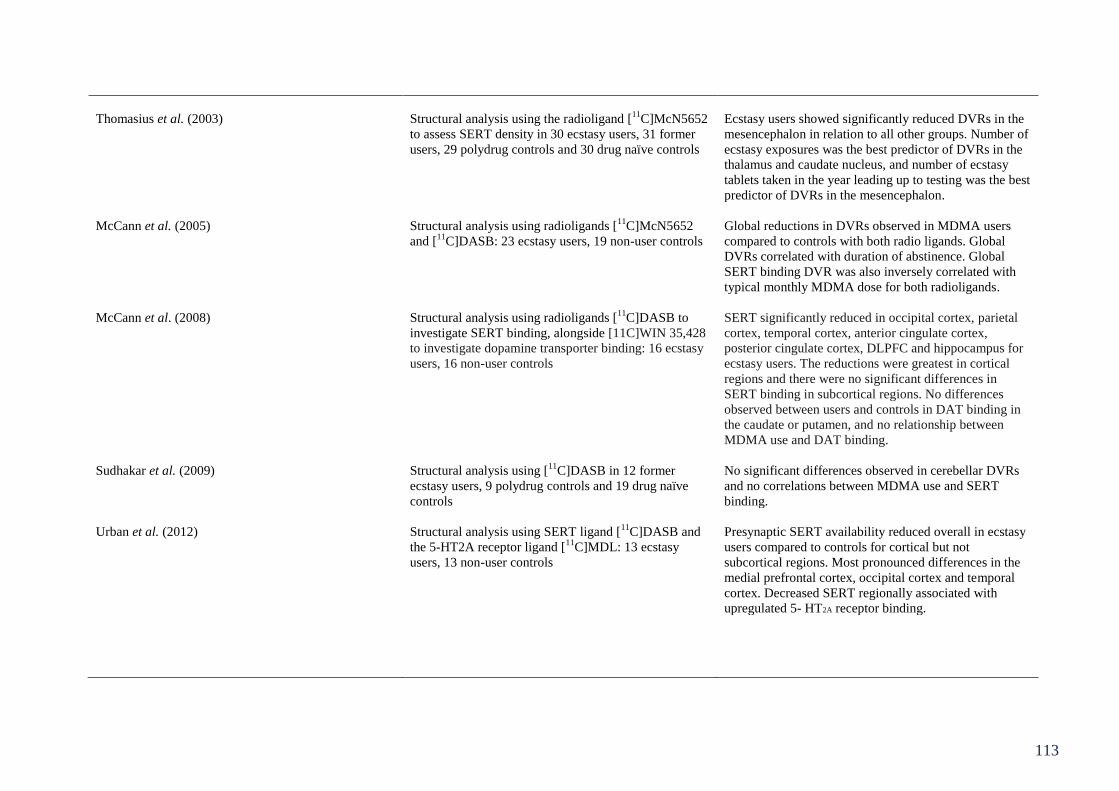
113
Thomasius et al. (2003) Structural analysis using the radioligand [11
C]McN5652
to assess SERT density in 30 ecstasy users, 31 former
users, 29 polydrug controls and 30 drug naïve controls
Ecstasy users showed significantly reduced DVRs in the
mesencephalon in relation to all other groups. Number of
ecstasy exposures was the best predictor of DVRs in the
thalamus and caudate nucleus, and number of ecstasy
tablets taken in the year leading up to testing was the best
predictor of DVRs in the mesencephalon.
McCann et al. (2005) Structural analysis using radioligands [11
C]McN5652
and [11
C]DASB: 23 ecstasy users, 19 non-user controls
Global reductions in DVRs observed in MDMA users
compared to controls with both radio ligands. Global
DVRs correlated with duration of abstinence. Global
SERT binding DVR was also inversely correlated with
typical monthly MDMA dose for both radioligands.
McCann et al. (2008) Structural analysis using radioligands [11
C]DASB to
investigate SERT binding, alongside [11C]WIN 35,428
to investigate dopamine transporter binding: 16 ecstasy
users, 16 non-user controls
SERT significantly reduced in occipital cortex, parietal
cortex, temporal cortex, anterior cingulate cortex,
posterior cingulate cortex, DLPFC and hippocampus for
ecstasy users. The reductions were greatest in cortical
regions and there were no significant differences in
SERT binding in subcortical regions. No differences
observed between users and controls in DAT binding in
the caudate or putamen, and no relationship between
MDMA use and DAT binding.
Sudhakar et al. (2009) Structural analysis using [11
C]DASB in 12 former
ecstasy users, 9 polydrug controls and 19 drug naïve
controls
No significant differences observed in cerebellar DVRs
and no correlations between MDMA use and SERT
binding.
Urban et al. (2012) Structural analysis using SERT ligand [11
C]DASB and
the 5-HT2A receptor ligand [11
C]MDL: 13 ecstasy
users, 13 non-user controls
Presynaptic SERT availability reduced overall in ecstasy
users compared to controls for cortical but not
subcortical regions. Most pronounced differences in the
medial prefrontal cortex, occipital cortex and temporal
cortex. Decreased SERT regionally associated with
upregulated 5- HT2A receptor binding.
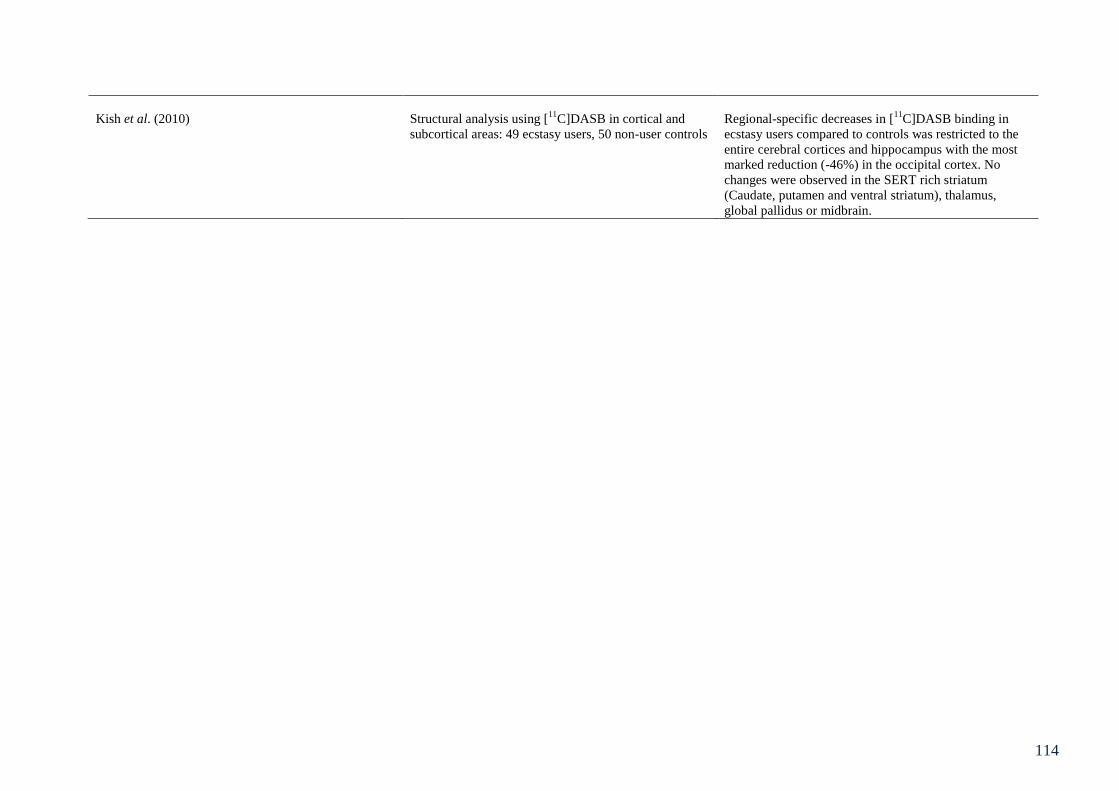
114
Kish et al. (2010) Structural analysis using [11
C]DASB in cortical and
subcortical areas: 49 ecstasy users, 50 non-user controls
Regional-specific decreases in [11
C]DASB binding in
ecstasy users compared to controls was restricted to the
entire cerebral cortices and hippocampus with the most
marked reduction (-46%) in the occipital cortex. No
changes were observed in the SERT rich striatum
(Caudate, putamen and ventral striatum), thalamus,
global pallidus or midbrain.
115
Chapter 6: Electrophysiological indices of executive function
6.1 Chapter overview
Chapter 3 reviewed the literature on executive function deficits in relation to MDMA
use. Furthermore Chapter 5 reviewed the evidence of structural and functional neural
alterations in relation to MDMA use. It was observed that there was a paucity of
neurophysiological data systematically assessing Miyake et al.’s (2000) conceptual
framework of executive function. One of the aims of this thesis is to fully characterise the
nature of MDMA’s effects upon the central executive of working memory. The following
chapter investigates each of the four previously defined executive functions with behavioural
tasks assumed to tap one function and their electrophysiological correlates. Twenty ecstasy
polydrug users, 20 ecstasy naïve polydrug controls and 20 drug naïve controls were recruited
and Go/NoGo, number-letter, n-back and semantic association tasks were undertaken.
ANOVA revealed no significant between group differences on performance measures for the
Go/NoGo, number-letter and semantic association tasks. There were no differences between
groups in terms of errors on the n-back task, however reaction time data revealed that drug
naïve controls were significantly slower to respond than polydrug controls on all levels of the
task. The ERP data showed drug related atypicalities in the P2 component during, the
Go/NoGo task. There were also drug related differences in the N2 component in the semantic
association task, as well as drug effects on positive components (P2 and P3) during the
number-letter task. There were no between groups differences on the ERP data during the n-
back task. The results from this chapter reflect ecstasy/polydrug related atypicalities of
processing during tasks that tap inhibitory control, switching and access that may reflect
compensatory mechanisms/cognitive reallocation of resources to attenuate behavioural
differences. The results from the data on inhibition, switching and access have been
116
published in three separate journal articles (Roberts et al., 2013a, b and c – in press) and
copies of these publications can be observed in the appendices of this thesis.
6.2 Introduction
Areas that are involved in working memory such as the DLPFC are richly innervated
with 5-HT receptors; therefore degradation to the serotonergic system via ecstasy use could
lead to deficits in cognitive processes associated with these forebrain structures. Significant
deficits have been observed in ecstasy users compared to non-users in components of
working memory such as spatial working memory (Wareing et al., 2005), access to semantic
memory, and memory updating (Fisk et al., 2004; Montgomery, Fisk, Newcombe &
Murphy,2005). Furthermore, ecstasy users perform poorly in information processing tasks
when cognitive demand is high (Wareing et al., 2000). It has been suggested (Cole et al.,
2002), that a lack of sleep (among other possible lifestyle variables), may exacerbate or
indeed cause the observed cognitive deficits in ecstasy using populations. Furthermore,
several characteristics of sleep such as sleep quality, length of sleep (hours) and related
changes in alertness have been reported to be altered in ecstasy users relative to controls
(Allen et al., 1993). However such deficits appear to have little mediating effect on ecstasy-
related cognitive deficits (e.g. Montgomery et al., 2010).
When looking at executive functioning in ecstasy users, some functions appear to be
more affected than others (See Chapter 3 for a review). There is a differential pattern of
impairment based on previous drug use history and type of function, with the updating
function of the executive being particularly susceptible to ecstasy use (Montgomery & Fisk,
2008; Montgomery, Fisk, Newcombe & Murphy, 2005) along with access to long term
memory (Montgomery, Fisk, Newcombe & Murphy., 2005). Inhibitory control and set
switching appear to be more robust to ecstasy-related deficits; however, recent research

117
suggests that even in the absence of behavioural differences, ecstasy users may show
electrophysiological differences related to task demands (Burgess et al. 2011). Consequently,
participants in previous studies displaying no impairments in the behavioural tasks may not
necessarily be exhibiting “normal” functioning. The present study therefore sought to assess
all aspects of executive functioning (in relation to Miyake et al.’s 2000, and Fisk & Sharp’s
2004 frameworks) in ecstasy users through behavioural and electrophysiological assessments
of performance.
Inhibitory control (see Chapter 3.2.2 for review) requires effortful control over
instinctive (predominant) responses. Although the DLPFC, ACC and Inferior Frontal Cortex
are commonly activated during working memory performance (Duncan & Owen, 2000),
neuroimaging and lesion data indicates that the inferior frontal cortex (IFC) may have a
particularly important role in inhibitory control (Aron et al., 2004). Furthermore this area
may also play a role in mental set switching, given that task switching may require inhibition
of responses to a now inappropriate task (Aron et al., 2004). The Stroop task has been used in
several studies to test whether ecstasy use impairs inhibitory control (Back-Madruga et al.,
2004; Gouzoulis-Mayfrank et al., 2000; Morgan et al., 2002), with all studies reporting no
ecstasy-related impairment. Wareing et al. (2000) employed the random letter generation
measure of inhibitory control and observed performance deficits in ecstasy users compared to
non-users, however there have been failures to replicate this (Fisk et al., 2004). A review by
Murphy et al. (2009) found that the literature on inhibition in ecstasy users was unclear,
although there is little evidence to suggest ecstasy-related impairments. Furthermore any
perceived impairment can be obscured by confounding variables such as polydrug use and
although the use of ANCOVA and regression are usually employed to statistically control for
this, the majority of findings in the literature need to be interpreted with some degree of
caution.
118
A commonly used task in the inhibition literature is the Go/NoGo task. This task
requires participants to only respond to certain stimuli and therefore inhibit prepotent or
dominant responses. Previous studies using this task with ecstasy users (e.g. Gouzoulis-
Mayfrank et al. 2003), have observed little difference in performance on the task between
non-users, moderate users and heavy users. However it has been suggested that 5-HT
depletion, as well as impaired executive functions may play a role in inhibitory control
(Morgan et al., 2006). One study conducted on ecstasy users with minimal exposure to other
drugs reported that heavy use of MDMA led to notable impairments in inhibition and
impulsivity (Halpern et al., 2004).
Although much of the research on behavioural tasks assessing inhibitory control in
ecstasy users has provided inconclusive evidence, perhaps such cases where no differences
have been observed can be attributed to compensatory mechanisms. This was proposed in an
fMRI study by Roberts and Garavan (2010), where increased activation was seen in right
middle and inferior frontal gyri, right middle frontal gyrus and right inferior parietal lobule,
in ecstasy users relative to controls in a Go/NoGo task, despite equivalent task performance
(see Chapter 5.5).
Mental set switching (or shifting; as defined in Chapter 3.2.1) is the ability to alternate
attention as required between two tasks, or between different components of a task. This
executive function reflects cognitive flexibility and deficits here may have implications for
real world situations; for example in the work environment where reallocation of attention (or
switching between tasks) is required continually. The neural basis of this executive function
is proposed to be localised to the lateral prefrontal cortex (Dove et al., 2000) and left DLPFC,
parietal and temporal regions (Smith, Taylor et al, 2004). In ecstasy users, research in
switching is equivocal (Fox et al., 2001; Fox et al., 2002). However tasks used do not always

119
solely assess switching (Fisk & Sharp, 2004). The WCST has been employed frequently to
assess switching (Reneman et al., 2006; Thomasius et al., 2003) yielding no ecstasy-related
deficits. The number-letter task (Rogers & Monsell, 1995) has also been used (Montgomery,
Fisk, Newcombe & Murphy, 2005), showing no clear ecstasy-related deficits. Conversely
Halpern et al. (2004) observed deficits in switching using the WCST. The cohort in this
sample had minimal exposure to other drugs and as such potential confounds from polydrug
use were reduced. However, in a follow up study (Halpern et al., 2011) with a larger sample
and similar controls for concomitant drug use and other lifestyle variables, no behavioural
deficits in switching were observed. However, Dafters (2006) did observe deficits in ecstasy
users relative to cannabis users and controls, in a task switching version of the Stroop task.
As such the impact of MDMA exposure on this executive function remains unclear.
The updating component of the central executive involves monitoring and updating
incoming information and replacing no longer relevant information with salient information.
This requires active manipulations of incoming information rather than simply acting as a
short term memory store (Morris & Jones, 1990). The updating memory paradigm (Morris &
Jones, 1990; Pollack et al., 1959) has been used to investigate the neural basis of the central
executive and to distinguish between this executive function and slave (storage) systems.
Neuroimaging studies have confirmed the dissociation between passive storage of
information and active manipulation of incoming information by localising the two processes
to separate areas (parietal lobes and frontal lobes respectively) (Smith & Jonides, 1997).
More recent neuroimaging studies have often used the n-back task to study this executive
function, finding activation in the left frontopolar cortex, bilateral dorsolateral prefrontal and
premotor cortex, bilateral intraparietal sulcus, right inferior parietal lobule and the cerebellum
(Collette et al., 2007). Updating as reviewed in Chapter 3 appears to be more reliably affected
by ecstasy use (Montgomery & Fisk, 2008: Montgomery, Fisk, Newcombe & Murphy, 2005).
120
However there is still a plethora of studies that observe no ecstasy-related deficits in this area
(Bhattachary & Powell 2001; Thomasius et al., 2003). The n-back task can be varied for
difficulty and is ideal for using during EEG as it is computerised with button responses.
Results from the n-back task in ecstasy using populations have not been as consistent as
results from consonant updating or spatial updating. Several studies have reported no
significant differences between users and controls (Daumann, Fimm et al.,2003; Daumann,
Fischermann, Heekeren et al., 2004; Gouzoulis-Mayfrank et al., 2003). However, the samples
in these studies were smaller than the present study. Moreover task difficulty has rarely been
varied to extend further than 2-back and there is evidence to suggest that ecstasy-related
deficits may be more pronounced with increased cognitive load (Wareing et al., 2000). As
such this study will include a 4-back condition. Further to this, some of the studies on the n-
back task that yielded no between group differences behaviourally, were combined with
neurophysiological measures and showed subtle brain functioning alterations in ecstasy users
(Daumann, Fimm et al., 2003), highlighting the sensitivity of neurophysiological
measurements for assessment of cognitive impairment.
Access requires activation of long term memory networks. Although not included in
the initial conceptualisation of Miyake et al.’s (2000) framework of executive function,
Baddeley (1996) suggested that temporary activation of long term memory stores was an
important function of the central executive. Indeed in Fisk and Sharp’s (2004) work on
cognitive ageing, the factor structure obtained was consistent with Miyake et al. (2000),
though an additional factor was obtained that reflected the efficiency of access to long term
memory, as measured by word fluency. Significantly, word fluency has been observed to
have neurological correlates in the left prefrontal cortex – left inferior frontal gyrus, anterior
cingulate and superior frontal sulcus (Phelps et al., 1997). For access to semantic memory
some studies using the COWA task have yielded deficits in ecstasy users compared to
121
controls (Bhattachary & Powell, 2001; Fox et al. 2002), whereas others report no such
deficits (e.g. Halpern et al., 2004). However, as a written variant of the COWA task, the
Chicago Word Fluency Test appears to yield more consistent observable deficits in ecstasy
users (Montgomery, Fisk, Newcombe & Murphy, 2005; Montgomery et al., 2007). It remains
a possibility that a verbal one minute retrieval task, with no restrictions upon word type or
length is too simple to require the involvement of the central executive and as such ecstasy
users may not show any impairment on the COWA. It has been noted that ecstasy users have
shown impairments on difficult aspects of tasks, yet appear unaffected on simple tasks that
require relatively automatic processing (Fox et al., 2002). Consequently further investigation
of ecstasy-related deficits in access to semantic memory is required.
Whitney et al., (2011) investigated the neuronal network involved in semantic
retrieval and processing, manipulating strength of semantic association with the cue word
(low vs. high). Transcranial Magnetic Stimulation (TMS) was employed to disrupt processing
in the Inferior Frontal Gyrus (IFG) and the posterior middle temporal cortex. Disruption to
both of these sites produced attenuation of effective processing of executively demanding
processes. However processing of cue-target stimuli with strong semantic association (that
are relatively automatic) was unaffected by the disruption. It was concluded that there is a
network of prefrontal and posterior temporal regions that underlie semantic control, and may
provide an explanation of why ecstasy users may be unaffected in relatively simple semantic
retrieval tasks, such as the COWA. As such in this experiment a similar semantic association
task will be used that has semantic strength manipulation.
Neuroimaging techniques such as EEG are useful in providing a clearer indication of
alterations of normal cognitive functioning; for example in patients with Alzheimer’s disease,
who exhibit increases in prefrontal activity in comparison to controls during executive

122
functioning tasks. Saykin et al. (1998) observed that Alzheimer’s patients displayed
additional activation in frontal regions which they postulated reflects recruitment of
additional resources from local and remote regions when conducting a semantic memory task
(see also Grady et al. 2003; Woodard et al. 1998 for other examples of compensatory
mechanisms). Similarly, fMRI research in ecstasy users, has revealed increased BOLD
response, during working memory tasks, despite equivalent performance, which has been
suggested to reflect compensatory mechanisms due to task inefficiency (Jager et al., 2008;
Moeller et al., 2004)
ERP research has demonstrated that cognitive impairment is associated with
alterations to the P3 amplitude or latency, as the P3 is involved in stimulus processing. Such
alterations in P3 activity have been reported in ecstasy users, for example, Casco et al. (2005)
observed a reduction in P3 amplitude in both heavy and moderate ecstasy user groups
compared to controls in Visually Evoked Potentials (VEP) pertaining to a simple
discrimination task, though no differences in latency were observed. Furthermore Mejias et al.
(2005) report longer P3 latencies for detection of target stimuli in a visual oddball task,
suggesting reduced cognitive processing. de Sola et al. (2008) observed a reduced auditory
ERP P3 amplitude in ecstasy users compared to non-drug controls and cannabis users,
although this was non-significant.
The Go/NoGo task requires continuous attention to the stimuli to effectively make
(Go) or inhibit (NoGo) responses, and is useful for measuring processing and attentional
capacity in ERPs (Smith et al., 2004). The P3 component, although a significant component
in many cognitive tasks due to its involvement in attentional processing, does not appear to
have a consistent role in response inhibition. This is possibly due to this component occurring
relatively late and therefore not in the initial early inhibition processes.

123
The N2 component, understood to be important in inhibition, due to this component
reflecting stimulus discrimination (Ritter et al., 1982), has been observed to be larger in
inhibition trials (NoGo) than non-inhibition (Go) trials (Kok et al., 2004). This component
also reflects neuronal processes involved in conflict monitoring, and is determined by the
processing of distracting information. Therefore the N2 is often increased in high conflict
trials (Yeung & Cohen, 2006). As such it may be expected that switch trials in the number-
letter task cause an increase in N2 amplitude.
Low association trials of the semantic association task in the present study possess
increased conflict compared to high association trials. This task requires participants to link a
cue word with a target word based on their semantic association, whist ignoring irrelevant
distractor words. In high association trials the association between the cue and the target is
very strong, whereas this is much weaker in the low association trials hence producing
conflict. Related tasks that produce conflict, for example the Stroop task have yielded
increases in negativity in waveforms of incongruent Stroop trials (West & Alain, 1999) and
this has been suggested to reflect increases in attention resources (Potter et al., 2002). Indeed,
studies on participants with mild head injuries have observed equivalent performance to
controls on cognitive tasks, coupled with increased N2 components that reflect recruitment of
additional resources (Rugg, et al., 1993). It is suggested by Rugg et al., (1993) that greater
negativity observed in head injury patients ERPs reflect allocation of attention resources
necessary to cope with task demands and to achieve similar performance output to controls.
Furthermore Suwazono et al. (2000) suggest that posterior N2 reflects the degree of attention
required for processing stimuli. Increases in attentional demand may reflect allocation of
additional resources.
124
The P2 wave can be observed at anterior and central sites, and elicits a larger
response to simple target features that are relatively infrequent (Luck & Hillyard, 1994). This
component precedes the N2 and is thought to be involved in the initial inhibition from further
processing in target stimuli (Hansen & Hillyard, 1988). The P2 component is an early
component in an ERP waveform, and thus is associated with early orienting and stimulus
evaluation. Furthermore this component has been observed to increase with age (Amendo &
Diaz, 1999; Ford & Pfefferbaum, 1991). Garcia-Larrea et al. (1992) suggest that in ageing
populations a growing deficit in ability to withdraw attention from stimuli becomes apparent.
Increases in the P2 component may reflect early orienting increases in cognitive allocation, or
fixation as a function of cognitive ageing, or may even reflect increased impulsivity
(Fritzsche et al., 2011).
Recently, Burgess et al. (2011) looked at ERPs as evidence for selective impairment
of verbal recollection in currently abstinent recreational MDMA/polydrug users. Interestingly,
there appeared to be no significant differences between ecstasy users, polydrug controls and
drug naïve controls on the behavioural tasks (memory tasks which involved recognition of
words and faces). However the ecstasy user group showed attenuation of late positivity over
left parietal scalp sites, which is a component associated with the memory process of
recollection. Ecstasy users showing a durable abnormality in this ERP component
exemplifies how EEG is a much more sensitive measure of cognitive impairment than
behavioural measures alone. This point is further elucidated by Nulsen et al. (2011) where
ecstasy users displayed alternative patterns of activity in ERPs compared to drug naïve and
polydrug controls in short term and working memory tasks, despite no significant behavioural
differences.

125
The aim of the current study was to observe whether there are any behavioural or
electrophysiological differences between ecstasy users and controls in tasks measuring
inhibitory control (Go/NoGo), mental set switching (number-letter task), updating (n-back
task) and access (semantic association task). It is predicted that group differences in
performance on the Go/NoGo task and the number-letter task will be negligible. However it
is expected that ecstasy users may show impaired performance on the n-back task and the
semantic association task. Regardless of behavioural performance observable differences in
components of the elicited ERPs are predicted. It is envisaged that ecstasy polydrug users
will show a diminished P3 response, in line with cognitive impairment. Furthermore if
behavioural differences are silent, ERP responses in line with compensatory
mechanisms/cognitive impairment are expected. More specifically, increases in N2 and P2
amplitudes that reflect compensatory mechanisms and recruitment of additional resources.
6.3 Method
Design:
In all analyses, a between groups factor of drug user group with three levels (ecstasy
user, non-ecstasy polydrug controls and drug naive controls) was employed. Univariate
ANOVA was conducted on the behavioural data for the Go/NoGo (inhibition) and the
number-letter task (switching) with scores on the Go/NoGo (NoGo errors) and composite
scores on the number-letter task (switch cost) as the dependent variables respectively. Mixed
ANOVA was conducted on the behavioural data for the semantic association (access) and n-
back (updating) tasks, with difficulty level as the within subjects factor (2 levels for semantic
association – high association vs. low association, and 3 levels for n-back – n=0, n=2 and
n=4).
126
ERP data on all tasks was analysed using mixed ANOVA, with drug user group as the
between subjects factor and electrode site as within subjects factors for the three ERP
components. The n-back task and the semantic association task had an extra within subjects
factor of difficulty. Mean amplitudes (µvolts) at the selected electrodes for the various
components were the dependent variables. Where appropriate significant main effects were
further investigated using ANOVA and Tukey HSD tests.
Participants:
Twenty ecstasy users (mean age = 23.95, SD = 0.57, 10 male), 20 non-drug user
controls (mean age = 23.1, SD = 0.66, 7 male) and 20 non-ecstasy drug user controls (mean
age = 22.58, SD = 0.79, 9 male) were recruited via direct approach to university students and
club goers. In terms of statistical power, with 20 participants in each of the three groups, the
sample is sufficient to detect a difference between pairs of means of at least 1 standard
deviation at alpha = .05 and beta =.20 (Hinkle et al., 1994).
Inclusion in the ecstasy user group required participants to have taken ecstasy/MDMA
on 5 or more occasions over their lifetime (actual minimum = 5 ecstasy tablets). Indices of
ecstasy use were as follows: total lifetime dose 177.65 tablets ± 301.73; mean amount used in
last 30 days 0.6 tablets ± 2.26, and frequency of use 0.24 times/week ± 0.42. Furthermore for
inclusion in both control groups participants must have never used ecstasy/MDMA, however
all other illicit substances were permitted for the poly drug user control group.
All participants were asked to abstain from consuming ecstasy for a minimum of 7
days prior to testing and urine samples were collected upon arrival to the lab to confirm
abstinence (after ingestion, MDMA is generally accepted to be detectable in urine for 1-3
days, this is the same for cocaine and amphetamines, with cannabis being detectable for
anything up to 95 days Verstraete, 2004). Participants were also requested to abstain from use

127
of other illicit drugs for a minimum of 24 hours prior to participating and ideally for 7 days.
Tobacco smoking was permitted on the day of testing. All participants reported no current or
last year diagnosis of psychological disorders.
Materials
Several questionnaires were issued to participants upon entering the lab, these
included: A background drug use questionnaire which provides the researcher with indices of
drug use patterns and other lifestyle variables. In this questionnaire comprehensive details of
ecstasy use as well as other illicit drug use are requested, such as first and last drug use,
patterns of drug use, frequencies and doses over time. Using a method employed by
(Montgomery, Fisk, Newcombe and Murphy, 2005), estimates of total lifetime drug use of
each drug were calculated. Totals for last 30 days drug use as well as weekly drug use
estimates were also calculated. This questionnaire also sought information about health, age,
years of education and changes to mood and cognition amongst other lifestyle variables.
Measures of sleep quality
Several questionnaires assessing sleep quality and alertness were employed to
investigate any possible relationship between sleep quality and cognition. These include a
sleep quality questionnaire, exploring typical quantities of sleep (how many hours slept
typically, how many hours over the last 3 nights) and level of quality of sleep. The Epworth
Sleepiness Scale (ESS, Johns, 1991), explores the chances of dozing or falling asleep in
various situations. A high total score here is indicative of increased subjective daytime
sleepiness. The Morningness-Eveningness Questionnaire (MEQ, Terman et al., 2001) is a
self-assessment of morningness-eveningness in human circadian rhythms (originally
developed by Horne & Östberg, 1976). A high score on this questionnaire is indicative of a
morning type person and a low score is indicative of an evening type person. Finally the
128
Karolinska Sleepiness Scale (KSS) (Akerstedt & Gillberg, 1990), is a self-assessment of
sleepiness at the current moment in time, therefore this can be administered at different time
points of the experiment to assess sleepiness,
State mood.
State Anxiety, Arousal and Depression were measured using scales devised by Fisk &
Warr (1996) (The UWIST mood adjective checklist – UMACL). Participants are required to
rate on a 5 point likert scale from 1 = not at all, to 5 = extremely, how they are feeling at the
time of testing. A high score on each subscale indicates increased hedonic
tone/anxiety/arousal.
Raven’s SPM (Raven et al., 1998)
Raven’s standard progressive matrices (SPM) were used an indicator of fluid
intelligence. This involves a series of problems (5 sets of 12, 60 in total), presented as a
symbolic sequence. Participants are required to select an appropriate response to complete the
sequence from a choice of six options. Successful completion of the task requires an
understanding of the parts of the sequence and their interaction with one another. Each block
of 12 problems begins with an intuitively simple problem and the problems become
progressively more difficult as the task continues.
NASA-TLX (Hart & Staveland, 1988)
This is a multi-dimensional scale, consisting of six sub-scales (mental demand,
physical demand, temporal demand, personal performance rating, effort and frustration).
Participants are required to place a mark on a 100ml VAS, indicating where they perceive
their demand to be on the scale. These are administered to observe whether there are any
differences between ecstasy users and non-users in demand perceived by the participant as it
129
has been suggested that ecstasy users may be more susceptible to stress than non-users
(Wetherell et al., 2012).
Tasks
All behavioural tasks were programmed in Inquisit version 3.0.6.0 (Millisecond
software, 2011).
Inhibitory Control: The Go/NoGo task is frequently used in combination with EEG to
assess inhibitory control (Gamma et al, 2005; Kok, 1986; Oddy & Barry, 2009). Participants
are required to “Go” (press the space bar) when an X appears on the screen, however they are
to inhibit their response “NoGo”, when any other letter appears (W, Y or Z). The task is
designed such that “X” appears 75% of the time and the “NoGo” letters appear only 25% of
the time. Thus, the task builds up a pre-potent response to “Go”. Furthermore, the first block
of the task has “X” appearing 100% of the time, again to build up a pre-potent/dominant
response which participants are required to inhibit. The task therefore comprises of two
blocks; a practise block with 60 “Go” trials, followed by an interval and then a larger main
block whereby participants are required to attend to 240 trials (180 Go/ 60 NoGo) lasting a
total of approximately 15 minutes. The task has an inter-trial interval of 1.5 seconds and
participants had an epoch of 2.5 seconds from stimulus onset to respond. Participants were
instructed to respond as quickly and as accurately as possible.
Mental set switching: This executive function was investigated using the number-
letter task as per Rogers and Monsell (1995). During this task, number-letter pairs e.g. “B6”
are displayed in one of four quadrants on a screen. If the number-letter pair appears in one of
the top two quadrants, participants attend to the letter and respond to whether it is a vowel or
a consonant. If the pair appears in the bottom two quadrants, participants are required to
attend to the number and respond to whether it is odd or even. In the first block of trials the

130
number-letter pairs alternate between the top two quadrants; in the second block the pairs
alternate between the bottom two quadrants. In the final block, the pairs are presented in anti-
clockwise rotation, therefore every two responses requires a switch in the mental set between
letters and numbers. The latency difference between the trials with the switch and those not
requiring a switch is the “switch cost”. The task is comprised of six blocks, the first two of
which are practise blocks consisting to 62 trials in each. This is followed by four main blocks,
each consisting of 64 trials (31 “switch” trials). There were 124 “switch” trials in total. There
was an inter-trial interval of 1.5 seconds and participants were allocated an epoch of 5
seconds to respond. Participants were instructed to respond as quickly and as accurately as
possible, and overall the task took around 20 minutes to complete.
Access to Semantic Memory: This was assessed using a semantic association task
based on those used by Whitney et al. (2011) and Badre et al. (2005); two types of semantic
judgement which differed in their level of difficulty (high association/low association) were
used. In both difficulty levels participants were presented with a cue word in the centre of a
computer monitor followed by three target words, one which had a semantic association with
the cue, and two distracters. Participants had to decide which of the three target words had the
strongest semantic association with the cue word. Participants selected their answer by
pressing one of three buttons on a response box which corresponded to their position on
screen. They were either high association between cue and target words (e.g. candle - flame)
or low association (e.g. detective - search). The low association judgement is deemed to be
more difficult and require more processing than the relatively automatic high association
semantic judgements. As such the low association between cue and targets leads to a less
obvious dissociation from distracters requiring recruitment of additional executive resources
in the semantic network (Whitney et al., 2011). The stimuli used were matched for word
length, frequency and cue-target association strength (Badre et al., 2005; Whitney et al., 2011)
131
and were kindly provided by Whitney et al. The task consisted of a practise round followed
by 4 blocks of 30 trials, with both high and low association trial types appearing in each
block pseudo-randomly (15 of each in each block). The cue word was presented for 1-second
in the centre of a computer screen. After this the three target words appeared below aligned to
the left, centre and right of the monitor. Participants were instructed to respond by pressing a
button on the response box corresponding to the position of the target on the screen (left,
centre, right). The targets remained on screen until a response was made or until the trial
timed-out (time out set to 8.5 seconds). An inter trial interval of 2 seconds was employed.
The task took around 20 minutes to complete. Participants were instructed to respond as
quickly and as accurately as possible.
Updating: This function was assessed using an n-back task. A variant of the task first
implemented by Kirchner (1958) was designed, whereby participants were shown a series of
digits presented singularly (either 7 or 8 digits in a series) followed by a probe requiring
participants to recall the “nth” digit back in the sequence, if n=0 was the last digit presented.
A version of the task was used in which after the series of digits were displayed participants
were required to recall n = 0, n = 2 or n = 4. Three blocks of 65 trials were completed, with
trial types appearing in each block pseudo randomly. Participants responded by selecting the
desired number (0-9), via scrolling through the numbers using the arrow keys on a likert scale.
The scale stayed on the screen until a response was made or until the trial timed-out (time out
set to 12 seconds). There was an inter trial interval of 3.5 seconds. The task took around 60
minutes to complete and participants were instructed to respond as quickly and as accurately
as possible.

132
Equipment
Electroencephalography (EEG) was recorded using a 64 channel Biosemi Ag-AgCl
active-two electrode system (Biosemi B.V, Amsterdam, Netherlands) with pin type
electrodes mounted in a stretch-lycra headcap (Biosemi). Electrodes were positioned
according to the international 10-20 system. Electrical activity was recorded from the
following sites: frontal (FPz, FP1, FP2), anterior-frontal (AFz, AF3, AF4, AF7, AF8), frontal
(Fz, F1, F2, F3, F4, F5, F6, F7, F8), frontocentral (FCz, FC1, FC2, FC3, FC4, FC5, FC6),
central (Cz, C1, C2, C3, C4, C5, C6), temporal (FT7, FT8, T7, T8, TP7, TP8), parietocentral
(CPz, CP1, CP2, CP3, CP4, CP5, CP6), parietal (Pz, P1, P2, P3, P4, P5, P6, P7, P8, P9, P10),
occipitoparietal (POz, PO3, PO4, PO7, PO8) and occipital (Oz, O1, O2, Iz). Sigma
electrolyte gel was used to ensure contact between scalp and electrodes. Vertical and
horizontal electro-occulograms were recorded using bipolar, flat Ag-ACl electrodes
positioned above and below the left eye as well as to the outer side of each eye. Data was
digitized at a sampling rate of 512Hz and no filters were applied online so that the data could
be visually inspected for noise and offline filtering could be performed.
Procedure
Testing sessions commenced at 9.30am or 1.30pm, and equal amounts of participants
from each condition were tested in the morning as were in the afternoon. Upon entering the
lab, participants were given a brief description of the experiment and written consent was
obtained. Following this, participants were required to give a urine sample. The urine sample
was frozen at -25 Celsius and later transported to the clinical laboratories for analysis. First,
participants were required to fill out the battery of questionnaires whilst their head
circumference and other details were measured, and an electrode cap and electrodes were
fitted. The questionnaires were administered in the following order: Background drug use
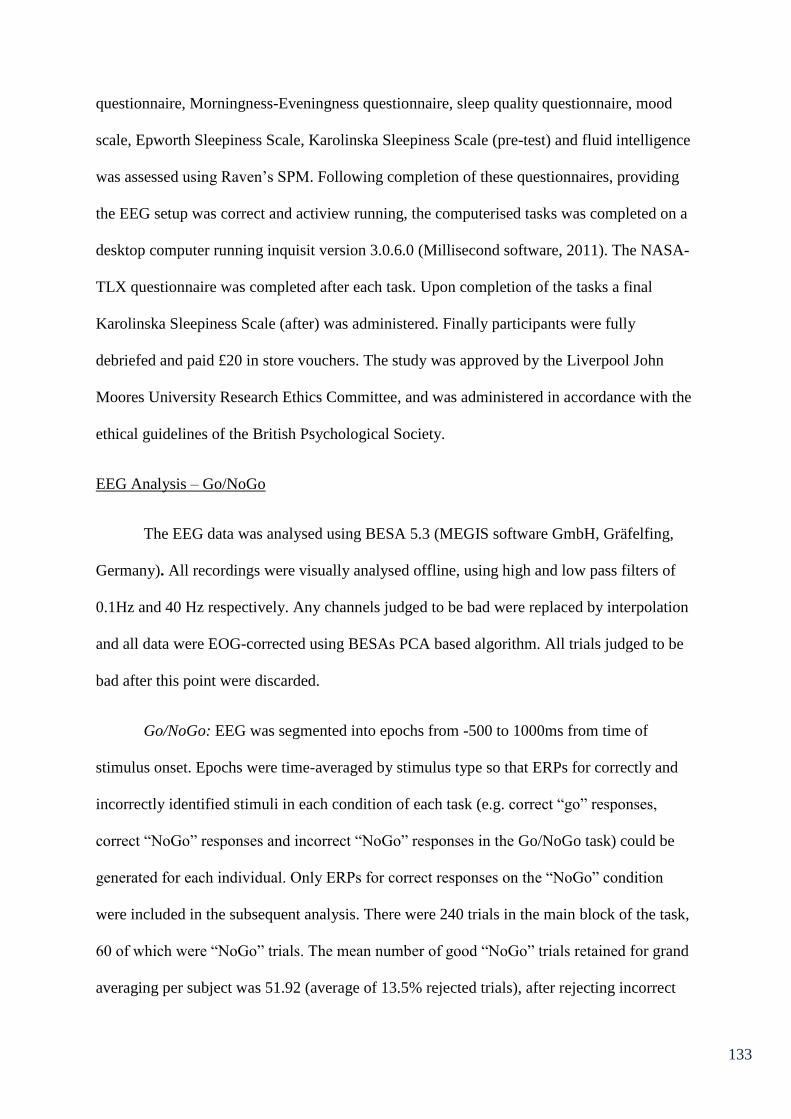
133
questionnaire, Morningness-Eveningness questionnaire, sleep quality questionnaire, mood
scale, Epworth Sleepiness Scale, Karolinska Sleepiness Scale (pre-test) and fluid intelligence
was assessed using Raven’s SPM. Following completion of these questionnaires, providing
the EEG setup was correct and actiview running, the computerised tasks was completed on a
desktop computer running inquisit version 3.0.6.0 (Millisecond software, 2011). The NASA-
TLX questionnaire was completed after each task. Upon completion of the tasks a final
Karolinska Sleepiness Scale (after) was administered. Finally participants were fully
debriefed and paid £20 in store vouchers. The study was approved by the Liverpool John
Moores University Research Ethics Committee, and was administered in accordance with the
ethical guidelines of the British Psychological Society.
EEG Analysis – Go/NoGo
The EEG data was analysed using BESA 5.3 (MEGIS software GmbH, Gräfelfing,
Germany). All recordings were visually analysed offline, using high and low pass filters of
0.1Hz and 40 Hz respectively. Any channels judged to be bad were replaced by interpolation
and all data were EOG-corrected using BESAs PCA based algorithm. All trials judged to be
bad after this point were discarded.
Go/NoGo: EEG was segmented into epochs from -500 to 1000ms from time of
stimulus onset. Epochs were time-averaged by stimulus type so that ERPs for correctly and
incorrectly identified stimuli in each condition of each task (e.g. correct “go” responses,
correct “NoGo” responses and incorrect “NoGo” responses in the Go/NoGo task) could be
generated for each individual. Only ERPs for correct responses on the “NoGo” condition
were included in the subsequent analysis. There were 240 trials in the main block of the task,
60 of which were “NoGo” trials. The mean number of good “NoGo” trials retained for grand
averaging per subject was 51.92 (average of 13.5% rejected trials), after rejecting incorrect
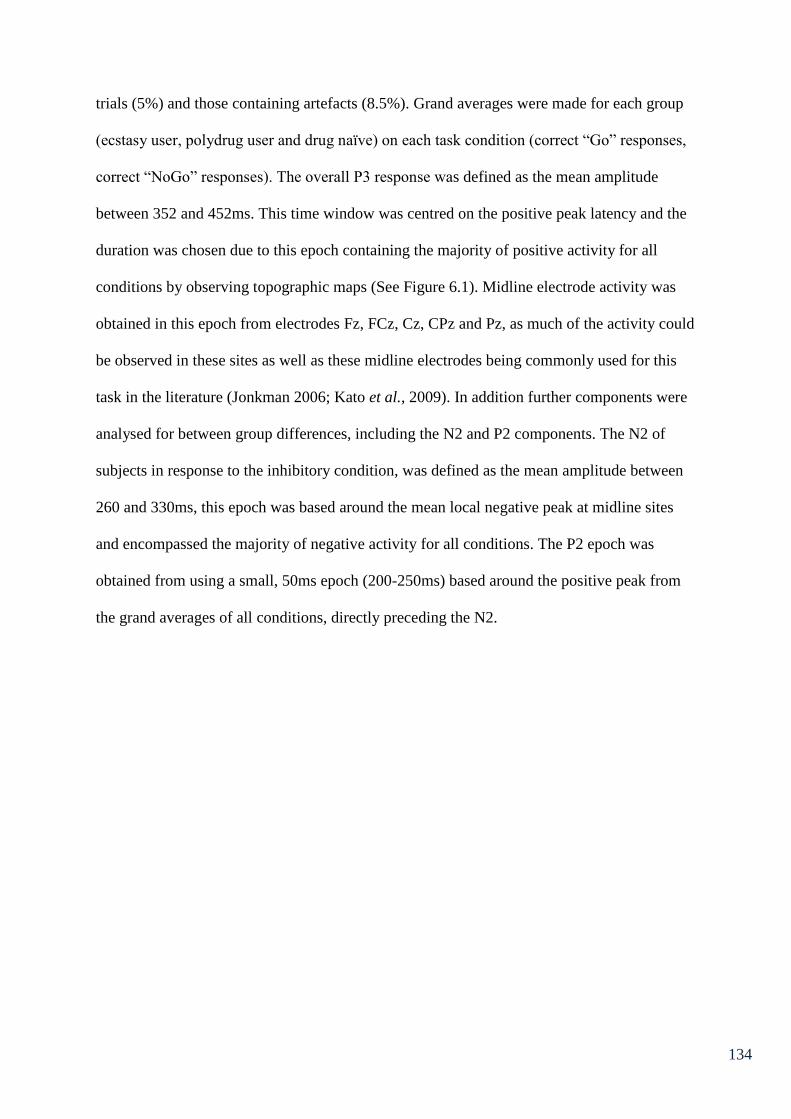
134
trials (5%) and those containing artefacts (8.5%). Grand averages were made for each group
(ecstasy user, polydrug user and drug naïve) on each task condition (correct “Go” responses,
correct “NoGo” responses). The overall P3 response was defined as the mean amplitude
between 352 and 452ms. This time window was centred on the positive peak latency and the
duration was chosen due to this epoch containing the majority of positive activity for all
conditions by observing topographic maps (See Figure 6.1). Midline electrode activity was
obtained in this epoch from electrodes Fz, FCz, Cz, CPz and Pz, as much of the activity could
be observed in these sites as well as these midline electrodes being commonly used for this
task in the literature (Jonkman 2006; Kato et al., 2009). In addition further components were
analysed for between group differences, including the N2 and P2 components. The N2 of
subjects in response to the inhibitory condition, was defined as the mean amplitude between
260 and 330ms, this epoch was based around the mean local negative peak at midline sites
and encompassed the majority of negative activity for all conditions. The P2 epoch was
obtained from using a small, 50ms epoch (200-250ms) based around the positive peak from
the grand averages of all conditions, directly preceding the N2.

135
Figure 6.1. Topographies at midpoints for each component (P2, N2 and P3) for the Go/NoGo
task.
Fig. 6.1: Depicts grand average topographies for the central point of each component. Note that this is from
grand averages of each group combined. P2 positivity (red) is clustered around the midline electrodes (a). N2
negativity (blue) is greatest in anterior midline electrodes (b). P3 positivity has a wide spread of activity peaking
at central electrodes (c).
Number-Letter: EEG was segmented into epochs from -500 to 1000ms from time of
stimulus onset. Epochs were time-averaged by stimulus type so that ERPs for correctly and
incorrectly identified stimuli in each condition of each task (e.g. correct “switches”, correct
“non-switches” and incorrect “switches” and “non-switches”) could be generated for each
individual. Only ERPs for correct responses on the “switch” condition were included in the
subsequent analysis. There were 124 “switch” trials in the entirety of the task. The mean
number of good “switch” trials retained for grand averaging per subject was 96.37 (average
22.28% rejected trials), after rejecting incorrect trials (4.48%) and those containing artefacts
(17.8%). Grand averages were made for each grouping condition (ecstasy user, polydrug user
and drug naïve) on each task condition (correct “switches”, correct “non-switches”). The
overall P3 response was defined as the mean amplitude between 290 and 400ms (the window
was centred on the positive peak latency and the duration was chosen as this epoch contained
6.56 µv
-6.56 µv
a) 225ms b) 290ms c) 400ms
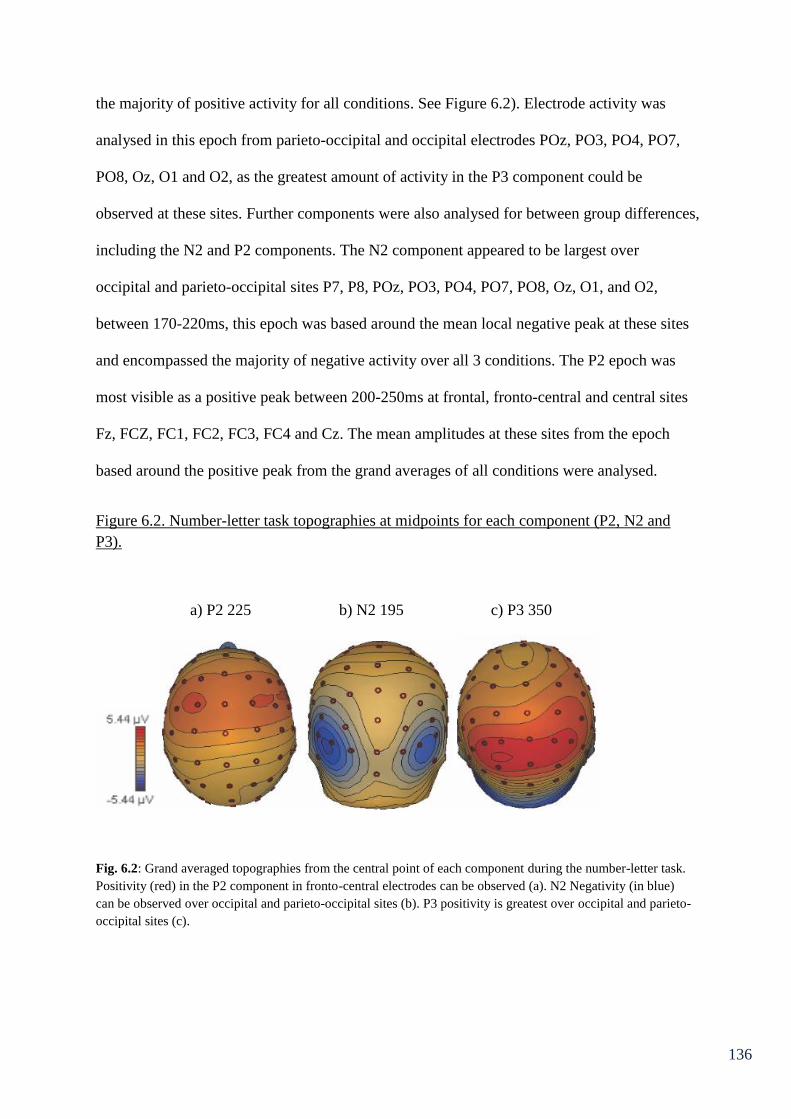
136
the majority of positive activity for all conditions. See Figure 6.2). Electrode activity was
analysed in this epoch from parieto-occipital and occipital electrodes POz, PO3, PO4, PO7,
PO8, Oz, O1 and O2, as the greatest amount of activity in the P3 component could be
observed at these sites. Further components were also analysed for between group differences,
including the N2 and P2 components. The N2 component appeared to be largest over
occipital and parieto-occipital sites P7, P8, POz, PO3, PO4, PO7, PO8, Oz, O1, and O2,
between 170-220ms, this epoch was based around the mean local negative peak at these sites
and encompassed the majority of negative activity over all 3 conditions. The P2 epoch was
most visible as a positive peak between 200-250ms at frontal, fronto-central and central sites
Fz, FCZ, FC1, FC2, FC3, FC4 and Cz. The mean amplitudes at these sites from the epoch
based around the positive peak from the grand averages of all conditions were analysed.
Figure 6.2. Number-letter task topographies at midpoints for each component (P2, N2 and
P3).
a) P2 225 b) N2 195 c) P3 350
Fig. 6.2: Grand averaged topographies from the central point of each component during the number-letter task.
Positivity (red) in the P2 component in fronto-central electrodes can be observed (a). N2 Negativity (in blue)
can be observed over occipital and parieto-occipital sites (b). P3 positivity is greatest over occipital and parieto-
occipital sites (c).

137
Semantic Association: EEG was segmented into epochs from -500 to 1000ms from
time of stimulus onset. Epochs were time-averaged by stimulus type so that ERPs for
correctly and incorrectly identified stimuli in each condition of each task (i.e. correct “high
associations” and incorrect “high associations” and correct “low associations” and incorrect
“low associations”) could be generated for each individual. Only ERPs for correct responses
were included in the subsequent analysis. There were 120 trials in total, the mean number of
good trials retained for grand averaging per subject was 109.66 (average of 8.6% rejected
trials), after rejecting incorrect trials (6.1%) and those containing artefacts (2.5%). Grand
averages were made for each group on each condition (correct “high associations”, correct
“low associations”). The overall P3 response was defined as the mean amplitude between 280
and 350ms, for the low association condition and 250-350ms for the high association
condition. These time windows were centred on the positive peak latency and the duration
was chosen due to this epoch containing the majority of positive activity for all conditions by
observing topographic maps (See Figures 6.3 & 6.4). Electrode activity was analysed in this
epoch from parieto-occipital and occipital electrodes PO7, PO3, O1, OZ, POZ, PO4, PO8 and
O2, as the greatest amount of activity in the P3 component could be observed at these sites.
Further components were also analysed for between group differences, including the N2 and
P2 components. The N2 component was also largest over parieto-occipital and occipital
electrodes (PO7, PO3, O1, OZ, POZ, , PO4, PO8 and O2) , between 120-190ms in the low
association condition and 120-200ms in the high association condition, again epochs were
based around the mean local negative peak at these sites and encompassed the majority of
negative activity over all 3 groups. The P2 component was most visible as a positive peak
between 170 and 230ms (for both low and high association) at anterior and midline sites (FZ,
FCZ, FC1, FC2, CZ, C1 and C2) the mean amplitudes at these sites from the epochs based
around the peaks from the grand averages of all conditions were analysed.
138
Figure 6.3. Semantic association task topographies at midpoints for each component (P2, N2
and P3) in the high association condition.
Fig. 6.3: Grand averaged topographies for central points of each component during high association trials. P2
positivity is greatest at midline/anterior electrodes (a). N2 negativity is greatest in occipital and parieto-occipital
electrodes (b). Positivity in the P3 component is greatest around occipital and parieto-occipital electrodes (c).
a) P2 200ms b) N2 160ms c) P3 315ms
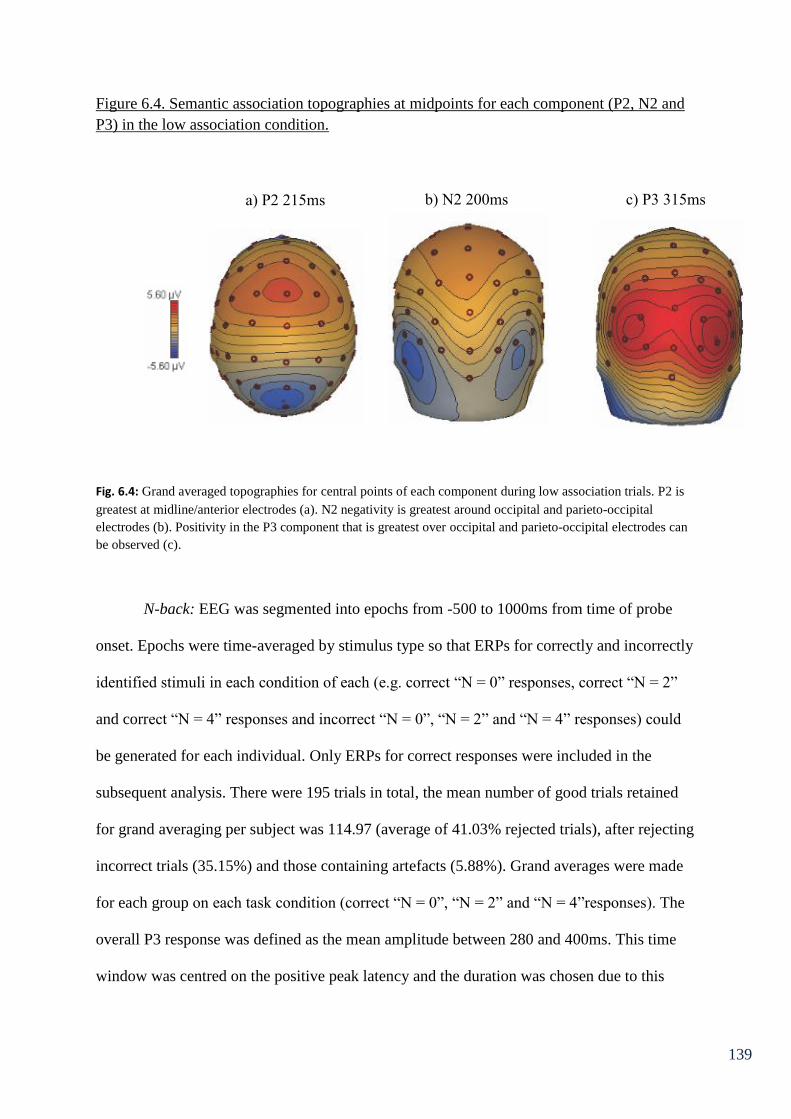
139
Figure 6.4. Semantic association topographies at midpoints for each component (P2, N2 and
P3) in the low association condition.
Fig. 6.4: Grand averaged topographies for central points of each component during low association trials. P2 is
greatest at midline/anterior electrodes (a). N2 negativity is greatest around occipital and parieto-occipital
electrodes (b). Positivity in the P3 component that is greatest over occipital and parieto-occipital electrodes can
be observed (c).
N-back: EEG was segmented into epochs from -500 to 1000ms from time of probe
onset. Epochs were time-averaged by stimulus type so that ERPs for correctly and incorrectly
identified stimuli in each condition of each (e.g. correct “N = 0” responses, correct “N = 2”
and correct “N = 4” responses and incorrect “N = 0”, “N = 2” and “N = 4” responses) could
be generated for each individual. Only ERPs for correct responses were included in the
subsequent analysis. There were 195 trials in total, the mean number of good trials retained
for grand averaging per subject was 114.97 (average of 41.03% rejected trials), after rejecting
incorrect trials (35.15%) and those containing artefacts (5.88%). Grand averages were made
for each group on each task condition (correct “N = 0”, “N = 2” and “N = 4”responses). The
overall P3 response was defined as the mean amplitude between 280 and 400ms. This time
window was centred on the positive peak latency and the duration was chosen due to this
a) P2 215ms b) N2 200ms c) P3 315ms
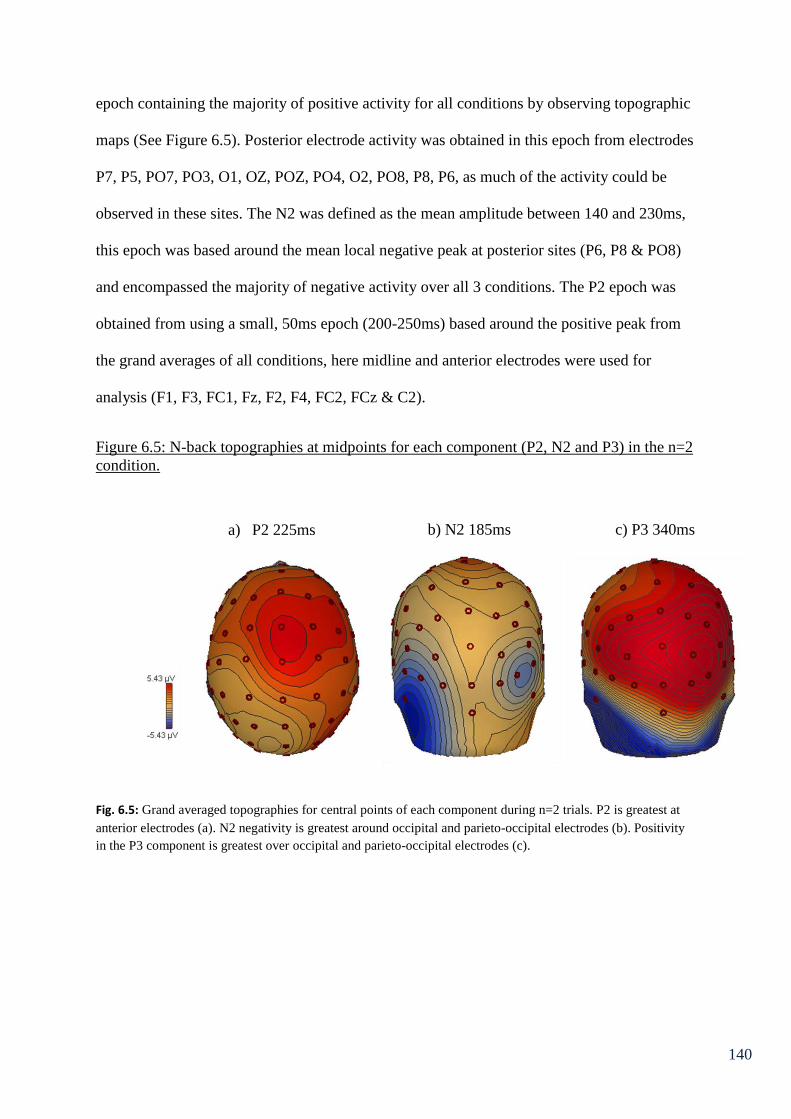
140
epoch containing the majority of positive activity for all conditions by observing topographic
maps (See Figure 6.5). Posterior electrode activity was obtained in this epoch from electrodes
P7, P5, PO7, PO3, O1, OZ, POZ, PO4, O2, PO8, P8, P6, as much of the activity could be
observed in these sites. The N2 was defined as the mean amplitude between 140 and 230ms,
this epoch was based around the mean local negative peak at posterior sites (P6, P8 & PO8)
and encompassed the majority of negative activity over all 3 conditions. The P2 epoch was
obtained from using a small, 50ms epoch (200-250ms) based around the positive peak from
the grand averages of all conditions, here midline and anterior electrodes were used for
analysis (F1, F3, FC1, Fz, F2, F4, FC2, FCz & C2).
Figure 6.5: N-back topographies at midpoints for each component (P2, N2 and P3) in the n=2
condition.
Fig. 6.5: Grand averaged topographies for central points of each component during n=2 trials. P2 is greatest at
anterior electrodes (a). N2 negativity is greatest around occipital and parieto-occipital electrodes (b). Positivity
in the P3 component is greatest over occipital and parieto-occipital electrodes (c).
a) P2 225ms b) N2 185ms c) P3 340ms
141
Urinary Analysis
Frozen urine samples were delivered to University Hospital Aintree (NHS) and were
analysed using Solid Phase Extraction (Mixed Mode Phase) followed by Reverse Phase
HPLC MS/MS detection using BOTH Positive & Negative Ion Multiple Reaction Monitoring
(MRM). Urine Specimens were been tested for the Synthetic Cannabinoids (JWH-018, JWH-
073, JWH-250, JWH-398, JWH-122, JWH-019, AM-694, WIN 48098 & WIN-55212-2), as
well as the ‘designer’ drugs ‘Mephedrone’, bk-MDMA or ‘Methylone’, bk-MBDB or
‘Butylone’, bk-PMMA or ‘Methedrone’, 1-benzylpiperazine, TFMPP, mCPP and MDPV. In
addition they were tested for were a series of 12 Piperazine compounds, 4 β-Keto
Amphetamines, a series of 11 Methcathinone compounds, 4-Fluoroamphetamine, Bupropion
& the Hallucinogenic Amphetamines: D.O.B. (‘bromo-STP’ or ‘Brolamphetamine’), D.O.C.
and D.O.I. and ‘Traditional’ Drugs of Abuse: Amphetamine(s) including M.D.M.A., M.D.A.
& M.D.E.A., Barbiturates, Benzodiazepines, THC & Cannabinoids, Buprenorphine, Cocaine
& metabolites, Methadone & metabolites, Opiates & Opioids (Morphine, Codeine,
Dihydrocodeine, Tramadol, d-Propoxyphene, Oxymorphone & Oxycodone), LSD, G.H.B.
(and the Lactone Precursor), Psilocybin, Ketamine and Methaqualone.

142
6.4 Results
Socio-demographic information about the participants, anxiety, depression and
arousal scores from the mood scale and sleep measures are shown in Table 6.1. Indices of
other drug and alcohol use are displayed in Table 6.2.
Table 6.1 – Indices sleep quality, fluid intelligence and socio-demographic variables
Ecstasy
users
Polydrug
controls
Drug naïve
controls
Males: n ( %) 10 (50) 9 (45) 7 (35)
Age (SD)
23.94 (2.50) 22.58 (3.45) 23.10 (2.94)
University degree: n
(%)
14 (70) 12 (60) 11 (55)
Employment status
Student; n, (%) 12 (60) 14 (70) 17 (85)
Employed; n (%) 4 (20) 4 (20) 3 (15)
Unemployed; n (%) 4 (20) 2 (10) 0 (0)
Mean (SD) Mean (SD) Mean (SD)
Ravens Progressive
Matrices (maximum
60)
48.68 (5.96) 48.35 (5.83) 51.35 (5.01)
Sleep – Hours/night
7.13 (1.91) 7.8 (1.39) 7.05 (1.16)
ESS Score
(maximum 24)
6.5 (3.3) 6.7 (3.15) 6.5 (3.32)
KSS before 5.05 (1.93)* 3.75 (1.48) 4.79 (1.23)
KSS after 6.53 (2.03) 5.85 (1.53) 6.56 (1.46)
MEQ total 42.10 (10.15) 45.70 (9.40) 47.90 (8.30)
UMACL anxiety 11.4 (4.08) 12.44 (2.18) 11.75 (2.12)
UMACL depression 13.1 (3.91) 12.61 (2.40) 12.1(3.14)
UMACL arousal 19.7 (4.54) 20.5 (3.68) 20.1 (3.02)
*Indicates a significant difference from polydrug controls at the .05 level, and ** at the .01 level;
† indicates a significant difference from drug naïve controls at the .05 level and †† at the .01 level.
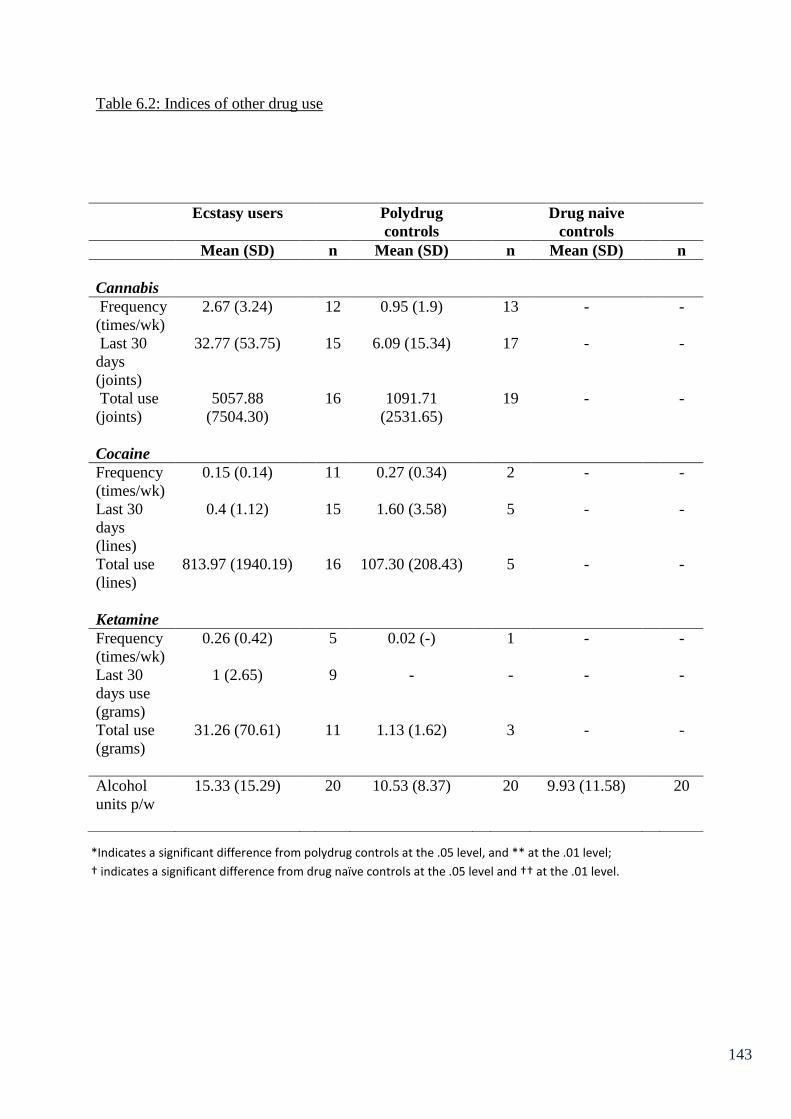
143
Table 6.2: Indices of other drug use
Ecstasy users Polydrug
controls
Drug naive
controls
Mean (SD) n Mean (SD) n Mean (SD) n
Cannabis
Frequency
(times/wk)
2.67 (3.24) 12 0.95 (1.9) 13 - -
Last 30
days
(joints)
32.77 (53.75) 15 6.09 (15.34) 17 - -
Total use
(joints)
5057.88
(7504.30)
16 1091.71
(2531.65)
19 - -
Cocaine
Frequency
(times/wk)
0.15 (0.14) 11 0.27 (0.34) 2 - -
Last 30
days
(lines)
0.4 (1.12) 15 1.60 (3.58) 5 - -
Total use
(lines)
813.97 (1940.19) 16 107.30 (208.43) 5 - -
Ketamine
Frequency
(times/wk)
0.26 (0.42) 5 0.02 (-) 1 - -
Last 30
days use
(grams)
1 (2.65) 9 - - - -
Total use
(grams)
31.26 (70.61) 11 1.13 (1.62) 3 - -
Alcohol
units p/w
15.33 (15.29) 20 10.53 (8.37) 20 9.93 (11.58) 20
*Indicates a significant difference from polydrug controls at the .05 level, and ** at the .01 level;
† indicates a significant difference from drug naïve controls at the .05 level and †† at the .01 level.

144
One way ANOVAs revealed that there were no significant between group differences
on measures such as age, average hours sleep per night, total score on the Epworth Sleepiness
Scale, Morningness-Eveningness questionnaire total score, post-test Karolinska Sleepiness
Scale, levels of arousal, depression and anxiety, total score on Ravens SPM or average
weekly alcohol consumption. However there were between group differences in the pre-
testing Karolinska Sleepiness Scale (i.e. how sleepy the participants felt before the test
battery) F(2,58)=3.78, p<.05, planned comparison t-tests revealed that the ecstasy user group
felt significantly more sleepy prior to testing than the polydrug control group t(38)=2.39,
p<.05, but not the drug naïve control group t(37)=0.50, p>.05.
t-tests between the ecstasy user group and polydrug controls revealed that the ecstasy
user group had a larger lifetime total of cannabis joints smoked (5057.88 ± 7504.30) than the
non-ecstasy drug users (1091.71 ± 2531.65), that is approaching significance t(17.88)=2.02,
p=.06 (Levene’s test was significant so degrees of freedom have been adjusted accordingly).
The ecstasy users had also smoked more joints within the last 30 days (32.77 ± 53.75
compared to 6.09 ± 15.34) and this difference was approaching significance t(16.01)=1.86,
p=.08. There were however no differences between these two groups on other drug intake
variables. However as can be seen from table 6.2, the ecstasy user group can be described as
polydrug users.
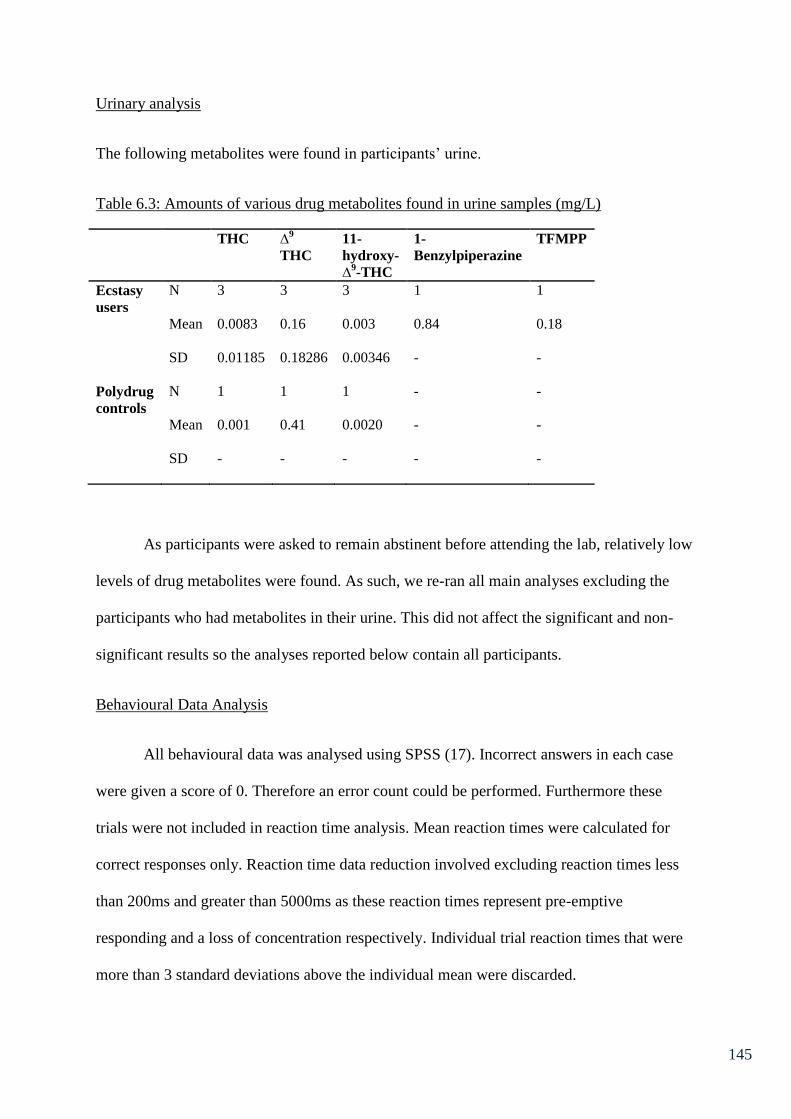
145
Urinary analysis
The following metabolites were found in participants’ urine.
Table 6.3: Amounts of various drug metabolites found in urine samples (mg/L)
THC ∆9
THC
11-
hydroxy-
∆9-THC
1-
Benzylpiperazine
TFMPP
Ecstasy
users
N 3 3 3 1 1
Mean 0.0083 0.16 0.003 0.84 0.18
SD 0.01185 0.18286 0.00346 - -
Polydrug
controls
N 1 1 1 - -
Mean 0.001 0.41 0.0020 - -
SD - - - - -
As participants were asked to remain abstinent before attending the lab, relatively low
levels of drug metabolites were found. As such, we re-ran all main analyses excluding the
participants who had metabolites in their urine. This did not affect the significant and non-
significant results so the analyses reported below contain all participants.
Behavioural Data Analysis
All behavioural data was analysed using SPSS (17). Incorrect answers in each case
were given a score of 0. Therefore an error count could be performed. Furthermore these
trials were not included in reaction time analysis. Mean reaction times were calculated for
correct responses only. Reaction time data reduction involved excluding reaction times less
than 200ms and greater than 5000ms as these reaction times represent pre-emptive
responding and a loss of concentration respectively. Individual trial reaction times that were
more than 3 standard deviations above the individual mean were discarded.
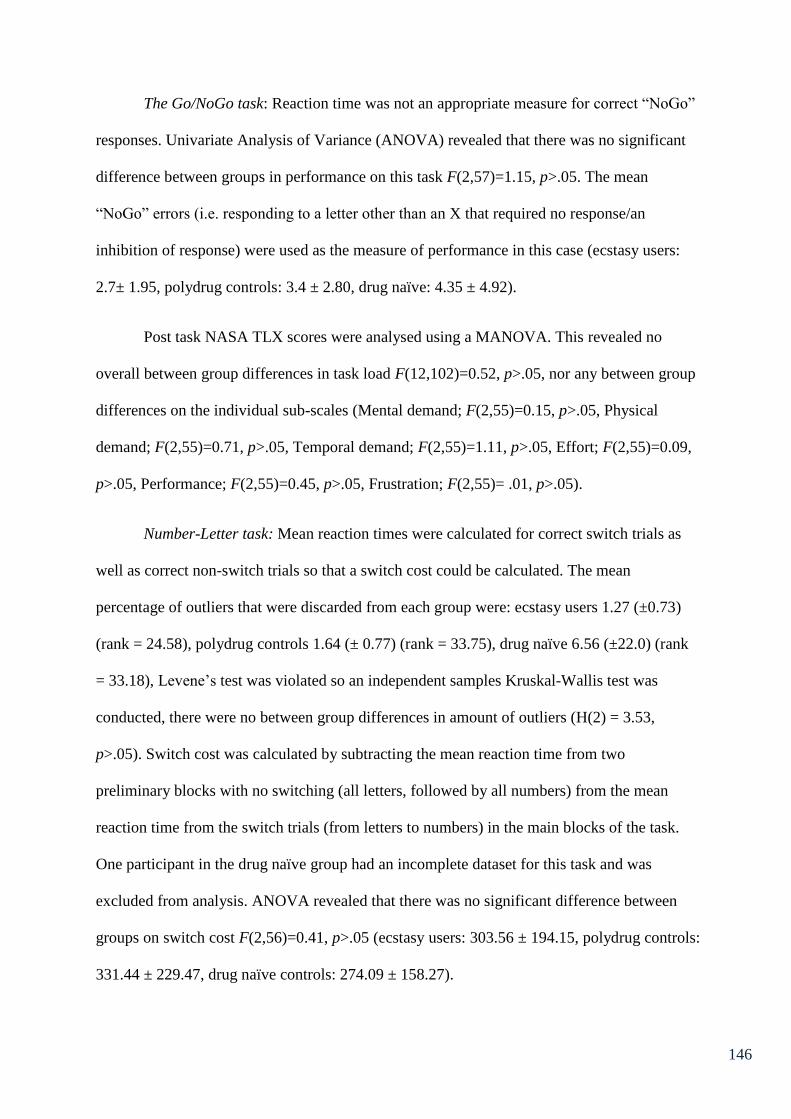
146
The Go/NoGo task: Reaction time was not an appropriate measure for correct “NoGo”
responses. Univariate Analysis of Variance (ANOVA) revealed that there was no significant
difference between groups in performance on this task F(2,57)=1.15, p>.05. The mean
“NoGo” errors (i.e. responding to a letter other than an X that required no response/an
inhibition of response) were used as the measure of performance in this case (ecstasy users:
2.7± 1.95, polydrug controls: 3.4 ± 2.80, drug naïve: 4.35 ± 4.92).
Post task NASA TLX scores were analysed using a MANOVA. This revealed no
overall between group differences in task load F(12,102)=0.52, p>.05, nor any between group
differences on the individual sub-scales (Mental demand; F(2,55)=0.15, p>.05, Physical
demand; F(2,55)=0.71, p>.05, Temporal demand; F(2,55)=1.11, p>.05, Effort; F(2,55)=0.09,
p>.05, Performance; F(2,55)=0.45, p>.05, Frustration; F(2,55)= .01, p>.05).
Number-Letter task: Mean reaction times were calculated for correct switch trials as
well as correct non-switch trials so that a switch cost could be calculated. The mean
percentage of outliers that were discarded from each group were: ecstasy users 1.27 (±0.73)
(rank = 24.58), polydrug controls 1.64 (± 0.77) (rank = 33.75), drug naïve 6.56 (±22.0) (rank
= 33.18), Levene’s test was violated so an independent samples Kruskal-Wallis test was
conducted, there were no between group differences in amount of outliers (H(2) = 3.53,
p>.05). Switch cost was calculated by subtracting the mean reaction time from two
preliminary blocks with no switching (all letters, followed by all numbers) from the mean
reaction time from the switch trials (from letters to numbers) in the main blocks of the task.
One participant in the drug naïve group had an incomplete dataset for this task and was
excluded from analysis. ANOVA revealed that there was no significant difference between
groups on switch cost F(2,56)=0.41, p>.05 (ecstasy users: 303.56 ± 194.15, polydrug controls:
331.44 ± 229.47, drug naïve controls: 274.09 ± 158.27).

147
Post task NASA TLX scores were analysed using a Multivariate Analysis of Variance
MANOVA. This revealed no overall between group differences in task load F(12,100)=1.62,
p>.05 for Pillai’s trace, nor any between group differences on the individual sub-scales
(Mental demand; F(2,54)=2.21, p>.05, Physical demand; F(2,54)=2.07, p>.05, Temporal
demand; F(2,54)=2.41, p>.05, Effort; F(2,54)=1.58, p>.05, Frustration; F(2,54)=0.37, p>.05
with the exception of performance F(2,54)=2.99, p=.06 (approaching significance), multiple
comparisons revealed that polydrug controls thought they had performed significantly better
than ecstasy users p<.05.
Semantic Association Task: The mean percentage of outliers that were discarded from
each group were; ecstasy users 1.46 (±0.66), polydrug controls 1.42 (± 1.05), drug naïve
controls 1.71 (±0.92), there were no between group differences in amount of outliers F
(2,57)=0.63, p>.05. Performance on the semantic retrieval task was measured both in terms
of number of errors made (incorrect responses) and reaction time. Mixed ANOVA on error
count revealed no significant effect of difficulty F(1,57)=0.04, p>.05, no main effect of
group F(2,57)=1.56, p>.05 and no group by difficulty interaction F(2,57)=0.01, p>.05.
Similarly using reaction time as the dependent variable no significant between group
differences were observed F(2,57)=0.07 p>.05. Difficulty and group by difficulty
interactions were non-significant p>.05 in both cases (Table 6.4).
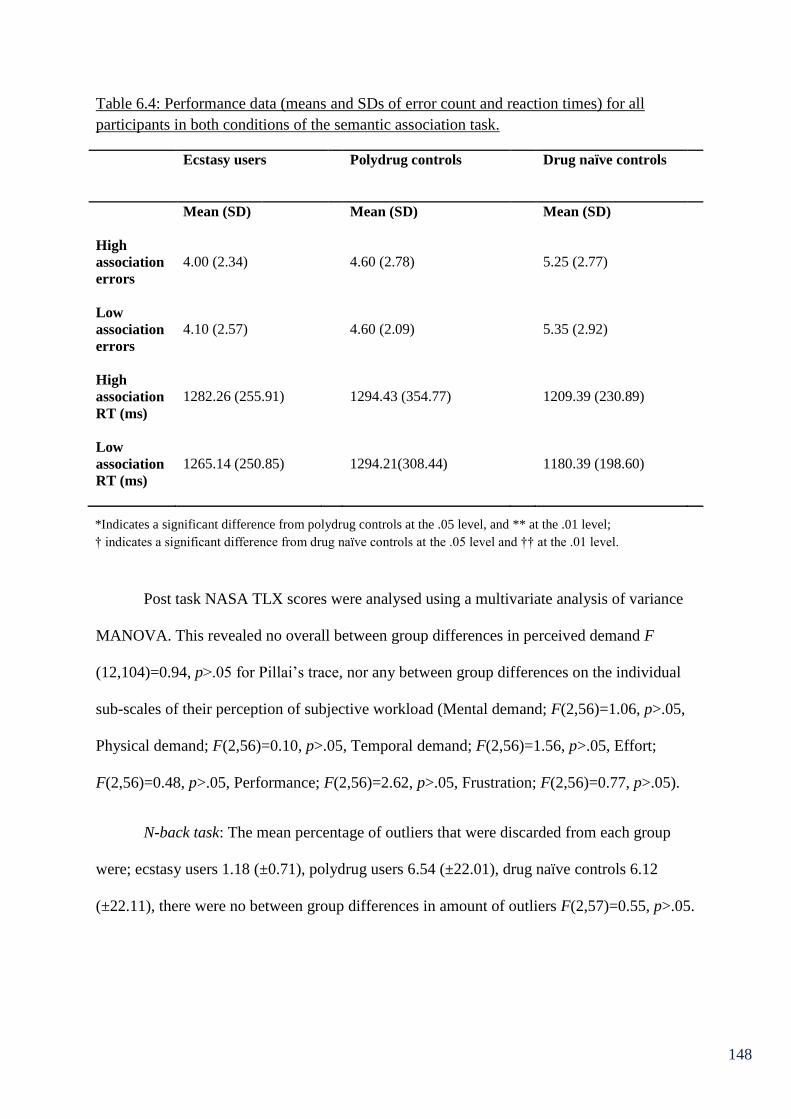
148
Table 6.4: Performance data (means and SDs of error count and reaction times) for all
participants in both conditions of the semantic association task.
Ecstasy users Polydrug controls Drug naïve controls
Mean (SD) Mean (SD) Mean (SD)
High
association
errors
4.00 (2.34)
4.60 (2.78)
5.25 (2.77)
Low
association
errors
4.10 (2.57)
4.60 (2.09)
5.35 (2.92)
High
association
RT (ms)
1282.26 (255.91)
1294.43 (354.77)
1209.39 (230.89)
Low
association
RT (ms)
1265.14 (250.85)
1294.21(308.44)
1180.39 (198.60)
Post task NASA TLX scores were analysed using a multivariate analysis of variance
MANOVA. This revealed no overall between group differences in perceived demand F
(12,104)=0.94, p>.05 for Pillai’s trace, nor any between group differences on the individual
sub-scales of their perception of subjective workload (Mental demand; F(2,56)=1.06, p>.05,
Physical demand; F(2,56)=0.10, p>.05, Temporal demand; F(2,56)=1.56, p>.05, Effort;
F(2,56)=0.48, p>.05, Performance; F(2,56)=2.62, p>.05, Frustration; F(2,56)=0.77, p>.05).
N-back task: The mean percentage of outliers that were discarded from each group
were; ecstasy users 1.18 (±0.71), polydrug users 6.54 (±22.01), drug naïve controls 6.12
(±22.11), there were no between group differences in amount of outliers F(2,57)=0.55, p>.05.
*Indicates a significant difference from polydrug controls at the .05 level, and ** at the .01 level;
† indicates a significant difference from drug naïve controls at the .05 level and †† at the .01 level.
149
A mixed analysis of variance (ANOVA) was conducted on both the mean reaction
times and number of errors on the n-back task, with between subjects factor of user group (3
levels) and within subject factor of difficulty (ranging from low difficulty; n=0, to medium
difficulty; n=2 and high difficulty; n=4). The error count yielded a significant effect of
difficulty (3 levels) F(2,110)=3.27, p<0.05, but no significant main effect of group
F(2,55)=1.35, p>0.05 and no group by difficulty interaction F(4,110)=0.30, p>.05.
Mixed ANOVA on the mean reaction times revealed a significant effect of difficulty
F(2,110)=16.92, p<0.001, and also a main effect of group F(2,55)=3.80, p<0.05. There was,
however no group by difficulty interaction F(4,110)=0.22, p>.05.
To explore the main effect of group further, univariate ANOVAs were conducted on
each difficulty level for mean reaction time. Significant between group differences in reaction
time were observed at n=0 F(2,55)=3.18, p<0.05, n=2 F(2,55)=4.50, p<0.05 and n=4
F(2,55)=4.50, p<0.05. Planned comparisons revealed that drug naïve participants took
significantly longer to respond than polydrug users at each level (p<.05 in each case), there
were no significant differences between ecstasy users and the two control groups in reaction
time at any level of the task (table 6.5).
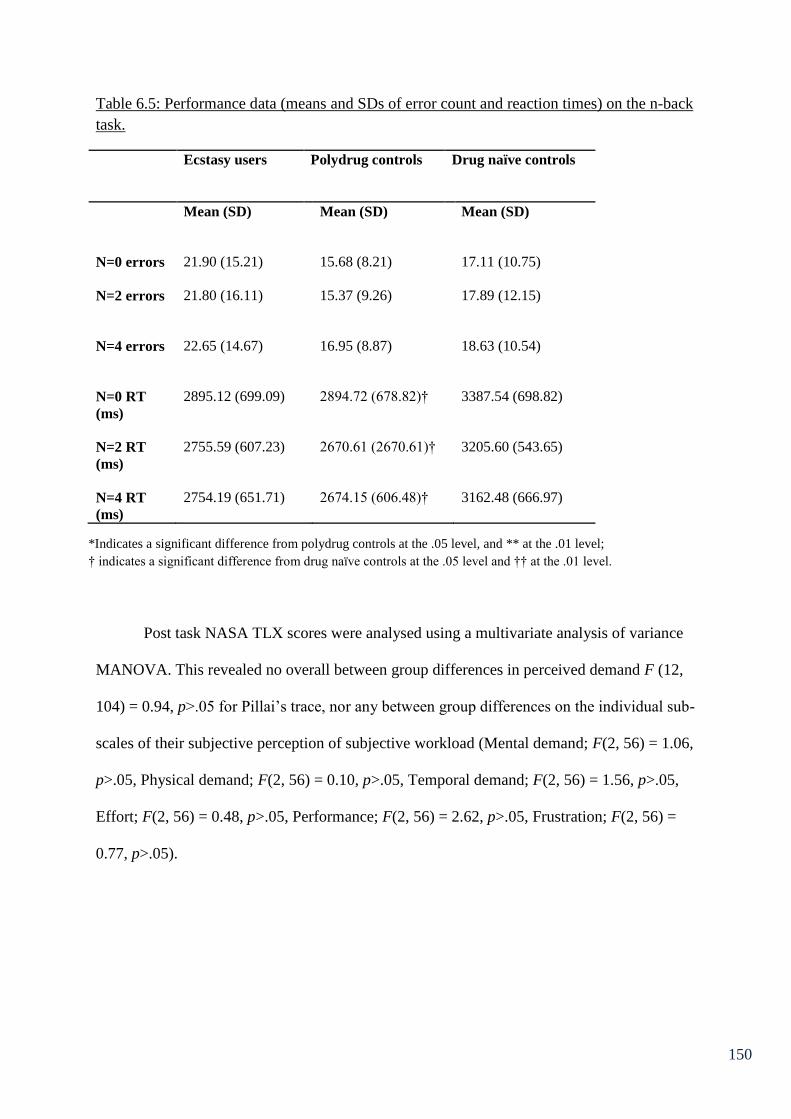
150
Table 6.5: Performance data (means and SDs of error count and reaction times) on the n-back
task.
Ecstasy users Polydrug controls Drug naïve controls
Mean (SD) Mean (SD) Mean (SD)
N=0 errors
21.90 (15.21)
15.68 (8.21)
17.11 (10.75)
N=2 errors
21.80 (16.11)
15.37 (9.26)
17.89 (12.15)
N=4 errors
22.65 (14.67)
16.95 (8.87)
18.63 (10.54)
N=0 RT
(ms)
2895.12 (699.09)
2894.72 (678.82)†
3387.54 (698.82)
N=2 RT
(ms)
2755.59 (607.23) 2670.61 (2670.61)† 3205.60 (543.65)
N=4 RT
(ms)
2754.19 (651.71) 2674.15 (606.48)† 3162.48 (666.97)
Post task NASA TLX scores were analysed using a multivariate analysis of variance
MANOVA. This revealed no overall between group differences in perceived demand F (12,
104) = 0.94, p>.05 for Pillai’s trace, nor any between group differences on the individual sub-
scales of their subjective perception of subjective workload (Mental demand; F(2, 56) = 1.06,
p>.05, Physical demand; F(2, 56) = 0.10, p>.05, Temporal demand; F(2, 56) = 1.56, p>.05,
Effort; F(2, 56) = 0.48, p>.05, Performance; F(2, 56) = 2.62, p>.05, Frustration; F(2, 56) =
0.77, p>.05).
*Indicates a significant difference from polydrug controls at the .05 level, and ** at the .01 level;
† indicates a significant difference from drug naïve controls at the .05 level and †† at the .01 level.
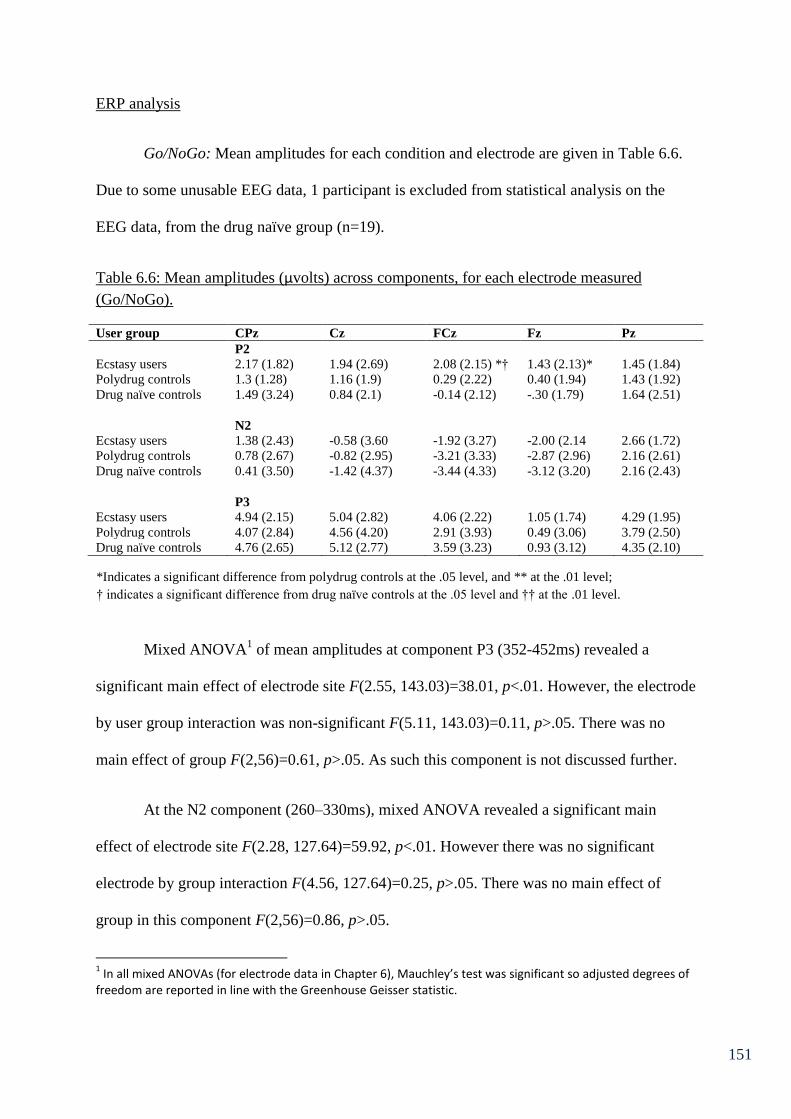
151
ERP analysis
Go/NoGo: Mean amplitudes for each condition and electrode are given in Table 6.6.
Due to some unusable EEG data, 1 participant is excluded from statistical analysis on the
EEG data, from the drug naïve group (n=19).
Table 6.6: Mean amplitudes (µvolts) across components, for each electrode measured
(Go/NoGo).
User group CPz Cz FCz Fz Pz
P2
Ecstasy users 2.17 (1.82) 1.94 (2.69) 2.08 (2.15) *† 1.43 (2.13)* 1.45 (1.84)
Polydrug controls 1.3 (1.28) 1.16 (1.9) 0.29 (2.22) 0.40 (1.94) 1.43 (1.92)
Drug naïve controls 1.49 (3.24) 0.84 (2.1) -0.14 (2.12) -.30 (1.79) 1.64 (2.51)
N2
Ecstasy users 1.38 (2.43) -0.58 (3.60 -1.92 (3.27) -2.00 (2.14 2.66 (1.72)
Polydrug controls 0.78 (2.67) -0.82 (2.95) -3.21 (3.33) -2.87 (2.96) 2.16 (2.61)
Drug naïve controls 0.41 (3.50) -1.42 (4.37) -3.44 (4.33) -3.12 (3.20) 2.16 (2.43)
P3
Ecstasy users 4.94 (2.15) 5.04 (2.82) 4.06 (2.22) 1.05 (1.74) 4.29 (1.95)
Polydrug controls 4.07 (2.84) 4.56 (4.20) 2.91 (3.93) 0.49 (3.06) 3.79 (2.50)
Drug naïve controls 4.76 (2.65) 5.12 (2.77) 3.59 (3.23) 0.93 (3.12) 4.35 (2.10)
Mixed ANOVA1 of mean amplitudes at component P3 (352-452ms) revealed a
significant main effect of electrode site F(2.55, 143.03)=38.01, p<.01. However, the electrode
by user group interaction was non-significant F(5.11, 143.03)=0.11, p>.05. There was no
main effect of group F(2,56)=0.61, p>.05. As such this component is not discussed further.
At the N2 component (260–330ms), mixed ANOVA revealed a significant main
effect of electrode site F(2.28, 127.64)=59.92, p<.01. However there was no significant
electrode by group interaction F(4.56, 127.64)=0.25, p>.05. There was no main effect of
group in this component F(2,56)=0.86, p>.05.
1 In all mixed ANOVAs (for electrode data in Chapter 6), Mauchley’s test was significant so adjusted degrees of
freedom are reported in line with the Greenhouse Geisser statistic.
*Indicates a significant difference from polydrug controls at the .05 level, and ** at the .01 level;
† indicates a significant difference from drug naïve controls at the .05 level and †† at the .01 level.
152
Mixed ANOVA on the mean amplitudes measured for the P2 component (200–250ms)
revealed a significant main effect of electrode site F(2.24, 125.50)=3.56, p<.05. The electrode
by group interaction was non-significant F(4.48, 125.50)=1.41, p>.05. However there was a
significant main effect of group F(2,56)=3.27, p<.05. To explore this effect further, a series
of univariate ANOVAs were conducted at each electrode site. Significant group differences
were observed at electrode FCz F(2,56)=5.81, p<0.01 and also electrode Fz F(2,56)=3.84,
p<0.05. Post-hoc Tukey’s test revealed that the ecstasy users had significantly greater mean
amplitudes than drug naïve controls at electrode site Fz (p<0.05). Furthermore the ecstasy
users showed significantly greater amplitude than polydrug controls and drug naïve controls
at electrode FCz (p<.05 in both cases). The grand average waveforms for each group (users,
polydrug nonusers and drug naïve controls) for the electrodes showing significant differences
can be observed in Figure 6.6.
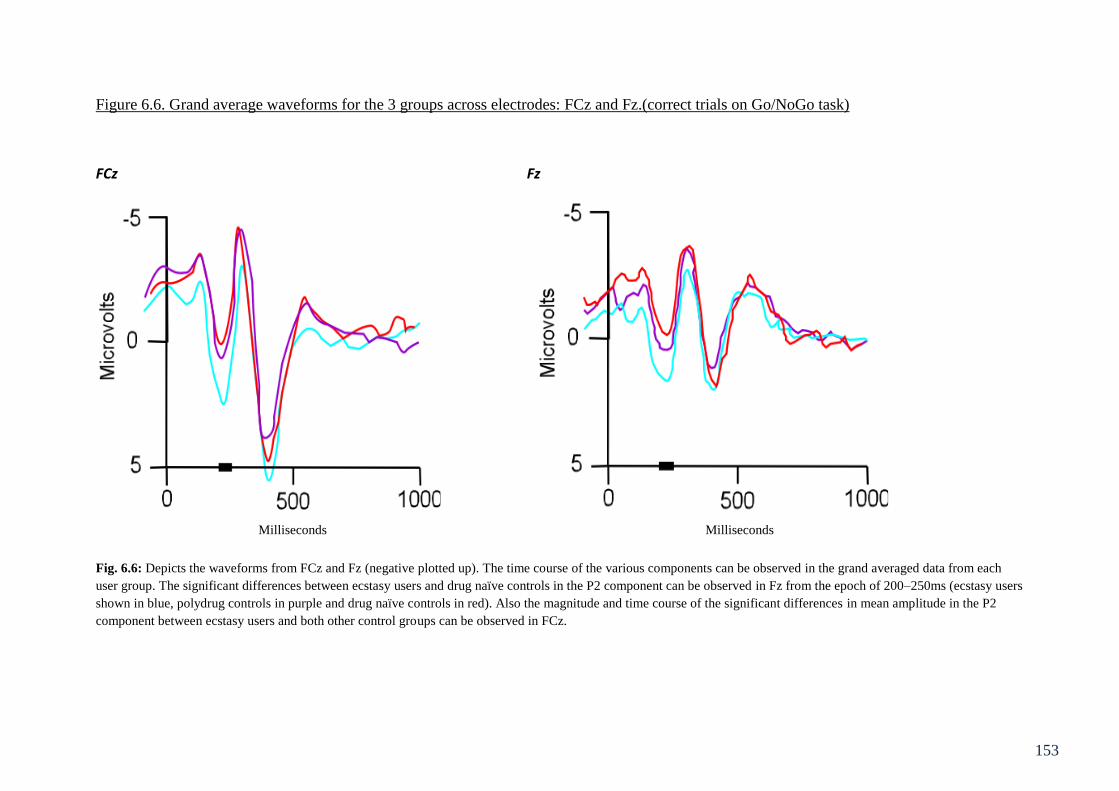
153
Figure 6.6. Grand average waveforms for the 3 groups across electrodes: FCz and Fz.(correct trials on Go/NoGo task)
FCz Fz
Fig. 6.6: Depicts the waveforms from FCz and Fz (negative plotted up). The time course of the various components can be observed in the grand averaged data from each
user group. The significant differences between ecstasy users and drug naïve controls in the P2 component can be observed in Fz from the epoch of 200–250ms (ecstasy users
shown in blue, polydrug controls in purple and drug naïve controls in red). Also the magnitude and time course of the significant differences in mean amplitude in the P2
component between ecstasy users and both other control groups can be observed in FCz.
Milliseconds Milliseconds

154
Given the heavy use of cannabis in the ecstasy user group in particular, multiple
regression analyses were conducted on the data, to observe whether level use of ecstasy (after
controlling for cannabis use) was a predictor of amplitude at the electrodes Fz and FCz. In the
first regression, amplitude at Fz was entered as the dependent variable; in the first step
indices of cannabis use were entered as predictors (frequency of use, total lifetime dose,
amount smoked in the last 30 days) and in the second step, the same indices of ecstasy use
were entered as predictors. The overall regression model accounted for a non-significant 9.5%
(R² = 0.10, R² adjusted = -0.01, F(6,52)=0.91, p>0.05) of the variance in Fz amplitude.
Cannabis use indices (step 1) did not predict a significant amount of variance in Fz amplitude
(R² = 0.04, R² adjusted = -0.01, F(3,55)=0.83, p>0.05). With none of the three cannabis use
variables predicting Fz amplitude; frequency of use (β=-0.70, p>0.05), total lifetime dose
(β=0.06, p>0.05) and amount smoked in the last 30 days (β=-0.72, p>0.05). The ecstasy use
indices (step 2) did not predict a significant amount of variance in Fz amplitude, after
controlling for cannabis use indices (R ²change=0.05, F-change (3,52)=1.00, p>.05).
Frequency of use (β=-0.01, p>0.05), last 30 day use (β=0.34, p>0.05) and lifetime dose
(β=0.01, p>0.05) were not significant predictors.
In the second regression, amplitude at FCz was entered as the dependent variable and
predictors entered as above. The overall regression model accounted for 14.2% (non-
significant) (R² = 0.14, R² adjusted = 0.04, F(6,52)=1.43, p>0.05) of the variance in FCz
amplitude. Cannabis use indices (step 1) did not predict a significant amount of variance in
FCz amplitude (R² = 0.06, R² adjusted = -0.01, F(3,55)=1.09, p>0.05). None of the three
cannabis use variables predicted FCz amplitude; frequency of use (β=0.60, p>0.05), total
lifetime dose (β=-0.25, p>0.05) and amount smoked in the last 30 days (β=-0.44, p>0.05).
The ecstasy use indices (step 2) did not predict a significant amount of variance in FCz
amplitude, after controlling for cannabis use indices (R ²change=0.09, F-change (3,52)=1.72,
155
p>.05). Frequency of use (β=06, p>0.05) and lifetime dose (β=0.04, p>0.05) were not
significant predictors. However last 30 days use was a significant predictor of amplitude
(β=0.42, p<0.05), with greater use associated with increased amplitude.
Number-Letter: Mean amplitudes for each condition and electrode are given in Table
6.7. Due to some participants not completing the task and some unusable EEG data 6
participants are excluded from statistical analysis on the EEG data, 4 from the drug naïve
group (n=16) and 2 from the ecstasy user group (n=18).

156
Table 6.7: Mean amplitudes (µvolts) across components, for each electrode measured during
the number-letter task.
P3
PO7 PO3 O1 Oz POz PO8 PO4 O2 Ecstasy
users
1.25
(2.13)
2.59
(1.63)
0.68
(1.84)†
0.40
(1.52)
2.67
(2.37)†
1.63
(2.58)
2.24
(1.70)
0.37
(1.76)
Polydrug
controls
1.94
(2.05)
2.57
(1.54)
0.71
(1.90) †
0.27
(1.72)†
2.27
(0.94)†
0.92
(3.11)
1.94
(1.77)†
0.32
(2.82)
Drug
naïve
controls
2.03
(2.20)
3.56
(2.61)
2.37
(2.41)
1.66
(2.33)
4.50
(3.26)
1.56
(3.49)
3.61
(2.75)
1.93
(2.72)
N2
P7 P8
Ecstasy
users
-2.56
(0.61)
-0.90
(0.46)
-1.58
(0.53)
-0.15
(0.48)
0.45
(0.60)
-0.66
(0.78)
-0.06
(0.60)
-0.48
(0.60)
-2.81
(0.46)
-1.36
(0.63)
Polydrug
controls
-2.08
(0.57)
-0.70
(0.44)
-1.17
(0.50)
0.47
(0.45)
0.81
(0.57)
-1.44
(0.74)
0.12
(0.57)
0.39
(0.57)
-1.88
(0.44)
-0.87
(0.60)
Drug
naïve
controls
-0.60
(0.64)
0.05
(0.50)
0.20
(0.56)
0.70
(0.51)
1.09
(0.64)
-0.45
(0.82)
0.57
(0.64)
0.56
(0.63)
-0.66
(0.49)
-0.13
(0.67)
P2
FC3 FC1 Fz FC4 FC2 FCz Cz
Ecstasy
users
-0.18
(4.22)
1.07
(1.38)
1.54
(1.63)*†
1.66
(1.33)
1.57
(1.24)
2.10
(1.45)*†
1.78
(1.24)*†
Polydrug
controls
0.95
(1.18)
0.65
(1.34)
0.37
(1.84)
1.61
(1.64)
1.10
(1.69)
0.64
(1.43)
0.45
(2.34)
Drug
naïve
controls
0.96
(2.30)
0.74
(1.86)
0.28
(1.12)
0.88
(1.53)
0.59
(1.29)
0.59
(1.71)
0.47
(1.63)
Mixed ANOVA of mean amplitudes at component P3 (290-400ms) revealed a
significant main effect of electrode site F(4.04, 206.02)=15.78, p<.01, though the electrode
by user group interaction was non-significant F(8.08, 206.02)=0.99, p>.05. There was
however a significant main effect of group F(2,51)=3.35, p<.05. To further explore this
difference, a series of one-way ANOVAs were conducted. This yielded significant effect of
*Indicates a significant difference from polydrug controls at the .05 level, and ** at the .01 level;
† indicates a significant difference from drug naïve controls at the .05 level and †† at the .01 level.

157
group at electrode O1 F(2,51)=3.80, p<.05, with post-hoc tests indicating that both drug
using groups had a significantly diminished mean amplitude compared to drug naïve
participants (p<.05), the two drug user groups did not differ from each other (p>.05). There
were also significant differences at electrode POz F(2,51)=4.56, p<.05, and again, post-hoc
analysis showed that both drug groups had significantly lower mean amplitude than drug
naïve participants (p<.05). The two drug user groups did not differ from each other (p>.05).
Significant differences were also apparent at PO4 F(2,51)=3.11, p<.05, with post-hoc tests
indicating that polydrug users had significantly lower mean amplitude than drug naive
participants (p<.05). Differences at electrode Oz were approaching significance F(2,51)=2.88,
p=.07. Post-hoc analysis showed that polydrug users had significantly lower mean amplitude
than drug naïve controls (p<.05). The grand average waveforms for each group (users,
polydrug controls and drug naïve controls), for the electrodes showing significant differences
in the P3 component can be observed in Figure 6.7.

158
Figure 6.7. Grand average waveforms for the 3 groups across electrodes: O1, Oz, POz and PO4 (correct switches)
O1 Oz POz PO4
Fig. 6.7: Depicts the waveforms from electrodes that showed significant group differences in the P3 component. Ecstasy users are displayed in blue, polydrug users are
displayed in black and drug naïve controls are displayed in lilac. These waveforms are from grand averaged data from each user group. The significant differences between
drug naïve controls and both drug user groups can be seen in O1and POz (290-400ms). Differences between polydrug users and drug naïve participants can be seen in Oz and
PO4.
Milliseconds Milliseconds Milliseconds Milliseconds
159
Regression analyses were conducted on the four electrodes showing differences, to
observe whether level use of ecstasy (after controlling for cannabis use) was a predictor of
amplitude at the electrodes O1, POz, PO4 and Oz. In the first regression, amplitude at O1 was
entered as the dependent variable; in the first step indices of cannabis use were entered as
predictors (frequency of use, total lifetime dose, amount smoked in the last 30 days) and in
the second step, the same indices of ecstasy use were entered as predictors. The overall
regression model accounted for a significant 24.4% (R² = 0.24, R² adjusted = 0.15,
F(6,47)=2.53, p<0.05) of the variance in O1 amplitude. However, cannabis use indices (step
1) did not predict a significant amount of the variance in O1 amplitude (R² = 0.10, R² adjusted
= 0.04, F(3,50)=1.80, p>0.05); Cannabis use variables; frequency of use (β=-0.72, p>0.05)
and amount smoked in the last 30 days (β=1.11, p>0.05) did not predict O1 amplitude,
however total lifetime dose (β=-1.11, p<0.01), was a significant predictor (greater use =
lower amplitude). The ecstasy use indices (step 2) predicted a significant amount of variance
in O1 amplitude, after controlling for cannabis use indices (R ²change=0.147, F-change
(3,47)=3.05, p<.05). Specifically lifetime ecstasy dose was a significant predictor (β=0.74,
p<.01) with greater ecstasy use being associated with increased amplitude. However
frequency of use (β=0.02, p>0.05) and last 30 day use (β=0.02, p>0.05) were not significant
predictors.
A second regression was conducted with amplitude at POz entered as the dependent
variable. The overall regression model accounted for a non-significant 6% (R² = 0.06, R²
adjusted = -0.06, F(6,47)=4.96, p>0.05) of the variance in POz amplitude. Cannabis use
indices (step 1) did not predict a significant amount of the variance in POz amplitude (R² =
0.05, R² adjusted = -0.01, F(3,50)=0.92, p>0.05); none of the three cannabis use variables
predicted POz amplitude; frequency of use (β=-0.15, p>0.05), total lifetime dose (β=-0.42,
p>0.05) and amount smoked in the last 30 days (β=0.41, p>0.05). The ecstasy use indices

160
(step 2) did not predict significant amount of variance in POz amplitude, after controlling for
cannabis use indices (R ²change=0.01, F-change (3,47)=0.12, p>.05). None of the ecstasy use
variables predicted POz amplitude; frequency of use (β=0.06, p>0.05), total lifetime dose
(β=0.07, p>0.05) and last 30 day use (β=-0.08, p>0.05).
Amplitude at PO4 was entered as the dependent variable in the third regression. The
overall regression model accounted for a non-significant 7.7% (R² = 0.08, R² adjusted = -0.04,
F(6,47)=0.65, p>0.05) of the variance in PO4 amplitude. Cannabis use indices (step 1) did
not predict a significant amount of the variance in PO4 amplitude (R² = 0.06, R² adjusted =
0.01, F(3,50)=1.09, p>0.05); none of the three cannabis use variables predicted PO4
amplitude; frequency of use (β=-0.50, p>0.05), total lifetime dose (β=-0.07, p>0.05) and
amount smoked in the last 30 days (β=0.53, p>0.05). The ecstasy use indices (step 2) did not
predict significant amount of variance in PO4 amplitude, after controlling for cannabis use
indices (R ²change=0.02, F-change (3,47)=0.26, p>.05). None of the ecstasy use variables
predicted PO4 amplitude; frequency of use (β=0.09, p>0.05), total lifetime dose (β=-0.17,
p>0.05) and last 30 day use (β=-0.13, p>0.05).
Amplitude at Oz was entered as the dependent variable in the 4th regression. The
steps entered were consistent with the previous regressions. The overall regression model
accounted for 20.3% (R² = 0.20, R² adjusted = 0.10, F(6,47)=1.99, p=0.09) of the variance in
Oz amplitude (approaching significance). Cannabis use indices (step 1) did not predict a
significant amount of the variance in Oz amplitude (R² = 0.11, R² adjusted = 0.06,
F(3,50)=2.11, p>0.05); however total lifetime joints (β=-0.95, p<0.05) significantly predicted
Oz amplitude (increased dose associated with decreased amplitude), and amount smoked in
the last 30 days approached significance (β=1.12, p=0.06) (increased use associated with
increased amplitude). Frequency of use did not predict Oz amplitude (β=-0.54, p>0.05). The

161
ecstasy use indices (step 2) did not predict significant amount of variance in Oz amplitude,
after controlling for cannabis use indices (R ²change=0.09, F-change (3,47)=1.77, p>.05).
The ecstasy use variables frequency of use (β=0.09, p>0.05) and last 30 day use (β=-0.17,
p>0.05) did not predict Oz amplitude; however total lifetime dose (β=0.46, p=0.08) was
approaching significance (increased use associated with increased amplitude).
Mixed ANOVA of mean amplitudes at component N2 (170-220) revealed a
significant main effect of electrode F(4.27, 217.82)=12.23, p<.01. The electrode by user
group interaction F(8.54, 217.82)=0.76, p>.05, and the main effect of group F(2,51)=1.83,
p>.05, were however non-significant so this component is not discussed further.
At component P2 (200-250ms) Mixed ANOVA revealed a non-significant effect of
electrode F(3.30, 168.44)=1.60, p>.05, though the electrode by user group interaction was
significant F(6.61, 168.44)=2.12, p<.05. The main effect of group was not significant for this
component F(2,51)=2.11, p>.05. To further explore the nature of the significant interaction, a
series of one way ANOVAs were used. These yielded significant group differences at
electrode Fz F(2,51)=3.52, p<.05, with post-hoc analysis showing that ecstasy users had
significantly greater mean amplitude compared to both other groups (p<.05); at electrode FCz
F(2,51)=5.66, p<.01, with ecstasy users having significantly greater mean amplitude than
both other groups (p<.05); and at electrode Cz F(2,51)=3.14, p<.05, with ecstasy users
showing greater amplitude than both other groups (p<.05). Inspection of Table 6.7 suggests
that for all the electrodes, ecstasy users have higher mean P2 amplitudes than the other two
groups, with the exception of electrode FC3, where the opposite pattern is seen. The grand
average waveforms of each group, for the electrodes showing significant differences in the P2
component can be observed in Figure 6.8.
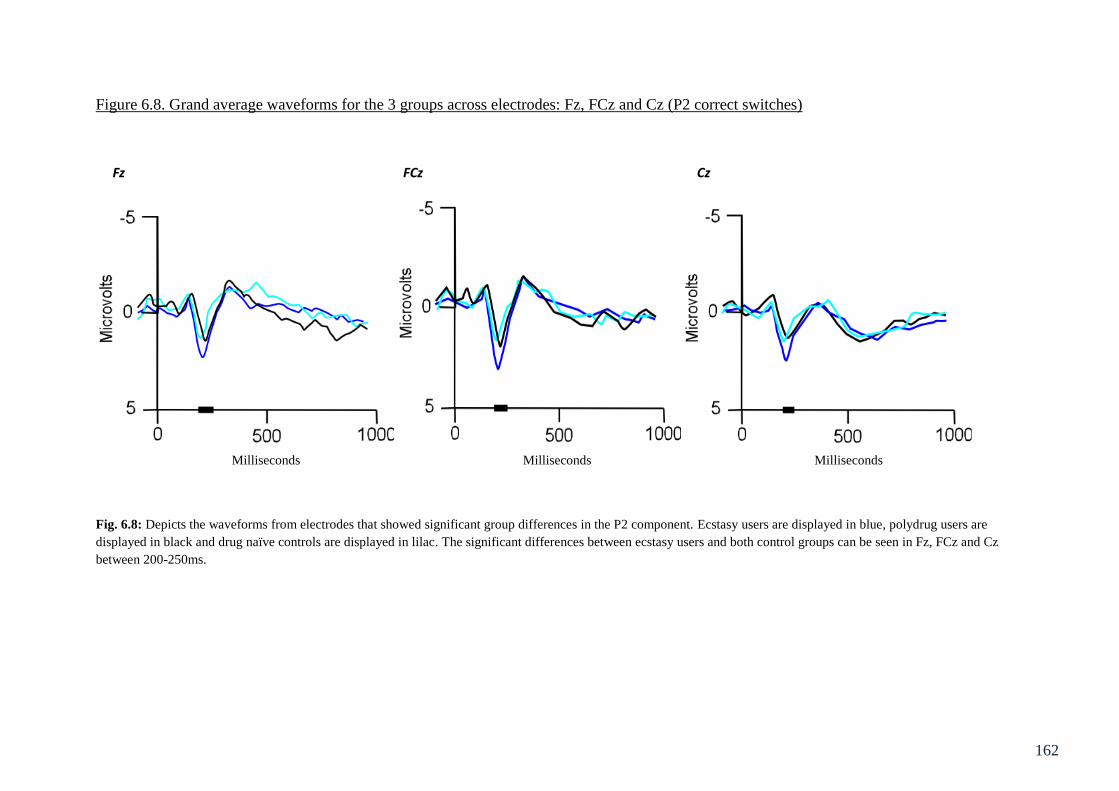
162
Figure 6.8. Grand average waveforms for the 3 groups across electrodes: Fz, FCz and Cz (P2 correct switches)
Fz FCz Cz
Fig. 6.8: Depicts the waveforms from electrodes that showed significant group differences in the P2 component. Ecstasy users are displayed in blue, polydrug users are
displayed in black and drug naïve controls are displayed in lilac. The significant differences between ecstasy users and both control groups can be seen in Fz, FCz and Cz
between 200-250ms.
Milliseconds Milliseconds Milliseconds
163
Regression analyses were conducted on the three electrodes showing differences, to
observe whether level use of ecstasy (after controlling for cannabis use) was a predictor of
amplitude at the electrodes Fz, FCz and Cz. In the first regression, amplitude at Fz was
entered as the dependent variable; in the first step indices of cannabis use were entered as
predictors (frequency of use, total lifetime dose, amount smoked in the last 30 days) and in
the second step, the same indices of ecstasy use were entered as predictors. The overall
regression model accounted for a non-significant 16.5% (R² = 0.16, R² adjusted = 0.06,
F(6,47)=1.55, p>0.05) of the variance in Fz amplitude. Cannabis use indices (step 1) did not
predict a significant amount of the variance in Fz amplitude, although this was approaching
significance (R² = 0.12, R² adjusted = 0.07, F(3,50)=2.34, p=0.09); none of the three cannabis
use variables predicted Fz amplitude; frequency of use (β=0.45, p>0.05), total lifetime dose
(β=-0.23, p>0.05) and amount smoked in the last 30 days (β=-0.19, p>0.05). The ecstasy use
indices (step 2) did not predict significant amount of variance in Fz amplitude, after
controlling for cannabis use indices (R ²change=0.04, F-change (3,47)=0.79, p>.05). None of
the ecstasy use variables predicted Fz amplitude; frequency of use (β=0.00, p>0.05), total
lifetime dose (β=-0.16, p>0.05) and last 30 day use (β=0.32, p>0.05).
FCz was entered as the dependent variable in the second regression. This overall
regression model accounted for a significant 22.4% (R² = 0.22, R² adjusted = 12.5,
F(6,47)=2.26, p<0.05) of the variance in FCz amplitude. Cannabis use indices (step 1)
predicted a significant amount of the variance in FCz amplitude (R² = 0.14, R² adjusted =
0.09, F(3, 50)=2.80, p<0.05); However none of the three individual cannabis use variables
predicted FCz amplitude; frequency of use (β=0.43, p>0.05), total lifetime dose (β=-0.46,
p>0.05) and amount smoked in the last 30 days (β=-0.17, p>0.05). The ecstasy use indices
(step 2) did not predict significant amount of variance in FCz amplitude, after controlling for
cannabis use indices (R ²change=0.08, F-change (3,47)=1.62, p>.05). Individual ecstasy use

164
variables did not predict FCz amplitude; frequency of use (β=0.03, p>0.05), and last 30 day
use (β=0.32, p>0.05), however total lifetime dose was approaching significance (β=0.46,
p=0.08) with increased use being associated with increased amplitude.
In the third regression Cz was entered as the dependent variable. This overall regres-
sion model accounted for a non-significant 5% (R² = 0.05, R² adjusted = -0.07, F(6,47)=0.43,
p>0.05) of the variance in Cz amplitude. Cannabis use indices (step 1) did not predict a
significant amount of the variance in Cz amplitude (R² = 0.03, R² adjusted = -0.03,
F(3,50)=0.47, p>0.05); None of the three individual cannabis use variables predicted Cz
amplitude; frequency of use (β=0.18, p>0.05), total lifetime dose (β=-0.39, p>0.05) and
amount smoked in the last 30 days (β=-0.04, p>0.05). The ecstasy use indices (step 2) did not
predict significant amount of variance in Cz amplitude, after controlling for cannabis use
indices (R ²change=0.03, F-change (3,47)=0.42, p>.05). None of the ecstasy use variables
predicted Cz amplitude; frequency of use (β=0.08, p>0.05), total lifetime dose (β=-0.26,
p>.05).and last 30 day use (β=0.49, p>0.05).
Semantic Association: Mean amplitudes for each condition and electrode are given in
Table 6.8. Due to some unusable EEG data, 1 participant is excluded from statistical analysis
on the EEG data, from the drug naïve group (n=19).

165
Table 6.8: Mean amplitudes (µvolts) across components, for each electrode measured for the
semantic association task.
User group PO7 PO3 O1 Oz POz PO8 PO4 O2
P3 high association
Ecstasy users 2.95 (4.02) 3.94 (2.42) 2.76 (3.01) 1.60 (3.24) 4.19 (2.34) 4.40 (3.23) 4.94 (2.99) 3.31 (3.59)
Polydrug controls 4.12 (2.83) 2.97 (2.57) 3.52 (4.60) 3.04 (3.40) 3.28 (2.27) 5.72 (3.78) 4.05 (3.27) 3.32 (3.32)
Drug naïve
controls
3.62 (3.19) 3.92 (2.39) 2.84 (3.17) 2.13 (3.14) 3.42 (2.56) 5.35 (3.40) 4.00 (2.21) 3.27 (2.75)
P3 low association
Ecstasy users 3.48 (3.74) 4.60 (2.74) 2.32 (3.57) 1.79 (2.90) 4.46 (2.40) 3.78 (2.92) 4.98 (3.33) 2.97 (3.39)
Polydrug controls 4.16 (3.29) 3.44 (3.16) 2.27 (4.40) 2.70 (2.85) 3.89 (2.26) 5.92 (4.61) 4.41 (3.67) 3.14 (3.90)
Drug naïve
controls
4.32 (3.42) 4.40 (2.64) 3.08 (3.46) 2.22 (3.21) 3.93 (2.80) 6.07 (3.32) 4.54 (2.69) 3.78 (2.92)
N2 high association
Ecstasy users -1.66 (3.41) -1.32 (3.55) -2.19 (3.53) -2.51 (3.45) -0.70 (4.01) -1.41 (3.20) -1.04 (3.69) -2.17 (4.12)
Polydrug Controls -2.06 (4.57) -2.37 (2.90)†† -2.41 (4.36) -0.59 (4.19) -0.58 (2.42) -0.09 (4.11) -0.44 (2.57) -1.15 (3.44)
Drug naïve
controls
-0.58 (3.11) 0.67 (2.95) -0.36 (3.43) 0.09 (3.78) 1.22 (3.03) 1.12 (3.50) 0.82 (3.19) 0.33 (3.51)
N2 low association
Ecstasy users -1.40 (3.55) -0.95 (3.76) -2.76 (4.19) -1.98 (3.57) -0.17 (3.62) -1.56 (3.53)† -1.01 (3.67) -2.40 (3.75)†
Polydrug controls -1.69 (4.69) -1.55 (3.15) -2.11 (4.47) -1.09 (3.43) -0.28 (2.16) -0.22 (4.02) -0.29 (1.91) -0.10 (3.71)
Drug naïve
controls
0.01 (3.67) 0.65 (2.97) -0.33 (4.07) -0.99 (3.62) 1.55 (2.91) 1.30 (3.58) 0.91 (2.73) 0.67 (3.48)
P2 high association
Fz FCz FC1 FC2 Cz C1 C2
Ecstasy users 0.55 (2.15) 1.49 (2.04) 1.15 (1.79) 0.86 (2.09) 1.91 (1.48) 0.89 (2.13) 0.77 (1.53)
Polydrug controls 1.07 (1.98) 1.85 (1.54) 1.28 (1.52) 1.05 (1.87) 1.53 (1.73) 0.87 (1.87) 0.40 (1.64)
Drug naïve
controls
-0.10 (2.43) 0.78 (2.43) 0.61 (1.45) 0.03 (2.75) 0.59 (2.78) 0.22 (2.03) -0.22 (2.72)
P2 low association
Ecstasy users 0.87 (2.59) 1.64 (2.39) 1.33 (2.54) 0.83 (2.75) 1.55 (1.97) 1.06 (1.45) 0.93 (1.40)
Polydrug controls 0.51 (1.42) 1.72 (1.62) 1.49 (2.81) 0.98 (1.74) 1.38 (1.77) 0.88 (1.99) 0.62 (1.79)
Drug naïve
controls
0.14 (1.90) 0.72 (2.16) 0.54 (1.98) 0.41 (1.79) 0.81 (2.41) 0.39 (2.22) 0.54 (1.97)
*Indicates a significant difference from polydrug controls at the .05 level, and ** at the .01 level;
† indicates a significant difference from drug naïve controls at the .05 level and †† at the .01 level.

166
A mixed ANOVA, with between subjects factor of group and within subjects factors
of difficulty (high association and low association) and site (PO7, PO3, O1, OZ, POZ, , PO4,
PO8 and O2) on the P3 component revealed no main effect of difficulty F(1,56) 0.71, p>.05,
no difficulty by group interaction F(2,56)=0.60, p>.05, no main effect of site F(4.18,
233.99)=13.97, p>.05, no difficulty by site interaction F(3.42, 191.64)=1.56, p>.05 and no
difficulty by site by group interaction F(6.84, 191.64)=0.61, p>.05. However there was a
significant site by user group interaction F(8.36, 233.99)=1.65, p<.05. There were no
significant between group effects F(2,56)=0.74, p>.05, so these were not investigated further.
To further explore the site by user group interaction, a series of univariate ANOVAs were run
with group as the between groups variable and amplitude at the various sites as the dependent
variable. This yielded no significant differences between the three groups and no significant
post-hoc comparisons, p>.05 in all cases.
A mixed ANOVA, with between subjects factor of group and within subjects factors
of difficulty (high association and low association) and site (PO7, PO3, O1, OZ, POZ, , PO4,
PO8 and O2) on the N2 component revealed no main effect of difficulty F(1,56)=1.05, p>.05,
no difficulty by group interaction F(2,56)=0.04, p>.05, no main effect of site F(3.82,
213.92)=6.37, p>.05, no site by group interaction F(7.64, 213.92)=1.10, p>.05, no difficulty
by site interaction F(4.78, 267.40)=0.81, p>.05 and no difficulty by site by group interaction
F(9.55, 267.40)=0.73, p>.05. Between group differences approached significance
F(2,56)=2.78, p=.07. In line with a priori predictions and to further explore this trend on the
N2 component a series of univariate ANOVAs were conducted. These revealed significant
between group differences at electrode PO3 in the high association condition F(2,56)=4.68,
p<.05, post-hoc analysis revealed that polydrug controls were significantly different (greater
negativity) to drug naïve controls at this electrode (p<.01). Significant between group
differences were also observed at electrode O2 in the low association condition F(2,56)=3.45,

167
p<.05), post-hoc analysis revealed that ecstasy users differed significantly (greater negativity)
from drug naive controls here (p<.05). Between group differences were also approaching
significance at PO8 in the low association condition F(2,56)=2.89, p=.06, again post-hoc
analysis showed that ecstasy users were significantly different (greater negativity) from drug
naïve controls here (p<.05). Ecstasy users and polydrug controls did not differ significantly
from one another at these three sites (p>.05). In all cases, ecstasy users showed a greater
negativity than drug naïve controls (Table 6.8). The grand average waveforms of each group,
for the electrodes showing significant differences in the N2 component can be observed in
Figures 6.9 and 6.10.

168
Figure 6.9. Grand average waveforms for the three groups across electrode PO3 on the high association condition of the semantic association
task.
PO3
-5
0
5
0 500 1000
Milliseconds
Mic
rovo
lts
Fig. 6.9: Depicts the grand average waveform for each user group (ecstasy users in blue, polydrug users in green and drug naïve controls in black) at PO3 for the high
association condition. Significant differences in mean amplitude in the N2component (120-200ms) between polydrug users and drug naïve controls can be observed.

169
Figure 6.10. Grand average waveforms for the three groups across electrodes O2 and PO8 on the low association condition of the semantic
association task.
O2 PO8
-5
0
5
0 500 1000
Milliseconds
Mic
rovo
lts
-5
0
5
0 500 1000
Milliseconds
Mic
rovo
lts
Fig. 6.10: Depicts the grand average waveforms for each user group (ecstasy users in blue, polydrug users in green and drug naïve controls in black) for O2 and PO8 during
the low association condition of the task.. Significant differences in mean amplitude, in the N2component (120-190ms), between ecstasy users and drug naïve controls can be
observed at both electrodes.
170
Regression analyses were conducted on the three electrodes showing significant
differences, to observe whether level use of ecstasy (after controlling for cannabis use) was a
predictor of amplitude at the electrodes PO3 (high association), O2 (low association) and
PO8 (low association). In the first regression, amplitude at PO3 (high association) was
entered as the dependent variable; in the first step indices of cannabis use were entered as
predictors (frequency of use, total lifetime dose, amount smoked in the last 30 days) and in
the second step, the same indices of ecstasy use were entered as predictors. The overall
regression model accounted for a significant 24.9% (R² = 0.25, R² adjusted = 0.16,
F(6,52)=2.88, p<0.05) of the variance in PO3 amplitude. Cannabis use indices (step 1) did
not predict a significant amount of the variance in PO3 amplitude, although this was
approaching significance (R² = 0.12, R² adjusted = 0.08, F(3,55)=2.59, p=0.06); lifetime dose
of cannabis significantly predicted PO3 amplitude (β=-1.13, p<0.01) (higher dose associated
with more negative amplitude), however frequency of use (β=0.24, p<0.05) and amount
smoked in the last 30 days (β=0.29, p>0.05) did not. The ecstasy use indices (step 2)
predicted a significant amount of variance in PO3 amplitude, after controlling for cannabis
use indices (R ²change=0.13, F-change (3,52)=2.90, p<.05). Specifically total lifetime dose
predicted PO3 amplitude (β=0.56, p<0.01) (higher dose associated with higher amplitude).
However frequency of use (β=0.11, p>0.05) and last 30 day use (β=0.22, p>0.05) did not
significantly predict PO3 amplitude.
For the second regression amplitude at O2 (low association) was entered as the
dependent variable. This overall regression model accounted for a significant 21.9% of the
variance in O2 amplitude (R² = 0.22, R² adjusted = 0.13, F(6,52)=2.43, p<0.05). Cannabis use
indices (step 1) did not predict a significant amount of the variance in O2 amplitude, although
this was approaching significance (R² = 0.12, R² adjusted = 0.07, F(3,55)=2.42, p=0.08);
lifetime dose of cannabis significantly predicted O2 amplitude (β=-0.91, p<0.01), with

171
greater use associated with greater negativity, however frequency of use (β=-0.01, p>0.05)
and amount smoked in the last 30 days (β=0.08, p>0.05) did not. The ecstasy use indices
(step 2) predicted variance in O2 amplitude that was approaching significance, after
controlling for cannabis use indices (R ²change=0.10, F-change (3,52)=2.28, p=.09). Total
lifetime dose predicted O2 amplitude (β=0.51, p<0.05) with greater use associated with
higher amplitude. However frequency of use (β=-0.13, p>0.05) and last 30 day use (β=0.28,
p>0.05) did not significantly predict PO3 amplitude.
PO8 was entered as the dependent variable in the third regression. This regression
model accounted for a non-significant 6% of the variance in PO8 amplitude (R² = 0.06, R²
adjusted = -0.05, F(6,52)=0.58, p>0.05). Cannabis use indices (step 1) did not predict a
significant amount of the variance in PO8 amplitude (R² = 0.05, R² adjusted = -0.00,
F(3,55)=0.98, p>.05); none of the individual cannabis use variables significantly predicted
PO8 amplitude; frequency of use (β=-0.03, p>0.05), lifetime dose of cannabis (β=-0.30,
p>0.05), and amount smoked in the last 30 days (β=-0.08, p>0.05). The ecstasy use indices
(step 2) did not predict a significant amount of variance in PO8 amplitude, after controlling
for cannabis use indices (R ²change=0.01, F-change (3,52)=0.23, p>.05). None of the
individual ecstasy use variables significantly predicted PO8 amplitude; frequency of use (β=-
0.05, p>0.05) total lifetime dose (β=-0.19, p>0.05) and last 30 day use (β=0.05, p>0.05).
A mixed ANOVA, with between subjects factor of group and within subjects factors
of difficulty (high association and low association) and site (FZ, FCZ, FC1, FC2, CZ, C1 and
C2) was conducted on the mean amplitudes across the epochs measured (170-230ms in both
conditions) for the P2 component. This revealed, no main effect of difficulty F(1,56)=0.32,
p>.05, no difficulty by group interaction F(2,56)=0.35, p>.05, no main effect of site F(4.21,
236.03)=5.22, p>.05, no site by group interaction F(8.43, 236.03)=0.26, p>.05, no difficulty
172
by site interaction F(4.85, 271.44)=0.51, p>.05 and no difficulty by site by group interaction
F(9.69, 271.44)=0.48, p>.05. Between group differences were also non-significant
F(2,56)=1.68, p>.05.
Updating: Mean amplitudes for each condition, ERP component and electrode are
given in Tables 6.9, 6.10, and 6.11. Due to some unusable EEG data, one participant from the
drug naïve group (n=19), one participant from the ecstasy users group (n=19) and two
participants from the polydrug group (n=18) have their data excluded from statistical analysis.
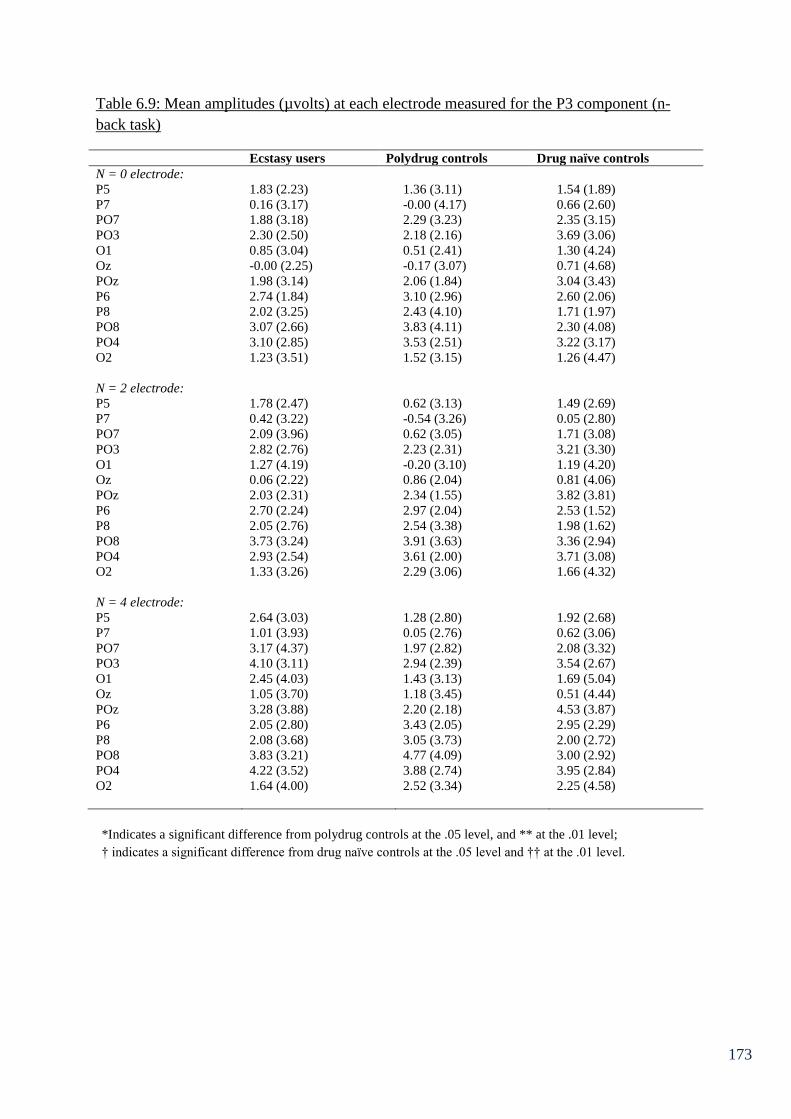
173
Table 6.9: Mean amplitudes (µvolts) at each electrode measured for the P3 component (n-
back task)
Ecstasy users Polydrug controls Drug naïve controls
N = 0 electrode:
P5 1.83 (2.23) 1.36 (3.11) 1.54 (1.89)
P7 0.16 (3.17) -0.00 (4.17) 0.66 (2.60)
PO7 1.88 (3.18) 2.29 (3.23) 2.35 (3.15)
PO3 2.30 (2.50) 2.18 (2.16) 3.69 (3.06)
O1 0.85 (3.04) 0.51 (2.41) 1.30 (4.24)
Oz -0.00 (2.25) -0.17 (3.07) 0.71 (4.68)
POz 1.98 (3.14) 2.06 (1.84) 3.04 (3.43)
P6 2.74 (1.84) 3.10 (2.96) 2.60 (2.06)
P8 2.02 (3.25) 2.43 (4.10) 1.71 (1.97)
PO8 3.07 (2.66) 3.83 (4.11) 2.30 (4.08)
PO4 3.10 (2.85) 3.53 (2.51) 3.22 (3.17)
O2 1.23 (3.51) 1.52 (3.15) 1.26 (4.47)
N = 2 electrode:
P5 1.78 (2.47) 0.62 (3.13) 1.49 (2.69)
P7 0.42 (3.22) -0.54 (3.26) 0.05 (2.80)
PO7 2.09 (3.96) 0.62 (3.05) 1.71 (3.08)
PO3 2.82 (2.76) 2.23 (2.31) 3.21 (3.30)
O1 1.27 (4.19) -0.20 (3.10) 1.19 (4.20)
Oz 0.06 (2.22) 0.86 (2.04) 0.81 (4.06)
POz 2.03 (2.31) 2.34 (1.55) 3.82 (3.81)
P6 2.70 (2.24) 2.97 (2.04) 2.53 (1.52)
P8 2.05 (2.76) 2.54 (3.38) 1.98 (1.62)
PO8 3.73 (3.24) 3.91 (3.63) 3.36 (2.94)
PO4 2.93 (2.54) 3.61 (2.00) 3.71 (3.08)
O2 1.33 (3.26) 2.29 (3.06) 1.66 (4.32)
N = 4 electrode:
P5 2.64 (3.03) 1.28 (2.80) 1.92 (2.68)
P7 1.01 (3.93) 0.05 (2.76) 0.62 (3.06)
PO7 3.17 (4.37) 1.97 (2.82) 2.08 (3.32)
PO3 4.10 (3.11) 2.94 (2.39) 3.54 (2.67)
O1 2.45 (4.03) 1.43 (3.13) 1.69 (5.04)
Oz 1.05 (3.70) 1.18 (3.45) 0.51 (4.44)
POz 3.28 (3.88) 2.20 (2.18) 4.53 (3.87)
P6 2.05 (2.80) 3.43 (2.05) 2.95 (2.29)
P8 2.08 (3.68) 3.05 (3.73) 2.00 (2.72)
PO8 3.83 (3.21) 4.77 (4.09) 3.00 (2.92)
PO4 4.22 (3.52) 3.88 (2.74) 3.95 (2.84)
O2 1.64 (4.00) 2.52 (3.34) 2.25 (4.58)
*Indicates a significant difference from polydrug controls at the .05 level, and ** at the .01 level;
† indicates a significant difference from drug naïve controls at the .05 level and †† at the .01 level.

174
Table 6.10: Mean amplitudes (µvolts) for each electrode measured for the N2 component.
Ecstasy users Polydrug controls Drug naïve controls
N = 0 electrode:
P6 -0.90 (1.89) -0.47 (20.6) 0.04 (1.45)
P8 -1.78 (2.68) -0.98 (2.38) -0.43 (2.40)
PO8 -2.45 (3.55) -1.45 (3.23) -0.95 (3.47)
N=2 electrode:
P6 -0.48 (1.77) -0.41 (1.78) -0.03 (1.45)
P8 -1.17 (3.05) -1.37 (2.82) -0.99 (2.40)
PO8 -1.65 (3.41) -1.87 (3.63) -0.76 (3.37)
N=4 electrode:
P6 -1.41 (2.17) 0.07 (2.42) 0.29 (1.57)
P8 -1.67 (3.61) -0.86 (3.03) -0.62 (2.51)
PO8 -1.73 (4.40) -1.15 (4.10) -0.88 (2.80)
*Indicates a significant difference from polydrug controls at the .05 level, and ** at the .01 level;
† indicates a significant difference from drug naïve controls at the .05 level and †† at the .01 level.
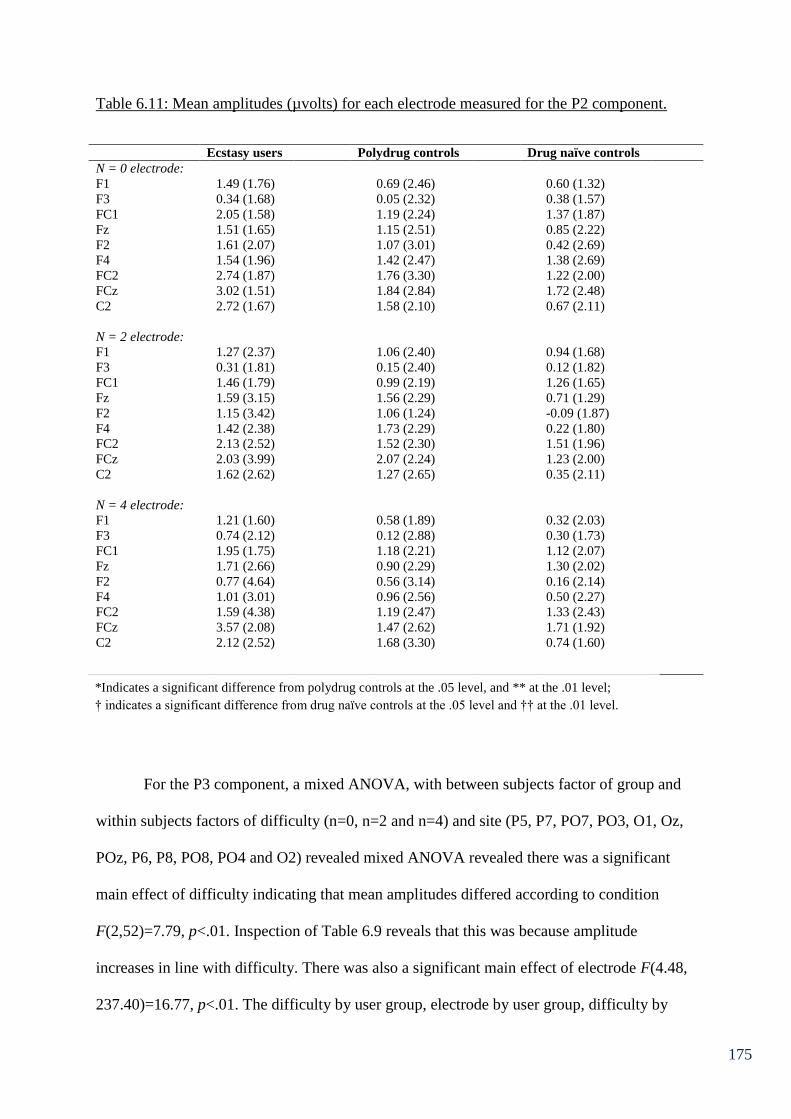
175
Table 6.11: Mean amplitudes (µvolts) for each electrode measured for the P2 component.
Ecstasy users Polydrug controls Drug naïve controls
N = 0 electrode:
F1 1.49 (1.76) 0.69 (2.46) 0.60 (1.32)
F3 0.34 (1.68) 0.05 (2.32) 0.38 (1.57)
FC1 2.05 (1.58) 1.19 (2.24) 1.37 (1.87)
Fz 1.51 (1.65) 1.15 (2.51) 0.85 (2.22)
F2 1.61 (2.07) 1.07 (3.01) 0.42 (2.69)
F4 1.54 (1.96) 1.42 (2.47) 1.38 (2.69)
FC2 2.74 (1.87) 1.76 (3.30) 1.22 (2.00)
FCz 3.02 (1.51) 1.84 (2.84) 1.72 (2.48)
C2 2.72 (1.67) 1.58 (2.10) 0.67 (2.11)
N = 2 electrode:
F1 1.27 (2.37) 1.06 (2.40) 0.94 (1.68)
F3 0.31 (1.81) 0.15 (2.40) 0.12 (1.82)
FC1 1.46 (1.79) 0.99 (2.19) 1.26 (1.65)
Fz 1.59 (3.15) 1.56 (2.29) 0.71 (1.29)
F2 1.15 (3.42) 1.06 (1.24) -0.09 (1.87)
F4 1.42 (2.38) 1.73 (2.29) 0.22 (1.80)
FC2 2.13 (2.52) 1.52 (2.30) 1.51 (1.96)
FCz 2.03 (3.99) 2.07 (2.24) 1.23 (2.00)
C2 1.62 (2.62) 1.27 (2.65) 0.35 (2.11)
N = 4 electrode:
F1 1.21 (1.60) 0.58 (1.89) 0.32 (2.03)
F3 0.74 (2.12) 0.12 (2.88) 0.30 (1.73)
FC1 1.95 (1.75) 1.18 (2.21) 1.12 (2.07)
Fz 1.71 (2.66) 0.90 (2.29) 1.30 (2.02)
F2 0.77 (4.64) 0.56 (3.14) 0.16 (2.14)
F4 1.01 (3.01) 0.96 (2.56) 0.50 (2.27)
FC2 1.59 (4.38) 1.19 (2.47) 1.33 (2.43)
FCz 3.57 (2.08) 1.47 (2.62) 1.71 (1.92)
C2 2.12 (2.52) 1.68 (3.30) 0.74 (1.60)
For the P3 component, a mixed ANOVA, with between subjects factor of group and
within subjects factors of difficulty (n=0, n=2 and n=4) and site (P5, P7, PO7, PO3, O1, Oz,
POz, P6, P8, PO8, PO4 and O2) revealed mixed ANOVA revealed there was a significant
main effect of difficulty indicating that mean amplitudes differed according to condition
F(2,52)=7.79, p<.01. Inspection of Table 6.9 reveals that this was because amplitude
increases in line with difficulty. There was also a significant main effect of electrode F(4.48,
237.40)=16.77, p<.01. The difficulty by user group, electrode by user group, difficulty by
*Indicates a significant difference from polydrug controls at the .05 level, and ** at the .01 level;
† indicates a significant difference from drug naïve controls at the .05 level and †† at the .01 level.
176
electrode and difficulty by electrode by user group interactions were all non-significant
(p>.05 in all cases). There was no significant effect of user group F(2,53)=0.03, p>.05.
Therefore this component will not be discussed further.
A mixed ANOVA, with between subjects factor of group and within subjects factors
of difficulty and site (P6, P9 and PO8) on the N2 component revealed a main effect of
electrode F(2,52)=5.58, p<.01. The effects of difficulty and the difficulty by user group,
electrode by user group, difficulty by electrode and difficulty by electrode by user group
interactions were all non-significant p>.05 in all cases. There was no effect of user group
F(2,53)=1.02, p>.05. Therefore this component will not be discussed further.
For the P2 component, a mixed ANOVA, with between subjects factor of group and
within subjects factors of difficulty and site (F1, F3, FC1, Fz, F2, F4, FC2, FCz and C2)
showed the effects of difficulty were non-significant F(2,52)=0.94, p>.05 as was the
difficulty by user group interaction F(4,106)=0.39, p>.05. There was however, a main effect
of electrode F(5.32,282.18)=8.92, p<.01. The electrode by user group, difficulty by electrode
and difficulty by electrode by user group interactions were all non-significant, p>.05 in all
cases. Finally, there was no significant effect of group F(2,53)=1.65, p>.05. As such this
component is not discussed further.
Implications of Chapter 6
The ERP results from Chapter 6 support the view that ecstasy/polydrug use does alter
cognitive processes involved in the executive functions of inhibitory control, switching and
access. Furthermore these findings are independent of gender, age, fluid intelligence, daytime
sleepiness, morningness-eveningness types, weekly alcohol intake and state levels of arousal,
anxiety and depression. Differences between ecstasy users and both control groups in the P2
component during the Go/NoGo task reflect atypical early processing in ecstasy users (the

177
implications of which will be discussed in more detail in Chapter 10). Moreover recency of
use may play a role in inhibition, given that amount of ecstasy used in the last 30 days was a
significant predictor of FCz amplitude after controlling for cannabis use indices.
Furthermore a diminished P3 response to switching was observed in ecstasy users and
polydrug controls relative to drug naïve controls at several parieto-occipital and occipital
electrode sites. The regression analysis on electrode O1 for the P3 component suggested that
lifetime cannabis use significantly predicted the diminished P3 amplitude in the first step.
Although lifetime ecstasy use was a significant predictor of P3 amplitude after controlling for
cannabis use, this appeared to predict amplitude in the opposite direction. This task also
yielded ecstasy specific alterations in the P2 component at fronto-central sites, perhaps again
reflecting alterations to early processing suggestive of compensatory mechanisms; lifetime
dose of ecstasy approached significance for predicting amplitude at FCz in this component.
The N2 component during the low association (more difficult) level of the semantic
association task showed ecstasy-related differences in comparison to controls at occipital and
parieto-occipital sites (O2 and PO8). Ecstasy users were not significantly different from
polydrug controls so the results need treating with caution. There were no differences in P3
amplitude between groups in the semantic association task. These results potentially reflect
evidence of cognitive reallocation, or compensatory mechanisms in ecstasy/polydrug users to
ameliorate behavioural differences, given that there were no between group differences on
behavioural performance on these three tasks. Unexpectedly, no between group differences
were observed in performance (errors) on the n-back task. However there were reaction time
differences indicating that drug naïve controls were significantly slower to respond than
polydrug users on the n-back task. Drug naïve controls were also slower than ecstasy users
for reaction times on the n-back task (although non-significant). Moreover, inspection of
table 6.5 shows that although non-significant, drug naïve participants made fewer errors on
178
the task than ecstasy users. This data tentatively suggests an accuracy/speed trade off as a
function of increased impulsivity in ecstasy users, although these differences are non-
significant. Furthermore polydrug controls show the lowest error rates as well as fastest
reaction time. There were no between group differences in the ERP components during the
updating task, this was contrary to expectations and potential reasons for this will be
discussed in Chapter 10. Due to this function showing more consistent deficits in ecstasy
users in the literature, it will be explored further in Chapter 7, using alternative tasks and
neuroimaging measures.
179
Chapter 7: fNIRS and Updating
7.1 Chapter Overview
Chapter 6 showed electrophysiological differences in the executive functions of inhibitory
control, switching and access. However no such difference was observed with regards to the
EEG data from memory updating. This chapter aims to further explore the nature of this
executive function in relation to ecstasy use. In this chapter the updating function of the
central executive has been assessed behaviourally using letter updating and spatial updating
tasks. Furthermore the haemodynamic response to task has been assessed using fNIRS.
Twenty ecstasy users, 20 polydrug controls and 20 drug naïve controls were recruited for this
study. Behavioural performance on the letter updating task and the spatial updating task was
equivalent between the 3 groups. However analysis of fNIRS data showed MDMA related
alterations to haemodynamic response that may reflect compensatory functioning.
7.2 Introduction
The Updating component of working memory as previously discussed has been
shown to be degraded in ecstasy users. Results from Chapter 6 do not reflect ecstasy-related
deficits in this function in the sample studied. However the n-back task has been employed in
the ecstasy literature previously and yielded few observable deficits between users and non-
users (Gouzoulis-Mayfrank et al., 2003; Daumann, Fimm et al., 2003). Nevertheless studies
employing this task with haemodynamic neurophysiological measures have observed
haemodynamic correlates that reflect subtle cognitive alterations (Daumann, Fimm et al.,
2003: Daumann, Schnitker et al., 2003). Perhaps electrophysiological differences were
undetectable in the last chapter due to the variability in response times from the time-locked
probe, due to the difficulty of the task. The n-back task that was employed would have
required more protracted mental calculations than the tasks assessing the other executive

180
functions, and as such may have produced a large amount of noise for the time locked ERPs.
Haemodynamic response to stimuli is not instantaneous. It is understood that the
haemodynamic response occurs over a 10-12 second epoch (Izzetoglu et al., 2005; Miezin et
al., 2000). As such, activity over a block of trials may be a better way to measure neuronal
response. Given that the updating task requires continuous monitoring of information,
perhaps measurements of neuronal activity over the entire updating process will provide a
greater understanding of how ecstasy affects this process.
fNIRS is an emerging non-invasive neuroimaging tool that measures cerebral blood
flow. Due to cerebral blood flow and neuronal activation being closely linked (Villringer &
Dirnagl, 1995), fNIRS can be used to assess the haemodynamic response to mental demand.
More specifically fNIRS uses wavelengths of light in the near infrared range to assess levels
of oxygenated and deoxygenated haemoglobin in the prefrontal cortex (PFC). Areas of the
PFC are easily accessed by this type of neuroimaging due to it having a penetration depth of
2-3mm (Firbank et al., 1998). As such fNIRS is ideal for observing neurological activation
during tasks that load on the (DL)PFC such as executive functioning tasks. Increases in the
chromophore oxy-Hb are accepted as reflecting an increase in neuronal activity in certain
brain regions (Leff et al., 2011). Furthermore it is hypothesised that although blood
oxygenation is expected to increase with increased workload, this is only if the participant is
engaged in the task, whereas if the task becomes too difficult and attention shifts (as well as
performance decline), a decrease in oxygenation will be observed (Izzetoglu et al., 2004).
The distribution of the activation response is regionally specific i.e. the cortical regions
underlying the voxels at which the activation is observed are responsible for the activation
(Leff et al., 2011). Often an increase in oxygenated haemoglobin is coupled with a decrease
in deoxygenated haemoglobin (Ehlis et al., 2008; Leff et al., 2008; Leff et al., 2011).
However, increases in oxy-Hb have also been observed to be coupled with increases in
181
deoxy-Hb (Hoshi & Tamura, 1993; Sakatani et al., 1999). The relationship between
oxygenated and deoxygenated haemoglobin is non-linear and estimates of total haemoglobin
are sometimes calculated as a correlate of neuronal activation (Ayaz et al., 2012). Total
haemoglobin is obtained from summating oxygenated and deoxygenated haemoglobin. As
such increases in deoxy-Hb may reflect increased neuronal activity. However oxy-Hb is
generally accepted as the best indicator of neuronal activity.
Although there is currently a paucity of empirical research on substance users with
this type of technology, there have been studies investigating cognitive impairments
associated with neurological disease and psychiatric disorders (Ehlis et al., 2008; Falgatter et
al., 1997; Hermann et al., 2008). Generally, participants with neurological disease such as
Alzheimer’s are reported as performing worse on cognitive tasks than healthy controls (Ehlis
et al., 2008; Herrmann et al., 2008), and this is usually coupled with a decrease in oxy-Hb.
This technology has also been used as a measure of mental workload in human operators
(Ayaz et al., 2012) to improve efficiency of human-machine systems in critical tasks.
Although human operators may have similar performance output, fNIRS was incorporated as
an additional measure of mental workload, given that increased effort (indexed by increased
oxy-Hb) is predictive of future failure. As such operator efficiency could be predicted from
their haemodynamic response to demanding tasks.
As well as integrating haemodynamic measures to assess this function in ecstasy
using populations. It may be useful to explore this function in greater depth using tasks that
are shown in the literature to reliably produce effects in ecstasy users. The letter updating task
and the spatial updating task have both yielded behavioural deficits in ecstasy users
previously (Montgomery & Fisk, 2008; Montgomery, Fisk, Newcombe & Murphy, 2005).
Montgomery, Fisk, Newcombe and Murphy (2005) observed performance deficits in ecstasy
182
users compared to non-users on the letter updating task. The nature of this deficit was
explored further by Montgomery and Fisk (2008), in which, the analyses explored whether
the ecstasy/polydrug deficit is more pronounced at specific serial positions, or whether length
of sequence was a critical factor in performance. In this study, analyses were also varied for
letter span and spatial span. Deficits in ecstasy users were observed for letter updating, in
participants with simple spans of 5 and 6 compared to controls, and deficits in spatial
updating were observed in ecstasy users with a simple span of 5. This study also suggested
that ecstasy users may display deficits in early serial position recall, with those with spatial
spans of 4 and 5, and those with letter spans of 6 showing impairment of recall of stimuli at
early serial positions. The authors suggest that ecstasy use may lead to greater susceptibility
to chunk destruction during the updating process as an explanation of why early serial
positions show impairments. Furthermore correlational analysis revealed that indices of
ecstasy use such as total lifetime dose and average weekly dose had a significant negative
correlation with letter updating and spatial updating performance. The correlations suggest
that greater use of ecstasy is associated with poorer updating performance. Moreover indices
of cannabis and cocaine use were not significantly correlated with letter or spatial updating
performance.
The aim of this study is to fully elucidate the effects of ecstasy on the haemodynamic
response to memory updating by using fNIRS in combination with spatial updating and
consonant updating tasks. It is predicted that ecstasy users will show performance deficits in
the updating tasks as well as alterations to their haemodynamic response relative to polydrug
controls and drug naïve controls. However if performance is equivalent, it is predicted that
ecstasy users will display evidence of more effortful cognition from their haemodynamic
response (increases in oxy-Hb).
183
7.3 Method
Design:
For analysis of behavioural data and fNIRS data a between groups design was used.
The between groups factor was drug user group which consisted of three levels (ecstasy users,
polydrug controls and drug naïve controls). Univariate ANOVA was performed on the
behavioural data for both letter updating and spatial updating, with composite scores on each
task as the dependent variables. The fNIRS data was analysed with univariate ANOVAs
using mean oxy and deoxy-Hb changes from baseline as the dependent variables (voxels 1-
16). Any significant main effects were further investigated using Tukey’s HSD.
Participants:
Twenty ecstasy users (mean age = 21.76, SD = 3.19, 11 = male), 20 polydrug controls
(mean age = 19.75, SD = 1.48, 11 = male) and 20 drug naïve controls (mean age = 19.68, SD
= 1.89, 9 = male) were recruited via direct approach (e-mail) to Liverpool John Moores
University students. Inclusion and exclusion criteria were the same as that in Chapter 6.
Indices of ecstasy use were as follows: total lifetime dose 1305.31 tablets ± 4951.61; mean
amount used in last 30 days 3.80 tablets ± 4.63, and frequency of use 0.39 times/week ± 0.48.
Materials
Questionnaires
The Background Drug Use Questionnaire, sleep quality questionnaire, The ESS, The
MEQ, KSS, UMACL, NASA-TLX and Raven’s SPM were used, as described in Chapter 6.
184
Updating Tasks
The letter and spatial updating tasks were carried out as per Montgomery and Fisk
(2008), whereby each participant’s letter and spatial span were first calculated prior to
conducting the updating tasks.
Letter span: Consonants appeared on a computer monitor sequentially and remained
on screen for 1.25s each. Following presentation of a sequence of letters, participants were
required to recall the order in which the letters appeared. To begin with three sets of two
letters were presented, progressing to three sets of three letters, then three sets of four letters
and so on up until three sets of seven letters. Participants’ span is noted as the largest string of
letters they can recall accurately on at least two of the three trials.
Spatial span: Analogous to the letter span task, participants had to recall the positions
of highlighted blocks in a Corsi block type arrangement in the order that they were presented.
Highlighted blocks appeared on screen for 1.25s each.
Letter updating: Based on running span memory task (Morris & Jones, 1990)
consonants appear on the computer screen in random sequences dependent upon the
participants calculated letter span. Twenty-four sequences were presented and in each trial
participants were unaware of the number of letters that would appear in the sequence (length
of list). Participants were required to recall the most recent n consonants in the order in which
they appeared (where n is the participants calculated letter span). There were four sequence
lengths; n, n + 2, n + 4 and n + 6 and six trials of each length were presented in randomised
order.
185
Spatial updating: This computer based task was again analogous to the letter updating
task. Spatial locations were highlighted on a Corsi block type arrangement, in random
sequences. Twenty-four trials were presented and again participants were unaware of the
length of the sequence being presented each time, with the exception of six trials, in which
participants were told how many spatial locations were going to be presented (in each case it
was always the participant’s span that was the list length for the known length trials).
Furthermore participants were required to recall the last n (where n is the participant’s spatial
span) positions in the order that they were presented. There were six trials at each list length;
known n, unknown n, n + 2, n + 4 and n + 6 and the order in which these appeared was
randomised.
Equipment
Haemodynamic response to task in the PFC was monitored using a continuous wave
fNIRS system developed by Drexel University (Philadelphia, PA) and supplied by Biopac
systems (Goleta, CA, USA). The fNIR sensor has a temporal resolution of 500ms per scan
(2Hz), with a source-detector separation of 2.5cm allowing 1.25cm penetration depth (Ayaz
et al., 2012). An fNIR100 control box and data acquisition and visualisation software COBI
studio (Drexel university) were used during data collection (as per Ayaz et al., 2011; Ayaz et
al., 2012) with a serial cable between display and acquisition PCs to identify task markers.
Procedure
Participants were required to attend the lab for a one off session lasting approximately
2.5 hours. Testing sessions commenced at 9am, 11.30am and 2pm, equal numbers of each
group were tested at each time. Upon entering the lab participants were given an information
sheet explaining what was involved in the study and written consent of their participation was
obtained. Following this, participants completed a battery of questionnaires in the following
186
order; Background drug use questionnaire, sleep quality questionnaire, MEQ, ESS, pre-test
KSS, UMACL and Raven’s SPM. Participants then completed the letter span task and the
spatial span task, the order in which these were given was randomised. The fNIRS headband
was then fitted to the participant’s forehead. The fNIRS signals were displayed on a desktop
computer running COBI studio (Drexel University) in an adjacent room to the testing room.
Providing the signals from the fNIRS were stable, a baseline of inactivity was recorded – this
involved participants watching a video of planet earth accompanied by soothing music.
Following this the letter updating and spatial updating tasks were completed (a baseline was
taken prior to each task). After completing the tasks participants completed the post task KSS
and post task NASA TLX (one for each task). Finally participants were fully debriefed and
were paid £20 in store vouchers. The study was approved by Liverpool John Moores
University Research Ethics Committee, and was administered in accordance with the ethical
guidelines of the British Psychological Society.
fNIRS Analysis
fNIRS raw data from COBI studio was pre-processed using fnirSoft (Biopac systems;
Goleta, CA, USA). All 16 voxels (oxy and deoxy-Hb) were visually inspected for light
saturation. Saturated channels were discarded. A high-pass filter (0.1Hz cut off) and a linear
phase filter (order of 20) were used to remove high frequency noise and noise due to
respiration (Ayaz et al., 2011; Ayaz et al., 2012). Using the modified Beer-Lambert law
logarithm in fnirSoft (Ayaz et al., 2010), total oxy-Hb and deoxy-Hb changes relative to
baseline over the entire epoch were calculated for the 16 voxels.
Statistical analysis
Behavioural data were analysed using ANOVA, with drug user group as the between
subjects factor and individual task performance score (A composite overall performance
187
score for each updating task, which was calculated by adding the score on each level of the
task e.g. n, n + 2, n + 4 and n + 6 in the case of letter updating, and dividing by the number of
levels to give a mean score) on each of the updating tasks as the dependent variables. For
analysis of fNIRS data, mean oxygenated and deoxygenated haemoglobin change from
baseline over the entire epoch of each task, at each voxel was calculated. fNIRS data were
analysed using ANOVA2 with drug user group as the between subjects factor and mean oxy
and deoxy-Hb change from baseline at each voxel as the dependent variables. Any significant
main effects were further explored using post-hoc Tukey’s HSD test.
7.4 Results
Socio-demographic information about the participants, sleep measures and scores of
anxiety, depression and arousal from the UMACL are shown in Table 7.1. Indices of other
drug and alcohol use are displayed in Table 7.2.
2 Due to small amounts of missing data on different voxels, MANOVA was not appropriate for this analysis.

188
Table 7.1 – Indices sleep quality, fluid intelligence and socio-demographic variables
Ecstasy users
Polydrug controls Drug naïve controls
Males: n, % 11 (55) 11 (55) 9 (45)
Age (SD)
21.76 (3.19)*† 19.75 (1.48) 19.78 (1.90)
University degree:
n (%)
3 (15) 2 (10) 1 (5)
Employment status
Student; n, (%) 19 (95) 20 (100) 20 (100)
Employed; n (%) 1 (5) 0 (0) 0 (0)
Unemployed; n (%) 0 (0) 0 (0) 0 (0)
Mean (SD) Mean (SD) Mean (SD)
Ravens Progressive
Matrices
(maximum 60)
47.88 (5.04) 46.90 (6.61) 49.72 (4.70)
Sleep – Hours/night
7.65 (1.51) 8.18 (1.55) 8.39 (1.23)
ESS Score
(maximum 24)
7.18 (3.13) 6.15 (3.63) 6.17 (3.13)
KSS before 5.31 (1.49)† 5.20 (1.47) 4.15 (1.35)
KSS after 6.00 (1.37) 4.79 (1.99) 4.74 (1.88)
MEQ total 40.29 (9.35) 40.70 (9.11) 44.44 (9.67)
UMACL anxiety 7.95 (2.63) 8.10 (1.77) 7.85 (2.39)
UMACL
depression
9.35 (2.08) 9.26 (1.85) 8.35 (2.41)
UMACL arousal 16.6 (3.45)† 16.5 (2.96)† 19.35 (3.38)
*Indicates a significant difference from polydrug controls at the .05 level, and ** at the .01 level;
† indicates a significant difference from drug naïve controls at the .05 level and †† at the .01 level.

189
Table 7.2 – Indices of other drug and alcohol use.
Ecstasy users Polydrug controls Drug naive controls
Mean (SD) n Mean (SD) n Mean (SD) n
Cannabis
Frequency
(times/wk)
2.28 (2.86) 16 2.05 (2.43) 19 - -
Last 30 days
(joints)
33.81 (57.61) 16 24.76 (40.27) 17 - -
Total use
(joints)
4183.42 (6353.33) 16 1137.27 (2516.24) 19 2 (0) 1
Cocaine
Frequency
(times/wk)
0.32 (0.47) 12 0.25 (0.21) 5 - -
Last 30 days
(lines)
9.38 (26.30) 13 2.75 (3.20) 4 - -
Total use
(lines)
964.63 (2876.88) 14 42.9 (67.17) 10 - -
Ketamine
Frequency
(times/wk)
0.39 (0.79) 6 0.08 (0.05) 2 - -
Last 30 days
use (grams)
1.2 (2.68) 5 0.10 (0.14) 2 - -
Total use
(grams)
118.73 (249.71) 9 0.44 (0.47) 5 - -
Alcohol units
p/w
23.05 (28.00)† 20 14.82 (13.15) 20 8.33 (6.15) 20
One way ANOVA revealed no significant between group differences on several
background variables including; average hours slept per night, total score on the ESS, total
score on the MEQ, levels of anxiety, depression and arousal and total score on Raven’s
SPM. However there were between group differences in age F(2,53)=4.89, p<0.05, KSS
before F(2,56)=3.94, p<0.05, and arousal F(2,57)=4.85, p<0.05 and a between group
difference approaching significance in post task KSS F(2,52)=2.84, p=0.07. Post-hoc t-tests
revealed that the ecstasy user group was significantly older than both other groups (p<.05 in
both cases). Ecstasy users were significantly more sleepy prior to testing than drug naïve
controls (p<.05) but not polydrug users, and drug naïve controls had significantly higher
*Indicates a significant difference from polydrug controls at the .05 level, and ** at the .01 level;
† indicates a significant difference from drug naïve controls at the .05 level and †† at the .01 level.

190
levels of arousal in comparison to both drug user groups (p<.05) in both cases. The post-hoc
t-tests on the post task KSS were not significant (p>.05).
t-tests on indices of drug use aside from ecstasy between the ecstasy user group and
polydrug controls revealed that ecstasy users had smoked a greater mean lifetime amount of
joints compared to polydrug controls (4183.42±6353.33 compared to 1137.27±2516.24) and
this difference was approaching significance t(18.95)=1.80, p=.09 (Levene’s test was
significant so degrees of freedom have been adjusted accordingly). However there were no
significant between group differences in frequency of cannabis, cocaine or ketamine use, nor
were there significant between group differences in lifetime total doses for cocaine or
ketamine, or last 30 day totals for cannabis, cocaine or ketamine. Nevertheless, as can be
observed in Table 7.2, the ecstasy user group can be described as polydrug users.
A one way ANOVA on average weekly alcohol consumption revealed a significant
between group difference F(2,57)=3.29, p<0.05. Multiple comparisons revealed that the
ecstasy users consumed significantly more alcohol than drug naïve controls on a weekly basis
(p<.05), there were no significant differences between ecstasy users and polydrug controls, or
polydrug controls and drug naïve controls in weekly alcohol consumption.
Behavioural data analysis
Performance on the updating tasks was compared using overall performance scores on
each task. For letter updating there were four levels of difficulty depending on the length of
the sequence presented; the easiest being n (where n is the participants letter span and only n
amount of letters are presented in the sequence) followed by n + 2 (list length is two letters
greater than participants span), then n + 4 (list length is four letters greater than participants
span), and finally n + 6 (list length is six letters greater than participants span). In each case,
participants had to recall the last n amount of letters in the sequence, in order. Points were
191
awarded for a correctly identified letter recalled, in the correct position of the sequence. The
spatial updating task follows the same structure. However there is an extra level of difficulty
in that it has a known n sequence (where participants have to recall their span (n) amount of
spatial locations, and they are informed that only n amount of spatial locations will be
presented) and an unknown n sequence (whereby participants have to recall n amount of
spatial locations, however they are not informed of the sequence length prior to the trial).
The overall performance scores were a composite of performance on each level of
difficulty of the task, relative to the participant’s span, divided by the number of levels of
difficulty, to give a mean score. For example, if a participant had a span of five on the letter
updating task, this would yield five responses on each trail. Therefore, for each level of
difficulty on the task, their total score would be divided by their span (in this case five) to
give a mean score of performance on each level of difficulty. To attain an overall
performance score, mean totals from each difficulty level are added together and divided by
the number of levels of difficulty (4 for letter updating, and 5 for spatial updating).
Task data is displayed in Tables 7.3 and 7.4. ANOVA revealed no between group
differences on overall performance of letter updating F(2,56)=1.21, p>.05, or spatial updating
F(2,56)=1.13, p>.05. Mixed ANOVA with list length as within groups and user group as
between groups was conducted on letter and spatial span separately. As there were no
significant differences aside from a within groups effect of length, for brevity, a total
composite score is reported here.

192
Table 7.3: Means and SDs of performance on the letter updating task.
Ecstasy users Polydrug controls Drug naïve controls
Sequence
length
Mean (SD) Mean (SD) Mean (SD)
n 4.97 (0.98) 4.85 (0.78) 5.04 (0.75)
n + 2 3.68 (0.96) 3.76 (1.22) 4.34 (1.02)
n + 4 3.50 (1.10) 3.68 (0.94) 3.93 (1.09)
n + 6 3.53 (1.03) 3.75 (1.23) 3.83 (1.10)
Table 7.4: Means and SDs of performance on the spatial updating task.
Ecstasy users Polydrug controls Drug naïve controls
Sequence
length
Mean (SD) Mean (SD) Mean (SD)
Kn n 4.85 (1.32) 5.09 (0.73) 5.01 (0.74)
Ukn n 4.70 (1.00) 5.00 (0.91) 4.70 (1.06)
n + 2 3.38 (1.41) 3.44 (0.74) 3.36 (1.32)
n + 4 3.46 (1.44) 4.03 (0.92) 3.07 (1.42)
n + 6 3.47 (1.31) 3.90 (0.98) 3.34 (1.52)
fNIRS Analysis
Mean averages of oxy and deoxy Hb changes from baseline for the letter updating
task are displayed in table 7.5, and oxy and deoxy-Hb changes from baseline for the spatial
updating task are displayed table 7.6. Due to inappropriate recording of baselines, nine
participant’s data was excluded from analysis (3 ecstasy users, 5 polydrug controls and 1
drug naïve control). Furthermore channels 4 and 6 failed to obtain any data throughout this
experiment, so these channels are omitted from analysis.
*Indicates a significant difference from polydrug controls at the .05 level, and ** at the .01 level;
† indicates a significant difference from drug naïve controls at the .05 level and †† at the .01 level.
*Indicates a significant difference from polydrug controls at the .05 level, and ** at the .01 level;
† indicates a significant difference from drug naïve controls at the .05 level and †† at the .01 level.
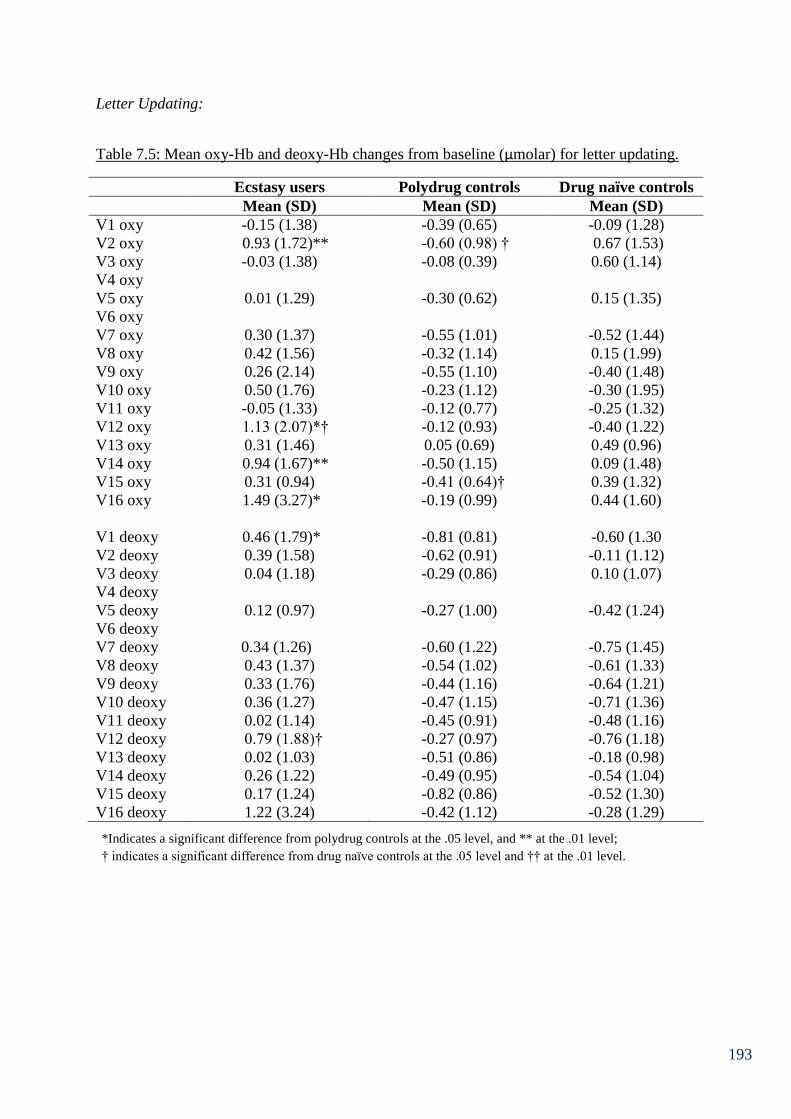
193
Letter Updating:
Table 7.5: Mean oxy-Hb and deoxy-Hb changes from baseline (µmolar) for letter updating.
Ecstasy users Polydrug controls Drug naïve controls
Mean (SD) Mean (SD) Mean (SD)
V1 oxy -0.15 (1.38) -0.39 (0.65) -0.09 (1.28)
V2 oxy 0.93 (1.72)** -0.60 (0.98) † 0.67 (1.53)
V3 oxy -0.03 (1.38) -0.08 (0.39) 0.60 (1.14)
V4 oxy
V5 oxy 0.01 (1.29) -0.30 (0.62) 0.15 (1.35)
V6 oxy
V7 oxy 0.30 (1.37) -0.55 (1.01) -0.52 (1.44)
V8 oxy 0.42 (1.56) -0.32 (1.14) 0.15 (1.99)
V9 oxy 0.26 (2.14) -0.55 (1.10) -0.40 (1.48)
V10 oxy 0.50 (1.76) -0.23 (1.12) -0.30 (1.95)
V11 oxy -0.05 (1.33) -0.12 (0.77) -0.25 (1.32)
V12 oxy 1.13 (2.07)*† -0.12 (0.93) -0.40 (1.22)
V13 oxy 0.31 (1.46) 0.05 (0.69) 0.49 (0.96)
V14 oxy 0.94 (1.67)** -0.50 (1.15) 0.09 (1.48)
V15 oxy 0.31 (0.94) -0.41 (0.64)† 0.39 (1.32)
V16 oxy 1.49 (3.27)* -0.19 (0.99) 0.44 (1.60)
V1 deoxy 0.46 (1.79)* -0.81 (0.81) -0.60 (1.30
V2 deoxy 0.39 (1.58) -0.62 (0.91) -0.11 (1.12)
V3 deoxy 0.04 (1.18) -0.29 (0.86) 0.10 (1.07)
V4 deoxy
V5 deoxy 0.12 (0.97) -0.27 (1.00) -0.42 (1.24)
V6 deoxy
V7 deoxy 0.34 (1.26) -0.60 (1.22) -0.75 (1.45)
V8 deoxy 0.43 (1.37) -0.54 (1.02) -0.61 (1.33)
V9 deoxy 0.33 (1.76) -0.44 (1.16) -0.64 (1.21)
V10 deoxy 0.36 (1.27) -0.47 (1.15) -0.71 (1.36)
V11 deoxy 0.02 (1.14) -0.45 (0.91) -0.48 (1.16)
V12 deoxy 0.79 (1.88)† -0.27 (0.97) -0.76 (1.18)
V13 deoxy 0.02 (1.03) -0.51 (0.86) -0.18 (0.98)
V14 deoxy 0.26 (1.22) -0.49 (0.95) -0.54 (1.04)
V15 deoxy 0.17 (1.24) -0.82 (0.86) -0.52 (1.30)
V16 deoxy 1.22 (3.24) -0.42 (1.12) -0.28 (1.29)
*Indicates a significant difference from polydrug controls at the .05 level, and ** at the .01 level;
† indicates a significant difference from drug naïve controls at the .05 level and †† at the .01 level.

194
Univariate ANOVA on the oxy-Hb data during the letter updating task revealed
significant between group differences at several voxels; V2 F(2,44)=4.62, p<.05, V12
F(2,45)=4.80, p<.01 and V14 F(2,47)=4.15, p<.05. Group differences also approached
significance at V15 F(2,45)=2.90, p=.07 and V16 F(2,47)=2.49, p=.09. There were no
significant differences at any of the other voxels measured (p>.05).
Planned comparisons revealed that ecstasy users had significantly increased oxy-Hb
compared to polydrug controls at V2 (p<.01), drug naïve controls also had significantly
increased oxy-Hb compared to polydrug controls at V2 (p<.05). Ecstasy users and drug naïve
controls were not significantly different to one another at this voxel (p>.05). At V12, ecstasy
users displayed significantly increased oxy-Hb compared to both control groups (p<.05 in
both cases). Polydrug controls and drug naïve controls did not differ significantly at V12. At
V14, ecstasy users displayed a significant increase in oxy-Hb relative to polydrug controls
(p<.01), but the difference between ecstasy users and drug naïve controls was non-significant
(p>.05), as was the difference between the two control groups (p>.05). At V15, ecstasy users
displayed increased oxy-Hb compared to polydrug controls that was approaching significance
(p=.07). However, drug naïve controls showed the greatest increase in oxy-Hb at this voxel,
and the difference between drug naïve controls and polydrug controls was significant (p<.05).
Differences between ecstasy users and drug naïve controls were non-significant (p>.05). At
V16, ecstasy users had significantly increased oxy-Hb compared to polydrug controls (p<.05)
Differences between drug naïve controls and both other groups were non-significant (p>.05).
195
Due to the groups showing differences in age and pre-test sleepiness and given the
heavy use of cannabis in the ecstasy user group, multiple regression analyses were conducted
on Voxel 12, at which ecstasy users showed significant increases in oxy-Hb compared to both
other groups. This was conducted to observe whether ecstasy use indices predicted oxy-Hb
increase after controlling for age, sleepiness and cannabis use. Oxy-Hb level at V12 was
entered as the dependent variable. In the first step, age and pre-test KSS score were entered as
predictors. In the second step indices of cannabis use were entered as predictors (frequency of
use, total lifetime dose, amount smoked in the last 30 days) and in the third step the same
indices of ecstasy use were entered as predictors.
The overall regression model accounted for a significant 46.9% (R² = 0.47, R²
adjusted = 0.34, F(8,34)=3.75, p<0.01) of the variance in oxy-Hb. Age and pre-test sleepiness
(step 1) did not predict a significant amount of variance in oxy-Hb (R² = 0.05, R² adjusted =
0.00, F(2,40)=1.01, p>0.05). Cannabis use indices (step 2) did not predict a significant
amount of variance oxy-Hb after controlling for age and pre-test sleepiness (R ²change=0.05,
F-change (3,37)=0.63, p>.05). Individual indices - frequency of use (β=-0.71, p>0.05) and
total lifetime dose (β=-0.02, p>0.05) did not predict oxy-Hb, however amount smoked in the
last 30 days was a significant predictor (β=-1.00, p<0.05), with increased use being
associated with reduced oxy-Hb. The ecstasy use indices (step 2) predicted a significant
amount of variance in oxy-Hb, after controlling for cannabis use indices (R ²change=0.37, F-
change (3,34)=7.99, p<.05). Specifically frequency of use (β=0.97, p<0.05) and last 30 day
use (β=-0.49, p<0.05), were significant predictors of variance in oxy-Hb. Lifetime dose
(β=0.14, p>0.05) was not a significant predictor. It would appear that frequency of use is the
most important predictor here as increased frequency is associated with increased level of
oxy-Hb.
196
ANOVA on the deoxy-Hb data revealed significant between group differences at
voxels; V1 F(2,44)=3.79, p<.05, V7 F(2,46)=3.41, p<.05, V8 F(2,44)=3.39, p<.05 and V12
F(2,45)=5.15, p<.01. Group differences were also approaching significance at V10
F(2,41)=3.04, p=.06, V14 F(2,47)=2.94, p=.06, V15 F(2,45)=2.97, p=.06 and V16
F(2,46)=3.01, p=.06. There were no significant differences at any of the other voxels
measured (p>.05).
Planned comparisons revealed that ecstasy users displayed a significant increase in
deoxy-Hb compared to drug naïve controls at voxel 12 (p<.01). At V12 ecstasy users also
showed increased deoxy-Hb compared to polydrug controls that was approaching
significance (p=.09). At V7, ecstasy users showed a strong trend for increased deoxy-Hb
compared to drug naïve controls (p=.05), the difference between ecstasy users and polydrug
controls was non-significant (p>.05). At V1 ecstasy users showed significantly greater deoxy-
Hb compared to polydrug controls (p<.05), and greater deoxy-Hb compared to drug naïve
controls that was approaching significance (p=.08). At V8 ecstasy users displayed greater
deoxy-Hb that was approaching significance to drug naïve controls (p=.06) and polydrug
controls (p=.09). Ecstasy users displayed greater deoxy-Hb than drug naïve controls that was
approaching significance at V10 (p=.06) and V14 (p=.09). Finally ecstasy users also
displayed greater deoxy-Hb compared to polydrug controls that was approaching significance
at V15 (p=.06) and V16 (p=.08). These were all that the 2 tailed level.
Regression analyses (using the same steps and predictor variables as earlier) were
conducted for voxels showing significant ecstasy-related increases in deoxy-Hb - V1 and V12.
With deoxy-Hb at voxel 1 as the dependent variable the overall regression model
accounted for a non-significant 13.8% (R² = 0.14, R² adjusted = 0.06, F(8,34)=0.68, p>0.05)
of the variance in deoxy-Hb. Age and pre-test sleepiness (step 1) did not predict a significant
197
amount of variance in deoxy-Hb (R² = 0.03, R² adjusted = -0.02, F(2,40)=0.51, p>0.05).
Cannabis use indices (step 2) did not predict a significant amount of variance in V1 deoxy-
Hb after controlling for age and pre-test sleepiness (R ²change=0.02, F-change (3,37)=0.27,
p>.05). None of the individual cannabis indices were significant predictors; frequency of use
(β=0.01, p>0.05), total lifetime dose (β=-0.12, p>0.05) and amount smoked in the last 30
days (β=-0.13, p>0.05). The ecstasy use indices (step 2) did not predict a significant amount
of variance in V1 deoxygenation, after controlling for cannabis use indices (R ²change=0.09,
F-change (3,34)=1.22, p>.05). Individual indices; frequency of use (β=0.23, p>0.05), lifetime
dose (β=-0.19, p>0.05) and last 30 day use (β=0.20, p>0.05) did not significantly predict V1
deoxygenation.
With deoxy-Hb at V12 as the DV the overall regression model accounted for a non-
significant 26.8% (R² = 0.27, R² adjusted = 0.10, F(8,34)=1.56, p>0.05) of the variance in
deoxygenation. Age and pre-test sleepiness (step 1) did not predict a significant amount of
variance in deoxygenation (R² = 0.02, R² adjusted = -0.03, F(2,40)=0.37, p>0.05). Cannabis
use indices (step 2) did not predict a significant amount of variance in V12 deoxygenation
after controlling for age and pre-test sleepiness (R ²change=0.03, F-change (3,37)=0.33,
p>.05). None of the individual cannabis indices were significant predictors; frequency of use
(β=0.57, p>0.05), total lifetime dose (β=-0.18, p>0.05) and amount smoked in the last 30
days (β=-0.76, p>0.05). The ecstasy use indices (step 2) did not predict a significant amount
of variance in V12 deoxy-Hb, after controlling for cannabis use indices (R ²change=0.22, F-
change (3,34)=3.47, p>.05). Individual indices; lifetime dose (β=-0.21, p>0.05) and last 30
day use (β=0.12, p>0.05) did not significantly predict V12 deoxygenation. However
frequency of use (β=0.74, p<0.05) was a significant predictor of V12 deoxygenation with
increased frequency of use being associated with increased deoxygenation.

198
Spatial Updating:
Table 7.6: Mean oxy-Hb and deoxy-Hb changes from baseline (µmolar) for spatial updating.
Ecstasy users Polydrug controls Drug naïve controls
Mean (SD) Mean (SD) Mean (SD)
V1 oxy 0.91 (1.68)* -0.81 (1.36)† 0.70 (1.42)
V2 oxy 1.06 (1.79)* -0.61 (1.18)† 0.76 (1.15)
V3 oxy 0.53 (1.33) -0.11 (0.70) 0.74 (1.23)
V4 oxy
V5 oxy 0.57 (1.74) -0.11 (0.85) 0.71 (1.86)
V6 oxy
V7 oxy 0.39 (1.72) -0.14 (0.85) 0.05 (1.54)
V8 oxy 1.05 (1.80)*† -0.31 (1.04) -0.06 (1.28)
V9 oxy 0.08 (1.73) -0.32 (0.75) 0.05 (1.57)
V10 oxy 0.59 (1.80) -0.42 (0.85) -0.11 (1.41)
V11 oxy 0.34 (1.65) -0.30 (0.72) 0.54 (1.34)
V12 oxy 0.64 (1.64)* -0.44 (0.93) 0.06 (1.35)
V13 oxy 0.26 (1.51) -0.19 (1.13) 0.26 (1.11)
V14 oxy 0.36 (1.79) -0.63 (1.30) 0.13 (1.50)
V15 oxy 0.12 (1.30) -0.34 (1.09) 0.22 (1.07)
V16 oxy 0.47 (1.07) -0.24 (1.17)† 0.83 (1.31)
V1 deoxy 0.07 (1.78) -0.41 (0.80) 0.61 (1.15)
V2 deoxy 0.12 (0.68) -0.26 (0.72) 0.37 (0.97)
V3 deoxy 0.09 (1.29) -0.18 (0.77) 0.74 (1.15)
V4 deoxy
V5 deoxy 0.22 (1.39) -0.05 (0.69) 0.69 (1.19)
V6 deoxy
V7 deoxy 0.13 (1.27) -0.14 (0.88) 0.51 (1.29)
V8 deoxy 0.34 (0.99) -0.06 (0.68) 0.32 (1.23)
V9 deoxy -0.13 (1.21) -0.20 (0.75) 0.56 (1.50)
V10 deoxy 0.27 (0.60) -0.14 (0.69) 0.18 (1.11)
V11 deoxy -0.03 (1.22) -0.01 (0.48) 0.61 (1.36)
V12 deoxy 0.16 (1.61) -0.19 (0.58) 0.36 (1.45)
V13 deoxy -0.05 (1.43) -0.40 (0.88) 0.39 (0.92)
V14 deoxy -0.06 (1.78) -0.38 (0.85) 0.06 (1.18)
V15 deoxy -0.45 (1.80) -0.45 (0.96) 0.24 (0.96)
V16 deoxy -0.09 (1.18) -0.40 (1.04) 0.37 (1.00)
Univariate ANOVA on the oxy-Hb data, revealed significant between group
differences at voxels; V1 F(2,42)=5.89, p<.01, V2 F(2,42)=5.88, p<.01, V8 F(2,42)=3.94,
p<.05 and V16 F(2,46)=3.47, p<.05. Between group differences were also approaching
*Indicates a significant difference from polydrug controls at the .05 level, and ** at the .01 level;
† indicates a significant difference from drug naïve controls at the .05 level and †† at the .01 level.

199
significance at V12 F(2,44)=2.54, p=.09. There were no significant between group
differences at any of the other voxels measured (p>.05)
Pairwise comparisons revealed that at V1 polydrug users had significantly lower oxy-
Hb that both other groups (p<.05), however the difference between ecstasy users and drug
naïve controls was non-significant (p>.05). At V2 polydrug users had significantly lower
oxy-Hb than both other groups (p<.05), however the difference between ecstasy users and
drug naïve controls was non-significant. At V8 ecstasy users had significantly increased oxy-
Hb relative to polydrug controls and drug naïve controls (p<.05). At V16 polydrug users had
significantly reduced oxy-Hb relative to drug naïve controls (p<.05). Ecstasy users did not
differ from either control group significantly (p>.05 in both cases). At V12 ecstasy users had
significantly increased oxy-Hb compared to polydrug users (p<.05) although they were not
significantly different to drug naïve controls (p>.05). Polydrug users and drug naïve controls
did not differ from one another significantly at this voxel.
A regression analysis with the same steps and indices entered as the letter updating
regressions with oxy-Hb at V8 as the dependent variable was conducted. This overall regres-
sion model accounted for a non-significant 0.8% (R² = 0.08, R² adjusted = -0.15,
F(8,31)=0.35, p>0.05) of the variance in oxy-Hb. Age and pre-test sleepiness (step 1) did not
predict a significant amount of variance in oxy-Hb (R² = 0.00, R² adjusted = -0.05,
F(2,37)=0.00, p>0.05). Cannabis use indices (step 2) did not predict a significant amount of
variance in V8 oxygenation after controlling for age and pre-test sleepiness (R ²change=0.01,
F-change (3,34)=0.09, p>.05). None of the individual cannabis indices were significant
predictors; frequency of use (β=0.58, p>0.05), total lifetime dose (β=-0.07, p>0.05) and
amount smoked in the last 30 days (β=-0.70, p>0.05). The ecstasy use indices (step 2) did not
predict a significant amount of variance in V8 oxy-Hb, after controlling for cannabis use
200
indices (R ²change=0.08, F-change (3,31)=.0.85, p>.05). Individual indices; frequency of use
(β=0.45, p>0.05), lifetime dose (β=0.02, p>0.05) and last 30 day use (β=-0.29, p>0.05) did
not significantly predict V8 oxy-Hb level.
ANOVA on the deoxy-Hb data during the spatial updating task revealed no
significant between group differences at any voxel (p>.05 in each case). However differences
were approaching significance at voxels V1 F(2,44)=2.63, p=.08 and V3 F(2,41)=2.59, p=.09.
Pairwise comparisons revealed that polydrug users showed decreased deoxy-Hb compared to
drug naïve controls that was approaching significance at V1 (p=.07) and V3 (p=.09). Ecstasy
users did not differ significantly from either group at either of these voxels.
7.5 Discussion and summary
Analysis of performance data in Chapter 7 suggest that ecstasy users perform
equivalently to non-users on letter updating and spatial updating. However the
haemodynamic response data suggest that ecstasy users may be engaged in more effortful
cognition to attenuate performance differences. During the letter updating task ecstasy users
showed significantly increased oxy-Hb compared to both control groups at voxel 12, located
over the right medial PFC. Furthermore regression analysis revealed that ecstasy use indices
predicted a significant amount of the variance in oxy-Hb at this voxel after controlling for age,
sleepiness and cannabis use variables; specifically, frequency of use predicted increased oxy-
Hb level. Furthermore ecstasy users showed increases in deoxy-Hb from baseline compared
to drug naïve controls at V12, this difference was also approaching significance at V1, V7
and V8. Ecstasy users also showed significantly increased deoxy-Hb from baseline compared
to polydrug controls at V1 and this was approaching significance at V12 and V8. This
indicates that ecstasy users were engaged in more effortful cognition and were perhaps
relying on additional cognitive resources. Regression analyses on deoxy-Hb data, were

201
generally non-significant, although frequency of MDMA use predicted deoxy-Hb at V12,
suggesting that more frequent use lead to greater deoxygenation.
During spatial updating, the oxy-Hb data again revealed that ecstasy users showed
significantly increased oxy-Hb compared to both control groups at voxel 8, pertaining to the
left medial prefrontal cortex. Ecstasy use indices did not significantly predict oxygenation at
this voxel after controlling for age, sleepiness and cannabis use indices in a regression
analysis. Nevertheless the between group differences are evidence that increased cognitive
effort is displayed in ecstasy users compared to non-users during spatial updating. The
implications of which will be discussed in greater detail in Chapter 10.
202
Chapter 8: fNIRS response to switching, inhibition and access
8.1 Chapter overview
Chapter 7 showed that ecstasy users show greater haemodynamic activation than
control groups when performing memory updating tasks. This chapter assessed the
haemodynamic response to the other three executive functions – inhibition, switching and
access. Twenty ecstasy users and 20 controls (polydrug users and drug naïve participants)
completed a random letter generation (RLG) task (inhibition), a number-letter task (switching)
and an oral variant of the CWFT (access). No performance differences were observed
between groups on any of the tasks. However significant increases in oxy-Hb from baseline
were observed in ecstasy users relative to controls at various sites on every level of every task.
Significant increases in deoxy-Hb were also observed in ecstasy users relative to controls at
various sites during the CWFT and the RLG task.
8.2 Introduction
As previously discussed research in cognitive psychology suggests that the central
executive of working memory is not a unified construct and is comprised of separable
functions including memory updating, mental set switching, inhibitory control and access to
semantic memory (Fisk and Sharp, 2004; Miyake et al., 2000). In ecstasy users, tasks that are
proposed to tap the executive function of mental set switching show equivocal results.
Dafters (2006) observed ecstasy users to be impaired on a switch component of the Stroop
task compared to cannabis users and non-users and Dafters et al. (1999) found MDMA use to
be negatively correlated with performance on the BADS rule shift cards test; however, the
majority of studies suggest that MDMA users are unimpaired on this function (Fox et al.,,
2001; Back-Madruga et al., 2003: Montgomery, Fisk, Newcombe & Murphy, 2005). Chapter
6 in this thesis examined performance on the number-letter task in combination with ERP
analysis. Atypicalities in the P2 component in ecstasy users compared to both polydrug and
203
drug naïve controls despite equivalent behavioural performance, as well as drug related
alterations to the P3 response (Roberts et al., 2013c in press). This highlights the importance
of using more sensitive measures of cognitive performance, such as EEG or fNIRS, to gain a
clearer understanding of the mechanisms underpinning cognitive deficits in substance users,
as behavioural measures alone may not be sensitive enough to detect subtle ecstasy-related
cognitive deficits in switching.
The effects of ecstasy use on inhibition have been reviewed in Chapters 3 and 6. As
with switching, results of behavioural studies are mixed though the general consensus is that
this executive function is relatively robust to ecstasy-related decline. Halpern et al., (2004)
found ecstasy-related deficits on the Stroop task in a relatively pure ecstasy using sample,
however this was not replicated in a follow up study (Halpern et al., 2011). Moreover, using
this task more studies have observed ecstasy users to be unimpaired at inhibition (Back-
Madruga et al., 2003; Gouzoulis-Mayfrank et al., 2000). Using the RLG task, Wareing et al.
(2000) observed performance deficits in ecstasy users compared to non-users, though these
findings were not replicated by Fisk et al. (2004), using a larger sample and more effective
controls for concomitant use of other drugs. Nevertheless it has been suggested that depletion
of Serotonin (5-HT) and impairment of other executive functions may lead to poor inhibitory
control (Morgan et al., 2006). Moreover, the use of neurophysiological measures may be
necessary to better understand the impact of MDMA on these cognitive processes. For
example Roberts and Garavan (2010) observed no performance deficits in ecstasy users on a
Go/NoGo task, however fMRI data revealed that users showed increased frontal and parietal
BOLD activation during successful inhibitions and hyperactivity of temporal, frontal and
cingulate regions during commission errors. Furthermore ERP data in this thesis from
Chapter 6 support the view that recreational ecstasy use may lead to subtle cognitive
alterations during this executive function that are more readily detected in neuroimaging data

204
than behavioural data. Atypicalities in early processing (P2 component), during a Go/NoGo
task suggest that compensatory cognitive mechanisms were being employed to enable
equivalent behavioural performance to controls (Roberts et al., 2013a).
While results for switching and inhibitory control are mixed, there appears to be more
evidence in support of impaired access in ecstasy users. The COWA task has yielded deficits
in ecstasy users compared to controls (Bhattachary & Powell, 2001; Fox et al., 2002), though
this is not always a consistent finding (Halpern et al., 2004). Ecstasy users do appear to
perform at a consistently lower level than controls when the written variant of this task is
used (CWFT). The CWFT is understood to be more complex than the COWA task as it
requires participants to name words that fit specific criteria (e.g. four-letter words beginning
with the letter C) and therefore places more demand on the central executive. Using this task,
ecstasy-related impairments have been more consistently reported (Montgomery et al., 2007;
Montgomery, Fisk, Newcombe & Murphy, 2005). Raj et al. (2010) investigated the BOLD
response to a semantic retrieval task of ecstasy users and suggested that MDMA exposure
results in reduced BOLD response in neuronal areas relating to verbal memory. Furthermore
Chapter 6 of this thesis reported evidence of abnormal executive functioning in ecstasy users
(the N2 ERP component) despite the absence of behavioural differences in a semantic
association paradigm (Roberts et al., 2013b).
Consequently studies into cognitive deficits associated with ecstasy use are
increasingly employing neuroimaging techniques to gain insight into processes underlying
such deficits. Burgess et al., (2011) observed differences in ecstasy users’ ERPs in a late
positive component over left parietal scalp sites in a recall task that had yielded no significant
performance deficits. The amelioration of this late positivity in ecstasy users is accepted as a
durable abnormality in processing that would not have been detected by behavioural
205
measures alone. fMRI studies (e.g. Daumann, Fimm et al., 2003) have reported increased
cortical activity in ecstasy users to compensate for behavioural differences. Furthermore
Moeller et al. (2004) report increases in blood volume in ecstasy users relative to controls in
several brain regions including the medial frontal gyrus and the thalamus, during a delayed
memory task. These fMRI studies show increases in cortical activity and blood volume that
are understood to reflect compensatory mechanisms in ecstasy users. In effect, ecstasy users
are working harder to achieve the same result behaviourally. Moreover results from Chapter 7
in this thesis, indicated that differences in haemodynamic response (increases in oxy-Hb and
deoxy-Hb) were apparent in ecstasy users compared to controls, despite equivalent
behavioural performance. The findings from Chapter 7 suggest that ecstasy users were
engaged in more effortful cognition (recruitment of additional resources) to attenuate
performance deficits, in letter updating and spatial updating.
The present chapter sought to investigate the cerebral haemodynamic response (using
fNIRS) to three executive functioning tasks in ecstasy users and non-user controls. The three
executive functions investigated were mental set switching, access and inhibitory control.
Based on previous research that has yielded the most interesting results and compatibility
with the technology being used, the following tasks have been used to assess each executive
function – the number-letter task (switching), the CWFT (access) and RLG (inhibition).
Performance and haemodynamic response were measured on each task. It was hypothesised
that although performance on each of the executive functions may be equivalent between
groups, differences will be observed in oxy-Hb and deoxy-Hb haemoglobin changes from
baseline, in line with findings from Chapter 7, that reflect increased cognitive effort
(increased oxy-Hb and deoxy-Hb) in ecstasy users.

206
8.3 Method
Participants:
Twenty ecstasy users (mean age = 21.85±2.76; 13 = male) and 20 non-user controls
(mean age = 20.89±2.05; 7 = male) were recruited via email to university students. Inclusion
criteria for the experiment was similar to that in Chapters 6 and 7, except due to practical
constraints only one control group was recruited that were ecstasy naïve (although the
majority of participants in the control group were drug naïve, so there is limited drug use in
the non-user group). Indices of ecstasy use were as follows: total lifetime dose 431.75 tablets
± 885.08; mean amount used in last 30 days 2.55 tablets ± 3.23, and frequency of use 0.37
times/week ± 0.51.
Materials
Questionnaires:
The Background Drug Use Questionnaire, The ESS, The MEQ, KSS, UMACL,
NASA-TLX and Raven’s SPM were used, as described in Chapter 6.
Executive function tasks:
Random Letter Generation (inhibition) (Baddeley, 1966)
Participants were presented with a bar on the screen that alternated between two
positions at a set pace, cueing participants to generate a letter. Participants had to produce
100 letters in each block of the task. There were three blocks and each block represented a
different production rate (one letter every 4, 2, and 1-seconds). Participants were instructed to
avoid alphabetical sequences, repetition of sequences of letters and to produce each letter
with the same overall frequency. Presentation of blocks was randomised and participants’
responses were recorded onto a cassette deck with a built in microphone. Four scores were
207
generated – the number of alphabetically ordered pairs, the number of repeat sequences,
“redundancy” (the extent to which all letters are produced equally with 0% being truly
random) and the number of letters produced. A high score on the first three indicates poor
performance whereas the opposite is true in the fourth case. All scores were standardised and
a single score for each random generation measure was obtained by calculating the mean
standardised scores for the three production rates (as per Montgomery, Fisk, Newcombe &
Murphy, 2005)
The Number Letter Task (switching) (Rogers & Monsell, 1995) – as described in Chapter 6.
The Chicago Word Fluency Task (access) (Thurstone, 1938)
A variation of the original Thurstone word fluency task, this task consisted of three
blocks in which participants had to verbally produce as many words as they could in one
minute. In the first block (semantic fluency), participants were instructed to name as many
animals as they could during the time period. Following this they were instructed to produce
as many words possible beginning with the letter “S”, and in the third and final block they
were required to name as many four letter words beginning with the letter “C” as possible
(word fluency). Participants were informed that place names, people’s names and plurals
were prohibited. Responses were recorded on a cassette deck with a built in microphone.
Scores for each of the fluency tasks were counted as the number of appropriate words in each
case.
Equipment
A continuous wave fNIRS system (developed by Drexel University, Philadelphia, PA)
supplied by Biopac systems (Goleta, CA, USA) was used for collecting haemodynamic
response to task data from the PFC as described in Chapter 7.

208
Procedure
Participants attended the lab for a single session lasting approximately 2 hours.
Testing sessions commenced at 9am, 11am and 1pm and 3pm, with equal numbers of each
group tested at each session time. Upon arrival participants were given an information sheet
explaining what was involved in the study, and written consent was obtained. Questionnaires
were administered in the following order: background drug use questionnaire, MEQ, ESS,
pre-test KSS, UMACL and Raven’s SPM. The fNIRS headband was then fitted to the
participant’s forehead. fNIRS signals were displayed on a desktop computer running COBI
studio (Drexel University) in an adjacent room to the testing room. Once stability of fNIRS
signals was obtained, a baseline of inactivity was recorded. Baselines were recorded prior to
each task. Participants watched a video of planet earth accompanied by soothing music and
the baselines were recorded during this period. Participants then completed one of the three
tasks (number-letter task, CWFT or RLG). After each task participants completed the NASA
TLX then the process was repeated for the other tasks starting with baseline recording. Task
order was randomised. After all three tasks had been completed participants were
administered the post task KSS. Participants were fully debriefed after the testing procedure
and were paid £20 in store vouchers. The study was approved by Liverpool John Moores
University Research Ethics Committee, and was administered in accordance with the ethical
guidelines of the British Psychological Society.

209
fNIRS analysis
Pre-processing and analysis followed the same procedure as that described in Chapter
7. fNIRS data was analysed using ANOVA3 in blocks of discrete epochs on each task. The
number-letter task was analysed over two switching blocks, the CWFT had three blocks
(animals, “S” letter words and four-letter long words beginning with “C”) and RLG had three
blocks where the speed at which letters had to be produced differed (every 4, 2, or 1-seconds).
Due to the various blocks in these tasks relating to the level of difficulty of the task, mean
oxy-Hb and deoxy-Hb changes from baseline at each channel were calculated for each block.
8.4 Results
Socio-demographic information about the participants, sleep measures and scores of
anxiety, depression and arousal are shown in Table 8.1. Indices of other drug and alcohol use
are displayed in Table 8.2.
3 Due to small amounts of missing data on different voxels, MANOVA was not appropriate for this analysis.
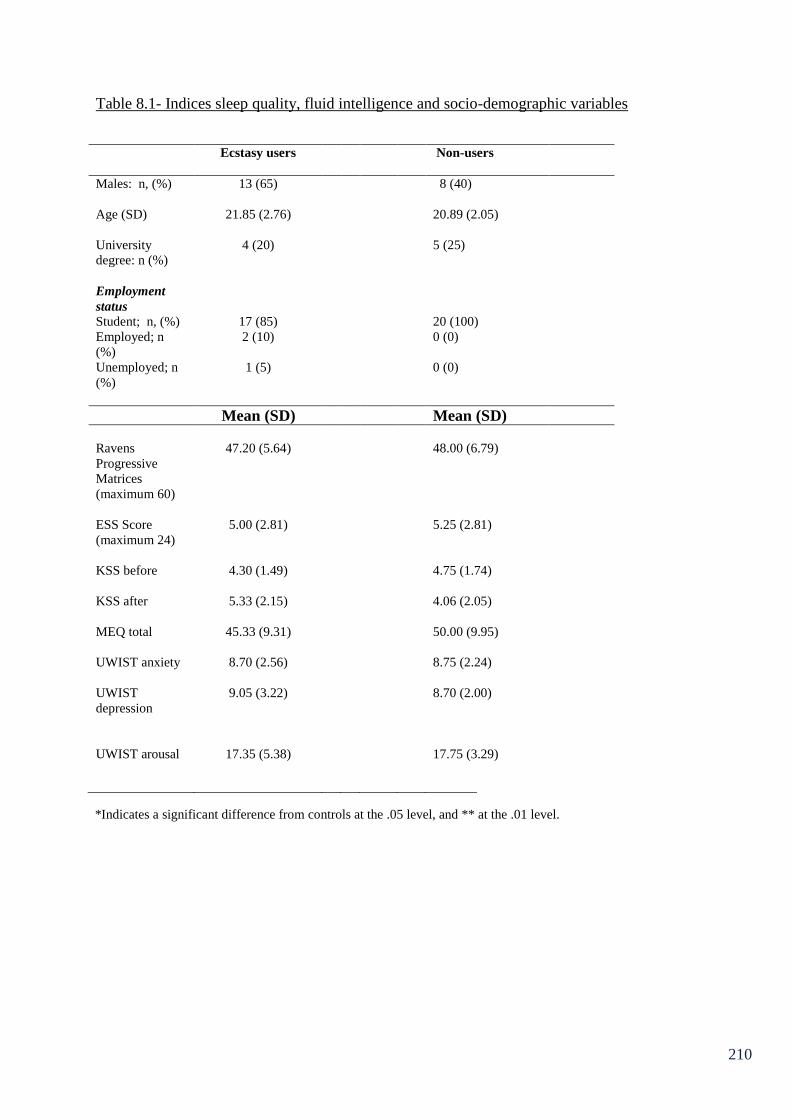
210
Table 8.1- Indices sleep quality, fluid intelligence and socio-demographic variables
Ecstasy users
Non-users
Males: n, (%) 13 (65) 8 (40)
Age (SD)
21.85 (2.76) 20.89 (2.05)
University
degree: n (%)
4 (20) 5 (25)
Employment
status
Student; n, (%) 17 (85) 20 (100)
Employed; n
(%)
2 (10) 0 (0)
Unemployed; n
(%)
1 (5) 0 (0)
Mean (SD) Mean (SD)
Ravens
Progressive
Matrices
(maximum 60)
47.20 (5.64) 48.00 (6.79)
ESS Score
(maximum 24)
5.00 (2.81) 5.25 (2.81)
KSS before 4.30 (1.49) 4.75 (1.74)
KSS after 5.33 (2.15) 4.06 (2.05)
MEQ total 45.33 (9.31) 50.00 (9.95)
UWIST anxiety 8.70 (2.56) 8.75 (2.24)
UWIST
depression
9.05 (3.22) 8.70 (2.00)
UWIST arousal 17.35 (5.38) 17.75 (3.29)
*Indicates a significant difference from controls at the .05 level, and ** at the .01 level.
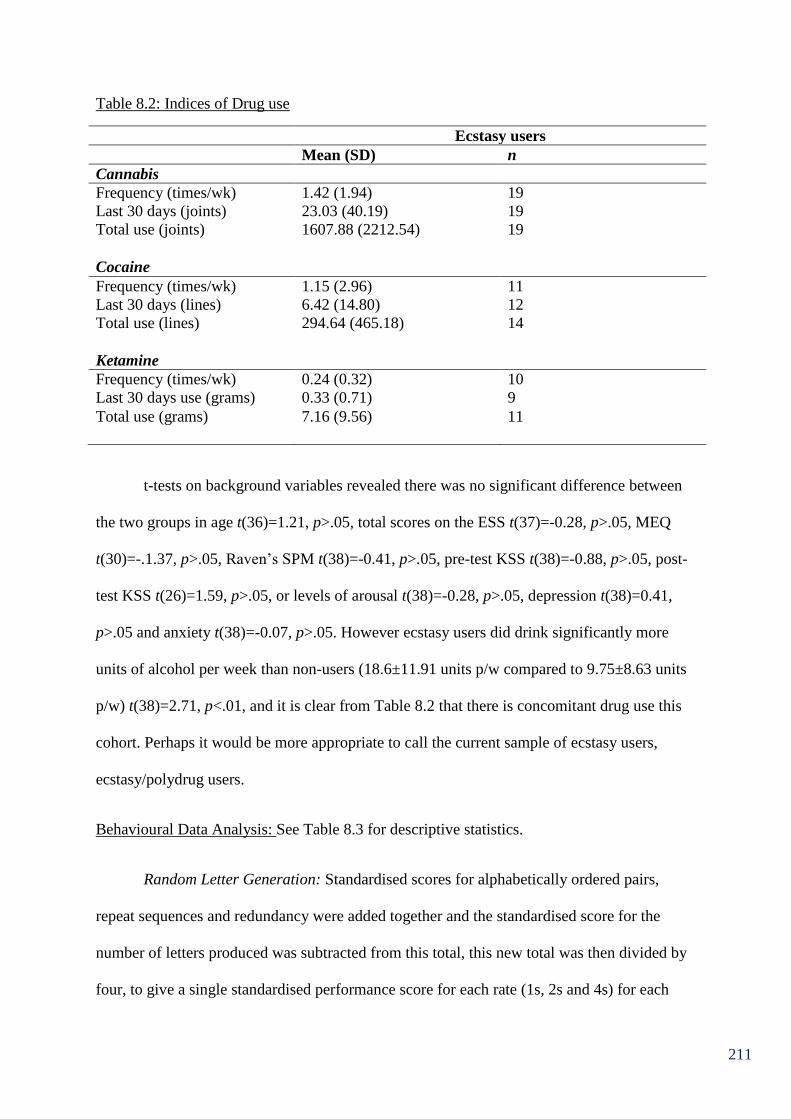
211
Table 8.2: Indices of Drug use
Ecstasy users
Mean (SD) n
Cannabis
Frequency (times/wk) 1.42 (1.94) 19
Last 30 days (joints) 23.03 (40.19) 19
Total use (joints) 1607.88 (2212.54) 19
Cocaine
Frequency (times/wk) 1.15 (2.96) 11
Last 30 days (lines) 6.42 (14.80) 12
Total use (lines) 294.64 (465.18) 14
Ketamine
Frequency (times/wk) 0.24 (0.32) 10
Last 30 days use (grams) 0.33 (0.71) 9
Total use (grams) 7.16 (9.56) 11
t-tests on background variables revealed there was no significant difference between
the two groups in age t(36)=1.21, p>.05, total scores on the ESS t(37)=-0.28, p>.05, MEQ
t(30)=-.1.37, p>.05, Raven’s SPM t(38)=-0.41, p>.05, pre-test KSS t(38)=-0.88, p>.05, post-
test KSS t(26)=1.59, p>.05, or levels of arousal t(38)=-0.28, p>.05, depression t(38)=0.41,
p>.05 and anxiety t(38)=-0.07, p>.05. However ecstasy users did drink significantly more
units of alcohol per week than non-users (18.6±11.91 units p/w compared to 9.75±8.63 units
p/w) t(38)=2.71, p<.01, and it is clear from Table 8.2 that there is concomitant drug use this
cohort. Perhaps it would be more appropriate to call the current sample of ecstasy users,
ecstasy/polydrug users.
Behavioural Data Analysis: See Table 8.3 for descriptive statistics.
Random Letter Generation: Standardised scores for alphabetically ordered pairs,
repeat sequences and redundancy were added together and the standardised score for the
number of letters produced was subtracted from this total, this new total was then divided by
four, to give a single standardised performance score for each rate (1s, 2s and 4s) for each
212
participant. MANOVA was conducted on the performance scores for this task, this revealed
no significant main effect of group, F(3,36)=0.85, p>.05 for Pillai’s trace. Univariate
ANOVA revealed no significant between group differences on performance at each
individual rate; 1s F(1,38)=0.01, p>.05, 2s F(1,38)=1.75, p>.05 or 4s F(1,38)=0.93, p>.05.
Number-Letter Task: Incorrect answers were given a score of 0 and were not
investigated any further. Responses before 200ms and after 4000ms were excluded from
analysis as these represent pre-emptive responding and loss of concentration respectively and
individual reaction times that were 3 standard deviations or more above the individual mean
were excluded. The mean percentage of outliers discarded from each group were: ecstasy
users 1.51 ±0.73, drug naïve 1.48 ±0.91, there were no between group differences in amount
of outliers F(1,37)=0.02, p>.05. One participant from the ecstasy user group had an
incomplete dataset and therefore was excluded from the final analysis. ANOVA revealed no
significant between groups difference on switch cost F(1,37)=0.31, p>.05.
Chicago Word Fluency Task: A mixed ANOVA was conducted on the CWFT data
with group as the between subjects variable and level of difficulty as the within subjects
variable (the easiest being “animals” followed by words beginning with “S” and the most
difficult being 4 letter words beginning with “C”). There was a significant main effect of
difficulty on the task F(1.59, 60.23)=158.33, p<.01 (the sphericity assumption was violated
so Greenhouse-Geisser adjusted stats are reported), however there was no group by difficulty
interaction F(1.59, 60.23)=0.75, p>.05. Furthermore there were no significant between group
differences in performance on the task F(1,38)=0.64, p>.05.
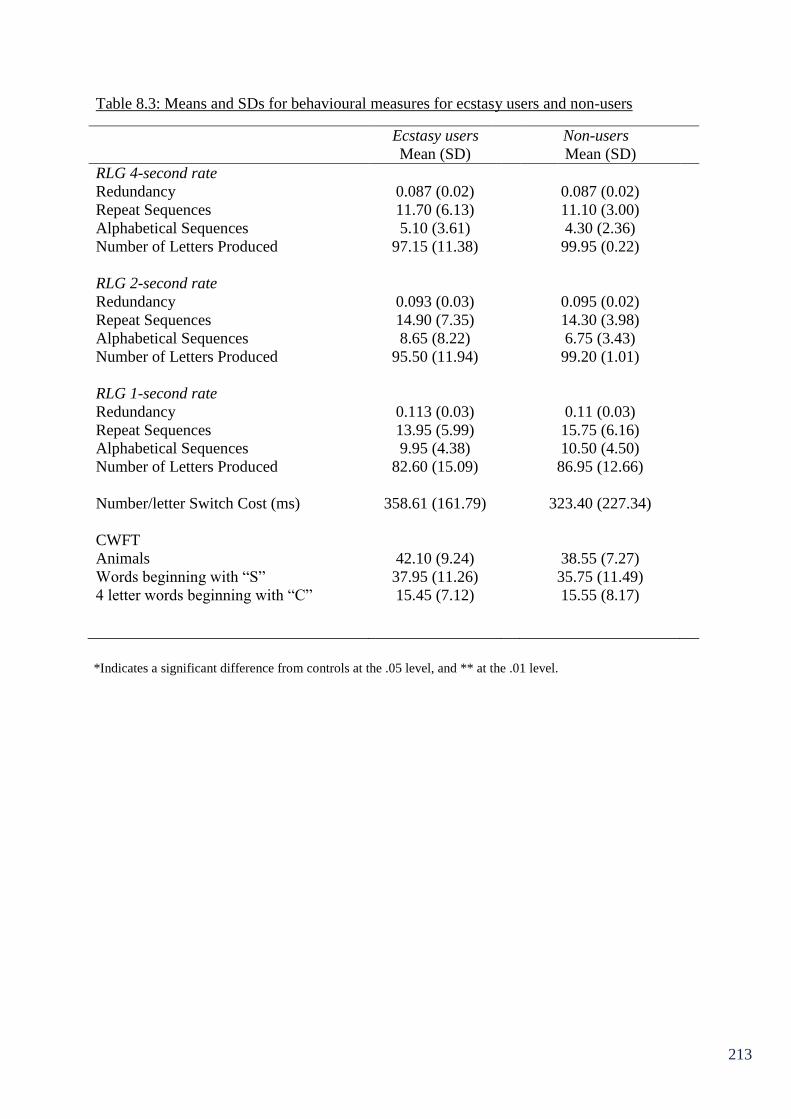
213
Table 8.3: Means and SDs for behavioural measures for ecstasy users and non-users
Ecstasy users Non-users
Mean (SD) Mean (SD)
RLG 4-second rate
Redundancy 0.087 (0.02) 0.087 (0.02)
Repeat Sequences 11.70 (6.13) 11.10 (3.00)
Alphabetical Sequences 5.10 (3.61) 4.30 (2.36)
Number of Letters Produced 97.15 (11.38) 99.95 (0.22)
RLG 2-second rate
Redundancy 0.093 (0.03) 0.095 (0.02)
Repeat Sequences 14.90 (7.35) 14.30 (3.98)
Alphabetical Sequences 8.65 (8.22) 6.75 (3.43)
Number of Letters Produced 95.50 (11.94) 99.20 (1.01)
RLG 1-second rate
Redundancy 0.113 (0.03) 0.11 (0.03)
Repeat Sequences 13.95 (5.99) 15.75 (6.16)
Alphabetical Sequences 9.95 (4.38) 10.50 (4.50)
Number of Letters Produced 82.60 (15.09) 86.95 (12.66)
Number/letter Switch Cost (ms) 358.61 (161.79) 323.40 (227.34)
CWFT
Animals 42.10 (9.24) 38.55 (7.27)
Words beginning with “S” 37.95 (11.26) 35.75 (11.49)
4 letter words beginning with “C” 15.45 (7.12) 15.55 (8.17)
*Indicates a significant difference from controls at the .05 level, and ** at the .01 level.
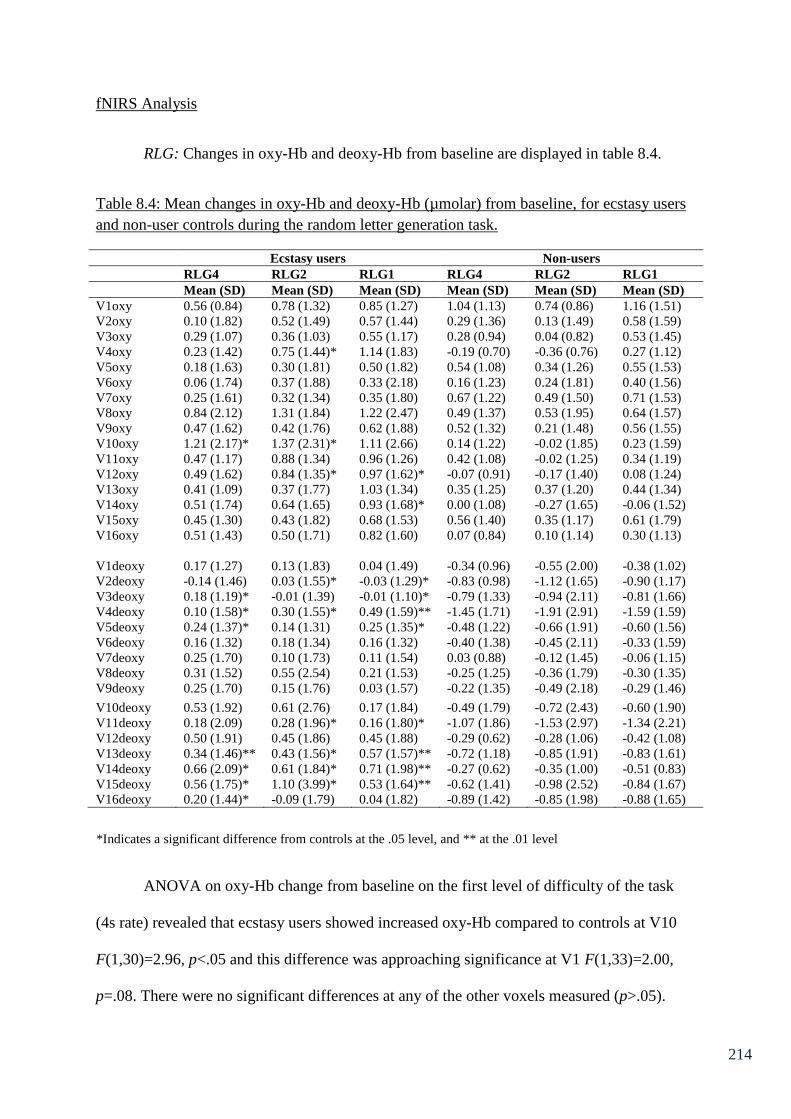
214
fNIRS Analysis
RLG: Changes in oxy-Hb and deoxy-Hb from baseline are displayed in table 8.4.
Table 8.4: Mean changes in oxy-Hb and deoxy-Hb (µmolar) from baseline, for ecstasy users
and non-user controls during the random letter generation task.
Ecstasy users Non-users
RLG4 RLG2 RLG1 RLG4 RLG2 RLG1
Mean (SD) Mean (SD) Mean (SD) Mean (SD) Mean (SD) Mean (SD)
V1oxy 0.56 (0.84) 0.78 (1.32) 0.85 (1.27) 1.04 (1.13) 0.74 (0.86) 1.16 (1.51)
V2oxy 0.10 (1.82) 0.52 (1.49) 0.57 (1.44) 0.29 (1.36) 0.13 (1.49) 0.58 (1.59)
V3oxy 0.29 (1.07) 0.36 (1.03) 0.55 (1.17) 0.28 (0.94) 0.04 (0.82) 0.53 (1.45)
V4oxy 0.23 (1.42) 0.75 (1.44)* 1.14 (1.83) -0.19 (0.70) -0.36 (0.76) 0.27 (1.12)
V5oxy 0.18 (1.63) 0.30 (1.81) 0.50 (1.82) 0.54 (1.08) 0.34 (1.26) 0.55 (1.53)
V6oxy 0.06 (1.74) 0.37 (1.88) 0.33 (2.18) 0.16 (1.23) 0.24 (1.81) 0.40 (1.56)
V7oxy 0.25 (1.61) 0.32 (1.34) 0.35 (1.80) 0.67 (1.22) 0.49 (1.50) 0.71 (1.53)
V8oxy 0.84 (2.12) 1.31 (1.84) 1.22 (2.47) 0.49 (1.37) 0.53 (1.95) 0.64 (1.57)
V9oxy 0.47 (1.62) 0.42 (1.76) 0.62 (1.88) 0.52 (1.32) 0.21 (1.48) 0.56 (1.55)
V10oxy 1.21 (2.17)* 1.37 (2.31)* 1.11 (2.66) 0.14 (1.22) -0.02 (1.85) 0.23 (1.59)
V11oxy 0.47 (1.17) 0.88 (1.34) 0.96 (1.26) 0.42 (1.08) -0.02 (1.25) 0.34 (1.19)
V12oxy 0.49 (1.62) 0.84 (1.35)* 0.97 (1.62)* -0.07 (0.91) -0.17 (1.40) 0.08 (1.24)
V13oxy 0.41 (1.09) 0.37 (1.77) 1.03 (1.34) 0.35 (1.25) 0.37 (1.20) 0.44 (1.34)
V14oxy 0.51 (1.74) 0.64 (1.65) 0.93 (1.68)* 0.00 (1.08) -0.27 (1.65) -0.06 (1.52)
V15oxy 0.45 (1.30) 0.43 (1.82) 0.68 (1.53) 0.56 (1.40) 0.35 (1.17) 0.61 (1.79)
V16oxy 0.51 (1.43) 0.50 (1.71) 0.82 (1.60) 0.07 (0.84) 0.10 (1.14) 0.30 (1.13)
V1deoxy 0.17 (1.27) 0.13 (1.83) 0.04 (1.49) -0.34 (0.96) -0.55 (2.00) -0.38 (1.02)
V2deoxy -0.14 (1.46) 0.03 (1.55)* -0.03 (1.29)* -0.83 (0.98) -1.12 (1.65) -0.90 (1.17)
V3deoxy 0.18 (1.19)* -0.01 (1.39) -0.01 (1.10)* -0.79 (1.33) -0.94 (2.11) -0.81 (1.66)
V4deoxy 0.10 (1.58)* 0.30 (1.55)* 0.49 (1.59)** -1.45 (1.71) -1.91 (2.91) -1.59 (1.59)
V5deoxy 0.24 (1.37)* 0.14 (1.31) 0.25 (1.35)* -0.48 (1.22) -0.66 (1.91) -0.60 (1.56)
V6deoxy 0.16 (1.32) 0.18 (1.34) 0.16 (1.32) -0.40 (1.38) -0.45 (2.11) -0.33 (1.59)
V7deoxy 0.25 (1.70) 0.10 (1.73) 0.11 (1.54) 0.03 (0.88) -0.12 (1.45) -0.06 (1.15)
V8deoxy 0.31 (1.52) 0.55 (2.54) 0.21 (1.53) -0.25 (1.25) -0.36 (1.79) -0.30 (1.35)
V9deoxy 0.25 (1.70) 0.15 (1.76) 0.03 (1.57) -0.22 (1.35) -0.49 (2.18) -0.29 (1.46)
V10deoxy 0.53 (1.92) 0.61 (2.76) 0.17 (1.84) -0.49 (1.79) -0.72 (2.43) -0.60 (1.90)
V11deoxy 0.18 (2.09) 0.28 (1.96)* 0.16 (1.80)* -1.07 (1.86) -1.53 (2.97) -1.34 (2.21)
V12deoxy 0.50 (1.91) 0.45 (1.86) 0.45 (1.88) -0.29 (0.62) -0.28 (1.06) -0.42 (1.08)
V13deoxy 0.34 (1.46)** 0.43 (1.56)* 0.57 (1.57)** -0.72 (1.18) -0.85 (1.91) -0.83 (1.61)
V14deoxy 0.66 (2.09)* 0.61 (1.84)* 0.71 (1.98)** -0.27 (0.62) -0.35 (1.00) -0.51 (0.83)
V15deoxy 0.56 (1.75)* 1.10 (3.99)* 0.53 (1.64)** -0.62 (1.41) -0.98 (2.52) -0.84 (1.67)
V16deoxy 0.20 (1.44)* -0.09 (1.79) 0.04 (1.82) -0.89 (1.42) -0.85 (1.98) -0.88 (1.65)
ANOVA on oxy-Hb change from baseline on the first level of difficulty of the task
(4s rate) revealed that ecstasy users showed increased oxy-Hb compared to controls at V10
F(1,30)=2.96, p<.05 and this difference was approaching significance at V1 F(1,33)=2.00,
p=.08. There were no significant differences at any of the other voxels measured (p>.05).
*Indicates a significant difference from controls at the .05 level, and ** at the .01 level
215
There were also significant differences in the amount of deoxy-Hb change from baseline at
V3 F(1,35)=5.42, p<.05, V4 F(1,16)=3.90, p<.05, V5 F(1,36)=2.92, p<.05, V13
F(1,36)=6.11, p<.01, V14 F(1,34)=3.11, p<.05, V15 F(1,34)=4.93, p<.05 and V16
F(1,35)=5.37, p<.05, whereby ecstasy users showed greater deoxygenation than controls.
This difference was also approaching significance at V2 F(1,32)=2.64, p=.06, V10
F(1,30)=2.44, p=.06, V11 F(1,20)=2.19, p=.08 and V12 F(1,31)=2.37, p=.07. No other
differences were observed for the other voxels measured (p>.05 in each case).
At the 2nd
level of difficulty in this task (2s rate) ANOVA revealed between group
differences in oxy-Hb at V4 F(1,16)=3.47, p<.05, V10 F(1,30)=3.52, p<.05, and V12
F(1,31)=4.45, p<.05 whereby ecstasy users showed greater oxy-Hb increase from baseline
than controls. This difference was approaching significance at V11 F(1,20)=2.65, p=.06 and
V14 F(1,34)=2.75, p=.06. There were no differences at any other voxels (p>.05). ANOVA on
deoxy-Hb changes at the 2-s rate revealed that ecstasy users showed significantly greater
deoxy-Hb increase than controls at V2 F(1,32)=4.33, p<.05, V4 F(1,16)=4.47, p<.05, V11
F(1,20)=2.84, p<.05, V13 F(1,36)=5.12, p<.05, V14 F(1,34)=3.67, p<.05 and V15
F(1,34)=3.48, p<.05. This difference was also approaching significance at V3 F(1,35)=2.56,
p=.06, V5 F(1,36)=2.27, p=.07, V10 F(1,30)=2.10, p=.08 and V12 F(1,31)=1.83, p<.09. No
other significant differences were observed (p>.05 in each case).
For the 3rd
and most difficult level of the task (1s rate) ANOVA revealed that ecstasy
users displayed significantly increased oxy-Hb from baseline relative to controls at V12
F(1,31)=3.08, p<.05 and V14 F(1,34)=3.42, p<.05. This difference was also approaching
significance at V13 F(1,36)=1.83, p=.09. There were no other significant differences at any
of the voxels measured (p>.05 in each case). ANOVA on the deoxy-Hb data in this block
revealed that ecstasy users displayed significantly greater deoxy-Hb than controls at V2
216
F(1,32)=4.24, p<.05, V3 F(1,35)=3.07, p<.05, V4 F(1,16)=7.20, p<.01, V5 F(1,36)=3.18,
p<.05, V11 F(1,20)=3.05, p<.05, V13 F(1,36)=7.28, p<.01, V14 F(1,34)=5.55, p<.01 and
V15 F(1,34)=6.14, p<.01. This difference was also approaching significance at V12
F(1,31)=2.50, p=.06 and V16 F(1,35)=2.59, p=.06. There were no significant differences at
the other voxels measured (p>.05 in each case).
Overall these results show a general increase in oxy-Hb and deoxy-Hb from baseline
for ecstasy users compared to controls that is significant at several voxels in each level of the
task.
Multiple regression analyses were conducted on all voxels showing significant
between group differences in oxy-Hb and deoxy-Hb. This was conducted to observe whether
ecstasy use indices predicted oxy-Hb and deoxy-Hb increase after controlling for cannabis
use. Values of oxy-Hb or deoxy-Hb (µmolar) were entered as dependent variables. In step
one indices of cannabis use were entered as predictors (frequency of use, total lifetime dose,
amount smoked in the last 30 days), in step two the same indices of ecstasy use were entered
as predictors. The results from these regression analyses can be seen in Appendix 1, for
brevity, only regressions yielding notable results are reported here.
Using deoxy-Hb at V14 during the 4s rate as the dependent variable, this overall
regression model accounted for a significant 43.8% (R² = 0.44, R² adjusted = 0.32,
F(6,29)=3.76, p<0.01) of the variance in deoxy-Hb. Cannabis use indices (step 1) did not
predict a significant amount of variance in V14 deoxygenation (R² = 0.05, R² adjusted = -0.04,
F(3,32)=0.56, p>0.05). None of the individual cannabis use indices were significant
predictors; frequency of use (β=-0.10, p>0.05), total lifetime dose (β=0.24, p>0.05) and
amount smoked in the last 30 days (β=-0.39, p>0.05). The ecstasy use indices (step 2) did,
however, predict a significant amount of variance in V14 deoxy-Hb, after controlling for

217
cannabis use indices (R² change=0.39, F-change (3,29)=6.66, p<.01). Individual indices;
frequency of use (β=-0.42, p<0.05) and last 30 day use (β=0.82, p<0.05) predicted V14
deoxy-Hb level at the 4s rate, with increased frequency being associated with decreased
deoxy-Hb and increased last 30 day use being associated with increased deoxy-Hb. Lifetime
dose (β=0.02, p>0.05) was not a significant predictor.
Using deoxy-Hb at V14 during the 2s rate as the dependent variable this overall
regression model accounted for a non-significant 25.1% (R² = 0.25, R² adjusted = 0.10,
F(6,29)=1.62, p>0.05) of the variance in deoxy-Hb. Cannabis use indices (step 1) did not
predict a significant amount of variance in V14 deoxygenation (R² = 0.03, R² adjusted = -0.07,
F(3,32)=0.28, p>0.05). None of the individual cannabis use indices were significant
predictors; frequency of use (β=-0.01, p>0.05), total lifetime dose (β=0.24, p>0.05) and
amount smoked in the last 30 days (β=-0.31, p>0.05). There was a strong trend for ecstasy
use indices (step 2) to predict variance in V14 deoxy-Hb, after controlling for cannabis use
indices (R² change=0.23, F-change (3,29)=2.92, p=.05). Individual indices; frequency of use
(β=-0.35, p>0.05) and lifetime dose (β=0.04, p>0.05) did not predict V14 deoxy-Hb level at
the 2s rate, whereas last 30 day use (β=0.62, p<0.01) was a significant predictor, with
increased use being associated with increased deoxy-Hb.
Using oxy-Hb at V12 during the 1s rate as the dependent variable this overall regres-
sion model accounted for a significant 38.9% (R² = 0.39, R² adjusted = 0.25, F(6,26)=2.76,
p<0.05) of the variance in oxy-Hb. Cannabis use indices (step 1) did not predict a significant
amount of variance in V12 oxy-Hb (R² = 0.23, R² adjusted = 0.15, F(3,29)=2.90, p>0.05).
None of the individual cannabis use indices were significant predictors; frequency of use
(β=0.73, p>0.05), total lifetime dose (β=0.39, p>0.05) and amount smoked in the last 30 days
(β=-0.31, p>0.05). Ecstasy use indices (step 2) did not predict a significant amount of

218
variance in V12 oxy-Hb, after controlling for cannabis use indices (R² change=0.16, F-
change (3,26)=2.25, p>.05). Individual indices; frequency of use (β=-0.27, p>0.05) and
lifetime dose (β=0.03, p>0.05) did not predict V12 oxy-Hb increase at the 1s rate. However
last 30 day use (β=0.52, p<0.05) was a significant predictor with increased use being
associated with increased oxy-Hb.
Using oxy-Hb level at V14 during the 1s rate as the dependent variable this overall
regression model accounted for a significant 33.8% (R² = 0.34, R² adjusted = 0.20, F(6,
29)=2.47, p<0.05) of the variance in oxy-Hb. Cannabis use indices (step 1) did not predict a
significant amount of variance in V14 oxy-Hb (R² = 0.18, R² adjusted = 0.11, F(3,32)=2.38,
p>0.05). None of the individual cannabis use indices were significant predictors; frequency of
use (β=0.11, p>0.05), total lifetime dose (β=0.16, p>0.05) and amount smoked in the last 30
days (β=0.21, p>0.05). Ecstasy use indices (step 2) did not predict a significant amount of
variance in V14 oxy-Hb, after controlling for cannabis use indices (R² change=0.16, F-
change (3,29)=2.28, p>.05). Individual indices; frequency of use (β=-0.27, p>0.05) and
lifetime dose (β=-0.19, p>0.05) did not predict V14 oxy-Hb level at the 1s rate. However, last
30 day use (β=0.49, p<0.05) was a significant predictor, with increased use being associated
with increased oxy-Hb change.
Using deoxy-Hb at V14 during the 1st rate as the dependent variable this overall
regression model accounted for a non-significant 30.7% (R² = 0.31, R² adjusted = 0.16, F(6,
29)=2.14, p>0.05) of the variance in deoxy-Hb. Cannabis use indices (step 1) did not predict
a significant amount of variance in V14 deoxy-Hb (R² = 0.03, R² adjusted = -0.06,
F(3,32)=0.34, p>0.05). None of the individual cannabis use indices were significant
predictors; frequency of use (β=-0.09, p>0.05), total lifetime dose (β=0.38, p>0.05) and
amount smoked in the last 30 days (β=-0.25, p>0.05). However, ecstasy use indices (step 2)

219
did predict a significant amount of variance in V14 deoxy-Hb, after controlling for cannabis
use indices (R² change=0.28, F-change (3,29)=3.85, p<.05). Individual indices; frequency of
use (β=-0.37, p>0.05) and lifetime dose (β=-0.86, p>0.05) did not predict V14 deoxy-Hb
level at the 1s rate. However, last 30 day use (β=0.69, p<0.01) was a significant predictor,
with increased use being associated with increased deoxy-Hb level.

220
Number-Letter Task: The fNIRS data from the two switching blocks of this task is
displayed in table 8.5.
Table 8.5: Mean changes in oxy-Hb and deoxy-Hb (µmolar) from baseline, for ecstasy users
and non-user controls on the switching blocks of the number/letter task.
Ecstasy users Non-users
NL1 NL2 NL1 NL2
Mean (SD) Mean (SD) Mean (SD) Mean (SD)
V1oxy 0.71 (1.78) 0.57 (1.74) 1.07 (2.37) 1.22 (2.53)
V2oxy 1.59 (2.57) 1.52 (2.50) 1.10 (1.45) 1.45 (1.51)
V3oxy 0.89 (1.70) 0.78 (1.73) 0.22 (1.37) 0.24 (1.38)
V4oxy 1.26 (2.17) 1.17 (2.23) 0.57 (1.47) 0.76 (1.40)
V5oxy 1.36 (2.57)* 1.29 (2.49) 0.10 (1.43) 0.26 (1.47)
V6oxy 1.70 (3.38) 1.68 (3.44) 0.57 (1.10) 0.57 (1.14)
V7oxy 0.95 (3.15) 0.89 (3.03) 0.69 (2.03) 0.96 (2.27)
V8oxy 3.33 (7.04) 3.51 (7.09) 1.11 (1.72) 1.52 (1.80)
V9oxy 1.05 (2.12) 0.91 (2.08) 0.27 (1.81) 0.60 (1.97)
V10oxy 1.26 (2.76) 1.60 (3.07) 0.88 (3.33) 1.36 (3.30)
V11oxy 0.64 (2.75) 0.52 (2.75) 0.40 (1.70) 0.78 (1.61)
V12oxy 0.59 (2.61) 0.48 (2.66) 0.50 (1.58) 0.80 (1.42)
V13oxy 1.34 (2.49) 1.29 (2.42) 0.39 (1.06) 0.49 (1.22)
V14oxy 0.90 (1.42) 0.88 (1.44) 0.66 (1.32) 0.81 (1.29)
V15oxy 0.94 (1.91) 0.83 (2.23) 1.11 (1.69) 1.21 (1.83)
V16oxy 1.22 (2.02) 1.20 (2.02) 1.05 (1.25) 1.11 (1.33)
V1deoxy -0.21 (2.23) -0.20 (2.29) 1.21 (3.57) 0.75 (2.78)
V2deoxy 0.17 (1.97) 0.28 (2.05) 0.35 (1.71) 0.11 (1.27)
V3deoxy -0.17 (1.54) -0.13 (1.52) 0.60 (1.96) 0.21 (0.91)
V4deoxy 0.43 (1.65) 0.45 (1.68) -0.01 (0.96) 0.05 (1.06)
V5deoxy 0.39 (1.81) 0.45 (1.86) 0.45 (2.03) 0.09 (1.04)
V6deoxy 0.54 (1.98) 0.60 (2.03) 0.33 (2.03) -0.06 (1.04)
V7deoxy 0.69 (3.35) 0.74 (3.41) 0.73 (2.87) 0.30 (1.79)
V8deoxy 2.25 (5.52) 2.63 (5.56) 1.18 (2.48) 1.02 (2.23)
V9deoxy 0.10 (1.81) 0.11 (1.75) 0.64 (2.85) 0.17 (1.68)
V10deoxy 0.63 (2.25) 1.14 (2.82) 0.95 (2.87) 0.70 (2.59)
V11deoxy -0.32 (1.55) -0.27 (1.60) 0.88 (2.83) 0.18 (1.23)
V12deoxy -0.46 (1.09) -0.44 (1.05) 0.28 (2.09) -0.06 (1.05)
V13deoxy -0.16 (1.27) -0.12 (1.28) 0.36 (2.34) -0.10 (1.03)
V14deoxy -0.40 (1.49) -0.31 (1.50) 0.08 (1.73) -0.22 (1.00)
V15deoxy -0.33 (1.53) -0.34 (1.54) 0.91 (3.19) 0.43 (2.22)
V16deoxy -0.32 (1.17) -0.20 (1.27) 0.07 (1.78) -0.28 (1.12)
*Indicates a significant difference from controls at the .05 level, and ** at the .01 level
221
Using the oxy-Hb data, ANOVA revealed that in the first switching block ecstasy
users showed a significant increase in oxy-Hb compared to non-user controls at voxel 5
F(1,36)=3.57, p<.05, and this difference was approaching significance at voxels 6
F(1,36)=1.99, p=.08 and 13 F(1,35)=2.41, p=.06. There were no significant differences at any
of the other voxels measured (p>.05 in all cases).
There were no significant differences in the deoxy-Hb data at any of the voxels
measured. However, there were differences that approached significance at V1 F(1,35)=2.02,
p=.08, V11 F(1,26)=2.03, p=.08 and V15 F(1,35)=2.15, p=.08, whereby ecstasy users had
decreased deoxy-Hb compared to controls.
ANOVA on the oxy-Hb data during the second switching block revealed that ecstasy
users displayed greater oxy-Hb at V5 compared to controls and this difference was
approaching significance F(1,35)=2.37, p=.07. There were no significant differences at any
voxels (p>.05). Analysis of the deoxy-Hb change during the second switching block also
revealed no significant between group differences on any of the voxels measured (p>.05 in
each case).
Multiple regression analyses were conducted on the voxel (V5) showing significant
between group differences in oxy-Hb. Oxy-Hb (µmolar) level at V5 during block 1 of the
number-letter task was entered as the dependent variable. In step one indices of cannabis use
were entered as predictors (frequency of use, total lifetime dose, amount smoked in the last
30 days), in step two the same indices of ecstasy use were entered as predictors. The overall
regression model accounted for a non-significant 18.8% (R² = 0.19, R² adjusted = 0.03,
F(6,31)=1.20, p>0.05) of the variance in oxy-Hb. Cannabis use indices (step 1) did not
predict a significant amount of variance in oxy-Hb (R² = 0.15, R² adjusted = 0.08,
F(3,34)=2.07, p>0.05). Individual cannabis use indices; frequency of use (β=-0.07, p>0.05)

222
and amount smoked in the last 30 days (β=-0.12, p>0.05), did not significantly predict oxy-
Hb. However total lifetime dose (β=0.56, p<0.05) was a significant predictor, with increased
dose being associated with increased oxy-Hb. Ecstasy use indices (step 2) did not predict a
significant amount of variance in oxy-Hb, after controlling for cannabis use indices (R²
change=0.03, F-change (3,31)=0.43, p>.05). None of the individual ecstasy use indices were
significant predictors of oxy-Hb at V5 during the first switching block; frequency of use
(β=0.07, p>0.05) and lifetime dose (β=-0.16, p>0.05) and last 30 day use (β=-0.17, p>0.05).
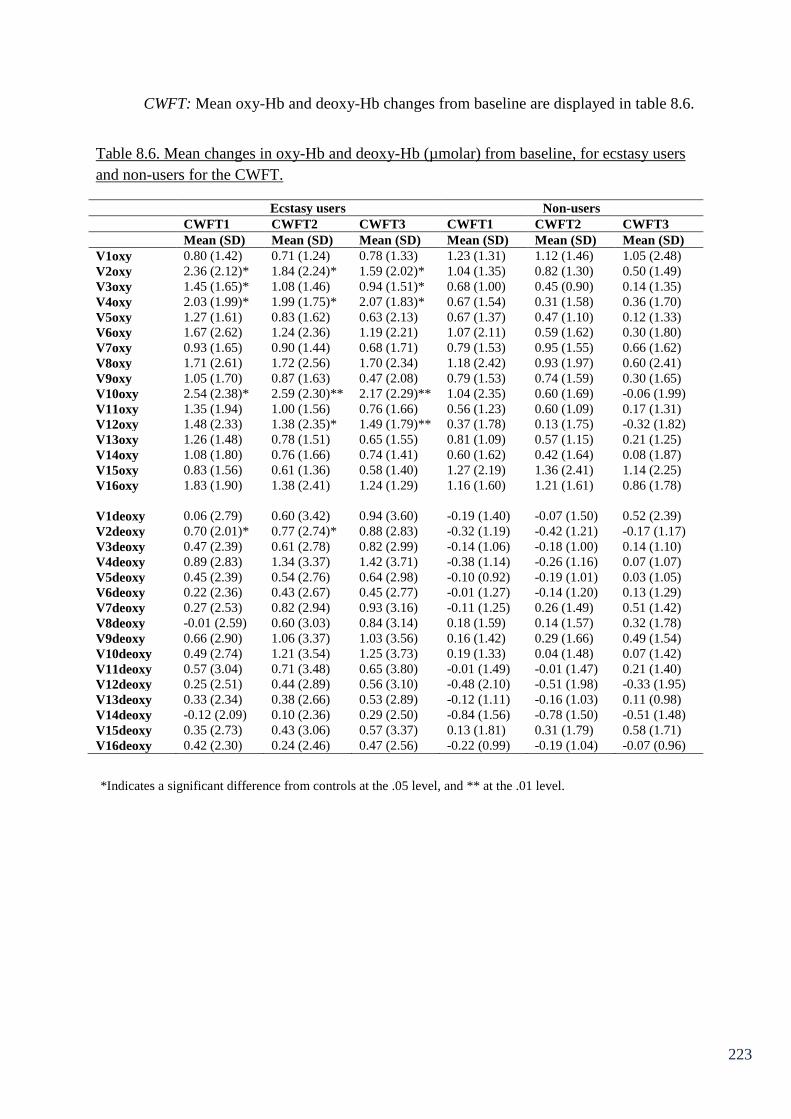
223
CWFT: Mean oxy-Hb and deoxy-Hb changes from baseline are displayed in table 8.6.
Table 8.6. Mean changes in oxy-Hb and deoxy-Hb (µmolar) from baseline, for ecstasy users
and non-users for the CWFT.
Ecstasy users Non-users
CWFT1 CWFT2 CWFT3 CWFT1 CWFT2 CWFT3
Mean (SD) Mean (SD) Mean (SD) Mean (SD) Mean (SD) Mean (SD)
V1oxy 0.80 (1.42) 0.71 (1.24) 0.78 (1.33) 1.23 (1.31) 1.12 (1.46) 1.05 (2.48)
V2oxy 2.36 (2.12)* 1.84 (2.24)* 1.59 (2.02)* 1.04 (1.35) 0.82 (1.30) 0.50 (1.49)
V3oxy 1.45 (1.65)* 1.08 (1.46) 0.94 (1.51)* 0.68 (1.00) 0.45 (0.90) 0.14 (1.35)
V4oxy 2.03 (1.99)* 1.99 (1.75)* 2.07 (1.83)* 0.67 (1.54) 0.31 (1.58) 0.36 (1.70)
V5oxy 1.27 (1.61) 0.83 (1.62) 0.63 (2.13) 0.67 (1.37) 0.47 (1.10) 0.12 (1.33)
V6oxy 1.67 (2.62) 1.24 (2.36) 1.19 (2.21) 1.07 (2.11) 0.59 (1.62) 0.30 (1.80)
V7oxy 0.93 (1.65) 0.90 (1.44) 0.68 (1.71) 0.79 (1.53) 0.95 (1.55) 0.66 (1.62)
V8oxy 1.71 (2.61) 1.72 (2.56) 1.70 (2.34) 1.18 (2.42) 0.93 (1.97) 0.60 (2.41)
V9oxy 1.05 (1.70) 0.87 (1.63) 0.47 (2.08) 0.79 (1.53) 0.74 (1.59) 0.30 (1.65)
V10oxy 2.54 (2.38)* 2.59 (2.30)** 2.17 (2.29)** 1.04 (2.35) 0.60 (1.69) -0.06 (1.99)
V11oxy 1.35 (1.94) 1.00 (1.56) 0.76 (1.66) 0.56 (1.23) 0.60 (1.09) 0.17 (1.31)
V12oxy 1.48 (2.33) 1.38 (2.35)* 1.49 (1.79)** 0.37 (1.78) 0.13 (1.75) -0.32 (1.82)
V13oxy 1.26 (1.48) 0.78 (1.51) 0.65 (1.55) 0.81 (1.09) 0.57 (1.15) 0.21 (1.25)
V14oxy 1.08 (1.80) 0.76 (1.66) 0.74 (1.41) 0.60 (1.62) 0.42 (1.64) 0.08 (1.87)
V15oxy 0.83 (1.56) 0.61 (1.36) 0.58 (1.40) 1.27 (2.19) 1.36 (2.41) 1.14 (2.25)
V16oxy 1.83 (1.90) 1.38 (2.41) 1.24 (1.29) 1.16 (1.60) 1.21 (1.61) 0.86 (1.78)
V1deoxy 0.06 (2.79) 0.60 (3.42) 0.94 (3.60) -0.19 (1.40) -0.07 (1.50) 0.52 (2.39)
V2deoxy 0.70 (2.01)* 0.77 (2.74)* 0.88 (2.83) -0.32 (1.19) -0.42 (1.21) -0.17 (1.17)
V3deoxy 0.47 (2.39) 0.61 (2.78) 0.82 (2.99) -0.14 (1.06) -0.18 (1.00) 0.14 (1.10)
V4deoxy 0.89 (2.83) 1.34 (3.37) 1.42 (3.71) -0.38 (1.14) -0.26 (1.16) 0.07 (1.07)
V5deoxy 0.45 (2.39) 0.54 (2.76) 0.64 (2.98) -0.10 (0.92) -0.19 (1.01) 0.03 (1.05)
V6deoxy 0.22 (2.36) 0.43 (2.67) 0.45 (2.77) -0.01 (1.27) -0.14 (1.20) 0.13 (1.29)
V7deoxy 0.27 (2.53) 0.82 (2.94) 0.93 (3.16) -0.11 (1.25) 0.26 (1.49) 0.51 (1.42)
V8deoxy -0.01 (2.59) 0.60 (3.03) 0.84 (3.14) 0.18 (1.59) 0.14 (1.57) 0.32 (1.78)
V9deoxy 0.66 (2.90) 1.06 (3.37) 1.03 (3.56) 0.16 (1.42) 0.29 (1.66) 0.49 (1.54)
V10deoxy 0.49 (2.74) 1.21 (3.54) 1.25 (3.73) 0.19 (1.33) 0.04 (1.48) 0.07 (1.42)
V11deoxy 0.57 (3.04) 0.71 (3.48) 0.65 (3.80) -0.01 (1.49) -0.01 (1.47) 0.21 (1.40)
V12deoxy 0.25 (2.51) 0.44 (2.89) 0.56 (3.10) -0.48 (2.10) -0.51 (1.98) -0.33 (1.95)
V13deoxy 0.33 (2.34) 0.38 (2.66) 0.53 (2.89) -0.12 (1.11) -0.16 (1.03) 0.11 (0.98)
V14deoxy -0.12 (2.09) 0.10 (2.36) 0.29 (2.50) -0.84 (1.56) -0.78 (1.50) -0.51 (1.48)
V15deoxy 0.35 (2.73) 0.43 (3.06) 0.57 (3.37) 0.13 (1.81) 0.31 (1.79) 0.58 (1.71)
V16deoxy 0.42 (2.30) 0.24 (2.46) 0.47 (2.56) -0.22 (0.99) -0.19 (1.04) -0.07 (0.96)
*Indicates a significant difference from controls at the .05 level, and ** at the .01 level.
224
Analysis of oxy-Hb change in block one of the CWFT (“animals”) revealed that
ecstasy users displayed a significant increase in oxy-Hb compared to controls at V2
F(1,37)=5.27, p<.05, V3 F(1,36)=2.94, p<.05, V4 F(1,18)=2.91, p<.05 and V10
F(1,31)=3.28, p<.05. All other differences were non-significant (p>.05). ANOVA on the
deoxy-Hb data revealed that ecstasy users showed greater deoxygenation compared to
controls at V2 F(1,37)=3.63, p<.05. No other differences were observed here for any other
voxel measured (p>.05 in each case).
The more difficult criteria of naming words beginning with the letter “S” yielded
significant increased oxy-Hb change in ecstasy users relative to controls at V2 F(1,37)=2.98,
p<.05, V4 F(1,18)=5.09, p<.05, V10 F(1,31)=8.06, p<.01 and V12 F(1,33)=3.14, p>.05.
This difference was also approaching significance at V3 F(1,36)=2.49, p=.06. There were no
significant between group differences at any of the other voxels measured (p>.05 in each
case). ANOVA on deoxy-Hb change during this block of the task revealed ecstasy users had
significantly greater deoxy-Hb at V2 F(1,37)=3.05, p<.05, with trends at V4 F(1,18)=2.01,
p=.09 and V14 F(1,37)=1.94, p=.09. There were no significant differences at any of the other
voxels measured (p>.05 in each case).
In the 3rd
and most difficult block of this task ANOVA on oxy-Hb change from
baseline revealed that ecstasy users displayed a significant increase in oxy-Hb compared to
controls at V2 F(1,37)=3.65, p<.05, V3 F(1,36)=2.96, p<.05, V4 F(1,18)=4.69, p<.05, V10
F(1,31)=9.01, p<.01 and V12 F(1,33)=8.68, p<.01. There were no significant differences at
any of the other voxels measured (p>.05 in each case). There were no significant between
group differences in deoxy-Hb change during this part of the task (p>.05 in all cases).
However ecstasy users displayed a greater deoxygenation compared to controls that was

225
approaching significance at V2 F(1,37)=2.26, p=.07. There were no significant differences at
any of the other voxels measured (p>.05 in each case).
As with the data from the other two tasks, multiple regression analyses were
conducted on the fNIRS data, at voxels showing between group differences, to observe
whether ecstasy use predicted oxy/deoxy-Hb level after controlling for cannabis use. Oxy-
Hb/deoxy-Hb (µmolar) change level was entered as the dependent variable in each case. In
step one indices of cannabis use were entered as predictors (frequency of use, total lifetime
dose, amount smoked in the last 30 days), in step two the same indices of ecstasy use were
entered as predictors. The results from these regression analyses can be seen in Appendix 2,
for brevity, only regressions yielding notable results are reported here.
Using oxy-Hb at V3 during the first block of the task (animals) as the dependent
variable, this overall regression model accounted for 30.8% of the variance in oxy-Hb and
this was approaching significance (R² = 0.31, R² adjusted = 0.17, F(6,31)=2.30, p=0.06).
Cannabis use indices (step 1) did not predict a significant amount of variance in oxy-Hb (R² =
0.10, R² adjusted = 0.02, F(3,34)=1.28, p>0.05). None of the individual cannabis use indices
were significant predictors; frequency of use (β=0.40, p>0.05), total lifetime dose (β=-0.29,
p>0.05) and amount smoked in the last 30 days (β=-0.19, p>0.05). The ecstasy use indices
(step 2) did, however, predict a significant amount of variance in oxy-Hb, after controlling
for cannabis use indices (R² change=0.21, F-change (3,31)=3.07, p<.05). Individual indices;
last 30 day use (β=-0.28, p>0.05) and lifetime dose (β=0.37, p>0.05) did not predict oxy-Hb.
However frequency of use (β=0.44, p<0.05) was a significant predictor with increased
frequency being associated with increased oxy-Hb.
Using oxy-Hb at V4 during the first block of the task (animals) as the dependent
variable, this overall regression model accounted for a non-significant 52.4% (R² = 0.52, R²

226
adjusted = 0.30, F(6,13)=2.38, p>.05) of the variance in oxy-Hb. Cannabis use indices (step 1)
did not predict a significant amount of variance in oxy-Hb (R² = 0.13, R² adjusted = -0.03,
F(3,16)=0.80, p>0.05). None of the individual cannabis use indices were significant
predictors; frequency of use (β=-0.04, p>0.05), total lifetime dose (β=0.54, p>0.05) and
amount smoked in the last 30 days (β=-0.38, p>0.05). The ecstasy use indices (step 2) did,
however, predict a significant amount of variance in oxy-Hb, after controlling for cannabis
use indices (R² change=0.39, F-change (3,13)=3.58, p<.05). Individual indices; frequency of
use (β=0.62, p<0.05) and lifetime dose (β=0.46, p<0.05) did significantly predict oxy-Hb
level, with increased frequency and increased dose being associated with increased oxy-Hb.
However last 30 day use (β=-0.35, p>0.05) was not a significant predictor.
Using deoxy-Hb at V2 during the first block of the task (animals) as the dependent
variable, this overall regression model accounted for a non-significant 14.8% (R² = 0.15, R²
adjusted = -0.01, F(6, 32)=0.92, p>.05) of the variance in oxy-Hb. Cannabis use indices (step
1) did not predict a significant amount of variance in deoxy-Hb (R² = 0.03, R² adjusted = -
0.01, F(3,35)=0.35, p>0.05). None of the individual cannabis use indices were significant
predictors; frequency of use (β=0.05, p>0.05), total lifetime dose (β=-0.14, p>0.05) and
amount smoked in the last 30 days (β=-0.01, p>0.05). The ecstasy use indices (step 2) did not
predict a significant amount of variance in deoxy-Hb, after controlling for cannabis use
indices (R² change=0.12, F-change (3,32)=1.48, p>.05). Individual indices; frequency of use
(β=0.44, p>0.05) and last 30 day use (β=-0.28, p>0.05) did not predict deoxy-Hb level.
However lifetime dose (β=0.34, p=0.06) approached significance as a predictor, with
increased use being associated with increased deoxy-Hb.
Using oxy-Hb at V4 during the second block of the task (S letter words) as the
dependent variable, this overall regression model accounted for a non-significant 52.1% (R² =
227
0.52, R² adjusted = 0.30, F(6, 13)=2.35, p>.05) of the variance in oxy-Hb. Cannabis use
indices (step 1) did not predict a significant amount of variance in oxy-Hb (R² = 0.31, R²
adjusted = 0.18, F(3,16)=2.35, p>0.05). Individual cannabis use indices; frequency of use
(β=-.029, p>0.05), and amount smoked in the last 30 days (β=-0.47, p>0.05) did not predict
oxy-Hb, however total lifetime dose (β=0.91, p<0.05) was a significant predictor, with
increased use being associated with increased oxy-Hb. The ecstasy use indices (step 2) did
not predict a significant amount of variance in oxy-Hb, after controlling for cannabis use
indices (R² change=0.22, F-change (3,13)=1.94, p>.05). Individual indices; frequency of use
(β=-0.03, p>0.05) and last 30 day use (β=0.29, p>0.05) did not predict oxy-Hb. However
lifetime dose (β=0.42, p=0.06) approached significance as a predictor, with increased use
being associated with increased oxy-Hb change.
Using deoxy-Hb at V2 during the second block of the task (S letter words) as the
dependent variable, this overall regression model accounted for a non-significant 14.1% (R² =
0.14, R² adjusted = -0.02, F(6, 32)=2.35, p>.05) of the variance in deoxy-Hb. Cannabis use
indices (step 1) did not predict a significant amount of variance in deoxy-Hb (R² = 0.03, R²
adjusted = -0.05, F(3,35)=0.35, p>0.05). None of the individual cannabis use indices were
significant predictors; frequency of use (β=-0.08, p>0.05), total lifetime dose (β=-0.15,
p>0.05) and amount smoked in the last 30 days (β=0.04, p>0.05). The ecstasy use indices
(step 2) did not predict a significant amount of variance in deoxy-Hb, after controlling for
cannabis use indices (R² change=0.11, F-change (3,32)=1.38, p>.05). Individual indices;
frequency of use (β=-0.00, p>0.05) and last 30 day use (β=0.06, p>0.05) did not predict
deoxy-Hb. However lifetime dose (β=0.44, p=0.06) approached significance as a predictor,
with increased use being associated with increased deoxy-Hb.
228
Using oxy-Hb at V3 during the third block of the task (4 letter C words) as the
dependent variable, this overall regression model accounted for a non-significant 26.7% (R² =
0.27, R² adjusted = 0.13, F(6, 31)=1.88, p>.05) of the variance in oxy-Hb. Cannabis use
indices (step 1) did not predict a significant amount of variance in oxy-Hb (R² = 0.03, R²
adjusted = -0.06, F(3,34)=0.33, p>0.05). None of the individual cannabis use indices were
significant predictors; frequency of use (β=0.01, p>0.05), total lifetime dose (β=-0.02, p>0.05)
and amount smoked in the last 30 days (β=-0.05, p>0.05). The ecstasy use indices (step 2) did
predict a significant amount of variance in oxy-Hb, after controlling for cannabis use indices
(R² change=0.24, F-change (3,31)=3.36, p<.05). Individual indices; lifetime dose (β=0.29,
p>0.05) and last 30 day use (β=-0.09, p>0.05) did not predict oxy-Hb level. However
frequency of use (β=0.48, p<0.05) was a significant predictor, with increased use being
associated with increased oxy-Hb.
Using oxy-Hb at V4 during the third block of the task (4 letter C words) as the
dependent variable, this overall regression model accounted for a non-significant 46.3% (R² =
0.46, R² adjusted = 0.22, F(6, 13)=1.87, p>.05) of the variance in oxy-Hb. Cannabis use
indices (step 1) did not predict a significant amount of variance in oxy-Hb (R² = 0.27, R²
adjusted = 0.14, F(3,16)=2.01, p>0.05). However individual cannabis use indices: total
lifetime dose (β=0.94, p<0.05) and amount smoked in the last 30 days (β=-1.17, p<0.05) were
significant predictors of oxy-Hb, with increased lifetime dose being associated with increased
oxy-Hb and increased amount smoked in last 30 days being associated with decreased oxy-
Hb. Frequency of use (β=0.31, p>0.05), was not a significant predictor. The ecstasy use
indices (step 2) did not predict a significant amount of variance in oxy-Hb, after controlling
for cannabis use indices (R² change=0.19, F-change (3,13)=1.53, p>.05). None of the
individual ecstasy use indices predicted oxygenation at V4; frequency of use (β=-0.07,
p>0.05) lifetime dose (β=0.33, p>0.05) and last 30 day use (β=0.39, p>0.05).
229
Implications of Chapter 8
The results from this chapter indicate that ecstasy users show an increase in effortful
cognition during all three executive functioning tasks, despite having similar behavioural
output to controls. Ecstasy users displayed significantly increased oxy-Hb changes from
baseline relative to controls over several voxels during the inhibition (RLG) task. At the
slowest rate (4second rate), that is understood to be the easiest level of the task, increases
were observed in V10 relating to the right medial PFC in ecstasy users. As difficulty
increased, a more pronounced difference between ecstasy users and controls was observed.
During the second block of the task (2 second rate) ecstasy users displayed significant
increases in oxy-Hb relative to controls at voxels 4, 10 and 12. This indicates a bilateral
induction of oxy-Hb increase. At the most difficult level of the task (1 second rate), ecstasy
users displayed significant increases in oxy-Hb in voxels relating to inferior parts of the right
medial PFC and right DLPFC (V12 and V14). Although, this is a less pronounced difference
than in block two, there were complimentary increases in deoxy-Hb that suggest more
pronounced differences between users and non-users as a function of difficulty. A total of
eight voxels, showed significant between group differences in deoxy-Hb at the one second
rate, compared to six voxels at the two second rate and seven voxels at the four second rate.
In each case, increases in deoxy-Hb, were observed over the breadth of the prefrontal cortex,
suggesting that induction of haemoglobin in ecstasy users during inhibition is bilateral. The
majority of the regression analyses, on voxels showing significant between group differences,
to observe whether ecstasy use predicted oxy and deoxy-Hb increases after controlling for
cannabis use indices, were non-significant. However ecstasy use indices predicted a
significant amount of the variance in deoxy-Hb at voxel 14, in the four second rate of the task.
Specifically frequency of use and last 30 days use were significant predictors, with increased
frequency being associated with reduced deoxy-Hb, and increased last 30 day use being

230
associated with increased deoxy-Hb. Last 30 days use was also a significant predictor of oxy-
Hb increase at V12 and V14 in the 1 second rate block, with increased use being associated
with increased oxygenation. Last 30 days use also predicted deoxy-Hb increase at V14 at the
two and one second rates. The results from regression analyses suggest that recency of
ecstasy use may play an important role in the observed cognitive function alterations during
inhibition.
Ecstasy users displayed increases in oxy-Hb relative to controls in voxels pertaining
to the left medial PFC during switching. Indeed voxel 5 in the first switching block saw
significant increases in oxygenated haemoglobin for ecstasy users relative to controls.
Moreover V5 also displayed differences in block two that were approaching significance.
Regression analyses did not show ecstasy use indices as significant predictors of oxy-Hb
change at V5 (block 1) after controlling for cannabis use. However lifetime dose of cannabis
was a significant predictor of oxygenation at V5, in block one, with increased use being
associated with increased oxy-Hb. Increases in oxy-Hb relative to controls were observed
consistently in several sites over the left DLPFC and right PFC during tasks that tap the
executive function of “access”. Furthermore the number of voxels showing differences here
increased as a function of difficulty. Ecstasy users also displayed significant increases in
deoxy-Hb compared to controls at V2 relating to the left DLPFC in blocks one (semantic
fluency – “animals”) and two (first level of word fluency – “s” letter words). Frequency of
ecstasy use was a significant predictor of oxy-Hb after controlling for cannabis use indices at
V3 and V4 of block one and V3 in block three. Increased frequency is associated with
increased oxy-Hb at these sites. Lifetime dose of ecstasy was also a significant predictor of
oxy-Hb at V4 in block one. Lifetime dose was also approaching significance (p=.06 in each
case) as a predictor of oxy-Hb at V4 in block two and of deoxy-Hb in V2 in blocks one and
two. Again increased lifetime dose was associated with increases in oxy and deoxy-Hb.
231
Lifetime dose of cannabis was also a significant predictor of oxy-Hb at V4 in blocks two and
three. These results suggest that frequency of use and lifetime dose of ecstasy may play a role
in neurocognitive alterations associated with access.
Thus far it appears that ecstasy users are engaged in more effortful cognition in terms
of haemodynamic response than non-users, during executive function tasks. This is consistent
across Chapters 7 and 8. Furthermore the results from this chapter corroborate the results
from Chapter 6 that suggest atypical processing of inhibition, switching and access in ecstasy
users. All three chapters thus far have a dissociation between behavioural output and
cognitive effort reflecting neuroimaging measures’ greater sensitivity to cognitive
impairment, and the results are consistent with ecstasy users relying on recruitment of
additional resources to attenuate performance deficits. The next chapter will assess the
haemodynamic response to a multitasking paradigm alongside cortisol sampling data as a
measure of the integrity of the HPA axis in ecstasy users.
232
Chapter 9: fNIRS multitasking and neuroendocrine response
9.1 Chapter overview
Thus far it appears that fNIRS has provided clear observable differences in relation to
effortful cognition exhibited between ecstasy users and controls. This chapter further explores
haemodynamic response in ecstasy users relative to controls. However this time a multi-
tasking paradigm has been employed. Furthermore a diurnal cortisol profile has been
completed by all participants to assess the integrity of the HPA axis. Twenty ecstasy users, 17
polydrug controls and 19 drug naïve controls were recruited for this study. Again
performance on the task was equivalent between groups. However, fNIRS data show
differences in haemodynamic response to task between groups. The cortisol profiling data
show generally increased levels of cortisol in ecstasy users compared to controls, which was
significant compared to both control groups at time 3 on day 1 of the study protocol and also
significantly increased compared to polydrug controls at time 1 of day 1 of the protocol.
9.2 Introduction
Recreational drug use is argued to be detrimental to normal physiological and
psychological functioning. As documented in this thesis, working memory deficits –
particularly those associated with higher level executive functioning tasks appear to be most
prominent in the literature (Fisk et al., 2004; Montgomery, Fisk, Newcombe & Murphy,
2005). However ecstasy produces its acute psychological and physiological effects by being a
powerful indirect serotonin agonist, whilst also having stimulatory effects on dopamine
amongst other neurotransmitters (McDowell & Kleber, 1994). After exposure, rebound
neurotransmitter depletion is common, leading to anhedonia (Curran & Travill, 1997),
amongst other psychobiological alterations to cognition sleep and mood (Parrott & Lasky,
233
1998; Parrott, 2006). Repeated exposure of MDMA may lead to long lasting effects on
monoamine mediated psychobiological functions.
MDMA’s agonist action on serotonin also leads to stimulation of the hypothalamic-
adrenal-axis (HPA) axis, resulting in altered neuroendocrine function (Parrott et al., 2008).
The neurohormone cortisol is understood to be produced in response to stress, and has been
used as an indicator of neuroendocrine function. In ecstasy users, acute effects of MDMA
combined with dancing in hot environments, have been reported to increase salivary cortisol
levels by up to 800% compared to clubbing without taking the drug (Parrott et al., 2008).
This combination of drug use and prolonged dancing in hot environments is proposed to have
an interactive effect on psychobiological functions, which has been termed the Bioenergetic
Stress Model of recreational MDMA use (Parrott, 2006; Parrott et al., 2008). Moreover
MDMA has been described as an acute metabolic stressor, due to its actions on cortisol
(Parrott, 2006; Parrott et al., 2008). Further evidence for acute increases of cortisol after
MDMA use comes from de la Torre et al. (2000) who observed marked elevation of plasma
cortisol and prolactin after doses of MDMA that are equivalent to recreational doses (50-
150mg). Peak cortisol concentration was observed 2 hours post ingestion. Harris et al. (2002)
report similar significant increases in plasma cortisol after administration (1.5mg/kg) of
MDMA in humans.
The most marked increases in cortisol have been observed in the field environment
where recreational MDMA users are predominantly using these drugs, such as night clubs
(Parrott et al., 2008). It is in these ‘real world’ situations where ecstasy users are exposed to
multiple stimulatory factors (heat, crowding, loud music, intense light), which can cause high
levels of bioenergetic stress (Parrott, 2009). Moreover, it has been suggested that repeated
234
exposure to such hyperstimulation will have cumulative effects and result in chronic
bioenergetic distress (Parrott, 2006; Parrott, 2009).
Gerra et al., (2000) investigated long lasting effects of MDMA use on cortisol and
prolactin. Ecstasy users’ basal cortisol levels appeared equivalent to controls, three weeks
post MDMA exposure. However a significantly reduced cortisol response to D-fenfluramine
challenge was observed in ecstasy users, three weeks post administration, though cortisol
responses appeared to normalise after 12 months abstinence. The same research group (Gerra
et al., 2001) observed significantly elevated baseline cortisol levels in MDMA users, who had
been free from MDMA for at least three weeks, compared to controls. A possibility for this
increase was suggested to be MDMA related alterations to basal HPA-axis function, due to
serotonergic changes produced by repeated MDMA exposure. Basal cortisol plasma levels
were again observed to be elevated in drug free ecstasy users compared to controls in a study
by Gerra et al. (2003); ecstasy users and controls were exposed to psychosocial stressors
(Stroop interference task, mental arithmetic and public speaking) and MDMA users showed a
blunted cortisol response to psychological stress compared to controls. It was suggested that
increased basal levels of cortisol may reflect increased worry about the tasks and perception
of them being more stressful. Alternatively, perhaps elevated basal cortisol due to MDMA
exposure exhausts HPA axis leading to blunted responses to stress (Gerra et al., 2003).
Nevertheless there is evidently a complex relationship between drug use and HPA-axis
function.
Cortisol release follows an established diurnal pattern, increasing rapidly within the
first 30 minutes of awakening (cortisol awakening response) (Pruessner et al., 1997), and
remaining elevated for up to 60 minutes. Following this a general decline in cortisol levels
throughout the day is normal. Hyperactivity of the HPA-axis has real health implications,
235
given that it is associated with susceptibility to infectious disease (Sapolsky, 1996) and
depression (Wong et al., 2000). Cortisol also increases as a response to stress and allostatic
load in normal individuals (McEwen, 1998). Thus investigation of diurnal cortisol profiles in
ecstasy users in the days leading up to a psychological stressor may yield more information
about basal cortisol levels and stress reactivity.
Wetherell et al., (2012) recently investigated psychological stress reactivity in ecstasy
users and controls using a multi-tasking stressor framework (including tasks that require
executive function resources). Self-reported feelings of calmness were significantly reduced
in ecstasy users compared to drug naïve controls in response to the stressor task. This is
suggestive that ecstasy use can have long lasting ill effects on the psychological response to
stress. This in turn has real life implications for recreational drug users and also warrants
further investigation.
The aims of this study were to investigate changes in prefrontal blood oxygenation in
response to a demanding task in ecstasy users, polydrug controls and drug naïve controls. The
acute stressor is provided in the form of a multitasking stressor task (Purple Research
Solutions, UK), with four higher-level processing tasks (Stroop task, two visual monitoring
tasks and mental arithmetic). The cerebral hemodynamic response to conducting several tasks
at once was measured as well as performance on the task behaviourally. Moreover a diurnal
cortisol profile was obtained from all participants in the day preceding the multitasking
stressor and the test day. Pre and post test samples were also collected (saliva samples) to
assess cortisol levels in response to a psychological stressor. It was hypothesised that
performance on the multitasking stressor task may be equivalent, as with other measures of
performance in this thesis, but MDMA users will again show increased haemodynamic
response to the task, reflective of increased cognitive effort. Furthermore in line with
236
previous research on cortisol, it was predicted that ecstasy users will show increased basal
cortisol levels from their diurnal cortisol profiles and as such will not display marked cortisol
increase in response to the multitasking stressor.
9.3 Method
Participants:
Twenty ecstasy users (mean age = 21.61, SD = 0.52, 12 = male), 17 non-ecstasy,
polydrug controls (mean age = 21.23, SD = 0.79, 12 = male) and 19 drug naïve controls
(mean age = 21.60, SD = 0.84, 6 = male) were recruited via direct approach (e-mail) to
Liverpool John Moores University students. Inclusion criteria were the same as that in
Chapter 6. Indices of ecstasy use were as follows: total lifetime dose 253.86 tablets ± 376.20;
mean amount used in last 30 days 2 tablets ± 3.46, and frequency of use 0.22 times/week ±
0.21.
Materials
Questionnaires:
The Background Drug Use Questionnaire, NASA-TLX and Raven’s SPM were used,
as described in Chapter 6.
The SAI VAS (State Anxiety Inventory – Visual Analogue Scale) was completed pre
and post testing period, this comprises 6 statements (I feel calm, I feel tense, I feel upset, I
feel relaxed, I feel content, I feel worried) and participants have to indicate on a 100mm line
how much they agree with the statement, ranging from 0 – not at all, to 100 – very much. To
attain a measure of perceived stress in the lab, the Perceived Stress Scale (PSS4) was used.
This is a four item scale that asks participants about their perceived stress, for example “How
237
often have you felt difficulties were piling up so high that you could not overcome them?”
Participants are required to respond from 0 = Never, to 4 = very often.
The HADS (Hospital Anxiety and Depression Scale) (Zigmond & Snaith, 1983), is a
14-item scale with seven items relating to anxiety and seven items relating to depression.
This scale includes items such as “I still enjoy things that I used to enjoy” and participants are
required to state how much they agree with this from for example 1 = definitely as much, to 4
= hardly at all. A high score for the anxiety related items reflects high levels of anxiety and a
high level on depression related items reflect high levels of depression.
Multitasking stress test
The multi-tasking framework (Purple Research Solutions, UK) is a PC run platform
used to elicit acute psychological stress (Wetherell & Sidgreaves, 2005). The same
combination of four stressor modules (Stroop, mental arithmetic, tracking/target area – visual
monitoring and warning/rising bars – visual monitoring) was used for all participants, at a
medium intensity workload. The task requires participants to attend to the four different
components/modules of the task simultaneously. The instructions on screen inform
participants of how points are scored and the participants were instructed to achieve the
highest score possible. The set of tasks included a mental arithmetic task whereby
participants were required to calculate a series of 2 x 3 digit addition sums; visual monitoring
(target area) whereby participants monitor the position of a moving cursor and reset this
cursor when it entered a points zone; a second visual monitoring module (rising bars)
comprises of a set of six bars that rise towards a target line at varying speeds. Once the bars
reach the target, participants select the order in which the bars reached the target, fastest first.
Finally a Stroop task module involved colour names appearing onscreen in various colours,
238
participants had to select the colour the word appeared in, rather than read the word. For more
information on the different modules of the framework, see Wetherell and Sidgreaves (2005)
Equipment
fNIRS: Haemodynamic response to task in the PFC was monitored as in Chapter 7.
Cortisol: Saliva samples were obtained by instructing participants to chew on a
salivette (Sarstedt Ltd, Germany) for one minute. Participants collected labelled salivettes
from the laboratory prior to commencing the study. Sample 1 was taken on day 1 on
awakening, sample 2 was taken 30 minutes after waking, sample 3 was taken in the afternoon
between 1-3 pm and a fourth sample was taken in the evening (between 9-11pm). The
following day (test day) a sample was again taken upon waking, a second sample was taken
30 minutes later, a third sample was taken upon entering the lab for testing, a fourth sample
was taken post-test and a final sample was collected in the evening (between 9-11pm). Saliva
samples were frozen until they were assayed for salivary cortisol using Neogen cortisol
ELISA kits (Neogen Corporation, USA). Assays were conducted by Northumbria University.
Procedure
Participants were required to attend the lab on two occasions. Upon entering the lab
for the first day participants were informed of what the study would entail and written
consent was obtained. Participants were given questionnaires in the following order:
background drug use questionnaire, PSS4, HADS and Raven’s SPM and informed of the
saliva sampling protocol (outlined above). The following day, participants did not attend the
lab, but did collect cortisol samples (day 1 of cortisol profile protocol). One day later (test
day, day 2 of sampling protocol), a pre-task SAI-VAS and HADS were given upon entering
the lab, and a pre–test cortisol sample was taken. After this the fNIRS sensor pad was

239
attached to the participants’ forehead whilst they read instructions on how to complete the
task. Participants were then instructed to complete a two minute practise trial of the task after
which any questions that the participant had about the task could be answered. The fNIRS
signals were displayed on a desktop computer running COBI studio (Drexel University) in an
adjacent room to the testing room. Providing the signals from the fNIRS were stable, a
baseline of inactivity was recorded before the participants were instructed to complete a 20
minute session of the multi-tasking stressor task on a desktop computer running the purple
framework (Purple Solutions, UK). After the 20 minutes had elapsed, participants completed
a post task SAI-VAS and gave post-test cortisol sample. The NASA TLX was also completed
post task. Finally participants were fully debriefed and were paid £20 in store vouchers. The
study was approved by Liverpool John Moores University Research Ethics Committee, and
was administered in accordance with the ethical guidelines of the British Psychological
Society.
fNIRS analysis
Pre-processing and analysis followed the same procedure as that described in Chapter
7.
Statistical analysis
Behavioural data was analysed using ANOVA with group as the between subjects
factor and total scores on each component of the task (Stroop, mental arithmetic,
tracking/target area – visual monitoring and warning/rising bars – visual monitoring) as well
as overall score on the task as the dependent variables. ANOVA4 was conducted on oxy-Hb
4 Due to small amounts of missing data on different voxels, MANOVA was not appropriate for this analysis.
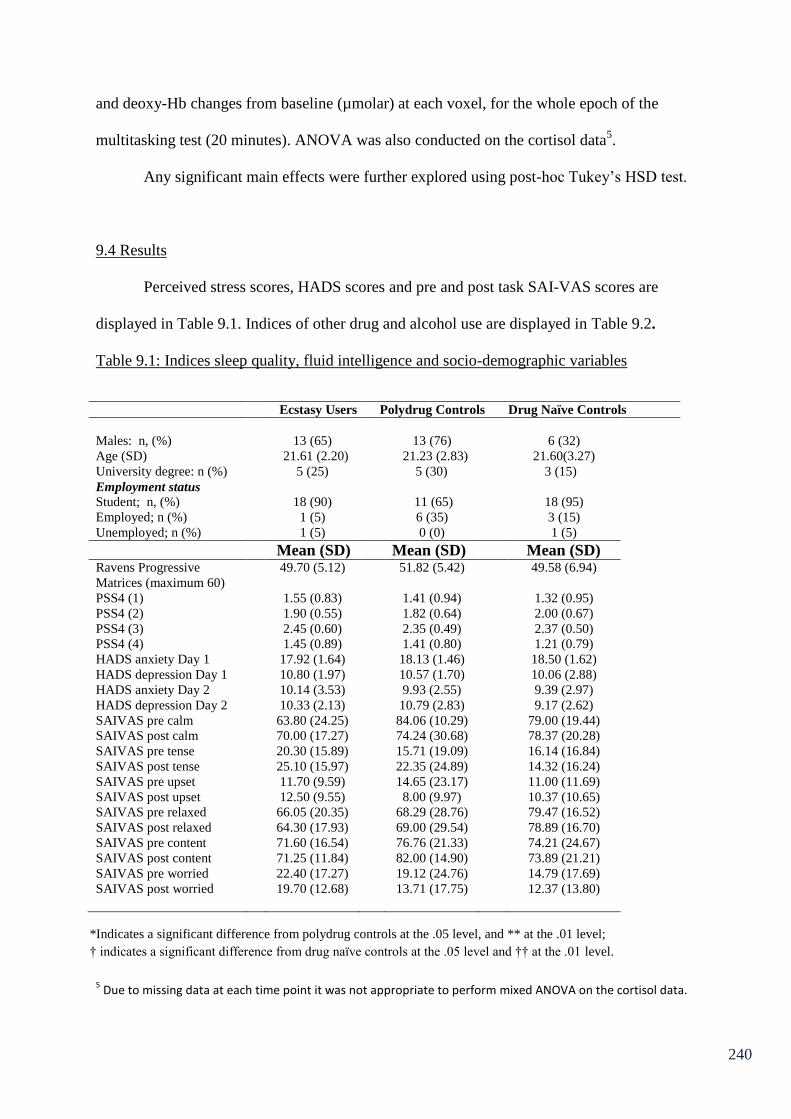
240
and deoxy-Hb changes from baseline (µmolar) at each voxel, for the whole epoch of the
multitasking test (20 minutes). ANOVA was also conducted on the cortisol data5.
Any significant main effects were further explored using post-hoc Tukey’s HSD test.
9.4 Results
Perceived stress scores, HADS scores and pre and post task SAI-VAS scores are
displayed in Table 9.1. Indices of other drug and alcohol use are displayed in Table 9.2.
Table 9.1: Indices sleep quality, fluid intelligence and socio-demographic variables
Ecstasy Users Polydrug Controls Drug Naïve Controls
Males: n, (%) 13 (65) 13 (76) 6 (32)
Age (SD) 21.61 (2.20) 21.23 (2.83) 21.60(3.27)
University degree: n (%) 5 (25) 5 (30) 3 (15)
Employment status
Student; n, (%) 18 (90) 11 (65) 18 (95)
Employed; n (%) 1 (5) 6 (35) 3 (15)
Unemployed; n (%) 1 (5) 0 (0) 1 (5)
Mean (SD) Mean (SD) Mean (SD) Ravens Progressive
Matrices (maximum 60)
49.70 (5.12) 51.82 (5.42) 49.58 (6.94)
PSS4 (1) 1.55 (0.83) 1.41 (0.94) 1.32 (0.95)
PSS4 (2) 1.90 (0.55) 1.82 (0.64) 2.00 (0.67)
PSS4 (3) 2.45 (0.60) 2.35 (0.49) 2.37 (0.50)
PSS4 (4) 1.45 (0.89) 1.41 (0.80) 1.21 (0.79)
HADS anxiety Day 1
HADS depression Day 1
HADS anxiety Day 2
HADS depression Day 2
SAIVAS pre calm
SAIVAS post calm
SAIVAS pre tense
SAIVAS post tense
SAIVAS pre upset
SAIVAS post upset
SAIVAS pre relaxed
SAIVAS post relaxed
SAIVAS pre content
SAIVAS post content
SAIVAS pre worried
SAIVAS post worried
17.92 (1.64)
10.80 (1.97)
10.14 (3.53)
10.33 (2.13)
63.80 (24.25)
70.00 (17.27)
20.30 (15.89)
25.10 (15.97)
11.70 (9.59)
12.50 (9.55)
66.05 (20.35)
64.30 (17.93)
71.60 (16.54)
71.25 (11.84)
22.40 (17.27)
19.70 (12.68)
18.13 (1.46)
10.57 (1.70)
9.93 (2.55)
10.79 (2.83)
84.06 (10.29)
74.24 (30.68)
15.71 (19.09)
22.35 (24.89)
14.65 (23.17)
8.00 (9.97)
68.29 (28.76)
69.00 (29.54)
76.76 (21.33)
82.00 (14.90)
19.12 (24.76)
13.71 (17.75)
18.50 (1.62)
10.06 (2.88)
9.39 (2.97)
9.17 (2.62)
79.00 (19.44)
78.37 (20.28)
16.14 (16.84)
14.32 (16.24)
11.00 (11.69)
10.37 (10.65)
79.47 (16.52)
78.89 (16.70)
74.21 (24.67)
73.89 (21.21)
14.79 (17.69)
12.37 (13.80)
5 Due to missing data at each time point it was not appropriate to perform mixed ANOVA on the cortisol data.
*Indicates a significant difference from polydrug controls at the .05 level, and ** at the .01 level;
† indicates a significant difference from drug naïve controls at the .05 level and †† at the .01 level.

241
Table 9.2: Indices of drug use.
Ecstasy Users Polydrug
Controls
Drug Naïve
Controls
Mean (SD) n Mean (SD) n Mean (SD) n
Cannabis
Frequency
(times/wk)
2.74 (2.81)* 20 1.11 (1.56) 16 - -
Last 30
days
(joints)
46.56 (59.89) 17 19.34 (46.36) 16 - -
Total use
(joints)
3613.80
(4469.70)
20 1562.96
(3021.05)
17 - -
Cocaine
Frequency
(times/wk)
0.06 (0.08) 2 0.05 (0.06) 2 - -
Last 30
days
(lines)
0.00 (0.00) 2 0.00 (0.00) 2 - -
Total use
(lines)
415.00 (43.84) 2 7.50 (0.71) 2 - -
Ketamine
Frequency
(times/wk)
0.19 (0.19) 5 - - - -
Last 30
days use
(grams)
0.00 (0.00) 5 - - - -
Total use
(grams)
21.72 (16.90)
5 - - - -
Alcohol
units p/w
13.20 (6.68) 20 12.44 (9.70) 16 6.99 (9.14) 19
*Indicates a significant difference from polydrug controls at the .05 level, and ** at the .01 level;
† indicates a significant difference from drug naïve controls at the .05 level and †† at the .01 level.
242
One way ANOVA revealed that there were no significant between group differences
on measures such as age and fluid intelligence or on measures of perceived stress (PSS4
pretesting), (p>.05 in all cases). Pre and post task SAI-VAS scores for each of the six
subscales (calm, tense, relaxed, content, upset and worried) were analysed using a mixed
ANOVA, with user group as the between subject factor and time point (pre/post-test) as the
within subjects factor. Using the score on the visual analogue scale as the DV, for calm there
was no significant main effect of time point F(1,53)=0.19, p>.05, no time point by group
interaction F(2,53)=1.97, p>.05, but there was a strong trend for main effect of group
F(2,53)=3.08, p=05. Pairwise comparisons showed that ecstasy users reported feeling less
calm than both other groups overall (p<.05) in both cases. For tense there was a strong trend
for main effect of time point F(1,53)=3.95, p=.05, with all three groups showing increases in
tenseness post-task. There was no time point by group interaction F(2,53)=0.32, p>.05.
There was no main effect of group F(2,53)=1.75, p>.05.
The subscale upset showed no main effect of time point F(1,53)=1.69, p>.05, no time
point by group interaction F(2,53)=1.82, p>.05 and no main effect of group F(2,53)=0.07,
p>.05. The subscale of relaxed also showed no main effect of time point F(1,53)=0.03, p>.05
and no time point by group interaction F(2,53)=0.05, p>.05, but does show a significant main
effect of group F(2,53)=3.04, p<.05, pairwise comparisons revealed that drug naïve controls
were significantly more relaxed than ecstasy users (p<.05). The content subscale revealed no
significant main effect of time point F(1,53)=0.25, p>.05, no time point by group interaction
F(2,53)=0.33, p>.05 and no main effect of group F(2,53)=1.39, p>.05. Finally, worried
revealed a main effect of time point, that was approaching significance F(2,53)=3.04, p=06,
with worry being greatest pre task, but no time point by group interaction F(2,53)=0.27,
p>.05 and there was no main effect of group F(2,53)=1.06, p>.05.

243
Mixed ANOVA was also performed on the HADS with user group as the between
subject factor and time point (day1/test day awakening) as within subjects. For anxiety there
was a significant main effect of time point F(1,44)=232.12, p<.05 with reduced anxiety on
the day of testing. There was however no group by time point interaction F(2,44)=0.53,
p>.05, or main effect of group F(2,44)=0.02, p>.05. For depression there was no main effect
of time point F(1,44)=1.98, p<.05, no time point by group interaction F(2,44)=1.41, p>.05
and no main effect of group F(2,44)=1.14, p>.05.
ANOVA revealed a significant between group difference in the amount of alcohol
consumed (weekly) F(2,52)=3.28, p<.05. Pairwise comparisons revealed a strong trend for
ecstasy users to drink more than drug naïve controls p=.05. t-tests between ecstasy users and
polydrug controls on drug use other than ecstasy revealed that ecstasy users reported smoking
cannabis more frequently than polydrug controls (2.74 ± 2.81 compared to 1.11 ± 1.56)
t(30.74)=2.20, p<.05 (Levene’s test was significant so degrees of freedom have been adjusted
accordingly). However there were no differences in total lifetime joints smoked or total joints
smoked in the last 30 days. The ecstasy user group showed greater total cocaine use (415 ±
43.84 compared to 7.5 ± 0.71) though only 2 participants in each group reported taking
cocaine. Ketamine was used by 5 participants in the ecstasy user group, though there were no
polydrug users who reported using ketamine, so a statistical comparison cannot be made.
However as seen in Table 9.2, the ecstasy user group can be considered a polydrug user
group. No differences were observed on other drug intake variables.
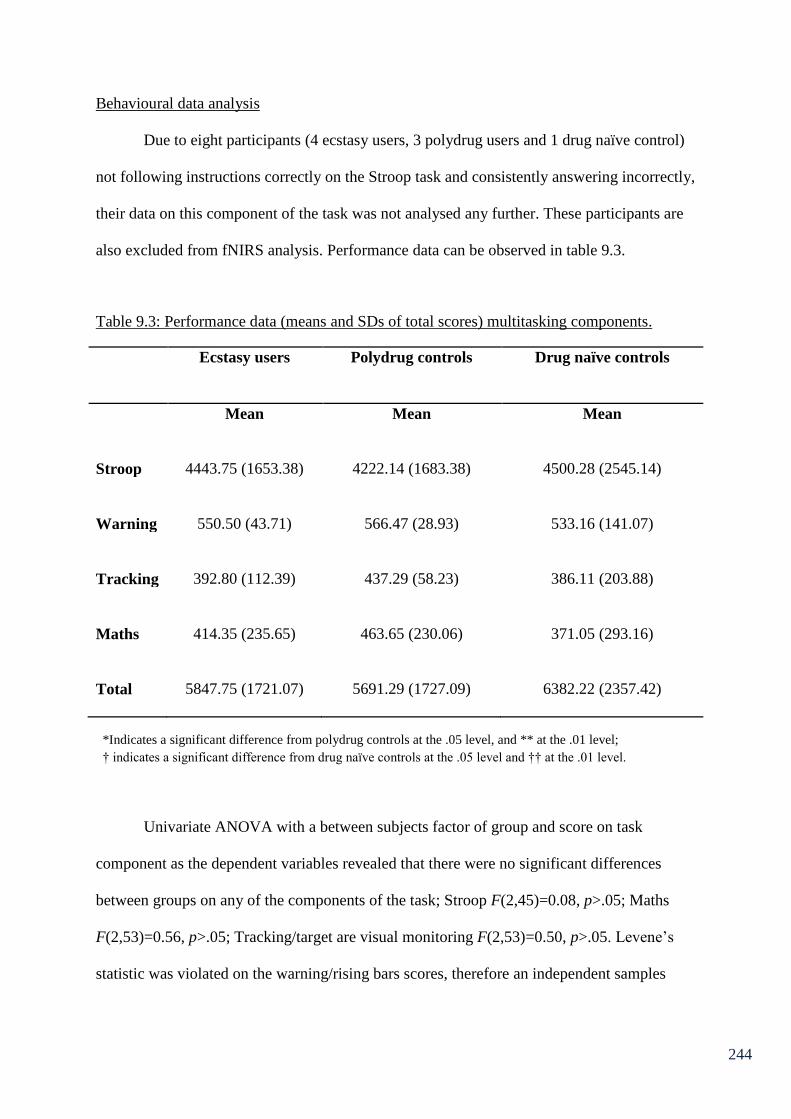
244
Behavioural data analysis
Due to eight participants (4 ecstasy users, 3 polydrug users and 1 drug naïve control)
not following instructions correctly on the Stroop task and consistently answering incorrectly,
their data on this component of the task was not analysed any further. These participants are
also excluded from fNIRS analysis. Performance data can be observed in table 9.3.
Table 9.3: Performance data (means and SDs of total scores) multitasking components.
Ecstasy users Polydrug controls Drug naïve controls
Mean Mean Mean
Stroop
4443.75 (1653.38)
4222.14 (1683.38)
4500.28 (2545.14)
Warning
550.50 (43.71)
566.47 (28.93)
533.16 (141.07)
Tracking
392.80 (112.39)
437.29 (58.23)
386.11 (203.88)
Maths
Total
414.35 (235.65)
5847.75 (1721.07)
463.65 (230.06)
5691.29 (1727.09)
371.05 (293.16)
6382.22 (2357.42)
Univariate ANOVA with a between subjects factor of group and score on task
component as the dependent variables revealed that there were no significant differences
between groups on any of the components of the task; Stroop F(2,45)=0.08, p>.05; Maths
F(2,53)=0.56, p>.05; Tracking/target are visual monitoring F(2,53)=0.50, p>.05. Levene’s
statistic was violated on the warning/rising bars scores, therefore an independent samples
*Indicates a significant difference from polydrug controls at the .05 level, and ** at the .01 level;
† indicates a significant difference from drug naïve controls at the .05 level and †† at the .01 level.
245
Kruskall-Wallace test was conducted. This revealed that there were no significant differences
between ecstasy users (rank = 560), polydrug controls (rank = 570) and drug naïve controls
(rank = 580) on this component of the task; (H(2) =1.43, p>.05). On the composite total score,
ANOVA revealed no significant between group differences F(2,45)=0.55, p>.05.
Post task NASA TLX scores were analysed using MANOVA. This revealed no
overall between group differences in task load F(12,96)=1.25, p>.05 for Pillai’s trace, nor
any between group differences on the individual sub-scales (Mental demand; F(2,52)=1.32,
p>.05, Physical demand; F(2,52)=0.11, p>.05, Temporal demand; F(2,52)=0.10, p>.05,
Effort; F(2,52)=1.97, p>.05, Performance; F(2,52)=2.39, p>.05, Frustration; F(2,52)=2.65,
p>.05).
fNIRS Analysis
Averaged oxy-Hb and deoxy-Hb changes (µmolar) from baseline are displayed in
table 9.4. A series of ANOVAs were used to assess group differences in changes from
baseline.
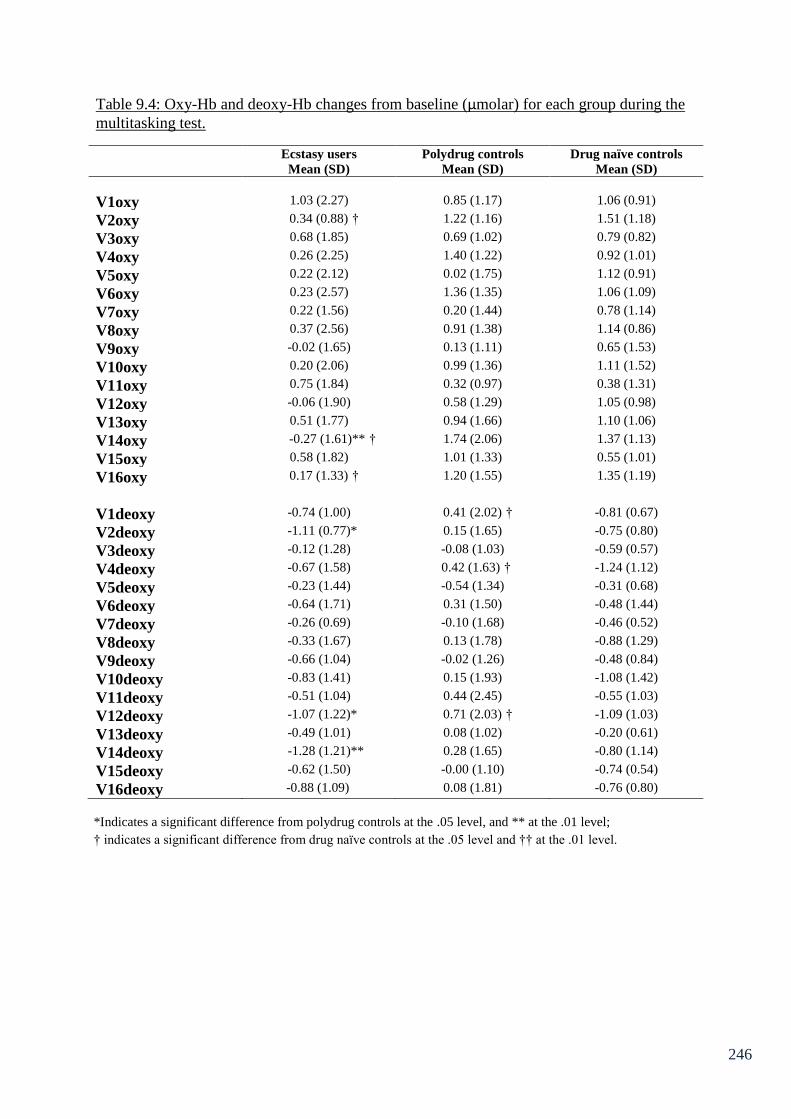
246
Table 9.4: Oxy-Hb and deoxy-Hb changes from baseline (µmolar) for each group during the
multitasking test.
Ecstasy users Polydrug controls Drug naïve controls
Mean (SD) Mean (SD) Mean (SD)
V1oxy 1.03 (2.27) 0.85 (1.17) 1.06 (0.91)
V2oxy 0.34 (0.88) † 1.22 (1.16) 1.51 (1.18)
V3oxy 0.68 (1.85) 0.69 (1.02) 0.79 (0.82)
V4oxy 0.26 (2.25) 1.40 (1.22) 0.92 (1.01)
V5oxy 0.22 (2.12) 0.02 (1.75) 1.12 (0.91)
V6oxy 0.23 (2.57) 1.36 (1.35) 1.06 (1.09)
V7oxy 0.22 (1.56) 0.20 (1.44) 0.78 (1.14)
V8oxy 0.37 (2.56) 0.91 (1.38) 1.14 (0.86)
V9oxy -0.02 (1.65) 0.13 (1.11) 0.65 (1.53)
V10oxy 0.20 (2.06) 0.99 (1.36) 1.11 (1.52)
V11oxy 0.75 (1.84) 0.32 (0.97) 0.38 (1.31)
V12oxy -0.06 (1.90) 0.58 (1.29) 1.05 (0.98)
V13oxy 0.51 (1.77) 0.94 (1.66) 1.10 (1.06)
V14oxy -0.27 (1.61)** † 1.74 (2.06) 1.37 (1.13)
V15oxy 0.58 (1.82) 1.01 (1.33) 0.55 (1.01)
V16oxy 0.17 (1.33) † 1.20 (1.55) 1.35 (1.19)
V1deoxy -0.74 (1.00) 0.41 (2.02) † -0.81 (0.67)
V2deoxy -1.11 (0.77)* 0.15 (1.65) -0.75 (0.80)
V3deoxy -0.12 (1.28) -0.08 (1.03) -0.59 (0.57)
V4deoxy -0.67 (1.58) 0.42 (1.63) † -1.24 (1.12)
V5deoxy -0.23 (1.44) -0.54 (1.34) -0.31 (0.68)
V6deoxy -0.64 (1.71) 0.31 (1.50) -0.48 (1.44)
V7deoxy -0.26 (0.69) -0.10 (1.68) -0.46 (0.52)
V8deoxy -0.33 (1.67) 0.13 (1.78) -0.88 (1.29)
V9deoxy -0.66 (1.04) -0.02 (1.26) -0.48 (0.84)
V10deoxy -0.83 (1.41) 0.15 (1.93) -1.08 (1.42)
V11deoxy -0.51 (1.04) 0.44 (2.45) -0.55 (1.03)
V12deoxy -1.07 (1.22)* 0.71 (2.03) † -1.09 (1.03)
V13deoxy -0.49 (1.01) 0.08 (1.02) -0.20 (0.61)
V14deoxy -1.28 (1.21)** 0.28 (1.65) -0.80 (1.14)
V15deoxy -0.62 (1.50) -0.00 (1.10) -0.74 (0.54)
V16deoxy -0.88 (1.09) 0.08 (1.81) -0.76 (0.80)
*Indicates a significant difference from polydrug controls at the .05 level, and ** at the .01 level;
† indicates a significant difference from drug naïve controls at the .05 level and †† at the .01 level.
247
ANOVA revealed significant between group differences in average oxy-Hb changes
at voxel 2 F(2,43)=4.78, p<.05; V14 F(2,43)=6.37, p<.01 and V16 F(2,42)=3.32, p<.05.
There were no significant between group differences at any of the other voxels measures
(p>.05).
Pairwise comparisons revealed that at V2 ecstasy users showed a significantly
reduced oxy-Hb change compared to drug naïve controls (p<.05). At V14 ecstasy users show
significantly lower oxy-Hb than both polydrug controls (p<.01) and drug naïve controls
(p<.05). At V16 ecstasy users again show significantly lower oxy-Hb than drug naïve
controls (p<.05).
ANOVA on deoxy-Hb changes from baseline revealed significant between group
differences at V1 F(2,42)=3.96, p<.05, V2 F(2,43)=4.71, p<.05, V4 F(2,30)=3.66, p<.05,
V12 F(2,30)=5.04, p<.05 and V14, F(2,43)=5.09, p<.01. There were no significant between
group differences at any of the other voxels measured (p>.05).
Pairwise comparisons revealed that at V1, polydrug controls showed significantly
greater deoxy-Hb than drug naïve controls (p<.05), and this difference approached
significance compared to ecstasy users (p=.07). At V2, polydrug controls showed
significantly greater deoxy-Hb increase than ecstasy users (p<.05) and this difference
approached significance compared to drug naïve controls (p=.08). At V4 polydrug controls
showed significantly increased deoxy-Hb compared to drug naïve controls (p<.05). At V12
polydrug controls showed significantly increased deoxy-Hb compared to both ecstasy users
and drug naïve controls (p<.05 in both cases) and at V14 polydrug controls showed
significantly greater deoxy-Hb compared to ecstasy users (p<.01). Ecstasy users and drug
naïve controls did not differ significantly from each other at any of these voxels.
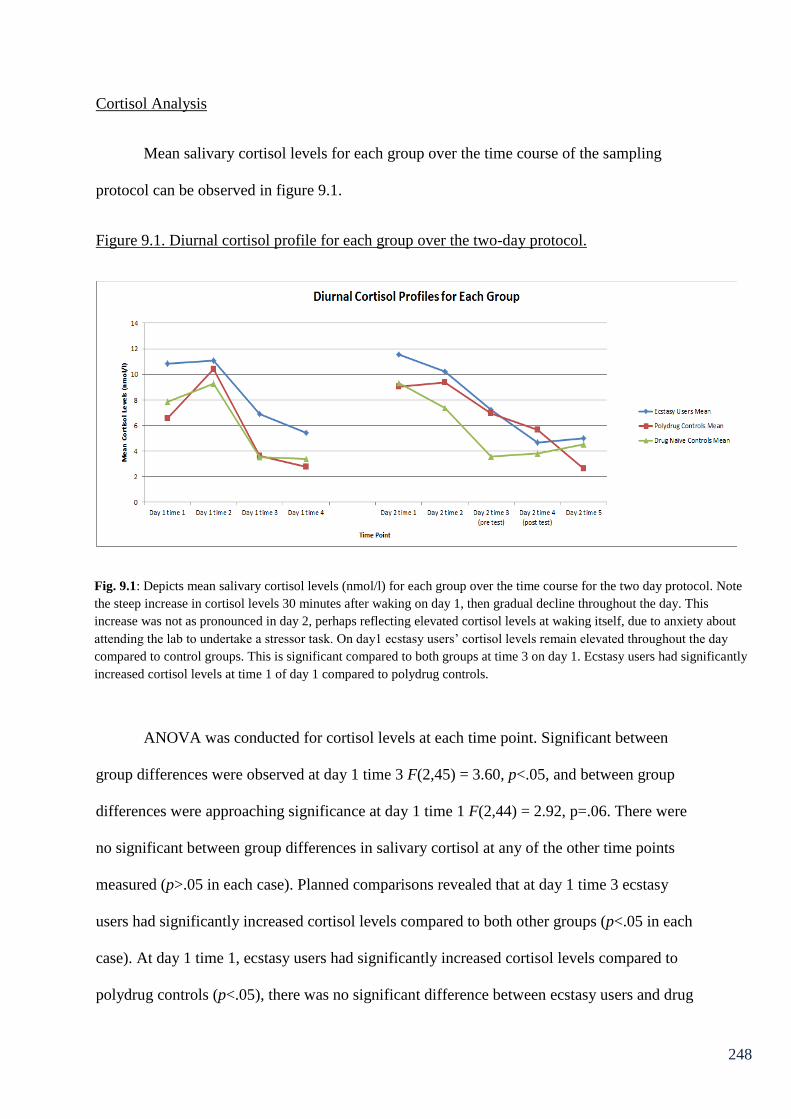
248
Cortisol Analysis
Mean salivary cortisol levels for each group over the time course of the sampling
protocol can be observed in figure 9.1.
Figure 9.1. Diurnal cortisol profile for each group over the two-day protocol.
ANOVA was conducted for cortisol levels at each time point. Significant between
group differences were observed at day 1 time 3 F(2,45) = 3.60, p<.05, and between group
differences were approaching significance at day 1 time 1 F(2,44) = 2.92, p=.06. There were
no significant between group differences in salivary cortisol at any of the other time points
measured (p>.05 in each case). Planned comparisons revealed that at day 1 time 3 ecstasy
users had significantly increased cortisol levels compared to both other groups (p<.05 in each
case). At day 1 time 1, ecstasy users had significantly increased cortisol levels compared to
polydrug controls (p<.05), there was no significant difference between ecstasy users and drug
Fig. 9.1: Depicts mean salivary cortisol levels (nmol/l) for each group over the time course for the two day protocol. Note
the steep increase in cortisol levels 30 minutes after waking on day 1, then gradual decline throughout the day. This
increase was not as pronounced in day 2, perhaps reflecting elevated cortisol levels at waking itself, due to anxiety about
attending the lab to undertake a stressor task. On day1 ecstasy users’ cortisol levels remain elevated throughout the day
compared to control groups. This is significant compared to both groups at time 3 on day 1. Ecstasy users had significantly
increased cortisol levels at time 1 of day 1 compared to polydrug controls.
249
controls at this time (p>.05). Furthermore, as can be observed in figure 9.1, ecstasy users and
polydrug users display decreased cortisol level post task compared to pre task.
9.5 Implications of Chapter 9
The results from this chapter show that there were no performance differences
between groups on any of the subscales of multitasking, or on total score for the task. In
addition, there were no significant differences on self-report measures of perceived workload
(indexed by the NASA – TLX). There were differences between groups in their
haemodynamic response to the task. However these were contrary to expectations. Analysis
of oxy-Hb change from baseline revealed that ecstasy users showed a blunted increase
compared to controls in response to the task. Indeed, at voxel 14 (pertaining to the right
DLPFC) ecstasy users showed significantly less oxy-Hb compared to both control groups.
Moreover drug naïve controls displayed a significant increase in oxy-Hb from baseline
compared to ecstasy users at V2 (left DLPFC), and V16 (right DLPFC). Polydrug controls
showed the greatest increase in deoxy-Hb. This was significant compared to ecstasy users at
V2, 12 and 14, and both ecstasy users and drug naïve controls at V12. Polydrug controls also
showed increases compared to drug naïve controls at V1 and V4. There were no differences
between ecstasy users and drug naïve controls in deoxy-Hb at any voxel. These results
provide difficulty for interpretation given what has preceded them in this thesis. Perhaps the
individual tasks that comprise the multitasking framework were not executive function
specific, rather they require other neuronal areas for performance. If this is the case, perhaps
ecstasy users showed a decrease in oxy-Hb compared to controls in the PFC due to
reallocating resources to other brain regions. This will be discussed in greater depth in
Chapter 10. However, the act of multitasking itself, should load on the central executive.
250
The results from cortisol sampling were more in line with predictions and current
knowledge of MDMA’s effects on the HPA axis. Observation of figure 9.1 shows a general
elevation in salivary cortisol levels in ecstasy users. However it was only at time 3 on day one
that ecstasy users displayed significantly increased cortisol levels compared to both other
groups. Ecstasy users did however show significant increase in salivary cortisol levels
compared to polydrug controls at time 1 day 1. These results reflect increased basal cortisol
levels in MDMA users relative to controls. Ecstasy users report significantly reduced feelings
of calmness, on the day of testing compared to both control groups on the SAI-VAS, and
significantly reduced feelings of being relaxed than drug naïve controls. Waking cortisol
levels are increased in control groups on the day of the test, by a greater amount than the
ecstasy user group. However the ecstasy users still show the greatest levels of cortisol at this
point. Perhaps such a high level of cortisol upon waking, reflects elevated anxiety about
undertaking the stressor task, and this increased level of cortisol is unsustainable, hence a
continuing drop in cortisol levels (as in day 1) rather than an increase post task. The
following chapter will discuss these results, along with the other results from the empirical
chapters in this thesis in greater depth.

251
10. General Discussion
The aim of the current thesis was to examine the neurophysiological response to
executive functioning in MDMA users. This was investigated using EEG and fNIRS, to aid
the current understanding of MDMA related cognitive deficits, due to potential serotonergic
neurotoxicity. Degradation to the serotonin system via repeated use of MDMA may also have
profound implications for other psychobiological functions. To this end a secondary aim of
this thesis was to examine neuroendocrine function in ecstasy users, and their neurohormonal
response to stressful events.
Chapter 6 of this thesis investigated the executive functions of inhibitory control,
switching, updating and, access to semantic memory and their behavioural and
electrophysiological correlates. Background variables such as fluid intelligence, age,
measures of sleep (apart from pre-test differences between polydrug controls and ecstasy
users on KSS), level of arousal, depression and anxiety showed no significant differences
between ecstasy users, polydrug controls and drug naïve controls. There were no behavioural
differences between groups in terms of number of errors for the Go/NoGo, N-back task and
semantic association tasks and there were no switch cost differences on the number-letter task.
No between group differences were observed in terms of reaction time on the semantic
association task. Furthermore ecstasy users did not differ significantly to the control groups
with respect to subjective mental workload on any of the tasks. However there were
differences in reaction time data on the n-back task, whereby drug naïve controls were
significantly slower to respond than polydrug controls. Although ecstasy users were not
significantly different in terms of reaction times compared to either control group, they did
show generally increased reaction times compared to drug naïve controls. Furthermore the
error count was generally higher for ecstasy users compared to controls (although not

252
significant) perhaps reflecting an accuracy versus speed trade off, that reflects increased
impulsivity in ecstasy users. The results here are non-significant however, and the polydrug
users show less errors than drug naïve controls as well as faster reaction times, so this
interpretation needs treating with caution. The lack of performance differences between
groups in response inhibition and switching was to be expected. Several studies have shown
that ecstasy users appear unimpaired at inhibitory control (Gouzoulis-Mayfrank et al., 2003;
Hanson & Luciana, 2010; Roberts & Garavan, 2010) and mental set switching (Back-
Madruga et al., 2003; Fox et al., 2001; Montgomery, Fisk, Newcombe & Murphy, 2005). It
was predicted that ecstasy users may show performance deficits in the semantic association
task. However, ecstasy users have been reported to display unimpaired performance in tasks
that assess access previously (Bedi & Redman, 2008; Halpern et al., 2004). Furthermore, it
was expected that ecstasy users may show performance deficits on the n-back task.
Nevertheless, the lack of performance impairment in updating on this task is in line with
previous research (Daumann, Fimm et al., 2003). Moreover as has been stipulated previously,
it was a central aim of this thesis to examine the neurophysiological response to executive
functioning tasks, as this may be more sensitive in exposing cognitive deficits.
Despite the lack of between-group differences on behavioural measures, there were
differences in EEG measures in line with our predictions that reflect atypical processing in
ecstasy users in response to executive function tasks involving inhibitory control, switching
and access. The following parts of this discussion will summarise the findings from EEG and
their relationship to the existing literature and implications for each executive function
separately. First to be discussed are the findings from the inhibitory control (Go/NoGo) task.
The ERP results from performing the Go/NoGo task are suggestive of changes in
attentional processes between the components involved in early inhibition processing (P2).
253
Ecstasy users exhibited significantly higher mean amplitudes than both control groups at
anterior midline site FCz and significantly higher amplitudes than drug-naïve controls at
another anterior midline site Fz. Furthermore regression analyses revealed that the amount of
ecstasy consumed in the last 30 days was a significant predictor of FCz amplitude after
controlling for cannabis use, suggesting that recent use of ecstasy may play a role in response
inhibition. It is interesting to observe such differences in the P2 component, given that it has
been suggested that problems with early orienting or preparation may have consequences for
later processing stages (Pliszka et al., 2000). Differences in this component have been
observed previously in attention deficit hyperactivity disorder (ADHD) subjects (Johnstone et
al., 2001; Lazzaro et al., 2001) who display greater amplitude in this component relative to
controls. This has been interpreted as atypical inhibition of sensory input in ADHD subjects
(Johnstone et al., 2001). In addition, research has shown that the P2 component is elevated in
unexpected versus expected inhibition trials (Gajewski et al., 2008). Research has also
investigated the P2 component in inhibitory control in high and low functional impulsives (i.e.
individuals whose impulsivity may facilitate performance). High functional impulsives show
an increase in P2 amplitude as a function of task demand (higher demand=increased
amplitude) whereas low functional impulsives do not (Fritzsche et al., 2011). Taken together,
this suggests a number of explanations for the elevation of P2 during performance of this
function. Firstly, ecstasy users have elevated impulsivity compared to nonusers and this
impulsivity may be masking performance deficits. Fritzsche et al. (2011) suggest that this
steeper P2 slope, as seen in the ecstasy-polydrug users, reflects earlier and more efficient
evaluation of stimuli as a result of impulsivity. This seems a reasonable assumption given
that elevated impulsivity has been noted in ecstasy users in previous research (e.g. Butler and
Montgomery, 2004). The heightened P2 has been shown to be associated with stimulus
evaluation and response (Gajewski et al., 2008). It is notable that Gajewski et al., (2008) only

254
reported elevated P2 when they increased the demands of their task, which tentatively
suggests that, in the present study, the task was more demanding for ecstasy users. Secondly
in line with the ADHD research cited above, the atypical early inhibitory processing
displayed in the P2 ERP component in ecstasy users could be due to recruitment of additional
compensatory resources, similar to the increased activity in prefrontal areas associated with
executive functioning deficits in Alzheimer’s disease patients (Grady, et al., 2003; Saykin et
al., 1998; Woodard et al., 1998). This proposal could also help explain the lack of observed
behavioural differences on the task. Moreover the recruitment of additional resources at this
early stage in processing could offset any further waveform modulation at later processing
stages.
Although some previous studies report differences between ecstasy users and controls
in the P3 component on a Go/NoGo task (Gamma et al., 2005), these have conceded that
between-group differences were lower after age, education level and cannabis use were
controlled for. Debates have arisen about the contribution of the P3 and N2 components in
response inhibition. For example, although often cited as being reflections of inhibitory
control (Kok, 1986; Kopp et al., 1996), the N2 has also been argued to have a role in conflict
monitoring, rather than response inhibition (Donkers and Boxtel, 2004; Nieuwenhuis et al.,
2003). Furthermore, the P3 has been suggested to be insensitive to performance differences in
inhibitory control and not necessarily involved in response inhibition (Falkenstein et al., 1999;
Kopp et al., 1996). If this is the case then perhaps the task used in the current study, which
was employed due to it tapping the executive function of inhibitory control only, would not
highlight any differences in these components.
Moving on to mental set switching in Chapter 6, ERP data during the number-letter
task also provide support for MDMA related disturbances to cognitive processing. The P3
255
component, thought to play an important role in the allocation of attentional resources and as
such an important role in the ability to switch between mental sets, showed significant
between group differences at several parieto-occipital and occipital electrode sites. Drug
naïve controls displayed significantly higher mean amplitude in this component compared to
ecstasy users as well as polydrug controls at O1 and POz. A diminished P3 component is
thought to reflect cognitive impairment, and as such these findings are consistent with those
of Casco et al. (2005) and Mejias et al. (2005) who observed reduced P3 in ecstasy users
compared to controls in other cognitive tasks. Interestingly, the polydrug control group
appear to have a reduced P3 in a further two sites (PO4 and Oz) compared to drug naïve
controls, suggesting some evidence of atypical processing that is related to the use of drugs in
general and not just ecstasy i.e. a polydrug effect. Furthermore, it has been suggested
previously that concomitant cannabis use may account in part or fully for cognitive deficits
observed in ecstasy users (Dafters et al., 2004; Gamma et al., 2005). Further to this point the
regression analyses suggested that lifetime dose of cannabis significantly predicted lower
mean amplitude at O1 and Oz. Although polydrug users did not differ from ecstasy users in
amplitude at PO4 and Oz, these results provide evidence for cannabis contributing to
processing atypicalities in mental set switching.
Ecstasy specific differences were also apparent in the P2 component, involved in
early processing of stimuli. It was observed that ecstasy users displayed a significantly higher
mean amplitude than both control groups at frontal, central and fronto-central sites; Fz, Cz
and FCz. Atypicalities at this early stage of processing in ecstasy users provide evidence that
suggest additional resources are being recruited as a compensatory mechanism as described
above. Perhaps additional recruitment of resources at this stage allowed for similar results
behaviourally, despite diminished P3 amplitude at a later stage of processing. These ERP

256
results are in line with our predictions and suggest evidence for an ecstasy/polydrug effect on
the degradation of the executive function of mental set switching.
In the semantic association task, there were no main effects of difficulty or site, or
any interactions with these and group, or difficulty by site by group for the N2 component.
There were however between group trends that warranted further exploration. In the low
association condition of the task ecstasy users displayed a significantly larger negativity in
the N2 component compared to drug naïve controls in occipital electrode site O2 and parieto-
occipital electrode PO8 although non-ecstasy polydrug users did not differ from either group.
The supposedly easier high association condition showed significant differences in
negativity at the N2 component in polydrug controls compared to drug naïve controls at
parieto-occipital site PO3. Components that reflect positivity’s (P2 and P3) showed no main
effects of difficulty or site, or any interactions with these and group, or difficulty by site by
group (except in P3 where there was a site by group interaction) and there were no between
group differences. Thus these components are less informative about access to semantic
memory in ecstasy users. However, the group difference in the N2 component does provide
some interesting points to consider. The N2 component has been reported as having a source
in the anterior cingulate cortex (Bekker et al., 2005; Nieuwenhuis et al., 2003) and to reflect
neural processes engaged during conflict monitoring, thus being increased in high conflict
trials (Yeung & Cohen, 2006), for example when incongruence between targets and
cues/distracters elicits a conflict of response in a Stroop task (Kopp et al., 1996). Firstly,
considering why the N2 was more pronounced in ecstasy users compared to drug naïve
controls in those trials where there was a lower semantic association between target and cue
words, it is possible that at this level of processing, the ecstasy users required the recruitment
of additional resources in order to access the semantic network of long term memory

257
compared to drug naïve controls. Previous research has provided evidence that ecstasy users’
performance can be more greatly impaired under higher task difficulty. For example
Montgomery, Fisk, Newcombe and Murphy (2005) observed a decline in performance in a
word fluency task when more rules were imposed, suggesting that deficits are more
prominent in tasks that place more demand on the central executive. Given that participants
reported no perceived differences in cognitive effort on the NASA-TLX it is possible that
compensatory cognitive processing at neurological sites is correcting for deficits in executive
function to eradicate behavioural differences and other research reporting null results, with
respect to performance may reflect similar reallocation of cognitive resources. This aspect of
the results was in line with our predictions.
Ecstasy users did not show significant differences to controls on the high association
condition of the task. It is generally accepted (Jefferies et al., 2004; Rossell et al., 2001;
Shiffrin & Schneider, 1977) that information processing involves two modes of processing:
automatic and controlled. Controlled processing, unlike automatic processing, involves
selectively and consciously attending to a stimulus, suggesting that controlled processing
involves higher level mental processes. As such automatic processing is proposed to rely on
long-term memory, whilst controlled processing loads more on working memory (Jeffries et
al. 2004), suggesting separable neural substrates. Indeed Rossell et al. (2001) used fMRI to
investigate differences in effortful and automatic processing in a similar lexical decision
priming experiment, and found that distinct sub regions of the anterior cingulate cortex
showed activation dependent on the processing type involved. The N2 component in a
semantic classification task was argued to reflect controlled processing by Ritter et al. (1982).
This could help explain why the magnitude of effects was larger under the more difficult low
association condition, as this was more effortful and as such required recruitment of
additional resources. Furthermore it has been observed that patients with mild head injuries
258
will display greater N2 amplitudes whilst performing at a similar level of performance on
cognitive tasks (Rugg et al., 1993). This is proposed as evidence for reallocation of cognitive
resources to cope with task demands and to achieve similar performance.
While the above discusses possible N2-related differences in access, it is possible that
the N2 here reflects changes in other cognitive processes additional to semantic access (See
Folstein & van Petten, 2008, for a review). The N2 in the current study was prominent in
more posterior electrodes which Suwazono et al. (2000) suggest is reflective of increased
attention demands in the visual cortex required for stimulus processing. In the study by
Suwazono et al. (2000) posterior N2 was eliminated by eliminating target novelty (i.e.
making targets completely predictable). Luck and Hillyard (1994) investigated
subcomponents of the N2 component using visual search tasks. It was found that the bilateral
posterior N2 as seen in the present study was related to visual search and target probability,
with an increased posterior N2 when participants could not predict a target before
presentation. Taken together this provides evidence that in the present study the posterior N2
may reflect increased demands on visual search and maintenance of visual representations,
with greater negativity in ecstasy polydrug users showing that they require increased
attentional resources for this. Durable abnormalities of the N2 component observed over
occipital and parieto-occipital sites of drug users compared to drug naïve controls are
indicative of compensatory mechanisms, or reallocation of cognitive resources to attenuate
any observable behavioural differences caused by ecstasy-related disturbances to traditional
processing of semantic information and allocation of attention during visual search.
Contrary to expectations, the n-back task yielded no observable ERP differences
between groups. It was predicted that ecstasy users would show alterations to ERP
components that reflect cognitive impairment/compensatory mechanisms, given that
259
performance was not significantly reduced. Furthermore, previous research combining this
task with neuroimaging methods has suggested neuronal alterations despite equivalent
performance (Daumann, Fimm et al., 2003). One possible explanation for the current lack of
differences may be the design of the n-back task employed. In several ERP studies using the
n-back task, a paradigm is employed whereby participants are presented with a series of
stimuli (letters or numbers) and are required to respond when a stimulus in the series matches
a stimulus presented n stimuli back in the series (Chen et al., 2008; Watter et al., 2001). This
would therefore elicit an ERP on each response, whereas the task used in the current thesis
required participants to select (from a display of numbers) which number was presented n
digits back. In this case the task is more difficult and requires more protracted mental
processing to calculate which digit was presented. As such this task may lend itself better to
imaging methods that are not time-locked, but rather evaluate the induction of neuronal
activity over time, for example ERD/ERS or measures or haemodynamic response such as
fMRI/fNIRS. Indeed the ecstasy-related activation differences observed by Daumann, Fimm
et al. (2003), were observed in an fMRI study.
To summarise the results from chapter 6, the ERP evidence suggests that
ecstasy/polydrug users are showing evidence of atypical cognitive processing during tasks
that require response inhibition, switching of the mental set and access of semantic/long term
memory stores. The durable abnormalities observed in these tasks in P2 and N2 components,
in line with predictions, reflect potential recruitment of additional resources to attenuate
behavioural differences. Whereas the diminished P3 response associated with mental set
switching may reflect general cognitive deficiencies that have been observed in ecstasy using
populations in the past. The lack of MDMA related differences in the ERPs elicited from the
n-back task are contrary to expectations. However the next part of this discussion focuses on
260
the results from haemodynamic response to memory updating tasks, which provide more
evidence consistent with expectations.
Chapter 7 investigated the haemodynamic response to memory updating using letter
updating and spatial updating tasks. Functional near-infrared spectroscopy was employed to
assess the haemodynamic response to task in ecstasy users, polydrug controls and drug naïve
controls. To summarise the results, performance was equivalent between groups on both
updating measures. Whilst this was again contrary to expectations due to previous research
suggesting that ecstasy users were consistently impaired on this function, it was in line with
results from updating performance in Chapter 6. Furthermore it was predicted that in the
absence of behavioural differences, haemodynamic measures would provide evidence of
ecstasy users being engaged in more effortful cognition as an index of cognitive
reallocation/compensatory mechanisms. The results from fNIRS showed that during the
letter-updating task ecstasy users showed significant increases in oxy-Hb from baseline
compared to both control groups at voxel 12, situated over the right medial PFC. Furthermore
significant increases in deoxy-Hb were observed in ecstasy users relative to drug naïve
controls at V12. At V12 the difference was approaching significance compared to polydrug
users. At V7 ecstasy users had greater deoxy-Hb compared to drug naïve controls that was
approaching significance. At V1 ecstasy users displayed significant increases in deoxy-Hb
compared to polydrug users, and differences compared to drug naïve controls that were
approaching significance and at V8 ecstasy users showed greater deoxy-Hb compared to both
control groups that was approaching significance. These voxels are located across the breadth
of the PFC showing a bilateral haemodynamic response to letter updating. This is consistent
with previous neuroimaging studies that suggest memory updating requires bilateral neuronal
response (e.g. Collette et al., 2007). During the spatial updating task ecstasy users showed
significant increases in oxy-Hb compared to both groups at voxel 8, situated over the left
261
medial prefrontal cortex. No significant between group differences were observed for deoxy-
Hb during the spatial updating task. Regression analyses were generally non-significant.
However frequency of MDMA use predicted oxy-Hb and deoxy-Hb at V12 during letter
updating, suggesting that frequency of use may affect haemodynamic response to memory
updating.
Increases in oxy-Hb compared to both control groups, are indicative of increased
cognitive effort displayed by ecstasy users to attenuate behavioural differences and are in line
with expectations. These results suggest that although performing at a similar level, the tasks
were more demanding for ecstasy users. Increases in oxygenated haemoglobin are understood
to reflect increases in neuronal activity (Leff et al., 2011), and levels of oxy-Hb increase with
increased demand (Izzetoglu et al., 2004). The importance of measuring haemodynamic
response to tasks where subjects perform at a similar level behaviourally has been explored
previously in human operators (for example, air traffic control operators – Ayaz et al., 2012).
Such studies highlight the dissociation between cognitive effort and performance output,
arguing that performance can be maintained at necessary levels via increased mental effort or
perhaps strategic alterations. However increased mental workload is also suggested to be
predictive of future performance failure (with increased demand or task changes). Increases
in oxy-Hb are accepted as increases in cognitive effort despite behaviourally similar
performance, and can be used as an assessment of operators’ ability (Ayaz et al., 2012). This
is an interesting distinction to make, as in previous studies neurological disorders are coupled
with task performance deficits and reductions in oxy-Hb (Ehlis et al., 2008). However given
that the current sample does not suffer from neurological impairment it is not appropriate to
compare results from this sample with those in studies such as that conducted by Ehlis et al.
(2008). The explanation of increasing cognitive effort to maintain similar behavioural
262
performance is more applicable and may reflect recruitment of additional cognitive resources
compared to controls and predict future cognitive decline.
The post-hoc statistical comparisons of means for the deoxy-Hb data in this chapter
were assessed at the 2 tailed level. This is because it is suggested that during neurovascular
coupling, increases in cerebral blood flow and cerebral blood volume are caused by
reductions in local glucose and oxygen due to increased consumption of these from the local
capillary bed (Irani et al., 2007). Thus increases in oxygenated haemoglobin delivery will
outweigh consumption leading to an excess of oxygenated haemoglobin in the activated area
(Fox et al., 1988). The excess of oxy-Hb is argued to cause decreases in deoxy-Hb, however
this has been the subject of much debate, as equally, increases in deoxy-Hb may be observed
in the capillary bed due to increased oxygen consumption (Irani et al., 2007). Previous
research has suggested that increases in oxy-Hb are often complimented by a decrease in
deoxy-Hb in the same area (Ehlis et al., 2008; Leff et al., 2008). However oxygenated and
deoxygenated haemoglobin do not necessarily have a linear relationship, rather they are
separate sources of haemodynamic response. Furthermore several studies have shown
increases in deoxy-Hb alongside increases in oxy-Hb (Hoshi & Tamura, 1993; Sakatani et al.,
1999). As such deoxy-Hb appears to be a less reliable measure of neuronal activation than
oxy-Hb in fNIRS. Nevertheless these results are better understood as an increase in total
haemoglobin to the areas of the prefrontal cortex that are involved in this executive function,
given that total-Hb is understood to be the sum of oxy-Hb and deoxy-Hb (Steinbrink et al.,
2006).
To summarise results from Chapter 7, there is evidence from fNIRS that ecstasy users
are engaged in more effortful cognition indexed by increases in oxy-Hb to areas of the
prefrontal cortex in letter-updating (V12 in the right medial PFC) and spatial updating (V8
263
left medial PFC). Increases in neuronal activation, reflect a compensatory mechanism due to
degradation of 5HT neurons in the PFC via MDMA use. Furthermore this may predict future
cognitive failure with increasing task demands. This is in line with our predictions and
supports previous research suggesting that ecstasy users show performance deficits in
updating (Montgomery & Fisk, 2008; Montgomery, Fisk, Newcombe & Murphy, 2005).
Moreover, these results are consistent with neural activation changes that have been observed
in ecstasy users during memory updating tasks in fMRI studies that are suggested to reflect
MDMA-induced neurotoxicity (Daumann, Fimm et al., 2003; Daumann, Schnitker et al.,
2003; Daumann, Fischermann, Heekeren et al., 2004).
Chapter 8 investigated the effects of ecstasy/MDMA on the haemodynamic response
to the remaining executive functions that were not covered in Chapter 7; inhibition, switching
and access. Ecstasy users were compared to a non-ecstasy control group (largely of drug
naïve participants) on performance of RLG, number-letter task and CWFT and their
haemodynamic response was assessed using fNIRS. The ecstasy users in this sample did not
differ significantly from controls in fluid intelligence, sleep measures or levels of arousal,
depression or anxiety. However, they did report drinking significantly more alcohol per week
than controls and due to their concomitant use of other drugs, it may be more adequate to
refer to them as polydrug users.
As in previous chapters behavioural data did not yield any significant differences at
any level of any of the tasks used. However, as predicted ecstasy users did display alterations
to neuronal activation on all three tasks used, which is consistent with findings from Chapter
6. Typically ecstasy users displayed increases in oxy-Hb compared to controls that reflect
increases in effortful cognition, which is in line with findings from Chapter 7. Furthermore

264
increases in deoxy-Hb were again observed in ecstasy users relative to controls during the
RLG task and the CWFT.
Inhibitory control was measured using RLG and analysis of fNIRS data during this
task revealed that on the easier level of the task (generation rate of 4s), ecstasy users showed
significant increases in oxy-Hb at one voxel (V10) in the right medial PFC and one voxel that
was approaching significance in the left DLPFC (V1). However deoxy-Hb was also increased
in ecstasy users relative to controls at several voxels relating the left DLPFC and the right
DLPFC. When difficulty was increased (2 second rate) a stronger haemodynamic response
was observed in the ecstasy user group. Increased levels of oxy-Hb were observed in V4
relating to the left DLPFC, and V10 and V12 relating to the (inferior) right medial PFC
compared to controls. A further two voxels (V1 and V14) also approached significance.
Significantly more deoxy-Hb was observed in six voxels in ecstasy users compared to
controls, covering the spectrum of the PFC. This marked increase in significantly different
voxels, suggest that neuronal activation is increasing as a function of difficulty. Again in the
most difficult block of the task (generation rate of 1s) ecstasy users display significant
increases in oxy-Hb at two voxels V12 (located on the inferior part on the right medial PFC)
and V14 (relating to the right DLPFC), with a third (V13) approaching significance. This was
a less pronounced difference than at the two second rate, however there was an increase in
the number of voxels showing increased deoxy-Hb (a total of 8 voxels, primarily relating to
the left DLPFC and right DLPFC, with a further two approaching significance).This shows a
general increase in neuronal activity at this rate, if we consider that the total amount of
haemoglobin to the prefrontal cortex appears increased. This supports the existing evidence
that suggests ecstasy users are more greatly affected when greater cognitive load is placed
upon them (Wareing et al., 2000; Montgomery, Fisk, Newcombe & Murphy, 2005).

265
The increase in neuronal activation observed in this inhibitory control task is bilateral
and suggests that ecstasy polydrug users find this task more difficult than non-users. Meta-
analysis of neuroimaging data during cognitive functions suggest a network of PFC regions
are regularly active, including bilateral activation of the DLPFC, inferior frontal cortex and
anterior cingulate cortex (Duncan & Owen, 2000). Interestingly, a review of lesion studies
(Aron et al., 2004), suggested that although the network of PFC areas described above is
necessary for inhibitory control, the right inferior frontal cortex is of particular importance in
this function. This is consistent with the current results that observe consistently increased
oxy-Hb in inferior voxels relating to the right of the PFC (V10 and V12), for ecstasy users. If
MDMA damages 5-HT neurons, which are abundant in the PFC, it is logical that these areas
that are necessary for performing executive tasks would require additional resources, or
would show increased activation as a function of increased demand. This is further support
for the argument that ecstasy users are recruiting additional resources to perform at a similar
level as controls on the task. This supports results from the ERP data on inhibition from
Chapter 6 (Roberts et al., 2013a), which suggests atypical processing, despite equivalent
behavioural performance. These results are also in agreement with those of Roberts and
Garavan (2010), who observed that ecstasy users displayed increased frontal and temporal
BOLD activation compared to controls during a Go/NoGo task, in an fMRI study. Morgan et
al. (2006) suggested that depletion of serotonin and impairment of other executive functions
may lead to poor inhibitory control. Taken together these results potentially reflect evidence
of MDMA related serotonergic neurotoxicity. The regression analyses on the present dataset
showed that last 30 day use significantly predicted oxy-Hb increase in voxels 12 and 14
during the one second rate of the task, after controlling for cannabis use indices. This is
indicative of recency of MDMA use having implications for inhibitory control. Indeed Hoshi
et al. (2007) observed impaired inhibitory control in ecstasy users which they suggest is
266
related to recency of use, given that current users were impaired, but former users were not. It
is suggested that abstention may lead to recovery of this function. Furthermore, last 30 day
use also predicted P2 amplitude during the Go/NoGo task in Chapter 6, this provides further
evidence that recency of use may be an important factor for inhibitory control.
In the first switching block of the number-letter task ecstasy users displayed
significantly more oxy-Hb than drug naïve controls in voxel 5 relating to the left medial PFC.
Increases in oxy-Hb were also approaching significance at V6 and V13. In the second block
ecstasy users showed increased oxy-Hb compared to controls that was approaching
significance at V5 again. There were no significant differences in the deoxy-Hb data.
Nevertheless, significant increases in oxy-Hb again suggest that ecstasy users are engaging in
more effortful cognition during mental set switching than non-users. The increase in oxy-Hb,
typically in the left medial PFC reflects recruitment of additional resources to attenuate
performance deficits. This is consistent with our predictions, and findings of atypical
processing during this task in Chapter 6 (Roberts et al., 2013c in press). This reflects an
increase in cognitive effort at the same level of performance that may predict future cognitive
failures (Ayaz et al., 2012). Interestingly, the regression analysis conducted on oxy-Hb
increase at V5, showed that lifetime dose of cannabis significantly predicted oxy-Hb increase.
Furthermore none of the ecstasy use indices predicted level of oxy-Hb after controlling for
cannabis use indices. This is particularly salient, given the observed contribution of cannabis
to the diminished P3 response during this executive function in Chapter 6. Dafters and Hoshi
(2004) have previously highlighted the contribution of cannabis to memory performance in
MDMA users. However work from the same lab (Dafters 2006), suggested that MDMA users
(who also used cannabis) were impaired in switching performance compared to cannabis only
users and drug naïve controls. The contribution of cannabis to the results on switching in this
thesis highlight the importance of understanding potential drug interactions that may affect

267
cognition. It is advised that the results here are treated with caution and are described as
polydrug effects due to the concomitant use of other drugs. However the interaction between
MDMA use and cannabis use appears to be particularly salient in relation to task switching.
fNIRS analysis during the CWFT (access) yielded some interesting results; as
predicted, ecstasy users displayed increases in oxy-Hb compared to controls in three voxels
relating to the left DLPFC as well as one voxel relating to the right medial PFC on what is
considered to be the easiest level of difficulty on the task (naming animals). As difficulty
increased, ecstasy users displayed a significantly greater increase in oxy-Hb relative to
controls at two voxels, and a third approaching significance relating to the left DLPFC and a
further two voxels relating to the right medial PFC. This increase in oxygenation is
complimented by an increase in deoxy-Hb compared to controls at V2 (and V4 that was
approaching significance) in the left DLPFC and V14 in the right DLPFC that was
approaching significance. In the final and most difficult phase of the task (4 letter words
beginning with C) ecstasy users displayed significant increases in oxy-Hb compared to
controls at three voxels (and a further 1 voxel approaching significance) that pertain to the
left DLPFC and two voxels relating to the right medial PFC.
Thus ecstasy users show consistently increased levels of oxy-Hb in the LDLPFC and
RPFC regions during the access executive function. Moreover the haemodynamic response to
the task increases with task difficulty, with ecstasy users displaying more significant
differences in oxy-Hb in more voxels as the task progresses. This supports previous
arguments that ecstasy users perform worse as cognitive demand increases (Wareing et al.,
2000). Further to this point Montgomery, Fisk, Newcombe and Murphy (2005) observed that
ecstasy users perform worse in word fluency tasks as more rules are imposed, as a function of
difficulty. Although the current task elicited no behavioural differences, oxy-Hb differences

268
were more pronounced as a function of difficulty, suggesting that, in agreement with
Montgomery, Fisk, Newcombe and Murphy (2005), ecstasy users are showing a greater
departure from normal cognitive functioning as difficulty increases. This highlights the
greater sensitivity of neurophysiological measures to detect cognitive impairment.
Compensatory mechanisms may explain the lack of behavioural differences observed using
this task in the literature (Bedi & Redman, 2008; Halpern et al., 2004; Morgan et al., 2002).
Especially if we consider that these studies, employed simpler word fluency measures, than
those yielding performance differences (Montgomery, Fisk, Newcombe & Murphy, 2005;
Montgomery et al., 2007). Moreover Montgomery, Fisk, Newcombe and Murphy (2005)
used a much longer time frame than the task employed in this thesis (and those in the studies
mentioned above), suggesting that longer periods of sustained load on the central executive
produce more pronounced effects. This is consistent with the current findings, as has been
previously stated, the increased neuronal activity that reflects increased cognitive effort to
attain equivalent performance, potentially predicts future failure with increasing task demand
(Ayaz et al., 2012).
Increases in oxy-Hb to both the left and right hemispheres reflect the need for more
cognitive resources to attenuate behavioural performance decline and that this effect is
bilateral. It is interesting to note this consistent increase in oxy-Hb in the left DLPFC and
right medial PFC over all three levels of CWFT, as these areas have been implicated in
semantic and word fluency previously. Stuss et al. (1998) observed that in patients with brain
lesions, those to the left DLPFC caused the most severe impairments on letter based word
fluency measures. The same lesion sites produced impairments in category based fluency, but
so did lesions to right medial and DLPFC regions. Indeed the left inferior frontal gyrus, has
been consistently associated with semantic and phonologic processing in functional
neuroimaging studies (Costafreda et al., 2006), so it is interesting that these areas should
269
show the greatest differences in the word fluency task in this thesis. These areas appear to be
working much harder in ecstasy users compared to controls to achieve similar performance.
Likewise, Raj et al. (2010) observed that ecstasy users displayed cognitive processing
aberrations that relate to areas of the DLPFC during semantic recognition, despite equivalent
task performance, in an fMRI study, that is broadly consistent with the present findings. This
potentially reflects MDMA induced neurotoxicity. The results from this study were in line
with our predictions as well as our interpretation of the results from Chapter 6 with ERP
correlates of semantic retrieval (Roberts et al., 2013b). Furthermore regression analyses
suggested that frequency of use and lifetime dose of ecstasy predicted oxy-Hb levels after
controlling for cannabis use indices at voxels (V3 and V4) relating to the left DLPFC.
Due to ecstasy using populations invariably using other recreational drugs, as well as
drinking significantly more alcohol than controls on weekly estimates, it cannot be ruled out
that other drugs, or alcohol or concomitant use of substances with ecstasy are not responsible
for the effects observed in this study. Nevertheless the ecstasy using sample did show a
differential pattern of PFC activation on the CWFT and RLG compared to non-users, which
is indicative of cognitive impairment in ecstasy using populations. This study provides
evidence of atypical executive functioning in ecstasy users compared to controls on tasks
relating to the executive functions of mental set switching, access and inhibitory control. All
three tasks invoke an increased haemodynamic response in ecstasy users that is bilateral in
the prefrontal cortex. These results show that ecstasy users are engaged in more effortful
cognition than non-users to achieve equivalent performance. This is indicative of recruitment
of additional cognitive resources in the prefrontal cortex, and perhaps predictive of future
cognitive decline.
270
Chapters 6, 7 and 8 provide evidence of altered cognitive processing in ecstasy users
relative to controls during executive functioning tasks that reflect compensatory mechanisms.
As previously noted in this thesis, differences in activation observed from neuroimaging
measures, despite equivalent performance reflect the increased sensitivity of neuroimaging
techniques to detect cognitive deficits than behavioural measures alone. Indeed, information
provided in this thesis may help explain the inconsistency in results from previous
behavioural studies in this area. This point is interesting to consider as the executive
functioning tasks in this thesis yielded no behavioural differences between ecstasy users and
controls throughout. This is not surprising given that the tasks used in this thesis are relatively
simple tasks of executive function and have been inconsistent in producing behavioural
effects in the literature.
There is however, a wealth of literature in other areas of memory and cognition that
show ecstasy related performance differences, particularly with tasks that involve higher
cognitive processing and mental reasoning. For example McCann et al. (1999) observed
ecstasy users to perform worse than controls in the Logical Reasoning task (correctly
identifying statements that accurately describe transformational grammar, from active/passive,
positive/negative statements), yet performance on several simpler cognitive tasks was
equivalent. These results lead the authors to suggest that ecstasy related alterations to
cognitive function are quite subtle and are only detected on sensitive tasks that place high
demand on the central executive. Montgomery, Fisk, Newcombe, Wareing and Murphy
(2005) observed MDMA users to be significantly impaired in syllogistic reasoning relative to
controls. Syllogistic reasoning involves participants drawing inferences from a set of
premises. Reasoning is suggested to be the most cognitively demanding of all intellectual
abilities and requires operation of working memory processes (Montgomery, Fisk,
Newcombe, Wareing & Murphy, 2005). Therefore consistency in these measures, that are
271
more demanding than simpler executive measures, yielding ecstasy related performance
differences may be expected. Indeed, Fisk et al. (2005) observed reasoning deficits in ecstasy
users relative to controls, particularly when problems are more difficult. These studies offer
consistent MDMA related difficulties in thinking and reasoning, that Fisk et al. (2005)
conclude is a result of working memory limitations.
Immediate and delayed recall has been investigated extensively in ecstasy users. Early
reports showed differences between ecstasy users (novice and regular users) and controls, in
both immediate and delayed memory that suggest performance deficits in ecstasy users
(Parrott et al., 1998). However, this study was criticised for not reporting use of other illicit
drugs (Parrott, 2000). The Rivermead Behavioural Memory Task (RBMT) was used to
investigate immediate and delayed memory in ecstasy users, polydrug controls and drug
naïve controls by Morgan (1999). This task requires a passage of prose to be remembered and
to be recalled as accurately as possible, immediately and then again 40-50 minutes later. This
study observed that ecstasy users recalled significantly less prose than both control groups in
both immediate and delayed recall conditions. Morgan (1999) suggests that impaired recall
performance may be an early sign of global, age related cognitive impairment, due to 5-HT
function declining with age. The author argues that ecstasy use may lead to exacerbation of
cognitive ageing. Similarly, Morgan (2002) observed ecstasy users (current and former) to be
impaired in recall on the RBMT, particularly in the delayed recall condition compared to
non-user controls. The results from this study suggest that ecstasy has protracted
neuropsychological impairment, due to abstinence not reversing recall deficits. A longitudinal
study by Zakzanis et al. (2003) suggested that continued ecstasy use was associated with
progressive decline in immediate and delayed recall. Furthermore, after observing ecstasy
users performing poorly in immediate and delayed recall, McCardle et al. (2004) posit that
272
ecstasy users have problems coding information into long term memory and are less able to
focus attention on complex tasks.
Studies into declarative memory have also frequently observed ecstasy related
deficits. Measures of ‘everyday’ memory, in particular prospective memory (remembering to
do something in the future) appear to have consistent impairment following regular ecstasy
use (Heffernan et al., 2001; Zakzanis et al., 2003). Prospective memory is understood to be
underpinned by central executive resources. Measures of prospective memory produce more
consistent evidence of behavioural deficits than simple executive tasks. Perhaps, such robust
impairment behaviourally in declarative memory, higher cognitive processing and mental
reasoning reflect how ecstasy related deficits are more apparent when greater demand is
placed on the central executive. This is consistent with findings from fNIRS data in Chapter 8,
which suggests haemodynamic response is greater when task difficulty increases, as well as
other studies that have observed greater ecstasy related performance deficits as difficulty
increases (Montgomery, Fisk, Newcombe & Murphy, 2005; Wareing et al., 2000).
Furthermore, such behavioural tests as those mentioned above are markedly more complex
than the relatively simple executive tasks employed throughout this thesis, which may
explain the lack of performance deficits in the current sample. With this in mind, it may be
interesting to observe neurophysiological correlates from fNIRS and EEG in future research
of these more complex measures of cognitive processing.
McCann et al. (1999) observed that cognitive function differences between ecstasy
users and non-users are quite subtle, and performance differences are only observed in tasks
that are more sensitive than those used in this thesis. However, they argue that this may lead
users to unwittingly continue MDMA use, oblivious to potential cumulative damage. It is
also suggested that difficulties may become manifest with aging and diminished neuronal
273
reserve. Indeed studies from the clinical literature into ageing and dementia may aid the
current understanding of the implications of the effects of increased cognitive load. For
example, it has been reported that early prefrontal connectivity abnormalities are modulated
by cognitive demand in pre Huntingdon’s disease subjects (Wolf et al., 2008). Furthermore
impairment in verbal memory and executive function are associated with the development of
dementia in those with Parkinson’s disease (Levy et al., 2002). Moreover studies into
cognitive ageing and prospective memory suggest that event-based prospective memory tasks
that require greater cognitive demand produce significantly larger age effects than event-
based prospective memory tasks that rely on more automatic processes (Henry et al., 2004).
Taken together the results from the current thesis that suggest that ecstasy users are engaged
in more effortful cognition to perform at similar levels to controls, and that this can be
modulated as a function of cognitive load, suggest that ecstasy use may exacerbate cognitive
ageing.
Chapter 9 investigated the effects of ecstasy use on neuroendocrine function and
neurohormonal response to stress, using a multitasking stressor task. Performance on the task
and the haemodynamic response was assessed, between ecstasy users, polydrug controls and
drug naïve controls. A diurnal cortisol profile was obtained from salivary cortisol samples
over a two day period, as well as pre and post stressor. The ecstasy users in this study did not
differ significantly from controls on background variables such as perceived stress, fluid
intelligence or age. Nor did they differ significantly on any of the individual components that
made up the multi-tasking stressor task. There were also no significant between group
differences on perceived workload as measured by the NASA TLX. There were however
differences on subscales of the SAI VAS, indicating that ecstasy users felt less calm than both
other groups overall and less relaxed than drug naïve controls. Furthermore as to be expected,
274
all groups showed a decrease in worry post task. Analysis of the HADS showed no
significant differences between groups on states of anxiety or depression.
Despite an absence of between group differences on behavioural measures the fNIRS
data revealed several significant differences that are worthy of discussion. Ecstasy users
displayed a significant reduction in oxy-Hb compared to both polydrug users and drug naïve
controls at voxel 14. At voxels 2 and 16, ecstasy users had significantly less oxy-Hb relative
to drug naïve controls. As such the results infer reduced activation of the right dorsolateral
prefrontal cortex in ecstasy users compared to both control groups. Polydrug users displayed
significant increases in deoxy-Hb compared to ecstasy users at voxels 2 and 14 and to both
ecstasy users and drug naïve controls at V12. The results from the fNIRS data are contrary to
expectation and are also in opposition to those observed from fNIRS data in Chapters 7 and 8.
Although reductions in oxy-Hb have been associated with cognitive impairment in fNIRS
studies previously (e.g. Ehlis et al., 2008; Herrmann et al., 2008), these are usually coupled
with task performance deficits. As the ecstasy user group in this experiment performed to
similar levels to controls, and given the interpretation of fNIRS results from Chapter 7 and 8,
this does not seem an adequate explanation of the fNIRS results during multi-tasking.
One possible explanation for these findings could be that the individual tasks that
comprise the multi-tasking paradigm are not executive tasks and perhaps do not load on the
PFC. Indeed two of the component tasks are visual monitoring tasks, which may induce more
activation of the visual cortex in the occipital lobe. Neuroimaging studies that have attempted
to define the neural substrates of mental arithmetic, suggest a widespread network of
activation that includes activation of the lateral prefrontal cortex, cingulate cortex, occipital
cortex and of particular salience the parietal cortex (Kong et al., 2005). Indeed Grabner et al.
(2007) observed that activation in the parietal cortex (particularly the left angular gyrus)
275
predicts mathematical competence using fMRI. Although the prefrontal cortex does appear to
play a role in mathematical calculation (Burbaud et al., 1995), it is reported to lie in a circuit
involving bilateral intraparietal, prefrontal and anterior cingulate components (Chochon et al.,
1999). The final component of the multi-tasking framework is a Stroop task which measures
inhibition (see Chapter 3.2.2). Potentially the diversity of the tasks used would require
widespread neuronal network activation; this may lead ecstasy users to reallocate resources to
other brain regions that this task requires that are not measured by prefrontal fNIRS. If this is
the case it may be possible that a reduction in oxy-Hb to the PFC reflects cognitive decline.
For example, when resources are reallocated to other regions, the PFC shows a deficit in
activation due to exhausted resources. However if this were the case it may be expected that
performance on the subcomponent of the Stroop task would decline, which is not the case. So
the results are difficult to interpret in terms of our hypothesis. However, it is noteworthy that
7 of the 8 participants’ data that were excluded from analysis of the Stroop task module, due
to incorrect interpretation of instructions were drug users (4 ecstasy users). It has been
observed previously that ecstasy users make more errors when completing a web based
questionnaire compared to other drug users and drug naïve controls (Rodgers et al., 2003).
Therefore it is possible that there are deficits in the processing of instructional information
associated with ecstasy use.
The results from analysis of salivary cortisol were more in line with our hypotheses. It
was observed that ecstasy users displayed significant increases in cortisol levels compared to
both other groups at time three of day one of the cortisol profiling protocol. Furthermore they
exhibited greater cortisol upon waking (time 1) on day one of the cortisol profile compared to
polydrug controls. These results reflect that ecstasy users show elevated basal cortisol levels
compared to healthy controls, suggesting that MDMA use has adverse effects on the HPA-
axis. This is in agreement with previous reports of acute, on drug elevation of cortisol level in
276
ecstasy users (Parrott et al., 2008), as well as longer lasting basal increases in plasma cortisol
secretion observed in ecstasy users (Gerra et al., 2003). Gerra et al., (2003) report a blunted
cortisol response to stress in ecstasy users comparative to controls from plasma cortisol levels,
the results from post task salivary cortisol analysis in our sample suggest that the current
sample had steadily declining cortisol levels throughout the day. Perhaps the multi-tasking
framework used in this thesis was not sufficiently stressful to observe elevated cortisol levels
post task. Alternatively, perhaps the HPA-axis becomes exhausted, due to high basal levels of
cortisol, and as such appears unresponsive to experimental stressors. This is a potential
explanation of the current findings that is in concordance with suggestions by Gerra et al.
(2003). In summary it appears that ecstasy users display increases in basal salivary cortisol
levels, which reflects damage to the integrity of the HPA-axis. Repeated doses of the acute
metabolic stressor MDMA (Parrott, 2006; Parrott et al., 2008), hyperstimulation (from
crowding, intense lighting, heat) and prolonged physical activity (dancing), may have
cumulative effects, resulting in chronic bioenergetic distress (Parrott, 2006; Parrott, 2009).
Such effects may lead to long lasting alterations to neuroendocrine function, which is
potentially what is being observed in the current ecstasy using sample.
Limitations:
Unlike the relatively “pure” MDMA user groups in the two studies by Halpern et al.
(2004 & 2011), the ecstasy user groups in this thesis tended to take several other drugs – in
particular cannabis. Although attempts to control for this have been made with the addition of
a polydrug control group in three out of the four experimental chapters, it was apparent that
the ecstasy user group generally smoked more cannabis and consumed more cocaine than
polydrug users in each case. This is problematic for our results as cocaine has been shown to
have strong associations with deficits in inhibitory control (Fillmore & Rush, 2002). As such
277
any observed differences could still be attributed to the use of these other drugs, or indeed a
synergistic effect of concomitant use of other drugs. Furthermore, in Chapter 6 there were 9
participants in the ecstasy user group who reported using ketamine in the last 30 days. This is
potentially problematic for the interpretation of the results given the association between
ketamine use and executive function deficits in humans (for a review see Morgan & Curran,
2006). Specifically, switching has been shown to be impaired in animals with ketamine
exposure (Stoet & Snyder, 2006). The polydrug control group showed a diminished P3
response compared to drug naïve controls in several sites in the switching task, also in the
semantic association task ecstasy users, although showing greater negativities in the N2 in the
low association condition of the task, compared to drug naïve controls, were not significantly
different to polydrug controls. Regression analyses were conducted to try and control for
cannabis use (as this was the primary co-used substance in the ecstasy using samples).
However statistical analysis and polydrug control groups cannot account for potentially
additive effects that concurrent drug use may have. Perhaps it would be more accurate to call
the observed effects “polydrug effects”. With this in mind, it can also not be ruled out that
premorbid factors do not predict drug use, and that such factors (for example differences in
sensation seeking) contribute to the observed differences in the present thesis. In addition, the
self-reporting of psychological state is potentially problematic and in future research, a
structured psychiatric assessment may be more appropriate. Tobacco use was also not
controlled for in this thesis, there has been previous research to suggest that tobacco smoking
has an effect on EEG measures (Gilbert et al., 2004; Illan & Polich, 2001). In particular
abstinence from tobacco is associated with performance and activity decline that can last for
up to 31 days (Gilbert et al., 2004). However, smokers were permitted to smoke tobacco on
the day of testing so this is unlikely to have affected the results reported here. The quasi-
experimental design employed in each study also means it cannot be ruled out that the

278
differences observed are not the result of factors other than drug use. Attempts have been
made to control for many of these such as sleep patterns, sleepiness, fluid intelligence, age,
state mood and residual intoxication of drugs. In most cases there were no between group
differences on these measures. However in Chapter 7, ecstasy users were significantly older
than both control groups and also reported being sleepier than drug naïve controls prior to
testing. These factors were entered into the regression analyses for this chapter and did not
predict significant amounts of variance in haemodynamic response in any case. Residual
intoxication of alcohol was self-report, but in future studies it would be advantageous to
verify this with a breathalyser to ensure no residual alcohol intoxication. Self-report measures
for background drug use are also problematic, however because of the legal status of the
drugs consumed, this remains the most appropriate measure of background drug use, and is
also the most commonly used in this area of research (Fox et al., 2001; Montgomery et
al.,2010). The purity of the tablets consumed by the current set of participants as well as the
strength of the cannabis being consumed is questionable. However, Parrott (2004) reported
that the purity of ecstasy tablets collected from amnesty bins in nightclubs in the UK is
approaching 100%. However if this is not the case then this raises additional concerns over
the magnitude of cognitive deficits incurred (Montgomery et al., 2010). Furthermore
although confirmation of drug abstinence (apart from cannabis) was sought through
collecting urine samples from participants in every experiment, these have only been
analysed from the participants in Chapter 6. This is due to the analysis being performed at
NHS hospitals, and relying on the time of our collaborator. Thus confirmation of abstinence
from illicit drug use (apart from cannabis) for 7 days prior to testing, again relies upon self-
report for Chapters 7, 8 and 9. However many of the published research articles in this area
do not report objective measures of drug use (Montgomery, Fisk, Newcombe & Murphy,
2005; Fisk & Montgomery 2009; Burgess et al., 2011).

279
Implications:
There are several implications from the research conducted in this thesis, firstly, the
neuroimaging results suggest that ecstasy users are employing compensatory mechanisms to
make up for shortcomings in executive functioning. Neuronal activity aberrations are
suggestive of potential serotonergic neurotoxicity due to repeated pharmacological
interference to the serotonin system by administration of MDMA. It has been suggested that
the evidence of compensatory mechanisms and increased effortful cognition predict future
failures. This is in line with the suggestion that MDMA use potentially exacerbates cognitive
ageing. Furthermore the atypicalities in processing observed in this thesis also reflect
cognitive inflexibility. These have real world implications as cognitive flexibility is a
desirable trait in every-day life. Serotonin is involved in the regulation of many
psychobiological functions; as such degradation to the serotonin system from MDMA use has
other psychobiological implications that stretch further than cognitive deficits. As already
shown in this thesis, MDMA use may have adverse effects on neuroendocrine function.
Neurohormonal activation has a role in moderating immune responses. Indeed increased
basal cortisol levels reflect elevated levels of physiological stress. Such physiological stress
can lead to exacerbation of infectious disease (Sapolsky, 1996). Furthermore pronounced and
sustained load on the HPA-axis can increase incidence of depression (Wong et al., 2000).
Work related stress, along with anxiety and depression accounted for the majority of sick
days from work taken in 2011/2012 (Labour Force Survey for 2011/2012, HSE). Indeed
Connor (2004) has already reported MDMA’s effects as a stressor on the immune system.
Therefore findings of this thesis could be used for educational purposes and could inform
prospective users or individuals who have used ecstasy in the past of the potential harms in
terms of neurohormonal changes and cognitive function alterations before consideration of
use.
280
The research from this thesis has implications for cognitive and psychobiological
health and well-being. It contributes to the existing knowledge about MDMA’s potential as a
selective serotonergic neurotoxin; as such it can aid the current understanding and treatment
of drug related disorders involving HPA axis dysfunction, and cognitive decline. The results
are useful for health education and have potential use in harm reduction strategies and
interventions for drug use disorders. This is of particular salience given the government’s
recent discussions about drug reclassification, information provided in this thesis could prove
beneficial when assessing the relative harms of ecstasy for reclassification under the Misuse
of Drugs Act (MDA).
Future Research:
There are a number of suggestions for future research that arise from the current thesis.
Firstly, in Chapters 6 and 8 it was observed that ecstasy users show differences to controls in
their neurophysiological response to inhibition. In both cases there were significant results
from regression analyses to suggest that recency of use may play a role in this executive
function. It would be interesting to conduct research into this function with ecstasy users that
have been abstinent from drug use for a reasonably long period of time, for example 12
months. Hoshi et al., (2007) conducted behavioural research into this area and observed
former users to be unimpaired compared to current users. Morgan et al. (2002) also compared
former users to current users and controls, observing little performance differences. However
as has been shown in this thesis, neuroimaging techniques provide more sensitive measures
of impairment and greater information about the nature of such impairments. Thus it would
be beneficial to observe former users performance on inhibitory control relative to current
users and controls in combination with fNIRS, EEG and fMRI. Indeed Reneman, Lavalaye et
al. (2001) have reported that MDMA’s neurotoxic effects on SERT may be reversible after
281
long periods of abstinence. A multi-faceted neuroimaging approach combining several
methods with strict inclusion criteria for group assignment might help address the
contribution to prolonged abstinence to this function.
In the switching tasks in chapters 6 and 8, there is evidence to suggest that cannabis
may be an important factor in ecstasy-related neuronal activation differences for this function.
Indeed the contribution on drug use besides ecstasy is always problematic for research in this
area. Few studies have the purity of the ecstasy user group observed in Halpern et al.’s 2004
and 2011 studies. Concomitant drug use is at least partially controlled for in the literature
with the inclusion of non-ecstasy polydrug users and various statistical controls. However,
ideally future research should concentrate on sampling techniques that recruit participants
that are ecstasy only users, cannabis only users etc. This may help aid the understanding of
the relative contributions of each drug to potential cognitive deficits. That said, in the real-
world environment of recreational drug use, where individuals are using ecstasy, it appears
that use is frequently coupled with co-use of other drugs. As such the results from studies
such as those in this thesis do offer validity in terms of understanding the nature of drug
interactions and the effects arising from drug use that is commonplace in recreational
environments.
The use of fNIRS in this thesis has been beneficial in aiding our understanding of
PFC activation in executive functioning tasks, and MDMA related changes to haemodynamic
responses in these areas. However this technology in the current thesis has been limited to the
PFC only. The whole head fNIRS systems would provide more information about
haemodynamic response across the cortex. This may be advantageous for gaining information
about connections with other neural areas that may be involved in some working memory
tasks. Indeed this may provide more information that is necessary to understand the results

282
from the multi-tasking neuronal response. To this end, it may also be beneficial to incorporate
fMRI into some of the protocols in the current thesis. fNIRS is a valuable and upcoming
portable technology that is easy to set up and is more robust to noise and movement artefacts
than fMRI. However it does not have the spatial resolution to provide the rich information
about specific neuronal areas showing activation during tasks across the whole brain that
fMRI affords. fMRI has been employed in the past to observe ecstasy-related changes to
neuronal activation during updating (Daumann, Fischermann, Heekeren et al., 2004),
inhibitory control (Roberts & Garavan, 2010) and semantic recognition (Raj et al., 2010).
However, future research could use this technology with greater task specificity such as that
employed by Raj et al. (2010) and with control groups (including drug naïve, cannabis only,
former drug users) that may provide more complete assessment of the executive functions
used in all three of the aforementioned studies.
The interesting results that have been observed in this thesis from salivary cortisol
levels in ecstasy users also have scope for future research. The long lasting effects of
bioenergetic stress on the HPA axis could be explored by conducting diurnal cortisol profiles
on participants who report taking ecstasy in environments with high levels of sensory
stimulation (hot environments, crowding, and intense lighting) and prolonged dancing, and
those who report taking the drug in more ambient environments with less physiological stress.
Although this thesis did attempt to control for a number of background factors that
may influence results (intelligence, sleep, age etc.), it may be that there are other individual
differences and lifestyle variables that have not been controlled for that may contribute to the
effects observed. Future research should aim to focus on protective factors (such as that
mentioned in the previous paragraph), to observe whether these may be useful in reducing
harm when on drug. Regular breaks from dancing, adequate nutrition and more research into

283
the effects of bingeing and higher nightly doses may lead future research to produce
neuroprotective strategies for drug users.
Thesis Summary:
This thesis sought to evaluate the neurophysiological response to executive functions
in a sample of recreational ecstasy users. This was investigated using Miyake et al.’s (2000)
conceptual framework of executive functioning with the additions made by Fisk and Sharp
(2004) with EEG and fNIRS. It was found that ecstasy users show atypical processing in ERP
components during inhibition, switching and access tasks that reflect cognitive
impairment/compensatory mechanisms. Furthermore the haemodynamic response to each of
the four proposed executive functions was altered in ecstasy users reflecting increased
cognitive effort and recruitment of additional resources as a result of potential degradation to
the serotonin system via MDMA related neurotoxicity. In most cases neuronal activation
changes appear to be due to ecstasy. However cannabis use emerged as an important
predictor of ERP amplitude and oxygenated haemoglobin increase during switching. The
changes to neuronal activation reflect compensatory mechanisms/reallocation of cognitive
resources to enable equivalent performance to controls in executive functioning as a whole.
There is also evidence of MDMA related alterations to HPA-axis function, whereby
increased salivary cortisol levels in ecstasy users from diurnal cortisol profiles reflect
elevated basal stress levels. The neurophysiological changes observed in this thesis suggest
that ecstasy is damaging to the human brain. This is likely to be a result of damage to the
serotonergic system. As such results from this thesis should be used to educate individuals
considering using ecstasy.

284
References:
Akerstedt, T., & Gillberg, M. (1990). Subjective and objective sleepiness in the active
individual. Inernational Journal of Neuroscience, 52, 29-37.
Allen, R. P., McCann, U.D., & Ricaurte, G.A. (1993). Persistent effects of 3,4-
methylenedioxymethamphetamine (MDMA, "ecstasy") on human sleep. Sleep, 16(6),
560-564.
Amendo, E., & Diaz, F. (1999). Ageing-related changes in the processing of attended and
unattended standard stimuli. NeuroReport, 10(11), 2383-2388.
Aron, A. R., Robbins, T. W., & Poldrack, R. A. (2004). Inhibition and the right inferior
frontal cortex. TRENDS in Cognitive Sciences, 8(4), 170-177.
Ayaz, H., Cakir, M.P., Izzetoglu, K., Curtin, A., Shewokis, P.A., Bunce, S.C., & Onaral, B.
(2012). Monitoring expertsie development during simulated UAVpiloting tasks using
optical brain imaging. IEEE Aerospace Conference, USA, 1-11.
Ayaz, H., Izzetoglu, M., Shewokis, P.A., & Onaral, B. (2010). Sliding-window motion
artifact rejection for functional near-infrared spectroscopy. Conference Proceedings
IEEE Engineering in Medicine & Biology Society, 6567-6570.
Ayaz, H., Shewokis, P.A., Curtin, A., Izzetoglu, M., Izzetoglu, K., & Onaral, B. (2011).
Functional near infrared spectroscopy to study learning in spatial navigation. Journal
of Visualized Experiments, 56, e3443.
Back-Madruga, C., Boone, K.B., Chang, L., Grob, C.S., Lee, A., Nations, H., & Poland, R.E.
(2003). Neuropsychological effects of 3,4-methylenedioxymethamphetamine
(MDMA or ecstasy) in recreational users. The Clinical Neuropsychologist, 17(4),
446-459.
Baddeley, A. D. (1966). The capacity for generating information by randomization. Quarterly
Journal of Experimental Psychology, 18(2), 119-129.
285
Baddeley, A. D. (1986). Working Memory. Oxford: Oxford University Press.
Baddeley, A. D. (1996). Exploring the central executive. Quarterly Journal of Experimental
Psychology, 49A, 5-28.
Baddeley, A. D. (2000). The episodic buffer: a new component of working memory? Trends
in Cognitive Science, 4, 417-423.
Baddely, A. (2003). Working memory: looking back and looking forward. Nature Reviews
Neuroscience, 4, 829-839.
Badre, D., Poldrack, R.A., Pare-Blagoev, E.J., Insler, R.Z., & Wagner, A. (2005). Dissociable
controlled retrieval and generalised selection mechanisms in ventrolateral prefrontal
cortex. Neuron, 47, 907-918.
Bedi, G., & Redman, J. (2008). Ecstasy use and higher-level cognitive functions: weak
effects of ecstasy after control for potential confounds. Psychological Medicine, 38(9),
1319-1330.
Bekker, E. M., Kenemans, L., & Verbaten, M.N. (2005). Source analysis of the N2 in a cued
Go/NoGo task. Cognitive Brain Research, 22(2), 221-231.
Bhattachary, S., & Powell, J.H. (2001). Recreational use of 3,4-
methylenedioxymethamphetamine (MDMA) or 'ecstasy': evidence for cognitive
impairment. Psychological Medicine, 31(4), 647-658.
Boas, D. A., Gaudette, T., Strangman, G., Cheng, X., Marota, J.J.A., & Mandeville, J.B.
(2001). The accuracy of near-infrared spectroscopy and imaging during focal changes
in cerebral hemodynamics. Neuroimage, 13, 76-90.
Buchert, R., Thomasius, R., Nebeling, B., Petersen, K., Obrocki, J., Jenicke, L., Wilke, F.,
Wartberg, L., Zapletalova, P., & Clausen, M. (2003). Long-term effects of "ecstasy"
use on serotonin transporters of the brain investigated by PET. The Journal of Nuclear
Medicine, 44(3), 375-384.

286
Burbaud, P., Degreze, P., Lafon, P., Franconi, J.M., Bouligand, B., Bioulac, B., Caille, J.M.,
& Allard, M. (1995). Lateralization of prefrontal activation during internal mental
calculation: a functional magnetic resonance imaging study. Journal of
Neurophysiology, 74(5), 2194-2200.
Burgess, A. P., Venables, L., Jones, H., Edwards, R., & Parrott, A.C. (2011). Event related
potential (ERP) evidence for selective impairment of verbal recollection in abstinent
recreational methylenedioxymethamphetamine ("ecstasy")/polydrug users.
Psychopharmacology, 216, 545-556.
Butler, G. K. L., & Montgomery, A.M.J. (2004). Impulsivity, risk taking and recreational
'ecstasy' (MDMA) use. Drug and Alcohol Dependence, 76(1), 55-62.
Casco, C., Forcella, M.C., Beretta, G., Griego, A., & Campana, G. (2005). Long-term effects
of MDMA (Ecstasy) on the human central nervous system revealed by visual evoked
potentials. Addiction Biology, 10, 187-195.
Chang, L., Ernst, T., Grob, C.S., & Poland, R.E. (1999). Cerebral 1H MRS alterations in
recreational 3,4-Methylenedioxymathamphetamine (MDMA, "ecstasy") users.
Journal of Magnetic Resonance Imaging, 10, 521-526.
Chang, L., Grob, C.S., Ernst, T., Itti, L., Mishkin, F.S., Jose-Melchor, R., & Poland, R.E.
(2000). Effect of ecstasy [3,4-methylenedioxymethamphetamine (MDMA)] on
cerebral blood flow: a co-registered SPECT and MRI study. Psychiatry Research:
Neuroimaging Section, 98, 15-28.
Chochon, F., Cohen, L., van de Moortele, P.F., & Dehaene, S. (1999). Differential
contributions of the left and right inferior parietal lobules to number processing.
Journal of Cognitive Neuroscience, 11(6), 617-630.

287
Clark, L., Roiser, J.P., Robbins, T.W. & Sahakian. (2009). Disrupted 'reflection' impulsivity
in cannabis users but not current or former ecstasy users. Journal of
Psychopharmacology, 23(1), 14-22.
Cole, J., Sumnall, H.R., & Grob, C.S. (2002). Sorted: Ecstasy facts and fiction. The
Psychologist, 15(9), 464-467.
Cole, J. C., & Sumnall, H.R. (2003). Altered states: the clinical effects of Ecstasy.
Pharmacology & Therapeutics, 98(1), 35-58.
Connor, T. J. (2004). Methylenedioxymethamphetamine (MDMA 'ecstasy'): a stressor on the
immune system. Immunology, 111(4), 357-367.
Copeland, D. (2003). The basal ganglia and semantic engagement: Potential insights from
semantic priming in individuals with subcortical vascular lesions, Parkinson's disease,
and cortical lesions. Journal of the international Neuropsychological Society, 9, 1041-
1052.
Costafreda, S. G., Fu, C.H.Y., Lee, L., Everitt, B., Brammer, M.J., & David, A.S. (2006). A
systematic review and quantitative appraisal of fMRI studies of verbal fluency: Role
of the left inferior frontal gyrus. Human Brain Mapping, 27, 799-810.
Cowan, R. L., Bolo, N.R., Dietrich, M., Haga, E., Lukas, S.E., Renshaw, P.F. (2007).
Occipital cortical proton MRS at 4 Tesla in human moderate MDMA polydrug users.
Psychiatry Research: Neuroimaging, 155, 179-188.
Cowan, R. L., Haga, E., Frederick, B.B, Dietrich, M.S., Vimal, R.L.P., Lukas, S.E.,
Renshaw.P.F. (2006). MDMA use is associated with increased spatial BOLD fMRI
visual cortex activation in human MDMA users. Psychopharmacology, Biochemistry
and Behavior, 84, 219-228.
Cowan, R. L., Lyoo, I.K., Sung, S.M., Ahn, K.H., Kim, M.J., Hwang, J., Haga, E., Vimal,
R.L.P., Lukas, S.E., & Renshaw, P.F. (2003). Reduced cortical gray matter density in
288
human MDMA (Ecstasy) users: a voxel-based morphometry study. Drug and Alcohol
Dependence, 72(3), 225-235.
Croft, R. J., Mackay, A.J., Mills, A.T.D., & Gruzelier, J.G.H. (2001). The relative
contributions of ecstasy and cannabis to cognitive impairment. Psychopharmacology,
153, 373-379.
Curran, H. V., & Travill, R.A. (1997). Mood and cognitive effects of 3,4-
methylenedioxymethamphetamine (MDMA, 'Ecstasy'): weekend 'high' followed by
mid-week 'low'. Addiction, 92(7), 821-831.
Dafters, R. I. (2006). Chronic ecstasy (MDMA) use is associated with deficits in task-
switching but not inhibition or memory updating of executive functions. Drug and
Alcohol Dependence, 83, 181-184.
Dafters, R. I., Duffy, F., O'Donnell, P.J., & Bouquet, C. (1999). Level use of 3,4-
methylenedioxymethamphetamine (MDMA or ecstasy) in humans correlates with
EEG power and coherence. Psychopharmacology, 145, 82-90.
Dafters, R. I., Hoshi, R., & Talbot, A, C. (2004). Contribution of cannabis and MDMA
("ecstasy") to cognitive changes in long-term polydrug users. Psychopharmacology,
173, 405-410.
Daumann, J., Fimm, B., Willmes, K., Thron, A., & Gouzoulis-Mayfrank, E. (2003). Cerebral
activation in abstinent ecstasy (MDMA) users during a working memory task: a
functional magnetic resonance imaging (fMRI) study. Cognitive Brain Research,
16(3), 479-487.
Daumann, J., Fischermann, T., Heekeren, K., Thron, A., & Gouzoulis-Mayfrank, E. (2004).
Neural mechanisms of working memory in ecstasy (MDMA) users who continue or
discontinue ecstasy and amphetamine use: Evidence from an 18-month longitudinal
functional magnetic resonance imaging study. Biological Psychiatry, 56(5).

289
Daumann, J., Fischermann, T., Pilatus, U., Thron, A., Moeller-Hartmann, W., & Gouzoulis-
Mayfrank, E. (2004). Proton magnetic resonance spectroscopy in ecstasy (MDMA)
users. Neuroscience Letters, 362(2), 113-116.
Daumann, J., Schnitker, R., Weidemann, J., Schnell, K., Thron, A., & Gouzoulis-Mayfrank.
(2003). Neural correlates of working memory in pure and polyvalent ecstasy (MDMA)
users. NeuroReport, 14(15), 1983-1987.
Davison, D., & Parrott, A.C. (1997). Ecstasy (MDMA) in recreational users: Self-reported
psychological and physiological effects. Human Psychopharmacology, 12, 221-226.
de la Torre, R., Farre, M., Roset, P.N., Lopez, C.H., Mas, M., Ortuno, J., Menoyo, E., Pizarro,
N., Segura, J., & Cami, J. (2000). Pharmacology of MDMA in humans. Annals of the
New York Academy of Sciences, 914, 225-237.
de Sola, S., Tarancón, T., Peña-Casanova, J., Espadaler, J.M., Langohr, K., Poudevida, S.,
Farré, M., Verdejo-García, A., & de la Torre, R. (2008). Auditory event-related
potentials (P3) and cognitive performance in recreational ecstasy polydrug users:
evidence from a 12-month longitudinal study. Psychopharmacology, 200, 425-437.
de Win, M. M. L., Jager, G., Booij, J., Reneman, L., Schilt, T., Lavini, C., Olabarriaga, S.D.,
den Heeten, G.J., & van den Brink, W. (2008a). Sustained effects of ecstasy on the
human brain: a prospective neuroimaging study in novel users. Brain, 131, 2936-2945.
de Win, M. L., Jager, G., Booij, J., Reneman, L., Schilt, T., Lavini, C., Olabarriaga, S.D.,
Ramsey, N.F., den Heeten, G.J., & van den Brink. (2008b). Neurotoxic effects of
ecstasy on the thalamus. The British Journal of Psychiatry, 193, 289-296.
Debener, S., Ullsperger, M., Siegel, M., & Engel, A.K. (2006). Single-trial EEG-fMRI
reveals the dynamics of cognitive function. TRENDS in Cognitive Sciences, 10(12),
558-563.
290
Di lorio, C. R., Watkins, T.J., Dietrich, M.S., Cao, A., Blackford, J.U., Rogers, B., Ansari,
M.S., Baldwin, R.M., Li, R., Kessler, R.M., Salomon, R.M., Benningfield, M., &
Cowan, R.L. (2012). Evidence for chronically altered cortical serotonin function in
human female recreational ecstasy (MDMA) polydrug users. Archives of General
Psychiatry, 69(4), 399-409.
Donkers, F. C. L., & Boxtel, G.J.M. (2004). The N2 in go/no-go tasks reflects conflict
monitoring not response inhibition. Brain and Cognition, 56, 165-176.
Dove, A., Pollmann, S., Schubert, T., Wiggins, C.J., & von Cramon, D.Y. (2000). Prefrontal
cortex activation in task switching: an event-related fMRI study. Cognitive Brain
Research, 9(1), 103-109.
Duncan, C. C., Barry, R.J., Connolly, J.F., Fischer, C., Michie, P.T., Näätänen, R., Polich, J.,
Reinvang, I., & van Petten, C. (2009). Event-related potentials in clinical research:
guidlines for eliciting, recording, and quantifying mismatch negativity, P300, and
N400. Clinical Neurophysiology, 120(11), 1883-1908.
Duncan, J., & Owen, A.M. (2000). Common regions of the human frontal lobe recruited by
diverse cognitive demands. Trends Neuroscience, 23, 475-483.
Ehlis, A.-C., Bähne, C.G., Jacob, C.P., Hermann, M.J., & Fallgatter, A.J. (2008). Reduced
lateral prefrontal activation in adult patients with attention-deficit/hyperactivity
disorder (ADHD) during a working memory task: A functional near-infrared
spectroscopy (fNIRS) study. Journal of Psychiatric Research, 42(13), 1060-1067.
Health and Safety Executive. (2012). Labour Force Survey for 2011/2012.
Falkenstein, M., Hoormann, J., & Hohnsbein, J. (1999). ERP components in Go/Nogo tasks
and their relation to inhibition. Acta Psychological, 101, 267-291.
291
Fallgatter, A. J., Roesler, M., Sitzmann, L., Heidrich, A., Mueller, T.J., & Strik, W.K. (1997).
Loss of functional hemispheric asymmetry in Alzheimer's dementia assessed with
near-infrared spectroscopy. Cognitive Brain Research, 6(1), 67-72.
Firbank, M., Okada, E., & Delpy, D.T. (1998). A theoretical study of the signal contribution
of regions of the adult head to near-infrared spectroscopy studies of visual evoked
responses. Neuroimage, 8, 69-78.
Fisk, J. E., & Montgomery, C. (2009). Sleep impairment in ecstasy/polydrug and cannabis-
only users. The American Journal on Addictions, 18, 430-437.
Fisk, J. E., & Sharp, C.A. (2004). Age-related impairment in executive functioning: Updating,
inhibition, shifting and access. Journal of Clinical and Experimental
Neuropsychology, 26(7), 874-890.
Fisk, J. E., & Warr, P. (1996). Age-related impairment in associative learning: the role of
anxiety, arousal and learning self efficacy. Personality and Individual Differences,
21(5), 675-686.
Fisk, J. E., Montgomery, C., Murphy, P., & Wareing, M. (2004). Evidence for executive
deficits among users of MDMA (ecstasy). British Journal of Psychology, 95, 457-466.
Fisk, J.E., Montgomery, C., Wareing, M., & Murphy, P. (2005). Reasoning deficits in ecstasy
(MDMA) users. Psychopharmacology, 181, 550-559.
Folstein, J. R., & van Petten, C. (2008). Influence of cognitive control and mismatch on the
N2 component of the ERP: a review. Psychophysiology, 45(1), 152-170.
Ford, J. M., & Pfefferbaum, A. (1991). Event-related potentials and eyeblink responses in
automatic and controlled processing: effects of age. Electroencephalography and
clinical Neurophysiology, 78(5), 361-377.
292
Fox, H. C., McLean, A., Turner, J.J.D., Parrott, A.C., Rogers, R., & Sahakian, B.J. (2002).
Neuropsychological evidence of a relatively selective profile of temporal dysfunction
in drug-free MDMA ("ecstasy") polydrug users. Psychopharmacology, 162, 203-214.
Fox, H. C., Parrott, A.C., & Turner, J.J.D. (2001). Ecstasy use: cognitive deficits related to
doseage rather than self reported problematic use of the drug. Journal of
Psychopharmacology, 15(4), 273-281.
Fox, P. T., Raichle, M.E., Mintus, M.A., & Dence, C. (1988). Nonoxidative glucose
consumption during focal physiologic neural activity. Science, 241(4864), 462-464.
Friedman, N. P., Miyake, A., Corley, R.P., Young, S.E., DeFries, J.C., & Hewitt, J.K. (2006).
Not all executive functions are related to intelligence. Psychological Science, 17, 172-
179.
Friedman, N. P., Miyake, A., Young, S.E., DeFries, J.C., Corley, R.P., & Hewitt, J.K. (2008).
Individual differences in executive functions are almost entirely genetic in origin.
Journal of Experimental Psychology: General, 137(2), 201-225.
Fritzsche, A.-S., Stahl, J., & Gibbons, H. (2011). An ERP study of target competition:
Individual differences in functional impulsive behavior. International Journal of
Psychophysiology, 81(1), 12-21.
Gajewski, P. D., Stoerig, P., & Falkenstein, M. (2008). ERP-Correlates of response selection
in a response conflict paradigm. Brain Research, 1189, 127-134.
Gamma, A., Brandeis, D., Brandeis, R., Vollenweider, F.X. (2005). The P3 in 'ecstasy'
polydrug users during response inhibition and execution. Journal of
Psychopharmacology, 19(5), 504-512.
Gamma, A., Buck, A., Berthold, T., Hell, D., & Vollenweider, F.X. (2000). 3,4-
Methylenedioxymethamphetamine (MDMA) modulates cortical and limbic brain

293
activity as measured by [H2 15
O]-PET in healthy humans. Neuropsychopharmacology,
23(4), 388-395.
Garcia-Larrea, L., Lukaszewicz, A.C., & Mauguiere, F. (1992). Revisiting the oddball
paradigm. Non-target vs. neutral stimuli and the evaluation of ERP attentional effects.
Neuropsychologica, 30(8), 723-741.
Gaspar, P. A., Ruiz, S., Zamorano, F., Altayo, M., Perez, C., Bosman, C.A., & Aboitiz, F.
(2011). P300 amplitude is insensitive to working memory load in schizophrenia. BMC
Psychiatry, 11, 29 .
Gerra, G., Bassignana, S., Zaimovic, A., Moi, G., Bussandri, M., Caccavari, R., Brambilla, F.,
& Molina, E. (2003). Hypothalamic-pituitary-adrenal axis responses to stress in
subjects with 3,4-methylenedioxy-methamphetamine ('ecstasy') use history:
correlation with dopamine receptor sensitivity. Psychiatry Research, 120(2), 115-124.
Gerra, G., Zaimovic, A., Ampollini, R., Giusti, F., Delsignore, R., Raggi, M.A., Laviola, G.,
Macchia, T., & Brambilla, F. (2001). Experimentally induced aggressive behavior in
subjects with 3,4-methylenedioxy-methamphetamine ("ecstasy") use history
Psychobiological correlates. Journal of Substance Abuse, 13, 471-491.
Gerra, G., Zaimovic, A., Ferri, M., Zambelli, U., Timpano, M., Neri, E., Marzocchi, G.F.,
Delsignore, R., & Brambilla, F. (2000). Long-lasting effects of 3,4-Methylene-
dioxymethamphetamine (ecstasy) on serotonin system function in humans. Biological
Psychiatry, 47, 127-136.
Gilbert, D. G., McClernon, F.J., Rabinovich, N.E., Sugain, C., Plath, L.C., Asgaard, G., Zuo,
Y., Huggenvik, J., & Botros, N. (2003). Effects of quitting smoking on EEG
activation and attention last for more than 31 days and are more severe with stress,
dependence, DRD2 A1 allele, and depressive traits. Nicotine & Tobacco Research,
6(2), 249-267.
294
Gouzoulis-Mayfrank, E., Daumann, J., Tuchtenhagen, F., Pelz, S., Becker, S., Kunert, H-J.,
Fimm, B., & Sass, H. (2000). Impaired cognitive performance in drug free users of
recreational ecstasy (MDMA). Journal of Neurology, Neurosurgery & Psychiatry,
68(6), 719-725.
Gouzoulis-Mayfrank, E., Thimm, B., Rezk, M., Hensen, G., & Daumann, J. (2003). Memory
impairment suggests hippocampal dysfunction in abstinent ecstasy users. Progress in
Neuro-Psychopharmacology & Biological Psychiatry, 27, 819-827.
Grabner, R. H., Ansari, D., Reishofer, G., Stern, E., Ebner, F., & Neuper, C. (2007).
Individual differences in mathermatical competence predict parietal brain activation
during mental calculation. Neuroimage, 38(2), 346-356.
Grady, C. L., McIntosh, A.R., Beig, S., Keightley, M.L., Burian, H., & Black, S.E. (2003).
Evidence from functional neuroimaging of a compensatory prefrontal network in
Alzheimer's disease. Journal of Neuroscience, 23(3), 986-993.
Hagemann, D., Naumann, E., & Thayer, J.F. (2001). The quest for the EEG reference
revisited: A glance from brain asymmetry research. Psychophysiology, 38, 847-857.
Halpern, J. H., Pope, Jr.,H.G., Sherwood, A.R., Barry, S., Hudson, J.I., & Yurgelun-Todd, D.
(2004). Residual neuropsychological effects of illicit 3,4-
methylenedioxymethamphetamine (MDMA) in individuals with minimal exposure to
other drugs. Drug and Alcohol Dependence, 75, 135-147.
Halpern, J. H., Sherwood, A.R., Hudson, J.I., Gruber, S., Kozin, D., & Pope, Jr, H.G. (2011).
Residual neurocognitive features of long-term ecstasy users with minimal exposure to
other drugs. Addiction, 106(4), 777-786.
Hansen, J. C., & Hillyard, S.A. (1988). Temporal dynamics of human auditory selective
attention. Psychophysiology, 25, 316-329.

295
Hanson, K., & Luciana, M. (2004). Neurocognitive function in users of MDMA: the
importance of clinically significant patterns of use. Psychological Medicine, 34(2),
229-246.
Hanson, K., & Luciana, M. (2010). Neurocognitive impairments in MDMA and other drug
users: MDMA alone may not be a cognitive risk factor. Journal of Clinical and
Experimental Neuropsychopharmacology, 32(4), 337-349.
Harris, D. S., Baggott, M., Mendelson, J.H., Mendelson, J.E., & Jones, R.T. (2002).
Subjective and hormonal effects of 3,4-methylenedioxymethamphetamine (MDMA)
in humans. Psychopharmacology, 162(4), 396-405.
Hart, S. G. & Staveland, L.E. (1988). Development of NASA-TLX (Task Load Index):
Results of empirical and theoretical research. In P.A. Hancock & N. Meshkati (Eds.)
Human Mental Workload (pp. 139-183). Amsterdam: North Holland.
Heffernan, T. M., Jarvis, H., Rodgers, J., Scholey, A.B., & Ling, J. (2001). Prospective
memory, everyday cognitive failure and central executive function in recreational
users of Ecstasy. Human Psychopharmacology, 16, 607-612.
Heffernan, T. M., Jarvis, H., Rodgers, J., Scholey, A.B., Ling, J. (2001). Prospective memory,
everyday cognitive failure and central executive functioning in recreational users of
ecstasy. Human Psychopharmacology, 16, 607-612.
Henry, J.D., MacLoed, M.S., Phillips, L.H., & Crawford, J.R. (2004). A meta-analytic review
of prospective memory and ageing. Psychology and Ageing, 19, 27-39.
Hermann, M. J., Langer, J.B., Jacob, C., Ehlis, A.C., & Fallgatter, A.J. (2008). Reduced
prefrontal oxygenation in Alzheimer disease during verbal fluency tasks. American
Journal of Geriatric Psychiatry, 16, 125-135.
Hinkle, D. E., Wiersma, W., & Jurs, S.G. (1994). Applied statistics for the behavioural
sciences (3rd
Ed.). Boston: USA: Houghton Mifflin.

296
Horne, J. A., & Östberg, O. (1976). A self-assessment questionnaire to determine
morningness-eveningness in human circadian rhythms. International Journal of
Chronobiology, 4, 97-100.
Hoshi, R., Mullins, K., Boundy, C., Brignell, C., Piccini, P., & Curran, H.V. (2007).
Neurocognitive function in current and ex-users of ecstasy in comparison to both
matched polydrug-using controls and drug naïve controls. Psychopharmacology, 194,
371-379.
Huettel, S. A., Song, A.W., & McCarthy, G. (2004). Functional magnetic resonance imaging.
Dunderland, Massachusetts: USA: Sinauer Associates, Inc. Publishers.
Ilan, A. B., & Polich, J. (2001). Tobacco smoking and event-related brain potentials in a
Stroop task. International Journal of Psychophysiology, 40(2), 109-118.
Irani, F., Platek, S.M., Bunce, S., Ruocco, A.C., & Chute, D. (2007). Functional near infrared
spectroscopy (fNIRS): an emerging neuroimaging technology with important
applications for the study of brain disorders. The Clinical Neuropsychologist, 21(1),
9-37.
Izzetoglu, K., Bunce, S., Onaral, B., Pourrezaei, K., & Chance, B. (2004). Functional optical
brain imaging using near-infrared during cognitive tasks. International Journal of
Human-Computer Interaction, 17(2), 211-227.
Izzetoglu, M., Izzetoglu, K., Bunce, S., Ayaz, H., Devaraj, A., Onaral, B., & Pourezaei, K.
(2005). Functional near-infrared neuroimaging. IEEE Transactions on Neural Systems
and Rehabilitation Engineering, 13(2), 153-159.
Jacobsen, L. K., Einar Mencl, W., Pugh, K.R., Skudlarski, P., & Krystal, J.H. (2004).
Preliminary evidence of hippocampal dysfunction in adolescent MDMA ("ecstasy")
users: possible relationship to neurotoxic effects. Psychopharmacology, 173, 383-390.

297
Jager, G., de Win, M.M.L., van der Tweel, I., Schilt, T., Kahn, R.S., van den Brink, W., van
Ree, J.M., & Ramsey, N.F. (2008). Assessment of cognitive brain function in ecstasy
users and contributions of other drugs of abuse: Results from an fMRI study.
Neuropsychopharmacology, 33, 247-258.
Jefferies, E., Lambon Ralph, M.A., Baddeley, A.D. (2004). Automatic and controlled
processing in sentence recall: The role of long-term and working memory. Journal of
Memory and Language, 51(4), 623-643.
Jersild, A. T. (1927). Mental set and shift. Archives of Psychology, 14(89), 5-81.
Jobsis, F. F. (1977). Noninvasive, infrared monitoring of cerebral and myocardial oxygen
sufficiency and circulatory parameters. Science, 198(4323), 1264-1267.
Johns, M. W. (1991). A new method for measuring daytime sleepiness: the Epworth
Sleepiness Scale. Sleep, 14, 540-545.
Johnstone, J. J., Barry, R.J., & Anderson, J.W. (2001). Topographic distribution and
development timecourse of auditory even-related potentials in two subtypes of
attention-deficit hyperactivity disorder. International Journal of Psychophysiology, 42,
73-94.
Jonkman, L. M. (2006). The development of preparation, conflict monitoring and inhibition
from early childhood to young adulthood; a Go/Nogo ERP study. Brain Research,
1097, 181-193.
Kamp, A., Pfurtscheller, G., Edlinger, G., & Lopes da Silva, F. (2005). Technological Basis
of EEG Recording. In E. Niedermeyer, & F. Lopes Da Silva (Eds.),
Electroencephalography -Basic Principles, Clinical Applications and Related Fields
(5th
Edition). Philadelphia, USA: Lippincot Williams & Wilkins.
298
Kato, Y., Endo, H., & Kizuka, T. (2009). Menatl fatigue and impaired response processes:
Event-related brain potentials in a Go/NoGo task. International Journal of
Psychophysiology, 72, 204-211.
Kennedy, D. N., Makris, N., Herbert, M.R., Takahashi, T., & Caviness Jr, V.S. (2002). Basic
principles of MRI and morphometry studies of human brain developments.
Developmental Science, 5(3), 268-278.
Keston, P., Murray, A.D., & Jackson, A. (2003). Cerebral perfusion imaging using contrast-
enhanced MRI. Clinical Radiology, 58(7), 505-513.
Kirchner, W. K. (1958). Age related differences in short-term retention of rapidly changing
information. Journal of Experimental Psychology, 55(4), 352 - 358.
Kish, S. J., Lerch, J., Furukawa, Y., Tong, J., McCluskey, T., Wilkins, D., Houle, S., Meyer,
J., Mundo, E., Wilson, A.A., Rusjan, P.M., Saint-Cyr, J.A., Guttman, M., Collins,
D.L., Shapiro, C., Warsh, J.J., & Boileau, I. (2010). Decreased cerebral cortical
serotonin transporter binding in ecstasy users: a positron emission
tomography/[11
C]DASB and structural brain imaging study. Brain, 113(6), 1779-1797.
Klomp, A., den Hollander, B., de Bruin, K., Booij, J., & Reneman. (2012). The effects of
ecstasy (MDMA) on brain serotonin transporters are dependent on age-of-first
exposure in recreational users and animals. PLOS ONE, 7(10), e47524.
Kok, A. (1986). Effects of degradation of visual stimulation on components of the event-
related potential (ERP) in Go/NoGo reaction tasks. Biological Psychology, 23, 21-38.
Kok, A., Ramautar, J.R., De Ruiter, M.B., Band, G.P.H., & Ridderinkhof, R. (2004). ERP
components associated with successful and unsuccessful stopping in a stop-signal task.
Psychophysiology, 41, 9-20.
299
Kong, J., Wang, C., Kwong, K., Vangel, M., Chua, E., & Gollub, R. (2005). The neural
substrate of arithmetic operation and procedure complexity. Cognitive Brain Research,
22(3), 397-405.
Kopp, B., Mattler, U., Goertz. R., Rist. F. (1996). N2, P3 and the lateralized readiness
potential in a nogo task involving selective response priming.
Electroencephalography and clinical Neurophysiology, 99(1), 19-27.
Lazzaro, I., Gordon, E., Whitmont, S., Meares, R., Clarke, S. (2001). The modulation of late
component event related potentials by pre-stimulus EEG theta activity in ADHD.
International Journal of Neuroscience, 107, 247-264.
Le Bihan, D. (2003). Looking into the functional architecture of the brain with diffusion MRI.
Nature Reviews Neuroscience, 4(6), 469-480.
Leff, D. R., Elwell, C.E., Orihuela-Espina, F., Atallah, L., Delpy, D.T., Darzi, A.W., & Yang,
G.Y. (2008). Changes in prefrontal cortical behaviour depend upon familiarity on a
bimanual co-ordination task: An fNIRS study. Neuroimage, 39(2), 805-813.
Leff, D. R., Orihuela-Espina, F., Elwell, C.E., Athanasiou, T., Delpy, D.T., Darzi, A.W., &
Yang, G-Z. (2011). Assessment of the cerebral cortex during motor task behaviours in
adults: A systematic review of functional near infrared spectroscopy (fNIRS) studies.
Neuroimage, 54, 2922-2936.
Lehto, J. (1996). Are executive function tests dependent on working memory capacity? The
Quarterly Journal of Experimental Psychology, 49A(1), 29-50.
Levy, G., Jacobs, D.M., Tang, M-X., Cote, L.J., Louis, E.D., Alfaro, B., Media, H., Stern, Y.,
& Marder, K. (2002). Memory and executive function impairment predict dementia in
Parkinson's disease. Movement Disorders, 17(6), 1221-1226.
Liu, H.-S., Chou, M-C., Chung, H-W., Cho, N-Y., Chiang, S-W., Wang, C-Y., Kao, H-W.,
Huang, G-S., & Chen, C-Y. (2011). Potential long-term effects of MDMA on the

300
Basal Ganglia-Thalamocortical circuit: A Proton MR Spectroscopy and Diffusion-
Tensor Imaging study. Radiology, 260(2), 531-540.
Liu, Z., & He, B. (2008). fMRI-EEG integrated cortical source imaging by use of time-
variant spatial constraints. Neuroimage, 39(3), 1198-1214.
Lopes da Silva, F. (2005). Event-Related Potentials: Methodology and Quantification. In E.
Niedermeyer, & F. Lopes Da Silva (Eds.), Electroencephalography - Basic Principles,
Clinical Applications and Related Fields (5th
Edition). Philadelphia, USA: Lippincott
Williams & Wilkins.
Luck, S. J. (2005). An introduction to the event-related potential technique. Cambridge,
Massachusetts: The MIT Press.
Luck, S. J., & Hillyard, S.A. (1994). Electrophysiological correlates of feature analysis
during visual search. Psychophysiology, 31, 291-308.
McCann, U., Szabo, Z., Seckin, E., Rosenblatt, P., Mathews, W.B., Ravert, H.T., Dannals,
R.F., & Ricaurte, G.A. (2005). Quantitative PET studies of the serotonin transporter
in MDMA users and controls using [11
C]McN5652 and [11
C]DASB.
Neuropsychopharmacology, 30, 1741-1750.
McCann, U.D., Mertl, M., Eligulashvili, V., & Ricaurte, G.A. (1999). Cognitive performance
in (±) 3,4-methylenedioxymethamphetamine (MDMA, "ecstasy") users: a controlled
study. Psychopharmacology, 143, 417-425.
McCann, U. D., Peterson, S.C., & Ricaurte, G.A. (2007). The effect of catecholamine
depletion by alpha-methyl-para-tyrosine on measures of cognitive performance and
sleep in abstinent MDMA users. Neuropsychopharmacology, 32, 1695-1706.
McCann, U. D., Szabo, Z., Scheffel, U., Dannals, R.F., & Ricaurte, G.A. (1998). Positron
emission tomographic evidence of toxic effect of MDMA ("ecstasy") on brain
serotonin neurons in human beings. The Lancet, 352, 1433-1437.

301
McCann, U. D., Szabo, Z., Vranesic, M., Palermo, M., Mathews, W.B., Ravert, H.T.,
Dannals, R.F., & Ricaurte, G.A. (2008). Positron emission tomographic studies of
brain dopamine and serotonin transporters in abstinent (±) 3,4-
methylenedioxymethamphetamine ("ecstasy") users: relationship to cognitive
performance. Psychopharmacology, 200(3), 439-450.
McCardle, K., Luebbers, S., Carter, J.D., Croft, R.J., & Stough, C. (2004). Chronic MDMA
(ecstasy) use, cognition and mood. Psychopharmacology, 173, 434-439.
McDowell, D. M., & Kleber, H.D. (1994). MDMA: Its history and pharmacology.
Psychiatric Annals, 24(3), 127-130.
McEwen, B. S. (1998). Protective and damaging effects of stress mediators. The New
England Journal of Medicine, 338, 171-179.
Mejias, S., Rossignol, M., Debatisse, D., Streel, E., Servais, L., Guerit, J.M., Philippot, P.,
Campanella, S. (2005). Event-related potentials (ERPs) in ecstasy (MDMA) users
during a visual oddball task. Biological Psychology, 69, 333-352.
Michel, C. M., Murray, M.M., Lantz, G., Gonzalez, S., Spinelli, L., & Grave de Peralta, R.
(2004). EEG source imaging. Clinical Neurophysiology, 115(10), 2195-2222.
Miezin, F. M., Maccotta, L., Ollinger, J.M., Petersen, S.E., & Buckner, R.L. (2000).
Characterizing the hemodynamic response: Effects of presentation rate, sampling
procedure, and the possibility of ordering brain activity based on relative timing.
Neuroimage, 11, 735-759.
Miyake, A., Friedman, N.P., Emerson, M.J., Witzki, Howerter, A., & Wager, T.D. (2000).
The unity and diversity of executive functions and their contributions to complex
"frontal lobe" tasks: A latent variable analysis. Cognitive Psychology, 41, 49-100.
302
Moeller, F. G., Steinberg, J.L., Dougherty, D.M., Narayana, P.A., Kramer, L.A., & Renshaw,
P.F. (2004). Functional MRI study of working memory in MDMA users.
Psychopharmacology, 177, 185-194.
Moeller, F. G., Steinberg, J.L., Lane, S.D., Buzby, M., Swann, A.C., Hasan, K.M., Kramer,
L.A., & Narayana, P.A. (2007). Diffusion Tensor Imaging in MDMA users and
controls: Association with decision making. The American Journal of Drug and
Alcohol Abuse, 33, 777-789.
Montgomery, C., & Fisk, J.E. (2008). Ecstasy-related deficits in the updating component of
executive processes. Human Psychopharmacology, 23, 495-511.
Montgomery, C., Fisk, J.E., & Newcombe, R. (2005). The nature of ecstasy-group related
deficits in associative learning. Psychopharmacology, 180, 141-149.
Montgomery, C., Fisk, J.E., Newcombe, R., & Murphy P.N. (2005). The differential effects
of ecstasy/polydrug use on executive components: shifting, inhibition, updating and
access to semantic memory. Psychopharmacology, 182, 262-276
Montgomery, C., Fisk, J.E., Wareing, M., & Murphy, P. (2007). Self reported sleep quality
and cognitive performance in ecstasy users. Human Psychopharmacology, 22, 537-
548.
Montgomery, C., Fisk, J.E.,, Wareing, M., Murphy, P.N., & Newcombe, R. (2005).
Syllogistic reasoning performance in MDMA (Ecstasy) users. Experimental and
Clinical Psychopharmacology, 13(2), 137-145.
Montgomery, C., Hatton, N.P., Fisk, J.E., Ogden, R.S., & Jansari, A. (2010). Assessing the
functional significance of ecstasy-related memory deficits using a virtual paradigm.
Human Psychopharmacology: Clinical and Experimental, 25(4), 318-325.
Morgan, C. J. A., & Curran, H.V. (2006). Acute and chronic effects of ketamine upon human
memory: a review. Psychopharmacology, 188, 408-424.

303
Morgan, M.J. (1999). Memory deficits associated with recreational use of "ecstasy"
(MDMA). Psychopharmacology, 141, 30-36.
Morgan, M. J. (2000). Ecstasy (MDMA): a review of its possible persistent psychological
effects. Psychopharmacology, 152, 230-248.
Morgan, M. J., Impallomeni, L.C., Pirona, A., & Rogers, R.D. (2006). Elevated impulsivity
and impaired decision-making in abstinent ecstasy (MDMA) users compared to
pulydrug and drug naïve controls. Neuropsychopharmacology, 31, 1562-1573.
Morgan, M. J., McFie, L., Fleetwood, L.H., & Robinson, J.A. (2002). Ecstasy (MDMA): are
the psychological problems associated with its use reversed by prolonged abstinence?
Psychopharmacology, 159, 294-303.
Morris, N., & Jones, D.M. (1990). Memory updating in working memory: The role of the
central executive. British Journal of Psychology, 81(2), 111-121.
Murphy, P. N., Erwin, P.G., Maciver, L., Fisk, J.E., Larkin, D., Wareing, M., Montgomery,
C., Hilton, J., Tames, F.J., Bradley, B., Yanulevitch, K., & Ralley, R. (2011). The
relationships of 'ecstasy' (MDMA) and cannabis use to impaired executive inhibition
and access to semantic long-term memory Human Psychopharmacology, 26, 460-469.
Murphy, P. N., Wareing, M., Fisk, J.E., & Montgomery, C. (2009). Executive working
memory deficits in abstinent ecstasy/MDMA users: A critical review.
Nueropsychobiology, 60, 159-175.
Nichols, D. E. (1986). Differences between the mechanism of action of MDMA, MBDB, and
the classic hallucinogens. Identification of a new therapeutic class: entactogens.
Journal of Psychoactive Drugs, 18(4), 305-313.
Nieuwenhuis, S., Yeung, N., Widenberg, W., & Ridderinkhof, R.K. (2003).
Electrophysiological correlates of anterior cingulate function is a go/no-go task:
304
Effects of response conflict and trial type frequency. Cognitive, Affective, &
Behavioural Neuroscience, 3(1), 17-26.
Nulsen, C., Fox, A., & Hammond, G. (2011). Electrophysiological indices of altered working
memory processes in long-term ecstasy users. Human Psychopharmacology, 26, 488-
497.
Nunez, P. L. (1981). Electric Fields of the Brain: The Neurophysics of EEG. New York:
Oxford University Press.
Nunez, P. L., Srinivasan, R., Westdorp, A.F., Wijesinghe, R.S., Tucker, D.M., Silberstein,
R.B., & Cadusch, P.J. (1997). EEG coherency I: statistics, reference electrode,
volume conduction, Laplacians, cortical imaging, and interpretation at multiple scales.
Electroencephalography and clinical Neurophysiology, 103, 499-515.
Obergriesser, T., Ende, G., Braus, D.F., & Henn, F. (2001). Hippocampal 1H-MRSI in
ecstasy users. European Archives of Psychiatry and Clinical Neuroscience, 251, 114-
116.
Oddy, B. W., & Barry, J. (2009). The relationship of N2 and P3 to inhibitory processing of
social drinkers in a Go/NoGo task. International Journal of Psychophysiology, 72,
323-330.
Home Office. (2012). Drug misuse declared: findings from the 2011/2012 crime survey for
England and Wales. London.
Parrott, A.C. (2000). Human research on MDMA (3,4-Methylenedioxymethamphetamine)
neurotoxicity: cognitive and behavioural indices of change. Neuropsychobiology, 42,
17-24.
Parrott, A. C. (2004). Is ecstasy MDMA? A review of the proportion of ecstasy tablets
containing MDMA, their dosage levels, and the changing perceptions of purity.
Psychopharmacology, 173, 234-241.

305
Parrott, A. C. (2006). MDMA in humans: factors which affect the neuropsychobiological
profiles of recreational ecstasy users, the integrative role of bioenergetic stress.
Journal of Psychpharmacology, 20(2), 147-163.
Parrott, A. C. (2009). Cortisol and 3,4-Methylenedioxymethamphetamine: Neurohormonal
aspects of bioenergetic stress in ecstasy users. Neuropsychobiology, 60(3-4), 148-158.
Parrott, A. C. (2011). Residual neurocognitive features of ecstasy use: A reinterpretation of
Halpern et al. (2011) consistent with serotonergic neurotoxicity. Addiction, 106, 1365-
1372.
Parrott, A. C., & Lasky, J. (1998). Ecstasy (MDMA) effects upon mood and cognition; before,
during, and after a Saturday night dance. Psychopharmacology, 139(3), 261-268.
Parrott, A.C., Lees, A., Garnham, N.J., Jones, M., & Wesnes, K. (1998). Cognitive
performance in recreational users of MDMA or 'ecstasy': evidence for memory
deficits. Journal of Psychopharmacology, 12, 79-83.
Parrott, A. C., Lock, J., Conner, A.C., Kissling, C., & Thome, J. (2008). Dance clubbing on
MDMA and during abstinence from ecstasy/MDMA: prospective neuroendocrine and
psychobiological changes. Neuropsychobiology, 57(4), 165-180.
Pascual-Marqui, R. D. (1999). Review of methods for solving the EEG inverse problem.
International Journal of Bioelectromagnetism, 1(1), 75-86.
Pazos, A., Prosbit, A., & Palacios, J.M. (1987). Serotonin receptors in the human brain - III.
Autoradiographic mapping of serotonin-1 receptors. Neuroscience, 21(1), 97-122.
Pliszka, S. R., Liotti, M., & Woldorff, M.G. (2000). Inhibitory control in children with
attention-deficit/hyperactivity disorder: event-related potentials identify the
processing component and timing of an impaired right-frontal response-inhibition
mechanism. Biological Psychiatry, 48(3), 238-246.

306
Pollack, I., Johnson, L.B., & Knaff, P.R. (1959). Running memory span. Journal of
Experimental Psychology, 57(3), 137-146.
Potter, D. D., Jory, S.H., Bassett, M.R.A., Barrett, K., & Mychalkiw, W. (2002). Effect of
mild head injury on event-related potential correlates of Stroop task performance.
Journal of the international Neuropsychological Society, 8, 828-837.
Pruessner, J. C., Eolf, O.T., Hellhammer, D.H., Buske-Kirschbaum, A., von Auer, K., Jobst,
S., Kaspers, F., & Kirschbaum, C. (1997). Free cortisol levels after awakening: A
reliable biological marker for the assessment of adrenocortical activity. Life Sciences,
61(26), 2539-2549.
Raj, V., Liang, H.C., Woodward, N.D., Bauernfeind, A.L., Lee, J., Dietrich, M.S., Park, S., &
Cowan, R.L. (2010). MDMA (ecstasy) use is associated with reduced BOLD signal
change during semantic recognition in abstinent human polydrug users: a preliminary
fMRI study. Journal of Psychopharmacology, 24(2), 187-201.
Raven, J., Raven, J.C., & Court, H.H. (1998). Manual for Raven's Progressive Matrices and
Vocabulary Scales. Oxford, UK: Oxford Psychologists Press.
Reay, J. L., Hamilton,C., Kennedy, D.O., & Scholey, A.B. (2006). MDMA polydrug users
show process-specific central executive impairments coupled with impaired social
and emotional judgement processes. Journal of Psychopharmacology, 20(3), 385-388.
Reneman, L., Booij, J., de Bruin, K., Reitsma, J.B., de Wolff, F.A., Gunning, W.B., den
Heeten, G.J., & van den Brink, W. (2001). Effects of dose, sex, and long-term
abstention from use on toxic effects of MDMA (ecstasy) on brain serotonin neurons.
The Lancet, 358(9296),1864-1869.
Reneman, L., Booij, J., Lavalaye, J., de Bruin, K., Reitsma, J.B., Gunning, W.B., den Heeten,
G.J., & van den Brink. (2002). Use of amphetamine by recreational users of ecstasy
307
(MDMA) is associated with reduced striatal dopamine transporter densities: a [123
I]ᵦCIT SPECT study - preliminary report. Psychopharmacology, 159, 335-340.
Reneman, L., Booij, J., Majoie, C.B.L.M., van den Brink, W., & den Heeten, G.J. (2001).
Investigating the potential neurotoxicity of Ecstasy (MDMA): an imaging approach.
Human Psychopharmacology, 16, 579-588.
Reneman, L., Booij, J., Schmand, B., van den Brink, W., & Gunning, B. (2000). Memory
disturbances in "Ecstasy" users are correlated with an altered brain serotonin
neurotransmission. Psychopharmacology, 148, 322-324.
Reneman, L., Habraken, J.B.A., Majoie, C.B.L., & den Heeten, G.J. (2000). MDMA
("Ecstasy") and its association with cerebrovascular accidents: preliminary findings.
American Journal of Neuroradiology, 21, 1001-1007.
Reneman, L., Lavalaye, J., Schmand, B., de Wolff, F.A., van den Brink, W., den Heeten, G.J.,
& Booij, J. (2001). Cortical serotonin transporter density and verbal memory in
individuals who stopped using 3,4-Methylenedioxymethamphetamine (MDMA or
"Ecstasy"). Archives of General Psychiatry, 58(10), 901-906.
Reneman, L., Majoie, C.B.L.M., Flick, H., & den Heeten, G.J. (2002). Reduced N-
acetylaspartate levels in the frontal cortex of 3,4-methylenedioxymethamphetamine
(ecstasy) users: Preliminary results. American Journal of Neuroradiology, 23, 231-
237.
Reneman, L., Majoie, C.B.L.M., Habraken, J.B.A., & den Heeten, G.J. (2001). Effects of
ecstasy (MDMA) on the brain in abstinent users: Initial observations with diffusion
and perfusion MR imaging. Radiology, 220, 611-617.
308
Reneman, L., Schilt, T., de Win, M.M., Booij, J., Schmand, B., van den Brink, W., & Bakker,
O. (2006). Memory function and serotonin transporter promoter gene polymorphism
in ecstasy (MDMA) users. Psychopharmacology, 20(3), 389-399.
Ricaurte, G. A., Sieden, L.S., & Schuster, C.R. (1984). Further evidence that amphetamines
produce long-lasting dopamine neurochamical deficits by destroying dopamine nerve
fibres. Brain Research, 303(2), 359-364.
Ricaurte, G. A., Yuan, J., & McCann, U.D. (2000). (±) 3,4-
Methylenedioxymethamphetamine ('Ecstasy')- induced serotonin neurotoxicity:
studies in animals. Neuropsychobiology, 42, 5-10.
Ritter, W., Simson, R., Vaughan, Jr, H.G., & Macht, M. (1982). Manipulation of event-
related potential manifestations of information processing stages. Science, 218(4575),
909-911.
Roberts, C. A., Fairclough, S.H., Tames, F., Fisk, J.E., & Montgomery, C. (2013a).
Electrophysiological indices of response inhibition in human ecstasy-polydrug users.
Journal of Psychopharmacology, 27(9), 779-789.
Roberts, C. A., Fairclough, S.H., Fisk, J.E., Tames, F., & Montgomery, C. (2013b). ERP
evidence suggests executive dysfunction in ecstasy polydrug users.
Psychopharmacology, 228, 375-388.
Roberts, C. A., Fairclough, S.H., Fisk, J.E., Tames, F., & Montgomery, C. (2013c).
Electrophysiological evidence of atypical processing underlying mental set shifting in
ecstasy polydrug and polydrug users. Experimental and Clinical
Psychopharmacology. In Press, DOI: 10.1037/a0034002.
Roberts, G. M., & Garavan, H. (2010). Evidence of increased activation underlysing
cognitive control in ecstasy and cannabis users. Neuroimage, 52, 429-435.

309
Rodgers, J., Buchanan, T., Scholey, A.B., Heffernan, T.M., Ling, J., & Parrott, A.C. (2003).
Pattern of drug use and the influence of gender on self reports of memory ability in
ecstasy users: a web based study. Journal of Psychpharmacology, 17(4), 389-396.
Rogers, G., Elston, J., Garside, R., Roome, C., Taylor, Younger, P., Zawada, A., &
Somerville, M. (2009). The harmful health effects of recreational ecstasy: a
systematic review of observational evidence. Health Technology Assessment, 13(6),
1-315.
Rogers, R. D., & Monsell, S. (1995). Cost of a predictable switch between simple cognitive
tasks. Journal of Experimental Psychology: General, 124(2), 207-231.
Rossell, S. L., Bullmore, E.T., Williams, S.C.R., & David, A.S. (2001). Brain activation
during automatic and controlled processing of semantic relations: a priming
experiment using lexical-decision. Neuropsychologia, 39(11), 1167-1176.
Rugg, M. D., Pickles, C.D., Potter, D.D., Doyle, M.C., Pentland, B., & Roberts, R.C. (1993).
Cognitive brain potentials in a three-stimulus auditory "oddball" task after closed
head injury. Neuropsychologica, 31(4), 373-393.
Sapolsky, R. M. (1996). Why stress is bad for your brain. Science, 273(5276), 749-750.
Saykin, A. J., Flashman, L.A., Frutiger, S.A., Johnson, S.C., Mamourian, A.C., Moritz, C.H.,
O'Jile, J.R., Riordan, H.J., Santulli, R.B., Smith, C.A., & Weaver, J.B. (1998).
Neuroanatomic substrates of semantic memory impairment in Alzheimer's disease:
Patterns of functional MRI activation. Journal of International Neuropsychological
Society, 5, 377-392.
Schaul, N. (1998). The fundamental neural mechanisms of electroencephalography.
Electroencephalography and clinical Neurophysiology, 106, 101-107.
310
Schouw, M. L. J., Gevers, S., Caan, M.W.A., Majoie, C.B.L.M., Booij, J., Nederveen, A.J., &
Reneman, L. (2012). Mapping serotonergic dysfunction in MDMA (ecstasy) users
using pharmacological MRI. European Neuropsychopharmacology, 22(8), 537-545.
Shallice, T., & Burgess, P.W. (1991). Deficits in strategy application following frontal lobe
damage in man. Brain, 114(2), 727-741.
Shiffrin, R. M., & Schneider, W. (1977). Controlled and automatic human information
processing: II. Perceptual learning, automatic attending and a general theory.
Psychological Review, 84(2), 127-190.
Smith, A. B., Taylor, E., Brammer, M., & Rubia, K. (2004). Neural correlates of switching
set as measured in fast, event-related functional magnetic resonance imaging. Human
Brain Mapping, 21(4), 247-256.
Smith, E. E., & Jonides, J. (1997). Working memory: A view from neuroimaging. Cognitive
Psychology, 33(1), 5-42.
Smith, J. L., Johnstone, S.J., & Barry, R.J. (2004). Inhibitory processing during the Go/NoGo
task: an ERP analysis of children with attention-deficit/hyperactivity disorder.
Clinical Neurophysiology, 115(6), 1320-1331.
Speckman, E. J., & Caspars, H. (1979). Origin of Cerebral Field Potentials. Stuttgart:
Thieme.
Speckmann, E-J., & Elger, C.E. (2005). Introduction to the Neurophysiological Basis of the
EEG and DC Potentials. In E. Niedermeyer, & F. Lopes da Silva (Eds.),
Electroencephalography - Basic Principles, Clinical Applications and Related Fields.
Philadelphia, USA: Lippincott Williams & Wilkins.
Steinbrink, J., Villringer, A., Kempf, F., Haux, D., Boden, S., & Obrig, H. (2006).
Illuminating the BOLD signal: combined fMRI-fNIRS studies. Magnetic Resonance
Imaging, 24(4), 495-505.

311
Stoet, G., & Snyder, L.H. (2006). Effects of the NMDA antagonist ketamine on task-
switching performance: evidence for specific impairments of executive control.
Neuropsychopharmacology, 31, 1675-1681.
Stroop, J. R. (1935). Studies of interference in serial verbal reactions. Journal of
Experimental Psychology, 18(6), 643-662.
Stuss, D. T., Alexander, M.P., Hamer, L., Palumbo, C., Dempster, R., Binns, M., Levine, B.,
& Izukawa, D. (1998). The effects of focal anterior and posterior brain lesions on
verbal fluency. Journal of the international Neuropsychological Society, 4, 265-278.
Sudhakar, S., Hoshi, R., Bhagwagar, Z., Murthy, N.V., Hinz, R., Cowen, P., Curran, H.V., &
Grasby, P. (2009). Brain serotonin transporter binding in former users of MDMA
('ecstasy'). The British Journal of Psychiatry, 194, 355-359.
Terman, M., Rifkin, J.B., Jacobs, J., & White, T.M. (2001). Morningness-Eveningness
Questionnaire (Revised). New York, NY: State Psychiatric Institute.
Thomasius, R., Petersen, K., Buchert, R., Andersen, B., Zapletalova, P., Wartberg, L.,
Nebeling, B., & Schmoldt. (2003). Mood, cognition and serotonin transporter
availability in current and former ecstasy (MDMA) users. Psychopharmacology, 167,
85-96.
Thomasius, R., Petersen, K., Buchert, R., Andersen, B., Zapletalova, P., Wartberg, L.,
Nebeling, B., & Schmoldt, A. (2003). Mood, cognition and serotonin transporter
availability in current and former ecstasy (MDMA) users. Psychopharmacology,
167(1), 85-96.
Thomasius, R., Zapletalova, P., Petersen, K., Buchert, R., Andersend, B., Wartberg, L.,
Nebeling, B., & Schmoldt, A. (2006). Mood, cognition and serotonin transporter
availability in current and former ecstasy (MDMA) users: the longitudinal perspective.
Journal of Psychopharmacology, 20(2), 211-225.
312
Thurstone, L. (1938). Primary mental abilities. Chicago: University of Chicago Press.
Urban, N. B. L., Girgis, R.R., Talbot, P.S., Kegeles, L.S., Xu, X., Frankle, W.G., Hart, C.L.,
Slifstein, M., Abi-Dargham, A., & Laruelle, M. (2012). Sustained recreational use of
ecstasy is associated with altered pre and postsynaptic markers of serotonin
transmission in neocortical areas: A PET study with [11
C]DASB and [11
C]MDL
100907. Neuropsychopharmacology, 37, 1465-1473.
Valdes, I. H., Steinberg, J.L., Narayana, P.A., Kramer, L.A., Dougherty, D.M., Swann, A.C.,
Barratt, E.S., Moeller, F.G. (2006). Impulsivity and BOLD fMRI activation in
MDMA users and healthy control subjects. Psychiatric Research: Neuroimaging, 147,
239-242.
Verstraete, A. G. (2004). Detection times of drugs of abuse in blood, urine and oral fluid.
Therepeutic Drug Monitoring, 26(2), 200-205.
Villringer, A., & Dirnagl, U. (1995). Coupling of brain activity and cerebral blood flow: basis
of functional neuroimaging. Cerebrovascular Brain Metabolism Review, 7, 240-276.
von Geusau, N. A., Stalenhoef, P., Huizinga, M., Snel, J., & Ridderinkhof, K.R. (2004).
Impaired executive function in male MDMA ("ecstasy") users. Psychopharmacology,
175, 331-341.
Wagner, D., Becker, B., Koester, P., Gouzoulis-Mayfrank, E., & Daumann, J. (2012). A
prospective study of learning, memory, and executive function in new MDMA users.
Addiction, 108, 136-145.
Wareing, M., Fisk, J.E., & Murphy, P.N. (2000). Working memory deficits in current and
previous users of MDMA ('ecstasy'). British Journal of Psychology, 91(2), 181-188.
Wareing, M., Fisk, J.E., Murphy, P., & Montgomery, C. (2004). Verbal working emory
deficits in current and previous users of MDMA. Human Psychopharmacology, 19,
225-234.

313
Wareing, M., Fisk, J.E., Murphy, P., & Montgomery,C. (2005). Visuo-spatial working
memory deficits in current and former users of MDMA ('ecstasy'). Human
Psychopharmacology, 20, 115-123.
Weishaupt, D., Kochli, V.D., & Marincek, B. (2008). How does MRI work? An introduction
to the physics and function of magnetic resonance imaging (Second Edition ed.).
Berlin: Springer.
West, R., & Alain, C. (1999). Event-related neural activity associated with the Stroop task.
Cognitive Brain Research, 8, 157-164.
Wetherell, M. A., & Sidgreaves, M.C. (2005). Short communication: Secretory
immunoglobulin - a reactivity following increases in workload intensity using the
Defined Intensity Stressor Simulation (DISS). Stress and Health, 21, 99-106.
Wetherell, M. A., Atherton, K., Grainger, J., Brosnan, R., Scholey, A.B. (2012). The effects
of multitasking on psychological stress reactivity in recreational users of cannabis and
MDMA. Human Psychopharmacology: Clinical and Experimental, 27(2), 167-176.
Whitney, C., Kirk, M., O'Sullivan, J., Ralph, M.A.L., & Jefferies. (2011). The neural
organization of semantic control: TMS evidence for a distributed network in left
inferior frontal and posterior middle temporal gyrus. Cerebral Cortex, 21(5), 1066-
1075.
Wolf, R.C., Sambataro, F., Vasic, N., Schonfeldt-Lecuona, C., Ecker, D., & Landwehmeyer,
B. (2008). Altered frontrostriatal coupling in pre-manifest Huntingdon's disease:
effects of increasing cognitive load. European Journal of Neurology, 15(11), 1180-
1190.
Wong, M. L., King, M.A., Munson, P.J., Listwak, S., Licinio, J., Prolo, B., Karp, B.,
McCutcheon, I.E., Geracioti Jr, T.D., DeBellis, M.D., Rice, K.C., Goldstein, D.S.,
Veldhuis, J.D., Chrousos, G.P., Oldfield, E.H., McCann, S.M., & Gold, P.W. (2000).

314
Pronounced and sustained hypernoradrenergic function in major depression with
melancholic features: relation to hypercorticolism and corticotropin-releasing
hormone. Proceedings of the National Academy of Sciences, 97(1), 325-330.
Woodard, J. L., Grafton, S.T., Votaw, J.R., Green, R.C., & Dobraski, M. (1998).
Compensatory recruitment of neuronal resources during overt rehearsal of word lists
in Alzheimer's disease. Neuropsychology, 12(4), 491-504.
Yeung, N., & Cohen, J.D. (2006). The impact of cognitive deficits on conflict monitoring:
predictable dissociations between the error-related negativity and N2. Psychological
Science, 17(2), 164-171.
Zakzanis, K. K., & Young,D.A. (2001). Memory impairment in abstinent MDMA ("ecstasy")
users: A longitudinal investigation. Neurology, 56, 966-969.
Zakzanis, K.K., Young, D.A., & Campbell, Z. (2003). Prospective memory impairment in
abstinent MDMA ("Ecstasy") users. Cognitive Neuropsychiatry, 8(2), 141-153.
Zigmond, A. S., & Snaith, R.P. (1983). The Hospital Anxiety and Depression Scale. Acta
Psychiatrica Scandinavica, 67(6), 361-370.

315
Appendices
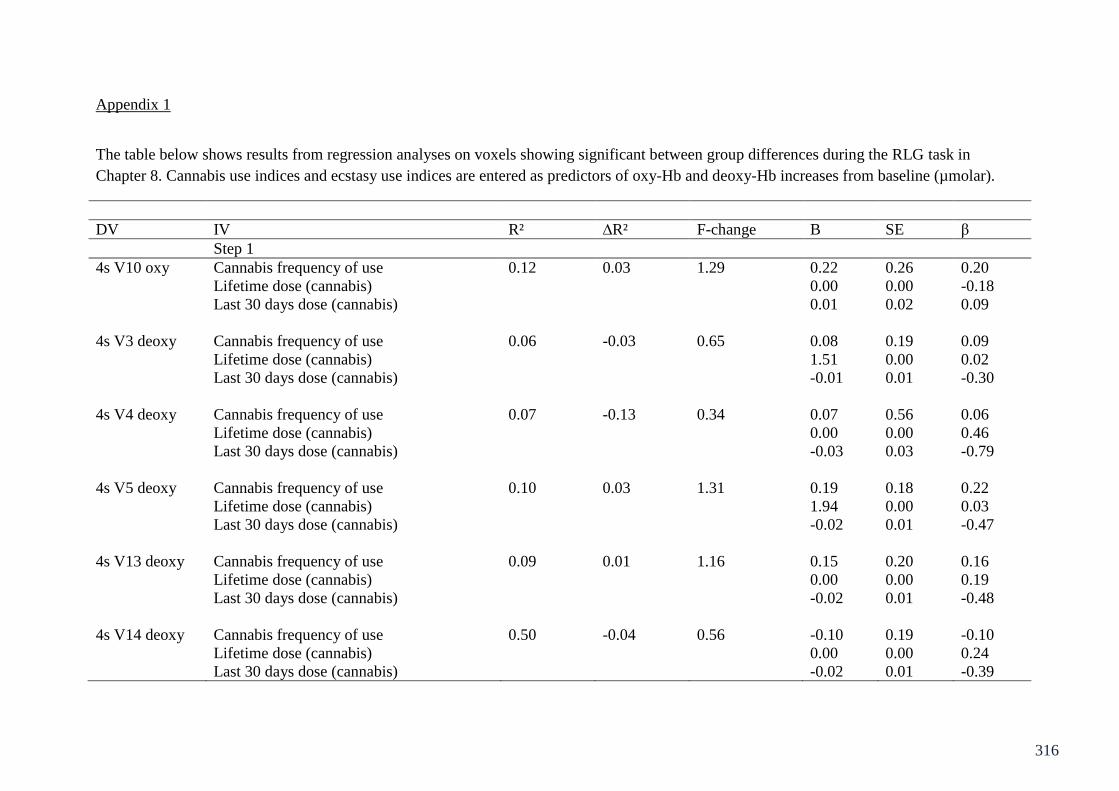
316
Appendix 1
The table below shows results from regression analyses on voxels showing significant between group differences during the RLG task in
Chapter 8. Cannabis use indices and ecstasy use indices are entered as predictors of oxy-Hb and deoxy-Hb increases from baseline (µmolar).
DV IV R² ∆R² F-change B SE β
Step 1
4s V10 oxy Cannabis frequency of use 0.12 0.03 1.29 0.22 0.26 0.20
Lifetime dose (cannabis) 0.00 0.00 -0.18
Last 30 days dose (cannabis) 0.01 0.02 0.09
4s V3 deoxy Cannabis frequency of use 0.06 -0.03 0.65 0.08 0.19 0.09
Lifetime dose (cannabis) 1.51 0.00 0.02
Last 30 days dose (cannabis) -0.01 0.01 -0.30
4s V4 deoxy Cannabis frequency of use 0.07 -0.13 0.34 0.07 0.56 0.06
Lifetime dose (cannabis) 0.00 0.00 0.46
Last 30 days dose (cannabis) -0.03 0.03 -0.79
4s V5 deoxy Cannabis frequency of use 0.10 0.03 1.31 0.19 0.18 0.22
Lifetime dose (cannabis) 1.94 0.00 0.03
Last 30 days dose (cannabis) -0.02 0.01 -0.47
4s V13 deoxy Cannabis frequency of use 0.09 0.01 1.16 0.15 0.20 0.16
Lifetime dose (cannabis) 0.00 0.00 0.19
Last 30 days dose (cannabis) -0.02 0.01 -0.48
4s V14 deoxy Cannabis frequency of use 0.50 -0.04 0.56 -0.10 0.19 -0.10
Lifetime dose (cannabis) 0.00 0.00 0.24
Last 30 days dose (cannabis) -0.02 0.01 -0.39
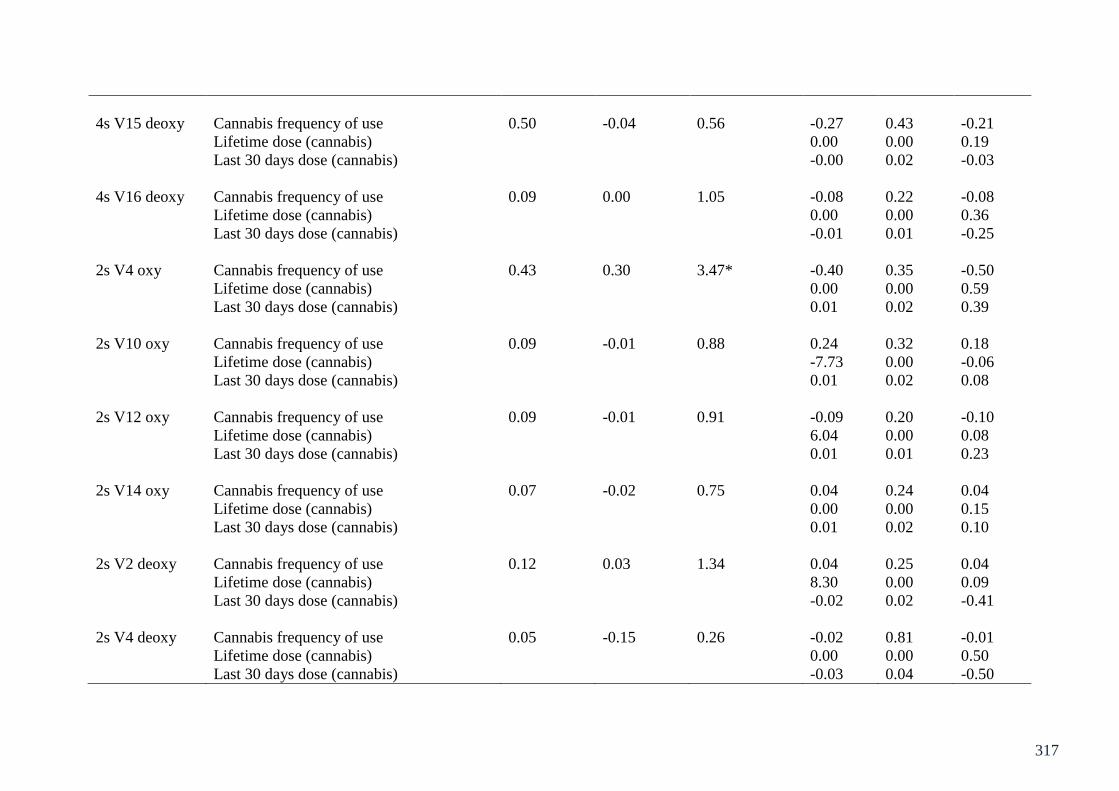
317
4s V15 deoxy Cannabis frequency of use 0.50 -0.04 0.56 -0.27 0.43 -0.21
Lifetime dose (cannabis) 0.00 0.00 0.19
Last 30 days dose (cannabis) -0.00 0.02 -0.03
4s V16 deoxy Cannabis frequency of use 0.09 0.00 1.05 -0.08 0.22 -0.08
Lifetime dose (cannabis) 0.00 0.00 0.36
Last 30 days dose (cannabis) -0.01 0.01 -0.25
2s V4 oxy Cannabis frequency of use 0.43 0.30 3.47* -0.40 0.35 -0.50
Lifetime dose (cannabis) 0.00 0.00 0.59
Last 30 days dose (cannabis) 0.01 0.02 0.39
2s V10 oxy Cannabis frequency of use 0.09 -0.01 0.88 0.24 0.32 0.18
Lifetime dose (cannabis) -7.73 0.00 -0.06
Last 30 days dose (cannabis) 0.01 0.02 0.08
2s V12 oxy Cannabis frequency of use 0.09 -0.01 0.91 -0.09 0.20 -0.10
Lifetime dose (cannabis) 6.04 0.00 0.08
Last 30 days dose (cannabis) 0.01 0.01 0.23
2s V14 oxy Cannabis frequency of use 0.07 -0.02 0.75 0.04 0.24 0.04
Lifetime dose (cannabis) 0.00 0.00 0.15
Last 30 days dose (cannabis) 0.01 0.02 0.10
2s V2 deoxy Cannabis frequency of use 0.12 0.03 1.34 0.04 0.25 0.04
Lifetime dose (cannabis) 8.30 0.00 0.09
Last 30 days dose (cannabis) -0.02 0.02 -0.41
2s V4 deoxy Cannabis frequency of use 0.05 -0.15 0.26 -0.02 0.81 -0.01
Lifetime dose (cannabis) 0.00 0.00 0.50
Last 30 days dose (cannabis) -0.03 0.04 -0.50
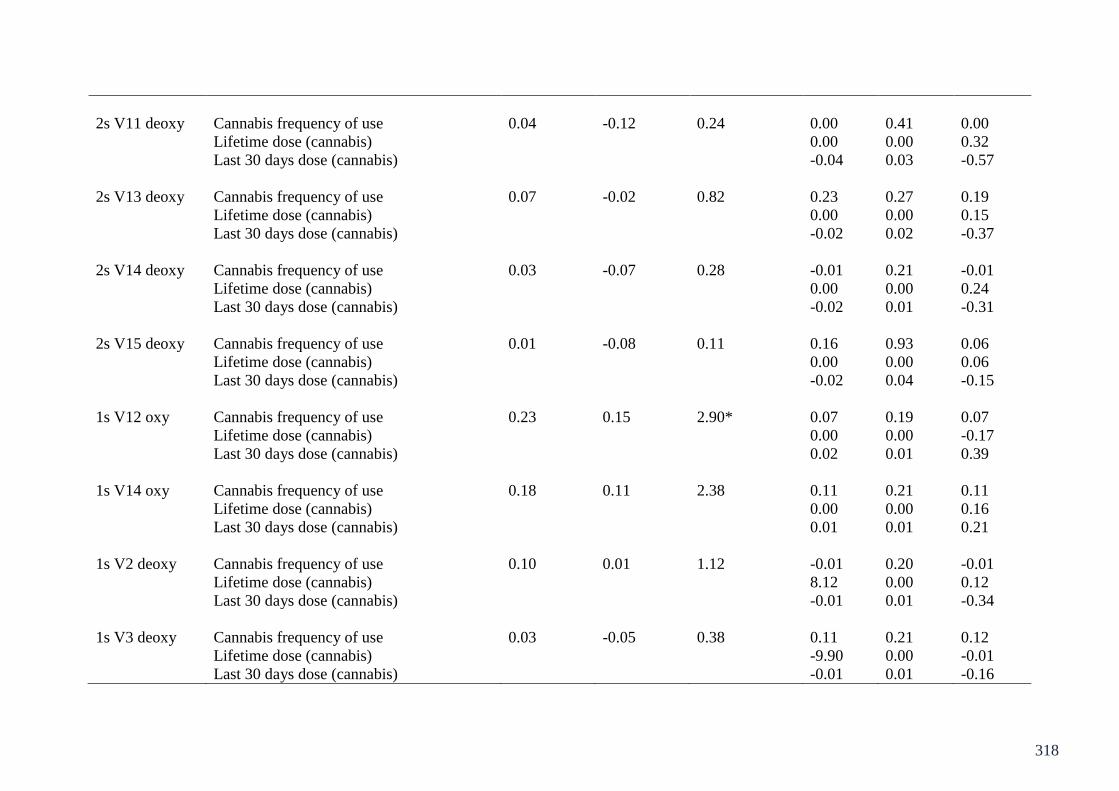
318
2s V11 deoxy Cannabis frequency of use 0.04 -0.12 0.24 0.00 0.41 0.00
Lifetime dose (cannabis) 0.00 0.00 0.32
Last 30 days dose (cannabis) -0.04 0.03 -0.57
2s V13 deoxy Cannabis frequency of use 0.07 -0.02 0.82 0.23 0.27 0.19
Lifetime dose (cannabis) 0.00 0.00 0.15
Last 30 days dose (cannabis) -0.02 0.02 -0.37
2s V14 deoxy Cannabis frequency of use 0.03 -0.07 0.28 -0.01 0.21 -0.01
Lifetime dose (cannabis) 0.00 0.00 0.24
Last 30 days dose (cannabis) -0.02 0.01 -0.31
2s V15 deoxy Cannabis frequency of use 0.01 -0.08 0.11 0.16 0.93 0.06
Lifetime dose (cannabis) 0.00 0.00 0.06
Last 30 days dose (cannabis) -0.02 0.04 -0.15
1s V12 oxy Cannabis frequency of use 0.23 0.15 2.90* 0.07 0.19 0.07
Lifetime dose (cannabis) 0.00 0.00 -0.17
Last 30 days dose (cannabis) 0.02 0.01 0.39
1s V14 oxy Cannabis frequency of use 0.18 0.11 2.38 0.11 0.21 0.11
Lifetime dose (cannabis) 0.00 0.00 0.16
Last 30 days dose (cannabis) 0.01 0.01 0.21
1s V2 deoxy Cannabis frequency of use 0.10 0.01 1.12 -0.01 0.20 -0.01
Lifetime dose (cannabis) 8.12 0.00 0.12
Last 30 days dose (cannabis) -0.01 0.01 -0.34
1s V3 deoxy Cannabis frequency of use 0.03 -0.05 0.38 0.11 0.21 0.12
Lifetime dose (cannabis) -9.90 0.00 -0.01
Last 30 days dose (cannabis) -0.01 0.01 -0.16
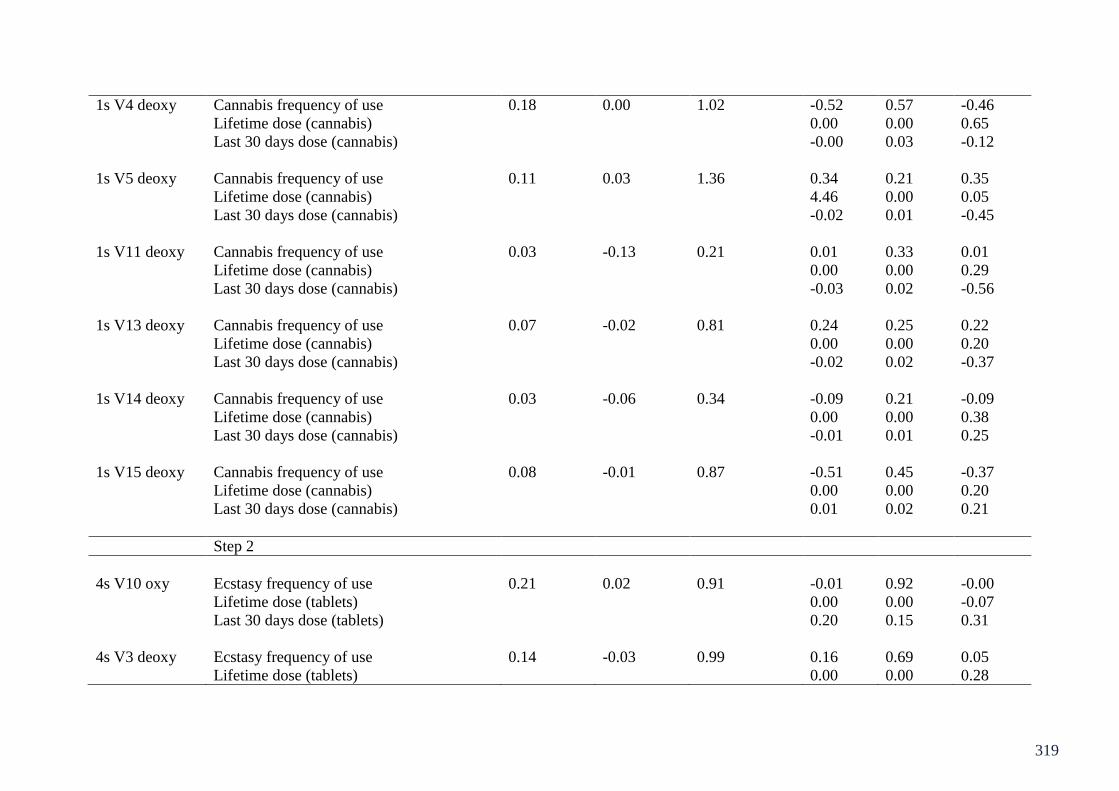
319
1s V4 deoxy Cannabis frequency of use 0.18 0.00 1.02 -0.52 0.57 -0.46
Lifetime dose (cannabis) 0.00 0.00 0.65
Last 30 days dose (cannabis) -0.00 0.03 -0.12
1s V5 deoxy Cannabis frequency of use 0.11 0.03 1.36 0.34 0.21 0.35
Lifetime dose (cannabis) 4.46 0.00 0.05
Last 30 days dose (cannabis) -0.02 0.01 -0.45
1s V11 deoxy Cannabis frequency of use 0.03 -0.13 0.21 0.01 0.33 0.01
Lifetime dose (cannabis) 0.00 0.00 0.29
Last 30 days dose (cannabis) -0.03 0.02 -0.56
1s V13 deoxy Cannabis frequency of use 0.07 -0.02 0.81 0.24 0.25 0.22
Lifetime dose (cannabis) 0.00 0.00 0.20
Last 30 days dose (cannabis) -0.02 0.02 -0.37
1s V14 deoxy Cannabis frequency of use 0.03 -0.06 0.34 -0.09 0.21 -0.09
Lifetime dose (cannabis) 0.00 0.00 0.38
Last 30 days dose (cannabis) -0.01 0.01 0.25
1s V15 deoxy Cannabis frequency of use 0.08 -0.01 0.87 -0.51 0.45 -0.37
Lifetime dose (cannabis) 0.00 0.00 0.20
Last 30 days dose (cannabis) 0.01 0.02 0.21
Step 2
4s V10 oxy Ecstasy frequency of use 0.21 0.02 0.91 -0.01 0.92 -0.00
Lifetime dose (tablets) 0.00 0.00 -0.07
Last 30 days dose (tablets) 0.20 0.15 0.31
4s V3 deoxy Ecstasy frequency of use 0.14 -0.03 0.99 0.16 0.69 0.05
Lifetime dose (tablets) 0.00 0.00 0.28

320
Last 30 days dose (tablets) 0.08 0.11 0.16
4s V4 deoxy Ecstasy frequency of use 0.34 -0.03 1.47 -0.34 1.15 -0.10
Lifetime dose (tablets) 0.00 0.00 0.38
Last 30 days dose (tablets) 0.31 0.23 0.50
4s V5 deoxy Ecstasy frequency of use 0.19 0.04 1.13 0.12 0.67 0.04
Lifetime dose (tablets) 0.00 0.00 0.25
Last 30 days dose (tablets) 0.10 0.12 0.20
4s V13 deoxy Ecstasy frequency of use 0.16 -0.00 0.82 -0.03 0.73 -0.01
Lifetime dose (tablets) 0.00 0.00 0.13
Last 30 days dose (tablets) 0.13 0.12 0.25
4s V14 deoxy Ecstasy frequency of use 0.44 0.32 6.66** -1.63 0.69 -0.42*
Lifetime dose (tablets) 9.37 0.00 0.04
Last 30 days dose (tablets) 0.49 0.11 0.82**
4s V15 deoxy Ecstasy frequency of use 0.09 -0.10 0.38 0.02 0.91 0.00
Lifetime dose (tablets) 0.00 0.00 0.10
Last 30 days dose (tablets) 0.11 0.15 0.18
4s V16 deoxy Ecstasy frequency of use 0.16 -0.01 0.07 -0.45 0.78 -0.12
Lifetime dose (tablets) 0.00 0.00 0.06
Last 30 days dose (tablets) 0.19 0.13 0.34
2s V4 oxy Ecstasy frequency of use 0.53 0.28 0.84 -0.87 0.72 -0.36
Lifetime dose (tablets) 0.00 0.00 0.12
Last 30 days dose (tablets) 0.22 0.14 0.47
2s V10 oxy Ecstasy frequency of use 0.12 -0.09 0.36 0.64 1.17 0.13
Lifetime dose (tablets) 0.00 0.00 -0.13

321
Last 30 days dose (tablets) 0.06 0.19 0.08
2s V12 oxy Ecstasy frequency of use 0.19 0.00 1.12 -0.39 0.74 -0.12
Lifetime dose (tablets) 1.47 0.00 -0.01
Last 30 days dose (tablets) 0.21 0.12 0.40
2s V14 oxy Ecstasy frequency of use 0.14 -0.04 0.84 -0.41 0.88 -0.10
Lifetime dose (tablets) 0.00 0.00 -0.16
Last 30 days dose (tablets) 0.20 0.14 0.32
2s V2 deoxy Ecstasy frequency of use 0.18 -0.00 0.70 -0.06 0.91 -0.01
Lifetime dose (tablets) 0.00 0.00 0.24
Last 30 days dose (tablets) 0.12 0.15 0.19
2s V4 deoxy Ecstasy frequency of use 0.24 -0.18 0.87 0.06 1.66 0.01
Lifetime dose (tablets) 0.00 0.00 0.30
Last 30 days dose (tablets) 0.29 0.33 0.36
2s V11 deoxy Ecstasy frequency of use 0.27 -0.03 1.55 3.12 2.63 0.36
Lifetime dose (tablets) 0.00 0.00 0.31
Last 30 days dose (tablets) 0.05 0.25 0.06
2s V13 deoxy Ecstasy frequency of use 0.10 -0.07 0.37 -0.04 0.98 -0.01
Lifetime dose (tablets) 0.00 0.00 0.13
Last 30 days dose (tablets) 0.11 0.16 0.16
2s V14 deoxy Ecstasy frequency of use 0.25 0.10 2.92 -1.31 0.76 -0.35
Lifetime dose (tablets) 9.77 0.00 0.04
Last 30 days dose (tablets) 0.36 0.12 0.62**
2s V15 deoxy Ecstasy frequency of use 0.02 -0.18 0.12 0.11 1.95 0.01
Lifetime dose (tablets) 0.00 0.00 0.08
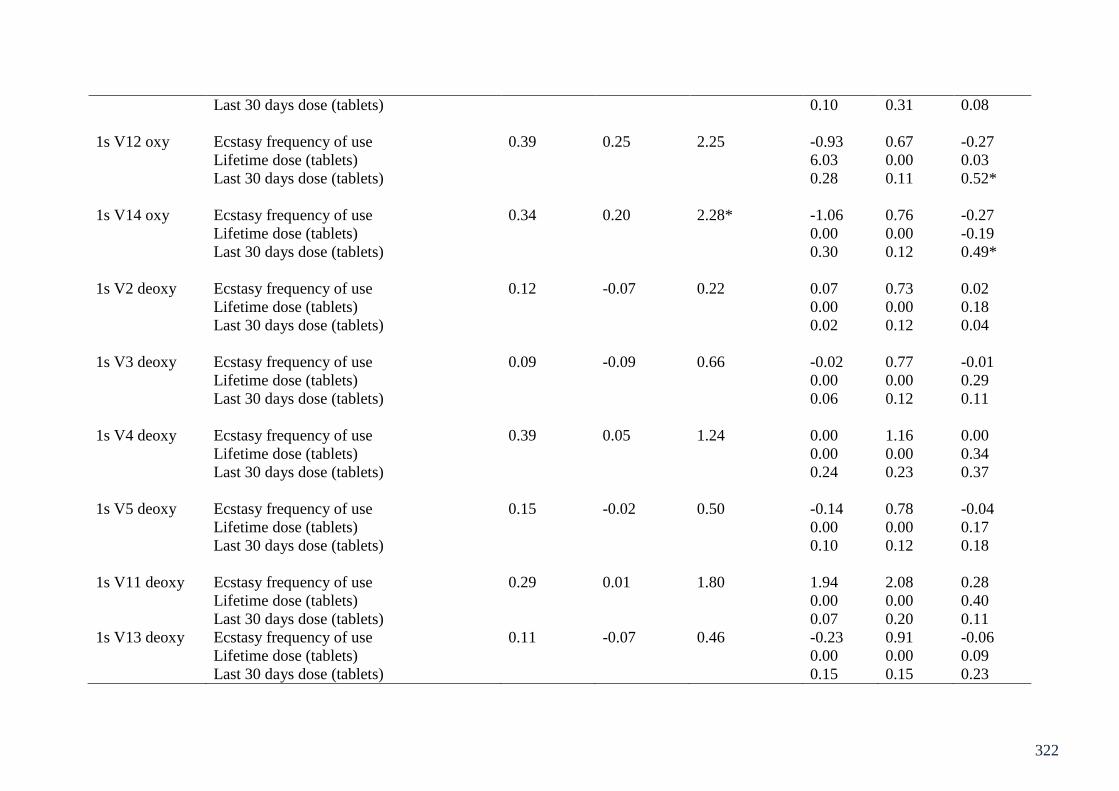
322
Last 30 days dose (tablets) 0.10 0.31 0.08
1s V12 oxy Ecstasy frequency of use 0.39 0.25 2.25 -0.93 0.67 -0.27
Lifetime dose (tablets) 6.03 0.00 0.03
Last 30 days dose (tablets) 0.28 0.11 0.52*
1s V14 oxy Ecstasy frequency of use 0.34 0.20 2.28* -1.06 0.76 -0.27
Lifetime dose (tablets) 0.00 0.00 -0.19
Last 30 days dose (tablets) 0.30 0.12 0.49*
1s V2 deoxy Ecstasy frequency of use 0.12 -0.07 0.22 0.07 0.73 0.02
Lifetime dose (tablets) 0.00 0.00 0.18
Last 30 days dose (tablets) 0.02 0.12 0.04
1s V3 deoxy Ecstasy frequency of use 0.09 -0.09 0.66 -0.02 0.77 -0.01
Lifetime dose (tablets) 0.00 0.00 0.29
Last 30 days dose (tablets) 0.06 0.12 0.11
1s V4 deoxy Ecstasy frequency of use 0.39 0.05 1.24 0.00 1.16 0.00
Lifetime dose (tablets) 0.00 0.00 0.34
Last 30 days dose (tablets) 0.24 0.23 0.37
1s V5 deoxy Ecstasy frequency of use 0.15 -0.02 0.50 -0.14 0.78 -0.04
Lifetime dose (tablets) 0.00 0.00 0.17
Last 30 days dose (tablets) 0.10 0.12 0.18
1s V11 deoxy Ecstasy frequency of use 0.29 0.01 1.80 1.94 2.08 0.28
Lifetime dose (tablets) 0.00 0.00 0.40
Last 30 days dose (tablets) 0.07 0.20 0.11
1s V13 deoxy Ecstasy frequency of use 0.11 -0.07 0.46 -0.23 0.91 -0.06
Lifetime dose (tablets) 0.00 0.00 0.09
Last 30 days dose (tablets) 0.15 0.15 0.23

323
1s V14 deoxy Ecstasy frequency of use 0.31 0.16 3.85 -1.44 0.77 -0.37
Lifetime dose (tablets) 0.00 0.00 -0.09
Last 30 days dose (tablets) 0.42 0.12 0.69**
1s V15 deoxy Ecstasy frequency of use 0.11 -0.07 0.40 0.11 0.95 0.03
Lifetime dose (tablets) 0.00 0.00 0.07
Last 30 days dose (tablets) 0.11 0.15 0.17
*Indicates significance at the .05 level, and ** at the .01 level.
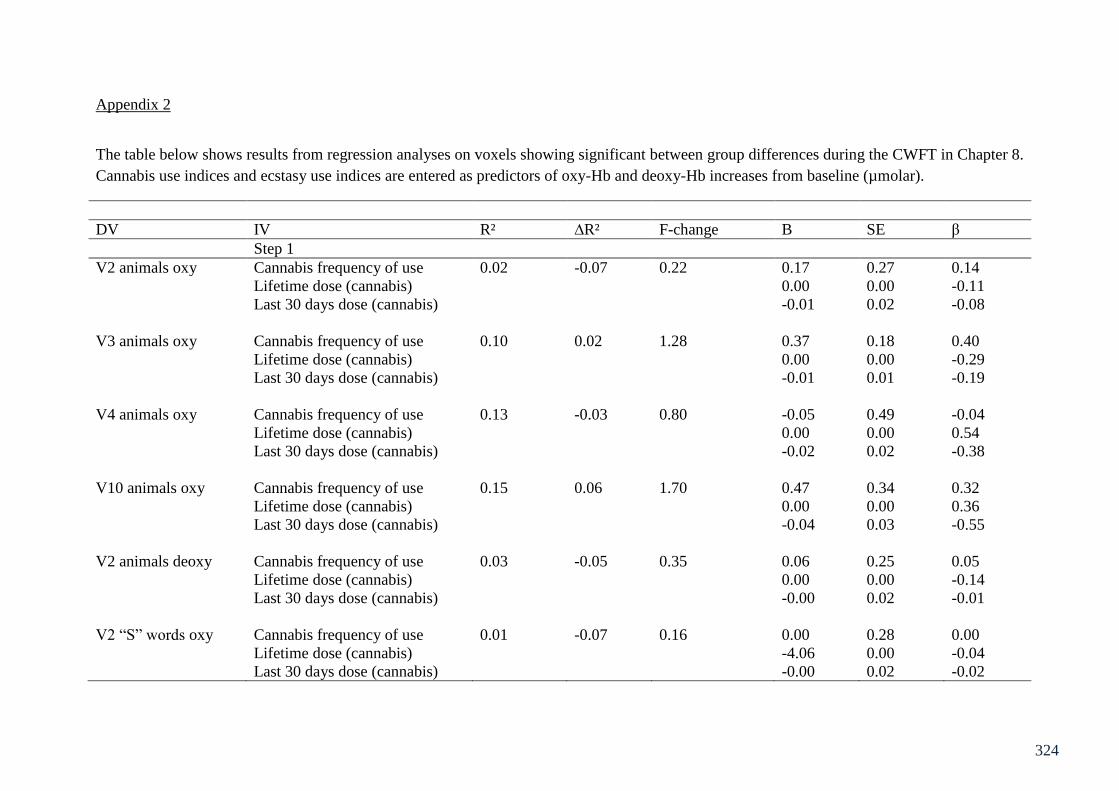
324
Appendix 2
The table below shows results from regression analyses on voxels showing significant between group differences during the CWFT in Chapter 8.
Cannabis use indices and ecstasy use indices are entered as predictors of oxy-Hb and deoxy-Hb increases from baseline (µmolar).
DV IV R² ∆R² F-change B SE β
Step 1
V2 animals oxy Cannabis frequency of use 0.02 -0.07 0.22 0.17 0.27 0.14
Lifetime dose (cannabis) 0.00 0.00 -0.11
Last 30 days dose (cannabis) -0.01 0.02 -0.08
V3 animals oxy Cannabis frequency of use 0.10 0.02 1.28 0.37 0.18 0.40
Lifetime dose (cannabis) 0.00 0.00 -0.29
Last 30 days dose (cannabis) -0.01 0.01 -0.19
V4 animals oxy Cannabis frequency of use 0.13 -0.03 0.80 -0.05 0.49 -0.04
Lifetime dose (cannabis) 0.00 0.00 0.54
Last 30 days dose (cannabis) -0.02 0.02 -0.38
V10 animals oxy Cannabis frequency of use 0.15 0.06 1.70 0.47 0.34 0.32
Lifetime dose (cannabis) 0.00 0.00 0.36
Last 30 days dose (cannabis) -0.04 0.03 -0.55
V2 animals deoxy Cannabis frequency of use 0.03 -0.05 0.35 0.06 0.25 0.05
Lifetime dose (cannabis) 0.00 0.00 -0.14
Last 30 days dose (cannabis) -0.00 0.02 -0.01
V2 “S” words oxy Cannabis frequency of use 0.01 -0.07 0.16 0.00 0.28 0.00
Lifetime dose (cannabis) -4.06 0.00 -0.04
Last 30 days dose (cannabis) -0.00 0.02 -0.02
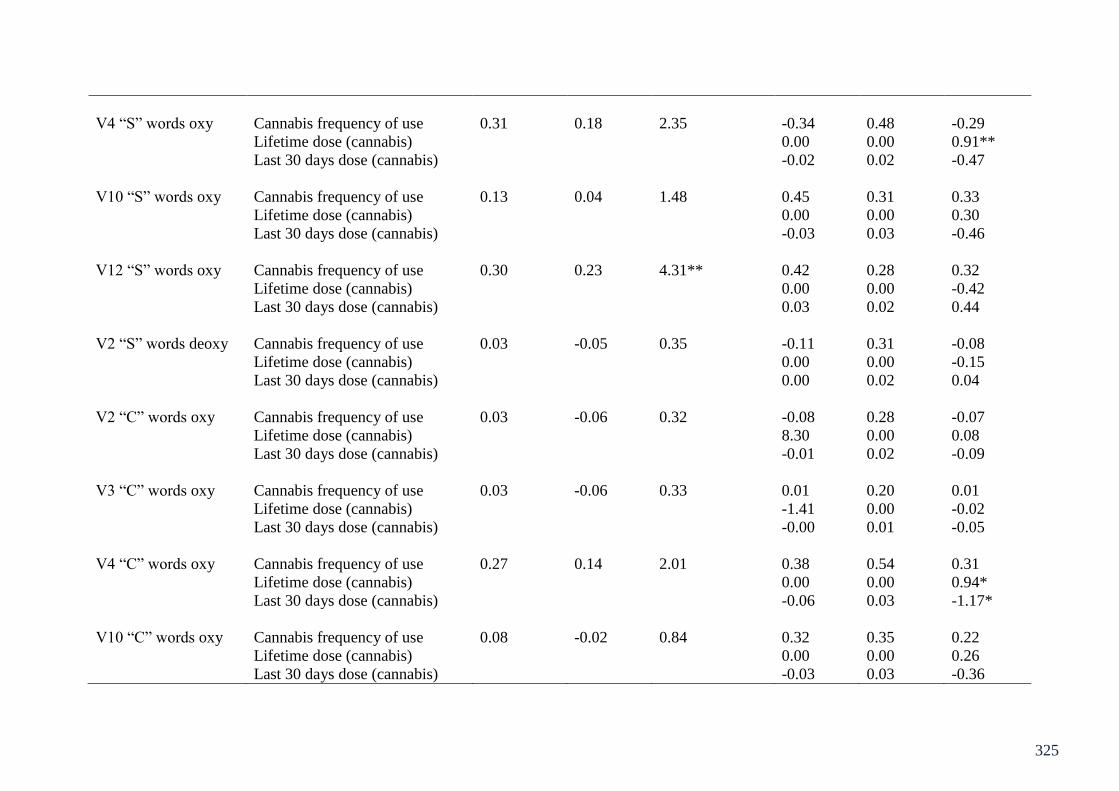
325
V4 “S” words oxy Cannabis frequency of use 0.31 0.18 2.35 -0.34 0.48 -0.29
Lifetime dose (cannabis) 0.00 0.00 0.91**
Last 30 days dose (cannabis) -0.02 0.02 -0.47
V10 “S” words oxy Cannabis frequency of use 0.13 0.04 1.48 0.45 0.31 0.33
Lifetime dose (cannabis) 0.00 0.00 0.30
Last 30 days dose (cannabis) -0.03 0.03 -0.46
V12 “S” words oxy Cannabis frequency of use 0.30 0.23 4.31** 0.42 0.28 0.32
Lifetime dose (cannabis) 0.00 0.00 -0.42
Last 30 days dose (cannabis) 0.03 0.02 0.44
V2 “S” words deoxy Cannabis frequency of use 0.03 -0.05 0.35 -0.11 0.31 -0.08
Lifetime dose (cannabis) 0.00 0.00 -0.15
Last 30 days dose (cannabis) 0.00 0.02 0.04
V2 “C” words oxy Cannabis frequency of use 0.03 -0.06 0.32 -0.08 0.28 -0.07
Lifetime dose (cannabis) 8.30 0.00 0.08
Last 30 days dose (cannabis) -0.01 0.02 -0.09
V3 “C” words oxy Cannabis frequency of use 0.03 -0.06 0.33 0.01 0.20 0.01
Lifetime dose (cannabis) -1.41 0.00 -0.02
Last 30 days dose (cannabis) -0.00 0.01 -0.05
V4 “C” words oxy Cannabis frequency of use 0.27 0.14 2.01 0.38 0.54 0.31
Lifetime dose (cannabis) 0.00 0.00 0.94*
Last 30 days dose (cannabis) -0.06 0.03 -1.17*
V10 “C” words oxy Cannabis frequency of use 0.08 -0.02 0.84 0.32 0.35 0.22
Lifetime dose (cannabis) 0.00 0.00 0.26
Last 30 days dose (cannabis) -0.03 0.03 -0.36
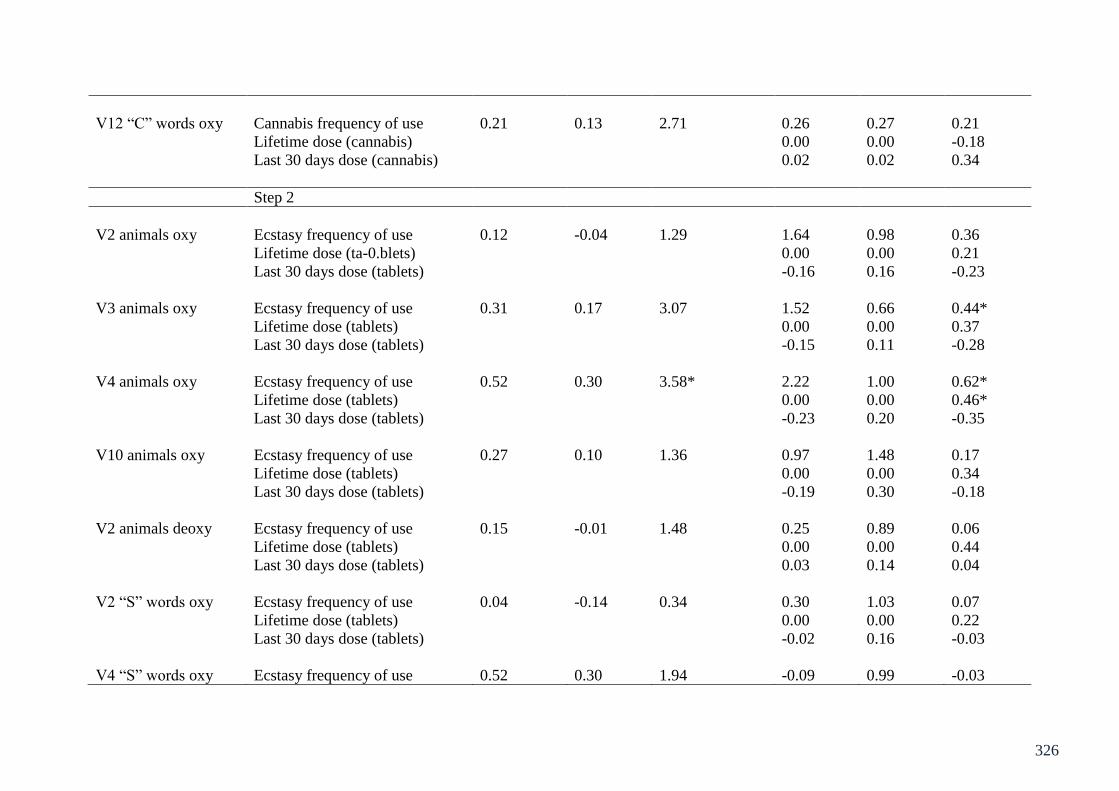
326
V12 “C” words oxy Cannabis frequency of use 0.21 0.13 2.71 0.26 0.27 0.21
Lifetime dose (cannabis) 0.00 0.00 -0.18
Last 30 days dose (cannabis) 0.02 0.02 0.34
Step 2
V2 animals oxy Ecstasy frequency of use 0.12 -0.04 1.29 1.64 0.98 0.36
Lifetime dose (ta-0.blets) 0.00 0.00 0.21
Last 30 days dose (tablets) -0.16 0.16 -0.23
V3 animals oxy Ecstasy frequency of use 0.31 0.17 3.07 1.52 0.66 0.44*
Lifetime dose (tablets) 0.00 0.00 0.37
Last 30 days dose (tablets) -0.15 0.11 -0.28
V4 animals oxy Ecstasy frequency of use 0.52 0.30 3.58* 2.22 1.00 0.62*
Lifetime dose (tablets) 0.00 0.00 0.46*
Last 30 days dose (tablets) -0.23 0.20 -0.35
V10 animals oxy Ecstasy frequency of use 0.27 0.10 1.36 0.97 1.48 0.17
Lifetime dose (tablets) 0.00 0.00 0.34
Last 30 days dose (tablets) -0.19 0.30 -0.18
V2 animals deoxy Ecstasy frequency of use 0.15 -0.01 1.48 0.25 0.89 0.06
Lifetime dose (tablets) 0.00 0.00 0.44
Last 30 days dose (tablets) 0.03 0.14 0.04
V2 “S” words oxy Ecstasy frequency of use 0.04 -0.14 0.34 0.30 1.03 0.07
Lifetime dose (tablets) 0.00 0.00 0.22
Last 30 days dose (tablets) -0.02 0.16 -0.03
V4 “S” words oxy Ecstasy frequency of use 0.52 0.30 1.94 -0.09 0.99 -0.03
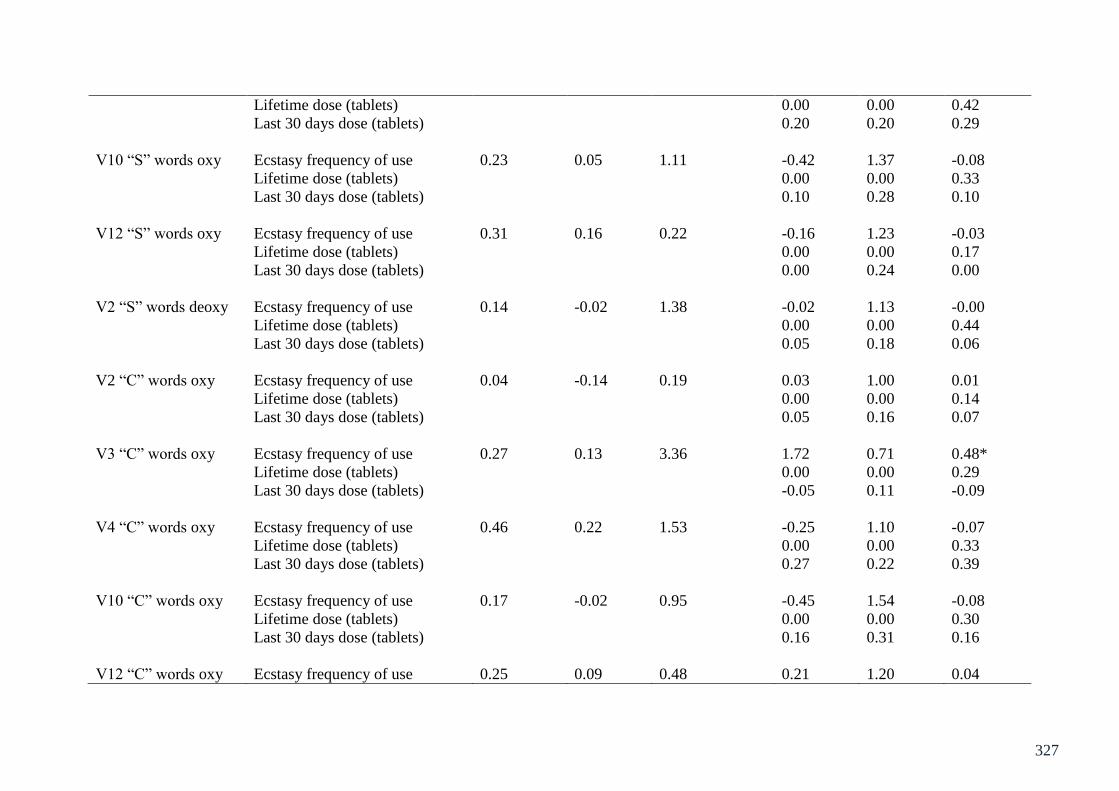
327
Lifetime dose (tablets) 0.00 0.00 0.42
Last 30 days dose (tablets) 0.20 0.20 0.29
V10 “S” words oxy Ecstasy frequency of use 0.23 0.05 1.11 -0.42 1.37 -0.08
Lifetime dose (tablets) 0.00 0.00 0.33
Last 30 days dose (tablets) 0.10 0.28 0.10
V12 “S” words oxy Ecstasy frequency of use 0.31 0.16 0.22 -0.16 1.23 -0.03
Lifetime dose (tablets) 0.00 0.00 0.17
Last 30 days dose (tablets) 0.00 0.24 0.00
V2 “S” words deoxy Ecstasy frequency of use 0.14 -0.02 1.38 -0.02 1.13 -0.00
Lifetime dose (tablets) 0.00 0.00 0.44
Last 30 days dose (tablets) 0.05 0.18 0.06
V2 “C” words oxy Ecstasy frequency of use 0.04 -0.14 0.19 0.03 1.00 0.01
Lifetime dose (tablets) 0.00 0.00 0.14
Last 30 days dose (tablets) 0.05 0.16 0.07
V3 “C” words oxy Ecstasy frequency of use 0.27 0.13 3.36 1.72 0.71 0.48*
Lifetime dose (tablets) 0.00 0.00 0.29
Last 30 days dose (tablets) -0.05 0.11 -0.09
V4 “C” words oxy Ecstasy frequency of use 0.46 0.22 1.53 -0.25 1.10 -0.07
Lifetime dose (tablets) 0.00 0.00 0.33
Last 30 days dose (tablets) 0.27 0.22 0.39
V10 “C” words oxy Ecstasy frequency of use 0.17 -0.02 0.95 -0.45 1.54 -0.08
Lifetime dose (tablets) 0.00 0.00 0.30
Last 30 days dose (tablets) 0.16 0.31 0.16
V12 “C” words oxy Ecstasy frequency of use 0.25 0.09 0.48 0.21 1.20 0.04

328
Lifetime dose (tablets) 0.00 0.00 0.21
Last 30 days dose (tablets) 0.06 0.23 0.07
*Indicates significance at the .05 level, and ** at the .01 level.

329

330
331

332
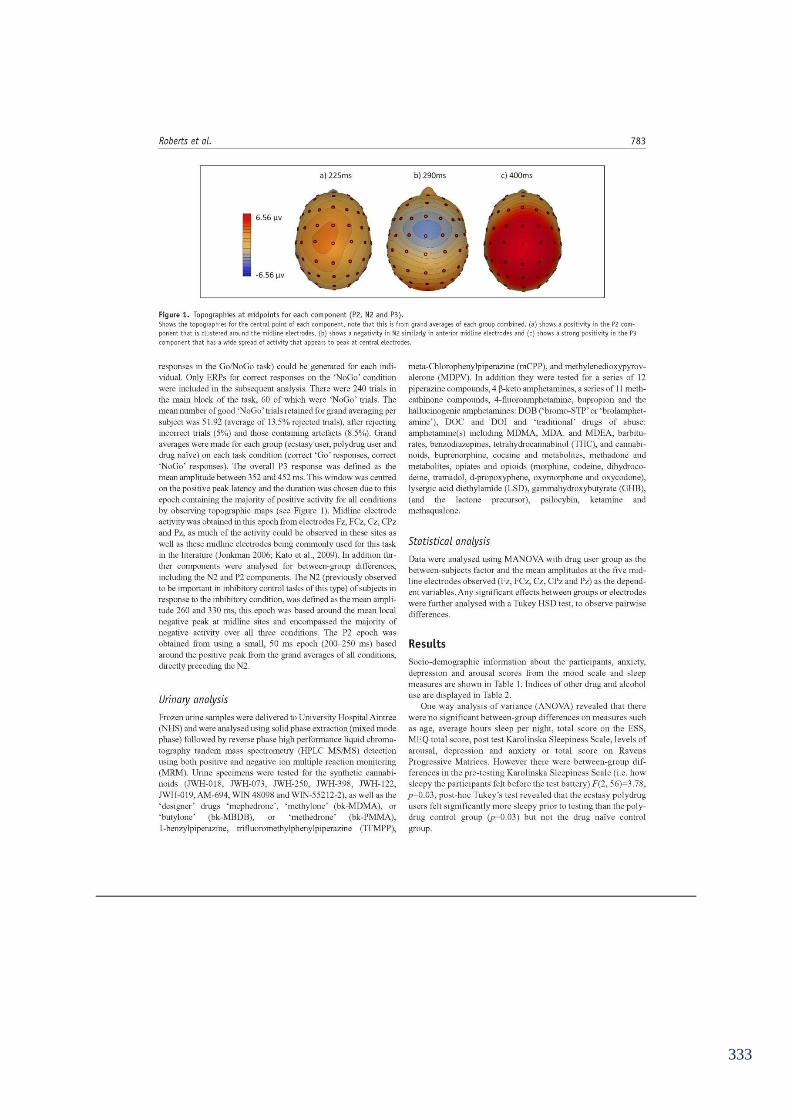
333

334
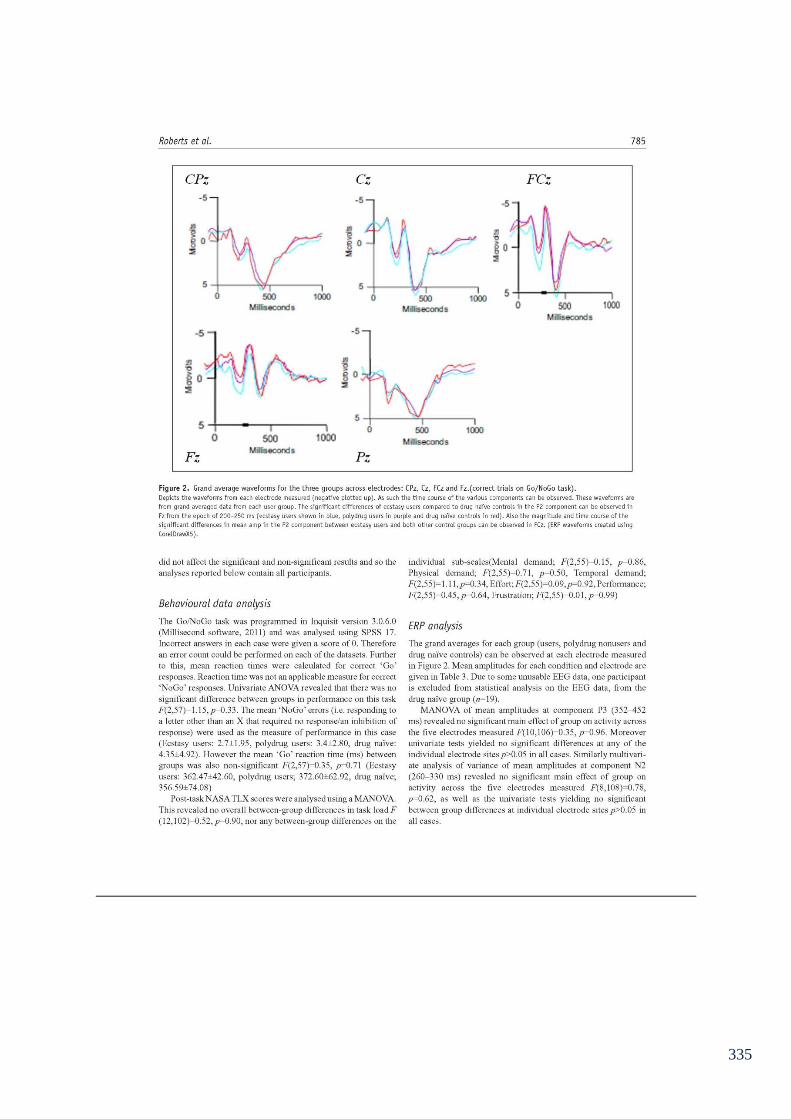
335
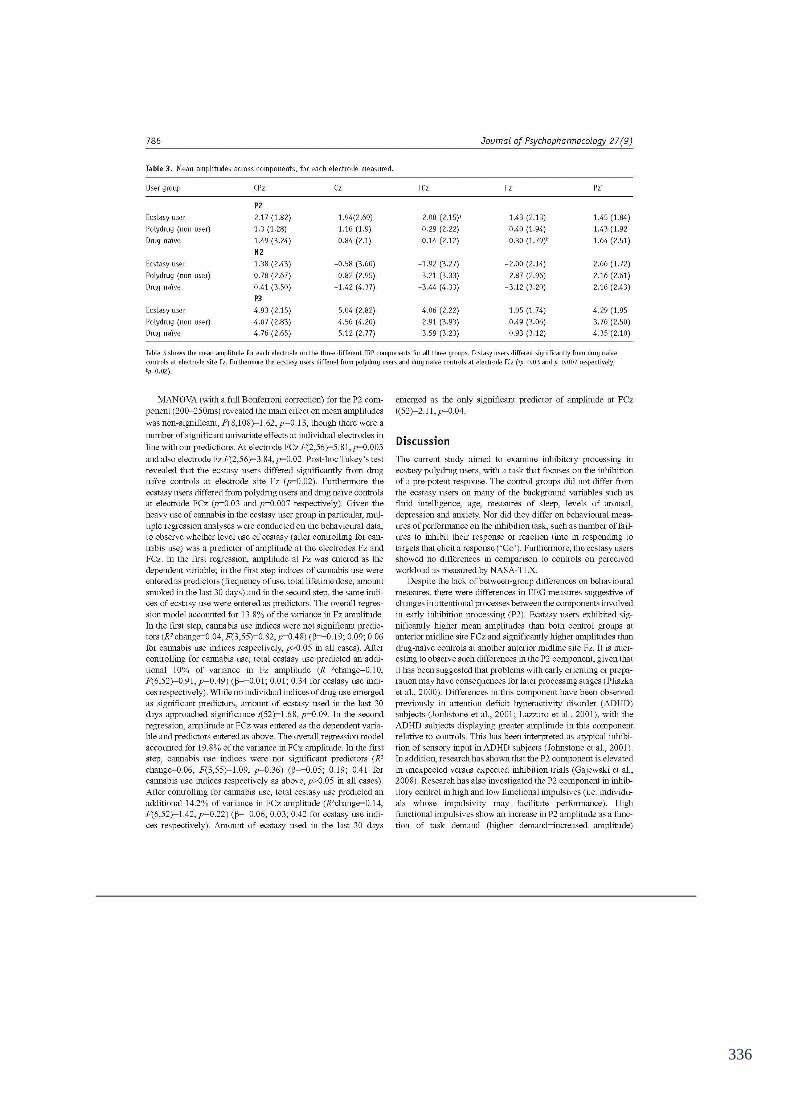
336
337
338

339
340
341
342
343
344
345

346

347
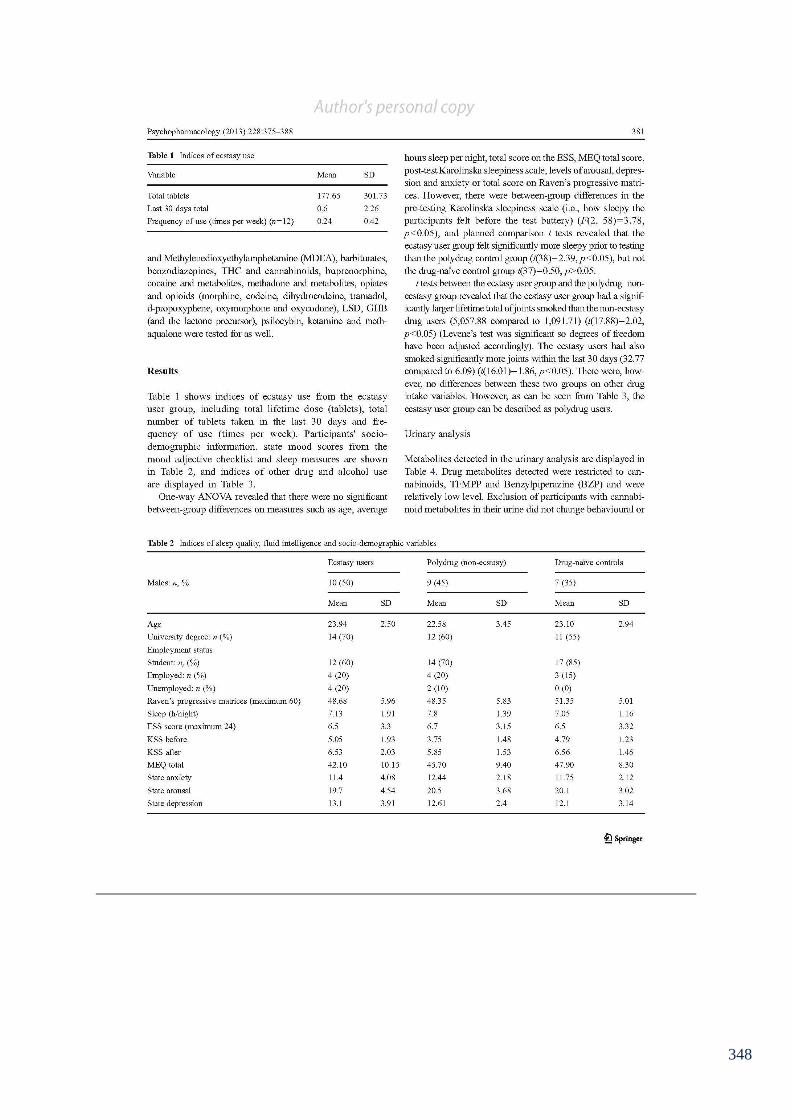
348

349
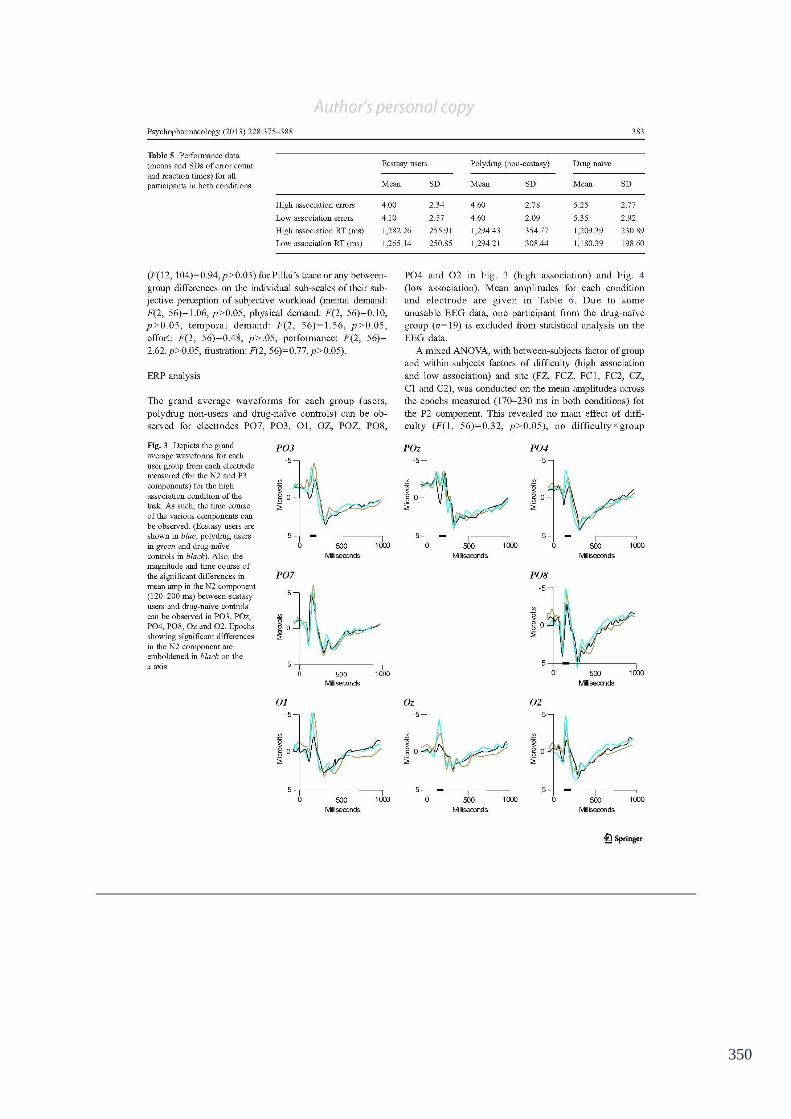
350

351

352
353
354
355

356
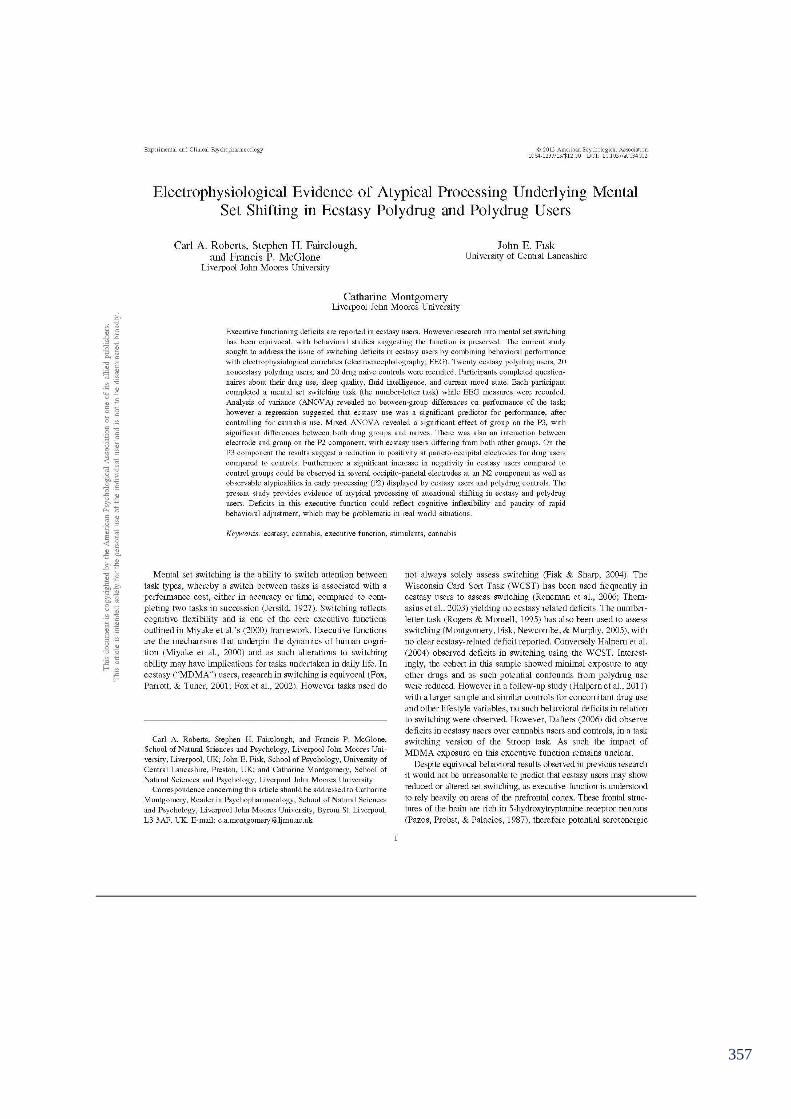
357
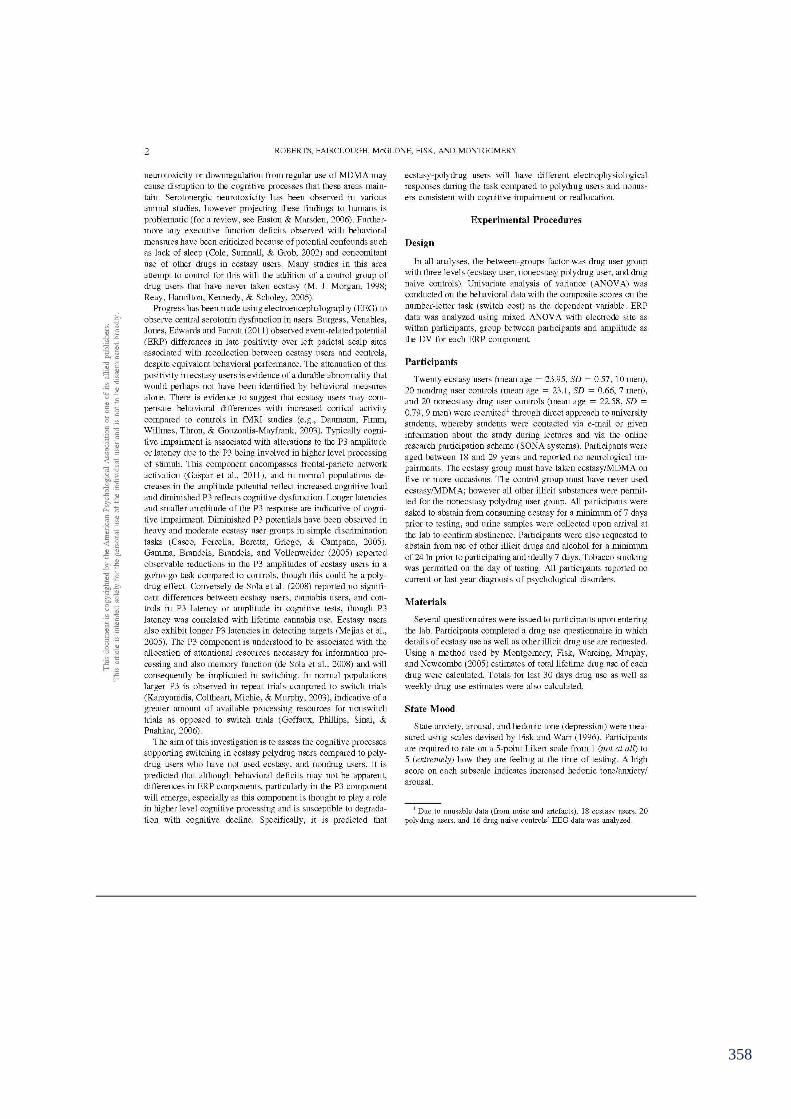
358
359

360

361

362

363

364
365
Copyright © 2022 FDOKUMEN