Hyperacusis-associated pathological resting-state brain oscillations in the tinnitus brain: a...
16
ORIGINAL ARTICLE Hyperacusis-associated pathological resting-state brain oscillations in the tinnitus brain: a hyperresponsiveness network with paradoxically inactive auditory cortex Jae-Jin Song • Dirk De Ridder • Nathan Weisz • Winfried Schlee • Paul Van de Heyning • Sven Vanneste Received: 19 January 2013 / Accepted: 11 April 2013 / Published online: 23 April 2013 Ó Springer-Verlag Berlin Heidelberg 2013 Abstract Although hyperacusis, a hyperresponsiveness to non-noxious auditory stimuli, is a sound-evoked symp- tom, possible resting-state pathologic oscillations in hyperacusis brain have never been explored. By comparing 17 tinnitus participants with hyperacusis (T?H?) and 17 without hyperacusis (T?H-), we aimed to explore char- acteristic resting-state cortical activity of hyperacusis. The T?H? and T?H- groups, strictly matched for all tinnitus sound characteristics to exclude tinnitus-related cortical changes, were compared using resting-state electroen- cephalography source-localized activity complemented by functional connectivity analyses. Correlation analysis revealed that hyperacusis questionnaire score was posi- tively correlated with the orbitofrontal cortex (OFC) beta power, the right auditory cortex (AC) alpha1 power, and the dorsal anterior cingulate cortex (dACC) beta1 power. Compared to the T?H- group, the T?H? group demon- strated increased beta power in the dACC and OFC, and increased alpha power in the right AC. Region of interest analyses including 17 normal controls further confirmed that these differences originated solely from relatively increased power of the T?H? group, not from a relative power decrease of the T?H- group. Also, the T?H? group showed increased connectivity between the OFC/ dACC and the AC as compared to the T?H- group. The beta power increase in the OFC/dACC may indicate increased resting-state vigilance in tinnitus patients with hyperacusis. In addition, increased alpha power in the AC may reflect an adaptive top-down inhibition against sound stimuli probably mediated by the increased beta power of the OFC. The OFC/dACC, also frequently found to be activated in analogous diseases such as allodynia/hyperal- gesia, may compose a hyperresponsiveness network. Keywords Hyperacusis Á Hyperalgesia Á Electroencephalography Á Neural networks Abbreviations HQ Hyperacusis questionnaire qEEG Quantitative electroencephalography J.-J. Song (&) Department of Otorhinolaryngology-Head and Neck Surgery, Seoul National University Hospital, Yun-Kun Dong 28, Chong-No Gu, Seoul 110-744, Korea e-mail: [email protected] D. De Ridder Department of Surgical Sciences, Dunedin School of Medicine, University of Otago, Dunedin, New Zealand D. De Ridder Á P. Van de Heyning Á S. Vanneste Department of Translational Neuroscience, Faculty of Medicine, University of Antwerp, Antwerp, Belgium N. Weisz Center for Mind/Brain Sciences, University of Trento, Trento, Italy W. Schlee Department of Clinical and Biological Psychology, University of Ulm, Ulm, Germany P. Van de Heyning Brai 2 n, TRI & ENT, University Hospital Antwerp, Antwerp, Belgium S. Vanneste School of Behavioral and Brain Sciences, The University of Texas at Dallas, Richardson, USA 123 Brain Struct Funct (2014) 219:1113–1128 DOI 10.1007/s00429-013-0555-1
-
Upload
independent -
Category
Documents
-
view
1 -
download
0
Transcript of Hyperacusis-associated pathological resting-state brain oscillations in the tinnitus brain: a...

ORIGINAL ARTICLE
Hyperacusis-associated pathological resting-state brainoscillations in the tinnitus brain: a hyperresponsivenessnetwork with paradoxically inactive auditory cortex
Jae-Jin Song • Dirk De Ridder • Nathan Weisz •
Winfried Schlee • Paul Van de Heyning •
Sven Vanneste
Received: 19 January 2013 / Accepted: 11 April 2013 / Published online: 23 April 2013
� Springer-Verlag Berlin Heidelberg 2013
Abstract Although hyperacusis, a hyperresponsiveness
to non-noxious auditory stimuli, is a sound-evoked symp-
tom, possible resting-state pathologic oscillations in
hyperacusis brain have never been explored. By comparing
17 tinnitus participants with hyperacusis (T?H?) and 17
without hyperacusis (T?H-), we aimed to explore char-
acteristic resting-state cortical activity of hyperacusis. The
T?H? and T?H- groups, strictly matched for all tinnitus
sound characteristics to exclude tinnitus-related cortical
changes, were compared using resting-state electroen-
cephalography source-localized activity complemented by
functional connectivity analyses. Correlation analysis
revealed that hyperacusis questionnaire score was posi-
tively correlated with the orbitofrontal cortex (OFC) beta
power, the right auditory cortex (AC) alpha1 power, and
the dorsal anterior cingulate cortex (dACC) beta1 power.
Compared to the T?H- group, the T?H? group demon-
strated increased beta power in the dACC and OFC, and
increased alpha power in the right AC. Region of interest
analyses including 17 normal controls further confirmed
that these differences originated solely from relatively
increased power of the T?H? group, not from a relative
power decrease of the T?H- group. Also, the T?H?
group showed increased connectivity between the OFC/
dACC and the AC as compared to the T?H- group. The
beta power increase in the OFC/dACC may indicate
increased resting-state vigilance in tinnitus patients with
hyperacusis. In addition, increased alpha power in the AC
may reflect an adaptive top-down inhibition against sound
stimuli probably mediated by the increased beta power of
the OFC. The OFC/dACC, also frequently found to be
activated in analogous diseases such as allodynia/hyperal-
gesia, may compose a hyperresponsiveness network.
Keywords Hyperacusis � Hyperalgesia �Electroencephalography � Neural networks
Abbreviations
HQ Hyperacusis questionnaire
qEEG Quantitative electroencephalography
J.-J. Song (&)
Department of Otorhinolaryngology-Head and Neck Surgery,
Seoul National University Hospital, Yun-Kun Dong 28,
Chong-No Gu, Seoul 110-744, Korea
e-mail: [email protected]
D. De Ridder
Department of Surgical Sciences, Dunedin School of Medicine,
University of Otago, Dunedin, New Zealand
D. De Ridder � P. Van de Heyning � S. Vanneste
Department of Translational Neuroscience, Faculty of Medicine,
University of Antwerp, Antwerp, Belgium
N. Weisz
Center for Mind/Brain Sciences, University of Trento,
Trento, Italy
W. Schlee
Department of Clinical and Biological Psychology,
University of Ulm, Ulm, Germany
P. Van de Heyning
Brai2n, TRI & ENT, University Hospital Antwerp,
Antwerp, Belgium
S. Vanneste
School of Behavioral and Brain Sciences,
The University of Texas at Dallas, Richardson, USA
123
Brain Struct Funct (2014) 219:1113–1128
DOI 10.1007/s00429-013-0555-1
TQ Tinnitus questionnaire
NRS Numeric rating scale
sLORETA Standardized low-resolution brain
electromagnetic tomography
MNI Montreal Neurological Institute
ROI Region of interest
AC Auditory cortex
A2 Secondary auditory cortex
A1 Primary auditory cortex
dACC Dorsal anterior cingulate cortex
OFC Orbitofrontal cortex
SnPM Statistical non-parametric mapping
SMA Supplementary motor area
dPMC Dorsal premotor cortex
Introduction
Hyperacusis has been defined as ‘‘an unusual intolerance to
ordinary environmental sounds’’ (Vernon 1987) or as
‘‘physical discomfort resulting from an exposure to mod-
erate or even weak sound that would not evoke a similar
reaction in an average person’’ (Hiller and Goebel 2006).
Although there are minute differences in description, these
definitions are generally based on the idea that hyperacusic
patients cannot tolerate sounds or sound levels acceptable
for the general population.
The reported prevalence of hyperacusis ranges from 8 to
15.2 % (Andersson et al. 2002; Baguley 2003), but may
have been underestimated because it is frequently over-
looked when it occurs in combination with other medical
conditions (Marriage and Barnes 1995). Indeed, hyperacu-
sis is often reported as a symptom in various neurological
diseases, including Williams syndrome, migraine, menin-
gitis, traumatic head injury, Ramsey-Hunt syndrome, Lyme
disease, and tinnitus (Gothelf et al. 2006; Woodhouse and
Drummond 1993; Dauman and Bouscau-Faure 2005;
Moller 2007b). Of these, tinnitus is one of the most common
diseases that accompany hyperacusis. The reported preva-
lence for sound intolerance in tinnitus patients ranges
widely, probably due to various definitions and question-
naires for hyperacusis, from 30 up to 79 % (Dauman and
Bouscau-Faure 2005; Meeus et al. 2010b). Moreover, 88 %
of the patients whose chief complaint was hyperacusis also
reported tinnitus (Anari et al. 1999). A recent animal study
has also asserted that high doses of salicylate, a reliable
inducer of tinnitus, can also cause a significant enhance-
ment of sound-evoked cortical response and acoustic startle
response mimicking hyperacusis (Sun et al. 2008).
Pathophysiological mechanisms of hyperacusis have
been suggested, e.g., disruptions in the amplification and
regulation processes of the cochlear outer hair cells or of
central auditory system gain for sound stimulation (Kat-
zenell and Segal 2001; Herraiz et al. 2006). Interestingly
similar mechanisms have also frequently been associated
with central neuropathic patients suffering painful sensa-
tions from innocuous somatosensory stimulation (allo-
dynia) or abnormally increased sensation of pain or
discomfort produced by minimally noxious stimuli
(hyperpathia/hyperalgesia). The similarities of the symp-
tom (i.e., exaggerated reaction to sensory stimuli) as well
as pathogenesis level between hyperacusis and neuropathic
pain have already been noted by previous authors (Mol-
ler2006, 2007a; De Ridder et al. 2011) and have been
subsumed under the term ‘‘plasticity diseases’’ (Moller
2009) expressing the conceptual assumption that harmful
neural plasticity leads to the hyperactivation in hyperacusis
and allodynia/hyperalgesia.
However, empirical evidence for this assumption has not
been reported yet and the underlying mechanism of
hyperacusis is currently unknown. Previous animal
research demonstrated enhanced responsiveness of the
auditory cortex (AC) by showing increased sound-evoked
potentials and spike firing rates as well as exaggerated
acoustic startle response, a behavioral correlate of hyper-
acusis, after salicylate injection (Norena et al. 2010; Sun
et al. 2009; Turner and Parrish 2008) or noise overexposure
(Norena et al. 2010; Sun et al. 2012). However, these
animal studies have limitations in that most studies inves-
tigated hyperacusis as a by-product while focusing at tin-
nitus, and cortical activities other than the AC were not
evaluated. Meanwhile, as an approach to reveal the neural
correlates of hyperacusis, functional imaging studies in
humans have been performed in idiopathic hyperacusis
participants (Hwang et al. 2009) and hyperacusis partici-
pants with other diseases such as Williams syndrome
(Levitin et al. 2003) or semantic dementia (Mahoney et al.
2011). Notwithstanding these efforts, the knowledge of the
neural correlates of hyperacusis is still limited due to
restricted number of study participants and possible biasing
effect of combined diseases to the results.
One of the biggest obstacles to unravel the neural cor-
relates of hyperacusis is that participants whose presenting
complaint is purely hyperacusis are extremely rare.
Therefore, participants with the above-mentioned pathol-
ogies which are frequently associated with hyperacusis
have been adopted to investigate hyperacusis-related neural
correlates (Levitin et al. 2003; Mahoney et al. 2011). To
obtain unbiased results by studying such participants, it is
essential to conduct a study in a relatively large group that
is well controlled for other factors affecting cortical
activity. Using our large database of tinnitus patients, we
found a relatively large amount of tinnitus participants with
hyperacusis defined by hyperacusis questionnaire (HQ)
(Khalfa et al. 2002) score. By strictly matching to the
1114 Brain Struct Funct (2014) 219:1113–1128
123

tinnitus with hyperacusis group (T?H? group) for all
hitherto-described affecting factors of tinnitus and its
related distress, we were able to obtain a control group of
tinnitus participants without hyperacusis (T?H- group).
By comparing these two groups, we attempted to retro-
spectively extract neural correlates only related to hyper-
acusis in tinnitus patients. In addition, we compared our
findings with previous neuroimaging studies on allodynia/
hyperalgesia to find commonalities and discrepancies and
thus to find a common network associated with sensory
hyperresponsiveness. Hereinafter, we describe the esti-
mated neural correlates of hyperacusis analyzed by source-
localized quantitative electroencephalography (qEEG).
Materials and methods
Participants
To maintain a homogenous study group, we selected a total
of 235 participants with bilateral pure tone (PT) tinnitus
from the database of the multidisciplinary Tinnitus
Research Initiative Clinic of the University Hospital of
Antwerp, Belgium. Of them, 63 participants have already
completed a validated Dutch version (Meeus et al. 2007) of
the hyperacusis questionnaire (HQ) (Khalfa et al. 2002)
that comprises 14 self-rating items with a total score range
of 0–42. From this group, participants scoring more than 28
on the HQ were allocated to the T?H? group, as the score
28 has been suggested as the cut-off value for hyperacusis
(Khalfa et al. 2002; Meeus et al. 2010b). Individuals with
combined pulsatile tinnitus component, otologic disorders
such as Meniere’s disease or otosclerosis, conductive/sen-
sorineural hearing loss exceeding the range of serviceable
hearing threshold (40 dB) (Farrior 1956) in at least one ear,
psychiatric or neurological disorder, chronic headache,
drug/alcohol abuse, current psychotropic/central nervous
system-active medications, and history of head injury (with
loss of consciousness) or seizures were not included in the
study. In this way, 17 of 235 participants with bilateral PT
tinnitus and hyperacusis (15 males and 2 females) with a
mean age of 41.0 ± 15.3 years (range 19–66) were inclu-
ded in the T?H? group.
Meanwhile, from the rest 46 bilateral PT tinnitus par-
ticipants scoring less than 28 on the HQ, 17 participants (14
males and 3 females) with a mean age of 40.8 ± 14.5
(range 21–66) were selected using one-by-one matching to
the T?H? participants with regard to all tinnitus sound
characteristics while blinded to the raw EEG data and
allocated to the T?H- group. As both the T?H? and
T?H- groups were selected from participants with bilat-
eral PT tinnitus, possible differences in cortical activity
arising from tinnitus sound characteristics (Vanneste et al.
2010b) and laterality (Vanneste et al. 2011a) could be
minimized from the initial stage of participant selection. In
addition, by selecting each T?H- patient who best mat-
ched to each T?H? patient with regard to all possible
affecting factors to the cortical activity of tinnitus brain
(Song et al. 2012a) such as sex (Vanneste et al. 2012), age
of tinnitus onset (Schlee et al. 2011; Vanneste et al. 2011b;
Song et al. 2013a) duration of tinnitus (Schlee et al. 2009),
and tinnitus questionnaire (TQ) (Hiller et al. 1994) score
(Schecklmann et al. 2013; Vanneste et al. 2010a; Golm
et al. 2013), we tried to compose near-ideal study groups
for comparison. Also, to minimize selection bias with
regards to the EEG findings, the authors were blinded to the
raw EEG data of the patients while selecting the study
groups. As a result, the T?H? and T?H- groups showed
no significant differences for sex, onset age and duration of
tinnitus, Numeric Rating Scale (NRS) intensity (answering
to a question ‘‘how loud is your tinnitus?’’ on a scale from
0 to 10), NRS distress (answering to a question ‘‘how
bothered are you by your tinnitus?’’ On a scale from 0 to
10), and mean total TQ score (Table 1). Therefore, the two
groups were maximally matched except for mean HQ score
(P \ 0.001). All participants underwent audiometry to
measure hearing threshold and tinnitus matching to eval-
uate tinnitus frequency and intensity. Psychophysical tin-
nitus loudness and frequency matching were performed
contralateral to the worse tinnitus ear as all the participants
were bilateral PT tinnitus patients (Meeus et al. 2010a). No
significant differences were found for hearing threshold
between the two groups, as measured by a conventional
hearing threshold calculation method (mean value of
Table 1 Participants’ characteristics
Tinnitus
with
hyperacusis
group
(n = 17)
Tinnitus
without
hyperacusis
group
(n = 17)
P values
Age (years) 41.0 ± 15.3 40.8 ± 14.5 0.97
Age of onset (years) 34.2 ± 16.5 32.3 ± 19.5 0.76
Male:female 15:2 14:3 –
Tinnitus duration (years) 4.3 ± 3.6 4.0 ± 5.9 0.87
Total score on tinnitus
questionnaire
56.4 ± 14.4 51.5 ± 5.9 0.21
Hearing threshold (dB HL) 17.8 ± 5.1 17.2 ± 7.4 0.63
Hearing threshold at tinnitus
frequency (dB HL)
35.3 ± 27.8 29.6 ± 26.6 0.55
Numeric rating scale
intensity
7.2 ± 2.1 6.8 ± 1.8 0.52
Numeric rating scale distress 8.1 ± 1.7 7.6 ± 2.0 0.40
Total score on hyperacusis
questionnaire
33.1 ± 3.6 17.8 ± 7.7 \0.001
Brain Struct Funct (2014) 219:1113–1128 1115
123

hearing thresholds at 0.5, 1, and 2 kHz) (Song et al. 2009,
2012b; Mirandola et al. 2013) and the loss in decibels (dB
HL) at the tinnitus frequency (Table 1). Therefore, possible
cortical activity differences between the two groups due to
different hearing level could be minimized.
EEG recording
This study has been approved by the Antwerp University
Hospital Institutional Review Board (‘Comite voor med-
ische ethiek’) and was in accordance with the declaration
of Helsinki. Patients gave informed consent before the
EEG recording. The EEG is obtained as a standard pro-
cedure for diagnostic and neuromodulation treatment
purposes.
EEGs were recorded for approximately 5 min at 19
scalp sites using a Tin-electrode cap (ElectroCap, Ohio,
United States), Mitsar amplifier (Mitsar EEG-201, St.
Petersburg, Russia), and the WinEEG software version
2.84.44 (Mitsar, St. Pertersburg, Russia; available at:
http://www.mitsar-medical.com) in a fully lighted room
shielded against sound and stray electric fields with each
participant eye-closed and sitting upright on a comfortable
chair. The EEG was sampled with 19 electrodes in the
standard 10–20 International placement referenced to
linked ears, and impedances were maintained below 5 kXat all electrodes throughout the EEG recording. Data were
recorded with a sampling rate of 1,024 Hz, a high-pass
filter of 0.15 Hz, and a low-pass filter of 200 Hz. The off-
line data processing involved resampling to 128 Hz and
band-pass filtering (fast Fourier transform filter applying a
Hanning window) with 2-44 Hz before the data were
imported into the Eureka! Software (Sherlin and Congedo
2005). A careful inspection of artifacts was done manually
and all episodic artifacts including eye blinks, eye move-
ments, teeth clenching, or body movement were removed
from the EEG stream. Also, further muscle artifacts were
removed by independent component analysis (ICA) using
ICoN software (http://sites.google.com/site/marcocongedo/
software/nica) (Koprivova et al. 2011; White et al. 2012).
Participants abstained from alcohol 24 h prior to EEG
recording and from caffeinated beverages on the day of
recording to avoid alcohol-induced changes in EEG (Vol-
kow et al. 2000) or a caffeine-induced alpha and beta
power decrease (Logan et al. 2002; Siepmann and Kirch
2002). The vigilance of participants was checked by
monitoring EEG parameters such as slowing of the alpha
rhythm or appearance of spindles to prevent possible
enhancement of the theta power due to drowsiness
(Moazami-Goudarzi et al. 2010), and no participants
included in the current study showed such drowsiness-
related EEG changes.
Source localization analysis
Standardized low-resolution brain electromagnetic tomog-
raphy (sLORETA), a functional imaging method based on
certain electrophysiological and neuroanatomical con-
straints (Pascual-Marqui 2002), was utilized to estimate
the intracerebral sources generating the scalp-recorded
electrical activity in each of the following eight fre-
quency bands: delta (2–3.5 Hz), theta (4–7.5 Hz), alpha1
(8–10 Hz), alpha2 (10–12 Hz), beta1 (13–18 Hz), beta2
(18.5–21 Hz), beta3 (21.5–30 Hz), and gamma (30.5–
44 Hz) (Song et al. 2013a, b). Because the sLORETA itself
corrects for multiple testing (i.e., for the collection of tests
performed for all electrodes and/or voxels, and for all time
samples and/or discrete frequencies) by conducting random
permutations (5,000 permutations in the current study), no
further correction is required for multiple comparison
(Nichols and Holmes 2002; Pascual-Marqui 2002). In
sLORETA, the cortex is modeled as a collection of volume
elements (6,239 voxels, size 5 9 5 9 5 mm) and is
restricted to cortical gray matter and hippocampi in the
digitized Montreal Neurological Institute (MNI) coordi-
nates corrected to the Talairach coordinates, and neuronal
activity is computed as current density (lA/mm2) without
assuming a predefined number of active sources (Fuchs
et al. 2002). Scalp electrode coordinates on the MNI brain
are derived from the international 5 % system (Jurcak et al.
2007). The sLORETA algorithm solves the inverse problem
by assuming related orientations and strengths of neigh-
boring neuronal sources (represented by adjacent voxels).
The sLORETA has proven to be an efficient tool for
functional mapping because it is consistent with physiology
and capable of correct localization (Pascual-Marqui 2002)
and independent validation of the localization properties of
sLORETA has been replicated (Wagner et al. 2004; Seki-
hara et al. 2005). sLORETA has been repeatedly validated
by comparing sLORETA with other established localization
methods such as positron emission tomography (PET)
(Pizzagalli et al. 2004; Zumsteg et al. 2005; Pae et al. 2003),
structural magnetic resonance imaging (MRI) (Worrell
et al. 2000), and functional MRI (Mulert et al. 2004; Vit-
acco et al. 2002). Further sLORETA validation has been
based on accepting the localization findings obtained from
previous studies using invasive, implanted depth electrodes
for epilepsy (Zumsteg et al. 2006a, c) and cognitive ERPs
(Volpe et al. 2007) as reasonable evidence. In addition,
previous studies have shown accurate localization of deep
brain structures such as the subgenual anterior cingulate
cortex (sgACC) (Pizzagalli et al. 2004) and the mesial
temporal lobe (Zumsteg et al. 2006b) using sLORETA. The
version of sLORETA employed here is available at http://
www.unizh.ch/keyinst/NewLORETA/LORETA01.htm.
1116 Brain Struct Funct (2014) 219:1113–1128
123

Region of interest analysis
Based on the results of source-localized correlation anal-
ysis and group comparison, four region of interests (ROIs)
composed of right A1s (BAs 41/42) and A2s (BAs 21/22)
separately for the alpha1 and 2 frequency bands were
selected and the log-transformed electric current density
was averaged across all voxels belonging to these ROIs. In
addition, to further better understand the differences
between the T?H? and T?H- groups with regard to these
ROIs, 17 individuals who had neither hyperacusis nor
tinnitus were collected from a normative database con-
sisting of 235 participants who underwent an EEG analysis.
By matching one-by-one to the study participants with
regard to age and sex, a normal control group consisting of
15 males and two females with a mean age of
40.2 ± 7.7 years (range 27–53 years) was generated and
their mean current densities in the A1/A2 for the alpha1
and two frequency bands were calculated. An analysis of
variance (ANOVA) test was performed among the T?H?
group, the T?H- group, and the normal control group, and
post hoc independent t tests with Bonferroni correction for
multiple comparisons were performed to compare the mean
current density values separately between the T?H? and
normal control groups, the T?H- and normal control
groups, and the T?H? and T?H- group if the ANOVA
test results were significant.
In the same way, to further investigate the differences
between the T?H? and T?H- groups, the mean current
densities of the data-driven post hoc ROIs, the bilateral
dorsal anterior cingulate cortex (dACC), and the left
orbitofrontal cortex (OFC) for the beta band, were calcu-
lated and compared among the T?H?/T?H- and normal
control groups.
Functional connectivity
The functional organization of the human brain can be
described as a network of rich connectivity whereby the
neurons (or cortical columns) are seen as nodes within the
network and the functional connections between them as
edges within this network. One possible method that has
been suggested for investigating this large-scale functional
connectivity is phase synchronization over multiple fre-
quency bands (Varela et al. 2001; Sauseng and Klimesch
2008). However, methods of phase synchronization mea-
surement are easily contaminated with instantaneous, non-
physiological contributions arising from volume conduc-
tion and low spatial resolution (Bruder et al. 2012). As a
solution for this problem, a refined technique (i.e., Her-
mitian covariance matrices) that removes this confounding
factor considerably has recently been introduced (Pascual-
Marqui 2007). This measure of dependence can be applied
to any number of brain areas jointly, i.e., distributed cor-
tical networks, whose activity can be estimated with
sLORETA. Measures of linear dependence (coherence)
between multivariate time series are defined and the mea-
sures are expressed as the sum of lagged/instantaneous
dependence. The measures are non-negative and take the
value zero only when there is independence of the pertinent
type, and they are defined in the above-described eight
frequency bands. Based on this principle, lagged connec-
tivity was calculated using the connectivity toolbox in
sLORETA. For functional connectivity analysis, a total of
28 ROIs were defined based on previous literature on
hyperacusis and tinnitus, and detailed information of these
28 ROIs are described in Table 2. Each ROI consist of a
single voxel (the one that is closest to the center of mass of
the ROI) in sLORETA, therefore the radius around each
centroid is 5 mm.
Statistical analysis
For all analyses, statistical significance was set at P \ 0.05.
We also report P \ 0.10 to include trend-level signifi-
cances. In order to identify neural correlates of hyperacusis
under resting state, the log-current density of all 34 partic-
ipants was correlated with the HQ score using voxel-by-
voxel correlation analysis for the eight different frequency
bands. Also, to identify potential differences in brain elec-
trical activity between the T?H? and T?H- groups,
voxel-by-voxel analysis using sLORETA was performed
for the eight different frequency bands between-condition
comparisons of the current density distribution. Non-para-
metric statistical analyses of sLORETA images (statistical
non-parametric mapping; SnPM) were performed for each
contrast using sLORETA’s built-in voxelwise randomiza-
tion tests (5,000 permutations) and employing a log-F-ratio
statistic for independent groups with a threshold of
P \ 0.05, corrected for multiple comparison. A correction
for multiple comparisons in SnPM using random permuta-
tions (5,000 in the current study) has been proven to give
results similar to those obtained from a statistical para-
metric mapping approach using a general linear model with
multiple comparisons corrections derived from random
field theory (Holmes et al. 1996; Nichols and Holmes 2002).
For lagged connectivity differences, we compared dif-
ferences between the T?H? and T?H- groups for each
contrast employing the t statistics for independent groups
with a threshold P \ 0.05, also corrected for multiple
comparisons by conducting sLORETA-built-in voxelwise
randomization tests for all the voxels included in the 28
ROIs for the connectivity analysis (5,000 permutations
were performed in the current study).
To further explore the relation between the alpha power
in the right A1 and A2 and the beta power in the left OFC
Brain Struct Funct (2014) 219:1113–1128 1117
123
and right dACC, Pearson cross-correlations between the
log-transformed electric current densities of the right A1
and A2 and those of the OFC/dACC were calculated and
corrected for multiple comparisons separately for the
T?H? and T?H- groups using MATLAB 2010b (The
MathWorks, Natick, MA, USA).
Results
Source-localized correlation analysis
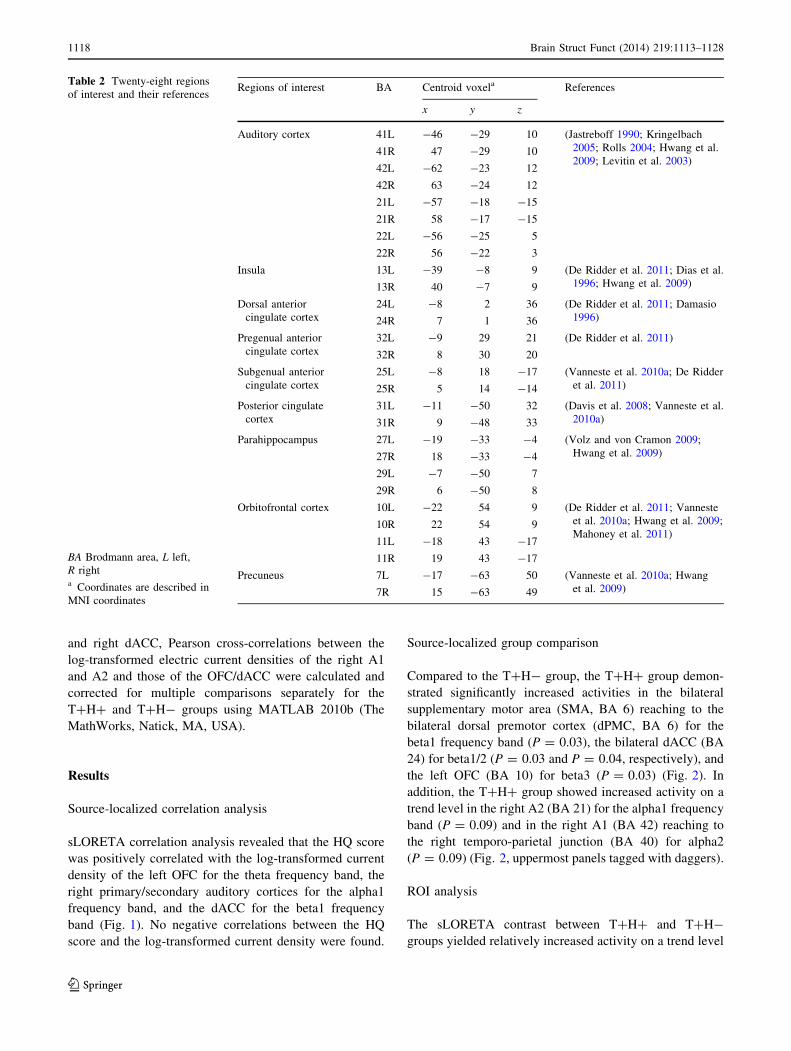
sLORETA correlation analysis revealed that the HQ score
was positively correlated with the log-transformed current
density of the left OFC for the theta frequency band, the
right primary/secondary auditory cortices for the alpha1
frequency band, and the dACC for the beta1 frequency
band (Fig. 1). No negative correlations between the HQ
score and the log-transformed current density were found.
Source-localized group comparison
Compared to the T?H- group, the T?H? group demon-
strated significantly increased activities in the bilateral
supplementary motor area (SMA, BA 6) reaching to the
bilateral dorsal premotor cortex (dPMC, BA 6) for the
beta1 frequency band (P = 0.03), the bilateral dACC (BA
24) for beta1/2 (P = 0.03 and P = 0.04, respectively), and
the left OFC (BA 10) for beta3 (P = 0.03) (Fig. 2). In
addition, the T?H? group showed increased activity on a
trend level in the right A2 (BA 21) for the alpha1 frequency
band (P = 0.09) and in the right A1 (BA 42) reaching to
the right temporo-parietal junction (BA 40) for alpha2
(P = 0.09) (Fig. 2, uppermost panels tagged with daggers).
ROI analysis
The sLORETA contrast between T?H? and T?H-
groups yielded relatively increased activity on a trend level
Table 2 Twenty-eight regions
of interest and their references
BA Brodmann area, L left,
R righta Coordinates are described in
MNI coordinates
Regions of interest BA Centroid voxela References
x y z
Auditory cortex 41L -46 -29 10 (Jastreboff 1990; Kringelbach
2005; Rolls 2004; Hwang et al.
2009; Levitin et al. 2003)41R 47 -29 10
42L -62 -23 12
42R 63 -24 12
21L -57 -18 -15
21R 58 -17 -15
22L -56 -25 5
22R 56 -22 3
Insula 13L -39 -8 9 (De Ridder et al. 2011; Dias et al.
1996; Hwang et al. 2009)13R 40 -7 9
Dorsal anterior
cingulate cortex
24L -8 2 36 (De Ridder et al. 2011; Damasio
1996)24R 7 1 36
Pregenual anterior
cingulate cortex
32L -9 29 21 (De Ridder et al. 2011)
32R 8 30 20
Subgenual anterior
cingulate cortex
25L -8 18 -17 (Vanneste et al. 2010a; De Ridder
et al. 2011)25R 5 14 -14
Posterior cingulate
cortex
31L -11 -50 32 (Davis et al. 2008; Vanneste et al.
2010a)31R 9 -48 33
Parahippocampus 27L -19 -33 -4 (Volz and von Cramon 2009;
Hwang et al. 2009)27R 18 -33 -4
29L -7 -50 7
29R 6 -50 8
Orbitofrontal cortex 10L -22 54 9 (De Ridder et al. 2011; Vanneste
et al. 2010a; Hwang et al. 2009;
Mahoney et al. 2011)10R 22 54 9
11L -18 43 -17
11R 19 43 -17
Precuneus 7L -17 -63 50 (Vanneste et al. 2010a; Hwang
et al. 2009)7R 15 -63 49
1118 Brain Struct Funct (2014) 219:1113–1128
123
in the right secondary auditory cortex (A2) for the alpha1
and in an area of the right primary auditory cortex (A1)
reaching to the temporo-parietal junction for the alpha2
frequency band in the T?H? group as compared to T?H-
group. These results were in contrast to previous studies
indicating that tinnitus is characterized by a reduction in
alpha power as compared to normal controls (Raz and
Rodrigue 2006; Weisz et al. 2005, 2007). The ROI analysis
using log-transformed mean current density for the alpha1
frequency band at BA 41, 42, 21, and 22 in the T?H?
group showed a higher tendency than that of the T?H-
group, but without statistical significance on ANOVA
(Fig. 3). However, the log-transformed mean current den-
sities for the alpha2 frequency band showed significance on
ANOVA for all A1 and A2 except for BA 21 (P = 0.03,
F = 3.89 for BA 41, P = 0.02, F = 4.11 for BA 42,
P = 0.03, F = 3.89 for BA 41, and P = 0.03, F = 3.94
for BA 22). The post hoc t tests (with Bonferroni correction
for multiple comparisons) revealed that the log-trans-
formed mean current densities for the alpha2 frequency
band in the T?H? group were significantly higher than
those in the T?H- at BA 41 (2.69 ± 1.07 vs. 1.86 ± 0.81,
t = 2.55, P = 0.02, df = 29.75), BA 42 (2.65 ± 1.08 vs.
1.76 ± 0.81, t = 2.72, P = 0.01, df = 29.62), and BA 22
(2.53 ± 1.06 vs. 1.69 ± 0.78, t = 2.64, P = 0.01,
df = 29.44) (Fig. 3). While the comparison of the current
density at these four ROIs between the T?H? group and
the normal control group yielded no significant differences
for the alpha1 and two frequency bands, the T?H- group
revealed significantly decreased current density as com-
pared to the normal control group at BAs 41 and 22 for the
alpha2 frequency band (Fig. 3). In brief, we found signif-
icantly higher activation of the right A1 and A2 in the
T?H? group relative to the T?H- group for the alpha2
frequency band by the ROI analysis including the normal
control group, although the difference did not reach
statistical significance using the sLORETA whole brain
analysis.
Meanwhile, another ROI analysis using the log-trans-
formed mean current density for the beta1/2 frequency
bands at bilateral BA 24 and beta3 frequency band at left
BA 10 showed no statistically significant differences
among the three groups on ANOVA (Fig. 4).
Functional connectivity
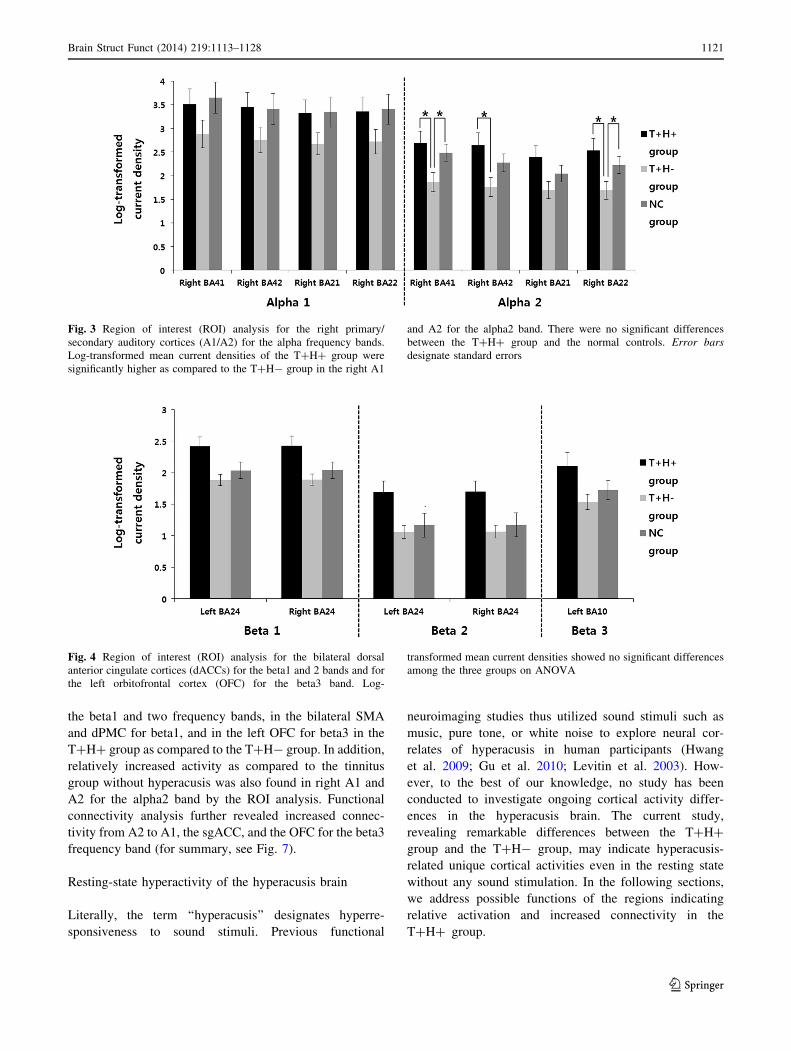
The functional connectivity analysis yielded significant
differences between the T?H? and T?H- groups for the
beta3 frequency band (P \ 0.05). The T?H? group
revealed increased functional connectivity as compared to
the T?H- group from the right A2 to the right A1, right
OFC and to the left sgACC. Increased connectivity of the
T?H? group for the beta3 frequency band was also found
between the left A1 and the left posterior cingulate cortex
(Fig. 5).
For the other seven frequency bands, no significant
differences could be obtained between the two control
groups by the contrast ‘‘the T?H? group—the T?H-
group’’.
Cross-correlation analysis
Pearson cross-correlation analyses demonstrated higher
correlation between the alpha2 power of the right A1 and
the beta3 power of the left OFC in the T?H? group
(Fig. 6, upper left panel) as compared to the T?H- group
(Fig. 6, upper middle panel). Meanwhile, the correlation
between the alpha2 power in the right A1 and the beta1 and
two powers in the right dACC showed no significant dif-
ferences between the two groups (Fig. 6, lower left and
middle panels).
Fig. 1 Standardized low-resolution brain electromagnetic tomogra-
phy (sLORETA) correlation analysis between the log-transformed
current density of all 34 patients and the hyperacusis questionnaire
(HQ) score. The left orbitofrontal cortex for the theta frequency band,
the right primary/secondary auditory cortices for the alpha1 fre-
quency band, and the dorsal anterior cingulate cortex for the beta1
frequency band showed positive correlations with the HQ score
Brain Struct Funct (2014) 219:1113–1128 1119
123

Discussion
Hyperacusis was originally regarded as a compensatory
mechanism for acquired hearing loss. Animal experiments
supported this theory, showing transient enhancement on
the evoked AC response induced by noise over-exposure
(Sun et al. 2008) and increased central neural gain by
systemic injection of salicylate (Sun et al. 2009). In
humans, transient hyperacusis could be induced in partic-
ipants with normal hearing threshold by wearing earplugs
for 2 weeks (Formby et al. 2003) and in hyperacusic par-
ticipants with normal hearing the amount of activation
produced by auditory stimuli was better correlated with the
perceived loudness of the sound stimuli than to their actual
level (Hall et al. 2001). In this regard, an active loudness
model has been suggested in which hyperacusis is
explained as increased nonlinear gain (Zeng 2013). In
short, however, most of the explanations are speculative
and the exact mechanism of hyperacusis is still missing
(Eggermont 2013).
In the current study, we attempted to find clues for the
neural correlates of hyperacusis by qEEG-derived cortical
activity in the resting state. In brief, HQ was positively
correlated with the activity in the left OFC for the theta
band, in the right A1/A2 for the alpha1, and in the dACC for
the beta1. We also found increased activity in the dACC for
Fig. 2 Standardized low-resolution brain electromagnetic tomogra-
phy (sLORETA) contrast analysis between the tinnitus with hyper-
acusis (T?H?) and tinnitus without hyperacusis (T?H-) groups.
Compared to the T?H- group, the T?H? group demonstrated
significantly increased activities (asterisks) in the bilateral
supplementary motor area, bilateral dorsal anterior cingulate cortex,
and left orbitofrontal cortex for the beta frequency bands. In addition,
the T?H? group showed increased activities on a trend level
(daggers) in the right auditory cortices for the alpha bands
1120 Brain Struct Funct (2014) 219:1113–1128
123
the beta1 and two frequency bands, in the bilateral SMA
and dPMC for beta1, and in the left OFC for beta3 in the
T?H? group as compared to the T?H- group. In addition,
relatively increased activity as compared to the tinnitus
group without hyperacusis was also found in right A1 and
A2 for the alpha2 band by the ROI analysis. Functional
connectivity analysis further revealed increased connec-
tivity from A2 to A1, the sgACC, and the OFC for the beta3
frequency band (for summary, see Fig. 7).
Resting-state hyperactivity of the hyperacusis brain
Literally, the term ‘‘hyperacusis’’ designates hyperre-
sponsiveness to sound stimuli. Previous functional
neuroimaging studies thus utilized sound stimuli such as
music, pure tone, or white noise to explore neural cor-
relates of hyperacusis in human participants (Hwang
et al. 2009; Gu et al. 2010; Levitin et al. 2003). How-
ever, to the best of our knowledge, no study has been
conducted to investigate ongoing cortical activity differ-
ences in the hyperacusis brain. The current study,
revealing remarkable differences between the T?H?
group and the T?H- group, may indicate hyperacusis-
related unique cortical activities even in the resting state
without any sound stimulation. In the following sections,
we address possible functions of the regions indicating
relative activation and increased connectivity in the
T?H? group.
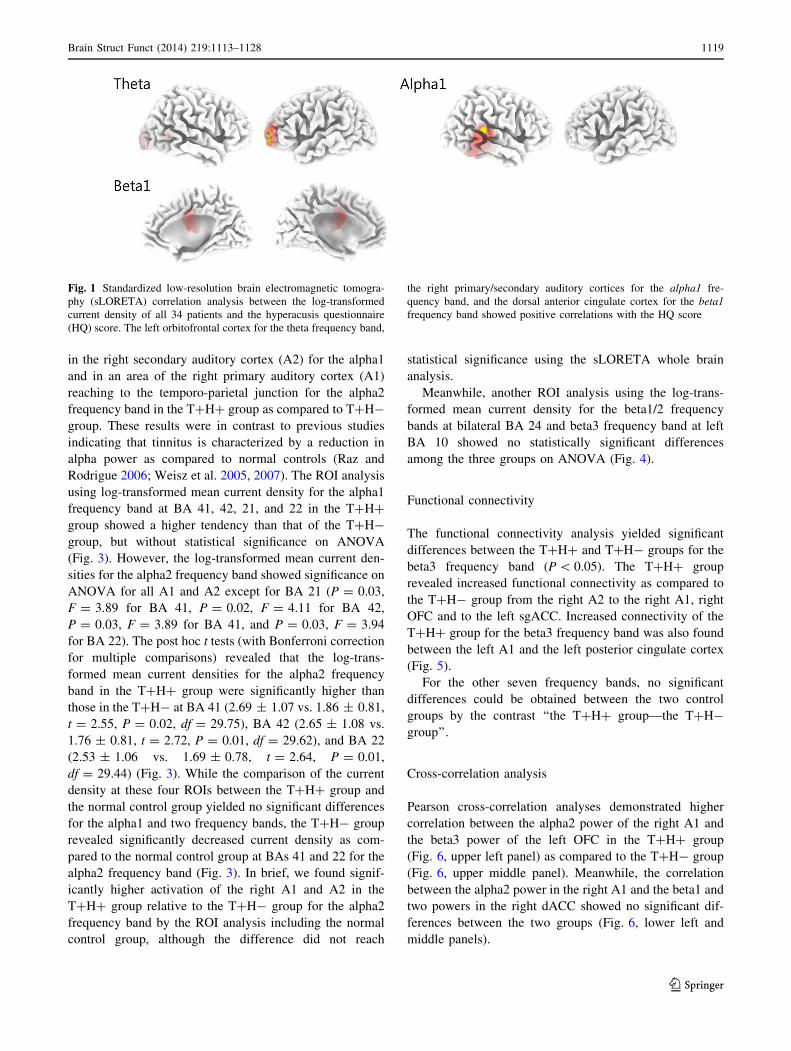
Fig. 3 Region of interest (ROI) analysis for the right primary/
secondary auditory cortices (A1/A2) for the alpha frequency bands.
Log-transformed mean current densities of the T?H? group were
significantly higher as compared to the T?H- group in the right A1
and A2 for the alpha2 band. There were no significant differences
between the T?H? group and the normal controls. Error bars
designate standard errors
Fig. 4 Region of interest (ROI) analysis for the bilateral dorsal
anterior cingulate cortices (dACCs) for the beta1 and 2 bands and for
the left orbitofrontal cortex (OFC) for the beta3 band. Log-
transformed mean current densities showed no significant differences
among the three groups on ANOVA
Brain Struct Funct (2014) 219:1113–1128 1121
123
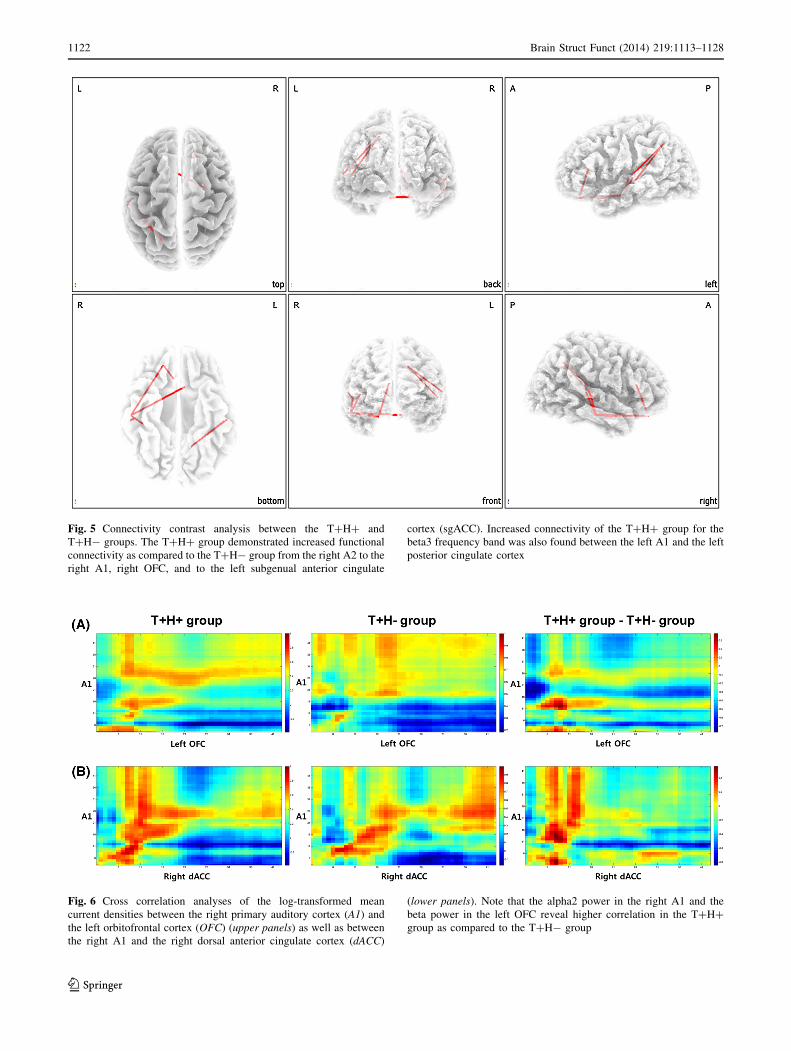
Fig. 5 Connectivity contrast analysis between the T?H? and
T?H- groups. The T?H? group demonstrated increased functional
connectivity as compared to the T?H- group from the right A2 to the
right A1, right OFC, and to the left subgenual anterior cingulate
cortex (sgACC). Increased connectivity of the T?H? group for the
beta3 frequency band was also found between the left A1 and the left
posterior cingulate cortex
Fig. 6 Cross correlation analyses of the log-transformed mean
current densities between the right primary auditory cortex (A1) and
the left orbitofrontal cortex (OFC) (upper panels) as well as between
the right A1 and the right dorsal anterior cingulate cortex (dACC)
(lower panels). Note that the alpha2 power in the right A1 and the
beta power in the left OFC reveal higher correlation in the T?H?
group as compared to the T?H- group
1122 Brain Struct Funct (2014) 219:1113–1128
123

Constantly enhanced vigilance to auditory stimuli due
to the increased activity in the dACC and OFC
Cued prediction of the occurrence of a nociceptive event
reliably elicits a potentiation of a fear response character-
ized by increased autonomic arousal and defensive
response mobilization (Hamm and Weike 2005; Hamm and
Vaitl 1996). Together with frequently suggested compo-
nents of this neural network such as the amygdala and the
insula, two notable brain regions, the dACC and the OFC,
are constantly indicated as the key areas of activation when
anticipating an interoceptive threat. The dACC and the
OFC have been found to be activated during anticipation of
noxious stimuli in several studies (Kalisch et al. 2006;
Kalisch et al. 2005; Holtz et al. 2012; Nitschke et al. 2006;
Atlas et al. 2010), and the activation of these two regions
was more sustained in high fear compared to low fear
persons (Holtz et al. 2012). In a recent meta-analysis of
fear studies, consistently significant activation in response
to the warning cue was found in a large cluster including
the dACC and this cluster was interpreted as an index of
increased appraisal of the warning cues (Mechias et al.
2010). Another recent study in primates demonstrated
suppression of the spontaneous recovery of aversive
memories by depressing the dACC activity with low fre-
quency stimulation (Klavir et al. 2012).
In this regard, the results of the current study showing
relatively increased activity in the dACC/OFC may con-
note constantly increased vigilance for sound stimuli
leading to increased reflex to sound stimuli only in the
T?H? group. This is in line with earlier work showing that
prestimulus activation of the dACC, a component of the
intrinsic alertness network (Dosenbach et al. 2007; Boly
et al. 2007), is associated with increased sensitivity to
external auditory stimuli (Sadaghiani et al. 2009). In this
sense, increased resting dACC activity may also render a
subject hyperacusic by increasing sensitivity to forthcom-
ing sound stimuli.
The relatively increased activity in the SMA/dPMC for
the beta1 frequency band may be interpreted as the priming
of flight behavior. The link between the sensorimotor
system and affective/cognitive function has been explained
by the embodied cognition theory (Garbarini and Adenzato
2004). In the context of the embodied cognition theory, the
constant anticipation of environmental sound stimuli may
evoke simulated motor action to avoid nociception. The
SMA plays a role in preparing voluntary movement
(Cunnington et al. 2005), and an increased activation in this
area during the confrontation with the feared object may
reflect participants’ urge to avoid the anticipated stimuli
(Scharmuller et al. 2011). From this viewpoint, the acti-
vation of the SMA/dPMC may reflect prepared avoidance
of sound stimuli in participants with hyperacusis.
Top-down inhibition of the resting-state auditory
cortical activity
The processing of auditory stimuli involves a reduction of
auditory alpha power (Lehtela et al. 1997), and especially
this auditory alpha reduction is marked in tinnitus subjects
(Weisz et al. 2005, 2011). The current study revealing
decreased alpha2 activity in the T?H- group as compared
to the normal control group by the ROI analysis thus rep-
licates previous literature. By contrast, the HQ was posi-
tively correlated with the activity in the A1/A2 for the
alpha1 frequency band. Since growing evidence from EEG
(Alper et al. 2006; Klimesch 1999) and magnetoencepha-
lography (Weisz et al. 2007) studies suggests that alpha
rhythms reflect the excitatory–inhibitory balance within
sensory/motor regions with strong alpha power, indicating
an inhibitory state, we may regard the positive correlation
and the increased alpha power in the T?H? group as a
relative inhibition of the AC in more hyperacusic patients.
As the mean current density of the ROIs was not signifi-
cantly different between the T?H? group and the normal
control group, we surmise that presumed alpha power
reduction by tinnitus may have been counterbalanced by
hyperacusis in the T?H? group.
Previous human studies on hyperacusis have yielded
inconsistent results. A functional magnetic resonance
imaging (fMRI) study revealed relatively decreased AC
activity by sound stimuli in hyperacusic Williams syn-
drome patients as compared to normal controls (Levitin
et al. 2003), while another voxel-based morphometry study
revealed relatively preserved grey matter volume in se-
matic dementia patients with tinnitus or hyperacusis as
compared to semantic dementia patients with no history of
Fig. 7 Schematic summary of the areas with increased and decreased
activities in the T?H? group as compared to the T?H- group. SMA
supplementary motor area, dPMC dorsal premotor cortex, A1/2
primary/secondary auditory cortices, dACC dorsal anterior cingulate
cortex, OFC orbitofrontal cortex
Brain Struct Funct (2014) 219:1113–1128 1123
123

hyperacusis (Mahoney et al. 2011). Meanwhile, as afore-
mentioned, previous animal research using hyperacusic
animal models demonstrated enhanced responsiveness of
the AC by showing increased sound-evoked potentials in
the AC and increased spike firing rates of AC neurons
(Norena et al. 2010; Sun et al. 2012). In sharp contrast to
these results from animal studies, the current study showed
increased alpha in the AC in the resting state. In short, the
AC of the hyperacusis brain may be hypoactive in the
resting state without any sound stimuli while hyperactive
when stimulated by sound.
One possible explanation for the relatively increased
alpha power in the right AC may be a top-down suppres-
sion of the low-level sensory cortex, that is, constant
anticipation of aversive sound stimuli may have resulted in
top-down deactivation of the AC in the resting state. In a
study utilizing cues either ‘‘to-remember’’ or ‘‘not-to-
remember’’ visual stimuli that could later be asked to be
retrieved, non-remember cues elicited pronounced top-
down alpha increase as opposed to remember cues
(Freunberger et al. 2009). Considering that forthcoming
sound stimuli are ‘‘not-to-hear’’ aversive auditory stimuli
to the T?H? participants, they may have modulated
auditory alpha power by a top-down alpha increase in the
silent environment to cope with sound-evoked distress.
Pearson cross-correlation demonstrated higher correla-
tion between the alpha2 power in the right A1 and the beta3
power in the left OFC in the T?H? group as compared to
the T?H- group. In addition, the left OFC revealed
increased connectivity to the right A2 for the beta3 band. In
this regard, the left OFC may be the center of the top-down
modulation of the auditory alpha power in hyperacusis. The
OFC, the highest order associative cortical region of the
brain, is frequently implicated in top-down processing of
emotion (Wright et al. 2008; O’Doherty 2004) and the
reward or affective value of the earliest cortical areas for
taste, touch, texture, and face expression (Grabenhorst et al.
2008; Rolls and Grabenhorst 2008). Also, the OFC is sug-
gested to be a key pain-processing region reflecting a
combination of nociceptive input and top-down information
related to expectations and anticipatory processes (Atlas
et al. 2010). Notably, the OFC was suggested to exert top-
down encoding of auditory information (Frey et al. 2004).
From this viewpoint, the OFC may be activated by antici-
pation of aversive sound stimuli as aforementioned, and at
the same time it may function as a top-down suppressor of
the AC as a coping mechanism against hyperacusis.
Hyperacusis and allodynia/hyperalgesia
As mentioned above, allodynia and hyperalgesia have been
frequently compared to hyperacusis based on the analogy
of exaggerated response to innocuous or minimally
aversive somatic stimuli. Many studies have focused on
defining the cortical network involved in allodynia/hyper-
algesia, but the results obtained have been very variable,
reflecting etiological heterogeneity, lesion topography,
symptoms, and stimulation paradigms (Moisset and
Bouhassira 2007).
However, intriguing similarities between the current
study and previous research on allodynia/hyperalgesia can
be found. For instance, the OFC has been frequently found
to be activated by allodynia-evoking stimulation (Witting
et al. 2001; Kramer et al. 2008). The dACC activity change
has also been found in most of the imaging studies on
allodynia/hyperalgesia, but some studies revealed
increased dACC activity (Lanz et al. 2011; Witting et al.
2006) while other studies showed a ‘paradoxical’ decrease
in dACC activity (Jones and Derbyshire 1997; Rosen et al.
1994; Peyron et al. 2000). In contrast to these discrepant
results, a recent meta-analysis of 21 studies on allodynia/
hyperalgesia demonstrated increased activity in the ACC
and prefrontal cortex, and hypothesized an increased
baseline activity during the presence of central sensitiza-
tion (Lanz et al. 2011). Although none of the included
studies in this meta-analysis evaluated resting-state cortical
activity, the cortical areas found and the deductive
hypothesis of baseline hyperactivity are in accordance with
the results of the current study. Another study suggested
the upregulation of activity in the OFC as the stronger
emotional load of neuropathic pain and higher computa-
tional demands of sensory processing (Witting et al. 2006).
In addition, participants who were familiar with allodynia
activated the ACC and prefrontal cortex as well as the
secondary sensory somatosensory cortex only by imagining
allodynia during tactile stimulation (Kramer et al. 2008). In
this regard, hyperacusis and allodynia/hyperalgesia may
share a common network for hyperresponsive behavior. As
seen in the current study, a ‘‘hyperresponsiveness network’’
comprising resting-state hyperactivity of the OFC and
dACC may be responsible for hyperacusis, and also for
allodynia/hyperalgesia. By exploring resting-state cortical
activity in participants with allodynia/hyperalgesia, this
perspective may be validated.
Limitation of the study has to be mentioned. First, even
though tinnitus-related characteristics were near-totally
matched, still the results may have been affected by tin-
nitus-related cortical activity changes. Future studies uti-
lizing purely hyperacusic patients should be performed to
confirm our findings. Second, the current study was con-
ducted retrospectively utilizing our resting-state EEG
database, we could only reveal ongoing resting-state cor-
tical activities related to hyperacusis. Because hyperacusis
itself is a sound-driven phenomenon and we have found
intriguing features under resting-state in participants with
hyperacusis, future prospective studies utilizing sound
1124 Brain Struct Funct (2014) 219:1113–1128
123
stimuli-evoked cortical responses as well as resting-state
ongoing cortical activities should be performed to reveal
changes in the cortical oscillation pattern. Third, we found
lateralized effects (increased left OFC activity and
increased right A1/A2 activity). As the HQ adopted in the
current study does not evaluate the left and right ear sep-
arately, these effects might have been originated from
lateralized hyperacusis of the enrolled participants. Future
studies addressing possible lateralized hyperacusis should
be performed to clearly address this issue. Fourth, signifi-
cant effects in the OFC for the beta band may have been
partially influenced by electromyogram (EMG) contami-
nation (Fu et al. 2006; Goncharova et al. 2003). Although
we have cleaned out all episodic artifacts from the EEG
stream by visual inspection and the application of ICA, and
the removal of muscle artifact in scalp-based recordings
has been validated (McMenamin et al. 2010; Keren et al.
2010), EMG contamination should be further checked by
performing future studies to replicate the current findings.
In conclusion, the characteristics of the participants with
hyperacusis could be described as resting-state increased
beta activity in the OFC/dACC as well as increased alpha
power in the right AC. The increased OFC/dACC activity
may be ascribed to constantly enhanced resting-state vigi-
lance and top-down inhibition of the resting-state AC in
tinnitus patients with hyperacusis. These findings as well as
previous literature on allodynia/hyperalgesia may suggest a
possible default hyperresponsive network, which may be
used for developing a neuromodulation treatment strategy
for these disease entities.
Acknowledgments The authors thank Jan Ost, Bram Van Achteren,
Bjorn Devree, Pieter van Looy and James Hartzell for their help in
preparing this manuscript and thank Thomas Hartmann and Nadia
Muller for their import comments. Also, the first author thanks Dr.
DY Yoon for giving invaluable support to this study. This work was
supported by Research Foundation Flanders (FWO), Tinnitus
Research Initiative, The Neurological Foundation of New Zealand,
TOP project University Antwerp, and the Korean Science and Engi-
neering Foundation (KOSEF) grant funded by the Korean government
(MOST) (No. 2012-0030102).
References
Alper KR, John ER, Brodie J, Gunther W, Daruwala R, Prichep LS
(2006) Correlation of PET and qEEG in normal subjects.
Psychiatry Res 146:271–282
Anari M, Axelsson A, Eliasson A, Magnusson L (1999) Hypersen-
sitivity to sound-questionnaire data, audiometry and classifica-
tion. Scand Audiol 28:219–230
Andersson G, Lindvall N, Hursti T, Carlbring P (2002) Hypersensi-
tivity to sound (hyperacusis): a prevalence study conducted via
the Internet and post. Int J Audiol 41:545–554
Atlas LY, Bolger N, Lindquist MA, Wager TD (2010) Brain
mediators of predictive cue effects on perceived pain. J Neurosci
30:12964–12977
Baguley DM (2003) Hyperacusis. J R Soc Med 96:582–585
Boly M, Balteau E, Schnakers C, Degueldre C, Moonen G, Luxen A,
Phillips C, Peigneux P, Maquet P, Laureys S (2007) Baseline
brain activity fluctuations predict somatosensory perception in
humans. Proc Natl Acad Sci USA 104:12187–12192
Bruder GE, Bansal R, Tenke CE, Liu J, Hao X, Warner V, Peterson
BS, Weissman MM (2012) Relationship of resting EEG with
anatomical MRI measures in individuals at high and low risk for
depression. Hum Brain Mapp 33:1325–1333
Cunnington R, Windischberger C, Moser E (2005) Premovement
activity of the pre-supplementary motor area and the readiness
for action: studies of time-resolved event-related functional
MRI. Hum Mov Sci 24:644–656
Damasio AR (1996) The somatic marker hypothesis and the possible
functions of the prefrontal cortex. Philos Trans R Soc Lond B
Biol Sci 351:1413–1420
Dauman R, Bouscau-Faure F (2005) Assessment and amelioration of
hyperacusis in tinnitus patients. Acta Otolaryngol 125:503–509
Davis SW, Dennis NA, Daselaar SM, Fleck MS, Cabeza R (2008)
Que PASA? The posterior-anterior shift in aging. Cereb Cortex
18:1201–1209
De Ridder D, Elgoyhen AB, Romo R, Langguth B (2011) Phantom
percepts: tinnitus and pain as persisting aversive memory
networks. Proc Natl Acad Sci USA 108:8075–8080
Dias R, Robbins TW, Roberts AC (1996) Dissociation in prefrontal
cortex of affective and attentional shifts. Nature 380:69–72
Dosenbach NU, Fair DA, Miezin FM, Cohen AL, Wenger KK,
Dosenbach RA, Fox MD, Snyder AZ, Vincent JL, Raichle ME,
Schlaggar BL, Petersen SE (2007) Distinct brain networks for
adaptive and stable task control in humans. Proc Natl Acad Sci
USA 104:11073–11078
Eggermont JJ (2013) Hearing loss, hyperacusis, or tinnitus: What is
modeled in animal research? Hear Res 295:140–149
Farrior JB (1956) Fenestration operation in the poor candidates; 44
cases selected from 637 operations. Laryngoscope 66:566–573
Formby C, Sherlock LP, Gold SL (2003) Adaptive plasticity of
loudness induced by chronic attenuation and enhancement of the
acoustic background. J Acoust Soc Am 114:55–58
Freunberger R, Fellinger R, Sauseng P, Gruber W, Klimesch W
(2009) Dissociation between phase-locked and nonphase-locked
alpha oscillations in a working memory task. Hum Brain Mapp
30:3417–3425
Frey S, Kostopoulos P, Petrides M (2004) Orbitofrontal contribution
to auditory encoding. Neuroimage 22:1384–1389
Fu MJ, Daly JJ, Cavusoglu MC (2006) A detection scheme for
frontalis and temporalis muscle EMG contamination of EEG
data. Conf Proc IEEE Eng Med Biol Soc 1:4514–4518
Fuchs M, Kastner J, Wagner M, Hawes S, Ebersole JS (2002) A
standardized boundary element method volume conductor
model. Clin Neurophysiol 113:702–712
Garbarini F, Adenzato M (2004) At the root of embodied cognition:
cognitive science meets neurophysiology. Brain Cogn 56:100–
106
Golm D, Schmidt-Samoa C, Dechent P, Kroner-Herwig B (2013)
Neural correlates of tinnitus related distress: an fMRI-study.
Hear Res 295:87–99
Goncharova II, McFarland DJ, Vaughan TM, Wolpaw JR (2003)
EMG contamination of EEG: spectral and topographical char-
acteristics. Clin Neurophysiol 114:1580–1593
Gothelf D, Farber N, Raveh E, Apter A, Attias J (2006) Hyperacusis
in Williams syndrome: characteristics and associated neuroau-
diologic abnormalities. Neurology 66:390–395
Grabenhorst F, Rolls ET, Bilderbeck A (2008) How cognition
modulates affective responses to taste and flavor: top-down
influences on the orbitofrontal and pregenual cingulate cortices.
Cereb Cortex 18:1549–1559
Brain Struct Funct (2014) 219:1113–1128 1125
123

Gu JW, Halpin CF, Nam EC, Levine RA, Melcher JR (2010)
Tinnitus, diminished sound-level tolerance, and elevated audi-
tory activity in humans with clinically normal hearing sensitiv-
ity. J Neurophysiol 104:3361–3370
Hall DA, Haggard MP, Summerfield AQ, Akeroyd MA, Palmer AR,
Bowtell RW (2001) Functional magnetic resonance imaging
measurements of sound-level encoding in the absence of
background scanner noise. J Acoust Soc Am 109:1559–1570
Hamm AO, Vaitl D (1996) Affective learning: awareness and
aversion. Psychophysiology 33:698–710
Hamm AO, Weike AI (2005) The neuropsychology of fear learning
and fear regulation. Int J Psychophysiol 57:5–14
Herraiz C, Plaza G, Aparicio JM (2006) Mechanisms and manage-
ment of hyperacusis (decreased sound tolerance). Acta Otorri-
nolaringol Esp 57:373–377
Hiller W, Goebel G (2006) Factors influencing tinnitus loudness and
annoyance. Arch Otolaryngol Head Neck Surg 132:1323–1330
Hiller W, Goebel G, Rief W (1994) Reliability of self-rated tinnitus
distress and association with psychological symptom patterns. Br
J Clin Psychol 33(Pt 2):231–239
Holmes AP, Blair RC, Watson JD, Ford I (1996) Nonparametric
analysis of statistic images from functional mapping experi-
ments. J Cereb Blood Flow Metab 16:7–22
Holtz K, Pane-Farre CA, Wendt J, Lotze M, Hamm AO (2012) Brain
activation during anticipation of interoceptive threat. Neuroim-
age 61:857–865
Hwang JH, Chou PH, Wu CW, Chen JH, Liu TC (2009) Brain
activation in patients with idiopathic hyperacusis. Am J Otolar-
yngol 30:432–434
Jastreboff PJ (1990) Phantom auditory perception (tinnitus): mech-
anisms of generation and perception. Neurosci Res 8:221–254
Jones AK, Derbyshire SW (1997) Reduced cortical responses to
noxious heat in patients with rheumatoid arthritis. Ann Rheum
Dis 56:601–607
Jurcak V, Tsuzuki D, Dan I (2007) 10/20, 10/10, and 10/5 systems
revisited: their validity as relative head-surface-based position-
ing systems. Neuroimage 34:1600–1611
Kalisch R, Wiech K, Critchley HD, Seymour B, O’Doherty JP,
Oakley DA, Allen P, Dolan RJ (2005) Anxiety reduction through
detachment: subjective, physiological, and neural effects. J Cogn
Neurosci 17:874–883
Kalisch R, Wiech K, Herrmann K, Dolan RJ (2006) Neural correlates
of self-distraction from anxiety and a process model of cognitive
emotion regulation. J Cogn Neurosci 18:1266–1276
Katzenell U, Segal S (2001) Hyperacusis: review and clinical
guidelines. Otol Neurotol 22:321–326 (discussion 326–327)
Keren AS, Yuval-Greenberg S, Deouell LY (2010) Saccadic spike
potentials in gamma-band EEG: characterization, detection and
suppression. Neuroimage 49:2248–2263
Khalfa S, Dubal S, Veuillet E, Perez-Diaz F, Jouvent R, Collet L
(2002) Psychometric normalization of a hyperacusis question-
naire. ORL J Otorhinolaryngol Relat Spec 64:436–442
Klavir O, Genud-Gabai R, Paz R (2012) Low-frequency stimulation
depresses the primate anterior-cingulate-cortex and prevents
spontaneous recovery of aversive memories. J Neurosci
32:8589–8597
Klimesch W (1999) EEG alpha and theta oscillations reflect cognitive
and memory performance: a review and analysis. Brain Res
Brain Res Rev 29:169–195
Koprivova J, Congedo M, Horacek J, Prasko J, Raszka M, Brunovsky
M, Kohutova B, Hoschl C (2011) EEG source analysis in
obsessive-compulsive disorder. Clin Neurophysiol 122:1735–1743
Kramer HH, Stenner C, Seddigh S, Bauermann T, Birklein F,
Maihofner C (2008) Illusion of pain: pre-existing knowledge
determines brain activation of ‘imagined allodynia’. J Pain
9:543–551
Kringelbach ML (2005) The human orbitofrontal cortex: linking
reward to hedonic experience. Nat Rev Neurosci 6:691–702
Lanz S, Seifert F, Maihofner C (2011) Brain activity associated with
pain, hyperalgesia and allodynia: an ALE meta-analysis. J Neural
Transm 118:1139–1154
Lehtela L, Salmelin R, Hari R (1997) Evidence for reactive magnetic
10-Hz rhythm in the human auditory cortex. Neurosci Lett
222:111–114
Levitin DJ, Menon V, Schmitt JE, Eliez S, White CD, Glover GH,
Kadis J, Korenberg JR, Bellugi U, Reiss AL (2003) Neural
correlates of auditory perception in Williams syndrome: an fMRI
study. Neuroimage 18:74–82
Logan JM, Sanders AL, Snyder AZ, Morris JC, Buckner RL (2002)
Under-recruitment and nonselective recruitment: dissociable
neural mechanisms associated with aging. Neuron 33:827–840
Mahoney CJ, Rohrer JD, Goll JC, Fox NC, Rossor MN, Warren JD
(2011) Structural neuroanatomy of tinnitus and hyperacusis in
semantic dementia. J Neurol Neurosurg Psychiatry 82:1274–1278
Marriage J, Barnes NM (1995) Is central hyperacusis a symptom of
5-hydroxytryptamine (5-HT) dysfunction? J Laryngol Otol
109:915–921
McMenamin BW, Shackman AJ, Maxwell JS, Bachhuber DR,
Koppenhaver AM, Greischar LL, Davidson RJ (2010) Validation
of ICA-based myogenic artifact correction for scalp and source-
localized EEG. Neuroimage 49:2416–2432
Mechias ML, Etkin A, Kalisch R (2010) A meta-analysis of instructed
fear studies: implications for conscious appraisal of threat.
Neuroimage 49:1760–1768
Meeus O, Blaivie C, Van de Heyning P (2007) Validation of the
Dutch and the French version of the Tinnitus Questionnaire.
B-ENT 3(Suppl 7):11–17
Meeus O, Heyndrickx K, Lambrechts P, De Ridder D, Van de
Heyning P (2010a) Phase-shift treatment for tinnitus of cochlear
origin. Eur Arch Otorhinolaryngol 267:881–888
Meeus OM, Spaepen M, Ridder DD, Heyning PH (2010b) Correlation
between hyperacusis measurements in daily ENT practice. Int J
Audiol 49:7–13
Mirandola P, Gobbi G, Malinverno C, Carubbi C, Ferne FM, Artico
M, Vitale M, Vaccarezza M (2013) Impact of sulphurous water
politzer inhalation on audiometric parameters in children with
otitis media with effusion. Clin Exp Otorhinolaryngol 6:7–11
Moazami-Goudarzi M, Michels L, Weisz N, Jeanmonod D (2010)
Temporo-insular enhancement of EEG low and high frequencies
in patients with chronic tinnitus. QEEG study of chronic tinnitus
patients. BMC Neurosci 11:40
Moisset X, Bouhassira D (2007) Brain imaging of neuropathic pain.
Neuroimage 37(Suppl 1):S80–S88
Moller AR (2006) Neural plasticity in tinnitus. Prog Brain Res
157:365–372
Moller AR (2007a) Tinnitus and pain. Prog Brain Res 166:47–53
Moller AR (2007b) Tinnitus: presence and future. Prog Brain Res
166:3–16
Moller AR (2009) Plasticity diseases. Neurol Res 31:1023–1030
Mulert C, Jager L, Schmitt R, Bussfeld P, Pogarell O, Moller HJ,
Juckel G, Hegerl U (2004) Integration of fMRI and simultaneous
EEG: towards a comprehensive understanding of localization
and time-course of brain activity in target detection. Neuroimage
22:83–94
Nichols TE, Holmes AP (2002) Nonparametric permutation tests for
functional neuroimaging: a primer with examples. Hum Brain
Mapp 15:1–25
Nitschke JB, Sarinopoulos I, Mackiewicz KL, Schaefer HS, Davidson
RJ (2006) Functional neuroanatomy of aversion and its antic-
ipation. Neuroimage 29:106–116
Norena AJ, Moffat G, Blanc JL, Pezard L, Cazals Y (2010) Neural
changes in the auditory cortex of awake guinea pigs after two
1126 Brain Struct Funct (2014) 219:1113–1128
123

tinnitus inducers: salicylate and acoustic trauma. Neuroscience
166:1194–1209
O’Doherty JP (2004) Reward representations and reward-related
learning in the human brain: insights from neuroimaging. Curr
Opin Neurobiol 14:769–776
Pae JS, Kwon JS, Youn T, Park HJ, Kim MS, Lee B, Park KS (2003)
LORETA imaging of P300 in schizophrenia with individual MRI
and 128-channel EEG. Neuroimage 20:1552–1560
Pascual-Marqui RD (2002) Standardized low-resolution brain elec-
tromagnetic tomography (sLORETA): technical details. Methods
Find Exp Clin Pharmacol 24(Suppl D):5–12
Pascual-Marqui RD (2007) Instantaneous and lagged measurements
of linear and nonlinear dependence between groups of multi-
variate time series: frequency decomposition. Arxiv preprint
arXiv:07111455
Peyron R, Laurent B, Garcia-Larrea L (2000) Functional imaging of
brain responses to pain. A review and meta-analysis (2000).
Neurophysiol Clin 30:263–288
Pizzagalli DA, Oakes TR, Fox AS, Chung MK, Larson CL,
Abercrombie HC, Schaefer SM, Benca RM, Davidson RJ
(2004) Functional but not structural subgenual prefrontal cortex
abnormalities in melancholia. Mol Psychiatry 9(325):393–405
Raz N, Rodrigue KM (2006) Differential aging of the brain: patterns,
cognitive correlates and modifiers. Neurosci Biobehav Rev
30:730–748
Rolls ET (2004) The functions of the orbitofrontal cortex. Brain Cogn
55:11–29
Rolls ET, Grabenhorst F (2008) The orbitofrontal cortex and beyond:
from affect to decision-making. Prog Neurobiol 86:216–244
Rosen SD, Paulesu E, Frith CD, Frackowiak RS, Davies GJ, Jones T,
Camici PG (1994) Central nervous pathways mediating angina
pectoris. Lancet 344:147–150
Sadaghiani S, Hesselmann G, Kleinschmidt A (2009) Distributed and
antagonistic contributions of ongoing activity fluctuations to
auditory stimulus detection. J Neurosci 29:13410–13417
Sauseng P, Klimesch W (2008) What does phase information of
oscillatory brain activity tell us about cognitive processes?
Neurosci Biobehav Rev 32:1001–1013
Scharmuller W, Leutgeb V, Schafer A, Kochel A, Schienle A (2011)
Source localization of late electrocortical positivity during
symptom provocation in spider phobia: an sLORETA study.
Brain Res 1397:10–18
Schecklmann M, Landgrebe M, Poeppl TB, Kreuzer P, Manner P,
Marienhagen J, Wack DS, Kleinjung T, Hajak G, Langguth B
(2013) Neural correlates of tinnitus duration and distress: a positron
emission tomography study. Hum Brain Mapp 34(1):233–240
Schlee W, Hartmann T, Langguth B, Weisz N (2009) Abnormal
resting-state cortical coupling in chronic tinnitus. BMC Neurosci
10:11
Schlee W, Kleinjung T, Hiller W, Goebel G, Kolassa IT, Langguth B
(2011) Does tinnitus distress depend on age of onset? PLoS ONE
6:e27379
Sekihara K, Sahani M, Nagarajan SS (2005) Localization bias and
spatial resolution of adaptive and non-adaptive spatial filters for
MEG source reconstruction. Neuroimage 25:1056–1067
Sherlin L, Congedo M (2005) Obsessive-compulsive dimension
localized using low-resolution brain electromagnetic tomogra-
phy (LORETA). Neurosci Lett 387:72–74
Siepmann M, Kirch W (2002) Effects of caffeine on topographic
quantitative EEG. Neuropsychobiology 45:161–166
Song JJ, Choi HG, Oh SH, Chang SO, Kim CS, Lee JH (2009)
Unilateral sensorineural hearing loss in children: the importance
of temporal bone computed tomography and audiometric follow-
up. Otol Neurotol 30:604–608
Song JJ, De Ridder D, Van de Heyning P, Vanneste S (2012a)
Mapping tinnitus-related brain activation: an activation-
likelihood estimation metaanalysis of PET studies. J Nucl Med
53:1550–1557
Song JJ, Hong SK, Kim JS, Koo JW (2012b) Enlarged vestibular
aqueduct may precipitate benign paroxysmal positional vertigo
in children. Acta Otolaryngol 132(Suppl 1):S109–S117
Song JJ, De Ridder D, Schlee W, Van de Heyning P, Vanneste S
(2013a) ‘‘Distressed aging’’: the differences in brain activity
between early- and late-onset tinnitus. Neurobiol Aging
34:1853–1863
Song JJ, Punte AK, De Ridder D, Vanneste S, Van de Heyning P
(2013b) Neural substrates predicting improvement of tinnitus
after cochlear implantation in patients with single-sided deaf-
ness. Hear Res 299C:1–9
Sun W, Zhang L, Lu J, Yang G, Laundrie E, Salvi R (2008) Noise
exposure-induced enhancement of auditory cortex response and
changes in gene expression. Neuroscience 156:374–380
Sun W, Lu J, Stolzberg D, Gray L, Deng A, Lobarinas E, Salvi RJ
(2009) Salicylate increases the gain of the central auditory
system. Neuroscience 159:325–334
Sun W, Deng A, Jayaram A, Gibson B (2012) Noise exposure
enhances auditory cortex responses related to hyperacusis
behavior. Brain Res 1485:108–116
Turner JG, Parrish J (2008) Gap detection methods for assessing
salicylate-induced tinnitus and hyperacusis in rats. Am J Audiol
17:S185–S192
Vanneste S, Plazier M, der Loo E, de Heyning PV, Congedo M, De
Ridder D (2010a) The neural correlates of tinnitus-related
distress. Neuroimage 52:470–480
Vanneste S, Plazier M, van der Loo E, Van de Heyning P, De Ridder
D (2010b) The differences in brain activity between narrow band
noise and pure tone tinnitus. PLoS ONE 5:e13618
Vanneste S, Plazier M, van der Loo E, Van de Heyning P, De Ridder
D (2011a) The difference between uni- and bilateral auditory
phantom percept. Clin Neurophysiol 122:578–587
Vanneste S, van de Heyning P, De Ridder D (2011b) The neural
network of phantom sound changes over time: a comparison
between recent-onset and chronic tinnitus patients. Eur J
Neurosci 34:718–731
Vanneste S, Joos K, De Ridder D (2012) Prefrontal cortex based sex
differences in tinnitus perception: same tinnitus intensity, same
tinnitus distress, different mood. PLoS ONE 7:e31182
Varela F, Lachaux JP, Rodriguez E, Martinerie J (2001) The
brainweb: phase synchronization and large-scale integration.
Nat Rev Neurosci 2:229–239
Vernon JA (1987) Pathophysiology of tinnitus: a special case–
hyperacusis and a proposed treatment. Am J Otol 8:201–202
Vitacco D, Brandeis D, Pascual-Marqui R, Martin E (2002) Corre-
spondence of event-related potential tomography and functional
magnetic resonance imaging during language processing. Hum
Brain Mapp 17:4–12
Volkow ND, Logan J, Fowler JS, Wang GJ, Gur RC, Wong C, Felder
C, Gatley SJ, Ding YS, Hitzemann R, Pappas N (2000)
Association between age-related decline in brain dopamine
activity and impairment in frontal and cingulate metabolism. Am
J Psychiatry 157:75–80
Volpe U, Mucci A, Bucci P, Merlotti E, Galderisi S, Maj M (2007)
The cortical generators of P3a and P3b: a LORETA study. Brain
Res Bull 73:220–230
Volz KG, von Cramon DY (2009) How the orbitofrontal cortex
contributes to decision making—a view from neuroscience. Prog
Brain Res 174:61–71
Wagner M, Fuchs M, Kastner J (2004) Evaluation of sLORETA in the
presence of noise and multiple sources. Brain Topogr 16:277–
280
Weisz N, Moratti S, Meinzer M, Dohrmann K, Elbert T (2005)
Tinnitus perception and distress is related to abnormal
Brain Struct Funct (2014) 219:1113–1128 1127
123

spontaneous brain activity as measured by magnetoencephalog-
raphy. PLoS Med 2:e153
Weisz N, Muller S, Schlee W, Dohrmann K, Hartmann T, Elbert T
(2007) The neural code of auditory phantom perception.
J Neurosci 27:1479–1484
Weisz N, Hartmann T, Muller N, Lorenz I, Obleser J (2011) Alpha
rhythms in audition: cognitive and clinical perspectives. Front
Psychol 2:73
White DJ, Congedo M, Ciorciari J, Silberstein RB (2012) Brain
oscillatory activity during spatial navigation: theta and gamma
activity link medial temporal and parietal regions. J Cogn
Neurosci 24:686–697
Witting N, Kupers RC, Svensson P, Arendt-Nielsen L, Gjedde A,
Jensen TS (2001) Experimental brush-evoked allodynia activates
posterior parietal cortex. Neurology 57:1817–1824
Witting N, Kupers RC, Svensson P, Jensen TS (2006) A PET
activation study of brush-evoked allodynia in patients with nerve
injury pain. Pain 120:145–154
Woodhouse A, Drummond PD (1993) Mechanisms of increased
sensitivity to noise and light in migraine headache. Cephalalgia
13:417–421
Worrell GA, Lagerlund TD, Sharbrough FW, Brinkmann BH,
Busacker NE, Cicora KM, O’Brien TJ (2000) Localization of
the epileptic focus by low-resolution electromagnetic
tomography in patients with a lesion demonstrated by MRI.
Brain Topogr 12:273–282
Wright P, Albarracin D, Brown RD, Li H, He G, Liu Y (2008)
Dissociated responses in the amygdala and orbitofrontal cortex
to bottom-up and top-down components of emotional evaluation.
Neuroimage 39:894–902
Zeng FG (2013) An active loudness model suggesting tinnitus as
increased central noise and hyperacusis as increased nonlinear
gain. Hear Res 295:172–179
Zumsteg D, Wennberg RA, Treyer V, Buck A, Wieser HG (2005)
H2(15)O or 13NH3 PET and electromagnetic tomography
(LORETA) during partial status epilepticus. Neurology 65:
1657–1660
Zumsteg D, Lozano AM, Wennberg RA (2006a) Depth electrode
recorded cerebral responses with deep brain stimulation of the
anterior thalamus for epilepsy. Clin Neurophysiol 117:1602–
1609
Zumsteg D, Lozano AM, Wennberg RA (2006b) Mesial temporal
inhibition in a patient with deep brain stimulation of the anterior
thalamus for epilepsy. Epilepsia 47:1958–1962
Zumsteg D, Lozano AM, Wieser HG, Wennberg RA (2006c) Cortical
activation with deep brain stimulation of the anterior thalamus
for epilepsy. Clin Neurophysiol 117:192–207
1128 Brain Struct Funct (2014) 219:1113–1128
123