Net growth rates of picocyanobacteria and nano- microphytoplankton inhabiting shelf waters of the...
16
AQUATIC MICROBIAL ECOLOGY Aquat Microb Ecol Vol. 24: 209–224, 2001 Published July 18 INTRODUCTION Planktonic primary productivity of oceans and seas, as C fixed per unit volume or area, is increasingly dom- inated by autotrophic picoplankton, particularly pico- cyanobacteria, as systems tend towards oligotrophy (Agawin et al. 2000). As nutrients increase within the water column, however, larger phytoplankton, particu- larly diatoms, are observed to increase their relative contribution to primary productivity (e.g. Mousseau et al. 1996, Furnas & Mitchell 1997, Velduis et al. 1997). While these patterns in primary productivity have been consistently observed, providing important clues on the processes underlying phytoplankton dynamics, direct estimates of in situ growth rates are often lack- ing or, if available, are low in biological information, due to the poor taxonomic resolution of the method(s) used to measure growth (see reviews by Furnas 1990, Furnas & Crosbie 1999). Estimates of in situ growth rates are particularly important in ecological studies because individual phytoplankton cells usually quickly convert increases in the biomass resulting from photo- synthesis to an increase in cell numbers through cell division (Furnas 1990). Phytoplankton growth rates therefore have a direct bearing on the rate at which phytoplankton biomass is channelled to higher trophic © Inter-Research 2001 *Present address: Institute for Limnology, Austrian Academy of Sciences, Gaisberg 116, 5310 Mondsee, Austria. E-mail: [email protected] Net growth rates of picocyanobacteria and nano-/ microphytoplankton inhabiting shelf waters of the central (17° S) and southern (20° S) Great Barrier Reef Nicholas D. Crosbie*, Miles J. Furnas Australian Institute of Marine Science, PMB. No. 3, Townsville M.C., Townsville 4810, Australia and Cooperative Research Centre for Ecologically Sustainable Development of the Great Barrier Reef, James Cook University, Townsville 4811, Australia ABSTRACT: Growth rates of diffusion cultures of nano- and microphytoplankton from Great Barrier Reef shelf water, especially diatoms (μ max = 3.2 doublings d –1 ), exceeded those of picocyanobacteria (Prochlorococcus and Synechococcus) when DIN (NH 4 + + NO 2 – + NO 3 – ) concentrations were ≥ 0.05 μM. The picocyanobacteria (μ max = 1.1 and 1.6 doublings d –1 for Prochlorococcus and Synechococcus respectively) achieved higher relative and absolute growth rates when time-averaged DIN concen- trations were < 0.05 μM. Most estimates (71%) of in situ growth rates of nano-/microphytoplankton were ≤ 0.25 of μ max when DIN concentrations were < 0.1 μM, while only 18% of in situ picocyanobac- teria growth rates were ≤ 0.25 of μ max when DIN concentrations were < 0.1 μM, the majority being ≥ 0.50 of μ max at such DIN concentrations. Thus growth rates of Synechococcus and Prochlorococcus populations did not appear to be significantly nutrient (nitrogen)-limited under ambient concentra- tions, and were of similar order to those measured in the equatorial Pacific Ocean, where NO 3 – con- centrations (> 2 μM) are far above growth-saturating levels, and in the oligotrophic North Pacific Gyre. In contrast, for those nano-/microphytoplankton for which in situ or simulated in situ growth rates were estimated, growth rates appeared to be nitrogen-limited at DIN concentrations < 0.1 μM. The results provide further support for the hypothesis that picocyanobacteria dominate oligotrophic marine water columns because of their superior ability to grow at low nutrient concentrations. KEY WORDS: Synechococcus · Prochlorococcus · Tropical nano-/microphytoplankton · Growth rates Resale or republication not permitted without written consent of the publisher
-
Upload
independent -
Category
Documents
-
view
2 -
download
0
Transcript of Net growth rates of picocyanobacteria and nano- microphytoplankton inhabiting shelf waters of the...

AQUATIC MICROBIAL ECOLOGYAquat Microb Ecol
Vol. 24: 209–224, 2001 Published July 18
INTRODUCTION
Planktonic primary productivity of oceans and seas,as C fixed per unit volume or area, is increasingly dom-inated by autotrophic picoplankton, particularly pico-cyanobacteria, as systems tend towards oligotrophy(Agawin et al. 2000). As nutrients increase within thewater column, however, larger phytoplankton, particu-larly diatoms, are observed to increase their relativecontribution to primary productivity (e.g. Mousseau etal. 1996, Furnas & Mitchell 1997, Velduis et al. 1997).
While these patterns in primary productivity havebeen consistently observed, providing important clueson the processes underlying phytoplankton dynamics,direct estimates of in situ growth rates are often lack-ing or, if available, are low in biological information,due to the poor taxonomic resolution of the method(s)used to measure growth (see reviews by Furnas 1990,Furnas & Crosbie 1999). Estimates of in situ growthrates are particularly important in ecological studiesbecause individual phytoplankton cells usually quicklyconvert increases in the biomass resulting from photo-synthesis to an increase in cell numbers through celldivision (Furnas 1990). Phytoplankton growth ratestherefore have a direct bearing on the rate at whichphytoplankton biomass is channelled to higher trophic
© Inter-Research 2001
*Present address: Institute for Limnology, Austrian Academyof Sciences, Gaisberg 116, 5310 Mondsee, Austria.E-mail: [email protected]
Net growth rates of picocyanobacteria and nano-/microphytoplankton inhabiting shelf waters of the
central (17°S) and southern (20°S) Great Barrier Reef
Nicholas D. Crosbie*, Miles J. Furnas
Australian Institute of Marine Science, PMB. No. 3, Townsville M.C., Townsville 4810, Australiaand
Cooperative Research Centre for Ecologically Sustainable Development of the Great Barrier Reef, James Cook University, Townsville 4811, Australia
ABSTRACT: Growth rates of diffusion cultures of nano- and microphytoplankton from Great BarrierReef shelf water, especially diatoms (µmax = 3.2 doublings d–1), exceeded those of picocyanobacteria(Prochlorococcus and Synechococcus) when DIN (NH4
+ + NO2– + NO3
–) concentrations were ≥0.05 µM.The picocyanobacteria (µmax = 1.1 and 1.6 doublings d–1 for Prochlorococcus and Synechococcusrespectively) achieved higher relative and absolute growth rates when time-averaged DIN concen-trations were <0.05 µM. Most estimates (71%) of in situ growth rates of nano-/microphytoplanktonwere ≤0.25 of µmax when DIN concentrations were <0.1 µM, while only 18% of in situ picocyanobac-teria growth rates were ≤0.25 of µmax when DIN concentrations were <0.1 µM, the majority being≥0.50 of µmax at such DIN concentrations. Thus growth rates of Synechococcus and Prochlorococcuspopulations did not appear to be significantly nutrient (nitrogen)-limited under ambient concentra-tions, and were of similar order to those measured in the equatorial Pacific Ocean, where NO3
– con-centrations (>2 µM) are far above growth-saturating levels, and in the oligotrophic North PacificGyre. In contrast, for those nano-/microphytoplankton for which in situ or simulated in situ growthrates were estimated, growth rates appeared to be nitrogen-limited at DIN concentrations <0.1 µM.The results provide further support for the hypothesis that picocyanobacteria dominate oligotrophicmarine water columns because of their superior ability to grow at low nutrient concentrations.
KEY WORDS: Synechococcus · Prochlorococcus · Tropical nano-/microphytoplankton · Growth rates
Resale or republication not permitted without written consent of the publisher

Aquat Microb Ecol 24: 209–224, 2001
levels. As such, phytoplankton growth rates measuredunder existing conditions can be used to predictchanges to phytoplankton standing stocks and primaryproductivity that might occur following increasednutrient concentrations and other changes to growthconditions. Bulk biochemical measurements provideone estimation of production, but cells, rather than car-bon per se, are the major currency of phytoplankton-based food webs (Banse 1992, 1994). Additionally, theextrapolation of biochemical measurements to phyto-plankton growth rates is notoriously difficult and theresulting estimates can be substantially different fromthe true in situ growth rates (Furnas 1990).
Picocyanobacteria- and diatom-based food chainsco-exist in shelf waters of the Great Barrier Reef (GBR),but their relative importance varies in time and space(Furnas & Mitchell 1997). Resident phytoplankton pop-ulations have the capacity to develop significantblooms within 1 to 2 d when significant amounts ofnutrients, particularly nitrogen, are introduced intoshelf waters (Furnas & Mitchell 1997). During themonths of monsoonal rainfall (November–April), theGBR shelf system may experience broad-scale, ele-vated water column nutrient concentrations (morethan 10 times greater than ‘normal’) associated withcyclonically generated resuspension of shelf sediments(e.g. after cyclone ‘Winifred’, 1986) and very large run-off or monsoonal rainfall (e.g. after cyclone ‘Joy’, 1991)(Furnas & Mitchell 1997). Although such elevatednutrient concentrations are short-lived (days to weeks,Liston 1990, Jokiel et al. 1993), the nutrients, particu-larly nitrogen and phosphorus, are rapidly taken up byphytoplankton in the lagoon, resulting in significantphytoplankton blooms (2- to 5-fold increase) overbroad areas (103 to 104 km2) (Brodie & Furnas 1996).These and other phytoplankton blooms, resulting fromsignificant nutrient input events such as shelf-breakupwelling (Furnas & Mitchell 1986), are characteristi-cally dominated by diatoms (>10 µm size fraction, Rev-elante & Gilmartin 1982, Furnas & Mitchell 1986),which are the preferred food of herbivorous copepodsand planktonic larvae. Enhancements of diatom andzooplankton production resulting from upwelling,flood or cyclonic disturbance events are thereforelikely to be important to the growth and survival ofplanktonic larvae, reef fish and other organisms. In theabsence of significant nutrient input events, picophyto-plankton (principally picocyanobacteria) dominate GBRshelf waters, accounting for 37 to 99% of integratedwater column primary production and frequently>50% of the chlorophyll standing stock (Furnas &Mitchell 1986, 1987). Benthic and pelagic consumersmay gain significant nutrition by direct consumption ofpicocyanobacteria prey (e.g. Ayukai 1995) or consump-tion of prey (e.g. ciliates) that feed on picocyanobacte-
ria cells (e.g. Sorokin 1994, Ferrier-Pages & Gattuso1998).
Prior to the commencement of this work, few esti-mates were available on the in situ growth rates ofGBR phytoplankton (Furnas 1989, 1991, Ayukai 1992).Previous studies, using diffusion chamber techniquesto estimate in situ growth rates of phytoplankton inGBR shelf waters (Furnas 1989, 1991), concluded thatdiatoms rather than picocyanobacteria, should con-sistently dominate phytoplankton blooms developingafter short-term nutrient input events, because of theirhigher growth potentials. In this study, we used dif-fusion chambers to simultaneously estimate in situgrowth rates of GBR picocyanobacteria and nano-/microphytoplankton under comparable growth condi-tions. Growth rates at the species, genus, and popula-tion levels were estimated from changes in cell con-centrations in diffusion chambers incubated under lownutrient concentrations typical of non-perturbed con-ditions in shelf waters of the central and southern GBR,and also under enhanced nitrogen and phosphorusconcentrations typical of upwelling, flood or cyclonicdisturbance events. By this approach, we found evi-dence in support of the hypothesis that in situ growthof GBR Synechococcus and Prochlorococcus popula-tions are not significantly nutrient (nitrogen)-limitedunder ambient concentrations, and are of similar orderto those measured in the equatorial Pacific Ocean,where NO3
– concentrations (>2 µM) are far abovegrowth-saturating levels, and in the oligotrophic NorthPacific Gyre. In contrast, our data suggest that growthrates of nano-/microphytoplankton under ‘normal’(<0.1 µM) GBR shelf water nutrient concentrations aretypically nutrient-limited. Of those nano-/microphyto-plankton for which in situ or simulated in situ growthrates were estimated, growth rates appeared to benitrogen-limited at DIN (= NH4
+ + NO2– + NO3
–) con-centrations <0.1 µM.
METHODS
Study sites. Phytoplankton growth experiments inthe central Great Barrier Reef (GBR) were conductedat inshore sites (Double Island: 16° 42’ S, 145° 41’ E), mid-shelf sites (Green Island: 16° 43’ S, 145° 59’ E), and outer-shelf sites (Euston Reef: 16° 45’ S, 146° 16’ E; NormanReef: 16° 23’ S, 146° 01’ E; Fig. 1). In the southern GBR,growth experiments were carried out at an outer shelfsite in the Pompey Reefs complex (Reef 20-345: 20° 46’ S,150° 53’ E) (Fig. 2).
Inocula. Inocula for diffusion culture experimentswere collected from incubation sites at 5 to 10 m depthwith an acid-cleaned (0.6 M AR-grade HCl) Niskin bot-tle. Shortly after collection, the inoculum sample was
210

Crosbie & Furnas: Picocyanobacteria and nano-/microphytoplankton growth
gently prescreened (Dodson & Thomas1964) to reduce grazer populations.Nano-/microphytoplankton inocula wereprepared by reverse flow gravity filtra-tion (Dodson & Thomas 1964) throughnylon mesh filters (10 or 35 µm). Pico-cyanobacteria inocula were prepared byreverse flow gravity filtration throughPoretics® polycarbonate membrane fil-ters with 1 or 2 µm pore diameters, or bygentle vacuum filtration through Poret-ics® polycarbonate membrane filterswith 0.6 or 1 µm pore diameters. Pressureheads during the preparation of inoculaby reverse flow gravity filtration and vac-uum filtration were always <0.4 kPa. In-ocula were prepared under subduedlight, after which aliquots (ca 67 to
211
16oS
17oS
Cairns
Cape Grafton
Coral Sea
Norman Reef
Green Island
Euston Reef
Grafto
nPa
ssage
146oE
Low Isles
Cape Tribulation
Double Island
N
Trinity Opening
100m
Fig. 1. Central Great Barrier Reef (GBR)region showing shelf sites where phytoplank-ton growth experiments were conducted(‘Norman Reef’ site, 16° 23’ S, 146° 01’ E;depth ≈ 50 m. ‘Euston Reef’ site, 16° 45’ S,146° 16’ E; depth ≈ 50 m. ‘Double Island’ site,16° 42’ S, 145° 41’ E; depth ≈ 15 m. ‘GreenIsland’ site, 16° 43’ S, 145° 59’ E; depth ≈ 50 m)
N
Mackay
20-345
Coral SeaWhitsunday Island
Pompey Reef
149°E 150°E 151°E
20°S
21°S
Fig. 2. Southern GBR region showing outer shelf site ‘Reef 20-345’ (20° 46’ S, 150° 53’ E; depth ≈ 50 m) where phytoplankton growth experiments were conducted

Aquat Microb Ecol 24: 209–224, 2001
650 ml, depending on diffusion chamber volume) weregently poured into the diffusion chambers, which wereincubated in situ or under simulated in situ conditions.Between 1 and 2 h elapsed between the collection of in-ocula and diffusion chamber deployment.
Diffusion chambers. The diffusion chambers used forin situ and simulated in situ phytoplankton growth ex-periments are based on those first described byMcFeeters & Stuart (1972) and later modified for phyto-plankton studies (Owens et al. 1977, Furnas 1982a,b).Three diffusion chamber designs were used (Fig. 3).Large and small chambers (Fig. 3A) used for in situ ex-periments were filled with nano-/microphytoplanktonand picocyanobacteria inocula respectively, while dif-fusion chambers used for simulated in situ incubations(‘shipboard’ chambers) were filled with both types ofinoculum. Large in situ chambers have a nominal vol-ume of 137 ml and were fitted with 147 mm (filter diam-eter) 0.4 µm (pore diameter) membranes. Small in situchambers have a nominal volume of 67 ml and were fit-ted with 90 mm 0.2 µm membranes. Both large andsmall in situ chambers have a nominal diffusive surfacearea to volume ratio of 1.57. Shipboard diffusion cham-bers (Fig. 3B) have a nominal volume of 650 ml and fea-ture a side port stoppered by a clear silicone rubberbung for syringe sub-sampling. Shipboard chamberswere fitted with 90 mm 0.2 µm membranes, and have adiffusive surface area to volume ratio of 0.16.
Attenuation of light by the body and containmentmembranes of diffusion chambers was determined byinserting a cosine quantum sensor (LI-190SA) througha slit in 1 membrane. Light supplied by cool-white flu-orescent tubes above chambers positioned as duringincubations was attenuated by ca 50% by large andsmall in situ chambers, and by ca 6% by shipboardchambers. Surface irradiance during incubations wasmeasured as described below.
Laboratory trials indicated that the internal PO43–
concentration in large or small in situ chambers ini-tially containing 1 mM PO4
3– was reduced by 50%within ca 1 h of being bathed in continuously stirreddeionized water. The time required for exchange ofhalf the PO4
3– in shipboard chambers was ca 5 h. Forcomparison, near-surface NH4
+ depletion times esti-mated from Redfield C:N ratios and 14C uptake rateshave previously been reported to be within the range 3to >10 h (Furnas & Mitchell 1984).
Potential intrusion or leakage of picocyanobacteriacells through diffusion chamber membranes waschecked by immersing chambers filled with twice-filtered (0.2 µm membranes) surface oceanic seawaterin unfiltered seawater containing Prochlorococcus cellsat an abundance of 6.12 × 10⁴ cells ml–1. After 48 himmersion, no Prochlorococcus cells were detected insamples taken from within the chambers and analysedby flow cytometry.
212
Fig. 3. (a) ‘Large’ (length = 17 cm) in situ diffusion chamber (adapted from Furnas 1991), (b) ‘shipboard’ diffusion chamber (length = 13.8 cm, width = 14.5 cm, height = 14.8 cm) with syringe-sampling port, and (c) in situ diffusion chamber mooring
(adapted from Furnas 1991)
a b c

Crosbie & Furnas: Picocyanobacteria and nano-/microphytoplankton growth
Before experiments, diffusion chambers were dis-mantled, washed with ‘phosphate-free’ laboratorydetergent, rinsed thoroughly with deionized (Super-Q)water, soaked for several days in 1 N trace-metal gradeHCl (Baker Instra-analyzed or Merck Suprapur),rinsed again with Super-Q, air-dried, reassembled,and stored in similarly cleaned polyethylene boxes.Fresh diffusive membranes were applied for eachexperiment. Between chamber filling and deploymentand after recovery, filled chambers were kept in poly-ethylene boxes full of seawater to cushion the diffusionmembranes from shocks and to prevent leakage ofchamber contents.
In situ phytoplankton growth experiments. Largeand small in situ diffusion chambers were suspendedin open water, at depths of up to 40 m, by clamping thechambers to a weighted mooring rope held taught by asub-surface buoy (Fig. 3C). Replicate chambers (2 or 3)were deployed, usually before 09:00 h for each incu-bation depth and inoculum prescreening treatment.Salinity, temperature, and irradiance at incubationdepths were measured once or twice per day by CTDcasts using a Seabird SBE25 CTD mounted with a Bio-spherical QSP–200 underwater scalar (4π) irradiancesensor, the output of which was referenced to the out-put from a surface irradiance sensor in order to obtainpercent surface irradiance.
Samples were taken at incubation depths for analy-sis of dissolved inorganic nutrients. These sampleswere filtered and frozen for later analysis (see below).At the end of each 1.5 to 2 d incubation period, themooring was recovered and the chambers brought onboard for end-of-experiment processing.
Simulated in situ phytoplankton growth experiments.Shipboard diffusion chambers (volume = 650 ml, seeFig. 3B) were suspended in grey polyethylene incu-bation tanks supplied with near-surface seawaterpumped continuously through PVC pipe, garden hoseand non-metallic fittings. Incubation tanks were acid-cleaned with 0.6 M AR-grade HCl and rinsed thor-oughly with Super-Q deionized water prior to eachcruise. The external plumbing and incubation tankswere always flushed with near-surface seawaterpumped from the incubation sites for at least 24 hbefore experiments were started. Ambient light reach-ing the diffusion chambers was attenuated by coveringthe incubation tanks with black shade cloth or, for‘dark controls’, totally eliminated by covering the incu-bation tanks with opaque black plastic. Water temper-atures in the incubation tanks were measured with amercury thermometer at least twice daily.
In 7 experiments, seawater pumped through incuba-tion tanks was enriched with ammonium and phospho-rus using a peristaltic pump which delivered a concen-trated mixture of NH4Cl and KH2PO4. In order to
minimise fluctuations in the supply of nutrients to theincubation tanks, the input of near-surface seawater tothe incubation tanks was controlled by means of aheader tank. The concentration of dissolved inorganicnutrients [NH4
+, NO2–, NO3
–, PO43–, Si(OH)4] in the
incubation tanks was determined from samples takenperiodically during the incubations and frozen for lateranalysis, or, for PO4
3– and NH4+, determined by manual
analysis of fresh samples (see below). Depending onavailable processing time, samples for manual analysiswere collected from the incubation tanks at up to 2-hourly intervals. At other times, especially duringrough sea conditions, only 2 or 3 samples were taken,spaced at regular intervals over the incubation period.
The simulated in situ growth experiments typicallycommenced before 9.00 h, usually at dawn. Samplesfor phytoplankton cell counts were collected from ship-board diffusion chambers at the beginning and end ofeach experiment, which were run for 1 to 1.5 d. Growthrates of picocyanobacteria incubated for a period of>1 d are given only in the case of Synechococcus, andresult from a single experiment conducted at aninshore location where time series data (Crosbie 1999)suggested that growth of the population was poorlysynchronized to the light-dark cycle.
Surface irradiance. Time-averaged daytime fluxes(µmol quanta m–2 s–1) during growth experiments werecalculated by averaging the trapezoidal integration(AREA.XFM transform, SigmaPlot® 4.0 for Windows®,SPSS Inc., 1997) of dawn-to-dusk (04:00 to 20:00 h)minute-averaged values from a 4π surface quantumsensor (Biospherical QSR–240) that had been cali-brated against a 2πquantum sensor (Li-Cor LS-190).
Dissolved inorganic nutrients. Concentrations ofNH4
+, NO2–, NO3
–, PO43–, and Si(OH)4 in frozen samples
were determined using a segmented flow analyzer(Treguer & LeCorre 1975). The lower limits of detectionfor analysis of dissolved inorganic nutrients by thismethod were 0.02 µM for NO2
–, NO3–, PO4
3–, 0.1 µM forNH4
+ (higher detection limit due to problems with con-tamination of stored samples; see Furnas & Brodie1996), and 0.3 µM for Si(OH)4 (Ryle et al. 1981).
For measurements of PO43– and NH4
+ concentrationsin fresh samples, duplicate 5 and 20 ml samples werecollected and processed immediately according to Par-sons et al. (1984) (for PO4
3–) and Solorzano (1969) (forNH4
+, using reagents modified from Dudek et al. 1986),respectively. After color development, absorbance wasmeasured on a Hitachi Spectrophotometer (1 cm cu-vette for PO4
3– analysis; 5 cm cuvette for NH4+ analy-
sis). The lower detection limit for the analysis of NH4+
was 0.02 µM (i.e. 3 × instrumental detection limit), and0.03 µM for the analysis of PO4
3– (Parsons et al. 1984).Flow cytometry. Duplicate or triplicate 3 ml samples
for flow-cytometric counts of picocyanobacteria were
213

Aquat Microb Ecol 24: 209–224, 2001
taken from inoculum samples, and from diffusionchambers at the end of each experiment. Sampleswere then treated with glutaraldehyde for 10 min(0.1% final conc.), stored in liquid nitrogen (Vaulot etal. 1989) for periods of generally <4 wk, then countedby flow cytometry as described below.
Samples were thawed in a water bath at 37°C justprior to cytometric analysis, then counted immediatelyon a Becton Dickinson FACScan flow cytometer. Theflow cytometer was equipped with an argon laser(power = 15 mW, at 488 nm). For each cell, 2 light scat-ter (side scatter and forward light scatter) and 3 fluo-rescence signals were recorded on 4-decade logarith-mic scales. The photomultipliers were set up toquantify: red fluorescence from chlorophyll (wave-length > 650 nm), orange fluorescence from phyco-erythrin (564–606 nm), and green fluorescence fromphycourobilin (515–545 nm).
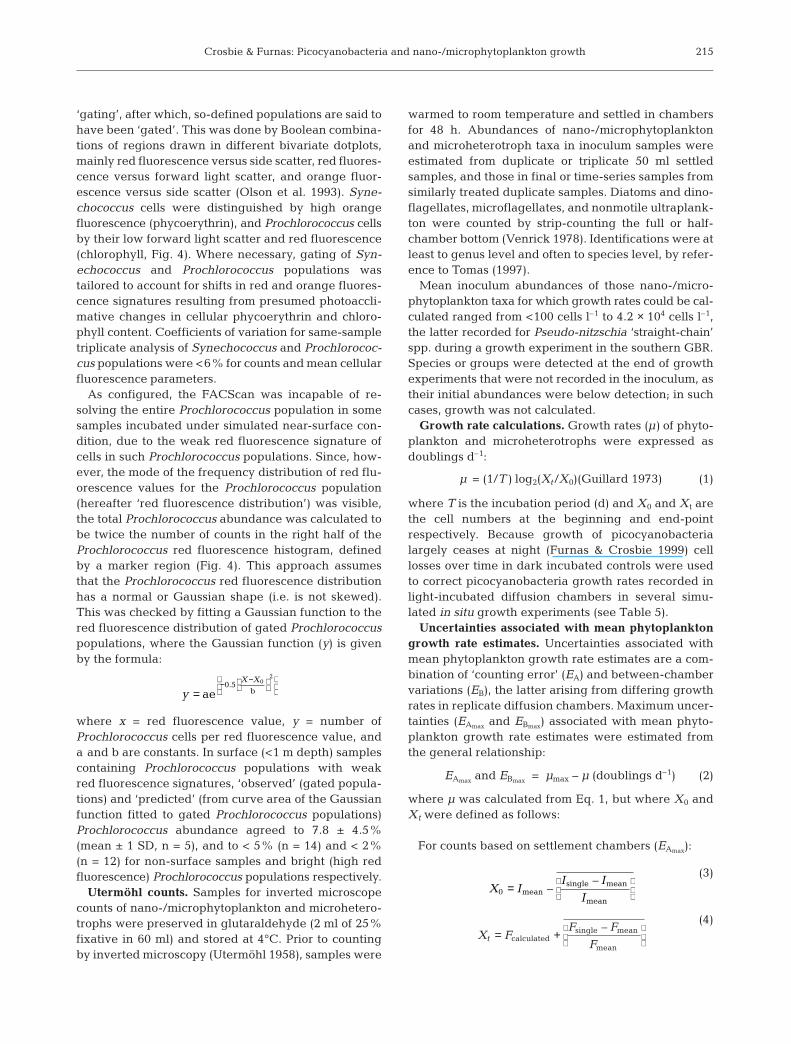
Procedures for flow cytometry generally followedthose of Olson et al. (1993). Instrument settings ap-propriate for the analysis of picocyanobacteria popula-tions in natural samples were chosen using GBR-derived cultures of Synechococcus and Prochlorococ-cus. Aged near-surface oceanic water filtered through0.2 µm polycarbonate filters was used as sheath fluid.Sheath fluid quality was checked periodically by run-ning blanks through the FACScan in the same manneras picocyanobacteria samples. Synechococcus and Pro-chlorococcus abundance were calculated by referenceto known additions of calibration grade, 0.92 µm yel-low-green fluorescent beads (FluoresbriteTM, Poly-sciences). Before and after running each sample set,flow rate was determined using a sample with a knownconcentration of beads. Working stock bead concen-tration was determined by the gravimetric method ofOlson et al. (1993). Samples were run on the flowcytometer until 20 000 events were recorded (typically100 to 150 µl of sample were analyzed). The resultingLYSYS II (Beckton Dickinson) data files were con-verted to DOS format with HP-READER (Verity Soft-ware House). The program MFI (E. Martz, Universityof Massachusetts) was used to convert file headerinformation to MS Excel (Microsoft Inc., Redmond)format. WinMDI flow cytometric analysis software(J. Trotter, BD PharMingen) was subsequently used todefine picocyanobacteria populations.
Using WinMDI, Synechococcus and Prochlorococcuspopulations were defined using a process known as
214
Fig. 4. Flow-cytometric ‘gating’ of picocyanobacteria popula-tions. (a,b) Synechococcus, Prochlorococcus, and calibrationgrade fluorescent YG microspheres (‘bead’ diameter =0.92 µm; FluoresbriteTM, Polysciences). (c) Frequency histo-gram of Prochlorococcus red fluorescence values. TotalProchlorococcus abundances calculated as twice the numberof counts in the right half of the red fluorescence distribution,
defined by a marker region (M1)
a
b
c
Crosbie & Furnas: Picocyanobacteria and nano-/microphytoplankton growth
‘gating’, after which, so-defined populations are said tohave been ‘gated’. This was done by Boolean combina-tions of regions drawn in different bivariate dotplots,mainly red fluorescence versus side scatter, red fluores-cence versus forward light scatter, and orange fluor-escence versus side scatter (Olson et al. 1993). Syne-chococcus cells were distinguished by high orangefluorescence (phycoerythrin), and Prochlorococcus cellsby their low forward light scatter and red fluorescence(chlorophyll, Fig. 4). Where necessary, gating of Syn-echococcus and Prochlorococcus populations wastailored to account for shifts in red and orange fluores-cence signatures resulting from presumed photoaccli-mative changes in cellular phycoerythrin and chloro-phyll content. Coefficients of variation for same-sampletriplicate analysis of Synechococcus and Prochlorococ-cus populations were <6% for counts and mean cellularfluorescence parameters.
As configured, the FACScan was incapable of re-solving the entire Prochlorococcus population in somesamples incubated under simulated near-surface con-dition, due to the weak red fluorescence signature ofcells in such Prochlorococcus populations. Since, how-ever, the mode of the frequency distribution of red flu-orescence values for the Prochlorococcus population(hereafter ‘red fluorescence distribution’) was visible,the total Prochlorococcus abundance was calculated tobe twice the number of counts in the right half of theProchlorococcus red fluorescence histogram, definedby a marker region (Fig. 4). This approach assumesthat the Prochlorococcus red fluorescence distributionhas a normal or Gaussian shape (i.e. is not skewed).This was checked by fitting a Gaussian function to thered fluorescence distribution of gated Prochlorococcuspopulations, where the Gaussian function (y) is givenby the formula:
where x = red fluorescence value, y = number ofProchlorococcus cells per red fluorescence value, anda and b are constants. In surface (<1 m depth) samplescontaining Prochlorococcus populations with weakred fluorescence signatures, ‘observed’ (gated popula-tions) and ‘predicted’ (from curve area of the Gaussianfunction fitted to gated Prochlorococcus populations)Prochlorococcus abundance agreed to 7.8 ± 4.5%(mean ± 1 SD, n = 5), and to < 5% (n = 14) and < 2%(n = 12) for non-surface samples and bright (high redfluorescence) Prochlorococcus populations respectively.
Utermöhl counts. Samples for inverted microscopecounts of nano-/microphytoplankton and microhetero-trophs were preserved in glutaraldehyde (2 ml of 25%fixative in 60 ml) and stored at 4°C. Prior to countingby inverted microscopy (Utermöhl 1958), samples were
warmed to room temperature and settled in chambersfor 48 h. Abundances of nano-/microphytoplanktonand microheterotroph taxa in inoculum samples wereestimated from duplicate or triplicate 50 ml settledsamples, and those in final or time-series samples fromsimilarly treated duplicate samples. Diatoms and dino-flagellates, microflagellates, and nonmotile ultraplank-ton were counted by strip-counting the full or half-chamber bottom (Venrick 1978). Identifications were atleast to genus level and often to species level, by refer-ence to Tomas (1997).
Mean inoculum abundances of those nano-/micro-phytoplankton taxa for which growth rates could be cal-culated ranged from <100 cells l–1 to 4.2 × 10⁴ cells l–1,the latter recorded for Pseudo-nitzschia ‘straight-chain’spp. during a growth experiment in the southern GBR.Species or groups were detected at the end of growthexperiments that were not recorded in the inoculum, astheir initial abundances were below detection; in suchcases, growth was not calculated.
Growth rate calculations. Growth rates (µ) of phyto-plankton and microheterotrophs were expressed asdoublings d–1:
µ = (1/T) log2(Xt/X0)(Guillard 1973) (1)
where T is the incubation period (d) and X0 and Xt arethe cell numbers at the beginning and end-pointrespectively. Because growth of picocyanobacterialargely ceases at night (Furnas & Crosbie 1999) celllosses over time in dark incubated controls were usedto correct picocyanobacteria growth rates recorded inlight-incubated diffusion chambers in several simu-lated in situ growth experiments (see Table 5).
Uncertainties associated with mean phytoplanktongrowth rate estimates. Uncertainties associated withmean phytoplankton growth rate estimates are a com-bination of ‘counting error’ (EA) and between-chambervariations (EB), the latter arising from differing growthrates in replicate diffusion chambers. Maximum uncer-tainties (EAmax and EBmax) associated with mean phyto-plankton growth rate estimates were estimated fromthe general relationship:
EAmax and EBmax = µmax – µ (doublings d–1) (2)
where µ was calculated from Eq. 1, but where X0 andXt were defined as follows:
For counts based on settlement chambers (EAmax):
(3)
(4)
X F
F F
Ft = +
calculated
single mean
mean
–
X I
I I
I0 =
mean
single mean
mean–
–
yX X
=− −
ae b0 5 0
2
.
215

Aquat Microb Ecol 24: 209–224, 2001
For counts based on flow-cytometric data (EAmax):
X0 = Imean – CVmean (5)
Xt = Fcalculated + CVmean (6)
For chamber errors (EBmax):
(7)
where Imean is the mean of duplicate or triplicate inocu-lum counts, and Fmean is the mean of duplicate finalcounts; Isingle and Fsingle are individual inoculum andfinal counts respectively; Fcalculated is an estimated finalcell abundance calculated using Eq. 1 assuming amean inoculum count, µmax (from Table 2) and a 2 dincubation; CVmean is the mean coefficient of variationfor triplicate flow-cytometric counts; Csingle are individ-ual chamber counts; Creplicate are means of replicatechambers counts.
RESULTS
A summary of conditions for growth of phtoplanktonin diffusion culture experiments is given in Table 1.
Nano-/microphytoplankton taxa and their abundance in growth experiments
A diverse range of nano-/microphytoplankters wereobserved in settled samples, including larger diatomtaxa such as Lioloma (individuals resembling L. deli-catulum and L. pacificum) and Thalassionema frauen-feldii (maximum length of ca 2 mm), which can passlengthwise as individual cells through pores in mem-branes with relatively small holes. Small (longest axis <
10 µm) solitary pennate diatoms resembling Naviculaand several capitate Nitzschia species were aggre-gated into 1 operational taxon, and referred to as ‘Navi-culoid’ diatoms. Several chain-forming species of thegenus Pseudo-nitzschia were frequently encountered.Pseudo-nitzschia cells were operationally classified asPseudo-nitzschia ‘straight-chain’ spp. or P. subcurvata.Cells identified as Thalassiosira spp. were generally<10 µm (longest axis), and solitary or joined by singlethreads into straight-chain colonies of 4 to 10 cells.Small hylachaete Chaetoceros spp. occurred in sam-ples, and at times exhibited rapid growth, but growthrates of individual species could not be reliably estab-lished because of difficulty in making consistent spe-cies identifications.
A number of dinoflagellate taxa were identified, in-cluding thecate and non-thecate taxa but, with theexception of several small (longest axis typically<20 µm) Gymnodinium spp., they were usually poorlypreserved. Coccolithophorids were also poorly pre-served, precluding growth rate estimates for thisgroup.
Maximum counting and between-chamber variabil-ity associated with nano-/microphytoplankton meangrowth rates ranged from 0.1 to 0.5 doublings d–1. Forpicocyanobacteria, maximum growth rate uncertain-ties associated with counting errors and between-chamber variability were ca 0.1 and 0.1 to 0.2 doub-lings d–1, respectively. Estimates of chamber errorswere generally lower for simulated in situ experimentsthan for in situ experiments with nano-/microphyto-plankton inocula, likely due to lower levels of environ-mental variability between replicate chamber deploy-ments. Total maximum uncertainties associated withsingle-chamber growth rate estimates (EAmax + EBmax)ranged from 0.4 to 0.9 doublings d–1 for nano-/micro-phytoplankton, and 0.3/0.2 doublings d–1 for Synecho-
X F
C C
Ct = +
calculated
single replicate
replicate
–
216
Table 1. Time-averaged nutrient concentrations and irradiances measured at incubation depths (in situ growth experiments) and in incubation tanks (shipboard growth experiments). *Median values given in parentheses
Type of Location of [NH4+] [DIN] [PO4
3–] [Si (OH)4] Irradiancegrowth experiment (µmol quantaexperiment
(µmol l–1)m–2 s–1)
In situ Central–inshore 0.02–0.07 (0.04) 0.03–0.09 (0.06) 0.01–0.02 (0.01) 3.92–10.57 (8.75) 175–852 (483)Central–offshore 0.02–0.03 (0.03) 0.05–0.07 (0.06) 0.01–0.02 (0.02) 1.26–2.10 (1.81) 76–698 (460)Southern GBR 0.01–0.40 (0.22) 0.02–0.41 (0.23) 0.01–0.03 (0.01) 0.19–2.40 (1.20) 17–232 (88)
Shipboard: Central–inshore 0.13–0.19 (0.15) 0.20–5.05 (4.24) 0.09–0.21 (0.11) 7.96–36.14 (31.63) 298–827 (429)Non- Central–offshore 0.32–0.98 (0.61) 1.23–5.26 (3.94) 0.04–0.26 (0.16) 9.38–35.38 (23.97) 339–418 (383)enriched Southern GBR 0.00–1.73 (0.69) 0.03–2.15 (0.86) 0.01–0.39 (0.12) 0.06–2.89 (1.63) 346–426 (381)
Shipboard: Central–inshore 7.22–13.87 (9.62) 12.08–16.37 (13.61) 0.09–0.76 (0.20) 7.96–36.14 (31.02) 298–412 (310)Nutrient- Central–offshore 5.90–31.62 (12.95) 6.15–36.56 (14.94) 0.26–6.53 (3.86) 9.38–35.38 (19.01) 339–403 (388)enriched Southern GBR 17.430 17.46 2.62 0.06 551
Crosbie & Furnas: Picocyanobacteria and nano-/microphytoplankton growth
coccus/Prochlorococcus respectively. For the nano-/microphytoplankton, these uncertainties were oftengreater than or equal to observed growth-rate meansand standard deviations, but were less than the ob-served growth-rate means and standard deviations inthe case of the picocyanobacteria. For paired compar-isons between nano-/microphytoplankton growth ratemeans derived from different prescreening treatments(see below), significant differences of 0.2 to 0.5 doub-lings d–1 would be detected with a power of 0.80(Cohen 1988).
Grazers and their abundance in growth experi-ments using nano-/microphytoplankton inocula
Favella-like tintinnids and Strombidium-likeoligotrichous ciliates in nano-/microphytoplank-ton inocula occurred at <100 cells l–1. Small het-erotrophic dinoflagellates and microflagellateswere occasionally observed, but may have beenunderestimated by poor preservation (Tomas1997) and the difficulty of distinguishing auto-trophic from heterotrophic forms (Lessard & Swift1986). Foraminifera, radiolarians, larvaceans, andcopepod nauplii were also occasionally observed,but always at ≤40 cells l–1.
Growth of nano-/microphytoplankton
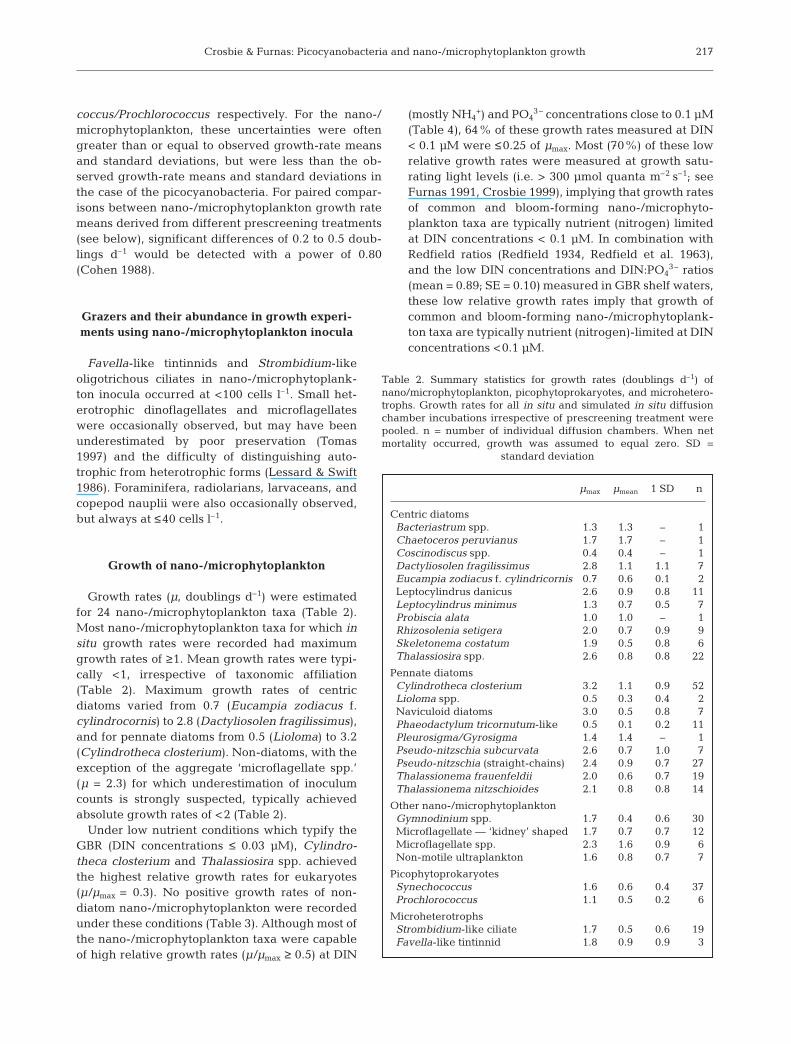
Growth rates (µ, doublings d–1) were estimatedfor 24 nano-/microphytoplankton taxa (Table 2).Most nano-/microphytoplankton taxa for which insitu growth rates were recorded had maximumgrowth rates of ≥1. Mean growth rates were typi-cally <1, irrespective of taxonomic affiliation(Table 2). Maximum growth rates of centricdiatoms varied from 0.7 (Eucampia zodiacus f.cylindrocornis) to 2.8 (Dactyliosolen fragilissimus),and for pennate diatoms from 0.5 (Lioloma) to 3.2(Cylindrotheca closterium). Non-diatoms, with theexception of the aggregate ‘microflagellate spp.’(µ = 2.3) for which underestimation of inoculumcounts is strongly suspected, typically achievedabsolute growth rates of <2 (Table 2).
Under low nutrient conditions which typify theGBR (DIN concentrations ≤ 0.03 µM), Cylindro-theca closterium and Thalassiosira spp. achievedthe highest relative growth rates for eukaryotes(µ/µmax = 0.3). No positive growth rates of non-diatom nano-/microphytoplankton were recordedunder these conditions (Table 3). Although most ofthe nano-/microphytoplankton taxa were capableof high relative growth rates (µ/µmax ≥ 0.5) at DIN
(mostly NH4+) and PO4
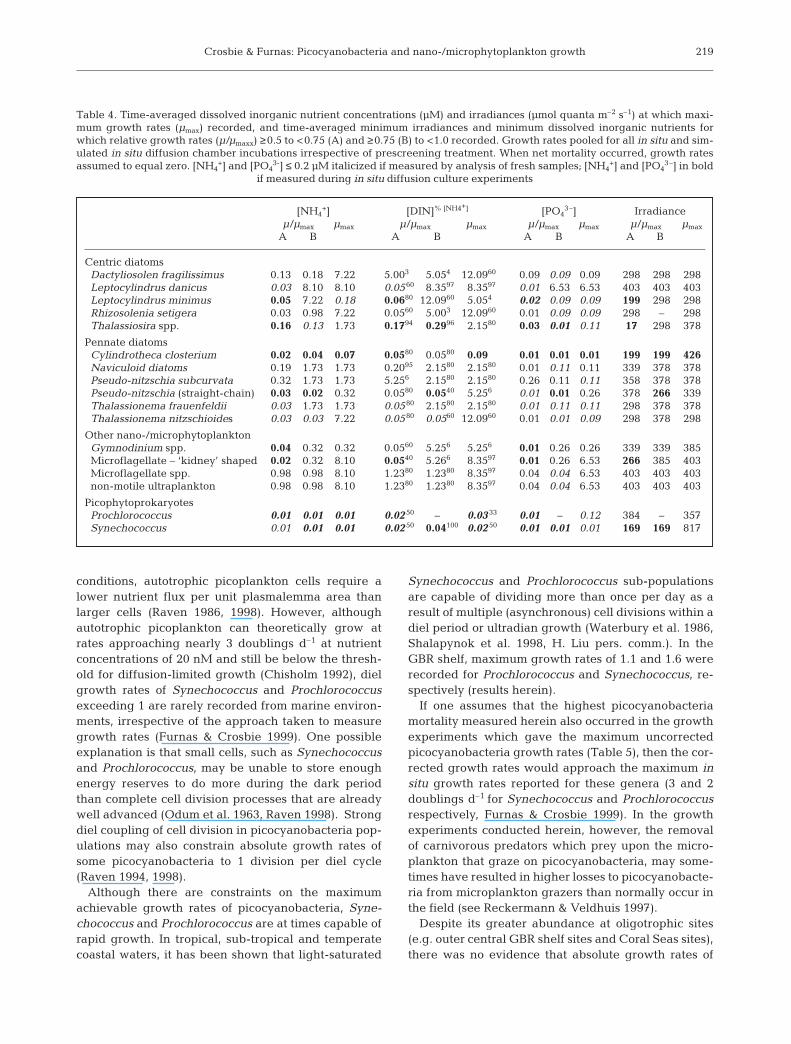
3– concentrations close to 0.1 µM(Table 4), 64% of these growth rates measured at DIN< 0.1 µM were ≤0.25 of µmax. Most (70%) of these lowrelative growth rates were measured at growth satu-rating light levels (i.e. > 300 µmol quanta m–2 s–1; seeFurnas 1991, Crosbie 1999), implying that growth ratesof common and bloom-forming nano-/microphyto-plankton taxa are typically nutrient (nitrogen) limitedat DIN concentrations < 0.1 µM. In combination withRedfield ratios (Redfield 1934, Redfield et al. 1963),and the low DIN concentrations and DIN:PO4
3– ratios(mean = 0.89; SE = 0.10) measured in GBR shelf waters,these low relative growth rates imply that growth ofcommon and bloom-forming nano-/microphytoplank-ton taxa are typically nutrient (nitrogen)-limited at DINconcentrations <0.1 µM.
217
Table 2. Summary statistics for growth rates (doublings d–1) of nano/microphytoplankton, picophytoprokaryotes, and microhetero-trophs. Growth rates for all in situ and simulated in situ diffusionchamber incubations irrespective of prescreening treatment werepooled. n = number of individual diffusion chambers. When netmortality occurred, growth was assumed to equal zero. SD =
standard deviation
µmax µmean 1 SD n
Centric diatomsBacteriastrum spp. 1.3 1.3 – 1Chaetoceros peruvianus 1.7 1.7 – 1Coscinodiscus spp. 0.4 0.4 – 1Dactyliosolen fragilissimus 2.8 1.1 1.1 7Eucampia zodiacus f. cylindricornis 0.7 0.6 0.1 2Leptocylindrus danicus 2.6 0.9 0.8 11Leptocylindrus minimus 1.3 0.7 0.5 7Probiscia alata 1.0 1.0 – 1Rhizosolenia setigera 2.0 0.7 0.9 9Skeletonema costatum 1.9 0.5 0.8 6Thalassiosira spp. 2.6 0.8 0.8 22
Pennate diatomsCylindrotheca closterium 3.2 1.1 0.9 52Lioloma spp. 0.5 0.3 0.4 2Naviculoid diatoms 3.0 0.5 0.8 7Phaeodactylum tricornutum-like 0.5 0.1 0.2 11Pleurosigma/Gyrosigma 1.4 1.4 – 1Pseudo-nitzschia subcurvata 2.6 0.7 1.0 7Pseudo-nitzschia (straight-chains) 2.4 0.9 0.7 27Thalassionema frauenfeldii 2.0 0.6 0.7 19Thalassionema nitzschioides 2.1 0.8 0.8 14
Other nano-/microphytoplanktonGymnodinium spp. 1.7 0.4 0.6 30Microflagellate — ‘kidney’ shaped 1.7 0.7 0.7 12Microflagellate spp. 2.3 1.6 0.9 6Non-motile ultraplankton 1.6 0.8 0.7 7
PicophytoprokaryotesSynechococcus 1.6 0.6 0.4 37Prochlorococcus 1.1 0.5 0.2 6
MicroheterotrophsStrombidium-like ciliate 1.7 0.5 0.6 19Favella-like tintinnid 1.8 0.9 0.9 3

Aquat Microb Ecol 24: 209–224, 2001
Visual examination of the data did not indicate anyobvious relationship between growth rates and eithertemperature or salinity within the relatively smallobserved ranges of these variables (26.0 to 29.1°C;33.71 to 35.56‰), although insufficient data precludedtesting such relationships statistically.
Growth and mortality of picocyanobacteria
Picocyanobacteria exhibited high absolute and rela-tive (>0.5 µmax) growth rates down to the lowest nutri-ent concentrations observed (Table 4). In experimentswhere positive growth rates were recorded, growthrates ranged from 0.3 to 1.1 for Prochlorococcus and0.2 to 1.6 for Synechococcus.
Grazing impact on picocyanobacteria appears tohave been reduced by prefiltering inocula throughmembranes with small pore diameters. In paired com-parisons, Synechococcus populations pre-screenedthrough membranes with a 1 µm pore diameterachieved 2.3 times higher mean growth rates than Syne-chococcus populations pre-screened through mem-branes with 2 µm diameters (t-test, p = 0.001, df = 5;mean µ = 0.7, 0.3 respectively). Synechococcus inocu-
lum populations prescreened through membranes with0.6 µm pore diameters achieved 3.5 times higher meangrowth rates than Synechococcus populations pre-screened through membranes with pore diameters of1 µm (t-test, p = 0.010, df = 6; mean µ = 0.7, 0.2 respec-tively).
Despite efforts to reduce grazing by prescreening,mortality nonetheless accounted for 42 to 140% of cor-rected picocyanobacteria growth rates achieved dur-ing simulated in situ growth experiments that incorpo-rated a ‘dark control’ (Table 5).
DISCUSSION
In comparison to nano-/microphytoplankton, highrelative growth rates (µ/µmax) of autotrophic picoplank-ton can be expected during oligotrophic conditionsbecause nutrient acquisition by large cells is limited bymolecular diffusion at the low nutrient concentrations(Fogg 1986, Raven 1986, 1998). The constraint on nu-trient acquisition imposed by diffusive boundary layersis much lower for a picoplankton-size cell than for anano- or, especially, a microplankton size cell. Toachieve a given fraction of µmax under nutrient limiting
218
Table 3. Maximum relative growth rates (µ/µmax) measured under time-averaged nutrient concentrations of <0.01, 0.01 to <0.1,0.1 to <1, and ≥1 µM NH4
+, DIN and PO43–. Growth rates for all in situ and simulated in situ diffusion chamber incubations irre-
spective of prescreening treatment were pooled. When net mortality occurred, growth rates were assumed to equal zero. Rela-tive growth rates italicized if [NH4
+] and [PO43–] ≤0.2 µM and fresh samples analysed. Relative growth rates in bold if measured
during in situ diffusion culture experiments. Corresponding [DIN] (in parentheses) given for maximum relative growth rates recorded under [NH4
+] and [DIN] categories <0.01 µM, and 0.01 to <0.1 µM respectively
[NH4+] [DIN] [PO4
3–]<0.01 0.01 0.1 ≥1 0.01 0.1 ≥1 <0.01 0.01 0.1 ≥1
to <0.1. to <1 to <0.1. to <1 to <0.1. to <1
Centric diatomsDactyliosolen fragilissimus 0.0 (0.02) – 0.8 1.0 0.0 (0.02) 0.8 1.0 0.0 1.0 0.2 –Leptocylindrus danicus – 0.5 0.6 1.0 0.5 (0.05) 0.6 1.0 0.5 0.6 – 0.5Leptocylindrus minimus 0.0 (0.02) 0.7 1.0 0.9 0.7 (0.06) 1.0 1.0 0.0 1.0 – –Rhizosolenia setigera 0.0 (0.02) 0.4 0.0 1.0 0.4 (0.05) 0.1 1.0 0.4 1.0 0.0 0.8Thalassiosira spp. 0.3 (0.02) 0.3 1.0 1.0 0.3 (0.05) 1.0 1.0 1.0 0.9 1.0 0.5
Pennate diatomsCylindrotheca closterium 0.3 (0.02) 0.9 0.9 0.8 0.9 (0.09) 0.9 0.8 0.8 1.0 0.0 0.8Naviculoid diatoms 0.1 (0.02) 0.1 0.4 1.0 0.1(0.05) 0.4 1.0 0.4 0.2 1.0 0.5Pseudo-nitzschia subcurvata 0.0 (0.02) – 0.6 1.0 0.1(0.05) 0.6 1.0 0.1 0.0 1.0 0.0Pseudo-nitzschia (straight-chain) 0.1 (0.02) 0.8 1.0 0.9 0.8 (0.05) 1.0 1.0 0.7 0.8 1.0 0.9Thalassionema frauenfeldii 0.1 (0.03) 0.5 0.6 0.9 0.5 (0.05) 0.6 1.0 0.5 0.7 1.0 0.0Thalassionema nitzschioides 0.1 (0.03) 0.9 0.5 1.0 0.9 (0.05) 0.5 1.0 1.0 1.0 0.9 0.0
Other nano-/microphytoplanktonGymnodinium spp. – 0.6 1.0 1.0 0.6 (0.05) 1.0 1.0 0.6 0.2 1.0 0.1Microflagellate – ‘kidney’ shaped – 0.7 0.9 1.0 0.7 (0.09) 0.9 1.0 – 0.7 0.9 1.0Microflagellate spp. – – 0.9 1.0 – 0.9 1.0 – 0.9 0.0 1.0non-motile ultraplankton – 0.0 0.8 1.0 0.0 (0.07) 0.8 1.0 – 0.8 – 1.0
PicophytoprokaryotesProchlorococcus 1.0 (0.02) 0.6 0.3 – 1.0 (0.02) 0.3 – 0.6 0.5 1.0 –Synechococcus 0.7 (0.02) 1.0 0.7 0.5 1.0 (0.02) 0.7 0.5 1.0 0.8 0.6 0.4
Crosbie & Furnas: Picocyanobacteria and nano-/microphytoplankton growth
conditions, autotrophic picoplankton cells require alower nutrient flux per unit plasmalemma area thanlarger cells (Raven 1986, 1998). However, althoughautotrophic picoplankton can theoretically grow atrates approaching nearly 3 doublings d–1 at nutrientconcentrations of 20 nM and still be below the thresh-old for diffusion-limited growth (Chisholm 1992), dielgrowth rates of Synechococcus and Prochlorococcusexceeding 1 are rarely recorded from marine environ-ments, irrespective of the approach taken to measuregrowth rates (Furnas & Crosbie 1999). One possibleexplanation is that small cells, such as Synechococcusand Prochlorococcus, may be unable to store enoughenergy reserves to do more during the dark periodthan complete cell division processes that are alreadywell advanced (Odum et al. 1963, Raven 1998). Strongdiel coupling of cell division in picocyanobacteria pop-ulations may also constrain absolute growth rates ofsome picocyanobacteria to 1 division per diel cycle(Raven 1994, 1998).
Although there are constraints on the maximumachievable growth rates of picocyanobacteria, Syne-chococcus and Prochlorococcus are at times capable ofrapid growth. In tropical, sub-tropical and temperatecoastal waters, it has been shown that light-saturated
Synechococcus and Prochlorococcus sub-populationsare capable of dividing more than once per day as aresult of multiple (asynchronous) cell divisions within adiel period or ultradian growth (Waterbury et al. 1986,Shalapynok et al. 1998, H. Liu pers. comm.). In theGBR shelf, maximum growth rates of 1.1 and 1.6 wererecorded for Prochlorococcus and Synechococcus, re-spectively (results herein).
If one assumes that the highest picocyanobacteriamortality measured herein also occurred in the growthexperiments which gave the maximum uncorrectedpicocyanobacteria growth rates (Table 5), then the cor-rected growth rates would approach the maximum insitu growth rates reported for these genera (3 and 2doublings d–1 for Synechococcus and Prochlorococcusrespectively, Furnas & Crosbie 1999). In the growthexperiments conducted herein, however, the removalof carnivorous predators which prey upon the micro-plankton that graze on picocyanobacteria, may some-times have resulted in higher losses to picocyanobacte-ria from microplankton grazers than normally occur inthe field (see Reckermann & Veldhuis 1997).
Despite its greater abundance at oligotrophic sites(e.g. outer central GBR shelf sites and Coral Seas sites),there was no evidence that absolute growth rates of
219
Table 4. Time-averaged dissolved inorganic nutrient concentrations (µM) and irradiances (µmol quanta m–2 s–1) at which maxi-mum growth rates (µmax) recorded, and time-averaged minimum irradiances and minimum dissolved inorganic nutrients forwhich relative growth rates (µ/µmaxx) ≥0.5 to <0.75 (A) and ≥0.75 (B) to <1.0 recorded. Growth rates pooled for all in situ and sim-ulated in situ diffusion chamber incubations irrespective of prescreening treatment. When net mortality occurred, growth rates assumed to equal zero. [NH4
+] and [PO43-] ≤ 0.2 µM italicized if measured by analysis of fresh samples; [NH4
+] and [PO43–] in bold
if measured during in situ diffusion culture experiments
[NH4+] [DIN]% [NH4+] [PO4
3–] Irradianceµ/µmax µmax µ/µmax µmax µ/µmax µmax µ/µmax µmax
A B A B A B A B
Centric diatomsDactyliosolen fragilissimus 0.13 0.18 7.22 5.003 5.054 12.0960 0.09 0.09 0.09 298 298 298Leptocylindrus danicus 0.03 8.10 8.10 0.05 60 8.3597 8.3597 0.01 6.53 6.53 403 403 403Leptocylindrus minimus 0.05 7.22 0.18 0.0680 12.0960 5.054 0.02 0.09 0.09 199 298 298Rhizosolenia setigera 0.03 0.98 7.22 0.0560 5.003 12.0960 0.01 0.09 0.09 298 – 298Thalassiosira spp. 0.16 0.13 1.73 0.1794 0.2996 2.1580 0.03 0.01 0.11 17 298 378
Pennate diatomsCylindrotheca closterium 0.02 0.04 0.07 0.0580 0.0580 0.09 0.01 0.01 0.01 199 199 426Naviculoid diatoms 0.19 1.73 1.73 0.2095 2.1580 2.1580 0.01 0.11 0.11 339 378 378Pseudo-nitzschia subcurvata 0.32 1.73 1.73 5.256 2.1580 2.1580 0.26 0.11 0.11 358 378 378Pseudo-nitzschia (straight-chain) 0.03 0.02 0.32 0.0580 0.0540 5.256 0.01 0.01 0.26 378 266 339Thalassionema frauenfeldii 0.03 1.73 1.73 0.05 80 2.1580 2.1580 0.01 0.11 0.11 298 378 378Thalassionema nitzschioides 0.03 0.03 7.22 0.0580 0.0560 12.0960 0.01 0.01 0.09 298 378 298
Other nano-/microphytoplanktonGymnodinium spp. 0.04 0.32 0.32 0.0560 5.256 5.256 0.01 0.26 0.26 339 339 385Microflagellate – ‘kidney’ shaped 0.02 0.32 8.10 0.0540 5.266 8.3597 0.01 0.26 6.53 266 385 403Microflagellate spp. 0.98 0.98 8.10 1.2380 1.2380 8.3597 0.04 0.04 6.53 403 403 403non-motile ultraplankton 0.98 0.98 8.10 1.2380 1.2380 8.3597 0.04 0.04 6.53 403 403 403
PicophytoprokaryotesProchlorococcus 0.01 0.01 0.01 0.02 50 – 0.03 33 0.01 – 0.12 384 – 357Synechococcus 0.01 0.01 0.01 0.02 50 0.04100 0.02 50 0.01 0.01 0.01 169 169 817

Aquat Microb Ecol 24: 209–224, 2001
Prochlorococcus were significantly greater than thoseof Synechococcus under oligotrophic conditions (DINconcentrations < 0.1 µM) (see Table 5). Liu et al. (1995)likewise found that Synechococcus can often grow athigher rates (µ = 1.6) than Prochlorococcus (µ = 1.0) atDIN concentrations as low as 0.02 µM. In oligotrophicwaters of the GBR, equatorial Pacific Ocean and NorthPacific Central Gyre, for which appropriate nutrientconcentration data are available (this study, JGOFSEqPac1 and HOT data archives2), both Synechococcusand Prochlorococcus exhibit high relative growth ratesat low (≤0.03 µM) concentrations of NH4
+ (Landry et al.1995a,b, Liu et al. 1995, 1997, Vaulot et al. 1995, resultsherein). In fact, in most settings, macronutrient avail-ability does not appear to strongly limit growth rates ofSynechococcus and Prochlorococcus (Furnas & Crosbie1999). For Synechococcus and Prochlorococcus in theequatorial Pacific Ocean, where NO3
– concentrations
(>2 µM) are far above growth-saturating levels(Landry et al. 1995a,b, Vaulot et al. 1995, Shalapyonoket al. 1998), in situ growth rates are of the same order asthose measured in the tropical shelf waters of the GBR(Furnas 1991, results herein) and in the oligotrophicNorth Pacific Gyre (e.g. Liu et al. 1995, 1997).
Estimation of phytoplankton growth rates in situunder the low nutrient concentrations that typicallyoccur in tropical waters requires that phytoplanktonremain in close chemical contact with surroundingwaters. This can be achieved by using diffusion culturetechniques (Sakshaug & Jensen 1978) where phyto-plankton are enclosed in permeable-membrane cham-bers. Growth can thus continue for periods longenough to average out, or measure, diurnal fluctua-tions in growth rates. Many phytoplankton incubatedin diffusion chambers have been shown to achievegrowth rates equal to, or in some cases greater than,those that have been recorded in batch or chemostatcultures (see review by Furnas 1990). Significantly, dif-fusion chambers deployed in low nutrient environ-
220
Table 5. Net and mortality-corrected (bold values, correction in parentheses) Prochlorococcus (Pro) and Synechococcus (Syn)growth rates (µ, doublings d–1) estimated from in situ (I) and simulated in situ (S) diffusion culture experiments. [NH4
+] and [DIN]concentrations (µM) and irradiances (µmol quanta m–2 s–1) time-averaged over period for which growth and grazing rates ex-pressed. Growth and mortality values mean of duplicate/triplicate chamber deployments, except where otherwise indicated. Re-sults pooled for in situ and simulated in situ experiments conducted in shelf waters near Double Island (CI), Green Island, Eustonand Norman Reefs (CO), or Reef 20-345 (So). Inocula prefiltered through polycarbonate membrane filters with pore diameters of0.6, 1, or 2 µm, or through nylon mesh filters with pore diametere of 10 µm. Incubations for 1.5 to 2 d. Growth and grazing rates
from simulated in situ incubations calculated for first diel period of incubation
Taxa Area Inoc. (µm) µ Light [NH4+] [DIN] °C Date I or S
Pro CI 1 0.3 852 0.07 0.09 – Apr 1996 IPro CO 1 1.0 (–1.4) 357 0.02 0.04 26.9 Nov 1995 SPro CO 2 0.4 76 0.06 0.09 27.1 Nov 1994 IPro CO 2 0.9 398 0.02 0.04 27.1 Nov 1995 IPro So 2 0.3 232 0.40 0.42 26.5 Feb 1996 ISyn CI 10 0.7a 622 0.40 0.42 26.1 Jun 1995 (A) SSyn CI 0.6 0.1a 600 0.40 0.42 26.1 Jun 1995 (A) SSyn CI 0.6 0.9a 373 0.40 0.42 26.1 Jun 1995 (A) SSyn CI 0.6 1.0a 360 0.40 0.42 26.1 Jun 1995 (A) SSyn CI 0.6 0.4a 404 0.40 0.42 26.1 Jun 1995 (A) SSyn CI 0.6 1.5 827 0.45 0.47 26.3 Jun 1995 (B) SSyn CI 0.6 0.5 496 0.45 0.47 26.3 Jun 1995 (B) SSyn CI 1 1.6 817 0.02 0.02 28.8 Apr 1995 SSyn CI 1 1.0 852 0.07 0.09 – Apr 1996 ISyn CO 1 0.7 (–0.4)a 406 0.02 7.50 26.5 Apr 1996 SSyn CO 1 0.5 (–0.3) 406 0.02 0.11 26.5 Apr 1996 SSyn CO 1 0.2 (–0.3) 357 0.02 0.04 26.9 Nov 1995 SSyn CO 2 1.2 521 0.02 0.04 26.8 Nov 1994 ISyn CO 2 1.2 169 0.04 0.04 26.4 Nov 1994 ISyn CO 2 0.6 76 0.06 0.09 27.1 Nov 1994 ISyn CO 2 1.0 398 0.02 0.04 27.1 Nov 1994 ISyn CO 10 1.0 521 0.04 0.04 26.8 Nov 1994 ISyn CO 10 0.3 169 0.04 0.04 26.4 Nov 1994 ISyn So 10 1.2 (–0.5) 551 0.02 0.04 28.0 Feb 1996 SSyn So 10 0.4 232 0.40 0.42 26.5 Feb 1996 I
aSingle chamber deployment
1http://ads.smr.uib.no/jgofs/Science/Regional/EP.htm2http://hahana.soest.hawaii.edu/hot/hot_jgofs.html

Crosbie & Furnas: Picocyanobacteria and nano-/microphytoplankton growth
ments have been shown to sustain high rates of phyto-plankton growth (Landry et al. 1984, Furnas 1989,1991, Ferrier-Pages & Gattuso 1998). The ratio of thesize of the transported nutrient to the pore size of thediffusion chamber membranes (e.g. 0.001 for PO4
3–)suggests that membrane hindrance of mass transport isprobably minimal (Deen et al. 1981, Deen 1987, Nakao1994). Any stirring would further weaken membrane-associated boundary layer resistance to solute convec-tion (Deen 1998). Transport of nutrients across the dif-fusion chamber membranes is therefore largelythrough entrainment in the bulk flow of water. Rela-tively efficient replacement of water within diffusionchambers (cf. bottles, dialysis bags) with outside watercan be expected to have minimized changes in nutri-ent availability caused by containment and prescreen-ing of the inocula in the growth experiments con-ducted herein. Nonetheless, further studies using, forexample, flow cytometric and/or molecular techniques(e.g. Gonzalez-Gil et al. 1998, La Roche et al. 1999,Scanlan & Wilson 1999) are needed to verify that thenutrient status of GBR phytoplankton grown withindiffusion chambers approaches that of GBR phyto-plankton growth under (non-contained) natural condi-tions.
This study provides evidence to support the predic-tions of Raven (1986, 1998) that marine picocyanobac-teria achieve higher relative and absolute growth ratesthan nano-/microphytoplankton when DIN concentra-tions are low (<0.05 µM). Our results extend previousstudies on the growth rates of GBR phytoplankton(Furnas 1989, 1991), which found no obvious differ-ence between the relative growth responses (µ/µmax) ofboth nano-/microphytoplankton and picocyanobacte-ria at DIN concentrations down to 0.1 µM. Although wepresent growth data for only a small proportion of thetotal number of nano-/microphytoplankton taxa thathave been recorded in GBR shelf waters (see Reve-lante & Gilmartin 1982, Hallegraeff & Jeffrey 1984), 16of the 24 nano-/microphytoplankton taxa (e.g. Cylin-drotheca closterium, Leptocylindrus danicus, Thalas-sionema nitzschioides) are important contributors tophytoplankton blooms arising from significant nutrientinput events in GBR shelf waters (Furnas & Mitchell1986, Furnas 1989). All are commonly observed in GBRshelf waters (Revelante & Gilmartin 1982, Furnas &Mitchell 1986, Furnas 1989).
As with picocyanobacteria, low nutrient concentra-tions do not prevent nano-/microphytoplankton intropical oligotrophic waters from achieving high ab-solute (µmax) and relative (µ/µmax) growth rates (Gold-man et al. 1979, Landry et al. 1984, Laws et al. 1984,1987, Furnas 1991). In fact, the results presentedherein show that common bloom-forming diatom taxahad the potential to grow at absolute rates exceeding
those of picocyanobacteria at DIN concentrations aslow as 0.05 µM.
Though most important GBR species or groups arecapable of high relative growth rates (µ/µmax > 0.5) atNH4
+ concentrations ≤0.1 µM and DIN concentrations≤0.2 µM (Furnas 1991, results herein), growth rates ofmost nano-/microphytoplankton taxa were apparentlynitrogen-limited for much of the time. Thus, 71% ofnano-/microphytoplankton growth rates estimatedfrom in situ growth experiments were ≤0.25 of µmax
when DIN concentrations were <0.1 µM. In compari-son, only 18% of picocyanobacteria growth rates esti-mated from in situ growth experiments were ≤0.25 ofµmax when DIN concentrations were <0.1 µM, themajority being ≥0.50 of µmax at these DIN concentra-tions. Even when nutrients were naturally or artificiallyelevated (e.g. DIN concentrations > 1 µM) relative totypical ambient concentrations (i.e. DIN concentrations< 0.1 µM), picocyanobacteria growth rates showed nosigns of being significantly stimulated.
Recurrent high growth rates of diatoms suggest thatprescreening was effective in relieving grazing pres-sure. Inocula prescreened through nylon mesh filterswith pore diameters of 10 µm generally containedfewer and smaller ciliates than inocula prescreenedthrough 35 µm nylon mesh filters. Given that ciliates,heterotrophic dinoflagellates and raptorial microflagel-lates were the most abundant grazers in nano-/micro-phytoplankton inocula, grazing pressures would prob-ably have been greatest on microflagellates andnon-motile ultraplankton (Hansen et al. 1997), butthere were insufficient data for a statistical compari-son of the growth rates of microflagellates and non-motile ultraplankton prescreened through the 10 and35 µm filters. No differences were found betweengrowth rates of Gymnodinium spp., Cylindrothecaclosterium, and Naviculoid diatoms prescreenedthrough the 10 and 35 µm filters (paired t-tests),implying that grazing of those taxa was either negligi-ble or at least similar for the 2 prescreening treat-ments. Since fewer micrograzers were present ininocula prescreened through the 10 µm filters, andthose present were typically smaller in size, the for-mer suggestion is the more likely.
Even under highly oligotrophic conditions (DIN ≤0.03 µM), small changes in nitrogen concentrations(10s of nanomoles) were enough to promote growth ofnano-/microphytoplankton over that of the picocyano-bacteria. According to steady-state diffusion calcula-tions of Chisholm (1992), however, a spherical cell ofradius 5 µm growing at 1 doubling d–1 should be diffu-sion-limited at nitrogen concentrations <0.1 µM. Sincethere is good evidence that nano-/microphytoplanktoncan achieve higher growth rates at DIN concentrations≤0.1 µM (Laws et al. 1984, 1987, Furnas 1991, results
221

Aquat Microb Ecol 24: 209–224, 2001
herein), how might these high growth rates beachieved at such low DIN concentrations?
Several ideas have been proposed to reconcile theco-occurrence of fast growth rates and low ambientnutrient concentrations, including saturating uptakerates (e.g. McCarthy 1980, Harrison et al. 1996), accessto small parcels of water where the concentration ofnutrients is considerably higher than in the rest of thewater column, as for example, due to micro(protozoan)-and macro(metazoan)-zooplankton excretion (McCarthy& Goldman 1979, Lehman & Scavia 1982a,b, Caron &Goldman 1990), or in association with ‘Marine snow’(flocs of detrital, bacterial and other organic matter, seeShanks & Trent 1980, Alldredge & Silver 1988). Addi-tionally, phytoplankton may supplement dissolvedinorganic nutrient uptake with uptake of dissolved or-ganic matter (see Antia et al. 1991, Palenik & Henson1997). Large zooplankton (e.g. copepods) and marinesnow would be most affective in supplying nutrientswhen they are in close proximity (10s of microns) tophytoplankton (Jackson 1980, Shanks & Trent 1980,Alldredge & Silver 1988). Due to the absence or lowabundance of large zooplankton and marine snowwithin diffusion chambers, these potential nutrientsources are unlikely to have contributed significantlyto the growth of phytoplankton in the diffusion cultureexperiments conducted herein.
Most high relative growth rates of phytoplankton atnanomolar DIN concentrations were recorded whenNH4
+ concentrations were ≥60% of DIN concentra-tions (Table 4), although NH4
+ is the most abundantinorganic nitrogen species in GBR surface waters atnanomolar DIN concentrations. Under certain condi-tions, the forms of inorganic nitrogen available tophytoplankton also influences achievable growth rates(Levasseur et al. 1993). When phytoplankton aregrown under saturating light conditions, highergrowth rates are achieved on an ammonium sourcethan a nitrate source (Levasseur et al. 1993). Preferen-tial storage of nitrate by larger phytoplankton, how-ever, can lead to higher growth rates of these phyto-plankton than is achievable on an ammonium source(Stolte 1996).
Acknowledgements. This manuscript forms part of a disserta-tion submitted in partial fulfilment of the requirements for thePhD degree at James Cook University of North Queensland.Comments by D. Griffiths and T. Weisse improved the manu-script. Funding and material support was provided by theAustralian Institute of Marine Science, James Cook Univer-sity of North Queensland, the Australian Coral Reef Society,and the Co-operative Research Center Program through theCo-operative Research Center for the Ecological Sustainabil-ity of the Great Barrier Reef. Shore-based analyses of dis-solved inorganic nutrients were conducted by Neil Johnsonand Jane Wu Won.
LITERATURE CITED
Agawin NSR, Duarte CM, Agusti S (2000) Nutrient and tem-perature control of the contribution of picoplankton tophytoplankton biomass and production. Limnol Oceanogr45:591–600
Alldredge A, Silver M (1988) Characteristics, dynamics, andsignificance of marine snow. Prog Oceanogr 20:41–82
Antia NJ, Harrison PJ, Oliveira L (1991) The role of dissolvedorganic nitrogen in phytoplankton nutrition, cell biologyand ecology. Phycologia 30:1–89
Ayukai T (1992) Picoplankton dynamics in Davies Reeflagoon, the Great Barrier Reef, Australia. J Plankton Res14:1593–1606
Ayukai T (1995) Retention of phytoplankton and planktonicmicrobes on coral reefs within the Great Barrier Reef, Aus-tralia. Coral Reefs 14:141–147
Banse K (1992) Grazing, temporal changes of phytoplanktonconcentrations, and the microbial loop in the open sea. In:Falkowski PG, Woodhead AD (eds) Primary productivityand biogeochemical cycles in the sea. Plenum, London,p 409–440
Banse K (1994) Grazing and zooplankton production as keycontrols of phytoplankton production in the open ocean.Oceanography 7:13–20
Berges JA, Falkowski PG (1998) Physiological stress and celldeath in marine phytoplankton: induction of proteases inresponse to nitrogen or light limitation. Limnol Oceanogr43:129–135
Brodie J, Furnas M (1996) Cyclones, river flood plumes andnatural water quality extremes in the Central Great Bar-rier Reef. In: Hunter HM, Eyles AG, Rayment GE (eds)Downstream effects of land use. Department of NaturalResources, Brisbane, p 367–374
Caron DA, Goldman JC (1990) Protozoan nutrient regenera-tion. In: Capriulo GM (ed) Ecology of marine protozoa.Oxford University Press, Oxford, p 283–306
Chisholm SW (1992) Phytoplankton size. In: Falkowski PG,Woodhead AD (eds) Primary productivity and biogeo-chemical cycles in the sea. Plenum, London, p 213–237
Cohen J (1988) Statistical power analysis for the behavioralsciences. Lawrence Erlbaum Associates, Hillsdale, NJ
Crosbie ND (1999) Environmental and ecological controls onpicophytoprokaryotes and nano-/microphytoplankton inshelf waters of the central (17° S) and southern (20° S)Great Barrier Reef. PhD thesis, James Cook University ofNorth Queensland
Deen WM (1987) Hindered transport of large molecules in liq-uid-filled pores. AICHE J 33:1409–1425
Deen WM (1998) Analysis of transport phenomena. OxfordUniversity Press, New York
Deen WM, Bohrer MP, Epstein NB (1981) Effects of molecularsize and configuration on diffusion in microporous mem-branes. AICHE J 27:952–959
Dodson AN, Thomas WH (1964) Concentrating plankton in agentle fashion. Limnol Oceanogr 9:455–456
Dudek N, Brzezinski M, Wheeler P (1986) Recovery of ammo-nium nitrogen by solvent extraction for the determinationof relative 15N abundance in regeneration experiments.Mar Chem 18:59–69
Ferrier-Pages C, Gattuso JP (1998) Biomass, production andgrazing rates of pico- and nanoplankton in coral reefwaters (Miyako, Japan). Microb Ecol 35:46–57
Fogg GE (1986) Picoplankton. Proc R Soc Lond B 228:1–30Furnas MJ (1982a) An evaluation of two diffusion culture
techniques for estimating phytoplankton growth rates insitu. Mar Biol 70:63–72
222

Crosbie & Furnas: Picocyanobacteria and nano-/microphytoplankton growth
Furnas MJ (1982b) Growth rates of summer nanoplankton(<10 µm) populations in Lower Narragansett Bay, RhodeIsland, USA. Mar Biol 70:105–115
Furnas MJ (1989) Cyclonic disturbance and a phytoplanktonbloom in a tropical shelf ecosytem. In: Okaichi, Anderson,Nemoto (eds) Red tides: biology, environmental science,and toxicology. Elsevier, Amsterdam, p 273–276
Furnas MJ (1990) In situ growth rates of marine phytoplank-ton: approaches to measurement, community and speciesgrowth rates. J Plankton Res 12:1117–1151
Furnas MJ (1991) Net in situ growth rates of phytoplanktonin an oligotrophic, tropical shelf ecosystem. LimnolOceanogr 36:13–29
Furnas MJ, Brodie J (1996) Current status of nutrient levelsand other water quality parameters in the Great BarrierReef. In: Hunter HM, Eyles AG, Rayment GE (eds) Down-stream effects of land use. Department of Natural Re-sources, Brisbane, p 9–21
Furnas MJ, Crosbie ND (1999) In situ growth dynamics ofphotosynthetic prokaryotic picoplankters Synechococcusand Prochlorococcus. In: Charpy L, Larkum AWD (eds)Marine cyanobacteria. Bulletin de l’Institut Océanograph-ique, Monaco, Spécial 19, p 387–417
Furnas MJ, Mitchell AW (1984) Phytoplankton productivitymeasurements in Palm Passage (central Great BarrierReef) during 1983. AIMS Data Rep. 05-84-2. AustralianInstitute of Marine Science, Townsville
Furnas MJ, Mitchell AW (1986) Phytoplankton dynamics inthe central Great Barrier Reef. I. Seasonal changes in bio-mass and community structure and their relation to intru-sive activity. Cont Shelf Res 6:363–384
Furnas MJ, Mitchell AW (1987) Phytoplankton dynamics inthe central Great Barrier Reef. II. Primary production.Cont Shelf Res 7:1049–1062
Furnas MJ, Mitchell AW (1997) Biological oceanography ofthe Great Barrier Reef. In: Proceedings of the Great Bar-rier Reef: Science, Use and Management National Confer-ence, Townsville, 25–29 November 1996. Great BarrierReef Marine Park Authority, Vol 1, p 75–87
Goldman JC, McCarthy JJ, Peavey DG (1979) Growth rateinfluence on the chemical composition of phytoplankton inoceanic waters. Nature 279:210–215
Gonzalez-Gil S, Keafer RVM, Jovine A, Aguilera A, Lu S,Anderson DM (1998) Detection and quantification of alka-line phosphatase in single cells of phosphorus-starvedmarine phytoplankton. Mar Ecol Prog Ser 164:21–35
Guillard RRL (1973) Division rates. In: Stein JR (ed) Handbookof phycological methods. Culture methods and growth meth-ods. Cambridge University Press, Cambridge, p 289–311
Hallegraeff GM, Jeffrey SW (1984) Tropical phytoplanktonspecies and pigments of continental shelf waters of northand north-west Australia. Mar Ecol Prog Ser 20:59–74
Hansen P, Bjornsen P, Hansen B (1997) Zooplankton grazingand growth: scaling within the 2–2000 micron body sizerange. Limnol Oceanogr 42:687–704
Harrison WG, Harris LR, Irwin BD (1996) The kinetics ofnitrogen utilization in the oceanic mixed layer: nitrate andammonium interactions at nanomolar concentrations.Limnol Oceanogr 41:16–32
Jackson GA (1980) Phytoplankton growth and zooplanktongrazing in oligotrophic oceans. Nature 284:439–440
Jokiel PL, Hunter CA, Taguchi S, Watarai L (1993) Ecologicalimpact of a fresh-water ‘reef kill’ in Kaneohe Bay, Hawaii.Coral Reefs 12:177–184
Landry MR, Haas LW, Fagerness VL (1984) Dynamics ofmicrobial plankton communities: experiments in KaneoheBay, Hawaii. Mar Ecol Prog Ser 16:127–133
Landry MR, Constantinou J, Kirshtein J (1995a) Microzoo-plankton grazing in the Central Equatorial Pacific duringFebruary and August, 1992. Deep-Sea Res II, Top StudOceanogr 42:657–671
Landry MR, Kirshtein J, Constantinou J (1995b) A refineddilution technique for measuring the community grazingimpact of microzooplankton, with experimental tests inthe central equatorial Pacific. Mar Ecol Prog Ser 120:53–63
La Roche J, McKay RML, Boyd P (1999) Immunological andmolecular probes to detect phytoplankton responses toenvironmental stress in nature. Hydrobiologia 401:177–198
Laws EA, Redalje DG, Haas LW, Bienfang PK, Eppley RW,Harrison WG, Karl DM, Marra J (1984) High phytoplank-ton growth and production rates in oligotrophic Hawaiiancoastal waters. Limnol Oceanogr 29:1161–1169
Laws EA, DiTullio GR, Redalje DG (1987) High phytoplank-ton growth and production rates in the North Pacific sub-tropical gyre. Limnol Oceanogr 32:905–917
Lehman JT, Scavia D (1982a) Microscale nutrient patchesproduced by zooplankton. Proc Natl Acad Sci USA 79:5001–5005
Lehman JT, Scavia D (1982b) Microscale patchiness of nutri-ents in plankton communities. Science 216:729–730
Lessard EJ, Swift E (1986) Dinoflagellates from the NorthAtlantic classified as phototrophic or heterotrophic by epi-fluorescence microscopy. J Plankton Res 8:1209–1215
Levasseur M, Thompson PA, Harrison PJ (1993) Physiologicalacclimation of marine phytoplankton to different nitrogensources. J Phycol 29:587–595
Liston PW (1990). Spatial variability and the co-variability ofchlorophyll and zooplankton on the Great Barrier Reef.PhD thesis, James Cook University of North Queensland
Liu H, Campbell L, Landry MR (1995) Growth and mortalityrates of Prochlorococcus and Synechococcus measuredwith a selective inhibitor technique. Mar Ecol Prog Ser116:277–287
Liu H, Nolla A, Campbell L (1997) Prochlorococcus growthrate and contribution to primary production in the equato-rial and subtropical North Pacific Ocean. Aquat MicrobEcol 12:39–47
McCarthy J (1980) Nitrogen. In: Morris I (ed) The physiologi-cal ecology of phytoplankton. Blackwell Science, Oxford,p 195–233
McCarthy JJ, Goldman JC (1979) Nitrogenous nutrition ofmarine phytoplankton in nutrient-depleted waters. Sci-ence 203:670–672
McFeeters GA, Stuart DG (1972) Survival of coliform bacteriain natural waters: field and laboratory studies with mem-brane filter chambers. Appl Microbiol 24:805–811
Mousseau L, Legendre L, Fortier L (1996) Dynamics of size-fractionated phytoplankton and trophic pathways on theScotian shelf and at the shelf break, northwest Atlantic.Aquat Microb Ecol 10:149–163
Nakao S (1994) Determination of pore size and pore sizedistribution 3. Filtration membranes. J Membr Sci 96:131–165
Odum HT, Beyers RJ, Armstrong NE (1963) Consequences ofsmall storage capacity in nanoplankton pertinent to mea-surement of primary production in tropical waters. J MarRes 21:191
Olson RJ, Zettler ER, Durand MD (1993) Phytoplanktonanalysis using flow cytometry. In: Kemp PF, Sherr BF, Sherr EB, Cole JJ (eds) Handbook of methods inaquatic microbial ecology. Lewis Publishers, Boca Raton, p 175–186
223

Aquat Microb Ecol 24: 209–224, 2001
Owens O, Dresler P, Crawford CC, Tyler MA, Seliger HH(1977) Phytoplankton cages for the measurement in situ ofthe growth rates of mixed natural populations. Chesa-peake Sci 18:325–333
Palenik B, Henson S (1997) The use of amides and otherorganic nitrogen sources by the phytoplankton Emilianiahuxleyi. Limnol Oceanogr 42:1544–1551
Parsons TR, Maita Y, Lalli CM (1984) A manual of chemicaland biological methods for seawater analysis. PergamonPress, Oxford
Raven JA (1986) Physiological consequences of extremelysmall size for autotrophic organisms in the sea. In: Plat T,Li WKW (eds) Photosynthetic picoplankton. Department ofFisheries and Oceans, Ottawa, p 1–70
Raven JA (1994) Why are there no picoplanktonic O2 evolverswith volumes less than 10–19 m3? J Plankton Res 16:565–580
Raven JA (1998) The twelfth Tansley lecture—small is beau-tiful—the picophytoplankton. Funct Ecol 12:503–513
Reckermann M, Veldhuis MJW (1997) Trophic interactionsbetween picophytoplankton and micro- and nanozoo-plankton in the western Arabian Sea during the NE mon-soon 1993. Aquat Microb Ecol 12:263–273
Revelante N, Gilmartin M (1982) Dynamics of phytoplank-ton in the Great Barrier Reef Lagoon. J Plankton Res 4:47–76
Ryle VD, Meuller HR, Gentian P (1981) Automated analysis ofnutrients in tropical seawater. Oceanography SeriesReport, AIMS-OS-82–2, Australian Institute of Marine Sci-ence, Townsville
Sakshaug E, Jensen A (1978) The use of cage cultures in stud-ies of the biochemistry and ecology of marine phytoplank-ton. Oceanogr Mar Biol Annu Rev 16:81–106
Scanlan DJ, Wilson WH (1999) Application of molecular tech-niques to addressing the role of P as a key effector inmarine ecosystems. Hydrobiologia 401:149–175
Shalapyonok A, Olson RJ, Shalapyonok LS (1998) Ultradiangrowth in Prochlorococcus spp. Appl Environ Microbiol64:1066–1069
Shanks A, Trent J (1980) Marine snow: sinking rates andpotential role in vertical flux. Deep-Sea Res 27A:137–143
Solorzano L (1969) Determination of ammonia in naturalwaters by the phenolhypochlorite method. LimnolOceanogr 14:799–801
Sorokin YI (1994) Role of plankton in the turnover of organicmatter on the Great Barrier Reef, Australia. Hydrobiologia308:35–44
Stolte W (1996) Size-dependent restrictions on competition fornutrients by marine phytoplankton. PhD thesis, Reijksuni-versitet, Groningen
Tomas CR (ed) (1997) Identifying marine phytoplankton. Aca-demic Press, San Diego
Treguer P, LeCorre P (1975) Manuel d’analyse des nutrififsdan l’eau de mer (Utilisation de l’Autoanalyzer II Techni-con). Laboratoire d’Oceanologie Chemistrie, University deBretagne Occidentale, Brest
Utermöhl H (1958) Zur Vervollkommnung der quantitativenphytoplankton-methodik. Mitt Int Ver Theor Angew Lim-nol 9:1–38
Vaulot D, Courties C, Partensky F (1989) A simple method topreserve oceanic phytoplankton for flow cytometric analy-ses. Cytometry 10:629–635
Vaulot D, Marie D, Olson RJ, Chisholm SW (1995) Growth ofProchlorococcus, a photosynthetic prokaryote, in theEquatorial Pacific Ocean. Science 268:1480–1482
Veldhuis MJW, Kraay GW, Vanbleijswijk JDL, Baars MA(1997) Seasonal and spatial variability in phytoplanktonbiomass, productivity and growth in the northwesternIndian Ocean—the southwest and northeast monsoon,1992–1993. Deep-Sea Res Part I—Oceanogr Res Pap 44:425–449
Venrick EL (1978) Estimating cell numbers. In: Sournia A (ed)Phytoplankton manual. UNESCO, Paris, p165–179
Waterbury JB, Watson SW, Valois FW, Franks DG (1986). Bio-logical and ecological characterization of the marine uni-cellular cyanobacterium Synechococcus. In: Platt T, LiWKW (eds) Photosynthetic picoplankton. Department ofFisheries and Oceans, Ottawa, p 71–120
224
Editorial responsibility: William Li, Dartmouth, Nova Scotia, Canada
Submitted: November 1, 2000; Accepted: March 28, 2001Proofs received from author(s): July 12, 2001