Effects of trap fishing on reef fish communities
22
AQUATIC CONSERVATION: MARINE AND FRESHWATER ECOSYSTEMS Aquatic Conserv: Mar. Freshw. Ecosyst. 17: 111–132 (2007) Published online 14 July 2006 in Wiley InterScience (www.interscience.wiley.com) DOI: 10.1002/aqc.784 Effects of trap fishing on reef fish communities JULIE P. HAWKINS a, *, CALLUM M. ROBERTS a , FIONA R. GELL a,1 and CALVIN DYTHAM b a Environment Department, University of York, Heslington, York, UK b Department of Biology, University of York, Heslington, York, UK ABSTRACT 1. Trap fishing is widespread on coral reefs but the sustainability of this practice is causing concern because it is efficient and unselective. The effects of trap fishing were investigated by comparing fish assemblages among six Caribbean islands subject to different trapping pressures. These ranged from none in Bonaire and Saba increasing through Puerto Rico, St Lucia, Dominica and Jamaica respectively. 2. Fish were censused at depths of 5 m and 15 m on fore-reef slopes by counting the numbers within replicate 10m diameter areas for 15min. Between 64 and 1375 counts were made in each country. 3. In St Lucia and Jamaica abundance of fish censused on the reef was compared to representation in traps which were visually sampled underwater in the area of fish counts. Twenty-three traps were sampled in Jamaica and 75 in St Lucia. For some comparisons between these islands, St Lucian sampling effort was reduced to that of Jamaica (23 traps and 112 counts) by randomly sub-sampling 10 times. 4. Traps contained 54 different species in St Lucia and 22 in Jamaica, while there were 90 and 57 respectively in counts. After reducing St Lucian sampling effort to Jamaican levels, an average of 35 species were found in traps and 70 seen in counts. Of these, 76% in St Lucia and 73% in Jamaica were relatively more abundant in traps than they were on the reef. 5. Species were considered to be highly susceptible to trapping if the ratio of their abundance in traps compared to that on the reef exceeded 3:1. Trapping pressure was approximately three and a half times greater in Jamaica than St Lucia. After equalizing sampling effort, there was an average of 16 highly trappable species in St Lucia compared to 13 in Jamaica. Species did not always appear highly trappable in both countries. Eleven of St Lucia’s highly trappable species were absent from Jamaica (falling to 8.5 on average after equalizing sampling effort), but none vice versa, suggesting that trapping may have contributed to their absence or rarity on Jamaican reefs. 6. The Tetraodontiformes, which include many non-target species, were particularly susceptible to trapping in both countries. Their abundance in the six islands censused was inversely related to trap fishing pressure, as was that of two other non-target families, butterflyfish (Chaetodontidae) and angelfish (Pomacanthidae). *Correspondence to: Julie P. Hawkins, Environment Department, University of York, Heslington, York, Y010 5DD, UK. E-mail: [email protected] 1 Present address: Wildlife and Conservation Division, Department of Agriculture, Fisheries and Forestry, Knockaloe Farm, Peel, Isle of Man IM5 3AJ, UK. Copyright # 2006 John Wiley & Sons, Ltd.
Transcript of Effects of trap fishing on reef fish communities

AQUATIC CONSERVATION: MARINE AND FRESHWATER ECOSYSTEMS
Aquatic Conserv: Mar. Freshw. Ecosyst. 17: 111–132 (2007)
Published online 14 July 2006 in Wiley InterScience(www.interscience.wiley.com) DOI: 10.1002/aqc.784
Effects of trap fishing on reef fish communities
JULIE P. HAWKINSa,*, CALLUM M. ROBERTSa, FIONA R. GELLa,1
and CALVIN DYTHAMb
aEnvironment Department, University of York, Heslington, York, UKbDepartment of Biology, University of York, Heslington, York, UK
ABSTRACT
1. Trap fishing is widespread on coral reefs but the sustainability of this practice is causing concernbecause it is efficient and unselective. The effects of trap fishing were investigated by comparing fishassemblages among six Caribbean islands subject to different trapping pressures. These ranged fromnone in Bonaire and Saba increasing through Puerto Rico, St Lucia, Dominica and Jamaicarespectively.2. Fish were censused at depths of 5m and 15m on fore-reef slopes by counting the numbers within
replicate 10m diameter areas for 15min. Between 64 and 1375 counts were made in each country.3. In St Lucia and Jamaica abundance of fish censused on the reef was compared to representation
in traps which were visually sampled underwater in the area of fish counts. Twenty-three traps weresampled in Jamaica and 75 in St Lucia. For some comparisons between these islands, St Luciansampling effort was reduced to that of Jamaica (23 traps and 112 counts) by randomly sub-sampling10 times.4. Traps contained 54 different species in St Lucia and 22 in Jamaica, while there were 90 and 57
respectively in counts. After reducing St Lucian sampling effort to Jamaican levels, an average of 35species were found in traps and 70 seen in counts. Of these, 76% in St Lucia and 73% in Jamaicawere relatively more abundant in traps than they were on the reef.5. Species were considered to be highly susceptible to trapping if the ratio of their abundance in
traps compared to that on the reef exceeded 3:1. Trapping pressure was approximately three and ahalf times greater in Jamaica than St Lucia. After equalizing sampling effort, there was an average of16 highly trappable species in St Lucia compared to 13 in Jamaica. Species did not always appearhighly trappable in both countries. Eleven of St Lucia’s highly trappable species were absent fromJamaica (falling to 8.5 on average after equalizing sampling effort), but none vice versa, suggestingthat trapping may have contributed to their absence or rarity on Jamaican reefs.6. The Tetraodontiformes, which include many non-target species, were particularly susceptible to
trapping in both countries. Their abundance in the six islands censused was inversely related to trapfishing pressure, as was that of two other non-target families, butterflyfish (Chaetodontidae) andangelfish (Pomacanthidae).
*Correspondence to: Julie P. Hawkins, Environment Department, University of York, Heslington, York, Y010 5DD, UK. E-mail:[email protected] address: Wildlife and Conservation Division, Department of Agriculture, Fisheries and Forestry, Knockaloe Farm, Peel, Isleof Man IM5 3AJ, UK.
Copyright # 2006 John Wiley & Sons, Ltd.

7. To determine whether fish that are common in traps in St Lucia are reaching sexual maturitybefore capture, size frequency data for 23 species from a sample of trap catches were gathered andexamined for their state of maturity. In seven species, more than a third of 705 trapped fish wereimmature, indicating that trap fishing causes growth over-fishing (premature removal of fish), andcalling into question the sustainability of yields for these species.8. In conclusion, at the intensities seen in this study, trap fisheries cause serious over-fishing,
reduce biodiversity, and alter ecosystem structure. While commonly perceived as low impact, coralreef trap fisheries in the Caribbean and further afield, need tighter regulation and control.Copyright # 2006 John Wiley & Sons, Ltd.
Received 2 December 2003; Revised 1 February 2006; Accepted 15 February 2006
KEY WORDS: coral reef; fish pot; overfishing; marine reserves
INTRODUCTION
Trap fishing is one of the oldest fishing methods and is widely practised throughout the world in bothtropical and temperate regions (Recksiek et al., 1991; Slack-Smith, 2002). It is the most common fishingtechnique used on Caribbean coral reefs (Gobert, 1998). In this region traps typically consist of a bamboo,wooden, or steel frame covered with chicken wire with a mesh size ranging from 2–5 cm (Stevenson andStuart-Sharkey, 1980). Depending on their design, traps may have one or two funnel-shaped openingsthrough which fish can enter. Fish can also escape from these openings or by squeezing through the mesh(Gobert, 1998). Trap retention rates vary between locations and depend on how long a trap has beensoaked for, and the trap’s internal structure (Whitelaw et al., 1991; Sheaves, 1995).
There are many reasons why traps are popular with reef fishers. They are easy to deploy (Ferry andKohler, 1987), relatively inexpensive to make (Garrison et al., 1998), and can be used in areas with ruggedsubstrata (Miller and Hunte, 1987). If the weather is bad, fishers can leave their traps out until conditionsimprove. Traps are also effective at catching a wide variety of species (Stevenson and Stuart-Sharkey, 1980).
Robichaud et al. (2000) reported there to be little quantitative information on what factors influence thecatchability of reef species. Their own study concluded that mobility was important because it increased therate at which fish encountered traps and hence their likelihood to enter them. While they found that preytended to avoid entering traps containing predators, they suggest that prey might also enter traps in aneffort to avoid predation. On balance, they found that the presence of prey in traps increased thecatchability of piscivores by reducing their escape rates. The study also noted that behaviouralcharacteristics such as schooling species following each other into traps and solitary species avoidingthem may influence catchability, while Wolff et al. (1999) have suggested that some species could beattracted into traps merely by the structure they provide.
Some of the factors that make trapping popular with fishers can also cause problems. As a fishingmethod that is effective but unselective it produces much unwanted bycatch which is commercially wastefuland could be threatening to biodiversity (Dayton et al., 1995; Alverson and Hughes, 1996; Boehlert, 1996).Around Florida about 100 different species are caught in traps with levels of bycatch ranging from 38% to54% (Sutherland and Harper, 1983; Taylor and McMichael, 1983). Taylor and McMichael (1983) foundthat unwanted angelfish (Pomacanthidae) constituted 17% of catches, trunkfish (Ostraciidae) 9%, andbutterflyfish (Chaetodontidae) and wrasse (Labridae) 5–6% each. In the Gulf of Mexico levels of bycatchfrom trap fishing are reported to have reached 65% (NMFS, 1995).
What counts as bycatch varies between regions depending on local traditions, income levels and intensityof exploitation. In parts of the Caribbean, such as Jamaica and Haiti, where many people are very poor andfisheries intense, almost nothing is discarded and fish are used either for food or for bait (Ferry and Kohler,1987; Sary, 1995). However, even if all the catch is used, the potential threat to biodiversity remains.
J.P. HAWKINS ET AL.112
Copyright # 2006 John Wiley & Sons, Ltd. Aquatic Conserv: Mar. Freshw. Ecosyst. 17: 111–132 (2007)
DOI: 10.1002/aqc

As desirable food fish become increasingly rare, even people from wealthy nations resort to eating speciesthat were once considered ‘trash’ such as squirrelfish (Holocentridae) and angelfish. This has happened inBermuda, where, by the 1980s, trap fisheries had decimated the grouper (Serranidae) and snapper(Lutjanidae) populations (Butler et al., 1993).
Although trapping is a multi-species fishing technique, it has more serious impacts on some species thanothers. For example, in the US Virgin Islands trapping, together with hook and line fishing, has virtuallyeliminated the Nassau grouper (Epinephelus striatus) (Garrison et al., 1998). Over a 6-year period duringthe 1970s, a spawning aggregation which consisted of tens of thousands of fish was wiped out (Olsen andLaPlace, 1978). Trap fishing also poses a threat to juvenile fish because of the small mesh sizes used (Saryet al., 1997), particularly to high-bodied species such as surgeonfish (Acanthuridae). In areas with highlevels of trapping, juveniles can represent a significant proportion of the catch (Robichaud et al., 1999) andtrapping can lead to reduced productivity through growth over-fishing, i.e. premature removal of fishleading to lower catches.
A further problem associated with trap fishing is the damage it causes to corals and other bottom-livingorganisms when traps are dropped onto the reef (Yoshikawa and Asoh, 2004). In St Lucia we observedfishers breaking corals with grappling hooks while retrieving their traps (pers. obs.). If traps are lost (theseare often called ‘ghost traps’), they can continue catching fish for weeks, or even months, until they fallapart. Biodegradable panels, which give way sooner than traps, help reduce this waste (Stewart and Ferrell,2002). Despite the problems associated with trap fishing it has received little regulation other than mesh sizerestrictions and limits on numbers and not much is known about how such management measures willimprove sustainability. Fishers have been reluctant to install biodegradable panels into their traps, evenwhen required to by law (Blott, 1978; Garrison et al., 1998; pers. obs.). In Bermuda, the problemsassociated with trapping led to the fishery being closed down in 1990 (Butler et al., 1993) and plans areunder way to phase it out in the Gulf of Mexico by 2007 (http://www.reefguardian.org/Campaigns/FishTrapGOM/MoreInfoFTrapGOM.html).
In this study, we investigate questions relating to the sustainability and biodiversity impacts of trapfishing in the Caribbean by examining the sensitivity of a broad range of species to trapping and looking atthe incidence of capture of juvenile fish of commercially valuable species.
METHODS
Coral reef fish assemblages were censused during single visits to the islands of Bonaire, Saba, Puerto Rico,Dominica and Jamaica between 1994 and 1998 (Figure 1), and on five visits to St Lucia, either annually orbiennially, between 1994 and 2000. Fish were counted over sections of coast covering ca 5–20 km,depending on island size, using an adaptation of the stationary point visual census method developed byBohnsack and Bannerot (1986). For each 15-min count a 10-m tape was laid on the reef to indicate thediameter of a cylinder extending 5m upwards. The location for the first count was the point of entry for thedive and subsequent counts were made along the same depth contour. Approximately equal numbers ofcounts were performed at depths of 5m and 15m and each was separated by at least 10m. The number ofcounts performed in each country was: 72 in Bonaire, 78 in Saba, 98 in Puerto Rico, 64 in Dominica and112 in Jamaica. In St Lucia, we used a sample of 275 counts in 1995 for an inter-island comparison of fishassemblages. For comparisons between fish caught in traps and counted on the reef we used a sample of1375 counts taken between 1995 and 2000.
Comparable measures of the absolute fishing intensity for these islands were not possible, because datahave been reported at different levels of detail, and the types of fishing gear used vary between islands.However, using estimates of number of fishers per kilometre of reef, it is possible to rank fishing pressureamong the islands. Data from published studies, information from fisheries departments and marine parks,
TRAP FISHING EFFECTS ON REEF FISH 113
Copyright # 2006 John Wiley & Sons, Ltd. Aquatic Conserv: Mar. Freshw. Ecosyst. 17: 111–132 (2007)
DOI: 10.1002/aqc

and personal observations on numbers of active fishers and gear types used were combined for the purpose(Table 1). On this basis fishing pressure was low in Bonaire (0.06 fishers km�1 of reef), light in Saba(0.12 fishers km�1) and higher in Puerto Rico (0.83 fishers km�1). Fishing pressure was intense in St Lucia(3.23 fishers km�1) and Dominica (3.03 fishers km�1) and extremely intense in Jamaica (7.14 fishers km�1).These measures include all methods of fishing. If trapping is considered independently, then Bonaire andSaba have none, levels were moderate in Puerto Rico, high in St Lucia and Dominica, and extremely high inJamaica. One other way of comparing fishing pressure is from trap counts. We counted traps during fishcounts in Jamaica and St Lucia only. Twenty-three traps were observed during 112 fish counts in Jamaicawhile in St Lucia 80 traps were observed during 1375 counts, implying that trapping pressure isapproximately three and a half times greater in Jamaica.
Effects of trap fishing pressure on non-target species throughout the Caribbean
The vulnerability of families containing species that are not generally popular food fish, but which do getcaught in traps, was investigated by comparing fish abundance on the reef among the six Caribbean islandsof a superfamily, the Tetraodontiformes (pufferfish (Tetraodontidae), boxfish and trunkfish (Ostraciidae),triggerfish and filefish (Balistidae)), butterflyfish (Chaetodontidae) and angelfish (Pomacanthidae). Theabundances of soldierfish (Holocentridae) which have no commercial value in Saba and Bonaire, are low-value food in Puerto Rico, and are commonly eaten in the other three countries where they make up a largeproportion of trap catches were also compared. Species from these families are predominantly taken bytrap fishing but some are also caught by spearfishing. Mean abundance per count of each family wasanalysed with one-way ANOVAs and post hoc LSD tests. To avoid any possibility of pseudoreplication, wereduced the degrees of freedom in the test to one for each island, i.e. treating islands as samples rather thanreplicates within islands. Data for St Lucia were taken from the 1995 survey prior to implementation ofmarine reserves there (Roberts et al., 2001).
Fish abundance on the reef versus that in traps
In St Lucia and Jamaica species’ abundances on the reef were compared to that inside traps. Trap contentswere recorded during dives to census fish after the fish counts were complete. On a single diveapproximately 100–120m linear distance of reef was searched for traps within the area of the fish counts.The number of traps counted per dive ranged from 0 to 5 in both countries. The numbers of each speciespresent were recorded for each trap. The contents of 23 traps in Jamaica and 75 traps in St Lucia were
Figure 1. Location of the islands studied.
J.P. HAWKINS ET AL.114
Copyright # 2006 John Wiley & Sons, Ltd. Aquatic Conserv: Mar. Freshw. Ecosyst. 17: 111–132 (2007)
DOI: 10.1002/aqc

sampled. In order to compare results between the two countries it was necessary to reduce the level ofsampling intensity in St Lucia to that in Jamaica. This was done by selecting 10 random samples of 112 fishcounts from the 1375 performed in St Lucia, and ten random samples of the contents of 23 traps from the75 traps sampled in St Lucia. Average values obtained from these two sets of 10 random samples are used inthe results to make direct comparisons possible with Jamaica.
Analysis of fish trappability
The trappability of a species is expressed as the ratio of its proportional abundance in traps (i.e. the fractionthat each species represented of the total sample of trapped fish) compared to its proportional abundance inall fish counts. This provides a measure of vulnerability to trapping. Data were pooled across depth andobserver and, from counts in St Lucia, for all the years that were sampled. Species with a trappability valueof one were equally represented in traps and fish counts, those scoring higher were more represented intraps and those scoring lower were more represented in counts. Species were considered highly trappable iftheir trappability ratio was greater than 3 and highly untrappable if it was less than 0.33 (i.e. if a species wasthree times less represented in traps than on the reef). Trappability at the family level was also assessed.
Prior to analyses all species shown in the Appendix were removed from the dataset. These were generallyeither too small (maximum cross-sectional body dimension less than 3 cm) or too big (maximum cross-sectional body dimension greater than 10 cm) to be caught by traps, or could not be counted effectivelyusing visual census because they were cryptic. Cryptic species would tend to be under-represented in counts,thereby giving misleading trappability ratios. Small juveniles of some species included in the analysis couldpass freely through the traps and large numbers of such fish on the reef could lead to underestimates oftrappability for such species.
Size at maturity of fish caught within traps in St Lucia
Between September 2000 and February 2001, the contents of 530 traps landed from 134 fishing trips thathad taken place within the study area in St Lucia were sampled. Size frequency distributions for 23commercially important species were compiled and the gonads of 705 fish bought from trap fishers over atwo-day period in September 2002 were examined and the minimum size at maturity calculated, and wherepossible the size at which 50% and 100% were mature.
RESULTS
Effects of trapping on non-target species throughout the Caribbean
Abundances of Tetraodontiformes, butterflyfish and angelfish on the reef, were all inversely related tofishing pressure (Figure 2) (one-way ANOVAs: F5;6 ¼ 33:5; p50:001 (Tetraodontiformes); F5;6 ¼ 48:0;p50:001 (butterflyfish); F5;6 ¼ 38:6; p50:001 (angelfish)). Tetraodontiformes abundance was much greaterin Bonaire and Saba, where there was no trap fishing, compared to those islands where trapping did occur.Butterflyfish, abundance declined steadily over the fishing pressure gradient. However, the difference inabundance between the most- and the least-fished countries was great, with only 6% as many fish presentin Jamaica as Bonaire. Angelfish were the least abundant of the families sampled. They were most commonin Bonaire and Saba, less so in Puerto Rico and were uncommon to absent in the most heavily fished islandsof St Lucia, Dominica and Jamaica. Soldierfish abundance initially increased with increasing fishingpressure but fell abruptly in intensively fished Jamaica (one-way ANOVA: F5;6 ¼ 42:7; p50:001).
TRAP FISHING EFFECTS ON REEF FISH 115
Copyright # 2006 John Wiley & Sons, Ltd. Aquatic Conserv: Mar. Freshw. Ecosyst. 17: 111–132 (2007)
DOI: 10.1002/aqc
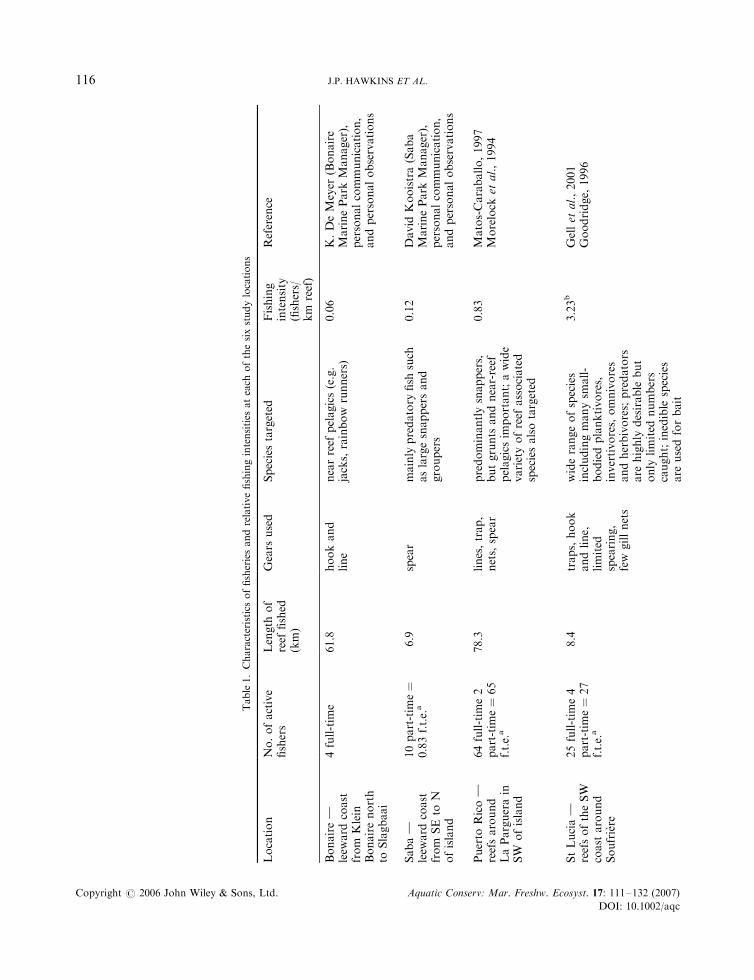
Table1.Characteristics
offisheriesandrelativefishingintensities
ateach
ofthesixstudylocations
Location
No.ofactive
fishers
Length
of
reef
fished
(km)
Gears
used
Speciestargeted
Fishing
intensity
(fishers/
km
reef)
Reference
Bonaire
}leew
ard
coast
from
Klein
Bonairenorth
toSlagbaai
4full-tim
e61.8
hookand
line
nearreef
pelagics(e.g.
jacks,rainbow
runners)
0.06
K.DeMeyer
(Bonaire
MarinePark
Manager),
personalcommunication,
andpersonalobservations
Saba
}leew
ard
coast
from
SEto
Nofisland
10part-tim
e¼
0:83f.t.e.a
6.9
spear
mainly
predatory
fish
such
aslargesnappersand
groupers
0.12
David
Kooistra(Saba
MarinePark
Manager),
personalcommunication,
andpersonalobservations
Puerto
Rico
}reefsaround
LaParguerain
SW
ofisland
64full-tim
e2
part-tim
e¼
65
f.t.e.a
78.3
lines,trap,
nets,spear
predominantlysnappers,
butgrunts
andnear-reef
pelagicsim
portant;awide
varietyofreef
associated
speciesalsotargeted
0.83
Matos-Caraballo,1997
Morelock
etal.,1994
StLucia
}reefsoftheSW
coast
around
Soufriere
25full-tim
e4
part-tim
e¼
27
f.t.e.a
8.4
traps,hook
andline,
limited
spearing,
few
gillnets
widerangeofspecies
includingmanysm
all-
bodiedplanktivores,
invertivores,omnivores
andherbivores;predators
are
highly
desirable
but
only
limited
numbers
caught;inedible
species
are
usedforbait
3.23b
Gellet
al.,2001
Goodridge,
1996
J.P. HAWKINS ET AL.116
Copyright # 2006 John Wiley & Sons, Ltd. Aquatic Conserv: Mar. Freshw. Ecosyst. 17: 111–132 (2007)
DOI: 10.1002/aqc

Dominica
}reefsofthe
NW
coast
around
Portsm
outh
32full-tim
e47part-tim
e=
56f.t.e.a
18.5
traps,hook
andline,
extensive
spearand
nets
widerangeofspecies
includingmanysm
all-
bodiedplanktivores,
invertivores,omnivores
andherbivores;predators
are
highly
desirable
but
only
limited
numbers
caught;inedible
species
are
usedforbait
3.03b
H.Guiste,(C
hiefFisheries
Officer,Dominica),
personalcommunication
Roberts
andHawkins,1996
Jamaica
}reefsofthe
Northcoast
around
DiscoveryBay
58full-tim
e24
part-tim
e¼
70
f.t.e.a
9.9
traps,hook
andline,
extensive
spearand
nets
virtuallyeverythinglarger
than10cm
istargeted.
Majority
ofcatchissm
all-
bodied;largepredators
desirable
butextrem
ely
uncommon
7.14
Sary,1995
Sandem
anandWoodley,
1994
Allison,1992
aThef.t.e.isfull-tim
eequivalents.In
Sabaweassumed
thateach
fisher
fished
for1dayevery2weeks(assuminga6-dayworkingweek)because
allfishingonthisislandis
recreational.Hence,each
fisher
isconsidered
one-tw
elfthafull-tim
eequivalent.In
allother
countries,wherefishingisdoneonacommercialorsubsistence
basis,we
assumed
thatpart-tim
efishersfished
forhalfoftheirtime.
bTheamountofreef
availableto
fishersin
StLuciaandDominicaisvirtuallyidentical.However,because
therangeofgears
usedin
StLuciawasmore
limited
(i.e.less
spearandnet
fishing),weconsidered
thisislandto
beslightlyless
heavilyfished
thanDominica.
TRAP FISHING EFFECTS ON REEF FISH 117
Copyright # 2006 John Wiley & Sons, Ltd. Aquatic Conserv: Mar. Freshw. Ecosyst. 17: 111–132 (2007)
DOI: 10.1002/aqc

Trappability of species
Figures 3 and 4 compare species abundance in traps to that on the reef in Jamaica and St Lucia respectively.Species are listed in rank order of their abundance in counts. In Jamaica, Haemulon plumieri, Holacanthusciliaris, Lutjanus apodus, Lutjanus synagris, Lactophrys polygonia and Chilomycterus antillarum were absentfrom counts but present in traps, while the same was true for C. antillarum and Haemulon striatum inSt Lucia. The most abundant species in both countries was the wrasse, Clepticus parrae, which has beenomitted from all graphs and tables since its dominance obscures results for other species. When C. parraewas included in the analysis it comprised 67.6% of the fish population in Jamaica and 66.5% in St Lucia,but only 0.6% and 3.3% respectively in traps, showing that this schooling, mid-water, planktivorousspecies, not preferable for eating, is not readily trappable.
Catches were generally diverse. In both countries Stegastes planifrons, Acanthurus bahianus, Sparisomaaurofrenatum and Scarus taeniopterus were among the six most numerous in counts. In Jamaica, 22 specieswere recorded in traps and 57 in counts (Figure 3), while in St Lucia there were 54 in traps and 90 in counts(Figure 4). Reducing the sampling intensity of St Lucia to that of Jamaica gave average figures of 35 speciesin traps and 70 in counts, for 10 randomly picked sub-samples of 23 traps and 112 counts.
0 2 4 6 8
Mea
n nu
mbe
r pe
r re
ef c
ensu
sM
ean
num
ber
per
reef
cen
sus
0
1
2
3
4
BonaireSabaPuerto RicoSt LuciaDominicaJamaica
Tetradontiformes
0 2 4 6 80
1
2
Fishers / km reef Fishers / km reef
0 2 4 6 80
1
2
3
4
0 2 4 6 80
5
10
15
20
25
Angelfish
Butterflyfish Soldierfish
Spearman's rho = - 0.45 Spearman's rho = - 0.36
Spearman's rho = 0.17Spearman's rho = - 0.57
Figure 2. Mean abundance ð�s:e:Þ of Tetraodontiformes, butterflyfish, angelfish and soldierfish versus fishing pressure.
J.P. HAWKINS ET AL.118
Copyright # 2006 John Wiley & Sons, Ltd. Aquatic Conserv: Mar. Freshw. Ecosyst. 17: 111–132 (2007)
DOI: 10.1002/aqc

Table 2 shows the trappability ratios of species in Jamaica and St Lucia. These represent the ratioof abundance of species in traps compared to that on the reef in counts. All data for trappability ratioswere taken from underwater observations since data from trap landings may have come from differenthabitats or depths to our fish counts. In Jamaica 73% of species caught in traps were proportionallymore common in traps than they were on the reef, and 35% of those potentially trappable had beencaught. In St Lucia these figures were 76% and 59% respectively for the full sample of 75 traps. Reducingthe sampling intensity to that of Jamaica gave average figures of 76% and 39% respectively, for 10randomly picked sub-samples of 23 traps and 112 counts. These figures are virtually the same as those forJamaica.
Including species caught in traps but not seen in counts there were 13 highly trappable and 43 highlyuntrappable species in Jamaica. St Lucia contained over twice as many highly trappable species (29) asJamaica, and virtually the same number of highly untrappable (44), suggesting that the higher fishingpressure in Jamaica could have eliminated species that are susceptible to trapping. However, reducing theSt Lucia sample size to that of Jamaica (23 traps and 112 counts) produces means of 16 highly trappablespecies and 43 highly untrappable species, showing that the difference was simply a sampling effect. Only sixspecies were considered highly trappable in both countries; three Tetraodontiformes, C. antillarum,
Species
Spa
risom
a au
rofr
enat
umS
caru
s is
erti
Ste
gast
es d
ienc
aeus
Aca
nthu
rus
bahi
anus
Ste
gast
es p
lani
fron
sS
caru
s ta
enio
pter
usS
tega
stes
leuc
ostic
tus
Myr
ipris
tis ja
cobu
sH
oloc
entr
us r
ufus
Aca
nthu
rus
coer
uleu
sC
epha
loph
olis
cru
enta
taS
paris
oma
viri
deH
ypop
lect
rus
puel
laC
epha
loph
olis
ful
vaH
oloc
entr
us m
aria
nus
Mic
rosp
atho
don
chry
suru
sH
aem
ulon
chr
ysar
gyre
umP
seud
open
eus
mac
ulat
usB
odia
nus
rufu
sH
aem
ulon
flav
olin
eatu
mH
oloc
entr
us v
exi
Hol
acan
thus
tric
olor
Ste
gast
es v
aria
bilis
Hyp
ople
ctru
s in
digo
Hyp
ople
ctru
s gu
ttava
rius
Mul
loid
icht
hys
mar
tinic
usC
anth
erhi
nes
pullu
sH
ypop
lect
rus
unic
olor
Hal
icho
eres
rad
iatu
sS
tega
stes
dor
sopu
nicu
sC
haet
odon
cap
istr
atus
Lutja
nus
anal
isS
paris
oma
chry
suru
sH
aem
ulon
sci
urus
Cha
etod
on s
tria
tus
Hyp
ople
ctru
s ni
gric
ans
Hyp
ople
ctru
s ch
loru
rus
Bot
hus
luna
tus
Aca
nthu
rus
chiru
gus
Mel
icht
hys
nige
rD
iodo
n ho
laca
nthu
sS
paris
oma
rubr
ipin
neR
yptic
us s
apon
aceu
sP
rican
thus
cru
enta
tus
Sph
oero
ides
spe
ngle
riLu
tjanu
s m
ahog
oni
Epi
neph
elus
gut
tatu
sLa
coph
rys
triq
uete
rC
haet
odon
oce
llatu
sLu
tjanu
s jo
cuH
oloc
entr
us a
dsce
nsio
nis
Ple
ctry
pops
ret
rosp
inis
Dio
don
hyst
rixS
corp
aena
plu
mie
riX
anth
icht
hys
ringe
nsH
aem
ulon
car
bona
rium
Hae
mul
on a
urol
inea
tum
Hae
mul
on p
lum
ieri
Hol
acan
thus
cili
aris
Lutja
nus
apod
usLu
tjanu
s sy
nagr
isLa
ctop
hrys
pol
ygon
iaC
hilo
myc
teru
s an
tilla
rium
30
20
10
0
10
20
TrapsCounts
% in
cou
nts
% in
trap
s
Figure 3. Proportional representation of species in traps compared to on the reef in Jamaica.
TRAP FISHING EFFECTS ON REEF FISH 119
Copyright # 2006 John Wiley & Sons, Ltd. Aquatic Conserv: Mar. Freshw. Ecosyst. 17: 111–132 (2007)
DOI: 10.1002/aqc

L. polygonia, Diodon holocanthus; one snapper, L. synagris and two grunts, H. plumieri and Haemulonflavolineatum. Of species that were highly trappable in St Lucia, 38% (11) were absent from both traps andcounts in Jamaica: H. striatum, Calamus calamus, Balistes vetula, Mycteroperca interstitialis, Aluterusscriptus, Haemulon melanurum, Kyphosus sectatrix, Lactophrys bicaudalis, Cantherhines macrocerus,Pomacanthus paru, and Ocyurus chrysurus. All occur throughout the Caribbean and so were expected tooccur in Jamaica (Humann, 1996). A third (4) of these highly trappable species were Tetraodontiformeswith most other families represented by just one species. No species trapped in Jamaica were absent fromSt Lucia. To explore the possibility that this difference is an artefact of the greater sampling intensity inSt Lucia compared to Jamaica, we randomly reduced the St Lucia sample size to that of Jamaica, repeated10 times, and counted the number of these vulnerable species that remained in the sample. On average, thereduced samples retained 8.5 of the 11 highly trappable species.
Only the Tetraodontiformes and snappers appear highly trappable in both St Lucia and Jamaica(Table 3). Of the four other families that were highly trappable in St Lucia, no butterflyfish or groupers(Serranidae not including Epinephelinae) were trapped in Jamaica while chub (Kyphosidae) and porgies(Sparidae) were not seen there. No family appeared to be highly untrappable in both countries.
Catch composition and size at maturity
Several commercially important species in St Lucia are commonly caught before they reach maturity(Figure 5, Table 4). For seven of the 23 species sampled, over one-third of the catch taken was immature,
Species
Myr
ipris
tis ja
cobu
sS
tega
stes
pla
nifr
ons
Sca
rus
taen
iopt
erus
Spa
risom
a au
rofr
enat
umA
cant
huru
s ba
hian
usH
oloc
entr
us r
ufus
Spa
risom
a vi
ride
Abu
defd
uf s
axat
ilis
Hae
mul
on c
hrys
argy
reum
Mul
loid
icht
hys
mar
tinic
usA
cant
huru
s co
erul
eus
Cep
halo
phol
is c
ruen
tata
Mic
rosp
atho
don
chry
suru
sS
caru
s ve
tula
Hol
ocen
trus
mar
ianu
sH
aem
ulon
aur
olin
eatu
mS
tega
stes
die
ncae
usS
tega
stes
dor
sopu
nnic
usH
aem
ulon
flav
olin
eatu
mLu
tjanu
s m
ahog
oni
Cha
etod
on c
apis
trat
usP
aran
thiu
s fu
rcife
rH
ypop
lect
rus
puel
laO
cyur
us c
hrys
urus
Aca
nthu
rus
chiru
gus
Sca
rus
iser
tiC
haet
odon
str
iatu
sC
epha
loph
olis
ful
vaB
odia
nus
rufu
sK
ypho
sus
sect
atrix
Lact
ophr
ys tr
ique
ter
Hol
acan
thus
tric
olor
Can
ther
hine
s pu
llus
Pse
udop
eneu
s m
acul
atus
Pria
cant
hus
crue
ntat
usS
paris
oma
rubr
ipin
neC
haet
odon
acu
leat
usH
ypop
lect
rus
chlo
ruru
sLu
tjani
s gr
iseu
sM
elic
hthy
s ni
ger
Hal
icho
eres
rad
iatu
sH
aem
ulon
car
bona
rium
Hol
ocen
trus
vex
illar
ius
Bot
hus
luna
tus
Hyp
ople
ctru
s sp
.H
ypop
lect
rus
nigr
ican
sX
anth
icht
hys
ringe
nsS
tega
stes
leuc
ostic
tus
Hae
mul
on p
lum
ieri
Lact
ophr
ys b
icau
dalis
Lutja
nus
apod
usS
corp
aena
plu
mie
riP
omac
anth
us p
aru
Spa
risom
chr
ysop
teru
mH
ypop
lect
rus
gutta
variu
sLa
ctop
hrys
pol
ygon
iaD
iodo
n ho
laca
nthu
sP
lect
rypo
ps r
etro
spin
isB
alis
tes
vetu
laLu
tjanu
s bu
ccan
ella
Can
ther
hine
s m
acro
ceru
sH
aem
ulon
par
raR
yptic
us s
apon
aceu
sH
oloc
entr
us a
dsce
nsio
nis
Lutja
nus
jocu
Hol
acan
thus
cili
aris
Cha
etod
on o
cella
tus
Lutja
nus
anal
isH
aem
ulon
mel
anur
umE
pine
phel
us a
dsce
nsio
nis
Epi
neph
elus
gut
tatu
sA
lute
rus
scrip
tus
Ani
sotr
emus
sur
inam
ensi
sH
aem
ulon
mac
rost
omum
Bot
hus
ocel
latu
sH
aem
ullo
n sc
iuru
sM
ycte
rope
rca
inte
rstit
ialis
Ste
gast
es v
aria
bilis
Ger
res
cine
reus
Hol
ocen
trus
cor
uscu
mC
alam
us c
alam
usD
iodo
n hy
strix
Bai
rdie
lla s
anct
aelu
ciae
Ryp
ticus
sub
bifr
enat
usR
hom
bopl
ites
auro
rube
nsS
caru
s co
erul
eus
Myc
tero
perc
a ve
neno
saS
phoe
roid
es s
peng
leri
Cal
amus
baj
onad
oLu
tjanu
s sy
nagr
isC
hilo
myc
teru
s an
tilla
rum
Hae
mul
on s
tria
tum
% in
cou
nts
10
0
10
20
Traps
Counts
% in
trap
s
Figure 4. Proportional representation of species in traps compared to on the reef in St Lucia.
J.P. HAWKINS ET AL.120
Copyright # 2006 John Wiley & Sons, Ltd. Aquatic Conserv: Mar. Freshw. Ecosyst. 17: 111–132 (2007)
DOI: 10.1002/aqc

Table 2. Trappability of species in Jamaica and St Lucia calculated as the ratio of their proportional abundance in traps compared tothat in fish counts. Species with an asterisk (*) were found in traps but not seen in counts. A trappability of zero indicates that the
species was seen in counts but not in traps
Species Family Jamaicatrappability
St Luciatrappability
Bothus ocellatus Bothidae not present 0Chaetodon aculeatus Chaetodontidae not present 0.8Epinephelus adscensionis Epinephelinae not present 0Mycteroperca interstitialis Epinephelinae not present 11.2Mycteroperca venenosa Epinephelinae not present 0Gerres cinereus Gerreidae not present 0Anisotremus surianamensis Haemulidae not present 0Haemulon melanurum Haemulidae not present 7.7Haemulon parrai Haemulidae not present 0Haemulon striatum Haemulidae not present *Holocentrus coruscum Holocentridae not present 0Kyphosus sectatrix Kyphosidae not present 6.2Lutjanus buccanella Lutjanidae not present 0Lutjanus griseus Lutjanidae not present 1.1Ocyurus chrysurus Lutjanidae not present 3.3Rhomboplites aurorubens Lutjanidae not present 0Pomacanthus paru Pomacanthidae not present 3.6Abudefduf saxatilis Pomacentridae not present 1.6Scarus coelestinus Scaridae not present 0Scarus vetula Scaridae not present 0.1Bairdiella sanctaeluciae Sciaenidae not present 0Hypoplectrus sp. Serranidae not present 0Paranthius furcifer Serranidae not present 1.2Rypticus subbifrenatus Serranidae not present 0Calamus bajonado Sparidae not present 0Calamus calamus Sparidae not present 14.7Aluterus scriptus Tetraodontiformes not present 9.2Balistes vetula Tetraodontiformes not present 14Cantherhines macrocerus Tetraodontiformes not present 4.1Lactophrys bicaudalis Tetraodontiformes not present 4.9Haemulon plumieri Haemulidae * 13.3Lutjanus apodus Lutjanidae * 0Lutjanus synagris Lutjanidae * 438.6Holacanthus ciliaris Pomacanthidae * 0Chilomycterus antillarum Tetraodontiformes * *Lactophrys polygonia Tetraodontiformes * 18.3Haemulon aurolineatum Haemulidae 210.3 0.2Acanthurus chirurgus Acanthuridae 112.2 2.3Diodon holocanthus Tetraodontiformes 42.1 18.3Sparisoma chrysopterum Scaridae 18 0Acanthurus coeruleus Acanthuridae 12 2.6Acanthurus bahianus Acanthuridae 3.6 2Haemulon flavolineatum Haemulidae 3.5 7.7Holacanthus tricolour Pomacanthidae 1.3 0.3Scarus taeniopterus Scaridae 1.2 0.2Sparisoma viride Scaridae 1.1 1.6Bodianus rufus Labridae 0.5 0Microspathodon chrysurus Pomacentridae 0.5 0.8Sparisoma aurofrenatum Scaridae 0.4 1.3Cephalopholis cruentata Epinephelinae 0.3 0.3
continued over
TRAP FISHING EFFECTS ON REEF FISH 121
Copyright # 2006 John Wiley & Sons, Ltd. Aquatic Conserv: Mar. Freshw. Ecosyst. 17: 111–132 (2007)
DOI: 10.1002/aqc

indicating that serious growth over-fishing is occurring. These include the snappers O. chrysurus (71%immature) and Lutjanus mahogoni (36% immature), surgeonfish Acanthurus coeruleus (45% immature),parrotfish Sparisoma viride (85% immature), grunts Haemulon flavolineatum (38% immature), Haemulonchrysargyreum (43% immature) and the goatfish Mulloidichthys martinicus (50% immature). In 12 species,for example Pseudopeneus maculatus and C. parrae, most fish (>85%) were sexually mature when theywere caught.
Table 2 continued
Species Family Jamaicatrappability
St Luciatrappability
Stegastes leucostictus Pomacentridae 0.2 1.4Scarus iserti Scaridae 0.04 0Bothus lunatus Bothidae 0 0Chaetodon capistratus Chaetodontidae 0 2.3Chaetodon ocellatus Chaetodontidae 0 7.3Chaetodon striatus Chaetodontidae 0 9.8Cephalopholis fulva Epinephelinae 0 0Epinephelus guttatus Epinephelinae 0 9.1Haemulon carbonarium Haemulidae 0 7.3Haemulon chrysargyreum Haemulidae 0 0.3Haemulon sciurus Haemulidae 0 0Holocentrus adscensionis Holocentridae 0 14.7Holocentrus marianus Holocentridae 0 0Holocentrus rufus Holocentridae 0 0.6Holocentrus vexillarius Holocentridae 0 0Myripristis jacobus Holocentridae 0 0.3Plectrypops retrospinis Holocentridae 0 0Halichoeres radiatus Labridae 0 1.1Lutjanus analis Lutjanidae 0 0Lutjanus jocu Lutjanidae 0 0Lutjanus mahogoni Lutjanidae 0 3.3Mulloidichthys martinicus Mullidae 0 0.7Pseudupeneus maculatus Mullidae 0 7Stegastes diencaeus Pomacentridae 0 0Stegastes dorsopunnicus Pomacentridae 0 0Stegastes planifrons Pomacentridae 0 0.02Stegastes variabilis Pomacentridae 0 0Priacanthus cruentatus Priacanthidae 0 0.6Sparisoma rubripinne Scaridae 0 3.6Scorpaena plumieri Scorpaenidae 0 0Hypoplectrus chlorurus Serranidae 0 0Hypoplectrus guttavarius Serranidae 0 0Hypoplectrus indigo Serranidae 0 not presentHypoplectrus nigricans Serranidae 0 0Hypoplectrus puella Serranidae 0 0Hypoplectrus unicolor Serranidae 0 not presentRypticus saponaceus Serranidae 0 4.6Cantherhines pullus Tetraodontiformes 0 8.6Diodon hystrix Tetraodontiformes 0 0Lactophrys triqueter Tetraodontiformes 0 2Melichthys niger Tetraodontiformes 0 7Sphoeroides spengleri Tetraodontiformes 0 0Xanthichthys ringens Tetraodontiformes 0 4.8
J.P. HAWKINS ET AL.122
Copyright # 2006 John Wiley & Sons, Ltd. Aquatic Conserv: Mar. Freshw. Ecosyst. 17: 111–132 (2007)
DOI: 10.1002/aqc

DISCUSSION
This study confirms that fish traps are highly unselective fishing gears, catching a wide variety of speciesfrom many different families. Some families and species are particularly vulnerable to being caught,including many that have traditionally been of little or no commercial value. Measures of abundance ofhighly trappable families across the Caribbean showed steep declines as fishing pressure increased.A comparison of trap catches between St Lucia and Jamaica showed that 11 species that were highlyvulnerable to trapping in St Lucia appeared to be absent from Jamaica. Since current levels of trap fishingin Jamaica were approximately three and a half times higher than in St Lucia, and fishing there has beenintense for over 100 years (Jackson, 1997), it seems that the absence of these species is due to long-termintensive trap fishing.
Examination of 705 fish gonads in St Lucia revealed that in 23 species constituting an importantcomponent of fish catches, there were seven where over a third of the fish caught were immature.Severe growth over-fishing is occurring and suggests that St Lucia’s trap fishery is wasteful and maybe unsustainable. Studies of trap fisheries in other parts of the world have reached similar conclusions.For example, work in Kenya showed that on average 39% of the fish caught in small traps and 49% of thosein big traps were juveniles (Mangi, 2006). For one of these species (Lethrinus xanthochilus) juveniles comprised100% of the catch while in five others, the figure was 75% or more. From St John in the US Virgin Islands,Garrison et al. (2004) reported that most of the commercially important Balistes vetula found in traps areimmature and concluded that the island’s trap fishery had been severely over-exploited. Similarly in the
Table 3. Trappability at the family level in St Lucia and Jamaica calculated as a ratio of a family’s abundance in traps compared tothat in fish counts. The Serranidae (*) have been split into four groups representing species of more similar life history characteristic.
Species denoted as ** were found in traps but not seen in counts
Family Trappability ratios
St Lucia Jamaica
Sparidae (porgies) 12.19 **Kyphosidae (chub) 6.18 **Tetraodontiformes (includes triggerfish, pufferfish, boxfish, filefish) 5.95 7.75Chaetodontidae (butterflyfish) 4.67 0Serranidae* } Grammistinae (soapfish) 4.07 0Lutjanidae (snappers) 3.14 12.94Haemulidae (grunts) 2.28 3.5Acanthuridae (surgeonfish) 2.18 6.12Mullidae (goatfish) 1.5 0Serranidae* } Paranthias furcifer (creole fish) 1.19 **Scaridae (parrotfish) 0.84 0.46Pomacanthidae (angelfish) 0.74 2.55Priacanthidae (cardinalfish) 0.65 0Holocentridae (soldierfish) 0.36 0Serranidae* } Epinephilinae (groupers) 0.36 0.18Pomacentridae (damselfish) 0.35 0.05Labridae (wrasse) 0.34 0.45Bothidae (flounders) 0 0Serranidae* } Hypoplectrus (hamlets) 0 0Gerreidae (mojarras) 0 **Sciaenidae (croakers) 0 **Scorpaenidae (scorpionfish) 0 0
TRAP FISHING EFFECTS ON REEF FISH 123
Copyright # 2006 John Wiley & Sons, Ltd. Aquatic Conserv: Mar. Freshw. Ecosyst. 17: 111–132 (2007)
DOI: 10.1002/aqc

Acanthurus bahianus
8 10 12 14 16 18 20 22 24 26 28
Num
ber
of fi
sh
0
20
40
60
80
100
120
140
160
180
Acanthurus coeruleus
6 8 10 12 14 16 18 20 22 24 26 280
5
10
15
20
25
30
35
Sparisoma viride
10 12 14 16 18 20 22 24 26 28 30
Num
ber
of fi
sh
0
2
4
6
8
10
12
14Sparisoma aurofrenatum
5 10 15 20 25 30 350
10
20
30
40
50
60
Scarus taeniopterus
12 14 16 18 20 22 24 26 28 30
Num
ber
of fi
sh
0
5
10
15
20
25
30
35 Sparisoma rubripinne
14 16 18 20 22 24 260
2
4
6
8
Mulloidichthys martinicus
Size (cm)5 10 15 20 25 30 35
Num
ber
of fi
sh
Num
ber
of fi
shN
umbe
r of
fish
Num
ber
of fi
shN
umbe
r of
fish
0
20
40
60
80
100 Pseudopeneus maculatus
Size (cm)
14 16 18 20 22 24 26 28 300
2
4
6
8
10
12
14
Min. size = 14
Min. size = 17
30.2%
n = 514
45.1%
n = 193
85.2%
n = 89
3.8%
n = 235
0.8%
n = 124
7.1%
n = 14
50%
n = 510
0%
n = 47
Figure 5. Size frequency distributions of species commonly caught in traps in St Lucia, from a sample of 530 fish catches. Arrows markfish size at first maturity. Data for maturity were obtained from a sample of 705 fish catches that were not included in the size frequencydistributions. ‘Min. size’ also describes fish size at first maturity and is indicated on graphs where individuals of this length wereabsent from catches analysed for size frequency distributions. Percentages shown indicate the fraction of fish landed below the size
at first maturity.
J.P. HAWKINS ET AL.124
Copyright # 2006 John Wiley & Sons, Ltd. Aquatic Conserv: Mar. Freshw. Ecosyst. 17: 111–132 (2007)
DOI: 10.1002/aqc

Haemulon carbonarium
14 16 18 20 22 24
Nu
mb
er
of fish
0
1
2
3
4Haemulon chrysargyreum
10 12 14 16 18 20
0
5
10
15
20
25
30
35
Haemulon flavolineatum
8 10 12 14 16 18 20 22
Nu
mb
er
of
fish
0
10
20
30
40
50Haemulon parrai
18 19 20 21 22 23 24 25 26
0
1
2
3
4
Haemulon plumieri
12 14 16 18 20 22 24 26 28 30 32 34
Nu
mb
er
of
fish
0
2
4
6
8Haemulon aurolineatum
6 8 10 12 14 16 18 20 22 24
0
20
40
60
80
100
Ocyurus chrysurus
Size (cm)
15 20 25 30 35 40 45 50 55
Nu
mb
er
of
fish
Nu
mb
er
of fish
Nu
mb
er
of
fish
Nu
mb
er
of
fish
Nu
mb
er
of
fish
0
5
10
15
20
25Lutjanus mahogoni
Size (cm)
10 15 20 25 30 35
0
2
4
6
8
10
12
14
16
Min. size = 16
6.6%
n = 15
43.4%
n = 83
38.2%
n = 136
0%
n = 11
10.3%
n = 29
25%
n = 436
70.9%
n = 179
36%
n = 114
Figure 5. continued
TRAP FISHING EFFECTS ON REEF FISH 125
Copyright # 2006 John Wiley & Sons, Ltd. Aquatic Conserv: Mar. Freshw. Ecosyst. 17: 111–132 (2007)
DOI: 10.1002/aqc

Clepticus parrae
16 18 20 22 24 26
Num
ber
of fi
sh
0
5
10
15
20
Cephalopholis cruentata
10 15 20 25 30 35 40
Num
ber
of fi
sh
0
2
4
6
8 Cephalopholis fulva
12 14 16 18 20 22 24 26
Num
ber
of fi
sh
0
2
4
6
8
10
12
Holocentrus rufus
8 10 12 14 16 18 20 22 24
Num
ber
of fi
sh
0
20
40
60
80
100
120
140
160
180 Holocentrus adscensionis
10 15 20 25 30 35
Num
ber
of fi
sh
0
1
2
3
4
5
6
7
Size (cm)
Myripristis jacobus
Size (cm)8 10 12 14 16 18
Num
ber
of fi
sh
0
50
100
150
200
250
Cantherhines pullus
10 15 20 25 30 35
Num
ber
of fi
sh
0
2
4
6
8
10
12
144.7%
n = 43
0%
n = 49
12.2%
n = 82
20%
n = 25
4.9%
n = 597
20%
n = 30
4.7%
n = 701
Figure 5. continued
J.P. HAWKINS ET AL.126
Copyright # 2006 John Wiley & Sons, Ltd. Aquatic Conserv: Mar. Freshw. Ecosyst. 17: 111–132 (2007)
DOI: 10.1002/aqc

Arabian Gulf the high incidence of juvenile catch in traps has led to a call for fishery reform (Grandcourtet al., 2004).
Comparing the species that were most susceptible to trapping in St Lucia and Jamaica revealeddifferences between these islands. Trappability ratios indicated that the Tetraodontiformes were highlysusceptible to trapping in both Jamaica and St Lucia, and butterflyfish were highly susceptible in St Lucia,but not in Jamaica. Long-term intensive exploitation could eliminate species susceptible to trapping, andthis has probably happened to butterflyfish and several of the Tetraodontiformes that were highly trappablein St Lucia but rare or absent from Jamaica. Although, the results from Jamaica are based on a relativelysmall sample size of 23 traps and 112 counts, a study by Sary (1995) in the same area a year earlier involvedsampling 886 traps. Comparing our list of highly trappable species in St Lucia, with the species that Saryfound in traps in Jamaica reveals that two-thirds of St Lucia’s highly trappable species were missing fromtraps in Sary’s study. This suggests that these species: H. striatum, C. calamus, M. interstitialis, A. scriptus,H. melanurum and K. sectatrix, really could have been fished out from this part of northern Jamaica andthat our findings are not simply an artefact of under-sampling. It is already acknowledged that once-abundant species of snappers, groupers and large parrotfish are virtually absent on Jamaica’s reefs (Koslowet al., 1994). Furthermore, reducing St Lucia samples to Jamaican levels left 8.5 of 11 highly trappablespecies still represented in St Lucia.
Soldierfish had low trappability ratios in both Jamaica and St Lucia, but were much more abundant in StLucia than in Jamaica. Since this study showed trapping pressure in Jamaica to be around three and a halftimes greater than in St Lucia, it is possible that even families which can usually withstand intensive fishingwill become over-exploited if trapping reaches extremely high levels.
Table 4. Catch composition from fish traps in St Lucia showing fish size at first maturity and where possible the size at 50% and 100%maturity
Species Sample size Minimum sizeat maturity
Range Size at which50% mature
Size at which100% mature
Acanthurus bahianus 38 14 12–19 16Acanthurus coeruleus 20 15 11–21 15 15Scarus taeniopterus 38 15 14–24Sparisoma aurofrenatum 67 14 14–23Sparisoma rubripinne 43 17 17–31 22Sparisoma viride 10 25 15–25Cephalopholis cruentata 50 16 12–29 26 26Cephalopholis fulva 23 19 12–25Lutjanus mahogoni 14 20 18–34Ocyurus chrysurus 19 32 17–43 32 32Haemulon aurolineatum 24 14 14–17 16 17Haemulon carbonarium 22 16 15–22Haemulon chrysargyreum 21 15 15–18Haemulon flavolineatum 42 15 13–19 19Haemulon parrai 55 16 13–20Haemulon plumieri 23 17 14–28 25 25Holocentrus adscensionis 46 17 13–24 19 20Holocentrus rufus 34 13 13–17 14 15Myripristis jacobus 29 11 10–15 11 14Pseudupeneus maculatus 19 14 13–21Mulloidichthys martinicus 23 20 13–25Cantherhines pullus 17 13 13–20Clepticus parrae 21 17 17–24 17 17
TRAP FISHING EFFECTS ON REEF FISH 127
Copyright # 2006 John Wiley & Sons, Ltd. Aquatic Conserv: Mar. Freshw. Ecosyst. 17: 111–132 (2007)
DOI: 10.1002/aqc

It is important to be cautious in attributing among-island differences in fish assemblages to differences infishing pressure. There are other factors among islands besides fishing that could have played a role. Forexample, islands differ in size, relief, human population densities and level of development, and thesemay influence processes on adjacent reefs. They also differ in terms of scale and history of human andother impacts, including coral disease outbreaks, hurricanes, watershed clearance and nutrient input, toname a few (e.g. see Gardner et al., 2003). However, findings from the study uphold many predictedeffects of fishing (Polunin and Roberts, 1996). Other factors, such as degree of watershed development,although not tested statistically, do not appear to relate in obvious ways to inter-island differencesin fish abundance or assemblage composition, nor are mechanisms by which they might exert theseeffects clear. One possible exception is that coral cover and habitat structural complexity decrease on thestudy reefs as fishing pressure increases (Hawkins and Roberts, 2004), which may affect reef carryingcapacity and favour some species over others. Hawkins and Roberts (2003) argue that this habitat shift is initself partly a consequence of overfishing of herbivores. Biomass of herbivores decreases 10-fold over thisfishing pressure gradient, from Bonaire to Jamaica, with a consequent reduction in grazing pressure onalgae. Without undertaking experimental manipulations of fishing pressure it is not possible to rule outinfluences other than exploitation, but our findings clearly show that trap fishing has the capacity to alterfish assemblage composition, and historical fishery data suggest that it already has in Jamaica (Koslowet al., 1994).
Some species may be highly trappable because of behavioural traits. For example, most butterflyfishform strong pair bonds (Roberts and Ormond, 1992), so if one member of a pair goes into a trap itspartner is likely to follow. Such behaviour would double the likelihood of a species getting trappedand indeed Chaetodon striatus (trappability ratio 9.8) and Chaetodon ocellatus (trappability ratio 7.3)were highly trappable in St Lucia. Similarly, species which move around in groups or schools mightfollow each other into traps. Highly trappable species which this might apply to in Jamaica includeAcanthurus chirugus (trappability ratio 112), Acanthurus coeruleus (trappability ratio 12) A. bahianus(trappability ratio 3.6) and Sparisoma chrysopterum (trappability ratio 18), and, in St Lucia, Melichthysniger (trappability ratio 7), K. sectatrix (trappability ratio 6.2) and Sparisoma rubripinne (trappability ratio3.6). Other species may be highly trappable simply because they are curious and readily enter enclosedspaces.
Differences in fish behaviour between St Lucia and Jamaica could also help explain why trappabilityratios differed between these countries. In Jamaica, species such as Balistes vetula and Calamus calamus,tended to avoid our counting area but were less timid in St Lucia. Wary behaviour towards people is oftenencountered in places that are intensively spear-fished and, from personal observations, spear-fishers weremuch more common in Jamaica than St Lucia.
Species that grow slowly and reproduce late may be extirpated by trapping even when trapping pressureis relatively light. Groupers and snappers contain species that are prime examples of animals whose lifehistory characteristics (e.g. late maturity) render them particularly vulnerable to over-exploitation(Reynolds, 2003). In St Lucia such species with high trappability ratios were the groupers M. interstitialis(trappability ratio: 11.2) and Epinephelus guttatus (trappability ratio: 9.1) and the snappers L. synagris(trappability ratio: 439), O. chrysurus (trappability ratio: 3.3) and L. mahogoni (trappability ratio: 3.3).L. synagris had the highest trappability ratio of any species in St Lucia. This species was rare in counts andmay have moved into traps at night after coming up from deeper water (www.fishbase.org). Thetrappability ratio of L. synagris thus probably represents an overestimate of the difference in abundancebetween reef and traps for this species.
Trap fishing is widely perceived as a relatively benign method whereby small-scale fishers canobtain a living from coral reefs. However, it is clear from the steep gradients in fish abundance acrossour inter-island fishing pressure gradient that fishing, particularly with traps, has greatly affected Caribbeanfish assemblages. Historical data from the region place this inter-island comparison in a different
J.P. HAWKINS ET AL.128
Copyright # 2006 John Wiley & Sons, Ltd. Aquatic Conserv: Mar. Freshw. Ecosyst. 17: 111–132 (2007)
DOI: 10.1002/aqc

perspective, showing steep declines in high-value, vulnerable species over time. In Puerto Rico, forexample, there were 1403 fishers in 1931, setting 4239 traps and catching 1400 tonnes of reef fish(Appeldoorn et al., 1992). By 1990, trap numbers climbed to 13 555, while catches fell to 854 tonnes.Most of the catch in 1931 was composed of Nassau groupers, Epinephelus striatus and other high-valuesnappers and groupers. By 1990, more than half of the catch was composed of low-value species such asgrunts, surgeonfish and parrotfish. Similar trends of increasing fishing effort, falling catches anddisappearance of high-value species have been seen over much of the region, including the US VirginIslands (Rogers and Beets, 2001), Florida (Ault et al., 1998) and Jamaica (Jackson, 1997). The perceptionthat trap fishing is a benign fishing method has perhaps permitted these fisheries to operate withlittle regulation or control. There is an urgent need for reappraisal, such as that under way in Floridawhere traps are due to be phased out by 2007 (http://www.reefguardian.org/Campaigns/FishTrapGOM/MoreInfoFTrapGOM.html).
Species with high trappability ratios may not necessarily be highly threatened by fishing, even in placeswhere trap fishing is intense. Species which are small at maturity, have short life-cycles and high turnoverrates might be able to withstand being highly trappable because their life history characteristics enable themto persist despite high rates of fishing mortality. In countries where levels of trap fishing are high thesespecies may constitute the majority of catches. However, intensive fishing may threaten sustainability ofeven these species eventually. Mesh size limits help reduce the impact of trapping on fish populations byallowing juvenile fish to escape capture until after they reach maturity (Hunte and Mahon, 1994). They canalso increase catches by reducing growth over-fishing. Work by Sary et al. (1997), done at the same place inJamaica as this study and at a similar time, showed that fishery yields increased when traps with 2.5 cmand 3.2 cm meshes were replaced with ones of a larger size of 3.8 cm mesh. However, meshes will needto be bigger than this if large species with late maturity and a susceptibility to trapping are to gain anyprotection. One way round this problem could be to introduce slots, known as ‘escape gaps’, into traps thatare larger than the mesh size. These help provide an opportunity for juveniles to escape (Stewart andFerrell, 2002).
In summary, certain taxa such as the Tetraodontiformes appear to be particularly vulnerable totrapping. Whatever reasons lure fish into traps and regardless of the fact that some species appear moretrappable than others, trapping is a highly non-selective form of fishing. If populations of vulnerablespecies are to be maintained on reefs, and more resilient species are to support productive and sustainablefisheries, then trapping needs to be regulated. This can include measures such as limiting numbers of trapfishers and how many traps each can use, increasing mesh sizes and introducing escape gaps to traps.Education could also help reduce waste from trap fisheries. For example, fishers could be encouraged tothrow back the small fish they catch from shallow water. Given that fisheries regulations are often difficultto enforce in areas with trap fisheries, marine reserves that are off-limits to fishing probably provide theeasiest and most effective way to tackle the problems associated with trap fishing, particularly if used inassociation with the other forms of management discussed (Murray et al., 1999; Roberts and Hawkins,2000; Russ, 2002; Gell and Roberts 2003). Even in areas where trapping pressure is fairly low, marinereserves will provide essential refuges for species that are particularly vulnerable to over-exploitation(Roberts, 2005).
ACKNOWLEDGEMENTS
We would like to thank the UK Natural Environmental Research Council, UK Department for InternationalDevelopment, University of Puerto Rico Seagrant and USAID for funding this work. Special thanks to the BonaireMarine Park, Saba Marine Park and Scuba St Lucia for generous use of their facilities during field trips. Erkki Siirila,Harold Guiste, Daniel Matos, Graciela Garcia-Moliner, Michelet Fontaine and John Clark helped us track downinformation on fishing pressure. Thanks to John Baxter and two reviewers whose comments greatly improved themanuscript.
TRAP FISHING EFFECTS ON REEF FISH 129
Copyright # 2006 John Wiley & Sons, Ltd. Aquatic Conserv: Mar. Freshw. Ecosyst. 17: 111–132 (2007)
DOI: 10.1002/aqc

REFERENCES
Allison WR. 1992. The Discovery Bay fisheries improvement project: status report. Proceedings of the Gulf andCaribbean Fisheries Institute 42: 331–337.
Alverson DL, Hughes SE. 1996. Bycatch: from emotive to effective natural resource management. Reviews in FishBiology and Fisheries 6: 443–462.
Appeldoorn R, Beets J, Bohnsack JA, Bolden S, Matos D, Meyers S, Rosario A, Sadovy Y, Tobias W. 1992. Shallowwater reef fish stock assessment for the US Caribbean. NOAA Technical Memorandum NMFS-SEFSC-304,National Oceanic and Atmospheric Administration, Miami, FL.
Ault JS, Bohnsack JA, Meester GA. 1998. A retrospective (1979–1996) multispecies assessment of coral reef fish stocksin the Florida Keys. Fishery Bulletin 96: 395–414.
Blott AJ. 1978. A preliminary study of timed release mechanisms for lobster traps. Marine Fisheries Review 40:44–49.
Boehlert GW. 1996. Biodiversity and the sustainability of marine fisheries. Oceanography 9: 28–35.Bohnsack JA, Bannerot SA. 1986. A stationary visual census technique for quantitatively assessing communitystructures of coral reef fishes. Technical report NMFS: 41. National Oceanic and Atmospheric Administration,Miami, FL.
Butler JN, Burnett-Herkes J, Barnes JA, Ward J. 1993. The Bermuda fisheries: a tragedy of the commons averted?Environment 35: 6–15 and 25–33.
Dayton PK, Thrush SF, Agardy MT, Hofman RJ. 1995. Environmental effects of marine fishing. Aquatic Conservation:Marine and Freshwater Ecosystems 5: 1–28.
Ferry RE, Kohler CC. 1987. Effects of trap fishing on fish populations inhabiting a fringing coral reef. North AmericanJournal of Fisheries Management 7: 580–588.
Gardner TA, Cote IM, Gill JA, Grant A, Watkinson AR. 2003. Long-term region-wide declines in Caribbean corals.Science 301: 958–960.
Garrison VH, Rogers CS, Beets J. 1998. Of reef fishes, overfishing and in situ observations of fish traps in St John, U.S.Virgin Islands. Revista de Biologia Tropical 5: 41–59.
Garrison VH, Rogers CS, Beets J, Friedlander AM. 2004. The habitats exploited and the species trapped in a Caribbeanisland trap fishery. Environmental Biology of Fishes 71: 247–260.
Gell FR, Roberts CM, Goodridge R. 2001. The fishery effects of the Soufriere Marine Management Area 1995/6 to2000/1. University of York, York.
Gell FR, Roberts CM. 2003. Benefits beyond boundaries: the fishery effects of marine reserves. Trends in Ecology andEvolution 18: 448–455.
Gobert B. 1998. Density-dependent size selectivity in Antillean fish traps. Fisheries Research 38: 159–167.Goodridge R. 1996. Changes in the coral reef fishery in Soufriere, St Lucia associated with implementation of a systemof fishing priority and marine reserves. MS thesis, University of the West Indies, Barbados.
Grandcourt EM, Al Abdessalaam TZ, Francis F, Al Shamsi A. 2004. Population biology and assessment ofrepresentatives of the family Carangidae } Carangoides bajad and Gnathanodon speciosus (Forsskal, 1775), in theSouthern Arabian Gulf. Fisheries Research 69: 331–341.
Hawkins JP, Roberts CM. 2003. Effects of fishing on sex-changing Caribbean parrotfishes. Biological Conservation 115:213–226.
Hawkins JP, Roberts CM. 2004. Effects of artisanal fishing on Caribbean coral reefs. Conservation Biology 18:215–226.
Humann P. 1996. Reef Fish Identification. New World Publications: Jacksonville, FL.Hunte W, Mahon R. 1994. Size selection of fish by the mesh of fish traps. Document no. LPRSF SSW/WP/21,CARICOM Fisheries Resource Assessment and Management Project, Kingstown, St Vincent.
Jackson JBC. 1997. Reefs since Columbus. Coral Reefs 16: S23–S32.Koslow JA, Aiken K, Auil S, Clementson A. 1994. Catch and effort analysis of the reef fisheries of Jamaica and Belize.Fishery Bulletin 92: 737–747.
Mangi SC. 2006. Gear management in Kenya’s coastal fisheries. PhD thesis, University of York, York.Matos-Caraballo D. 1997. Puerto Rico fisheries census, 1995–1996. Puerto Rico Department of Natural andEnvironmental Resources, Mayaguez.
Miller RJ, Hunte W. 1987. Effective area fished by Antillean fish traps. Bulletin of Marine Science 40: 484–493.Morelock J, Winget EA, Goenaga C. 1994. Geologic maps of the southwestern Puerto Rico Parguera to Guanicainsular reef. Miscellaneous investigations series. US Geological Survey.
Murray SN, Ambrose RF, Bohnsack JA, Botsford LW, Carr MH, Davis GE, Dayton PK, Gotshall D, Gunderson DR,Hixon MA, Lubchenco J, Mangel M, MacCall A, McArdle DA, Ogden JC, Roughgarden J, Starr RM, Tegner MJ,
J.P. HAWKINS ET AL.130
Copyright # 2006 John Wiley & Sons, Ltd. Aquatic Conserv: Mar. Freshw. Ecosyst. 17: 111–132 (2007)
DOI: 10.1002/aqc

Yoklarich MM. 1999. No-take reserve networks: sustaining fishery populations and marine ecosystems. Fisheries24: 11–25.
NMFS (National Marine Fisheries Service). 1995. Characterization of the reef fish fishery of the eastern U.S. Gulf ofMexico. NMFS Memo, Report prepared for the GMFMC.
Olsen DA, LaPlace JA. 1978. A study of a Virgin Islands grouper fishery based on a breeding aggregation. Proceedingsof the Gulf and Fisheries Institute 31: 130–144.
Polunin NVC, Roberts CM (eds). 1996. Reef Fisheries. Chapman & Hall: London.Recksiek CW, Appeldoorn RS, Turingan RG. 1991. Studies of fish traps as stock assessment devices on a shallow reefin south-western Puerto Rico. Fisheries Research 10: 177–197.
Reynolds JD. 2003. Life histories and extinction risk. In Macroecology, Gaston KJ, Blackburn TM (eds). Blackwell:Oxford.
Roberts CM. 2005. Marine protected areas and biodiversity conservation. In Marine Conservation Biology, Norse EA,Crowder LB (eds). Island Press: Washington, DC.
Roberts CM, Hawkins JP. 1996. Status of reef fish and coral communities of the Cabrits National Park. University ofYork, York.
Roberts CM, Hawkins JP. 2000. Fully-protected marine reserves: a guide. WWF Endangered Seas Campaign,Washington, DC, and Environment Department, University of York, York.
Roberts CM, Ormond RFG. 1992. Butterflyfish social behaviour, with special reference to the incidence ofterritoriality: a review. Environmental Biology of Fishes 34: 79–93.
Roberts CM, Bohnsack JA, Gell F, Hawkins JP, Goodridge R. 2001. Effects of marine reserves on adjacent fisheries.Science 294: 1920–1923.
Robichaud D, Hunte W, Oxenford HA. 1999. Effects of increased mesh size on catch and fishing power of coral reef fishtraps. Fisheries Research 39: 275–294.
Robichaud D, Hunte W, Chapman MR. 2000. Factors affecting the catchability of reef fishes in Antillean fish traps.Bulletin of Marine Science 67: 831–844.
Rogers CS, Beets J. 2001. Degradation of marine ecosystems and decline of fishery resources in marine protected areasin the US Virgin Islands. Environmental Conservation 28: 312–322.
Russ GR. 2002. Yet another review of marine reserves as reef fishery management tools. In Coral Reef Fishes, Sale PF(ed.). Academic Press: San Diego, CA; 421–443.
Sandeman IM, Woodley JD. 1994. Jamaica north coast fisheries improvement project } final report to the CanadianInternational Development Agency. 504/13778. Canadian International Development Agency, Hull, Quebec.
Sary Z. 1995. Responses of an over-exploited Caribbean trap fishery to the introduction of a larger mesh size inDiscovery Bay, Jamaica. MSc thesis, University of the West Indies.
Sary Z, Oxenford HA, Woodley JD. 1997. Effects of an increase in trap mesh size on an overexploited coral reef fisheryat Discovery Bay Jamaica. Marine Ecology Progress Series 154: 107–120.
Sheaves MJ. 1995. Effect of design modification and soak time variations on Antillean-Z fish trap performance in atropical estuary. Bulletin of Marine Science 56: 475–489.
Slack-Smith RJ. 2002. Fishing with traps and pots. http://www.fao.org/DOCREP/004/X2590E/x2590e04.htm#TopOfPage
Stevenson DK, Stuart-Sharkey P. 1980. Performance of wire fish traps on the western cost of Puerto Rico. InProceedings of the 32nd Annual Gulf and Caribbean Fisheries Institute; 173–193.
Stewart J, Ferrell DJ. 2002. Escape panels to reduce by-catch in the New South Wales demersal trap fishery.Marine andFreshwater Research 53: 1179–1188.
Sutherland DL, Harper DE. 1983. The wire fish trap fishery of Dade and Broward counties. Florida Marine ResearchPublication no. 40.
Taylor RG, McMichael RH. 1983. The wire fish-trap fishery in Monroe and Collier counties. Florida Marine ResearchPublication no. 39.
Yoshikawa T, Asoh K. 2004. Entanglement of monofilament fishing lines and coral death. Biological Conservation 117:557–560.
Whitelaw AW, Sainsbury KJ, Dews GJ, Campbell RA. 1991. Catching characteristics of four fish-trap types on thenorth west shelf of Australia. Australian Journal of Marine and Freshwater Research 42: 369–382.
Wolff N, Grober-Dunsmore R, Rogers C, Beets J. 1999. Management implications of fish trap effectiveness in adjacentcoral reef and gorgonian habitats. Environmental Biology of Fishes 55: 81–90.
TRAP FISHING EFFECTS ON REEF FISH 131
Copyright # 2006 John Wiley & Sons, Ltd. Aquatic Conserv: Mar. Freshw. Ecosyst. 17: 111–132 (2007)
DOI: 10.1002/aqc

APPENDIX: SPECIES REMOVED FROM TRAPPABILITY ANALYSIS (ARRANGED IN
ALPHABETICAL ORDER)
Species Size (cm) Cryptic
Amblycirrhitus pinos 9 YesApogon maculates 9 YesAulostomus maculatus 75 NoBairdiella sanctaeluciae 15 YesCanthigaster rostrata 9 NoCentropyge argi 6 YesCentropyge aurantonotus 6 YesChannomuraena vittata 120 YesChromis cyanea 10 NoChromis insolata 9 NoChromis multilineata 14 NoCryptotomus roseus 9 YesEchidna catenata 45 YesEnchelycore carychroa 25 YesEnchelycore nigricans 60 YesEquetus acuminatus 20 YesEquetus lanceolatus 20 YesEquetus punctatus 23 YesFistularia tabacaria 120 NoGinglymostoma cirratum 270 NoGramma loreto 6 YesGymnothorax funebris 150 YesGymnothorax miliaris 45 YesGymnothorax moringa 90 YesHalichoeres bivittatus 18 NoHalichoeres cyanocephalus 11 NoHalichoeres garnoti 15 NoHalichoeres maculipinna 13 NoHalichoeres pictus 14 NoHalichoeres poeyi 14 NoHemiemblemaria simulus 9 YesHemipteronotus martinicensis 9 YesHeteroconger halis 38 YesHippocampus erectus 10 YesInermia vittata 18 NoLiopropoma carmabi 4 YesLiopropoma rubre 8 YesLucayablennius zingaro 4 YesMalacanthus plumieri 45 NoMegalops atlanticus 120 NoMonacanthus tuckeri 9 YesMyrichthys breviceps 75 YesMyrichthys ocellatus 75 YesNarcine brasiliensis 38 NoOdontoscion dentax 19 YesOphichthus ophis 75 YesOpistognathus aurifrons 8 YesPempheris schomburgki 13 YesScorpaenodes caribbaeus 10 YesSerranus baldwini 5 YesSerranus tabacarius 11 NoSerranus tigrinus 9 NoSparisoma atomarium 10 YesSparisoma radians 13 YesStegastes partitus 9 NoSynodus intermedius 35 NoSynodus saurus 18 NoThalisoma bifasciatum 13 NoUrolophus jamaicensis 30 No
J.P. HAWKINS ET AL.132
Copyright # 2006 John Wiley & Sons, Ltd. Aquatic Conserv: Mar. Freshw. Ecosyst. 17: 111–132 (2007)
DOI: 10.1002/aqc